Verdict — Balanced Powerhouse For Work And Game
The Alienware 16X Aurora is notable for its high quality construction and 240 Hz IPS display with P3 colors across all current configurations. Other lower-end or midrange gaming laptops tend to use more plastic or ship with cheaper IPS panels to save on costs and so we appreciate the higher standards Dell is setting with the 16X Aurora. Even the less expensive (non-X) 16 Aurora promises full sRGB colors at the baseline.
Fan behavior is another high point as the fans don't pulse when running undemanding loads. While common on subnotebooks with ULV CPUs, this behavior is something we'd like to see more of on larger gaming laptops.
Many of the drawbacks to the 16X Aurora are similar to the Area-51. The higher quality construction means a heavier unit while power consumption can be quite high leading to average battery life at best even for a gaming laptop. Meanwhile, GPU options top out at the GeForce RTX 5070 instead of the RTX 5070 Ti which would have been a much better fit for 1600p gaming. Dell reserves its RTX 5070 Ti options for the much pricier Area-51 series as an incentive for potential buyers to upgrade.
Pros
Cons
Price and Availability
Dell is now shipping the Alienware Aurora 16X as configured in this review for $1600 USD. A similar SKU with more RAM and storage is also available on Amazon for $2270.
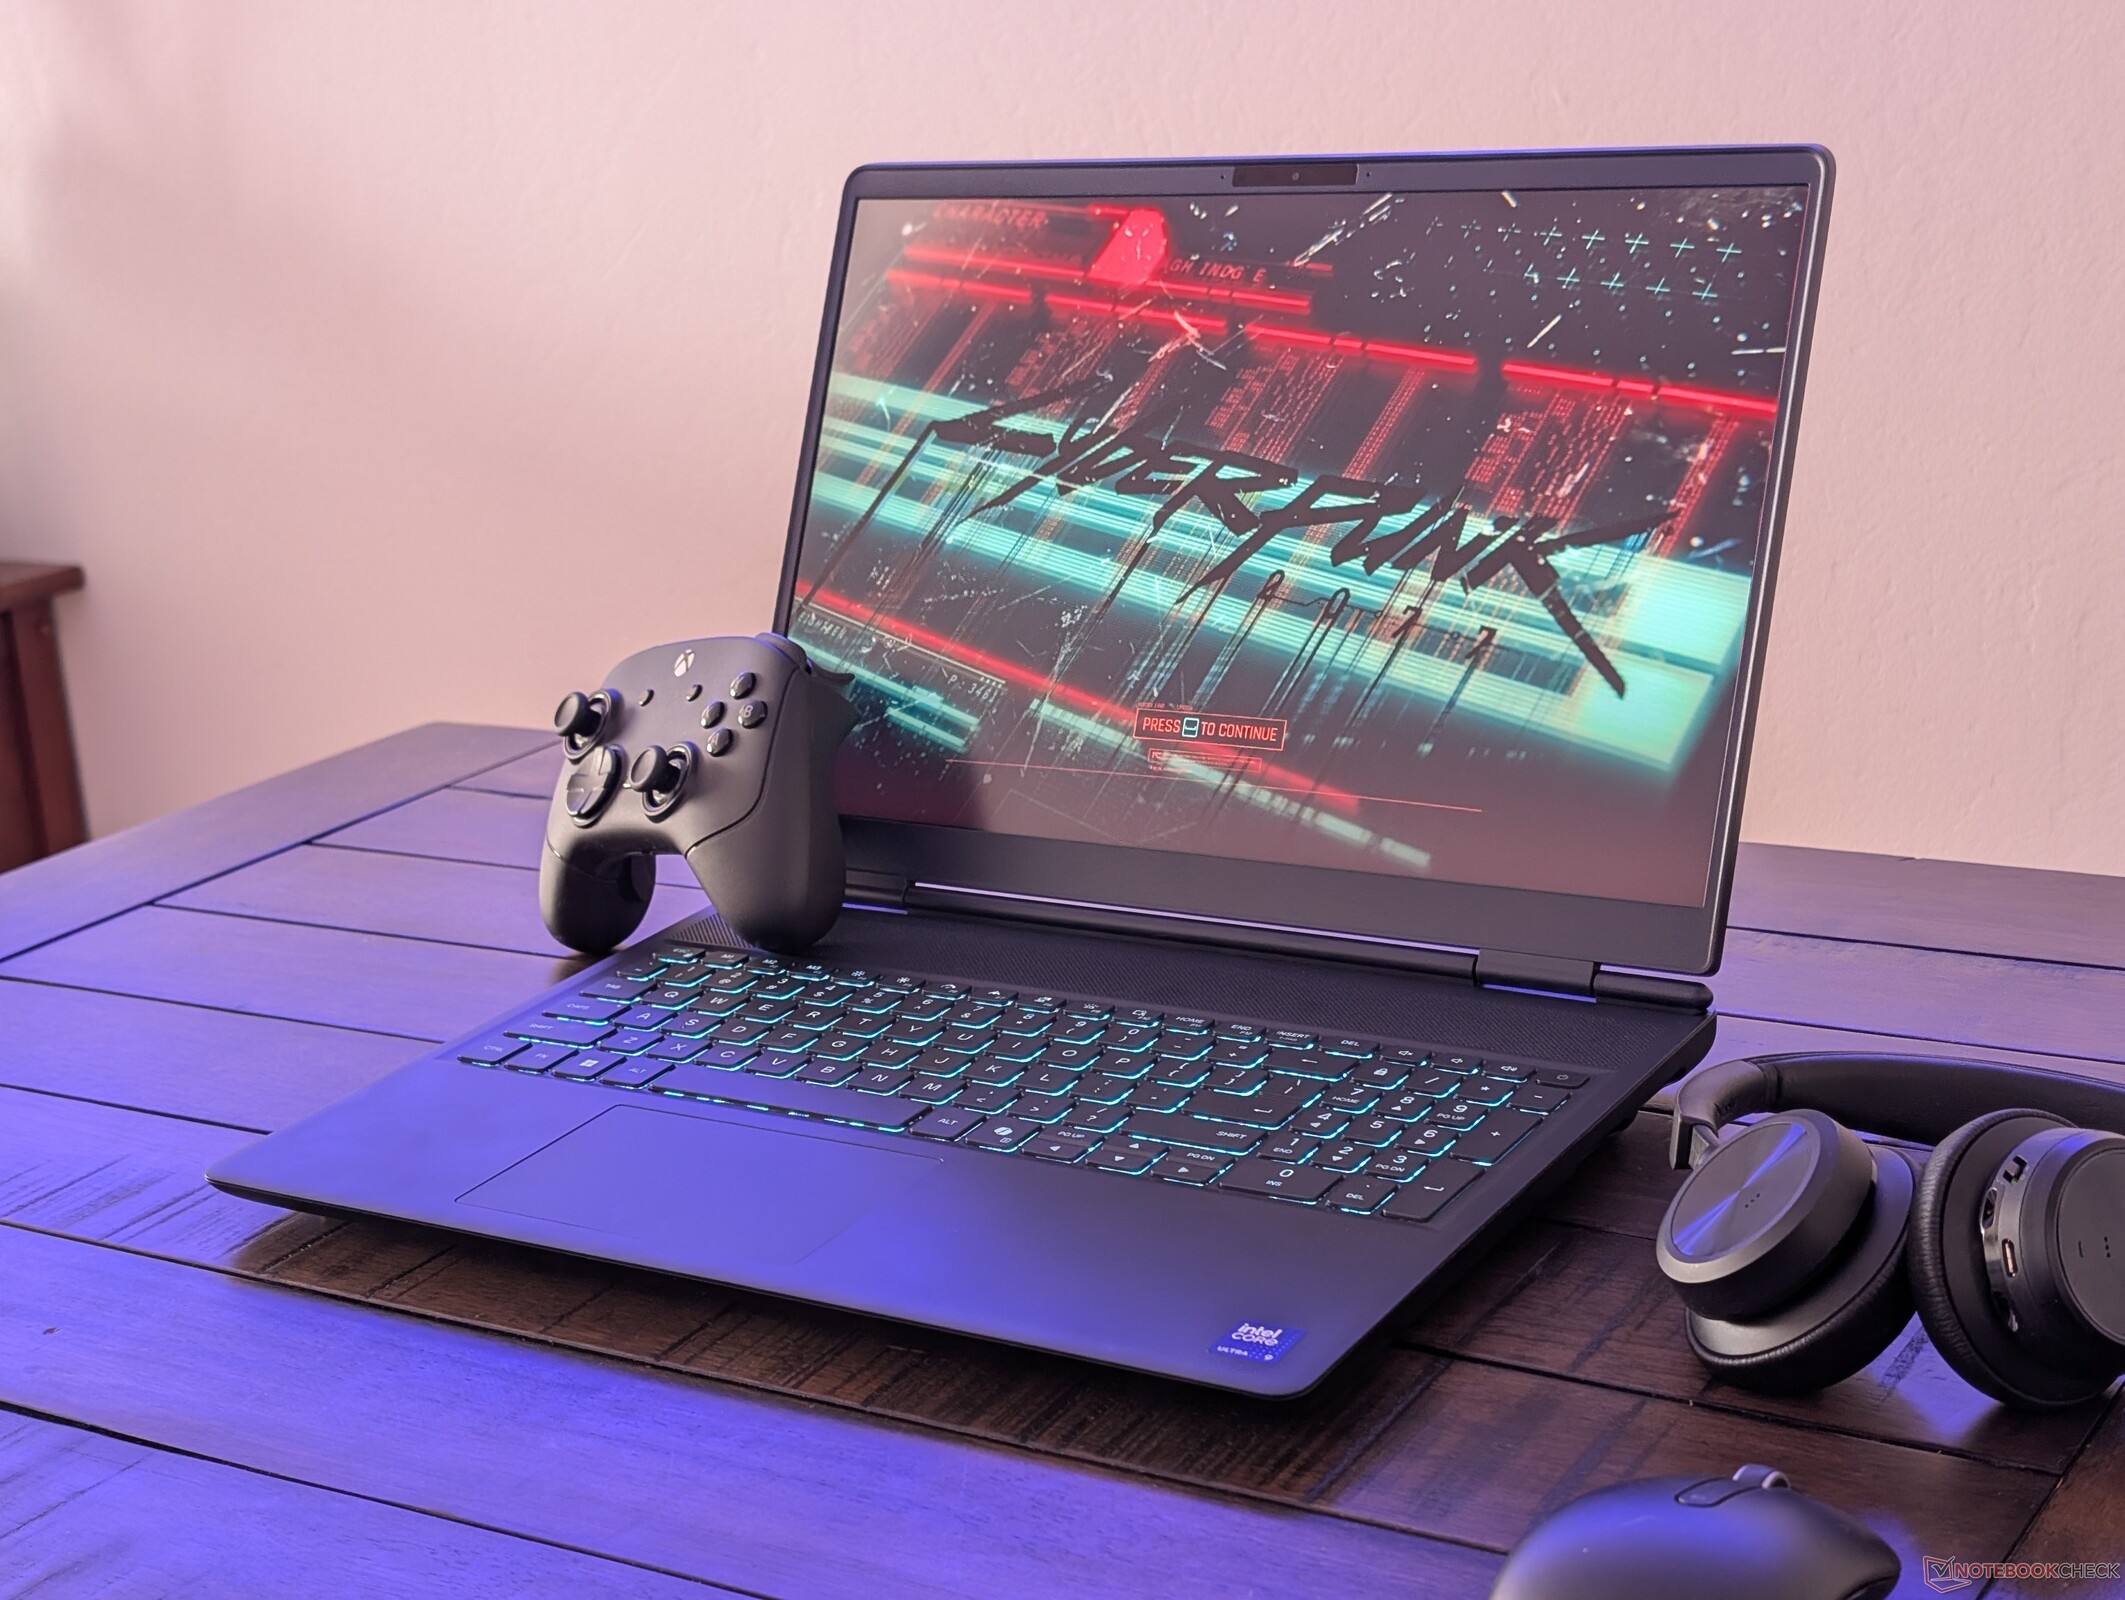
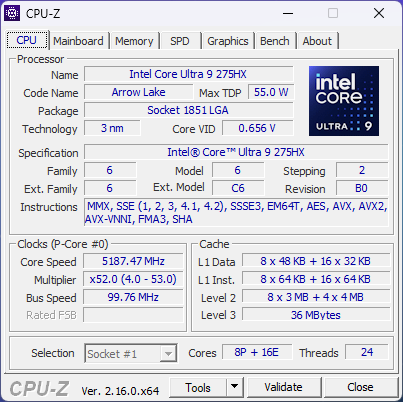
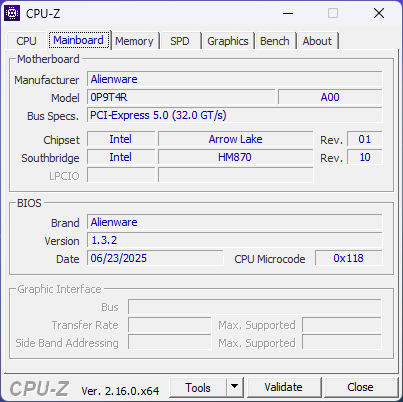
The Alienware Aurora 16X is a midrange gaming laptop from Dell sitting just below the high-end Alienware Area-51 series. It features the same Intel Arrow Lake-HX CPUs as found on the Area-51 albeit with lower-end Nvidia Blackwell options running at lower power ceilings to save on costs. The 16X Aurora can be considered a successor to the older Alienware m16 series.
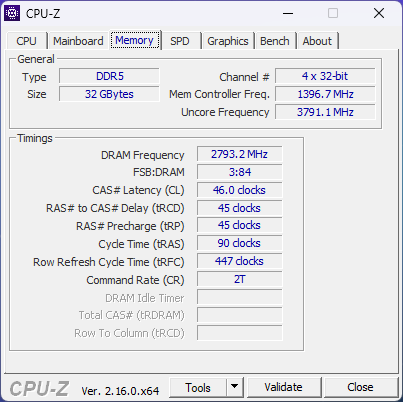
Our test unit is a higher-end configuration with the Core Ultra 9 275HX CPU, 115 W GeForce RTX 5070 GPU, and 1600p240 Hz IPS P3 display for approximately $1600 USD. Lower-end SKUs (called the 16 Aurora) ship with the Core Ultra 7 255HX and/or RTX 5060 with a 1600p120 IPS sRGB display.
Alternatives to the Aurora 16X include other midrange 16-inch gaming laptops like the MSI Vector 16 HX, Asus TUF Gaming A16, or Lenovo Legion 5 Pro.
More Dell reviews:
Specifications
Case
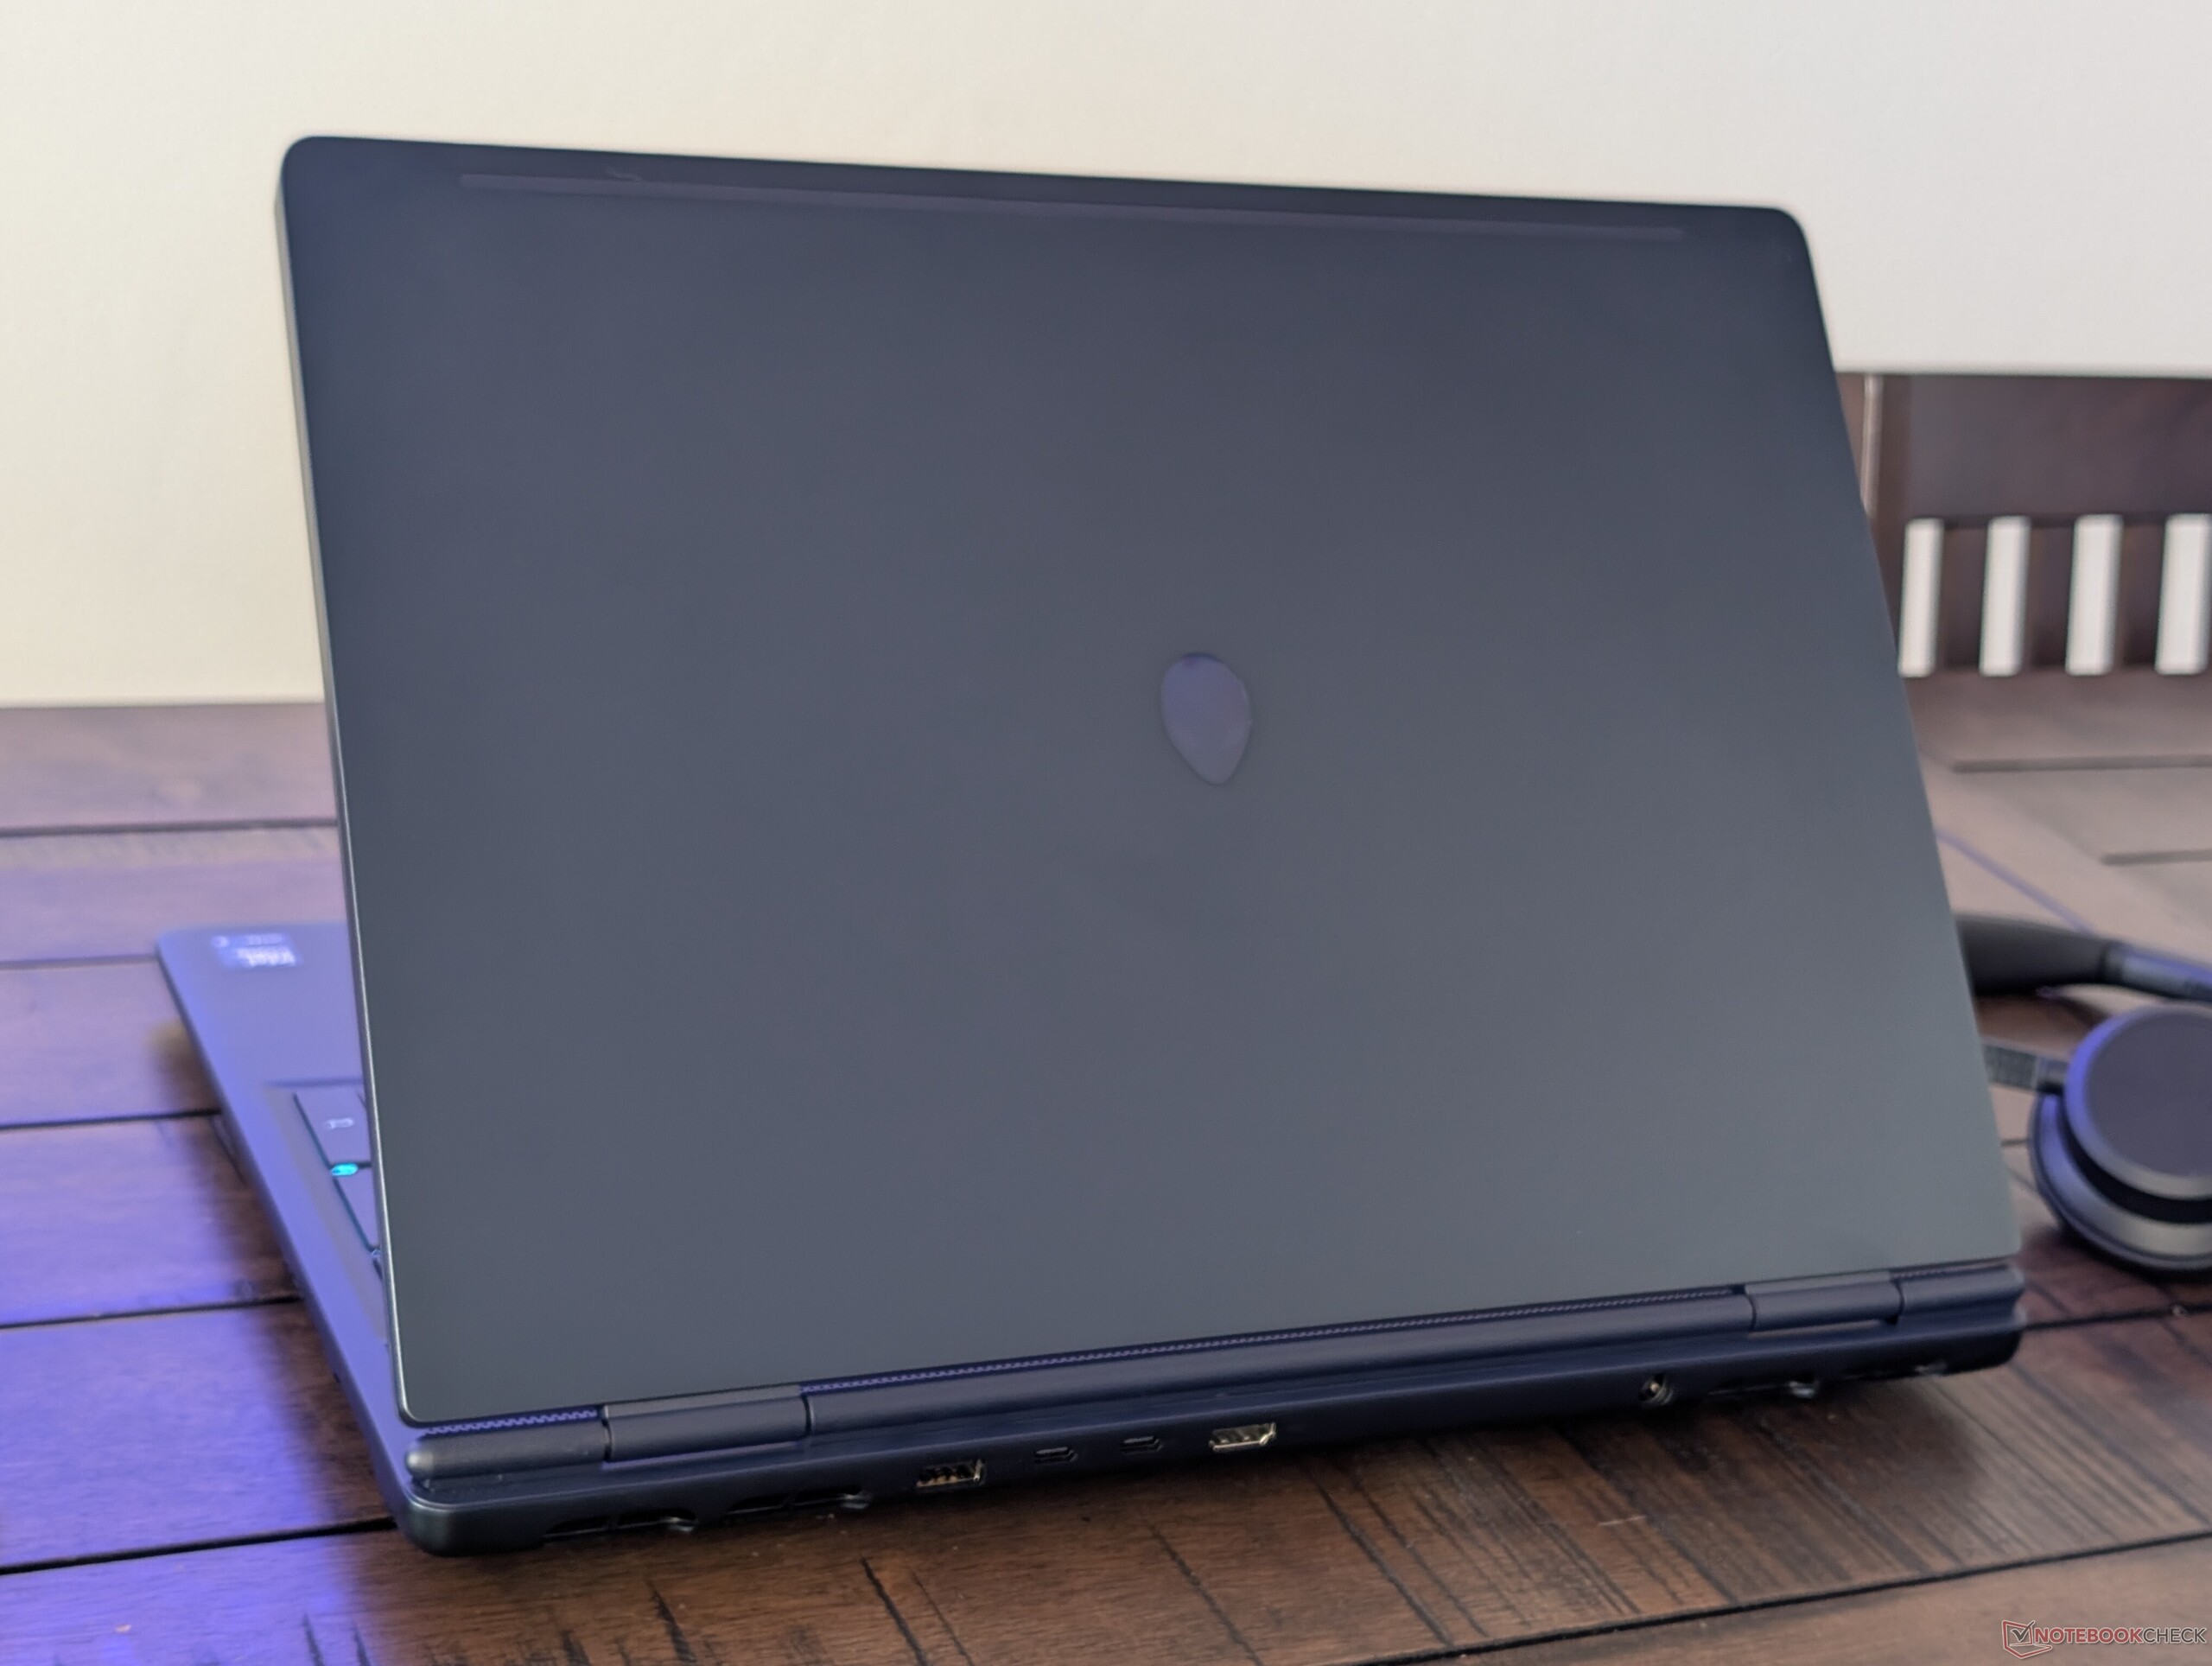
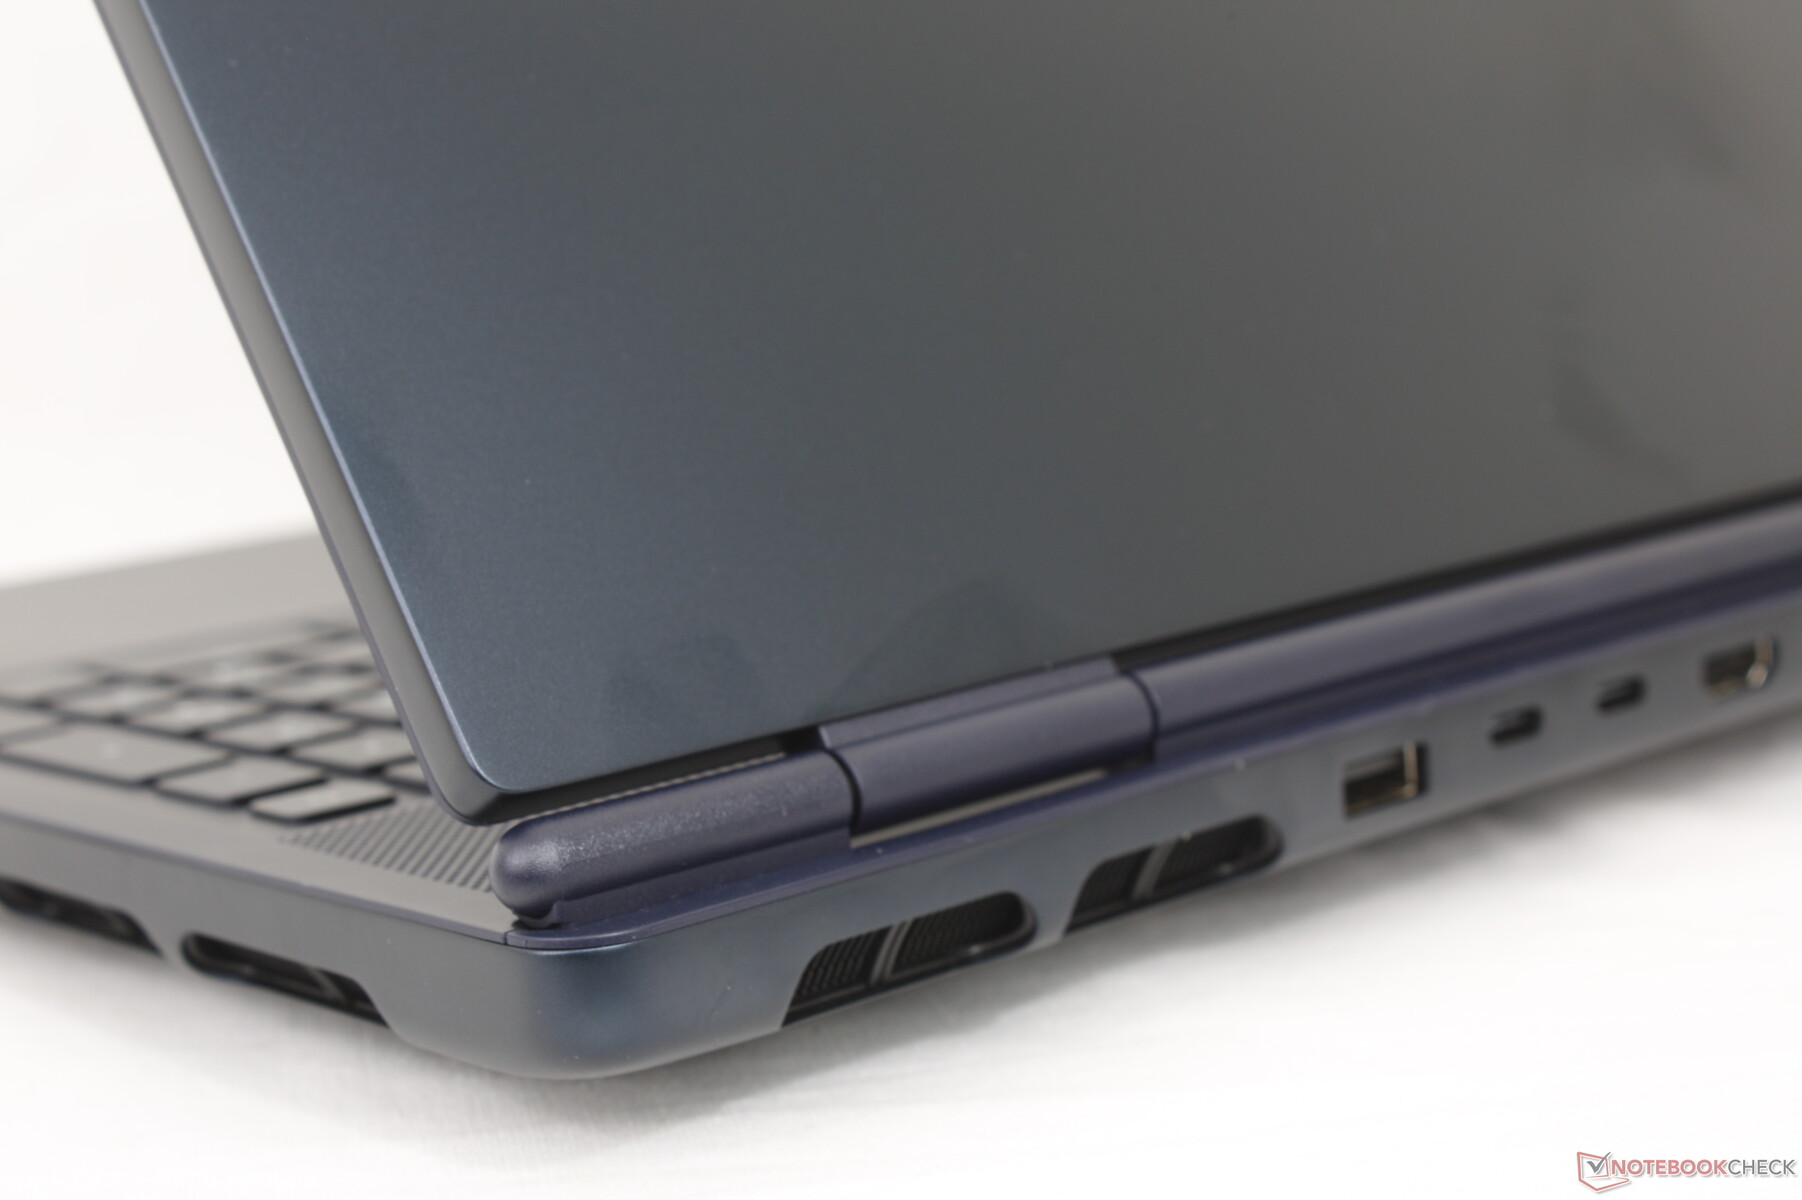
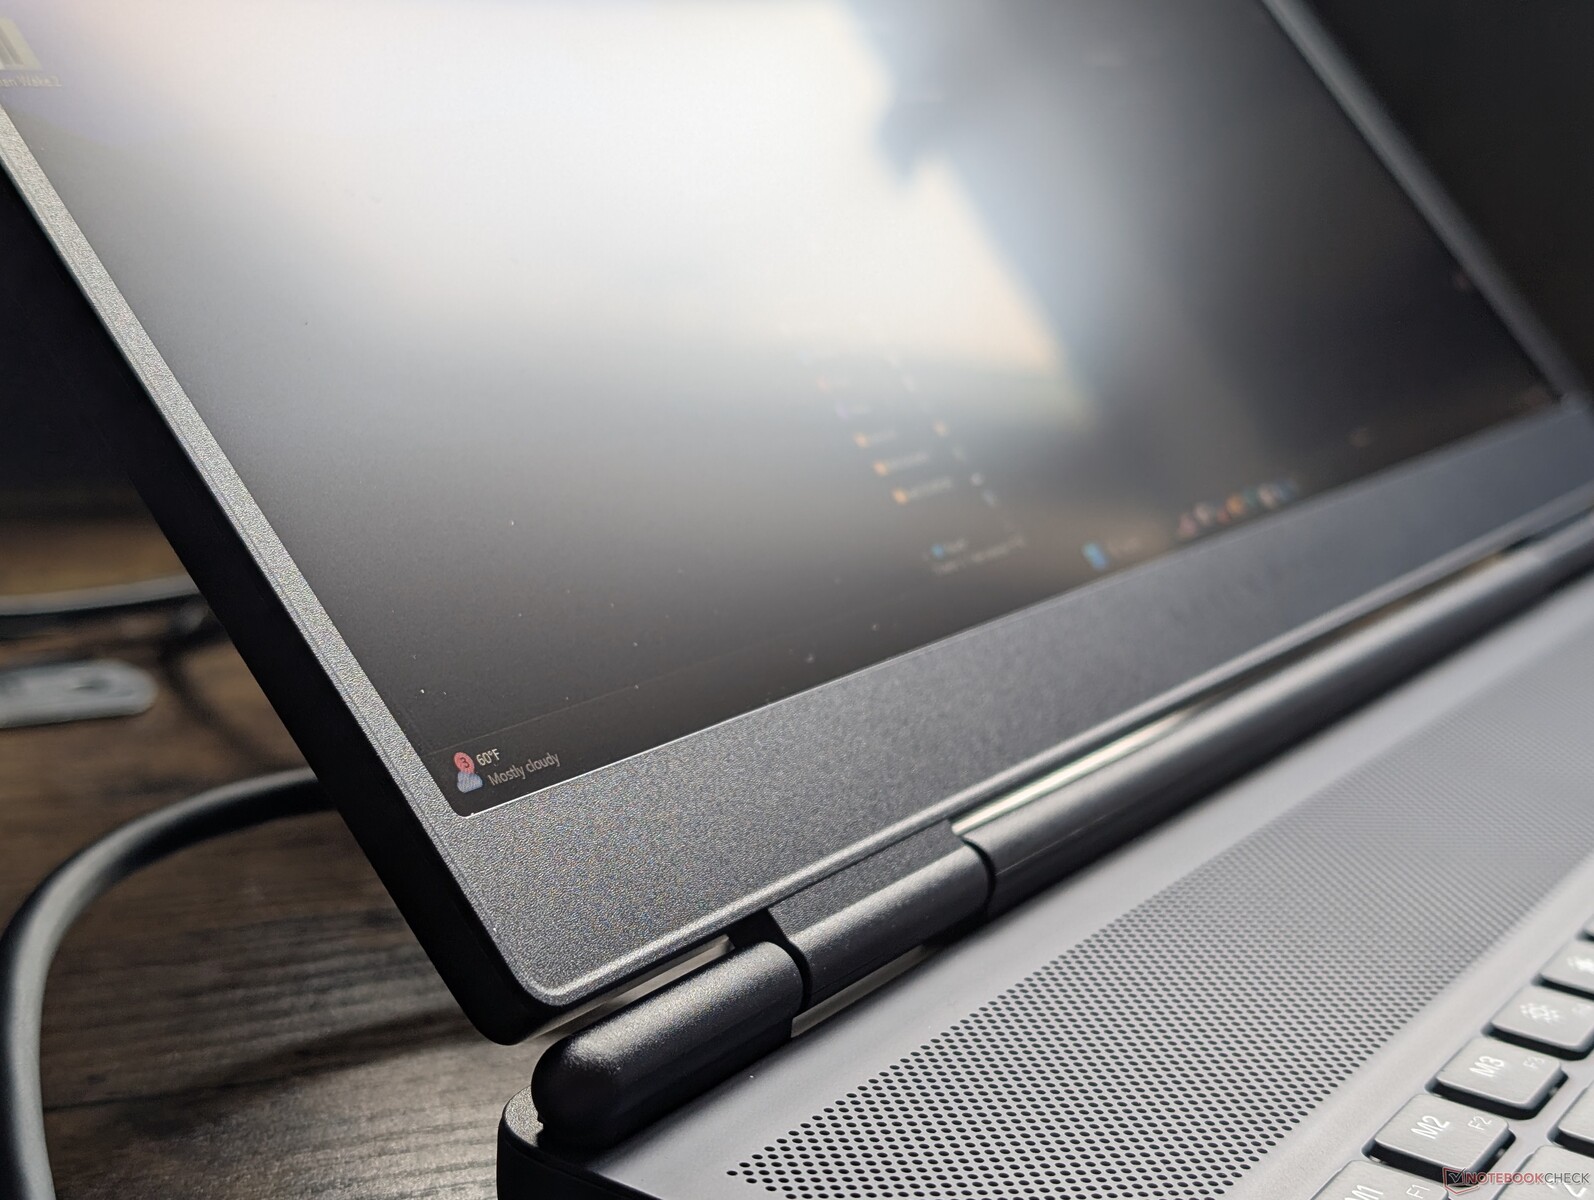
The case can be best described as a toned-down version of the Alienware 16 Area-51. Gone are the RGB lights along the rear, Gorilla Glass window on the bottom, per-key RGB lighting, and two-tone color options in favor of a straightforward jet black look. Perhaps most importantly, plastic is thankfully kept to a minimum as much of the chassis still consists of magnesium alloy and anodized aluminum which isn't always the case for budget to midrange gaming laptops. Chassis rigidity feels great for the price as a result.
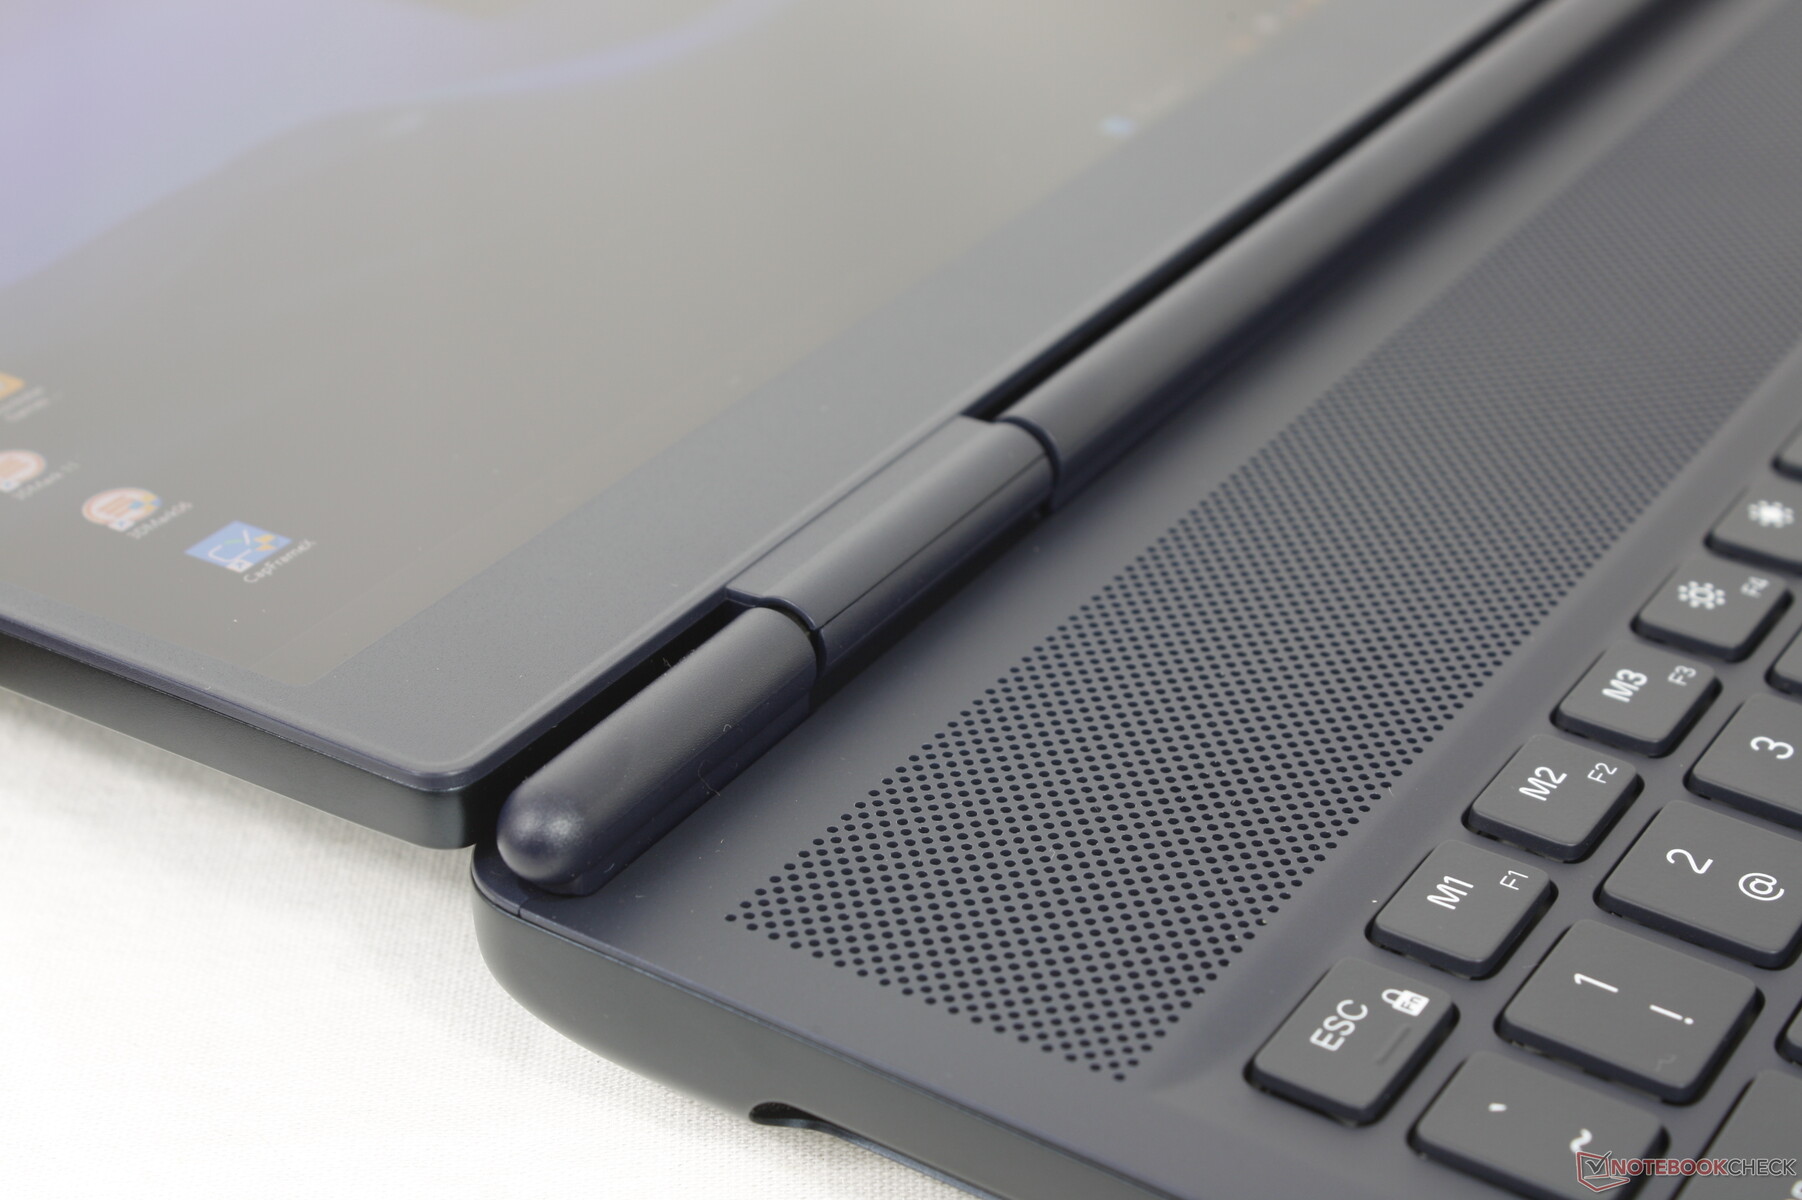
Hinge rigidity could nonetheless be stiffer for a better sense of longevity as they can open the full 180 degrees unlike on the Area-51. Be prepared to clean the palm rests and keys often as well as fingerprints readily collect all over the machine.
While nowhere near as heavy as the Area-51, the Aurora 16X is still quite heavy for a 16-inch gaming laptop. Alternatives like the Asus TUF Gaming A16 or Gigabyte Gaming A16 GA6H are each a few hundred grams lighter albeit the former option is also slightly thicker.
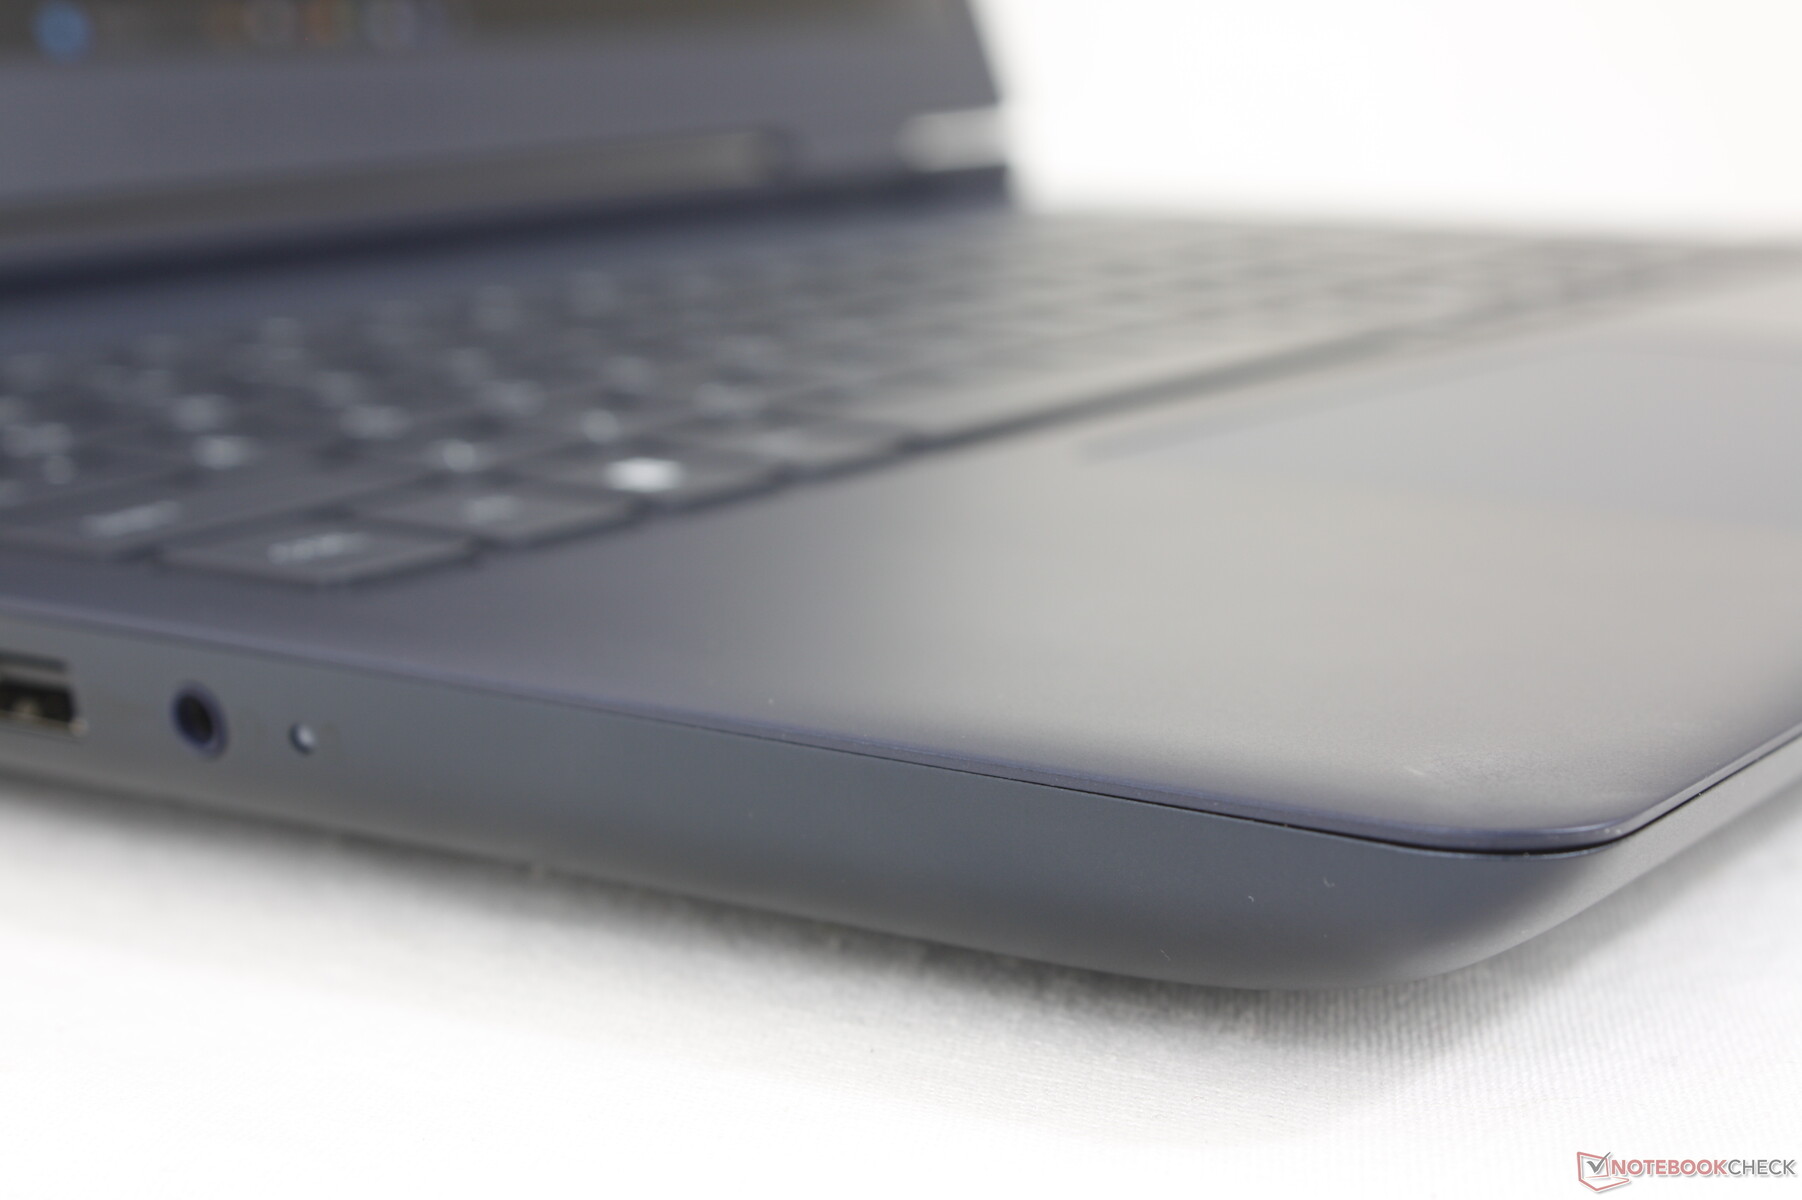

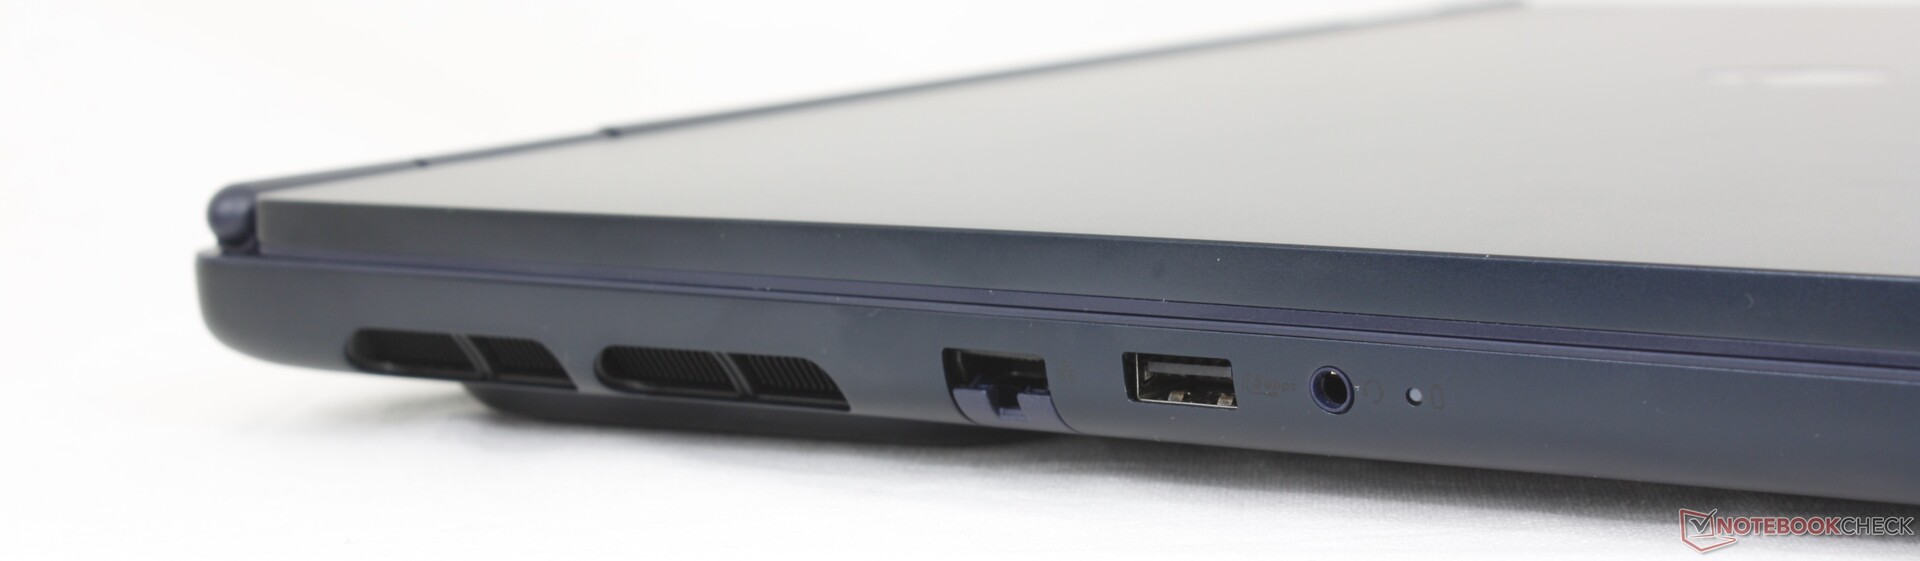
Connectivity
An RJ-45 port comes standard whereas it is missing on the Alienware Area-51. The model nonetheless features fewer USB-A ports and no SD card reader to save on costs.
Note that Power Delivery or charging with third-party USB-C AC adapters is supported only on the USB-C 3.2 Gen. 2 port and not the Thunderbolt 4 port.


Communication
| Networking | |
| iperf3 transmit AXE11000 | |
| Asus TUF Gaming A16 FA608WV | |
| Gigabyte Gaming A16 GA6H | |
| Alienware 16 Area-51 | |
| MSI Vector 16 HX AI A2XWHG | |
| Lenovo Legion 5 Pro 16IAX10H | |
| Alienware 16X Aurora, RTX 5070 | |
| iperf3 receive AXE11000 | |
| Asus TUF Gaming A16 FA608WV | |
| MSI Vector 16 HX AI A2XWHG | |
| Gigabyte Gaming A16 GA6H | |
| Alienware 16 Area-51 | |
| Alienware 16X Aurora, RTX 5070 | |
| Lenovo Legion 5 Pro 16IAX10H | |
| iperf3 transmit AXE11000 6GHz | |
| Asus TUF Gaming A16 FA608WV | |
| Alienware 16X Aurora, RTX 5070 | |
| Alienware 16 Area-51 | |
| iperf3 receive AXE11000 6GHz | |
| Asus TUF Gaming A16 FA608WV | |
| Alienware 16X Aurora, RTX 5070 | |
| Alienware 16 Area-51 | |
Webcam
A 2 MP webcam comes standard with IR but no privacy shutter.


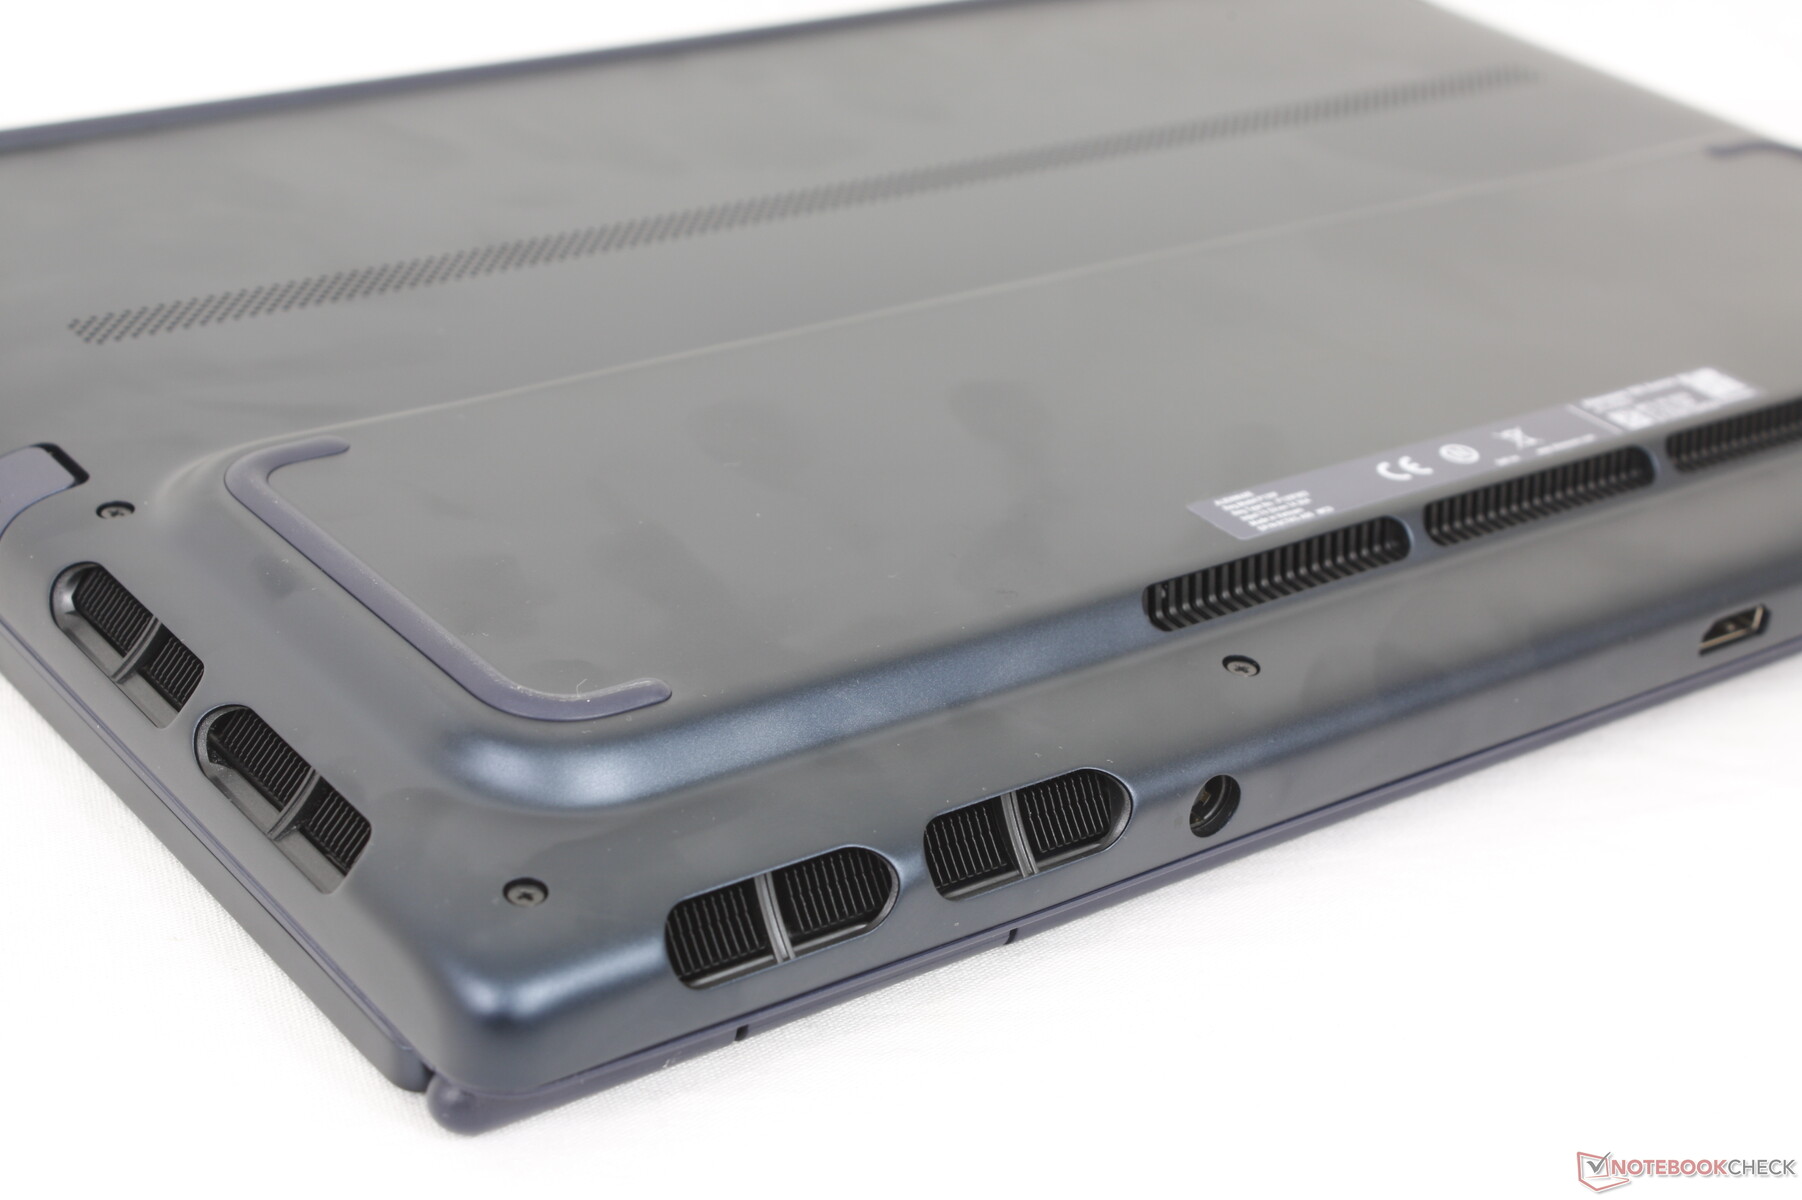
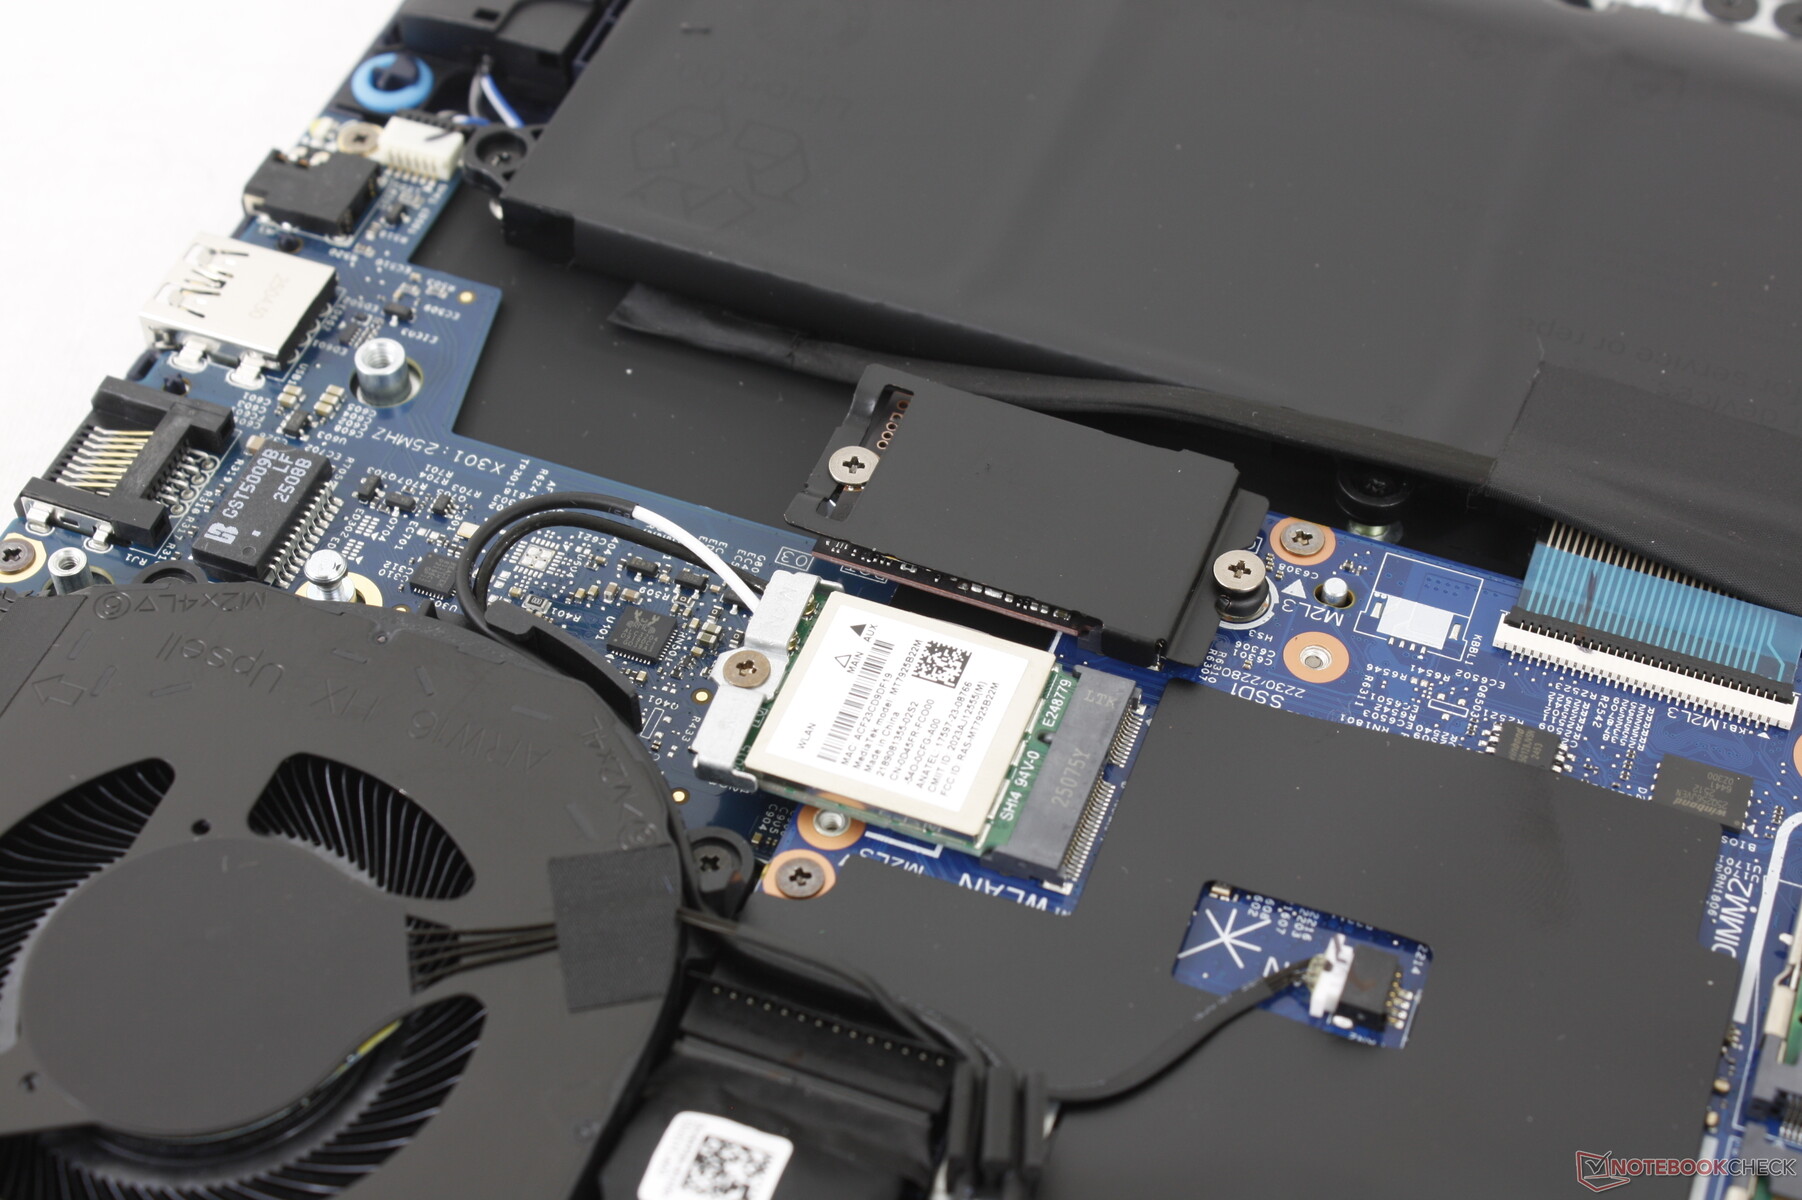
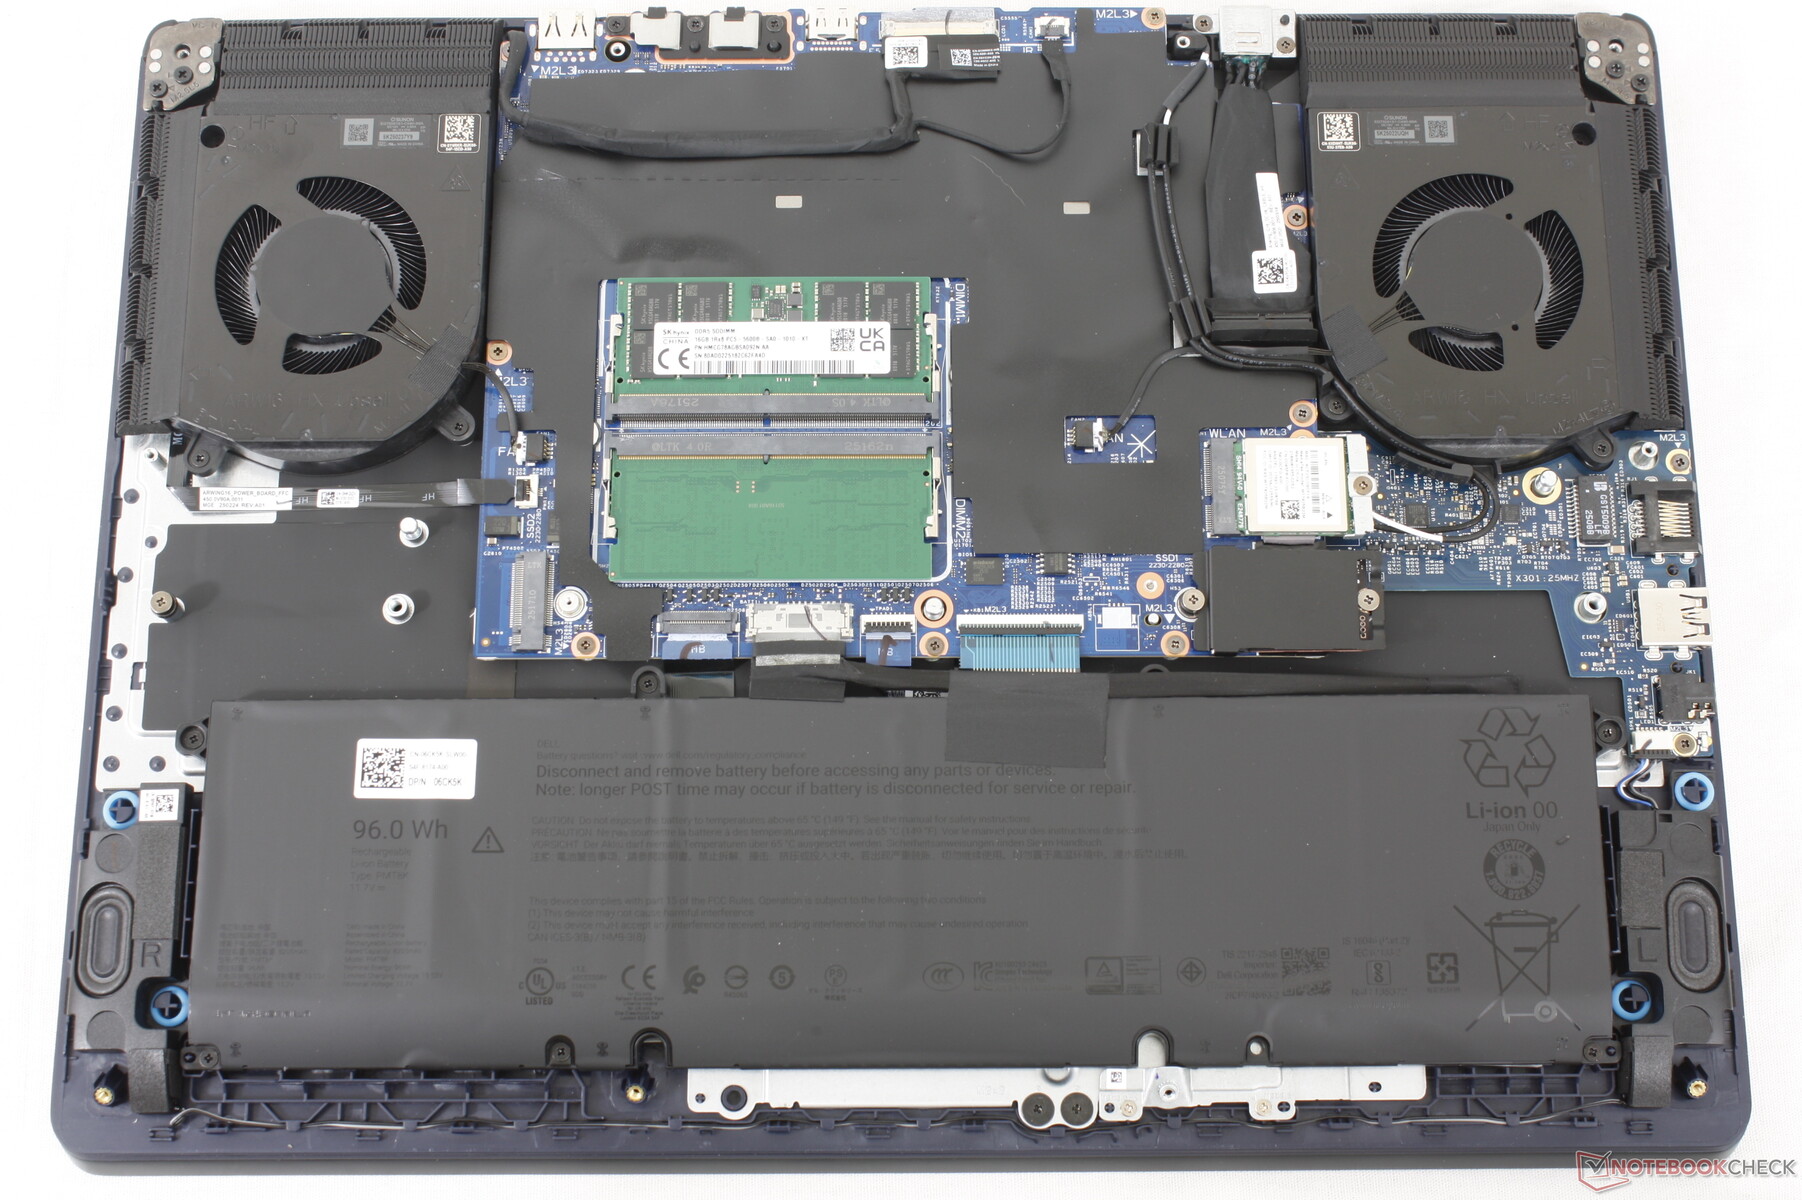
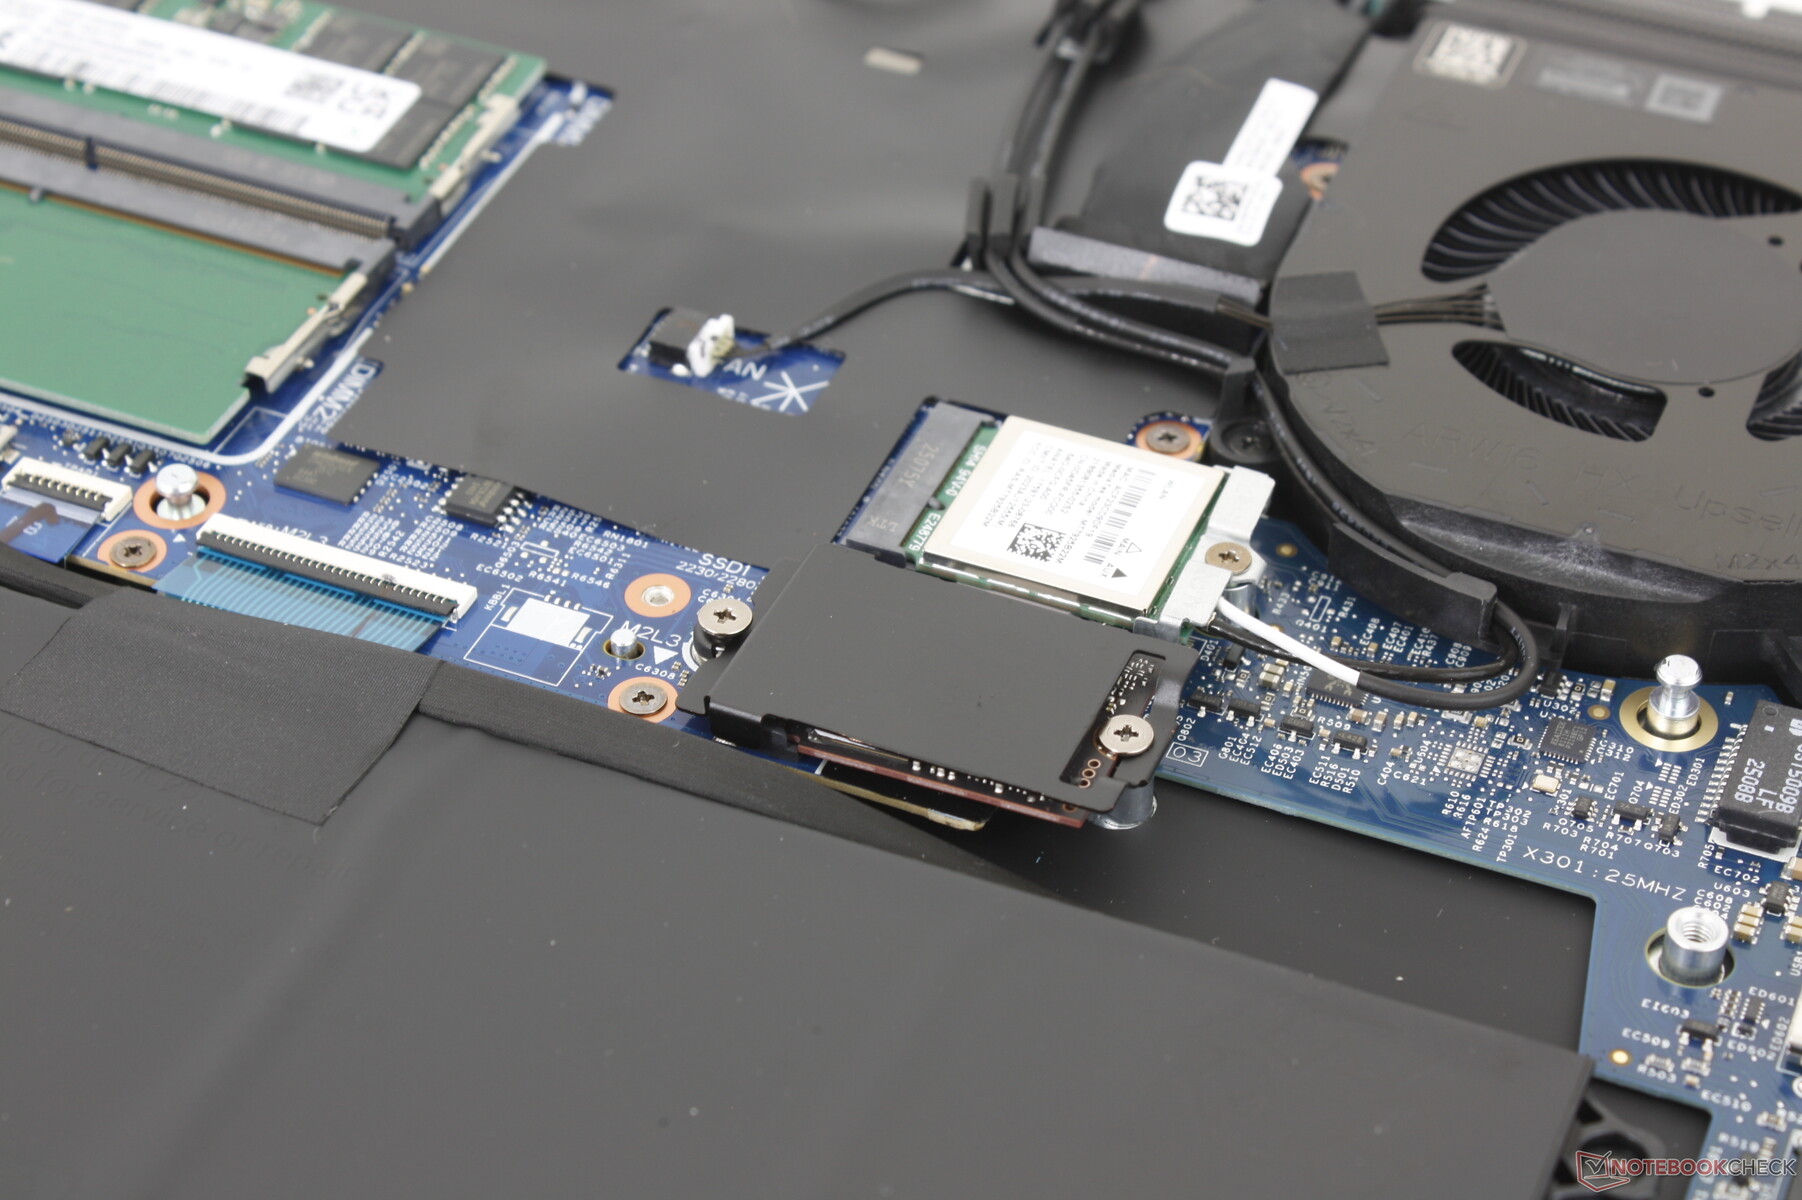
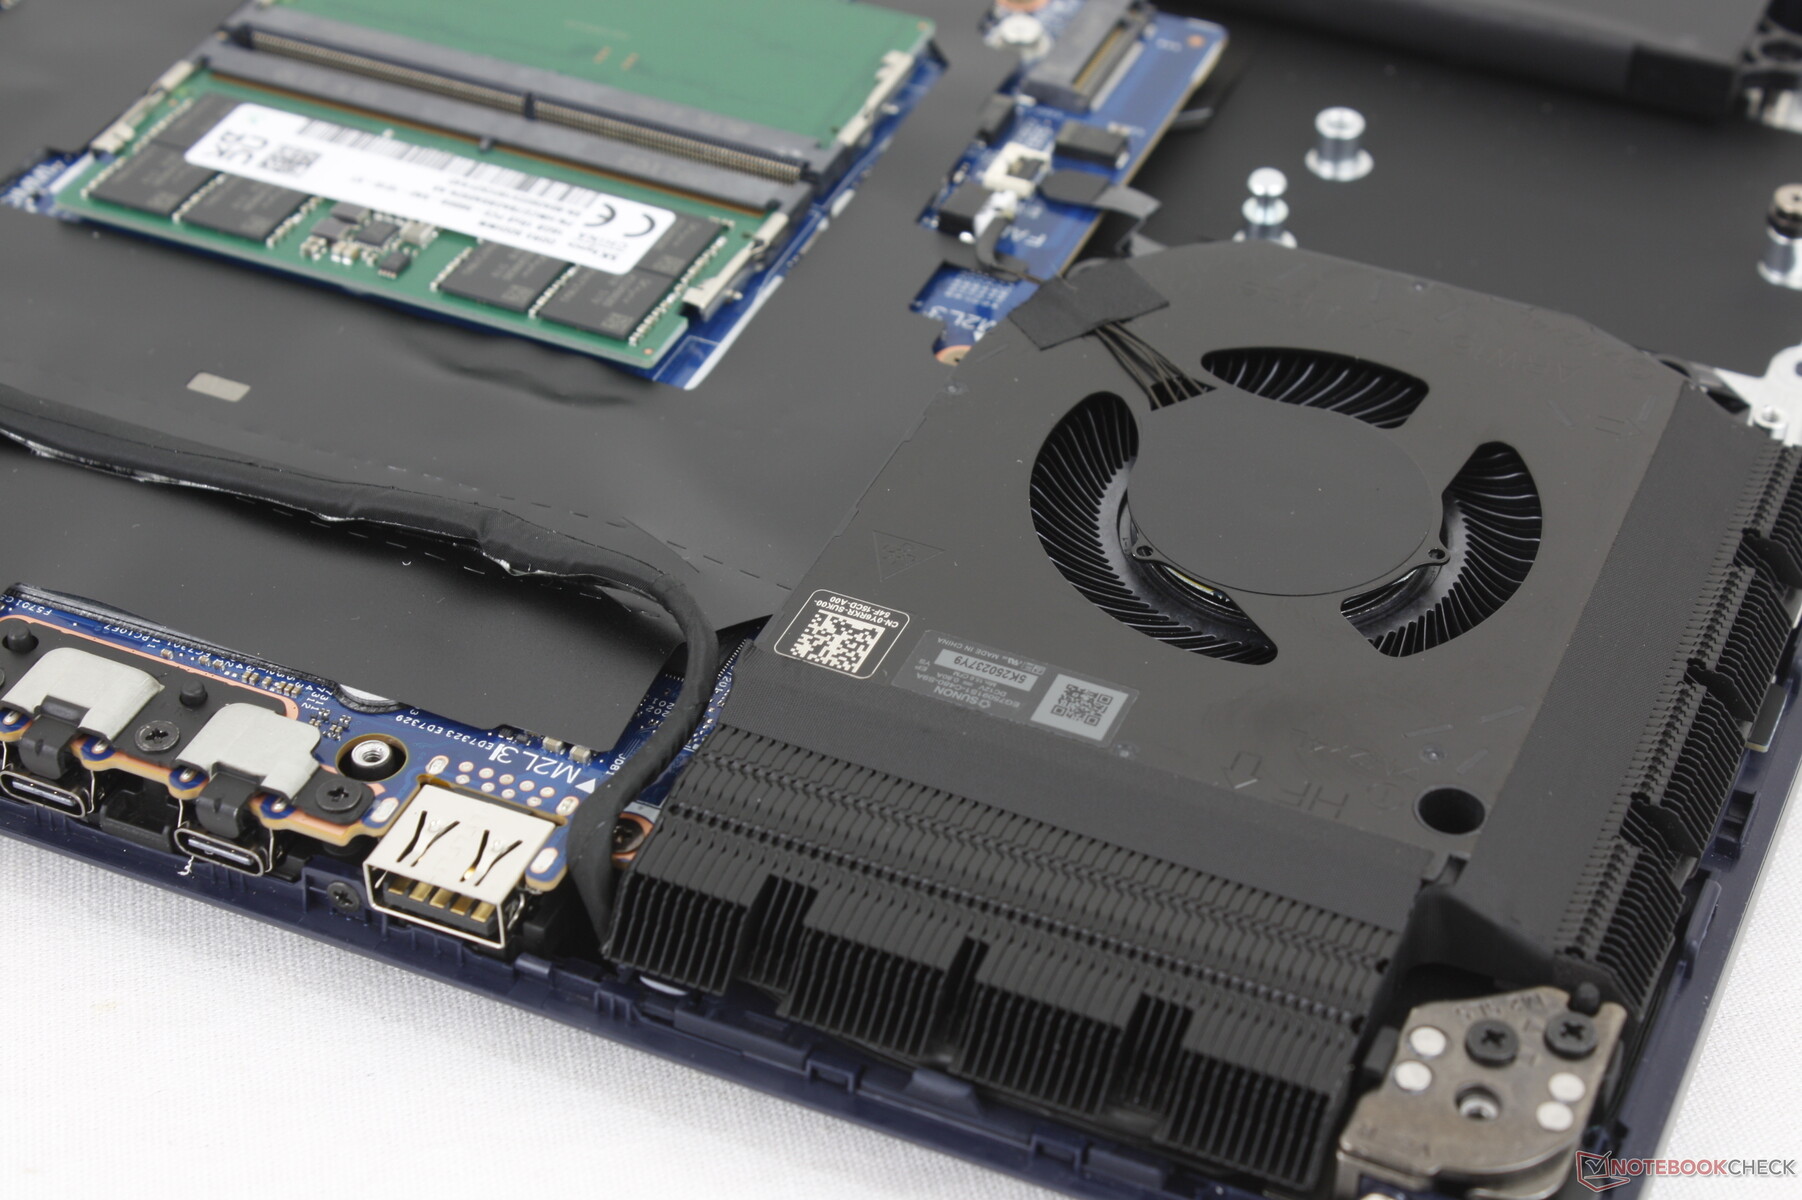
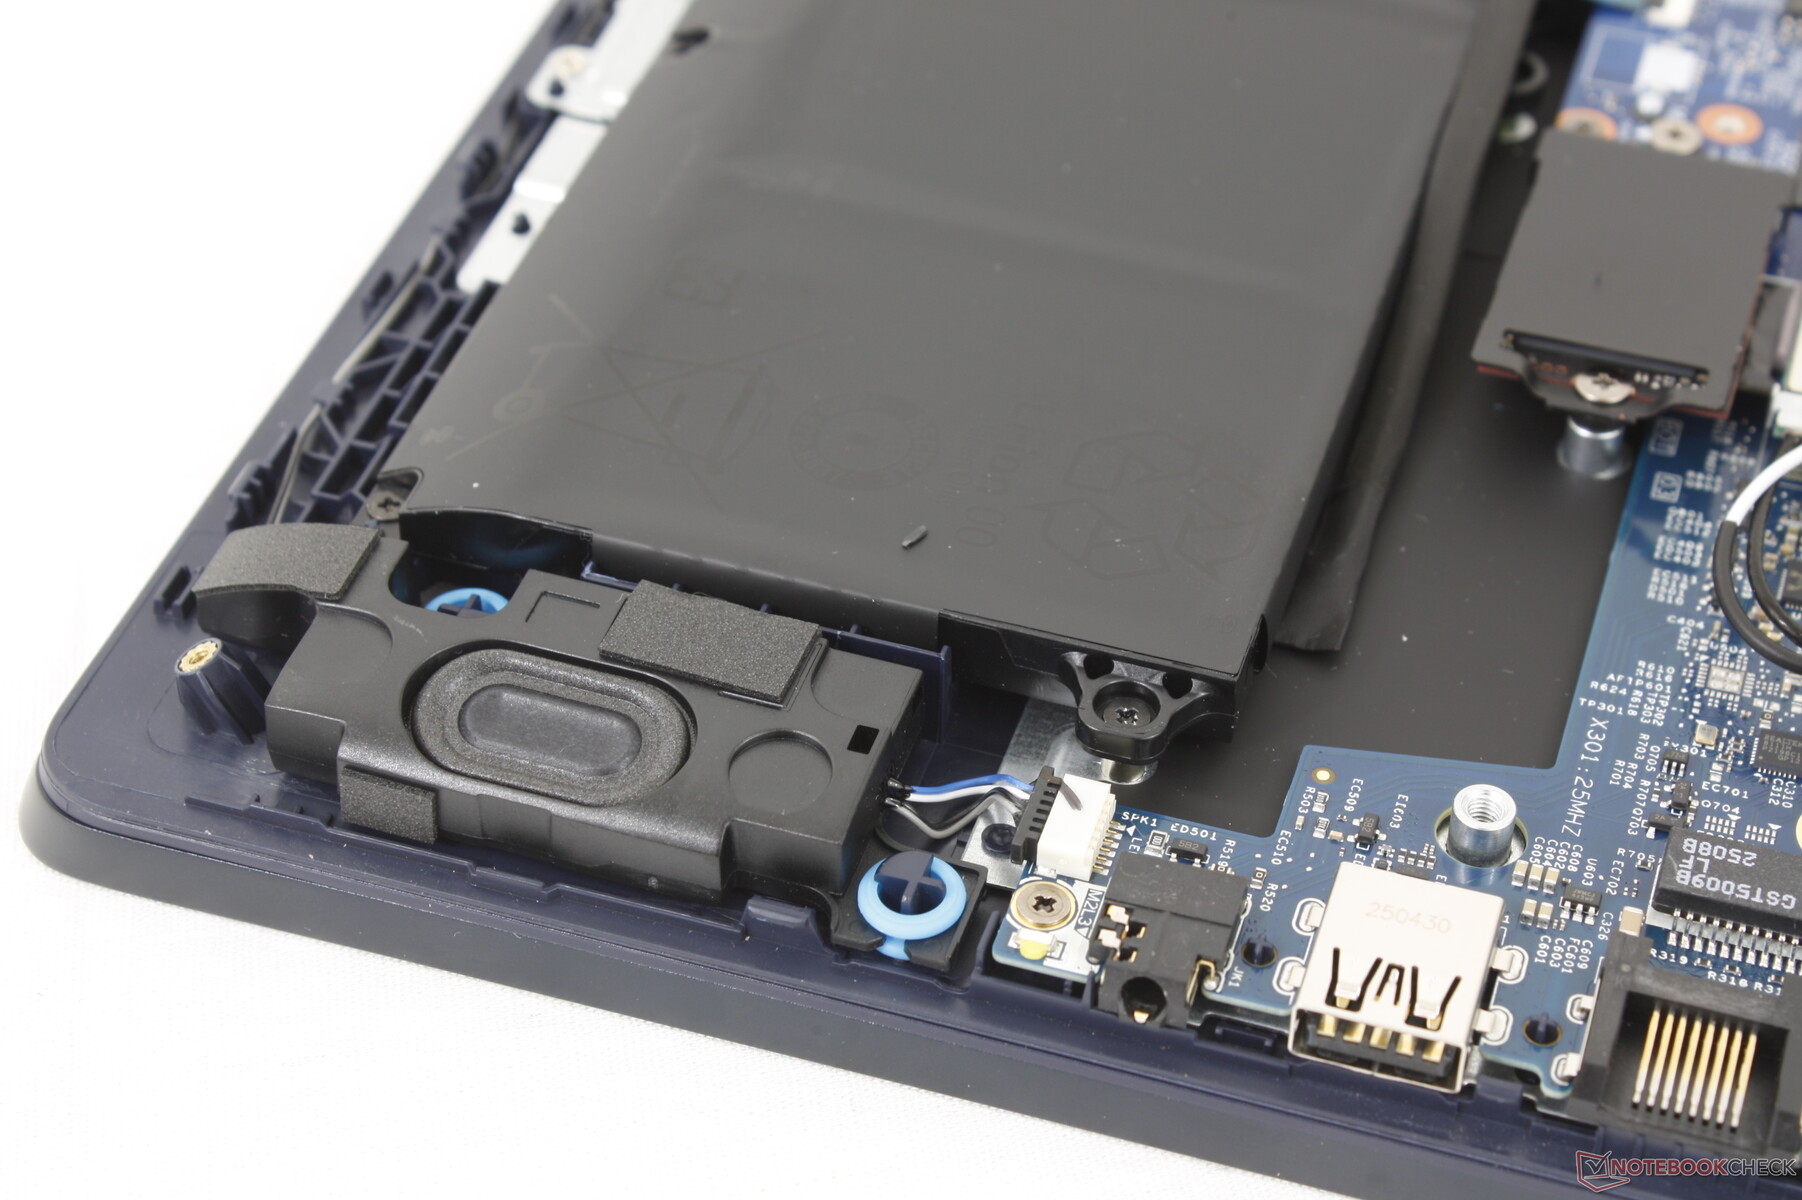
Maintenance
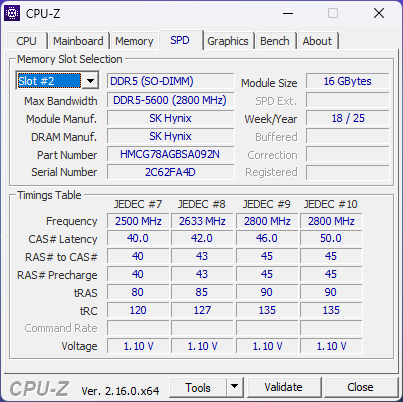
The bottom panel requires only a Phillips screwdriver to remove for relatively easy servicing. Users are granted to two M.2 2280 SSD slots, two DDR5 SODIMM slots, and the removable WLAN module once inside for a good level of upgradeability.
Sustainability
Dell utilizes recycled plastics and metals to manufacture its range of laptops with increasing percentages over time. With that said, Dell has not specified the exact percentages of recycled materials used for its 16X Aurora series. The packaging is otherwise fully recyclable with no plastic.
Accessories And Warranty
There are no extras in the box other than the AC adapter and paperwork. The usual one-year limited manufacturer warranty applies if purchased in the US.
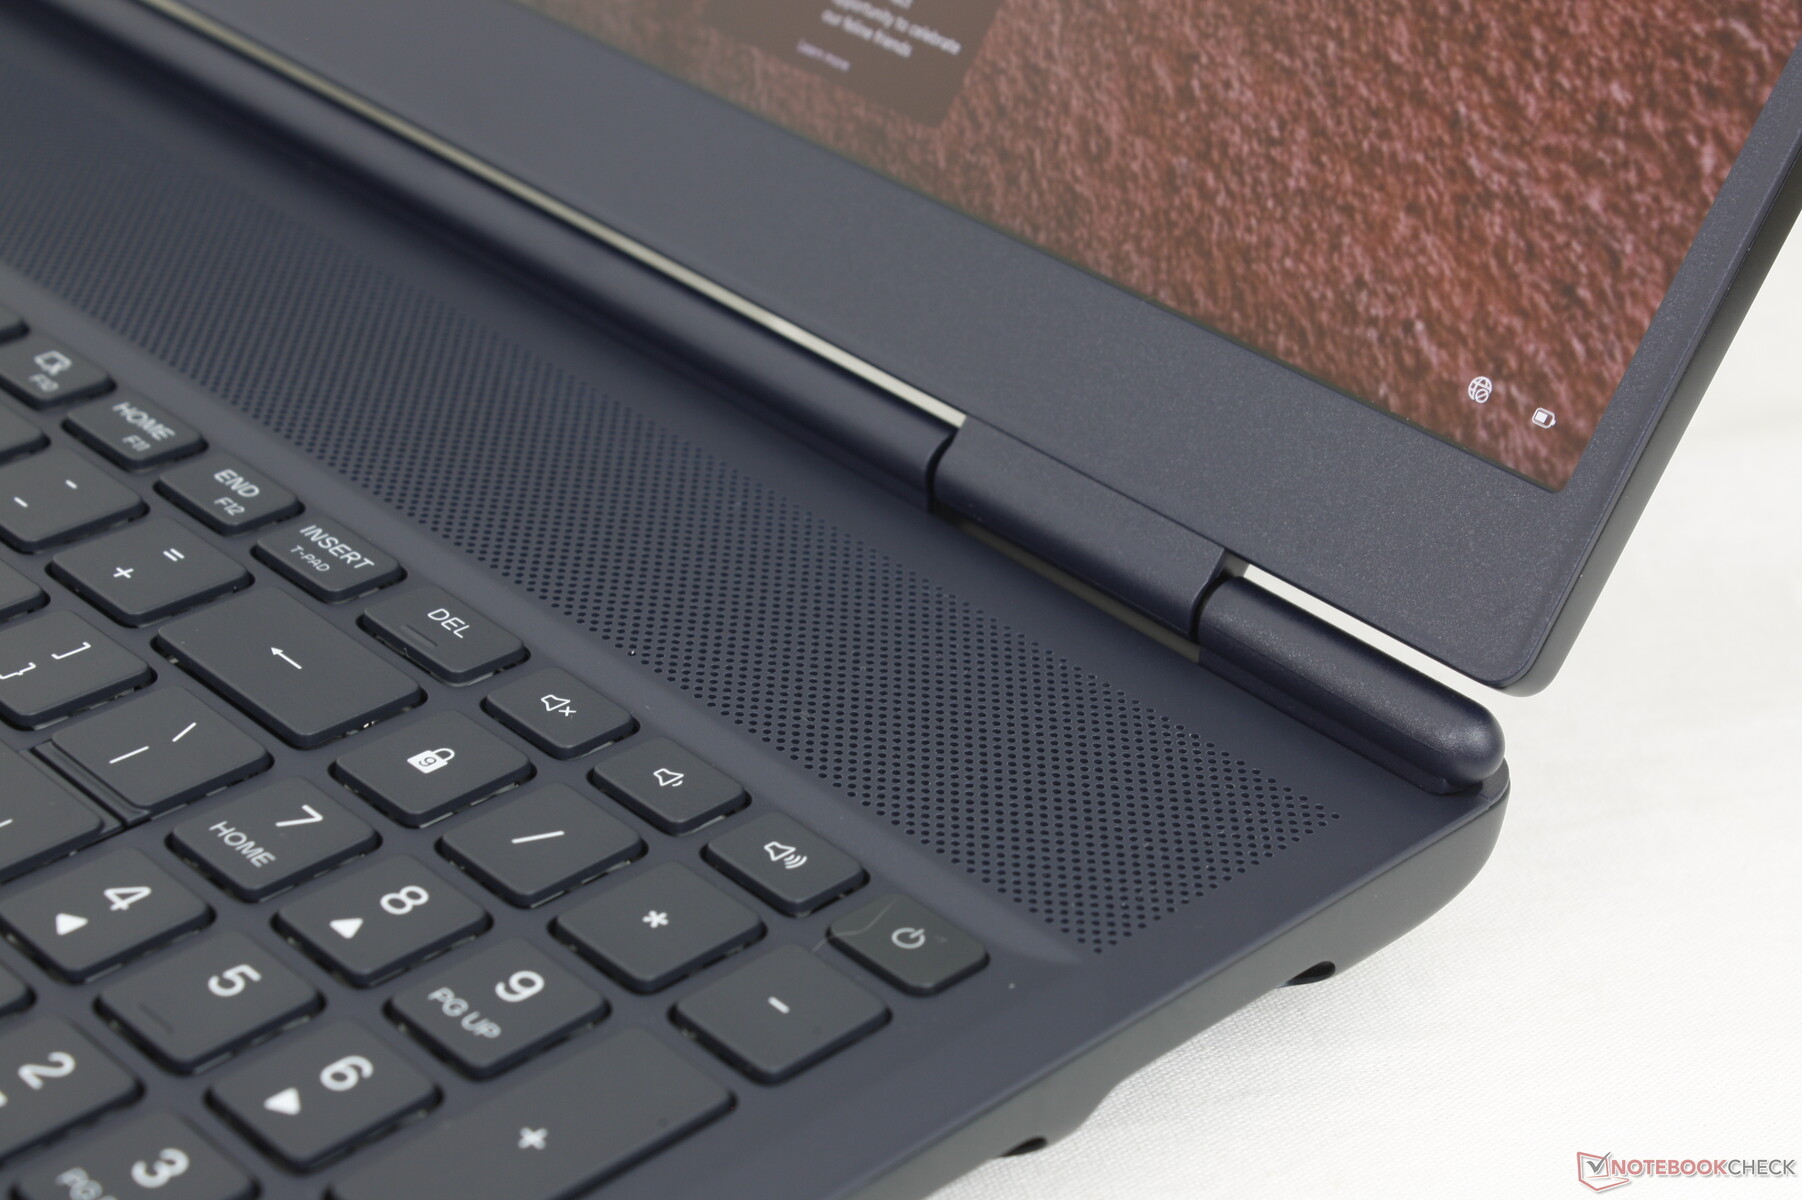
Input Devices
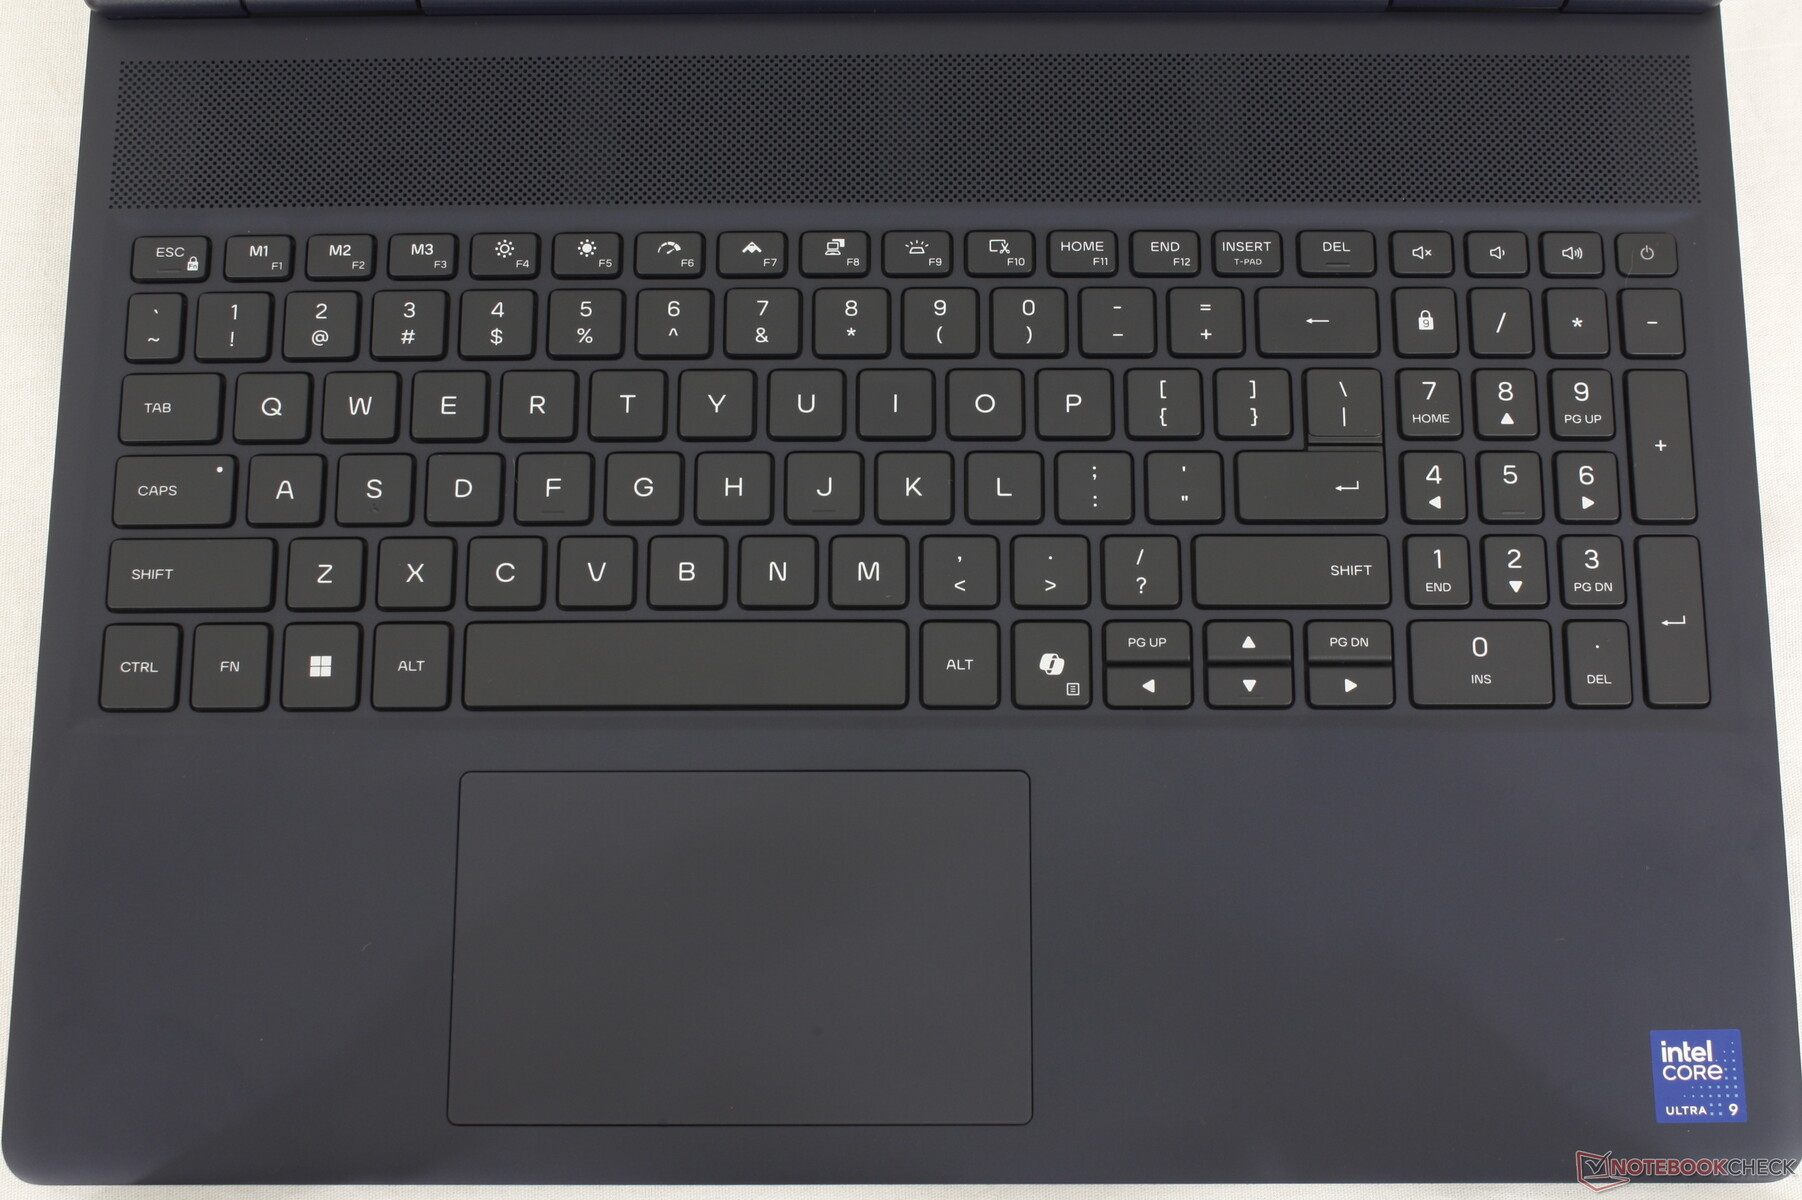
Keyboard
The keys are quieter than expected while offering decent feedback for an Ultrabook-like typing experience. It feels a little too much like typing on a Dell Inspiron, however, which is one of Dell's cheaper laptop models. The light Enter key in particular could have benefited from deeper and/or firmer feedback.
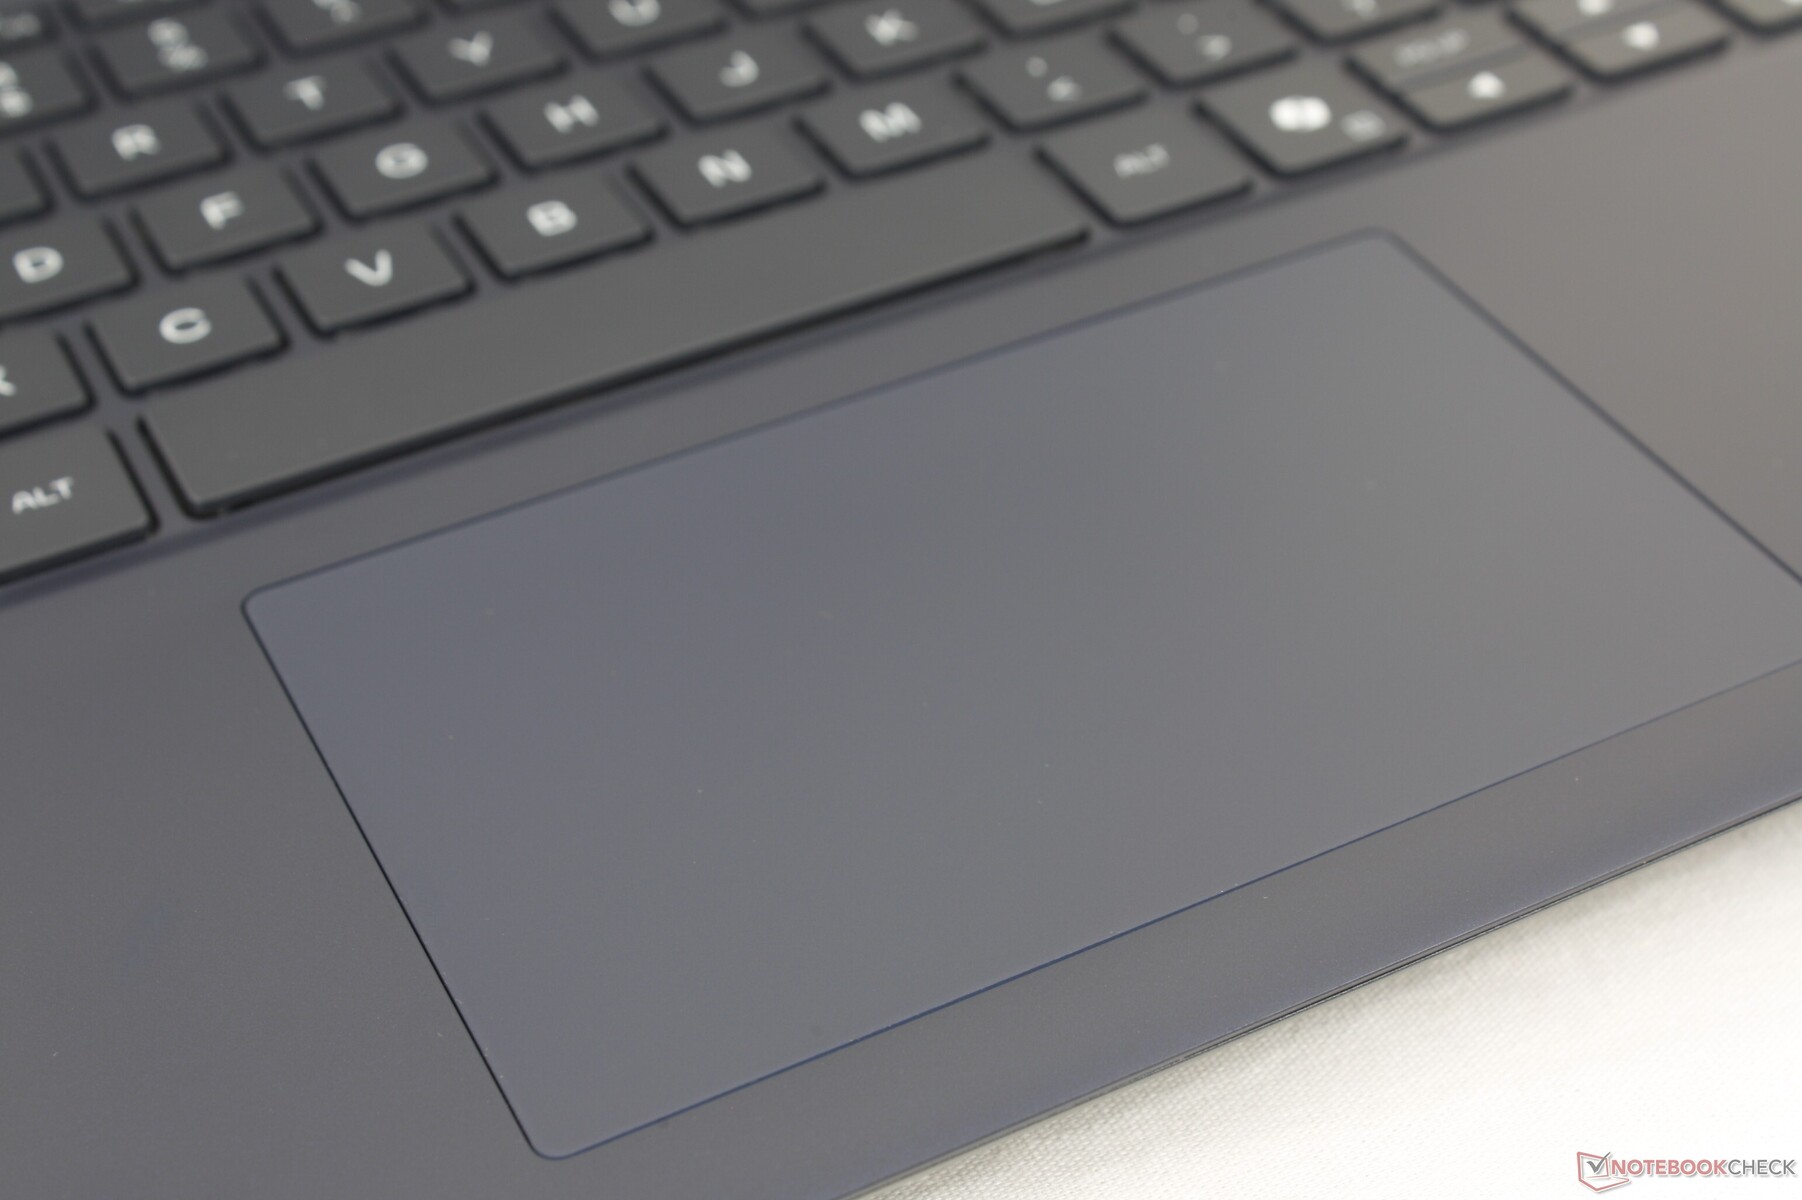
Touchpad
The clickpad is actually slightly larger than the clickpad on the Alienware Area-51 (11.5 x 7 cm vs. 11.2 x 6.5 cm). It is nevertheless quite small when compared to clickpad on competitors like the Gigabyte Aero X16. While cursor control is smooth and reliable at all speeds, feedback when clicking is far too soft with an unsatisfying spongy feel.


Display — Pretty Good For IPS
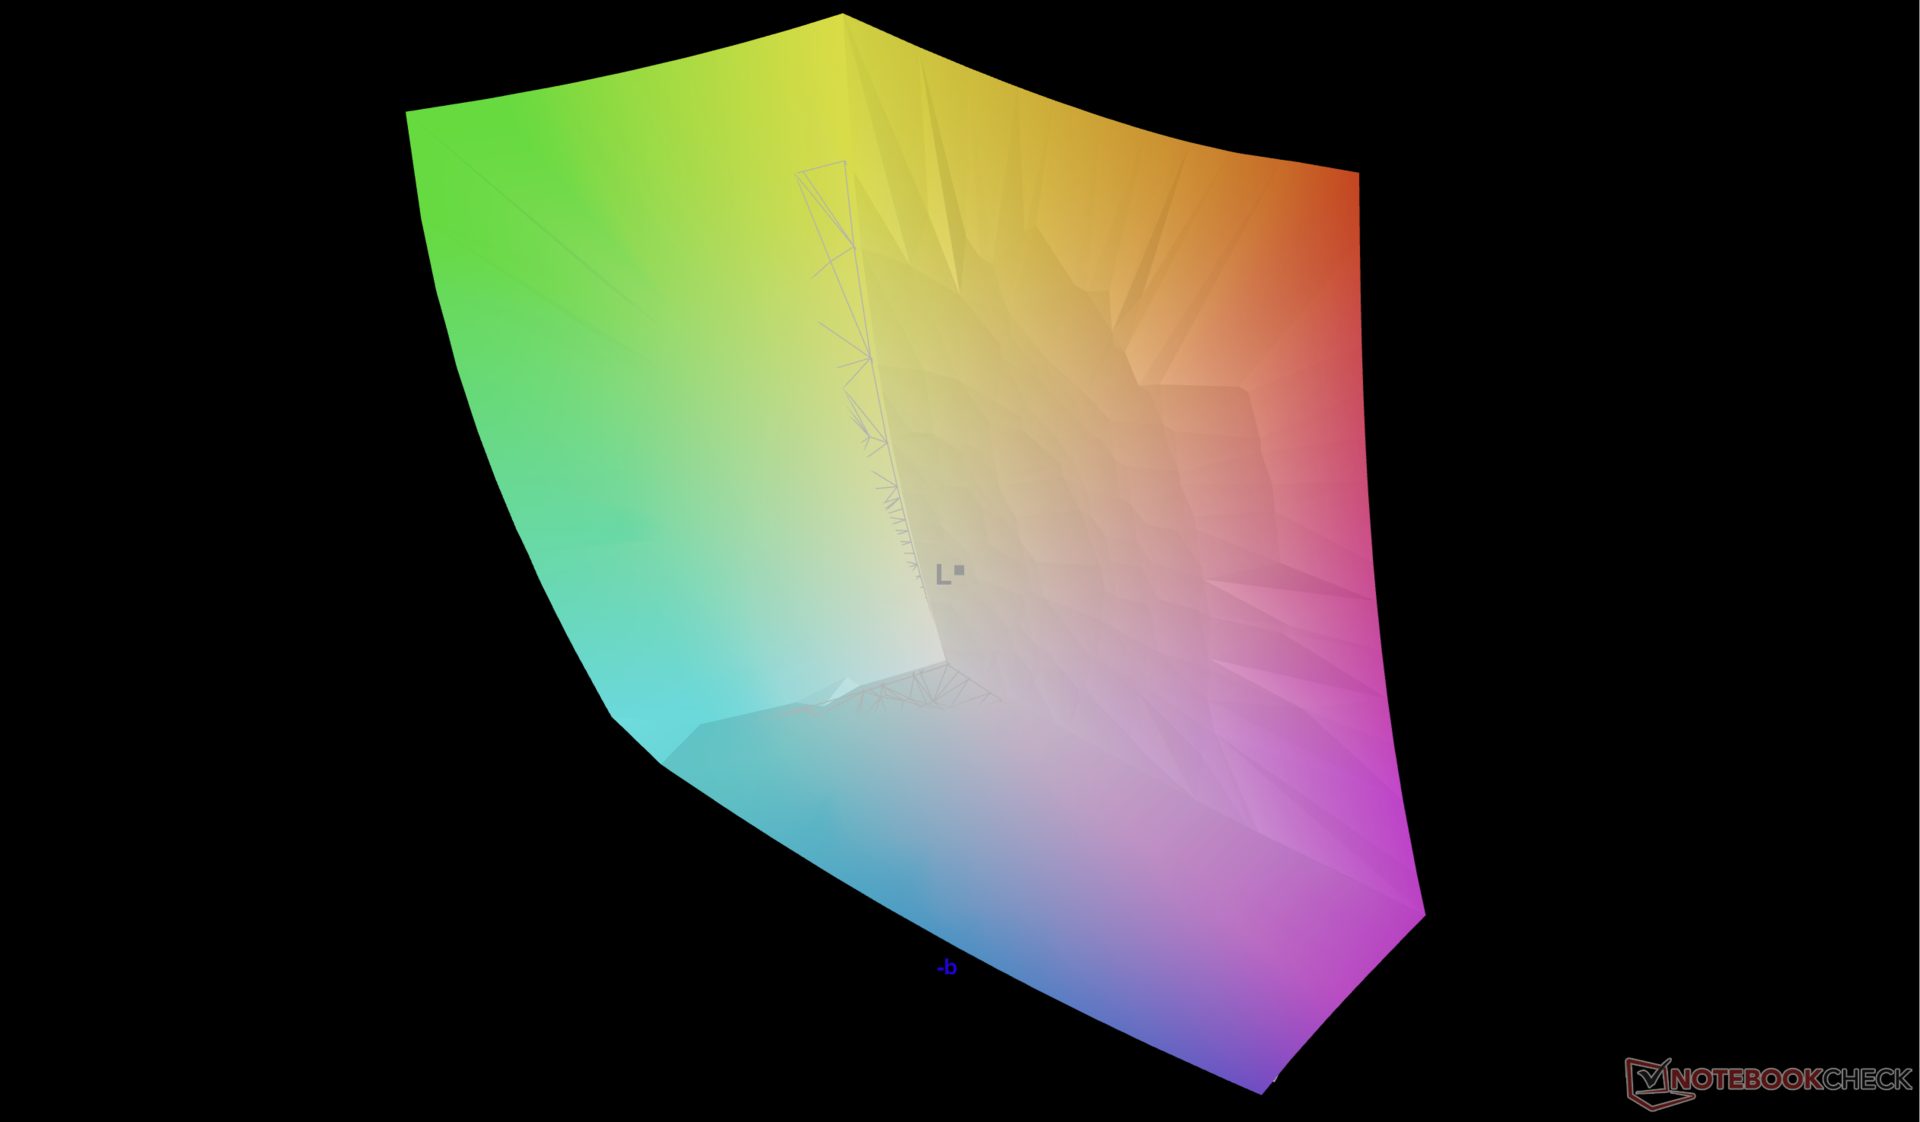
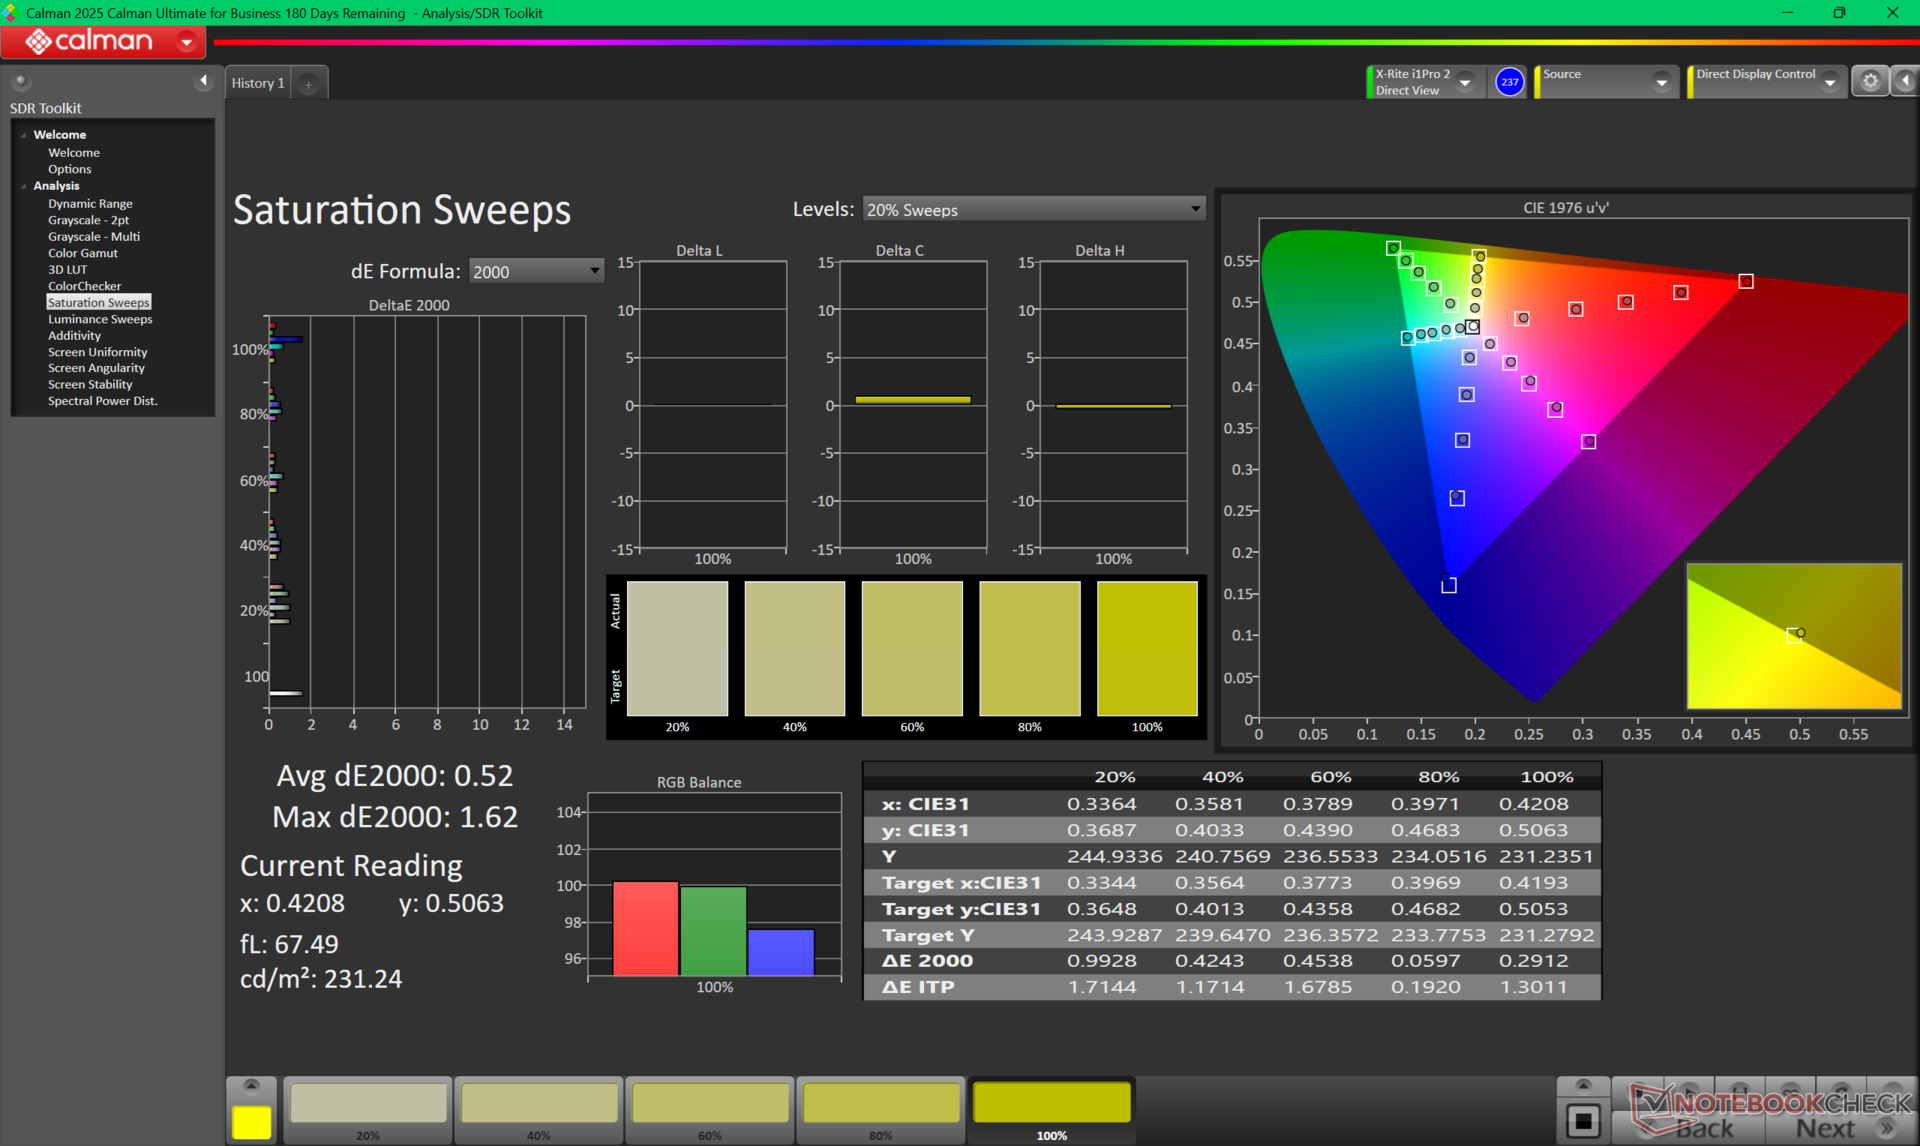
The QHD+ IPS panel offers full DCI-P3 colors, fast response times, and a fast 240 Hz refresh rate to be fit for both gaming and editing tasks. Its attributes are essentially identical to the AU Optronics 1600p240 display option on the Alienware Area-51 even though the panel on our Aurora 16X is from LG Philips.
Arguably the worst aspect of the display is its low contrast ratio of only ~1000:1 for poor black levels and no HDR support. There are no Mini-LED or OLED options to speak of likely to keep costs low for the Aurora 16X series.


| |||||||||||||||||||||||||
Brightness Distribution: 93 %
Center on Battery: 493.2 cd/m²
Contrast: 986:1 (Black: 0.5 cd/m²)
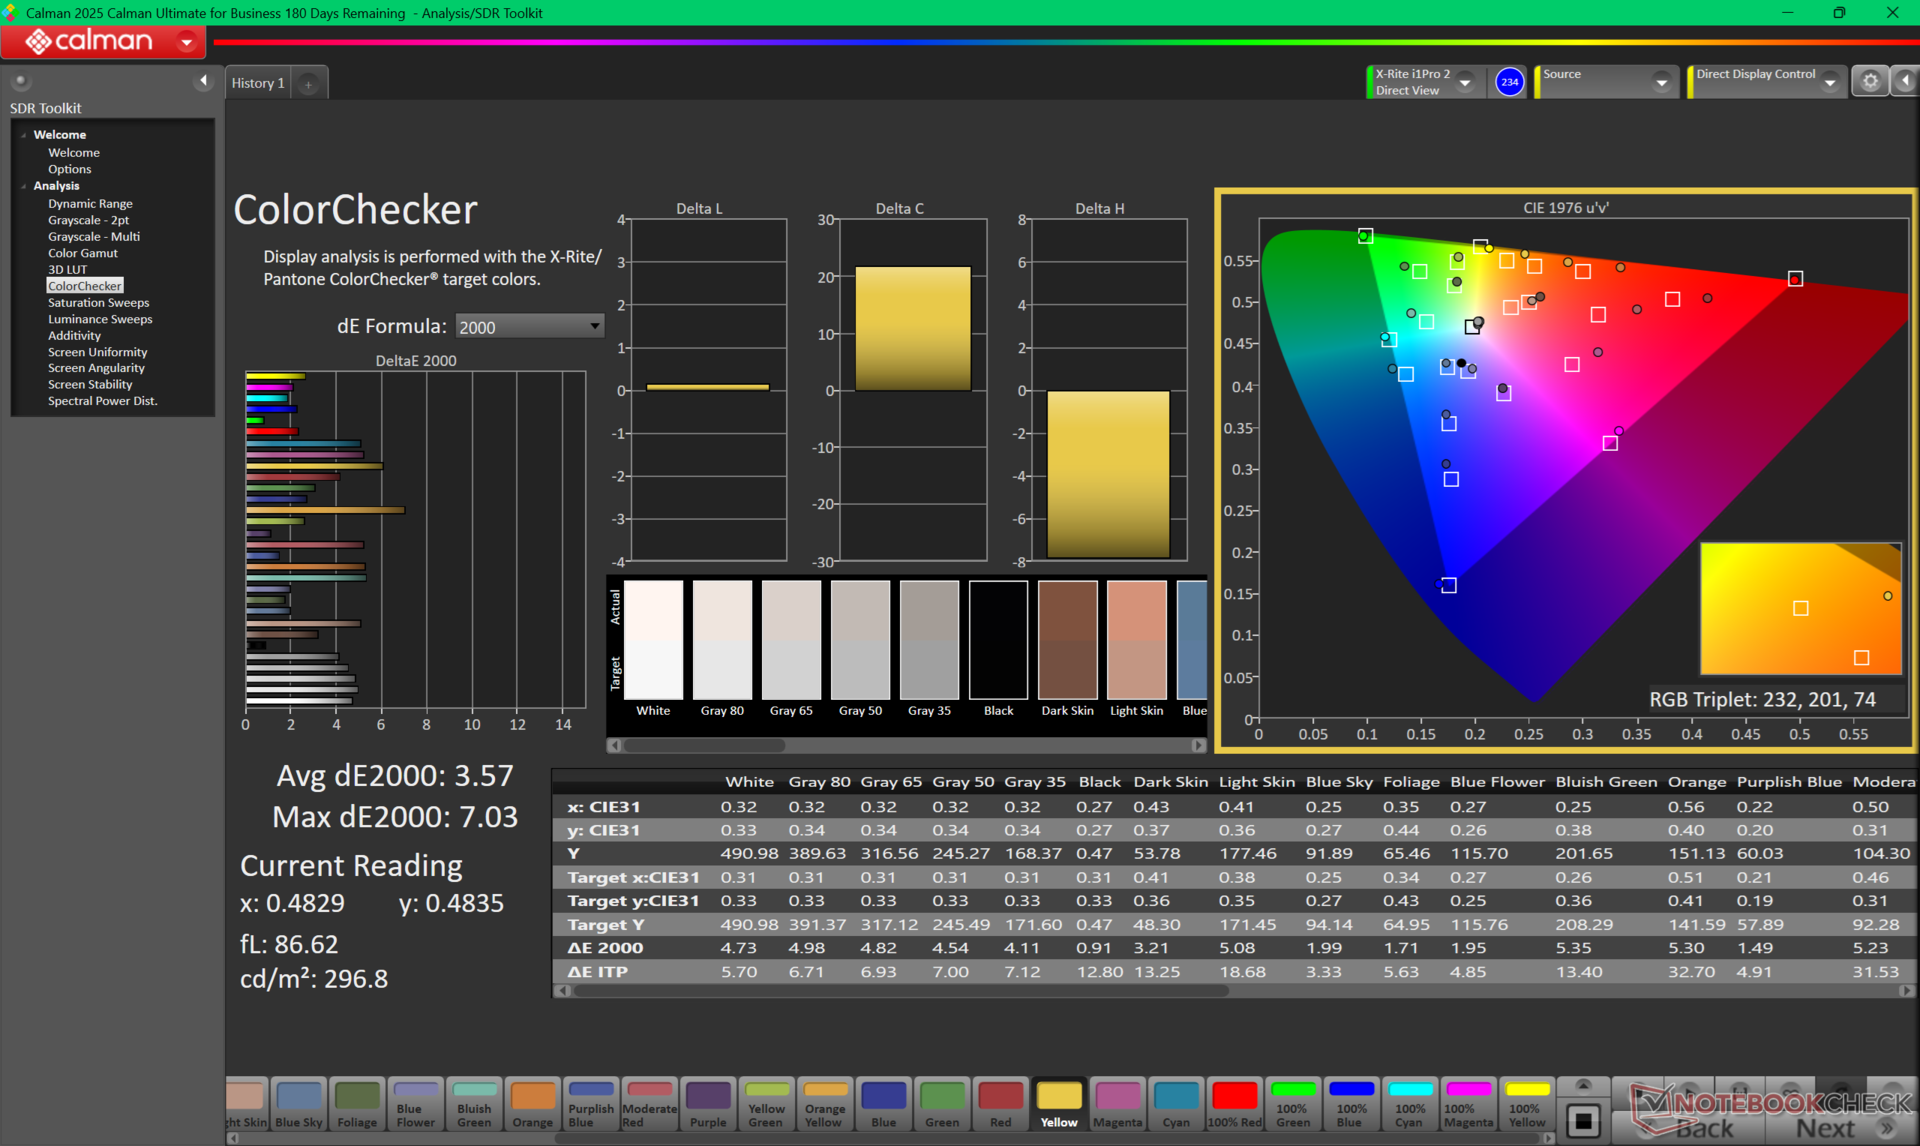
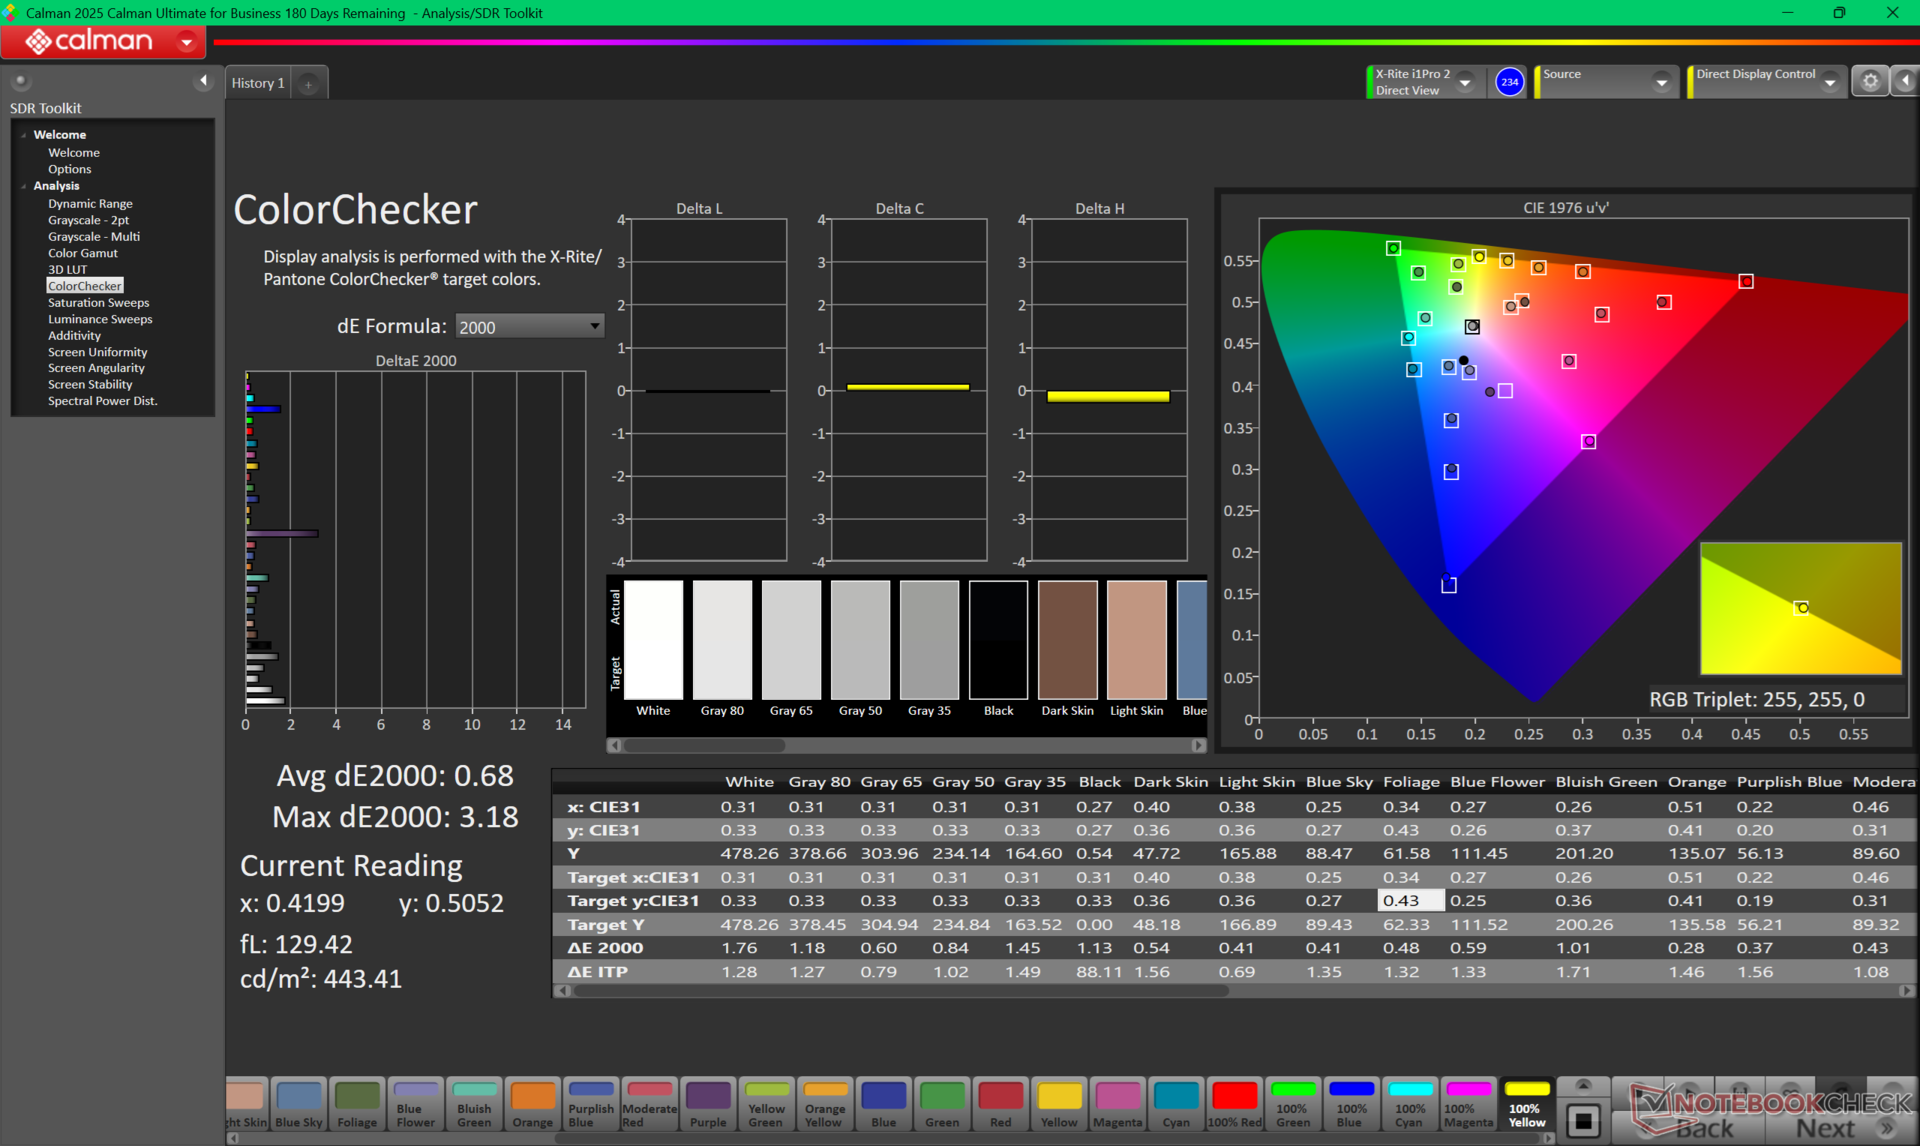
ΔE ColorChecker Calman: 3.57 | ∀{0.5-29.43 Ø4.73}
calibrated: 0.68
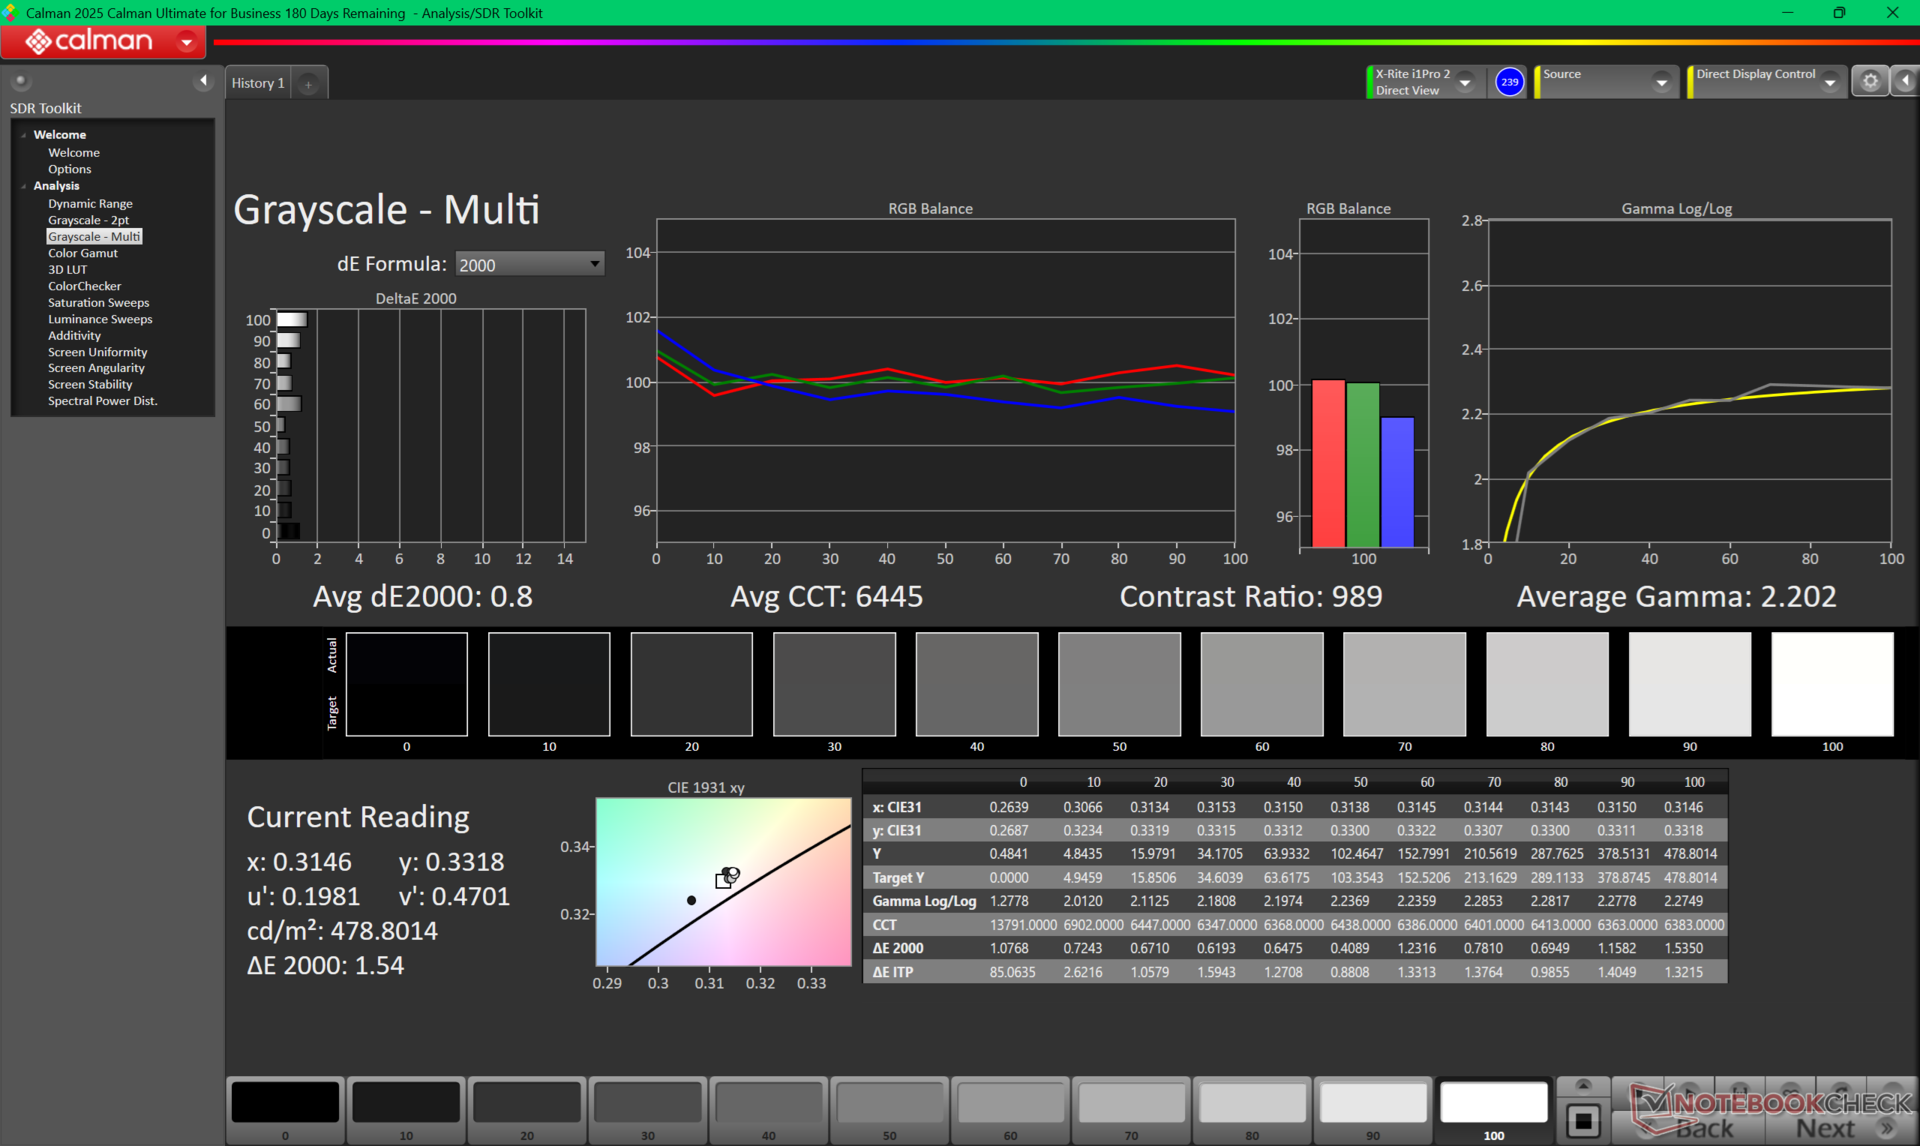
ΔE Greyscale Calman: 3.7 | ∀{0.09-98 Ø4.97}
89.7% AdobeRGB 1998 (Argyll 3D)
99.8% sRGB (Argyll 3D)
96.9% Display P3 (Argyll 3D)
Gamma: 2.16
CCT: 5876 K
| Alienware 16X Aurora, RTX 5070 LG Philips 160WQG, IPS, 2560x1600, 16", 240 Hz | Alienware 16 Area-51 AU Optronics B160QAN, IPS, 2560x1600, 16", 240 Hz | Gigabyte Gaming A16 GA6H NE160QDM-NYJ (BOE0C80), IPS, 2560x1600, 16", 165 Hz | MSI Vector 16 HX AI A2XWHG B160QAN02.3 (AUO7DB2), IPS, 2560x1600, 16", 240 Hz | Asus TUF Gaming A16 FA608WV B160UAN08.1 (AUO9BB0), IPS, 1920x1200, 16", 144 Hz | Lenovo Legion 5 Pro 16IAX10H ATNA60HS01-0 (Samsung SDC420A), OLED, 2560x1600, 16", 165 Hz | |
|---|---|---|---|---|---|---|
| Display | -1% | -16% | -2% | -51% | 3% | |
| Display P3 Coverage (%) | 96.9 | 96 -1% | 69.4 -28% | 96.6 0% | 39.8 -59% | 99.9 3% |
| sRGB Coverage (%) | 99.8 | 100 0% | 99.5 0% | 99.8 0% | 59.7 -40% | 100 0% |
| AdobeRGB 1998 Coverage (%) | 89.7 | 89.2 -1% | 71.6 -20% | 84.4 -6% | 41.1 -54% | 94.1 5% |
| Response Times | 3% | -107% | 16% | -107% | 69% | |
| Response Time Grey 50% / Grey 80% * (ms) | 4.3 ? | 4.8 ? -12% | 14.3 ? -233% | 4.3 ? -0% | 13.6 ? -216% | 2 ? 53% |
| Response Time Black / White * (ms) | 8.7 ? | 7.2 ? 17% | 7 ? 20% | 6 ? 31% | 8.4 ? 3% | 1.4 ? 84% |
| PWM Frequency (Hz) | 1300 | |||||
| PWM Amplitude * (%) | 16.7 | |||||
| Screen | 0% | -20% | -9% | -89% | -18% | |
| Brightness middle (cd/m²) | 493.2 | 554 12% | 432 -12% | 473 -4% | 347 -30% | 518 5% |
| Brightness (cd/m²) | 477 | 532 12% | 425 -11% | 426 -11% | 321 -33% | 522 9% |
| Brightness Distribution (%) | 93 | 88 -5% | 91 -2% | 85 -9% | 88 -5% | 97 4% |
| Black Level * (cd/m²) | 0.5 | 0.52 -4% | 0.37 26% | 0.42 16% | 0.3 40% | |
| Contrast (:1) | 986 | 1065 8% | 1168 18% | 1126 14% | 1157 17% | |
| Colorchecker dE 2000 * | 3.57 | 2.81 21% | 4.76 -33% | 3.47 3% | 5.89 -65% | 2.49 30% |
| Colorchecker dE 2000 max. * | 7.03 | 8.32 -18% | 8.59 -22% | 7.24 -3% | 19.26 -174% | 5.25 25% |
| Colorchecker dE 2000 calibrated * | 0.68 | 0.65 4% | 1.18 -74% | 1.36 -100% | 4.3 -532% | 2.15 -216% |
| Greyscale dE 2000 * | 3.7 | 4.7 -27% | 6.2 -68% | 3.1 16% | 4.27 -15% | 3.02 18% |
| Gamma | 2.16 102% | 2.3 96% | 2.079 106% | 2.486 88% | 2.47 89% | 2.37 93% |
| CCT | 5876 111% | 6476 100% | 6690 97% | 6832 95% | 7158 91% | 6426 101% |
| Total Average (Program / Settings) | 1% /
0% | -48% /
-31% | 2% /
-4% | -82% /
-83% | 18% /
2% |
* ... smaller is better

The display ships decently calibrated against P3 colors even though Dell doesn't advertise any factory calibration services. Color temperature is nonetheless a bit warmer than we would like at around 5900K. Our calibrated ICM profile is available to download above for free.


Display Response Times
| ↔ Response Time Black to White | ||
|---|---|---|
| 8.7 ms ... rise ↗ and fall ↘ combined | ↗ 4.6 ms rise | 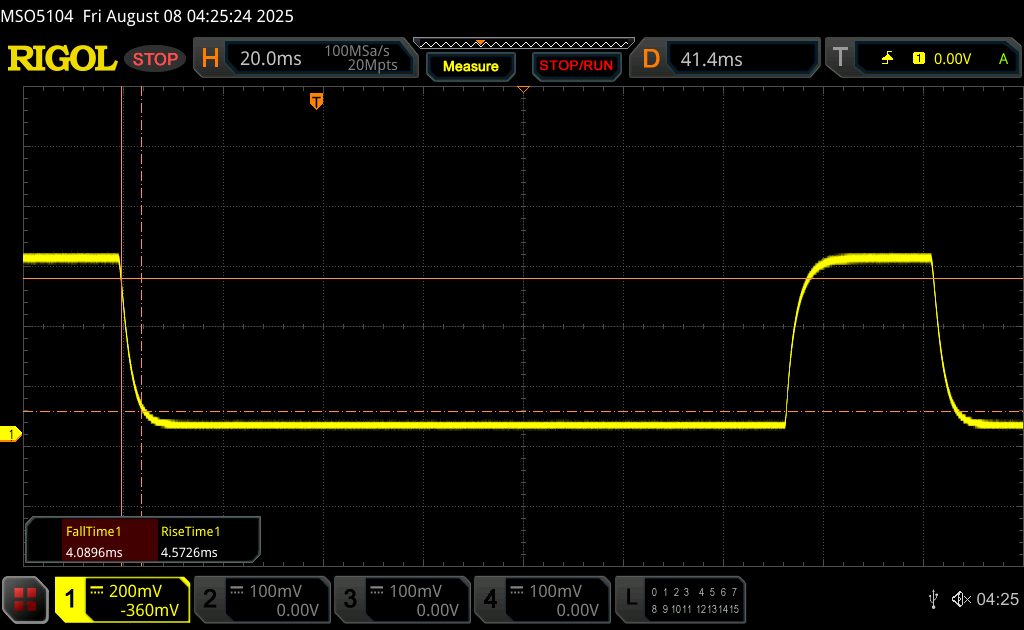 |
| ↘ 4.1 ms fall | ||
| The screen shows fast response rates in our tests and should be suited for gaming. In comparison, all tested devices range from 0.1 (minimum) to 240 (maximum) ms. » 24 % of all devices are better. This means that the measured response time is better than the average of all tested devices (19.9 ms). | ||
| ↔ Response Time 50% Grey to 80% Grey | ||
| 4.3 ms ... rise ↗ and fall ↘ combined | ↗ 1.9 ms rise | 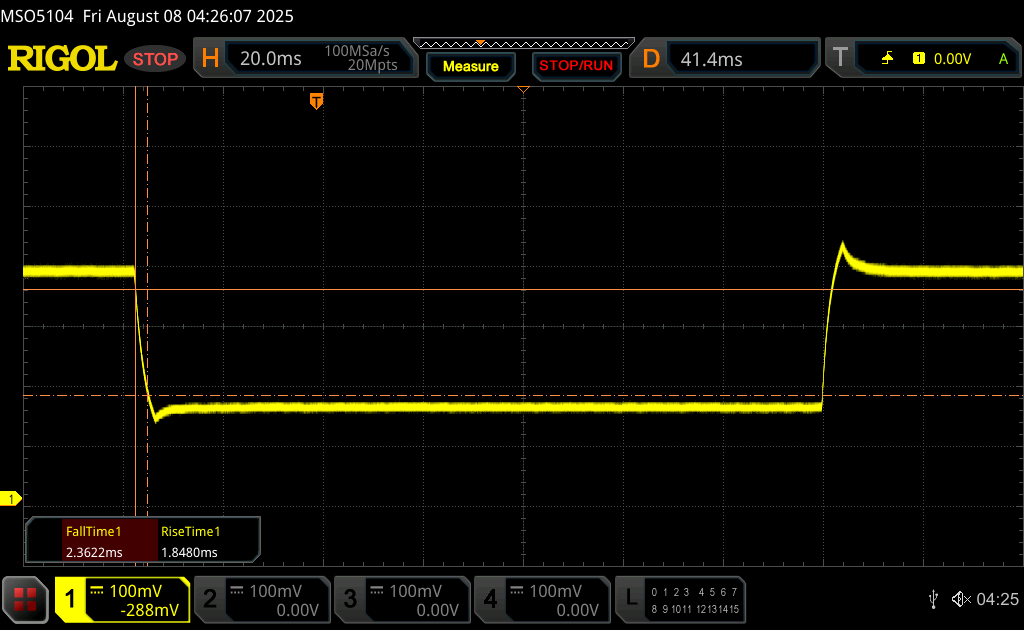 |
| ↘ 2.4 ms fall | ||
| The screen shows very fast response rates in our tests and should be very well suited for fast-paced gaming. In comparison, all tested devices range from 0.165 (minimum) to 636 (maximum) ms. » 16 % of all devices are better. This means that the measured response time is better than the average of all tested devices (31.1 ms). | ||
Screen Flickering / PWM (Pulse-Width Modulation)
| Screen flickering / PWM not detected |  | ||
In comparison: 52 % of all tested devices do not use PWM to dim the display. If PWM was detected, an average of 7791 (minimum: 5 - maximum: 343500) Hz was measured. | |||
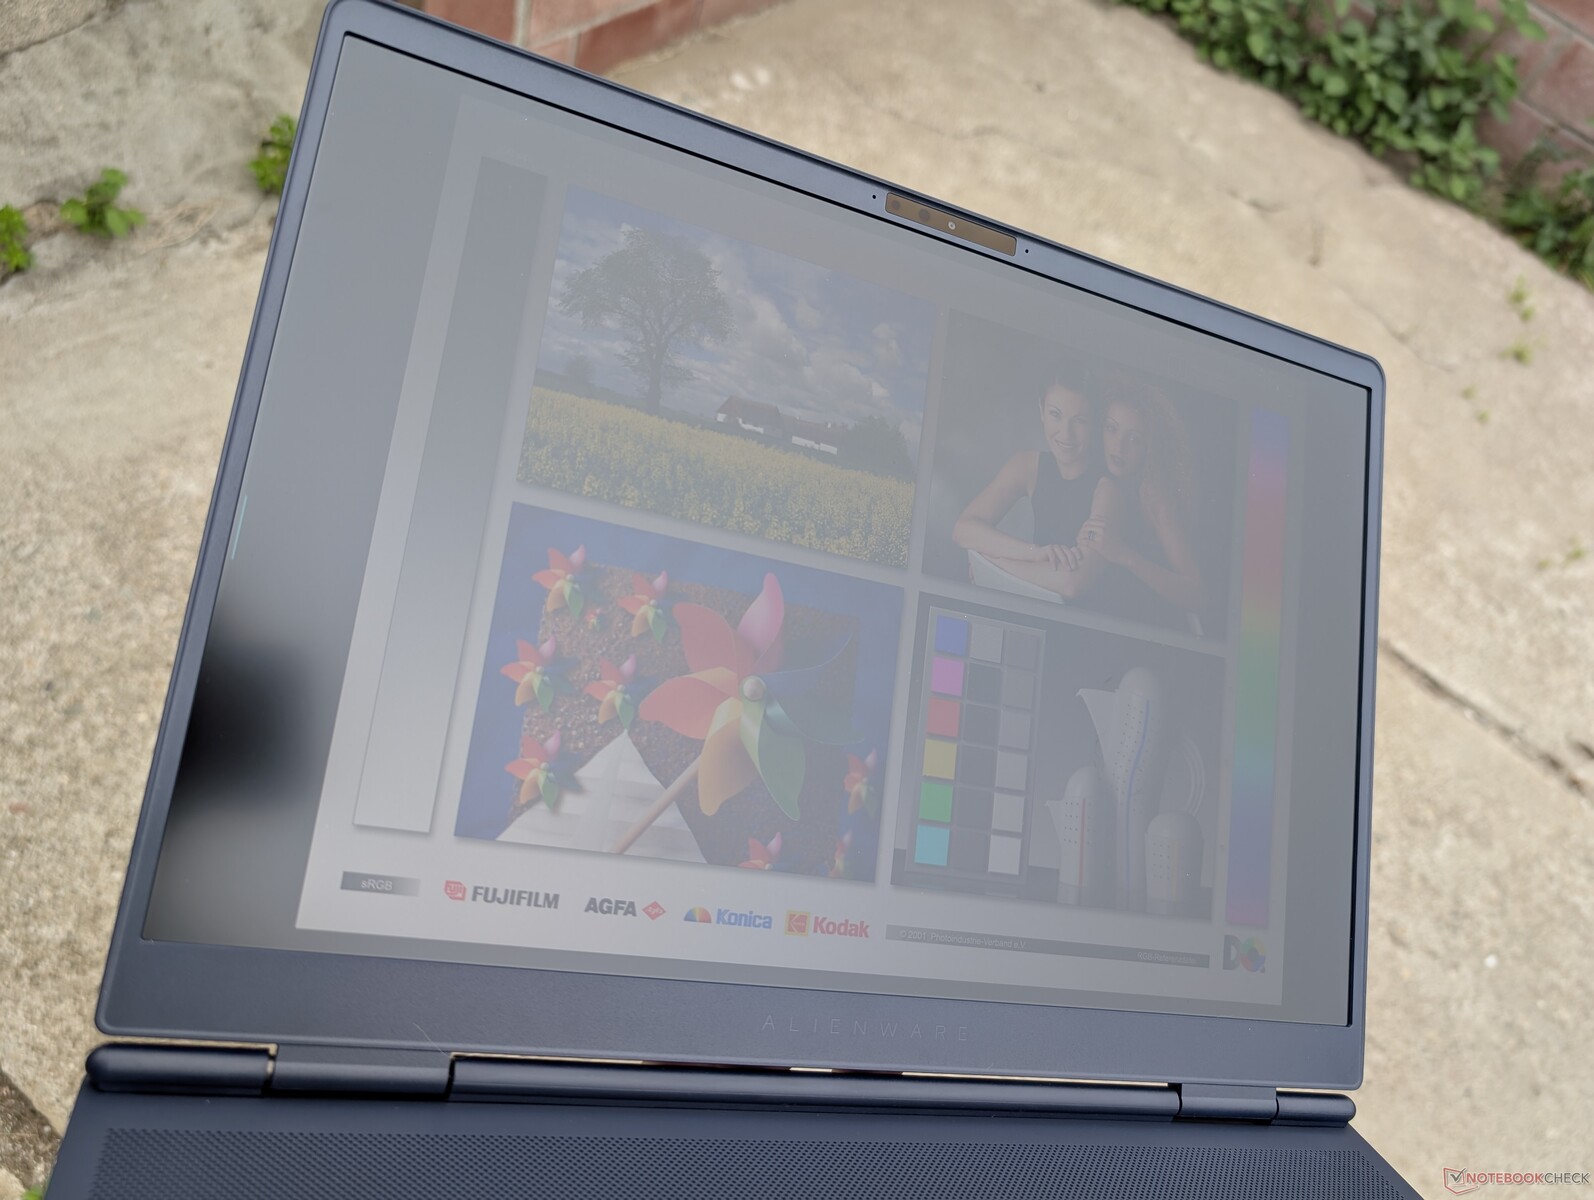
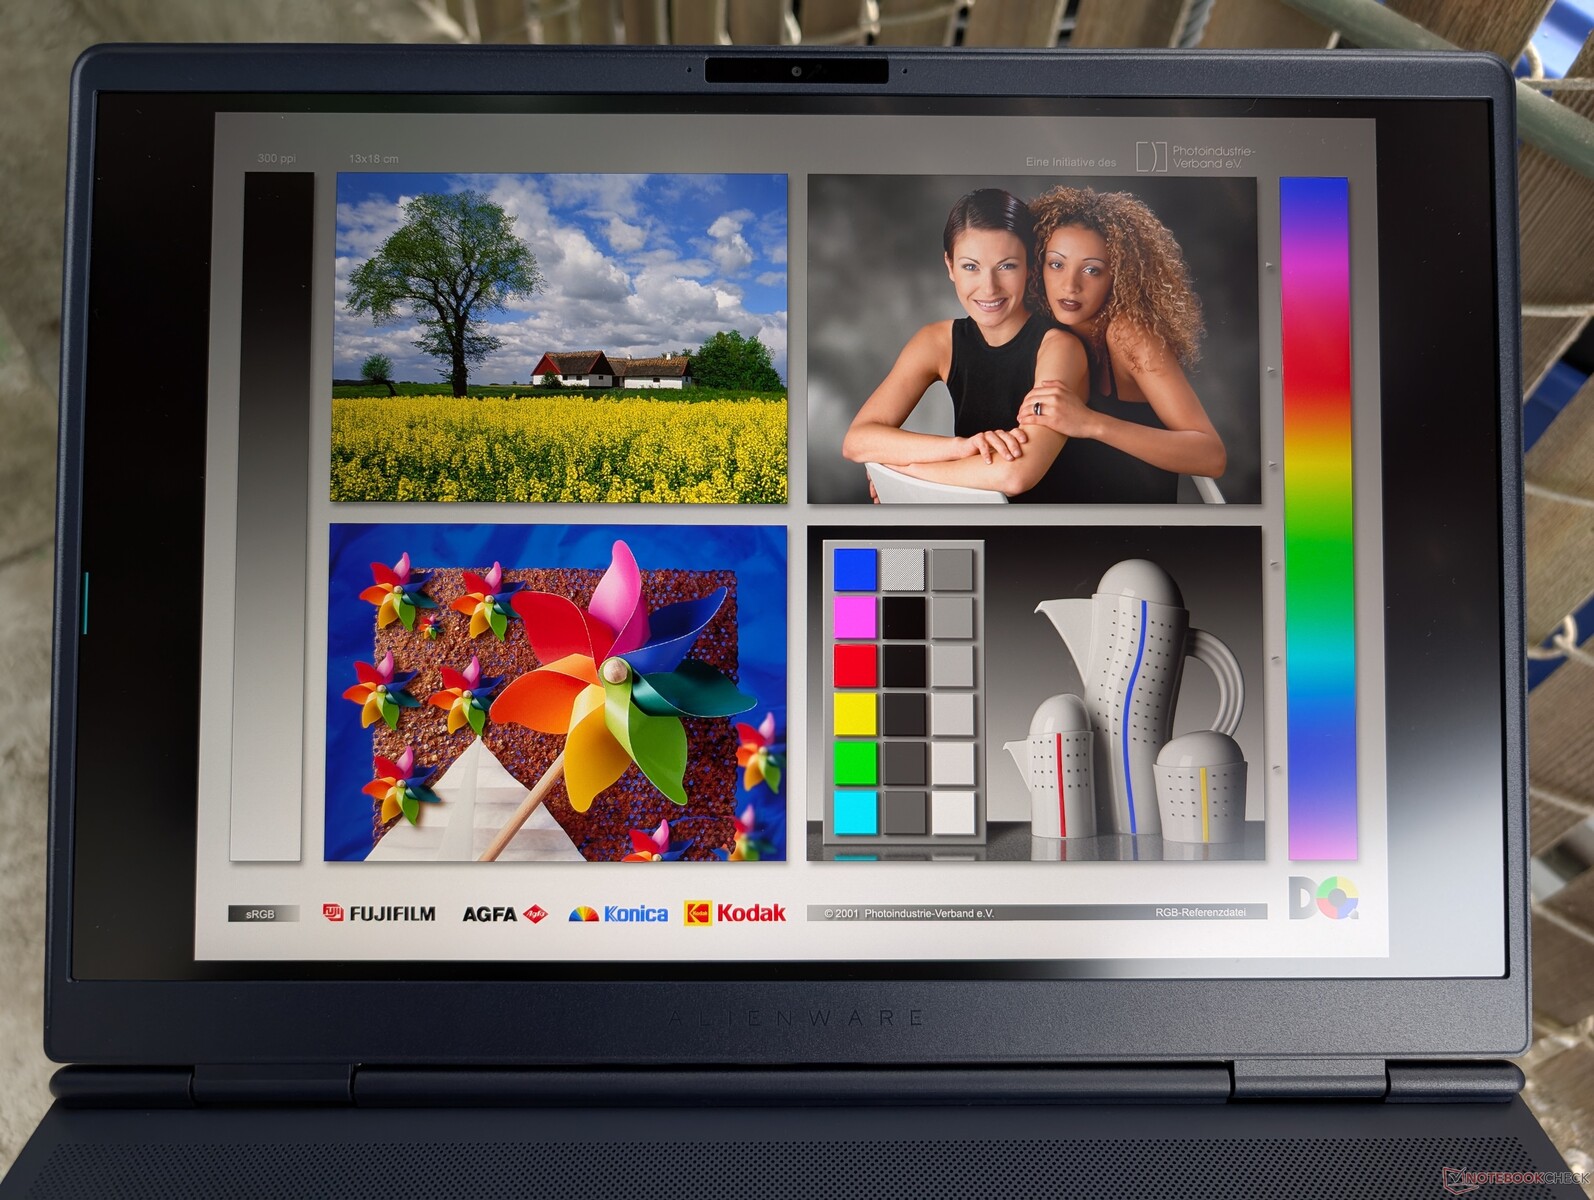
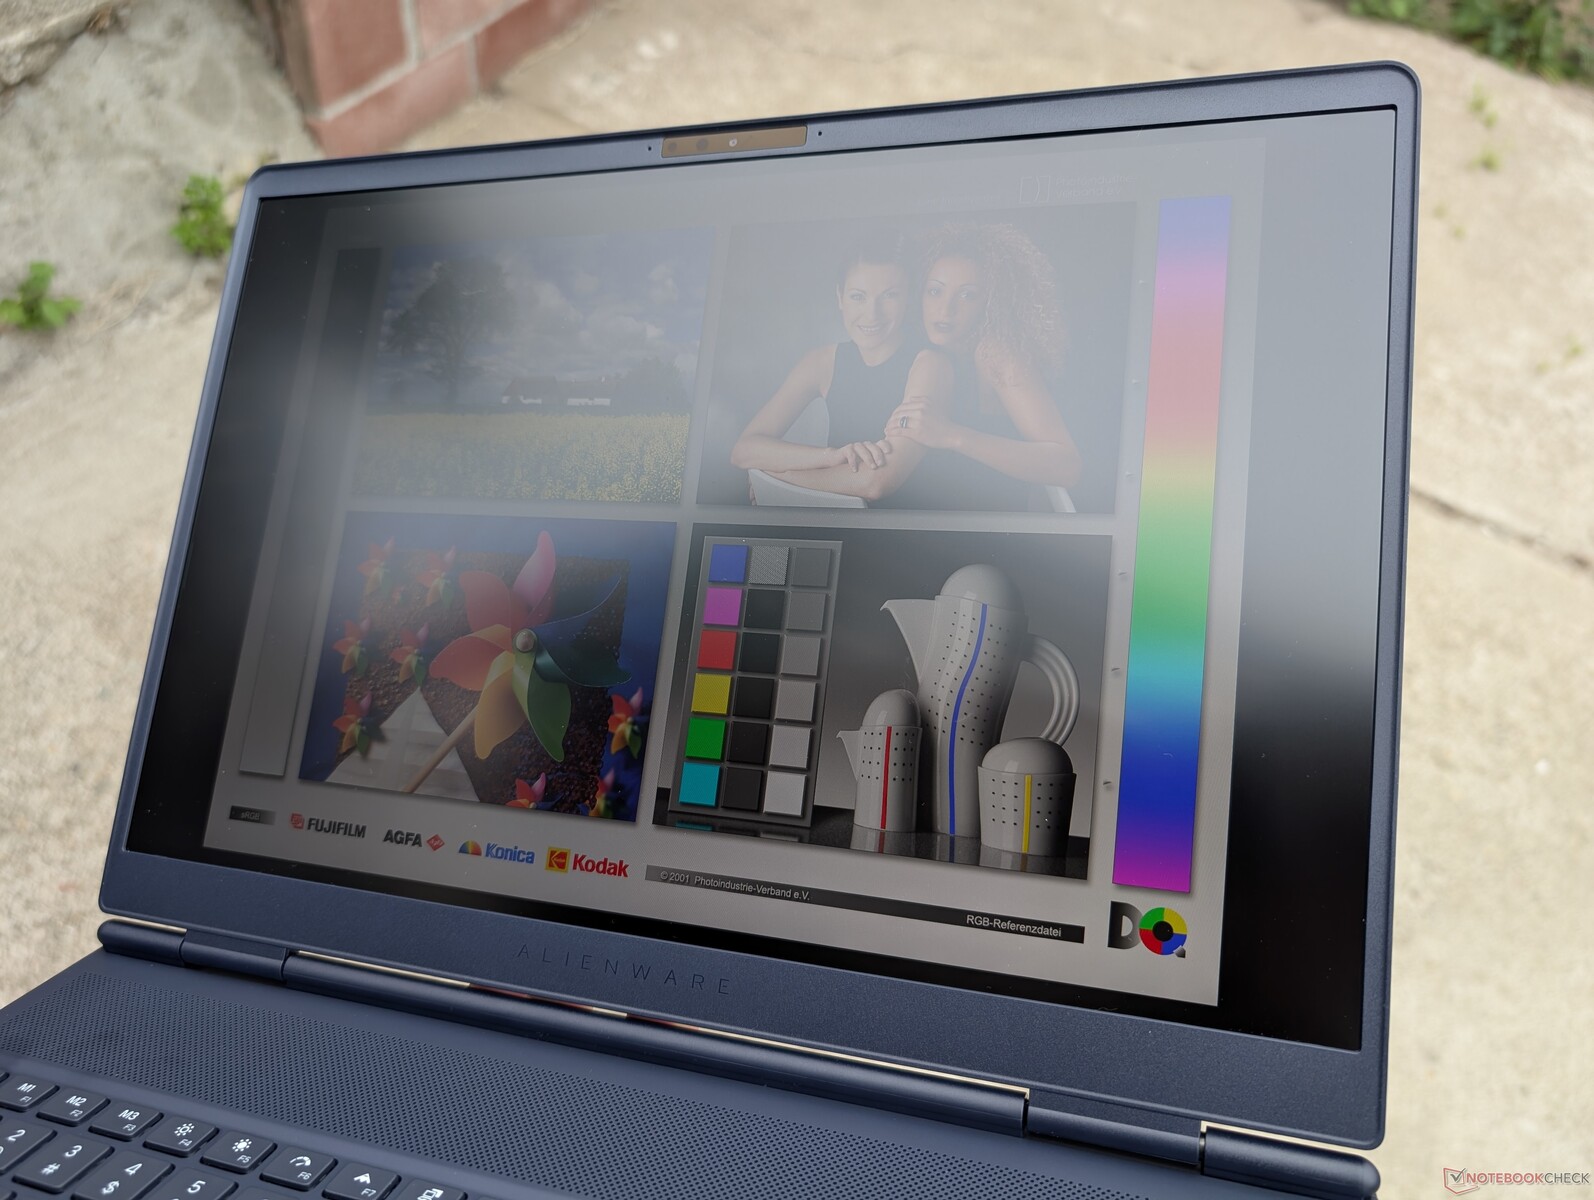
The display is quite bright for a gaming laptop at almost 500 nits compared to only ~350 nits on the Asus TUF Gaming A16. Viewability is decent if working under shade, but colors become washed out if under brighter conditions.

Performance

Testing Conditions
We set both Windows and Alienware Command Center to Performance mode prior to running the benchmarks below. An Overdrive mode is available on Command Center which raises the fan ceiling even louder ()()(), but any performance benefits are minimal at best as our benchmarks below will show.
Processor
CPU performance is excellent but not perfect. When running CineBench R15 xT in a loop, for example, performance would drop by about 8 percent after the first few loops to suggest limited Turbo Boost sustainability. The very high core temperature of almost 100 C when the CPU is at full utilization is another sign as well. Overall multi-thread performance is nonetheless faster than the Core Ultra 7 255HX configuration by up to 25 percent or the older Core Ultra 7 155H in the Alienware m16 R2 by almost 2x.
Cinebench R15 Multi Loop
Cinebench R23: Multi Core | Single Core
Cinebench R20: CPU (Multi Core) | CPU (Single Core)
Cinebench R15: CPU Multi 64Bit | CPU Single 64Bit
Blender: v2.79 BMW27 CPU
7-Zip 18.03: 7z b 4 | 7z b 4 -mmt1
Geekbench 6.7: Multi-Core | Single-Core
Geekbench 5.5: Multi-Core | Single-Core
HWBOT x265 Benchmark v2.2: 4k Preset
LibreOffice : 20 Documents To PDF
R Benchmark 2.5: Overall mean
* ... smaller is better
AIDA64: FP32 Ray-Trace | FPU Julia | CPU SHA3 | CPU Queen | FPU SinJulia | FPU Mandel | CPU AES | CPU ZLib | FP64 Ray-Trace | CPU PhotoWorxx
| Performance rating | |
| Lenovo Legion 5 Pro 16IAX10H | |
| Average Intel Core Ultra 9 275HX | |
| Alienware 16 Area-51 | |
| Alienware 16X Aurora, RTX 5070 | |
| Asus TUF Gaming A16 FA608WV | |
| MSI Vector 16 HX AI A2XWHG | |
| Gigabyte Gaming A16 GA6H | |
| AIDA64 / FP32 Ray-Trace | |
| Asus TUF Gaming A16 FA608WV | |
| Average Intel Core Ultra 9 275HX (28039 - 39895, n=30) | |
| Lenovo Legion 5 Pro 16IAX10H | |
| Alienware 16 Area-51 | |
| Alienware 16X Aurora, RTX 5070 | |
| MSI Vector 16 HX AI A2XWHG | |
| Gigabyte Gaming A16 GA6H | |
| AIDA64 / FPU Julia | |
| Lenovo Legion 5 Pro 16IAX10H | |
| Average Intel Core Ultra 9 275HX (140254 - 200744, n=30) | |
| Alienware 16 Area-51 | |
| Alienware 16X Aurora, RTX 5070 | |
| Asus TUF Gaming A16 FA608WV | |
| MSI Vector 16 HX AI A2XWHG | |
| Gigabyte Gaming A16 GA6H | |
| AIDA64 / CPU SHA3 | |
| Average Intel Core Ultra 9 275HX (6710 - 9817, n=30) | |
| Lenovo Legion 5 Pro 16IAX10H | |
| Alienware 16 Area-51 | |
| Alienware 16X Aurora, RTX 5070 | |
| MSI Vector 16 HX AI A2XWHG | |
| Asus TUF Gaming A16 FA608WV | |
| Gigabyte Gaming A16 GA6H | |
| AIDA64 / CPU Queen | |
| Lenovo Legion 5 Pro 16IAX10H | |
| Alienware 16X Aurora, RTX 5070 | |
| Average Intel Core Ultra 9 275HX (113887 - 140937, n=30) | |
| Alienware 16 Area-51 | |
| MSI Vector 16 HX AI A2XWHG | |
| Asus TUF Gaming A16 FA608WV | |
| Gigabyte Gaming A16 GA6H | |
| AIDA64 / FPU SinJulia | |
| Asus TUF Gaming A16 FA608WV | |
| Lenovo Legion 5 Pro 16IAX10H | |
| Alienware 16 Area-51 | |
| Alienware 16X Aurora, RTX 5070 | |
| Average Intel Core Ultra 9 275HX (11172 - 14425, n=30) | |
| MSI Vector 16 HX AI A2XWHG | |
| Gigabyte Gaming A16 GA6H | |
| AIDA64 / FPU Mandel | |
| Average Intel Core Ultra 9 275HX (72596 - 104508, n=30) | |
| Lenovo Legion 5 Pro 16IAX10H | |
| Alienware 16 Area-51 | |
| Alienware 16X Aurora, RTX 5070 | |
| Asus TUF Gaming A16 FA608WV | |
| MSI Vector 16 HX AI A2XWHG | |
| Gigabyte Gaming A16 GA6H | |
| AIDA64 / CPU AES | |
| Lenovo Legion 5 Pro 16IAX10H | |
| Average Intel Core Ultra 9 275HX (105608 - 247074, n=30) | |
| Alienware 16 Area-51 | |
| Alienware 16X Aurora, RTX 5070 | |
| MSI Vector 16 HX AI A2XWHG | |
| Asus TUF Gaming A16 FA608WV | |
| Gigabyte Gaming A16 GA6H | |
| AIDA64 / CPU ZLib | |
| Lenovo Legion 5 Pro 16IAX10H | |
| Average Intel Core Ultra 9 275HX (1582 - 2263, n=30) | |
| Alienware 16 Area-51 | |
| Alienware 16X Aurora, RTX 5070 | |
| Asus TUF Gaming A16 FA608WV | |
| MSI Vector 16 HX AI A2XWHG | |
| Gigabyte Gaming A16 GA6H | |
| AIDA64 / FP64 Ray-Trace | |
| Asus TUF Gaming A16 FA608WV | |
| Average Intel Core Ultra 9 275HX (14847 - 21854, n=30) | |
| Lenovo Legion 5 Pro 16IAX10H | |
| Alienware 16 Area-51 | |
| Alienware 16X Aurora, RTX 5070 | |
| MSI Vector 16 HX AI A2XWHG | |
| Gigabyte Gaming A16 GA6H | |
| AIDA64 / CPU PhotoWorxx | |
| Alienware 16 Area-51 | |
| Average Intel Core Ultra 9 275HX (37482 - 62916, n=30) | |
| Lenovo Legion 5 Pro 16IAX10H | |
| Alienware 16X Aurora, RTX 5070 | |
| MSI Vector 16 HX AI A2XWHG | |
| Asus TUF Gaming A16 FA608WV | |
| Gigabyte Gaming A16 GA6H | |
Stress Test
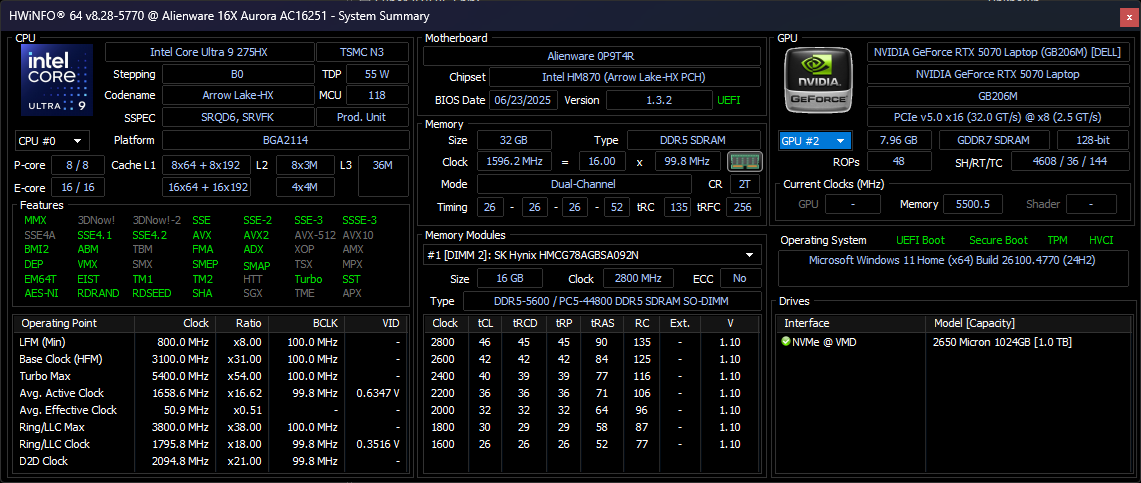
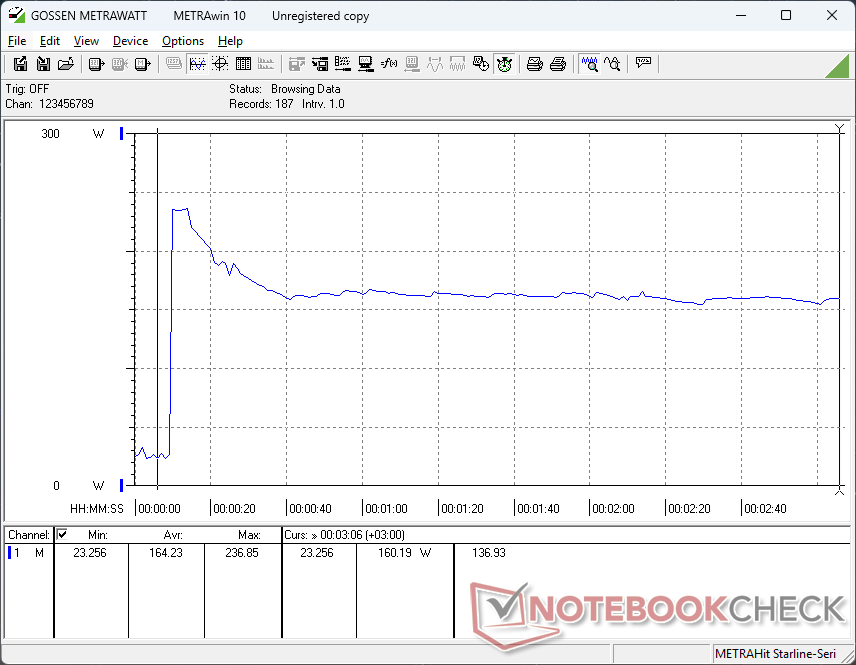
When running Prime95 stress, the CPU would boost to 4.1 GHz, 165 W, and 102 C before quickly stabilizing at 3.4 GHz, 102 W, and 99 C shortly thereafter. Core temperature would be very warm even if running on Overdrive mode and when compared to other gaming laptops like the Razer Blade 16 where core temperature would stabilize at a cooler 80 C under similar conditions. The Aurora 16X is clearly prioritizing CPU performance as much as possible even if it means running at much warmer core temperatures.
GPU board power draw would stabilize at 94 W, 111 W, and 114 W when running Cyberpunk 2077 on Balanced, Performance, and Overdrive modes, respectively. GPU clock rates would inch higher between each performance setting as shown by the table and screenshots below, but note that GPU temperatures would actually change very little as fan noise becomes louder to compensate for the faster clock rates. CPU and GPU temperatures when gaming would plateau at the low 80 C range which is typical for most gaming laptops.
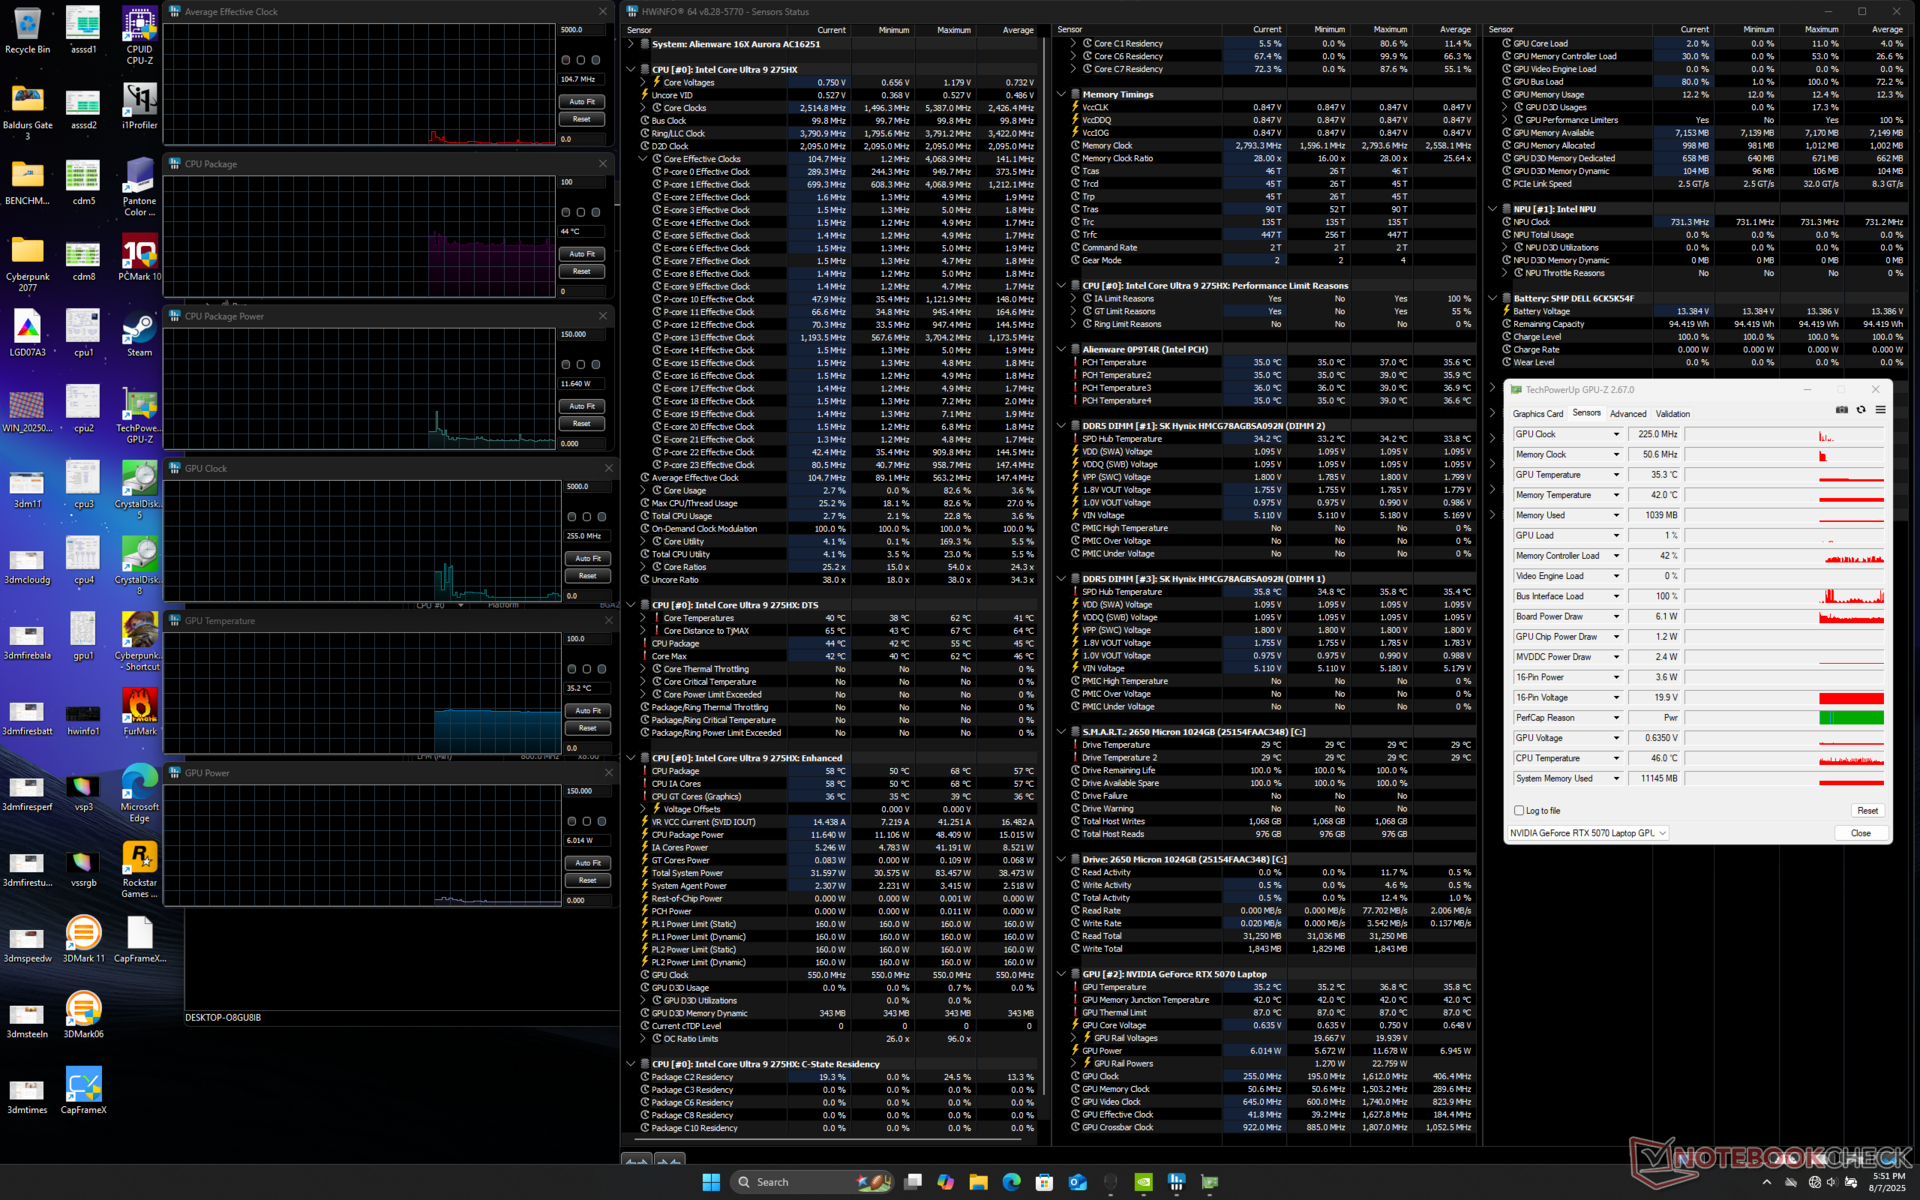
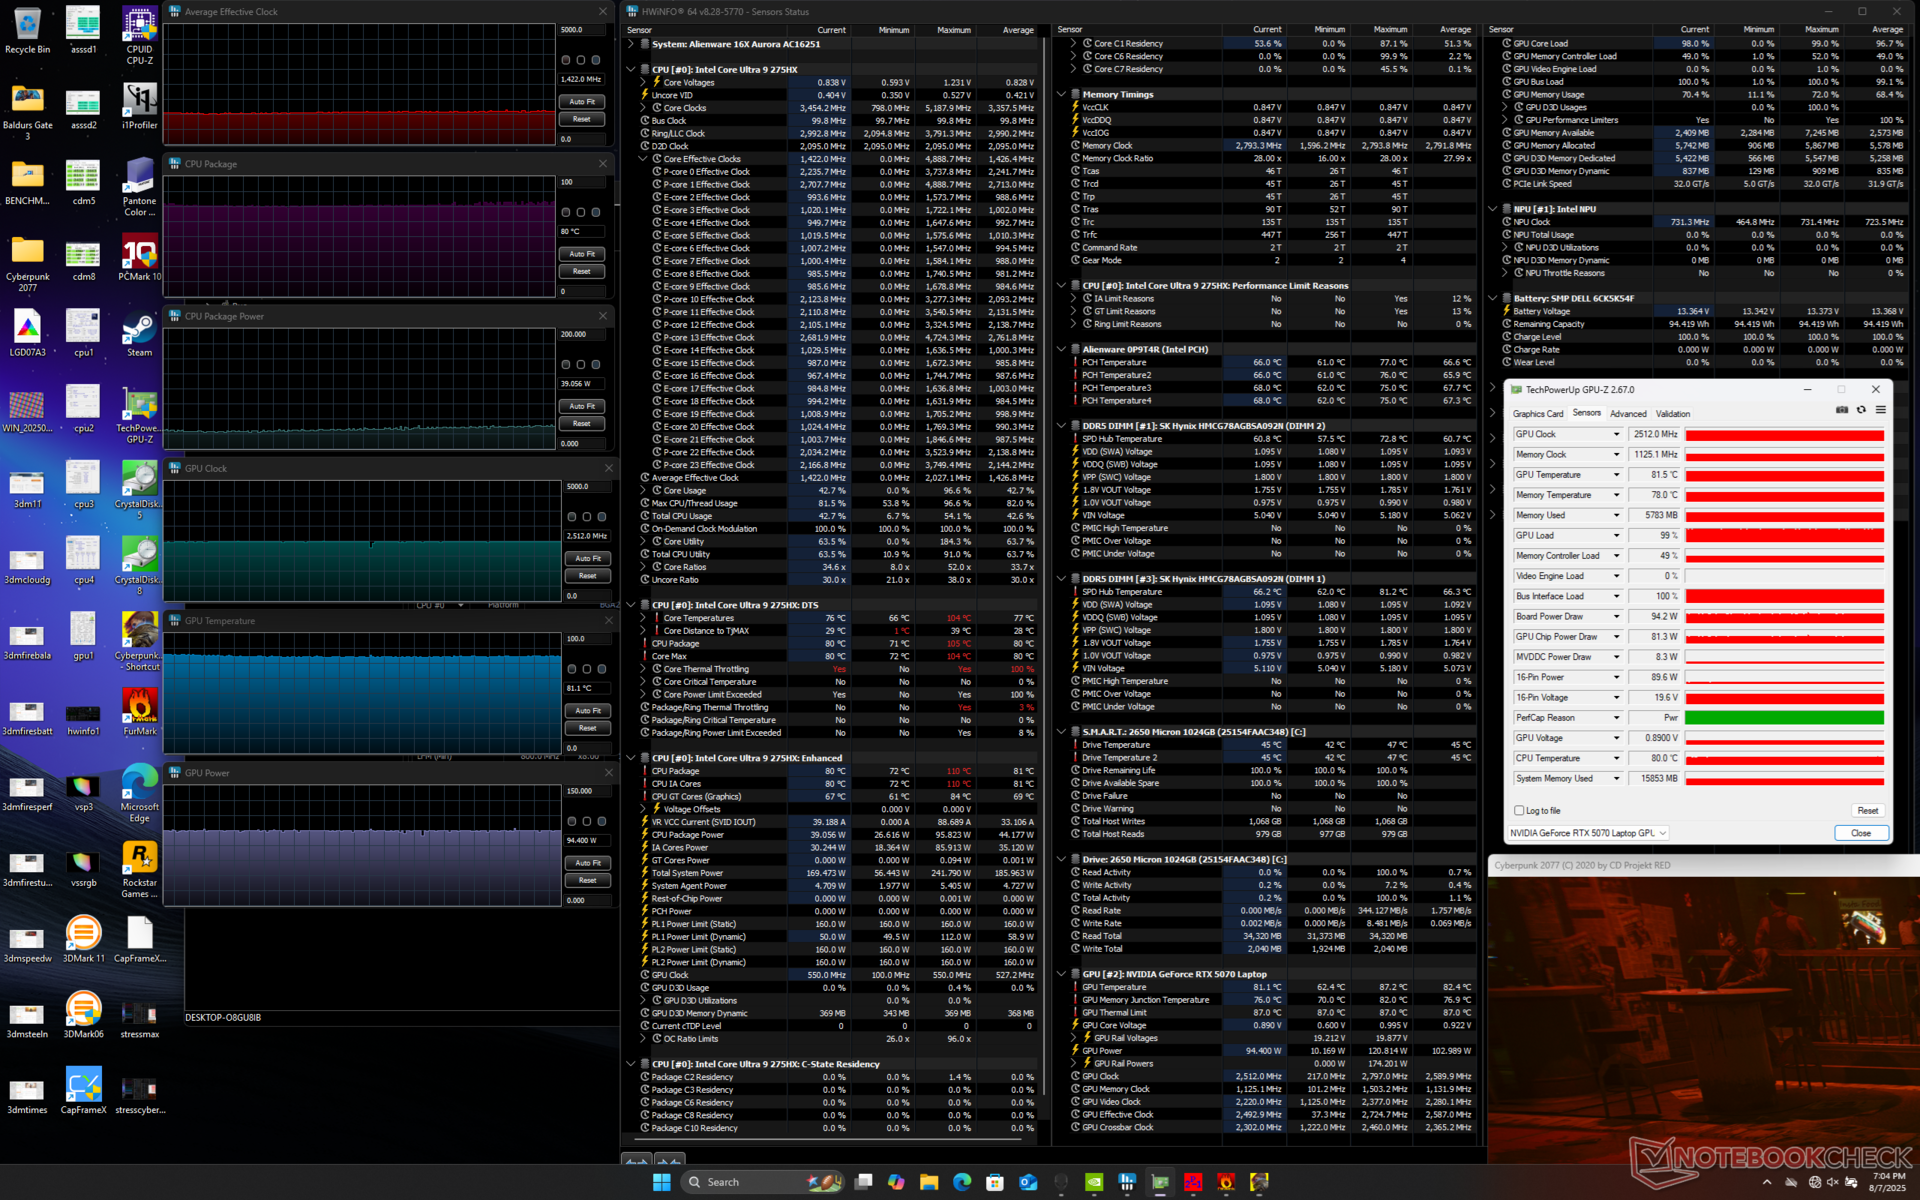

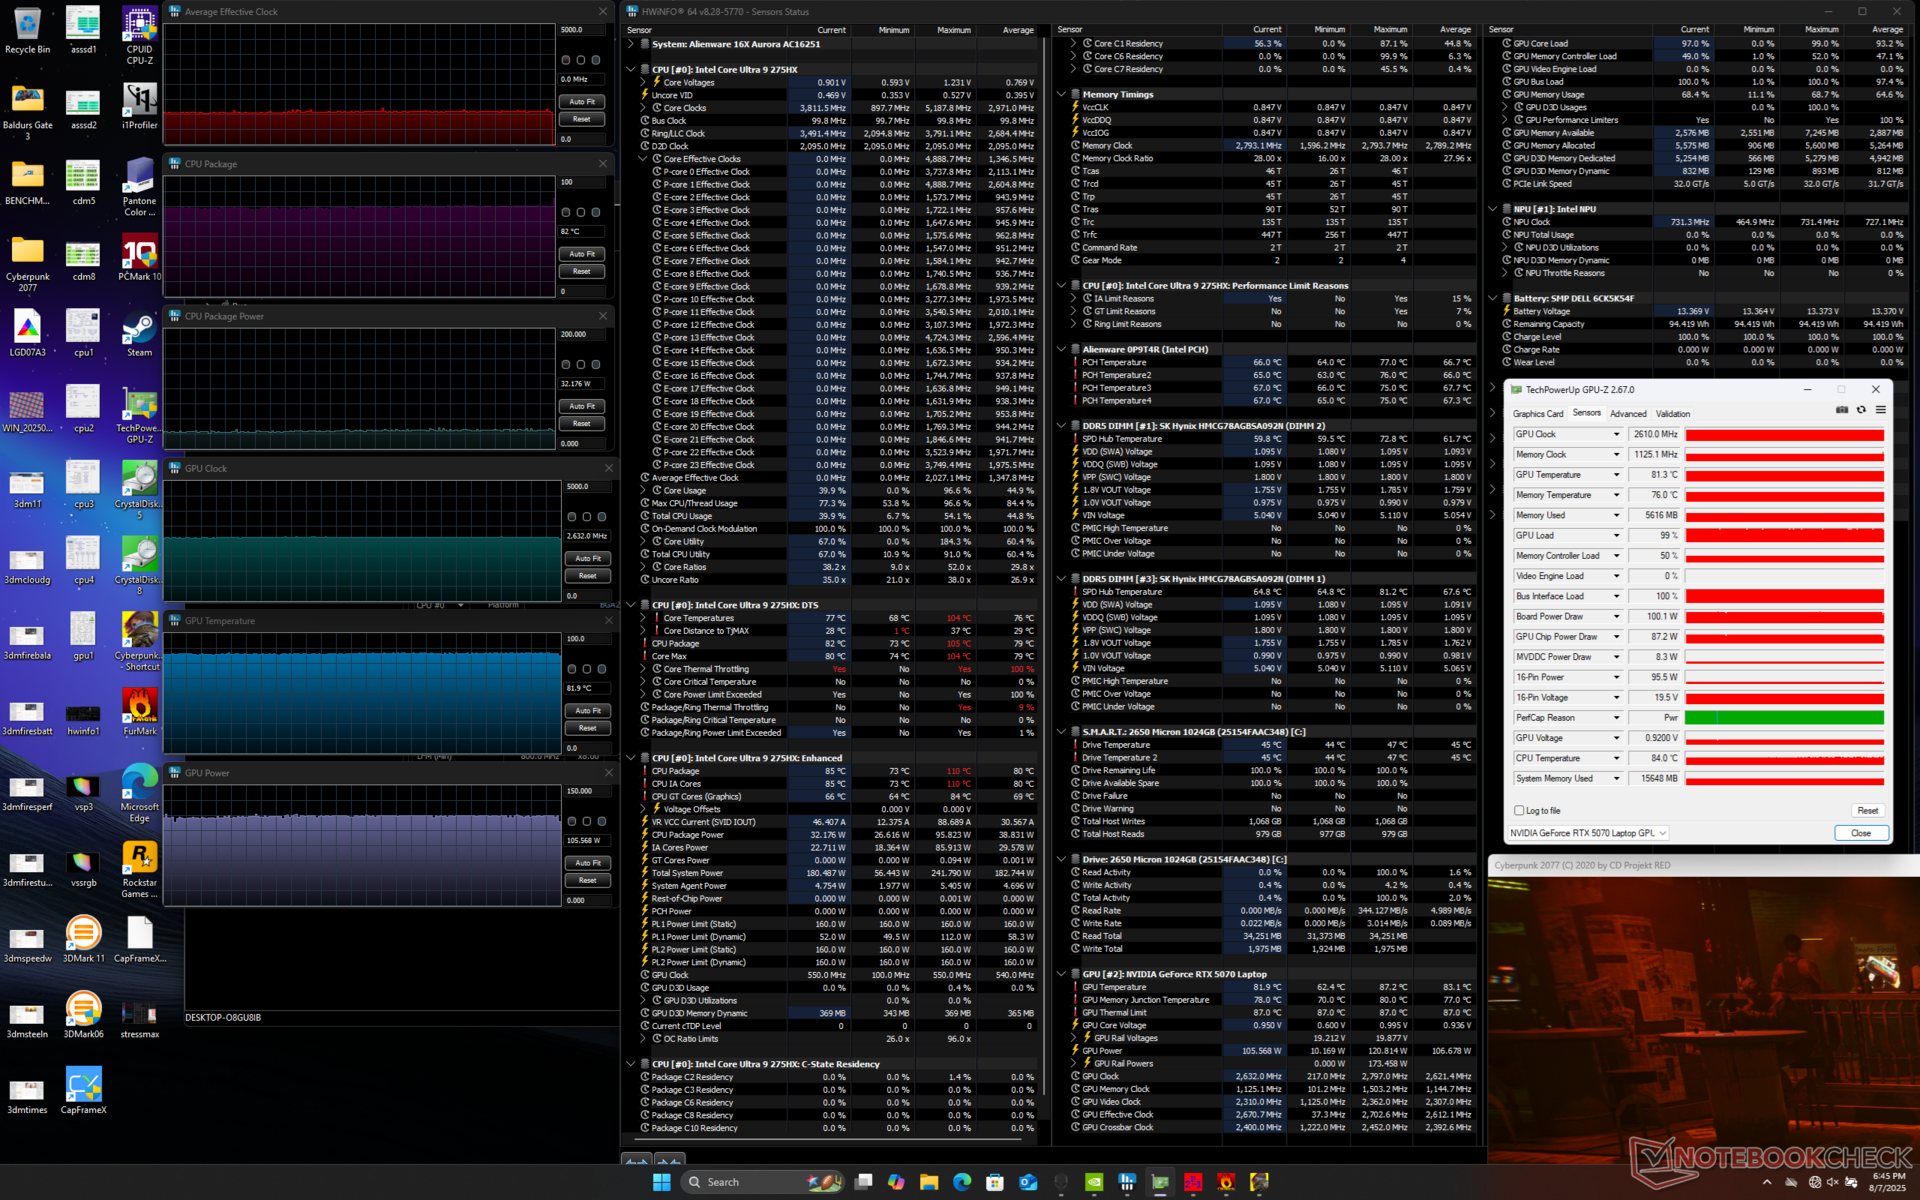


| Average CPU Clock (GHz) | GPU Clock (MHz) | Average CPU Temperature (°C) | Average GPU Temperature (°C) | |
| System Idle | -- | -- | 44 | 35 |
| Prime95 Stress | 3.3 | -- | 99 | 52 |
| Prime95 + FurMark Stress | 2.1 | 2017 | 85 | 84 |
| Cyberpunk 2077 Stress (Balanced mode) | 1.4 | 2512 | 80 | 81 |
| Cyberpunk 2077 Stress (Performance mode) | 1.4 | 2610 | 82 | 82 |
| Cyberpunk 2077 Stress (Overdrive mode) | 1.6 | 2707 | 83 | 82 |
System Performance
PCMark 10 would constantly crash with OpenCL errors even after reinstallation and multiple retries. Its results are therefore not provided here. CrossMark and AIDA results are otherwise where we expect them to be and quite close to the Alienware 16 Area-51.
| AIDA64 / Memory Copy | |
| Asus TUF Gaming A16 FA608WV | |
| Alienware 16 Area-51 | |
| Average Intel Core Ultra 9 275HX (56003 - 94460, n=30) | |
| Lenovo Legion 5 Pro 16IAX10H | |
| Alienware 16X Aurora, RTX 5070 | |
| MSI Vector 16 HX AI A2XWHG | |
| Gigabyte Gaming A16 GA6H | |
| AIDA64 / Memory Read | |
| Asus TUF Gaming A16 FA608WV | |
| Alienware 16 Area-51 | |
| Lenovo Legion 5 Pro 16IAX10H | |
| Alienware 16X Aurora, RTX 5070 | |
| Average Intel Core Ultra 9 275HX (55795 - 97151, n=30) | |
| MSI Vector 16 HX AI A2XWHG | |
| Gigabyte Gaming A16 GA6H | |
| AIDA64 / Memory Write | |
| Asus TUF Gaming A16 FA608WV | |
| Alienware 16 Area-51 | |
| Average Intel Core Ultra 9 275HX (55663 - 116129, n=30) | |
| Alienware 16X Aurora, RTX 5070 | |
| Lenovo Legion 5 Pro 16IAX10H | |
| MSI Vector 16 HX AI A2XWHG | |
| Gigabyte Gaming A16 GA6H | |
| AIDA64 / Memory Latency | |
| Alienware 16 Area-51 | |
| Average Intel Core Ultra 9 275HX (105.8 - 161.6, n=30) | |
| Alienware 16X Aurora, RTX 5070 | |
| Asus TUF Gaming A16 FA608WV | |
| Lenovo Legion 5 Pro 16IAX10H | |
| MSI Vector 16 HX AI A2XWHG | |
| Gigabyte Gaming A16 GA6H | |
* ... smaller is better
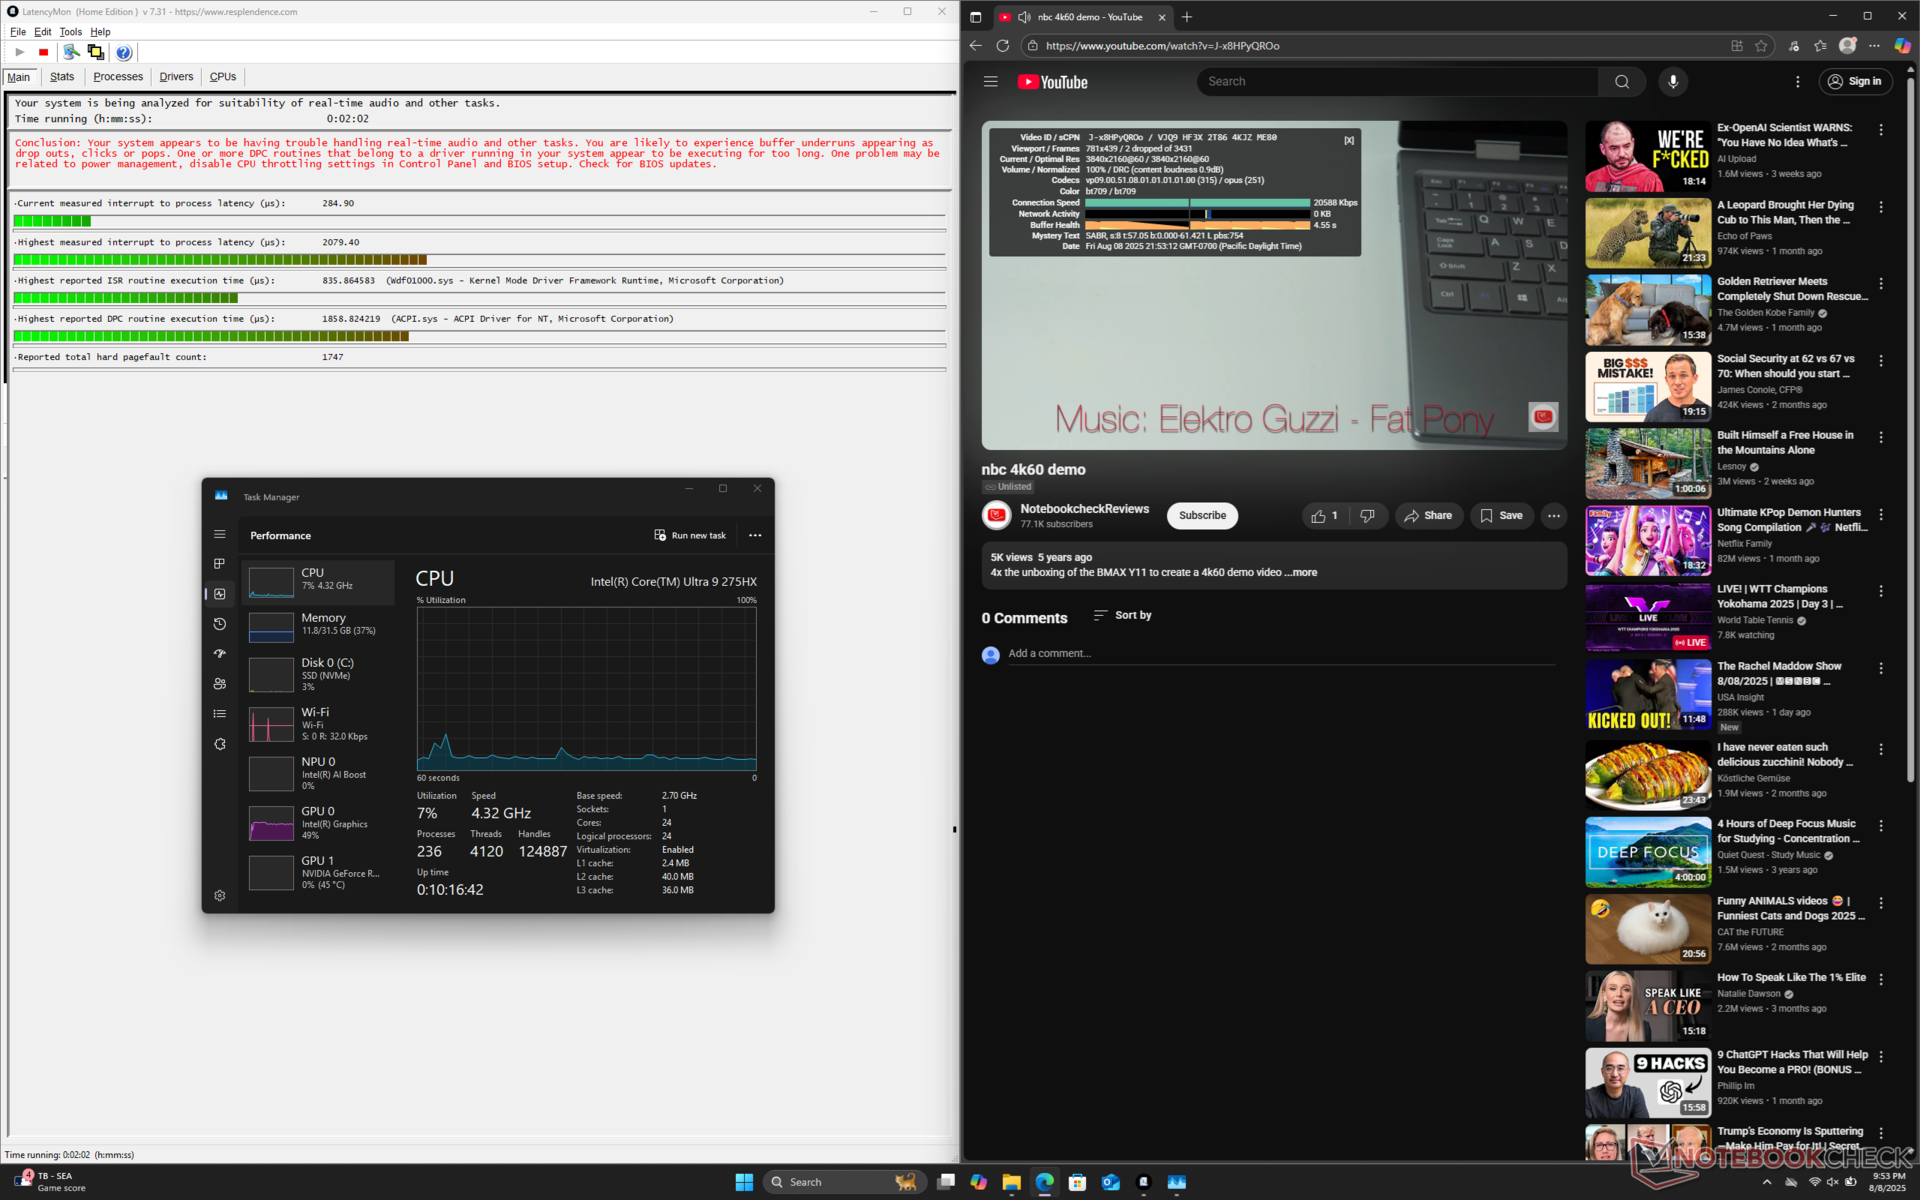
DPC Latency
LatencyMon shows only minor DPC issues when opening multiple tabs of our homepage as well as 2 dropped frames when playing a 60-second 4K60 video.

| DPC Latencies / LatencyMon - interrupt to process latency (max), Web, Youtube, Prime95 | |
| MSI Vector 16 HX AI A2XWHG | |
| Gigabyte Gaming A16 GA6H | |
| Alienware 16 Area-51 | |
| Alienware 16X Aurora, RTX 5070 | |
| Asus TUF Gaming A16 FA608WV | |
| Lenovo Legion 5 Pro 16IAX10H | |
* ... smaller is better
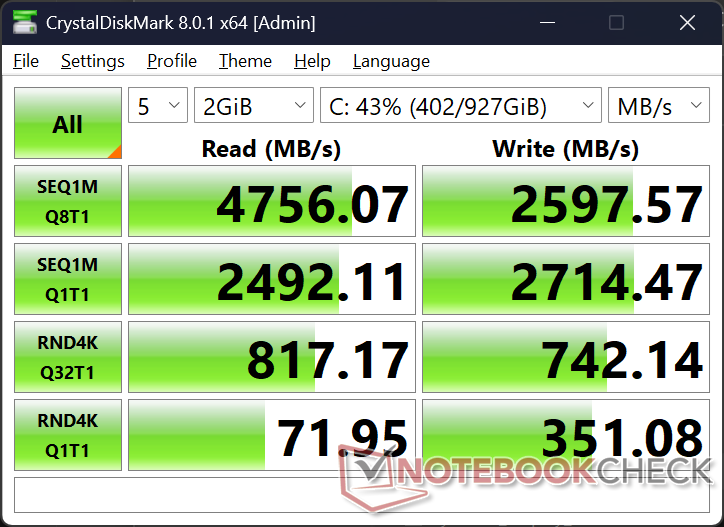
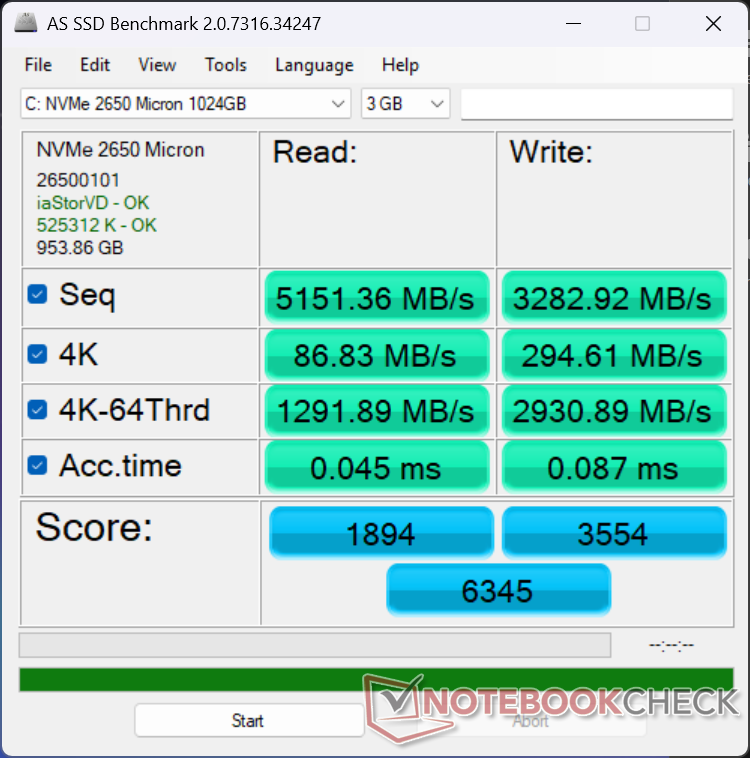
Storage Devices
The Micron 2650 PCIe4 x4 NVMe SSD in our unit offers read rates of up to 7000 MB/s before throttling would occur after a minute or so into our DiskSpd loop stress test. Transfer rates would drop to as low as 3000 MB/s as shown by our graph below whereas the Samsung PM9C1a in the Alienware Area-51 would remain steady at 6200 MB/s when under similar testing conditions. For gaming scenarios, however, the delayed SSD throttling of the Aurora 16X should have minimal to no impact to the user experience.


| Drive Performance rating - Percent | |
| Alienware 16 Area-51 | |
| Alienware 16X Aurora, RTX 5070 | |
| Lenovo Legion 5 Pro 16IAX10H | |
| Gigabyte Gaming A16 GA6H | |
| MSI Vector 16 HX AI A2XWHG | |
| Asus TUF Gaming A16 FA608WV | |
* ... smaller is better
Disk Throttling: DiskSpd Read Loop, Queue Depth 8
GPU Performance
The mobile RTX 5070 is about 10 percent faster than the mobile RTX 4070 in terms of raw rasterization performance. Beyond that, It offers other auxiliary benefits including MFG support and 4:2:2 color depth encoding/decoding that were previously unavailable.
Keep in mind that the mobile RTX 5070 is significantly slower than the desktop RTX 5070 by about 35 to 40 percent and with much less VRAM as well. Downgrading to the mobile RTX 5060 configuration is expected to impact performance by about 10 percent.
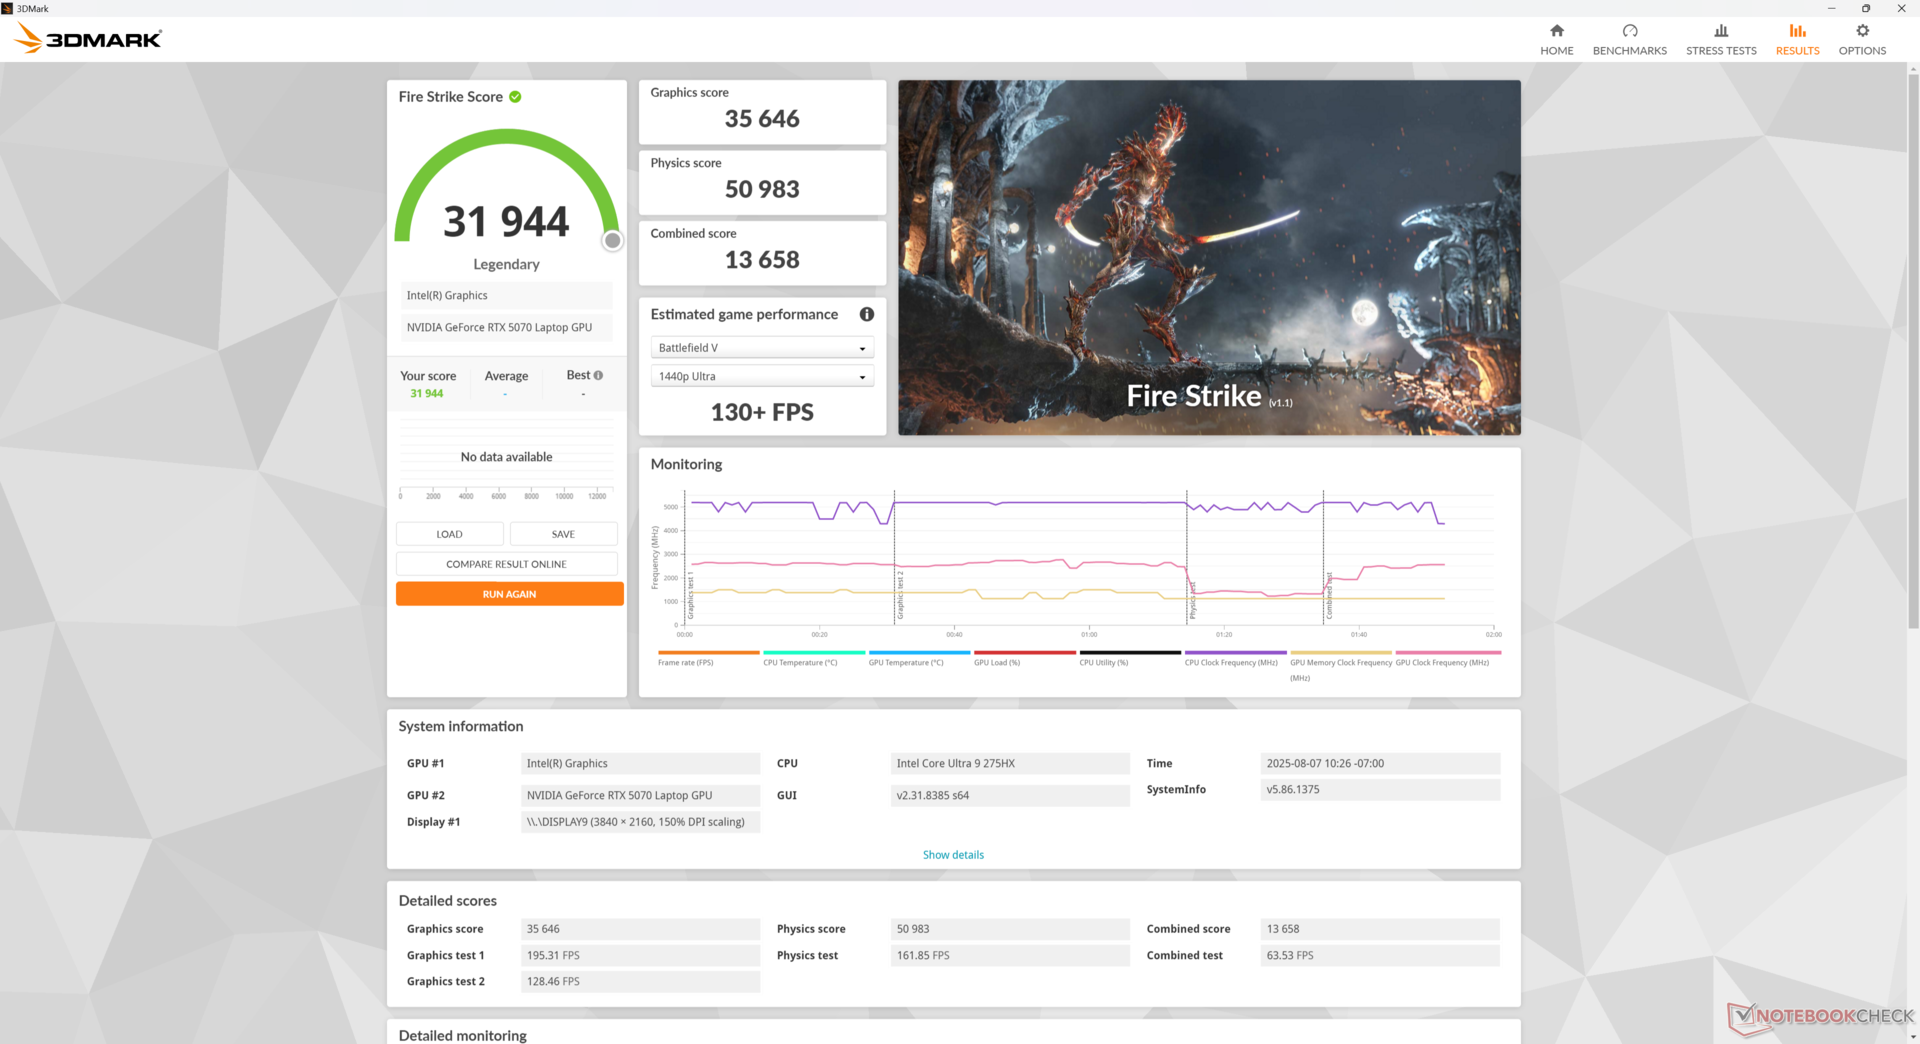
| Power Profile | Graphics Score | Physics Score | Combined Score |
| Overdrive Mode | 36334 | 51210 | 12767 |
| Performance Mode | 35646 (-2%) | 50983 (-0%) | 13658 (-0%) |
| Balanced Mode | 33459 (-8%) | 50799 (-1%) | 12594 (-1%) |
| Battery Power | 26776 (-26%) | 29665 (-42%) | 9154 (-28%) |
There are no significant performance differences between the Overdrive and Performance modes as shown by our Fire Strike results table above. Meanwhile, graphics performance would drop by about 8 percent for users who prefer to game on the much quieter Balanced power profile.
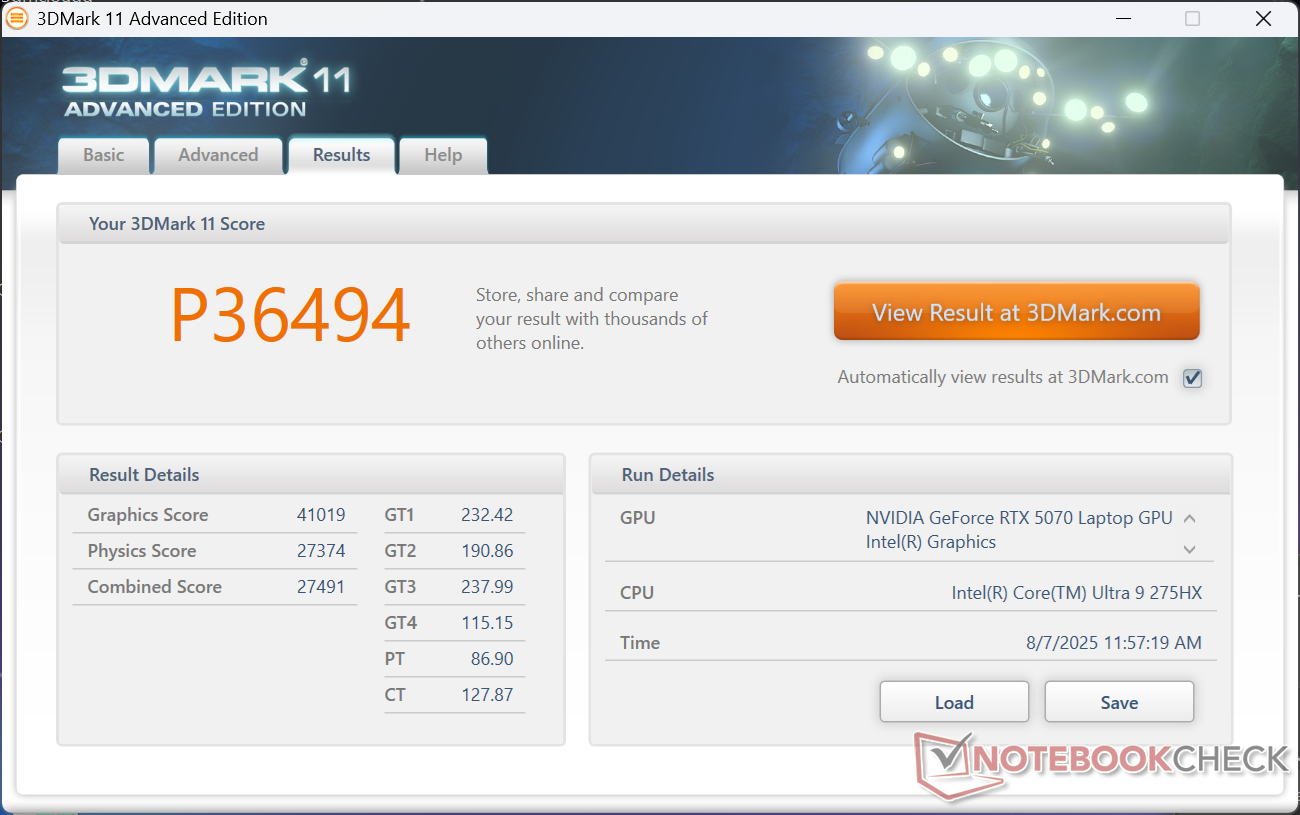


| 3DMark 11 Performance | 36494 points | |
| 3DMark Cloud Gate Standard Score | 71379 points | |
| 3DMark Fire Strike Score | 31944 points | |
| 3DMark Time Spy Score | 14321 points | |
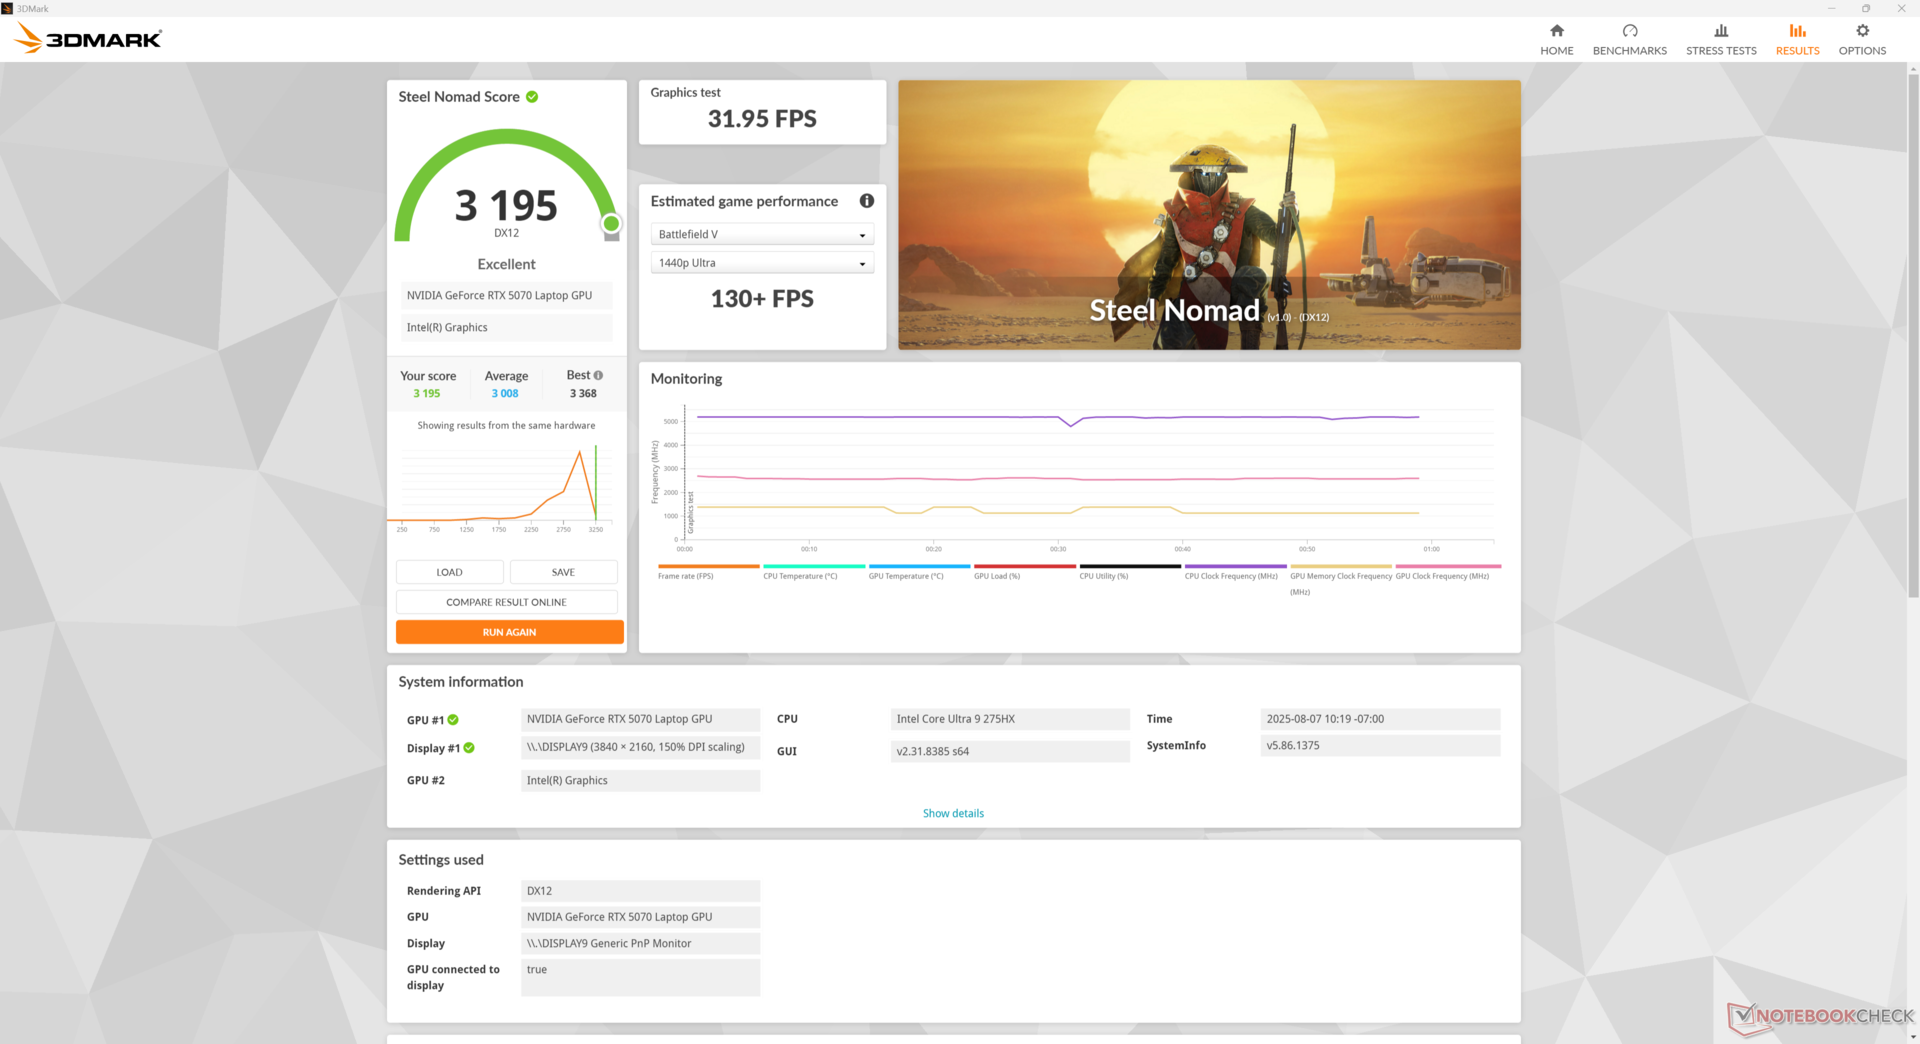
| 3DMark Steel Nomad Score | 3195 points | |
Help | ||
* ... smaller is better
Gaming Performance
Gaming with the mobile RTX 5070 is a mixed bag. While the desktop RTX 5070 can comfortably run most titles at 1440p maximum settings including demanding ones like Indiana Jones or Assassin's Creed Shadows, the mobile GPU struggles on these very same titles. For example, Alan Wake 2 at 1440p Ultra settings only runs at 45 FPS on our Aurora 16X compared to 74 FPS on our desktop RTX 5070 reference. DLSS can certainly help to narrow that gap, but lowering the overall settings to medium or medium-high is recommended instead. Of course, the mobile RTX 5070 is much more portable than its faster desktop counterpart.
The 8 GB VRAM is also a notable limitation. Enabling advanced features like ray tracing or higher textures that eat up VRAM would often tank frame rates or lead to a crash when testing games likes Monster Hunter Wilds, Indiana Jones, Alan Wake 2, or Black Myth Wukong. Monster Hunter Wilds, for example, would run over 40 percent slower than a laptop with RTX 5070 Ti graphics on maximum 1080p settings. Our Indiana Jones results are also unusually low even after multiple retries and updating to the latest drivers at the time of publishing.
| Performance rating - Percent | |
| Alienware 16 Area-51 -1! | |
| Lenovo Legion 5 Pro 16IAX10H | |
| MSI Vector 16 HX AI A2XWHG -1! | |
| Alienware 16X Aurora, RTX 5070 | |
| Gigabyte Gaming A16 GA6H | |
| Asus TUF Gaming A16 FA608WV | |
| Cyberpunk 2077 - 1920x1080 Ultra Preset (FSR off) | |
| Alienware 16 Area-51 | |
| Lenovo Legion 5 Pro 16IAX10H | |
| MSI Vector 16 HX AI A2XWHG | |
| Alienware 16X Aurora, RTX 5070 | |
| Gigabyte Gaming A16 GA6H | |
| Asus TUF Gaming A16 FA608WV | |
| Baldur's Gate 3 - 1920x1080 Ultra Preset AA:T | |
| Alienware 16 Area-51 | |
| MSI Vector 16 HX AI A2XWHG | |
| Alienware 16X Aurora, RTX 5070 | |
| Lenovo Legion 5 Pro 16IAX10H | |
| Gigabyte Gaming A16 GA6H | |
| Asus TUF Gaming A16 FA608WV | |
| GTA V - 1920x1080 Highest AA:4xMSAA + FX AF:16x | |
| Alienware 16X Aurora, RTX 5070 | |
| Lenovo Legion 5 Pro 16IAX10H | |
| MSI Vector 16 HX AI A2XWHG | |
| Asus TUF Gaming A16 FA608WV | |
| Gigabyte Gaming A16 GA6H | |
| Final Fantasy XV Benchmark - 1920x1080 High Quality | |
| Alienware 16 Area-51 | |
| Lenovo Legion 5 Pro 16IAX10H | |
| MSI Vector 16 HX AI A2XWHG | |
| Alienware 16X Aurora, RTX 5070 | |
| Asus TUF Gaming A16 FA608WV | |
| Gigabyte Gaming A16 GA6H | |
| Strange Brigade - 1920x1080 ultra AA:ultra AF:16 | |
| Alienware 16 Area-51 | |
| Lenovo Legion 5 Pro 16IAX10H | |
| Alienware 16X Aurora, RTX 5070 | |
| Gigabyte Gaming A16 GA6H | |
| Asus TUF Gaming A16 FA608WV | |
| Dota 2 Reborn - 1920x1080 ultra (3/3) best looking | |
| Alienware 16X Aurora, RTX 5070 | |
| Lenovo Legion 5 Pro 16IAX10H | |
| MSI Vector 16 HX AI A2XWHG | |
| Alienware 16 Area-51 | |
| Gigabyte Gaming A16 GA6H | |
| Asus TUF Gaming A16 FA608WV | |
| X-Plane 11.11 - 1920x1080 high (fps_test=3) | |
| Alienware 16X Aurora, RTX 5070 | |
| Lenovo Legion 5 Pro 16IAX10H | |
| Alienware 16 Area-51 | |
| MSI Vector 16 HX AI A2XWHG | |
| Gigabyte Gaming A16 GA6H | |
| Asus TUF Gaming A16 FA608WV | |
| Monster Hunter Wilds | |
| 1920x1080 medium, no upscaling | |
| Chuwi Gamebook, R9 9955HX | |
| Alienware 16X Aurora, RTX 5070 | |
| Average NVIDIA GeForce RTX 5070 Laptop (61.6 - 78.2, n=4) | |
| 1920x1080 ultra, RT: high, no upscaling | |
| Alienware 16 Area-51 | |
| Chuwi Gamebook, R9 9955HX | |
| Razer Blade 16 RTX 5080 | |
| Average NVIDIA GeForce RTX 5070 Laptop (39.1 - 44.5, n=3) | |
| Alienware 16X Aurora, RTX 5070 | |
| 2560x1440 ultra, RT: high, no upscaling | |
| Alienware 16 Area-51 | |
| Razer Blade 16 RTX 5080 | |
| Chuwi Gamebook, R9 9955HX | |
| Average NVIDIA GeForce RTX 5070 Laptop (21.1 - 31.7, n=3) | |
| Alienware 16X Aurora, RTX 5070 | |
Cyberpunk 2077 ultra FPS Chart
| low | med. | high | ultra | QHD DLSS | QHD | 4K DLSS | 4K | |
|---|---|---|---|---|---|---|---|---|
| GTA V (2015) | 156.4 | 129 | 125.6 | |||||
| Dota 2 Reborn (2015) | 239 | 210 | 201 | 184 | 148.8 | |||
| Final Fantasy XV Benchmark (2018) | 150.7 | 107.4 | 58.8 | |||||
| X-Plane 11.11 (2018) | 162.3 | 141.3 | 116.1 | 89.3 | ||||
| Strange Brigade (2018) | 259 | 177.9 | 96.1 | |||||
| Baldur's Gate 3 (2023) | 140.8 | 140 | 96.3 | 83.7 | 49.6 | |||
| Cyberpunk 2077 (2023) | 180.3 | 142.7 | 117.7 | 102.9 | 76.6 | 65.4 | 28.4 | |
| Alan Wake 2 (2023) | 62.6 | 45.1 | 23.8 | |||||
| F1 24 (2024) | 88.3 | 85.8 | 54.7 | 22.7 | 19 | |||
| Black Myth: Wukong (2024) | 66 | 37 | 41 | 27 | 7 | |||
| Indiana Jones and the Great Circle (2024) | 153.8 | 56.1 | 8.3 | 7.6 | ||||
| Monster Hunter Wilds (2025) | 78.2 | 39.1 | 21.1 | |||||
| Assassin's Creed Shadows (2025) | 61 | 38 | 37 | 37 | 29 | 22 |
Emissions
System Noise
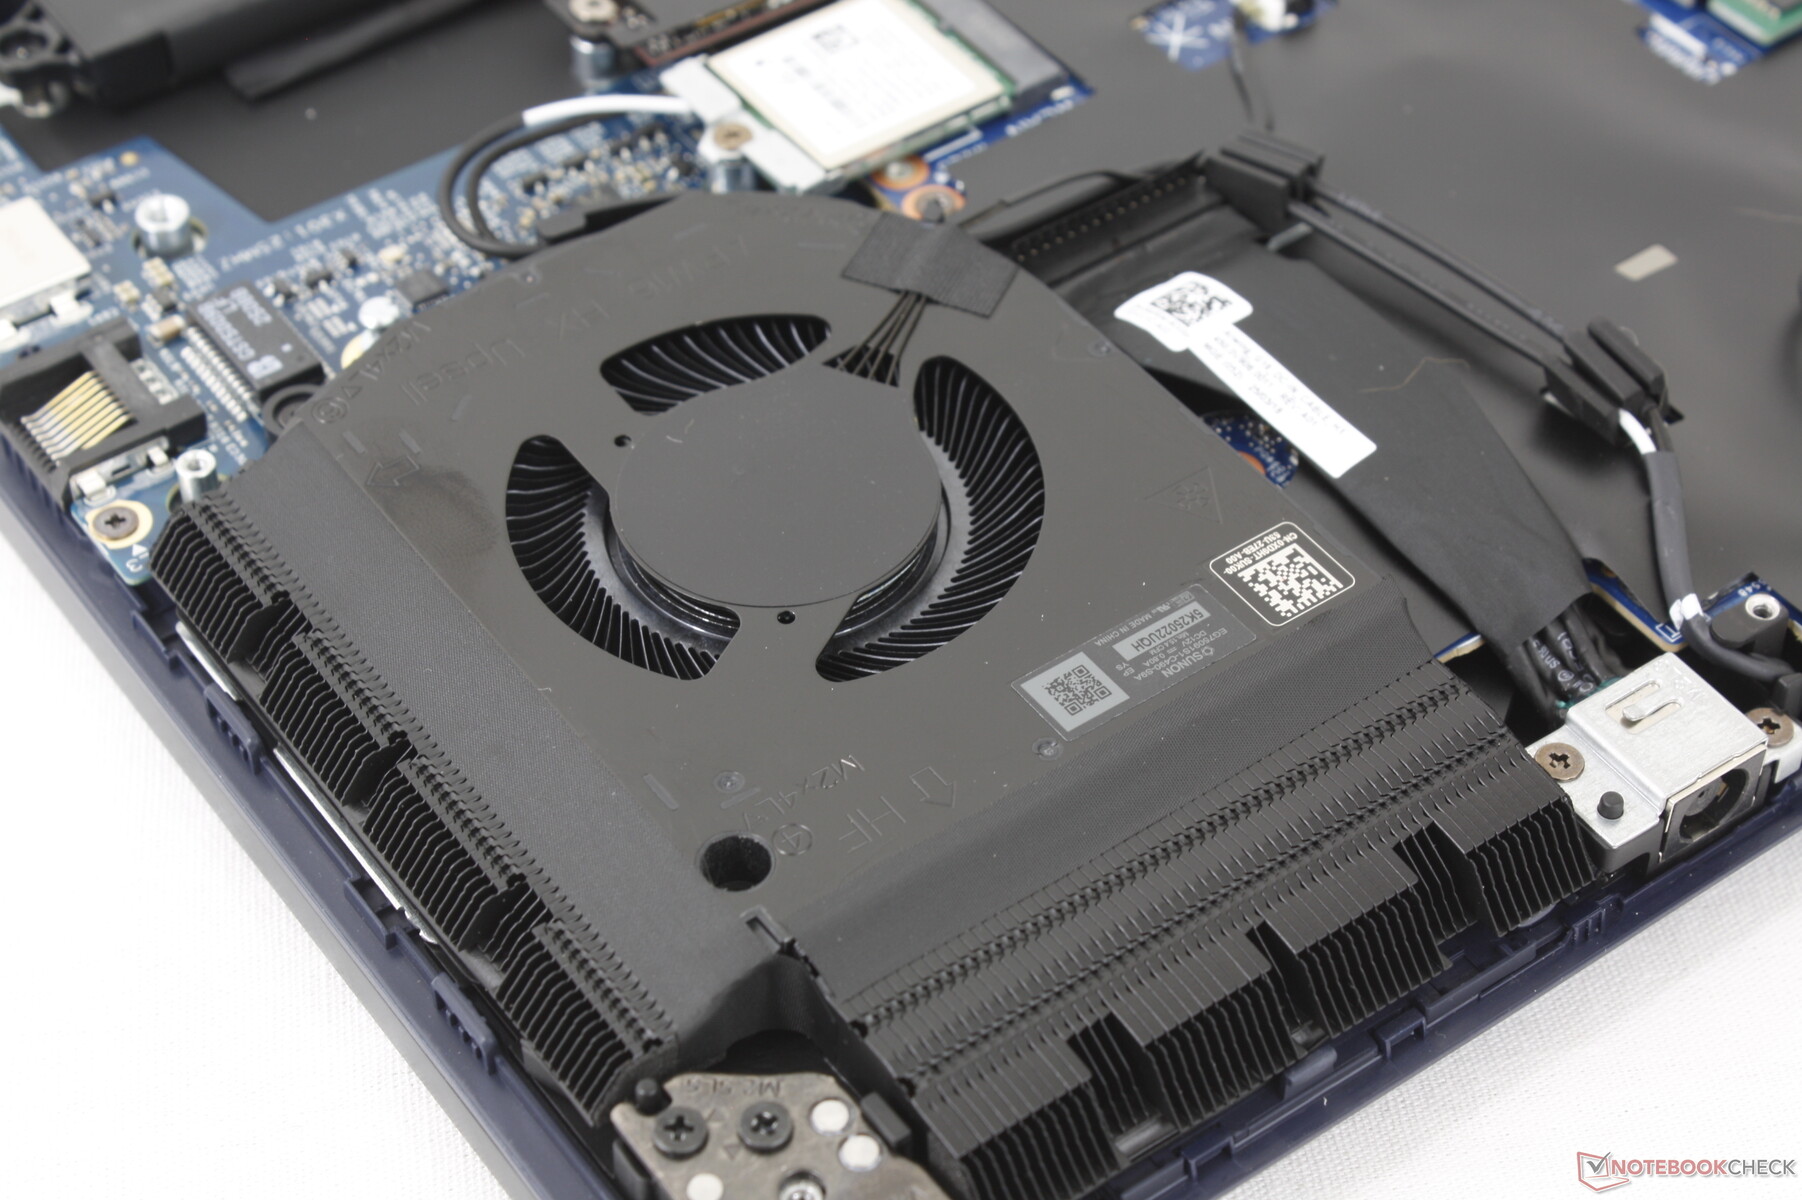
Although it trades away the vapor chamber cooler of the Area-51 for a more traditional approach, fan noise and behavior on the Aurora 16X is surprisingly similar. The dual fans remain quiet throughout the first benchmark scene of 3DMark 06 whereas they tend to pulse early on most other gaming laptops. This means steadier fan behavior on the Aurora 16X when running more undemanding loads like browsers or video.
Fan noise tops out at 48.5 dB(A), 51.8 dB(A), and 58 dB(A) when gaming on Balanced mode, Performance mode, and Overdrive mode, respectively. Gaming on Performance mode is recommended as the performance benefits of Overdrive mode are extremely small when compared to the extreme increase in noise levels.
Noise level
| Idle |
| 23.9 / 23.9 / 26.1 dB(A) |
| Load |
| 26.8 / 58 dB(A) |
 | ||
30 dB silent 40 dB(A) audible 50 dB(A) loud |
||
min: | ||
| Alienware 16X Aurora, RTX 5070 GeForce RTX 5070 Laptop, Ultra 9 275HX | Alienware 16 Area-51 GeForce RTX 5080 Laptop, Ultra 9 275HX, Samsung PM9C1a MZ9L81T0HDLB | Gigabyte Gaming A16 GA6H GeForce RTX 5070 Laptop, i7-13620H, Kingston OM8PGP41024Q-A0 | MSI Vector 16 HX AI A2XWHG GeForce RTX 5070 Ti Laptop, Ultra 7 255HX, Micron 2400 MTFDKBA512QFM | Asus TUF Gaming A16 FA608WV GeForce RTX 4060 Laptop GPU, Ryzen AI 9 HX 370, Micron 2400 MTFDKBA1T0QFM | Lenovo Legion 5 Pro 16IAX10H GeForce RTX 5070 Ti Laptop, Ultra 9 275HX, Western Digital PC SN8000S SDEPNRK-1T00 | |
|---|---|---|---|---|---|---|
| Noise | -4% | -17% | -25% | 6% | -19% | |
| off / environment * (dB) | 23.7 | 23.6 -0% | 24 -1% | 25 -5% | 23 3% | 24 -1% |
| Idle Minimum * (dB) | 23.9 | 25.4 -6% | 25 -5% | 33 -38% | 23 4% | 24 -0% |
| Idle Average * (dB) | 23.9 | 27.8 -16% | 26 -9% | 34 -42% | 23 4% | 24 -0% |
| Idle Maximum * (dB) | 26.1 | 28.1 -8% | 27 -3% | 38 -46% | 29.11 -12% | 30.9 -18% |
| Load Average * (dB) | 26.8 | 28.8 -7% | 54 -101% | 46 -72% | 31 -16% | 55.9 -109% |
| Cyberpunk 2077 ultra * (dB) | 51.8 | 50.4 3% | 54 -4% | 47 9% | 36.23 30% | 56.72 -9% |
| Load Maximum * (dB) | 58 | 56.4 3% | 55 5% | 49 16% | 39.44 32% | 56.72 2% |
* ... smaller is better
Temperature
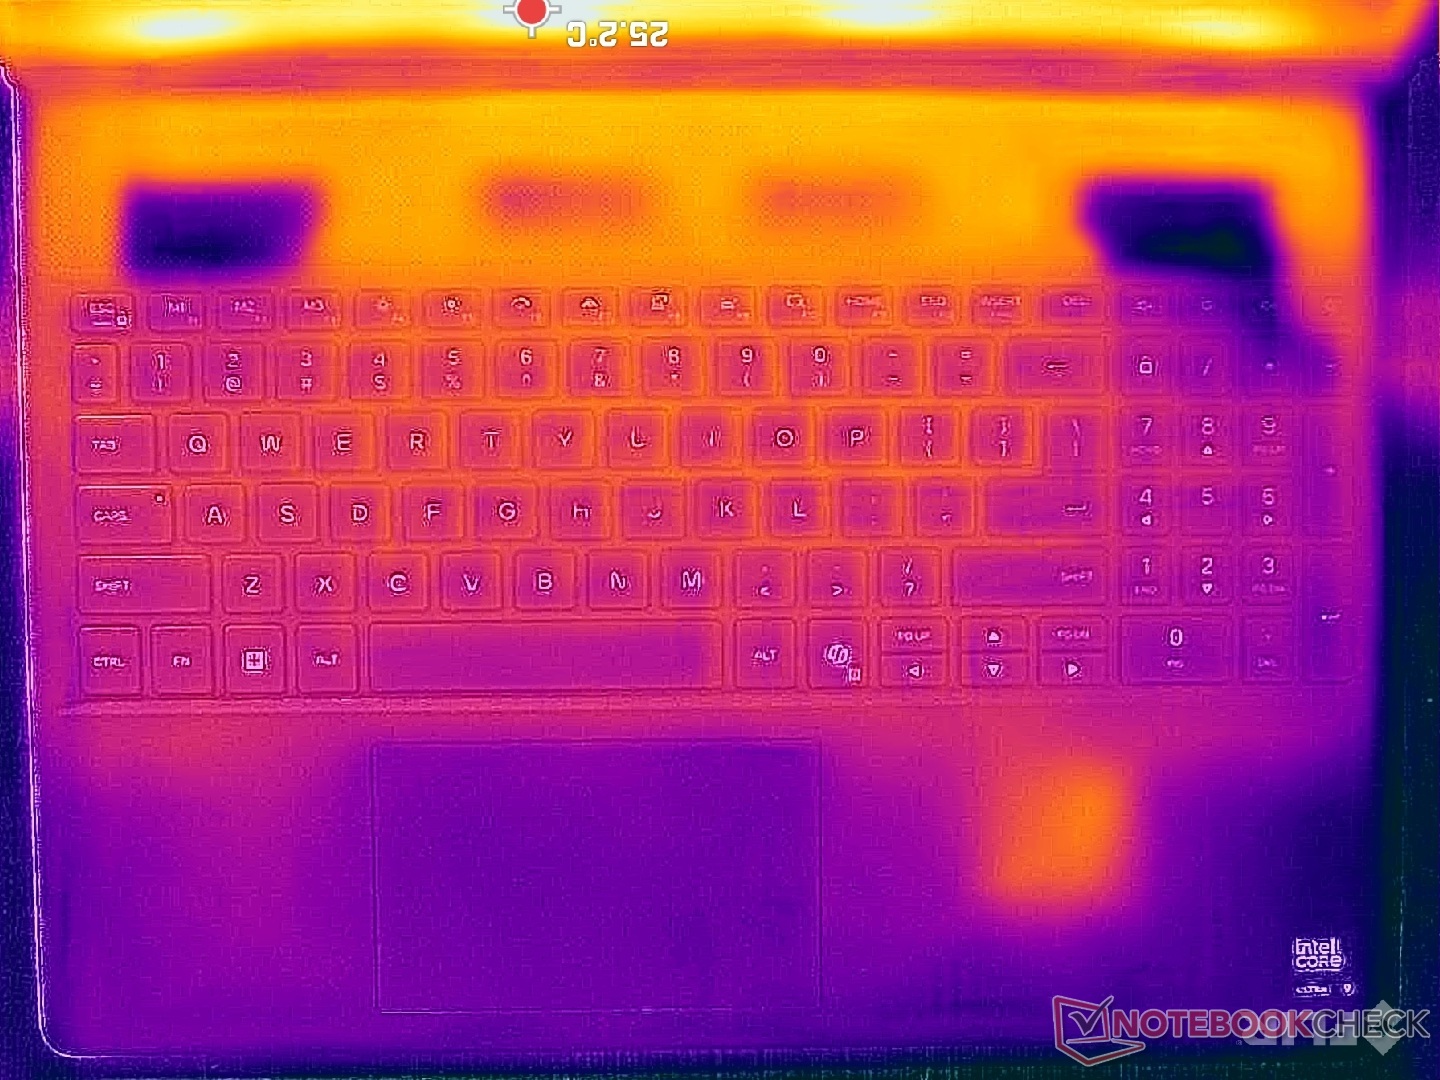
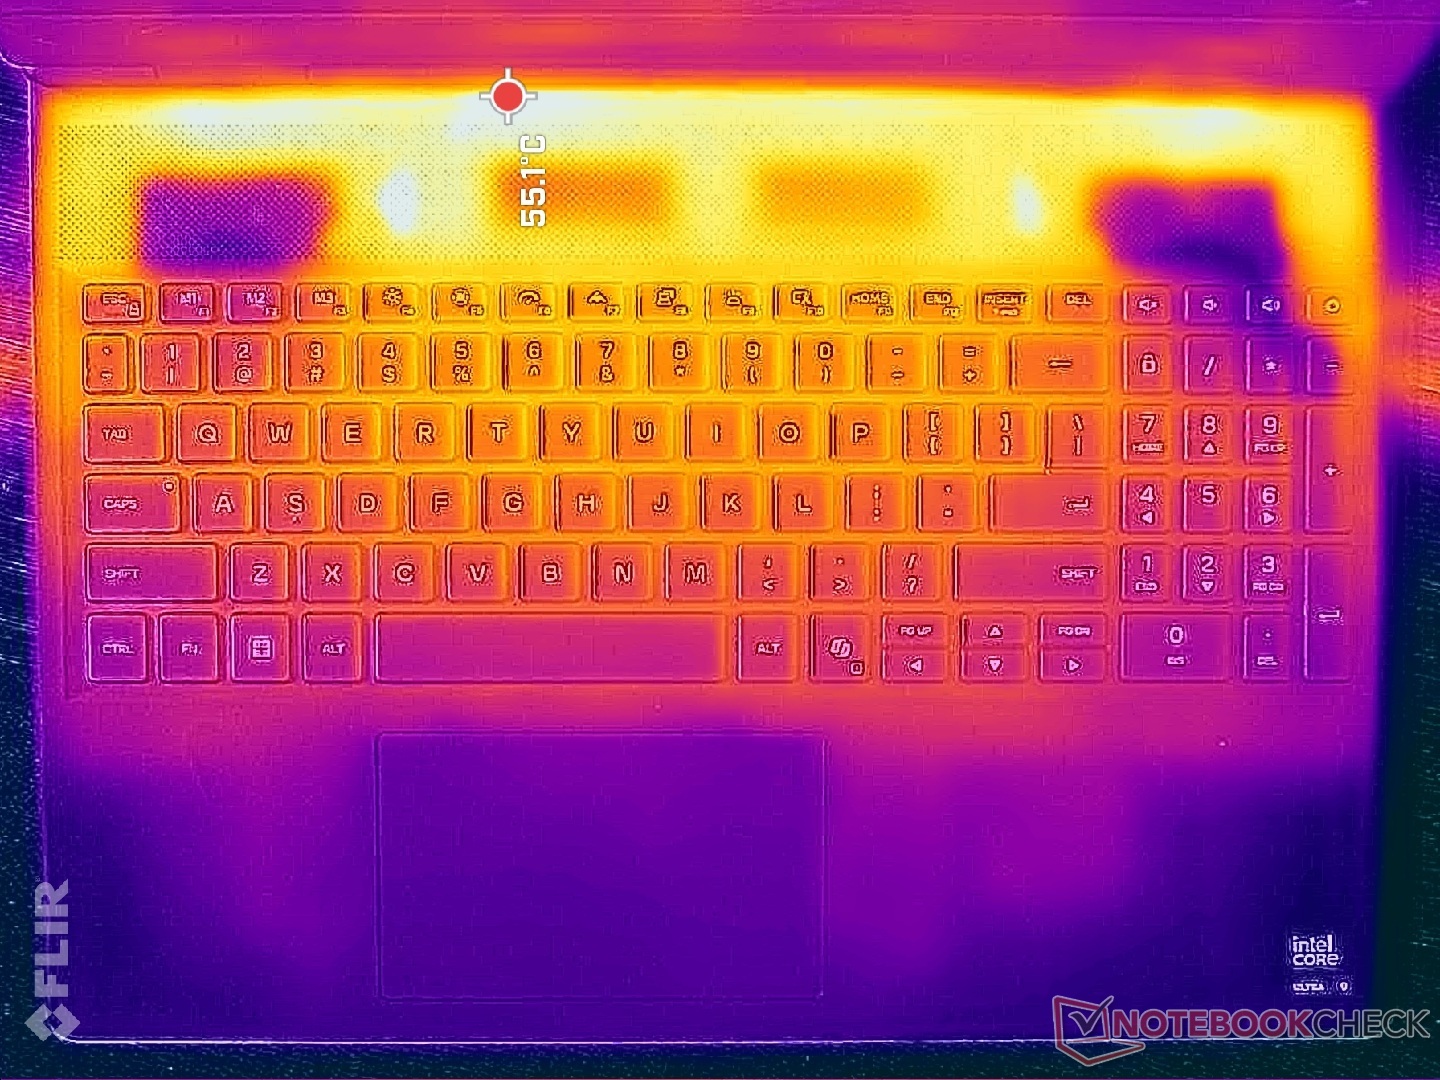
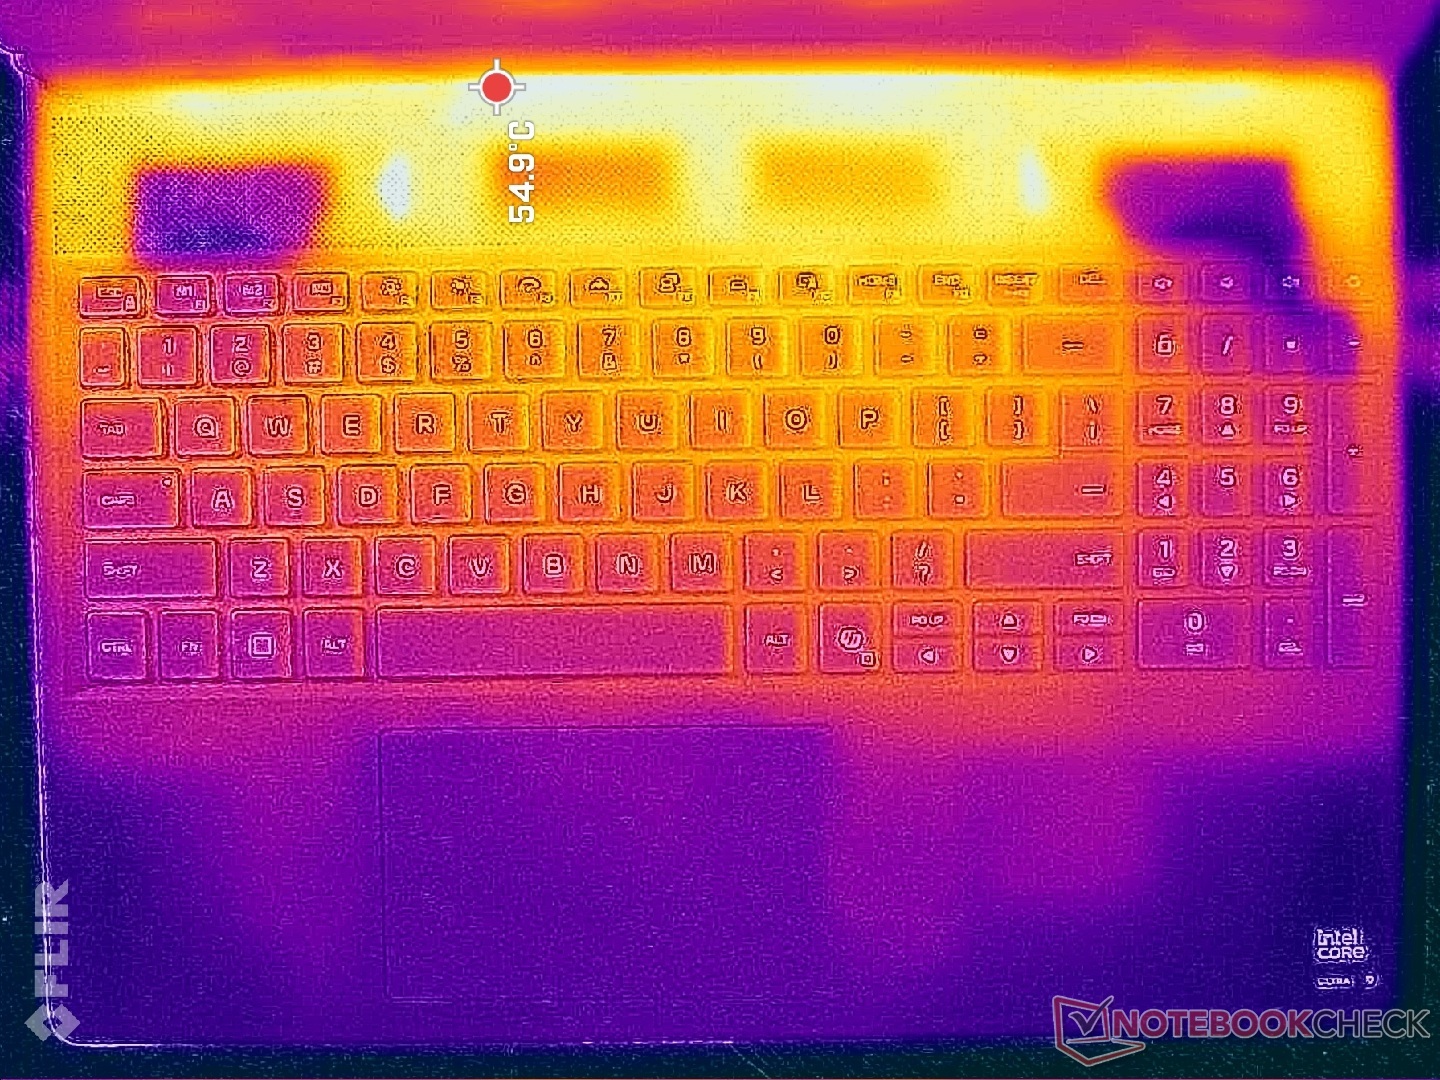
Surface temperatures can be quite warm even if running undemanding loads. When gaming, the palm rests can be as warm as 30 C while much of the keyboard can be as warm as 42 C for toasty fingers and palms. Though not necessarily uncomfortable, cooler palm rests and WASD keys are certainly preferable during longer gaming sessions. The competing MSI Vector 16 HX runs even warmer under similar conditions.
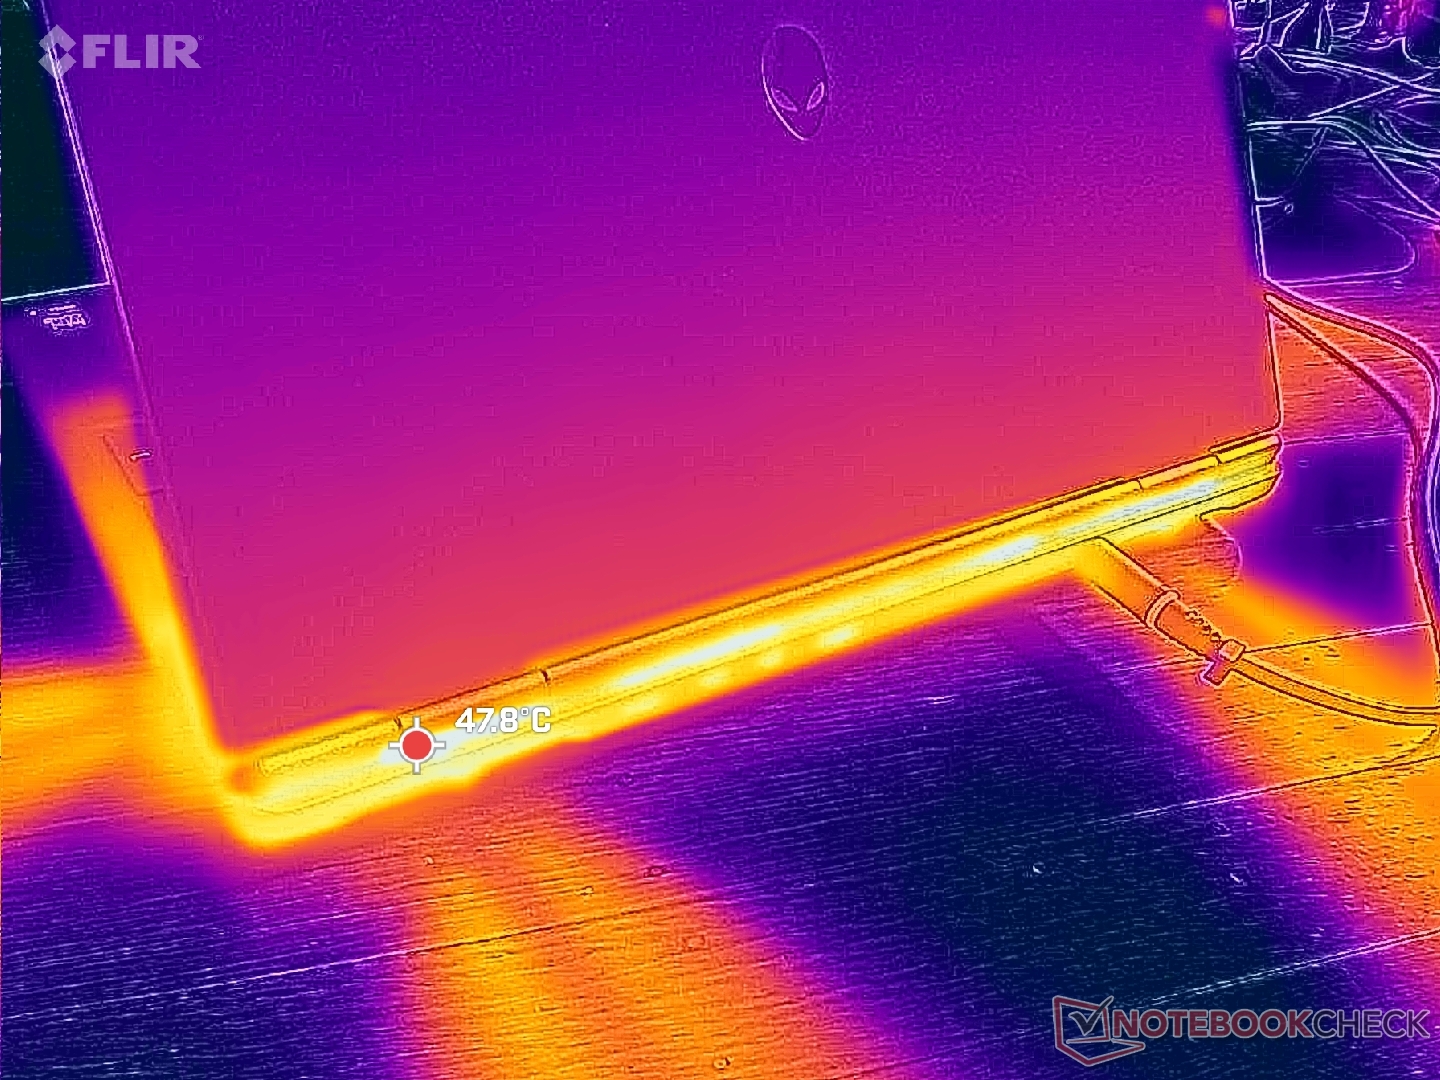
(-) The maximum temperature on the upper side is 51 °C / 124 F, compared to the average of 40.4 °C / 105 F, ranging from 21.2 to 68.8 °C for the class Gaming.
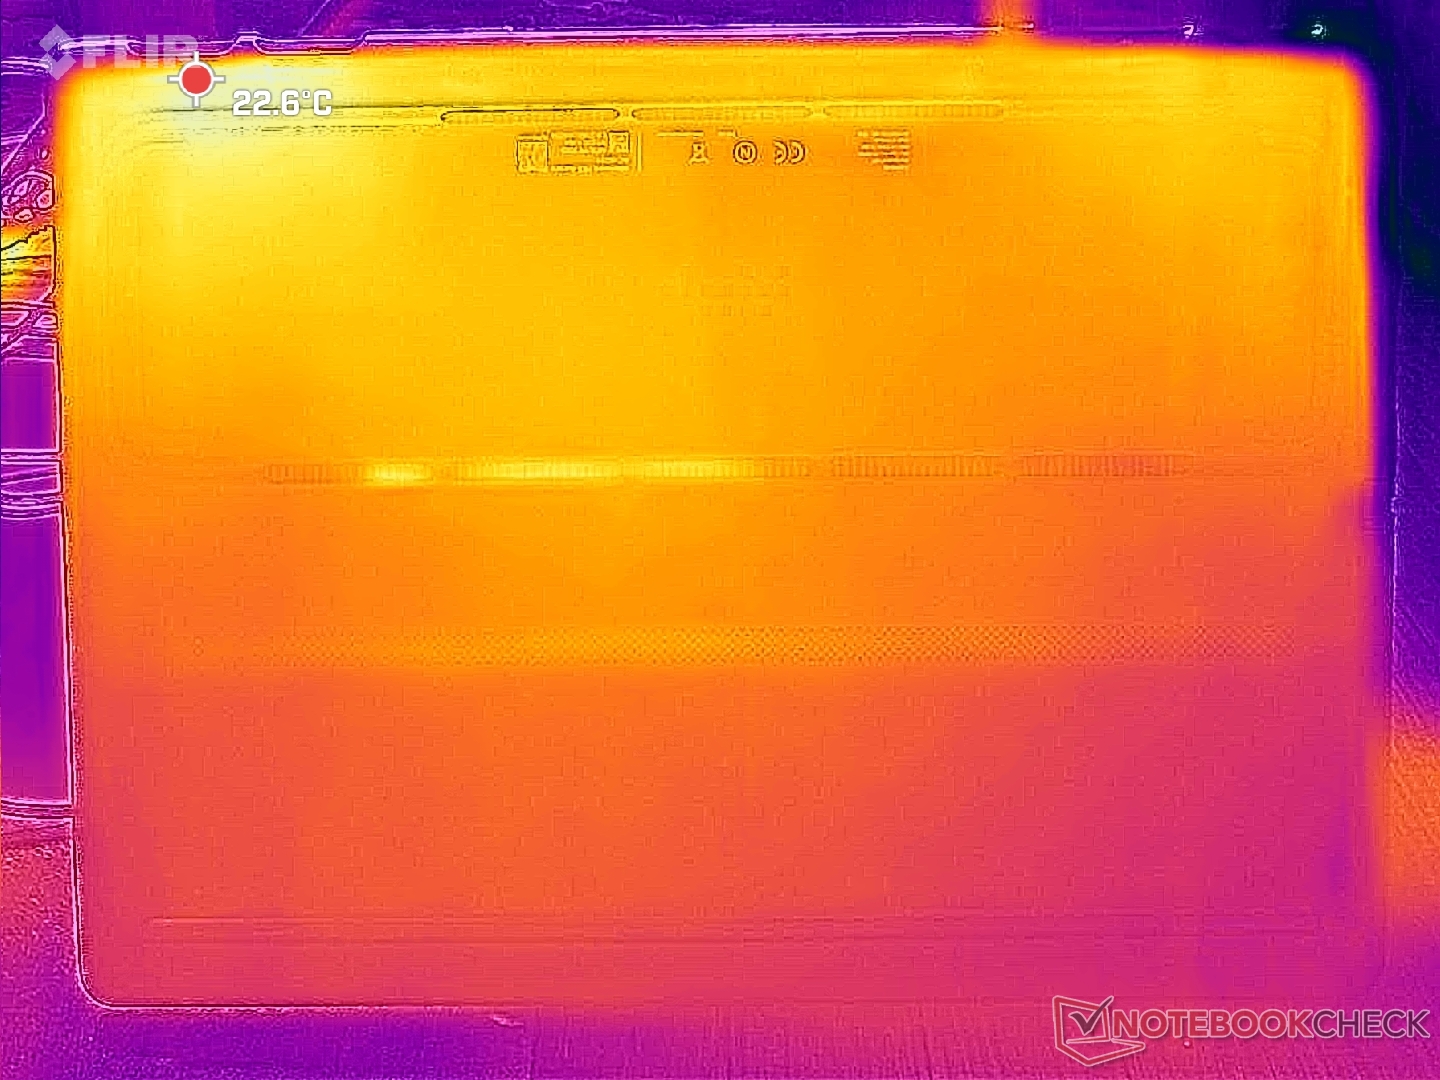
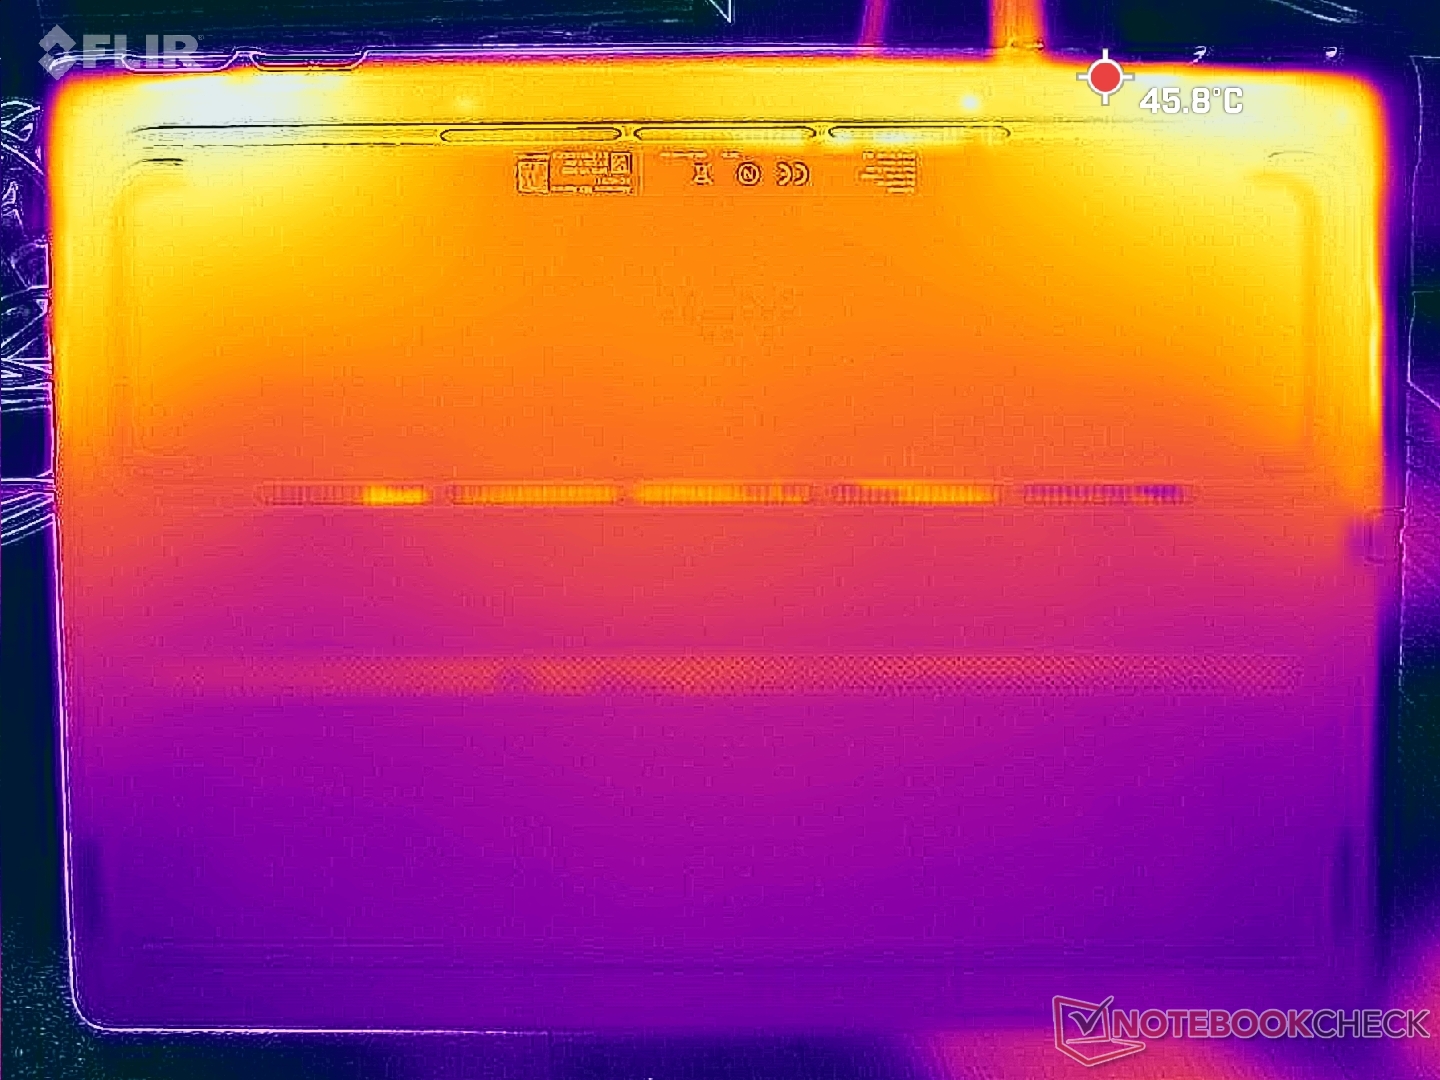
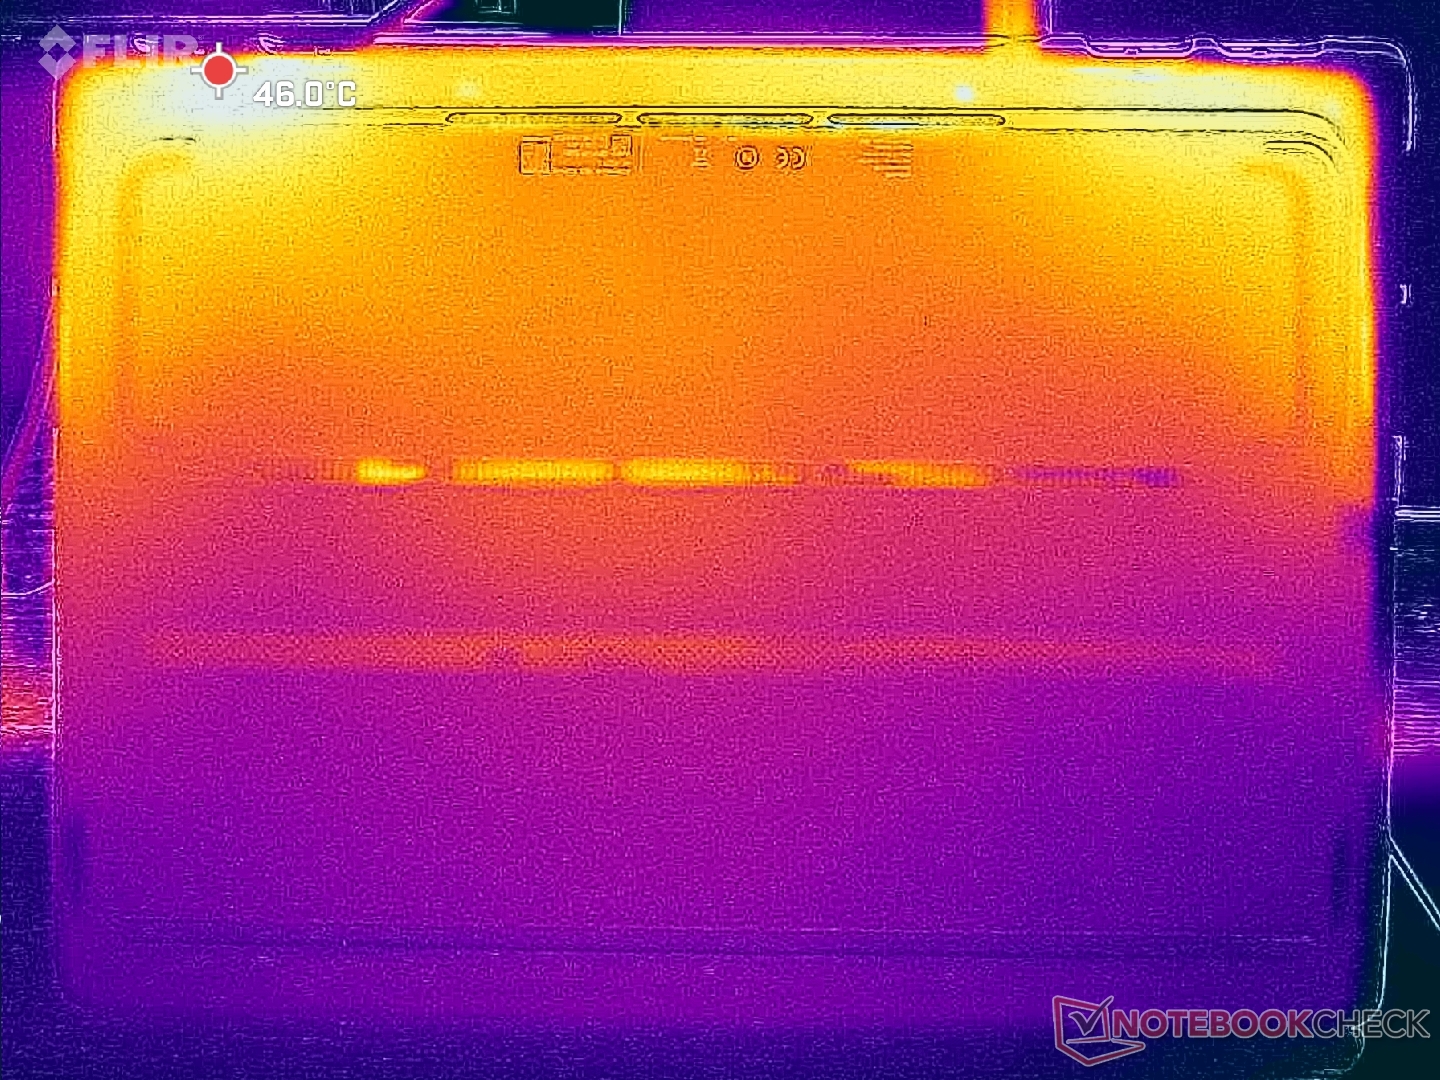
(-) The bottom heats up to a maximum of 45.6 °C / 114 F, compared to the average of 43.2 °C / 110 F
(+) In idle usage, the average temperature for the upper side is 27.7 °C / 82 F, compared to the device average of 33.9 °C / 93 F.
(-) 3: The average temperature for the upper side is 41.4 °C / 107 F, compared to the average of 33.9 °C / 93 F for the class Gaming.
(+) The palmrests and touchpad are reaching skin temperature as a maximum (33.4 °C / 92.1 F) and are therefore not hot.
(-) The average temperature of the palmrest area of similar devices was 28.8 °C / 83.8 F (-4.6 °C / -8.3 F).
| Alienware 16X Aurora, RTX 5070 Intel Core Ultra 9 275HX, NVIDIA GeForce RTX 5070 Laptop | Alienware 16 Area-51 Intel Core Ultra 9 275HX, NVIDIA GeForce RTX 5080 Laptop | Gigabyte Gaming A16 GA6H Intel Core i7-13620H, NVIDIA GeForce RTX 5070 Laptop | MSI Vector 16 HX AI A2XWHG Intel Core Ultra 7 255HX, NVIDIA GeForce RTX 5070 Ti Laptop | Asus TUF Gaming A16 FA608WV AMD Ryzen AI 9 HX 370, NVIDIA GeForce RTX 4060 Laptop GPU | Lenovo Legion 5 Pro 16IAX10H Intel Core Ultra 9 275HX, NVIDIA GeForce RTX 5070 Ti Laptop | |
|---|---|---|---|---|---|---|
| Heat | -6% | -12% | -9% | 10% | -21% | |
| Maximum Upper Side * (°C) | 51 | 43.8 14% | 50 2% | 53 -4% | 38 25% | 48 6% |
| Maximum Bottom * (°C) | 45.6 | 40 12% | 49 -7% | 52 -14% | 37 19% | 50 -10% |
| Idle Upper Side * (°C) | 29.8 | 35.8 -20% | 35 -17% | 33 -11% | 28 6% | 38 -28% |
| Idle Bottom * (°C) | 27.4 | 35.2 -28% | 34 -24% | 29 -6% | 30 -9% | 42 -53% |
* ... smaller is better
Speakers
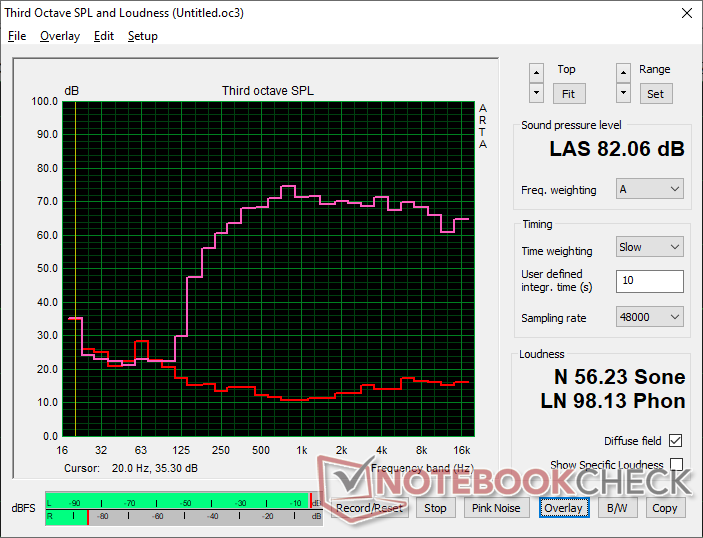
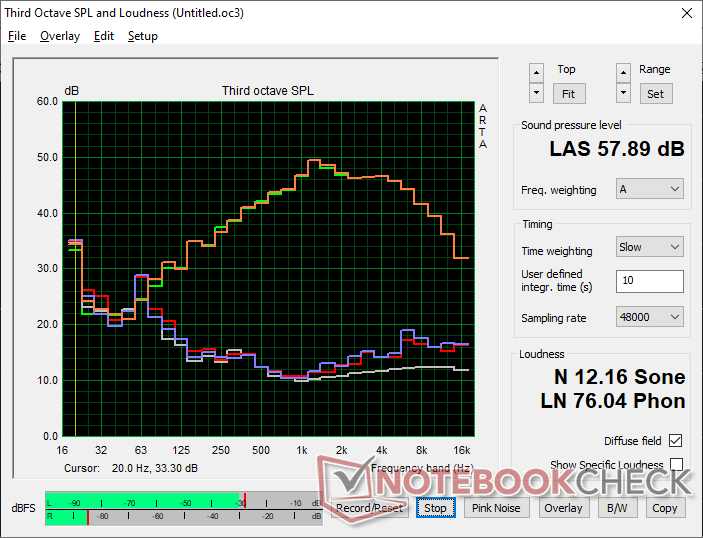
Alienware 16X Aurora, RTX 5070 audio analysis
(+) | speakers can play relatively loud (82.1 dB)
Bass 100 - 315 Hz
(-) | nearly no bass - on average 21.6% lower than median
(±) | linearity of bass is average (12.9% delta to prev. frequency)
Mids 400 - 2000 Hz
(+) | balanced mids - only 2.3% away from median
(+) | mids are linear (4% delta to prev. frequency)
Highs 2 - 16 kHz
(+) | balanced highs - only 1.3% away from median
(+) | highs are linear (3.7% delta to prev. frequency)
Overall 100 - 16.000 Hz
(+) | overall sound is linear (14.5% difference to median)
Compared to same class
» 27% of all tested devices in this class were better, 7% similar, 66% worse
» The best had a delta of 6%, average was 18%, worst was 132%
Compared to all devices tested
» 18% of all tested devices were better, 4% similar, 78% worse
» The best had a delta of 4%, average was 24%, worst was 134%
Apple MacBook Pro 16 2021 M1 Pro audio analysis
(+) | speakers can play relatively loud (84.7 dB)
Bass 100 - 315 Hz
(+) | good bass - only 3.8% away from median
(+) | bass is linear (5.2% delta to prev. frequency)
Mids 400 - 2000 Hz
(+) | balanced mids - only 1.3% away from median
(+) | mids are linear (2.1% delta to prev. frequency)
Highs 2 - 16 kHz
(+) | balanced highs - only 1.9% away from median
(+) | highs are linear (2.7% delta to prev. frequency)
Overall 100 - 16.000 Hz
(+) | overall sound is linear (4.6% difference to median)
Compared to same class
» 0% of all tested devices in this class were better, 0% similar, 100% worse
» The best had a delta of 5%, average was 17%, worst was 45%
Compared to all devices tested
» 0% of all tested devices were better, 0% similar, 100% worse
» The best had a delta of 4%, average was 24%, worst was 134%
Energy Management
Power Consumption
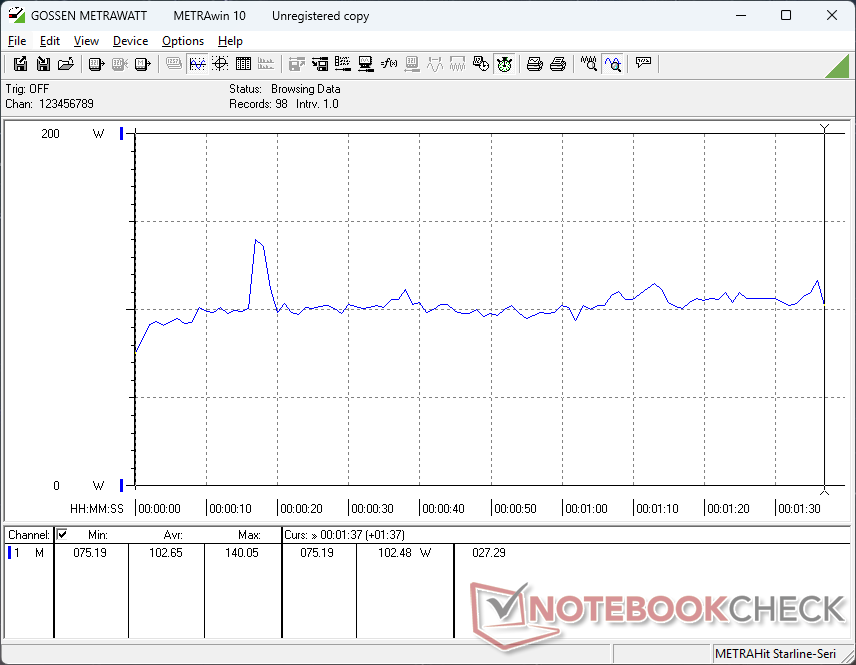
Idling on desktop demands between 20 W and 32 W depending on the brightness and power profile setting. These minimums are higher than on many competing gaming laptops but still in line with most other Alienware models.
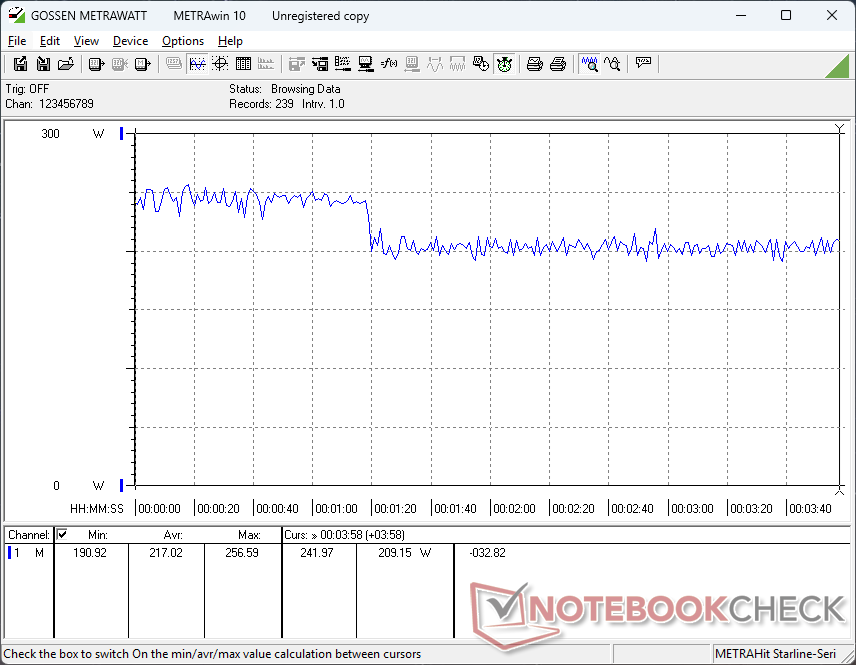
Running Cyberpunk 2077 demands 192 W or 11 percent less than the MSI Vector 16 HX with RTX 5070 Ti graphics. When considering that the RTX 5070 Ti can be 25 to 30 percent faster than our RTX 5070, the performance-per-watt of our Aurora 16X configuration isn't as good as we were expecting.
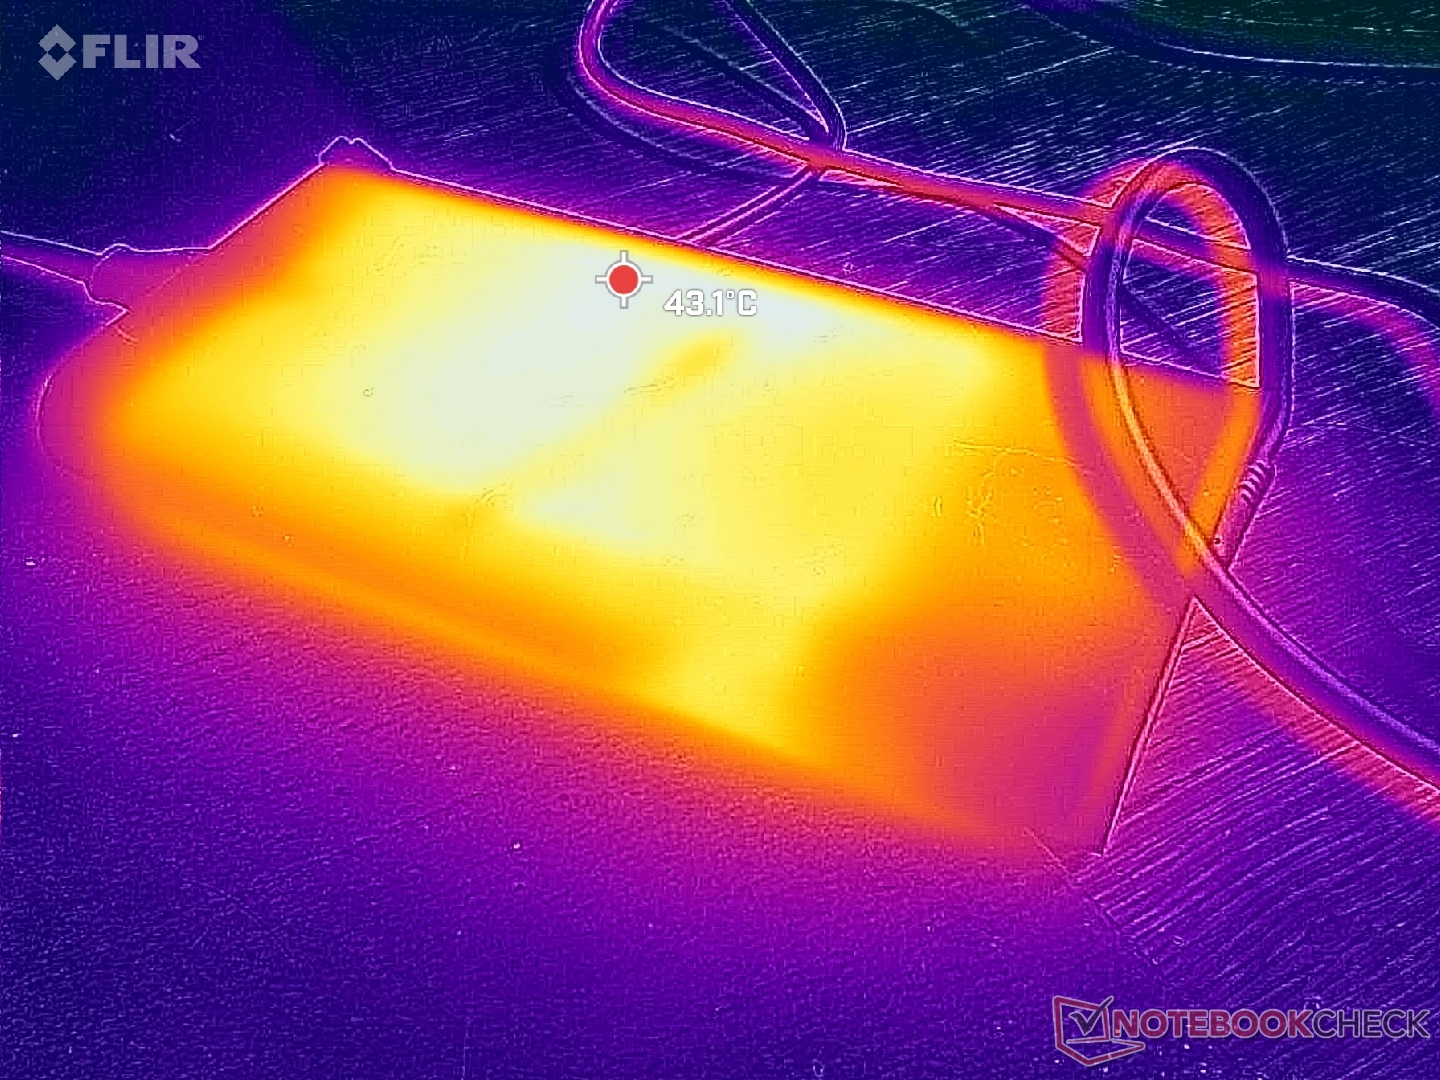
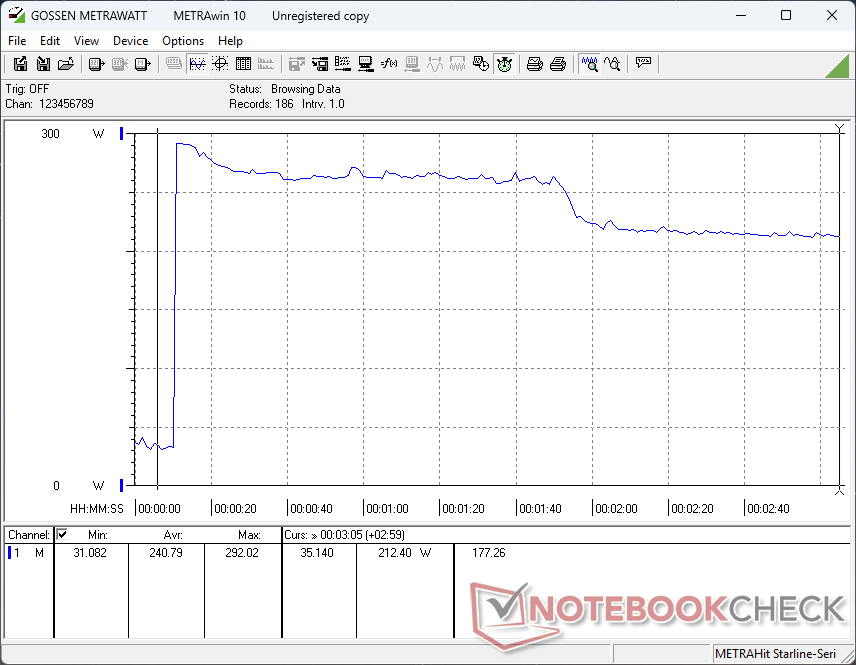
We're able to record a temporary maximum draw of 292 W from the relatively large (~20.5 x 10.5 x 2.5 cm) 280 W AC adapter when the CPU and GPU are each at 100 percent utilization.
| Off / Standby | |
| Idle | |
| Load |
|
Key:
min: | |
| Alienware 16X Aurora, RTX 5070 Ultra 9 275HX, GeForce RTX 5070 Laptop, , IPS, 2560x1600, 16" | Alienware 16 Area-51 Ultra 9 275HX, GeForce RTX 5080 Laptop, Samsung PM9C1a MZ9L81T0HDLB, IPS, 2560x1600, 16" | Gigabyte Gaming A16 GA6H i7-13620H, GeForce RTX 5070 Laptop, Kingston OM8PGP41024Q-A0, IPS, 2560x1600, 16" | MSI Vector 16 HX AI A2XWHG Ultra 7 255HX, GeForce RTX 5070 Ti Laptop, Micron 2400 MTFDKBA512QFM, IPS, 2560x1600, 16" | Asus TUF Gaming A16 FA608WV Ryzen AI 9 HX 370, GeForce RTX 4060 Laptop GPU, Micron 2400 MTFDKBA1T0QFM, IPS, 1920x1200, 16" | Lenovo Legion 5 Pro 16IAX10H Ultra 9 275HX, GeForce RTX 5070 Ti Laptop, Western Digital PC SN8000S SDEPNRK-1T00, OLED, 2560x1600, 16" | |
|---|---|---|---|---|---|---|
| Power Consumption | -26% | 39% | 9% | 40% | -1% | |
| Idle Minimum * (Watt) | 20.1 | 27 -34% | 9 55% | 7.1 65% | 6.8 66% | 14 30% |
| Idle Average * (Watt) | 27.6 | 33.5 -21% | 11 60% | 15.9 42% | 12.7 54% | 14.3 48% |
| Idle Maximum * (Watt) | 31.8 | 41.4 -30% | 23 28% | 29.5 7% | 15.2 52% | 20.1 37% |
| Load Average * (Watt) | 102.7 | 124.7 -21% | 91 11% | 124 -21% | 85 17% | 177 -72% |
| Cyberpunk 2077 ultra external monitor * (Watt) | 192.3 | 249 -29% | 130 32% | 217 -13% | 143 26% | 255 -33% |
| Cyberpunk 2077 ultra * (Watt) | 217 | 256 -18% | 132.5 39% | 222 -2% | 145 33% | 255 -18% |
| Load Maximum * (Watt) | 292 | 367.2 -26% | 155 47% | 336 -15% | 199 32% | 294 -1% |
* ... smaller is better
Power Consumption Cyberpunk / Stress Test
Power Consumption external Monitor
Battery Life
Battery capacity is the same as on the Alienware 15 Area-51 despite the more wallet-friendly appeal of the Aurora 16X. Runtimes are still nevertheless poor or average at best at only 4 hours of real-world WLAN browsing on the Balanced power profile.
Charging from empty to full capacity with the included AC adapter takes almost 2.5 hours.
| Alienware 16X Aurora, RTX 5070 Ultra 9 275HX, GeForce RTX 5070 Laptop, 96 Wh | Alienware 16 Area-51 Ultra 9 275HX, GeForce RTX 5080 Laptop, 96 Wh | Gigabyte Gaming A16 GA6H i7-13620H, GeForce RTX 5070 Laptop, 76 Wh | MSI Vector 16 HX AI A2XWHG Ultra 7 255HX, GeForce RTX 5070 Ti Laptop, 90 Wh | Asus TUF Gaming A16 FA608WV Ryzen AI 9 HX 370, GeForce RTX 4060 Laptop GPU, 90 Wh | Lenovo Legion 5 Pro 16IAX10H Ultra 9 275HX, GeForce RTX 5070 Ti Laptop, 80 Wh | |
|---|---|---|---|---|---|---|
| Battery runtime | -35% | 79% | 63% | 230% | 14% | |
| WiFi v1.3 (h) | 4.3 | 2.8 -35% | 7.7 79% | 7 63% | 14.2 230% | 4.9 14% |
| Reader / Idle (h) | 3.1 | |||||
| H.264 (h) | 14.7 | 4.8 | ||||
| Load (h) | 2.1 | 1.7 |
Notebookcheck Rating
Alienware 16X Aurora, RTX 5070
- 08/13/2025 v8
Allen Ngo
 Total Sustainability Score:
 Potential Competitors in Comparison
Image | Model / Review | Price | Weight | Height | Display |
|---|---|---|---|---|---|
1. 84.9%  | Alienware 16X Aurora, RTX 5070 Intel Core Ultra 9 275HX ⎘ NVIDIA GeForce RTX 5070 Laptop ⎘ 32 GB Memory | Amazon: List Price: 1800 USD | 2.5 kg | 23.4 mm | 16.00" 2560x1600 189 PPI IPS |
2. 85.7%  | Alienware 16 Area-51 Intel Core Ultra 9 275HX ⎘ NVIDIA GeForce RTX 5080 Laptop ⎘ 32 GB Memory, 1024 GB SSD | Amazon: 1. $2,348.98 Alienware 16 Area-51 Gaming ... 2. $3,799.99 Alienware 16 Area-51 Gaming ... 3. $4,199.99 Alienware 16 Area-51 Gaming ... List Price: 3500 USD | 3.3 kg | 28.5 mm | 16.00" 2560x1600 189 PPI IPS |
3. 80.1%  | Gigabyte Gaming A16 GA6H Intel Core i7-13620H ⎘ NVIDIA GeForce RTX 5070 Laptop ⎘ 16 GB Memory, 1024 GB SSD | Amazon: 1. $1,341.81 GIGABYTE - Gaming A16 Gaming... 2. $1,069.00 GIGABYTE - Gaming A16 Gaming... 3. $1,232.21 GIGABYTE - Gaming A16 Gaming... List Price: 1700 EUR | 2.3 kg | 23 mm | 16.00" 2560x1600 189 PPI IPS |
4. 84%  | MSI Vector 16 HX AI A2XWHG Intel Core Ultra 7 255HX ⎘ NVIDIA GeForce RTX 5070 Ti Laptop ⎘ 16 GB Memory, 512 GB SSD | Amazon: List Price: 2000 EUR | 2.6 kg | 28.6 mm | 16.00" 2560x1600 189 PPI IPS |
5. 83% 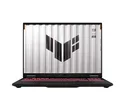 | Asus TUF Gaming A16 FA608WV AMD Ryzen AI 9 HX 370 ⎘ NVIDIA GeForce RTX 4060 Laptop GPU ⎘ 16 GB Memory, 1024 GB SSD | Amazon: List Price: 1399 Euro | 2.2 kg | 25.7 mm | 16.00" 1920x1200 142 PPI IPS |
6. 84.5%  | Lenovo Legion 5 Pro 16IAX10H Intel Core Ultra 9 275HX ⎘ NVIDIA GeForce RTX 5070 Ti Laptop ⎘ 32 GB Memory, 1024 GB SSD | Amazon: 1. $2,299.99 Lenovo Legion Pro 7 16IAX10H... 2. $1,749.99 Lenovo Legion Pro 5 AI Gamin... 3. $2,474.00 Lenovo Legion Pro 5i Gen 10 ... List Price: 2500 Euro | 2.4 kg | 25.95 mm | 16.00" 2560x1600 189 PPI OLED |
Transparency
The selection of devices to be reviewed is made by our editorial team. The test sample was provided to the author as a loan by the manufacturer or retailer for the purpose of this review. The lender had no influence on this review, nor did the manufacturer receive a copy of this review before publication. There was no obligation to publish this review. As an independent media company, Notebookcheck is not subjected to the authority of manufacturers, retailers or publishers.
This is how Notebookcheck is testing
Every year, Notebookcheck independently reviews hundreds of laptops and smartphones using standardized procedures to ensure that all results are comparable. We have continuously developed our test methods for around 20 years and set industry standards in the process. In our test labs, high-quality measuring equipment is utilized by experienced technicians and editors. These tests involve a multi-stage validation process. Our complex rating system is based on hundreds of well-founded measurements and benchmarks, which maintains objectivity. Further information on our test methods can be found here.
