
Verdict - The Asus ROG Strix G18 lags behind the G16
The new ROG Strix G18 is a large 18-inch gaming laptop, priced significantly lower than the Strix SCAR models. This is mainly due to the weaker GeForce RTX 5070 laptop GPU, with the case also being an area where you'll have to live with some compromises (interestingly, this also applies to the Strix G16). All in all, we find the fans a bit too loud for the performance on offer, especially since they're almost always active even under light load.
In principle, it's perfectly acceptable to install a weaker graphics card to reduce the price. However, we're left wondering why Asus has used the Ryzen 9 995HX instead of switching to a smaller AMD processor.
The port layout on the sides is also not ideal, but the built-in 240 Hz IPS display is an excellent choice for gaming. Even hassle-free image editing is possible, thanks to accurate colors.
The problem, however, is the price. A $2,449 MSRP is hard to justify due to the RTX 5070 laptop's gaming performance - even if the rest of the specs are good. We would have preferred to see some features dropped in favor of the 5070 Ti.
Pros
Cons
Price and availability
Our review configuration of the ROG Strix G18 is currently available on Amazon.
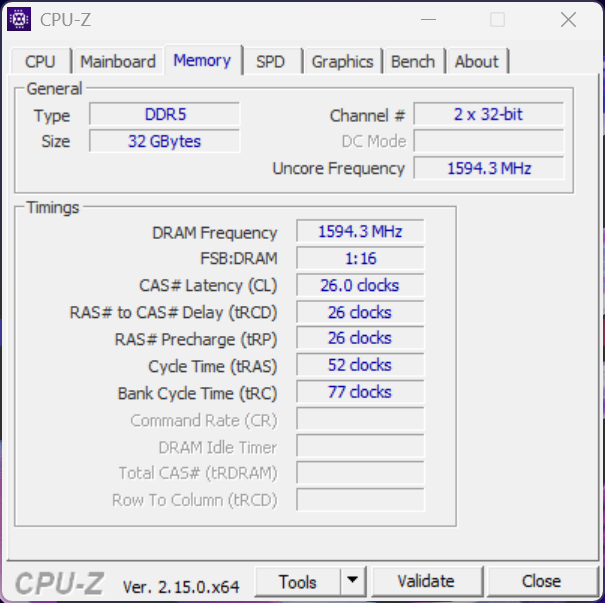
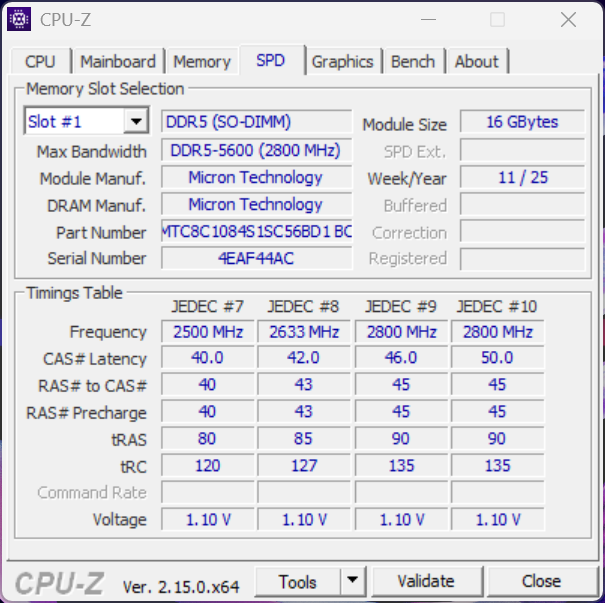
With the ROG Strix G18 G814, Asus offers a large 18-inch gaming laptop complete with a powerful AMD Ryzen processor and a good feature set. Our review model comes equipped with the AMD Ryzen 9 9955HX, 32 GB of RAM, a fast 240 Hz IPS display and the Nvidia GeForce RTX 5070 laptop GPU, all for $2,449
Most of the 18-inch gaming laptops we've reviewed so far have typically been equipped with the fastest mobile GPUs (RTX 5090/5080 laptops), which is why we have also chosen to use 17-inch devices as comparison devices.
Specifications
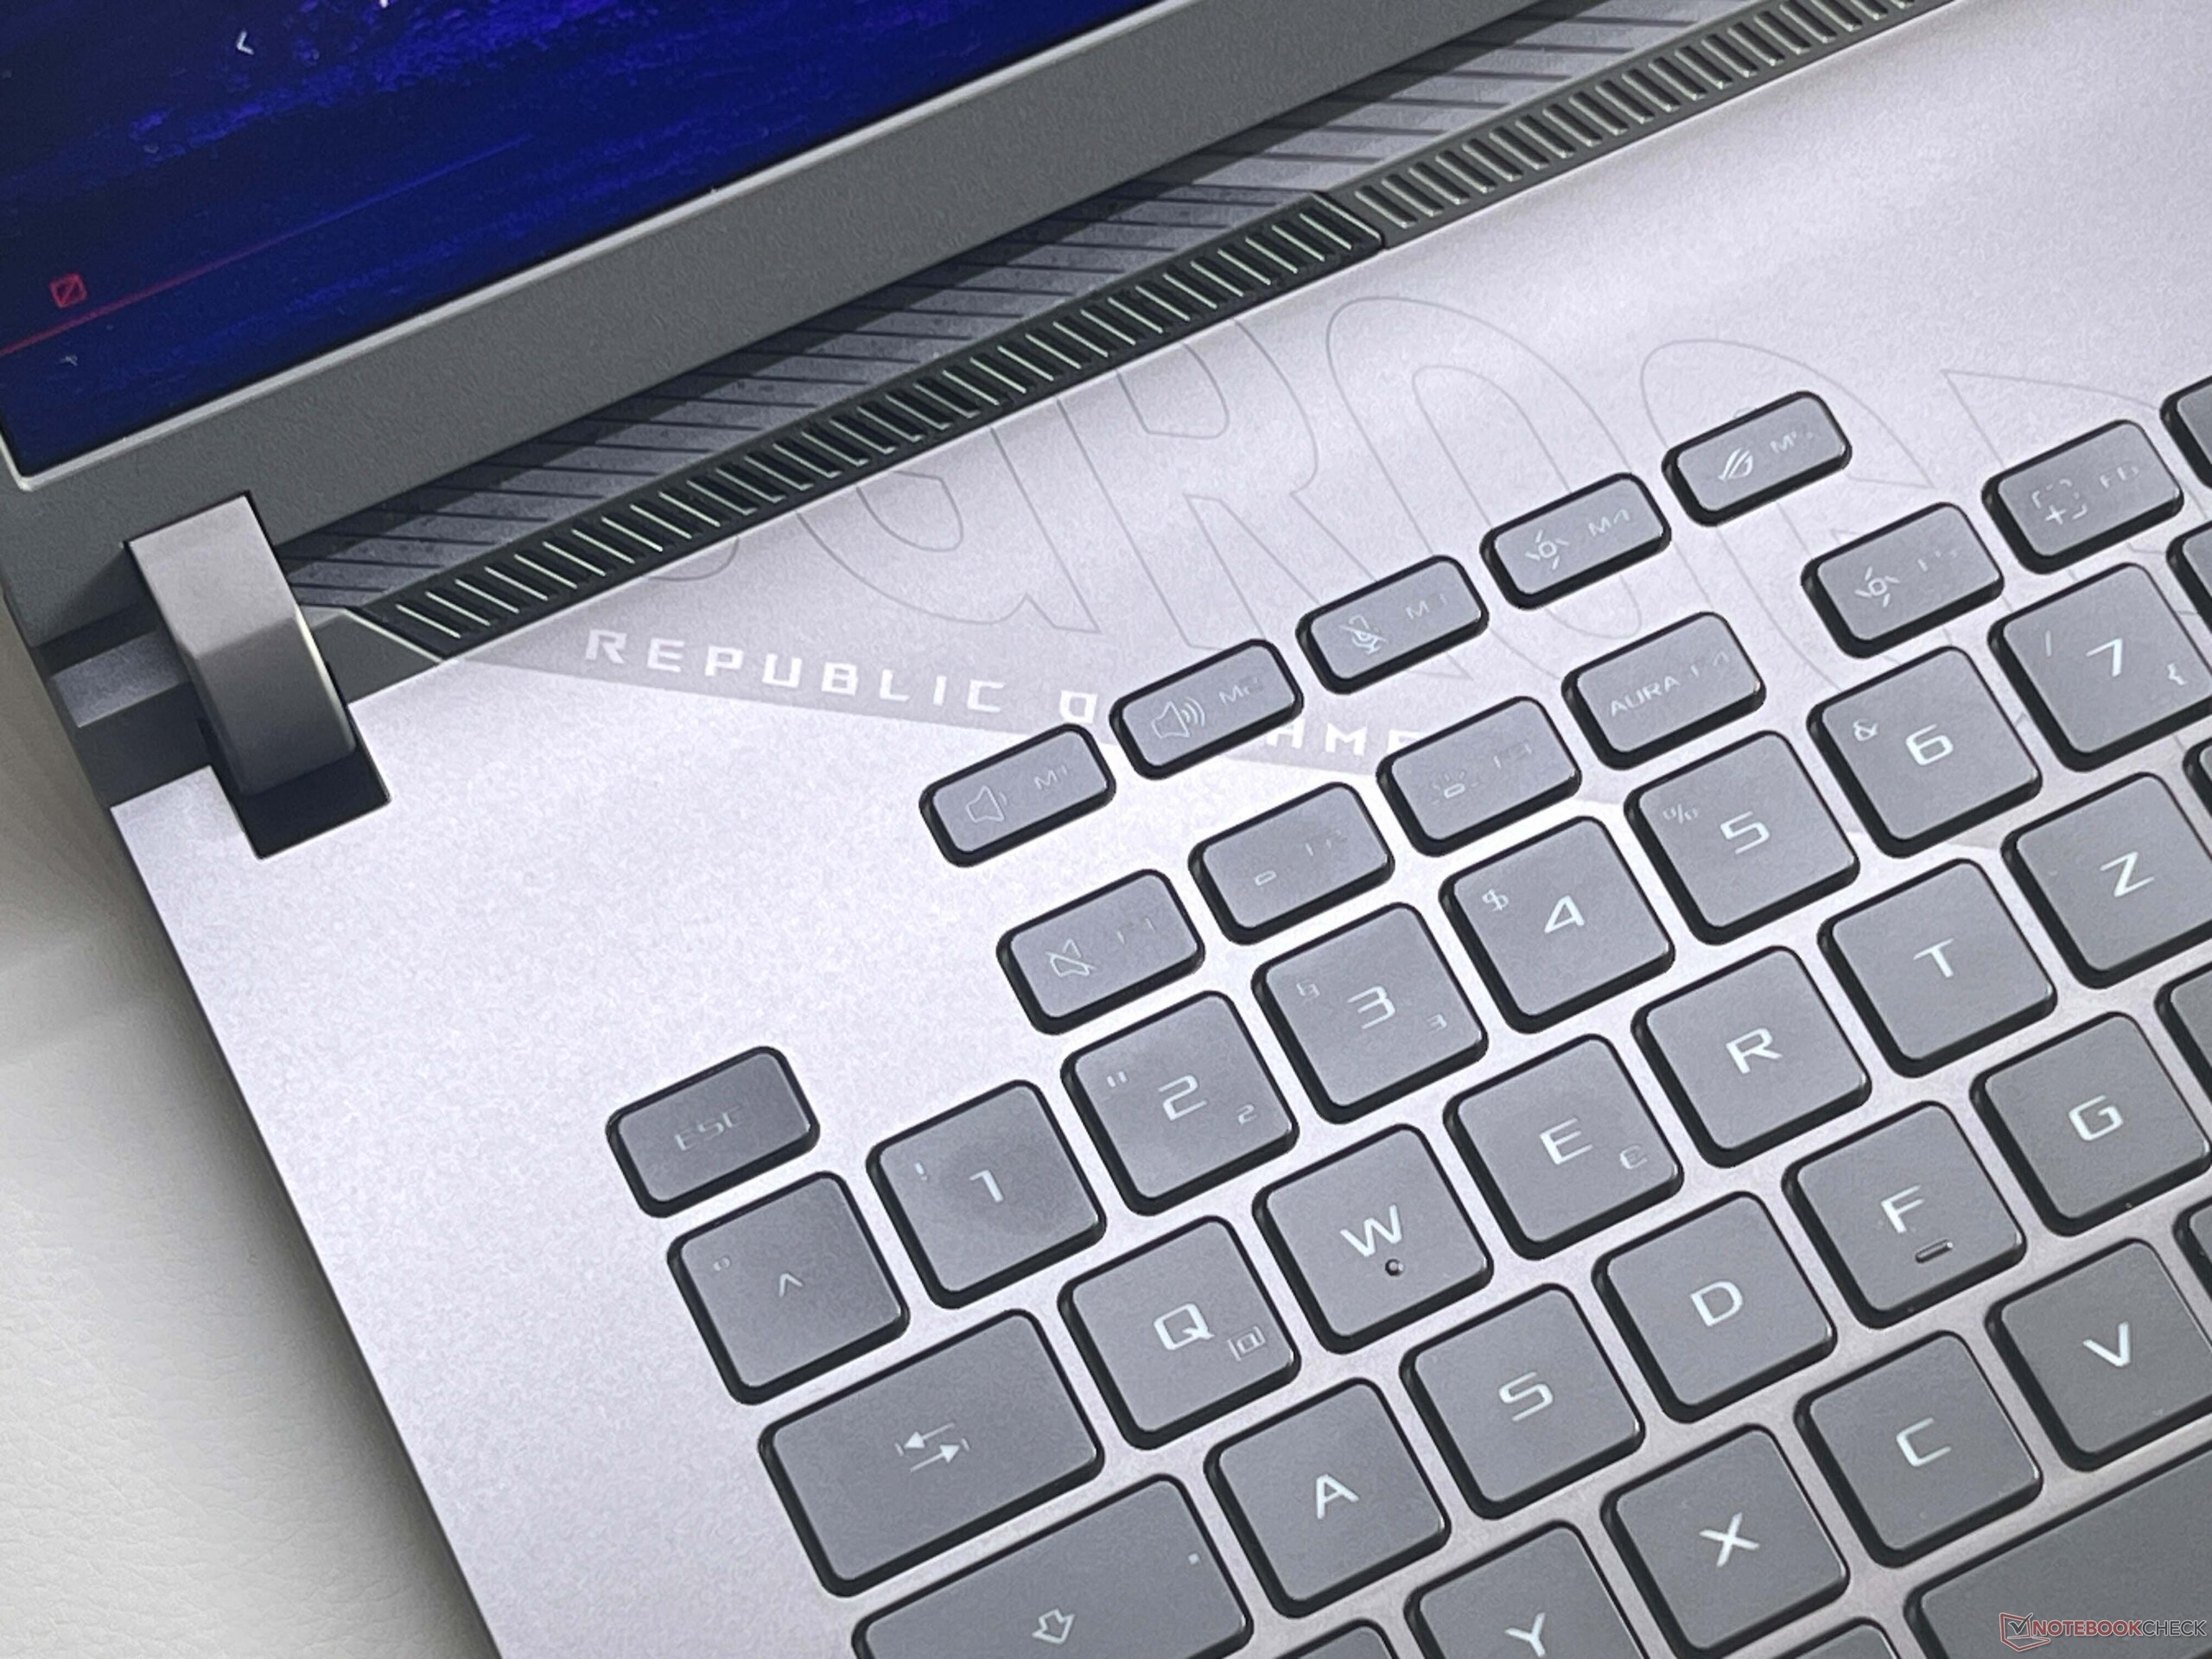
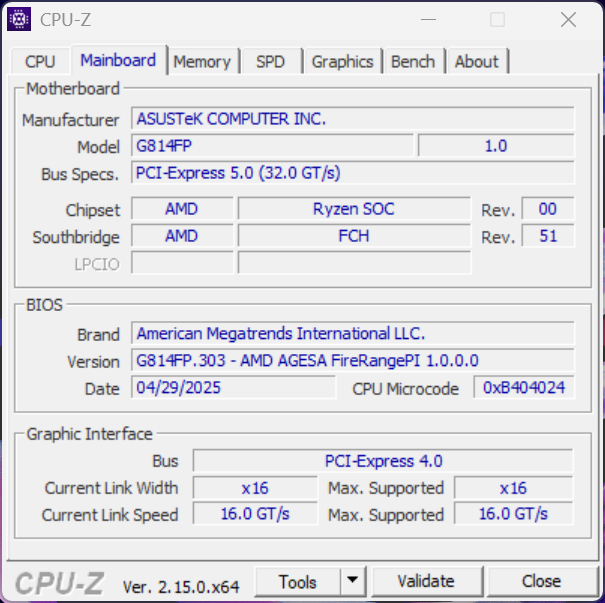
Case & features
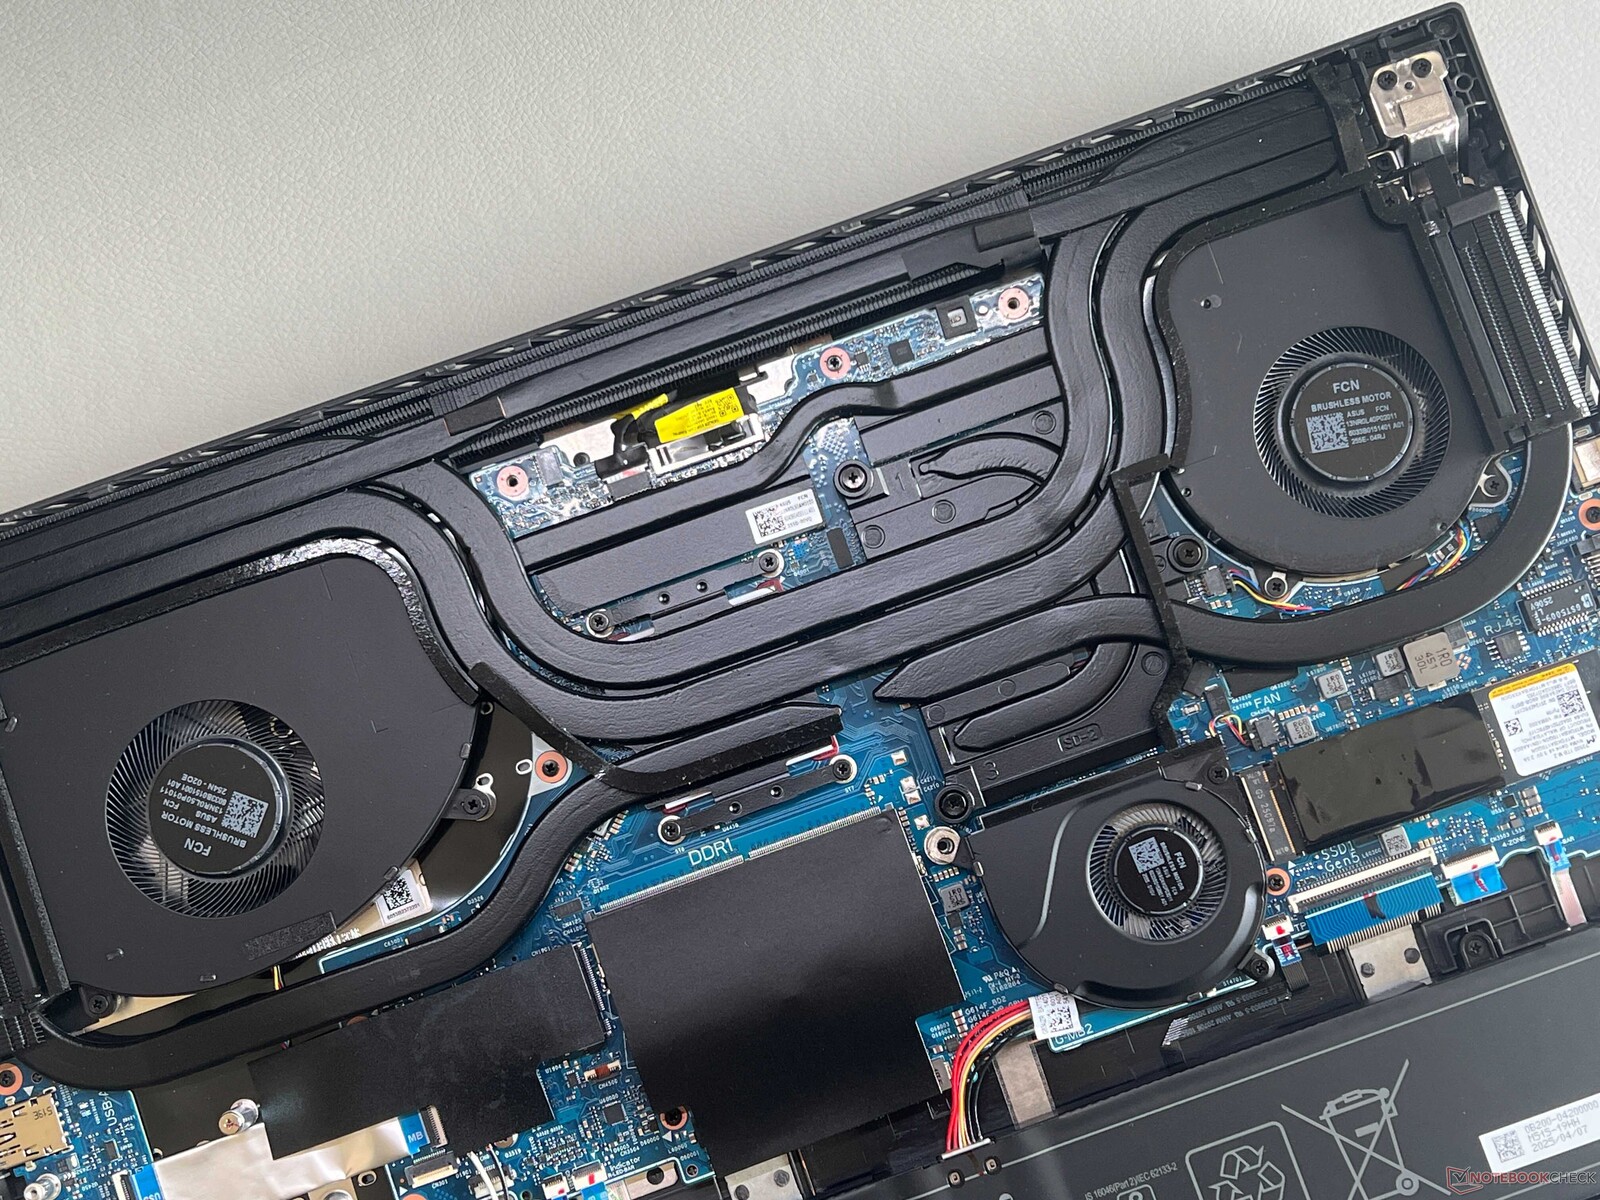
The ROG Strix G18 features a dark gray plastic chassis with some design elements and ROG lettering, but the lighting has been significantly pared down compared to the smaller Strix G16. The Aura Sync bar doesn't run around the entire chassis, but is only located on the front edge and the front areas of both sides. The quality chassis made a good impression, and the 2.9 kg laptop is also impressive in terms of stability. This applies to both the base unit and the lid. The hinges are well-adjusted and only allow for minimal rocking (max. opening angle ~130 degrees). However, the smooth surfaces are very susceptible to dirt. The bottom is secured with screws and can be easily removed, providing access to the fans, battery, Wi-Fi module, and two SSD/RAM drives.
The ports are distributed exclusively along the middle of both sides, which isn't always a perfect solution. There are two USB-C 4.0 ports (one with Power Delivery) and one network port. The Wi-Fi module achieved very good and stable transfer speeds in our tests, but it doesn't yet support the current Wi-Fi 7 standard. The 1080p webcam (no Studio Effects) takes only average pictures.


| Networking | |
| Asus ROG Strix G18 2025 G814 | |
| iperf3 transmit AXE11000 | |
| iperf3 receive AXE11000 | |
| Razer Blade 18 RTX 4070 | |
| iperf3 transmit AXE11000 | |
| iperf3 receive AXE11000 | |
| iperf3 transmit AXE11000 6GHz | |
| iperf3 receive AXE11000 6GHz | |
| MSI Crosshair A17 HX D8WGKG | |
| iperf3 transmit AXE11000 | |
| iperf3 receive AXE11000 | |
| Schenker XMG Focus 17 M25 | |
| iperf3 transmit AXE11000 | |
| iperf3 receive AXE11000 | |
| MSI Katana 17 HX B14WGK | |
| iperf3 transmit AXE11000 | |
| iperf3 receive AXE11000 | |
| MSI Vector A18 HX A9W | |
| iperf3 transmit AXE11000 | |
| iperf3 receive AXE11000 | |
| iperf3 transmit AXE11000 6GHz | |
| iperf3 receive AXE11000 6GHz | |


Sustainability
Asus has not provided any sustainability information regarding the device or its packaging, but the latter is fully recyclable.
Input devices
The black keyboard features a dedicated number pad and full-size arrow keys, although the layout around the arrow keys takes some getting used to. When typing, the keyboard impressed us with rich, precise, and quiet keystrokes, making it easy to compose even long texts. The RGB keyboard lighting (key adjustable) offers three brightness levels and can be dynamically adjusted to the display content via Aura Sync with the light bar.
The clickpad is smooth to the touch and, at 13 x 8.5 cm, is sufficiently large, although slightly offset to the left. It's easy to use, but the mechanical clicks in the lower area are too loud.


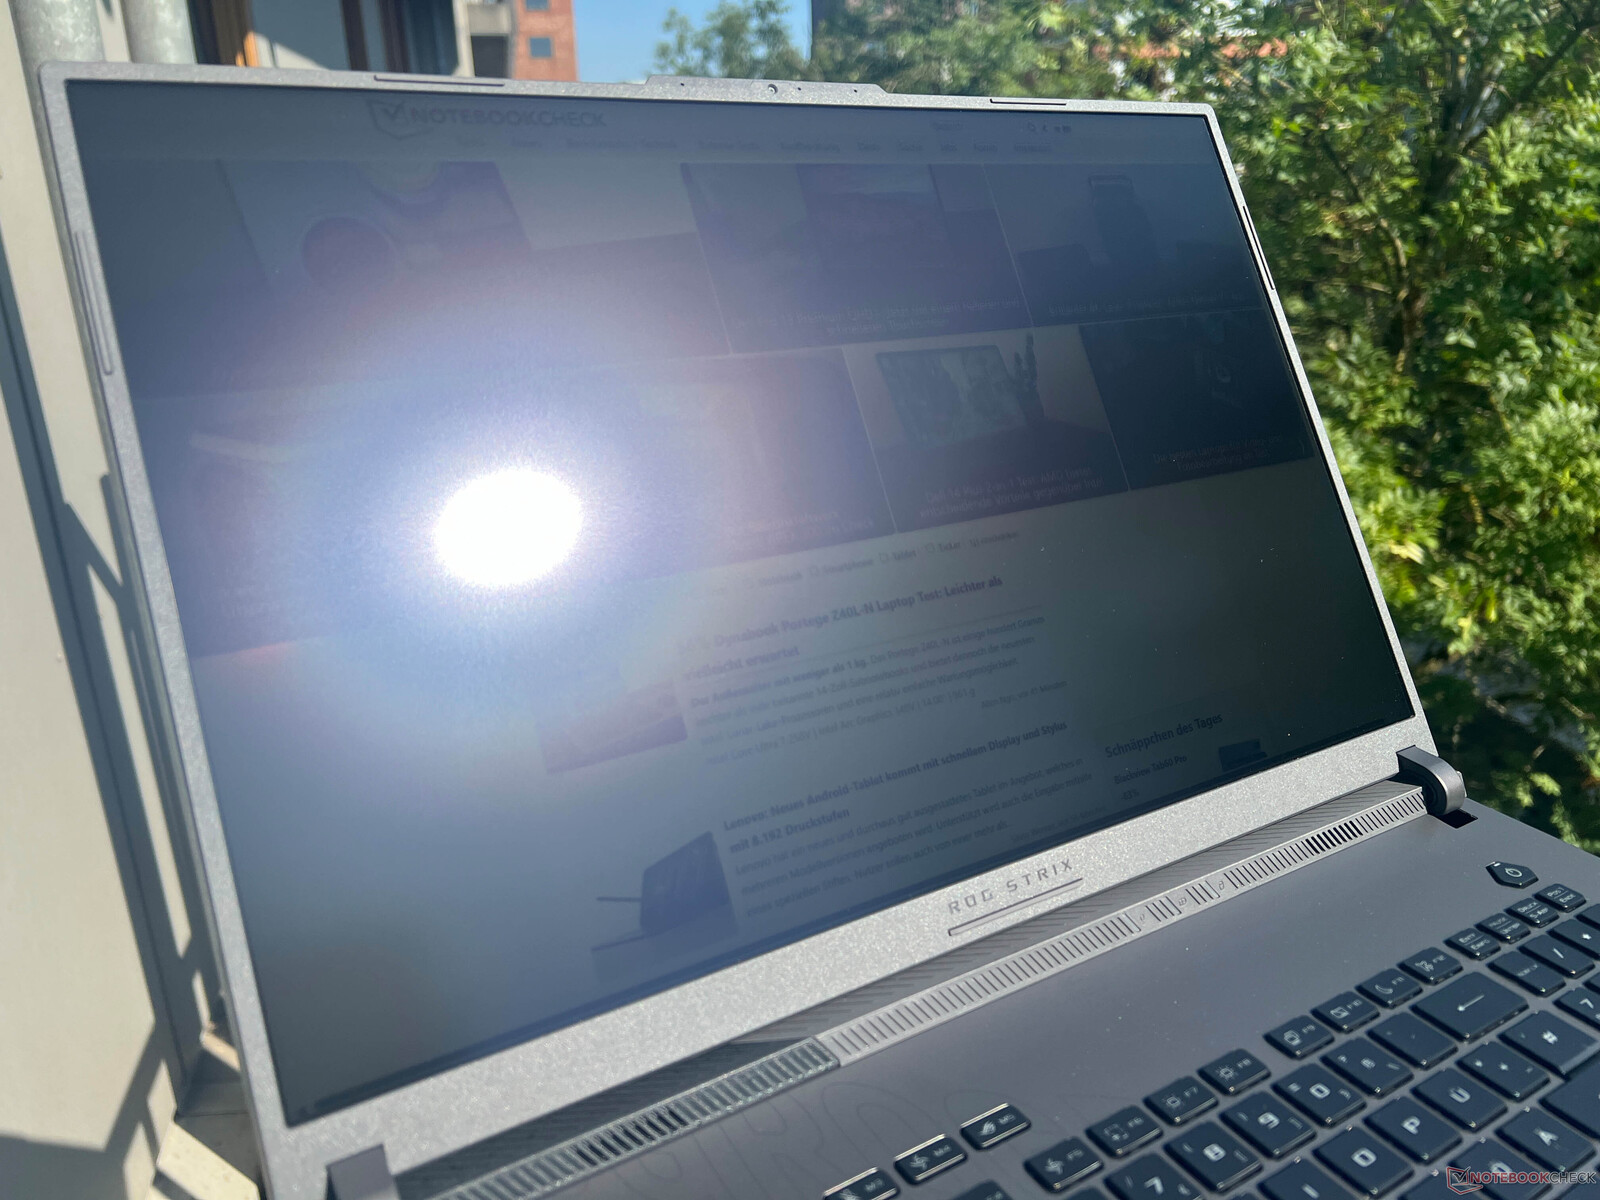
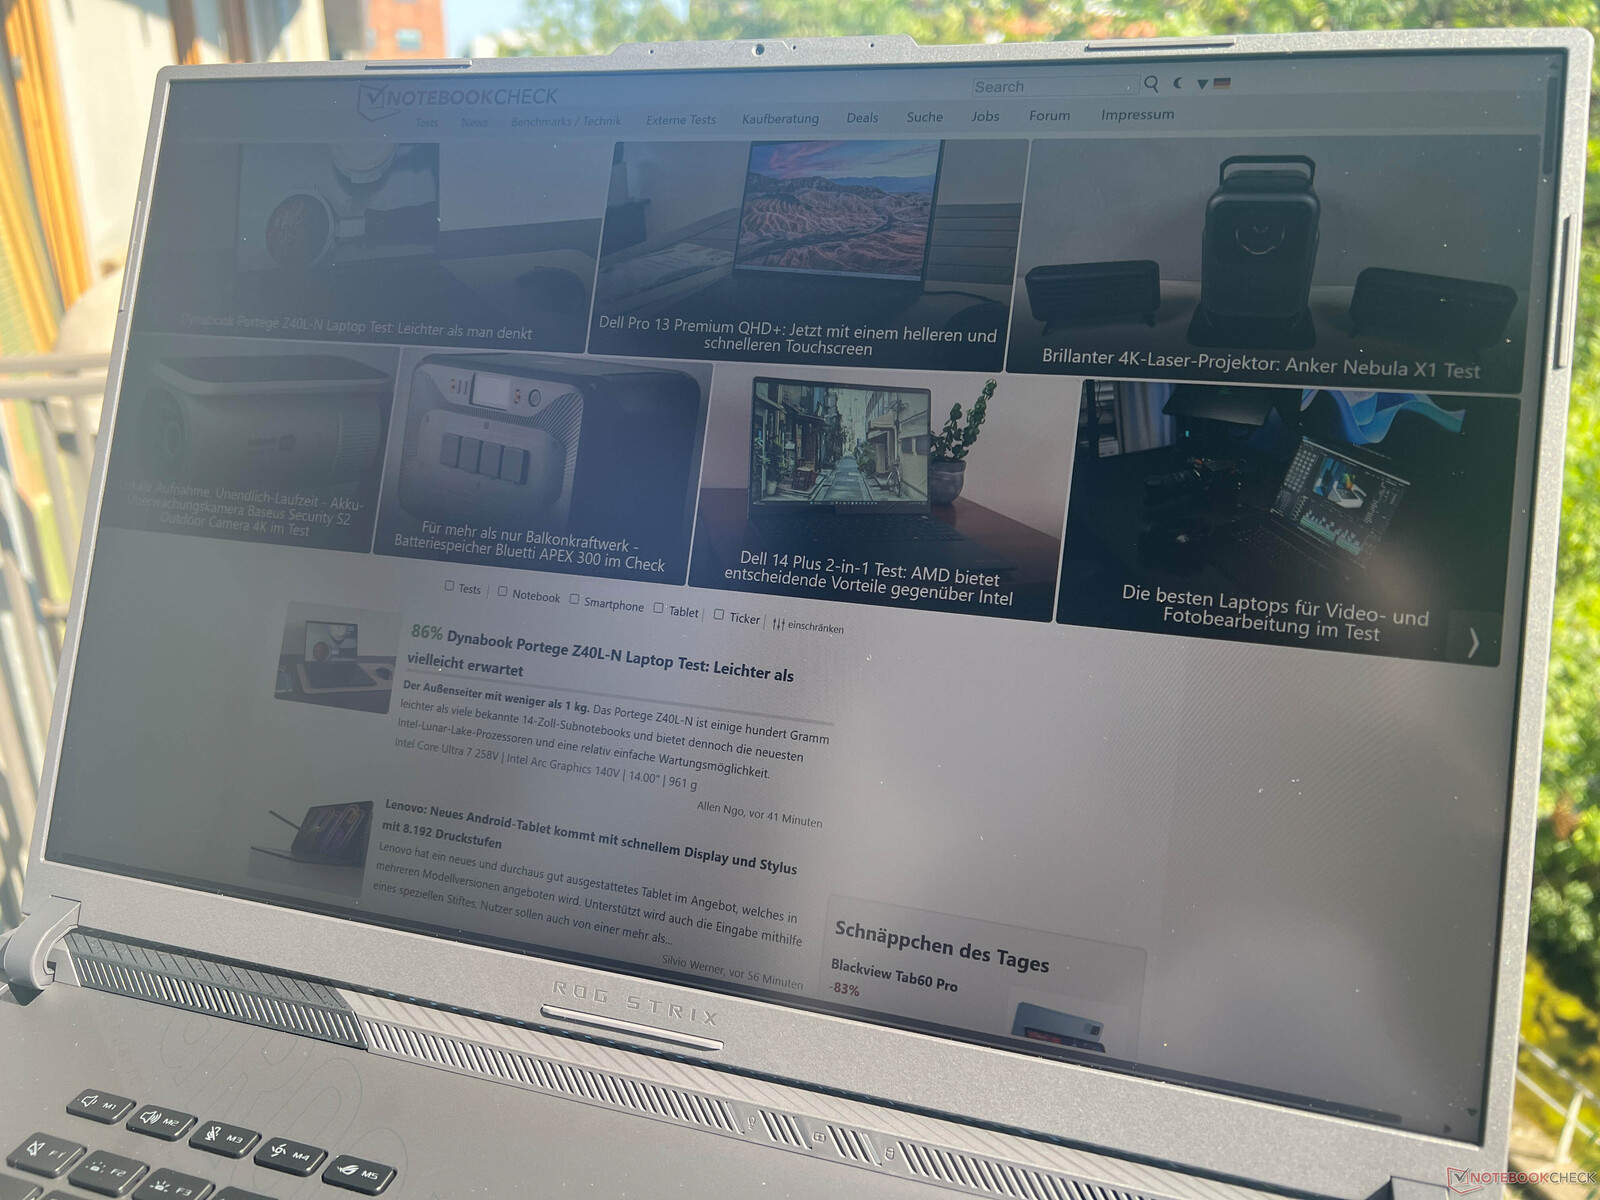
Display - 240 Hz IPS

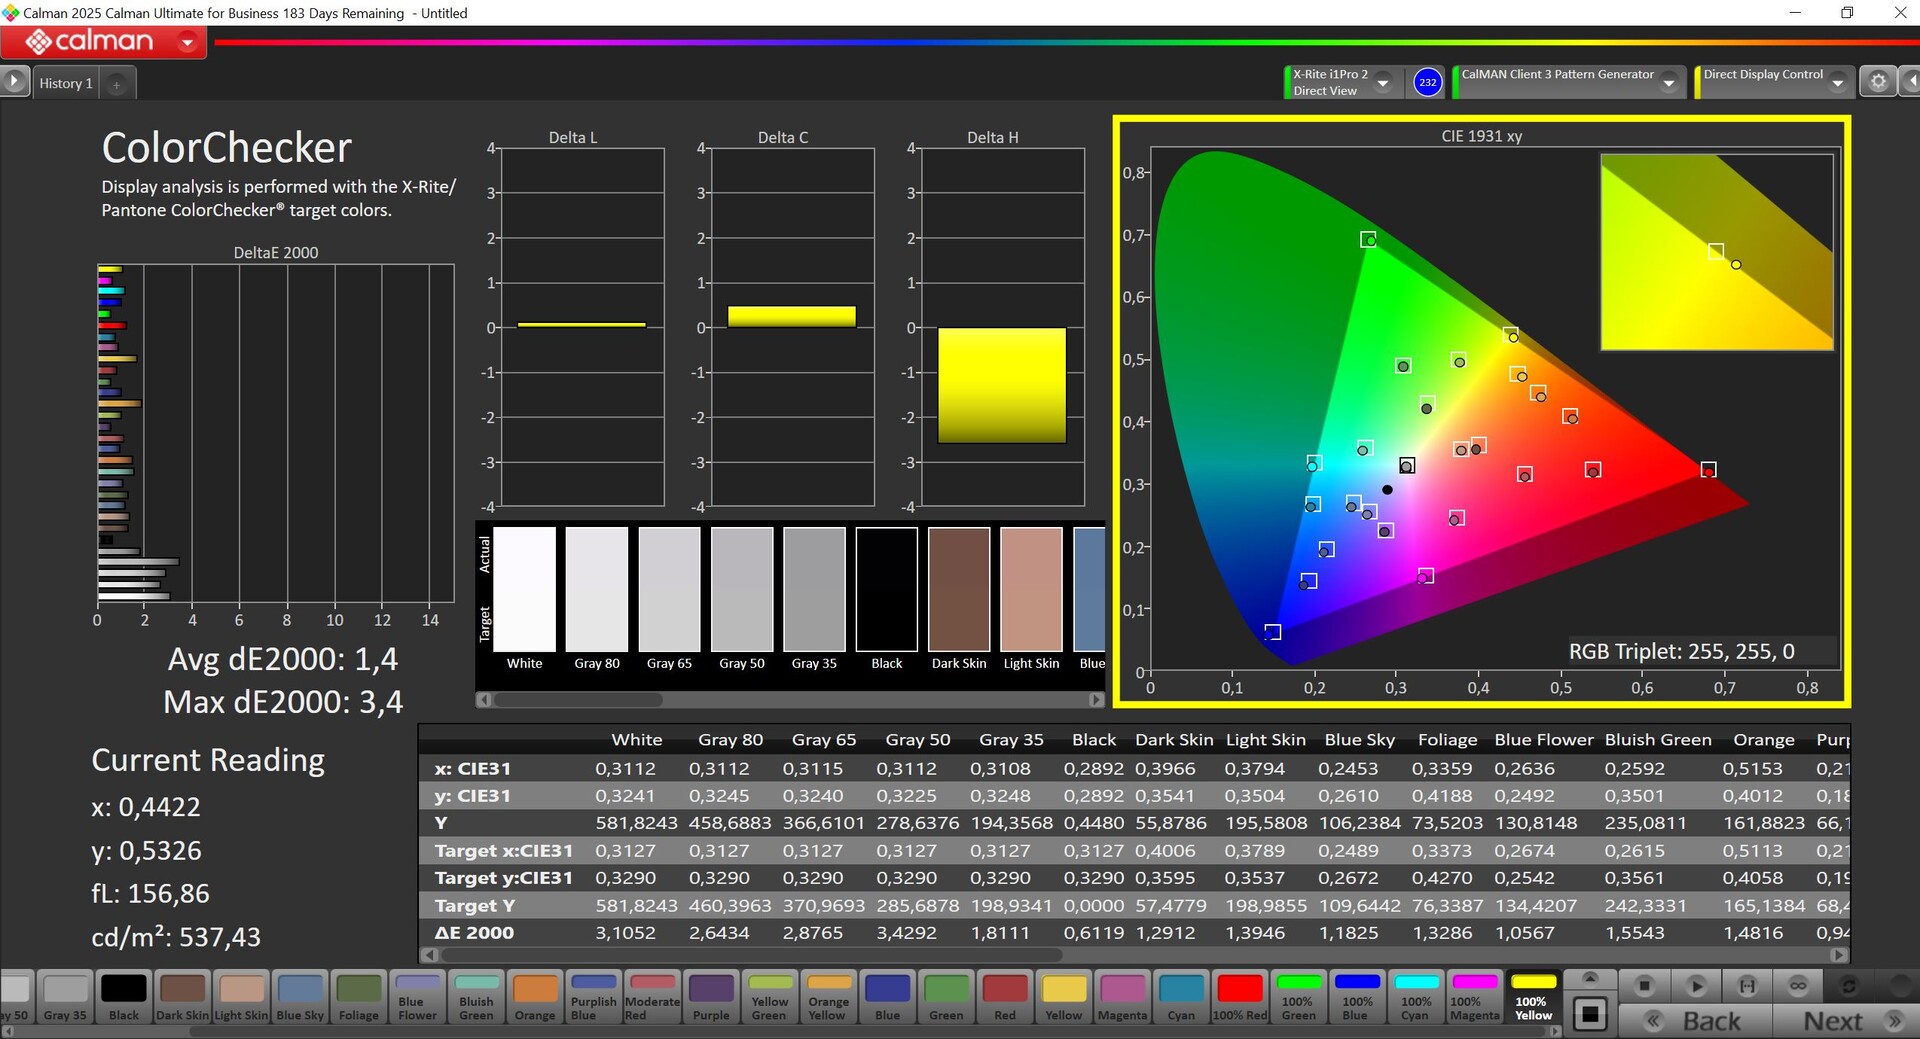
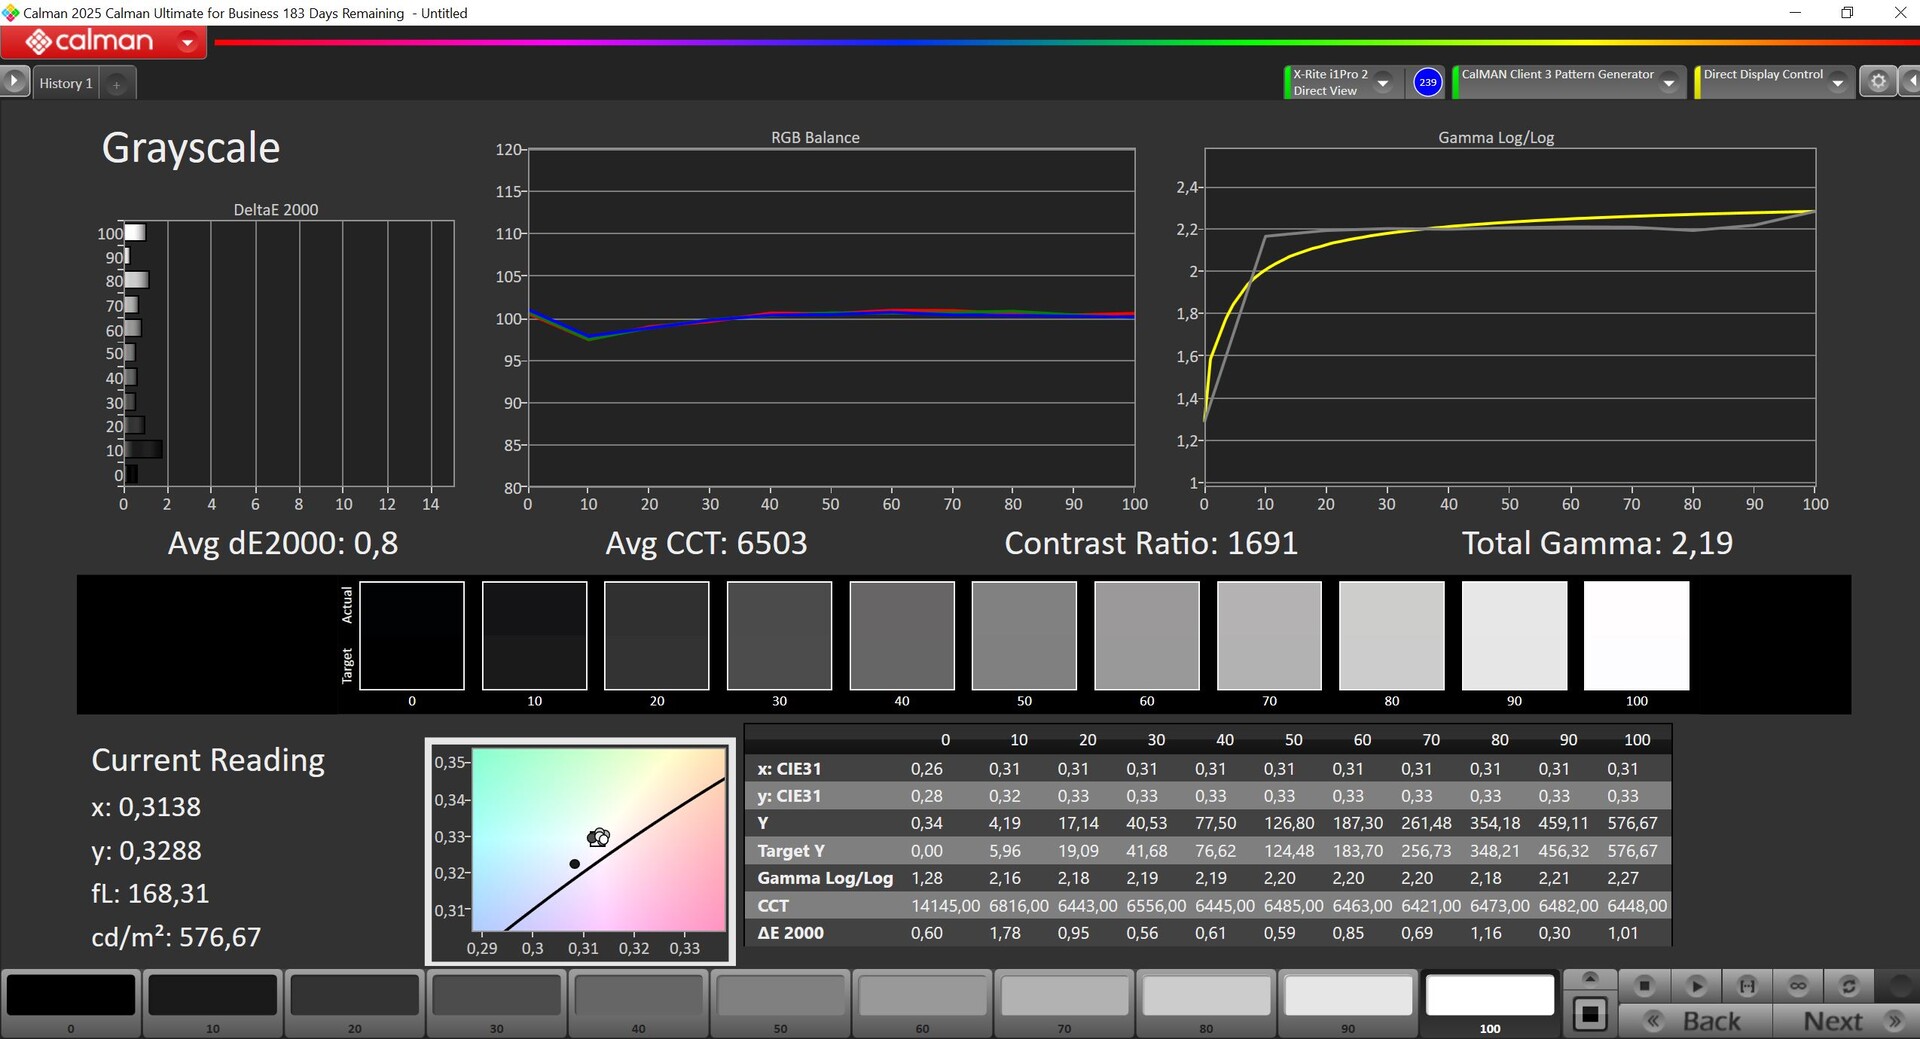
Asus uses a matte IPS panel (2,560 x 1,600 pixels, 16:10) with a refresh rate of 240 Hz. Seen subjectively, the image quality is very good, with bright areas appearing only minimally grainy, although this isn't noticeable at a normal viewing distance. PWM flickering is absent, and response times are fast.
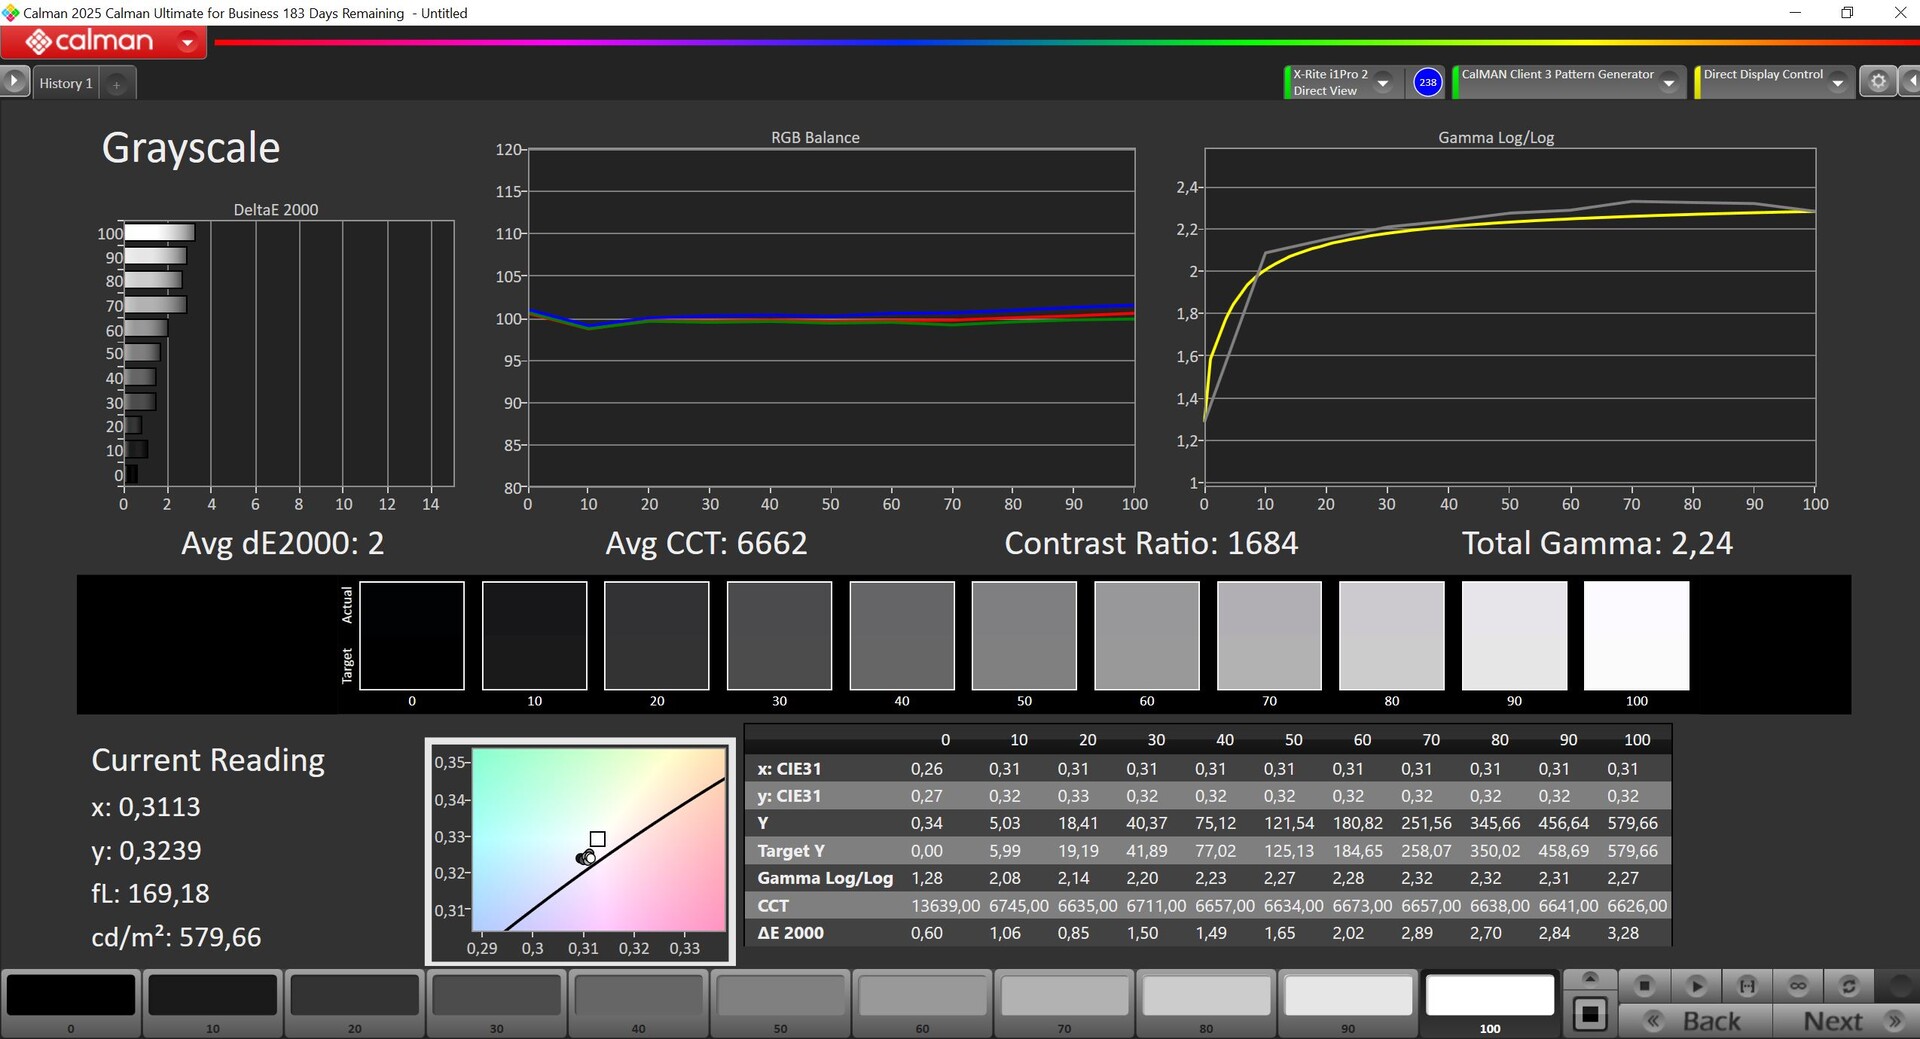
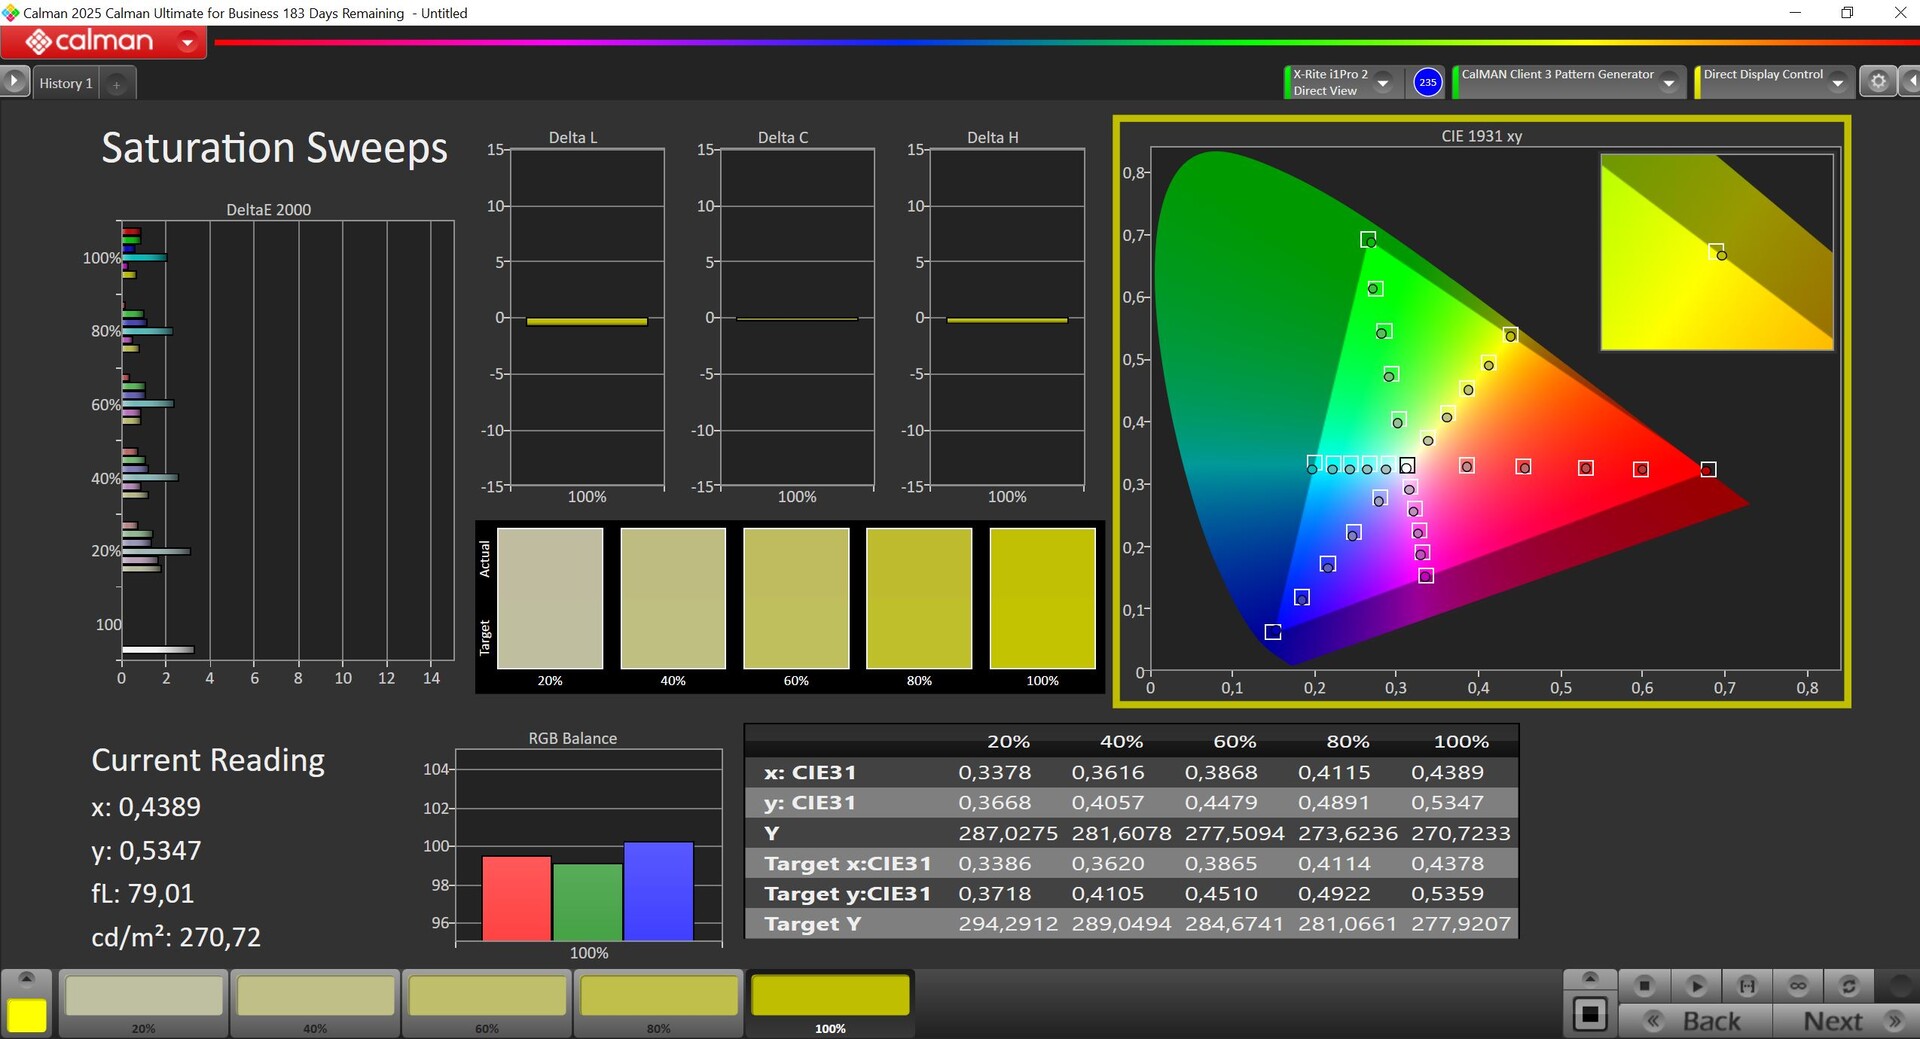
The panel also performed impressively in our analysis using the professional CalMAN software. The maximum brightness is 582 cd/m² (average ~560 cd/m²), and the contrast ratio is almost 1,500:1. Asus has provided various color profiles (P3 and sRGB) that are already well-adjusted. Using our calibration (the profile is available for free download in the box on the right), we were able to further improve the display. Combined with the full color space coverage, image editing is also straightforward.
| |||||||||||||||||||||||||
Brightness Distribution: 93 %
Center on Battery: 582 cd/m²
Contrast: 1455:1 (Black: 0.4 cd/m²)
ΔE ColorChecker Calman: 1.4 | ∀{0.5-29.43 Ø4.73}
calibrated: 0.7
ΔE Greyscale Calman: 1.8 | ∀{0.09-98 Ø4.97}
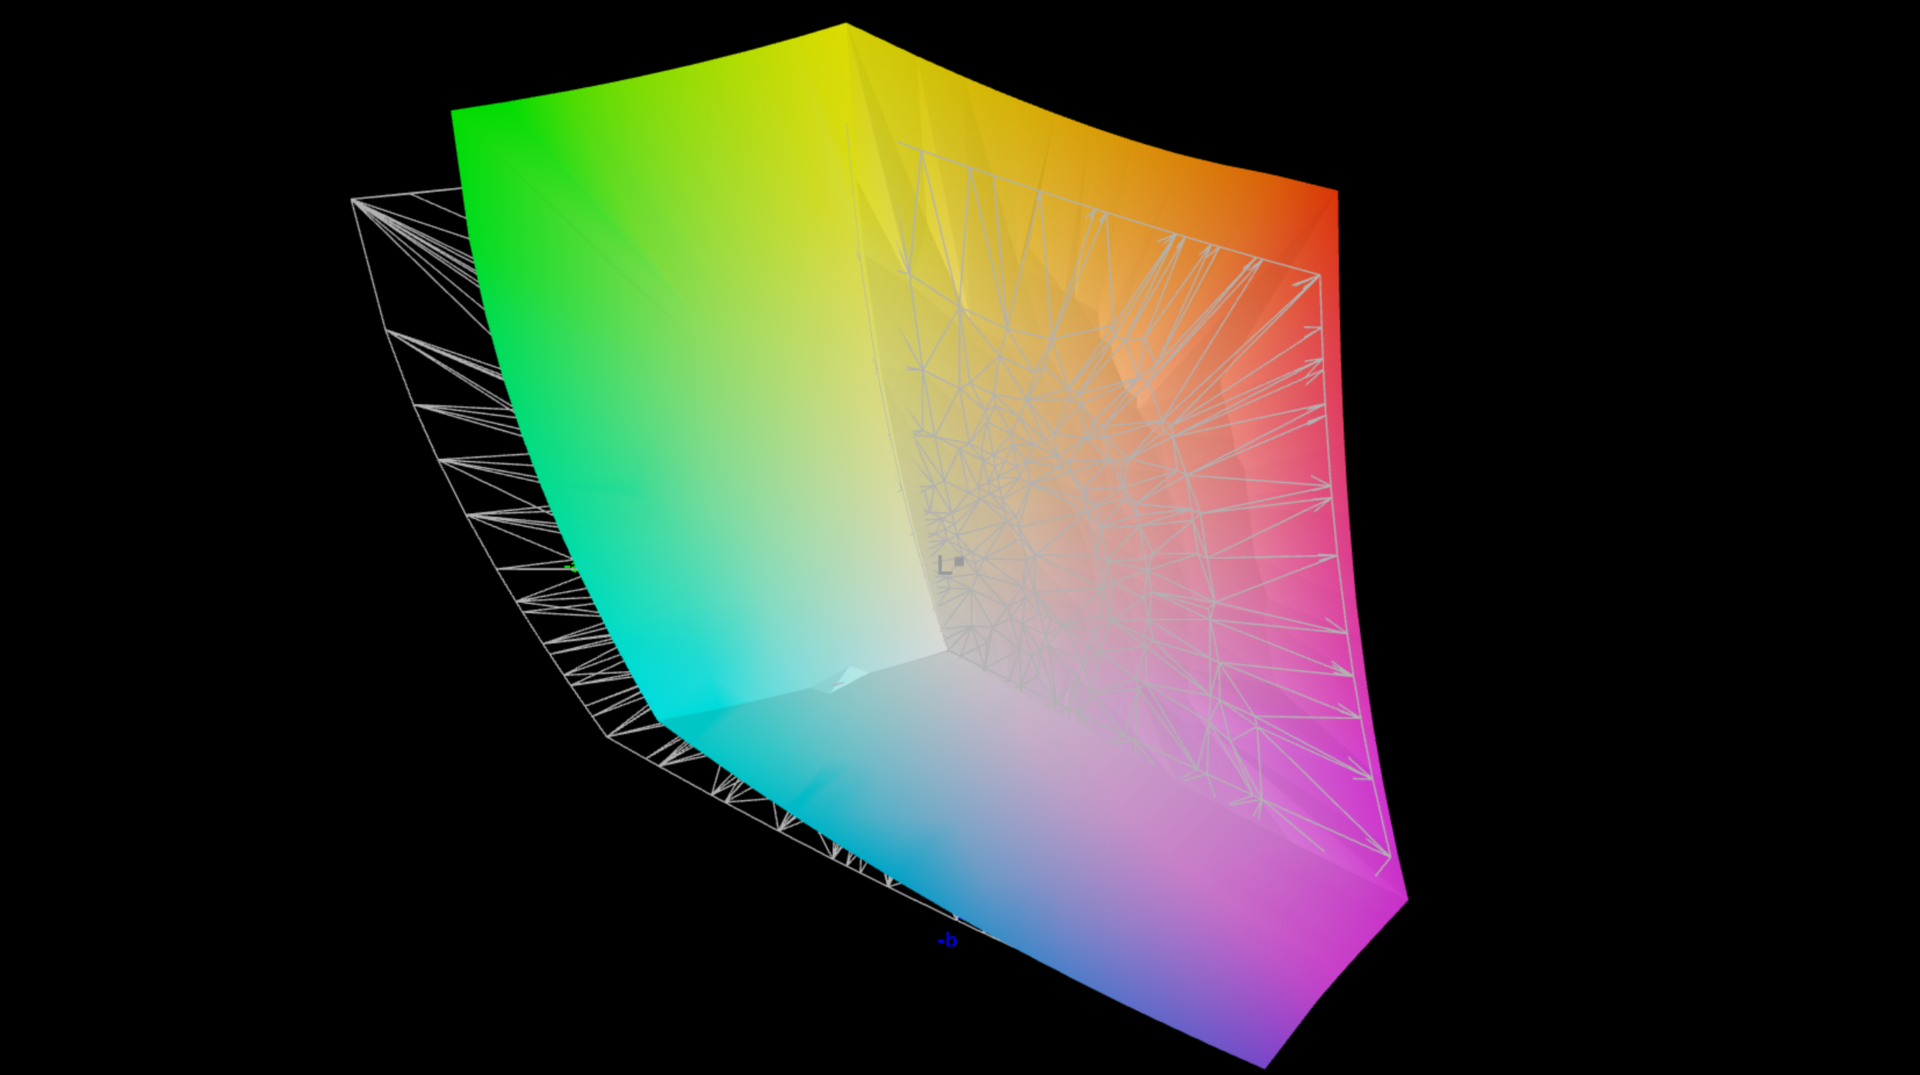
87.7% AdobeRGB 1998 (Argyll 3D)
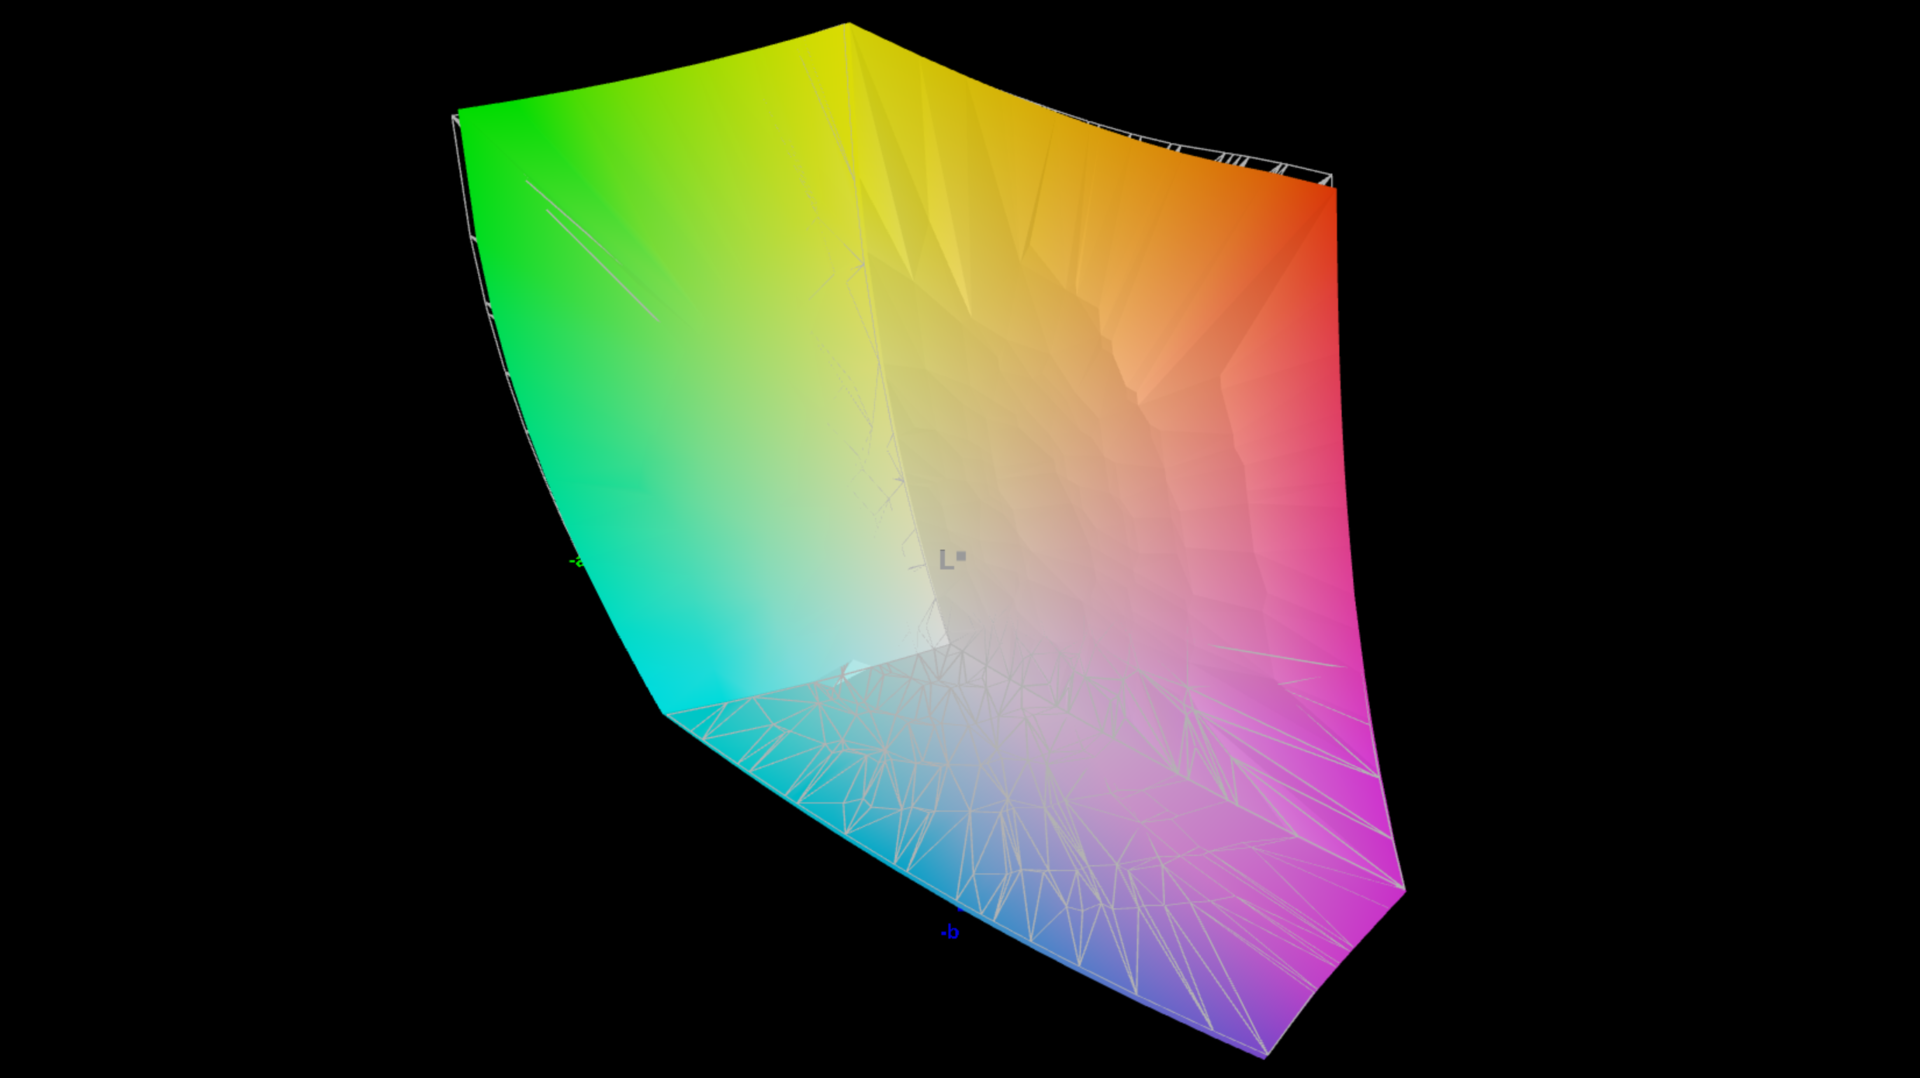
100% sRGB (Argyll 3D)
99.4% Display P3 (Argyll 3D)
Gamma: 2.24
CCT: 6633 K
| Asus ROG Strix G18 2025 G814 NE180QDM-NZC, IPS, 2560x1600, 18", 240 Hz | Razer Blade 18 RTX 4070 AU Optronics B180QAN01.0, IPS, 2560x1600, 18", 240 Hz | MSI Crosshair A17 HX D8WGKG B170QAN01.2, IPS, 2560x1600, 17", 240 Hz | Schenker XMG Focus 17 M25 NE173QHM-NZ1, IPS, 2560x1440, 17.3", 240 Hz | MSI Katana 17 HX B14WGK CSOT MNH301CA3-1, IPS, 2560x1440, 17.3", 240 Hz | MSI Vector A18 HX A9W AU Optronics B180QAN01.0, IPS, 2560x1600, 18", 240 Hz | |
|---|---|---|---|---|---|---|
| Display | -2% | -2% | -1% | -0% | -1% | |
| Display P3 Coverage (%) | 99.4 | 96.9 -3% | 97.1 -2% | 98.3 -1% | 97.3 -2% | 98.1 -1% |
| sRGB Coverage (%) | 100 | 99.8 0% | 99.9 0% | 99.9 0% | 99.6 0% | 99.9 0% |
| AdobeRGB 1998 Coverage (%) | 87.7 | 85.3 -3% | 84.9 -3% | 86 -2% | 89 1% | 86.3 -2% |
| Response Times | -25% | -124% | -146% | -48% | -27% | |
| Response Time Grey 50% / Grey 80% * (ms) | 3.8 ? | 4.2 ? -11% | 13.3 ? -250% | 13.7 ? -261% | 5.2 ? -37% | 4.3 ? -13% |
| Response Time Black / White * (ms) | 5.8 ? | 8 ? -38% | 5.7 ? 2% | 7.6 ? -31% | 9.2 ? -59% | 8.1 ? -40% |
| PWM Frequency (Hz) | ||||||
| Screen | -67% | -38% | -59% | -22% | -46% | |
| Brightness middle (cd/m²) | 582 | 549.6 -6% | 471 -19% | 347 -40% | 296 -49% | 543 -7% |
| Brightness (cd/m²) | 557 | 524 -6% | 468 -16% | 325 -42% | 272 -51% | 502 -10% |
| Brightness Distribution (%) | 93 | 89 -4% | 96 3% | 84 -10% | 87 -6% | 86 -8% |
| Black Level * (cd/m²) | 0.4 | 0.53 -33% | 0.4 -0% | 0.26 35% | 0.27 32% | 0.56 -40% |
| Contrast (:1) | 1455 | 1037 -29% | 1178 -19% | 1335 -8% | 1096 -25% | 970 -33% |
| Colorchecker dE 2000 * | 1.4 | 3.32 -137% | 2.72 -94% | 3.3 -136% | 1.35 4% | 3.41 -144% |
| Colorchecker dE 2000 max. * | 3.4 | 6.63 -95% | 5.49 -61% | 8.4 -147% | 4.76 -40% | 6.4 -88% |
| Colorchecker dE 2000 calibrated * | 0.7 | 2.7 -286% | 1.12 -60% | 0.9 -29% | 0.78 -11% | 0.66 6% |
| Greyscale dE 2000 * | 1.8 | 2 -11% | 3.2 -78% | 4.5 -150% | 2.7 -50% | 3.4 -89% |
| Gamma | 2.24 98% | 2.29 96% | 2.227 99% | 2.05 107% | 2.201 100% | 2.3 96% |
| CCT | 6633 98% | 6319 103% | 6925 94% | 7365 88% | 6770 96% | 6070 107% |
| Total Average (Program / Settings) | -31% /
-47% | -55% /
-43% | -69% /
-59% | -23% /
-21% | -25% /
-34% |
* ... smaller is better


Display Response Times
| ↔ Response Time Black to White | ||
|---|---|---|
| 5.8 ms ... rise ↗ and fall ↘ combined | ↗ 1.5 ms rise |  |
| ↘ 4.3 ms fall | ||
| The screen shows very fast response rates in our tests and should be very well suited for fast-paced gaming. In comparison, all tested devices range from 0.1 (minimum) to 240 (maximum) ms. » 18 % of all devices are better. This means that the measured response time is better than the average of all tested devices (19.9 ms). | ||
| ↔ Response Time 50% Grey to 80% Grey | ||
| 3.8 ms ... rise ↗ and fall ↘ combined | ↗ 1.6 ms rise | 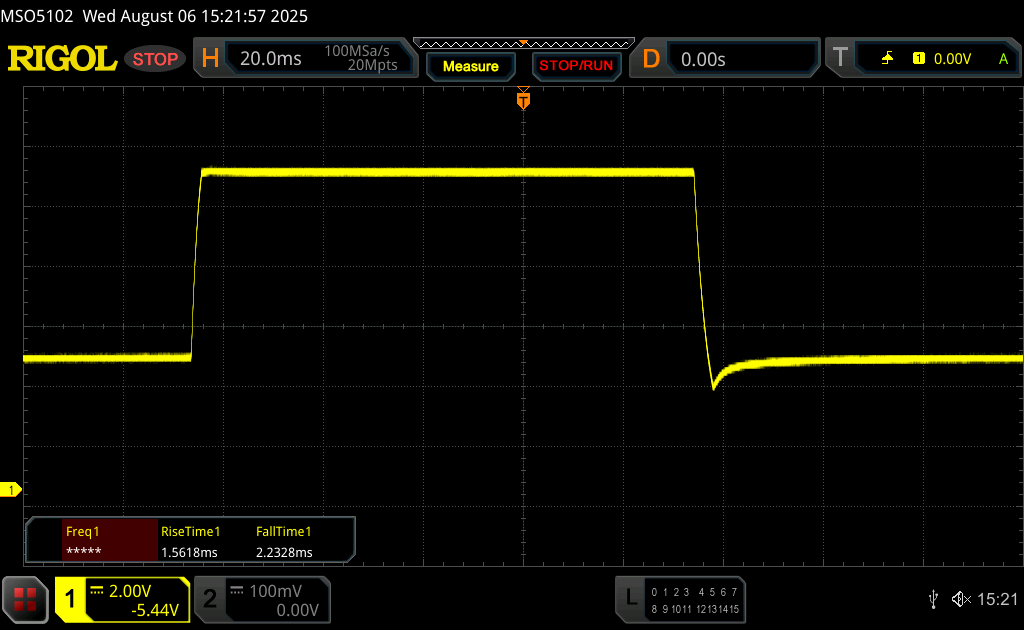 |
| ↘ 2.2 ms fall | ||
| The screen shows very fast response rates in our tests and should be very well suited for fast-paced gaming. In comparison, all tested devices range from 0.165 (minimum) to 636 (maximum) ms. » 15 % of all devices are better. This means that the measured response time is better than the average of all tested devices (31.1 ms). | ||
Screen Flickering / PWM (Pulse-Width Modulation)
| Screen flickering / PWM not detected |  | ||
In comparison: 52 % of all tested devices do not use PWM to dim the display. If PWM was detected, an average of 7798 (minimum: 5 - maximum: 343500) Hz was measured. | |||


Performance - Ryzen HX & Blackwell

Test conditions
Asus offers various power profiles, which are listed in the table below. Turbo mode is only available when plugged in and is only worthwhile if you require maximum CPU performance. However, both GPU and gaming performance are no better than in Performance mode. For this reason, we used Performance mode for our benchmarks and measurements.
| Energy profile | CPU TDP | CB24 Multi | GPU TGP | Time Spy Graphics | CP2077 QHD Ultra | max. fan volume |
|---|---|---|---|---|---|---|
| Quiet | 95/65 watts | 1,711 points | 42 watts | 8,805 points | 43fps | 44.1 dB(A) |
| Performance | 120/90 watts | 1,862 points | 115 watts | 14,224 points | 67.8fps | 49.7 dB(A) |
| Turbo | 140 watts | 2,036 points | 115 watts | 14,213 points | 68.2fps | 57.4 dB(A) |
| Battery (performance) | 75/60 watts | 1,638 points | 42 watts | 8,884 points | 43.2fps | 40.9 dB(A) |
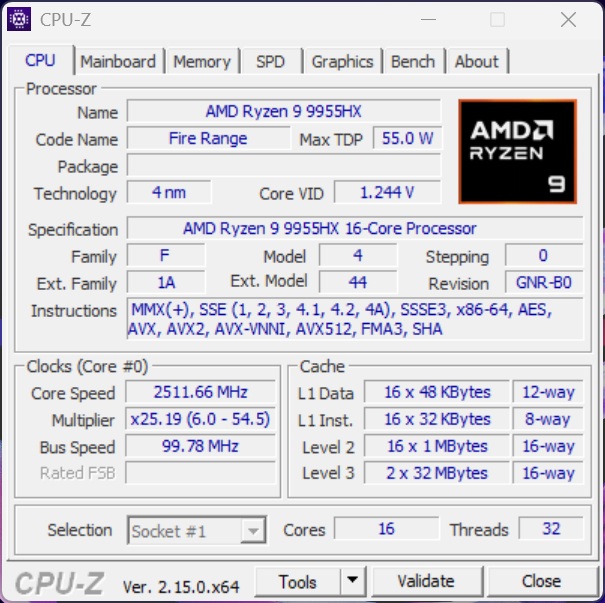
Processor - Ryzen 9 9955HX
With the AMD Ryzen 9 9955HX, we are dealing with a speedy mobile processor that also performs well in the benchmark tests. As previously mentioned, CPU performance can be further increased in Turbo mode.
Cinebench R15 Multi Sustained Test
Cinebench R23: Multi Core | Single Core
Cinebench R20: CPU (Multi Core) | CPU (Single Core)
Cinebench R15: CPU Multi 64Bit | CPU Single 64Bit
Blender: v2.79 BMW27 CPU
7-Zip 18.03: 7z b 4 | 7z b 4 -mmt1
Geekbench 6.7: Multi-Core | Single-Core
Geekbench 5.5: Multi-Core | Single-Core
HWBOT x265 Benchmark v2.2: 4k Preset
LibreOffice : 20 Documents To PDF
R Benchmark 2.5: Overall mean
| CPU Performance rating | |
| Average AMD Ryzen 9 9955HX | |
| Asus ROG Strix G18 2025 G814 | |
| MSI Vector A18 HX A9W | |
| MSI Crosshair A17 HX D8WGKG | |
| Schenker XMG Focus 17 M25 | |
| Razer Blade 18 RTX 4070 -2! | |
| Average of class Gaming | |
| MSI Katana 17 HX B14WGK | |
| Cinebench R23 / Multi Core | |
| MSI Vector A18 HX A9W | |
| Average AMD Ryzen 9 9955HX (35960 - 39690, n=9) | |
| Asus ROG Strix G18 2025 G814 | |
| MSI Crosshair A17 HX D8WGKG | |
| Schenker XMG Focus 17 M25 | |
| Razer Blade 18 RTX 4070 | |
| Average of class Gaming (10488 - 40970, n=113, last 2 years) | |
| MSI Katana 17 HX B14WGK | |
| Cinebench R23 / Single Core | |
| Asus ROG Strix G18 2025 G814 | |
| Average AMD Ryzen 9 9955HX (1828 - 2183, n=9) | |
| Razer Blade 18 RTX 4070 | |
| Schenker XMG Focus 17 M25 | |
| Average of class Gaming (1166 - 2356, n=113, last 2 years) | |
| MSI Katana 17 HX B14WGK | |
| MSI Crosshair A17 HX D8WGKG | |
| MSI Vector A18 HX A9W | |
| Cinebench R20 / CPU (Multi Core) | |
| MSI Vector A18 HX A9W | |
| Average AMD Ryzen 9 9955HX (13963 - 15524, n=9) | |
| Asus ROG Strix G18 2025 G814 | |
| MSI Crosshair A17 HX D8WGKG | |
| Schenker XMG Focus 17 M25 | |
| Razer Blade 18 RTX 4070 | |
| Average of class Gaming (4029 - 16108, n=112, last 2 years) | |
| MSI Katana 17 HX B14WGK | |
| Cinebench R20 / CPU (Single Core) | |
| Asus ROG Strix G18 2025 G814 | |
| Average AMD Ryzen 9 9955HX (819 - 856, n=9) | |
| MSI Vector A18 HX A9W | |
| Razer Blade 18 RTX 4070 | |
| Schenker XMG Focus 17 M25 | |
| Average of class Gaming (442 - 895, n=112, last 2 years) | |
| MSI Katana 17 HX B14WGK | |
| MSI Crosshair A17 HX D8WGKG | |
| Cinebench R15 / CPU Multi 64Bit | |
| MSI Vector A18 HX A9W | |
| Asus ROG Strix G18 2025 G814 | |
| Average AMD Ryzen 9 9955HX (5624 - 6103, n=9) | |
| MSI Crosshair A17 HX D8WGKG | |
| Schenker XMG Focus 17 M25 | |
| Razer Blade 18 RTX 4070 | |
| Average of class Gaming (1578 - 6271, n=113, last 2 years) | |
| MSI Katana 17 HX B14WGK | |
| Cinebench R15 / CPU Single 64Bit | |
| Asus ROG Strix G18 2025 G814 | |
| Average AMD Ryzen 9 9955HX (320 - 338, n=9) | |
| MSI Vector A18 HX A9W | |
| Schenker XMG Focus 17 M25 | |
| Razer Blade 18 RTX 4070 | |
| Average of class Gaming (188.8 - 343, n=112, last 2 years) | |
| MSI Crosshair A17 HX D8WGKG | |
| MSI Katana 17 HX B14WGK | |
| Blender / v2.79 BMW27 CPU | |
| MSI Katana 17 HX B14WGK | |
| Average of class Gaming (80 - 330, n=110, last 2 years) | |
| Schenker XMG Focus 17 M25 | |
| Razer Blade 18 RTX 4070 | |
| MSI Crosshair A17 HX D8WGKG | |
| Asus ROG Strix G18 2025 G814 | |
| Average AMD Ryzen 9 9955HX (80 - 91, n=9) | |
| MSI Vector A18 HX A9W | |
| 7-Zip 18.03 / 7z b 4 | |
| MSI Vector A18 HX A9W | |
| Average AMD Ryzen 9 9955HX (132435 - 144064, n=9) | |
| Asus ROG Strix G18 2025 G814 | |
| MSI Crosshair A17 HX D8WGKG | |
| Schenker XMG Focus 17 M25 | |
| Razer Blade 18 RTX 4070 | |
| Average of class Gaming (33491 - 148086, n=111, last 2 years) | |
| MSI Katana 17 HX B14WGK | |
| 7-Zip 18.03 / 7z b 4 -mmt1 | |
| Asus ROG Strix G18 2025 G814 | |
| MSI Crosshair A17 HX D8WGKG | |
| Average AMD Ryzen 9 9955HX (7061 - 7462, n=9) | |
| MSI Vector A18 HX A9W | |
| Schenker XMG Focus 17 M25 | |
| Razer Blade 18 RTX 4070 | |
| Average of class Gaming (4199 - 7436, n=111, last 2 years) | |
| MSI Katana 17 HX B14WGK | |
| Geekbench 6.7 / Multi-Core | |
| Asus ROG Strix G18 2025 G814 | |
| Average AMD Ryzen 9 9955HX (16313 - 19725, n=9) | |
| Schenker XMG Focus 17 M25 | |
| MSI Crosshair A17 HX D8WGKG | |
| MSI Vector A18 HX A9W | |
| Average of class Gaming (6625 - 22104, n=112, last 2 years) | |
| MSI Katana 17 HX B14WGK | |
| Geekbench 6.7 / Single-Core | |
| Asus ROG Strix G18 2025 G814 | |
| Average AMD Ryzen 9 9955HX (3156 - 3259, n=9) | |
| MSI Vector A18 HX A9W | |
| Schenker XMG Focus 17 M25 | |
| MSI Crosshair A17 HX D8WGKG | |
| Average of class Gaming (1490 - 3259, n=112, last 2 years) | |
| MSI Katana 17 HX B14WGK | |
| Geekbench 5.5 / Multi-Core | |
| MSI Vector A18 HX A9W | |
| Asus ROG Strix G18 2025 G814 | |
| Average AMD Ryzen 9 9955HX (20576 - 22716, n=9) | |
| Schenker XMG Focus 17 M25 | |
| Razer Blade 18 RTX 4070 | |
| MSI Crosshair A17 HX D8WGKG | |
| Average of class Gaming (6460 - 27010, n=111, last 2 years) | |
| MSI Katana 17 HX B14WGK | |
| Geekbench 5.5 / Single-Core | |
| Average AMD Ryzen 9 9955HX (2307 - 2474, n=9) | |
| Asus ROG Strix G18 2025 G814 | |
| MSI Vector A18 HX A9W | |
| Schenker XMG Focus 17 M25 | |
| Average of class Gaming (986 - 2474, n=111, last 2 years) | |
| Razer Blade 18 RTX 4070 | |
| MSI Katana 17 HX B14WGK | |
| MSI Crosshair A17 HX D8WGKG | |
| HWBOT x265 Benchmark v2.2 / 4k Preset | |
| MSI Vector A18 HX A9W | |
| Average AMD Ryzen 9 9955HX (38.9 - 43, n=9) | |
| Asus ROG Strix G18 2025 G814 | |
| MSI Crosshair A17 HX D8WGKG | |
| Razer Blade 18 RTX 4070 | |
| Schenker XMG Focus 17 M25 | |
| Average of class Gaming (11.5 - 44.3, n=111, last 2 years) | |
| MSI Katana 17 HX B14WGK | |
| LibreOffice / 20 Documents To PDF | |
| MSI Katana 17 HX B14WGK | |
| Average of class Gaming (19 - 88.8, n=111, last 2 years) | |
| Schenker XMG Focus 17 M25 | |
| Average AMD Ryzen 9 9955HX (42.2 - 52.4, n=9) | |
| Asus ROG Strix G18 2025 G814 | |
| MSI Vector A18 HX A9W | |
| Razer Blade 18 RTX 4070 | |
| MSI Crosshair A17 HX D8WGKG | |
| R Benchmark 2.5 / Overall mean | |
| MSI Crosshair A17 HX D8WGKG | |
| Average of class Gaming (0.3439 - 0.759, n=112, last 2 years) | |
| MSI Katana 17 HX B14WGK | |
| Schenker XMG Focus 17 M25 | |
| Razer Blade 18 RTX 4070 | |
| Average AMD Ryzen 9 9955HX (0.3439 - 0.3737, n=9) | |
| Asus ROG Strix G18 2025 G814 | |
| MSI Vector A18 HX A9W | |
* ... smaller is better
AIDA64: FP32 Ray-Trace | FPU Julia | CPU SHA3 | CPU Queen | FPU SinJulia | FPU Mandel | CPU AES | CPU ZLib | FP64 Ray-Trace | CPU PhotoWorxx
| Performance rating | |
| MSI Vector A18 HX A9W | |
| Asus ROG Strix G18 2025 G814 | |
| Average AMD Ryzen 9 9955HX | |
| MSI Crosshair A17 HX D8WGKG | |
| Schenker XMG Focus 17 M25 | |
| Razer Blade 18 RTX 4070 | |
| Average of class Gaming | |
| MSI Katana 17 HX B14WGK | |
| AIDA64 / FP32 Ray-Trace | |
| MSI Vector A18 HX A9W | |
| Average AMD Ryzen 9 9955HX (66596 - 85542, n=9) | |
| Asus ROG Strix G18 2025 G814 | |
| MSI Crosshair A17 HX D8WGKG | |
| Average of class Gaming (10227 - 85542, n=110, last 2 years) | |
| Schenker XMG Focus 17 M25 | |
| Razer Blade 18 RTX 4070 | |
| MSI Katana 17 HX B14WGK | |
| AIDA64 / FPU Julia | |
| MSI Vector A18 HX A9W | |
| Average AMD Ryzen 9 9955HX (191535 - 232031, n=9) | |
| Asus ROG Strix G18 2025 G814 | |
| MSI Crosshair A17 HX D8WGKG | |
| Average of class Gaming (51376 - 238426, n=110, last 2 years) | |
| Schenker XMG Focus 17 M25 | |
| Razer Blade 18 RTX 4070 | |
| MSI Katana 17 HX B14WGK | |
| AIDA64 / CPU SHA3 | |
| MSI Vector A18 HX A9W | |
| Average AMD Ryzen 9 9955HX (8489 - 9780, n=9) | |
| Asus ROG Strix G18 2025 G814 | |
| MSI Crosshair A17 HX D8WGKG | |
| Schenker XMG Focus 17 M25 | |
| Razer Blade 18 RTX 4070 | |
| Average of class Gaming (2180 - 9817, n=110, last 2 years) | |
| MSI Katana 17 HX B14WGK | |
| AIDA64 / CPU Queen | |
| MSI Crosshair A17 HX D8WGKG | |
| Asus ROG Strix G18 2025 G814 | |
| MSI Vector A18 HX A9W | |
| Average AMD Ryzen 9 9955HX (153027 - 164154, n=9) | |
| Razer Blade 18 RTX 4070 | |
| Schenker XMG Focus 17 M25 | |
| Average of class Gaming (49785 - 173351, n=101, last 2 years) | |
| MSI Katana 17 HX B14WGK | |
| AIDA64 / FPU SinJulia | |
| MSI Vector A18 HX A9W | |
| Average AMD Ryzen 9 9955HX (29876 - 32647, n=9) | |
| Asus ROG Strix G18 2025 G814 | |
| MSI Crosshair A17 HX D8WGKG | |
| Razer Blade 18 RTX 4070 | |
| Schenker XMG Focus 17 M25 | |
| Average of class Gaming (4424 - 33636, n=110, last 2 years) | |
| MSI Katana 17 HX B14WGK | |
| AIDA64 / FPU Mandel | |
| MSI Vector A18 HX A9W | |
| Average AMD Ryzen 9 9955HX (101131 - 128721, n=9) | |
| MSI Crosshair A17 HX D8WGKG | |
| Asus ROG Strix G18 2025 G814 | |
| Average of class Gaming (25115 - 128721, n=110, last 2 years) | |
| Schenker XMG Focus 17 M25 | |
| Razer Blade 18 RTX 4070 | |
| MSI Katana 17 HX B14WGK | |
| AIDA64 / CPU AES | |
| Asus ROG Strix G18 2025 G814 | |
| Average AMD Ryzen 9 9955HX (146979 - 218385, n=9) | |
| MSI Crosshair A17 HX D8WGKG | |
| MSI Vector A18 HX A9W | |
| Razer Blade 18 RTX 4070 | |
| Schenker XMG Focus 17 M25 | |
| Average of class Gaming (39258 - 247074, n=110, last 2 years) | |
| MSI Katana 17 HX B14WGK | |
| AIDA64 / CPU ZLib | |
| MSI Vector A18 HX A9W | |
| Average AMD Ryzen 9 9955HX (2186 - 2531, n=9) | |
| Asus ROG Strix G18 2025 G814 | |
| MSI Crosshair A17 HX D8WGKG | |
| Schenker XMG Focus 17 M25 | |
| Razer Blade 18 RTX 4070 | |
| Average of class Gaming (574 - 2531, n=110, last 2 years) | |
| MSI Katana 17 HX B14WGK | |
| AIDA64 / FP64 Ray-Trace | |
| MSI Vector A18 HX A9W | |
| Average AMD Ryzen 9 9955HX (35252 - 45446, n=9) | |
| Asus ROG Strix G18 2025 G814 | |
| MSI Crosshair A17 HX D8WGKG | |
| Average of class Gaming (5509 - 45446, n=110, last 2 years) | |
| Razer Blade 18 RTX 4070 | |
| Schenker XMG Focus 17 M25 | |
| MSI Katana 17 HX B14WGK | |
| AIDA64 / CPU PhotoWorxx | |
| Razer Blade 18 RTX 4070 | |
| Schenker XMG Focus 17 M25 | |
| Average of class Gaming (12271 - 89891, n=110, last 2 years) | |
| Asus ROG Strix G18 2025 G814 | |
| MSI Vector A18 HX A9W | |
| Average AMD Ryzen 9 9955HX (35974 - 42495, n=9) | |
| MSI Crosshair A17 HX D8WGKG | |
| MSI Katana 17 HX B14WGK | |
System performance
Overall, the Strix G18 is a very fast computer, with benchmark results to match. Although we didn't experience any stability issues during testing, as normal, the Advanced Optimus GPU switching does cause a brief freeze when activating the Nvidia GPU.
PCMark 10: Score | Essentials | Productivity | Digital Content Creation
CrossMark: Overall | Productivity | Creativity | Responsiveness
WebXPRT 3: Overall
WebXPRT 4: Overall
Mozilla Kraken 1.1: Total
| Performance rating | |
| MSI Vector A18 HX A9W | |
| Asus ROG Strix G18 2025 G814 | |
| Average AMD Ryzen 9 9955HX, NVIDIA GeForce RTX 5070 Laptop | |
| Razer Blade 18 RTX 4070 | |
| Schenker XMG Focus 17 M25 | |
| Average of class Gaming | |
| MSI Crosshair A17 HX D8WGKG | |
| MSI Katana 17 HX B14WGK | |
| PCMark 10 / Score | |
| MSI Vector A18 HX A9W | |
| Asus ROG Strix G18 2025 G814 | |
| Average AMD Ryzen 9 9955HX, NVIDIA GeForce RTX 5070 Laptop (n=1) | |
| Average of class Gaming (5828 - 11574, n=96, last 2 years) | |
| MSI Crosshair A17 HX D8WGKG | |
| Razer Blade 18 RTX 4070 | |
| Schenker XMG Focus 17 M25 | |
| MSI Katana 17 HX B14WGK | |
| PCMark 10 / Essentials | |
| Asus ROG Strix G18 2025 G814 | |
| Average AMD Ryzen 9 9955HX, NVIDIA GeForce RTX 5070 Laptop (n=1) | |
| Razer Blade 18 RTX 4070 | |
| MSI Vector A18 HX A9W | |
| MSI Crosshair A17 HX D8WGKG | |
| Schenker XMG Focus 17 M25 | |
| Average of class Gaming (8810 - 12600, n=100, last 2 years) | |
| MSI Katana 17 HX B14WGK | |
| PCMark 10 / Productivity | |
| Asus ROG Strix G18 2025 G814 | |
| Average AMD Ryzen 9 9955HX, NVIDIA GeForce RTX 5070 Laptop (n=1) | |
| MSI Vector A18 HX A9W | |
| Average of class Gaming (6845 - 18766, n=98, last 2 years) | |
| Razer Blade 18 RTX 4070 | |
| MSI Crosshair A17 HX D8WGKG | |
| Schenker XMG Focus 17 M25 | |
| MSI Katana 17 HX B14WGK | |
| PCMark 10 / Digital Content Creation | |
| MSI Vector A18 HX A9W | |
| Asus ROG Strix G18 2025 G814 | |
| Average AMD Ryzen 9 9955HX, NVIDIA GeForce RTX 5070 Laptop (n=1) | |
| Average of class Gaming (7602 - 19657, n=98, last 2 years) | |
| Schenker XMG Focus 17 M25 | |
| MSI Crosshair A17 HX D8WGKG | |
| MSI Katana 17 HX B14WGK | |
| Razer Blade 18 RTX 4070 | |
| CrossMark / Overall | |
| Asus ROG Strix G18 2025 G814 | |
| Average AMD Ryzen 9 9955HX, NVIDIA GeForce RTX 5070 Laptop (n=1) | |
| Schenker XMG Focus 17 M25 | |
| MSI Vector A18 HX A9W | |
| Razer Blade 18 RTX 4070 | |
| Average of class Gaming (1366 - 2409, n=98, last 2 years) | |
| MSI Crosshair A17 HX D8WGKG | |
| MSI Katana 17 HX B14WGK | |
| CrossMark / Productivity | |
| Schenker XMG Focus 17 M25 | |
| Asus ROG Strix G18 2025 G814 | |
| Average AMD Ryzen 9 9955HX, NVIDIA GeForce RTX 5070 Laptop (n=1) | |
| Razer Blade 18 RTX 4070 | |
| MSI Vector A18 HX A9W | |
| MSI Katana 17 HX B14WGK | |
| Average of class Gaming (1386 - 2254, n=98, last 2 years) | |
| MSI Crosshair A17 HX D8WGKG | |
| CrossMark / Creativity | |
| Asus ROG Strix G18 2025 G814 | |
| Average AMD Ryzen 9 9955HX, NVIDIA GeForce RTX 5070 Laptop (n=1) | |
| MSI Vector A18 HX A9W | |
| Schenker XMG Focus 17 M25 | |
| Razer Blade 18 RTX 4070 | |
| Average of class Gaming (1343 - 2729, n=98, last 2 years) | |
| MSI Crosshair A17 HX D8WGKG | |
| MSI Katana 17 HX B14WGK | |
| CrossMark / Responsiveness | |
| Schenker XMG Focus 17 M25 | |
| MSI Katana 17 HX B14WGK | |
| Razer Blade 18 RTX 4070 | |
| Asus ROG Strix G18 2025 G814 | |
| Average AMD Ryzen 9 9955HX, NVIDIA GeForce RTX 5070 Laptop (n=1) | |
| MSI Crosshair A17 HX D8WGKG | |
| Average of class Gaming (1226 - 2334, n=98, last 2 years) | |
| MSI Vector A18 HX A9W | |
| WebXPRT 3 / Overall | |
| MSI Vector A18 HX A9W | |
| Razer Blade 18 RTX 4070 | |
| Asus ROG Strix G18 2025 G814 | |
| Average AMD Ryzen 9 9955HX, NVIDIA GeForce RTX 5070 Laptop (n=1) | |
| Average of class Gaming (242 - 532, n=101, last 2 years) | |
| Schenker XMG Focus 17 M25 | |
| MSI Katana 17 HX B14WGK | |
| MSI Crosshair A17 HX D8WGKG | |
| WebXPRT 4 / Overall | |
| MSI Vector A18 HX A9W | |
| Razer Blade 18 RTX 4070 | |
| Schenker XMG Focus 17 M25 | |
| Asus ROG Strix G18 2025 G814 | |
| Average AMD Ryzen 9 9955HX, NVIDIA GeForce RTX 5070 Laptop (n=1) | |
| Average of class Gaming (176.4 - 354, n=101, last 2 years) | |
| MSI Katana 17 HX B14WGK | |
| MSI Crosshair A17 HX D8WGKG | |
| Mozilla Kraken 1.1 / Total | |
| MSI Crosshair A17 HX D8WGKG | |
| MSI Katana 17 HX B14WGK | |
| Schenker XMG Focus 17 M25 | |
| Average of class Gaming (391 - 590, n=106, last 2 years) | |
| Razer Blade 18 RTX 4070 | |
| Asus ROG Strix G18 2025 G814 | |
| Average AMD Ryzen 9 9955HX, NVIDIA GeForce RTX 5070 Laptop (n=1) | |
| MSI Vector A18 HX A9W | |
* ... smaller is better
| PCMark 10 Score | 8879 points | |
Help | ||
| AIDA64 / Memory Copy | |
| Schenker XMG Focus 17 M25 | |
| Razer Blade 18 RTX 4070 | |
| Average of class Gaming (21750 - 129946, n=110, last 2 years) | |
| Asus ROG Strix G18 2025 G814 | |
| MSI Vector A18 HX A9W | |
| Average AMD Ryzen 9 9955HX (53598 - 62777, n=9) | |
| MSI Katana 17 HX B14WGK | |
| MSI Crosshair A17 HX D8WGKG | |
| AIDA64 / Memory Read | |
| Schenker XMG Focus 17 M25 | |
| Razer Blade 18 RTX 4070 | |
| Average of class Gaming (22956 - 118858, n=110, last 2 years) | |
| MSI Katana 17 HX B14WGK | |
| Average AMD Ryzen 9 9955HX (63953 - 67256, n=9) | |
| Asus ROG Strix G18 2025 G814 | |
| MSI Vector A18 HX A9W | |
| MSI Crosshair A17 HX D8WGKG | |
| AIDA64 / Memory Write | |
| Average of class Gaming (22297 - 135096, n=110, last 2 years) | |
| Razer Blade 18 RTX 4070 | |
| Schenker XMG Focus 17 M25 | |
| MSI Vector A18 HX A9W | |
| Average AMD Ryzen 9 9955HX (65421 - 72060, n=9) | |
| Asus ROG Strix G18 2025 G814 | |
| MSI Crosshair A17 HX D8WGKG | |
| MSI Katana 17 HX B14WGK | |
| AIDA64 / Memory Latency | |
| Average of class Gaming (75.3 - 259, n=110, last 2 years) | |
| MSI Vector A18 HX A9W | |
| Asus ROG Strix G18 2025 G814 | |
| Average AMD Ryzen 9 9955HX (92.1 - 103.5, n=9) | |
| MSI Katana 17 HX B14WGK | |
| Razer Blade 18 RTX 4070 | |
| MSI Crosshair A17 HX D8WGKG | |
| Schenker XMG Focus 17 M25 | |
* ... smaller is better
DPC latencies
In our standardized latency test (web browsing, 4K YouTube playback, CPU load), the review device with the current BIOS version showed no limitations when using real-time audio applications.


| DPC Latencies / LatencyMon - interrupt to process latency (max), Web, Youtube, Prime95 | |
| MSI Katana 17 HX B14WGK | |
| Schenker XMG Focus 17 M25 | |
| Razer Blade 18 RTX 4070 | |
| MSI Crosshair A17 HX D8WGKG | |
| Asus ROG Strix G18 2025 G814 | |
| MSI Vector A18 HX A9W | |
* ... smaller is better
Mass storage
Two M.2 2280 slots are available (1x PCIe 5.0, 1x PCIe 4.0). The review unit is equipped with the 1 TB version (855 GB free) of the Micron 2500, which offers good transfer speeds. In our endurance test, performance dropped slightly at some point, but this didn't have a major impact on everyday use.

* ... smaller is better
Sustained Performance: DiskSpd Read Loop, Queue Depth 8
GPU performance
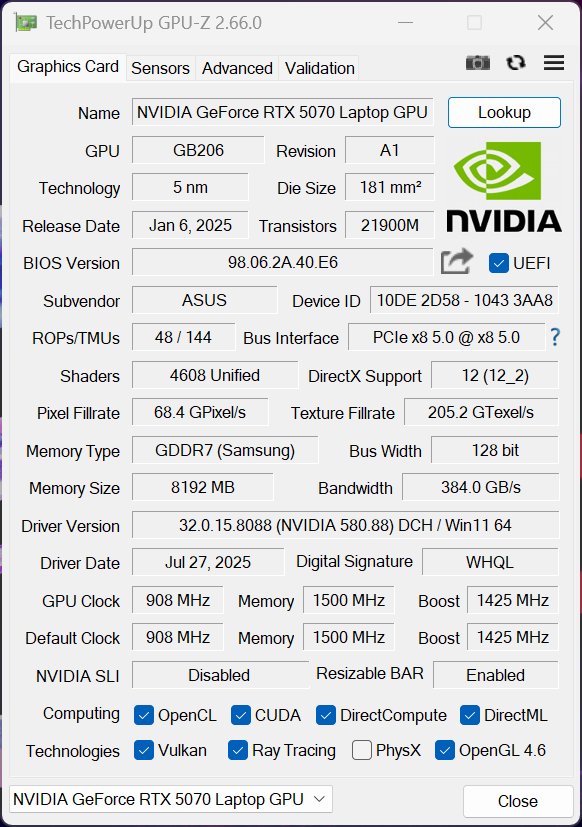
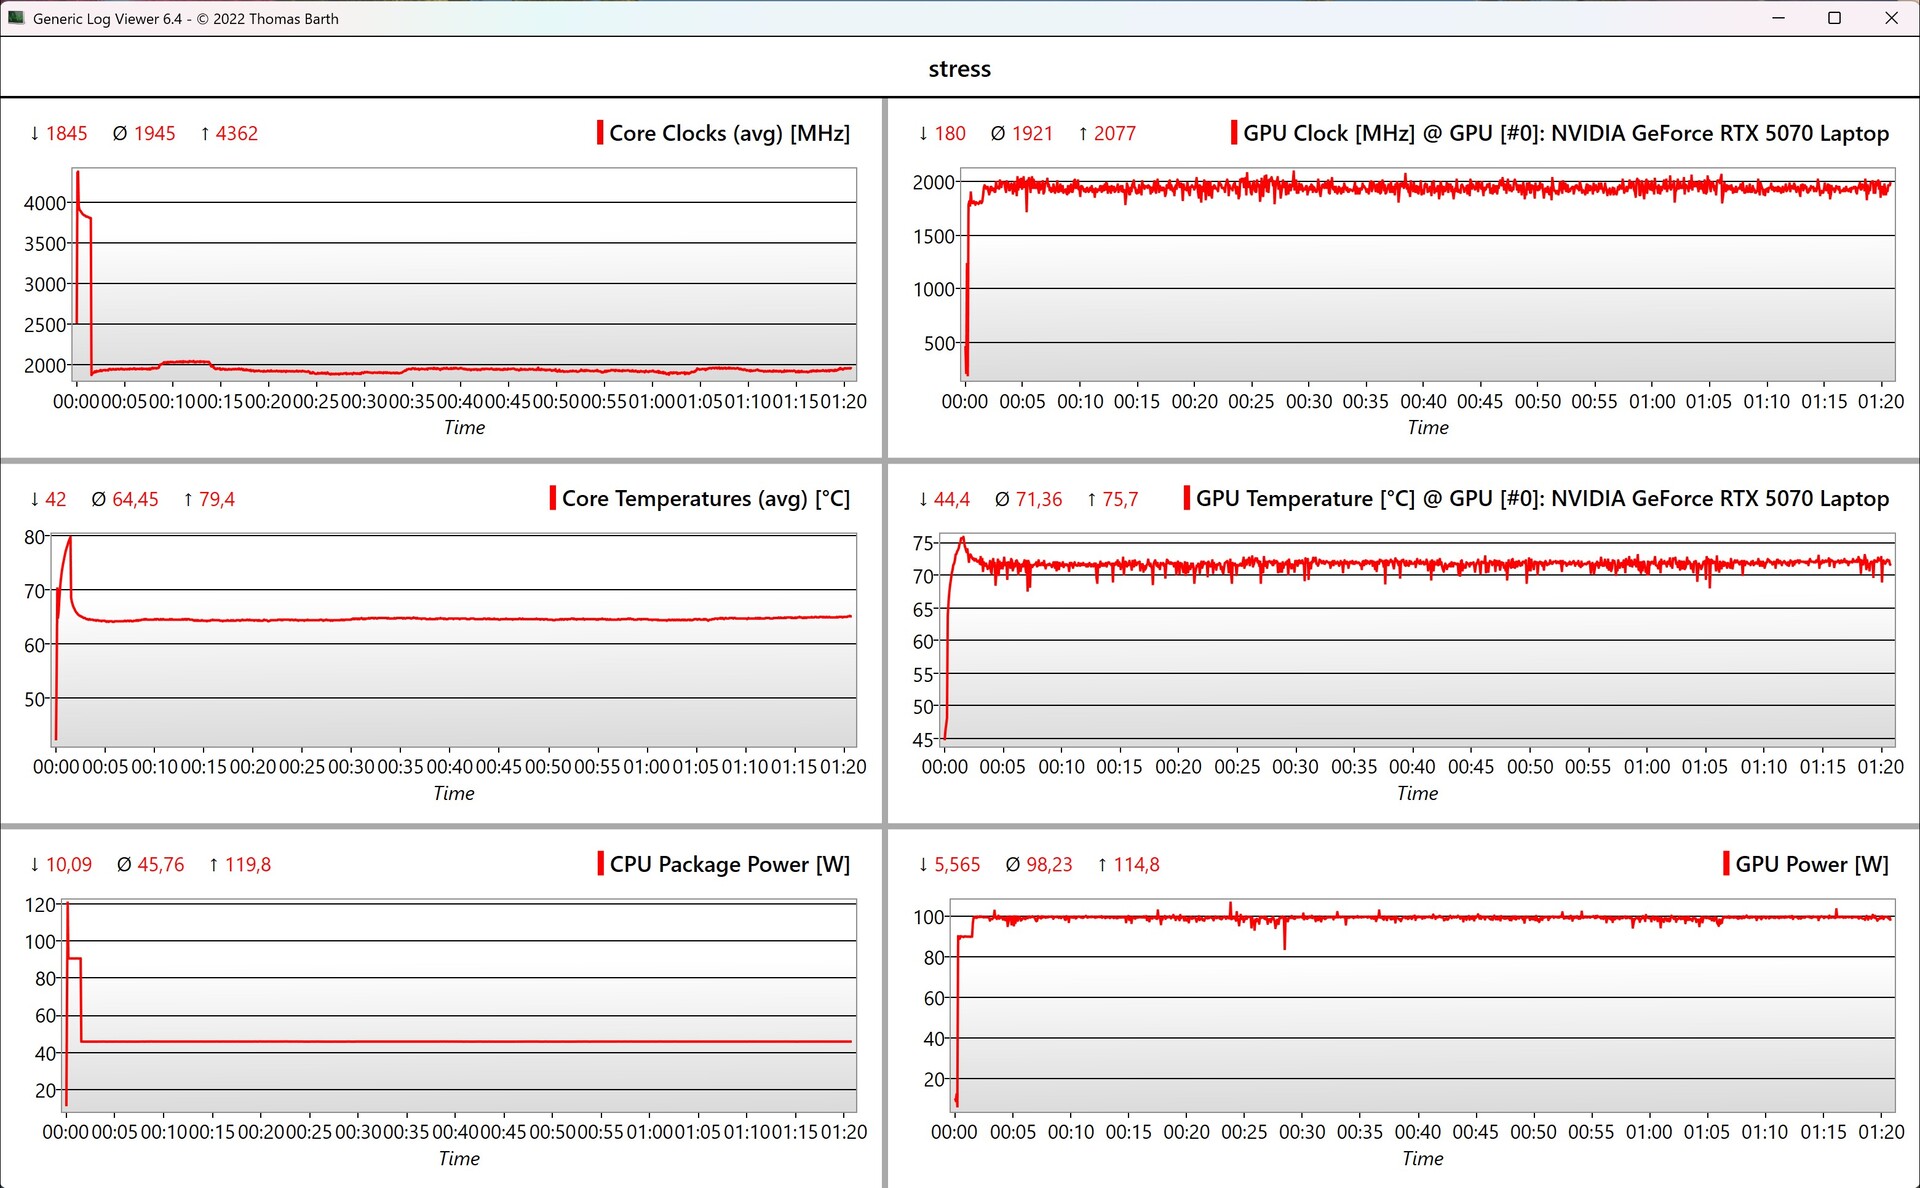
The device comes fitted with the Nvidia GeForce RTX 5070 laptop GPU, using the 115-watt version (100 watts + 15 watts Dynamic Boost). Graphics switching is handled via Advanced Optimus, and performance is generally good, although the GPU still only offers 8 GB of VRAM. Depending on the title, this can cause problems at QHD resolution, so it's best to stick to Full HD resolution.
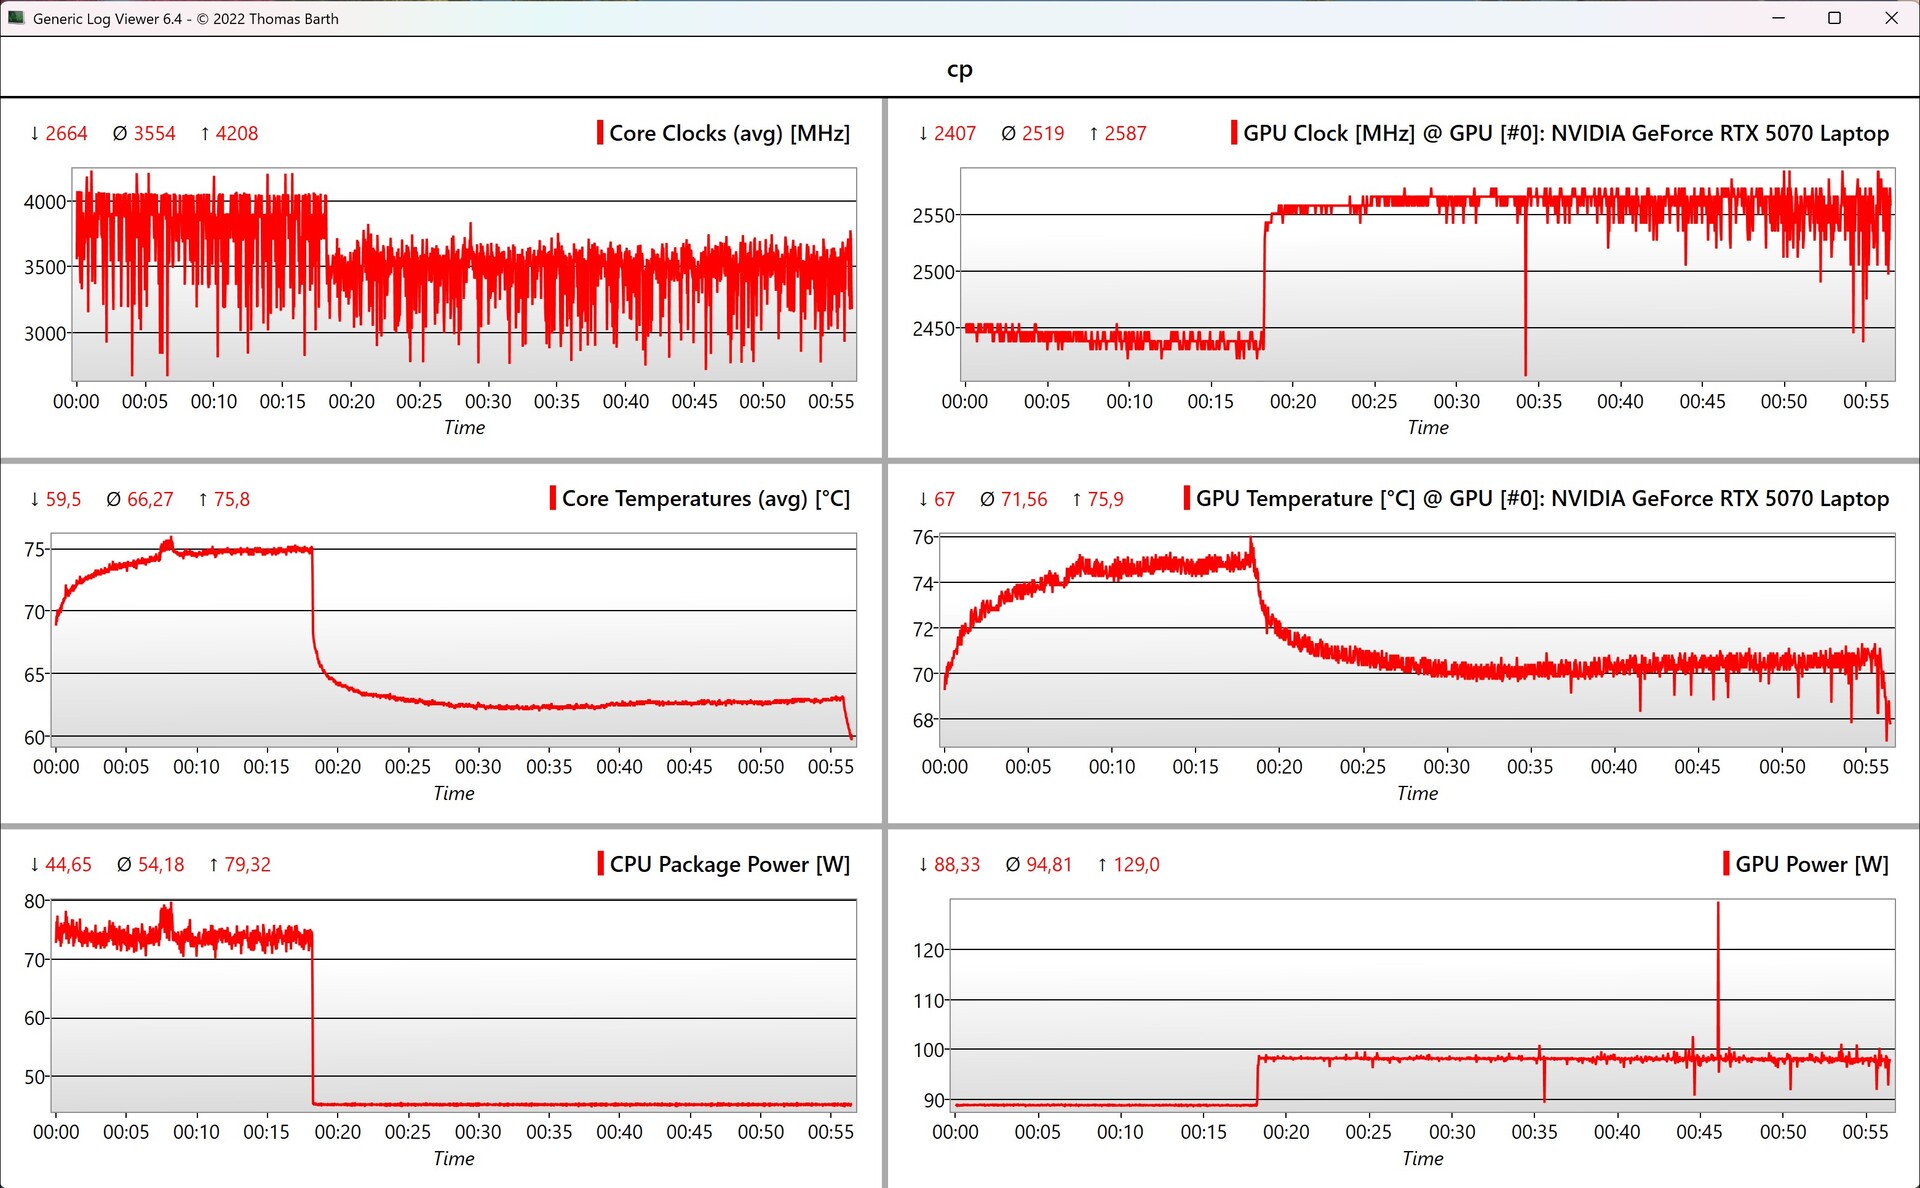
When gaming, it also becomes evident that Asus ought to rework the power profiles. The GPU can't run at full power for the first few minutes because the processor initially runs at 80 watts and only settles at 50 watts after a while. Only then can the GPU run at the full 100 watts. This is also clearly apparent in the data from our Cyberpunk loop.
| 3DMark 11 Performance | 38780 points | |
| 3DMark Fire Strike Score | 34042 points | |
| 3DMark Time Spy Score | 14085 points | |
| 3DMark Steel Nomad Score | 3123 points | |
| 3DMark Steel Nomad Light Score | 14399 points | |
| 3DMark Steel Nomad Light Unlimited Score | 14291 points | |
Help | ||
| Blender / v3.3 Classroom OPTIX/RTX | |
| Razer Blade 18 RTX 4070 | |
| MSI Katana 17 HX B14WGK | |
| Average NVIDIA GeForce RTX 5070 Laptop (17 - 24, n=27) | |
| Average of class Gaming (9 - 32, n=112, last 2 years) | |
| Asus ROG Strix G18 2025 G814 | |
| MSI Crosshair A17 HX D8WGKG | |
| MSI Vector A18 HX A9W | |
| Schenker XMG Focus 17 M25 | |
| Blender / v3.3 Classroom CUDA | |
| Average NVIDIA GeForce RTX 5070 Laptop (29 - 228, n=28) | |
| Razer Blade 18 RTX 4070 | |
| Average of class Gaming (15 - 228, n=112, last 2 years) | |
| Schenker XMG Focus 17 M25 | |
| MSI Katana 17 HX B14WGK | |
| MSI Crosshair A17 HX D8WGKG | |
| Asus ROG Strix G18 2025 G814 | |
| MSI Vector A18 HX A9W | |
| Blender / v3.3 Classroom CPU | |
| MSI Katana 17 HX B14WGK | |
| Average NVIDIA GeForce RTX 5070 Laptop (137 - 507, n=25) | |
| Average of class Gaming (122 - 565, n=108, last 2 years) | |
| Razer Blade 18 RTX 4070 | |
| Schenker XMG Focus 17 M25 | |
| Asus ROG Strix G18 2025 G814 | |
| MSI Vector A18 HX A9W | |
* ... smaller is better
| Performance rating - Percent | |
| MSI Vector A18 HX A9W -1! | |
| Schenker XMG Focus 17 M25 | |
| MSI Crosshair A17 HX D8WGKG -1! | |
| Asus ROG Strix G18 2025 G814 | |
| Razer Blade 18 RTX 4070 -2! | |
| Average of class Gaming | |
| MSI Katana 17 HX B14WGK -2! | |
| Cyberpunk 2077 - 1920x1080 Ultra Preset (FSR off) | |
| MSI Vector A18 HX A9W | |
| Schenker XMG Focus 17 M25 | |
| MSI Crosshair A17 HX D8WGKG | |
| Asus ROG Strix G18 2025 G814 | |
| Average of class Gaming (17.7 - 169.9, n=121, last 2 years) | |
| MSI Katana 17 HX B14WGK | |
| Baldur's Gate 3 - 1920x1080 Ultra Preset AA:T | |
| MSI Vector A18 HX A9W | |
| Schenker XMG Focus 17 M25 | |
| Average of class Gaming (59.4 - 246, n=107, last 2 years) | |
| MSI Crosshair A17 HX D8WGKG | |
| Asus ROG Strix G18 2025 G814 | |
| MSI Katana 17 HX B14WGK | |
| GTA V - 1920x1080 Highest AA:4xMSAA + FX AF:16x | |
| MSI Crosshair A17 HX D8WGKG | |
| Asus ROG Strix G18 2025 G814 | |
| Schenker XMG Focus 17 M25 | |
| Average of class Gaming (48.3 - 186.9, n=103, last 2 years) | |
| Razer Blade 18 RTX 4070 | |
| MSI Katana 17 HX B14WGK | |
| Final Fantasy XV Benchmark - 1920x1080 High Quality | |
| MSI Vector A18 HX A9W | |
| Schenker XMG Focus 17 M25 | |
| Average of class Gaming (41 - 215, n=104, last 2 years) | |
| MSI Crosshair A17 HX D8WGKG | |
| Asus ROG Strix G18 2025 G814 | |
| Razer Blade 18 RTX 4070 | |
| Strange Brigade - 1920x1080 ultra AA:ultra AF:16 | |
| MSI Vector A18 HX A9W | |
| Schenker XMG Focus 17 M25 | |
| Average of class Gaming (76.3 - 456, n=94, last 2 years) | |
| Asus ROG Strix G18 2025 G814 | |
| Razer Blade 18 RTX 4070 | |
| Dota 2 Reborn - 1920x1080 ultra (3/3) best looking | |
| MSI Vector A18 HX A9W | |
| MSI Crosshair A17 HX D8WGKG | |
| Asus ROG Strix G18 2025 G814 | |
| Razer Blade 18 RTX 4070 | |
| Schenker XMG Focus 17 M25 | |
| Average of class Gaming (84.8 - 248, n=113, last 2 years) | |
| MSI Katana 17 HX B14WGK | |
Cyberpunk 2077 ultra quality FPS chart
| low | med. | high | ultra | QHD DLSS | QHD | |
|---|---|---|---|---|---|---|
| GTA V (2015) | 153.5 | 124.7 | ||||
| Dota 2 Reborn (2015) | 252 | 204 | 201 | 180.9 | ||
| Final Fantasy XV Benchmark (2018) | 232 | 189.3 | 140.6 | 102.3 | ||
| X-Plane 11.11 (2018) | 161.3 | 146.8 | 116.3 | |||
| Strange Brigade (2018) | 649 | 369 | 300 | 259 | 168.9 | |
| Baldur's Gate 3 (2023) | 179.1 | 144 | 126.1 | 121.9 | 88.6 | |
| Cyberpunk 2077 (2023) | 169.7 | 138.3 | 118.6 | 106.4 | 80.1 | 67.8 |
| F1 24 (2024) | 333 | 312 | 247 | 85.3 | 81.8 | 52.7 |
| Assassin's Creed Shadows (2025) | 80 | 76 | 64 | 43 | 34 | |
| F1 25 (2025) | 274 | 242 | 198.4 | 31.2 | 33.4 | 14.1 |
Emissions & energy
Noise emissions
We are a bit disappointed by the cooling system, since the fans almost always produce an audible noise (~30 dB(A)) even when idling and under light load. While it is possible to counteract this somewhat with the quiet mode, the G18 isn't truly silent in everyday use. Even under load (gaming/stress testing), the noise level is too high given the relatively low power limits (for an 18-inch screen). In performance mode, it's just under 50 dB(A), which will almost have you reaching for headphones. The recently tested XMG Focus 17 with the RTX 5070 Ti, for example, achieves the same gaming performance at 46 dB(A). In turbo mode, we measured a very loud 57.4 dB(A) on the G18. No other electronic noises were emitted from the review device.
Noise level
| Idle |
| 24.6 / 30 / 30 dB(A) |
| Load |
| 34.4 / 49.7 dB(A) |
 | ||
30 dB silent 40 dB(A) audible 50 dB(A) loud |
||
min: | ||
| Asus ROG Strix G18 2025 G814 GeForce RTX 5070 Laptop, R9 9955HX, Micron 2500 1TB MTFDKBA1T0QGN | Razer Blade 18 RTX 4070 GeForce RTX 4070 Laptop GPU, i9-13950HX, SSSTC CA6-8D1024 | MSI Crosshair A17 HX D8WGKG GeForce RTX 5070 Laptop, R9 8940HX, Samsung PM9C1 MZVL81T0HELB-00BTW | Schenker XMG Focus 17 M25 GeForce RTX 5070 Ti Laptop, i9-13900HX, Kingston Fury Renegade SFYRS500G | MSI Katana 17 HX B14WGK GeForce RTX 5070 Laptop, i7-14650HX, Micron 2500 1TB MTFDKBA1T0QGN | MSI Vector A18 HX A9W GeForce RTX 5070 Ti Laptop, R9 9955HX | |
|---|---|---|---|---|---|---|
| Noise | 4% | -22% | -7% | -18% | -6% | |
| off / environment * (dB) | 24.6 | 23.5 4% | 24 2% | 24.8 -1% | 25 -2% | 22.5 9% |
| Idle Minimum * (dB) | 24.6 | 23.8 3% | 25 -2% | 24.8 -1% | 31 -26% | 26 -6% |
| Idle Average * (dB) | 30 | 23.8 21% | 30 -0% | 24.8 17% | 32 -7% | 26 13% |
| Idle Maximum * (dB) | 30 | 26.8 11% | 47 -57% | 27.7 8% | 34 -13% | 32 -7% |
| Load Average * (dB) | 34.4 | 37.3 -8% | 57 -66% | 51 -48% | 50 -45% | 44.4 -29% |
| Cyberpunk 2077 ultra * (dB) | 49.7 | 57 -15% | 56.2 -13% | 58 -17% | 49.8 -0% | |
| Load Maximum * (dB) | 49.7 | 53.5 -8% | 58 -17% | 56.2 -13% | 59 -19% | 61.6 -24% |
| Witcher 3 ultra * (dB) | 48 |
* ... smaller is better
Temperature
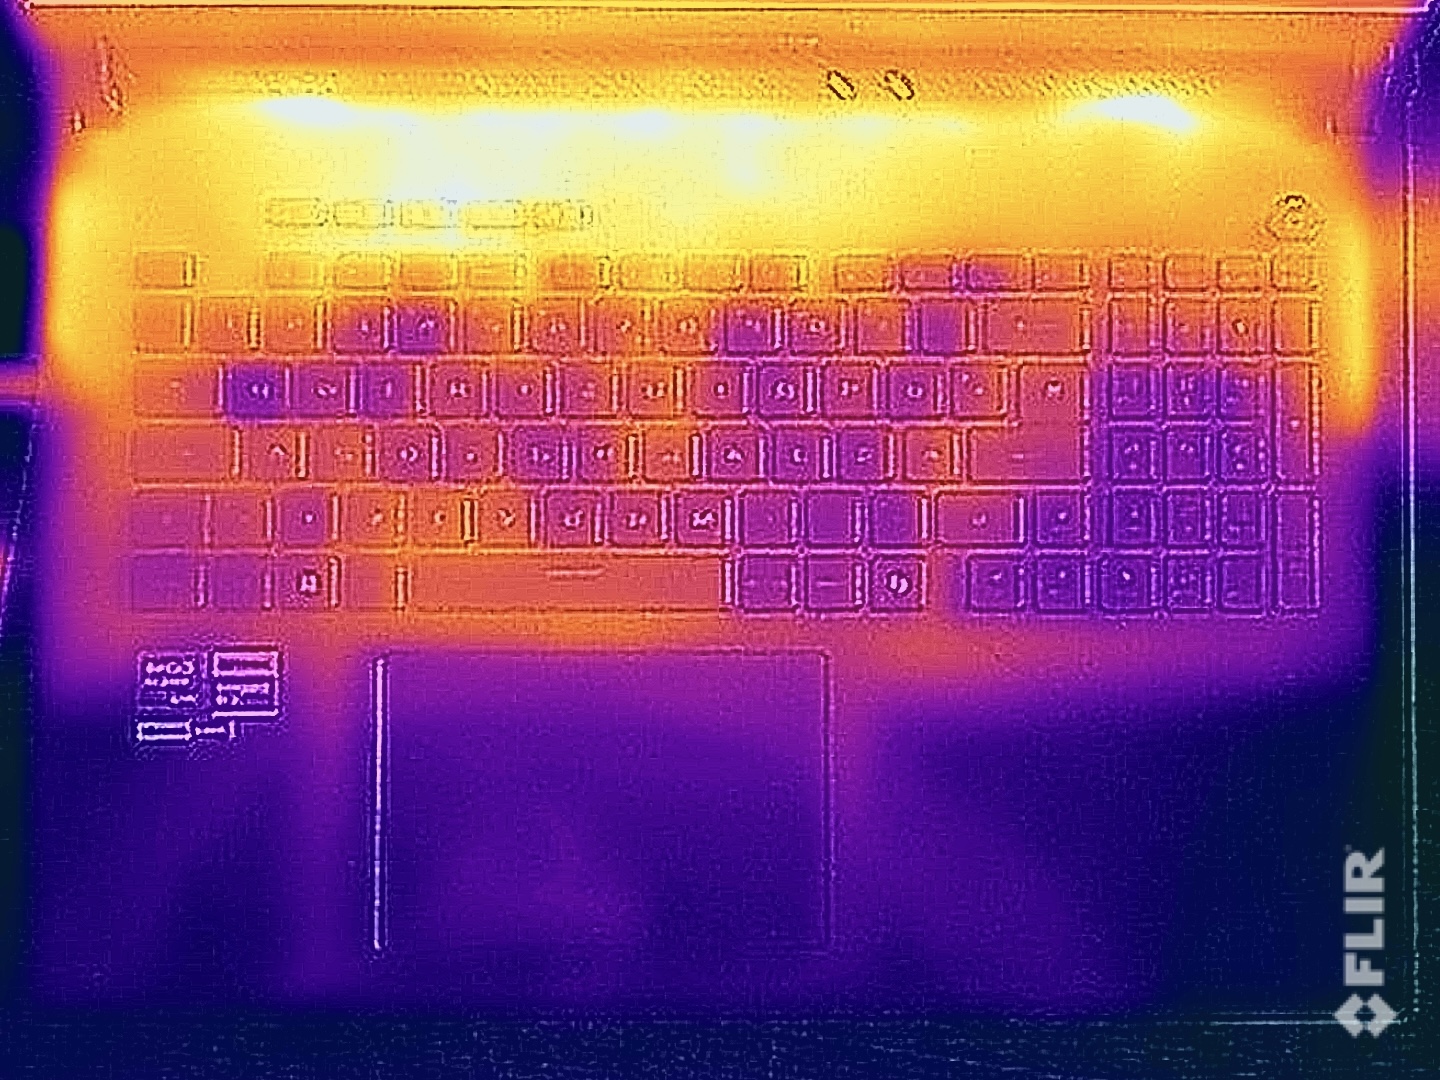
One benefit of the high fan speed is the low surface temperatures. We even measured a maximum of 43°C in the stress test, so there are no limitations here. In the stress test, the CPU/GPU settled at 45 watts (65°C) and 100 watts (72°C), respectively.
(±) The maximum temperature on the upper side is 42.8 °C / 109 F, compared to the average of 40.4 °C / 105 F, ranging from 21.2 to 68.8 °C for the class Gaming.
(±) The bottom heats up to a maximum of 43.1 °C / 110 F, compared to the average of 43.2 °C / 110 F
(+) In idle usage, the average temperature for the upper side is 25.4 °C / 78 F, compared to the device average of 33.9 °C / 93 F.
(±) 3: The average temperature for the upper side is 32.3 °C / 90 F, compared to the average of 33.9 °C / 93 F for the class Gaming.
(+) The palmrests and touchpad are cooler than skin temperature with a maximum of 26.8 °C / 80.2 F and are therefore cool to the touch.
(±) The average temperature of the palmrest area of similar devices was 28.8 °C / 83.8 F (+2 °C / 3.6 F).

| Asus ROG Strix G18 2025 G814 AMD Ryzen 9 9955HX, NVIDIA GeForce RTX 5070 Laptop | Razer Blade 18 RTX 4070 Intel Core i9-13950HX, NVIDIA GeForce RTX 4070 Laptop GPU | MSI Crosshair A17 HX D8WGKG AMD Ryzen 9 8940HX, NVIDIA GeForce RTX 5070 Laptop | Schenker XMG Focus 17 M25 Intel Core i9-13900HX, NVIDIA GeForce RTX 5070 Ti Laptop | MSI Katana 17 HX B14WGK Intel Core i7-14650HX, NVIDIA GeForce RTX 5070 Laptop | MSI Vector A18 HX A9W AMD Ryzen 9 9955HX, NVIDIA GeForce RTX 5070 Ti Laptop | |
|---|---|---|---|---|---|---|
| Heat | -5% | -29% | -6% | -24% | -10% | |
| Maximum Upper Side * (°C) | 42.8 | 39.2 8% | 51 -19% | 41.2 4% | 52 -21% | 46.6 -9% |
| Maximum Bottom * (°C) | 43.1 | 35.6 17% | 49 -14% | 48.8 -13% | 56 -30% | 45.6 -6% |
| Idle Upper Side * (°C) | 26.8 | 31.8 -19% | 40 -49% | 27.6 -3% | 33 -23% | 31.2 -16% |
| Idle Bottom * (°C) | 26.6 | 33.2 -25% | 36 -35% | 30.1 -13% | 32 -20% | 28.6 -8% |
* ... smaller is better
Speakers
The stereo speakers do a good job, but the loud fans are annoying, especially when gaming.
Asus ROG Strix G18 2025 G814 audio analysis
(+) | speakers can play relatively loud (83.3 dB)
Bass 100 - 315 Hz
(±) | reduced bass - on average 11% lower than median
(±) | linearity of bass is average (8.4% delta to prev. frequency)
Mids 400 - 2000 Hz
(+) | balanced mids - only 4.4% away from median
(+) | mids are linear (3.1% delta to prev. frequency)
Highs 2 - 16 kHz
(+) | balanced highs - only 2.7% away from median
(+) | highs are linear (4.8% delta to prev. frequency)
Overall 100 - 16.000 Hz
(+) | overall sound is linear (12.1% difference to median)
Compared to same class
» 12% of all tested devices in this class were better, 4% similar, 84% worse
» The best had a delta of 6%, average was 18%, worst was 132%
Compared to all devices tested
» 9% of all tested devices were better, 2% similar, 88% worse
» The best had a delta of 4%, average was 24%, worst was 134%
Razer Blade 18 RTX 4070 audio analysis
(+) | speakers can play relatively loud (85.7 dB)
Bass 100 - 315 Hz
(±) | reduced bass - on average 7.5% lower than median
(±) | linearity of bass is average (9.2% delta to prev. frequency)
Mids 400 - 2000 Hz
(+) | balanced mids - only 3.5% away from median
(+) | mids are linear (4.1% delta to prev. frequency)
Highs 2 - 16 kHz
(+) | balanced highs - only 4.8% away from median
(+) | highs are linear (3.8% delta to prev. frequency)
Overall 100 - 16.000 Hz
(+) | overall sound is linear (9.2% difference to median)
Compared to same class
» 3% of all tested devices in this class were better, 1% similar, 95% worse
» The best had a delta of 6%, average was 18%, worst was 132%
Compared to all devices tested
» 3% of all tested devices were better, 1% similar, 96% worse
» The best had a delta of 4%, average was 24%, worst was 134%
MSI Crosshair A17 HX D8WGKG audio analysis
(±) | speaker loudness is average but good (81 dB)
Bass 100 - 315 Hz
(-) | nearly no bass - on average 18% lower than median
(±) | linearity of bass is average (12.4% delta to prev. frequency)
Mids 400 - 2000 Hz
(±) | higher mids - on average 6.6% higher than median
(±) | linearity of mids is average (7% delta to prev. frequency)
Highs 2 - 16 kHz
(+) | balanced highs - only 3% away from median
(+) | highs are linear (5.1% delta to prev. frequency)
Overall 100 - 16.000 Hz
(±) | linearity of overall sound is average (17.8% difference to median)
Compared to same class
» 53% of all tested devices in this class were better, 10% similar, 37% worse
» The best had a delta of 6%, average was 18%, worst was 132%
Compared to all devices tested
» 36% of all tested devices were better, 8% similar, 56% worse
» The best had a delta of 4%, average was 24%, worst was 134%
Schenker XMG Focus 17 M25 audio analysis
(±) | speaker loudness is average but good (78.5 dB)
Bass 100 - 315 Hz
(-) | nearly no bass - on average 21.9% lower than median
(±) | linearity of bass is average (13.4% delta to prev. frequency)
Mids 400 - 2000 Hz
(+) | balanced mids - only 2.8% away from median
(±) | linearity of mids is average (7.3% delta to prev. frequency)
Highs 2 - 16 kHz
(+) | balanced highs - only 3.9% away from median
(+) | highs are linear (5.8% delta to prev. frequency)
Overall 100 - 16.000 Hz
(±) | linearity of overall sound is average (18.8% difference to median)
Compared to same class
» 62% of all tested devices in this class were better, 8% similar, 30% worse
» The best had a delta of 6%, average was 18%, worst was 132%
Compared to all devices tested
» 43% of all tested devices were better, 8% similar, 49% worse
» The best had a delta of 4%, average was 24%, worst was 134%
MSI Katana 17 HX B14WGK audio analysis
(+) | speakers can play relatively loud (84 dB)
Bass 100 - 315 Hz
(-) | nearly no bass - on average 19% lower than median
(±) | linearity of bass is average (10.6% delta to prev. frequency)
Mids 400 - 2000 Hz
(±) | higher mids - on average 8.7% higher than median
(±) | linearity of mids is average (7.5% delta to prev. frequency)
Highs 2 - 16 kHz
(+) | balanced highs - only 4.6% away from median
(±) | linearity of highs is average (9.7% delta to prev. frequency)
Overall 100 - 16.000 Hz
(±) | linearity of overall sound is average (20.6% difference to median)
Compared to same class
» 74% of all tested devices in this class were better, 5% similar, 21% worse
» The best had a delta of 6%, average was 18%, worst was 132%
Compared to all devices tested
» 55% of all tested devices were better, 8% similar, 37% worse
» The best had a delta of 4%, average was 24%, worst was 134%
MSI Vector A18 HX A9W audio analysis
(+) | speakers can play relatively loud (86.2 dB)
Bass 100 - 315 Hz
(-) | nearly no bass - on average 16% lower than median
(±) | linearity of bass is average (10.9% delta to prev. frequency)
Mids 400 - 2000 Hz
(±) | higher mids - on average 5.7% higher than median
(±) | linearity of mids is average (7.2% delta to prev. frequency)
Highs 2 - 16 kHz
(+) | balanced highs - only 3.3% away from median
(+) | highs are linear (6.8% delta to prev. frequency)
Overall 100 - 16.000 Hz
(+) | overall sound is linear (13.5% difference to median)
Compared to same class
» 19% of all tested devices in this class were better, 7% similar, 73% worse
» The best had a delta of 6%, average was 18%, worst was 132%
Compared to all devices tested
» 14% of all tested devices were better, 4% similar, 82% worse
» The best had a delta of 4%, average was 24%, worst was 134%
Power consumption
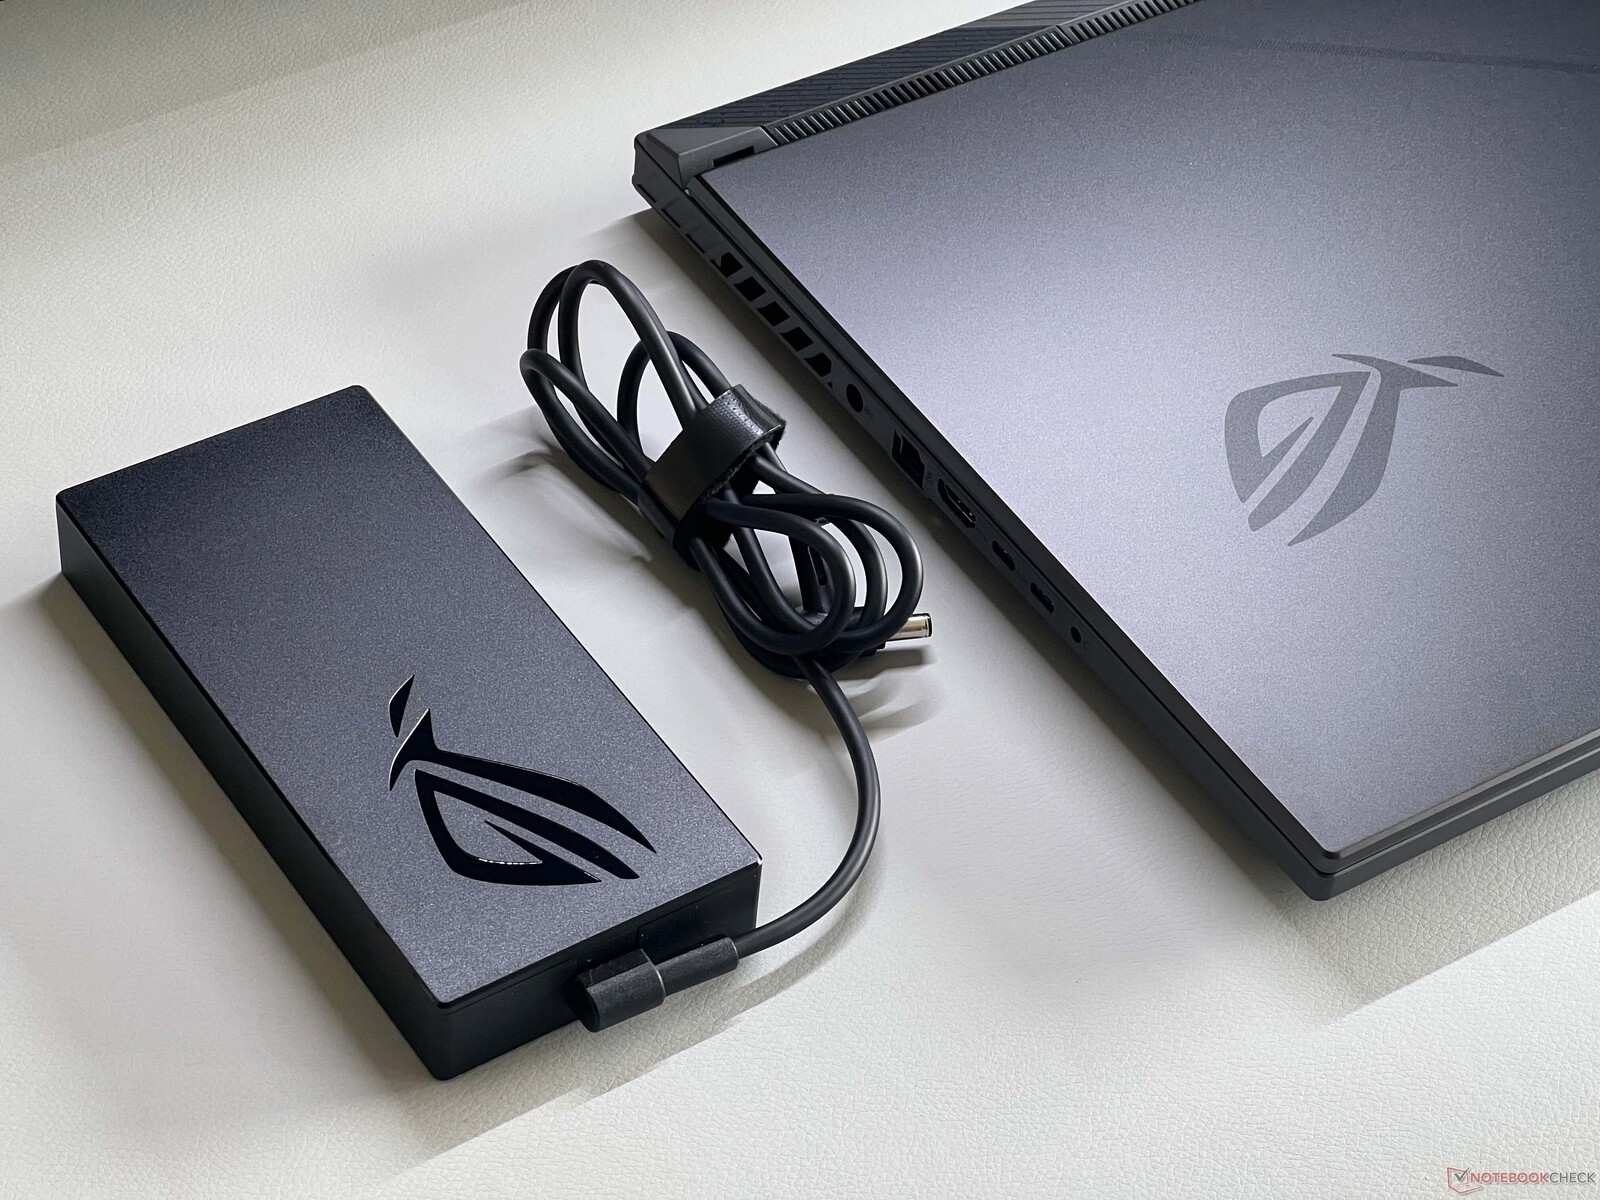
There are no surprises when it comes to the power consumption. We measured a maximum of 21 watts while idle, and briefly up to 249 watts during the stress test, which then quickly settled to around 193 watts. The included 280-watt power supply is therefore perfectly adequate.
| Off / Standby | |
| Idle | |
| Load |
|
Key:
min: | |
| Asus ROG Strix G18 2025 G814 GeForce RTX 5070 Laptop, R9 9955HX, Micron 2500 1TB MTFDKBA1T0QGN | Razer Blade 18 RTX 4070 GeForce RTX 4070 Laptop GPU, i9-13950HX, SSSTC CA6-8D1024 | MSI Crosshair A17 HX D8WGKG GeForce RTX 5070 Laptop, R9 8940HX, Samsung PM9C1 MZVL81T0HELB-00BTW | Schenker XMG Focus 17 M25 GeForce RTX 5070 Ti Laptop, i9-13900HX, Kingston Fury Renegade SFYRS500G | MSI Katana 17 HX B14WGK GeForce RTX 5070 Laptop, i7-14650HX, Micron 2500 1TB MTFDKBA1T0QGN | MSI Vector A18 HX A9W GeForce RTX 5070 Ti Laptop, R9 9955HX | |
|---|---|---|---|---|---|---|
| Power Consumption | -59% | -54% | -5% | 6% | -71% | |
| Idle Minimum * (Watt) | 13.1 | 24.5 -87% | 32 -144% | 12 8% | 9.7 26% | 20.8 -59% |
| Idle Average * (Watt) | 20.6 | 34.1 -66% | 36 -75% | 17.5 15% | 15 27% | 52.8 -156% |
| Idle Maximum * (Watt) | 21.1 | 47.7 -126% | 47 -123% | 18.1 14% | 23.7 -12% | 54.5 -158% |
| Load Average * (Watt) | 123.4 | 140 -13% | 132 -7% | 121.1 2% | 126 -2% | 146.6 -19% |
| Cyberpunk 2077 ultra * (Watt) | 215 | 222 -3% | 255 -19% | 205 5% | 285 -33% | |
| Cyberpunk 2077 ultra external monitor * (Watt) | 179.2 | 216 -21% | 244 -36% | 202 -13% | 278 -55% | |
| Load Maximum * (Watt) | 249.7 | 261 -5% | 261 -5% | 292.1 -17% | 227 9% | 297.3 -19% |
| Witcher 3 ultra * (Watt) | 202 |
* ... smaller is better
Power consumption Cyberpunk / stress test
Power consumption with an external monitor
Battery life
The 90 Wh battery provides reasonable runtimes. In the Wi-Fi test at 150 cd/m² (39% of maximum brightness) and 60 Hz, it kept going for 7 hours, and at full brightness, approximately 4.5 hours.

Notebookcheck overall rating
Asus ROG Strix G18 2025 G814
- 08/07/2025 v8
Andreas Osthoff
 Total Sustainability Score:
 Possible alternatives compared
Image | Model / Review | Price | Weight | Height | Display |
|---|---|---|---|---|---|
1. 86.4%  | Asus ROG Strix G18 2025 G814 AMD Ryzen 9 9955HX ⎘ NVIDIA GeForce RTX 5070 Laptop ⎘ 32 GB Memory, 1024 GB SSD | Amazon: List Price: 2299€ | 2.9 kg | 30.8 mm | 18.00" 2560x1600 168 PPI IPS |
2. 91.4% v7 (old)  | Razer Blade 18 RTX 4070 Intel Core i9-13950HX ⎘ NVIDIA GeForce RTX 4070 Laptop GPU ⎘ 32 GB Memory, 1024 GB SSD | Amazon: 1. $227.77 18" 240Hz Screen Replacement... 2. $179.99 PEHDPVS Replacement for Raze... 3. $4,299.00 Razer Blade 18 Gaming Laptop... List Price: 3200 USD | 3 kg | 21.9 mm | 18.00" 2560x1600 168 PPI IPS |
3. 79.6%  | MSI Crosshair A17 HX D8WGKG AMD Ryzen 9 8940HX ⎘ NVIDIA GeForce RTX 5070 Laptop ⎘ 32 GB Memory, 1024 GB SSD | Amazon: List Price: 2000 EUR | 2.9 kg | 29.7 mm | 17.00" 2560x1600 178 PPI IPS |
4. 82.5%  | Schenker XMG Focus 17 M25 Intel Core i9-13900HX ⎘ NVIDIA GeForce RTX 5070 Ti Laptop ⎘ 32 GB Memory, 500 GB NVMe | Amazon: List Price: 1990€ | 2.8 kg | 28.5 mm | 17.30" 2560x1440 170 PPI IPS |
5. 77.3%  | MSI Katana 17 HX B14WGK Intel Core i7-14650HX ⎘ NVIDIA GeForce RTX 5070 Laptop ⎘ 16 GB Memory, 1024 GB SSD | Amazon: List Price: 1800 EUR | 2.7 kg | 28 mm | 17.30" 2560x1440 170 PPI IPS |
6. 84.8%  | MSI Vector A18 HX A9W AMD Ryzen 9 9955HX ⎘ NVIDIA GeForce RTX 5070 Ti Laptop ⎘ 32 GB Memory | Amazon: List Price: 3200 USD | 3.5 kg | 32.05 mm | 18.00" 2560x1600 189 PPI IPS |
Transparency
The selection of devices to be reviewed is made by our editorial team. The test sample was provided to the author as a loan by the manufacturer or retailer for the purpose of this review. The lender had no influence on this review, nor did the manufacturer receive a copy of this review before publication. There was no obligation to publish this review. As an independent media company, Notebookcheck is not subjected to the authority of manufacturers, retailers or publishers.
This is how Notebookcheck is testing
Every year, Notebookcheck independently reviews hundreds of laptops and smartphones using standardized procedures to ensure that all results are comparable. We have continuously developed our test methods for around 20 years and set industry standards in the process. In our test labs, high-quality measuring equipment is utilized by experienced technicians and editors. These tests involve a multi-stage validation process. Our complex rating system is based on hundreds of well-founded measurements and benchmarks, which maintains objectivity. Further information on our test methods can be found here.

