Verdict - The sword could be sharper
The katana 17 HX B14WGK faces challenges not only within the MSI portfolio but also in comparison to its counterparts. Although the case is well-made, it tends to rattle and generally doesn't feel very high-quality. Cost-cutting measures can also be seen in the interfaces. Thunderbolt or modern USB ports (keyword USB 4) are missing, as is a card reader. In addition, there is a very high noise level under load, which practically forces you to use headphones. MSI could also improve the keyboard, which takes some getting used to, the speaker sound, the webcam quality, and the battery life.
There is little to complain about in terms of the display: apart from the poor brightness, the 240 Hz screen achieves good values almost everywhere. The fact that the GeForce RTX 5070 leaves mixed feelings is more a result of Nvidia's product decisions. Furthermore, 8 GB of VRAM is no longer sufficient in 2025, especially for resource-intensive applications like Indiana Jones, although GDDR7 at least mitigates the situation somewhat. Apart from that, the 17-incher is quite unspectacular, i.e. it doesn't stand out from the crowd either positively or negatively, so in the end it's just enough for a "good" rating.
Pros
Cons
Price and availability
In Germany, the MSI Katana 17 HX B14WGK with Core i7-14650HX and GeForce RTX 5070 is listed from around 1,800 euros (approx. US$2,065) at various online stores (i.e. playox.de)
- $57.95240W 12A Adapter for MSI Katana 15 17 HX B13V B13VGK B13VFK B13VEK B12V B12VGK B12VEK B12VFK B14W B14WGK Pulse 15 17 B13V B13VGK Delta 15 A5EFK Chicony A20-240P2A Gaming Laptop Charger 4.5 * 3.0 mm
- $59.99240W 200W AC Charger for MSI Katana 15 17 HX Pulse 15 17 B13V B13VF B13VGK B13VEK B13VGK-484US B13VEK-277US B14W B14WGK B14WFK B12V B12VFK B12VGK B12VEK GF66 GF76 12UE 12UGS 12UG Laptop
- $1,469.00msi Katana 15 HX B14WGK 15.6" 165Hz WQHD (2560x1440) IPS Laptop 2025 New | Intel i7-14650HX 16-Core | NVIDIA GeForce RTX 5070 | Four-Zone RGB Backlit KB | Wi-Fi 6E | 16GB DDR5 1TB SSD | Win11 Home
The Katana 17's competitors include other RTX 5070 (Ti) gaming laptops such as the Gigabyte Aero X16, the Asus ProArt P16, the Schenker XMG Pro 16, or the in-house Vector 16 HX AI.
Specifications
Case
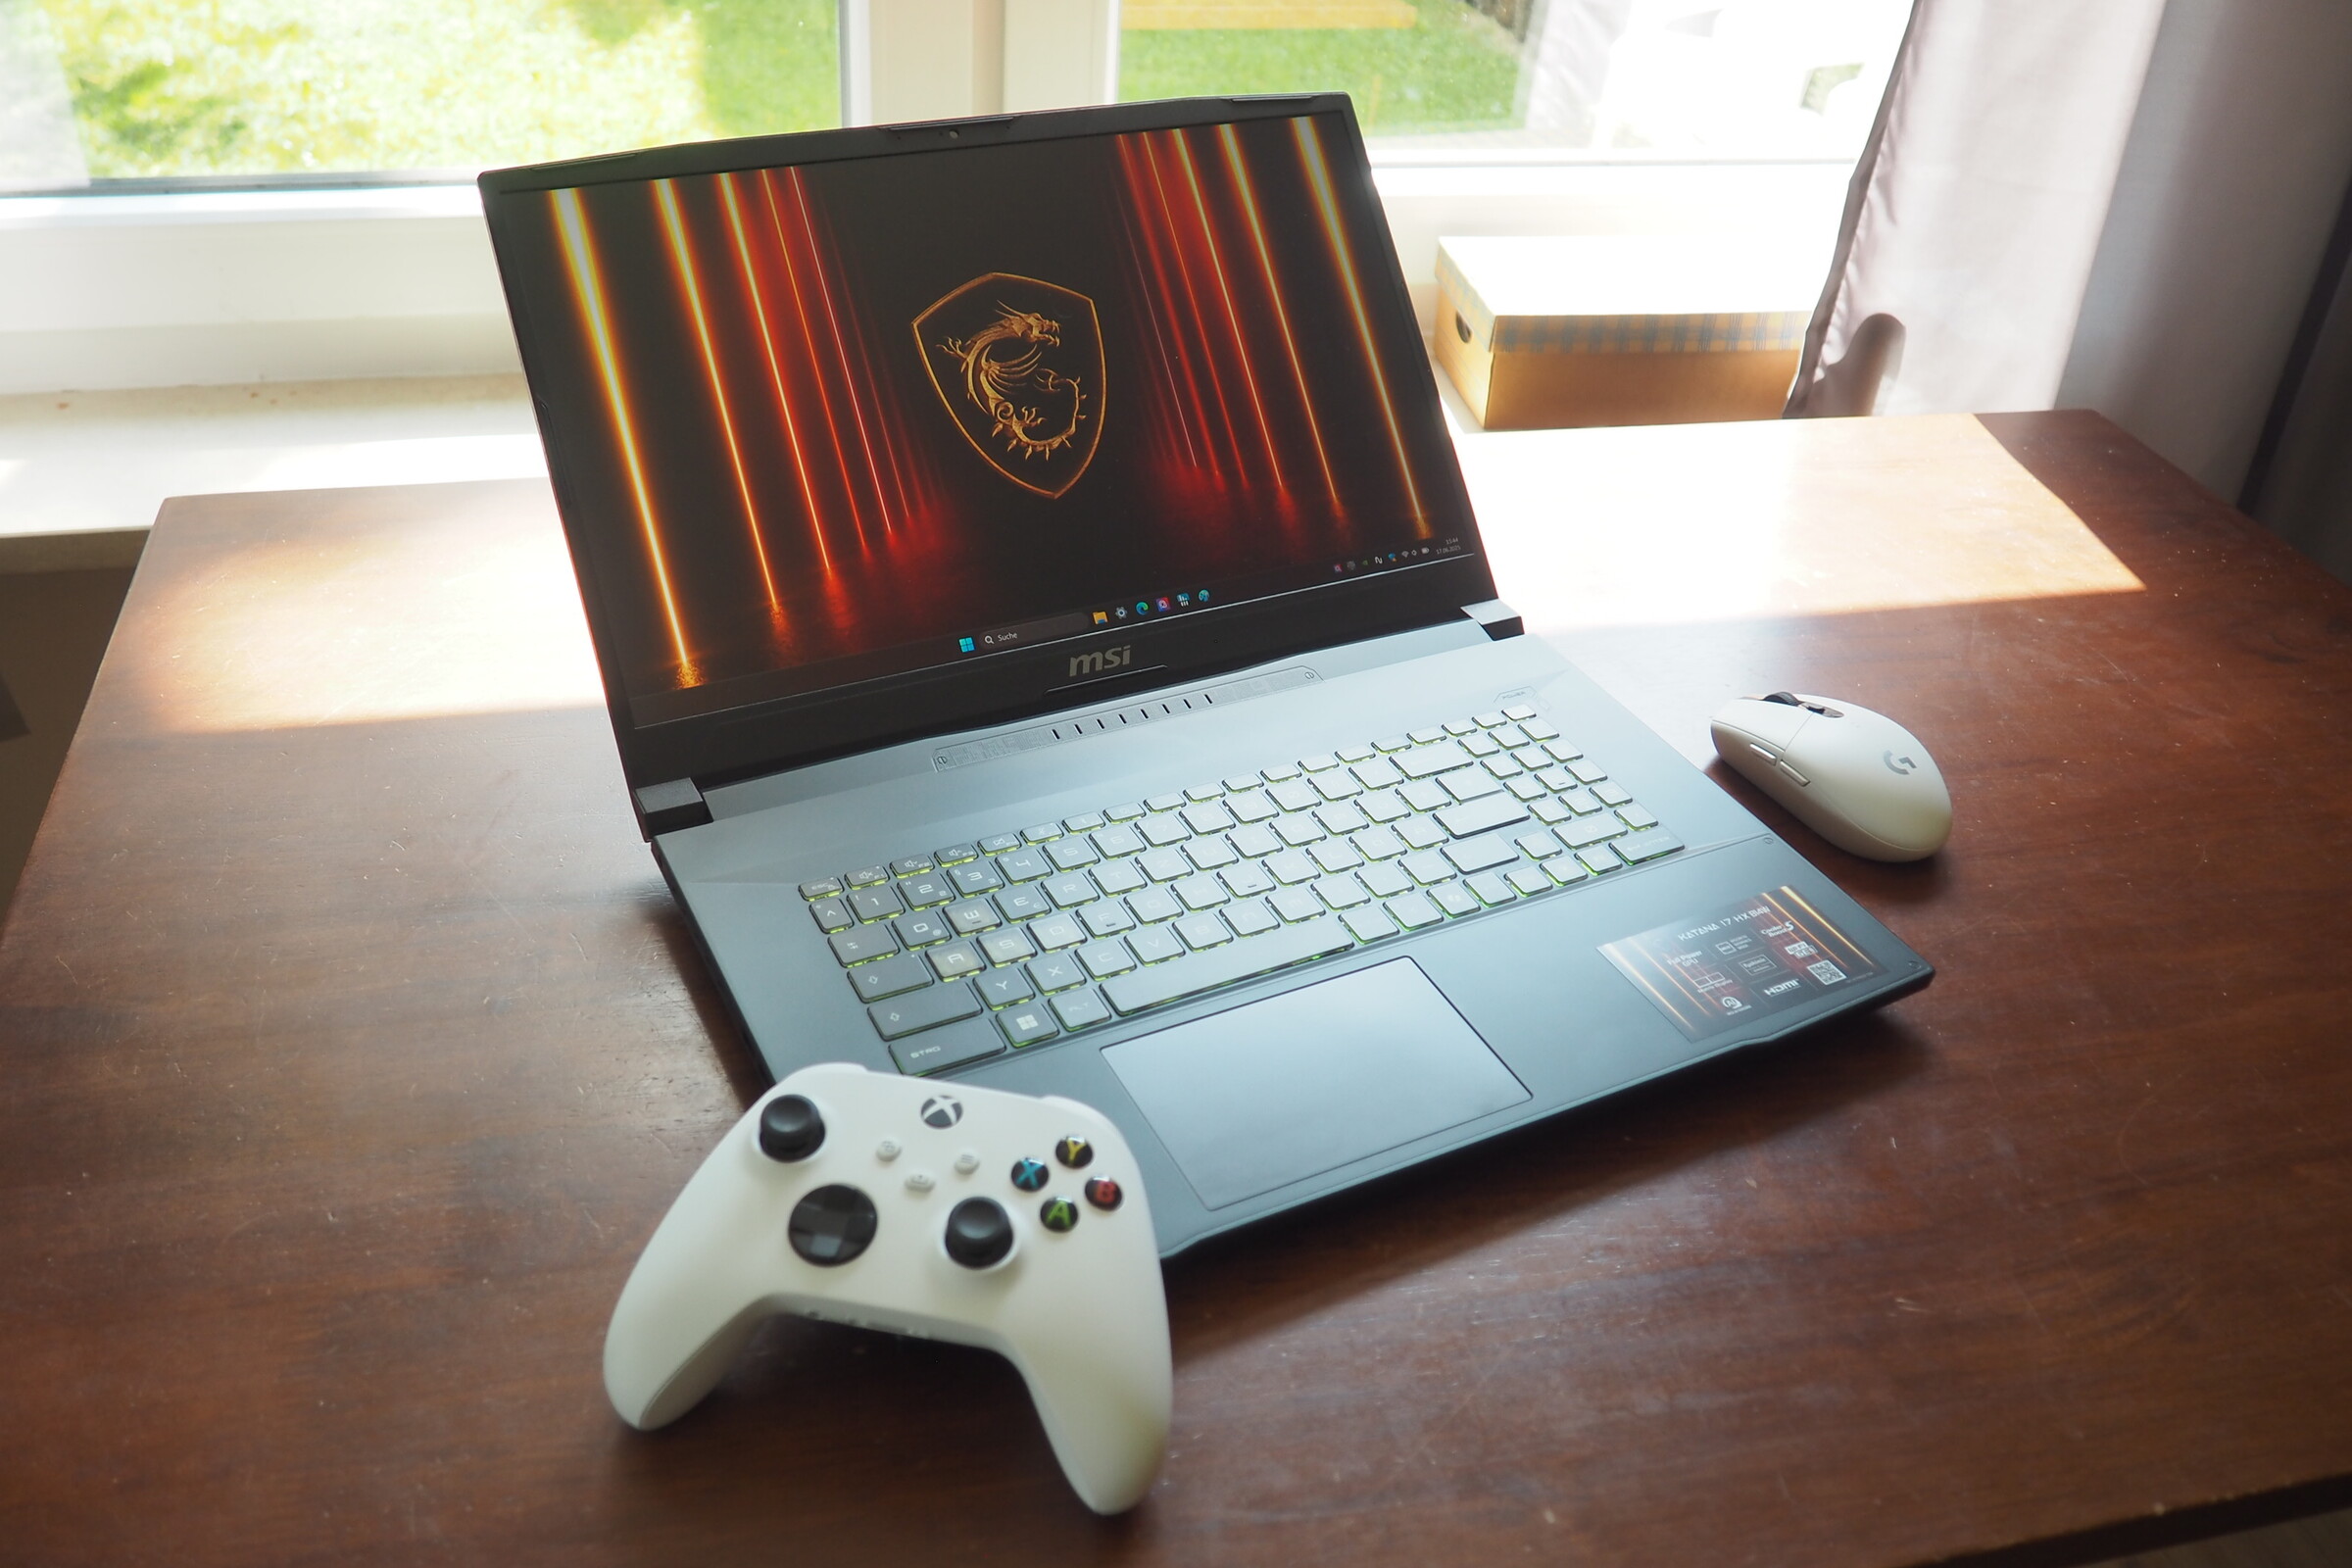
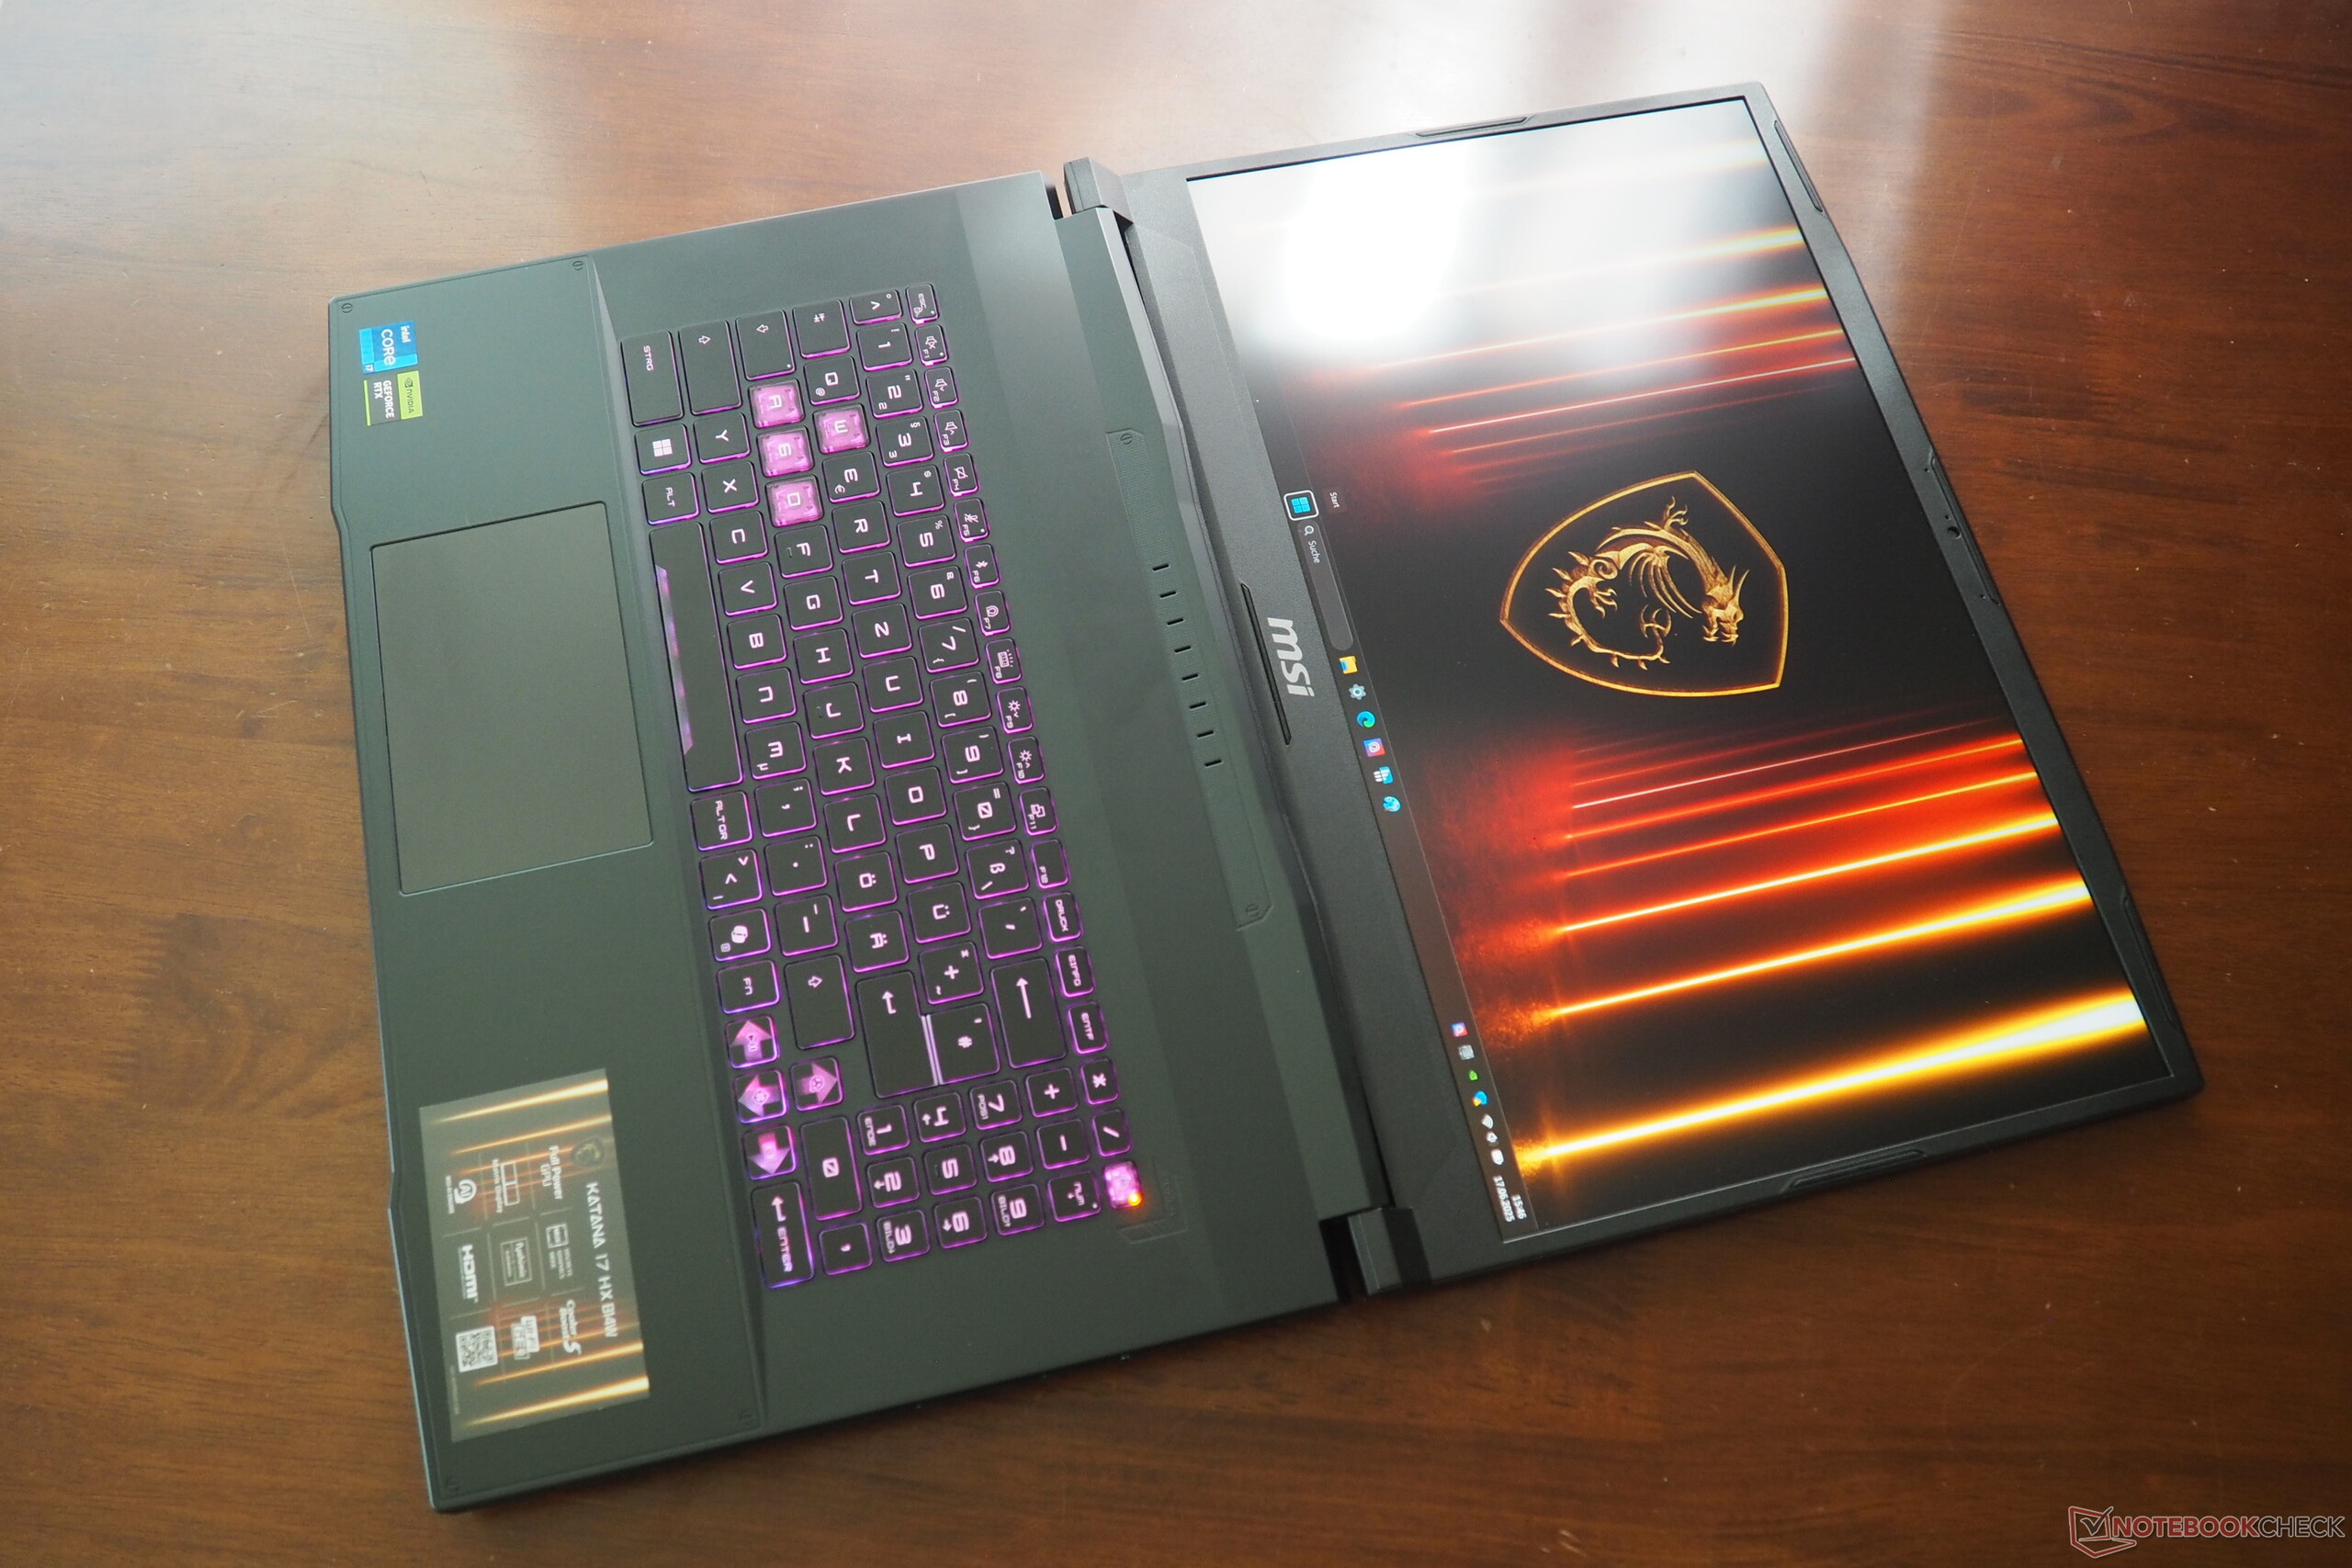
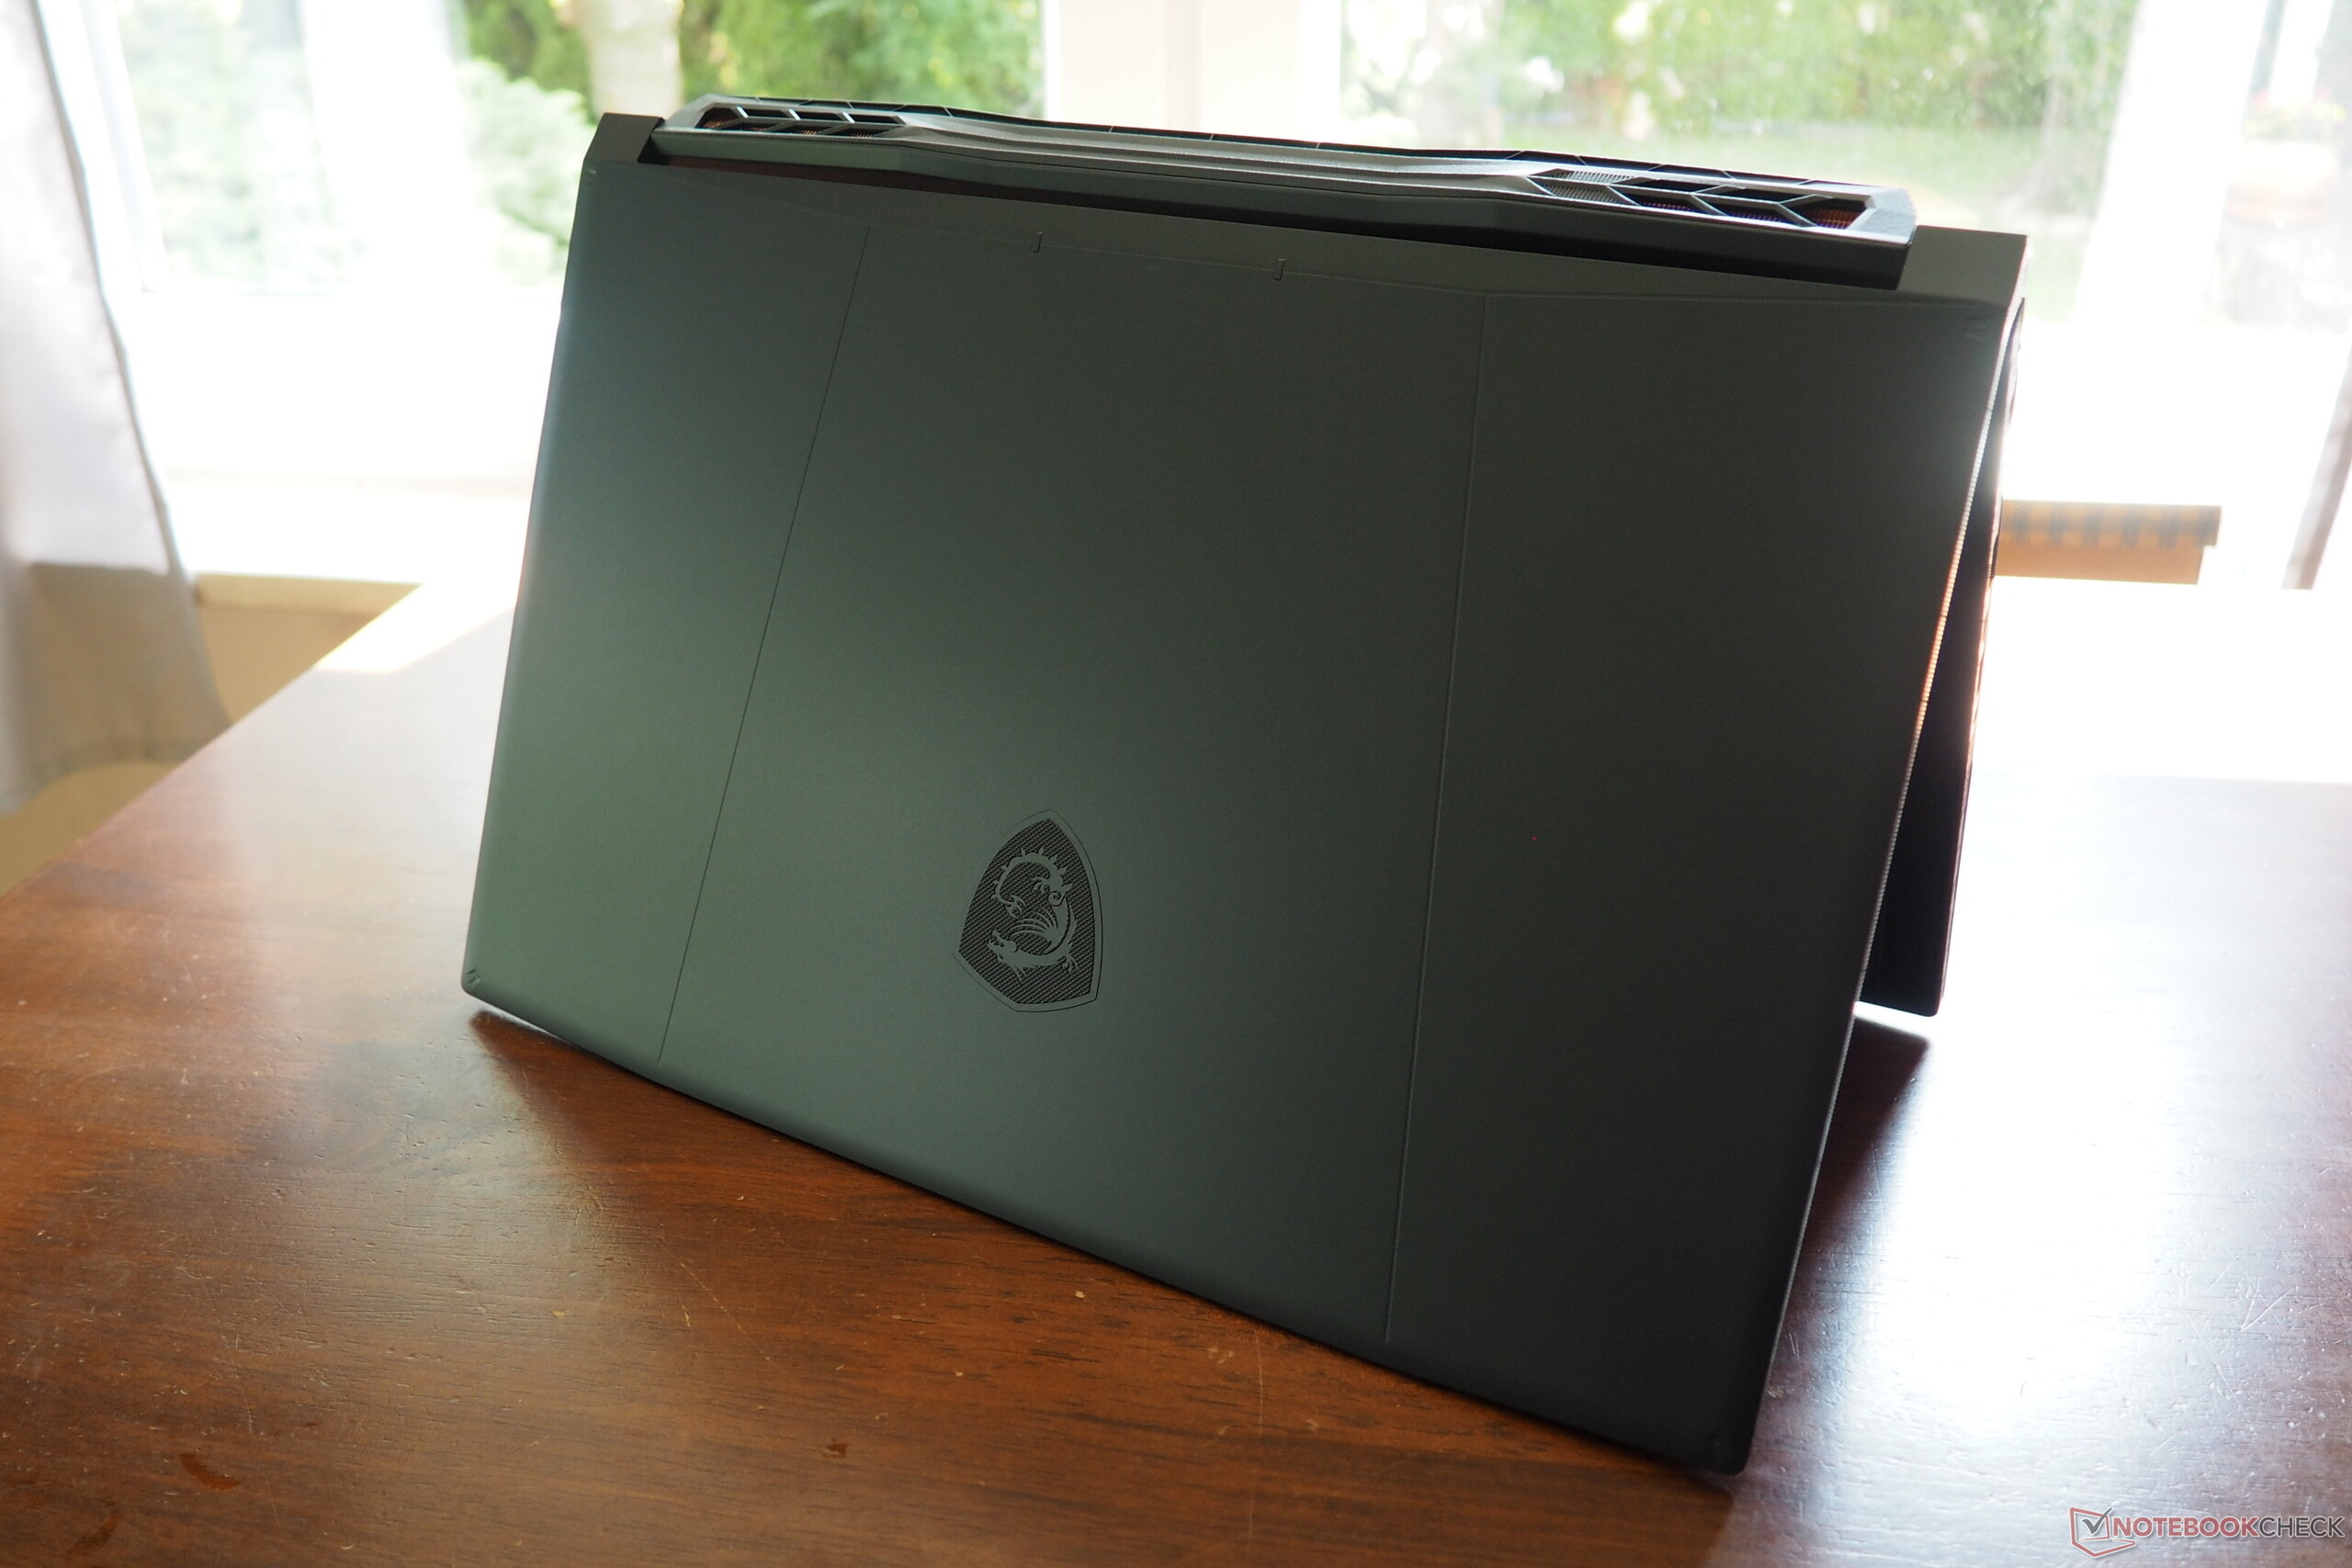
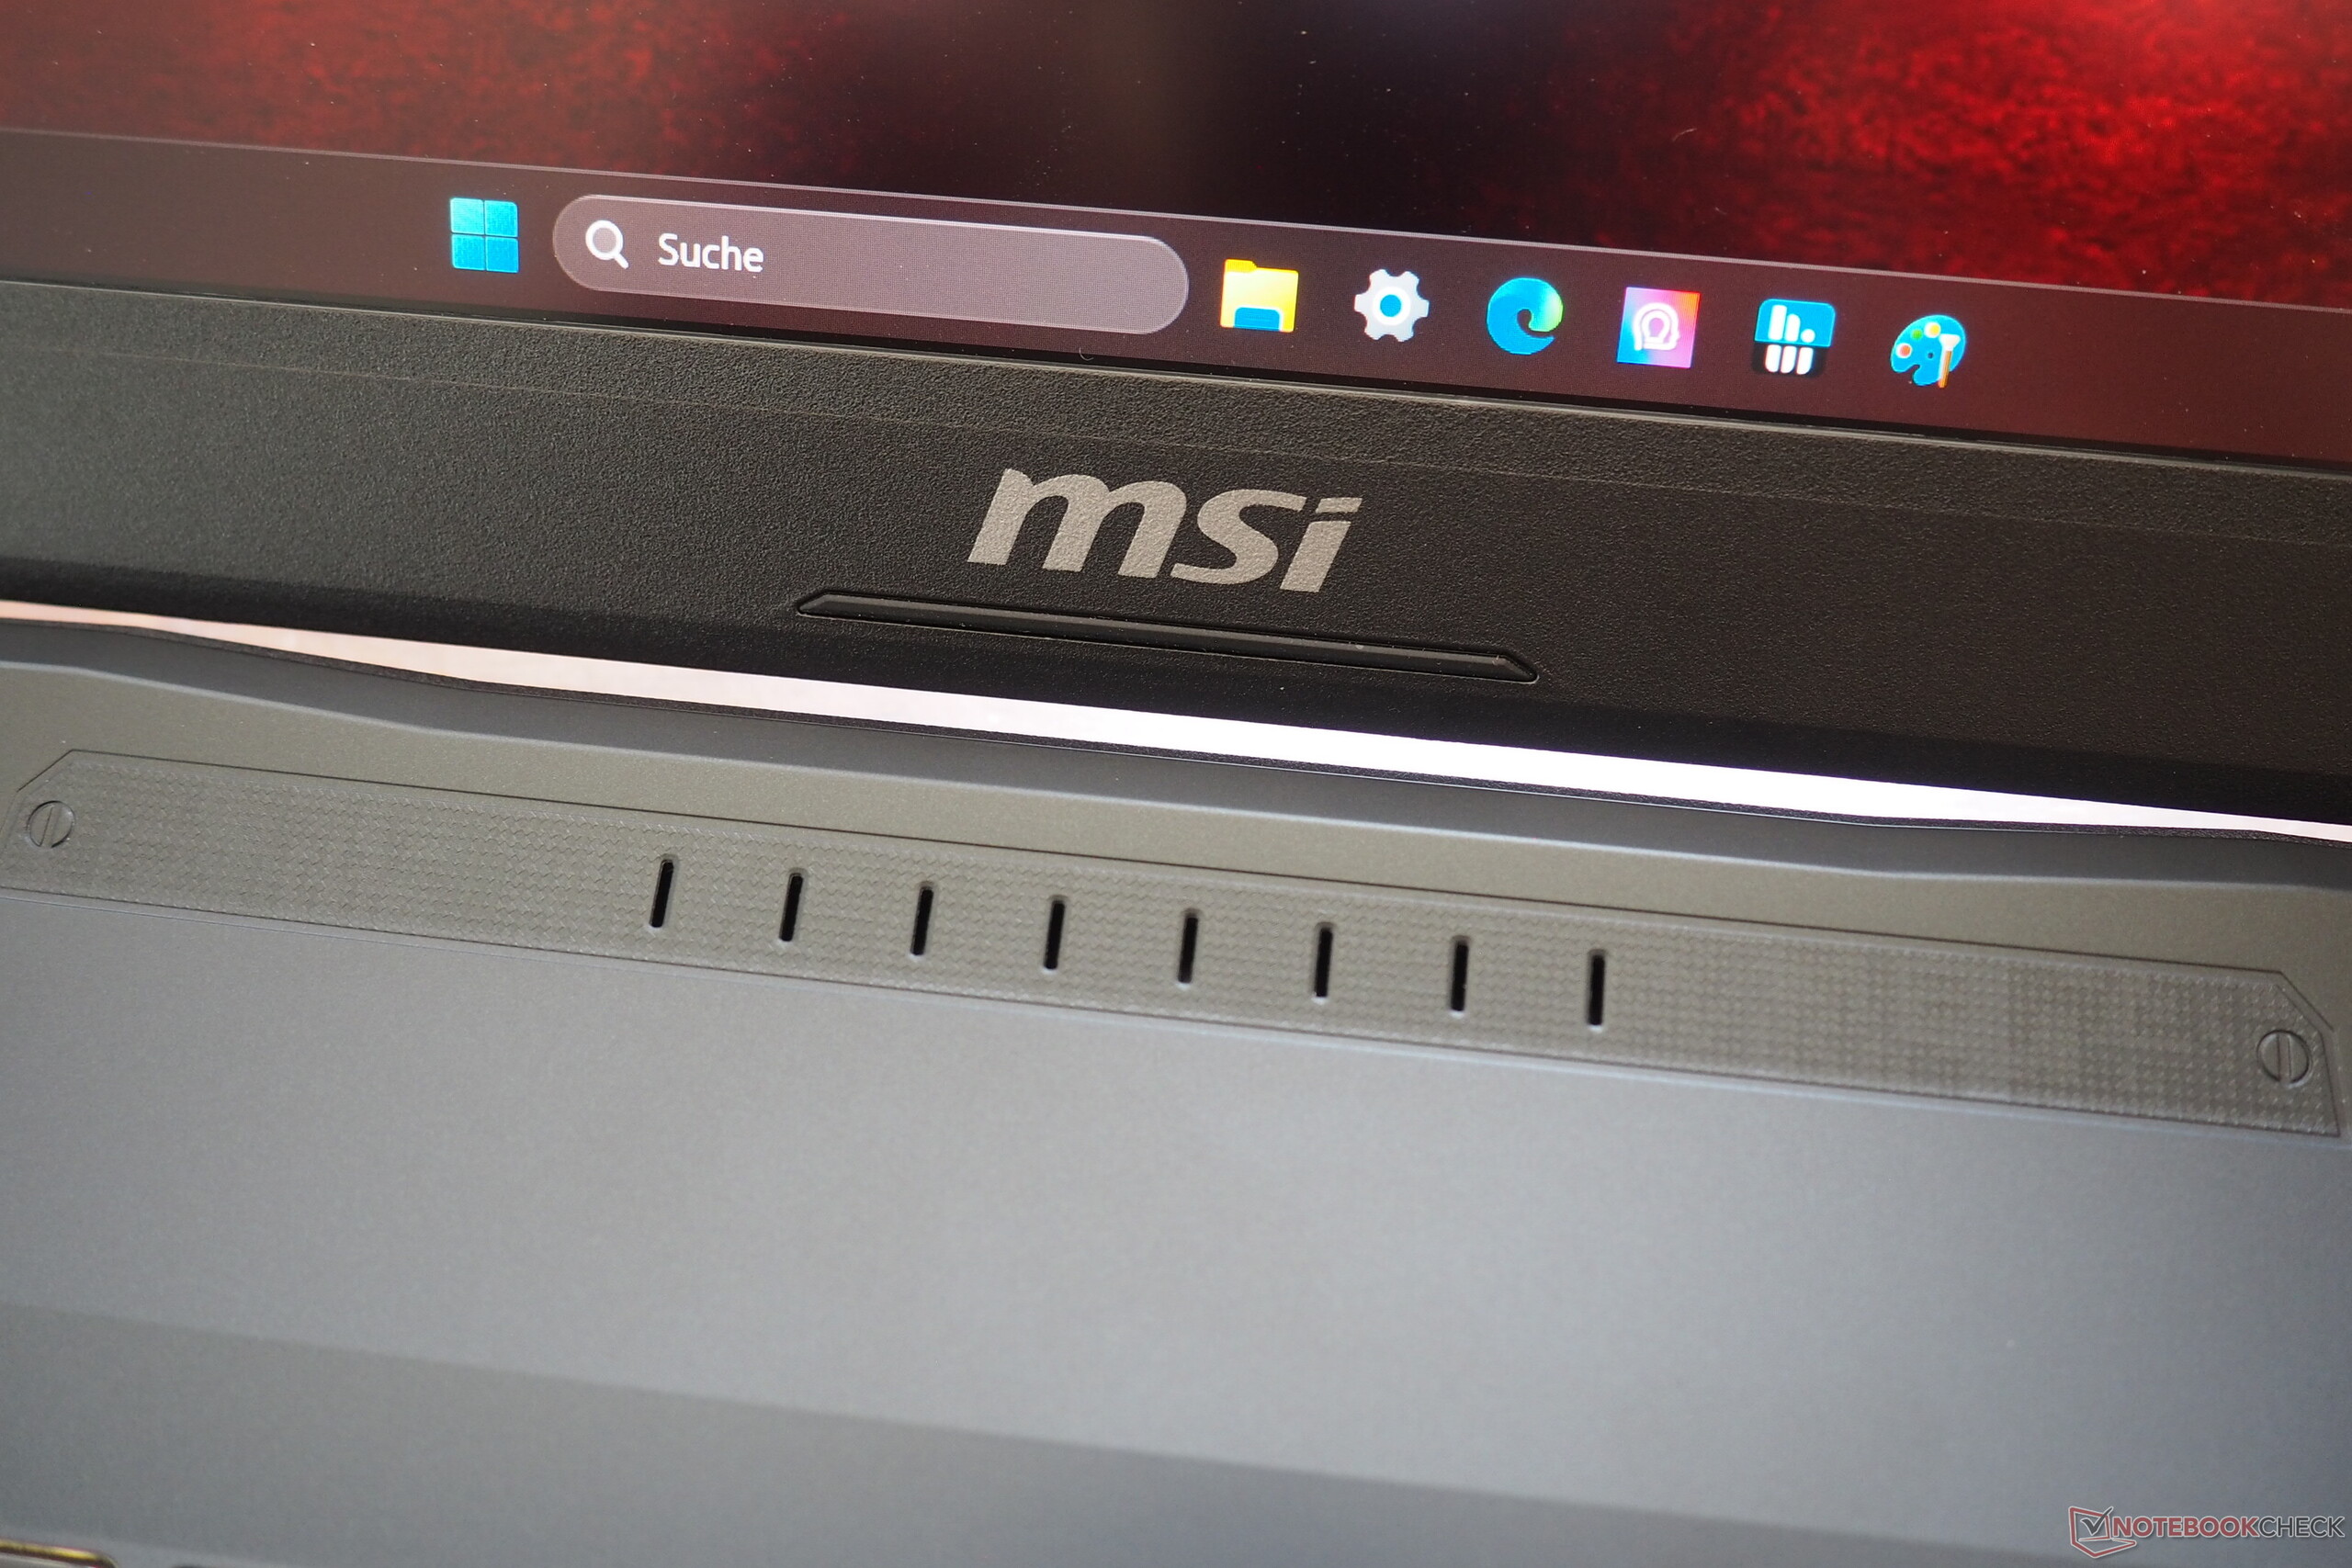
As mentioned at the beginning, the case quality is somewhat disappointing. MSI has dispensed with metal on the outside and opted for plastic over a large area, which tends to give way in some places and looks rather cheap to the touch. Meanwhile, there are several advantages to the generous opening angle. It can be opened up to 180°, which isn't a typical feature. With a weight of 2.7 kg, the 17-inch model is slightly to significantly heavier than its 16-inch competitors (1.8 to 2.6 kg). Basically, the case is very similar to its predecessor (which we tested in the AMD and Intel versions), although there are a few differences in the details.

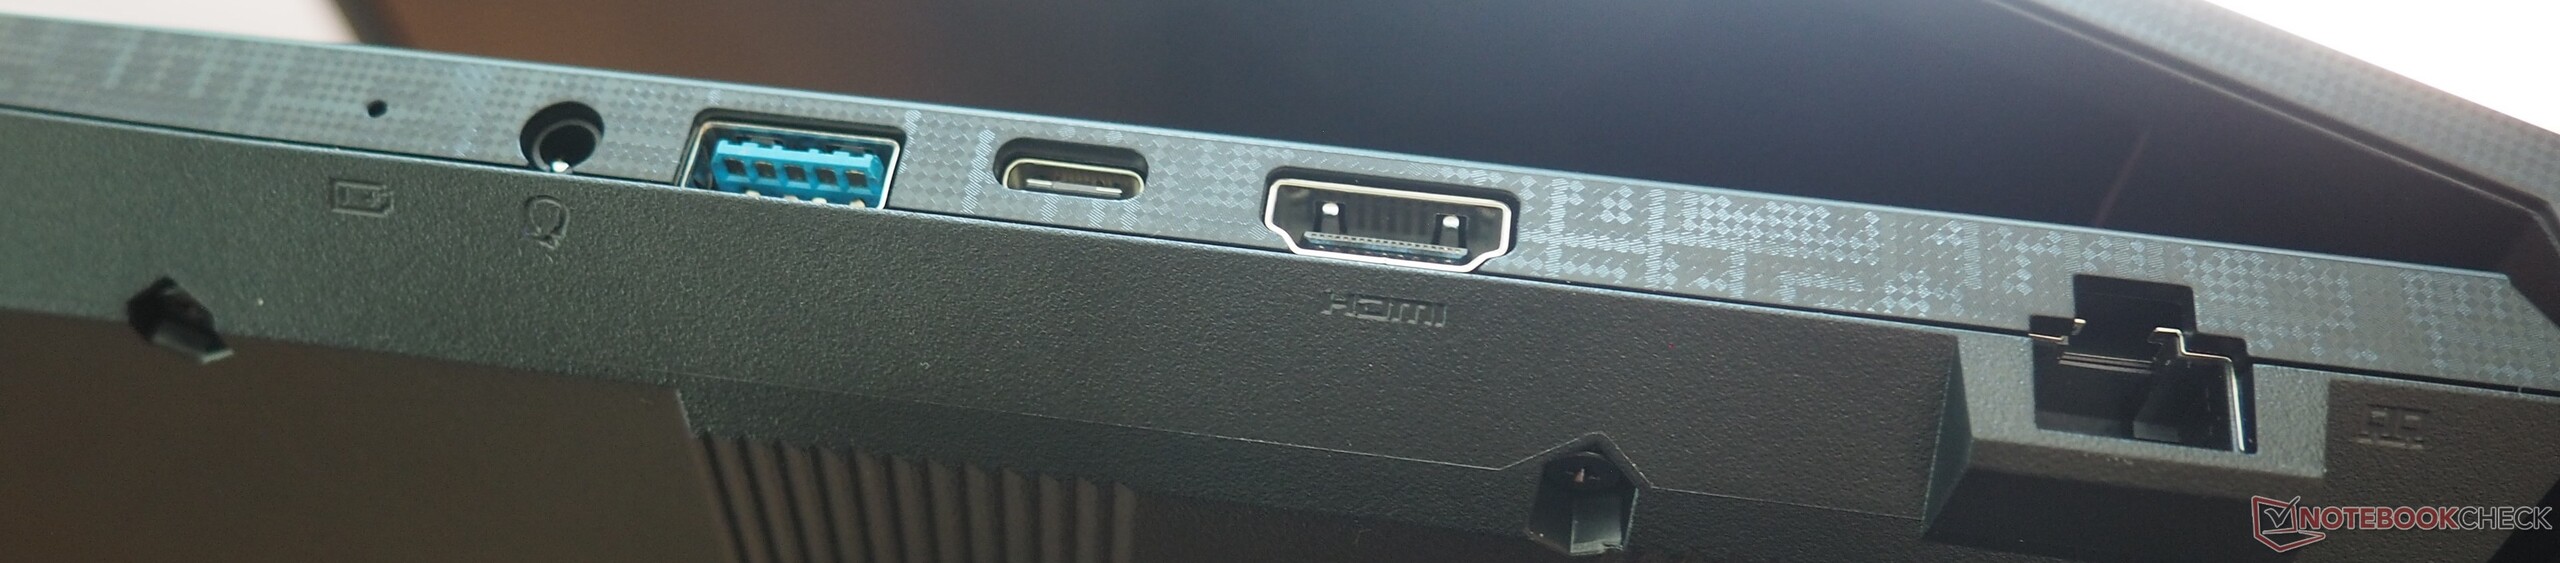
Ports and connectivity
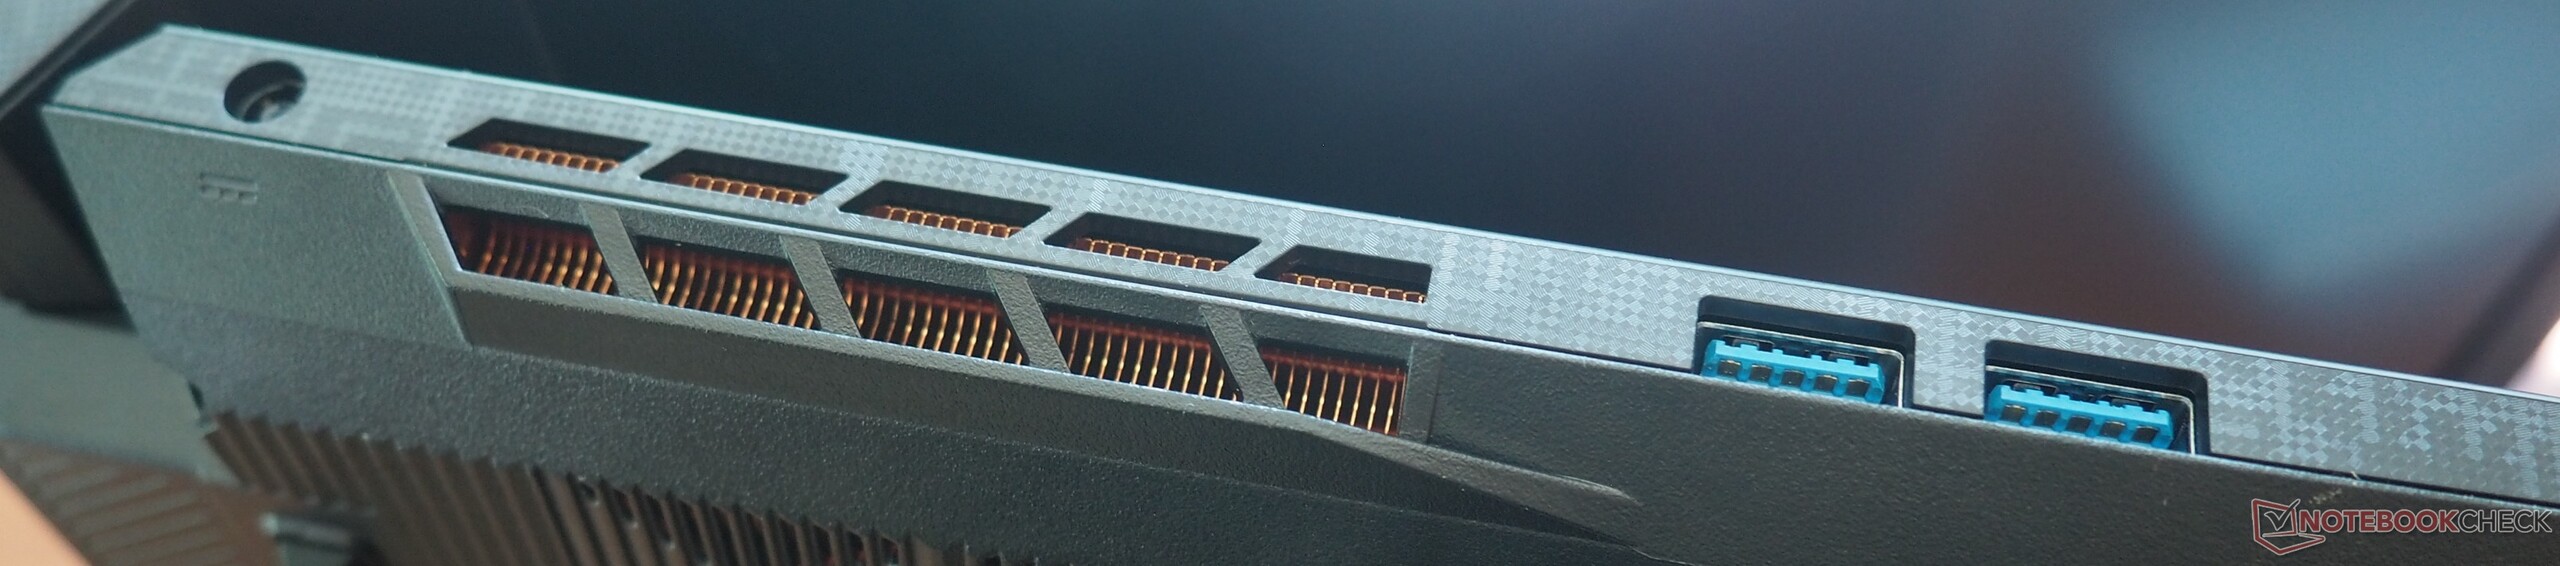
The Katana 17 offers three USB-A ports (3.0) and one USB-C port (3.1 Gen 2 including DisplayPort) as well as an audio jack, a Gigabit Ethernet port, and an HDMI 2.1 output. The speed of the built-in Wi-Fi module (Intel Wi-Fi 6E AX211) is decent to very good, depending on the test. However, the HD webcam has a very blurred picture.
Communication
Webcam


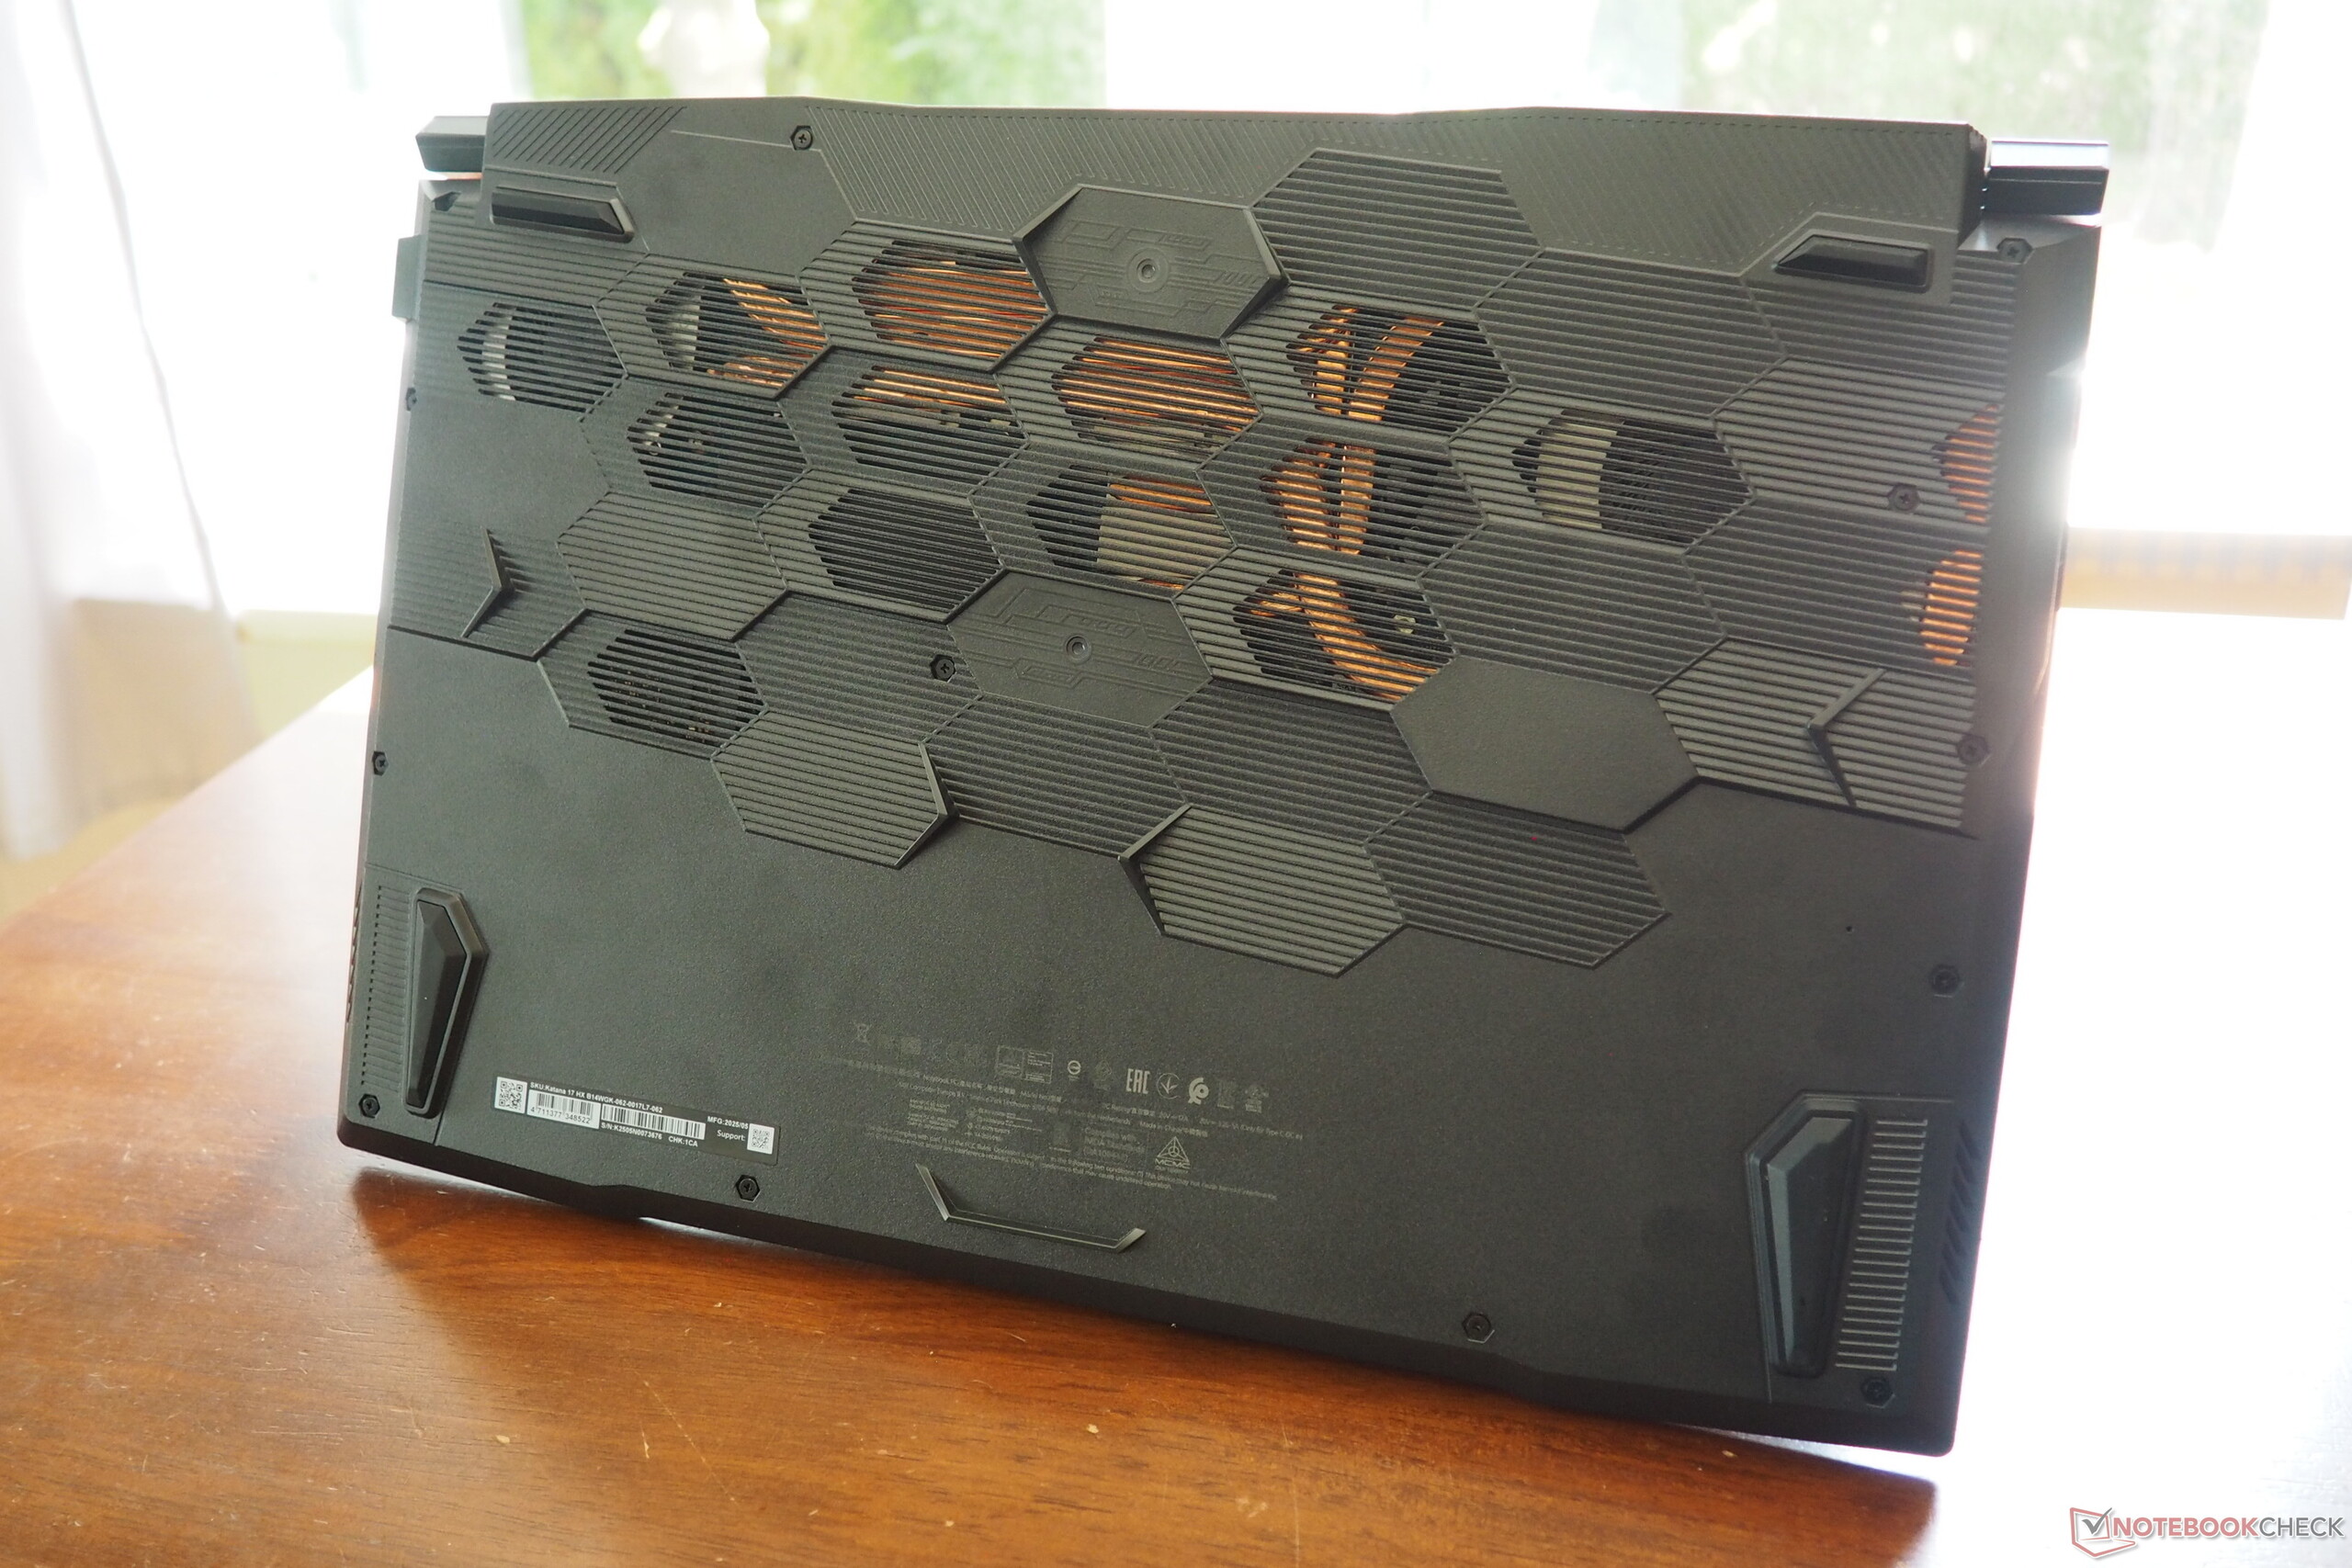
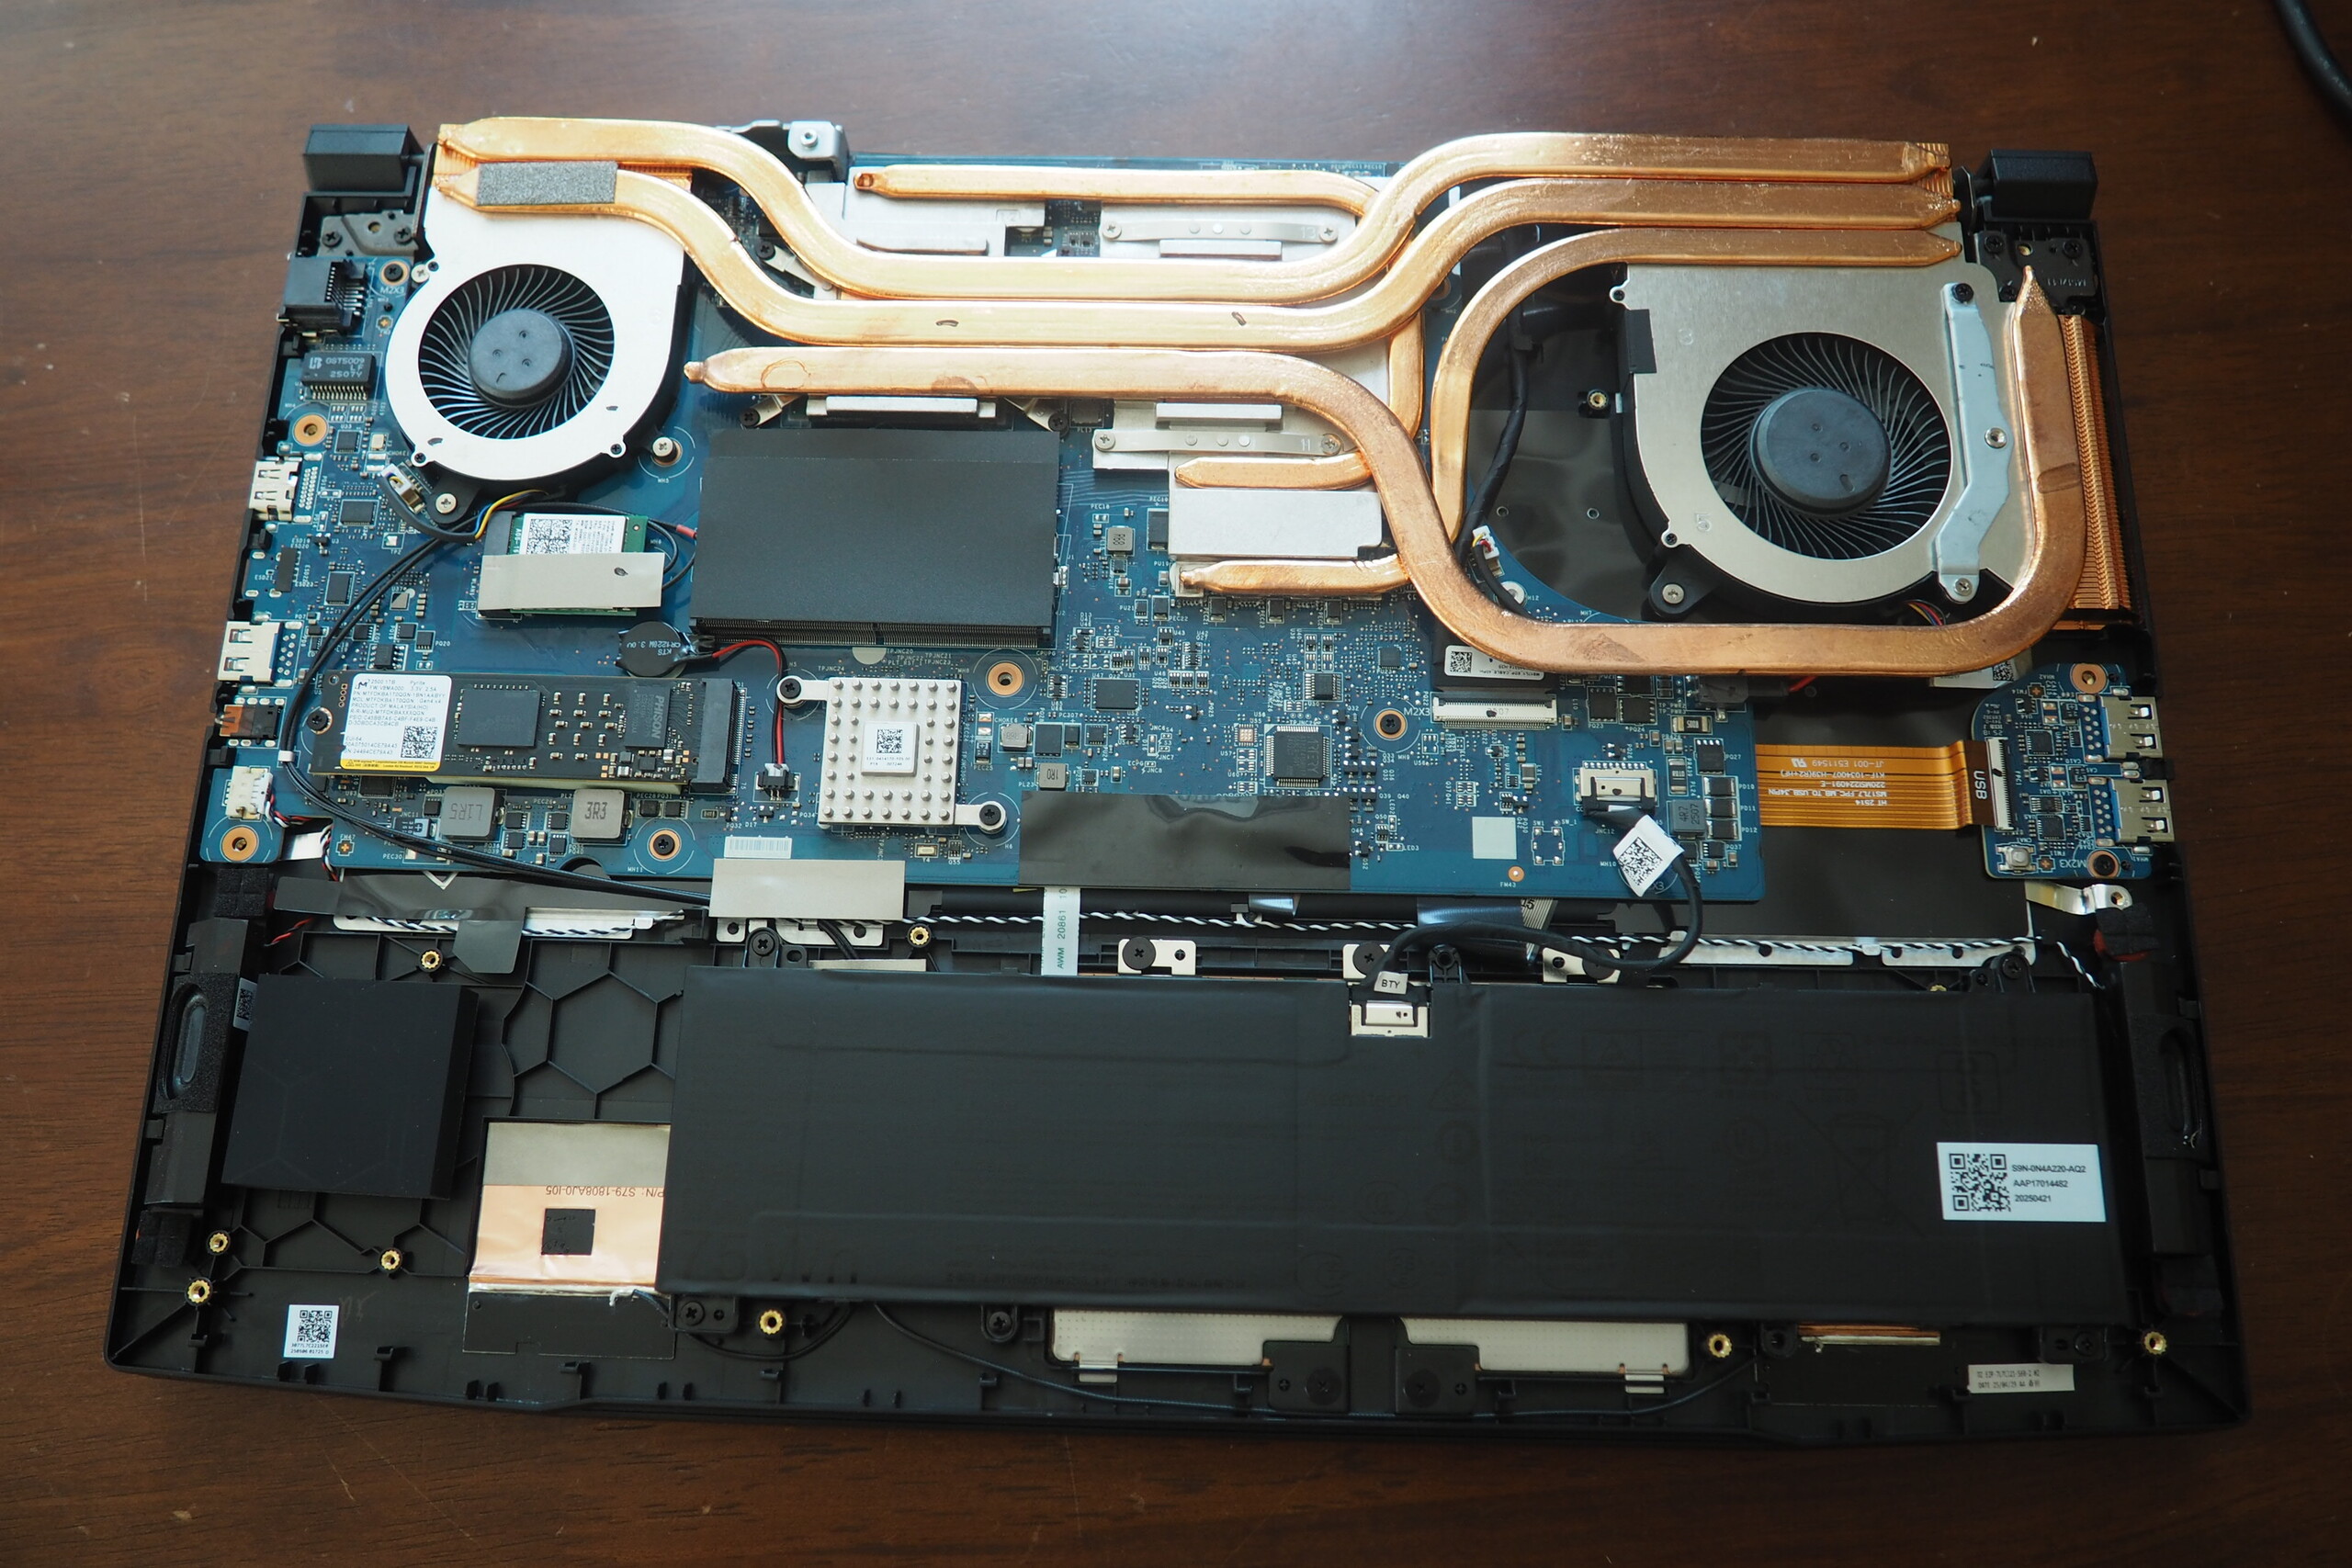
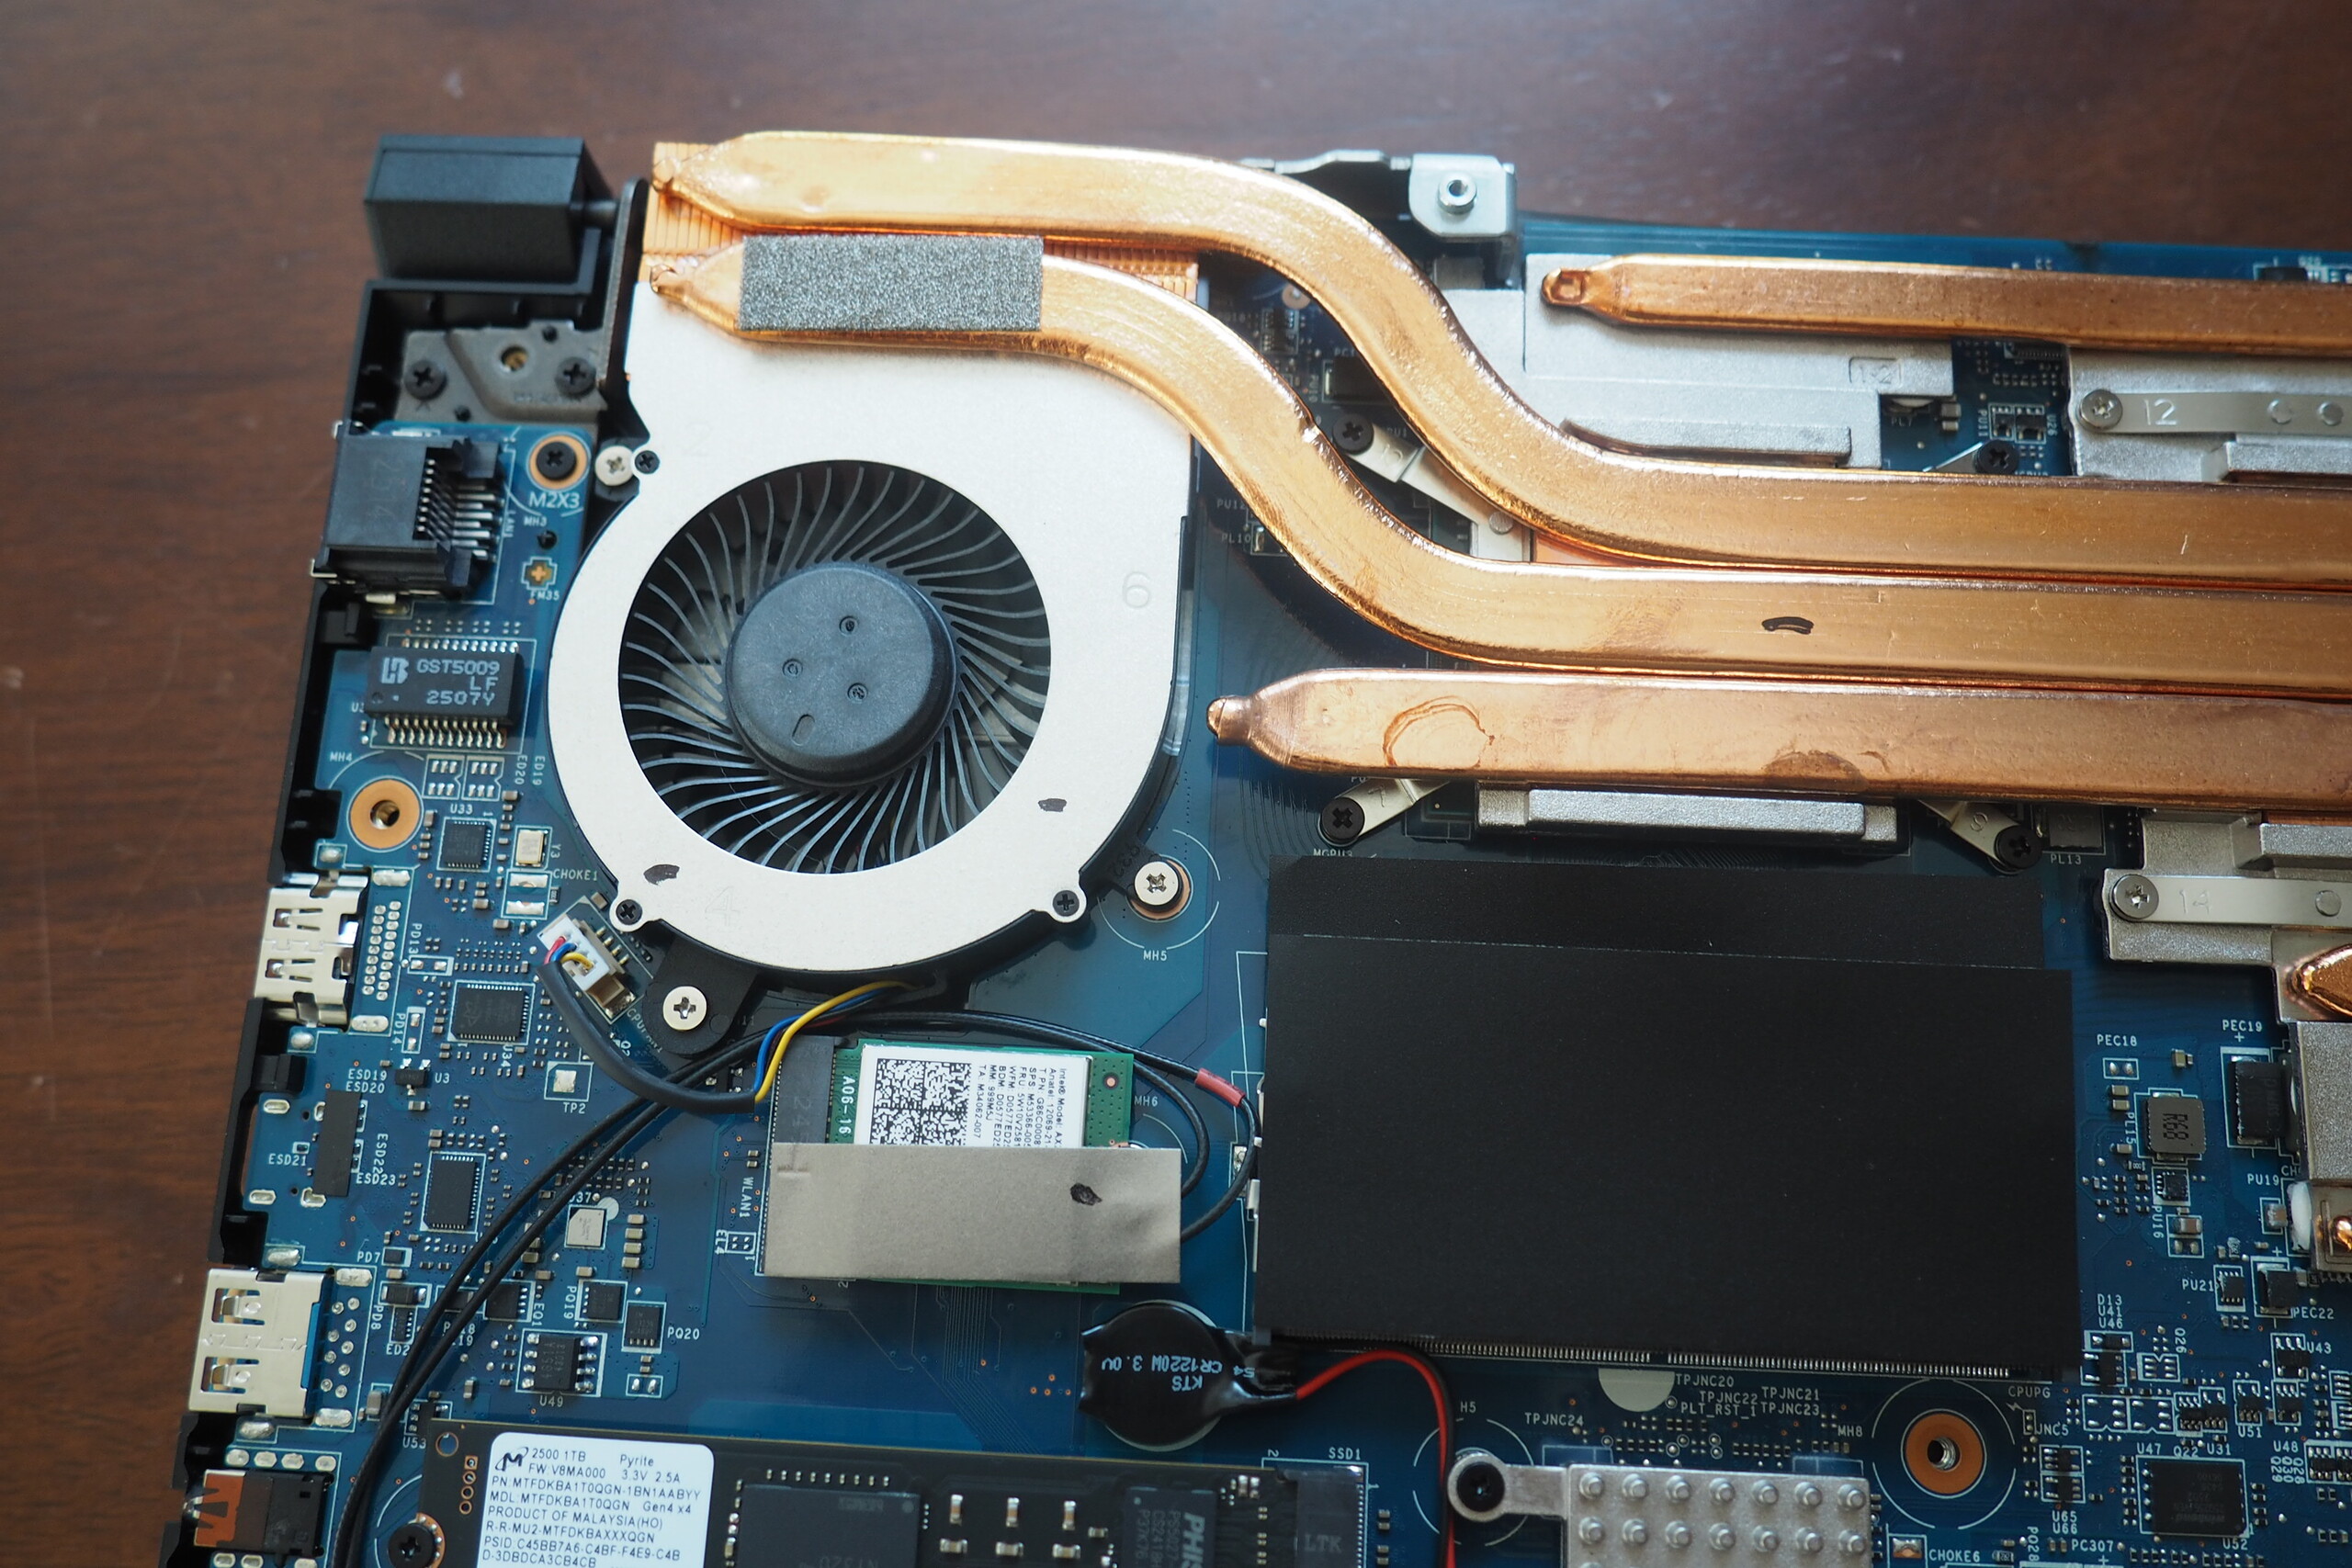
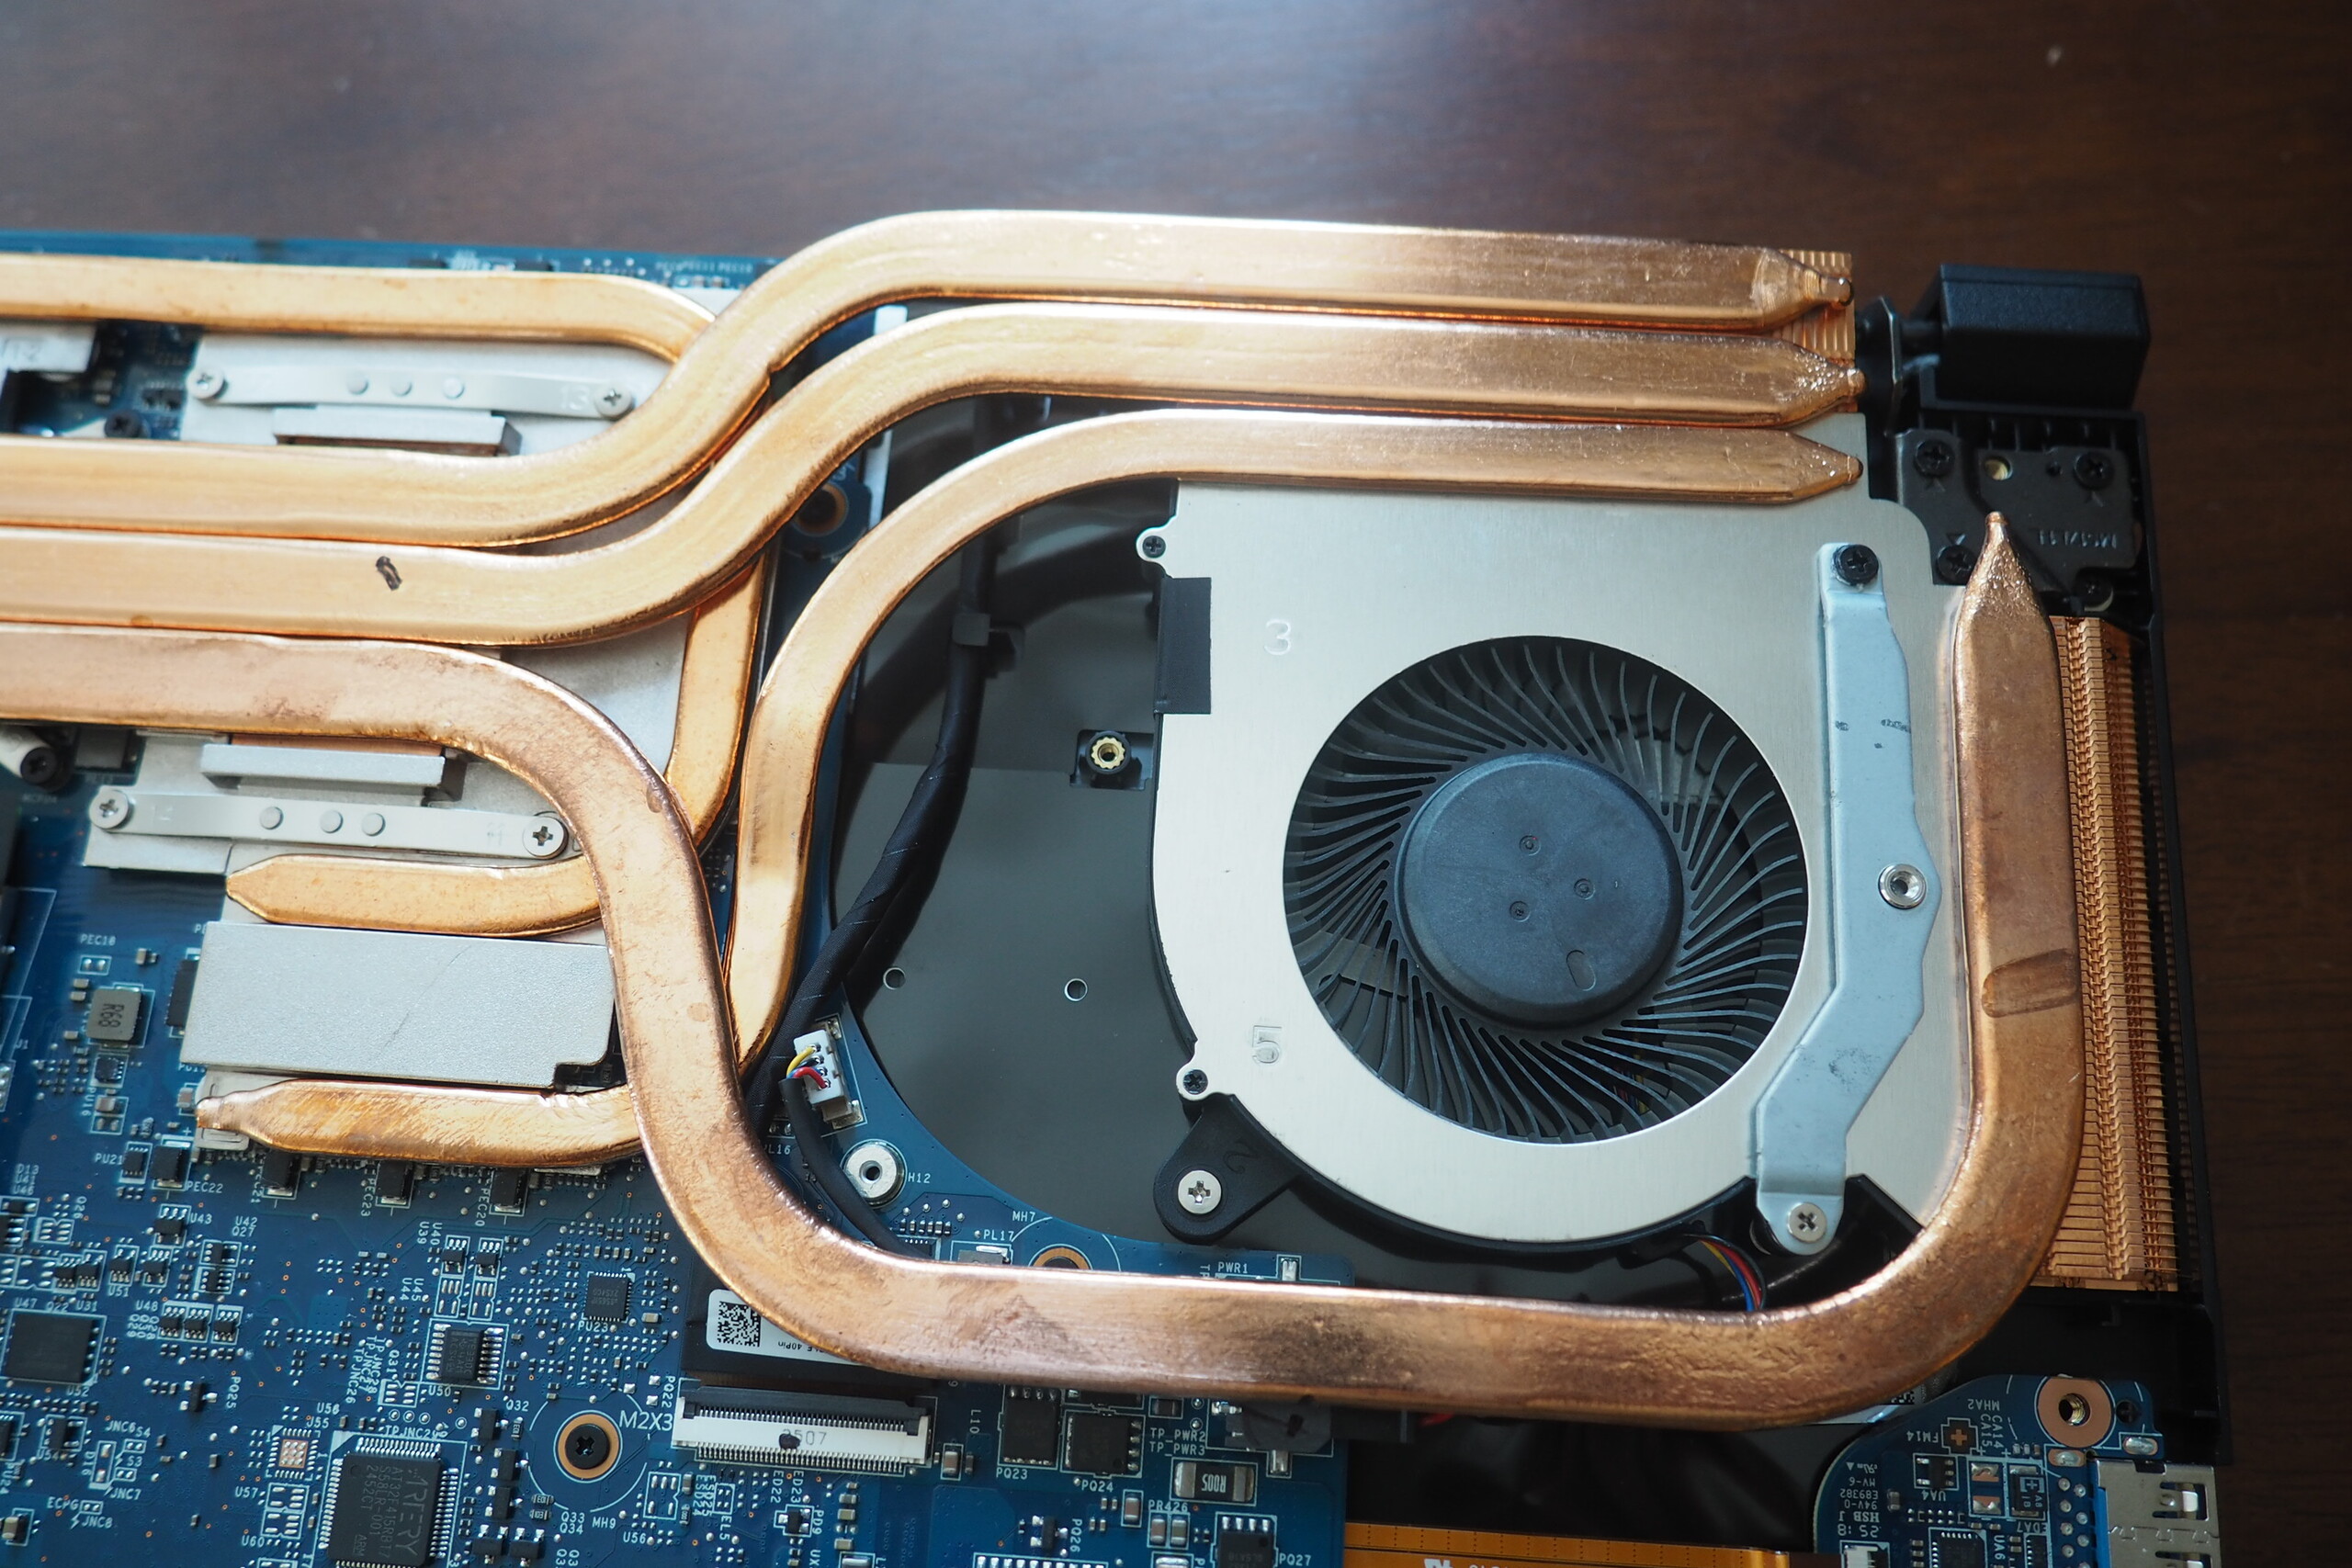
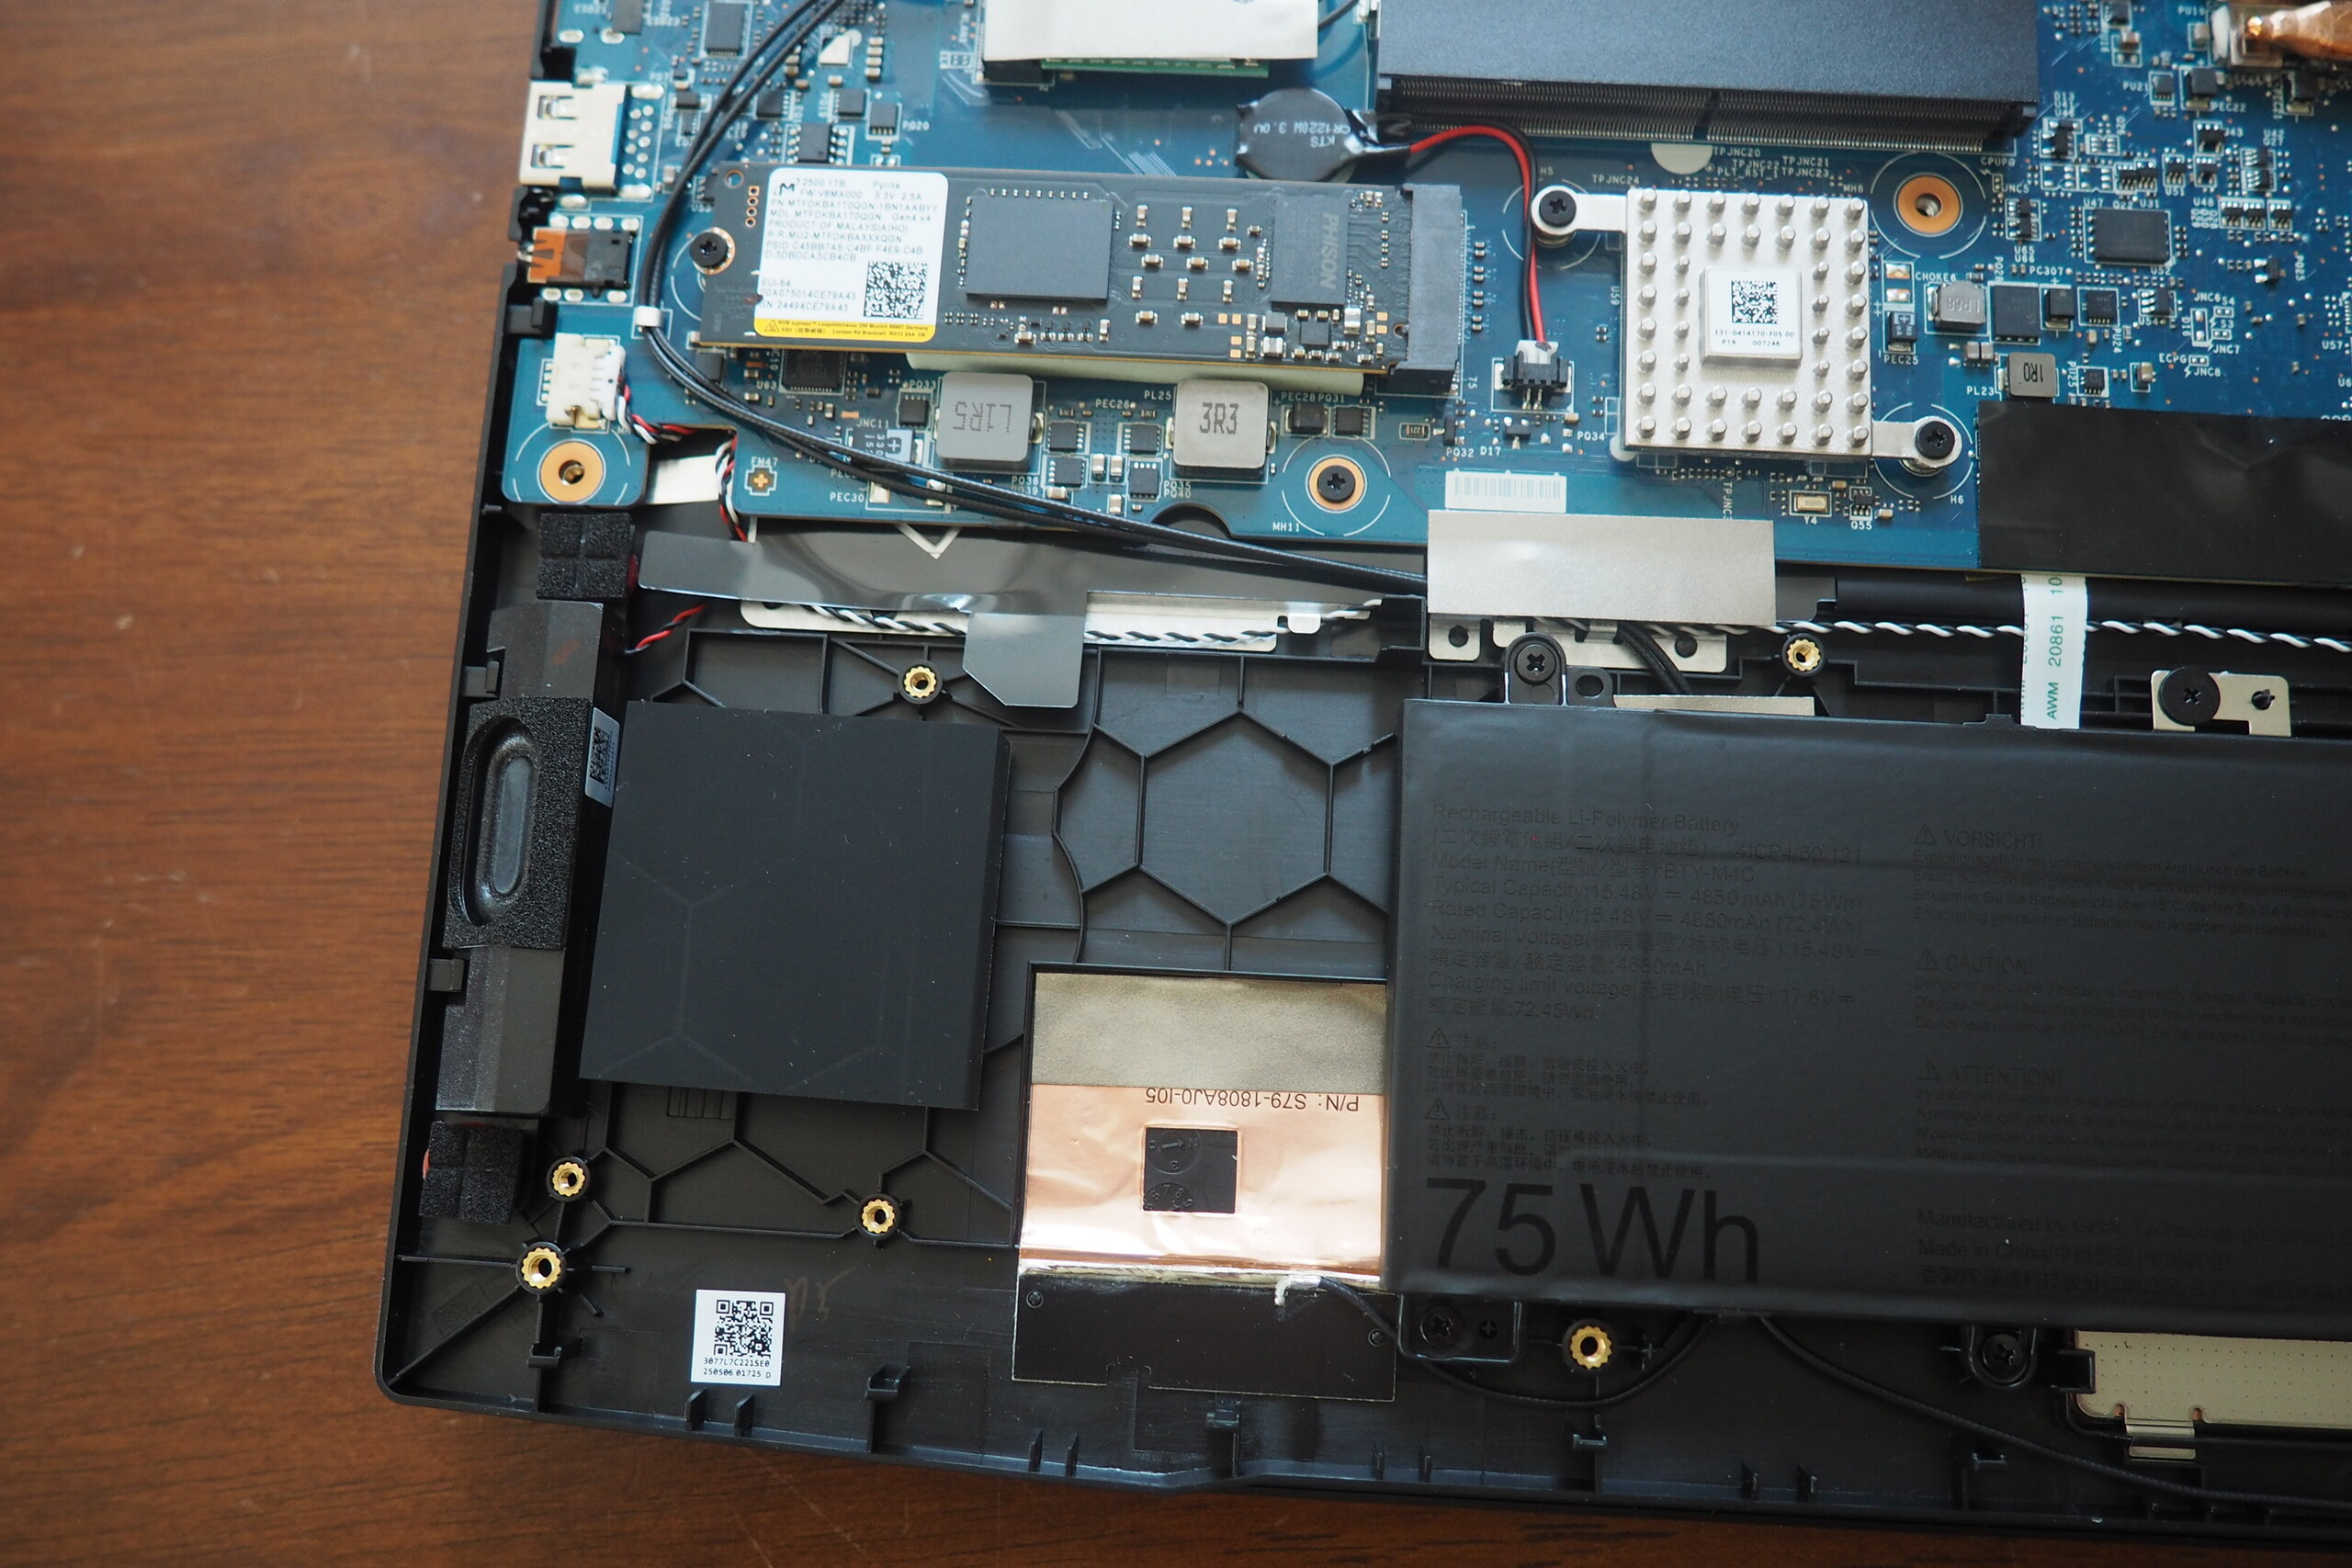
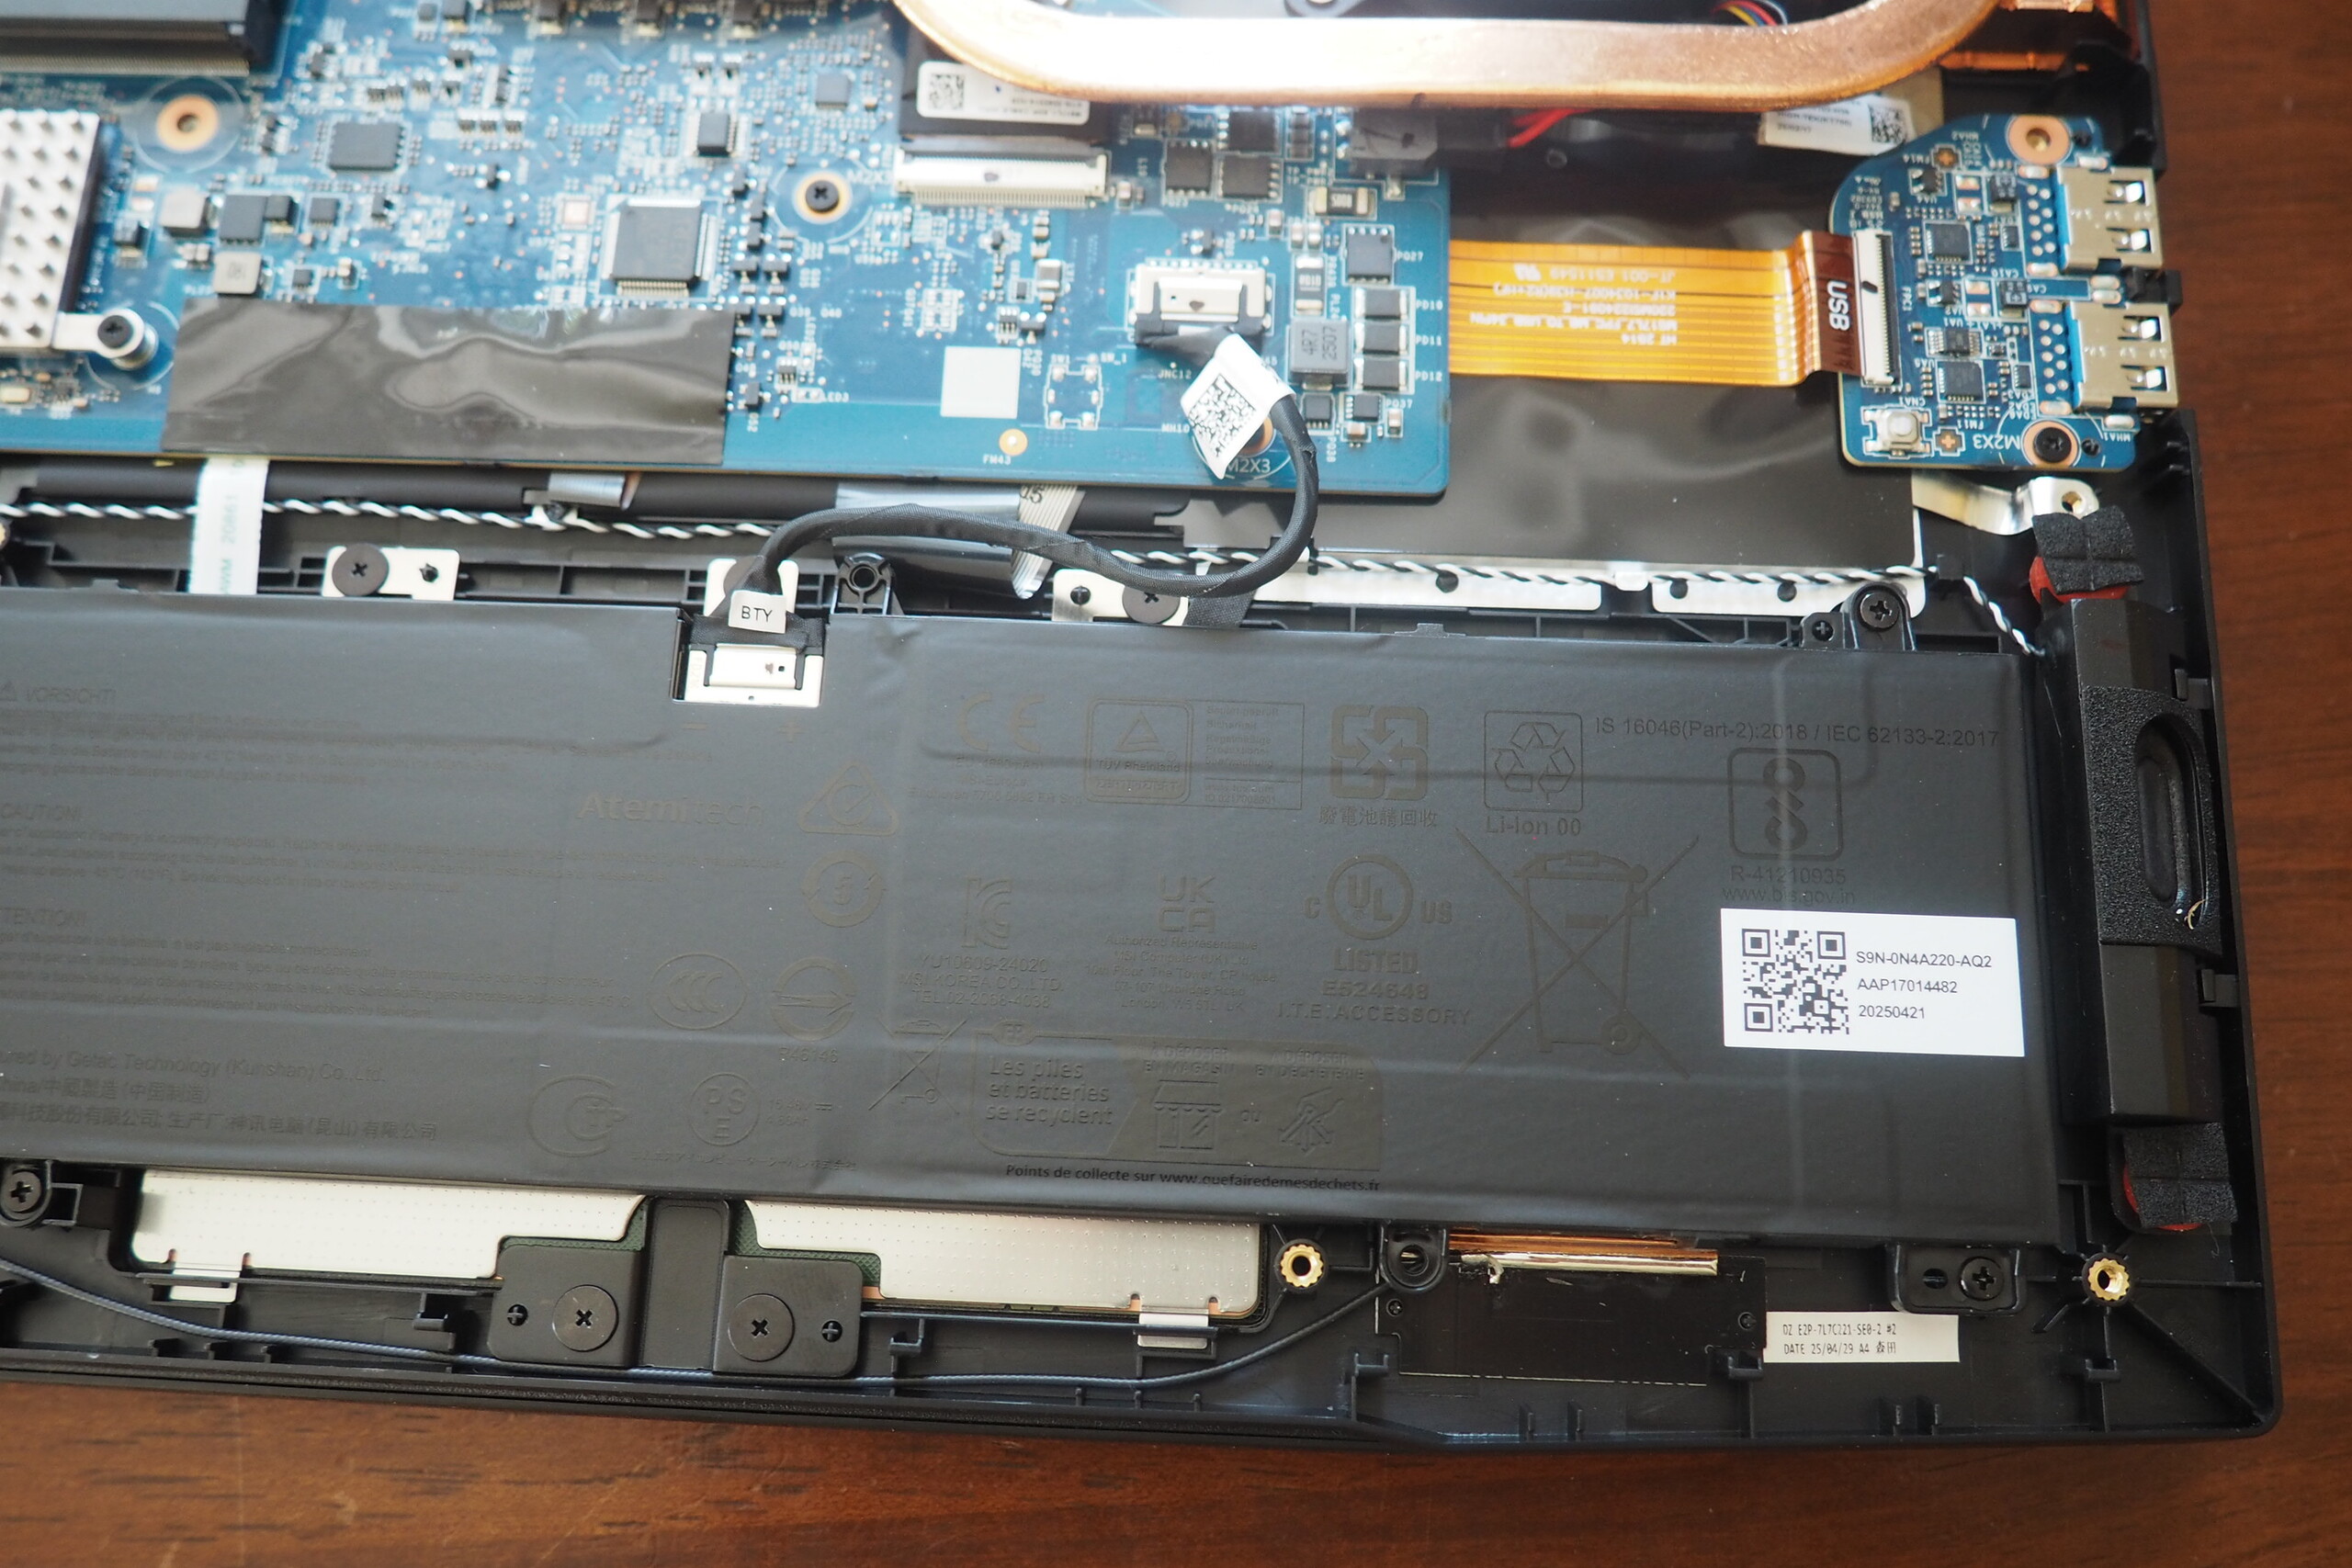
Maintenance
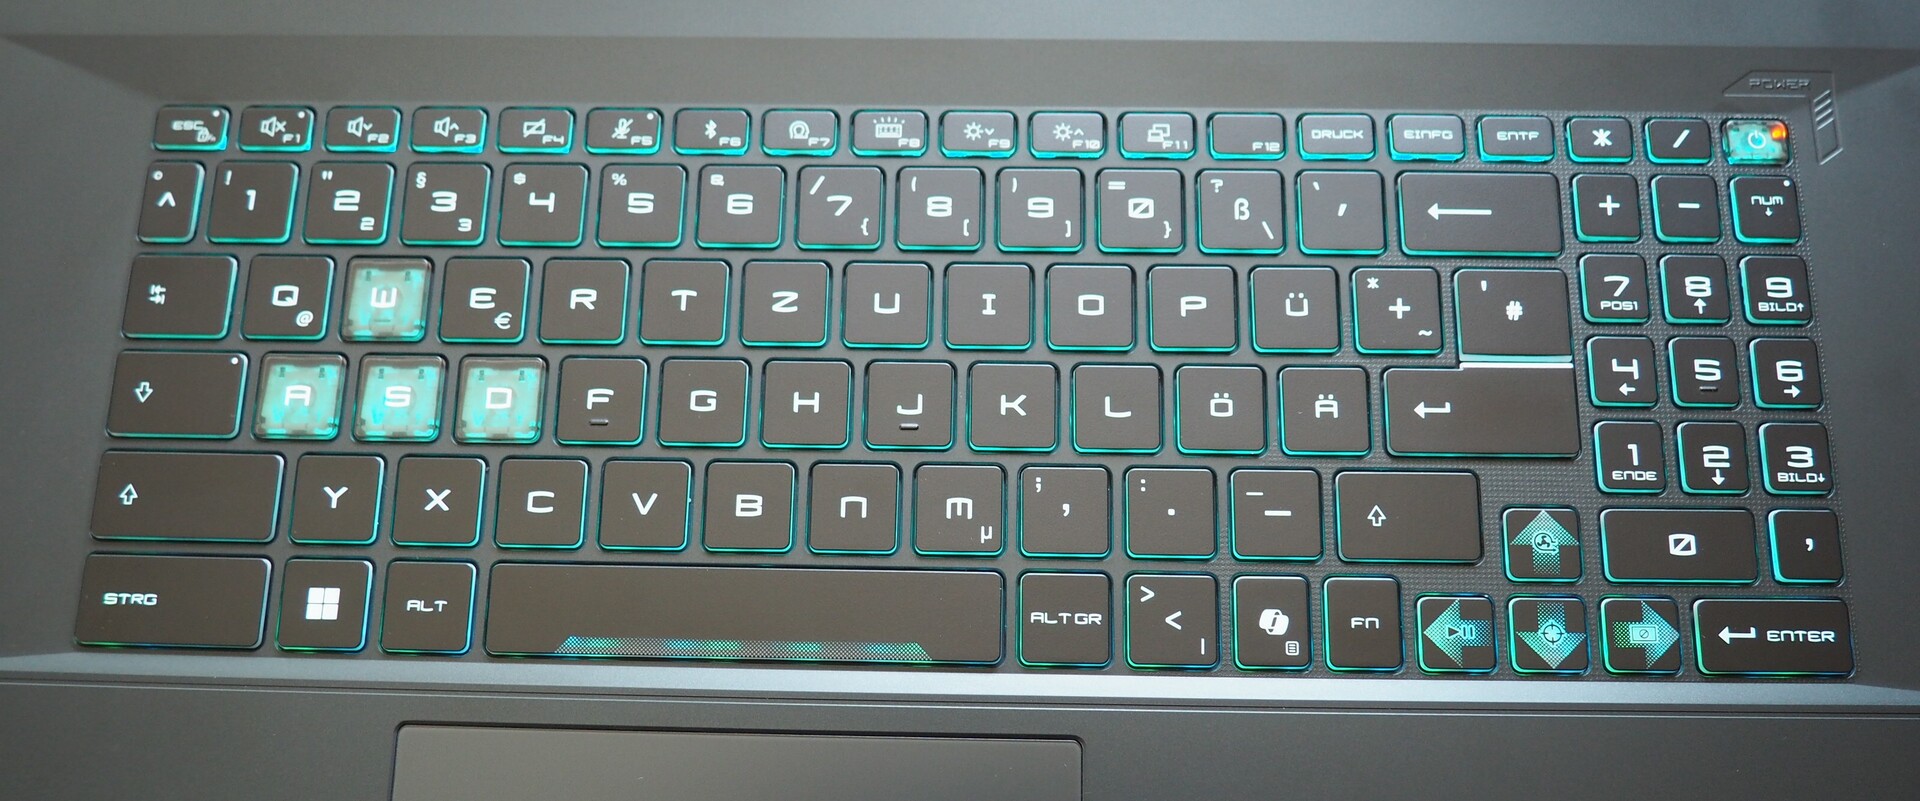
Input devices
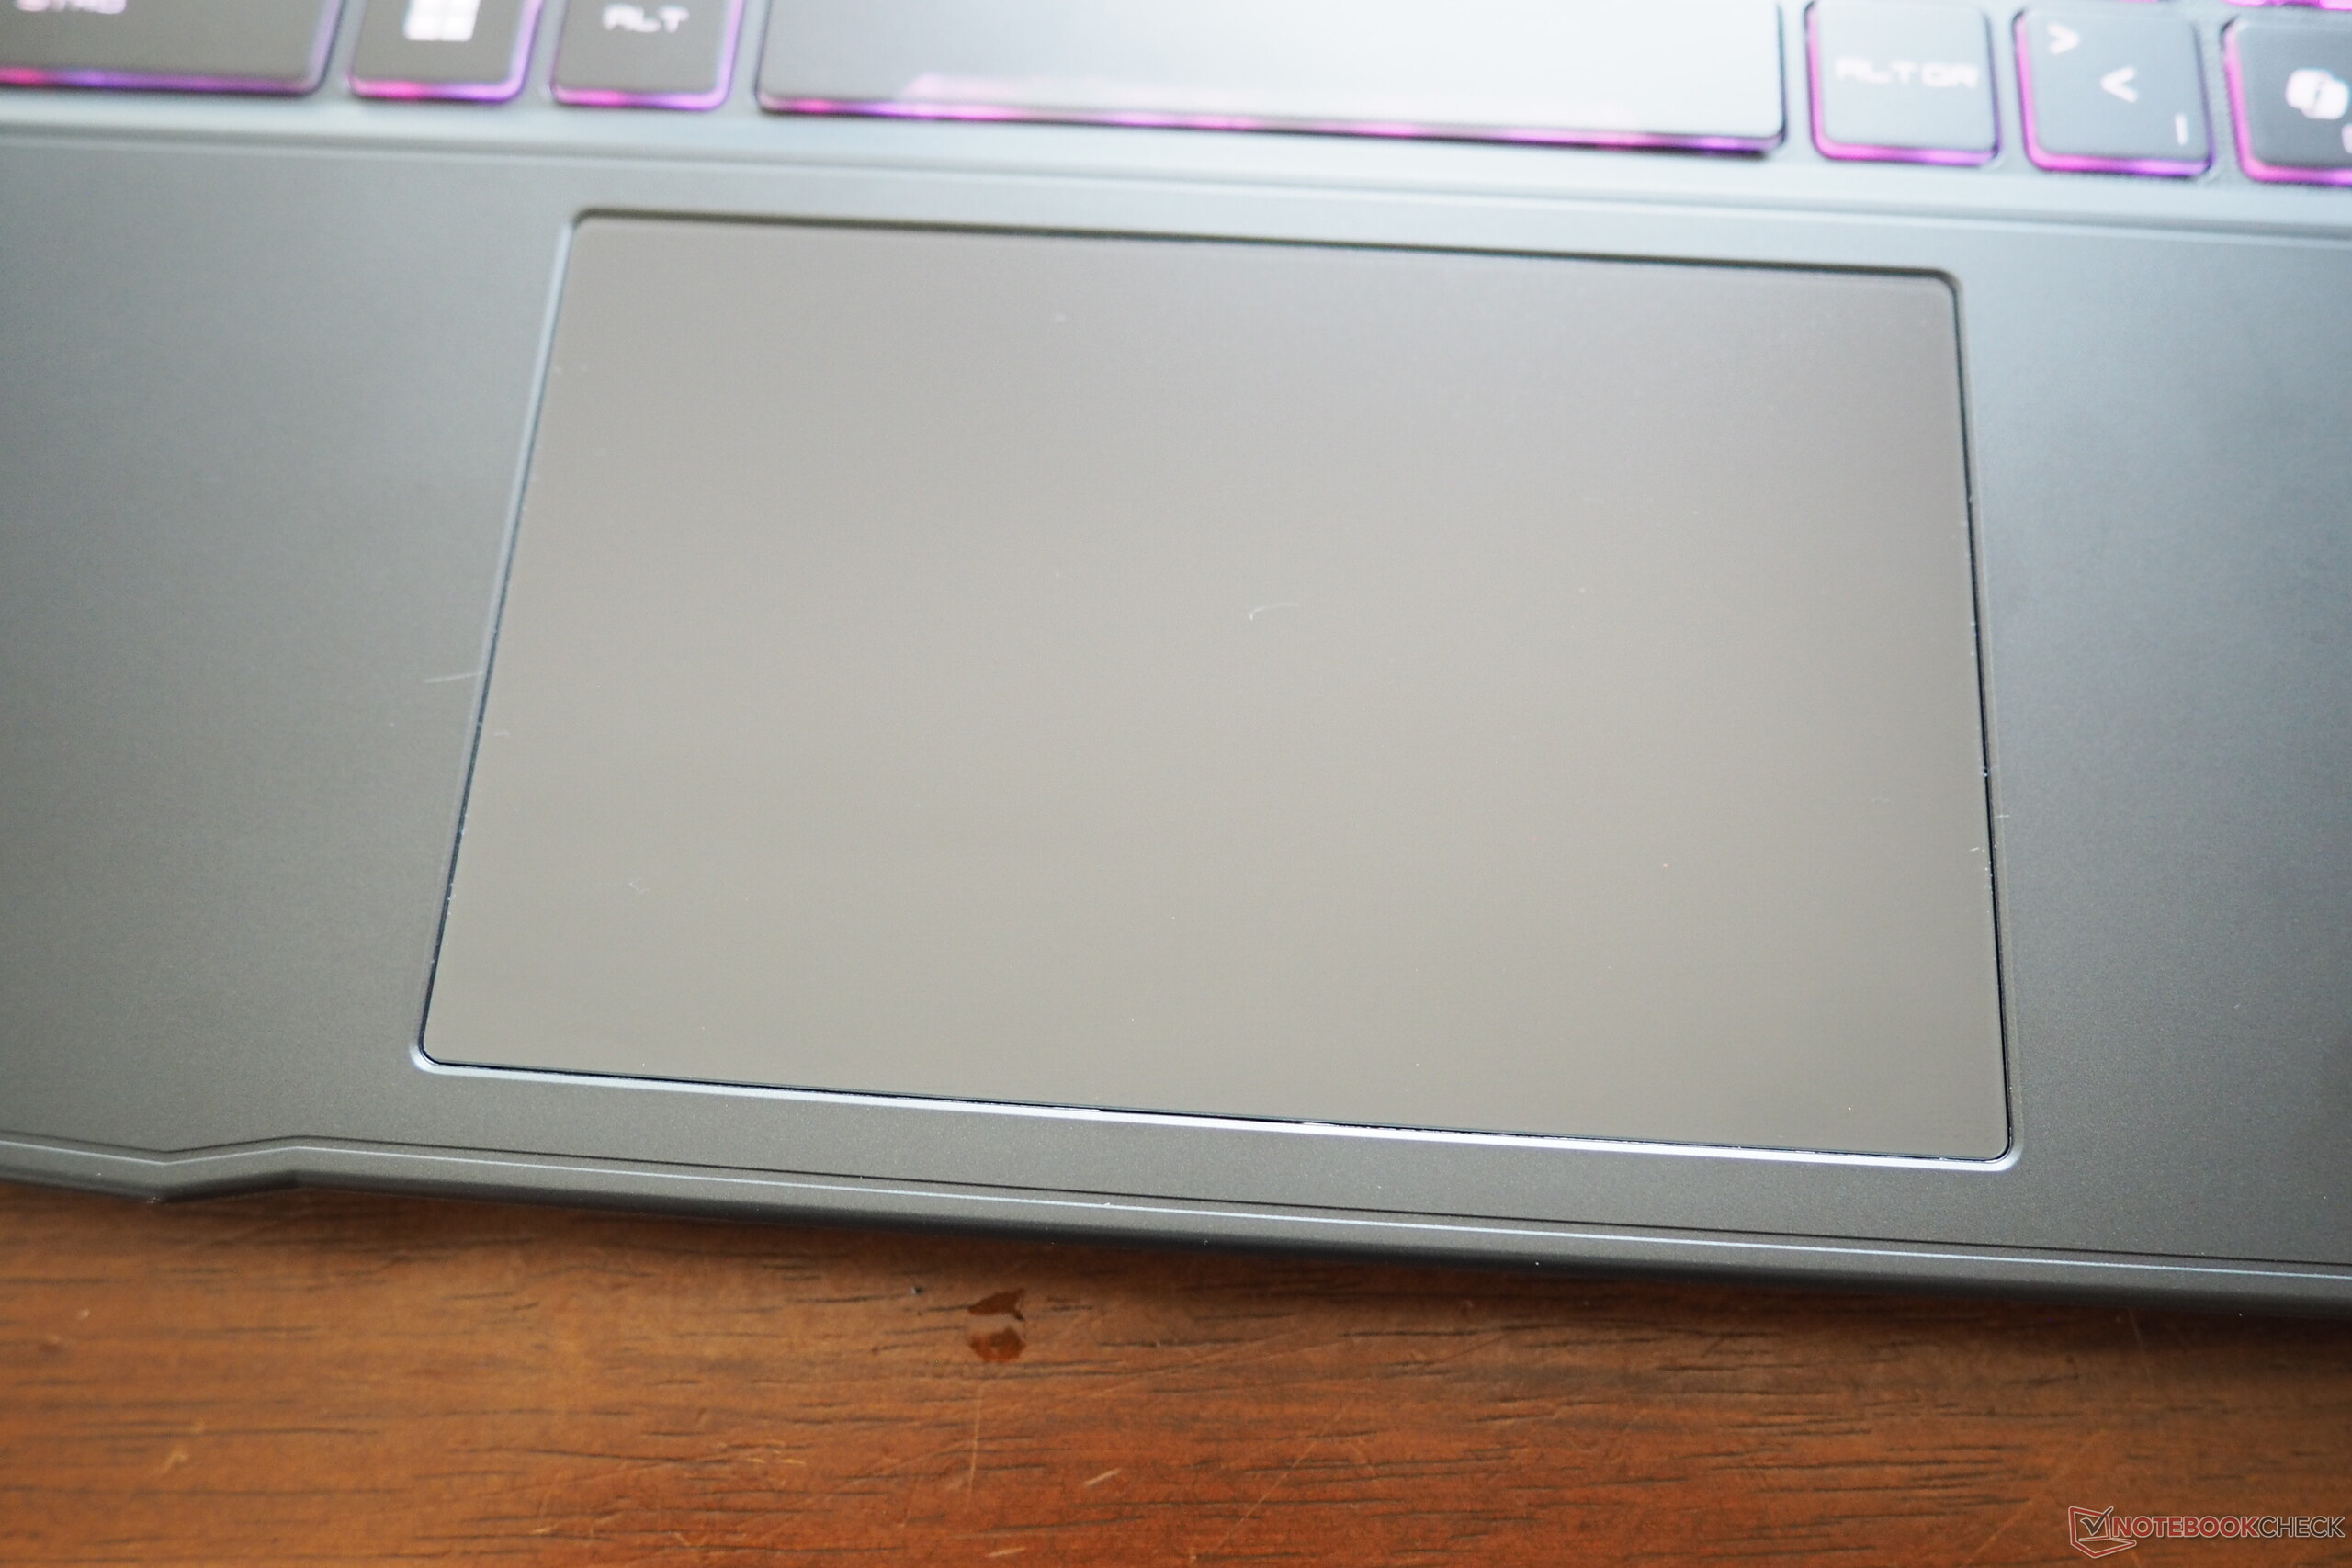
MSI continues to rely on its unconventional keyboard layout. Despite the available space, the numeric keypad only has three columns instead of four. On the other hand, gamers can look forward to adjustable RGB lighting. The typing feel is decent, but it doesn't generate enthusiasm. The mouse replacement measures a reasonable 12 x 7.5 cm and could be even more stable for our taste (especially when clicking). Gliding characteristics and precision are acceptable.
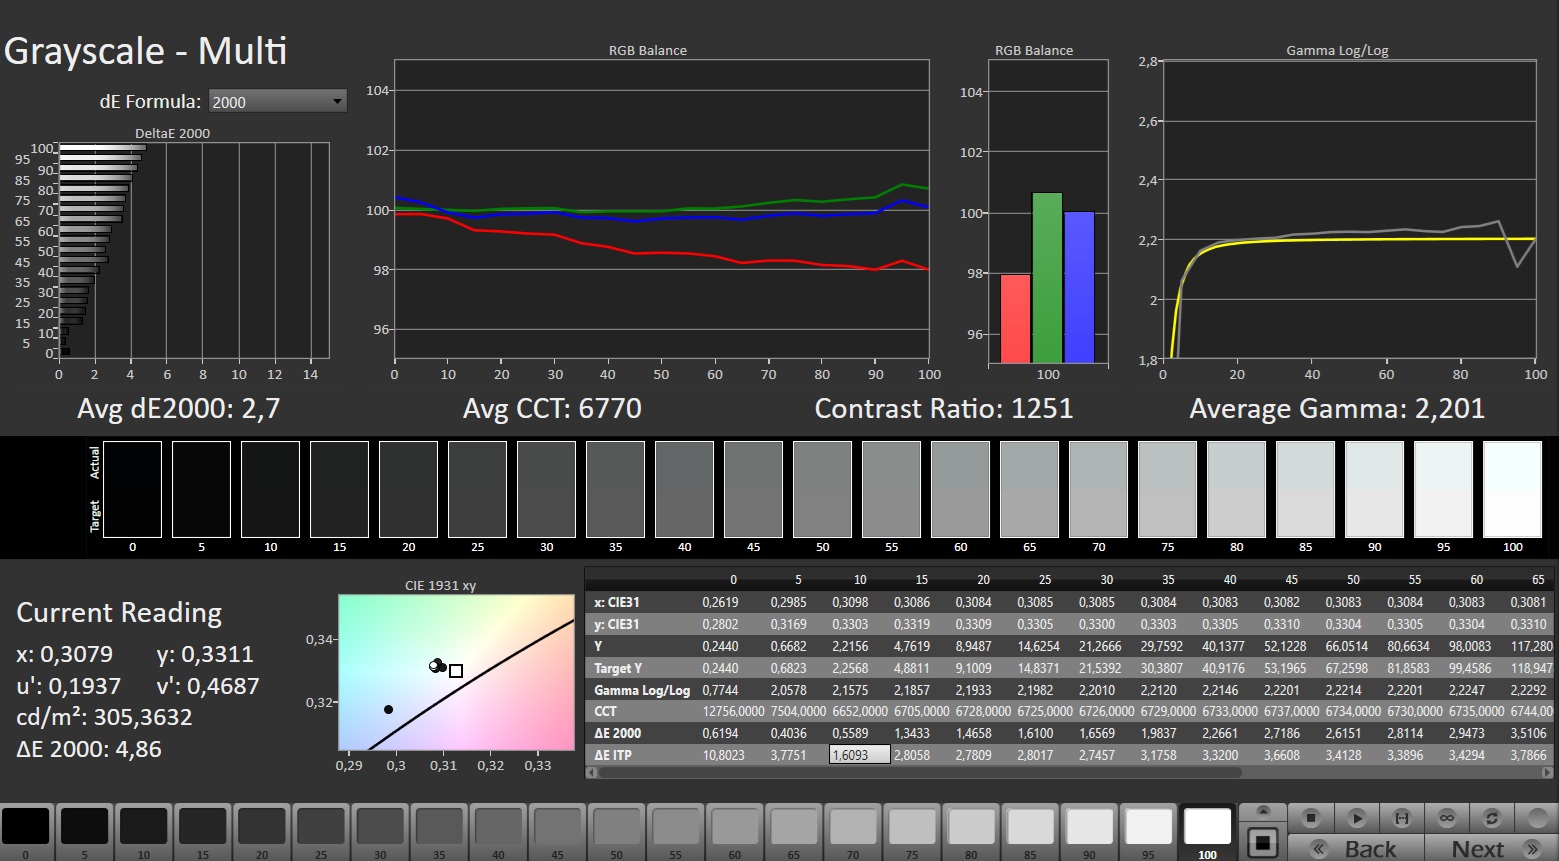
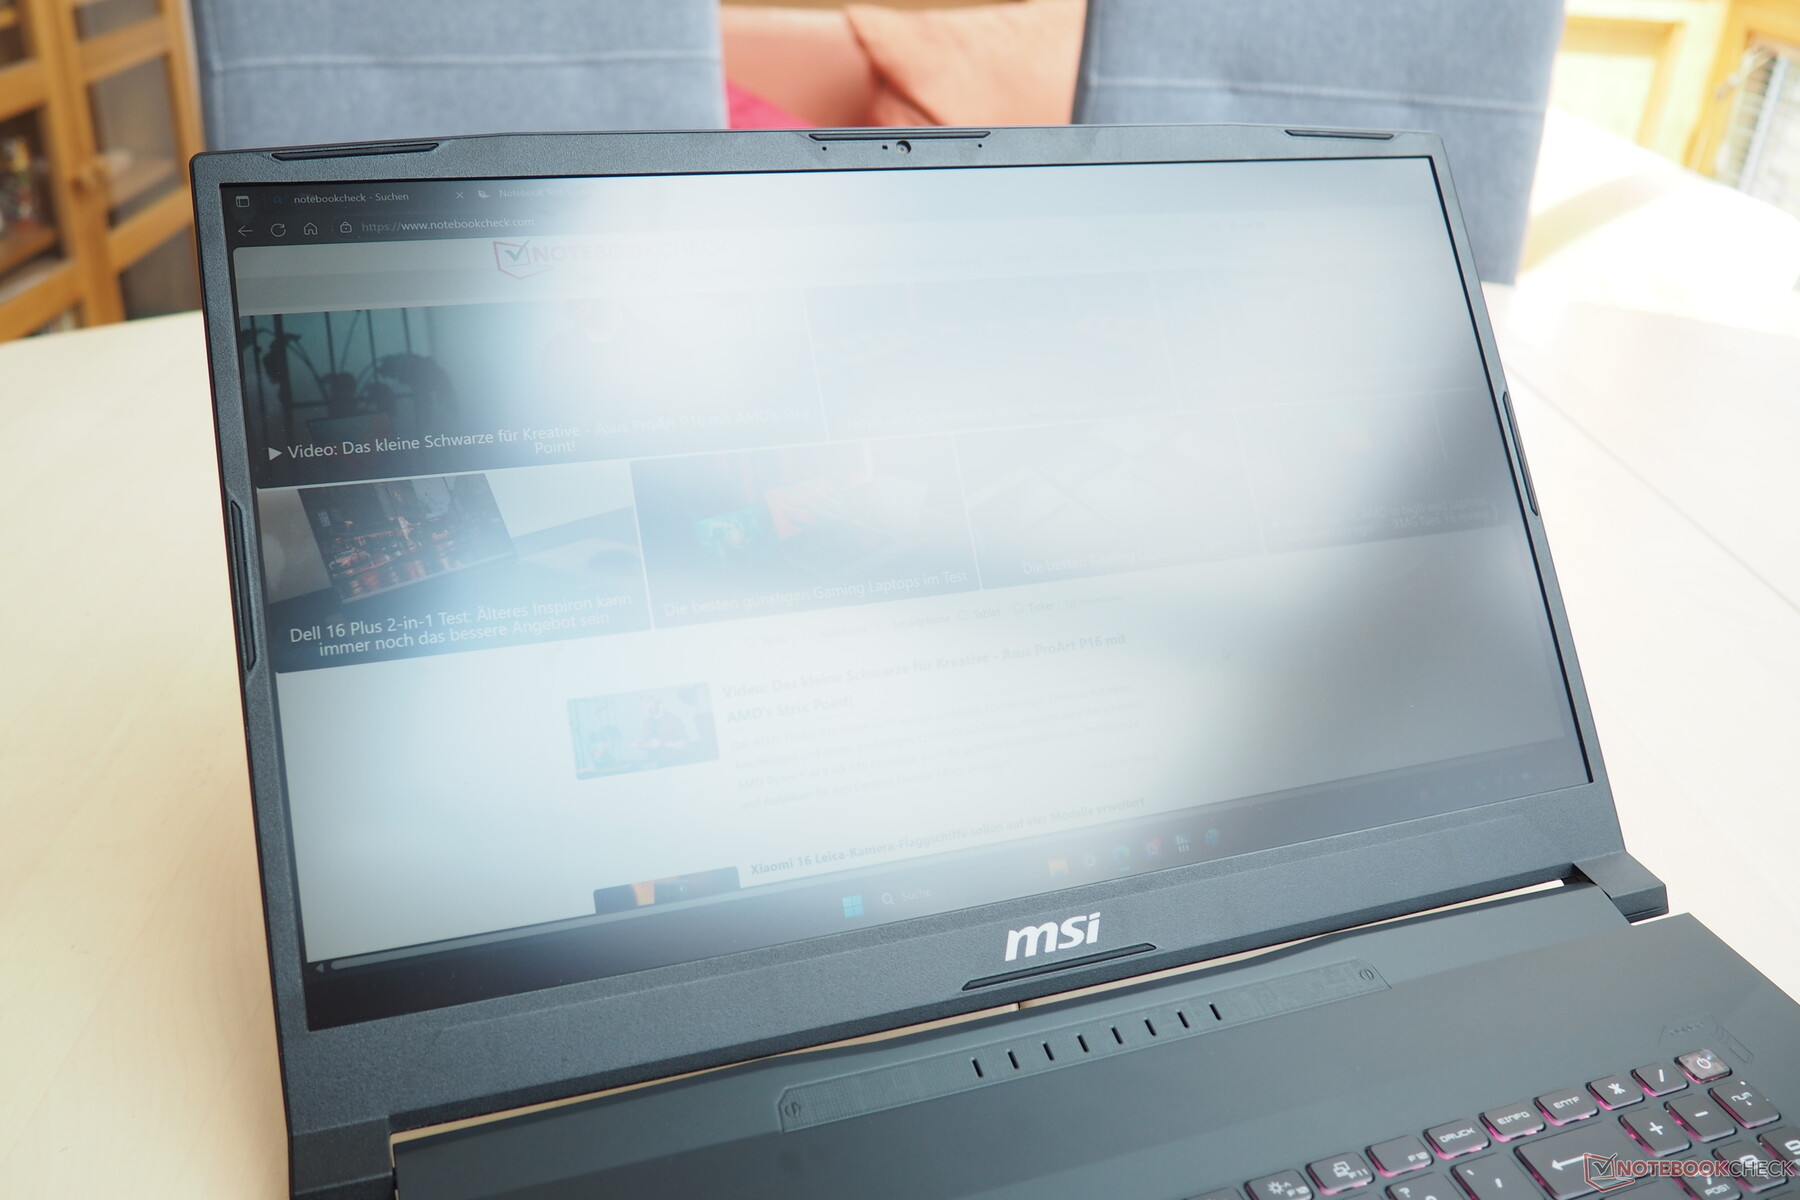
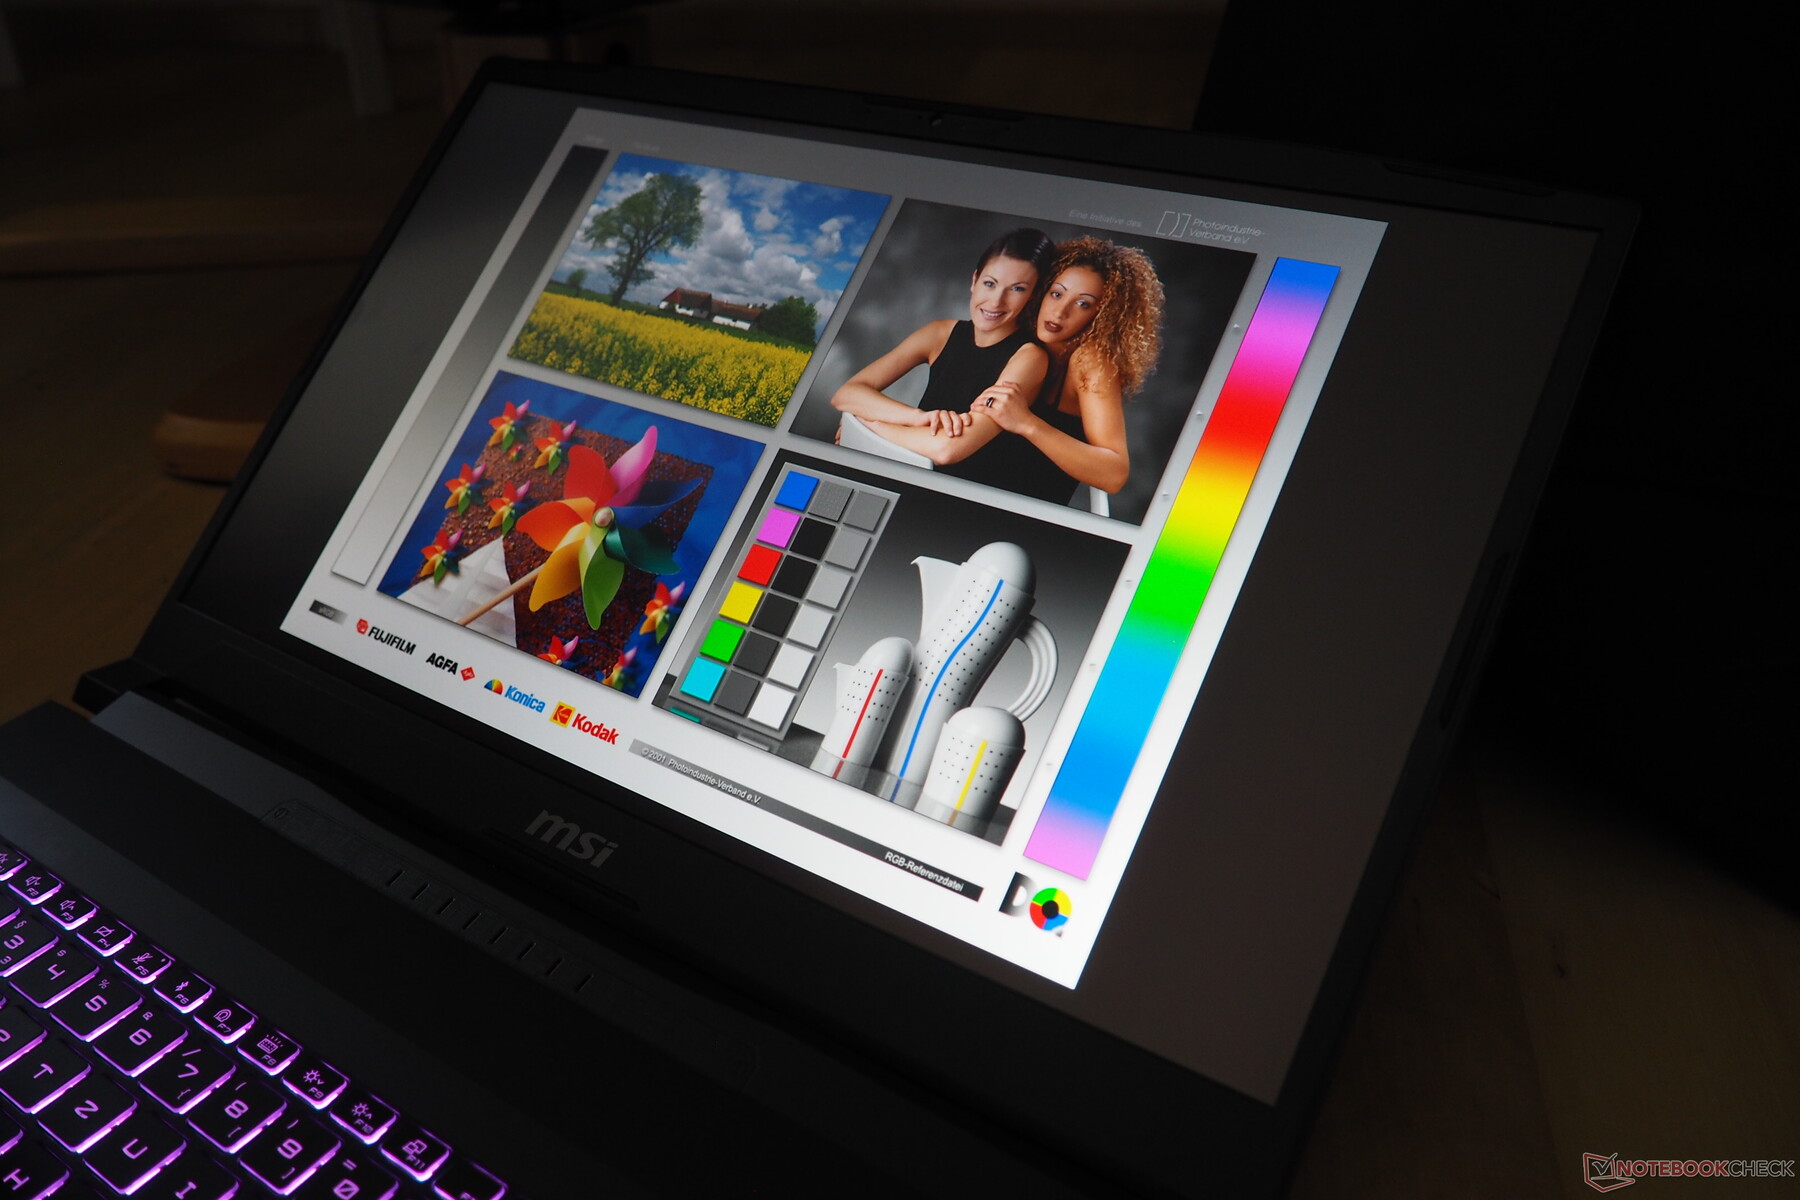
Display
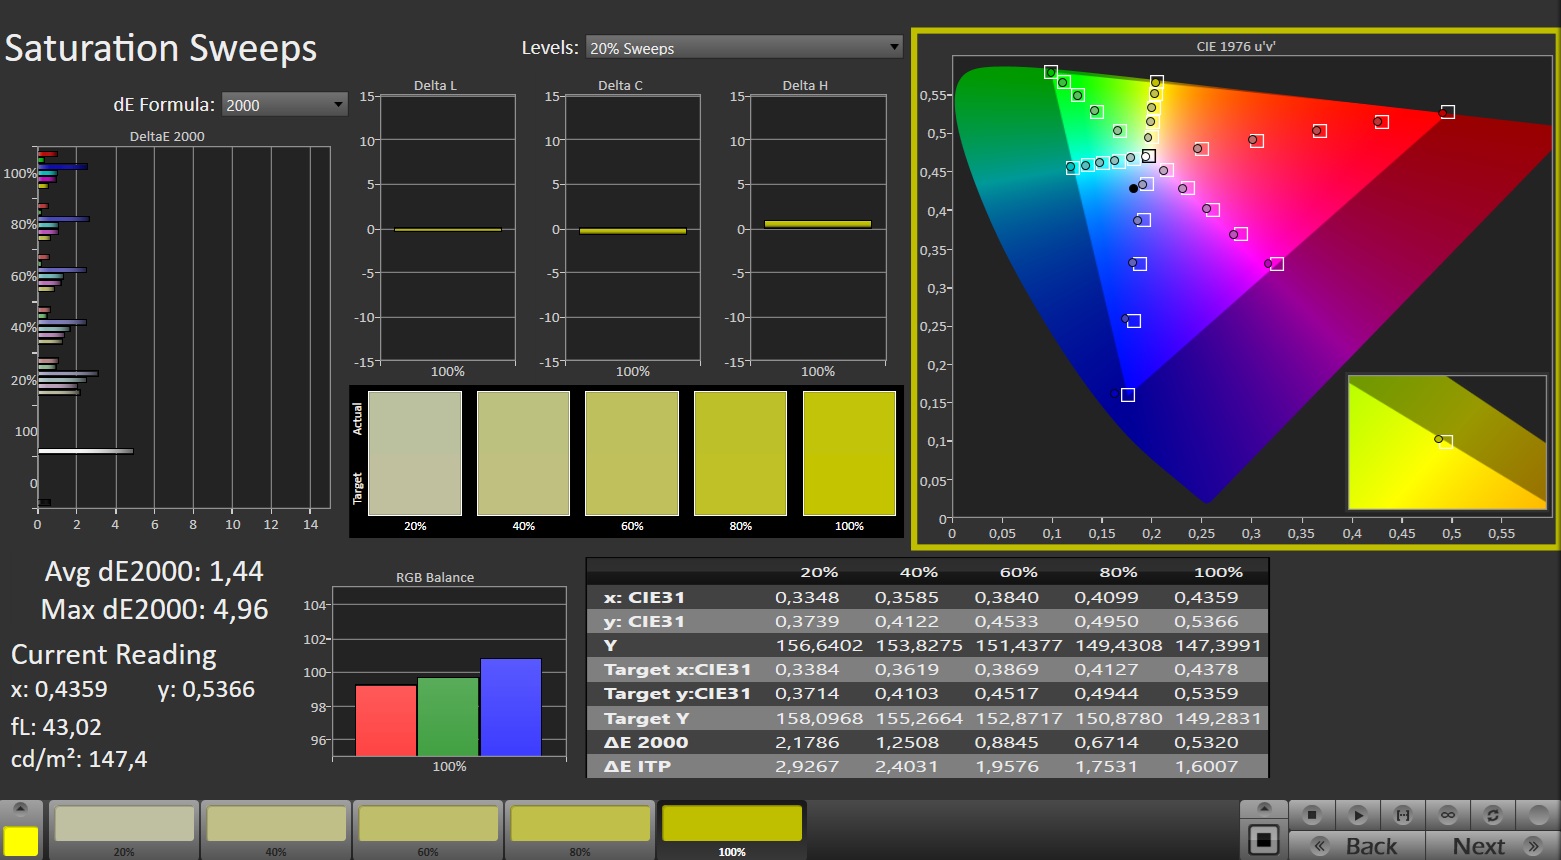
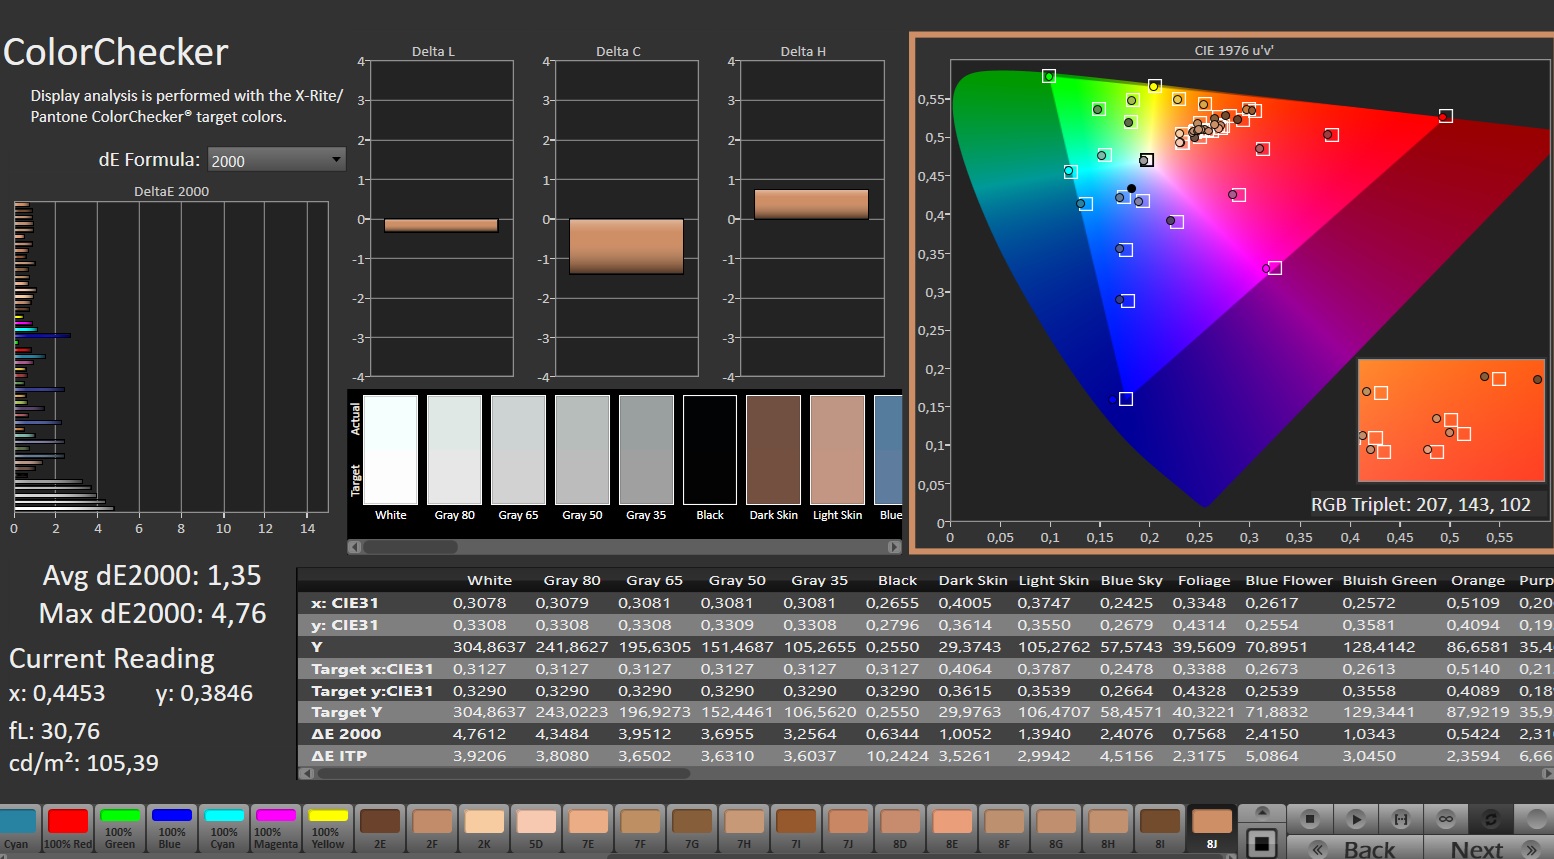
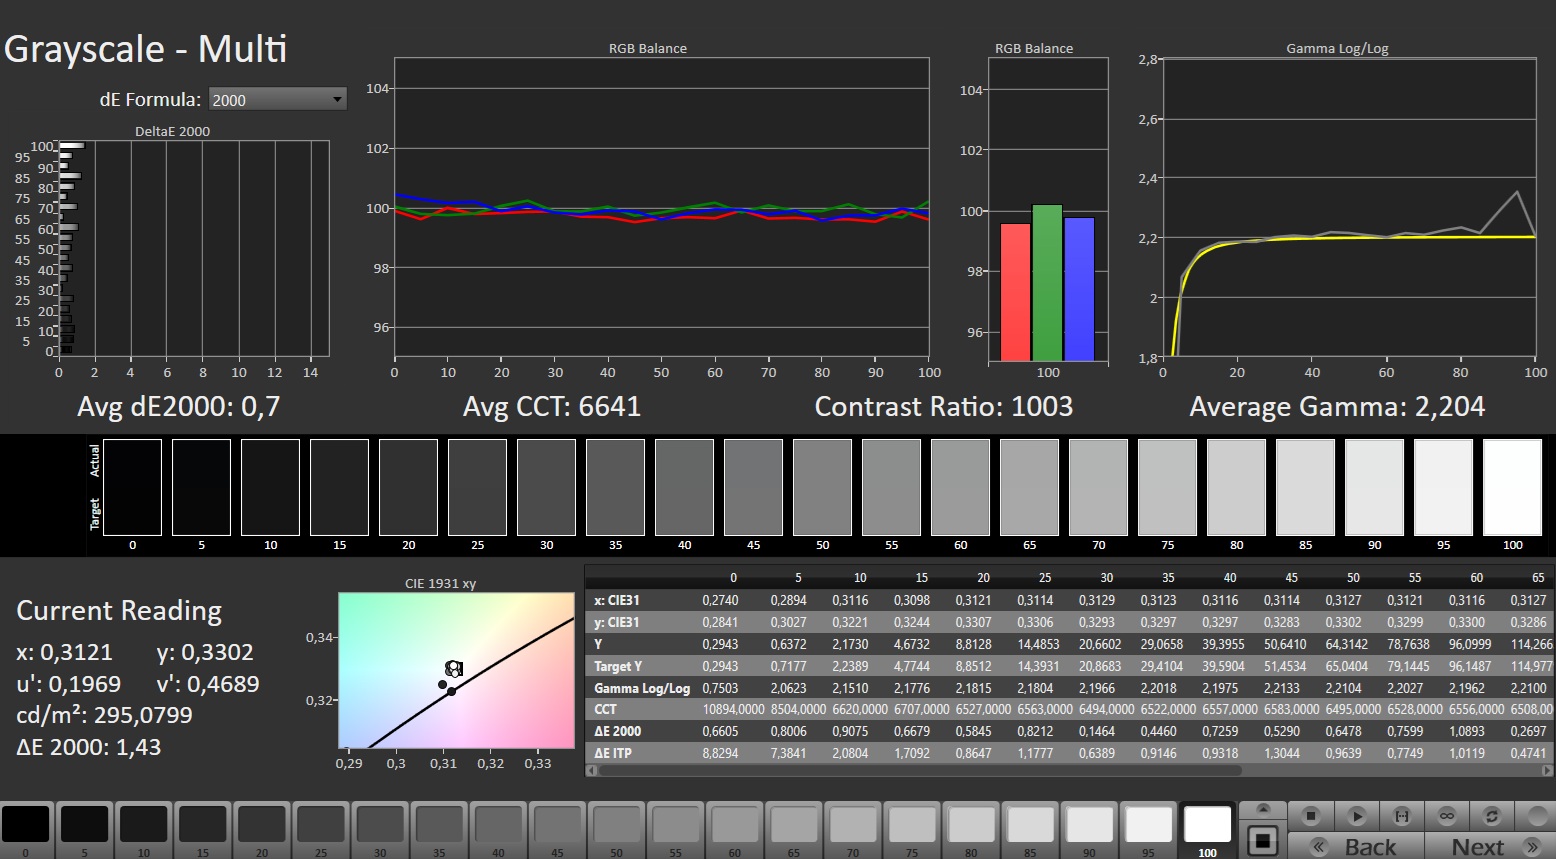
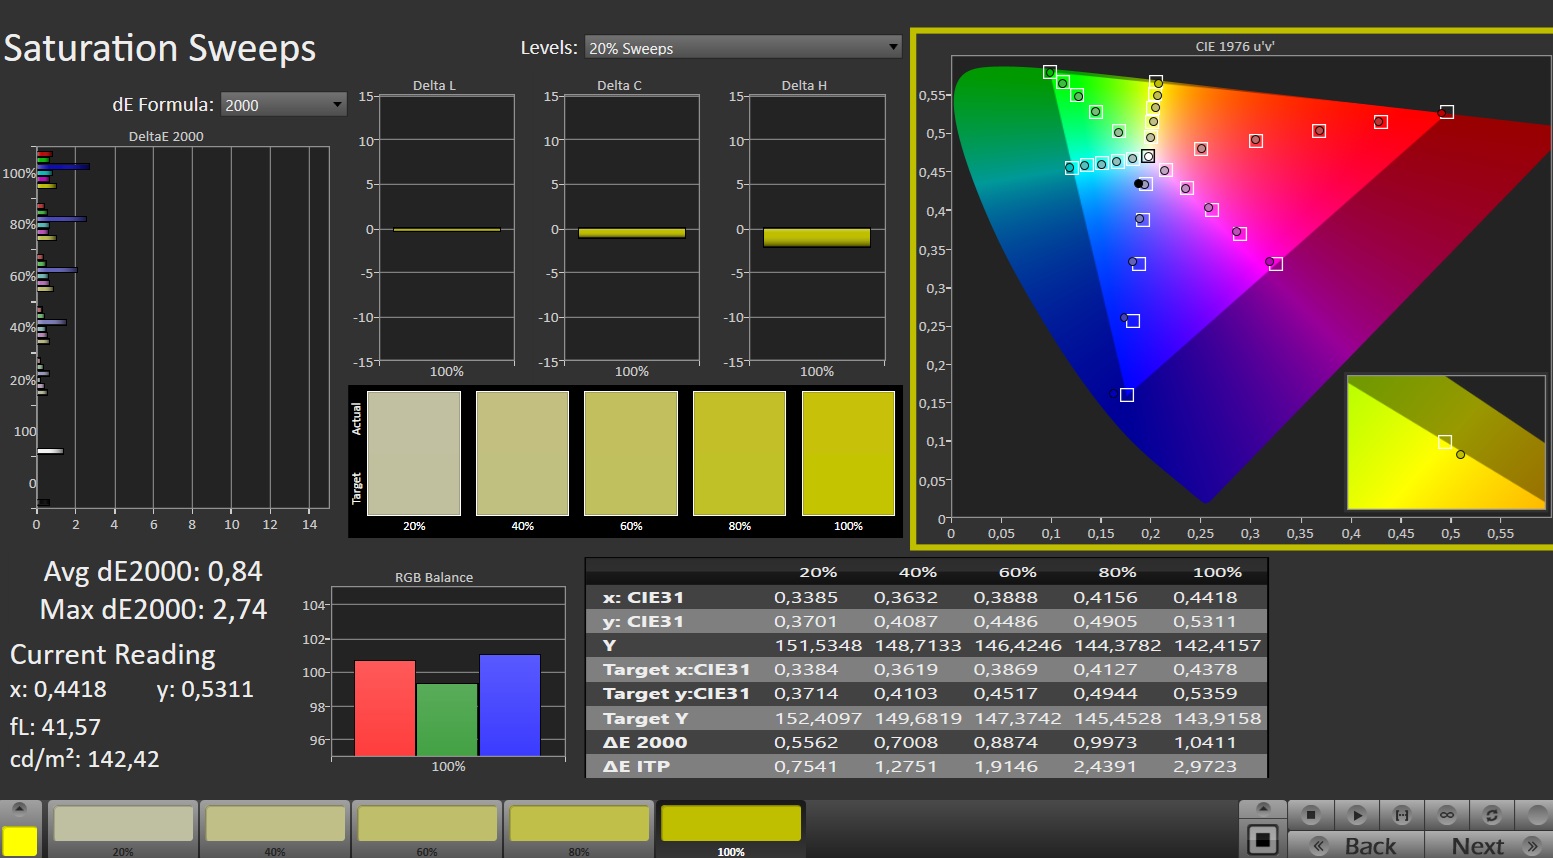
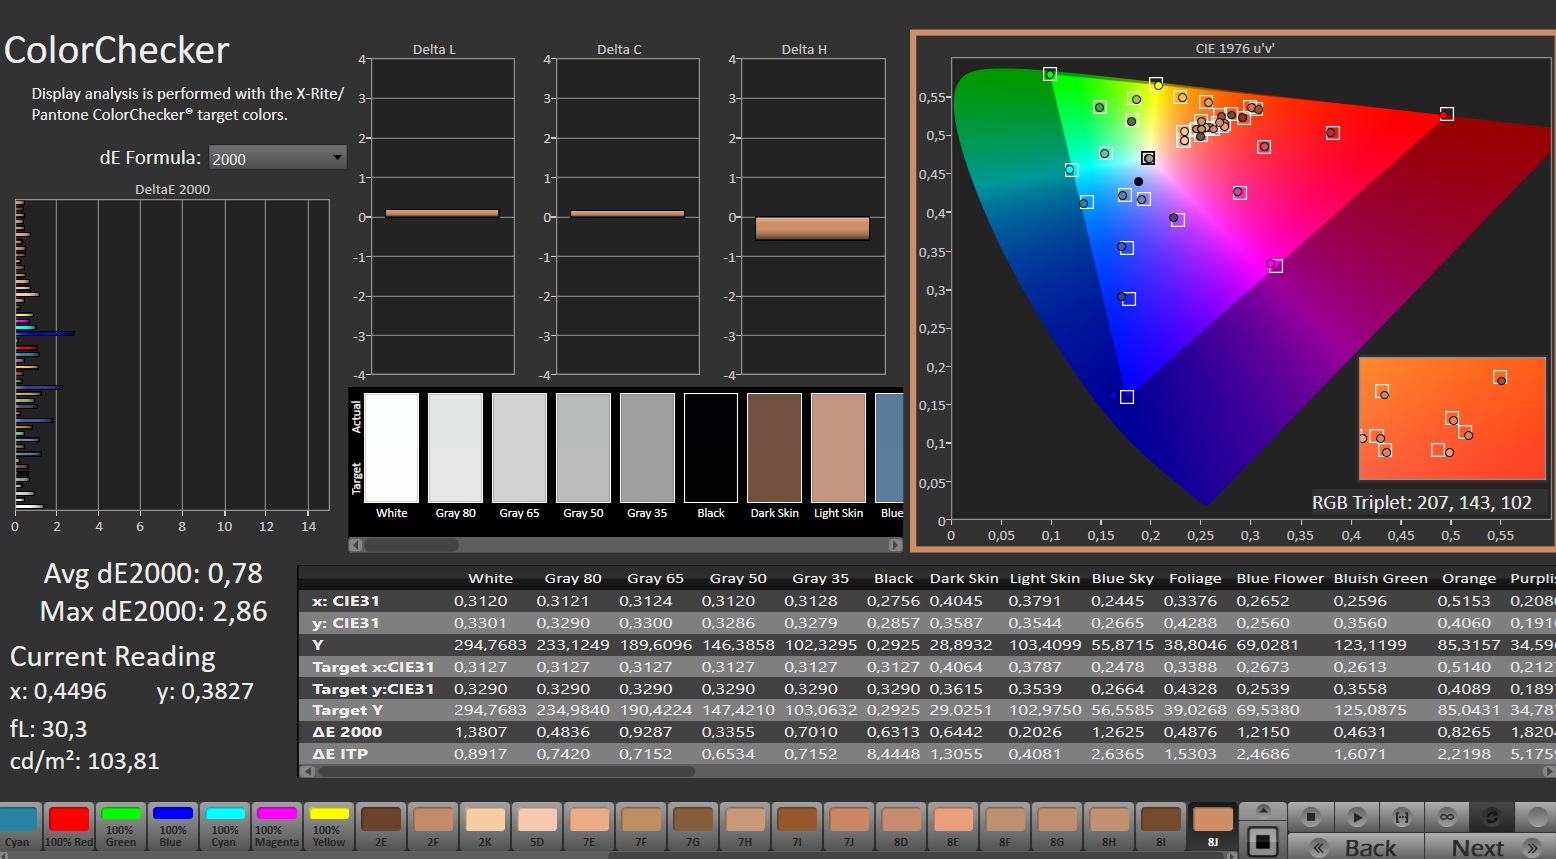
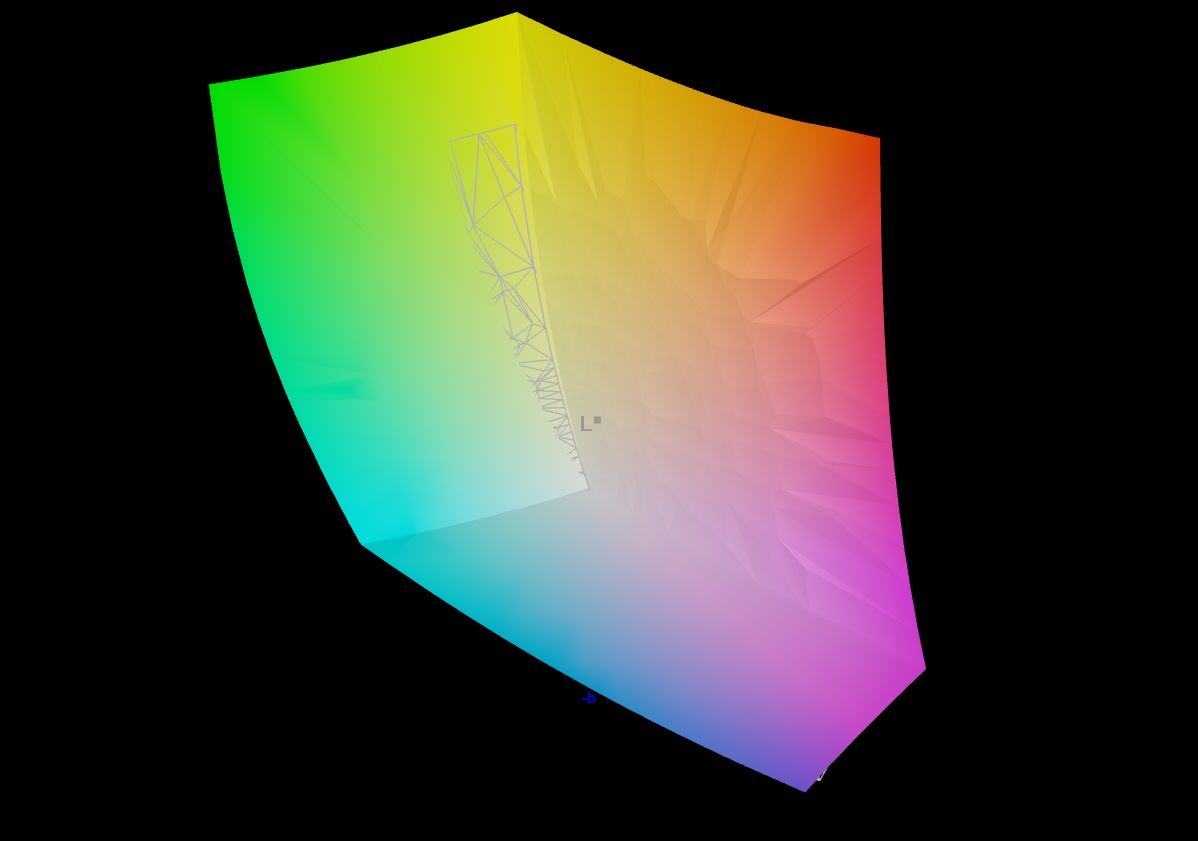
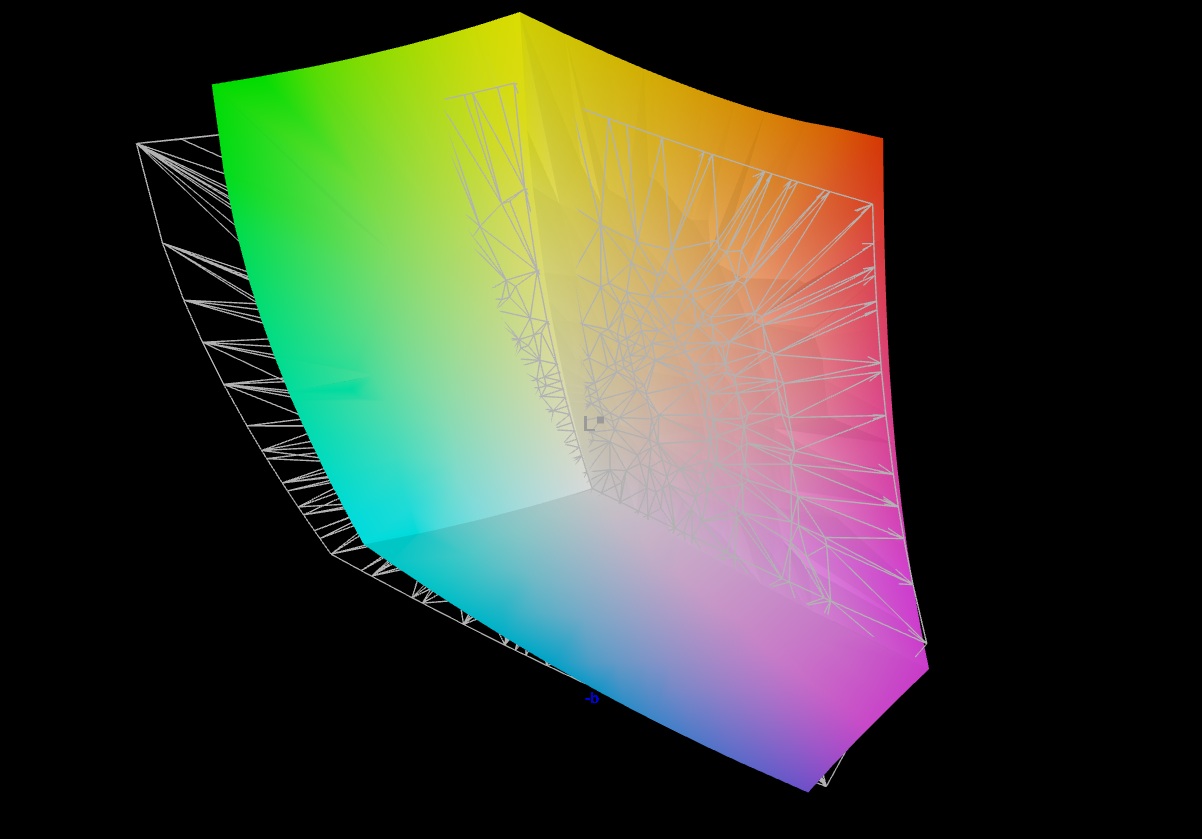
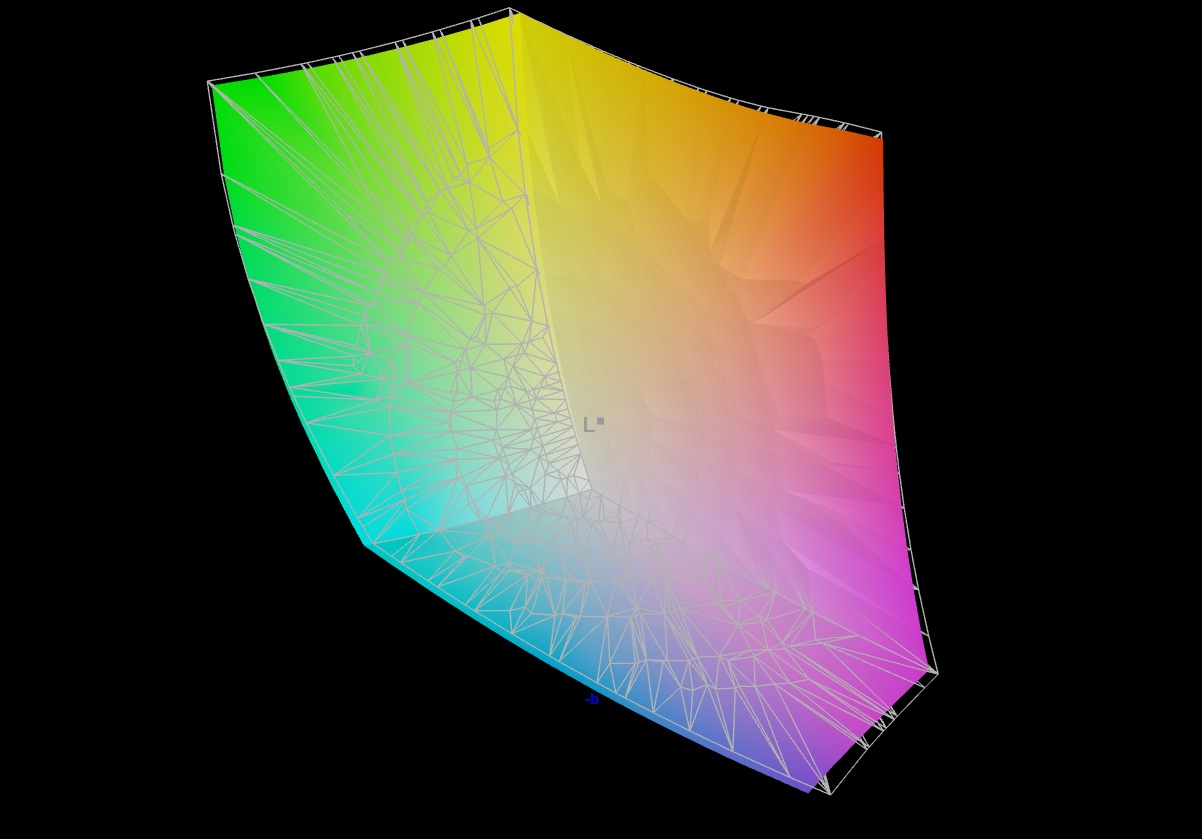
MSI has opted for a matte IPS screen in 16:9 format with a resolution of 2,560 x 1,440 pixels, which offers a solid contrast ratio of more than 1,000:1 thanks to its relatively low black value (0.27 cd/m²). However, this comes at the cost of brightness, with an average of 272 cd/m², making it suitable only for indoor use. The color gamut, on the other hand, is surprisingly high at just under 100% sRGB or DCI-P3. The response times and color fidelity also give little cause for complaint.
| |||||||||||||||||||||||||
Brightness Distribution: 87 %
Center on Battery: 296 cd/m²
Contrast: 1096:1 (Black: 0.27 cd/m²)
ΔE ColorChecker Calman: 1.35 | ∀{0.5-29.43 Ø4.73}
calibrated: 0.78
ΔE Greyscale Calman: 2.7 | ∀{0.09-98 Ø4.97}
89% AdobeRGB 1998 (Argyll 3D)
99.6% sRGB (Argyll 3D)
97.3% Display P3 (Argyll 3D)
Gamma: 2.201
CCT: 6770 K
| MSI Katana 17 HX B14WGK CSOT MNH301CA3-1, IPS, 2560x1440, 17.3", 240 Hz | Gigabyte Aero X16 1WH MNG007DA5-1, IPS, 2560x1600, 16", 165 Hz | Asus ProArt P16 H7606WP ATNA60CL10-0, OLED, 2880x1800, 16", 120 Hz | Schenker XMG Pro 16 (E25) NE160QDM-NZL, IPS, 2560x1600, 16", 300 Hz | MSI Vector 16 HX AI A2XWHG B160QAN02.3 (AUO7DB2), IPS, 2560x1600, 16", 240 Hz | |
|---|---|---|---|---|---|
| Display | -18% | 1% | -13% | -2% | |
| Display P3 Coverage (%) | 97.3 | 68.7 -29% | 99.5 2% | 74.7 -23% | 96.6 -1% |
| sRGB Coverage (%) | 99.6 | 96.1 -4% | 100 0% | 99.8 0% | 99.8 0% |
| AdobeRGB 1998 Coverage (%) | 89 | 71.2 -20% | 89.5 1% | 75.4 -15% | 84.4 -5% |
| Response Times | -46% | 91% | -31% | 26% | |
| Response Time Grey 50% / Grey 80% * (ms) | 5.2 ? | 12 ? -131% | 0.63 ? 88% | 10.5 ? -102% | 4.3 ? 17% |
| Response Time Black / White * (ms) | 9.2 ? | 5.6 ? 39% | 0.63 ? 93% | 5.4 ? 41% | 6 ? 35% |
| PWM Frequency (Hz) | 480 ? | ||||
| PWM Amplitude * (%) | 26 | ||||
| Screen | 9% | 37% | 9% | -26% | |
| Brightness middle (cd/m²) | 296 | 395 33% | 362 22% | 538 82% | 473 60% |
| Brightness (cd/m²) | 272 | 398 46% | 363 33% | 508 87% | 426 57% |
| Brightness Distribution (%) | 87 | 97 11% | 99 14% | 88 1% | 85 -2% |
| Black Level * (cd/m²) | 0.27 | 0.32 -19% | 0.47 -74% | 0.42 -56% | |
| Contrast (:1) | 1096 | 1234 13% | 1145 4% | 1126 3% | |
| Colorchecker dE 2000 * | 1.35 | 1.3 4% | 0.8 41% | 1.9 -41% | 3.47 -157% |
| Colorchecker dE 2000 max. * | 4.76 | 2.8 41% | 1.8 62% | 4 16% | 7.24 -52% |
| Colorchecker dE 2000 calibrated * | 0.78 | 1.4 -79% | 1.36 -74% | ||
| Greyscale dE 2000 * | 2.7 | 1.8 33% | 1.3 52% | 2.7 -0% | 3.1 -15% |
| Gamma | 2.201 100% | 2.2 100% | 2.2 100% | 2.24 98% | 2.486 88% |
| CCT | 6770 96% | 6842 95% | 6741 96% | 7027 93% | 6832 95% |
| Total Average (Program / Settings) | -18% /
-4% | 43% /
37% | -12% /
-2% | -1% /
-14% |
* ... smaller is better
Display Response Times
| ↔ Response Time Black to White | ||
|---|---|---|
| 9.2 ms ... rise ↗ and fall ↘ combined | ↗ 5.2 ms rise | 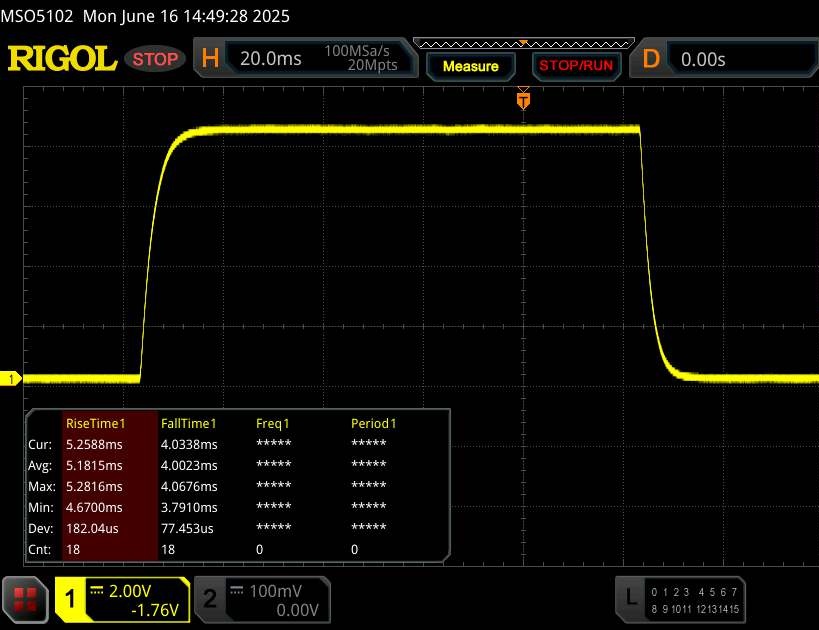 |
| ↘ 4 ms fall | ||
| The screen shows fast response rates in our tests and should be suited for gaming. In comparison, all tested devices range from 0.1 (minimum) to 240 (maximum) ms. » 25 % of all devices are better. This means that the measured response time is better than the average of all tested devices (19.9 ms). | ||
| ↔ Response Time 50% Grey to 80% Grey | ||
| 5.2 ms ... rise ↗ and fall ↘ combined | ↗ 2.4 ms rise | 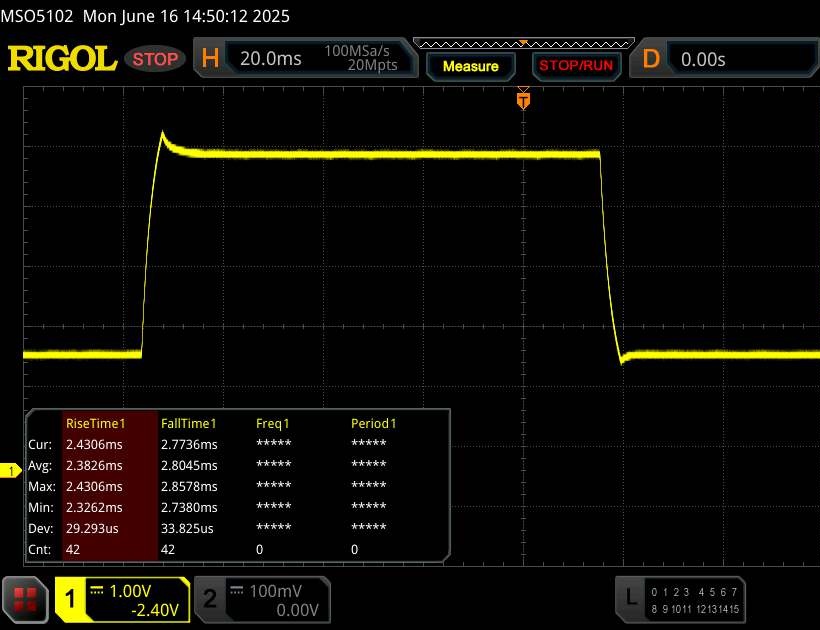 |
| ↘ 2.8 ms fall | ||
| The screen shows very fast response rates in our tests and should be very well suited for fast-paced gaming. In comparison, all tested devices range from 0.165 (minimum) to 636 (maximum) ms. » 17 % of all devices are better. This means that the measured response time is better than the average of all tested devices (31.1 ms). | ||
Screen Flickering / PWM (Pulse-Width Modulation)
| Screen flickering / PWM not detected |  | ||
In comparison: 52 % of all tested devices do not use PWM to dim the display. If PWM was detected, an average of 7797 (minimum: 5 - maximum: 343500) Hz was measured. | |||
Performance
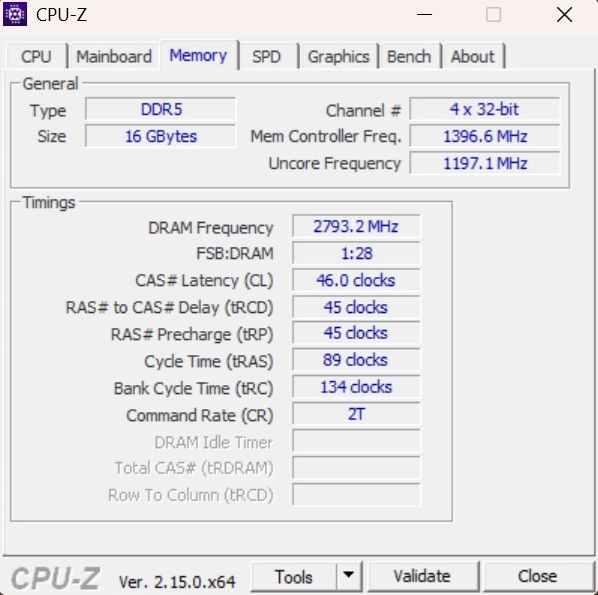
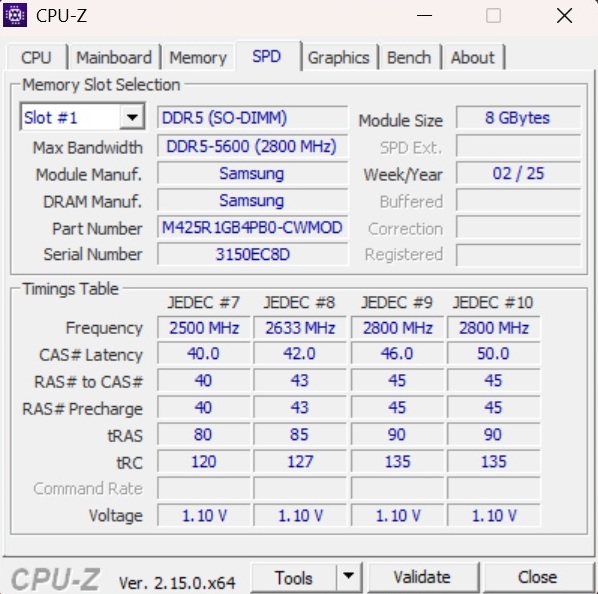
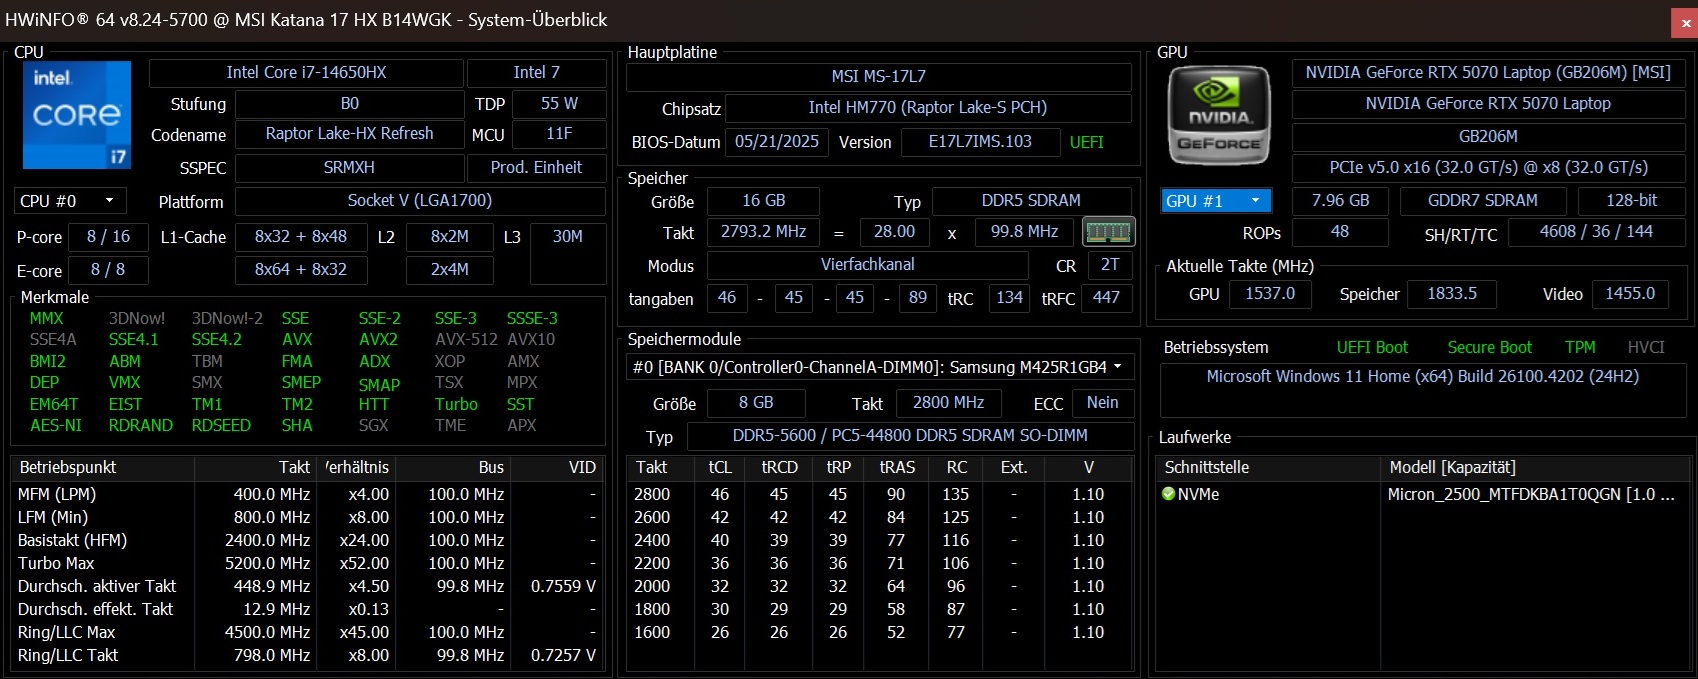
The Katana 17 HX only belongs to the (upper) mid-range, mainly due to its 8 GB VRAM. Top: Thanks to two SO-DIMM banks, nothing stands in the way of upgrading the 16 GB RAM (2x 8 GB DDR5-5600). However, it is somewhat disappointing that MSI has only integrated one M.2 slot.
Test conditions
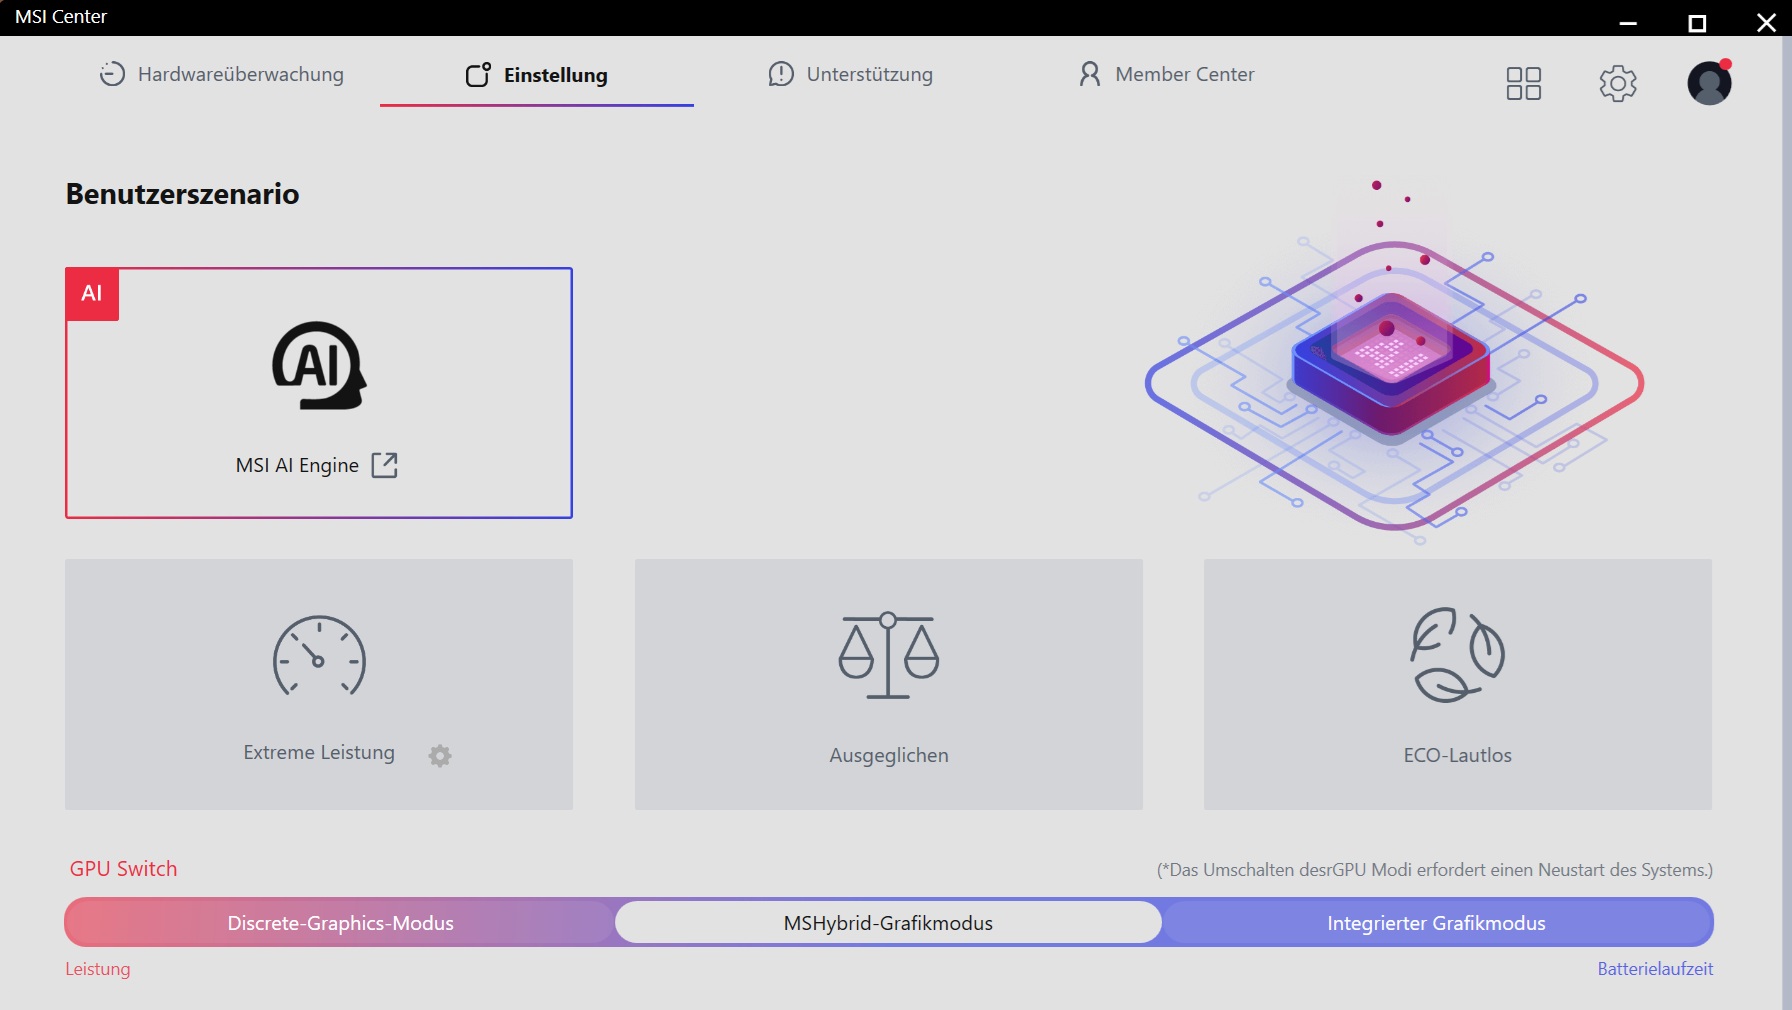
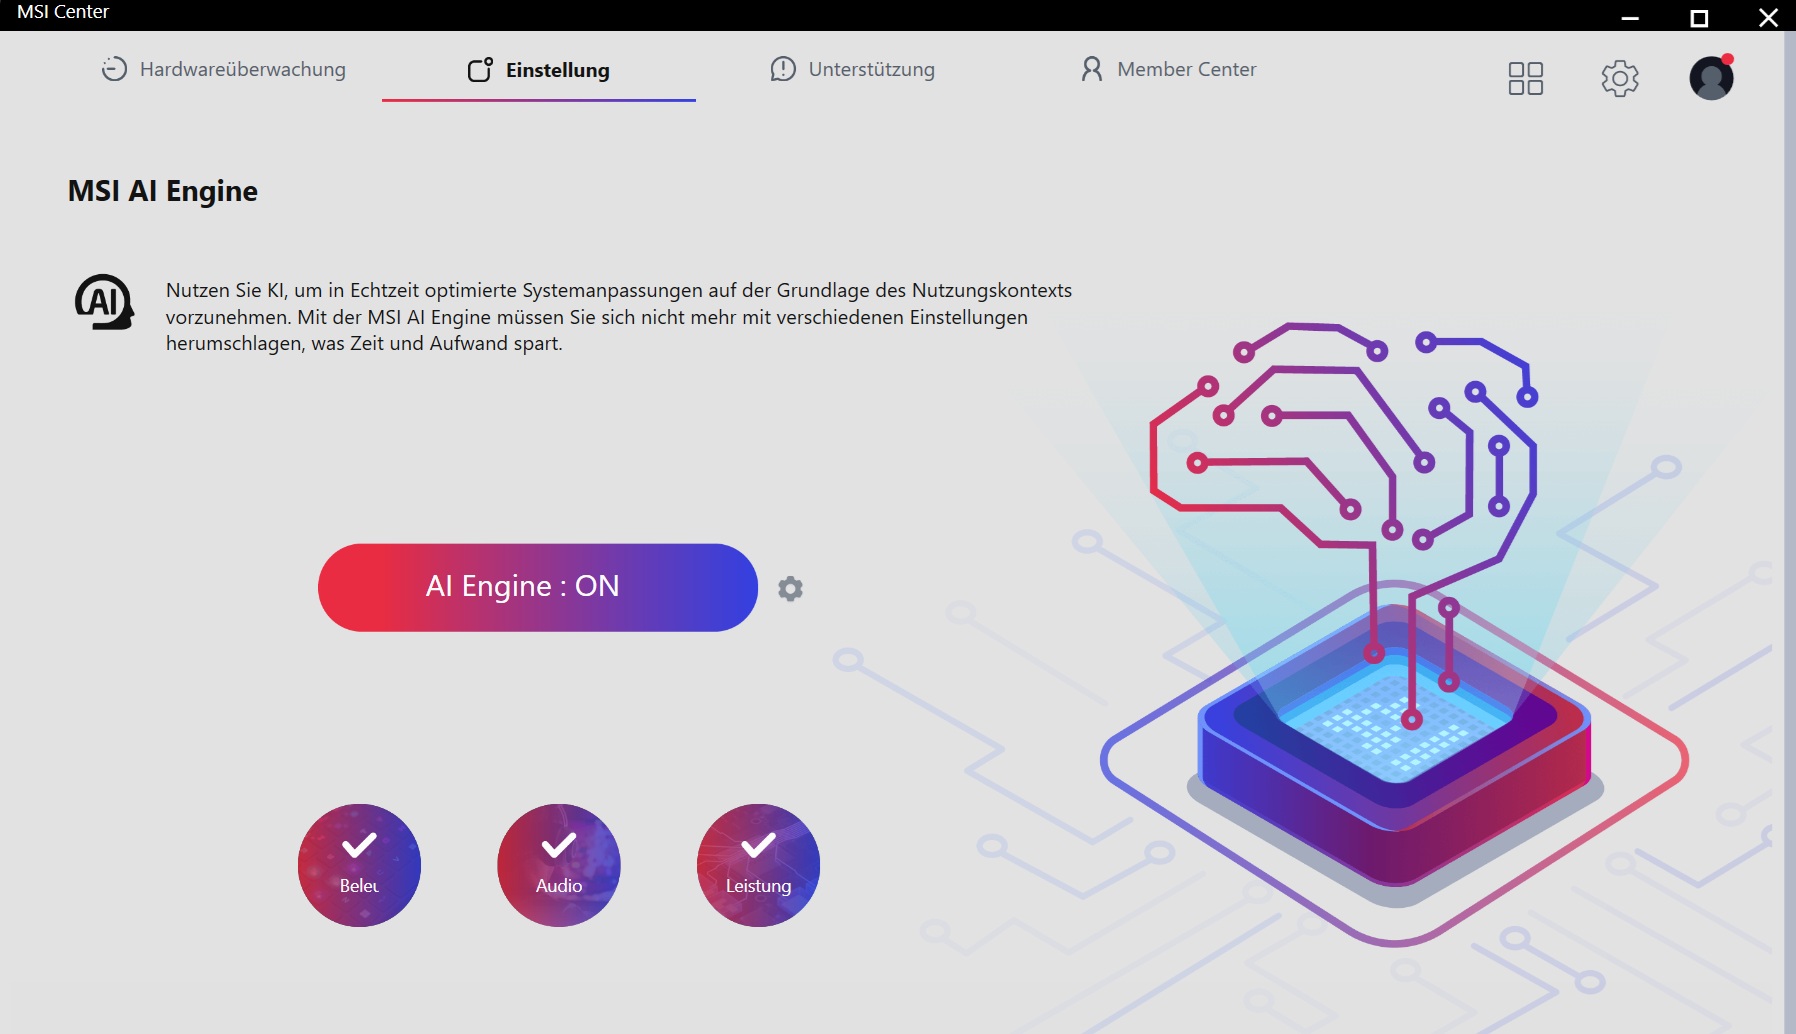
Various operating modes can be found in the pre-installed MSI Center. All of our measurements were carried out with the AI profile, which should automatically select the appropriate settings for the respective scenario.
Processor
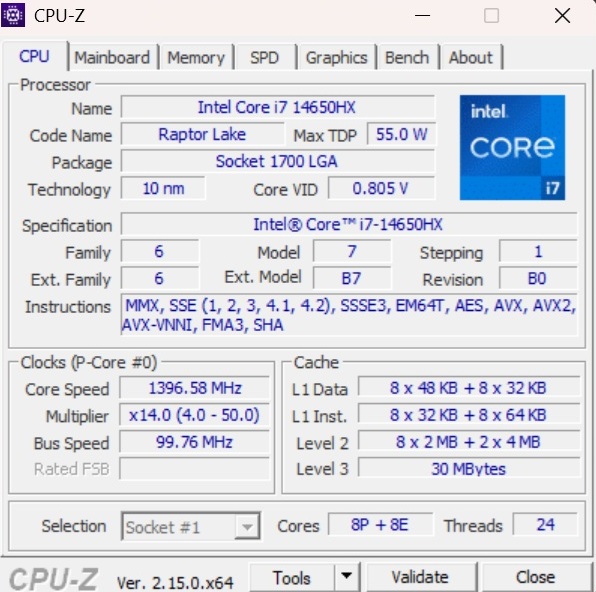
Since the installed Core i7-14650HX comes from Intel's Raptor Lake generation and contains 8 performance cores including Hyper-Threading and 8 efficiency cores without HT, is no longer quite up to date, the competitors are sometimes clearly pulling ahead in the CPU benchmarks - be it the Ryzen AI 9 HX 370 or the Core Ultra 7 255HX or Ultra 9 275HX. As our tables indicate, the performance is closer to that of the Ryzen AI 7 350.
Cinebench R15 Multi loop
* ... smaller is better
AIDA64: FP32 Ray-Trace | FPU Julia | CPU SHA3 | CPU Queen | FPU SinJulia | FPU Mandel | CPU AES | CPU ZLib | FP64 Ray-Trace | CPU PhotoWorxx
| Performance rating | |
| Schenker XMG Pro 16 (E25) | |
| Asus ProArt P16 H7606WP | |
| Average of class Gaming | |
| MSI Vector 16 HX AI A2XWHG | |
| Gigabyte Aero X16 1WH | |
| Average Intel Core i7-14650HX | |
| MSI Katana 17 HX B14WGK | |
| AIDA64 / FP32 Ray-Trace | |
| Asus ProArt P16 H7606WP | |
| Schenker XMG Pro 16 (E25) | |
| Average of class Gaming (10227 - 85542, n=109, last 2 years) | |
| MSI Vector 16 HX AI A2XWHG | |
| Gigabyte Aero X16 1WH | |
| Average Intel Core i7-14650HX (13096 - 19044, n=2) | |
| MSI Katana 17 HX B14WGK | |
| AIDA64 / FPU Julia | |
| Schenker XMG Pro 16 (E25) | |
| Asus ProArt P16 H7606WP | |
| MSI Vector 16 HX AI A2XWHG | |
| Average of class Gaming (51376 - 238426, n=109, last 2 years) | |
| Gigabyte Aero X16 1WH | |
| Average Intel Core i7-14650HX (67335 - 95271, n=2) | |
| MSI Katana 17 HX B14WGK | |
| AIDA64 / CPU SHA3 | |
| Schenker XMG Pro 16 (E25) | |
| MSI Vector 16 HX AI A2XWHG | |
| Average of class Gaming (2180 - 9817, n=109, last 2 years) | |
| Asus ProArt P16 H7606WP | |
| Gigabyte Aero X16 1WH | |
| Average Intel Core i7-14650HX (3109 - 4214, n=2) | |
| MSI Katana 17 HX B14WGK | |
| AIDA64 / CPU Queen | |
| Schenker XMG Pro 16 (E25) | |
| MSI Vector 16 HX AI A2XWHG | |
| Average of class Gaming (49785 - 173351, n=100, last 2 years) | |
| Average Intel Core i7-14650HX (89907 - 101500, n=2) | |
| Asus ProArt P16 H7606WP | |
| MSI Katana 17 HX B14WGK | |
| Gigabyte Aero X16 1WH | |
| AIDA64 / FPU SinJulia | |
| Asus ProArt P16 H7606WP | |
| Average of class Gaming (4424 - 33636, n=109, last 2 years) | |
| Schenker XMG Pro 16 (E25) | |
| Gigabyte Aero X16 1WH | |
| MSI Vector 16 HX AI A2XWHG | |
| Average Intel Core i7-14650HX (9159 - 11913, n=2) | |
| MSI Katana 17 HX B14WGK | |
| AIDA64 / FPU Mandel | |
| Schenker XMG Pro 16 (E25) | |
| Asus ProArt P16 H7606WP | |
| MSI Vector 16 HX AI A2XWHG | |
| Average of class Gaming (25115 - 128721, n=109, last 2 years) | |
| Gigabyte Aero X16 1WH | |
| Average Intel Core i7-14650HX (32747 - 47097, n=2) | |
| MSI Katana 17 HX B14WGK | |
| AIDA64 / CPU AES | |
| Schenker XMG Pro 16 (E25) | |
| Asus ProArt P16 H7606WP | |
| Average of class Gaming (39258 - 247074, n=109, last 2 years) | |
| MSI Vector 16 HX AI A2XWHG | |
| Gigabyte Aero X16 1WH | |
| Average Intel Core i7-14650HX (63627 - 86485, n=2) | |
| MSI Katana 17 HX B14WGK | |
| AIDA64 / CPU ZLib | |
| Schenker XMG Pro 16 (E25) | |
| Average of class Gaming (574 - 2531, n=109, last 2 years) | |
| MSI Vector 16 HX AI A2XWHG | |
| Asus ProArt P16 H7606WP | |
| Gigabyte Aero X16 1WH | |
| Average Intel Core i7-14650HX (924 - 1289, n=2) | |
| MSI Katana 17 HX B14WGK | |
| AIDA64 / FP64 Ray-Trace | |
| Asus ProArt P16 H7606WP | |
| Schenker XMG Pro 16 (E25) | |
| Average of class Gaming (5509 - 45446, n=109, last 2 years) | |
| MSI Vector 16 HX AI A2XWHG | |
| Gigabyte Aero X16 1WH | |
| Average Intel Core i7-14650HX (7064 - 10316, n=2) | |
| MSI Katana 17 HX B14WGK | |
| AIDA64 / CPU PhotoWorxx | |
| Schenker XMG Pro 16 (E25) | |
| Asus ProArt P16 H7606WP | |
| Average of class Gaming (12271 - 89891, n=109, last 2 years) | |
| Gigabyte Aero X16 1WH | |
| MSI Vector 16 HX AI A2XWHG | |
| MSI Katana 17 HX B14WGK | |
| Average Intel Core i7-14650HX (33763 - 34470, n=2) | |
System performance
In terms of system performance, the Katana 17 brings up the rear in the test field, although the gap to the competition (except the XMG Pro 16) is fairly small.
PCMark 10: Score | Essentials | Productivity | Digital Content Creation
CrossMark: Overall | Productivity | Creativity | Responsiveness
WebXPRT 3: Overall
WebXPRT 4: Overall
Mozilla Kraken 1.1: Total
| Performance rating | |
| Schenker XMG Pro 16 (E25) | |
| Average of class Gaming | |
| MSI Vector 16 HX AI A2XWHG | |
| Asus ProArt P16 H7606WP | |
| Gigabyte Aero X16 1WH | |
| MSI Katana 17 HX B14WGK | |
| Average Intel Core i7-14650HX, NVIDIA GeForce RTX 5070 Laptop | |
| PCMark 10 / Score | |
| Schenker XMG Pro 16 (E25) | |
| Average of class Gaming (5828 - 11574, n=95, last 2 years) | |
| Asus ProArt P16 H7606WP | |
| Gigabyte Aero X16 1WH | |
| MSI Vector 16 HX AI A2XWHG | |
| MSI Katana 17 HX B14WGK | |
| Average Intel Core i7-14650HX, NVIDIA GeForce RTX 5070 Laptop (n=1) | |
| PCMark 10 / Essentials | |
| Schenker XMG Pro 16 (E25) | |
| MSI Vector 16 HX AI A2XWHG | |
| Average of class Gaming (8810 - 12600, n=99, last 2 years) | |
| Asus ProArt P16 H7606WP | |
| Gigabyte Aero X16 1WH | |
| MSI Katana 17 HX B14WGK | |
| Average Intel Core i7-14650HX, NVIDIA GeForce RTX 5070 Laptop (n=1) | |
| PCMark 10 / Productivity | |
| Average of class Gaming (6845 - 18766, n=97, last 2 years) | |
| Gigabyte Aero X16 1WH | |
| Schenker XMG Pro 16 (E25) | |
| MSI Vector 16 HX AI A2XWHG | |
| Asus ProArt P16 H7606WP | |
| MSI Katana 17 HX B14WGK | |
| Average Intel Core i7-14650HX, NVIDIA GeForce RTX 5070 Laptop (n=1) | |
| PCMark 10 / Digital Content Creation | |
| Schenker XMG Pro 16 (E25) | |
| Asus ProArt P16 H7606WP | |
| Average of class Gaming (7602 - 19657, n=97, last 2 years) | |
| MSI Vector 16 HX AI A2XWHG | |
| Gigabyte Aero X16 1WH | |
| MSI Katana 17 HX B14WGK | |
| Average Intel Core i7-14650HX, NVIDIA GeForce RTX 5070 Laptop (n=1) | |
| CrossMark / Overall | |
| Schenker XMG Pro 16 (E25) | |
| Average of class Gaming (1366 - 2409, n=97, last 2 years) | |
| MSI Katana 17 HX B14WGK | |
| Average Intel Core i7-14650HX, NVIDIA GeForce RTX 5070 Laptop (n=1) | |
| MSI Vector 16 HX AI A2XWHG | |
| Asus ProArt P16 H7606WP | |
| Gigabyte Aero X16 1WH | |
| CrossMark / Productivity | |
| Schenker XMG Pro 16 (E25) | |
| MSI Katana 17 HX B14WGK | |
| Average Intel Core i7-14650HX, NVIDIA GeForce RTX 5070 Laptop (n=1) | |
| Average of class Gaming (1386 - 2254, n=97, last 2 years) | |
| MSI Vector 16 HX AI A2XWHG | |
| Asus ProArt P16 H7606WP | |
| Gigabyte Aero X16 1WH | |
| CrossMark / Creativity | |
| Schenker XMG Pro 16 (E25) | |
| Asus ProArt P16 H7606WP | |
| MSI Vector 16 HX AI A2XWHG | |
| Average of class Gaming (1343 - 2729, n=97, last 2 years) | |
| MSI Katana 17 HX B14WGK | |
| Average Intel Core i7-14650HX, NVIDIA GeForce RTX 5070 Laptop (n=1) | |
| Gigabyte Aero X16 1WH | |
| CrossMark / Responsiveness | |
| MSI Katana 17 HX B14WGK | |
| Average Intel Core i7-14650HX, NVIDIA GeForce RTX 5070 Laptop (n=1) | |
| Schenker XMG Pro 16 (E25) | |
| Average of class Gaming (1226 - 2334, n=97, last 2 years) | |
| Asus ProArt P16 H7606WP | |
| MSI Vector 16 HX AI A2XWHG | |
| Gigabyte Aero X16 1WH | |
| WebXPRT 3 / Overall | |
| Schenker XMG Pro 16 (E25) | |
| Gigabyte Aero X16 1WH | |
| Asus ProArt P16 H7606WP | |
| MSI Vector 16 HX AI A2XWHG | |
| Average of class Gaming (242 - 532, n=100, last 2 years) | |
| MSI Katana 17 HX B14WGK | |
| Average Intel Core i7-14650HX, NVIDIA GeForce RTX 5070 Laptop (n=1) | |
| WebXPRT 4 / Overall | |
| Schenker XMG Pro 16 (E25) | |
| MSI Vector 16 HX AI A2XWHG | |
| Average of class Gaming (176.4 - 354, n=100, last 2 years) | |
| Gigabyte Aero X16 1WH | |
| Asus ProArt P16 H7606WP | |
| MSI Katana 17 HX B14WGK | |
| Average Intel Core i7-14650HX, NVIDIA GeForce RTX 5070 Laptop (n=1) | |
| Mozilla Kraken 1.1 / Total | |
| MSI Katana 17 HX B14WGK | |
| Average Intel Core i7-14650HX, NVIDIA GeForce RTX 5070 Laptop (n=1) | |
| Average of class Gaming (391 - 590, n=105, last 2 years) | |
| Asus ProArt P16 H7606WP | |
| Gigabyte Aero X16 1WH | |
| MSI Vector 16 HX AI A2XWHG | |
| Schenker XMG Pro 16 (E25) | |
* ... smaller is better
| PCMark 10 Score | 6864 points | |
Help | ||
| AIDA64 / Memory Copy | |
| Asus ProArt P16 H7606WP | |
| Schenker XMG Pro 16 (E25) | |
| Gigabyte Aero X16 1WH | |
| Average of class Gaming (21750 - 129946, n=109, last 2 years) | |
| MSI Vector 16 HX AI A2XWHG | |
| Average Intel Core i7-14650HX (58978 - 59727, n=2) | |
| MSI Katana 17 HX B14WGK | |
| AIDA64 / Memory Read | |
| Asus ProArt P16 H7606WP | |
| Schenker XMG Pro 16 (E25) | |
| MSI Vector 16 HX AI A2XWHG | |
| Average of class Gaming (22956 - 118858, n=109, last 2 years) | |
| Average Intel Core i7-14650HX (70720 - 71455, n=2) | |
| MSI Katana 17 HX B14WGK | |
| Gigabyte Aero X16 1WH | |
| AIDA64 / Memory Write | |
| Asus ProArt P16 H7606WP | |
| Gigabyte Aero X16 1WH | |
| Schenker XMG Pro 16 (E25) | |
| Average of class Gaming (22297 - 135096, n=109, last 2 years) | |
| MSI Vector 16 HX AI A2XWHG | |
| MSI Katana 17 HX B14WGK | |
| Average Intel Core i7-14650HX (51138 - 56811, n=2) | |
| AIDA64 / Memory Latency | |
| Asus ProArt P16 H7606WP | |
| MSI Vector 16 HX AI A2XWHG | |
| Average of class Gaming (75.3 - 259, n=109, last 2 years) | |
| Schenker XMG Pro 16 (E25) | |
| Gigabyte Aero X16 1WH | |
| MSI Katana 17 HX B14WGK | |
| Average Intel Core i7-14650HX (89.8 - 95.2, n=2) | |
* ... smaller is better
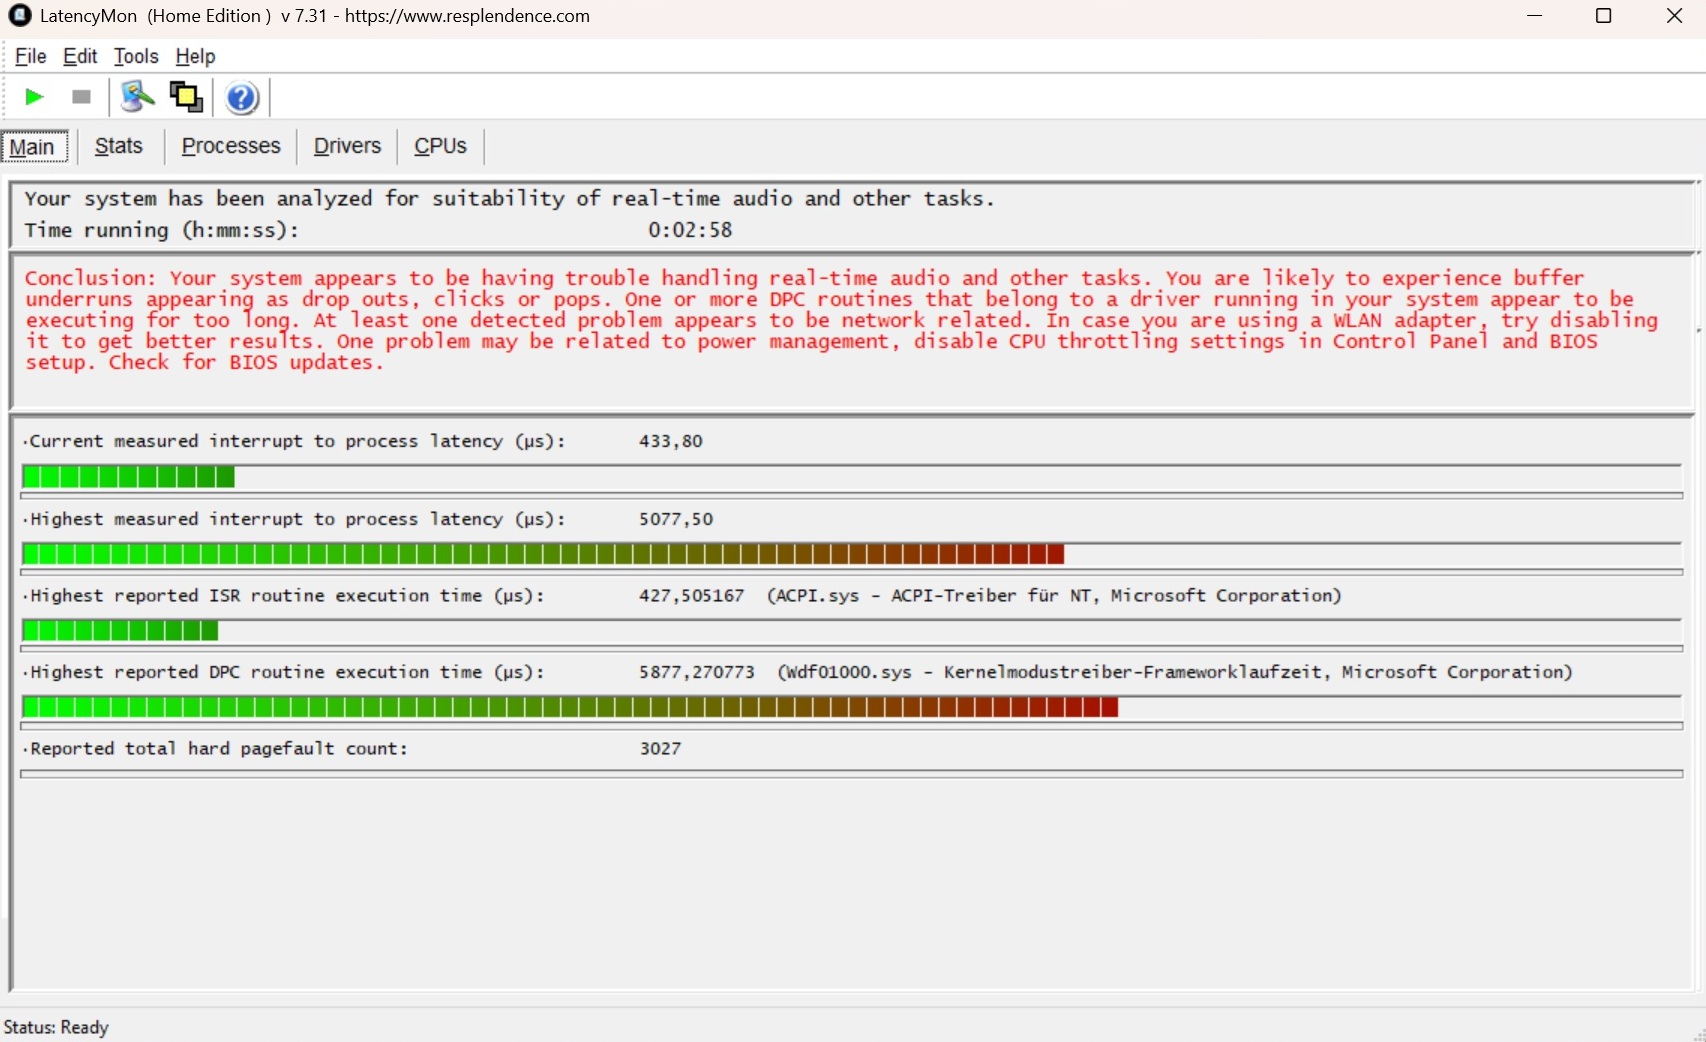
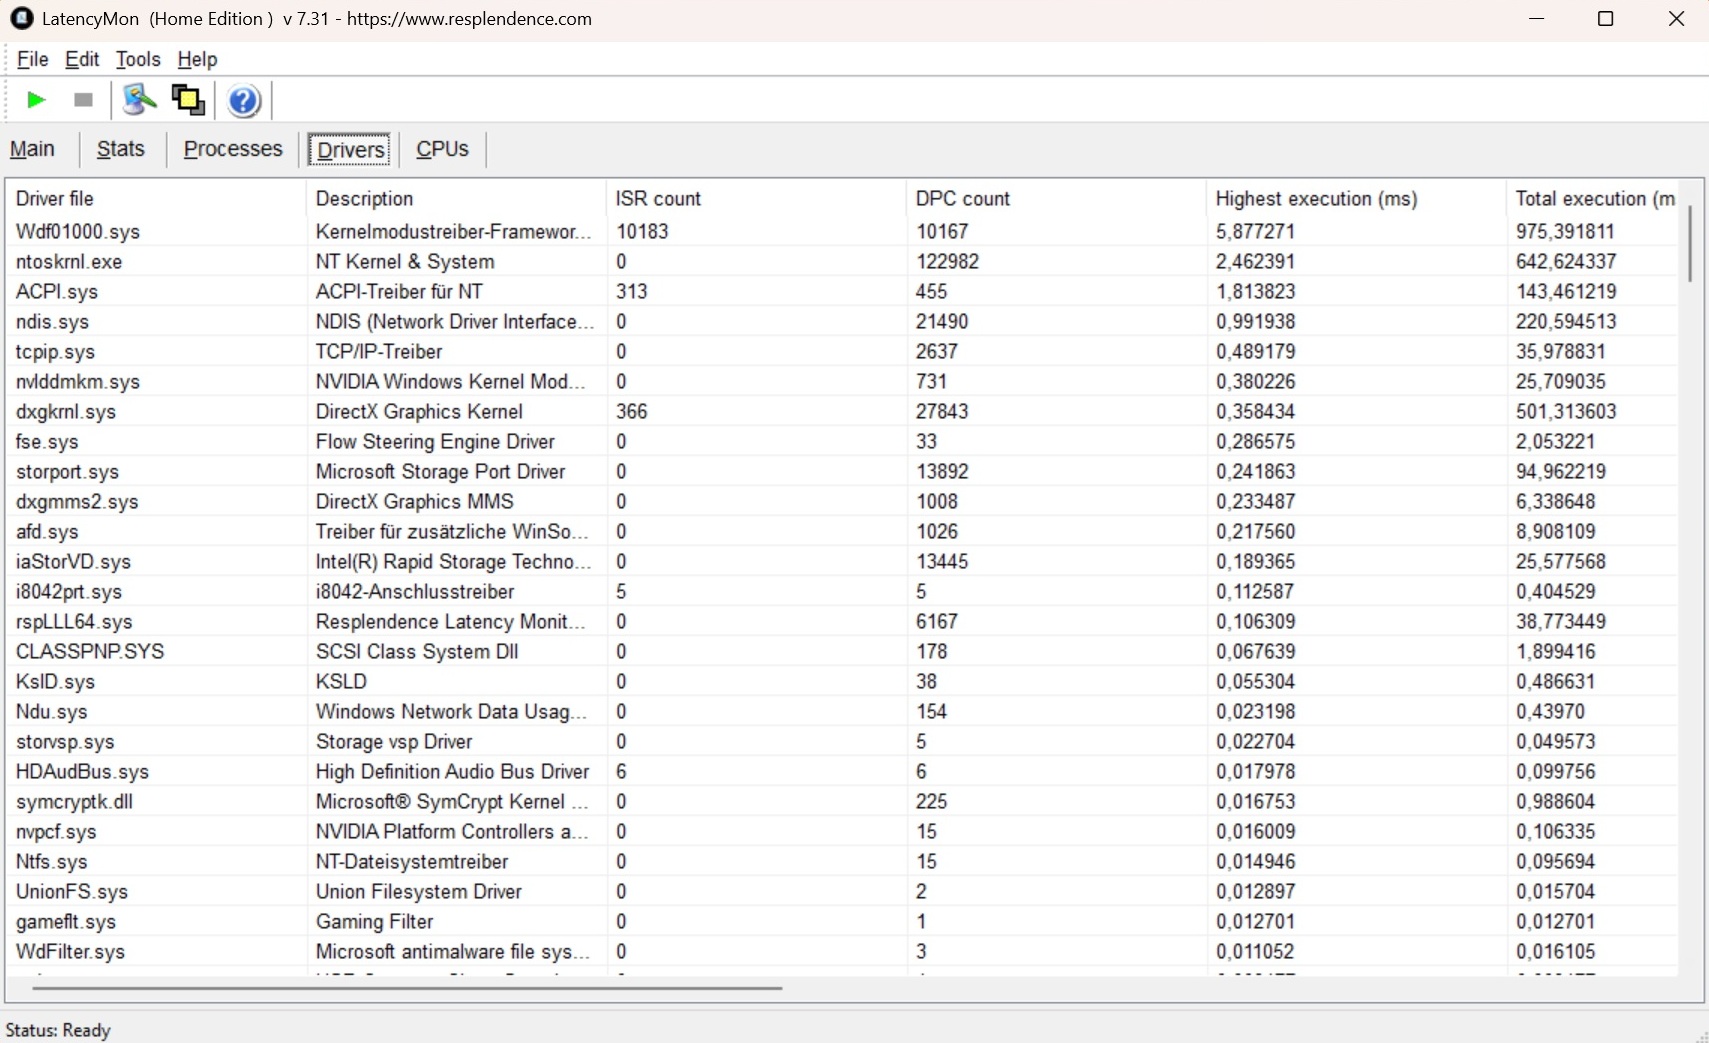
DPC latencies
One problem for some users could be the very high latency, which also affects the Vector 16.
| DPC Latencies / LatencyMon - interrupt to process latency (max), Web, Youtube, Prime95 | |
| MSI Katana 17 HX B14WGK | |
| MSI Vector 16 HX AI A2XWHG | |
| Gigabyte Aero X16 1WH | |
| Schenker XMG Pro 16 (E25) | |
| Asus ProArt P16 H7606WP | |
* ... smaller is better
Storage devices
MSI deserves praise for the fast SSD. The 1 TB drive from Micron (model 2500) delivers excellent and stable values for both reading and writing.

* ... smaller is better
Continuous read: DiskSpd Read Loop, Queue Depth 8
GPU performance
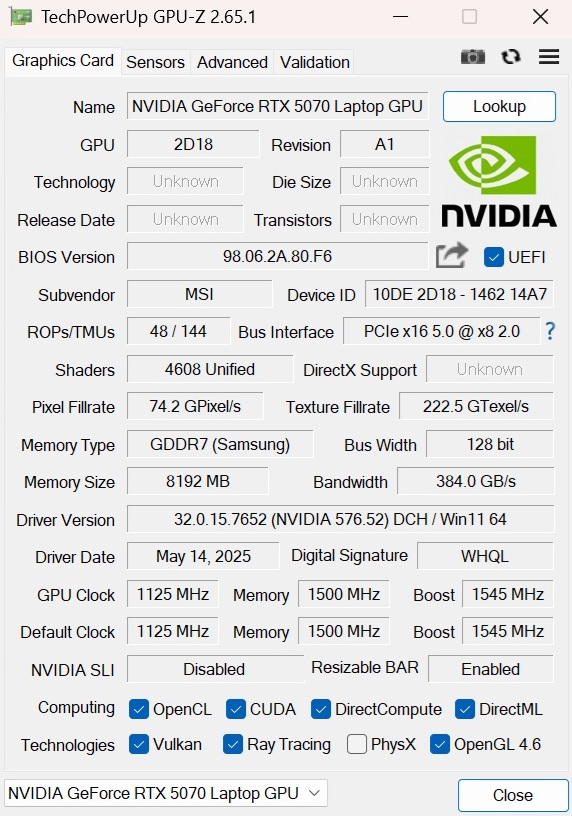
From our perspective, the GeForce RTX 5070 laptop shouldn't exist in this form. The RTX 5070 Ti laptop, with its 12 GB of GDDR7 VRAM instead of 8 GB, should be the actual "standard version" (at the price of the RTX 5070 laptop, of course). However, this results in a gaming laptop that is only future-proof to a very limited extent due to its limited video memory, and it is already reaching its limits with some modern titles - more on this in a moment. In synthetic benchmarks, the Katana 17 with its 115-watt TGP (including Dynamic Boost) is at least in line with the previously determined average for this GPU. An RTX 5070 Ti laptop model averages around 30% faster performance.
| 3DMark 11 Performance | 33622 points | |
| 3DMark Cloud Gate Standard Score | 56625 points | |
| 3DMark Fire Strike Score | 29564 points | |
| 3DMark Time Spy Score | 12583 points | |
Help | ||
* ... smaller is better
Gaming performance
This gap continues in the gaming course. Here, too, an RTX 5070 Ti laptop performs 30% faster on average. Meanwhile, an RTX 5080 laptop is around 60% faster in QHD. The difference can be stark in VRAM-heavy games. With the Very Ultra preset, an RTX 5070 Ti laptop achieves around 150% more frames per second in Indiana Jones (32.4 vs 82.5 FPS @ MSI Vector A18 HX), an RTX 5080 laptop is even almost 200% ahead (99.5 FPS @ MSI Raider A18 HX).
However, the RTX 5070 laptop currently still has enough power to run almost all titles with high to maximum details in the native resolution of 2,560 x 1,440 pixels. Things get tight with very demanding or poorly optimized titles such as Hellblade 2, Star Wars Outlaws, Until Dawn, and Oblivion Remastered - here, the 40 FPS mark is not cracked. As usual, upscaling in the form of DLSS (4) and optional (Multi) Frame Generation provides a remedy. The capabilities of the latter in terms of frame rate can be seen, for example, in Stalker 2 (see table).
| Performance rating - Percent | |
| Medion Erazer Beast 18 X1 MD62731 -1! | |
| MSI Vector 16 HX AI A2XWHG -1! | |
| Average of class Gaming | |
| Average NVIDIA GeForce RTX 5070 Laptop | |
| MSI Katana 17 HX B14WGK | |
| Doom: The Dark Ages | |
| 2560x1440 Ultra Nightmare AA:T | |
| Medion Erazer Beast 18 X1 MD62731 | |
| MSI Vector 16 HX AI A2XWHG | |
| Average of class Gaming (30.4 - 92.2, n=19, last 2 years) | |
| MSI Katana 17 HX B14WGK | |
| Average NVIDIA GeForce RTX 5070 Laptop (39.5 - 49.4, n=5) | |
| 2560x1440 Ultra Nightmare - DLSS Quality | |
| Medion Erazer Beast 18 X1 MD62731 | |
| MSI Vector 16 HX AI A2XWHG | |
| Average of class Gaming (48 - 107.3, n=18, last 2 years) | |
| Average NVIDIA GeForce RTX 5070 Laptop (54.6 - 70, n=5) | |
| MSI Katana 17 HX B14WGK | |
| The Elder Scrolls IV Oblivion Remastered | |
| 2560x1440 Ultra Preset AA:T | |
| Medion Erazer Beast 18 X1 MD62731 | |
| MSI Vector 16 HX AI A2XWHG | |
| Average of class Gaming (12.7 - 45.9, n=14, last 2 years) | |
| MSI Katana 17 HX B14WGK | |
| Average NVIDIA GeForce RTX 5070 Laptop (19.5 - 20.9, n=3) | |
| 2560x1440 Ultra Preset + Quality DLSS | |
| Medion Erazer Beast 18 X1 MD62731 | |
| MSI Vector 16 HX AI A2XWHG | |
| Average of class Gaming (25.3 - 59.7, n=12, last 2 years) | |
| Average NVIDIA GeForce RTX 5070 Laptop (30.3 - 34, n=3) | |
| MSI Katana 17 HX B14WGK | |
| Kingdom Come Deliverance 2 | |
| 2560x1440 Ultra Preset | |
| Medion Erazer Beast 18 X1 MD62731 | |
| Average of class Gaming (36.8 - 97.2, n=13, last 2 years) | |
| MSI Vector 16 HX AI A2XWHG | |
| Average NVIDIA GeForce RTX 5070 Laptop (42.6 - 52.1, n=3) | |
| MSI Katana 17 HX B14WGK | |
| 2560x1440 Ultra Preset + Quality DLSS | |
| Medion Erazer Beast 18 X1 MD62731 | |
| Average of class Gaming (50.3 - 115.5, n=13, last 2 years) | |
| MSI Vector 16 HX AI A2XWHG | |
| Average NVIDIA GeForce RTX 5070 Laptop (58.5 - 71.5, n=3) | |
| MSI Katana 17 HX B14WGK | |
| Until Dawn | |
| 2560x1440 Ultra Preset | |
| Medion Erazer Beast 18 X1 MD62731 | |
| Average of class Gaming (30.4 - 76.6, n=11, last 2 years) | |
| MSI Vector 16 HX AI A2XWHG | |
| Average NVIDIA GeForce RTX 5070 Laptop (35.4 - 44.4, n=2) | |
| MSI Katana 17 HX B14WGK | |
| 2560x1440 Ultra Preset + Quality DLSS + Ray Tracing | |
| Medion Erazer Beast 18 X1 MD62731 | |
| MSI Vector 16 HX AI A2XWHG | |
| Average of class Gaming (39.5 - 86.3, n=10, last 2 years) | |
| Average NVIDIA GeForce RTX 5070 Laptop (46.7 - 57.8, n=2) | |
| MSI Katana 17 HX B14WGK | |
| Ghost of Tsushima | |
| 2560x1440 Very High Preset AA:T | |
| Medion Erazer Beast 18 X1 MD62731 | |
| MSI Vector 16 HX AI A2XWHG | |
| Average of class Gaming (22.7 - 100.3, n=13, last 2 years) | |
| Average NVIDIA GeForce RTX 5070 Laptop (49.1 - 53.8, n=2) | |
| MSI Katana 17 HX B14WGK | |
| 2560x1440 Very High Preset + Quality DLSS | |
| Medion Erazer Beast 18 X1 MD62731 | |
| MSI Vector 16 HX AI A2XWHG | |
| Average of class Gaming (55.2 - 105.2, n=10, last 2 years) | |
| Average NVIDIA GeForce RTX 5070 Laptop (66.5 - 74.6, n=2) | |
| MSI Katana 17 HX B14WGK | |
| Horizon Forbidden West | |
| 2560x1440 Very High Preset AA:T | |
| Medion Erazer Beast 18 X1 MD62731 | |
| MSI Vector 16 HX AI A2XWHG | |
| Average of class Gaming (39.6 - 100.9, n=10, last 2 years) | |
| Average NVIDIA GeForce RTX 5070 Laptop (57.9 - 64, n=2) | |
| MSI Katana 17 HX B14WGK | |
| 2560x1440 Very High Preset + DLSS Quality | |
| Medion Erazer Beast 18 X1 MD62731 | |
| MSI Vector 16 HX AI A2XWHG | |
| Average of class Gaming (58.4 - 116.6, n=8, last 2 years) | |
| Average NVIDIA GeForce RTX 5070 Laptop (70.3 - 81.3, n=2) | |
| MSI Katana 17 HX B14WGK | |
| Indiana Jones and the Great Circle - 2560x1440 Very Ultra Preset | |
| Average of class Gaming (4.2 - 121.9, n=33, last 2 years) | |
| MSI Katana 17 HX B14WGK | |
| Average NVIDIA GeForce RTX 5070 Laptop (7.6 - 32.4, n=4) | |
| Final Fantasy XV Benchmark - 1920x1080 High Quality | |
| MSI Vector 16 HX AI A2XWHG | |
| Schenker XMG Pro 16 (E25) | |
| Average of class Gaming (41 - 215, n=103, last 2 years) | |
| Average NVIDIA GeForce RTX 5070 Laptop (96 - 150.7, n=25) | |
| Asus ProArt P16 H7606WP | |
| Gigabyte Aero X16 1WH | |
| Strange Brigade - 1920x1080 ultra AA:ultra AF:16 | |
| Average of class Gaming (76.3 - 456, n=93, last 2 years) | |
| Asus ProArt P16 H7606WP | |
| Average NVIDIA GeForce RTX 5070 Laptop (203 - 261, n=23) | |
| Gigabyte Aero X16 1WH | |
| Schenker XMG Pro 16 (E25) | |
| low | med. | high | ultra | QHD DLSS | QHD | |
|---|---|---|---|---|---|---|
| GTA V (2015) | 180.8 | 167.2 | 119 | 108.3 | ||
| Dota 2 Reborn (2015) | 199.1 | 170.8 | 161.7 | 149.3 | ||
| X-Plane 11.11 (2018) | 146.6 | 127.7 | 106.4 | |||
| Baldur's Gate 3 (2023) | 127.2 | 123.8 | 101.3 | 82.5 | ||
| Cyberpunk 2077 (2023) | 126.8 | 113.8 | 101.5 | 64.5 | ||
| Counter-Strike 2 (2023) | 222 | 170.4 | 156.5 | 115.4 | ||
| Prince of Persia The Lost Crown (2024) | 356 | 356 | 356 | 352 | ||
| Helldivers 2 (2024) | 102.1 | 101.2 | 97.4 | 81.3 | ||
| Dragon's Dogma 2 (2024) | 66 | 60.2 | ||||
| Horizon Forbidden West (2024) | 91.1 | 74.9 | 73.2 | 70.3 | 57.9 | |
| Ghost of Tsushima (2024) | 84.5 | 80.4 | 64.9 | 66.5 | 49.1 | |
| Senua's Saga Hellblade 2 (2024) | 64.1 | 46.3 | 49.4 | 31.7 | ||
| Star Wars Outlaws (2024) | 65.4 | 58.5 | 49.4 | 48.5 | 35.1 | |
| Space Marine 2 (2024) | 64.7 | 61.6 | 58.9 | 58.5 | 54.7 | |
| Until Dawn (2024) | 76.8 | 59.6 | 48.8 | 46.7 | 35.4 | |
| Stalker 2 (2024) | 64 | 54.1 | 47.1 | 74.1 | 36 | |
| Indiana Jones and the Great Circle (2024) | 60 | 42.3 | 32.4 | |||
| Kingdom Come Deliverance 2 (2025) | 111.5 | 91.4 | 67.6 | 61.5 | 45.5 | |
| Civilization 7 (2025) | 154.1 | 142.7 | 97.9 | |||
| The Elder Scrolls IV Oblivion Remastered (2025) | 72.8 | 62.3 | 30.7 | 32 | 20.9 | |
| Doom: The Dark Ages (2025) | 69.6 | 66 | 64.8 | 59.9 | 45.4 |
We tested whether the GPU performance remains constant over a longer period with Cyberpunk 2077: The Katana 17 can output stable FPS without drops.
Cyberpunk 2077 Ultra settings FPS chart
Emissions
Noise emissions
While the 17-inch device remains reasonably quiet in idle mode at 31 to 34 dB(A), the case fans become quite loud under load at 50 to 59 dB(A). All competitors were quieter in 3D mode.
Noise level
| Idle |
| 31 / 32 / 34 dB(A) |
| Load |
| 50 / 59 dB(A) |
 | ||
30 dB silent 40 dB(A) audible 50 dB(A) loud |
||
min: | ||
| MSI Katana 17 HX B14WGK i7-14650HX, GeForce RTX 5070 Laptop | Gigabyte Aero X16 1WH Ryzen AI 7 350, GeForce RTX 5070 Laptop | Asus ProArt P16 H7606WP Ryzen AI 9 HX 370, GeForce RTX 5070 Laptop | Schenker XMG Pro 16 (E25) Ultra 9 275HX, GeForce RTX 5070 Ti Laptop | MSI Vector 16 HX AI A2XWHG Ultra 7 255HX, GeForce RTX 5070 Ti Laptop | |
|---|---|---|---|---|---|
| Noise | 21% | 10% | 14% | 3% | |
| off / environment * (dB) | 25 | 23.9 4% | 23.5 6% | 23.3 7% | 25 -0% |
| Idle Minimum * (dB) | 31 | 23.9 23% | 26.7 14% | 25 19% | 33 -6% |
| Idle Average * (dB) | 32 | 23.9 25% | 26.7 17% | 25 22% | 34 -6% |
| Idle Maximum * (dB) | 34 | 23.9 30% | 31.1 9% | 25 26% | 38 -12% |
| Load Average * (dB) | 50 | 33.2 34% | 44.8 10% | 45.5 9% | 46 8% |
| Cyberpunk 2077 ultra * (dB) | 58 | 50.2 13% | 53.7 7% | 53.3 8% | 47 19% |
| Load Maximum * (dB) | 59 | 50.2 15% | 53.7 9% | 53.3 10% | 49 17% |
* ... smaller is better
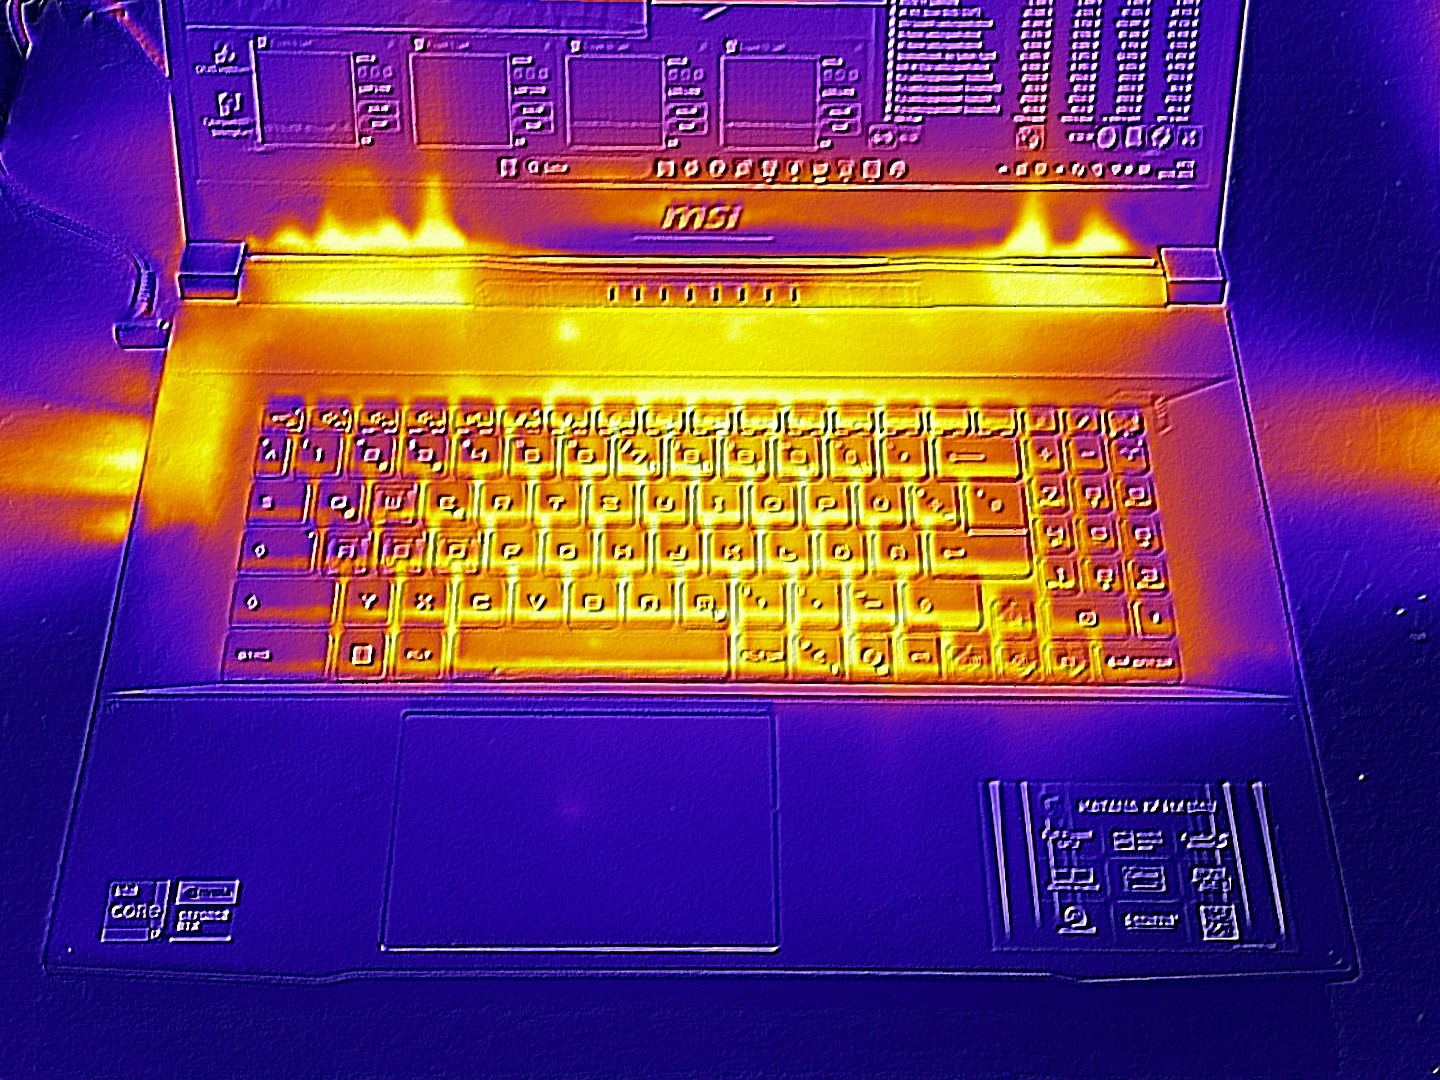
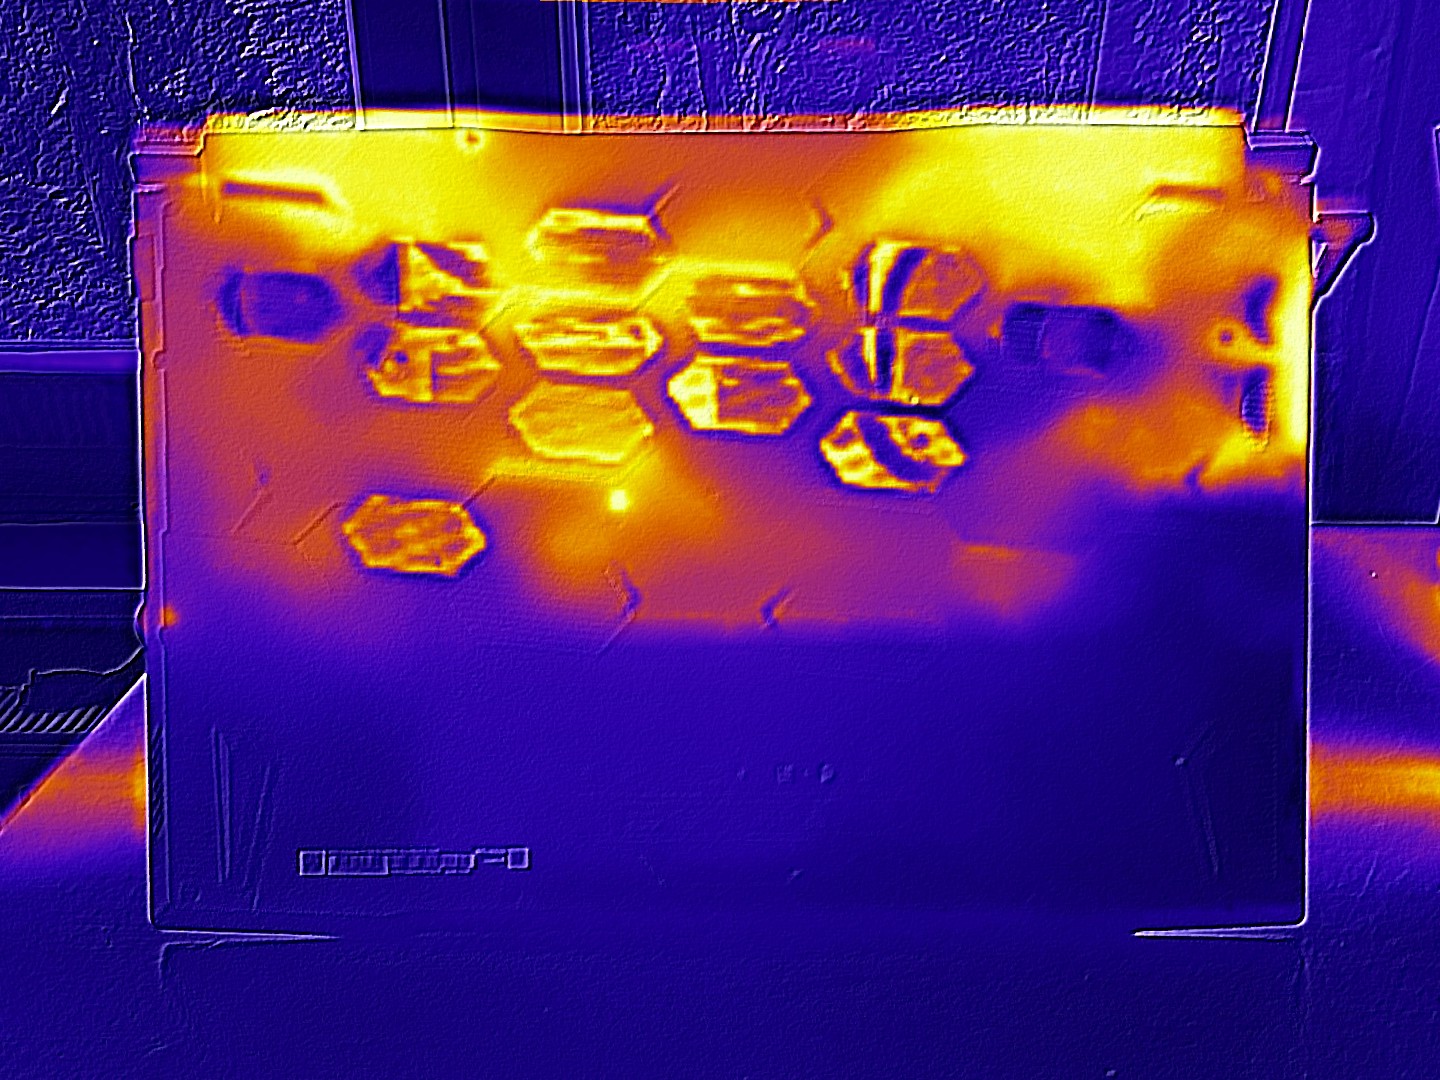
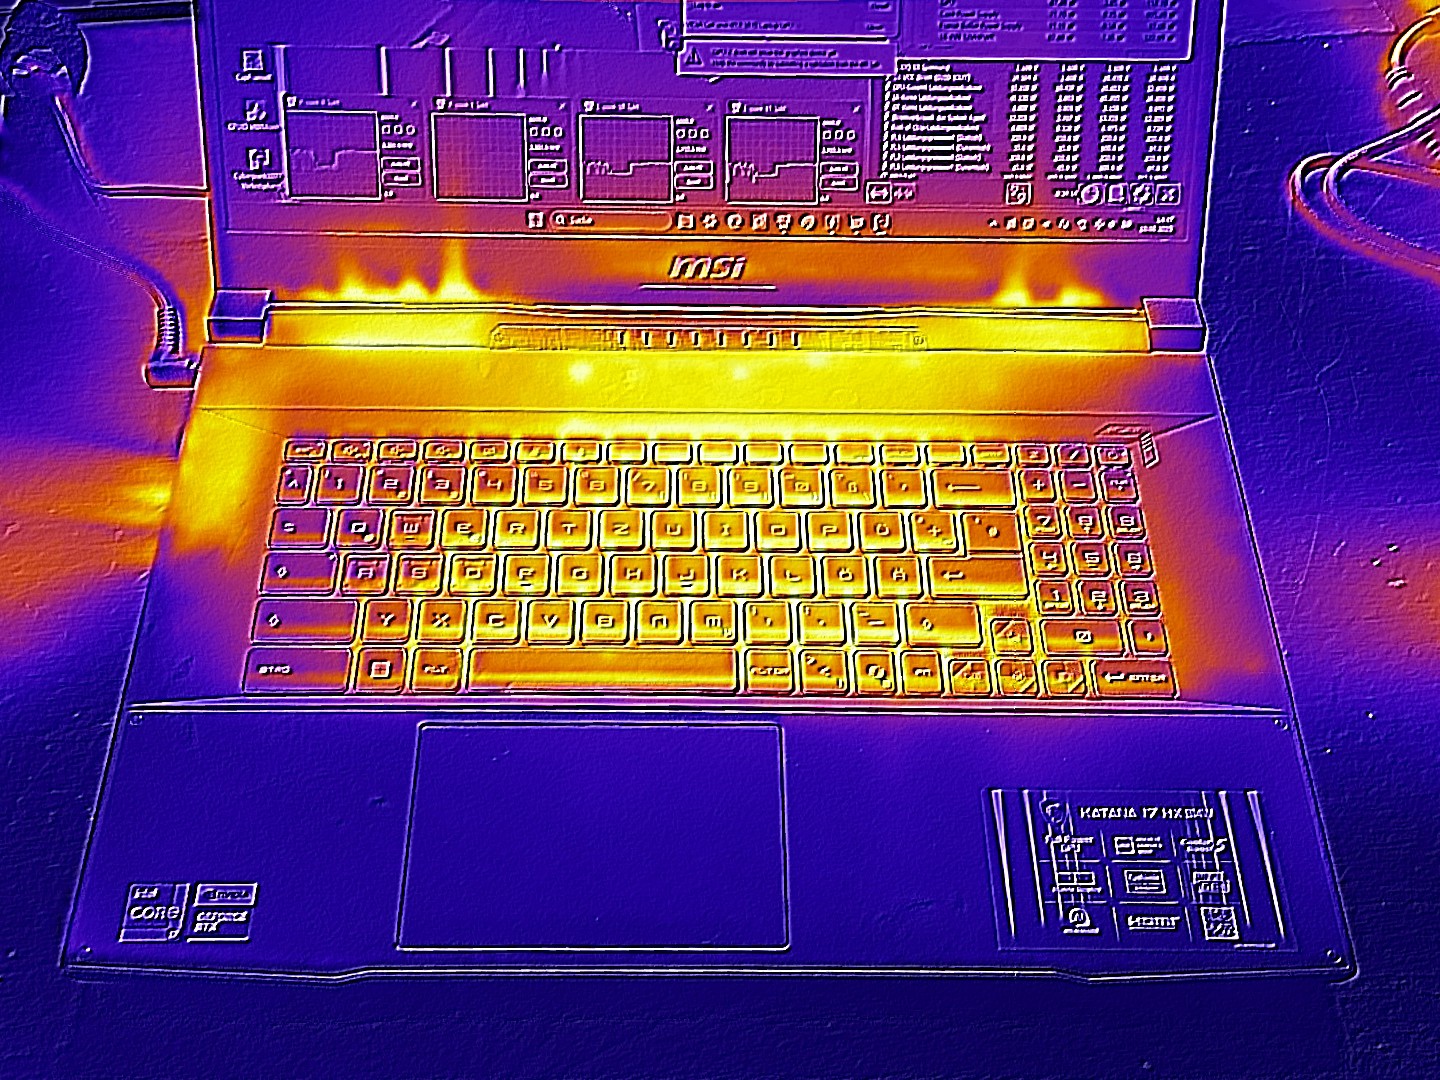
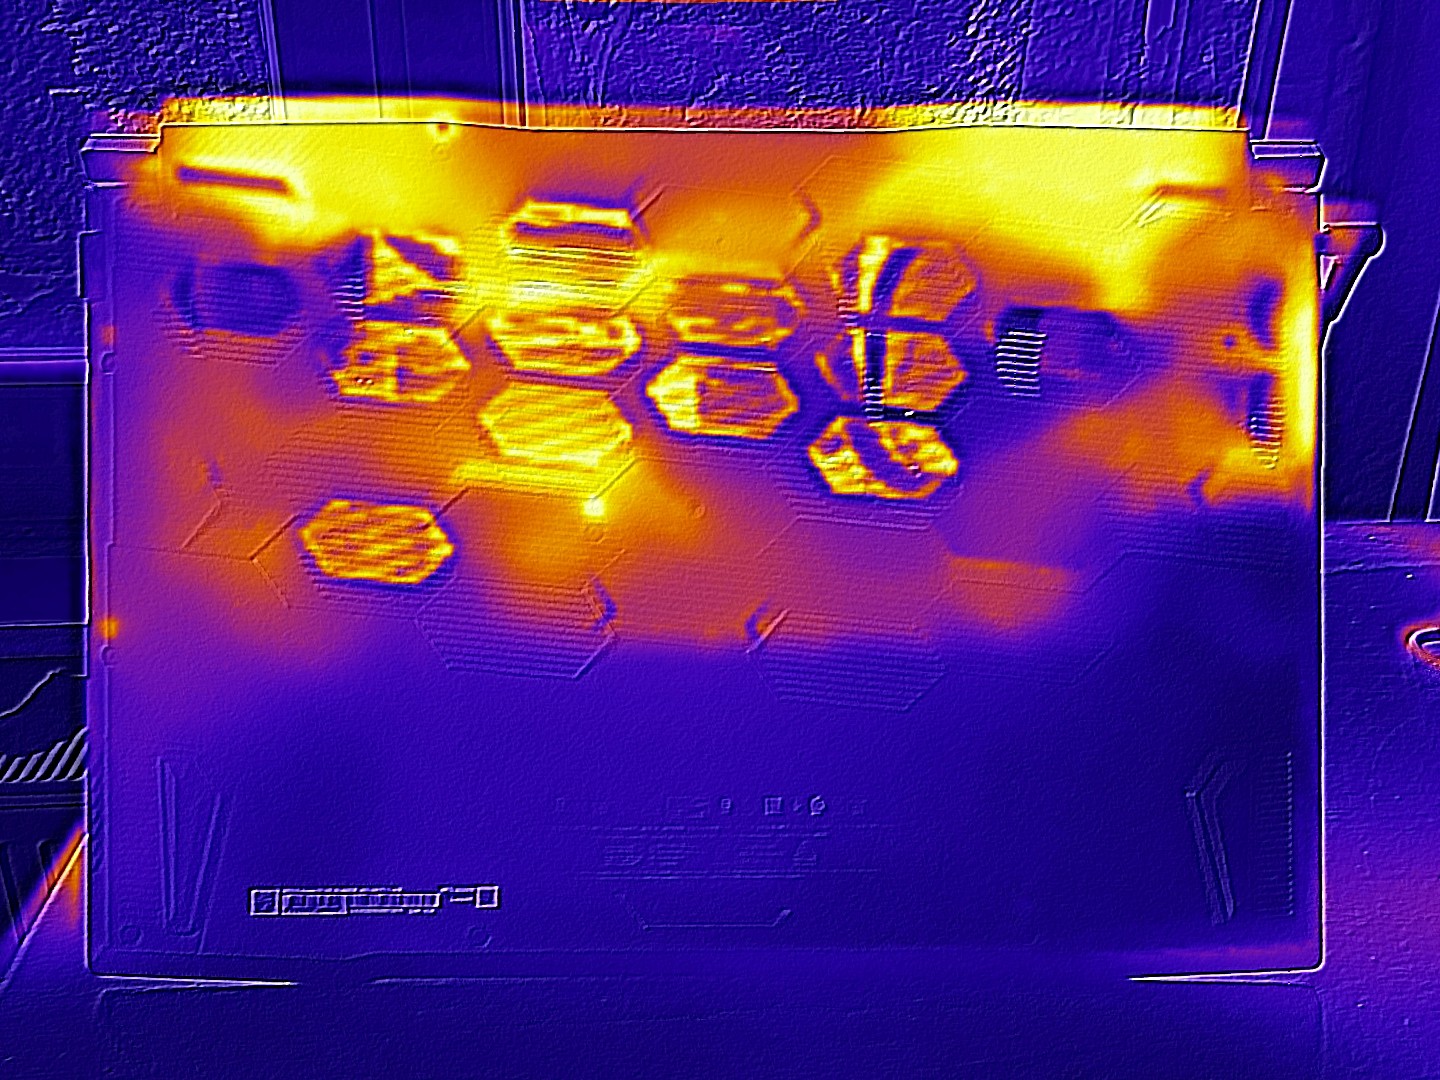
Temperature
With a maximum of 52 °C on the top and a maximum of 56 °C on the bottom of the case, the Katana 17 gets warmer than its competitors in 3D mode. The situation is noticeably more relaxed in idle mode with an average of 29 °C.
(-) The maximum temperature on the upper side is 52 °C / 126 F, compared to the average of 40.4 °C / 105 F, ranging from 21.2 to 68.8 °C for the class Gaming.
(-) The bottom heats up to a maximum of 56 °C / 133 F, compared to the average of 43.2 °C / 110 F
(+) In idle usage, the average temperature for the upper side is 29.2 °C / 85 F, compared to the device average of 33.9 °C / 93 F.
(-) 3: The average temperature for the upper side is 42.7 °C / 109 F, compared to the average of 33.9 °C / 93 F for the class Gaming.
(±) The palmrests and touchpad can get very hot to the touch with a maximum of 36 °C / 96.8 F.
(-) The average temperature of the palmrest area of similar devices was 28.8 °C / 83.8 F (-7.2 °C / -13 F).
| MSI Katana 17 HX B14WGK Intel Core i7-14650HX, NVIDIA GeForce RTX 5070 Laptop | Gigabyte Aero X16 1WH AMD Ryzen AI 7 350, NVIDIA GeForce RTX 5070 Laptop | Asus ProArt P16 H7606WP AMD Ryzen AI 9 HX 370, NVIDIA GeForce RTX 5070 Laptop | Schenker XMG Pro 16 (E25) Intel Core Ultra 9 275HX, NVIDIA GeForce RTX 5070 Ti Laptop | MSI Vector 16 HX AI A2XWHG Intel Core Ultra 7 255HX, NVIDIA GeForce RTX 5070 Ti Laptop | |
|---|---|---|---|---|---|
| Heat | 14% | 16% | -169% | 4% | |
| Maximum Upper Side * (°C) | 52 | 43.3 17% | 47 10% | 43.2 17% | 53 -2% |
| Maximum Bottom * (°C) | 56 | 50.3 10% | 47.4 15% | 46 18% | 52 7% |
| Idle Upper Side * (°C) | 33 | 27 18% | 26.1 21% | 27.7 16% | 33 -0% |
| Idle Bottom * (°C) | 32 | 28.3 12% | 26.4 17% | 264 -725% | 29 9% |
* ... smaller is better
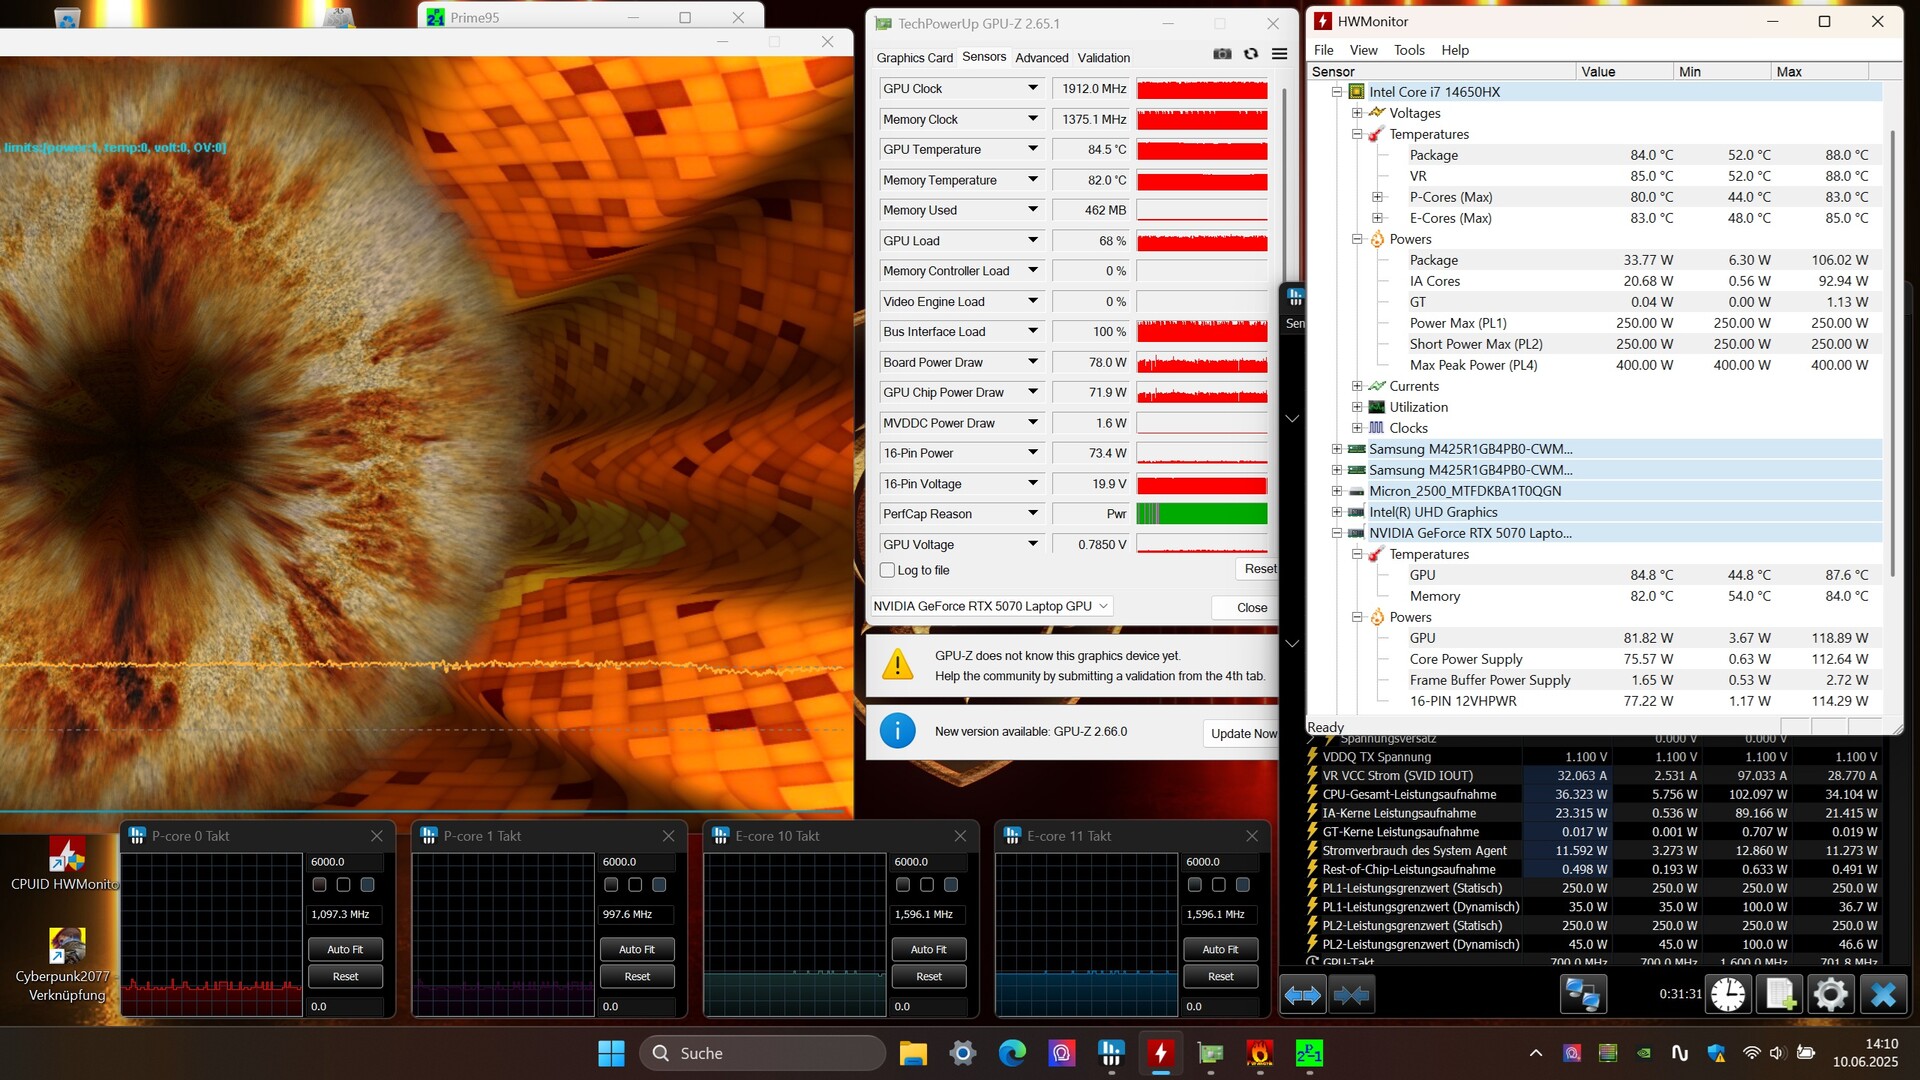
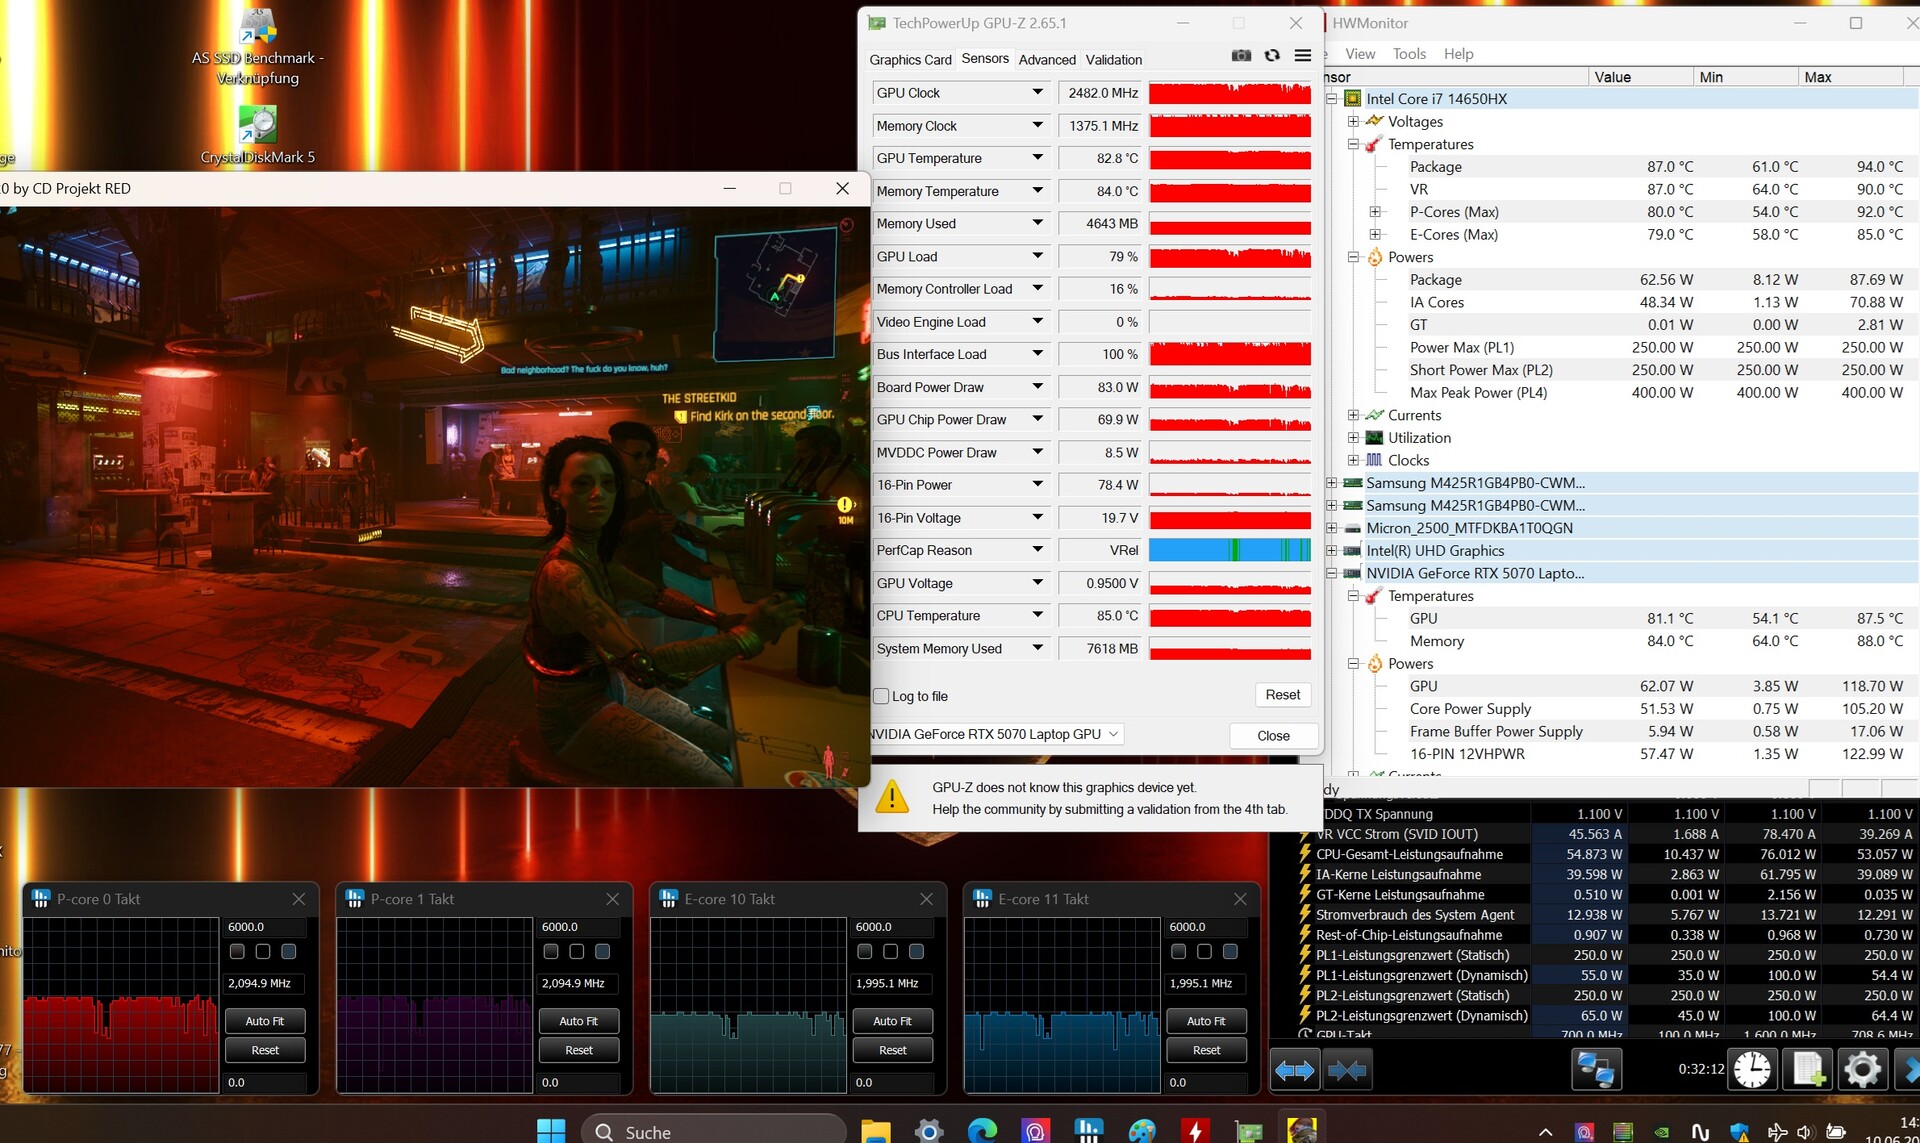
Stress test
In our stress test with the Furmark and Prime95 tools, the CPU and GPU stabilized at around 84 °C after a while - a reasonable value. Cyberpunk 2077 generated similar temperatures.
Speakers
Unfortunately, the sound quality leaves a lot to be desired. Bass in particular is very weak. Most competitors perform better in terms of sound.
MSI Katana 17 HX B14WGK audio analysis
(+) | speakers can play relatively loud (84 dB)
Bass 100 - 315 Hz
(-) | nearly no bass - on average 19% lower than median
(±) | linearity of bass is average (10.6% delta to prev. frequency)
Mids 400 - 2000 Hz
(±) | higher mids - on average 8.7% higher than median
(±) | linearity of mids is average (7.5% delta to prev. frequency)
Highs 2 - 16 kHz
(+) | balanced highs - only 4.6% away from median
(±) | linearity of highs is average (9.7% delta to prev. frequency)
Overall 100 - 16.000 Hz
(±) | linearity of overall sound is average (20.6% difference to median)
Compared to same class
» 74% of all tested devices in this class were better, 5% similar, 21% worse
» The best had a delta of 6%, average was 18%, worst was 132%
Compared to all devices tested
» 55% of all tested devices were better, 8% similar, 37% worse
» The best had a delta of 4%, average was 24%, worst was 134%
MSI Vector 16 HX AI A2XWHG audio analysis
(+) | speakers can play relatively loud (86 dB)
Bass 100 - 315 Hz
(±) | reduced bass - on average 12.3% lower than median
(±) | linearity of bass is average (8.5% delta to prev. frequency)
Mids 400 - 2000 Hz
(±) | higher mids - on average 9.9% higher than median
(+) | mids are linear (6.8% delta to prev. frequency)
Highs 2 - 16 kHz
(+) | balanced highs - only 1.8% away from median
(+) | highs are linear (2.9% delta to prev. frequency)
Overall 100 - 16.000 Hz
(±) | linearity of overall sound is average (15.8% difference to median)
Compared to same class
» 37% of all tested devices in this class were better, 7% similar, 56% worse
» The best had a delta of 6%, average was 18%, worst was 132%
Compared to all devices tested
» 24% of all tested devices were better, 5% similar, 71% worse
» The best had a delta of 4%, average was 24%, worst was 134%
Energy management
Power consumption
At 10 to 24 watts in idle mode and 126 to 227 watts under load, the power consumption is typical for a gaming laptop in this performance class, although the Aero 16X with its Ryzen AI 7 350 is even more economical.
| Off / Standby | |
| Idle | |
| Load |
|
Key:
min: | |
| MSI Katana 17 HX B14WGK i7-14650HX, GeForce RTX 5070 Laptop | Gigabyte Aero X16 1WH Ryzen AI 7 350, GeForce RTX 5070 Laptop | Asus ProArt P16 H7606WP Ryzen AI 9 HX 370, GeForce RTX 5070 Laptop | Schenker XMG Pro 16 (E25) Ultra 9 275HX, GeForce RTX 5070 Ti Laptop | MSI Vector 16 HX AI A2XWHG Ultra 7 255HX, GeForce RTX 5070 Ti Laptop | Average of class Gaming | |
|---|---|---|---|---|---|---|
| Power Consumption | 37% | 17% | -10% | -9% | -13% | |
| Idle Minimum * (Watt) | 9.7 | 5.8 40% | 9.9 -2% | 11.7 -21% | 7.1 27% | 13.2 ? -36% |
| Idle Average * (Watt) | 15 | 10.9 27% | 13.6 9% | 16.6 -11% | 15.9 -6% | 18.9 ? -26% |
| Idle Maximum * (Watt) | 23.7 | 11.2 53% | 14 41% | 17.1 28% | 29.5 -24% | 24.3 ? -3% |
| Load Average * (Watt) | 126 | 91.3 28% | 93.8 26% | 122.4 3% | 124 2% | 108 ? 14% |
| Cyberpunk 2077 ultra external monitor * (Watt) | 202 | 117.9 42% | 158.3 22% | 241 -19% | 217 -7% | |
| Cyberpunk 2077 ultra * (Watt) | 205 | 123.8 40% | 162.1 21% | 245 -20% | 222 -8% | |
| Load Maximum * (Watt) | 227 | 155.3 32% | 229 -1% | 291.5 -28% | 336 -48% | 254 ? -12% |
* ... smaller is better
Power consumption Cyberpunk / Stress test
Power consumption with the external monitor
Battery life
You shouldn't place high demands on the battery life. In our WLAN test (with brightness reduced to 150 cd/m²), the 75 Wh battery lasted only around 5 hours. In comparison, the competition achieves 7 to 9 hours.
| MSI Katana 17 HX B14WGK i7-14650HX, GeForce RTX 5070 Laptop, 75 Wh | Gigabyte Aero X16 1WH Ryzen AI 7 350, GeForce RTX 5070 Laptop, 76 Wh | Asus ProArt P16 H7606WP Ryzen AI 9 HX 370, GeForce RTX 5070 Laptop, 90 Wh | Schenker XMG Pro 16 (E25) Ultra 9 275HX, GeForce RTX 5070 Ti Laptop, 99.8 Wh | MSI Vector 16 HX AI A2XWHG Ultra 7 255HX, GeForce RTX 5070 Ti Laptop, 90 Wh | Average of class Gaming | |
|---|---|---|---|---|---|---|
| Battery runtime | ||||||
| WiFi v1.3 (h) | 5.1 | 8.6 69% | 9.2 80% | 9.1 78% | 7 37% | 7.02 ? 38% |
Notebookcheck overall rating
With the Katana 17 HX B14WGK, MSI has gone overboard in many respects, making it difficult for the 17-inch gamer to hold its own against the competition.
MSI Katana 17 HX B14WGK
- 06/23/2025 v8
Florian Glaser
 Total Sustainability Score:
 Possible competitors comparison
Image | Model / Review | Price | Weight | Height | Display |
|---|---|---|---|---|---|
1. 77.3%  | MSI Katana 17 HX B14WGK Intel Core i7-14650HX ⎘ NVIDIA GeForce RTX 5070 Laptop ⎘ 16 GB Memory, 1024 GB SSD | Amazon: List Price: 1800 EUR | 2.7 kg | 28 mm | 17.30" 2560x1440 170 PPI IPS |
2. 83.7%  | Gigabyte Aero X16 1WH AMD Ryzen AI 7 350 ⎘ NVIDIA GeForce RTX 5070 Laptop ⎘ 32 GB Memory, 1024 GB SSD | Amazon: List Price: 1799€ | 2 kg | 19.9 mm | 16.00" 2560x1600 189 PPI IPS |
3. 89.1%  | Asus ProArt P16 H7606WP AMD Ryzen AI 9 HX 370 ⎘ NVIDIA GeForce RTX 5070 Laptop ⎘ 64 GB Memory, 2048 GB SSD | Amazon: 1. $2,999.99 ASUS ProArt P16 Creator Lapt... 2. $4,924.00 HIDevolution [2025] ASUS Pro... 3. $2,979.99 ASUS ProArt P16 Creator Lapt... List Price: 3399€ | 1.8 kg | 17.3 mm | 16.00" 2880x1800 212 PPI OLED |
4. 87.4%  | Schenker XMG Pro 16 (E25) Intel Core Ultra 9 275HX ⎘ NVIDIA GeForce RTX 5070 Ti Laptop ⎘ 32 GB Memory, 1024 GB SSD | Amazon: List Price: 2480€ | 2.5 kg | 26.5 mm | 16.00" 2560x1600 189 PPI IPS |
5. 84%  | MSI Vector 16 HX AI A2XWHG Intel Core Ultra 7 255HX ⎘ NVIDIA GeForce RTX 5070 Ti Laptop ⎘ 16 GB Memory, 512 GB SSD | Amazon: List Price: 2000 EUR | 2.6 kg | 28.6 mm | 16.00" 2560x1600 189 PPI IPS |
Transparency
The selection of devices to be reviewed is made by our editorial team. The test sample was provided to the author as a loan by the manufacturer or retailer for the purpose of this review. The lender had no influence on this review, nor did the manufacturer receive a copy of this review before publication. There was no obligation to publish this review. As an independent media company, Notebookcheck is not subjected to the authority of manufacturers, retailers or publishers.
This is how Notebookcheck is testing
Every year, Notebookcheck independently reviews hundreds of laptops and smartphones using standardized procedures to ensure that all results are comparable. We have continuously developed our test methods for around 20 years and set industry standards in the process. In our test labs, high-quality measuring equipment is utilized by experienced technicians and editors. These tests involve a multi-stage validation process. Our complex rating system is based on hundreds of well-founded measurements and benchmarks, which maintains objectivity. Further information on our test methods can be found here.

