Verdict - The ProArt P16 now with 120 Hz, but lower HDR brightness
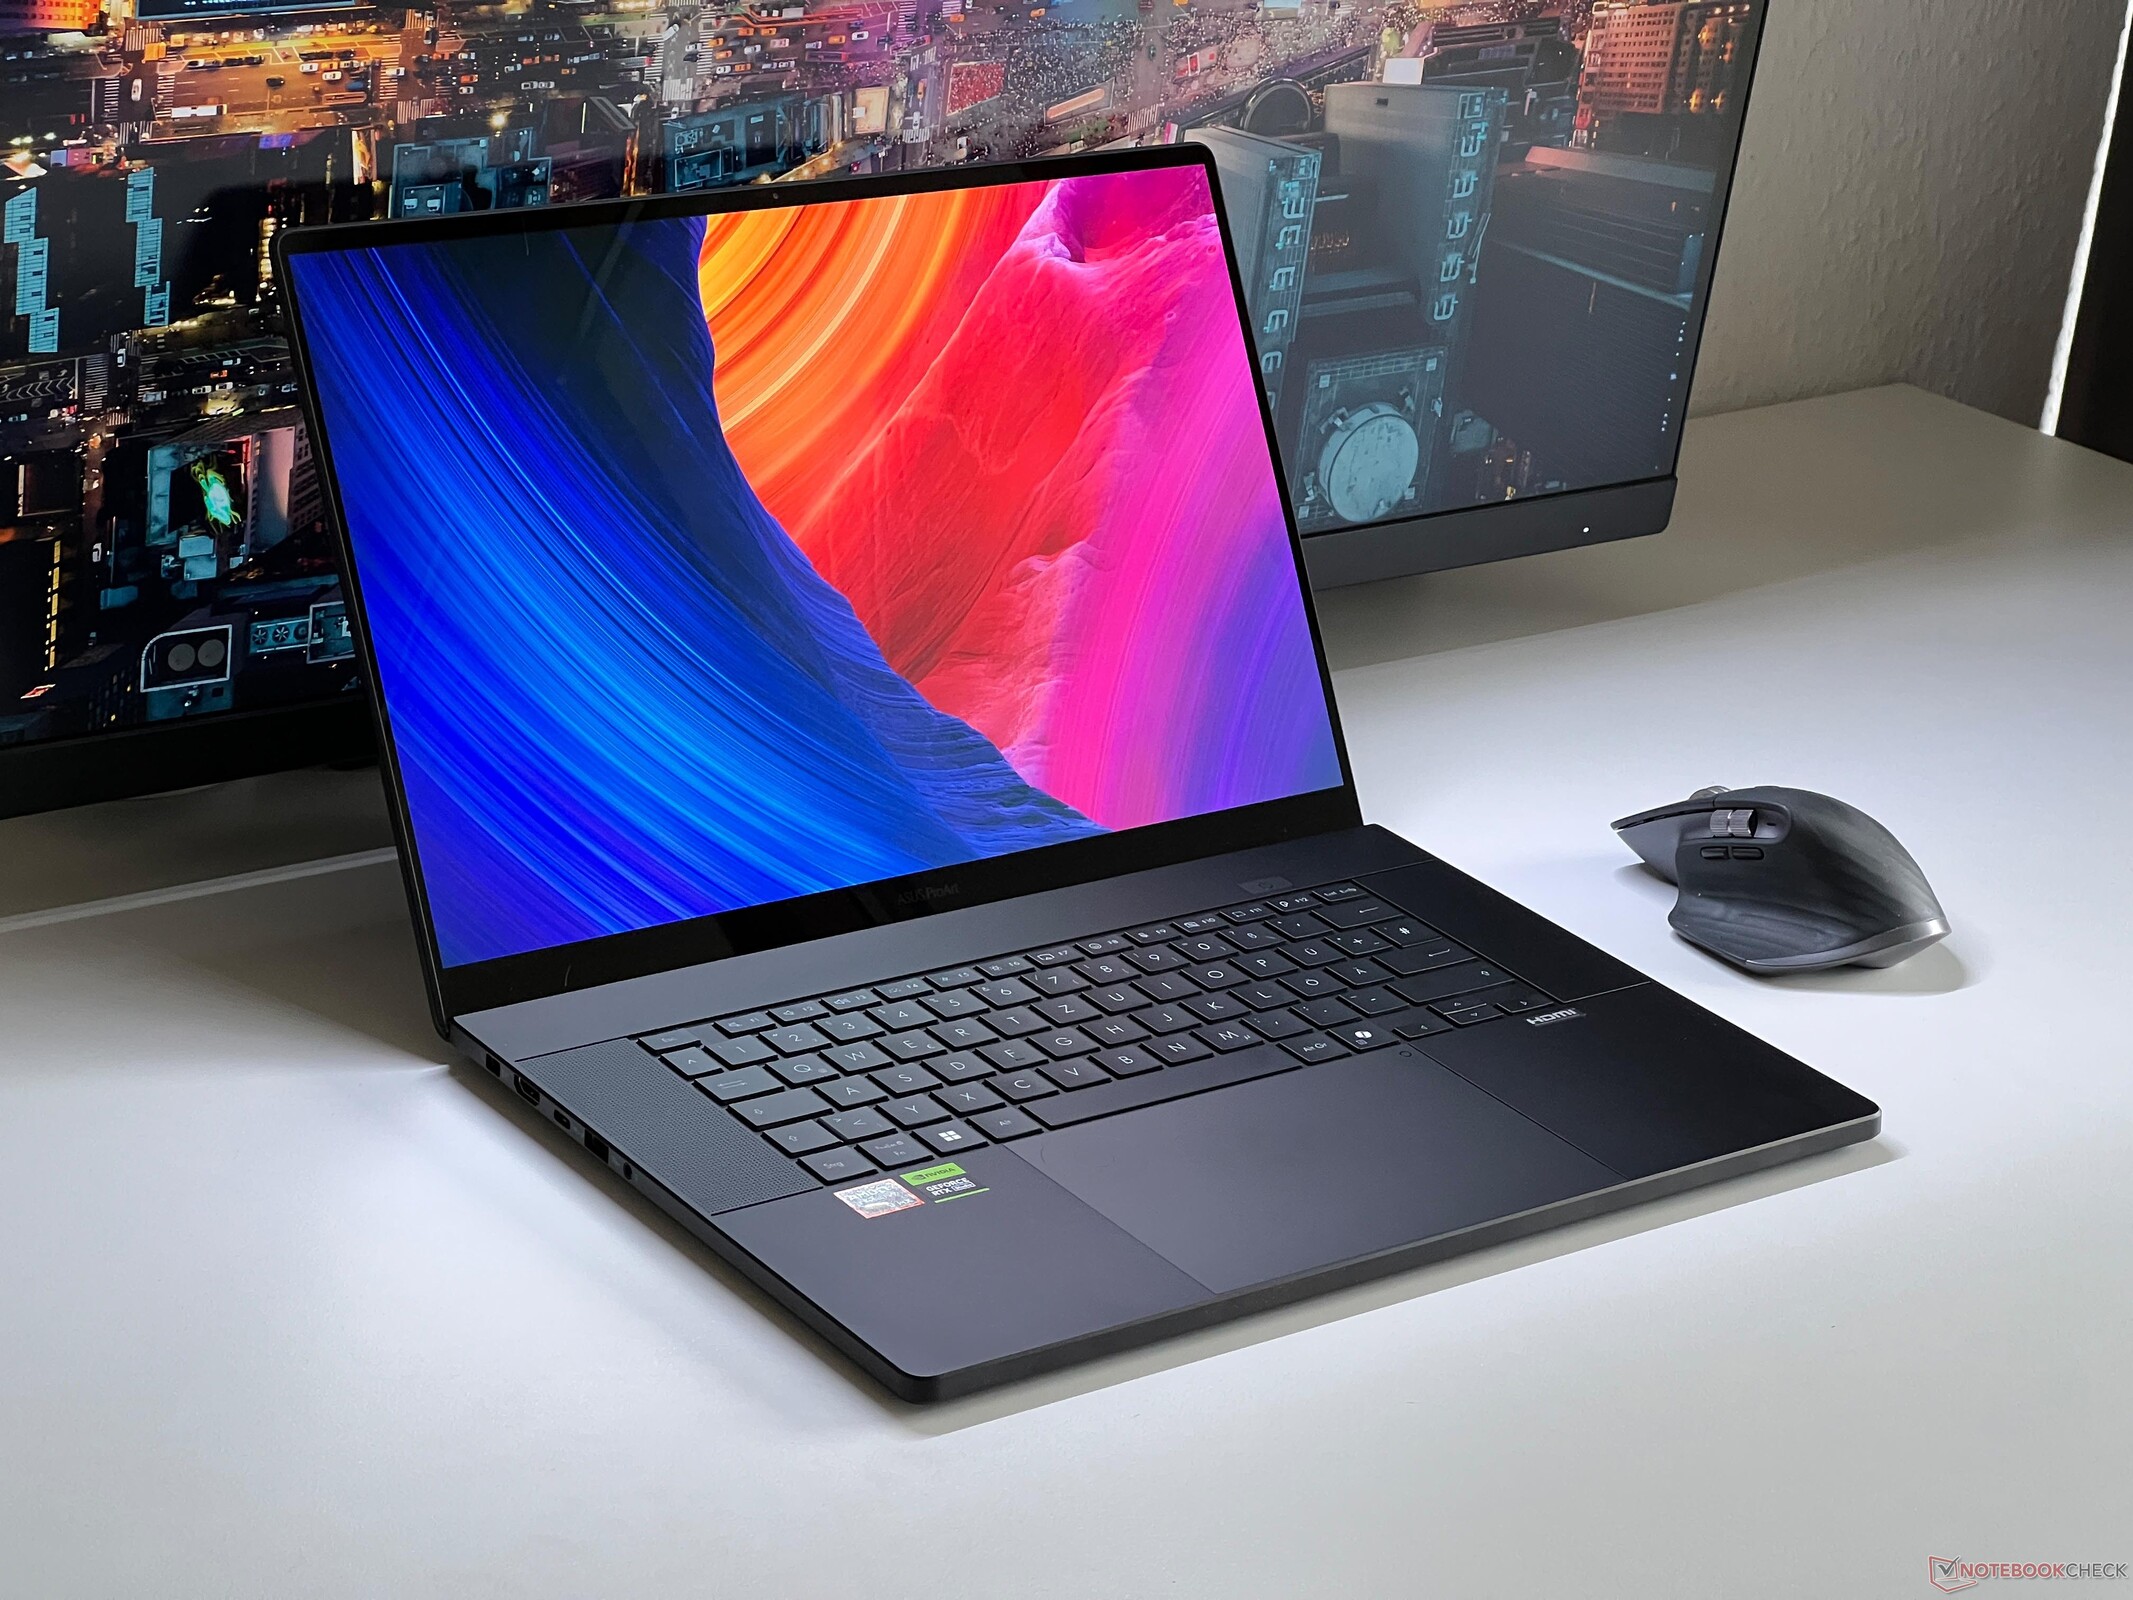
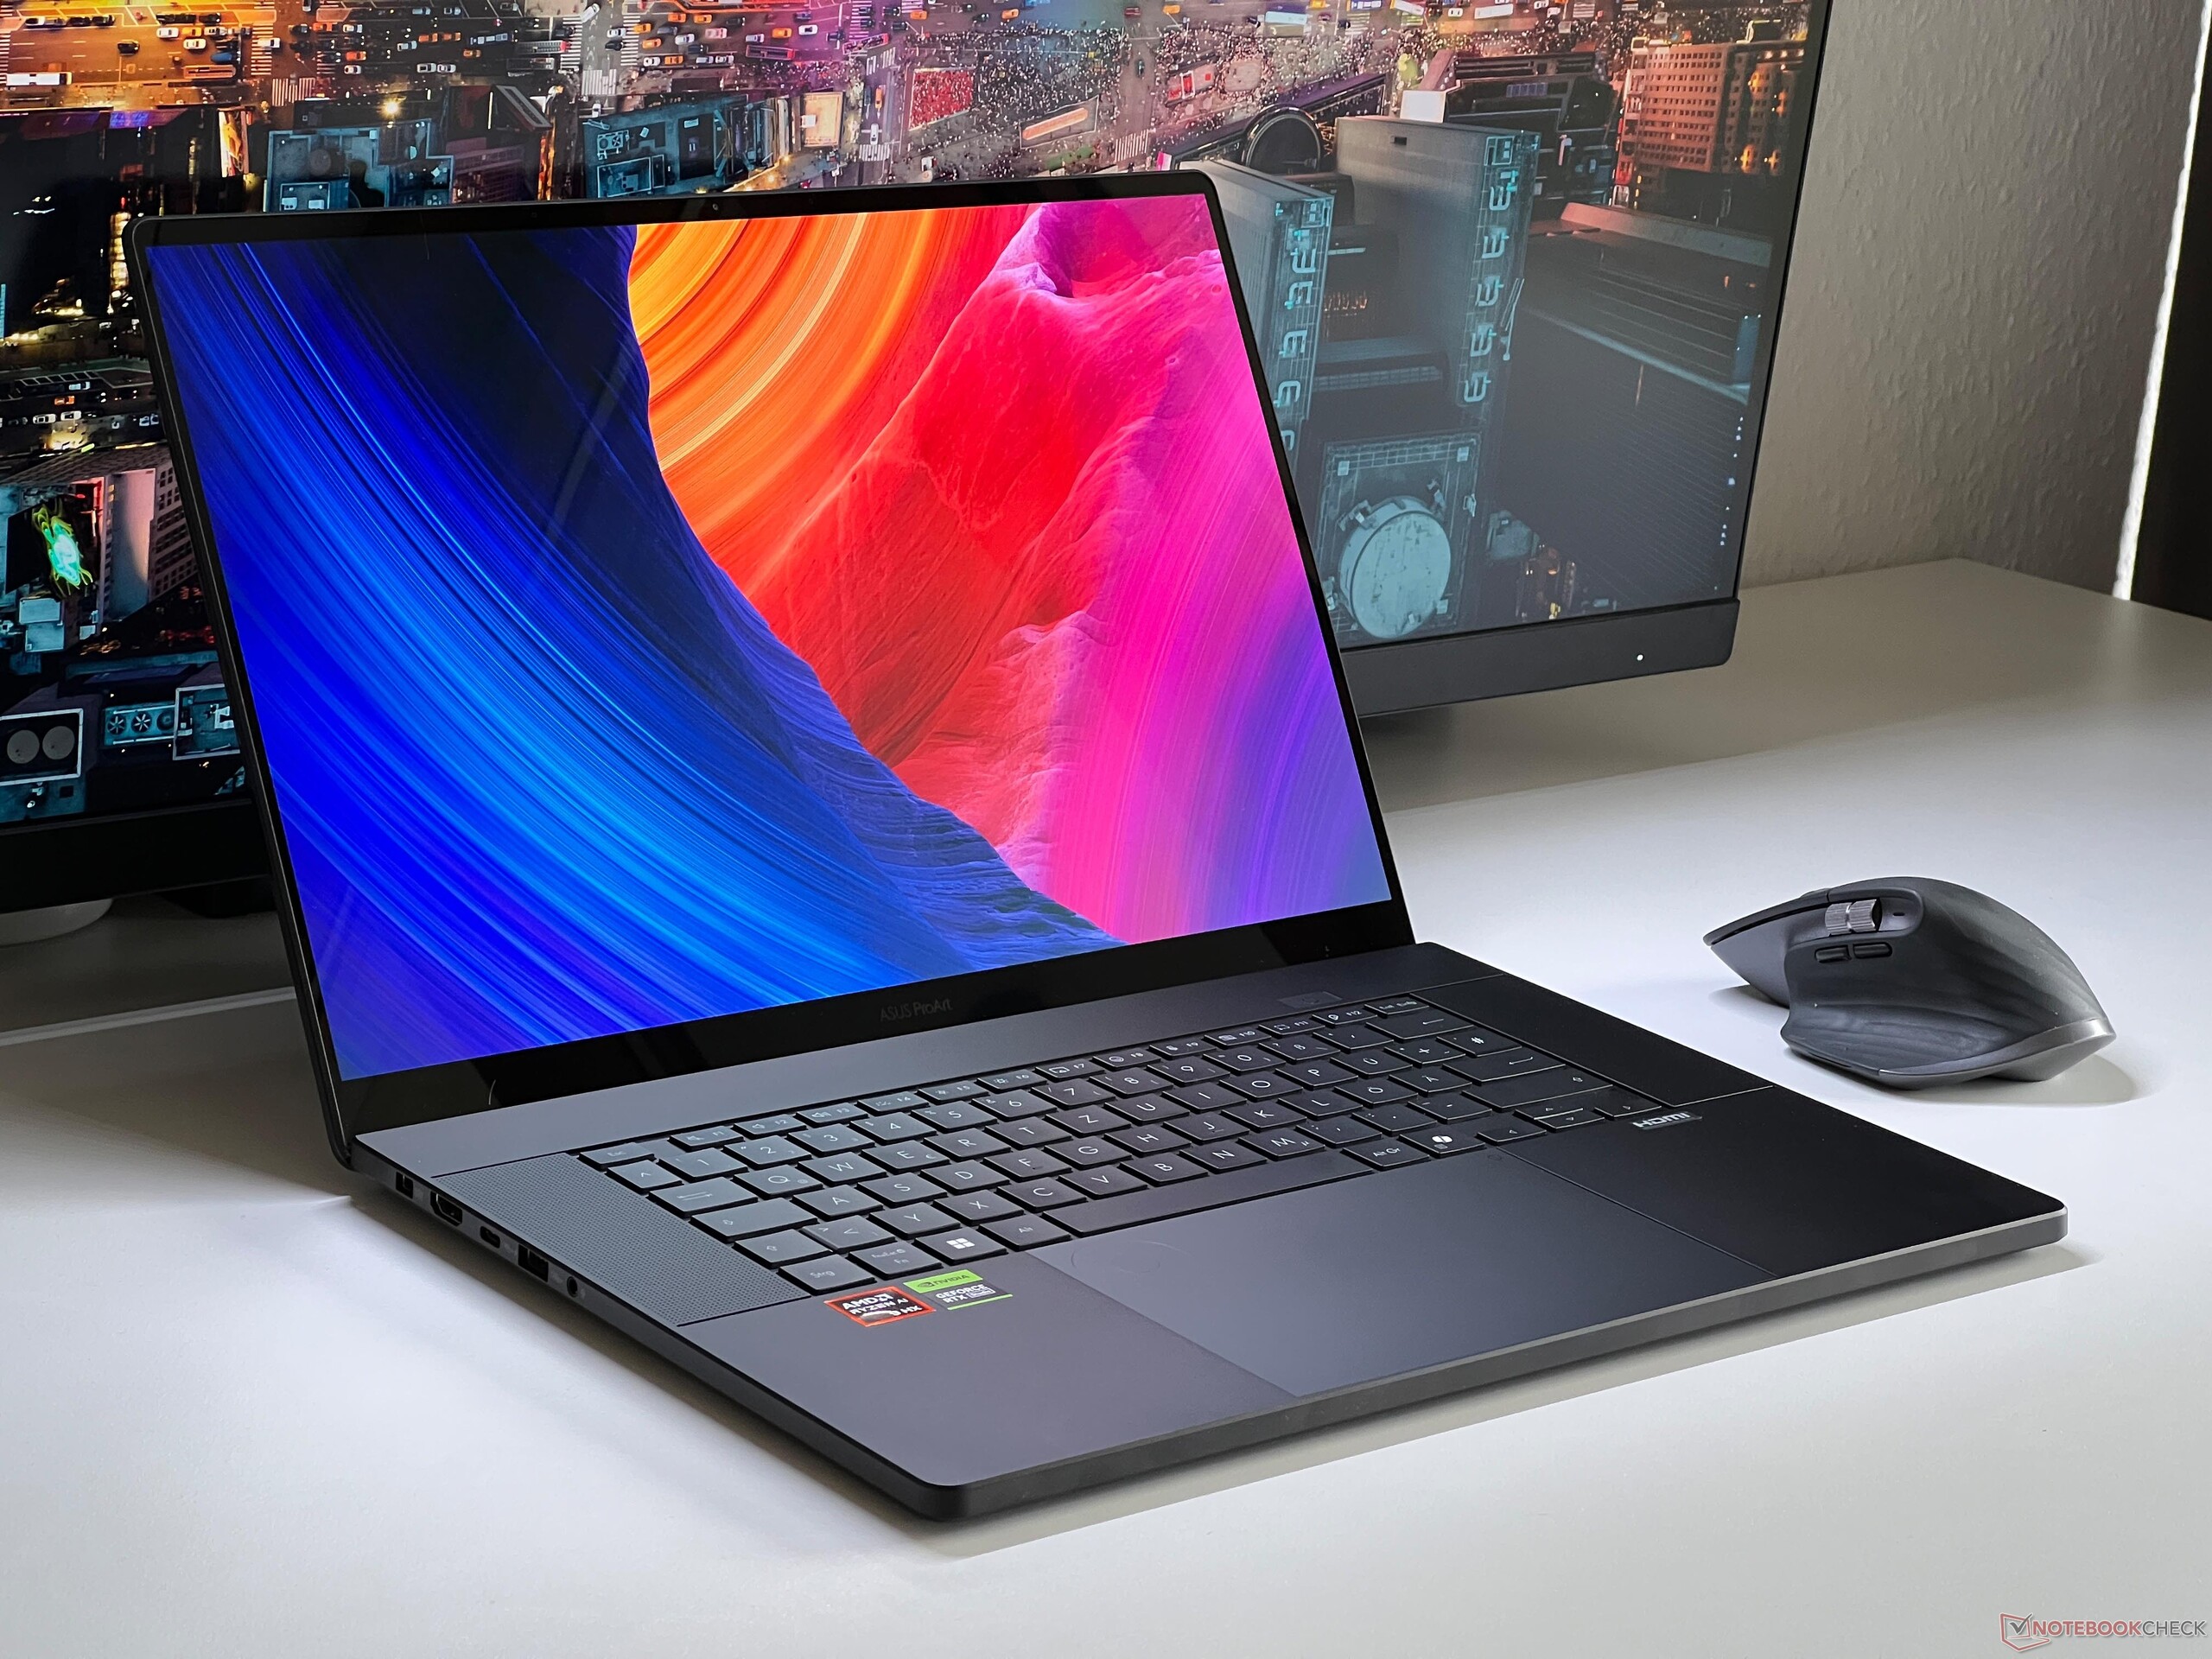
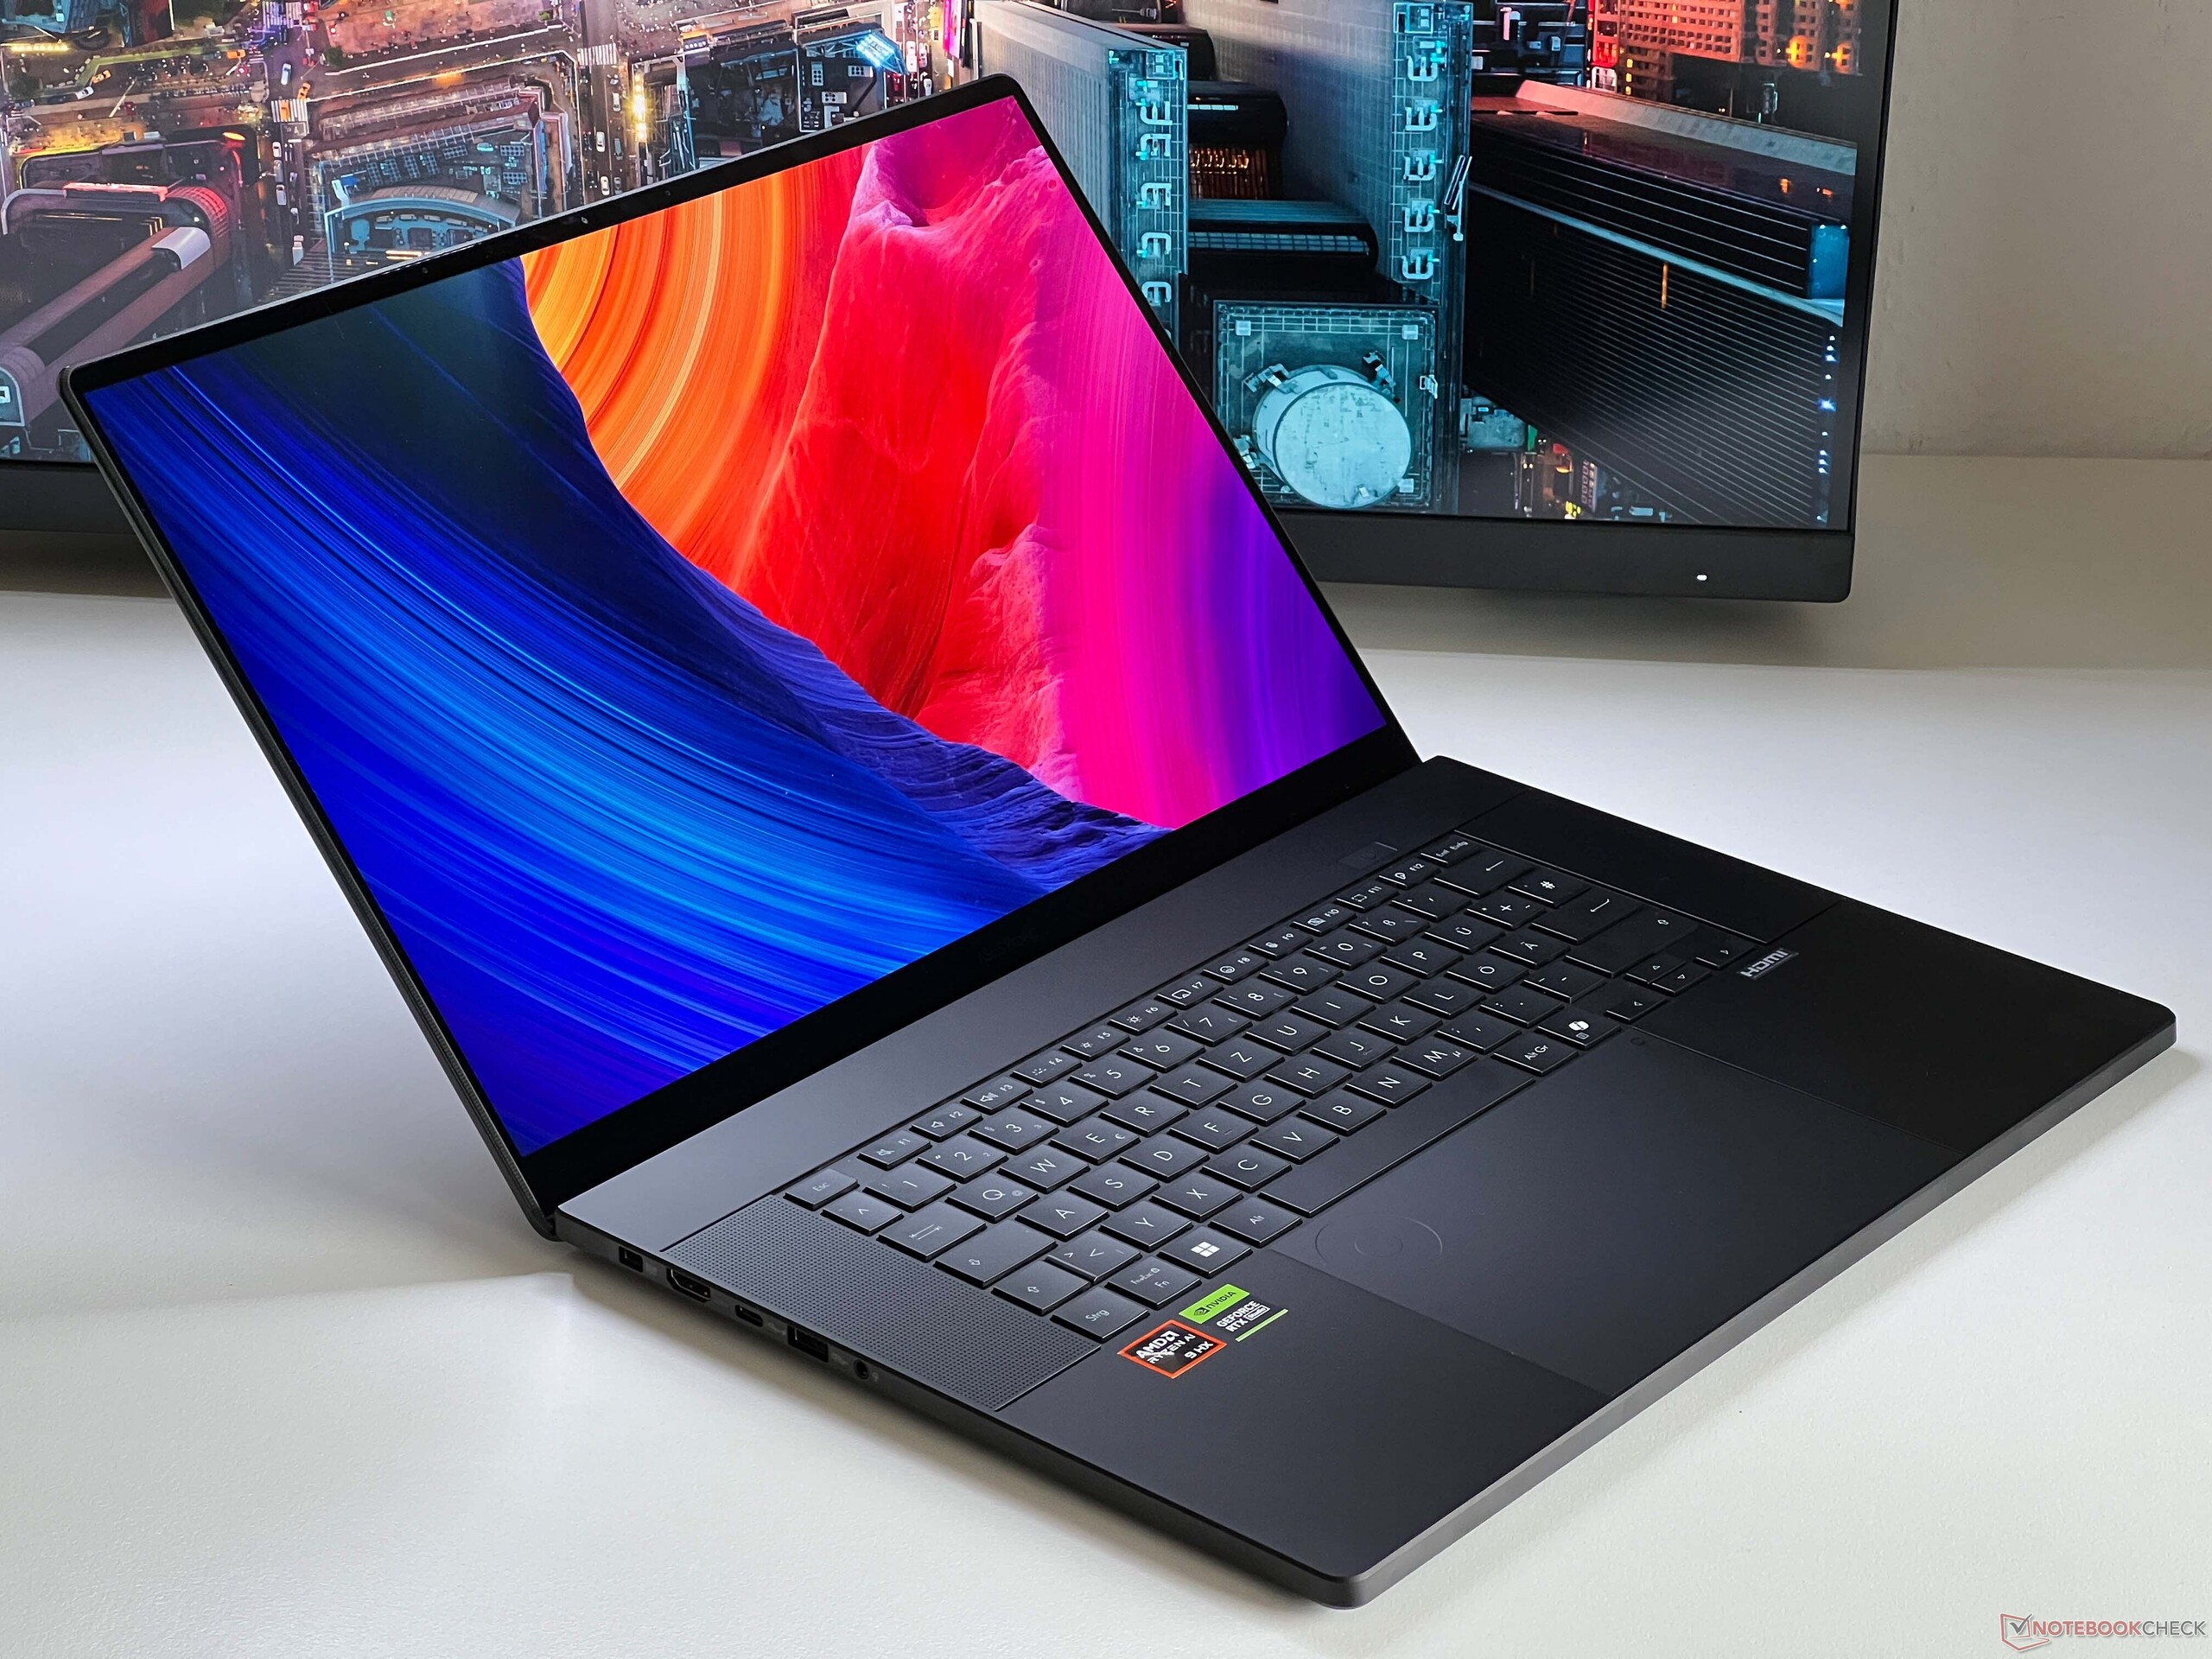
The ProArt P16 is the creative offshoot of the ROG Zephyrus G16 gaming laptop, primarily aimed at content creators as a result of its touchscreen, stylus support and DialPad. Its new display has a refresh rate of 120 Hz, but its resolution is lower than before and its maximum HDR brightness in particular is very low, which we already criticized about the Zephyrus G16. Asus provides super accurate color profiles and the ProArt is suitable for editing images/videos.
Apart from its hinges being slightly too weak, the laptop's case is great and it features all the important connections. Its keyboard and sound system are among the best in the mobile sector. On the other hand, not much has changed about its performance, as its processor is the same and the new RTX 5070 Laptop isn't much faster than the old RTX 4070 Laptop. In contrast to the Zephyrus G16, you can't select any more powerful GPUs—we would at least have liked to have seen the RTX 5070 Ti Laptop. Its fans also get very loud under load.
The ProArt P16 is still a very good multimedia laptop, but the MacBook Pro 16 still proves to be the better overall package and has some clear advantages, especially when it comes to its CPU performance, fan control, display and battery life.
Pros
Cons
Price and availability
You can order the ProArt P16 from Asus' website soon. Prices will start from $2,899.99.
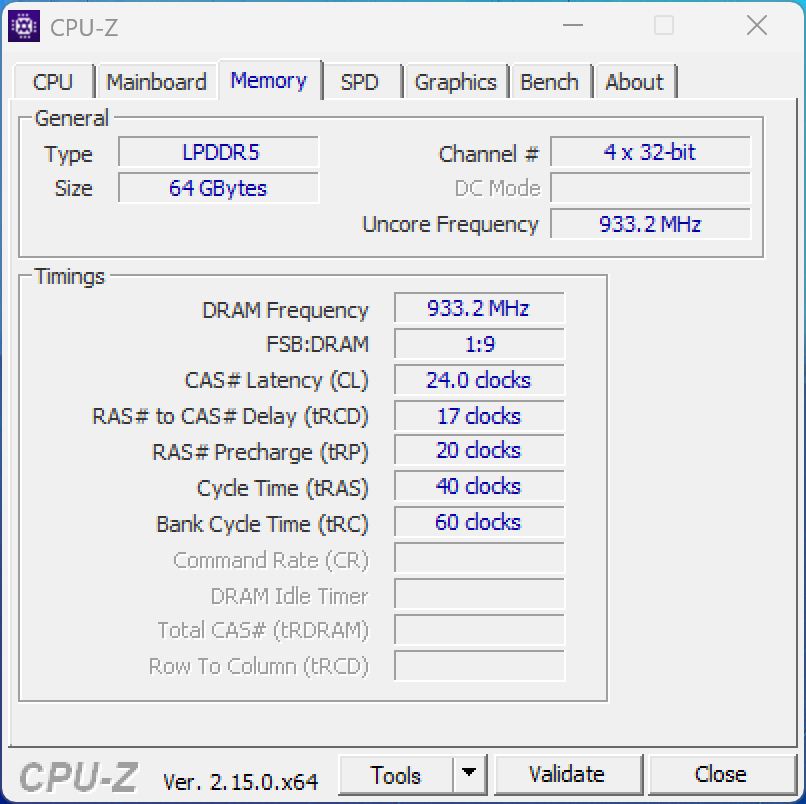
Asus has updated its ProArt P16 and while the multimedia laptop has kept the same AMD processor, it now features the new RTX-5000 GPUs. Moreover, its 60 Hz 4K OLED display has been swapped out for the 120 Hz 2.8K OLED panel from the ROG Zephyrus G16 gaming laptop. Our test device is the high-end variant with the RTX 5070 Laptop, 64 GB RAM and a 2 TB SSD, costing approximately $3,860.
Specifications
Case & connectivity
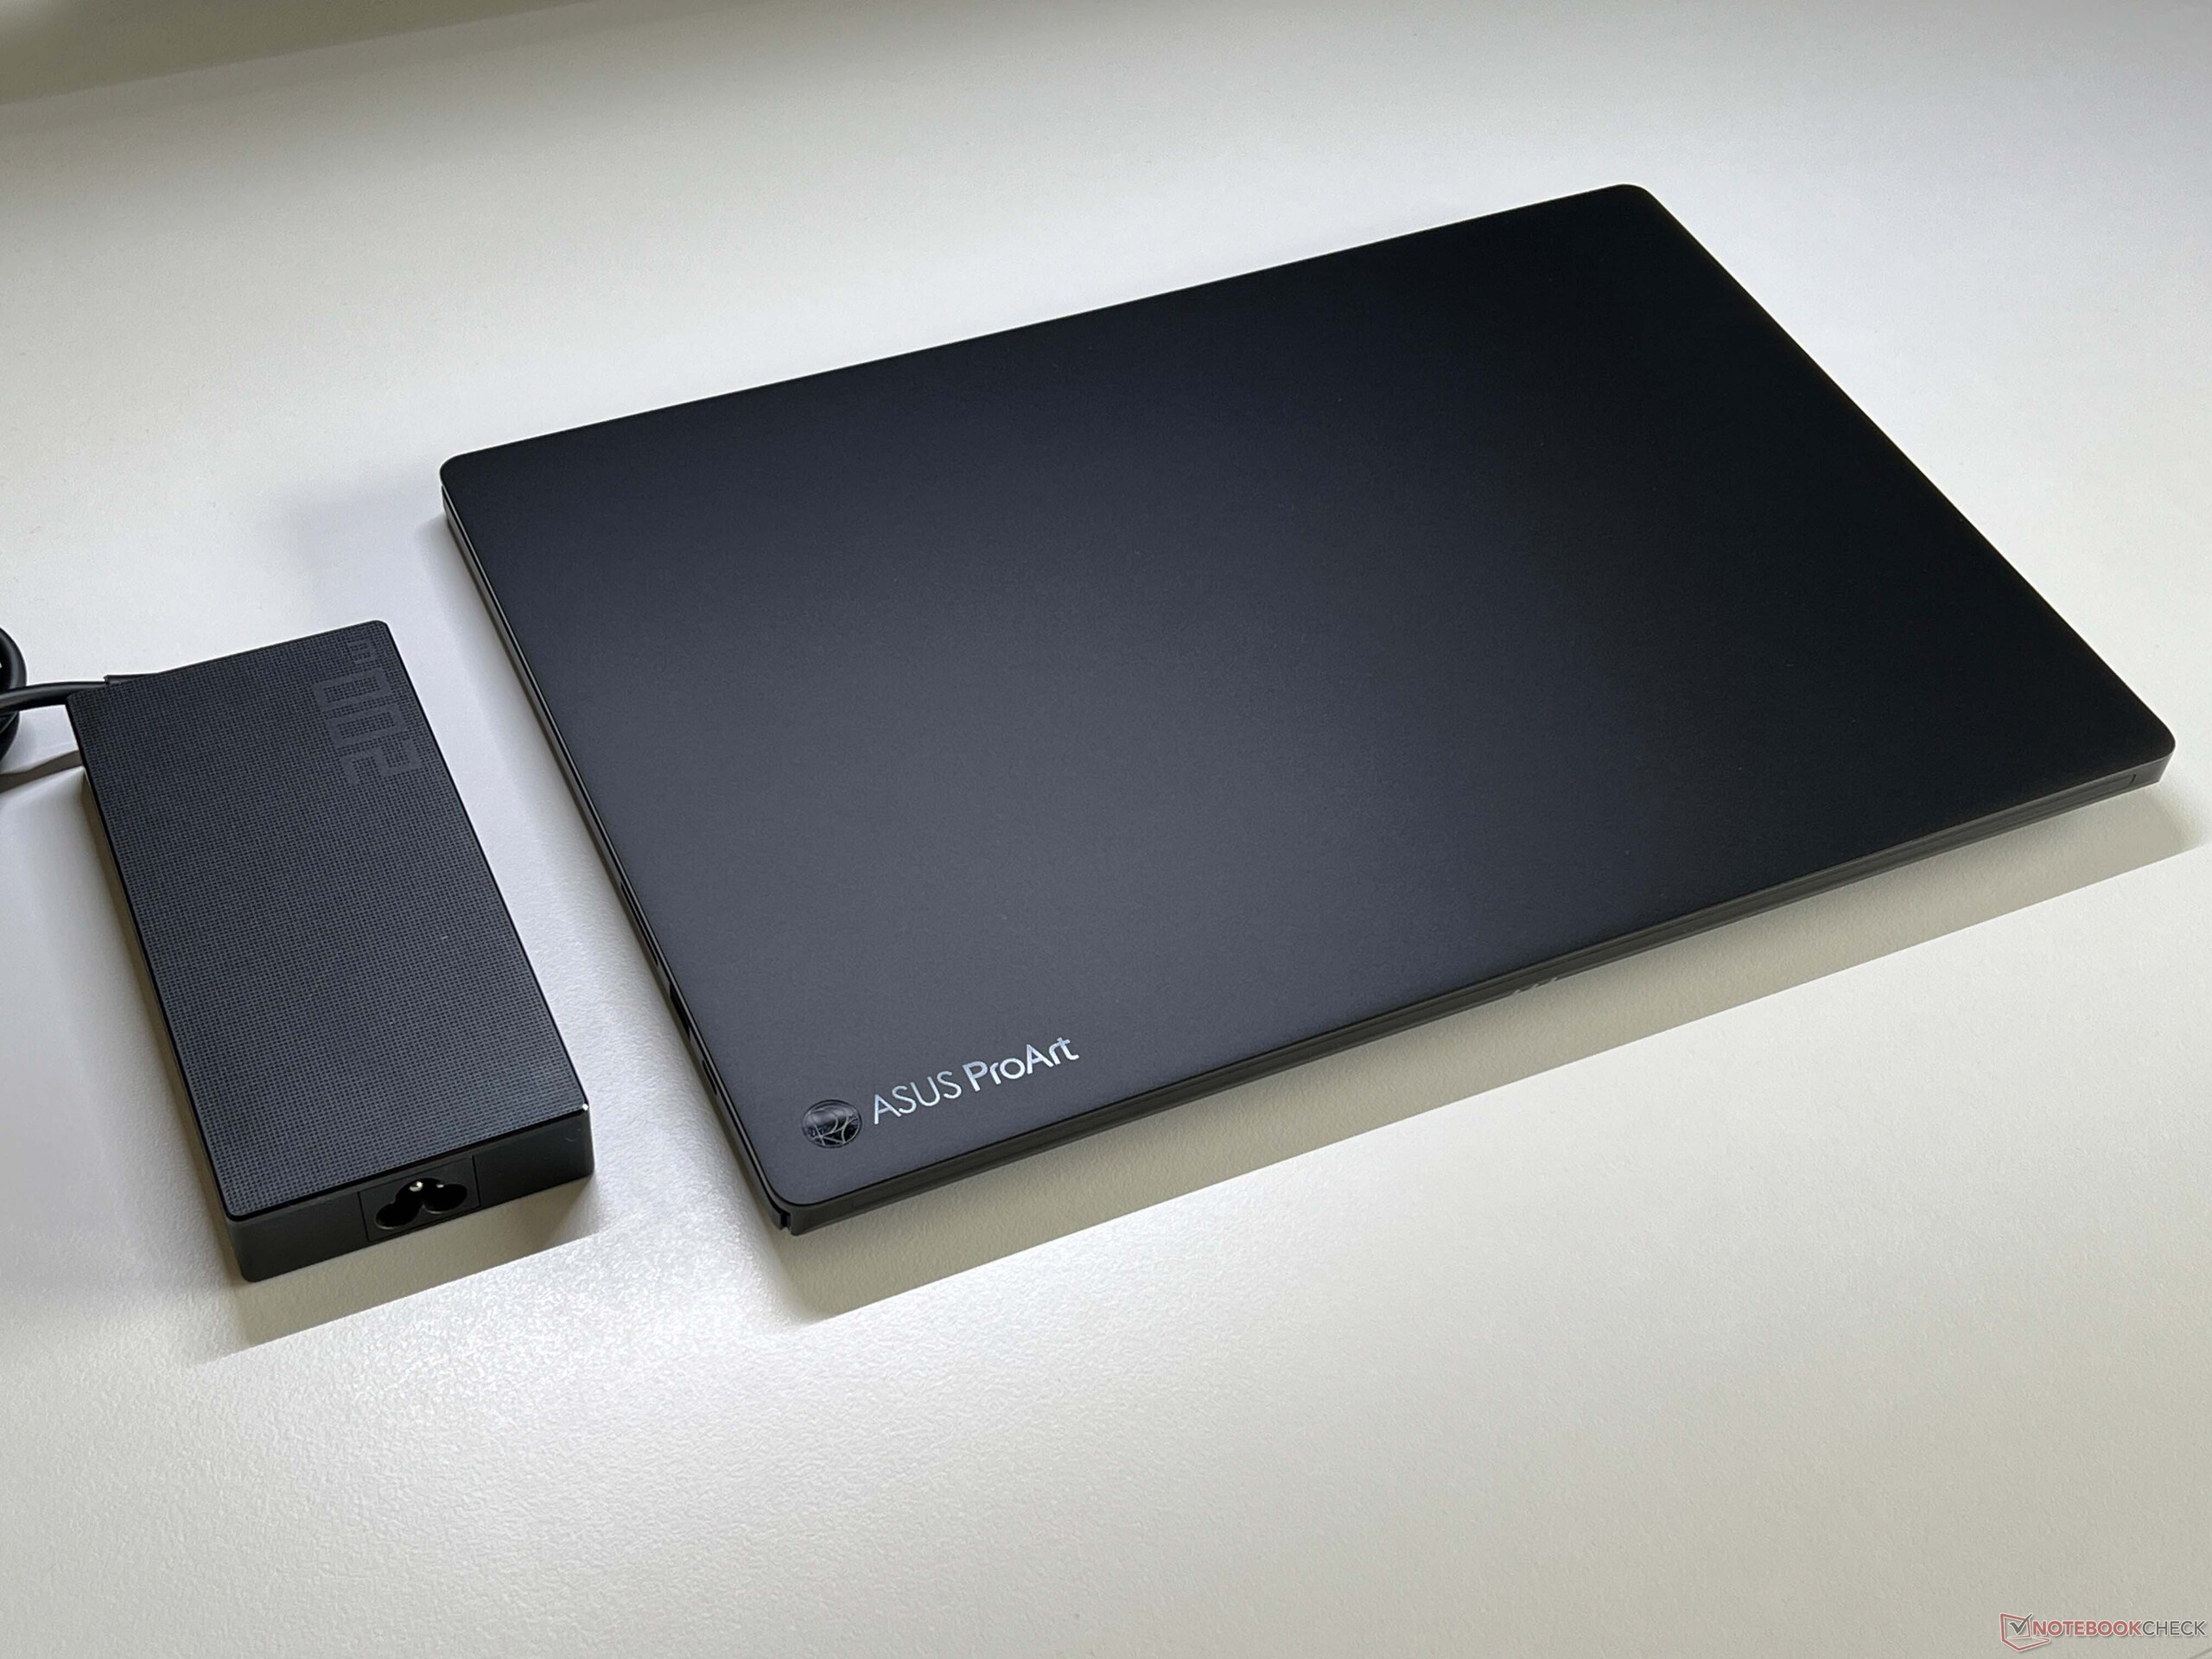
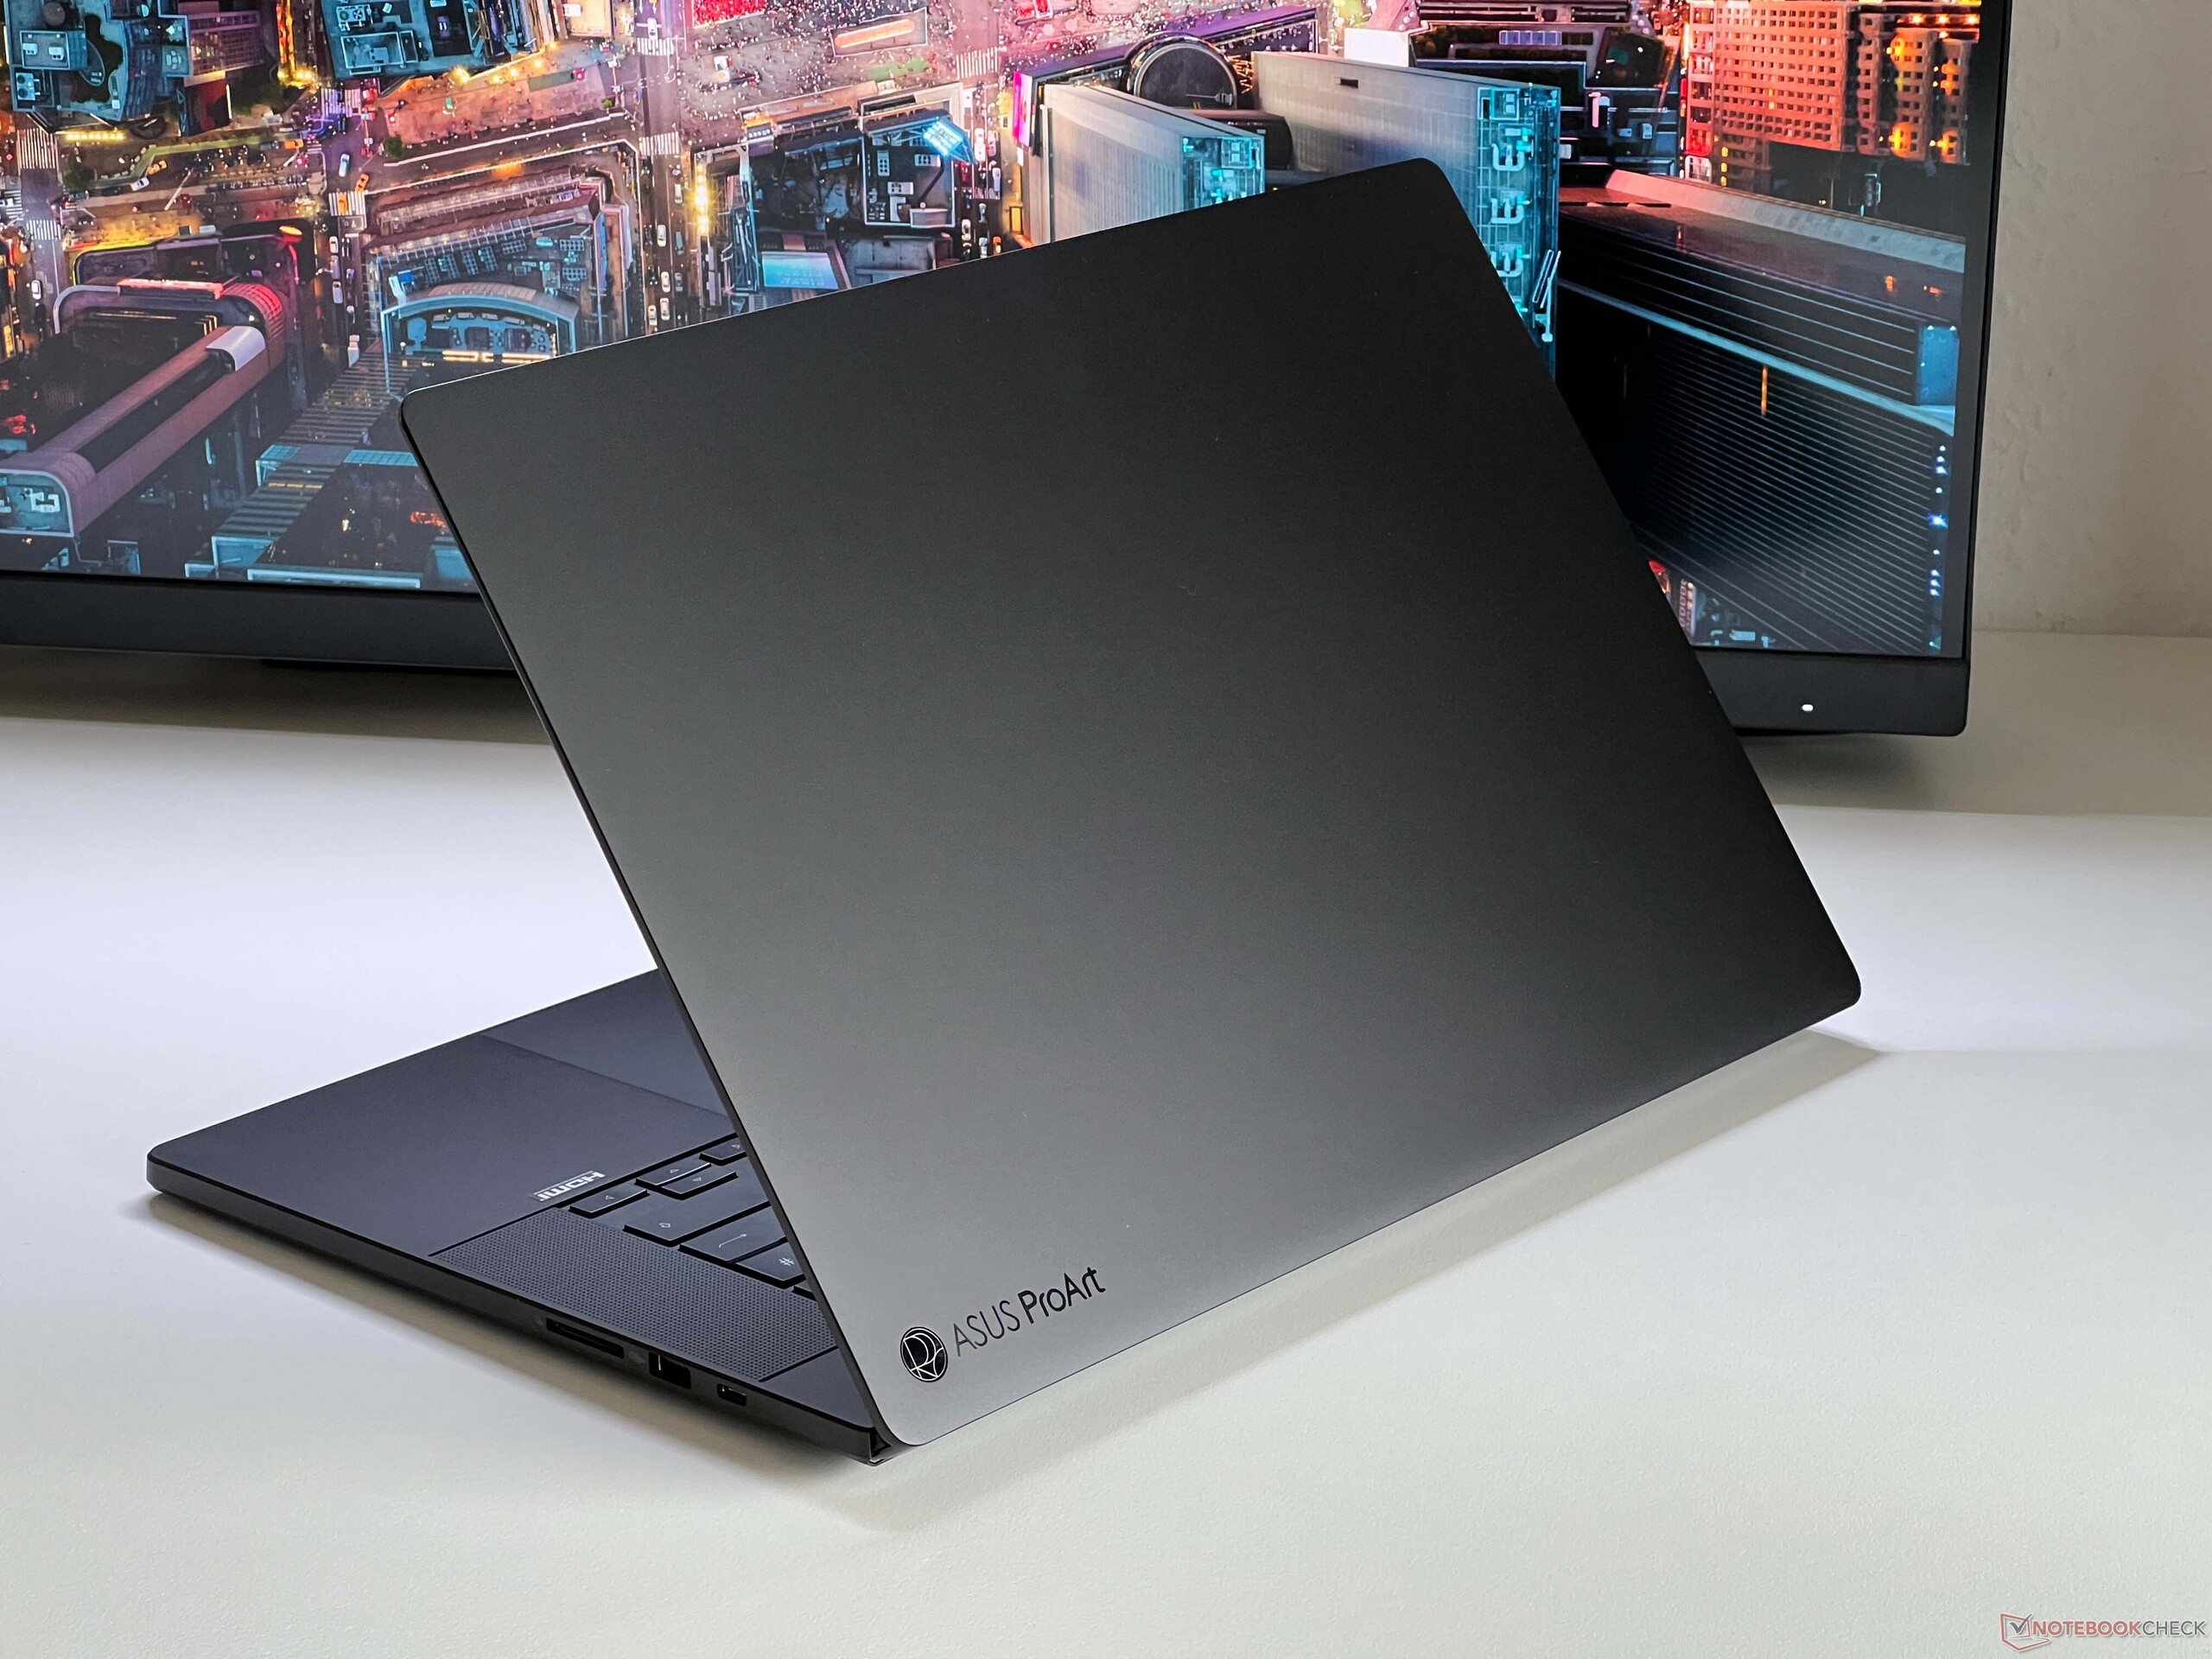
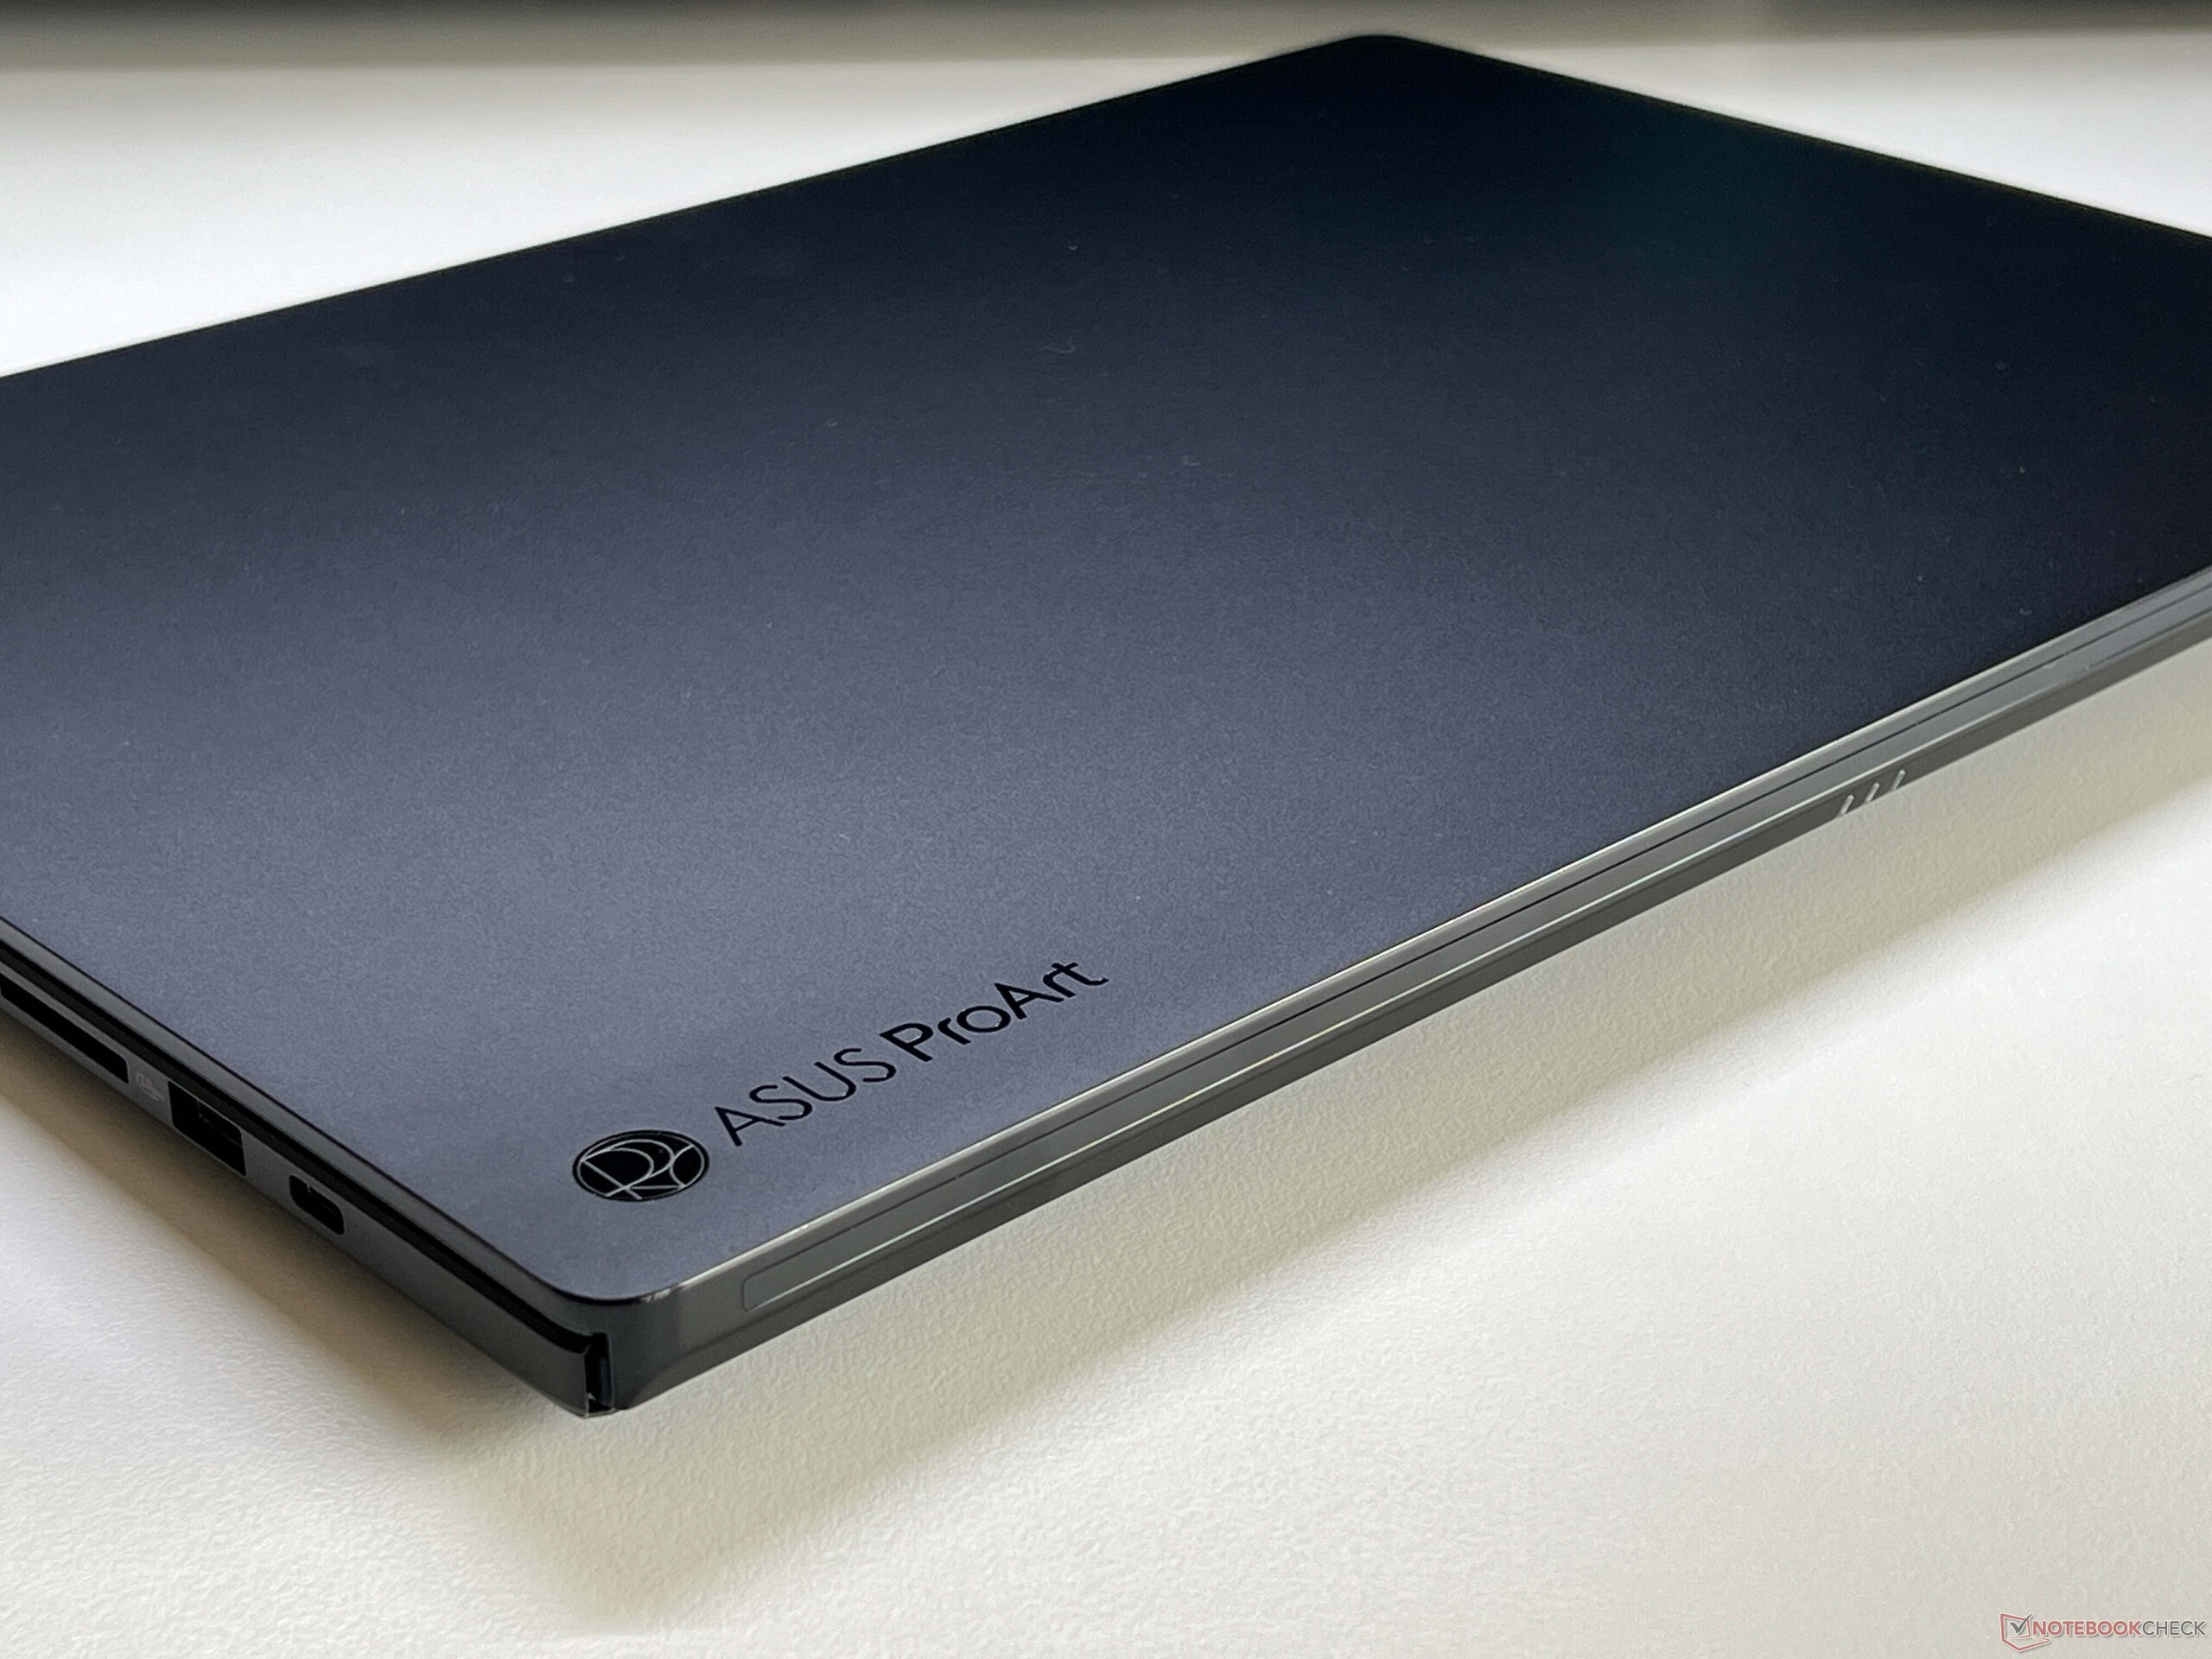
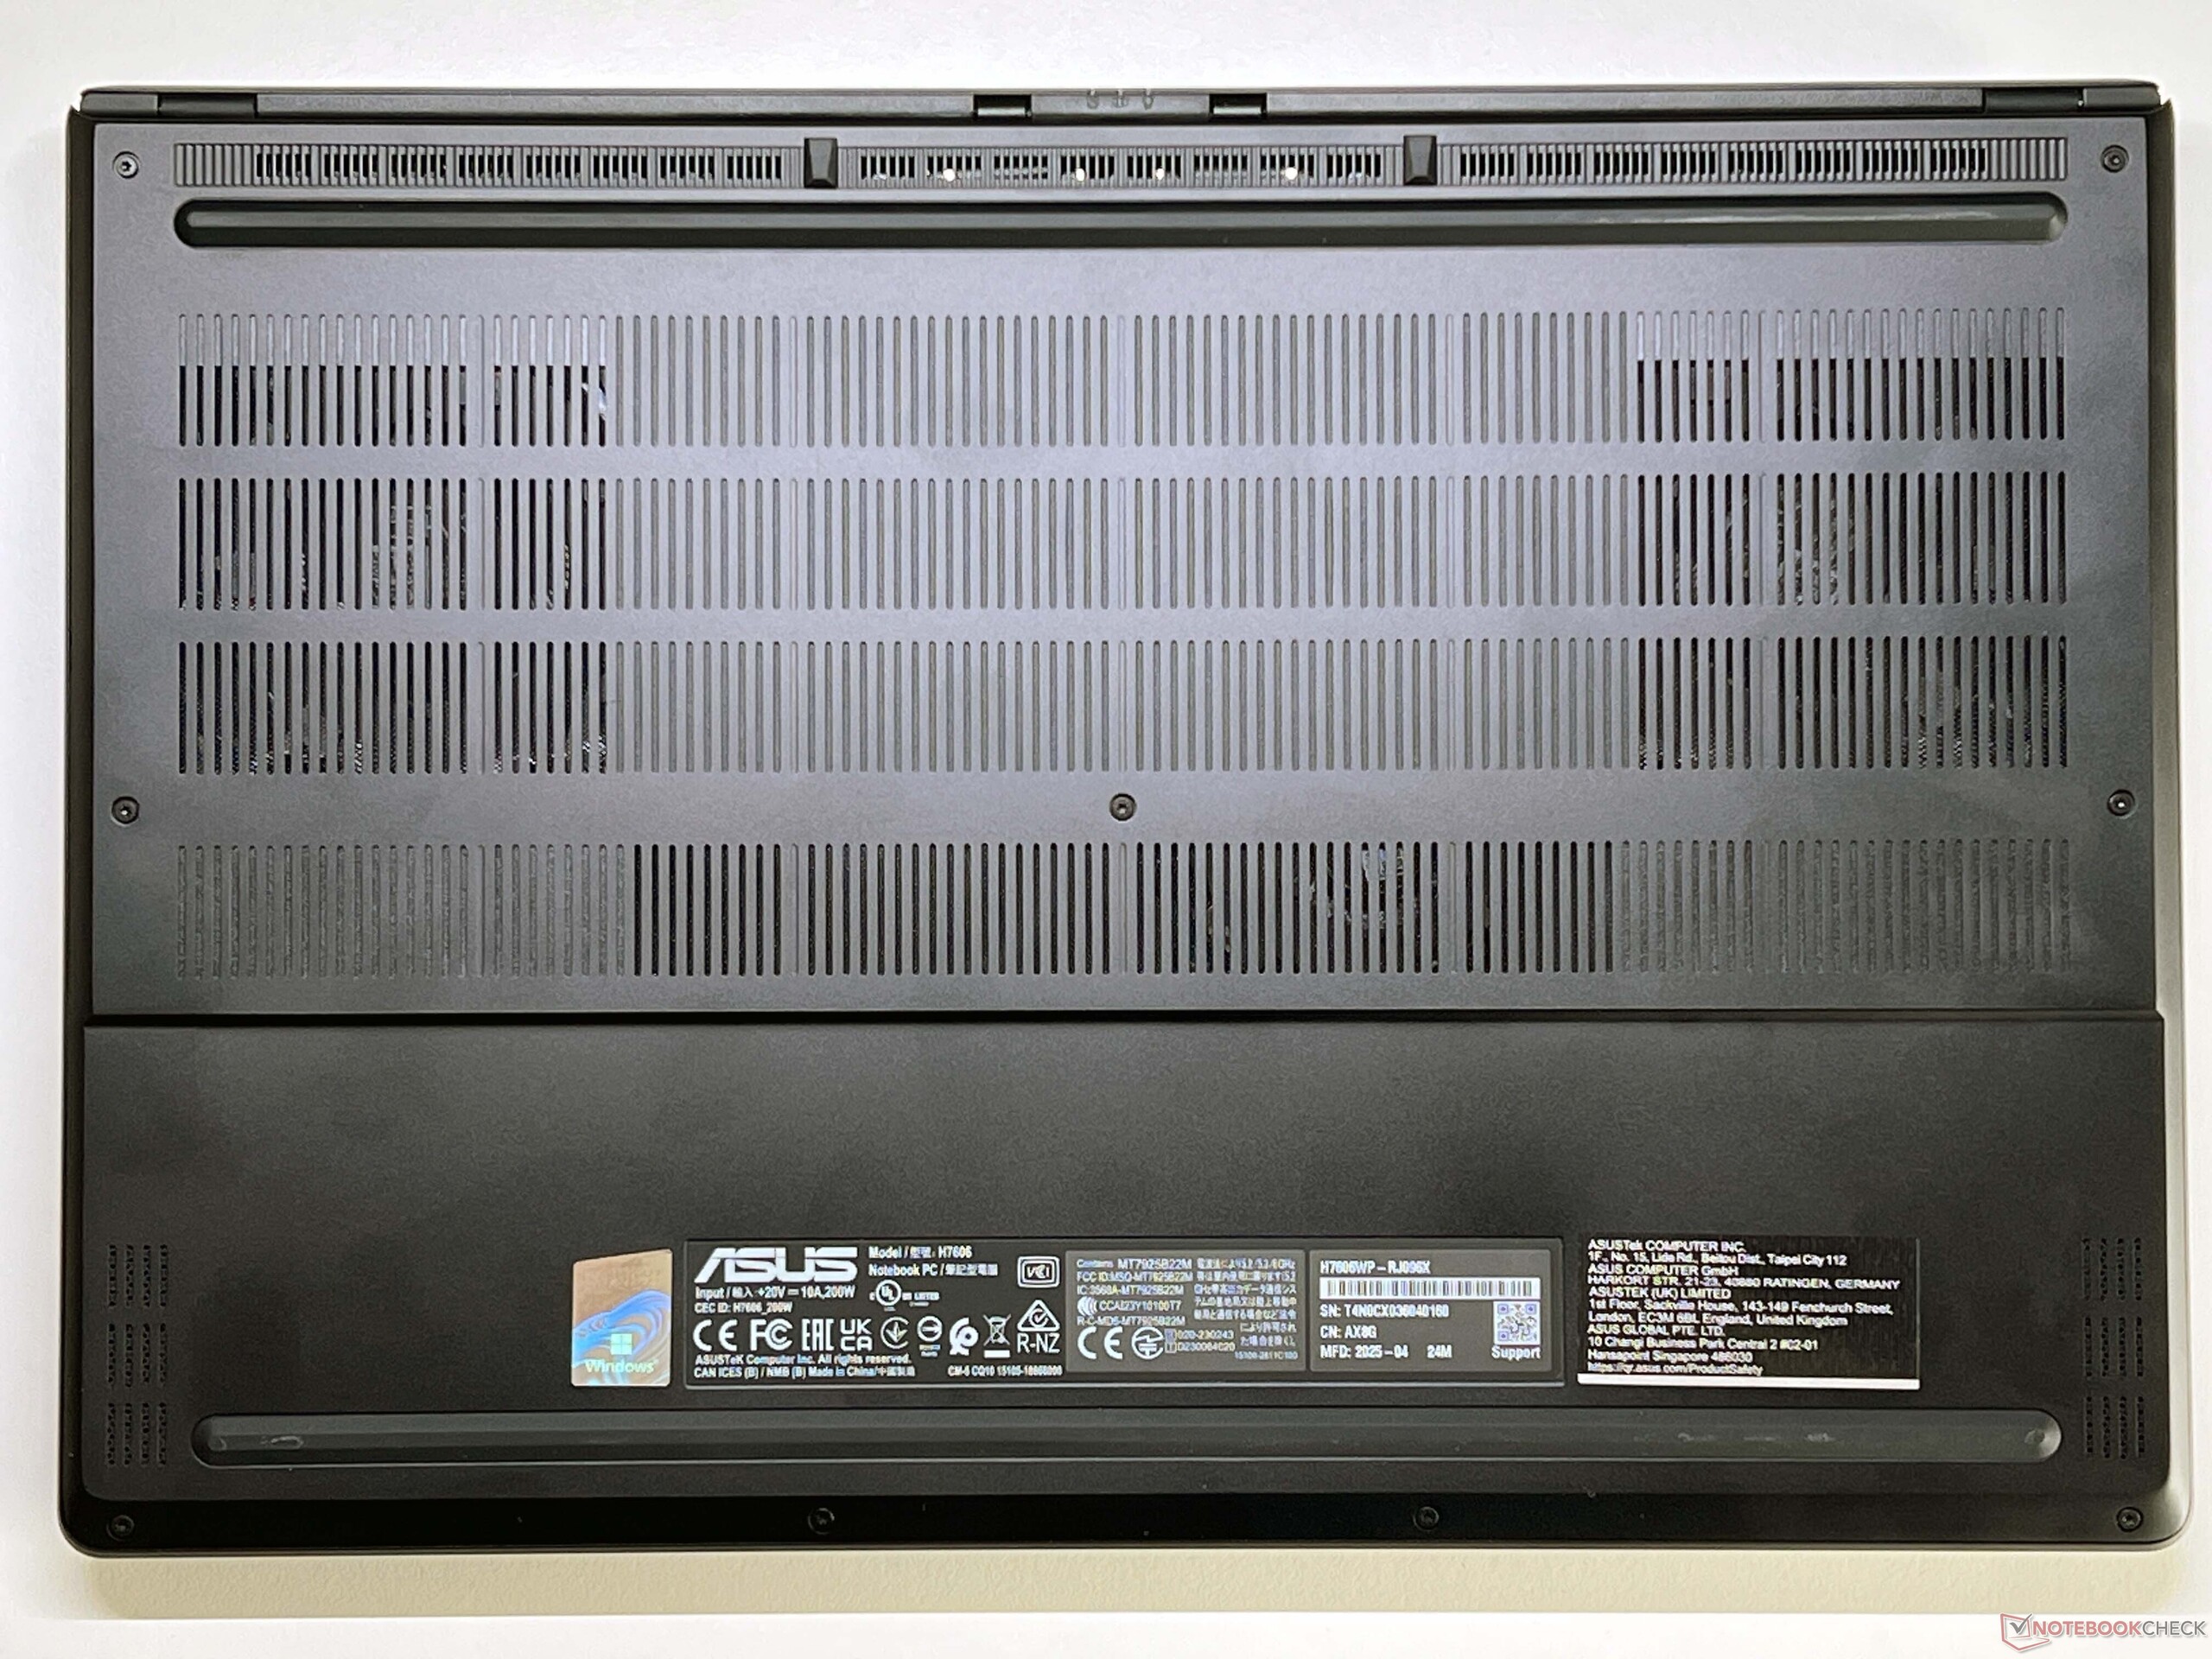
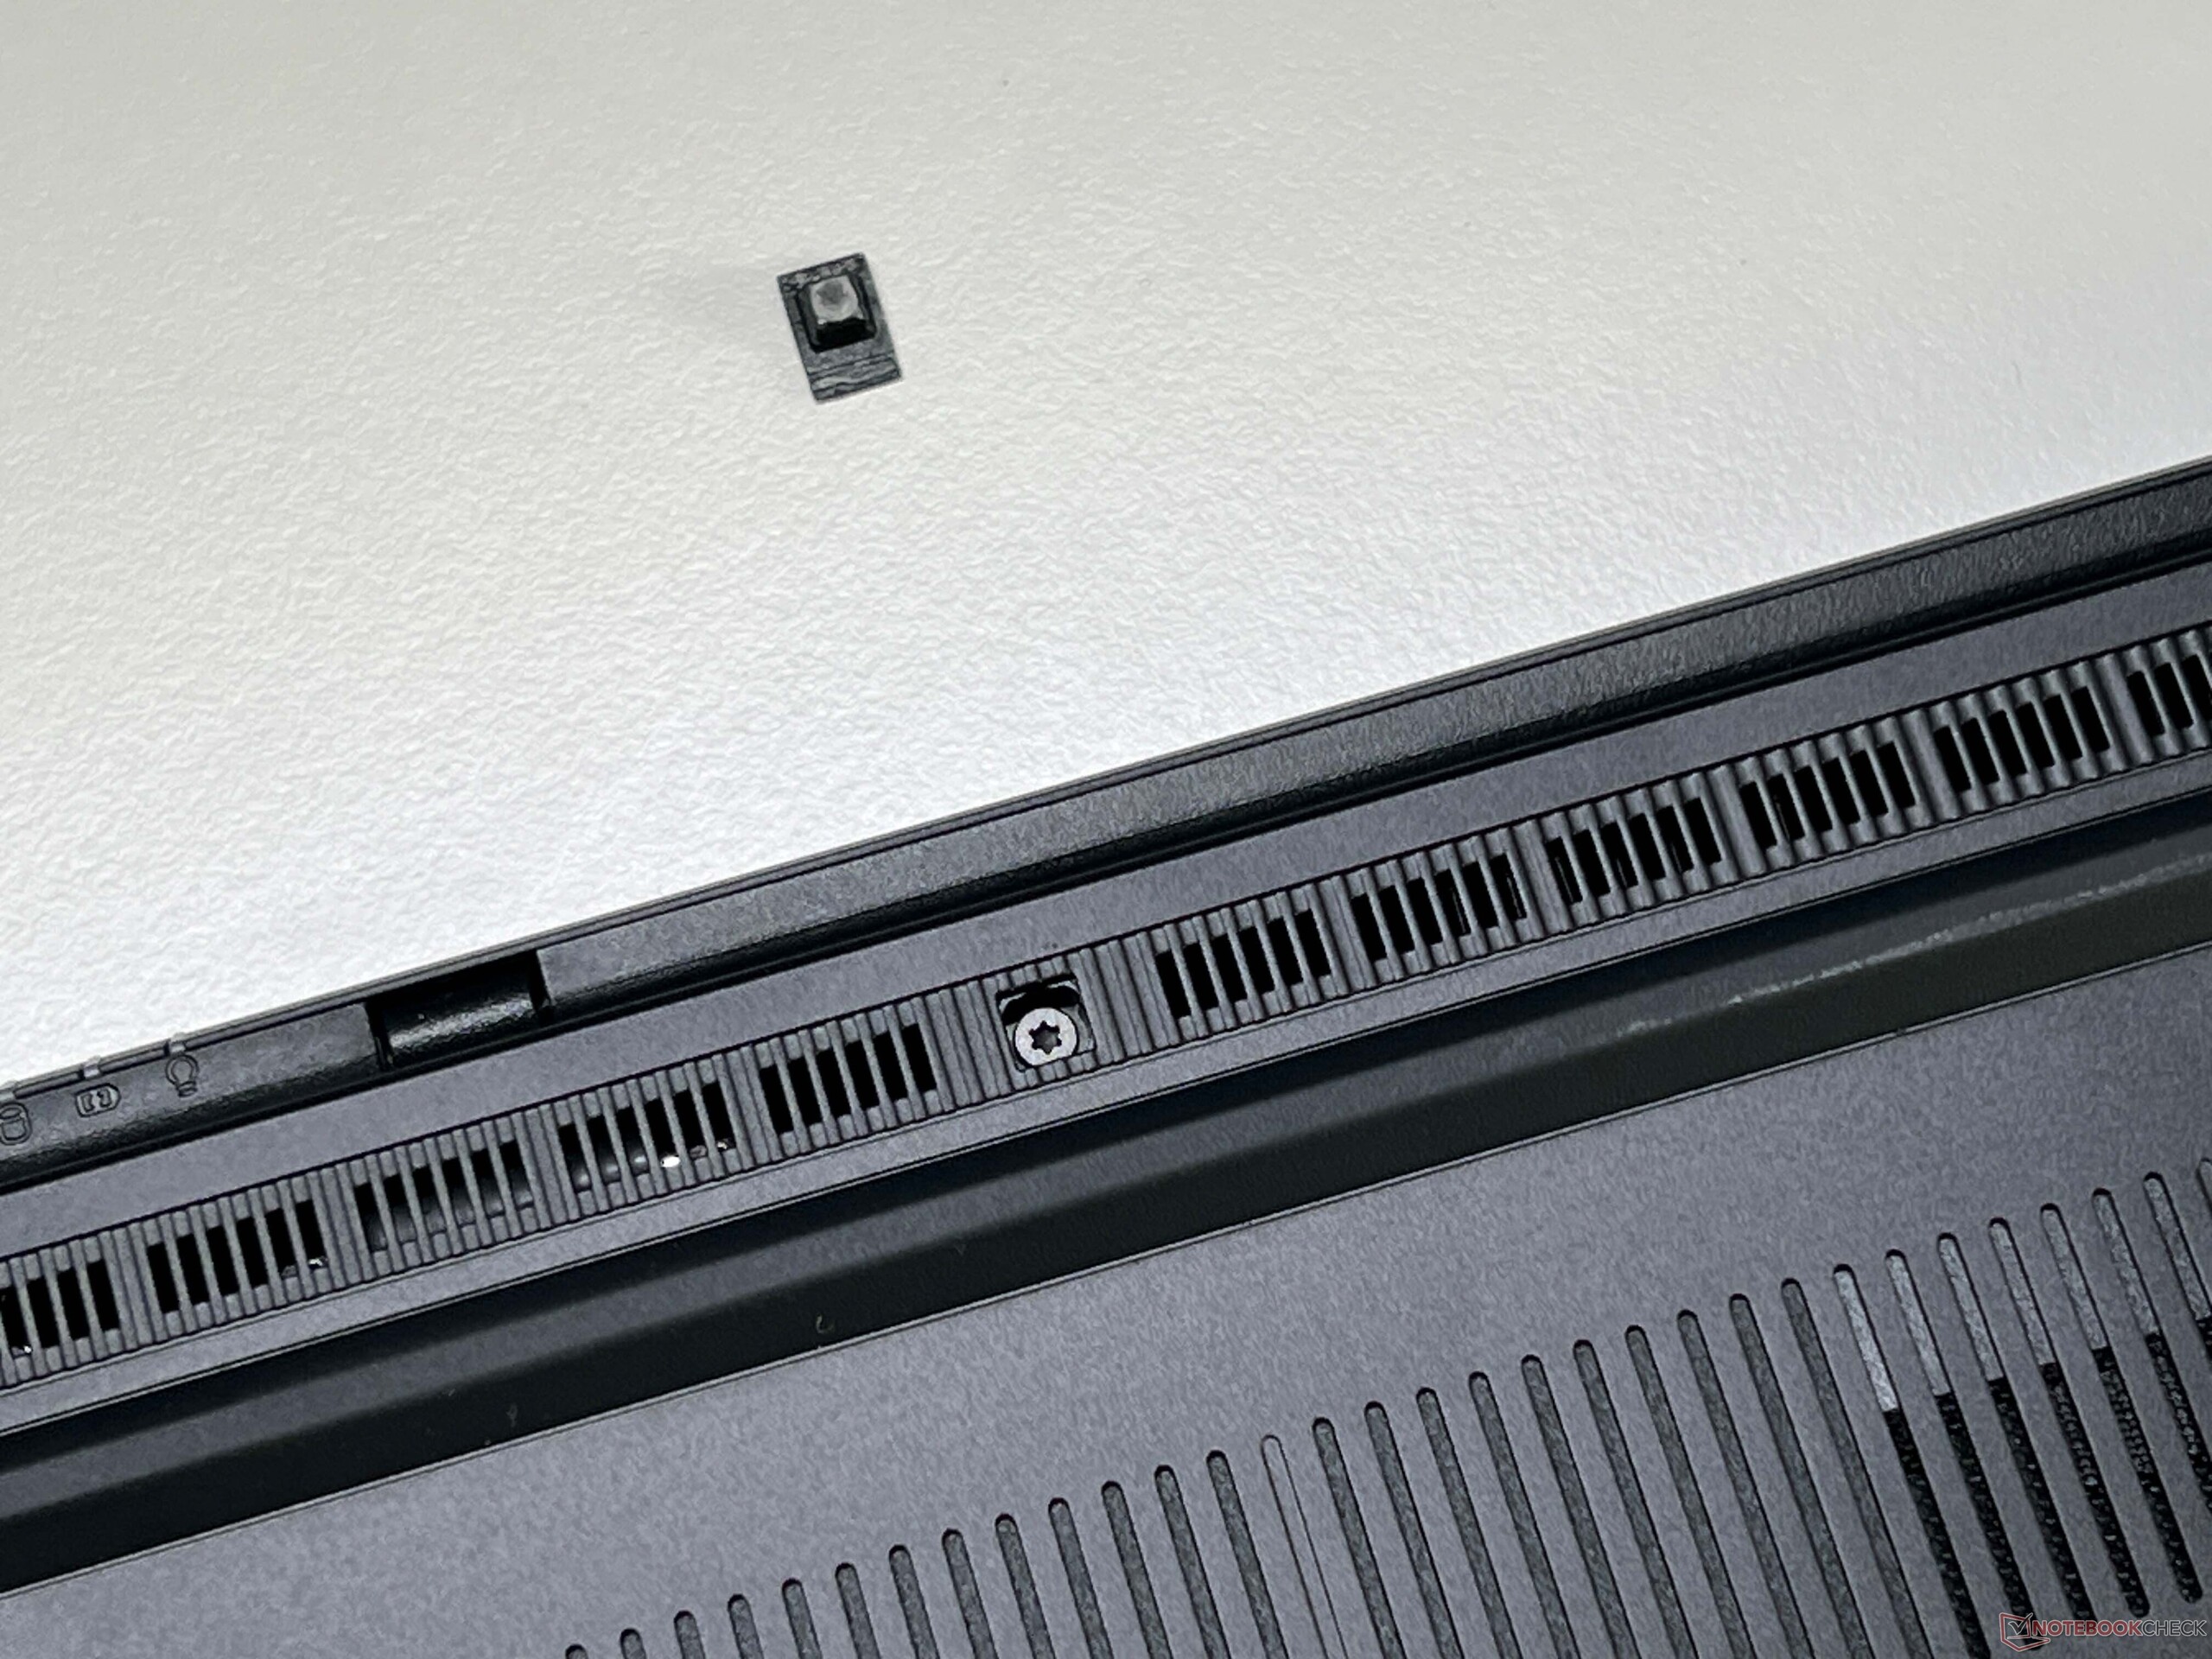
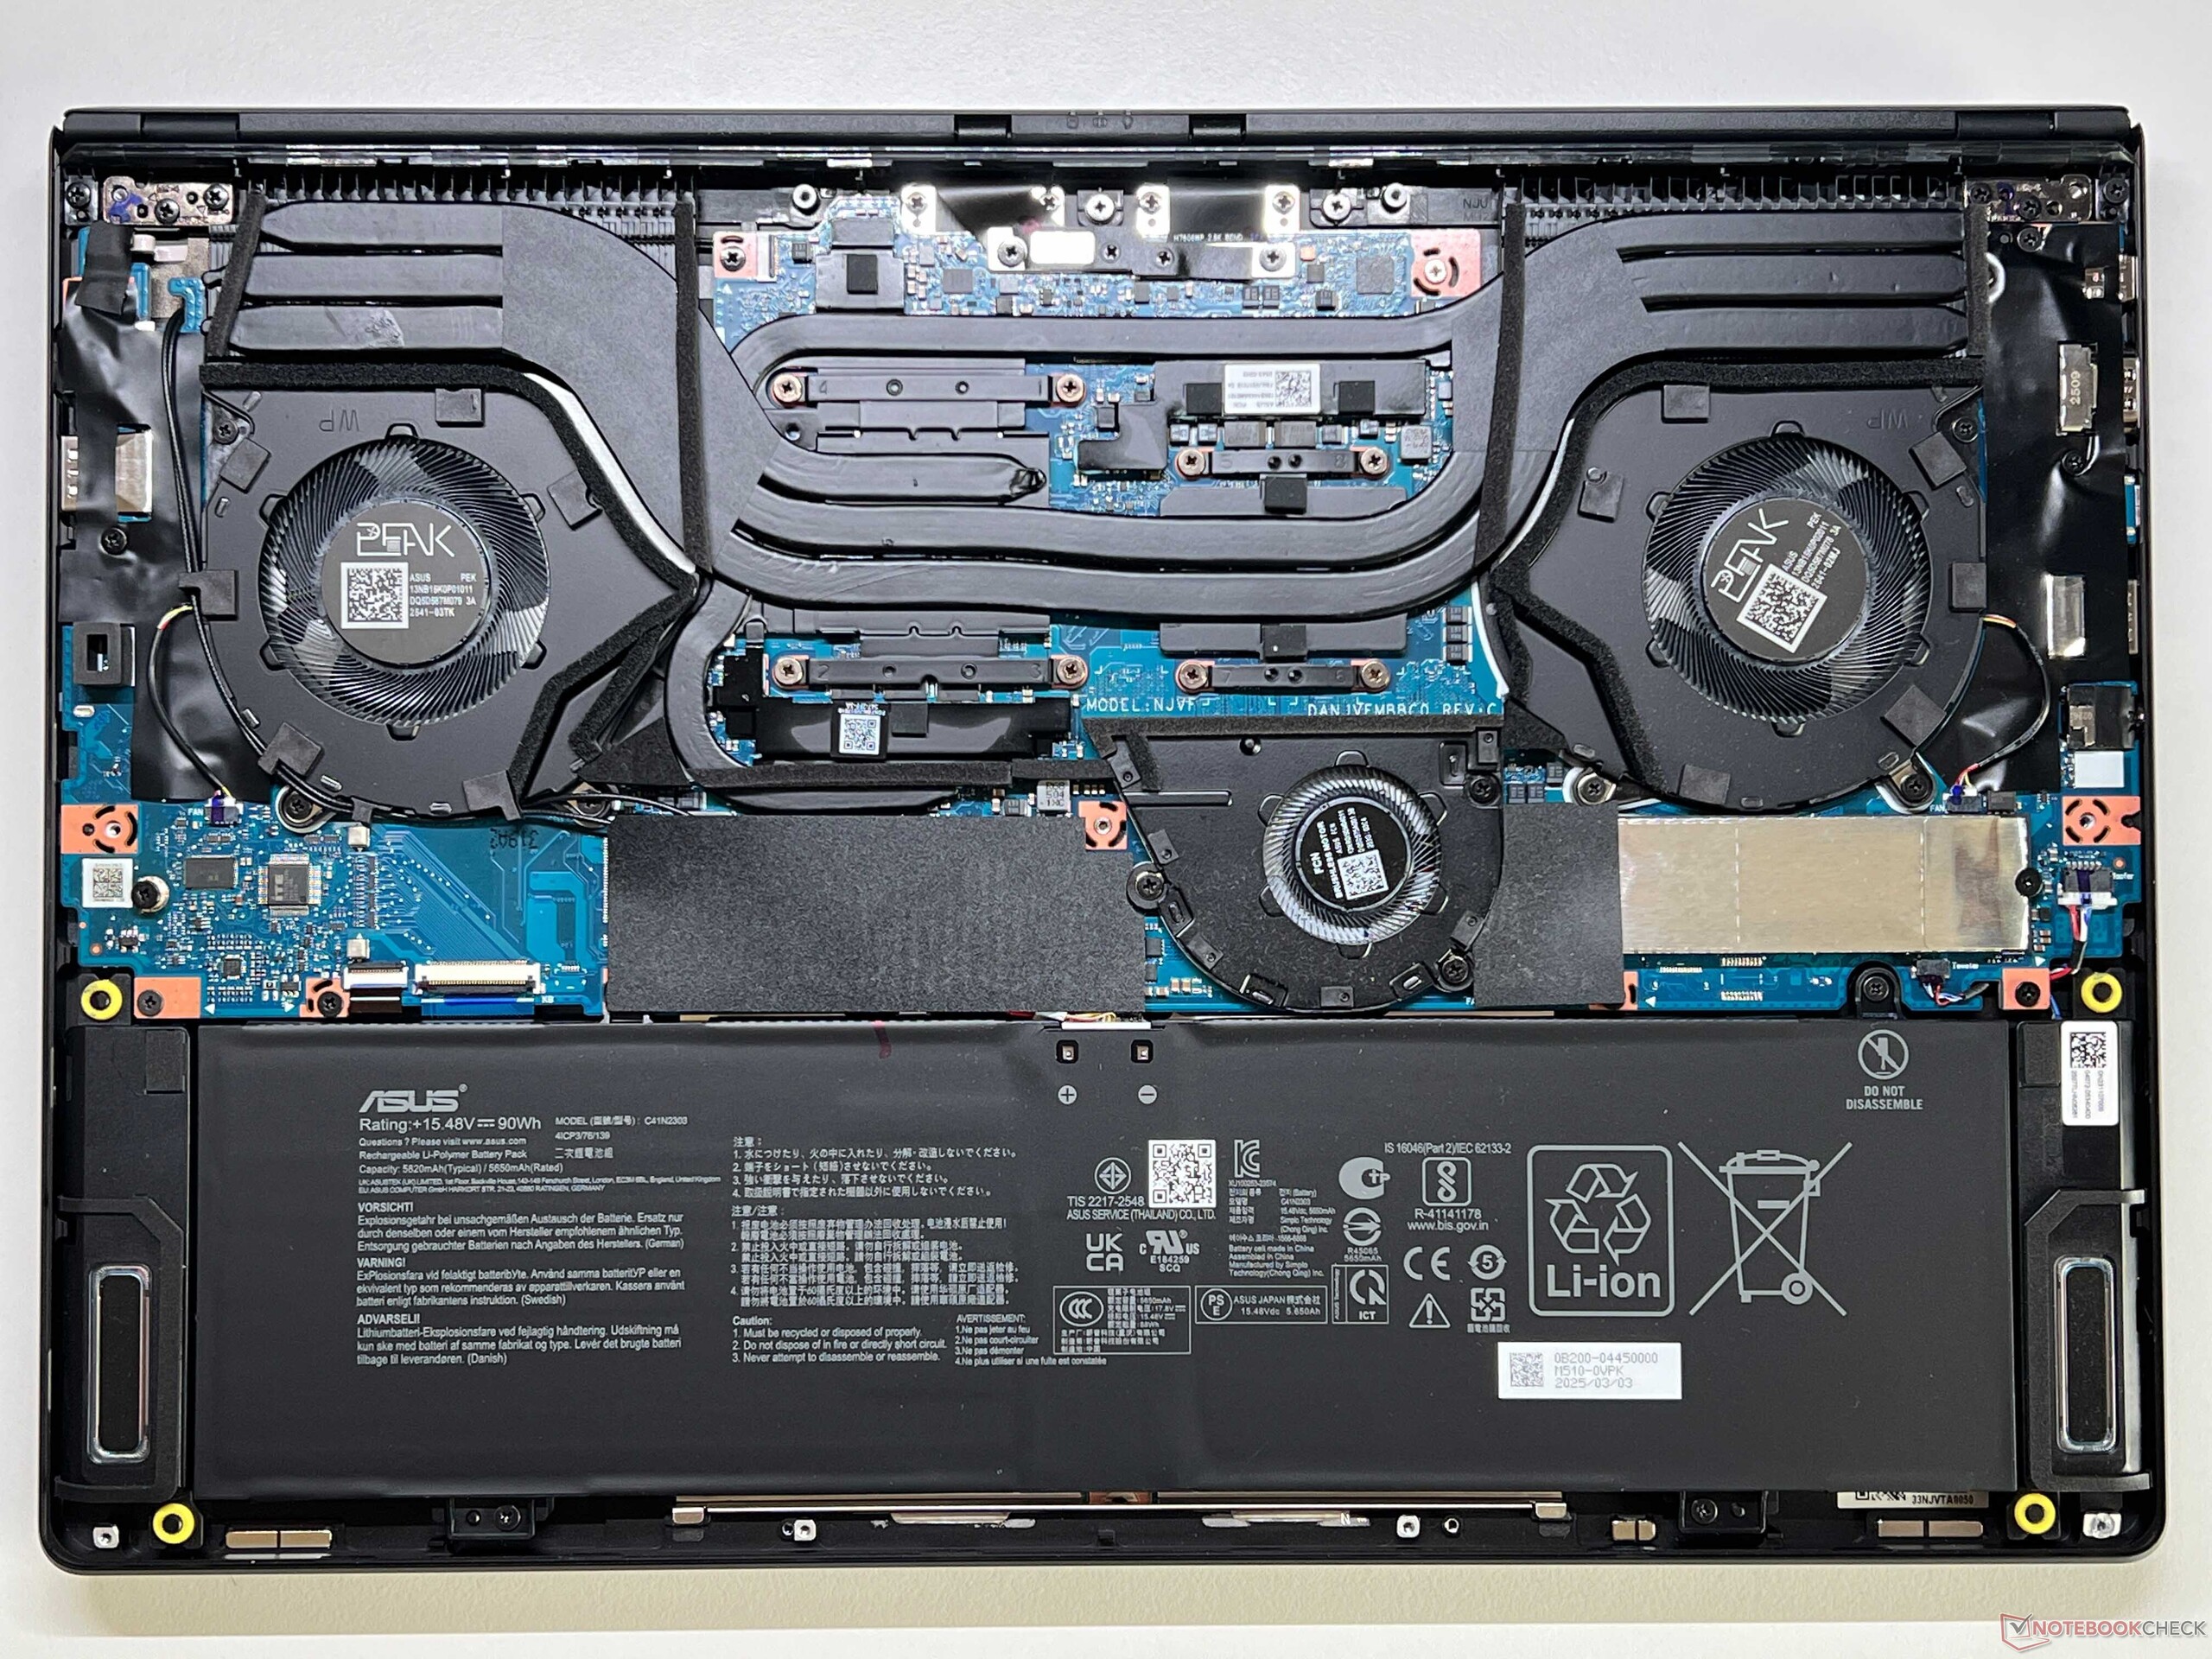
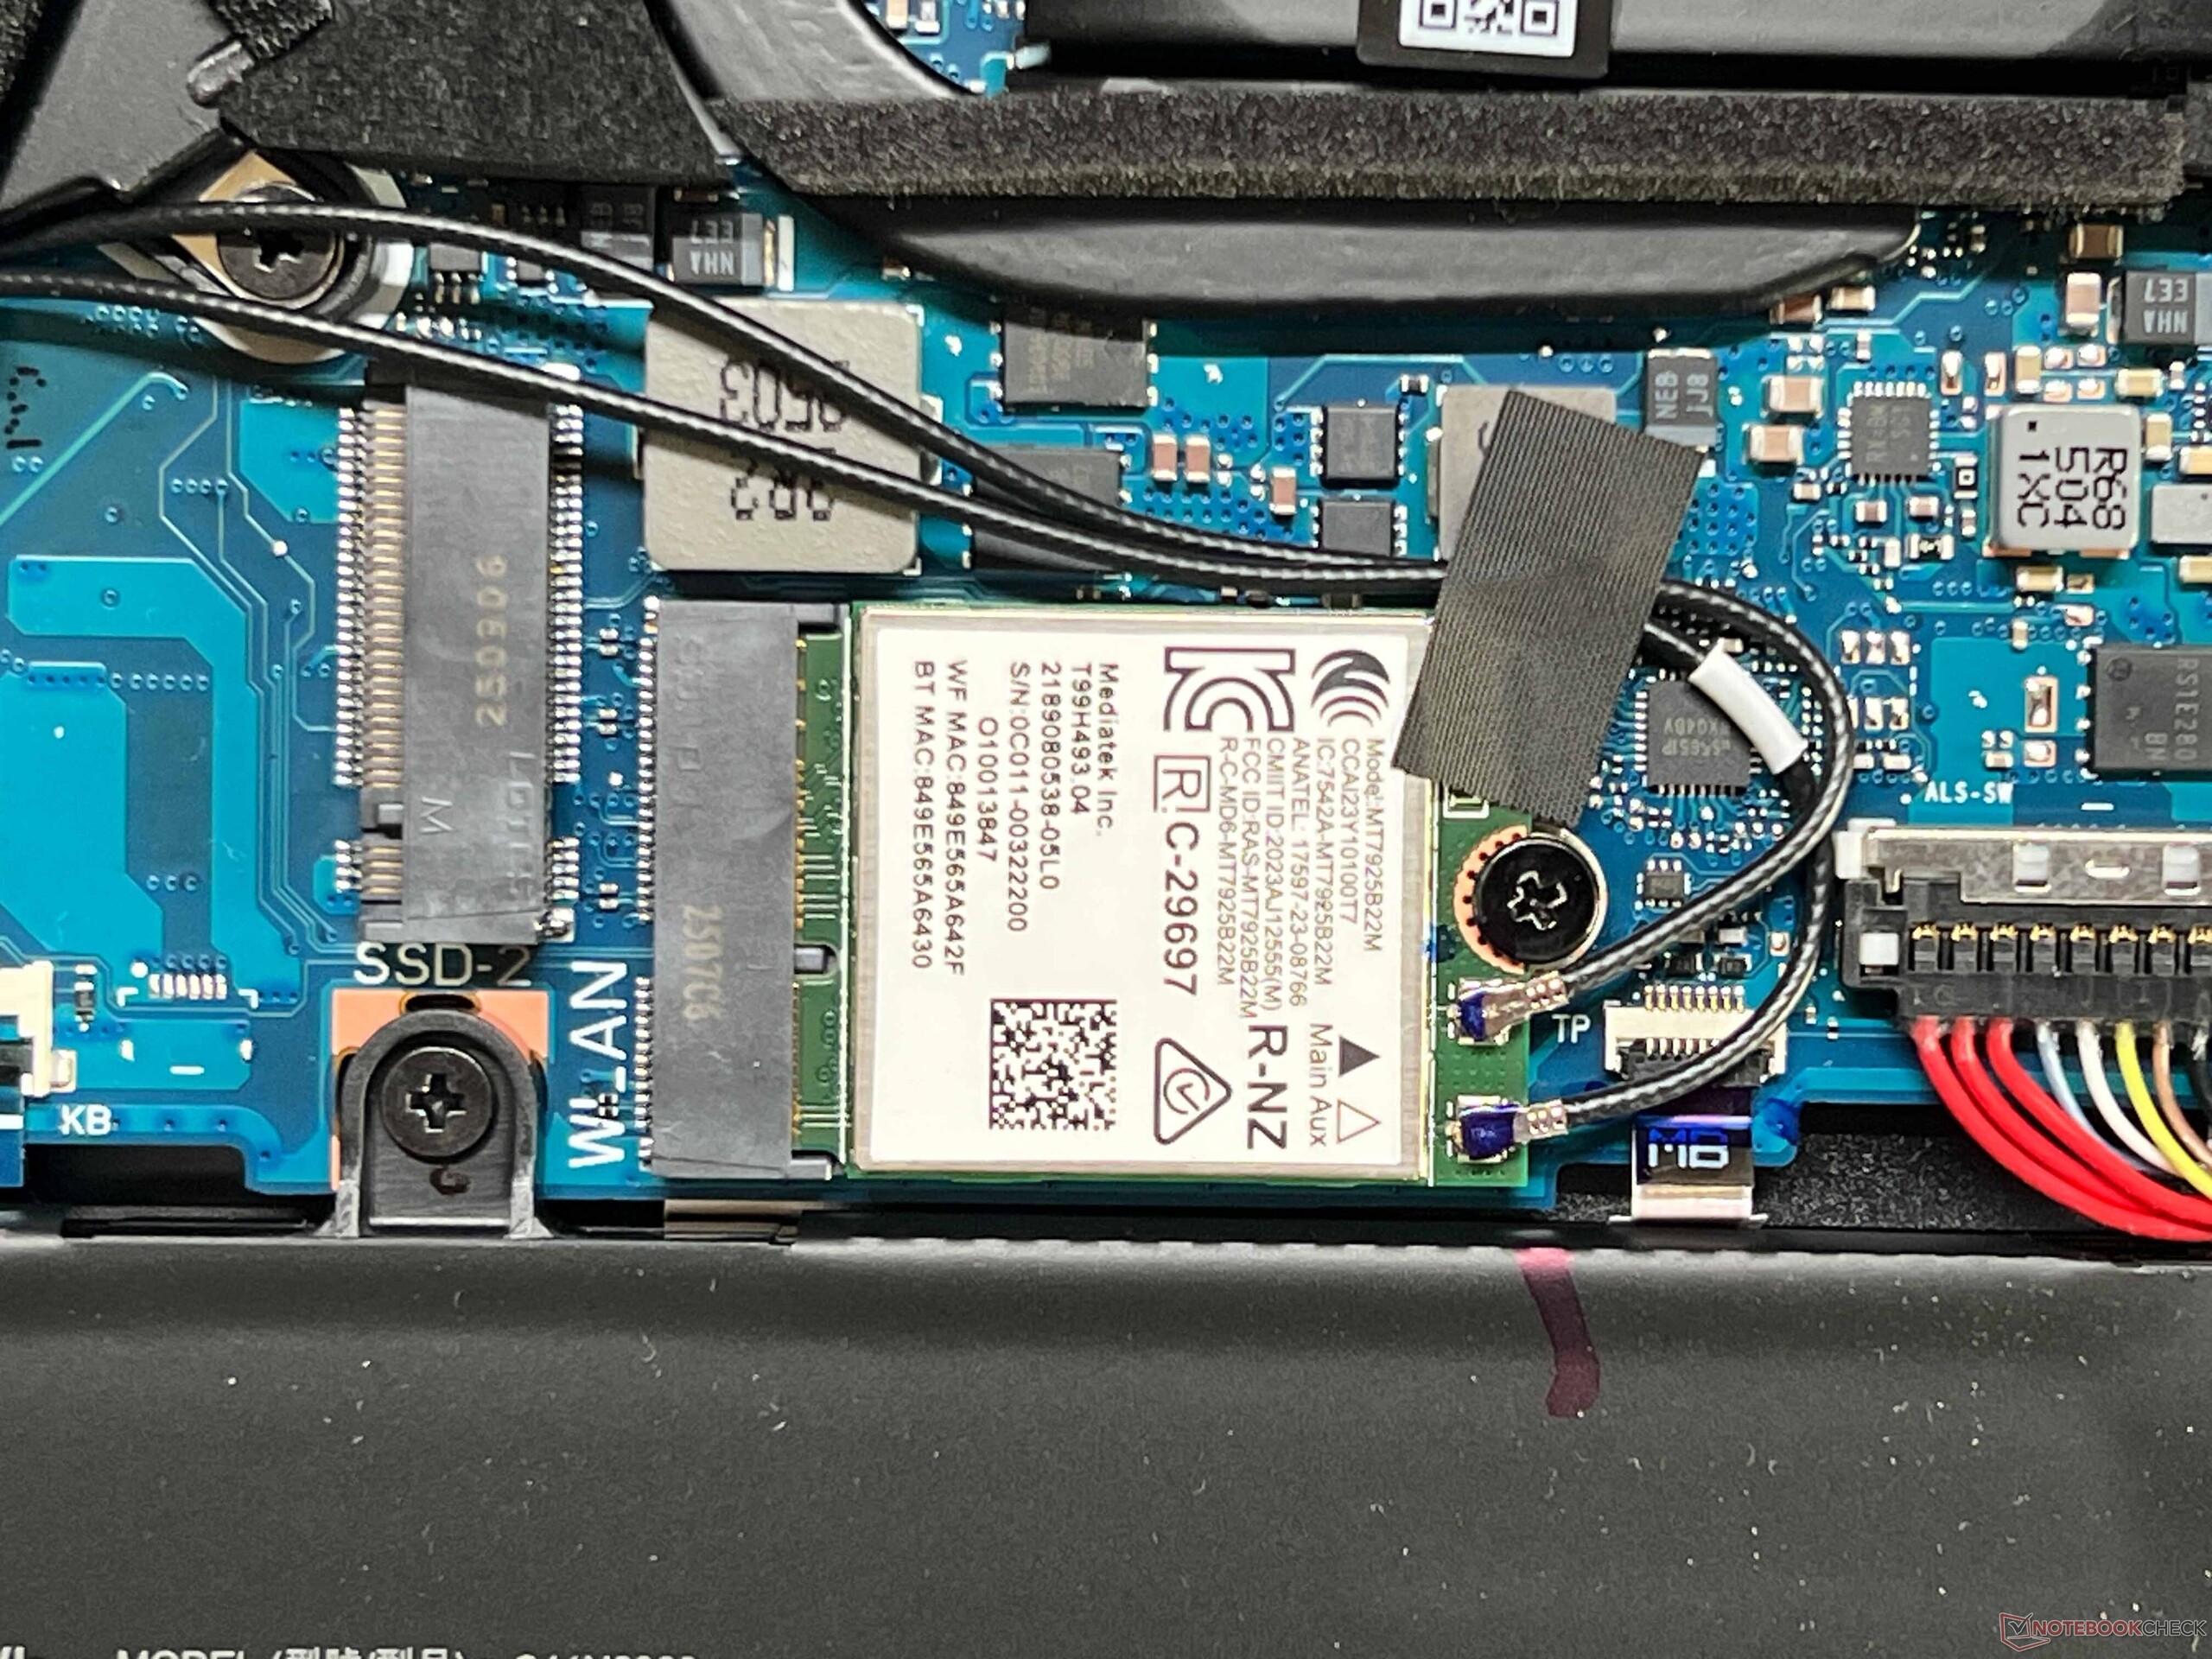
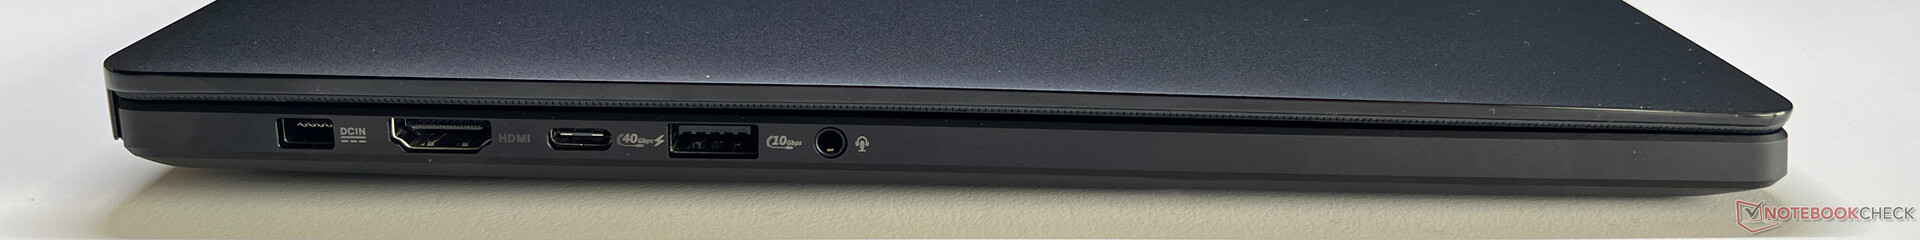
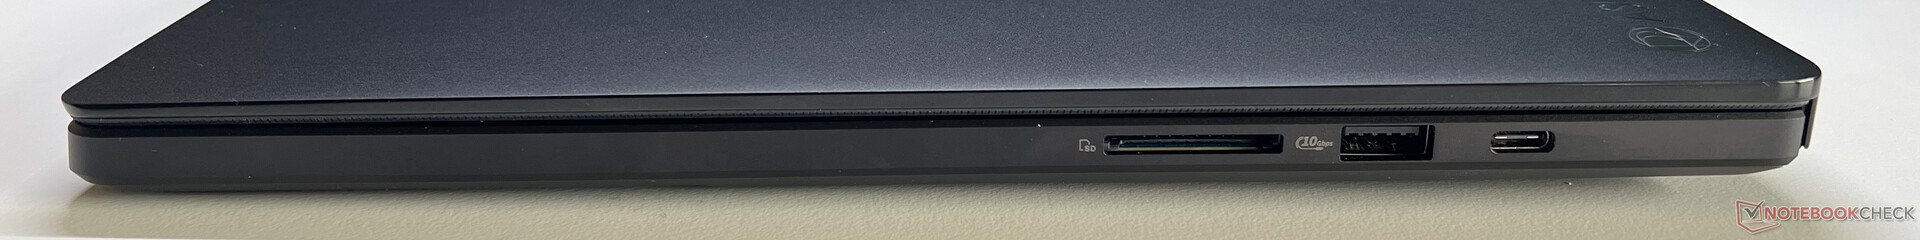
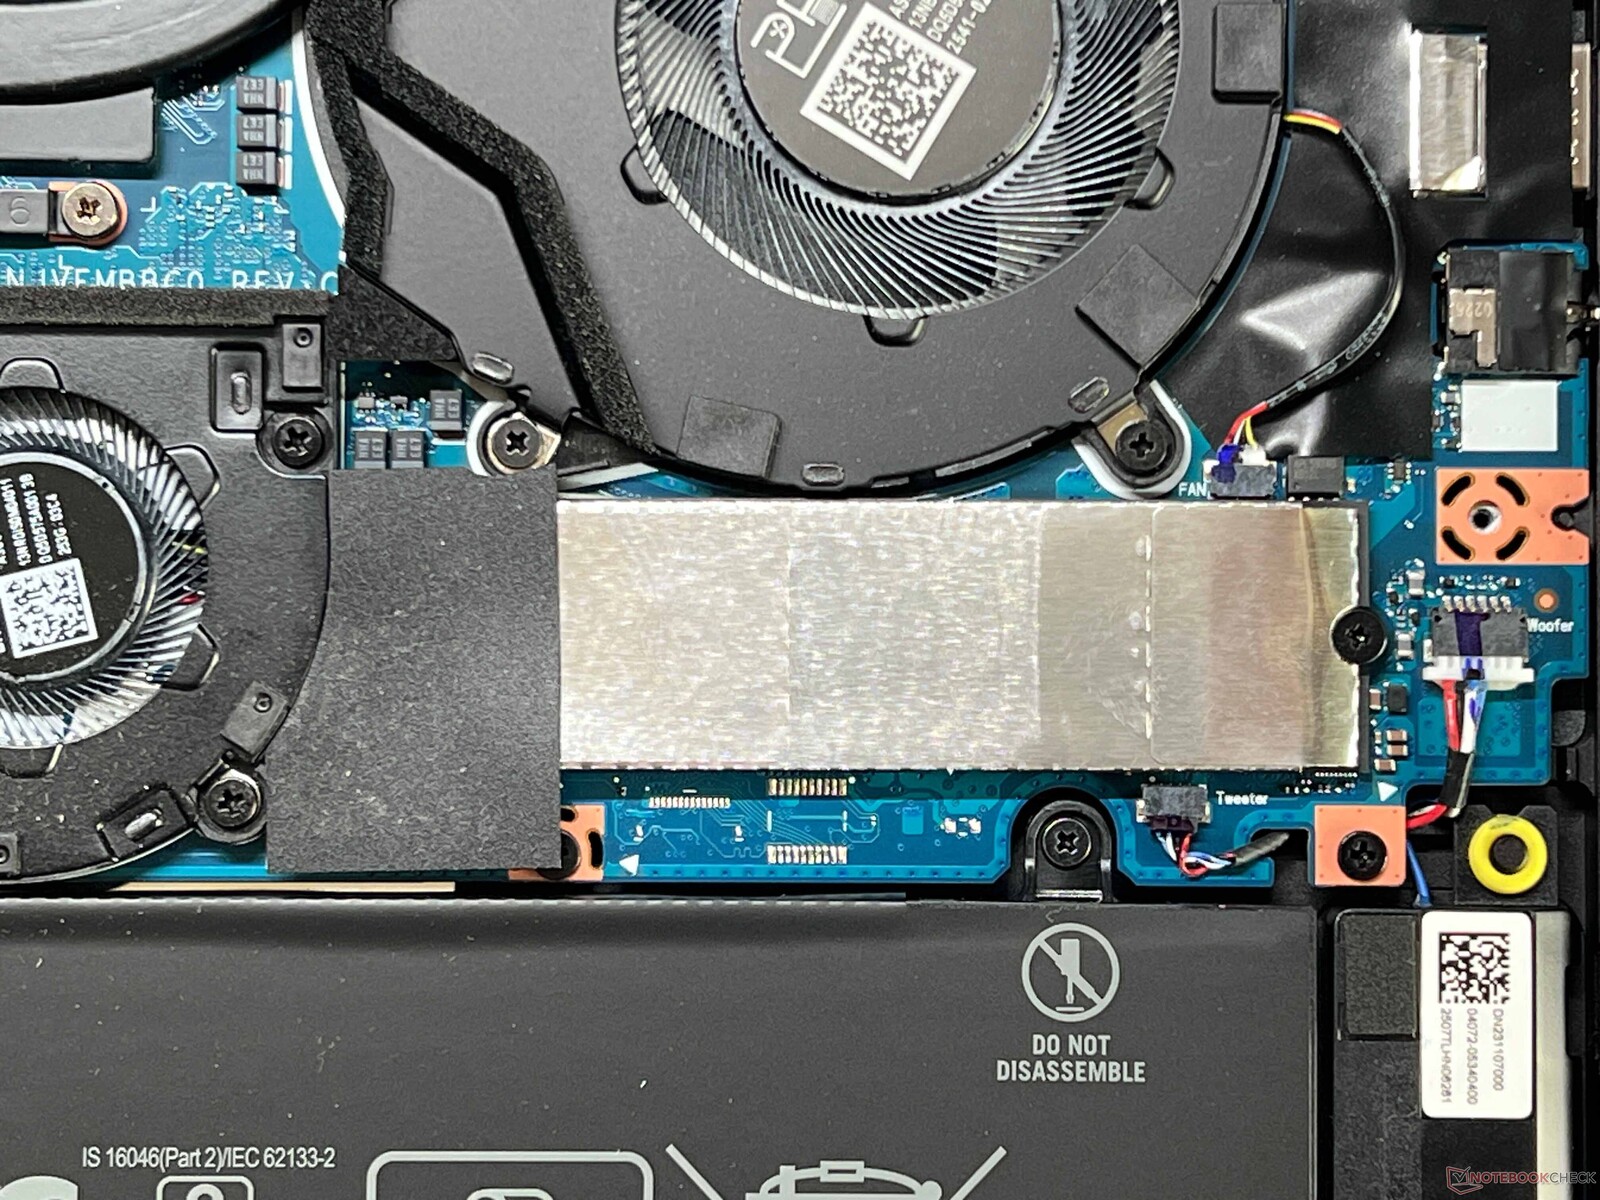
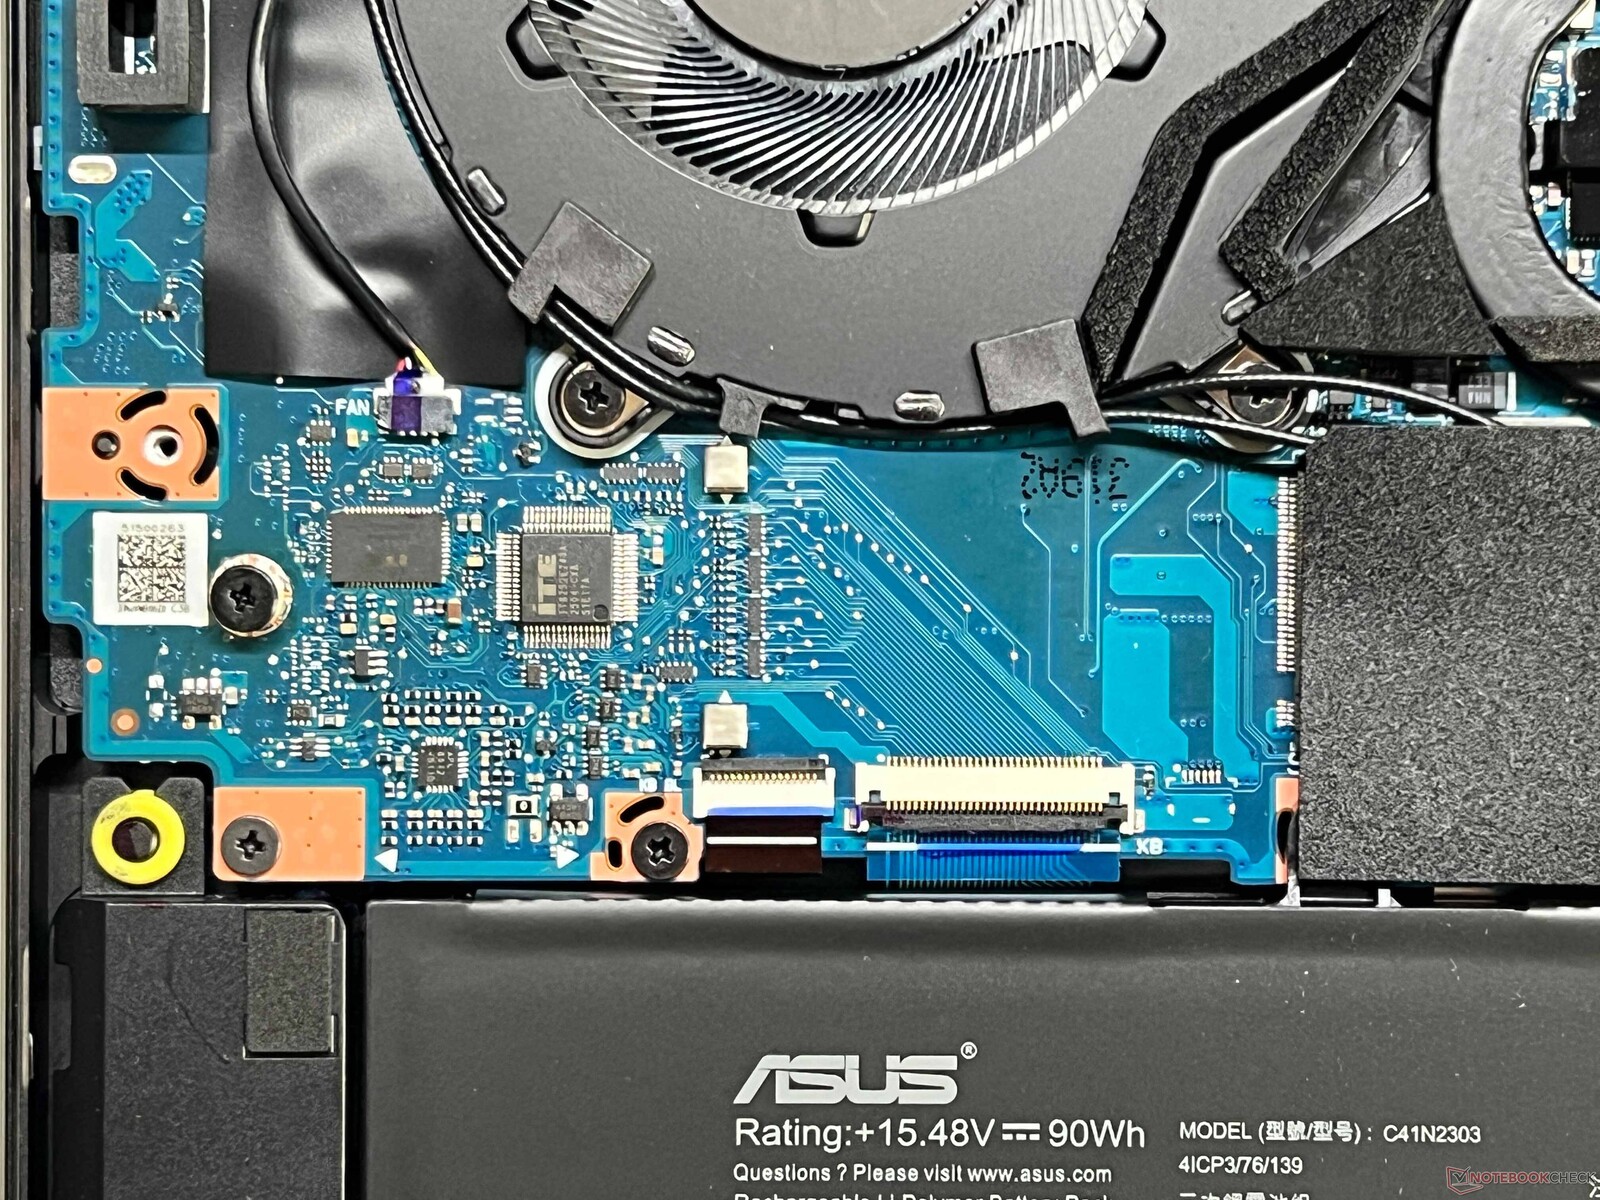
The laptop's black case is identical to the old model and, compared to the Zephyrus G16, it has no lighting element on its lid. This case is also black and proves to be quite the fingerprint magnet. Its overall quality is excellent, but its weak point is still its hinges, as the display's lid clearly bounces after adjusting its angle. Access to the device's components (fan, battery, WLAN module, 2x SSD) is still made difficult by two hidden screws. No changes have been made to its connectivity and all important standards (USB 4.0, Wi-Fi 7) are on board. Its card reader is super fast, but the laptop's 1080p webcam doesn't take particularly good photos. The ProArt P16 is a Copilot+ laptop.
| SD Card Reader | |
| average JPG Copy Test (av. of 3 runs) | |
| Asus ProArt P16 H7606WP (Angelbird AV Pro V60) | |
| Apple MacBook Pro 16 2024 M4 Pro (Angelbird AV Pro V60) | |
| Dell XPS 16 9640 (Angelbird AV Pro V60) | |
| Asus ProArt P16 H7606WI (Angelbird AV Pro V60) | |
| Average of class Multimedia (23 - 531, n=41, last 2 years) | |
| Lenovo Yoga Pro 9 16IMH9 (Angelbird AV Pro V60) | |
| Lenovo ThinkBook 16p G5 IRX 21N50011GE (AV Pro V60) | |
| maximum AS SSD Seq Read Test (1GB) | |
| Asus ProArt P16 H7606WP (Angelbird AV Pro V60) | |
| Asus ProArt P16 H7606WI (Angelbird AV Pro V60) | |
| Apple MacBook Pro 16 2024 M4 Pro (Angelbird AV Pro V60) | |
| Dell XPS 16 9640 (Angelbird AV Pro V60) | |
| Average of class Multimedia (37.3 - 1455, n=40, last 2 years) | |
| Lenovo ThinkBook 16p G5 IRX 21N50011GE (AV Pro V60) | |
| Lenovo Yoga Pro 9 16IMH9 (Angelbird AV Pro V60) | |
| Networking | |
| Asus ProArt P16 H7606WP | |
| iperf3 transmit AXE11000 | |
| iperf3 receive AXE11000 | |
| Apple MacBook Pro 16 2024 M4 Pro | |
| iperf3 transmit AXE11000 | |
| iperf3 receive AXE11000 | |
| Lenovo ThinkBook 16p G5 IRX 21N50011GE | |
| iperf3 transmit AXE11000 | |
| iperf3 receive AXE11000 | |
| iperf3 transmit AXE11000 6GHz | |
| iperf3 receive AXE11000 6GHz | |
| Asus ProArt P16 H7606WI | |
| iperf3 transmit AXE11000 | |
| iperf3 receive AXE11000 | |
| Lenovo Yoga Pro 9 16IMH9 | |
| iperf3 transmit AXE11000 | |
| iperf3 receive AXE11000 | |
| Dell XPS 16 9640 | |
| iperf3 transmit AXE11000 | |
| iperf3 receive AXE11000 | |


Sustainability
Asus has provided no information on the laptop's CO2 footprint or environmental standards. In contrast to the ROG Zephyrus G16, the packaging of the ProArt is completely plastic-free.
Input devices - 1.7 mm travel and a DialPad
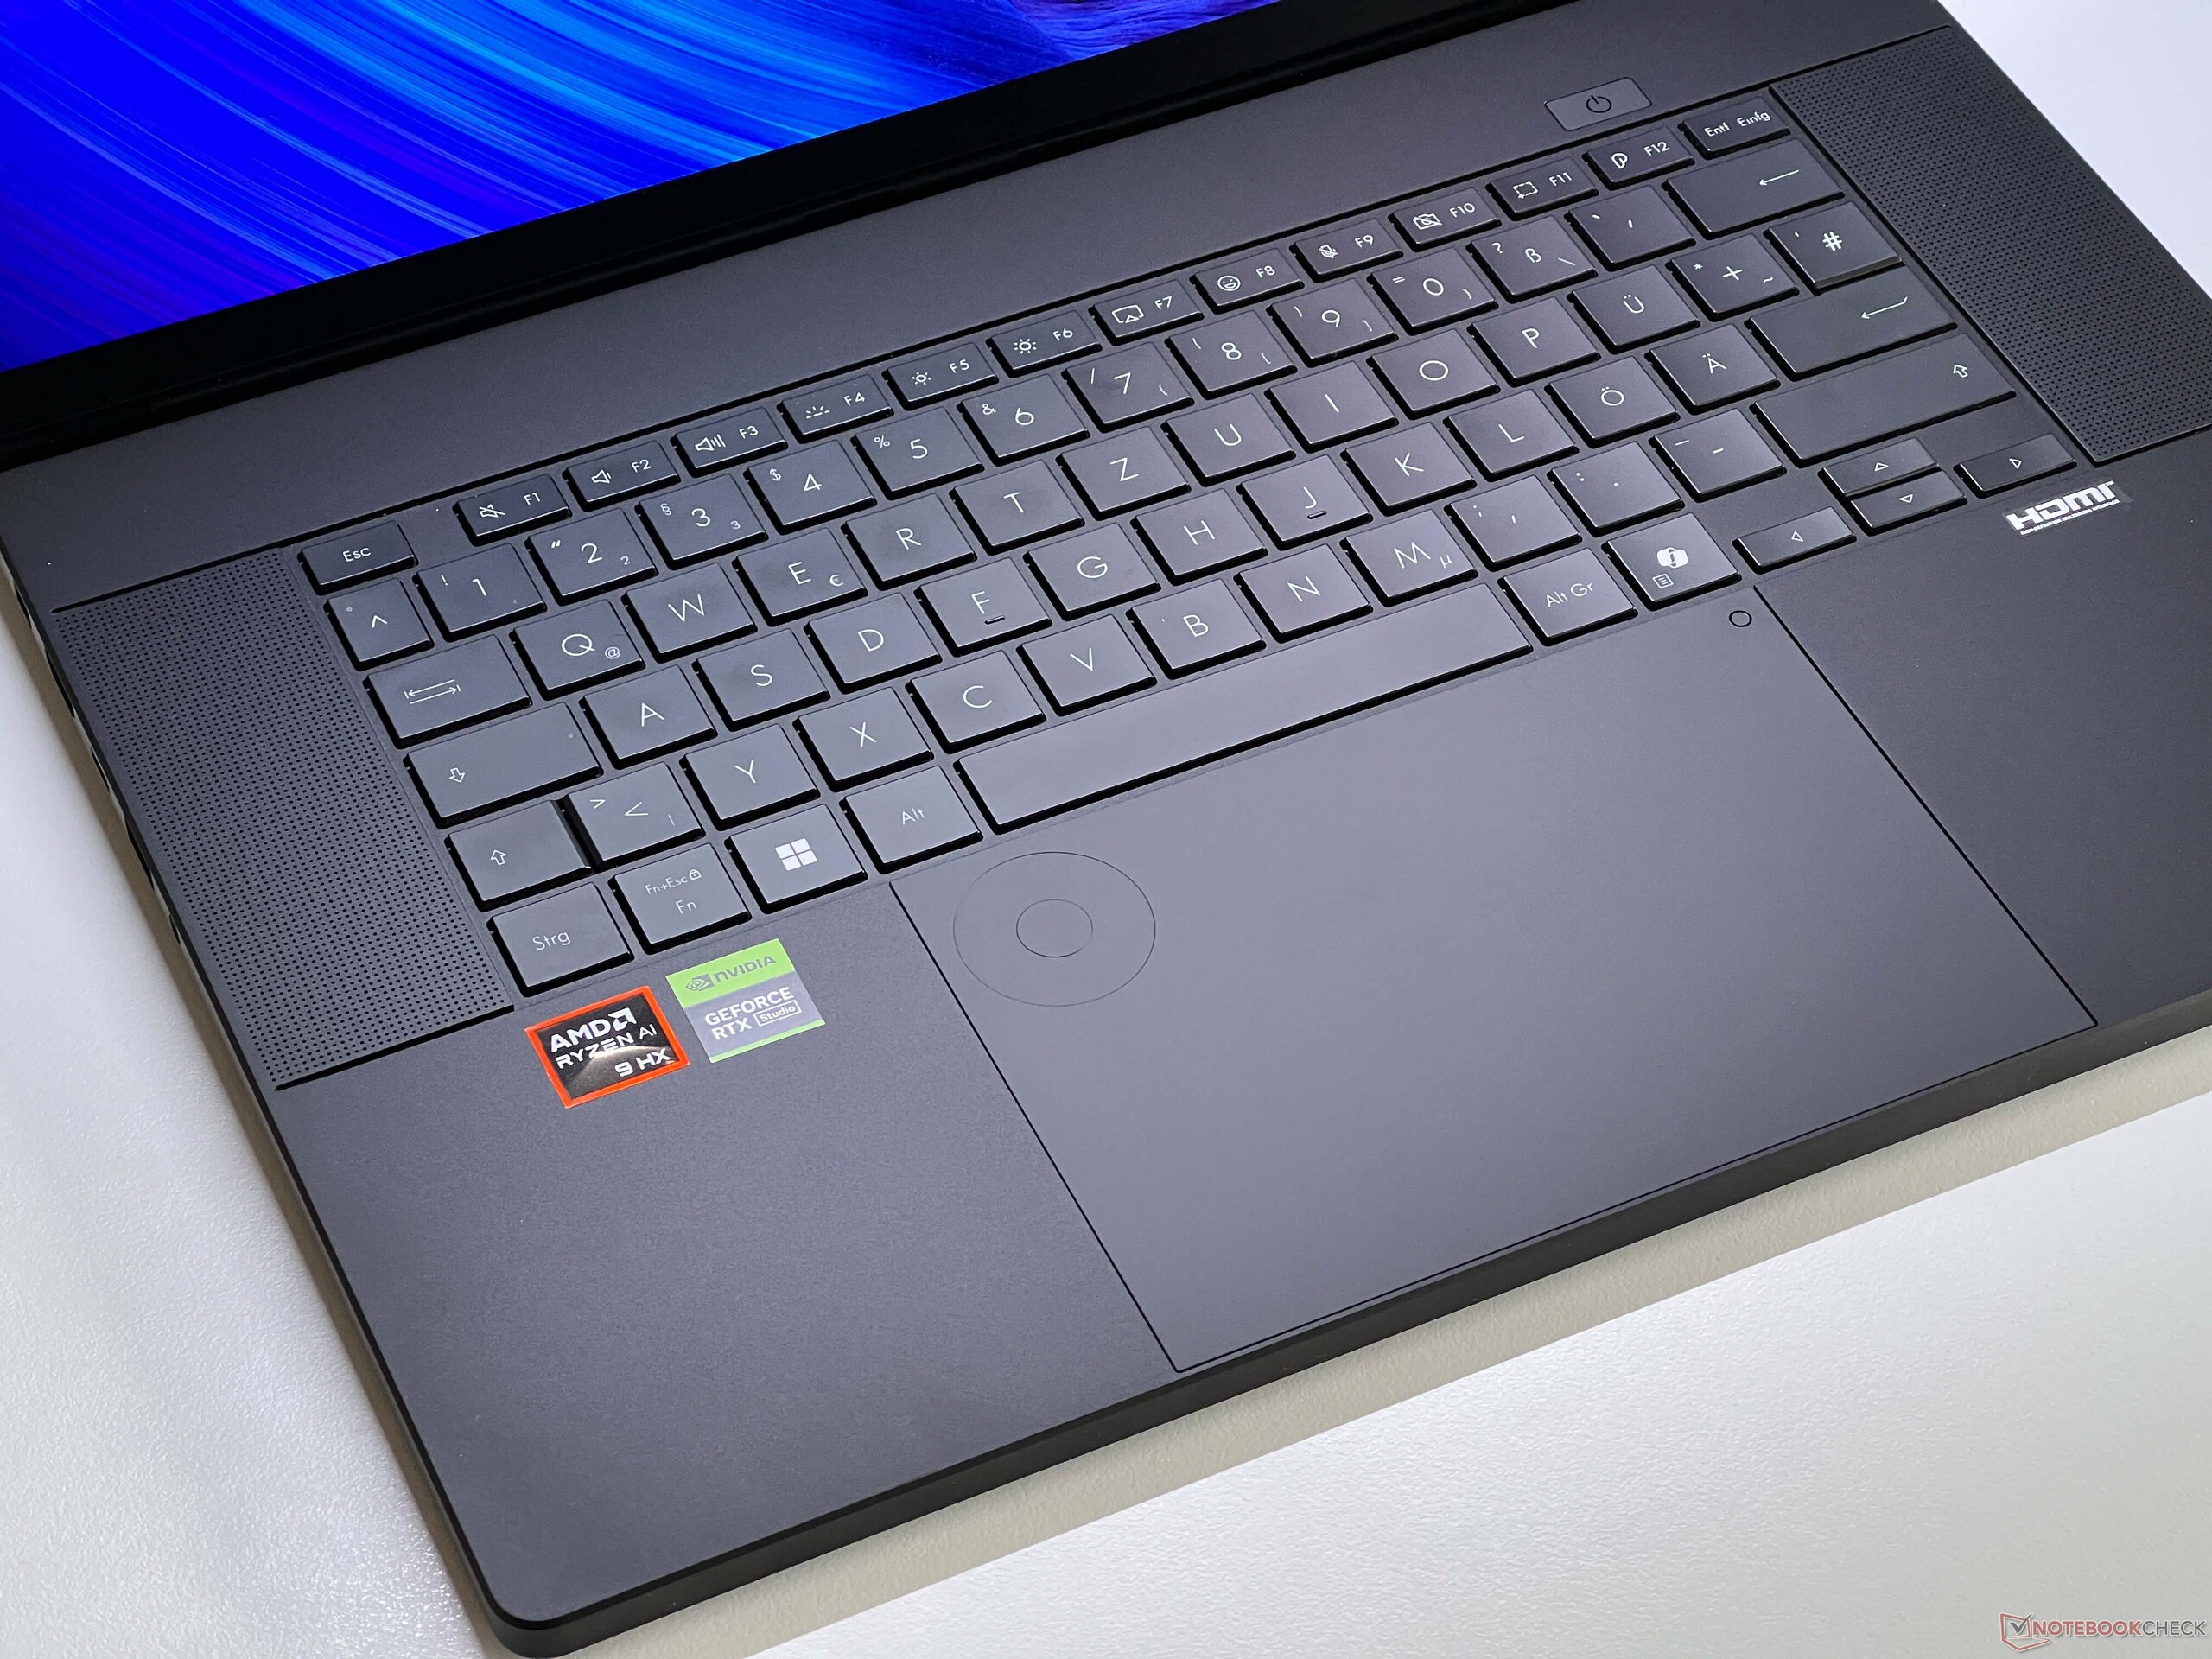
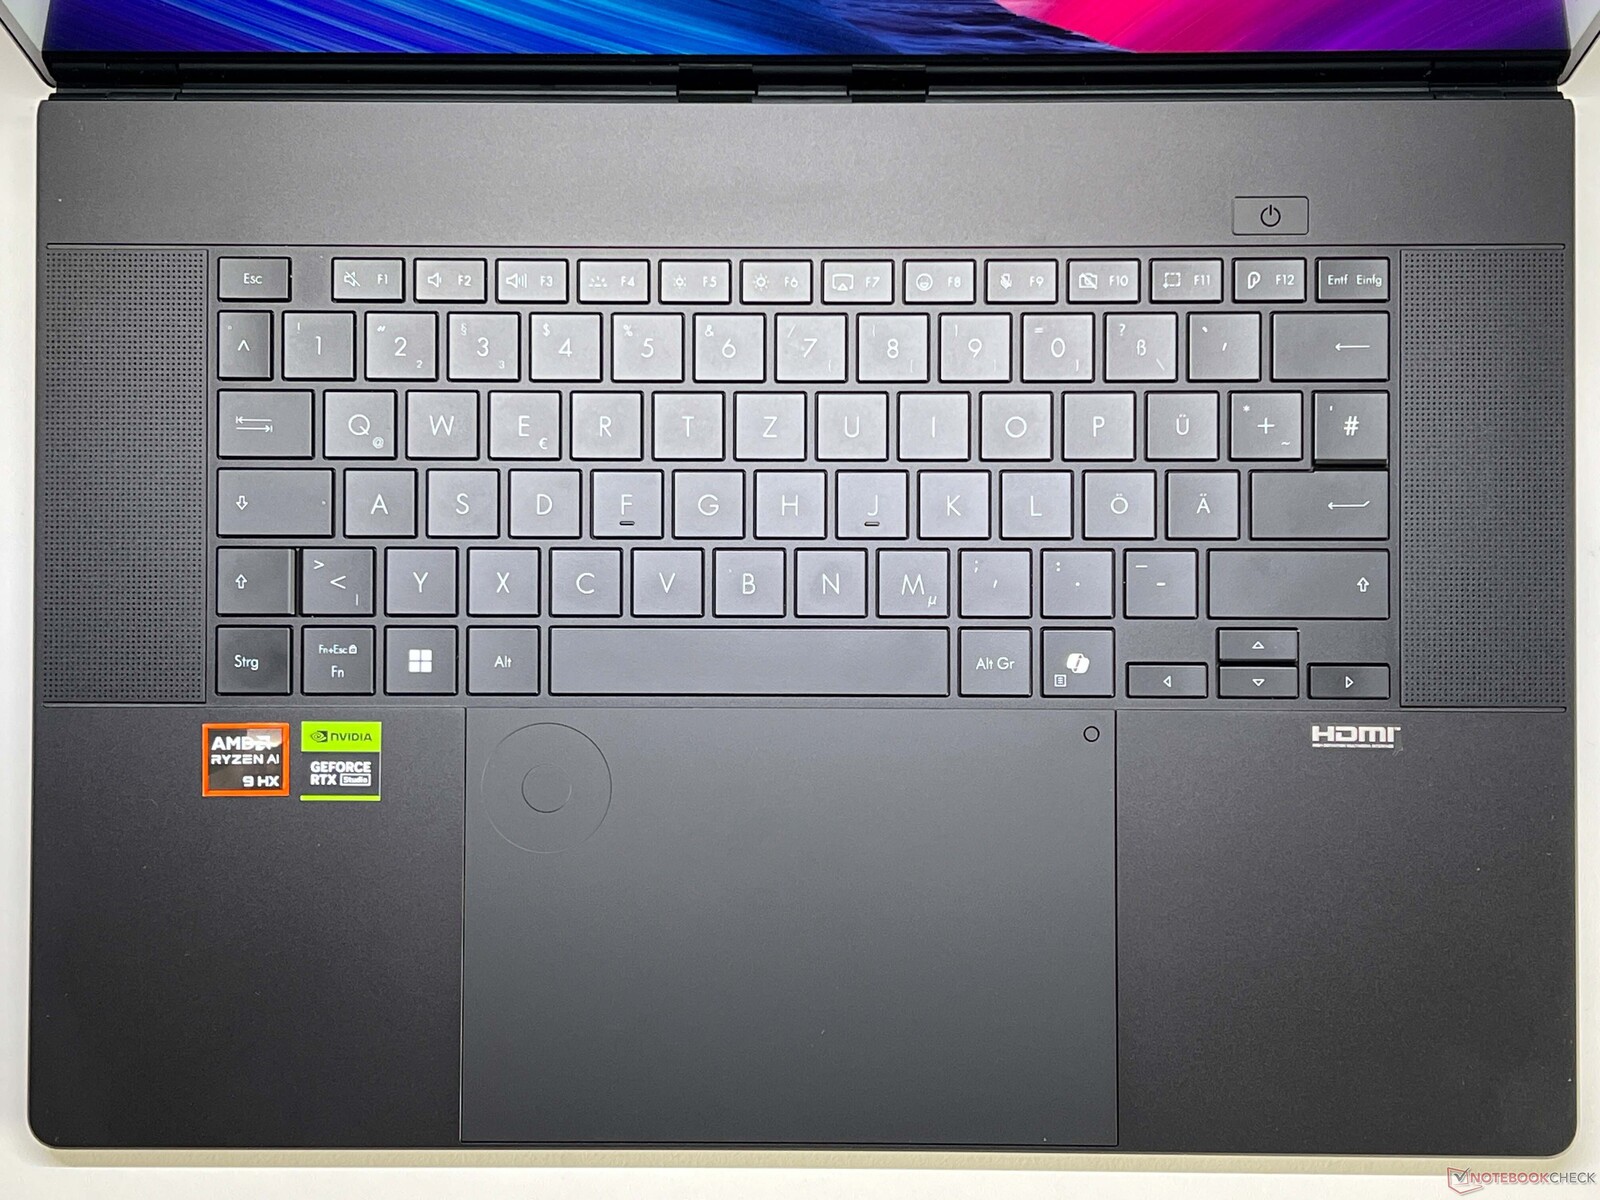
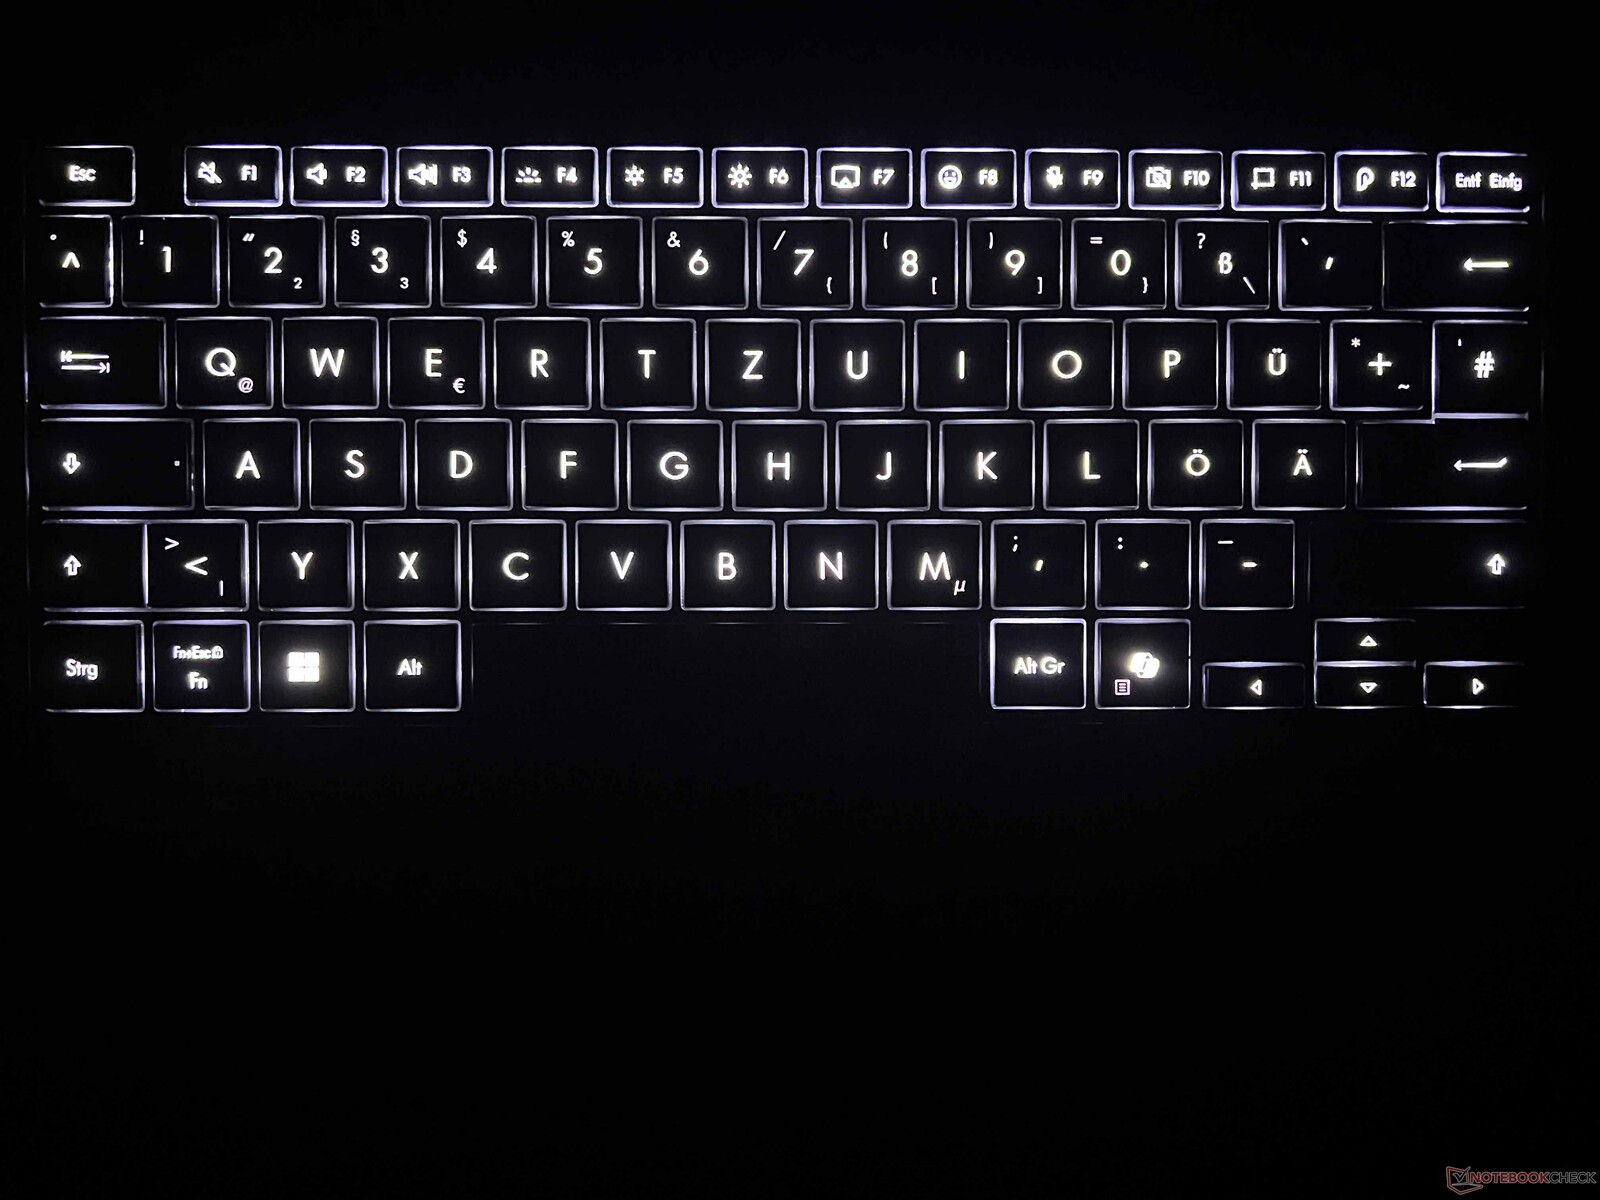
The device's input devices have been retained unchanged, so users still get to benefit from a very comfortable keyboard. Its 1.7 mm travel is very generous for a laptop, its keystrokes are precise and white backlighting helps with visibility in darker environments. The large ClickPad feels nice and smooth and emits muffled, high-quality mechanical clicks. Furthermore, it once again has a DialPad installed in the top left corner, which can be particularly useful for programs such as Adobe Photoshop or Premiere Pro.
Display - 2.8K OLED instead of 4K
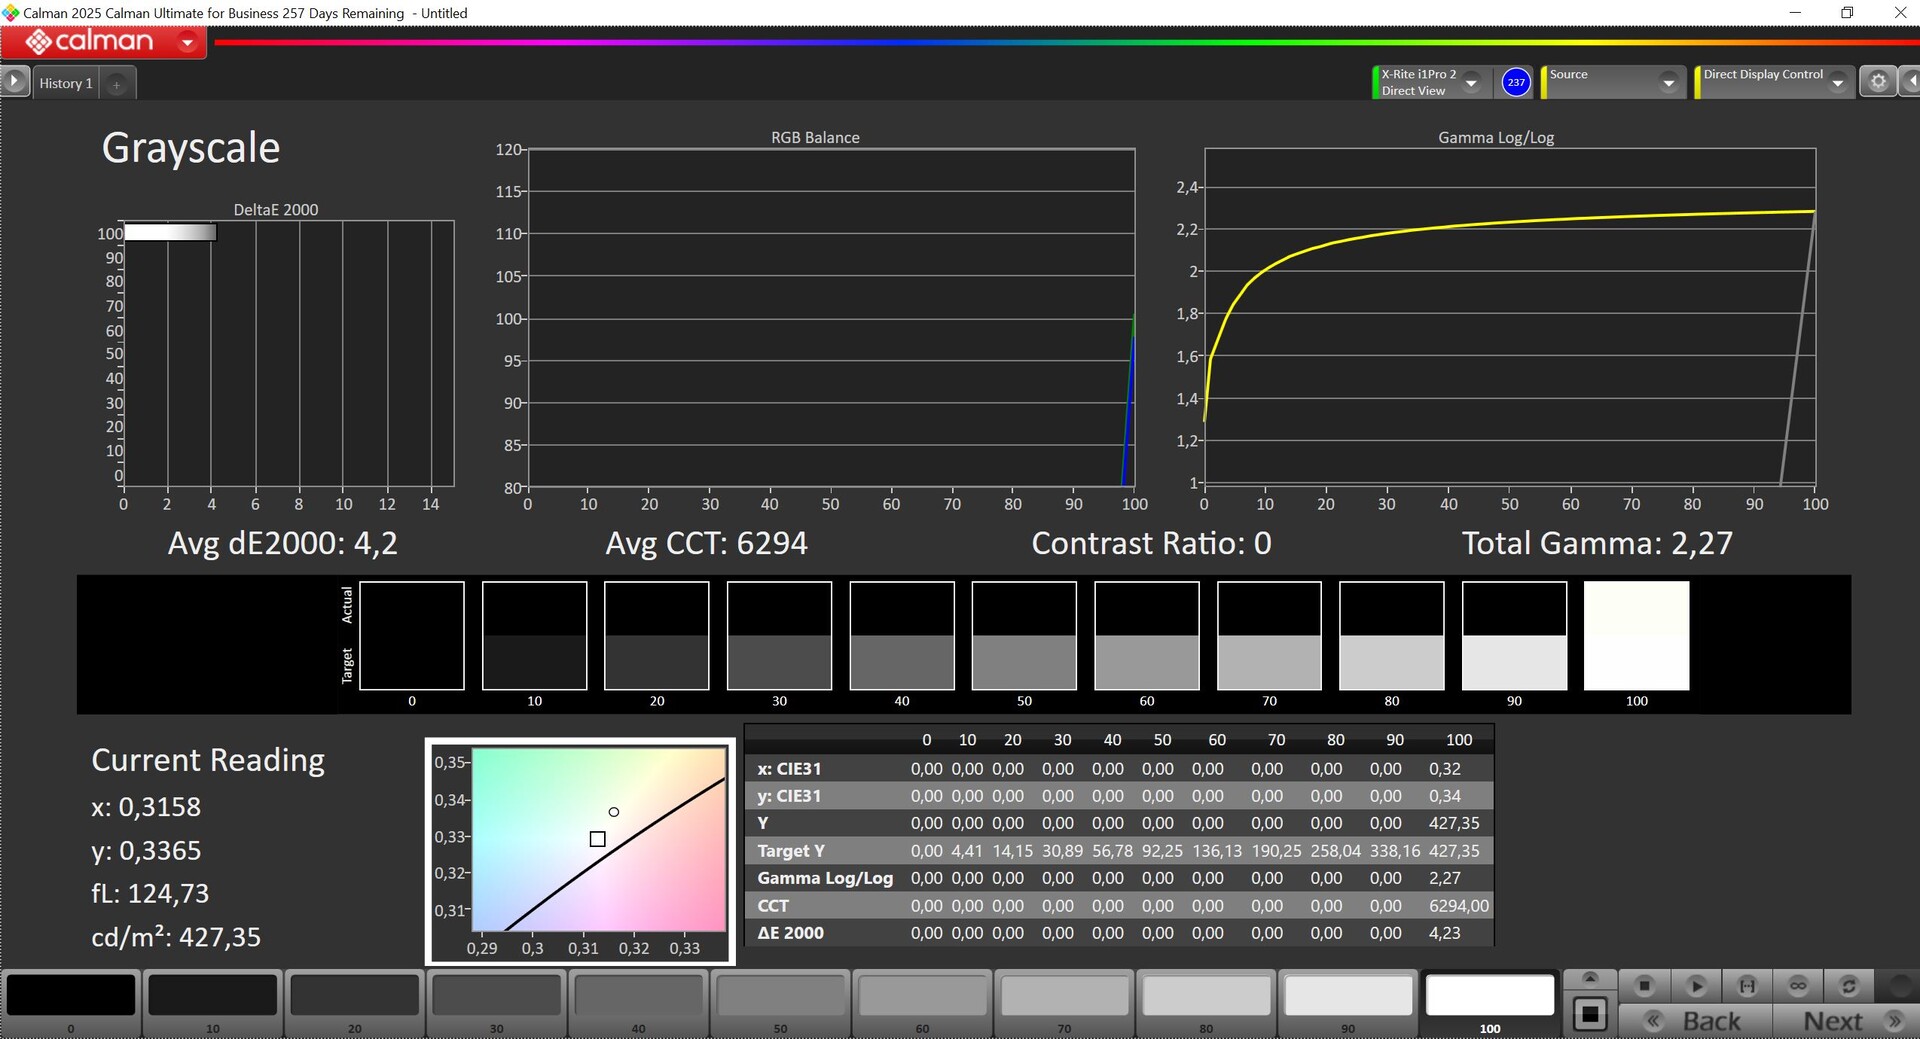
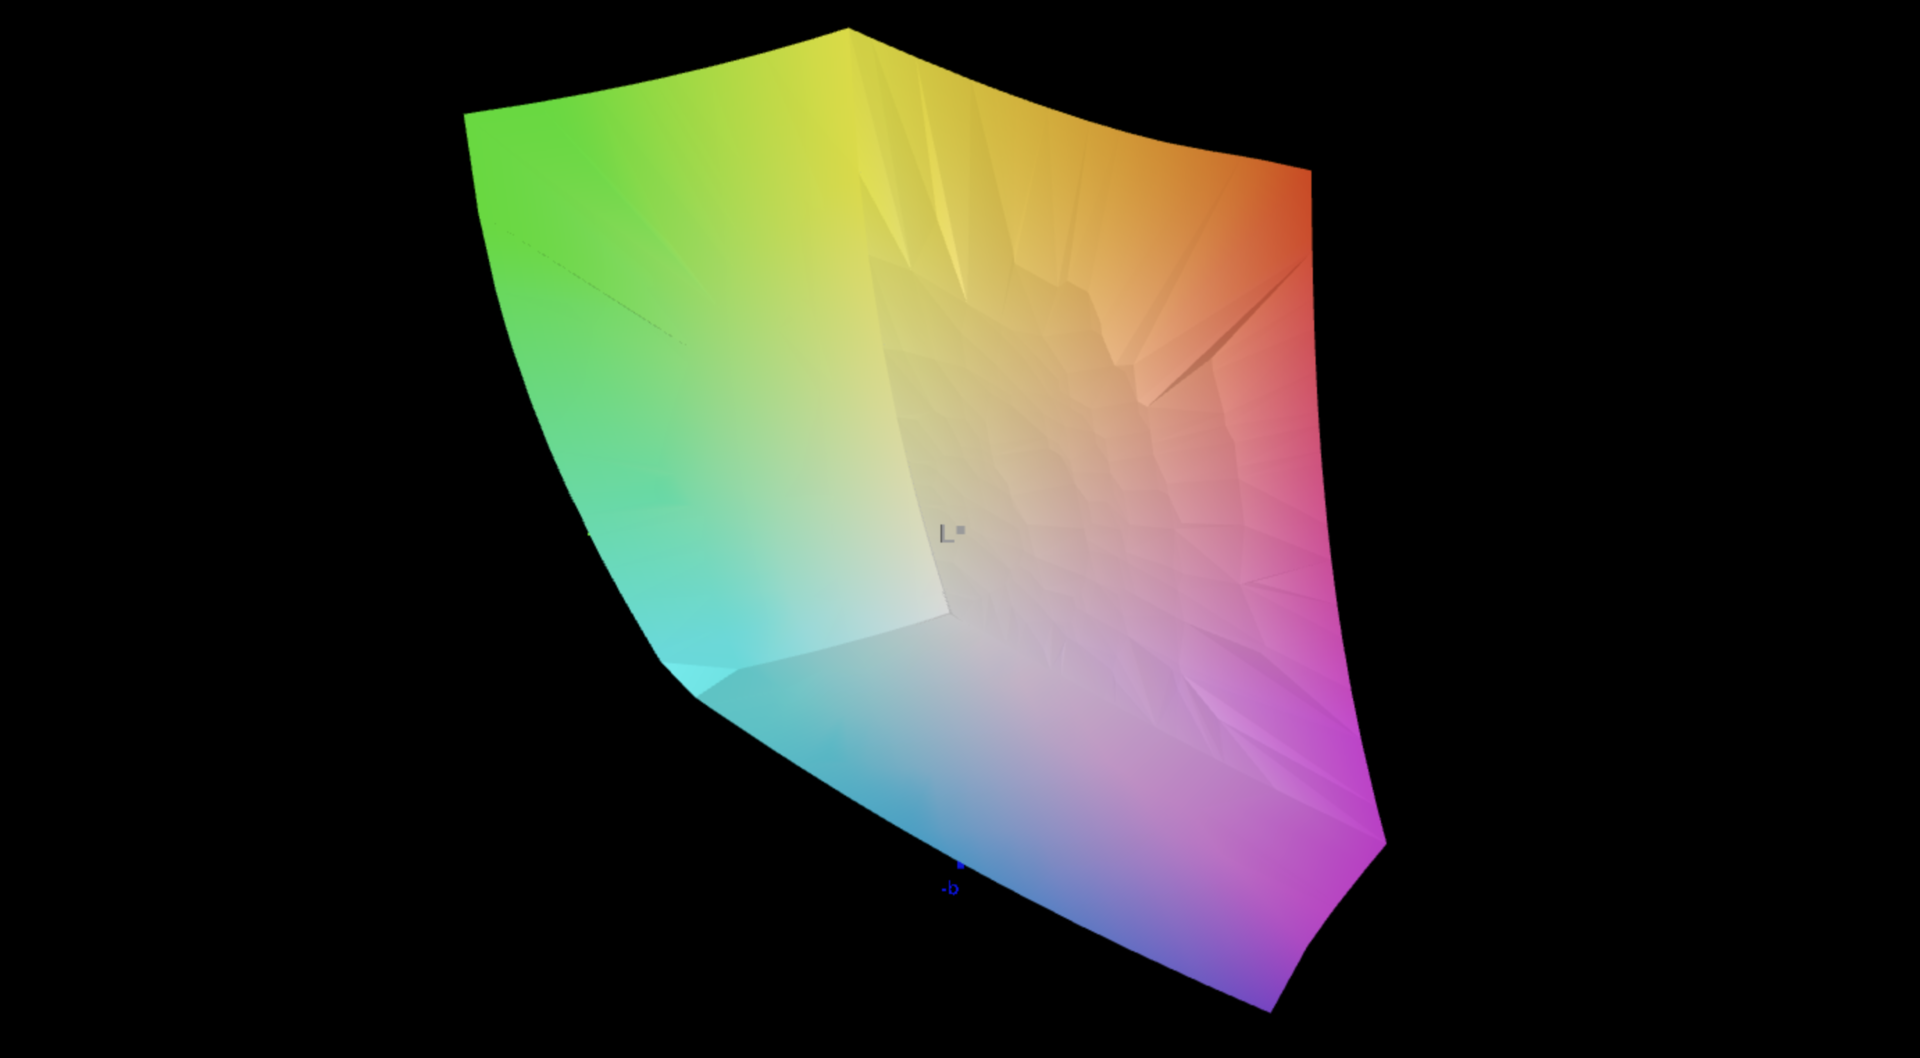
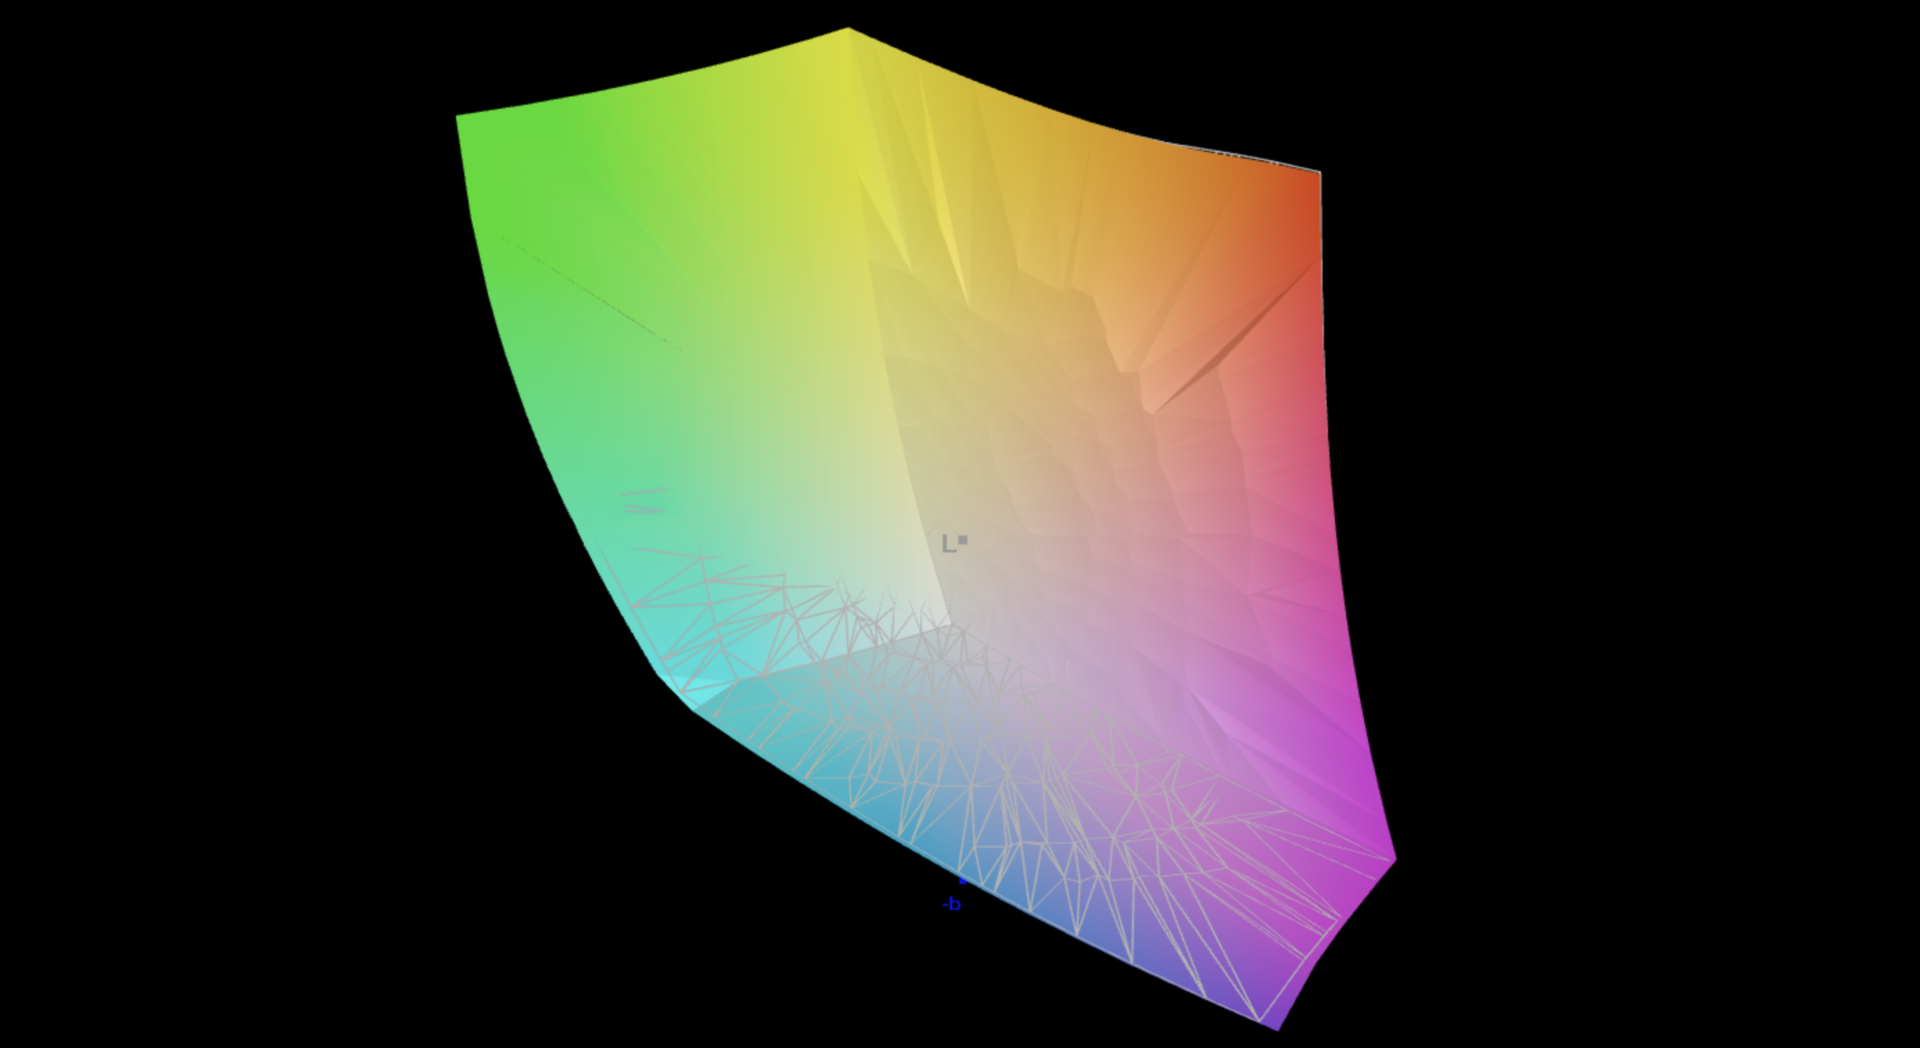
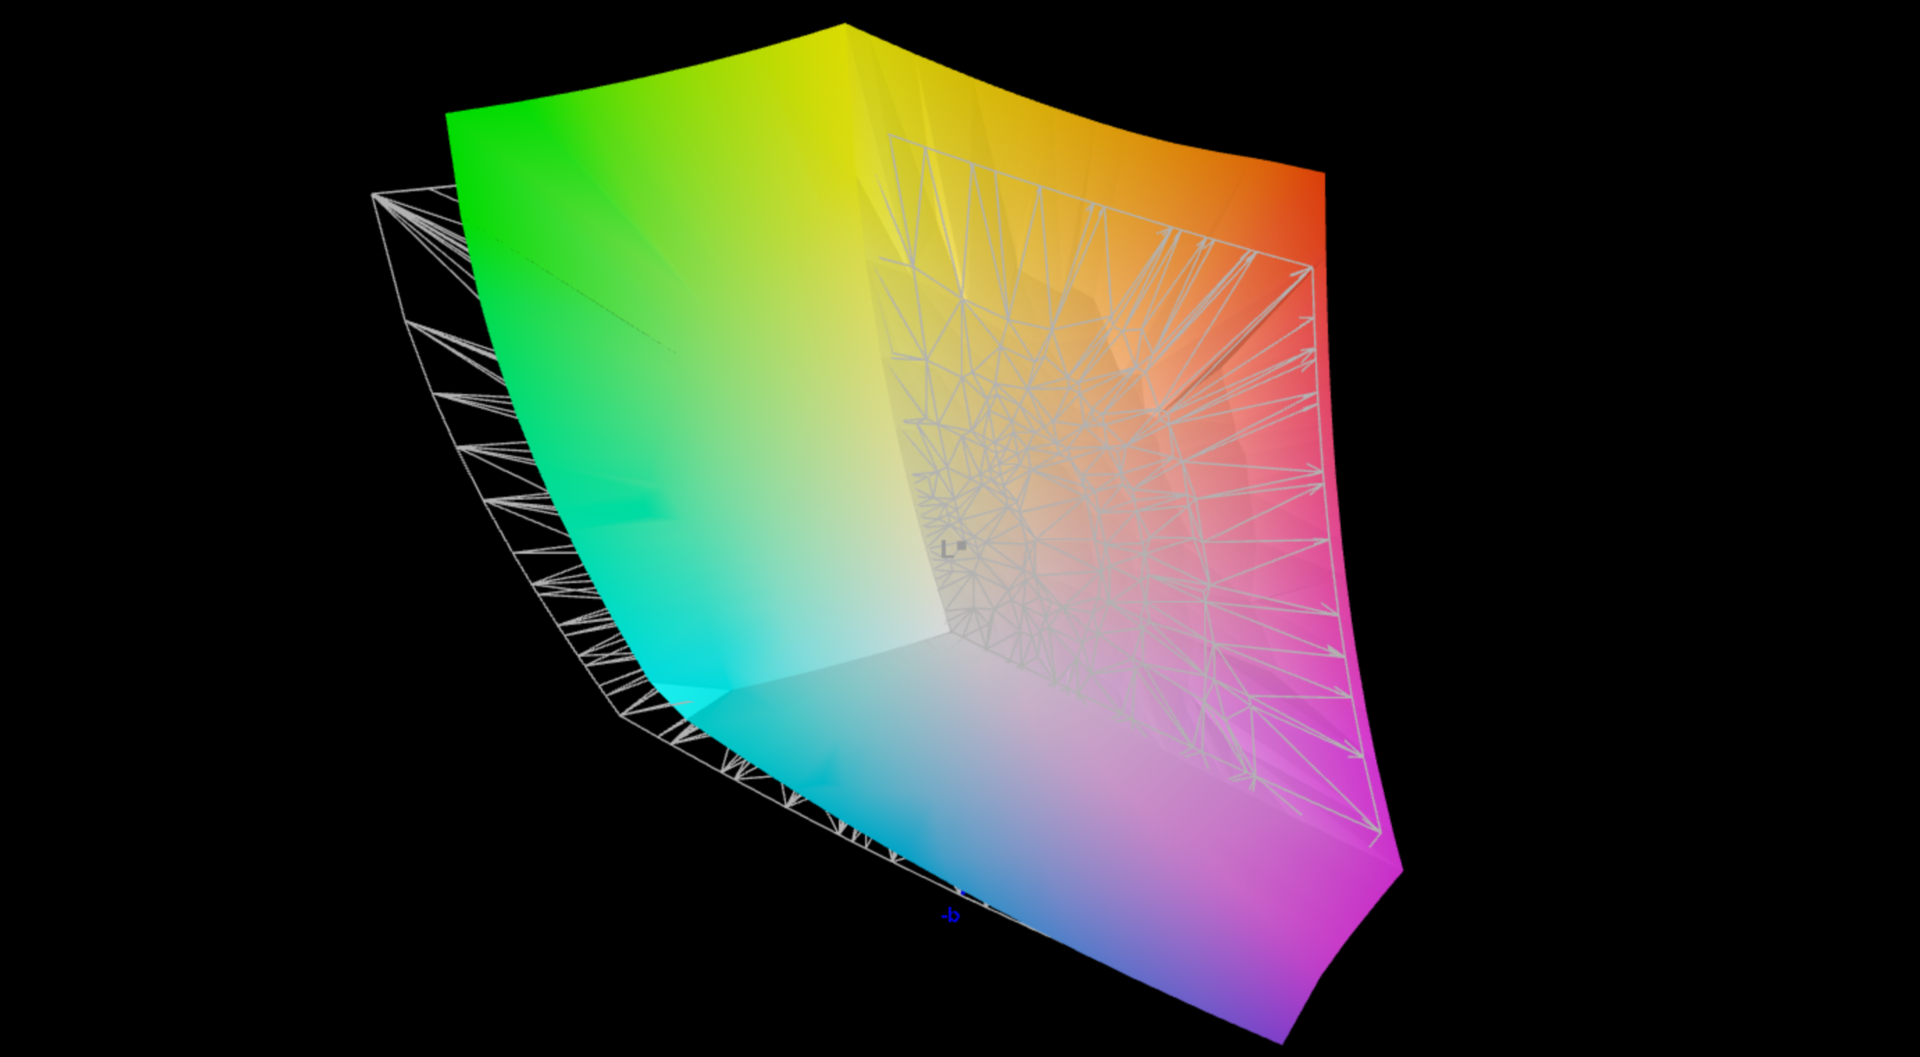
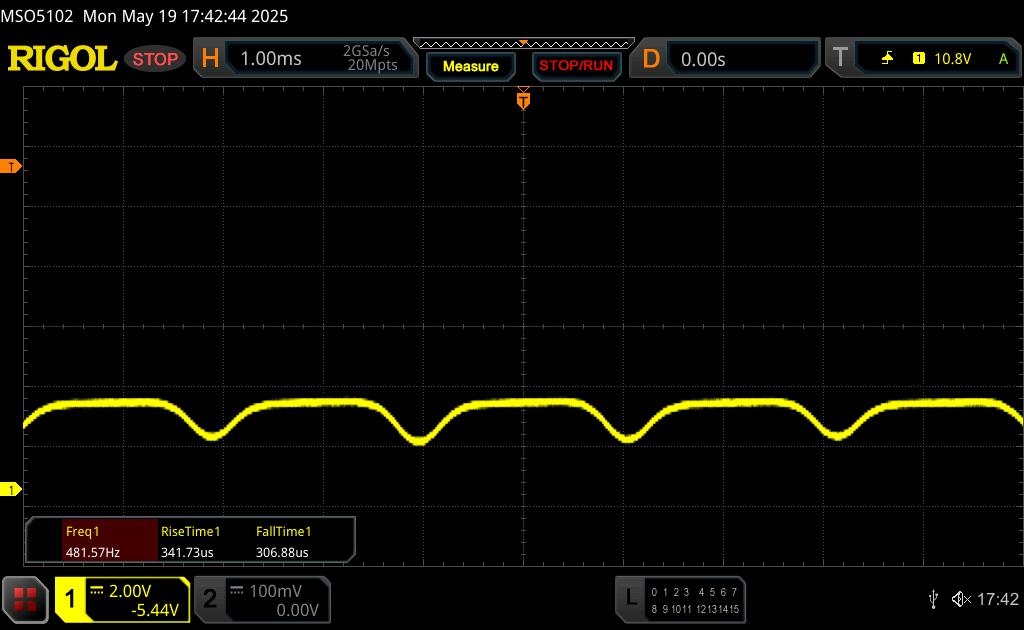
Last year's ProArt P16 was equipped with a high-resolution 4K OLED display, but with a frequency of only 60 Hz, which we criticized during our test. For the 2025 model, Asus has now gone for a 120 Hz 2.8K OLED panel, which, aside from its frequency (Zephyrus has 240 Hz), has a lot of similarities to the one installed in the Zephyrus G16. However, as it is now a touchscreen again, the image looks a little grainy when depicting bright content. Apart from that, its subjective picture quality is very good, but as with all other OLED panels, we noted the use of PWM flickering (480 Hz). In addition, the OLED panel is very reflective.
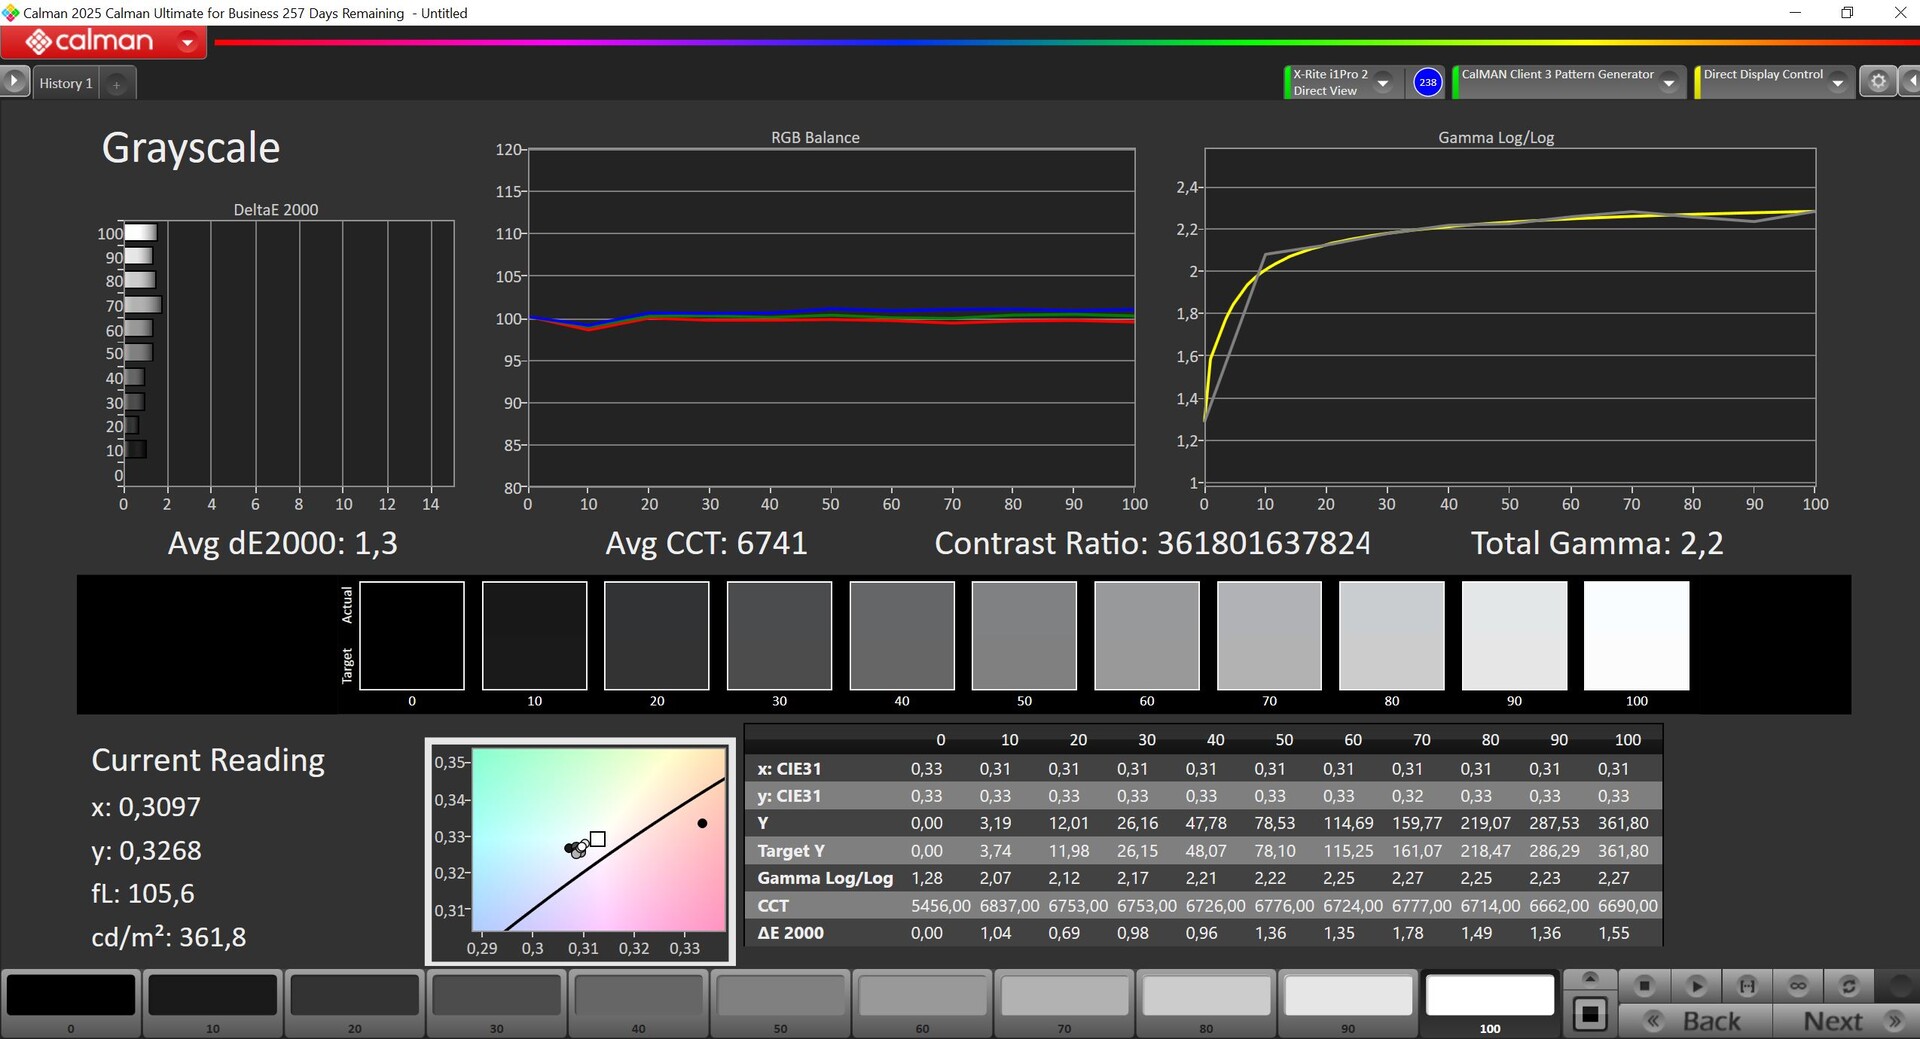
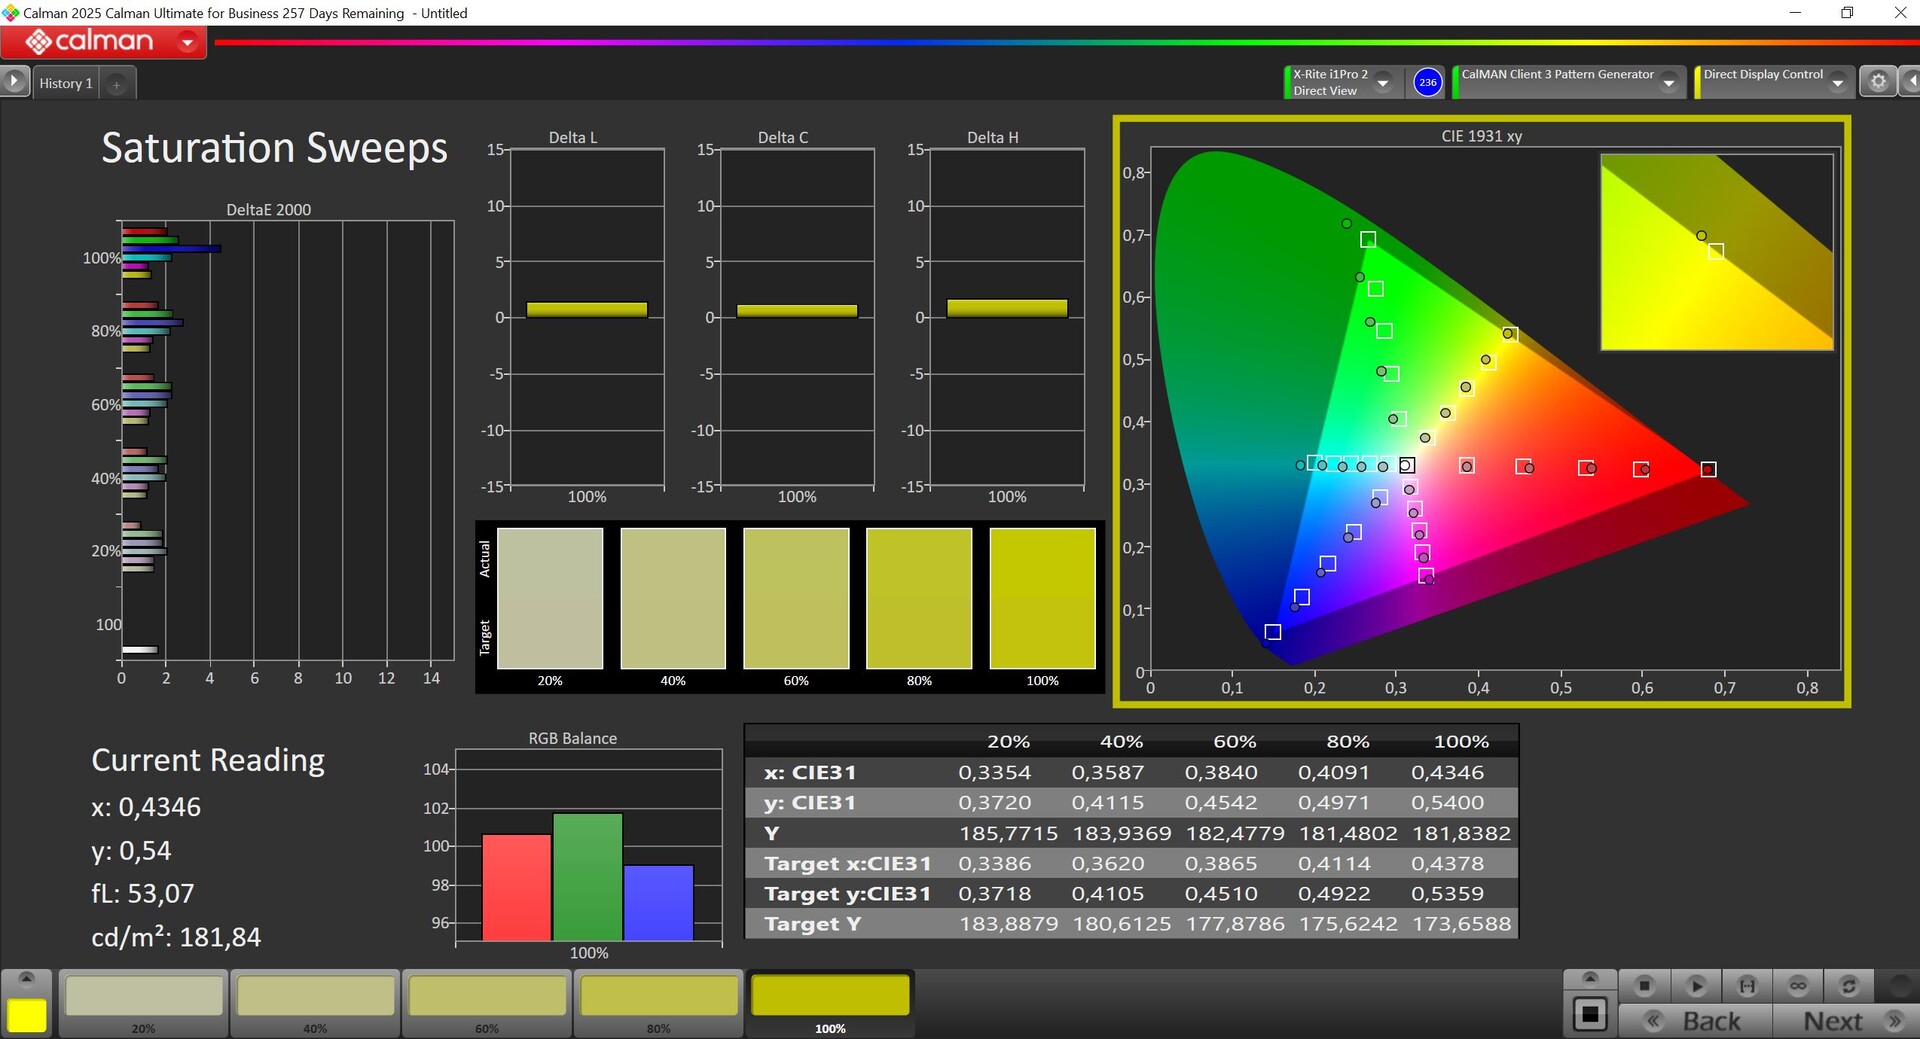
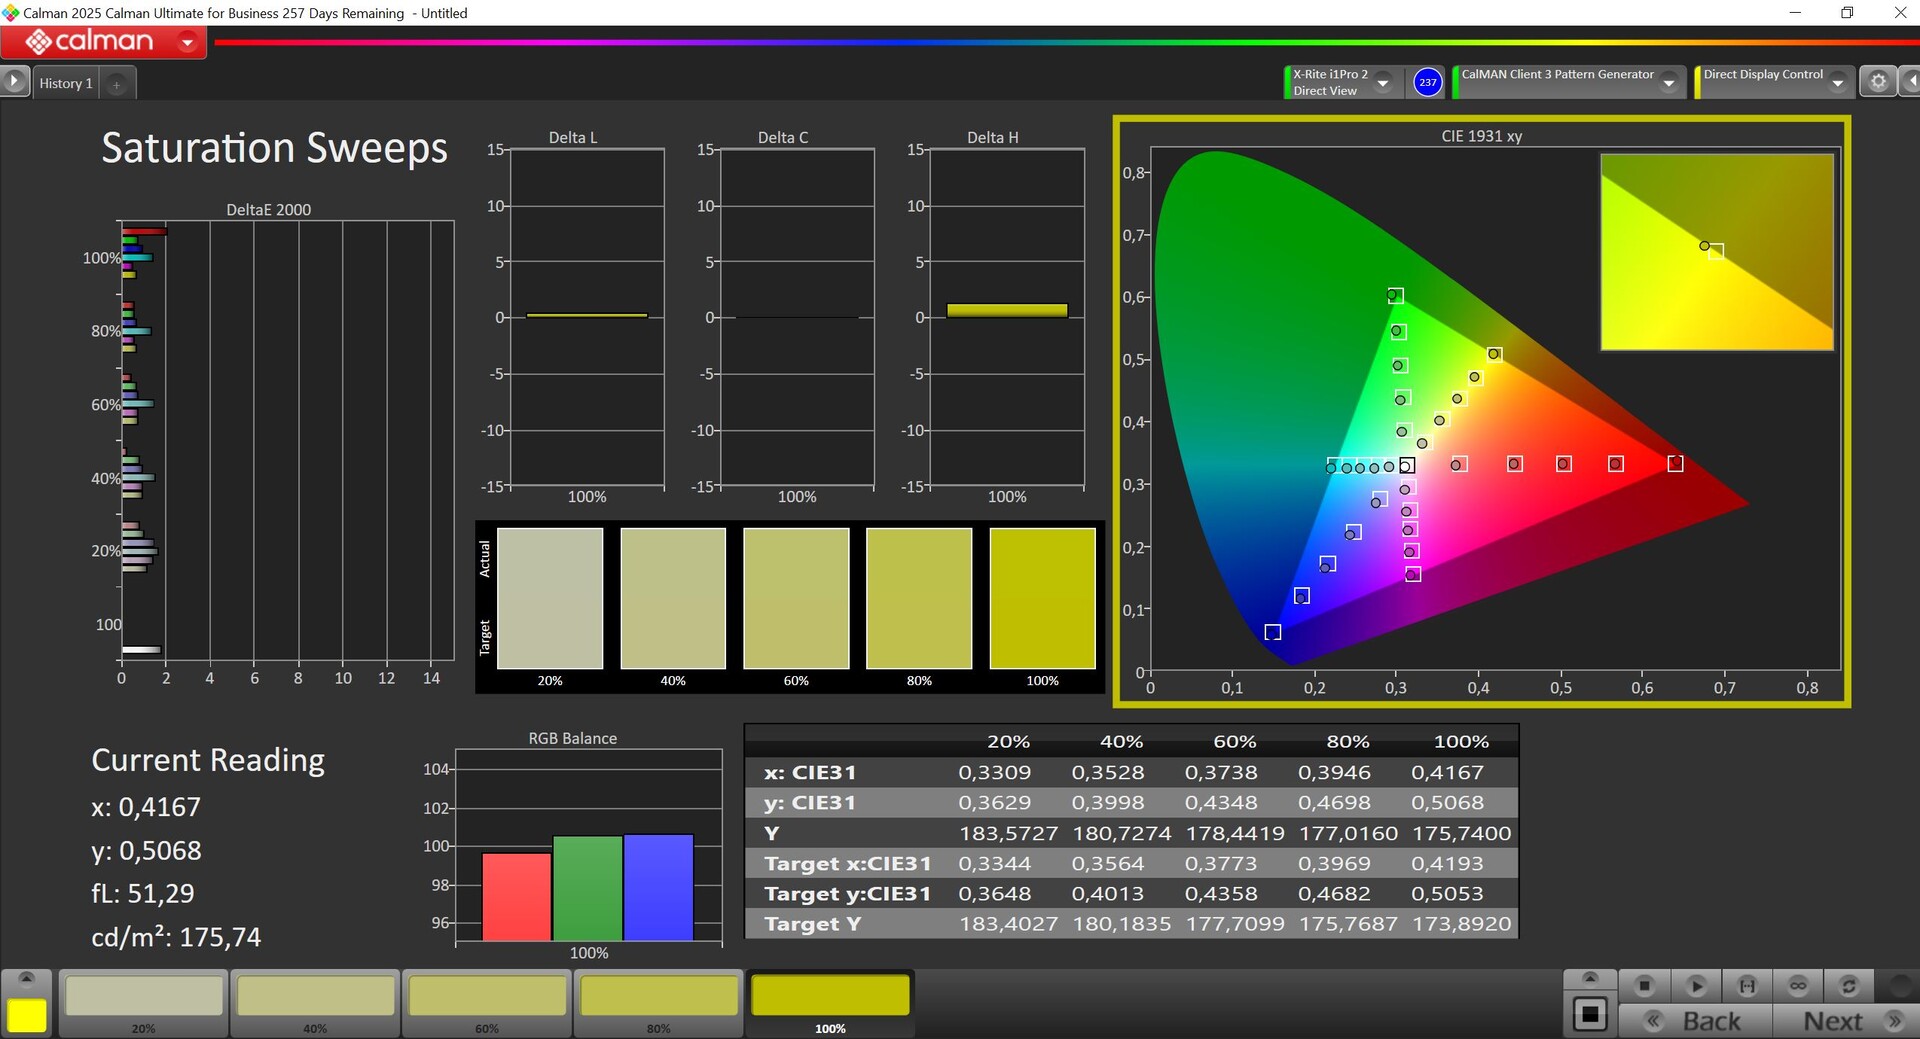
Brightness still seems to be a problem for the laptop, as we only measured around 360 cd/m² in SDR mode, which is significantly less than some of the competition. Its HDR capabilities are even worse than the old model, as we only noted a maximum of just under 430 cd/m² (previously a maximum of ~600 cd/m²). As a result, its HDR capabilities are pretty limited. As usual, Asus offers very accurate color profiles for the P3 and sRGB color spaces and we were unable to improve the display any further with our own calibration.
| |||||||||||||||||||||||||
Brightness Distribution: 99 %
Center on Battery: 362 cd/m²
Contrast: ∞:1 (Black: 0 cd/m²)
ΔE ColorChecker Calman: 0.8 | ∀{0.5-29.43 Ø4.72}
ΔE Greyscale Calman: 1.3 | ∀{0.09-98 Ø4.97}
89.5% AdobeRGB 1998 (Argyll 3D)
100% sRGB (Argyll 3D)
99.5% Display P3 (Argyll 3D)
Gamma: 2.2
CCT: 6741 K
| Asus ProArt P16 H7606WP ATNA60CL10-0, OLED, 2880x1800, 16", 120 Hz | Asus ProArt P16 H7606WI ATNA60YV02-0, OLED, 3840x2400, 16", 60 Hz | Apple MacBook Pro 16 2024 M4 Pro Mini-LED, 3456x2234, 16.2", 120 Hz | Lenovo ThinkBook 16p G5 IRX 21N50011GE MNG007ZA1-2 , IPS LCD, 3200x2000, 16", 165 Hz | Lenovo Yoga Pro 9 16IMH9 LEN160-3.2K, Mini-LED, 3200x2000, 16", 165 Hz | Dell XPS 16 9640 SDC4196, OLED, 3840x2400, 16.3", 90 Hz | |
|---|---|---|---|---|---|---|
| Display | 4% | -0% | -3% | -2% | -1% | |
| Display P3 Coverage (%) | 99.5 | 99.9 0% | 99.7 0% | 94.4 -5% | 97 -3% | 98.3 -1% |
| sRGB Coverage (%) | 100 | 100 0% | 100 0% | 99.9 0% | 99.9 0% | 100 0% |
| AdobeRGB 1998 Coverage (%) | 89.5 | 99.1 11% | 88.8 -1% | 86 -4% | 86.6 -3% | 87.8 -2% |
| Response Times | -96% | -4470% | -1868% | -3011% | -33% | |
| Response Time Grey 50% / Grey 80% * (ms) | 0.63 ? | 1.58 ? -151% | 43 ? -6725% | 15.5 ? -2360% | 22.2 ? -3424% | 0.82 ? -30% |
| Response Time Black / White * (ms) | 0.63 ? | 1.25 ? -98% | 41.2 ? -6440% | 9.3 ? -1376% | 17 ? -2598% | 0.85 ? -35% |
| PWM Frequency (Hz) | 480 ? | 240 ? | 14880 | 4840 ? | 360 ? | |
| PWM Amplitude * (%) | 26 | 36 -38% | 90 -246% | |||
| Screen | -15% | 40% | -103% | -40% | -39% | |
| Brightness middle (cd/m²) | 362 | 355 -2% | 632 75% | 448 24% | 651 80% | 366 1% |
| Brightness (cd/m²) | 363 | 360 -1% | 616 70% | 426 17% | 673 85% | 367 1% |
| Brightness Distribution (%) | 99 | 98 -1% | 95 -4% | 84 -15% | 93 -6% | 96 -3% |
| Black Level * (cd/m²) | 0.4 | 0.22 | ||||
| Colorchecker dE 2000 * | 0.8 | 1.2 -50% | 0.6 25% | 3.3 -312% | 1.9 -137% | 1.3 -63% |
| Colorchecker dE 2000 max. * | 1.8 | 2.6 -44% | 1.2 33% | 5.4 -200% | 4.2 -133% | 3.6 -100% |
| Greyscale dE 2000 * | 1.3 | 1.2 8% | 0.8 38% | 3 -131% | 3 -131% | 2.2 -69% |
| Gamma | 2.2 100% | 2.14 103% | 2.21 100% | 2.27 97% | 2.18 101% | 2.14 103% |
| CCT | 6741 96% | 6526 100% | 6450 101% | 7110 91% | 6738 96% | 6680 97% |
| Contrast (:1) | 1120 | 2959 | ||||
| Colorchecker dE 2000 calibrated * | 2.7 | 0.6 | 1 | |||
| Total Average (Program / Settings) | -36% /
-31% | -1477% /
-1098% | -658% /
-397% | -1018% /
-570% | -24% /
-27% |
* ... smaller is better


Display Response Times
| ↔ Response Time Black to White | ||
|---|---|---|
| 0.63 ms ... rise ↗ and fall ↘ combined | ↗ 0.36 ms rise | 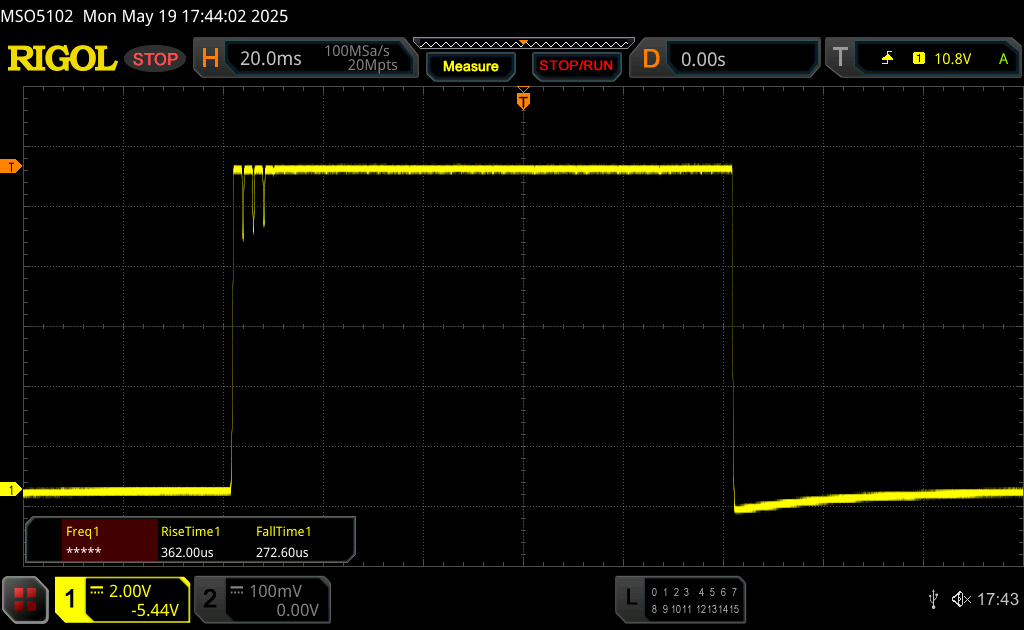 |
| ↘ 0.27 ms fall | ||
| The screen shows very fast response rates in our tests and should be very well suited for fast-paced gaming. In comparison, all tested devices range from 0.1 (minimum) to 240 (maximum) ms. » 1 % of all devices are better. This means that the measured response time is better than the average of all tested devices (19.8 ms). | ||
| ↔ Response Time 50% Grey to 80% Grey | ||
| 0.63 ms ... rise ↗ and fall ↘ combined | ↗ 0.34 ms rise | 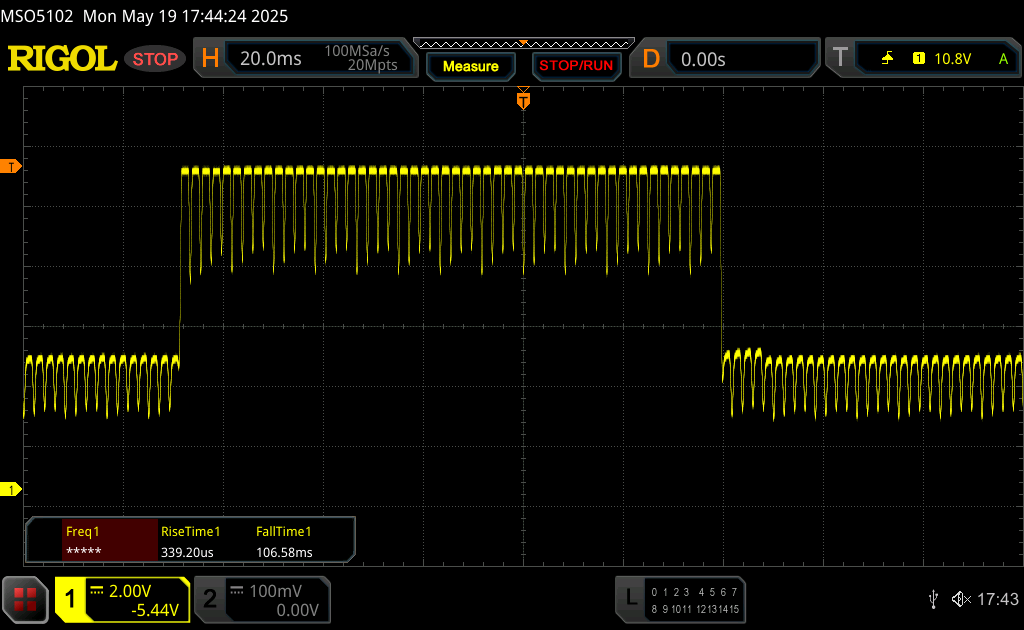 |
| ↘ 0.29 ms fall | ||
| The screen shows very fast response rates in our tests and should be very well suited for fast-paced gaming. In comparison, all tested devices range from 0.165 (minimum) to 636 (maximum) ms. » 2 % of all devices are better. This means that the measured response time is better than the average of all tested devices (31 ms). | ||
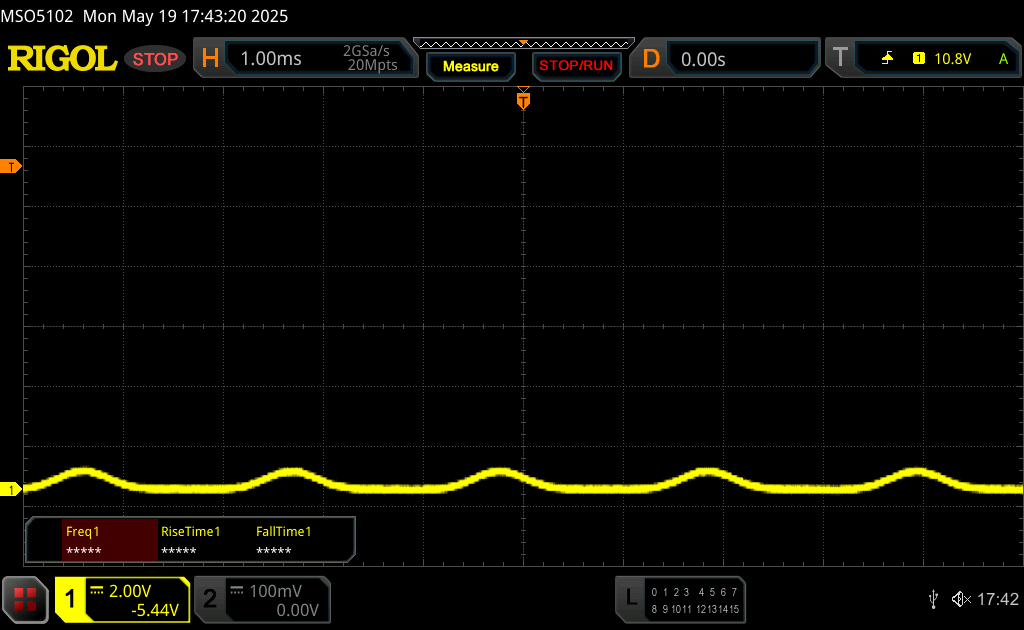
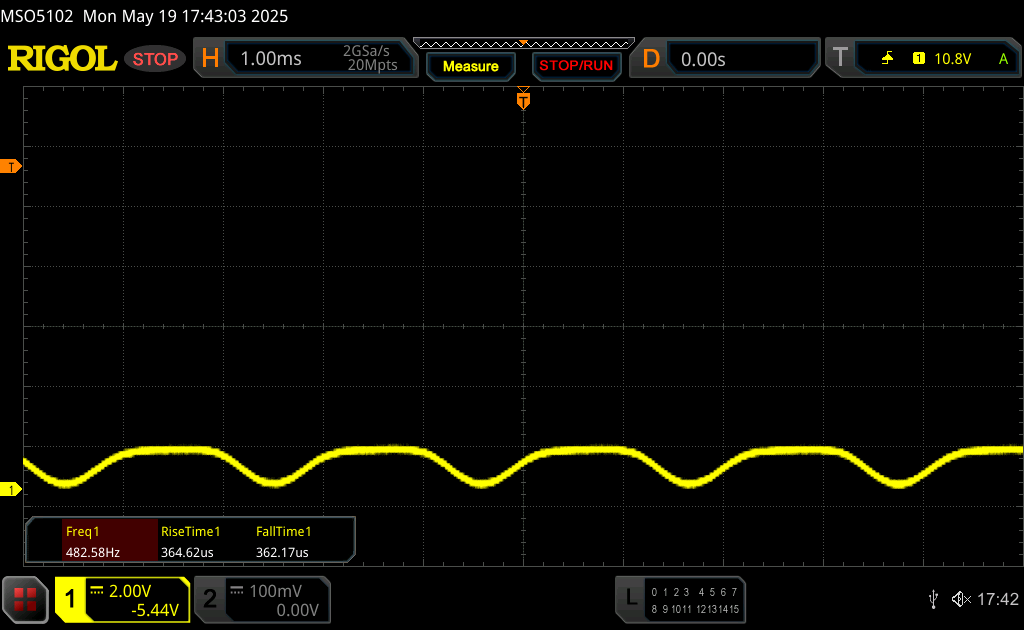
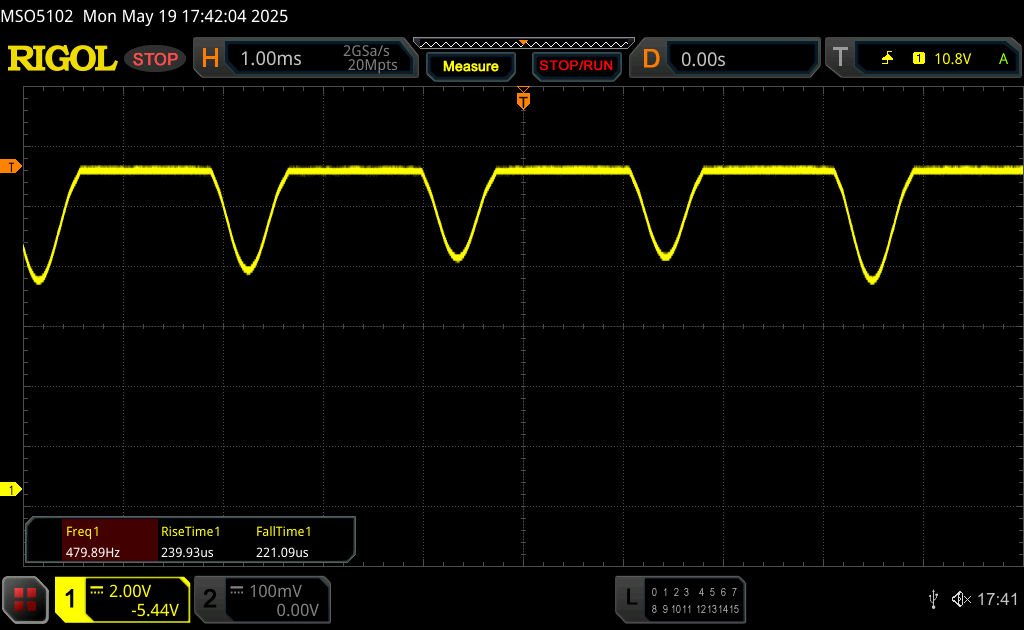
Screen Flickering / PWM (Pulse-Width Modulation)
| Screen flickering / PWM detected | 480 Hz Amplitude: 26 % | ≤ 100 % brightness setting | 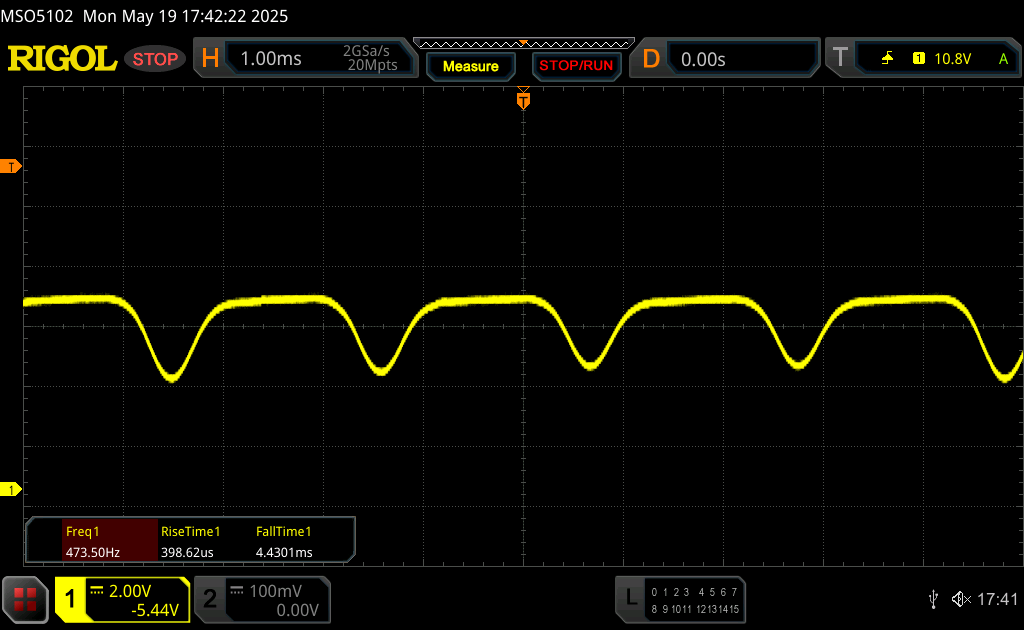 |
The display backlight flickers at 480 Hz (worst case, e.g., utilizing PWM) Flickering detected at a brightness setting of 100 % and below. There should be no flickering or PWM above this brightness setting. The frequency of 480 Hz is relatively high, so most users sensitive to PWM should not notice any flickering. However, there are reports that some users are still sensitive to PWM at 500 Hz and above, so be aware. In comparison: 52 % of all tested devices do not use PWM to dim the display. If PWM was detected, an average of 7750 (minimum: 5 - maximum: 343500) Hz was measured. | |||


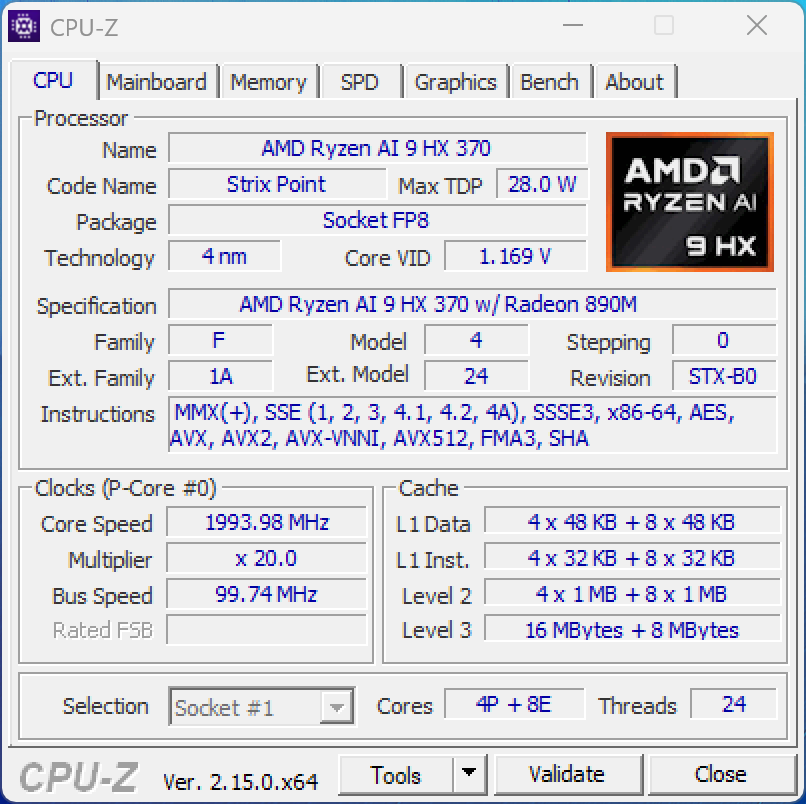
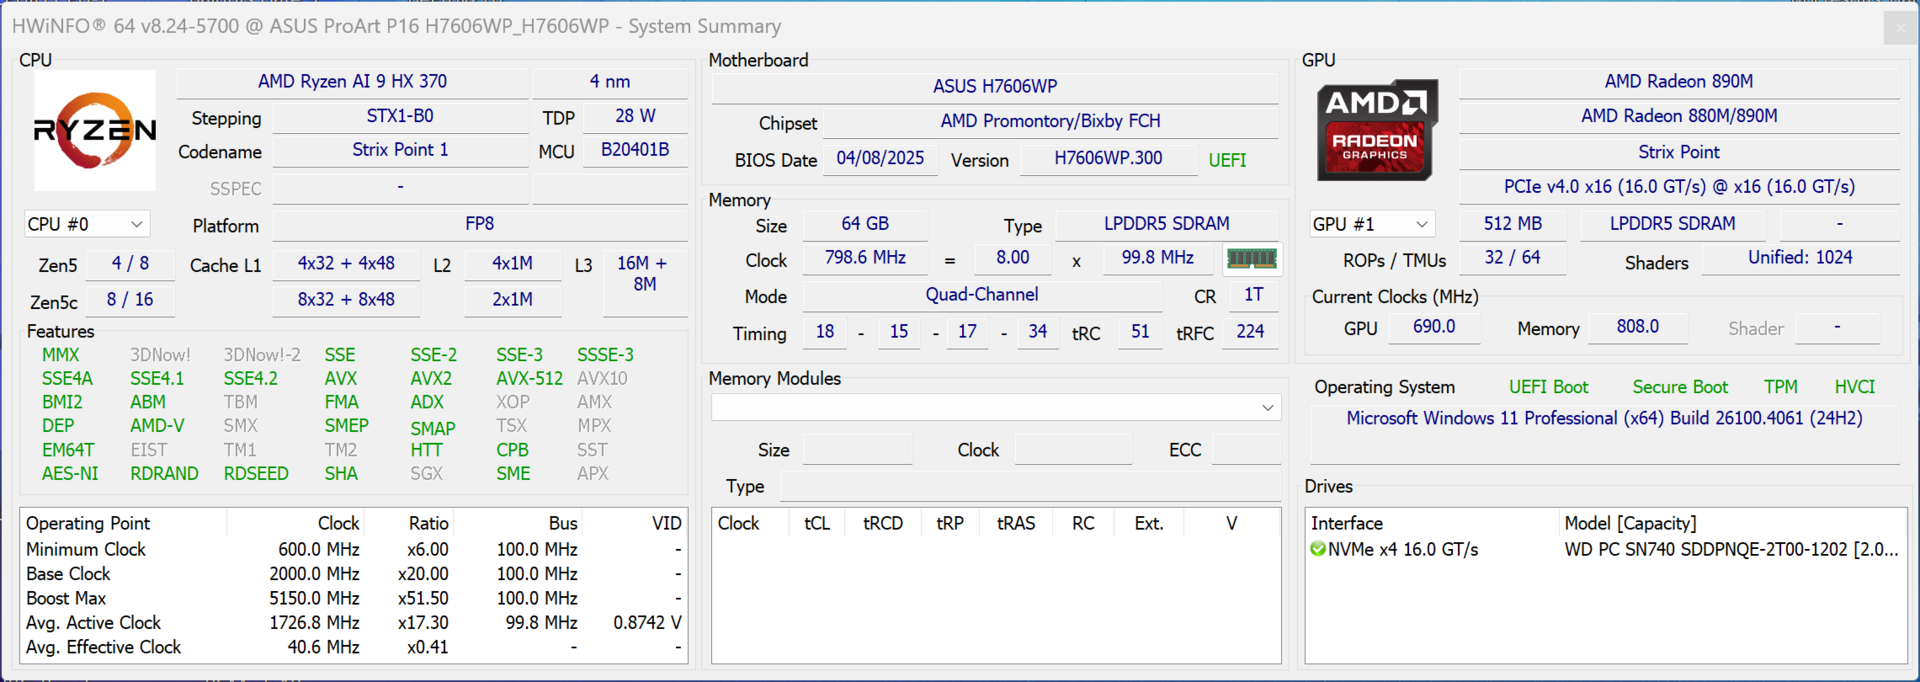
Performance - Ryzen AI 9 HX 370
Testing conditions
Asus offers various energy profiles and for the following benchmarks/measurements, we used Performance mode.
| Energy profile | CPU TDP | CB24 Multi | GPU TGP | Time Spy Graphics | Cyberpunk 2077 QHD | max. fan noise emissions |
|---|---|---|---|---|---|---|
| Whisper mode | 55 watts | 1,169 points | 42 watts | 8,687 points | 66fps | 42.8 dB(A) |
| Standard mode | 70/55 watts | 1,178 points | 80 watts | 11,603 points | 86.7fps | 49.3 dB(A) |
| Performance mode | 80 watts | 1,215 points | 105 watts | 13,010 points | 97.8fps | 53.7 dB(A) |
| Battery | 70/50 watts | 1,193 points | 42 watts | 8,141 points | 64.4fps | 44.2 dB(A) |


Processor - Ryzen AI 9 HX 370
The laptop still uses a Ryzen AI 9 HX 370 processor, which can consume 80 watts permanently. As a result, its performance is at the same level as its predecessor and remains stable even under constant load. Even so, the ThinkBook 16p with the Core i9-14900HX and Apple's M4 Pro CPU are significantly faster.
Cinebench R15 Multi continuous test
Cinebench 2024: CPU Multi Core | CPU Single Core
Cinebench R23: Multi Core | Single Core
Cinebench R20: CPU (Multi Core) | CPU (Single Core)
Cinebench R15: CPU Multi 64Bit | CPU Single 64Bit
Blender: v2.79 BMW27 CPU
7-Zip 18.03: 7z b 4 | 7z b 4 -mmt1
Geekbench 6.7: Multi-Core | Single-Core
Geekbench 5.5: Multi-Core | Single-Core
HWBOT x265 Benchmark v2.2: 4k Preset
LibreOffice : 20 Documents To PDF
R Benchmark 2.5: Overall mean
| CPU Performance rating | |
| Apple MacBook Pro 16 2024 M4 Pro -12! | |
| Lenovo ThinkBook 16p G5 IRX 21N50011GE -2! | |
| Asus ProArt P16 H7606WI | |
| Asus ProArt P16 H7606WP | |
| Average AMD Ryzen AI 9 HX 370 | |
| Lenovo Yoga Pro 9 16IMH9 -2! | |
| Dell XPS 16 9640 | |
| Average of class Multimedia | |
| Cinebench 2024 / CPU Multi Core | |
| Apple MacBook Pro 16 2024 M4 Pro | |
| Asus ProArt P16 H7606WP | |
| Asus ProArt P16 H7606WI | |
| Average AMD Ryzen AI 9 HX 370 (621 - 1299, n=33) | |
| Average of class Multimedia (327 - 2437, n=77, last 2 years) | |
| Dell XPS 16 9640 | |
| Cinebench 2024 / CPU Single Core | |
| Apple MacBook Pro 16 2024 M4 Pro | |
| Average of class Multimedia (72.5 - 201, n=61, last 2 years) | |
| Asus ProArt P16 H7606WP | |
| Average AMD Ryzen AI 9 HX 370 (113.6 - 121, n=23) | |
| Asus ProArt P16 H7606WI | |
| Dell XPS 16 9640 | |
| Cinebench R23 / Multi Core | |
| Lenovo ThinkBook 16p G5 IRX 21N50011GE | |
| Asus ProArt P16 H7606WP | |
| Asus ProArt P16 H7606WI | |
| Apple MacBook Pro 16 2024 M4 Pro | |
| Average AMD Ryzen AI 9 HX 370 (10435 - 23902, n=32) | |
| Lenovo Yoga Pro 9 16IMH9 | |
| Dell XPS 16 9640 | |
| Average of class Multimedia (4861 - 33362, n=78, last 2 years) | |
| Cinebench R23 / Single Core | |
| Apple MacBook Pro 16 2024 M4 Pro | |
| Lenovo ThinkBook 16p G5 IRX 21N50011GE | |
| Asus ProArt P16 H7606WI | |
| Asus ProArt P16 H7606WP | |
| Average AMD Ryzen AI 9 HX 370 (1921 - 2049, n=25) | |
| Average of class Multimedia (1128 - 2459, n=70, last 2 years) | |
| Lenovo Yoga Pro 9 16IMH9 | |
| Dell XPS 16 9640 | |
| Cinebench R20 / CPU (Multi Core) | |
| Lenovo ThinkBook 16p G5 IRX 21N50011GE | |
| Asus ProArt P16 H7606WP | |
| Asus ProArt P16 H7606WI | |
| Average AMD Ryzen AI 9 HX 370 (6449 - 9280, n=24) | |
| Lenovo Yoga Pro 9 16IMH9 | |
| Dell XPS 16 9640 | |
| Average of class Multimedia (1887 - 12912, n=61, last 2 years) | |
| Cinebench R20 / CPU (Single Core) | |
| Lenovo ThinkBook 16p G5 IRX 21N50011GE | |
| Asus ProArt P16 H7606WI | |
| Asus ProArt P16 H7606WP | |
| Average AMD Ryzen AI 9 HX 370 (737 - 804, n=24) | |
| Lenovo Yoga Pro 9 16IMH9 | |
| Average of class Multimedia (425 - 853, n=61, last 2 years) | |
| Dell XPS 16 9640 | |
| Cinebench R15 / CPU Multi 64Bit | |
| Lenovo ThinkBook 16p G5 IRX 21N50011GE | |
| Asus ProArt P16 H7606WI | |
| Asus ProArt P16 H7606WP | |
| Average AMD Ryzen AI 9 HX 370 (2498 - 3551, n=24) | |
| Lenovo Yoga Pro 9 16IMH9 | |
| Dell XPS 16 9640 | |
| Average of class Multimedia (856 - 5224, n=65, last 2 years) | |
| Cinebench R15 / CPU Single 64Bit | |
| Lenovo ThinkBook 16p G5 IRX 21N50011GE | |
| Asus ProArt P16 H7606WI | |
| Average AMD Ryzen AI 9 HX 370 (188.8 - 315, n=24) | |
| Average of class Multimedia (184.8 - 326, n=63, last 2 years) | |
| Lenovo Yoga Pro 9 16IMH9 | |
| Dell XPS 16 9640 | |
| Asus ProArt P16 H7606WP | |
| Blender / v2.79 BMW27 CPU | |
| Average of class Multimedia (100 - 557, n=62, last 2 years) | |
| Dell XPS 16 9640 | |
| Lenovo Yoga Pro 9 16IMH9 | |
| Average AMD Ryzen AI 9 HX 370 (139 - 192, n=25) | |
| Asus ProArt P16 H7606WP | |
| Asus ProArt P16 H7606WI | |
| Lenovo ThinkBook 16p G5 IRX 21N50011GE | |
| 7-Zip 18.03 / 7z b 4 | |
| Lenovo ThinkBook 16p G5 IRX 21N50011GE | |
| Asus ProArt P16 H7606WI | |
| Asus ProArt P16 H7606WP | |
| Average AMD Ryzen AI 9 HX 370 (66154 - 84735, n=24) | |
| Lenovo Yoga Pro 9 16IMH9 | |
| Dell XPS 16 9640 | |
| Average of class Multimedia (26062 - 130368, n=59, last 2 years) | |
| 7-Zip 18.03 / 7z b 4 -mmt1 | |
| Lenovo ThinkBook 16p G5 IRX 21N50011GE | |
| Asus ProArt P16 H7606WI | |
| Average AMD Ryzen AI 9 HX 370 (5859 - 6497, n=24) | |
| Asus ProArt P16 H7606WP | |
| Average of class Multimedia (3666 - 7545, n=60, last 2 years) | |
| Lenovo Yoga Pro 9 16IMH9 | |
| Dell XPS 16 9640 | |
| Geekbench 6.7 / Multi-Core | |
| Apple MacBook Pro 16 2024 M4 Pro | |
| Lenovo ThinkBook 16p G5 IRX 21N50011GE | |
| Asus ProArt P16 H7606WP | |
| Asus ProArt P16 H7606WI | |
| Average of class Multimedia (4983 - 29415, n=73, last 2 years) | |
| Average AMD Ryzen AI 9 HX 370 (11973 - 16311, n=26) | |
| Lenovo Yoga Pro 9 16IMH9 | |
| Dell XPS 16 9640 | |
| Geekbench 6.7 / Single-Core | |
| Apple MacBook Pro 16 2024 M4 Pro | |
| Lenovo ThinkBook 16p G5 IRX 21N50011GE | |
| Asus ProArt P16 H7606WP | |
| Average of class Multimedia (1534 - 4335, n=72, last 2 years) | |
| Average AMD Ryzen AI 9 HX 370 (2780 - 2965, n=26) | |
| Asus ProArt P16 H7606WI | |
| Lenovo Yoga Pro 9 16IMH9 | |
| Dell XPS 16 9640 | |
| Geekbench 5.5 / Multi-Core | |
| Lenovo ThinkBook 16p G5 IRX 21N50011GE | |
| Asus ProArt P16 H7606WP | |
| Asus ProArt P16 H7606WI | |
| Average AMD Ryzen AI 9 HX 370 (11394 - 16322, n=25) | |
| Lenovo Yoga Pro 9 16IMH9 | |
| Dell XPS 16 9640 | |
| Average of class Multimedia (4652 - 20422, n=60, last 2 years) | |
| Geekbench 5.5 / Single-Core | |
| Lenovo ThinkBook 16p G5 IRX 21N50011GE | |
| Asus ProArt P16 H7606WP | |
| Average AMD Ryzen AI 9 HX 370 (1957 - 2175, n=25) | |
| Asus ProArt P16 H7606WI | |
| Average of class Multimedia (805 - 2974, n=60, last 2 years) | |
| Lenovo Yoga Pro 9 16IMH9 | |
| Dell XPS 16 9640 | |
| HWBOT x265 Benchmark v2.2 / 4k Preset | |
| Lenovo ThinkBook 16p G5 IRX 21N50011GE | |
| Asus ProArt P16 H7606WP | |
| Average AMD Ryzen AI 9 HX 370 (20.3 - 28.7, n=24) | |
| Asus ProArt P16 H7606WI | |
| Lenovo Yoga Pro 9 16IMH9 | |
| Dell XPS 16 9640 | |
| Average of class Multimedia (5.26 - 36.1, n=60, last 2 years) | |
| LibreOffice / 20 Documents To PDF | |
| Asus ProArt P16 H7606WI | |
| Average AMD Ryzen AI 9 HX 370 (46.8 - 66.6, n=24) | |
| Asus ProArt P16 H7606WP | |
| Average of class Multimedia (23.9 - 146.7, n=61, last 2 years) | |
| Lenovo ThinkBook 16p G5 IRX 21N50011GE | |
| Dell XPS 16 9640 | |
| Lenovo Yoga Pro 9 16IMH9 | |
| R Benchmark 2.5 / Overall mean | |
| Dell XPS 16 9640 | |
| Average of class Multimedia (0.3604 - 0.947, n=60, last 2 years) | |
| Lenovo Yoga Pro 9 16IMH9 | |
| Average AMD Ryzen AI 9 HX 370 (0.3892 - 0.529, n=24) | |
| Asus ProArt P16 H7606WI | |
| Asus ProArt P16 H7606WP | |
| Lenovo ThinkBook 16p G5 IRX 21N50011GE | |
* ... smaller is better
AIDA64: FP32 Ray-Trace | FPU Julia | CPU SHA3 | CPU Queen | FPU SinJulia | FPU Mandel | CPU AES | CPU ZLib | FP64 Ray-Trace | CPU PhotoWorxx
| Performance rating | |
| Asus ProArt P16 H7606WP | |
| Lenovo ThinkBook 16p G5 IRX 21N50011GE | |
| Asus ProArt P16 H7606WI -2! | |
| Average AMD Ryzen AI 9 HX 370 | |
| Lenovo Yoga Pro 9 16IMH9 | |
| Dell XPS 16 9640 | |
| Average of class Multimedia | |
| AIDA64 / FP32 Ray-Trace | |
| Asus ProArt P16 H7606WP | |
| Average AMD Ryzen AI 9 HX 370 (24673 - 37804, n=25) | |
| Lenovo ThinkBook 16p G5 IRX 21N50011GE | |
| Lenovo Yoga Pro 9 16IMH9 | |
| Average of class Multimedia (2214 - 50388, n=57, last 2 years) | |
| Dell XPS 16 9640 | |
| AIDA64 / FPU Julia | |
| Asus ProArt P16 H7606WI | |
| Asus ProArt P16 H7606WP | |
| Lenovo ThinkBook 16p G5 IRX 21N50011GE | |
| Average AMD Ryzen AI 9 HX 370 (95655 - 148045, n=26) | |
| Lenovo Yoga Pro 9 16IMH9 | |
| Dell XPS 16 9640 | |
| Average of class Multimedia (12867 - 201874, n=58, last 2 years) | |
| AIDA64 / CPU SHA3 | |
| Lenovo ThinkBook 16p G5 IRX 21N50011GE | |
| Asus ProArt P16 H7606WP | |
| Asus ProArt P16 H7606WI | |
| Average AMD Ryzen AI 9 HX 370 (4421 - 5932, n=26) | |
| Lenovo Yoga Pro 9 16IMH9 | |
| Dell XPS 16 9640 | |
| Average of class Multimedia (626 - 8623, n=58, last 2 years) | |
| AIDA64 / CPU Queen | |
| Lenovo ThinkBook 16p G5 IRX 21N50011GE | |
| Asus ProArt P16 H7606WP | |
| Asus ProArt P16 H7606WI | |
| Lenovo Yoga Pro 9 16IMH9 | |
| Dell XPS 16 9640 | |
| Average AMD Ryzen AI 9 HX 370 (41744 - 99088, n=24) | |
| Average of class Multimedia (13483 - 181505, n=45, last 2 years) | |
| AIDA64 / FPU SinJulia | |
| Asus ProArt P16 H7606WI | |
| Asus ProArt P16 H7606WP | |
| Average AMD Ryzen AI 9 HX 370 (16445 - 19120, n=26) | |
| Lenovo ThinkBook 16p G5 IRX 21N50011GE | |
| Lenovo Yoga Pro 9 16IMH9 | |
| Dell XPS 16 9640 | |
| Average of class Multimedia (886 - 28794, n=58, last 2 years) | |
| AIDA64 / FPU Mandel | |
| Asus ProArt P16 H7606WP | |
| Average AMD Ryzen AI 9 HX 370 (50357 - 93798, n=25) | |
| Lenovo ThinkBook 16p G5 IRX 21N50011GE | |
| Lenovo Yoga Pro 9 16IMH9 | |
| Dell XPS 16 9640 | |
| Average of class Multimedia (6395 - 105740, n=57, last 2 years) | |
| AIDA64 / CPU AES | |
| Lenovo ThinkBook 16p G5 IRX 21N50011GE | |
| Asus ProArt P16 H7606WP | |
| Lenovo Yoga Pro 9 16IMH9 | |
| Average AMD Ryzen AI 9 HX 370 (67015 - 118993, n=26) | |
| Dell XPS 16 9640 | |
| Asus ProArt P16 H7606WI | |
| Average of class Multimedia (8171 - 126790, n=58, last 2 years) | |
| AIDA64 / CPU ZLib | |
| Lenovo ThinkBook 16p G5 IRX 21N50011GE | |
| Asus ProArt P16 H7606WI | |
| Asus ProArt P16 H7606WP | |
| Average AMD Ryzen AI 9 HX 370 (1077 - 1530, n=26) | |
| Lenovo Yoga Pro 9 16IMH9 | |
| Dell XPS 16 9640 | |
| Average of class Multimedia (143.8 - 2022, n=58, last 2 years) | |
| AIDA64 / FP64 Ray-Trace | |
| Asus ProArt P16 H7606WI | |
| Asus ProArt P16 H7606WP | |
| Average AMD Ryzen AI 9 HX 370 (13665 - 20648, n=26) | |
| Lenovo ThinkBook 16p G5 IRX 21N50011GE | |
| Lenovo Yoga Pro 9 16IMH9 | |
| Average of class Multimedia (1014 - 26875, n=58, last 2 years) | |
| Dell XPS 16 9640 | |
| AIDA64 / CPU PhotoWorxx | |
| Lenovo Yoga Pro 9 16IMH9 | |
| Dell XPS 16 9640 | |
| Average of class Multimedia (8187 - 88154, n=58, last 2 years) | |
| Lenovo ThinkBook 16p G5 IRX 21N50011GE | |
| Average AMD Ryzen AI 9 HX 370 (36752 - 52671, n=26) | |
| Asus ProArt P16 H7606WI | |
| Asus ProArt P16 H7606WP | |
System performance
The new ProArt P16 was very fast during the synthetic system tests and all inputs are implemented quickly during everyday use, too. We noted no stability problems during our test.
PCMark 10: Score | Essentials | Productivity | Digital Content Creation
CrossMark: Overall | Productivity | Creativity | Responsiveness
WebXPRT 3: Overall
WebXPRT 4: Overall
Mozilla Kraken 1.1: Total
| Performance rating | |
| Apple MacBook Pro 16 2024 M4 Pro -4! | |
| Lenovo ThinkBook 16p G5 IRX 21N50011GE | |
| Average AMD Ryzen AI 9 HX 370, NVIDIA GeForce RTX 5070 Laptop | |
| Dell XPS 16 9640 -1! | |
| Asus ProArt P16 H7606WP | |
| Average of class Multimedia | |
| Asus ProArt P16 H7606WI | |
| Lenovo Yoga Pro 9 16IMH9 | |
| PCMark 10 / Score | |
| Lenovo ThinkBook 16p G5 IRX 21N50011GE | |
| Asus ProArt P16 H7606WP | |
| Average AMD Ryzen AI 9 HX 370, NVIDIA GeForce RTX 5070 Laptop (n=1) | |
| Asus ProArt P16 H7606WI | |
| Average of class Multimedia (4325 - 10386, n=56, last 2 years) | |
| Lenovo Yoga Pro 9 16IMH9 | |
| Dell XPS 16 9640 | |
| PCMark 10 / Essentials | |
| Lenovo ThinkBook 16p G5 IRX 21N50011GE | |
| Lenovo Yoga Pro 9 16IMH9 | |
| Asus ProArt P16 H7606WP | |
| Average AMD Ryzen AI 9 HX 370, NVIDIA GeForce RTX 5070 Laptop (n=1) | |
| Average of class Multimedia (8025 - 11664, n=55, last 2 years) | |
| Dell XPS 16 9640 | |
| Asus ProArt P16 H7606WI | |
| PCMark 10 / Productivity | |
| Average of class Multimedia (7323 - 18233, n=55, last 2 years) | |
| Lenovo ThinkBook 16p G5 IRX 21N50011GE | |
| Asus ProArt P16 H7606WI | |
| Dell XPS 16 9640 | |
| Lenovo Yoga Pro 9 16IMH9 | |
| Asus ProArt P16 H7606WP | |
| Average AMD Ryzen AI 9 HX 370, NVIDIA GeForce RTX 5070 Laptop (n=1) | |
| PCMark 10 / Digital Content Creation | |
| Asus ProArt P16 H7606WP | |
| Average AMD Ryzen AI 9 HX 370, NVIDIA GeForce RTX 5070 Laptop (n=1) | |
| Lenovo ThinkBook 16p G5 IRX 21N50011GE | |
| Asus ProArt P16 H7606WI | |
| Lenovo Yoga Pro 9 16IMH9 | |
| Average of class Multimedia (3651 - 16240, n=55, last 2 years) | |
| Dell XPS 16 9640 | |
| CrossMark / Overall | |
| Lenovo ThinkBook 16p G5 IRX 21N50011GE | |
| Apple MacBook Pro 16 2024 M4 Pro | |
| Average AMD Ryzen AI 9 HX 370, NVIDIA GeForce RTX 5070 Laptop (1897 - 2028, n=2) | |
| Asus ProArt P16 H7606WP | |
| Average of class Multimedia (866 - 2728, n=64, last 2 years) | |
| Dell XPS 16 9640 | |
| Asus ProArt P16 H7606WI | |
| Lenovo Yoga Pro 9 16IMH9 | |
| CrossMark / Productivity | |
| Lenovo ThinkBook 16p G5 IRX 21N50011GE | |
| Apple MacBook Pro 16 2024 M4 Pro | |
| Average AMD Ryzen AI 9 HX 370, NVIDIA GeForce RTX 5070 Laptop (1718 - 1820, n=2) | |
| Average of class Multimedia (931 - 2489, n=64, last 2 years) | |
| Dell XPS 16 9640 | |
| Asus ProArt P16 H7606WP | |
| Lenovo Yoga Pro 9 16IMH9 | |
| Asus ProArt P16 H7606WI | |
| CrossMark / Creativity | |
| Apple MacBook Pro 16 2024 M4 Pro | |
| Lenovo ThinkBook 16p G5 IRX 21N50011GE | |
| Average AMD Ryzen AI 9 HX 370, NVIDIA GeForce RTX 5070 Laptop (2259 - 2455, n=2) | |
| Asus ProArt P16 H7606WI | |
| Asus ProArt P16 H7606WP | |
| Average of class Multimedia (907 - 3465, n=64, last 2 years) | |
| Dell XPS 16 9640 | |
| Lenovo Yoga Pro 9 16IMH9 | |
| CrossMark / Responsiveness | |
| Lenovo ThinkBook 16p G5 IRX 21N50011GE | |
| Dell XPS 16 9640 | |
| Apple MacBook Pro 16 2024 M4 Pro | |
| Average AMD Ryzen AI 9 HX 370, NVIDIA GeForce RTX 5070 Laptop (1516 - 1581, n=2) | |
| Average of class Multimedia (605 - 2024, n=64, last 2 years) | |
| Asus ProArt P16 H7606WP | |
| Lenovo Yoga Pro 9 16IMH9 | |
| Asus ProArt P16 H7606WI | |
| WebXPRT 3 / Overall | |
| Apple MacBook Pro 16 2024 M4 Pro | |
| Lenovo ThinkBook 16p G5 IRX 21N50011GE | |
| Average AMD Ryzen AI 9 HX 370, NVIDIA GeForce RTX 5070 Laptop (326 - 352, n=2) | |
| Average of class Multimedia (136.4 - 596, n=67, last 2 years) | |
| Asus ProArt P16 H7606WP | |
| Asus ProArt P16 H7606WI | |
| Lenovo Yoga Pro 9 16IMH9 | |
| Dell XPS 16 9640 | |
| WebXPRT 4 / Overall | |
| Apple MacBook Pro 16 2024 M4 Pro | |
| Lenovo ThinkBook 16p G5 IRX 21N50011GE | |
| Average AMD Ryzen AI 9 HX 370, NVIDIA GeForce RTX 5070 Laptop (275 - 345, n=2) | |
| Average of class Multimedia (167.3 - 402, n=69, last 2 years) | |
| Asus ProArt P16 H7606WP | |
| Lenovo Yoga Pro 9 16IMH9 | |
| Dell XPS 16 9640 | |
| Asus ProArt P16 H7606WI | |
| Mozilla Kraken 1.1 / Total | |
| Lenovo Yoga Pro 9 16IMH9 | |
| Average of class Multimedia (228 - 835, n=70, last 2 years) | |
| Asus ProArt P16 H7606WP | |
| Asus ProArt P16 H7606WI | |
| Lenovo ThinkBook 16p G5 IRX 21N50011GE | |
| Average AMD Ryzen AI 9 HX 370, NVIDIA GeForce RTX 5070 Laptop (416 - 444, n=2) | |
| Apple MacBook Pro 16 2024 M4 Pro | |
* ... smaller is better
| PCMark 10 Score | 8114 points | |
Help | ||
| AIDA64 / Memory Copy | |
| Lenovo Yoga Pro 9 16IMH9 | |
| Dell XPS 16 9640 | |
| Asus ProArt P16 H7606WI | |
| Asus ProArt P16 H7606WP | |
| Average AMD Ryzen AI 9 HX 370 (71902 - 93640, n=26) | |
| Average of class Multimedia (11299 - 132135, n=58, last 2 years) | |
| Lenovo ThinkBook 16p G5 IRX 21N50011GE | |
| AIDA64 / Memory Read | |
| Asus ProArt P16 H7606WI | |
| Asus ProArt P16 H7606WP | |
| Average AMD Ryzen AI 9 HX 370 (81367 - 102937, n=26) | |
| Lenovo Yoga Pro 9 16IMH9 | |
| Lenovo ThinkBook 16p G5 IRX 21N50011GE | |
| Dell XPS 16 9640 | |
| Average of class Multimedia (11624 - 174586, n=58, last 2 years) | |
| AIDA64 / Memory Write | |
| Asus ProArt P16 H7606WI | |
| Asus ProArt P16 H7606WP | |
| Average AMD Ryzen AI 9 HX 370 (78939 - 108954, n=26) | |
| Average of class Multimedia (11755 - 134998, n=58, last 2 years) | |
| Lenovo ThinkBook 16p G5 IRX 21N50011GE | |
| Lenovo Yoga Pro 9 16IMH9 | |
| Dell XPS 16 9640 | |
| AIDA64 / Memory Latency | |
| Dell XPS 16 9640 | |
| Lenovo Yoga Pro 9 16IMH9 | |
| Average of class Multimedia (7 - 535, n=57, last 2 years) | |
| Asus ProArt P16 H7606WI | |
| Asus ProArt P16 H7606WP | |
| Average AMD Ryzen AI 9 HX 370 (86.7 - 119.4, n=26) | |
| Lenovo ThinkBook 16p G5 IRX 21N50011GE | |
* ... smaller is better
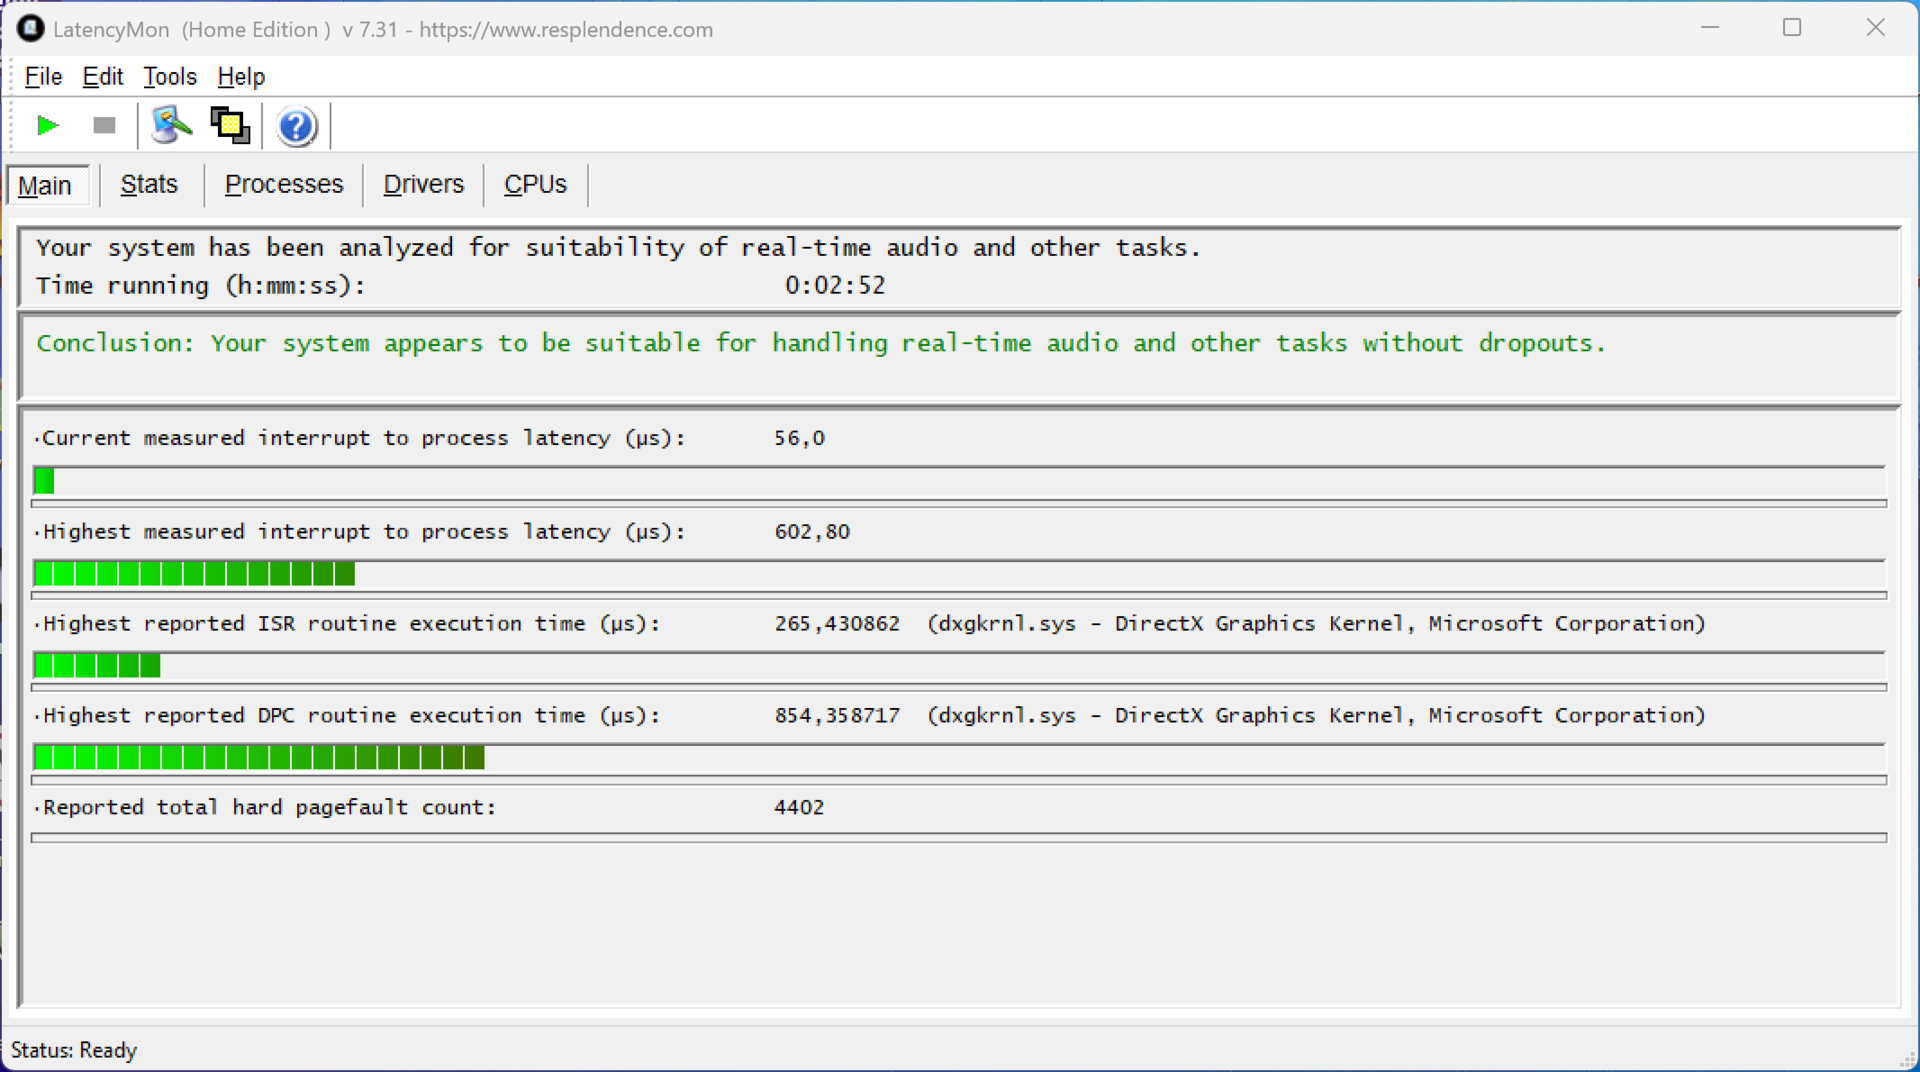
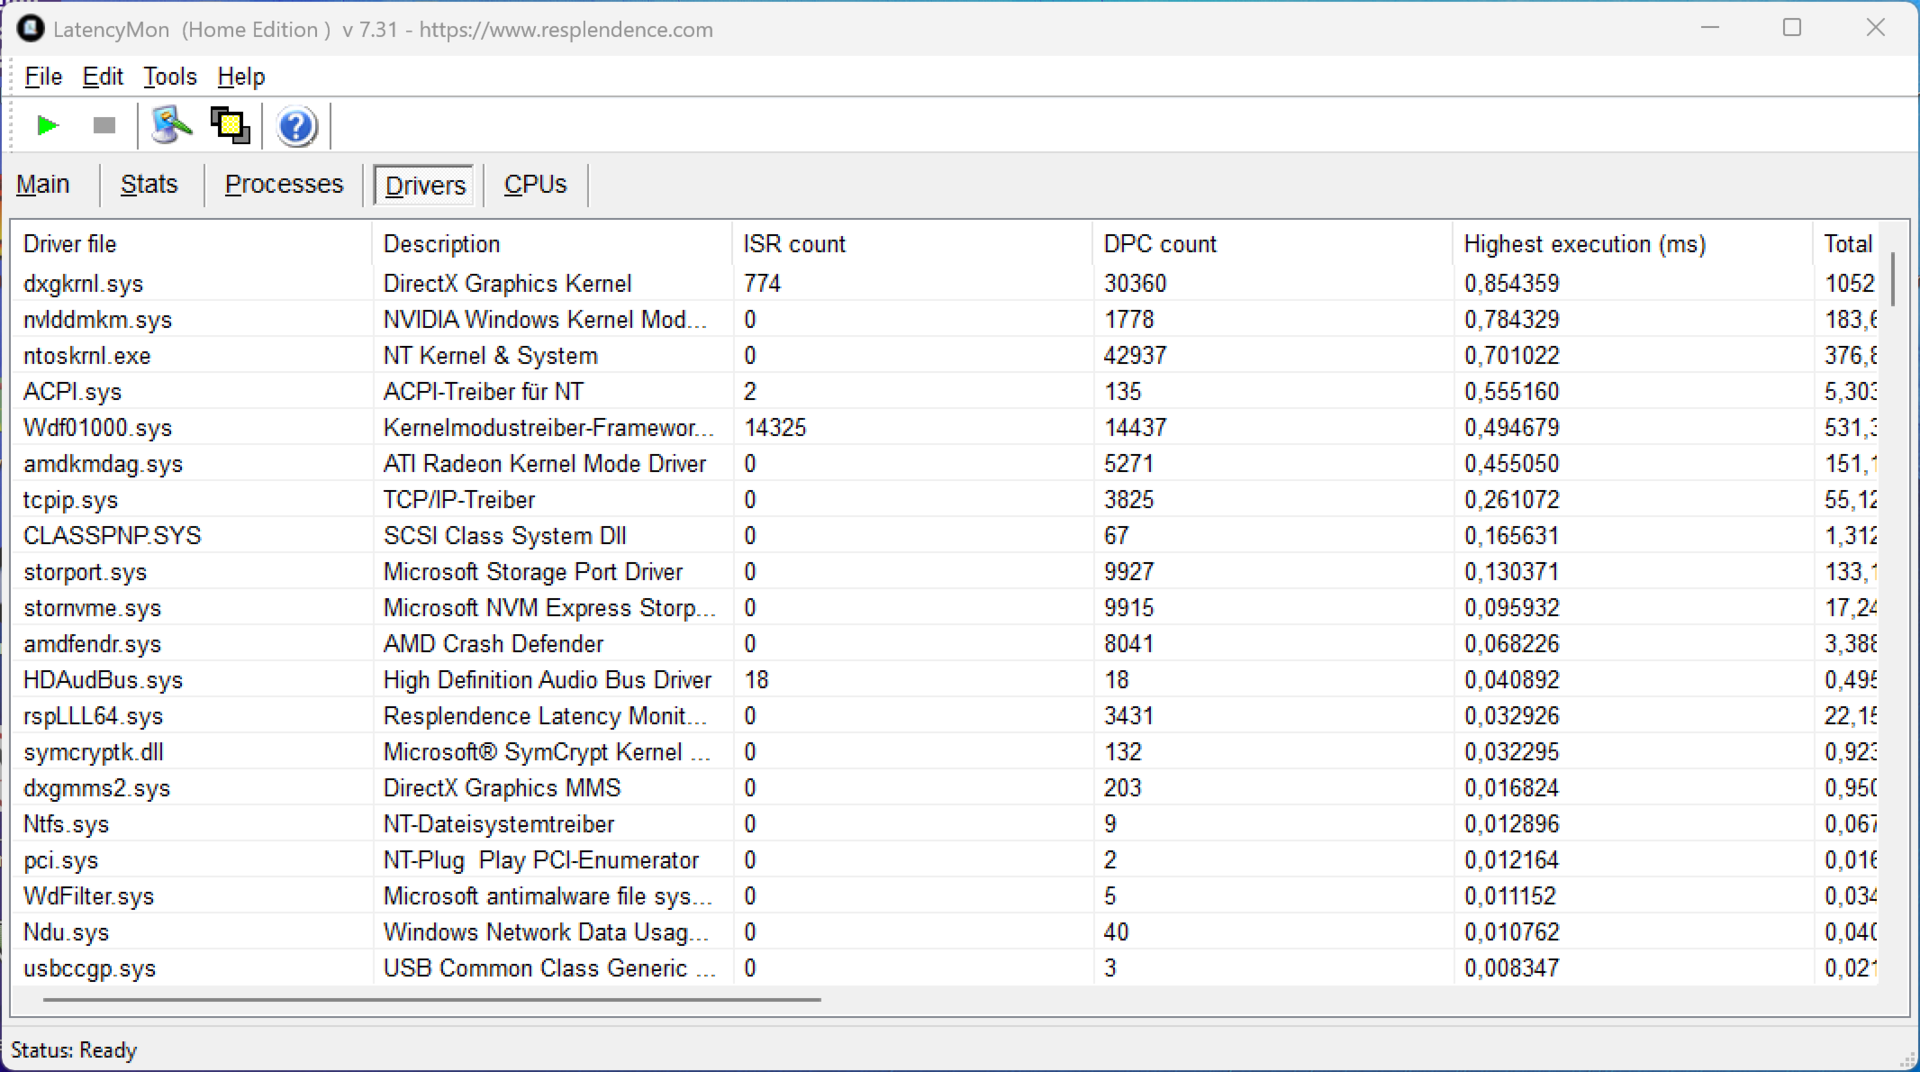
DPC latencies
During our standardized latency test (surfing the web, 4K YouTube playback, CPU load), our test device with the current BIOS version showed no restrictions when using real-time audio applications.
| DPC Latencies / LatencyMon - interrupt to process latency (max), Web, Youtube, Prime95 | |
| Dell XPS 16 9640 | |
| Asus ProArt P16 H7606WP | |
| Lenovo ThinkBook 16p G5 IRX 21N50011GE | |
| Lenovo Yoga Pro 9 16IMH9 | |
* ... smaller is better
Storage device
The ProArt P16 features two M.2-2280 slots for SSDs, whereby one is only connected at half the speed (1x PCIe 4.0 x4, 1x PCIe 4.0 x2). A 2 TB version of the WD SN740 is installed in our test device (1.75 TB free to the user), which offers decent transfer rates that don't drop even under permanent load.

* ... smaller is better
Reading continuous performance: DiskSpd Read Loop, Queue Depth 8
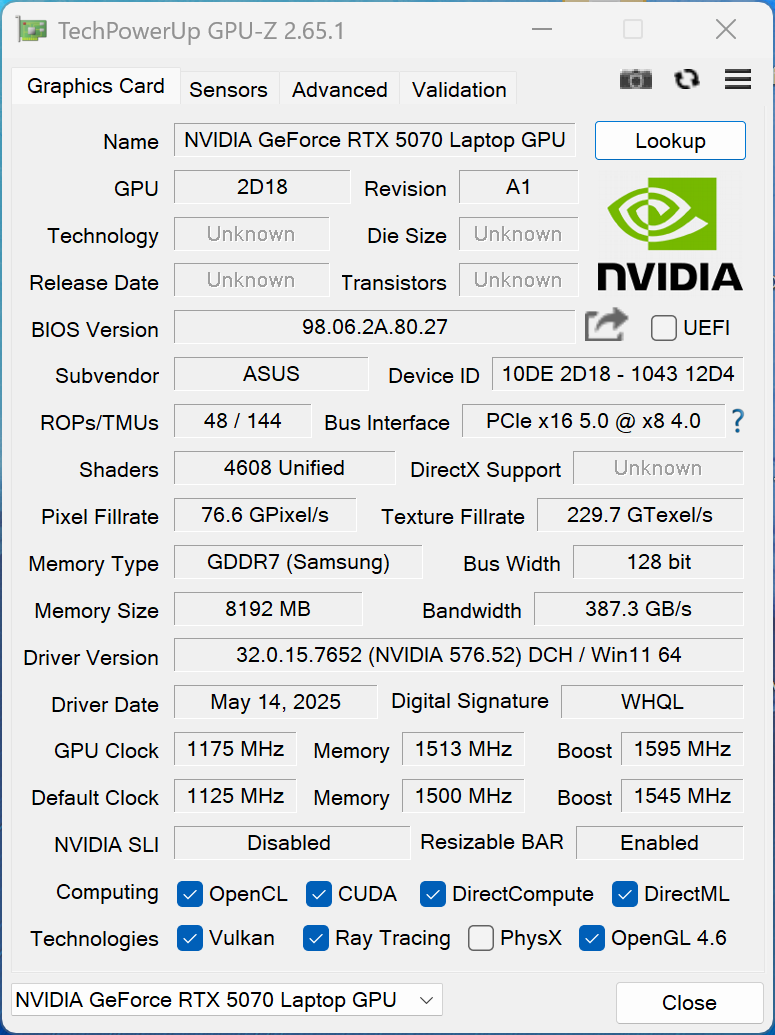
GPU performance
Our test device is equipped with the new GeForce RTX 5070 Laptop and the graphics switching is done using normal Optimus technology. This is the 105-watt version of the RTX 5070 Laptop and the laptop still has 8 GB of VRAM, which may be limiting when playing some games. In terms of its pure performance, the new model was only 6-12% ahead of the old ProArt P16 with the RTX 4070 Laptop during our test. When gaming, its lead when running our standard tested games was 16%, although there can of course be differences depending on the game.
| 3DMark 11 Performance | 35945 points | |
| 3DMark Fire Strike Score | 29156 points | |
| 3DMark Time Spy Score | 12466 points | |
| 3DMark Steel Nomad Score | 2935 points | |
| 3DMark Steel Nomad Light Score | 13261 points | |
| 3DMark Steel Nomad Light Unlimited Score | 13765 points | |
Help | ||
| Blender / v3.3 Classroom OPTIX/RTX | |
| Average of class Multimedia (12 - 105, n=24, last 2 years) | |
| Lenovo ThinkBook 16p G5 IRX 21N50011GE | |
| Asus ProArt P16 H7606WI | |
| Dell XPS 16 9640 | |
| Average NVIDIA GeForce RTX 5070 Laptop (17 - 24, n=28) | |
| Lenovo Yoga Pro 9 16IMH9 | |
| Asus ProArt P16 H7606WP | |
| Blender / v3.3 Classroom CUDA | |
| Average of class Multimedia (20 - 186, n=24, last 2 years) | |
| Lenovo ThinkBook 16p G5 IRX 21N50011GE | |
| Average NVIDIA GeForce RTX 5070 Laptop (29 - 228, n=29) | |
| Dell XPS 16 9640 | |
| Asus ProArt P16 H7606WI | |
| Asus ProArt P16 H7606WP | |
| Lenovo Yoga Pro 9 16IMH9 | |
| Blender / v3.3 Classroom CPU | |
| Average of class Multimedia (134.5 - 1042, n=65, last 2 years) | |
| Dell XPS 16 9640 | |
| Lenovo Yoga Pro 9 16IMH9 | |
| Average NVIDIA GeForce RTX 5070 Laptop (137 - 507, n=26) | |
| Asus ProArt P16 H7606WI | |
| Asus ProArt P16 H7606WP | |
| Lenovo ThinkBook 16p G5 IRX 21N50011GE | |
* ... smaller is better
| Performance rating - Percent | |
| Asus ProArt P16 H7606WP | |
| Lenovo ThinkBook 16p G5 IRX 21N50011GE -1! | |
| Lenovo Yoga Pro 9 16IMH9 | |
| Asus ProArt P16 H7606WI | |
| Dell XPS 16 9640 | |
| Average of class Multimedia | |
| Cyberpunk 2077 - 1920x1080 Ultra Preset (FSR off) | |
| Asus ProArt P16 H7606WP | |
| Asus ProArt P16 H7606WI | |
| Lenovo Yoga Pro 9 16IMH9 | |
| Lenovo ThinkBook 16p G5 IRX 21N50011GE | |
| Dell XPS 16 9640 | |
| Average of class Multimedia (6.41 - 112.3, n=75, last 2 years) | |
| Baldur's Gate 3 - 1920x1080 Ultra Preset AA:T | |
| Asus ProArt P16 H7606WP | |
| Lenovo Yoga Pro 9 16IMH9 | |
| Lenovo ThinkBook 16p G5 IRX 21N50011GE | |
| Dell XPS 16 9640 | |
| Asus ProArt P16 H7606WI | |
| Average of class Multimedia (7.8 - 158.7, n=69, last 2 years) | |
| GTA V - 1920x1080 Highest AA:4xMSAA + FX AF:16x | |
| Lenovo ThinkBook 16p G5 IRX 21N50011GE | |
| Asus ProArt P16 H7606WP | |
| Asus ProArt P16 H7606WI | |
| Lenovo Yoga Pro 9 16IMH9 | |
| Dell XPS 16 9640 | |
| Average of class Multimedia (7.92 - 141.6, n=60, last 2 years) | |
| Final Fantasy XV Benchmark - 1920x1080 High Quality | |
| Asus ProArt P16 H7606WP | |
| Lenovo Yoga Pro 9 16IMH9 | |
| Asus ProArt P16 H7606WI | |
| Lenovo ThinkBook 16p G5 IRX 21N50011GE | |
| Dell XPS 16 9640 | |
| Average of class Multimedia (7.61 - 144.4, n=62, last 2 years) | |
| Strange Brigade - 1920x1080 ultra AA:ultra AF:16 | |
| Asus ProArt P16 H7606WP | |
| Lenovo Yoga Pro 9 16IMH9 | |
| Asus ProArt P16 H7606WI | |
| Dell XPS 16 9640 | |
| Average of class Multimedia (13.3 - 303, n=62, last 2 years) | |
| Dota 2 Reborn - 1920x1080 ultra (3/3) best looking | |
| Lenovo ThinkBook 16p G5 IRX 21N50011GE | |
| Asus ProArt P16 H7606WI | |
| Lenovo Yoga Pro 9 16IMH9 | |
| Asus ProArt P16 H7606WP | |
| Average of class Multimedia (29 - 179.9, n=64, last 2 years) | |
| Dell XPS 16 9640 | |
Cyberpunk 2077 ultra FPS diagram
| low | med. | high | ultra | QHD | |
|---|---|---|---|---|---|
| GTA V (2015) | 121.1 | 109.9 | |||
| Dota 2 Reborn (2015) | 170.3 | 151.8 | 138.8 | 130.9 | |
| Final Fantasy XV Benchmark (2018) | 202 | 165.5 | 132 | 100.5 | |
| X-Plane 11.11 (2018) | 102.8 | 94.1 | 73.9 | ||
| Strange Brigade (2018) | 391 | 318 | 281 | 247 | 166.6 |
| Baldur's Gate 3 (2023) | 165.1 | 143.6 | 129.3 | 127.3 | 88.4 |
| Cyberpunk 2077 (2023) | 127 | 121.1 | 108.3 | 97.8 | 64.6 |
| Alan Wake 2 (2023) | 84.1 | 76.8 | 71.3 | 43.8 | |
| F1 24 (2024) | 199.3 | 80.7 | 51.1 | ||
| Assassin's Creed Shadows (2025) | 81 | 71 | 61 | 43 | 31 |
| F1 25 (2025) | 176.5 | 171 | 161 | 27.7 | 9.17 |
Emissions & energy
Noise emissions
During everyday use, we recommend using Whisper mode, as the device's two fans are often deactivated when performing simple tasks. However, the fans are pretty much always active in Performance mode, and they also tend to pulse a little, which can feel a little annoying. Things also get loud quickly under load, as we measured almost 54 dB(A) both when gaming and in the stress test. There were no other electronic noises on our test device.
Noise level
| Idle |
| 26.7 / 26.7 / 31.1 dB(A) |
| Load |
| 44.8 / 53.7 dB(A) |
 | ||
30 dB silent 40 dB(A) audible 50 dB(A) loud |
||
min: | ||
| Asus ProArt P16 H7606WP GeForce RTX 5070 Laptop, Ryzen AI 9 HX 370, WD PC SN740 SDDPNQE-2T00 | Apple MacBook Pro 16 2024 M4 Pro M4 Pro 20-Core GPU, M4 Pro 14-Core, Apple SSD AP2048Z | Lenovo ThinkBook 16p G5 IRX 21N50011GE GeForce RTX 4060 Laptop GPU, i9-14900HX, SK Hynix HFS001TEJ9X115N | Asus ProArt P16 H7606WI GeForce RTX 4070 Laptop GPU, Ryzen AI 9 HX 370, Micron 2400 MTFDKBA1T0QFM | Lenovo Yoga Pro 9 16IMH9 GeForce RTX 4070 Laptop GPU, Ultra 9 185H, SK Hynix HFS001TEJ9X115N | Dell XPS 16 9640 GeForce RTX 4070 Laptop GPU, Ultra 7 155H, Kioxia XG8 KXG80ZNV1T02 | |
|---|---|---|---|---|---|---|
| Noise | 20% | 1% | 1% | 4% | 7% | |
| off / environment * (dB) | 23.5 | 24 -2% | 25 -6% | 24.4 -4% | 24.3 -3% | 24.5 -4% |
| Idle Minimum * (dB) | 26.7 | 24 10% | 25 6% | 24.4 9% | 24.3 9% | 24.5 8% |
| Idle Average * (dB) | 26.7 | 24 10% | 25 6% | 27.7 -4% | 24.3 9% | 24.5 8% |
| Idle Maximum * (dB) | 31.1 | 24 23% | 25 20% | 32.3 -4% | 25.8 17% | 27.5 12% |
| Load Average * (dB) | 44.8 | 25.3 44% | 47.9 -7% | 42.2 6% | 48.1 -7% | 39.6 12% |
| Cyberpunk 2077 ultra * (dB) | 53.7 | 33.9 37% | 57.3 -7% | 53.2 1% | ||
| Load Maximum * (dB) | 53.7 | 42.3 21% | 57.4 -7% | 53.2 1% | 53.9 -0% | 49.7 7% |
| Witcher 3 ultra * (dB) | 49.7 | 49.7 |
* ... smaller is better
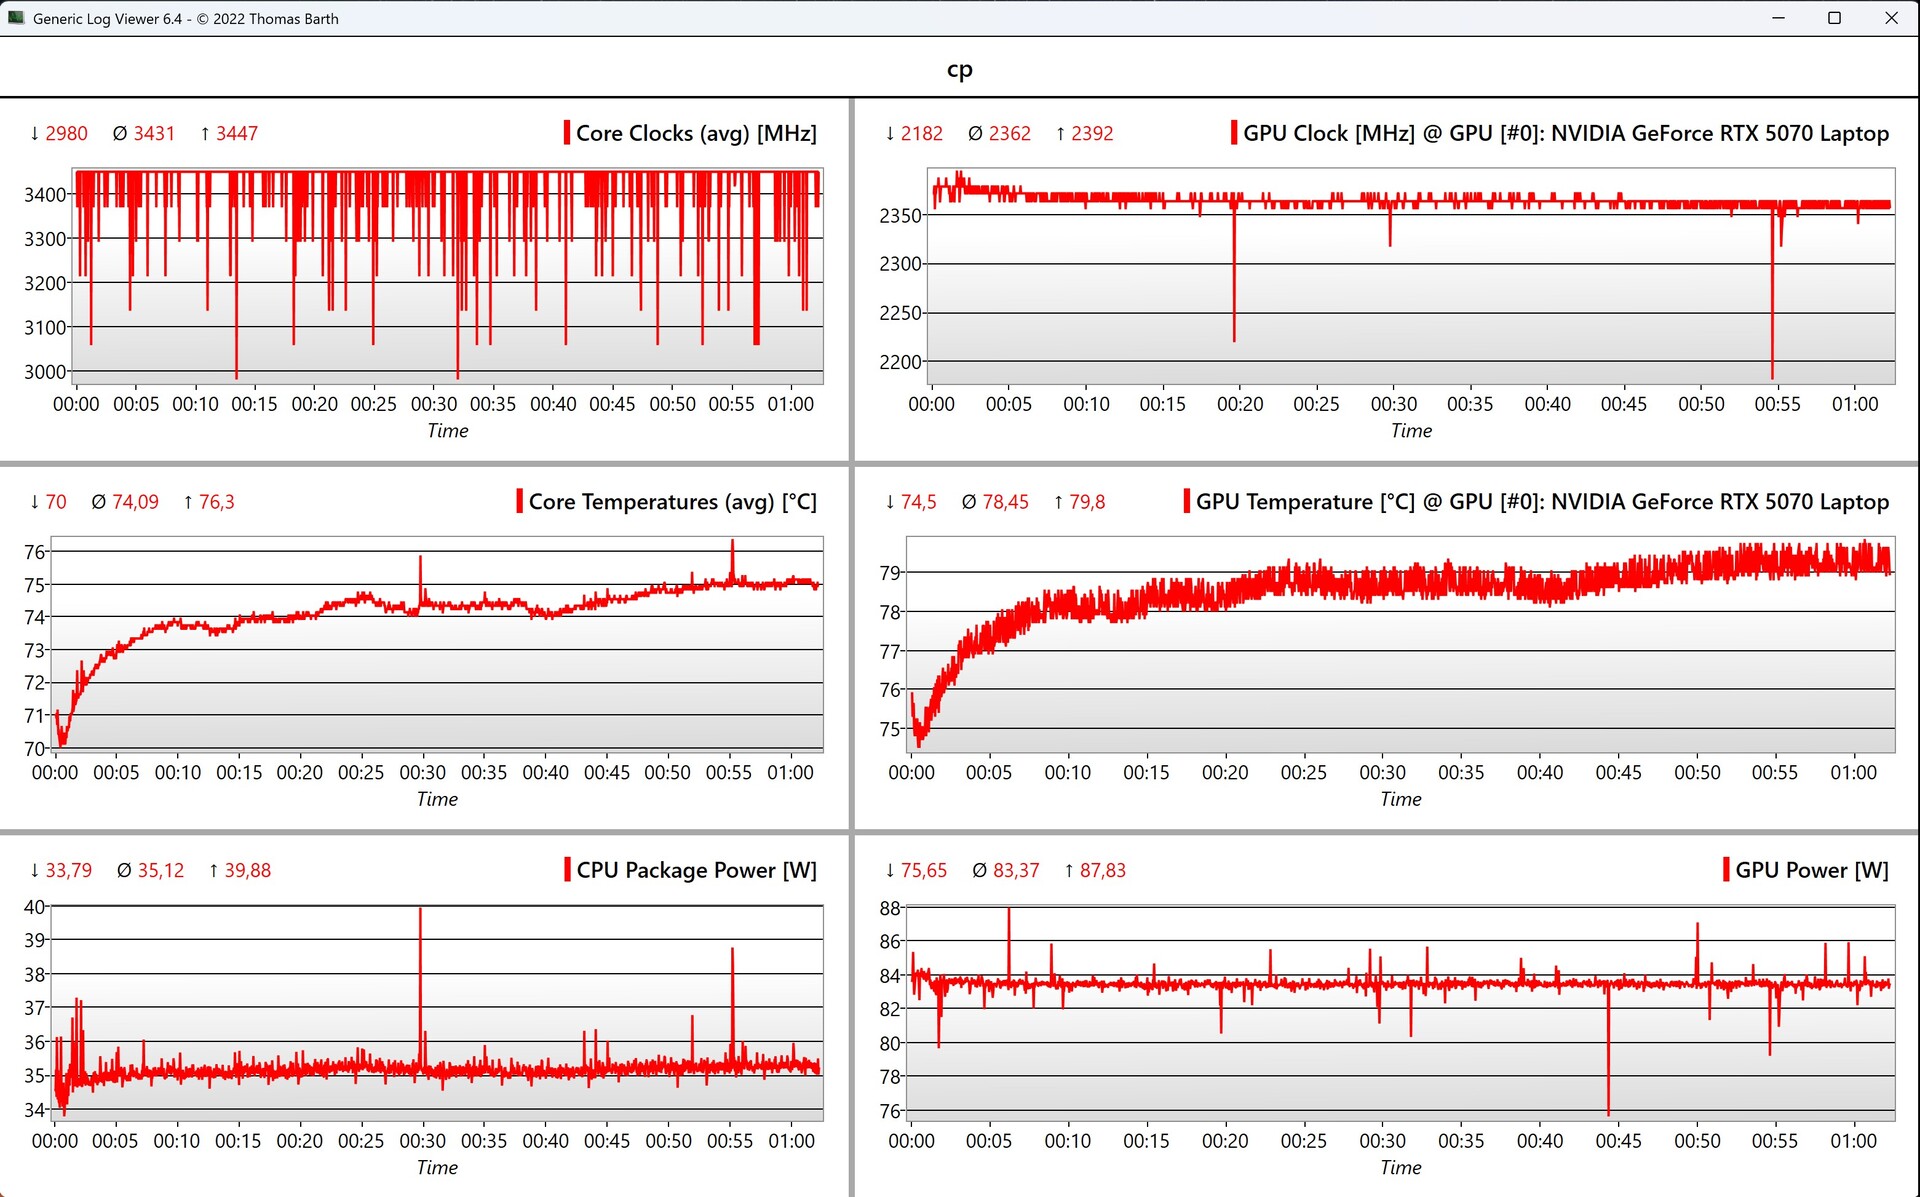
Temperature
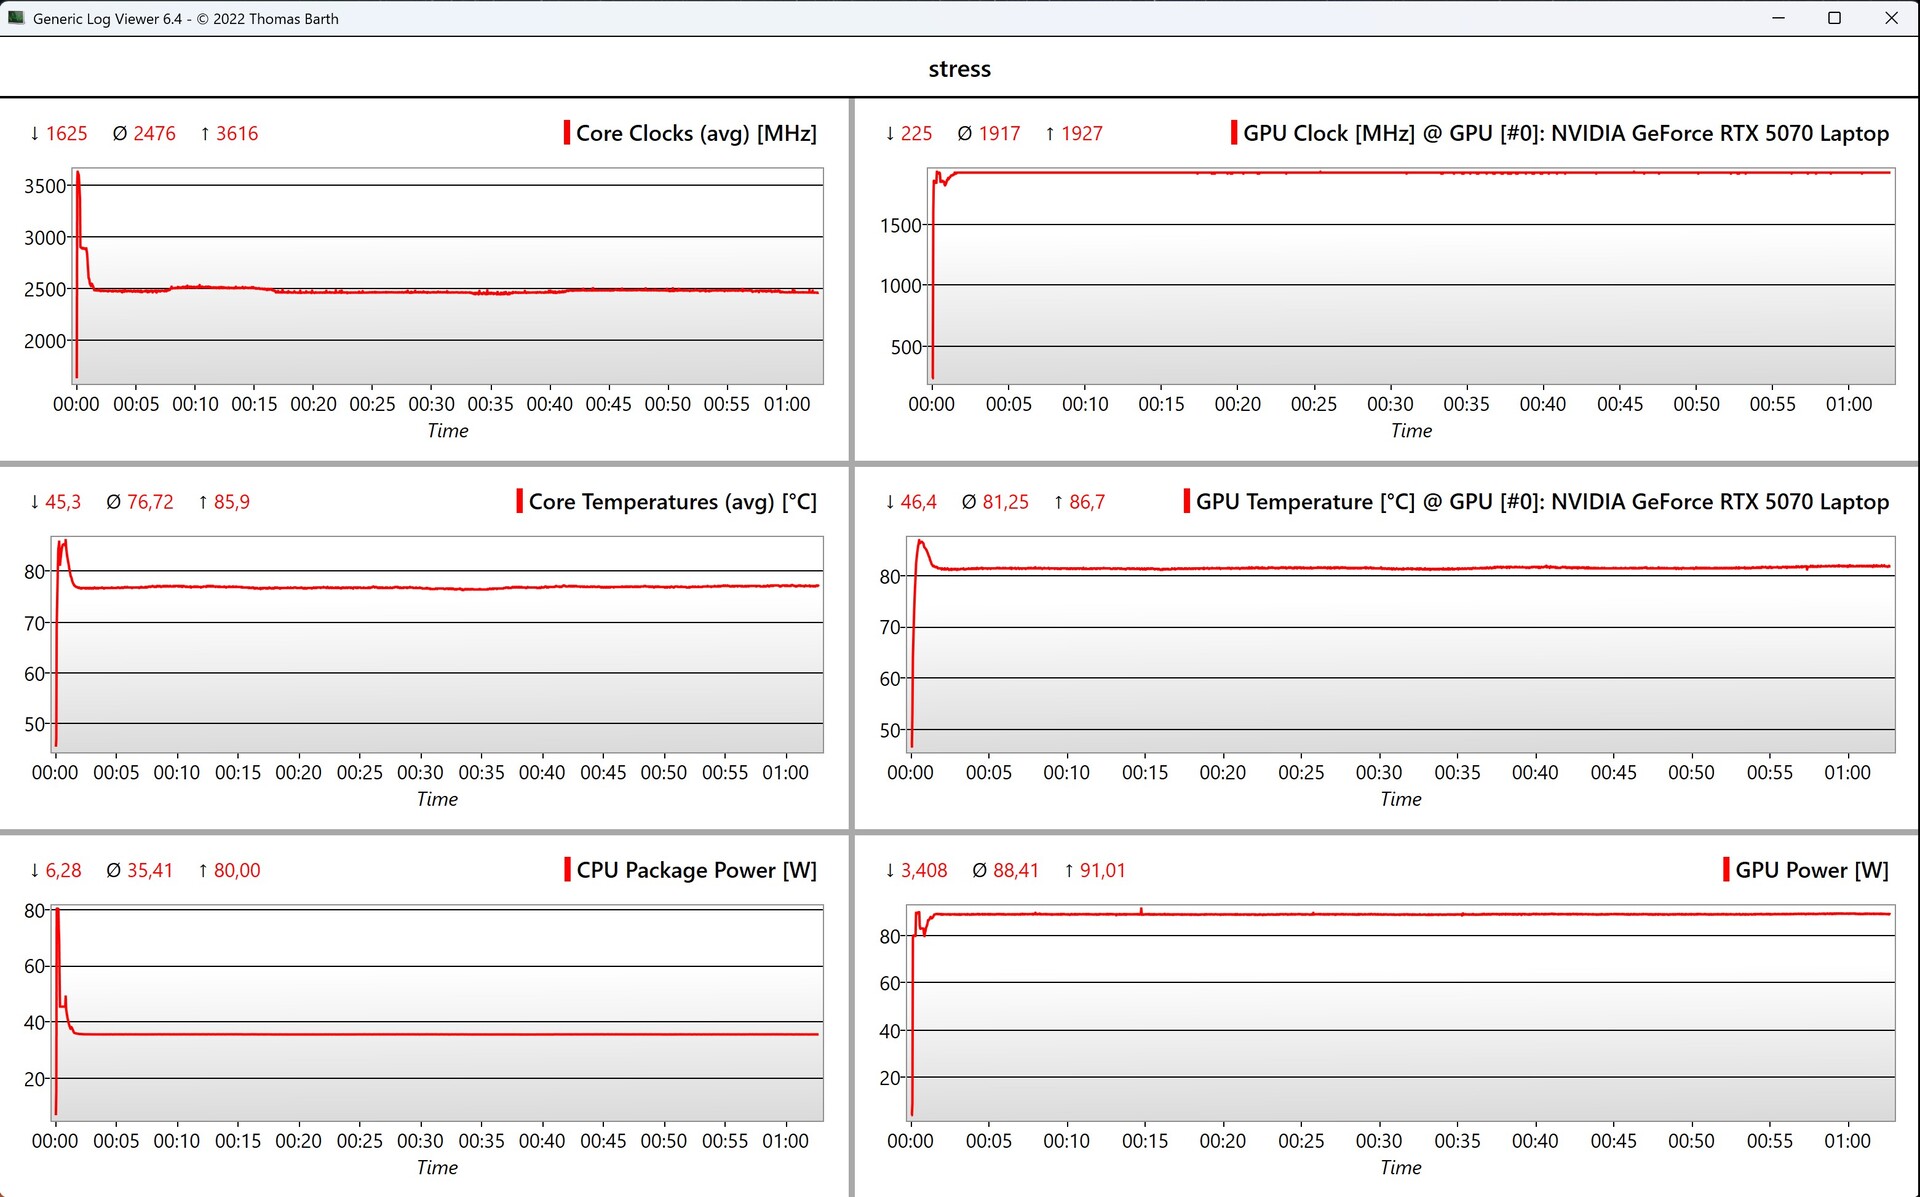
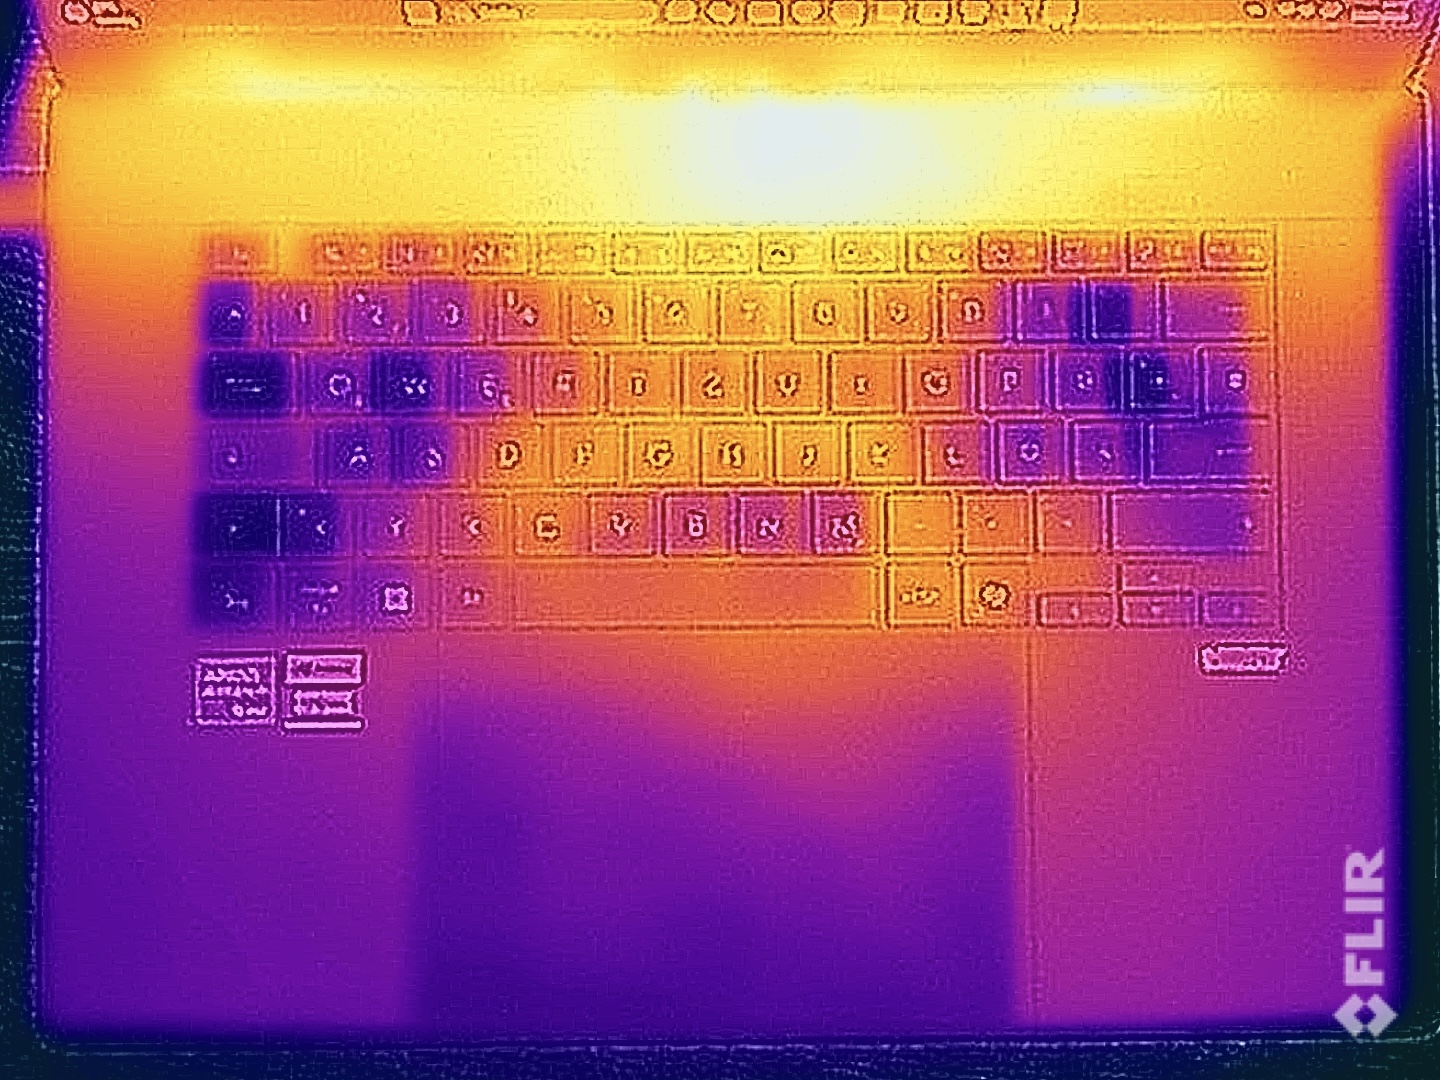
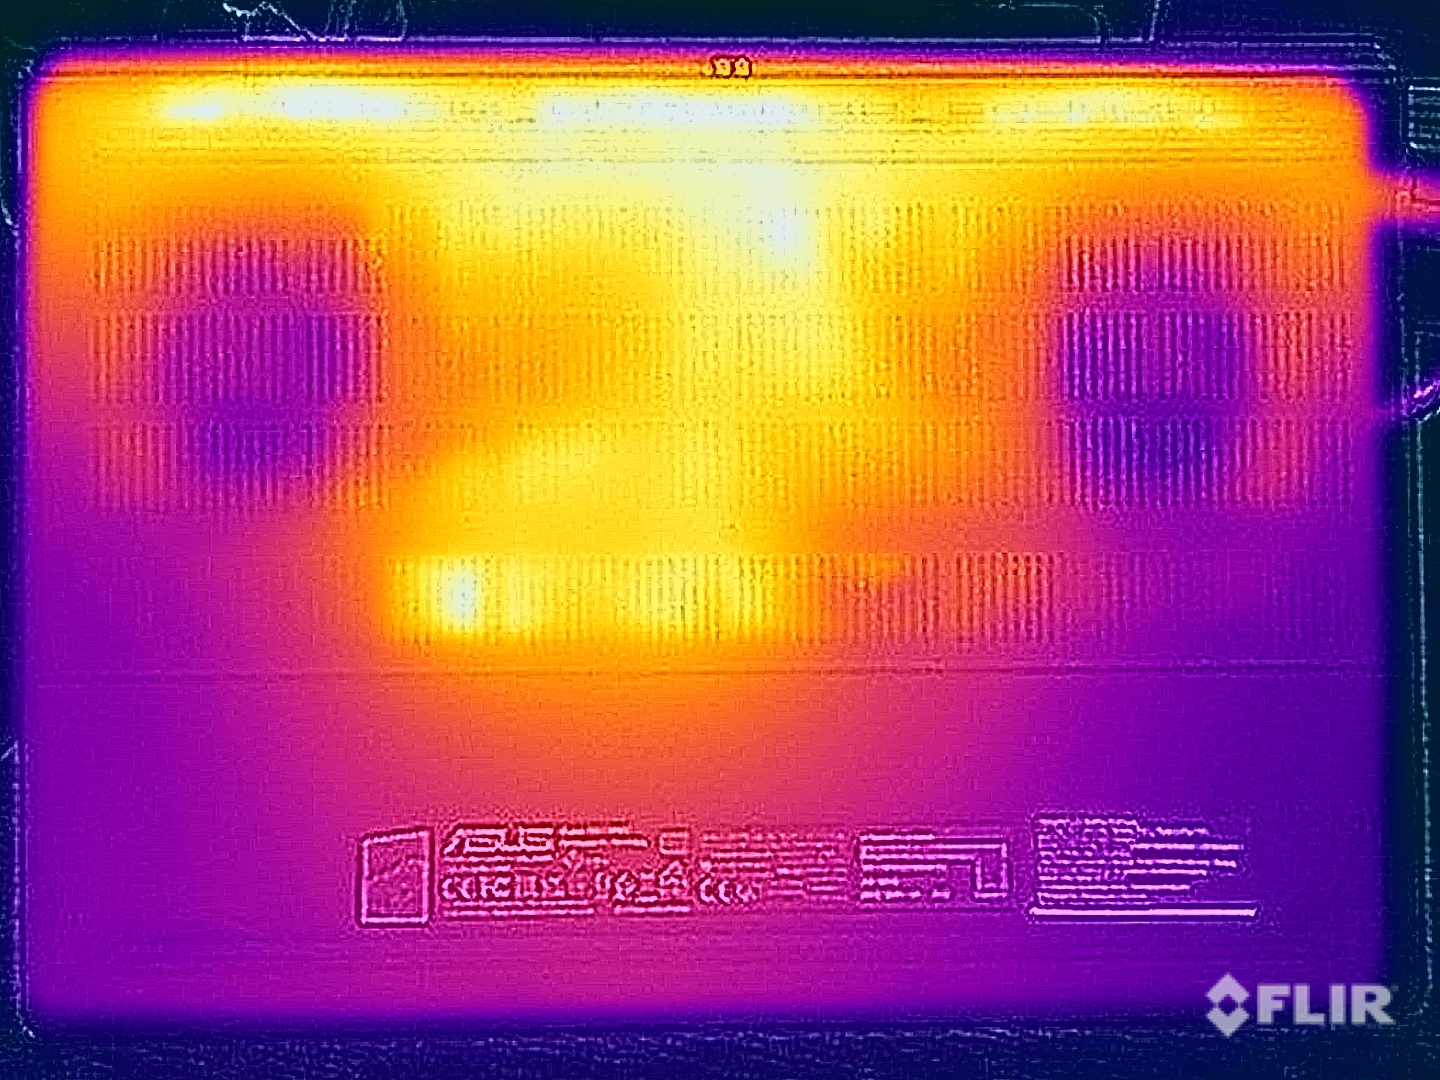
The laptop's surface temperatures are slightly lower than the old model, but the ProArt P16 still gets quite warm under load. Still, with a maximum of 47 °C in the middle area of the underside, this is by no means critical and the device can still be placed on your thighs. There is a hotspot above the keyboard on the top, but the keyboard itself stays a lot cooler. During the stress test, the CPU & GPU stabilized at 35 and 88 watts respectively.
(-) The maximum temperature on the upper side is 47 °C / 117 F, compared to the average of 36.8 °C / 98 F, ranging from 21 to 71 °C for the class Multimedia.
(-) The bottom heats up to a maximum of 47.4 °C / 117 F, compared to the average of 39.1 °C / 102 F
(+) In idle usage, the average temperature for the upper side is 25.4 °C / 78 F, compared to the device average of 31.3 °C / 88 F.
(±) 3: The average temperature for the upper side is 37.7 °C / 100 F, compared to the average of 31.3 °C / 88 F for the class Multimedia.
(+) The palmrests and touchpad are reaching skin temperature as a maximum (32.5 °C / 90.5 F) and are therefore not hot.
(-) The average temperature of the palmrest area of similar devices was 28.7 °C / 83.7 F (-3.8 °C / -6.8 F).
| Asus ProArt P16 H7606WP AMD Ryzen AI 9 HX 370, NVIDIA GeForce RTX 5070 Laptop | Apple MacBook Pro 16 2024 M4 Pro Apple M4 Pro 14-Core, Apple M4 Pro 20-Core GPU | Lenovo ThinkBook 16p G5 IRX 21N50011GE Intel Core i9-14900HX, NVIDIA GeForce RTX 4060 Laptop GPU | Asus ProArt P16 H7606WI AMD Ryzen AI 9 HX 370, NVIDIA GeForce RTX 4070 Laptop GPU | Lenovo Yoga Pro 9 16IMH9 Intel Core Ultra 9 185H, NVIDIA GeForce RTX 4070 Laptop GPU | Dell XPS 16 9640 Intel Core Ultra 7 155H, NVIDIA GeForce RTX 4070 Laptop GPU | |
|---|---|---|---|---|---|---|
| Heat | 14% | 7% | -8% | 3% | 7% | |
| Maximum Upper Side * (°C) | 47 | 42.7 9% | 41.1 13% | 46.9 -0% | 41.7 11% | 39.4 16% |
| Maximum Bottom * (°C) | 47.4 | 43.1 9% | 40.8 14% | 50.9 -7% | 46.3 2% | 36.9 22% |
| Idle Upper Side * (°C) | 26.1 | 21.5 18% | 26 -0% | 28.9 -11% | 26.2 -0% | 28.2 -8% |
| Idle Bottom * (°C) | 26.4 | 21.5 19% | 26 2% | 30 -14% | 27.2 -3% | 27.4 -4% |
* ... smaller is better
Speakers
Its sound system is still great and the ProArt P16 is one of the best laptops on the market in this respect.
Asus ProArt P16 H7606WP audio analysis
(+) | speakers can play relatively loud (82 dB)
Bass 100 - 315 Hz
(+) | good bass - only 4.2% away from median
(±) | linearity of bass is average (8.8% delta to prev. frequency)
Mids 400 - 2000 Hz
(+) | balanced mids - only 4.4% away from median
(+) | mids are linear (3.2% delta to prev. frequency)
Highs 2 - 16 kHz
(+) | balanced highs - only 1.3% away from median
(+) | highs are linear (3.3% delta to prev. frequency)
Overall 100 - 16.000 Hz
(+) | overall sound is linear (7.8% difference to median)
Compared to same class
» 6% of all tested devices in this class were better, 3% similar, 91% worse
» The best had a delta of 5%, average was 17%, worst was 45%
Compared to all devices tested
» 1% of all tested devices were better, 0% similar, 98% worse
» The best had a delta of 4%, average was 23%, worst was 134%
Apple MacBook Pro 16 2024 M4 Pro audio analysis
(+) | speakers can play relatively loud (84.6 dB)
Bass 100 - 315 Hz
(±) | reduced bass - on average 5.1% lower than median
(+) | bass is linear (5.6% delta to prev. frequency)
Mids 400 - 2000 Hz
(+) | balanced mids - only 1.4% away from median
(+) | mids are linear (2.4% delta to prev. frequency)
Highs 2 - 16 kHz
(+) | balanced highs - only 1.6% away from median
(+) | highs are linear (3% delta to prev. frequency)
Overall 100 - 16.000 Hz
(+) | overall sound is linear (4.8% difference to median)
Compared to same class
» 0% of all tested devices in this class were better, 0% similar, 99% worse
» The best had a delta of 5%, average was 17%, worst was 45%
Compared to all devices tested
» 0% of all tested devices were better, 0% similar, 100% worse
» The best had a delta of 4%, average was 23%, worst was 134%
Lenovo ThinkBook 16p G5 IRX 21N50011GE audio analysis
(±) | speaker loudness is average but good (78.9 dB)
Bass 100 - 315 Hz
(±) | reduced bass - on average 7.6% lower than median
(±) | linearity of bass is average (10.1% delta to prev. frequency)
Mids 400 - 2000 Hz
(+) | balanced mids - only 3.3% away from median
(+) | mids are linear (6.8% delta to prev. frequency)
Highs 2 - 16 kHz
(+) | balanced highs - only 0.9% away from median
(+) | highs are linear (3.1% delta to prev. frequency)
Overall 100 - 16.000 Hz
(+) | overall sound is linear (8.8% difference to median)
Compared to same class
» 11% of all tested devices in this class were better, 2% similar, 87% worse
» The best had a delta of 5%, average was 17%, worst was 45%
Compared to all devices tested
» 3% of all tested devices were better, 1% similar, 97% worse
» The best had a delta of 4%, average was 23%, worst was 134%
Asus ProArt P16 H7606WI audio analysis
(±) | speaker loudness is average but good (81.4 dB)
Bass 100 - 315 Hz
(+) | good bass - only 3% away from median
(±) | linearity of bass is average (8.3% delta to prev. frequency)
Mids 400 - 2000 Hz
(+) | balanced mids - only 3.5% away from median
(+) | mids are linear (2.5% delta to prev. frequency)
Highs 2 - 16 kHz
(+) | balanced highs - only 3% away from median
(+) | highs are linear (3.6% delta to prev. frequency)
Overall 100 - 16.000 Hz
(+) | overall sound is linear (8.5% difference to median)
Compared to same class
» 9% of all tested devices in this class were better, 3% similar, 88% worse
» The best had a delta of 5%, average was 17%, worst was 45%
Compared to all devices tested
» 2% of all tested devices were better, 1% similar, 97% worse
» The best had a delta of 4%, average was 23%, worst was 134%
Lenovo Yoga Pro 9 16IMH9 audio analysis
(+) | speakers can play relatively loud (84.5 dB)
Bass 100 - 315 Hz
(±) | reduced bass - on average 7% lower than median
(±) | linearity of bass is average (7.2% delta to prev. frequency)
Mids 400 - 2000 Hz
(+) | balanced mids - only 3.9% away from median
(+) | mids are linear (4.5% delta to prev. frequency)
Highs 2 - 16 kHz
(+) | balanced highs - only 2.8% away from median
(+) | highs are linear (3.2% delta to prev. frequency)
Overall 100 - 16.000 Hz
(+) | overall sound is linear (8.8% difference to median)
Compared to same class
» 11% of all tested devices in this class were better, 2% similar, 87% worse
» The best had a delta of 5%, average was 17%, worst was 45%
Compared to all devices tested
» 3% of all tested devices were better, 1% similar, 97% worse
» The best had a delta of 4%, average was 23%, worst was 134%
Dell XPS 16 9640 audio analysis
(+) | speakers can play relatively loud (83.4 dB)
Bass 100 - 315 Hz
(±) | reduced bass - on average 11.2% lower than median
(±) | linearity of bass is average (8.9% delta to prev. frequency)
Mids 400 - 2000 Hz
(+) | balanced mids - only 4.5% away from median
(+) | mids are linear (3% delta to prev. frequency)
Highs 2 - 16 kHz
(+) | balanced highs - only 1.4% away from median
(+) | highs are linear (2% delta to prev. frequency)
Overall 100 - 16.000 Hz
(+) | overall sound is linear (10% difference to median)
Compared to same class
» 13% of all tested devices in this class were better, 2% similar, 84% worse
» The best had a delta of 5%, average was 17%, worst was 45%
Compared to all devices tested
» 4% of all tested devices were better, 1% similar, 94% worse
» The best had a delta of 4%, average was 23%, worst was 134%
Power consumption
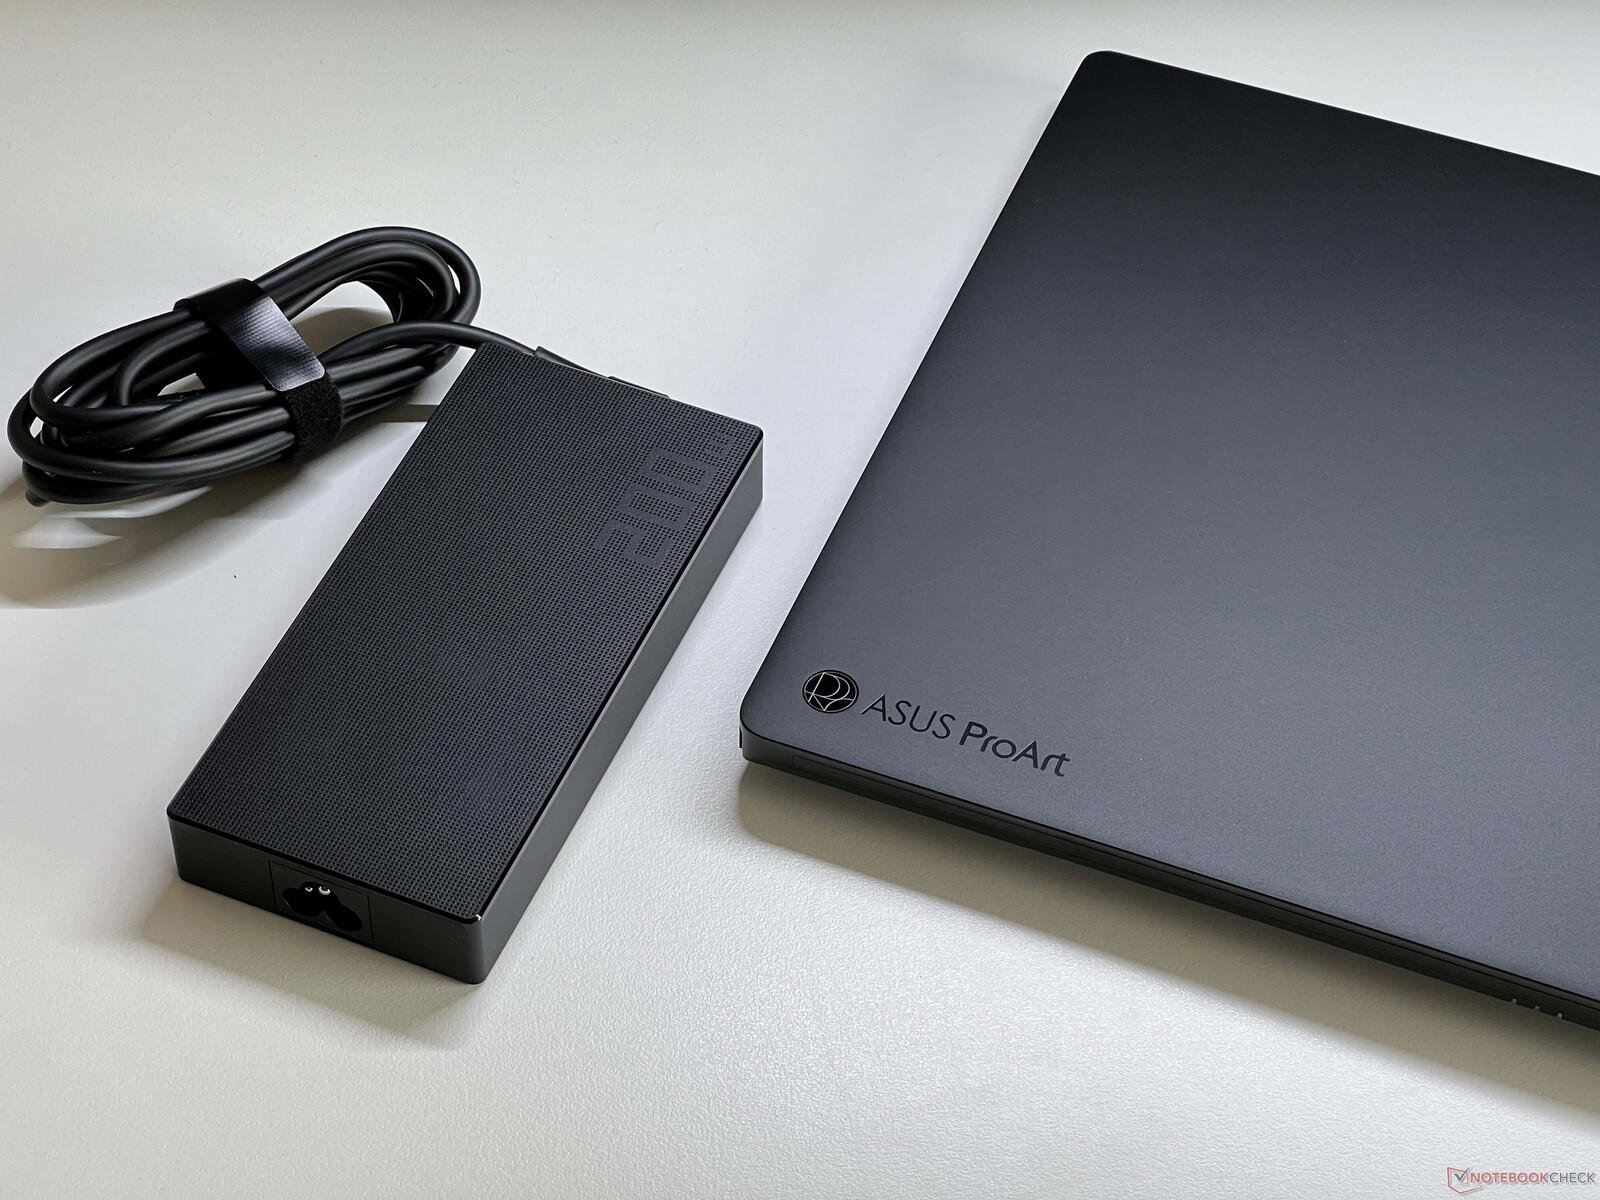
The new ProArt P16 with its 120 Hz screen requires slightly more power in idle mode than its predecessor, and its consumption has also increased slightly under load. During the stress test, we briefly measured a maximum of 229 watts, which then leveled off at 180-190 watts. The 200 watt power supply unit supplied isn't particularly generous in size, but is sufficient.
| Off / Standby | |
| Idle | |
| Load |
|
Key:
min: | |
| Asus ProArt P16 H7606WP Ryzen AI 9 HX 370, GeForce RTX 5070 Laptop, WD PC SN740 SDDPNQE-2T00, OLED, 2880x1800, 16" | Apple MacBook Pro 16 2024 M4 Pro M4 Pro 14-Core, M4 Pro 20-Core GPU, Apple SSD AP2048Z, Mini-LED, 3456x2234, 16.2" | Lenovo ThinkBook 16p G5 IRX 21N50011GE i9-14900HX, GeForce RTX 4060 Laptop GPU, SK Hynix HFS001TEJ9X115N, IPS LCD, 3200x2000, 16" | Asus ProArt P16 H7606WI Ryzen AI 9 HX 370, GeForce RTX 4070 Laptop GPU, Micron 2400 MTFDKBA1T0QFM, OLED, 3840x2400, 16" | Lenovo Yoga Pro 9 16IMH9 Ultra 9 185H, GeForce RTX 4070 Laptop GPU, SK Hynix HFS001TEJ9X115N, Mini-LED, 3200x2000, 16" | Dell XPS 16 9640 Ultra 7 155H, GeForce RTX 4070 Laptop GPU, Kioxia XG8 KXG80ZNV1T02, OLED, 3840x2400, 16.3" | |
|---|---|---|---|---|---|---|
| Power Consumption | 24% | -35% | 13% | -21% | 26% | |
| Idle Minimum * (Watt) | 9.9 | 4.6 54% | 11.6 -17% | 8 19% | 10.3 -4% | 7.7 22% |
| Idle Average * (Watt) | 13.6 | 16.8 -24% | 18.5 -36% | 9.9 27% | 21.9 -61% | 10.3 24% |
| Idle Maximum * (Watt) | 14 | 17.1 -22% | 19.9 -42% | 11.6 17% | 22.4 -60% | 10.6 24% |
| Load Average * (Watt) | 93.8 | 76.4 19% | 126.3 -35% | 76.9 18% | 96.9 -3% | 76.5 18% |
| Cyberpunk 2077 ultra * (Watt) | 162.1 | 83.4 49% | 233 -44% | 157.7 3% | ||
| Cyberpunk 2077 ultra external monitor * (Watt) | 158.3 | 79.3 50% | 237 -50% | 156.6 1% | ||
| Load Maximum * (Watt) | 229 | 138.1 40% | 270.4 -18% | 212.6 7% | 173.8 24% | 138.5 40% |
| Witcher 3 ultra * (Watt) | 159.6 | 126.4 |
* ... smaller is better
Power consumption Cyberpunk / stress test
Power consumption with external monitor
Runtimes
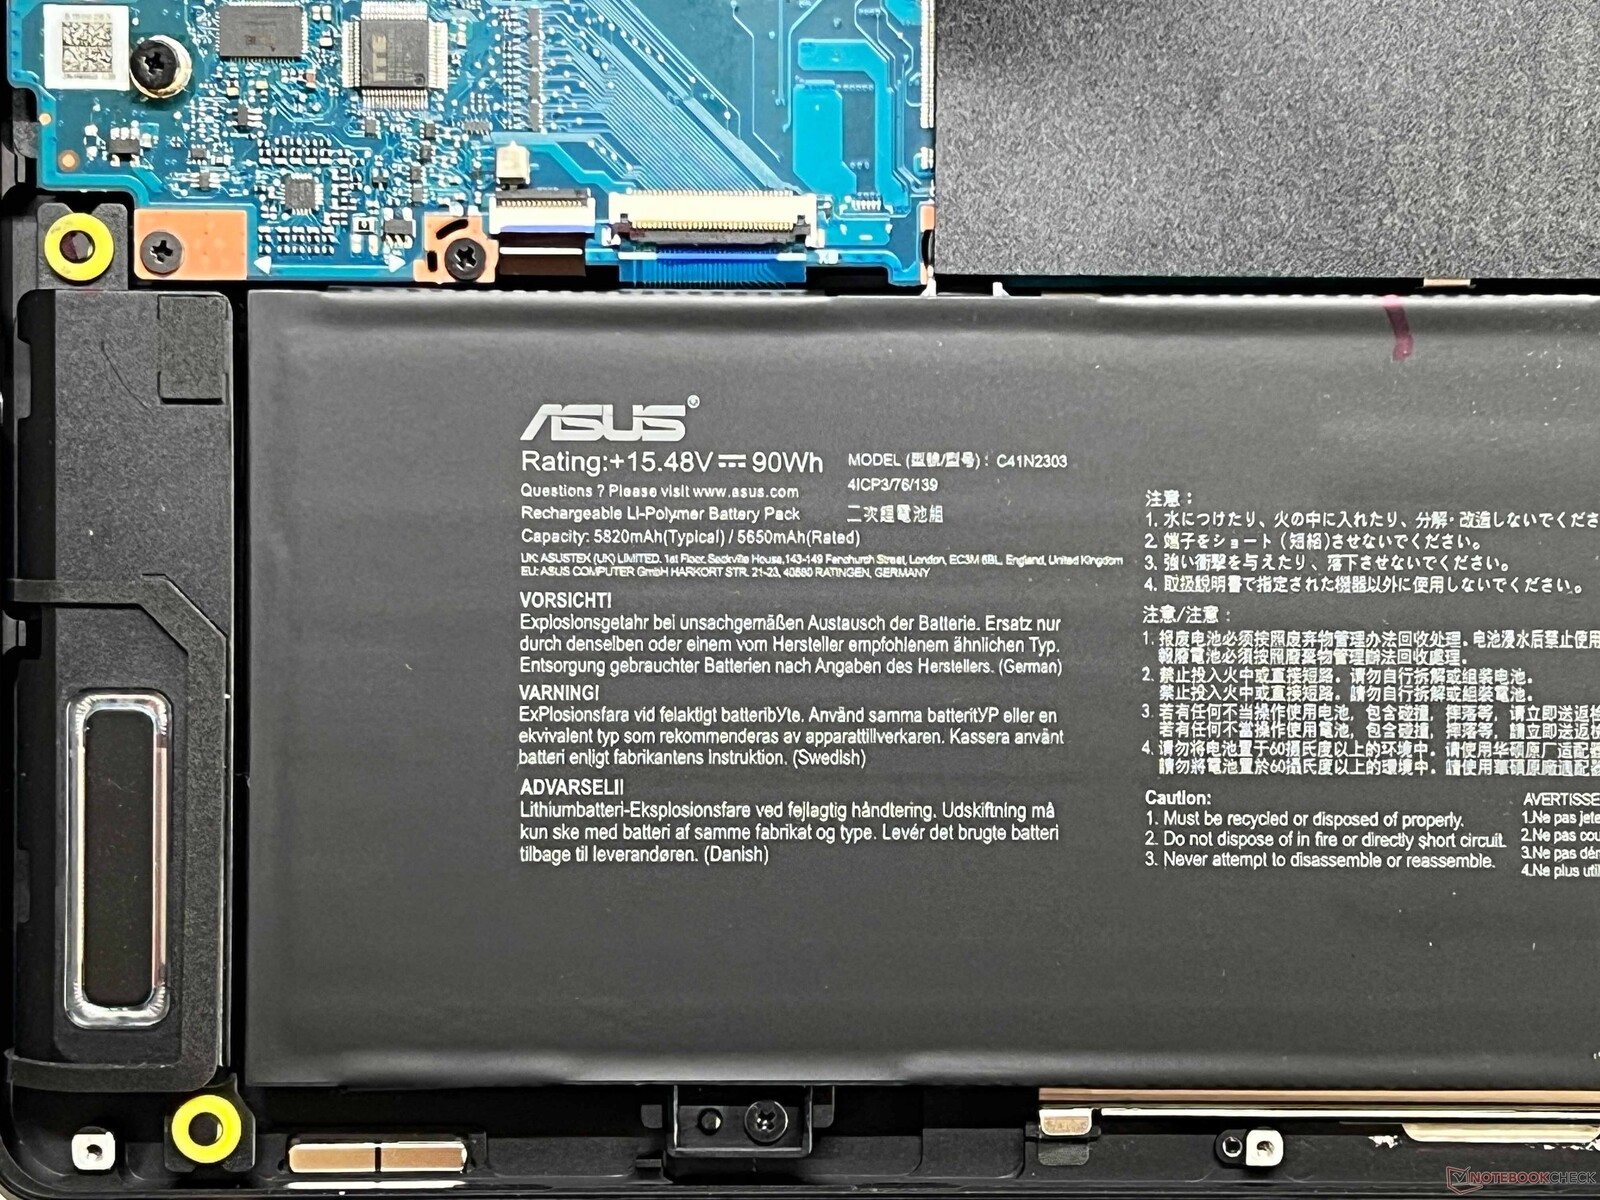
Its battery capacity hasn't changed (90 Wh) and the laptop's runtime in our WLAN test was still around 6.5 hours at full brightness. On the other hand, the new model lasted almost an hour longer at 150 cd/m² (70% of our test device's maximum brightness) (09:14 hours). Overall, the ProArt P16 is still in the midfield when it comes to its battery life.
Notebookcheck total rating
Asus ProArt P16 H7606WP
- 05/28/2025 v8
Andreas Osthoff
 Total Sustainability Score:
 Possible alternatives compared
Image | Model / Review | Price | Weight | Height | Display |
|---|---|---|---|---|---|
1. 89.1%  | Asus ProArt P16 H7606WP AMD Ryzen AI 9 HX 370 ⎘ NVIDIA GeForce RTX 5070 Laptop ⎘ 64 GB Memory, 2048 GB SSD | Amazon: 1. $4,924.00 HIDevolution [2025] ASUS Pro... 2. $8,049.00 HIDevolution [2025] ASUS Pro... 3. $2,069.99 ASUS ProArt PX13 (Replace P1... List Price: 3399€ | 1.8 kg | 17.3 mm | 16.00" 2880x1800 212 PPI OLED |
2. 93%  | Apple MacBook Pro 16 2024 M4 Pro Apple M4 Pro 14-Core ⎘ Apple M4 Pro 20-Core GPU ⎘ 48 GB Memory, 2048 GB SSD | Amazon: List Price: 4219€ | 2.1 kg | 16.8 mm | 16.20" 3456x2234 254 PPI Mini-LED |
3. 85.1%  | Lenovo ThinkBook 16p G5 IRX 21N50011GE Intel Core i9-14900HX ⎘ NVIDIA GeForce RTX 4060 Laptop GPU ⎘ 32 GB Memory, 1024 GB SSD | Amazon: List Price: 2120 Euro | 2.2 kg | 23.1 mm | 16.00" 3200x2000 236 PPI IPS LCD |
4. 87.8%  | Asus ProArt P16 H7606WI AMD Ryzen AI 9 HX 370 ⎘ NVIDIA GeForce RTX 4070 Laptop GPU ⎘ 64 GB Memory, 1024 GB SSD | Amazon: List Price: 4000€ | 1.8 kg | 17.3 mm | 16.00" 3840x2400 283 PPI OLED |
5. 88.7% v7 (old)  | Lenovo Yoga Pro 9 16IMH9 Intel Core Ultra 9 185H ⎘ NVIDIA GeForce RTX 4070 Laptop GPU ⎘ 32 GB Memory, 1024 GB SSD | Amazon: List Price: 2700€ | 2.1 kg | 18.3 mm | 16.00" 3200x2000 236 PPI Mini-LED |
6. 88.6% v7 (old)  | Dell XPS 16 9640 Intel Core Ultra 7 155H ⎘ NVIDIA GeForce RTX 4070 Laptop GPU ⎘ 32 GB Memory, 1024 GB SSD | Amazon: 1. $2,199.00 New XPS 16 9640 Business Lap... 2. $2,499.00 Dell XPS 16 9640 16.3" Touch... 3. $1,699.00 Dell XPS 16 9640 (Replace XP... | 2.3 kg | 18.7 mm | 16.30" 3840x2400 139 PPI OLED |
Transparency
The selection of devices to be reviewed is made by our editorial team. The test sample was provided to the author as a loan by the manufacturer or retailer for the purpose of this review. The lender had no influence on this review, nor did the manufacturer receive a copy of this review before publication. There was no obligation to publish this review. As an independent media company, Notebookcheck is not subjected to the authority of manufacturers, retailers or publishers.
This is how Notebookcheck is testing
Every year, Notebookcheck independently reviews hundreds of laptops and smartphones using standardized procedures to ensure that all results are comparable. We have continuously developed our test methods for around 20 years and set industry standards in the process. In our test labs, high-quality measuring equipment is utilized by experienced technicians and editors. These tests involve a multi-stage validation process. Our complex rating system is based on hundreds of well-founded measurements and benchmarks, which maintains objectivity. Further information on our test methods can be found here.

