Verdict – good, but good enough to outpace the competition?
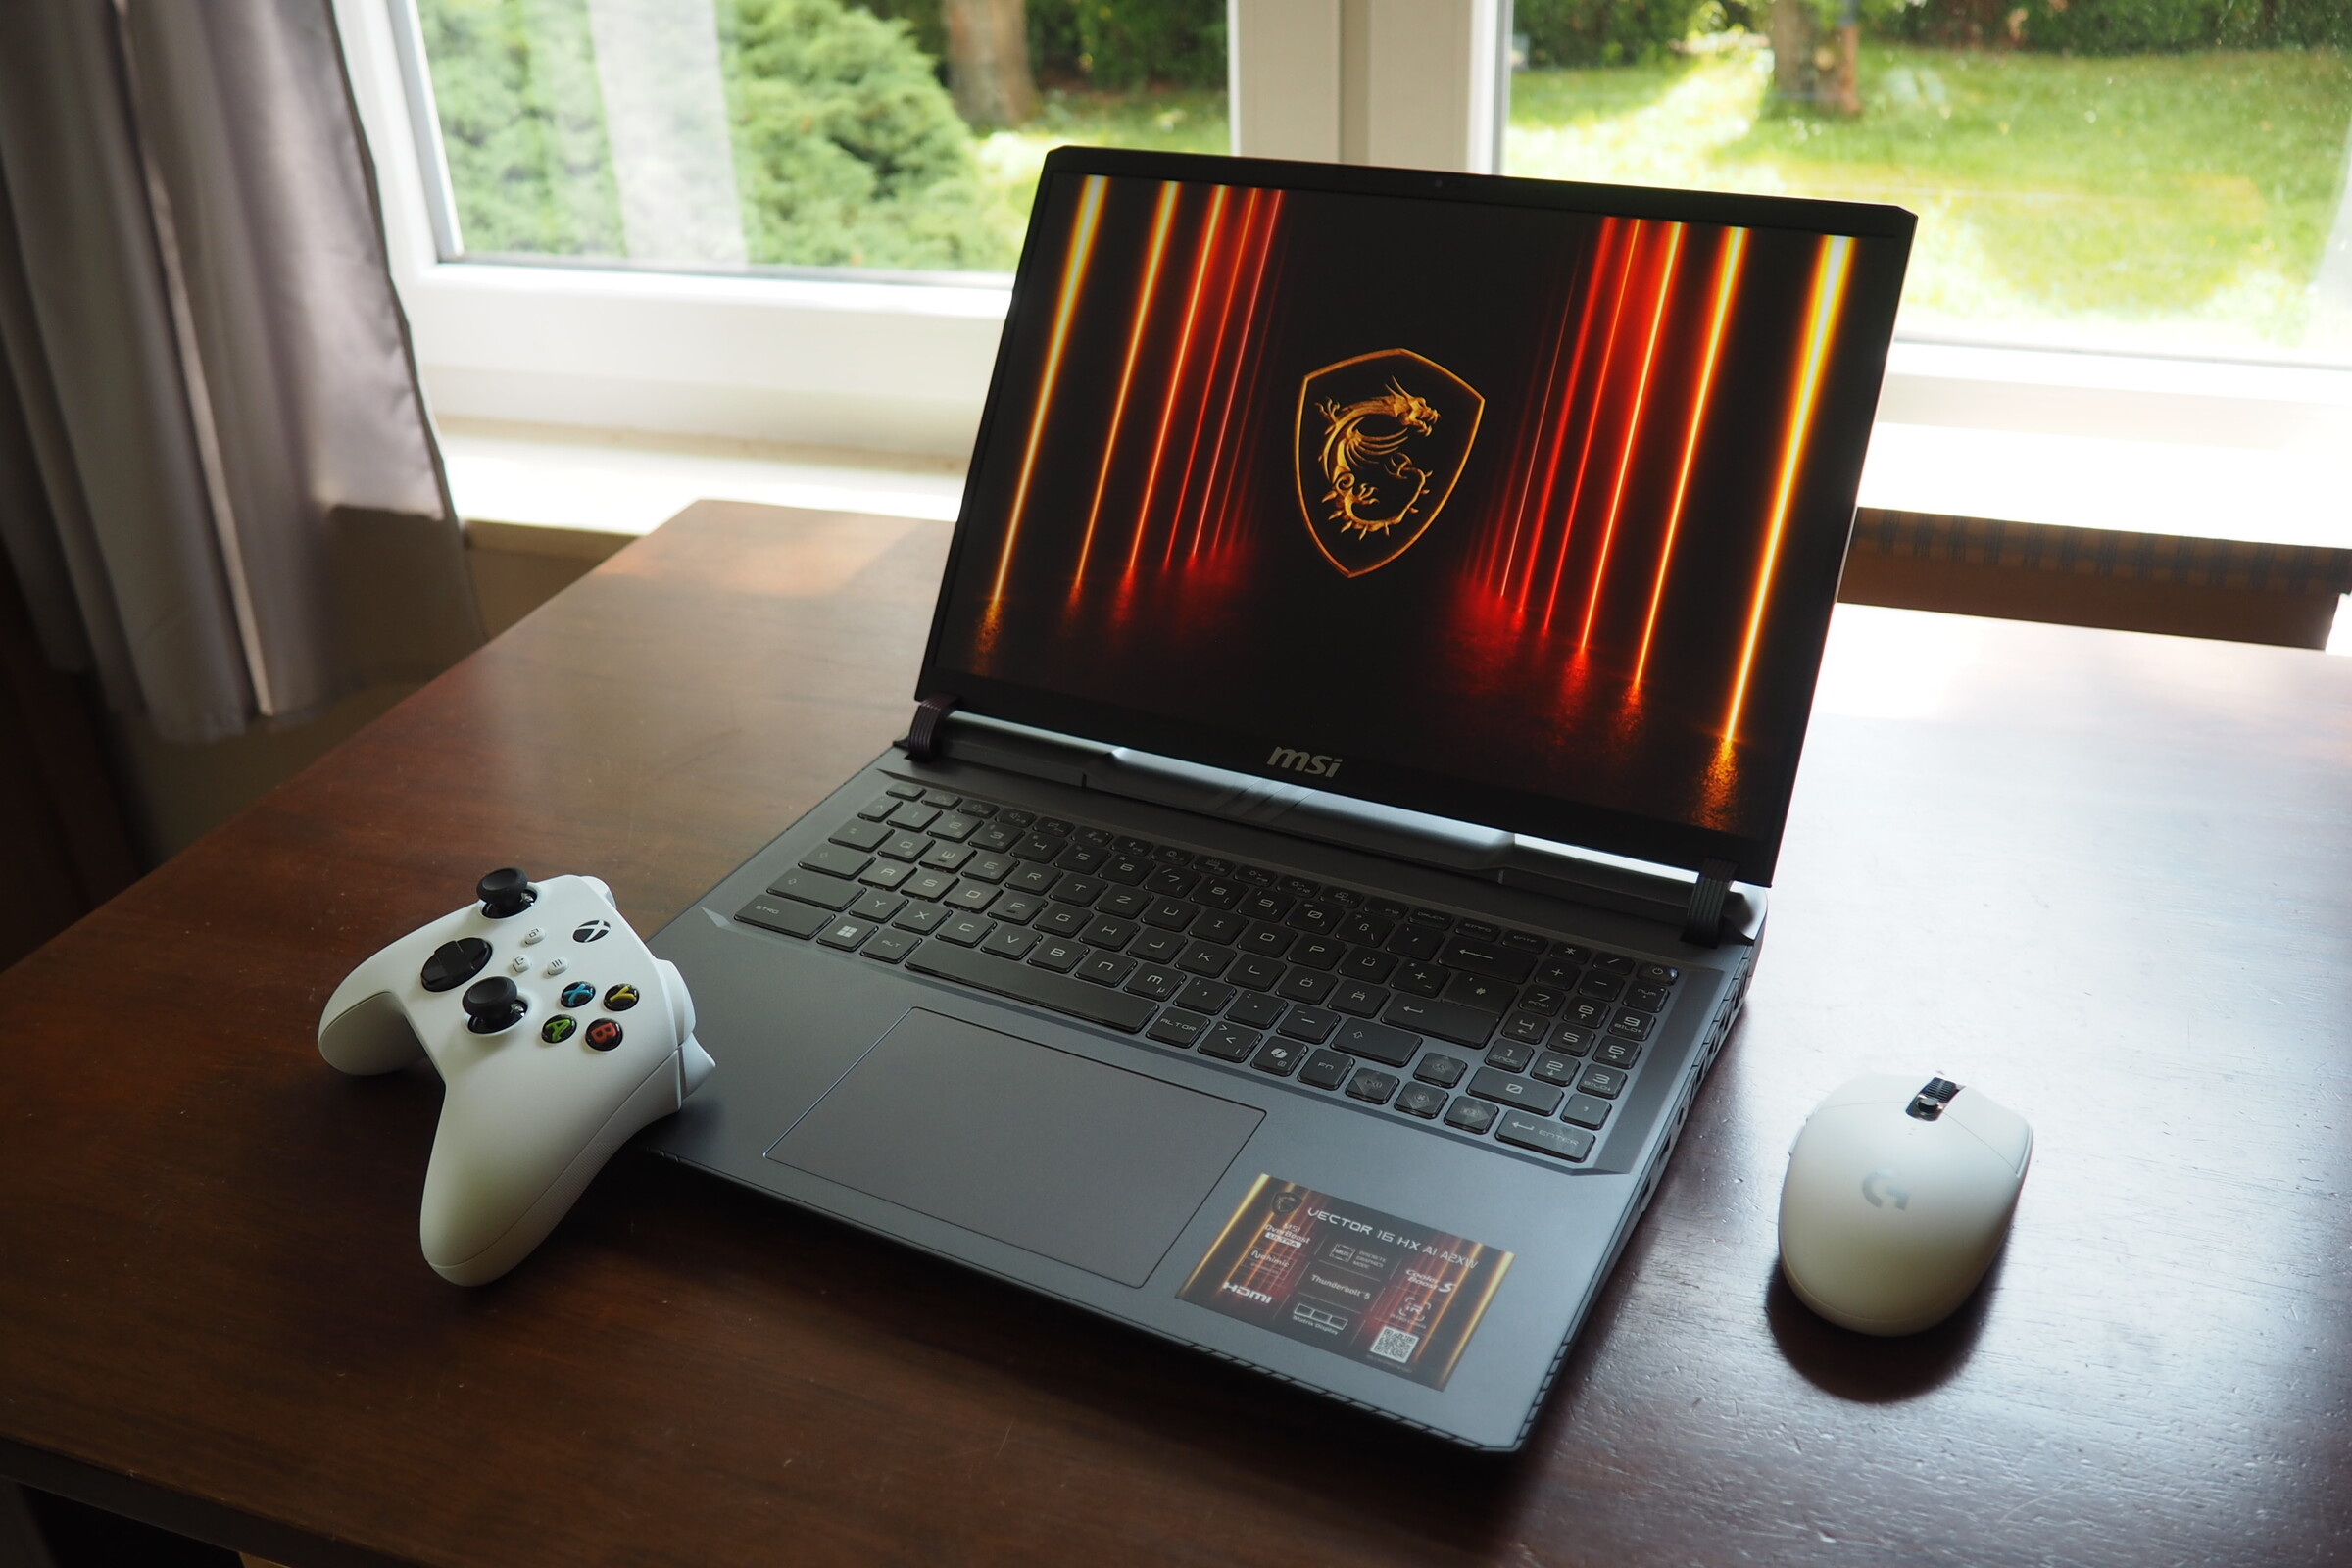
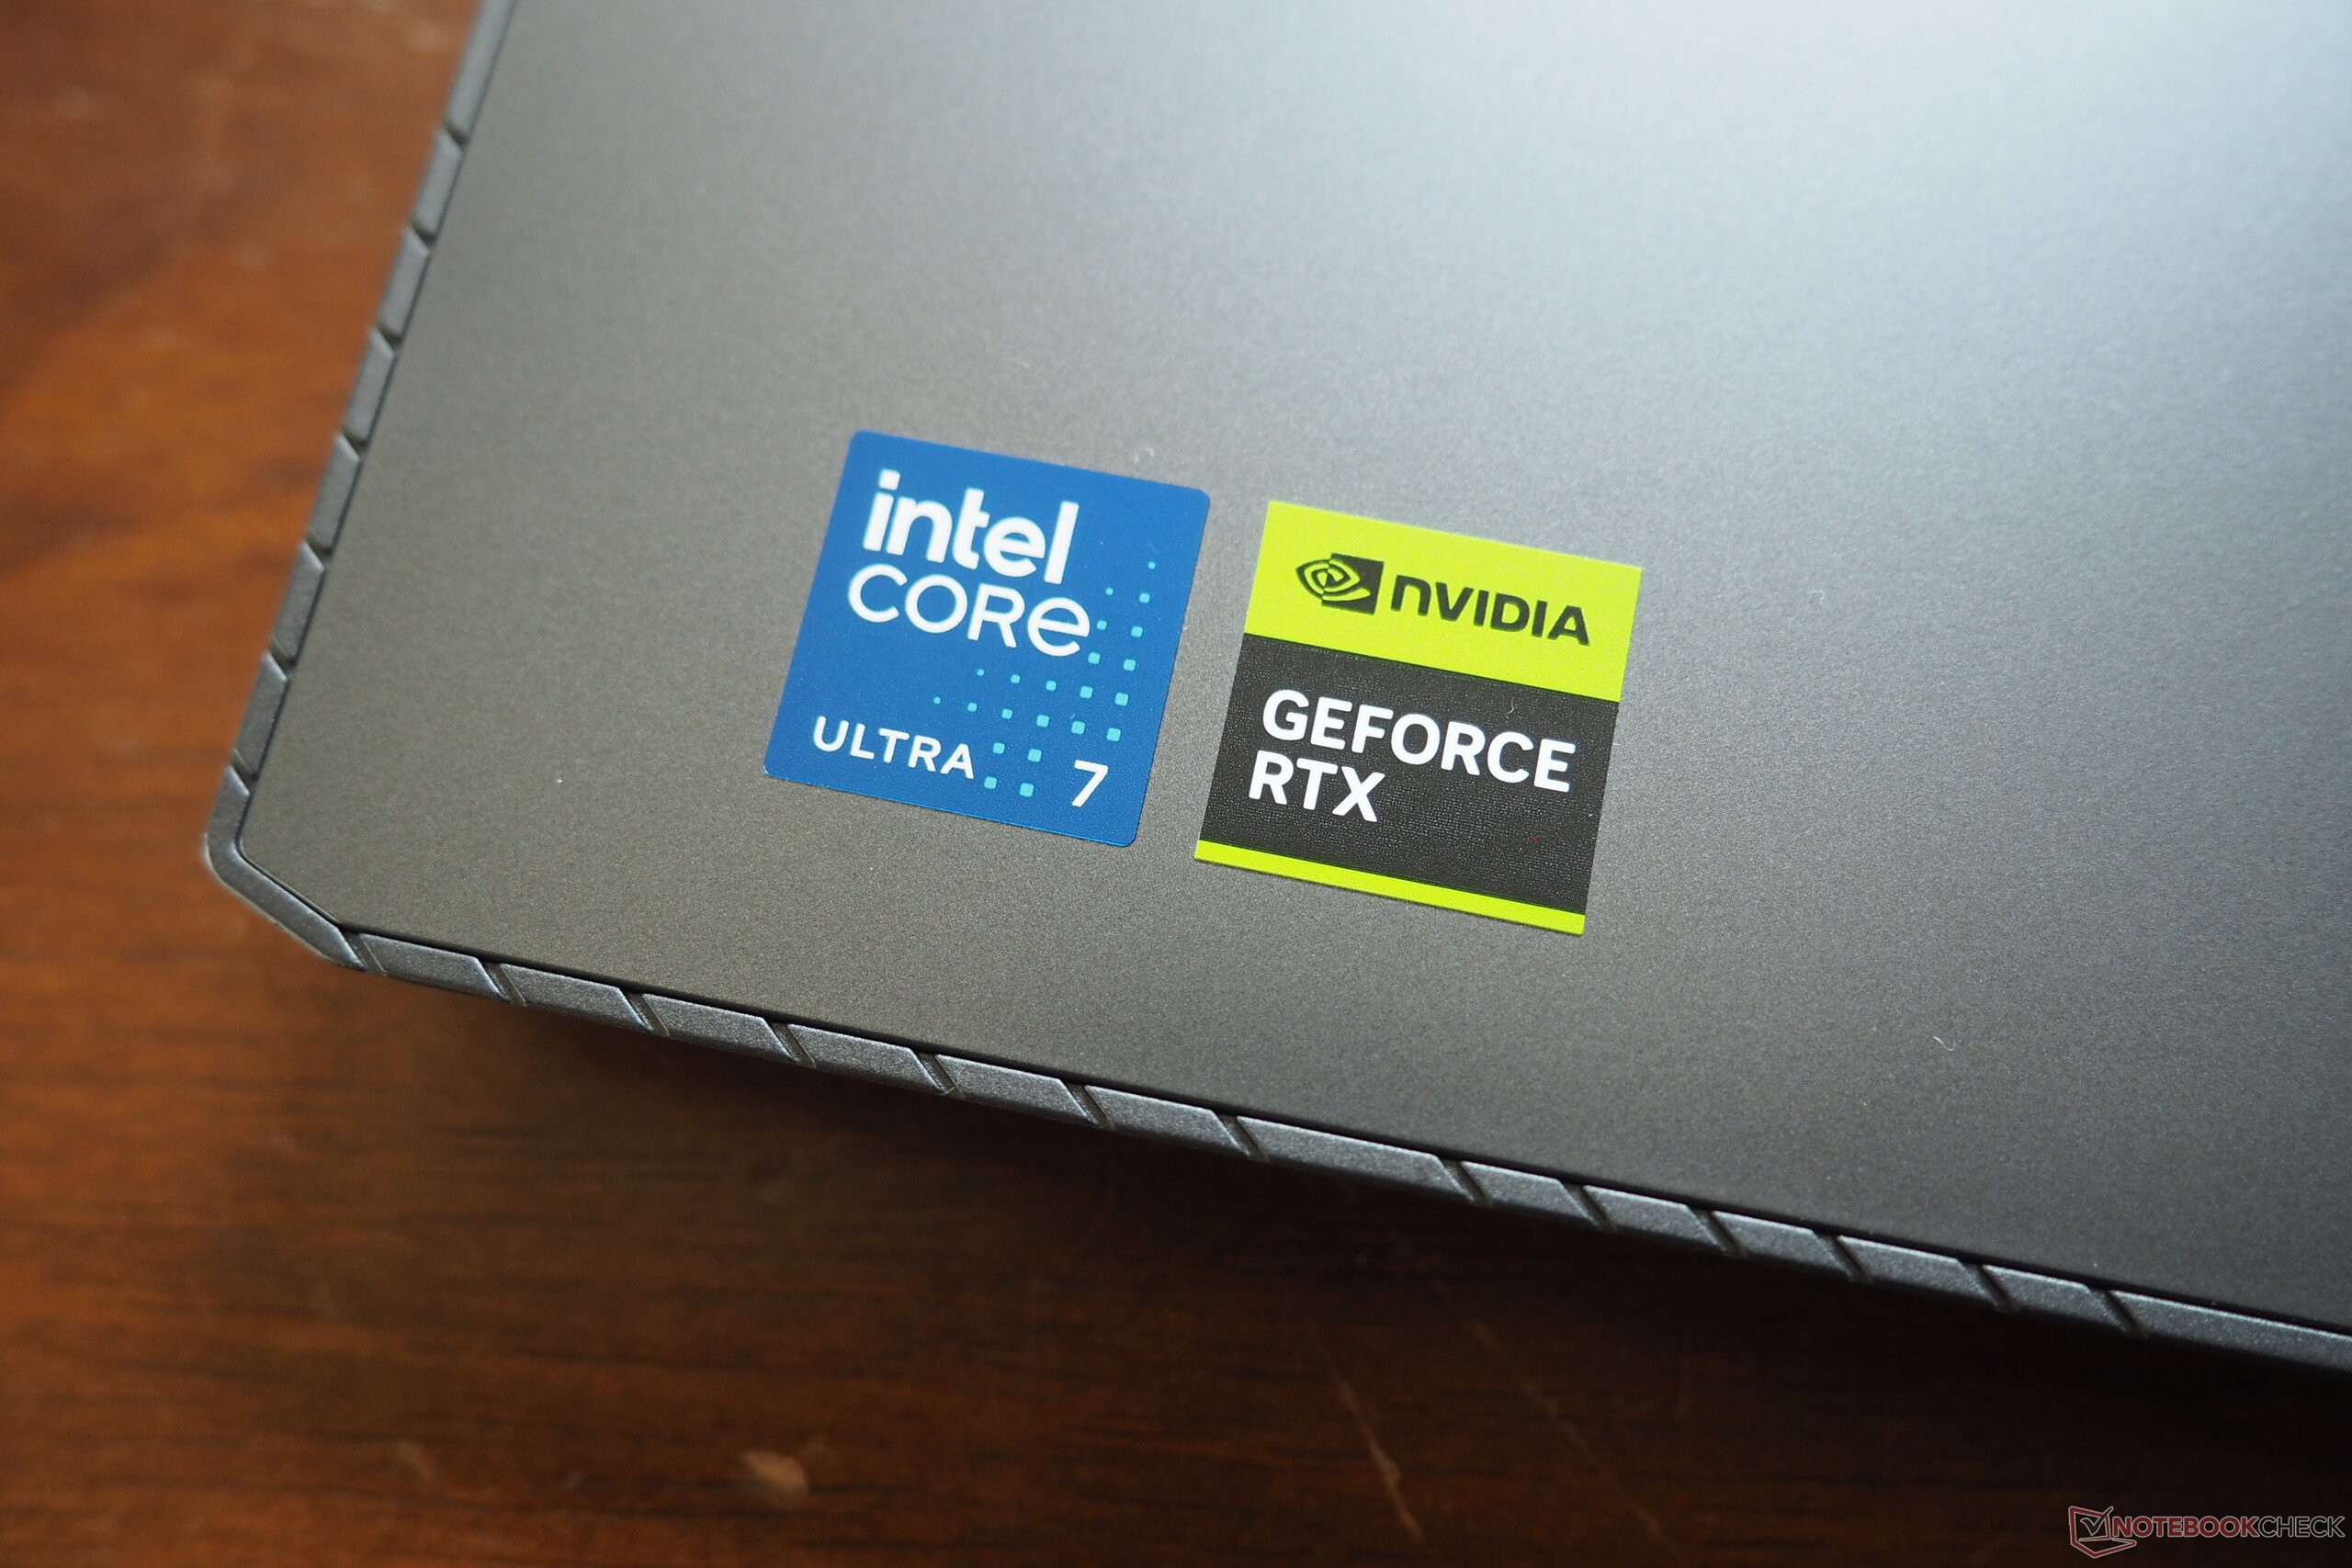
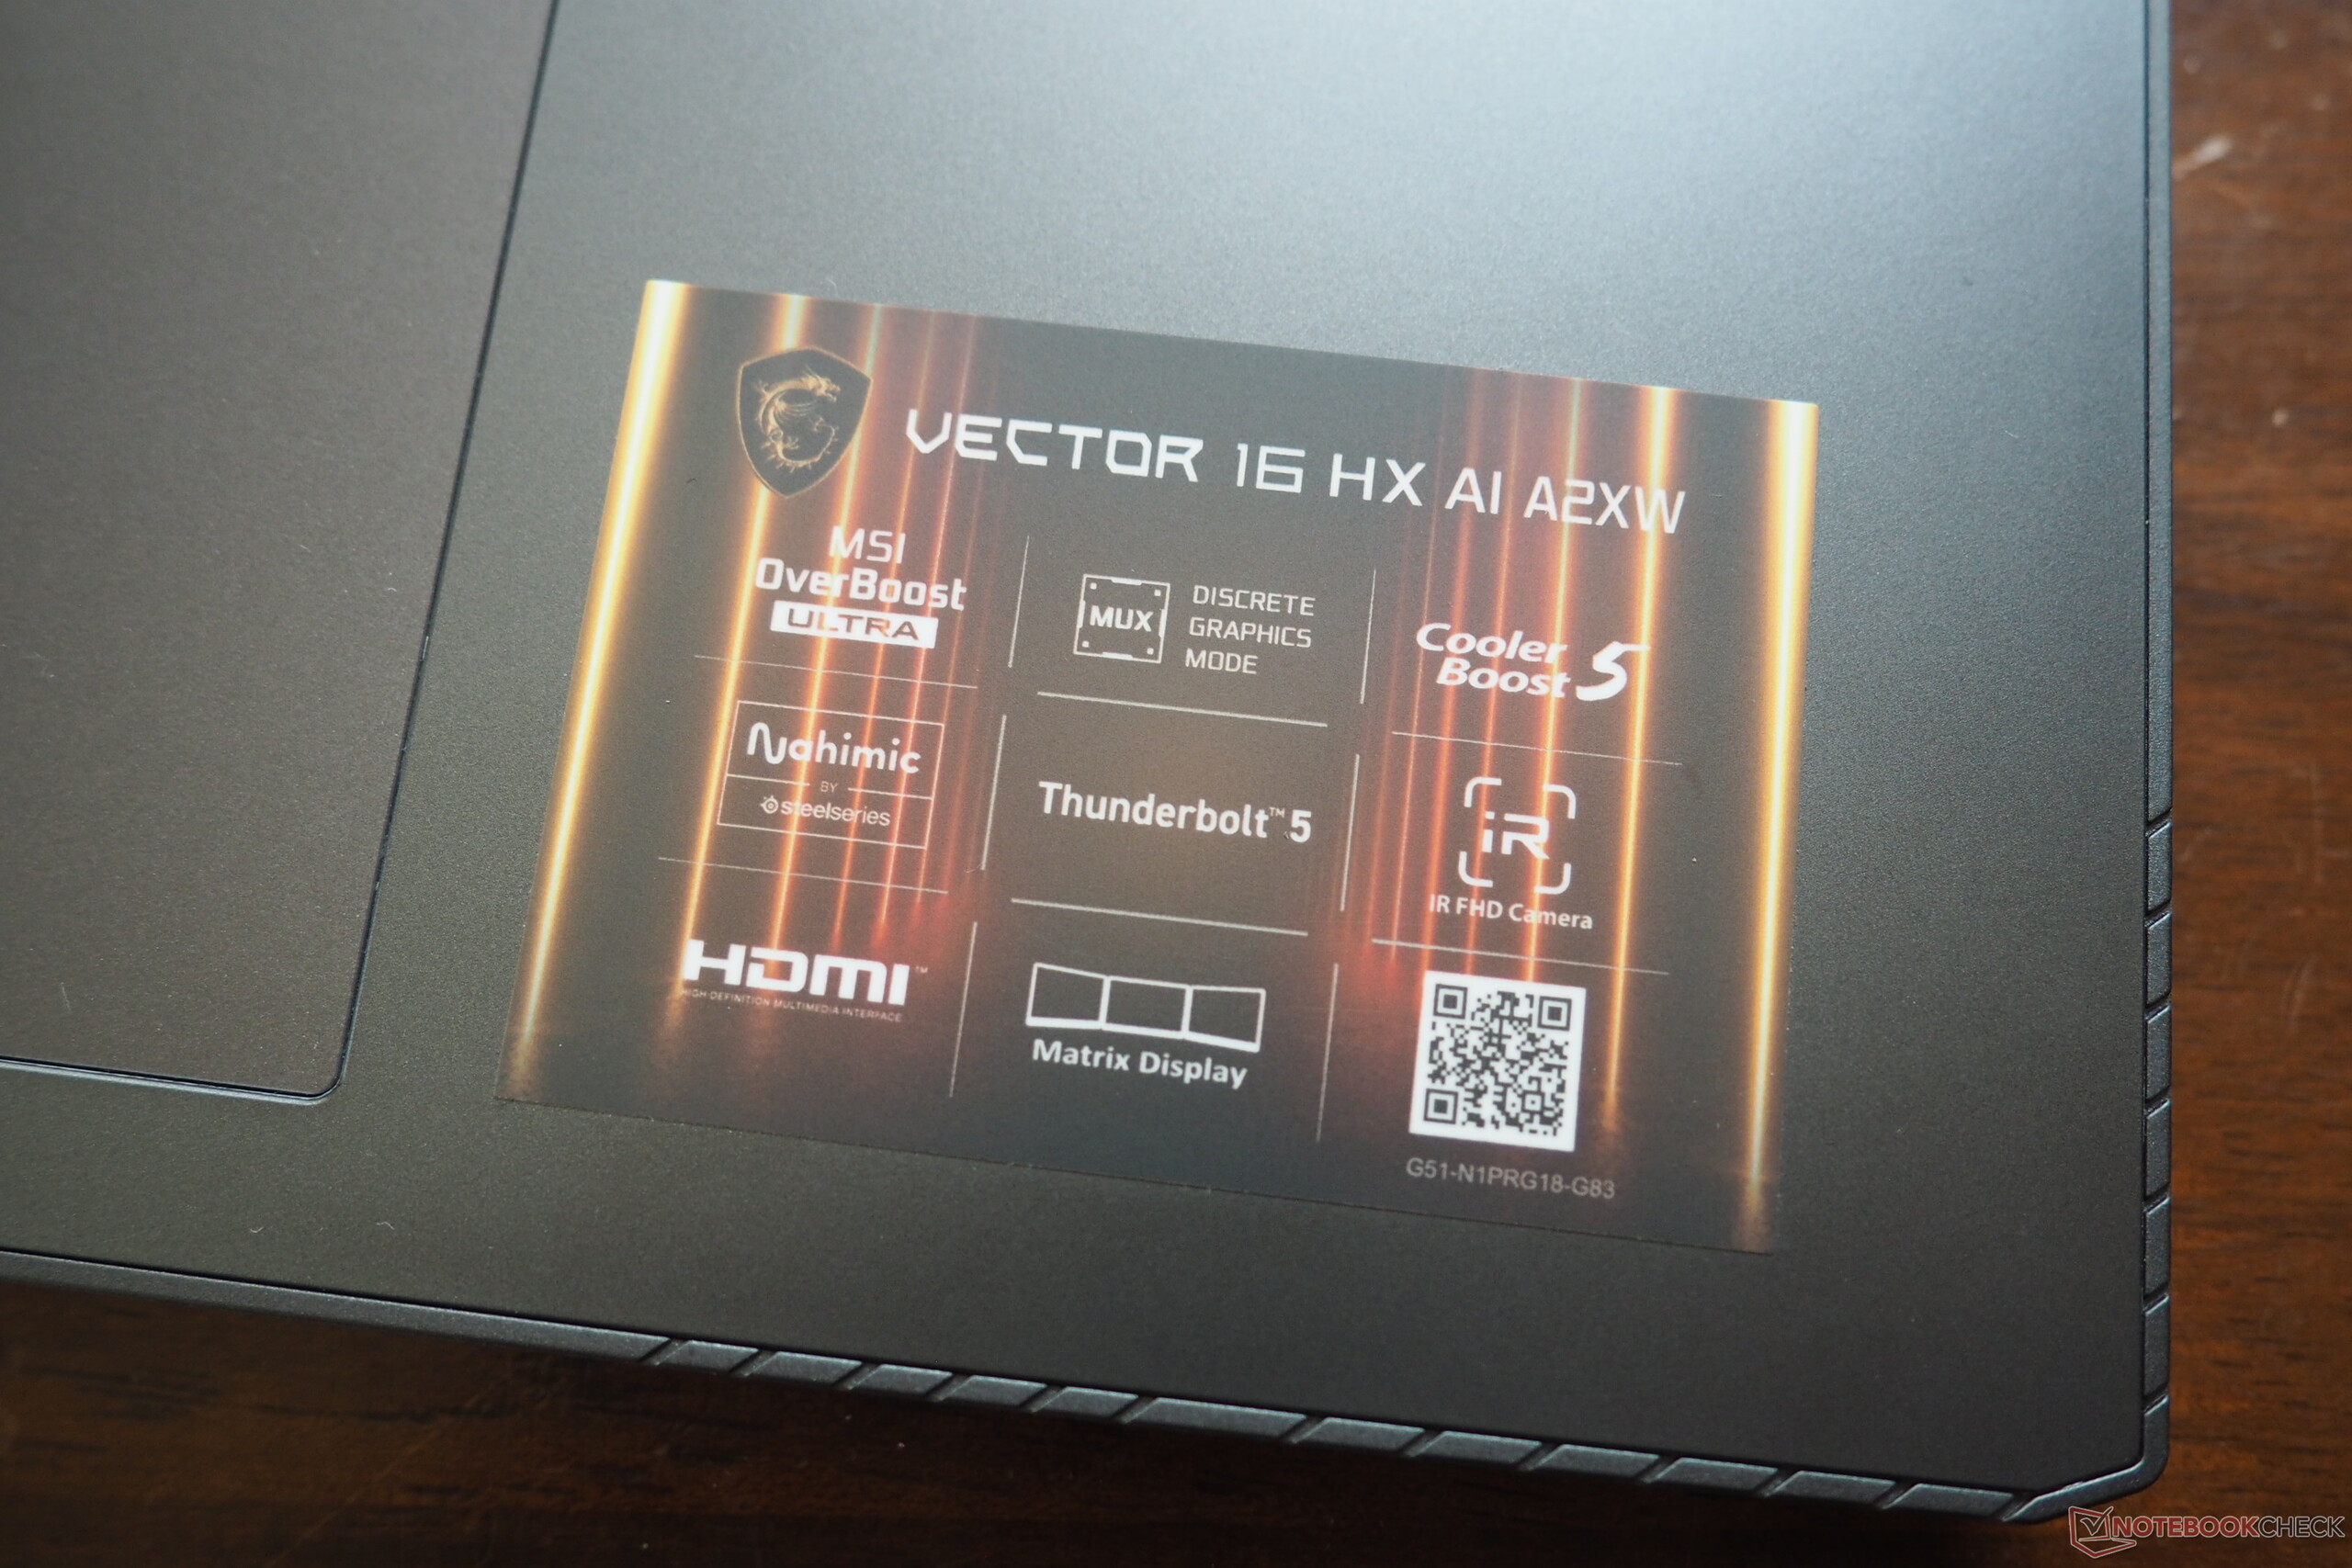
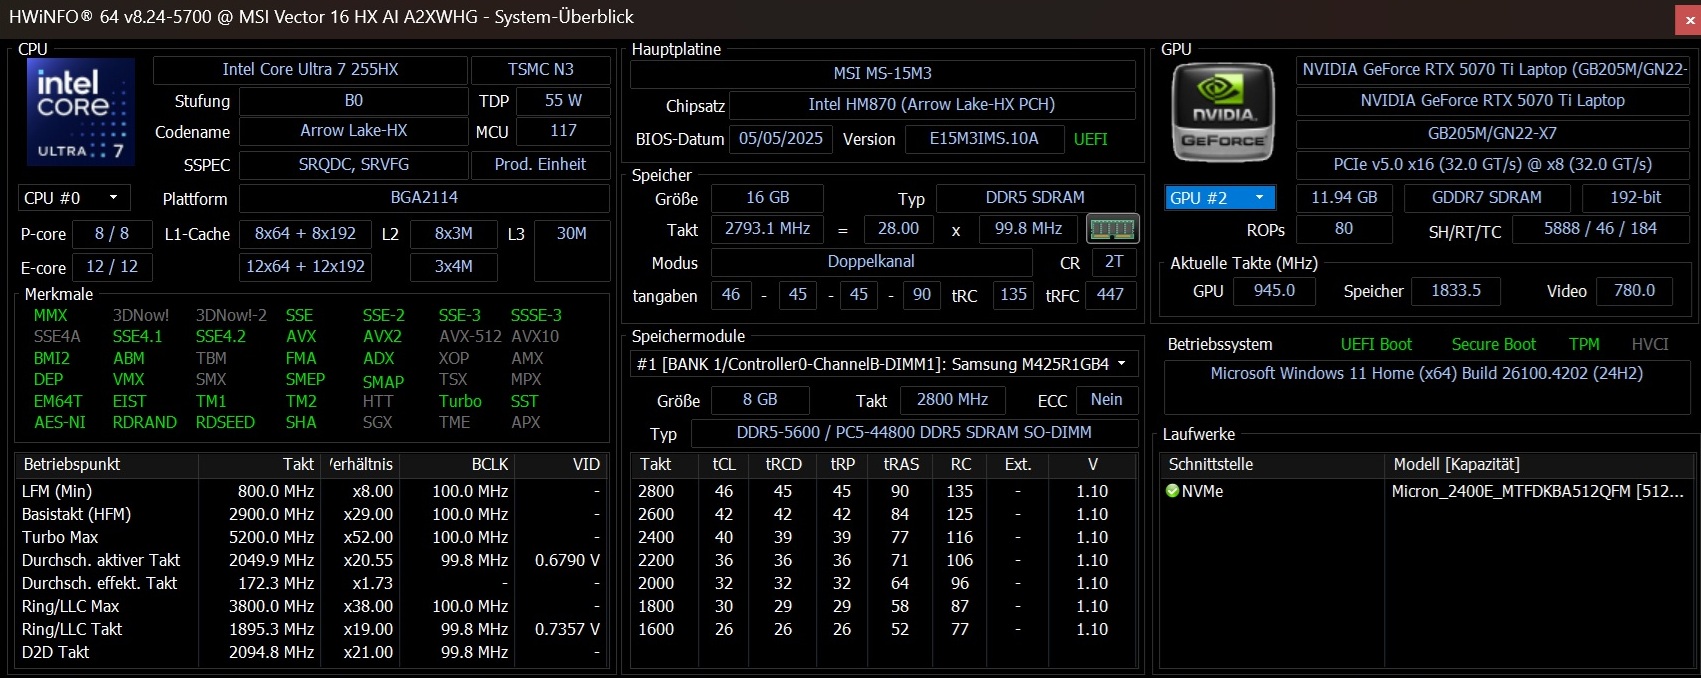
At first glance, MSI scores highly with the Vector 16 HX AI. The tested A2XWHG(074) configuration priced at around €2,000 offers a strong feature set, though the relatively modest 512 GB SSD stands out as a notable limitation. While 16 GB of DDR5-5600 RAM (2x 8 GB SO-DIMM) may not spark wild enthusiasm, the Core Ultra 7 255HX and the GeForce RTX 5070 Ti, with a solid 12 GB of GDDR7 VRAM, promise plenty of gaming power. The IPS display impresses with its sharp 2,560 by 1,600 resolution, smooth 240 hertz refresh rate, and nearly complete coverage of the sRGB and DCI-P3 colour spaces. Among the standout features is the abundant connectivity, featuring two Thunderbolt 5 ports.
When you take a closer look at individual aspects, a number of criticisms emerge. For example, while the chassis is generally well designed, it offers a relatively limited opening angle and a noticeably bulky rear. The keyboard layout, in typical MSI fashion, is also a matter of personal preference. The power supply is particularly hefty in both size and weight, and would be more appropriate for a notebook featuring an RTX 5080 or 5090. What we found most frustrating, however, was the suboptimal fan control. In AI mode, the Vector 16 remains clearly audible even when idle. Taken as a whole, this 16-inch machine still earns a solid overall rating, though it falls just short of a 'Very Good'.
Pros
Cons
Price and availability
The MSI Vector 16 HX AI A2XWHG, equipped with the Core Ultra 7 255HX and GeForce RTX 5070 Ti, is available from various online retailers, with pricing starting at approximately $2,100 USD. Availability may vary by region.
Competitors to the Vector 16 include other newly released gaming laptops in the 16- to 17-inch range, such as the Schenker XMG Pro 16 E25, the Alienware 16 Area-51, and MSI's own Katana 17 HX. The previous model, which we reviewed with a Core i9-14900HX and GeForce RTX 4080, also appears in our comparison tables.
Specifications
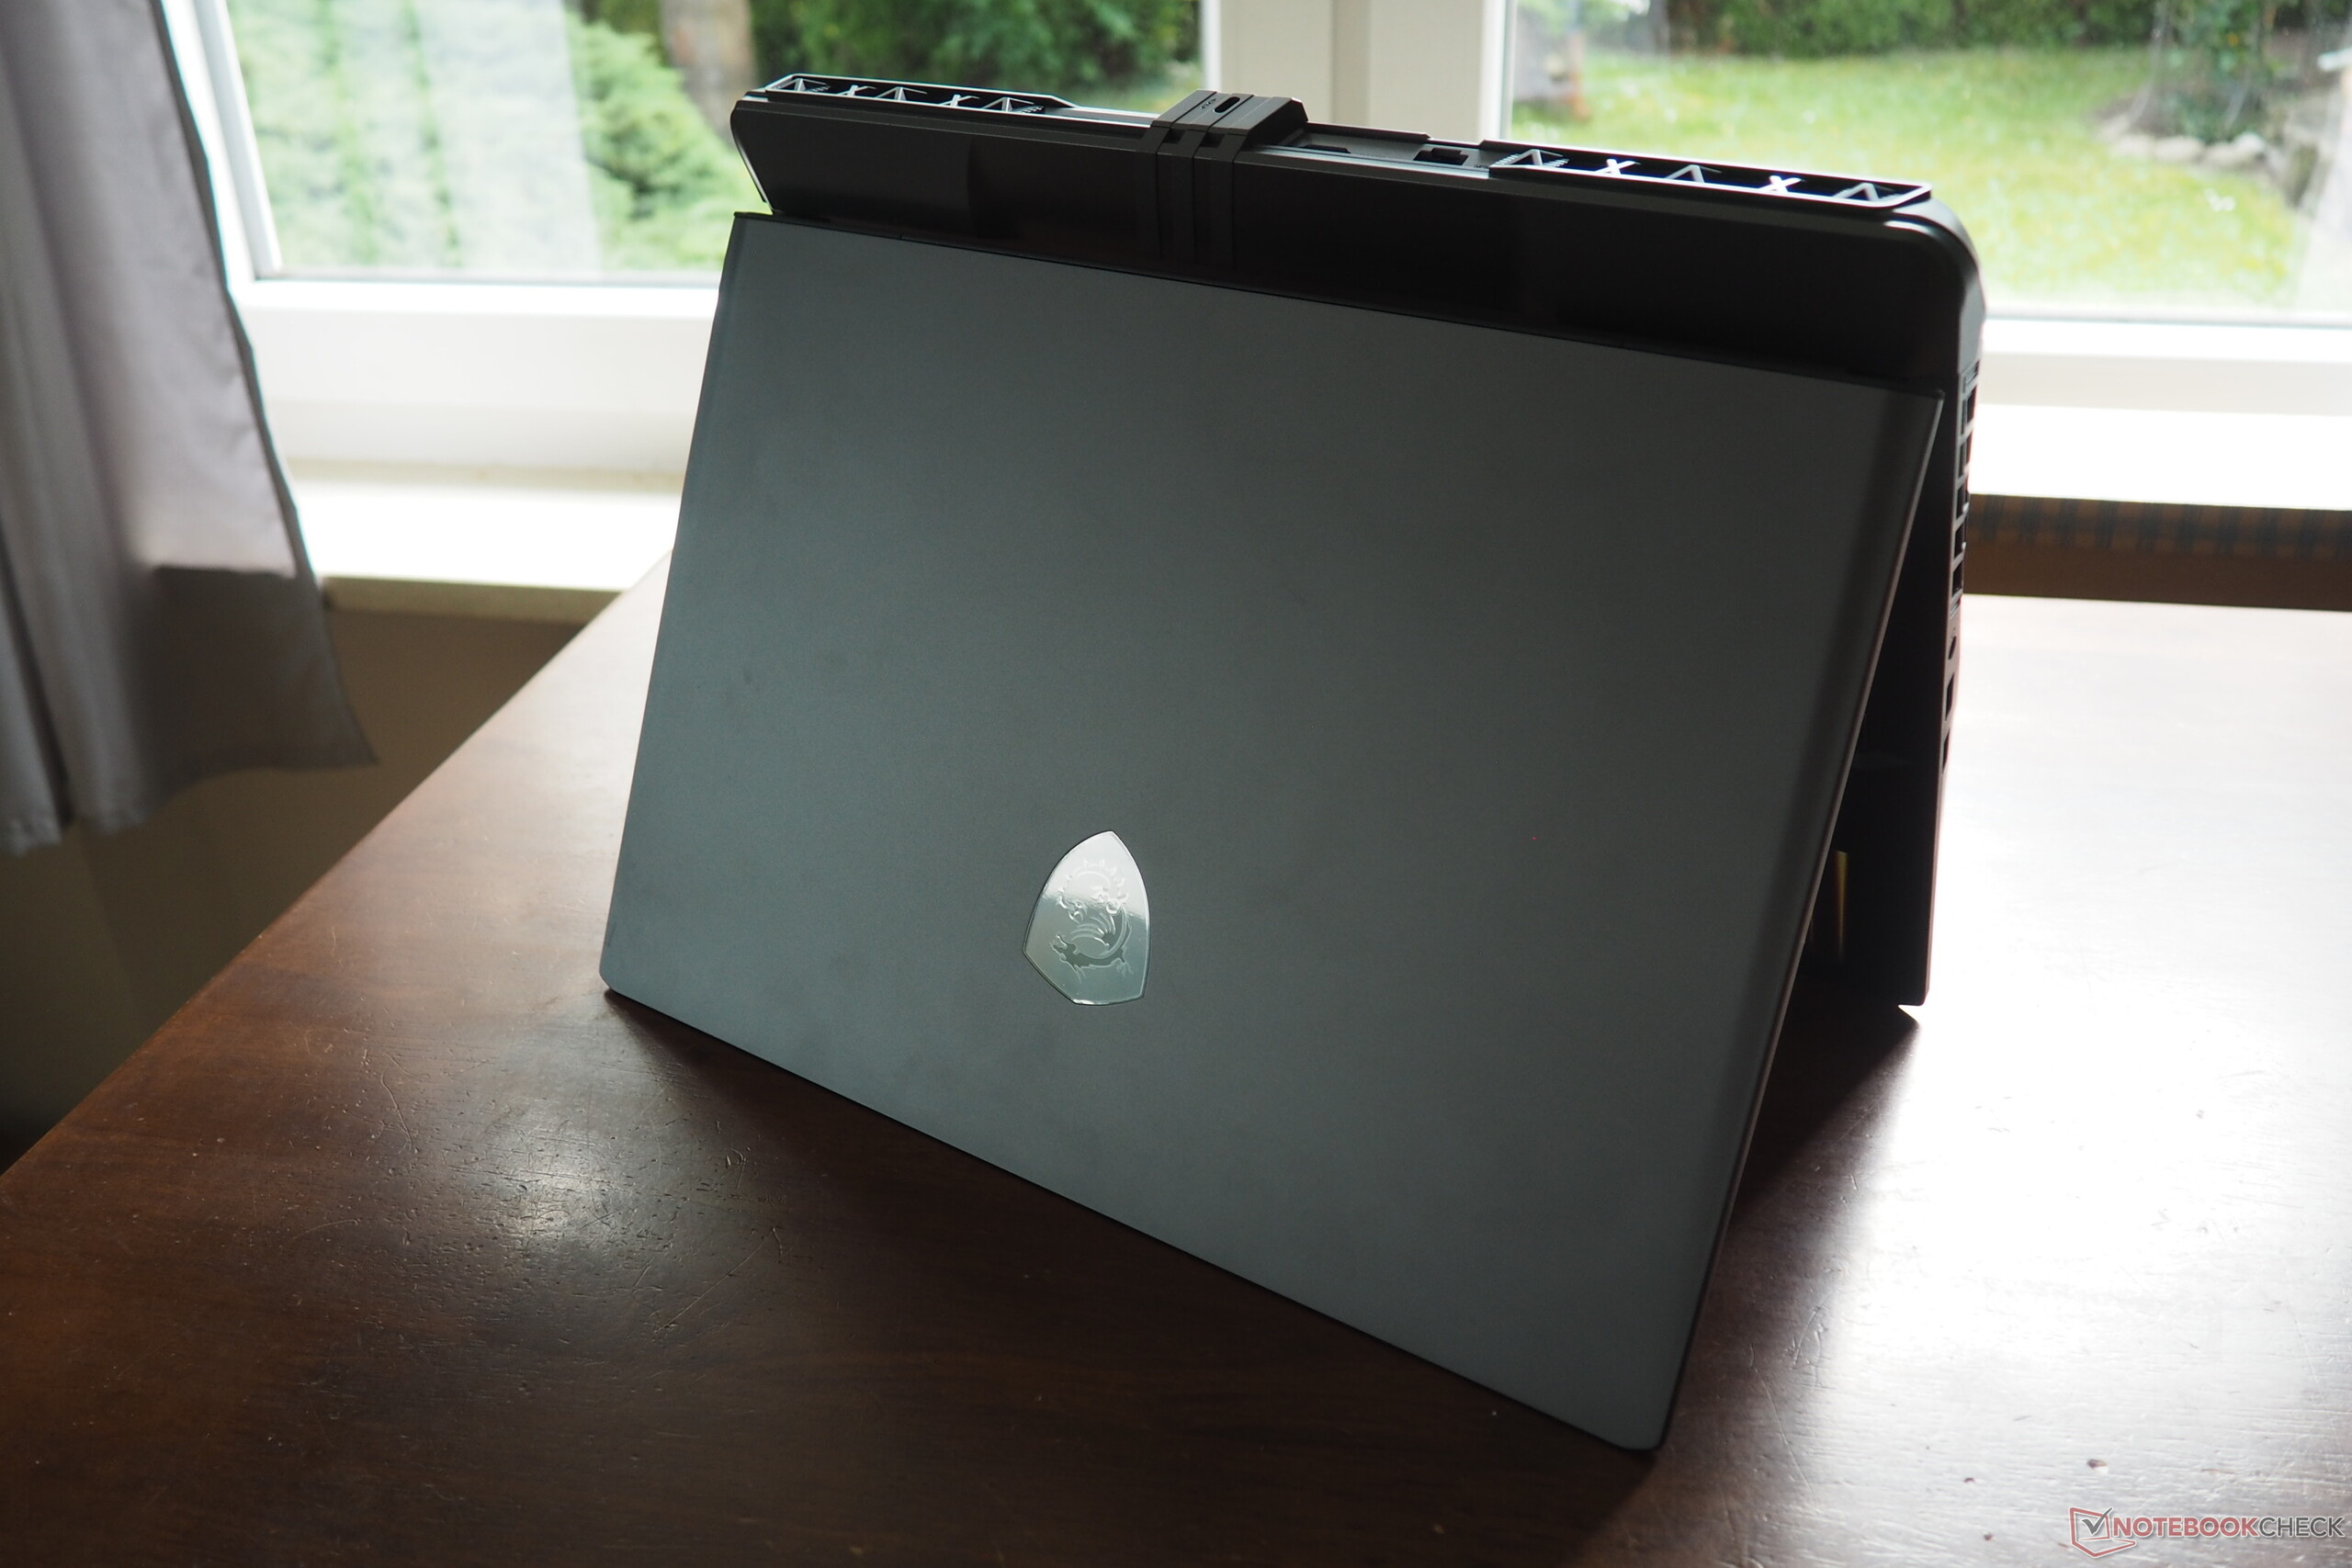
Case
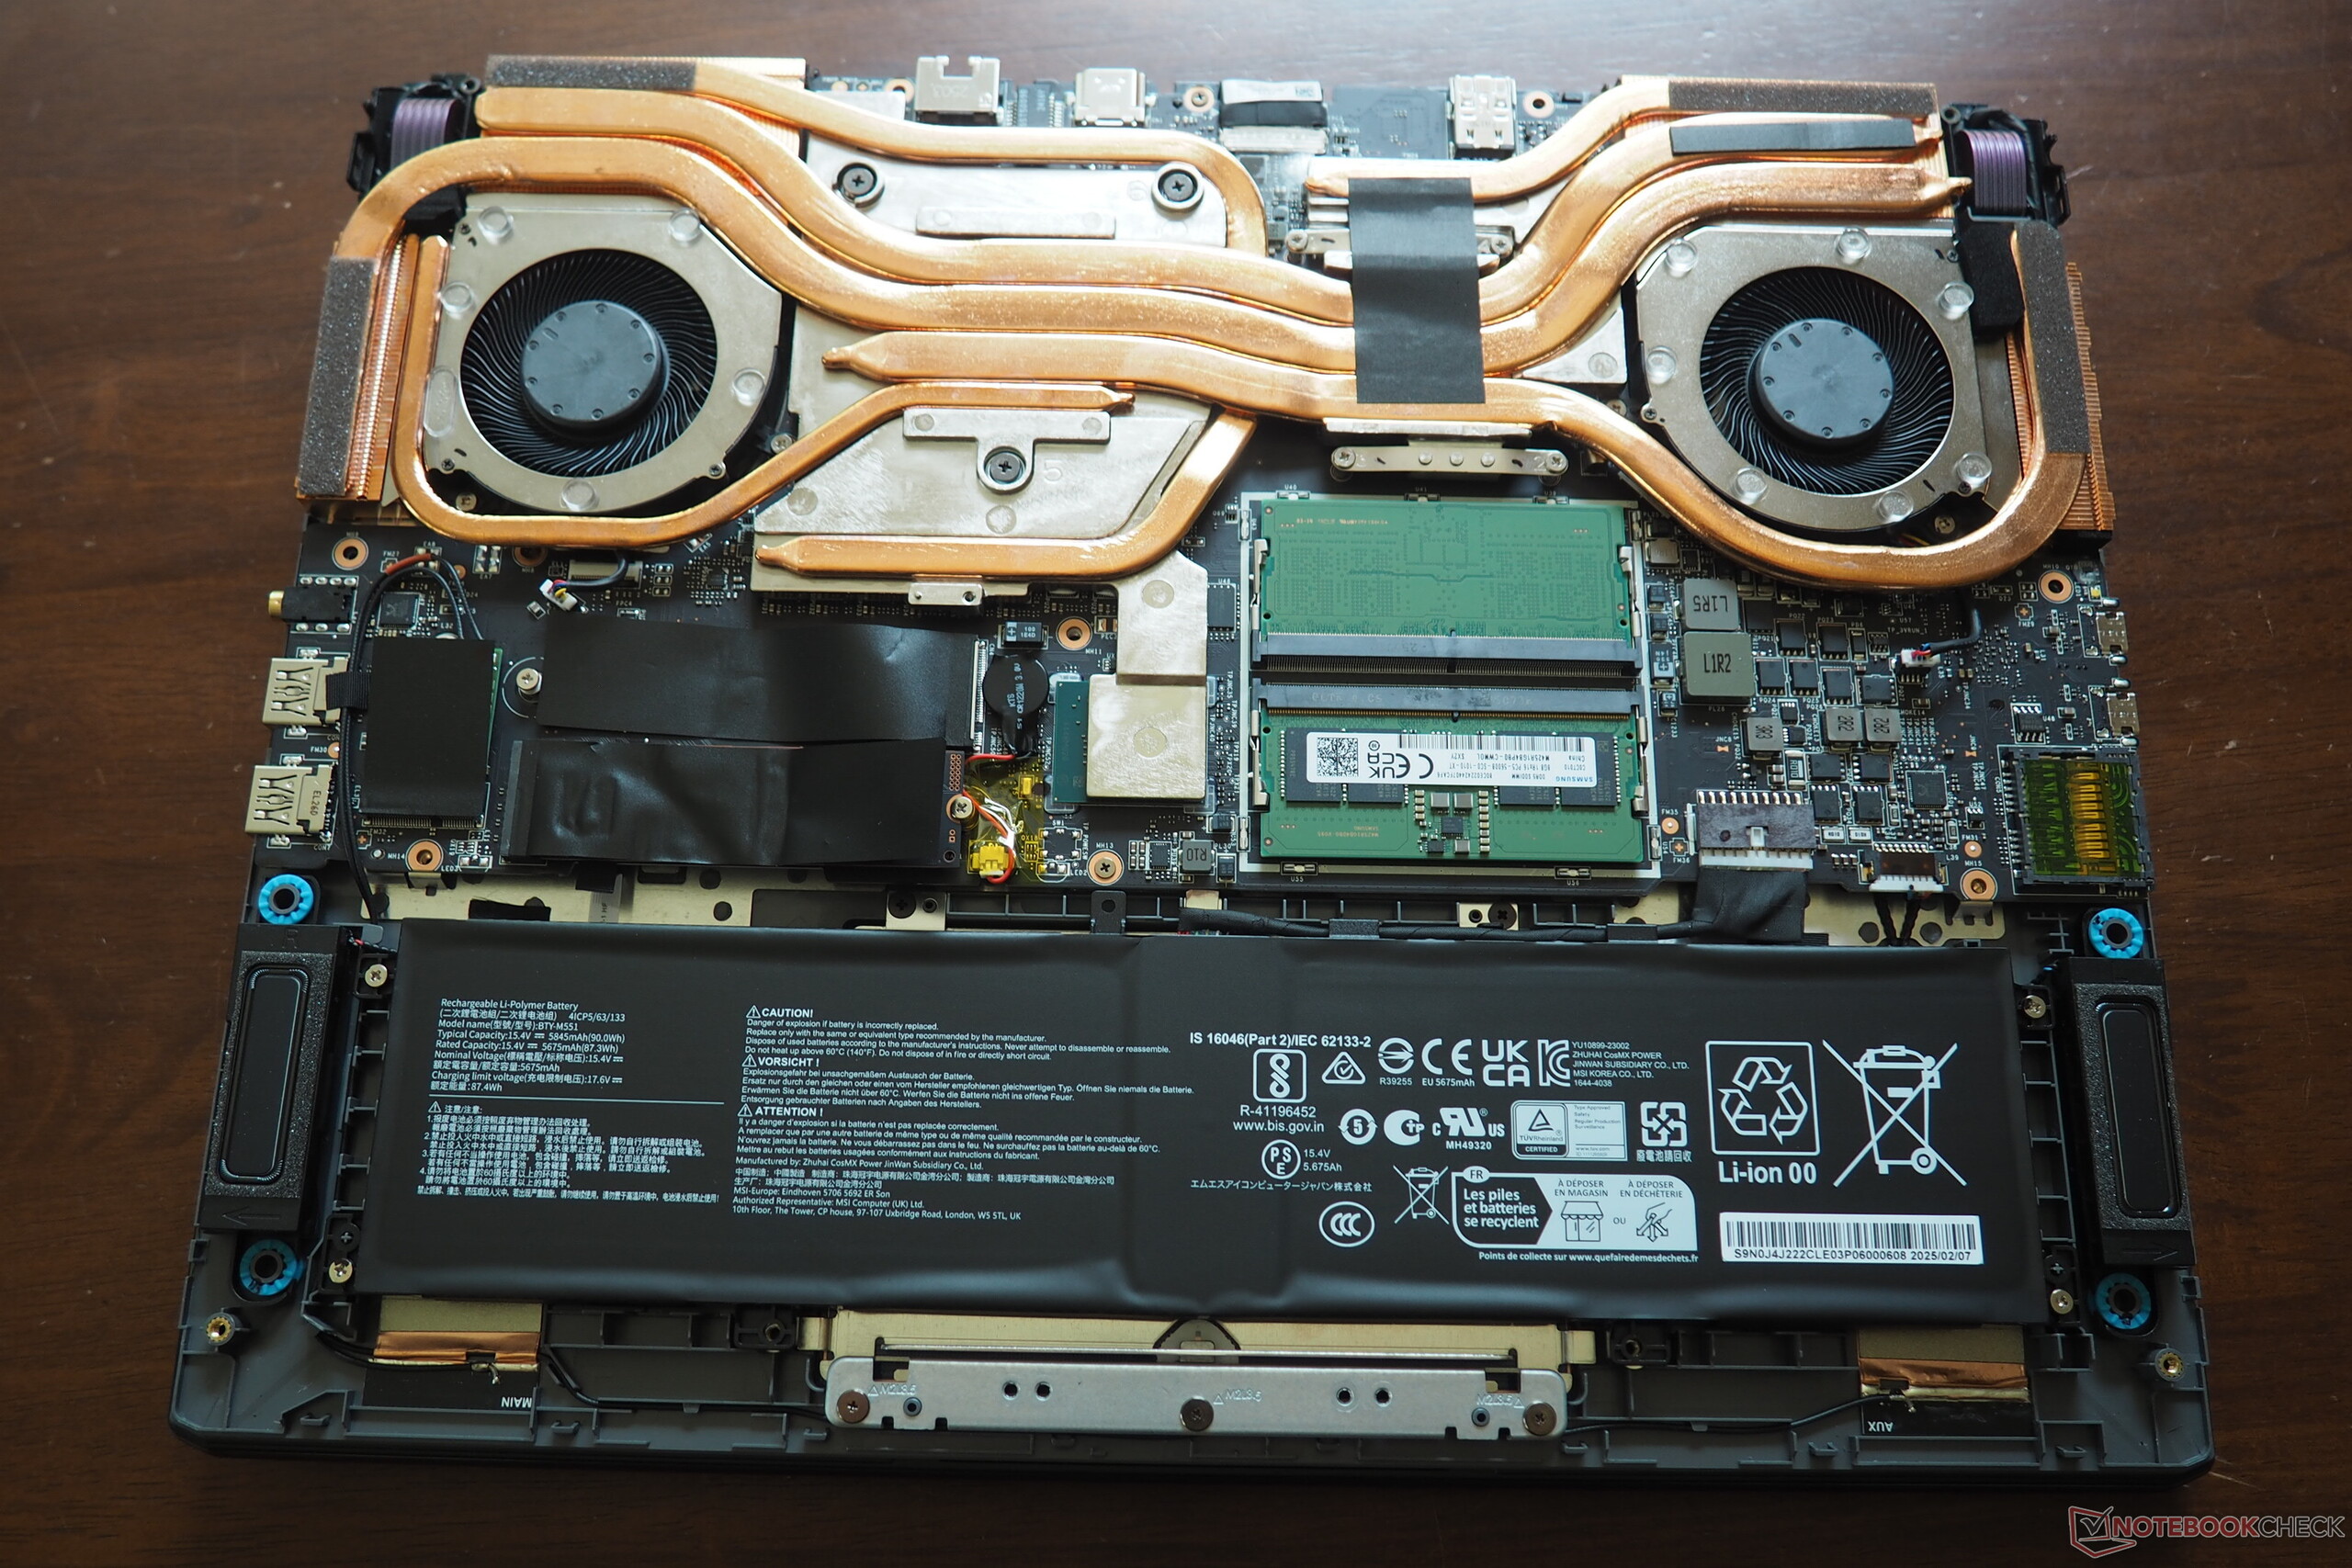
The chassis largely retains the design language of its predecessor, with subtle refinements notably in port selection and layout. In terms of build quality, it delivers a markedly more solid and premium feel compared to the somewhat flimsy and insubstantial Katana 17. While only the lid is made of metal, the base unit still feels solid and well built. The bold lines and striking shapes clearly target a gaming audience. At 2.6 kg, the Vector 16 HX AI sits squarely among other 16-inch competitors, with only the Alienware 16 standing out due to its hefty 3.3-kg frame. Overall, build quality leaves little room for complaint.

Connectivity and features
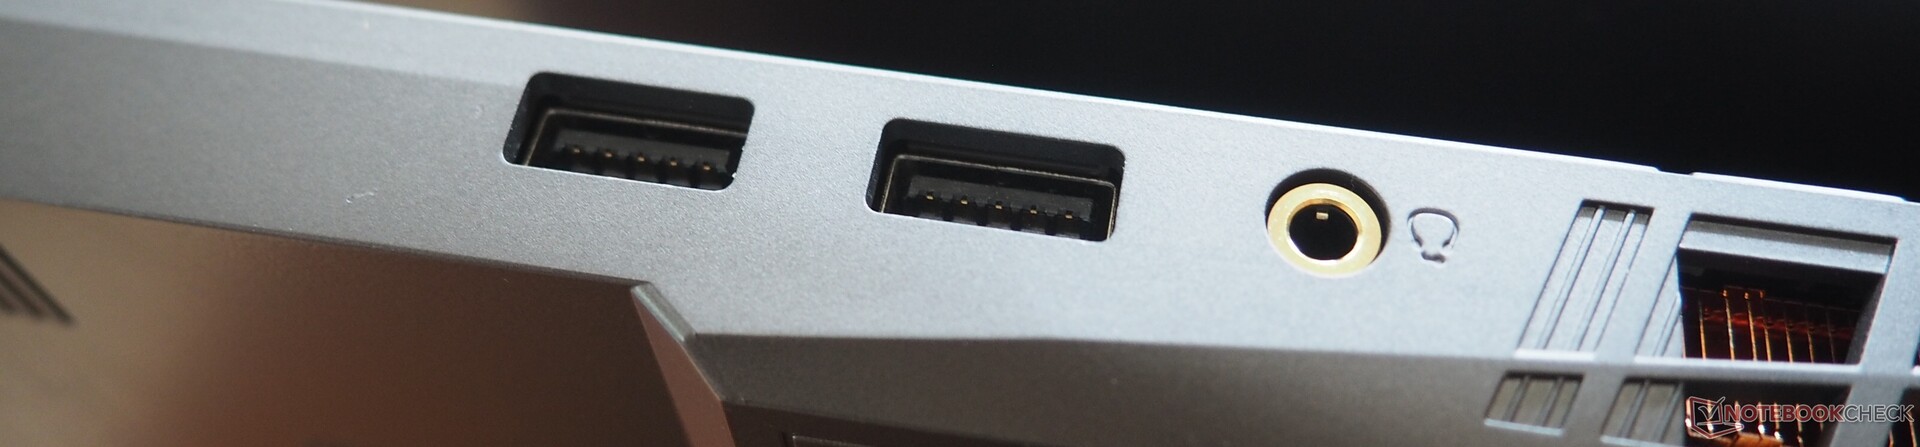
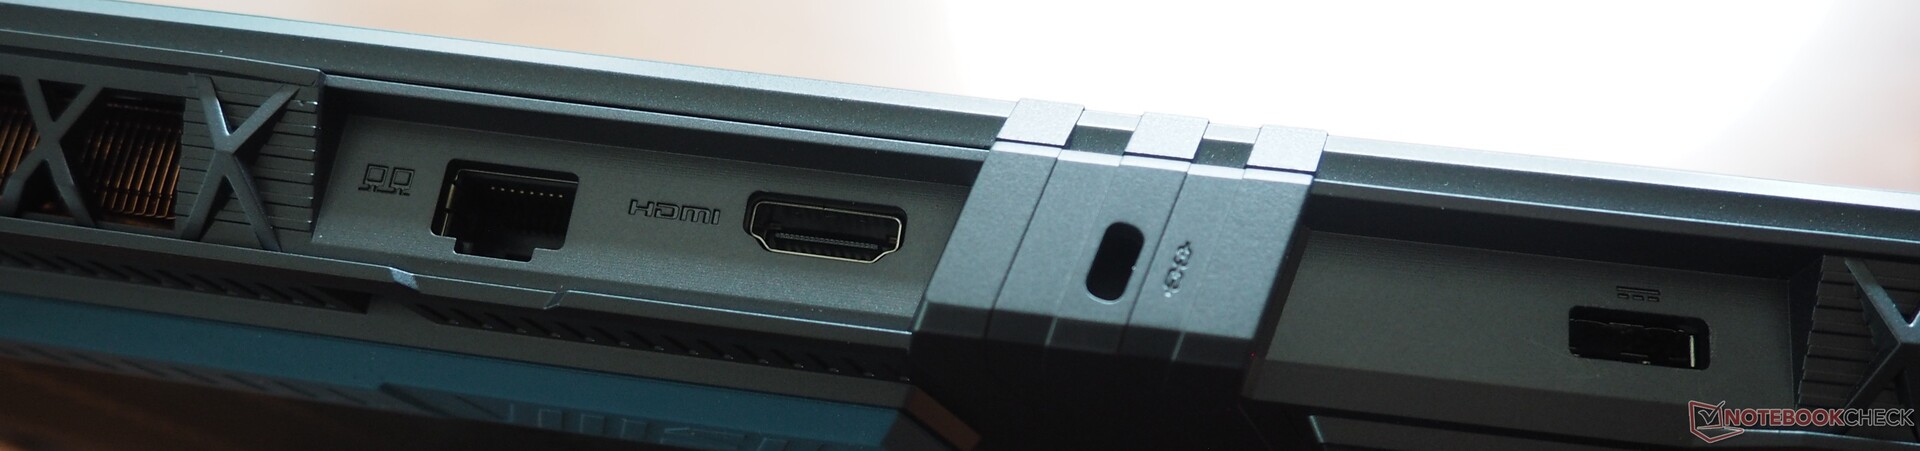
MSI goes all out when it comes to connectivity. On the left-hand side, there are two Thunderbolt 5 ports with Power Delivery, USB 4, and DisplayPort 2.1 support. The right-hand side hosts two USB-A 3.1 Gen2 ports. The selection is rounded off with an HDMI 2.1 output, a 2.5 Gbit Ethernet port, a combined audio jack, a Kensington lock slot, and a moderately fast card reader. Wireless communication is handled by Intel's Wi-Fi 6E module (AX211), which delivers particularly strong performance when receiving data. The Full HD webcam is decent by notebook standards, though not especially impressive. Maintenance remains somewhat awkward, much like with the previous model, as the chassis is more difficult and time-consuming to open compared to other devices.

SD Card Reader
| SD Card Reader | |
| average JPG Copy Test (av. of 3 runs) | |
| Alienware 16 Area-51 (Toshiba Exceria Pro SDXC 64 GB UHS-II) | |
| Schenker XMG Pro 16 (E25) (Angelbird AV Pro V60) | |
| Average of class Gaming (20.9 - 210, n=54, last 2 years) | |
| MSI Vector 16 HX A14V (Toshiba Exceria Pro SDXC 64 GB UHS-II) | |
| MSI Vector 16 HX AI A2XWHG (AV PRO microSD 128 GB V60) | |
| maximum AS SSD Seq Read Test (1GB) | |
| Schenker XMG Pro 16 (E25) (Angelbird AV Pro V60) | |
| Alienware 16 Area-51 (Toshiba Exceria Pro SDXC 64 GB UHS-II) | |
| Average of class Gaming (25.5 - 261, n=51, last 2 years) | |
| MSI Vector 16 HX A14V (Toshiba Exceria Pro SDXC 64 GB UHS-II) | |
| MSI Vector 16 HX AI A2XWHG (AV PRO microSD 128 GB V60) | |
Communication
Webcam


Maintenance
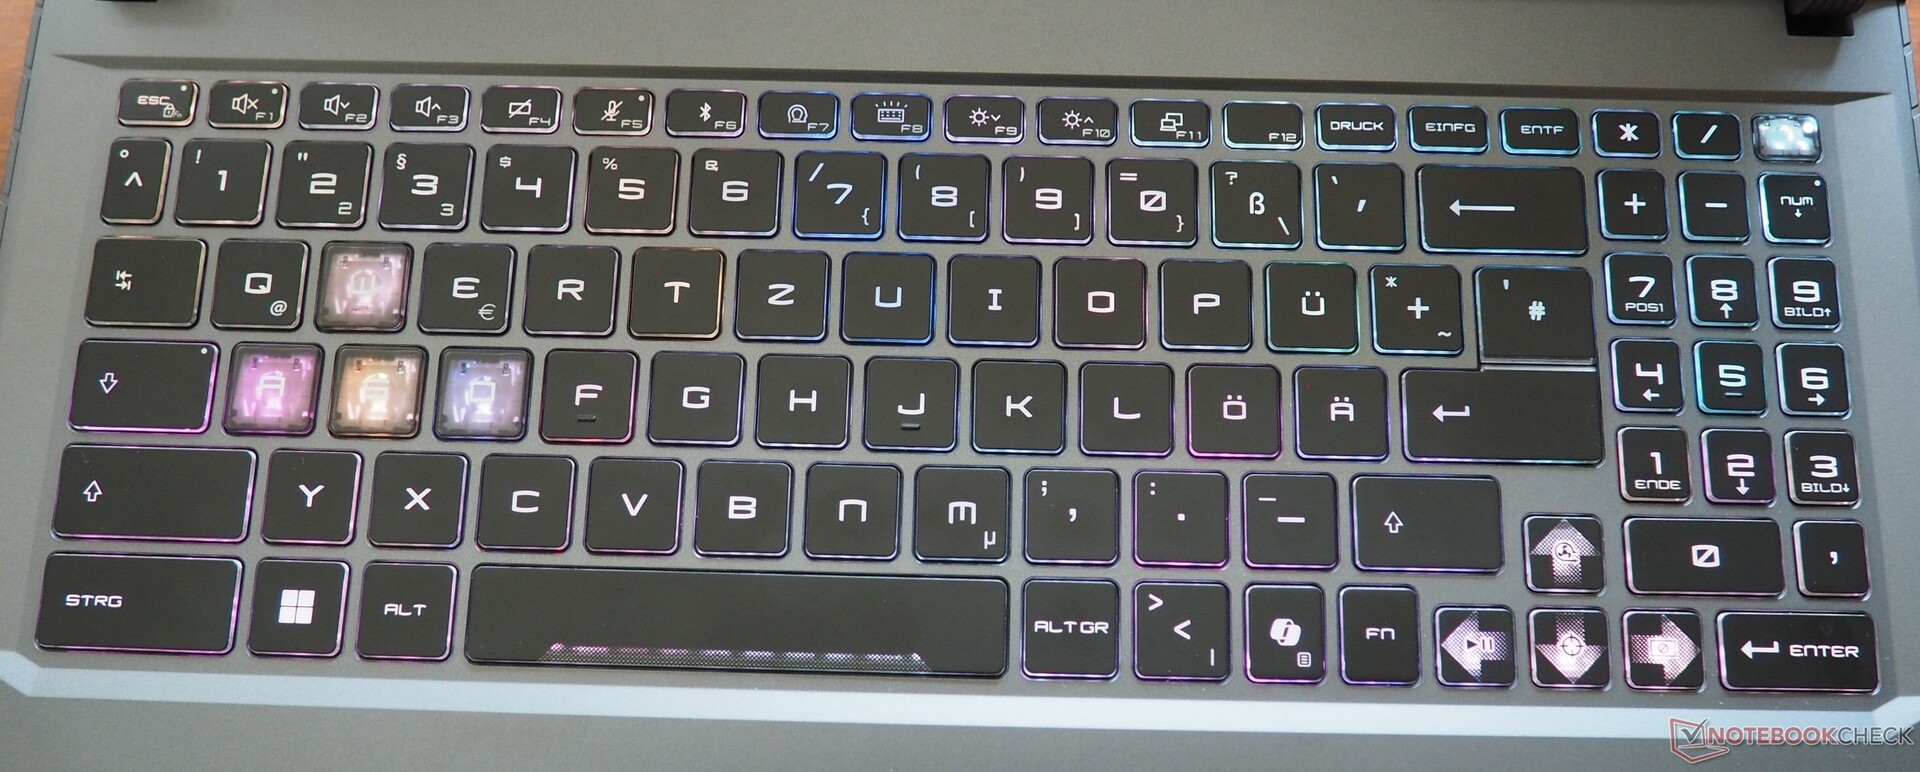
Input devices
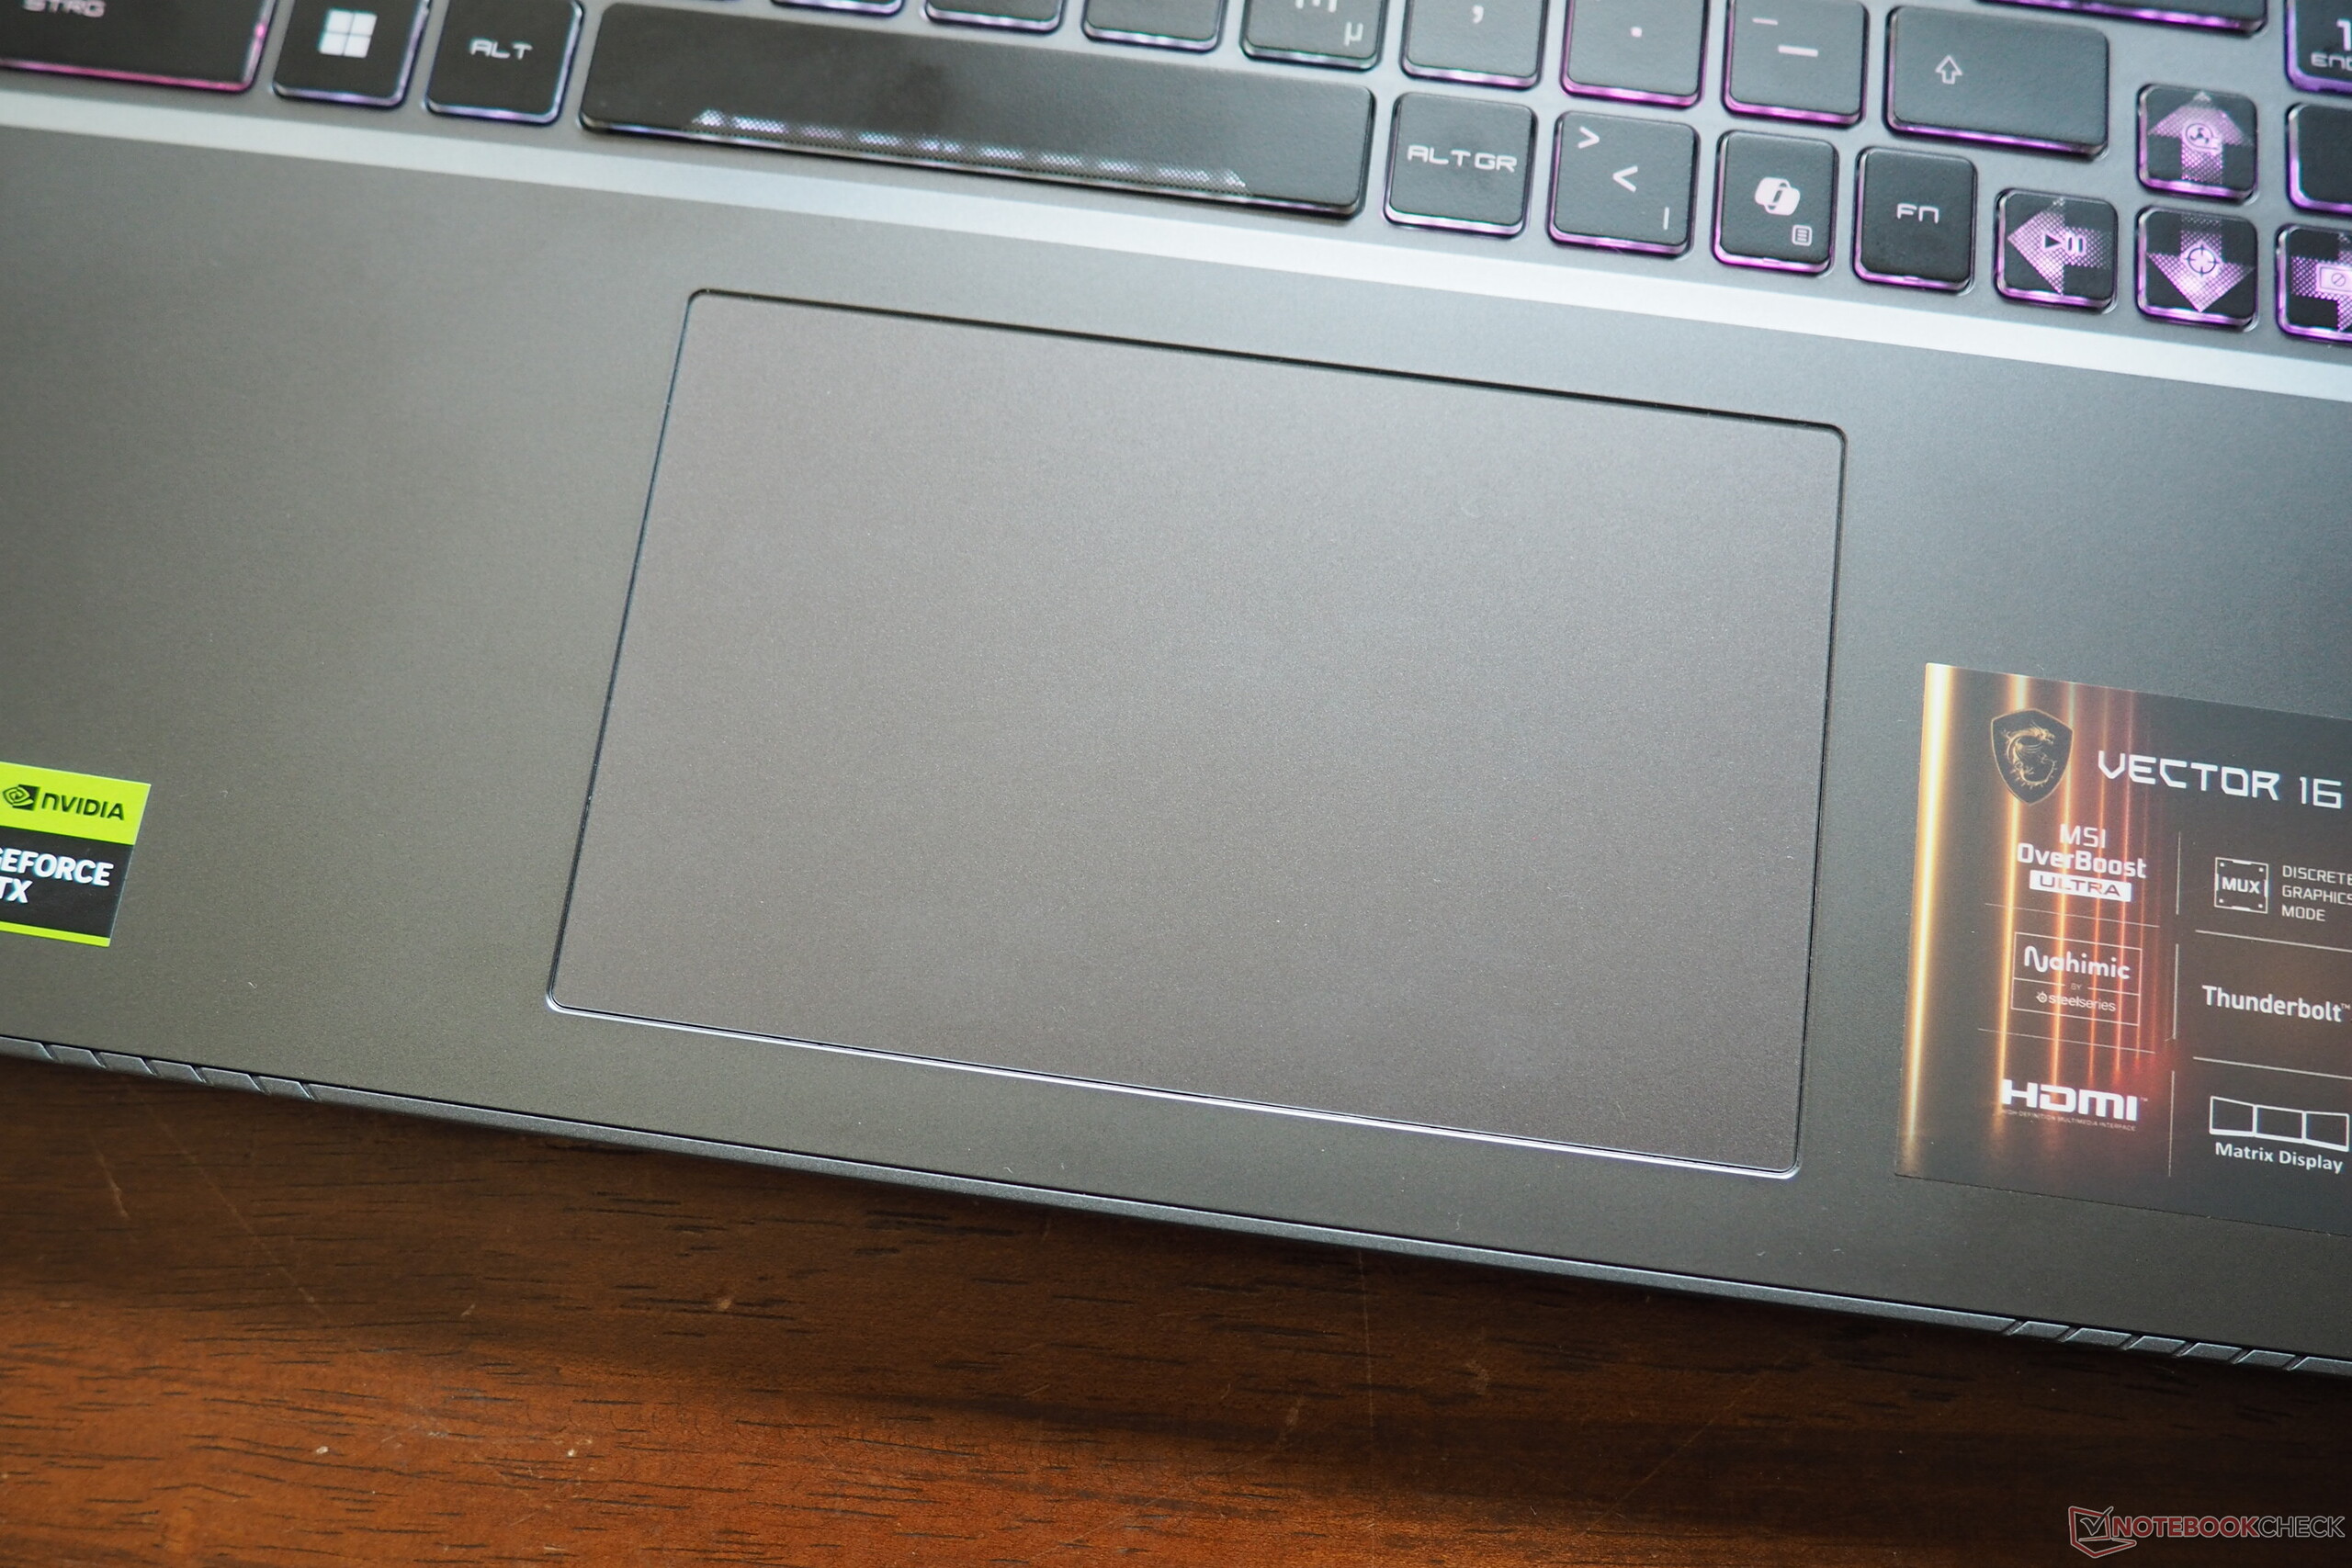
MSI has stuck with its rather unconventional keyboard layout for several years, and it takes some time to get used to. The placement of many keys does not follow the standard layout. The decision to use a three-column rather than the more common four-column number pad also strikes us as somewhat odd. In terms of typing feel, the keyboard performs well overall, though it naturally cannot match the tactile quality of mechanical models. One plus point is the extensive RGB lighting, which can be customised individually. The touchpad measures a generous 13 cm by 8 cm and offers smooth gliding and solid precision. The clickable areas along the bottom edge respond reliably, although they feel a little flimsy to our taste.
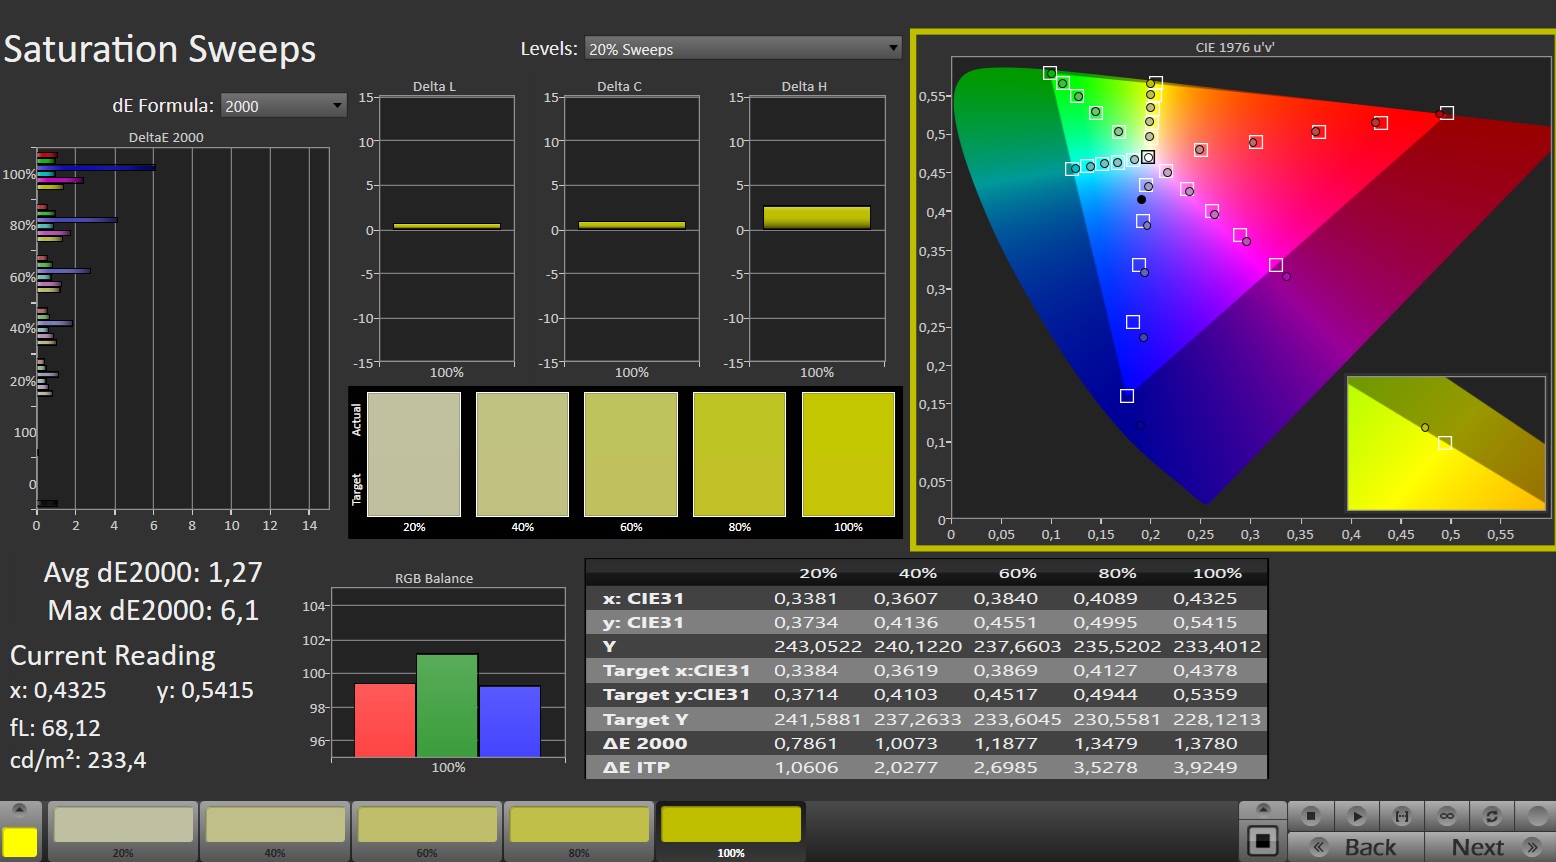
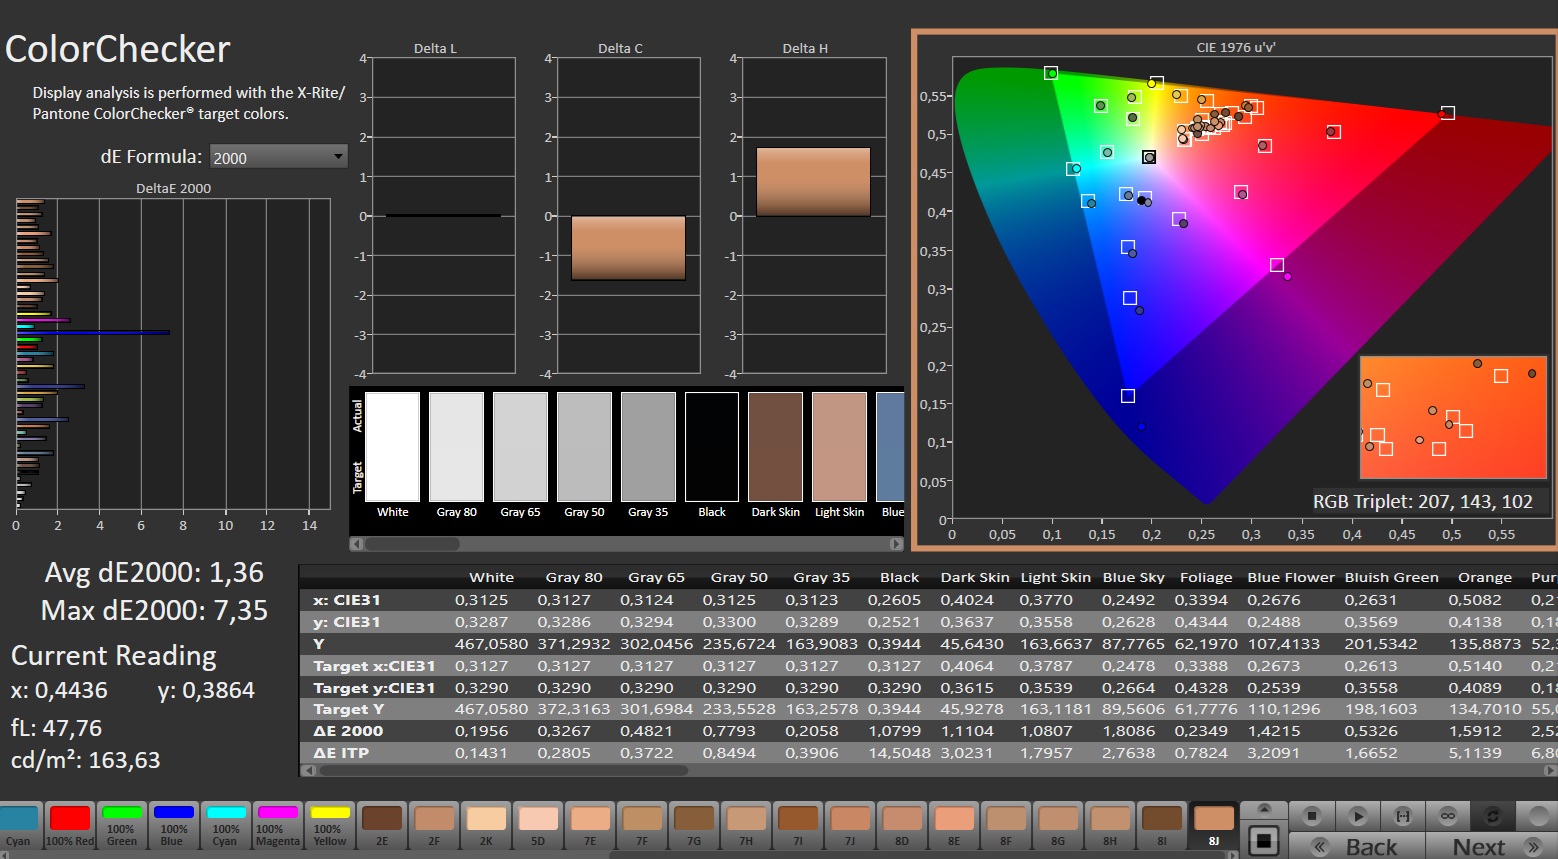
Display
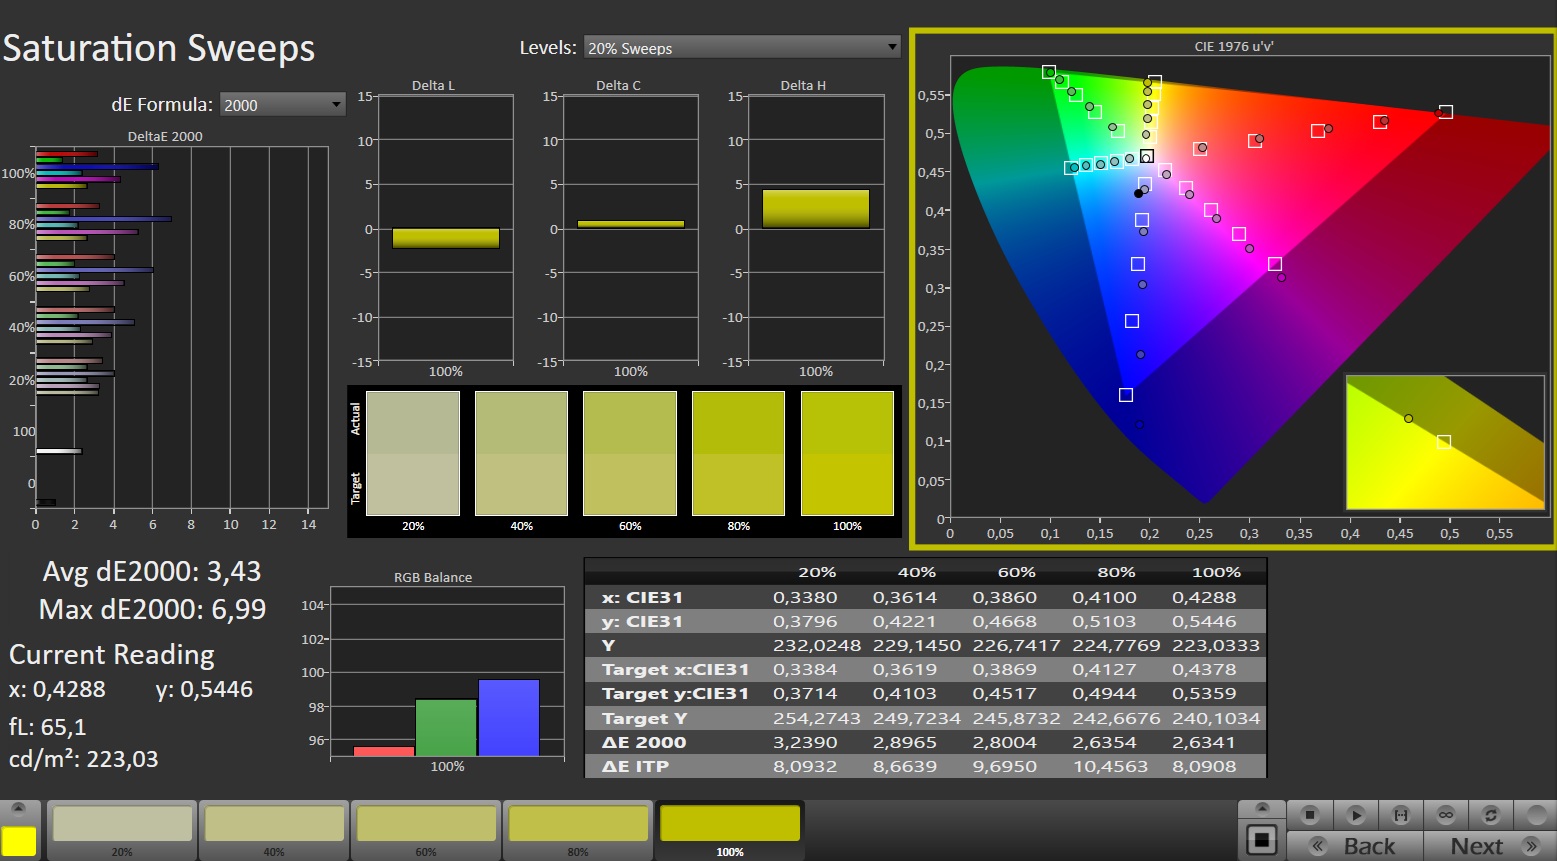
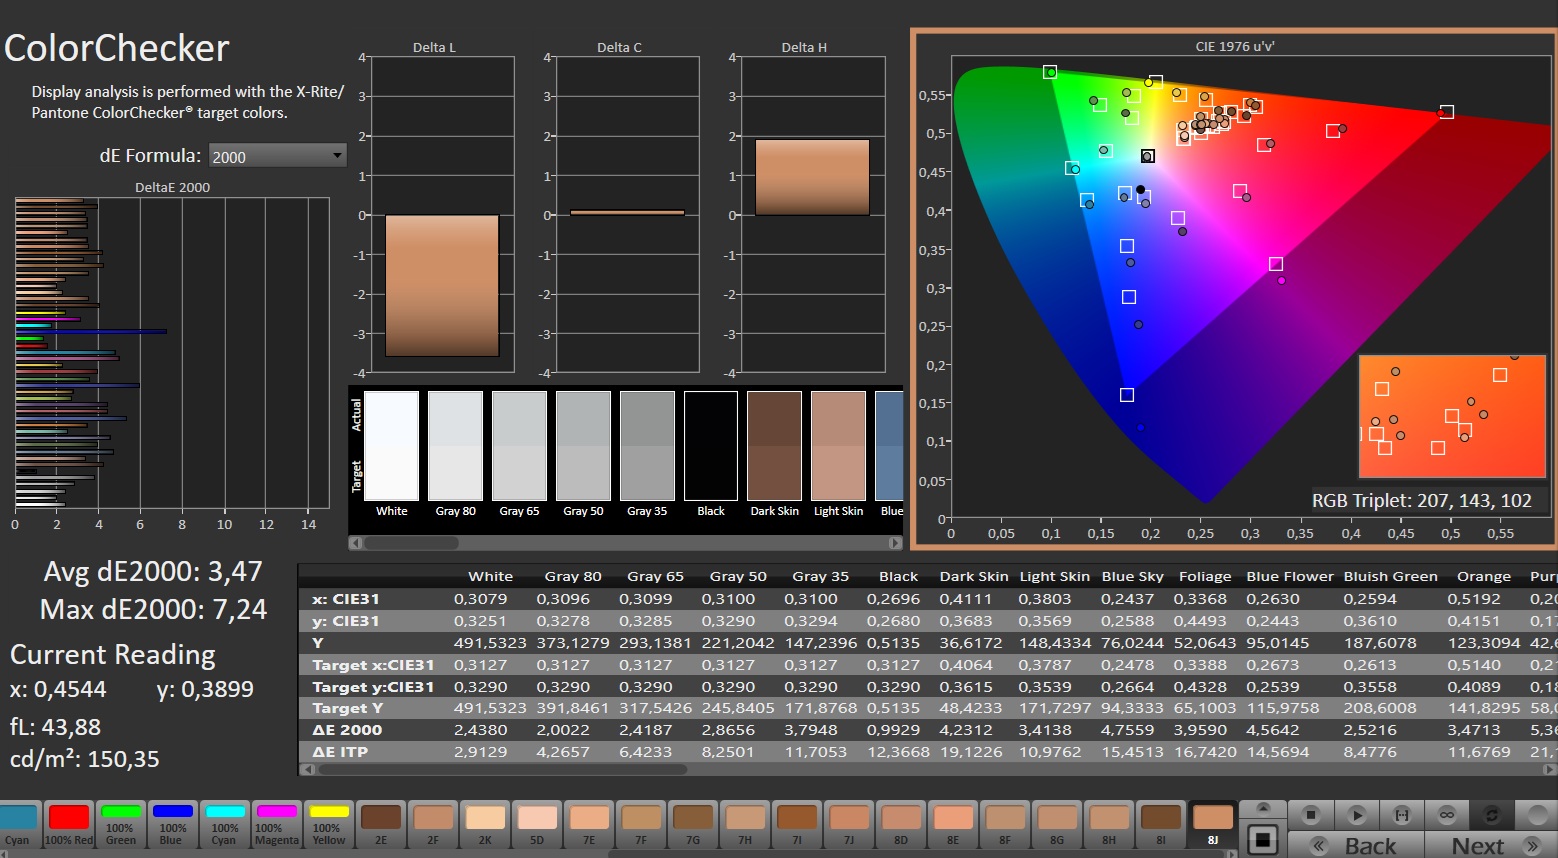
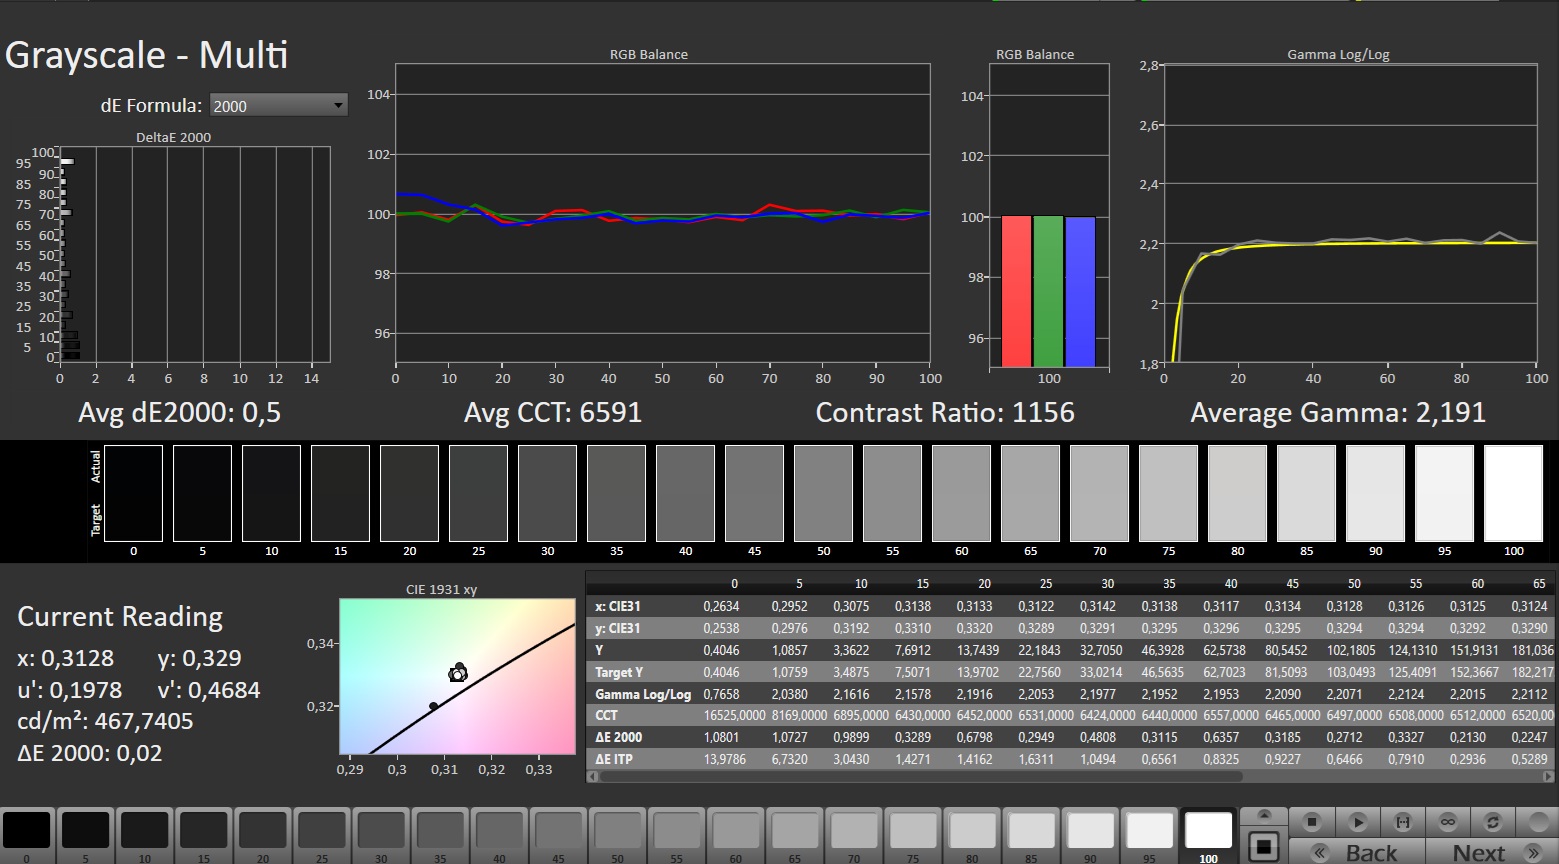
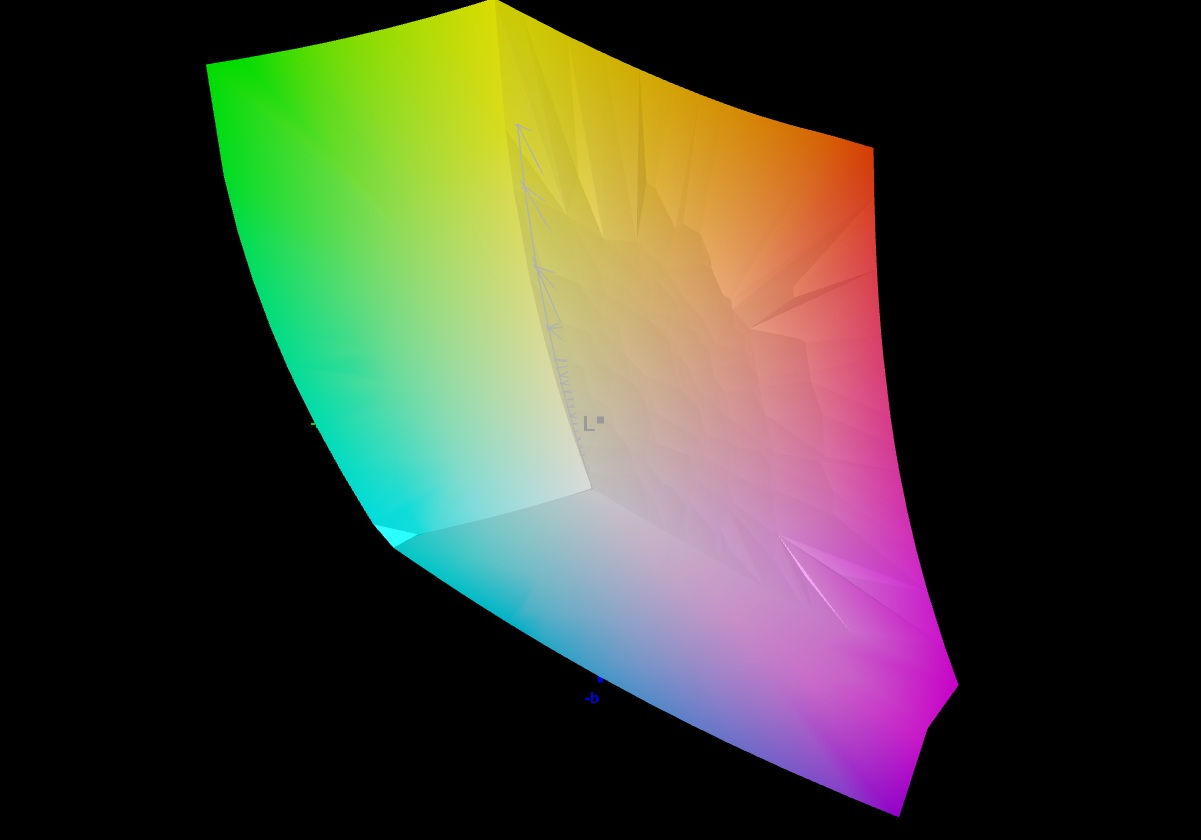
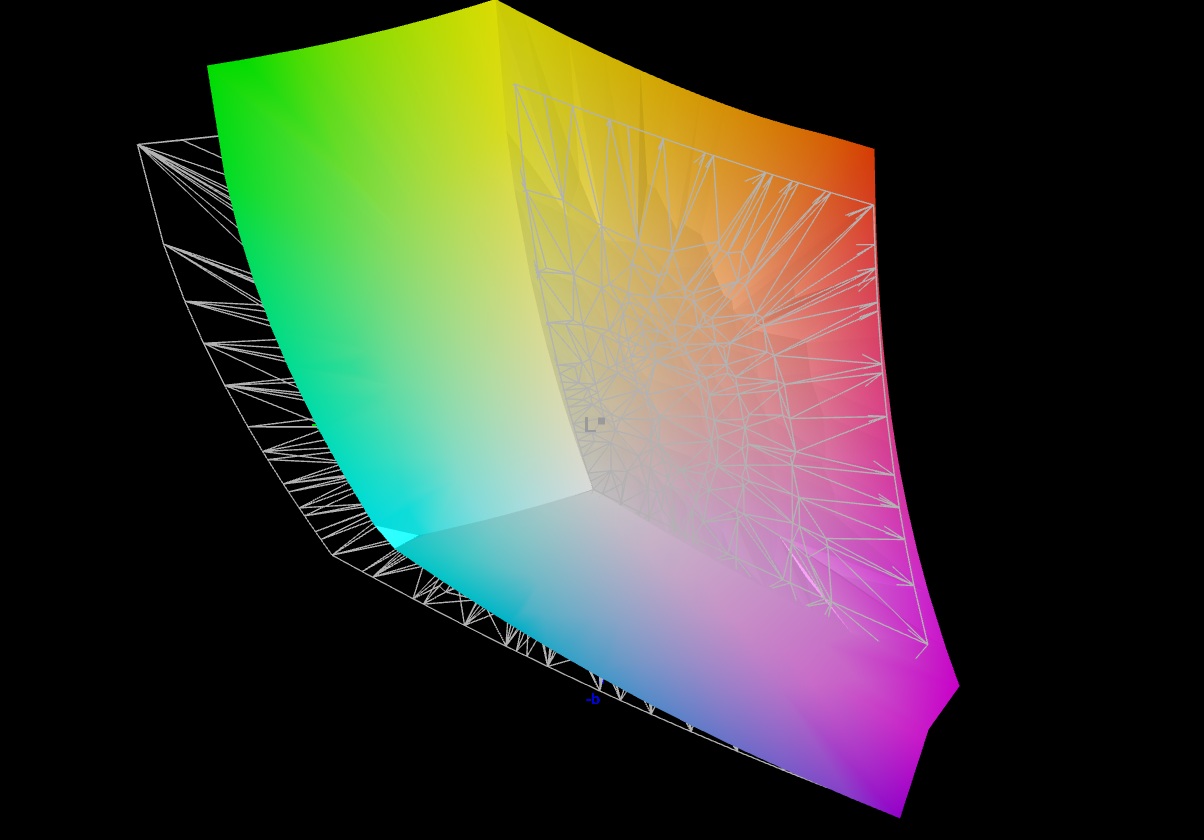
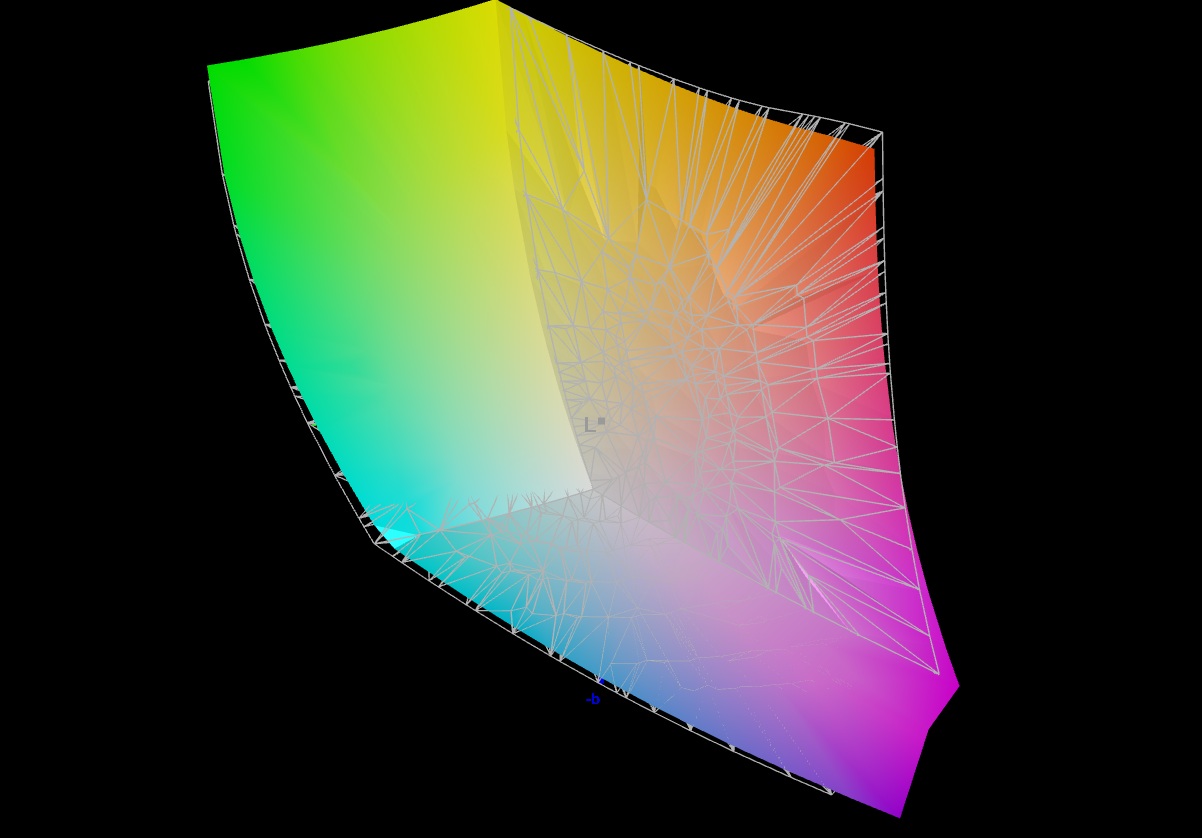
The screen adopts the currently popular 16:10 aspect ratio and performs without any major flaws. While the IPS panel does not reach OLED levels in most areas, the Vector 16 holds its own compared to other gaming laptops. It starts with a good response time, which should be fast enough even for high-paced 3D games. The display also offers a solid average brightness of 426 cd/m², clearly outperforming the Katana 17's underwhelming 272 cd/m². Despite a merely average black level of 0.42 cd/m², the 16-inch panel still surpasses the 1,000:1 contrast ratio threshold. Colour accuracy out of the box is also impressive and can be further improved through calibration. We observed no screen flickering, and viewing angles are consistent with typical IPS standards.
| |||||||||||||||||||||||||
Brightness Distribution: 85 %
Center on Battery: 473 cd/m²
Contrast: 1126:1 (Black: 0.42 cd/m²)
ΔE ColorChecker Calman: 3.47 | ∀{0.5-29.43 Ø4.73}
calibrated: 1.36
ΔE Greyscale Calman: 3.1 | ∀{0.09-98 Ø4.97}
84.4% AdobeRGB 1998 (Argyll 3D)
99.8% sRGB (Argyll 3D)
96.6% Display P3 (Argyll 3D)
Gamma: 2.486
CCT: 6832 K
| MSI Vector 16 HX AI A2XWHG B160QAN02.3 (AUO7DB2), IPS, 2560x1600, 16", 240 Hz | MSI Vector 16 HX A14V Chi Mei N160GME-GTB, IPS, 2560x1600, 16", 240 Hz | MSI Katana 17 HX B14WGK CSOT MNH301CA3-1, IPS, 2560x1440, 17.3", 240 Hz | Schenker XMG Pro 16 (E25) NE160QDM-NZL, IPS, 2560x1600, 16", 300 Hz | Alienware 16 Area-51 AU Optronics B160QAN, IPS, 2560x1600, 16", 240 Hz | |
|---|---|---|---|---|---|
| Display | 0% | 2% | -11% | 2% | |
| Display P3 Coverage (%) | 96.6 | 95.4 -1% | 97.3 1% | 74.7 -23% | 96 -1% |
| sRGB Coverage (%) | 99.8 | 99.7 0% | 99.6 0% | 99.8 0% | 100 0% |
| AdobeRGB 1998 Coverage (%) | 84.4 | 85.4 1% | 89 5% | 75.4 -11% | 89.2 6% |
| Response Times | -62% | -37% | -67% | -16% | |
| Response Time Grey 50% / Grey 80% * (ms) | 4.3 ? | 5.7 ? -33% | 5.2 ? -21% | 10.5 ? -144% | 4.8 ? -12% |
| Response Time Black / White * (ms) | 6 ? | 11.4 ? -90% | 9.2 ? -53% | 5.4 ? 10% | 7.2 ? -20% |
| PWM Frequency (Hz) | |||||
| Screen | 5% | 13% | 16% | 2% | |
| Brightness middle (cd/m²) | 473 | 557.2 18% | 296 -37% | 538 14% | 554 17% |
| Brightness (cd/m²) | 426 | 506 19% | 272 -36% | 508 19% | 532 25% |
| Brightness Distribution (%) | 85 | 83 -2% | 87 2% | 88 4% | 88 4% |
| Black Level * (cd/m²) | 0.42 | 0.41 2% | 0.27 36% | 0.47 -12% | 0.52 -24% |
| Contrast (:1) | 1126 | 1359 21% | 1096 -3% | 1145 2% | 1065 -5% |
| Colorchecker dE 2000 * | 3.47 | 2.91 16% | 1.35 61% | 1.9 45% | 2.81 19% |
| Colorchecker dE 2000 max. * | 7.24 | 5.94 18% | 4.76 34% | 4 45% | 8.32 -15% |
| Colorchecker dE 2000 calibrated * | 1.36 | 1.63 -20% | 0.78 43% | 0.65 52% | |
| Greyscale dE 2000 * | 3.1 | 3.8 -23% | 2.7 13% | 2.7 13% | 4.7 -52% |
| Gamma | 2.486 88% | 2.23 99% | 2.201 100% | 2.24 98% | 2.3 96% |
| CCT | 6832 95% | 6408 101% | 6770 96% | 7027 93% | 6476 100% |
| Total Average (Program / Settings) | -19% /
-5% | -7% /
3% | -21% /
-3% | -4% /
-0% |
* ... smaller is better


Display Response Times
| ↔ Response Time Black to White | ||
|---|---|---|
| 6 ms ... rise ↗ and fall ↘ combined | ↗ 2.2 ms rise | 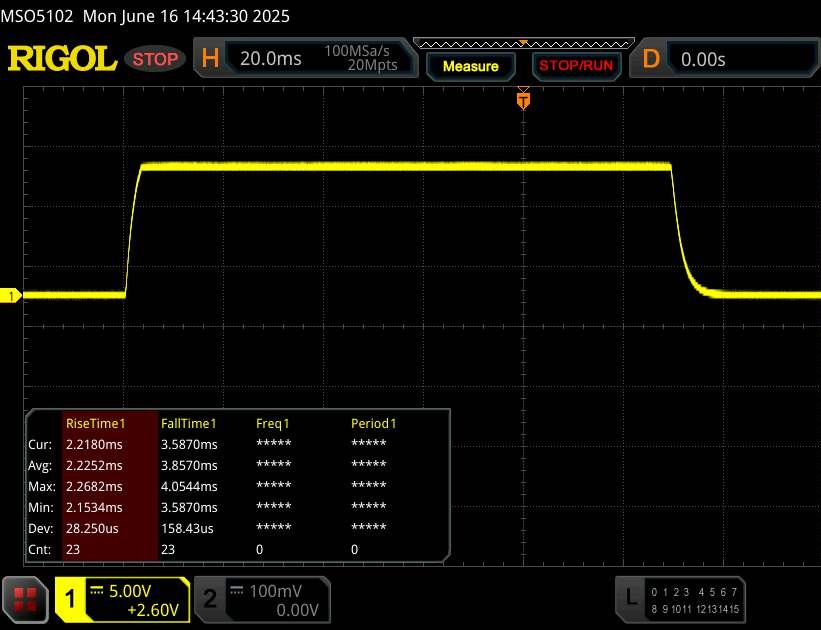 |
| ↘ 3.8 ms fall | ||
| The screen shows very fast response rates in our tests and should be very well suited for fast-paced gaming. In comparison, all tested devices range from 0.1 (minimum) to 240 (maximum) ms. » 18 % of all devices are better. This means that the measured response time is better than the average of all tested devices (19.9 ms). | ||
| ↔ Response Time 50% Grey to 80% Grey | ||
| 4.3 ms ... rise ↗ and fall ↘ combined | ↗ 1.8 ms rise | 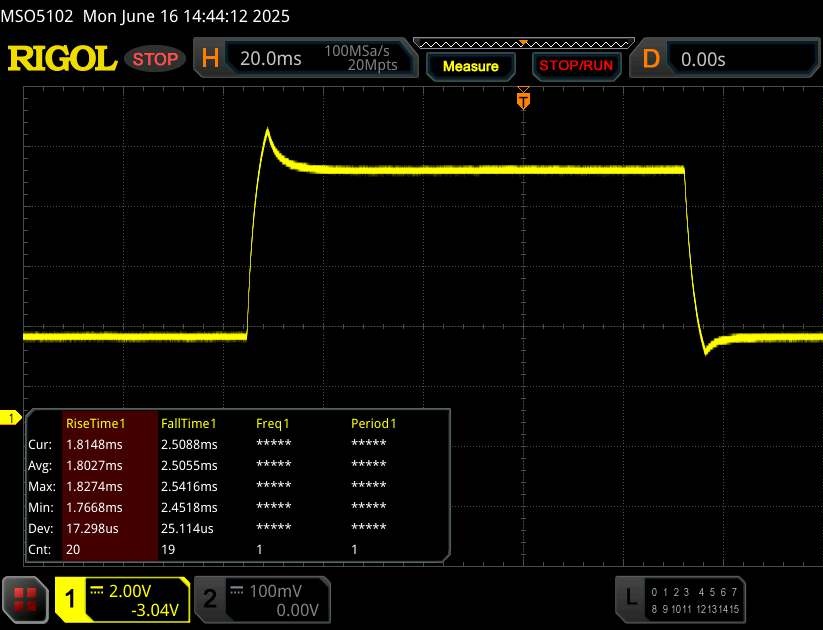 |
| ↘ 2.5 ms fall | ||
| The screen shows very fast response rates in our tests and should be very well suited for fast-paced gaming. In comparison, all tested devices range from 0.165 (minimum) to 636 (maximum) ms. » 16 % of all devices are better. This means that the measured response time is better than the average of all tested devices (31.1 ms). | ||
Screen Flickering / PWM (Pulse-Width Modulation)
| Screen flickering / PWM not detected |  | ||
In comparison: 52 % of all tested devices do not use PWM to dim the display. If PWM was detected, an average of 7797 (minimum: 5 - maximum: 343500) Hz was measured. | |||

Performance
In terms of CPU and GPU power, the Vector 16 HX sits comfortably between the mid-range and the absolute high-end of gaming laptops. SSD and RAM capacity can be easily upgraded or expanded as required thanks to two slots each.


Test conditions
The MSI Center contains four operating modes, of which the AI profile was used for the measurements, which, according to our tests, is mostly based on the "Balanced" mode rather than the "Maximum performance" mode. We wouldn't generally recommend the latter, as the 16-inch model is otherwise absurdly loud under load at just under 60 dB(A). The GPU performance climbs by almost 10% in the maximum profile.


| MSI Center Mode | MSI AI Engine | Extreme performance | Balanced | ECO Silent |
| Cyberpunk 2077 Noise | 47 dB(A) | 60 dB(A) | 47 dB(A) | 41 dB(A) |
| Cyberpunk 2077 Performance (FHD/Ultra) | 119.6 fps | 129.9 fps | 117.1 fps | 51.5 fps |
| Cinebench R15 Multi Score | 4118 Points | 5196 Points | 4037 Points | 1064 Points |
| CPU PL1 | 80 watts | 110 watts | 80 watts | 15 watts |
| CPU PL2 | 80 watts | 220 watts | 80 watts | 15 watts |
Processor
Intel's Core Ultra 7 255HX celebrates its premiere in the Vector 16. The 3 nm model from the Arrow Lake generation is equipped with 8 performance cores and 12 efficiency cores, each without Hyper-Threading. In the benchmark course, the 255HX performs slightly worse than the old high-end Core i9-14900HX chip, but significantly better than the Core i7-14650HX of the Katana 17 Core Ultra 9 275HX is only around 10% faster on average, which is a respectable result for the 255HX.
Cinebench R15 multi sustained test
* ... smaller is better
AIDA64: FP32 Ray-Trace | FPU Julia | CPU SHA3 | CPU Queen | FPU SinJulia | FPU Mandel | CPU AES | CPU ZLib | FP64 Ray-Trace | CPU PhotoWorxx
| Performance rating | |
| Schenker XMG Pro 16 (E25) | |
| Alienware 16 Area-51 | |
| MSI Vector 16 HX A14V | |
| Average Intel Core Ultra 7 255HX | |
| Average of class Gaming | |
| MSI Vector 16 HX AI A2XWHG | |
| MSI Katana 17 HX B14WGK | |
| AIDA64 / FP32 Ray-Trace | |
| Schenker XMG Pro 16 (E25) | |
| Alienware 16 Area-51 | |
| Average Intel Core Ultra 7 255HX (27732 - 34250, n=5) | |
| Average of class Gaming (10227 - 85542, n=109, last 2 years) | |
| MSI Vector 16 HX A14V | |
| MSI Vector 16 HX AI A2XWHG | |
| MSI Katana 17 HX B14WGK | |
| AIDA64 / FPU Julia | |
| Schenker XMG Pro 16 (E25) | |
| Alienware 16 Area-51 | |
| Average Intel Core Ultra 7 255HX (140290 - 167758, n=5) | |
| MSI Vector 16 HX A14V | |
| MSI Vector 16 HX AI A2XWHG | |
| Average of class Gaming (51376 - 238426, n=109, last 2 years) | |
| MSI Katana 17 HX B14WGK | |
| AIDA64 / CPU SHA3 | |
| Schenker XMG Pro 16 (E25) | |
| Alienware 16 Area-51 | |
| Average Intel Core Ultra 7 255HX (6445 - 7694, n=5) | |
| MSI Vector 16 HX A14V | |
| MSI Vector 16 HX AI A2XWHG | |
| Average of class Gaming (2180 - 9817, n=109, last 2 years) | |
| MSI Katana 17 HX B14WGK | |
| AIDA64 / CPU Queen | |
| MSI Vector 16 HX A14V | |
| Alienware 16 Area-51 | |
| Schenker XMG Pro 16 (E25) | |
| Average Intel Core Ultra 7 255HX (115802 - 135237, n=5) | |
| MSI Vector 16 HX AI A2XWHG | |
| Average of class Gaming (49785 - 173351, n=100, last 2 years) | |
| MSI Katana 17 HX B14WGK | |
| AIDA64 / FPU SinJulia | |
| MSI Vector 16 HX A14V | |
| Average of class Gaming (4424 - 33636, n=109, last 2 years) | |
| Schenker XMG Pro 16 (E25) | |
| Alienware 16 Area-51 | |
| Average Intel Core Ultra 7 255HX (11066 - 12286, n=5) | |
| MSI Vector 16 HX AI A2XWHG | |
| MSI Katana 17 HX B14WGK | |
| AIDA64 / FPU Mandel | |
| Schenker XMG Pro 16 (E25) | |
| Alienware 16 Area-51 | |
| Average Intel Core Ultra 7 255HX (72938 - 87947, n=5) | |
| MSI Vector 16 HX AI A2XWHG | |
| MSI Vector 16 HX A14V | |
| Average of class Gaming (25115 - 128721, n=109, last 2 years) | |
| MSI Katana 17 HX B14WGK | |
| AIDA64 / CPU AES | |
| MSI Vector 16 HX A14V | |
| Alienware 16 Area-51 | |
| Schenker XMG Pro 16 (E25) | |
| Average Intel Core Ultra 7 255HX (96832 - 116158, n=5) | |
| Average of class Gaming (39258 - 247074, n=109, last 2 years) | |
| MSI Vector 16 HX AI A2XWHG | |
| MSI Katana 17 HX B14WGK | |
| AIDA64 / CPU ZLib | |
| MSI Vector 16 HX A14V | |
| Schenker XMG Pro 16 (E25) | |
| Alienware 16 Area-51 | |
| Average Intel Core Ultra 7 255HX (1510 - 1850, n=5) | |
| Average of class Gaming (574 - 2531, n=109, last 2 years) | |
| MSI Vector 16 HX AI A2XWHG | |
| MSI Katana 17 HX B14WGK | |
| AIDA64 / FP64 Ray-Trace | |
| Alienware 16 Area-51 | |
| Schenker XMG Pro 16 (E25) | |
| Average Intel Core Ultra 7 255HX (15137 - 18315, n=5) | |
| Average of class Gaming (5509 - 45446, n=109, last 2 years) | |
| MSI Vector 16 HX A14V | |
| MSI Vector 16 HX AI A2XWHG | |
| MSI Katana 17 HX B14WGK | |
| AIDA64 / CPU PhotoWorxx | |
| Alienware 16 Area-51 | |
| Schenker XMG Pro 16 (E25) | |
| MSI Vector 16 HX A14V | |
| Average Intel Core Ultra 7 255HX (39697 - 54070, n=5) | |
| Average of class Gaming (12271 - 89891, n=109, last 2 years) | |
| MSI Vector 16 HX AI A2XWHG | |
| MSI Katana 17 HX B14WGK | |
System performance
The system performance proves to be inconspicuous, the 16-incher performs within the expected range. Interesting: Despite supposedly weaker components (CPU/GPU), the Katana 17, which was tested at the same time, boots faster.
PCMark 10: Score | Essentials | Productivity | Digital Content Creation
CrossMark: Overall | Productivity | Creativity | Responsiveness
WebXPRT 3: Overall
WebXPRT 4: Overall
Mozilla Kraken 1.1: Total
| Performance rating | |
| Alienware 16 Area-51 | |
| Schenker XMG Pro 16 (E25) | |
| MSI Vector 16 HX A14V | |
| Average of class Gaming | |
| Average Intel Core Ultra 7 255HX, NVIDIA GeForce RTX 5070 Ti Laptop | |
| MSI Vector 16 HX AI A2XWHG | |
| MSI Katana 17 HX B14WGK | |
| PCMark 10 / Score | |
| Alienware 16 Area-51 | |
| MSI Vector 16 HX A14V | |
| Schenker XMG Pro 16 (E25) | |
| Average of class Gaming (5828 - 11574, n=95, last 2 years) | |
| Average Intel Core Ultra 7 255HX, NVIDIA GeForce RTX 5070 Ti Laptop (7842 - 7858, n=2) | |
| MSI Vector 16 HX AI A2XWHG | |
| MSI Katana 17 HX B14WGK | |
| PCMark 10 / Essentials | |
| MSI Vector 16 HX A14V | |
| Schenker XMG Pro 16 (E25) | |
| Alienware 16 Area-51 | |
| Average Intel Core Ultra 7 255HX, NVIDIA GeForce RTX 5070 Ti Laptop (10737 - 10773, n=2) | |
| MSI Vector 16 HX AI A2XWHG | |
| Average of class Gaming (8810 - 12600, n=99, last 2 years) | |
| MSI Katana 17 HX B14WGK | |
| PCMark 10 / Productivity | |
| Average of class Gaming (6845 - 18766, n=97, last 2 years) | |
| MSI Vector 16 HX A14V | |
| Schenker XMG Pro 16 (E25) | |
| MSI Vector 16 HX AI A2XWHG | |
| Average Intel Core Ultra 7 255HX, NVIDIA GeForce RTX 5070 Ti Laptop (9270 - 9510, n=2) | |
| Alienware 16 Area-51 | |
| MSI Katana 17 HX B14WGK | |
| PCMark 10 / Digital Content Creation | |
| Alienware 16 Area-51 | |
| MSI Vector 16 HX A14V | |
| Schenker XMG Pro 16 (E25) | |
| Average of class Gaming (7602 - 19657, n=97, last 2 years) | |
| Average Intel Core Ultra 7 255HX, NVIDIA GeForce RTX 5070 Ti Laptop (12817 - 13186, n=2) | |
| MSI Vector 16 HX AI A2XWHG | |
| MSI Katana 17 HX B14WGK | |
| CrossMark / Overall | |
| Schenker XMG Pro 16 (E25) | |
| MSI Vector 16 HX A14V | |
| Alienware 16 Area-51 | |
| Average Intel Core Ultra 7 255HX, NVIDIA GeForce RTX 5070 Ti Laptop (1944 - 2097, n=2) | |
| Average of class Gaming (1366 - 2409, n=97, last 2 years) | |
| MSI Katana 17 HX B14WGK | |
| MSI Vector 16 HX AI A2XWHG | |
| CrossMark / Productivity | |
| MSI Vector 16 HX A14V | |
| Schenker XMG Pro 16 (E25) | |
| Alienware 16 Area-51 | |
| Average Intel Core Ultra 7 255HX, NVIDIA GeForce RTX 5070 Ti Laptop (1845 - 1959, n=2) | |
| MSI Katana 17 HX B14WGK | |
| Average of class Gaming (1386 - 2254, n=97, last 2 years) | |
| MSI Vector 16 HX AI A2XWHG | |
| CrossMark / Creativity | |
| Schenker XMG Pro 16 (E25) | |
| MSI Vector 16 HX A14V | |
| Alienware 16 Area-51 | |
| Average Intel Core Ultra 7 255HX, NVIDIA GeForce RTX 5070 Ti Laptop (2249 - 2400, n=2) | |
| MSI Vector 16 HX AI A2XWHG | |
| Average of class Gaming (1343 - 2729, n=97, last 2 years) | |
| MSI Katana 17 HX B14WGK | |
| CrossMark / Responsiveness | |
| Alienware 16 Area-51 | |
| MSI Vector 16 HX A14V | |
| MSI Katana 17 HX B14WGK | |
| Schenker XMG Pro 16 (E25) | |
| Average of class Gaming (1226 - 2334, n=97, last 2 years) | |
| Average Intel Core Ultra 7 255HX, NVIDIA GeForce RTX 5070 Ti Laptop (1468 - 1713, n=2) | |
| MSI Vector 16 HX AI A2XWHG | |
| WebXPRT 3 / Overall | |
| Schenker XMG Pro 16 (E25) | |
| Alienware 16 Area-51 | |
| MSI Vector 16 HX A14V | |
| Average Intel Core Ultra 7 255HX, NVIDIA GeForce RTX 5070 Ti Laptop (319 - 325, n=2) | |
| MSI Vector 16 HX AI A2XWHG | |
| Average of class Gaming (242 - 532, n=100, last 2 years) | |
| MSI Katana 17 HX B14WGK | |
| WebXPRT 4 / Overall | |
| Schenker XMG Pro 16 (E25) | |
| Alienware 16 Area-51 | |
| Average Intel Core Ultra 7 255HX, NVIDIA GeForce RTX 5070 Ti Laptop (305 - 306, n=2) | |
| MSI Vector 16 HX AI A2XWHG | |
| MSI Vector 16 HX A14V | |
| Average of class Gaming (176.4 - 354, n=100, last 2 years) | |
| MSI Katana 17 HX B14WGK | |
| Mozilla Kraken 1.1 / Total | |
| MSI Katana 17 HX B14WGK | |
| Average of class Gaming (391 - 590, n=105, last 2 years) | |
| MSI Vector 16 HX A14V | |
| MSI Vector 16 HX AI A2XWHG | |
| Average Intel Core Ultra 7 255HX, NVIDIA GeForce RTX 5070 Ti Laptop (425 - 425, n=2) | |
| Alienware 16 Area-51 | |
| Schenker XMG Pro 16 (E25) | |
* ... smaller is better
| PCMark 10 Score | 7842 points | |
Help | ||
| AIDA64 / Memory Copy | |
| Schenker XMG Pro 16 (E25) | |
| Alienware 16 Area-51 | |
| Average Intel Core Ultra 7 255HX (68939 - 104987, n=5) | |
| MSI Vector 16 HX A14V | |
| Average of class Gaming (21750 - 129946, n=109, last 2 years) | |
| MSI Vector 16 HX AI A2XWHG | |
| MSI Katana 17 HX B14WGK | |
| AIDA64 / Memory Read | |
| Schenker XMG Pro 16 (E25) | |
| Alienware 16 Area-51 | |
| Average Intel Core Ultra 7 255HX (82336 - 95821, n=5) | |
| MSI Vector 16 HX A14V | |
| MSI Vector 16 HX AI A2XWHG | |
| Average of class Gaming (22956 - 118858, n=109, last 2 years) | |
| MSI Katana 17 HX B14WGK | |
| AIDA64 / Memory Write | |
| Average Intel Core Ultra 7 255HX (66479 - 133486, n=5) | |
| Schenker XMG Pro 16 (E25) | |
| Alienware 16 Area-51 | |
| MSI Vector 16 HX A14V | |
| Average of class Gaming (22297 - 135096, n=109, last 2 years) | |
| MSI Vector 16 HX AI A2XWHG | |
| MSI Katana 17 HX B14WGK | |
| AIDA64 / Memory Latency | |
| Alienware 16 Area-51 | |
| Average Intel Core Ultra 7 255HX (104.2 - 110, n=5) | |
| MSI Vector 16 HX AI A2XWHG | |
| Average of class Gaming (75.3 - 259, n=109, last 2 years) | |
| Schenker XMG Pro 16 (E25) | |
| MSI Katana 17 HX B14WGK | |
| MSI Vector 16 HX A14V | |
* ... smaller is better
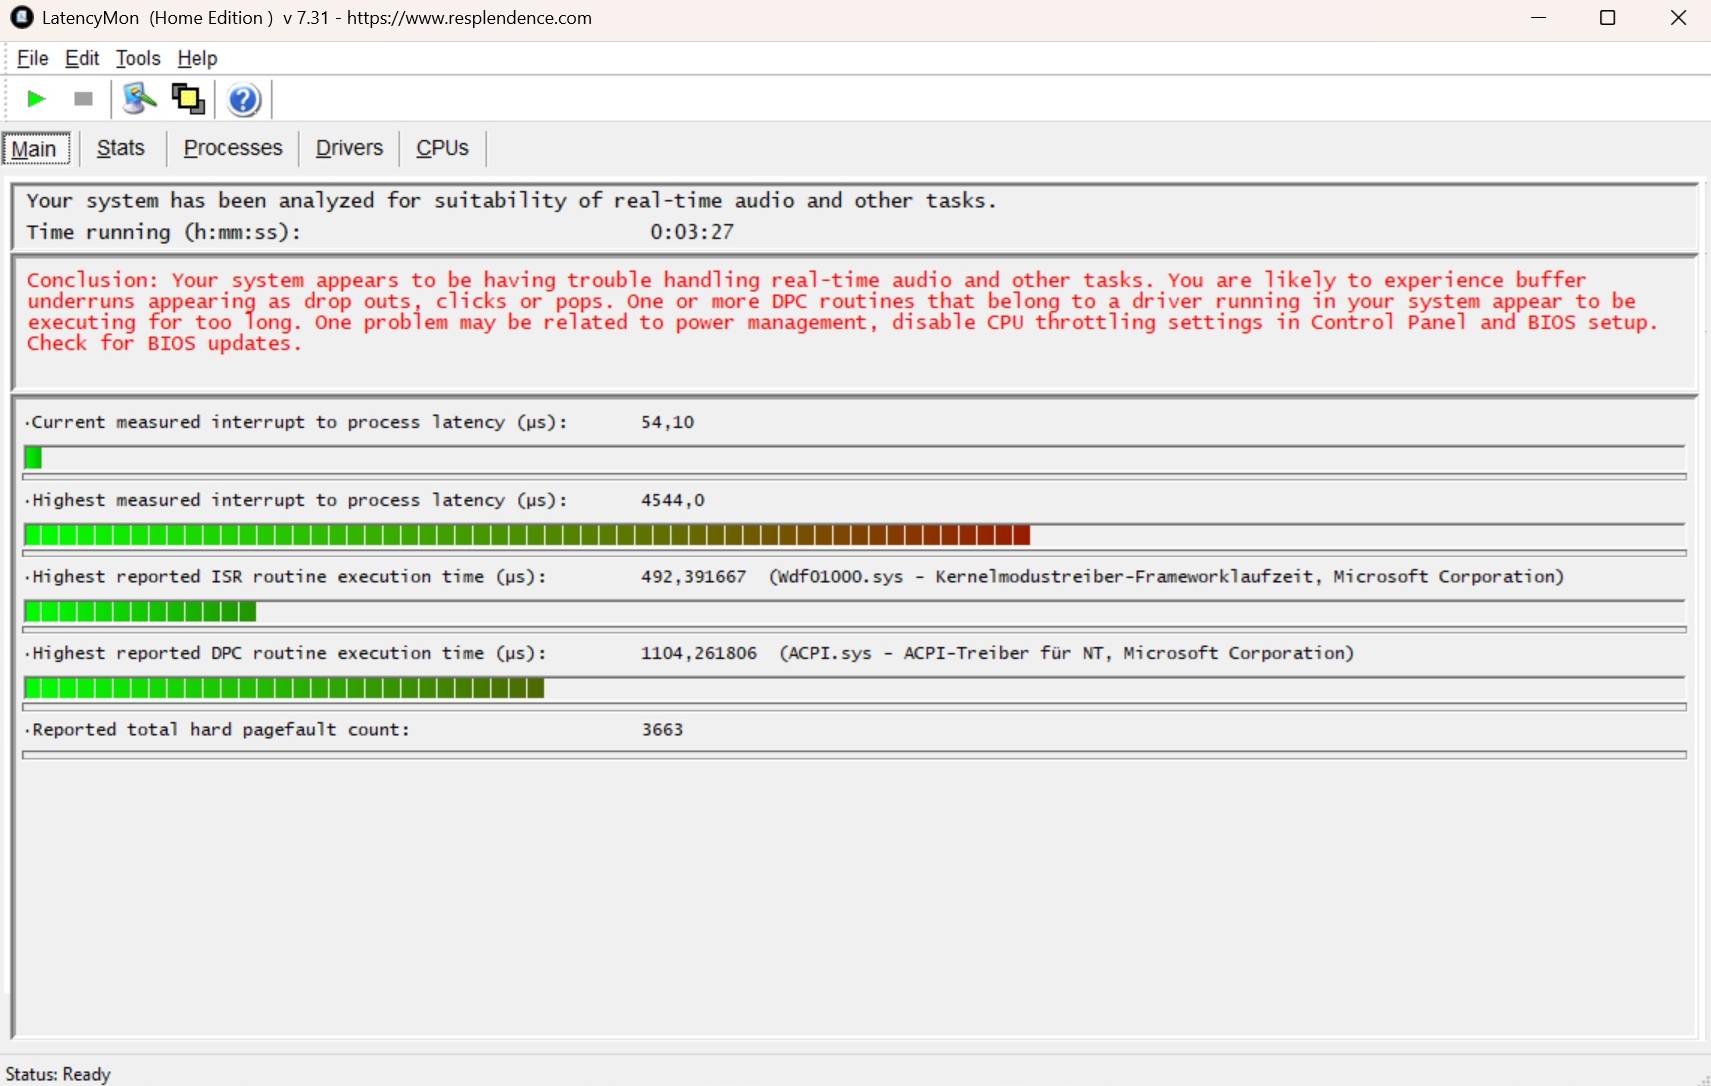
DPC latencies
MSI should still work on the issue of latency. According to LatencyMon, both the Vector 16 and the Katana 17 achieve extremely high values, which can lead to dropouts.

| DPC Latencies / LatencyMon - interrupt to process latency (max), Web, Youtube, Prime95 | |
| MSI Katana 17 HX B14WGK | |
| MSI Vector 16 HX AI A2XWHG | |
| Alienware 16 Area-51 | |
| Schenker XMG Pro 16 (E25) | |
| MSI Vector 16 HX A14V | |
* ... smaller is better
Storage devices
There is also room for improvement in terms of mass storage. While the read speed of the built-in Micron drive is quite decent for an NVMe model, the write speed leaves something to be desired. Nevertheless, the 16-incher did not have to contend with drops in the loop test.

* ... smaller is better
Sustained read performance: DiskSpd read loop, queue depth 8
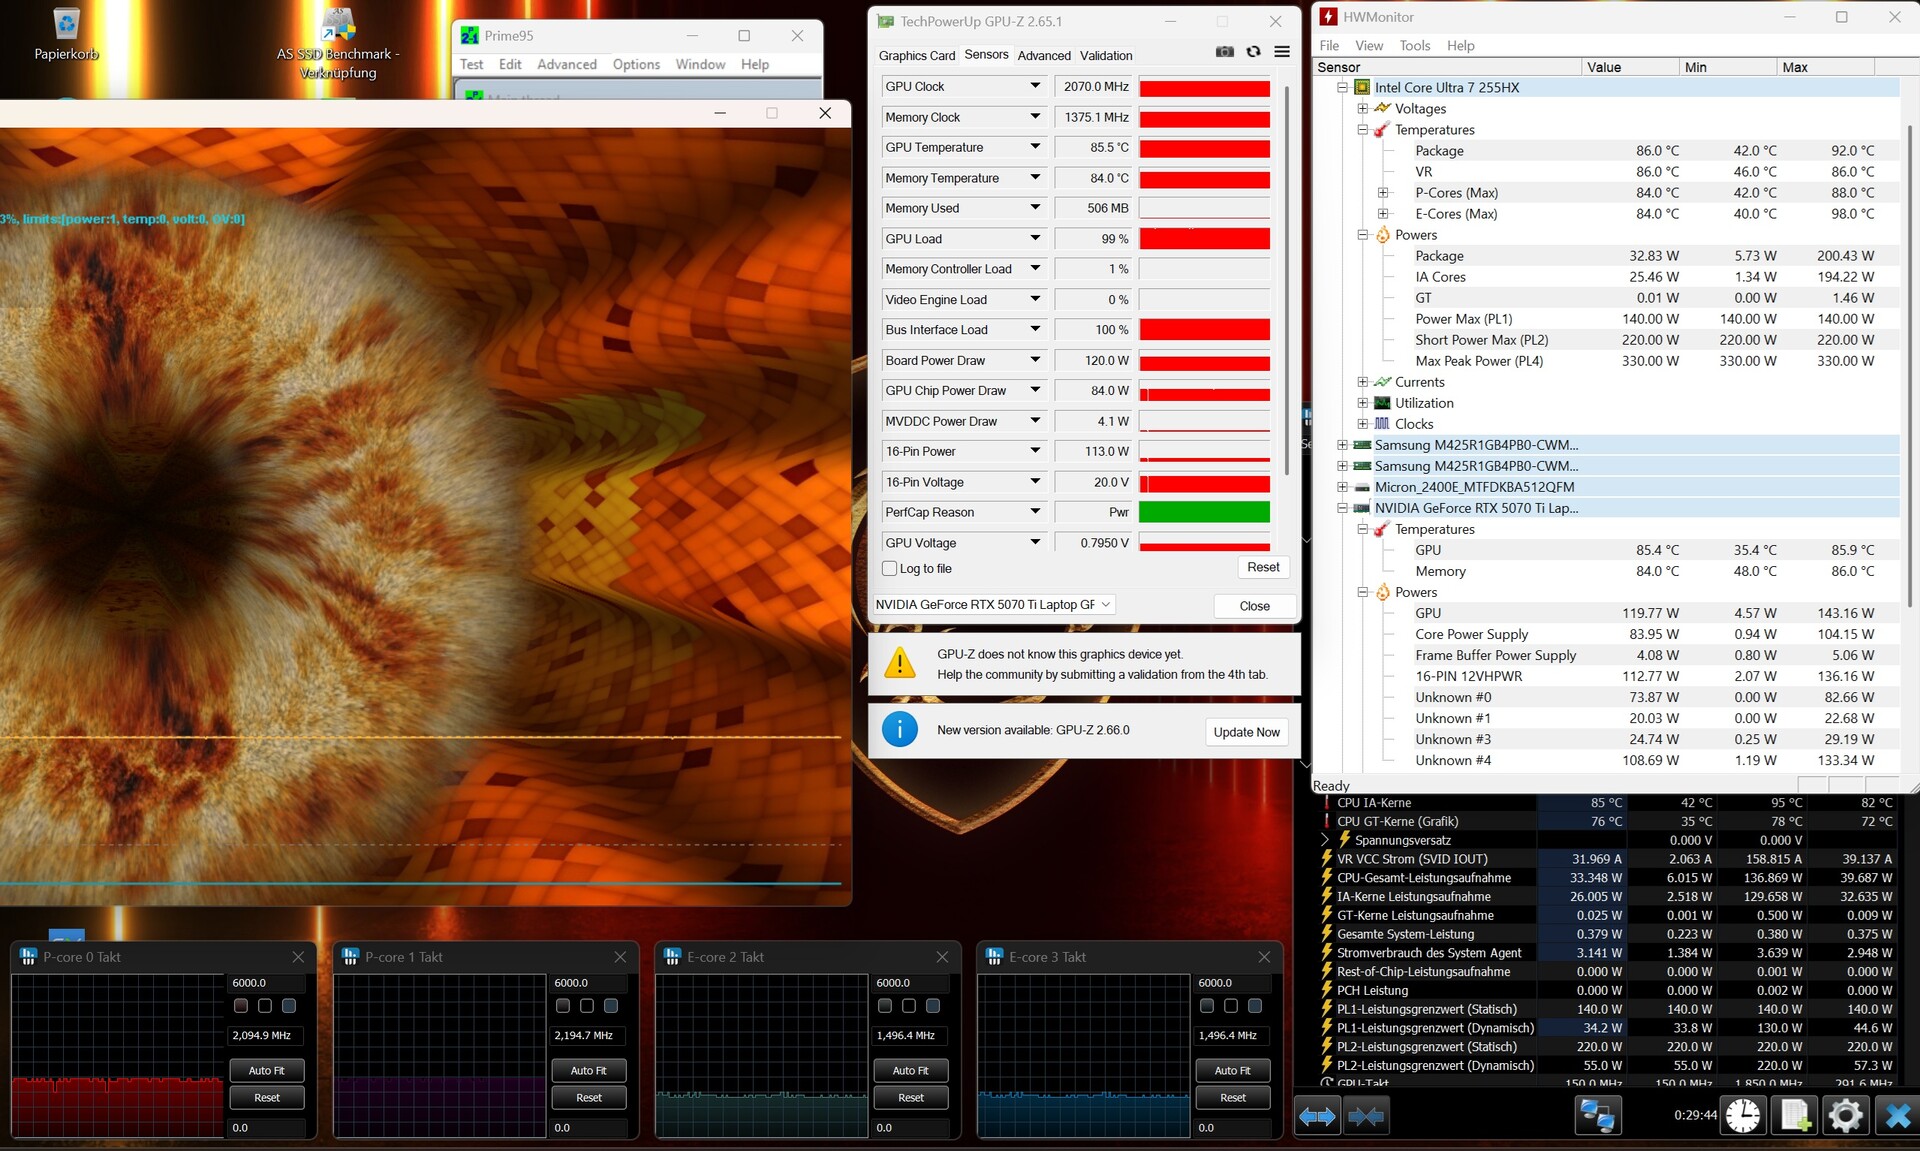
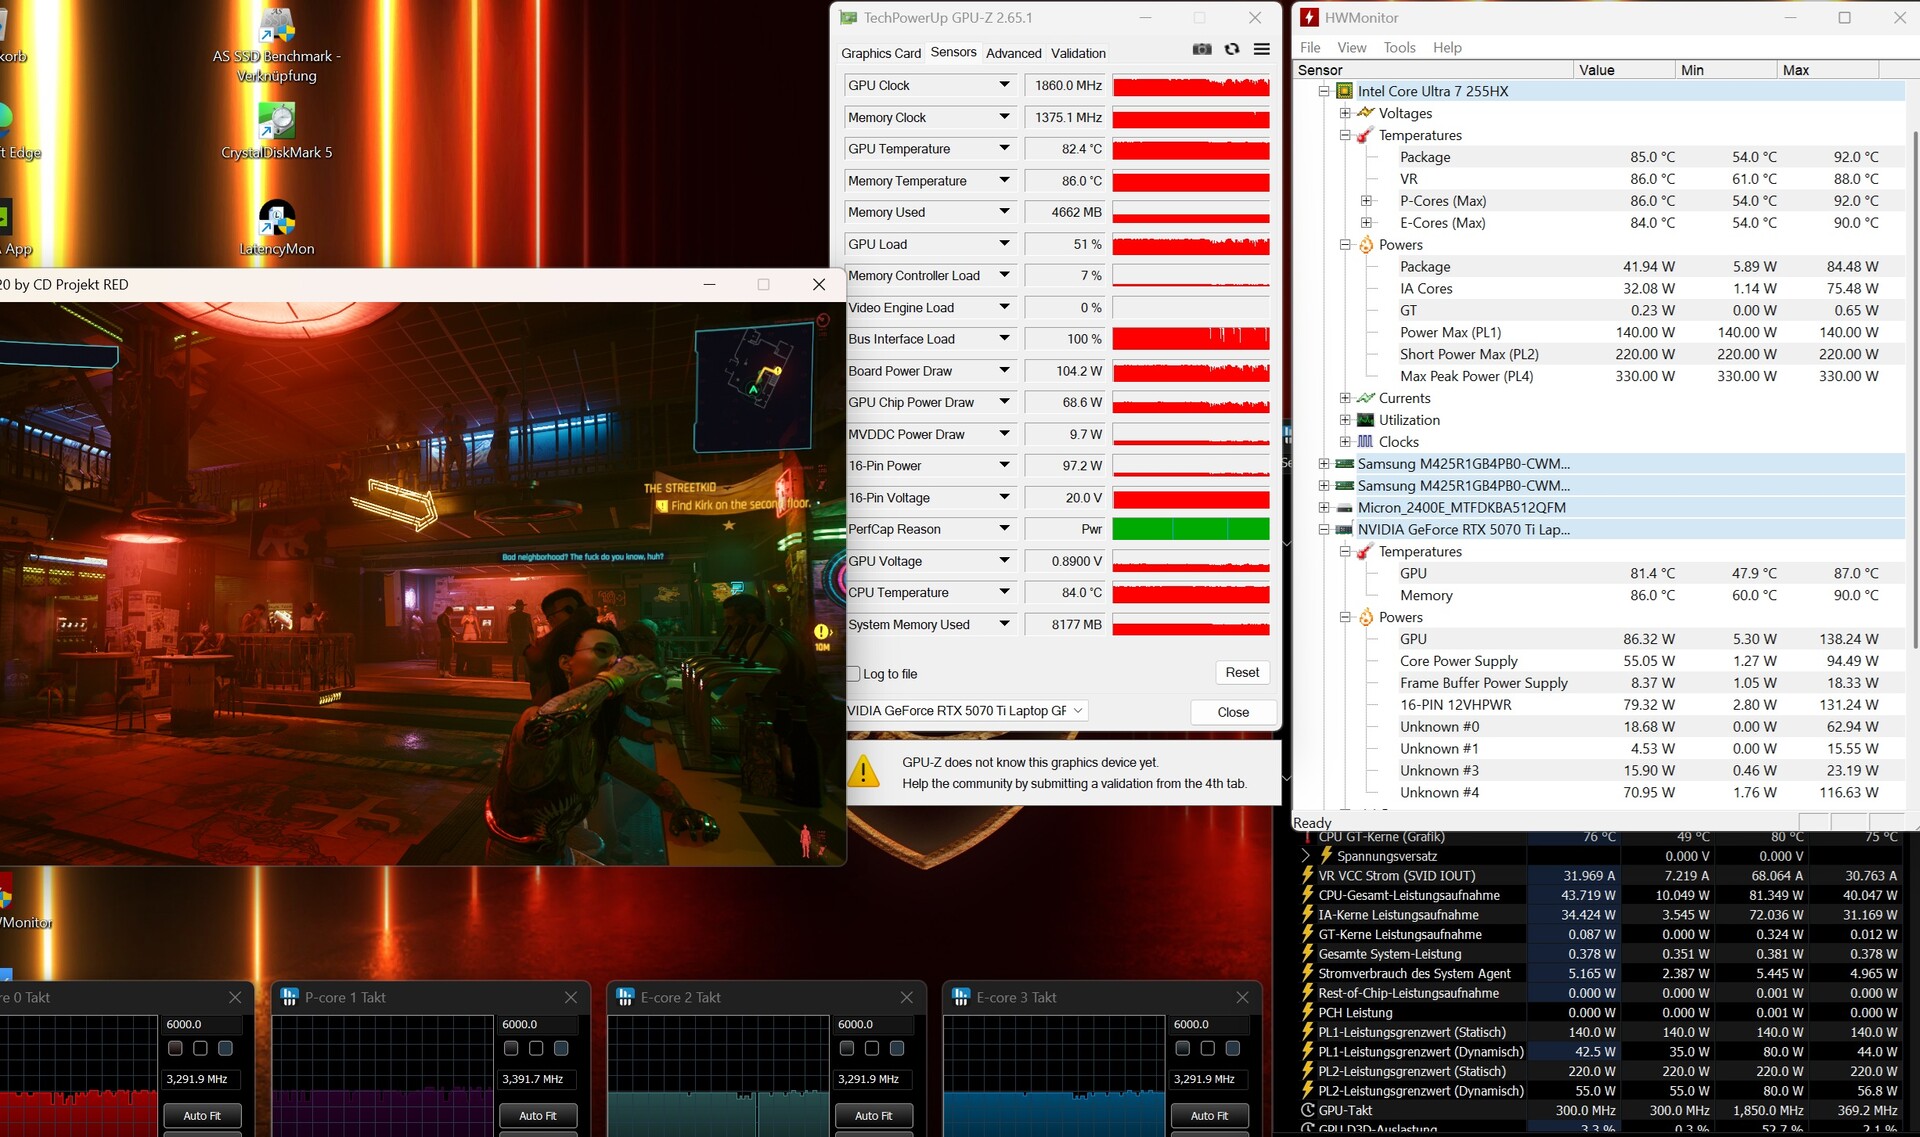
GPU performance
The GeForce RTX 5070 Ti in our opinion should have been the actual RTX 5070 which, with 8 instead of 12 GB of VRAM, is no longer up to date. However, the Ti version leaves a good impression in both synthetic benchmarks and games. The results in Vector 16 are based on the previously determined average for this graphics card. MSI gives the Blackwell representative a maximum of 140 watts TGP including Dynamic Boost. The RTX 5080 of the Alienware 16 outperforms the RTX 5070 Ti by around 20 %.
| 3DMark 06 Standard Score | 60964 points | |
| 3DMark 11 Performance | 41662 points | |
| 3DMark Cloud Gate Standard Score | 61167 points | |
| 3DMark Fire Strike Score | 36625 points | |
| 3DMark Time Spy Score | 15886 points | |
Help | ||
* ... smaller is better
Gaming performance
The RTX 5070 Ti is a suitable companion for Full HD and QHD displays. In our standard resolution of 2,560 x 1,440 pixels, with the exception of the poorly optimised Oblivion Remastered all titles ran at 40+ fps - in maximum details, of course. The situation looks even better when upscaling is activated. Including DLSS (4) and (Multi) Frame Generation, significantly higher values can usually be achieved, such as Stalker 2 shows (see table), which ensures a smoother display.
| Doom: The Dark Ages | |
| 2560x1440 Ultra Nightmare AA:T | |
| Medion Erazer Beast 18 X1 MD62731 | |
| MSI Vector 16 HX AI A2XWHG | |
| Average of class Gaming (30.4 - 92.2, n=19, last 2 years) | |
| Average NVIDIA GeForce RTX 5070 Ti Laptop (45.7 - 59.1, n=3) | |
| MSI Katana 17 HX B14WGK | |
| 2560x1440 Ultra Nightmare - DLSS Quality | |
| Medion Erazer Beast 18 X1 MD62731 | |
| MSI Vector 16 HX AI A2XWHG | |
| Average NVIDIA GeForce RTX 5070 Ti Laptop (61 - 82.5, n=3) | |
| Average of class Gaming (48 - 107.3, n=18, last 2 years) | |
| MSI Katana 17 HX B14WGK | |
| The Elder Scrolls IV Oblivion Remastered | |
| 2560x1440 Ultra Preset AA:T | |
| Medion Erazer Beast 18 X1 MD62731 | |
| Average NVIDIA GeForce RTX 5070 Ti Laptop (28 - 30.9, n=3) | |
| MSI Vector 16 HX AI A2XWHG | |
| Average of class Gaming (12.7 - 45.9, n=14, last 2 years) | |
| MSI Katana 17 HX B14WGK | |
| 2560x1440 Ultra Preset + Quality DLSS | |
| Medion Erazer Beast 18 X1 MD62731 | |
| Average NVIDIA GeForce RTX 5070 Ti Laptop (41.9 - 47.4, n=3) | |
| MSI Vector 16 HX AI A2XWHG | |
| Average of class Gaming (25.3 - 59.7, n=12, last 2 years) | |
| MSI Katana 17 HX B14WGK | |
| Kingdom Come Deliverance 2 | |
| 2560x1440 Ultra Preset | |
| Medion Erazer Beast 18 X1 MD62731 | |
| Average NVIDIA GeForce RTX 5070 Ti Laptop (59 - 65, n=3) | |
| Average of class Gaming (36.8 - 97.2, n=13, last 2 years) | |
| MSI Vector 16 HX AI A2XWHG | |
| MSI Katana 17 HX B14WGK | |
| 2560x1440 Ultra Preset + Quality DLSS | |
| Medion Erazer Beast 18 X1 MD62731 | |
| Average NVIDIA GeForce RTX 5070 Ti Laptop (79.2 - 94.7, n=3) | |
| Average of class Gaming (50.3 - 115.5, n=13, last 2 years) | |
| MSI Vector 16 HX AI A2XWHG | |
| MSI Katana 17 HX B14WGK | |
| Until Dawn | |
| 2560x1440 Ultra Preset | |
| Medion Erazer Beast 18 X1 MD62731 | |
| Average of class Gaming (30.4 - 76.6, n=11, last 2 years) | |
| MSI Vector 16 HX AI A2XWHG | |
| Average NVIDIA GeForce RTX 5070 Ti Laptop (n=1) | |
| MSI Katana 17 HX B14WGK | |
| 2560x1440 Ultra Preset + Quality DLSS + Ray Tracing | |
| Medion Erazer Beast 18 X1 MD62731 | |
| MSI Vector 16 HX AI A2XWHG | |
| Average NVIDIA GeForce RTX 5070 Ti Laptop (n=1) | |
| Average of class Gaming (39.5 - 86.3, n=10, last 2 years) | |
| MSI Katana 17 HX B14WGK | |
| Space Marine 2 | |
| 2560x1440 Ultra Preset AA:T | |
| Medion Erazer Beast 18 X1 MD62731 | |
| MSI Vector 16 HX AI A2XWHG | |
| Average NVIDIA GeForce RTX 5070 Ti Laptop (n=1) | |
| Average of class Gaming (48.2 - 107.4, n=11, last 2 years) | |
| MSI Katana 17 HX B14WGK | |
| 2560x1440 Ultra Preset + Quality DLSS | |
| Medion Erazer Beast 18 X1 MD62731 | |
| MSI Vector 16 HX AI A2XWHG | |
| Average NVIDIA GeForce RTX 5070 Ti Laptop (n=1) | |
| Average of class Gaming (58.5 - 100.8, n=10, last 2 years) | |
| MSI Katana 17 HX B14WGK | |
| Senua's Saga Hellblade 2 | |
| 2560x1440 High Preset | |
| Medion Erazer Beast 18 X1 MD62731 | |
| MSI Vector 16 HX AI A2XWHG | |
| Average NVIDIA GeForce RTX 5070 Ti Laptop (n=1) | |
| Average of class Gaming (24.2 - 63.1, n=11, last 2 years) | |
| MSI Katana 17 HX B14WGK | |
| 2560x1440 High Preset + Quality DLSS | |
| Medion Erazer Beast 18 X1 MD62731 | |
| MSI Vector 16 HX AI A2XWHG | |
| Average NVIDIA GeForce RTX 5070 Ti Laptop (n=1) | |
| Average of class Gaming (39.6 - 81.9, n=9, last 2 years) | |
| MSI Katana 17 HX B14WGK | |
| Ghost of Tsushima | |
| 2560x1440 Very High Preset AA:T | |
| Medion Erazer Beast 18 X1 MD62731 | |
| MSI Vector 16 HX AI A2XWHG | |
| Average NVIDIA GeForce RTX 5070 Ti Laptop (n=1) | |
| Average of class Gaming (22.7 - 100.3, n=13, last 2 years) | |
| MSI Katana 17 HX B14WGK | |
| 2560x1440 Very High Preset + Quality DLSS | |
| Medion Erazer Beast 18 X1 MD62731 | |
| MSI Vector 16 HX AI A2XWHG | |
| Average NVIDIA GeForce RTX 5070 Ti Laptop (n=1) | |
| Average of class Gaming (55.2 - 105.2, n=10, last 2 years) | |
| MSI Katana 17 HX B14WGK | |
| Horizon Forbidden West | |
| 2560x1440 Very High Preset AA:T | |
| Medion Erazer Beast 18 X1 MD62731 | |
| MSI Vector 16 HX AI A2XWHG | |
| Average NVIDIA GeForce RTX 5070 Ti Laptop (n=1) | |
| Average of class Gaming (39.6 - 100.9, n=10, last 2 years) | |
| MSI Katana 17 HX B14WGK | |
| 2560x1440 Very High Preset + DLSS Quality | |
| Medion Erazer Beast 18 X1 MD62731 | |
| MSI Vector 16 HX AI A2XWHG | |
| Average NVIDIA GeForce RTX 5070 Ti Laptop (n=1) | |
| Average of class Gaming (58.4 - 116.6, n=8, last 2 years) | |
| MSI Katana 17 HX B14WGK | |
| GTA V - 1920x1080 Highest AA:4xMSAA + FX AF:16x | |
| Schenker XMG Pro 16 (E25) | |
| MSI Vector 16 HX AI A2XWHG | |
| Average NVIDIA GeForce RTX 5070 Ti Laptop (98 - 166.3, n=14) | |
| MSI Vector 16 HX A14V | |
| Average of class Gaming (48.3 - 186.9, n=102, last 2 years) | |
| MSI Katana 17 HX B14WGK | |
| Final Fantasy XV Benchmark - 1920x1080 High Quality | |
| Alienware 16 Area-51 | |
| MSI Vector 16 HX A14V | |
| MSI Vector 16 HX AI A2XWHG | |
| Average NVIDIA GeForce RTX 5070 Ti Laptop (108.9 - 181.4, n=15) | |
| Schenker XMG Pro 16 (E25) | |
| Average of class Gaming (41 - 215, n=103, last 2 years) | |
| Strange Brigade - 1920x1080 ultra AA:ultra AF:16 | |
| Alienware 16 Area-51 | |
| MSI Vector 16 HX A14V | |
| Average NVIDIA GeForce RTX 5070 Ti Laptop (136.4 - 353, n=12) | |
| Average of class Gaming (76.3 - 456, n=93, last 2 years) | |
| Schenker XMG Pro 16 (E25) | |
| low | med. | high | ultra | QHD DLSS | QHD | |
|---|---|---|---|---|---|---|
| GTA V (2015) | 185.6 | 179 | 144.8 | 138.8 | ||
| Dota 2 Reborn (2015) | 209 | 183.9 | 175.8 | 164.7 | ||
| Final Fantasy XV Benchmark (2018) | 208 | 163.1 | 119.7 | |||
| X-Plane 11.11 (2018) | 138.7 | 114.7 | 106.6 | |||
| Baldur's Gate 3 (2023) | 179.1 | 151.9 | 147.4 | 99.1 | ||
| Cyberpunk 2077 (2023) | 138.5 | 135.4 | 119.6 | 75 | ||
| Counter-Strike 2 (2023) | 316 | 265 | 222 | 174.1 | ||
| Prince of Persia The Lost Crown (2024) | 358 | 358 | 357 | 356 | ||
| Helldivers 2 (2024) | 143.8 | 141.7 | 141.4 | 101.6 | ||
| Dragon's Dogma 2 (2024) | 83 | 74.8 | ||||
| Horizon Forbidden West (2024) | 131.1 | 97.5 | 96 | 93.1 | 72.6 | |
| Ghost of Tsushima (2024) | 106.5 | 102 | 83.8 | 83.9 | 60.7 | |
| Senua's Saga Hellblade 2 (2024) | 77.2 | 55 | 59.1 | 40 | ||
| Star Wars Outlaws (2024) | 70.7 | 66.5 | 55.9 | 56.8 | 40.3 | |
| Space Marine 2 (2024) | 90.9 | 88.8 | 87.7 | 84.6 | 73.1 | |
| Until Dawn (2024) | 99.3 | 85.9 | 67.7 | 61.4 | 48 | |
| Stalker 2 (2024) | 84.6 | 73.6 | 62 | 100.8 | 46.9 | |
| Kingdom Come Deliverance 2 (2025) | 145.2 | 118.8 | 84.1 | 79.2 | 59 | |
| Civilization 7 (2025) | 192.1 | 187.5 | 129.1 | |||
| The Elder Scrolls IV Oblivion Remastered (2025) | 86.9 | 78.2 | 40 | 41.9 | 28 | |
| Doom: The Dark Ages (2025) | 94.8 | 84.3 | 82.7 | 79.1 | 57.9 |
Our Cyberpunk 2077 Test also proves that the GPU performance remains constant over a longer period of time. It was a similar story with the CPU in the Cinebench loop.
Cyberpunk 2077 Ultra settings fps chart
Emissions
Noise levels
MSI should reconsider the fan control. With the AI profile, the two case fans, as mentioned earlier, are already quite audible when idle. In 3D mode, the Vector 16 is somewhat quieter than several competitors, registering between 46 and 49 dB, provided there is no exclusive CPU load. However, this does not mean the 16-inch laptop is quiet.
Noise level
| Idle |
| 33 / 34 / 38 dB(A) |
| Load |
| 46 / 49 dB(A) |
 | ||
30 dB silent 40 dB(A) audible 50 dB(A) loud |
||
min: | ||
| MSI Vector 16 HX AI A2XWHG Ultra 7 255HX, GeForce RTX 5070 Ti Laptop | MSI Vector 16 HX A14V i9-14900HX, GeForce RTX 4080 Laptop GPU | MSI Katana 17 HX B14WGK i7-14650HX, GeForce RTX 5070 Laptop | Schenker XMG Pro 16 (E25) Ultra 9 275HX, GeForce RTX 5070 Ti Laptop | Alienware 16 Area-51 Ultra 9 275HX, GeForce RTX 5080 Laptop | |
|---|---|---|---|---|---|
| Noise | -4% | -4% | 10% | 13% | |
| off / environment * (dB) | 25 | 23.2 7% | 25 -0% | 23.3 7% | 23.6 6% |
| Idle Minimum * (dB) | 33 | 33.5 -2% | 31 6% | 25 24% | 25.4 23% |
| Idle Average * (dB) | 34 | 33.5 1% | 32 6% | 25 26% | 27.8 18% |
| Idle Maximum * (dB) | 38 | 33.5 12% | 34 11% | 25 34% | 28.1 26% |
| Load Average * (dB) | 46 | 52.1 -13% | 50 -9% | 45.5 1% | 28.8 37% |
| Cyberpunk 2077 ultra * (dB) | 47 | 58 -23% | 53.3 -13% | 50.4 -7% | |
| Load Maximum * (dB) | 49 | 62 -27% | 59 -20% | 53.3 -9% | 56.4 -15% |
| Witcher 3 ultra * (dB) | 62 |
* ... smaller is better
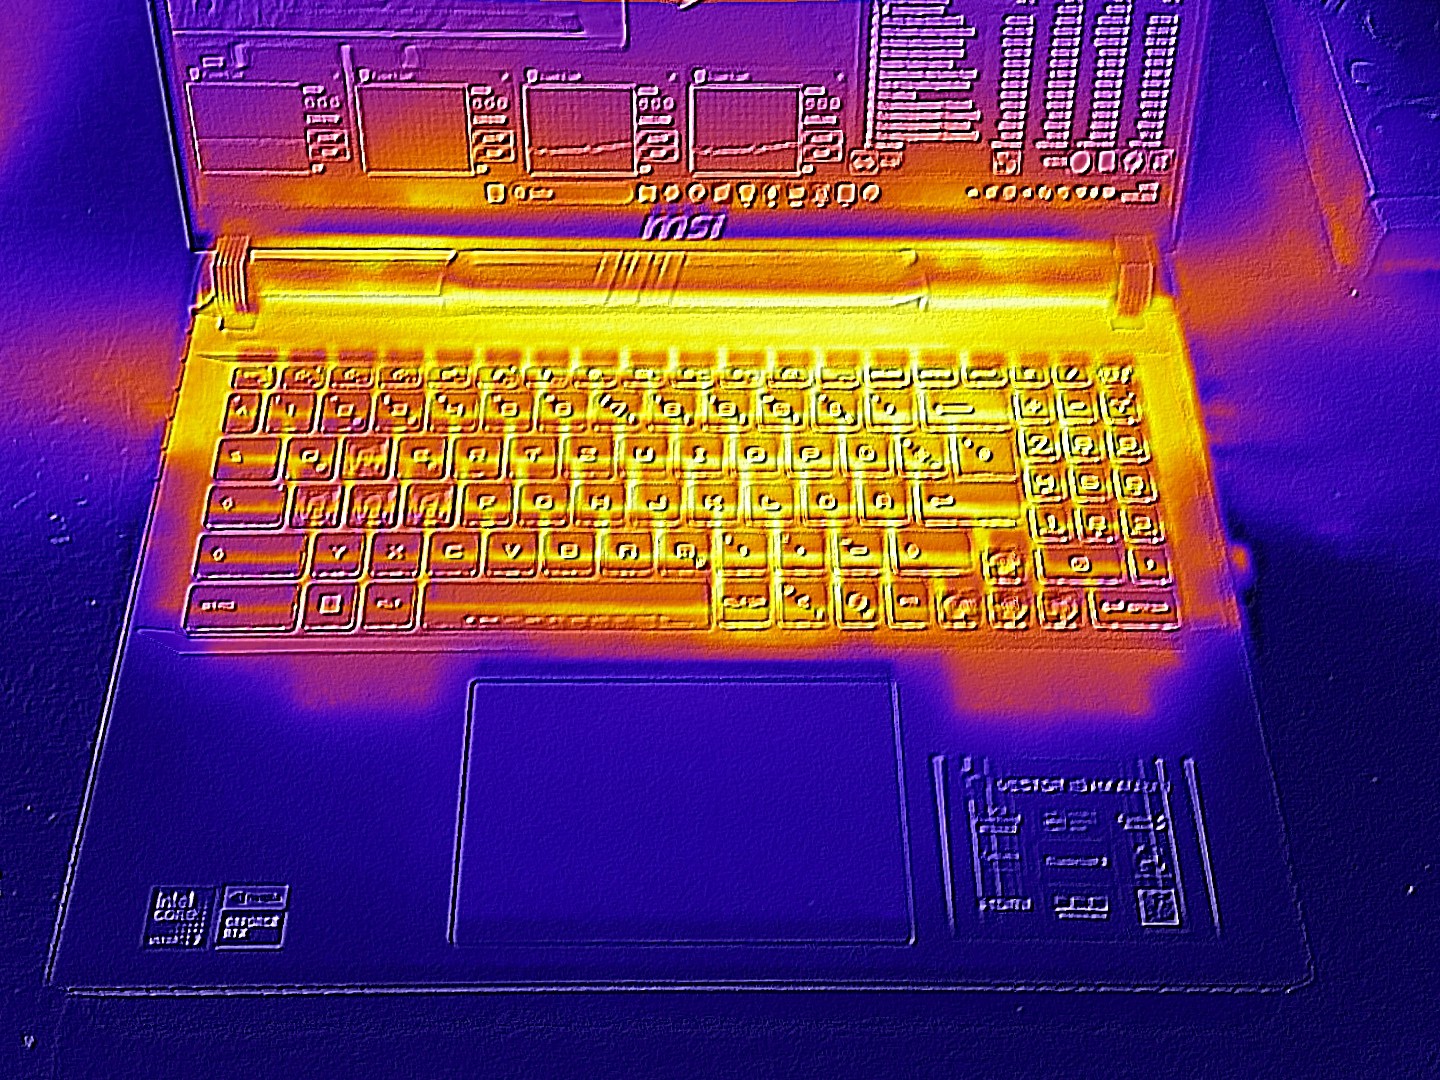
Temperature
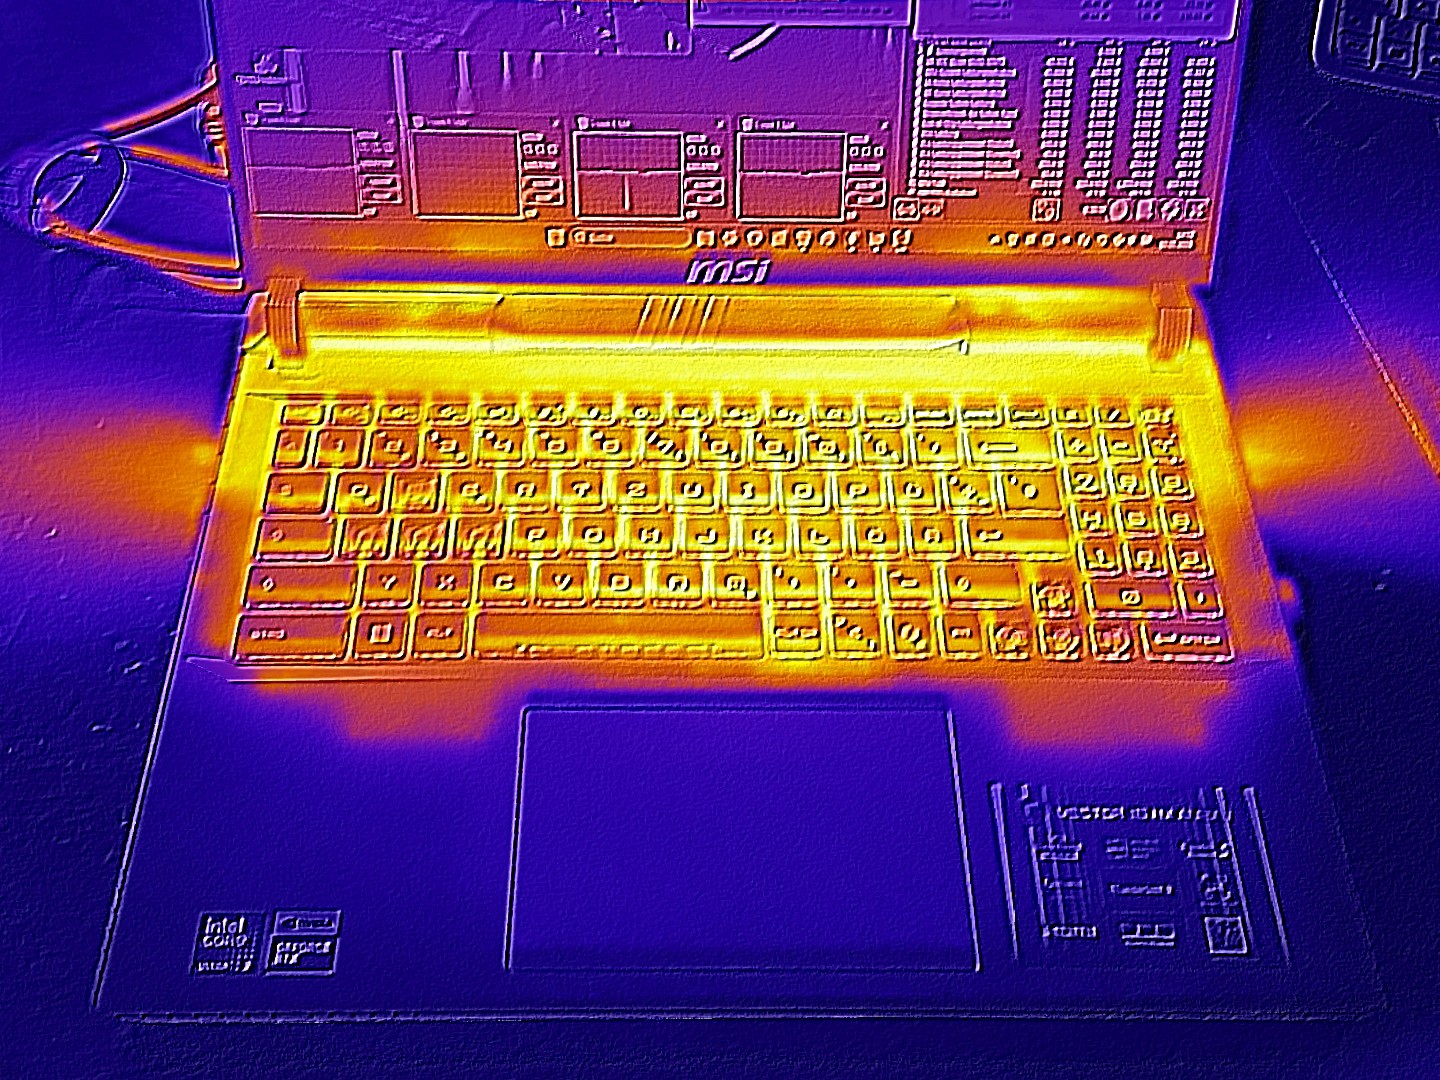
Under load, the chassis becomes warmest towards the rear third. Peak temperatures of 53 °C on the top surface and 52 °C on the underside are less than ideal and slightly higher than those of competing devices. When idle, however, the chassis typically remains below the 30 °C mark, keeping comfortably cool.
(-) The maximum temperature on the upper side is 53 °C / 127 F, compared to the average of 40.4 °C / 105 F, ranging from 21.2 to 68.8 °C for the class Gaming.
(-) The bottom heats up to a maximum of 52 °C / 126 F, compared to the average of 43.2 °C / 110 F
(+) In idle usage, the average temperature for the upper side is 28.1 °C / 83 F, compared to the device average of 33.9 °C / 93 F.
(-) 3: The average temperature for the upper side is 43.9 °C / 111 F, compared to the average of 33.9 °C / 93 F for the class Gaming.
(±) The palmrests and touchpad can get very hot to the touch with a maximum of 37 °C / 98.6 F.
(-) The average temperature of the palmrest area of similar devices was 28.8 °C / 83.8 F (-8.2 °C / -14.8 F).
| MSI Vector 16 HX AI A2XWHG Ultra 7 255HX, GeForce RTX 5070 Ti Laptop | MSI Vector 16 HX A14V i9-14900HX, GeForce RTX 4080 Laptop GPU | MSI Katana 17 HX B14WGK i7-14650HX, GeForce RTX 5070 Laptop | Schenker XMG Pro 16 (E25) Ultra 9 275HX, GeForce RTX 5070 Ti Laptop | Alienware 16 Area-51 Ultra 9 275HX, GeForce RTX 5080 Laptop | |
|---|---|---|---|---|---|
| Heat | 22% | -4% | -191% | 3% | |
| Maximum Upper Side * (°C) | 53 | 36.4 31% | 52 2% | 43.2 18% | 43.8 17% |
| Maximum Bottom * (°C) | 52 | 35.6 32% | 56 -8% | 46 12% | 40 23% |
| Idle Upper Side * (°C) | 33 | 26.6 19% | 33 -0% | 27.7 16% | 35.8 -8% |
| Idle Bottom * (°C) | 29 | 27 7% | 32 -10% | 264 -810% | 35.2 -21% |
* ... smaller is better
Stress test
The stress test using FurMark and Prime95 produced mixed results. Temperatures of around 86 °C for both the CPU and GPU are neither especially low nor excessively high. In Cyberpunk 2077, component temperatures were only slightly lower.


Speakers
Sound quality ranks in the middle of the pack for gaming laptops. As is often the case, the bass could be more pronounced. That said, the built-in sound system is clearly better than the one found in the Katana 17 (see comparison table).
MSI Vector 16 HX AI A2XWHG audio analysis
(+) | speakers can play relatively loud (86 dB)
Bass 100 - 315 Hz
(±) | reduced bass - on average 12.3% lower than median
(±) | linearity of bass is average (8.5% delta to prev. frequency)
Mids 400 - 2000 Hz
(±) | higher mids - on average 9.9% higher than median
(+) | mids are linear (6.8% delta to prev. frequency)
Highs 2 - 16 kHz
(+) | balanced highs - only 1.8% away from median
(+) | highs are linear (2.9% delta to prev. frequency)
Overall 100 - 16.000 Hz
(±) | linearity of overall sound is average (15.8% difference to median)
Compared to same class
» 37% of all tested devices in this class were better, 7% similar, 56% worse
» The best had a delta of 6%, average was 18%, worst was 132%
Compared to all devices tested
» 24% of all tested devices were better, 5% similar, 71% worse
» The best had a delta of 4%, average was 24%, worst was 134%
MSI Katana 17 HX B14WGK audio analysis
(+) | speakers can play relatively loud (84 dB)
Bass 100 - 315 Hz
(-) | nearly no bass - on average 19% lower than median
(±) | linearity of bass is average (10.6% delta to prev. frequency)
Mids 400 - 2000 Hz
(±) | higher mids - on average 8.7% higher than median
(±) | linearity of mids is average (7.5% delta to prev. frequency)
Highs 2 - 16 kHz
(+) | balanced highs - only 4.6% away from median
(±) | linearity of highs is average (9.7% delta to prev. frequency)
Overall 100 - 16.000 Hz
(±) | linearity of overall sound is average (20.6% difference to median)
Compared to same class
» 74% of all tested devices in this class were better, 5% similar, 21% worse
» The best had a delta of 6%, average was 18%, worst was 132%
Compared to all devices tested
» 55% of all tested devices were better, 8% similar, 37% worse
» The best had a delta of 4%, average was 24%, worst was 134%
Power management
Power consumption
Idle power draw averages around 16 watts, which is lower than that of many other RTX 5070 (Ti) laptops. Under load, the 16-inch system consumes between 124 watts (3DMark 06) and a peak of 336 watts during the stress test. During gaming, power consumption typically hovers around 220 watts. Please note that when using external monitors, the system defaults to the dedicated GPU, which results in higher idle power usage.
| Off / Standby | |
| Idle | |
| Load |
|
Key:
min: | |
| MSI Vector 16 HX AI A2XWHG Ultra 7 255HX, GeForce RTX 5070 Ti Laptop | MSI Vector 16 HX A14V i9-14900HX, GeForce RTX 4080 Laptop GPU | MSI Katana 17 HX B14WGK i7-14650HX, GeForce RTX 5070 Laptop | Schenker XMG Pro 16 (E25) Ultra 9 275HX, GeForce RTX 5070 Ti Laptop | Alienware 16 Area-51 Ultra 9 275HX, GeForce RTX 5080 Laptop | Average of class Gaming | |
|---|---|---|---|---|---|---|
| Power Consumption | -33% | 5% | -5% | -67% | -10% | |
| Idle Minimum * (Watt) | 7.1 | 15.8 -123% | 9.7 -37% | 11.7 -65% | 27 -280% | 13.2 ? -86% |
| Idle Average * (Watt) | 15.9 | 23.3 -47% | 15 6% | 16.6 -4% | 33.5 -111% | 18.9 ? -19% |
| Idle Maximum * (Watt) | 29.5 | 30 -2% | 23.7 20% | 17.1 42% | 41.4 -40% | 24.3 ? 18% |
| Load Average * (Watt) | 124 | 123.9 -0% | 126 -2% | 122.4 1% | 124.7 -1% | 108 ? 13% |
| Cyberpunk 2077 ultra external monitor * (Watt) | 217 | 202 7% | 241 -11% | 249 -15% | ||
| Cyberpunk 2077 ultra * (Watt) | 222 | 205 8% | 245 -10% | 256 -15% | ||
| Load Maximum * (Watt) | 336 | 306 9% | 227 32% | 291.5 13% | 367.2 -9% | 254 ? 24% |
| Witcher 3 ultra * (Watt) | 285 |
* ... smaller is better
Power consumption: Cyberpunk/stress test
Power consumption with external monitor
Battery runtime
Boasting a generous 90 Wh capacity, the battery impresses with its endurance. During our Wi-Fi test at a reduced brightness of 150 cd/m², the 16-inch laptop ran for just under seven hours. Although this runtime is commendable, the Schenker XMG Pro 16 still holds the edge with an impressive nine hours of battery life.
| MSI Vector 16 HX AI A2XWHG Ultra 7 255HX, GeForce RTX 5070 Ti Laptop, 90 Wh | MSI Vector 16 HX A14V i9-14900HX, GeForce RTX 4080 Laptop GPU, 90 Wh | MSI Katana 17 HX B14WGK i7-14650HX, GeForce RTX 5070 Laptop, 75 Wh | Schenker XMG Pro 16 (E25) Ultra 9 275HX, GeForce RTX 5070 Ti Laptop, 99.8 Wh | Alienware 16 Area-51 Ultra 9 275HX, GeForce RTX 5080 Laptop, 96 Wh | Average of class Gaming | |
|---|---|---|---|---|---|---|
| Battery runtime | -21% | -27% | 30% | -60% | 0% | |
| WiFi v1.3 (h) | 7 | 5.5 -21% | 5.1 -27% | 9.1 30% | 2.8 -60% | 7.02 ? 0% |
| Reader / Idle (h) | 10.7 | 3.1 | 8.71 ? | |||
| Load (h) | 1.4 | 1.47 ? |
Notebookcheck overall rating
The MSI Vector 16 is a largely successful RTX 5070 (Ti) model, though it is somewhat let down by its lacklustre fan control.
MSI Vector 16 HX AI A2XWHG
- 06/20/2025 v8
Florian Glaser
 Total Sustainability Score:
 Comparable models for reference
Image | Model / Review | Price | Weight | Height | Display |
|---|---|---|---|---|---|
1. 84%  | MSI Vector 16 HX AI A2XWHG Intel Core Ultra 7 255HX ⎘ NVIDIA GeForce RTX 5070 Ti Laptop ⎘ 16 GB Memory, 512 GB SSD | Amazon: List Price: 2000 EUR | 2.6 kg | 28.6 mm | 16.00" 2560x1600 189 PPI IPS |
2. 88% v7 (old)  | MSI Vector 16 HX A14V Intel Core i9-14900HX ⎘ NVIDIA GeForce RTX 4080 Laptop GPU ⎘ 32 GB Memory, 1024 GB SSD | Amazon: 1. $1,999.99 msi Vector 16 HX AI 16” 24... 2. $2,189.00 msi Vector 16 HX AI Gaming L... 3. $2,469.99 msi Vector 16 HX AI Gaming L... List Price: 2700 USD | 2.7 kg | 28.55 mm | 16.00" 2560x1600 189 PPI IPS |
3. 77.3%  | MSI Katana 17 HX B14WGK Intel Core i7-14650HX ⎘ NVIDIA GeForce RTX 5070 Laptop ⎘ 16 GB Memory, 1024 GB SSD | Amazon: List Price: 1800 EUR | 2.7 kg | 28 mm | 17.30" 2560x1440 170 PPI IPS |
4. 87.4%  | Schenker XMG Pro 16 (E25) Intel Core Ultra 9 275HX ⎘ NVIDIA GeForce RTX 5070 Ti Laptop ⎘ 32 GB Memory, 1024 GB SSD | Amazon: List Price: 2480€ | 2.5 kg | 26.5 mm | 16.00" 2560x1600 189 PPI IPS |
5. 85.7%  | Alienware 16 Area-51 Intel Core Ultra 9 275HX ⎘ NVIDIA GeForce RTX 5080 Laptop ⎘ 32 GB Memory, 1024 GB SSD | Amazon: 1. $2,348.98 Alienware 16 Area-51 Gaming ... 2. $3,799.99 Alienware 16 Area-51 Gaming ... 3. $4,299.99 Alienware 16 Area-51 Gaming ... List Price: 3500 USD | 3.3 kg | 28.5 mm | 16.00" 2560x1600 189 PPI IPS |
Transparency
The selection of devices to be reviewed is made by our editorial team. The test sample was provided to the author as a loan by the manufacturer or retailer for the purpose of this review. The lender had no influence on this review, nor did the manufacturer receive a copy of this review before publication. There was no obligation to publish this review. As an independent media company, Notebookcheck is not subjected to the authority of manufacturers, retailers or publishers.
This is how Notebookcheck is testing
Every year, Notebookcheck independently reviews hundreds of laptops and smartphones using standardized procedures to ensure that all results are comparable. We have continuously developed our test methods for around 20 years and set industry standards in the process. In our test labs, high-quality measuring equipment is utilized by experienced technicians and editors. These tests involve a multi-stage validation process. Our complex rating system is based on hundreds of well-founded measurements and benchmarks, which maintains objectivity. Further information on our test methods can be found here.

