Conclusion - Strong overall package with minor weaknesses
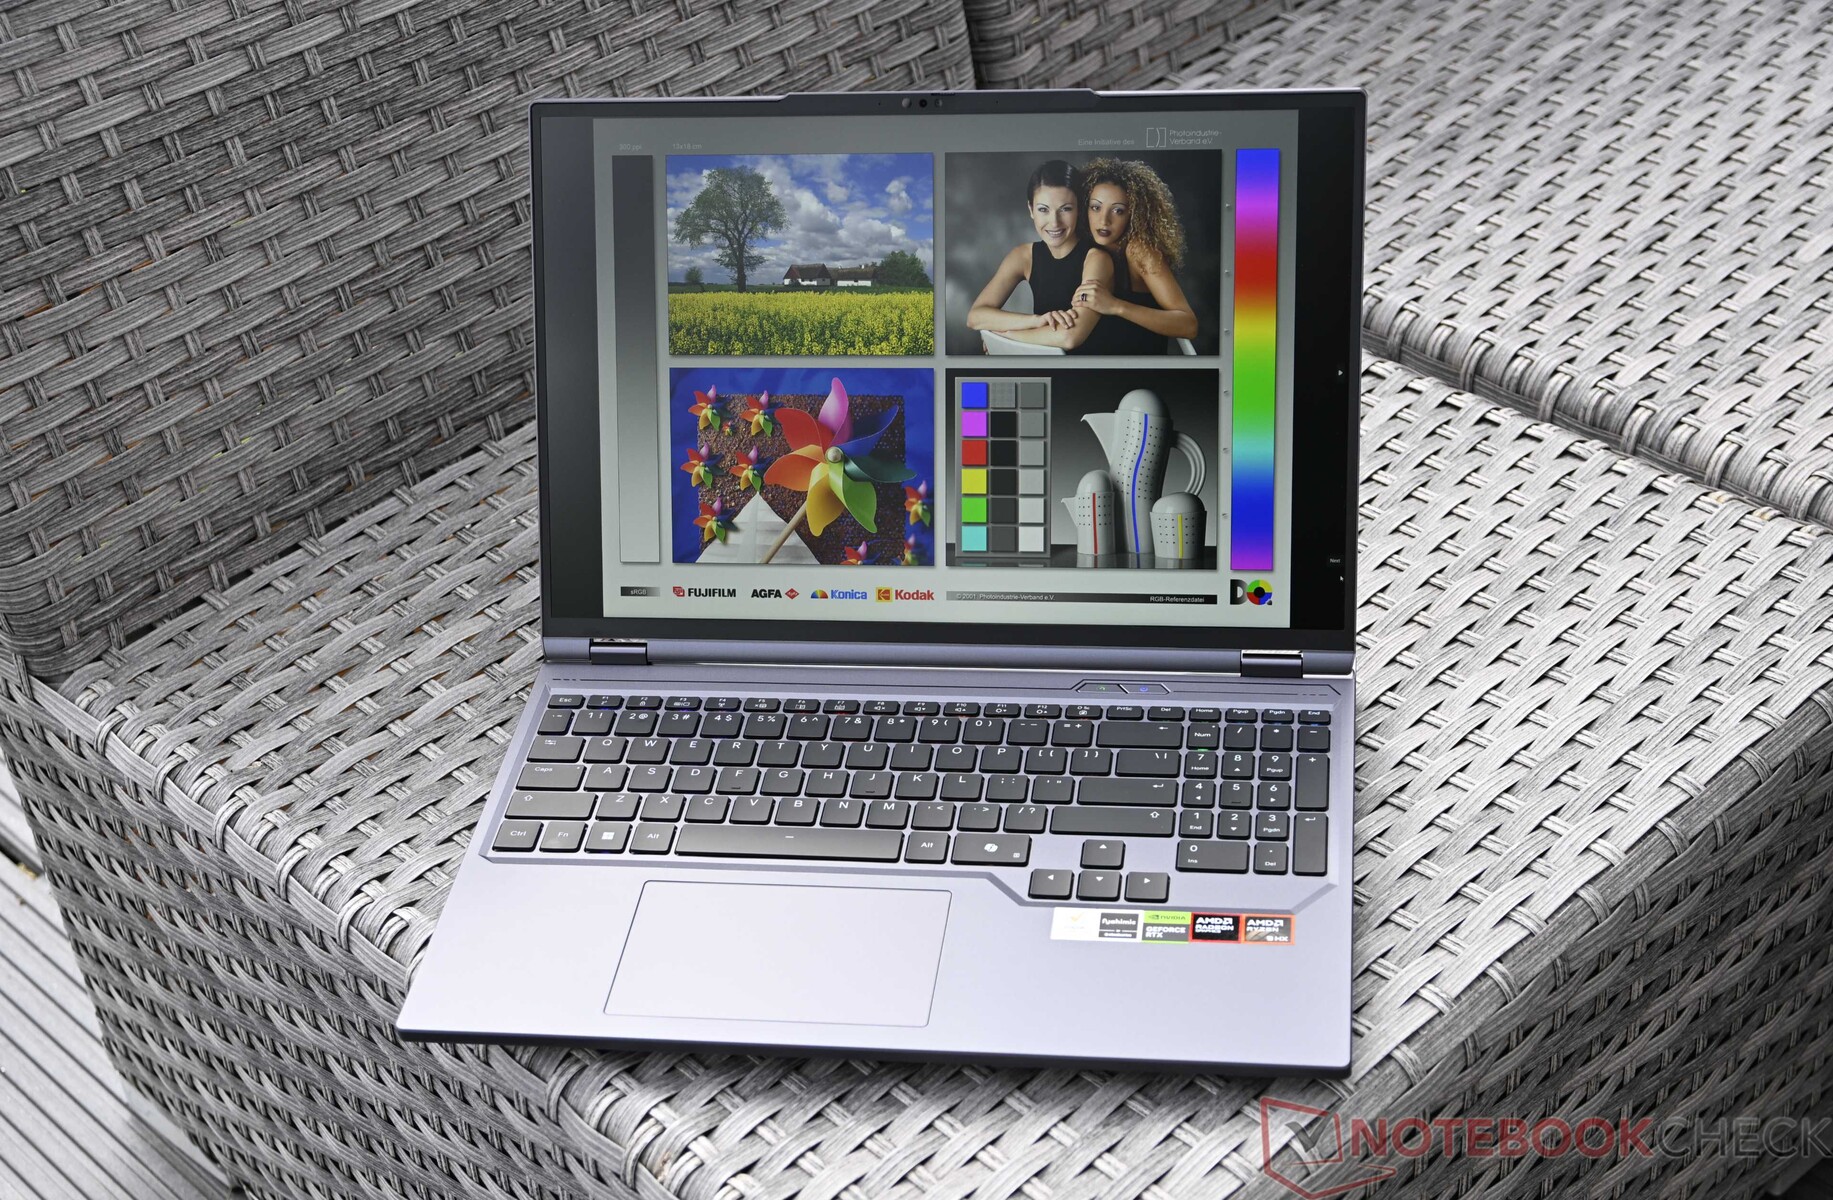
The Chuwi Gamebook presents itself as a powerful gaming notebook with solid features and a sophisticated design. The AMD Ryzen 9 9955HX and the RTX 5070 Ti laptop GPU are particularly impressive, offering strong performance in games and applications. The IPS display scores with high brightness and a high refresh rate of up to 300 Hz - ideal for demanding gamers. However, this option is only available in dGPU mode. In addition, the dedicated graphics card does not work with the optimal connection, which fortunately does not result in poor performance.
There are hardly any points of criticism in terms of workmanship and connectivity. Less successful are the speakers and the clearly excessive standby consumption. Overall, Chuwi's Gamebook offers a well-rounded overall package for users looking for performance and display quality in a comparatively compact case.
Pros
Cons
- $389.99CHUWI MiniBook X 2-in-1 Laptop 10.51", 16GB LPDDR5 512GB SSD, Intel N150 (up to 3.6GHz), Windows 11 Pro Mini Laptop with Office, FHD IPS 2K Touchscreen, Backlit Keyboard, WiFi 6, BT5.2
- $319.89CHUWI 2 in 1 Laptop Tablet, 8GB RAM 256GB SSD, Intel Core i3 (3.9GHz), Hi10 X2 Windows 11 Tablet with Magnetic Keyboard, 10.1'' HD Touchscreen Display, 5MP Camera, WiFi 6, BT 5.3
- $389.98CHUWI 2-in-1 Touchscreen Laptop 10.51'', 16GB RAM 512GB SSD, Intel N150, Windows 11, Portable Mini Laptop, 2K FHD IPS Display, Backlit Keyboard, WiFi 6, BT 5.2, Camera, USB-C
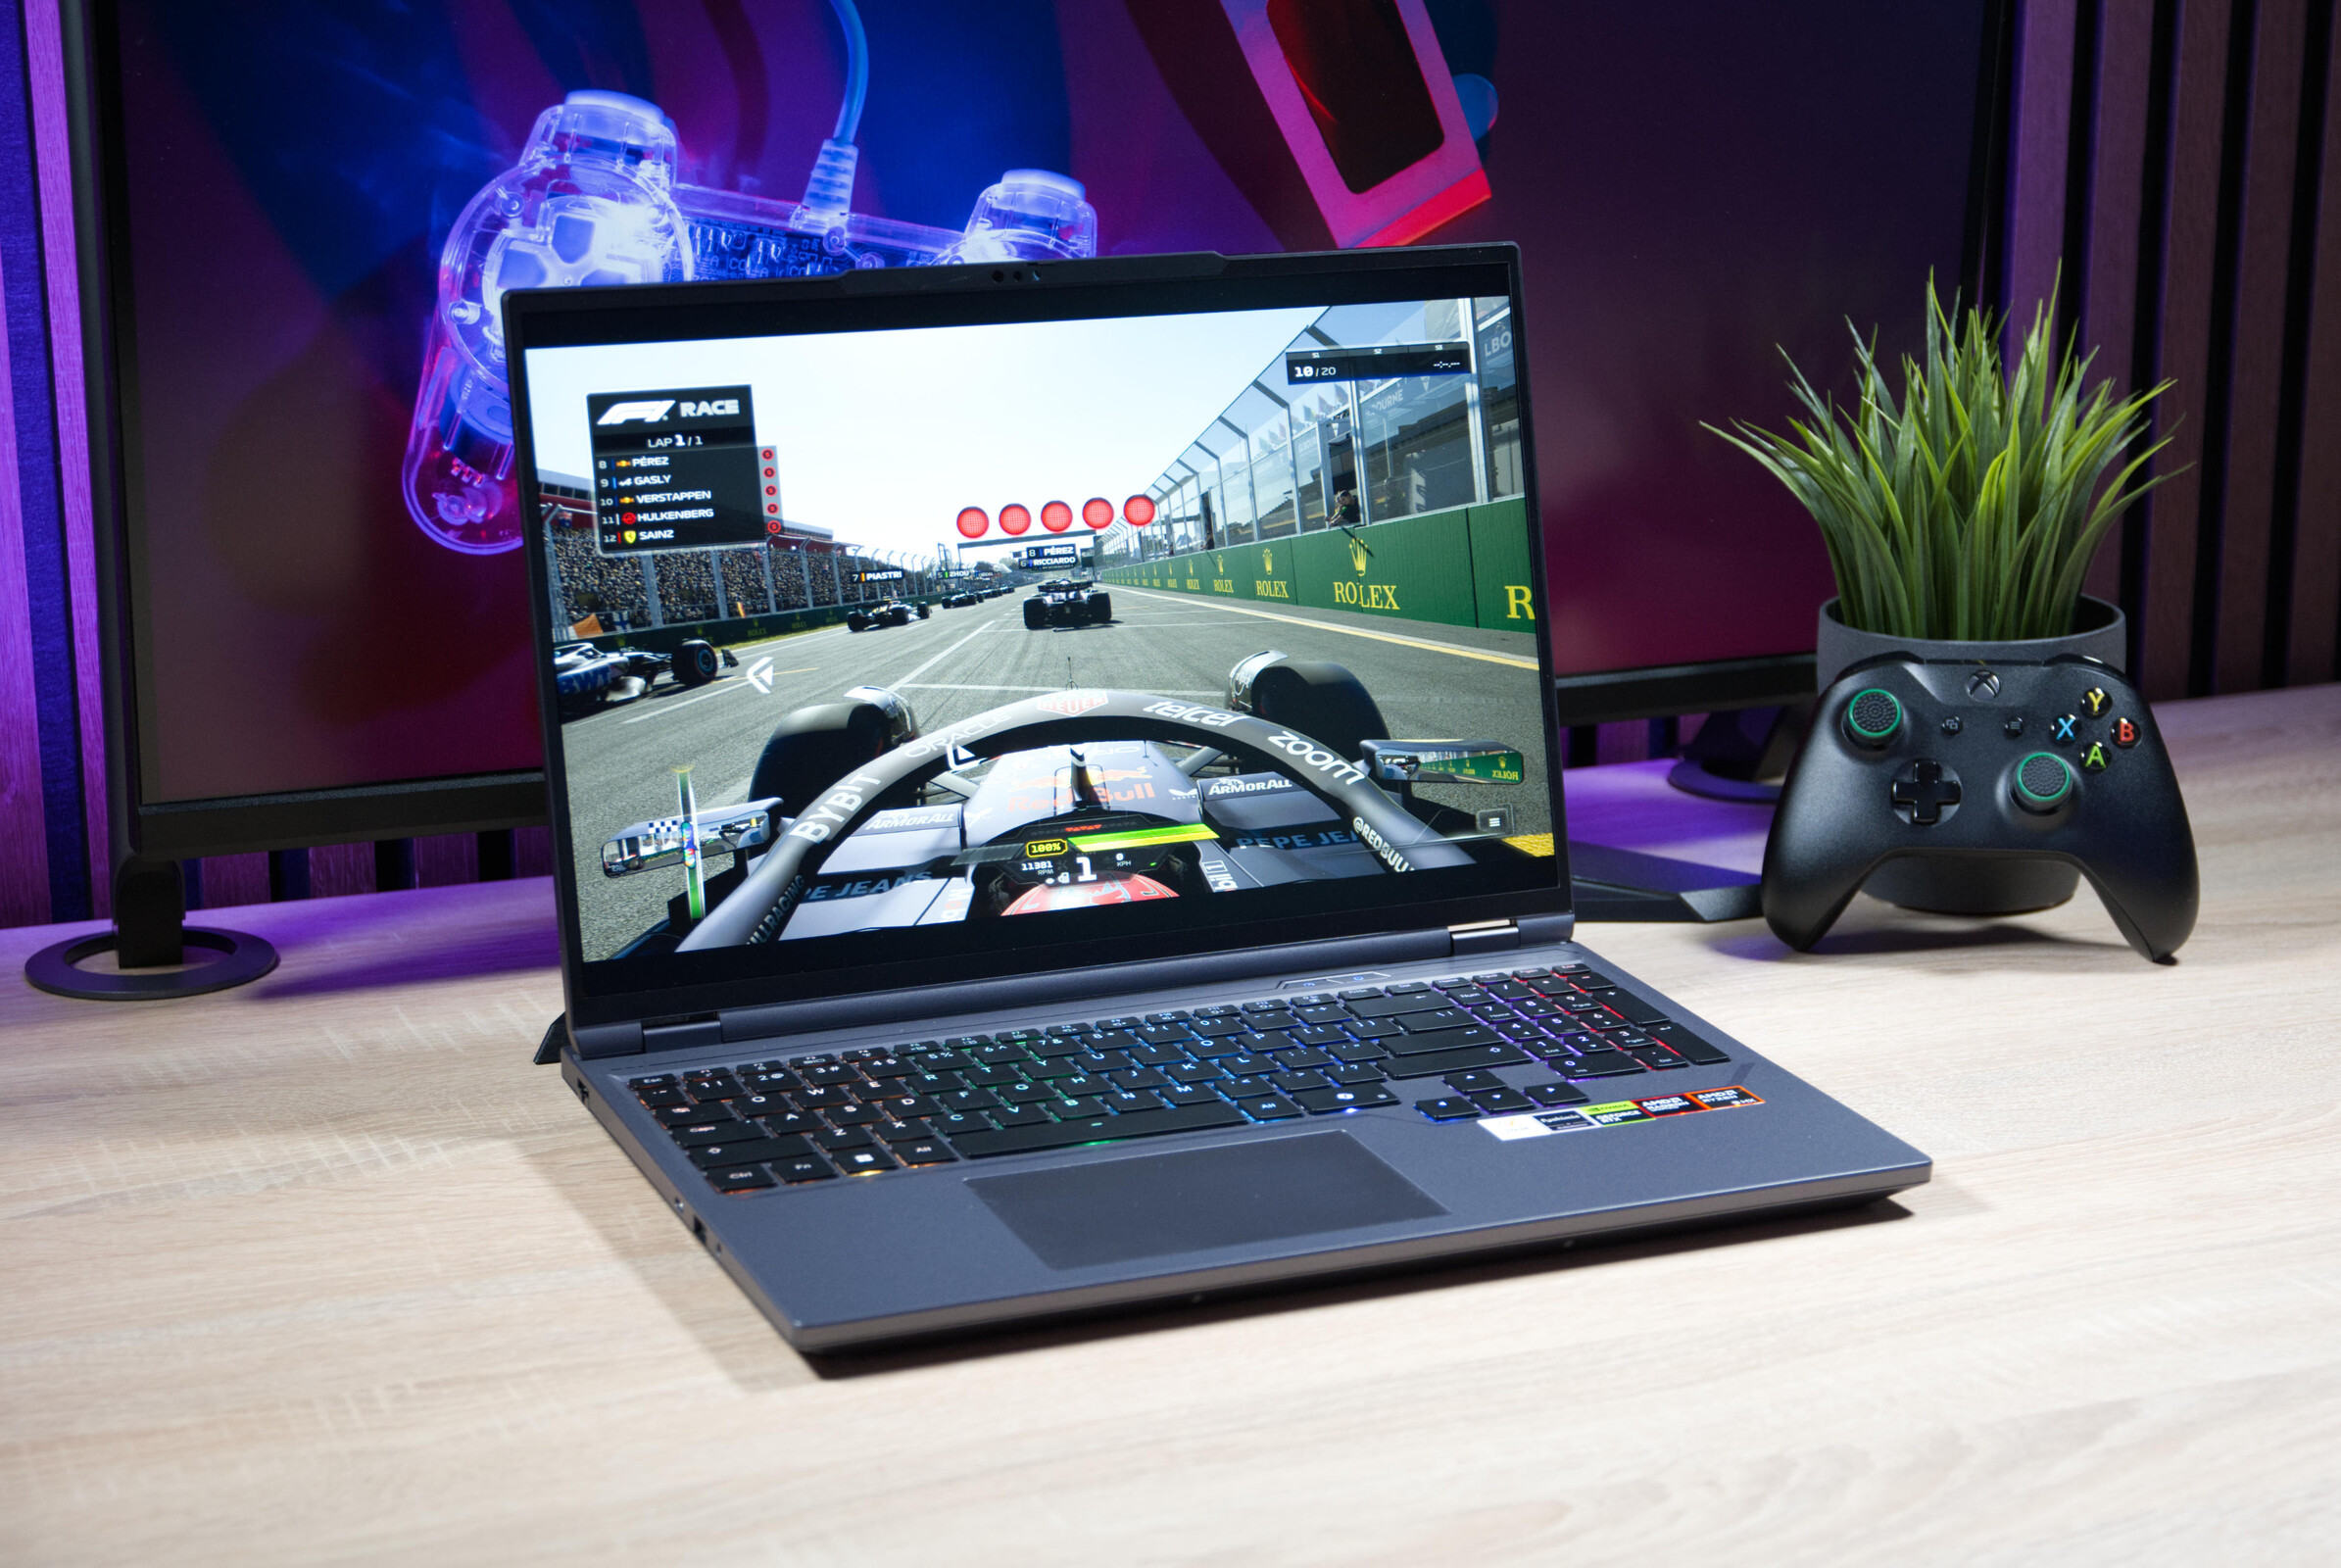
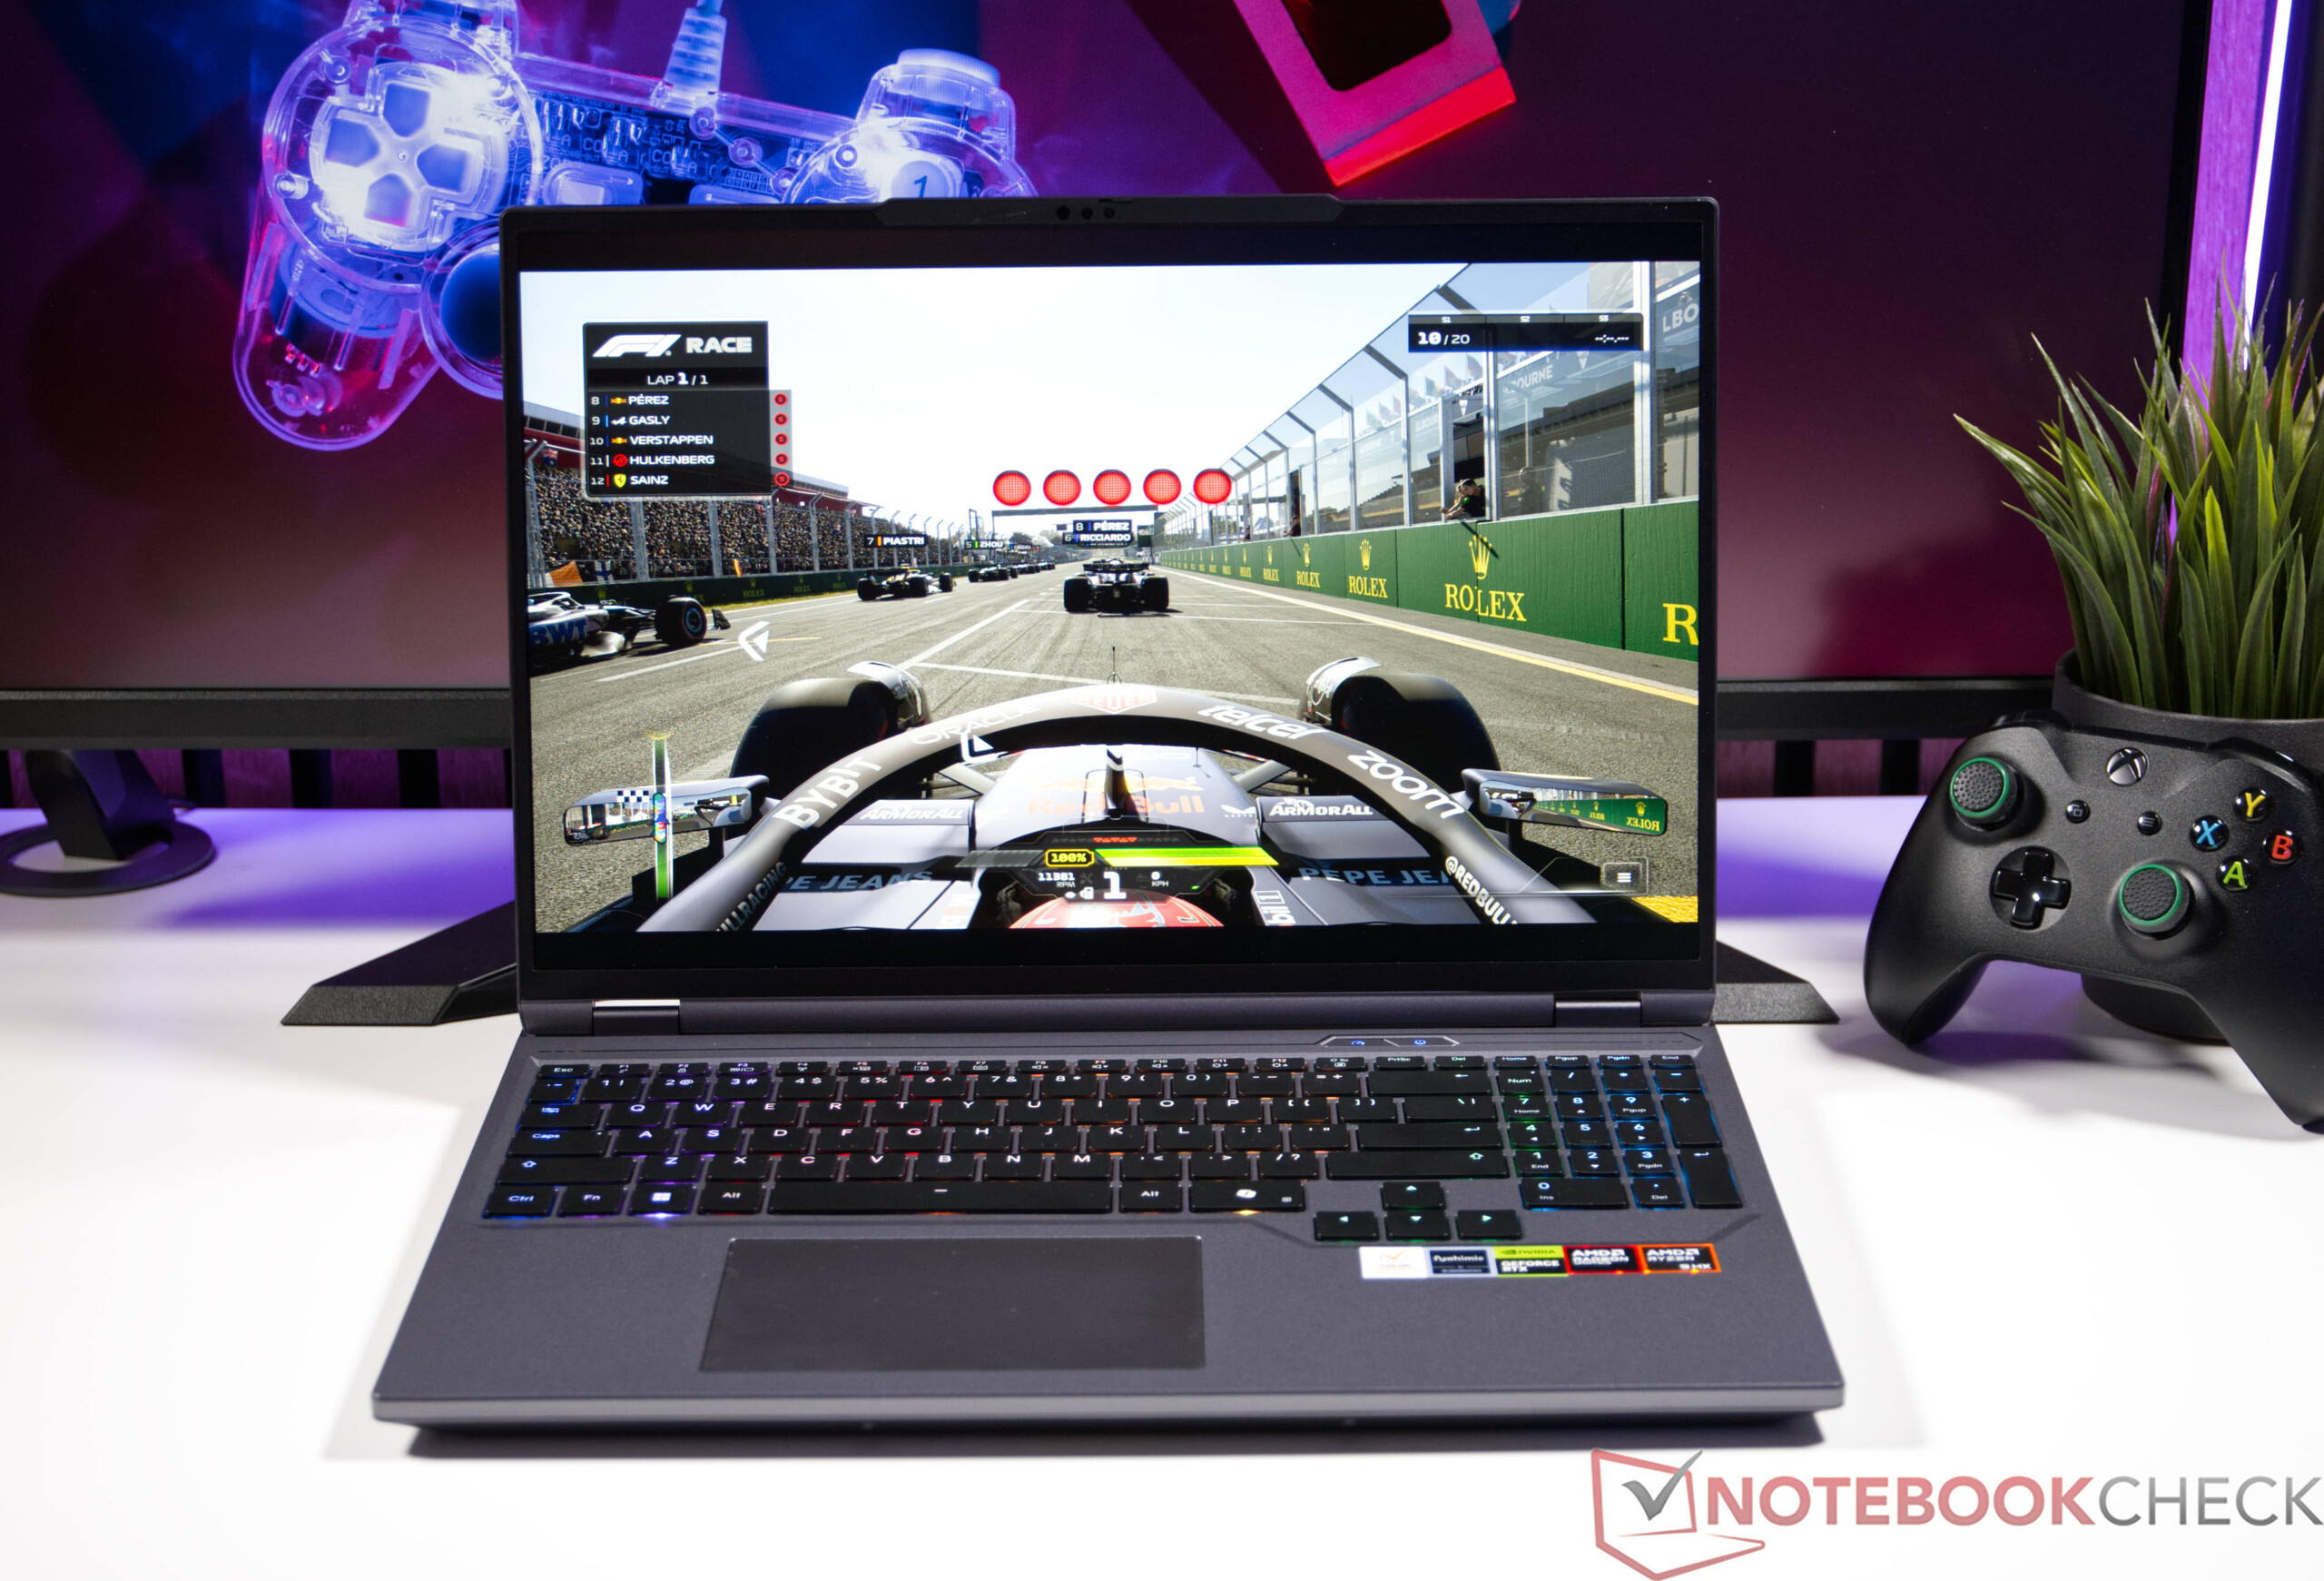
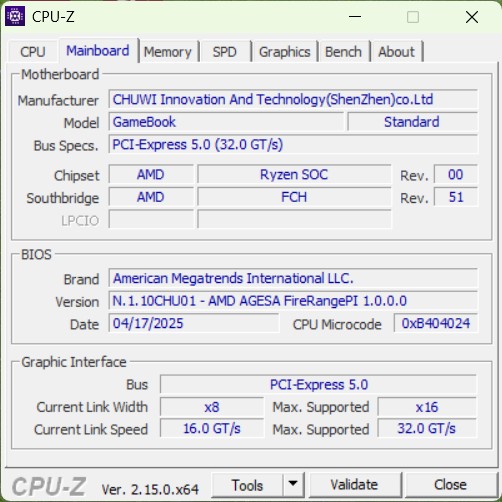
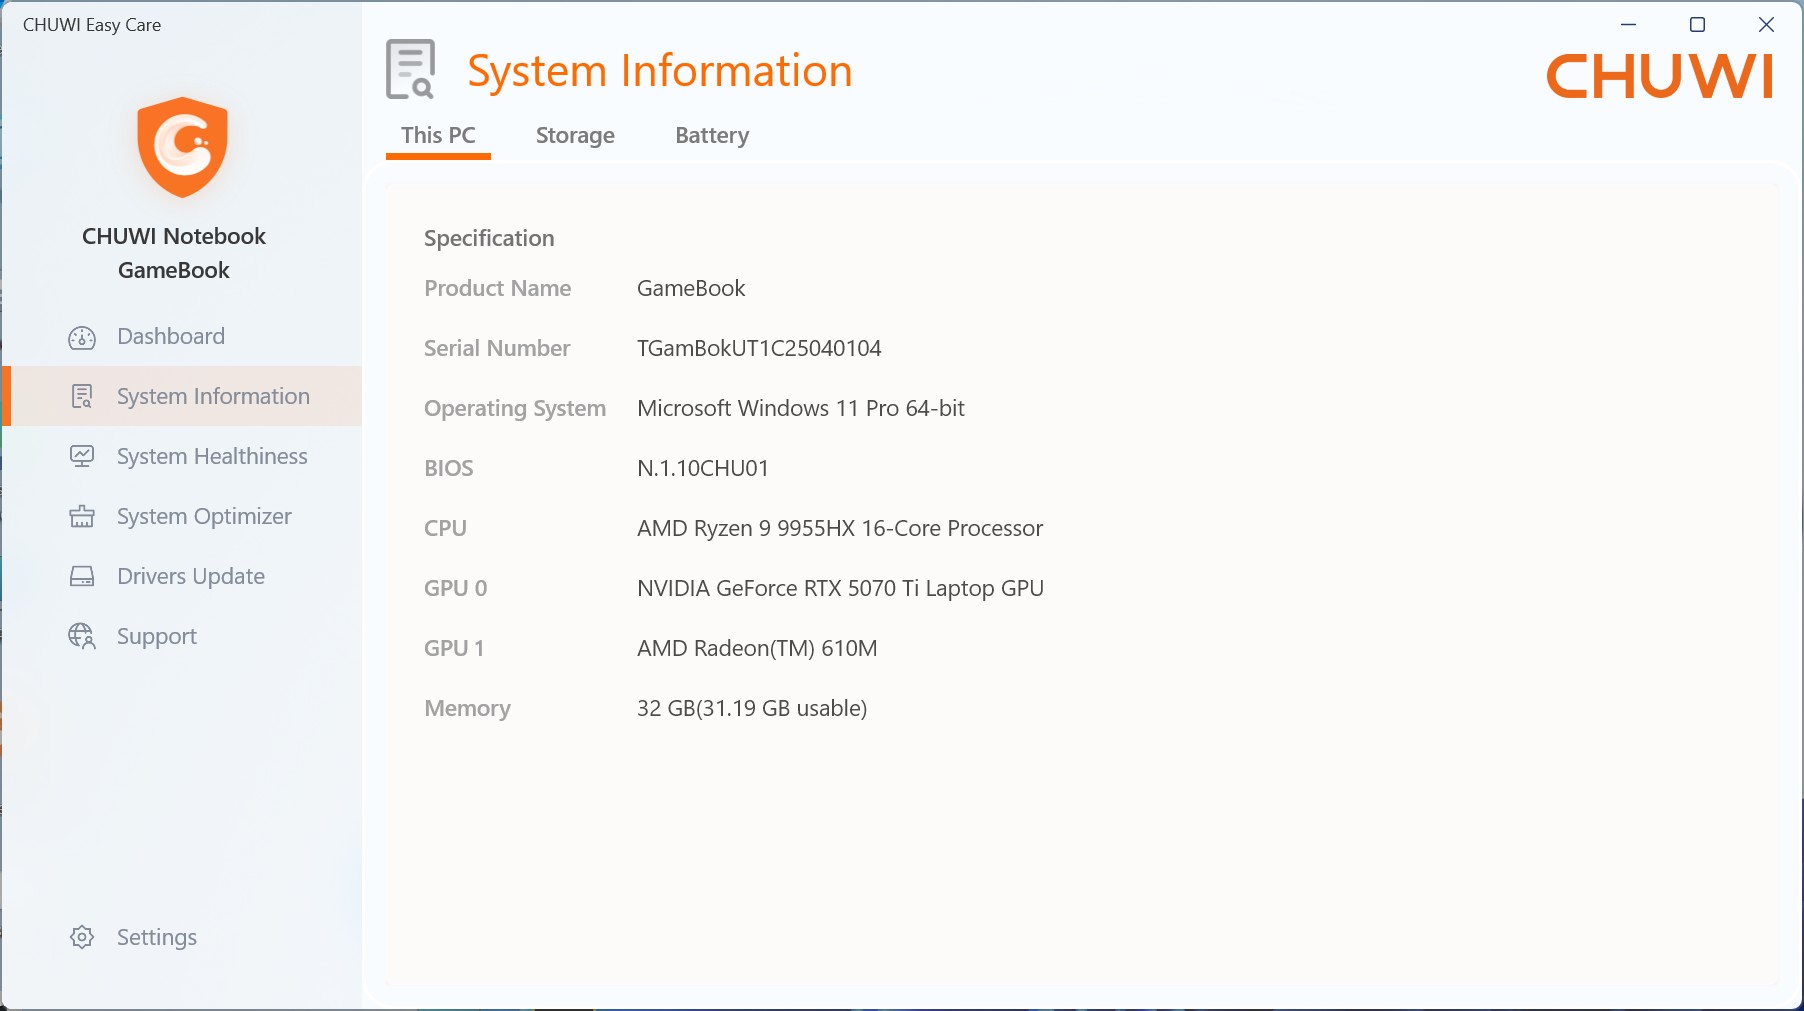
With the AMD Ryzen 9 9955HX and an Nvidia GeForce RTX 5070 Ti laptop, the Chuwi Gamebook offers a very solid basis for playing the latest games. The combination promises a lot of performance, which is generally the case. Nevertheless, there are minor inconsistencies, which also affect the dedicated graphics card. We go into the individual points in the test. Meanwhile, the Chuwi Gamebook is only available in one configuration. The Chuwi Gamebook is based on an already familiar barebone base (Tongfang), which is why the notebook shares some similarities with the Schenker XMG Pro 16 (E25) shares.
Spezifikationen
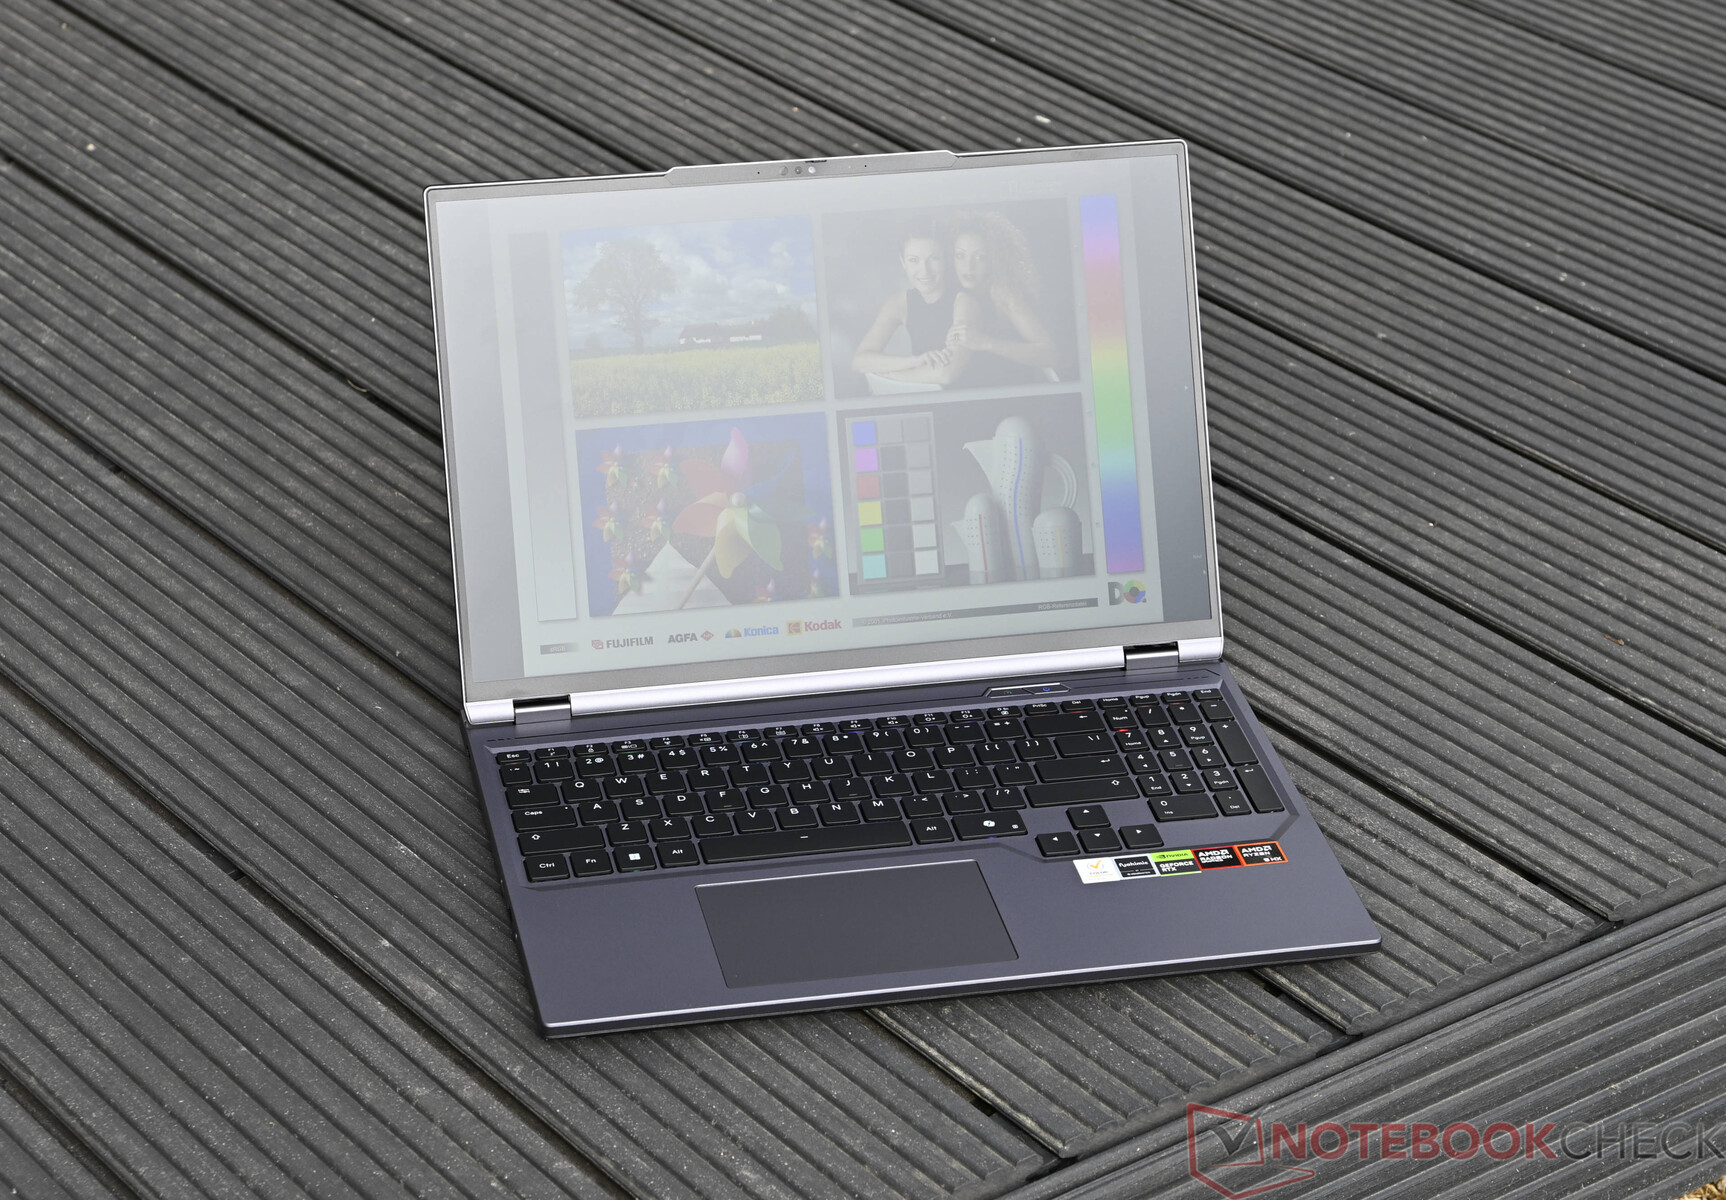
Case & equipment
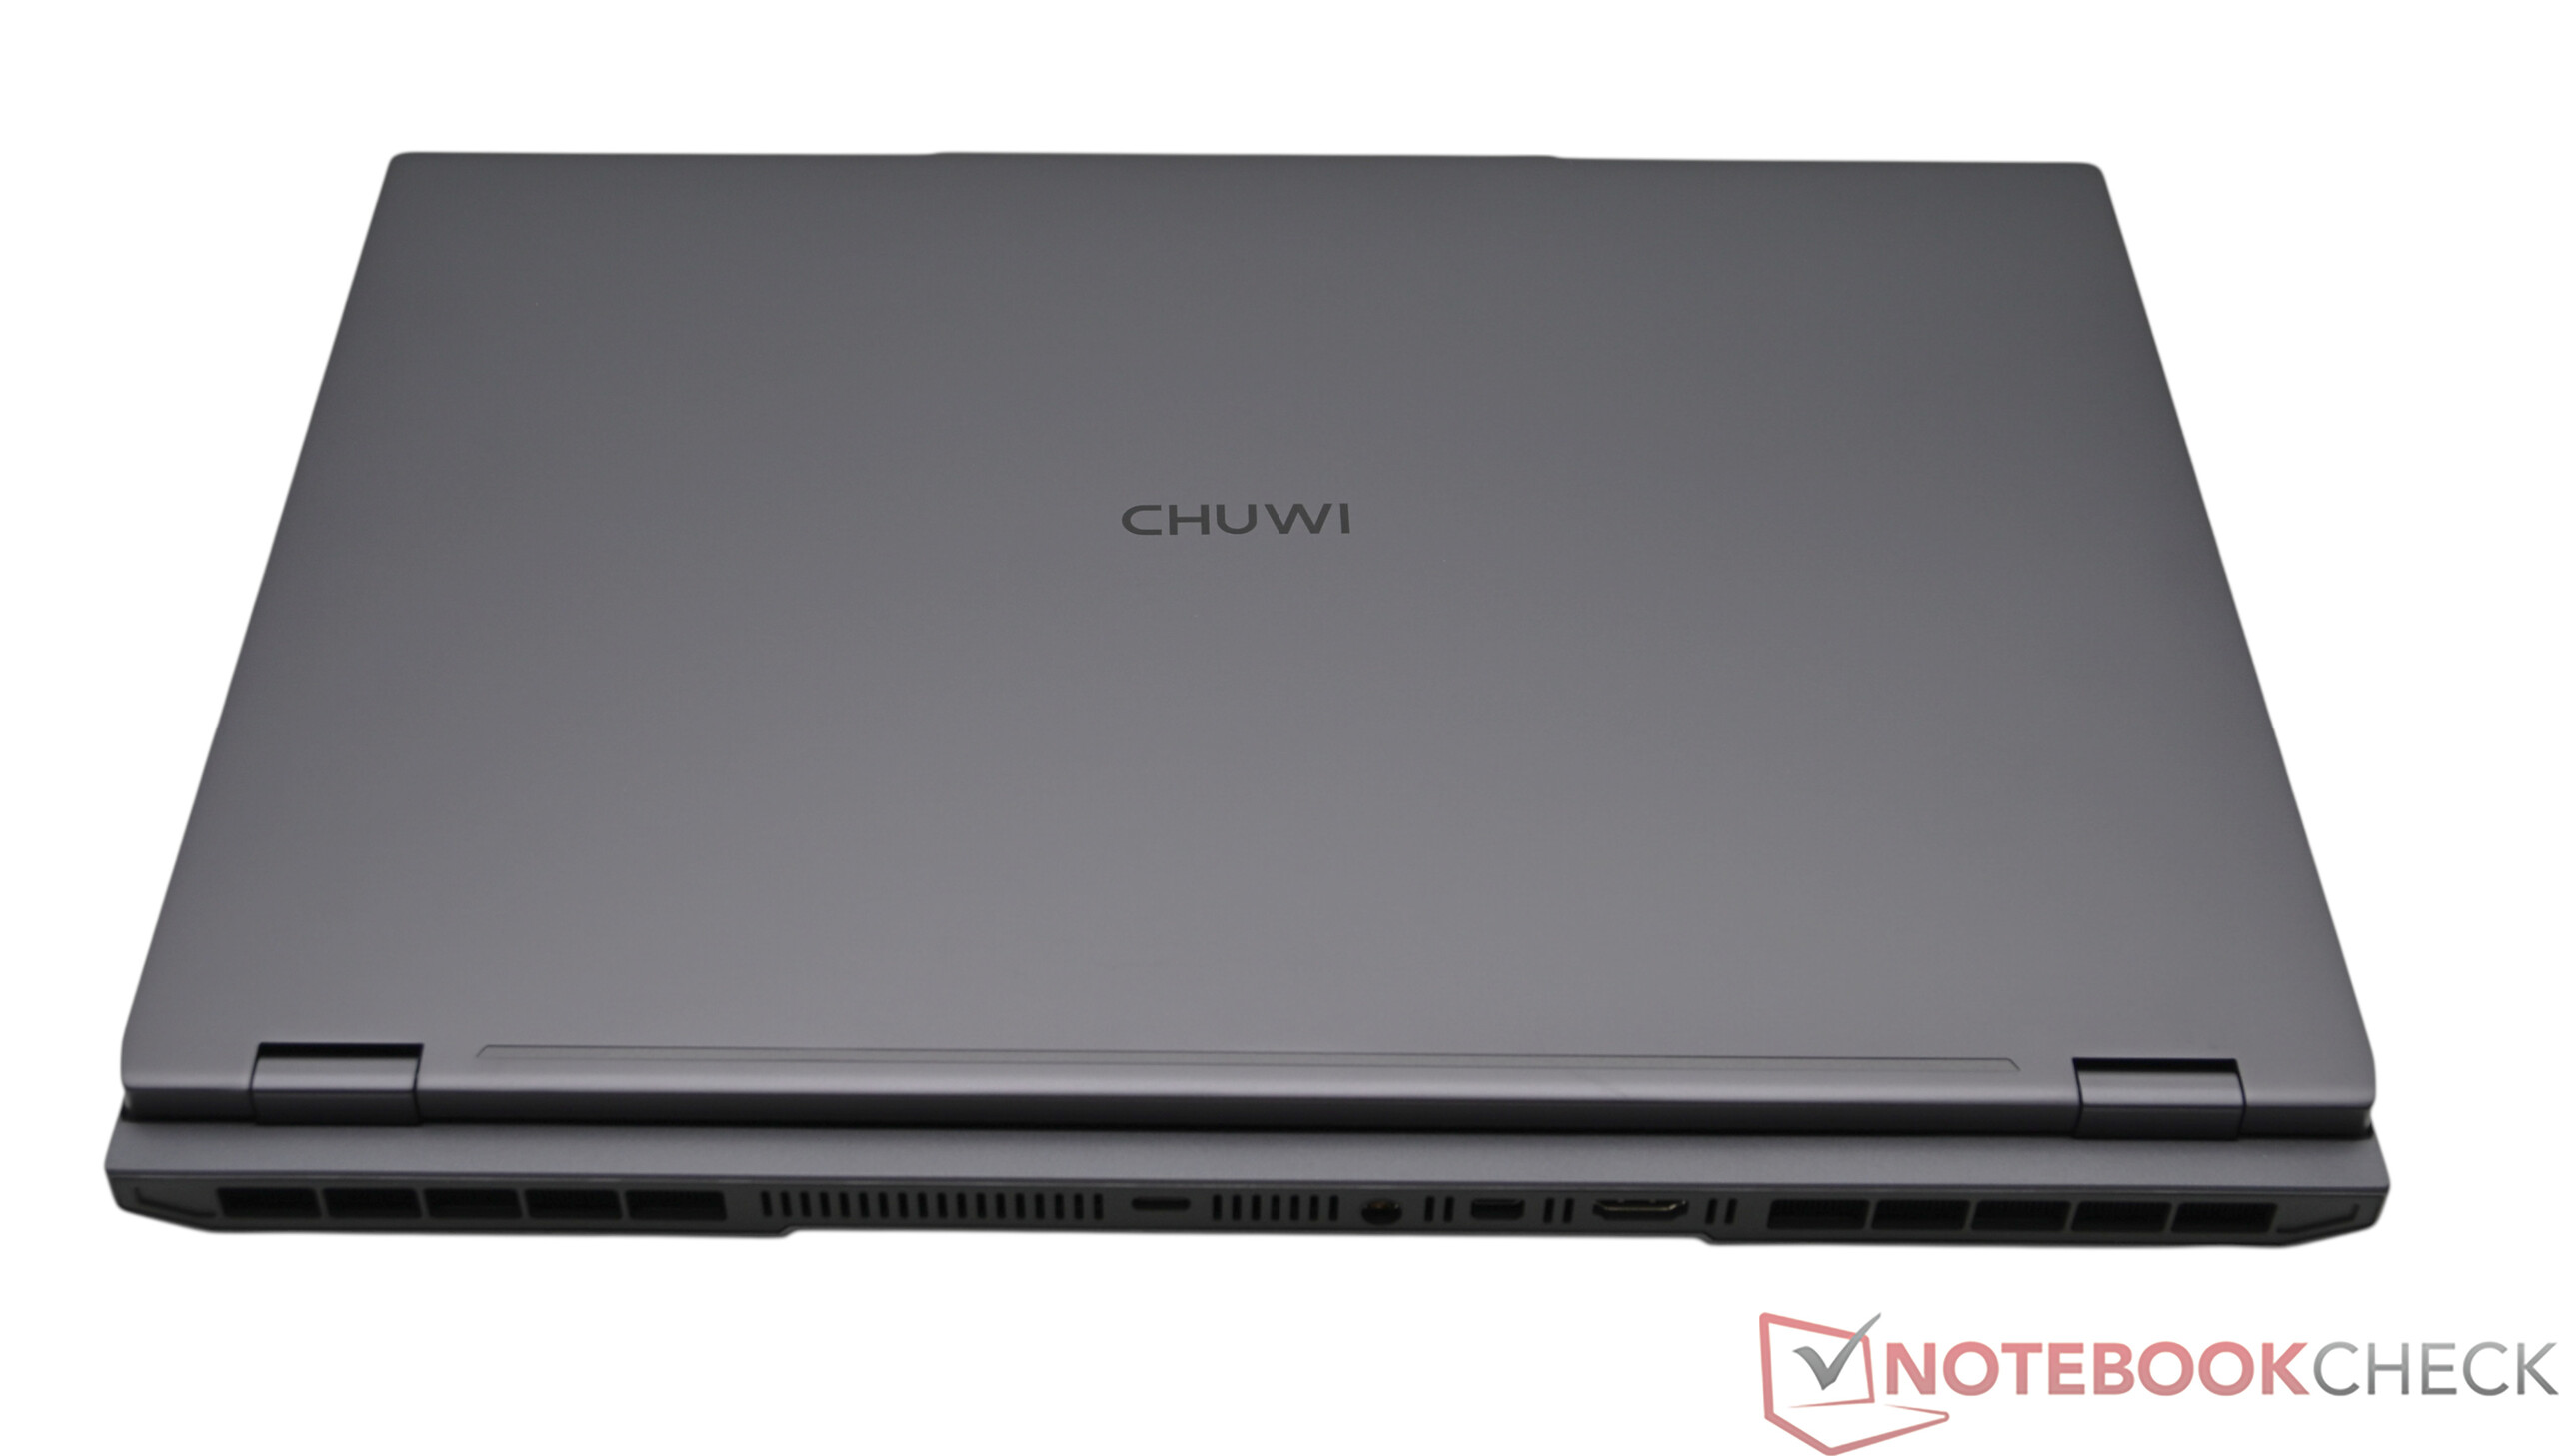
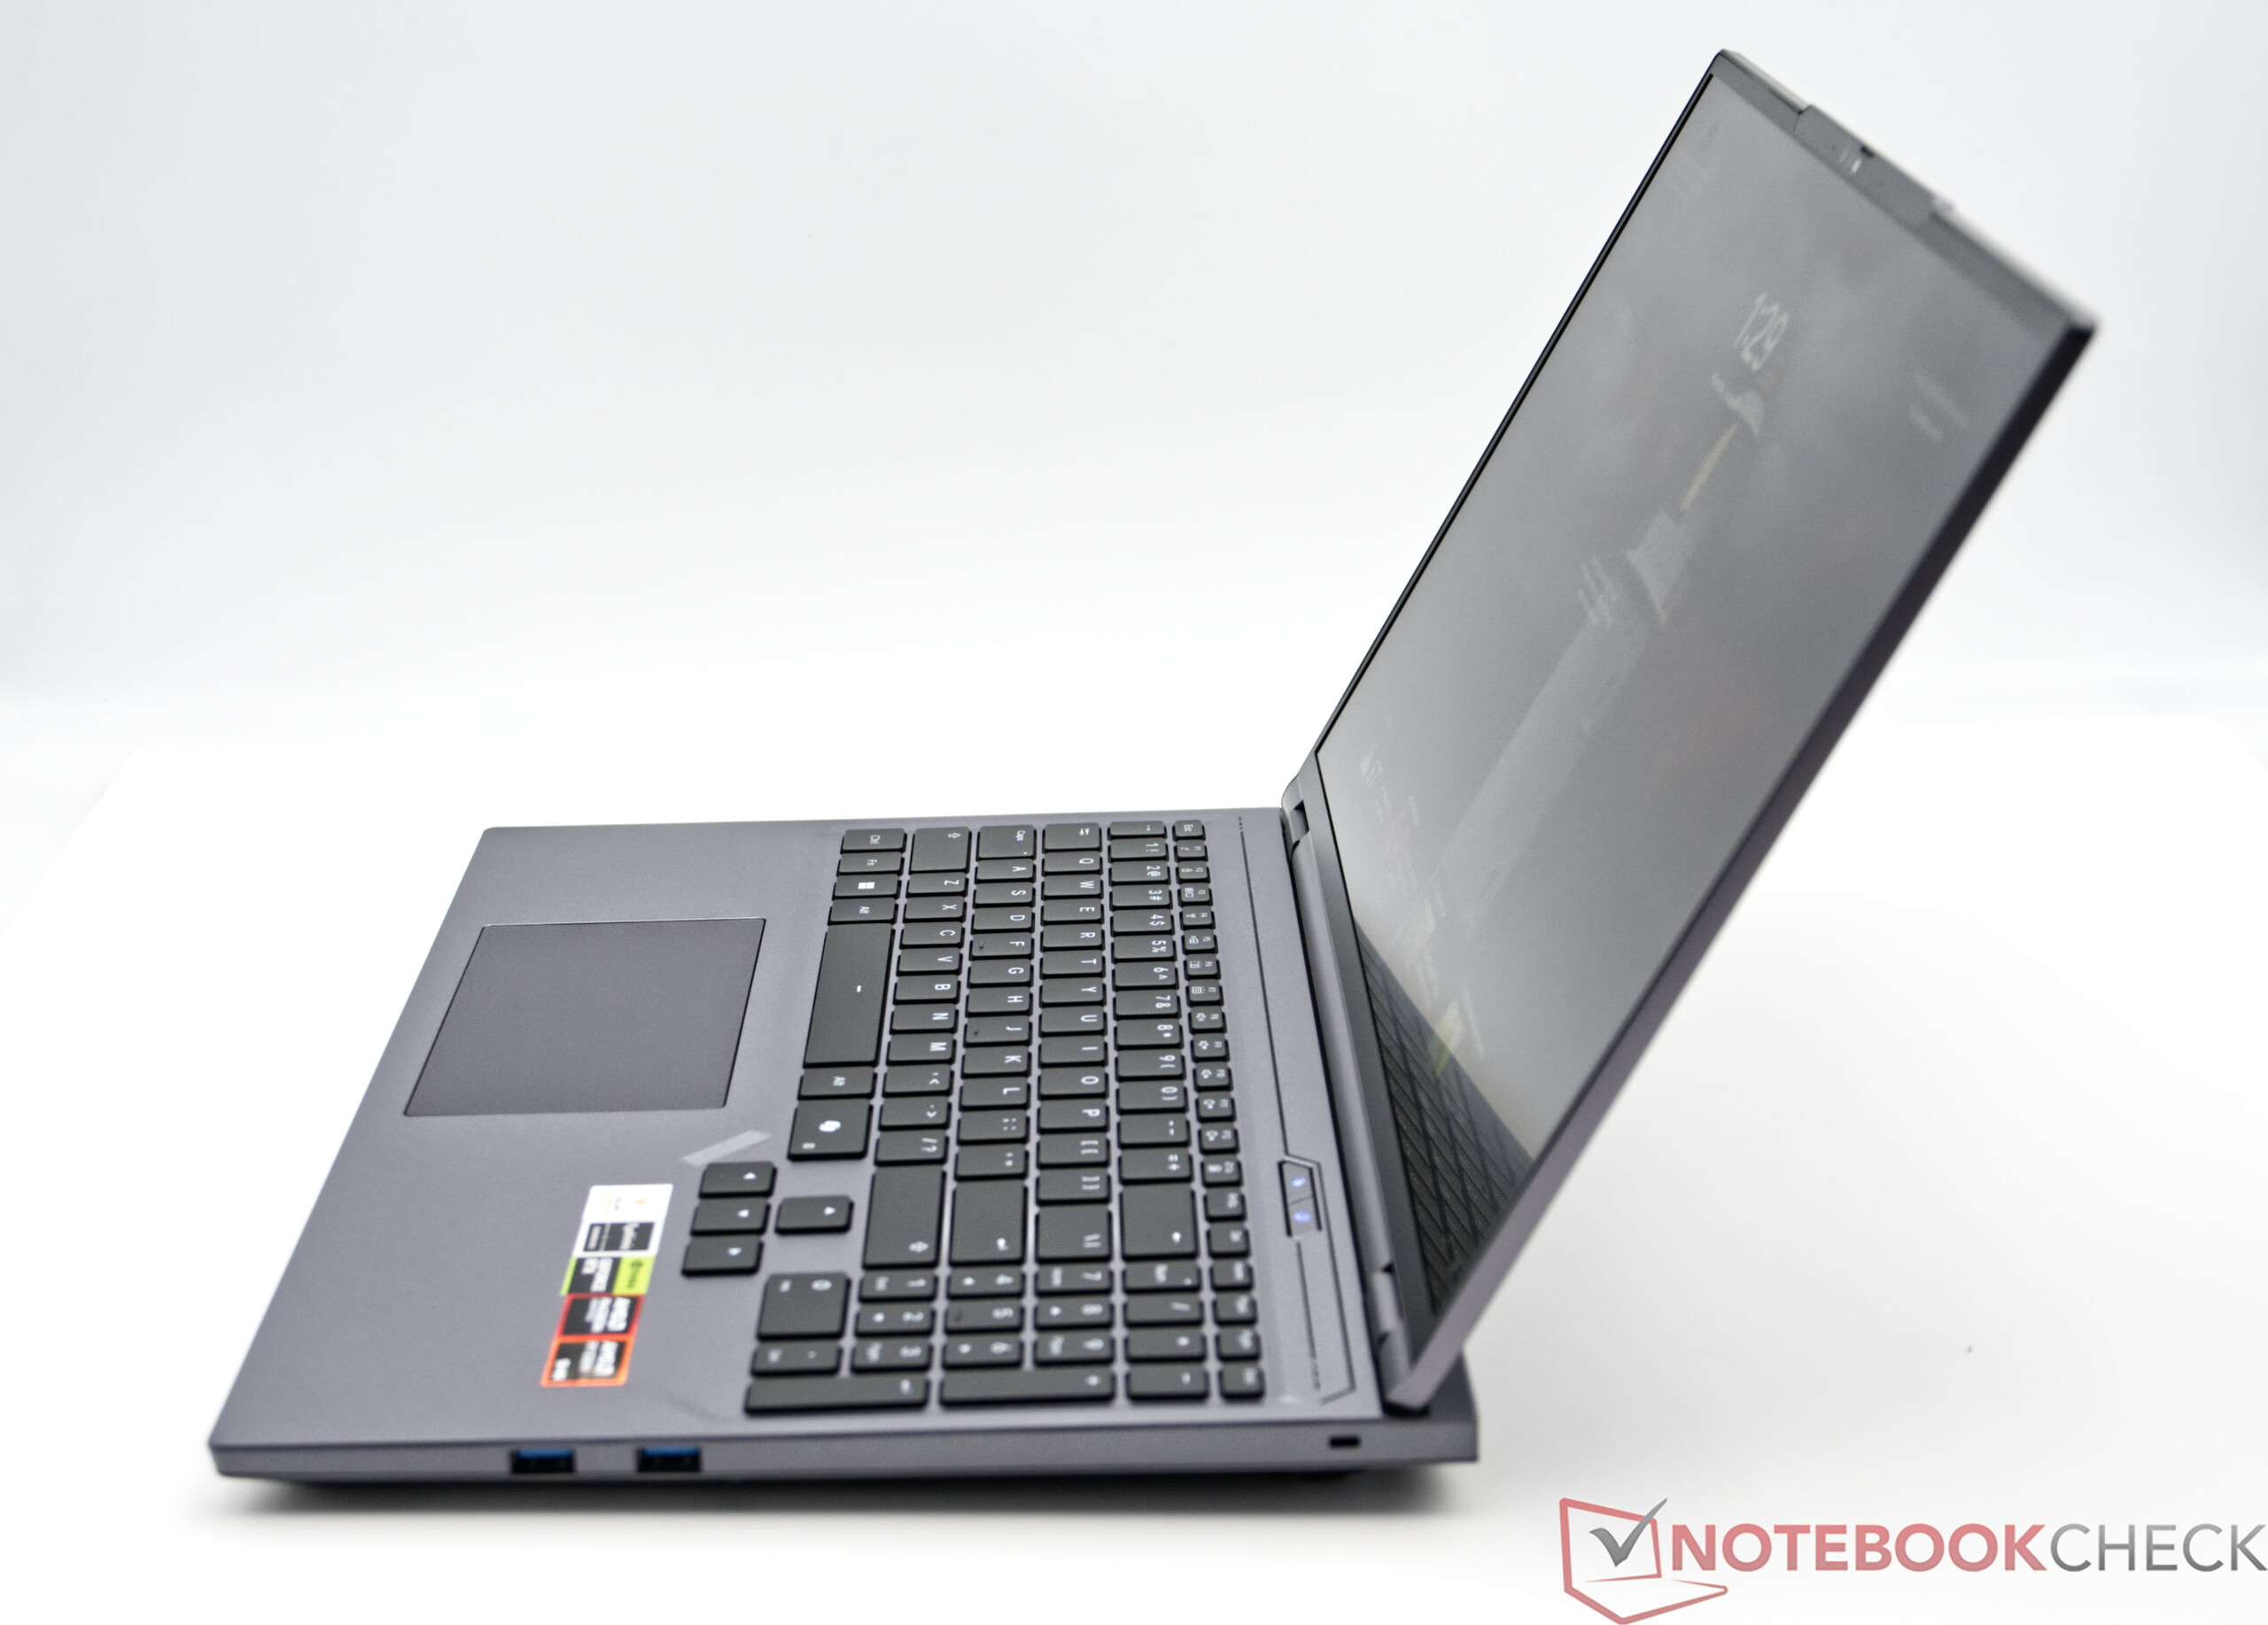
The design of the Chuwi Gamebook is successful and looks very high-quality, not least due to the good choice of materials made from an aluminum and magnesium alloy. Workmanship and stability remain at a high level, although the surfaces are quite susceptible to fingerprints and dirt.
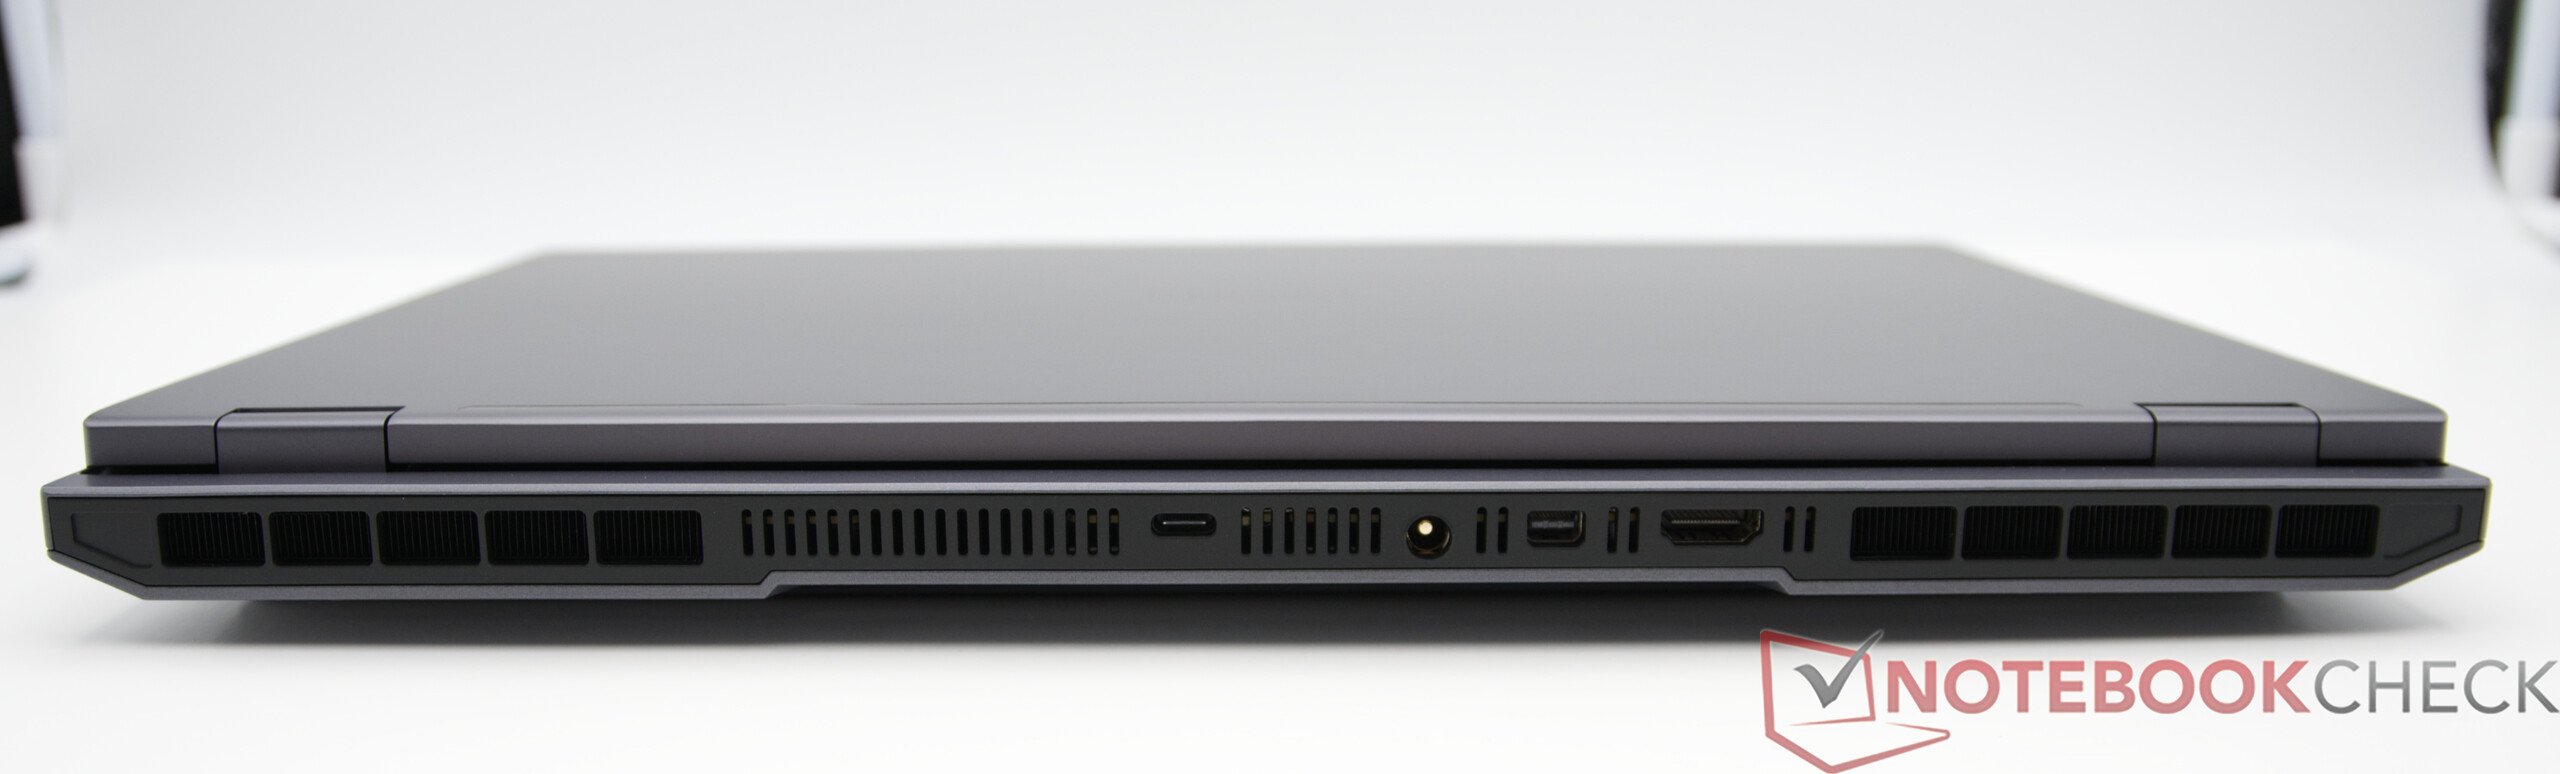
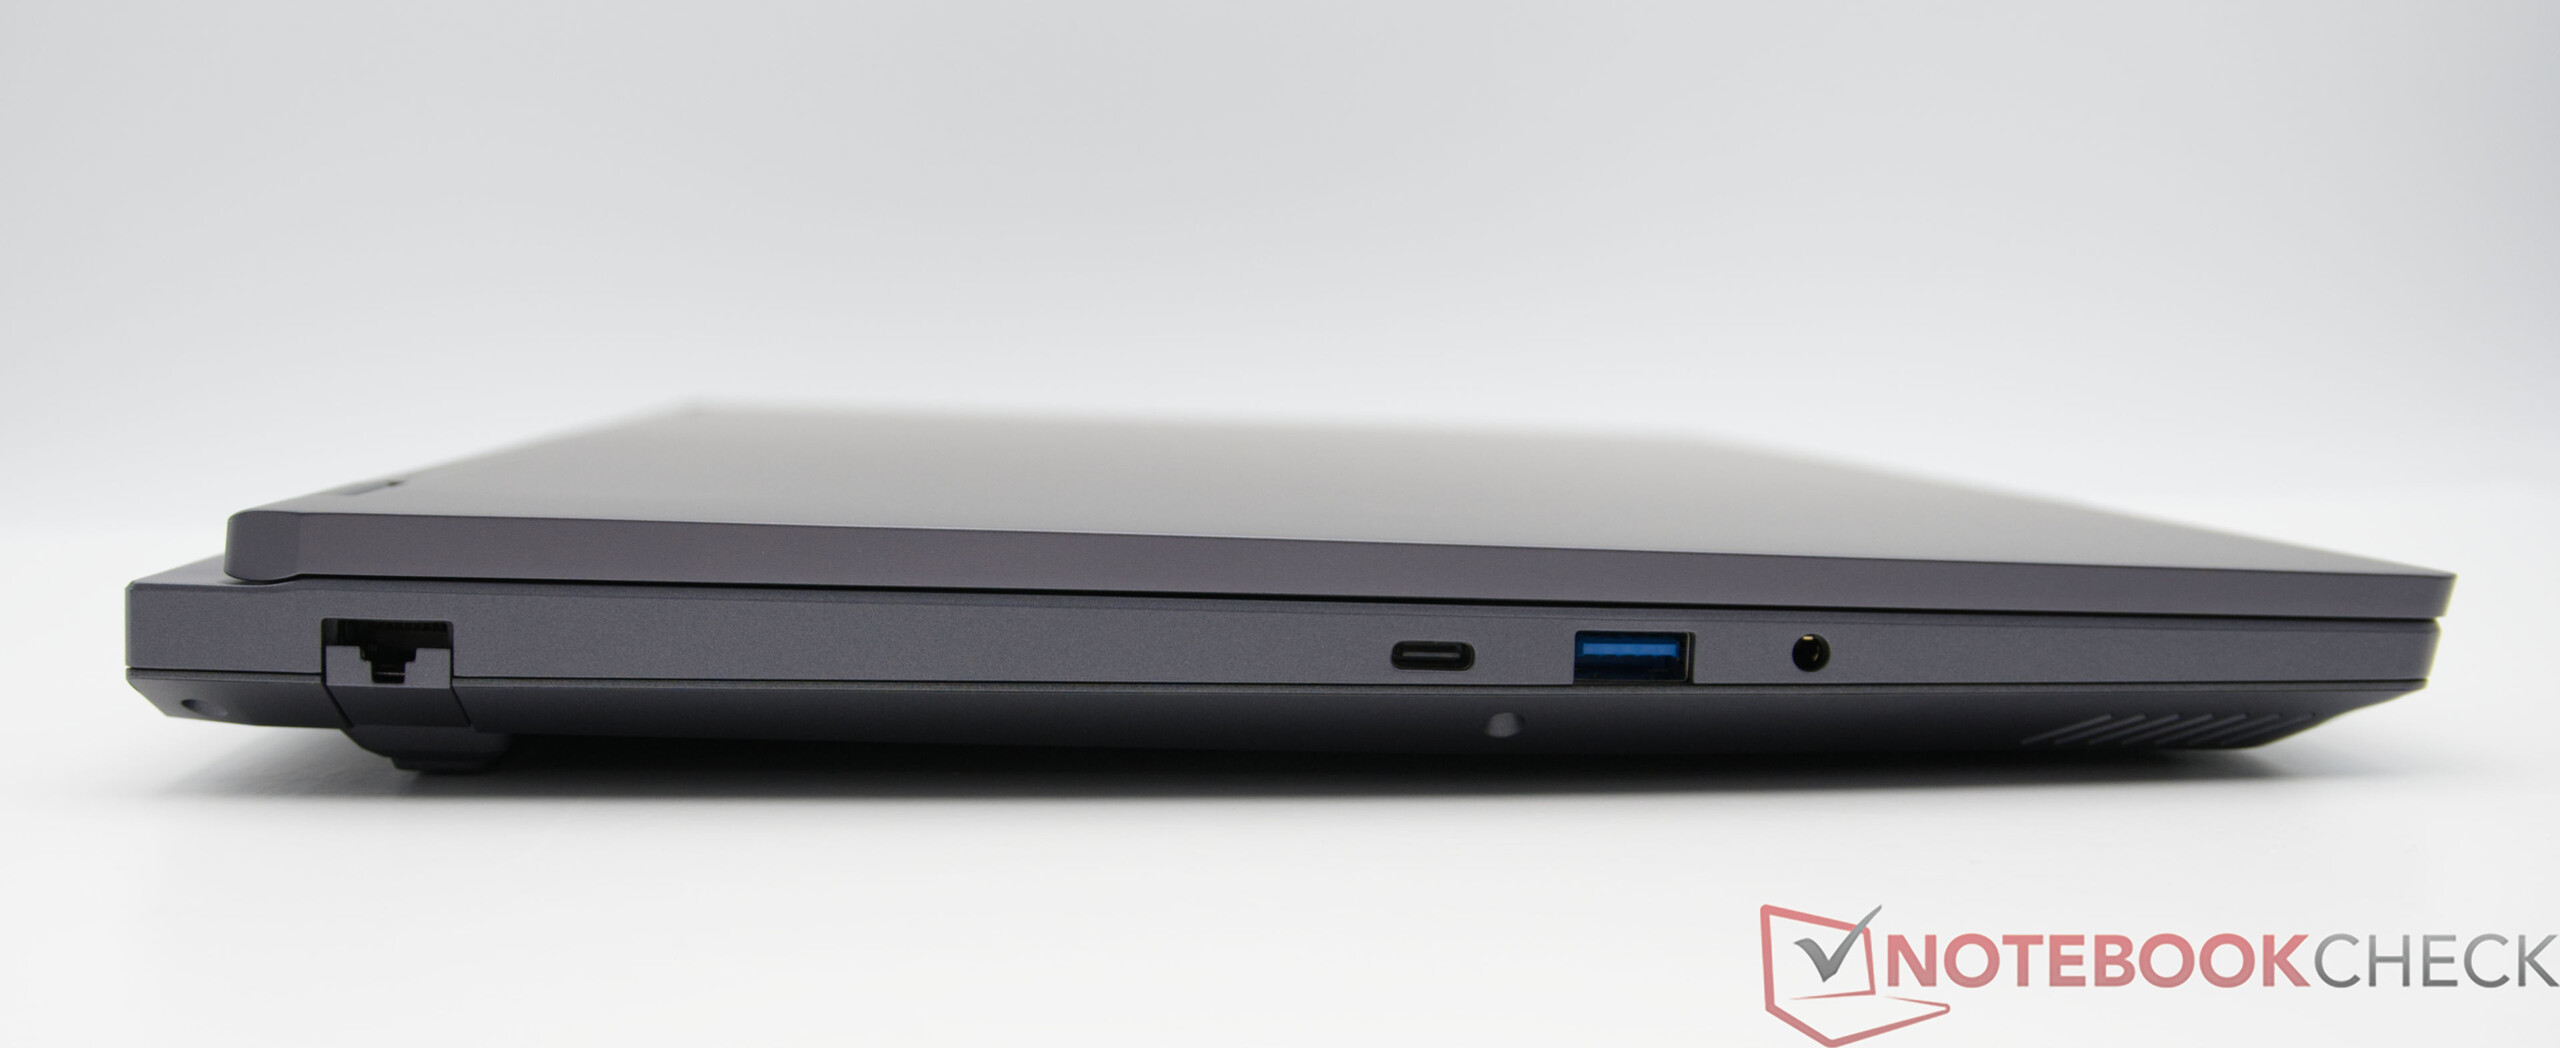
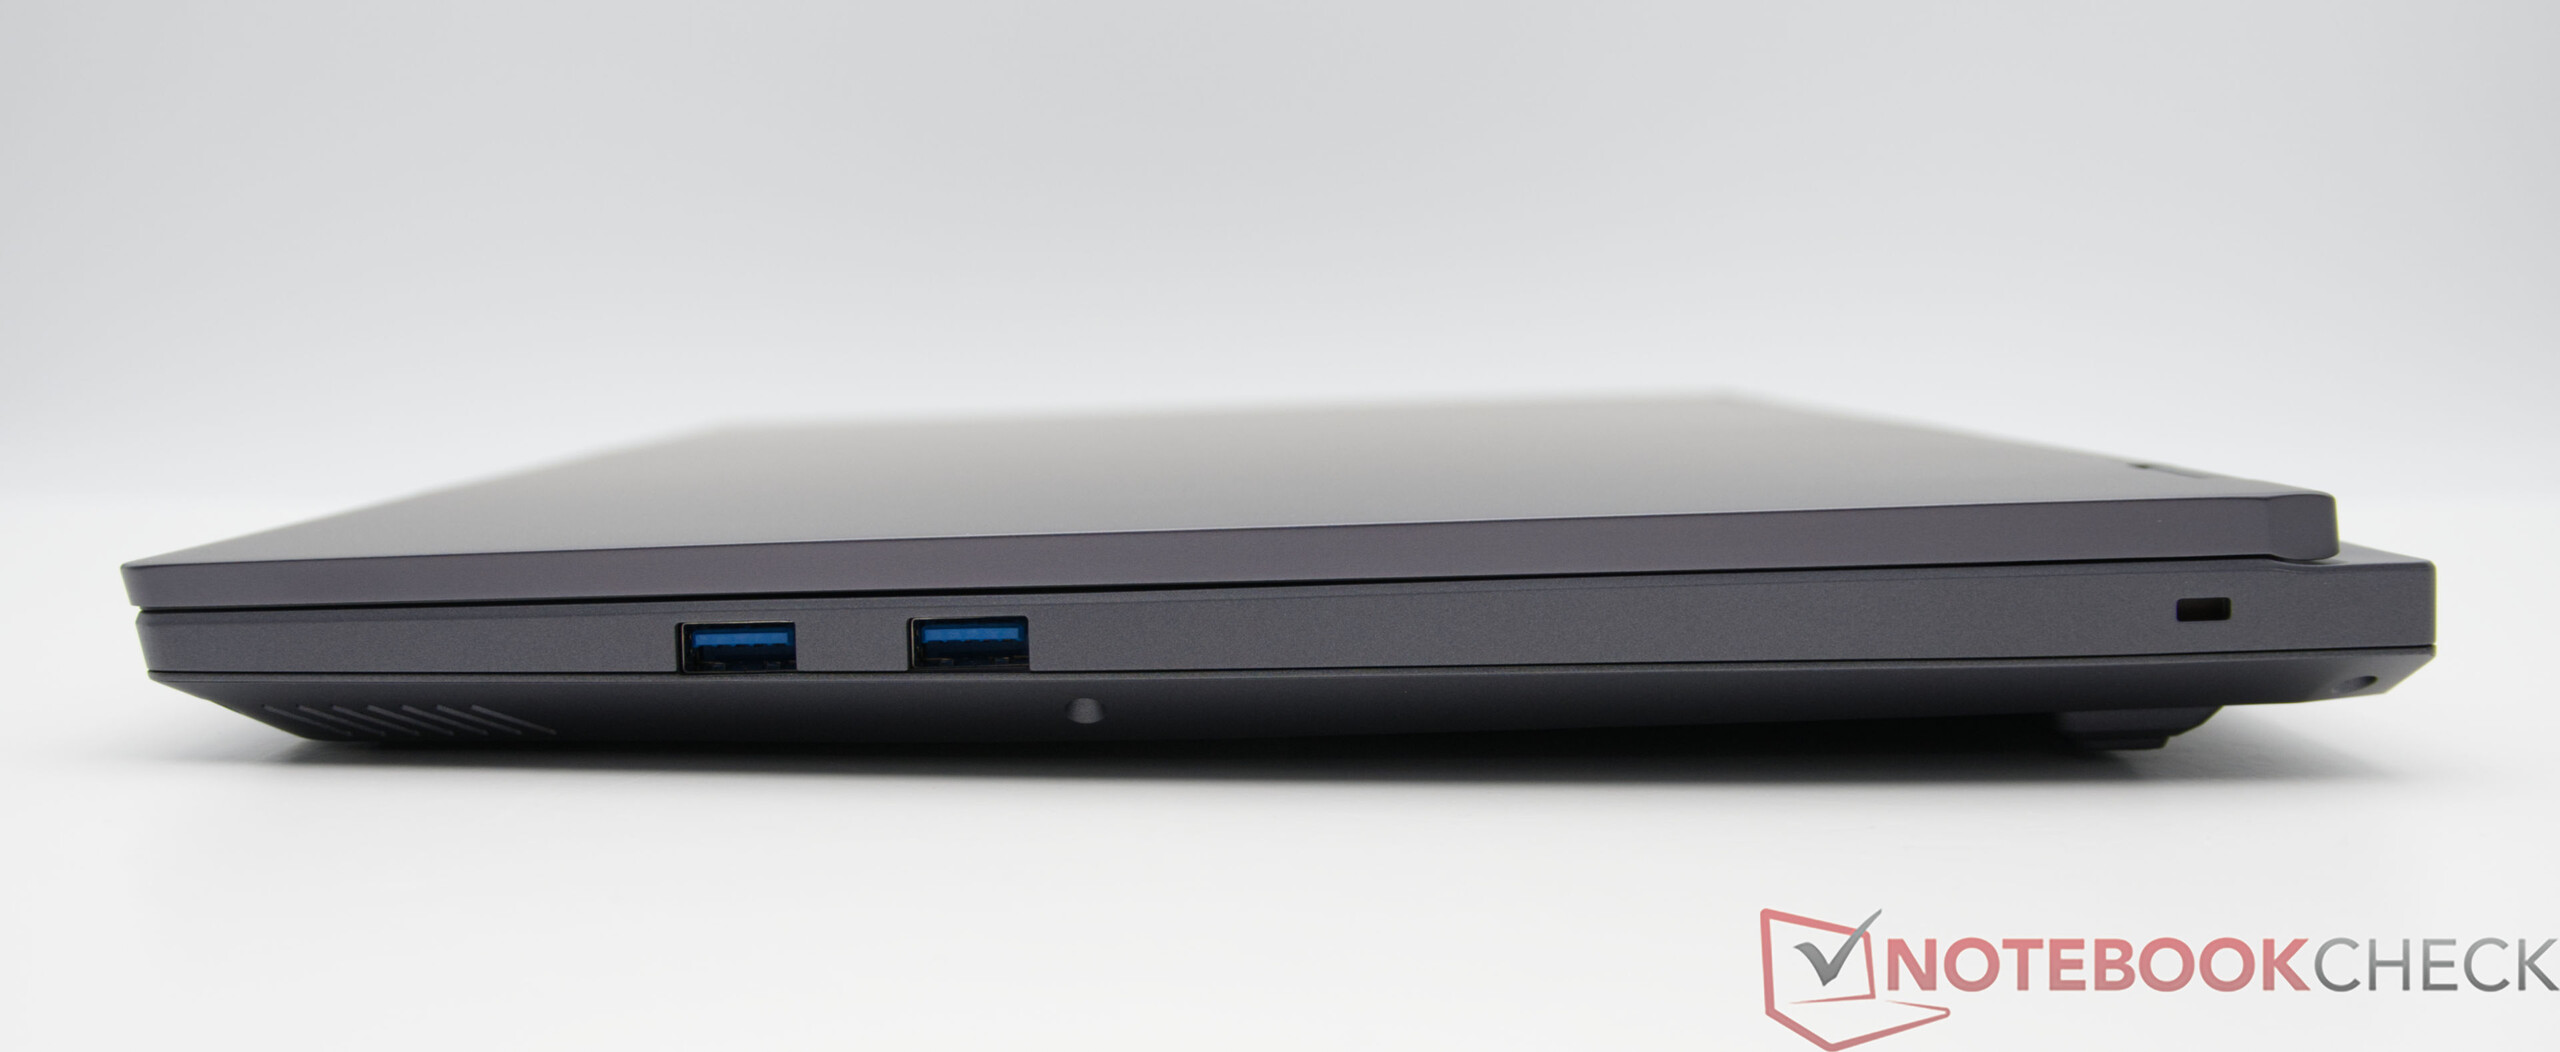
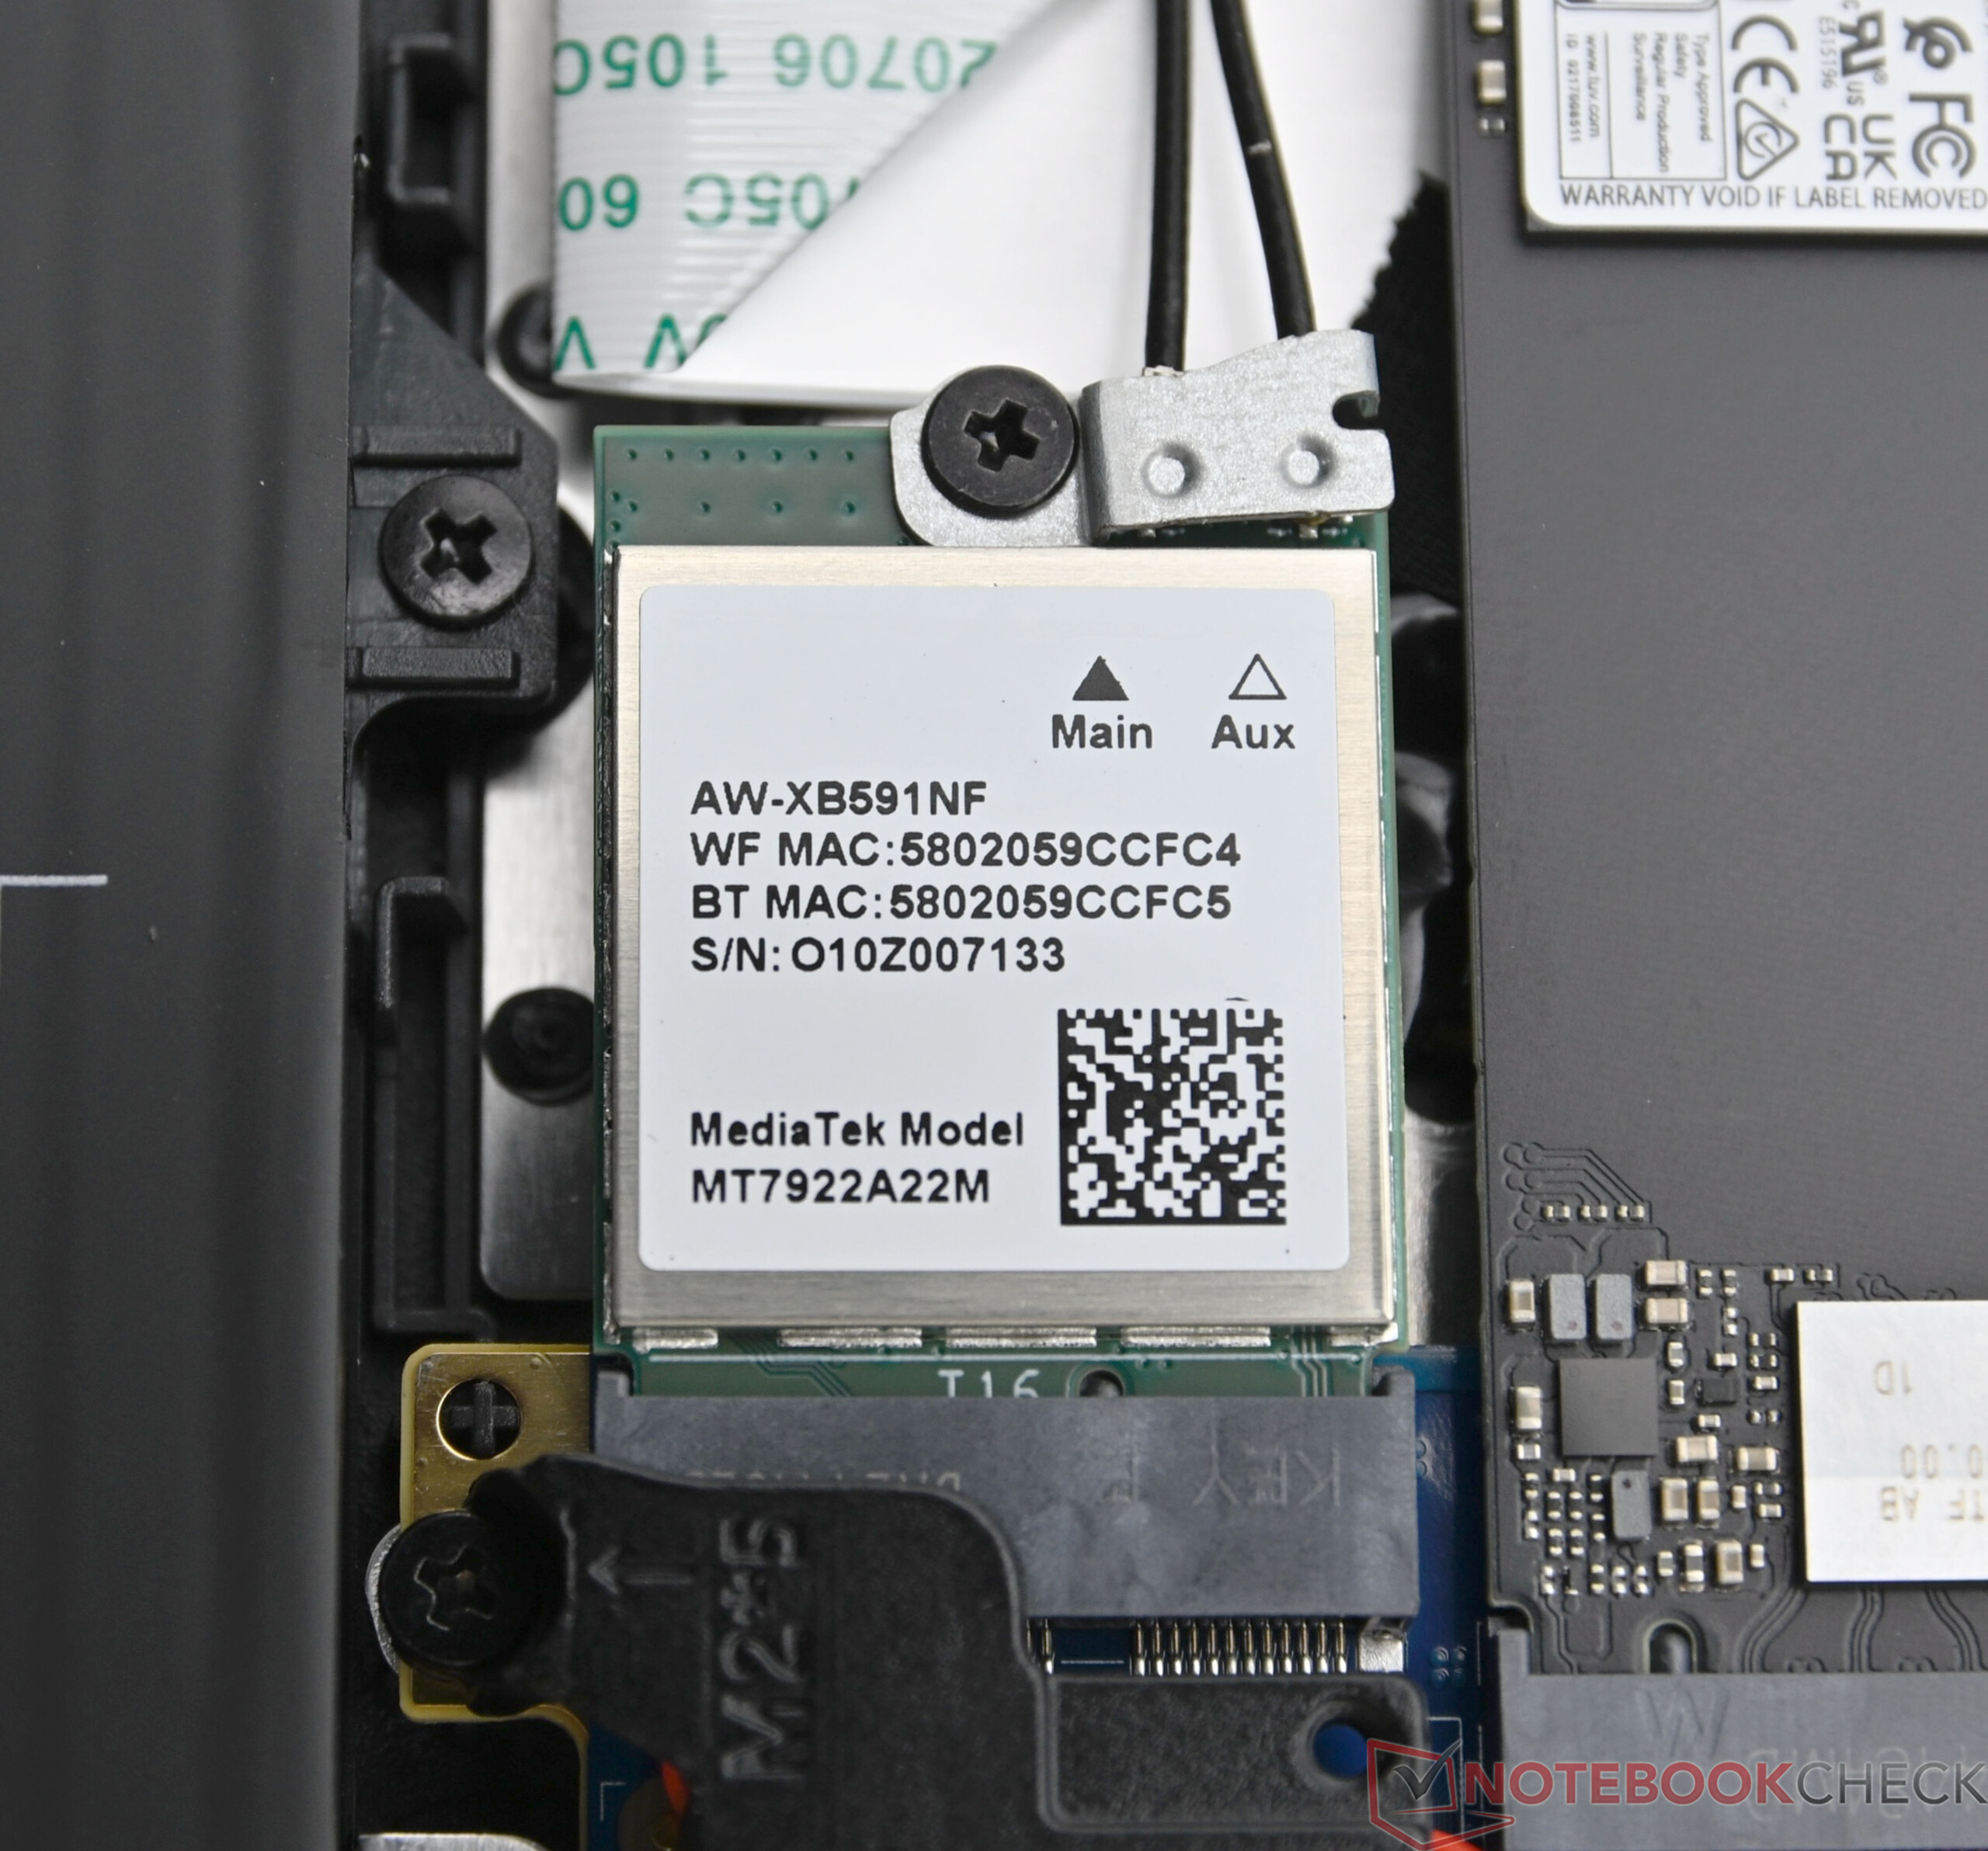
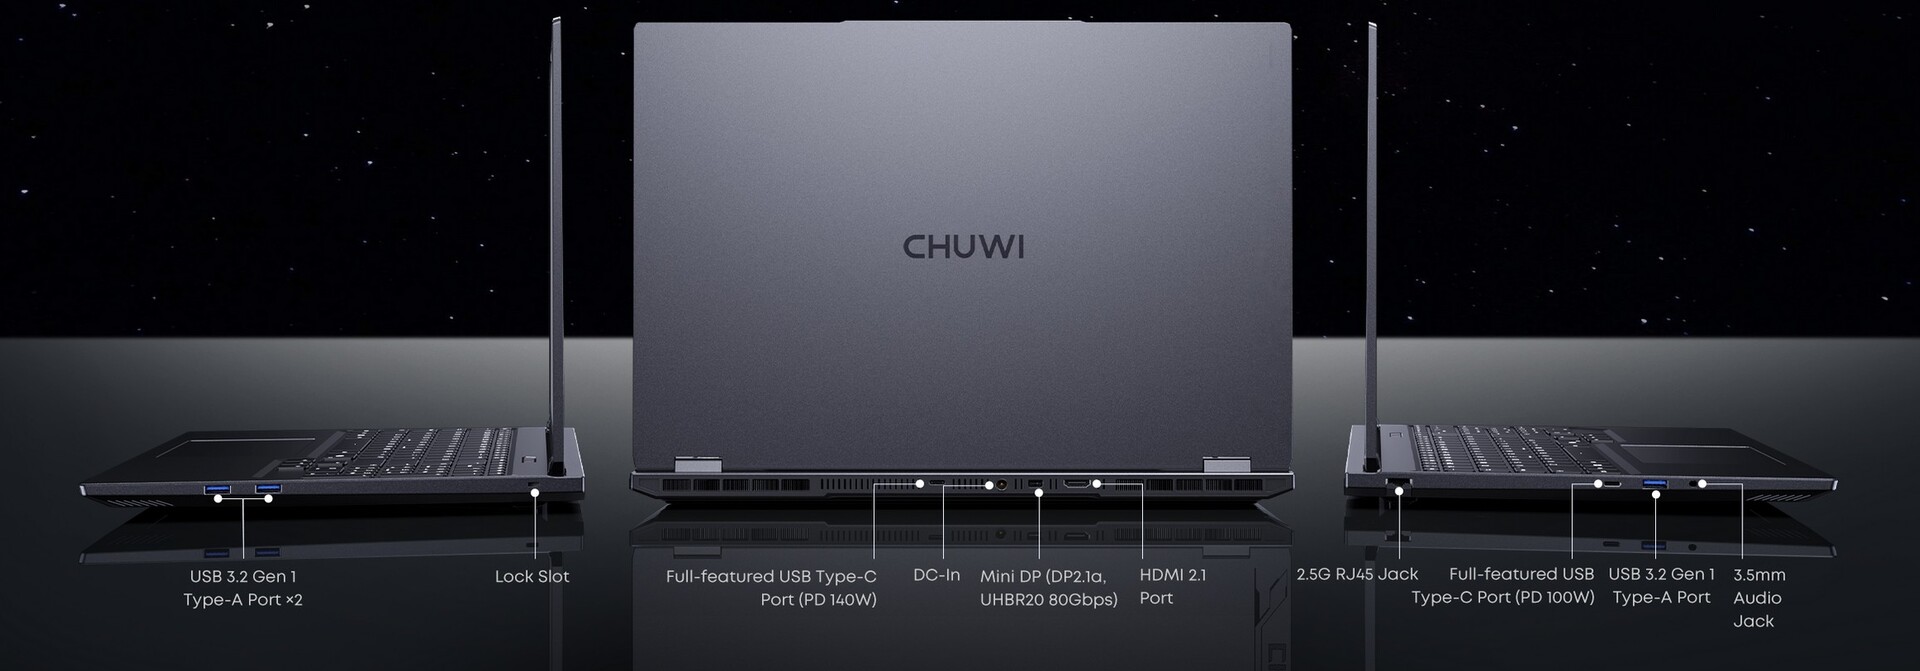
With a solid variety of connections on the sides and rear, the Gamebook is well equipped. Although there is no Thunderbolt available, the WLAN scores with good performance. The 1,080p webcam with IR sensor and mechanical cover delivers decent results, even if studio effects are missing.


Sustainability
Chuwi does not provide any precise information on the carbon footprint or the use of recycled materials. Positive: The packaging of the Chuwi Gamebook consists almost entirely of cardboard.
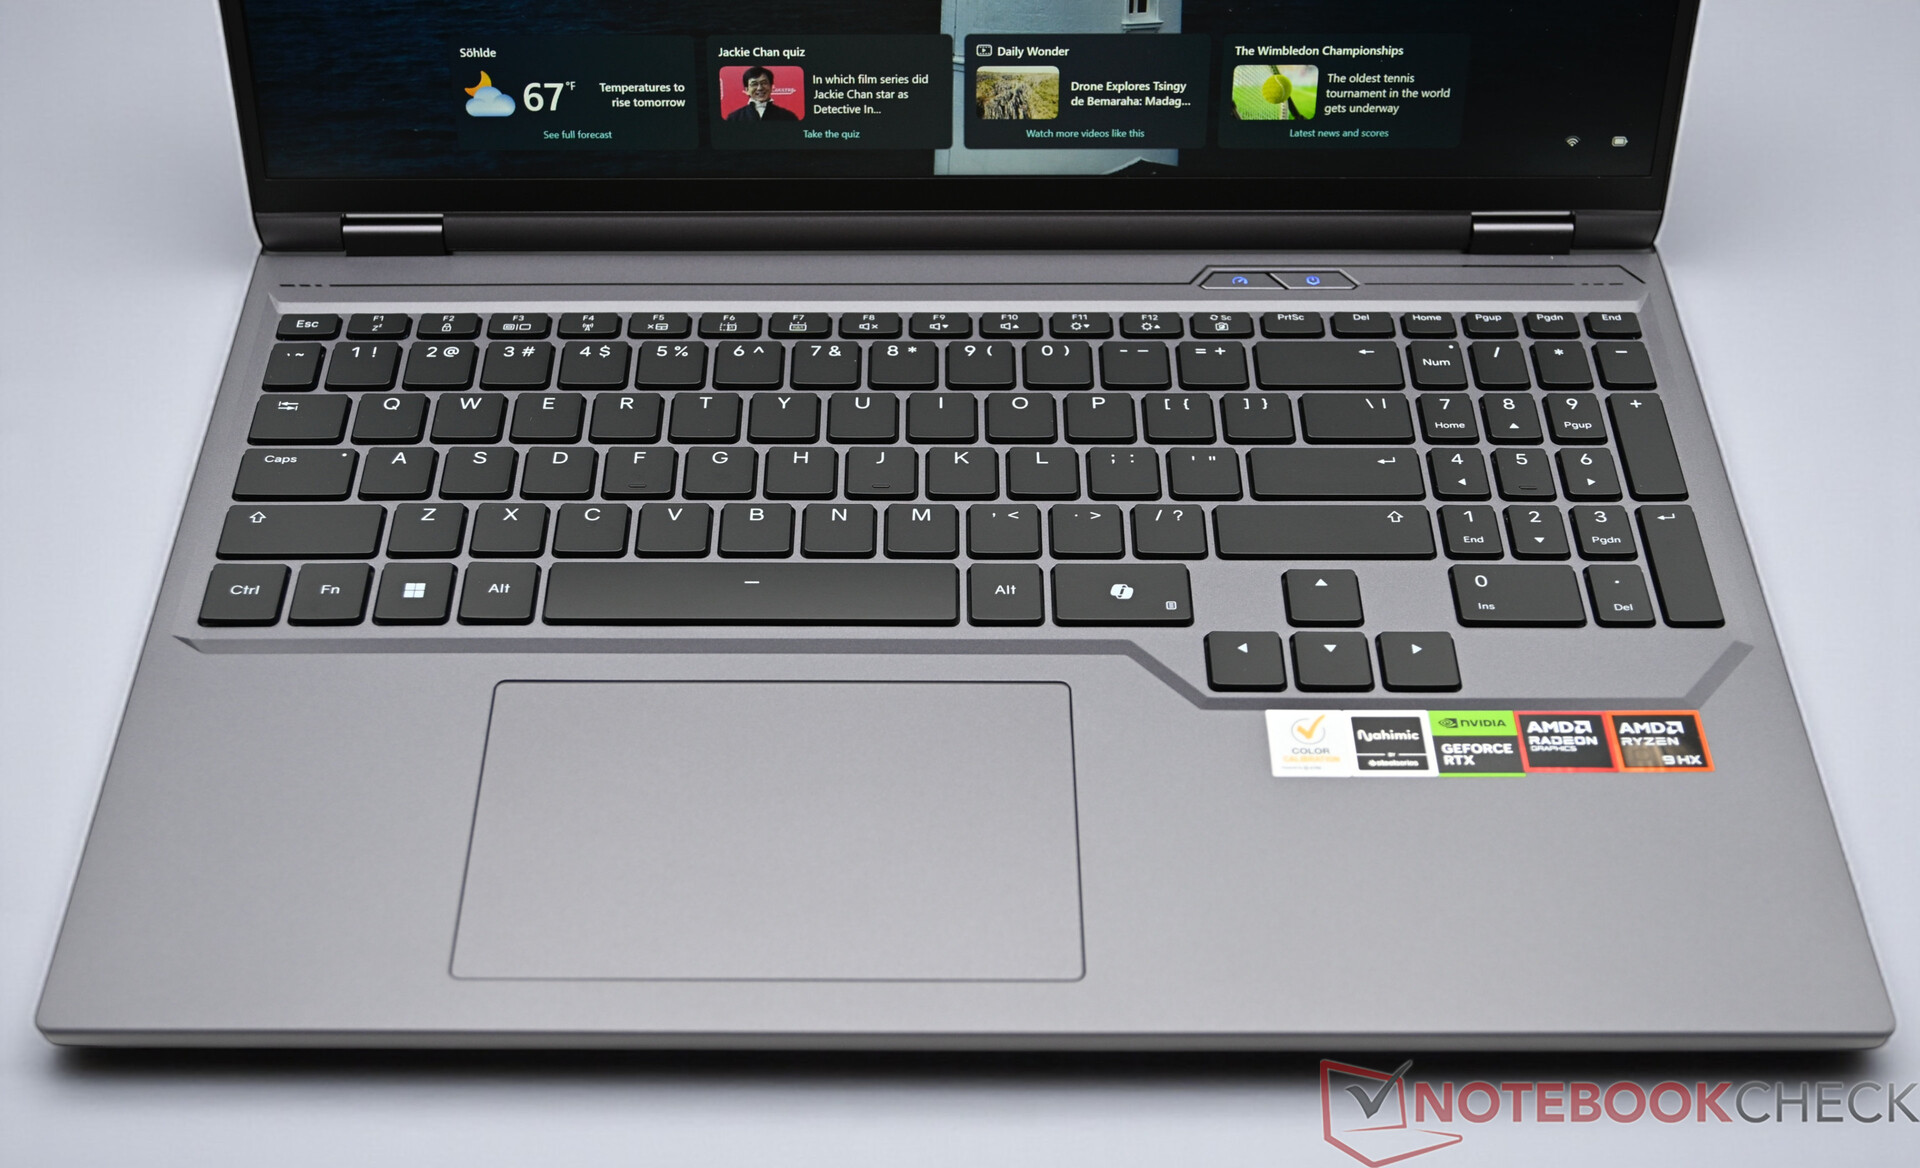
Input devices
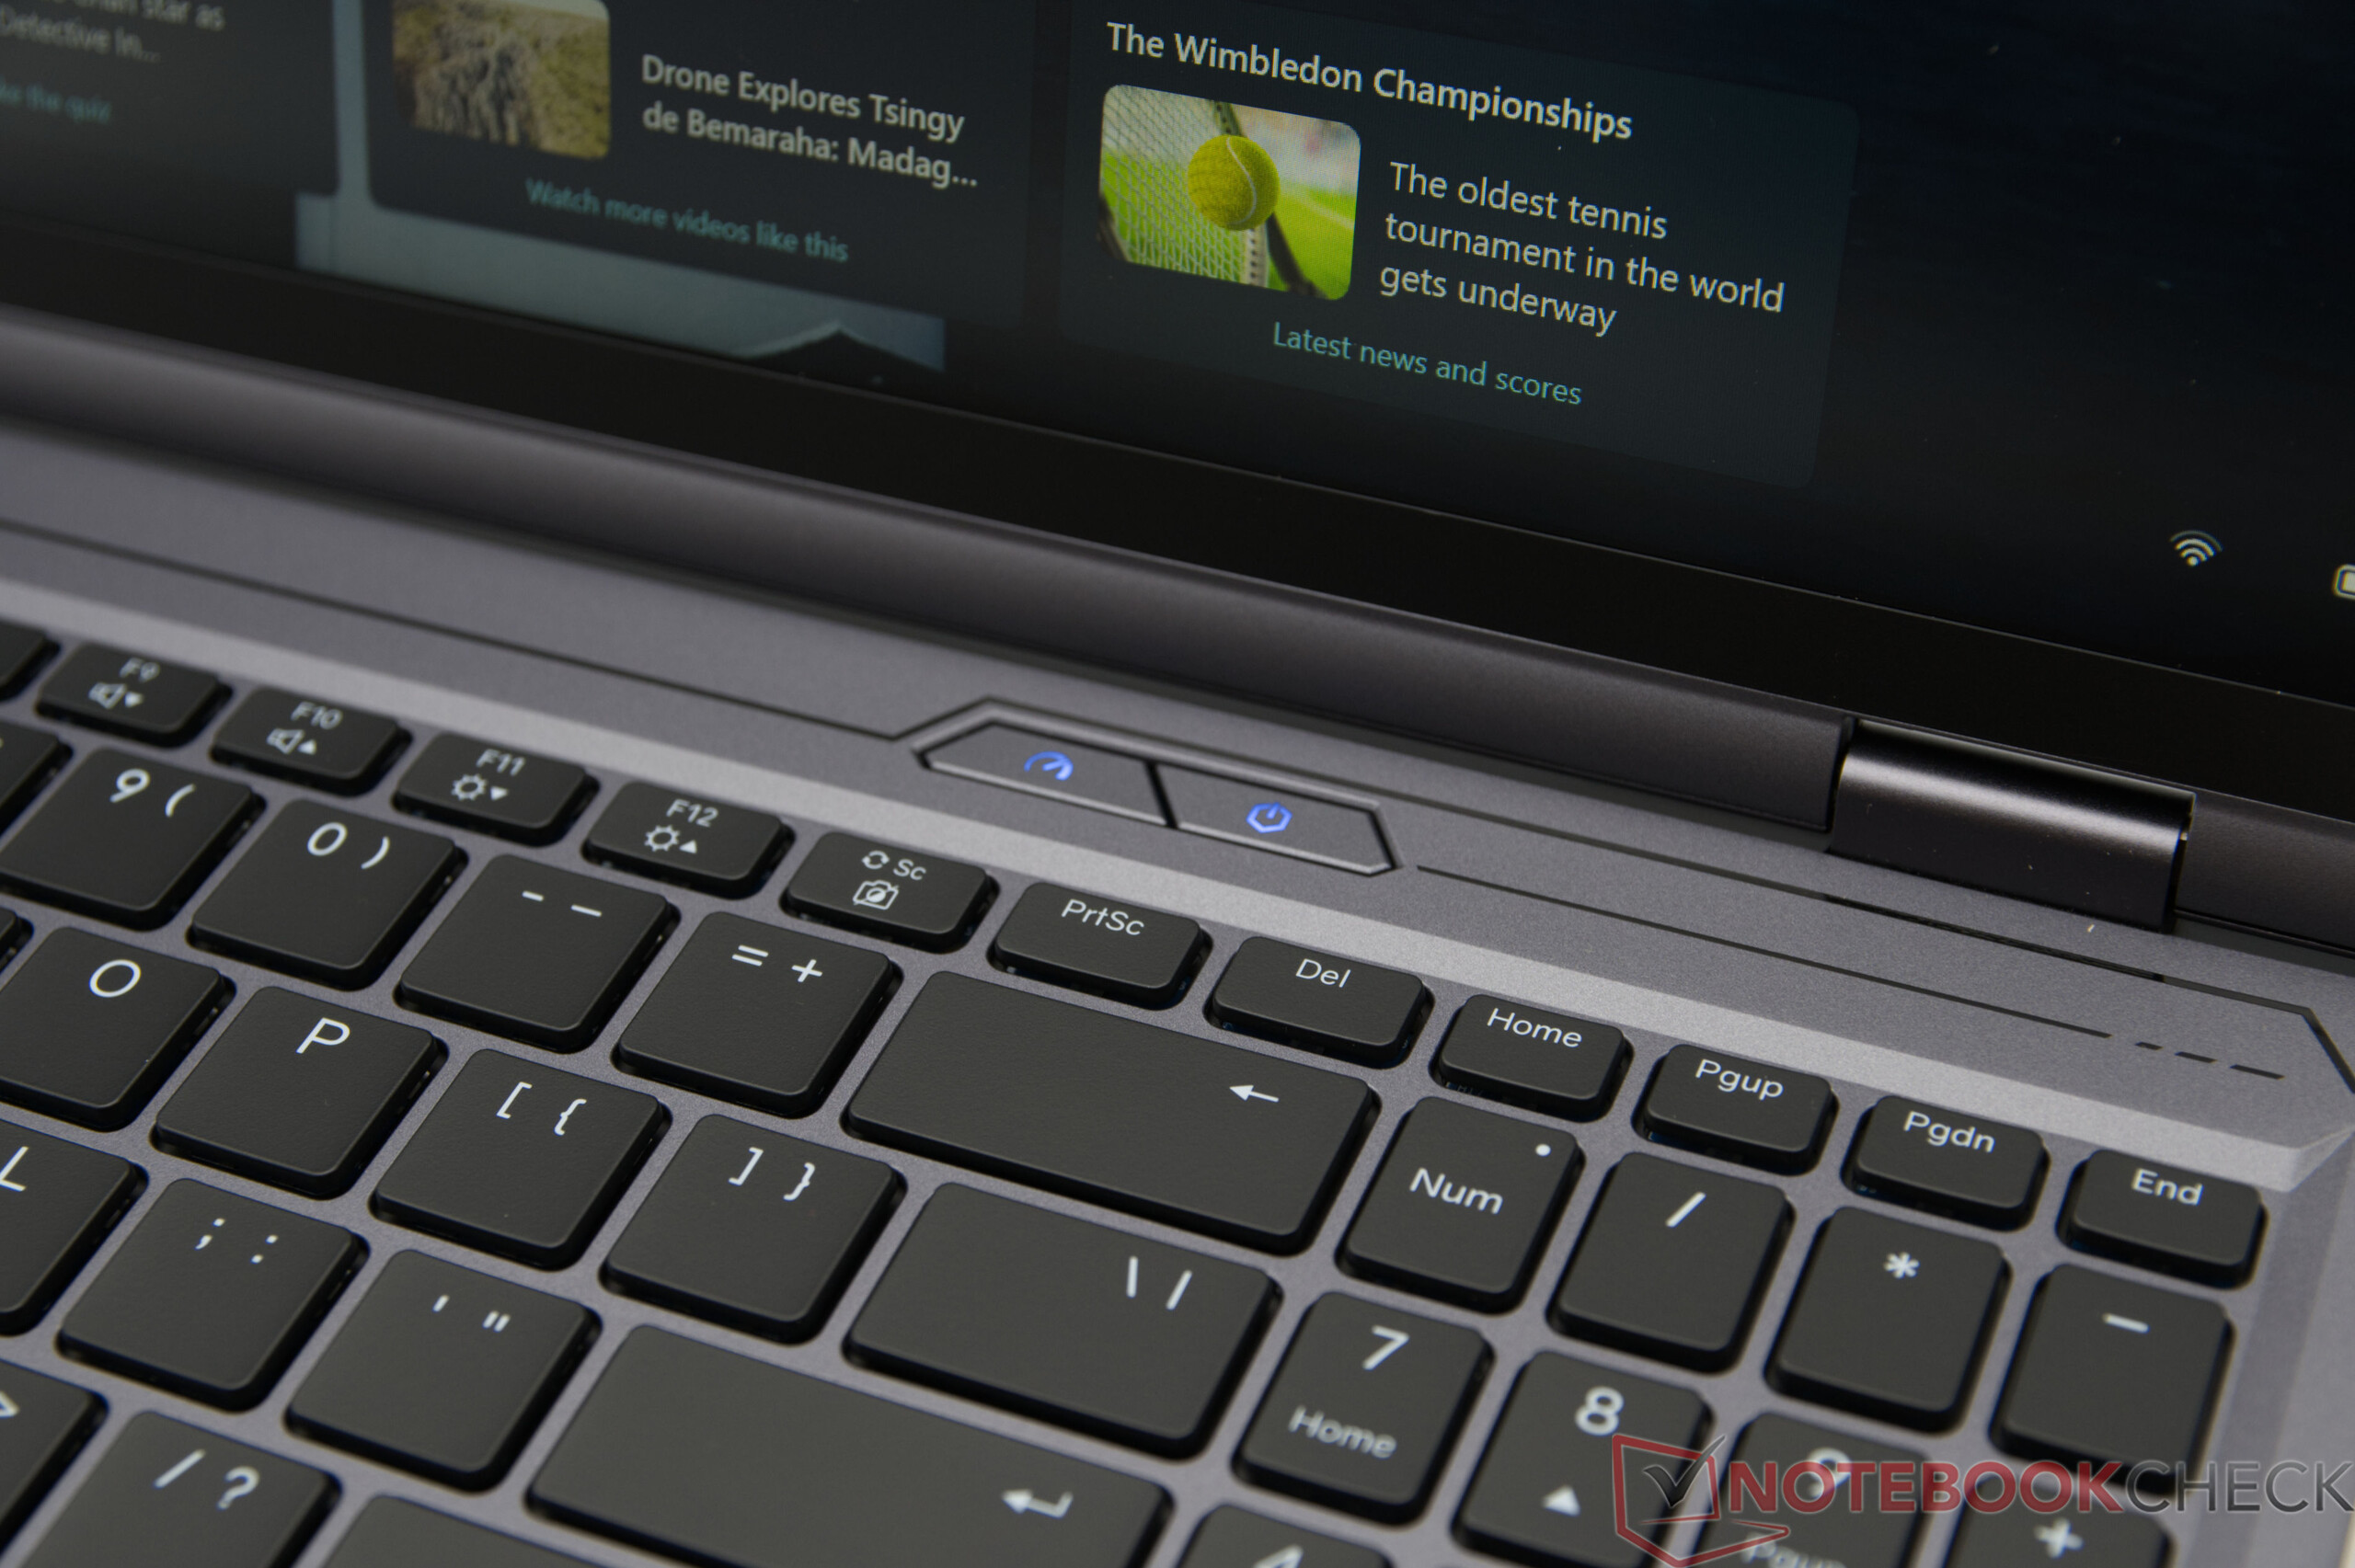
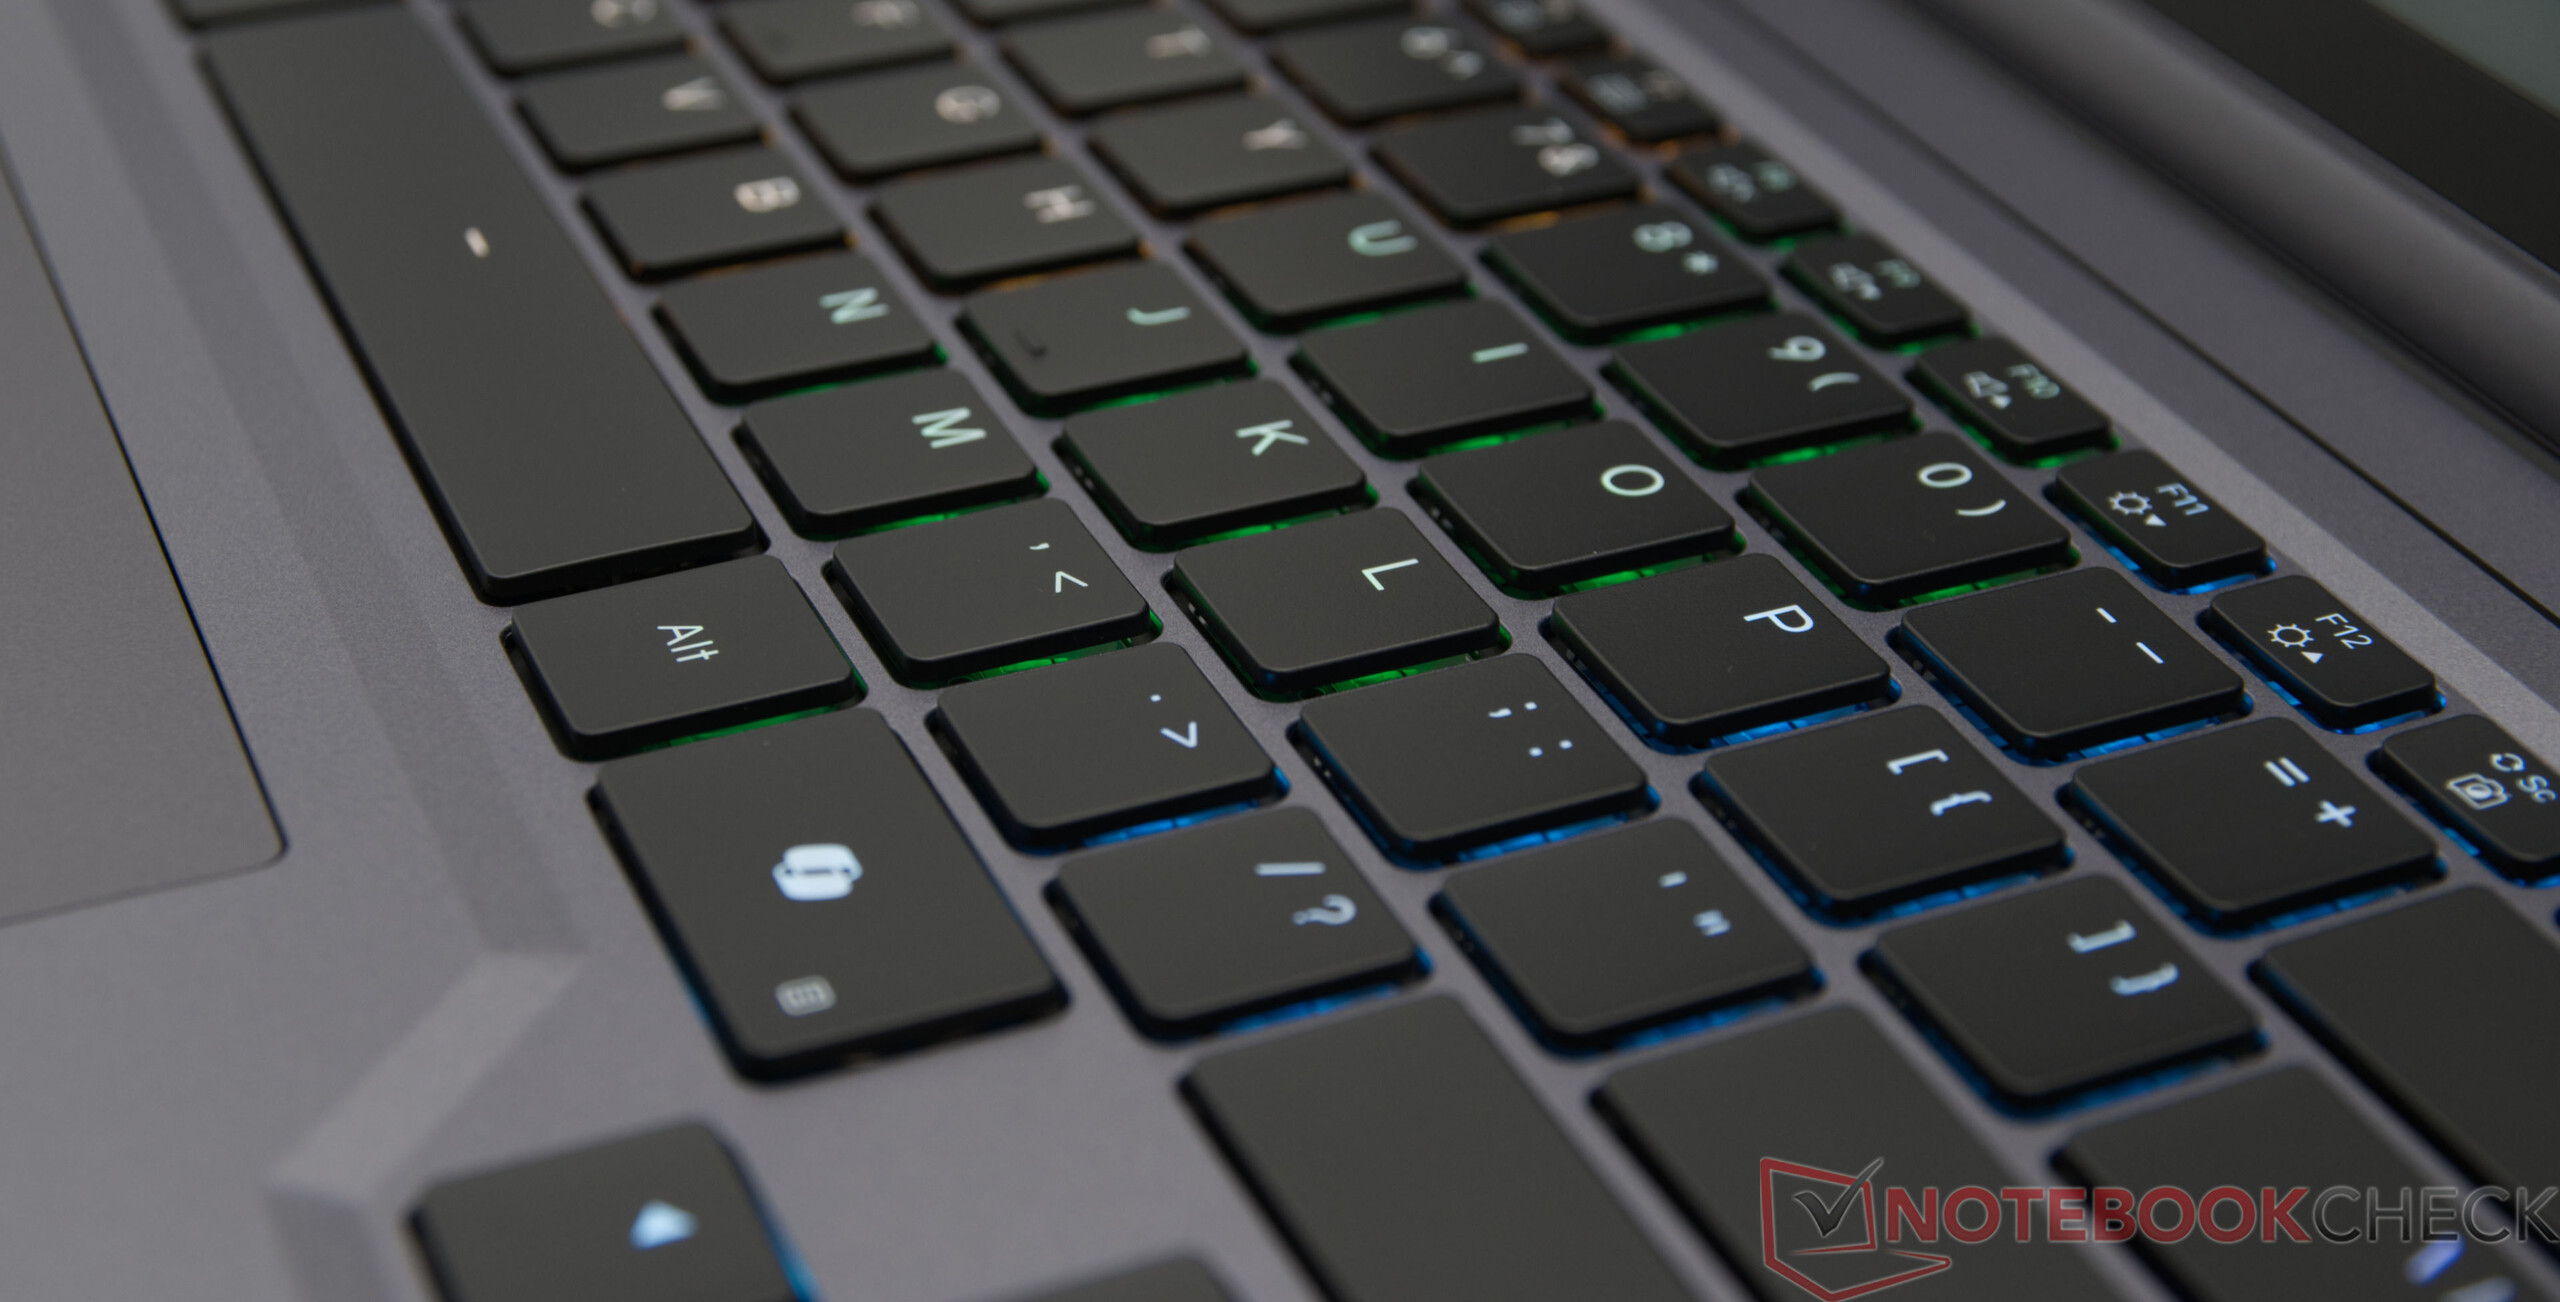
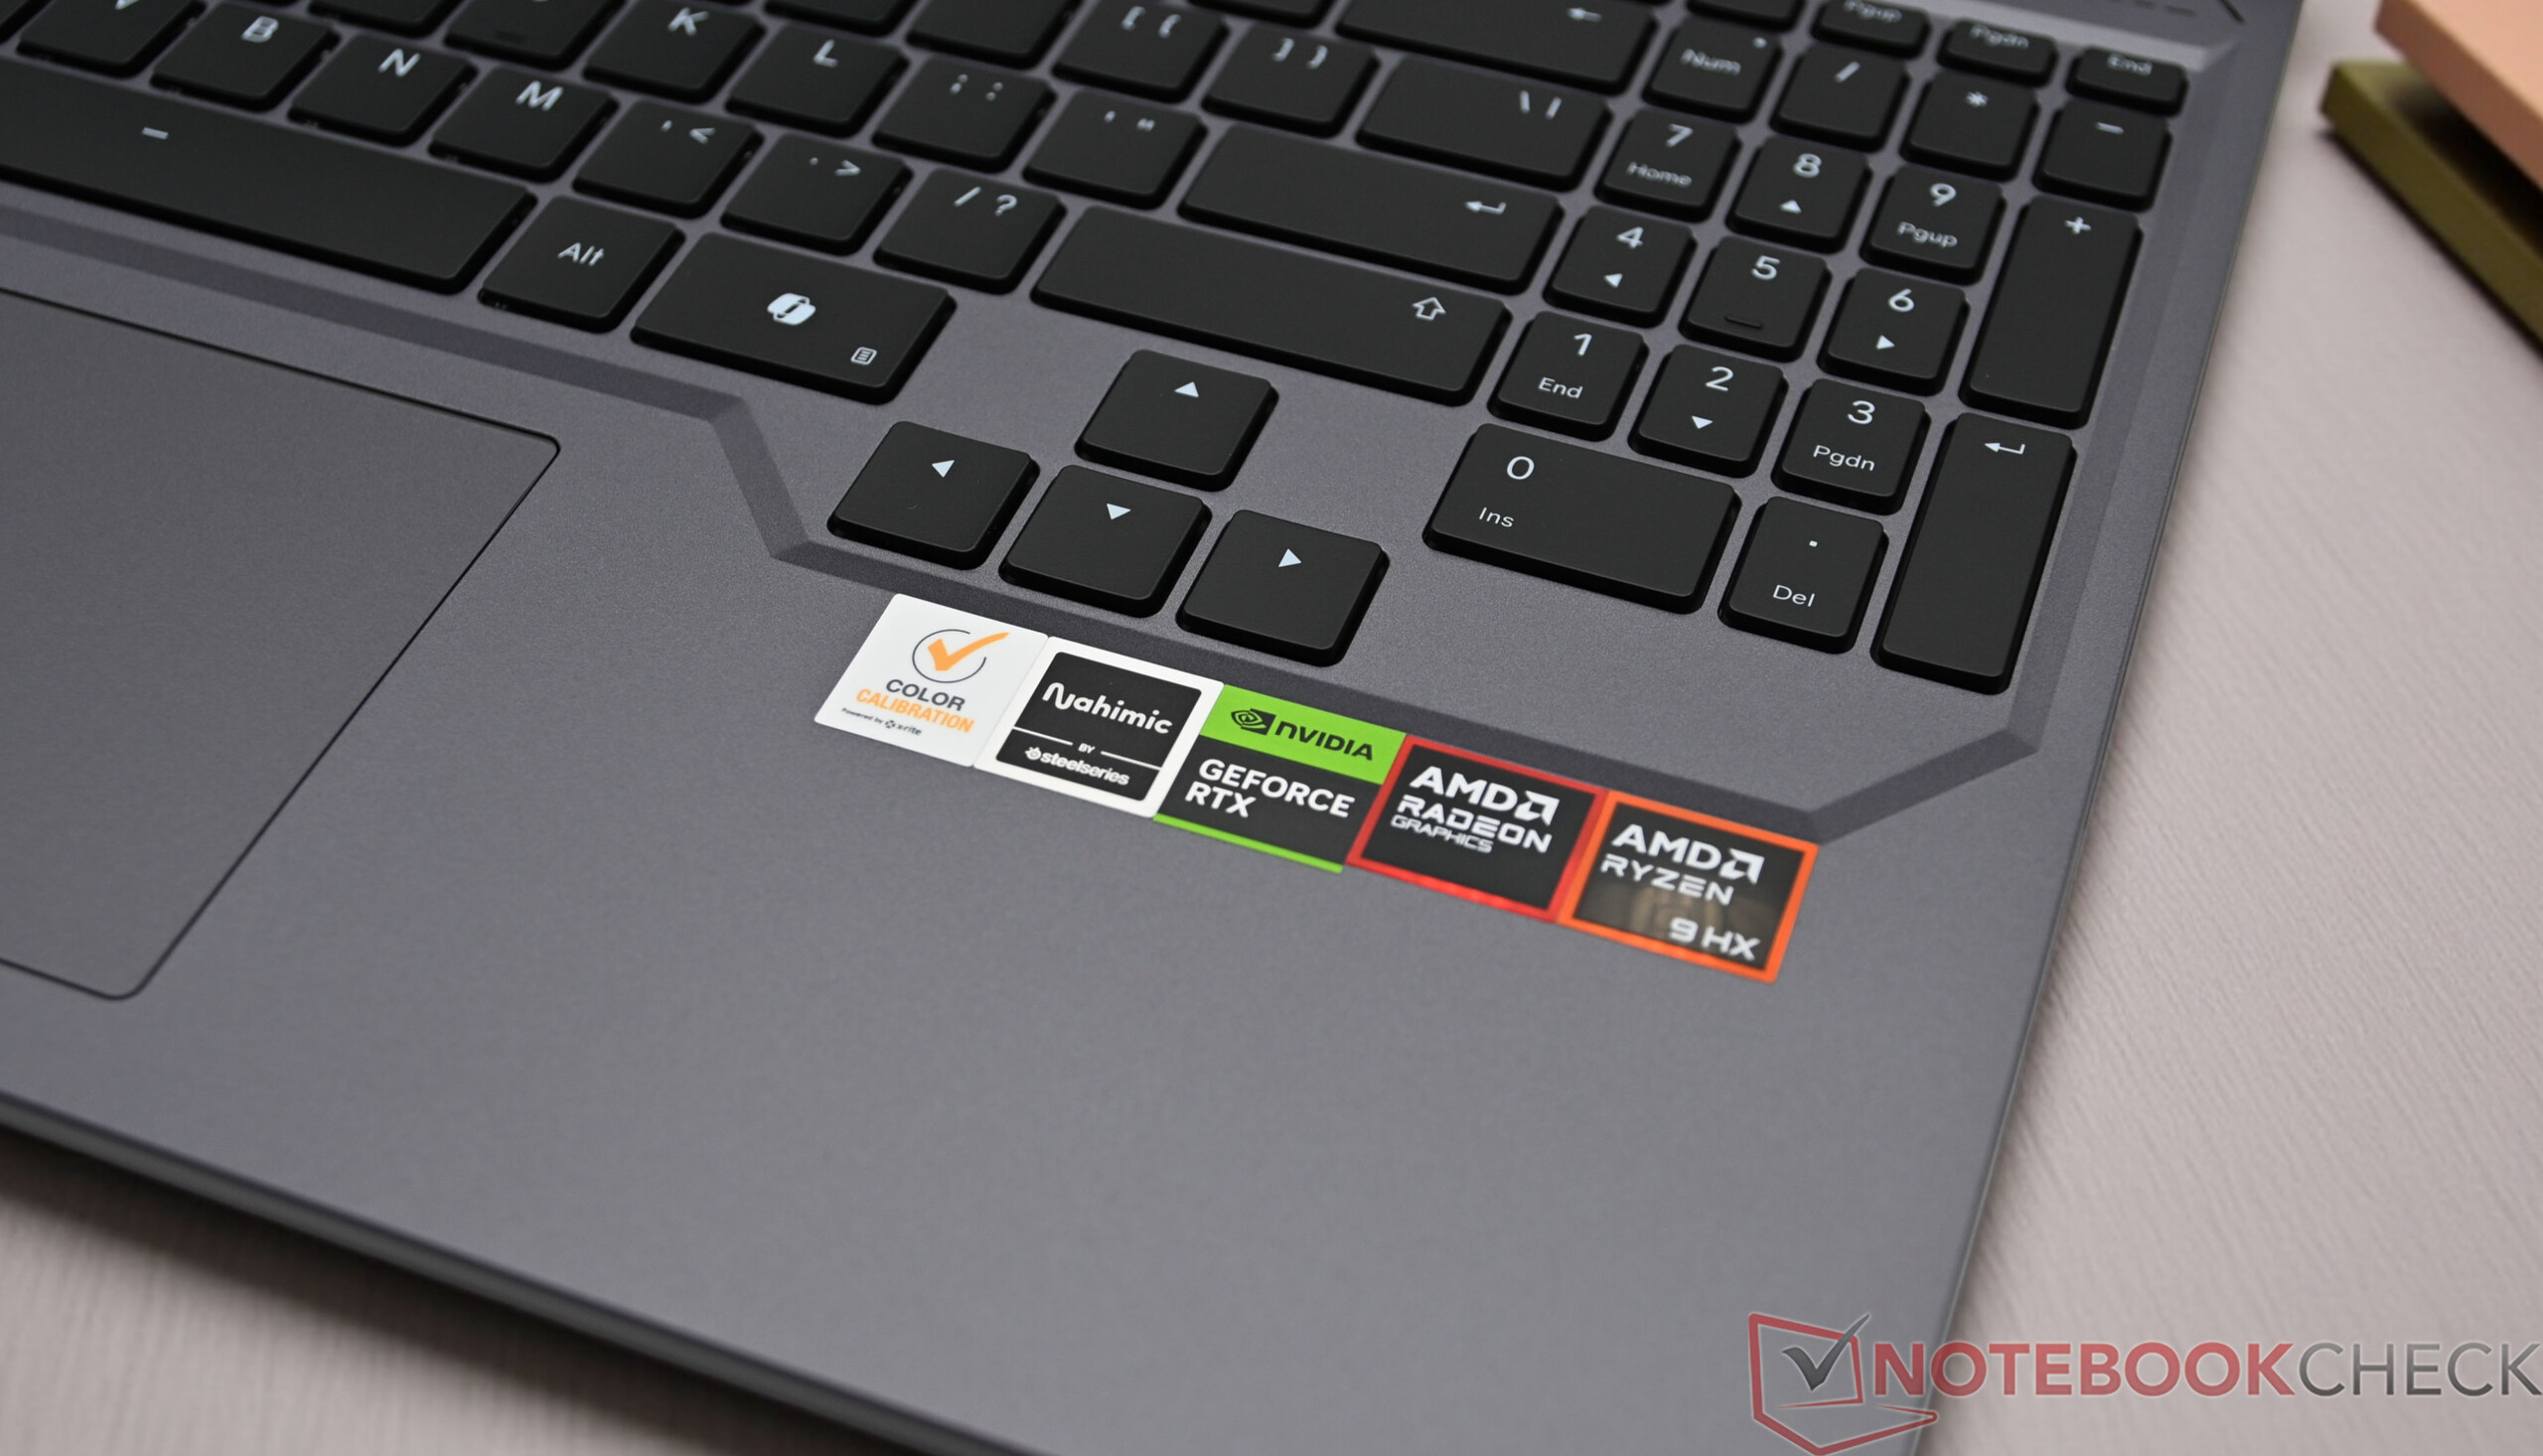
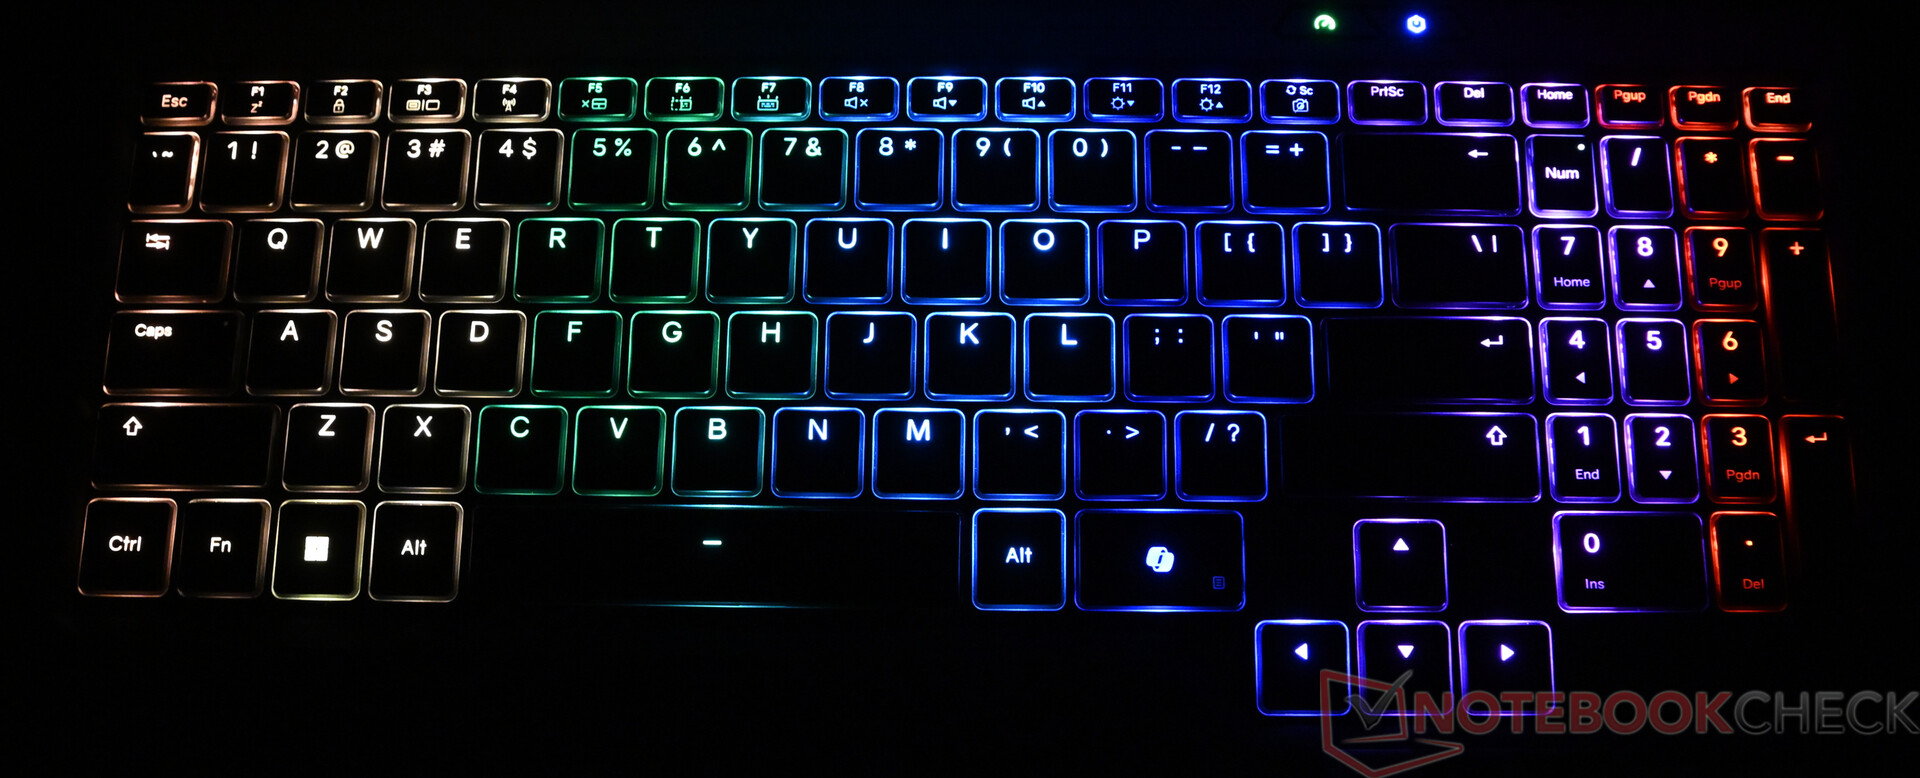
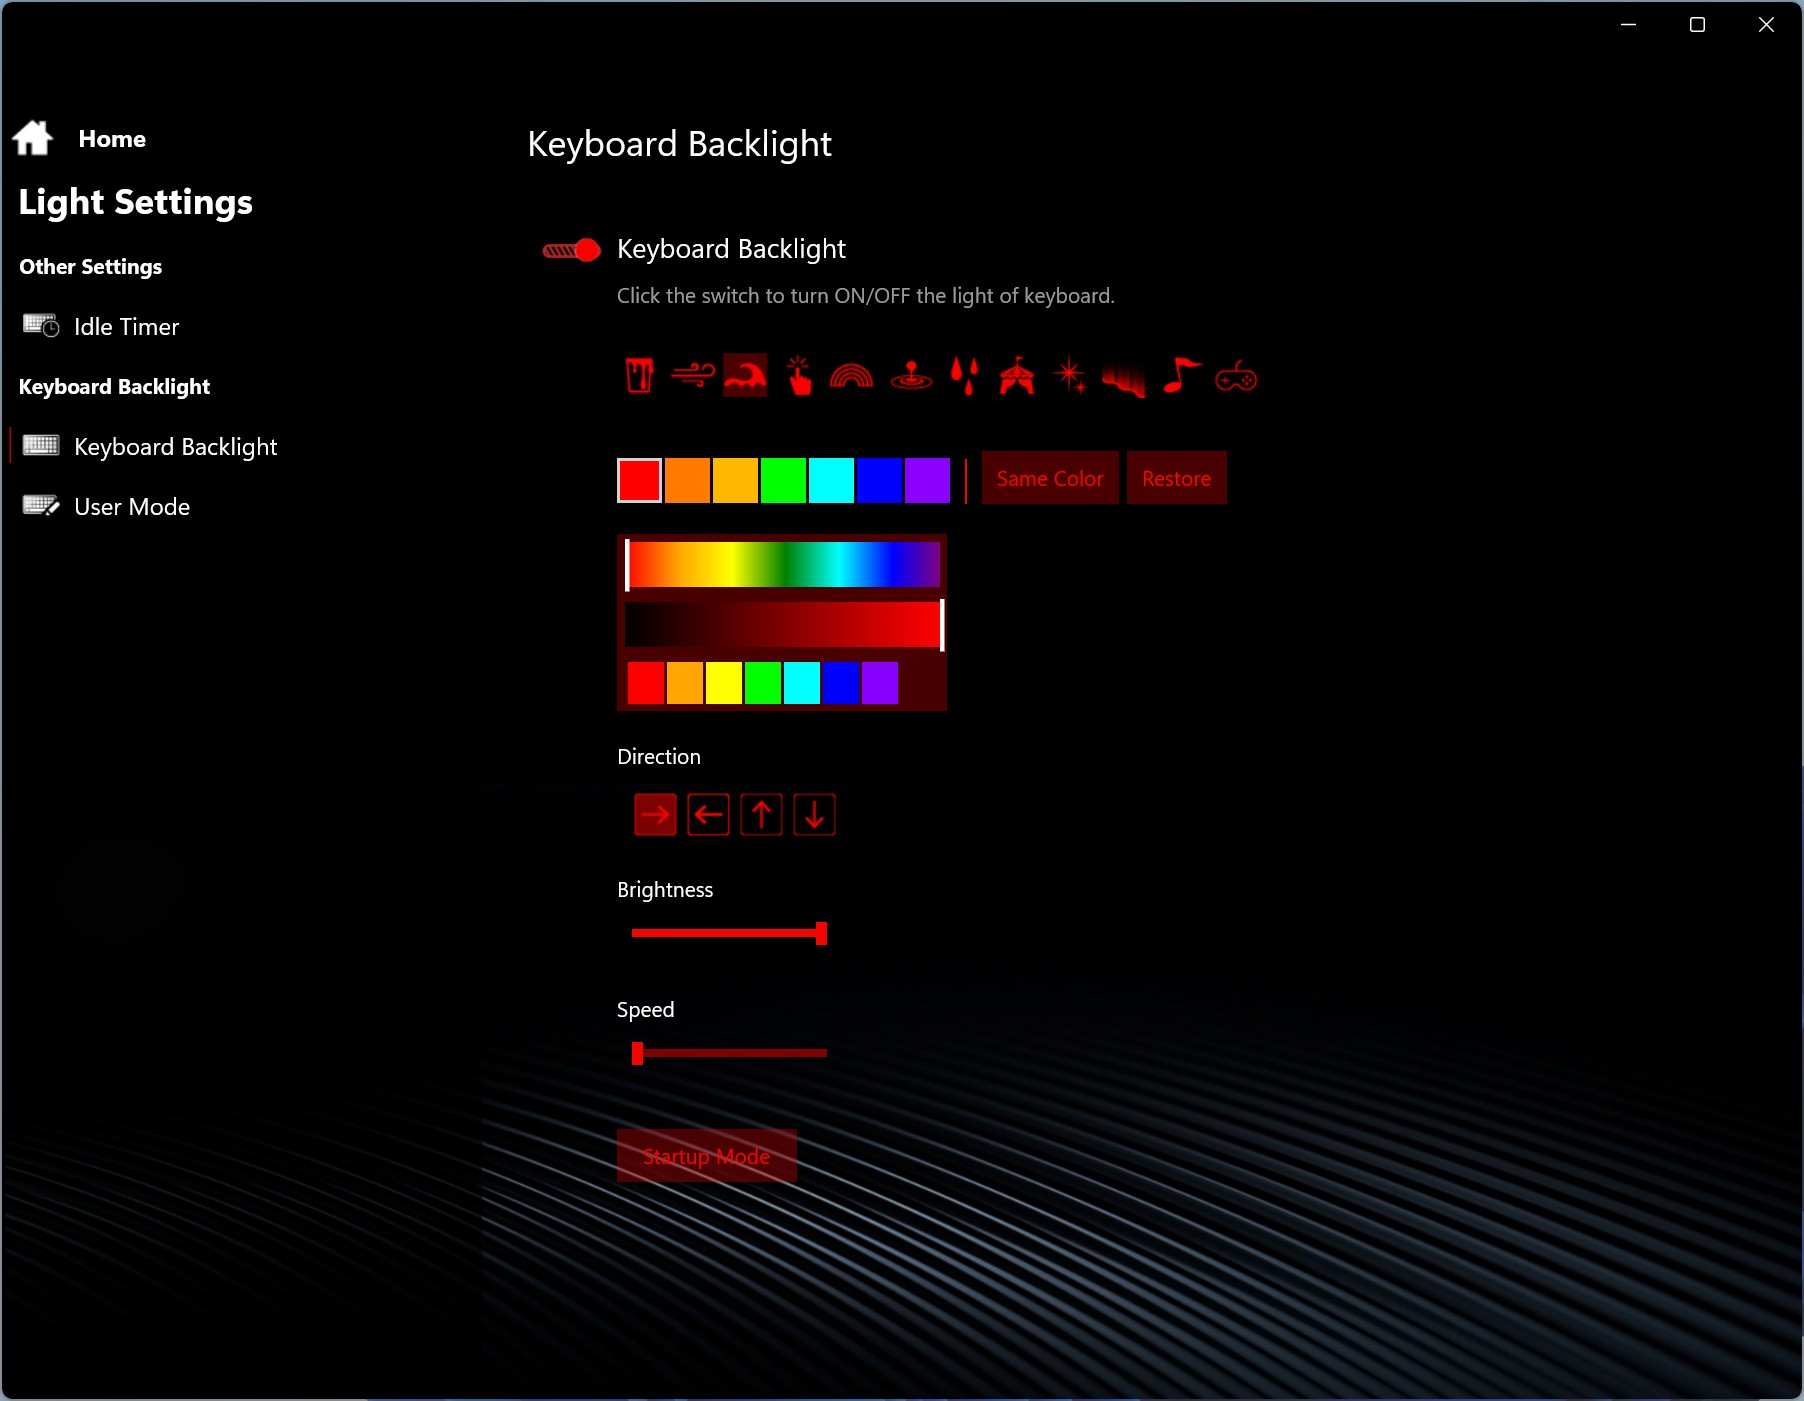
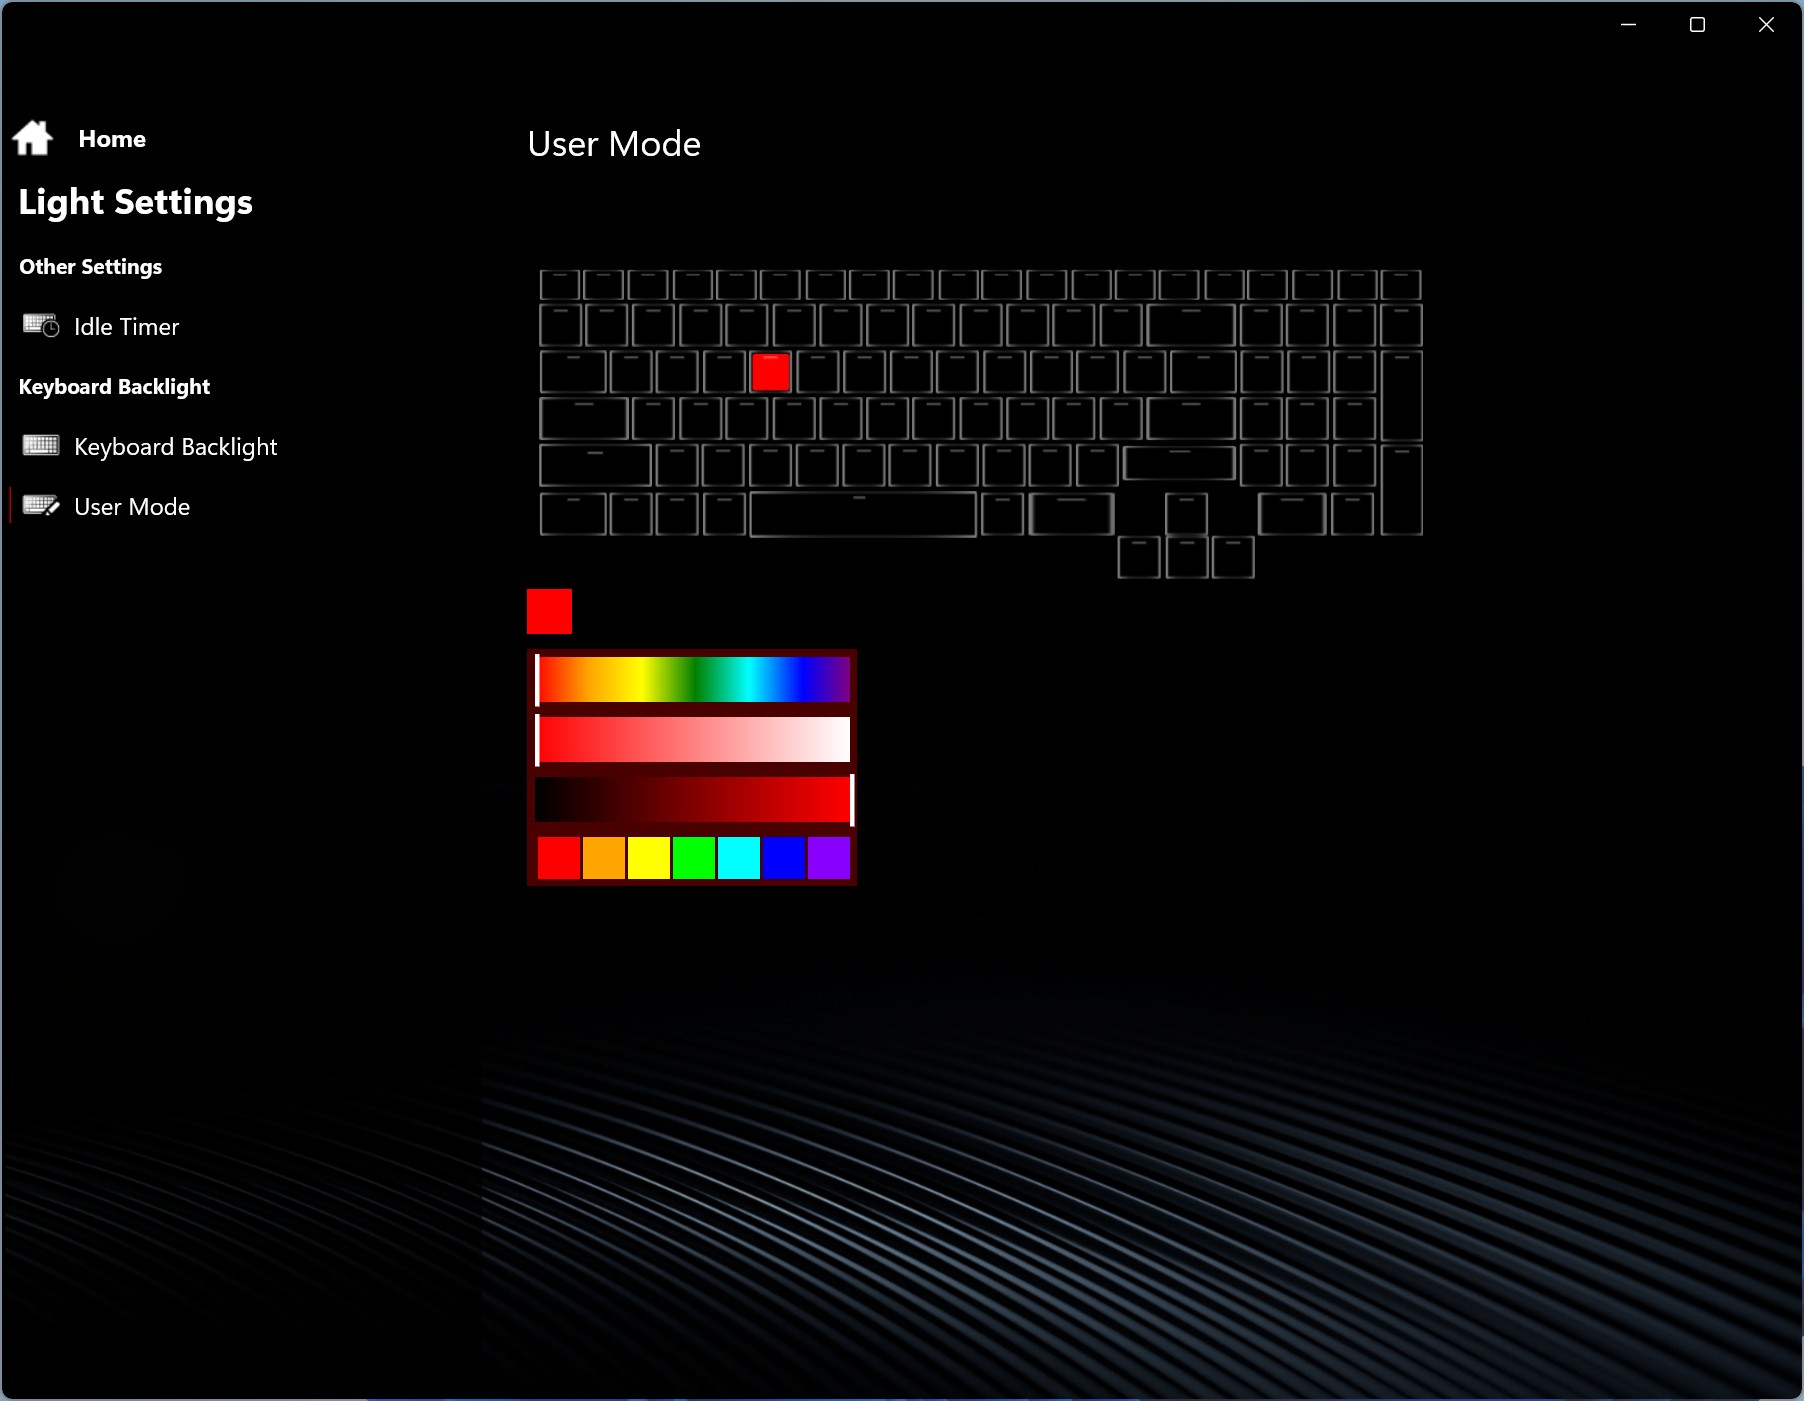
The input devices of the Chuwi Gamebook are generally convincing and leave a high-quality overall impression. The keyboard with a numeric keypad continues to offer a pleasant typing experience with a clearly defined pressure point. The layout is clear, and the RGB lighting can be individually adjusted in four brightness levels for each key. The generous Clickpad (12.3 x 7.8 cm) impresses with good gliding properties and does not rattle, although the mechanical clicks in the lower area are moderately loud. It should also be mentioned that Chuwi only offers the Gamebook with the QWERTY layout.
Display

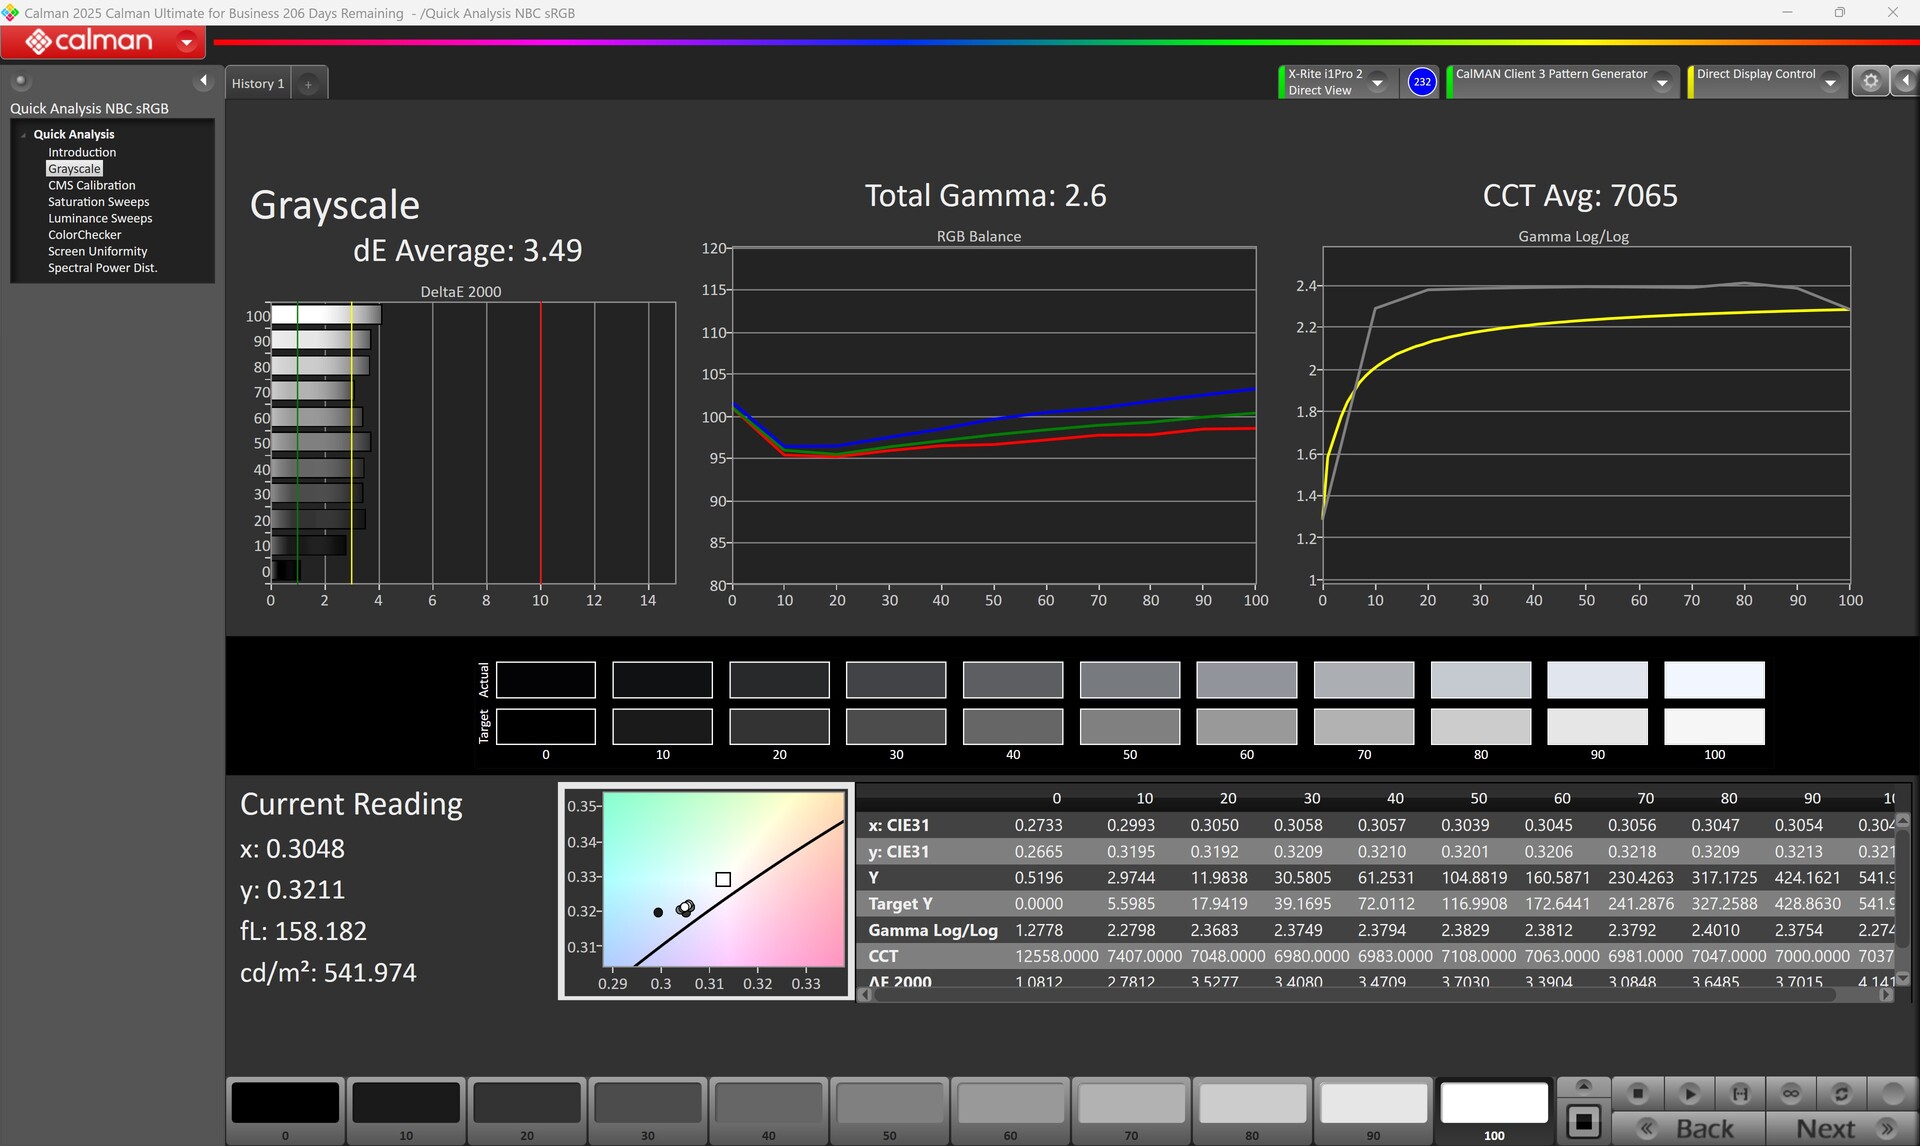
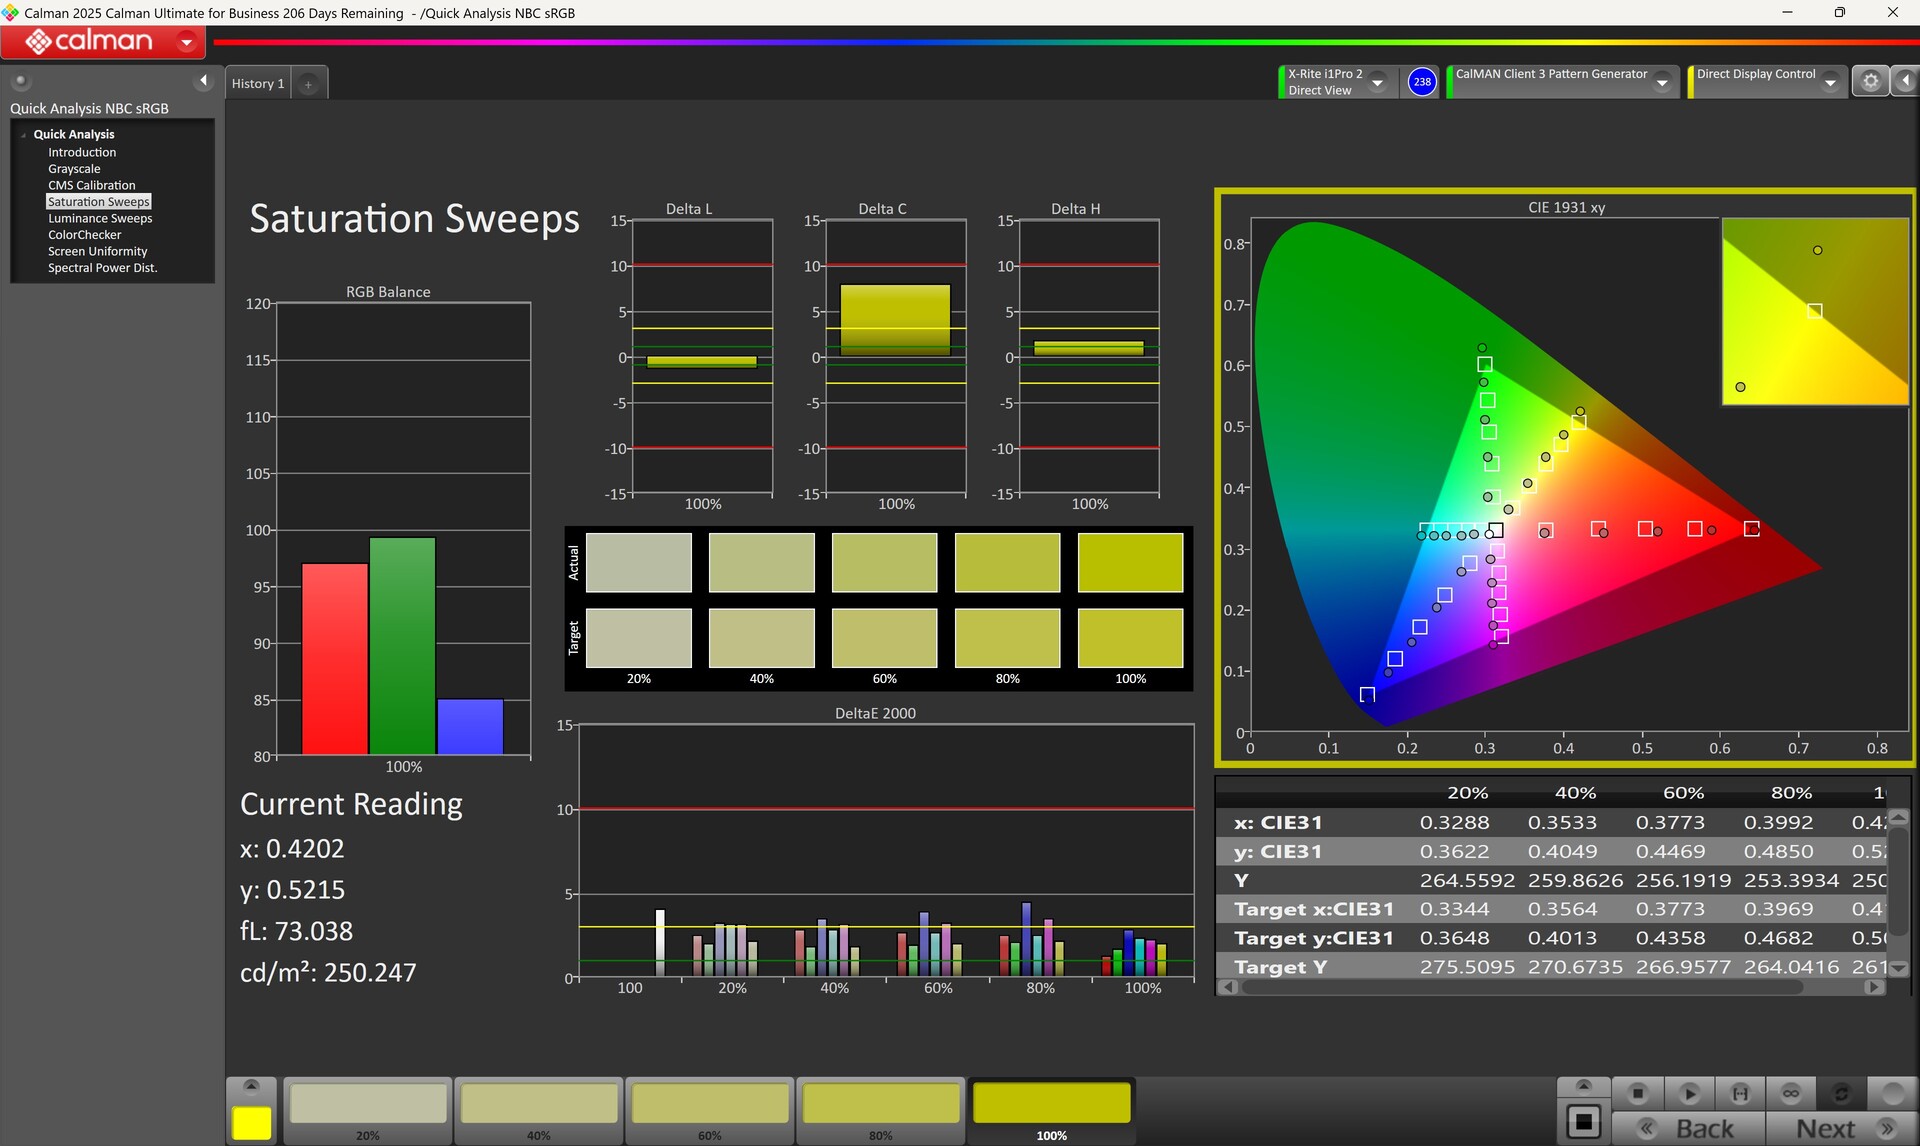
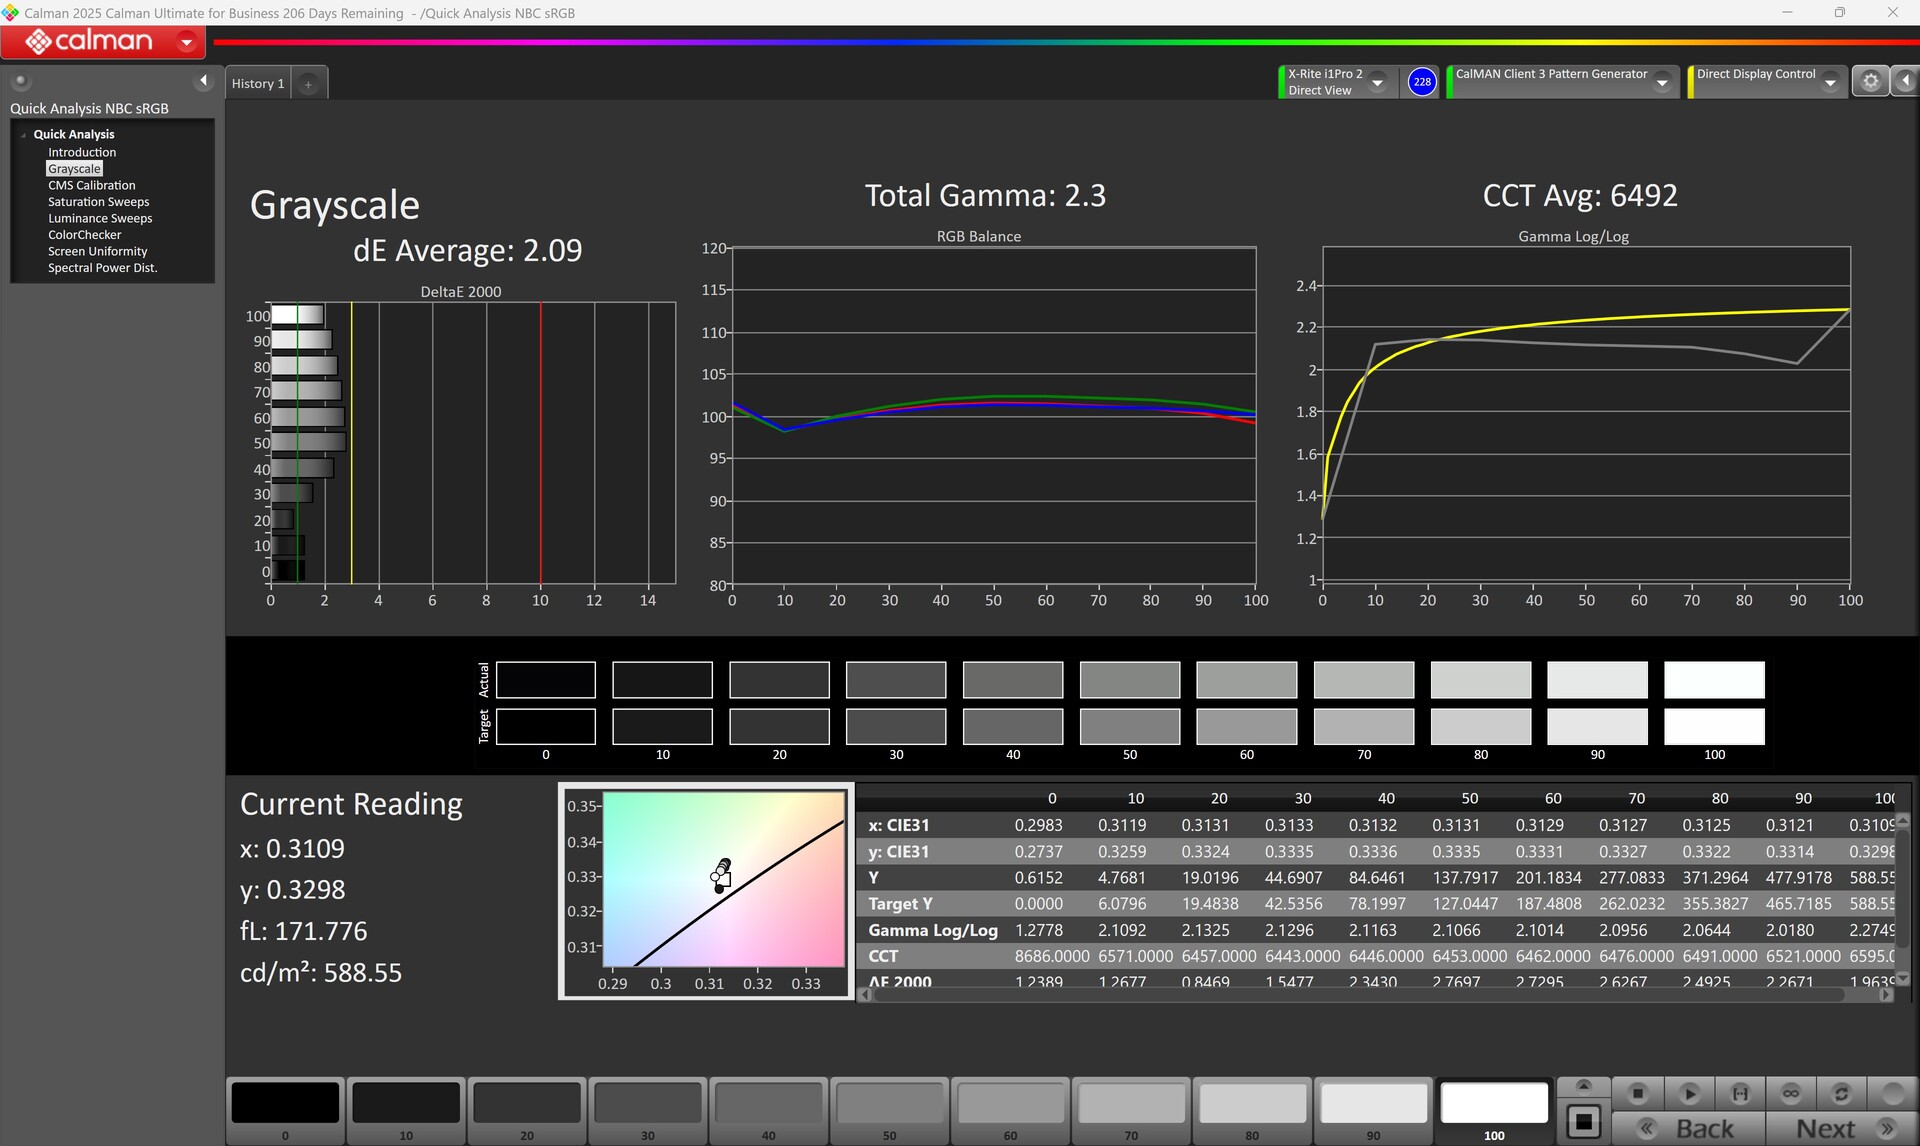
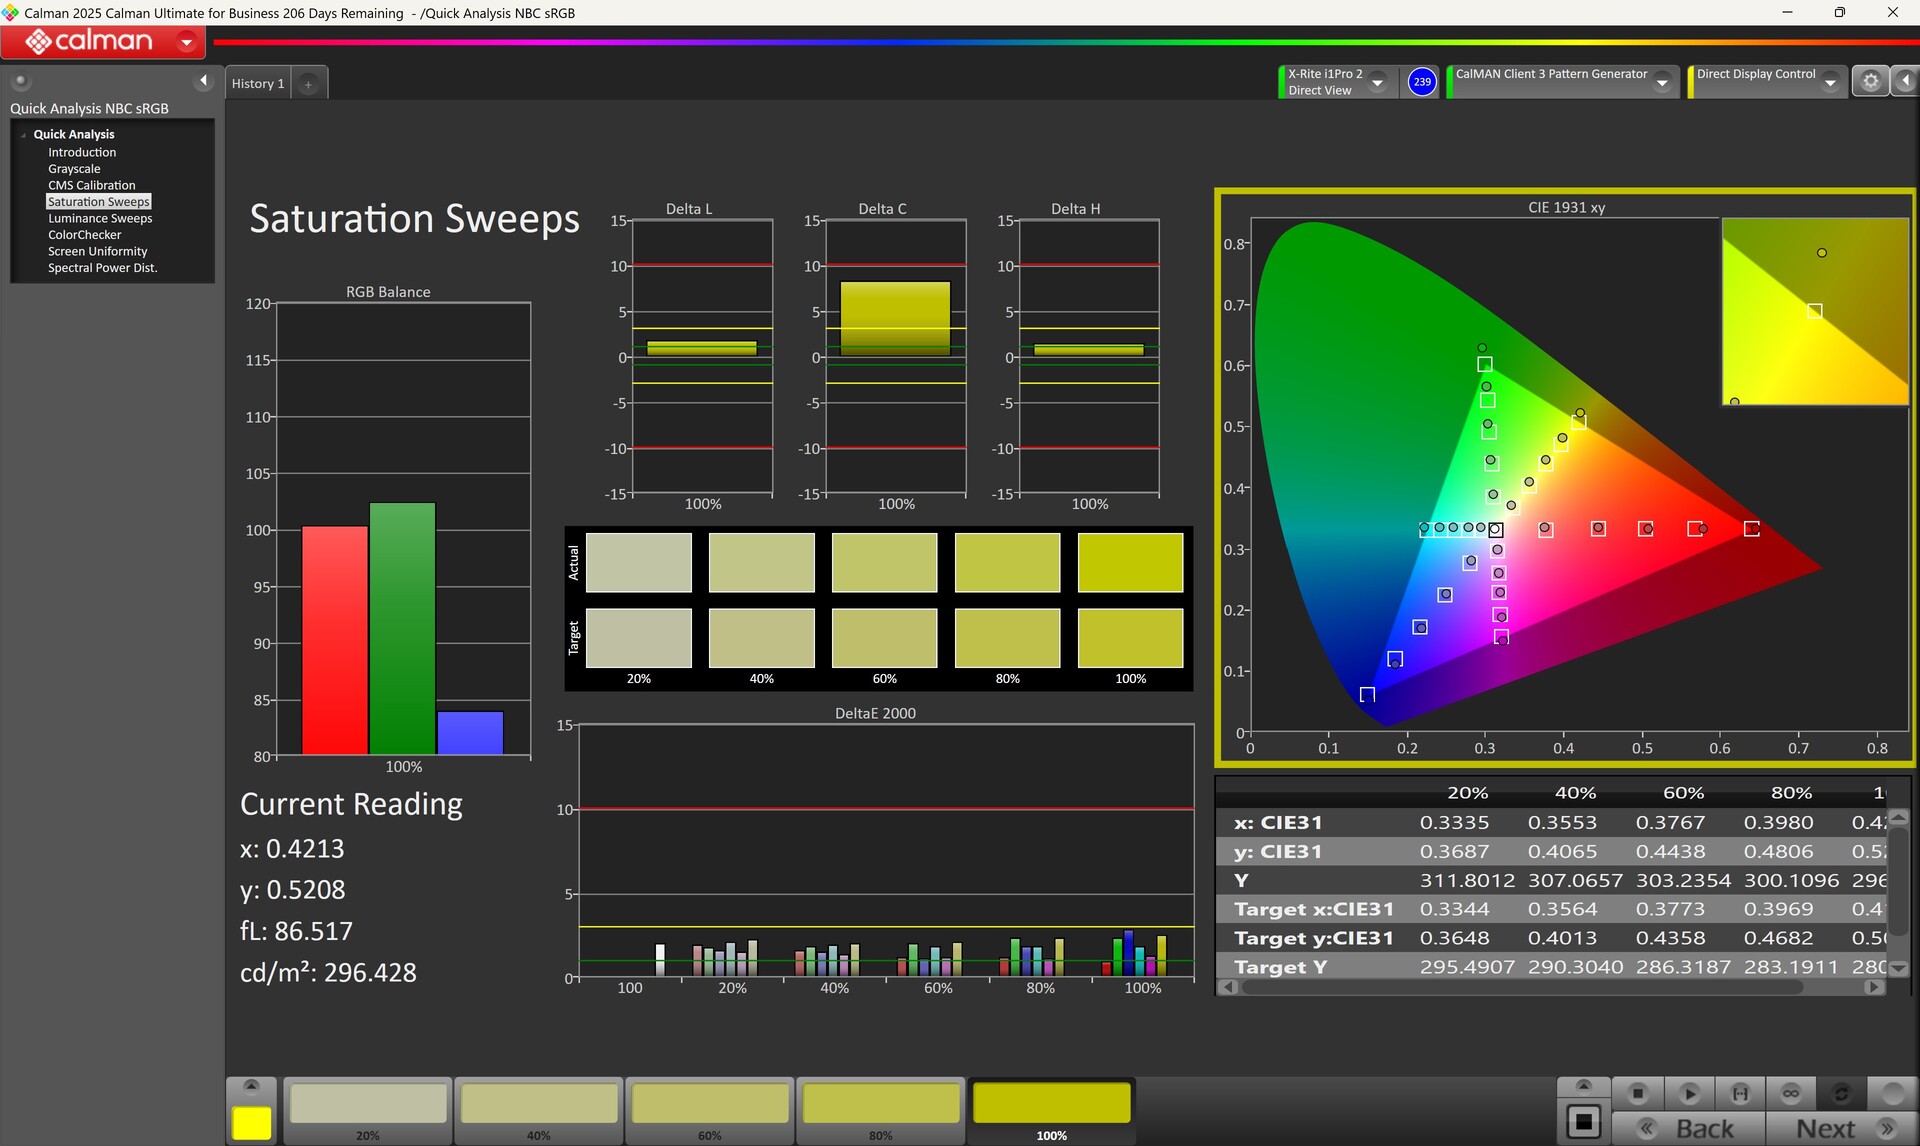
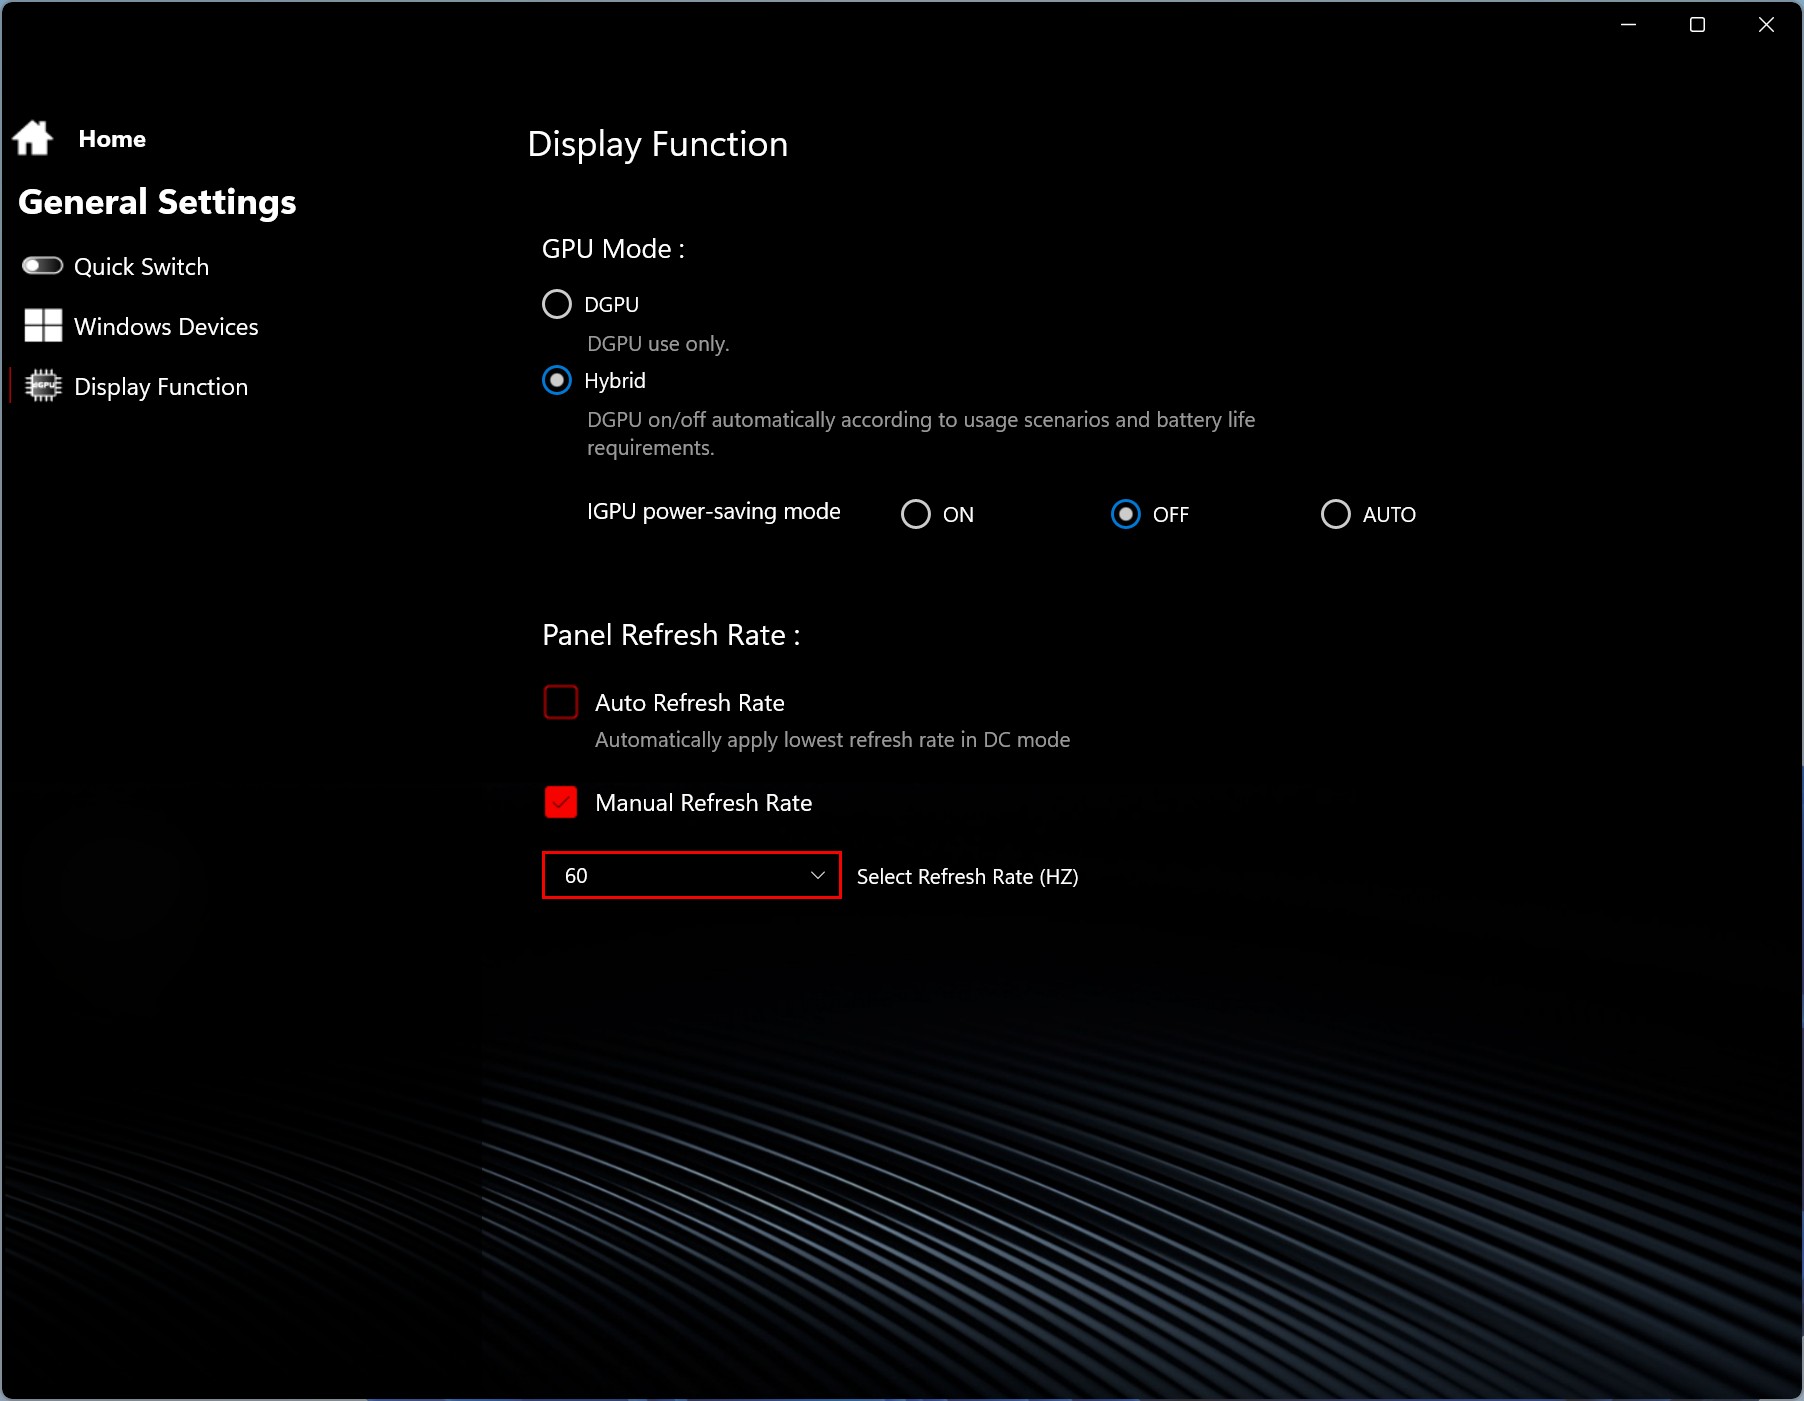
Chuwi installs a 16:10 panel with 300 Hz refresh rate in the Gamebook, which underpins the gaming claim. However, this option is only available to the user when switching to dGPU-only mode. Only 240 Hz can be set in hybrid mode. The resolution is 2,560 x 1,600 pixels with a display size of 16 inches. The subjective image quality of the anti-glare panel is excellent: bright image areas do not appear grainy and we were unable to detect PWM flickering. Chuwi delivers the Gamebook in a very usable condition with the sRGB color profile. In our measurements, we only see slight deviations from the Delta-E-2000 values. Our manual calibration was only able to slightly improve the already good results. The color space coverage is also good. The sRGB color space is almost completely covered.
| |||||||||||||||||||||||||
Brightness Distribution: 88 %
Center on Battery: 576 cd/m²
Contrast: 1152:1 (Black: 0.5 cd/m²)
ΔE ColorChecker Calman: 2.04 | ∀{0.5-29.43 Ø4.73}
calibrated: 1.85
ΔE Greyscale Calman: 2.09 | ∀{0.09-98 Ø4.97}
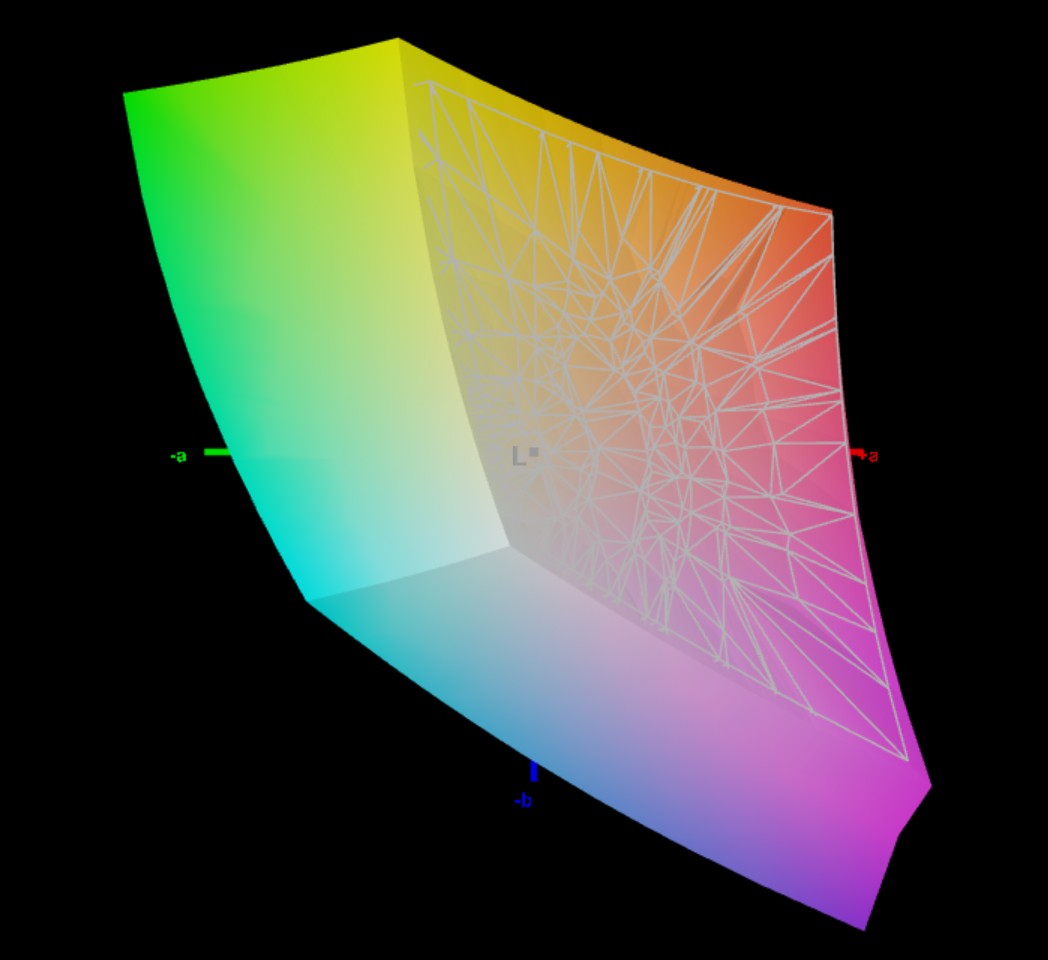
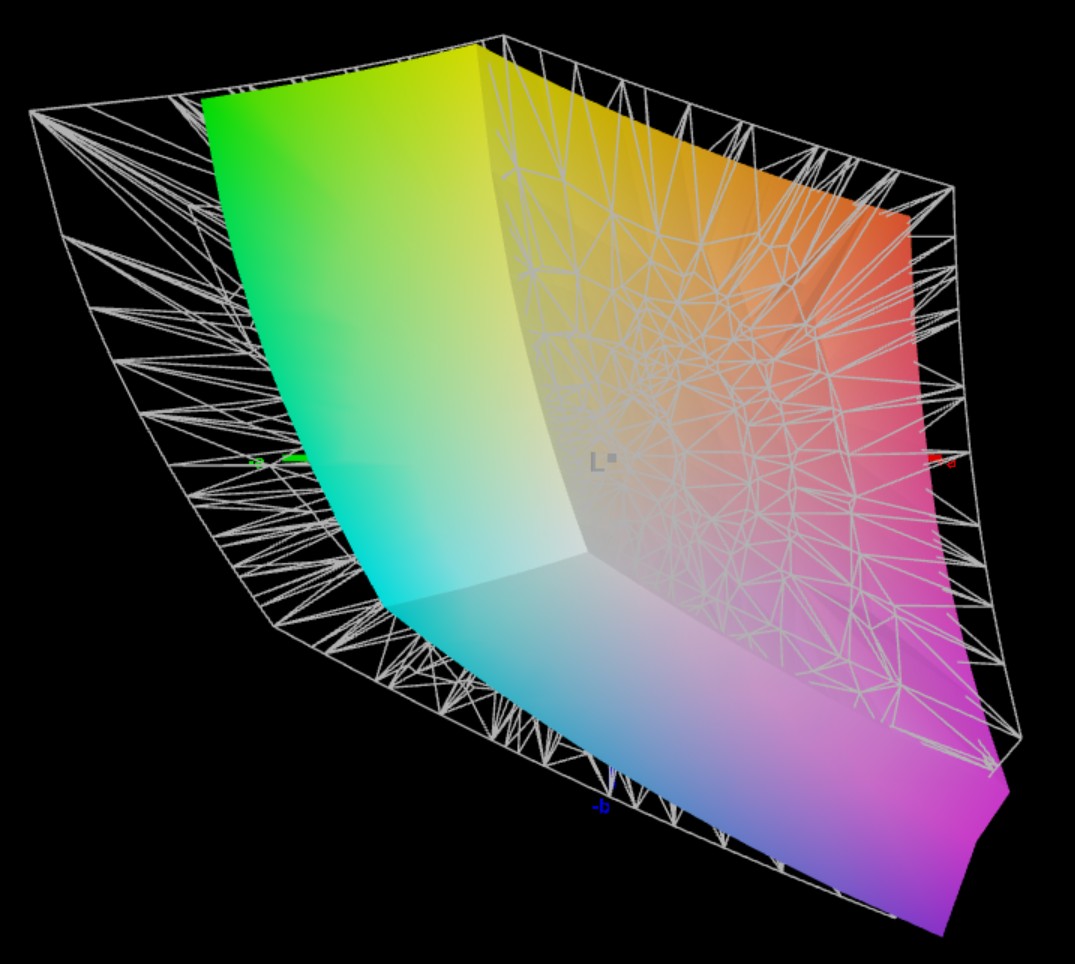
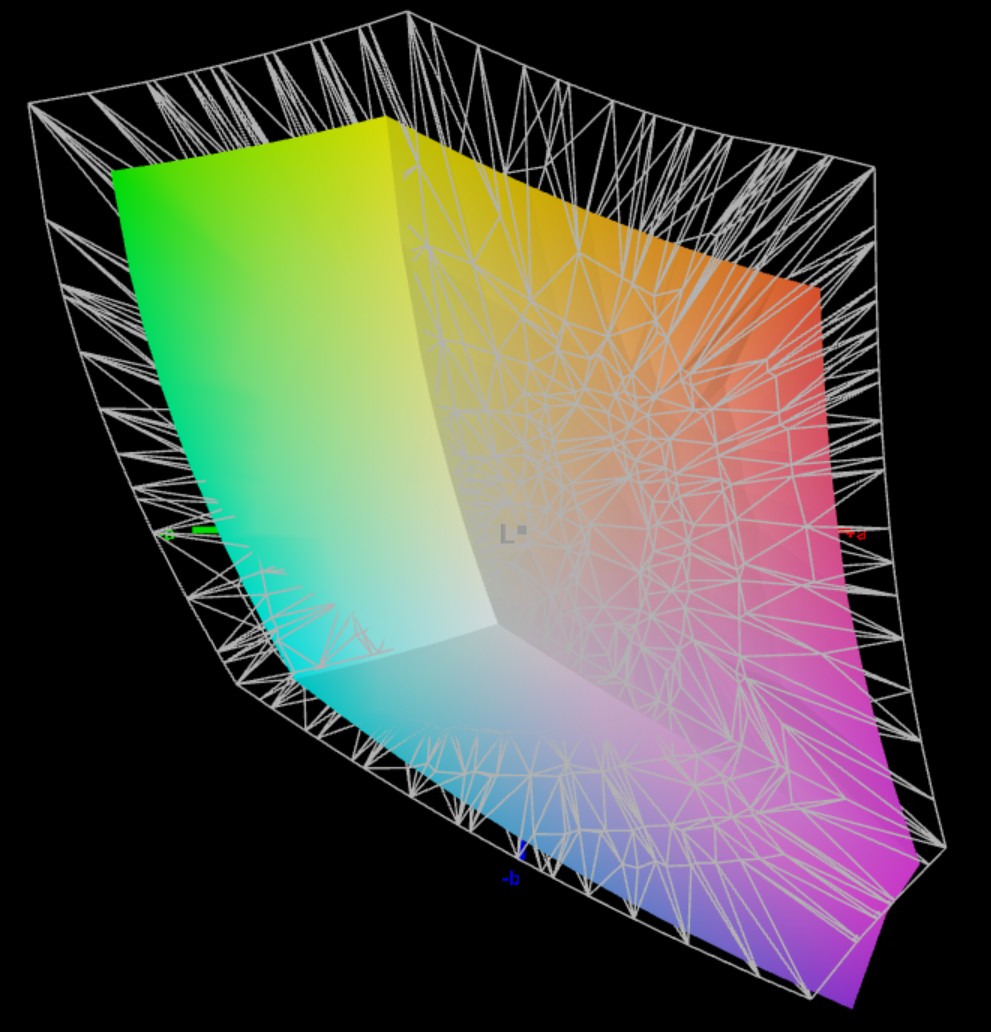
72.5% AdobeRGB 1998 (Argyll 3D)
97.9% sRGB (Argyll 3D)
72.5% Display P3 (Argyll 3D)
Gamma: 2.3
CCT: 6492 K
| Chuwi Gamebook, R9 9955HX BOE0D55, IPS, 2560x1600, 16", 300 Hz | Schenker XMG Pro 16 (E25) NE160QDM-NZL, IPS, 2560x1600, 16", 300 Hz | Medion Erazer Major 16 X1 MD62736 NE160QDM-NZL (BOE0D55), IPS, 2560x1600, 16", 300 Hz | Lenovo Legion 5 Pro 16IAX10H ATNA60HS01-0 (Samsung SDC420A), OLED, 2560x1600, 16", 165 Hz | MSI Vector 16 HX AI A2XWHG B160QAN02.3 (AUO7DB2), IPS, 2560x1600, 16", 240 Hz | |
|---|---|---|---|---|---|
| Display | 3% | 2% | 23% | 17% | |
| Display P3 Coverage (%) | 72.5 | 74.7 3% | 73.2 1% | 99.9 38% | 96.6 33% |
| sRGB Coverage (%) | 97.9 | 99.8 2% | 99.8 2% | 100 2% | 99.8 2% |
| AdobeRGB 1998 Coverage (%) | 72.5 | 75.4 4% | 73.9 2% | 94.1 30% | 84.4 16% |
| Response Times | 18% | 22% | 82% | 39% | |
| Response Time Grey 50% / Grey 80% * (ms) | 12.4 ? | 10.5 ? 15% | 10 ? 19% | 2 ? 84% | 4.3 ? 65% |
| Response Time Black / White * (ms) | 6.8 ? | 5.4 ? 21% | 5.2 ? 24% | 1.4 ? 79% | 6 ? 12% |
| PWM Frequency (Hz) | 1300 | ||||
| PWM Amplitude * (%) | 16.7 | ||||
| Screen | -5% | 2% | -19% | -25% | |
| Brightness middle (cd/m²) | 576 | 538 -7% | 577 0% | 518 -10% | 473 -18% |
| Brightness (cd/m²) | 545 | 508 -7% | 539 -1% | 522 -4% | 426 -22% |
| Brightness Distribution (%) | 88 | 88 0% | 85 -3% | 97 10% | 85 -3% |
| Black Level * (cd/m²) | 0.5 | 0.47 6% | 0.5 -0% | 0.42 16% | |
| Contrast (:1) | 1152 | 1145 -1% | 1154 0% | 1126 -2% | |
| Colorchecker dE 2000 * | 2.04 | 1.9 7% | 2.12 -4% | 2.49 -22% | 3.47 -70% |
| Colorchecker dE 2000 max. * | 3.56 | 4 -12% | 3.32 7% | 5.25 -47% | 7.24 -103% |
| Colorchecker dE 2000 calibrated * | 1.85 | 1.33 28% | 2.15 -16% | 1.36 26% | |
| Greyscale dE 2000 * | 2.09 | 2.7 -29% | 2.2 -5% | 3.02 -44% | 3.1 -48% |
| Gamma | 2.3 96% | 2.24 98% | 2.123 104% | 2.37 93% | 2.486 88% |
| CCT | 6492 100% | 7027 93% | 6457 101% | 6426 101% | 6832 95% |
| Total Average (Program / Settings) | 5% /
0% | 9% /
5% | 29% /
8% | 10% /
-7% |
* ... smaller is better


Color space coverings
Display Response Times
| ↔ Response Time Black to White | ||
|---|---|---|
| 6.8 ms ... rise ↗ and fall ↘ combined | ↗ 1.6 ms rise | 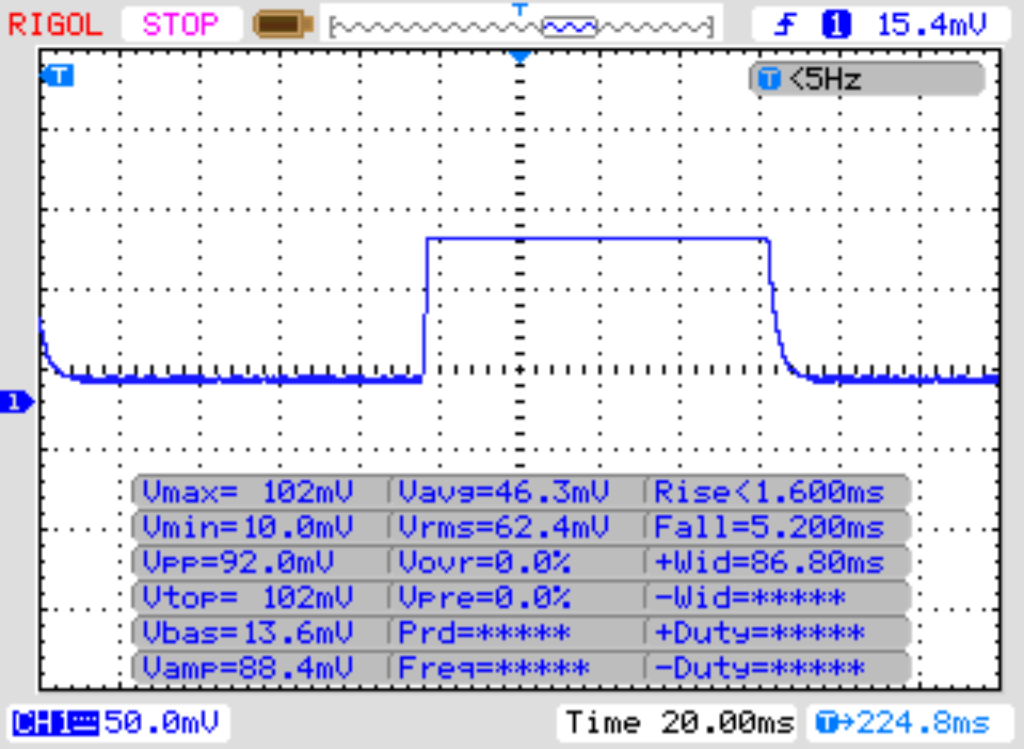 |
| ↘ 5.2 ms fall | ||
| The screen shows very fast response rates in our tests and should be very well suited for fast-paced gaming. In comparison, all tested devices range from 0.1 (minimum) to 240 (maximum) ms. » 21 % of all devices are better. This means that the measured response time is better than the average of all tested devices (19.9 ms). | ||
| ↔ Response Time 50% Grey to 80% Grey | ||
| 12.4 ms ... rise ↗ and fall ↘ combined | ↗ 3.2 ms rise | 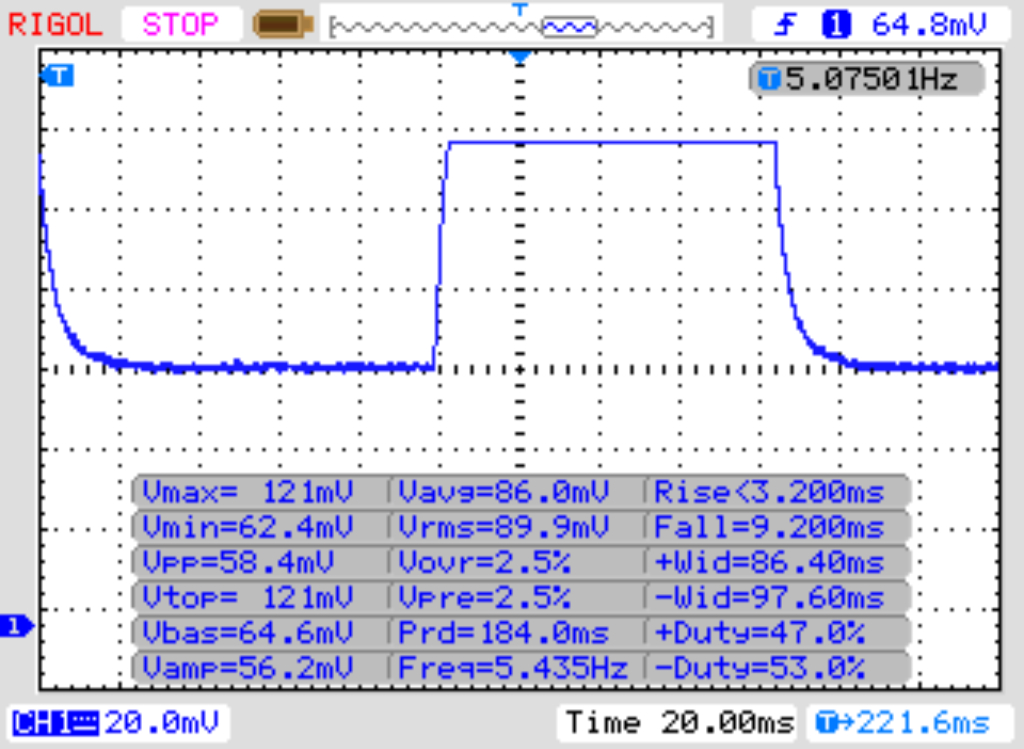 |
| ↘ 9.2 ms fall | ||
| The screen shows good response rates in our tests, but may be too slow for competitive gamers. In comparison, all tested devices range from 0.165 (minimum) to 636 (maximum) ms. » 26 % of all devices are better. This means that the measured response time is better than the average of all tested devices (31.1 ms). | ||
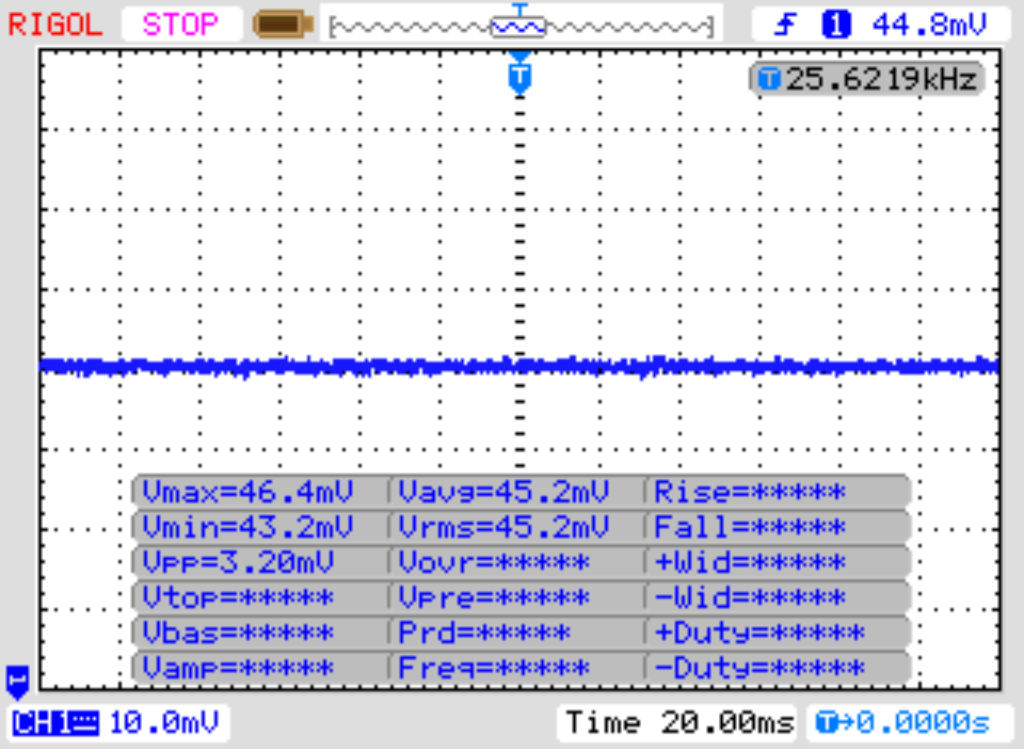
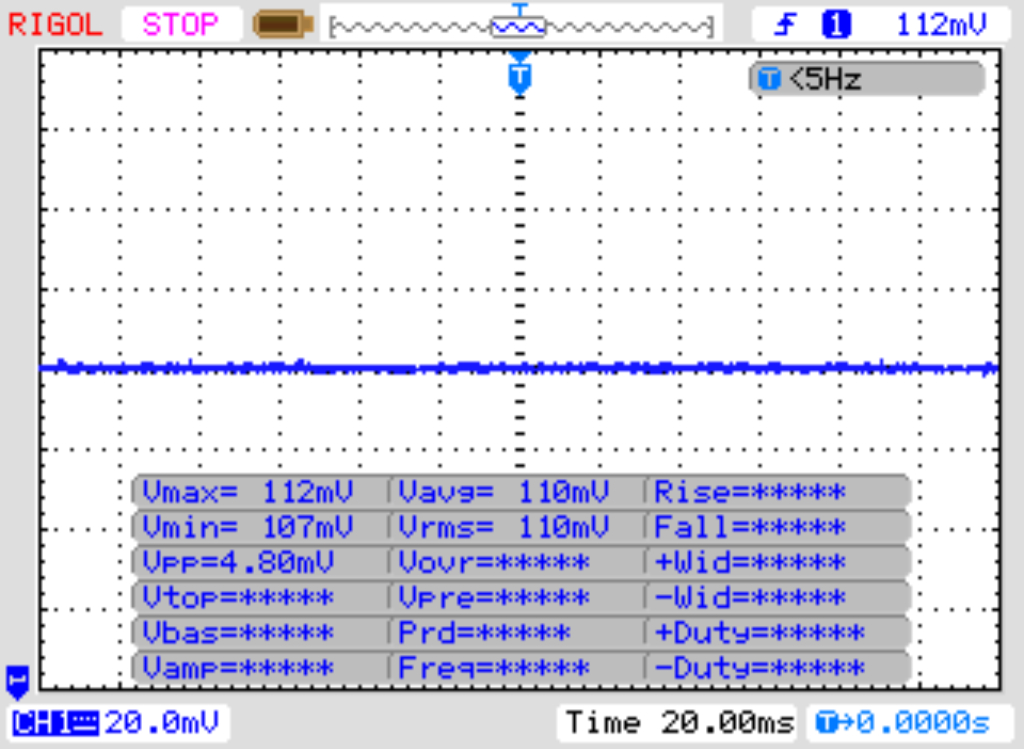
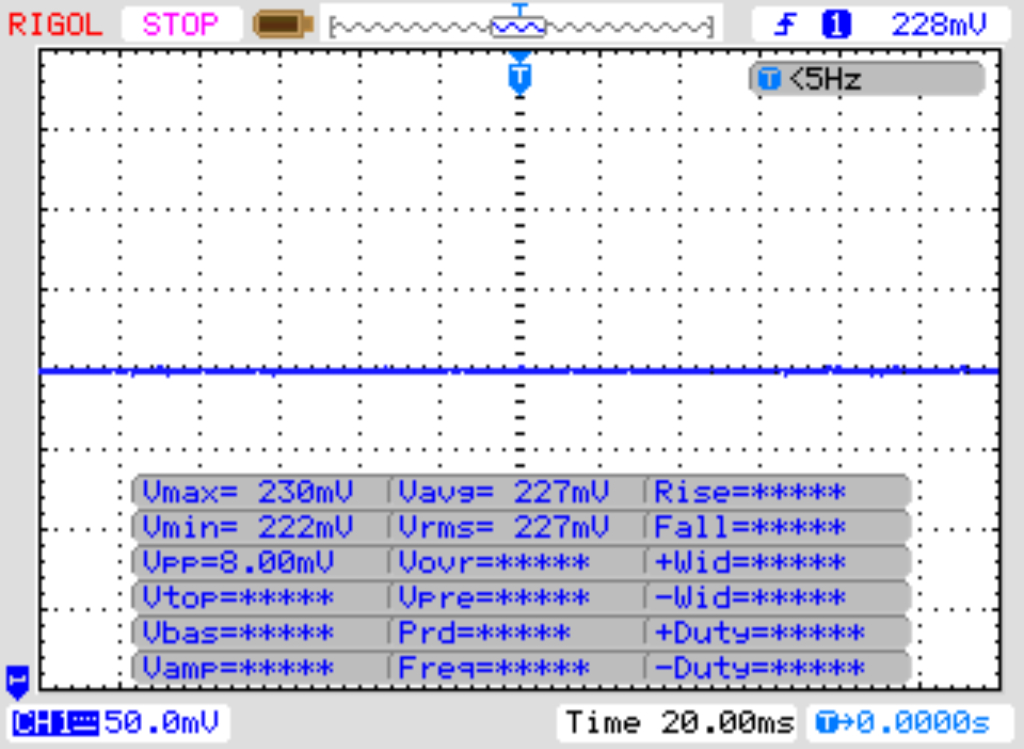
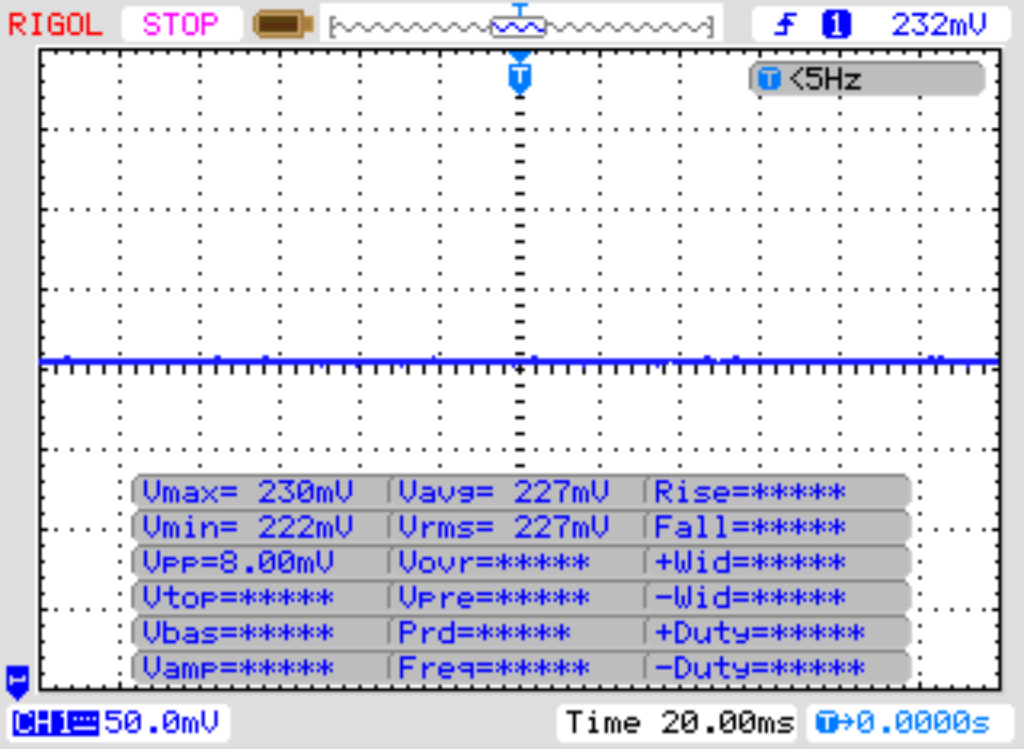
Screen Flickering / PWM (Pulse-Width Modulation)
| Screen flickering / PWM not detected | 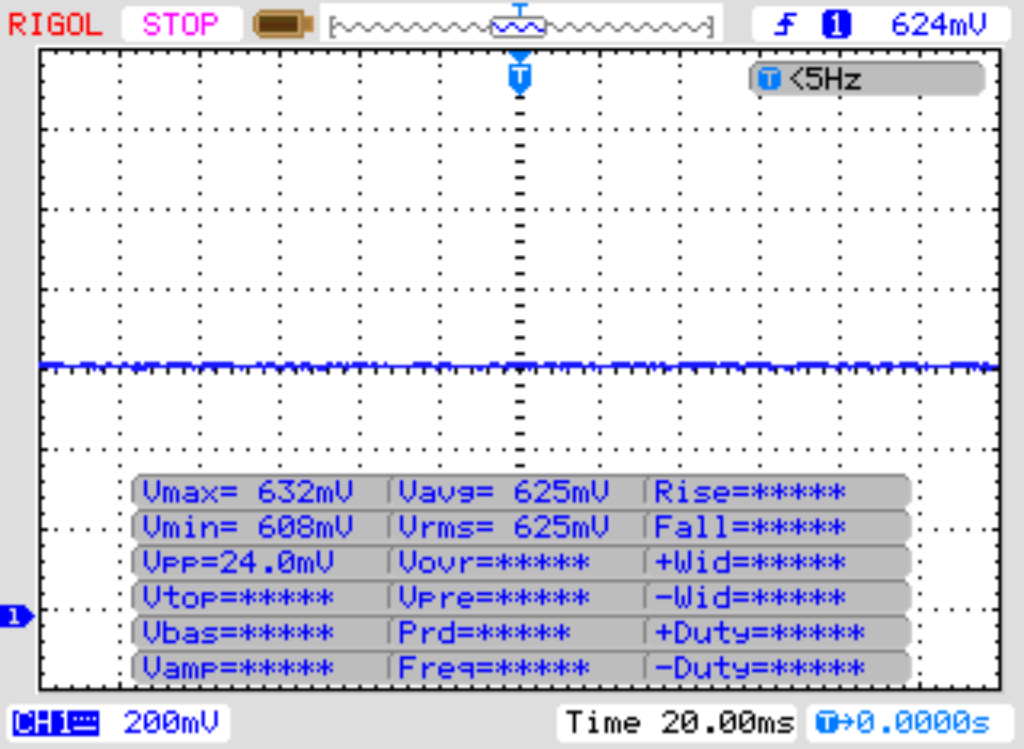 | ||
In comparison: 52 % of all tested devices do not use PWM to dim the display. If PWM was detected, an average of 7798 (minimum: 5 - maximum: 343500) Hz was measured. | |||

Performance
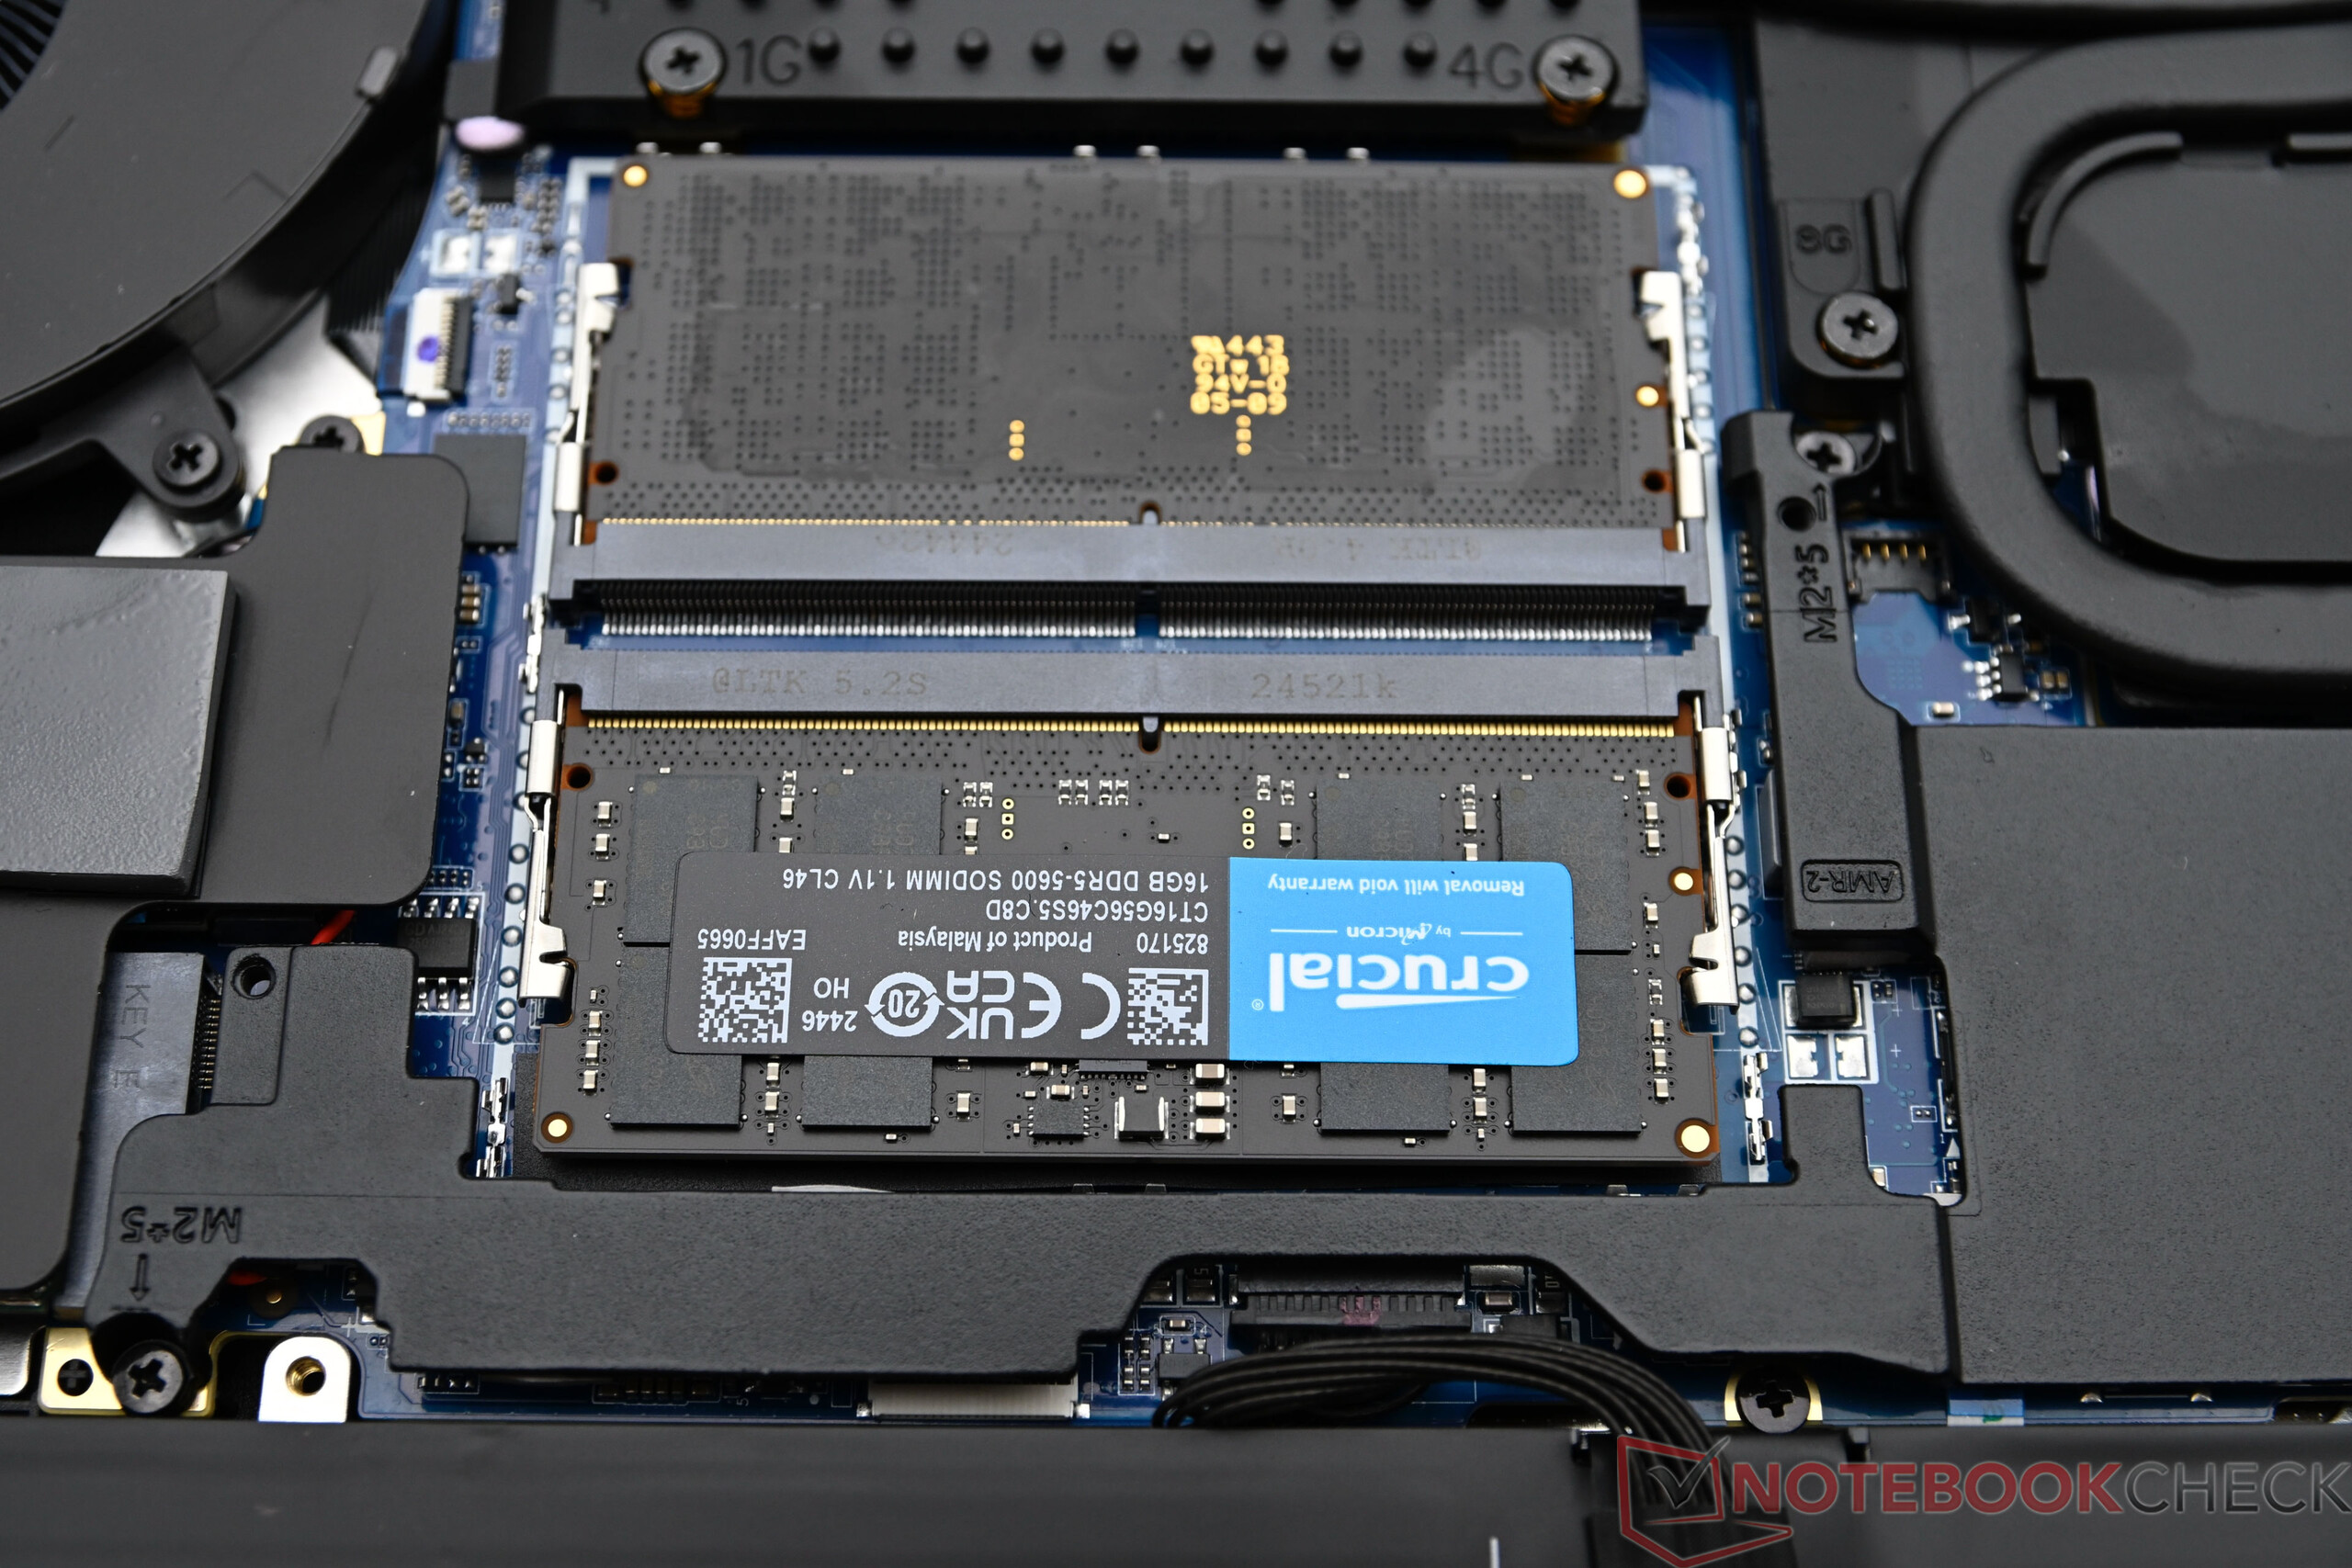
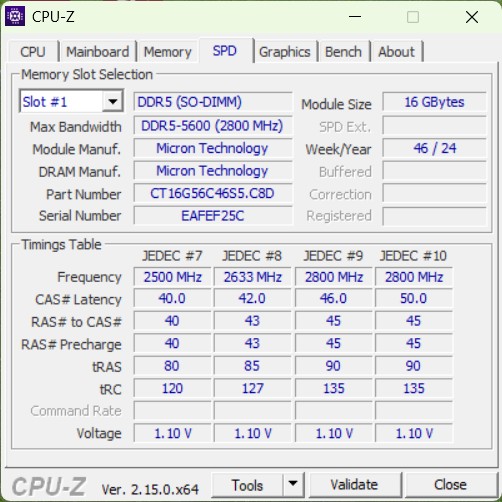
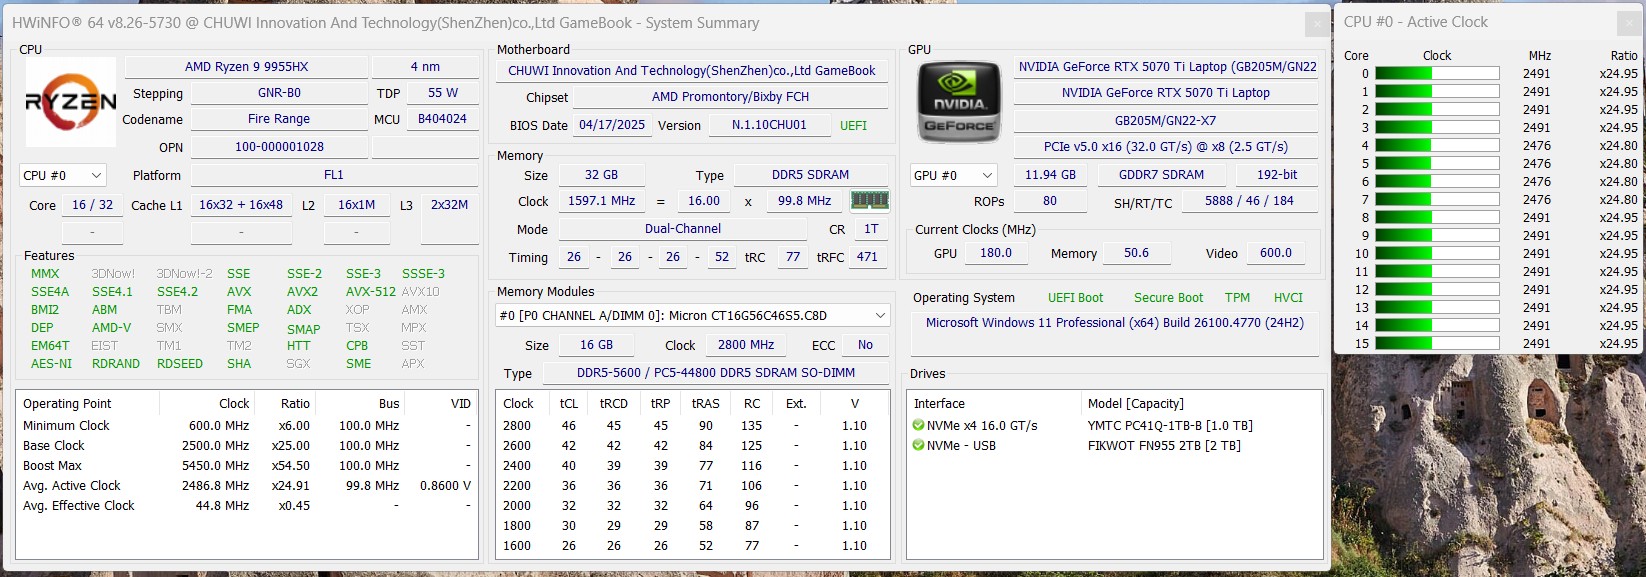
The Chuwi Gamebook is only available in combination with the AMD Ryzen 9 9955HX and the Nvidia GeForce RTX 5070 Ti laptop GPU. The standard equipment also includes 32 GB RAM and a 1 TB SSD.
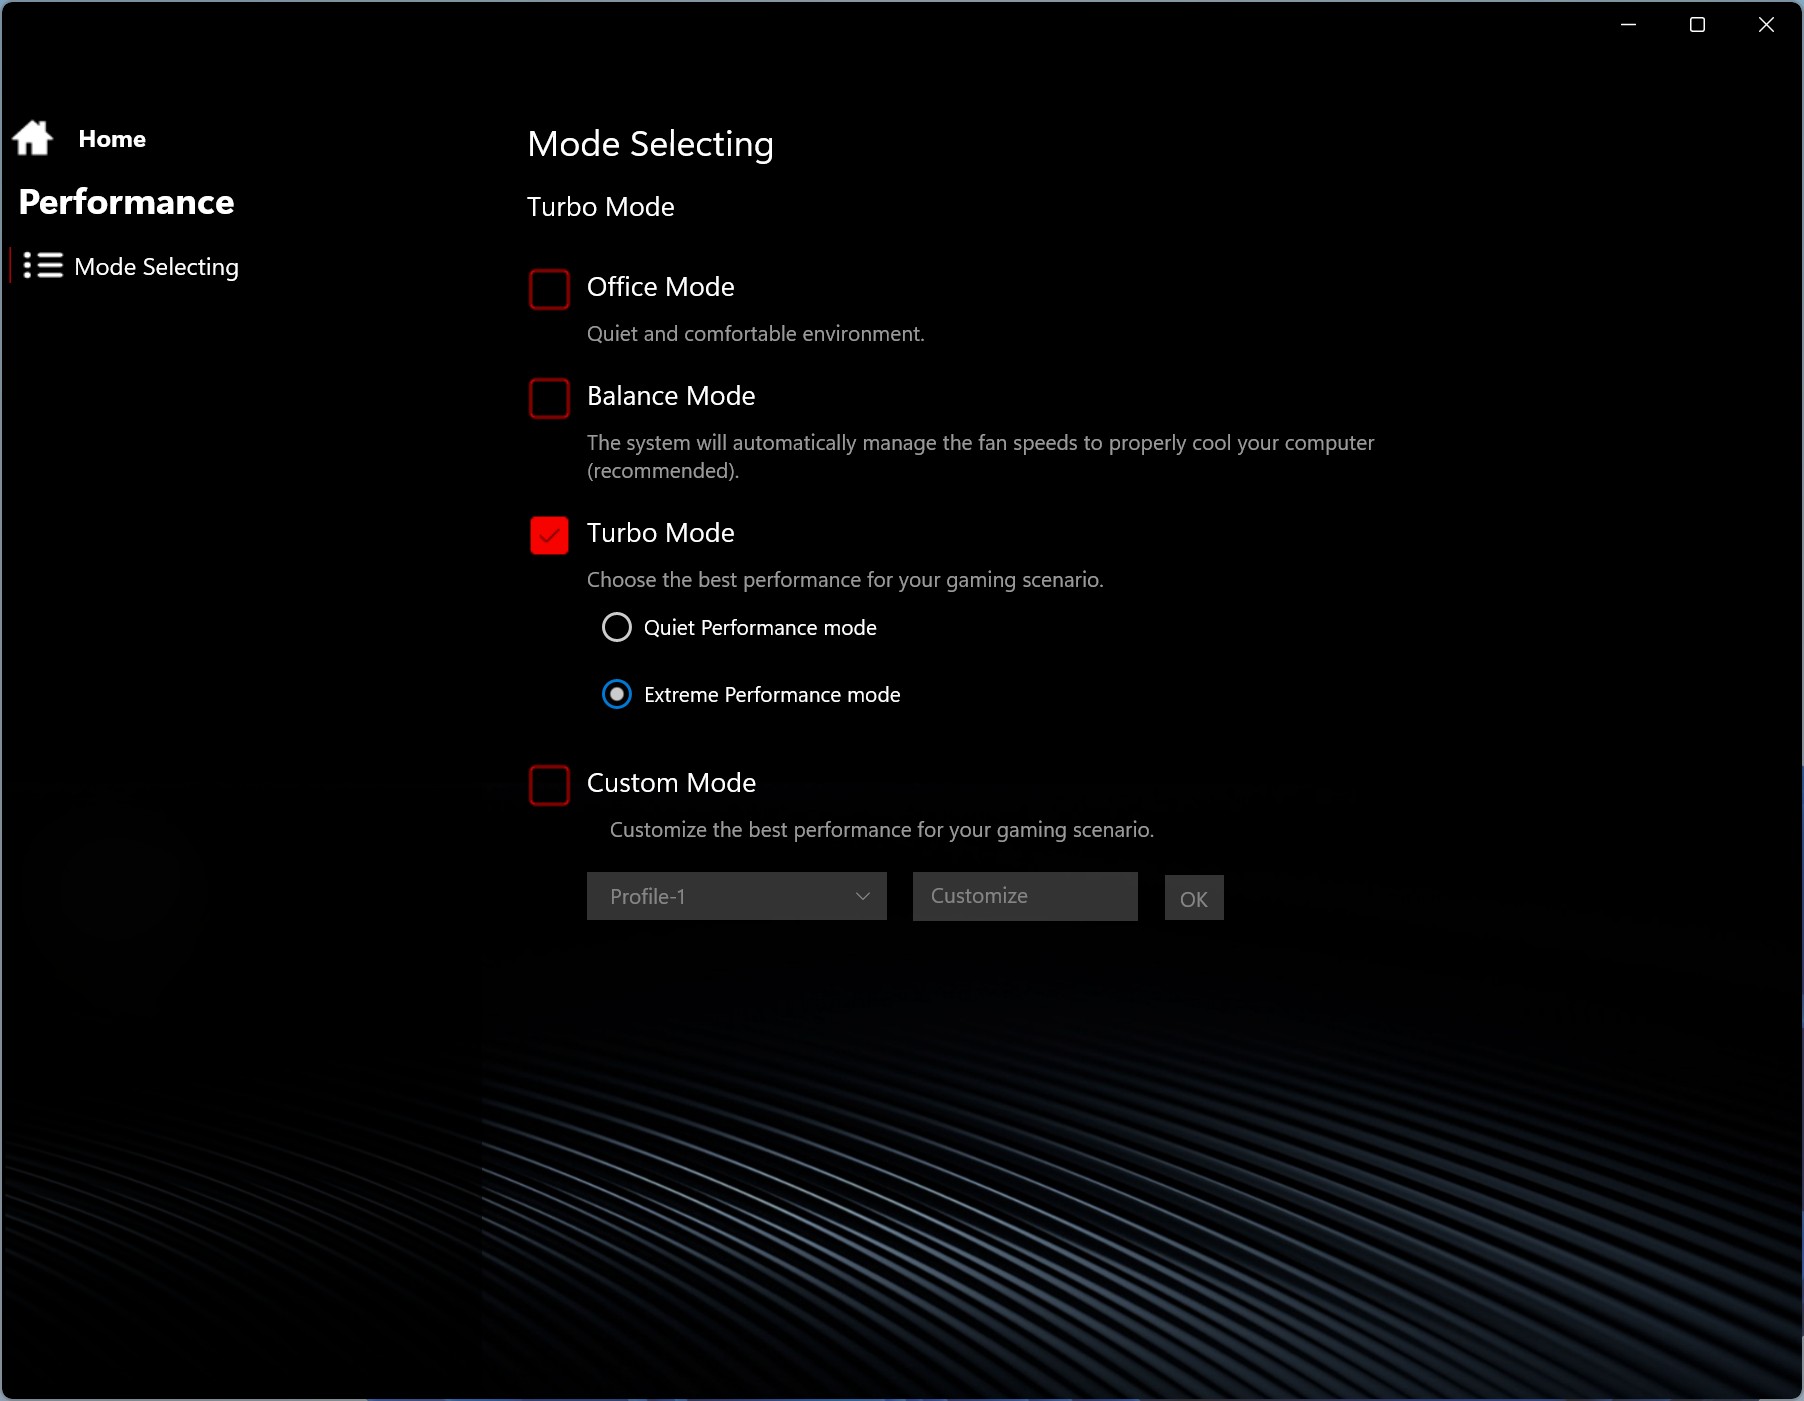
Test conditions
All performance tests were carried out with the Turbo profile. Alternatively, the user has further options via the Control Center with Office and Balanced modes.
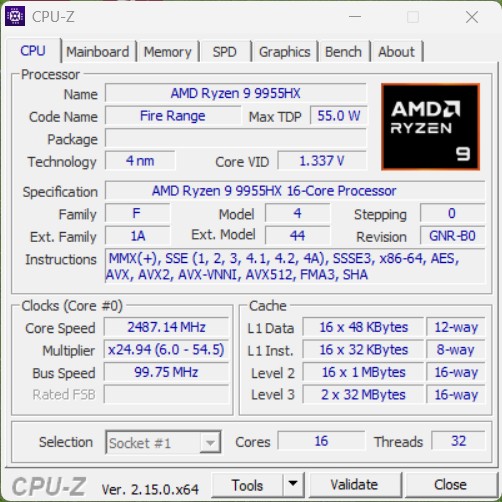
Processor
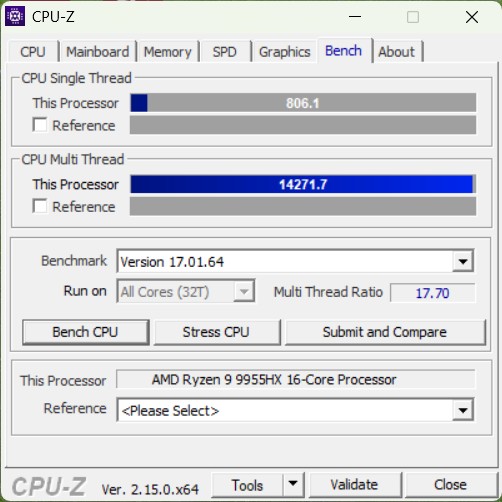
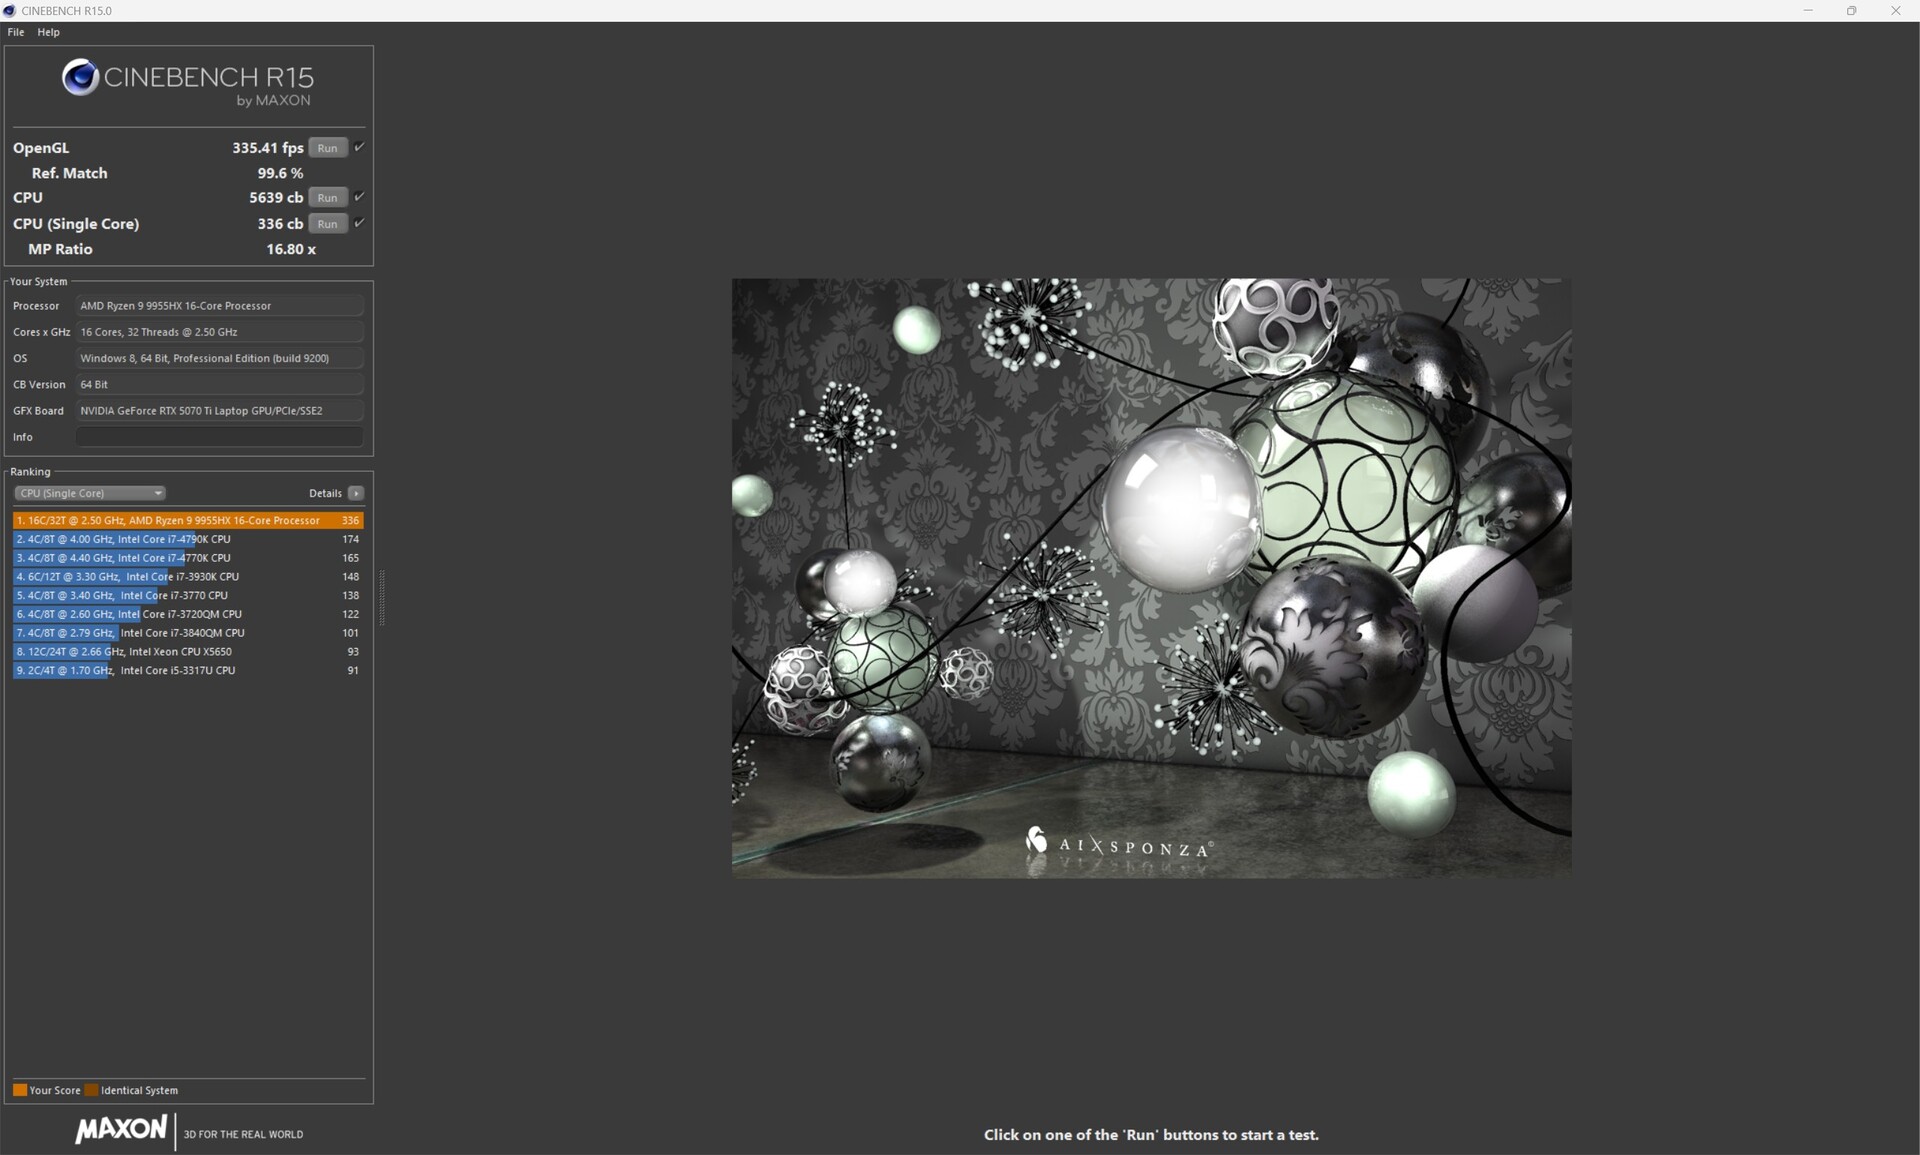
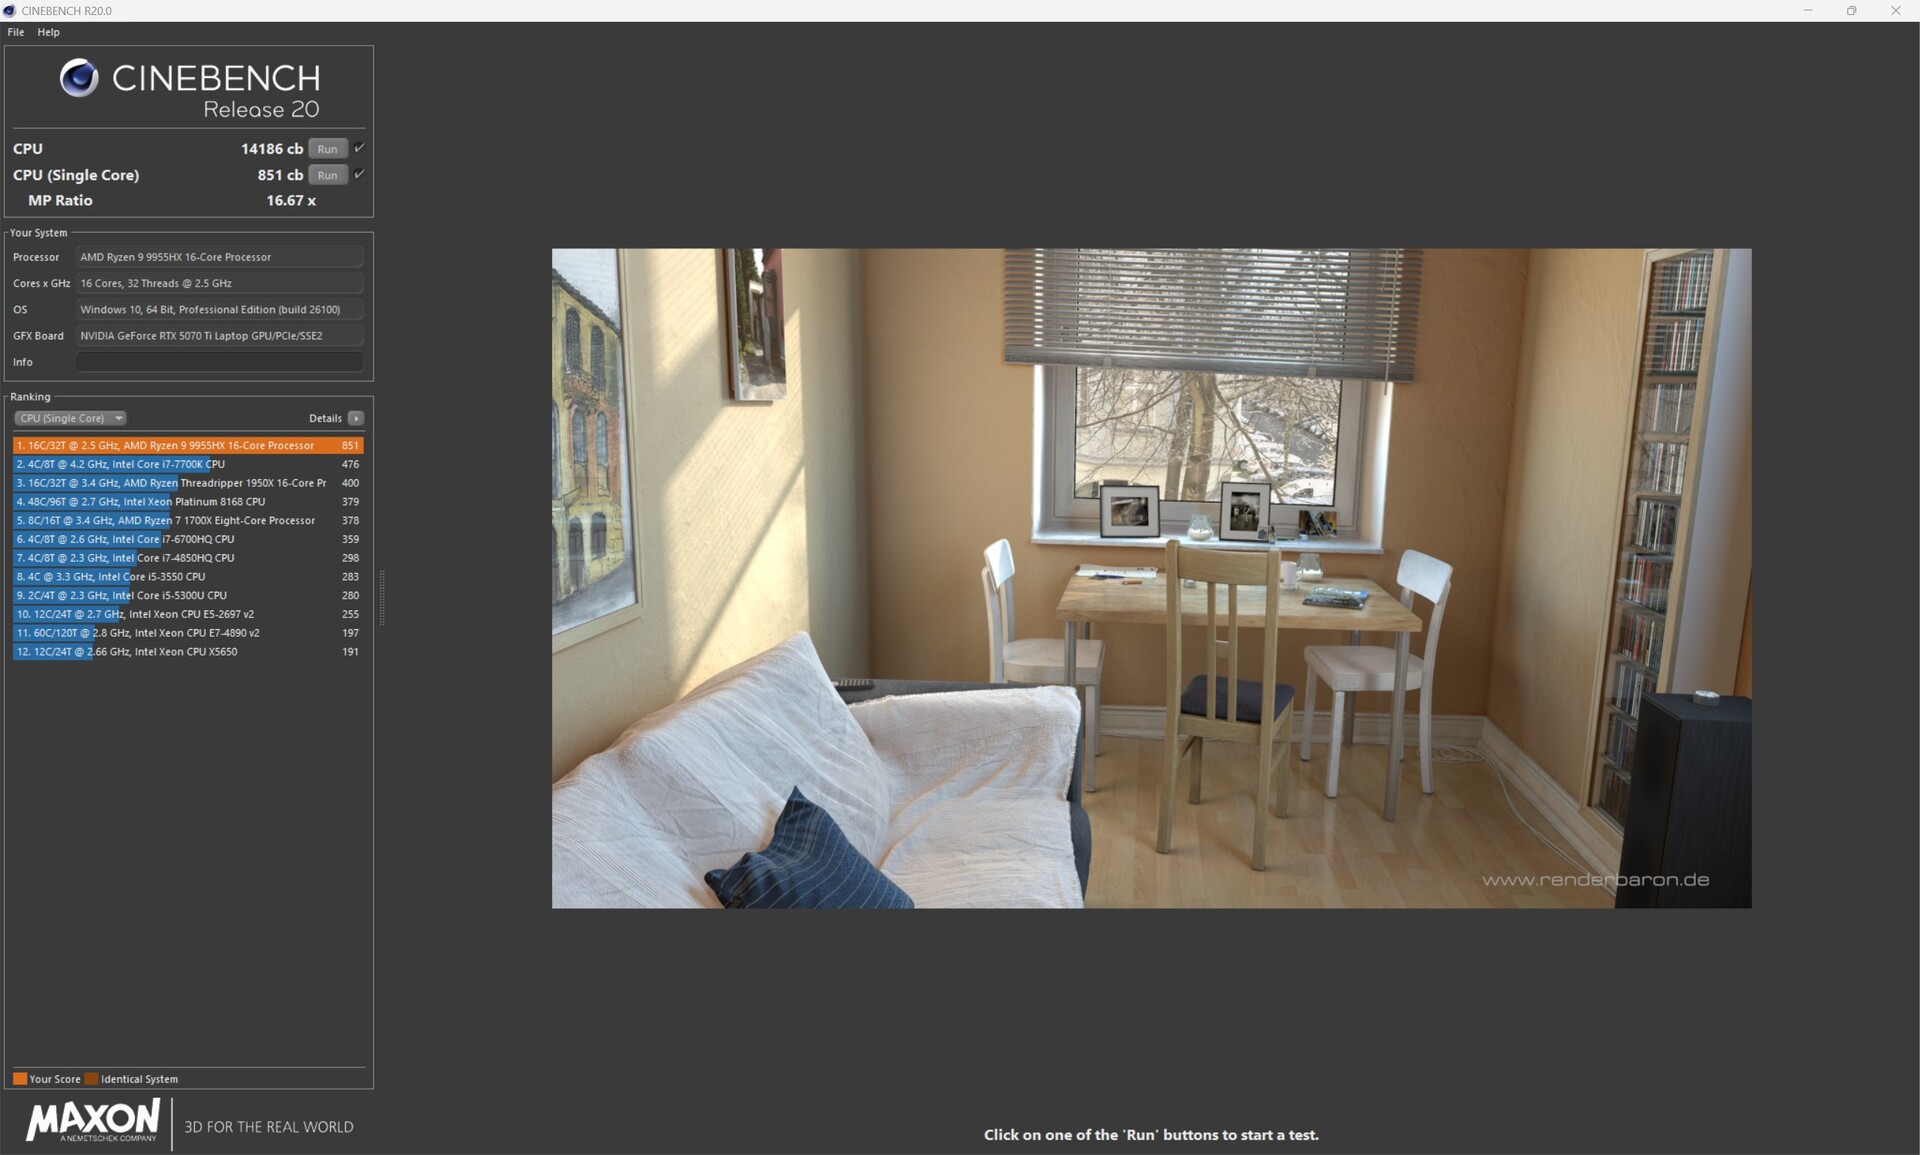
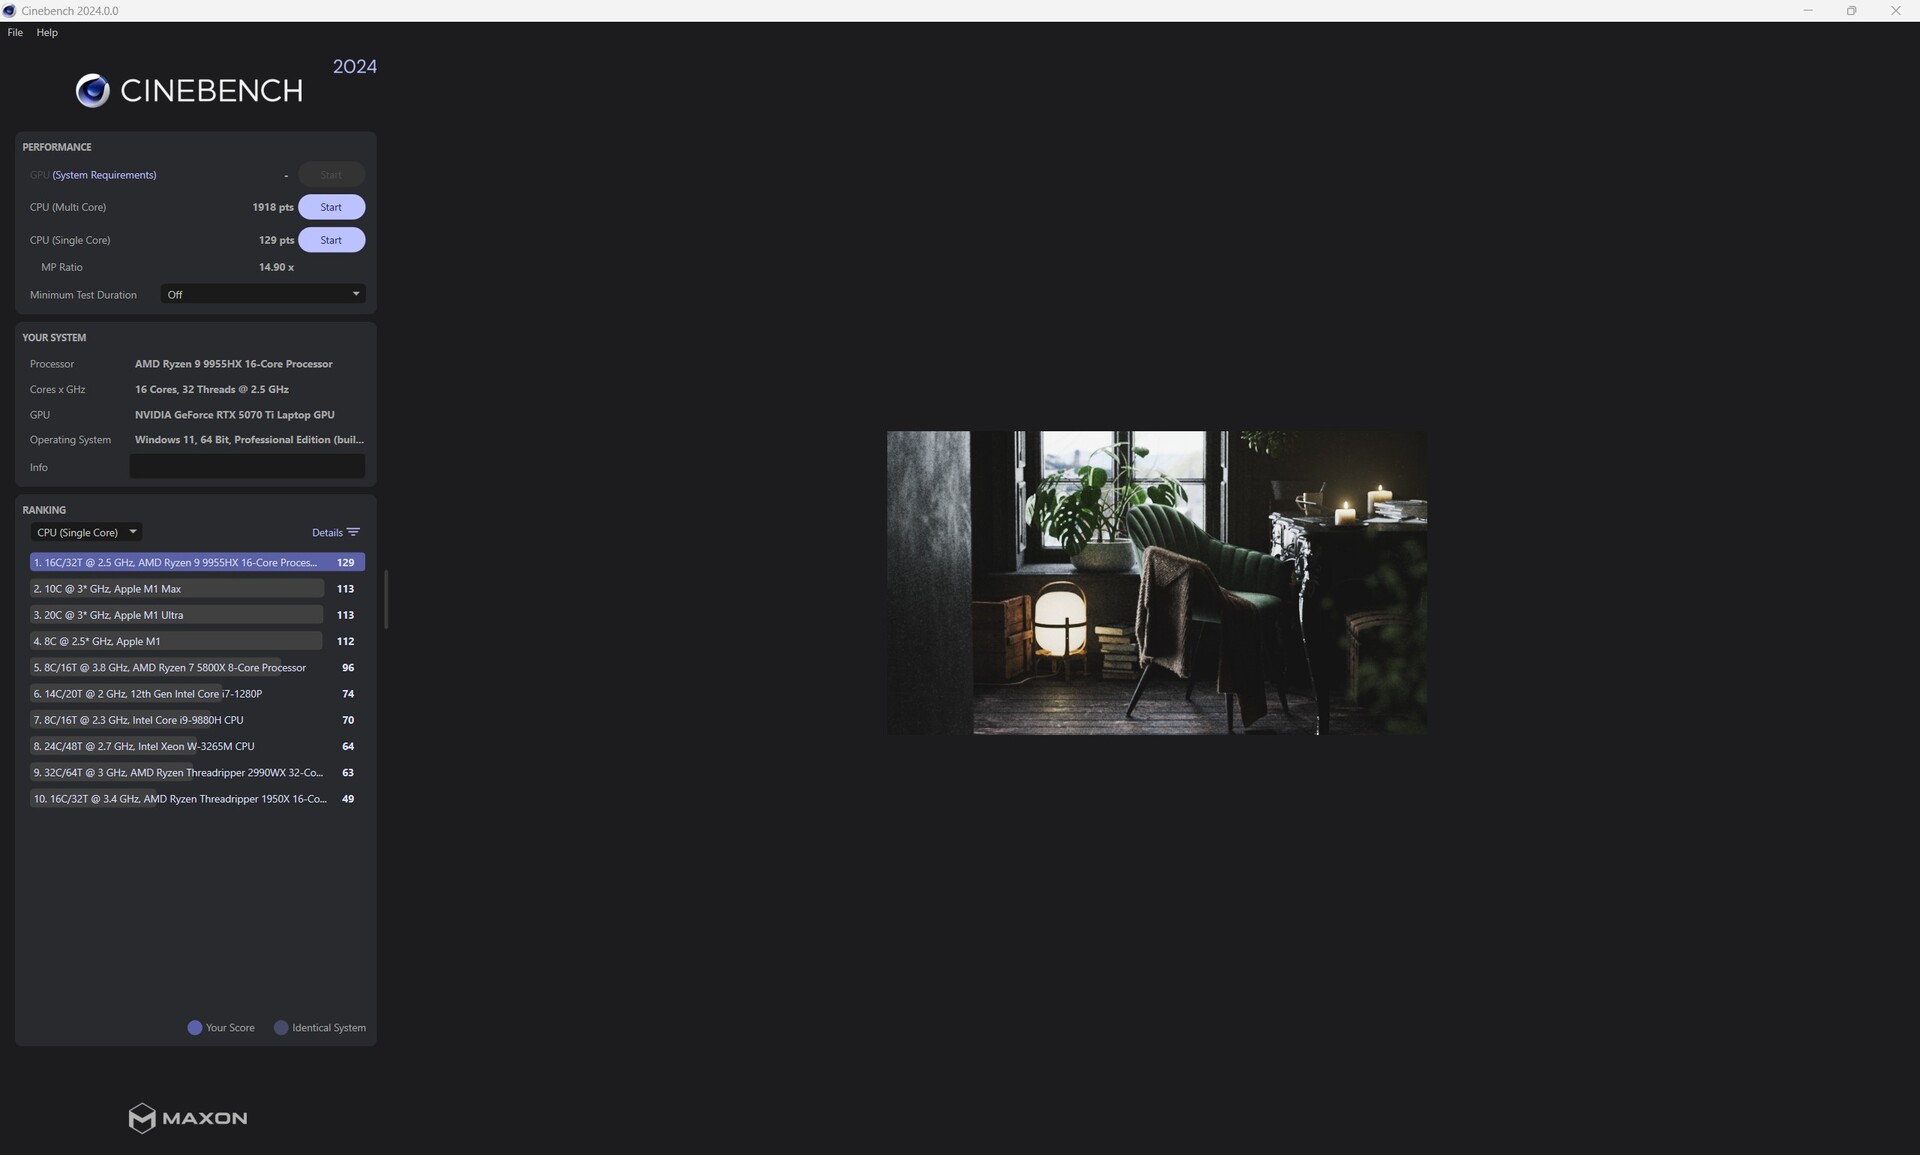
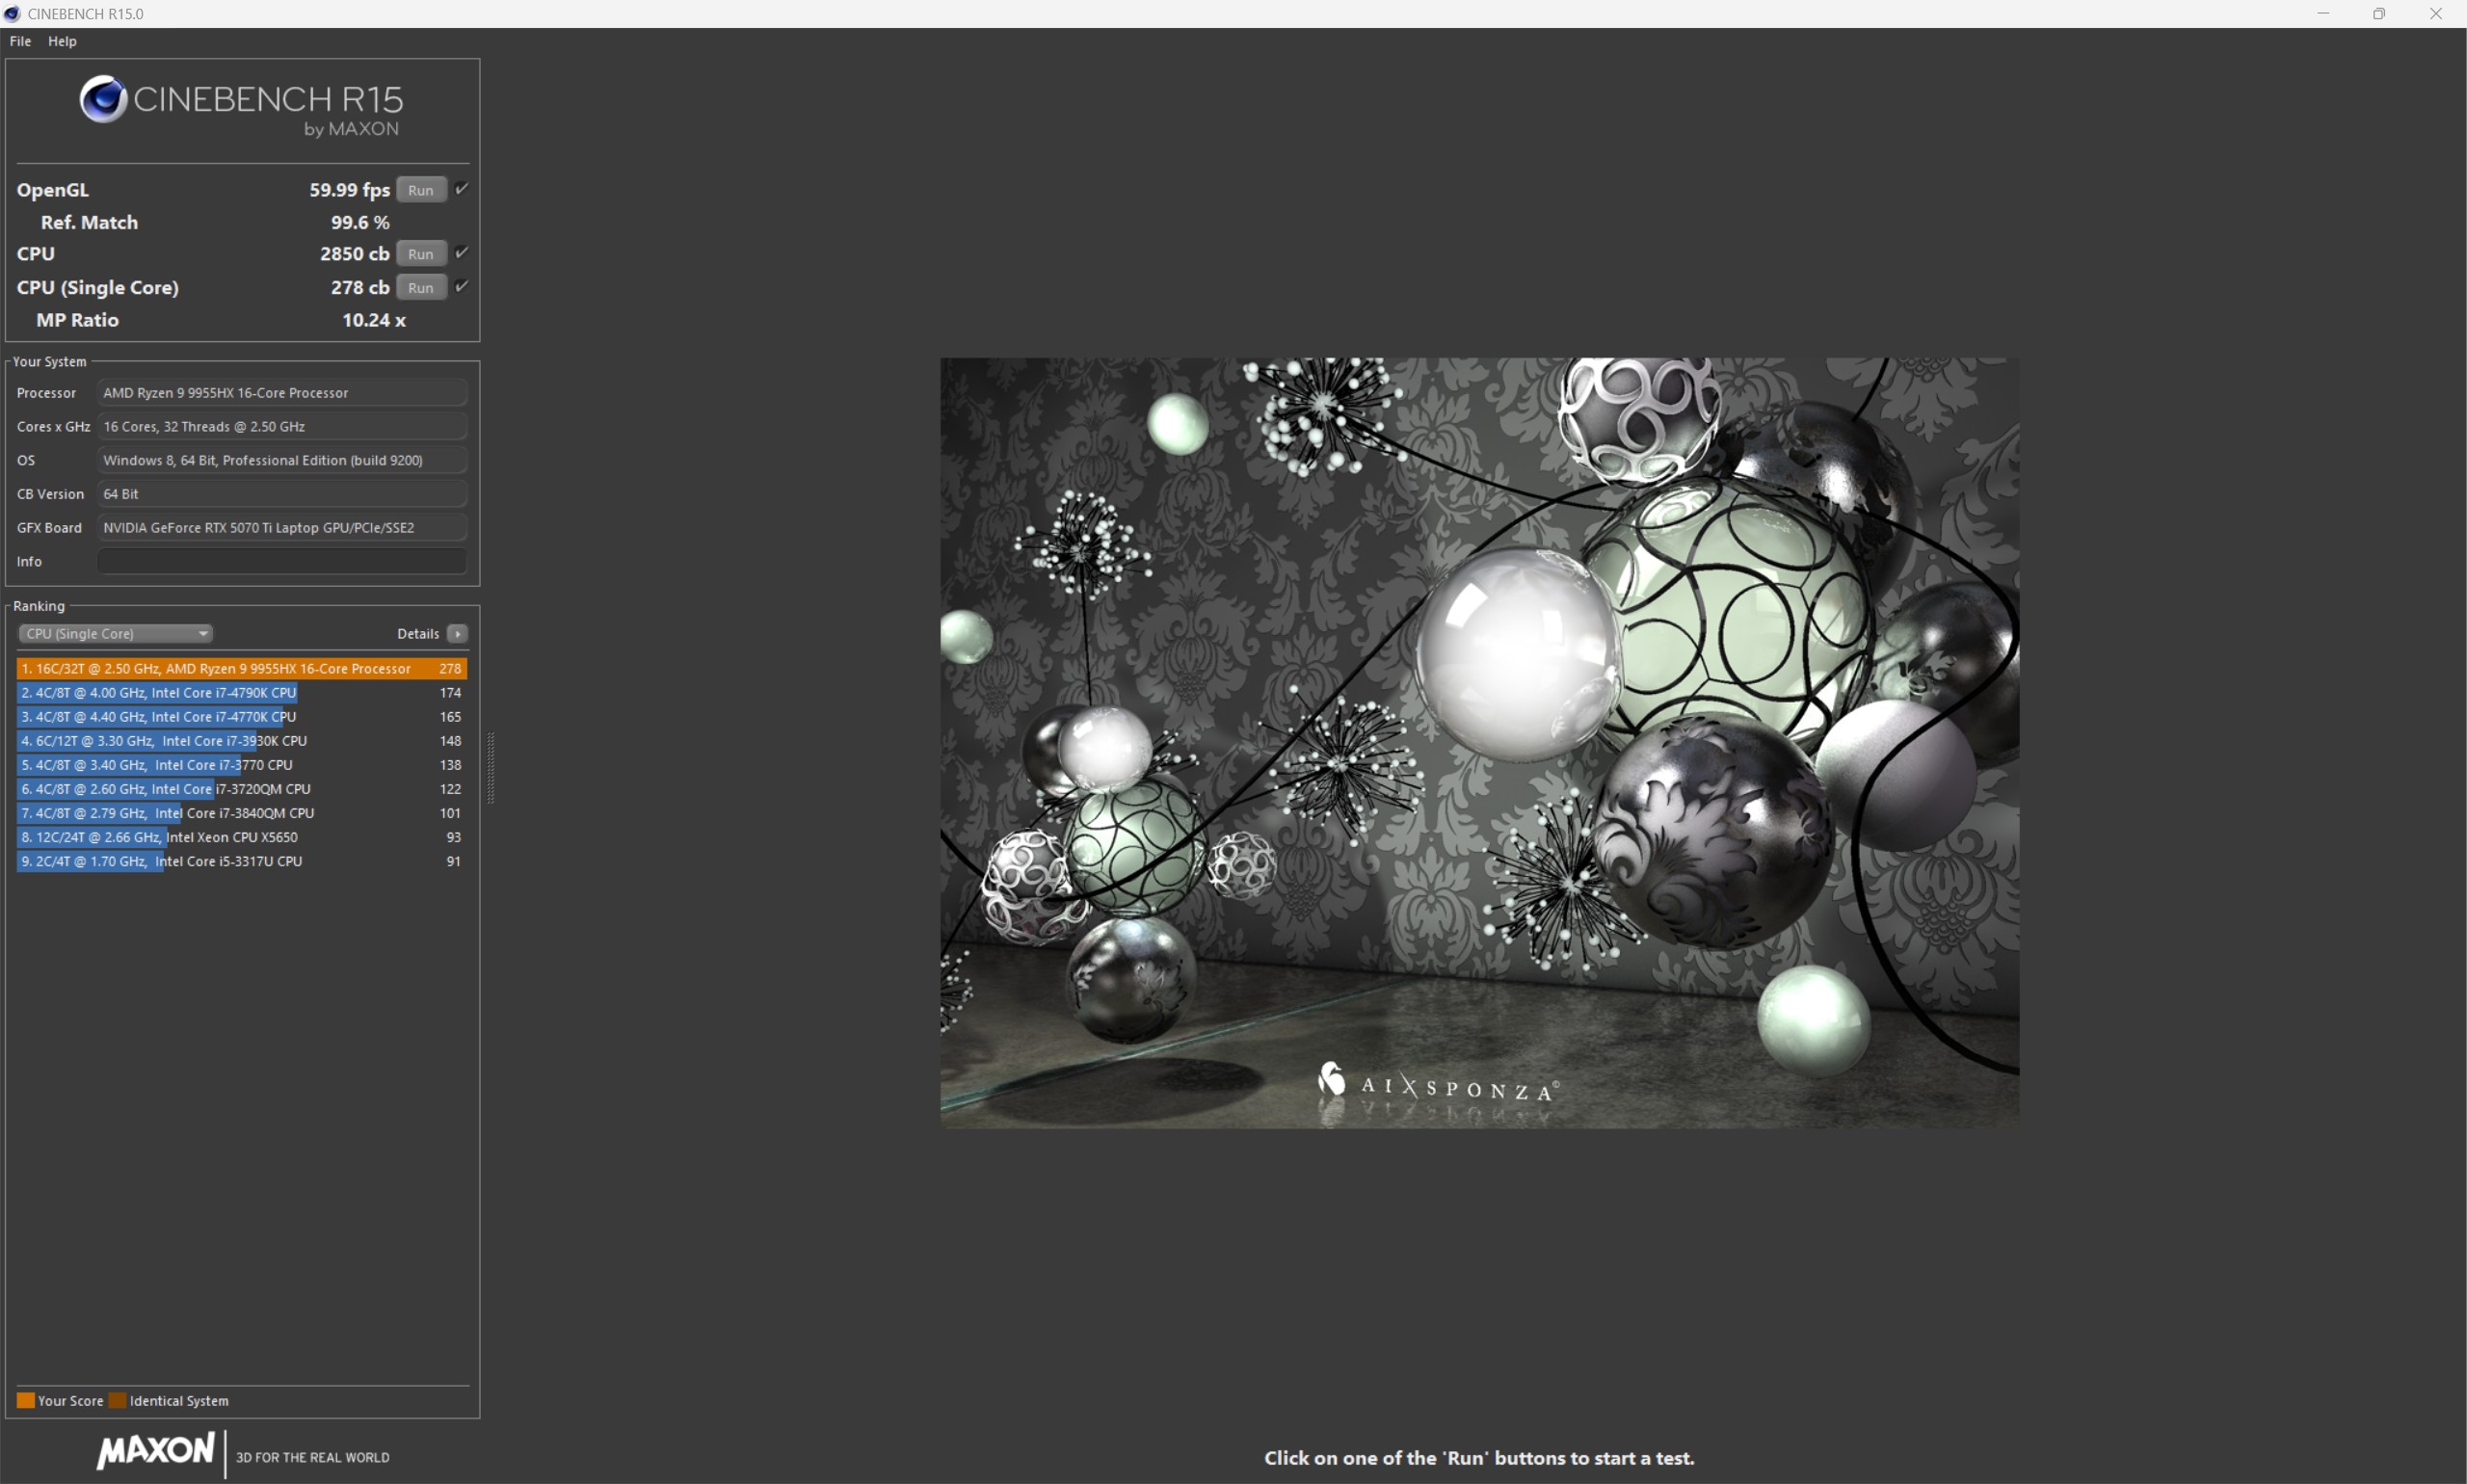
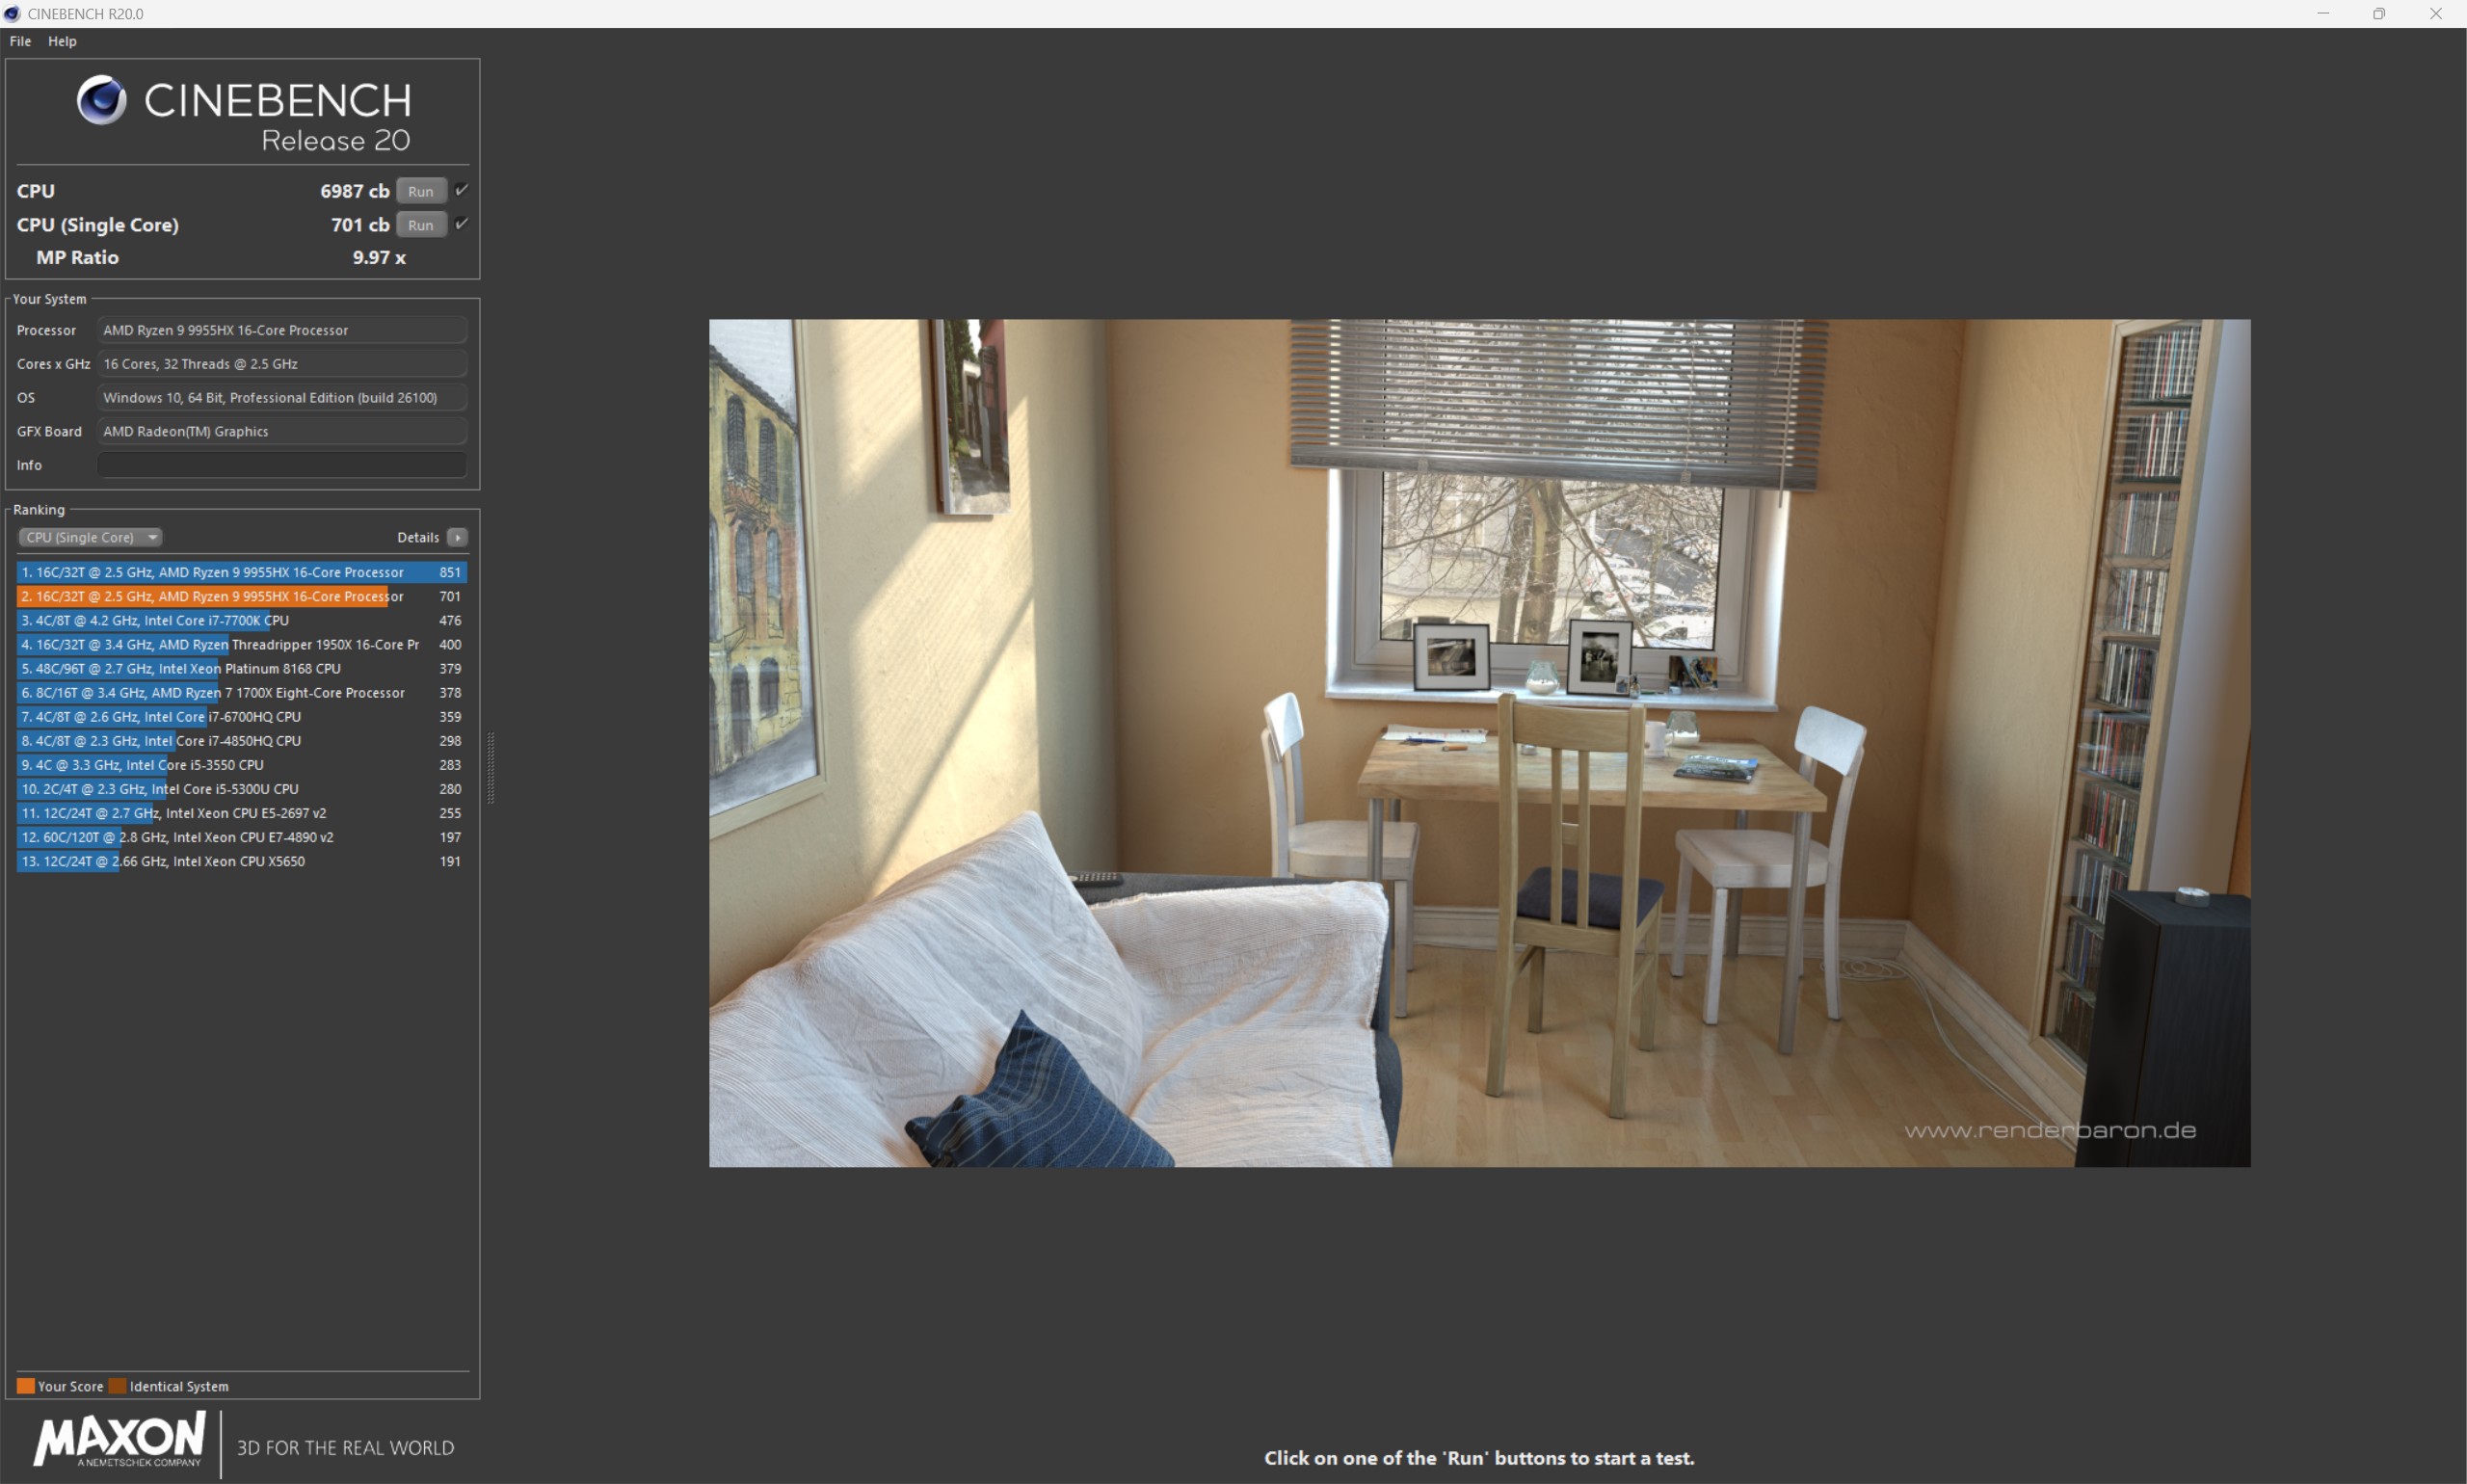
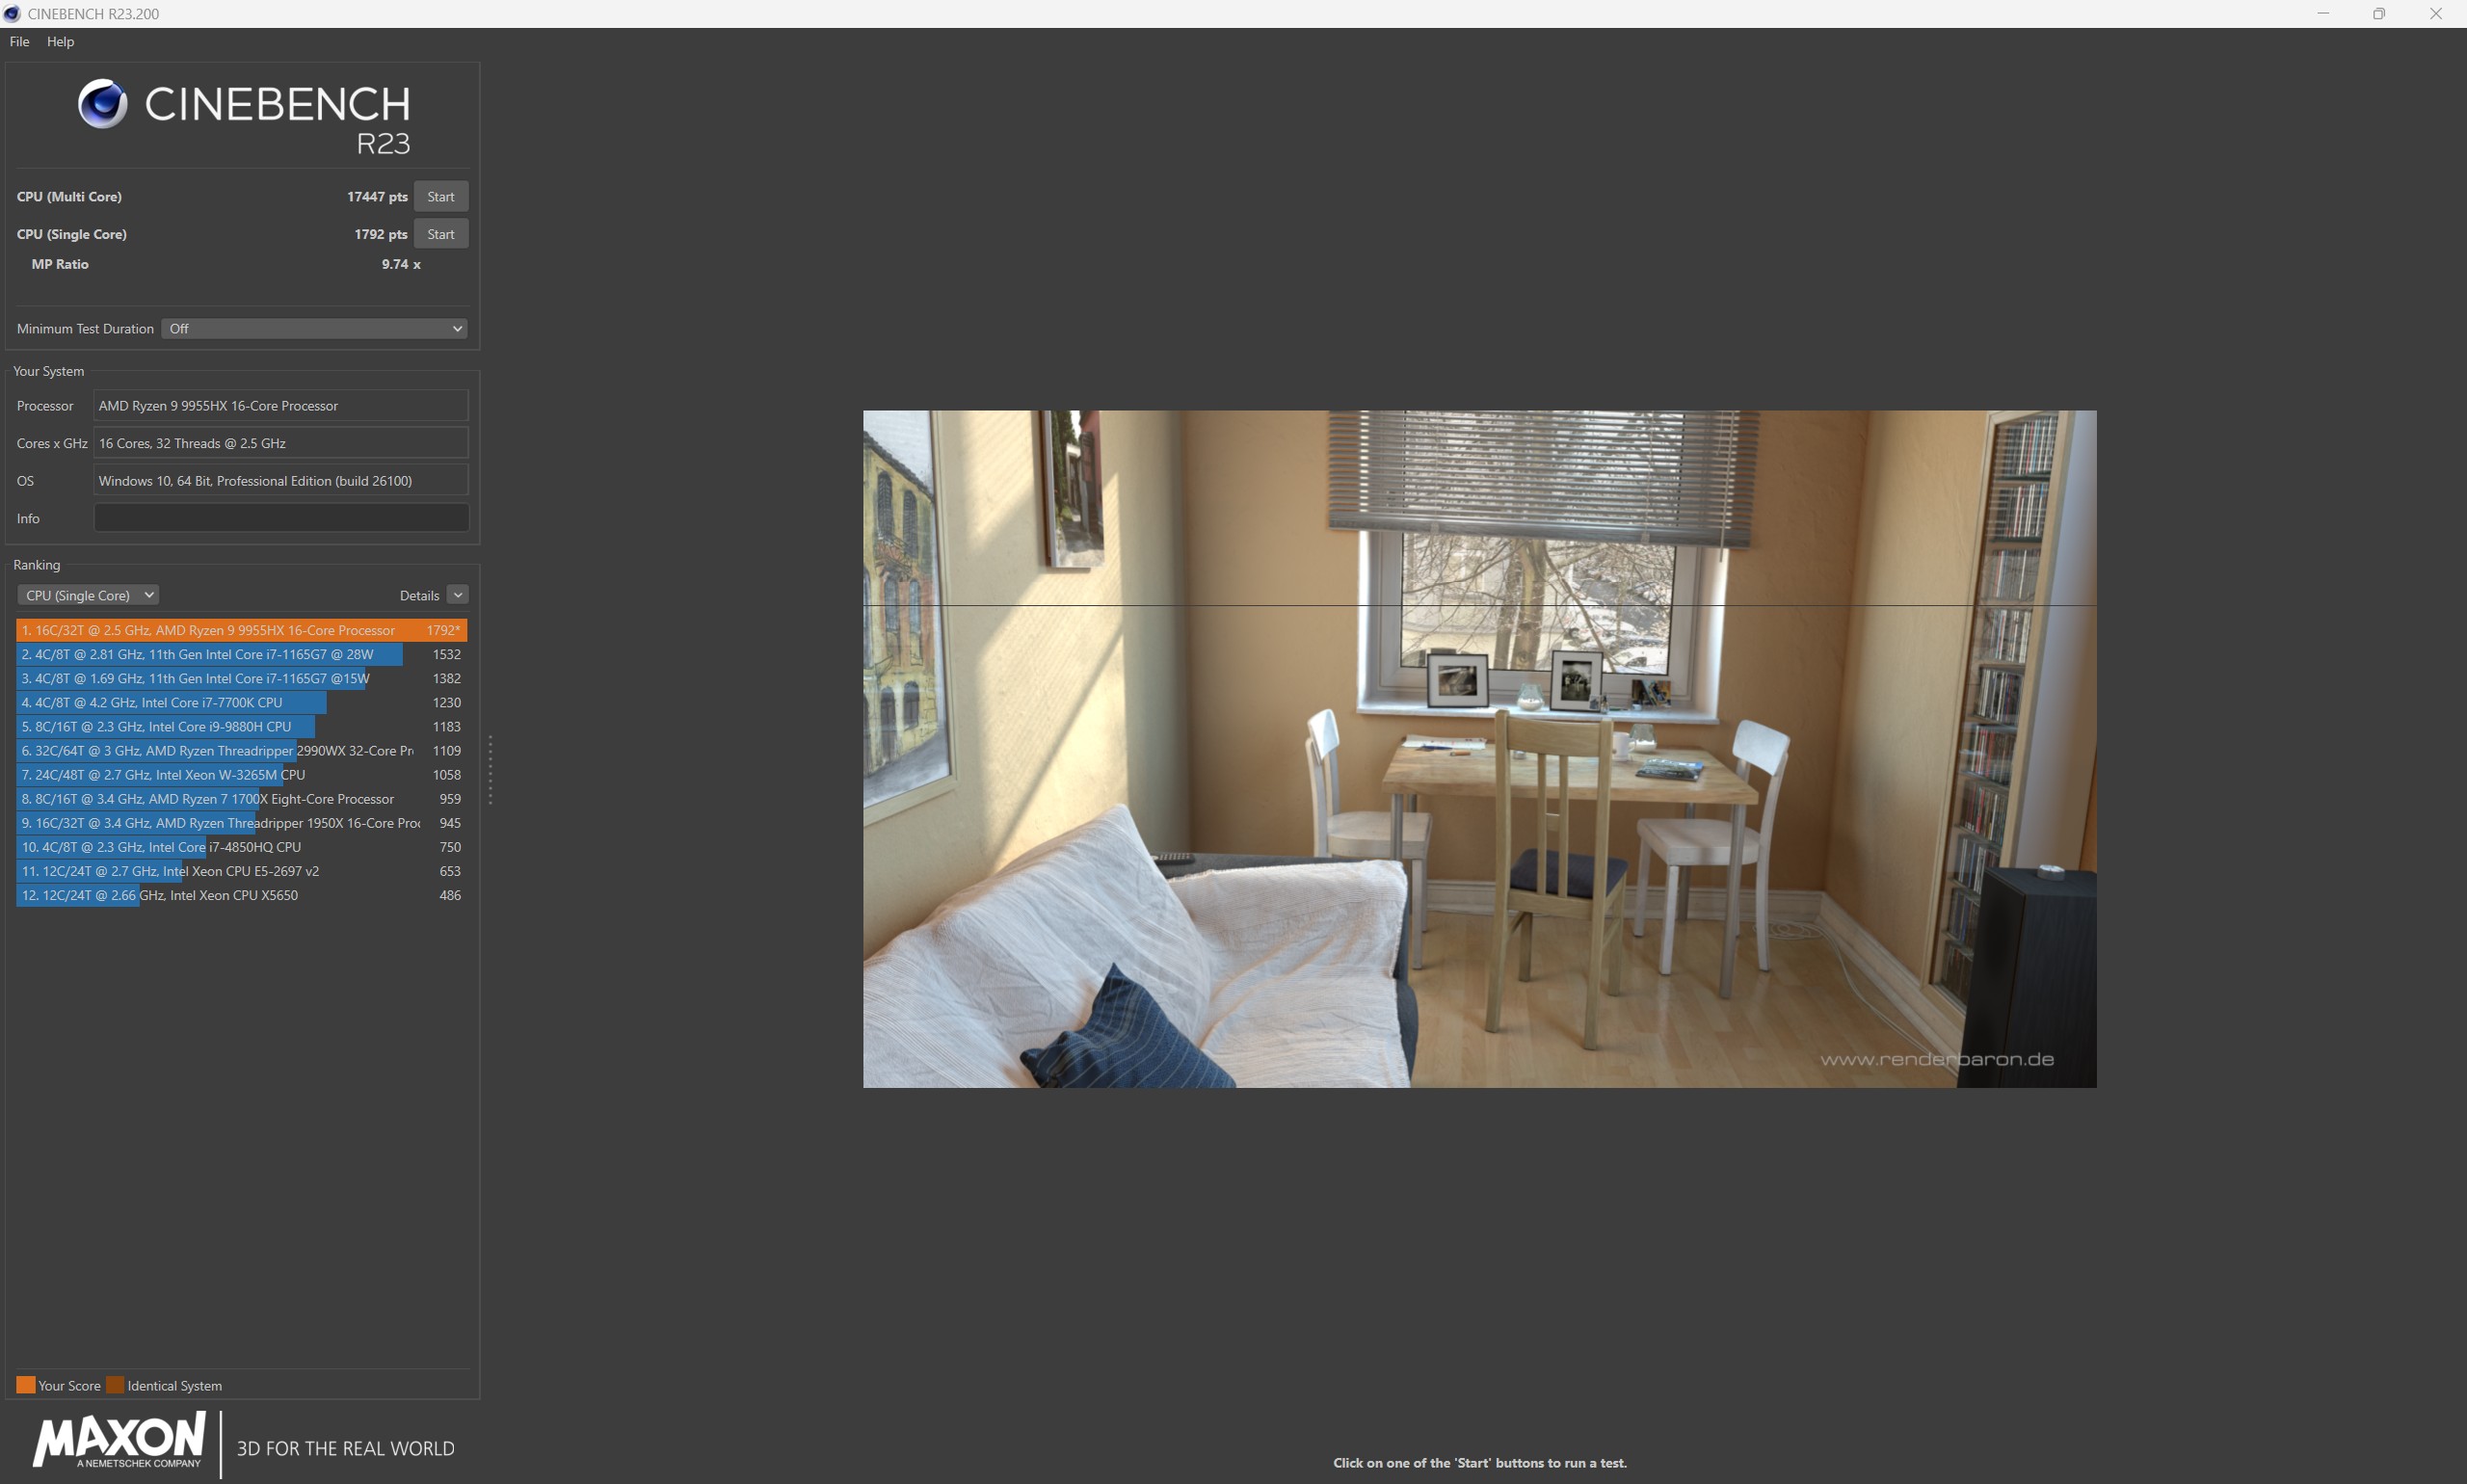
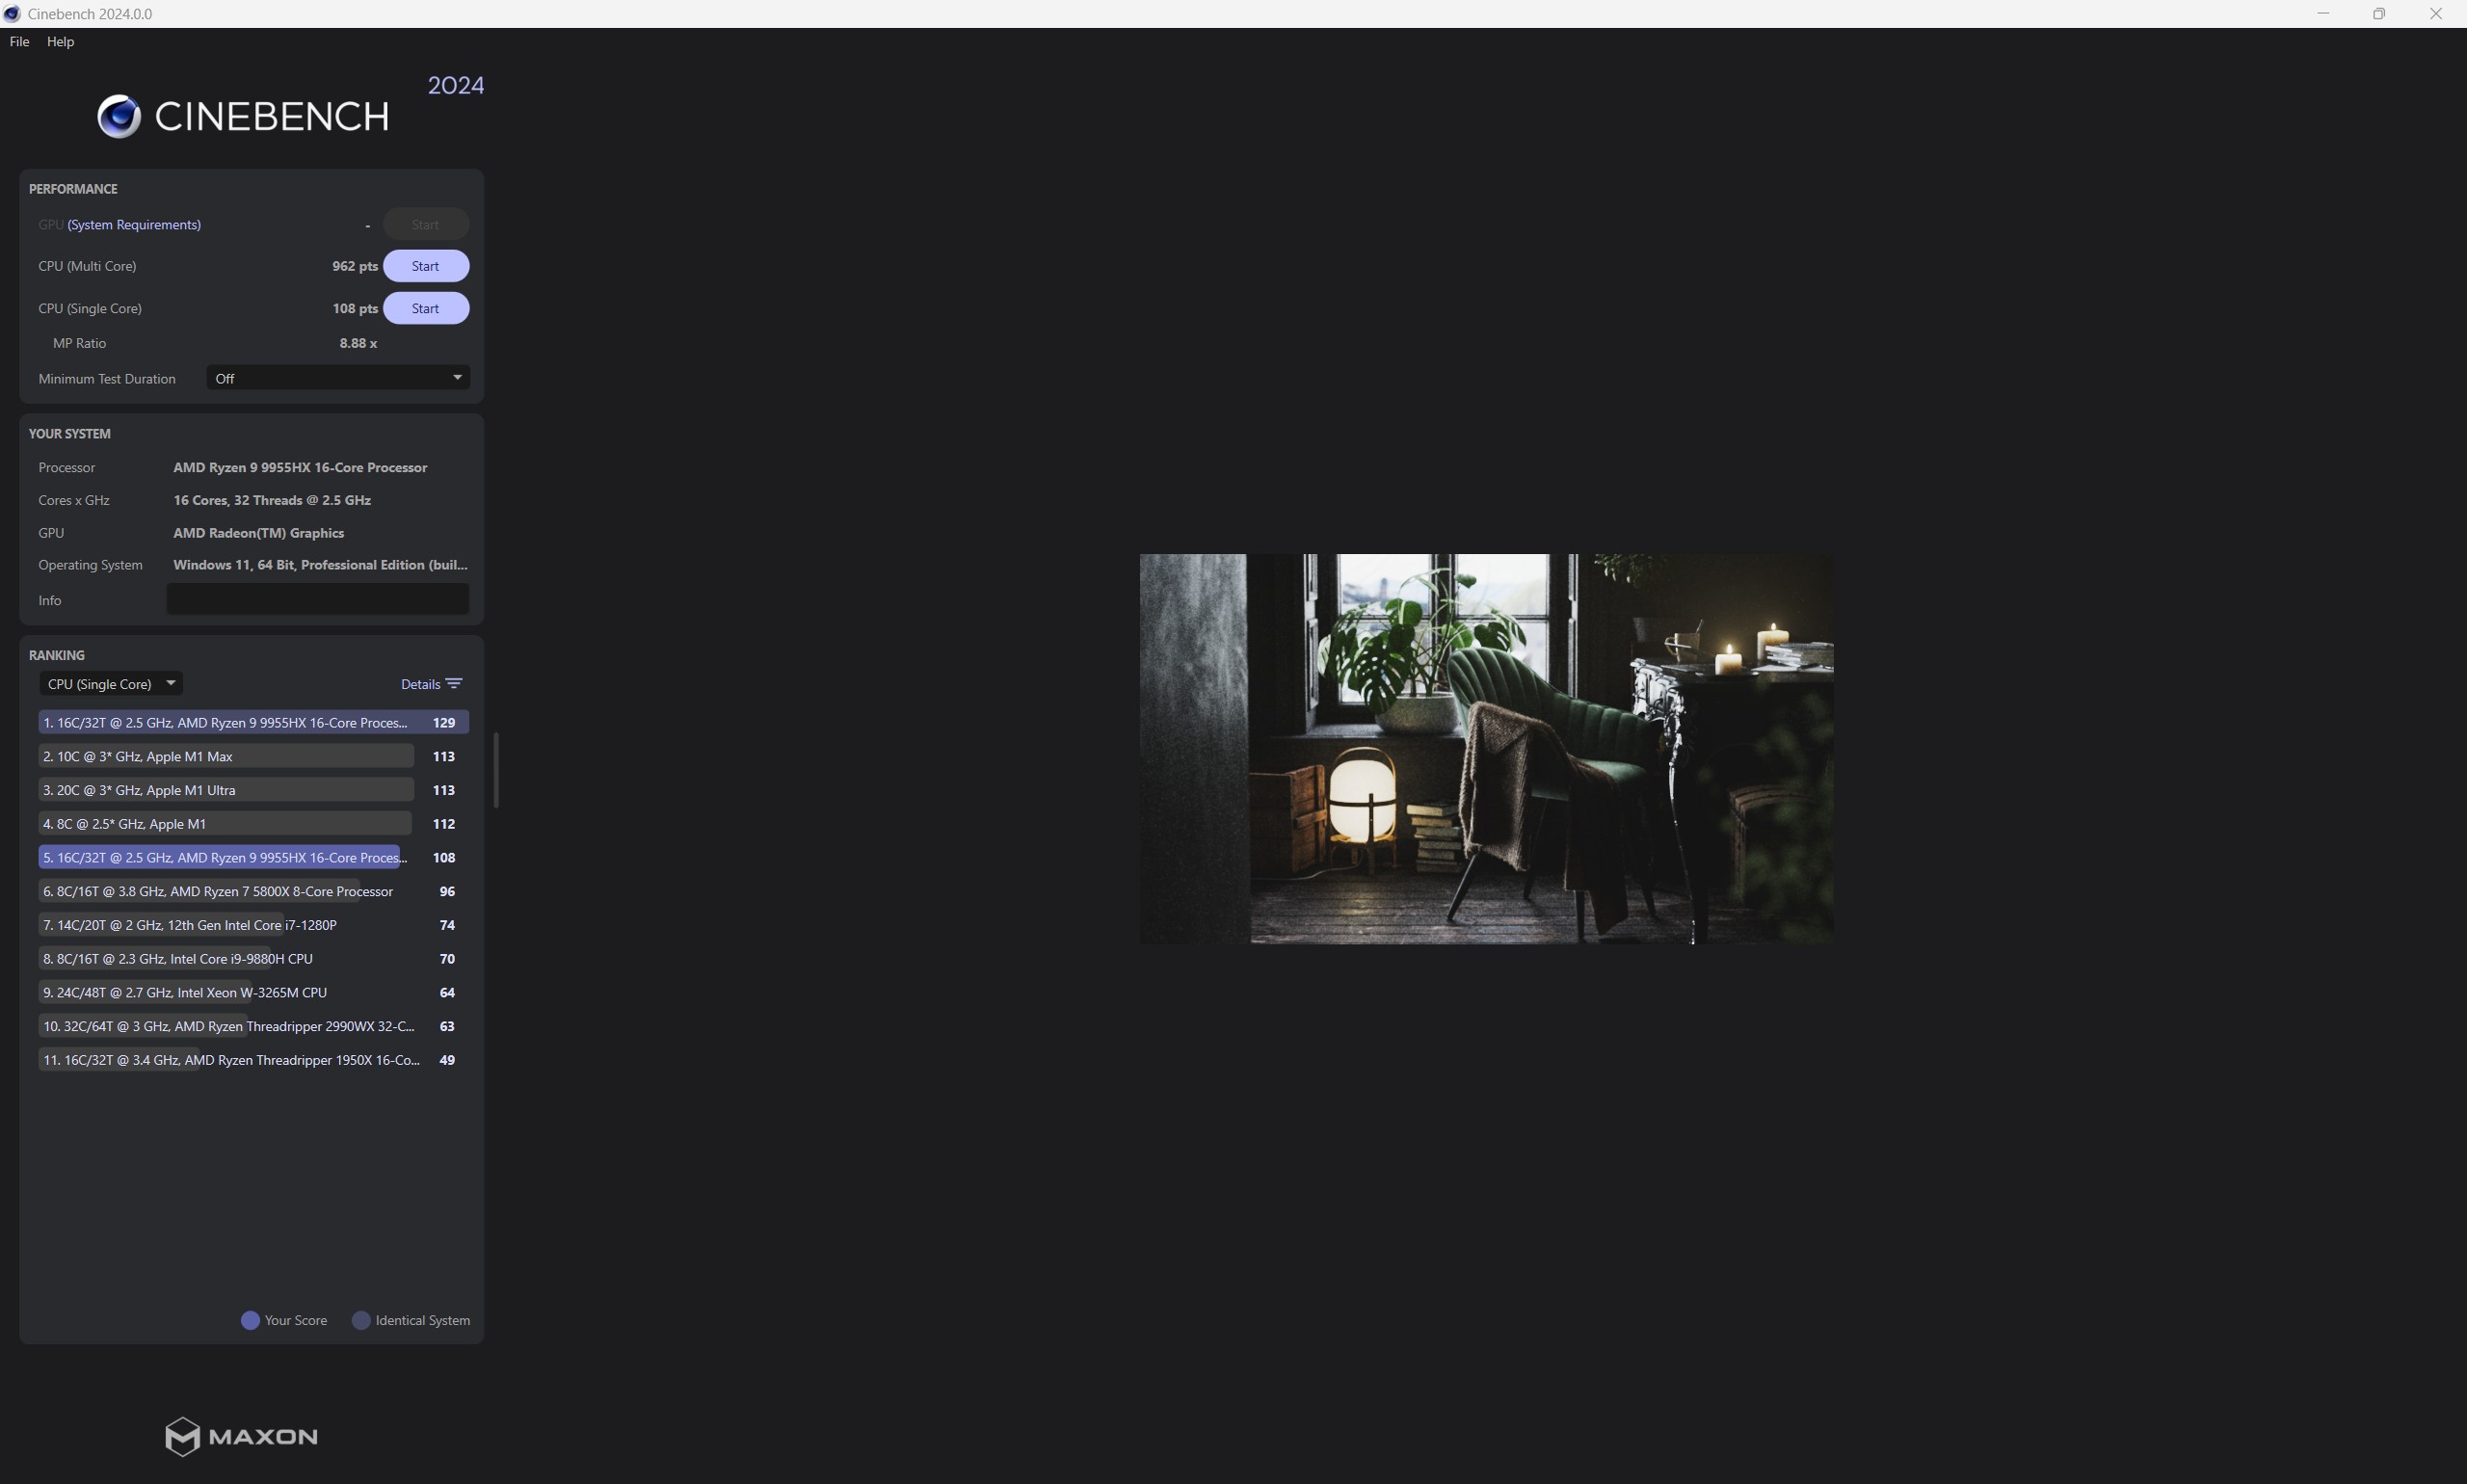
The AMD Ryzen 9 9955HX with 16 cores and 32 threads offers strong performance in both single- and multi-core applications. Due to its extremely high performance, the AMD Ryzen 9 9955HX is the perfect choice for a gaming laptop. The competitors, all Intel-based, can be clearly outperformed in the pure CPU performance tests. If you run the Chuwi Gamebook in Office or Balanced mode, you have to expect a loss in performance, as you can see from the table.
| Power Mode | Cinebench R15 1T | Cinebench R15 nT | Cinebench R20 1T | Cinebench R20 nT | Cinebench R23 1T | Cinebench R23 nT | Cinebench 2024 1T | Cinebench 2024 nT |
|---|---|---|---|---|---|---|---|---|
| Turbo | 336 | 5,639 | 851 | 14,186 | 2,174 | 36,127 | 129 | 1,918 |
| Balanced | 339 | 5,241 | 851 | 13,321 | 2,182 | 33,814 | 129 | 1,809 |
| office | 281 | 3,132 | 704 | 8,041 | 1,805 | 20,840 | 109 | 1,127 |
Cinebench results (Turbo mode)

Cinebench results (battery operation)
Cinebench R15 Multi Sustained Test
Cinebench R23: Multi Core | Single Core
Cinebench R20: CPU (Multi Core) | CPU (Single Core)
Cinebench R15: CPU Multi 64Bit | CPU Single 64Bit
Blender: v2.79 BMW27 CPU
7-Zip 18.03: 7z b 4 | 7z b 4 -mmt1
Geekbench 6.7: Multi-Core | Single-Core
Geekbench 5.5: Multi-Core | Single-Core
HWBOT x265 Benchmark v2.2: 4k Preset
LibreOffice : 20 Documents To PDF
R Benchmark 2.5: Overall mean
| CPU Performance rating | |
| Average AMD Ryzen 9 9955HX | |
| Chuwi Gamebook, R9 9955HX | |
| Lenovo Legion 5 Pro 16IAX10H | |
| Schenker XMG Pro 16 (E25) | |
| Medion Erazer Major 16 X1 MD62736 | |
| MSI Vector 16 HX AI A2XWHG | |
| Average of class Gaming | |
| Cinebench R23 / Multi Core | |
| Average AMD Ryzen 9 9955HX (35960 - 39690, n=9) | |
| Lenovo Legion 5 Pro 16IAX10H | |
| Schenker XMG Pro 16 (E25) | |
| Chuwi Gamebook, R9 9955HX | |
| Medion Erazer Major 16 X1 MD62736 | |
| MSI Vector 16 HX AI A2XWHG | |
| Average of class Gaming (10488 - 40970, n=113, last 2 years) | |
| Cinebench R23 / Single Core | |
| Lenovo Legion 5 Pro 16IAX10H | |
| Schenker XMG Pro 16 (E25) | |
| Chuwi Gamebook, R9 9955HX | |
| MSI Vector 16 HX AI A2XWHG | |
| Average AMD Ryzen 9 9955HX (1828 - 2183, n=9) | |
| Medion Erazer Major 16 X1 MD62736 | |
| Average of class Gaming (1166 - 2356, n=113, last 2 years) | |
| Cinebench R20 / CPU (Multi Core) | |
| Lenovo Legion 5 Pro 16IAX10H | |
| Average AMD Ryzen 9 9955HX (13963 - 15524, n=9) | |
| Schenker XMG Pro 16 (E25) | |
| Chuwi Gamebook, R9 9955HX | |
| Medion Erazer Major 16 X1 MD62736 | |
| MSI Vector 16 HX AI A2XWHG | |
| Average of class Gaming (4029 - 16108, n=112, last 2 years) | |
| Cinebench R20 / CPU (Single Core) | |
| Lenovo Legion 5 Pro 16IAX10H | |
| Schenker XMG Pro 16 (E25) | |
| Chuwi Gamebook, R9 9955HX | |
| Average AMD Ryzen 9 9955HX (819 - 856, n=9) | |
| MSI Vector 16 HX AI A2XWHG | |
| Medion Erazer Major 16 X1 MD62736 | |
| Average of class Gaming (442 - 895, n=112, last 2 years) | |
| Cinebench R15 / CPU Multi 64Bit | |
| Lenovo Legion 5 Pro 16IAX10H | |
| Average AMD Ryzen 9 9955HX (5624 - 6103, n=9) | |
| Chuwi Gamebook, R9 9955HX | |
| Schenker XMG Pro 16 (E25) | |
| Medion Erazer Major 16 X1 MD62736 | |
| MSI Vector 16 HX AI A2XWHG | |
| Average of class Gaming (1578 - 6271, n=113, last 2 years) | |
| Cinebench R15 / CPU Single 64Bit | |
| Chuwi Gamebook, R9 9955HX | |
| Schenker XMG Pro 16 (E25) | |
| Average AMD Ryzen 9 9955HX (320 - 338, n=9) | |
| Lenovo Legion 5 Pro 16IAX10H | |
| MSI Vector 16 HX AI A2XWHG | |
| Medion Erazer Major 16 X1 MD62736 | |
| Average of class Gaming (188.8 - 343, n=112, last 2 years) | |
| Blender / v2.79 BMW27 CPU | |
| Average of class Gaming (80 - 330, n=110, last 2 years) | |
| MSI Vector 16 HX AI A2XWHG | |
| Medion Erazer Major 16 X1 MD62736 | |
| Lenovo Legion 5 Pro 16IAX10H | |
| Schenker XMG Pro 16 (E25) | |
| Chuwi Gamebook, R9 9955HX | |
| Average AMD Ryzen 9 9955HX (80 - 91, n=9) | |
| 7-Zip 18.03 / 7z b 4 | |
| Average AMD Ryzen 9 9955HX (132435 - 144064, n=9) | |
| Chuwi Gamebook, R9 9955HX | |
| Schenker XMG Pro 16 (E25) | |
| Lenovo Legion 5 Pro 16IAX10H | |
| Medion Erazer Major 16 X1 MD62736 | |
| Average of class Gaming (33491 - 148086, n=111, last 2 years) | |
| MSI Vector 16 HX AI A2XWHG | |
| 7-Zip 18.03 / 7z b 4 -mmt1 | |
| Average AMD Ryzen 9 9955HX (7061 - 7462, n=9) | |
| Chuwi Gamebook, R9 9955HX | |
| Schenker XMG Pro 16 (E25) | |
| Lenovo Legion 5 Pro 16IAX10H | |
| Medion Erazer Major 16 X1 MD62736 | |
| MSI Vector 16 HX AI A2XWHG | |
| Average of class Gaming (4199 - 7436, n=111, last 2 years) | |
| Geekbench 6.7 / Multi-Core | |
| Schenker XMG Pro 16 (E25) | |
| Lenovo Legion 5 Pro 16IAX10H | |
| Chuwi Gamebook, R9 9955HX | |
| Average AMD Ryzen 9 9955HX (16313 - 19725, n=9) | |
| Medion Erazer Major 16 X1 MD62736 | |
| MSI Vector 16 HX AI A2XWHG | |
| Average of class Gaming (6625 - 22104, n=112, last 2 years) | |
| Geekbench 6.7 / Single-Core | |
| Average AMD Ryzen 9 9955HX (3156 - 3259, n=9) | |
| Chuwi Gamebook, R9 9955HX | |
| Schenker XMG Pro 16 (E25) | |
| Lenovo Legion 5 Pro 16IAX10H | |
| Medion Erazer Major 16 X1 MD62736 | |
| MSI Vector 16 HX AI A2XWHG | |
| Average of class Gaming (1490 - 3259, n=112, last 2 years) | |
| Geekbench 5.5 / Multi-Core | |
| Schenker XMG Pro 16 (E25) | |
| Lenovo Legion 5 Pro 16IAX10H | |
| Average AMD Ryzen 9 9955HX (20576 - 22716, n=9) | |
| Chuwi Gamebook, R9 9955HX | |
| Medion Erazer Major 16 X1 MD62736 | |
| MSI Vector 16 HX AI A2XWHG | |
| Average of class Gaming (6460 - 27010, n=111, last 2 years) | |
| Geekbench 5.5 / Single-Core | |
| Average AMD Ryzen 9 9955HX (2307 - 2474, n=9) | |
| Chuwi Gamebook, R9 9955HX | |
| Schenker XMG Pro 16 (E25) | |
| Lenovo Legion 5 Pro 16IAX10H | |
| MSI Vector 16 HX AI A2XWHG | |
| Medion Erazer Major 16 X1 MD62736 | |
| Average of class Gaming (986 - 2474, n=111, last 2 years) | |
| HWBOT x265 Benchmark v2.2 / 4k Preset | |
| Average AMD Ryzen 9 9955HX (38.9 - 43, n=9) | |
| Chuwi Gamebook, R9 9955HX | |
| Schenker XMG Pro 16 (E25) | |
| Lenovo Legion 5 Pro 16IAX10H | |
| Medion Erazer Major 16 X1 MD62736 | |
| MSI Vector 16 HX AI A2XWHG | |
| Average of class Gaming (11.5 - 44.3, n=111, last 2 years) | |
| LibreOffice / 20 Documents To PDF | |
| Average of class Gaming (19 - 88.8, n=111, last 2 years) | |
| Schenker XMG Pro 16 (E25) | |
| Average AMD Ryzen 9 9955HX (42.2 - 52.4, n=9) | |
| Chuwi Gamebook, R9 9955HX | |
| Medion Erazer Major 16 X1 MD62736 | |
| MSI Vector 16 HX AI A2XWHG | |
| Lenovo Legion 5 Pro 16IAX10H | |
| R Benchmark 2.5 / Overall mean | |
| Average of class Gaming (0.3439 - 0.759, n=112, last 2 years) | |
| MSI Vector 16 HX AI A2XWHG | |
| Medion Erazer Major 16 X1 MD62736 | |
| Lenovo Legion 5 Pro 16IAX10H | |
| Schenker XMG Pro 16 (E25) | |
| Chuwi Gamebook, R9 9955HX | |
| Average AMD Ryzen 9 9955HX (0.3439 - 0.3737, n=9) | |
* ... smaller is better
AIDA64: FP32 Ray-Trace | FPU Julia | CPU SHA3 | CPU Queen | FPU SinJulia | FPU Mandel | CPU AES | CPU ZLib | FP64 Ray-Trace | CPU PhotoWorxx
| Performance rating | |
| Average AMD Ryzen 9 9955HX | |
| Chuwi Gamebook, R9 9955HX | |
| Lenovo Legion 5 Pro 16IAX10H | |
| Schenker XMG Pro 16 (E25) | |
| Medion Erazer Major 16 X1 MD62736 | |
| Average of class Gaming | |
| MSI Vector 16 HX AI A2XWHG | |
| AIDA64 / FP32 Ray-Trace | |
| Chuwi Gamebook, R9 9955HX | |
| Average AMD Ryzen 9 9955HX (66596 - 85542, n=9) | |
| Lenovo Legion 5 Pro 16IAX10H | |
| Schenker XMG Pro 16 (E25) | |
| Medion Erazer Major 16 X1 MD62736 | |
| Average of class Gaming (10227 - 85542, n=110, last 2 years) | |
| MSI Vector 16 HX AI A2XWHG | |
| AIDA64 / FPU Julia | |
| Average AMD Ryzen 9 9955HX (191535 - 232031, n=9) | |
| Chuwi Gamebook, R9 9955HX | |
| Lenovo Legion 5 Pro 16IAX10H | |
| Schenker XMG Pro 16 (E25) | |
| Medion Erazer Major 16 X1 MD62736 | |
| MSI Vector 16 HX AI A2XWHG | |
| Average of class Gaming (51376 - 238426, n=110, last 2 years) | |
| AIDA64 / CPU SHA3 | |
| Average AMD Ryzen 9 9955HX (8489 - 9780, n=9) | |
| Chuwi Gamebook, R9 9955HX | |
| Schenker XMG Pro 16 (E25) | |
| Lenovo Legion 5 Pro 16IAX10H | |
| Medion Erazer Major 16 X1 MD62736 | |
| MSI Vector 16 HX AI A2XWHG | |
| Average of class Gaming (2180 - 9817, n=110, last 2 years) | |
| AIDA64 / CPU Queen | |
| Average AMD Ryzen 9 9955HX (153027 - 164154, n=9) | |
| Chuwi Gamebook, R9 9955HX | |
| Lenovo Legion 5 Pro 16IAX10H | |
| Schenker XMG Pro 16 (E25) | |
| Medion Erazer Major 16 X1 MD62736 | |
| Average of class Gaming (49785 - 173351, n=101, last 2 years) | |
| MSI Vector 16 HX AI A2XWHG | |
| AIDA64 / FPU SinJulia | |
| Average AMD Ryzen 9 9955HX (29876 - 32647, n=9) | |
| Chuwi Gamebook, R9 9955HX | |
| Average of class Gaming (4424 - 33636, n=110, last 2 years) | |
| Schenker XMG Pro 16 (E25) | |
| Lenovo Legion 5 Pro 16IAX10H | |
| Medion Erazer Major 16 X1 MD62736 | |
| MSI Vector 16 HX AI A2XWHG | |
| AIDA64 / FPU Mandel | |
| Average AMD Ryzen 9 9955HX (101131 - 128721, n=9) | |
| Chuwi Gamebook, R9 9955HX | |
| Schenker XMG Pro 16 (E25) | |
| Lenovo Legion 5 Pro 16IAX10H | |
| Medion Erazer Major 16 X1 MD62736 | |
| MSI Vector 16 HX AI A2XWHG | |
| Average of class Gaming (25115 - 128721, n=110, last 2 years) | |
| AIDA64 / CPU AES | |
| Average AMD Ryzen 9 9955HX (146979 - 218385, n=9) | |
| Chuwi Gamebook, R9 9955HX | |
| Lenovo Legion 5 Pro 16IAX10H | |
| Schenker XMG Pro 16 (E25) | |
| Medion Erazer Major 16 X1 MD62736 | |
| Average of class Gaming (39258 - 247074, n=110, last 2 years) | |
| MSI Vector 16 HX AI A2XWHG | |
| AIDA64 / CPU ZLib | |
| Average AMD Ryzen 9 9955HX (2186 - 2531, n=9) | |
| Chuwi Gamebook, R9 9955HX | |
| Lenovo Legion 5 Pro 16IAX10H | |
| Schenker XMG Pro 16 (E25) | |
| Medion Erazer Major 16 X1 MD62736 | |
| Average of class Gaming (574 - 2531, n=110, last 2 years) | |
| MSI Vector 16 HX AI A2XWHG | |
| AIDA64 / FP64 Ray-Trace | |
| Chuwi Gamebook, R9 9955HX | |
| Average AMD Ryzen 9 9955HX (35252 - 45446, n=9) | |
| Lenovo Legion 5 Pro 16IAX10H | |
| Schenker XMG Pro 16 (E25) | |
| Medion Erazer Major 16 X1 MD62736 | |
| Average of class Gaming (5509 - 45446, n=110, last 2 years) | |
| MSI Vector 16 HX AI A2XWHG | |
| AIDA64 / CPU PhotoWorxx | |
| Schenker XMG Pro 16 (E25) | |
| Medion Erazer Major 16 X1 MD62736 | |
| Lenovo Legion 5 Pro 16IAX10H | |
| Average of class Gaming (12271 - 89891, n=110, last 2 years) | |
| Chuwi Gamebook, R9 9955HX | |
| Average AMD Ryzen 9 9955HX (35974 - 42495, n=9) | |
| MSI Vector 16 HX AI A2XWHG | |
System performance
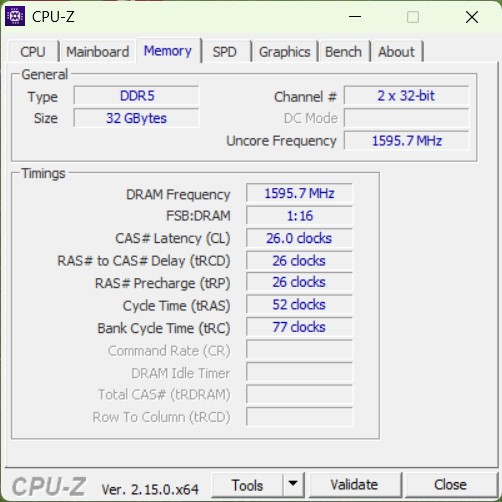
The Chuwi Gamebook delivers a strong system performance overall and can take the lead in the comparison by a wafer-thin margin. However, the Chuwi Gamebook cannot convince in the RAM tests and falls significantly behind. In everyday use, however, there was subjectively no noticeable drop in performance.
PCMark 10: Score | Essentials | Productivity | Digital Content Creation
CrossMark: Overall | Productivity | Creativity | Responsiveness
WebXPRT 3: Overall
WebXPRT 4: Overall
Mozilla Kraken 1.1: Total
| Performance rating | |
| Average AMD Ryzen 9 9955HX, NVIDIA GeForce RTX 5070 Ti Laptop | |
| Lenovo Legion 5 Pro 16IAX10H | |
| Chuwi Gamebook, R9 9955HX | |
| Schenker XMG Pro 16 (E25) | |
| Medion Erazer Major 16 X1 MD62736 | |
| Average of class Gaming | |
| MSI Vector 16 HX AI A2XWHG | |
| PCMark 10 / Score | |
| Average AMD Ryzen 9 9955HX, NVIDIA GeForce RTX 5070 Ti Laptop (9208 - 10060, n=3) | |
| Chuwi Gamebook, R9 9955HX | |
| Schenker XMG Pro 16 (E25) | |
| Average of class Gaming (5828 - 11574, n=96, last 2 years) | |
| Lenovo Legion 5 Pro 16IAX10H | |
| Medion Erazer Major 16 X1 MD62736 | |
| MSI Vector 16 HX AI A2XWHG | |
| PCMark 10 / Essentials | |
| Average AMD Ryzen 9 9955HX, NVIDIA GeForce RTX 5070 Ti Laptop (11178 - 11719, n=3) | |
| Schenker XMG Pro 16 (E25) | |
| Chuwi Gamebook, R9 9955HX | |
| Medion Erazer Major 16 X1 MD62736 | |
| Lenovo Legion 5 Pro 16IAX10H | |
| MSI Vector 16 HX AI A2XWHG | |
| Average of class Gaming (8810 - 12600, n=100, last 2 years) | |
| PCMark 10 / Productivity | |
| Average AMD Ryzen 9 9955HX, NVIDIA GeForce RTX 5070 Ti Laptop (10734 - 16314, n=3) | |
| Chuwi Gamebook, R9 9955HX | |
| Average of class Gaming (6845 - 18766, n=98, last 2 years) | |
| Lenovo Legion 5 Pro 16IAX10H | |
| Schenker XMG Pro 16 (E25) | |
| MSI Vector 16 HX AI A2XWHG | |
| Medion Erazer Major 16 X1 MD62736 | |
| PCMark 10 / Digital Content Creation | |
| Chuwi Gamebook, R9 9955HX | |
| Average AMD Ryzen 9 9955HX, NVIDIA GeForce RTX 5070 Ti Laptop (14454 - 18192, n=3) | |
| Schenker XMG Pro 16 (E25) | |
| Lenovo Legion 5 Pro 16IAX10H | |
| Average of class Gaming (7602 - 19657, n=98, last 2 years) | |
| Medion Erazer Major 16 X1 MD62736 | |
| MSI Vector 16 HX AI A2XWHG | |
| CrossMark / Overall | |
| Chuwi Gamebook, R9 9955HX | |
| Schenker XMG Pro 16 (E25) | |
| Lenovo Legion 5 Pro 16IAX10H | |
| Average AMD Ryzen 9 9955HX, NVIDIA GeForce RTX 5070 Ti Laptop (2111 - 2215, n=3) | |
| Medion Erazer Major 16 X1 MD62736 | |
| Average of class Gaming (1366 - 2409, n=98, last 2 years) | |
| MSI Vector 16 HX AI A2XWHG | |
| CrossMark / Productivity | |
| Lenovo Legion 5 Pro 16IAX10H | |
| Schenker XMG Pro 16 (E25) | |
| Chuwi Gamebook, R9 9955HX | |
| Medion Erazer Major 16 X1 MD62736 | |
| Average AMD Ryzen 9 9955HX, NVIDIA GeForce RTX 5070 Ti Laptop (1882 - 1999, n=3) | |
| Average of class Gaming (1386 - 2254, n=98, last 2 years) | |
| MSI Vector 16 HX AI A2XWHG | |
| CrossMark / Creativity | |
| Average AMD Ryzen 9 9955HX, NVIDIA GeForce RTX 5070 Ti Laptop (2592 - 2660, n=3) | |
| Chuwi Gamebook, R9 9955HX | |
| Schenker XMG Pro 16 (E25) | |
| Lenovo Legion 5 Pro 16IAX10H | |
| Medion Erazer Major 16 X1 MD62736 | |
| MSI Vector 16 HX AI A2XWHG | |
| Average of class Gaming (1343 - 2729, n=98, last 2 years) | |
| CrossMark / Responsiveness | |
| Chuwi Gamebook, R9 9955HX | |
| Lenovo Legion 5 Pro 16IAX10H | |
| Schenker XMG Pro 16 (E25) | |
| Medion Erazer Major 16 X1 MD62736 | |
| Average AMD Ryzen 9 9955HX, NVIDIA GeForce RTX 5070 Ti Laptop (1608 - 1854, n=3) | |
| Average of class Gaming (1226 - 2334, n=98, last 2 years) | |
| MSI Vector 16 HX AI A2XWHG | |
| WebXPRT 3 / Overall | |
| Lenovo Legion 5 Pro 16IAX10H | |
| Schenker XMG Pro 16 (E25) | |
| Average AMD Ryzen 9 9955HX, NVIDIA GeForce RTX 5070 Ti Laptop (328 - 361, n=3) | |
| Chuwi Gamebook, R9 9955HX | |
| Medion Erazer Major 16 X1 MD62736 | |
| MSI Vector 16 HX AI A2XWHG | |
| Average of class Gaming (242 - 532, n=101, last 2 years) | |
| WebXPRT 4 / Overall | |
| Schenker XMG Pro 16 (E25) | |
| Lenovo Legion 5 Pro 16IAX10H | |
| Medion Erazer Major 16 X1 MD62736 | |
| MSI Vector 16 HX AI A2XWHG | |
| Average AMD Ryzen 9 9955HX, NVIDIA GeForce RTX 5070 Ti Laptop (282 - 322, n=3) | |
| Chuwi Gamebook, R9 9955HX | |
| Average of class Gaming (176.4 - 354, n=101, last 2 years) | |
| Mozilla Kraken 1.1 / Total | |
| Average of class Gaming (391 - 590, n=106, last 2 years) | |
| MSI Vector 16 HX AI A2XWHG | |
| Medion Erazer Major 16 X1 MD62736 | |
| Average AMD Ryzen 9 9955HX, NVIDIA GeForce RTX 5070 Ti Laptop (403 - 440, n=3) | |
| Lenovo Legion 5 Pro 16IAX10H | |
| Schenker XMG Pro 16 (E25) | |
| Chuwi Gamebook, R9 9955HX | |
* ... smaller is better
| PCMark 10 Score | 9208 points | |
Help | ||
| AIDA64 / Memory Copy | |
| Schenker XMG Pro 16 (E25) | |
| Lenovo Legion 5 Pro 16IAX10H | |
| Medion Erazer Major 16 X1 MD62736 | |
| Average of class Gaming (21750 - 129946, n=110, last 2 years) | |
| MSI Vector 16 HX AI A2XWHG | |
| Chuwi Gamebook, R9 9955HX | |
| Average AMD Ryzen 9 9955HX (53598 - 62777, n=9) | |
| AIDA64 / Memory Read | |
| Schenker XMG Pro 16 (E25) | |
| Lenovo Legion 5 Pro 16IAX10H | |
| Medion Erazer Major 16 X1 MD62736 | |
| MSI Vector 16 HX AI A2XWHG | |
| Average of class Gaming (22956 - 118858, n=110, last 2 years) | |
| Average AMD Ryzen 9 9955HX (63953 - 67256, n=9) | |
| Chuwi Gamebook, R9 9955HX | |
| AIDA64 / Memory Write | |
| Medion Erazer Major 16 X1 MD62736 | |
| Schenker XMG Pro 16 (E25) | |
| Lenovo Legion 5 Pro 16IAX10H | |
| Average of class Gaming (22297 - 135096, n=110, last 2 years) | |
| Average AMD Ryzen 9 9955HX (65421 - 72060, n=9) | |
| Chuwi Gamebook, R9 9955HX | |
| MSI Vector 16 HX AI A2XWHG | |
| AIDA64 / Memory Latency | |
| Lenovo Legion 5 Pro 16IAX10H | |
| Medion Erazer Major 16 X1 MD62736 | |
| MSI Vector 16 HX AI A2XWHG | |
| Average of class Gaming (75.3 - 259, n=110, last 2 years) | |
| Schenker XMG Pro 16 (E25) | |
| Chuwi Gamebook, R9 9955HX | |
| Average AMD Ryzen 9 9955HX (92.1 - 103.5, n=9) | |
* ... smaller is better
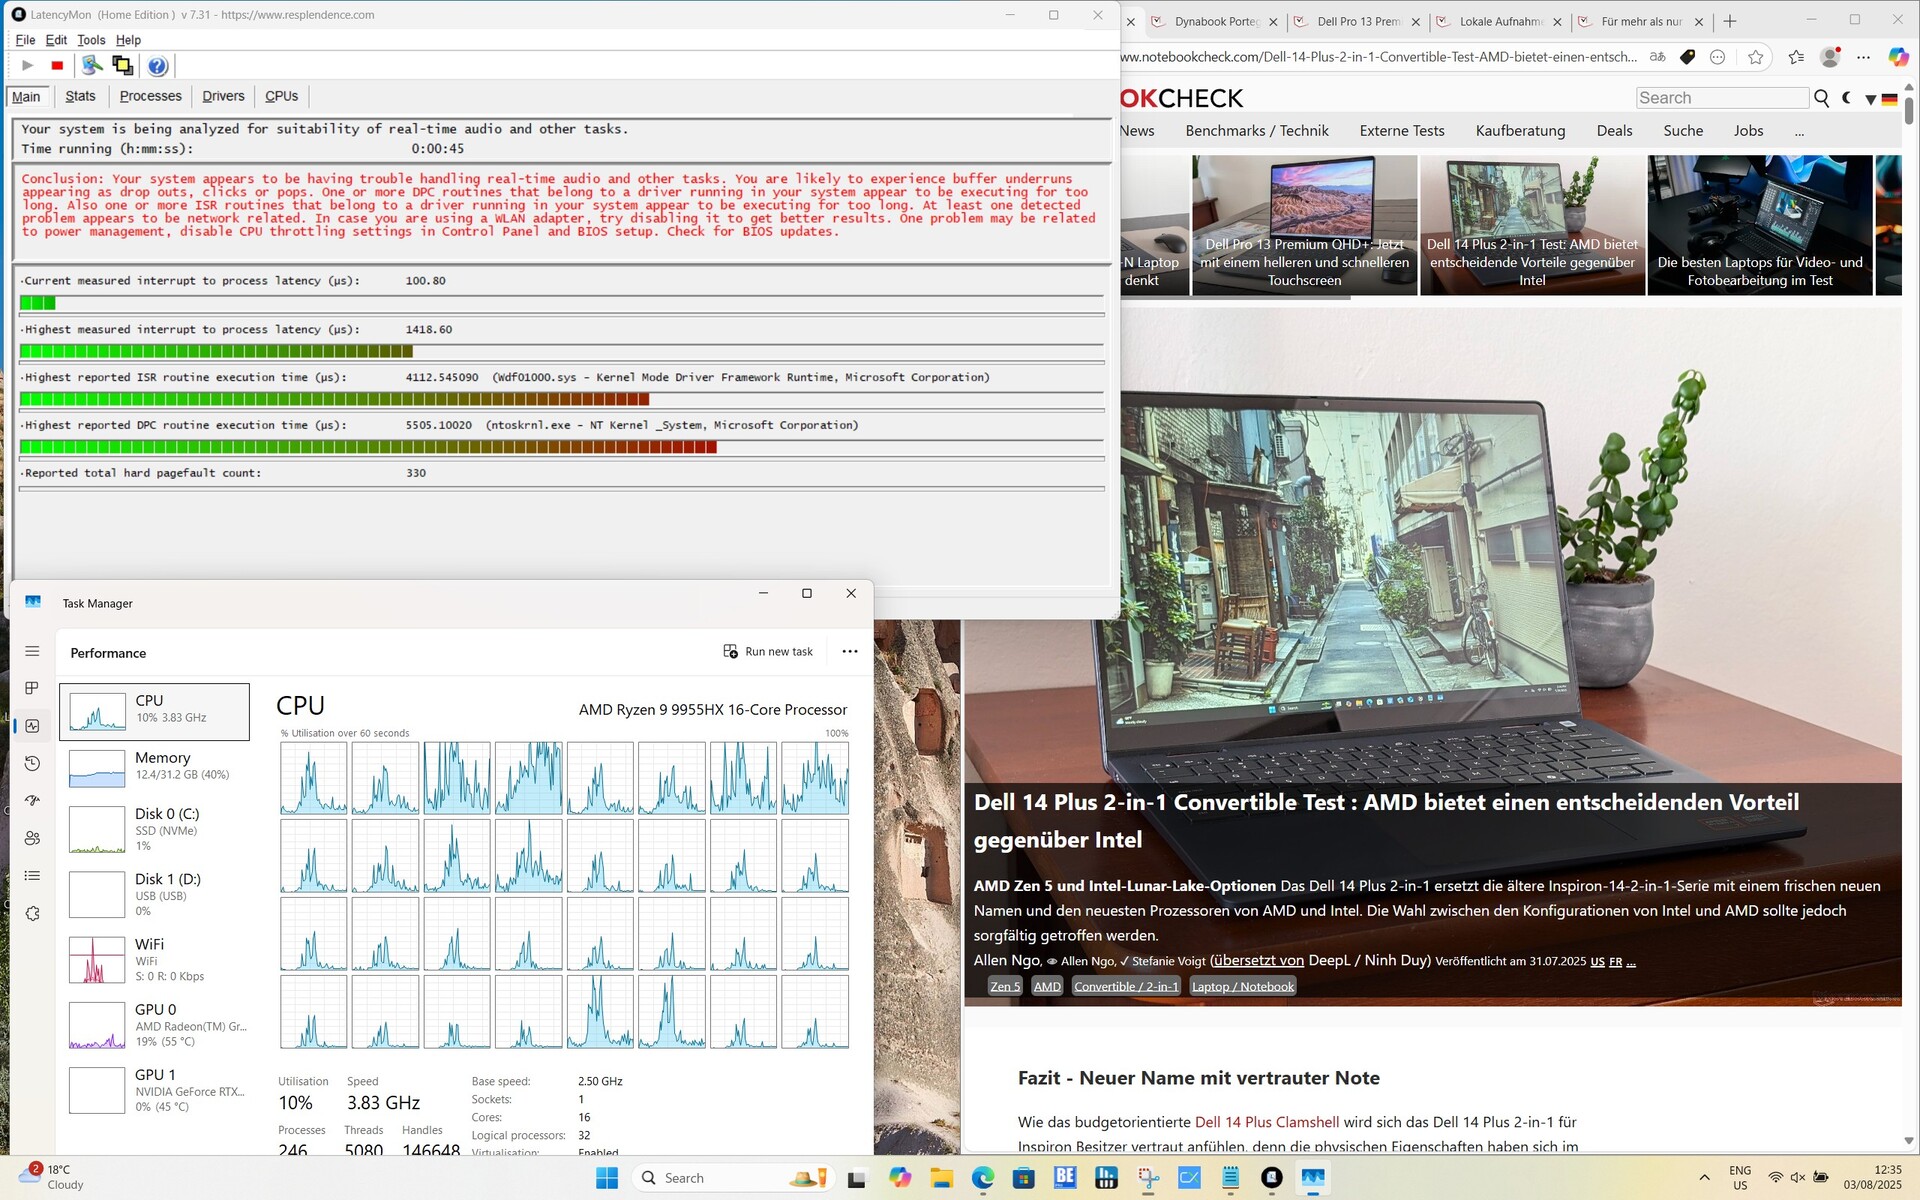
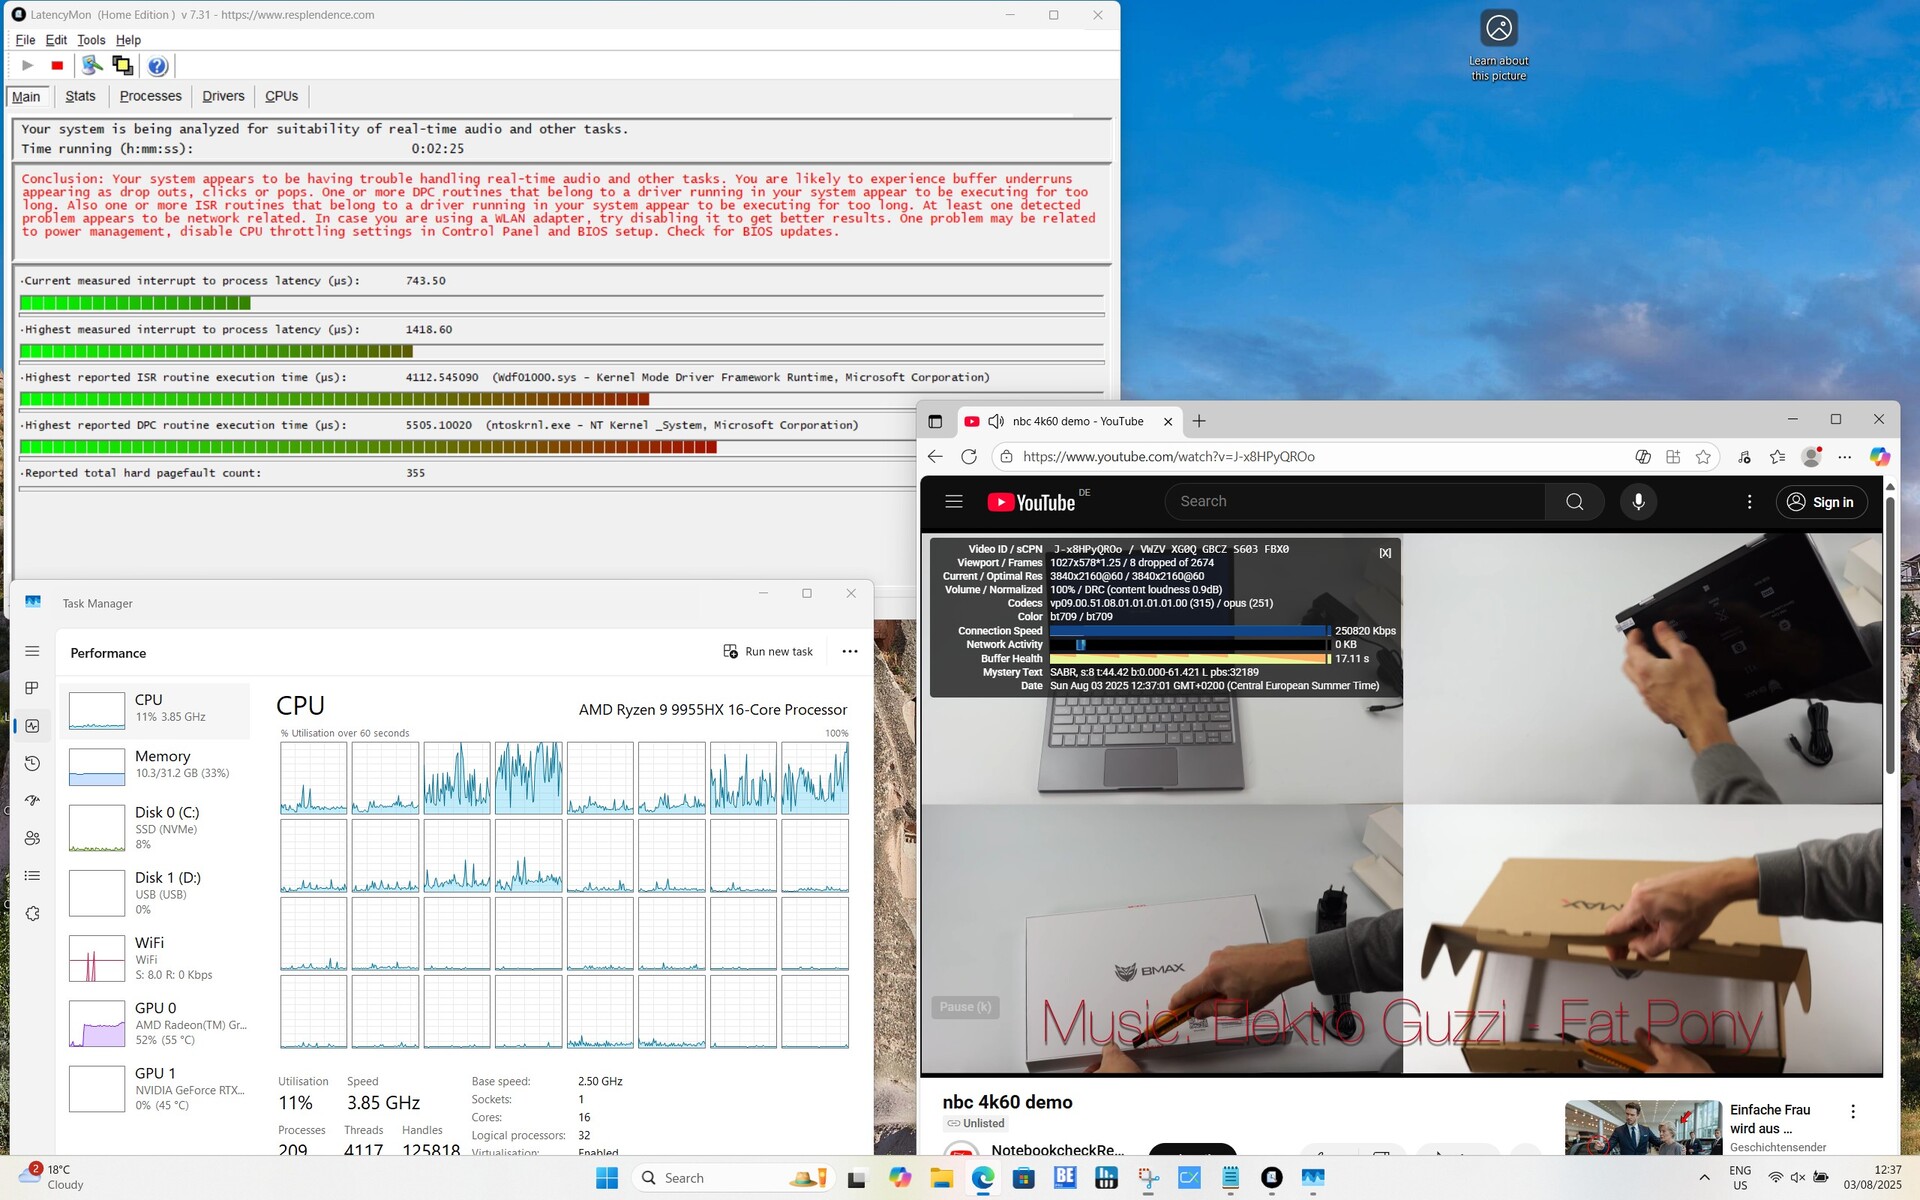
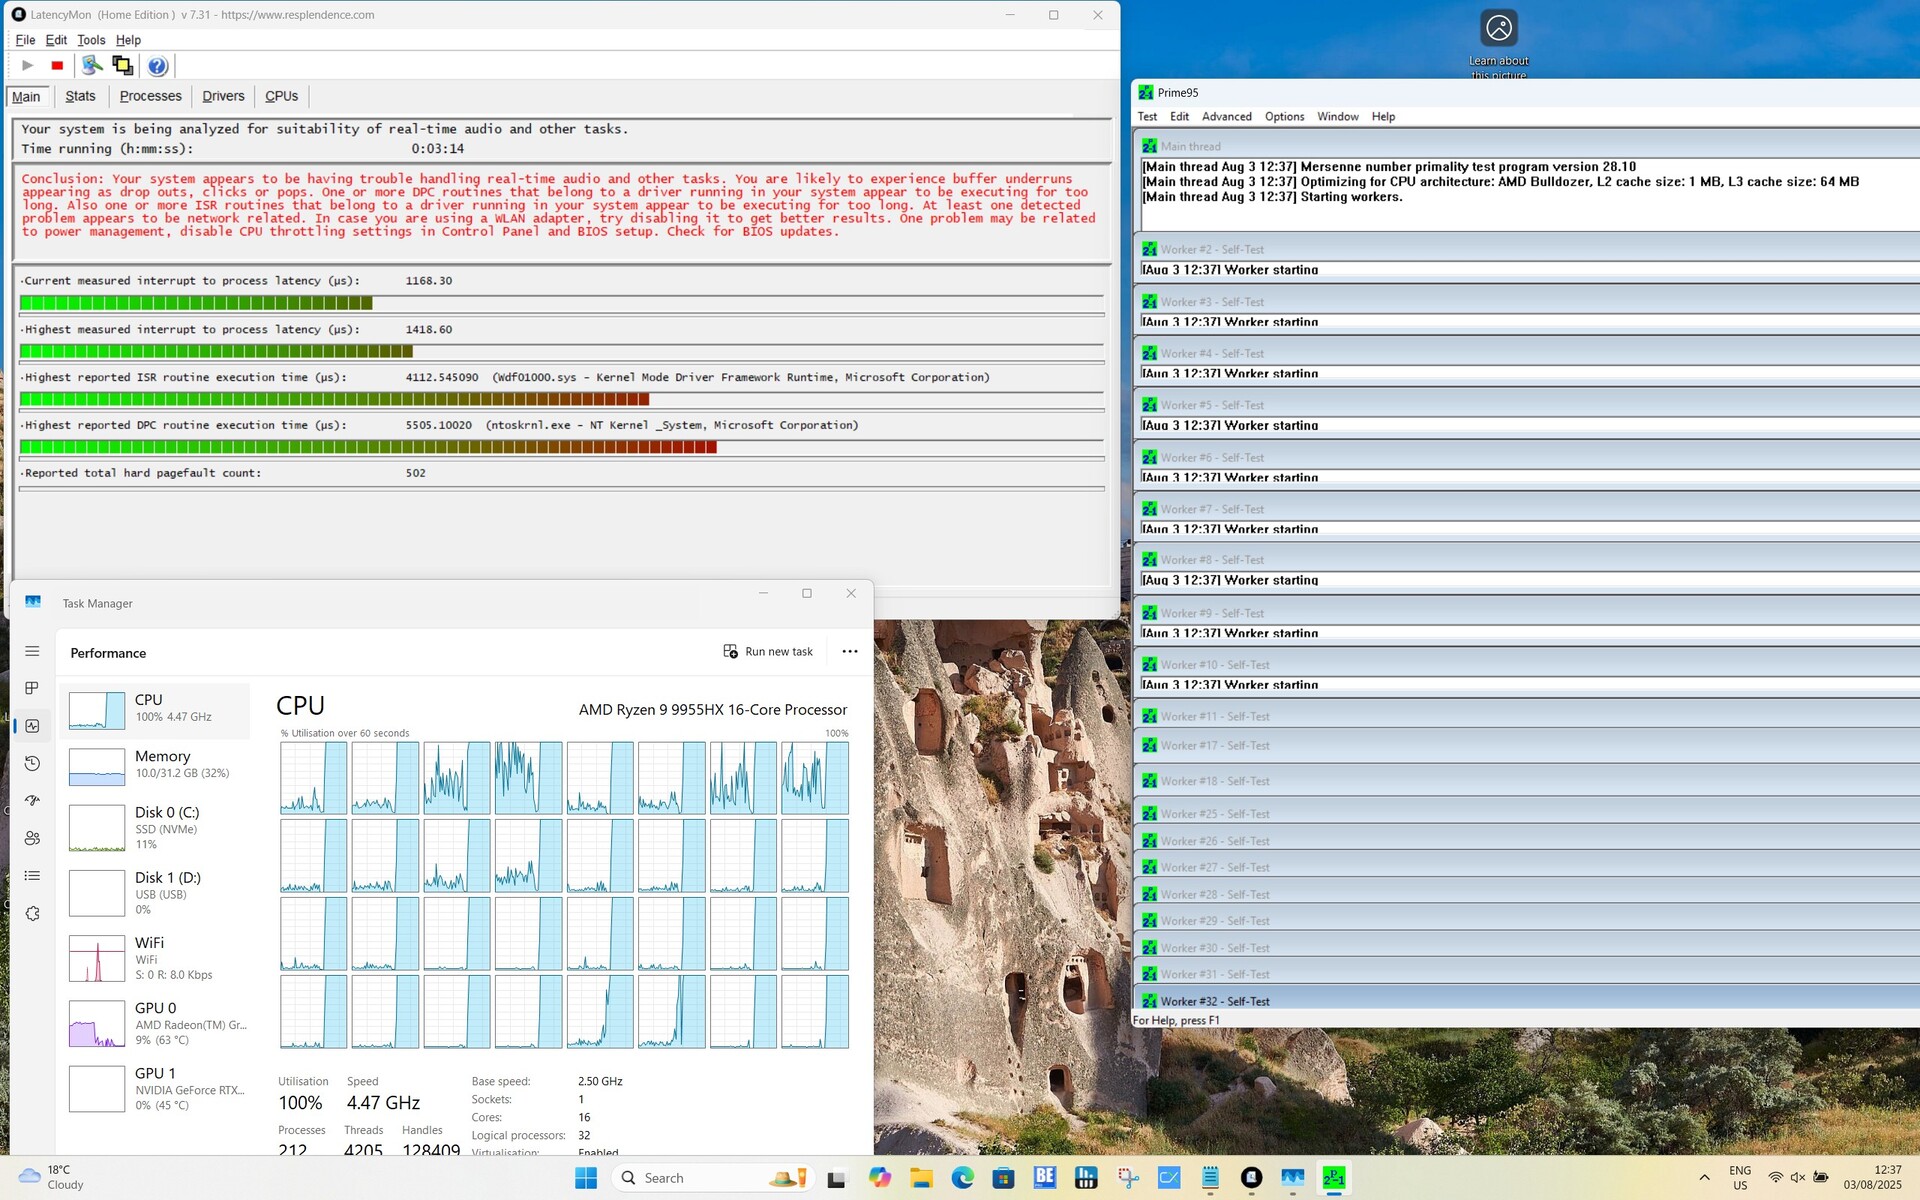
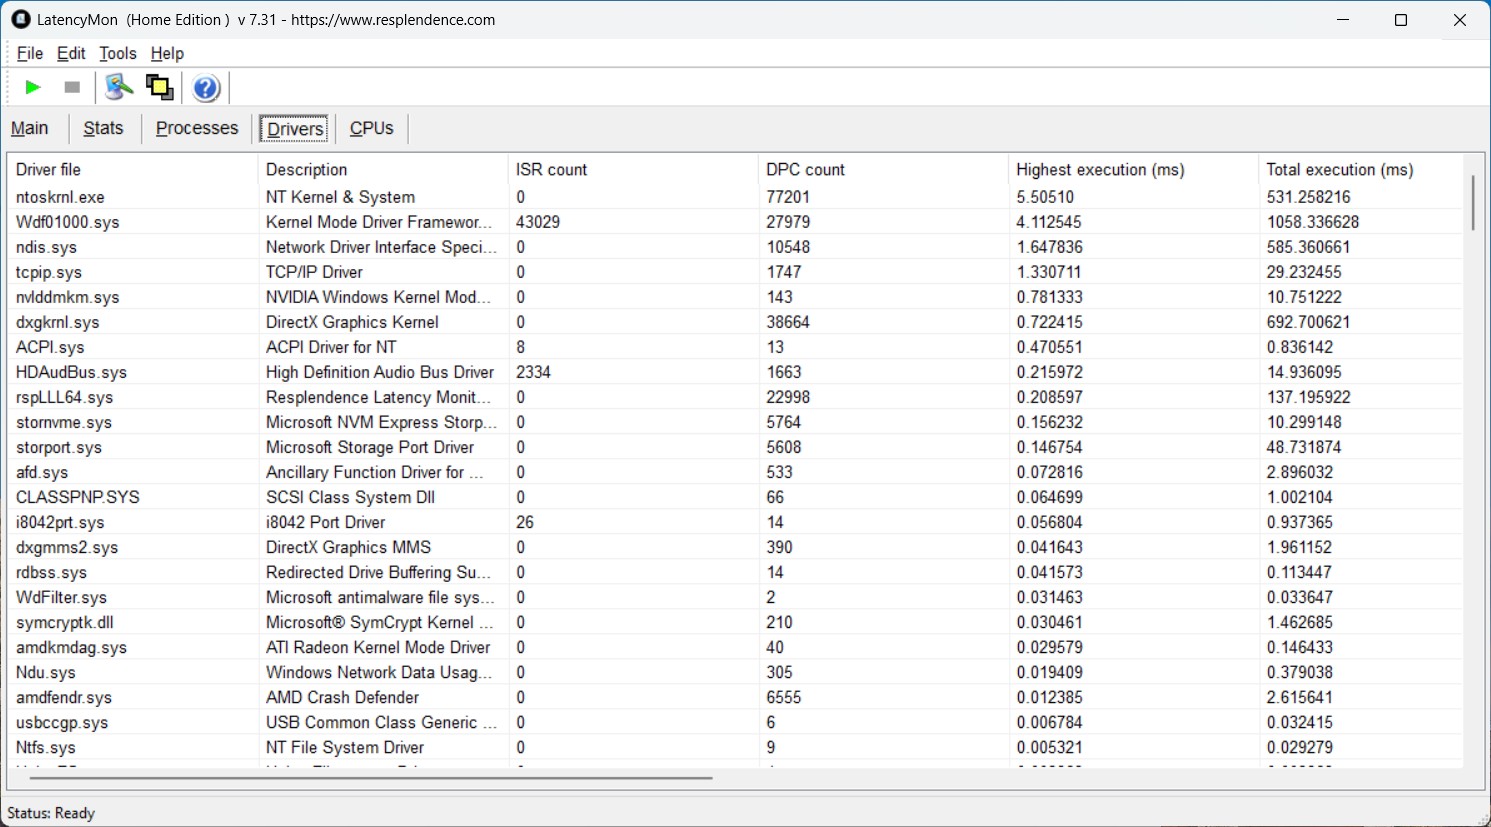
DPC latencies
The Chuwi Gamebook already exhibits excessive DPC latencies when surfing the Internet. However, it is positive that these do not deteriorate further under 4K video playback and even in the stress test.
| DPC Latencies / LatencyMon - interrupt to process latency (max), Web, Youtube, Prime95 | |
| Chuwi Gamebook, R9 9955HX | |
| MSI Vector 16 HX AI A2XWHG | |
| Medion Erazer Major 16 X1 MD62736 | |
| Schenker XMG Pro 16 (E25) | |
| Lenovo Legion 5 Pro 16IAX10H | |
* ... smaller is better
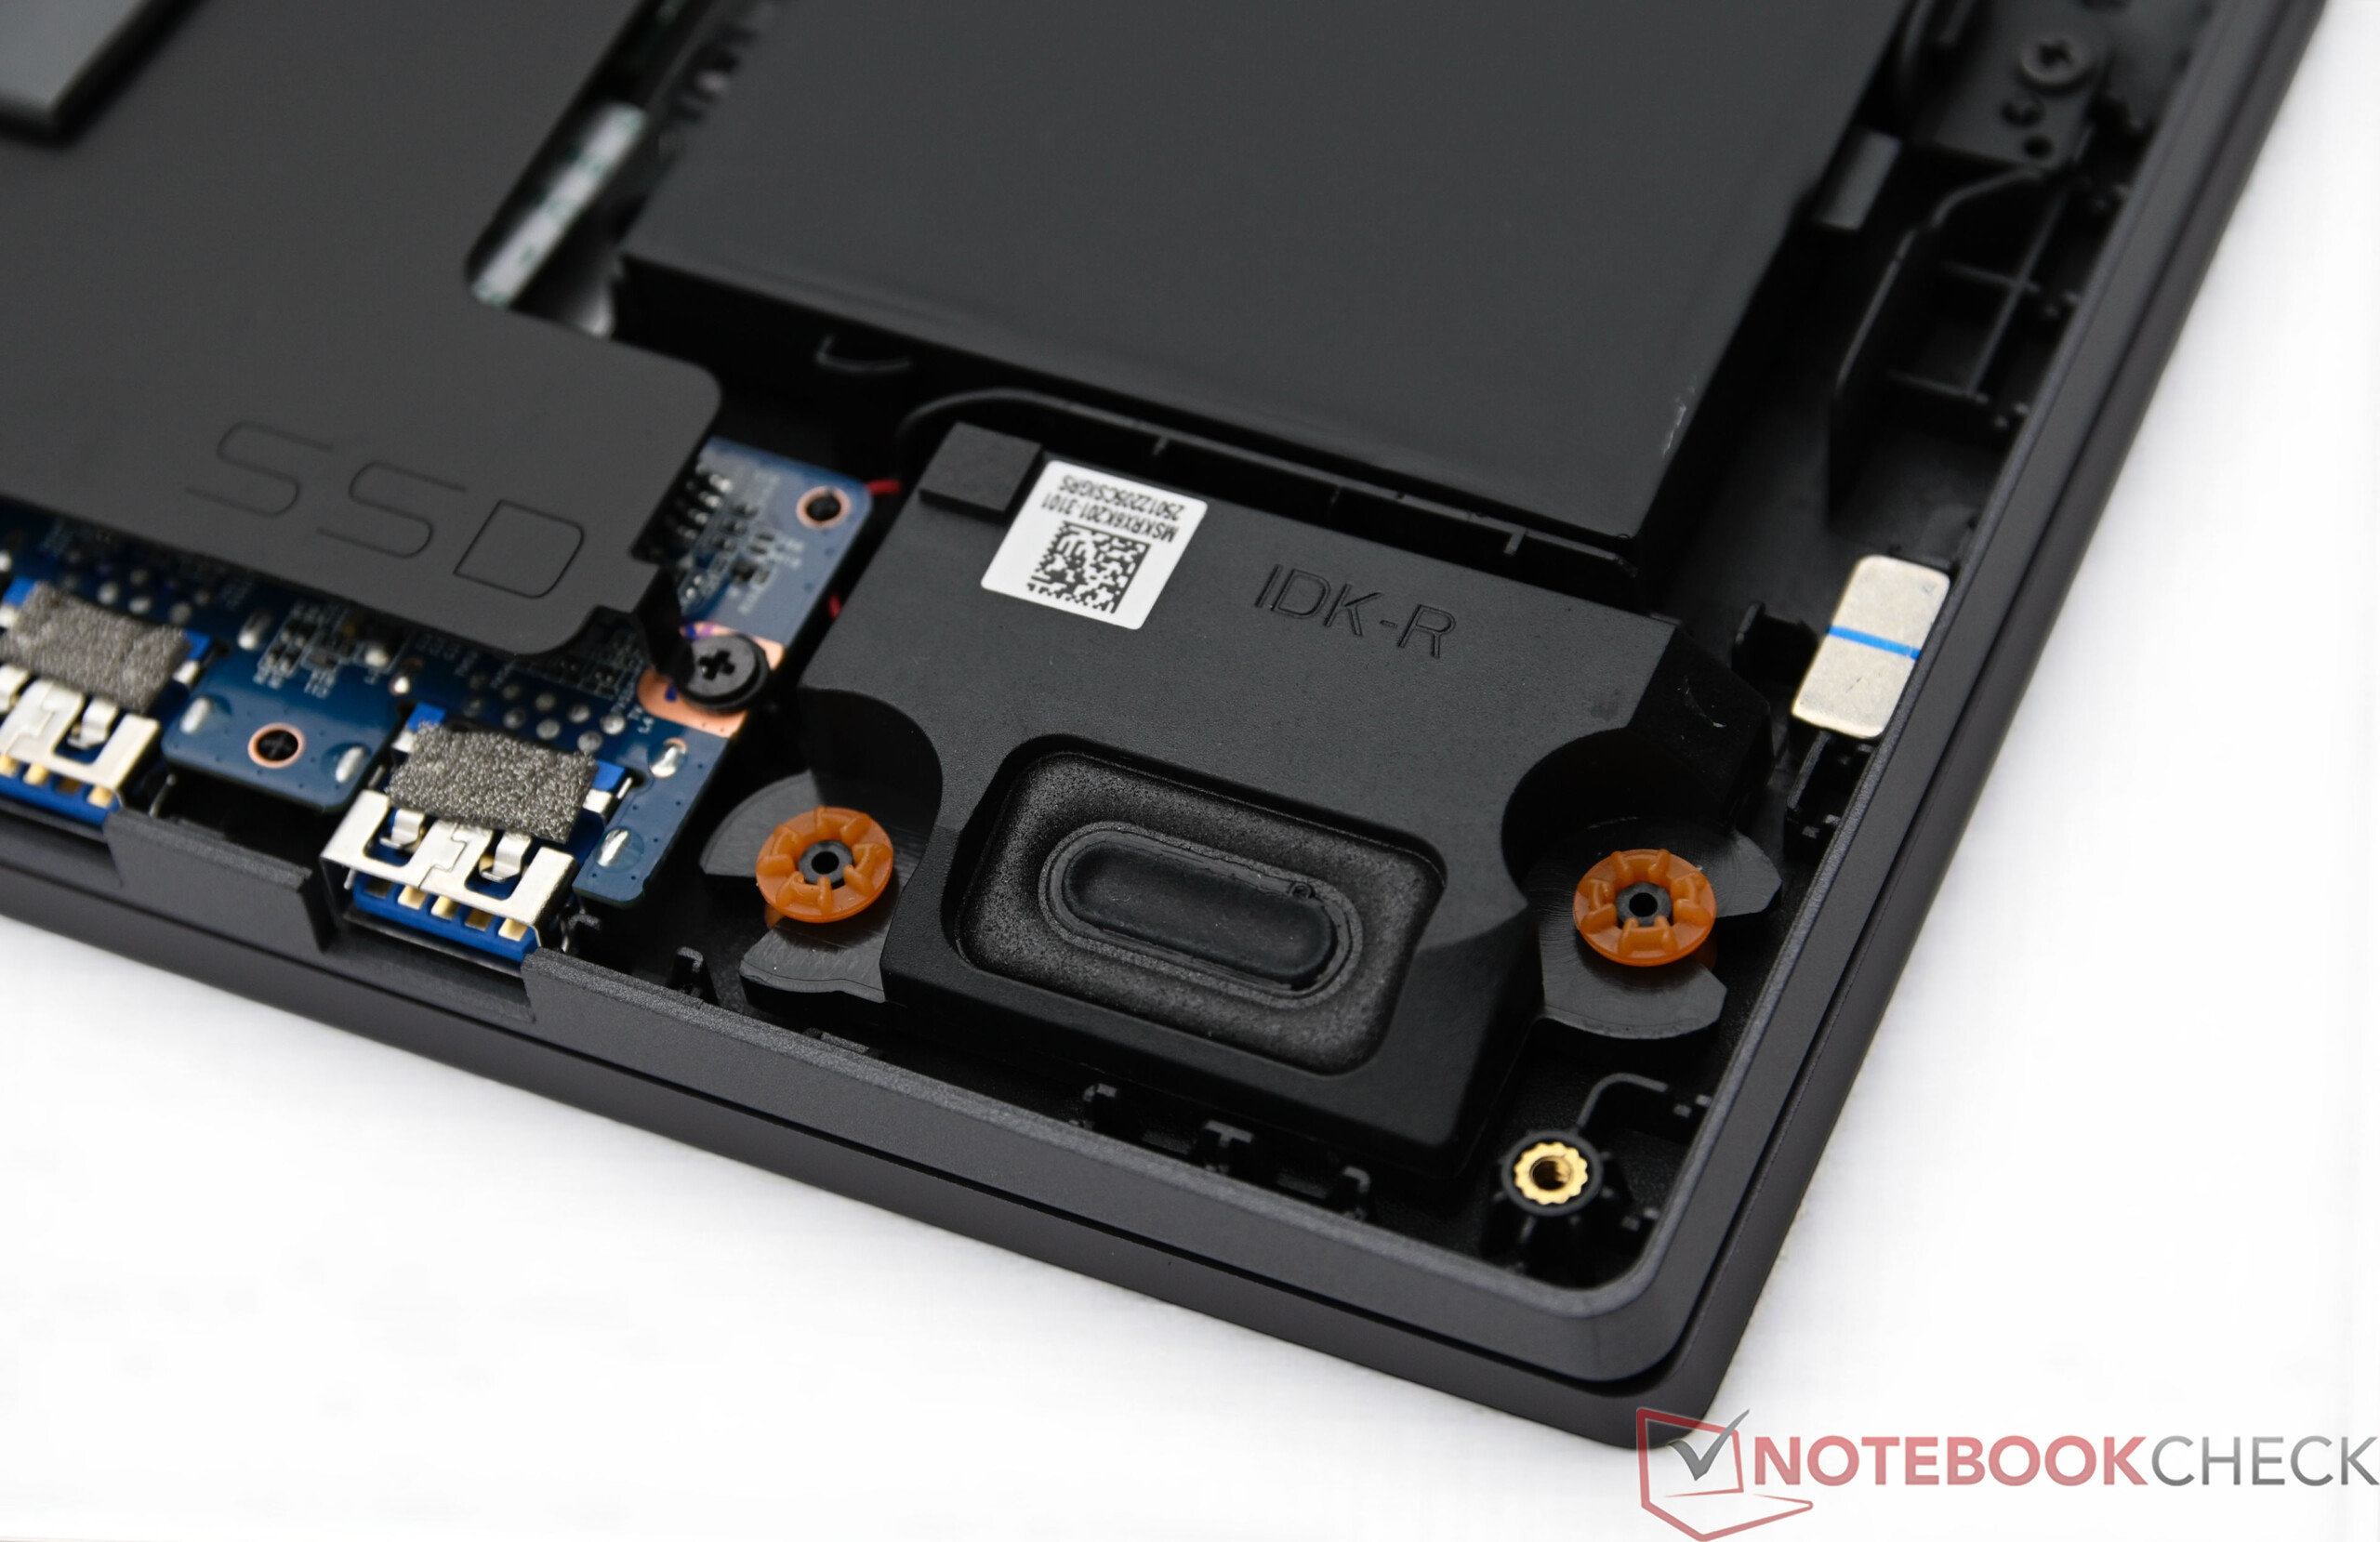
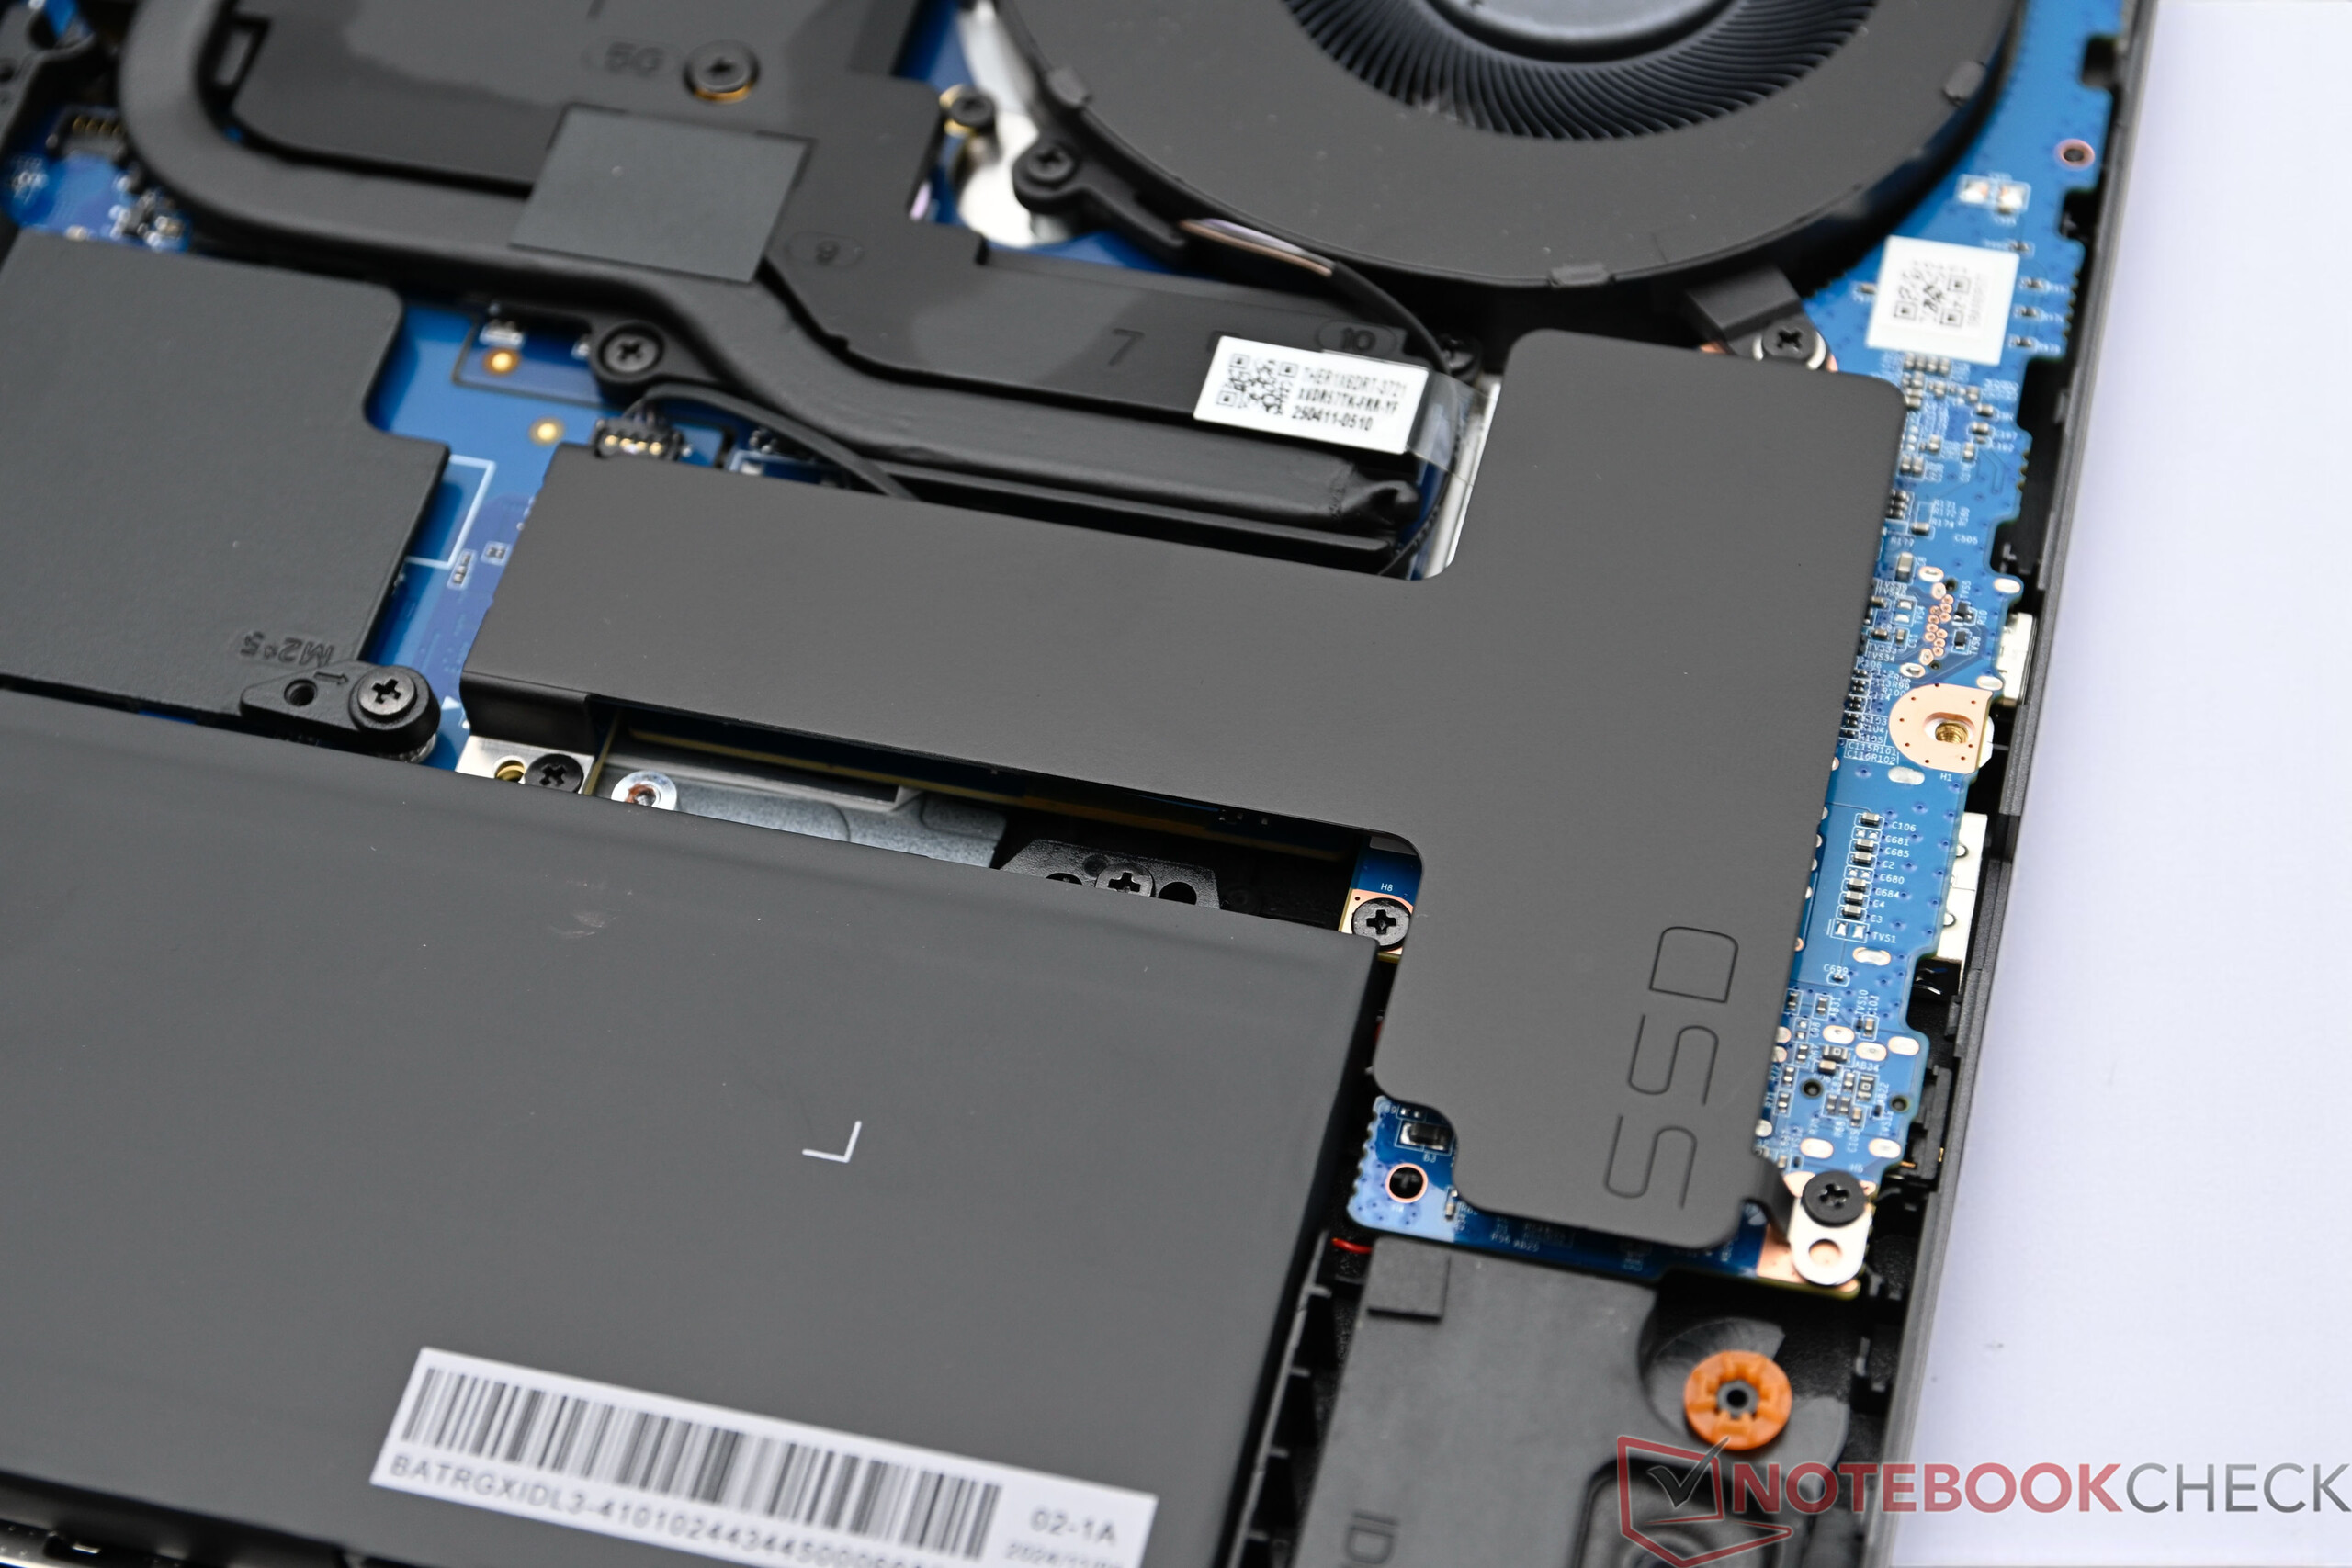
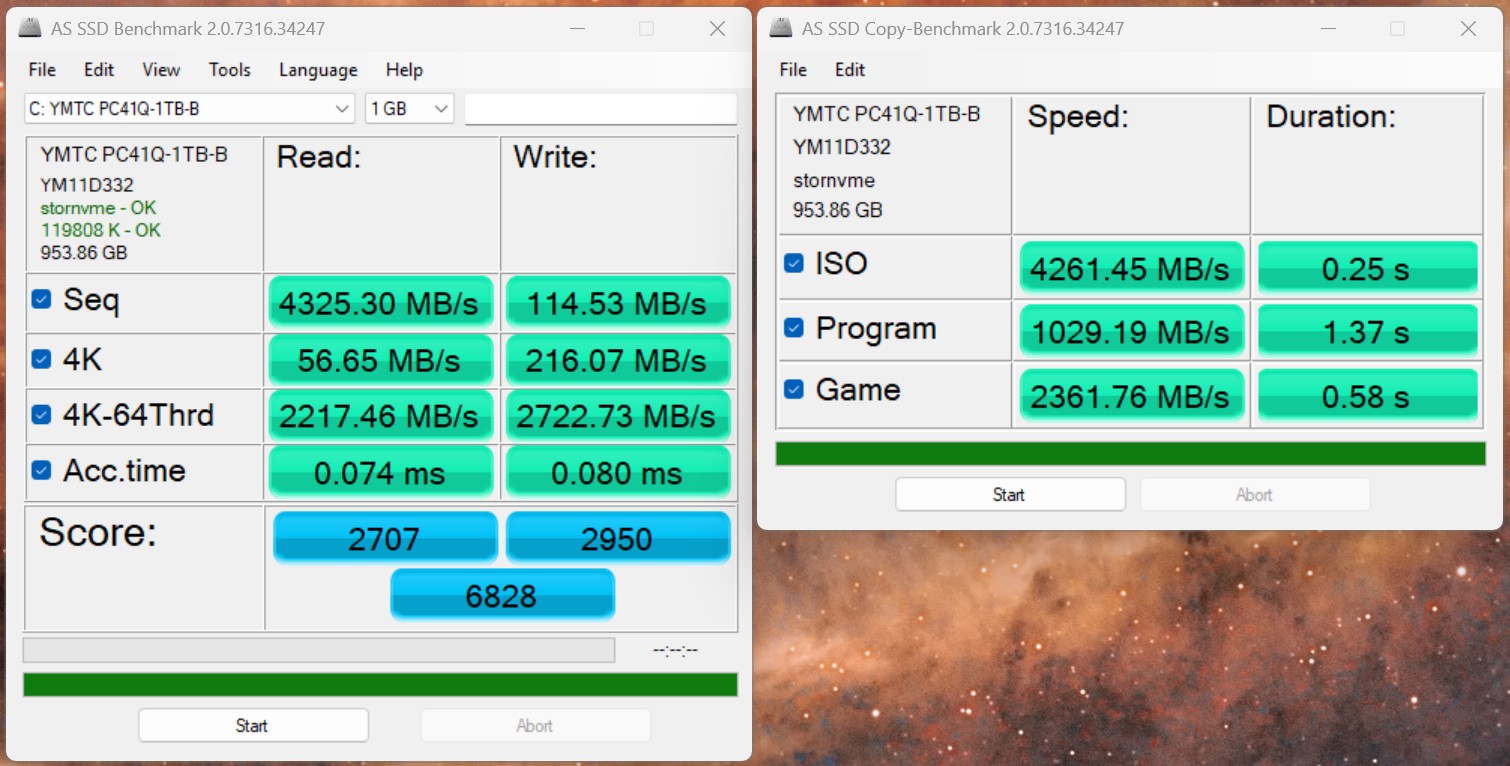
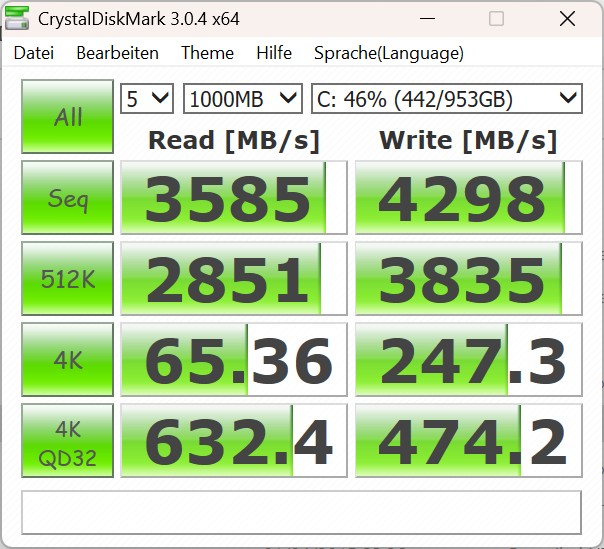
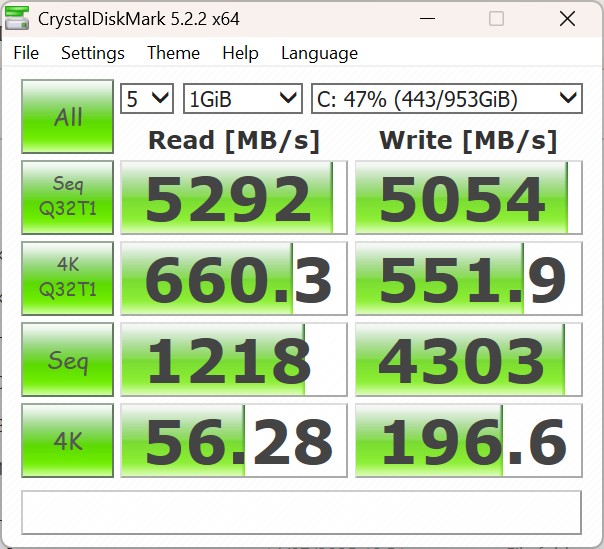
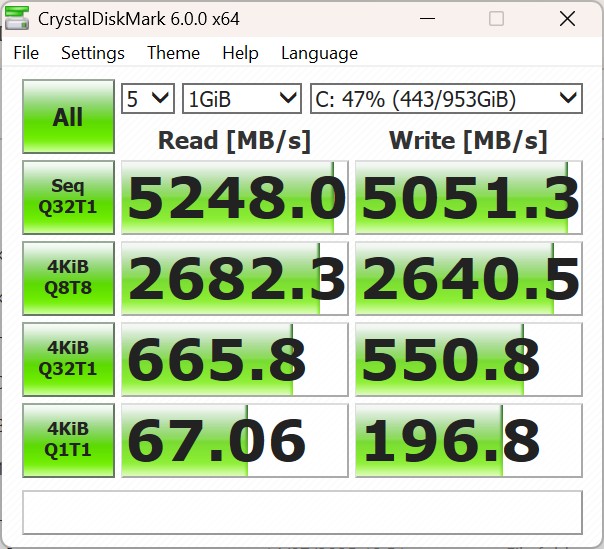
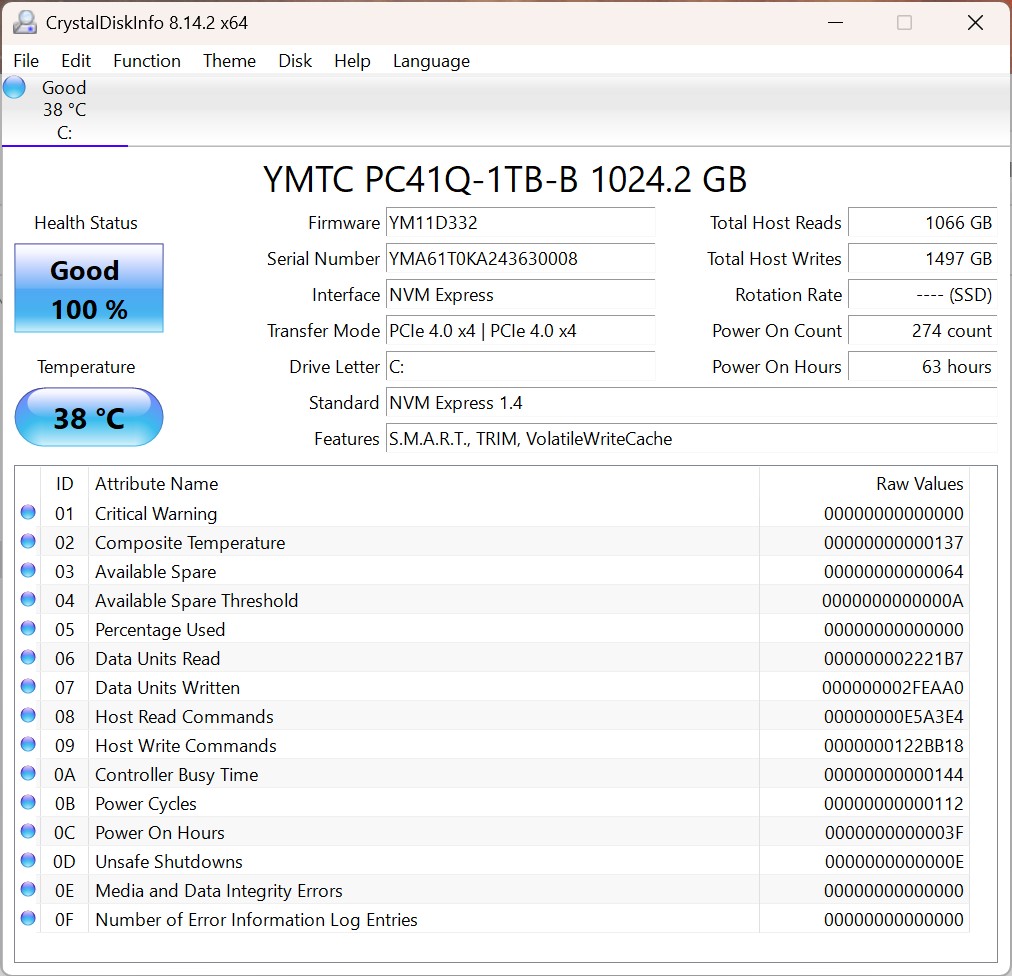
Mass storage
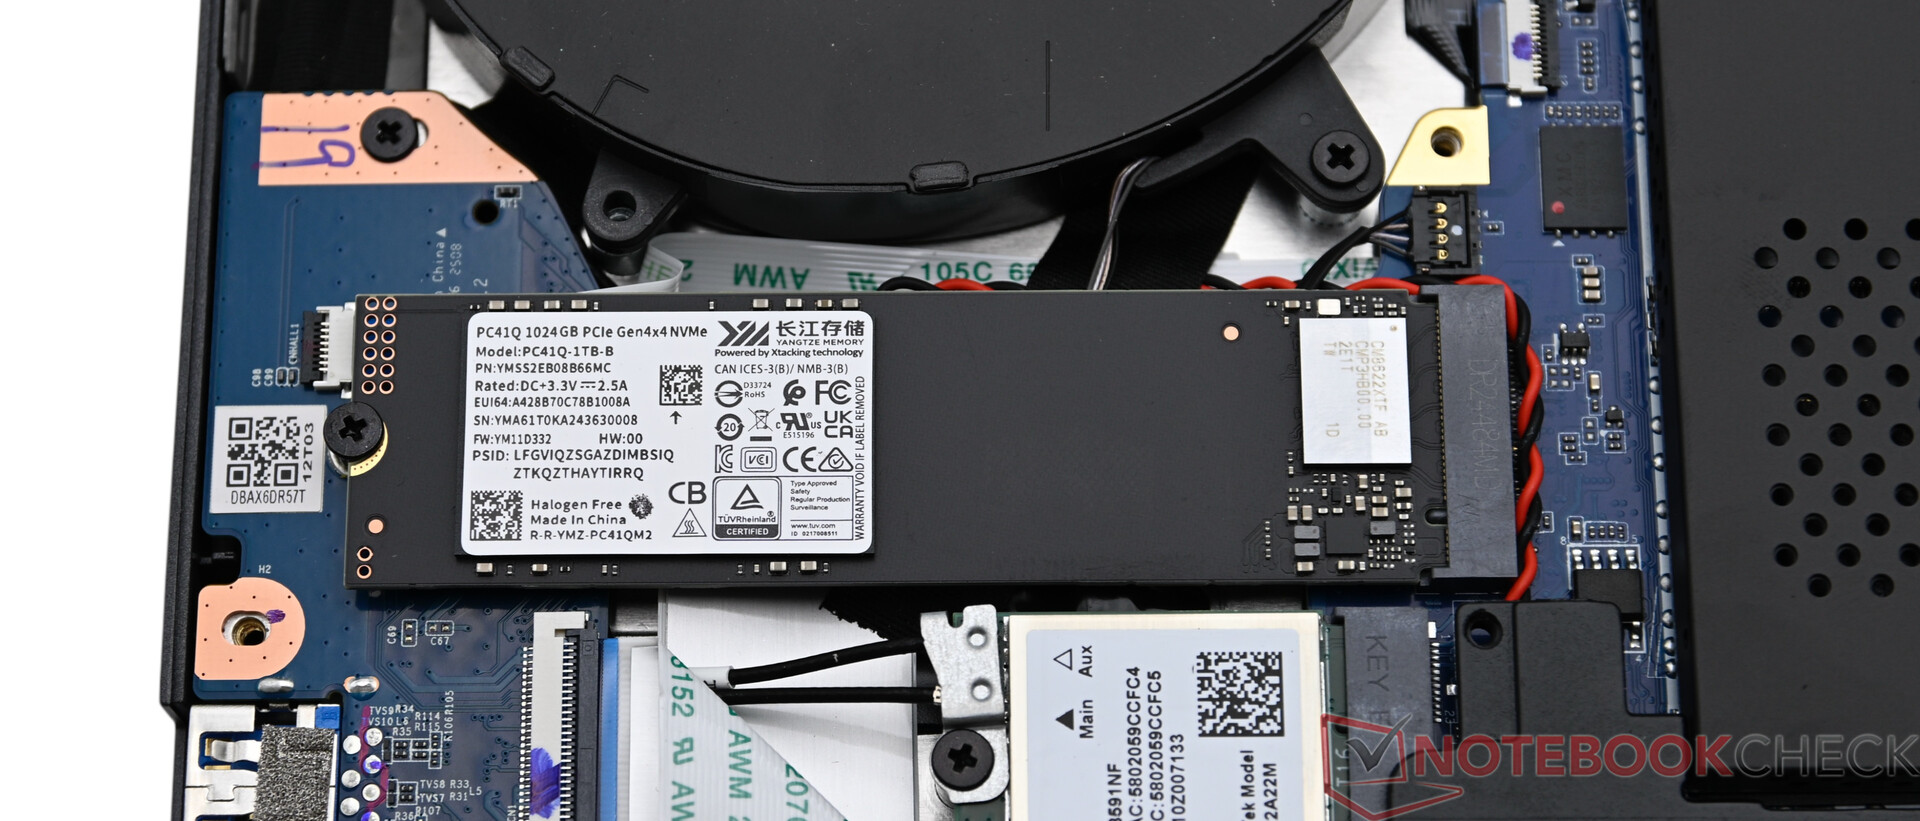
The Chuwi Gamebook is equipped with an NVMe SSD with 1 TB of storage space. With its background as a gaming device, a model with 2 TB of storage space would have suited the laptop better. Nevertheless, the device can be upgraded with a second M.2 SSD. Although the mass storage is covered with a passive heat sink, the performance under load cannot be maintained at a consistently high level. Compared to the competitors, the SSD in the Chuwi Gamebook delivers slightly worse results.

* ... smaller is better
Sustained Performance Read: DiskSpd Read Loop, Queue Depth 8
GPU performance
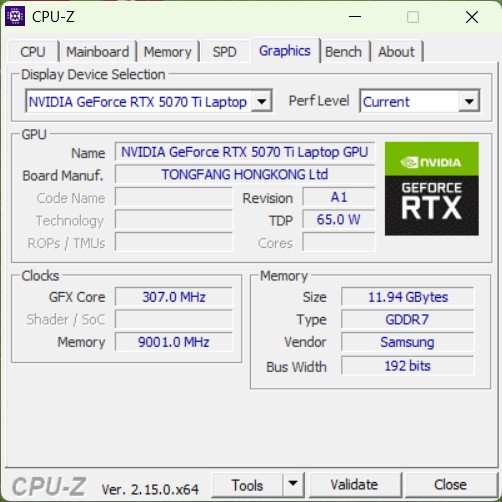
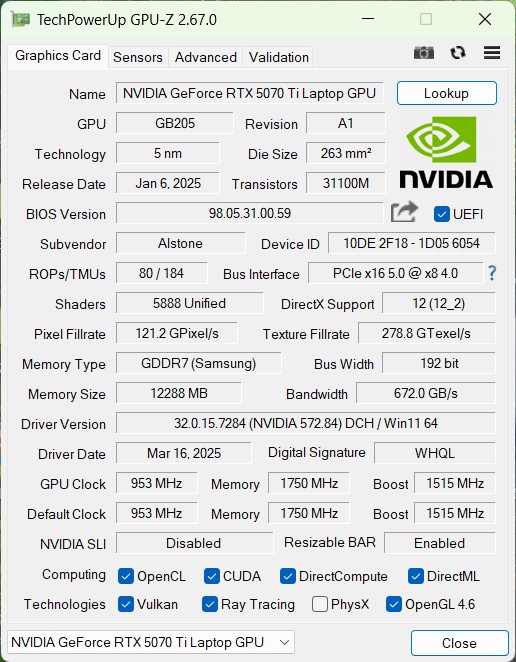
The Chuwi Gamebook is exclusively combined with the Nvidia GeForce RTX 5070 Ti laptop and 12 GB VRAM. This is the most powerful version with a TGP of up to 140 watts (115 watts plus 25 watts Dynamic Boost). Graphics switching takes place via the classic Optimus technology.
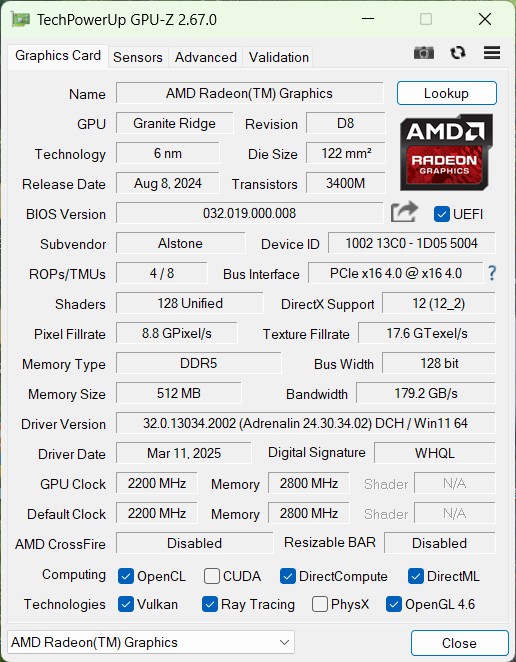
The Nvidia GeForce RTX 5070 Ti Laptop offers solid performance overall in the Chuwi Gamebook, as the comparison graphics also show - although the dedicated graphics chip only works with a PCIe 4.0 connection. We assume that this is a similar problem to the XMG Neo 16, which could ultimately be solved with a BIOS update. When asked by the manufacturer Chuwi, no concrete explanation could be given on this point. However, since the graphics performance corresponds to the level of comparable devices and is even higher in places, it cannot be assumed that this circumstance has a negative impact on performance.
| 3DMark 05 Standard | 68580 points | |
| 3DMark 06 Standard Score | 70064 points | |
| 3DMark Vantage P Result | 121273 points | |
| 3DMark 11 Performance | 45324 points | |
| 3DMark Ice Storm Standard Score | 273764 points | |
| 3DMark Cloud Gate Standard Score | 82832 points | |
| 3DMark Fire Strike Score | 40685 points | |
| 3DMark Fire Strike Extreme Score | 22435 points | |
| 3DMark Time Spy Score | 16664 points | |
| 3DMark Steel Nomad Score | 4283 points | |
Help | ||
* ... smaller is better
| GTA V - 1920x1080 Highest AA:4xMSAA + FX AF:16x | |
| Chuwi Gamebook, R9 9955HX | |
| Schenker XMG Pro 16 (E25) | |
| Medion Erazer Major 16 X1 MD62736 | |
| Lenovo Legion 5 Pro 16IAX10H | |
| MSI Vector 16 HX AI A2XWHG | |
| Average of class Gaming (48.3 - 186.9, n=103, last 2 years) | |
| Strange Brigade - 1920x1080 ultra AA:ultra AF:16 | |
| Lenovo Legion 5 Pro 16IAX10H | |
| Chuwi Gamebook, R9 9955HX | |
| Average of class Gaming (76.3 - 456, n=94, last 2 years) | |
| Asus ROG Zephyrus G16 2025 5070 Ti | |
| Schenker XMG Pro 16 (E25) | |
Cyberpunk 2077 ultra FPS diagram
| low | med. | high | ultra | QHD DLSS | QHD | |
|---|---|---|---|---|---|---|
| GTA V (2015) | 187.6 | 187.6 | 184.7 | 164.6 | 151.4 | |
| The Witcher 3 (2015) | 686 | 517 | 341 | 176.2 | 130 | |
| Dota 2 Reborn (2015) | 263 | 222 | 213 | 193.9 | ||
| Final Fantasy XV Benchmark (2018) | 231 | 216 | 166 | 126.2 | ||
| X-Plane 11.11 (2018) | 155.1 | 145.4 | 118.3 | |||
| Far Cry 5 (2018) | 174 | 155 | 145 | 142 | 144 | |
| Strange Brigade (2018) | 585 | 464 | 381 | 337 | 228 | |
| Anno 1800 (2019) | 182.4 | 164.8 | 133.5 | 86.4 | 76.6 | |
| Far Cry 6 (2021) | 170.9 | 150.2 | 136 | 135.7 | 116.7 | |
| Baldur's Gate 3 (2023) | 175.8 | 129.1 | 111.1 | 108.3 | ||
| Cyberpunk 2077 (2023) | 161.7 | 156.8 | 138 | 124.1 | ||
| Total War Pharaoh (2023) | 521.4 | 317.1 | 200.2 | 161.4 | 127.4 | |
| Avatar Frontiers of Pandora (2023) | 126 | 114 | 98 | 74 | 47 | |
| F1 24 (2024) | 322 | 350 | 291 | 106.4 | 106 | 68.5 |
| Black Myth: Wukong (2024) | 133 | 100 | 78 | 44 | 49 | 33 |
| Star Wars Outlaws (2024) | 86.8 | 82.3 | 72.2 | 60.3 | 59.6 | 43.5 |
| Indiana Jones and the Great Circle (2024) | 158.1 | 118.6 | 105.1 | 96 | 80.8 | |
| Kingdom Come Deliverance 2 (2025) | 189.3 | 152.4 | 125.2 | 90 | 94.7 | 65 |
| Monster Hunter Wilds (2025) | 93.1 | 84 | 67.2 | 66.6 | 54.7 | |
| Civilization 7 (2025) | 443 | 261 | 213 | 144 | ||
| Assassin's Creed Shadows (2025) | 94 | 89 | 77 | 58 | 59 | 48 |
| The Elder Scrolls IV Oblivion Remastered (2025) | 116 | 112.6 | 90.8 | 44 | 47.4 | 30.9 |
| F1 25 (2025) | 260 | 243 | 225 | 42.1 | 45.9 | 25 |
| Borderlands 4 (2025) | 92.9 | 77.8 | 64.4 | 44.5 | 49.5 | 31.4 |
| Battlefield 6 (2025) | 160.7 | 149.2 | 129.4 | 97.1 | 89 | 68.1 |
| The Outer Worlds 2 (2025) | 105.6 | 103.2 | 94.5 | 58.4 | 45 | 37.8 |
| ARC Raiders (2025) | 215 | 187.4 | 144.4 | 98.6 | 96.8 | 68.3 |
| Anno 117: Pax Romana (2025) | 149.4 | 118.8 | 93.3 | 49 | 49.9 | 34.2 |
| Call of Duty Black Ops 7 (2025) | 218 | 198 | 157 | 58 | 60 | 38 |
| Resident Evil Requiem (2026) | 155.8 | 124.7 | 114.8 | 65.4 | 42.1 | |
| Death Stranding 2 (2026) | 118.9 | 109.3 | 97.2 | 74.3 | 72 | 56.6 |
| Crimson Desert (2026) | 123.6 | 93.6 | 89.8 | 78 | 75.4 | 60.3 |
| Pragmata (2026) | 184.8 | 129.9 | 108.5 | 103.2 | 79.3 | |
| Forza Horizon 6 (2026) | 184 | 133 | 104 | 58 | 56 | 42 |
| 007 First Light (2026) | 110.7 | 102.2 | 90.6 | 86.6 | 77.4 | 58.8 |
Emissions & Energy
Noise emissions
The fans of the Chuwi Gamebook run continuously, but remain almost inaudible at just over 26 dB(A) when idle and under low load. The device remains pleasantly quiet in everyday use, especially in the "Office" profile. However, the high power limits are noticeable under load and when gaming: Depending on the performance profile, the volume reaches between 42 and 50 dB(A), which is why the use of headphones is recommended when gaming.
Noise level
| Idle |
| 26.3 / 26.5 / 27.3 dB(A) |
| Load |
| 50.4 / 50.4 dB(A) |
 | ||
30 dB silent 40 dB(A) audible 50 dB(A) loud |
||
min: | ||
| Chuwi Gamebook, R9 9955HX GeForce RTX 5070 Ti Laptop, R9 9955HX, YMTC PC41Q-1TB-B | Schenker XMG Pro 16 (E25) GeForce RTX 5070 Ti Laptop, Ultra 9 275HX, Samsung 9100 Pro 1 TB | Medion Erazer Major 16 X1 MD62736 GeForce RTX 5070 Ti Laptop, Ultra 7 255HX, Phison E31 2 TB | Lenovo Legion 5 Pro 16IAX10H GeForce RTX 5070 Ti Laptop, Ultra 9 275HX, Western Digital PC SN8000S SDEPNRK-1T00 | MSI Vector 16 HX AI A2XWHG GeForce RTX 5070 Ti Laptop, Ultra 7 255HX, Micron 2400 MTFDKBA512QFM | |
|---|---|---|---|---|---|
| Noise | 3% | -4% | -4% | -10% | |
| off / environment * (dB) | 25 | 23.3 7% | 25 -0% | 24 4% | 25 -0% |
| Idle Minimum * (dB) | 26.3 | 25 5% | 26 1% | 24 9% | 33 -25% |
| Idle Average * (dB) | 26.5 | 25 6% | 27 -2% | 24 9% | 34 -28% |
| Idle Maximum * (dB) | 27.3 | 25 8% | 30 -10% | 30.9 -13% | 38 -39% |
| Load Average * (dB) | 50.4 | 45.5 10% | 53 -5% | 55.9 -11% | 46 9% |
| Witcher 3 ultra * (dB) | 50.4 | ||||
| Cyberpunk 2077 ultra * (dB) | 50.3 | 53.3 -6% | 54 -7% | 56.72 -13% | 47 7% |
| Load Maximum * (dB) | 50.4 | 53.3 -6% | 54 -7% | 56.72 -13% | 49 3% |
* ... smaller is better
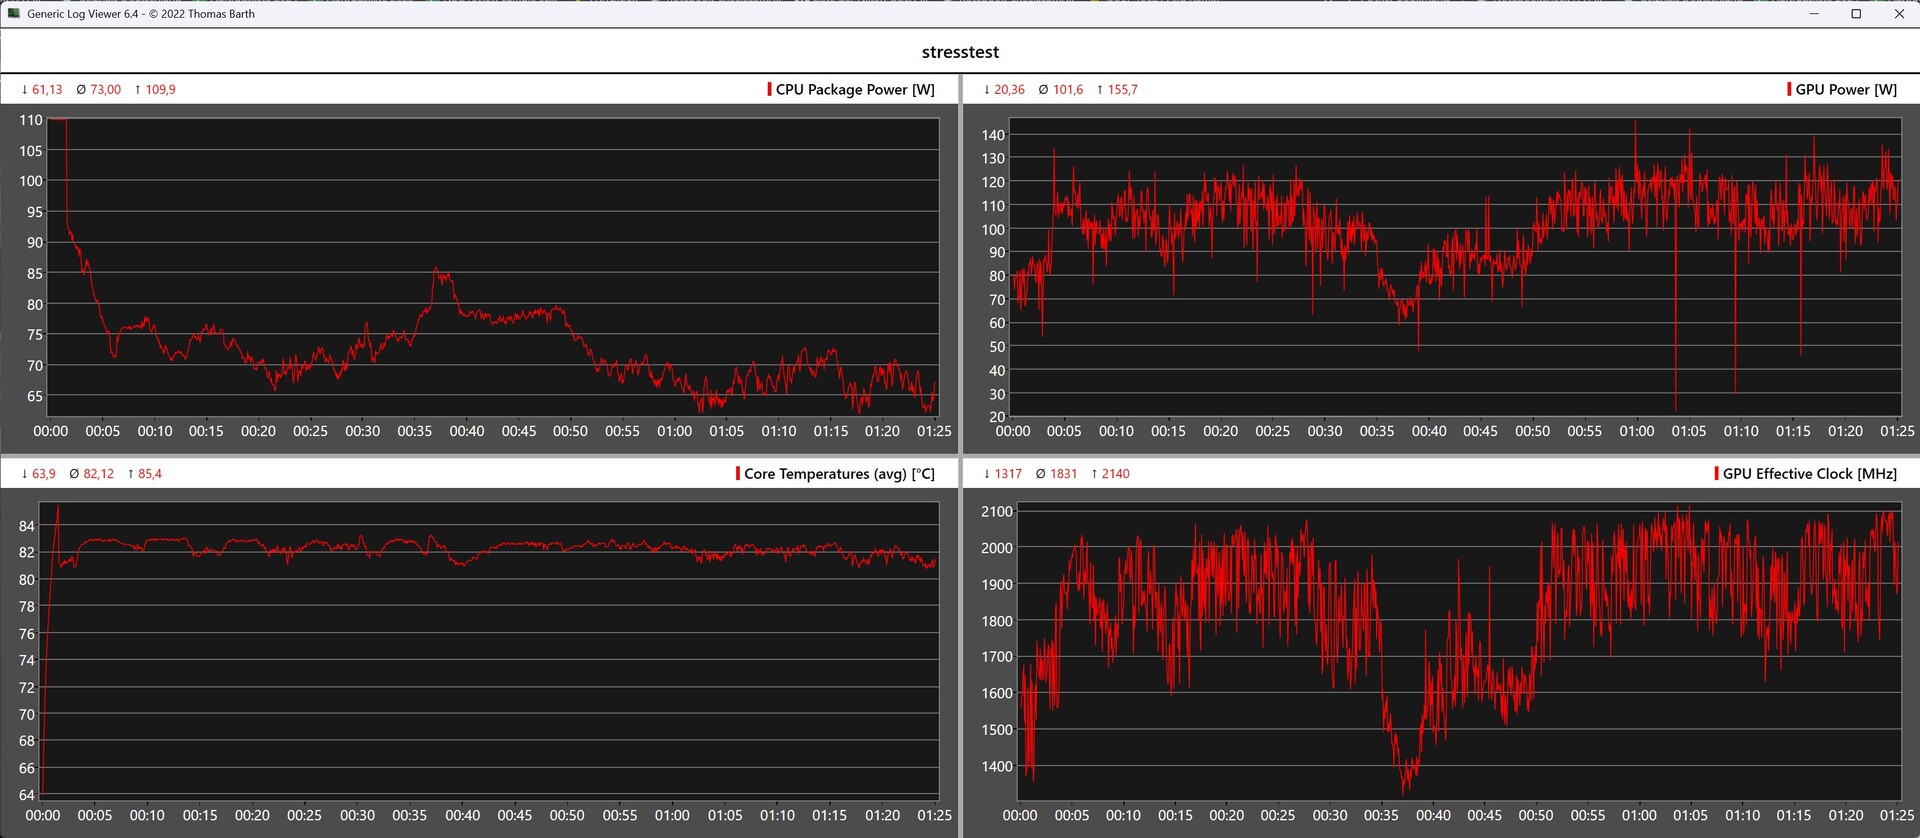
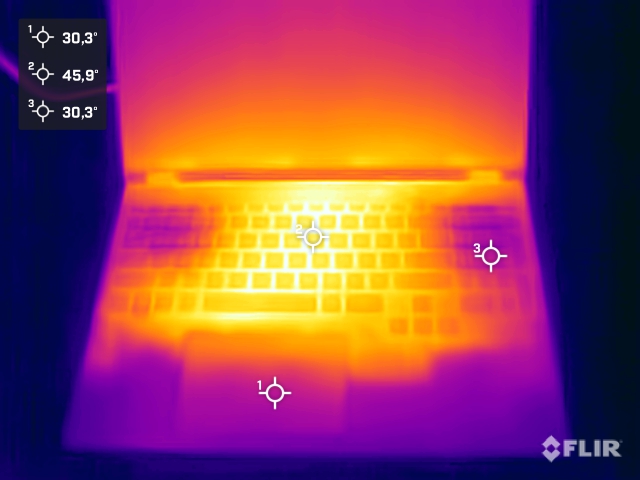
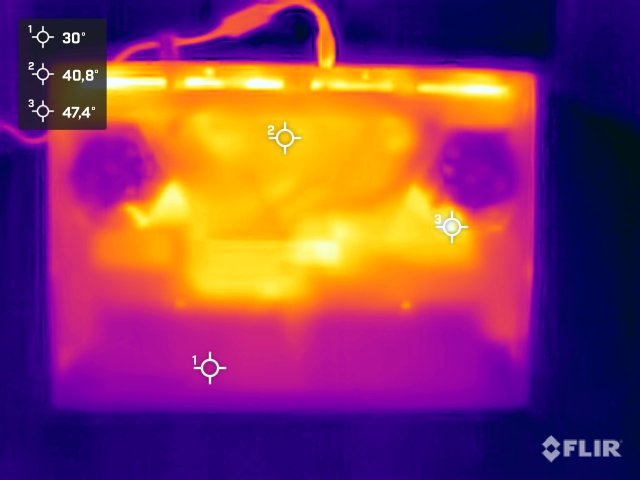
Temperature
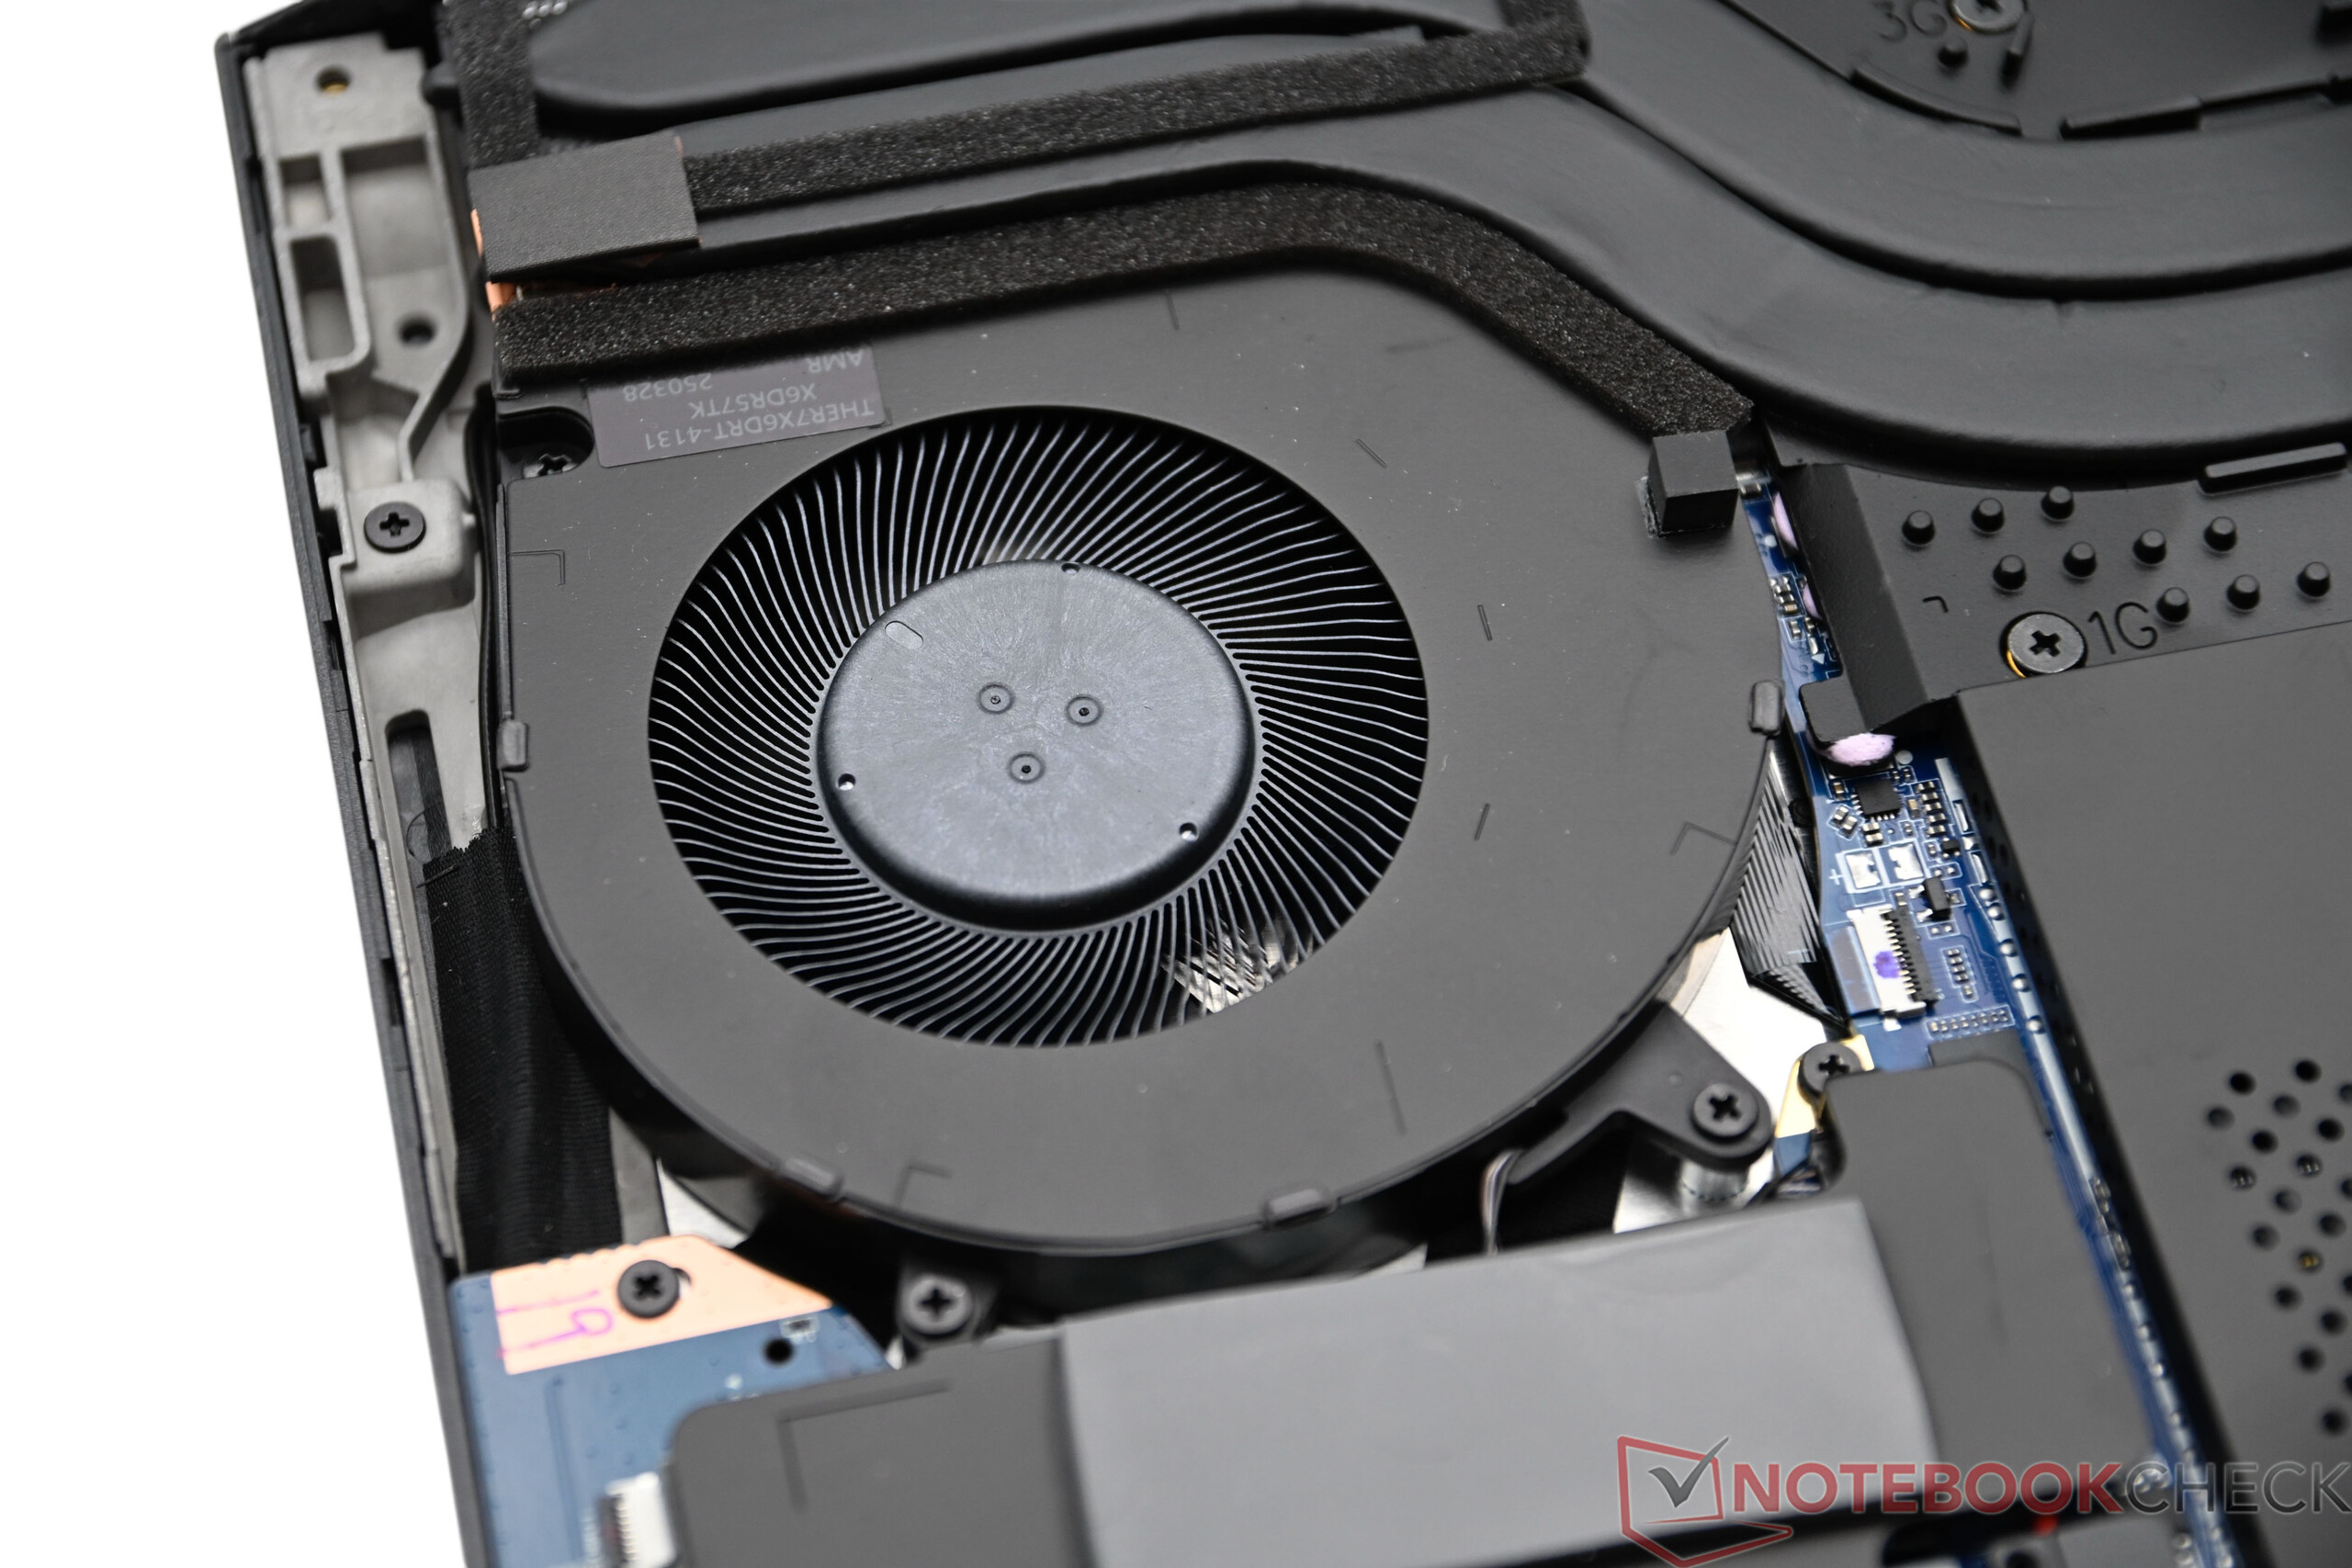
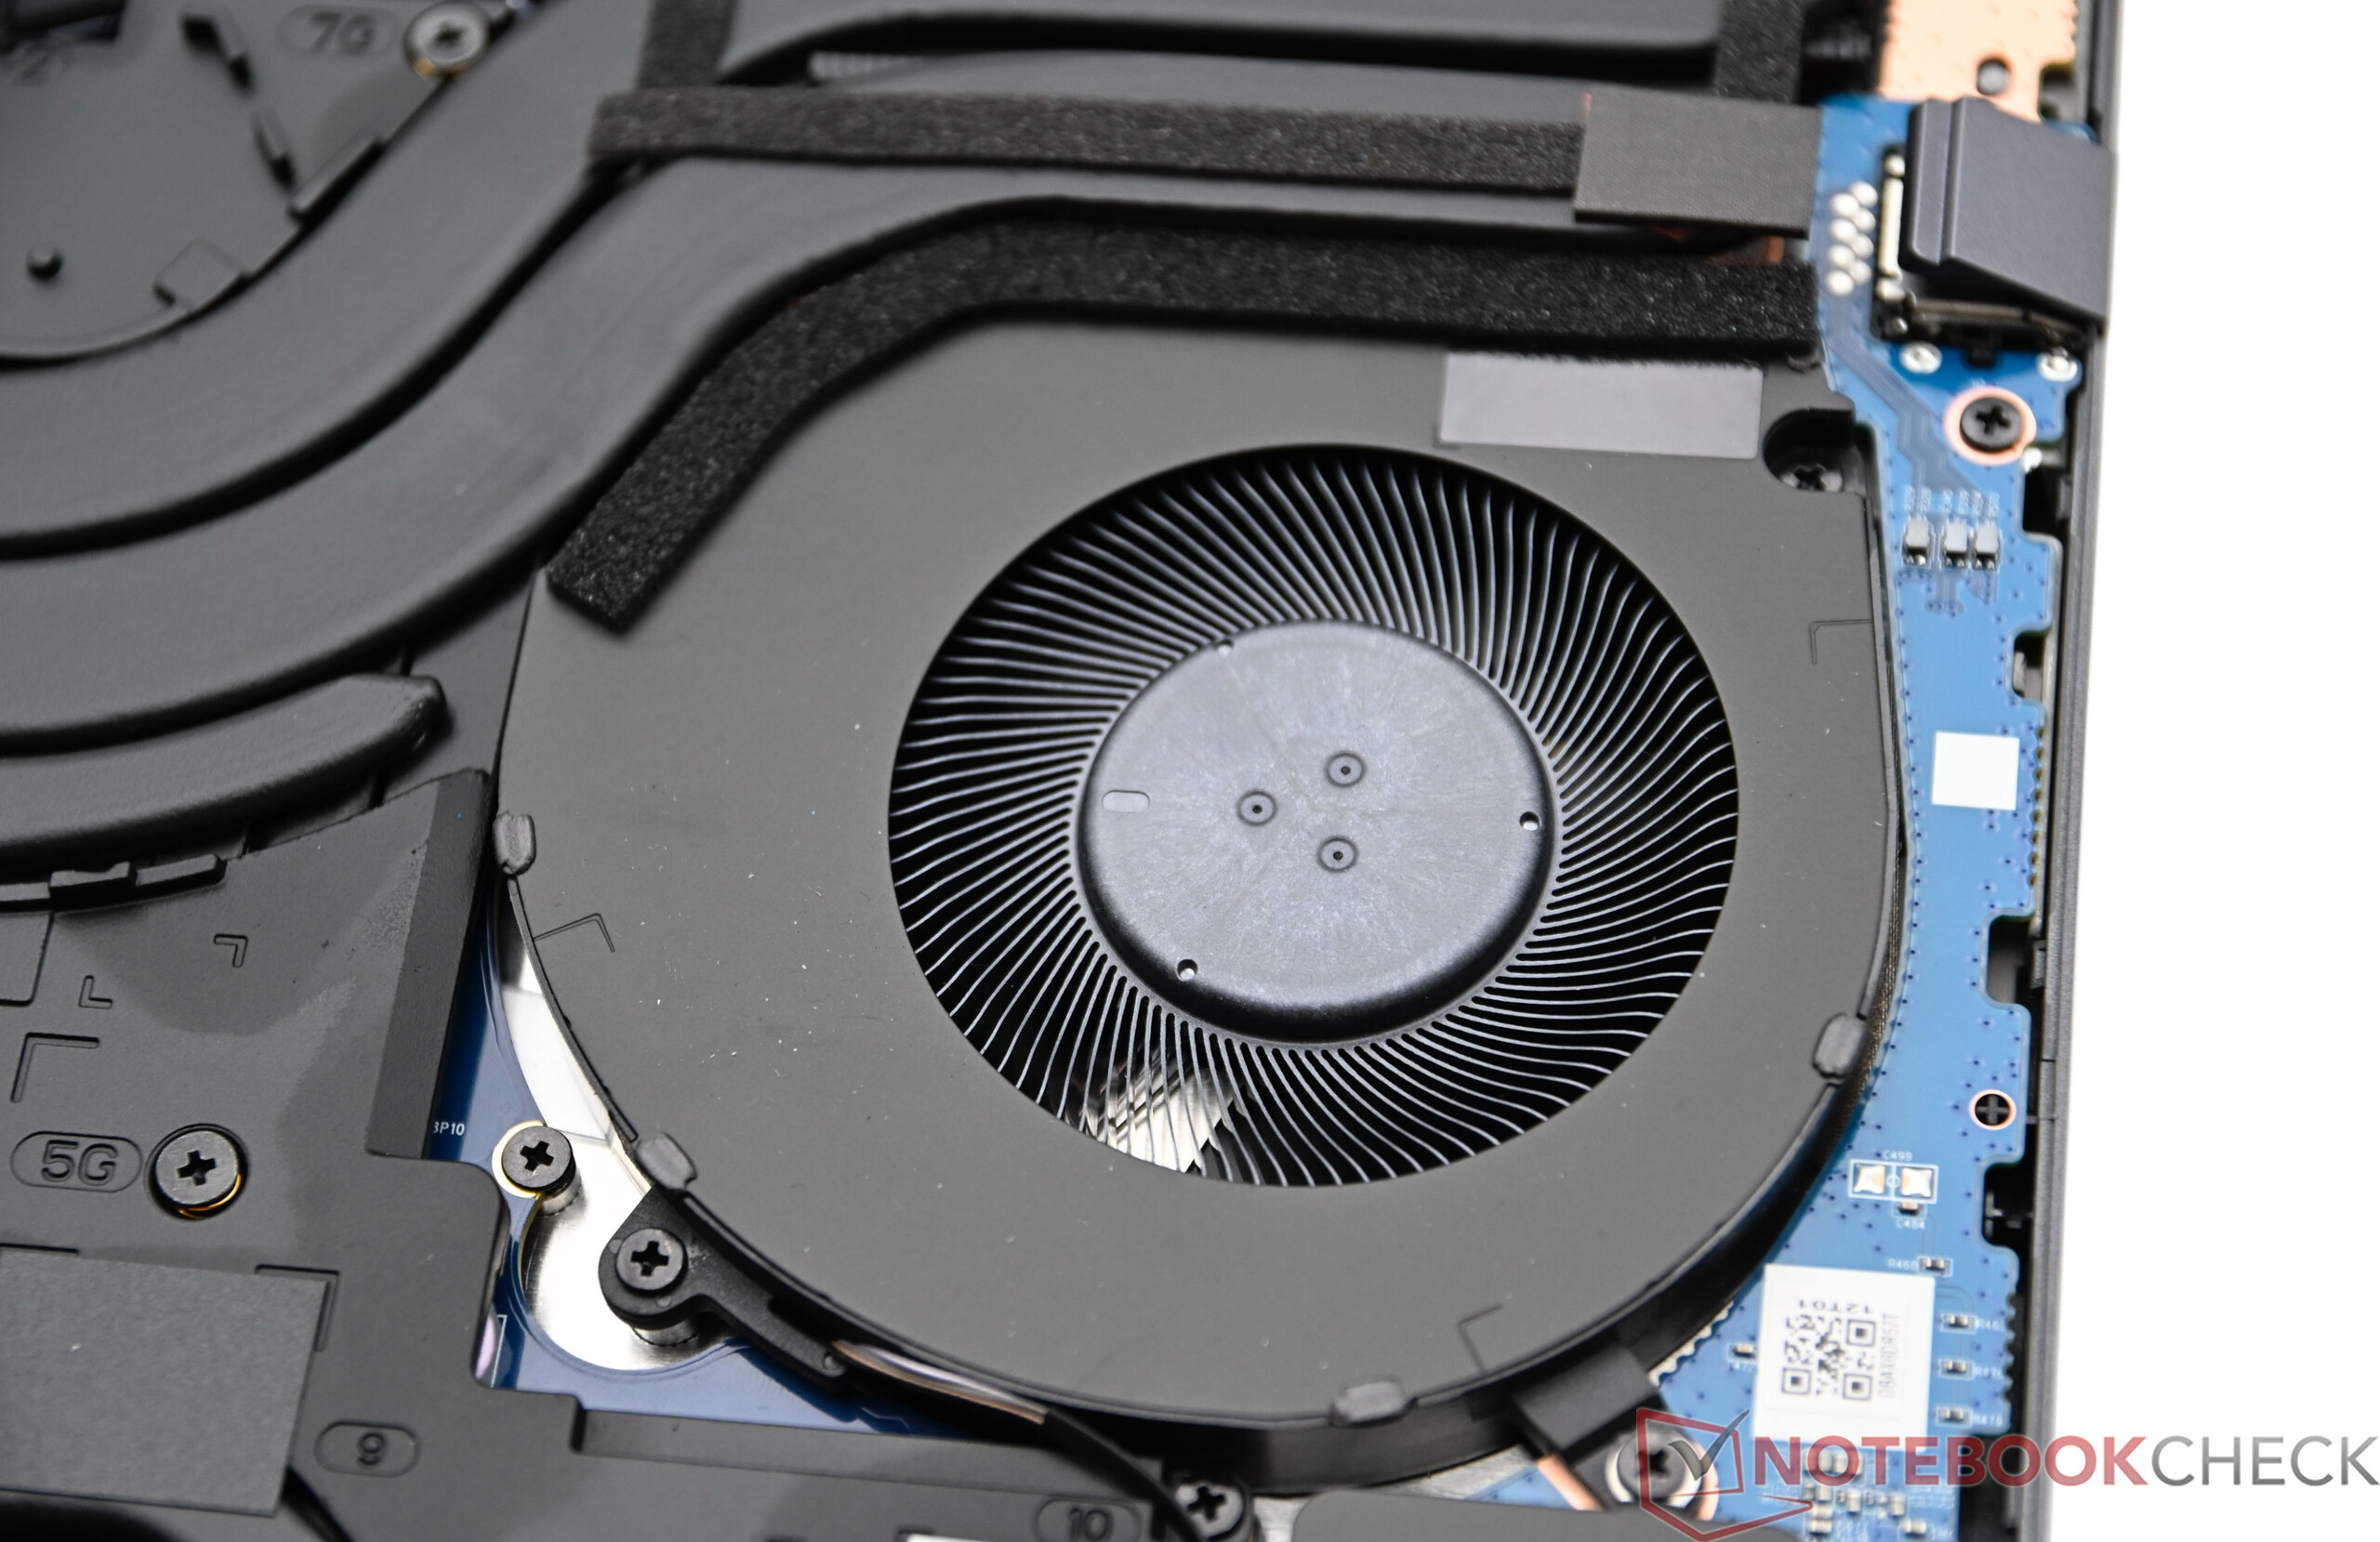
The casing surfaces of the Chuwi Gamebook remain inconspicuous in idle mode and during everyday tasks. A noticeable heat development is noticeable under heavy load, with temperatures of just over 50 °C measured in some places. In the stress test, the CPU and dGPU stabilize at around 70 and 110 watts of power consumption, respectively. Overall, the Gamebook's cooling system is capable of reliably dissipating around 180 watts on a permanent basis.
(-) The maximum temperature on the upper side is 51.8 °C / 125 F, compared to the average of 40.4 °C / 105 F, ranging from 21.2 to 68.8 °C for the class Gaming.
(-) The bottom heats up to a maximum of 46.6 °C / 116 F, compared to the average of 43.2 °C / 110 F
(+) In idle usage, the average temperature for the upper side is 31.2 °C / 88 F, compared to the device average of 33.9 °C / 93 F.
(±) 3: The average temperature for the upper side is 33.2 °C / 92 F, compared to the average of 33.9 °C / 93 F for the class Gaming.
(+) The palmrests and touchpad are reaching skin temperature as a maximum (32.2 °C / 90 F) and are therefore not hot.
(-) The average temperature of the palmrest area of similar devices was 28.8 °C / 83.8 F (-3.4 °C / -6.2 F).
| Chuwi Gamebook, R9 9955HX AMD Ryzen 9 9955HX, NVIDIA GeForce RTX 5070 Ti Laptop | Schenker XMG Pro 16 (E25) Intel Core Ultra 9 275HX, NVIDIA GeForce RTX 5070 Ti Laptop | Medion Erazer Major 16 X1 MD62736 Intel Core Ultra 7 255HX, NVIDIA GeForce RTX 5070 Ti Laptop | Lenovo Legion 5 Pro 16IAX10H Intel Core Ultra 9 275HX, NVIDIA GeForce RTX 5070 Ti Laptop | MSI Vector 16 HX AI A2XWHG Intel Core Ultra 7 255HX, NVIDIA GeForce RTX 5070 Ti Laptop | |
|---|---|---|---|---|---|
| Heat | -163% | -4% | -9% | 1% | |
| Maximum Upper Side * (°C) | 51.8 | 43.2 17% | 49 5% | 48 7% | 53 -2% |
| Maximum Bottom * (°C) | 46.6 | 46 1% | 50 -7% | 50 -7% | 52 -12% |
| Idle Upper Side * (°C) | 34.9 | 27.7 21% | 36 -3% | 38 -9% | 33 5% |
| Idle Bottom * (°C) | 33.4 | 264 -690% | 37 -11% | 42 -26% | 29 13% |
* ... smaller is better
Speakers
The two stereo speakers do not deliver a high sound quality and seem rather weak overall.
Chuwi Gamebook, R9 9955HX audio analysis
(±) | speaker loudness is average but good (75.7 dB)
Bass 100 - 315 Hz
(-) | nearly no bass - on average 18.7% lower than median
(±) | linearity of bass is average (10.3% delta to prev. frequency)
Mids 400 - 2000 Hz
(±) | higher mids - on average 7.2% higher than median
(±) | linearity of mids is average (9.9% delta to prev. frequency)
Highs 2 - 16 kHz
(+) | balanced highs - only 3.2% away from median
(±) | linearity of highs is average (8.1% delta to prev. frequency)
Overall 100 - 16.000 Hz
(±) | linearity of overall sound is average (21.2% difference to median)
Compared to same class
» 76% of all tested devices in this class were better, 4% similar, 19% worse
» The best had a delta of 6%, average was 18%, worst was 132%
Compared to all devices tested
» 59% of all tested devices were better, 7% similar, 34% worse
» The best had a delta of 4%, average was 24%, worst was 134%
Schenker XMG Pro 16 (E25) audio analysis
(±) | speaker loudness is average but good (79.2 dB)
Bass 100 - 315 Hz
(±) | reduced bass - on average 14.2% lower than median
(±) | linearity of bass is average (10.6% delta to prev. frequency)
Mids 400 - 2000 Hz
(±) | higher mids - on average 8.2% higher than median
(±) | linearity of mids is average (9.9% delta to prev. frequency)
Highs 2 - 16 kHz
(+) | balanced highs - only 3.8% away from median
(+) | highs are linear (5.9% delta to prev. frequency)
Overall 100 - 16.000 Hz
(±) | linearity of overall sound is average (18.5% difference to median)
Compared to same class
» 60% of all tested devices in this class were better, 8% similar, 32% worse
» The best had a delta of 6%, average was 18%, worst was 132%
Compared to all devices tested
» 41% of all tested devices were better, 8% similar, 51% worse
» The best had a delta of 4%, average was 24%, worst was 134%
Power consumption
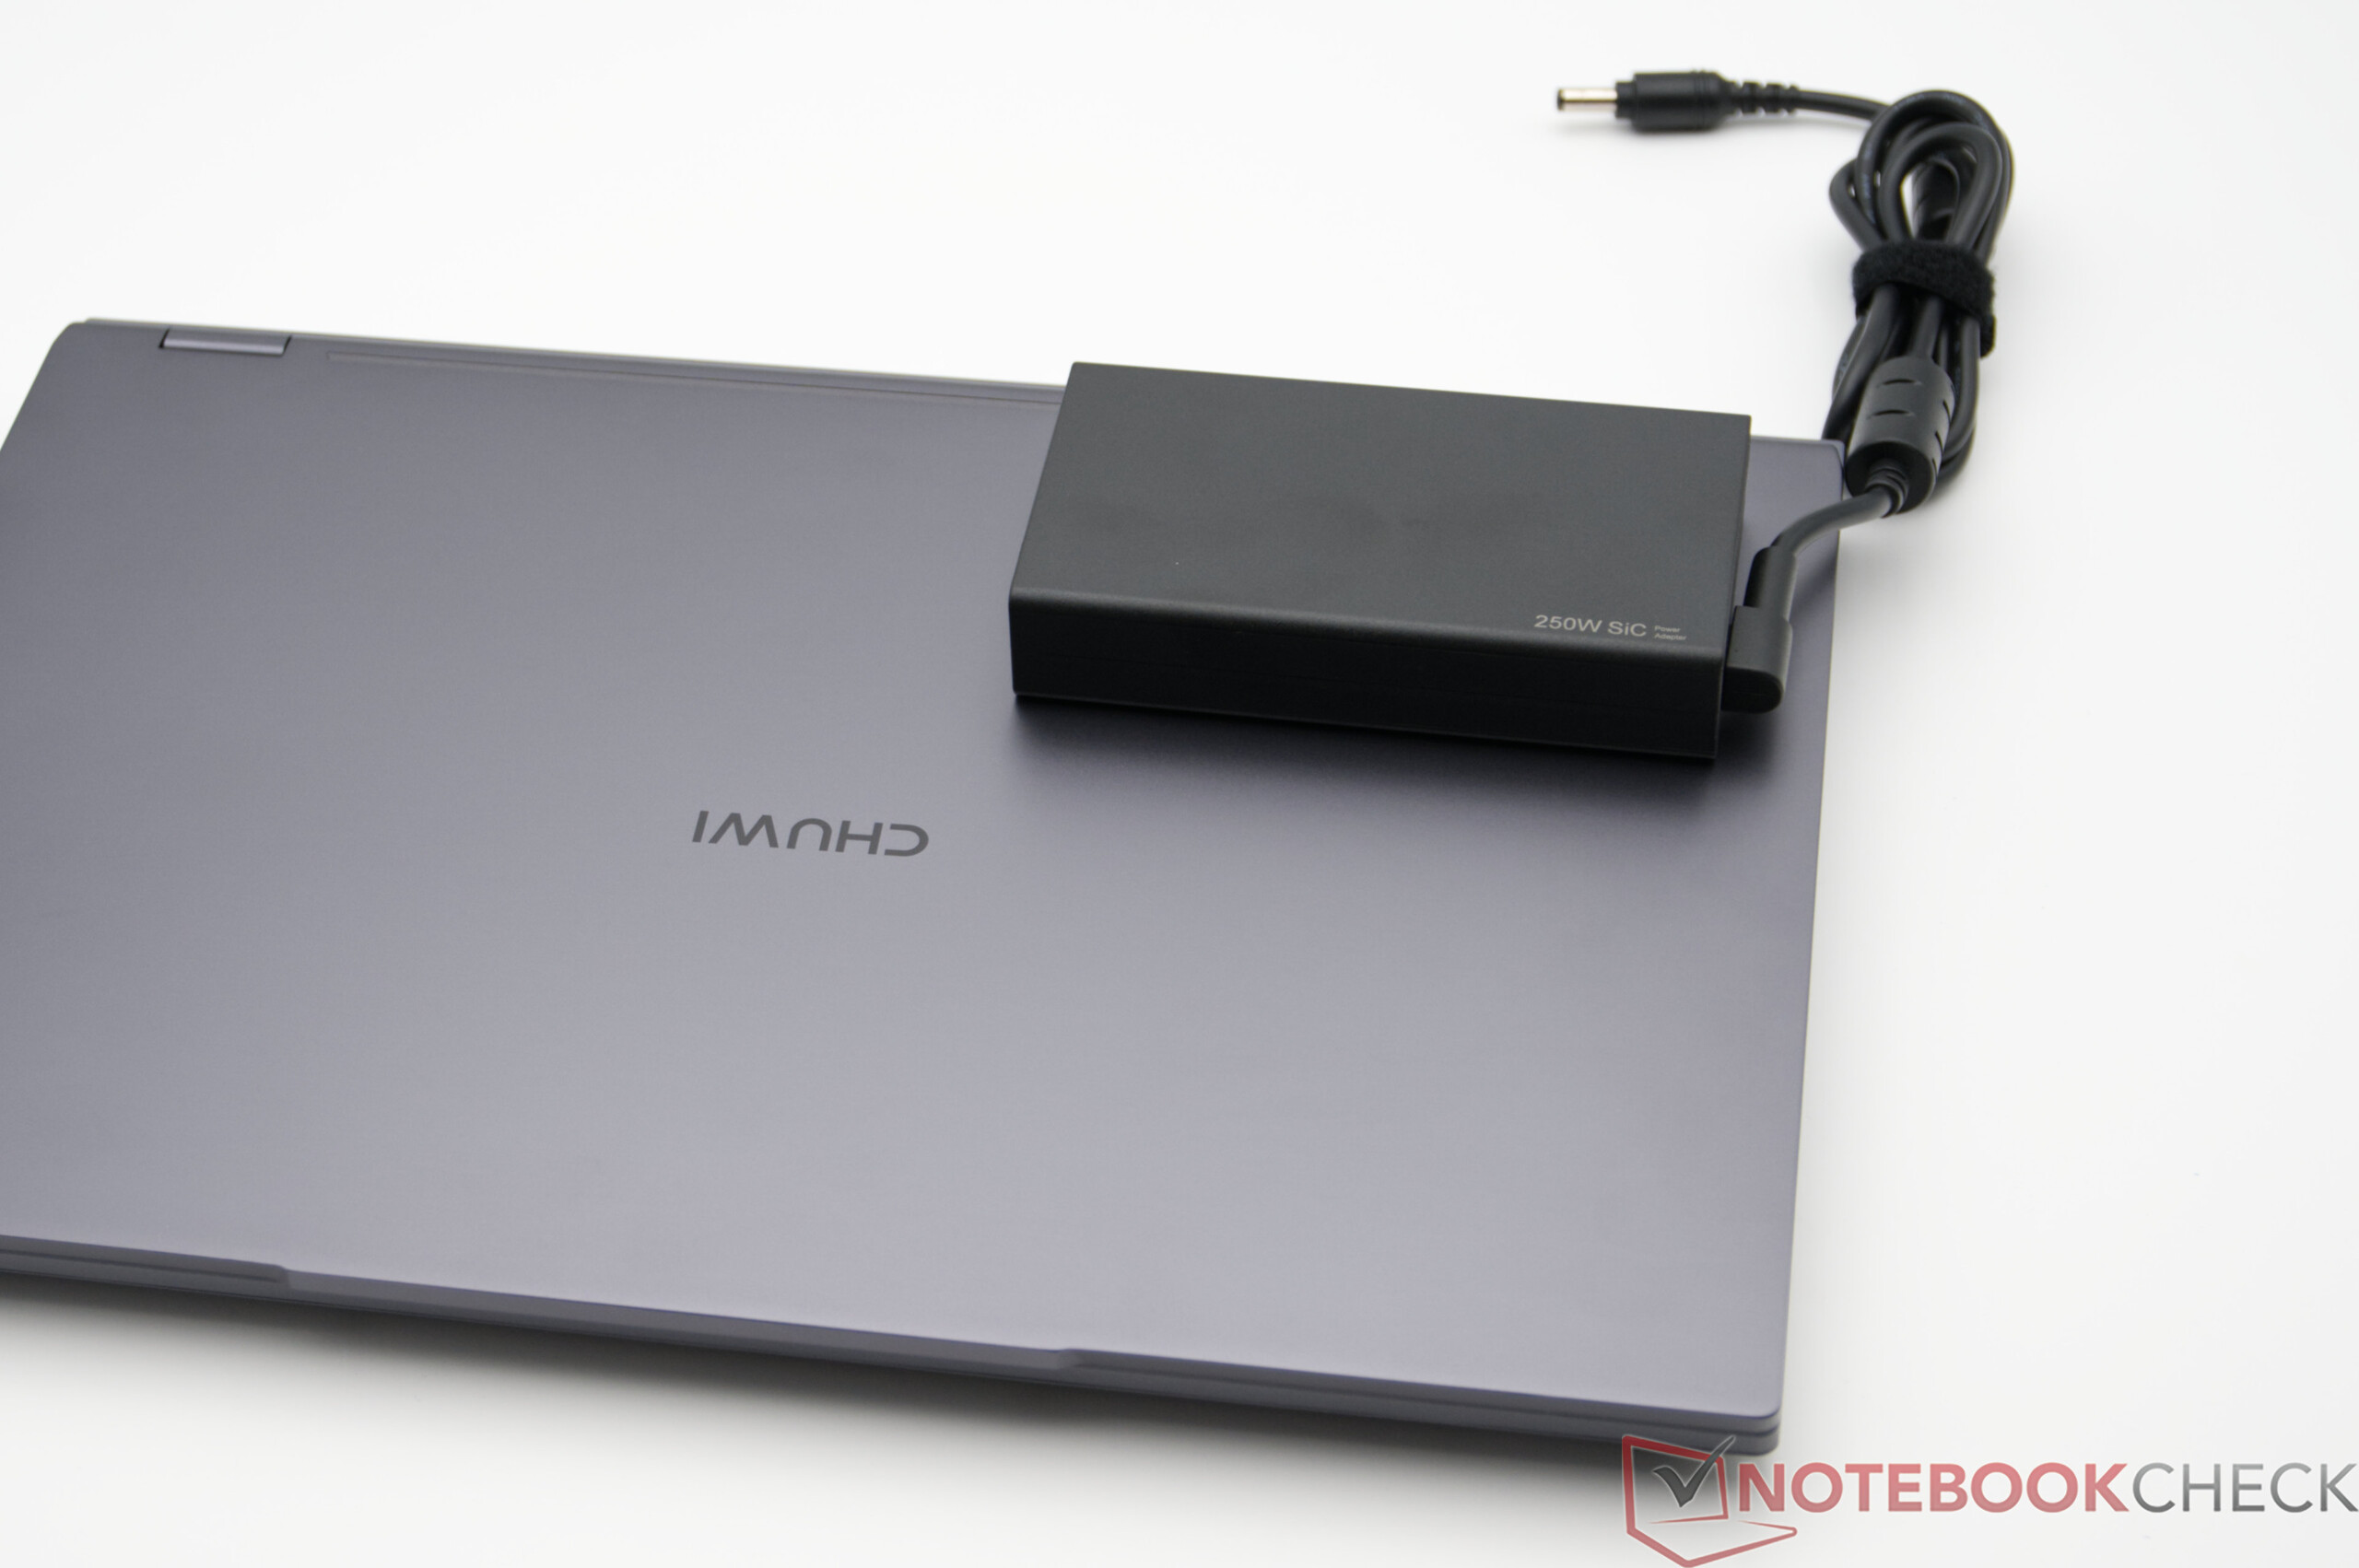
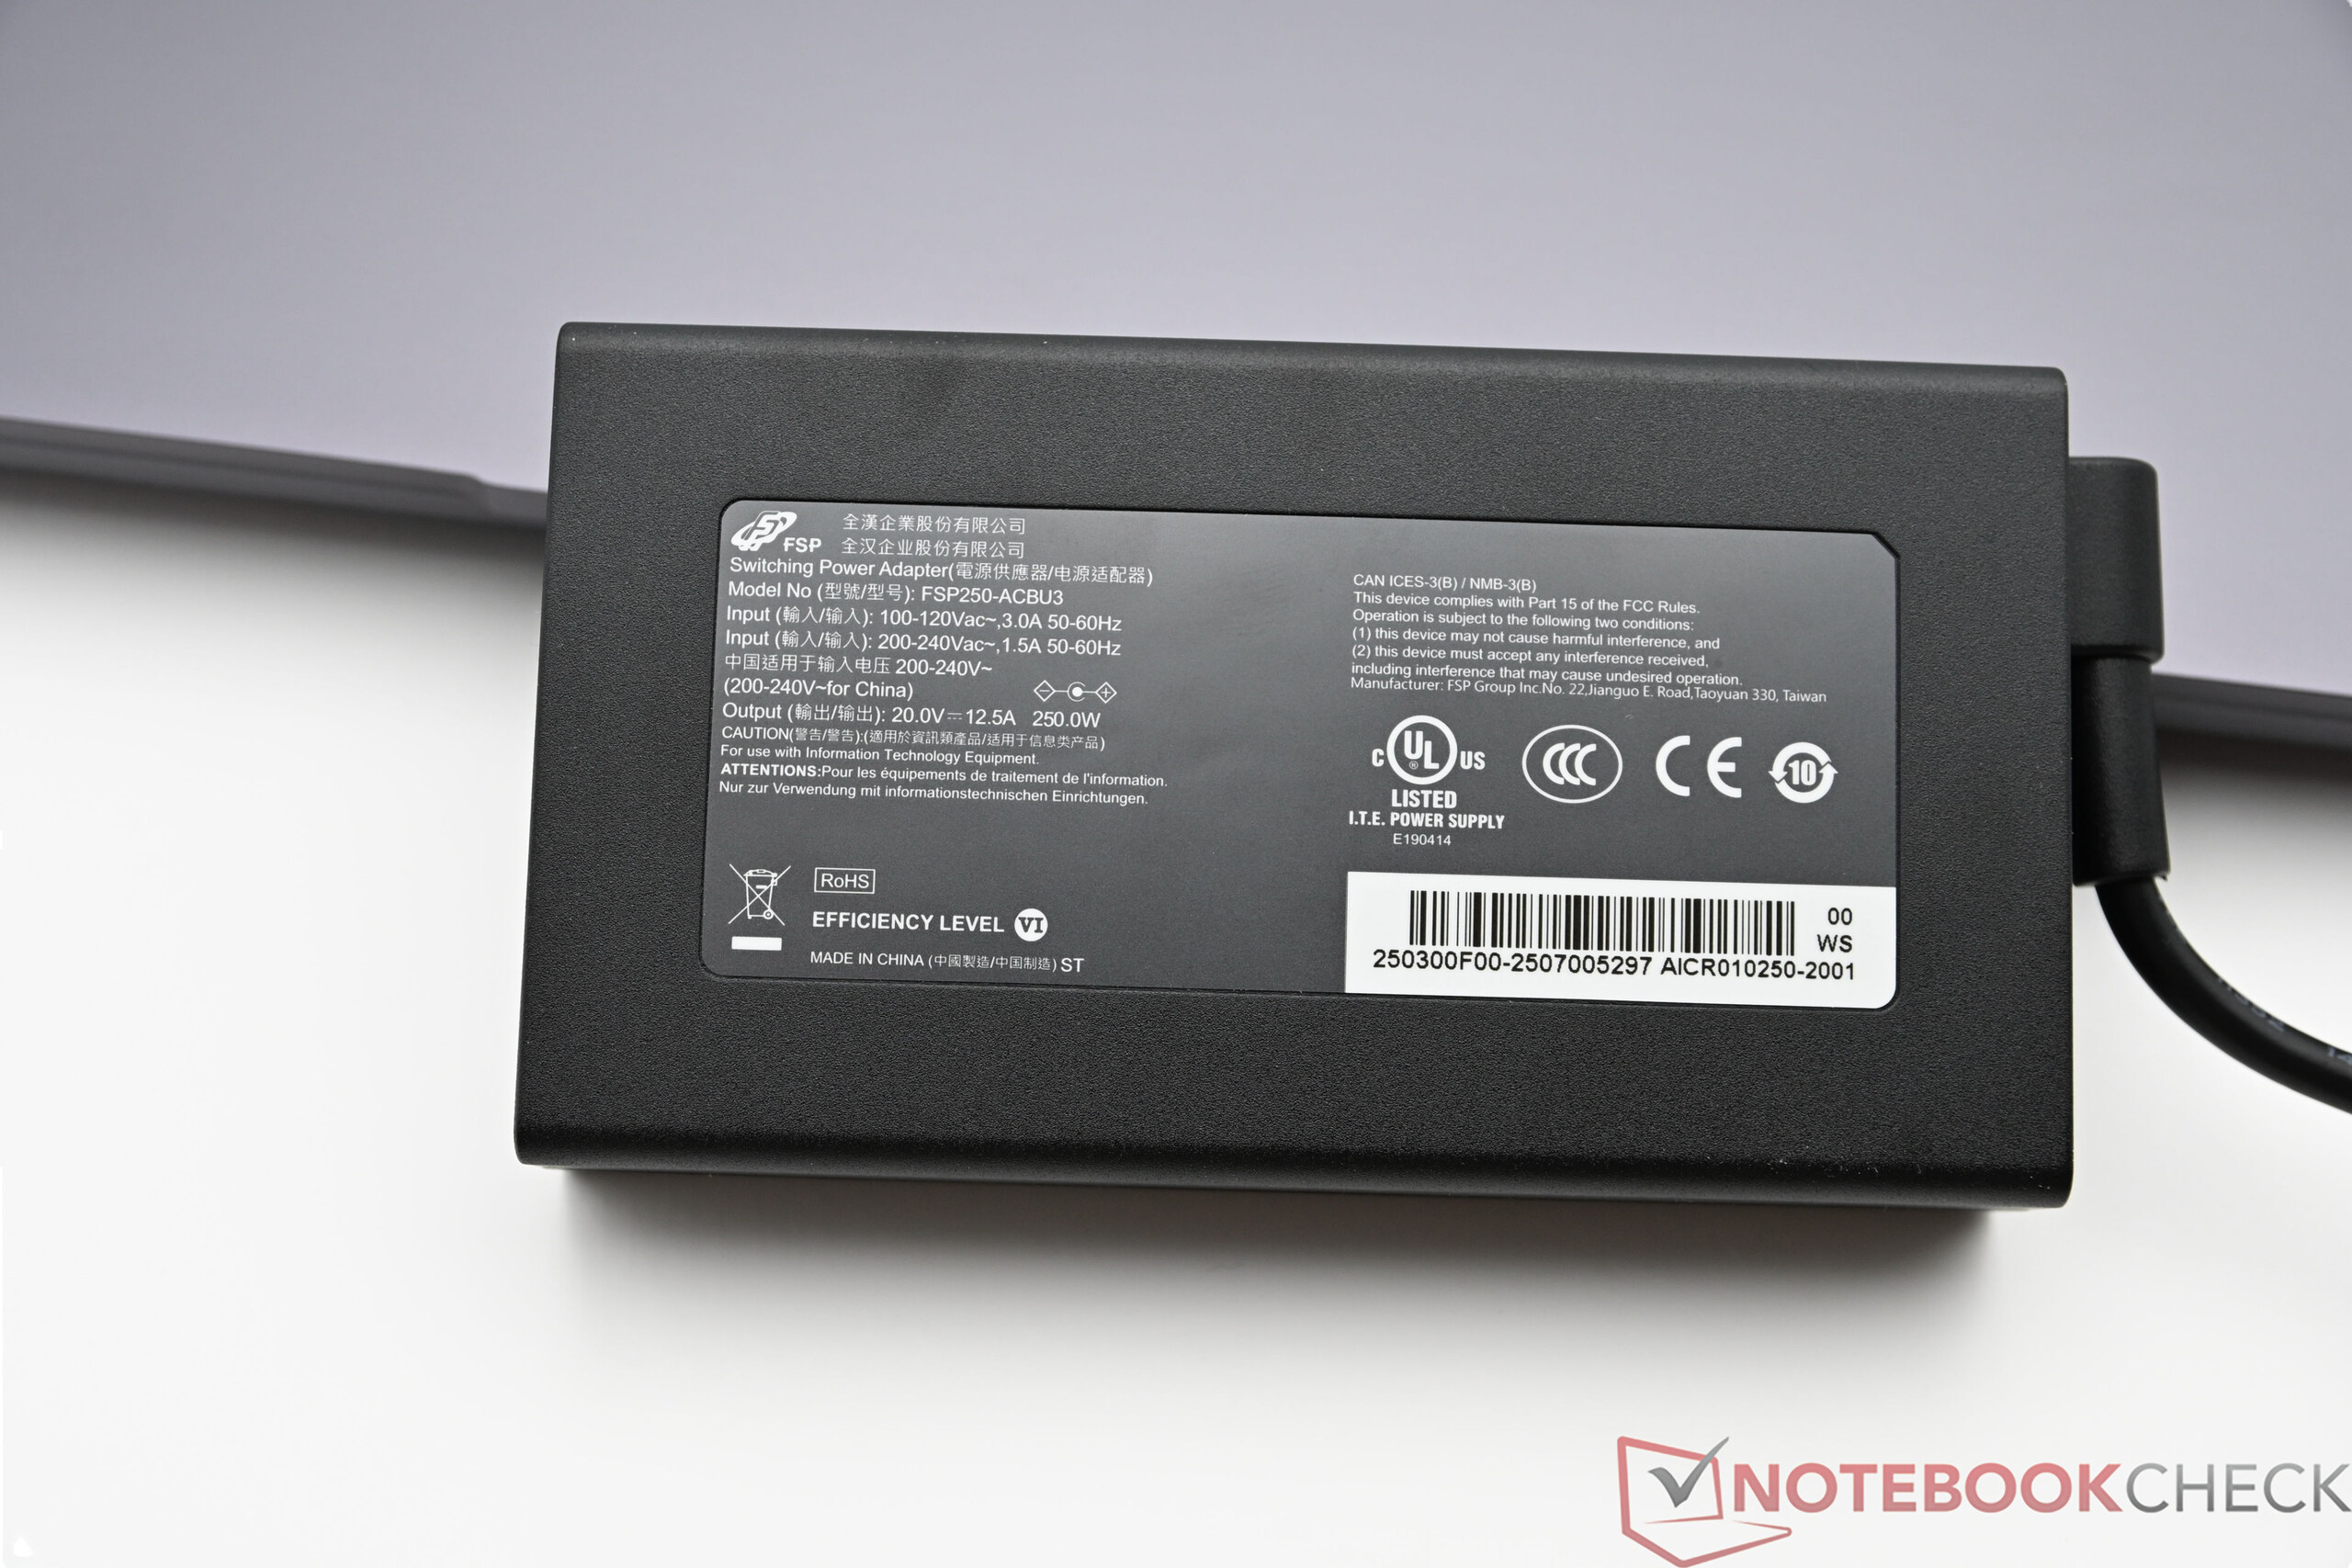
The Chuwi Gamebook is quite efficient in idle mode, although some of its competitors perform even better. When gaming, the energy consumption stabilizes at around 210-230 watts. In the stress test, peak values of up to 284 watts were repeatedly measured for short periods. The compact 250-watt power supply that Chuwi includes is powerful enough to cover even short-term load peaks without any problems. However, the measured power consumption in standby mode is clearly too high at 8 watts.
| Off / Standby | |
| Idle | |
| Load |
|
Key:
min: | |
| Chuwi Gamebook, R9 9955HX R9 9955HX, GeForce RTX 5070 Ti Laptop, YMTC PC41Q-1TB-B, IPS, 2560x1600, 16" | Schenker XMG Pro 16 (E25) Ultra 9 275HX, GeForce RTX 5070 Ti Laptop, Samsung 9100 Pro 1 TB, IPS, 2560x1600, 16" | Medion Erazer Major 16 X1 MD62736 Ultra 7 255HX, GeForce RTX 5070 Ti Laptop, Phison E31 2 TB, IPS, 2560x1600, 16" | Lenovo Legion 5 Pro 16IAX10H Ultra 9 275HX, GeForce RTX 5070 Ti Laptop, Western Digital PC SN8000S SDEPNRK-1T00, OLED, 2560x1600, 16" | MSI Vector 16 HX AI A2XWHG Ultra 7 255HX, GeForce RTX 5070 Ti Laptop, Micron 2400 MTFDKBA512QFM, IPS, 2560x1600, 16" | |
|---|---|---|---|---|---|
| Power Consumption | 12% | 3% | 3% | 11% | |
| Idle Minimum * (Watt) | 16.4 | 11.7 29% | 17.8 -9% | 14 15% | 7.1 57% |
| Idle Average * (Watt) | 21.2 | 16.6 22% | 20.7 2% | 14.3 33% | 15.9 25% |
| Idle Maximum * (Watt) | 28.3 | 17.1 40% | 23.4 17% | 20.1 29% | 29.5 -4% |
| Load Average * (Watt) | 145.6 | 122.4 16% | 110 24% | 177 -22% | 124 15% |
| Cyberpunk 2077 ultra * (Watt) | 221 | 245 -11% | 233 -5% | 255 -15% | 222 -0% |
| Cyberpunk 2077 ultra external monitor * (Watt) | 218 | 241 -11% | 232 -6% | 255 -17% | 217 -0% |
| Load Maximum * (Watt) | 284 | 291.5 -3% | 297 -5% | 294 -4% | 336 -18% |
* ... smaller is better
Power consumption Cyberpunk / stress test
Power consumption with an external monitor
Battery life
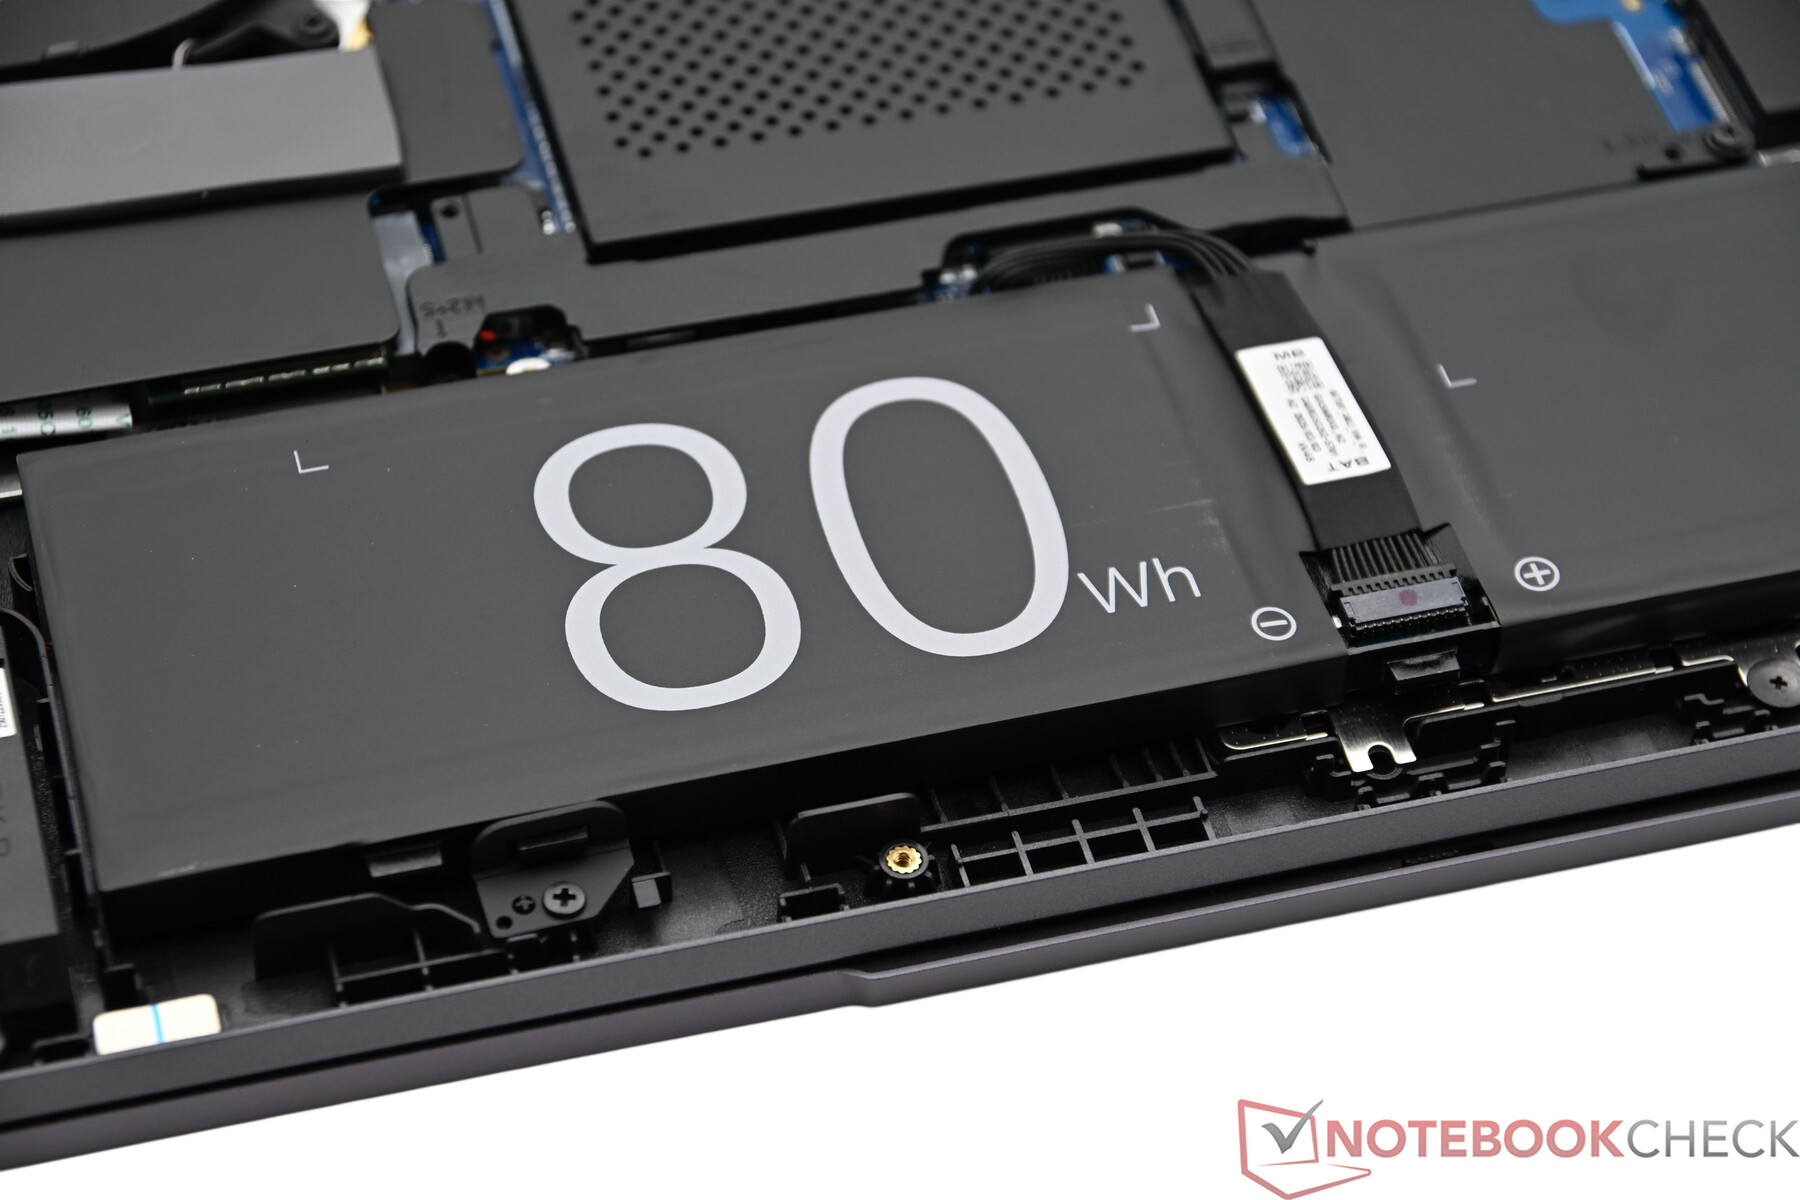
In the WLAN test with a display brightness of 150 cd/m² (around 40% of the maximum brightness), the Chuwi Gamebook achieves a runtime of just under 5 hours with its 77 Wh battery. Charging with the device switched on takes around 100 minutes, whereby around 80% is already reached after one hour. The 3D performance is massively throttled in battery mode.
| Chuwi Gamebook, R9 9955HX R9 9955HX, GeForce RTX 5070 Ti Laptop, 77 Wh | Schenker XMG Pro 16 (E25) Ultra 9 275HX, GeForce RTX 5070 Ti Laptop, 99.8 Wh | Medion Erazer Major 16 X1 MD62736 Ultra 7 255HX, GeForce RTX 5070 Ti Laptop, 80 Wh | Lenovo Legion 5 Pro 16IAX10H Ultra 9 275HX, GeForce RTX 5070 Ti Laptop, 80 Wh | MSI Vector 16 HX AI A2XWHG Ultra 7 255HX, GeForce RTX 5070 Ti Laptop, 90 Wh | Average of class Gaming | |
|---|---|---|---|---|---|---|
| Battery runtime | 86% | 29% | 7% | 43% | 20% | |
| Reader / Idle (h) | 7.3 | 8.71 ? 19% | ||||
| WiFi v1.3 (h) | 4.9 | 9.1 86% | 6.3 29% | 4.9 0% | 7 43% | 7.01 ? 43% |
| Load (h) | 1.5 | 1.7 13% | 1.47 ? -2% | |||
| H.264 (h) | 4.8 | 8.26 ? |
Notebookcheck overall rating
Chuwi Gamebook, R9 9955HX
- 08/05/2025 v8
Sebastian Bade
 Total Sustainability Score:
 Possible alternatives compared
Image | Model / Review | Price | Weight | Height | Display |
|---|---|---|---|---|---|
1. 84.9%  | Chuwi Gamebook, R9 9955HX AMD Ryzen 9 9955HX ⎘ NVIDIA GeForce RTX 5070 Ti Laptop ⎘ 32 GB Memory, 1024 GB SSD | Amazon: 1. $389.99 CHUWI MiniBook X 2-in-1 Lapt... 2. $319.89 CHUWI 2 in 1 Laptop Tablet, ... 3. $389.98 CHUWI 2-in-1 Touchscreen Lap... List Price: 2300 EUR | 2.5 kg | 21.4 mm | 16.00" 2560x1600 189 PPI IPS |
2. 89.9% 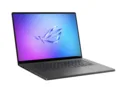 | Asus ROG Zephyrus G16 2025 5070 Ti Intel Core Ultra 9 285H ⎘ NVIDIA GeForce RTX 5070 Ti Laptop ⎘ 32 GB Memory, 1024 GB SSD | Amazon: List Price: 3399€ | 1.9 kg | 17.4 mm | 16.00" 2560x1600 189 PPI |
3. 87.4%  | Schenker XMG Pro 16 (E25) Intel Core Ultra 9 275HX ⎘ NVIDIA GeForce RTX 5070 Ti Laptop ⎘ 32 GB Memory, 1024 GB SSD | Amazon: List Price: 2480€ | 2.5 kg | 26.5 mm | 16.00" 2560x1600 189 PPI IPS |
4. 85.2%  | Medion Erazer Major 16 X1 MD62736 Intel Core Ultra 7 255HX ⎘ NVIDIA GeForce RTX 5070 Ti Laptop ⎘ 32 GB Memory, SSD | Amazon: List Price: 2600 EUR | 2.5 kg | 22.7 mm | 16.00" 2560x1600 189 PPI IPS |
5. 84.5% 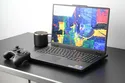 | Lenovo Legion 5 Pro 16IAX10H Intel Core Ultra 9 275HX ⎘ NVIDIA GeForce RTX 5070 Ti Laptop ⎘ 32 GB Memory, 1024 GB SSD | Amazon: 1. $99.99 Lenovo Slim 245W AC Adapter ... 2. $1,699.99 Lenovo Legion Pro 5 AI Gamin... 3. $2,801.75 Lenovo Legion Pro 7 16IAX10H... List Price: 2500 Euro | 2.4 kg | 25.95 mm | 16.00" 2560x1600 189 PPI OLED |
6. 84%  | MSI Vector 16 HX AI A2XWHG Intel Core Ultra 7 255HX ⎘ NVIDIA GeForce RTX 5070 Ti Laptop ⎘ 16 GB Memory, 512 GB SSD | Amazon: List Price: 2000 EUR | 2.6 kg | 28.6 mm | 16.00" 2560x1600 189 PPI IPS |
Transparency
The selection of devices to be reviewed is made by our editorial team. The test sample was provided to the author as a loan by the manufacturer or retailer for the purpose of this review. The lender had no influence on this review, nor did the manufacturer receive a copy of this review before publication. There was no obligation to publish this review. As an independent media company, Notebookcheck is not subjected to the authority of manufacturers, retailers or publishers.
This is how Notebookcheck is testing
Every year, Notebookcheck independently reviews hundreds of laptops and smartphones using standardized procedures to ensure that all results are comparable. We have continuously developed our test methods for around 20 years and set industry standards in the process. In our test labs, high-quality measuring equipment is utilized by experienced technicians and editors. These tests involve a multi-stage validation process. Our complex rating system is based on hundreds of well-founded measurements and benchmarks, which maintains objectivity. Further information on our test methods can be found here.
