
Acer Predator Helios 16 (PH16-72) gaming laptop review: A predator with sharp teeth and quiet paws
Top-tier hardware.
High-end hardware, a brilliant mini LED display and efficient cooling make the Acer Predator Helios 16 a real gaming dream. In reality, the predator among gaming laptops is actually quiet. Nevertheless, our review reveals that the laptop's many advantages go hand in hand with some compromises.Marc Herter, 👁 Marc Herter (translated by Andrew Dickson) Published 🇩🇪 🇷🇺 ...
Verdict: An apex predator that purrs like a cat
The Acer Predator Helios 16 is a powerful gaming laptop with many benefits. The outstanding performance, paired with a brilliant mini LED display and an efficient cooling solution, enables an immersive gaming experience. A wide range of customization options and good features round off the overall positive picture.
In terms of performance, the Acer gaming laptop is a comprehensively impressive package that avoids having excessively loud fans to dissipate heat. In addition to gaming, the gamer is also suitable for all kinds of AI applications, video editing or creative work with Blender or other 3D programs thanks to the powerful RTX 4080 and a generous amount of RAM.
However, you will also have to put up with some compromises. The battery life is not outstanding, and the poorly installed SSD tends to throttle under sustained load.
Overall, the Acer Predator Helios 16 is a good choice for gamers looking for a powerful and individually customizable laptop. However, anyone who places particular importance on long battery life should maybe look for alternatives. For example, two competitors from our database are much better positioned here. The Asus ROG Strix Scar 16 and the Acer Predator Triton Neo have better battery life, and the Strix Scar has comparably similar specs to our review device.
Pros
Cons
Price and availability
Our review configuration Acer Predator Helios 16 is currently the most modern version of this gaming machine. However, Acer has already announced a successor with the latest Intel processors and NVIDIA GeForce RTX 5000 GPUs. However, it isn't expected to come onto the market until the second quarter of 2025, at the earliest.
The announcement of the successor has already caused the price of the current Helios 16 to drop. While the RRP was originally $3,000, it can now be had for around $2,500. Therefore, if you're looking for a powerful gaming laptop with an excellent price-performance ratio, you should compare now and keep an eye on the price development.
Possible alternatives compared
Image | Model / Review | Price | Weight | Height | Display |
|---|---|---|---|---|---|
1. 86%  | Acer Predator Helios 16 PH16-72 Intel Core i9-14900HX ⎘ NVIDIA GeForce RTX 4080 Laptop GPU ⎘ 32 GB Memory, 2048 GB SSD | Amazon: | 2.7 kg | 29.6 mm | 16.00" 2560x1600 189 PPI IPS |
2. 84.7%  | MSI Raider 18 HX A14V Intel Core i9-14900HX ⎘ NVIDIA GeForce RTX 4080 Laptop GPU ⎘ 64 GB Memory, 2048 GB SSD | Amazon: 1. $72.99 330W USB Tip Laptop Charger ... 2. $74.99 330W 280W Laptop Charger Com... 3. $80.00 330W USB Tip Charger for Msi... List Price: 3400 USD | 3.6 kg | 32 mm | 18.00" 3840x2400 252 PPI Mini-LED |
3. 87.6% v7 (old)  | Asus ROG Strix Scar 16 G634JZR Intel Core i9-14900HX ⎘ NVIDIA GeForce RTX 4080 Laptop GPU ⎘ 32 GB Memory, 2048 GB SSD | Amazon: List Price: 3199 EUR | 2.7 kg | 30.4 mm | 16.00" 2560x1600 189 PPI Mini LED |
4. 89.5% v7 (old)  | Lenovo Legion Pro 7 16IRX9H Intel Core i9-14900HX ⎘ NVIDIA GeForce RTX 4080 Laptop GPU ⎘ 32 GB Memory, 1024 GB SSD | Amazon: List Price: 2999 Euro | 2.7 kg | 21.95 mm | 16.00" 2560x1600 189 PPI IPS |
5. 81.1%  | Acer Predator Triton Neo 16 PTN16-51-978P Intel Core Ultra 9 185H ⎘ NVIDIA GeForce RTX 4070 Laptop GPU ⎘ 32 GB Memory, 1024 GB SSD | Amazon: List Price: 1900 EUR | 2 kg | 21 mm | 16.00" 3200x2000 236 PPI IPS |
6. 85.1%  | Schenker Key 17 Pro (M24) Intel Core i9-14900HX ⎘ NVIDIA GeForce RTX 4090 Laptop GPU ⎘ 32 GB Memory, 1024 GB SSD | Amazon: List Price: 4273€ | 3.4 kg | 24.9 mm | 17.30" 3840x2160 255 PPI IPS |
Table of Contents
- Verdict: An apex predator that purrs like a cat
- Specifications
- Case
- Features: Fast and versatile
- Input devices: MagiKey 3.0 keyboard
- Display: A high-resolution, 1,000 cd/m² mini LED panel
- Performance: Top specs ensure high performance
- Emissions: A feline predator with silent paws
- Energy management: High consumption running idle
- Notebookcheck overall rating
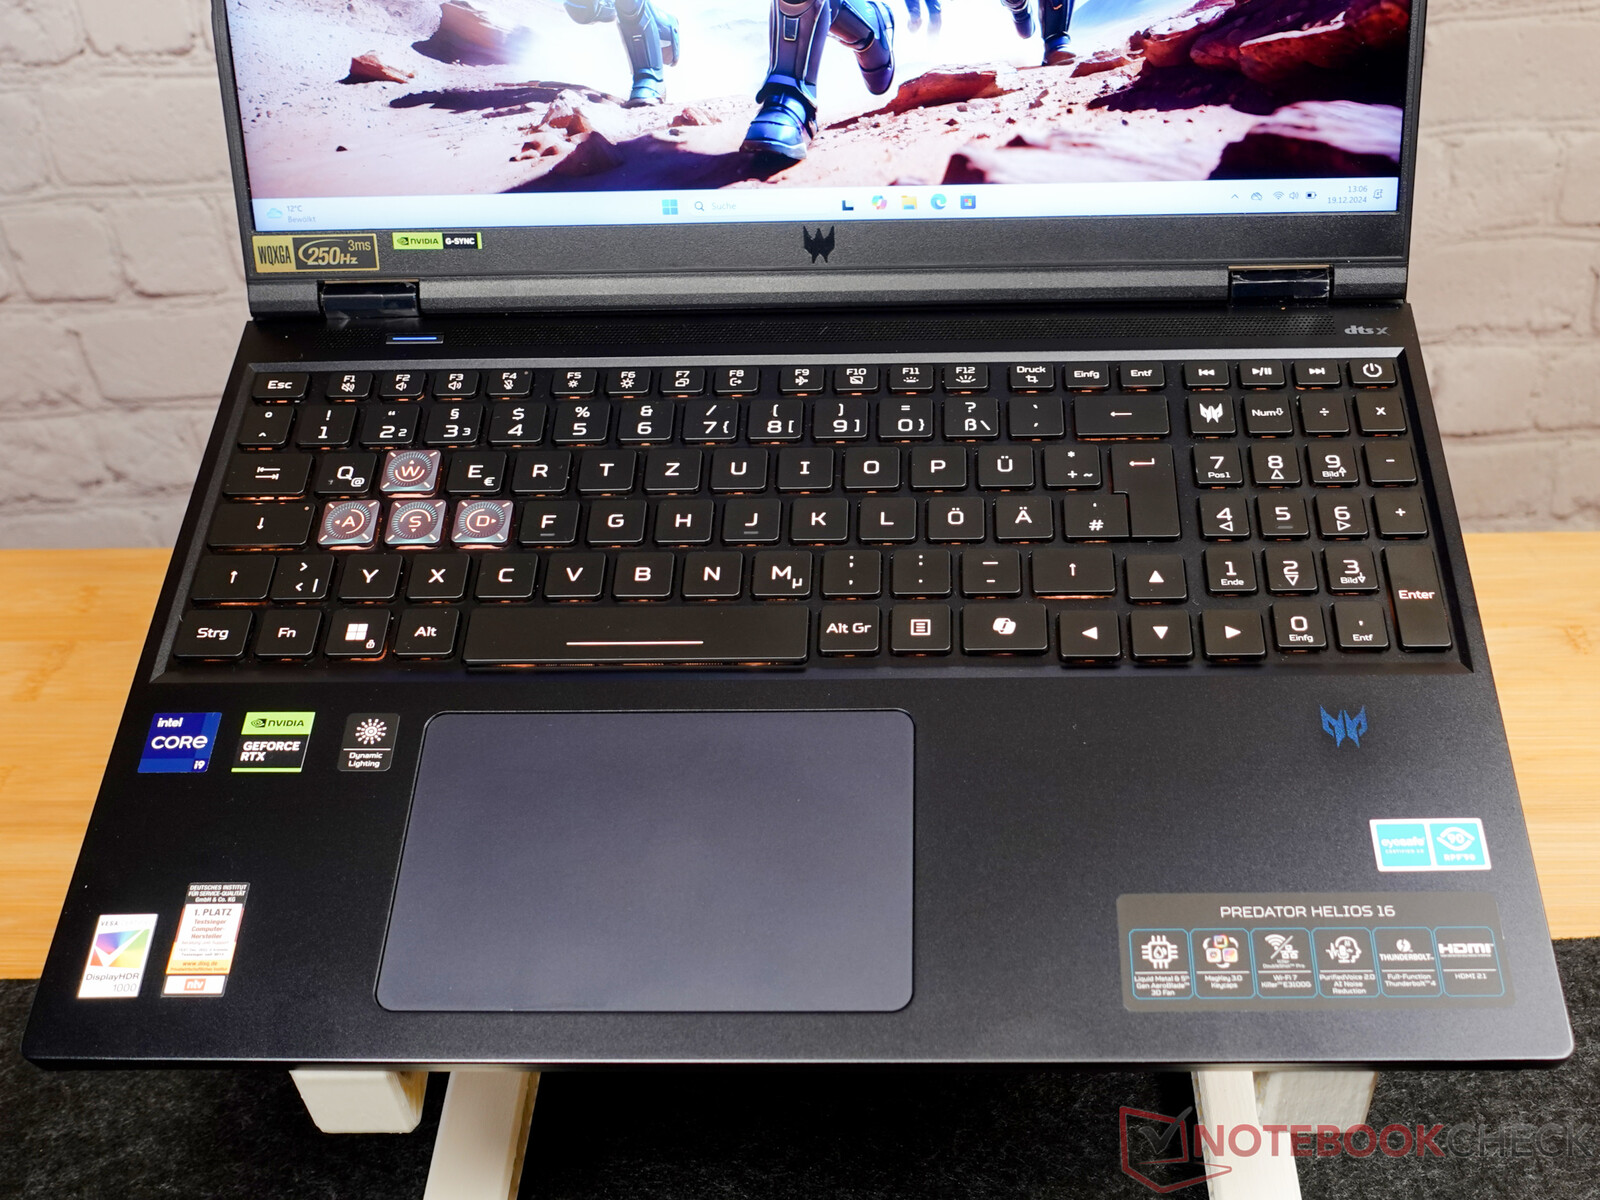
The Acer Predator Helios 16 (PH16-72-90ZU) is a top-tier gaming laptop with a recommended retail price of $3,000 (current market price around $2,500) aimed at gamers and content creators on the hunt for maximum performance and innovative features. Highlights include the mini LED display offering brilliant color reproduction and the interchangeable MagKey 3.0 keycaps. The Helios 16 is also equipped with the latest WiFi 7 standard, which helps enable the fastest possible wireless connections.
But it's not just that particular feature set that impresses. Acer has also done a great job on the inside. An advanced cooling solution based on two AeroBlade 3D fans and liquid metal thermal paste ensures that the powerful hardware, an Intel Core i9-14900HX processor and an NVIDIA GeForce RTX 4080, is optimally cooled while managing to remain comparatively quiet. This combination of high-end components and efficient cooling leads to excellent benchmark scores.
Specifications
Case
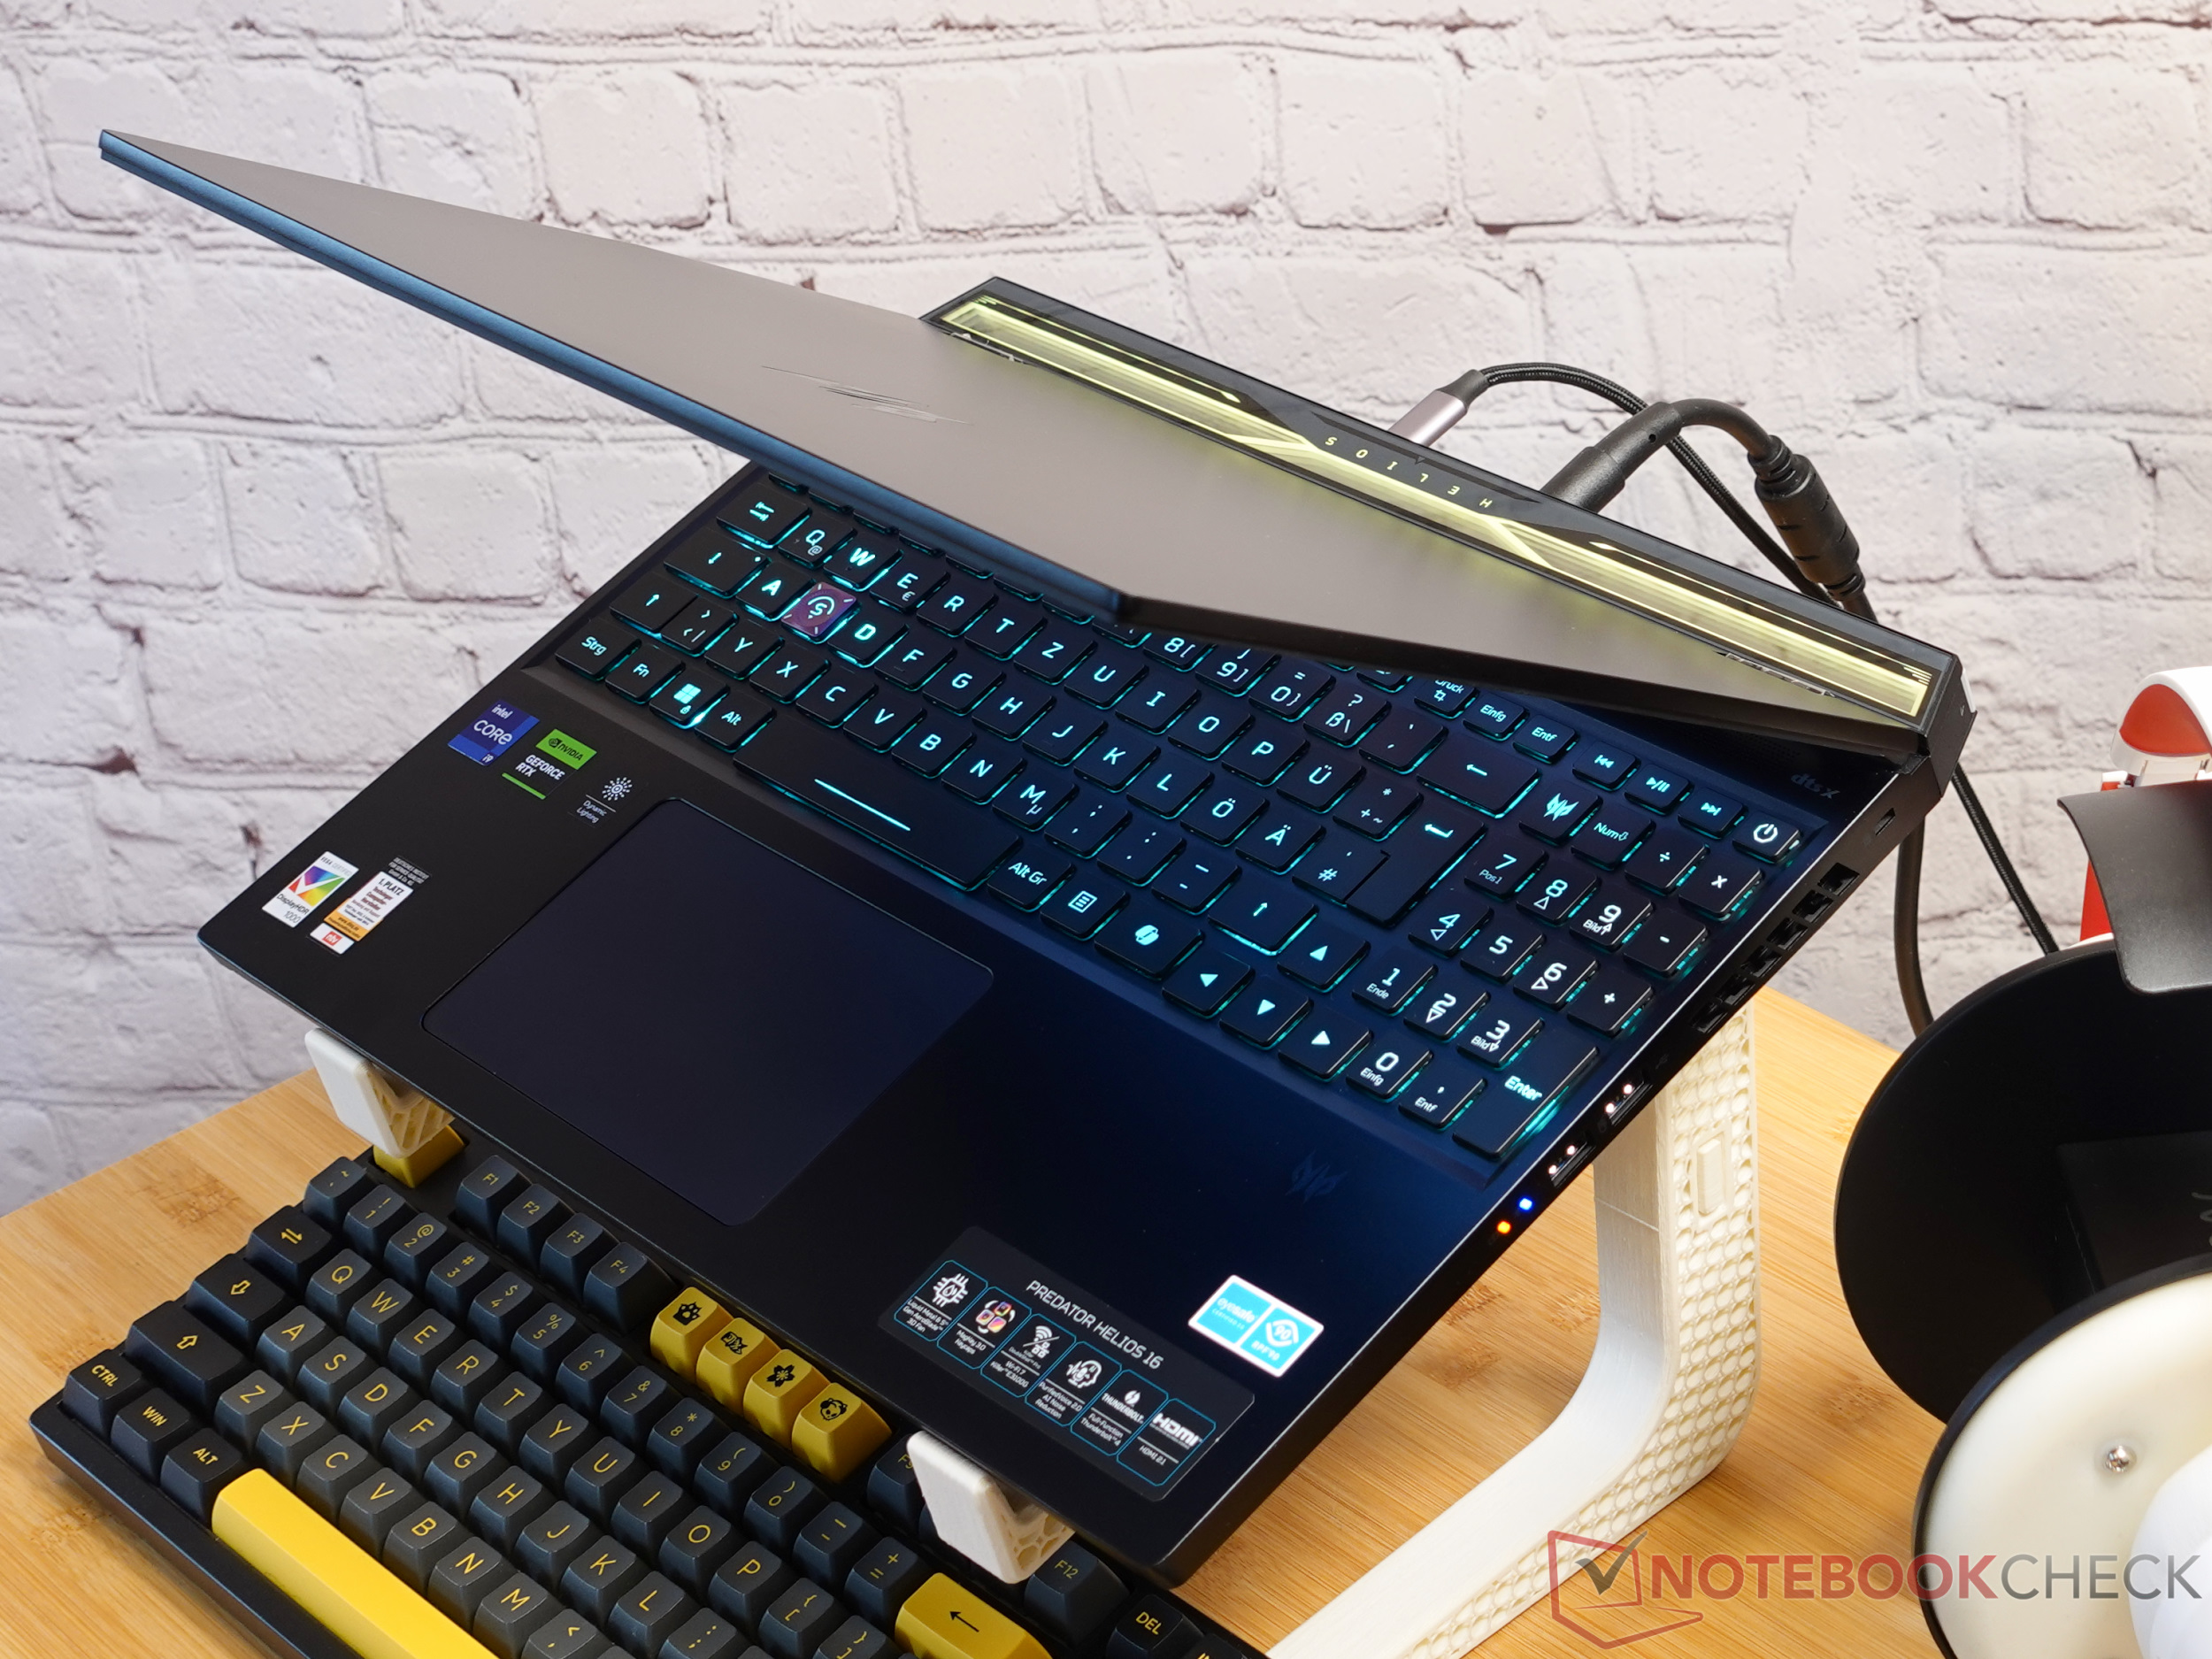
The Acer Predator Helios 16's case comes clothed in an elegant garment made of dark blue to black aluminum, which not only looks sturdy but also lends the device a high-quality feel. The workmanship is flawless, with precise gaps that testify to the attention paid by Acer engineers. Even when the gaming hardware inside is caught up in heated battles, the surfaces remain pleasantly cool - a real blessing for long gaming sessions.
The Helios 16's design is angular and modern. Its RGB light bar is discreetly hidden behind the screen, meaning it doesn't distract the user while gaming. The Predator logos on the palm rest and the screen lid are striking graphical exclamation marks. The screen can be opened pleasantly far back, which ensures ergonomic sitting posture and prevents tense neck muscles. The two hinges hold their position securely but are still smooth to operate.

Features: Fast and versatile
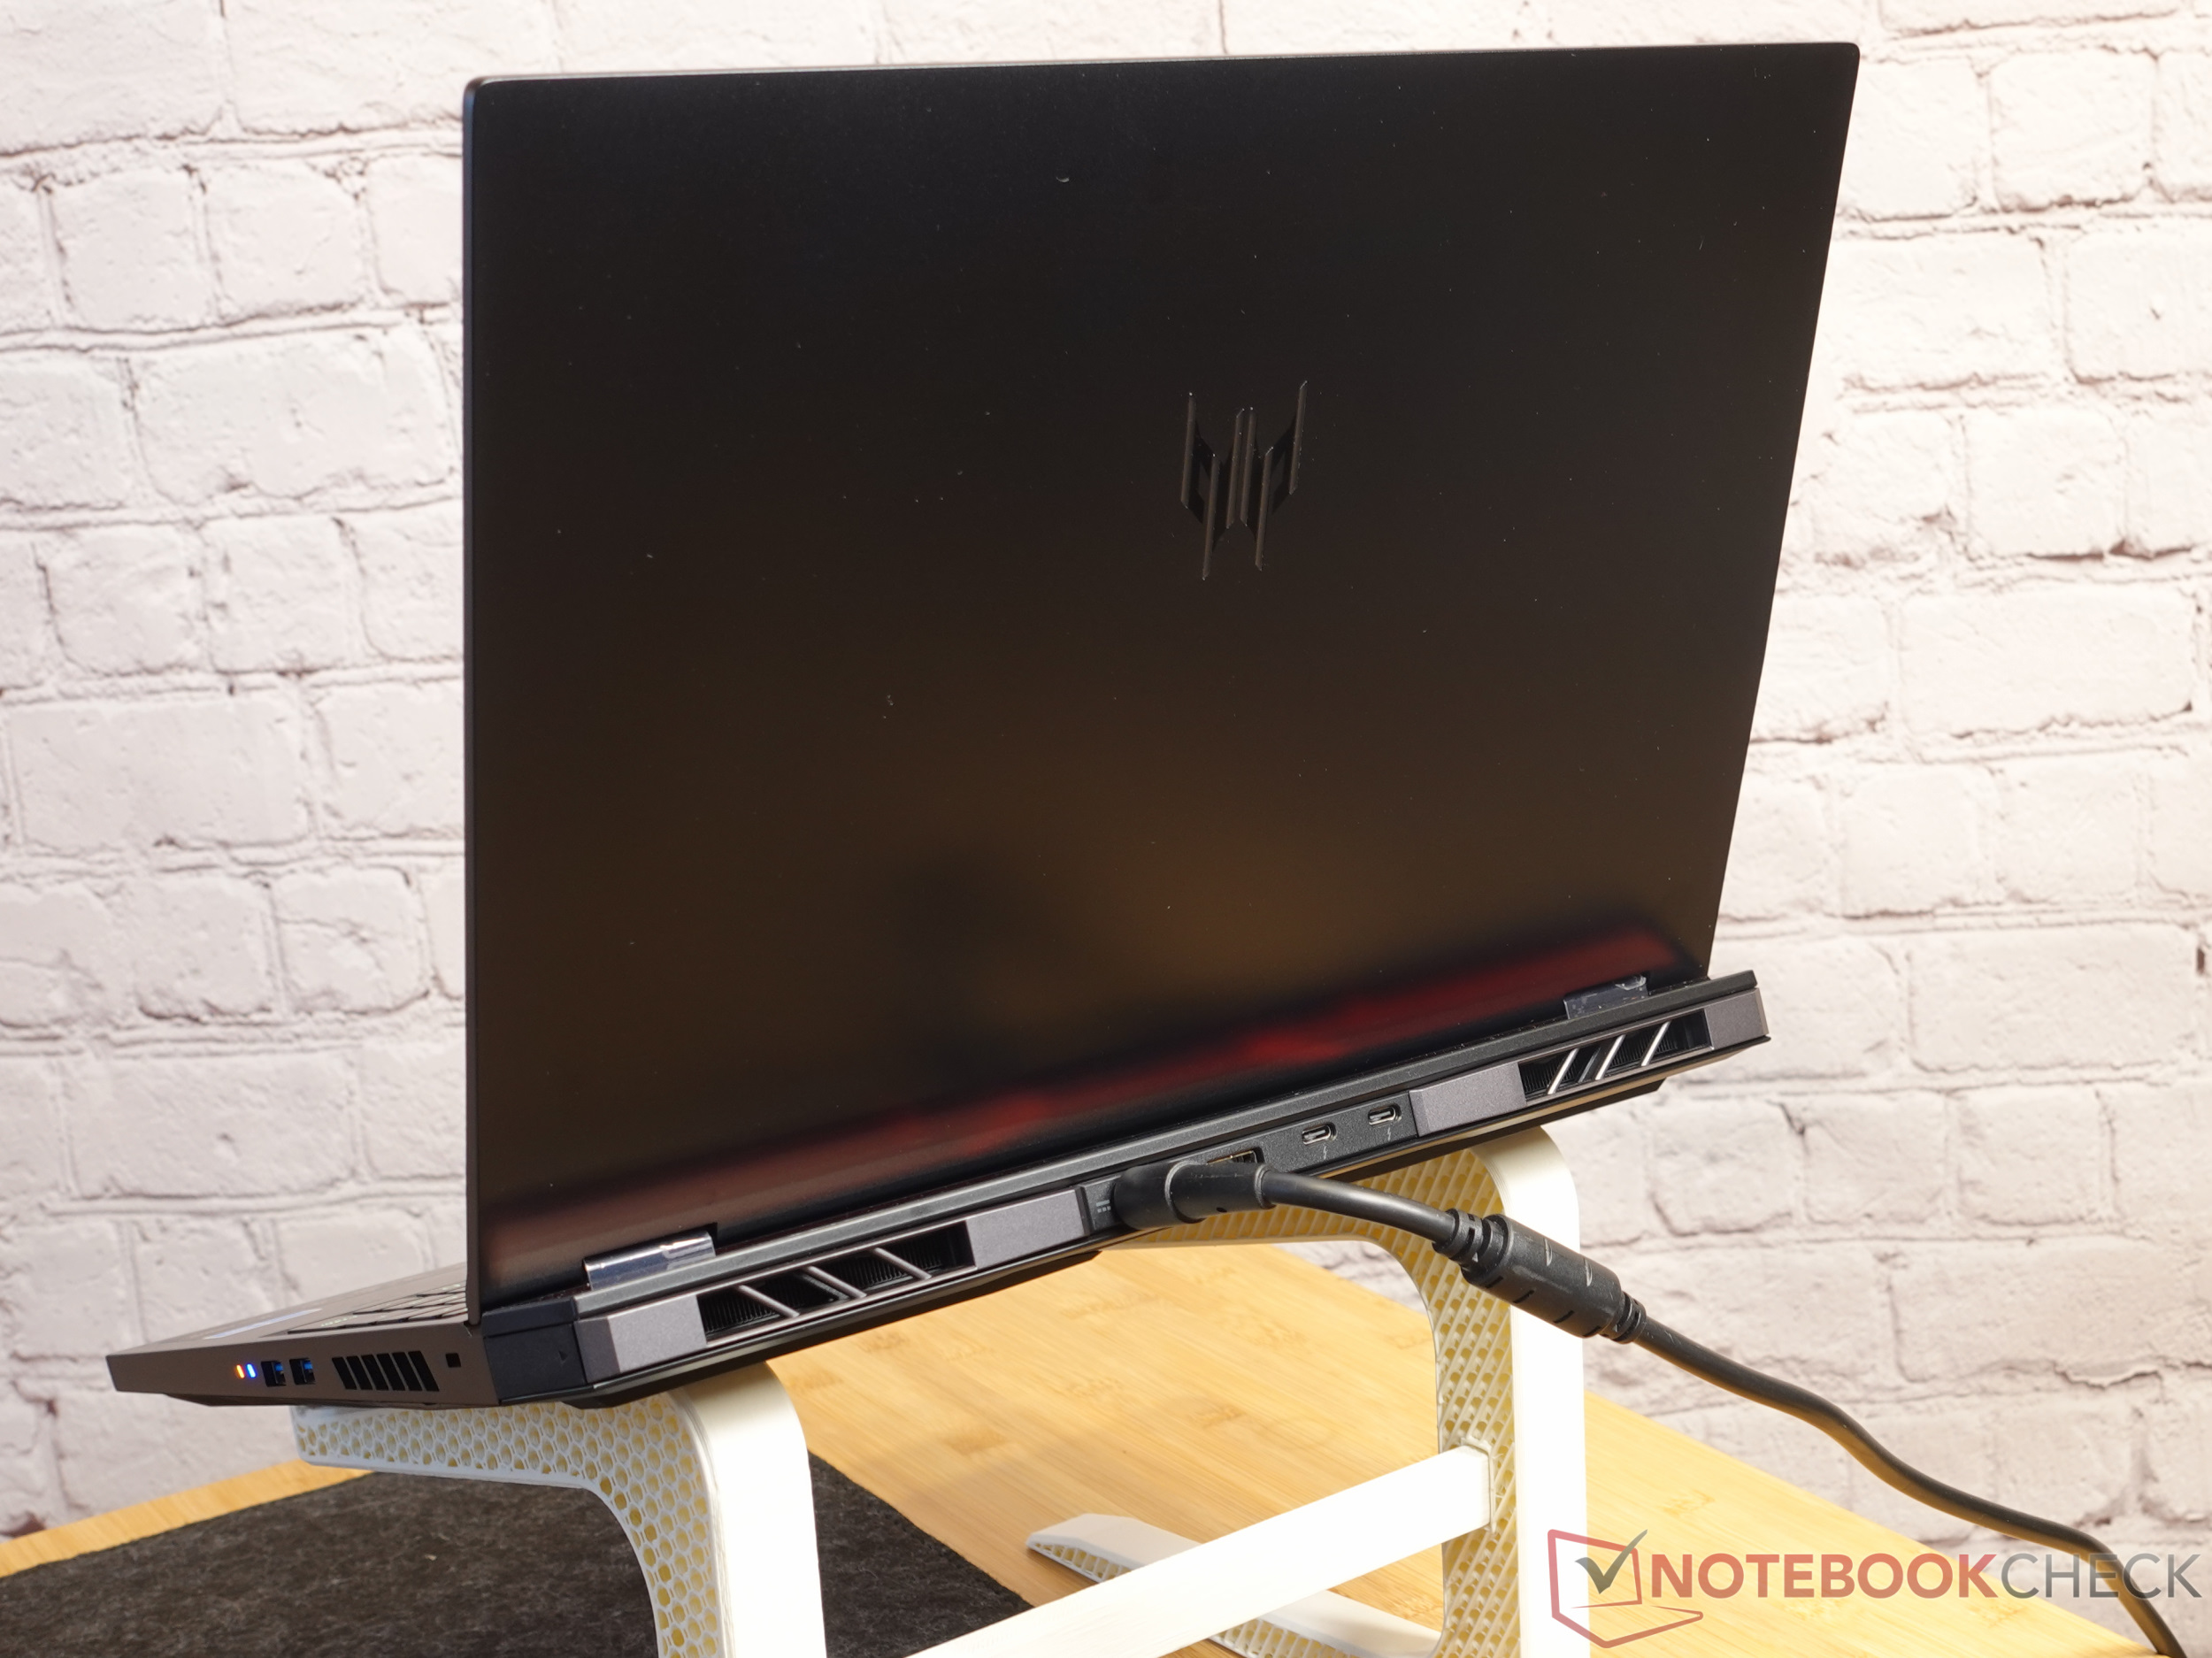
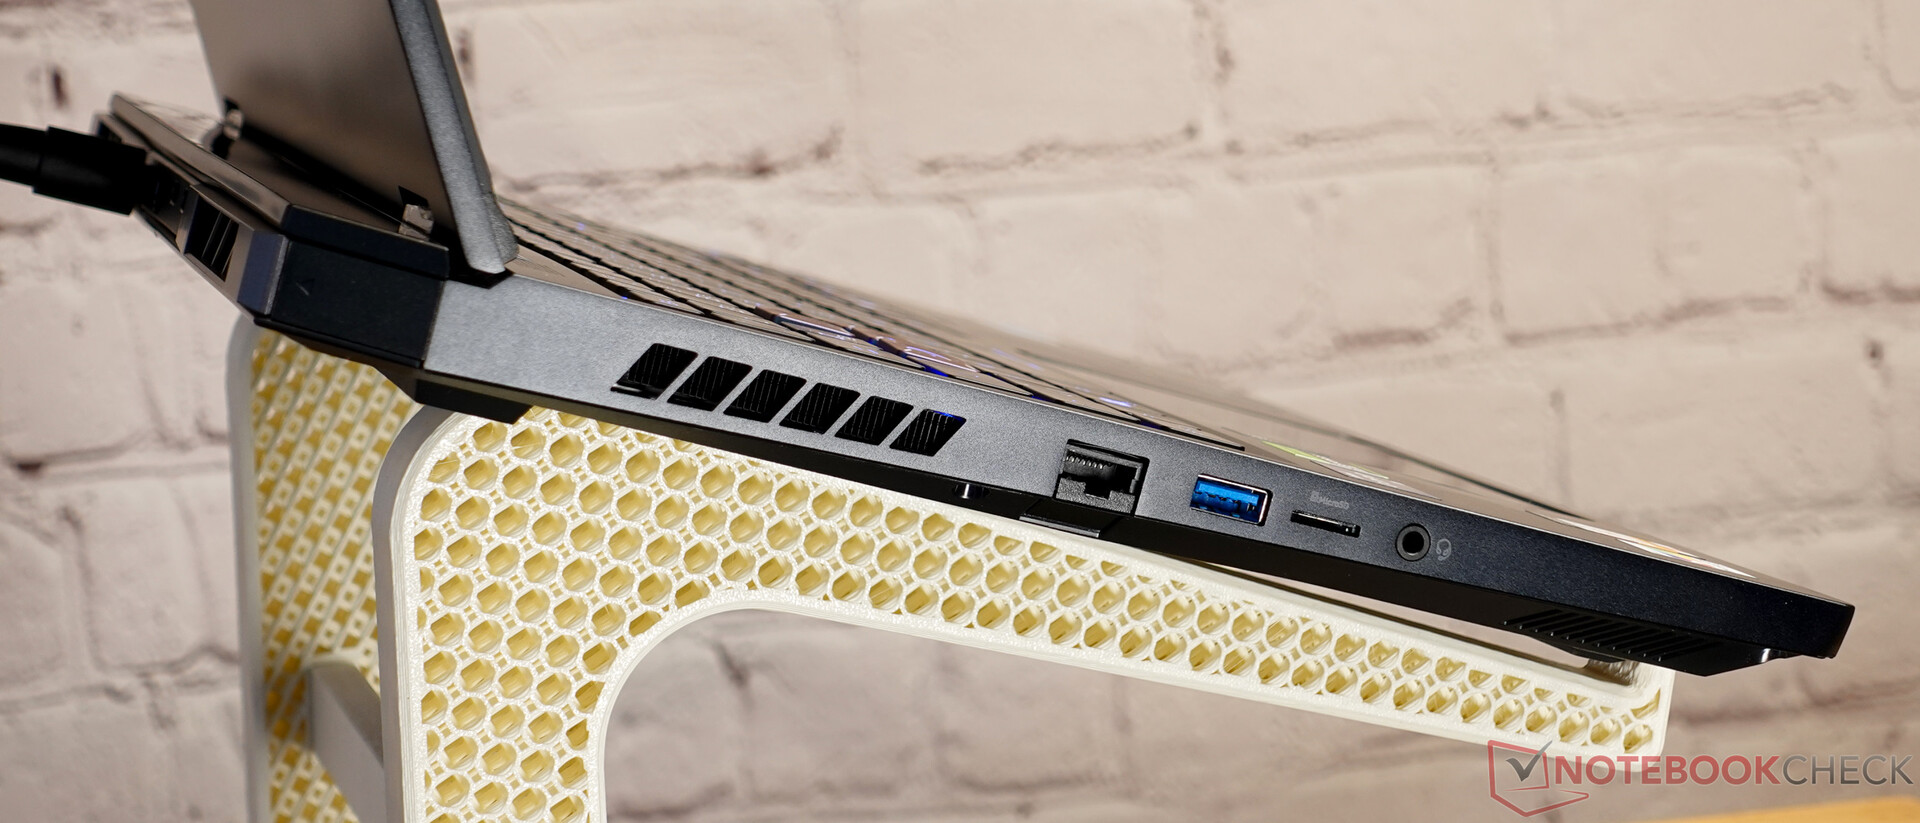
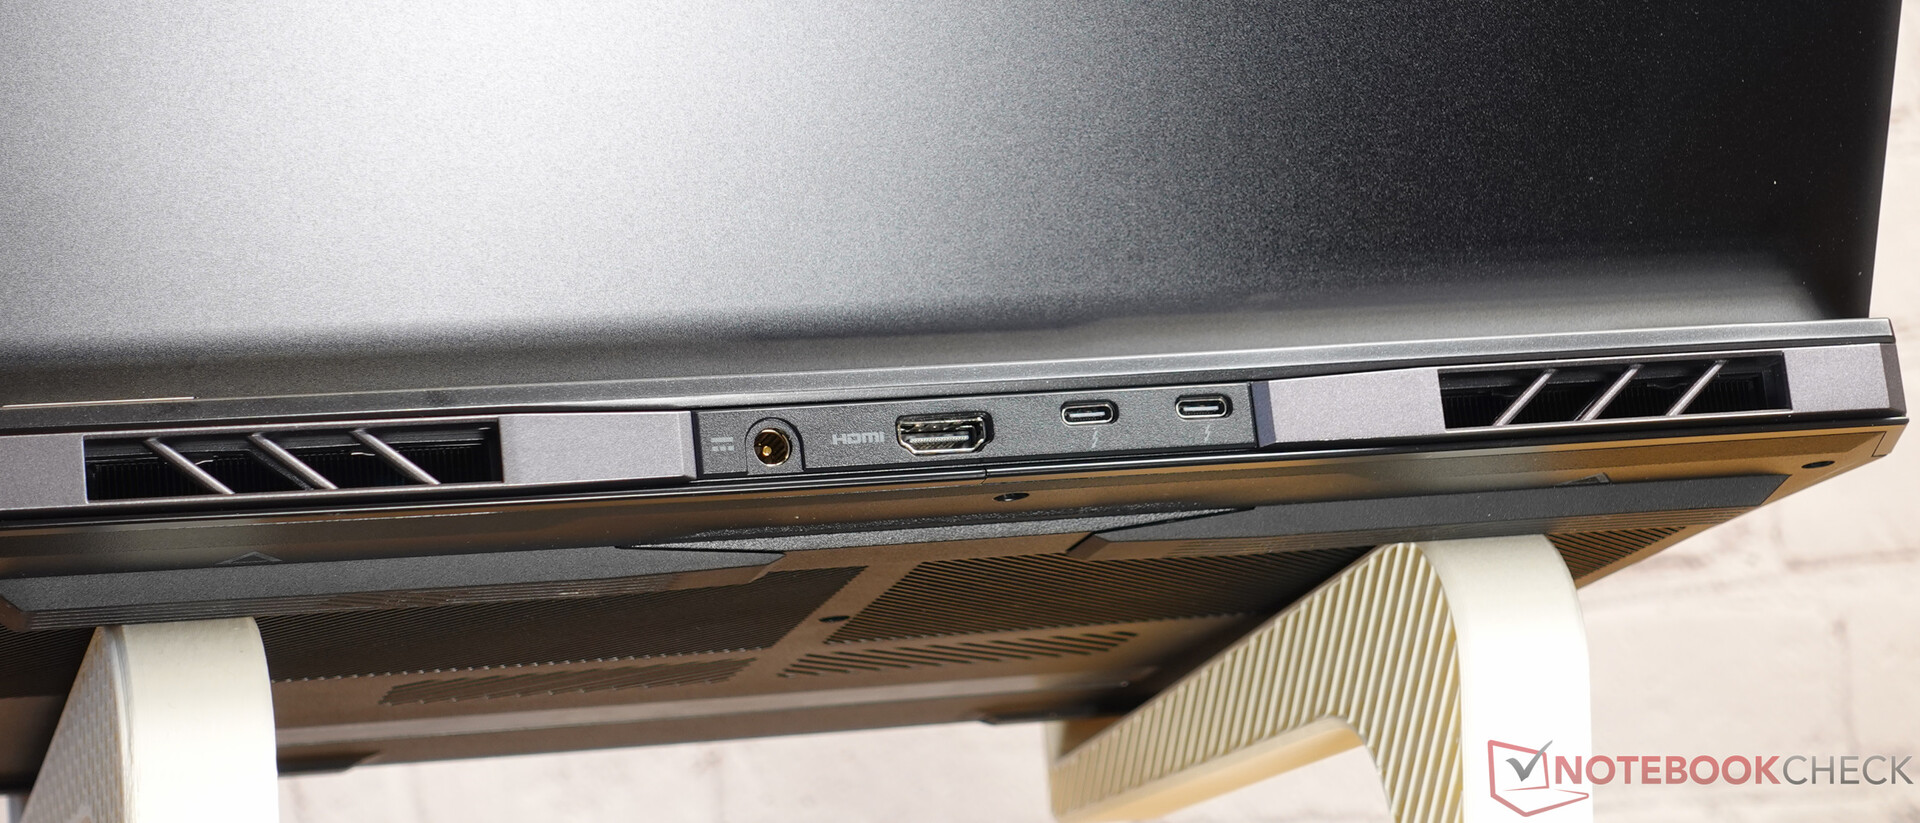
The Acer Predator Helios 16 is equipped with a variety of modern ports, which are conveniently distributed on three sides of the device. WiFi 7, the latest Wi-Fi standard, ensures fast internet connections. Wired networks are supported with 2.5 GBit LAN, the port of which is on the left-hand side.
While the USB ports are on all three sides, HDMI and DisplayPort (via USB-C) are only located on the rear. An averagely fast microSD card reader and a Kensington lock slot complete the port selection.
| SD Card Reader | |
| average JPG Copy Test (av. of 3 runs) | |
| Average of class Gaming (20.9 - 210, n=54, last 2 years) | |
| Acer Predator Triton Neo 16 PTN16-51-978P (AV PRO microSD 128 GB V60) | |
| MSI Raider 18 HX A14V (Toshiba Exceria Pro SDXC 64 GB UHS-II) | |
| Acer Predator Helios 16 PH16-72 | |
| maximum AS SSD Seq Read Test (1GB) | |
| Average of class Gaming (25.5 - 261, n=51, last 2 years) | |
| MSI Raider 18 HX A14V (Toshiba Exceria Pro SDXC 64 GB UHS-II) | |
| Acer Predator Helios 16 PH16-72 | |
| Acer Predator Triton Neo 16 PTN16-51-978P (AV PRO microSD 128 GB V60) | |
Webcam
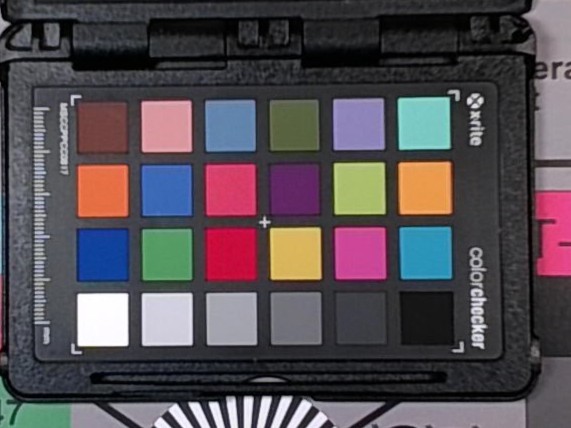
A full HD webcam is available for video conferencing and streaming, providing standard image quality and good color reproduction.


Security
In the digital age, the protection of sensitive data is becoming a greater concern. The Acer Predator Helios 16 takes this requirement into account and offers various security mechanisms. The device has a Kensington lock slot to protect it from theft. TPM 2.0 is also on board, a security mechanism that keeps passwords and encryption codes safe. However, you will have to do without biometric authentication methods such as fingerprint sensors or facial recognition.
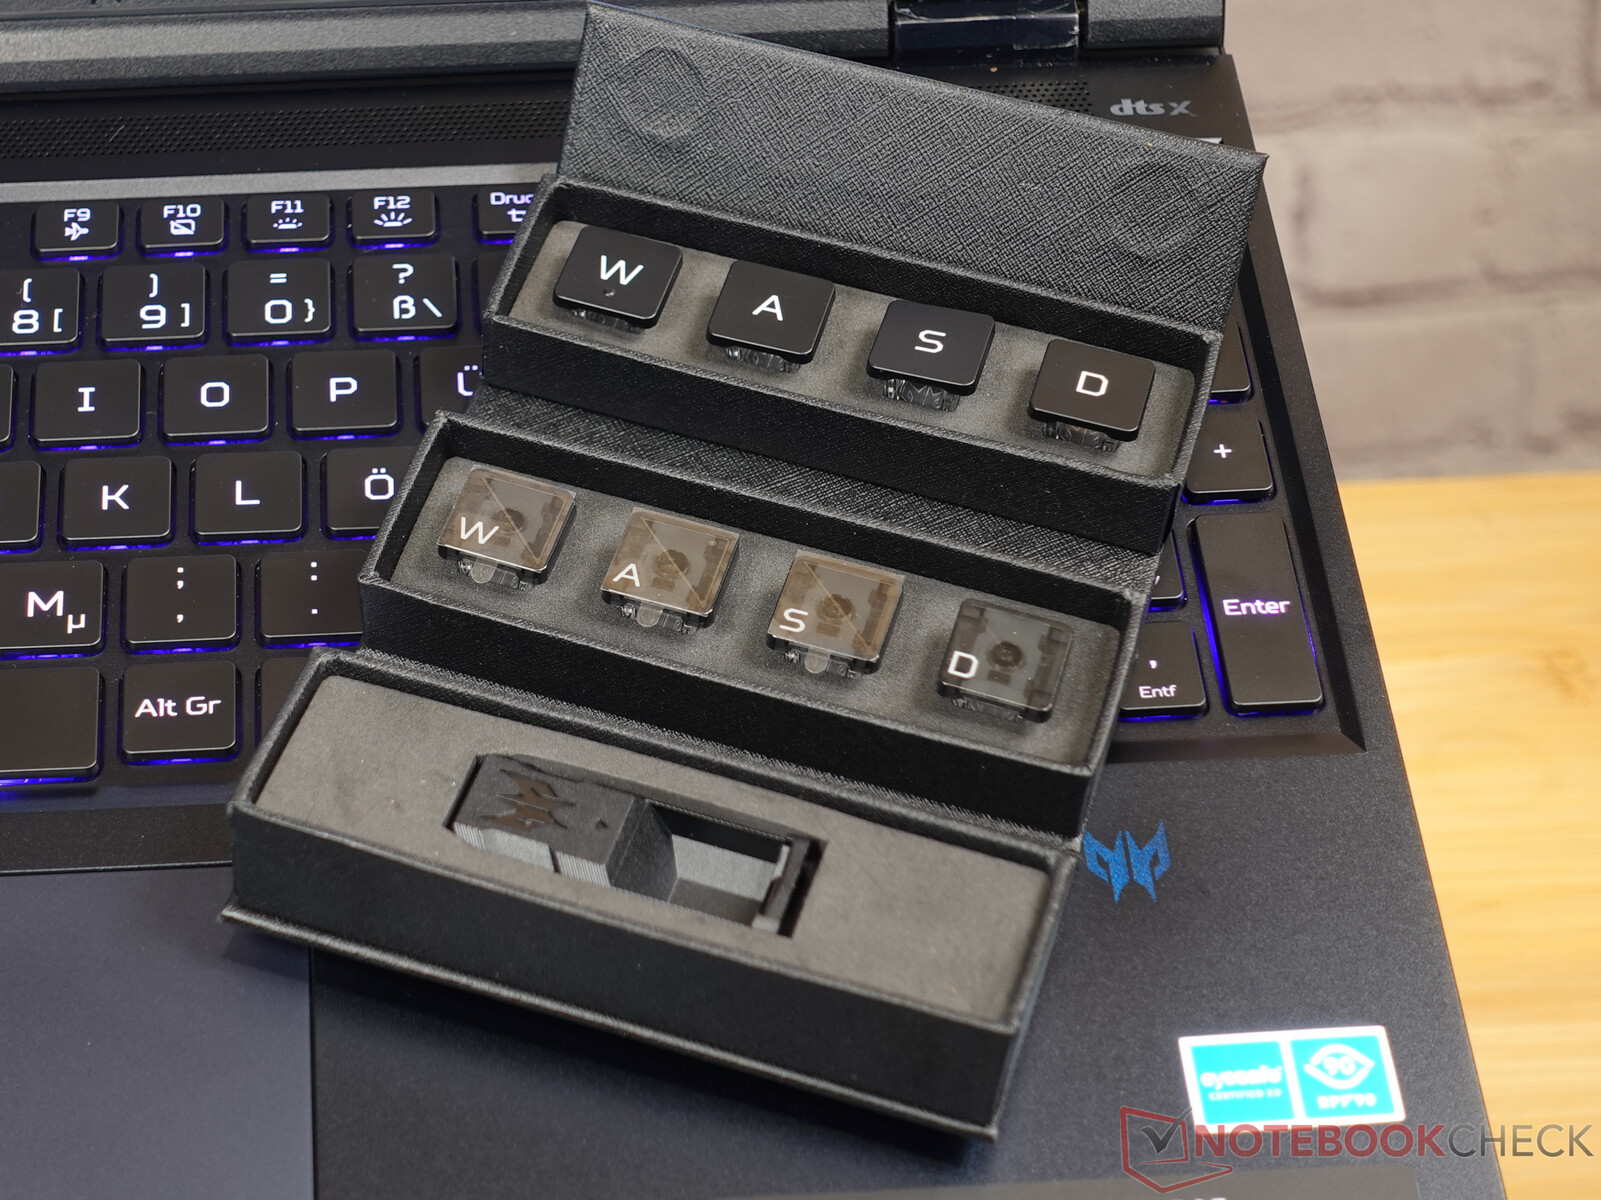
Accessories
With the Predator Helios 16, Acer has placed great importance on customization. The fan grilles can be replaced to give the laptop a personal touch. The keycaps for the W, A, S, and D keys can also be replaced, which not only sets visual accents but also adapts the feel of the keyboard to your own personal preferences.
Sustainability
When buying a gaming laptop, sustainability is probably not at the top of the purchasing criteria. Unfortunately, Acer has not provided any data regarding our review device's CO₂ footprint. We are also unable to find an EPEAT registration or anything similar. The gaming laptop is also shipped in a box that contains a large amount of foam packaging material.
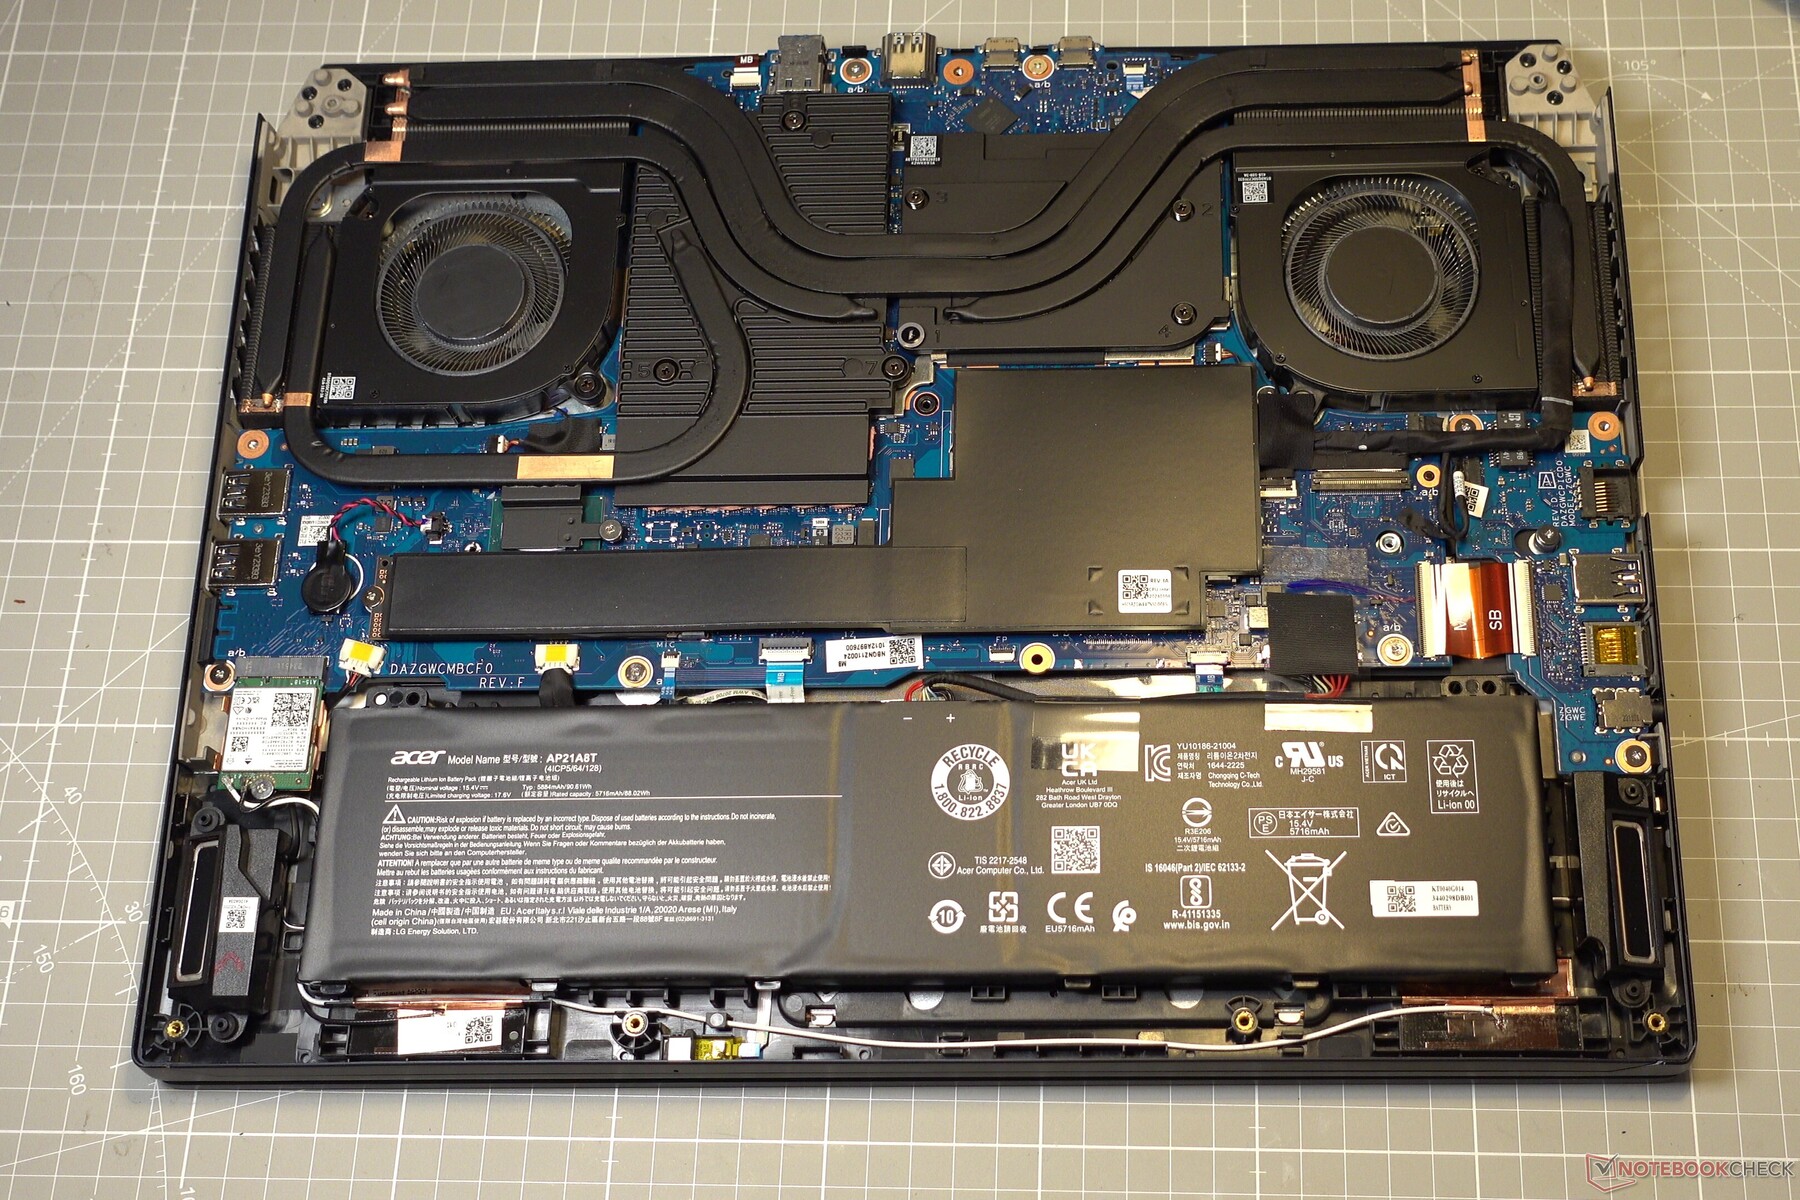
The Acer Predator Helios 16 is, however, pleasantly easy to maintain. The base plate is secured with a few Torx screws, after which you can access the most important components. Both the Wi-Fi module and the RAM can be easily replaced - once you have removed the glued black plastic covers. Regarding mass storage, in addition to the already installed NVMe SSD, there is the availability of an additional M.2 slot to expand the storage capacity.

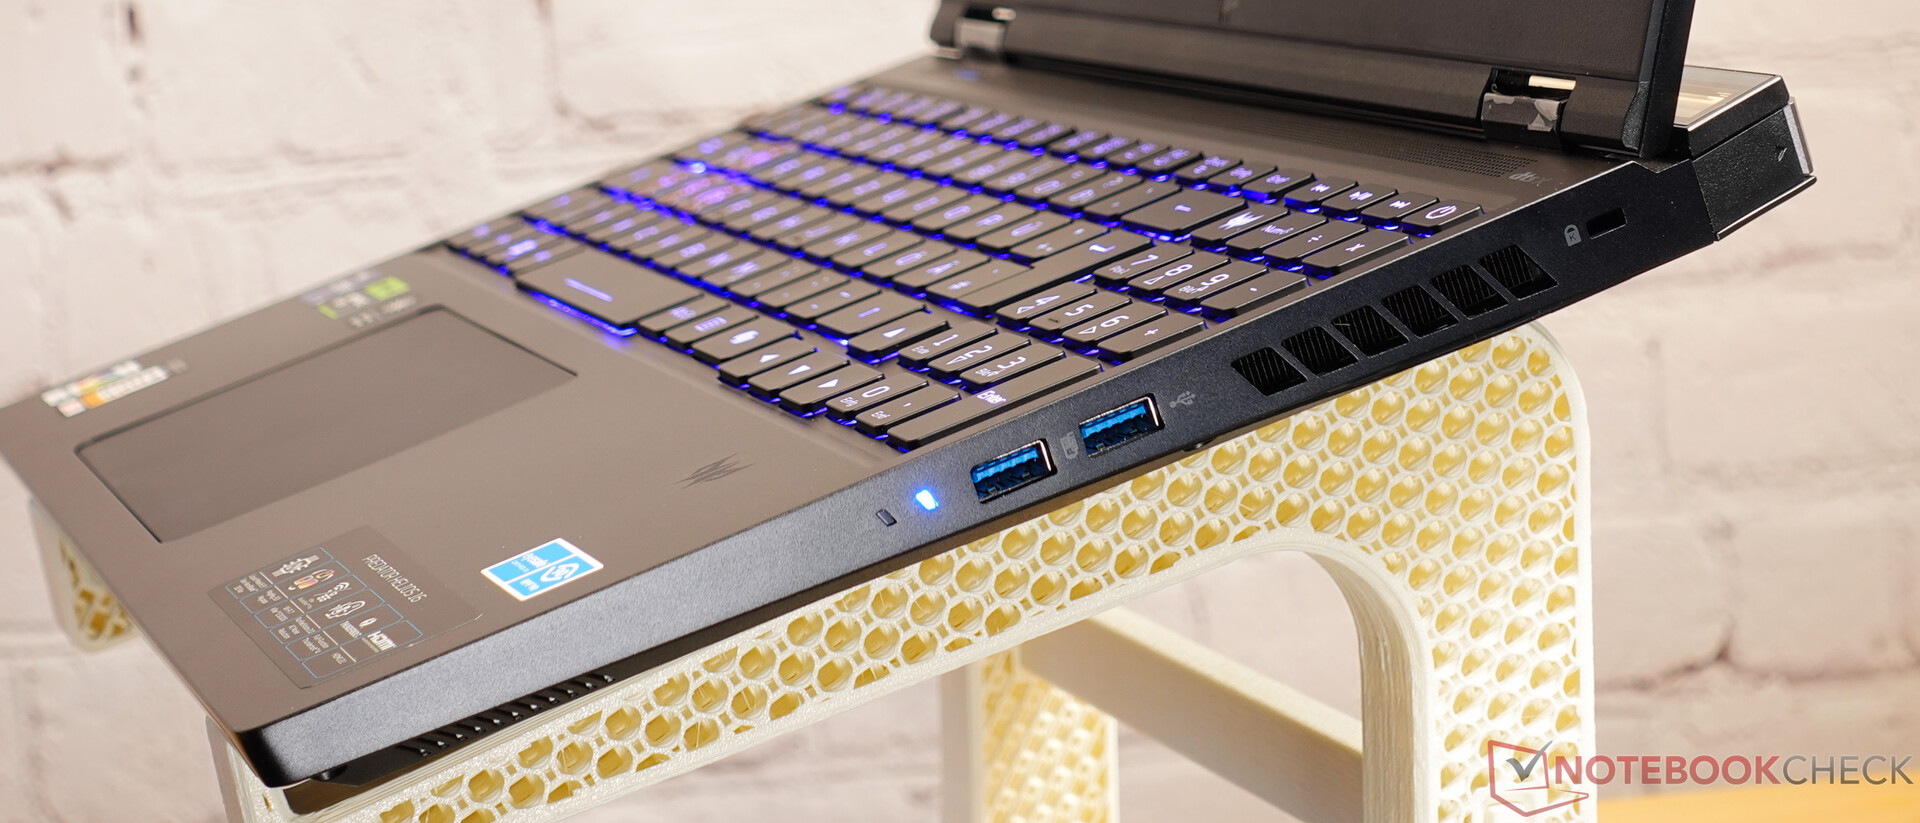
Input devices: MagiKey 3.0 keyboard
The Acer Predator Helios 16's keyboard is more than adequate for a high-quality gaming laptop. N-Key Rollover ensures that every keystroke is registered, no matter how many keys are pressed at the same time. The RGB lighting immerses the keyboard in an atmospheric sea of colors, ensuring every key can have its own color. A special gimmick is the interchangeable WASD keys, which not only stand out from a visual point of view but also enable individual haptic feedback. Acer has included two interesting alternatives with this laptop. With MagClick, the user experiences unique haptic feedback, while MagSpeed highlights the RGB lighting. Overall, the keyboard offers great haptics and a pleasant pressure point.
The touchpad is generously dimensioned and offers a smooth surface. The mouse pointer follows every movement quickly and precisely. There is one small downside, however: the touchpad has been moved slightly to the left, which means that the WASD keys are not as easily accessible when gaming as you would hope for in a gaming laptop.
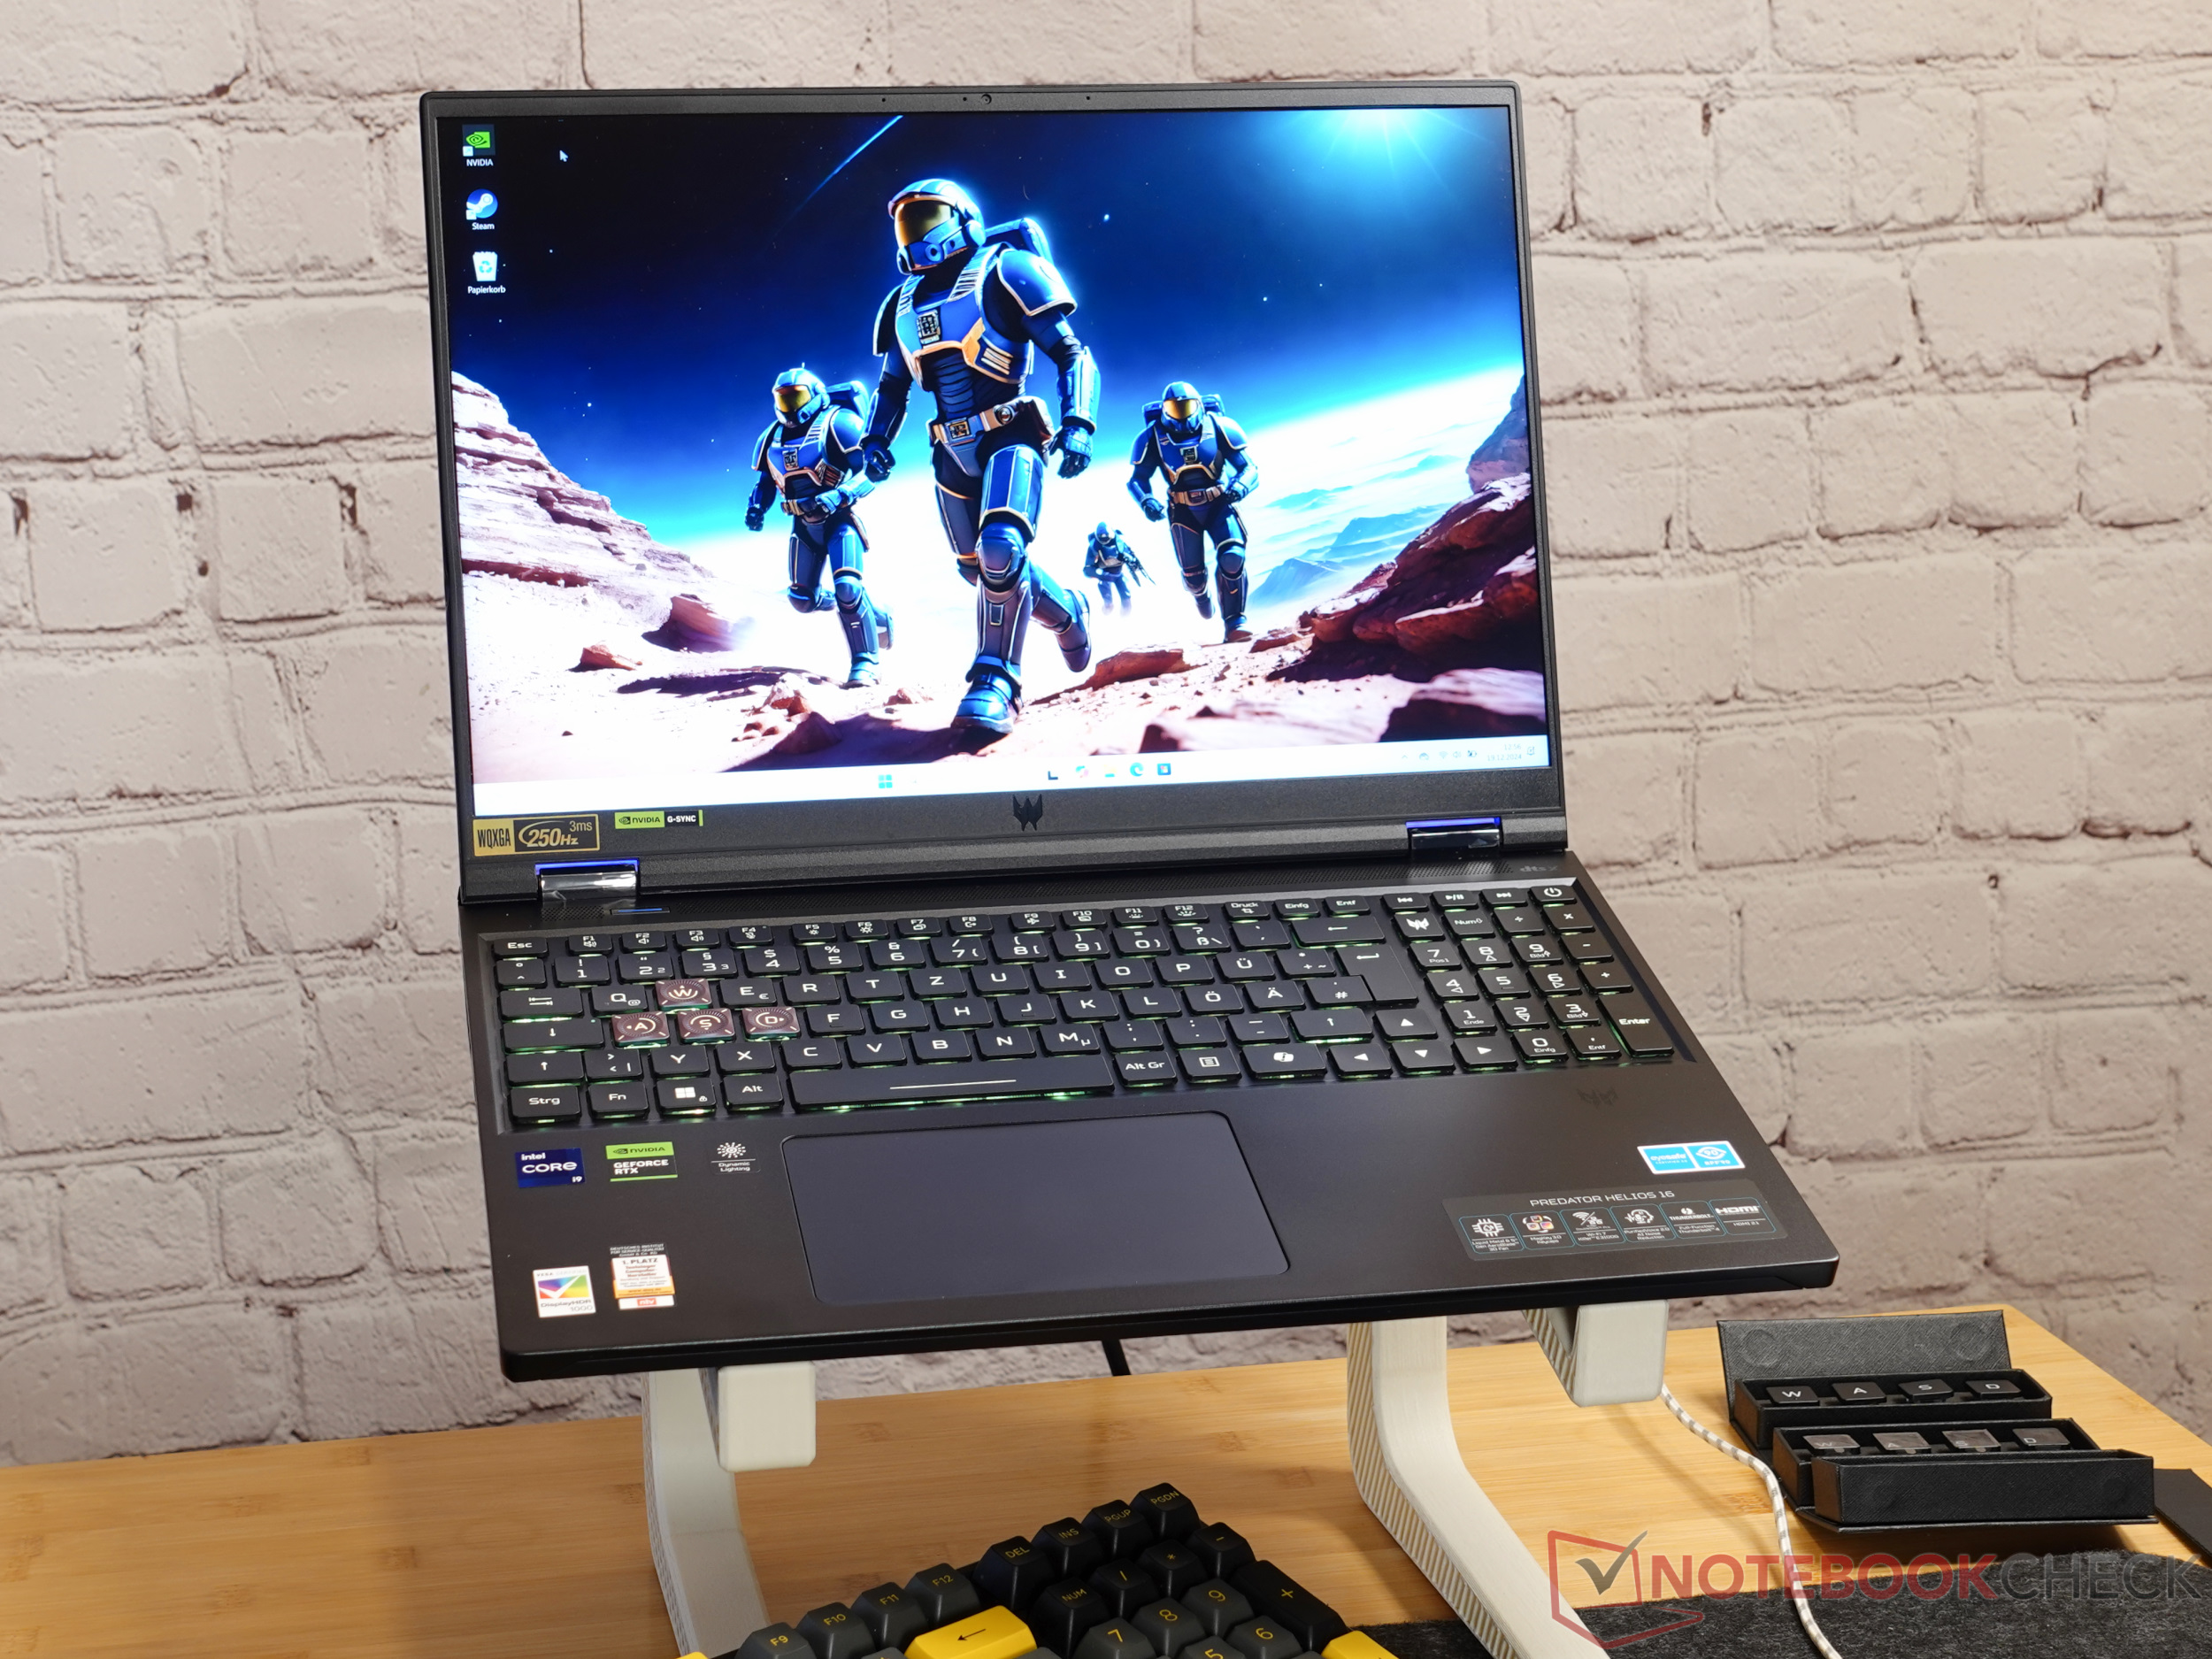
Display: A high-resolution, 1,000 cd/m² mini LED panel
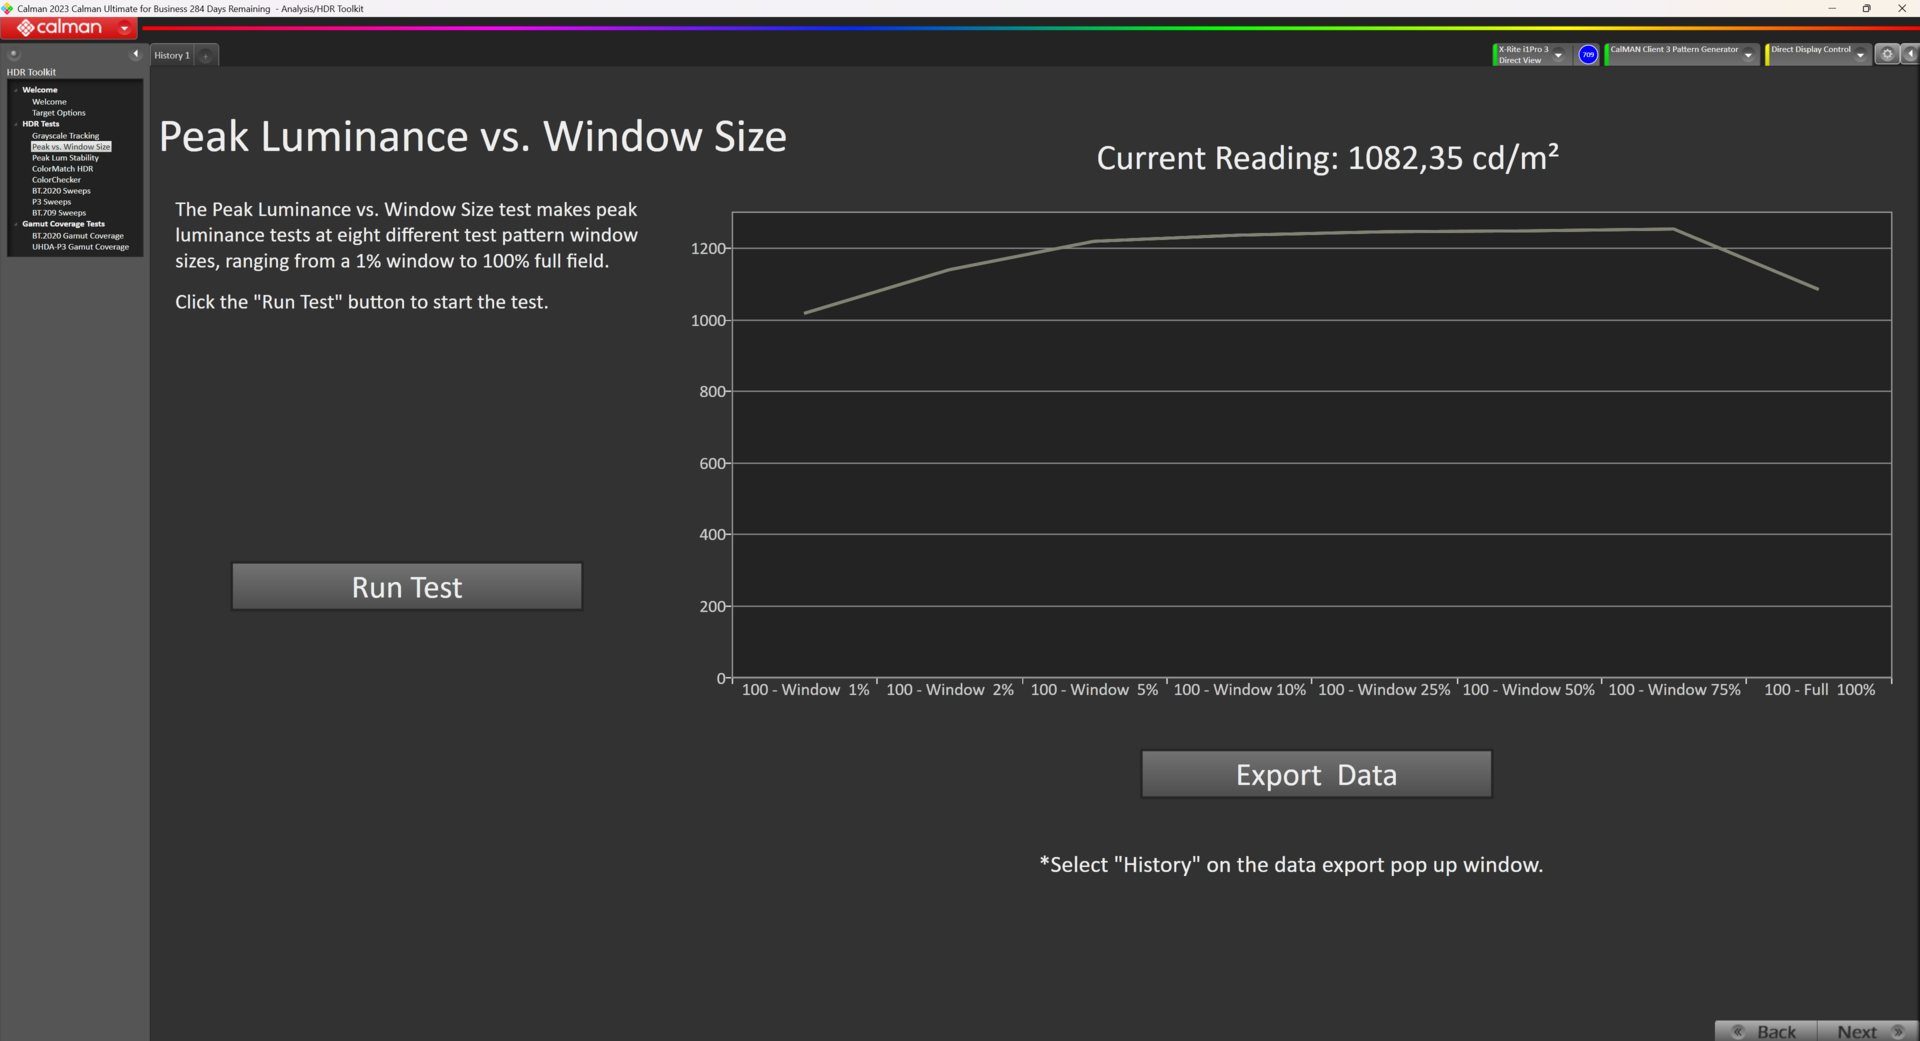
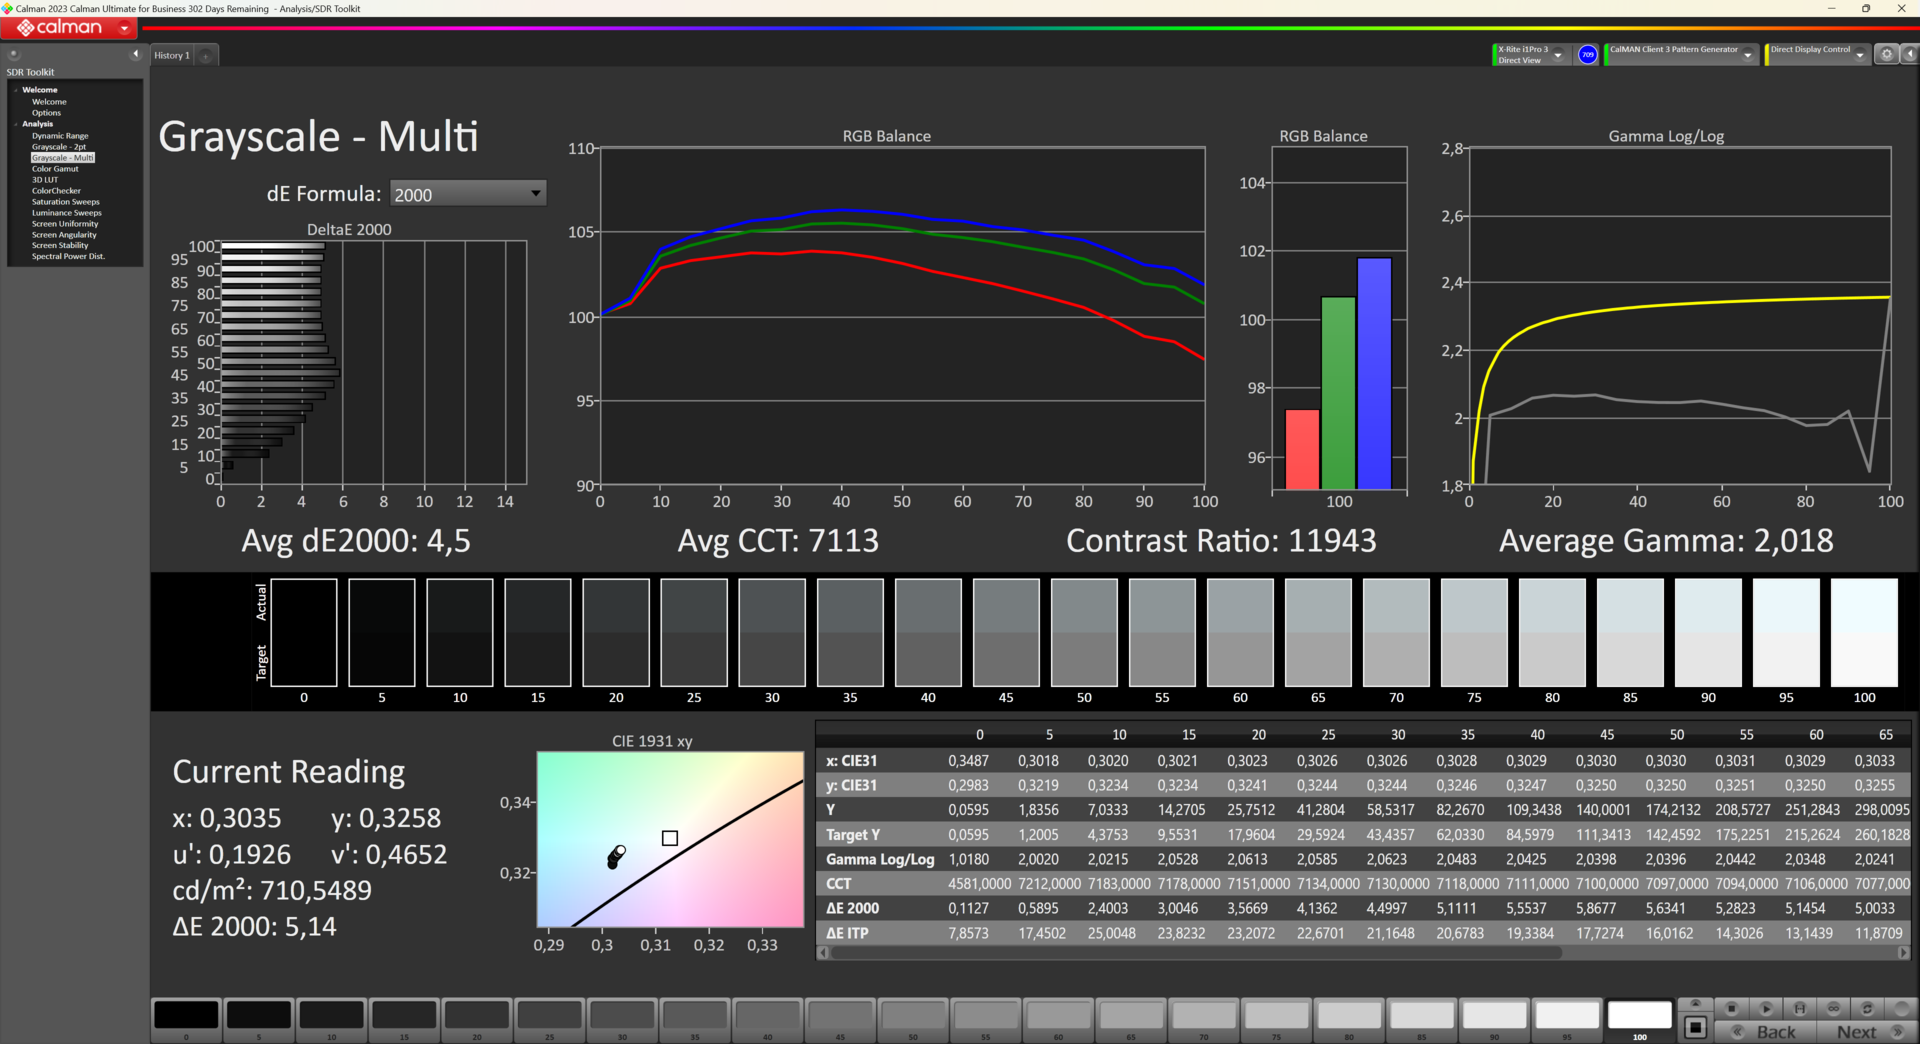
If you want to play games properly, you need a fast screen. The Acer Predator Helios 16 has a brilliant 16-inch mini LED display with a 16:10 aspect ratio that displays 250 frames per second. With a resolution of 2,560 × 1,600 pixels and a pixel density of 189 PPI, it offers sharp images and plenty of space for creative work and gaming. Thanks to HDR1000 support, the screen shines with a brightness of over 1,000 cd/m², delivering clear and high-contrast images even in bright environments. Even without HDR activated, at around 670 cd/m², the brightness is impressive.
Another plus point is the fast response times, especially when changing from 20% gray to 80% gray. This ensures smooth movements without annoying smearing, which is particularly beneficial for action-packed games. However, the transition from black to white results in significantly longer response times. This is due to technical reasons and is typical for mini-LED displays. In practice, however, this effect is hardly noticeable, since extreme brightness changes rarely occur even when gaming.
| |||||||||||||||||||||||||
Brightness Distribution: 92 %
Center on Battery: 380 cd/m²
Contrast: 6990000:1 (Black: 0.0001 cd/m²)
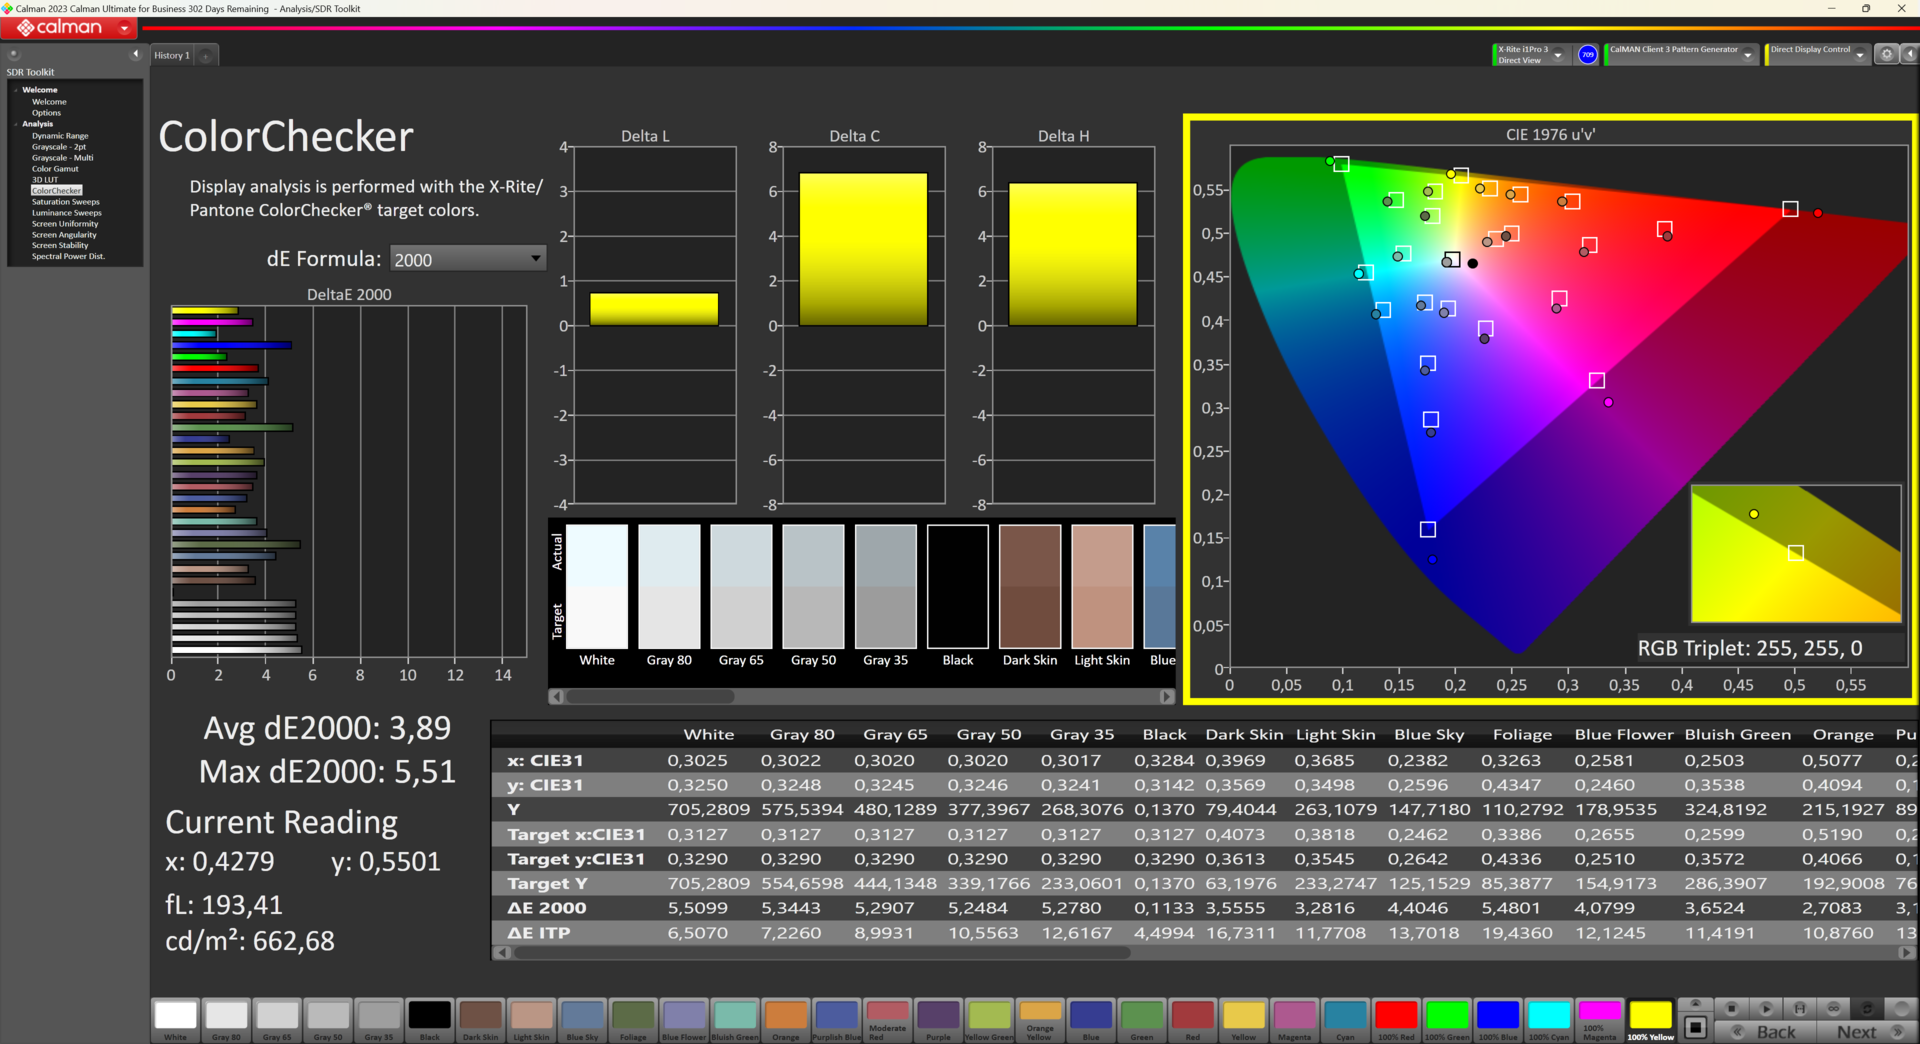
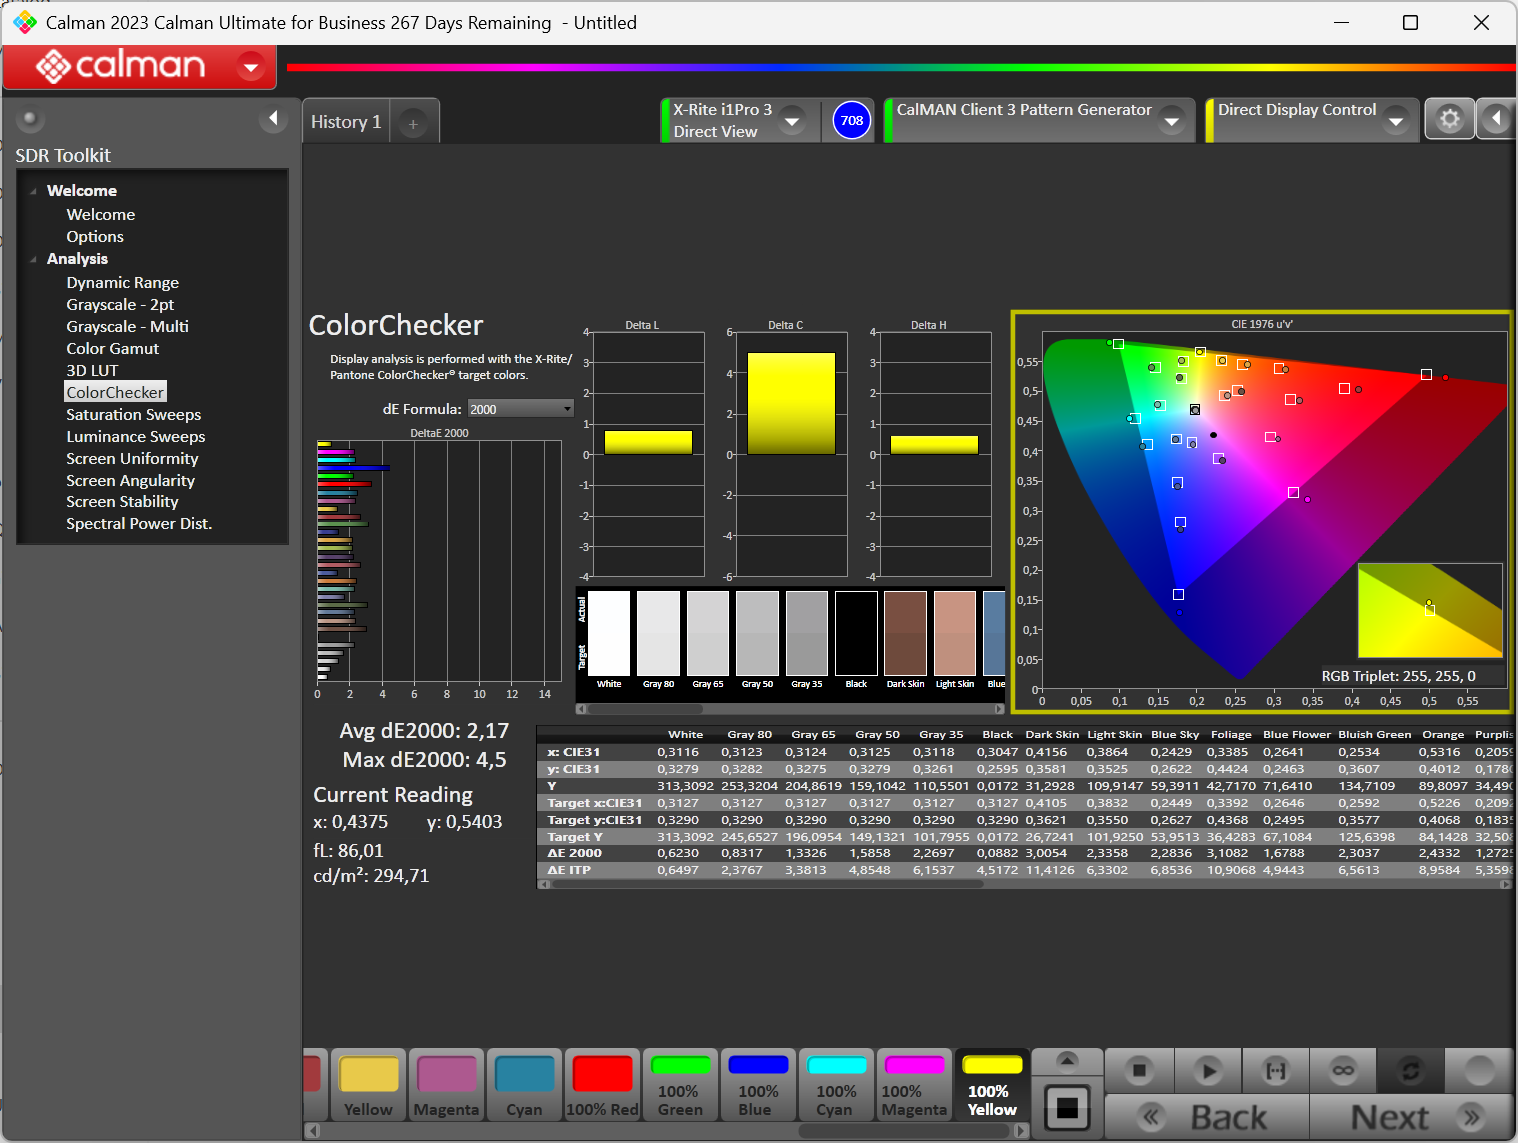
ΔE ColorChecker Calman: 3.89 | ∀{0.5-29.43 Ø4.73}
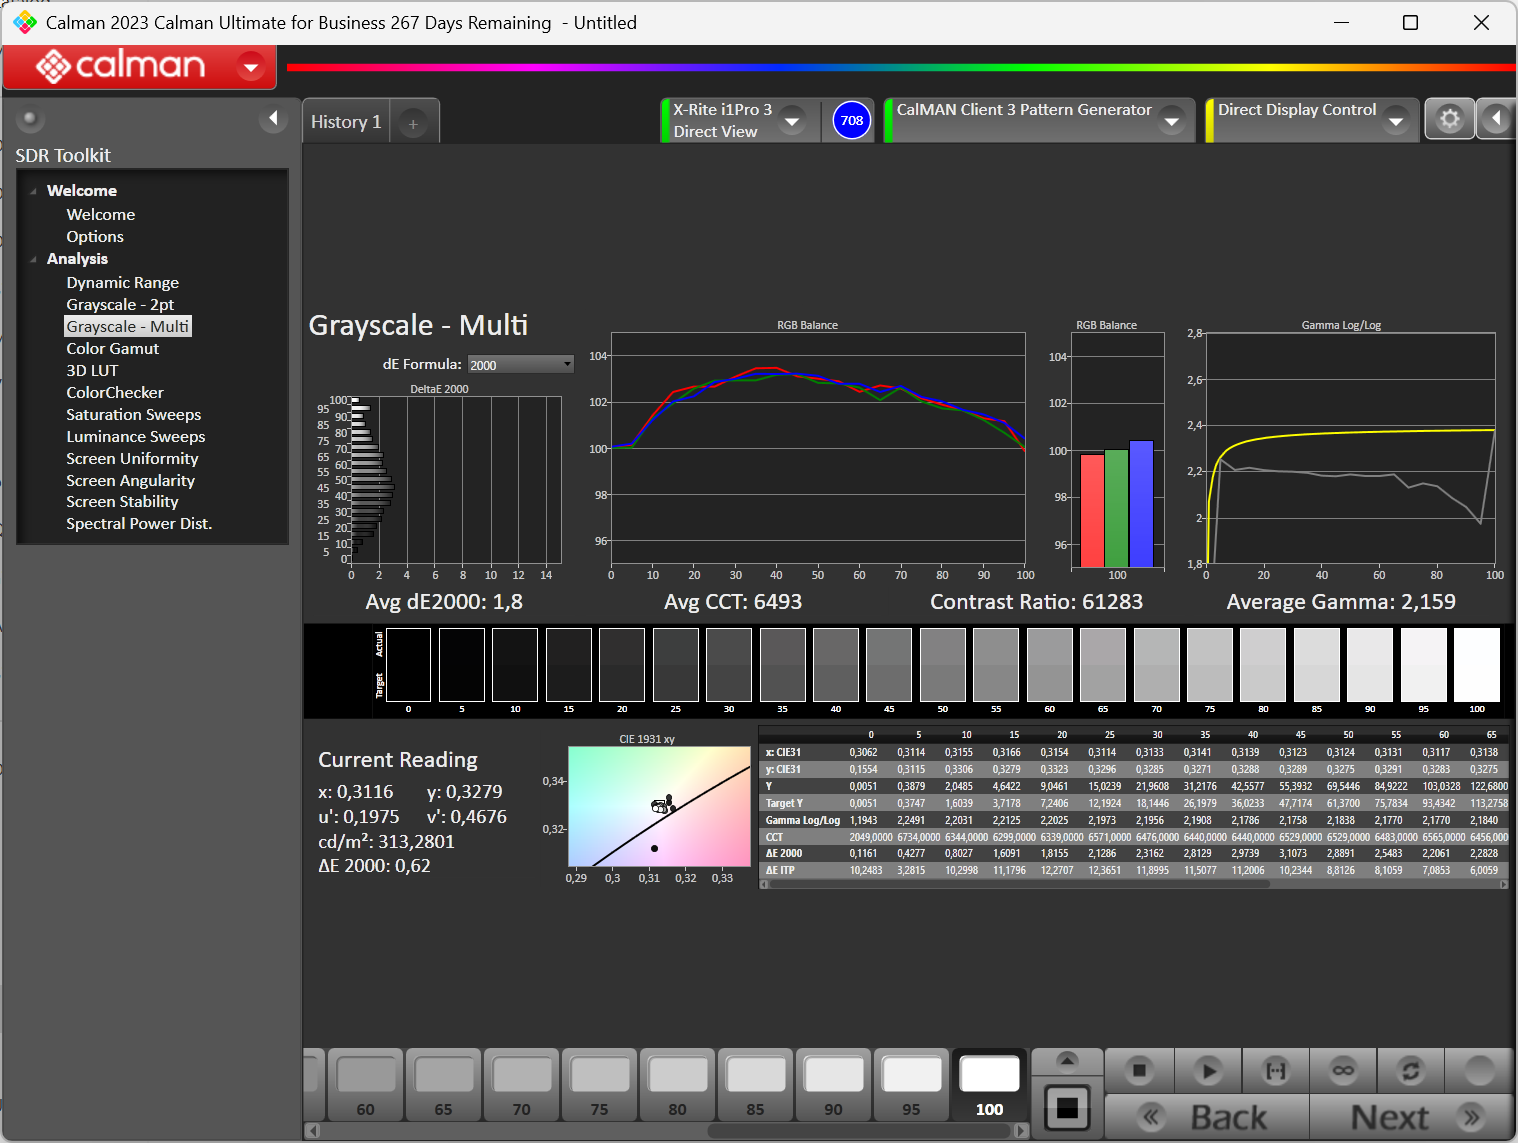
calibrated: 2.17
ΔE Greyscale Calman: 5.14 | ∀{0.09-98 Ø4.97}
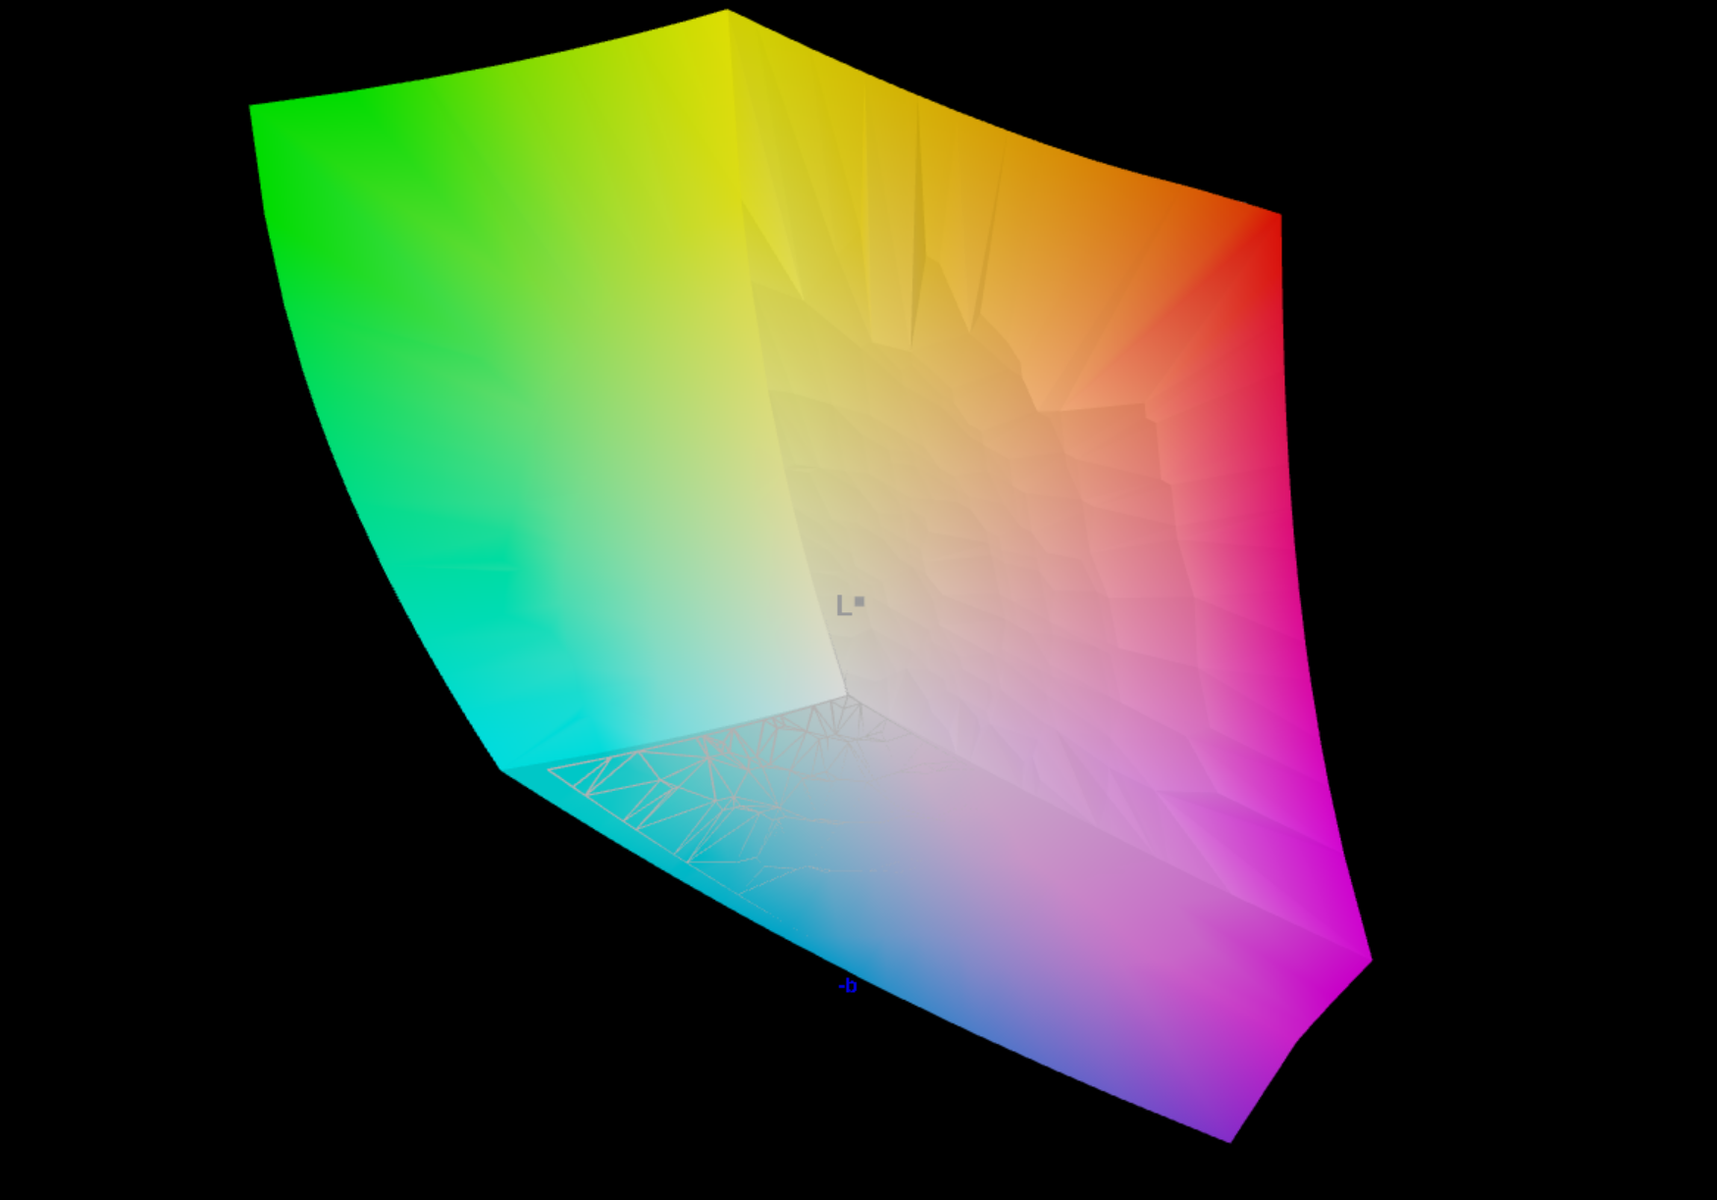
94.12% AdobeRGB 1998 (Argyll 3D)
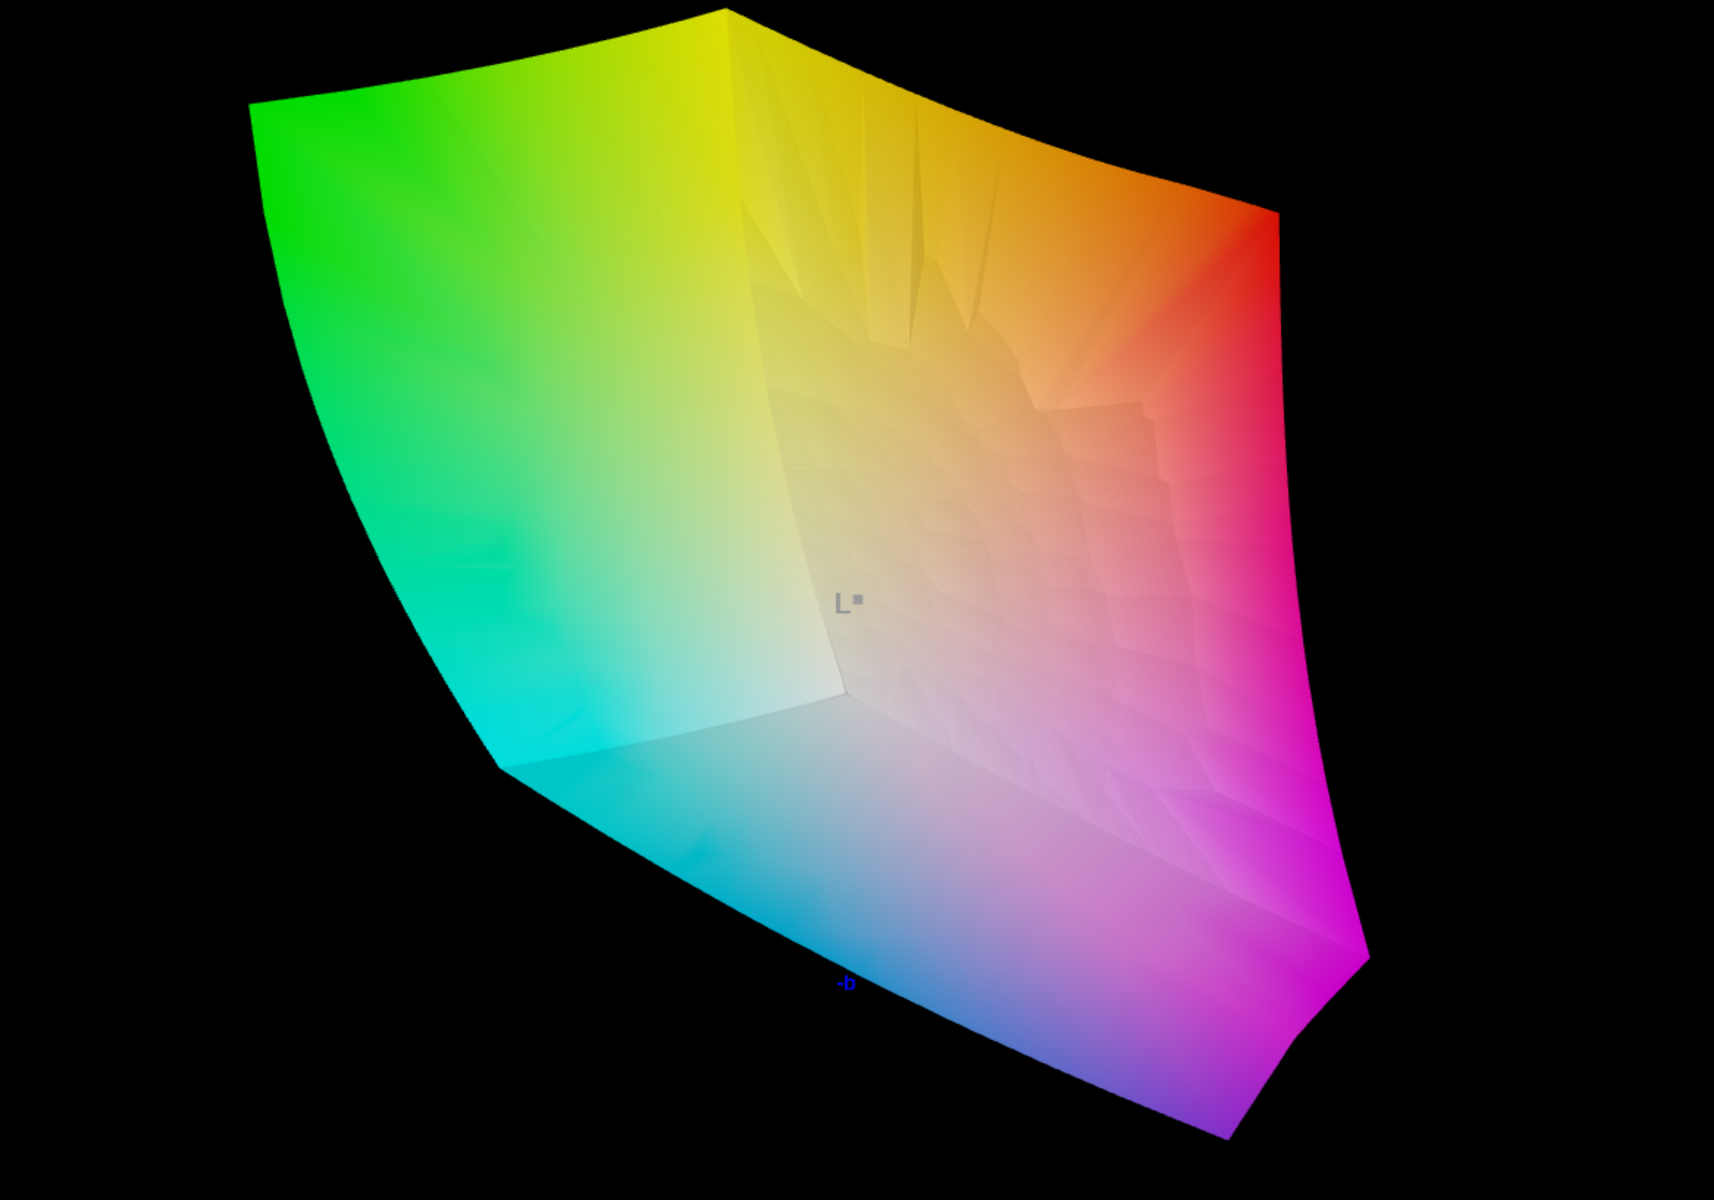
100% sRGB (Argyll 3D)
99.82% Display P3 (Argyll 3D)
Gamma: 2.018
CCT: 7113 K
| Acer Predator Helios 16 PH16-72 AUO43A8, IPS, 2560x1600, 16", 240 Hz | MSI Raider 18 HX A14V AU Optronics B180ZAN1.0, Mini-LED, 3840x2400, 18", 120 Hz | Asus ROG Strix Scar 16 G634JZR BOE NE160QDM-NM7, Mini LED, 2560x1600, 16", 240 Hz | Lenovo Legion Pro 7 16IRX9H BOE CQ NE16QDM-NZB, IPS, 2560x1600, 16", 240 Hz | Acer Predator Triton Neo 16 PTN16-51-978P AU Optronics B160QAN04.S, IPS, 3200x2000, 16", 165 Hz | Schenker Key 17 Pro (M24) BOE, IPS, 3840x2160, 17.3", 144 Hz | |
|---|---|---|---|---|---|---|
| Display | -4% | -1% | -3% | -5% | -5% | |
| HDR Peak Brightness (cd/m²) | 1020 | |||||
| Display P3 Coverage (%) | 99.82 | 96.6 -3% | 99.8 0% | 98.5 -1% | 94.2 -6% | 93.51 -6% |
| sRGB Coverage (%) | 100 | 99.9 0% | 100 0% | 99.9 0% | 99.7 0% | 99.86 0% |
| AdobeRGB 1998 Coverage (%) | 94.12 | 84.8 -10% | 90.8 -4% | 86.7 -8% | 85.3 -9% | 84.33 -10% |
| Response Times | -15% | 58% | 8% | 10% | 15% | |
| Response Time Grey 50% / Grey 80% * (ms) | 7.2 ? | 10.4 ? -44% | 5 ? 31% | 12.6 ? -75% | 12.3 ? -71% | 11.593 ? -61% |
| Response Time Black / White * (ms) | 67.6 ? | 75.8 ? -12% | 10.4 ? 85% | 5.8 ? 91% | 5.8 ? 91% | 6 ? 91% |
| PWM Frequency (Hz) | 2630 | 2606.2 ? | 2040 ? | |||
| PWM Amplitude * (%) | 100 | 90 10% | ||||
| Screen | -16% | -44421% | -46643% | -46650% | -60013% | |
| Brightness middle (cd/m²) | 699 | 575.7 -18% | 490 -30% | 487 -30% | 458 -34% | 548 -22% |
| Brightness (cd/m²) | 672 | 574 -15% | 487 -28% | 460 -32% | 453 -33% | 505 -25% |
| Brightness Distribution (%) | 92 | 94 2% | 94 2% | 88 -4% | 90 -2% | 86 -7% |
| Black Level * (cd/m²) | 0.0001 | 0.4 -399900% | 0.42 -419900% | 0.42 -419900% | 0.54 -539900% | |
| Contrast (:1) | 6990000 | 1225 -100% | 1160 -100% | 1090 -100% | 1015 -100% | |
| Colorchecker dE 2000 * | 3.89 | 3.56 8% | 1.08 72% | 1.12 71% | 1.58 59% | 3.81 2% |
| Colorchecker dE 2000 max. * | 5.51 | 8.64 -57% | 2.38 57% | 2.26 59% | 3.47 37% | 7.9 -43% |
| Colorchecker dE 2000 calibrated * | 2.17 | 2.69 -24% | 0.9 59% | 0.54 75% | 0.77 65% | 2.54 -17% |
| Greyscale dE 2000 * | 5.14 | 5.6 -9% | 1.1 79% | 1.4 73% | 2.3 55% | 5.4 -5% |
| Gamma | 2.018 109% | 2.34 94% | 2.13 103% | 2.242 98% | 2.201 100% | 2.062 107% |
| CCT | 7113 91% | 7872 83% | 6724 97% | 6809 95% | 6540 99% | 7224 90% |
| Total Average (Program / Settings) | -12% /
-13% | -14788% /
-28548% | -15546% /
-29984% | -15548% /
-29989% | -20001% /
-38579% |
* ... smaller is better
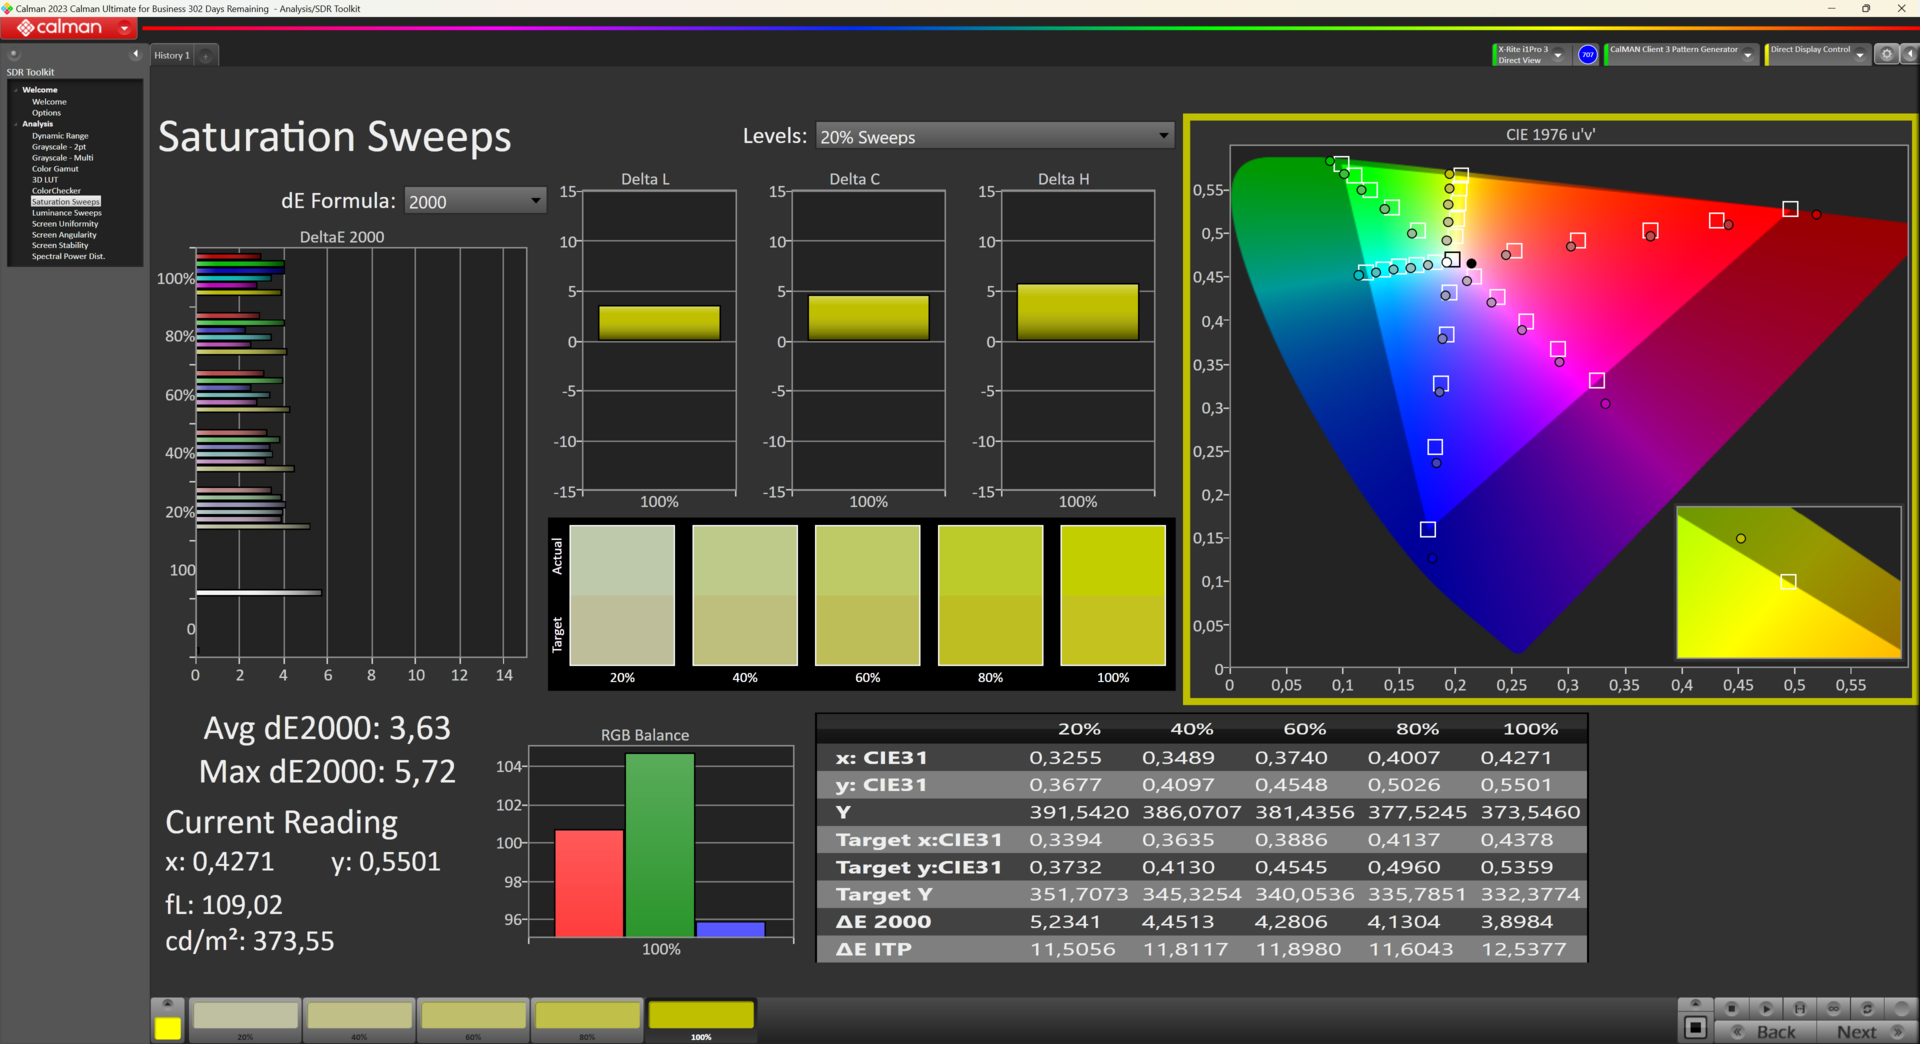
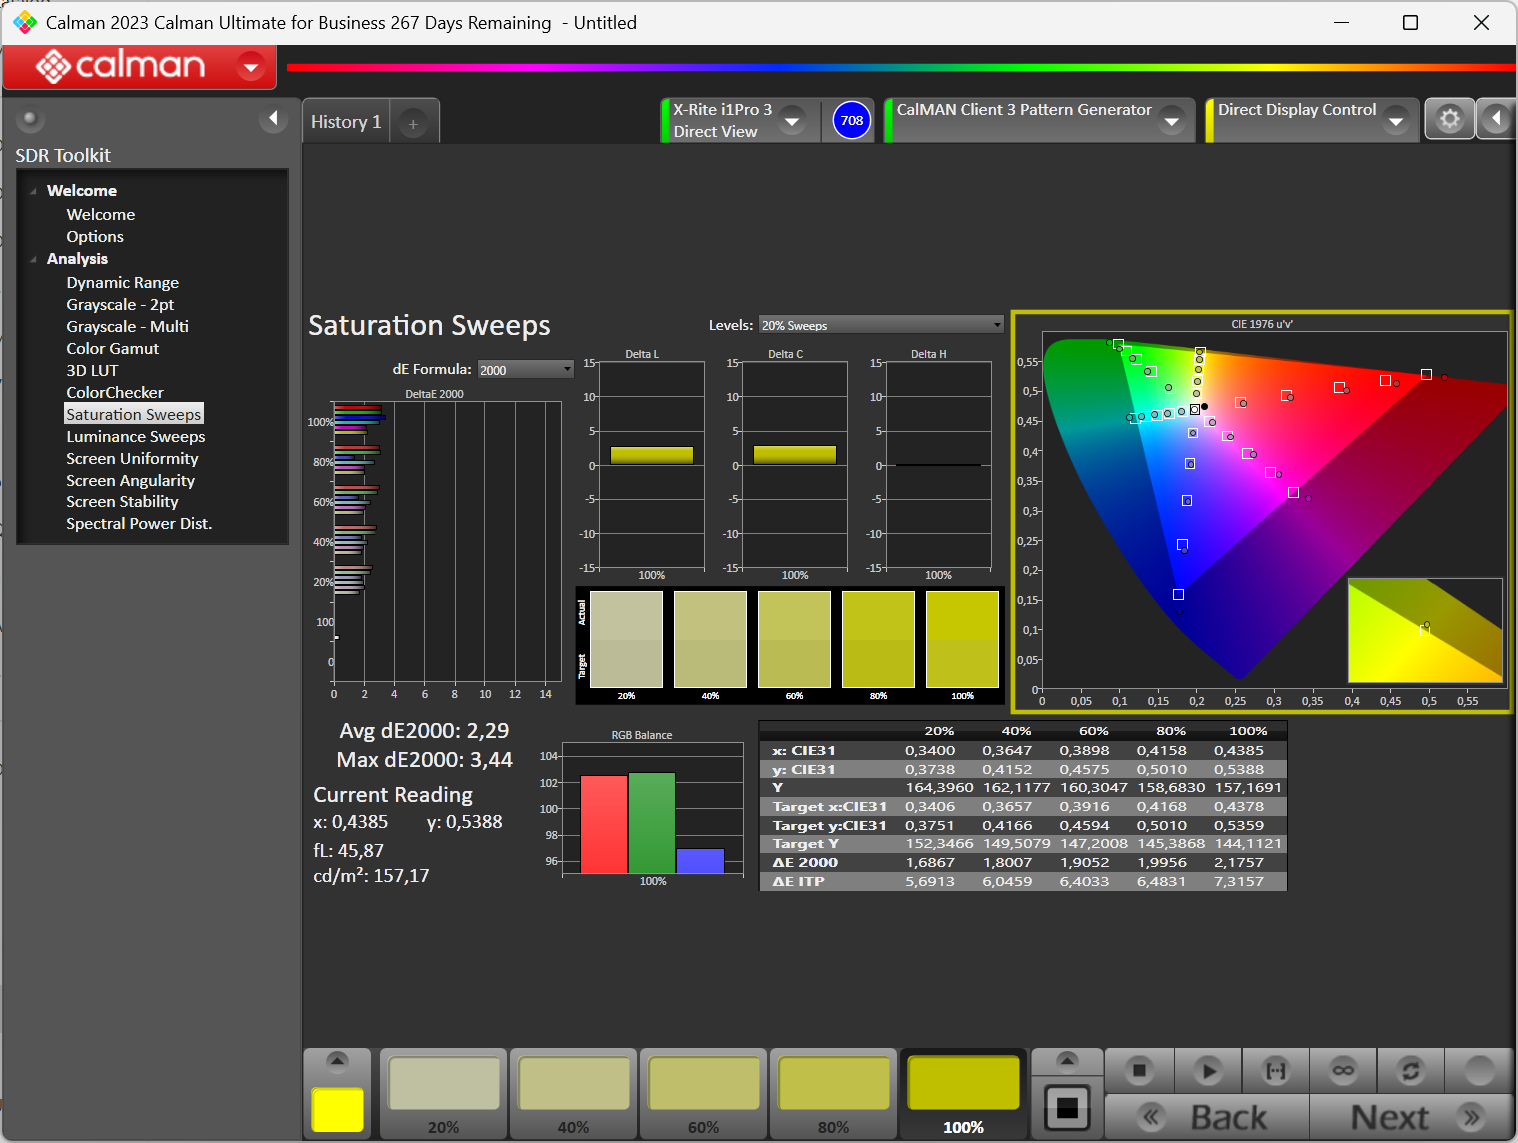
The Acer Predator Helios 16's display covers 99.82% of the DCI-P3 color space, making it ideal for creative tasks such as image and video editing. Even when uncalibrated, the screen impresses with its excellent color accuracy. The slight color deviations with an average Delta-E value of 3.89 are barely noticeable to the naked eye. Post calibration, the Delta-E value even drops well below 3, which also makes the screen suitable for professional applications.

Display Response Times
| ↔ Response Time Black to White | ||
|---|---|---|
| 67.6 ms ... rise ↗ and fall ↘ combined | ↗ 64.8 ms rise |   |
| ↘ 2.8 ms fall | ||
| The screen shows slow response rates in our tests and will be unsatisfactory for gamers. In comparison, all tested devices range from 0.1 (minimum) to 240 (maximum) ms. » 100 % of all devices are better. This means that the measured response time is worse than the average of all tested devices (19.9 ms). | ||
| ↔ Response Time 50% Grey to 80% Grey | ||
| 7.2 ms ... rise ↗ and fall ↘ combined | ↗ 2.8 ms rise |   |
| ↘ 4.4 ms fall | ||
| The screen shows very fast response rates in our tests and should be very well suited for fast-paced gaming. In comparison, all tested devices range from 0.165 (minimum) to 636 (maximum) ms. » 20 % of all devices are better. This means that the measured response time is better than the average of all tested devices (31.1 ms). | ||
Screen Flickering / PWM (Pulse-Width Modulation)
| Screen flickering / PWM detected | 2630 Hz Amplitude: 100 % |  | |
The display backlight flickers at 2630 Hz (worst case, e.g., utilizing PWM) . The frequency of 2630 Hz is quite high, so most users sensitive to PWM should not notice any flickering. In comparison: 52 % of all tested devices do not use PWM to dim the display. If PWM was detected, an average of 7791 (minimum: 5 - maximum: 343500) Hz was measured. | |||


Thanks to the high brightness of over 1,000 cd/m², the Acer Predator Helios 16 can also be used outdoors, even in direct sunlight. Although reflections on the display cannot be completely avoided, they are kept to a minimum. The matte display surface also helps to minimize annoying reflections.
The mini LED display's viewing angle stability is excellent. Even at extreme viewing angles, colors and contrast remain stable without distortions or inversions. This allows several people to view the screen at the same time without anyone having to forego an optimum viewing experience.
Performance: Top specs ensure high performance
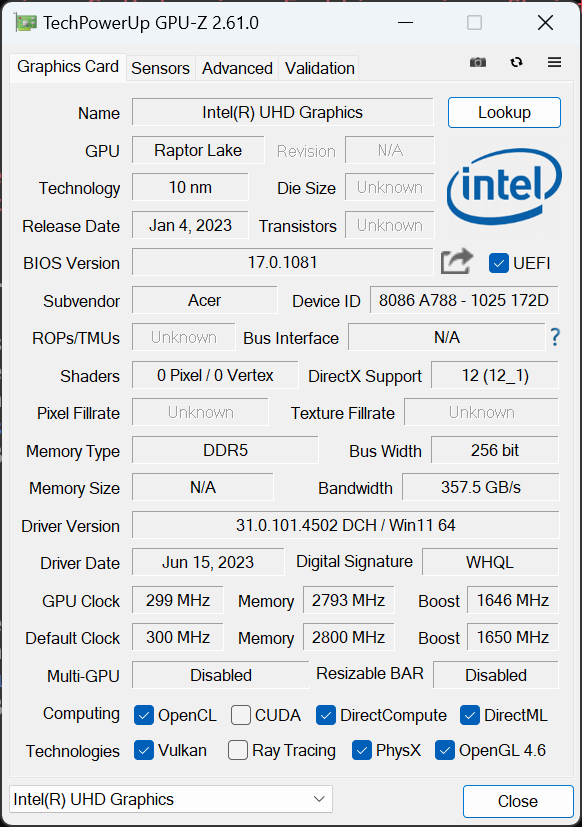
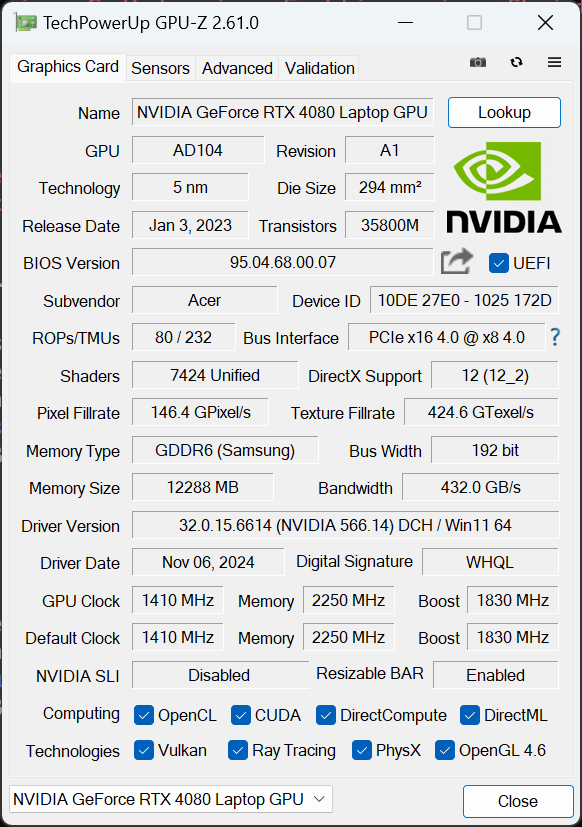
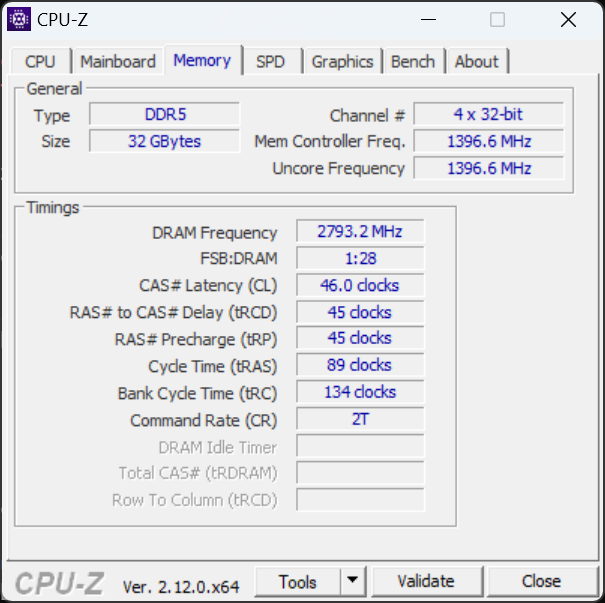
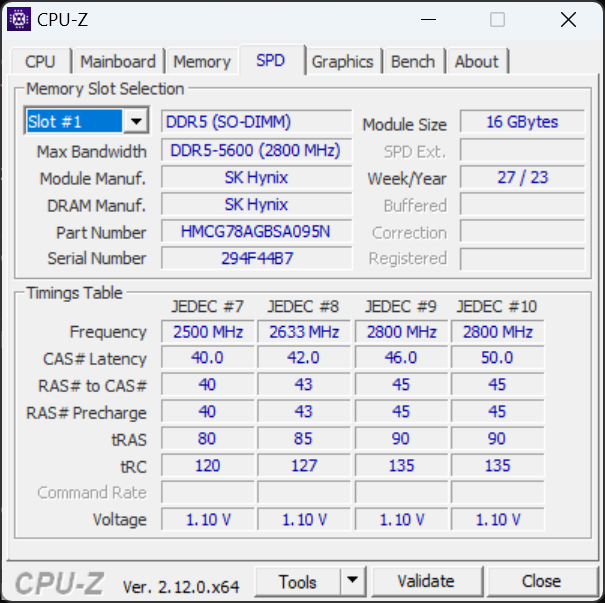
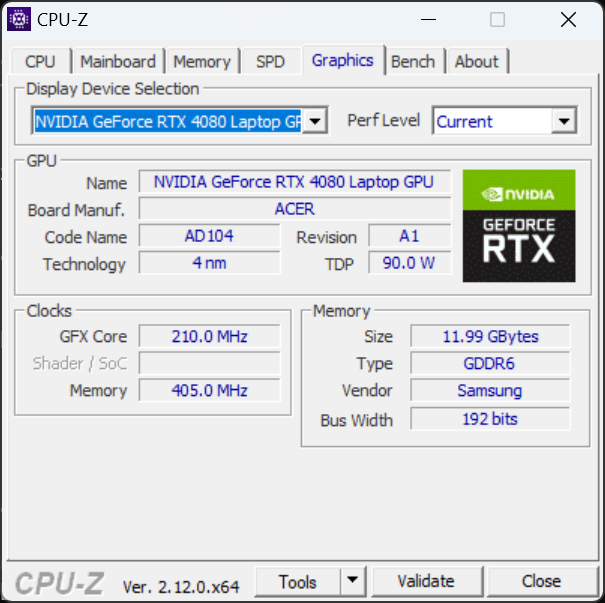
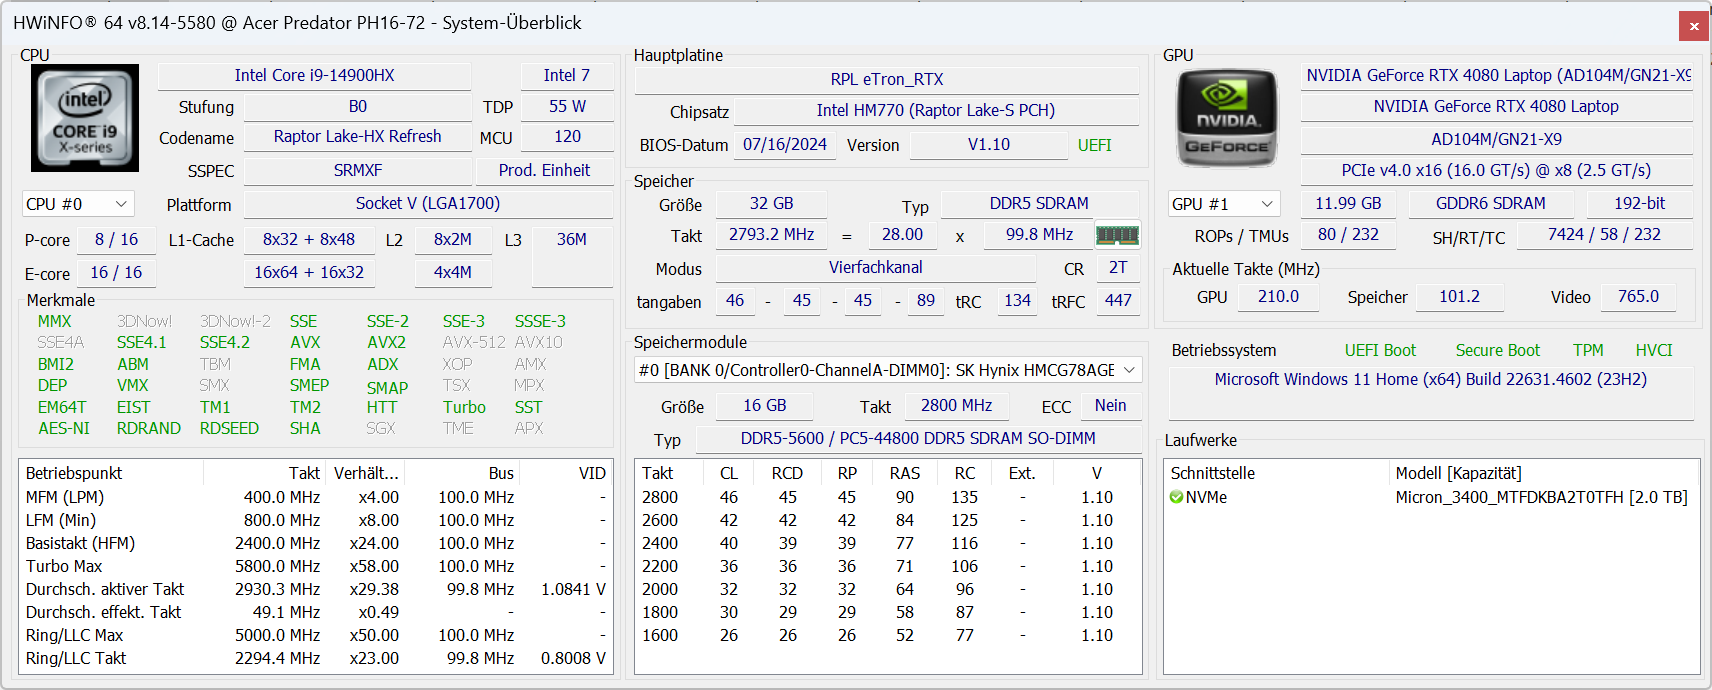
The Acer Predator Helios 16 can be purchased in various configurations to meet the user's individual needs. Our review device is equipped with the top features: An Intel Core i9-14900HX processor with 24 cores (32 threads) and a clock speed of 2.20 GHz are responsible for enormous computing power. Paired with an NVIDIA GeForce RTX 4080 laptop GPU with 12 GB of dedicated graphics memory and 32 GB of DDR5 RAM, even the most demanding games and applications are a straightforward task. The 2 TB PCIe NVMe SSD guarantees lightning-fast loading times and smooth multitasking.
Alternatively, configurations with an NVIDIA GeForce RTX 4070 laptop GPU or an Intel Core i7-14700HX processor are also available. The RAM is available in 16 GB and 32 GB, and the SSD comes in capacities of either 1 or 2 TB. This means that the Helios 16 can be optimally adapted to your budget and desired performance. Depending on the retailer, different configurations are available. From the second quarter of 2025, the Predator Helios 16, with Intel's latest AI processors and RTX 5000 GPUs, will be available.
Test conditions
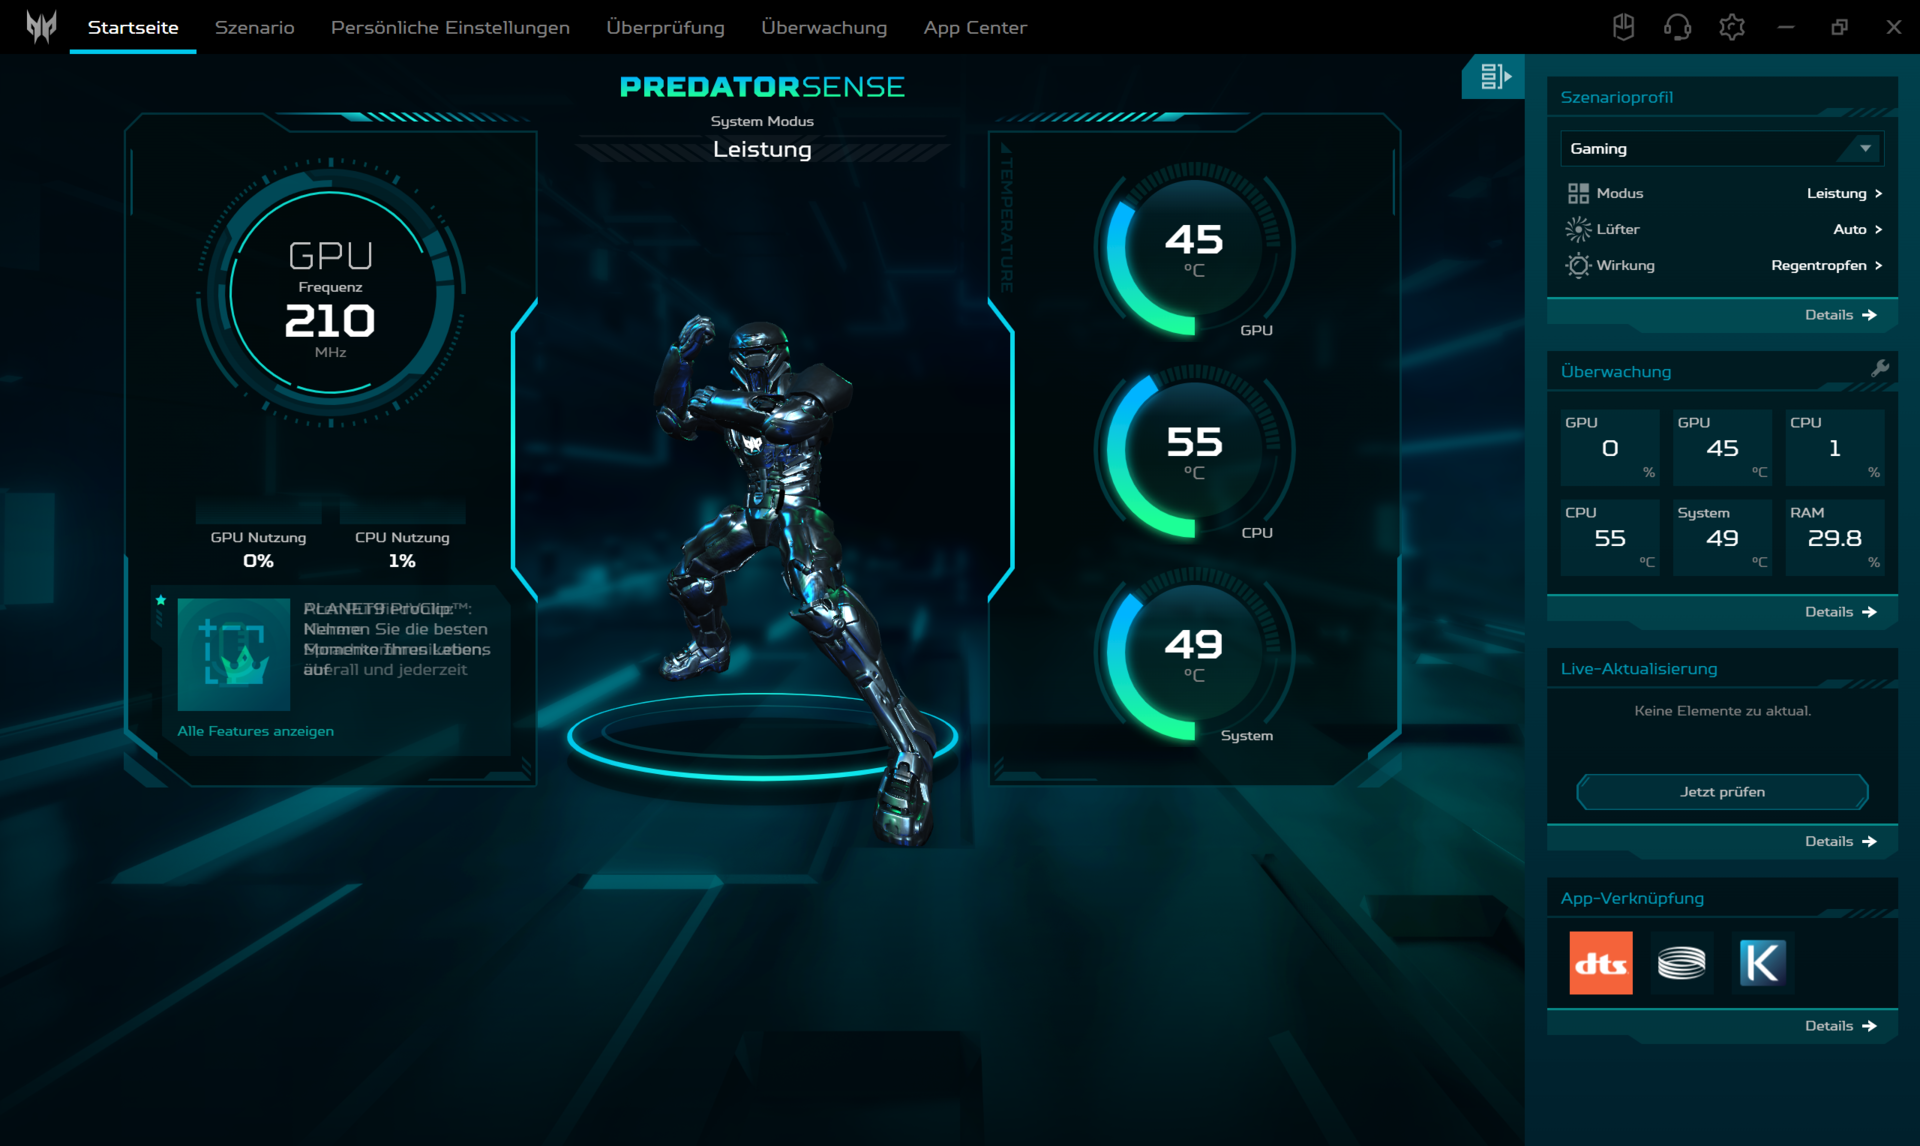
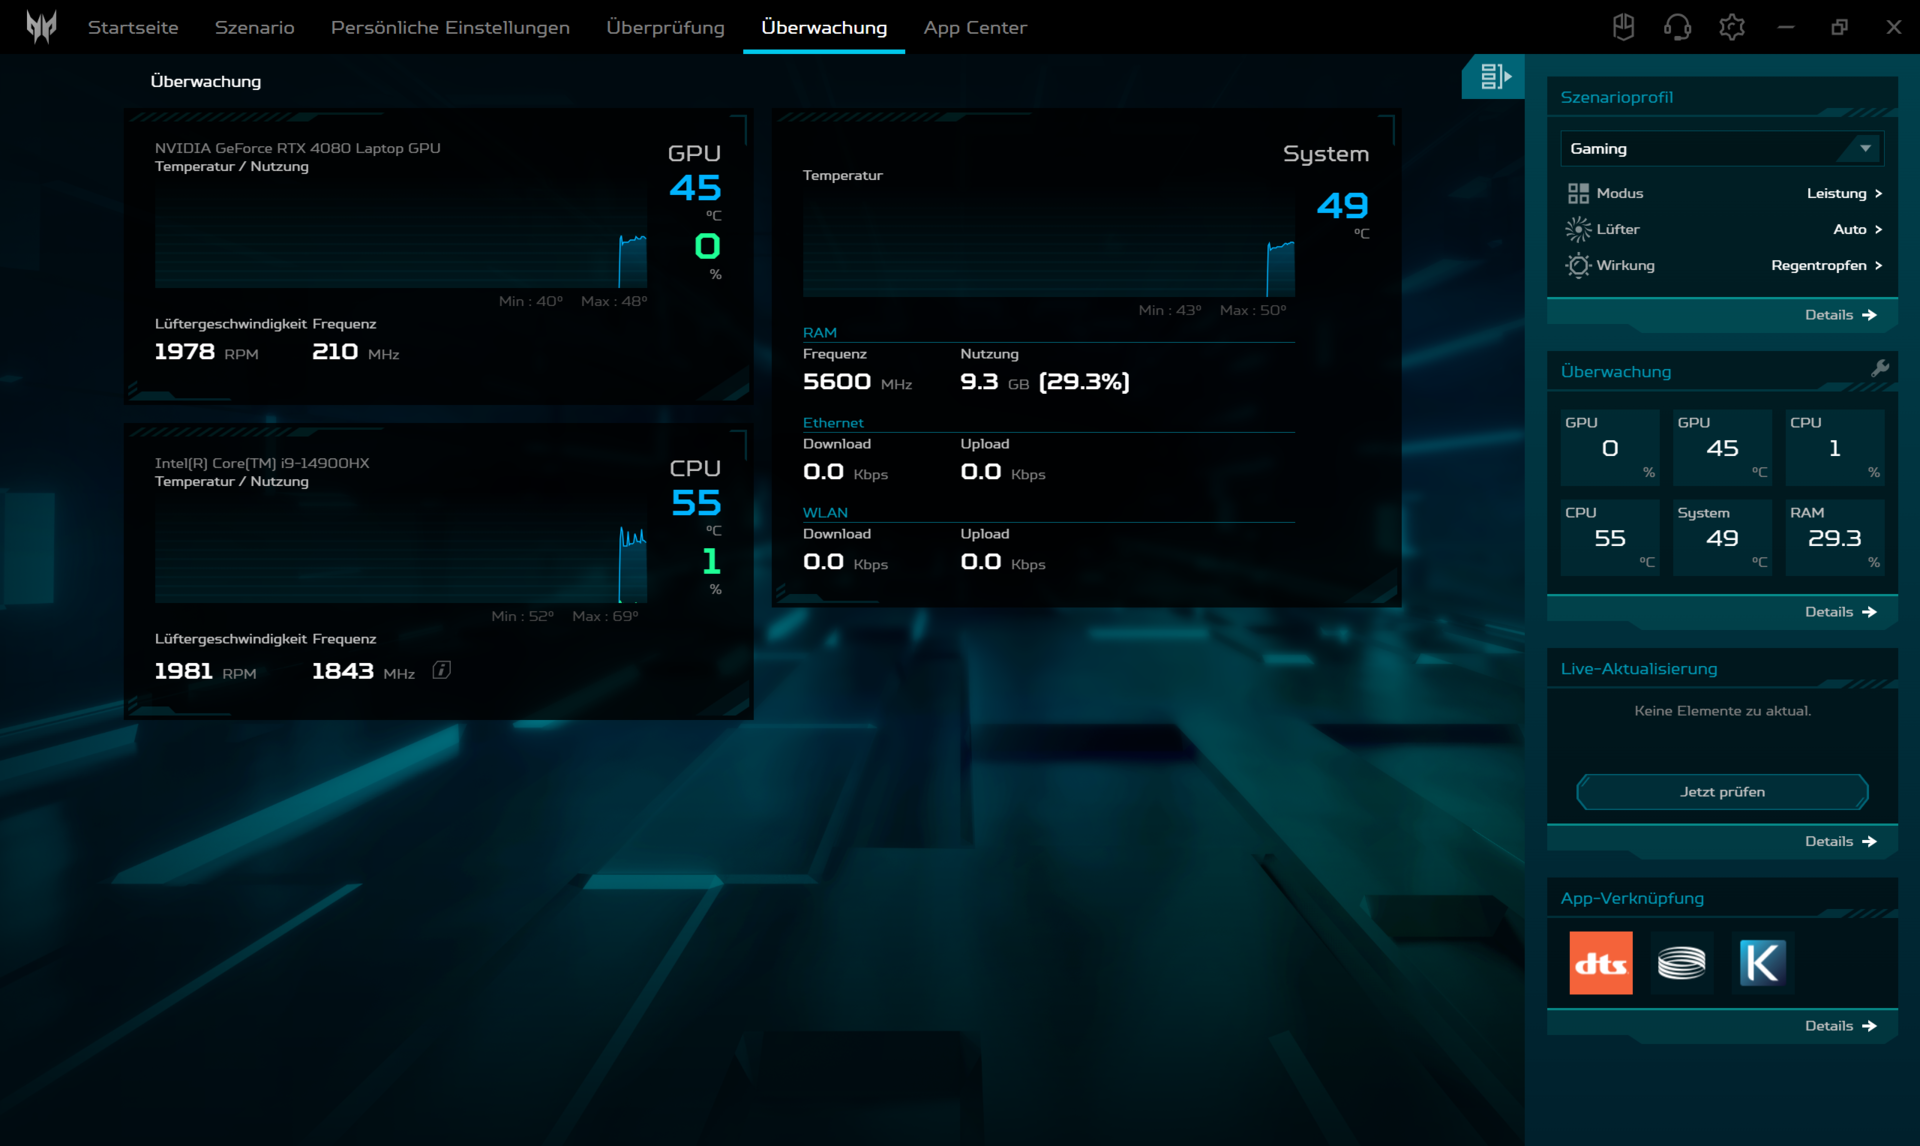
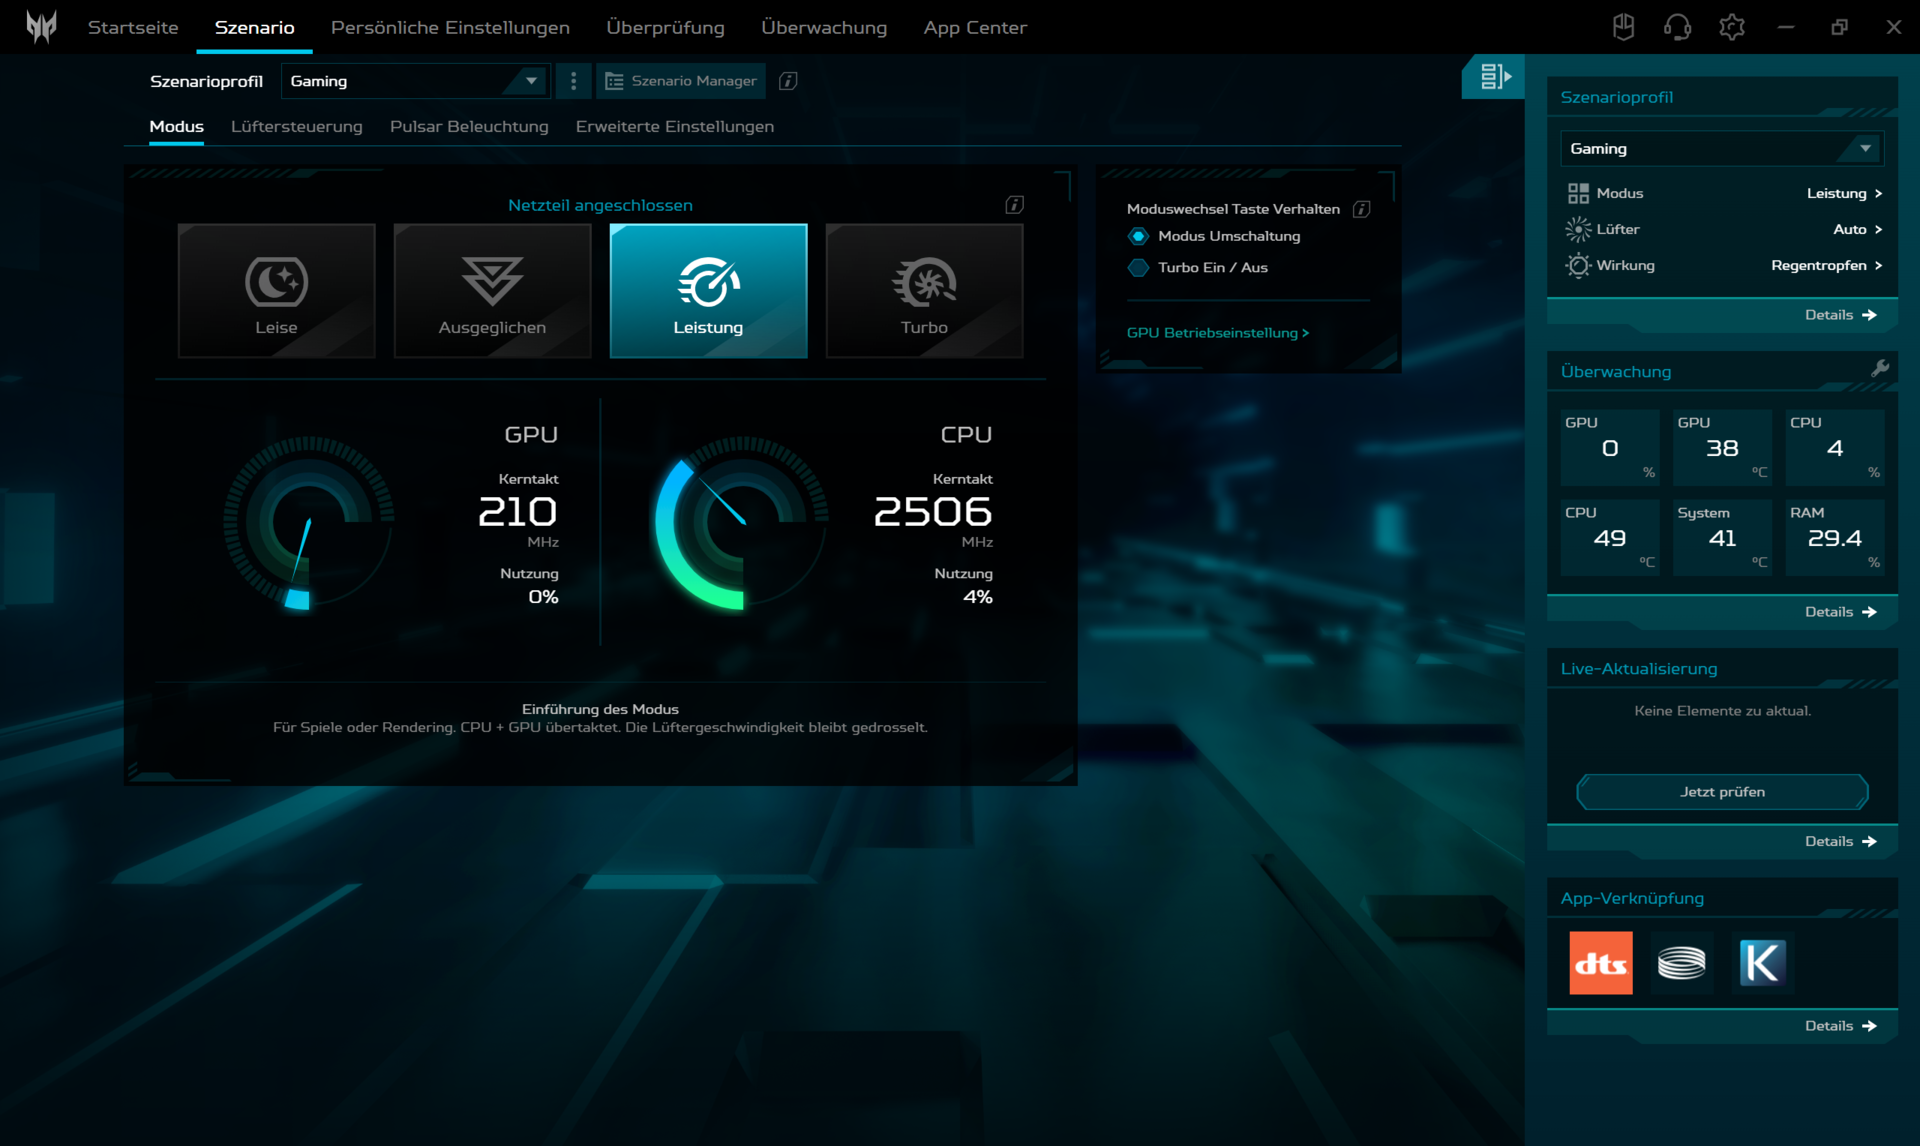
The Acer Predator Helios 16's performance can be influenced via the pre-installed PredatorSense software. There are four different performance options to choose from: "Quiet", "Balanced", "Performance", and "Turbo". After some tests, the "Performance" mode proved to be the optimum choice for our other benchmarks. It offers the best balance between pleasant fan noise and high performance when gaming.
It should be noted that the Helios 16's performance management is rather cautious with the 14900HX and slowly gets close to the target temperatures. This means that, in some cases, it can take a few minutes before the full performance of the processor is available to the user.
Performance mode overview
| Performance mode | Prime95 CPU power consumption | Furmark GPU power consumption | Prime95 and Furmark power consumption CPU/GPU | Cyberpunk 2077 PL QHD benchmark |
|---|---|---|---|---|
| Quiet | 55 watts | 95 watts | 50 watts/35 watts | 61fps |
| Balanced | 85 watts | 115 watts | 65 watts/85 watts | 64fps |
| Performance | 95 watts | 140 watts | 55 watts/ 110 watts | 72fps |
| Turbo | 120 Watt | 175 Watt | 90 Watt/ 130 Watt | 81 FPS |
Processor
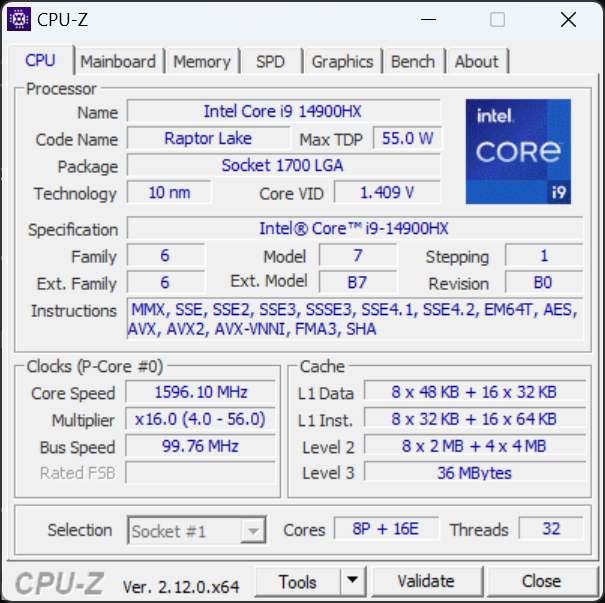
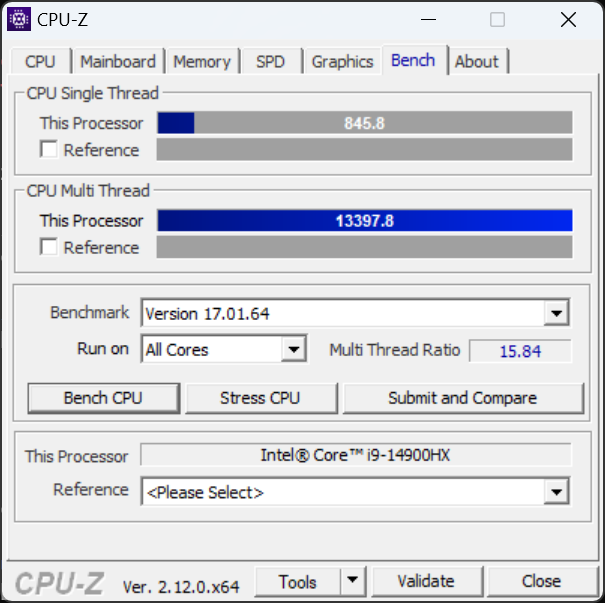
The Intel Core i9-14900HX in the Acer Predator Helios 16 is a real powerhouse. With 24 cores (8 P-cores and 16 E-cores) that can handle 32 threads in tandem, it provides more than enough computing power for demanding games and applications. Interestingly, the processor's boost power consumption (PL2) remains at 140 watts across all performance modes.
In the Acer Predator Helios 16, the i9-14900HX delivers above-average performance without the fans having to run at full speed. The Helios 16's efficient cooling solution allows it to keep the CPU under control even under high load while ensuring pleasant noise levels. This is remarkable, primarily in comparison to other gaming laptops such as the Lenovo Legion Pro 7, the Asus ROG Strix Scar 16 or the SCHENKER Key 17 Pro, some of which have significantly higher PL1 and PL2 values but are significantly louder.
Cinebench R15 Multi Continuous Test
Cinebench R23: Multi Core | Single Core
Cinebench R20: CPU (Multi Core) | CPU (Single Core)
Cinebench R15: CPU Multi 64Bit | CPU Single 64Bit
Blender: v2.79 BMW27 CPU
7-Zip 18.03: 7z b 4 | 7z b 4 -mmt1
Geekbench 6.7: Multi-Core | Single-Core
Geekbench 5.5: Multi-Core | Single-Core
HWBOT x265 Benchmark v2.2: 4k Preset
LibreOffice : 20 Documents To PDF
R Benchmark 2.5: Overall mean
| CPU Performance rating | |
| Lenovo Legion Pro 7 16IRX9H | |
| Asus ROG Strix Scar 16 G634JZR | |
| MSI Raider 18 HX A14V | |
| Acer Predator Helios 16 PH16-72 | |
| Average Intel Core i9-14900HX | |
| Schenker Key 17 Pro (M24) | |
| Average of class Gaming | |
| Acer Predator Triton Neo 16 PTN16-51-978P | |
| Cinebench R23 / Multi Core | |
| Lenovo Legion Pro 7 16IRX9H | |
| Asus ROG Strix Scar 16 G634JZR | |
| Acer Predator Helios 16 PH16-72 | |
| MSI Raider 18 HX A14V | |
| Average Intel Core i9-14900HX (17078 - 36249, n=37) | |
| Schenker Key 17 Pro (M24) | |
| Average of class Gaming (10488 - 40970, n=110, last 2 years) | |
| Acer Predator Triton Neo 16 PTN16-51-978P | |
| Cinebench R23 / Single Core | |
| Lenovo Legion Pro 7 16IRX9H | |
| Asus ROG Strix Scar 16 G634JZR | |
| MSI Raider 18 HX A14V | |
| Average Intel Core i9-14900HX (1720 - 2245, n=37) | |
| Acer Predator Helios 16 PH16-72 | |
| Schenker Key 17 Pro (M24) | |
| Average of class Gaming (1166 - 2356, n=110, last 2 years) | |
| Acer Predator Triton Neo 16 PTN16-51-978P | |
| Cinebench R20 / CPU (Multi Core) | |
| Lenovo Legion Pro 7 16IRX9H | |
| Asus ROG Strix Scar 16 G634JZR | |
| MSI Raider 18 HX A14V | |
| Acer Predator Helios 16 PH16-72 | |
| Average Intel Core i9-14900HX (6579 - 13832, n=37) | |
| Schenker Key 17 Pro (M24) | |
| Average of class Gaming (4029 - 16108, n=109, last 2 years) | |
| Acer Predator Triton Neo 16 PTN16-51-978P | |
| Cinebench R20 / CPU (Single Core) | |
| MSI Raider 18 HX A14V | |
| Asus ROG Strix Scar 16 G634JZR | |
| Lenovo Legion Pro 7 16IRX9H | |
| Acer Predator Helios 16 PH16-72 | |
| Average Intel Core i9-14900HX (657 - 859, n=37) | |
| Schenker Key 17 Pro (M24) | |
| Average of class Gaming (442 - 895, n=109, last 2 years) | |
| Acer Predator Triton Neo 16 PTN16-51-978P | |
| Cinebench R15 / CPU Multi 64Bit | |
| Asus ROG Strix Scar 16 G634JZR | |
| Lenovo Legion Pro 7 16IRX9H | |
| MSI Raider 18 HX A14V | |
| Acer Predator Helios 16 PH16-72 | |
| Average Intel Core i9-14900HX (3263 - 5589, n=38) | |
| Schenker Key 17 Pro (M24) | |
| Average of class Gaming (1578 - 6271, n=109, last 2 years) | |
| Acer Predator Triton Neo 16 PTN16-51-978P | |
| Cinebench R15 / CPU Single 64Bit | |
| Asus ROG Strix Scar 16 G634JZR | |
| Lenovo Legion Pro 7 16IRX9H | |
| MSI Raider 18 HX A14V | |
| Acer Predator Helios 16 PH16-72 | |
| Average Intel Core i9-14900HX (247 - 323, n=37) | |
| Average of class Gaming (188.8 - 343, n=109, last 2 years) | |
| Schenker Key 17 Pro (M24) | |
| Acer Predator Triton Neo 16 PTN16-51-978P | |
| Blender / v2.79 BMW27 CPU | |
| Acer Predator Triton Neo 16 PTN16-51-978P | |
| Average of class Gaming (80 - 330, n=107, last 2 years) | |
| Average Intel Core i9-14900HX (91 - 206, n=37) | |
| Acer Predator Helios 16 PH16-72 | |
| Schenker Key 17 Pro (M24) | |
| Asus ROG Strix Scar 16 G634JZR | |
| MSI Raider 18 HX A14V | |
| Lenovo Legion Pro 7 16IRX9H | |
| 7-Zip 18.03 / 7z b 4 | |
| Lenovo Legion Pro 7 16IRX9H | |
| MSI Raider 18 HX A14V | |
| Asus ROG Strix Scar 16 G634JZR | |
| Average Intel Core i9-14900HX (66769 - 136645, n=37) | |
| Schenker Key 17 Pro (M24) | |
| Acer Predator Helios 16 PH16-72 | |
| Average of class Gaming (33491 - 148086, n=108, last 2 years) | |
| Acer Predator Triton Neo 16 PTN16-51-978P | |
| 7-Zip 18.03 / 7z b 4 -mmt1 | |
| Asus ROG Strix Scar 16 G634JZR | |
| Lenovo Legion Pro 7 16IRX9H | |
| Average Intel Core i9-14900HX (5452 - 7545, n=37) | |
| Acer Predator Helios 16 PH16-72 | |
| Schenker Key 17 Pro (M24) | |
| MSI Raider 18 HX A14V | |
| Average of class Gaming (4199 - 7436, n=108, last 2 years) | |
| Acer Predator Triton Neo 16 PTN16-51-978P | |
| Geekbench 6.7 / Multi-Core | |
| Asus ROG Strix Scar 16 G634JZR | |
| Lenovo Legion Pro 7 16IRX9H | |
| Acer Predator Helios 16 PH16-72 | |
| Average Intel Core i9-14900HX (13158 - 19665, n=37) | |
| MSI Raider 18 HX A14V | |
| Schenker Key 17 Pro (M24) | |
| Average of class Gaming (6625 - 22104, n=109, last 2 years) | |
| Acer Predator Triton Neo 16 PTN16-51-978P | |
| Geekbench 6.7 / Single-Core | |
| Lenovo Legion Pro 7 16IRX9H | |
| Asus ROG Strix Scar 16 G634JZR | |
| MSI Raider 18 HX A14V | |
| Acer Predator Helios 16 PH16-72 | |
| Average Intel Core i9-14900HX (2419 - 3129, n=37) | |
| Average of class Gaming (1490 - 3259, n=109, last 2 years) | |
| Schenker Key 17 Pro (M24) | |
| Acer Predator Triton Neo 16 PTN16-51-978P | |
| Geekbench 5.5 / Multi-Core | |
| Asus ROG Strix Scar 16 G634JZR | |
| Acer Predator Helios 16 PH16-72 | |
| Lenovo Legion Pro 7 16IRX9H | |
| MSI Raider 18 HX A14V | |
| Average Intel Core i9-14900HX (8618 - 23194, n=37) | |
| Schenker Key 17 Pro (M24) | |
| Average of class Gaming (6460 - 27010, n=108, last 2 years) | |
| Acer Predator Triton Neo 16 PTN16-51-978P | |
| Geekbench 5.5 / Single-Core | |
| Asus ROG Strix Scar 16 G634JZR | |
| MSI Raider 18 HX A14V | |
| Lenovo Legion Pro 7 16IRX9H | |
| Average Intel Core i9-14900HX (1669 - 2210, n=37) | |
| Acer Predator Helios 16 PH16-72 | |
| Average of class Gaming (986 - 2474, n=108, last 2 years) | |
| Schenker Key 17 Pro (M24) | |
| Acer Predator Triton Neo 16 PTN16-51-978P | |
| HWBOT x265 Benchmark v2.2 / 4k Preset | |
| Lenovo Legion Pro 7 16IRX9H | |
| MSI Raider 18 HX A14V | |
| Asus ROG Strix Scar 16 G634JZR | |
| Average Intel Core i9-14900HX (16.8 - 38.9, n=37) | |
| Acer Predator Helios 16 PH16-72 | |
| Average of class Gaming (11.5 - 44.3, n=108, last 2 years) | |
| Schenker Key 17 Pro (M24) | |
| Acer Predator Triton Neo 16 PTN16-51-978P | |
| LibreOffice / 20 Documents To PDF | |
| Acer Predator Triton Neo 16 PTN16-51-978P | |
| Average of class Gaming (19 - 88.8, n=108, last 2 years) | |
| Asus ROG Strix Scar 16 G634JZR | |
| Schenker Key 17 Pro (M24) | |
| Average Intel Core i9-14900HX (19 - 85.1, n=37) | |
| Lenovo Legion Pro 7 16IRX9H | |
| MSI Raider 18 HX A14V | |
| Acer Predator Helios 16 PH16-72 | |
| R Benchmark 2.5 / Overall mean | |
| Acer Predator Triton Neo 16 PTN16-51-978P | |
| Average of class Gaming (0.3439 - 0.759, n=109, last 2 years) | |
| Schenker Key 17 Pro (M24) | |
| Lenovo Legion Pro 7 16IRX9H | |
| Average Intel Core i9-14900HX (0.3604 - 0.4859, n=37) | |
| MSI Raider 18 HX A14V | |
| Acer Predator Helios 16 PH16-72 | |
| Asus ROG Strix Scar 16 G634JZR | |
* ... smaller is better
AIDA64: FP32 Ray-Trace | FPU Julia | CPU SHA3 | CPU Queen | FPU SinJulia | FPU Mandel | CPU AES | CPU ZLib | FP64 Ray-Trace | CPU PhotoWorxx
| Performance rating | |
| Lenovo Legion Pro 7 16IRX9H | |
| Asus ROG Strix Scar 16 G634JZR | |
| MSI Raider 18 HX A14V | |
| Average of class Gaming | |
| Average Intel Core i9-14900HX | |
| Acer Predator Helios 16 PH16-72 | |
| Schenker Key 17 Pro (M24) | |
| Acer Predator Triton Neo 16 PTN16-51-978P | |
| AIDA64 / FP32 Ray-Trace | |
| Average of class Gaming (10227 - 85542, n=107, last 2 years) | |
| Lenovo Legion Pro 7 16IRX9H | |
| MSI Raider 18 HX A14V | |
| Asus ROG Strix Scar 16 G634JZR | |
| Average Intel Core i9-14900HX (13098 - 33474, n=36) | |
| Acer Predator Helios 16 PH16-72 | |
| Schenker Key 17 Pro (M24) | |
| Acer Predator Triton Neo 16 PTN16-51-978P | |
| AIDA64 / FPU Julia | |
| Lenovo Legion Pro 7 16IRX9H | |
| MSI Raider 18 HX A14V | |
| Average of class Gaming (51376 - 238426, n=107, last 2 years) | |
| Asus ROG Strix Scar 16 G634JZR | |
| Average Intel Core i9-14900HX (67573 - 166040, n=36) | |
| Acer Predator Helios 16 PH16-72 | |
| Schenker Key 17 Pro (M24) | |
| Acer Predator Triton Neo 16 PTN16-51-978P | |
| AIDA64 / CPU SHA3 | |
| Lenovo Legion Pro 7 16IRX9H | |
| MSI Raider 18 HX A14V | |
| Asus ROG Strix Scar 16 G634JZR | |
| Average of class Gaming (2180 - 9817, n=107, last 2 years) | |
| Average Intel Core i9-14900HX (3589 - 7979, n=36) | |
| Acer Predator Helios 16 PH16-72 | |
| Schenker Key 17 Pro (M24) | |
| Acer Predator Triton Neo 16 PTN16-51-978P | |
| AIDA64 / CPU Queen | |
| Asus ROG Strix Scar 16 G634JZR | |
| Lenovo Legion Pro 7 16IRX9H | |
| MSI Raider 18 HX A14V | |
| Acer Predator Helios 16 PH16-72 | |
| Schenker Key 17 Pro (M24) | |
| Average Intel Core i9-14900HX (118405 - 148966, n=36) | |
| Average of class Gaming (49785 - 173351, n=98, last 2 years) | |
| Acer Predator Triton Neo 16 PTN16-51-978P | |
| AIDA64 / FPU SinJulia | |
| MSI Raider 18 HX A14V | |
| Lenovo Legion Pro 7 16IRX9H | |
| Asus ROG Strix Scar 16 G634JZR | |
| Acer Predator Helios 16 PH16-72 | |
| Average Intel Core i9-14900HX (10475 - 18517, n=36) | |
| Average of class Gaming (4424 - 33636, n=107, last 2 years) | |
| Schenker Key 17 Pro (M24) | |
| Acer Predator Triton Neo 16 PTN16-51-978P | |
| AIDA64 / FPU Mandel | |
| Average of class Gaming (25115 - 128721, n=107, last 2 years) | |
| Lenovo Legion Pro 7 16IRX9H | |
| MSI Raider 18 HX A14V | |
| Asus ROG Strix Scar 16 G634JZR | |
| Average Intel Core i9-14900HX (32543 - 83662, n=36) | |
| Acer Predator Helios 16 PH16-72 | |
| Schenker Key 17 Pro (M24) | |
| Acer Predator Triton Neo 16 PTN16-51-978P | |
| AIDA64 / CPU AES | |
| Asus ROG Strix Scar 16 G634JZR | |
| Average Intel Core i9-14900HX (86964 - 241777, n=36) | |
| Lenovo Legion Pro 7 16IRX9H | |
| MSI Raider 18 HX A14V | |
| Acer Predator Helios 16 PH16-72 | |
| Schenker Key 17 Pro (M24) | |
| Average of class Gaming (39258 - 247074, n=107, last 2 years) | |
| Acer Predator Triton Neo 16 PTN16-51-978P | |
| AIDA64 / CPU ZLib | |
| Lenovo Legion Pro 7 16IRX9H | |
| MSI Raider 18 HX A14V | |
| Asus ROG Strix Scar 16 G634JZR | |
| Average Intel Core i9-14900HX (1054 - 2292, n=36) | |
| Acer Predator Helios 16 PH16-72 | |
| Schenker Key 17 Pro (M24) | |
| Average of class Gaming (574 - 2531, n=107, last 2 years) | |
| Acer Predator Triton Neo 16 PTN16-51-978P | |
| AIDA64 / FP64 Ray-Trace | |
| Average of class Gaming (5509 - 45446, n=107, last 2 years) | |
| Lenovo Legion Pro 7 16IRX9H | |
| MSI Raider 18 HX A14V | |
| Asus ROG Strix Scar 16 G634JZR | |
| Average Intel Core i9-14900HX (6809 - 18349, n=36) | |
| Acer Predator Helios 16 PH16-72 | |
| Schenker Key 17 Pro (M24) | |
| Acer Predator Triton Neo 16 PTN16-51-978P | |
| AIDA64 / CPU PhotoWorxx | |
| Schenker Key 17 Pro (M24) | |
| Asus ROG Strix Scar 16 G634JZR | |
| Acer Predator Helios 16 PH16-72 | |
| Lenovo Legion Pro 7 16IRX9H | |
| Average Intel Core i9-14900HX (23903 - 54702, n=36) | |
| Acer Predator Triton Neo 16 PTN16-51-978P | |
| Average of class Gaming (12271 - 89891, n=107, last 2 years) | |
| MSI Raider 18 HX A14V | |
System performance
The symbiosis of a high-end processor, powerful graphics card, ample RAM and fast mass storage enables smooth and responsive operation that leaves nothing to be desired, even with computationally intensive tasks. Whether in everyday digital life, immersing yourself in virtual worlds or being creative - the Helios 16 handles all of these challenges with ease. The Helios 16 also shines in the field of artificial intelligence and delivers fast results.
CrossMark: Overall | Productivity | Creativity | Responsiveness
WebXPRT 3: Overall
WebXPRT 4: Overall
Mozilla Kraken 1.1: Total
| PCMark 10 / Score | |
| MSI Raider 18 HX A14V | |
| Acer Predator Helios 16 PH16-72 | |
| Lenovo Legion Pro 7 16IRX9H | |
| Average Intel Core i9-14900HX, NVIDIA GeForce RTX 4080 Laptop GPU (7703 - 9223, n=7) | |
| Average of class Gaming (5828 - 11574, n=94, last 2 years) | |
| Schenker Key 17 Pro (M24) | |
| Asus ROG Strix Scar 16 G634JZR | |
| Acer Predator Triton Neo 16 PTN16-51-978P | |
| PCMark 10 / Essentials | |
| Acer Predator Helios 16 PH16-72 | |
| MSI Raider 18 HX A14V | |
| Lenovo Legion Pro 7 16IRX9H | |
| Average Intel Core i9-14900HX, NVIDIA GeForce RTX 4080 Laptop GPU (11255 - 12600, n=7) | |
| Asus ROG Strix Scar 16 G634JZR | |
| Schenker Key 17 Pro (M24) | |
| Average of class Gaming (8810 - 12600, n=98, last 2 years) | |
| Acer Predator Triton Neo 16 PTN16-51-978P | |
| PCMark 10 / Productivity | |
| Lenovo Legion Pro 7 16IRX9H | |
| MSI Raider 18 HX A14V | |
| Acer Predator Helios 16 PH16-72 | |
| Average of class Gaming (6845 - 18766, n=96, last 2 years) | |
| Average Intel Core i9-14900HX, NVIDIA GeForce RTX 4080 Laptop GPU (6662 - 11410, n=7) | |
| Acer Predator Triton Neo 16 PTN16-51-978P | |
| Schenker Key 17 Pro (M24) | |
| Asus ROG Strix Scar 16 G634JZR | |
| PCMark 10 / Digital Content Creation | |
| MSI Raider 18 HX A14V | |
| Asus ROG Strix Scar 16 G634JZR | |
| Average Intel Core i9-14900HX, NVIDIA GeForce RTX 4080 Laptop GPU (14211 - 16246, n=7) | |
| Schenker Key 17 Pro (M24) | |
| Acer Predator Helios 16 PH16-72 | |
| Lenovo Legion Pro 7 16IRX9H | |
| Average of class Gaming (7602 - 19657, n=96, last 2 years) | |
| Acer Predator Triton Neo 16 PTN16-51-978P | |
| CrossMark / Overall | |
| Lenovo Legion Pro 7 16IRX9H | |
| Acer Predator Helios 16 PH16-72 | |
| Average Intel Core i9-14900HX, NVIDIA GeForce RTX 4080 Laptop GPU (1992 - 2334, n=7) | |
| MSI Raider 18 HX A14V | |
| Asus ROG Strix Scar 16 G634JZR | |
| Average of class Gaming (1366 - 2409, n=96, last 2 years) | |
| CrossMark / Productivity | |
| Lenovo Legion Pro 7 16IRX9H | |
| Acer Predator Helios 16 PH16-72 | |
| Average Intel Core i9-14900HX, NVIDIA GeForce RTX 4080 Laptop GPU (1812 - 2204, n=7) | |
| MSI Raider 18 HX A14V | |
| Asus ROG Strix Scar 16 G634JZR | |
| Average of class Gaming (1386 - 2254, n=96, last 2 years) | |
| CrossMark / Creativity | |
| Lenovo Legion Pro 7 16IRX9H | |
| Acer Predator Helios 16 PH16-72 | |
| Average Intel Core i9-14900HX, NVIDIA GeForce RTX 4080 Laptop GPU (2327 - 2500, n=7) | |
| MSI Raider 18 HX A14V | |
| Asus ROG Strix Scar 16 G634JZR | |
| Average of class Gaming (1343 - 2729, n=96, last 2 years) | |
| CrossMark / Responsiveness | |
| Lenovo Legion Pro 7 16IRX9H | |
| Acer Predator Helios 16 PH16-72 | |
| Average Intel Core i9-14900HX, NVIDIA GeForce RTX 4080 Laptop GPU (1520 - 2254, n=7) | |
| MSI Raider 18 HX A14V | |
| Asus ROG Strix Scar 16 G634JZR | |
| Average of class Gaming (1226 - 2334, n=96, last 2 years) | |
| WebXPRT 3 / Overall | |
| Lenovo Legion Pro 7 16IRX9H | |
| MSI Raider 18 HX A14V | |
| Average Intel Core i9-14900HX, NVIDIA GeForce RTX 4080 Laptop GPU (310 - 345, n=7) | |
| Acer Predator Helios 16 PH16-72 | |
| Average of class Gaming (242 - 532, n=99, last 2 years) | |
| Asus ROG Strix Scar 16 G634JZR | |
| Schenker Key 17 Pro (M24) | |
| Acer Predator Triton Neo 16 PTN16-51-978P | |
| Acer Predator Triton Neo 16 PTN16-51-978P | |
| WebXPRT 4 / Overall | |
| MSI Raider 18 HX A14V | |
| Lenovo Legion Pro 7 16IRX9H | |
| Average Intel Core i9-14900HX, NVIDIA GeForce RTX 4080 Laptop GPU (300 - 321, n=7) | |
| Asus ROG Strix Scar 16 G634JZR | |
| Acer Predator Helios 16 PH16-72 | |
| Average of class Gaming (176.4 - 354, n=99, last 2 years) | |
| Schenker Key 17 Pro (M24) | |
| Acer Predator Triton Neo 16 PTN16-51-978P | |
| Acer Predator Triton Neo 16 PTN16-51-978P | |
| Mozilla Kraken 1.1 / Total | |
| Acer Predator Triton Neo 16 PTN16-51-978P | |
| Acer Predator Triton Neo 16 PTN16-51-978P | |
| Schenker Key 17 Pro (M24) | |
| Average of class Gaming (391 - 590, n=104, last 2 years) | |
| MSI Raider 18 HX A14V | |
| Asus ROG Strix Scar 16 G634JZR | |
| Acer Predator Helios 16 PH16-72 | |
| Average Intel Core i9-14900HX, NVIDIA GeForce RTX 4080 Laptop GPU (437 - 446, n=7) | |
| Lenovo Legion Pro 7 16IRX9H | |
* ... smaller is better
| PCMark 10 Score | 9070 points | |
Help | ||
| AIDA64 / Memory Copy | |
| Acer Predator Triton Neo 16 PTN16-51-978P | |
| Acer Predator Helios 16 PH16-72 | |
| Asus ROG Strix Scar 16 G634JZR | |
| Schenker Key 17 Pro (M24) | |
| Lenovo Legion Pro 7 16IRX9H | |
| Average Intel Core i9-14900HX (38028 - 83392, n=36) | |
| Average of class Gaming (21750 - 129946, n=107, last 2 years) | |
| MSI Raider 18 HX A14V | |
| AIDA64 / Memory Read | |
| Asus ROG Strix Scar 16 G634JZR | |
| Lenovo Legion Pro 7 16IRX9H | |
| Schenker Key 17 Pro (M24) | |
| Acer Predator Helios 16 PH16-72 | |
| Average Intel Core i9-14900HX (43306 - 87568, n=36) | |
| Average of class Gaming (22956 - 118858, n=107, last 2 years) | |
| Acer Predator Triton Neo 16 PTN16-51-978P | |
| MSI Raider 18 HX A14V | |
| AIDA64 / Memory Write | |
| Asus ROG Strix Scar 16 G634JZR | |
| Schenker Key 17 Pro (M24) | |
| Acer Predator Helios 16 PH16-72 | |
| Average of class Gaming (22297 - 135096, n=107, last 2 years) | |
| Acer Predator Triton Neo 16 PTN16-51-978P | |
| Average Intel Core i9-14900HX (37146 - 80589, n=36) | |
| Lenovo Legion Pro 7 16IRX9H | |
| MSI Raider 18 HX A14V | |
| AIDA64 / Memory Latency | |
| Acer Predator Triton Neo 16 PTN16-51-978P | |
| Average of class Gaming (75.3 - 259, n=107, last 2 years) | |
| MSI Raider 18 HX A14V | |
| Average Intel Core i9-14900HX (76.1 - 105, n=36) | |
| Schenker Key 17 Pro (M24) | |
| Acer Predator Helios 16 PH16-72 | |
| Asus ROG Strix Scar 16 G634JZR | |
| Lenovo Legion Pro 7 16IRX9H | |
* ... smaller is better
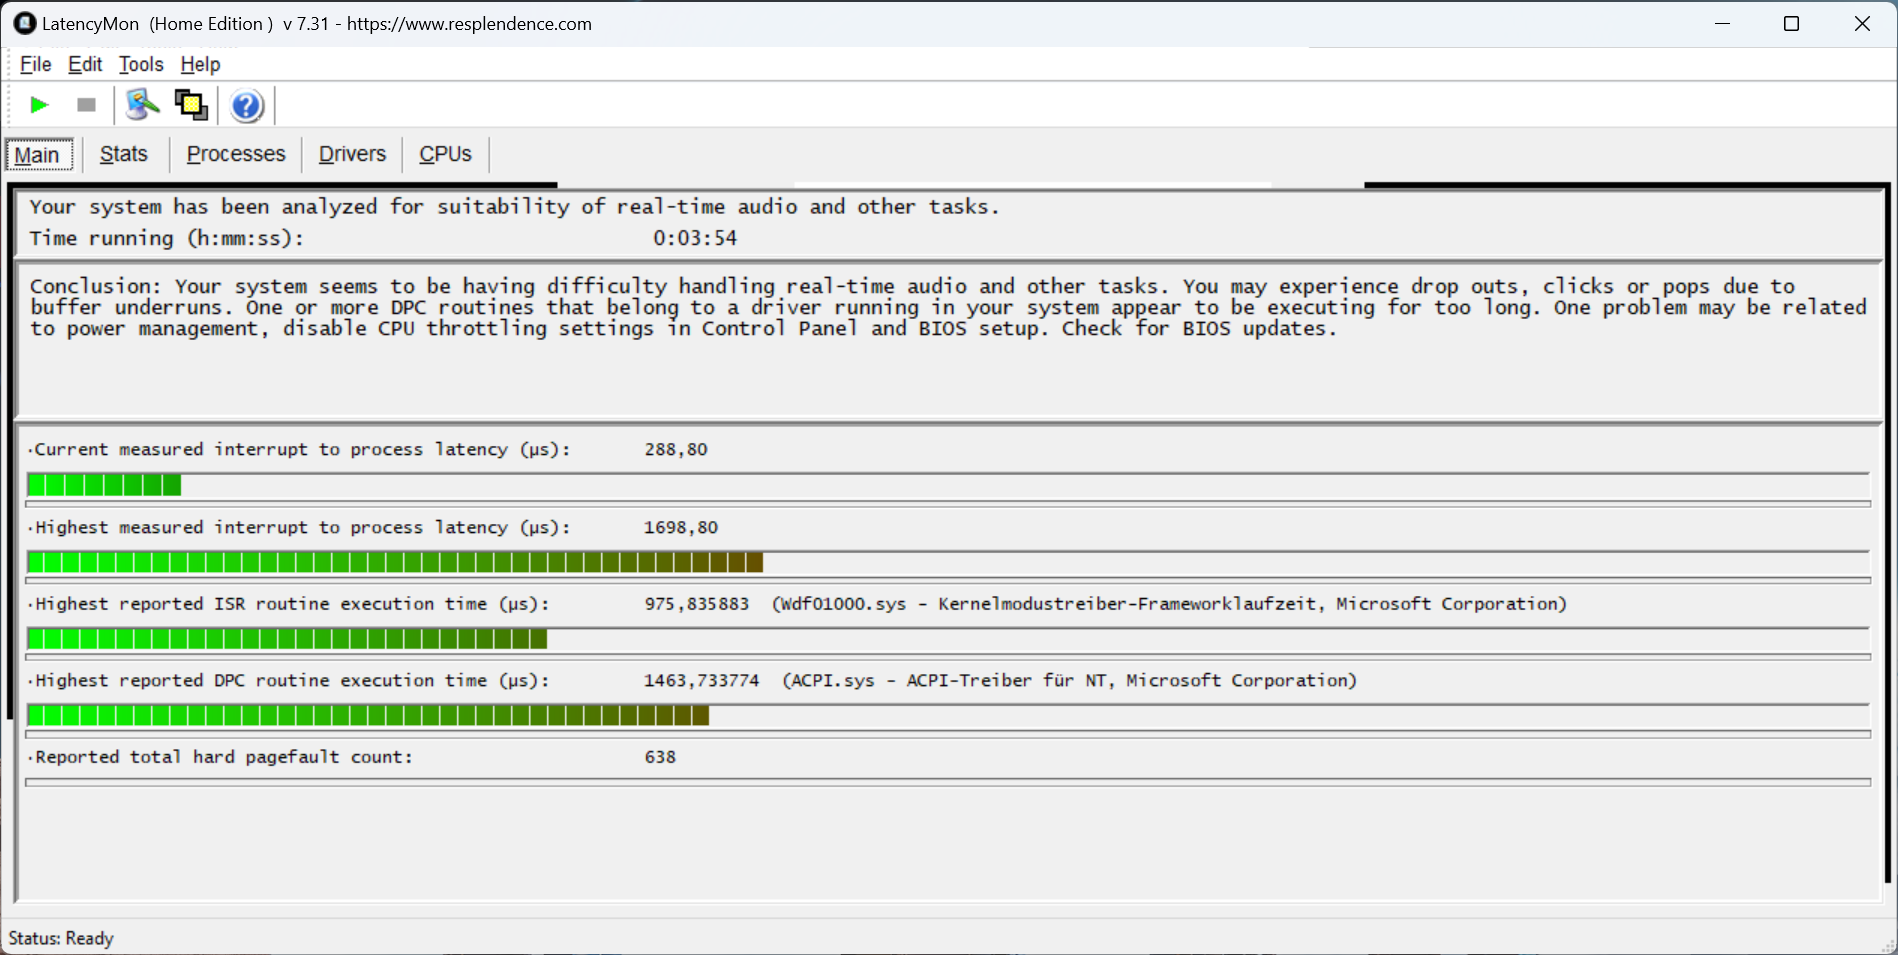
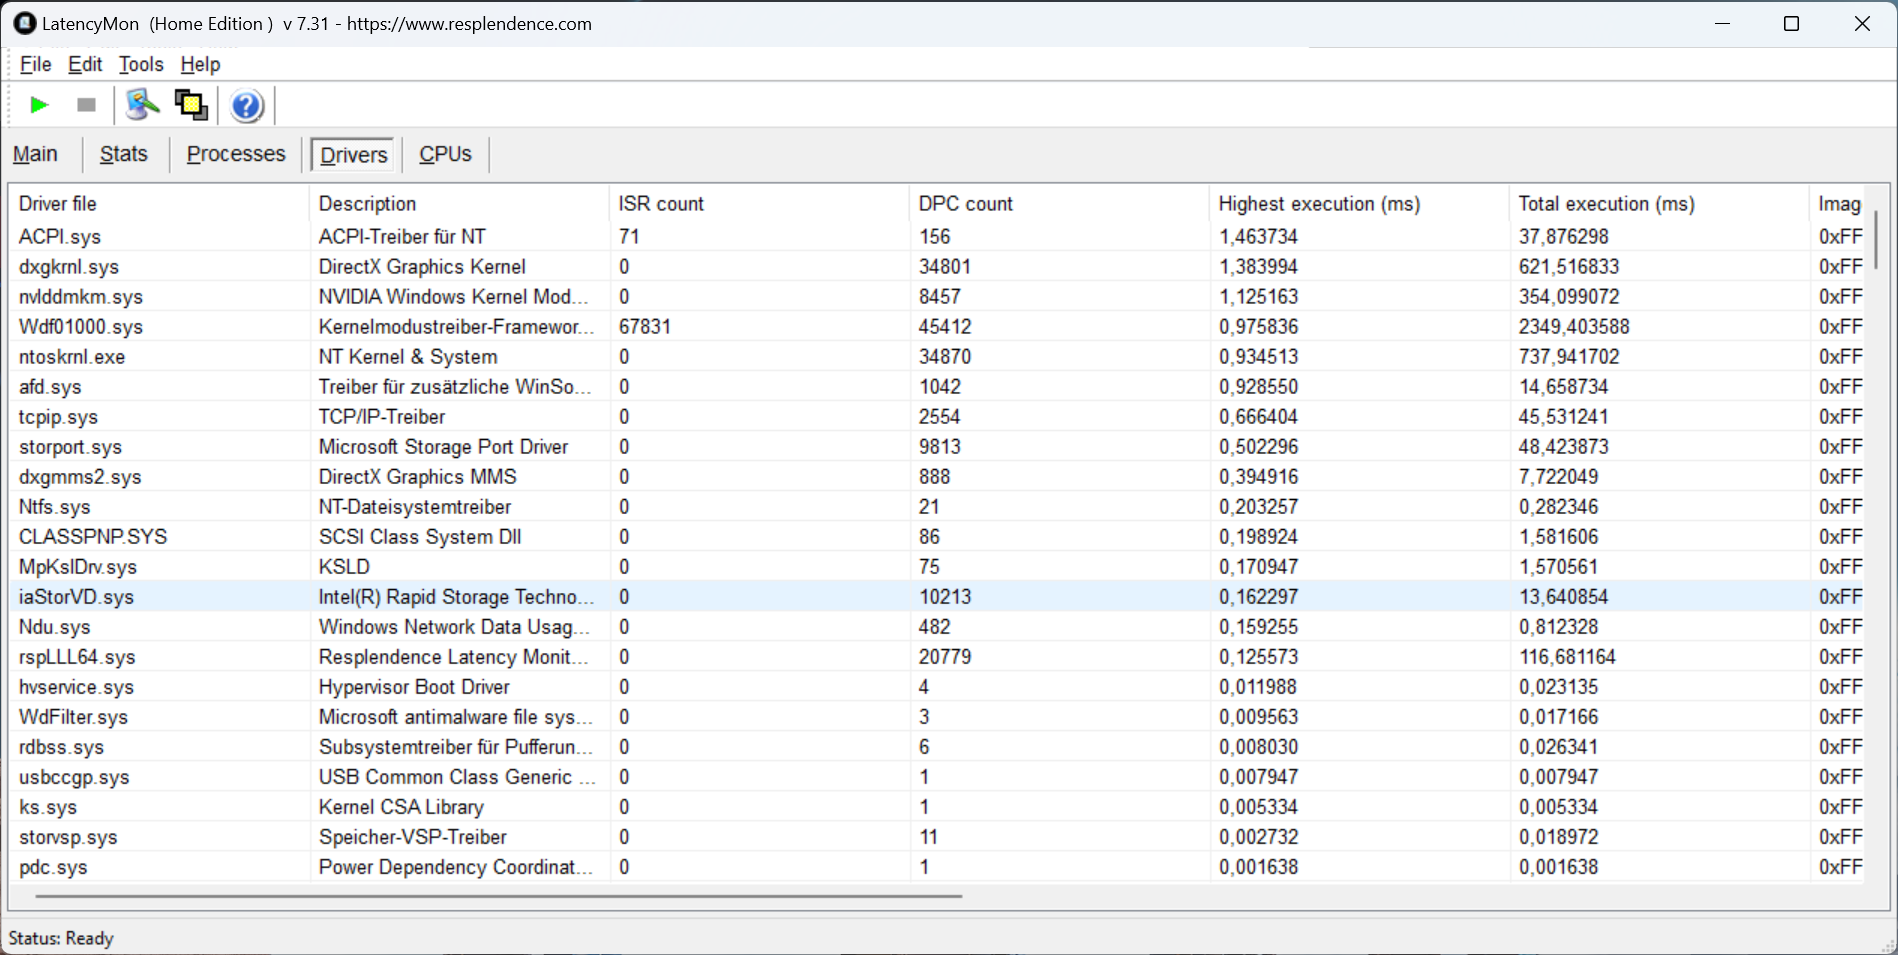
DPC latencies
The Acer Predator Helios 16 has comparatively low DPC latencies. However, LatencyMon highlights that difficulties may arise under certain conditions, which may manifest themselves in audio crackles or stutters. Whether and to which extent such problems occur depends on the individual software configuration and the drivers used.
| DPC Latencies / LatencyMon - interrupt to process latency (max), Web, Youtube, Prime95 | |
| Asus ROG Strix Scar 16 G634JZR | |
| MSI Raider 18 HX A14V | |
| Acer Predator Triton Neo 16 PTN16-51-978P | |
| Schenker Key 17 Pro (M24) | |
| Acer Predator Helios 16 PH16-72 | |
| Lenovo Legion Pro 7 16IRX9H | |
* ... smaller is better
Mass storage
The 2 TB Micron 3400 housed inside the Predator Helios might be fast but is more of a sprinter. Under lengthy load, the NVMe SSD gets too hot, and it reduces its speed. However, Acer also has some covers over the memory modules, which make them look nicer but also cause heat to build up. Gamers can probably still tweak some improvements in this area.

* ... smaller is better
Continuous Performance Read: DiskSpd Read Loop, Queue Depth 8
Graphics card
The NVIDIA GeForce RTX 4080 laptop GPU is one of the most powerful graphics cards on the market and makes the Acer Predator Helios 16 a true gaming machine. Even without activating the "Turbo" mode, the GPU delivers impressive performance, which is reflected in high scores in rendering and AI benchmarks. Although the gap to its competitors with the same graphics card can be seen in the scores, the Helios 16 gains points with much quieter noise levels. Although, for example, the MSI Raider 18 hits 60 dB(A) when gaming, the Acer Predator Helios 16 only reaches 48 dB(A) using our test mode. A clear advantage for those who like things to be a little quieter when gaming.
| 3DMark Cloud Gate Standard Score | 64258 points | |
| 3DMark Fire Strike Score | 31656 points | |
| 3DMark Time Spy Score | 17167 points | |
| 3DMark Steel Nomad Score | 4173 points | |
| 3DMark Steel Nomad Light Score | 17244 points | |
Help | ||
* ... smaller is better
| Geekbench ML - 0.6 ONNX DirectML GPU | |
| Schenker Key 17 Pro (M24) | |
| Razer Blade 16 Early 2023 | |
| Acer Predator Helios 16 PH16-72 | |
| Minisforum AtomMan G7 Ti | |
| Geekbench AI | |
| Quantized ONNX DirectML GPU 1.1 | |
| Acer Predator Helios 16 PH16-72 | |
| Razer Blade 16 Early 2023 | |
| Minisforum AtomMan G7 Ti | |
| Gigabyte G5 KF5 2024 | |
| MSI Prestige 13 AI Plus Evo A2VMG | |
| Half Precision ONNX DirectML GPU 1.1 | |
| Razer Blade 16 Early 2023 | |
| Acer Predator Helios 16 PH16-72 | |
| Minisforum AtomMan G7 Ti | |
| Gigabyte G5 KF5 2024 | |
| MSI Prestige 13 AI Plus Evo A2VMG | |
| Single Precision ONNX DirectML GPU 1.1 | |
| Razer Blade 16 Early 2023 | |
| Acer Predator Helios 16 PH16-72 | |
| Minisforum AtomMan G7 Ti | |
| Gigabyte G5 KF5 2024 | |
| MSI Prestige 13 AI Plus Evo A2VMG | |
Gaming performance
When putting together gaming hardware for the desktop segment, you usually choose the screen and graphics card together. The screen should be able to display twice to three times as many images per second as the graphics card generates frames. This effectively avoids noticeable screen tearing. With the Predator Helios 16's 250 Hz screen, 83 to 125fps should be possible in all games in order to properly power the excellent screen.
In most of the games we tested, this is possible using the highest quality settings and at the display's native resolution. Ray tracing titles such as Cyberpunk 2077 and F1 2024 also run well above the 60fps mark.
Overall, the Acer Predator Helios 16 makes a strong overall impression when gaming.
| Baldur's Gate 3 - 1920x1080 Ultra Preset AA:T | |
| Schenker Key 17 Pro (M24) | |
| Acer Predator Helios 16 PH16-72 | |
| Average of class Gaming (59.4 - 246, n=106, last 2 years) | |
| Acer Predator Triton Neo 16 PTN16-51-978P | |
| Strange Brigade - 1920x1080 ultra AA:ultra AF:16 | |
| Schenker Key 17 Pro (M24) | |
| MSI Raider 18 HX A14V | |
| Lenovo Legion Pro 7 16IRX9H | |
| Asus ROG Strix Scar 16 G634JZR | |
| Average of class Gaming (76.3 - 456, n=91, last 2 years) | |
| Acer Predator Helios 16 PH16-72 | |
In the long-term test running Cyberpunk 2077, a slight drop in the number of frames per second was seen after a few minutes of gaming. However, the frame rates then remained consistently above 100fps. The drop in performance was approximately 10%.
Cyberpunk 2077 ultra FPS diagram
| low | med. | high | ultra | QHD | 4K | |
|---|---|---|---|---|---|---|
| GTA V (2015) | 184.5 | 171.9 | 112.1 | 106.5 | ||
| Dota 2 Reborn (2015) | 231 | 212 | 201 | 172.7 | 182.4 | |
| Final Fantasy XV Benchmark (2018) | 183.9 | 177.3 | 139 | 116.6 | 71.1 | |
| X-Plane 11.11 (2018) | 185 | 153.3 | 122.6 | 119 | ||
| Strange Brigade (2018) | 337 | 293 | 266 | 197.1 | ||
| Baldur's Gate 3 (2023) | 140 | 99.7 | ||||
| Cyberpunk 2077 (2023) | 144.7 | 104.3 | 106.1 | 72.5 | ||
| Senua's Saga Hellblade 2 (2024) | 62.5 | 40.7 | ||||
| F1 24 (2024) | 233 | 231 | 68.7 | |||
| God of War Ragnarök (2024) | 146.3 | 111.2 |
Emissions: A feline predator with silent paws
Noise emissions
In turbo mode, the Acer Predator Helios 16 flexes its muscles and, in addition to impressive performance, also achieves an impressive noise level of up to 59.4 dB(A). As already mentioned, the performance mode offers an excellent alternative for gamers who like it a little quieter. Here, the volume climbs to a maximum of 45.6 dB(A) to 48 dB(A). This volume is bearable over lengthier sessions and, together with the good speakers, offers an immersive gaming experience without having to sacrifice too much in the way of performance.
If you like your gaming to be particularly quiet, you can even operate the Helios 16 for longer periods so that it is barely audible or silent. In balanced mode, the noise level under load remains pleasantly discrete in the background at around 35 dB(A) to 39 dB(A). When streaming or doing office work, the fans are almost always inaudible to very quiet. It is also pleasing to note that the gaming laptop's fans do not produce any unpleasant frequencies that could be annoying in the long term.
Noise level
| Idle |
| 26.1 / 29.4 / 31.9 dB(A) |
| Load |
| 0 / 45.6 dB(A) |
 | ||
30 dB silent 40 dB(A) audible 50 dB(A) loud |
||
min: | ||
| Acer Predator Helios 16 PH16-72 GeForce RTX 4080 Laptop GPU, i9-14900HX, Micron 3400 2TB MTFDKBA2T0TFH | MSI Raider 18 HX A14V GeForce RTX 4080 Laptop GPU, i9-14900HX, Samsung PM9A1 MZVL22T0HBLB | Asus ROG Strix Scar 16 G634JZR GeForce RTX 4080 Laptop GPU, i9-14900HX, SK hynix PC801 HFS002TEJ9X101N | Lenovo Legion Pro 7 16IRX9H GeForce RTX 4080 Laptop GPU, i9-14900HX, SK Hynix HFS001TEJ9X115N | Acer Predator Triton Neo 16 PTN16-51-978P GeForce RTX 4070 Laptop GPU, Ultra 9 185H, SK Hynix PC801 HFS001TEJ9X125N | Schenker Key 17 Pro (M24) GeForce RTX 4090 Laptop GPU, i9-14900HX, Samsung 990 Pro 1 TB | |
|---|---|---|---|---|---|---|
| Noise | -9% | -3% | -11% | -12% | -3% | |
| off / environment * (dB) | 26.1 | 23.3 11% | 21.07 19% | 24 8% | 24 8% | 23.41 10% |
| Idle Minimum * (dB) | 26.1 | 28.6 -10% | 29.75 -14% | 25 4% | 32 -23% | 25.33 3% |
| Idle Average * (dB) | 29.4 | 28.6 3% | 29.75 -1% | 30 -2% | 34 -16% | 25.33 14% |
| Idle Maximum * (dB) | 31.9 | 31.3 2% | 29.75 7% | 45 -41% | 40 -25% | 25.33 21% |
| Load Average * (dB) | 44.1 | 54.85 | 50 | 48 | 33.57 | |
| Cyberpunk 2077 ultra * (dB) | 48.2 | 59.4 -23% | 50 -4% | 61.97 -29% | ||
| Load Maximum * (dB) | 45.6 | 62.7 -38% | 58 -27% | 56 -23% | 51 -12% | 62.14 -36% |
| Witcher 3 ultra * (dB) | 57.8 | 54 |
* ... smaller is better
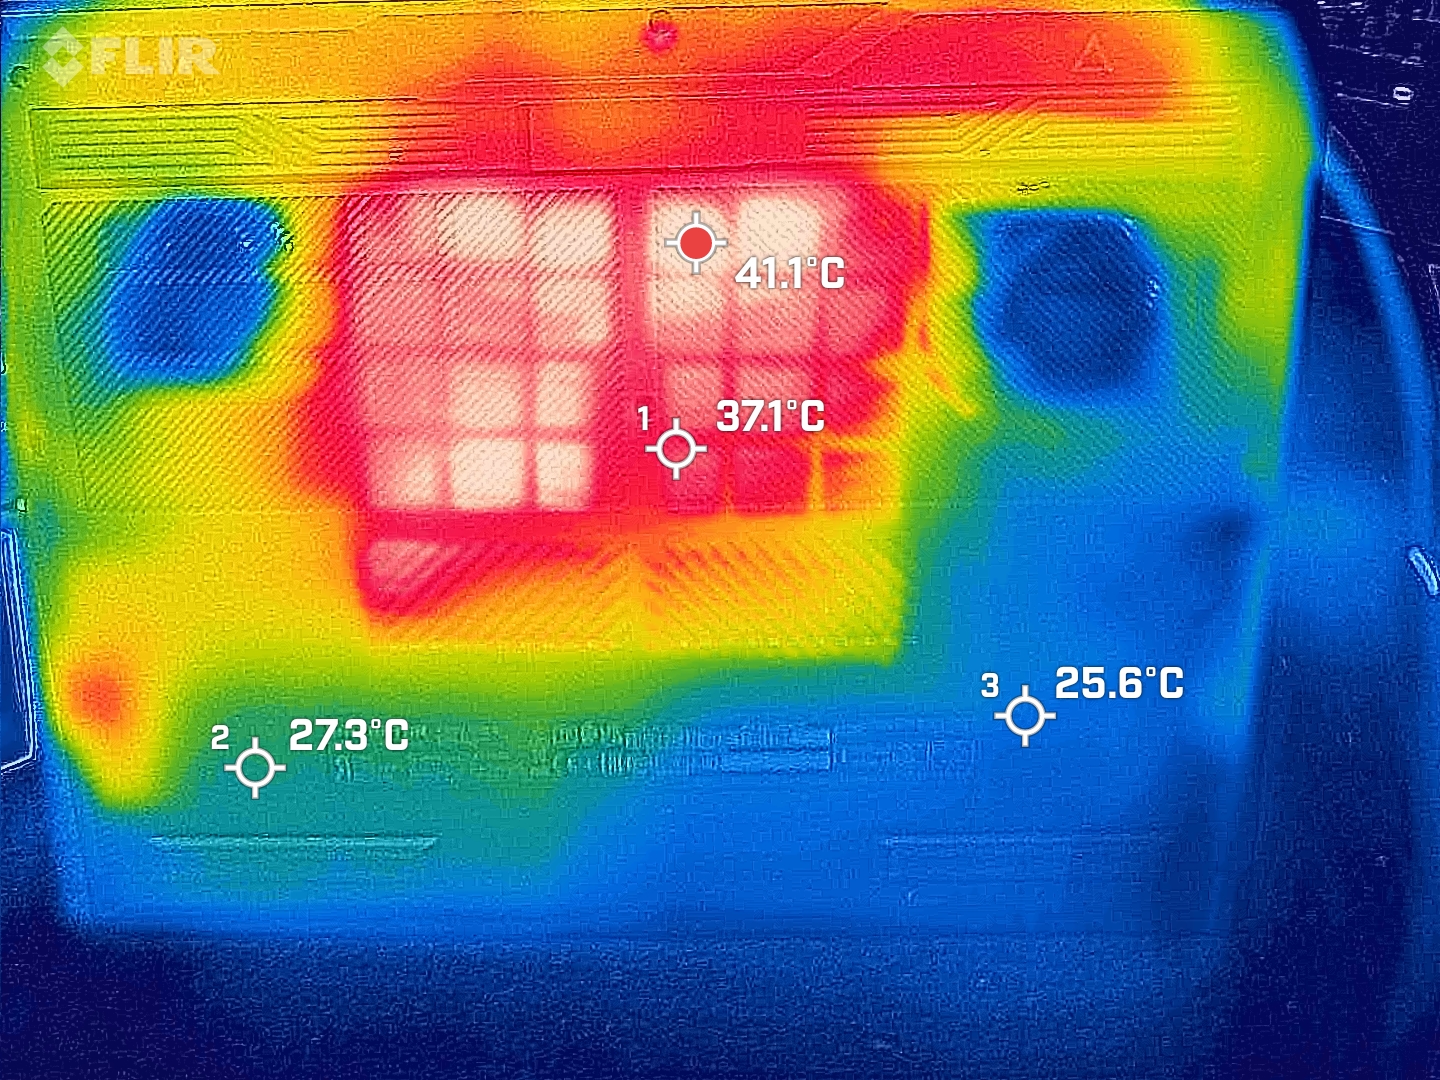
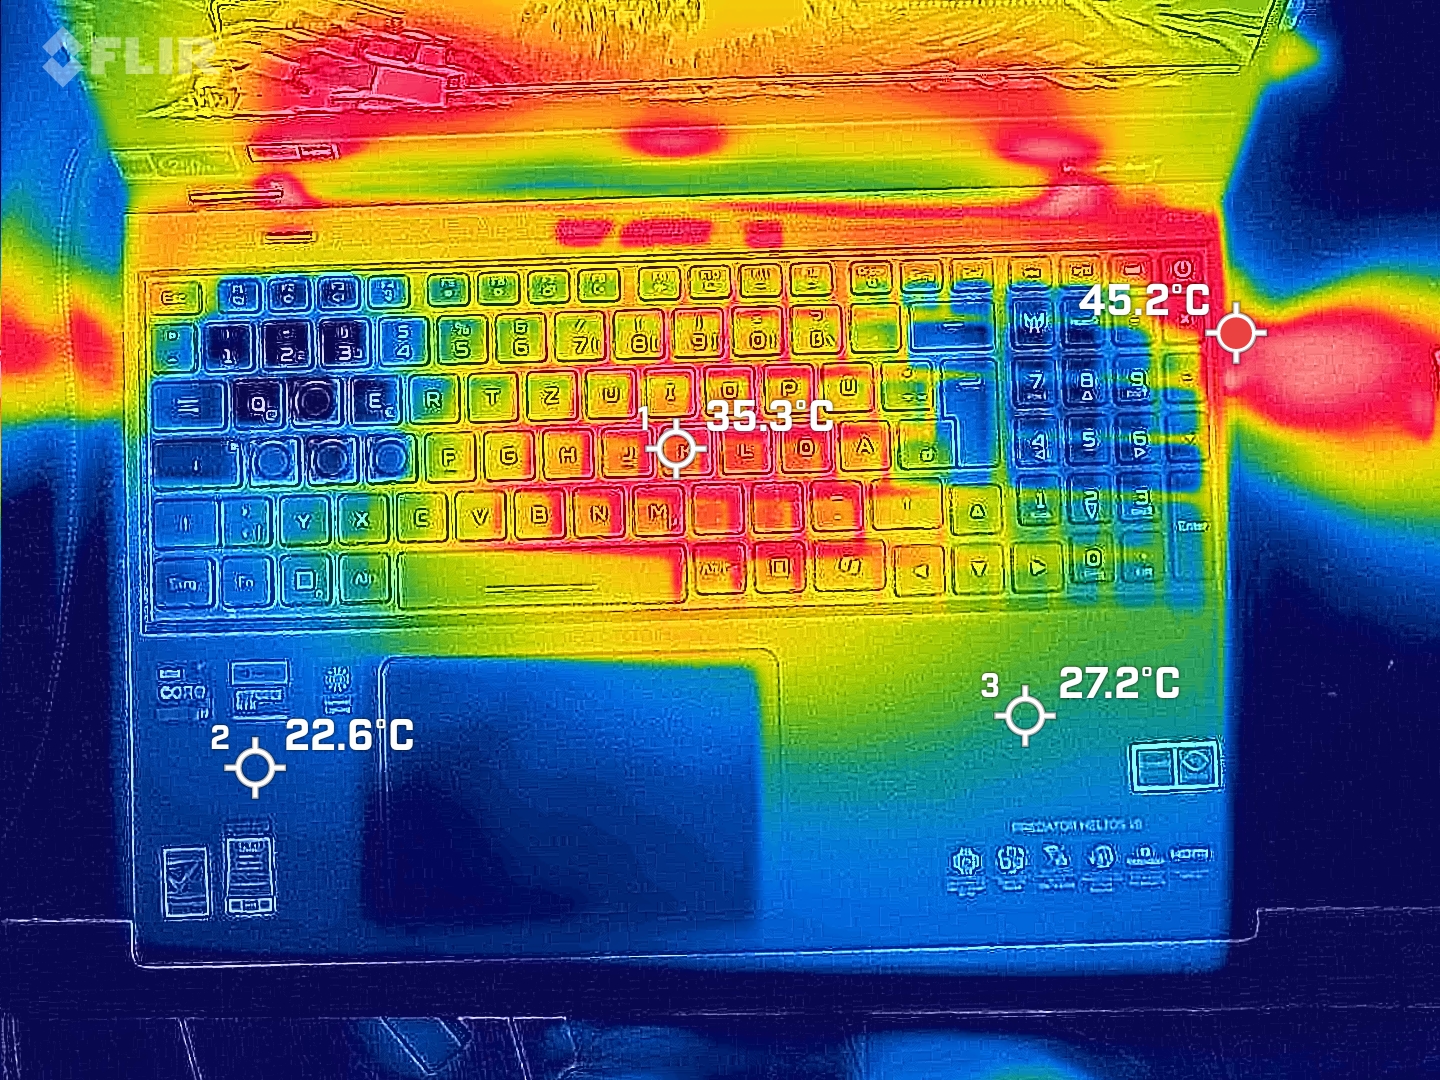
Temperature
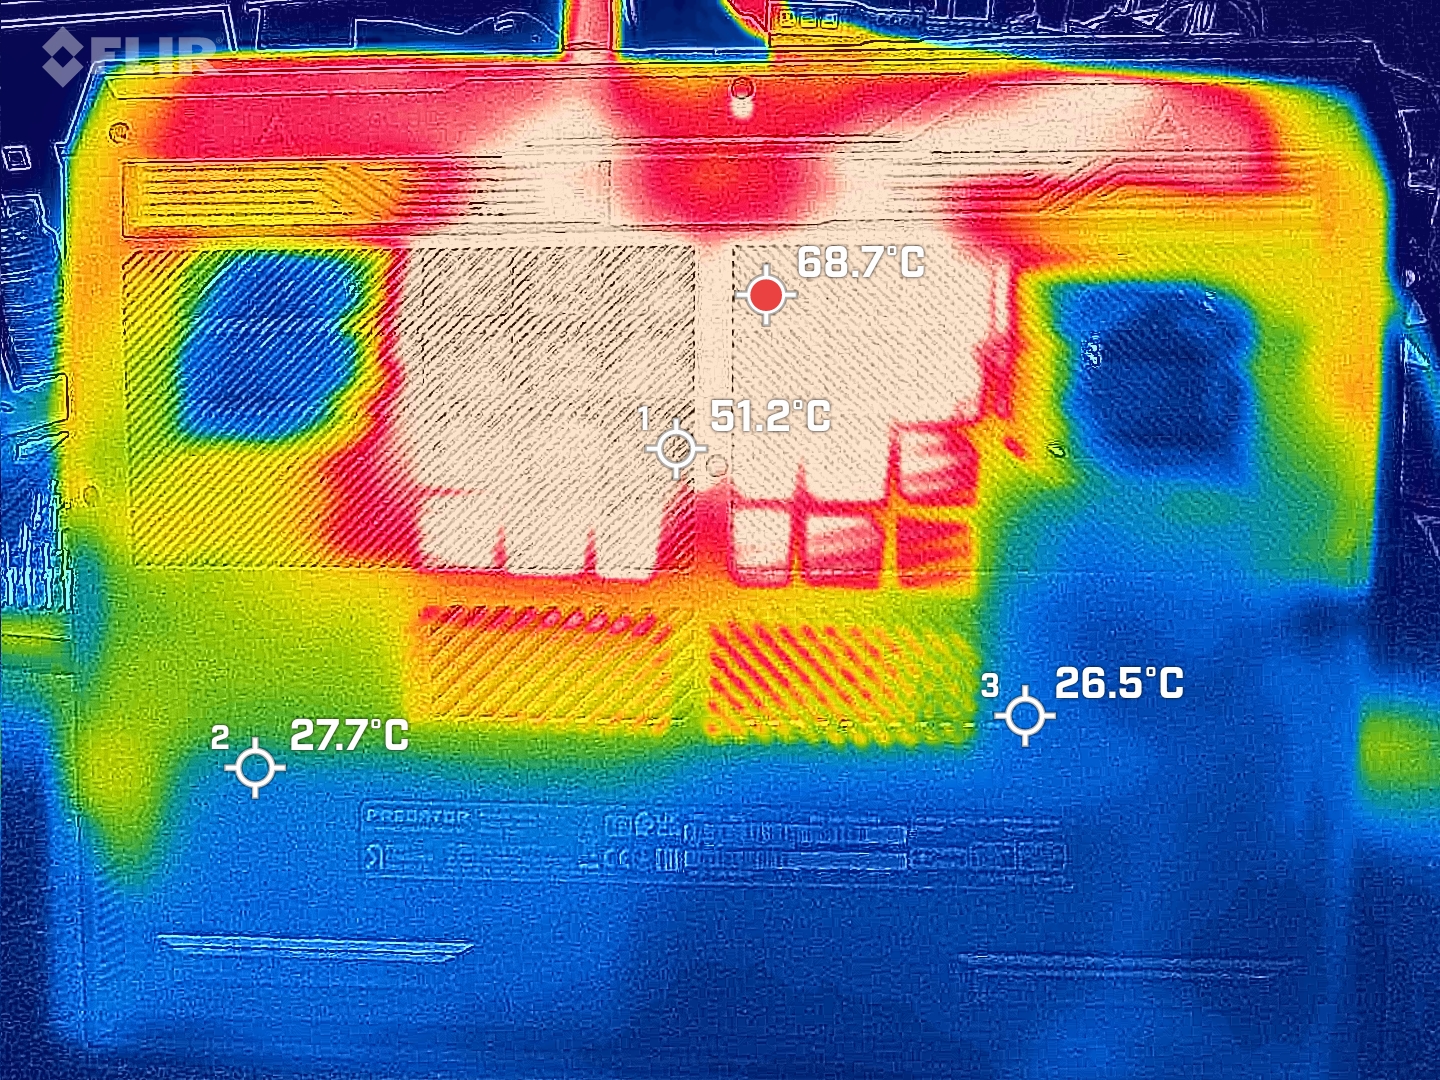
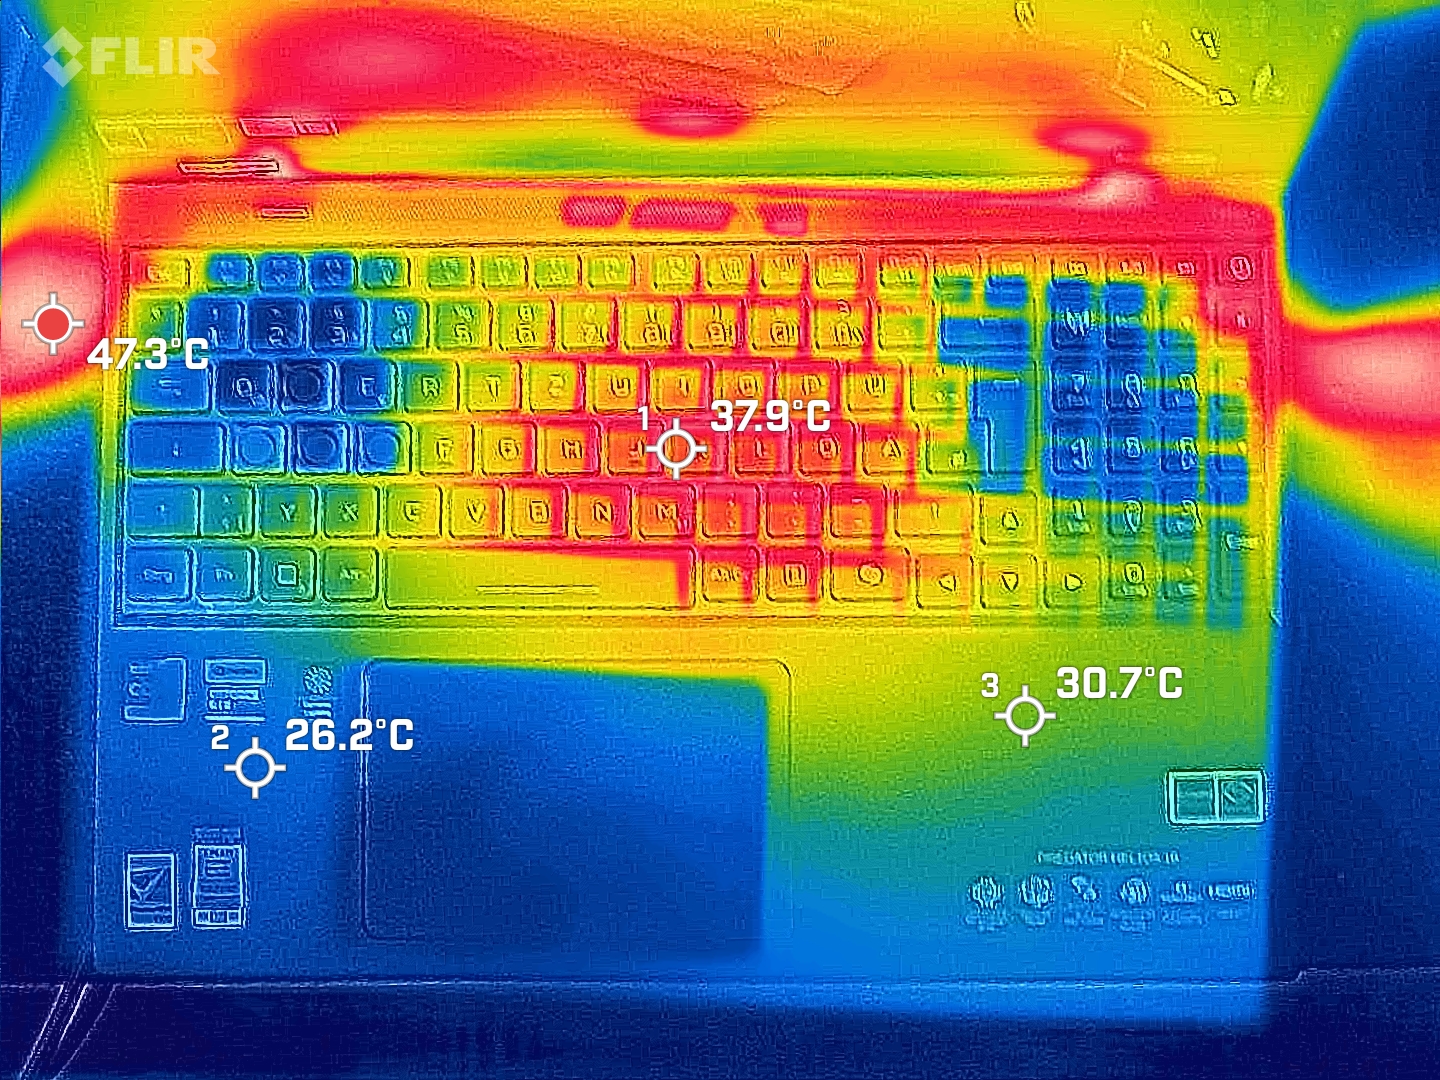
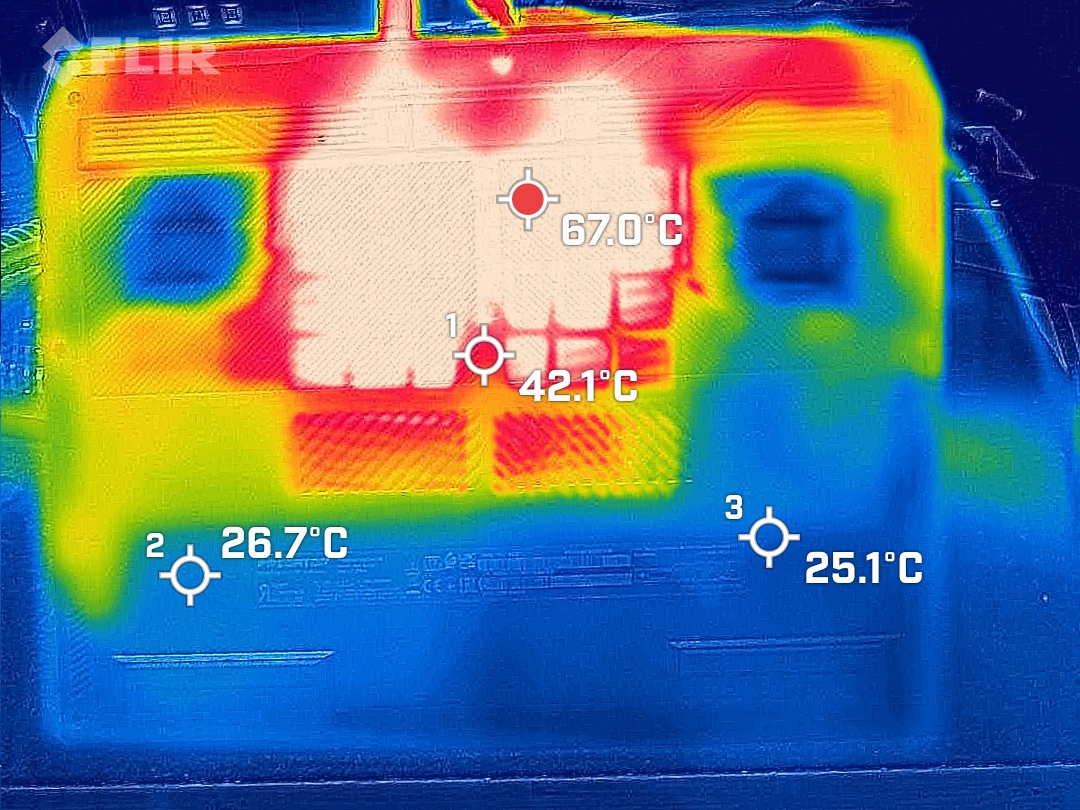
Even under the toughest conditions, the Acer Predator Helios 16 keeps both a cool head and a cool case. The keys and palm rests always remain pleasantly fresh, even when the internal heat from the CPU and GPU dominates. The thermal images may show that the heat sinks inside are running hot, but this waste heat does not reach the case. Our camera takes a look through the ventilation slots. Admittedly, in the stress test, the base cover is exposed to a quite warm 50 °C but it's probably quite rare that you'll find the gaming laptop on your lap under full load. What's particularly impressive is that the Helios 16 doesn't lose its nerve even when gaming and in turbo mode.
(+) The maximum temperature on the upper side is 37.5 °C / 100 F, compared to the average of 40.4 °C / 105 F, ranging from 21.2 to 68.8 °C for the class Gaming.
(±) The bottom heats up to a maximum of 43.9 °C / 111 F, compared to the average of 43.2 °C / 110 F
(+) In idle usage, the average temperature for the upper side is 28.7 °C / 84 F, compared to the device average of 33.9 °C / 93 F.
(+) 3: The average temperature for the upper side is 28.9 °C / 84 F, compared to the average of 33.9 °C / 93 F for the class Gaming.
(+) The palmrests and touchpad are cooler than skin temperature with a maximum of 30.7 °C / 87.3 F and are therefore cool to the touch.
(±) The average temperature of the palmrest area of similar devices was 28.8 °C / 83.8 F (-1.9 °C / -3.5 F).

| Acer Predator Helios 16 PH16-72 Intel Core i9-14900HX, NVIDIA GeForce RTX 4080 Laptop GPU | |
|---|---|
| Heat | |
| Maximum Upper Side * (°C) | 37.5 |
| Maximum Bottom * (°C) | 43.9 |
| Idle Upper Side * (°C) | 31 |
| Idle Bottom * (°C) | 42 |
* ... smaller is better
Stress test
To push the Acer Predator Helios 16 to its limits, we carried out a stress test using Prime95 and FurMark. These two programs put the CPU and GPU under maximum load over a longer period, simulating a worst-case scenario. We recorded the changes in temperature and performance over an hour.
The result: After an initial boost phase, which can last between a few seconds and two minutes, depending on the performance mode, the Helios 16 settled to a constant level. The temperatures remained within a tolerable range, and no drops in performance were observed. This shows that the Helios 16's liquid metal cooling system works efficiently even under extreme load and protects the hardware from overheating.
Speakers
The Acer Predator Helios 16's speakers deliver rich sound with balanced lows and distinct mids. The maximum volume of 81.9 dB(A) clearly overwhelms the fans, and this means they can be heard even during intensive gaming sessions.
Acer Predator Helios 16 PH16-72 audio analysis
(±) | speaker loudness is average but good (81.9 dB)
Bass 100 - 315 Hz
(±) | reduced bass - on average 14.2% lower than median
(±) | linearity of bass is average (11.7% delta to prev. frequency)
Mids 400 - 2000 Hz
(±) | higher mids - on average 8.3% higher than median
(±) | linearity of mids is average (8.8% delta to prev. frequency)
Highs 2 - 16 kHz
(+) | balanced highs - only 4.2% away from median
(+) | highs are linear (6% delta to prev. frequency)
Overall 100 - 16.000 Hz
(±) | linearity of overall sound is average (19% difference to median)
Compared to same class
» 63% of all tested devices in this class were better, 8% similar, 29% worse
» The best had a delta of 6%, average was 18%, worst was 132%
Compared to all devices tested
» 45% of all tested devices were better, 7% similar, 48% worse
» The best had a delta of 4%, average was 24%, worst was 134%
Schenker Key 17 Pro (M24) audio analysis
(±) | speaker loudness is average but good (80.9 dB)
Bass 100 - 315 Hz
(±) | reduced bass - on average 12.7% lower than median
(±) | linearity of bass is average (9.1% delta to prev. frequency)
Mids 400 - 2000 Hz
(+) | balanced mids - only 2.3% away from median
(+) | mids are linear (5.1% delta to prev. frequency)
Highs 2 - 16 kHz
(+) | balanced highs - only 2.9% away from median
(±) | linearity of highs is average (8.9% delta to prev. frequency)
Overall 100 - 16.000 Hz
(+) | overall sound is linear (11.2% difference to median)
Compared to same class
» 13% of all tested devices in this class were better, 4% similar, 83% worse
» The best had a delta of 7%, average was 17%, worst was 35%
Compared to all devices tested
» 7% of all tested devices were better, 2% similar, 91% worse
» The best had a delta of 4%, average was 24%, worst was 134%
Energy management: High consumption running idle
Power consumption
Running idle, the Acer Predator Helios 16 isn't exactly at its most economical. The power consumption is comparatively high, which, of course, affects the battery life. Under load, however, the power consumption is within the expected range for a gaming laptop packed with this type of powerful hardware. Therefore, if you seek a laptop with maximum battery life, you should look for alternatives. However, for gamers and power users who wish to exploit the Helios 16's full performance, the power consumption is acceptable.
| Off / Standby | |
| Idle | |
| Load |
|
Key:
min: | |
| Acer Predator Helios 16 PH16-72 i9-14900HX, GeForce RTX 4080 Laptop GPU, Micron 3400 2TB MTFDKBA2T0TFH, IPS, 2560x1600, 16" | MSI Raider 18 HX A14V i9-14900HX, GeForce RTX 4080 Laptop GPU, Samsung PM9A1 MZVL22T0HBLB, Mini-LED, 3840x2400, 18" | Asus ROG Strix Scar 16 G634JZR i9-14900HX, GeForce RTX 4080 Laptop GPU, SK hynix PC801 HFS002TEJ9X101N, Mini LED, 2560x1600, 16" | Lenovo Legion Pro 7 16IRX9H i9-14900HX, GeForce RTX 4080 Laptop GPU, SK Hynix HFS001TEJ9X115N, IPS, 2560x1600, 16" | Acer Predator Triton Neo 16 PTN16-51-978P Ultra 9 185H, GeForce RTX 4070 Laptop GPU, SK Hynix PC801 HFS001TEJ9X125N, IPS, 3200x2000, 16" | Schenker Key 17 Pro (M24) i9-14900HX, GeForce RTX 4090 Laptop GPU, Samsung 990 Pro 1 TB, IPS, 3840x2160, 17.3" | Average NVIDIA GeForce RTX 4080 Laptop GPU | Average of class Gaming | |
|---|---|---|---|---|---|---|---|---|
| Power Consumption | -10% | 40% | 23% | 52% | 24% | 27% | 42% | |
| Idle Minimum * (Watt) | 31.5 | 27.7 12% | 10.71 66% | 16 49% | 10 68% | 12.16 61% | 16.9 ? 46% | 13.2 ? 58% |
| Idle Average * (Watt) | 31.5 | 38.3 -22% | 14.75 53% | 21 33% | 15 52% | 15.97 49% | 22 ? 30% | 18.9 ? 40% |
| Idle Maximum * (Watt) | 47.5 | 47.1 1% | 30 37% | 36 24% | 23 52% | 23.71 50% | 34.1 ? 28% | 24.3 ? 49% |
| Cyberpunk 2077 ultra * (Watt) | 231 | 313 -35% | 122 47% | 274 -19% | ||||
| Cyberpunk 2077 ultra external monitor * (Watt) | 270 | 306 -13% | 118.7 56% | 280 -4% | ||||
| Load Maximum * (Watt) | 313 | 321.8 -3% | 307 2% | 360 -15% | 206 34% | 301 4% | 297 ? 5% | 254 ? 19% |
| Load Average * (Watt) | 121.2 | 135 | 132 | 80 | 113.06 | 117.9 ? | 108.3 ? | |
| Witcher 3 ultra * (Watt) | 286 | 267 |
* ... smaller is better
Power consumption Cyberpunk / Stress Test
Power consumption with an external monitor
Battery life
Equipped with a 90 Wh battery, you would expect the Acer Predator Helios 16 to have decent battery life. However, the high power consumption of around 30 watts, even when running idle, puts a damper on this hope. The Helios 16 does not achieve outstanding runtimes, which could be due to the power-hungry Intel Core i9-14900HX and a GPU that is not optimally managed.
However, there is hope for improvement: a software update with improved energy management could increase the future battery life. Until then, users will have to make do with the given runtimes, which are, however, within the expected range for a gaming laptop in this performance category.
| Acer Predator Helios 16 PH16-72 i9-14900HX, GeForce RTX 4080 Laptop GPU, 90 Wh | MSI Raider 18 HX A14V i9-14900HX, GeForce RTX 4080 Laptop GPU, 99.9 Wh | Asus ROG Strix Scar 16 G634JZR i9-14900HX, GeForce RTX 4080 Laptop GPU, 90 Wh | Lenovo Legion Pro 7 16IRX9H i9-14900HX, GeForce RTX 4080 Laptop GPU, 99.9 Wh | Acer Predator Triton Neo 16 PTN16-51-978P Ultra 9 185H, GeForce RTX 4070 Laptop GPU, 76 Wh | Schenker Key 17 Pro (M24) i9-14900HX, GeForce RTX 4090 Laptop GPU, 99 Wh | Average of class Gaming | |
|---|---|---|---|---|---|---|---|
| Battery runtime | -28% | 57% | 35% | 61% | 6% | 53% | |
| WiFi v1.3 (h) | 4.6 | 3.3 -28% | 7.2 57% | 6.2 35% | 7.4 61% | 3.4 -26% | 7.04 ? 53% |
| Cyberpunk 2077 ultra 150cd (h) | 0.8 | 1.1 38% | |||||
| Reader / Idle (h) | 4.4 | 8.71 ? | |||||
| Load (h) | 1.3 | 0.9 | 1.1 | 1.47 ? | |||
| H.264 (h) | 7.5 | 8.26 ? | |||||
| Witcher 3 ultra (h) | 1 |
Notebookcheck overall rating
The Acer Predator Helios 16 is an extremely useful and powerful gaming laptop that excels in almost every discipline. The wide range of customization options allows you to adapt the device to your own preferences. The performance is outstanding, and the fans remain at a pleasant volume level even under load. It is particularly worth mentioning that the Helios 16 offers excellent gaming performance even with the fans set to quiet. Only the battery life could be a little better.
Acer Predator Helios 16 PH16-72
- 01/13/2025 v8
Marc Herter
 Total Sustainability Score:
 Transparency
The selection of devices to be reviewed is made by our editorial team. The test sample was provided to the author as a loan by the manufacturer or retailer for the purpose of this review. The lender had no influence on this review, nor did the manufacturer receive a copy of this review before publication. There was no obligation to publish this review. As an independent media company, Notebookcheck is not subjected to the authority of manufacturers, retailers or publishers.
This is how Notebookcheck is testing
Every year, Notebookcheck independently reviews hundreds of laptops and smartphones using standardized procedures to ensure that all results are comparable. We have continuously developed our test methods for around 20 years and set industry standards in the process. In our test labs, high-quality measuring equipment is utilized by experienced technicians and editors. These tests involve a multi-stage validation process. Our complex rating system is based on hundreds of well-founded measurements and benchmarks, which maintains objectivity. Further information on our test methods can be found here.

