Acer Predator Triton Neo 16 review: A premium laptop with an RTX 4070 for gamers and creators
Brilliant display.
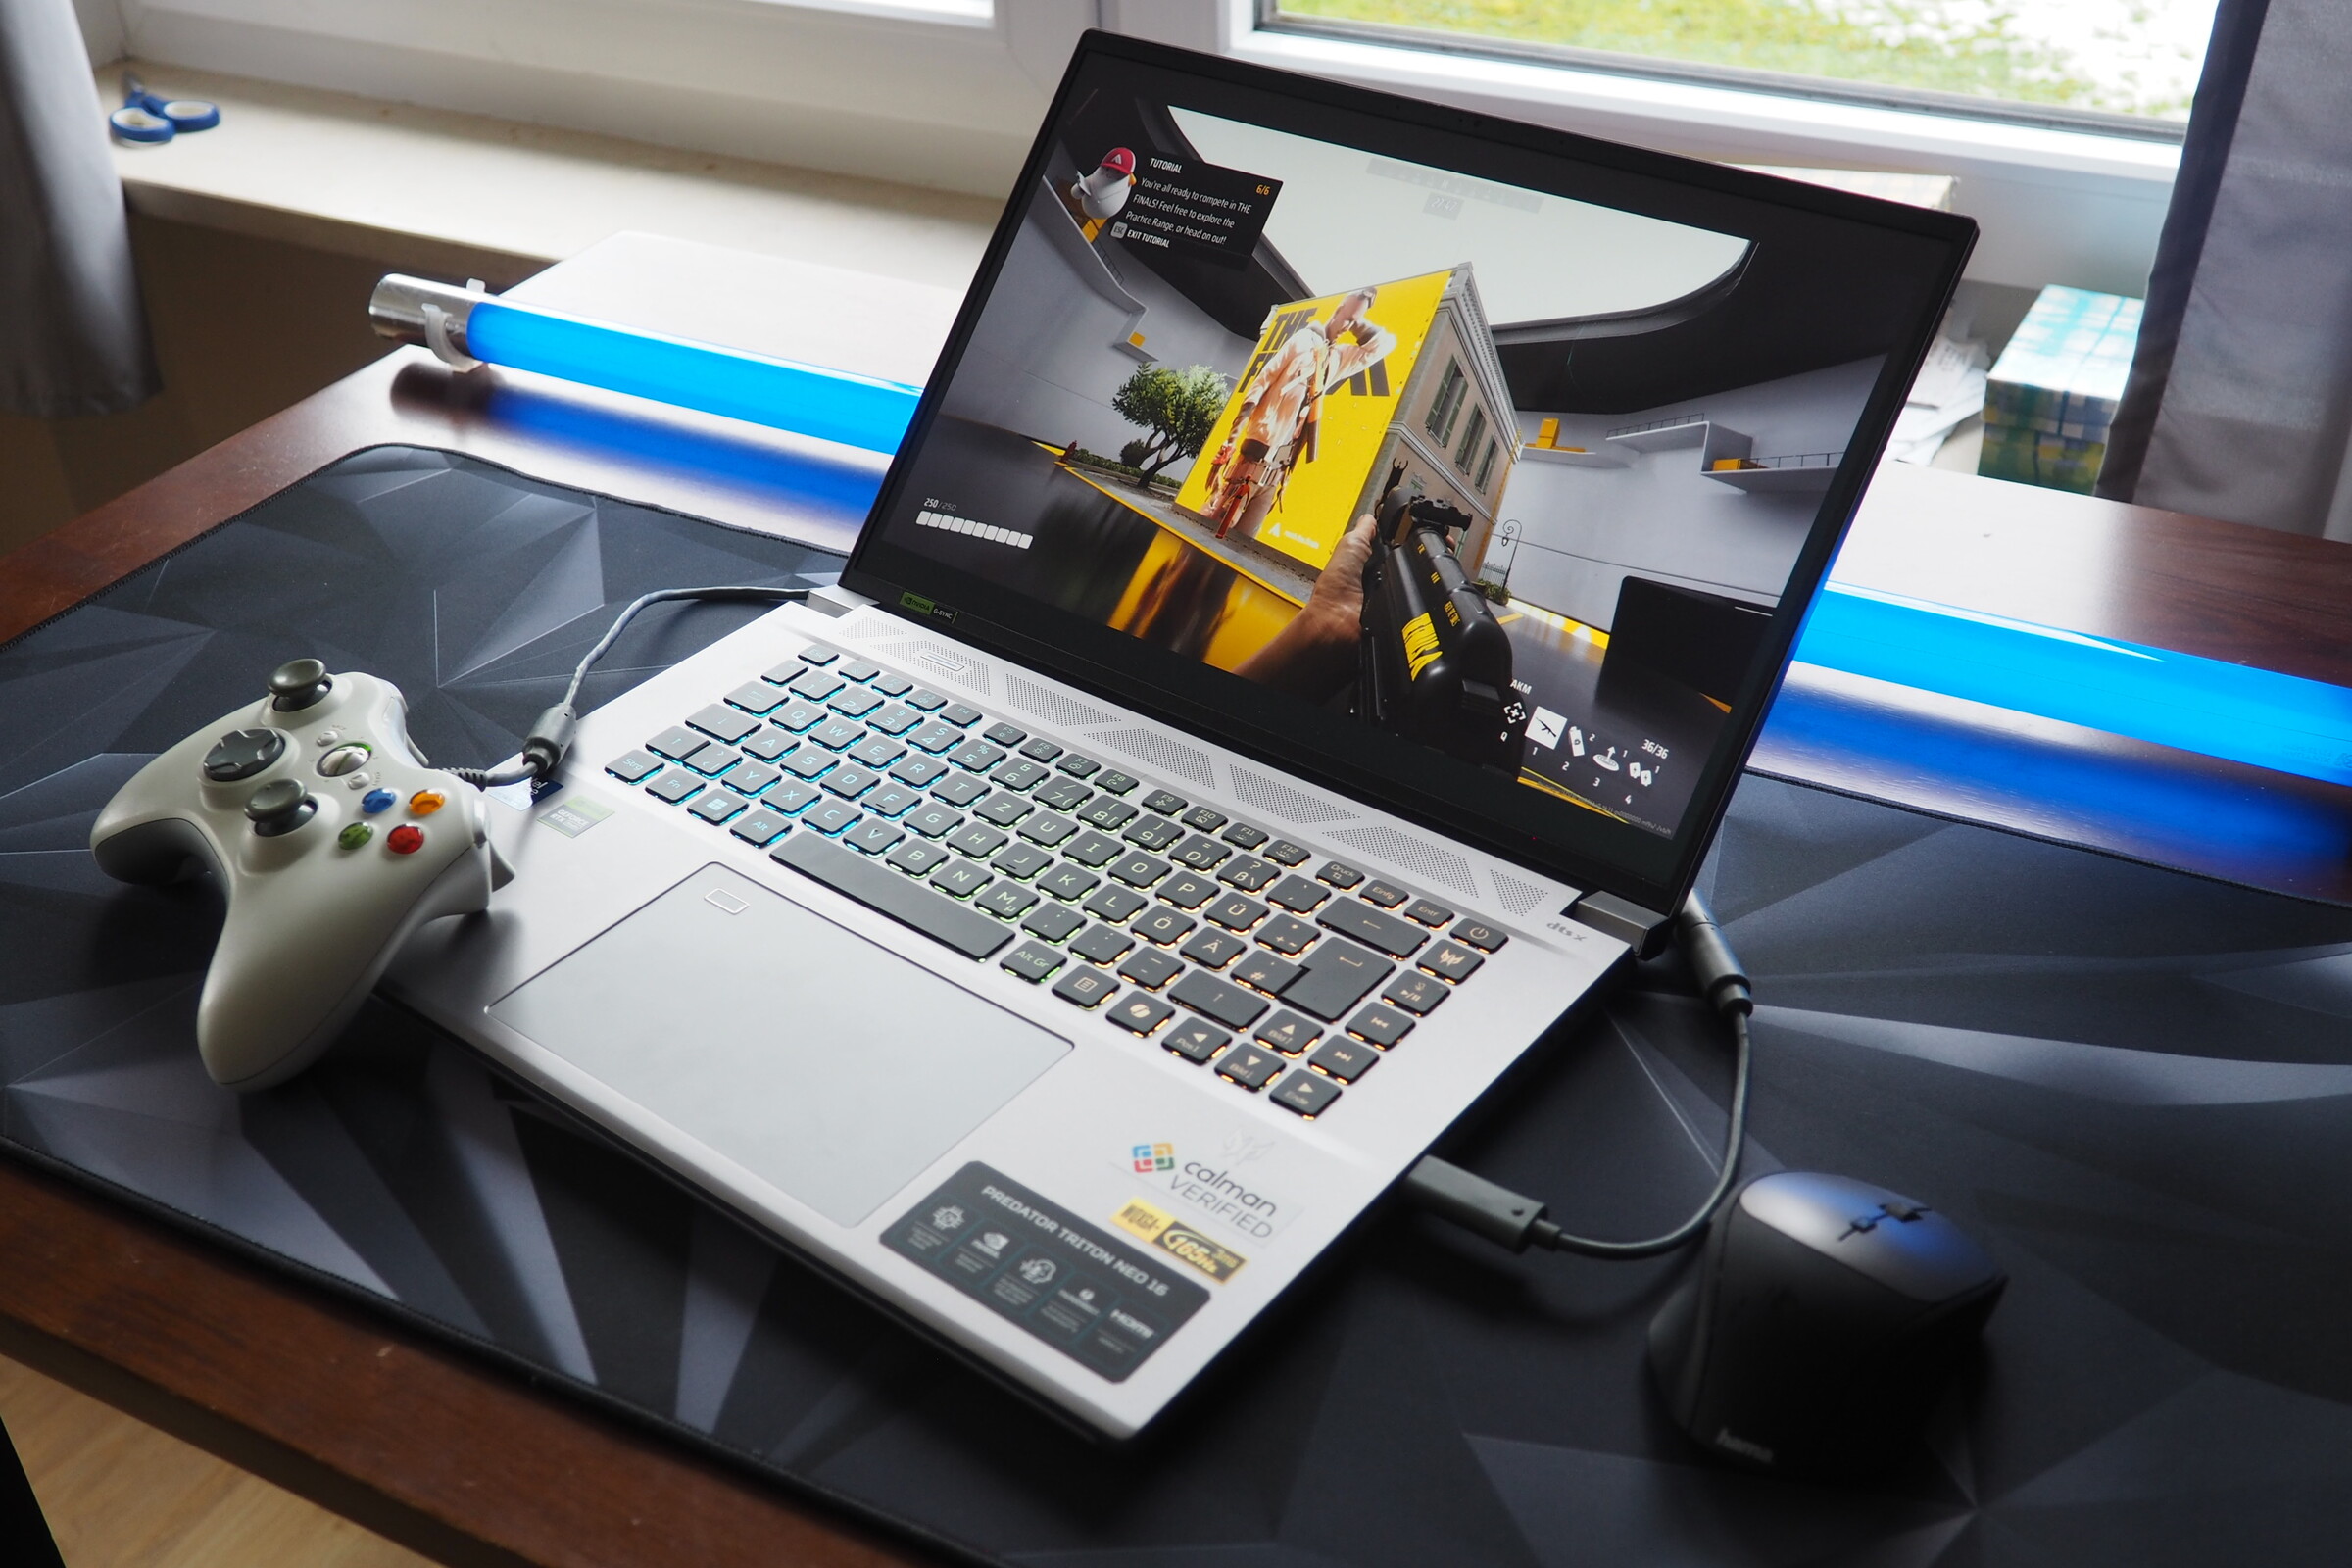
While the Nitro V 16 that we tested recently only impressed us a limited amount due to its poor display, the Predator Triton Neo 16 cut a much better figure. We put the 16-inch gamer with a Meteor Lake CPU and a GeForce RTX 4070 to the test.Florian Glaser, 👁 Florian Glaser (translated by Daisy Dickson) Published 🇩🇪 🇫🇷 ...
Verdict - Eye candy from Acer
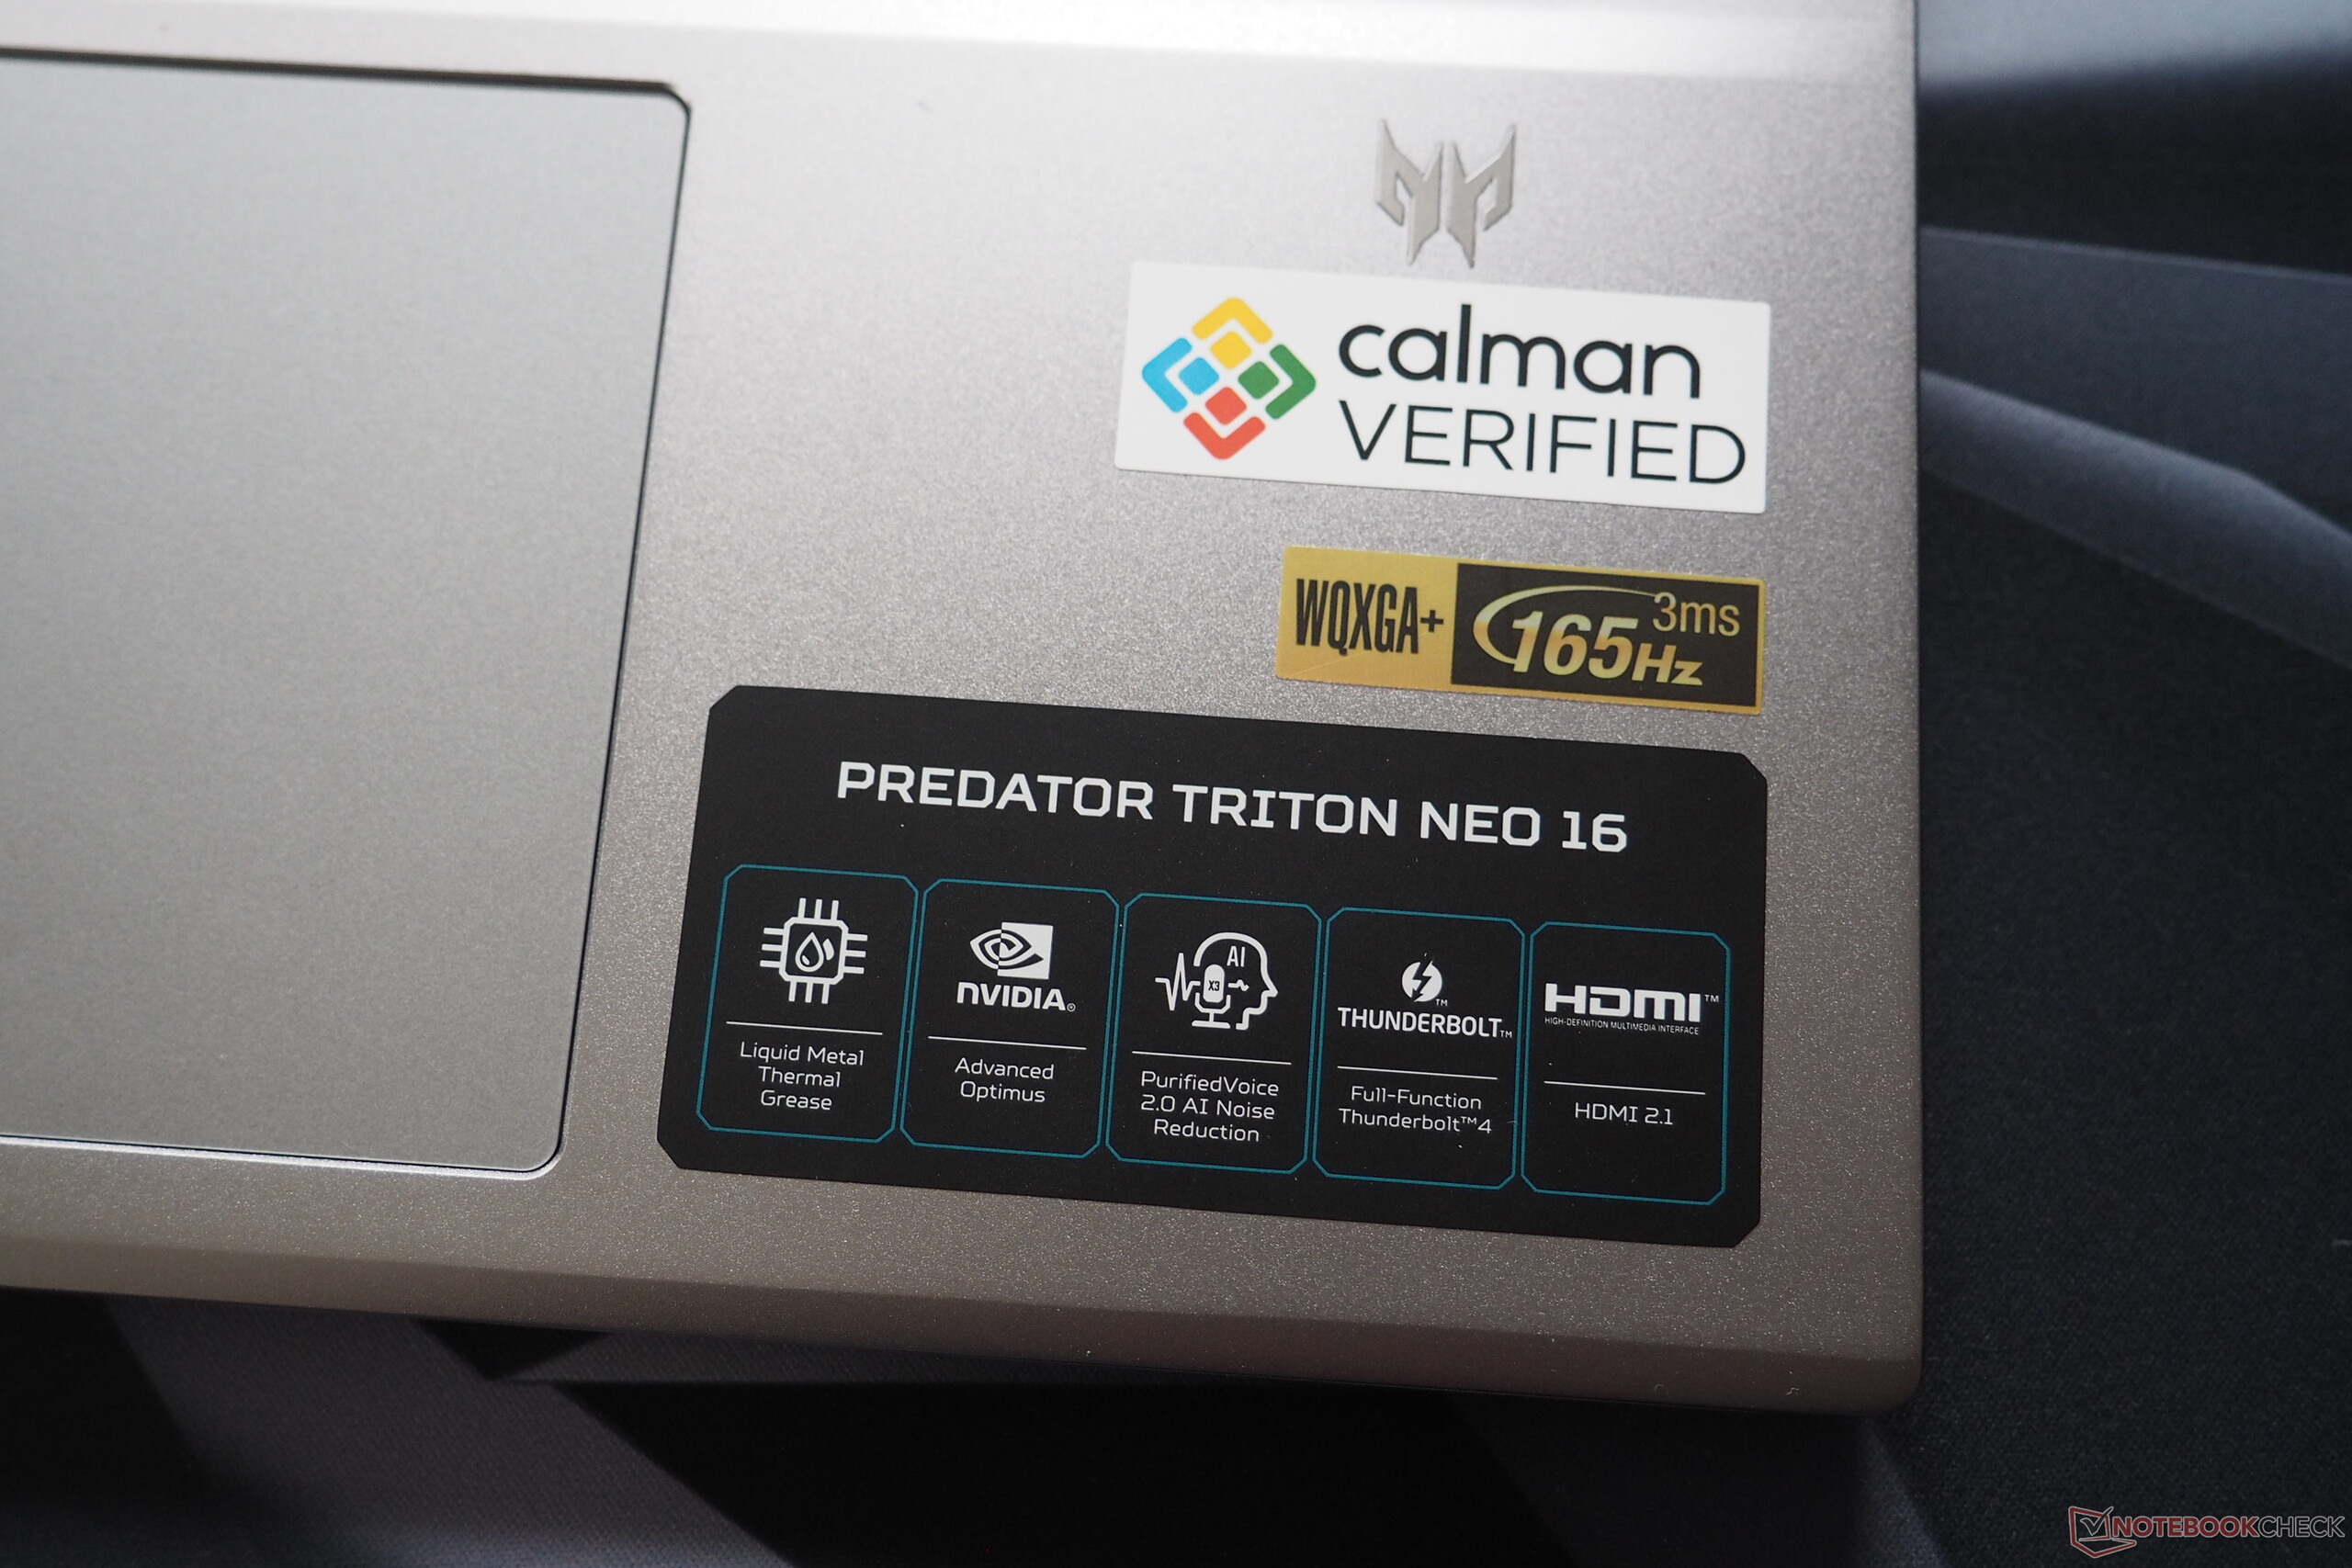
If you're on the hunt for a high-quality and sleek gaming and creating laptop, then the Predator Triton Neo 16 may just be the one for you. Acer hasn't only given the 16-inch device an absurdly long name, but also a stable metal case whose silver-gray surfaces barely attract any fingerprint marks. Its connectivity options aren't all too shabby either thanks to its USB 4 support. In addition, the Neo 16's picture quality is similarly impressive. Its 165-Hz screen based on IPS technology delivers good brightness levels, a high resolution (3,200 x 2,000 pixels), generous color space coverage and, thanks to its Calman certification, a respectable color accuracy.
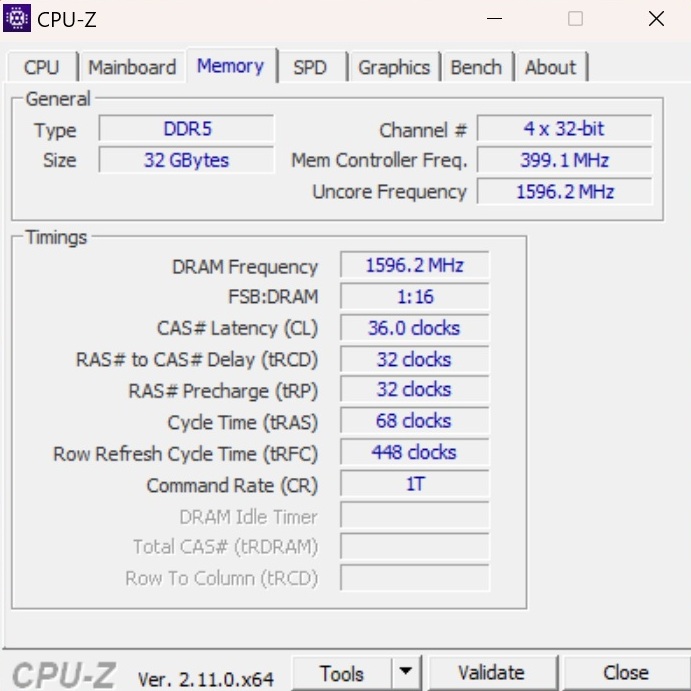
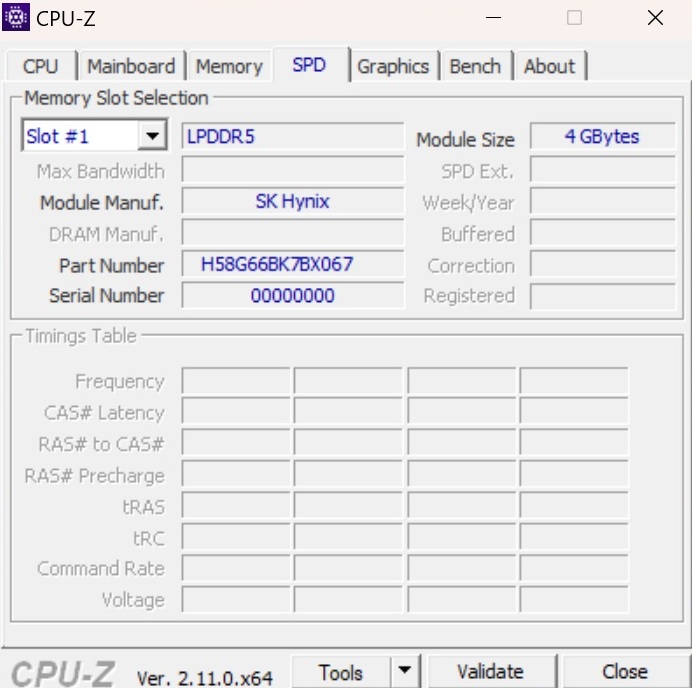
Its GPU performance, on the other hand, isn't quite as impressive. The GeForce RTX 4070 can only develop a limited part of its potential performance and balances out below our previously determined average. Furthermore, there aren't many maintenance and upgrade options. Although the 16-inch device has two M.2 slots (one of which is still free), its RAM has been soldered on—whereby the 32 GB that our test device features should probably be enough for most users for the time being. All-in-all, we would rate the Predator Triton Neo 16 as a good but not outstanding gaming and creating laptop.
The competition includes other 16-inch devices with an RTX 4070 such as the Asus ProArt P16 H7606WI, Lenovo Yoga Pro 9 16IMH9, Asus ROG Zephyrus G16 GU605M and the Alienware m16 R2, which are generally more expensive, however.
Pros
Cons
Price and availability
Currently, the Acer Predator Triton Neo 16 PTN16-51-978P is available via major online retailers such as Amazon, where it costs $1,399.
Possible alternatives compared
Image | Model / Review | Price | Weight | Height | Display |
|---|---|---|---|---|---|
1. 81.1%  | Acer Predator Triton Neo 16 PTN16-51-978P Intel Core Ultra 9 185H ⎘ NVIDIA GeForce RTX 4070 Laptop GPU ⎘ 32 GB Memory, 1024 GB SSD | Amazon: List Price: 1900 EUR | 2 kg | 21 mm | 16.00" 3200x2000 236 PPI IPS |
2. 87.8%  | Asus ProArt P16 H7606WI AMD Ryzen AI 9 HX 370 ⎘ NVIDIA GeForce RTX 4070 Laptop GPU ⎘ 64 GB Memory, 1024 GB SSD | Amazon: List Price: 4000€ | 1.8 kg | 17.3 mm | 16.00" 3840x2400 283 PPI OLED |
3. 88.7% v7 (old)  | Lenovo Yoga Pro 9 16IMH9 Intel Core Ultra 9 185H ⎘ NVIDIA GeForce RTX 4070 Laptop GPU ⎘ 32 GB Memory, 1024 GB SSD | Amazon: List Price: 2700€ | 2.1 kg | 18.3 mm | 16.00" 3200x2000 236 PPI Mini-LED |
4. 92.3% v7 (old)  | Asus ROG Zephyrus G16 2024 GU605M Intel Core Ultra 7 155H ⎘ NVIDIA GeForce RTX 4070 Laptop GPU ⎘ 16 GB Memory, 1024 GB SSD | Amazon: List Price: 3000€ | 1.8 kg | 16.4 mm | 16.00" 2560x1600 189 PPI OLED |
5. 90.2% v7 (old)  | Alienware m16 R2 Intel Core Ultra 7 155H ⎘ NVIDIA GeForce RTX 4070 Laptop GPU ⎘ 16 GB Memory, 1024 GB SSD | Amazon: List Price: 1850 USD | 2.5 kg | 23.5 mm | 16.00" 2560x1600 189 PPI IPS |
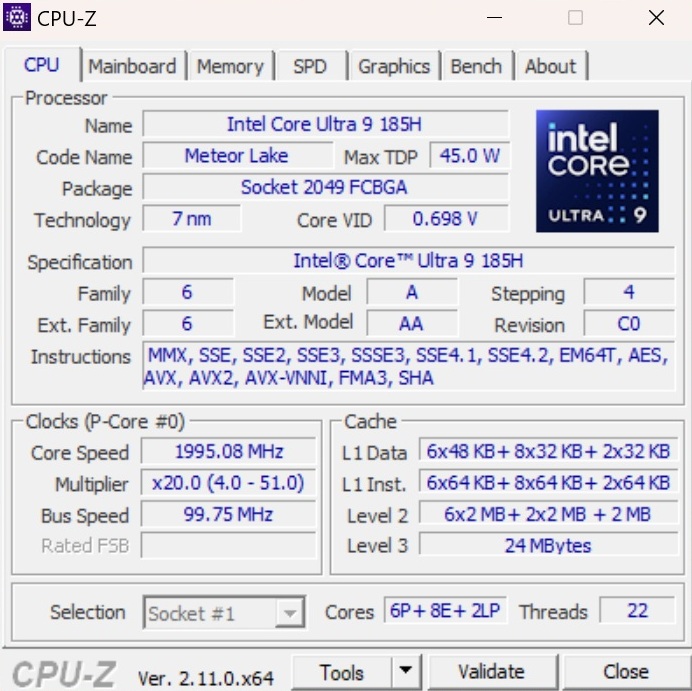
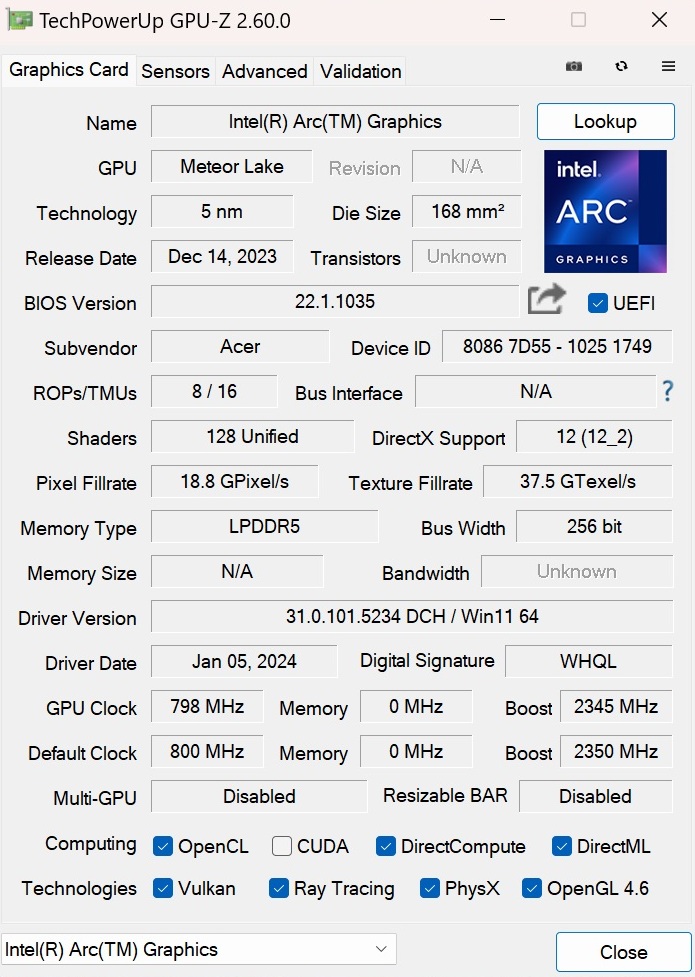
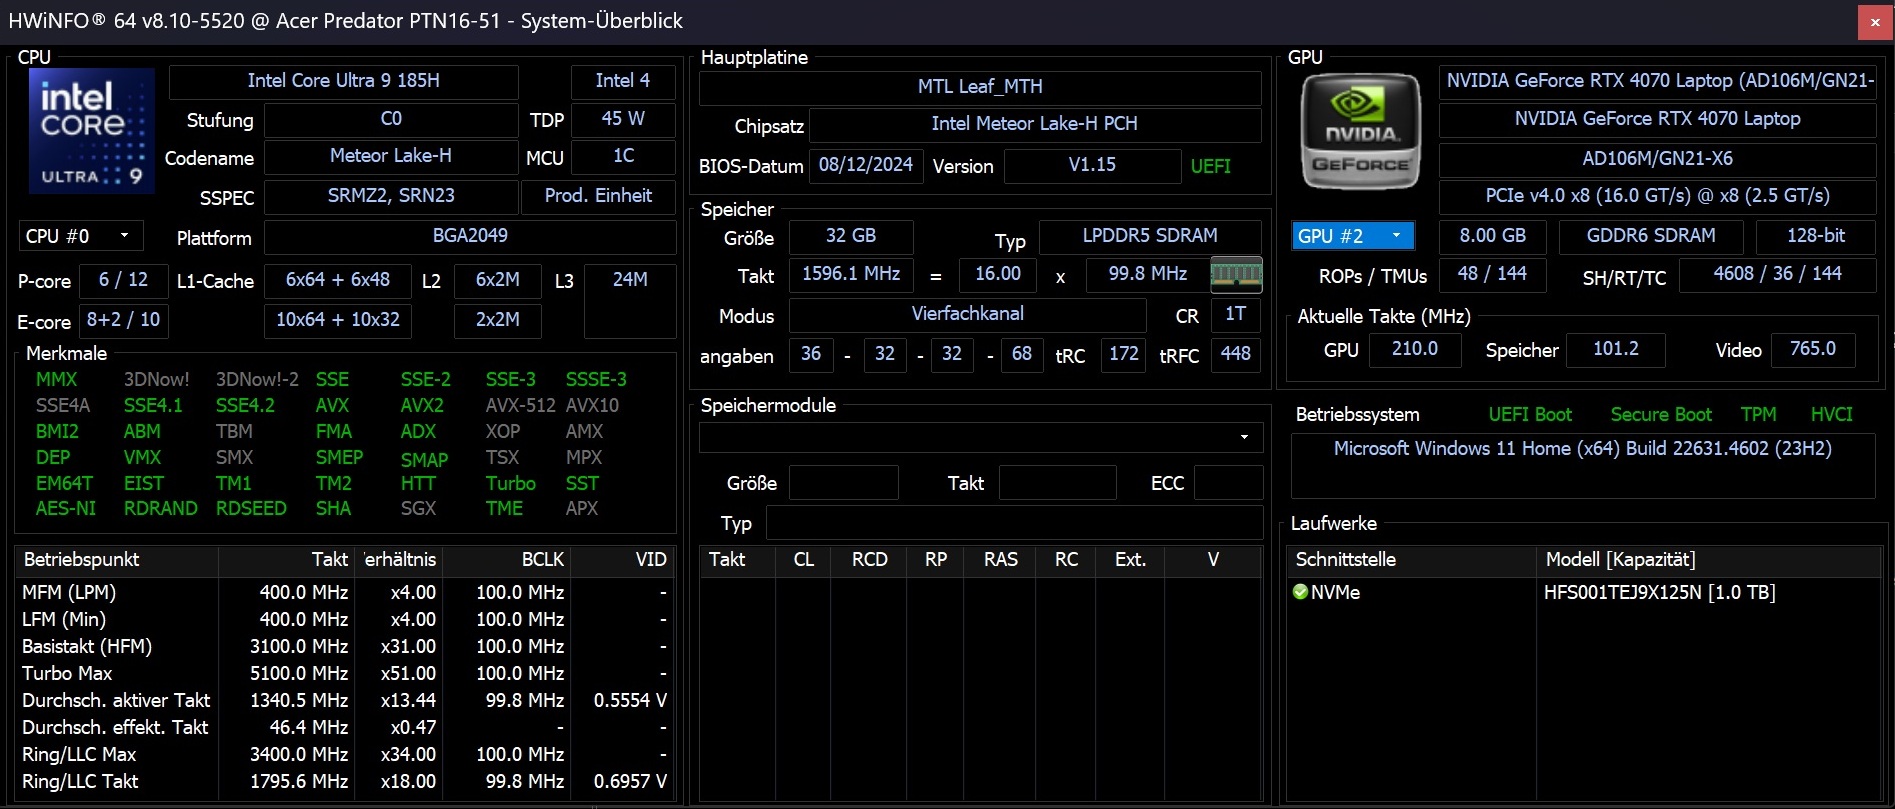
Acer has equipped our test configuration with a Core Ultra 9 185H from the Meteor Lake series and—as mentioned earlier—with a GeForce RTX 4070. It also features an impressive 32 GB of LPDDR5X RAM. The installed NVMe SSD has a capacity of 1 TB. The laptop's screen has a 16:10 aspect ratio and its operating system is Windows 11 Home. Its battery capacity of 76 Wh is neither low nor particularly generous.
Specifications
Case
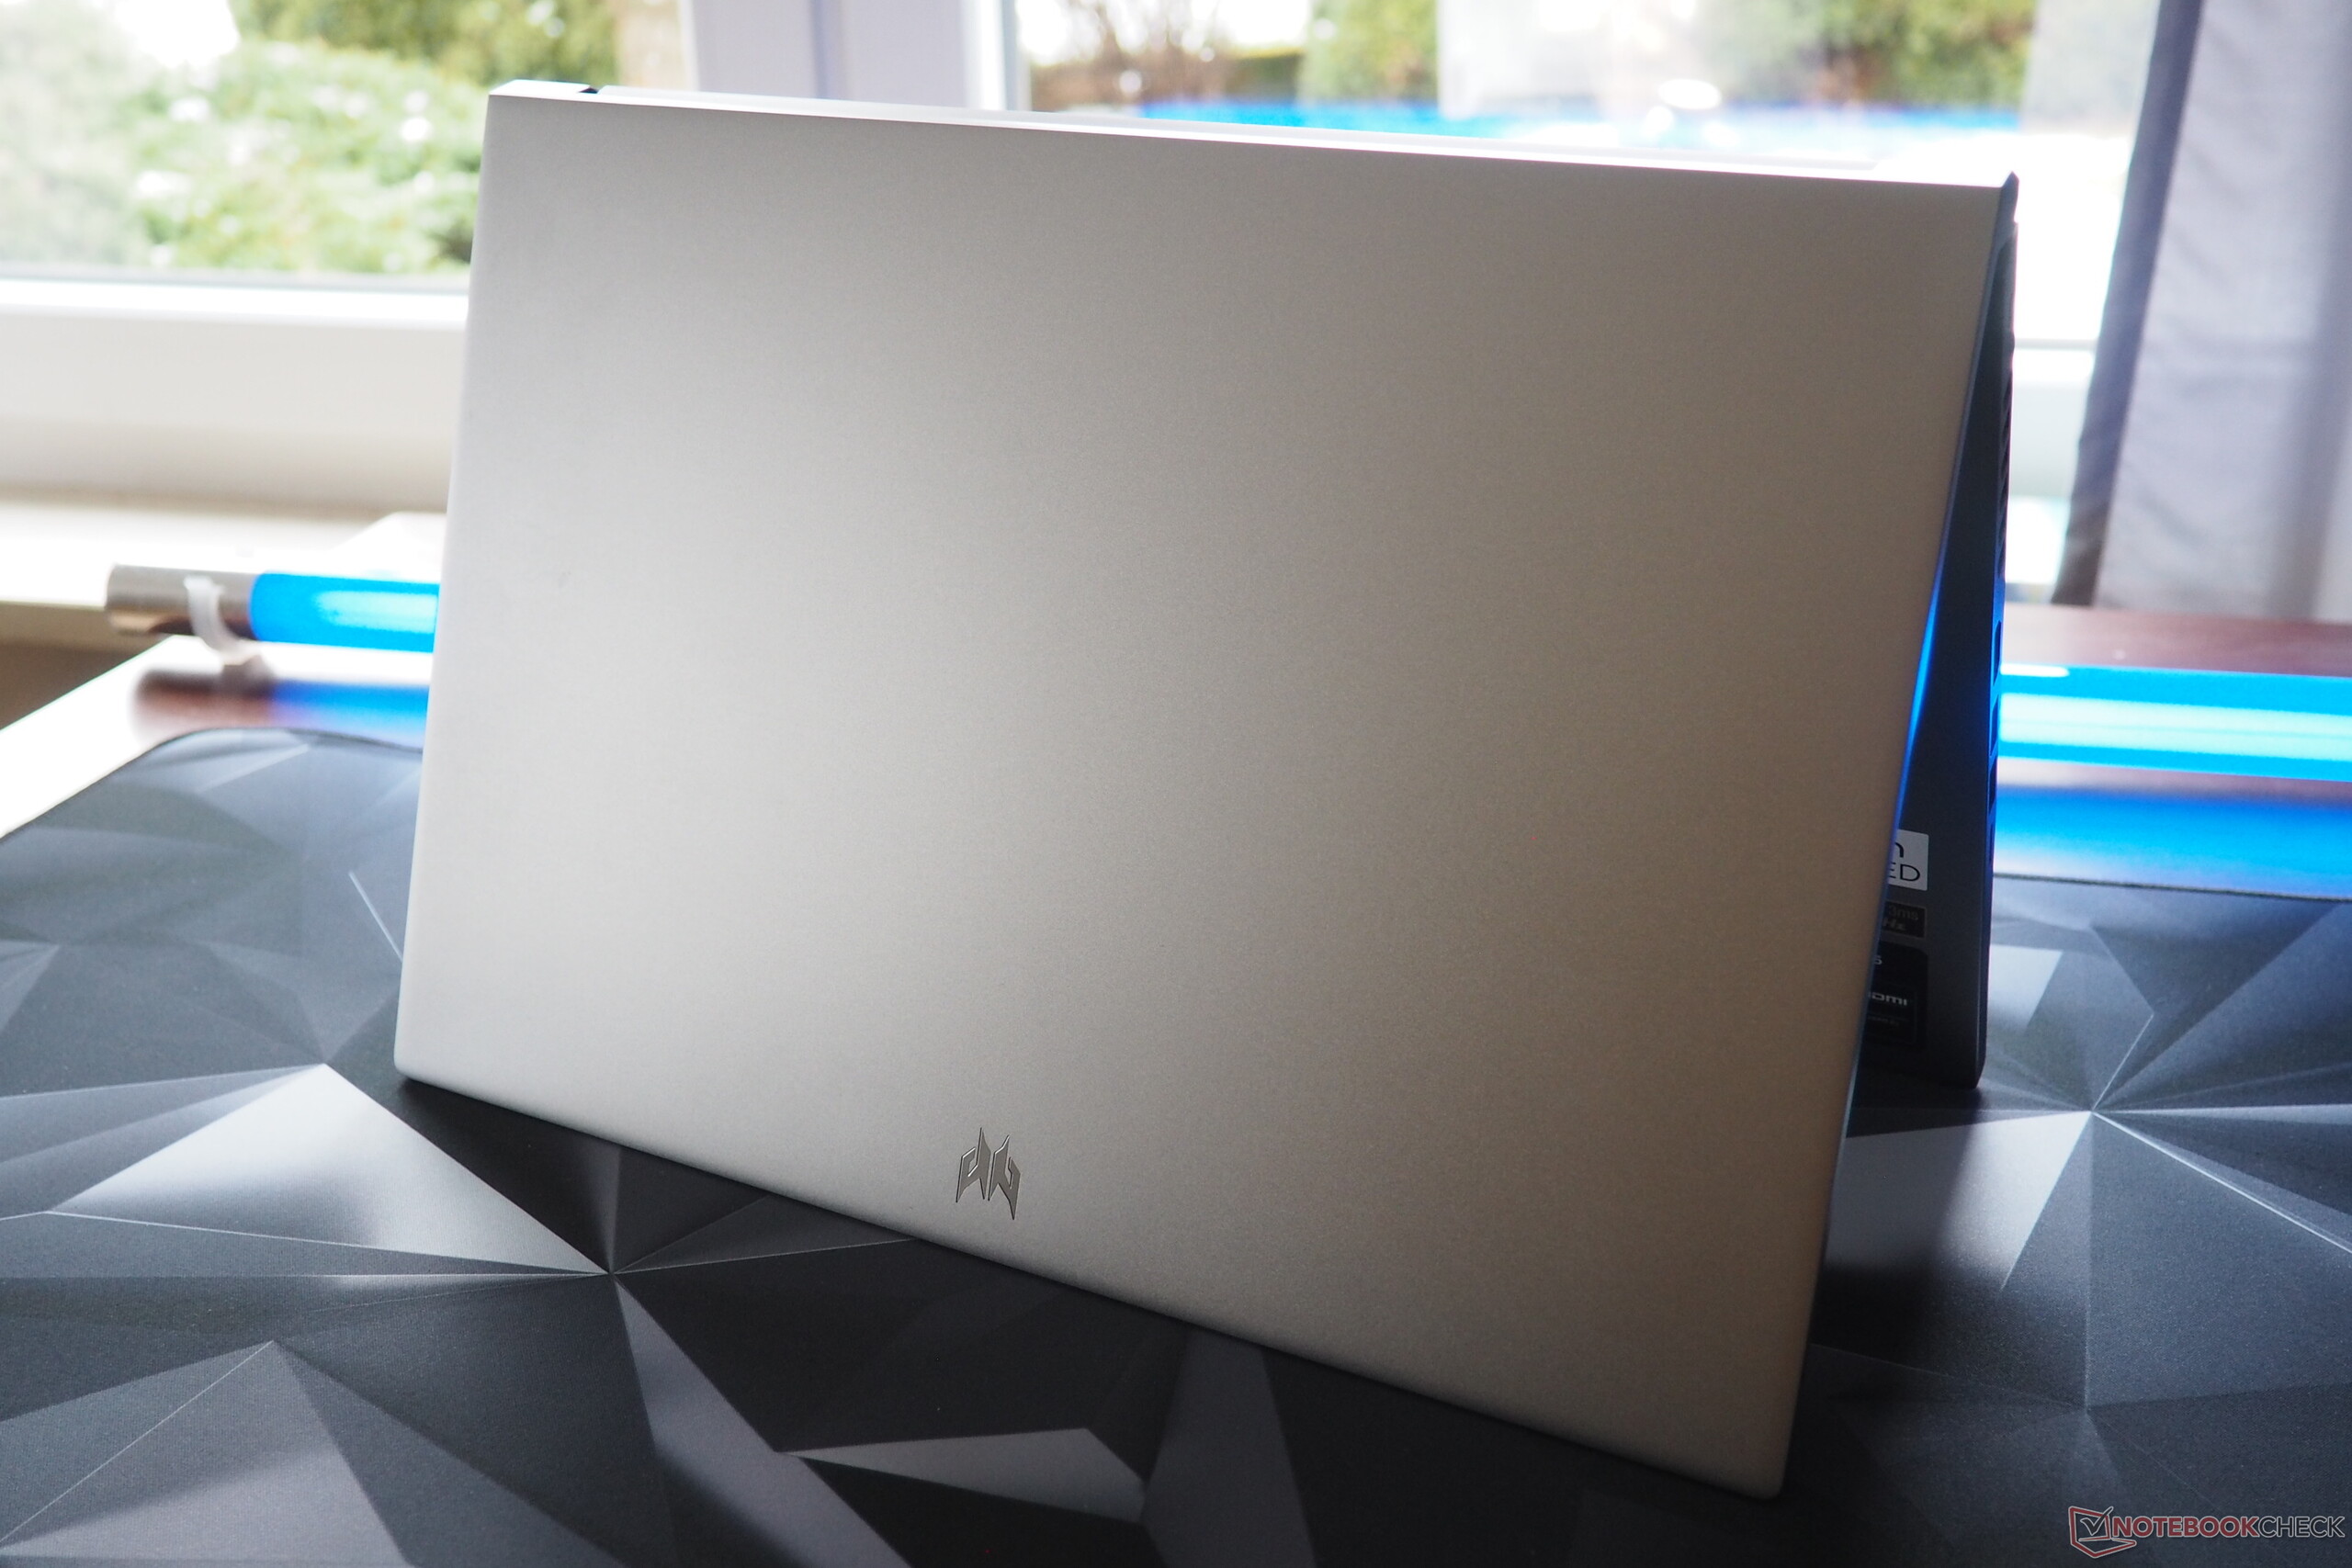
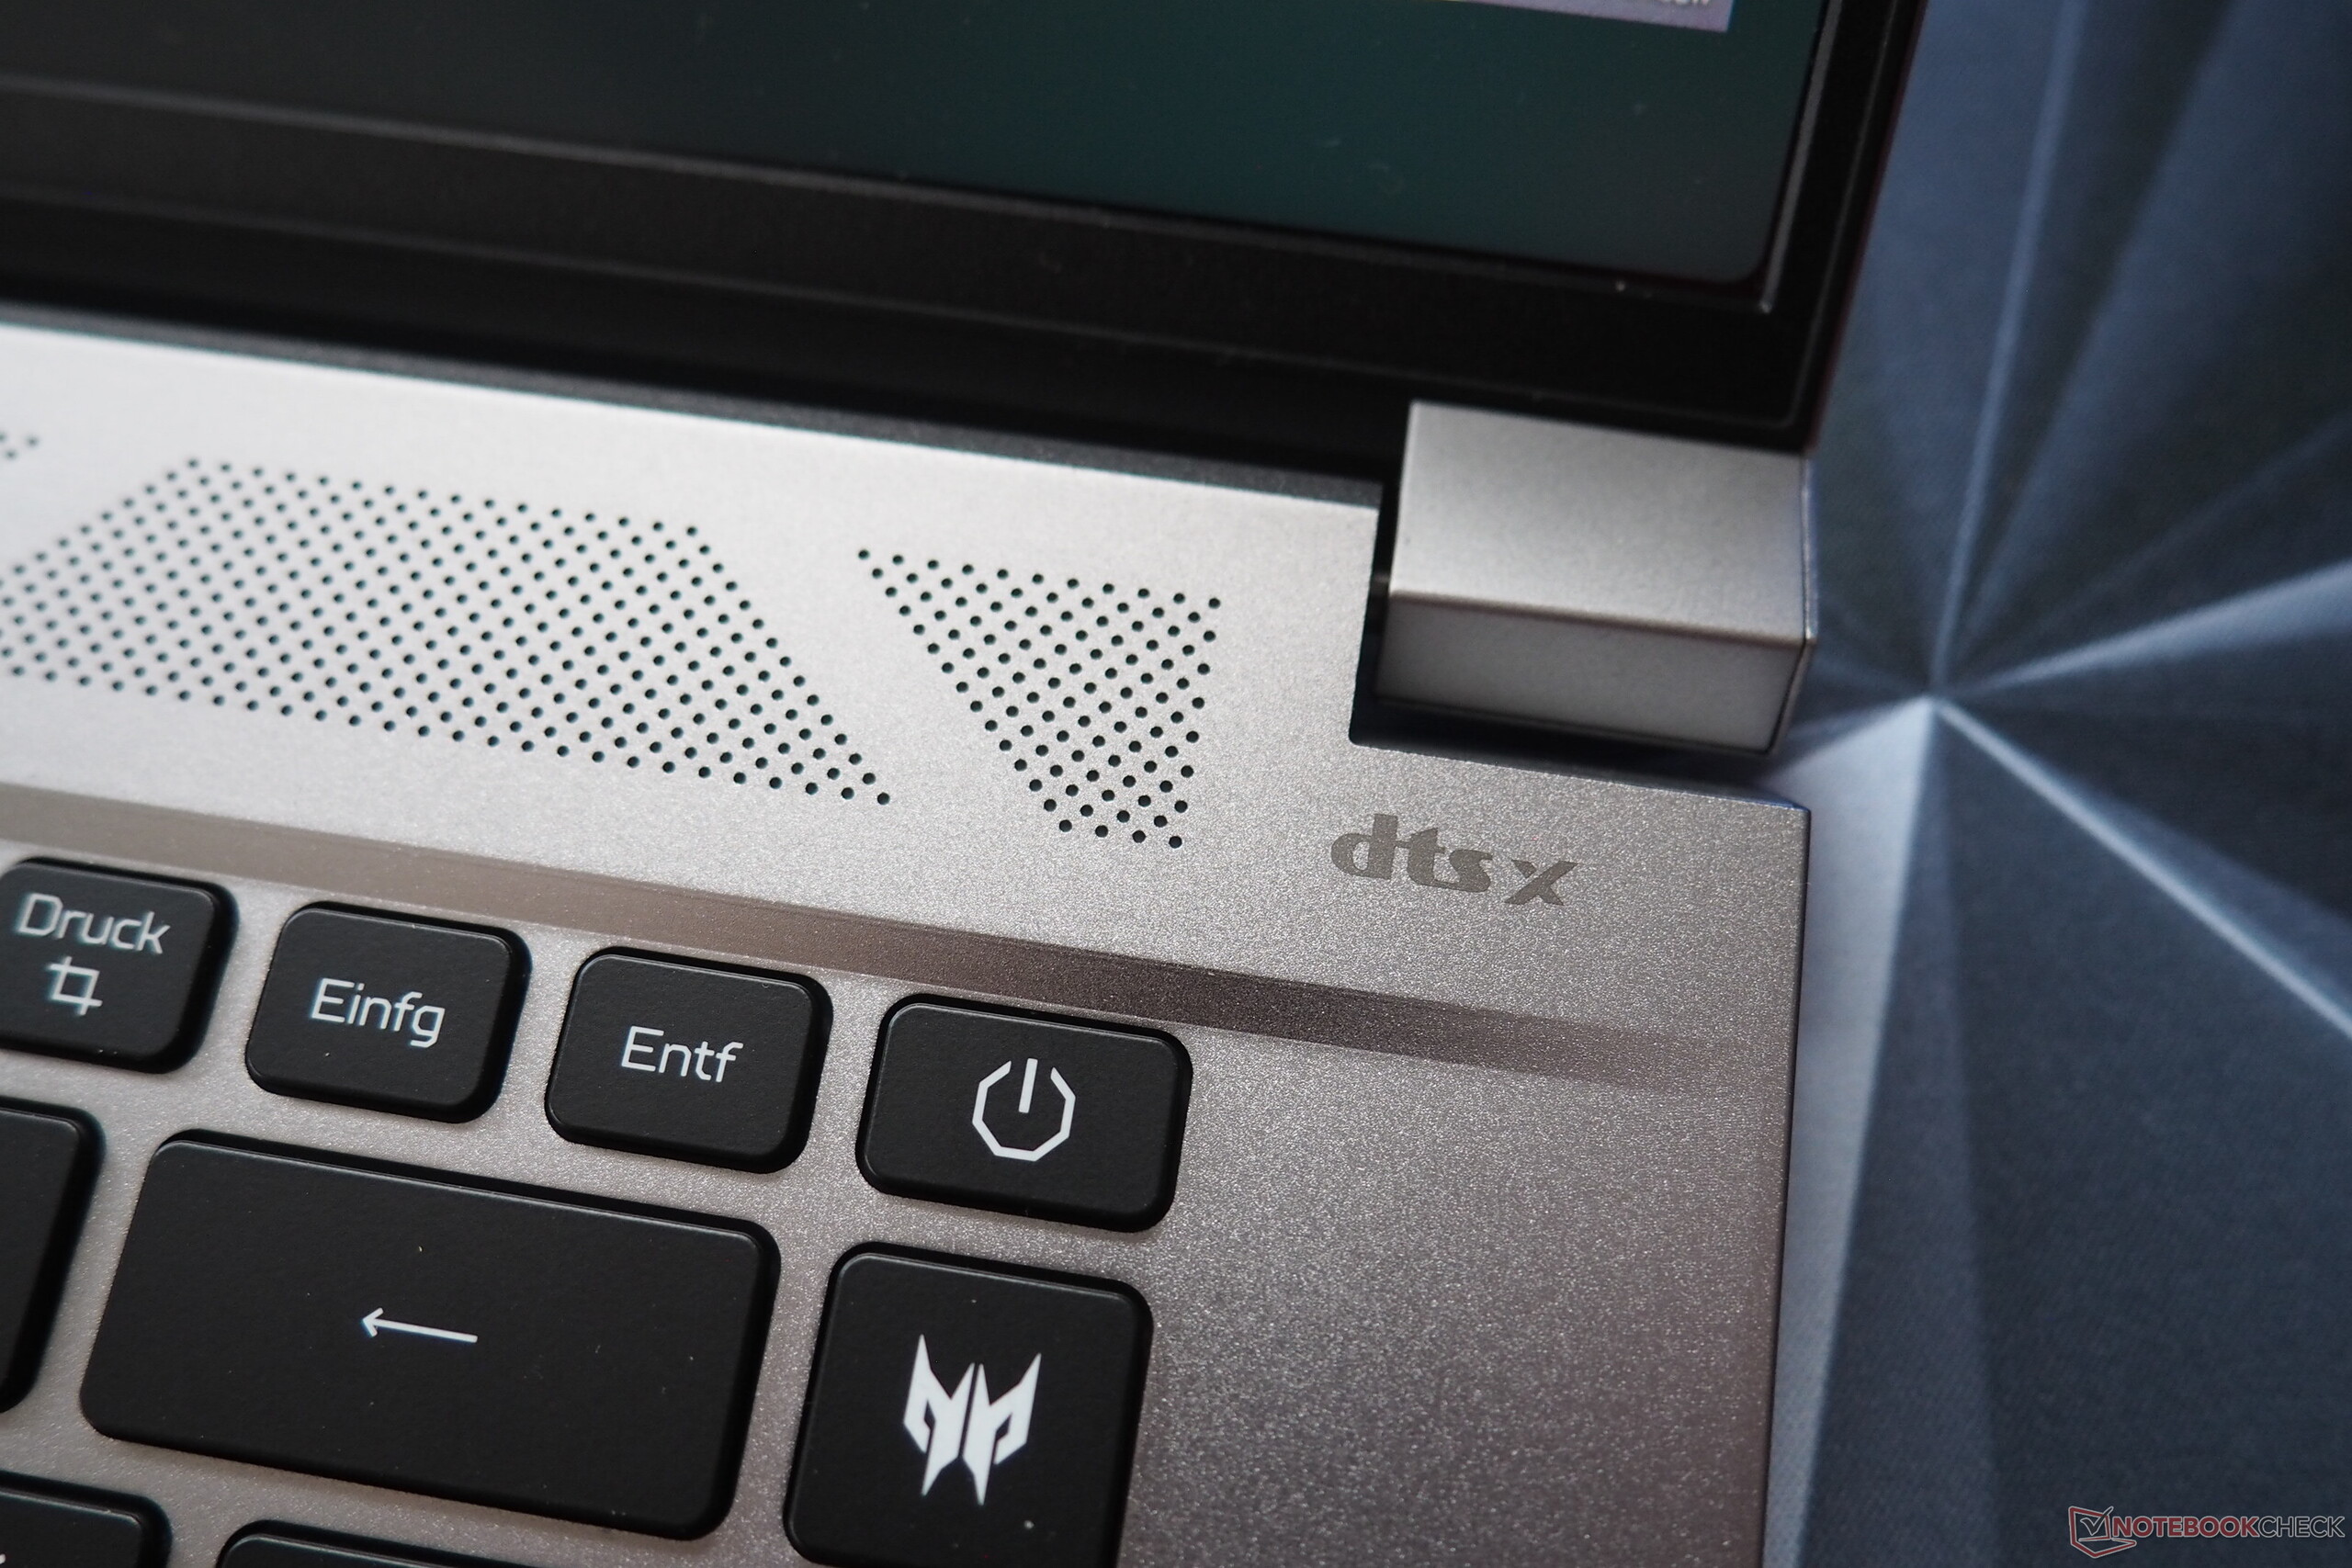
One of the biggest highlights of the Predator Triton is its elegant and nice-looking case. Its metal surfaces leave a high-quality impression and barely attract fingerprints thanks to its light color. The case's stability is equally good, with the exception of a few details (the touchpad gives way quite a bit in places). Acer also deserves praise for the device's well-functioning hinges, although their maximum opening angle of approx. 135° could be a little wider. On the other hand, we have nothing to criticize about its build quality.


With its weight of around 2 kg, the 16-inch device lies between its competitors, which all weigh between 1.8 and 2.5 kg. Their height and basic dimensions are similar: Here too, the Acer laptop makes itself comfortable in the midfield.
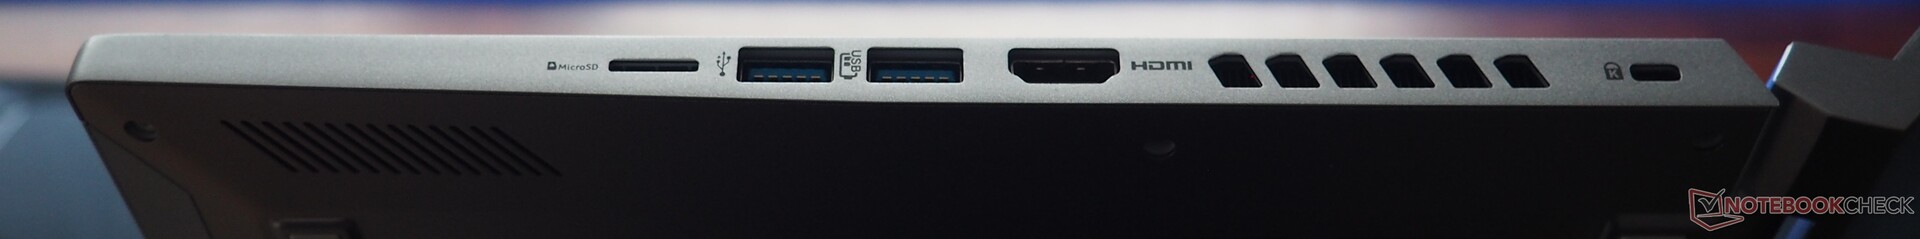
Connectivity
Ports
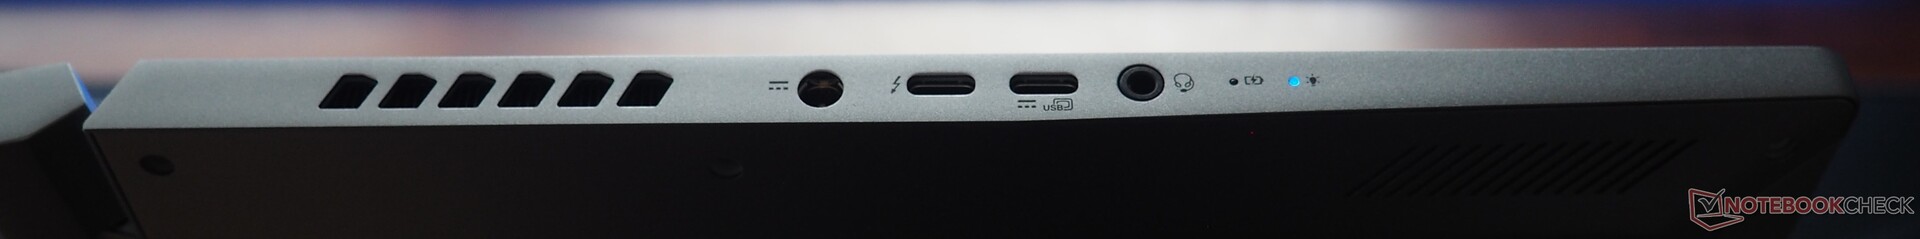
The Neo 16 offers a wide range of ports. While the left side houses the power connection, an audio jack and two USB-C ports (1x USB 4 with DisplayPort 1.4 & PowerDelivery), the right side is equipped with a micro SD card reader, two USB-A ports (3.1 Gen 2), HDMI 2.1 and an opening for Kensington locks. Even so, Acer should have added an RJ45 port to the device to secure it a very good connectivity rating.
SD card reader
The laptop's card reader achieved mediocre speeds of around 90 MB/s during our test. The Alienware m16 and the Asus ProArt P16 did much better when it came to sequential reading.
| SD Card Reader | |
| average JPG Copy Test (av. of 3 runs) | |
| Asus ProArt P16 H7606WI (Angelbird AV Pro V60) | |
| Average of class Gaming (20.9 - 210, n=55, last 2 years) | |
| Acer Predator Triton Neo 16 PTN16-51-978P (AV PRO microSD 128 GB V60) | |
| Asus ROG Zephyrus G16 2024 GU605M | |
| Lenovo Yoga Pro 9 16IMH9 (Angelbird AV Pro V60) | |
| Alienware m16 R2 (AV PRO microSD 128 GB V60) | |
| maximum AS SSD Seq Read Test (1GB) | |
| Asus ProArt P16 H7606WI (Angelbird AV Pro V60) | |
| Alienware m16 R2 (AV PRO microSD 128 GB V60) | |
| Average of class Gaming (25.5 - 261, n=52, last 2 years) | |
| Acer Predator Triton Neo 16 PTN16-51-978P (AV PRO microSD 128 GB V60) | |
| Asus ROG Zephyrus G16 2024 GU605M | |
| Lenovo Yoga Pro 9 16IMH9 (Angelbird AV Pro V60) | |
Communication
Its wireless module goes by the name Killer Wi-Fi 6E AX1675x and performed solidly (transmitting) to very well (receiving) during our connection speed test at a distance of 1 meter from the reference router.
Webcam
The device's 2MP webcam is slightly sharper and more color-accurate than on most gaming laptops, but you can't expect any miracles. There is no cover for added privacy.


Accessories
The Acer laptop comes with a 230-watt power supply and multiple information leaflets.
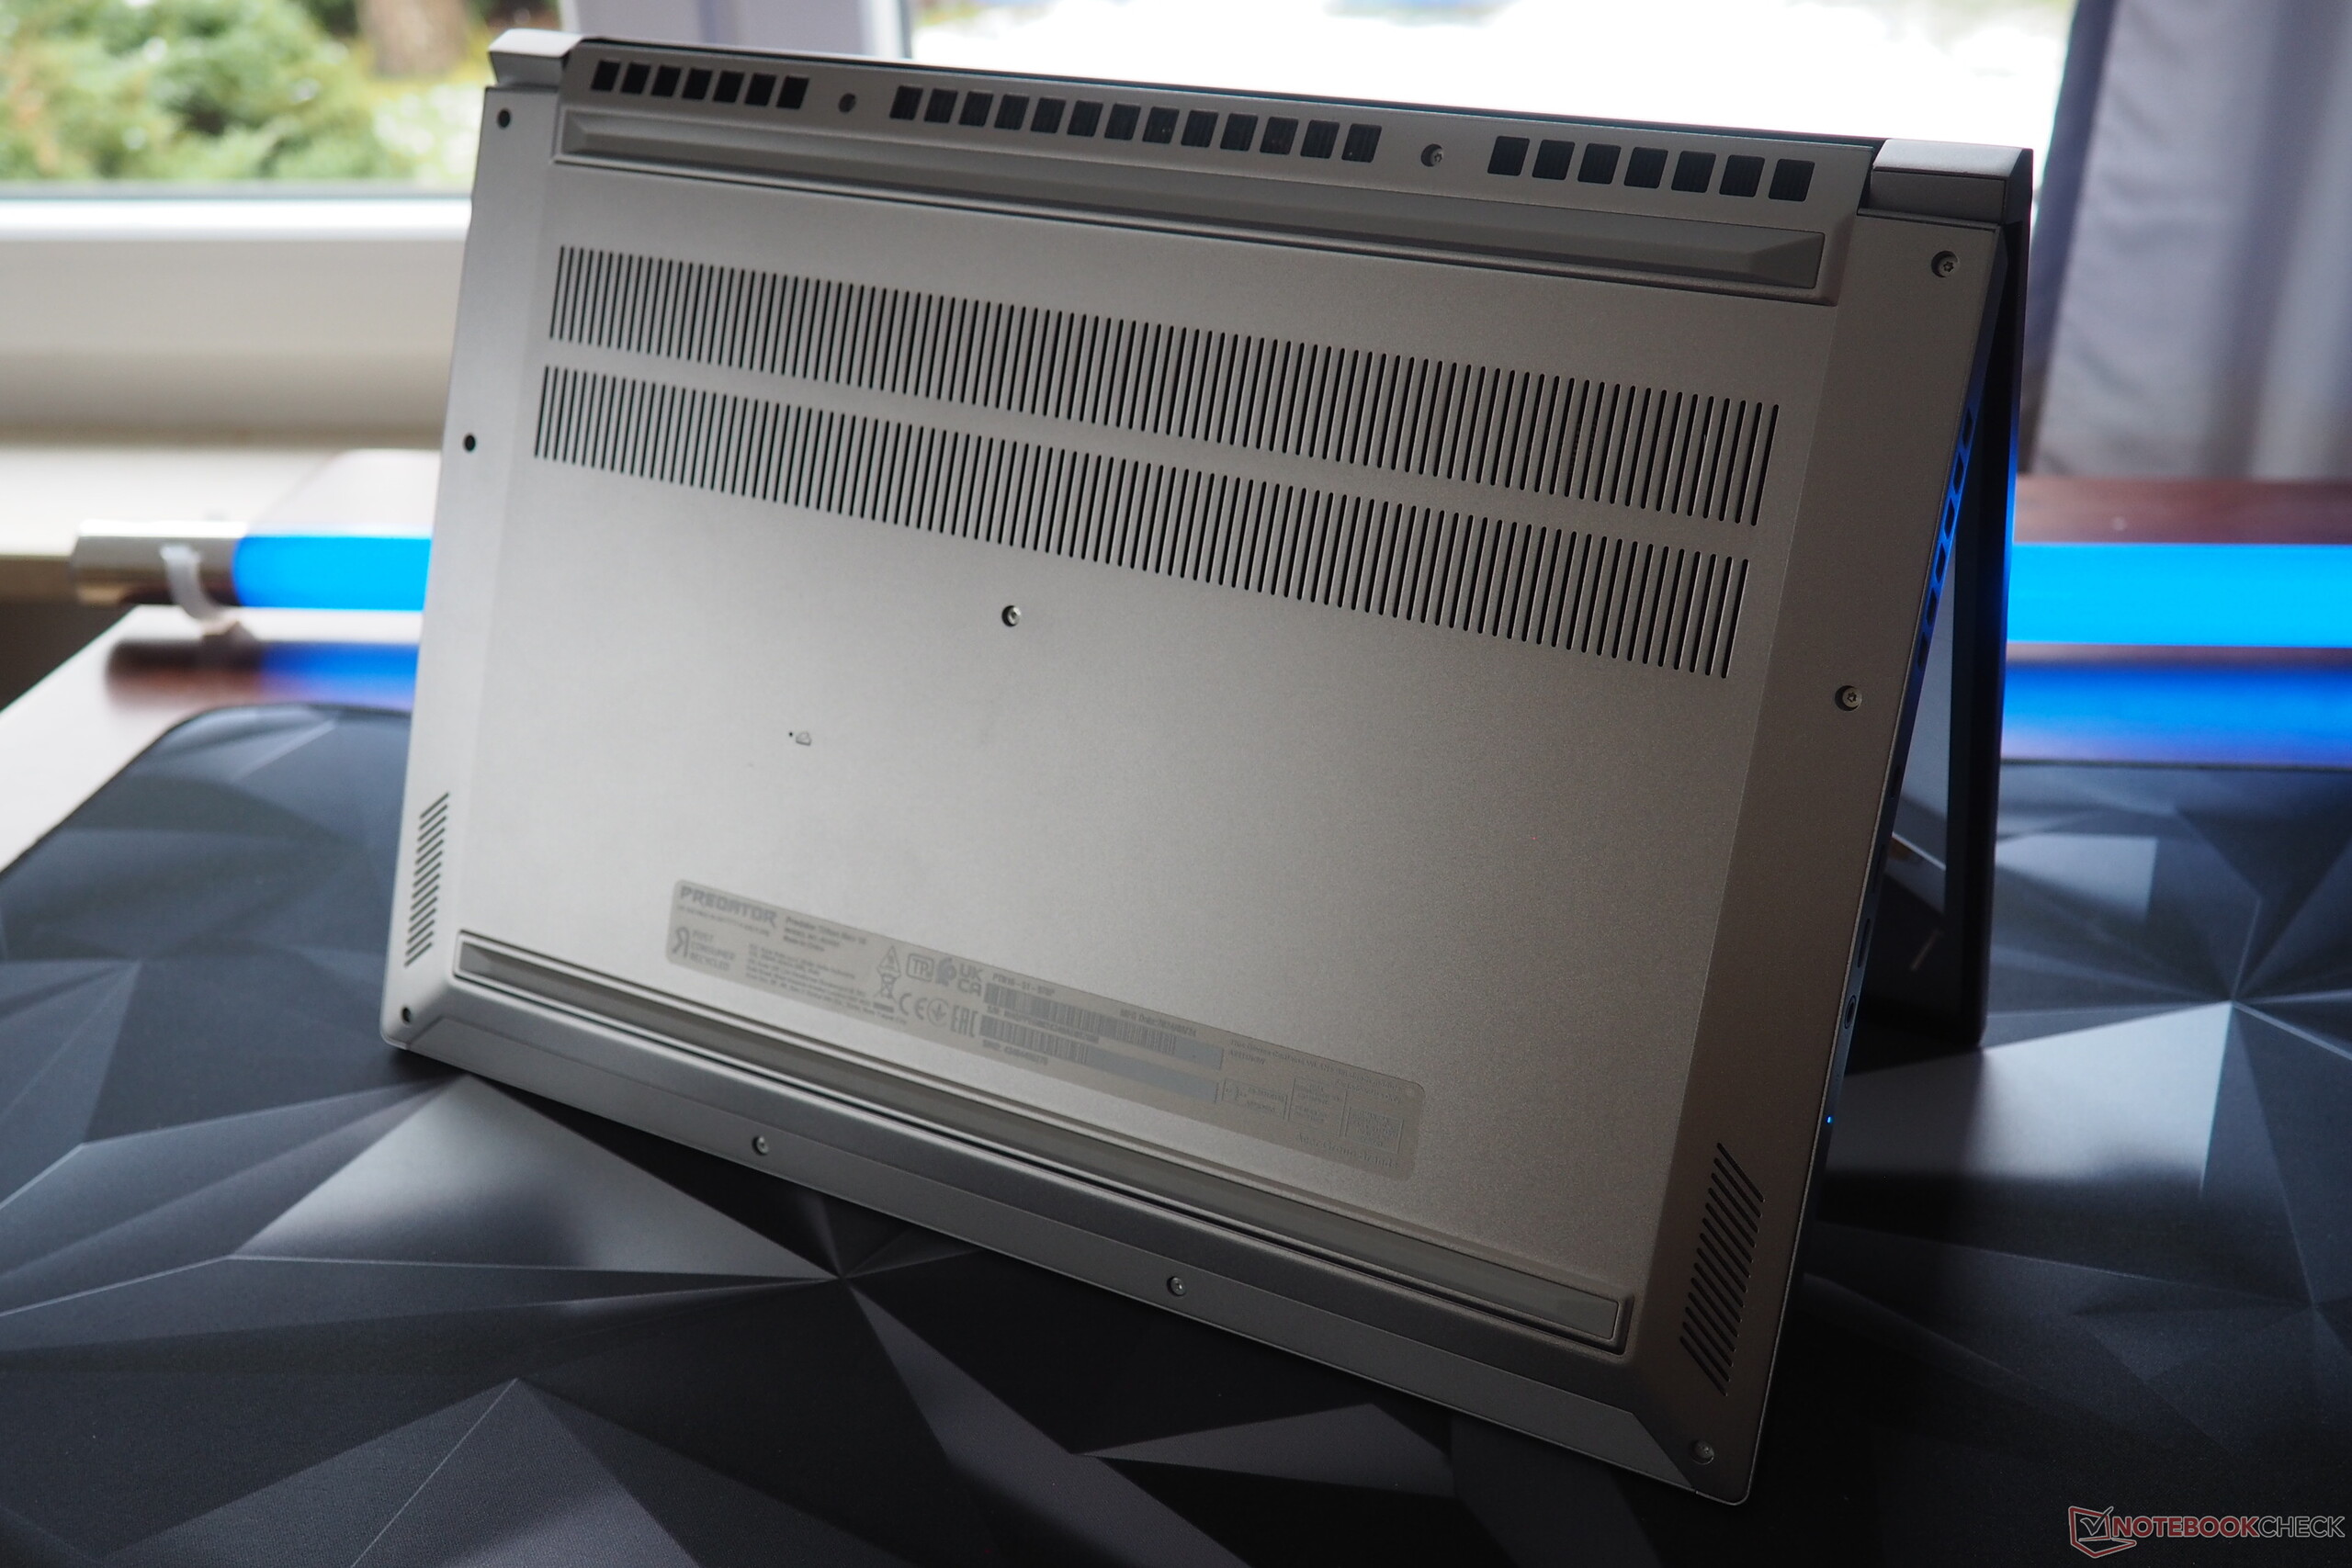
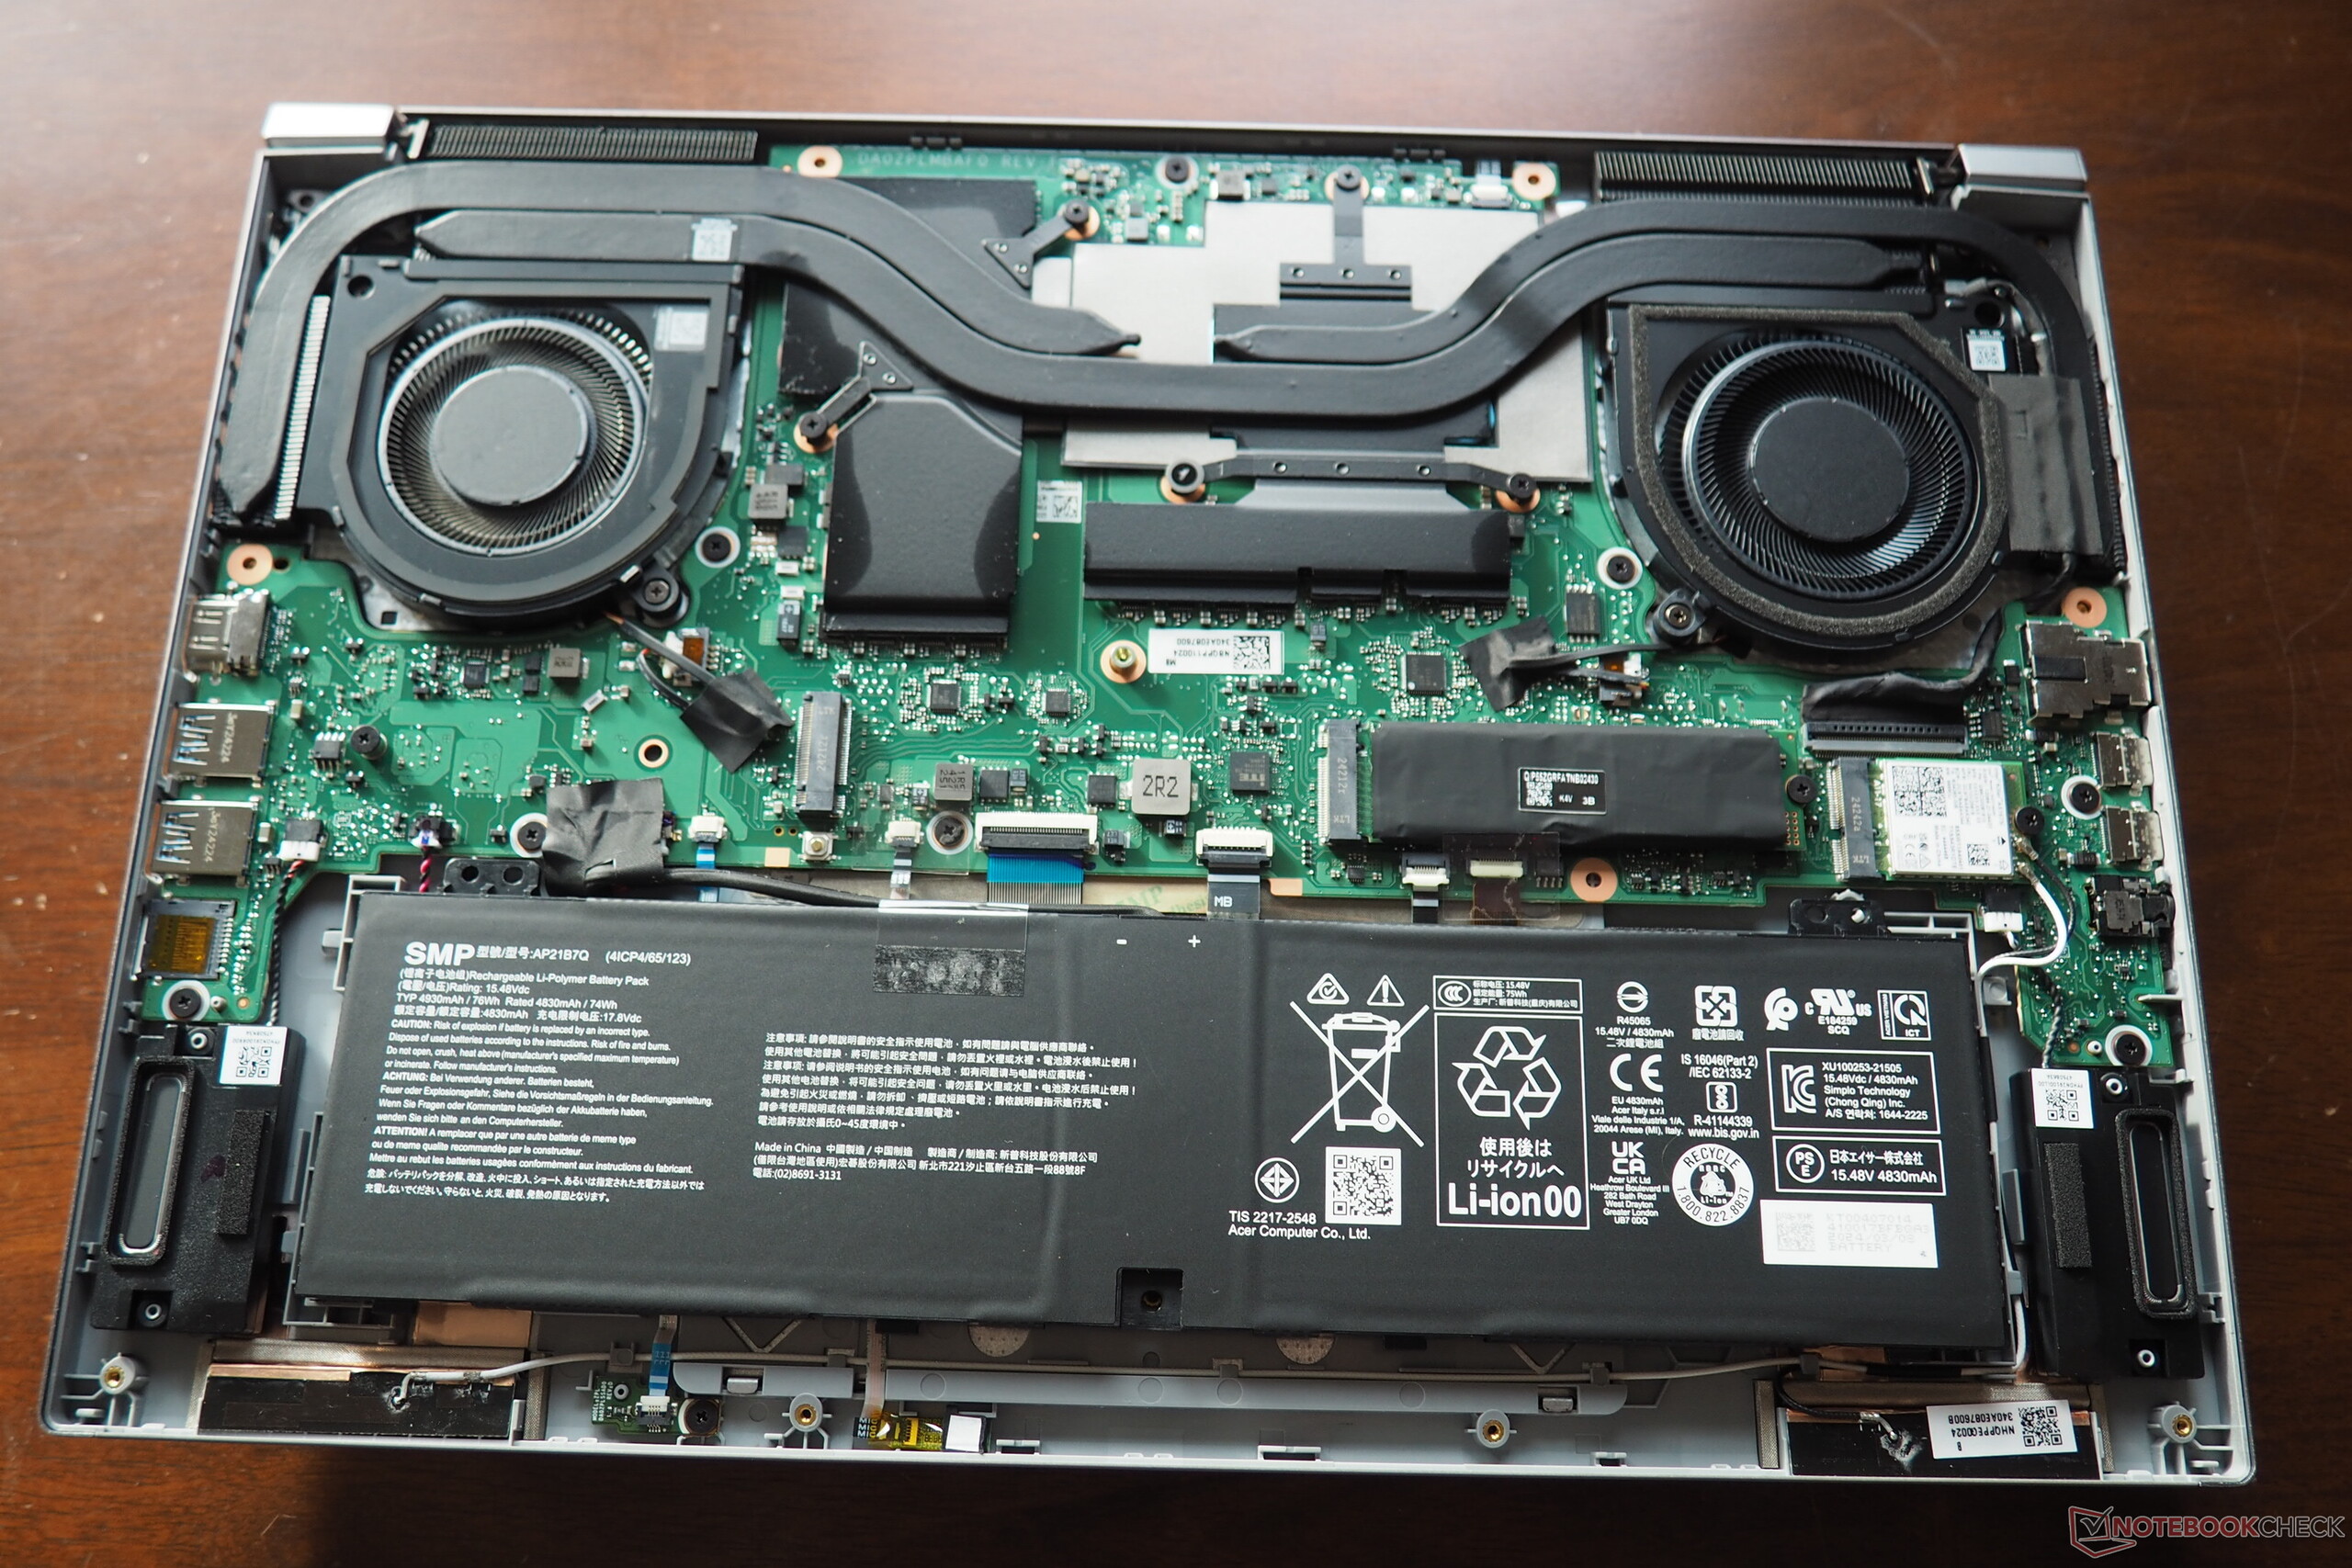
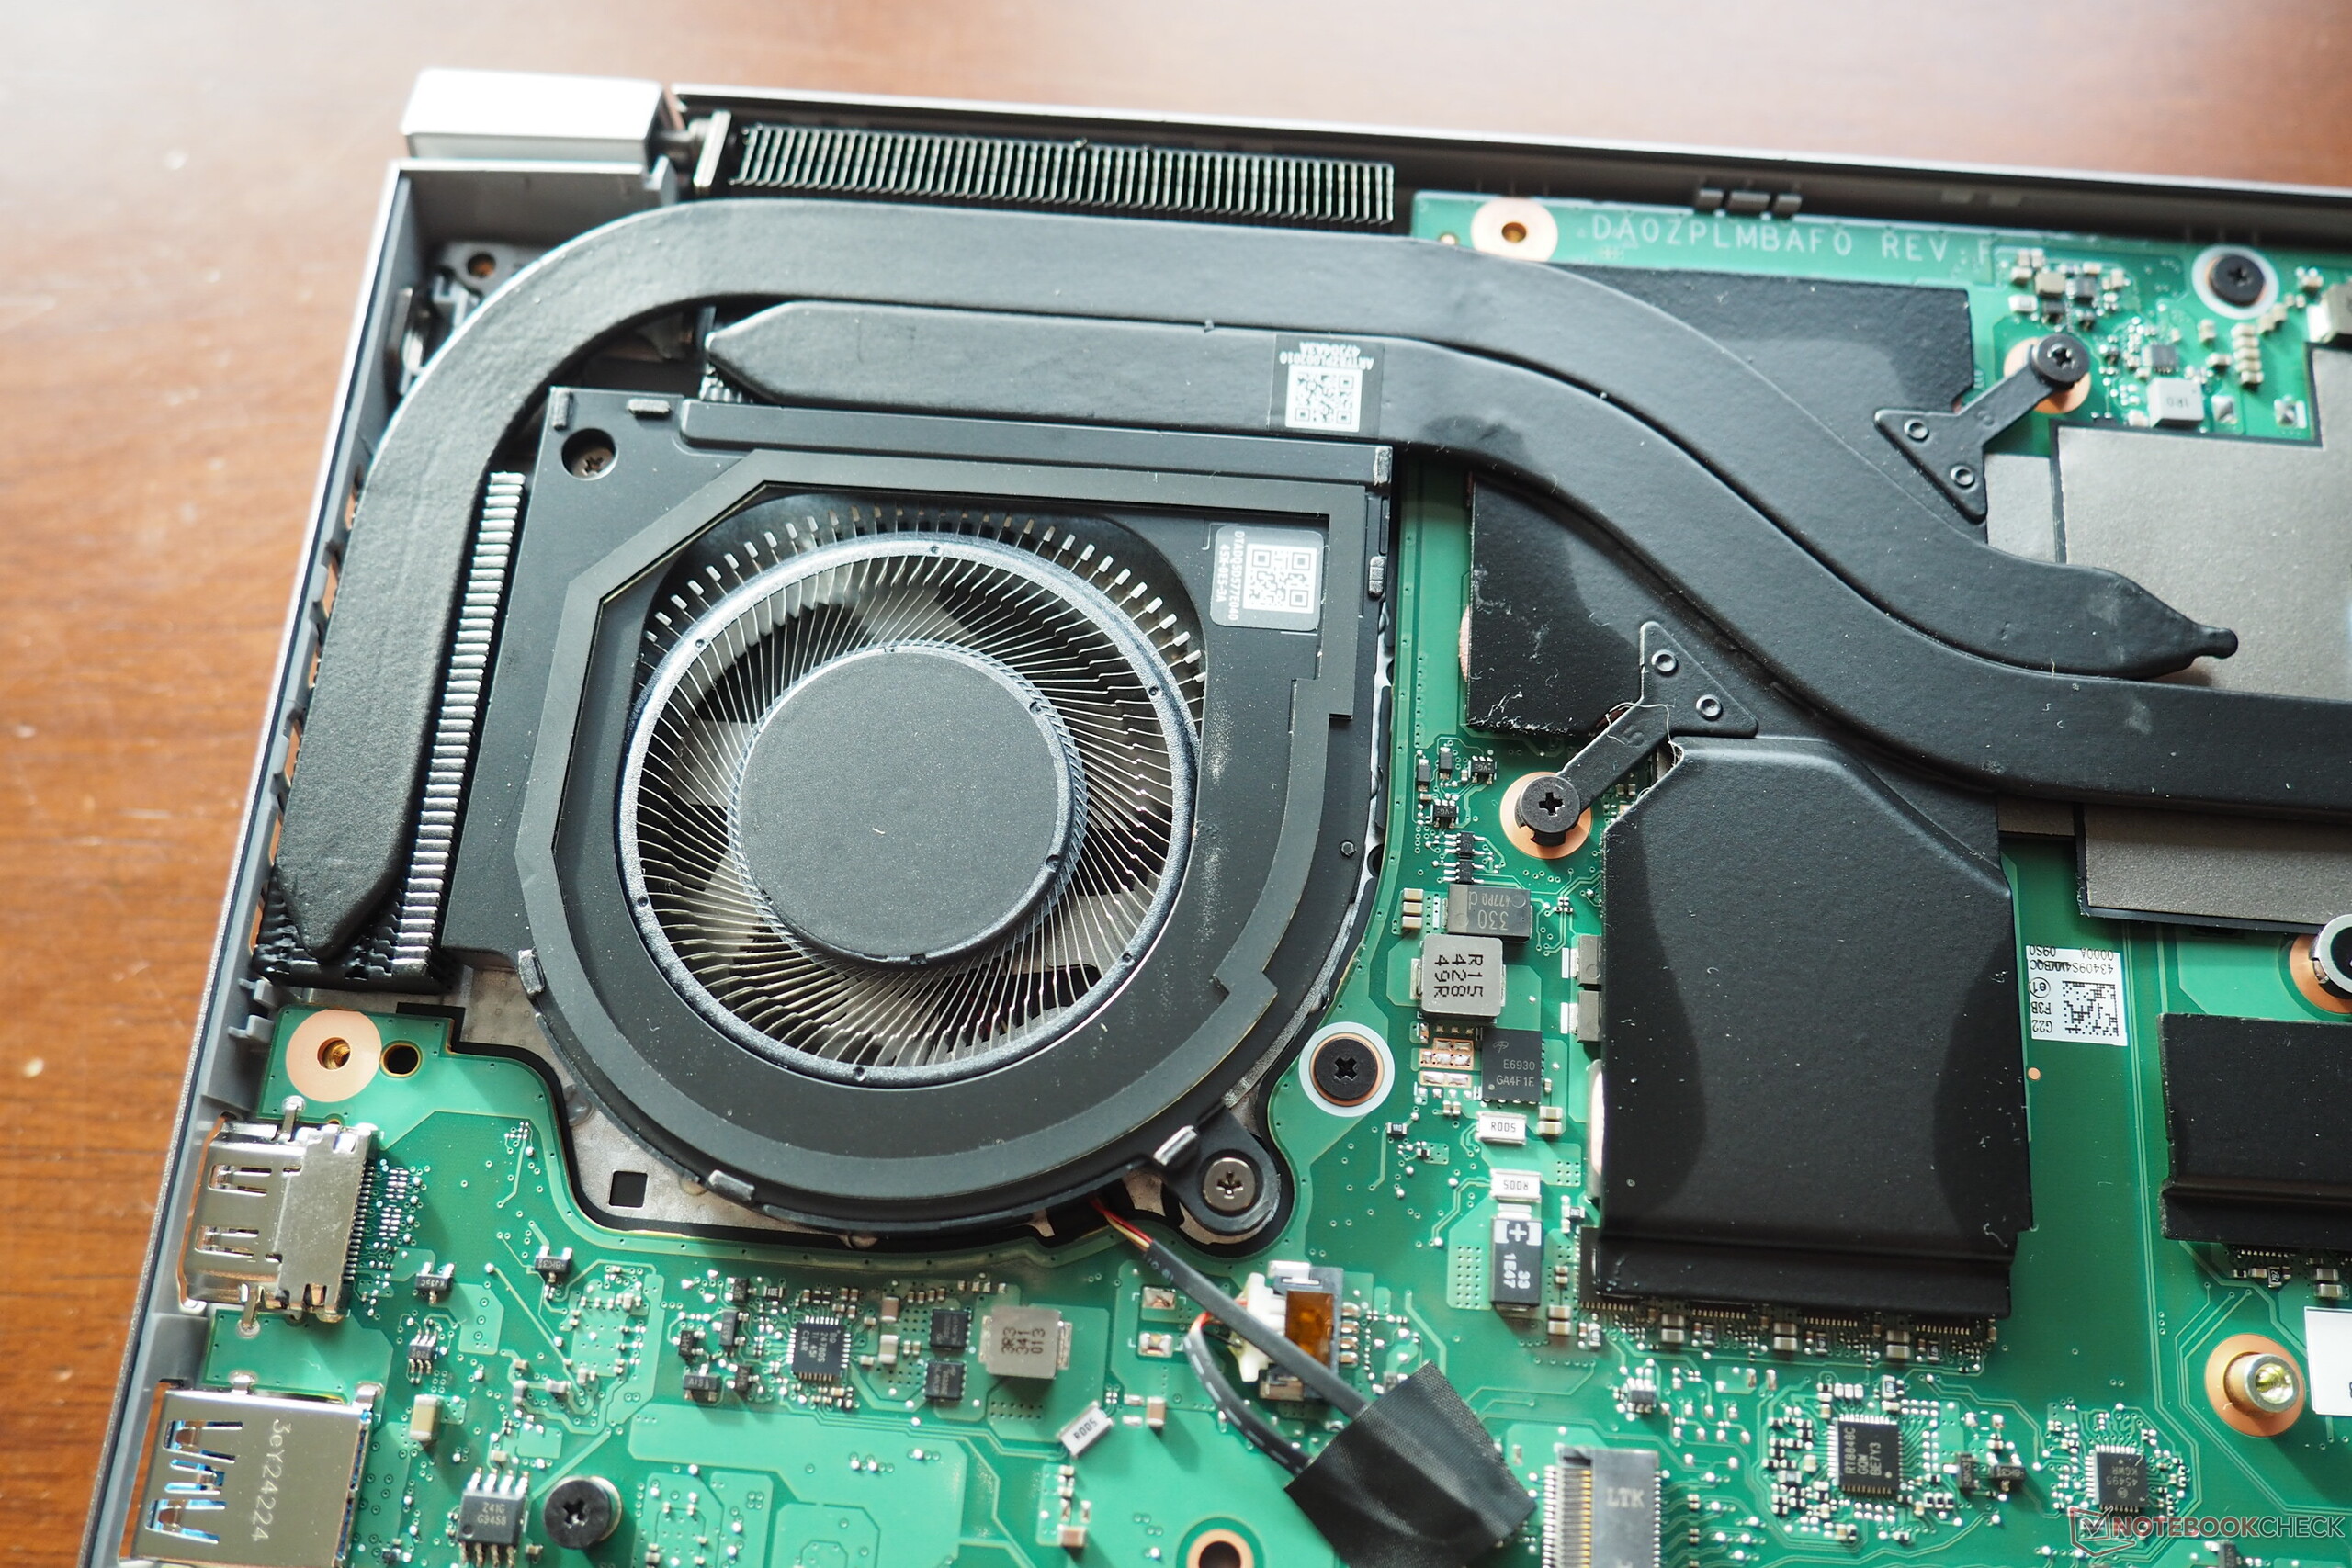
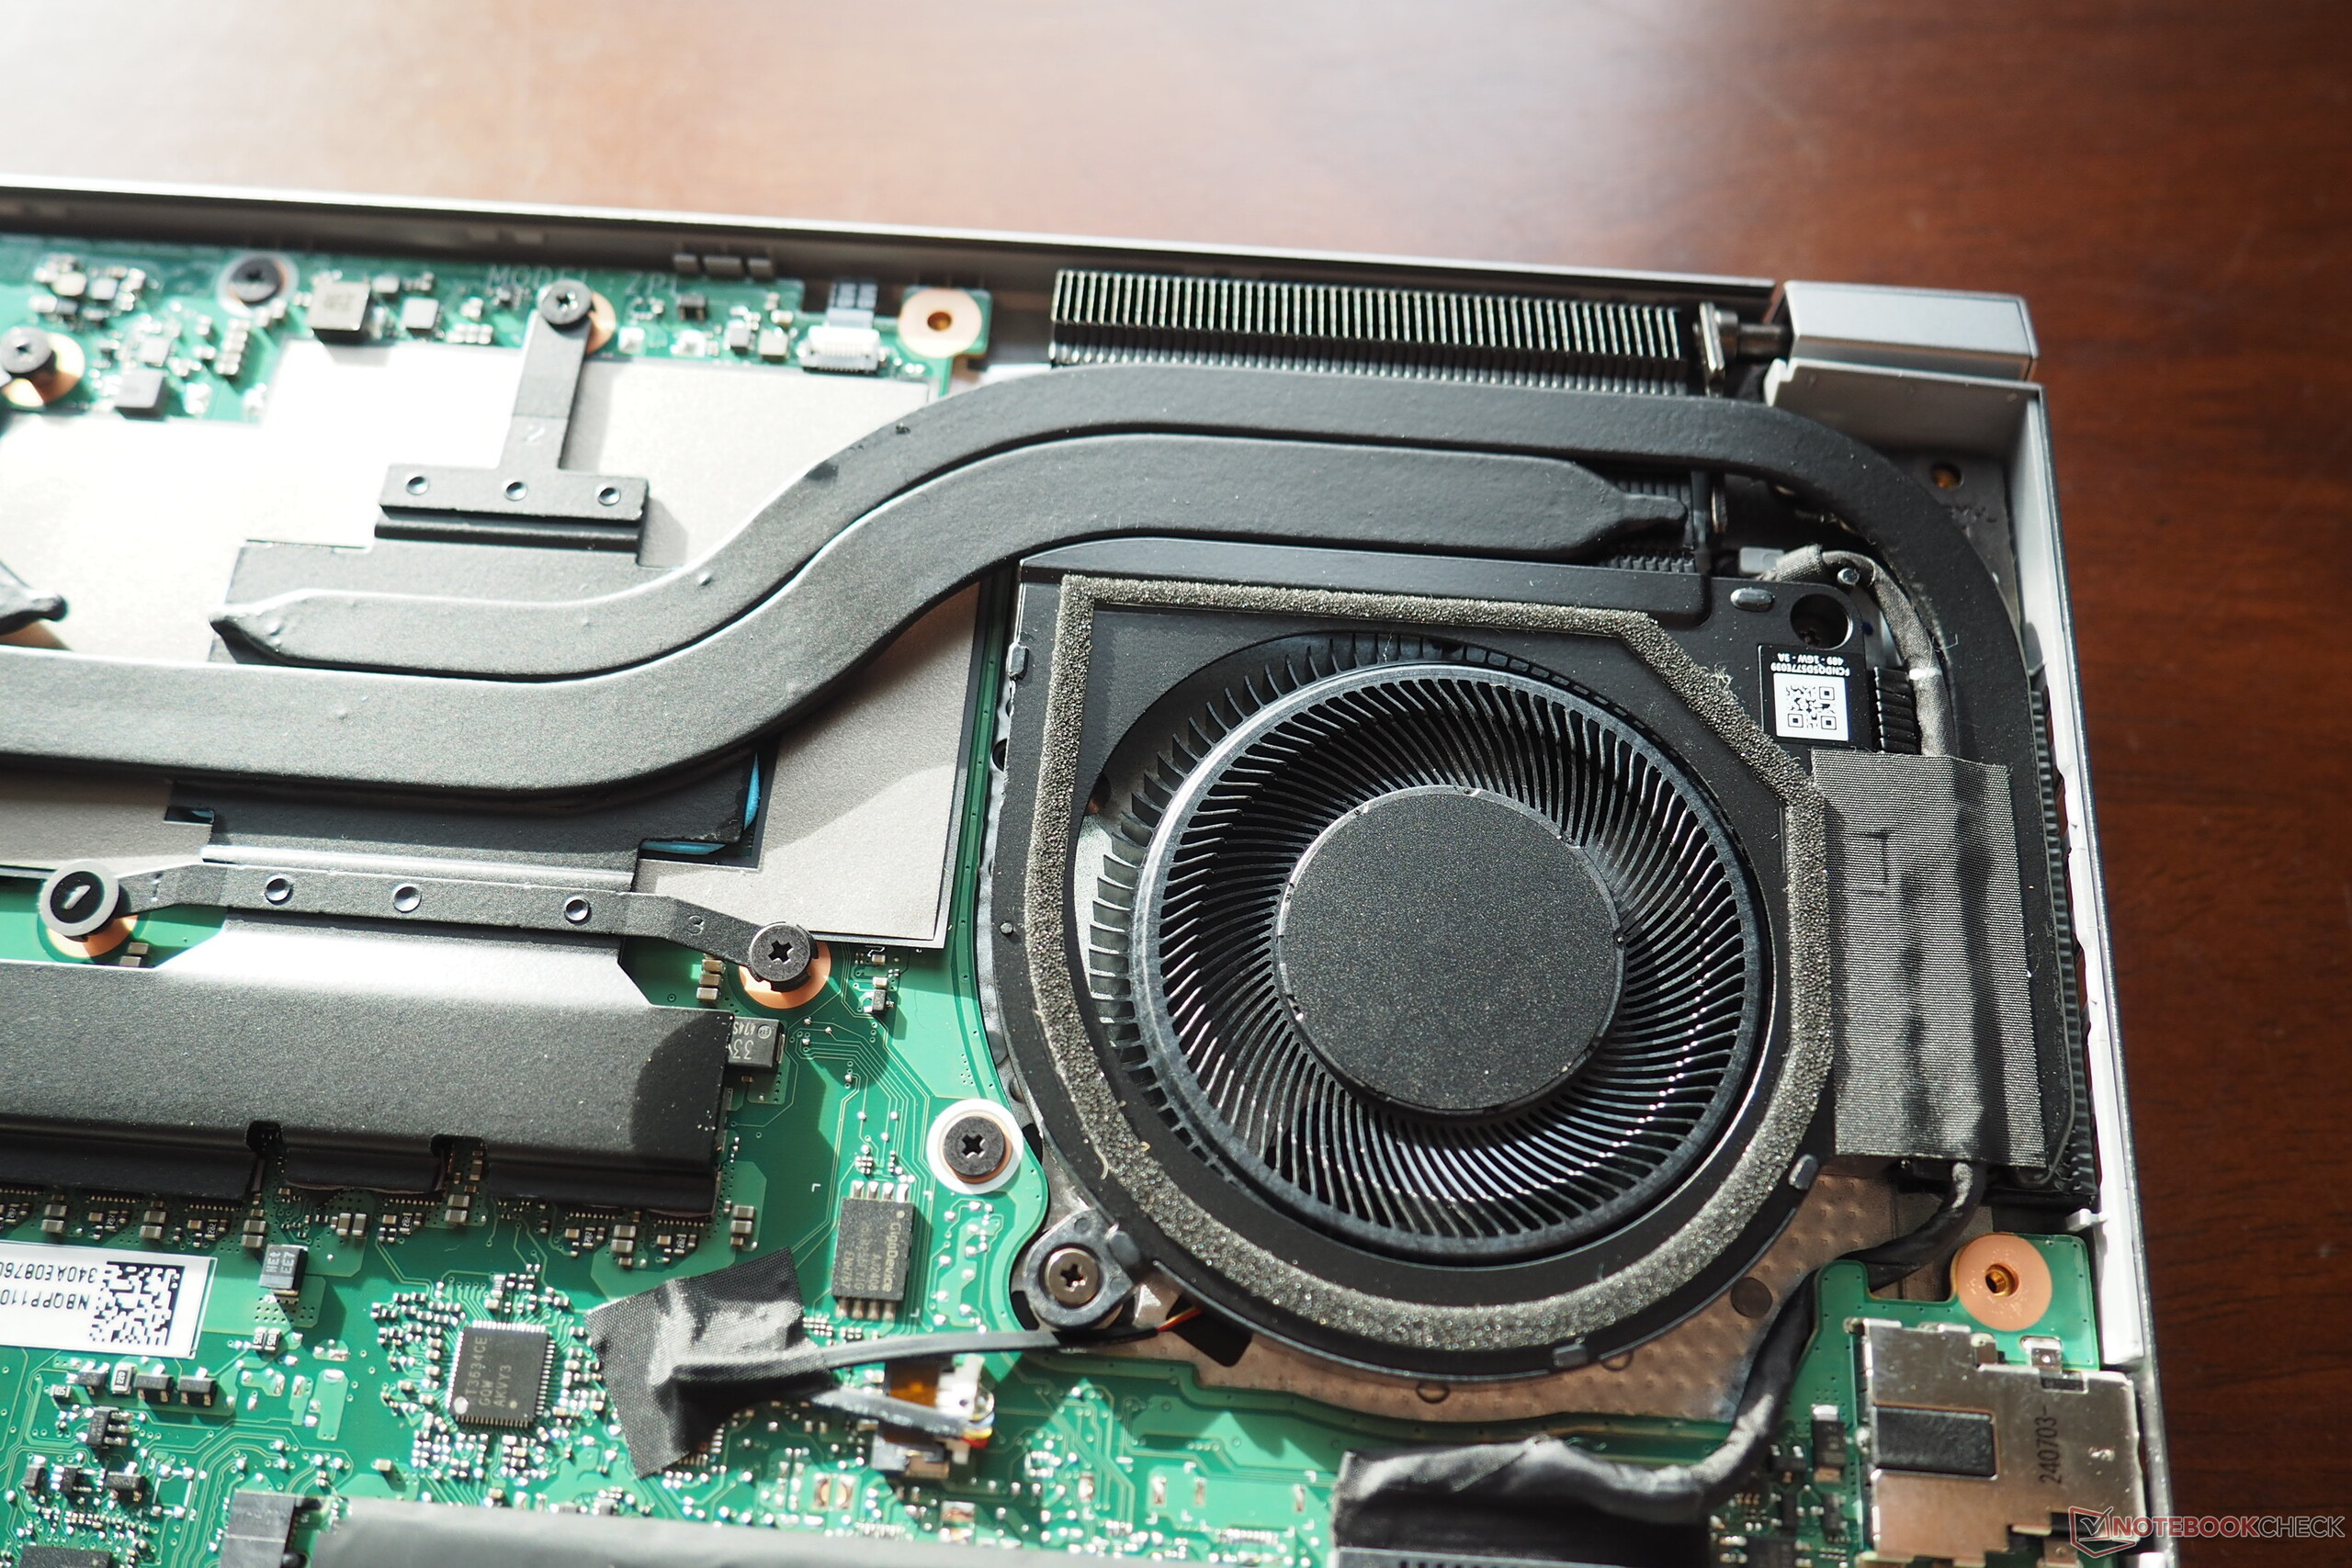
Maintenance
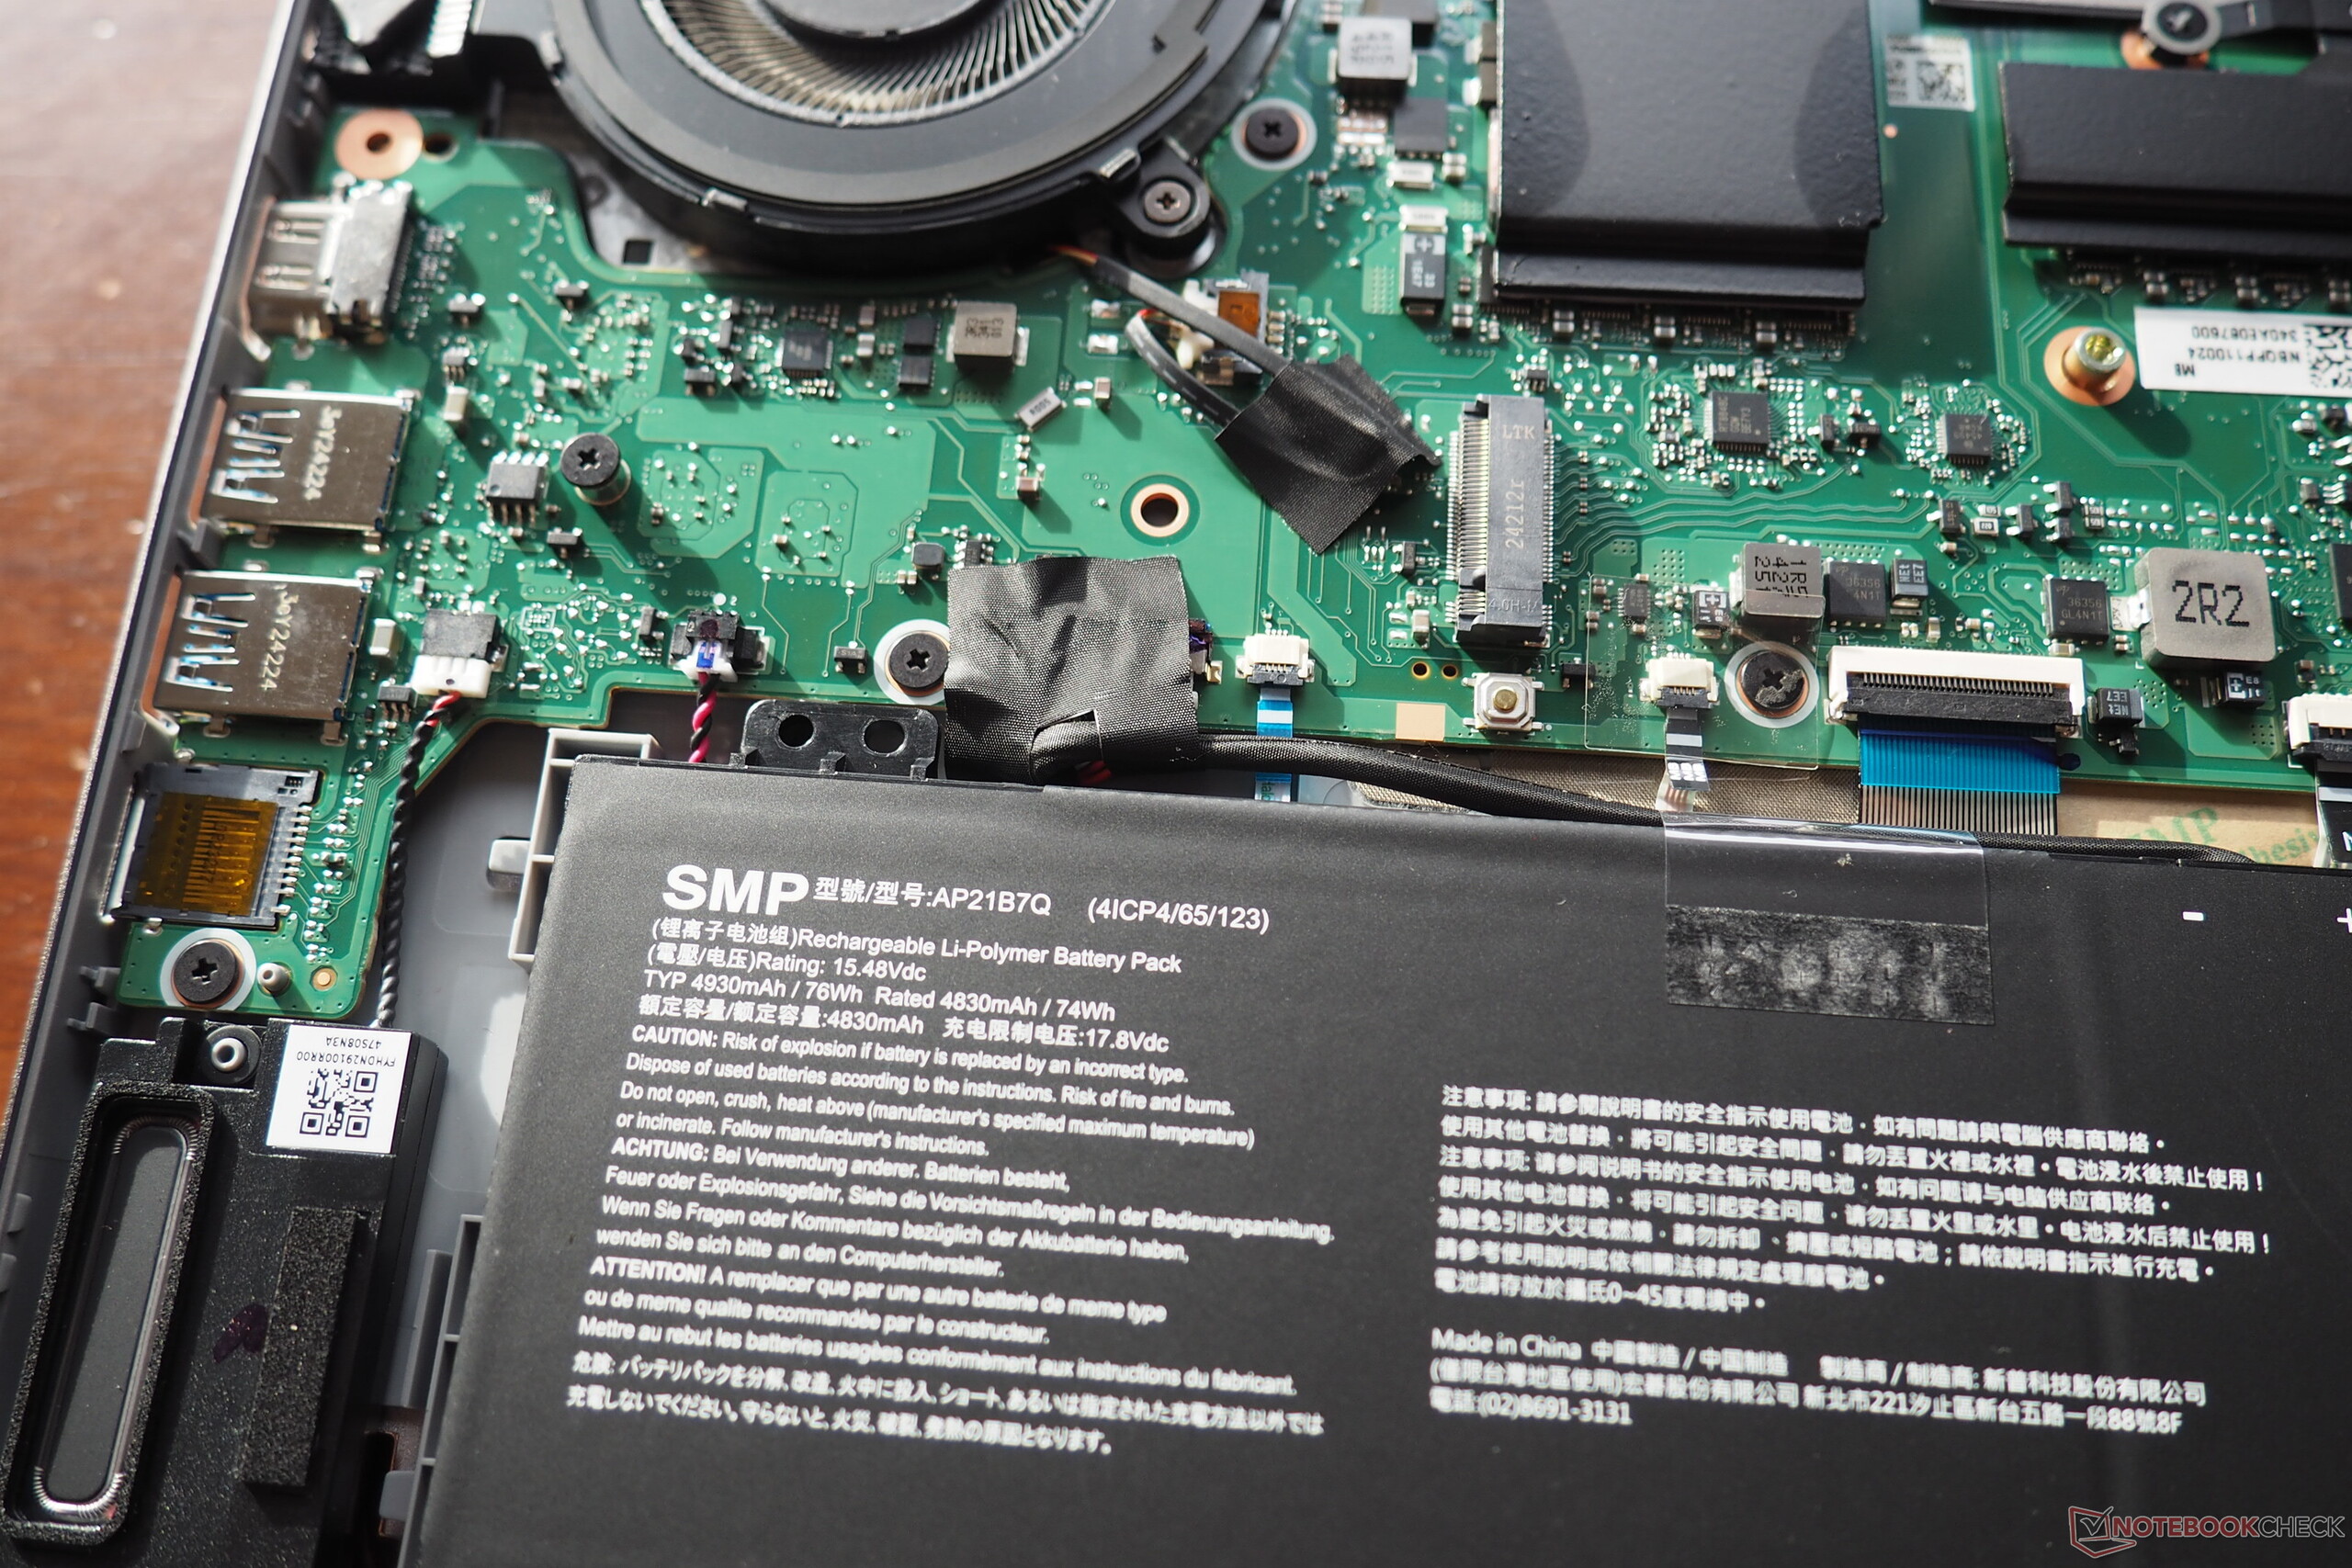
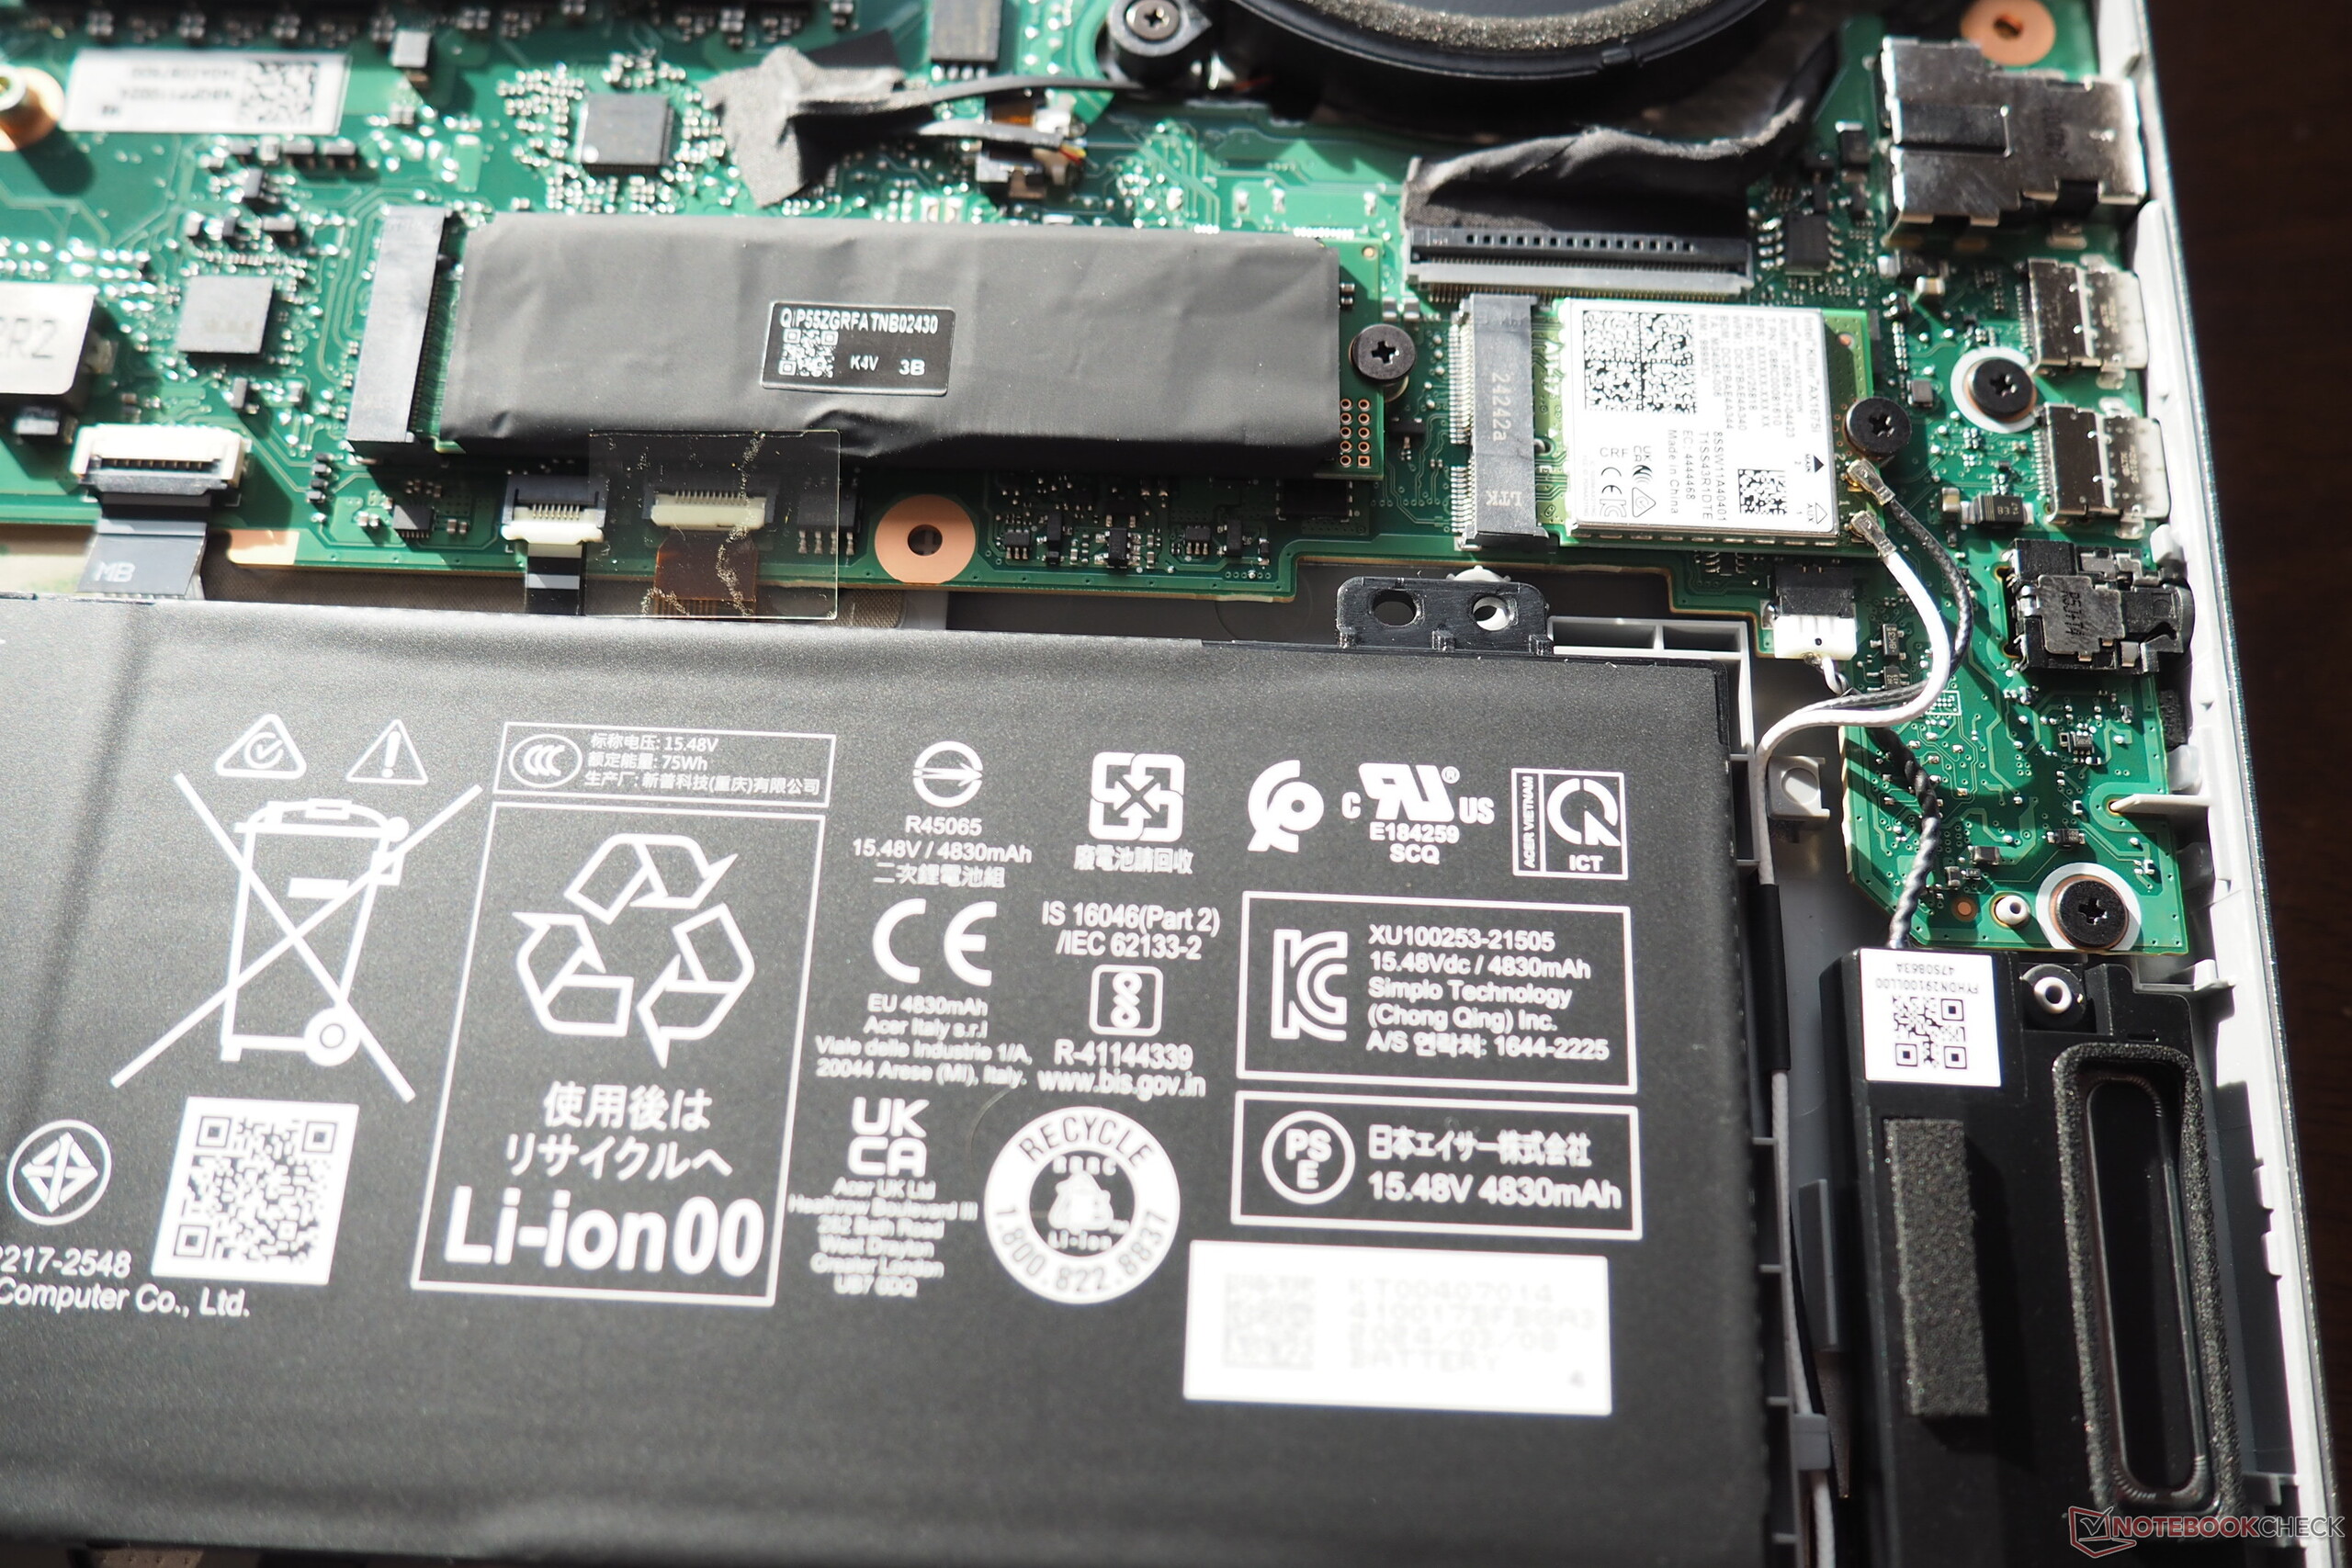
The fairly tight-fitting base plate is secured with 11 Torx screws. Inside, the picture is quite tidy and straightforward. Apart from the wireless module, only the SSD and the battery can be removed. The laptop's cooling system (which, according to Acer, uses liquid metal) consists of two fans and several heat pipes.
Sustainability
Acer refers to "Post Consumer Recycled" on one of the case stickers. The packaging material consists mainly of cardboard. The laptop is packed in a cloth bag, and the power supply unit is in a plastic film (each type is labeled).
Warranty
The laptop is covered by a standard 12-month warranty in the USA.
Input devices
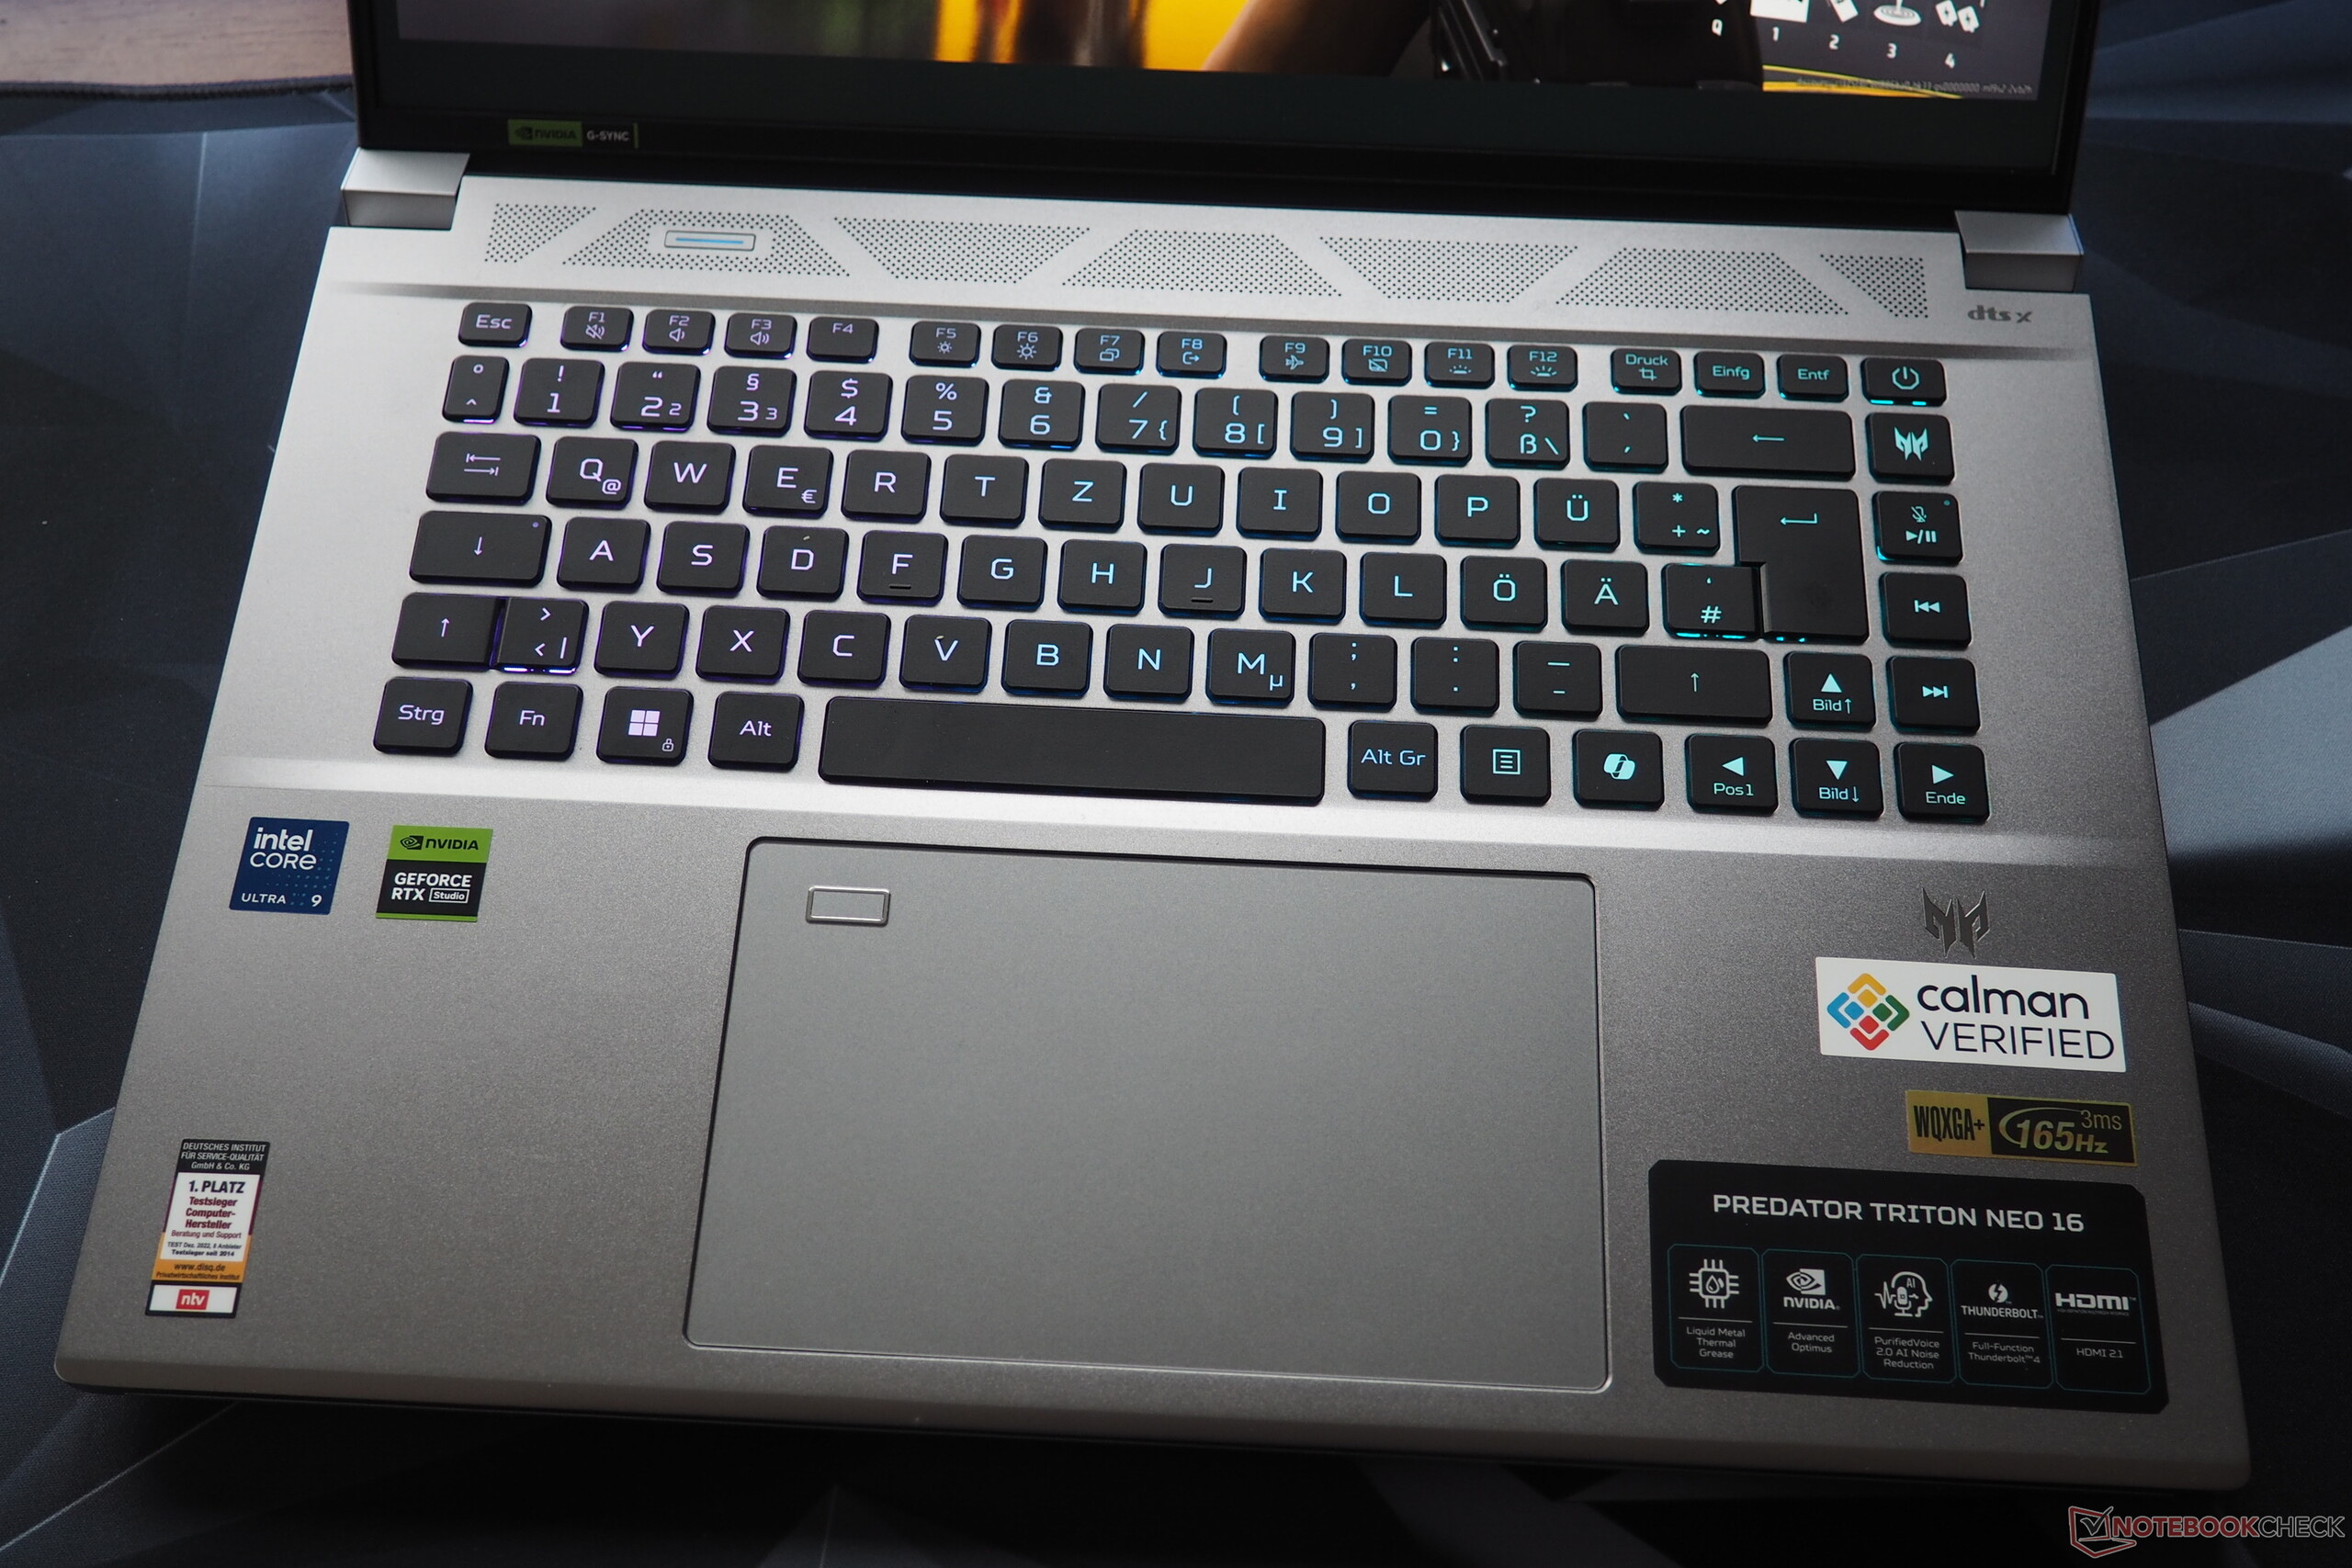
Keyboard
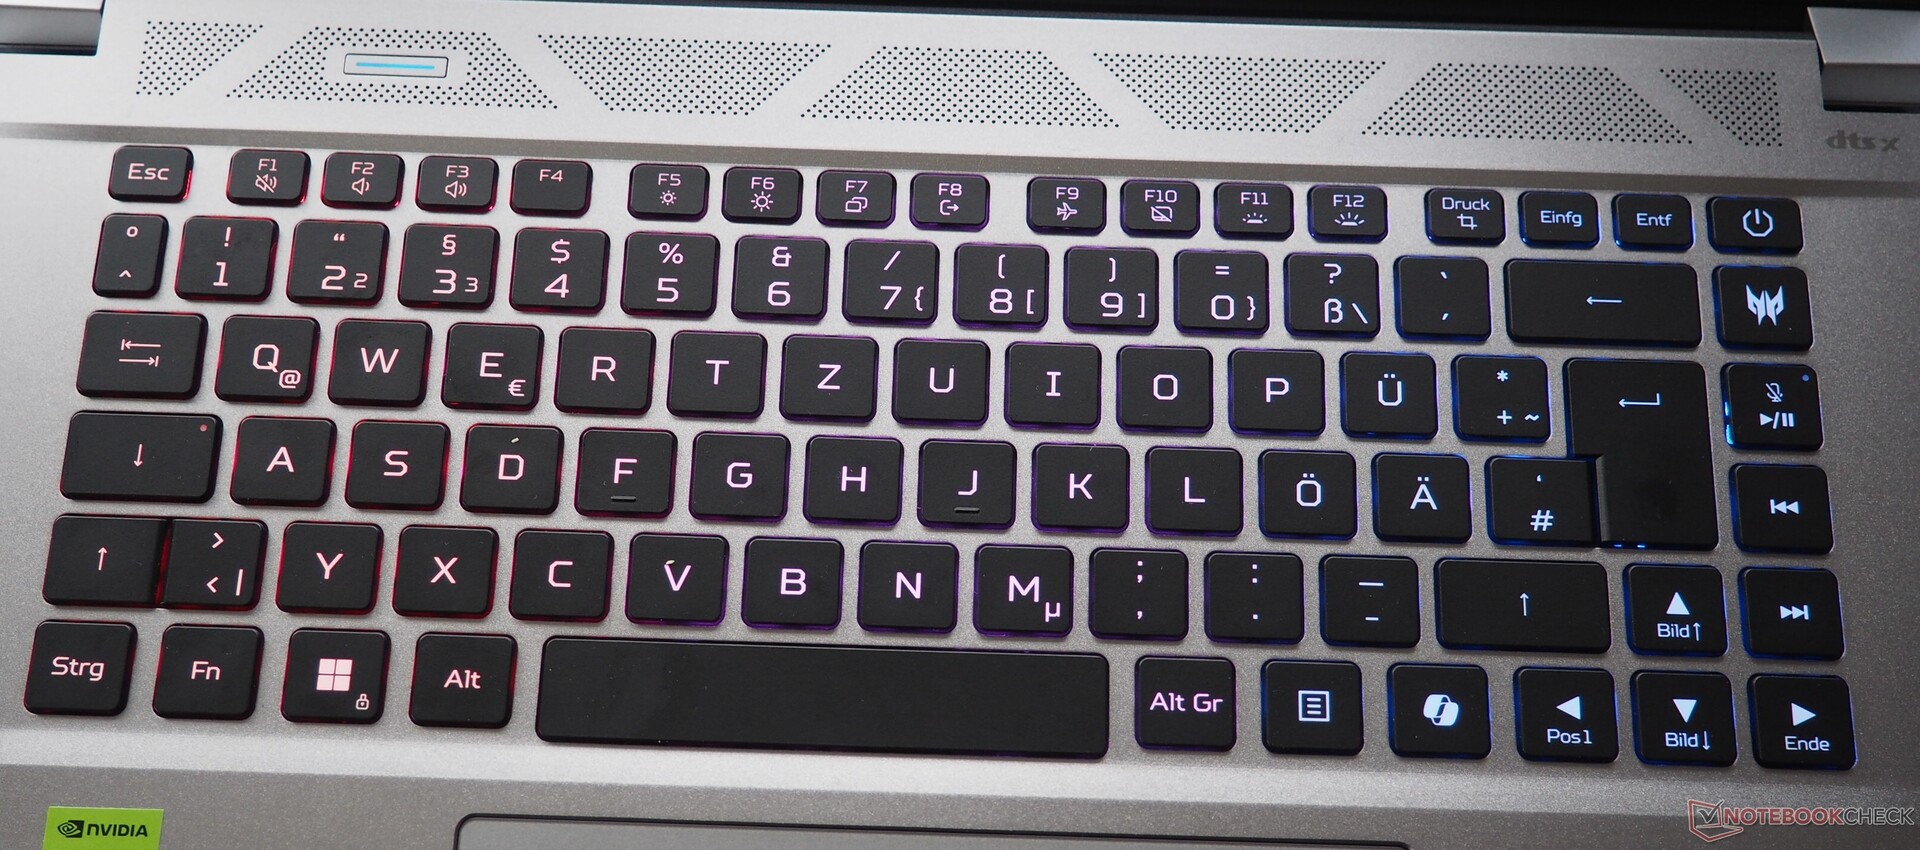
For a rubber dome model, the keyboard delivers more than decent feedback and typing feel. Acer has chosen a fairly classic layout, whereby the manufacturer has spared a number pad and limited itself to a single column to the right of the "main block", which is intended for media control and for opening the Predator Sense system software. With the exception of the function row, all keys are reasonably sized—including the directional arrows. Gamers can look forward to multi-level adjustable RGB lighting divided into three zones.
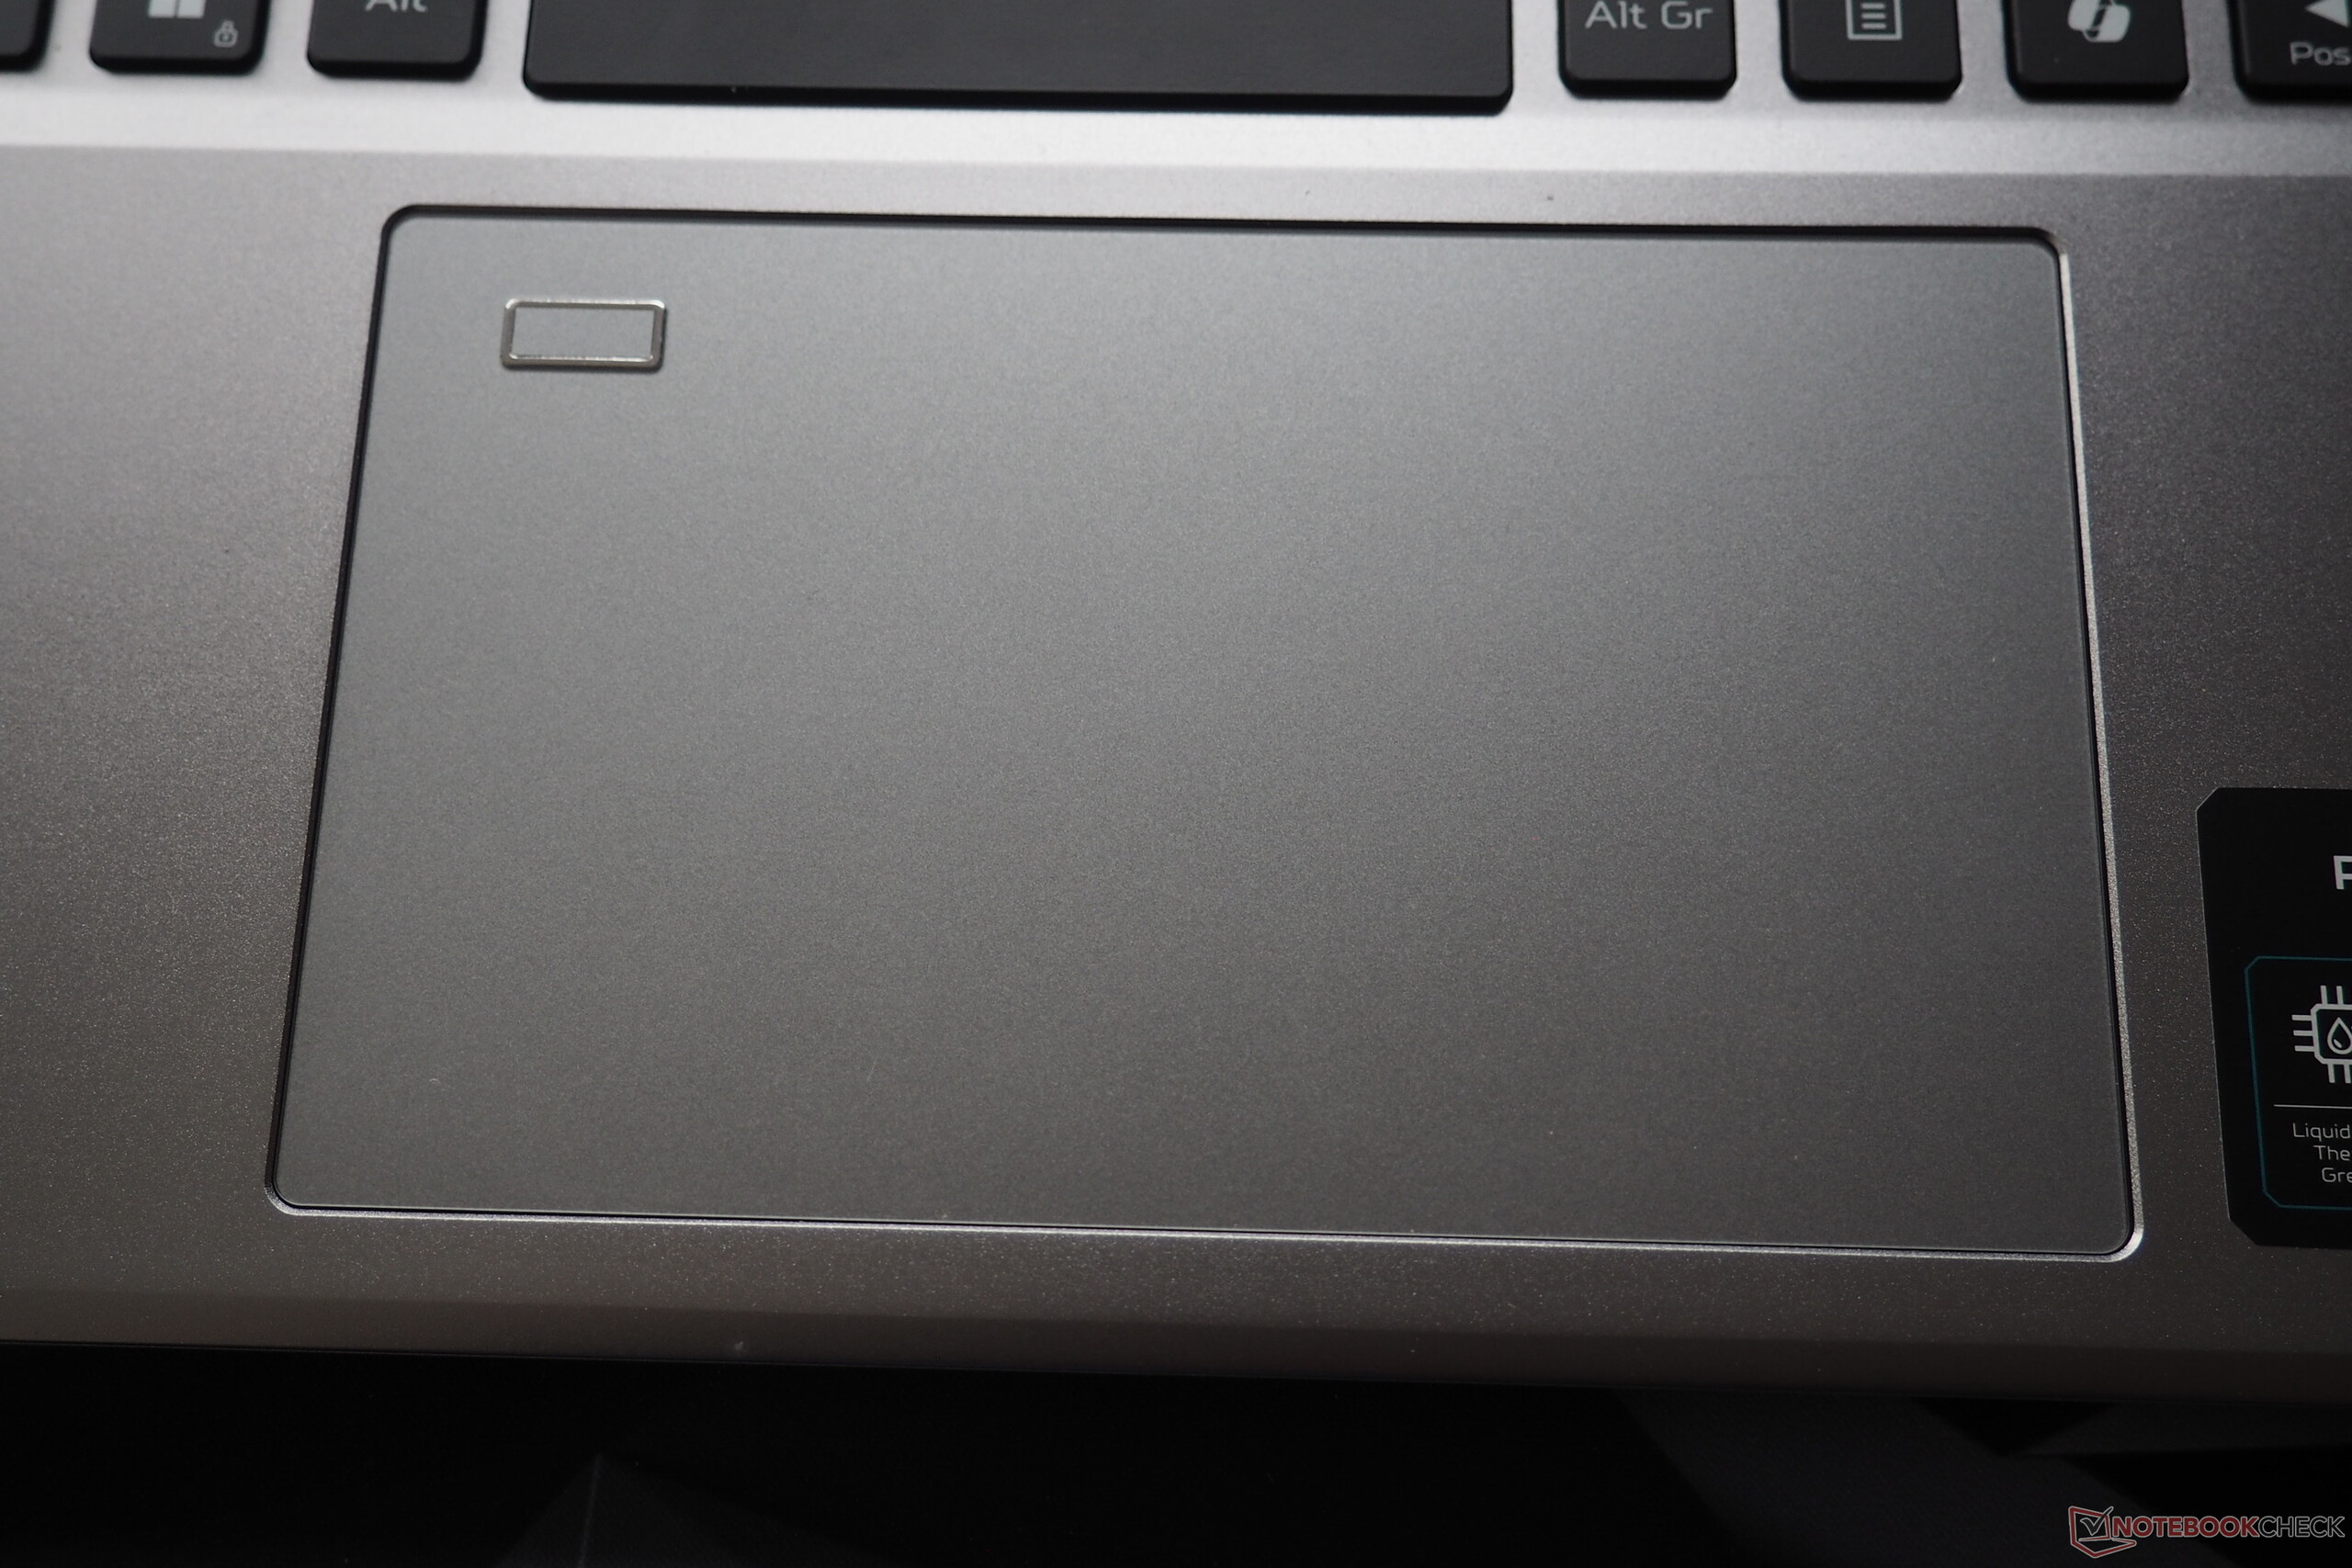
Touchpad
With a size of 15 x 9 cm, the device's touchpad is extremely generously sized, but in our opinion could have been a bit more stable, as left clicks in particular lead to some noticeable yielding. We would describe its surface as being nice and smooth. We also have nothing to criticize about its gesture and multi-touch support.
Display
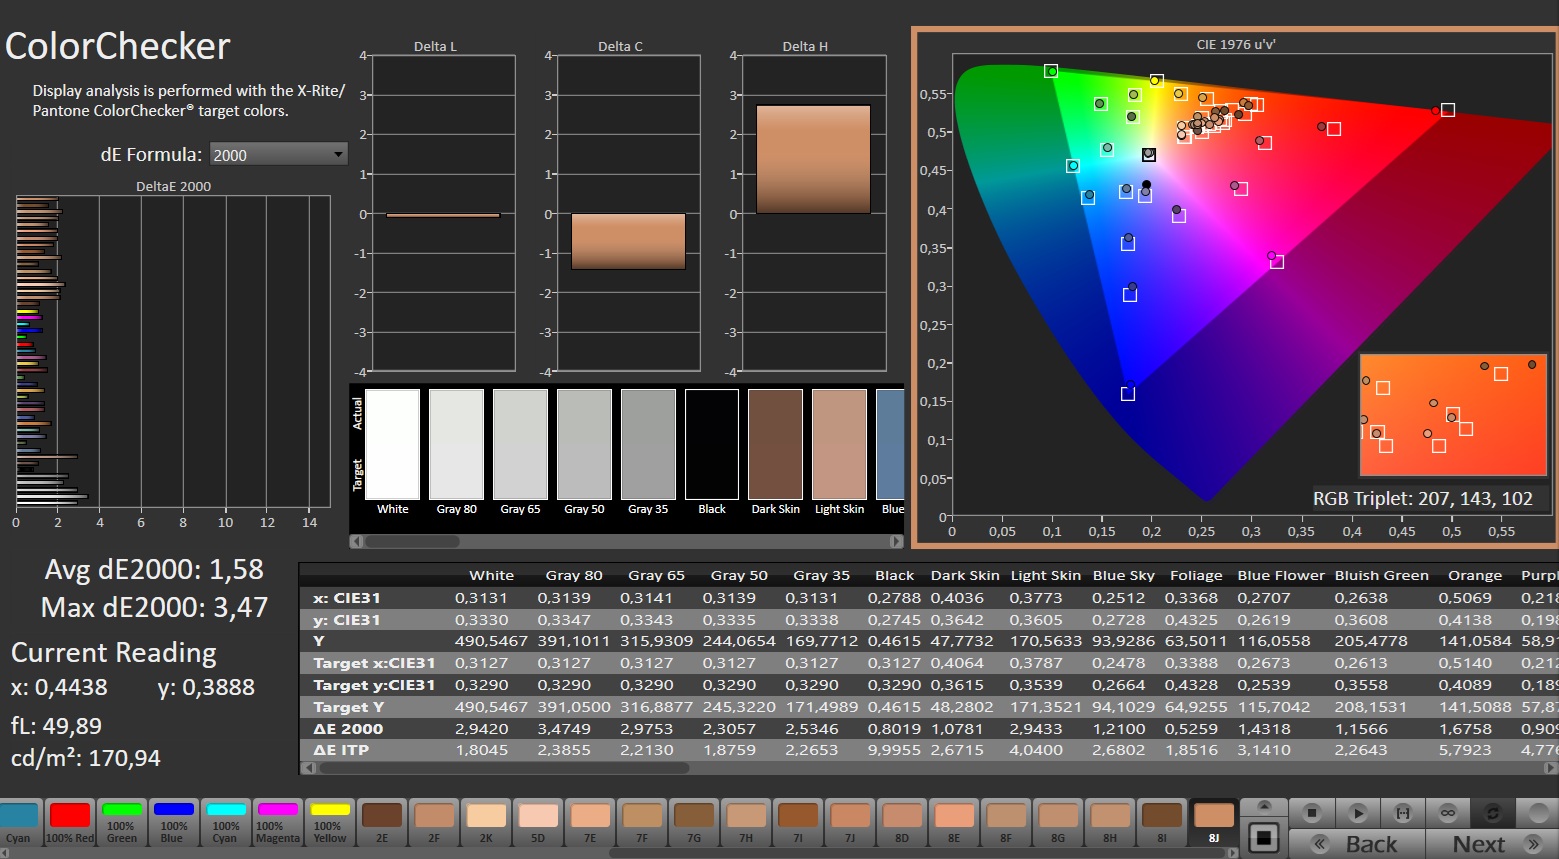
In contrast to the Nitro V 16, which has to make do with a limited color space and relatively low brightness, the Predator Triton Neo 16 boasts a high-quality IPS panel.
| |||||||||||||||||||||||||
Brightness Distribution: 90 %
Center on Battery: 458 cd/m²
Contrast: 1090:1 (Black: 0.42 cd/m²)
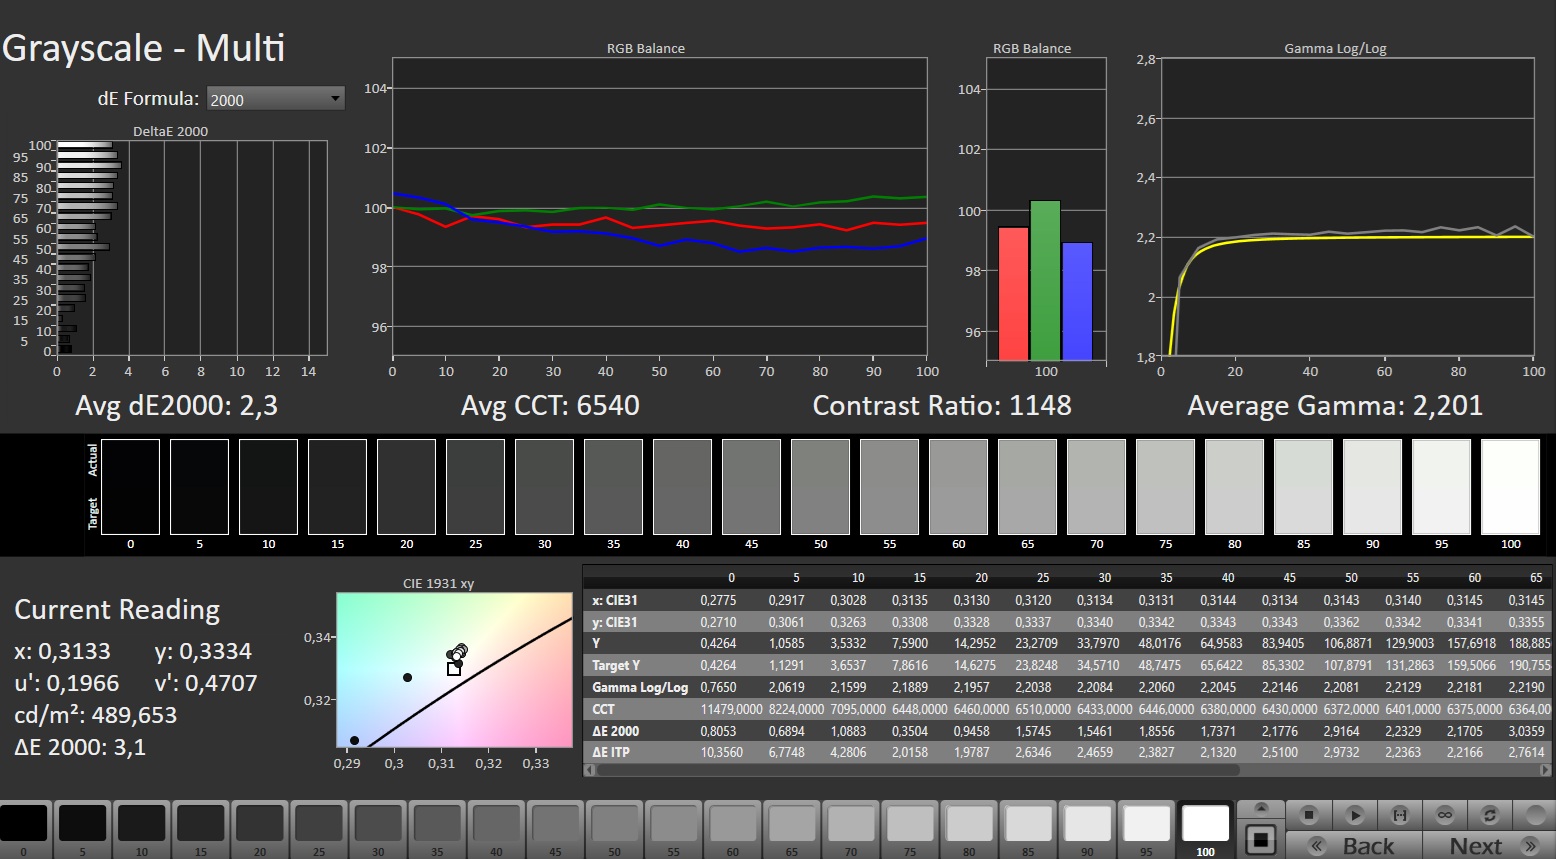
ΔE ColorChecker Calman: 1.58 | ∀{0.5-29.43 Ø4.73}
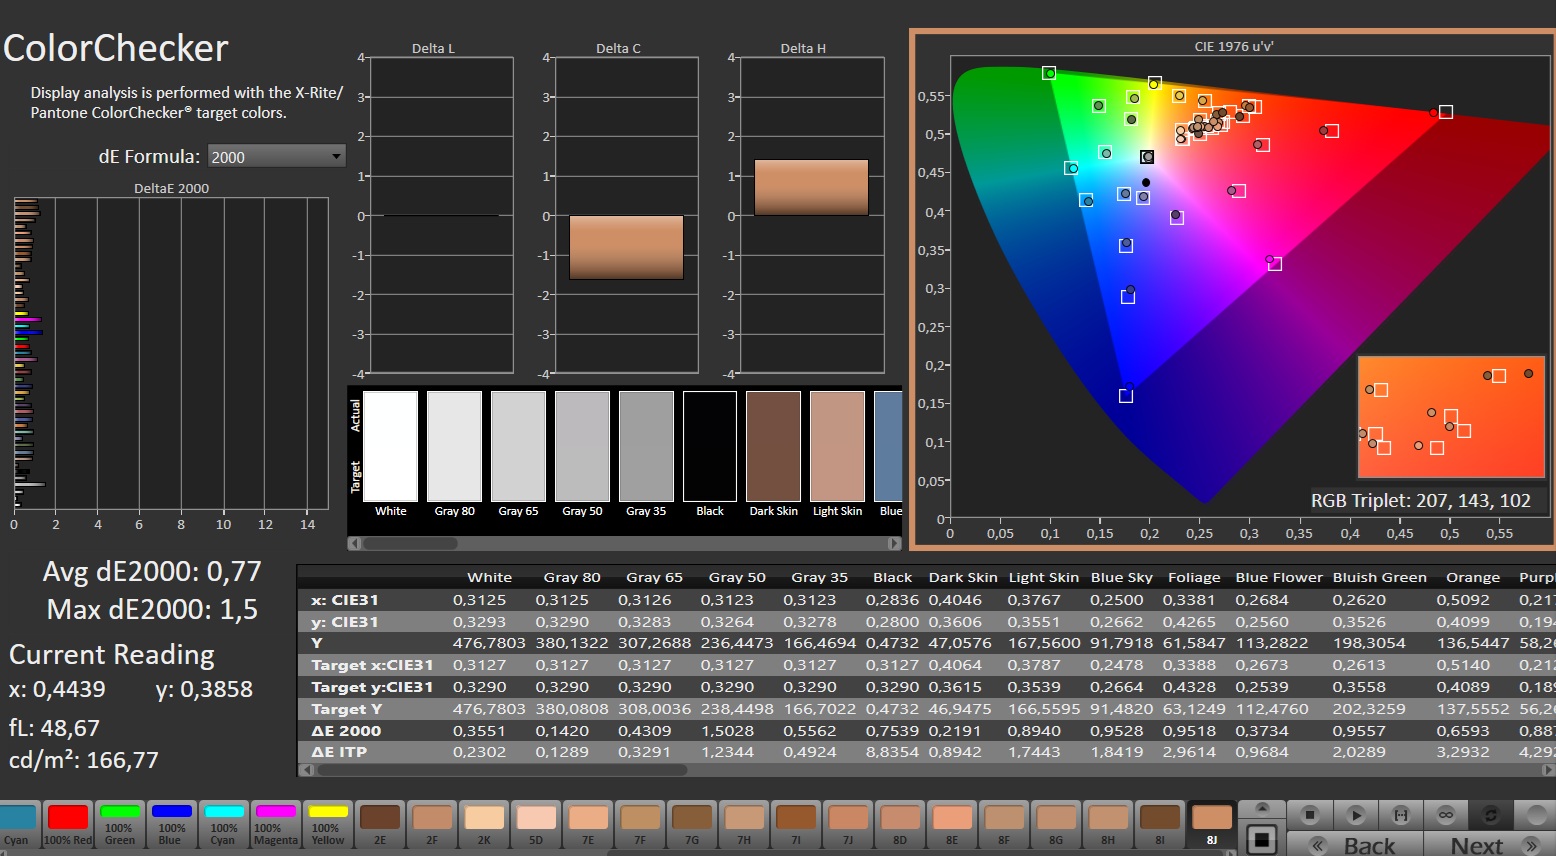
calibrated: 0.77
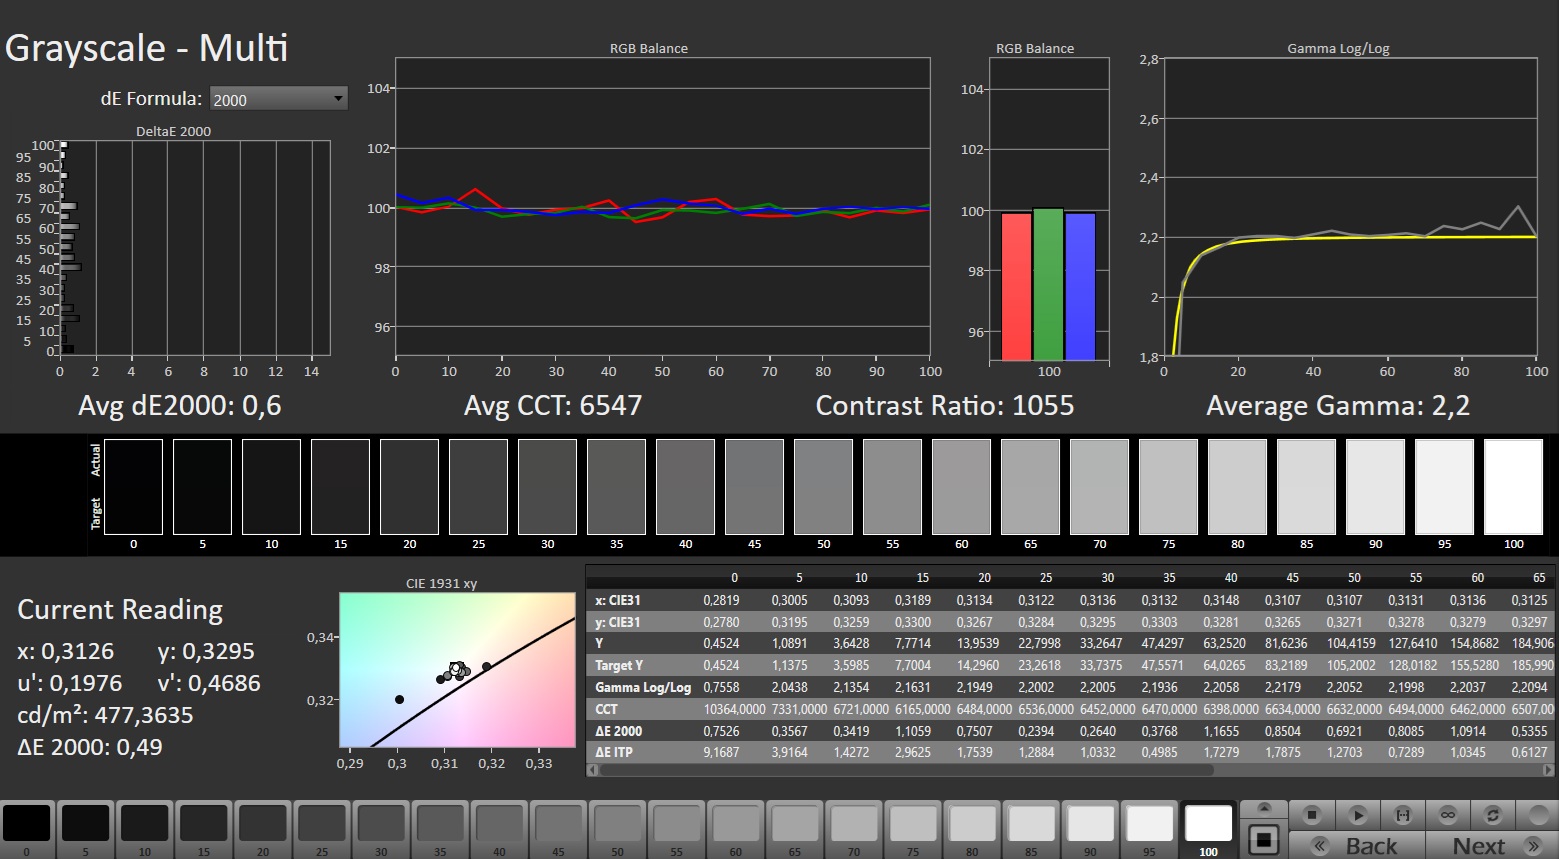
ΔE Greyscale Calman: 2.3 | ∀{0.09-98 Ø4.97}
85.3% AdobeRGB 1998 (Argyll 3D)
99.7% sRGB (Argyll 3D)
94.2% Display P3 (Argyll 3D)
Gamma: 2.201
CCT: 6540 K
| Acer Predator Triton Neo 16 PTN16-51-978P AU Optronics B160QAN04.S, IPS, 3200x2000, 16", 165 Hz | Asus ProArt P16 H7606WI ATNA60YV02-0, OLED, 3840x2400, 16", 60 Hz | Lenovo Yoga Pro 9 16IMH9 LEN160-3.2K, Mini-LED, 3200x2000, 16", 165 Hz | Asus ROG Zephyrus G16 2024 GU605M ATNA60DL01-0, OLED, 2560x1600, 16", 240 Hz | Alienware m16 R2 BOE NE16NYH, IPS, 2560x1600, 16", 240 Hz | |
|---|---|---|---|---|---|
| Display | 7% | 2% | 7% | -14% | |
| Display P3 Coverage (%) | 94.2 | 99.9 6% | 97 3% | 99.9 6% | 71 -25% |
| sRGB Coverage (%) | 99.7 | 100 0% | 99.9 0% | 100 0% | 100 0% |
| AdobeRGB 1998 Coverage (%) | 85.3 | 99.1 16% | 86.6 2% | 96.9 14% | 71.4 -16% |
| Response Times | 83% | -137% | 97% | 2% | |
| Response Time Grey 50% / Grey 80% * (ms) | 12.3 ? | 1.58 ? 87% | 22.2 ? -80% | 0.22 ? 98% | 5.7 ? 54% |
| Response Time Black / White * (ms) | 5.8 ? | 1.25 ? 78% | 17 ? -193% | 0.25 ? 96% | 8.7 ? -50% |
| PWM Frequency (Hz) | 240 ? | 4840 ? | 960 ? | ||
| PWM Amplitude * (%) | 36 | ||||
| Screen | 11% | 29% | 2% | -2% | |
| Brightness middle (cd/m²) | 458 | 355 -22% | 651 42% | 416 -9% | 345.8 -24% |
| Brightness (cd/m²) | 453 | 360 -21% | 673 49% | 418 -8% | 337 -26% |
| Brightness Distribution (%) | 90 | 98 9% | 93 3% | 96 7% | 87 -3% |
| Black Level * (cd/m²) | 0.42 | 0.22 48% | 0.3 29% | ||
| Contrast (:1) | 1090 | 2959 171% | 1153 6% | ||
| Colorchecker dE 2000 * | 1.58 | 1.2 24% | 1.9 -20% | 1.6 -1% | 1.99 -26% |
| Colorchecker dE 2000 max. * | 3.47 | 2.6 25% | 4.2 -21% | 2.1 39% | 3.52 -1% |
| Colorchecker dE 2000 calibrated * | 0.77 | 0.6 22% | 0.62 19% | ||
| Greyscale dE 2000 * | 2.3 | 1.2 48% | 3 -30% | 2.7 -17% | 2.1 9% |
| Gamma | 2.201 100% | 2.14 103% | 2.18 101% | 2.16 102% | 2.32 95% |
| CCT | 6540 99% | 6526 100% | 6738 96% | 6331 103% | 6369 102% |
| Total Average (Program / Settings) | 34% /
23% | -35% /
-0% | 35% /
20% | -5% /
-4% |
* ... smaller is better
An average brightness of 453 cd/m² is not only sufficient for indoor use but—depending on the lighting conditions—also for outdoor use. Meanwhile, its contrast ratio is only solid at just under 1,100:1, which is due to its poor black level (0.42 cd/m²). Here, the OLED panels of some competitors show how it can be done better, and the same can be said for its response times (although these are quite good for an IPS panel).

On the flip side, the Acer laptop features a low-reflection surface and does not experience any flickering at any brightness level.
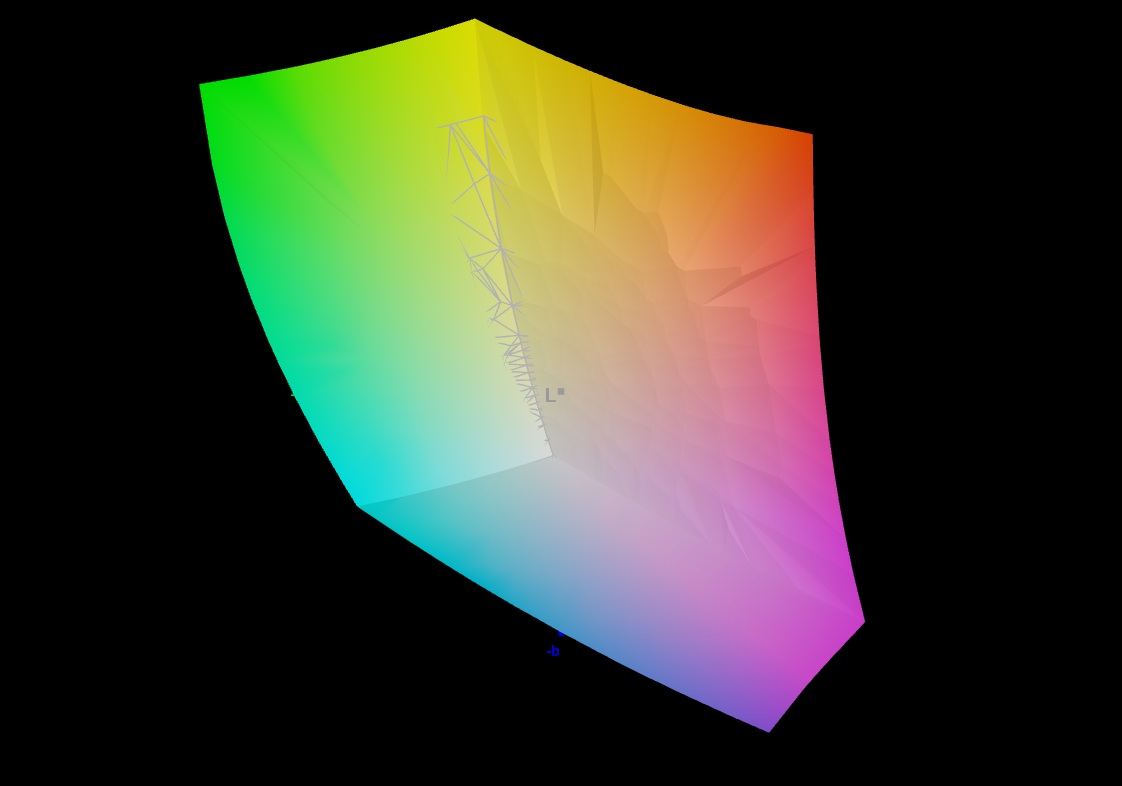

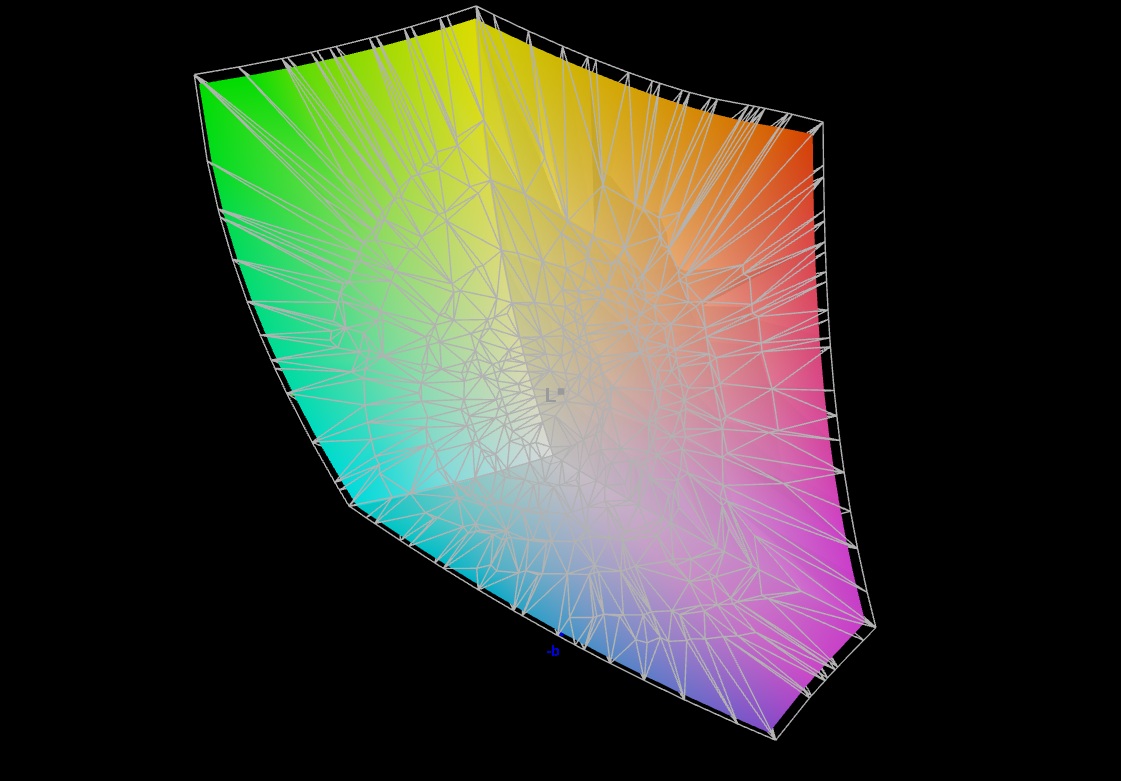
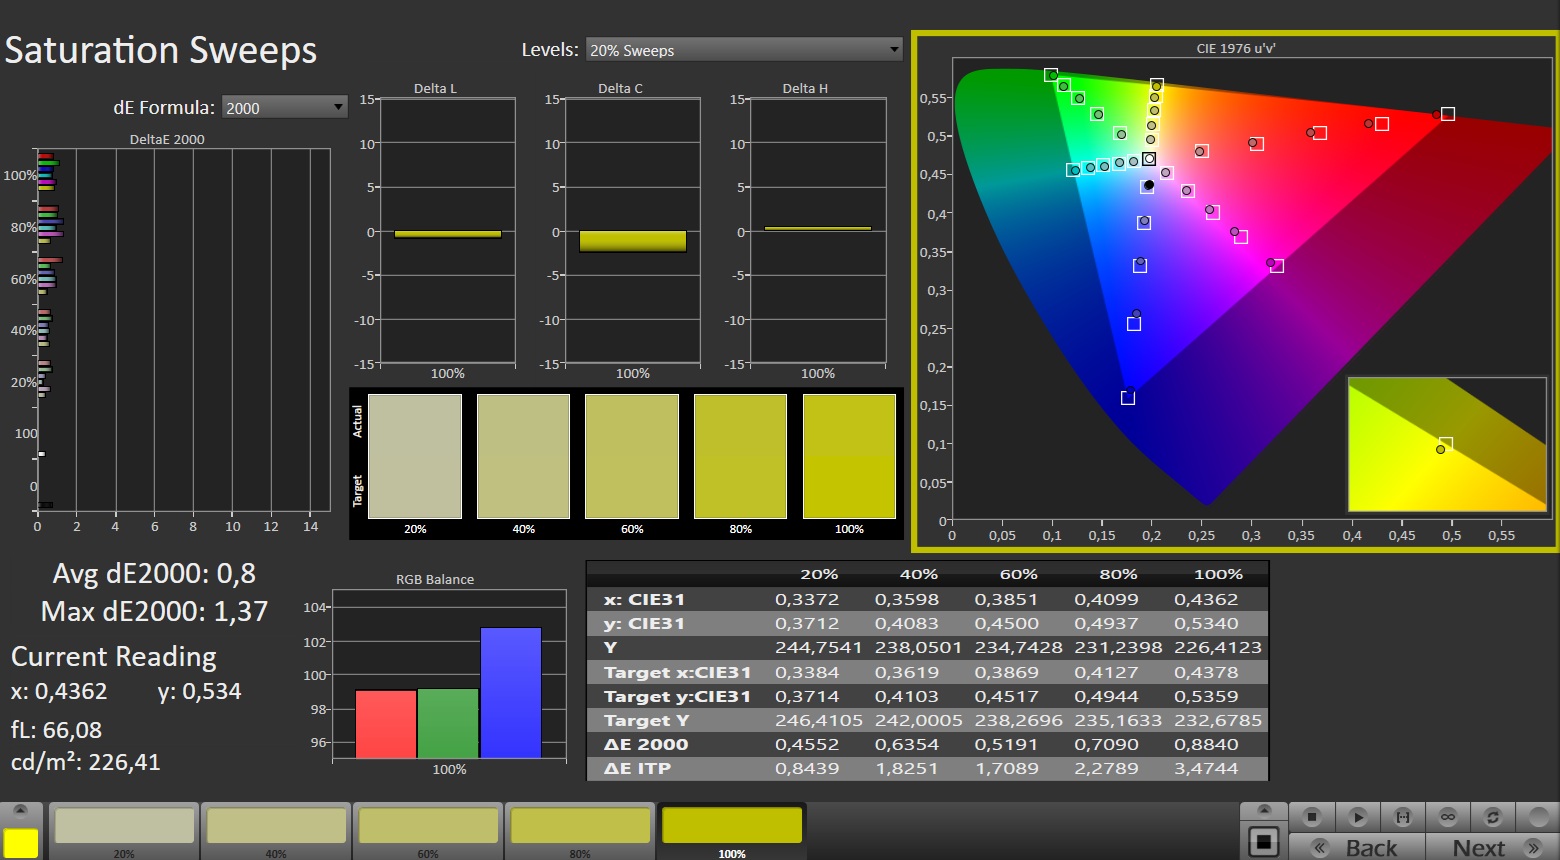
The Neo 16 aims to appeal to professional users with its large color space: Almost 100% sRGB coverage, 94% of DCI-P3 and 85% of AdobeRGB make the 16-inch offshoot a true creator product. Thanks to its Calman verification, the colors already look quite natural straight out of the box. The package is rounded off by reasonable viewing angles.


Display Response Times
| ↔ Response Time Black to White | ||
|---|---|---|
| 5.8 ms ... rise ↗ and fall ↘ combined | ↗ 2.2 ms rise | 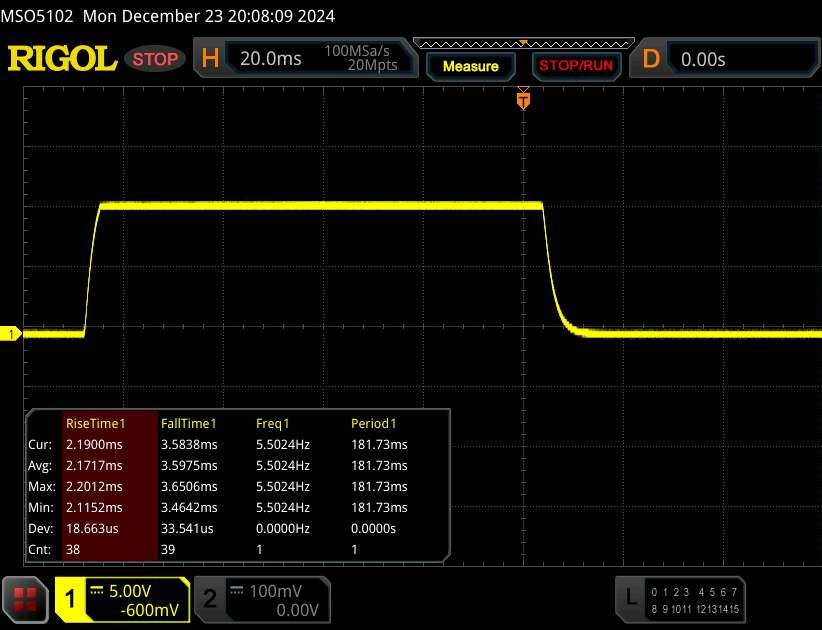 |
| ↘ 3.6 ms fall | ||
| The screen shows very fast response rates in our tests and should be very well suited for fast-paced gaming. In comparison, all tested devices range from 0.1 (minimum) to 240 (maximum) ms. » 18 % of all devices are better. This means that the measured response time is better than the average of all tested devices (19.9 ms). | ||
| ↔ Response Time 50% Grey to 80% Grey | ||
| 12.3 ms ... rise ↗ and fall ↘ combined | ↗ 5.9 ms rise | 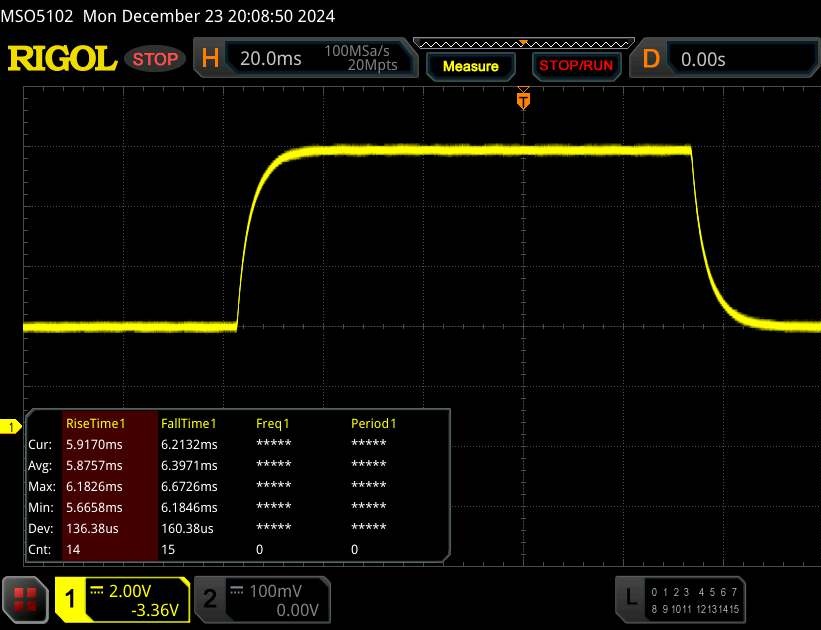 |
| ↘ 6.4 ms fall | ||
| The screen shows good response rates in our tests, but may be too slow for competitive gamers. In comparison, all tested devices range from 0.165 (minimum) to 636 (maximum) ms. » 26 % of all devices are better. This means that the measured response time is better than the average of all tested devices (31.1 ms). | ||
Screen Flickering / PWM (Pulse-Width Modulation)
| Screen flickering / PWM not detected |  | ||
In comparison: 52 % of all tested devices do not use PWM to dim the display. If PWM was detected, an average of 7798 (minimum: 5 - maximum: 343500) Hz was measured. | |||
Performance
The performance of our test version PTN16-51-978P is in the (upper) mid-range. The Predator Triton Neo 16 starts at just under $1,200. The entry-level model comes with a WQXGA display (2,560 x 1,600 pixels, 240 Hz), a Core Ultra 7 155H, a GeForce RTX 4060, 16 GB RAM and a 1-TB SSD.

Testing conditions
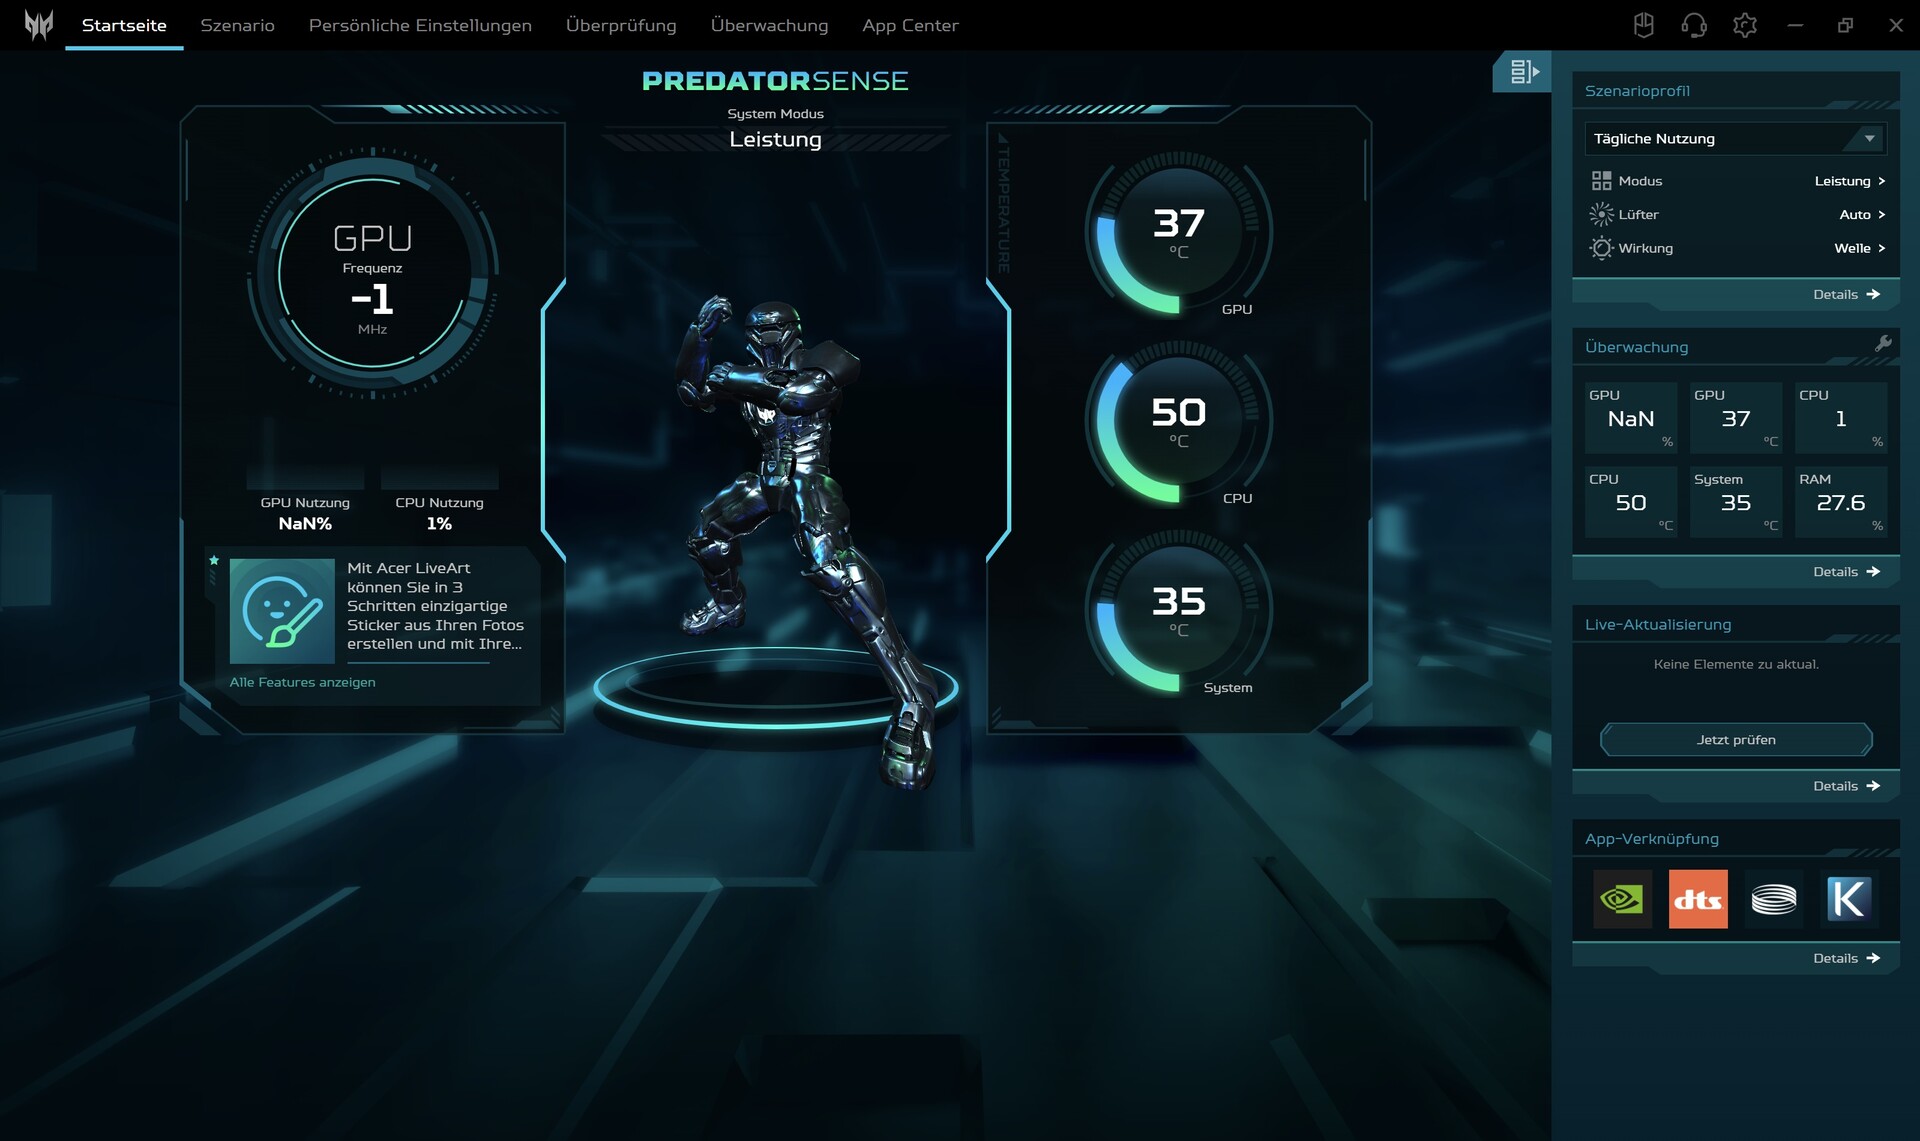
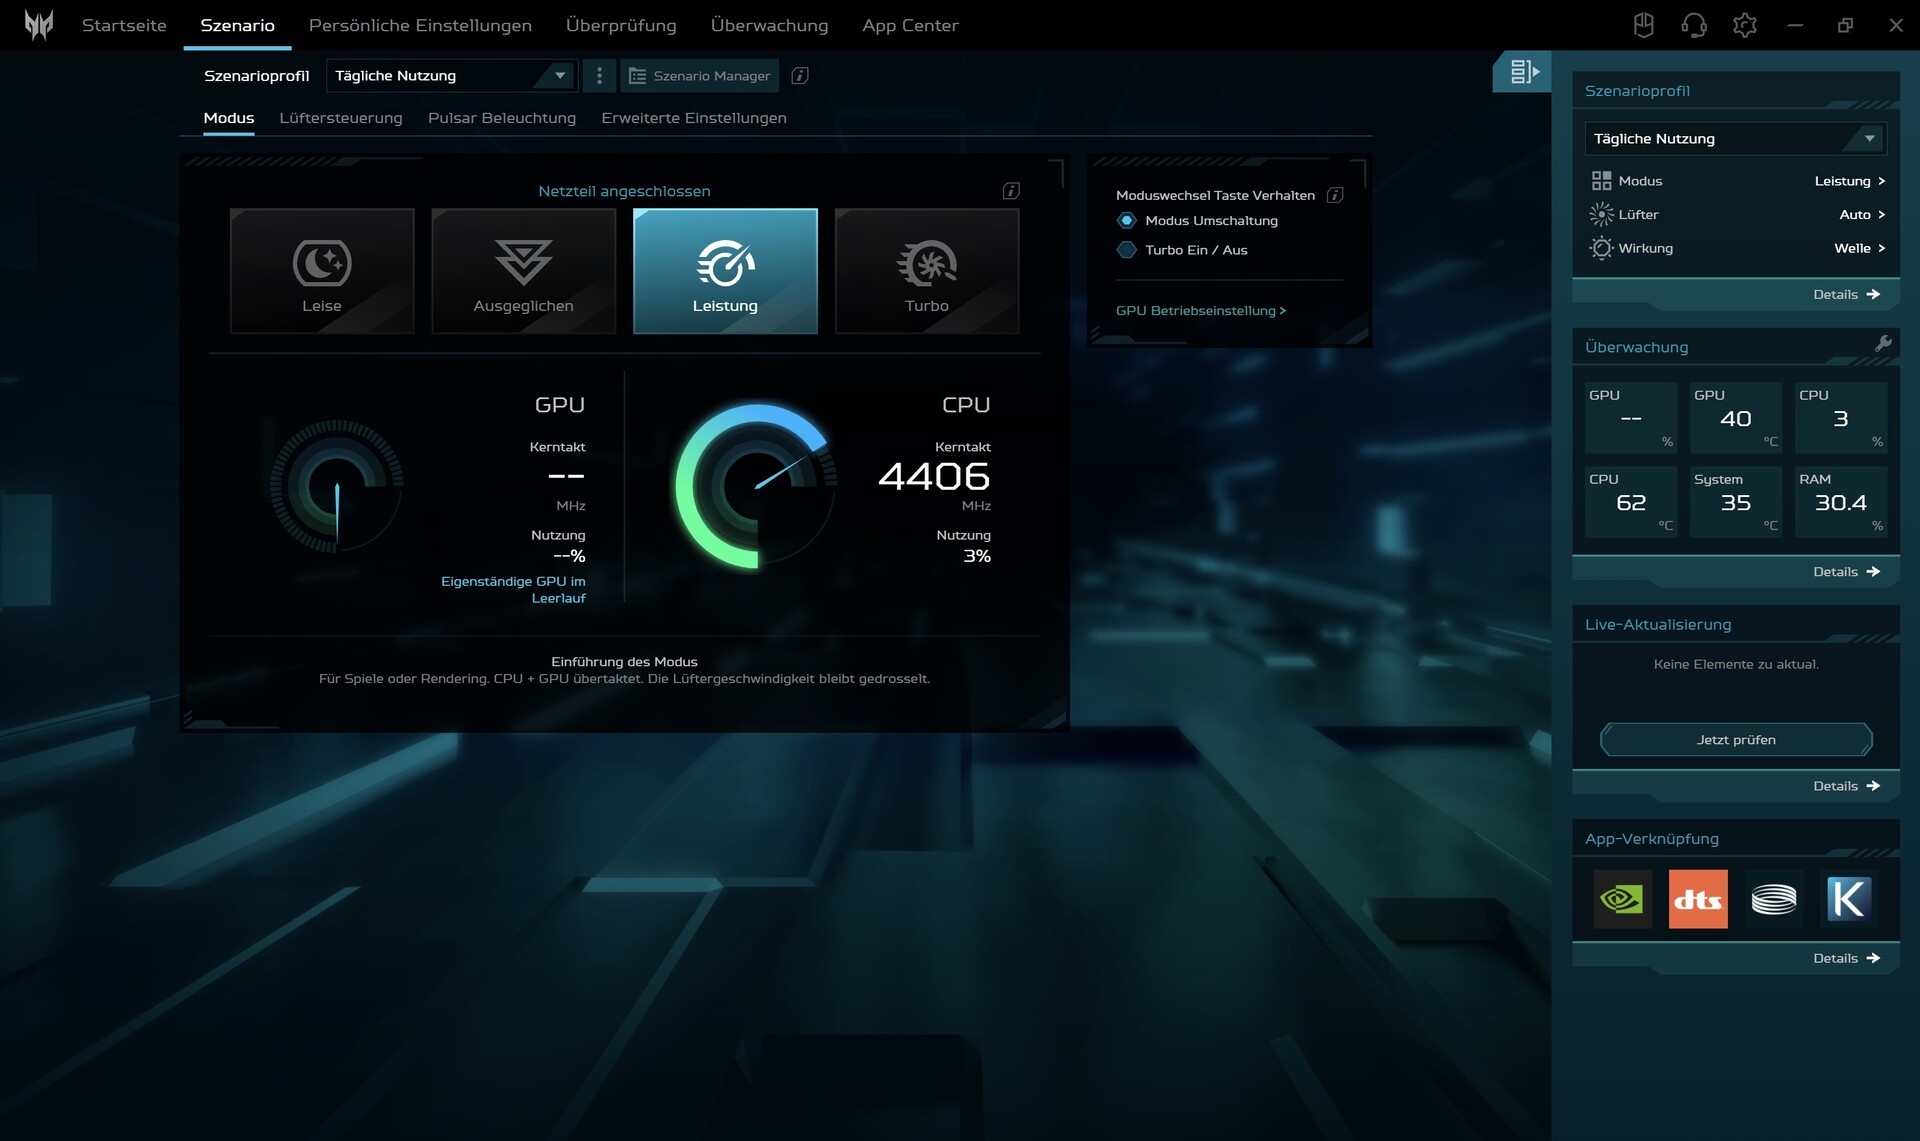
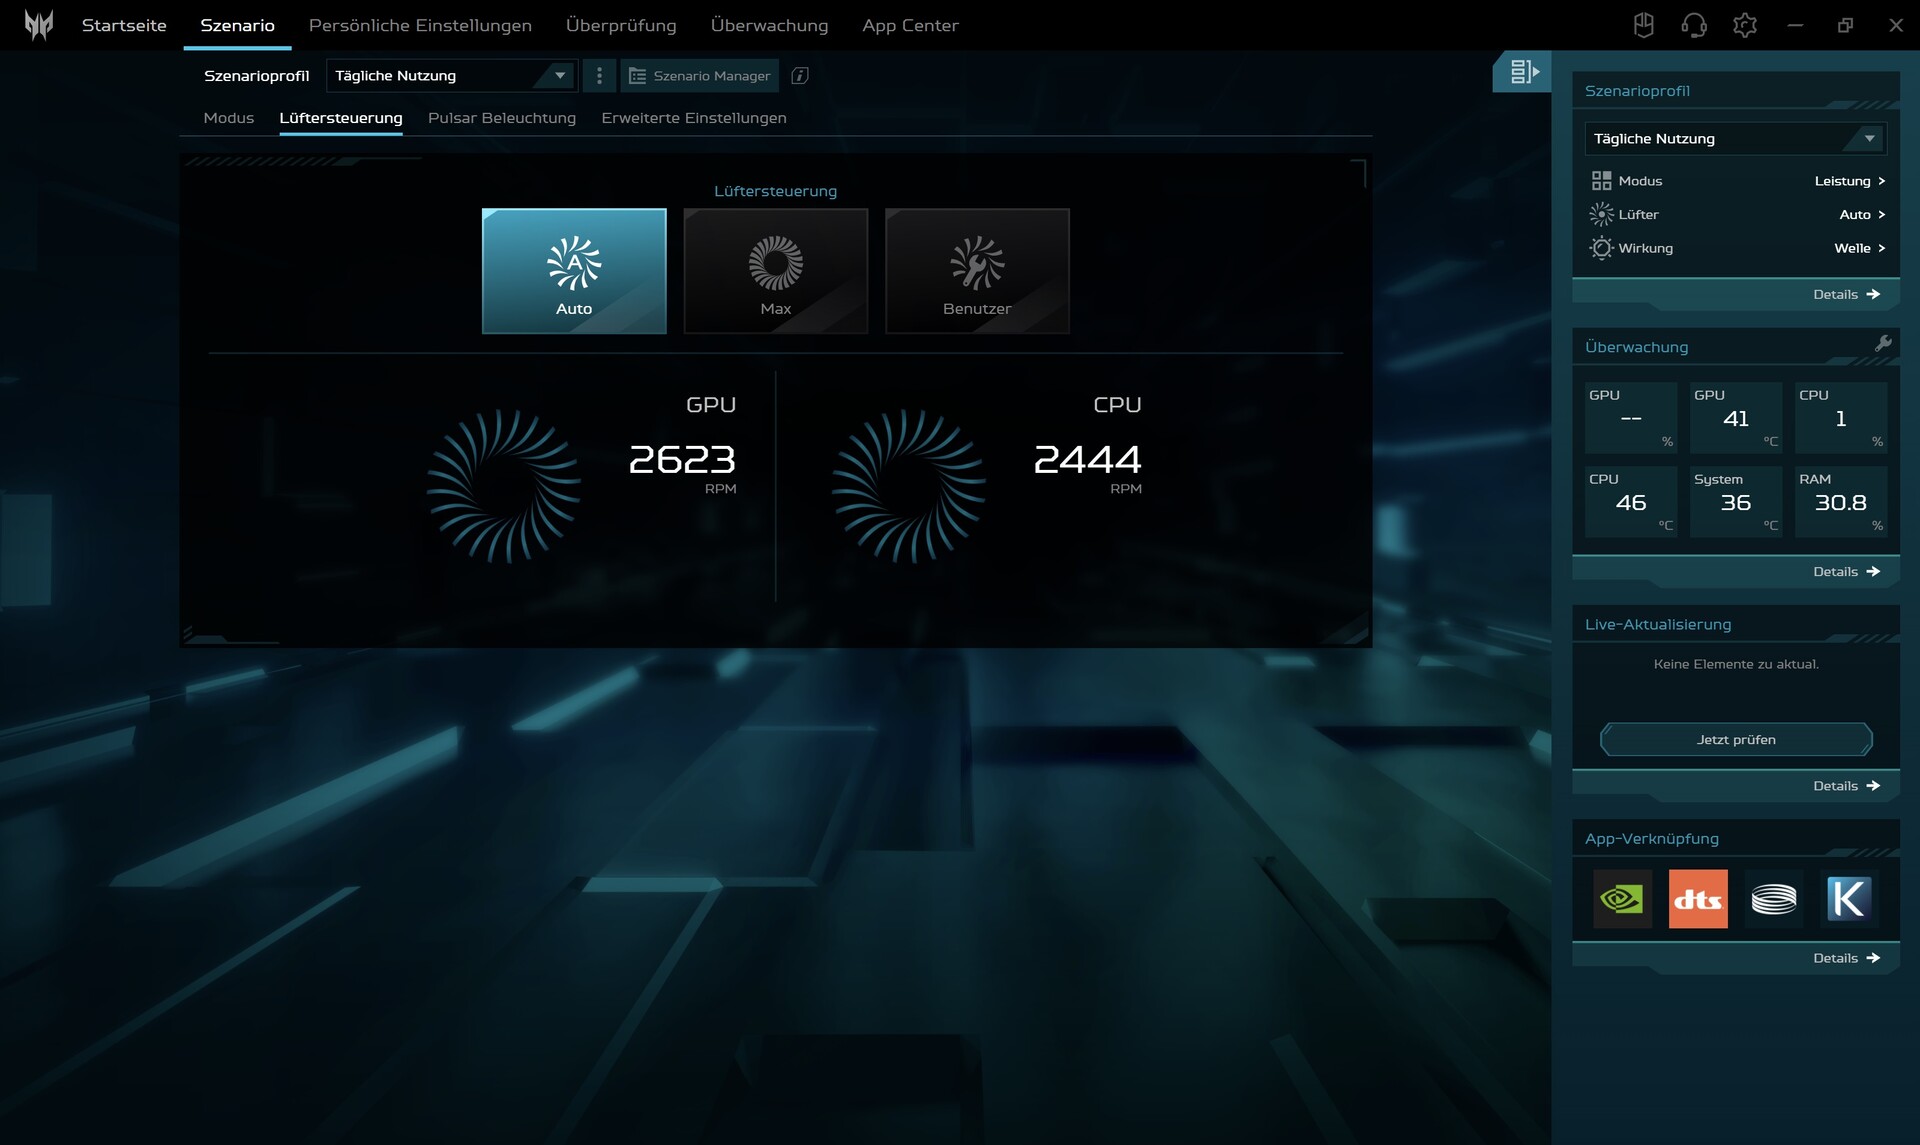
Users can choose from four different profiles, some of which differ significantly in terms of performance and noise development. As Turbo mode is very loud in 3D mode (almost 58 dB), we opted for Performance mode during our tests, which offers slightly less performance, but also ensures a significantly lower (albeit still high) operating noise.
| Cyberpunk 2077 Loop sequence (FHD/Ultra) | Quiet | Balanced | Performance | Turbo |
| Noise | 39 dB(A) | 47 dB(A) | 50 dB(A) | 58 dB(A) |
| Performance | 32 fps | 62 fps | 66 fps | 74 fps |
| GPU board power draw | max. 53 watts | max. 66 watts | max. 76 watts | max. 116 watts |
Processor
The Core Ultra 9 185H is a powerful laptop processor with 16 cores (three different core types), which can process up to 22 threads simultaneously via hyper-threading. In our benchmark course, the CPU performance ranked approximately at the level of our previously determined average for the Ultra 9 185H. However, the Ultra 7 155H, which is found in some competitors, was often barely slower (the Alienware m16 even came slightly ahead in the overall rating). The Cinebench loop also showed that the Acer laptop's results weren't particularly constant, but rather showed some fluctuations. However, neither Intel model stood a chance against AMD's Ryzen AI 9 HX 370.
Cinebench R15 Multi continuous test
* ... smaller is better
AIDA64: FP32 Ray-Trace | FPU Julia | CPU SHA3 | CPU Queen | FPU SinJulia | FPU Mandel | CPU AES | CPU ZLib | FP64 Ray-Trace | CPU PhotoWorxx
| Performance rating | |
| Asus ProArt P16 H7606WI -2! | |
| Average of class Gaming | |
| Lenovo Yoga Pro 9 16IMH9 | |
| Acer Predator Triton Neo 16 PTN16-51-978P | |
| Alienware m16 R2 | |
| Average Intel Core Ultra 9 185H | |
| Asus ROG Zephyrus G16 2024 GU605M | |
| AIDA64 / FP32 Ray-Trace | |
| Average of class Gaming (10227 - 85542, n=110, last 2 years) | |
| Acer Predator Triton Neo 16 PTN16-51-978P | |
| Alienware m16 R2 | |
| Lenovo Yoga Pro 9 16IMH9 | |
| Asus ROG Zephyrus G16 2024 GU605M | |
| Average Intel Core Ultra 9 185H (9220 - 18676, n=20) | |
| AIDA64 / FPU Julia | |
| Asus ProArt P16 H7606WI | |
| Average of class Gaming (51376 - 238426, n=110, last 2 years) | |
| Acer Predator Triton Neo 16 PTN16-51-978P | |
| Lenovo Yoga Pro 9 16IMH9 | |
| Alienware m16 R2 | |
| Asus ROG Zephyrus G16 2024 GU605M | |
| Average Intel Core Ultra 9 185H (48865 - 96463, n=20) | |
| AIDA64 / CPU SHA3 | |
| Average of class Gaming (2180 - 9817, n=110, last 2 years) | |
| Asus ProArt P16 H7606WI | |
| Acer Predator Triton Neo 16 PTN16-51-978P | |
| Lenovo Yoga Pro 9 16IMH9 | |
| Alienware m16 R2 | |
| Average Intel Core Ultra 9 185H (2394 - 4534, n=20) | |
| Asus ROG Zephyrus G16 2024 GU605M | |
| AIDA64 / CPU Queen | |
| Average of class Gaming (49785 - 173351, n=101, last 2 years) | |
| Asus ProArt P16 H7606WI | |
| Acer Predator Triton Neo 16 PTN16-51-978P | |
| Lenovo Yoga Pro 9 16IMH9 | |
| Asus ROG Zephyrus G16 2024 GU605M | |
| Average Intel Core Ultra 9 185H (66785 - 95241, n=20) | |
| Alienware m16 R2 | |
| AIDA64 / FPU SinJulia | |
| Asus ProArt P16 H7606WI | |
| Average of class Gaming (4424 - 33636, n=110, last 2 years) | |
| Lenovo Yoga Pro 9 16IMH9 | |
| Acer Predator Triton Neo 16 PTN16-51-978P | |
| Asus ROG Zephyrus G16 2024 GU605M | |
| Alienware m16 R2 | |
| Average Intel Core Ultra 9 185H (7255 - 11392, n=20) | |
| AIDA64 / FPU Mandel | |
| Average of class Gaming (25115 - 128721, n=110, last 2 years) | |
| Alienware m16 R2 | |
| Lenovo Yoga Pro 9 16IMH9 | |
| Acer Predator Triton Neo 16 PTN16-51-978P | |
| Asus ROG Zephyrus G16 2024 GU605M | |
| Average Intel Core Ultra 9 185H (24004 - 48020, n=20) | |
| AIDA64 / CPU AES | |
| Average of class Gaming (39258 - 247074, n=110, last 2 years) | |
| Lenovo Yoga Pro 9 16IMH9 | |
| Acer Predator Triton Neo 16 PTN16-51-978P | |
| Average Intel Core Ultra 9 185H (53116 - 154066, n=20) | |
| Alienware m16 R2 | |
| Asus ProArt P16 H7606WI | |
| Asus ROG Zephyrus G16 2024 GU605M | |
| AIDA64 / CPU ZLib | |
| Asus ProArt P16 H7606WI | |
| Average of class Gaming (574 - 2531, n=110, last 2 years) | |
| Lenovo Yoga Pro 9 16IMH9 | |
| Acer Predator Triton Neo 16 PTN16-51-978P | |
| Alienware m16 R2 | |
| Average Intel Core Ultra 9 185H (678 - 1341, n=20) | |
| Asus ROG Zephyrus G16 2024 GU605M | |
| AIDA64 / FP64 Ray-Trace | |
| Asus ProArt P16 H7606WI | |
| Average of class Gaming (5509 - 45446, n=110, last 2 years) | |
| Alienware m16 R2 | |
| Lenovo Yoga Pro 9 16IMH9 | |
| Acer Predator Triton Neo 16 PTN16-51-978P | |
| Asus ROG Zephyrus G16 2024 GU605M | |
| Average Intel Core Ultra 9 185H (4428 - 10078, n=20) | |
| AIDA64 / CPU PhotoWorxx | |
| Lenovo Yoga Pro 9 16IMH9 | |
| Asus ROG Zephyrus G16 2024 GU605M | |
| Average Intel Core Ultra 9 185H (44547 - 53918, n=20) | |
| Asus ProArt P16 H7606WI | |
| Acer Predator Triton Neo 16 PTN16-51-978P | |
| Average of class Gaming (12271 - 89891, n=110, last 2 years) | |
| Alienware m16 R2 | |
System performance
There were no surprises when it came to system performance. 7,443 points in PCMark 10 are typical for a device with these components or from this performance class.
CrossMark: Overall | Productivity | Creativity | Responsiveness
WebXPRT 3: Overall
WebXPRT 4: Overall
Mozilla Kraken 1.1: Total
| PCMark 10 / Score | |
| Average of class Gaming (5828 - 11574, n=96, last 2 years) | |
| Alienware m16 R2 | |
| Asus ProArt P16 H7606WI | |
| Average Intel Core Ultra 9 185H, NVIDIA GeForce RTX 4070 Laptop GPU (7443 - 7761, n=4) | |
| Lenovo Yoga Pro 9 16IMH9 | |
| Acer Predator Triton Neo 16 PTN16-51-978P | |
| Asus ROG Zephyrus G16 2024 GU605M | |
| PCMark 10 / Essentials | |
| Lenovo Yoga Pro 9 16IMH9 | |
| Average of class Gaming (8810 - 12600, n=100, last 2 years) | |
| Average Intel Core Ultra 9 185H, NVIDIA GeForce RTX 4070 Laptop GPU (9728 - 11133, n=4) | |
| Alienware m16 R2 | |
| Asus ROG Zephyrus G16 2024 GU605M | |
| Asus ProArt P16 H7606WI | |
| Acer Predator Triton Neo 16 PTN16-51-978P | |
| PCMark 10 / Productivity | |
| Average of class Gaming (6845 - 18766, n=98, last 2 years) | |
| Asus ProArt P16 H7606WI | |
| Acer Predator Triton Neo 16 PTN16-51-978P | |
| Alienware m16 R2 | |
| Average Intel Core Ultra 9 185H, NVIDIA GeForce RTX 4070 Laptop GPU (9067 - 9555, n=4) | |
| Asus ROG Zephyrus G16 2024 GU605M | |
| Lenovo Yoga Pro 9 16IMH9 | |
| PCMark 10 / Digital Content Creation | |
| Average of class Gaming (7602 - 19657, n=98, last 2 years) | |
| Alienware m16 R2 | |
| Asus ProArt P16 H7606WI | |
| Average Intel Core Ultra 9 185H, NVIDIA GeForce RTX 4070 Laptop GPU (11369 - 13194, n=4) | |
| Acer Predator Triton Neo 16 PTN16-51-978P | |
| Lenovo Yoga Pro 9 16IMH9 | |
| Asus ROG Zephyrus G16 2024 GU605M | |
| CrossMark / Overall | |
| Average of class Gaming (1366 - 2409, n=98, last 2 years) | |
| Asus ProArt P16 H7606WI | |
| Average Intel Core Ultra 9 185H, NVIDIA GeForce RTX 4070 Laptop GPU (1663 - 1917, n=3) | |
| Alienware m16 R2 | |
| Asus ROG Zephyrus G16 2024 GU605M | |
| Lenovo Yoga Pro 9 16IMH9 | |
| CrossMark / Productivity | |
| Average of class Gaming (1386 - 2254, n=98, last 2 years) | |
| Alienware m16 R2 | |
| Average Intel Core Ultra 9 185H, NVIDIA GeForce RTX 4070 Laptop GPU (1573 - 1849, n=3) | |
| Asus ROG Zephyrus G16 2024 GU605M | |
| Lenovo Yoga Pro 9 16IMH9 | |
| Asus ProArt P16 H7606WI | |
| CrossMark / Creativity | |
| Asus ProArt P16 H7606WI | |
| Average of class Gaming (1343 - 2729, n=98, last 2 years) | |
| Lenovo Yoga Pro 9 16IMH9 | |
| Average Intel Core Ultra 9 185H, NVIDIA GeForce RTX 4070 Laptop GPU (1872 - 2008, n=3) | |
| Asus ROG Zephyrus G16 2024 GU605M | |
| Alienware m16 R2 | |
| CrossMark / Responsiveness | |
| Average of class Gaming (1226 - 2334, n=98, last 2 years) | |
| Alienware m16 R2 | |
| Average Intel Core Ultra 9 185H, NVIDIA GeForce RTX 4070 Laptop GPU (1338 - 1856, n=3) | |
| Asus ROG Zephyrus G16 2024 GU605M | |
| Lenovo Yoga Pro 9 16IMH9 | |
| Asus ProArt P16 H7606WI | |
| WebXPRT 3 / Overall | |
| Average of class Gaming (242 - 532, n=101, last 2 years) | |
| Asus ProArt P16 H7606WI | |
| Lenovo Yoga Pro 9 16IMH9 | |
| Alienware m16 R2 | |
| Asus ROG Zephyrus G16 2024 GU605M | |
| Average Intel Core Ultra 9 185H, NVIDIA GeForce RTX 4070 Laptop GPU (240 - 295, n=5) | |
| Acer Predator Triton Neo 16 PTN16-51-978P | |
| Acer Predator Triton Neo 16 PTN16-51-978P | |
| WebXPRT 4 / Overall | |
| Average of class Gaming (176.4 - 354, n=101, last 2 years) | |
| Lenovo Yoga Pro 9 16IMH9 | |
| Alienware m16 R2 | |
| Asus ROG Zephyrus G16 2024 GU605M | |
| Average Intel Core Ultra 9 185H, NVIDIA GeForce RTX 4070 Laptop GPU (248 - 268, n=5) | |
| Acer Predator Triton Neo 16 PTN16-51-978P | |
| Acer Predator Triton Neo 16 PTN16-51-978P | |
| Asus ProArt P16 H7606WI | |
| Mozilla Kraken 1.1 / Total | |
| Acer Predator Triton Neo 16 PTN16-51-978P | |
| Acer Predator Triton Neo 16 PTN16-51-978P | |
| Asus ROG Zephyrus G16 2024 GU605M | |
| Alienware m16 R2 | |
| Average Intel Core Ultra 9 185H, NVIDIA GeForce RTX 4070 Laptop GPU (494 - 549, n=5) | |
| Lenovo Yoga Pro 9 16IMH9 | |
| Average of class Gaming (391 - 590, n=106, last 2 years) | |
| Asus ProArt P16 H7606WI | |
* ... smaller is better
| PCMark 10 Score | 7443 points | |
Help | ||
| AIDA64 / Memory Copy | |
| Lenovo Yoga Pro 9 16IMH9 | |
| Asus ProArt P16 H7606WI | |
| Asus ROG Zephyrus G16 2024 GU605M | |
| Average Intel Core Ultra 9 185H (69929 - 95718, n=20) | |
| Acer Predator Triton Neo 16 PTN16-51-978P | |
| Average of class Gaming (21750 - 129946, n=110, last 2 years) | |
| Alienware m16 R2 | |
| AIDA64 / Memory Read | |
| Asus ProArt P16 H7606WI | |
| Lenovo Yoga Pro 9 16IMH9 | |
| Asus ROG Zephyrus G16 2024 GU605M | |
| Average Intel Core Ultra 9 185H (64619 - 87768, n=20) | |
| Alienware m16 R2 | |
| Average of class Gaming (22956 - 118858, n=110, last 2 years) | |
| Acer Predator Triton Neo 16 PTN16-51-978P | |
| AIDA64 / Memory Write | |
| Asus ProArt P16 H7606WI | |
| Average of class Gaming (22297 - 135096, n=110, last 2 years) | |
| Lenovo Yoga Pro 9 16IMH9 | |
| Acer Predator Triton Neo 16 PTN16-51-978P | |
| Asus ROG Zephyrus G16 2024 GU605M | |
| Average Intel Core Ultra 9 185H (51114 - 93871, n=20) | |
| Alienware m16 R2 | |
| AIDA64 / Memory Latency | |
| Average Intel Core Ultra 9 185H (121.4 - 259, n=20) | |
| Acer Predator Triton Neo 16 PTN16-51-978P | |
| Asus ROG Zephyrus G16 2024 GU605M | |
| Lenovo Yoga Pro 9 16IMH9 | |
| Alienware m16 R2 | |
| Asus ProArt P16 H7606WI | |
| Average of class Gaming (75.3 - 259, n=110, last 2 years) | |
* ... smaller is better
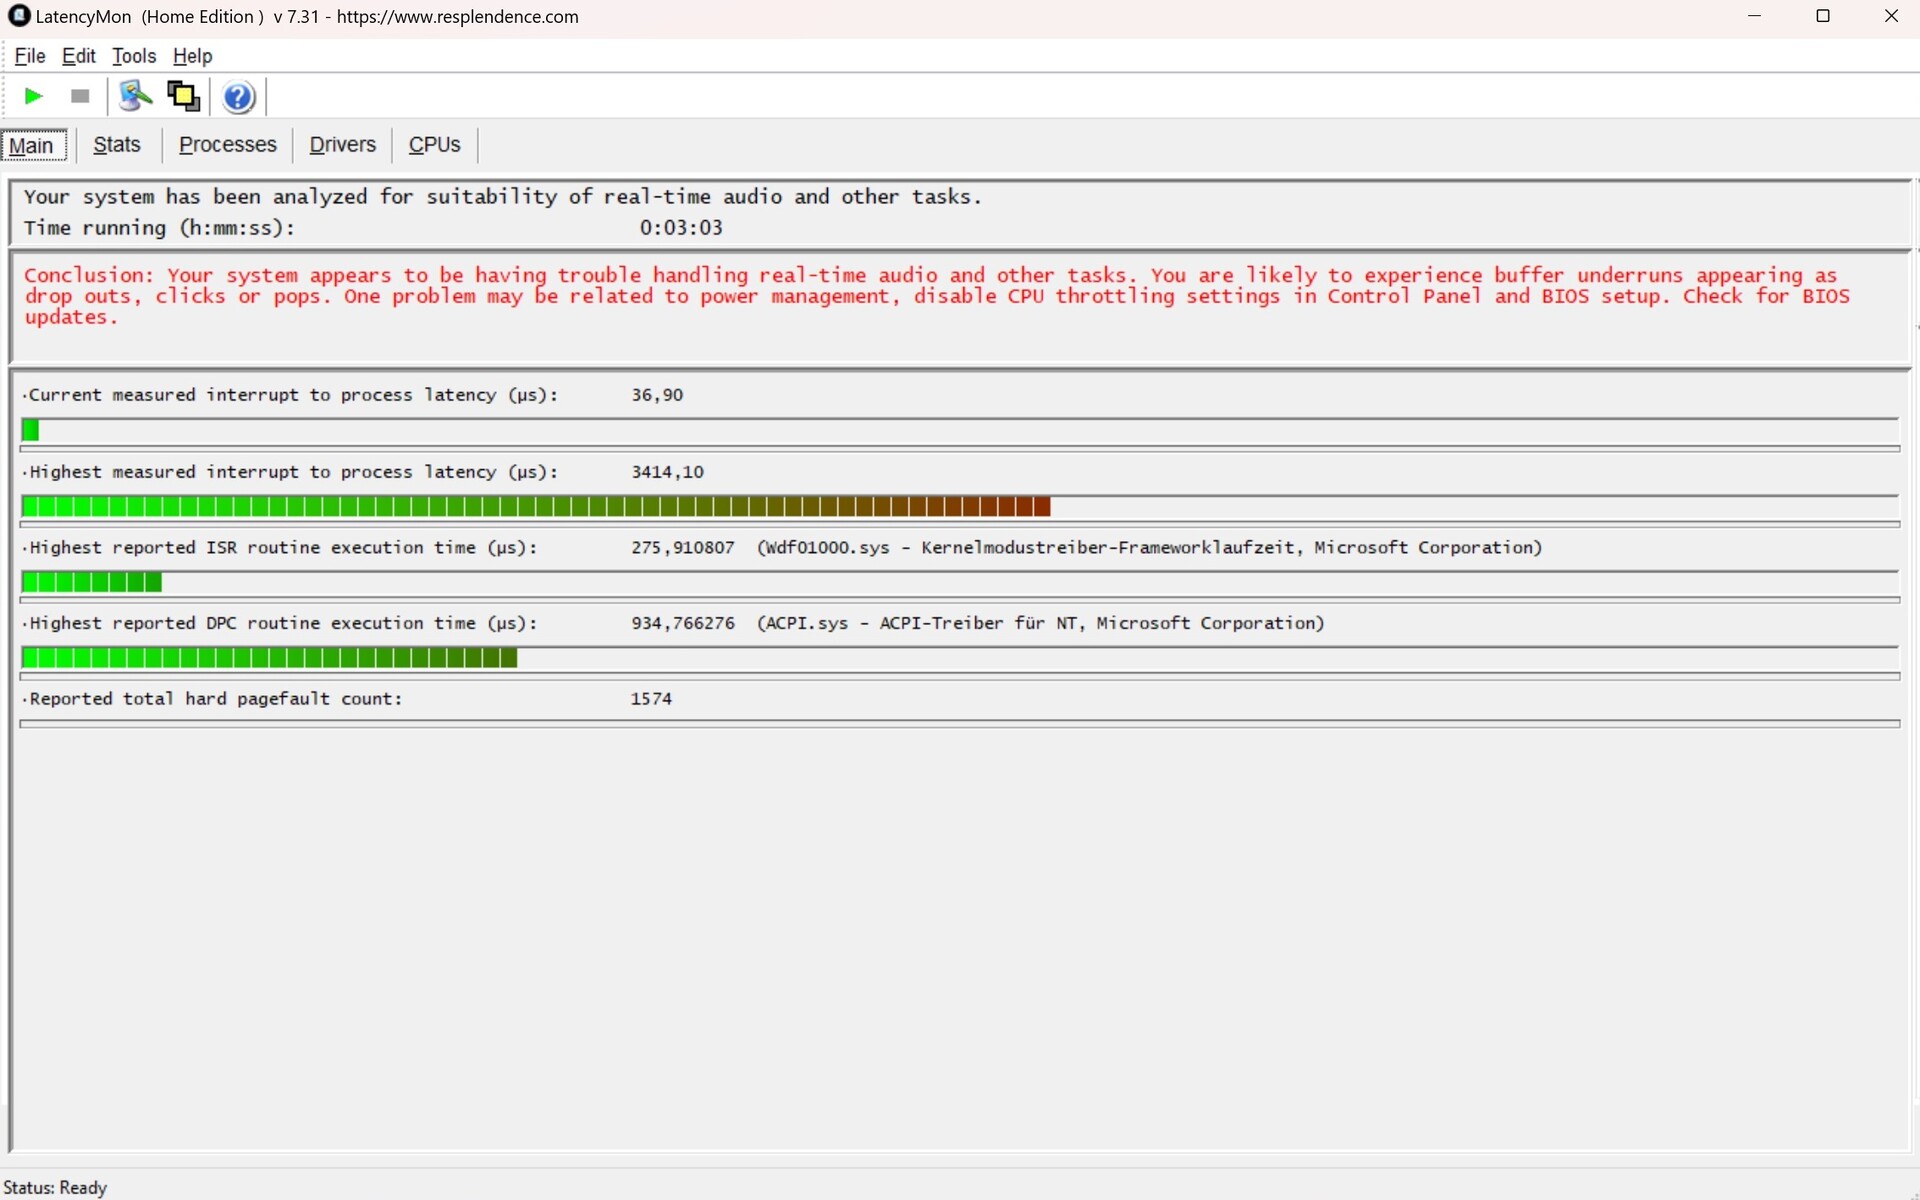
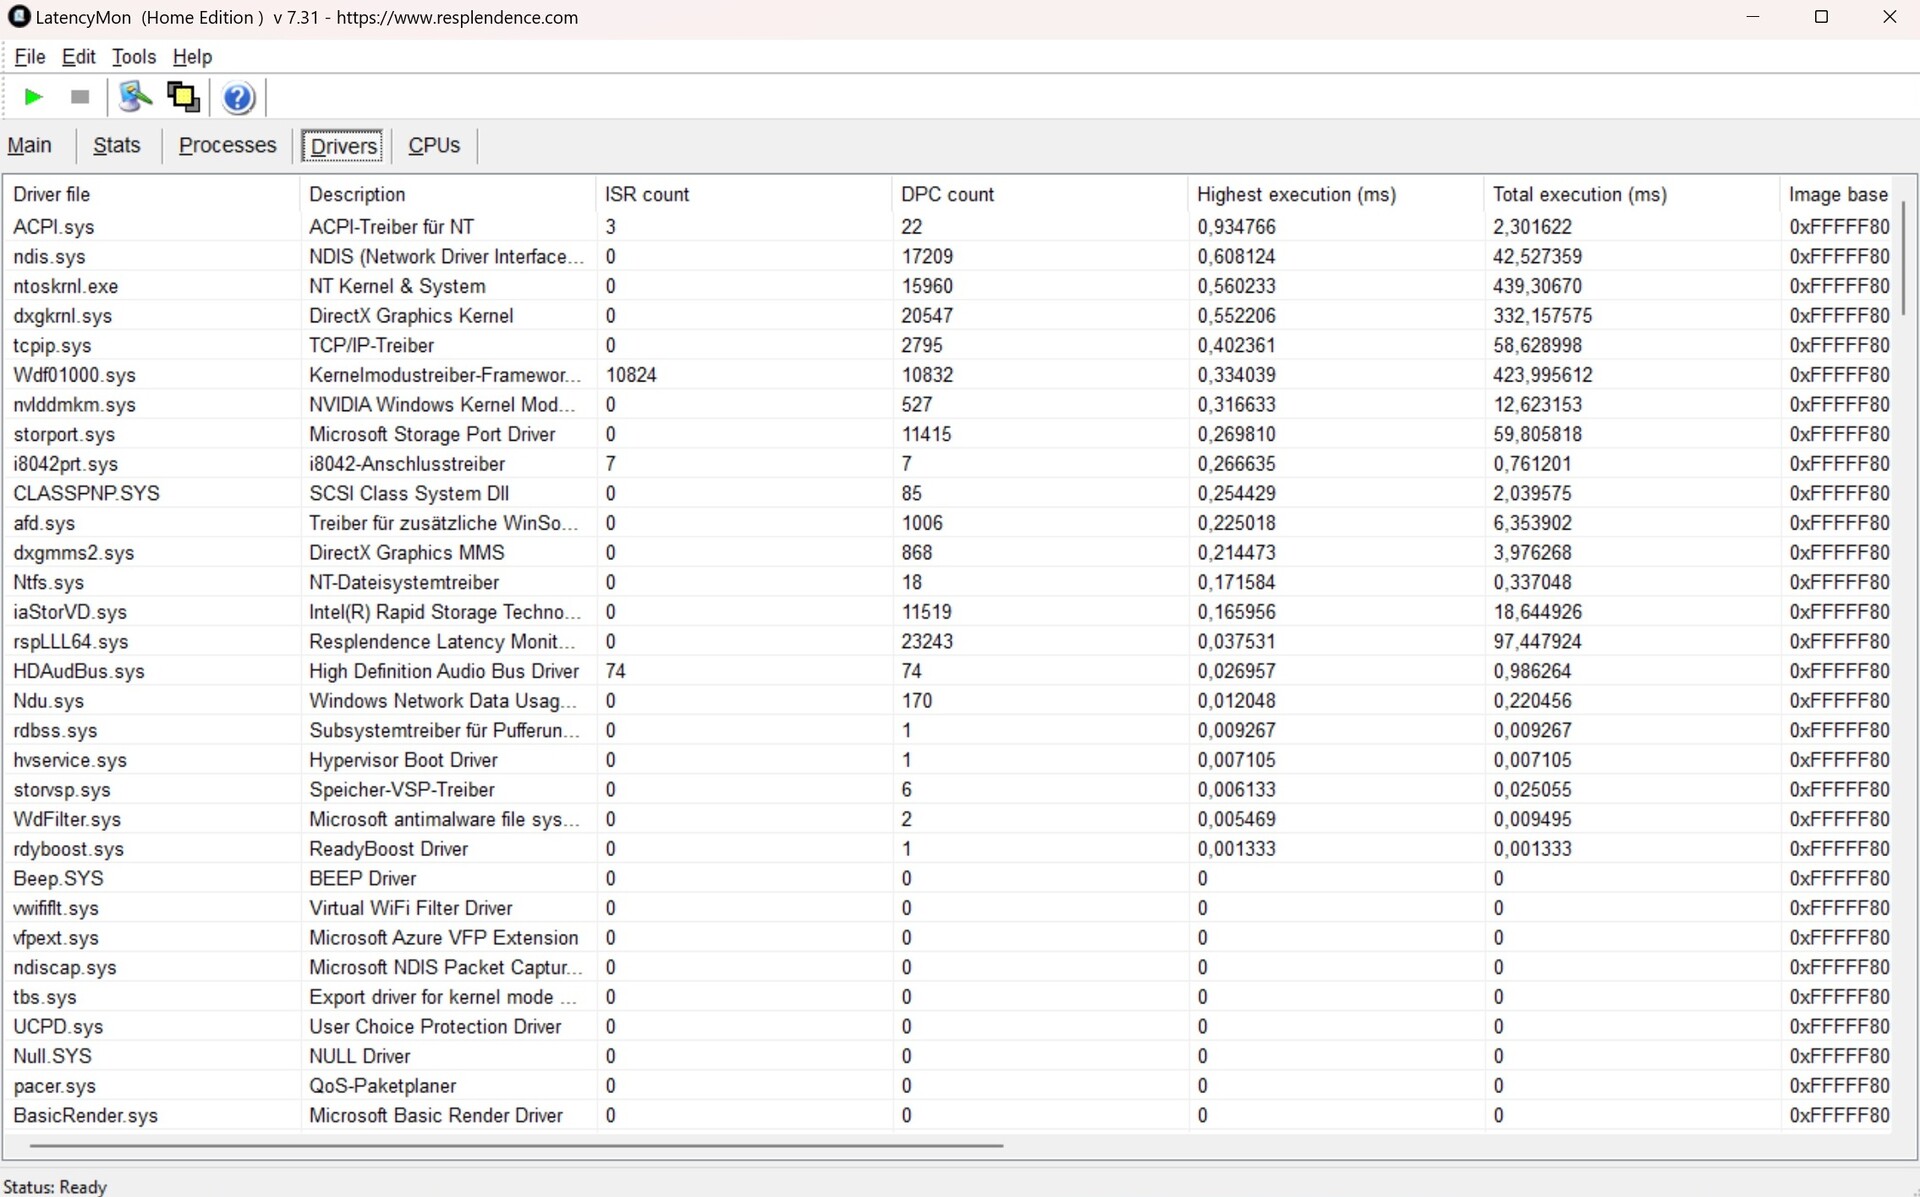
DPC latencies
Acer could do with improving its latencies. The LatencyMon tool revealed quite high values, but the same could be said for some competitors. Only the Lenovo Yoga Pro 9 16 remained below the 1,000 µs mark.
| DPC Latencies / LatencyMon - interrupt to process latency (max), Web, Youtube, Prime95 | |
| Acer Predator Triton Neo 16 PTN16-51-978P | |
| Asus ROG Zephyrus G16 2024 GU605M | |
| Alienware m16 R2 | |
| Lenovo Yoga Pro 9 16IMH9 | |
* ... smaller is better
Storage device
On the other hand, the Predator Triton impressed with its super fast 1 TB SSD (SK Hynix PC801). According to our performance rating, the Acer laptop took the top position among the comparison devices. However, it should be mentioned that there were strong performance fluctuations under prolonged load, which wasn't the case with the competition (see DiskSpd loop).

* ... smaller is better
Reading continuous performance: DiskSpd Read Loop, Queue Depth 8
Graphics card
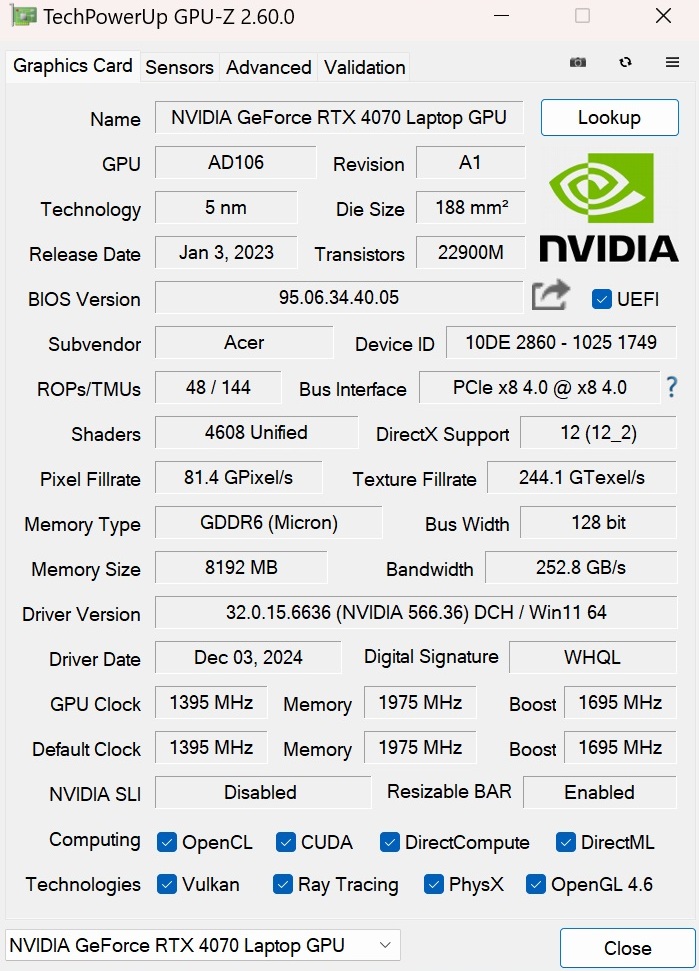
The GeForce RTX 4070 now generates mixed feelings. While its basic performance is pretty respectable, its limited VRAM of 8 GB becomes more and more of a stumbling block when running demanding games (take Indiana Jones, for example). Acer has additionally opted for a rather moderate TGP of 110 watts including Dynamic Boost for the Predator Triton Neo 16 (up to 140 watts could be possible), which is also evident from the benchmarks. During the GPU test, this was only enough to secure itself the last place in the test field. Interesting: Even the Asus ROG Zephyrus G16, which has an 80-watt TGP, was faster (when playing Cyberpunk 2077, for example, the RTX 4070's power consumption in the Neo 16 was limited to a maximum of 76 watts when using Performance mode).
| 3DMark 11 Performance | 31196 points | |
| 3DMark Ice Storm Standard Score | 196686 points | |
| 3DMark Cloud Gate Standard Score | 58960 points | |
| 3DMark Fire Strike Score | 23102 points | |
| 3DMark Time Spy Score | 10712 points | |
Help | ||
* ... smaller is better
Gaming performance
Things look a little better during everyday gaming. Here, the Acer laptop came a few percent ahead of its Asus counterpart but still lagged behind the other competitors. In general, the RTX 4070 is fast enough to run most current games smoothly with maximum details in Full HD resolution (e.g. 1,920 x 1,080). In the QHD range (e.g. 2,560 x 1,440 pixels), the situation no longer looks quite so rosy. Compute-intensive games such as Hellblade 2, Until Dawn and Stalker 2 require a reduction in details or the use of DLSS (see table). We would only recommend using the Neo 16's native resolution for less demanding games. 3,200 x 2,000 pixels are now borderline for an RTX 4070 (unless you use powerful upscaling methods).
| Strange Brigade - 1920x1080 ultra AA:ultra AF:16 | |
| Average of class Gaming (76.3 - 456, n=94, last 2 years) | |
| Alienware m16 R2 | |
| Lenovo Yoga Pro 9 16IMH9 | |
| Asus ProArt P16 H7606WI | |
| Average NVIDIA GeForce RTX 4070 Laptop GPU (76.3 - 234, n=63) | |
| Asus ROG Zephyrus G16 2024 GU605M | |
| low | med. | high | ultra | QHD DLSS | QHD | |
|---|---|---|---|---|---|---|
| GTA V (2015) | 173.4 | 166.4 | 104.6 | |||
| Dota 2 Reborn (2015) | 169.6 | 150.5 | 144.3 | 135.9 | ||
| Final Fantasy XV Benchmark (2018) | 132.4 | 99.7 | ||||
| X-Plane 11.11 (2018) | 130.8 | 116.5 | 89.2 | |||
| Baldur's Gate 3 (2023) | 108.4 | 94.8 | 91.1 | 65 | ||
| Cyberpunk 2077 (2023) | 93.9 | 80.1 | 69.1 | 42.3 | ||
| Senua's Saga Hellblade 2 (2024) | 53.2 | 39.3 | 42.2 | 27.1 | ||
| Star Wars Outlaws (2024) | 44.9 | 40.8 | 34.4 | 34.1 | 23.3 | |
| Space Marine 2 (2024) | 74.4 | 72.8 | 67.9 | 65.1 | 48.2 | |
| Final Fantasy XVI (2024) | 68.2 | 59 | 54.3 | 53.9 | 37.6 | |
| Until Dawn (2024) | 83.7 | 58.9 | 44.9 | 41.5 | 32.9 | |
| Call of Duty Black Ops 6 (2024) | 105 | 81 | 76 | 65 | 60 | |
| Stalker 2 (2024) | 57.1 | 49.7 | 42.3 | 58.3 | 31.7 |
In contrast to its CPU and SSD performance, the laptop's GPU speed seems to remain quite stable. During our 30-minute test using Cyberpunk 2077, we measured no noticeable FPS drops or the like.
Cyberpunk 2077 ultra FPS diagram
Emissions
Noise emissions
Acer could still do with revising its fan control. In Performance mode, the Neo 16 is sometimes quite noticeable even when idling (32 to 34 dB) and occasionally tends to rev up towards 40 dB(A). The counterparts usually stay much quieter. We noted around 50 dB(A) under load, which is very present and can get annoying without a headset. However, the competitors achieve similar or even higher values during this scenario.
Noise level
| Idle |
| 32 / 34 / 40 dB(A) |
| Load |
| 48 / 51 dB(A) |
 | ||
30 dB silent 40 dB(A) audible 50 dB(A) loud |
||
min: | ||
| Acer Predator Triton Neo 16 PTN16-51-978P Ultra 9 185H, GeForce RTX 4070 Laptop GPU | Asus ProArt P16 H7606WI Ryzen AI 9 HX 370, GeForce RTX 4070 Laptop GPU | Lenovo Yoga Pro 9 16IMH9 Ultra 9 185H, GeForce RTX 4070 Laptop GPU | Asus ROG Zephyrus G16 2024 GU605M Ultra 7 155H, GeForce RTX 4070 Laptop GPU | Alienware m16 R2 Ultra 7 155H, GeForce RTX 4070 Laptop GPU | |
|---|---|---|---|---|---|
| Noise | 9% | 14% | 18% | 16% | |
| off / environment * (dB) | 24 | 24.4 -2% | 24.3 -1% | 23.9 -0% | 24.7 -3% |
| Idle Minimum * (dB) | 32 | 24.4 24% | 24.3 24% | 23.9 25% | 25.3 21% |
| Idle Average * (dB) | 34 | 27.7 19% | 24.3 29% | 27.8 18% | 25.3 26% |
| Idle Maximum * (dB) | 40 | 32.3 19% | 25.8 35% | 30.1 25% | 25.3 37% |
| Load Average * (dB) | 48 | 42.2 12% | 48.1 -0% | 34.2 29% | 31.7 34% |
| Cyberpunk 2077 ultra * (dB) | 50 | 53.2 -6% | |||
| Load Maximum * (dB) | 51 | 53.2 -4% | 53.9 -6% | 46.4 9% | 62 -22% |
| Witcher 3 ultra * (dB) | 49.7 | 46.4 | 53.8 |
* ... smaller is better
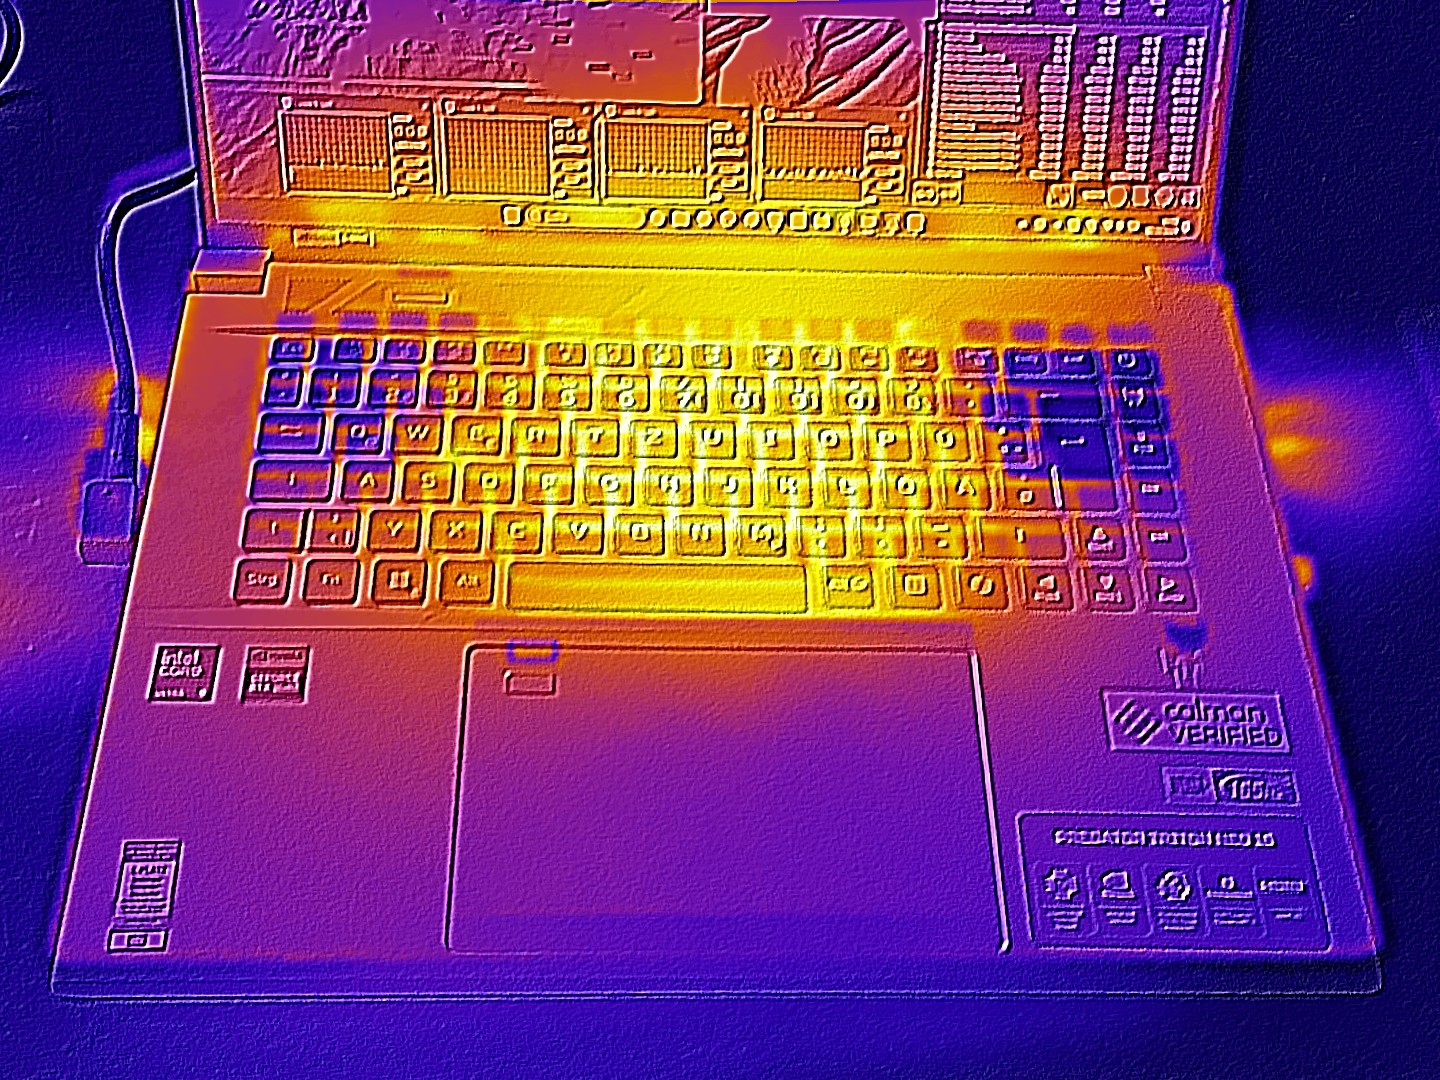
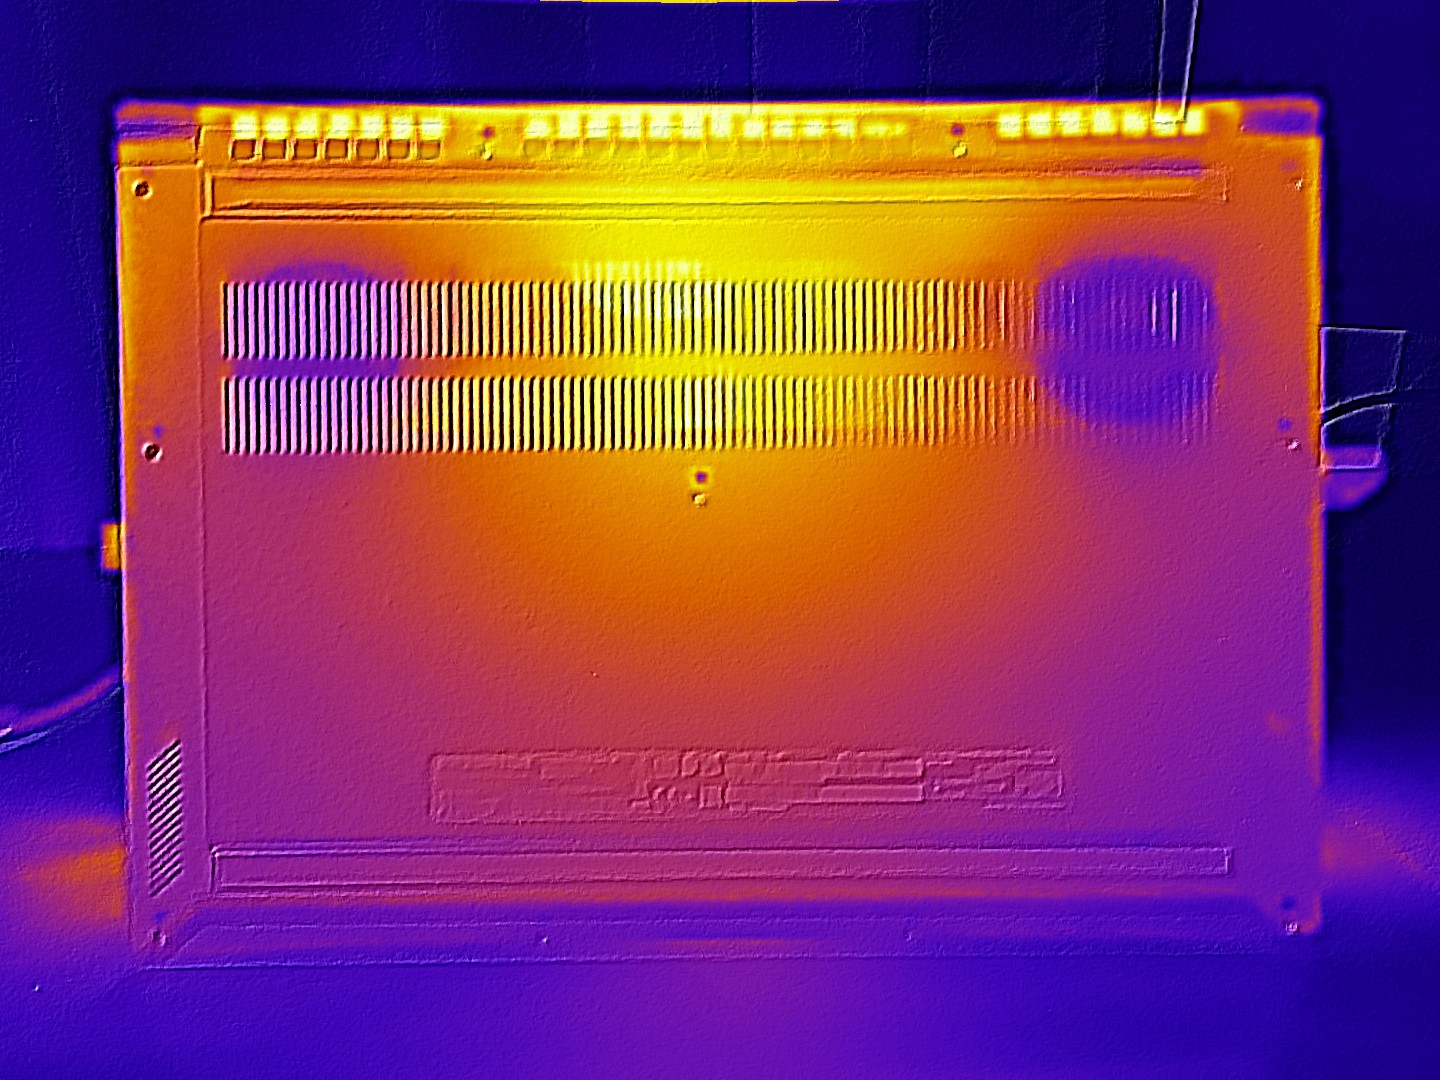
Temperature
When it comes to temperatures, the Acer offshoot isn't out of line at all. A maximum of 46 °C on the top and a maximum of 48 °C on the bottom are typical for an RTX 4070 device. In idle mode, the case stays below the 30 °C mark and therefore remains nice and cool.
(-) The maximum temperature on the upper side is 46 °C / 115 F, compared to the average of 40.4 °C / 105 F, ranging from 21.2 to 68.8 °C for the class Gaming.
(-) The bottom heats up to a maximum of 48 °C / 118 F, compared to the average of 43.2 °C / 110 F
(+) In idle usage, the average temperature for the upper side is 25.8 °C / 78 F, compared to the device average of 33.9 °C / 93 F.
(-) 3: The average temperature for the upper side is 39.3 °C / 103 F, compared to the average of 33.9 °C / 93 F for the class Gaming.
(+) The palmrests and touchpad are reaching skin temperature as a maximum (34 °C / 93.2 F) and are therefore not hot.
(-) The average temperature of the palmrest area of similar devices was 28.8 °C / 83.8 F (-5.2 °C / -9.4 F).
| Acer Predator Triton Neo 16 PTN16-51-978P Ultra 9 185H, GeForce RTX 4070 Laptop GPU | Asus ProArt P16 H7606WI Ryzen AI 9 HX 370, GeForce RTX 4070 Laptop GPU | Lenovo Yoga Pro 9 16IMH9 Ultra 9 185H, GeForce RTX 4070 Laptop GPU | Asus ROG Zephyrus G16 2024 GU605M Ultra 7 155H, GeForce RTX 4070 Laptop GPU | Alienware m16 R2 Ultra 7 155H, GeForce RTX 4070 Laptop GPU | |
|---|---|---|---|---|---|
| Heat | -5% | 6% | -5% | -20% | |
| Maximum Upper Side * (°C) | 46 | 46.9 -2% | 41.7 9% | 50.3 -9% | 44.8 3% |
| Maximum Bottom * (°C) | 48 | 50.9 -6% | 46.3 4% | 48 -0% | 48 -0% |
| Idle Upper Side * (°C) | 27 | 28.9 -7% | 26.2 3% | 28.8 -7% | 37.2 -38% |
| Idle Bottom * (°C) | 29 | 30 -3% | 27.2 6% | 29.8 -3% | 42 -45% |
* ... smaller is better
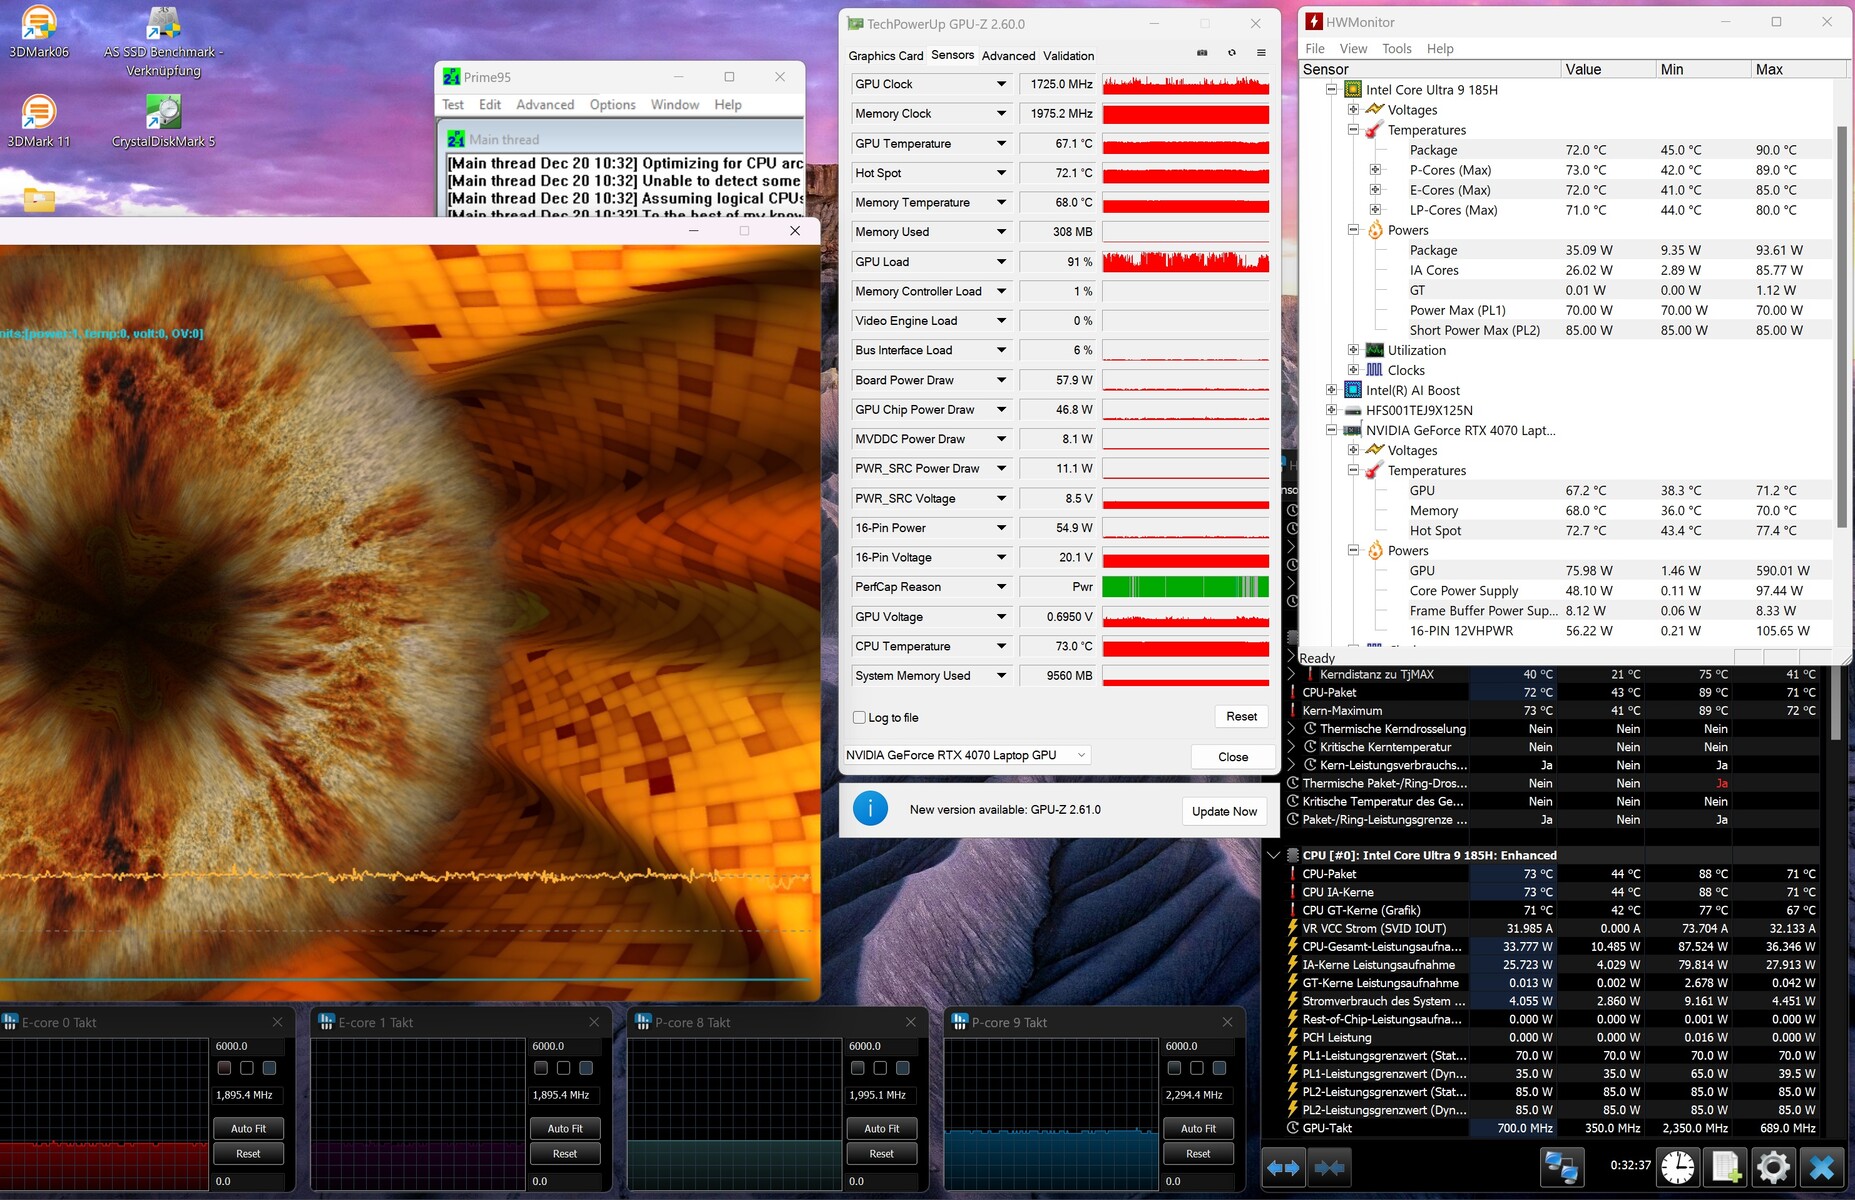
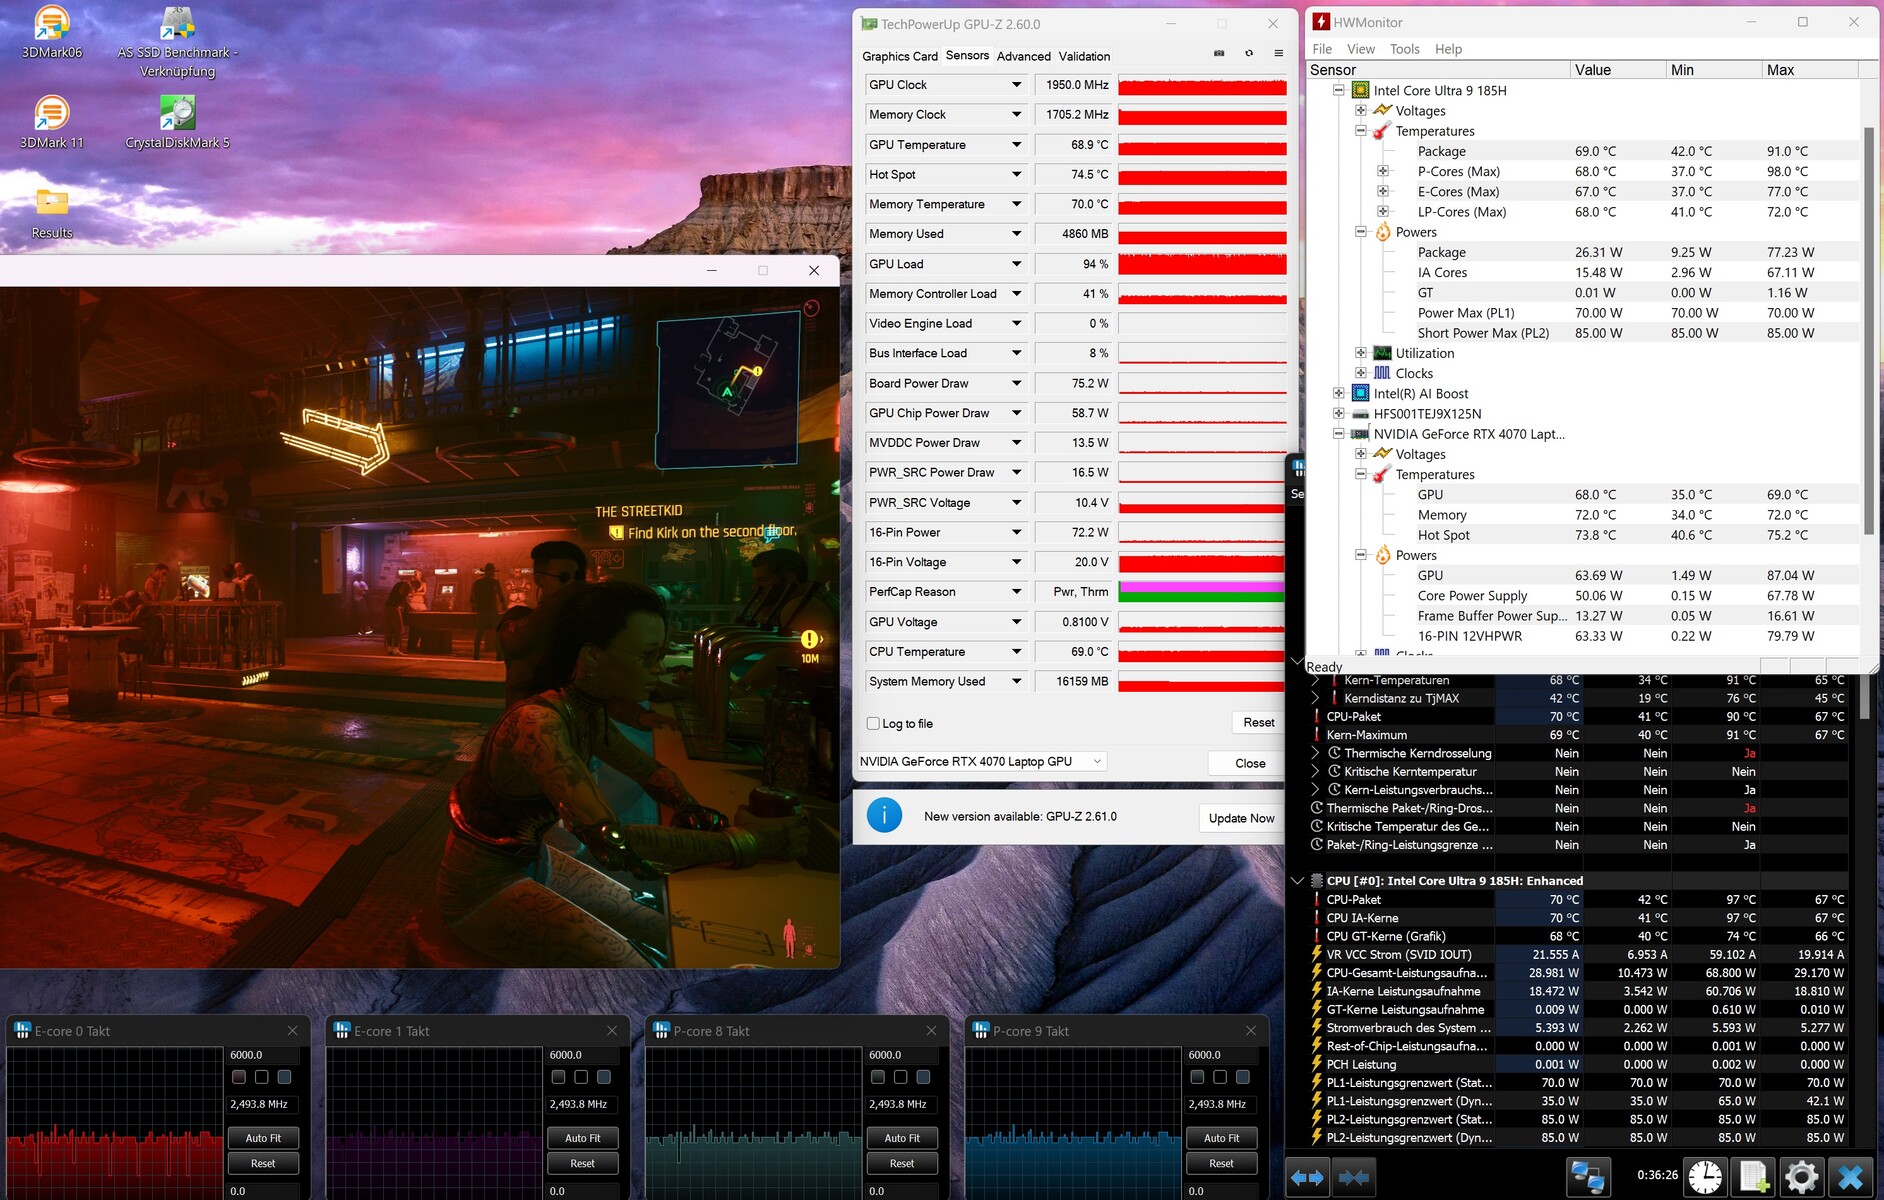
Stress test
Both in the stress test using the Furmark and Prime95 tools and when running Cyberpunk 2077, the CPU and GPU heated up to around 70 °C, which can be classed as a moderate level.


Speakers
The laptop's sound quality is in the mid-range. In addition to bass, the mids and highs could do with being more powerful and precise. On the other hand, the 16-inch device's speakers boast a good maximum volume of 86 dB(A).
Acer Predator Triton Neo 16 PTN16-51-978P audio analysis
(+) | speakers can play relatively loud (86 dB)
Bass 100 - 315 Hz
(-) | nearly no bass - on average 22.7% lower than median
(±) | linearity of bass is average (10.9% delta to prev. frequency)
Mids 400 - 2000 Hz
(±) | higher mids - on average 5.9% higher than median
(+) | mids are linear (5.3% delta to prev. frequency)
Highs 2 - 16 kHz
(±) | higher highs - on average 5.6% higher than median
(±) | linearity of highs is average (7.2% delta to prev. frequency)
Overall 100 - 16.000 Hz
(±) | linearity of overall sound is average (17.6% difference to median)
Compared to same class
» 50% of all tested devices in this class were better, 11% similar, 39% worse
» The best had a delta of 6%, average was 18%, worst was 132%
Compared to all devices tested
» 34% of all tested devices were better, 8% similar, 57% worse
» The best had a delta of 4%, average was 24%, worst was 134%
Asus ProArt P16 H7606WI audio analysis
(±) | speaker loudness is average but good (81.4 dB)
Bass 100 - 315 Hz
(+) | good bass - only 3% away from median
(±) | linearity of bass is average (8.3% delta to prev. frequency)
Mids 400 - 2000 Hz
(+) | balanced mids - only 3.5% away from median
(+) | mids are linear (2.5% delta to prev. frequency)
Highs 2 - 16 kHz
(+) | balanced highs - only 3% away from median
(+) | highs are linear (3.6% delta to prev. frequency)
Overall 100 - 16.000 Hz
(+) | overall sound is linear (8.5% difference to median)
Compared to same class
» 9% of all tested devices in this class were better, 3% similar, 88% worse
» The best had a delta of 5%, average was 17%, worst was 45%
Compared to all devices tested
» 2% of all tested devices were better, 1% similar, 97% worse
» The best had a delta of 4%, average was 24%, worst was 134%
Power management
Power consumption
Thanks to its integrated graphics switching, the Predator Triton is reasonably frugal when idling—we measured 10 to 23 watts, so well below the gaming average. Under load, the Acer laptop consumes between 80 and 206 watts, meaning the 230-watt power supply is not overloaded at any point.
| Off / Standby | |
| Idle | |
| Load |
|
Key:
min: | |
| Acer Predator Triton Neo 16 PTN16-51-978P Ultra 9 185H, GeForce RTX 4070 Laptop GPU | Asus ProArt P16 H7606WI Ryzen AI 9 HX 370, GeForce RTX 4070 Laptop GPU | Lenovo Yoga Pro 9 16IMH9 Ultra 9 185H, GeForce RTX 4070 Laptop GPU | Asus ROG Zephyrus G16 2024 GU605M Ultra 7 155H, GeForce RTX 4070 Laptop GPU | Alienware m16 R2 Ultra 7 155H, GeForce RTX 4070 Laptop GPU | Average of class Gaming | |
|---|---|---|---|---|---|---|
| Power Consumption | 6% | -10% | 21% | -13% | -25% | |
| Idle Minimum * (Watt) | 10 | 8 20% | 10.3 -3% | 8.3 17% | 8.1 19% | 13.3 ? -33% |
| Idle Average * (Watt) | 15 | 9.9 34% | 21.9 -46% | 12.5 17% | 13 13% | 19 ? -27% |
| Idle Maximum * (Watt) | 23 | 11.6 50% | 22.4 3% | 12.8 44% | 40.3 -75% | 24.5 ? -7% |
| Load Average * (Watt) | 80 | 76.9 4% | 96.9 -21% | 71.3 11% | 79 1% | 108.1 ? -35% |
| Cyberpunk 2077 ultra * (Watt) | 122 | 157.7 -29% | ||||
| Cyberpunk 2077 ultra external monitor * (Watt) | 118.7 | 156.6 -32% | ||||
| Load Maximum * (Watt) | 206 | 212.6 -3% | 173.8 16% | 169.1 18% | 254.9 -24% | 254 ? -23% |
| Witcher 3 ultra * (Watt) | 159.6 | 127.5 | 188.1 |
* ... smaller is better
Power consumption Cyberpunk / stress test
Power consumption with external monitor
Runtimes
Although its counterparts feature slightly larger batteries (84 to 90 Wh instead of 76 Wh), the Neo 16's battery life has nothing to hide. Around 7.5 hours of surfing the web wirelessly with the brightness reduced to 150 cd/m² is a decent value. In comparison: the competition manages between 7 and 9 hours.
| Acer Predator Triton Neo 16 PTN16-51-978P Ultra 9 185H, GeForce RTX 4070 Laptop GPU, 76 Wh | Asus ProArt P16 H7606WI Ryzen AI 9 HX 370, GeForce RTX 4070 Laptop GPU, 90 Wh | Lenovo Yoga Pro 9 16IMH9 Ultra 9 185H, GeForce RTX 4070 Laptop GPU, 84 Wh | Asus ROG Zephyrus G16 2024 GU605M Ultra 7 155H, GeForce RTX 4070 Laptop GPU, 90 Wh | Alienware m16 R2 Ultra 7 155H, GeForce RTX 4070 Laptop GPU, 90 Wh | Average of class Gaming | |
|---|---|---|---|---|---|---|
| Battery runtime | 12% | 19% | -1% | 9% | -5% | |
| WiFi v1.3 (h) | 7.4 | 8.3 12% | 8.8 19% | 7.3 -1% | 8.1 9% | 7.01 ? -5% |
| H.264 (h) | 21 | 11.5 | 11.2 | 8.26 ? | ||
| Load (h) | 1.9 | 1.2 | 1.2 | 1 | 1.47 ? | |
| Reader / Idle (h) | 12.6 | 8.71 ? |
Notebookcheck total rating
You can't go far wrong with the Predator Triton Neo 16, as the 16-inch model suffers from no glaring weaknesses. However, the competition from other manufacturers is tough and sometimes takes the lead.
Acer Predator Triton Neo 16 PTN16-51-978P
- 12/31/2024 v8
Florian Glaser
 Total Sustainability Score:
 Transparency
The selection of devices to be reviewed is made by our editorial team. The test sample was provided to the author as a loan by the manufacturer or retailer for the purpose of this review. The lender had no influence on this review, nor did the manufacturer receive a copy of this review before publication. There was no obligation to publish this review. As an independent media company, Notebookcheck is not subjected to the authority of manufacturers, retailers or publishers.
This is how Notebookcheck is testing
Every year, Notebookcheck independently reviews hundreds of laptops and smartphones using standardized procedures to ensure that all results are comparable. We have continuously developed our test methods for around 20 years and set industry standards in the process. In our test labs, high-quality measuring equipment is utilized by experienced technicians and editors. These tests involve a multi-stage validation process. Our complex rating system is based on hundreds of well-founded measurements and benchmarks, which maintains objectivity. Further information on our test methods can be found here.

