Acer Aspire 14 AI review: Basic home and office laptop done right
Verdict — Lunar Lake For The Masses
The efficiency gains with Intel Lunar Lake has made for leaner and longer-lasting multimedia machines this year. While they don't necessarily have the fastest processor performance relative to most AMD Zen 5 alternatives, the Intel architecture balances CPU, GPU, and RAM performances extremely well even at lower power envelopes. Basic office work, web browsing, streaming, light gaming, and day-to-day multitasking excel on this budget Acer machine.
There are plenty of cut corners especially when compared to the higher-end Swift 14 AI. The IPS panel in particular offers both narrow colors and a dim backlight to be unfit for most graphics editors while the dull plastic base is modest if not unexciting. Users who demand more accurate colors can consider the Swift 14 AI which offers a similar typing experience but with OLED, higher resolution webcam, smaller design, and Wi-Fi 7 compatibility. Competitors like the HP Pavilion Plus 14 are also built a little tougher to be more resilient when traveling.
Pros
Cons
Price and Availability
The Aspire 14 AI is not yet widely available in most retailers at the time of writing. Costco currently has a single SKU in stock for $700 as reviewed.
- $109.99Replacement for Acer Aspire 14 AI Model N24Q14 A14-52MT A14-52MT-59DP 14" 60Hz 40 Pin LCD Touch Screen Digitizer Display Panel (for 1920x1200 Only)
- $1,699.00Acer 2026 Aspire AI Laptop for Business & Creators | Intel Core Ultra 7 258V, 32GB RAM, 4TB SSD, 14" FHD Touchscreen, Backlit KB, USB-C HUB, Lifetime Office 365, Long Battery Life, Windows 11 H, Gray
- $109.00New KrystalPix LCD Display FITS- Replacement Screen for Acer Aspire 14 AI Model N24Q14 14" FHD+ LCD Screen 1920x1200 Touch On Cell WUXGA eDP-40pin Matte Touch Display Panel
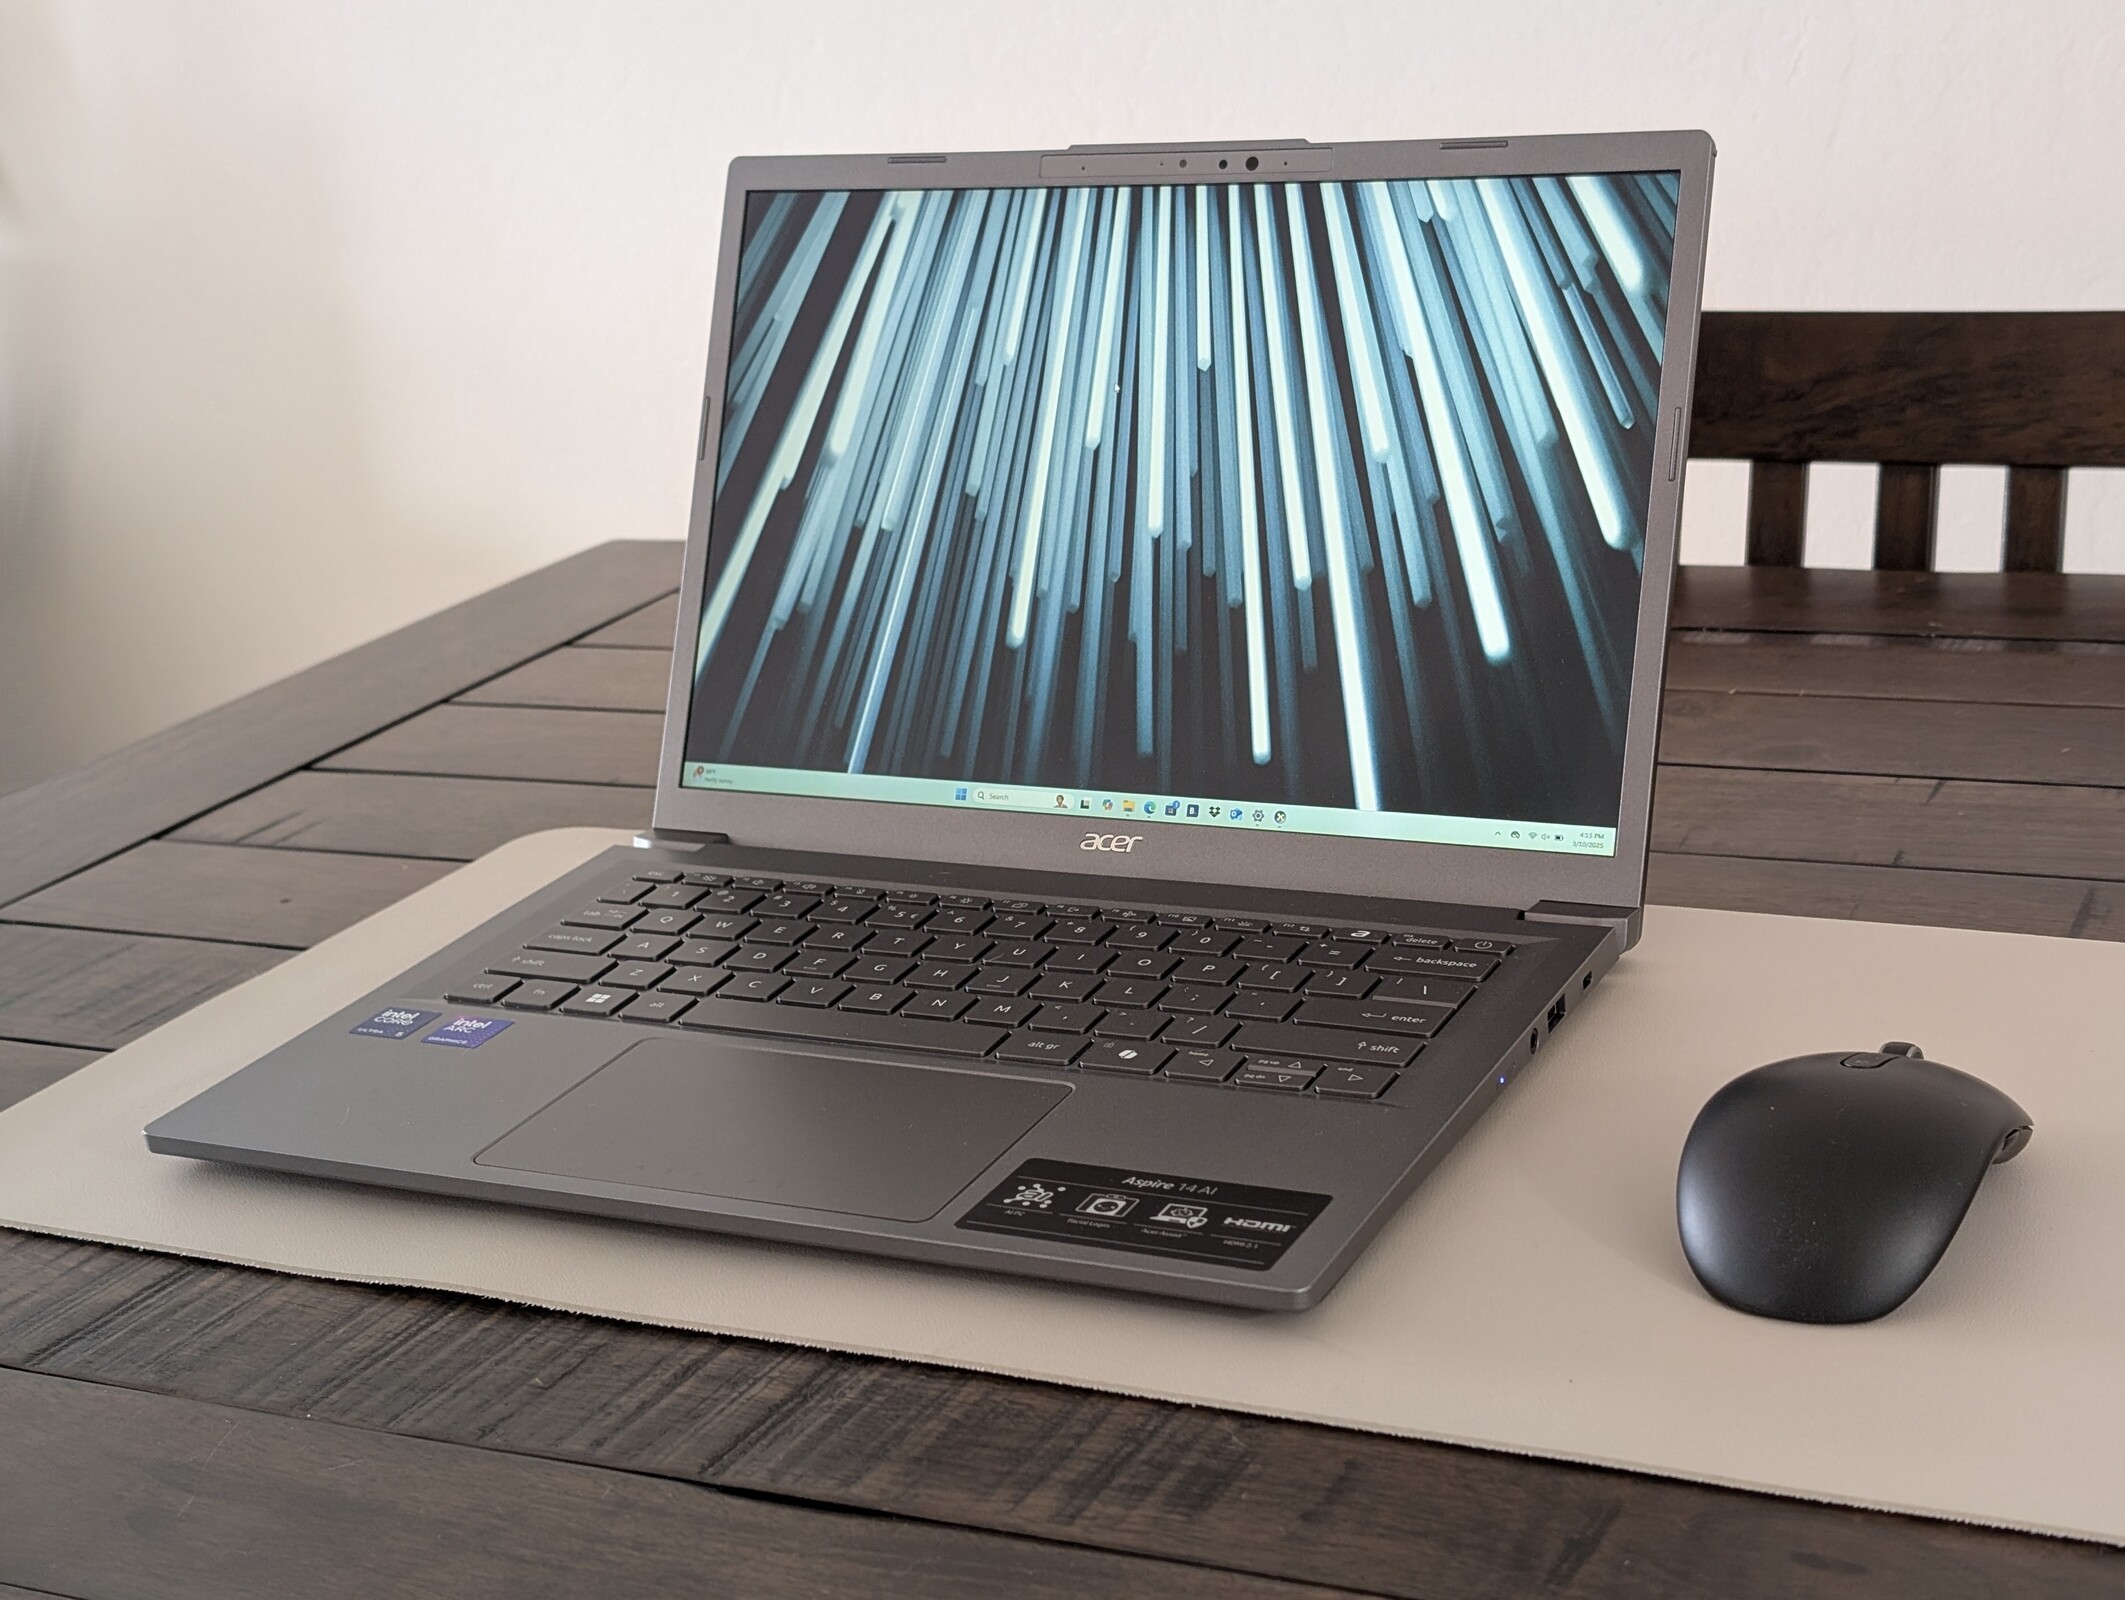
The Aspire 14 AI is one of Acer's least expensive AI-ready multimedia laptops equipped with Intel's latest Lunar Lake processors. It is essentially the lesser version of the more expensive Swift 14 AI.
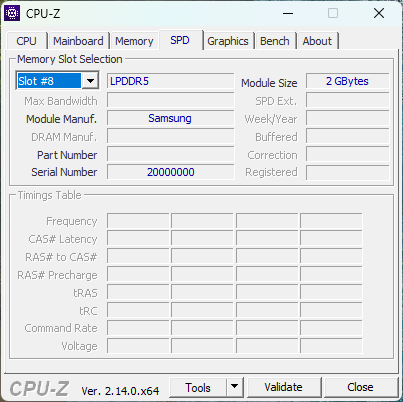
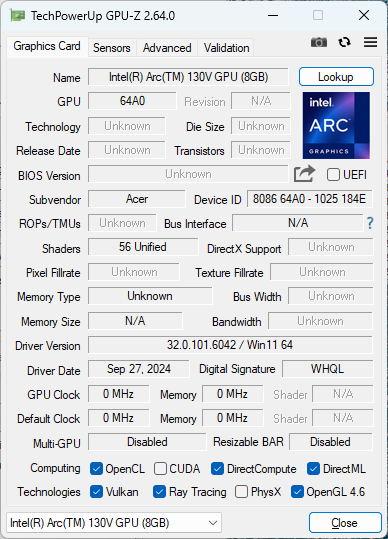
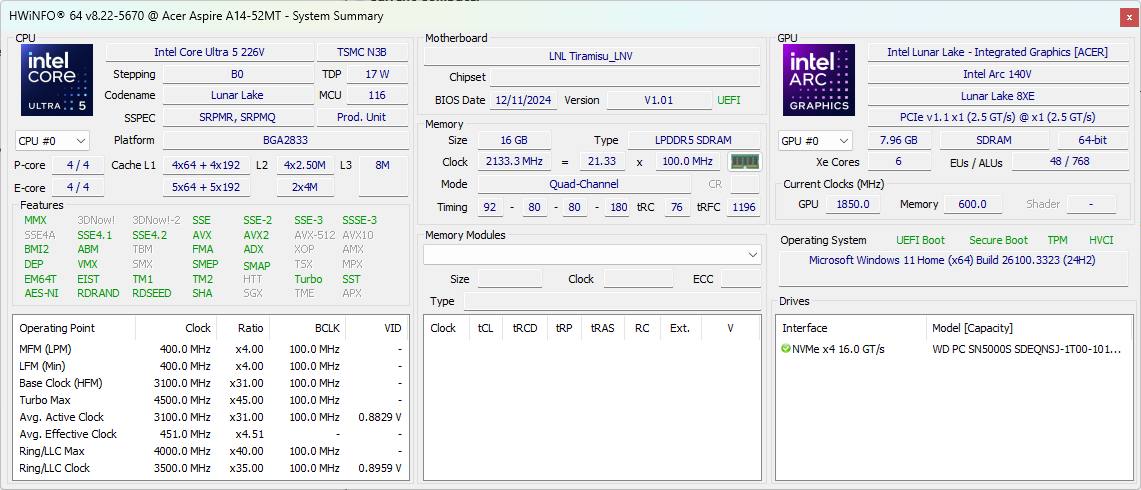
Our test unit is a lower-end configuration with the Core Ultra 5 226V CPU, integrated Arc 130V GPU, 1200p matte IPS touchscreen, and 16 GB of soldered LPDDR5x RAM for approximately $700 retail. Higher-end configurations may include OLED, double the RAM, and the Core Ultra 7 258V instead.
More Acer reviews:
Specifications
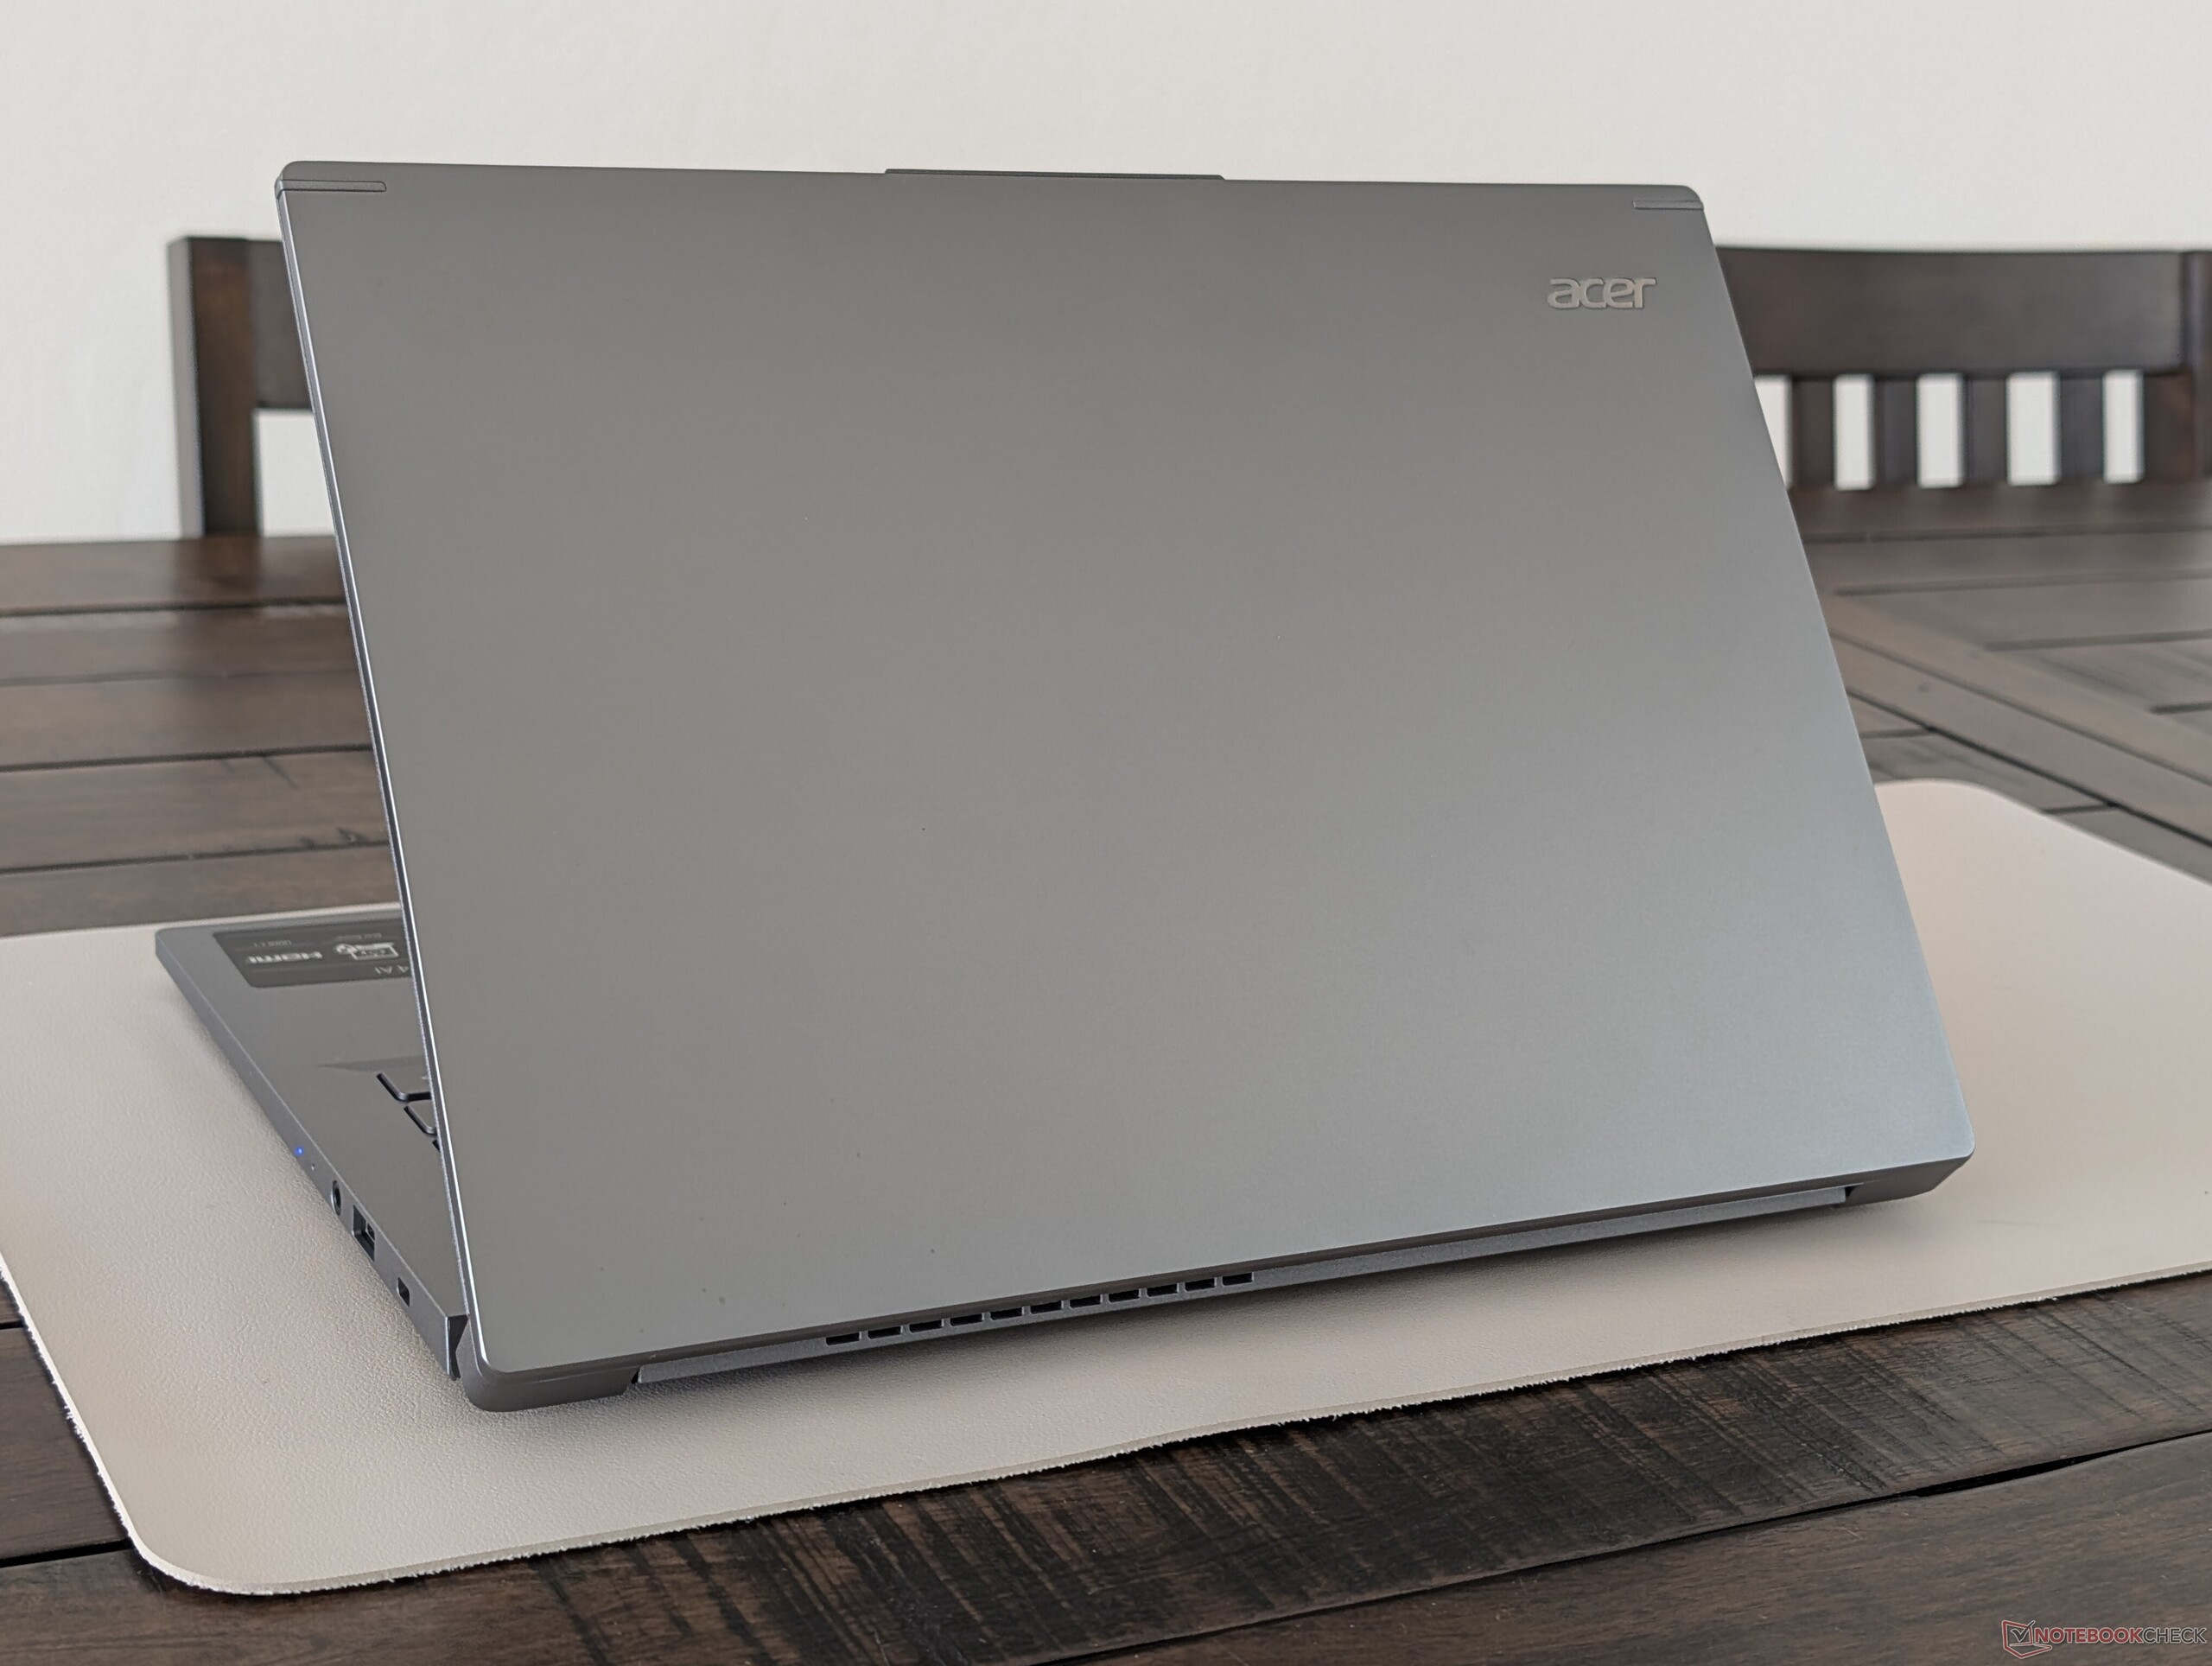
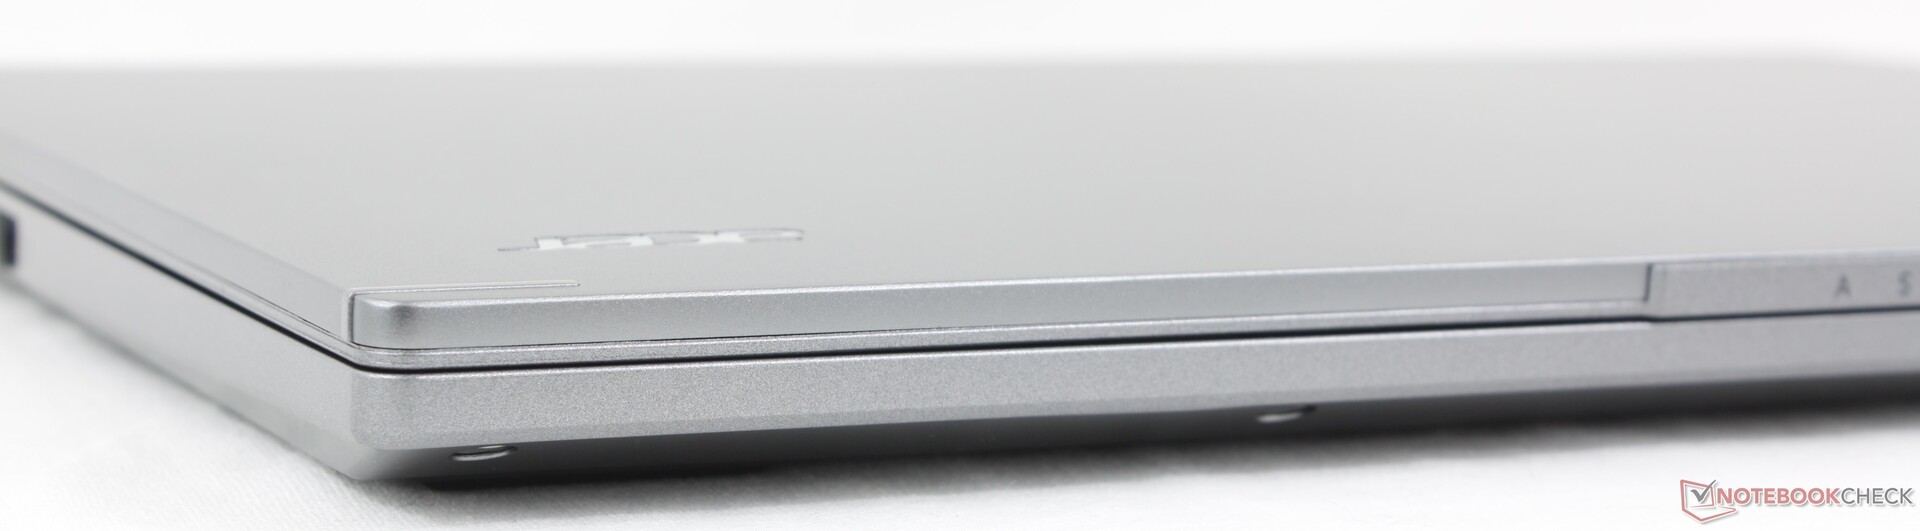
Case — Dull Gray Plastic
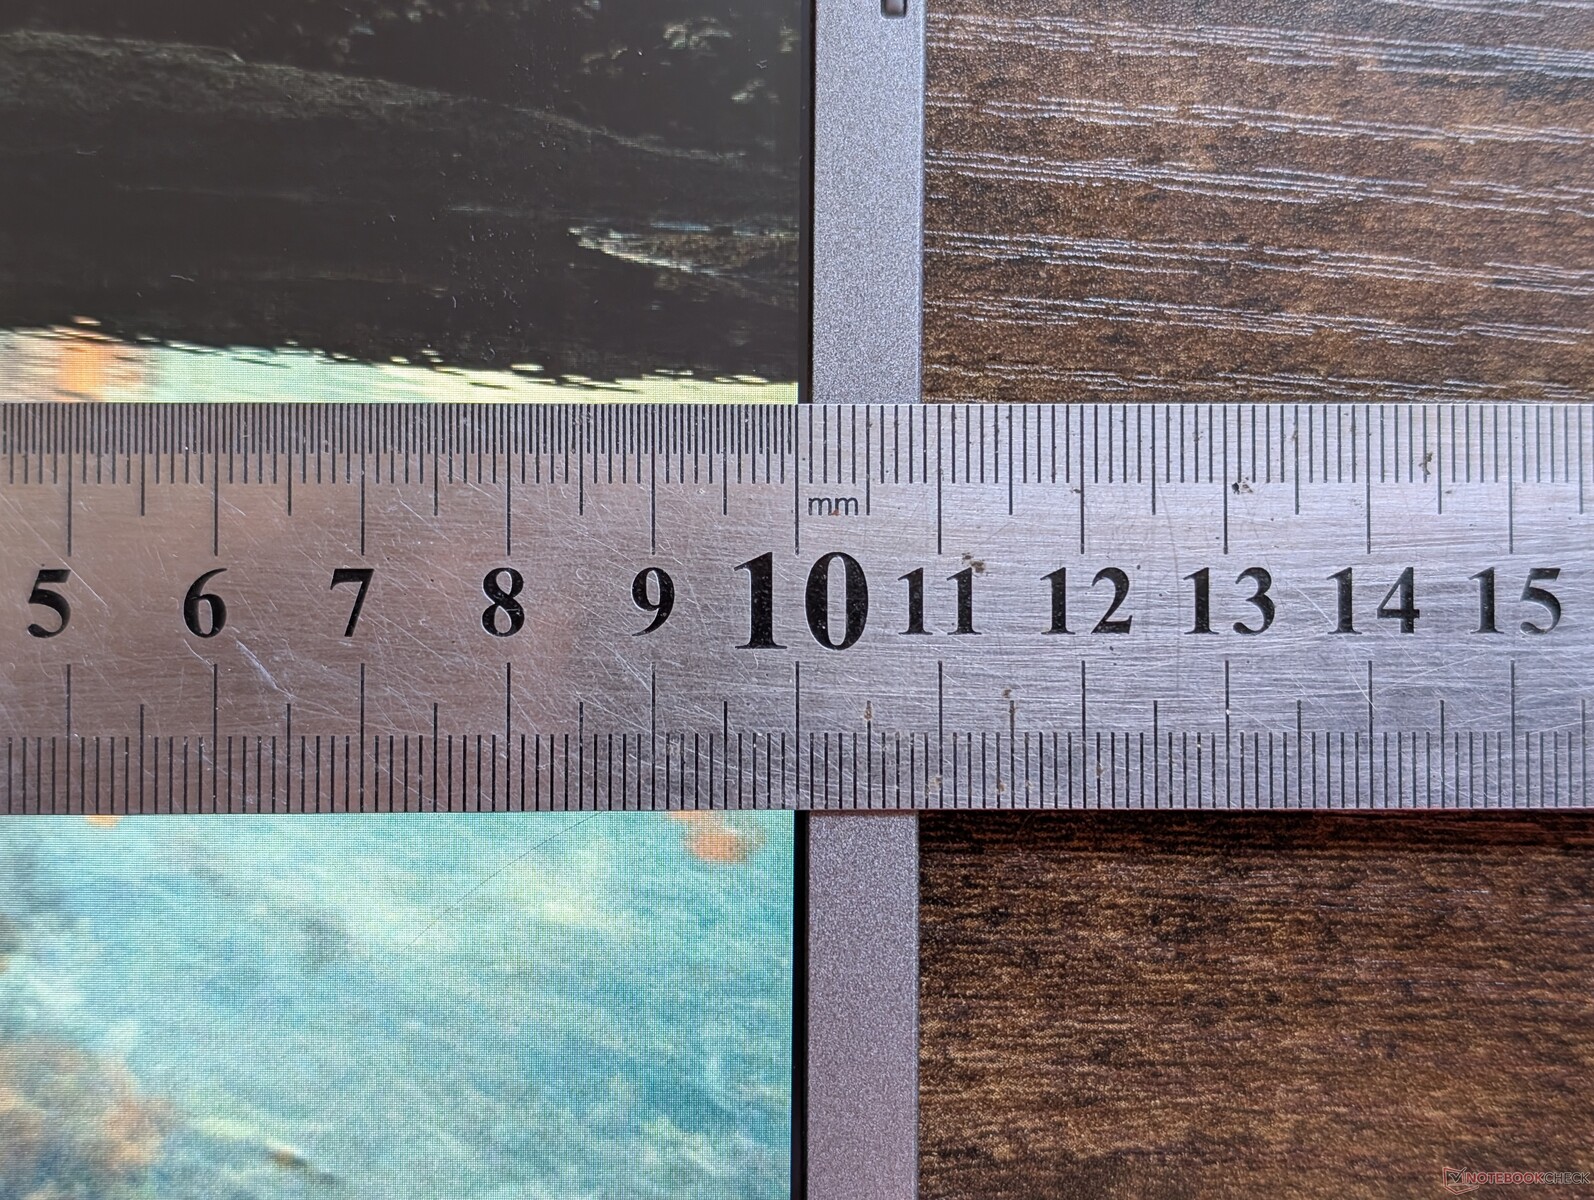
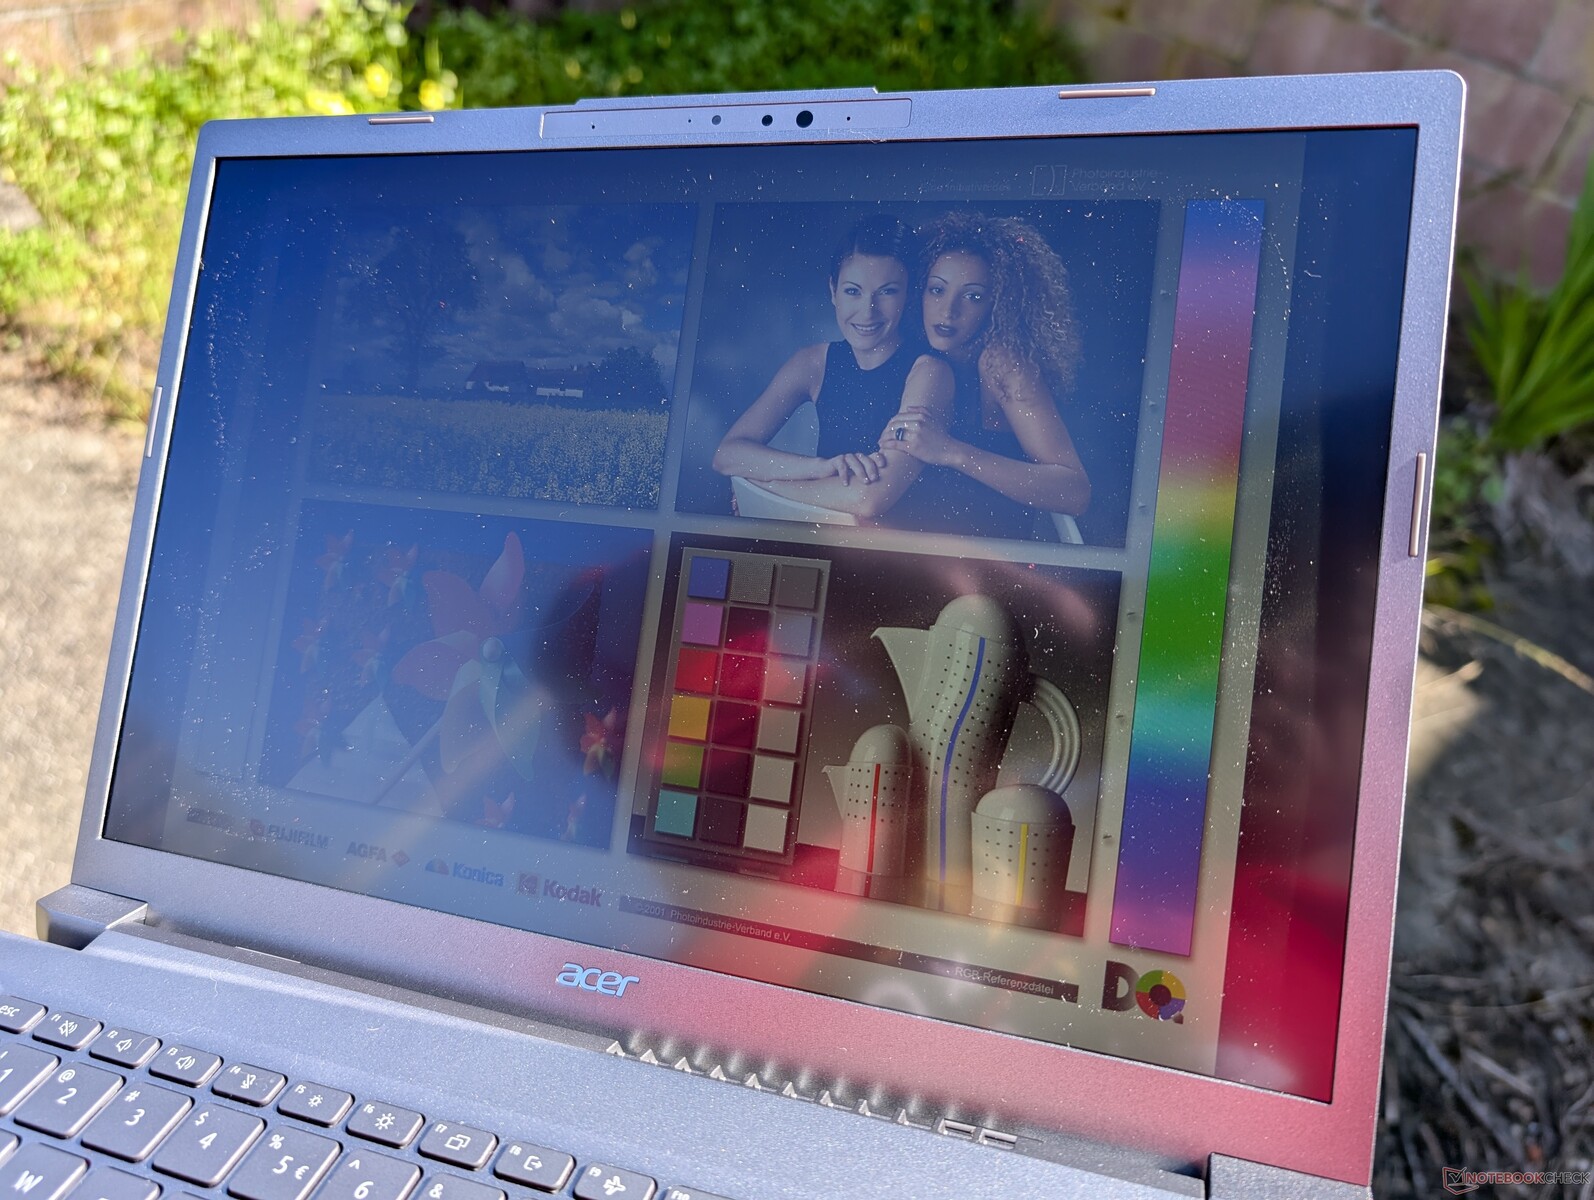
The Aspire 14 AI is slightly larger and heavier than the more expensive Swift 14 AI. It looks sleek when in the closed position because of the metal outer lid, but the cheaper plastic base becomes obvious when using the laptop up close. The chassis and lid are also both slightly more susceptible to twisting than competitors like the HP Pavilion 14 or Dell Inspiron 14 Plus.
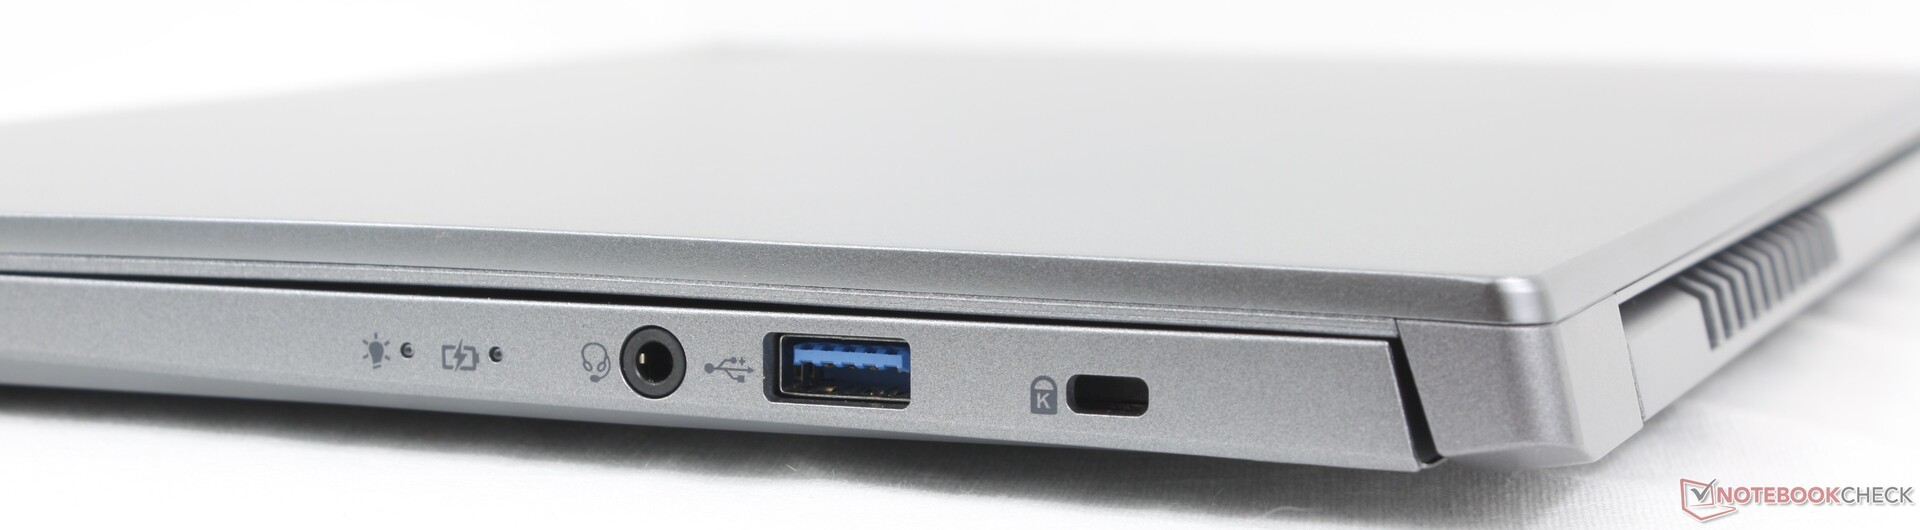
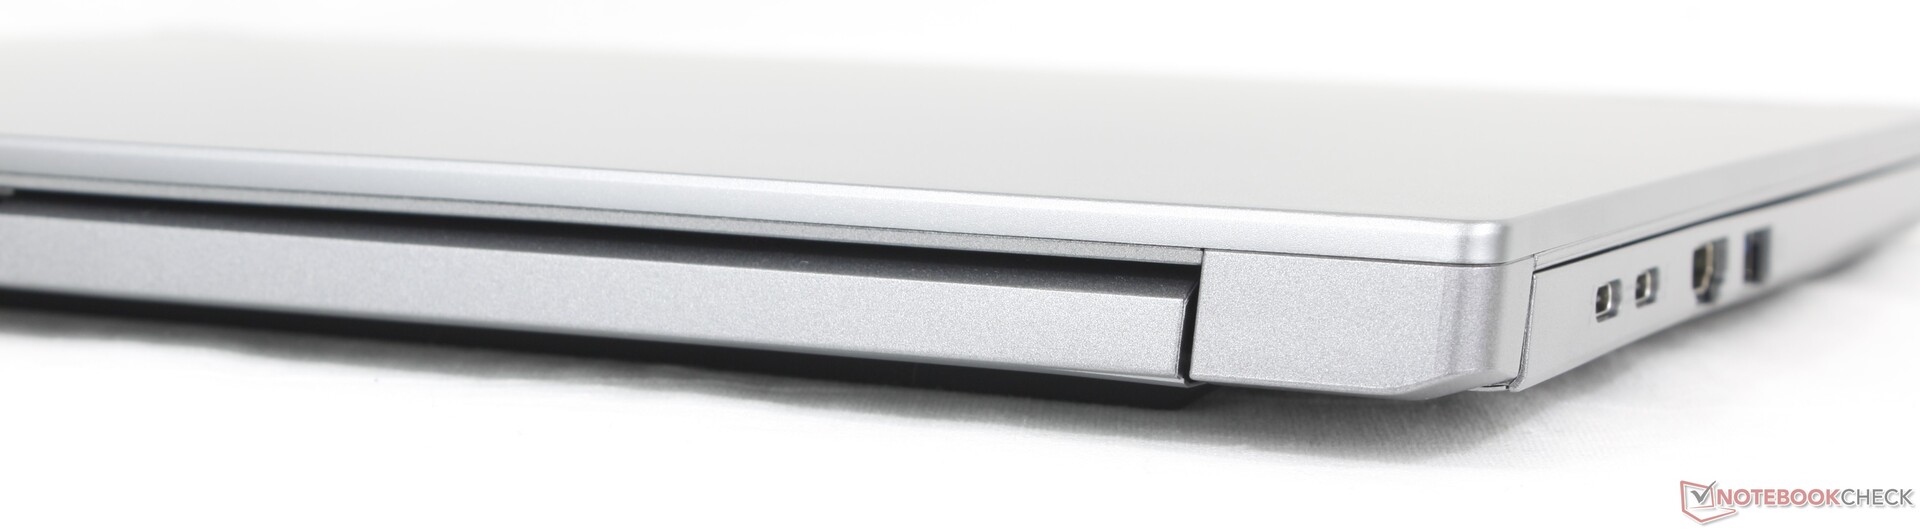
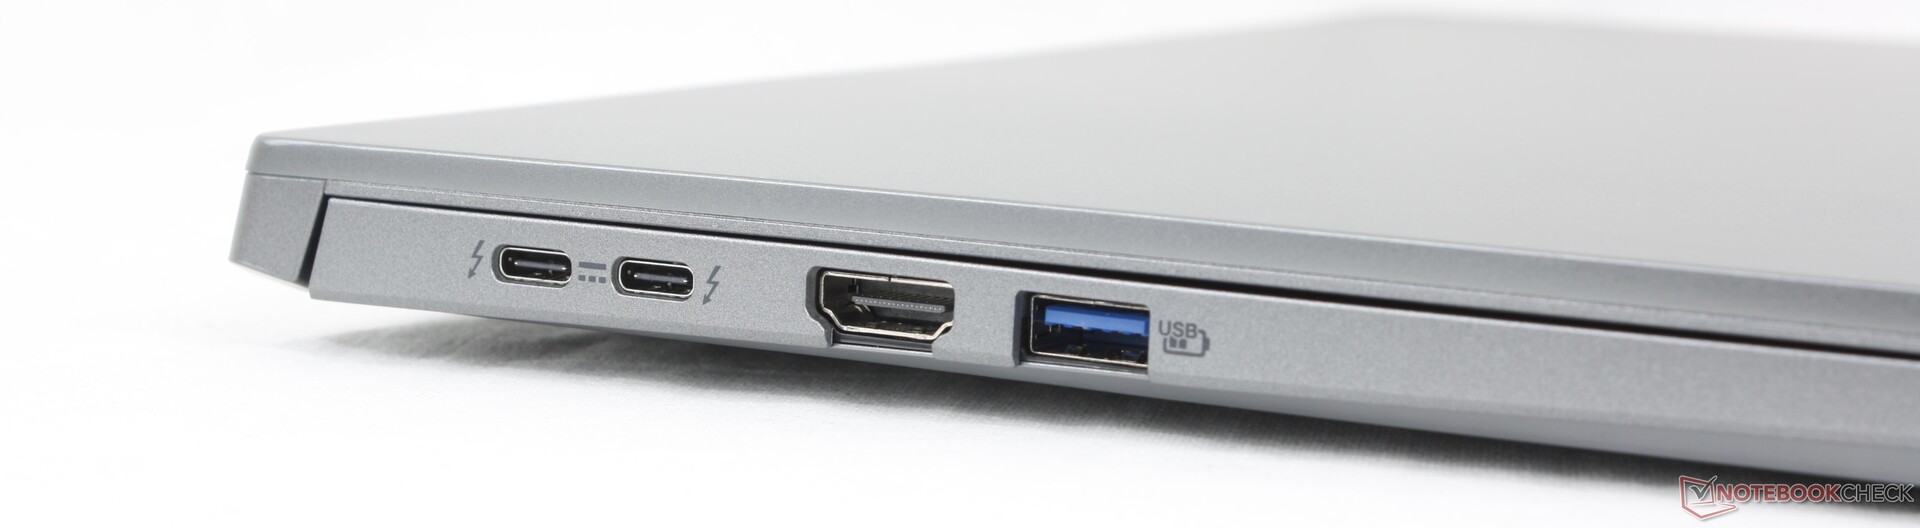
Connectivity
Port options are identical to the Swift 14 AI but with the addition of a Kensington Lock port.
Communication
An Intel AX211 comes standard for Wi-Fi 6, 6E, and Bluetooth 5.3 connectivity.
Webcam
A 2 MP webcam comes standard alongside IR. However, the model lacks a privacy shutter.


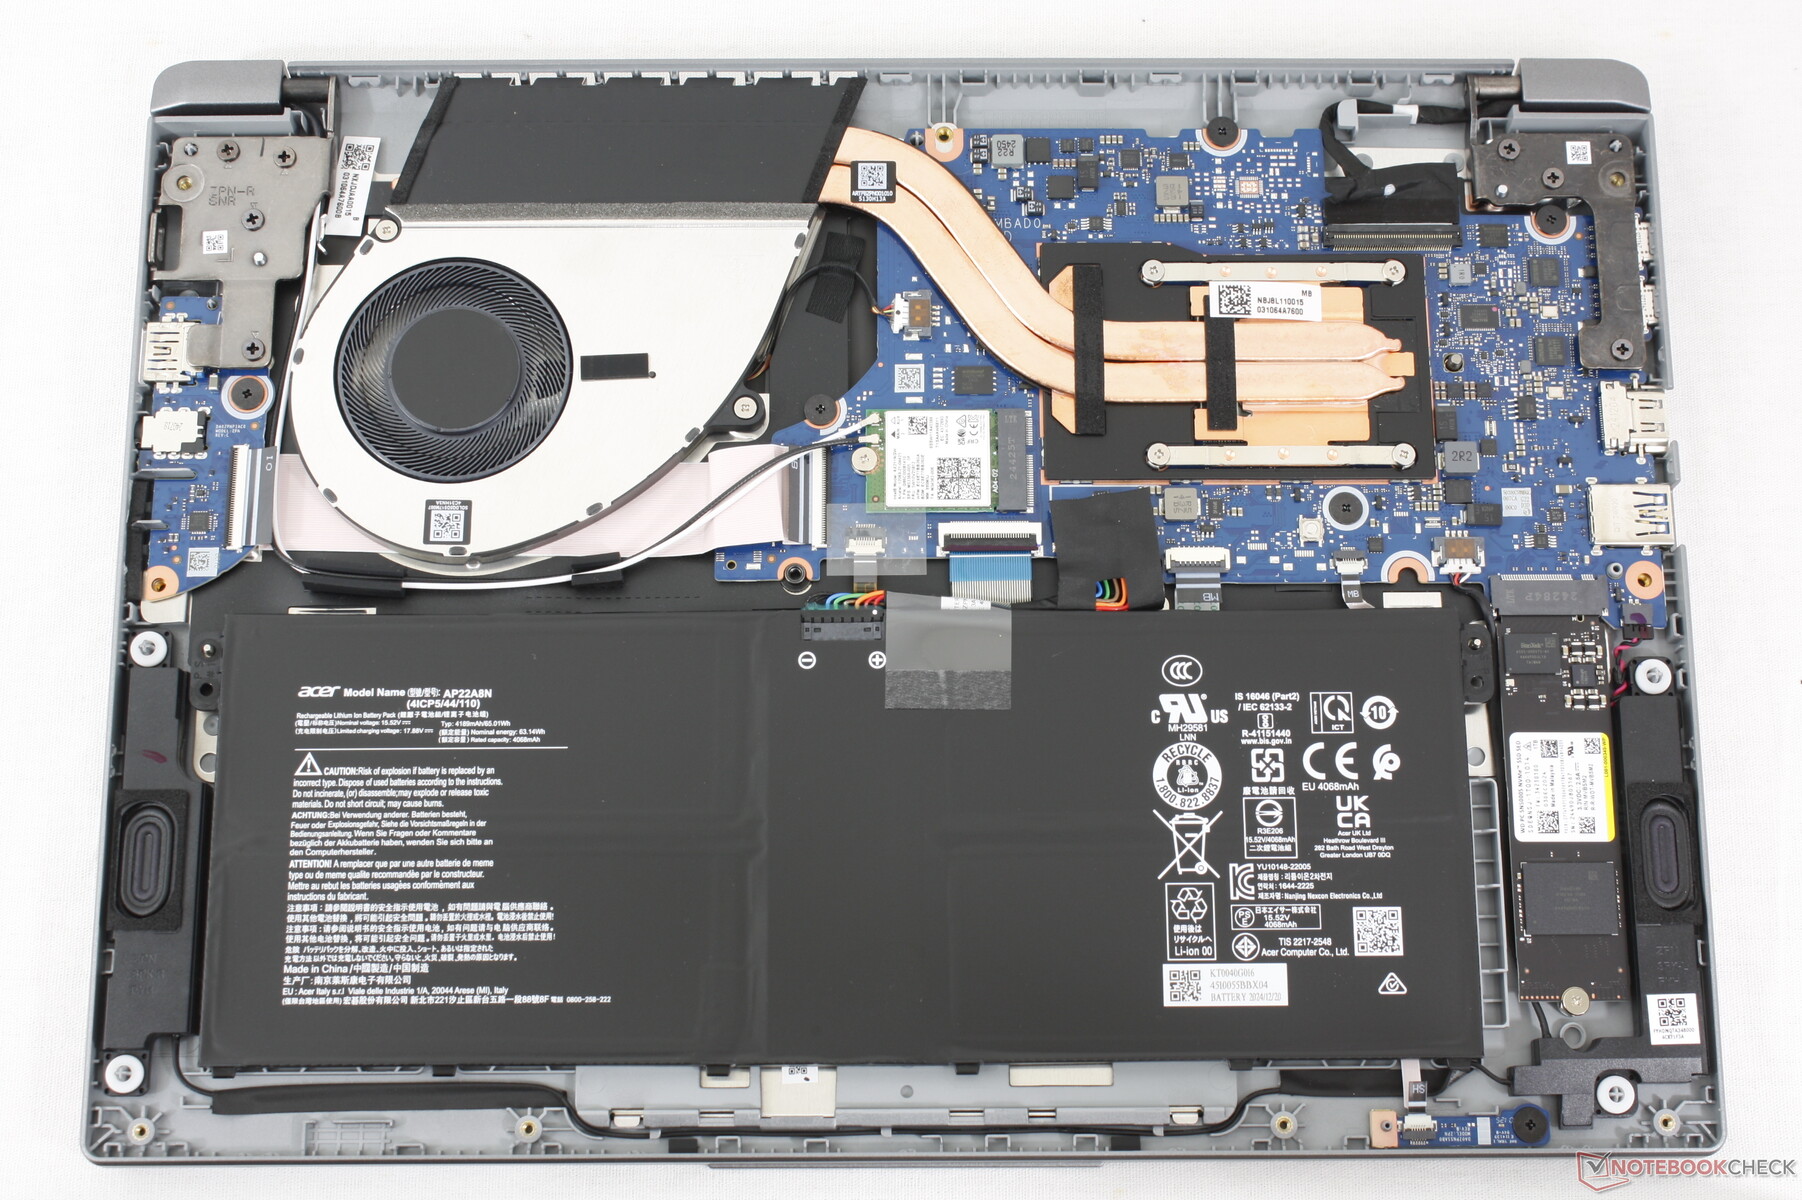
Maintenance
The bottom panel requires only a Phllips screwdriver for easy servicing. However, there's nothing to upgrade as RAM is soldered and the model supports just one M.2 2280 SSD.
Sustainability
Acer does not advertise any sustainability measures taken during manufacturing of this product. The retail packaging is mostly cardboard and paper with a bit of plastic wrapping.
Accessories And Warranty
The retail box includes a carrying sleeve in addition to the usual AC adapter and paperwork. A one-year limited manufacturer warranty applies if purchased in the US.
Input Devices
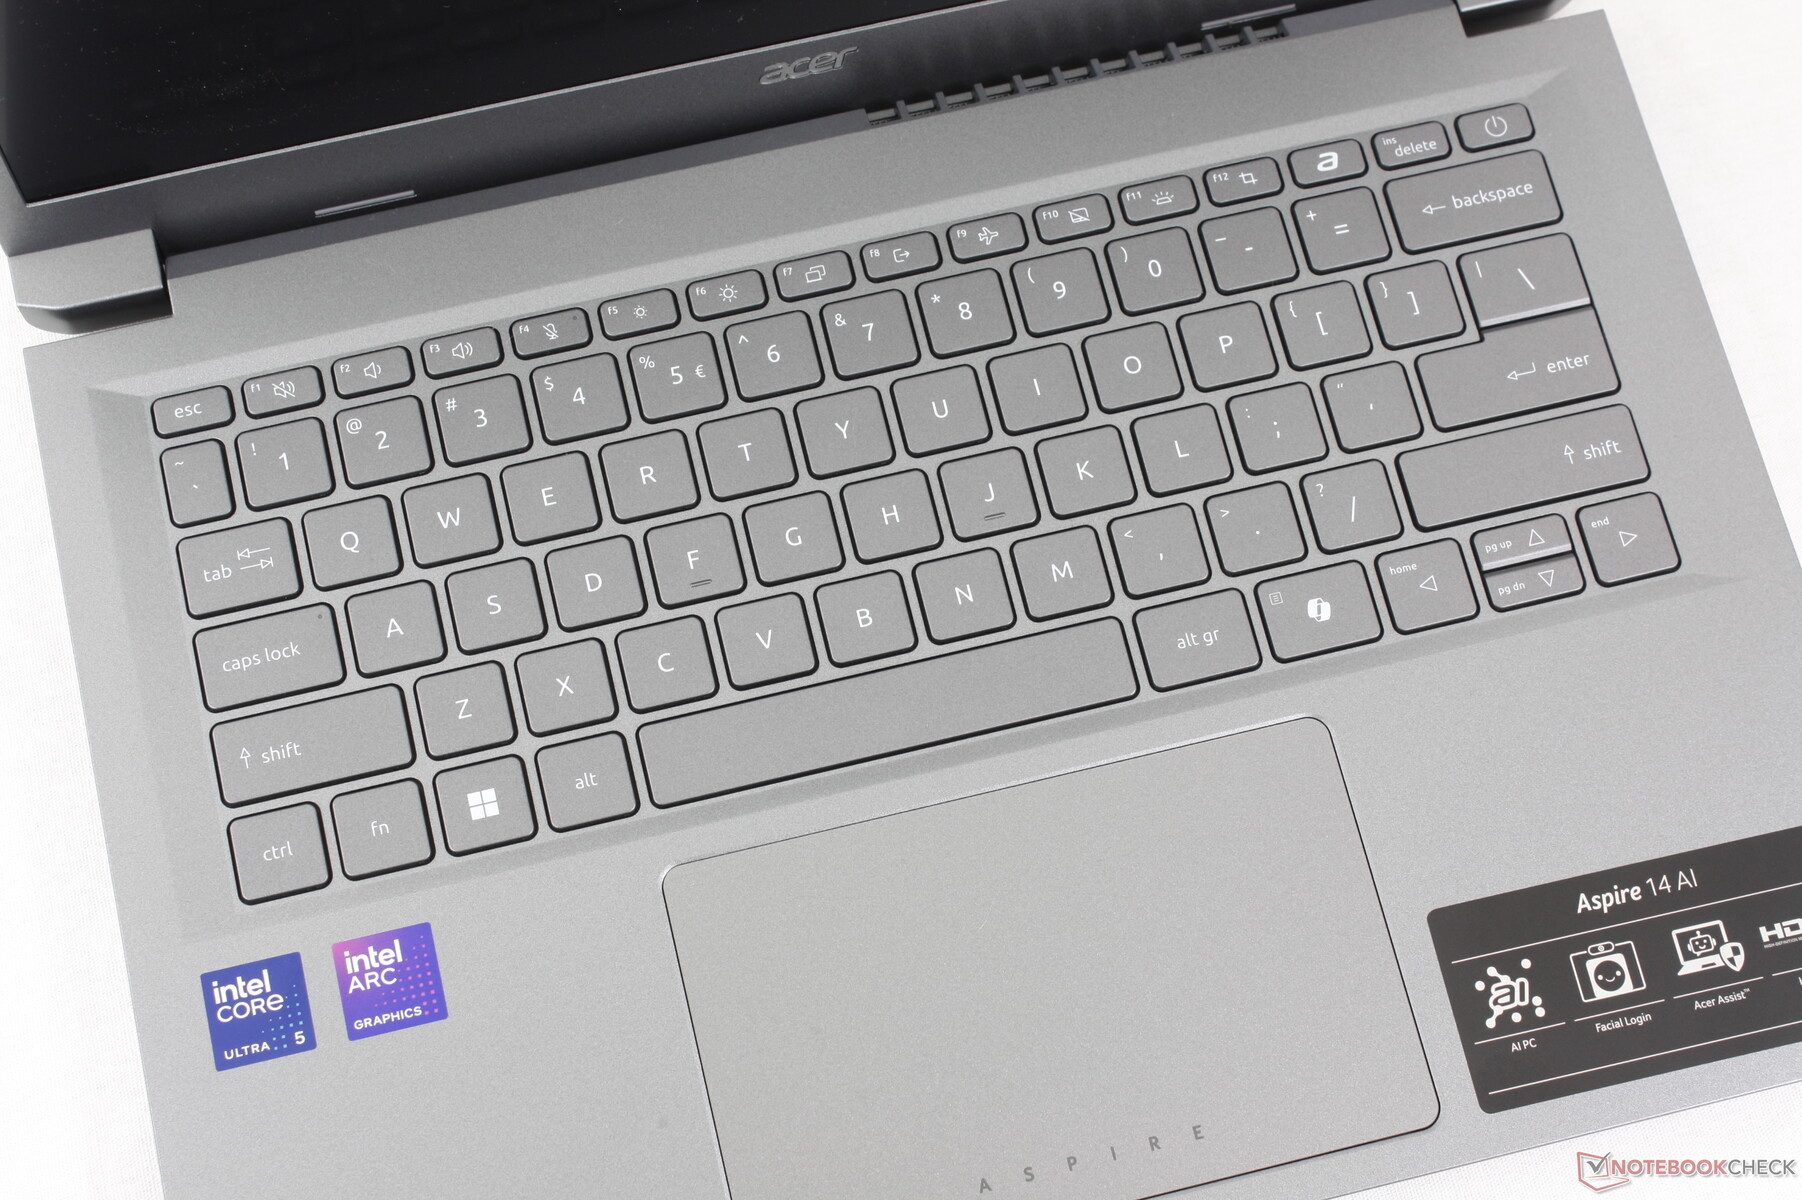
Keyboard
The keyboards between the Aspire 14 AI and Swift 14 AI are identical down to even the secondary functions. We weren't impressed by the mediocre keyboard on the Swift 14 AI and the same can be said for the Aspire 14 AI. Since the latter model is cheaper, however, the keyboard is tolerable given the budget category.
Touchpad
Clickpad size is again identical to the one on the more expensive Swift 14 AI at 12.6 x 7.8 cm. Feedback is similar as well including the uneven feedback between the bottom corners and very center of the surface.
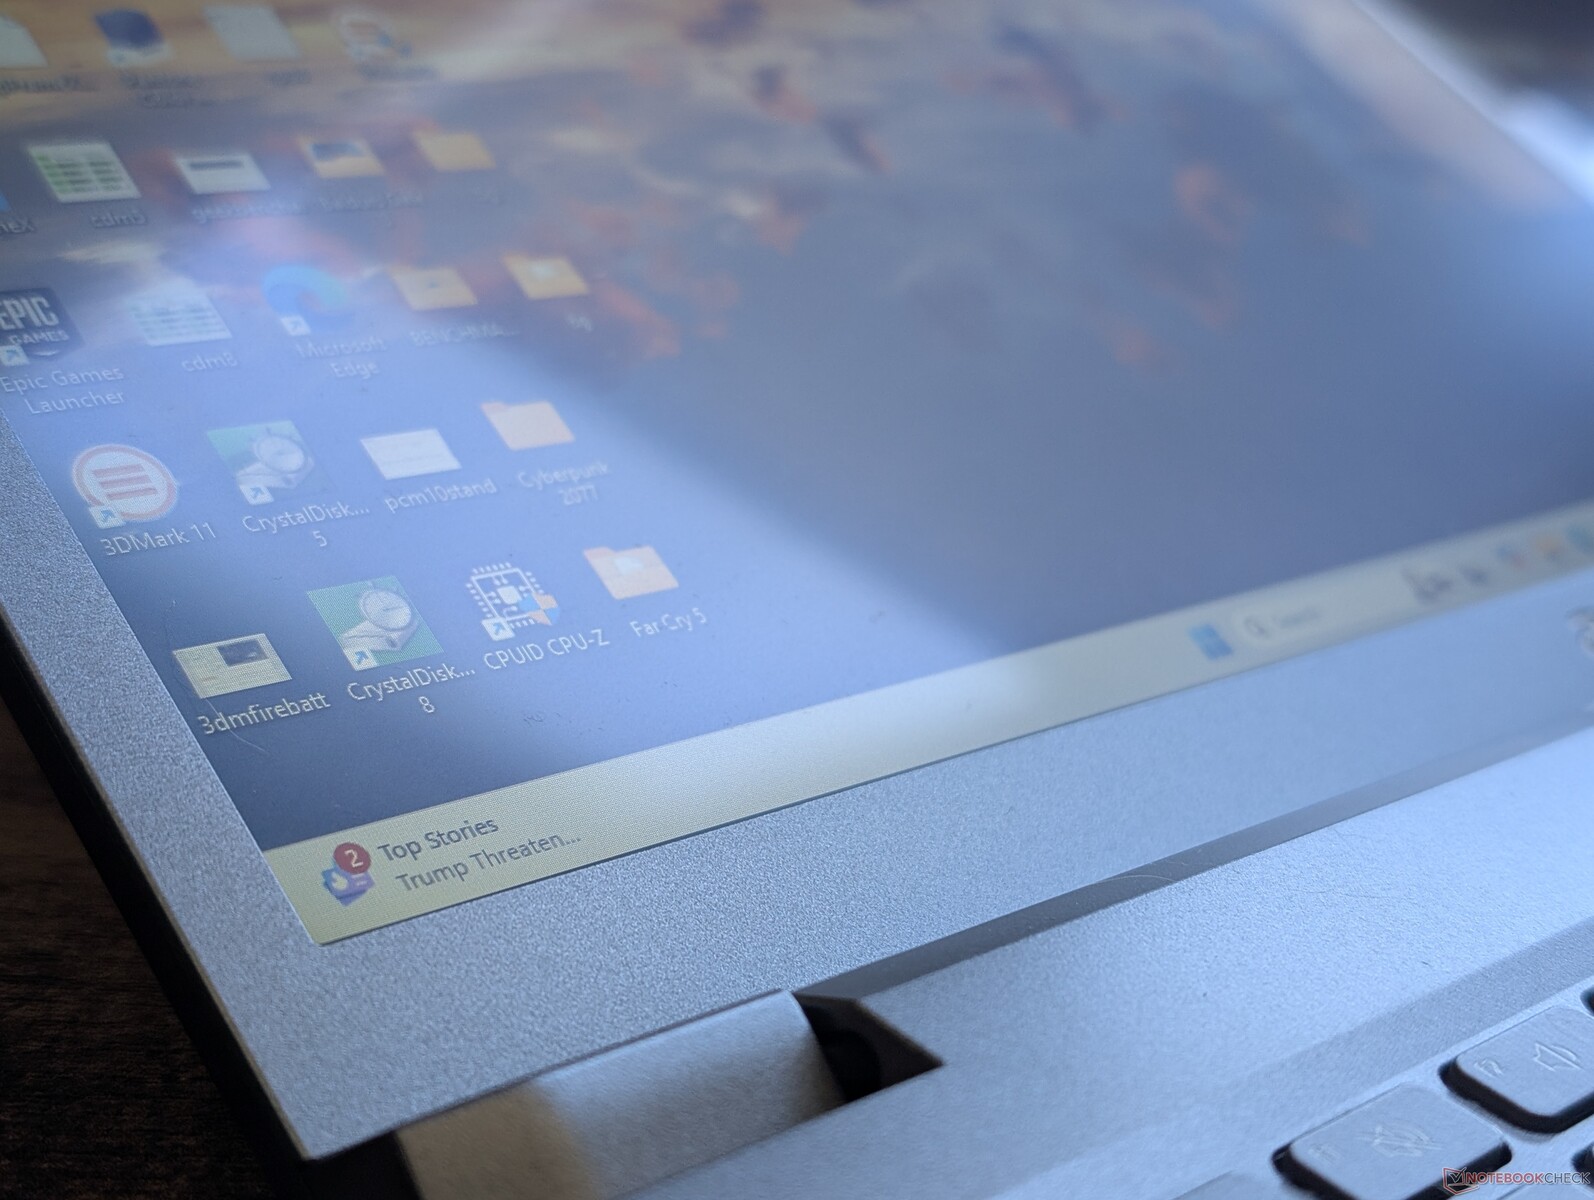
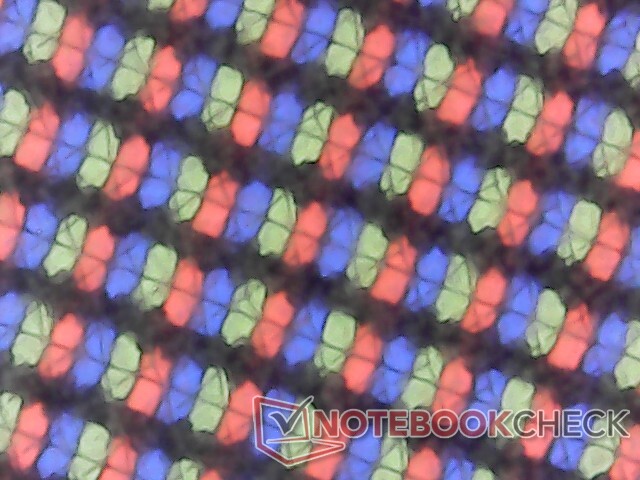
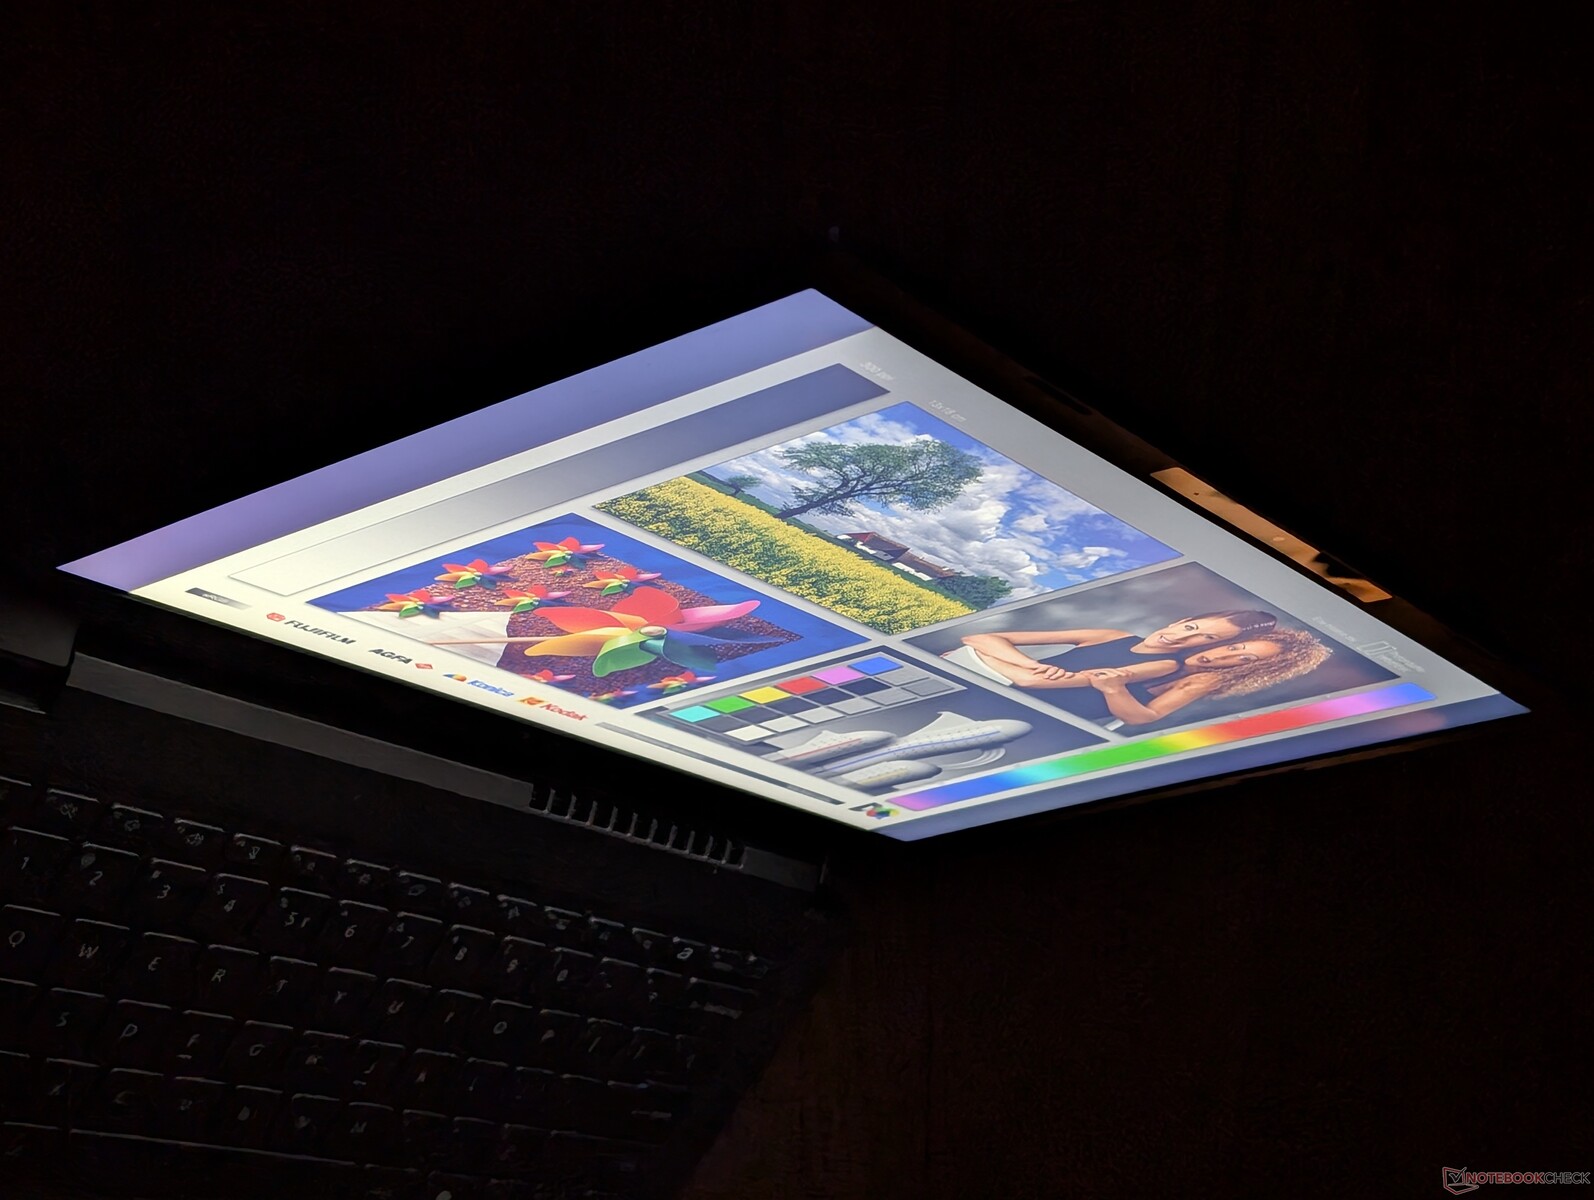
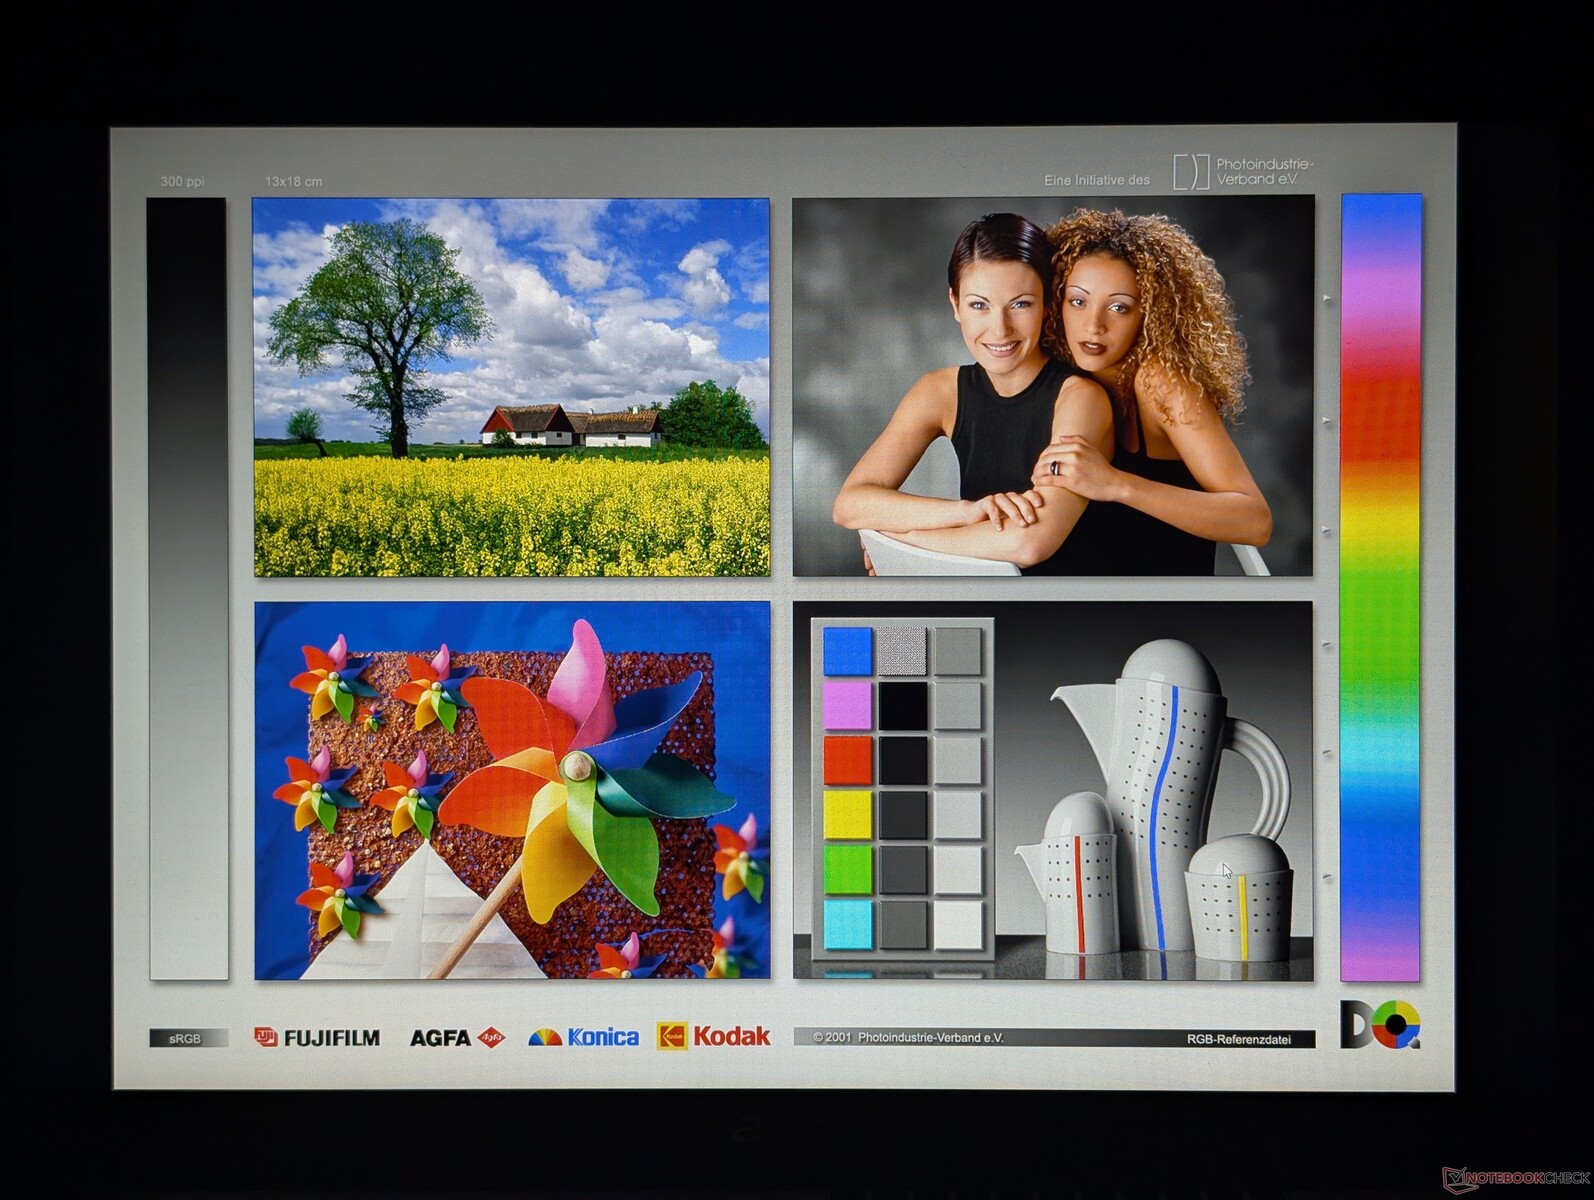
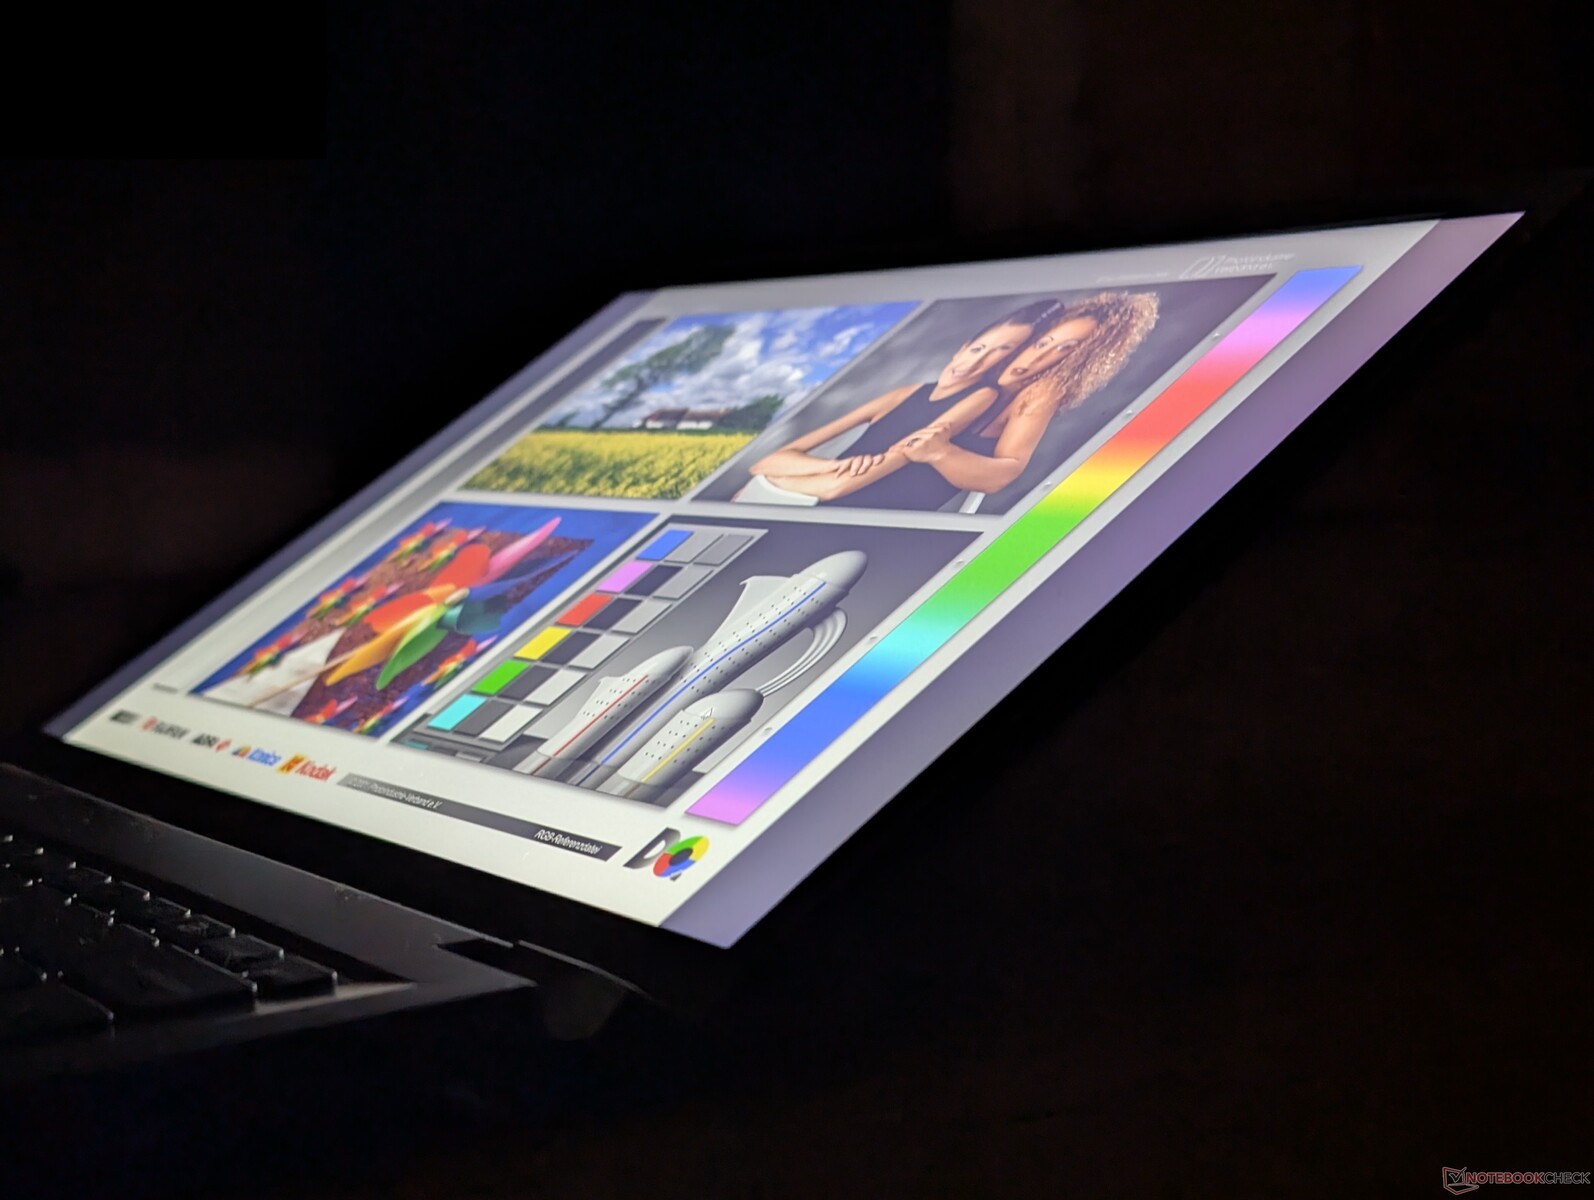
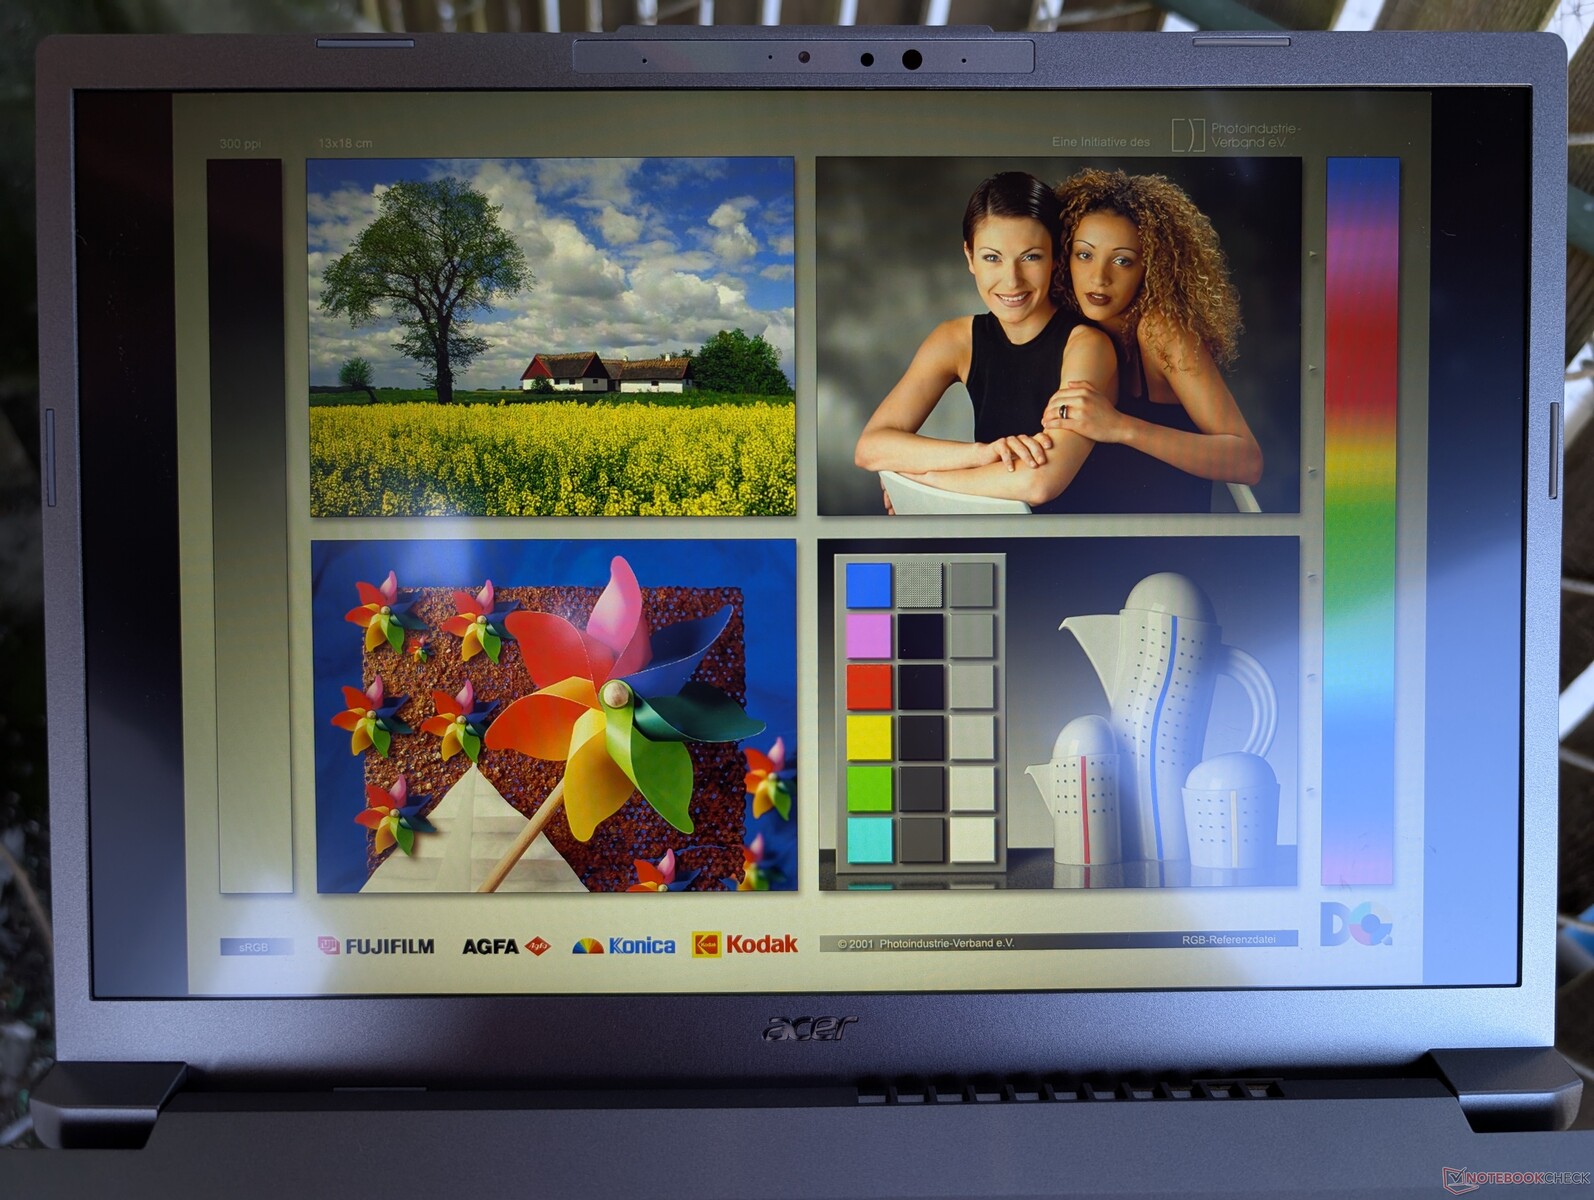
Display — Cheap IPS Touchscreen
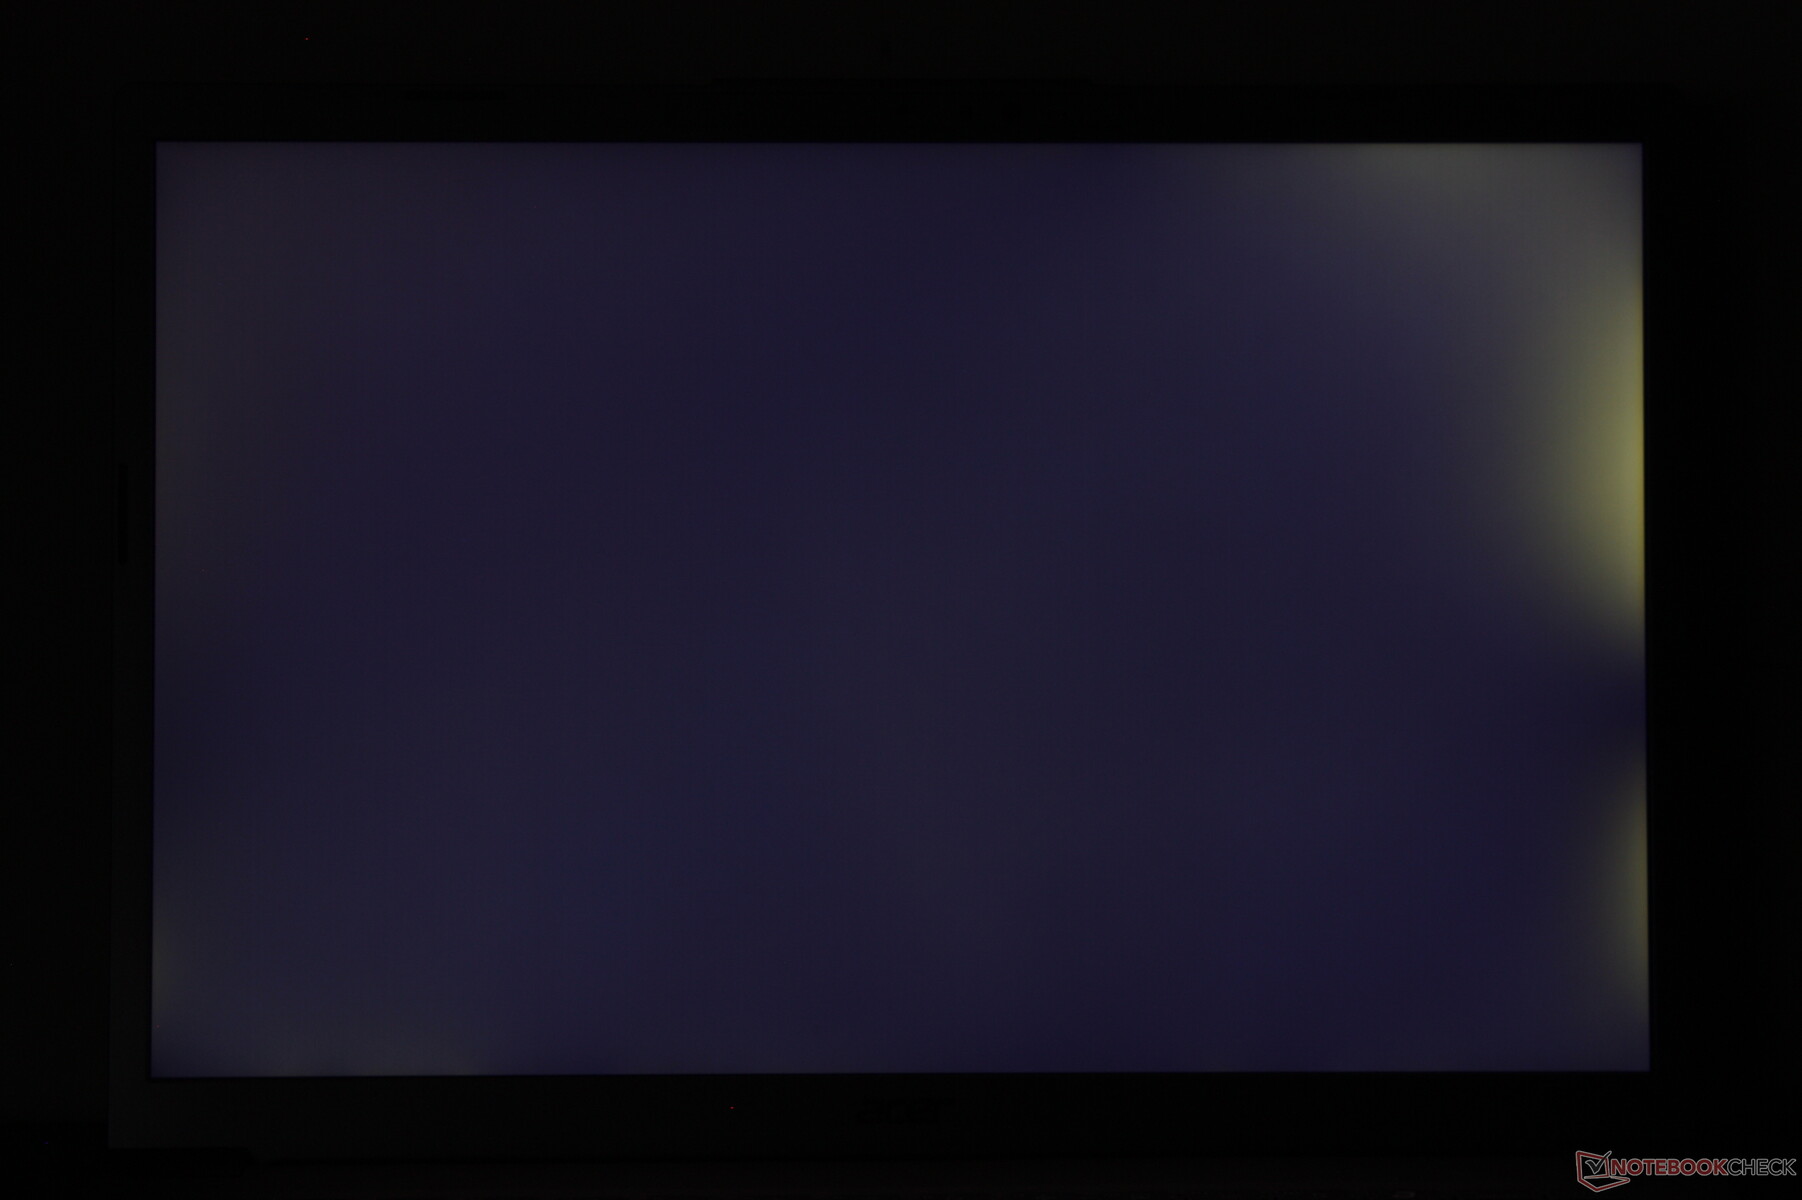
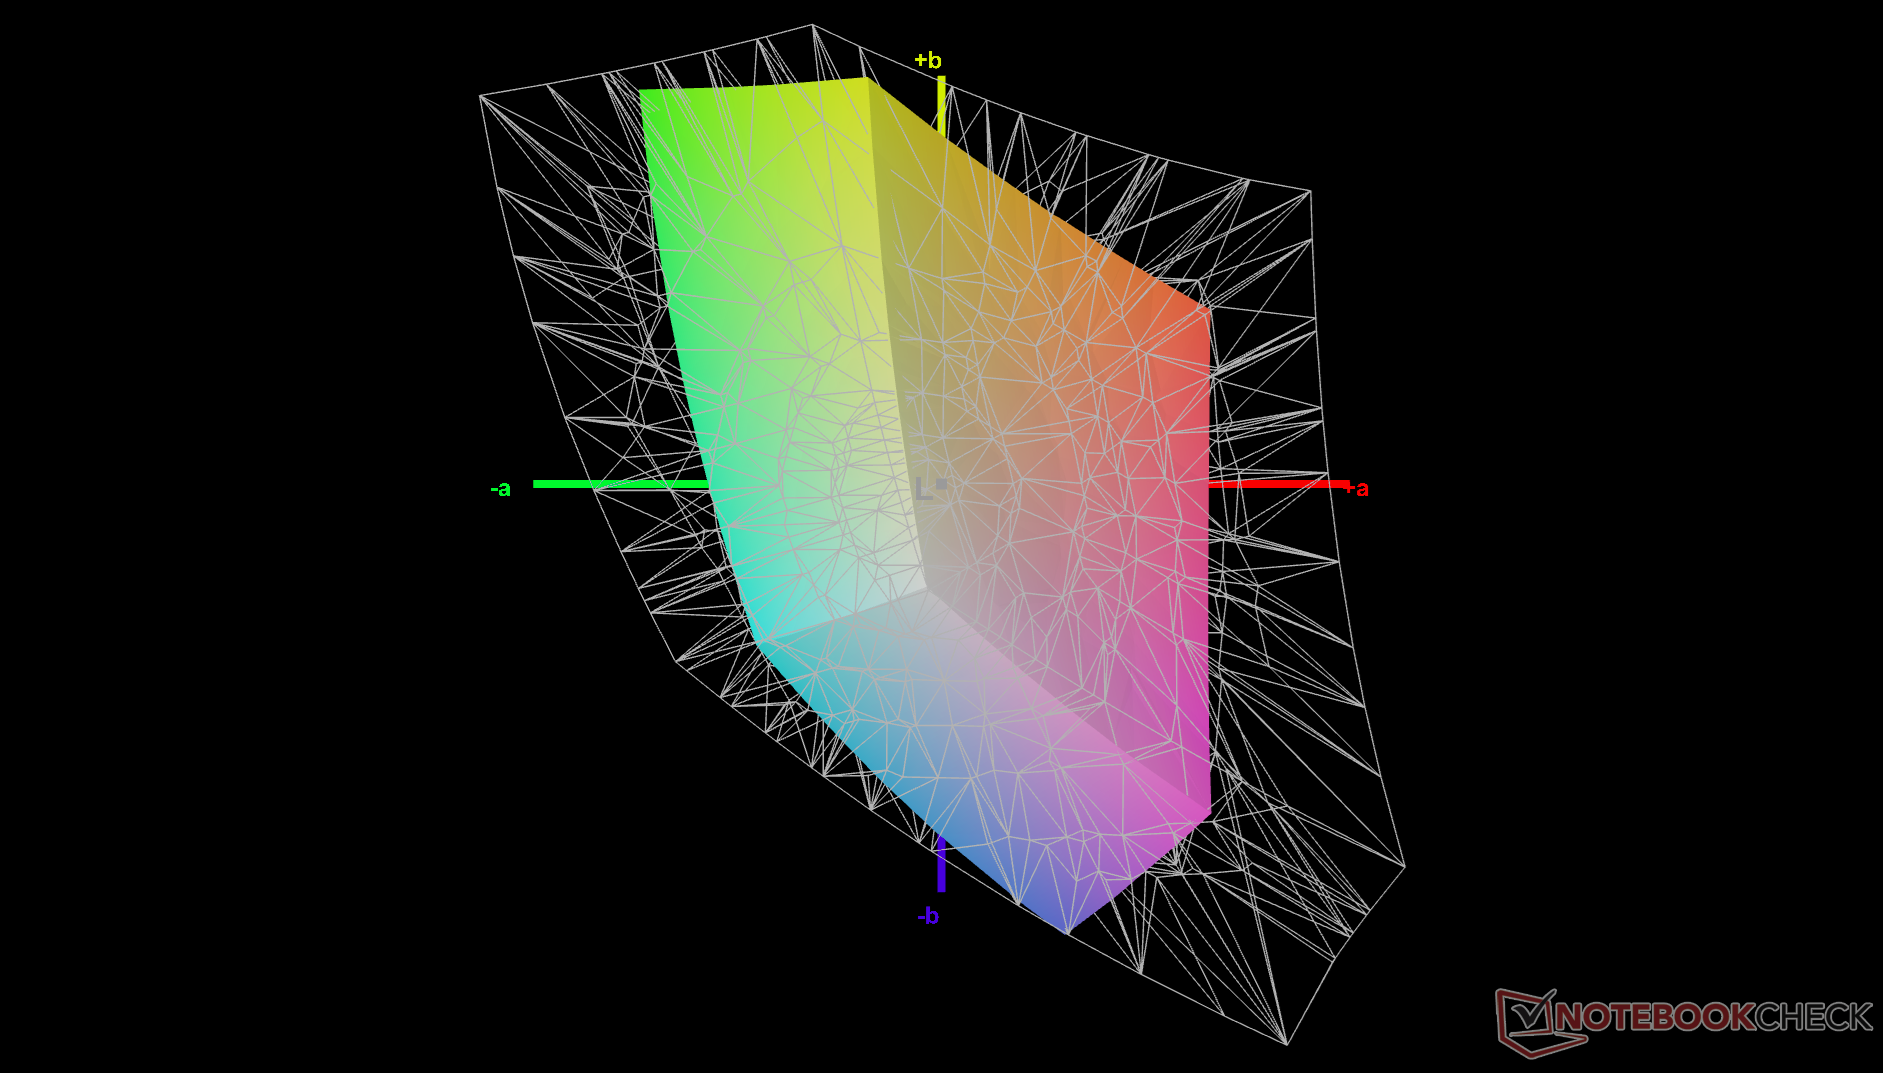
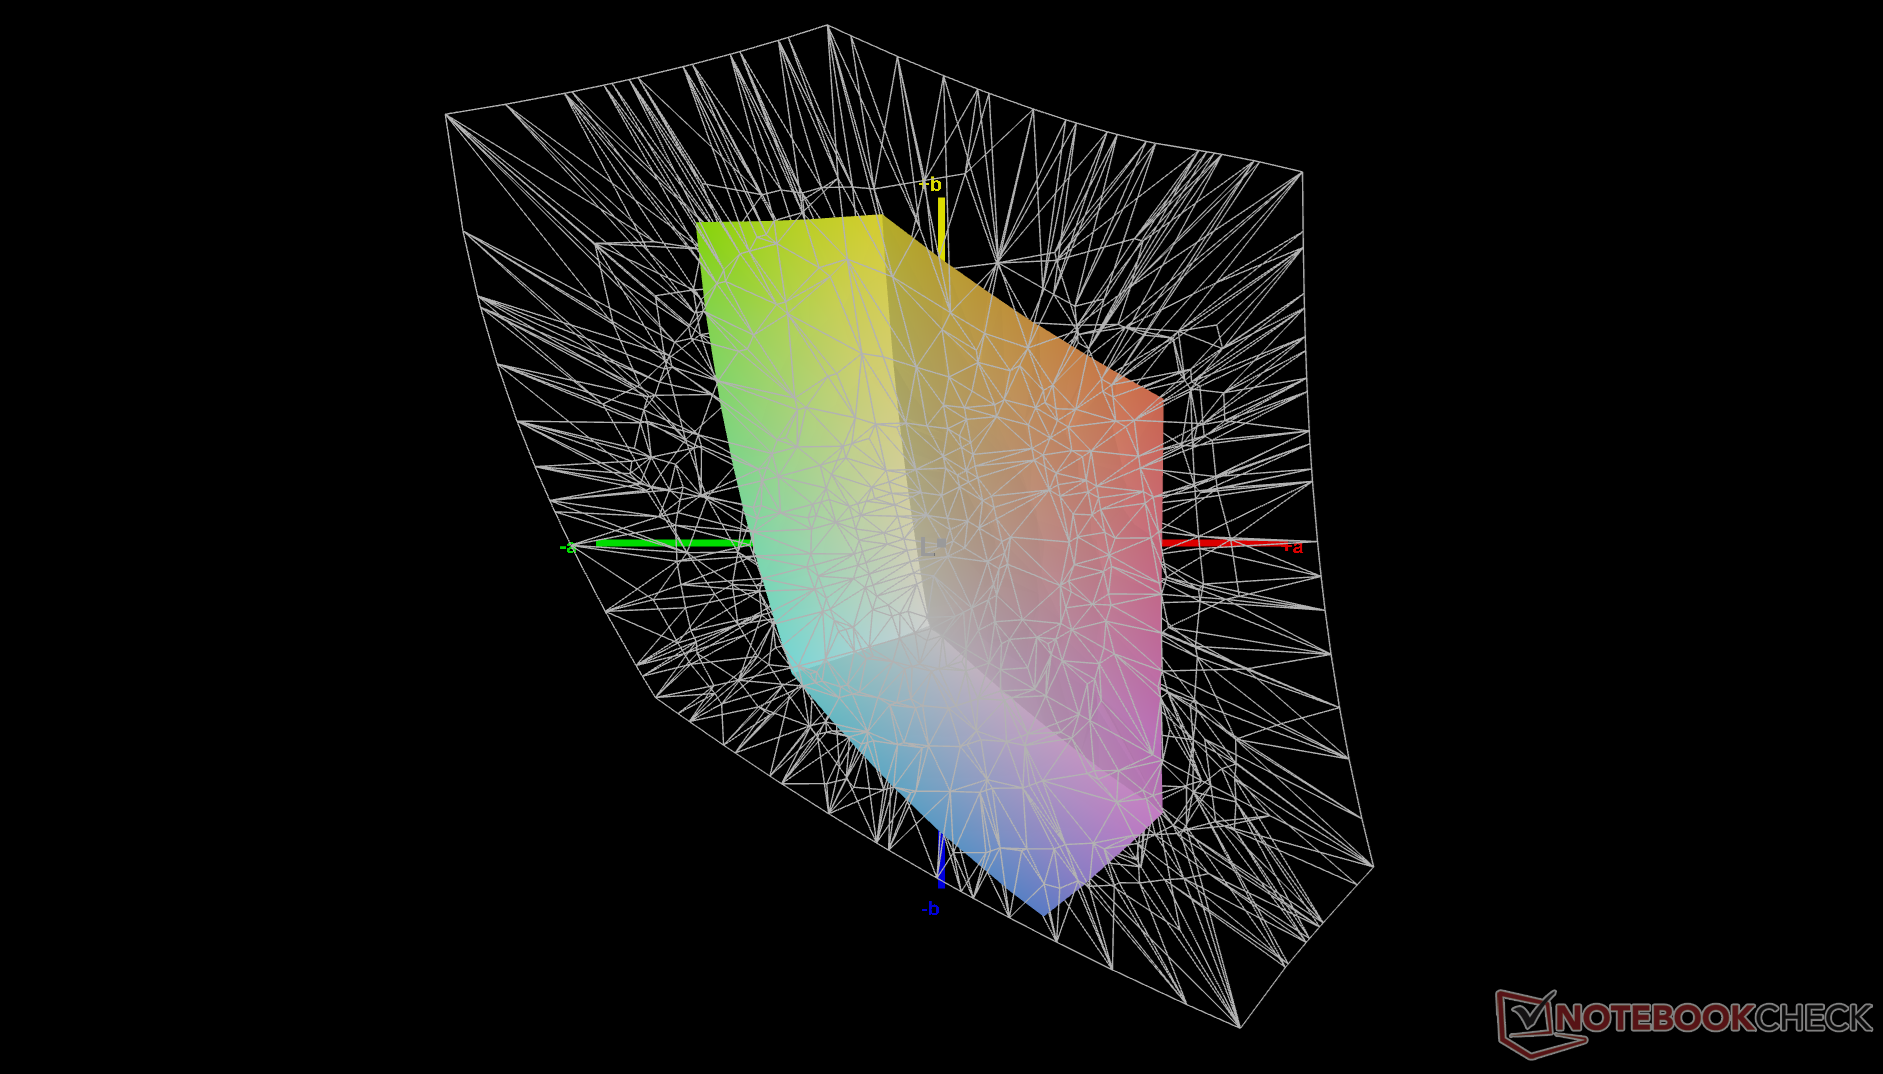
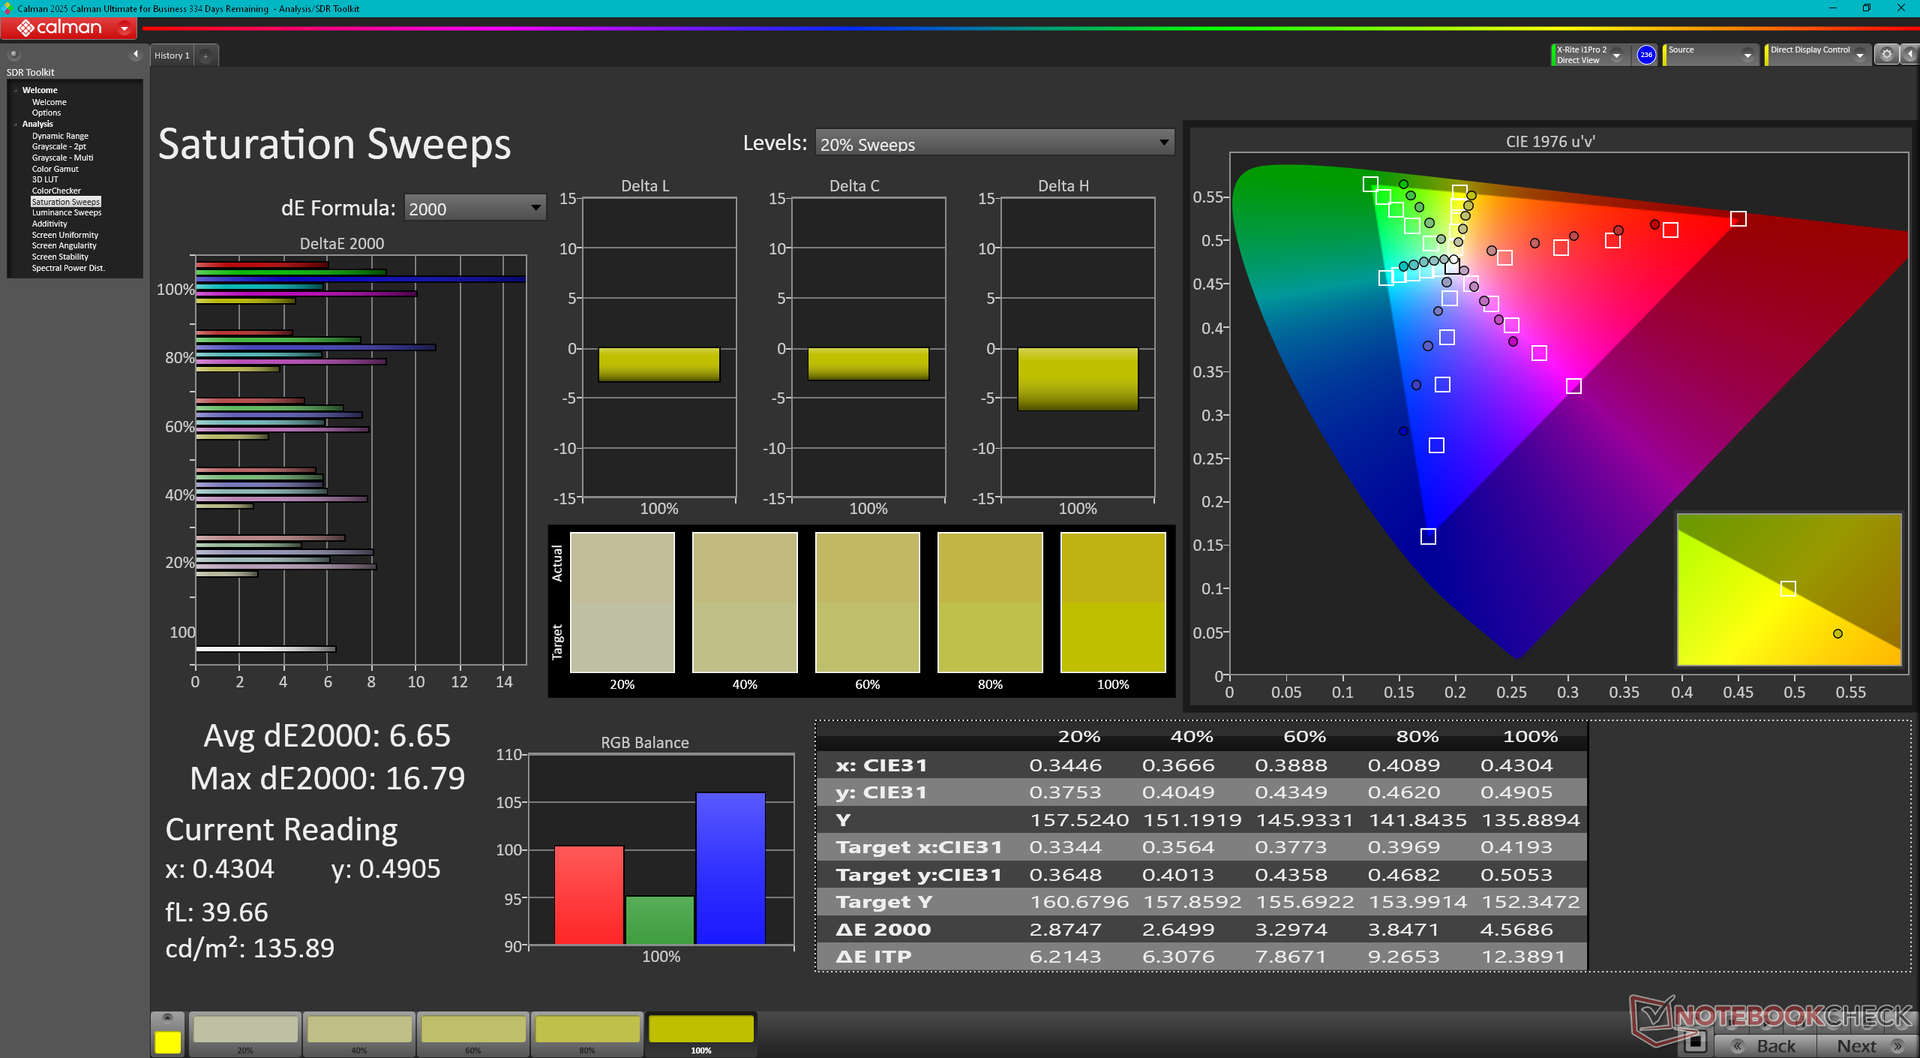
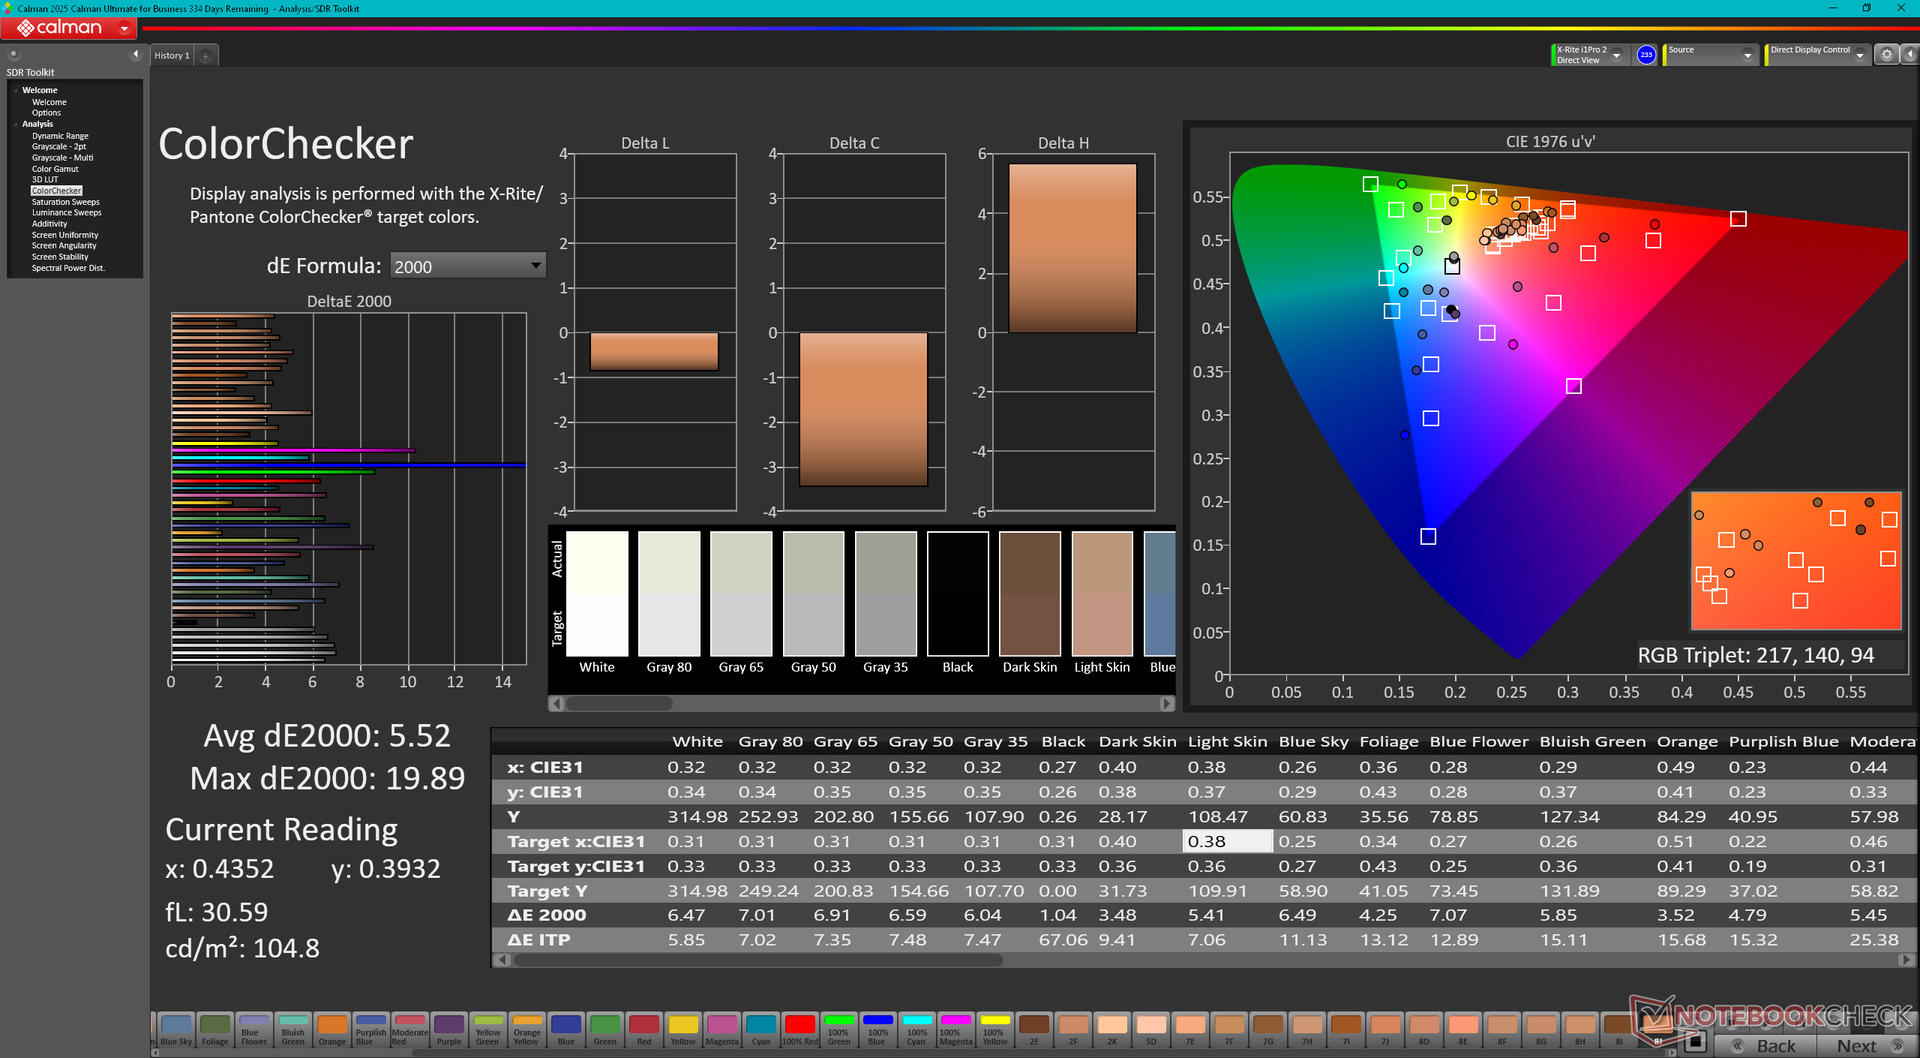
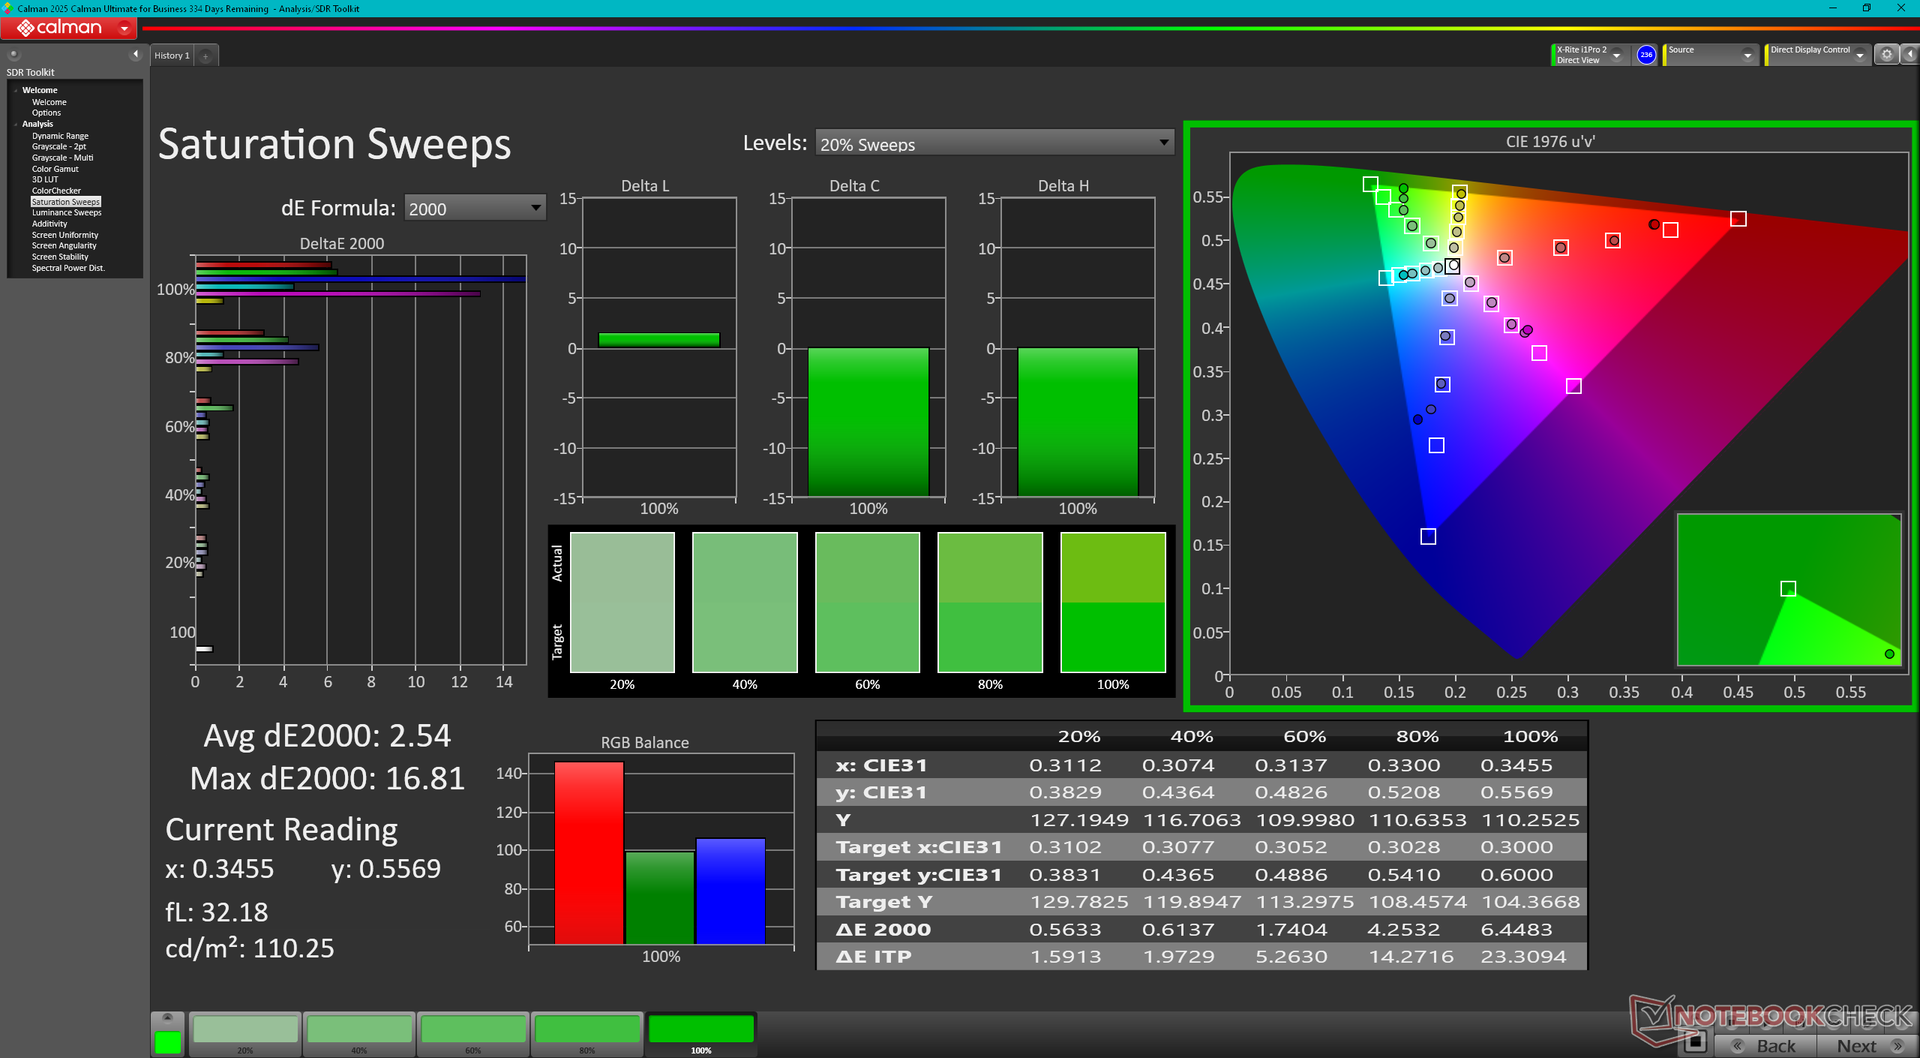
The IPS display on our Aspire 14 AI is firmly in the budget category with its narrow <60 percent sRGB colors, meager 60 Hz refresh rate, and just average brightness and response time levels. Our unit also suffers from moderately high uneven backlight bleeding as shown by the picture below.
| |||||||||||||||||||||||||
Brightness Distribution: 93 %
Center on Battery: 312.1 cd/m²
Contrast: 1040:1 (Black: 0.3 cd/m²)
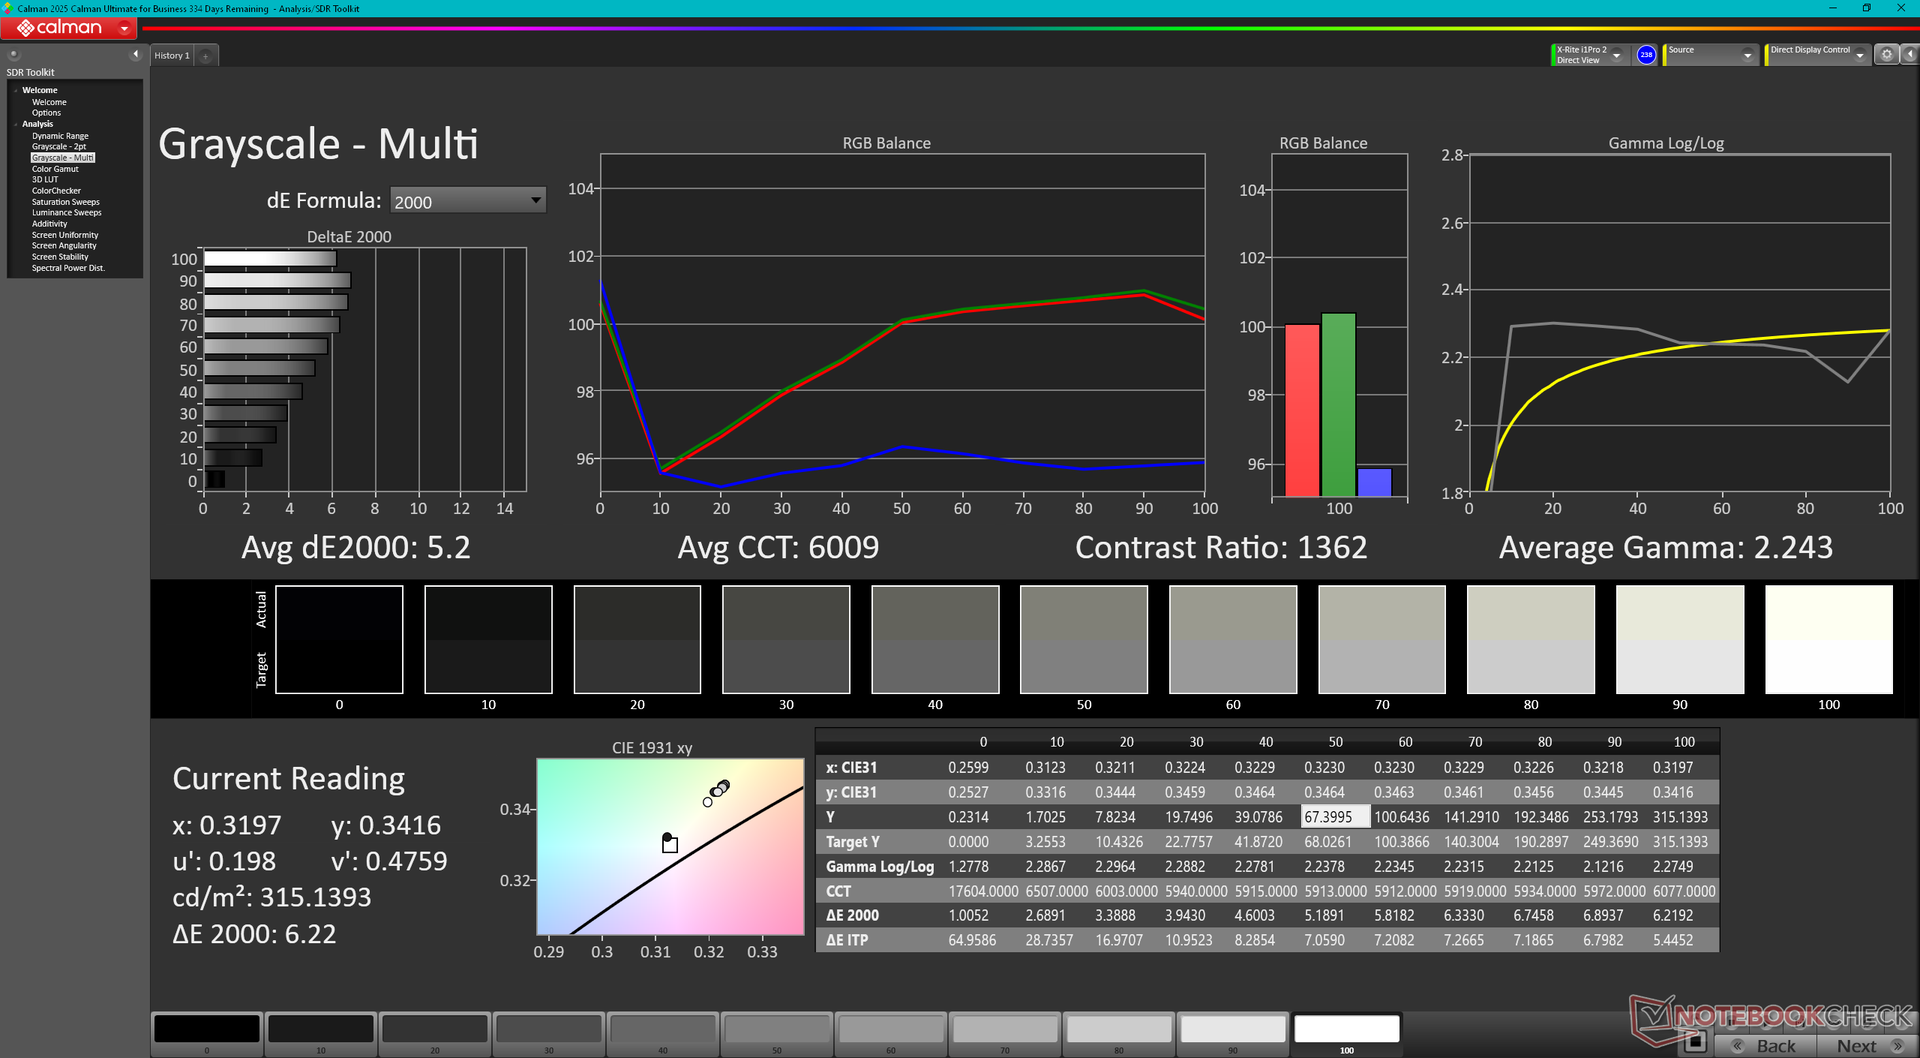
ΔE ColorChecker Calman: 5.52 | ∀{0.5-29.43 Ø4.73}
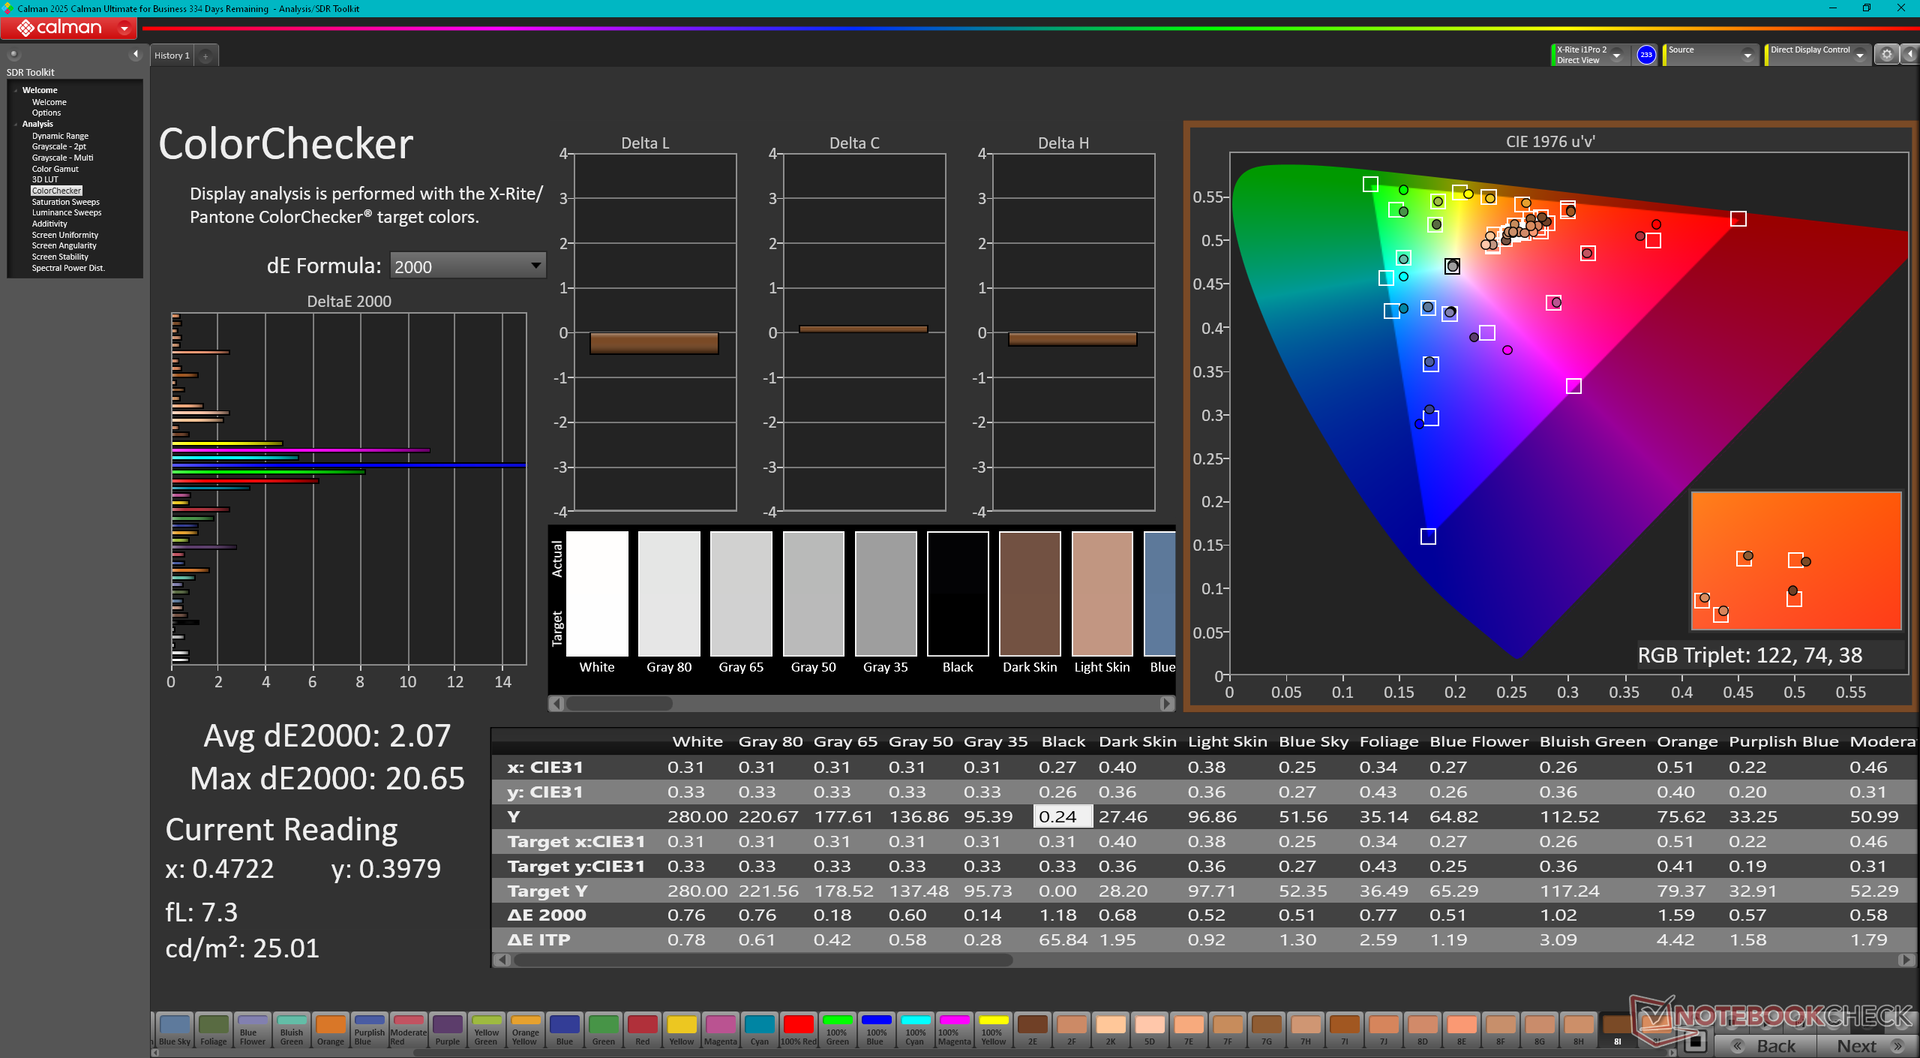
calibrated: 2.07
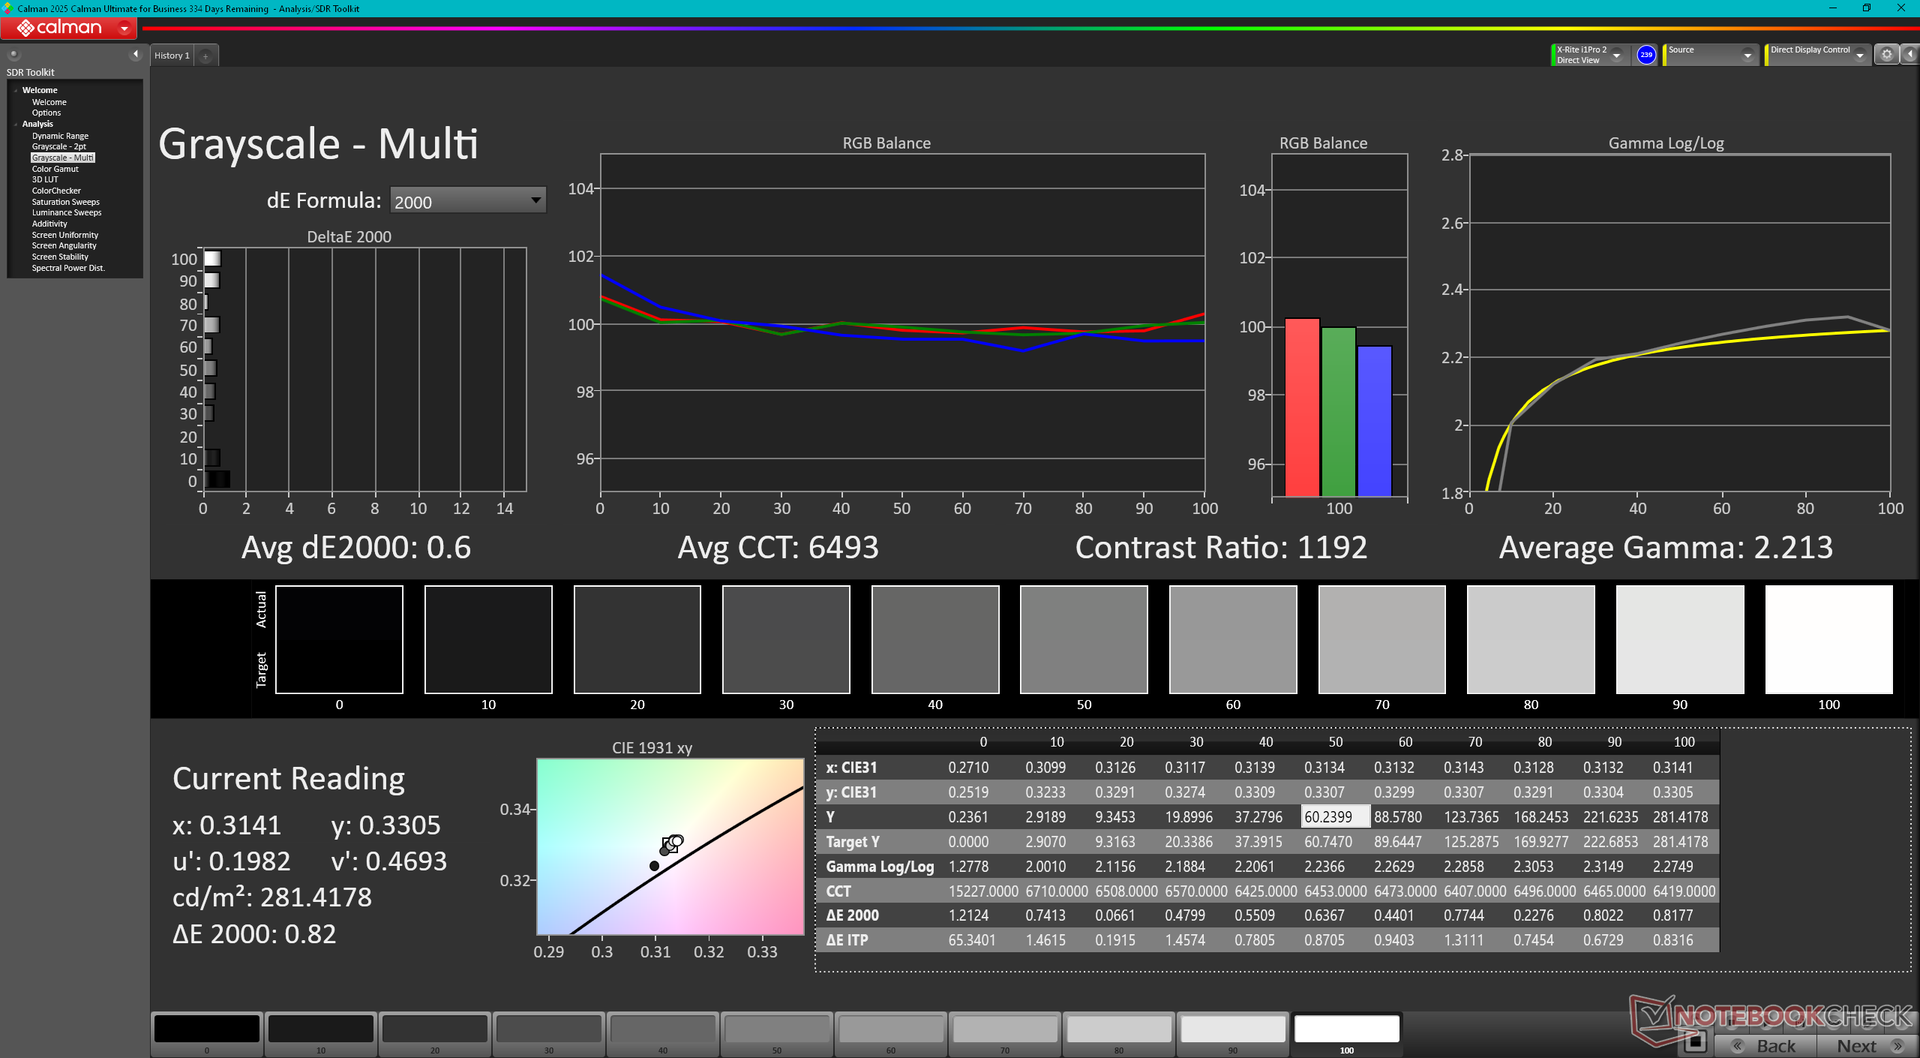
ΔE Greyscale Calman: 5.2 | ∀{0.09-98 Ø4.97}
38.1% AdobeRGB 1998 (Argyll 3D)
55.2% sRGB (Argyll 3D)
36.8% Display P3 (Argyll 3D)
Gamma: 2.24
CCT: 6009 K
| Acer Aspire 14 AI N24Q14 AU Optronics B140UAK02.5, IPS, 1920x1200, 14", 60 Hz | Acer Swift 14 AI SF14-51-58TU Samsung ATNA40YK11-0 (SDC4181), OLED, 2880x1800, 14", 90 Hz | Lenovo IdeaPad Slim 3 14 AHP G10 LEN140WUXGA, IPS, 1920x1200, 14", 60 Hz | Asus VivoBook S 14 OLED M5406WA ATNA40CT02-0 (SDC41A0), OLED, 1920x1200, 14", 60 Hz | Dell Inspiron 14 Plus 7440 BOE NV14N44, IPS, 2240x1400, 14", 60 Hz | HP Pavilion Plus 14-ew0153TU Samsung SDC4197, OLED, 2880x1800, 14", 120 Hz | |
|---|---|---|---|---|---|---|
| Display | 136% | 6% | 136% | 85% | 129% | |
| Display P3 Coverage (%) | 36.8 | 99.9 171% | 39.1 6% | 99.9 171% | 69.3 88% | 97.9 166% |
| sRGB Coverage (%) | 55.2 | 100 81% | 58.4 6% | 100 81% | 99.5 80% | 99.6 80% |
| AdobeRGB 1998 Coverage (%) | 38.1 | 97.6 156% | 40.4 6% | 97.2 155% | 71.4 87% | 92.1 142% |
| Response Times | 95% | -64% | 92% | -109% | 36% | |
| Response Time Grey 50% / Grey 80% * (ms) | 22 ? | 0.8 ? 96% | 31.4 ? -43% | 1.3 ? 94% | 41 ? -86% | 10.8 ? 51% |
| Response Time Black / White * (ms) | 11.6 ? | 0.8 ? 93% | 21.3 ? -84% | 1.2 ? 90% | 26.8 ? -131% | 9.29 ? 20% |
| PWM Frequency (Hz) | 115.4 | 60 ? | 240 ? | 120 ? | ||
| PWM Amplitude * (%) | 53 | |||||
| Screen | 564% | -8% | 169% | 28% | 444% | |
| Brightness middle (cd/m²) | 312.1 | 500 60% | 304 -3% | 385 23% | 403.2 29% | 387 24% |
| Brightness (cd/m²) | 300 | 499 66% | 281 -6% | 382 27% | 388 29% | 387 29% |
| Brightness Distribution (%) | 93 | 97 4% | 89 -4% | 95 2% | 93 0% | 97 4% |
| Black Level * (cd/m²) | 0.3 | 0.01 97% | 0.22 27% | 0.03 90% | 0.27 10% | 0.01 97% |
| Contrast (:1) | 1040 | 50000 4708% | 1382 33% | 12833 1134% | 1493 44% | 38700 3621% |
| Colorchecker dE 2000 * | 5.52 | 3.55 36% | 5.9 -7% | 1.99 64% | 4.15 25% | 2.03 63% |
| Colorchecker dE 2000 max. * | 19.89 | 6.38 68% | 19.2 3% | 3.69 81% | 6.92 65% | 3.86 81% |
| Colorchecker dE 2000 calibrated * | 2.07 | 2.55 -23% | 4.7 -127% | 1.79 14% | 1.04 50% | 1.6 23% |
| Greyscale dE 2000 * | 5.2 | 2.2 58% | 4.5 13% | 0.8 85% | 5.1 2% | 2.3 56% |
| Gamma | 2.24 98% | 1.94 113% | 2.21 100% | 2.204 100% | 2.2 100% | 2.23 99% |
| CCT | 6009 108% | 6405 101% | 6098 107% | 6474 100% | 6677 97% | 6523 100% |
| Total Average (Program / Settings) | 265% /
405% | -22% /
-13% | 132% /
151% | 1% /
21% | 203% /
318% |
* ... smaller is better
The display does not come calibrated out of the box. However, we still recommend applying our calibrated ICM profile above to significantly improve the average grayscale deltaE.
Display Response Times
| ↔ Response Time Black to White | ||
|---|---|---|
| 11.6 ms ... rise ↗ and fall ↘ combined | ↗ 5.1 ms rise | 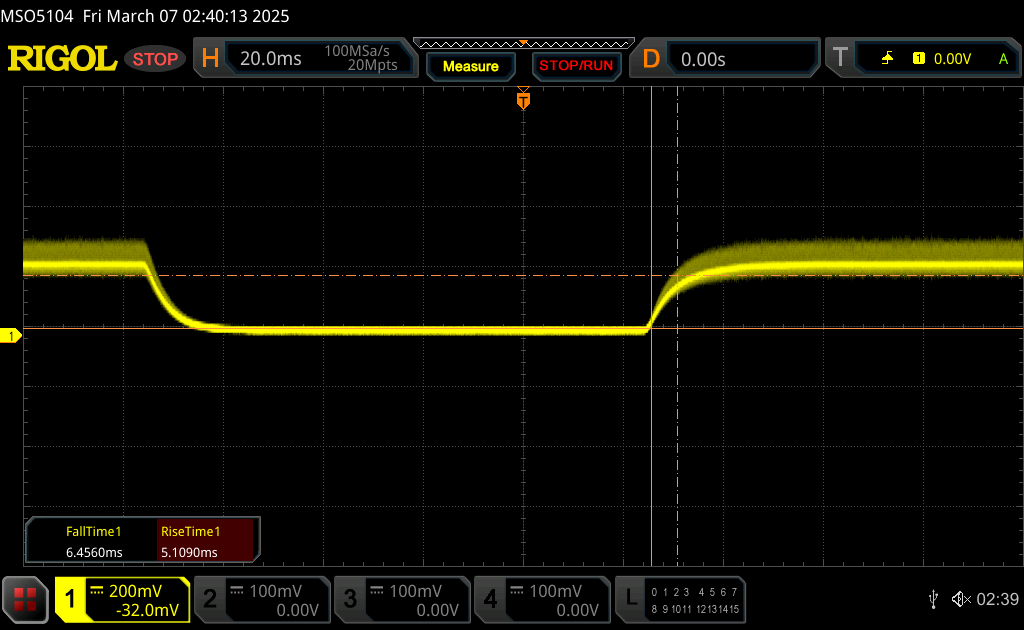 |
| ↘ 6.5 ms fall | ||
| The screen shows good response rates in our tests, but may be too slow for competitive gamers. In comparison, all tested devices range from 0.1 (minimum) to 240 (maximum) ms. » 31 % of all devices are better. This means that the measured response time is better than the average of all tested devices (19.9 ms). | ||
| ↔ Response Time 50% Grey to 80% Grey | ||
| 22 ms ... rise ↗ and fall ↘ combined | ↗ 11 ms rise | 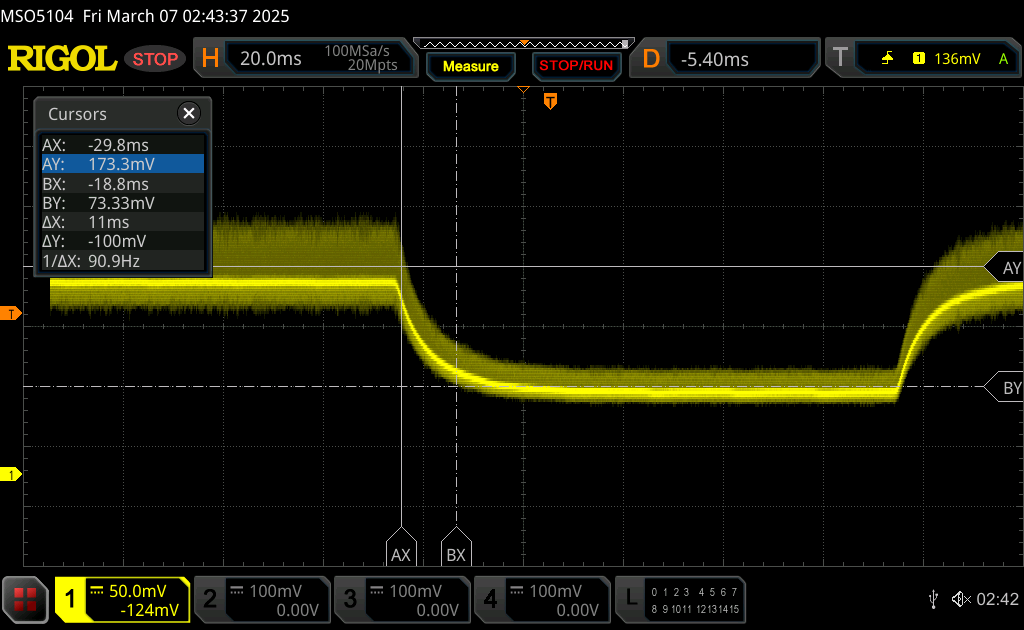 |
| ↘ 11 ms fall | ||
| The screen shows good response rates in our tests, but may be too slow for competitive gamers. In comparison, all tested devices range from 0.165 (minimum) to 636 (maximum) ms. » 33 % of all devices are better. This means that the measured response time is better than the average of all tested devices (31.1 ms). | ||
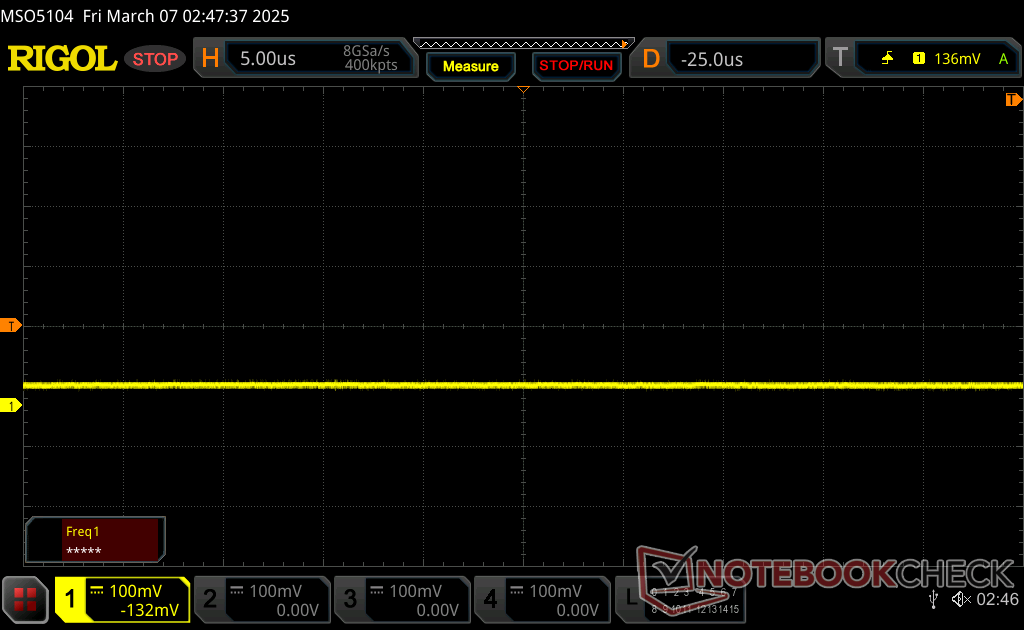
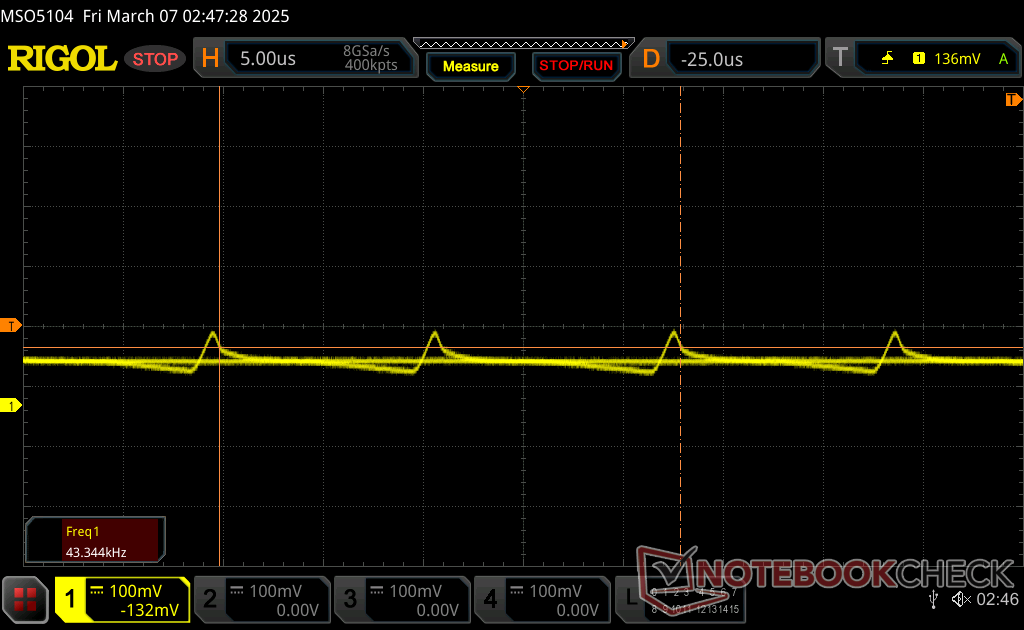
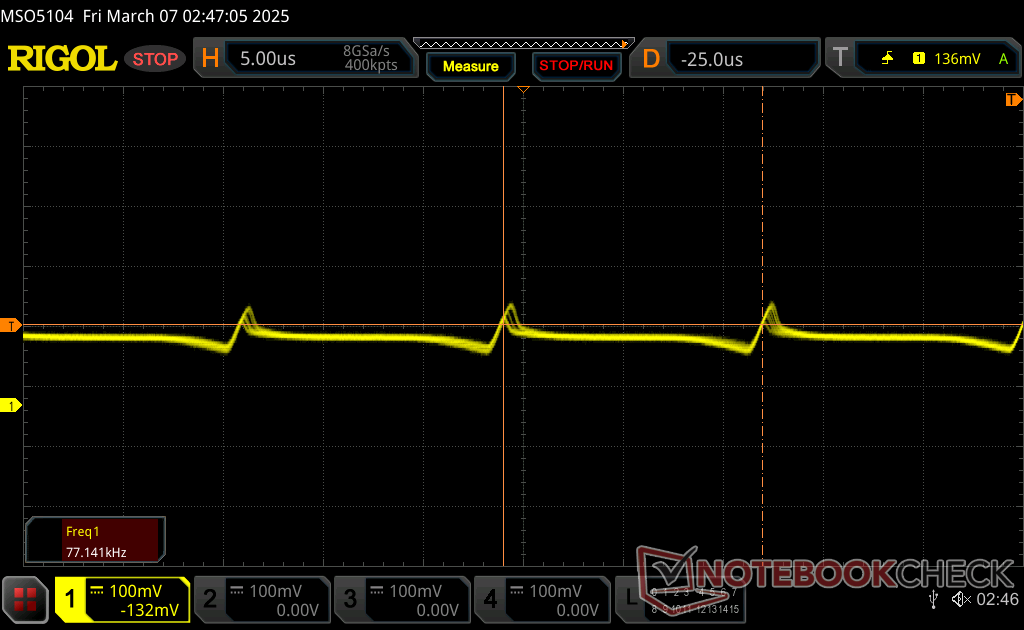
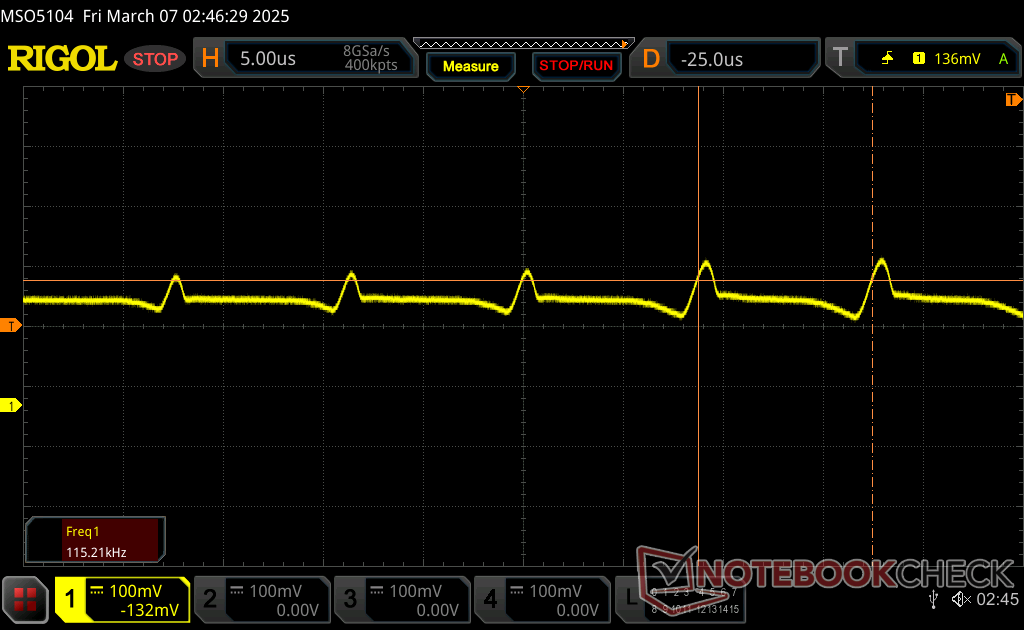
Screen Flickering / PWM (Pulse-Width Modulation)
| Screen flickering / PWM detected | 115.4 Hz Amplitude: 53 % | 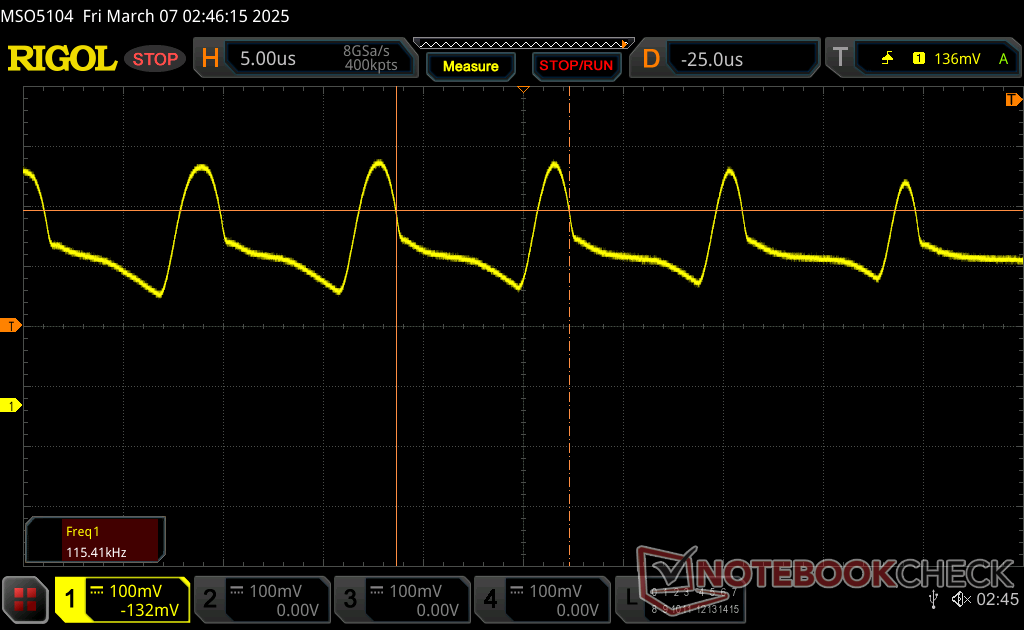 | |
The display backlight flickers at 115.4 Hz (worst case, e.g., utilizing PWM) . The frequency of 115.4 Hz is very low, so the flickering may cause eyestrain and headaches after extended use. In comparison: 52 % of all tested devices do not use PWM to dim the display. If PWM was detected, an average of 7784 (minimum: 5 - maximum: 343500) Hz was measured. | |||
Pulse-width modulation (PWM) is present on all brightness levels including the maximum setting.
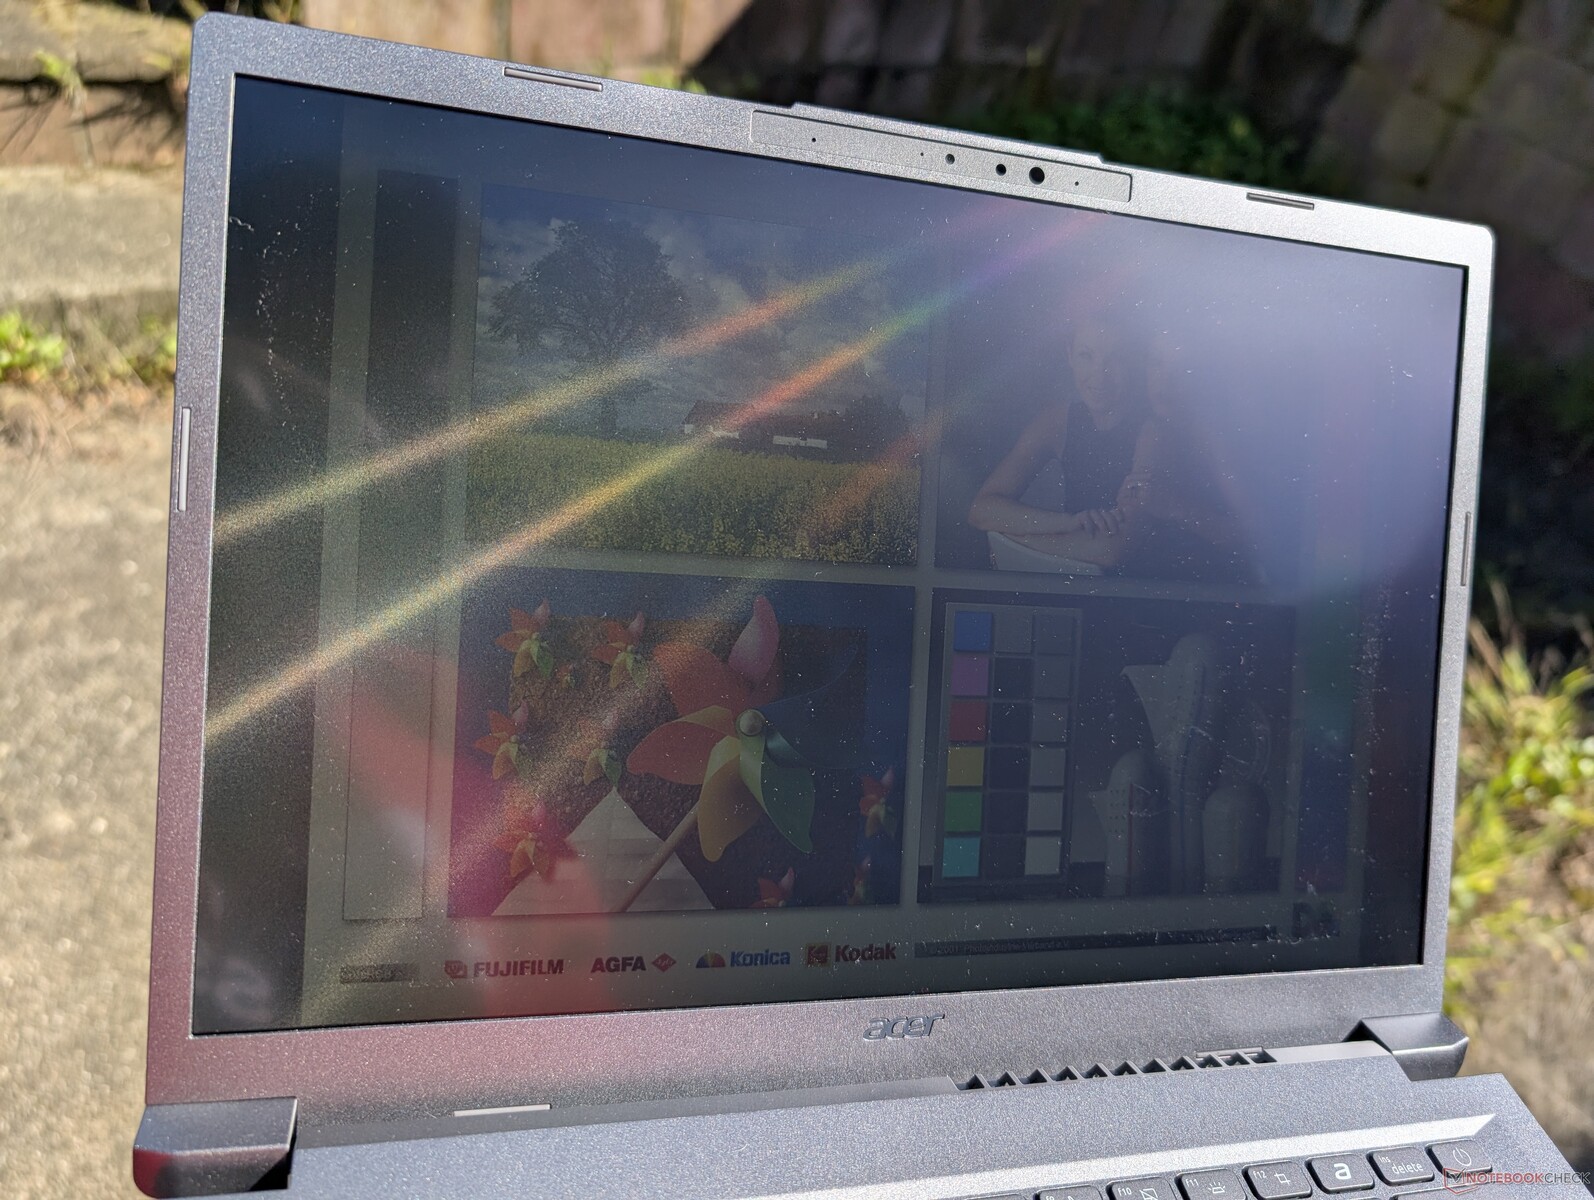
Outdoor visibility is average at best due to the limited 300-nit brightness.
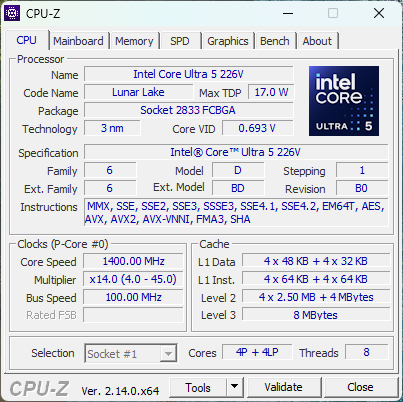
Performance — Efficient Lunar Lake Processor
Testing Conditions
We set Windows to Performance mode prior to running the benchmarks below.
Processor
The Core Ultra 5 226V offers minimal performance benefits over the older Core i7-1355U when it comes to raw processing horsepower. Its advantages instead lie in the integrated NPU, faster integrated GPU, and more power-efficient embedded RAM.
Upgrading to the Core Ultra 7 258V configuration is only expected to increase processor performance by a minor 5 to 10 percent based on our time with the HP OmniBook Ultra Flip 14.
Cinebench R15 Multi Loop
Cinebench R23: Multi Core | Single Core
Cinebench R20: CPU (Multi Core) | CPU (Single Core)
Cinebench R15: CPU Multi 64Bit | CPU Single 64Bit
Blender: v2.79 BMW27 CPU
7-Zip 18.03: 7z b 4 | 7z b 4 -mmt1
Geekbench 6.7: Multi-Core | Single-Core
Geekbench 5.5: Multi-Core | Single-Core
HWBOT x265 Benchmark v2.2: 4k Preset
LibreOffice : 20 Documents To PDF
R Benchmark 2.5: Overall mean
* ... smaller is better
AIDA64: FP32 Ray-Trace | FPU Julia | CPU SHA3 | CPU Queen | FPU SinJulia | FPU Mandel | CPU AES | CPU ZLib | FP64 Ray-Trace | CPU PhotoWorxx
| Performance rating | |
| Lenovo IdeaPad Slim 3 14 AHP G10 | |
| Dell Inspiron 14 Plus 7440 | |
| Acer Swift 14 AI SF14-51-58TU | |
| Asus Vivobook S 14 OLED S5406SA | |
| Average Intel Core Ultra 5 226V | |
| Acer Aspire 14 AI N24Q14 | |
| HP Pavilion Plus 14-ew0153TU | |
| AIDA64 / FP32 Ray-Trace | |
| Lenovo IdeaPad Slim 3 14 AHP G10 | |
| Dell Inspiron 14 Plus 7440 | |
| Asus Vivobook S 14 OLED S5406SA | |
| Average Intel Core Ultra 5 226V (11849 - 12299, n=6) | |
| Acer Swift 14 AI SF14-51-58TU | |
| Acer Aspire 14 AI N24Q14 | |
| HP Pavilion Plus 14-ew0153TU | |
| AIDA64 / FPU Julia | |
| Lenovo IdeaPad Slim 3 14 AHP G10 | |
| Dell Inspiron 14 Plus 7440 | |
| Acer Swift 14 AI SF14-51-58TU | |
| Asus Vivobook S 14 OLED S5406SA | |
| Average Intel Core Ultra 5 226V (56296 - 60191, n=6) | |
| Acer Aspire 14 AI N24Q14 | |
| HP Pavilion Plus 14-ew0153TU | |
| AIDA64 / CPU SHA3 | |
| Lenovo IdeaPad Slim 3 14 AHP G10 | |
| Dell Inspiron 14 Plus 7440 | |
| Acer Swift 14 AI SF14-51-58TU | |
| Average Intel Core Ultra 5 226V (2551 - 2570, n=6) | |
| Asus Vivobook S 14 OLED S5406SA | |
| Acer Aspire 14 AI N24Q14 | |
| HP Pavilion Plus 14-ew0153TU | |
| AIDA64 / CPU Queen | |
| Lenovo IdeaPad Slim 3 14 AHP G10 | |
| Dell Inspiron 14 Plus 7440 | |
| HP Pavilion Plus 14-ew0153TU | |
| Acer Swift 14 AI SF14-51-58TU | |
| Acer Aspire 14 AI N24Q14 | |
| Average Intel Core Ultra 5 226V (46991 - 47087, n=6) | |
| Asus Vivobook S 14 OLED S5406SA | |
| AIDA64 / FPU SinJulia | |
| Lenovo IdeaPad Slim 3 14 AHP G10 | |
| Dell Inspiron 14 Plus 7440 | |
| HP Pavilion Plus 14-ew0153TU | |
| Asus Vivobook S 14 OLED S5406SA | |
| Average Intel Core Ultra 5 226V (3909 - 3918, n=6) | |
| Acer Swift 14 AI SF14-51-58TU | |
| Acer Aspire 14 AI N24Q14 | |
| AIDA64 / FPU Mandel | |
| Lenovo IdeaPad Slim 3 14 AHP G10 | |
| Asus Vivobook S 14 OLED S5406SA | |
| Acer Swift 14 AI SF14-51-58TU | |
| Dell Inspiron 14 Plus 7440 | |
| Average Intel Core Ultra 5 226V (28485 - 32488, n=6) | |
| Acer Aspire 14 AI N24Q14 | |
| HP Pavilion Plus 14-ew0153TU | |
| AIDA64 / CPU AES | |
| Lenovo IdeaPad Slim 3 14 AHP G10 | |
| Dell Inspiron 14 Plus 7440 | |
| Acer Swift 14 AI SF14-51-58TU | |
| Average Intel Core Ultra 5 226V (34159 - 36373, n=6) | |
| Acer Aspire 14 AI N24Q14 | |
| Asus Vivobook S 14 OLED S5406SA | |
| HP Pavilion Plus 14-ew0153TU | |
| AIDA64 / CPU ZLib | |
| Dell Inspiron 14 Plus 7440 | |
| Lenovo IdeaPad Slim 3 14 AHP G10 | |
| Acer Aspire 14 AI N24Q14 | |
| Asus Vivobook S 14 OLED S5406SA | |
| Average Intel Core Ultra 5 226V (539 - 572, n=6) | |
| Acer Swift 14 AI SF14-51-58TU | |
| HP Pavilion Plus 14-ew0153TU | |
| AIDA64 / FP64 Ray-Trace | |
| Lenovo IdeaPad Slim 3 14 AHP G10 | |
| Asus Vivobook S 14 OLED S5406SA | |
| Acer Swift 14 AI SF14-51-58TU | |
| Dell Inspiron 14 Plus 7440 | |
| Average Intel Core Ultra 5 226V (6098 - 6773, n=6) | |
| Acer Aspire 14 AI N24Q14 | |
| HP Pavilion Plus 14-ew0153TU | |
| AIDA64 / CPU PhotoWorxx | |
| Acer Swift 14 AI SF14-51-58TU | |
| Average Intel Core Ultra 5 226V (50038 - 50372, n=6) | |
| Asus Vivobook S 14 OLED S5406SA | |
| Acer Aspire 14 AI N24Q14 | |
| Dell Inspiron 14 Plus 7440 | |
| HP Pavilion Plus 14-ew0153TU | |
| Lenovo IdeaPad Slim 3 14 AHP G10 | |
System Performance
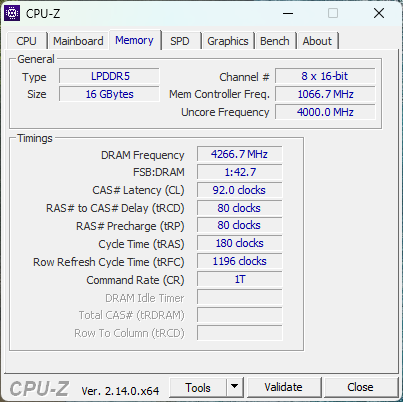
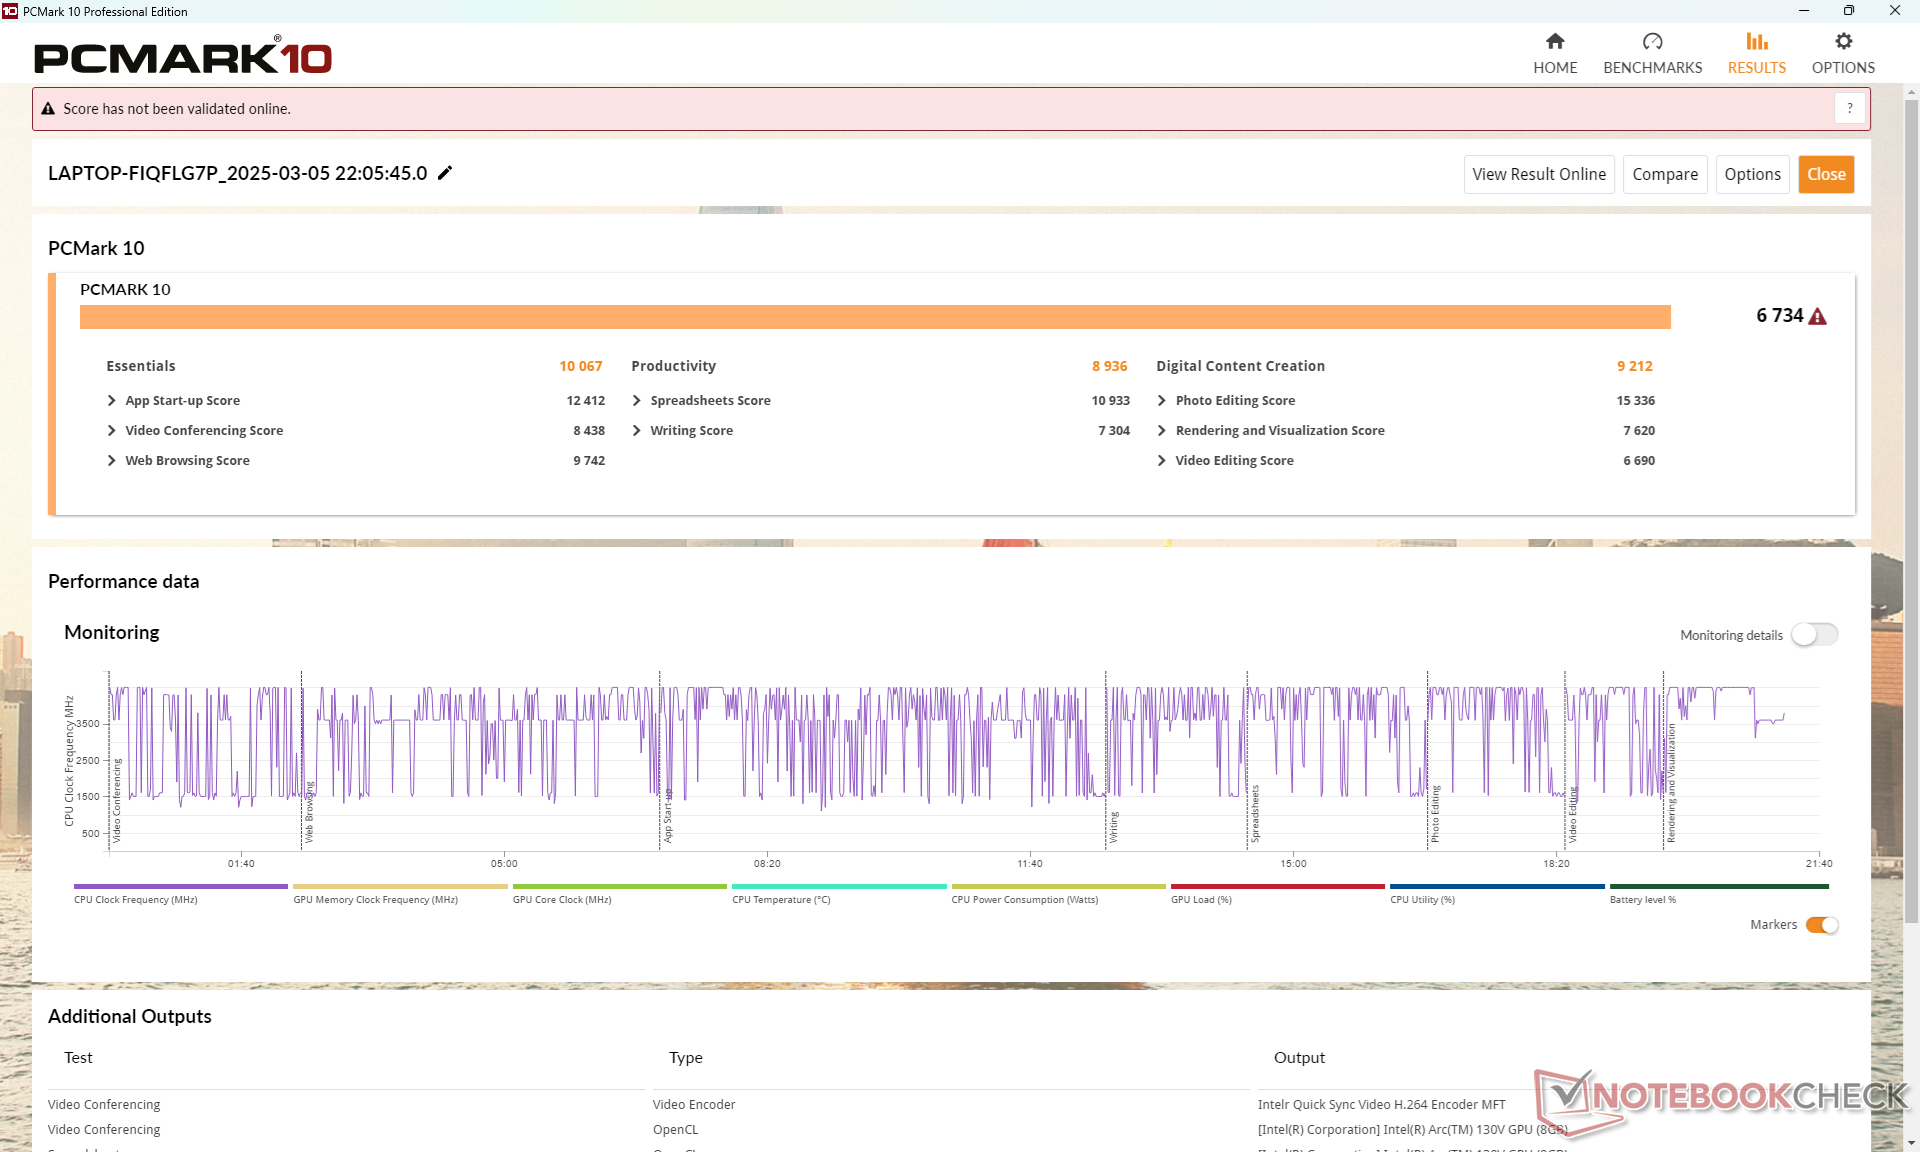
PCMark scores are comparable to the Dell Inspiron 14 Plus 7440 running on the more demanding Ultra 7 155H. RAM performance is also quite fast as to be expected from the Lunar Lake design.
CrossMark: Overall | Productivity | Creativity | Responsiveness
WebXPRT 3: Overall
WebXPRT 4: Overall
Mozilla Kraken 1.1: Total
| PCMark 10 / Score | |
| Asus VivoBook S 14 OLED M5406WA | |
| Lenovo IdeaPad Slim 3 14 AHP G10 | |
| Acer Aspire 14 AI N24Q14 | |
| Dell Inspiron 14 Plus 7440 | |
| Average Intel Core Ultra 5 226V, Intel Arc Graphics 130V (6445 - 6734, n=6) | |
| Acer Swift 14 AI SF14-51-58TU | |
| HP Pavilion Plus 14-ew0153TU | |
| PCMark 10 / Essentials | |
| Asus VivoBook S 14 OLED M5406WA | |
| HP Pavilion Plus 14-ew0153TU | |
| Lenovo IdeaPad Slim 3 14 AHP G10 | |
| Dell Inspiron 14 Plus 7440 | |
| Acer Aspire 14 AI N24Q14 | |
| Average Intel Core Ultra 5 226V, Intel Arc Graphics 130V (9350 - 10067, n=6) | |
| Acer Swift 14 AI SF14-51-58TU | |
| PCMark 10 / Productivity | |
| Asus VivoBook S 14 OLED M5406WA | |
| Lenovo IdeaPad Slim 3 14 AHP G10 | |
| Acer Aspire 14 AI N24Q14 | |
| Average Intel Core Ultra 5 226V, Intel Arc Graphics 130V (8457 - 8977, n=6) | |
| Dell Inspiron 14 Plus 7440 | |
| Acer Swift 14 AI SF14-51-58TU | |
| HP Pavilion Plus 14-ew0153TU | |
| PCMark 10 / Digital Content Creation | |
| Asus VivoBook S 14 OLED M5406WA | |
| Dell Inspiron 14 Plus 7440 | |
| Acer Aspire 14 AI N24Q14 | |
| Average Intel Core Ultra 5 226V, Intel Arc Graphics 130V (8983 - 9276, n=6) | |
| Acer Swift 14 AI SF14-51-58TU | |
| Lenovo IdeaPad Slim 3 14 AHP G10 | |
| HP Pavilion Plus 14-ew0153TU | |
| CrossMark / Overall | |
| Dell Inspiron 14 Plus 7440 | |
| Lenovo IdeaPad Slim 3 14 AHP G10 | |
| Average Intel Core Ultra 5 226V, Intel Arc Graphics 130V (1522 - 1620, n=5) | |
| Acer Aspire 14 AI N24Q14 | |
| HP Pavilion Plus 14-ew0153TU | |
| CrossMark / Productivity | |
| Lenovo IdeaPad Slim 3 14 AHP G10 | |
| Dell Inspiron 14 Plus 7440 | |
| HP Pavilion Plus 14-ew0153TU | |
| Average Intel Core Ultra 5 226V, Intel Arc Graphics 130V (1481 - 1575, n=5) | |
| Acer Aspire 14 AI N24Q14 | |
| CrossMark / Creativity | |
| Dell Inspiron 14 Plus 7440 | |
| Lenovo IdeaPad Slim 3 14 AHP G10 | |
| Average Intel Core Ultra 5 226V, Intel Arc Graphics 130V (1719 - 1746, n=5) | |
| Acer Aspire 14 AI N24Q14 | |
| HP Pavilion Plus 14-ew0153TU | |
| CrossMark / Responsiveness | |
| Lenovo IdeaPad Slim 3 14 AHP G10 | |
| Dell Inspiron 14 Plus 7440 | |
| HP Pavilion Plus 14-ew0153TU | |
| Average Intel Core Ultra 5 226V, Intel Arc Graphics 130V (1144 - 1408, n=5) | |
| Acer Aspire 14 AI N24Q14 | |
| WebXPRT 3 / Overall | |
| Lenovo IdeaPad Slim 3 14 AHP G10 | |
| Dell Inspiron 14 Plus 7440 | |
| Acer Aspire 14 AI N24Q14 | |
| Average Intel Core Ultra 5 226V, Intel Arc Graphics 130V (272 - 286, n=5) | |
| HP Pavilion Plus 14-ew0153TU | |
| WebXPRT 4 / Overall | |
| Acer Aspire 14 AI N24Q14 | |
| Acer Aspire 14 AI N24Q14 | |
| Asus VivoBook S 14 OLED M5406WA | |
| Average Intel Core Ultra 5 226V, Intel Arc Graphics 130V (248 - 266, n=8) | |
| Dell Inspiron 14 Plus 7440 | |
| HP Pavilion Plus 14-ew0153TU | |
| Lenovo IdeaPad Slim 3 14 AHP G10 | |
| Acer Swift 14 AI SF14-51-58TU | |
| Acer Swift 14 AI SF14-51-58TU | |
| Mozilla Kraken 1.1 / Total | |
| Acer Swift 14 AI SF14-51-58TU | |
| Acer Swift 14 AI SF14-51-58TU | |
| Lenovo IdeaPad Slim 3 14 AHP G10 | |
| Dell Inspiron 14 Plus 7440 | |
| Average Intel Core Ultra 5 226V, Intel Arc Graphics 130V (503 - 543, n=7) | |
| HP Pavilion Plus 14-ew0153TU | |
| Acer Aspire 14 AI N24Q14 | |
| Asus VivoBook S 14 OLED M5406WA | |
| Asus VivoBook S 14 OLED M5406WA | |
* ... smaller is better
| PCMark 10 Score | 6734 points | |
Help | ||
| AIDA64 / Memory Copy | |
| Acer Aspire 14 AI N24Q14 | |
| Average Intel Core Ultra 5 226V (99126 - 100584, n=6) | |
| Acer Swift 14 AI SF14-51-58TU | |
| Asus VivoBook S 14 OLED M5406WA | |
| Dell Inspiron 14 Plus 7440 | |
| Lenovo IdeaPad Slim 3 14 AHP G10 | |
| HP Pavilion Plus 14-ew0153TU | |
| AIDA64 / Memory Read | |
| Asus VivoBook S 14 OLED M5406WA | |
| Acer Aspire 14 AI N24Q14 | |
| Average Intel Core Ultra 5 226V (83661 - 84864, n=6) | |
| Acer Swift 14 AI SF14-51-58TU | |
| Dell Inspiron 14 Plus 7440 | |
| Lenovo IdeaPad Slim 3 14 AHP G10 | |
| HP Pavilion Plus 14-ew0153TU | |
| AIDA64 / Memory Write | |
| Acer Aspire 14 AI N24Q14 | |
| Acer Swift 14 AI SF14-51-58TU | |
| Average Intel Core Ultra 5 226V (106434 - 111533, n=6) | |
| Asus VivoBook S 14 OLED M5406WA | |
| Lenovo IdeaPad Slim 3 14 AHP G10 | |
| HP Pavilion Plus 14-ew0153TU | |
| Dell Inspiron 14 Plus 7440 | |
| AIDA64 / Memory Latency | |
| Dell Inspiron 14 Plus 7440 | |
| Asus VivoBook S 14 OLED M5406WA | |
| HP Pavilion Plus 14-ew0153TU | |
| Acer Aspire 14 AI N24Q14 | |
| Average Intel Core Ultra 5 226V (90.5 - 95.9, n=6) | |
| Acer Swift 14 AI SF14-51-58TU | |
| Lenovo IdeaPad Slim 3 14 AHP G10 | |
* ... smaller is better
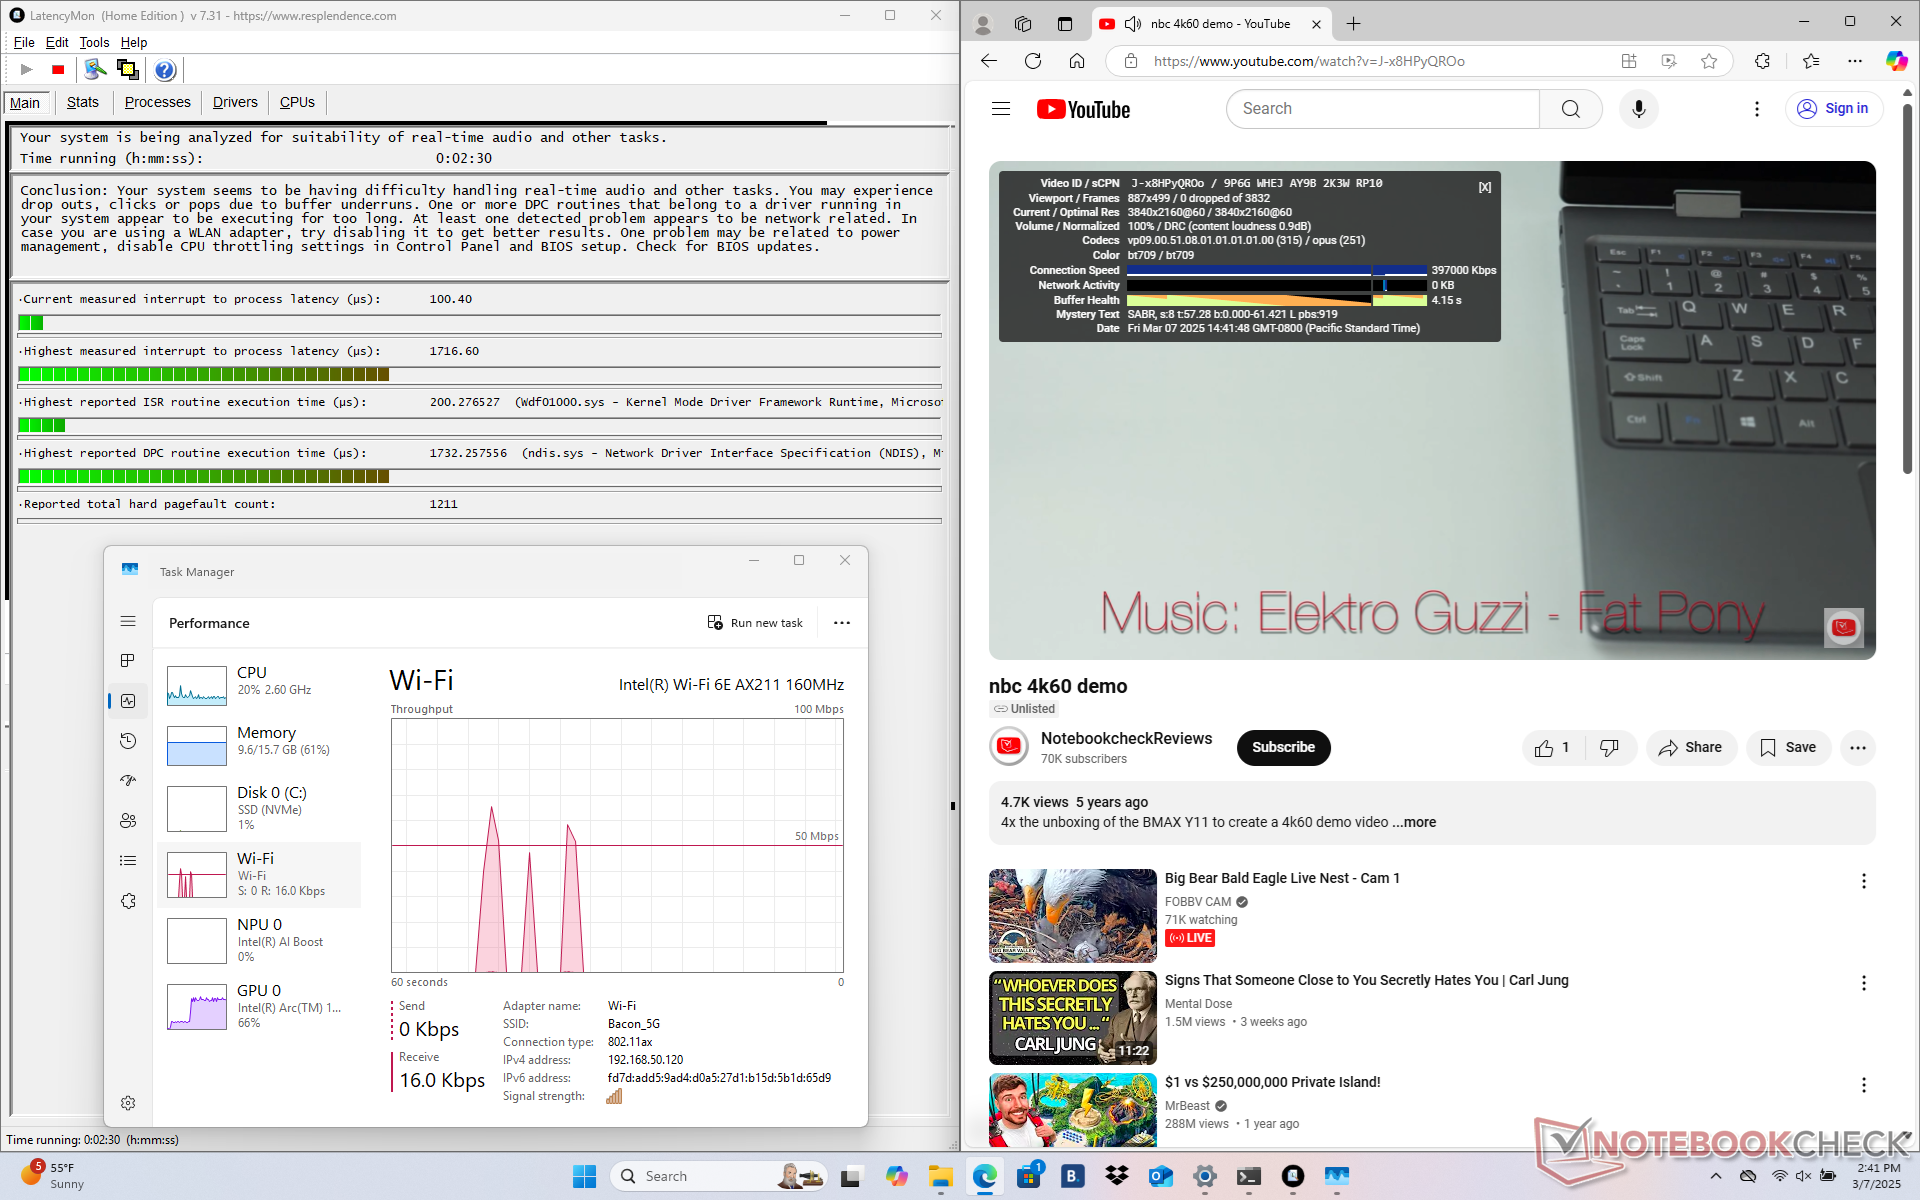
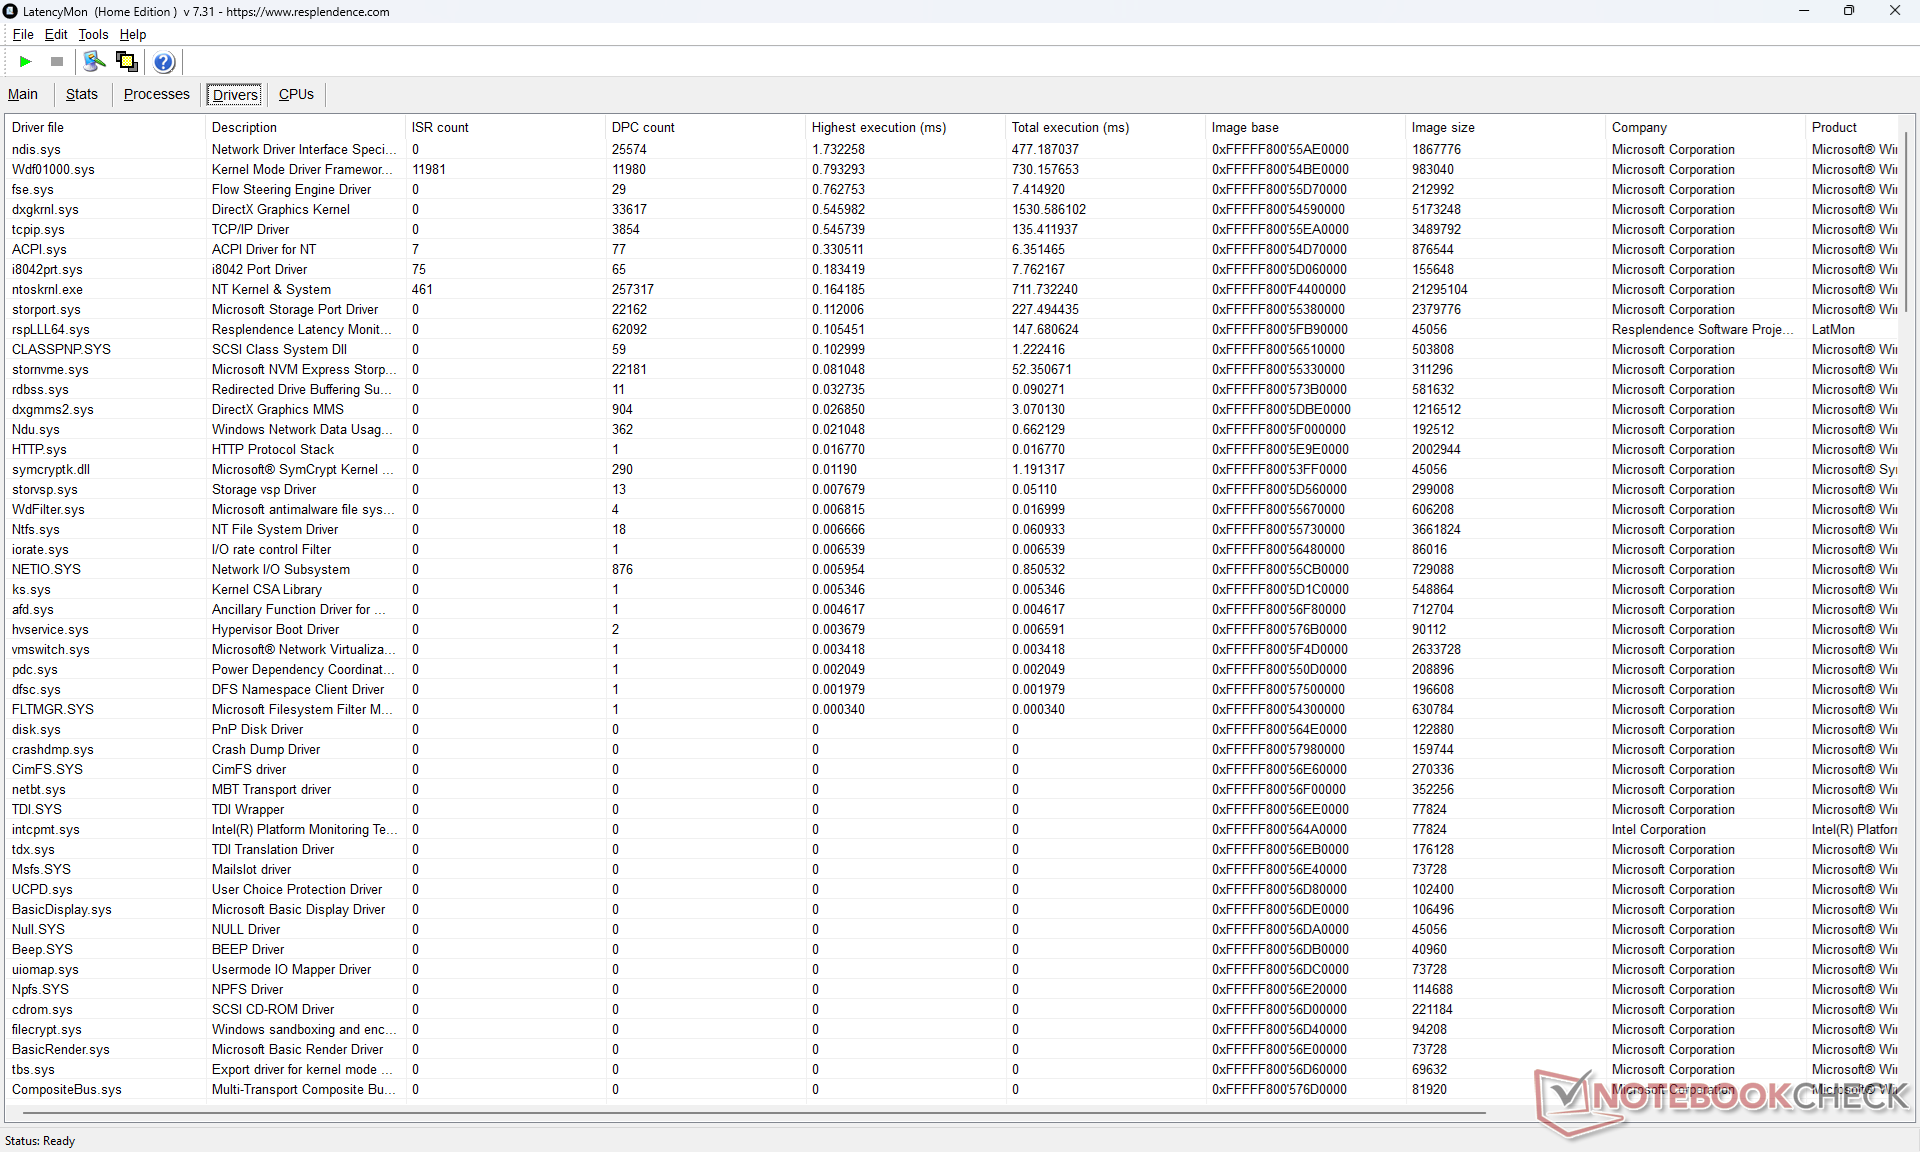
DPC Latency
LatencyMon shows minor DPC issues when opening multiple browser tabs of our homepage but with otherwise no dropped frames when playing 4K60 video.
| DPC Latencies / LatencyMon - interrupt to process latency (max), Web, Youtube, Prime95 | |
| Dell Inspiron 14 Plus 7440 | |
| HP Pavilion Plus 14-ew0153TU | |
| Acer Aspire 14 AI N24Q14 | |
| Acer Swift 14 AI SF14-51-58TU | |
| Lenovo IdeaPad Slim 3 14 AHP G10 | |
| Asus Vivobook S 14 OLED S5406SA | |
* ... smaller is better
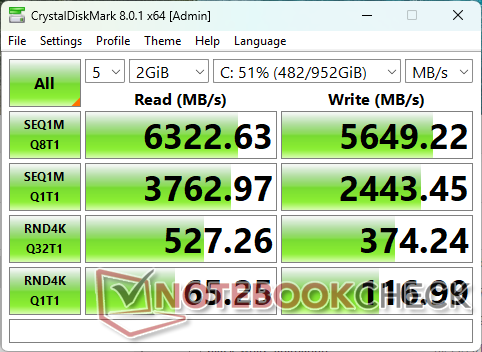
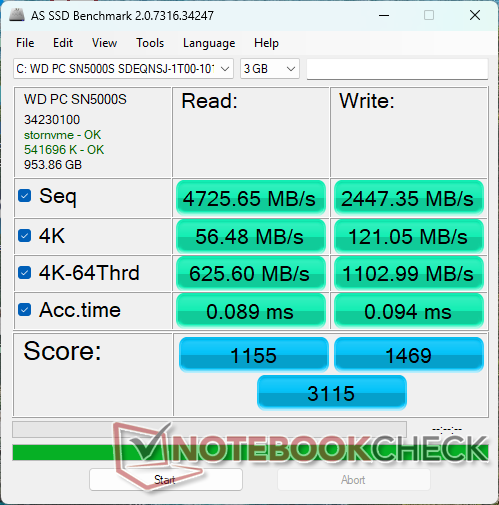
Storage Devices
The WD SN5000S in our test unit can reach speeds of up to 6400 MB/s for only a few minutes before throttling down to the low 5000 MB/s range. It nonetheless still outperforms the Micron 2550 in the Swift 14 AI if just slightly.

* ... smaller is better
Disk Throttling: DiskSpd Read Loop, Queue Depth 8
GPU Performance
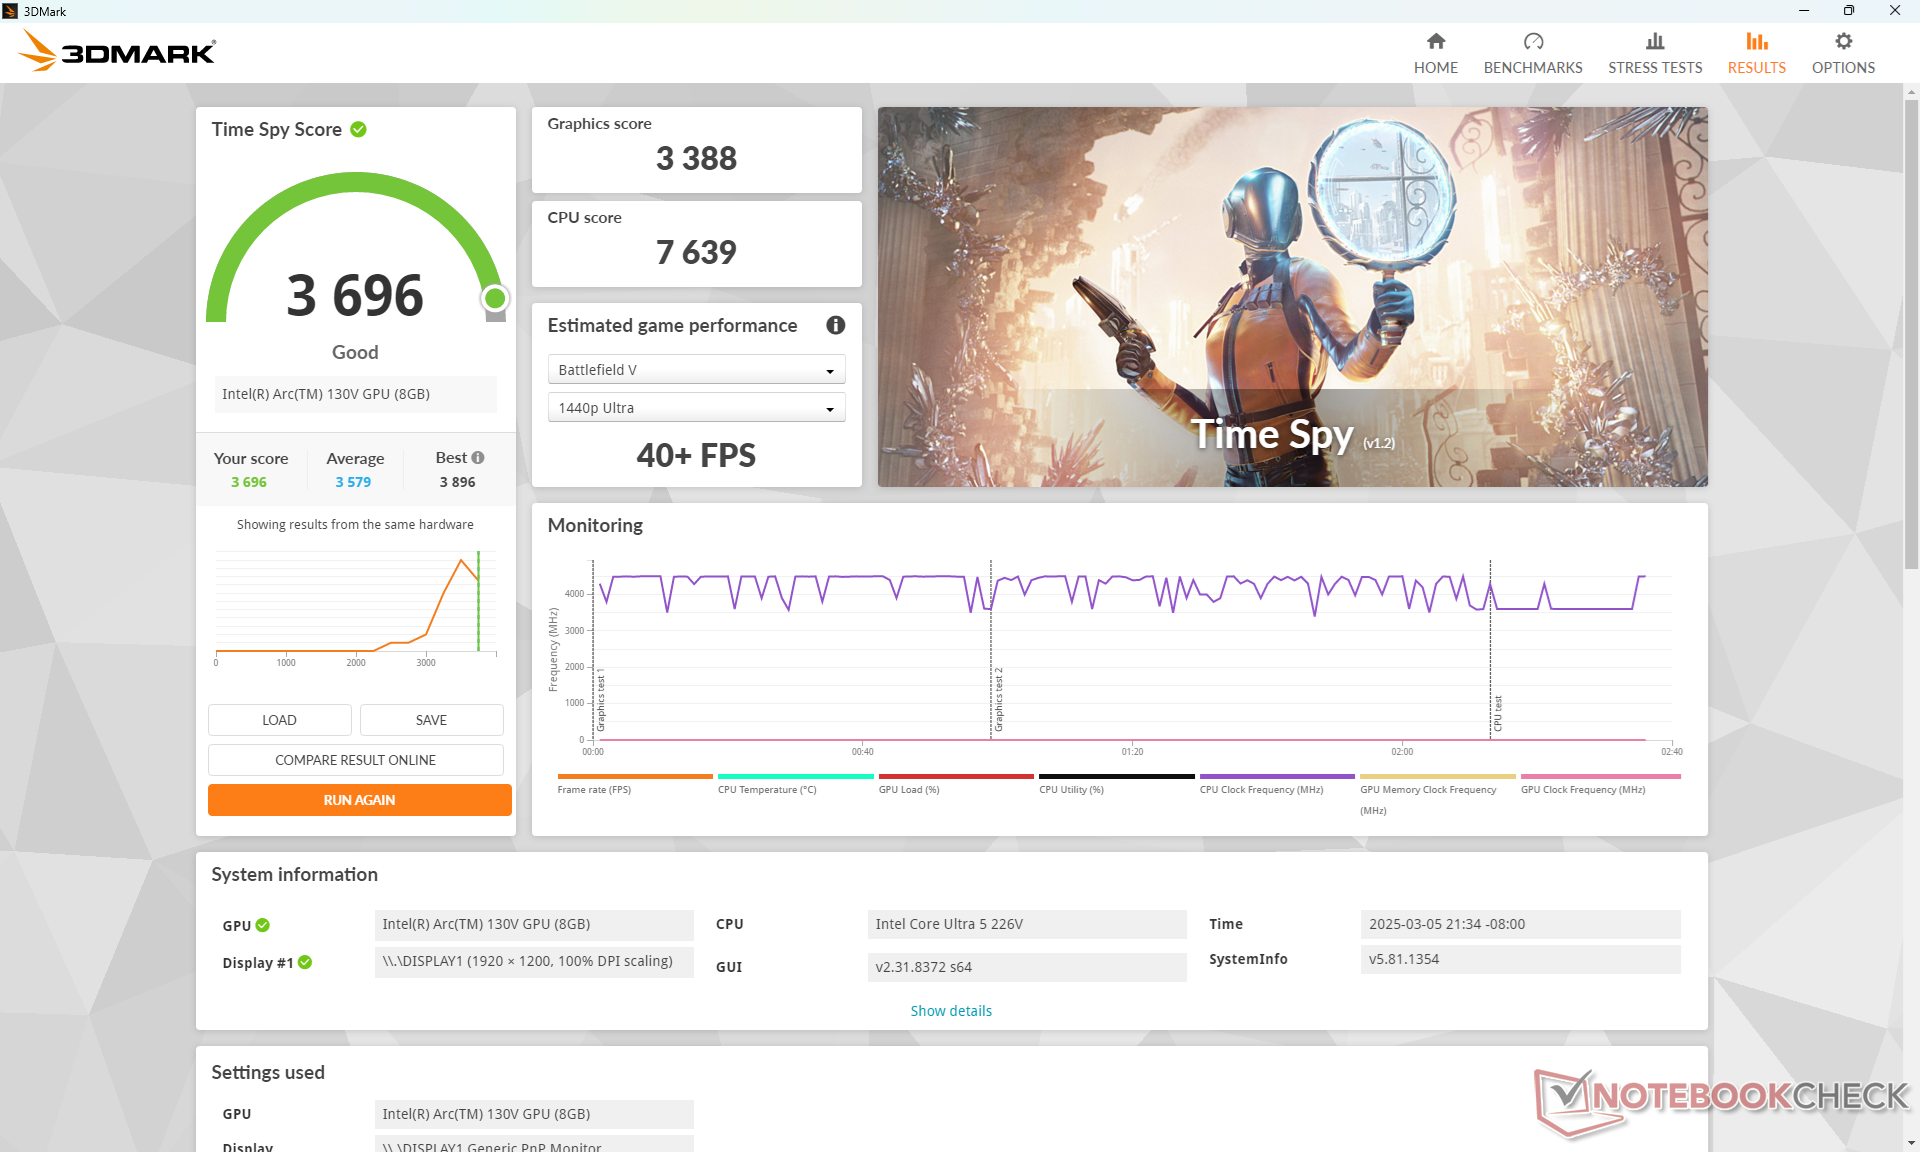
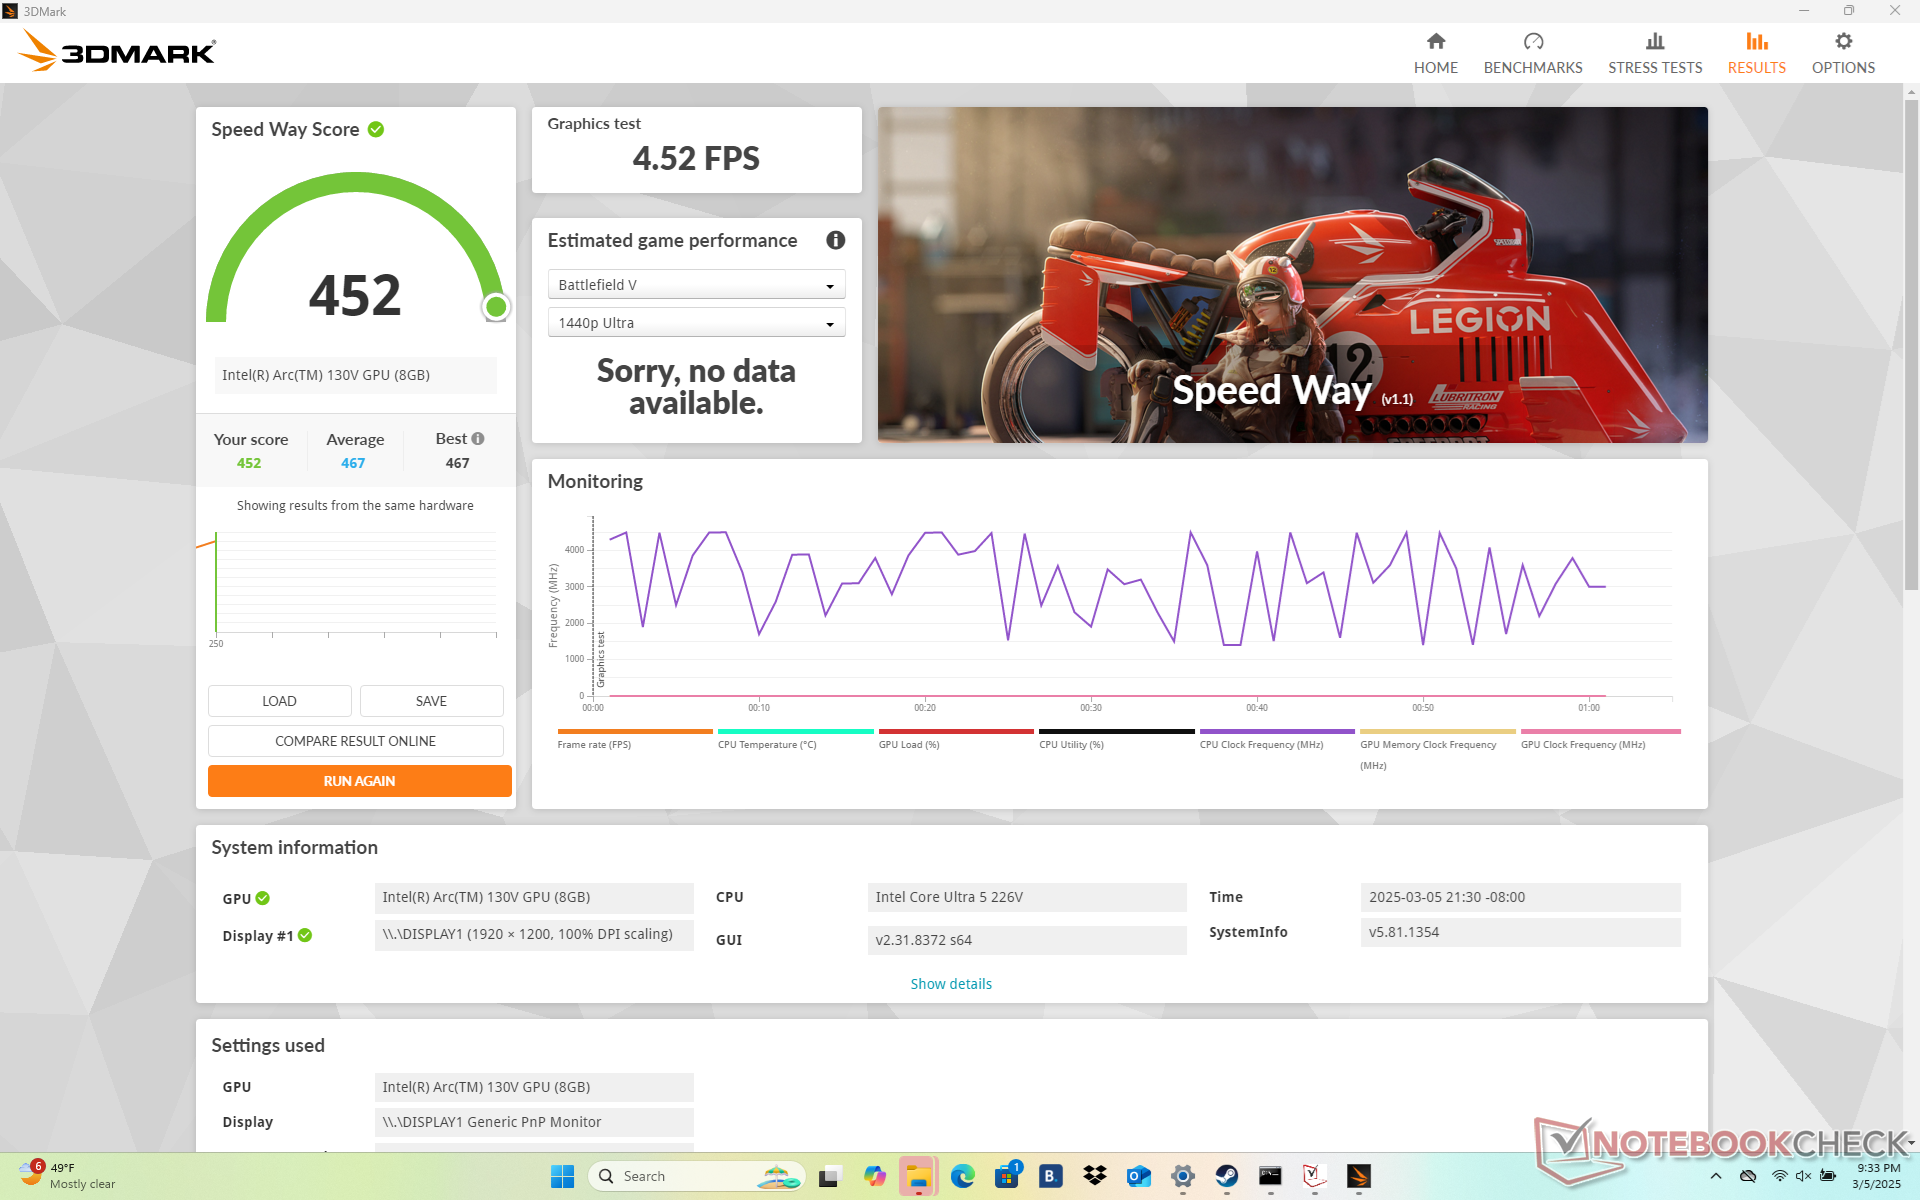
Our integrated Arc 130V is about 10 to 15 percent slower than the Arc 140V in the Core Ultra 7 configuration to be more in line with last year's Arc 8. Even so, it's still significantly faster than the common Iris Xe Graphics G7 96EU by about 2x in titles that support DX12.
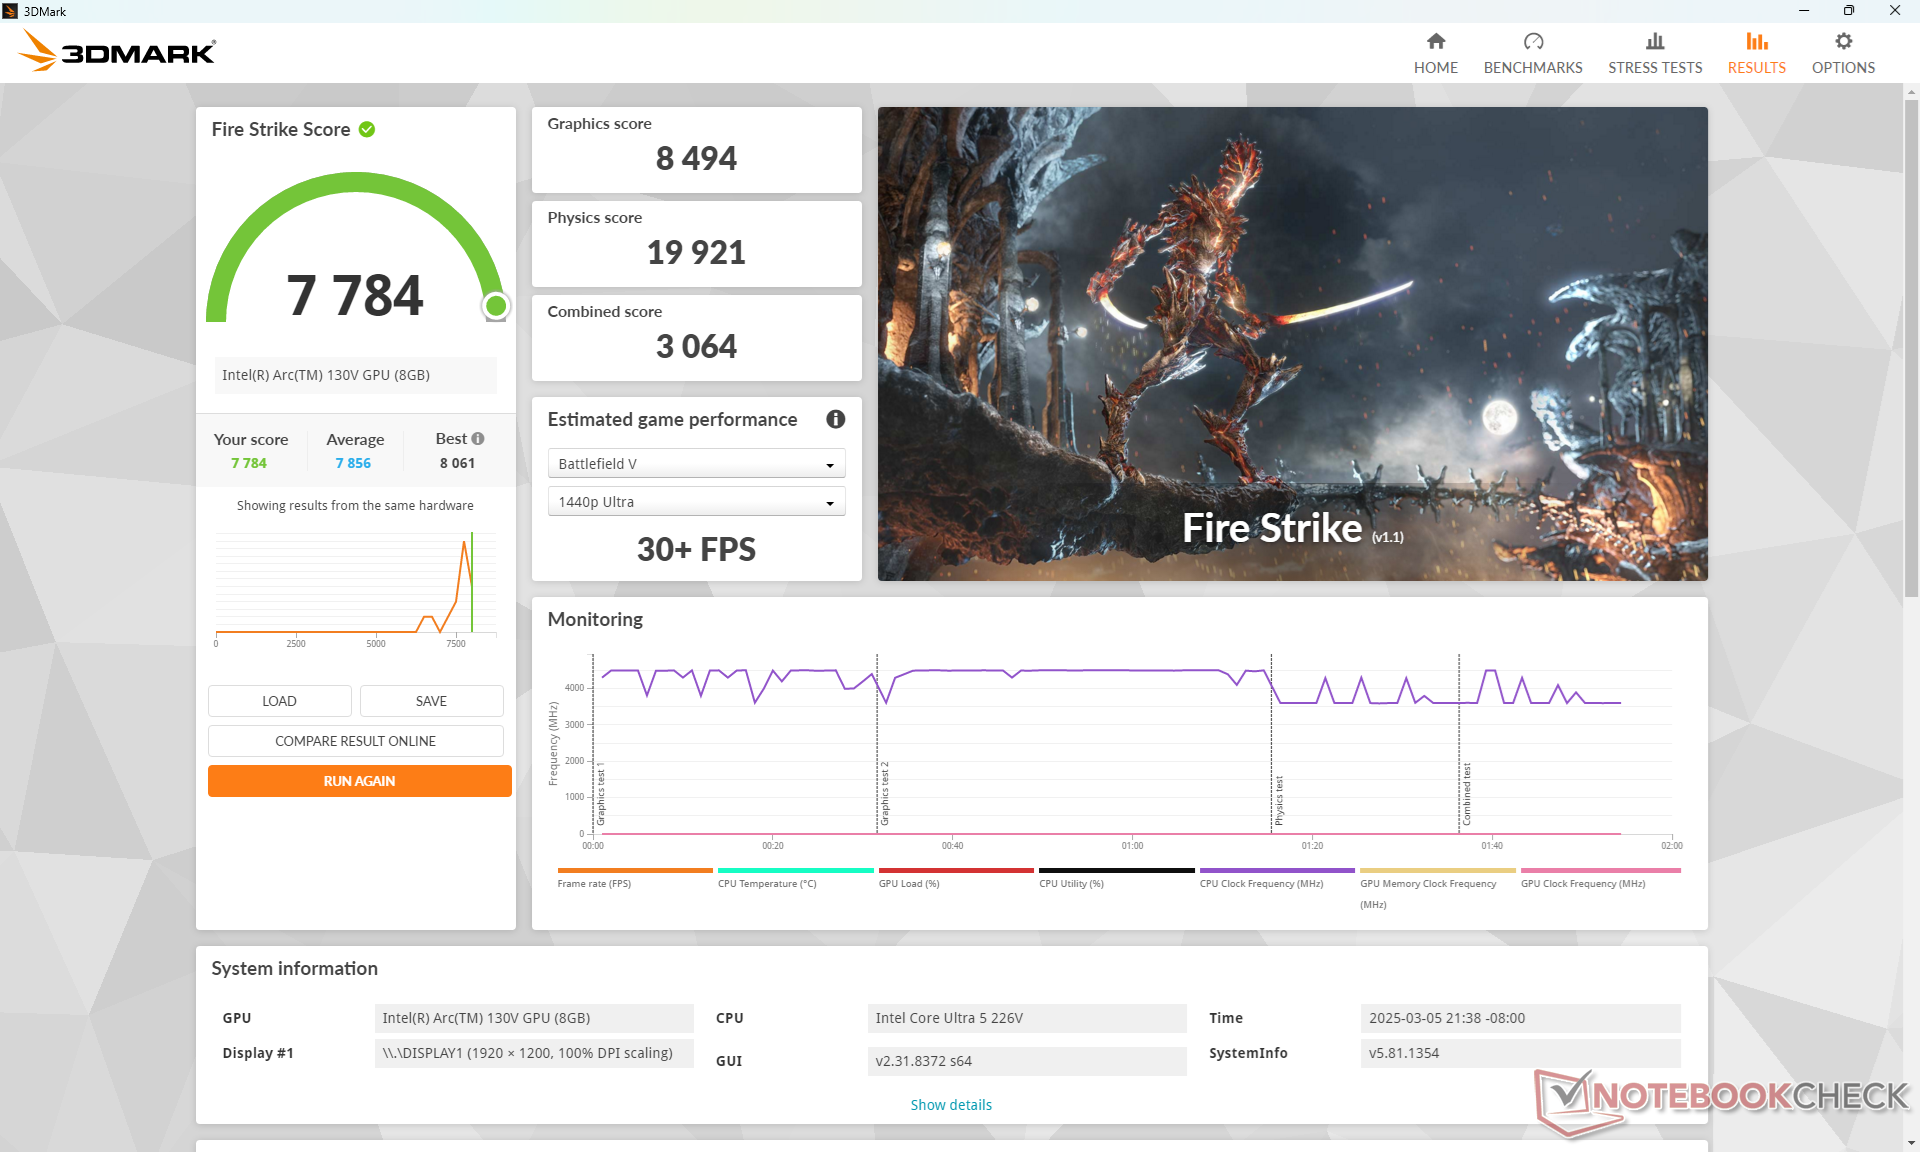
| Power Profile | Graphics Score | Physics Score | Combined Score |
| Performance Mode | 8494 | 19921 | 3064 |
| Balanced Mode | 8622 | 19892 | 3075 |
| Battery Power | 8467 | 19877 | 3150 |
Performance levels differ only minimally at most between the power profiles as shown by our Fire Strike results table above.
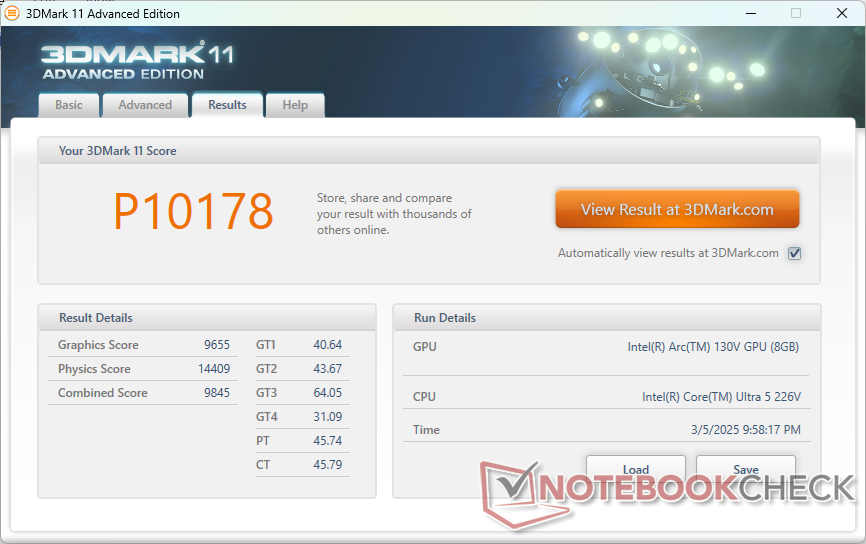
| 3DMark 11 Performance | 10178 points | |
| 3DMark Cloud Gate Standard Score | 31095 points | |
| 3DMark Fire Strike Score | 7784 points | |
| 3DMark Time Spy Score | 3696 points | |
Help | ||
* ... smaller is better
| F1 22 | |
| 1280x720 Ultra Low Preset AA:T AF:16x | |
| HP OmniBook Ultra Flip 14 | |
| Acer Aspire 14 AI N24Q14 | |
| Average Intel Arc Graphics 130V (n=1) | |
| Dell Inspiron 14 Plus 7440 | |
| HP Pavilion Plus 14-ew0153TU | |
| 1920x1080 Low Preset AA:T AF:16x | |
| HP OmniBook Ultra Flip 14 | |
| Acer Aspire 14 AI N24Q14 | |
| Average Intel Arc Graphics 130V (n=1) | |
| Dell Inspiron 14 Plus 7440 | |
| HP Pavilion Plus 14-ew0153TU | |
| 1920x1080 Medium Preset AA:T AF:16x | |
| HP OmniBook Ultra Flip 14 | |
| Acer Aspire 14 AI N24Q14 | |
| Average Intel Arc Graphics 130V (n=1) | |
| Dell Inspiron 14 Plus 7440 | |
| HP Pavilion Plus 14-ew0153TU | |
| 1920x1080 High Preset AA:T AF:16x | |
| HP OmniBook Ultra Flip 14 | |
| Acer Aspire 14 AI N24Q14 | |
| Average Intel Arc Graphics 130V (n=1) | |
| HP Pavilion Plus 14-ew0153TU | |
| 1920x1080 Ultra High Preset AA:T AF:16x | |
| HP OmniBook Ultra Flip 14 | |
| HP Pavilion Plus 14-ew0153TU | |
| Acer Aspire 14 AI N24Q14 | |
| Average Intel Arc Graphics 130V (n=1) | |
| Tiny Tina's Wonderlands | |
| 1280x720 Lowest Preset (DX12) | |
| Acer Aspire 14 AI N24Q14 | |
| Average Intel Arc Graphics 130V (n=1) | |
| HP OmniBook Ultra Flip 14 | |
| Dell Inspiron 14 Plus 7440 | |
| 1920x1080 Low Preset (DX12) | |
| HP OmniBook Ultra Flip 14 | |
| Acer Aspire 14 AI N24Q14 | |
| Average Intel Arc Graphics 130V (n=1) | |
| Dell Inspiron 14 Plus 7440 | |
| 1920x1080 Medium Preset (DX12) | |
| HP OmniBook Ultra Flip 14 | |
| Acer Aspire 14 AI N24Q14 | |
| Average Intel Arc Graphics 130V (n=1) | |
| Dell Inspiron 14 Plus 7440 | |
| 1920x1080 High Preset (DX12) | |
| HP OmniBook Ultra Flip 14 | |
| Acer Aspire 14 AI N24Q14 | |
| Average Intel Arc Graphics 130V (n=1) | |
| Dell Inspiron 14 Plus 7440 | |
| 1920x1080 Badass Preset (DX12) | |
| HP OmniBook Ultra Flip 14 | |
| Acer Aspire 14 AI N24Q14 | |
| Average Intel Arc Graphics 130V (n=1) | |
| Dell Inspiron 14 Plus 7440 | |
Cyberpunk 2077 ultra FPS Chart
| low | med. | high | ultra | |
|---|---|---|---|---|
| GTA V (2015) | 151.2 | 133.6 | 58.1 | 22.7 |
| Dota 2 Reborn (2015) | 90.9 | 82.8 | 78.5 | 82.9 |
| Final Fantasy XV Benchmark (2018) | 73.5 | 41.4 | 30 | |
| X-Plane 11.11 (2018) | 43.3 | 33.5 | 29.7 | |
| Far Cry 5 (2018) | 80 | 45 | 41 | 38 |
| Strange Brigade (2018) | 205 | 76.7 | 62 | 51.8 |
| Tiny Tina's Wonderlands (2022) | 61.1 | 43.6 | 27.2 | 21.2 |
| F1 22 (2022) | 91.2 | 81.3 | 59.7 | 18 |
| Baldur's Gate 3 (2023) | 27.3 | 24.6 | 23.8 | |
| Cyberpunk 2077 (2023) | 39.3 | 30.5 | 26.9 | 23.9 |
Emissions
System Noise
Fan noise is quieter than competing machines especially those running on AMD hardware or Intel H-series CPUs. The fan also takes longer to speed up and so the machine is able to run quieter for longer before fan noise becomes noticeable.
Noise level
| Idle |
| 23.7 / 23.7 / 26.2 dB(A) |
| Load |
| 33.5 / 38.3 dB(A) |
 | ||
30 dB silent 40 dB(A) audible 50 dB(A) loud |
||
min: | ||
| Acer Aspire 14 AI N24Q14 Arc 130V, Core Ultra 5 226V, Western Digital PC SN5000S SDEQNSJ-1T00 | Acer Swift 14 AI SF14-51-58TU Arc 130V, Core Ultra 5 226V, Micron 2550 512GB | Lenovo IdeaPad Slim 3 14 AHP G10 Radeon 780M, R7 8840HS, Micron 2500 MTFDKBA512QGN | Asus Vivobook S 14 OLED S5406SA Arc 130V, Core Ultra 5 226V, Micron 2500 MTFDKBA512QGN | Dell Inspiron 14 Plus 7440 Arc 8-Core, Ultra 7 155H, WD PC SN740 SDDPTQD-1T00 | HP Pavilion Plus 14-ew0153TU Iris Xe G7 96EUs, i7-1355U, SK hynix PC801 HFS001TEJ9X101N | |
|---|---|---|---|---|---|---|
| Noise | -9% | -6% | -1% | -10% | 14% | |
| off / environment * (dB) | 23.7 | 25 -5% | 24.2 -2% | 24.2 -2% | 23.6 -0% | 19.35 18% |
| Idle Minimum * (dB) | 23.7 | 25 -5% | 24.2 -2% | 24.2 -2% | 23.7 -0% | 20.57 13% |
| Idle Average * (dB) | 23.7 | 26 -10% | 24.2 -2% | 24.2 -2% | 23.7 -0% | 20.57 13% |
| Idle Maximum * (dB) | 26.2 | 29 -11% | 26.8 -2% | 24.2 8% | 27 -3% | 20.57 21% |
| Load Average * (dB) | 33.5 | 40 -19% | 40.8 -22% | 28.8 14% | 41.8 -25% | 32.18 4% |
| Cyberpunk 2077 ultra * (dB) | 37 | 40 -8% | 38 -3% | 37.6 -2% | ||
| Load Maximum * (dB) | 38.3 | 41 -7% | 40.8 -7% | 45.6 -19% | 50.7 -32% | 32.26 16% |
| Witcher 3 ultra * (dB) | 45.7 | 29.44 |
* ... smaller is better
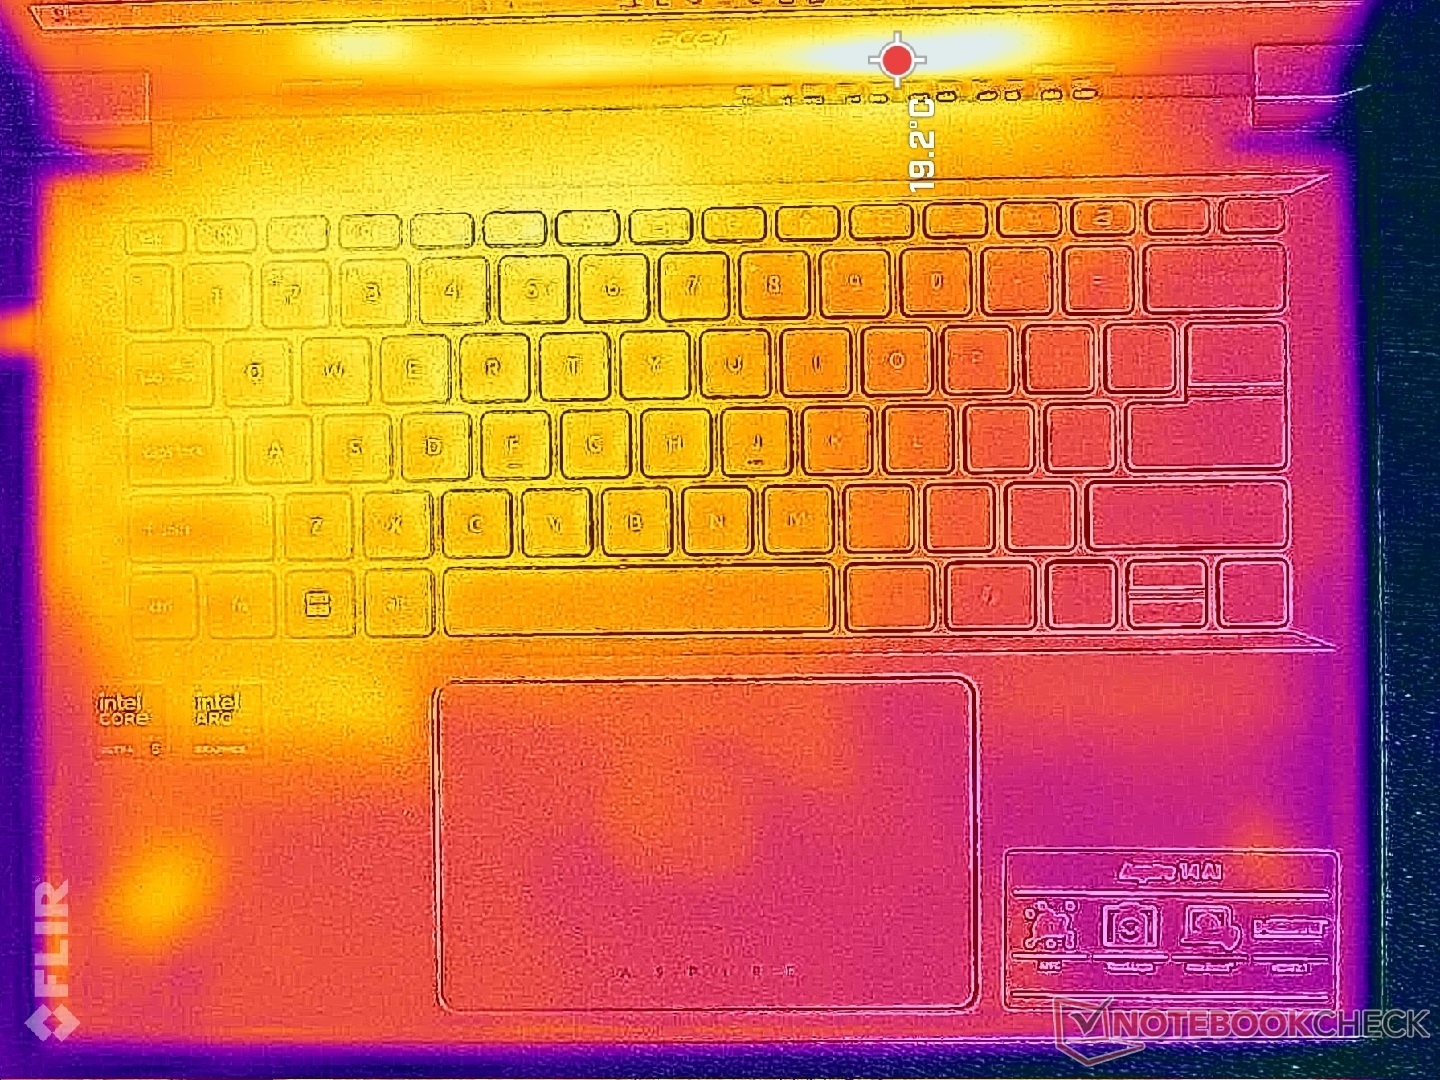
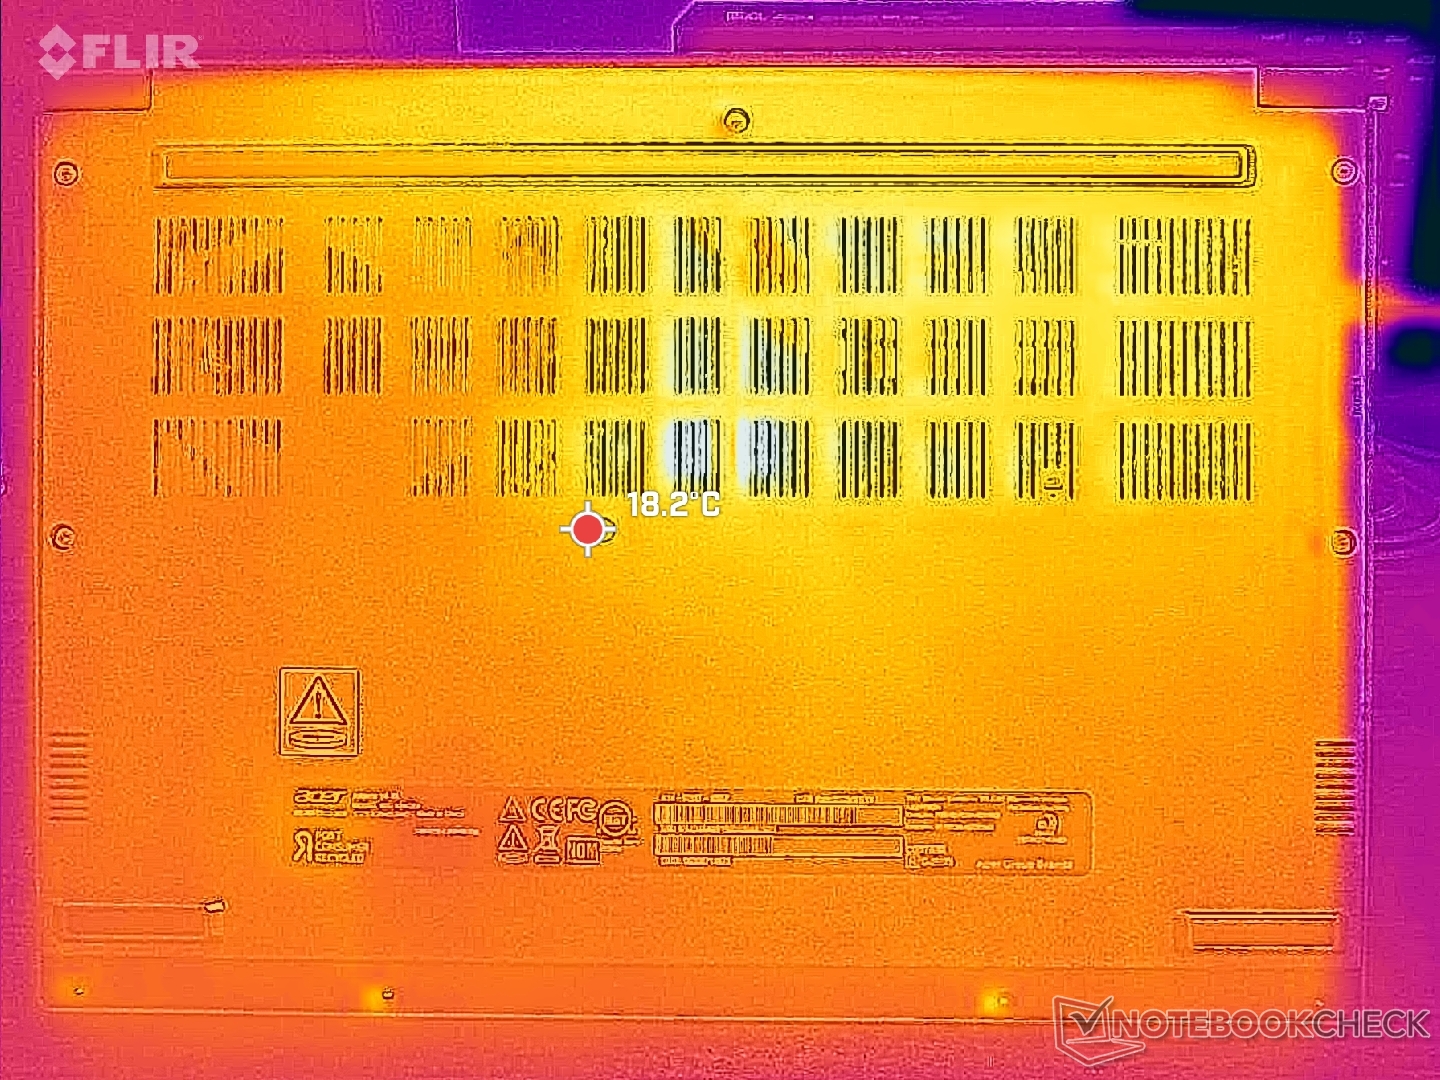
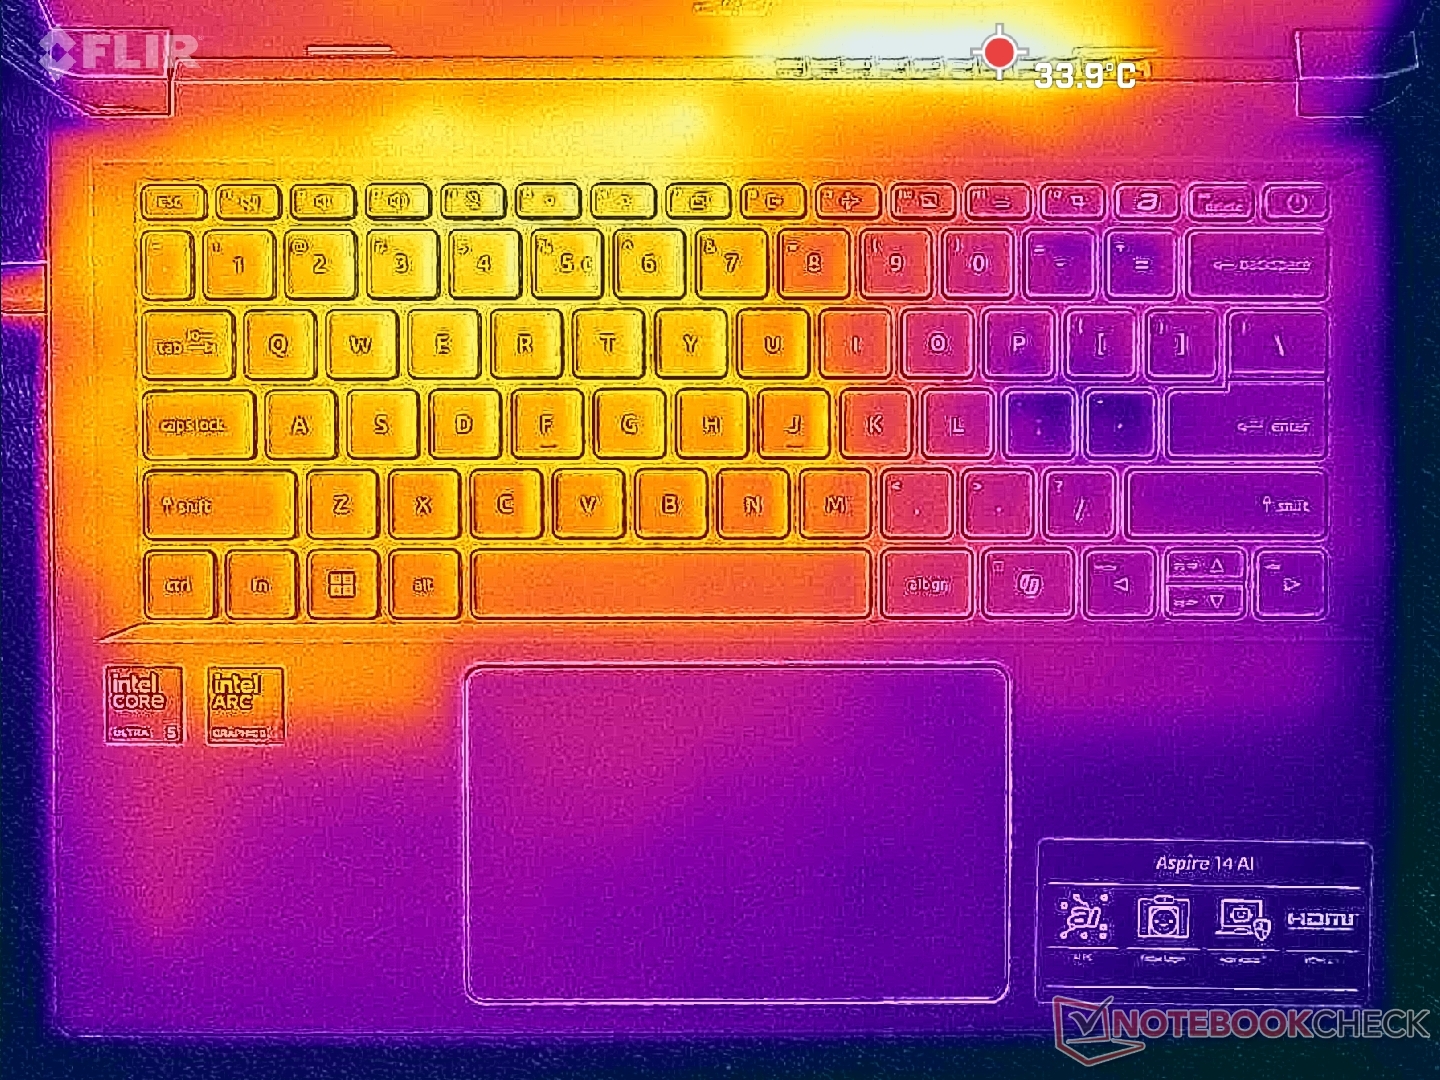
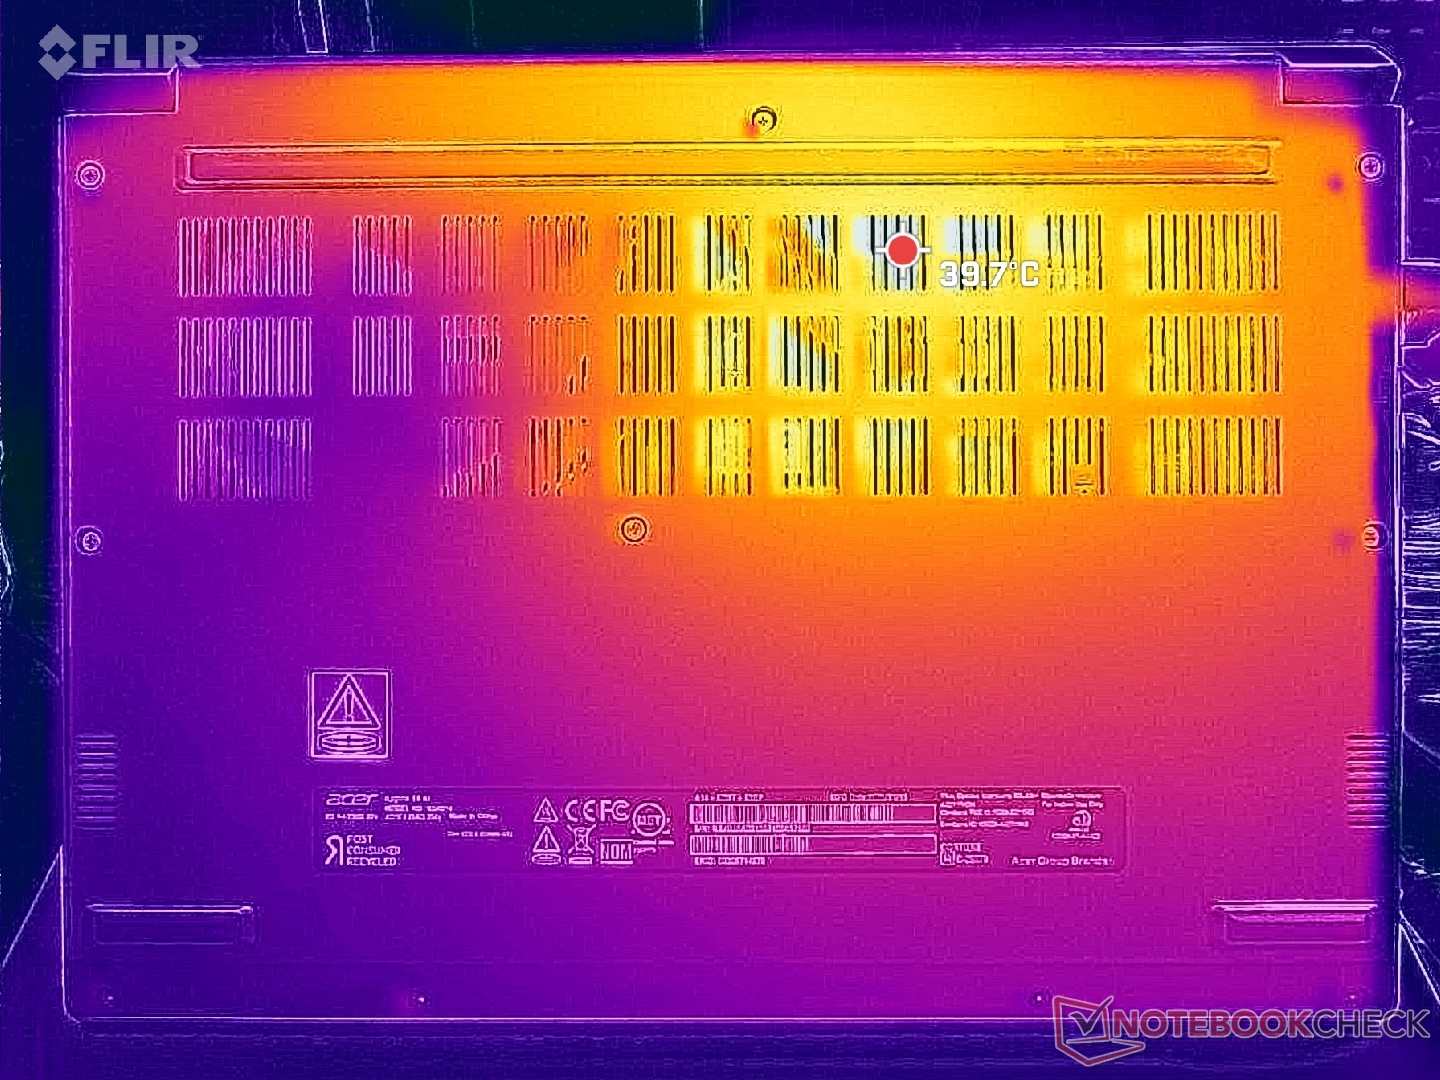
Temperature
Surface temperatures are warmest on the left half of the chassis where hot spots can reach 35 C. The system runs noticeably cooler than on the more expensive but thinner Swift 14 AI running on the same processor.
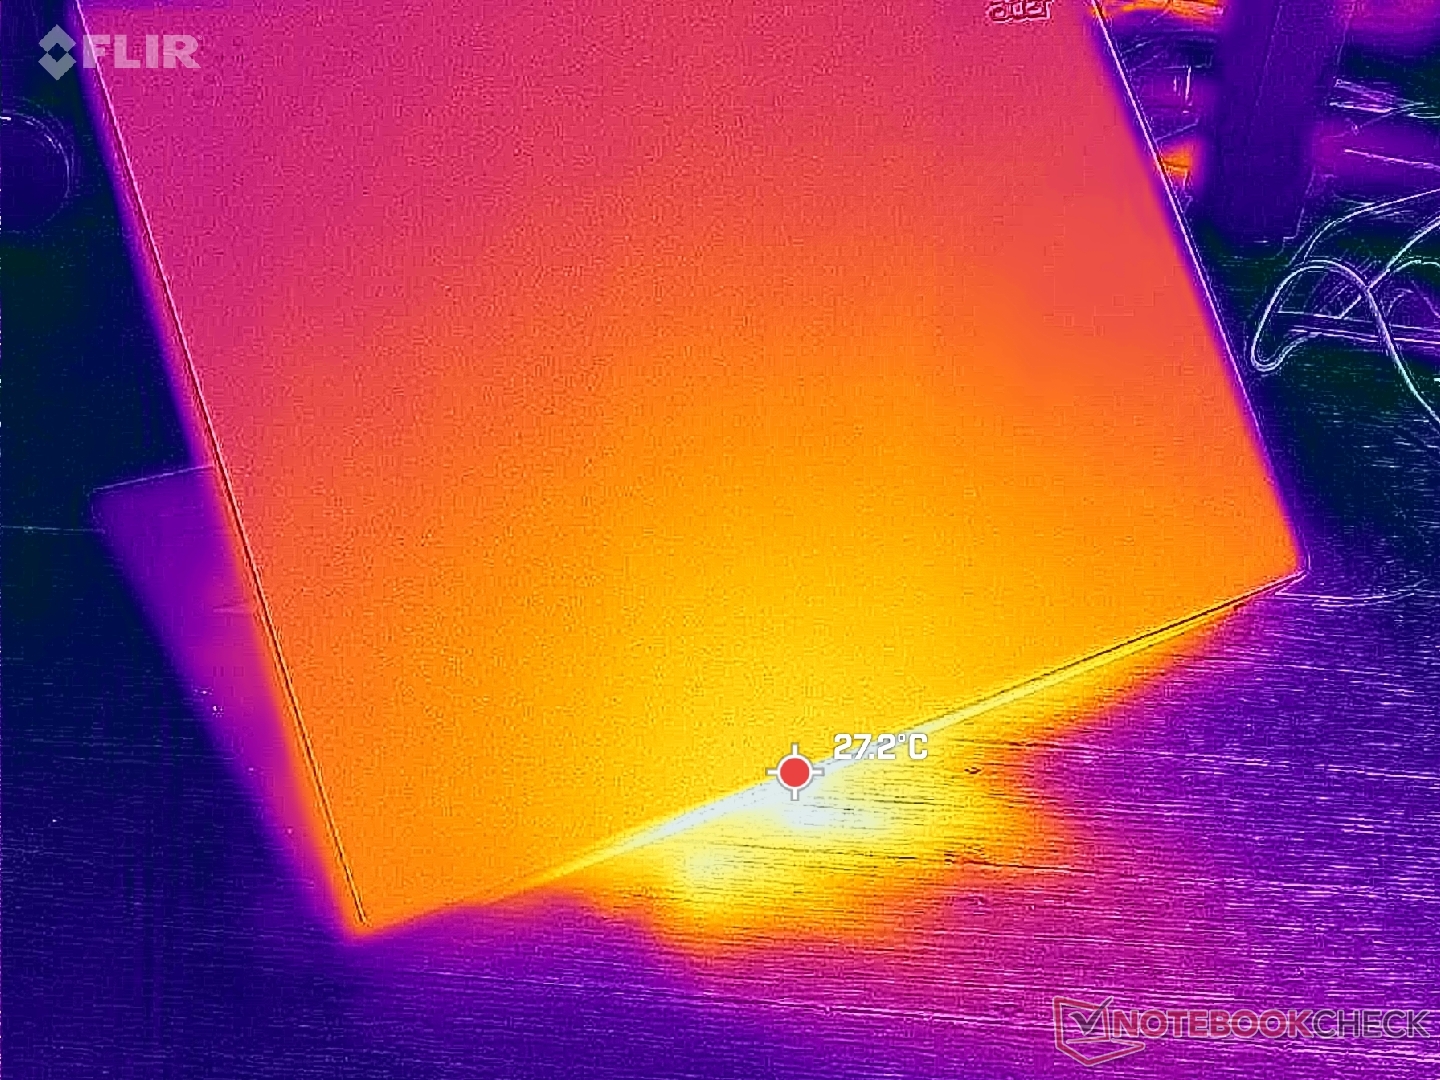
(+) The maximum temperature on the upper side is 35 °C / 95 F, compared to the average of 35.9 °C / 97 F, ranging from 21.4 to 59 °C for the class Subnotebook.
(+) The bottom heats up to a maximum of 34.6 °C / 94 F, compared to the average of 39.2 °C / 103 F
(+) In idle usage, the average temperature for the upper side is 22 °C / 72 F, compared to the device average of 30.8 °C / 87 F.
(+) The palmrests and touchpad are cooler than skin temperature with a maximum of 25 °C / 77 F and are therefore cool to the touch.
(+) The average temperature of the palmrest area of similar devices was 28.2 °C / 82.8 F (+3.2 °C / 5.8 F).
| Acer Aspire 14 AI N24Q14 Intel Core Ultra 5 226V, Intel Arc Graphics 130V | Acer Swift 14 AI SF14-51-58TU Intel Core Ultra 5 226V, Intel Arc Graphics 130V | Lenovo IdeaPad Slim 3 14 AHP G10 AMD Ryzen 7 8840HS, AMD Radeon 780M | Asus VivoBook S 14 OLED M5406WA AMD Ryzen AI 9 HX 370, AMD Radeon 890M | Dell Inspiron 14 Plus 7440 Intel Core Ultra 7 155H, Intel Arc 8-Core iGPU | HP Pavilion Plus 14-ew0153TU Intel Core i7-1355U, Intel Iris Xe Graphics G7 96EUs | |
|---|---|---|---|---|---|---|
| Heat | -19% | -23% | -38% | -13% | -18% | |
| Maximum Upper Side * (°C) | 35 | 41 -17% | 38.3 -9% | 49 -40% | 39.2 -12% | 36.6 -5% |
| Maximum Bottom * (°C) | 34.6 | 45 -30% | 51.5 -49% | 59 -71% | 41 -18% | 37.2 -8% |
| Idle Upper Side * (°C) | 23.6 | 26 -10% | 25.8 -9% | 28 -19% | 25.4 -8% | 31.6 -34% |
| Idle Bottom * (°C) | 23.8 | 28 -18% | 29.5 -24% | 29 -22% | 26.8 -13% | 30 -26% |
* ... smaller is better
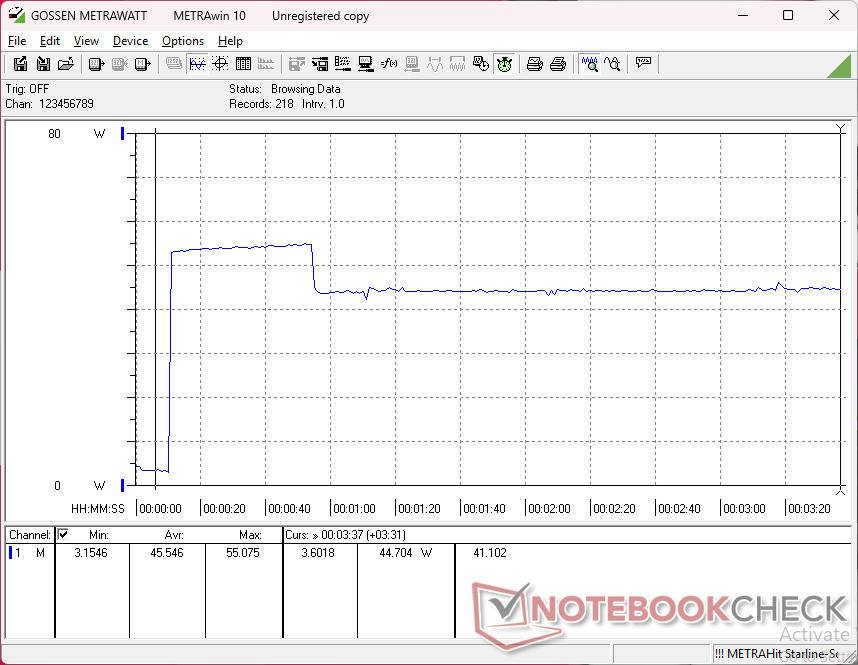
Stress Test
The CPU would boost to 3.1 GHz and 37 W lasting for about 40 seconds or until reaching a core temperature of 72 C. Thereafter, the processor would hover around 2.5 GHz and 25 W in order to maintain a core temperature of 61 C. Core temperature would be about the same as on the Swift 14 AI when under load.
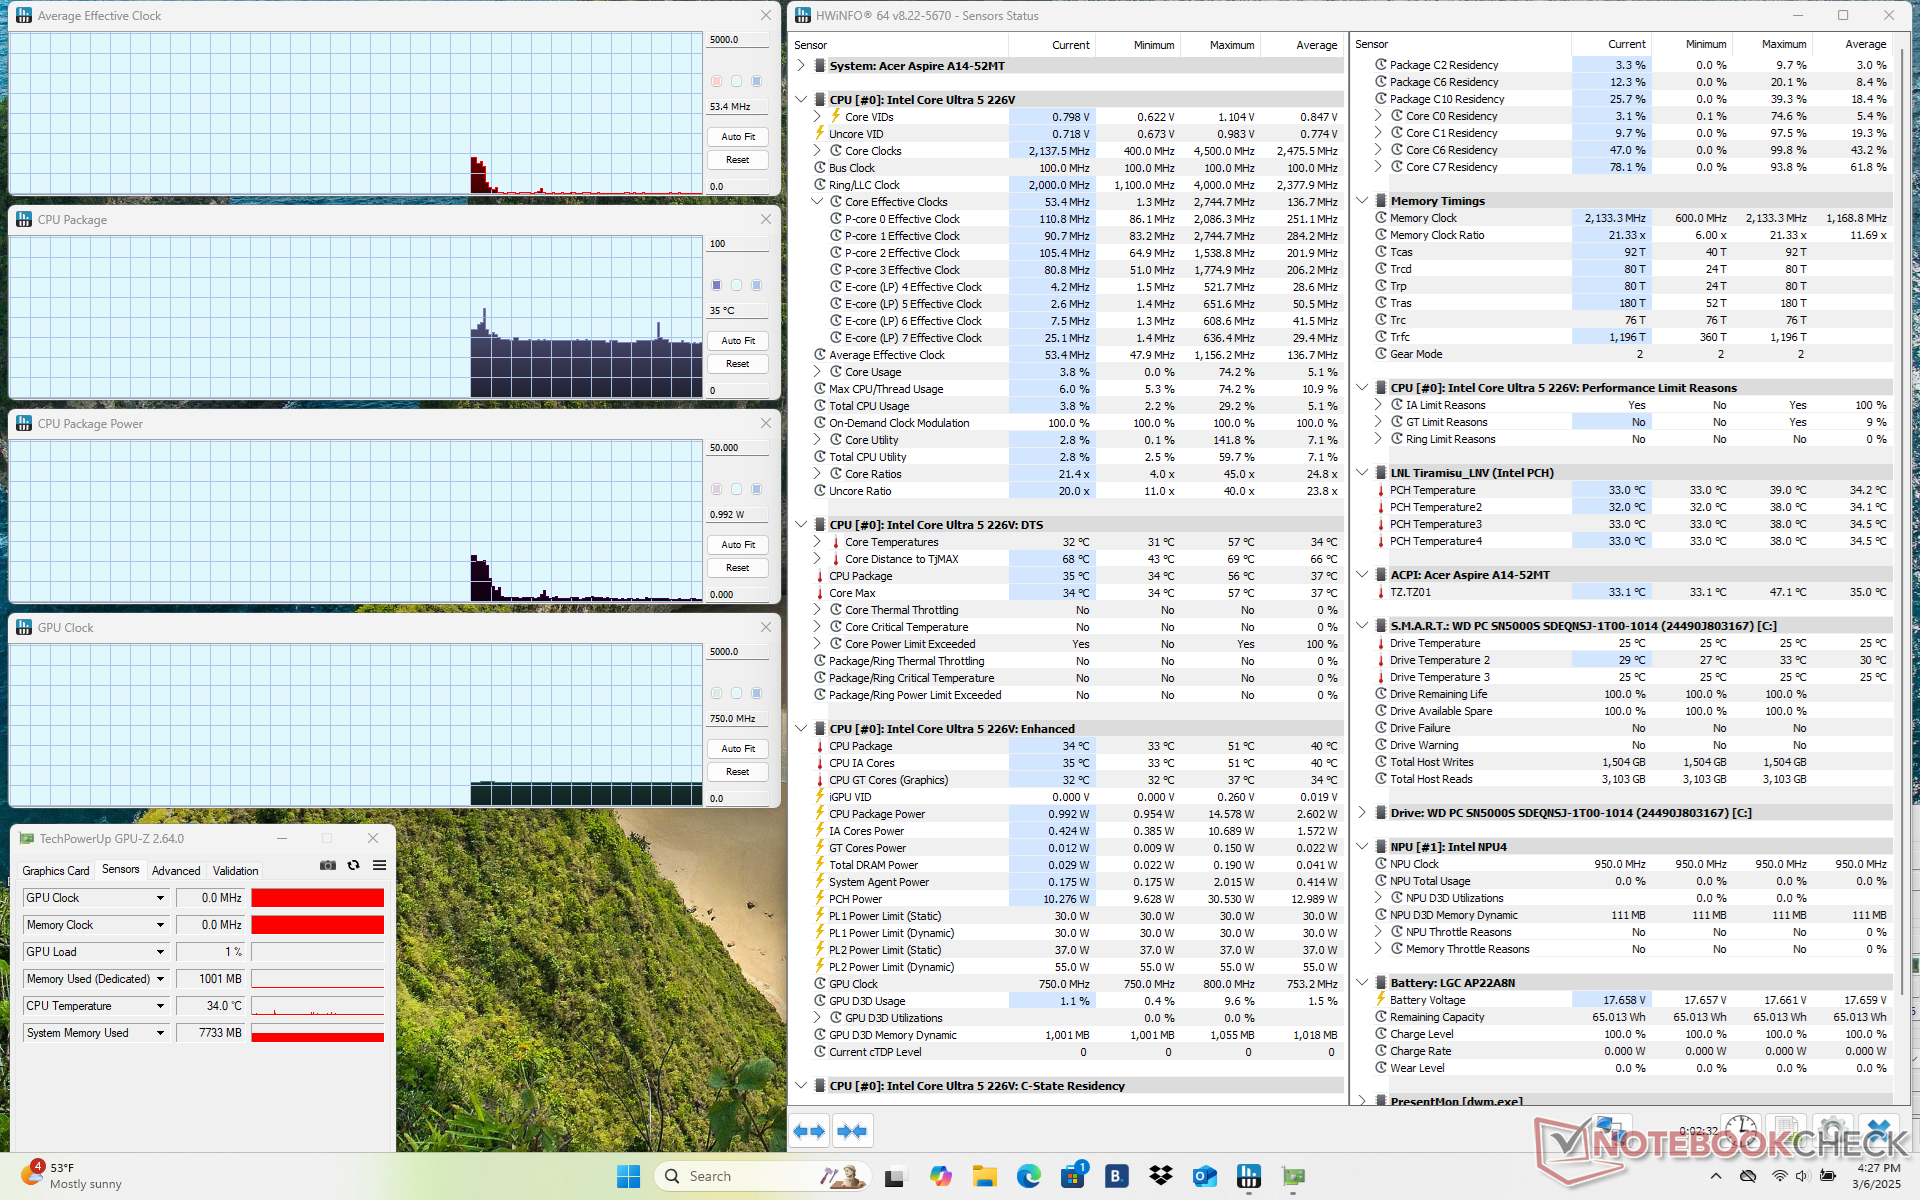
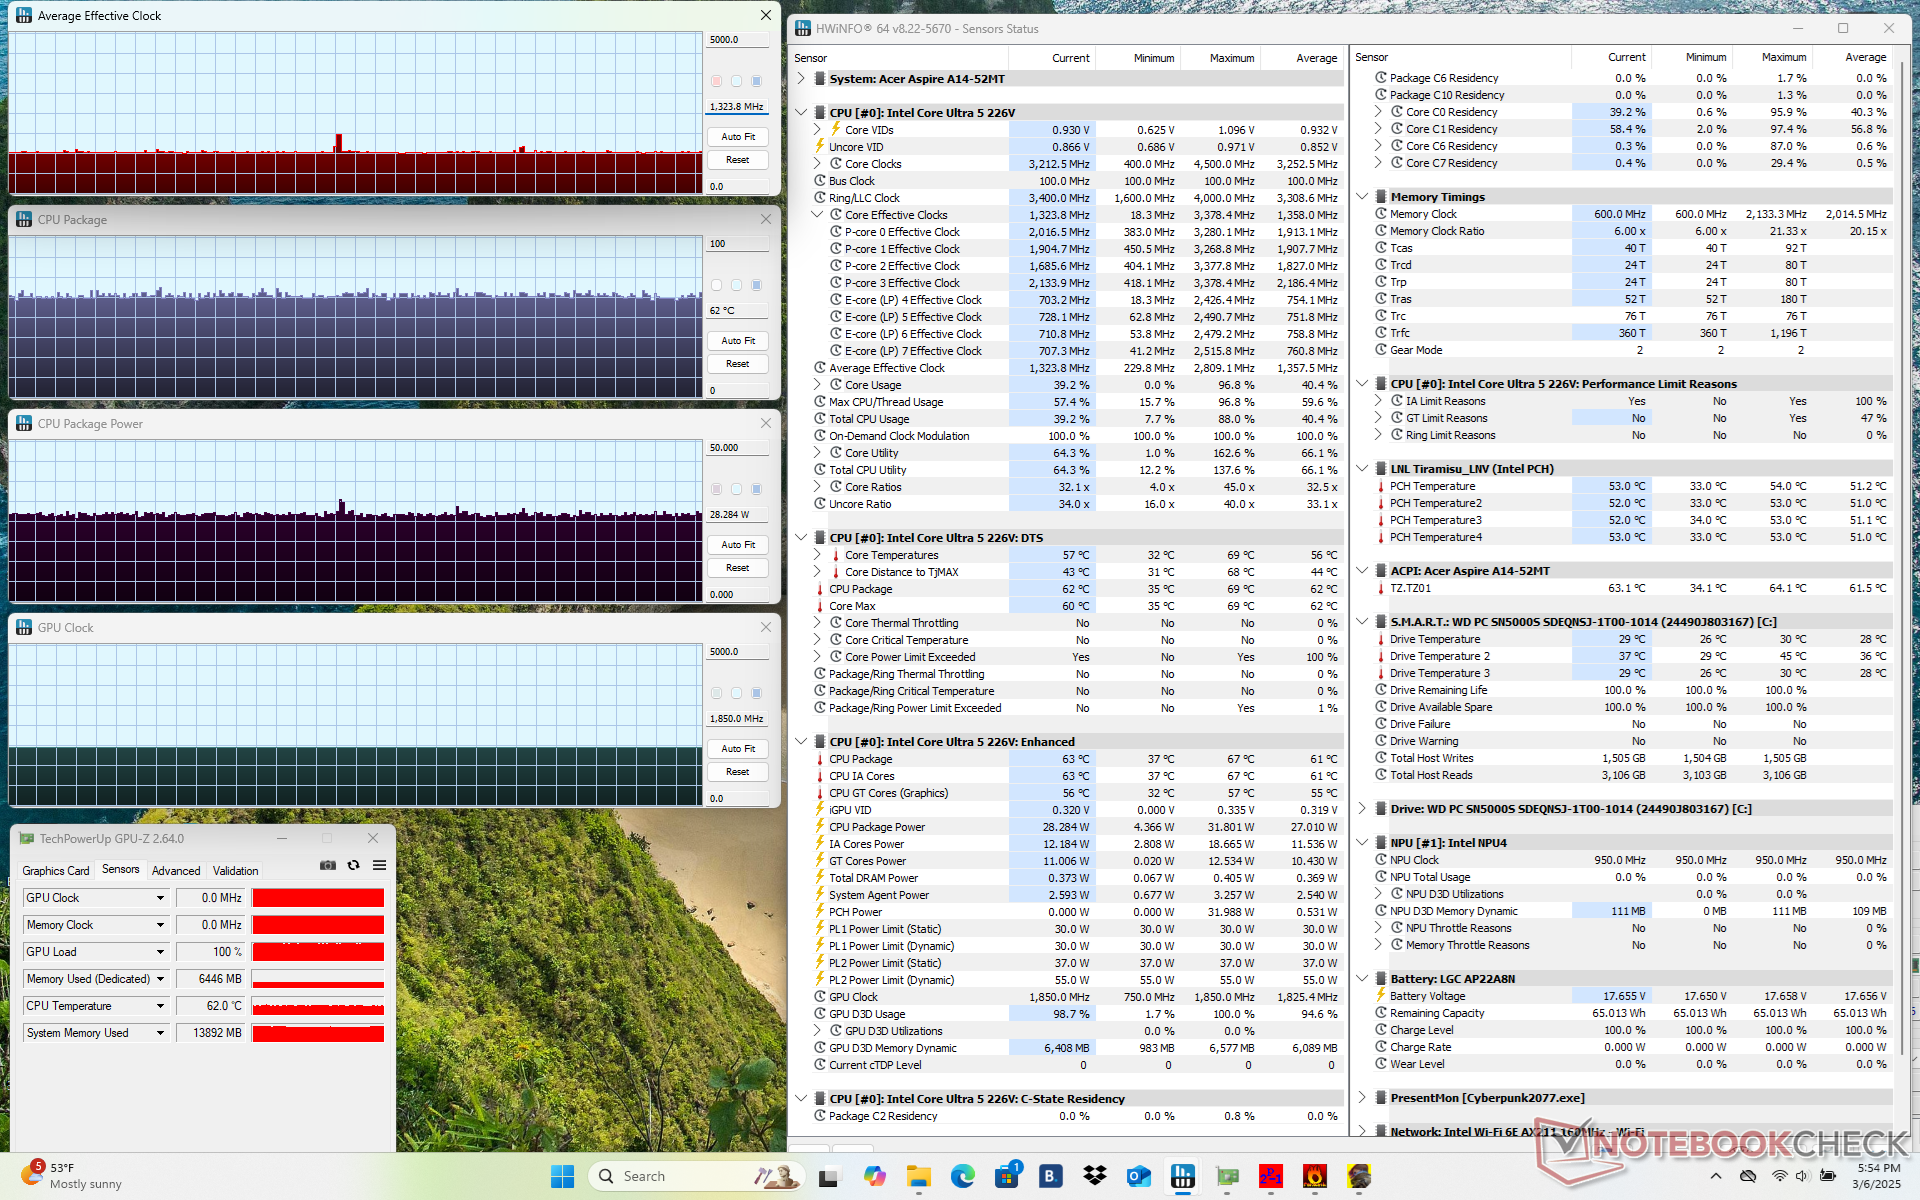
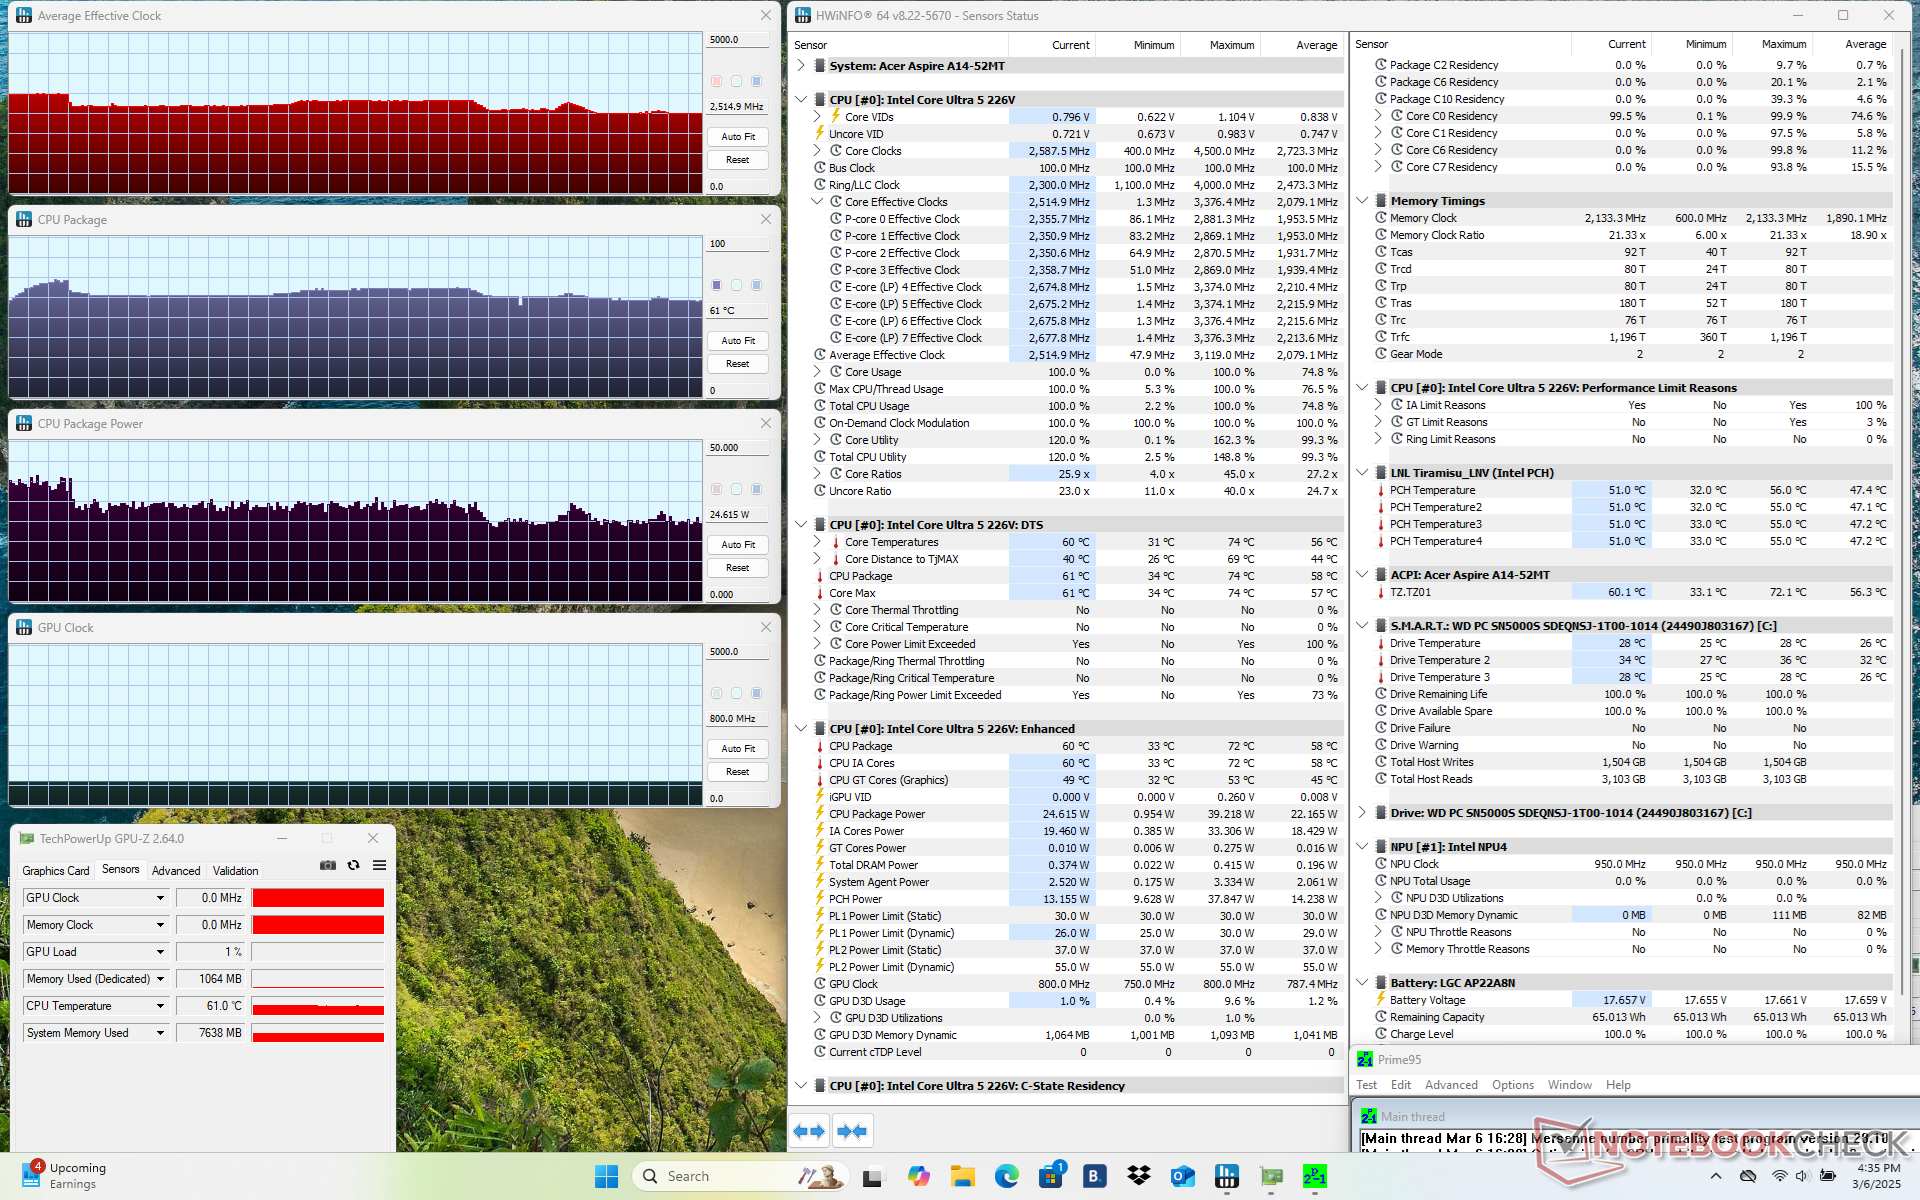
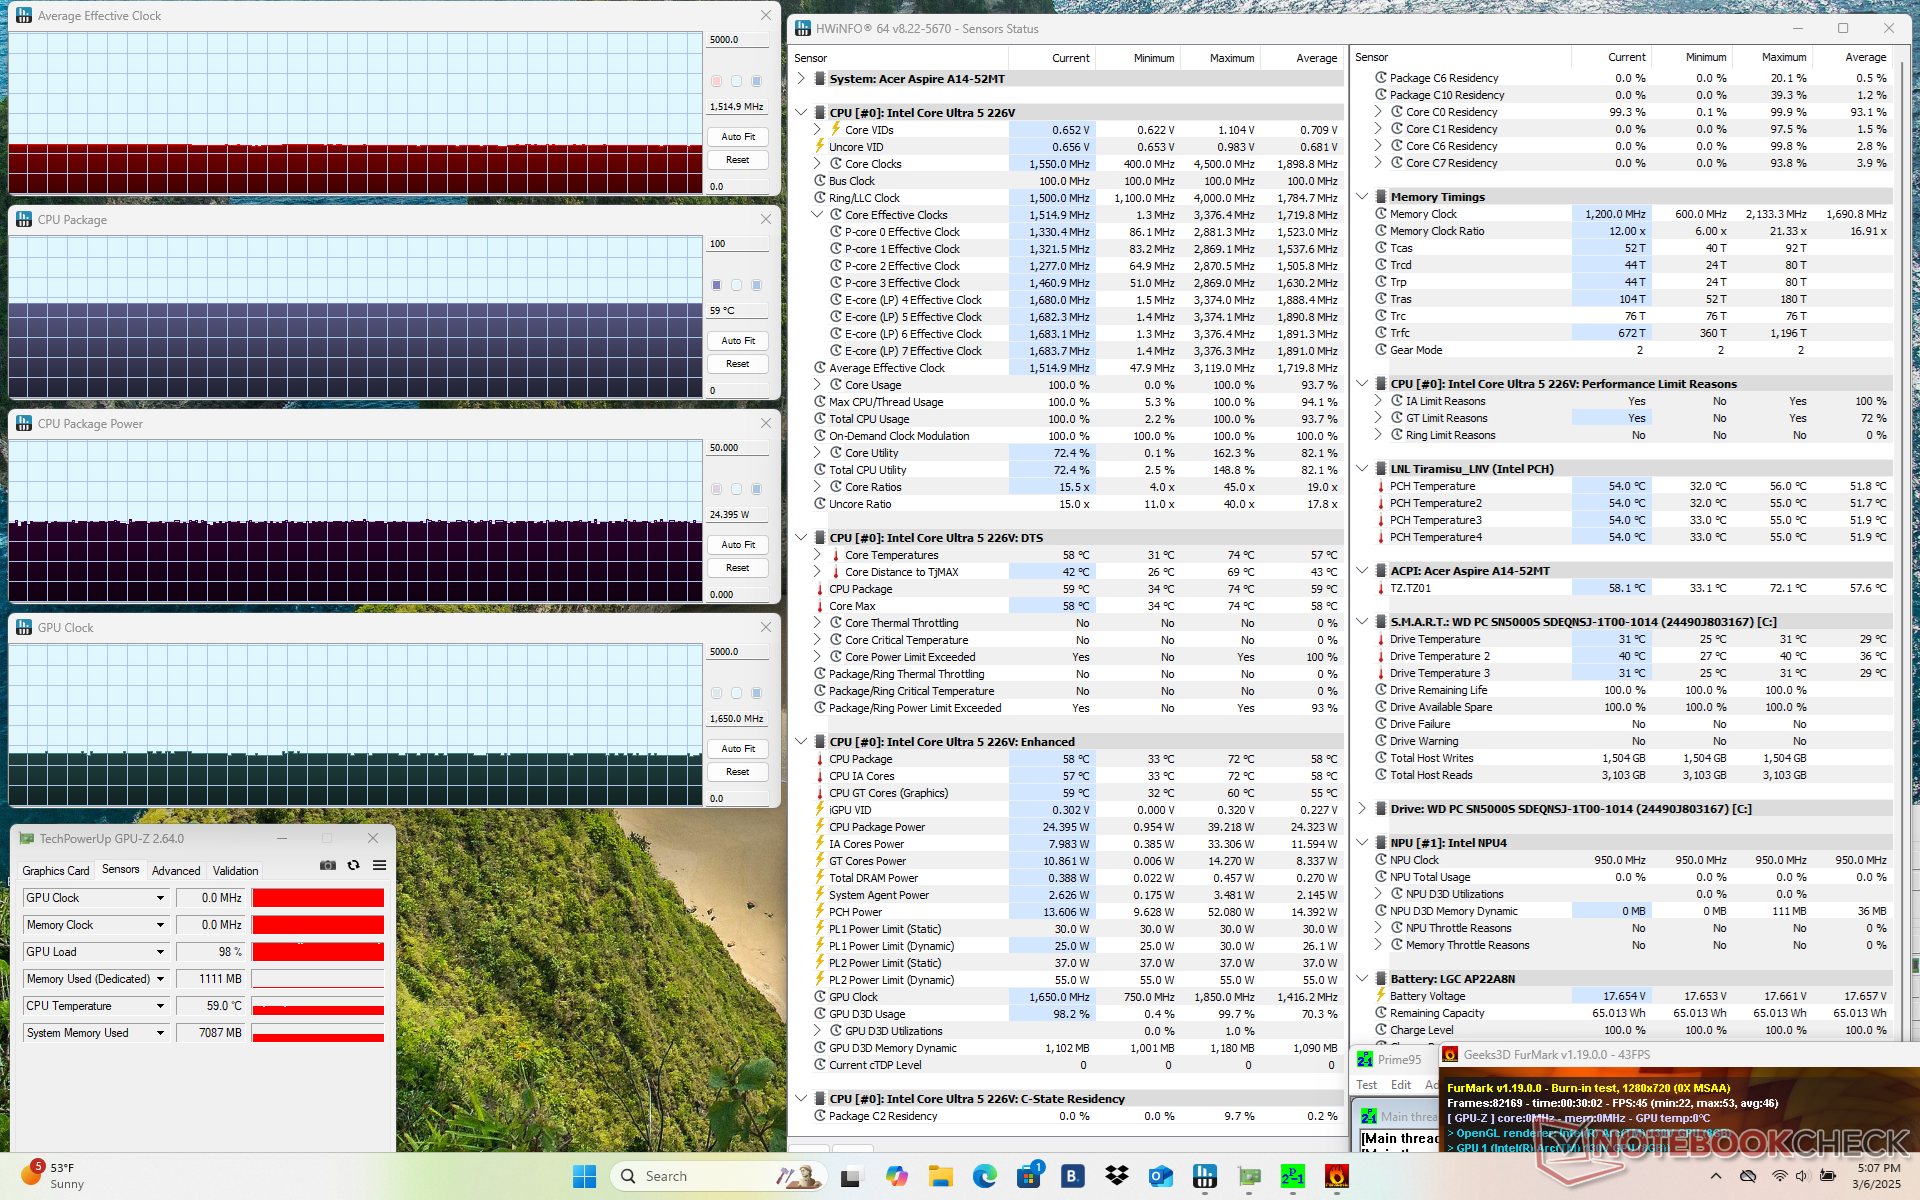
| Average CPU Clock (GHz) | GPU Clock (MHz) | Average CPU Temperature (°C) | |
| System Idle | -- | -- | 35 |
| Prime95 Stress | 2.5 | -- | 61 |
| Prime95 + FurMark Stress | 1.5 | 1650 | 59 |
| Cyberpunk 2077 Stress | 1.3 | 1850 | 62 |
Speakers
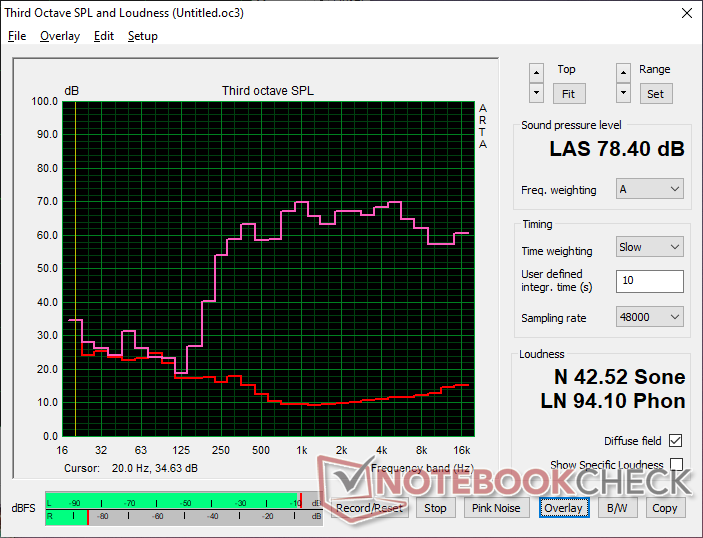
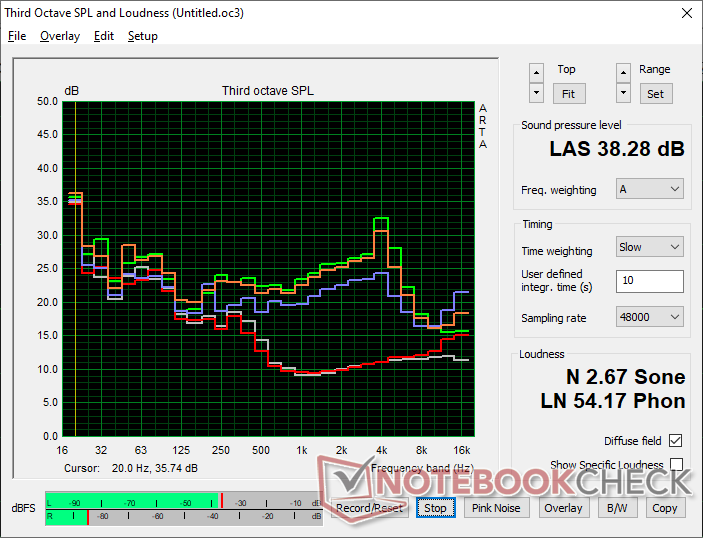
Acer Aspire 14 AI N24Q14 audio analysis
(±) | speaker loudness is average but good (78.4 dB)
Bass 100 - 315 Hz
(-) | nearly no bass - on average 25.1% lower than median
(-) | bass is not linear (15% delta to prev. frequency)
Mids 400 - 2000 Hz
(+) | balanced mids - only 3.8% away from median
(±) | linearity of mids is average (7.7% delta to prev. frequency)
Highs 2 - 16 kHz
(+) | balanced highs - only 4.3% away from median
(+) | highs are linear (5% delta to prev. frequency)
Overall 100 - 16.000 Hz
(±) | linearity of overall sound is average (20.3% difference to median)
Compared to same class
» 64% of all tested devices in this class were better, 9% similar, 27% worse
» The best had a delta of 5%, average was 18%, worst was 53%
Compared to all devices tested
» 53% of all tested devices were better, 8% similar, 39% worse
» The best had a delta of 4%, average was 24%, worst was 134%
Apple MacBook Pro 16 2021 M1 Pro audio analysis
(+) | speakers can play relatively loud (84.7 dB)
Bass 100 - 315 Hz
(+) | good bass - only 3.8% away from median
(+) | bass is linear (5.2% delta to prev. frequency)
Mids 400 - 2000 Hz
(+) | balanced mids - only 1.3% away from median
(+) | mids are linear (2.1% delta to prev. frequency)
Highs 2 - 16 kHz
(+) | balanced highs - only 1.9% away from median
(+) | highs are linear (2.7% delta to prev. frequency)
Overall 100 - 16.000 Hz
(+) | overall sound is linear (4.6% difference to median)
Compared to same class
» 0% of all tested devices in this class were better, 0% similar, 100% worse
» The best had a delta of 5%, average was 17%, worst was 45%
Compared to all devices tested
» 0% of all tested devices were better, 0% similar, 100% worse
» The best had a delta of 4%, average was 24%, worst was 134%
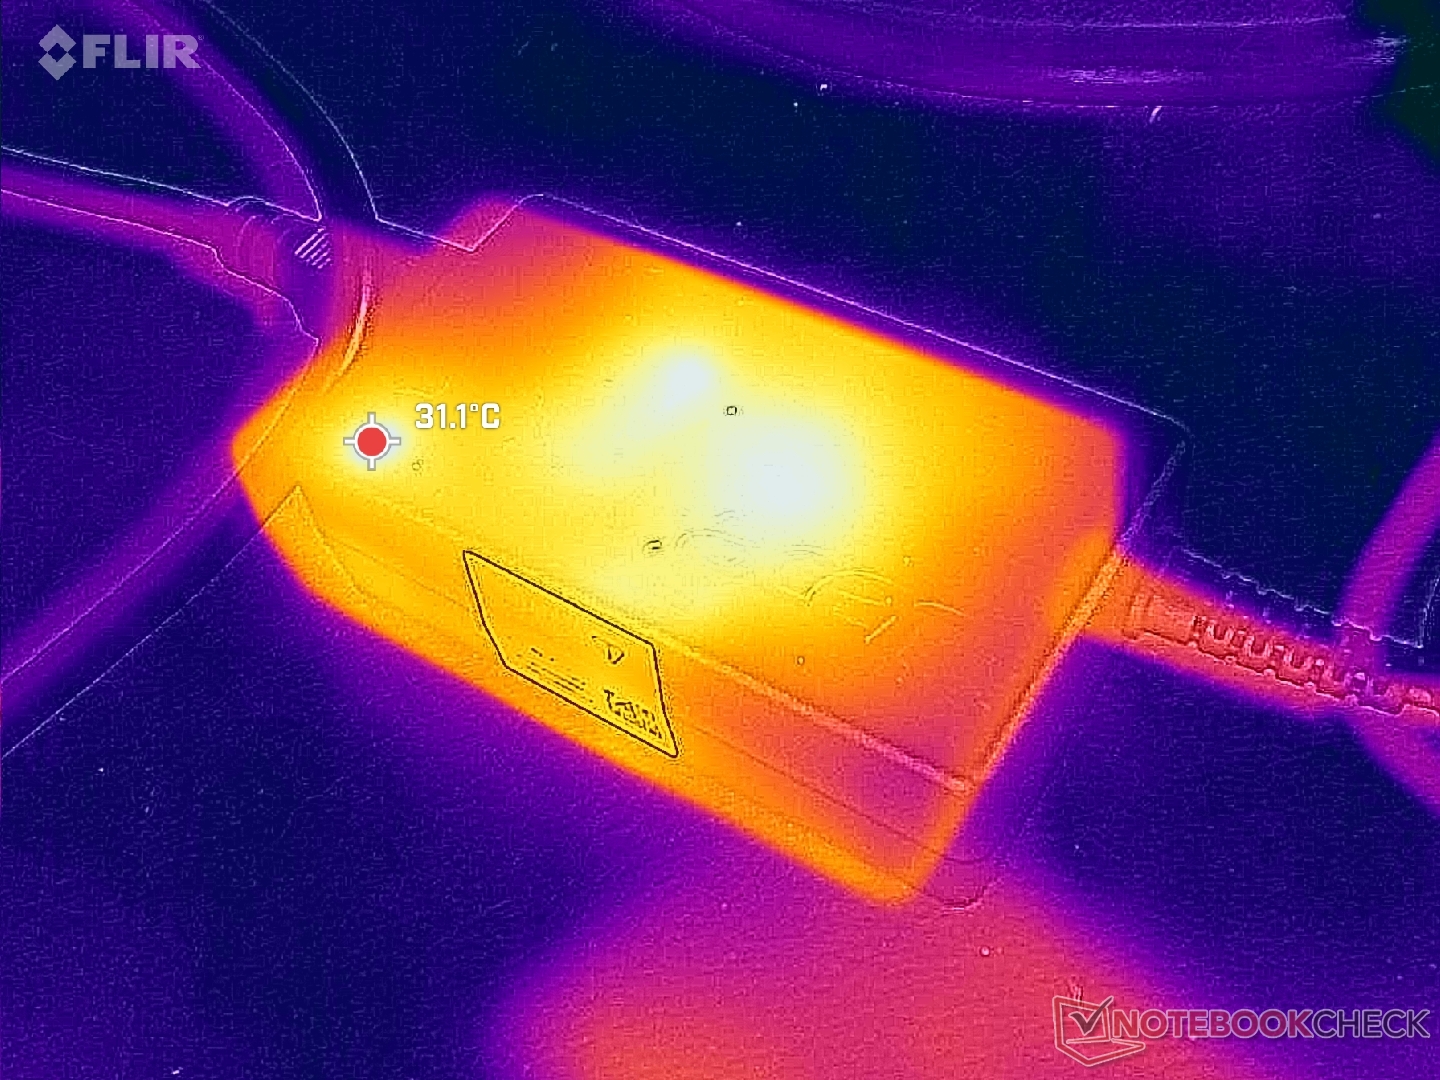
Energy Management
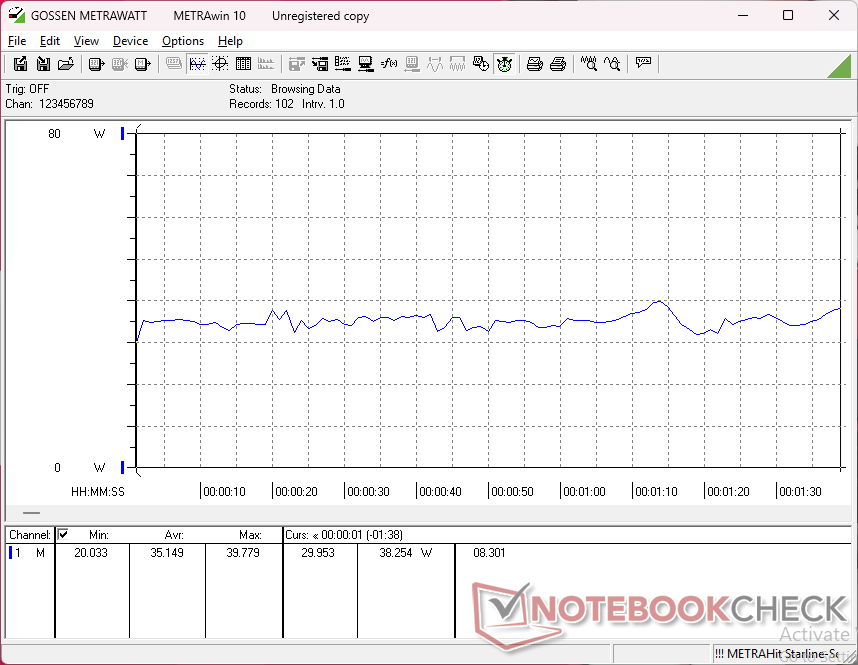
Power Consumption
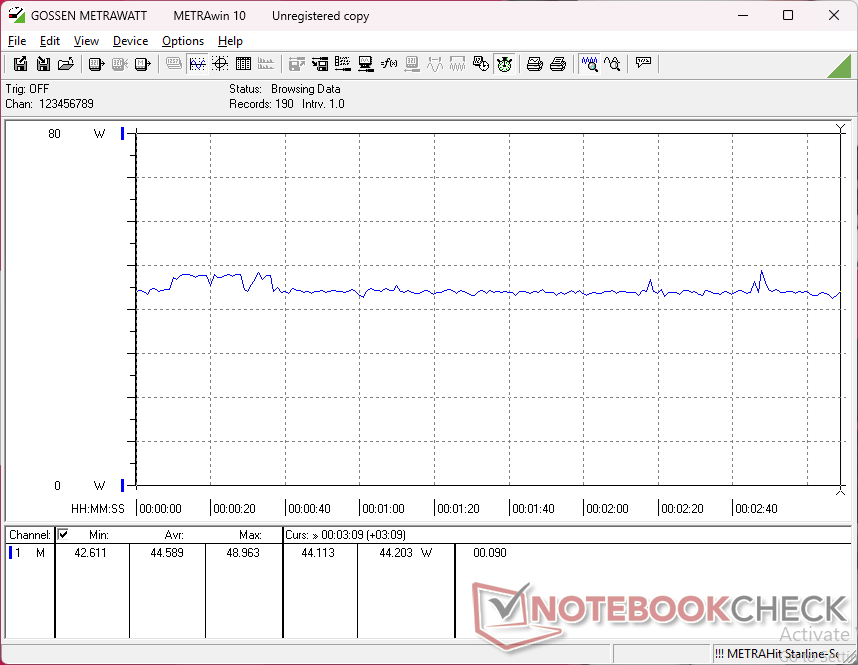
Idling demands between 2 W and 7 W compared to 5 W and 10 W on the OLED-equipped Swift 14 AI. Differences would remain minimal when running more demanding loads despite the differing display technologies.
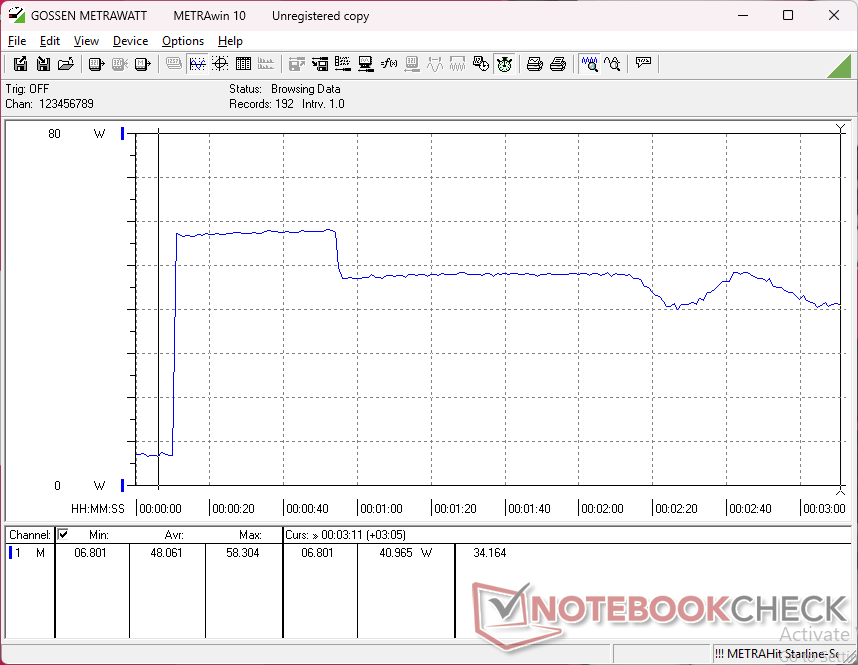
Interestingly, our Acer consumes more power than the IdeaPad Slim 3 14 AHP G10 when running Prime95 even though the Lenovo offers faster multi-thread performance. The Acer would again demand more power when running Cyberpunk 2077, but it offers faster graphics performance than the Lenovo to compensate.
| Off / Standby | |
| Idle | |
| Load |
|
Key:
min: | |
| Acer Aspire 14 AI N24Q14 Core Ultra 5 226V, Arc 130V, Western Digital PC SN5000S SDEQNSJ-1T00, IPS, 1920x1200, 14" | Acer Swift 14 AI SF14-51-58TU Core Ultra 5 226V, Arc 130V, Micron 2550 512GB, OLED, 2880x1800, 14" | Lenovo IdeaPad Slim 3 14 AHP G10 R7 8840HS, Radeon 780M, Micron 2500 MTFDKBA512QGN, IPS, 1920x1200, 14" | Asus VivoBook S 14 OLED M5406WA Ryzen AI 9 HX 370, Radeon 890M, Micron 2400 MTFDKBA1T0QFM, OLED, 1920x1200, 14" | Dell Inspiron 14 Plus 7440 Ultra 7 155H, Arc 8-Core, WD PC SN740 SDDPTQD-1T00, IPS, 2240x1400, 14" | HP Pavilion Plus 14-ew0153TU i7-1355U, Iris Xe G7 96EUs, SK hynix PC801 HFS001TEJ9X101N, OLED, 2880x1800, 14" | |
|---|---|---|---|---|---|---|
| Power Consumption | -18% | -3% | -74% | -53% | -55% | |
| Idle Minimum * (Watt) | 2.7 | 5 -85% | 3.3 -22% | 6 -122% | 3.5 -30% | 6.7 -148% |
| Idle Average * (Watt) | 6.2 | 6 3% | 6.3 -2% | 8 -29% | 7.9 -27% | 7.16 -15% |
| Idle Maximum * (Watt) | 6.6 | 10 -52% | 6.8 -3% | 14 -112% | 8.8 -33% | 11.17 -69% |
| Load Average * (Watt) | 35.2 | 36 -2% | 45.7 -30% | 76 -116% | 66.4 -89% | 46.5 -32% |
| Cyberpunk 2077 ultra external monitor * (Watt) | 40.7 | 38.2 6% | 35.8 12% | 61.9 -52% | ||
| Cyberpunk 2077 ultra * (Watt) | 44.6 | 41.6 7% | 38.2 14% | 58.6 -31% | ||
| Load Maximum * (Watt) | 59 | 60 -2% | 51.7 12% | 94 -59% | 110.3 -87% | 64.36 -9% |
| Witcher 3 ultra * (Watt) | 55.7 | 37.2 |
* ... smaller is better
Power Consumption Cyberpunk / Stress Test
Power Consumption external Monitor
Battery Life
Battery capacity is the same as on the Swift 14 AI with subsequently similar battery life results at almost 13 hours of constant WLAN browsing.
| Acer Aspire 14 AI N24Q14 Core Ultra 5 226V, Arc 130V, 65 Wh | Acer Swift 14 AI SF14-51-58TU Core Ultra 5 226V, Arc 130V, 65 Wh | Lenovo IdeaPad Slim 3 14 AHP G10 R7 8840HS, Radeon 780M, 60 Wh | Asus Vivobook S 14 OLED S5406SA Core Ultra 5 226V, Arc 130V, 75 Wh | Dell Inspiron 14 Plus 7440 Ultra 7 155H, Arc 8-Core, 64 Wh | HP Pavilion Plus 14-ew0153TU i7-1355U, Iris Xe G7 96EUs, 68 Wh | |
|---|---|---|---|---|---|---|
| Battery runtime | -2% | -16% | 34% | -2% | -25% | |
| WiFi v1.3 (h) | 12.8 | 12.6 -2% | 10.7 -16% | 17.2 34% | 12.5 -2% | 9.6 -25% |
| H.264 (h) | 14 | 20 | 12 | |||
| Load (h) | 2.9 | 1.3 | ||||
| Reader / Idle (h) | 32.9 |
Notebookcheck Rating
Acer Aspire 14 AI N24Q14
- 03/11/2025 v8
Allen Ngo
 Total Sustainability Score:
 Potential Competitors in Comparison
Image | Model / Review | Price | Weight | Height | Display |
|---|---|---|---|---|---|
1. 82.5% 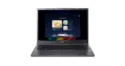 | Acer Aspire 14 AI N24Q14 Intel Core Ultra 5 226V ⎘ Intel Arc Graphics 130V ⎘ 16 GB Memory, 1024 GB SSD | Amazon: 1. $109.99 Replacement for Acer Aspire ... 2. $1,699.00 Acer 2026 Aspire AI Laptop f... 3. $109.00 New KrystalPix LCD Display F... List Price: 700 USD | 1.4 kg | 17 mm | 14.00" 1920x1200 162 PPI IPS |
2. 83.5% 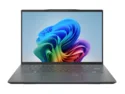 | Acer Swift 14 AI SF14-51-58TU Intel Core Ultra 5 226V ⎘ Intel Arc Graphics 130V ⎘ 16 GB Memory, 512 GB SSD | Amazon: List Price: 1200 EUR | 1.3 kg | 16 mm | 14.00" 2880x1800 243 PPI OLED |
3. 81.1% 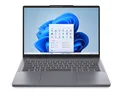 | Lenovo IdeaPad Slim 3 14 AHP G10 AMD Ryzen 7 8840HS ⎘ AMD Radeon 780M ⎘ 16 GB Memory, 512 GB SSD | Amazon: 1. $121.23 GENTERUN 14.0-Inch Matrix La... 2. $12.99 HSXIRQA 65W 45W AC Charger F... 3. $589.00 Lenovo IdeaPad Slim 3 Laptop... List Price: 649€ | 1.5 kg | 17.9 mm | 14.00" 1920x1200 162 PPI IPS |
4. 85.9%  | Asus Vivobook S 14 OLED S5406SA Intel Core Ultra 5 226V ⎘ Intel Arc Graphics 130V ⎘ 16 GB Memory, 512 GB SSD | Amazon: List Price: 1099€ | 1.3 kg | 15.9 mm | 14.00" 1920x1200 162 PPI OLED |
5. 85.2% v7 (old) 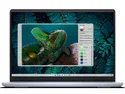 | Dell Inspiron 14 Plus 7440 Intel Core Ultra 7 155H ⎘ Intel Arc 8-Core iGPU ⎘ 16 GB Memory, 1024 GB SSD | Amazon: 1. $799.98 Dell Inspiron 14 7445 7440 2... 2. $1,199.99 Dell 2-in-1 Business Laptop ... 3. $849.99 Dell Inspiron 14 7440 2-in-1... List Price: 1000 USD | 1.6 kg | 18.99 mm | 14.00" 2240x1400 189 PPI IPS |
6. 87.5% v7 (old)  | HP Pavilion Plus 14-ew0153TU Intel Core i7-1355U ⎘ Intel Iris Xe Graphics G7 96EUs ⎘ 16 GB Memory, 1024 GB SSD | Amazon: 1. $22.00 FRUPART for HP Pavilion Plus... 2. $22.39 HT03XL Battery for HP Pavili... 3. $349.00 HP 14" FHD Pavilion x360 Con... List Price: 1020 USD | 1.4 kg | 17.5 mm | 14.00" 2880x1800 243 PPI OLED |
Transparency
The selection of devices to be reviewed is made by our editorial team. The test sample was freely purchased by the author at his/her own expense. The lender had no influence on this review, nor did the manufacturer receive a copy of this review before publication. There was no obligation to publish this review. As an independent media company, Notebookcheck is not subjected to the authority of manufacturers, retailers or publishers.
This is how Notebookcheck is testing
Every year, Notebookcheck independently reviews hundreds of laptops and smartphones using standardized procedures to ensure that all results are comparable. We have continuously developed our test methods for around 20 years and set industry standards in the process. In our test labs, high-quality measuring equipment is utilized by experienced technicians and editors. These tests involve a multi-stage validation process. Our complex rating system is based on hundreds of well-founded measurements and benchmarks, which maintains objectivity. Further information on our test methods can be found here.
