Dell XPS 13 9350 laptop review: Intel Lunar Lake is the perfect fit
Most balanced XPS 13 option thus far.
The new Intel CPU provides more consistent processor performance than the XPS 13 9340 while boosting both battery life and graphics by considerable margins. The changes help make the XPS 13 an even better contender to the MacBook Air 13 series.Allen Ngo 👁 Published 🇷🇺 🇫🇷 ...
Verdict
Say what you will about the chassis design of the XPS 13, but the new Lunar Lake CPU has certainly transformed the system into something with more consistent performance and much longer battery life. The Core H-series processor in the XPS 13 9340 proved to be a little too much for the thin chassis to handle and the more efficient Core Ultra 7 256V addresses this directly while improving graphics performance simultaneously. These changes should directly benefit travelers and editors who can exploit the longer runtimes and faster GPU to be a much more attractive alternative to the MacBook Air 13.
Turbo Boost performance suffers a bit when compared to the XPS 13 9340. However, the gains in graphics performance and battery life from moving to the new Lunar Lake platform more than outweighs the drawback in multi-thread performance.
Pros
Cons
Potential Competitors in Comparison
Image | Model / Review | Price | Weight | Height | Display |
|---|---|---|---|---|---|
1. 85.3%  | Dell XPS 13 9350 Intel Core Ultra 7 256V ⎘ Intel Arc Graphics 140V ⎘ 16 GB Memory, 512 GB SSD | 1.2 kg | 15.3 mm | 13.40" 1920x1200 169 PPI IPS | |
2. 87.3% v7 (old)  | Dell XPS 13 Plus 9320 i7-1280P OLED Intel Core i7-1280P ⎘ Intel Iris Xe Graphics G7 96EUs ⎘ 16 GB Memory, 512 GB SSD | 1.3 kg | 15.28 mm | 13.40" 3456x2160 304 PPI OLED | |
3. 90.1% v7 (old)  | Lenovo ThinkBook 13x G4 21KR0008GE Intel Core Ultra 5 125H ⎘ Intel Arc 7-Core iGPU ⎘ 16 GB Memory, 512 GB SSD | 1.2 kg | 12.9 mm | 13.50" 2880x1920 256 PPI IPS | |
4. 91.9% v7 (old)  | HP Dragonfly G4 Intel Core i7-1365U ⎘ Intel Iris Xe Graphics G7 96EUs ⎘ 16 GB Memory, 512 GB SSD | 1.1 kg | 16.3 mm | 13.50" 1920x1280 171 PPI IPS | |
5. 85.4% v7 (old)  | Asus ZenBook S13 OLED UX5304 Intel Core i7-1355U ⎘ Intel Iris Xe Graphics G7 96EUs ⎘ 16 GB Memory, 1024 GB SSD | 1 kg | 11.8 mm | 13.30" 2880x1800 255 PPI OLED | |
6. 86.6% v7 (old)  | MSI Prestige 13 AI Evo Intel Core Ultra 7 155H ⎘ Intel Arc 8-Core iGPU ⎘ 32 GB Memory, 1024 GB SSD | 967 g | 16.9 mm | 13.30" 2880x1800 OLED |
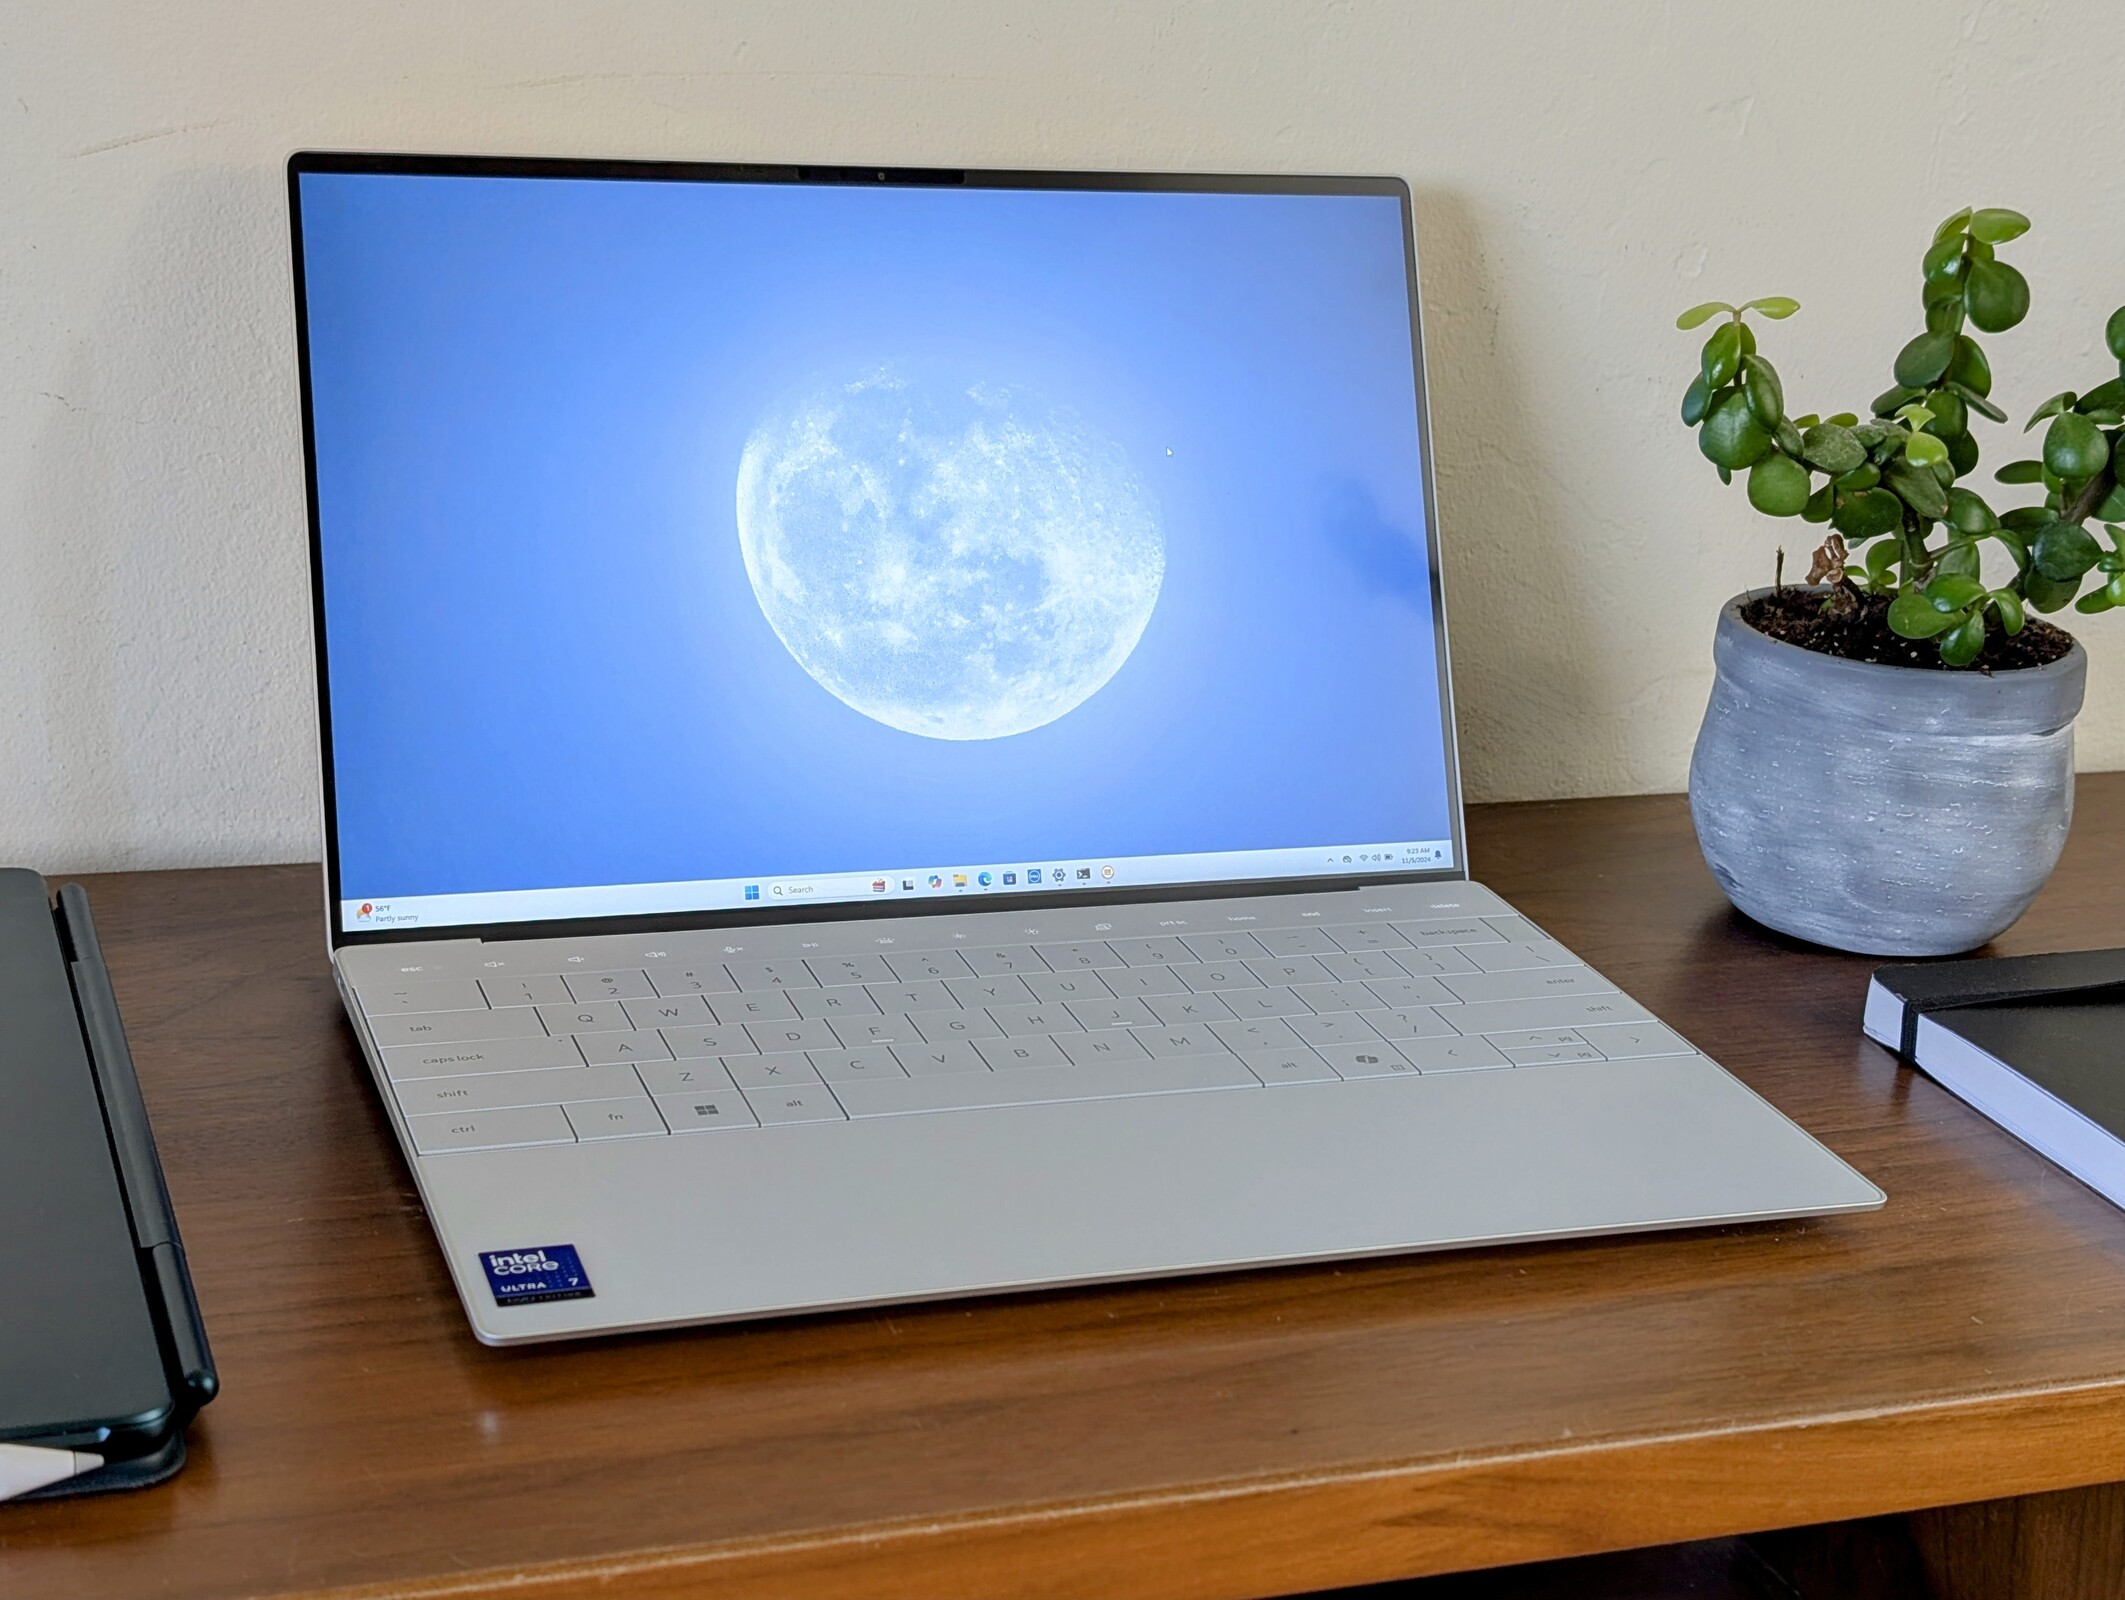
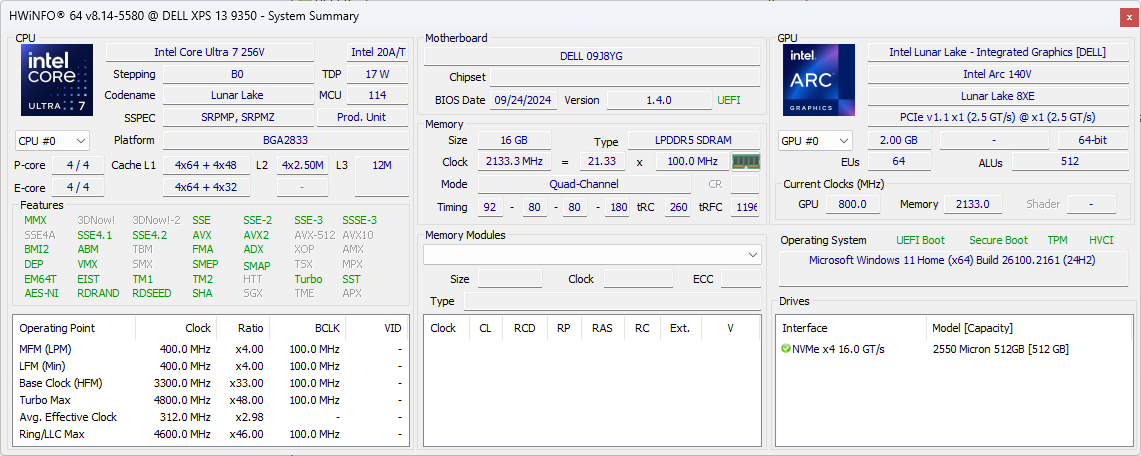
Dell has refreshed its XPS 13 lineup this season with the Intel Lunar Lake processor series. Called the XPS 13 9350, it succeeds the XPS 13 9340 and its Meteor Lake-H options. The physical features of the system are otherwise identical to the 9340 and so we recommend checking out our reviews on the XPS 13 9340 and 9320 to learn more about the chassis and external design of the model.
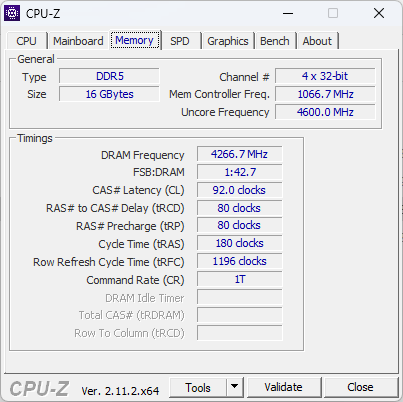
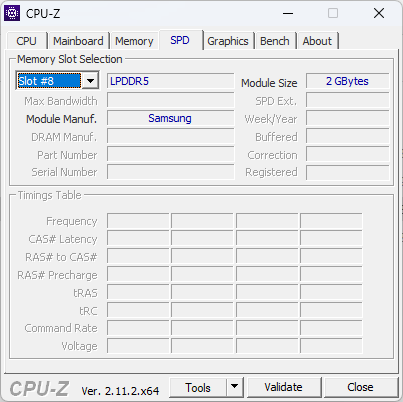
Our test unit comes equipped with the Core Ultra 7 256V CPU, 16 GB of fast LPDDR5x-8533 RAM, 512 GB NVMe SSD, and 1200p IPS display for approximately $1400. No other configurations are available at the time of writing, but SKUs with an 1800p touchscreen are planned.
Alternatives to the XPS 13 include other high-end subnotebooks like the MSI Prestige 13 AI Evo, Asus ZenBook S13 OLED, HP Dragonfly G4, or the Apple MacBook Air 13 series.
More Dell reviews:
Specifications
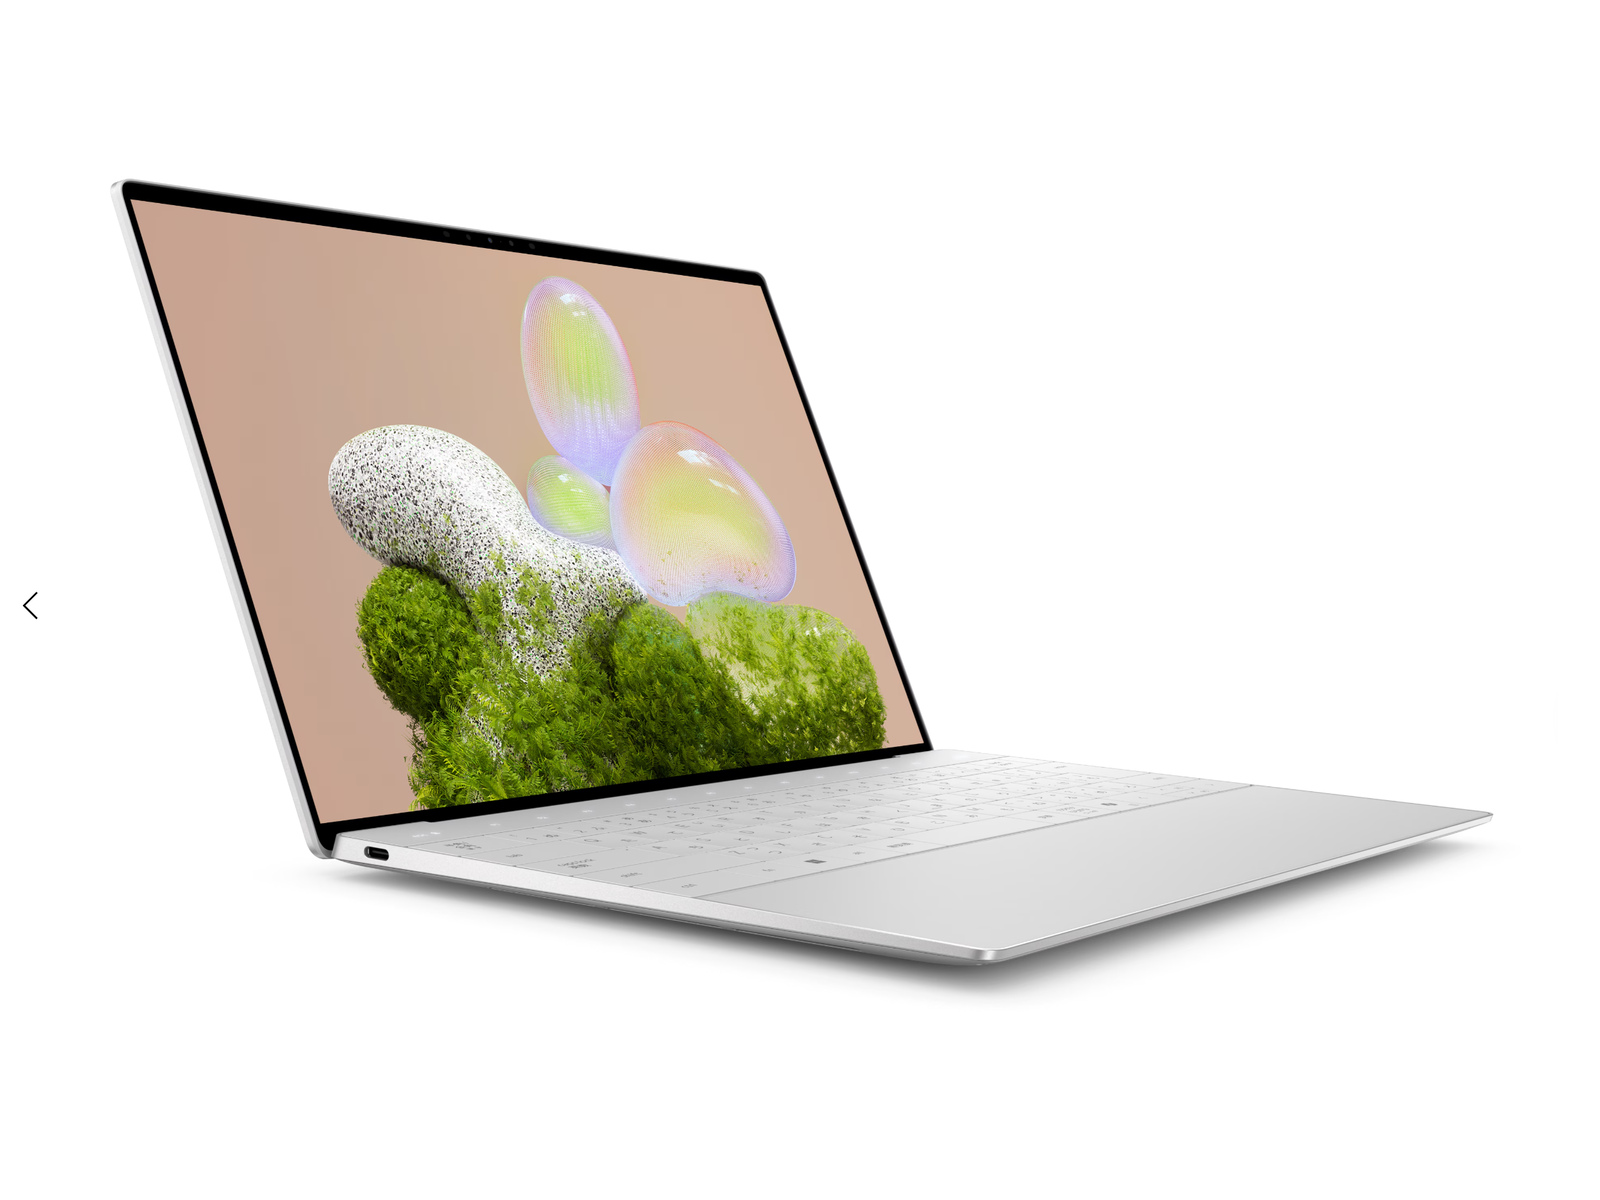
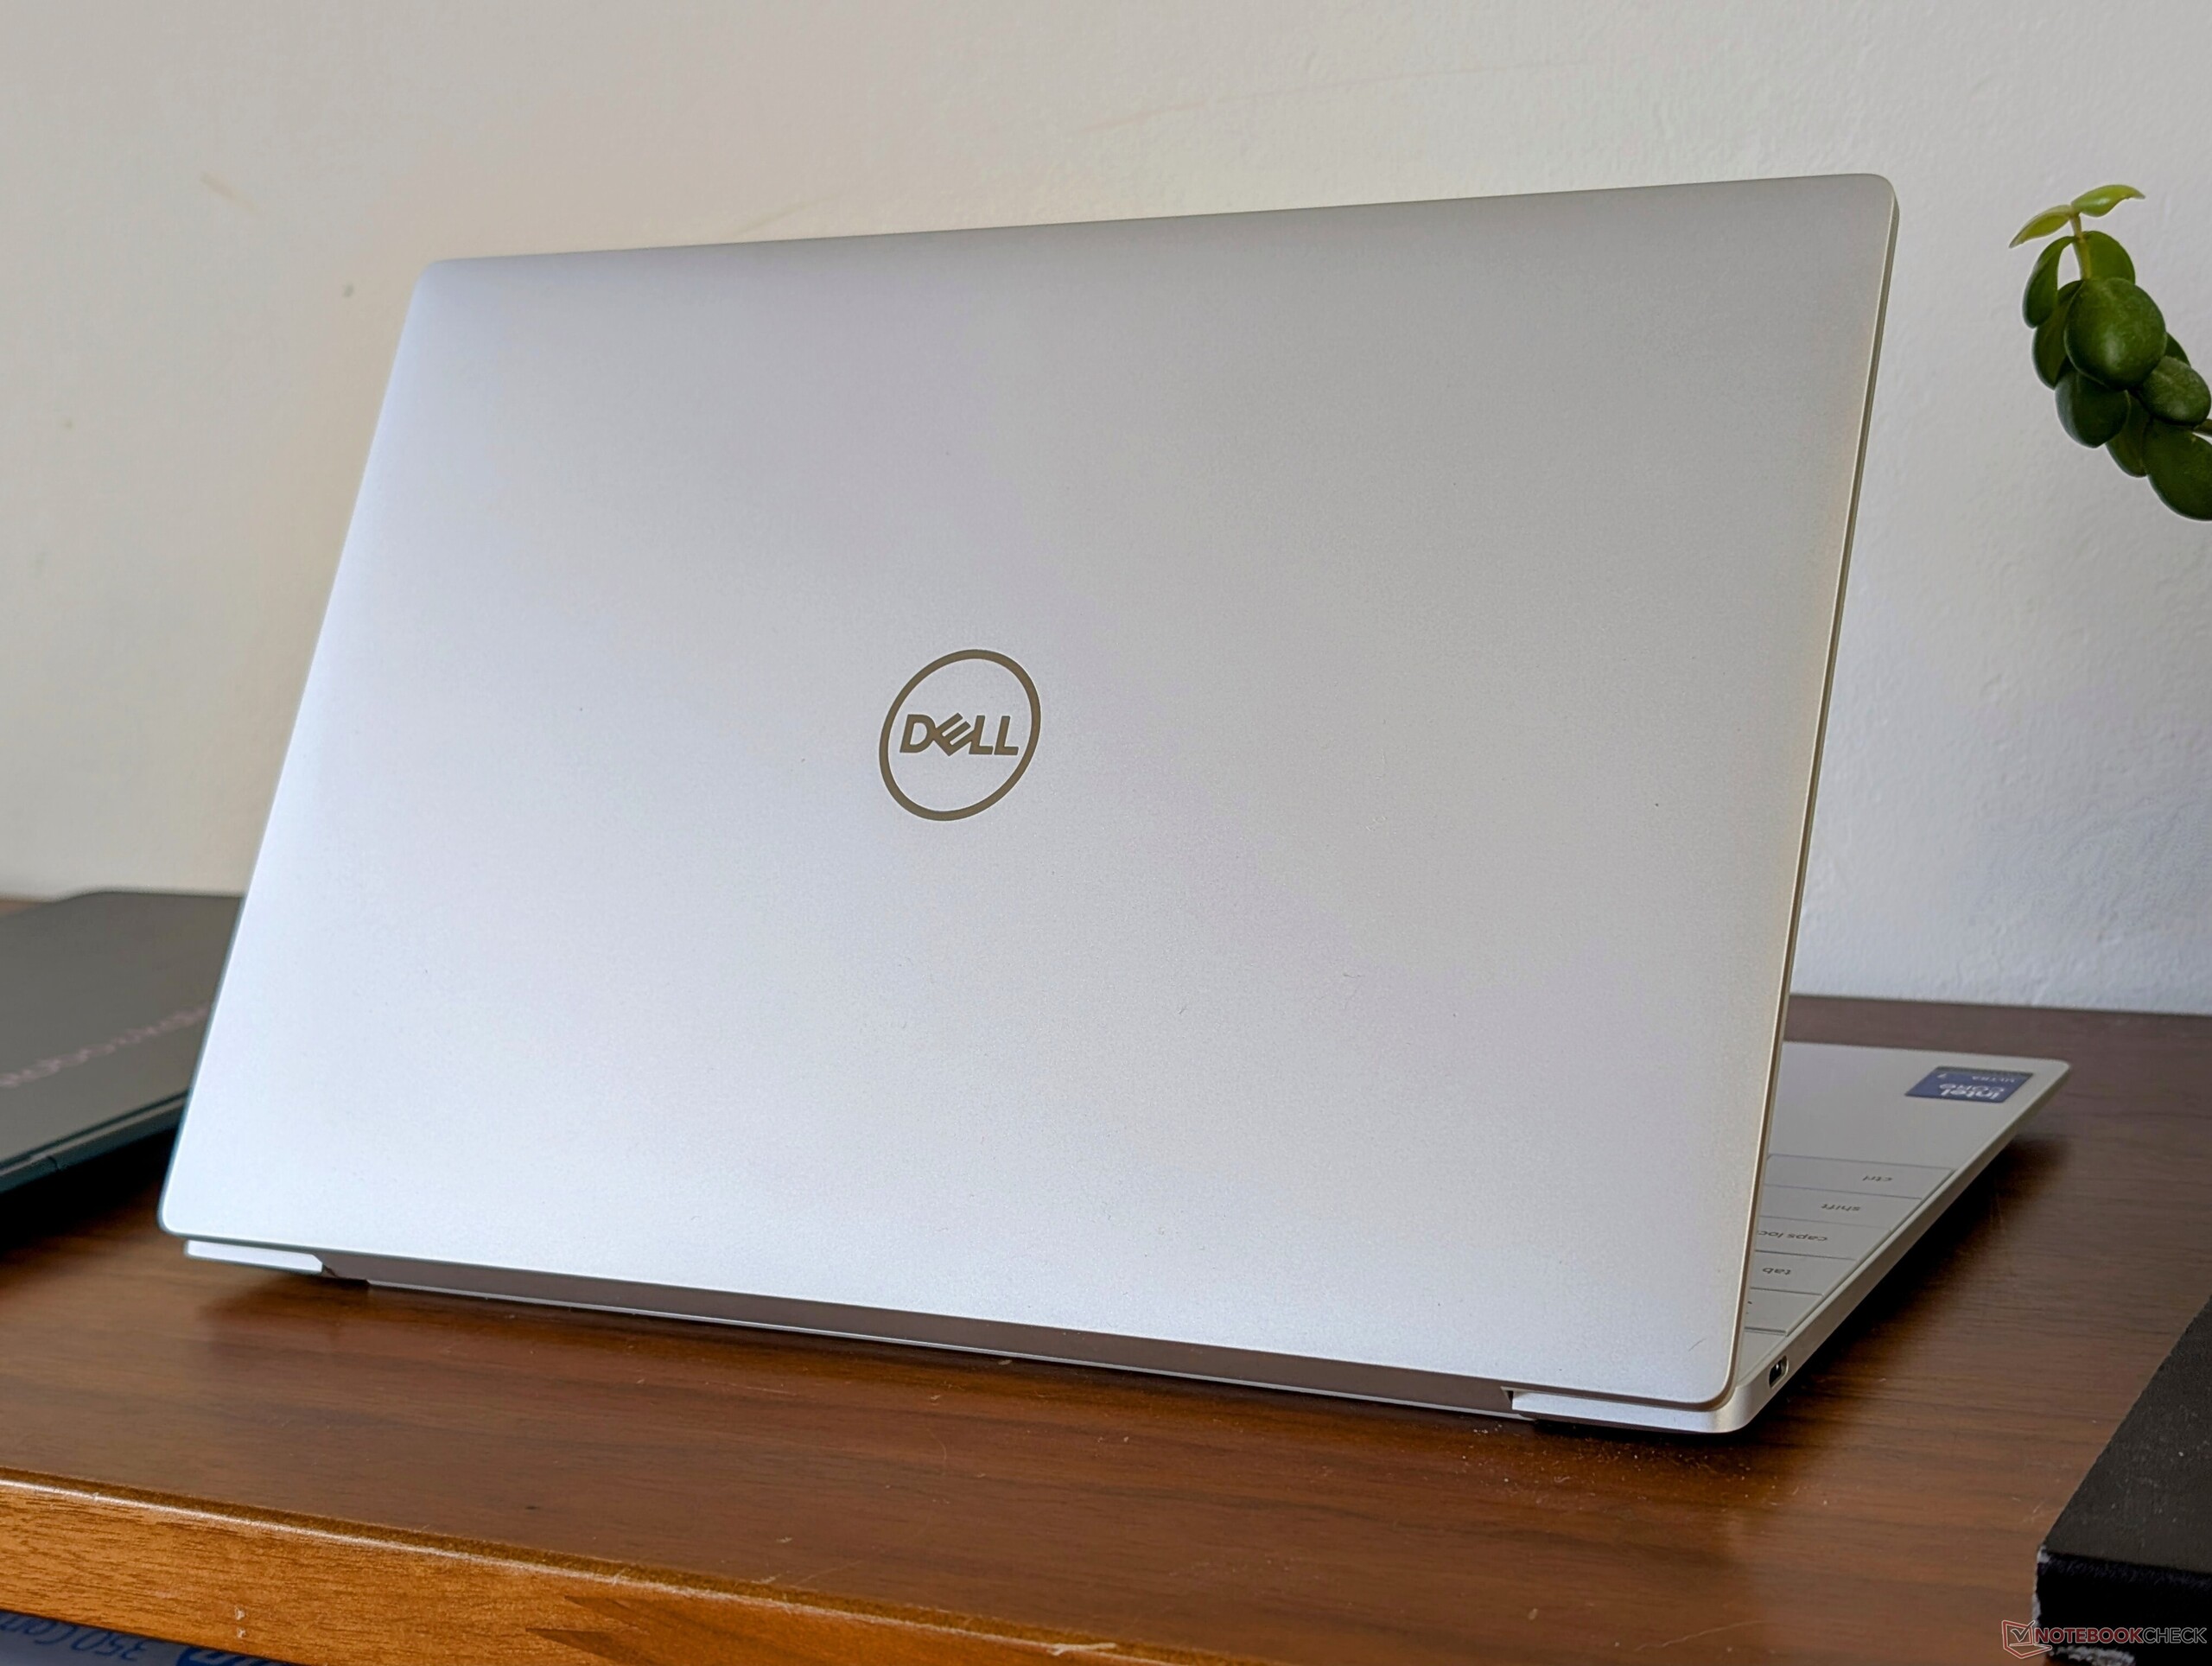
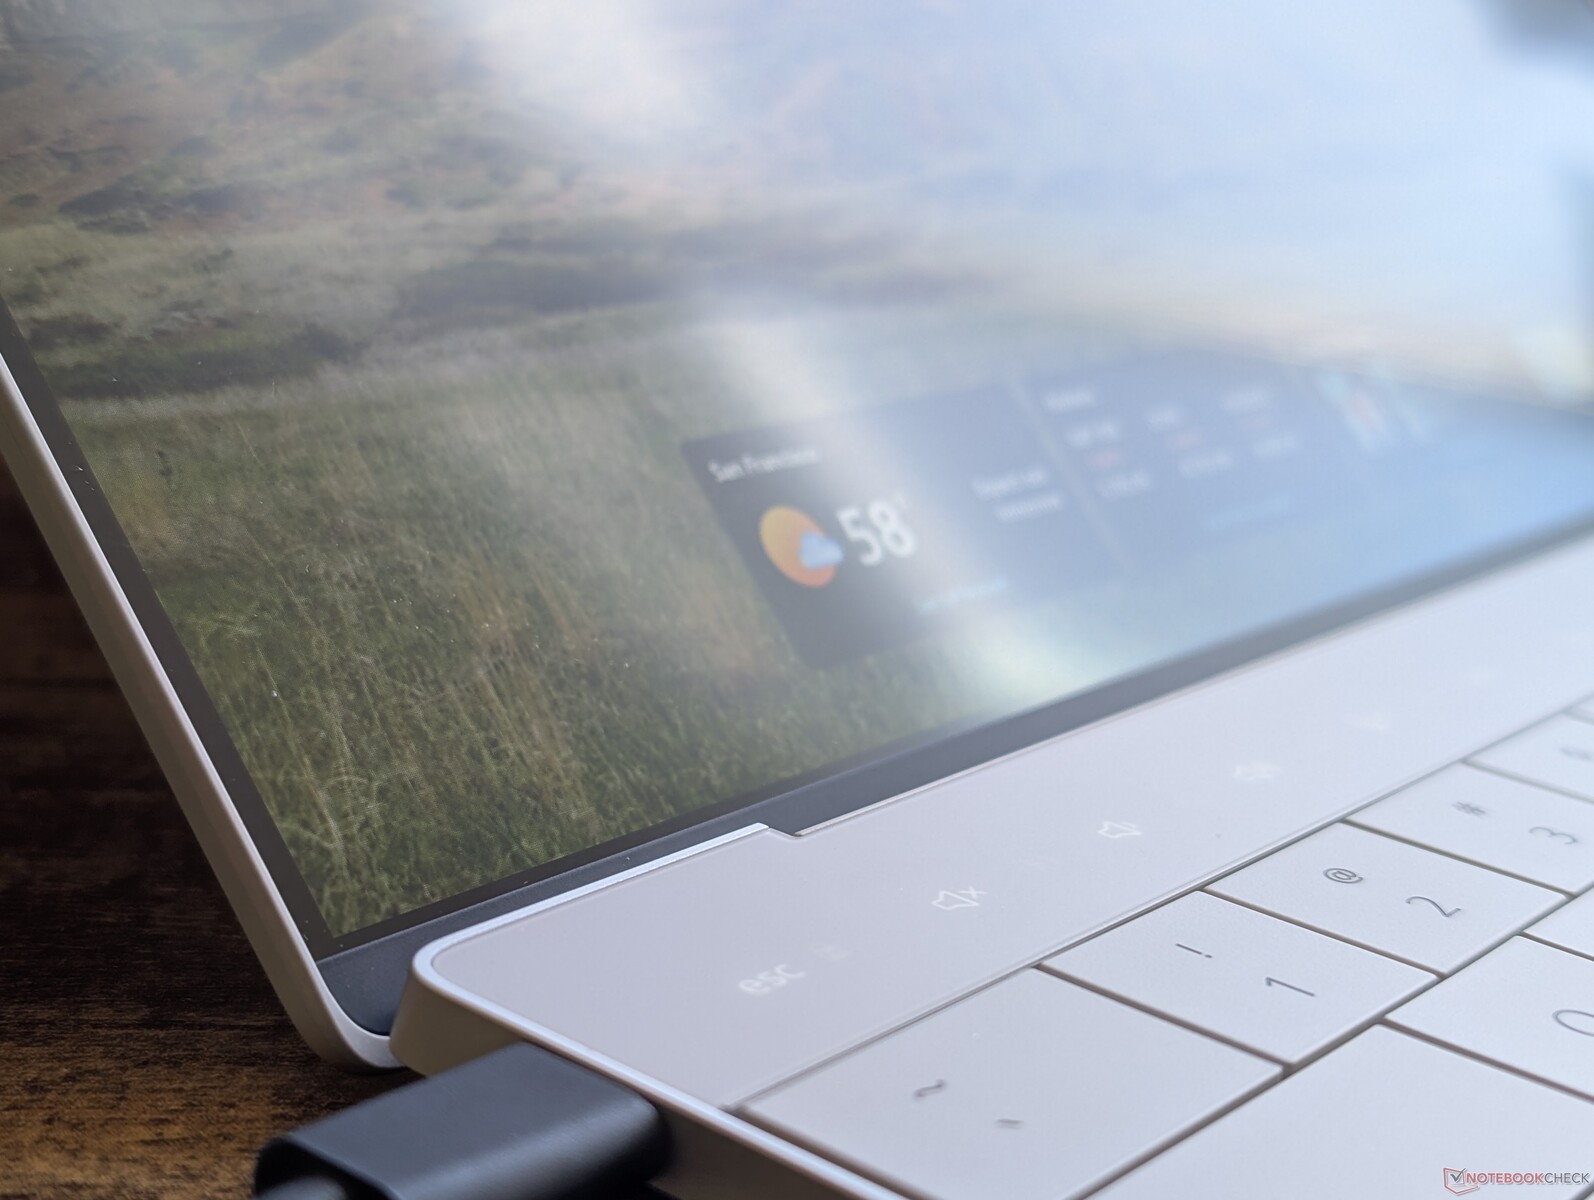
Case — An Attractive Mixed Bag
The chassis remains unchanged from the original launch of the XPS 13 9320 back in 2022. The design has been controversial from the start as it seemingly prioritizes form over function; features like the touch bar and edgeless clickpad may look smooth and sleek, but they lack the haptic feedback that most other laptops offer.
The design still holds up well against newer competitors in terms of size and looks. The Dragonfly G4 and ThinkBook 13x G4, for example, are larger and with thicker bezels despite their similar 13-inch screen sizes.
Communication
The Intel BE201 comes standard for Wi-Fi 7 and Bluetooth 5.4 support. Nonetheless, most users will still be connecting to the internet through Wi-Fi 6 or 6E instead as Wi-Fi 7 remains relatively uncommon in most households.
| Networking | |
| iperf3 transmit AXE11000 | |
| Lenovo ThinkBook 13x G4 21KR0008GE | |
| MSI Prestige 13 AI Evo | |
| Asus ZenBook S13 OLED UX5304 | |
| HP Dragonfly G4 | |
| Dell XPS 13 9350 | |
| iperf3 receive AXE11000 | |
| Lenovo ThinkBook 13x G4 21KR0008GE | |
| MSI Prestige 13 AI Evo | |
| Asus ZenBook S13 OLED UX5304 | |
| HP Dragonfly G4 | |
| Dell XPS 13 9350 | |
| iperf3 transmit AXE11000 6GHz | |
| HP Dragonfly G4 | |
| Dell XPS 13 9350 | |
| iperf3 receive AXE11000 6GHz | |
| Dell XPS 13 9350 | |
| HP Dragonfly G4 | |
Webcam
The 1080p webcam is on the lower-end of of the resolution spectrum when compared to the 5 MP or greater offerings on many Lenovo and HP models. Perhaps more annoyingly, the system continues to have no privacy shutter which has become a common feature on most other laptops regardless of price point.


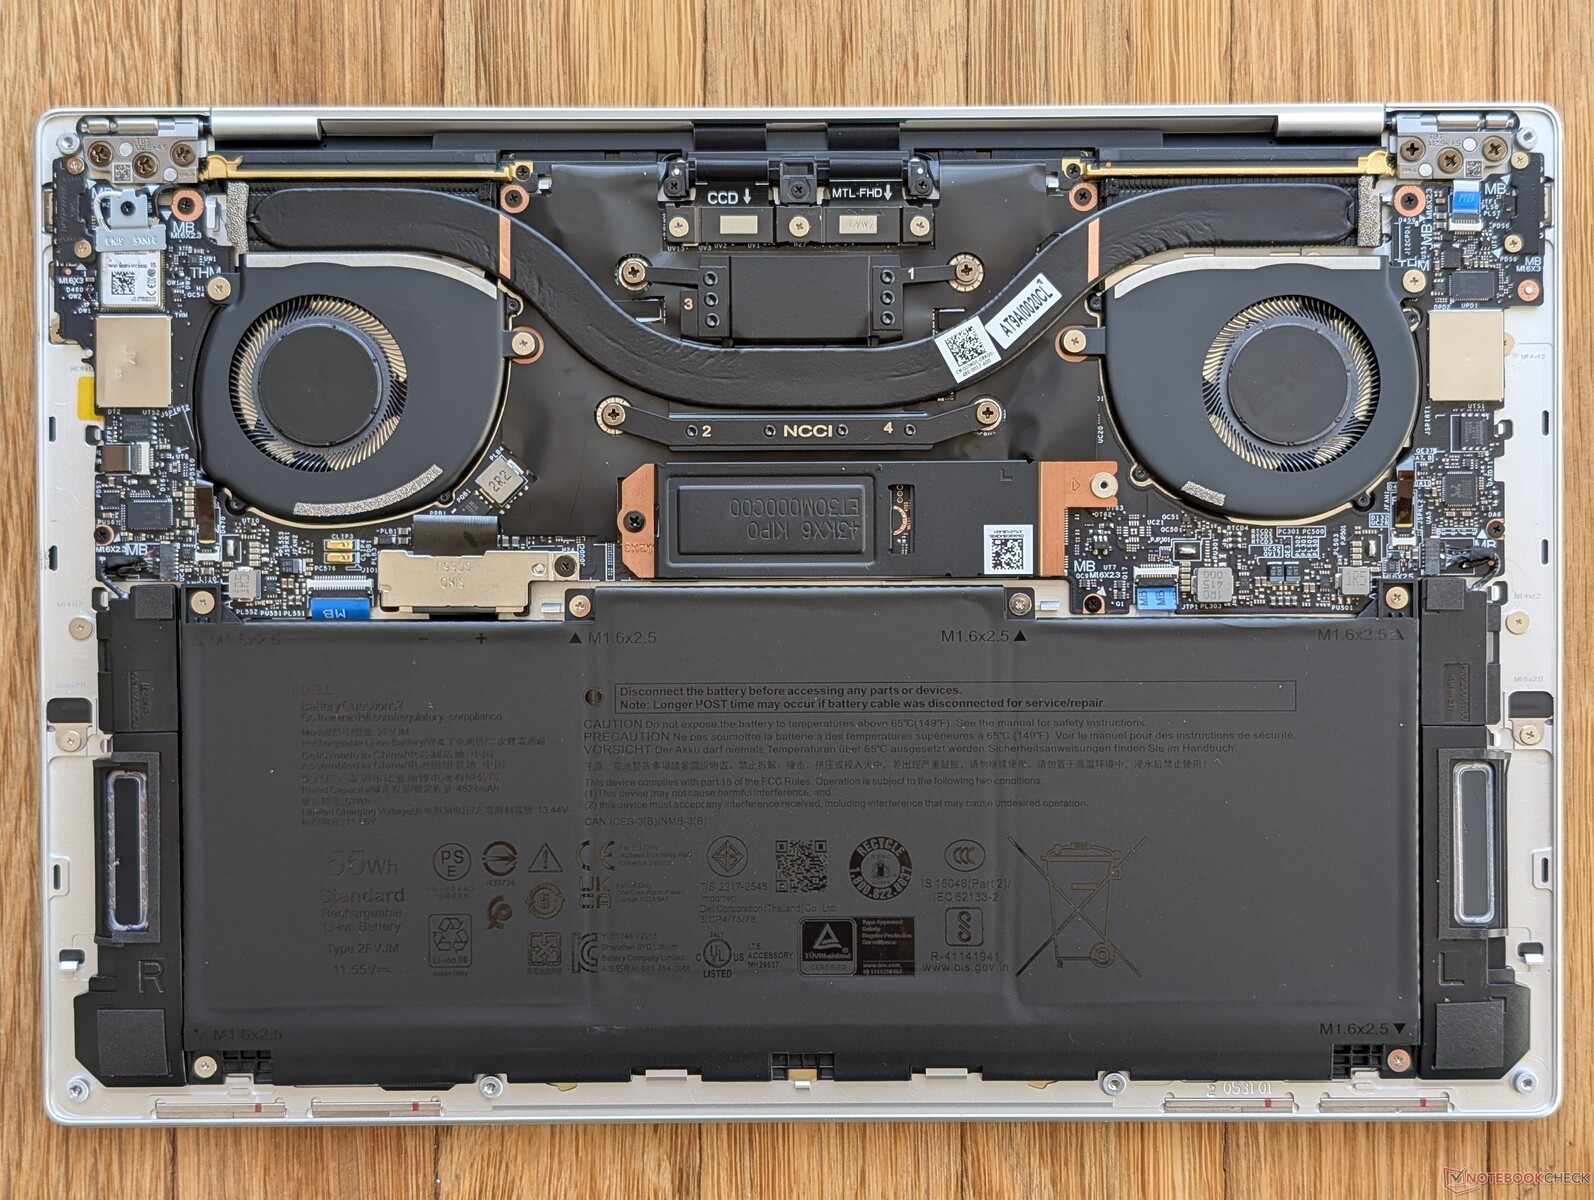
Maintenance
There are no major internal changes when compared to the previous generation XPS 13 9340 or even the Snapdragon-powered XPS 13 9345. WLAN and RAM remain soldered and so only the single M.2 2280 SSD is upgradeable.
Sustainability
The model is manufactured using hydro-power renewable energy sources to reduce carbon footprint. Dell is also claiming that the system is 100 percent recyclable.
The packaging consists of 100 percent recycled paper and cardboard with no plastic anywhere to be found.
Accessories And Warranty
The retail packaging includes only the paperwork and AC adapter with no USB-C to 3.5 mm audio jack adapter. Older XPS models would include the adapter, but Dell may be phasing this out altogether.
The standard one-year limited warranty applies if purchased in the US.
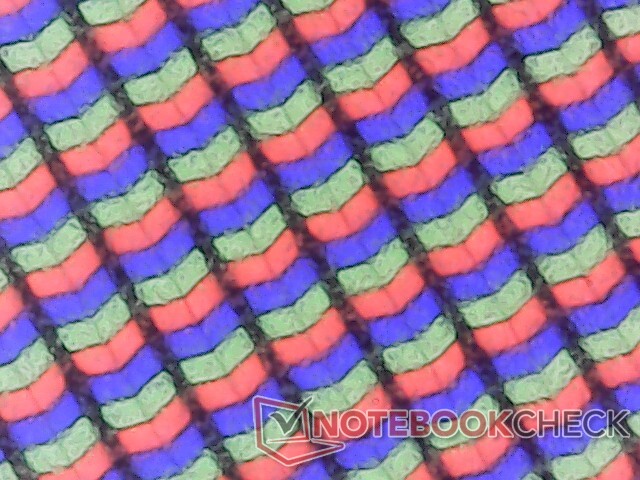
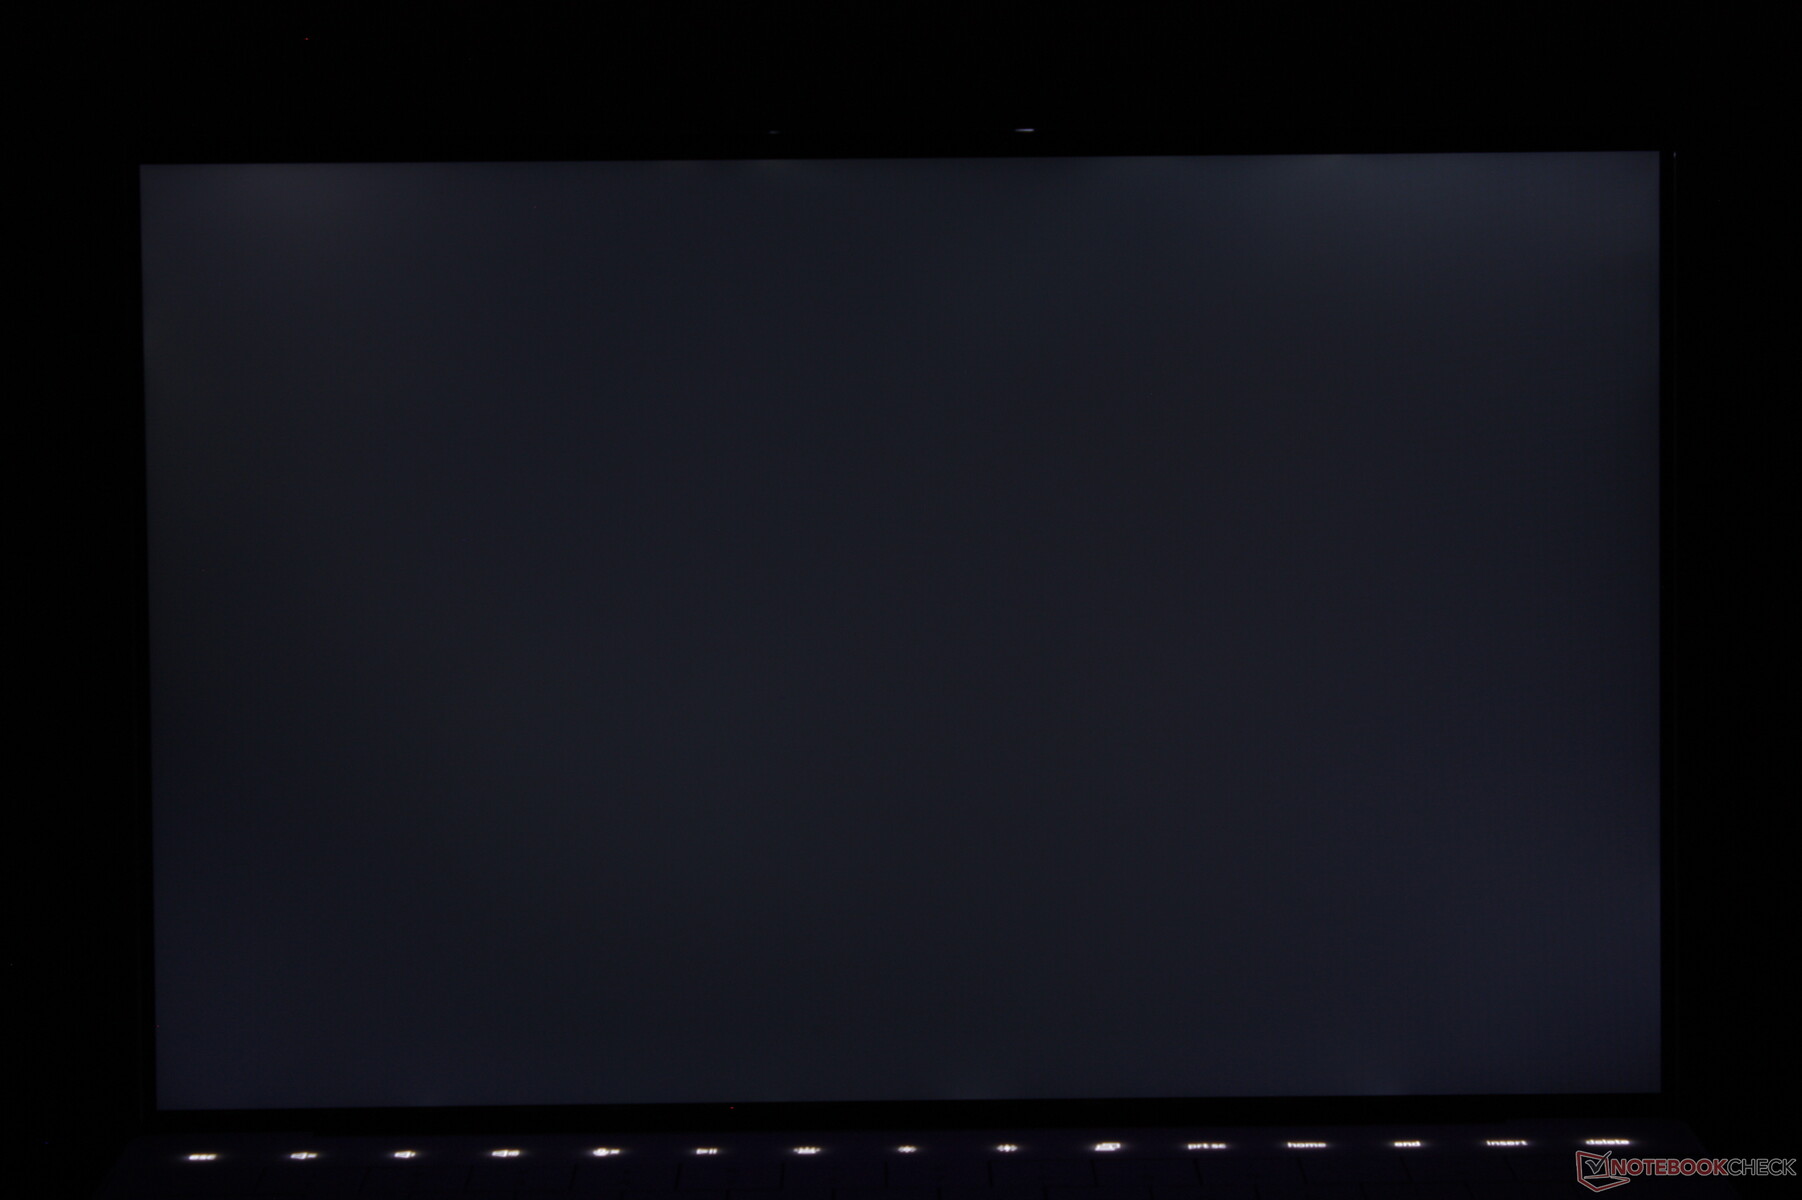
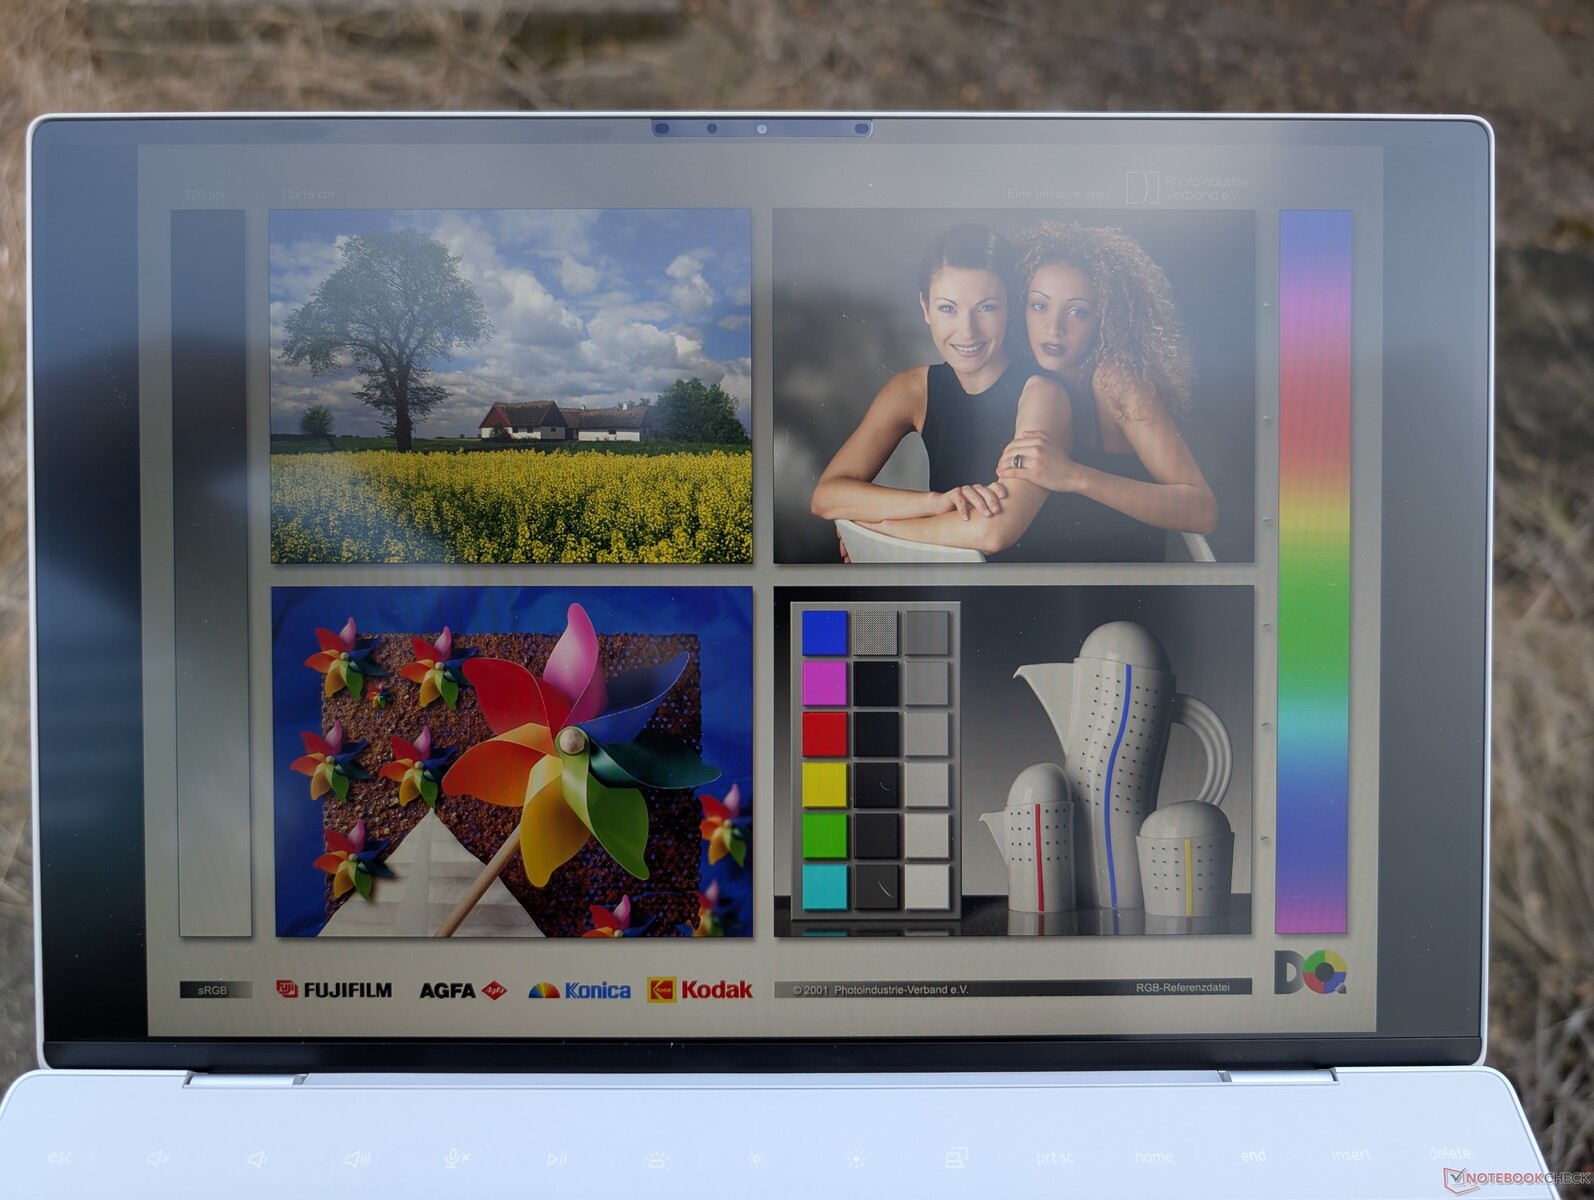
Display — Solid For An IPS
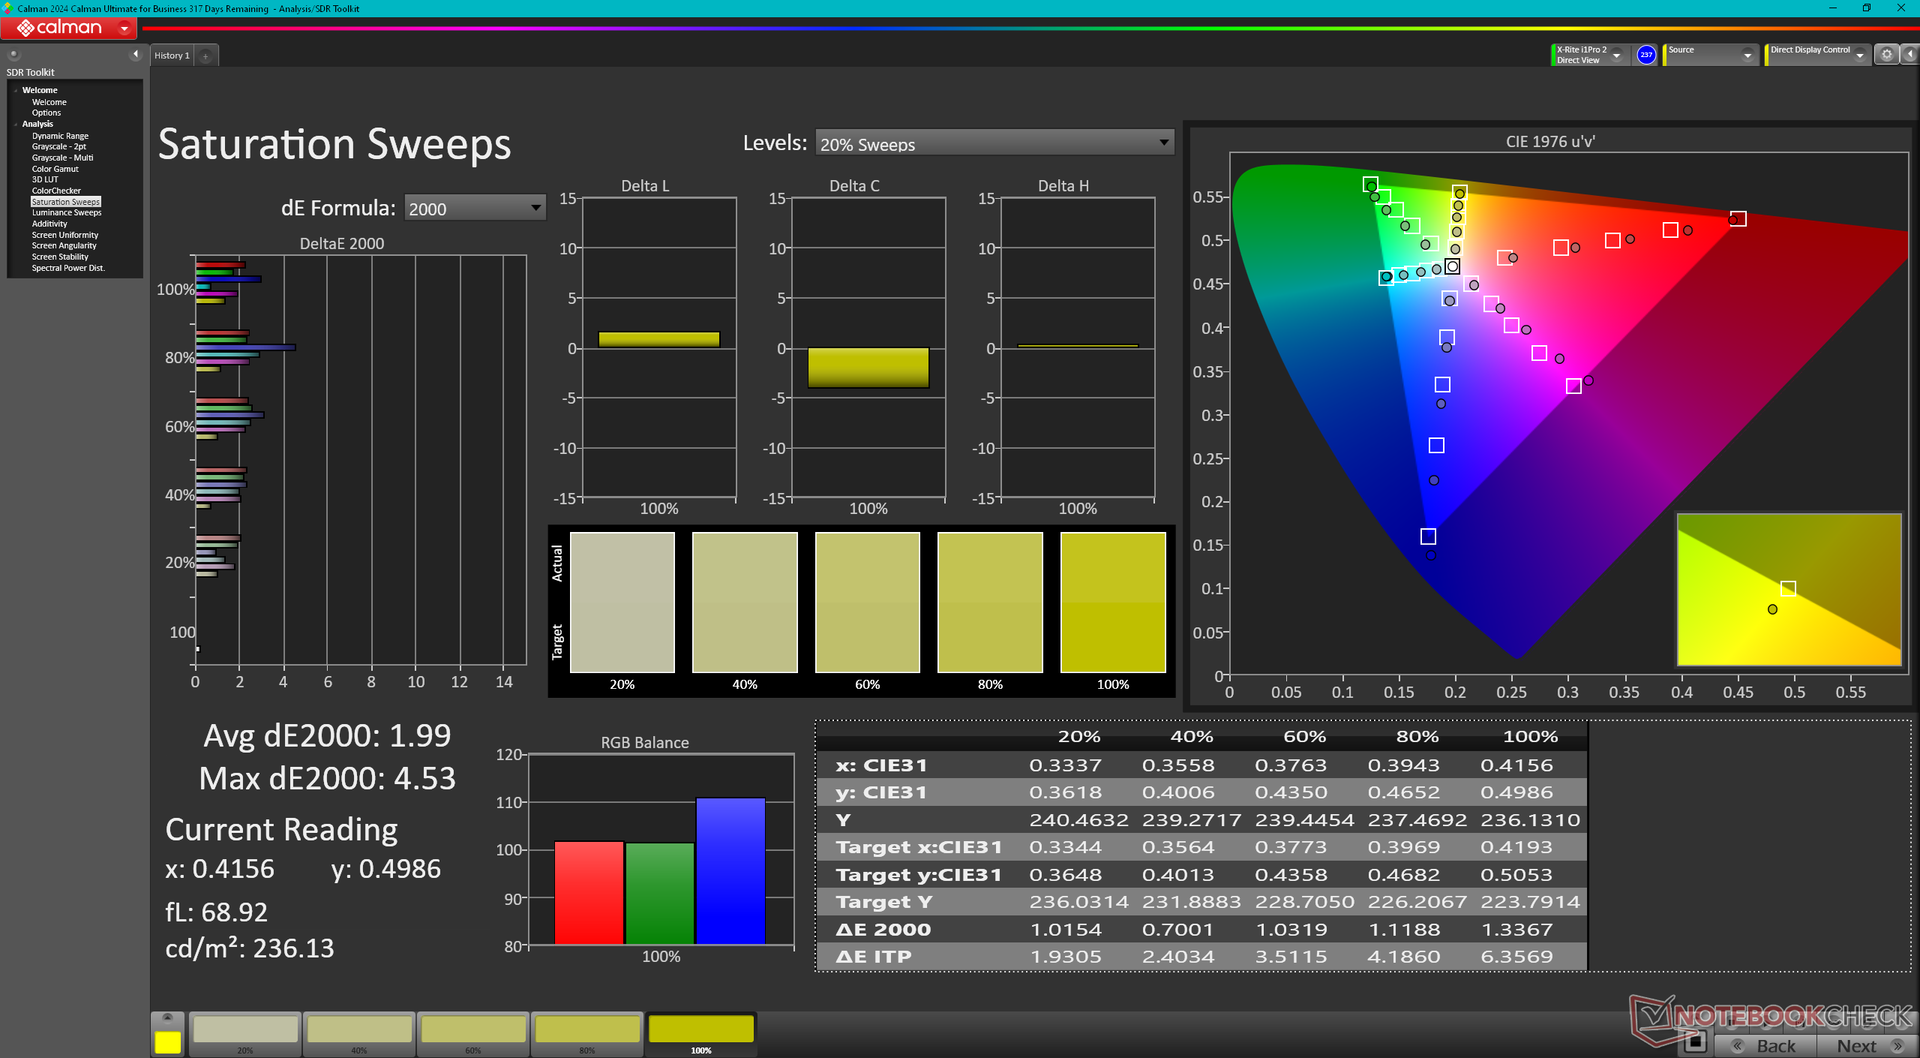
The only display option available at the time of writing is our 120 Hz 1200p configuration. While this was also available on previous models, Dell has swapped panel providers this time from Sharp to LG Philips. Contrast ratio is now higher to help make colors pop, but everything else remains almost the same as before including the full sRGB coverage, refresh rate, and average black-white response times.
Something we'd like to see on future models is support for Windows variable refresh rate or VRR. Currently, users can only select between a fixed 60 Hz or 120 Hz refresh rate whereas some displays like on the Framework Laptop 16 can dynamically change to <60 Hz. Applying this to the XPS 13 would help it save even more power on battery mode.
| |||||||||||||||||||||||||
Brightness Distribution: 87 %
Center on Battery: 462.8 cd/m²
Contrast: 2436:1 (Black: 0.19 cd/m²)
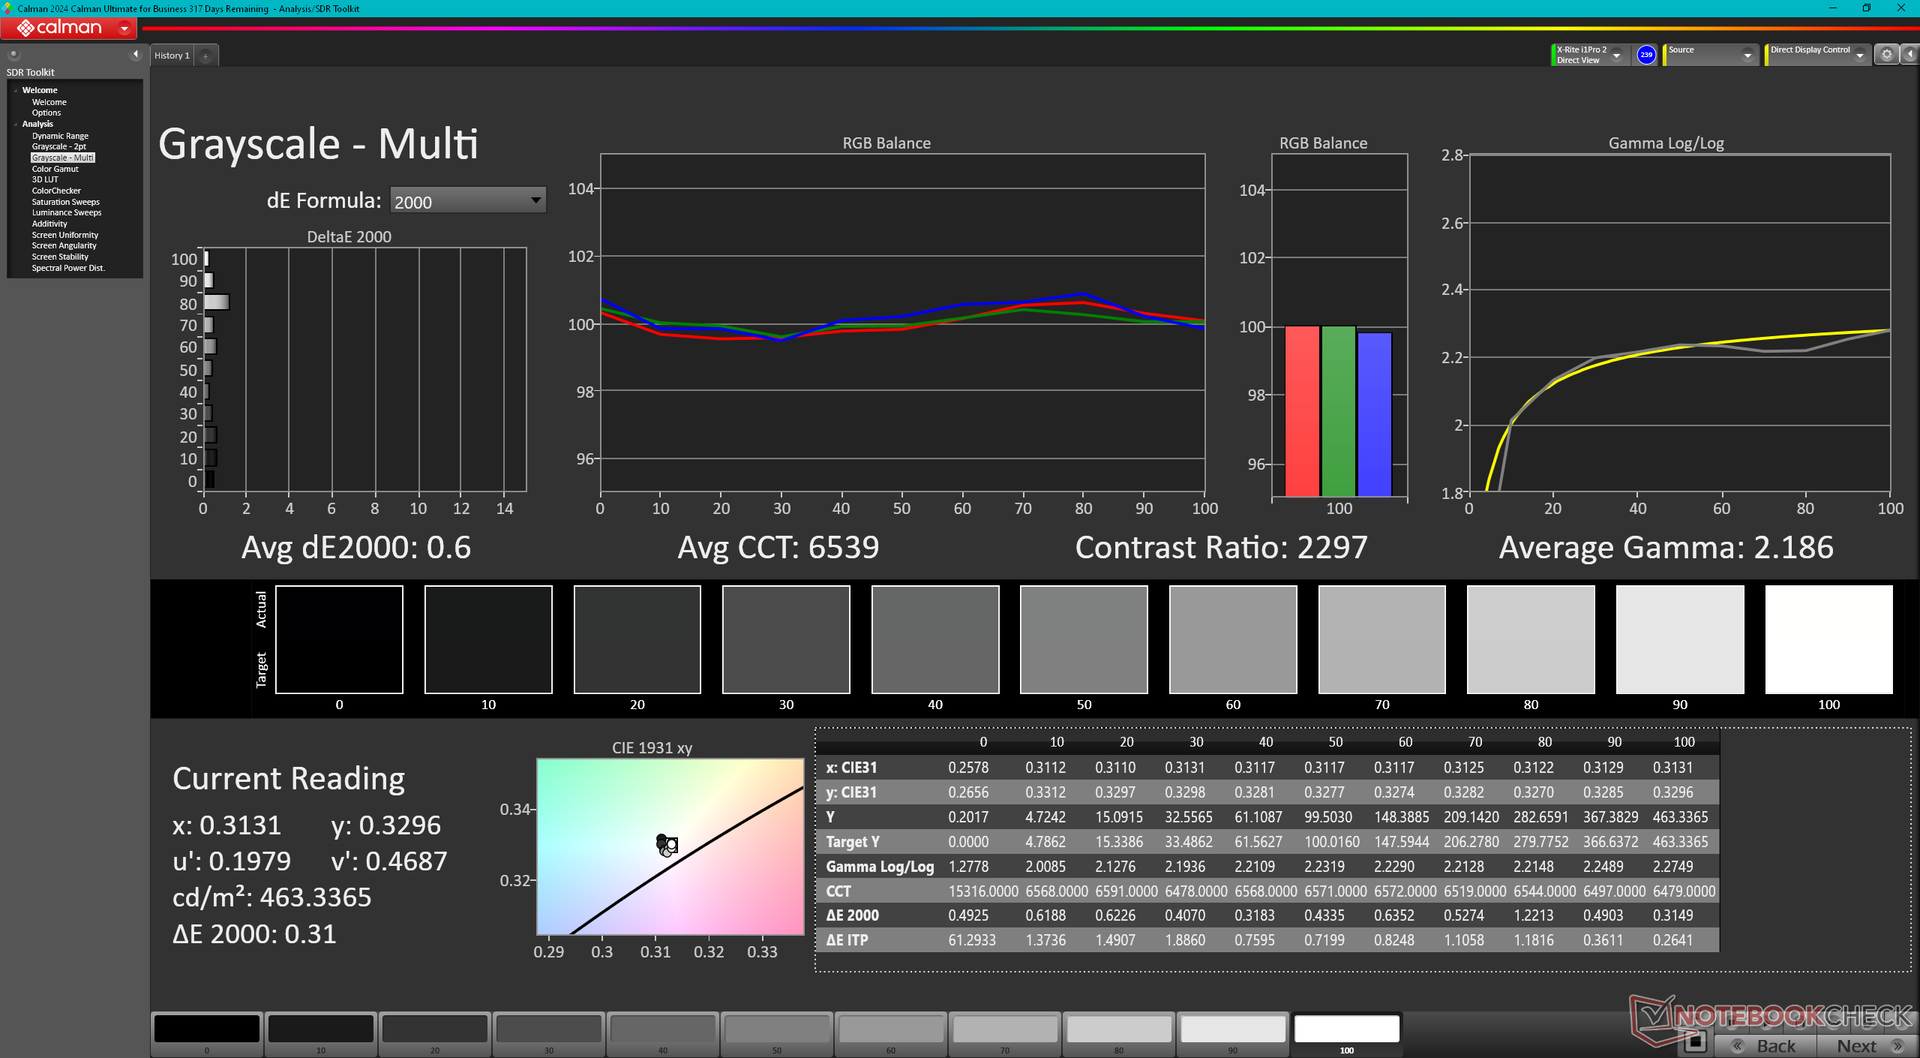
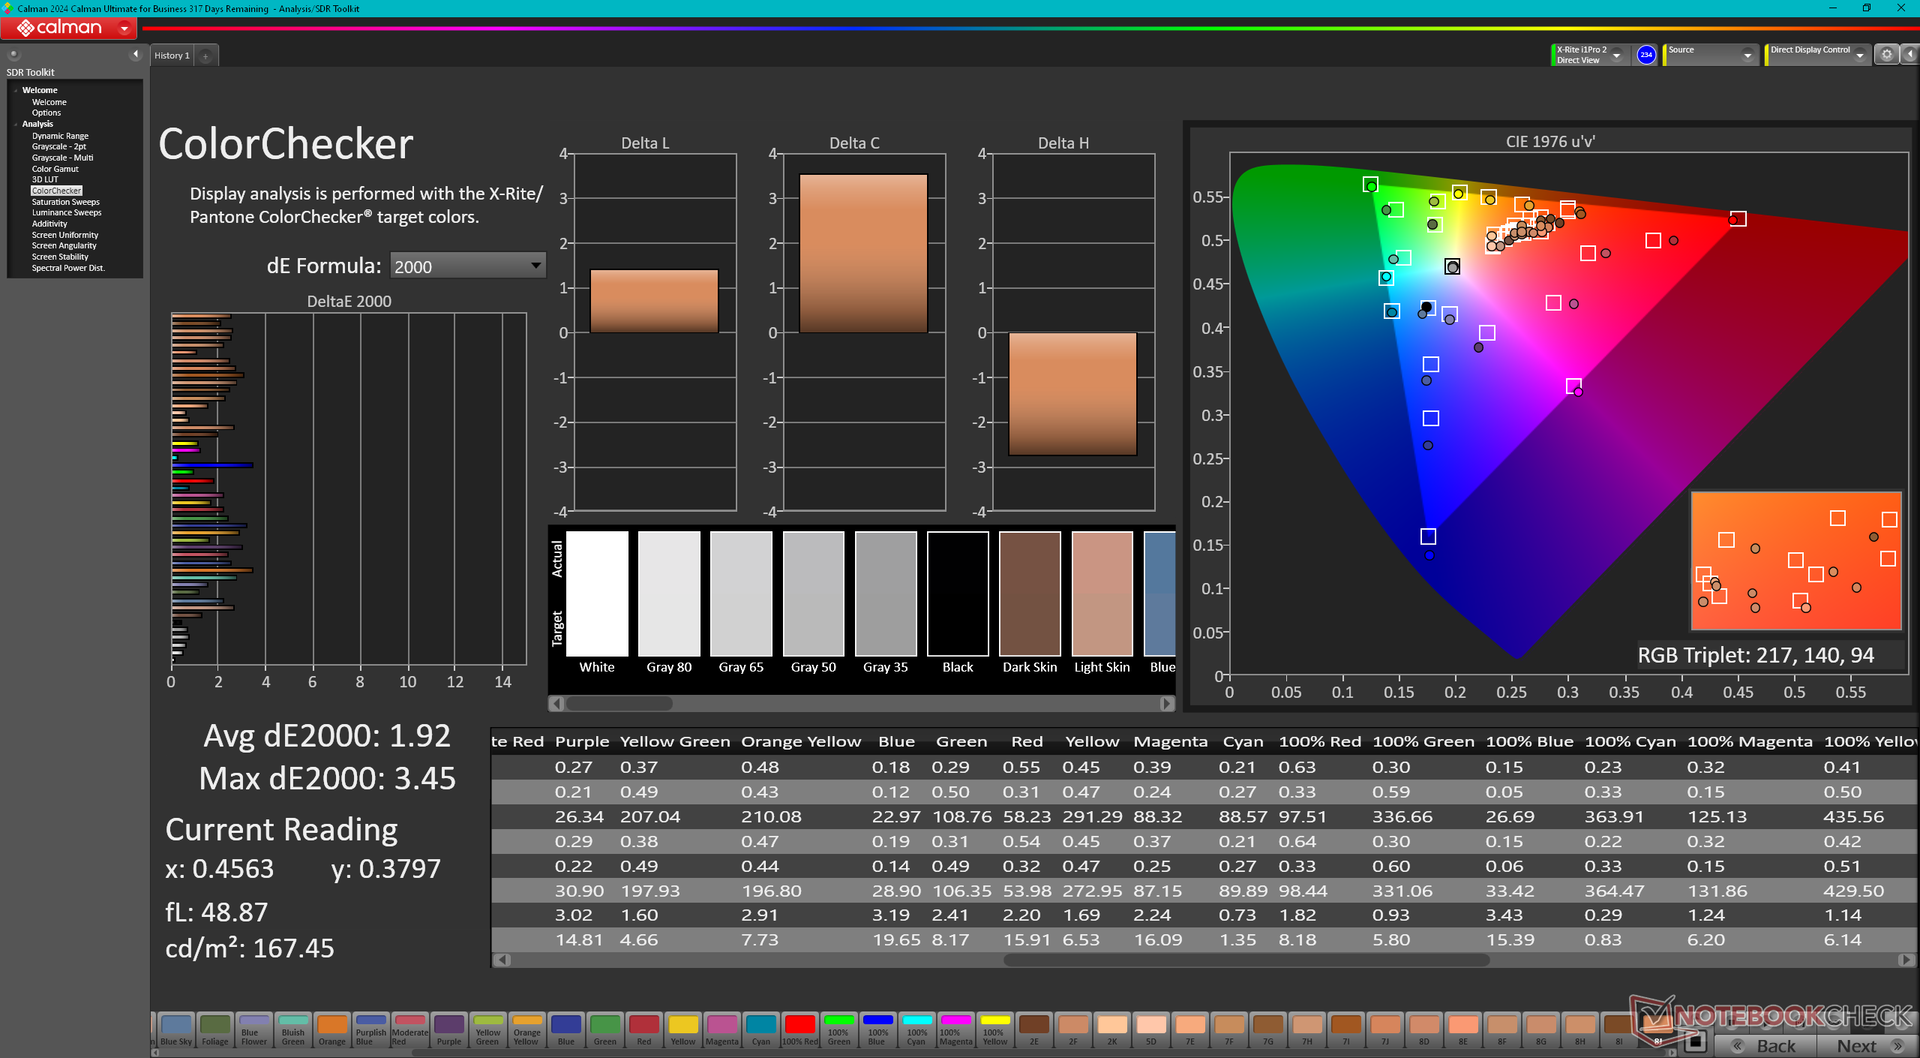
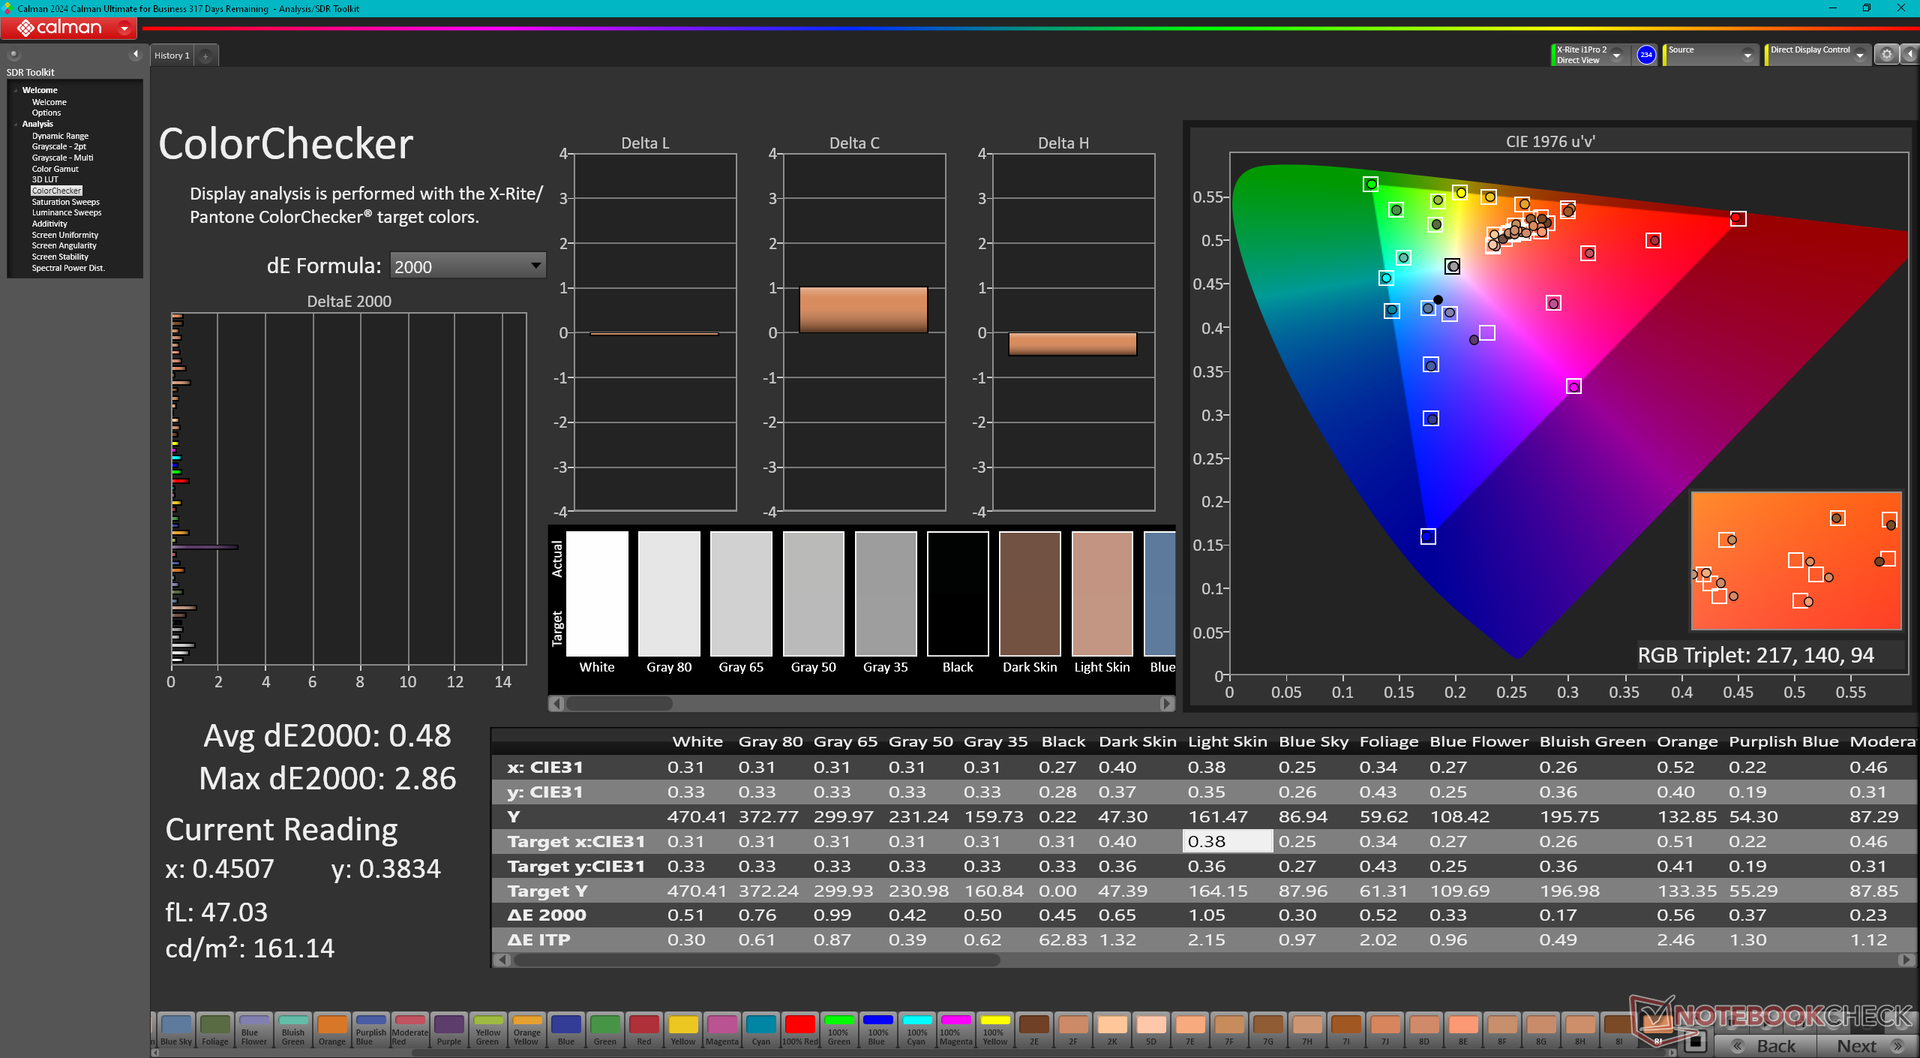
ΔE ColorChecker Calman: 1.92 | ∀{0.5-29.43 Ø4.71}
calibrated: 0.48
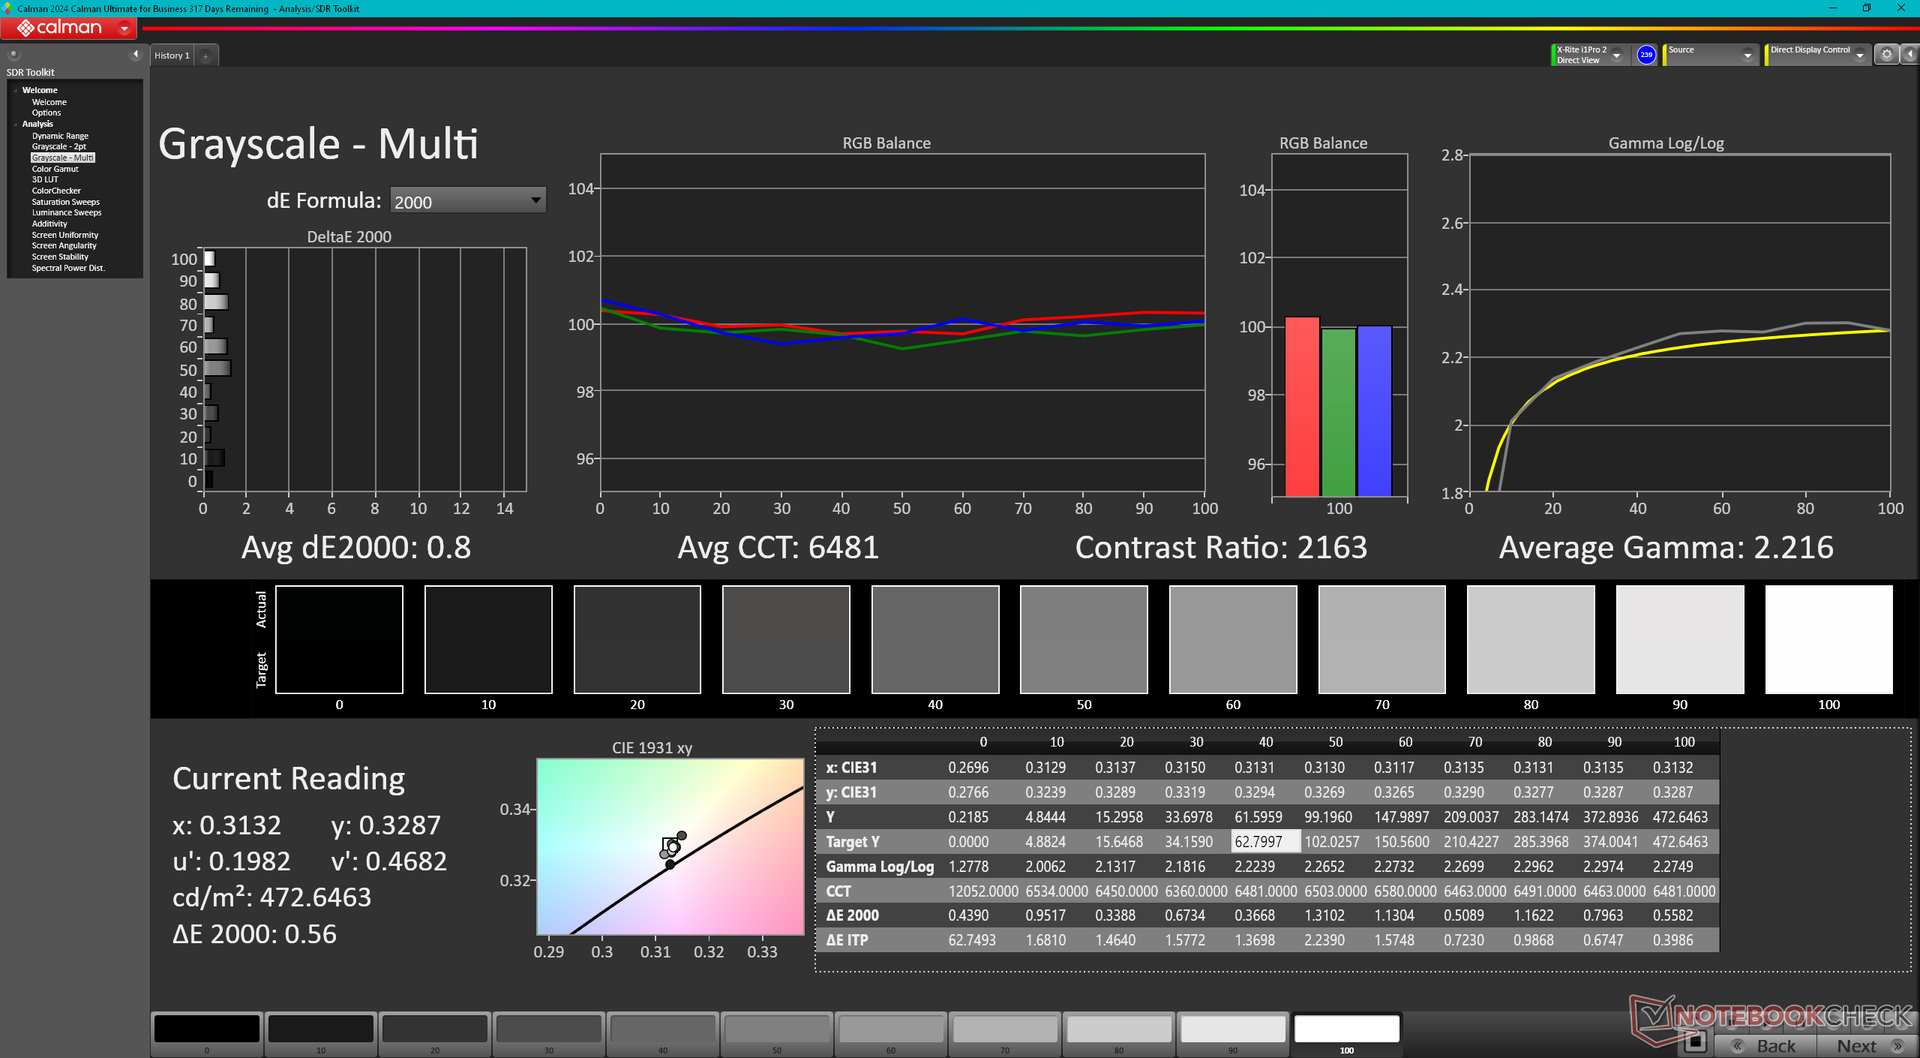
ΔE Greyscale Calman: 0.6 | ∀{0.09-98 Ø4.96}
68.6% AdobeRGB 1998 (Argyll 3D)
99% sRGB (Argyll 3D)
67.3% Display P3 (Argyll 3D)
Gamma: 2.19
CCT: 6539 K
| Dell XPS 13 9350 LG Philips 134WU2, IPS, 1920x1200, 13.4", 120 Hz | Dell XPS 13 Plus 9320 i7-1280P OLED Samsung 134XK04, OLED, 3456x2160, 13.4", 60 Hz | Lenovo ThinkBook 13x G4 21KR0008GE LEN135WQ+, IPS, 2880x1920, 13.5", 120 Hz | HP Dragonfly G4 Chi Mei CMN13C0, IPS, 1920x1280, 13.5", 60 Hz | Asus ZenBook S13 OLED UX5304 SDC417B, OLED, 2880x1800, 13.3", 60 Hz | MSI Prestige 13 AI Evo ATNA33AA07-0, OLED, 2880x1800, 13.3", 60 Hz | |
|---|---|---|---|---|---|---|
| Display | 31% | -2% | 1% | 30% | 31% | |
| Display P3 Coverage (%) | 67.3 | 99.5 48% | 65.5 -3% | 68.4 2% | 99.7 48% | 99.9 48% |
| sRGB Coverage (%) | 99 | 100 1% | 97.3 -2% | 98.3 -1% | 100 1% | 100 1% |
| AdobeRGB 1998 Coverage (%) | 68.6 | 98.4 43% | 67.7 -1% | 70.4 3% | 96.9 41% | 97.8 43% |
| Response Times | 93% | 39% | -26% | 95% | 95% | |
| Response Time Grey 50% / Grey 80% * (ms) | 37.3 ? | 2.6 ? 93% | 27.3 ? 27% | 48.8 ? -31% | 2 ? 95% | 1.54 ? 96% |
| Response Time Black / White * (ms) | 25.9 ? | 2.1 ? 92% | 12.8 ? 51% | 31.3 ? -21% | 1.6 ? 94% | 1.44 ? 94% |
| PWM Frequency (Hz) | 59.5 | 240 ? | 240 ? | |||
| Screen | -59% | -44% | -51% | -7% | -23% | |
| Brightness middle (cd/m²) | 462.8 | 371.8 -20% | 539 16% | 408.8 -12% | 361 -22% | 404 -13% |
| Brightness (cd/m²) | 435 | 374 -14% | 513 18% | 399 -8% | 365 -16% | 407 -6% |
| Brightness Distribution (%) | 87 | 98 13% | 89 2% | 90 3% | 98 13% | 98 13% |
| Black Level * (cd/m²) | 0.19 | 0.38 -100% | 0.32 -68% | |||
| Contrast (:1) | 2436 | 1418 -42% | 1278 -48% | |||
| Colorchecker dE 2000 * | 1.92 | 2.37 -23% | 1.4 27% | 2.02 -5% | 1.2 37% | 2.1 -9% |
| Colorchecker dE 2000 max. * | 3.45 | 6.1 -77% | 3.5 -1% | 3.84 -11% | 1.9 45% | 4.3 -25% |
| Colorchecker dE 2000 calibrated * | 0.48 | 0.7 -46% | 0.61 -27% | |||
| Greyscale dE 2000 * | 0.6 | 2 -233% | 2.2 -267% | 2.3 -283% | 1.2 -100% | 1.2 -100% |
| Gamma | 2.19 100% | 2.29 96% | 2.19 100% | 2.2 100% | 2.27 97% | 2.16 102% |
| CCT | 6539 99% | 6261 104% | 6710 97% | 6203 105% | 6486 100% | 6465 101% |
| Total Average (Program / Settings) | 22% /
-7% | -2% /
-23% | -25% /
-36% | 39% /
21% | 34% /
13% |
* ... smaller is better
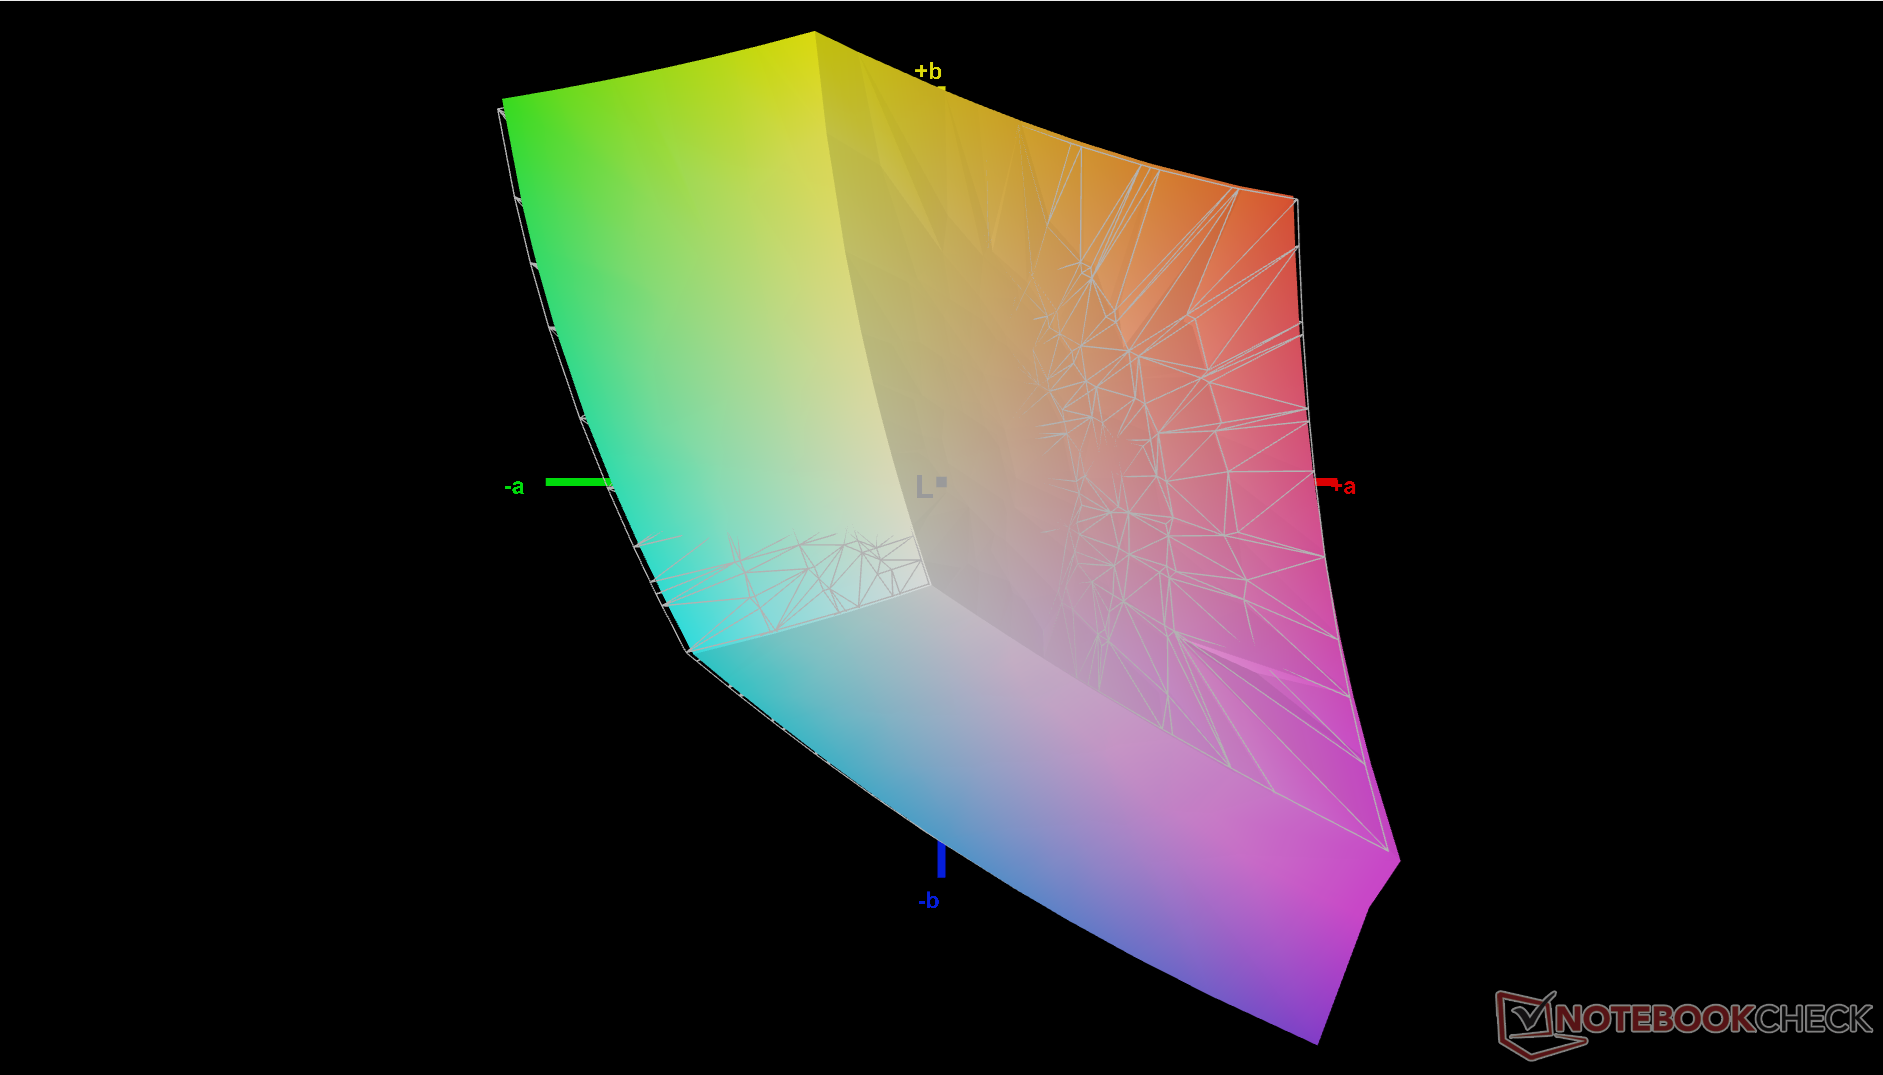
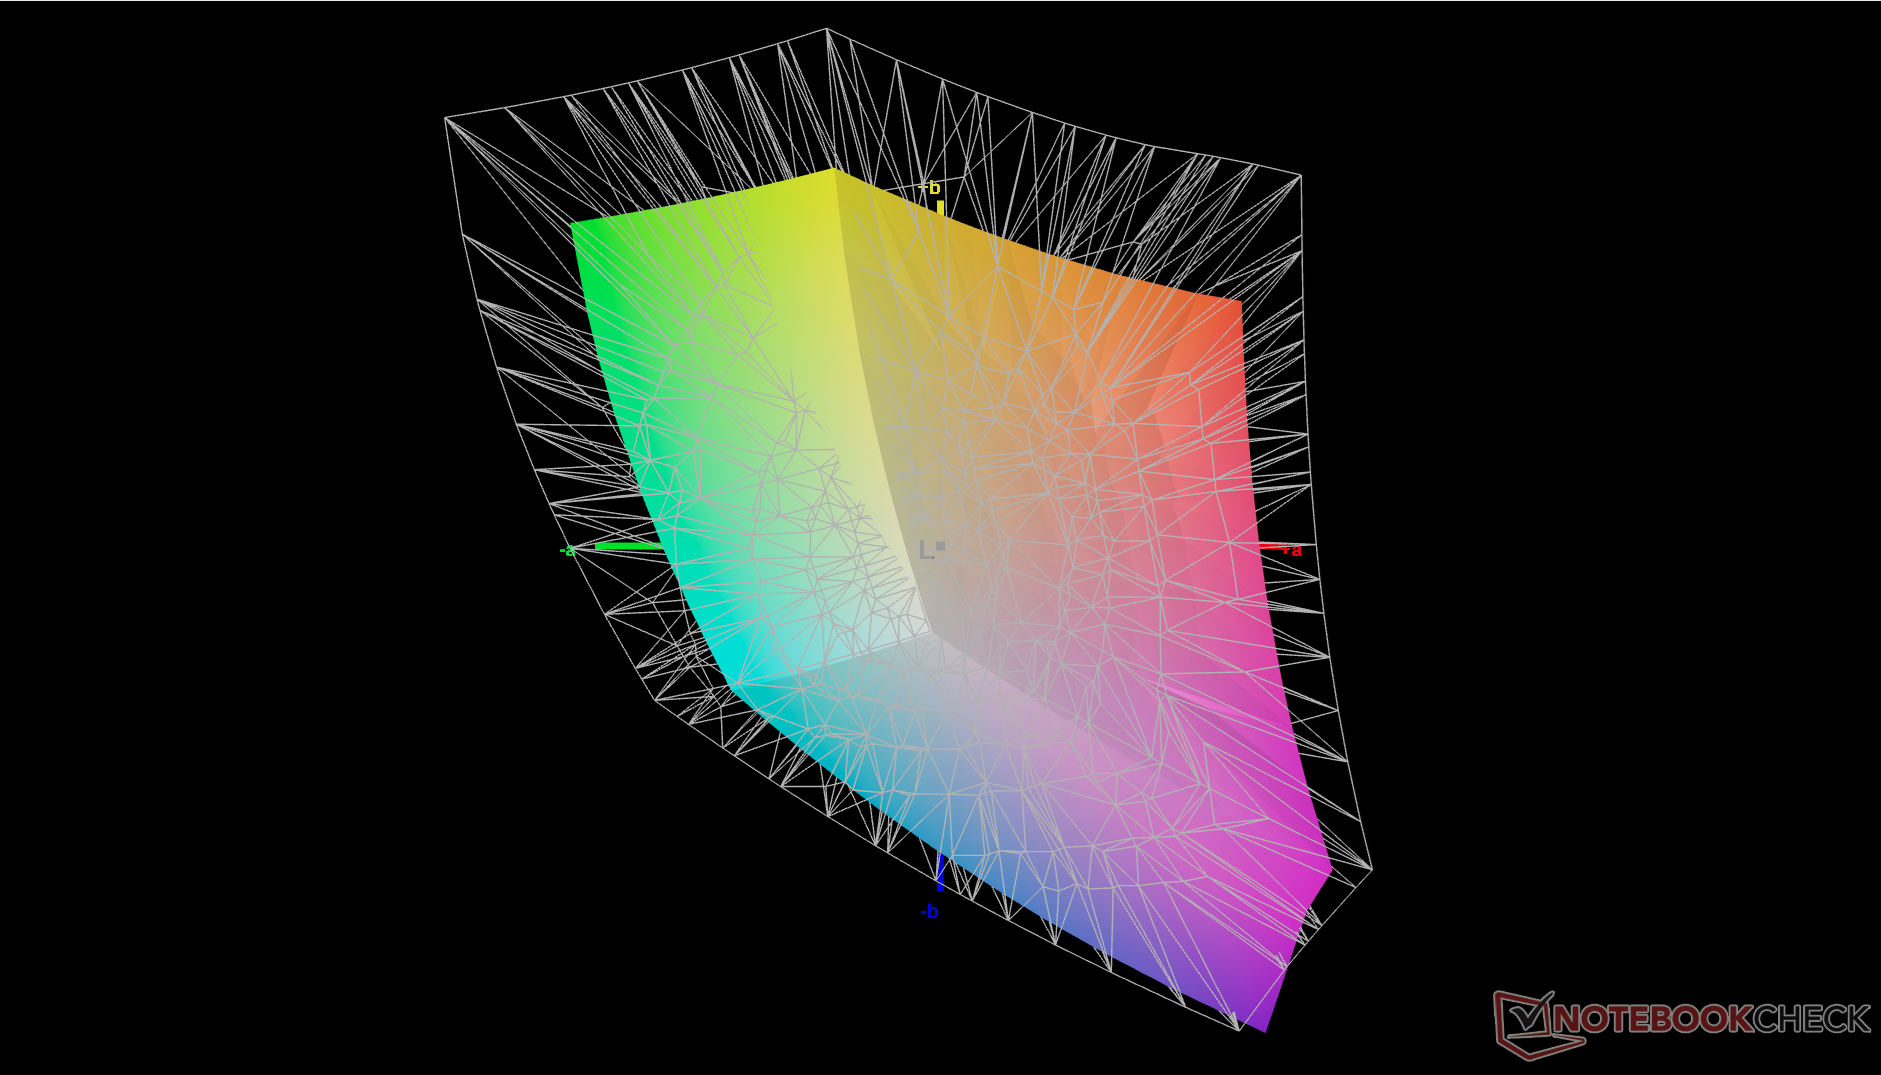
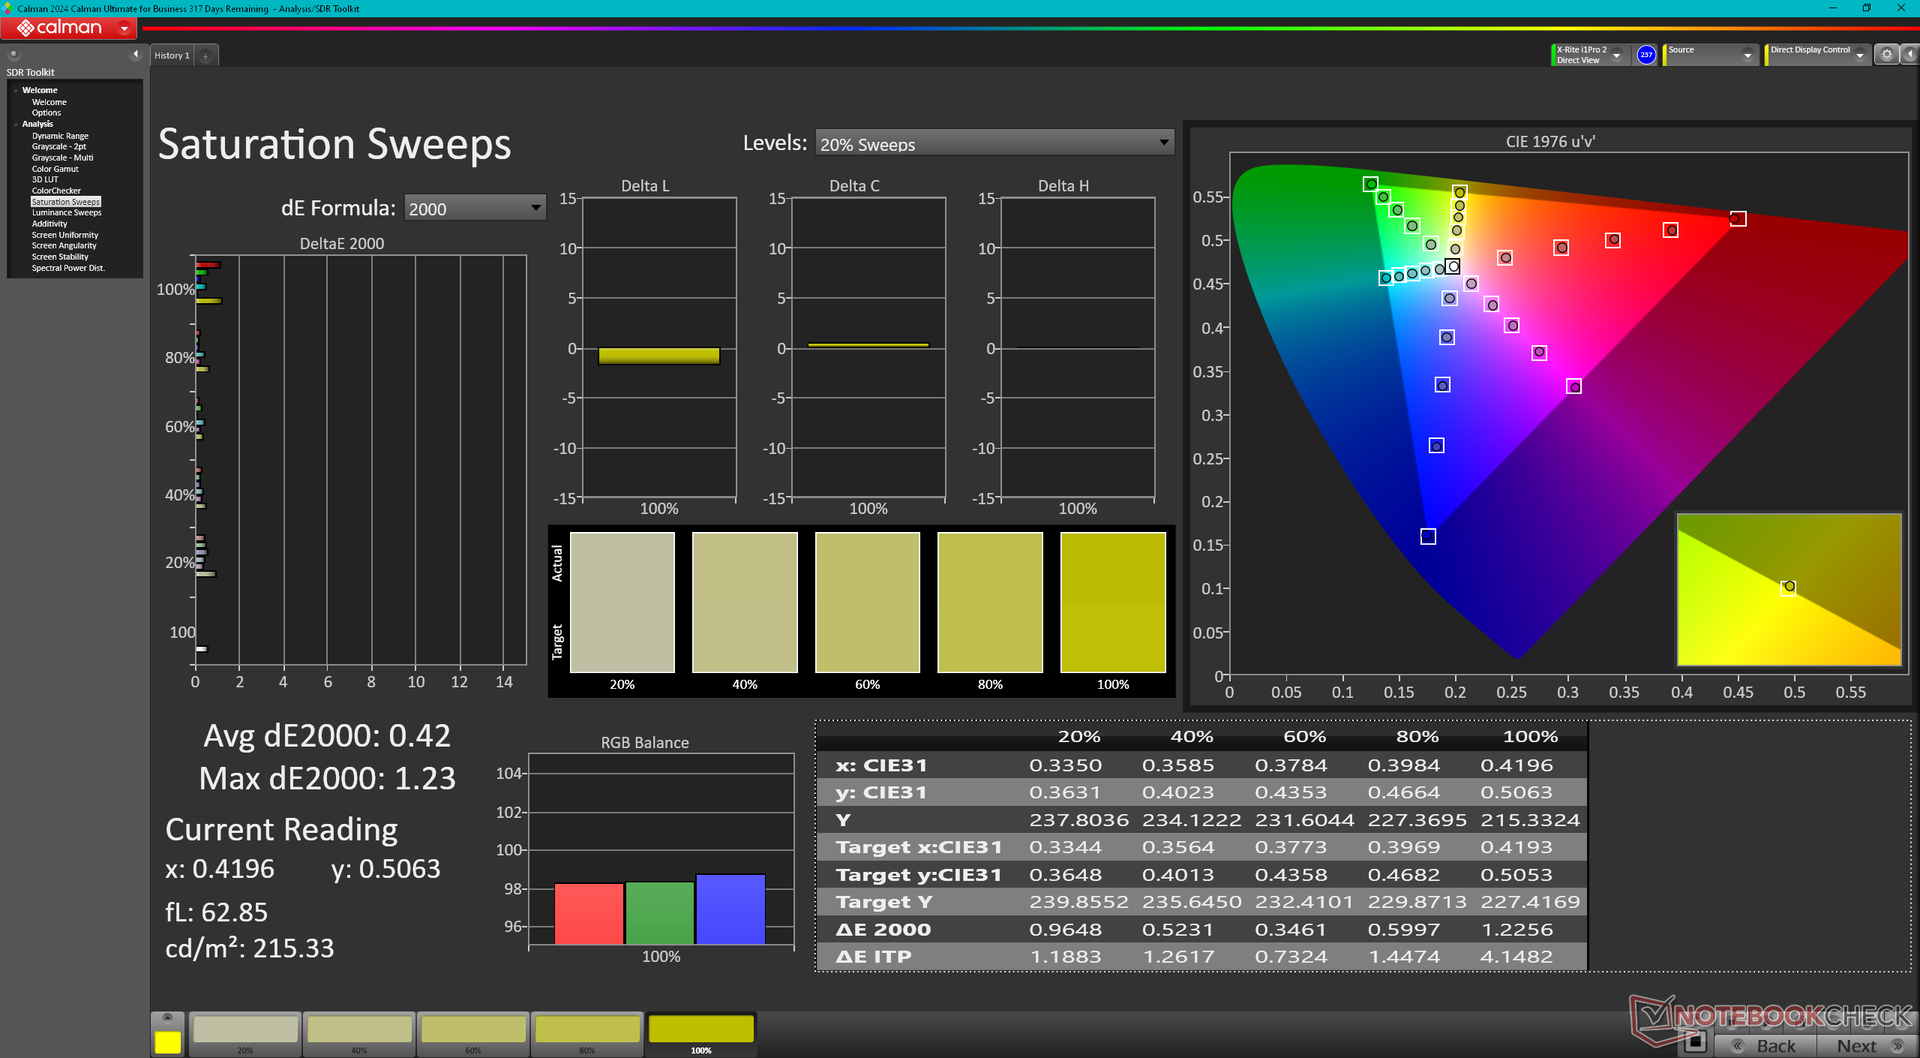
The display comes pre-calibrated out of the box with average grayscale and color deltaE values of just 0.6 and 1.92, respectively. If we are to be picky, colors could have been more accurate at higher saturation levels where DeltaE for certain colors can reach 3 or 4 as shown by our screenshots below. Calibrating the panel ourselves with an X-Rite colorimeter would improve this small shortcoming, but an end-user calibration shouldn't be necessary for the majority of users in this case.
Display Response Times
| ↔ Response Time Black to White | ||
|---|---|---|
| 25.9 ms ... rise ↗ and fall ↘ combined | ↗ 12.5 ms rise | 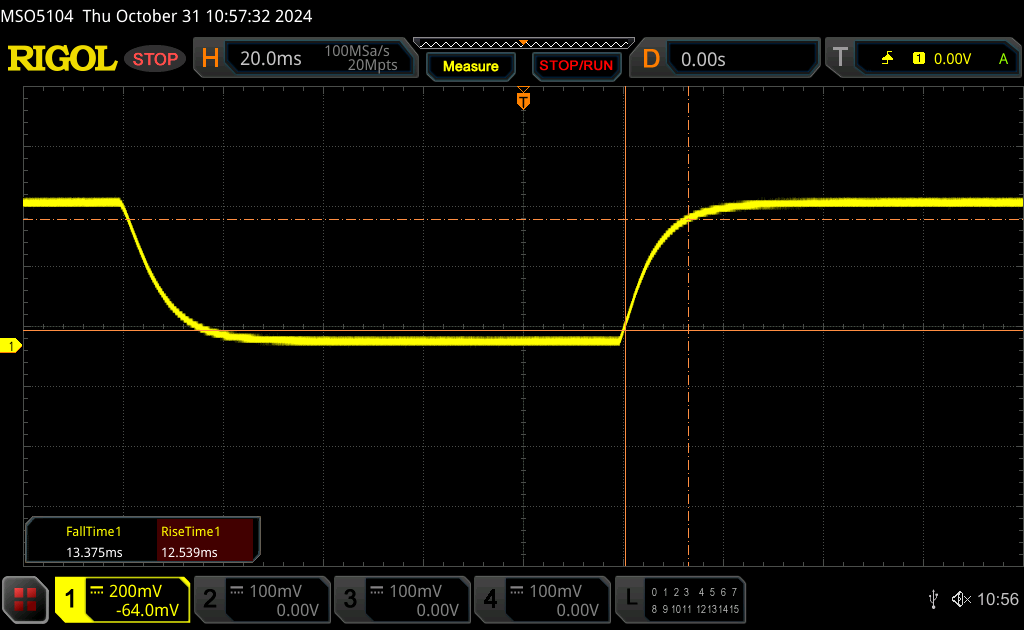 |
| ↘ 13.4 ms fall | ||
| The screen shows relatively slow response rates in our tests and may be too slow for gamers. In comparison, all tested devices range from 0.1 (minimum) to 240 (maximum) ms. » 62 % of all devices are better. This means that the measured response time is worse than the average of all tested devices (19.8 ms). | ||
| ↔ Response Time 50% Grey to 80% Grey | ||
| 37.3 ms ... rise ↗ and fall ↘ combined | ↗ 17 ms rise | 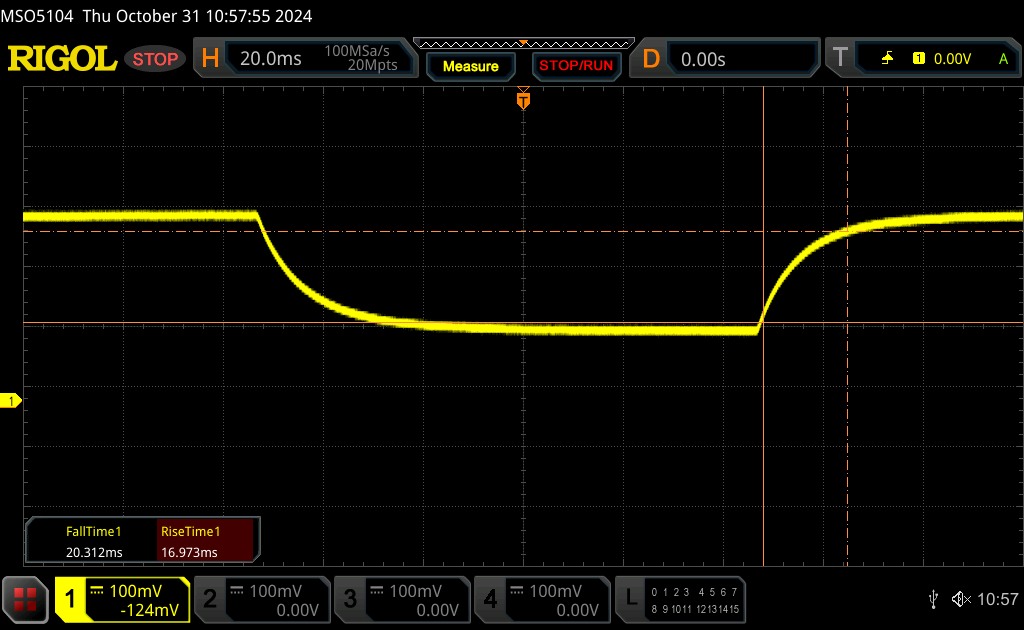 |
| ↘ 20.3 ms fall | ||
| The screen shows slow response rates in our tests and will be unsatisfactory for gamers. In comparison, all tested devices range from 0.165 (minimum) to 636 (maximum) ms. » 55 % of all devices are better. This means that the measured response time is worse than the average of all tested devices (31 ms). | ||
Screen Flickering / PWM (Pulse-Width Modulation)
| Screen flickering / PWM not detected | 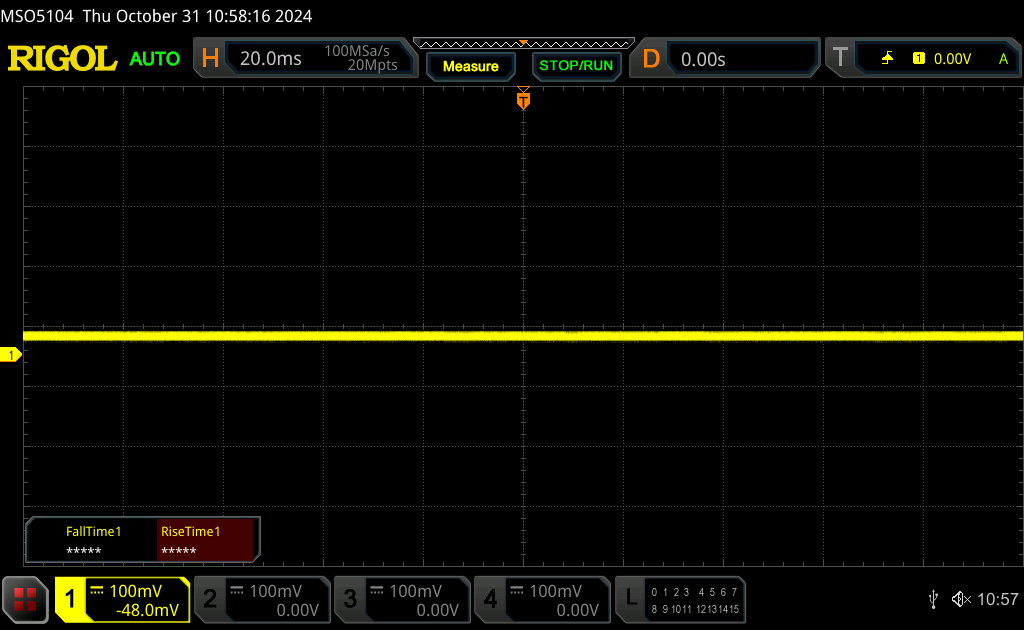 | ||
In comparison: 52 % of all tested devices do not use PWM to dim the display. If PWM was detected, an average of 7754 (minimum: 5 - maximum: 343500) Hz was measured. | |||
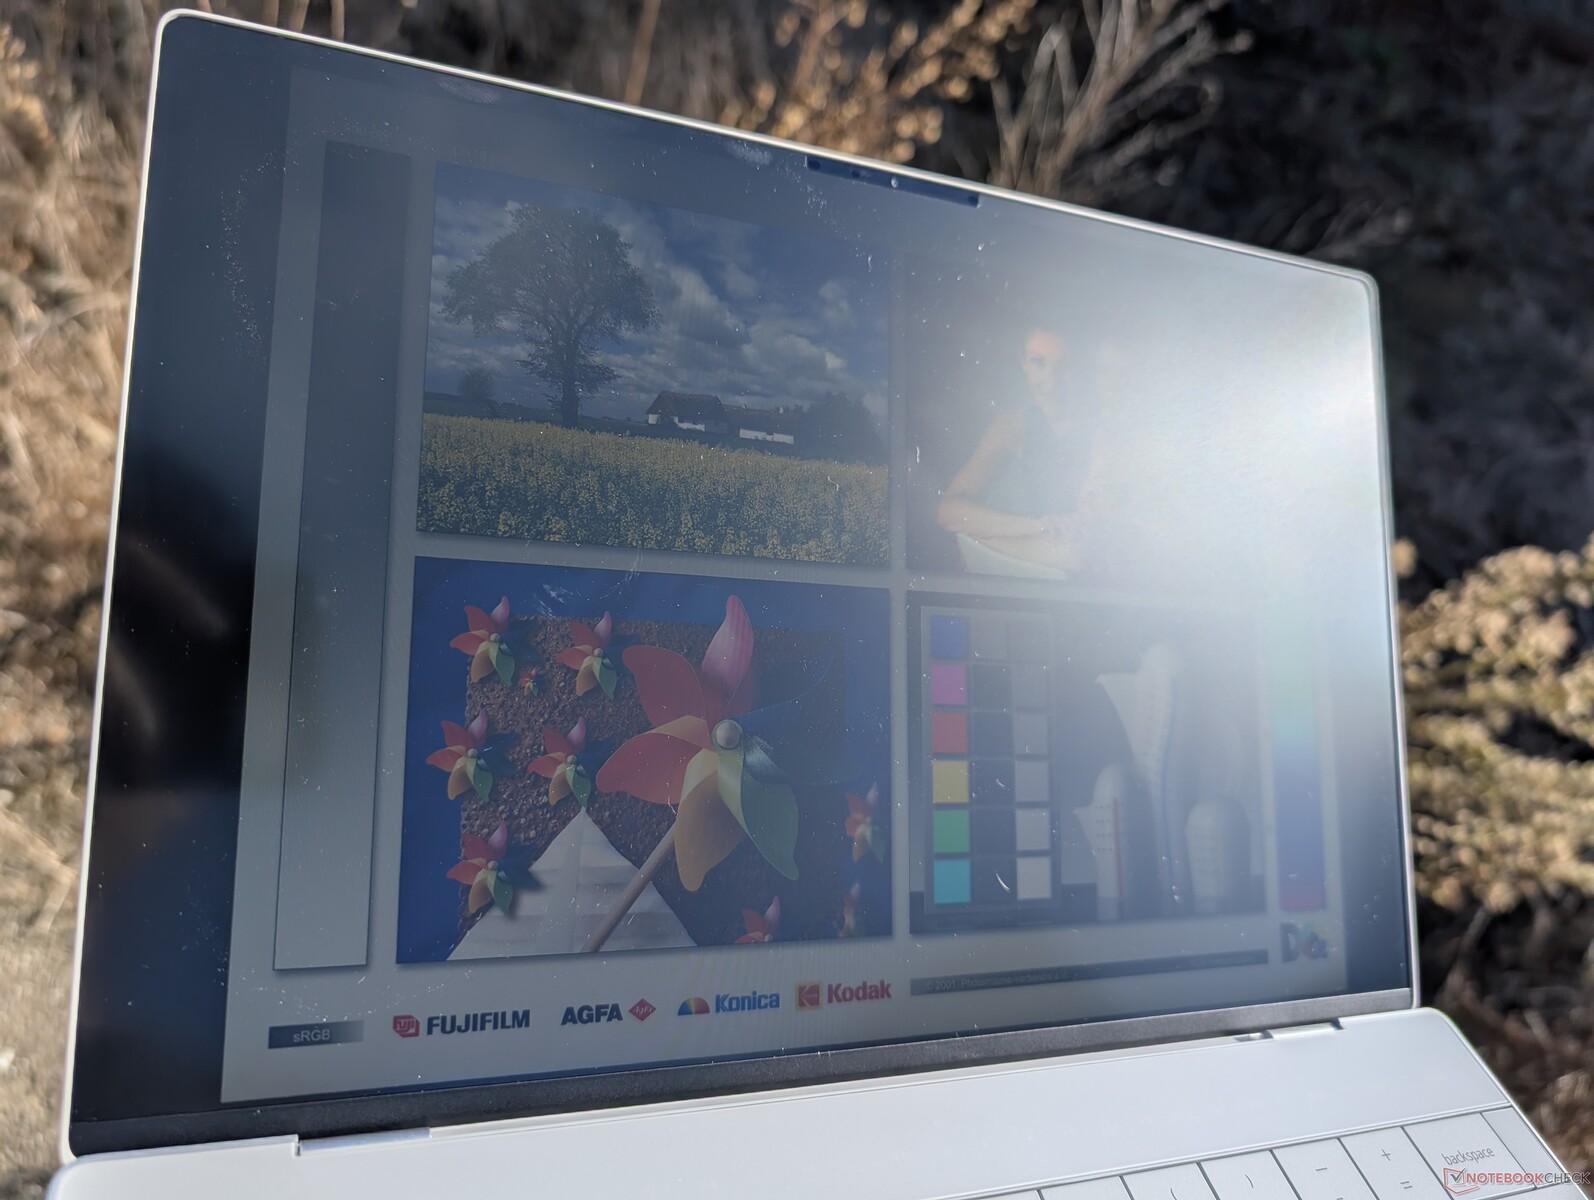
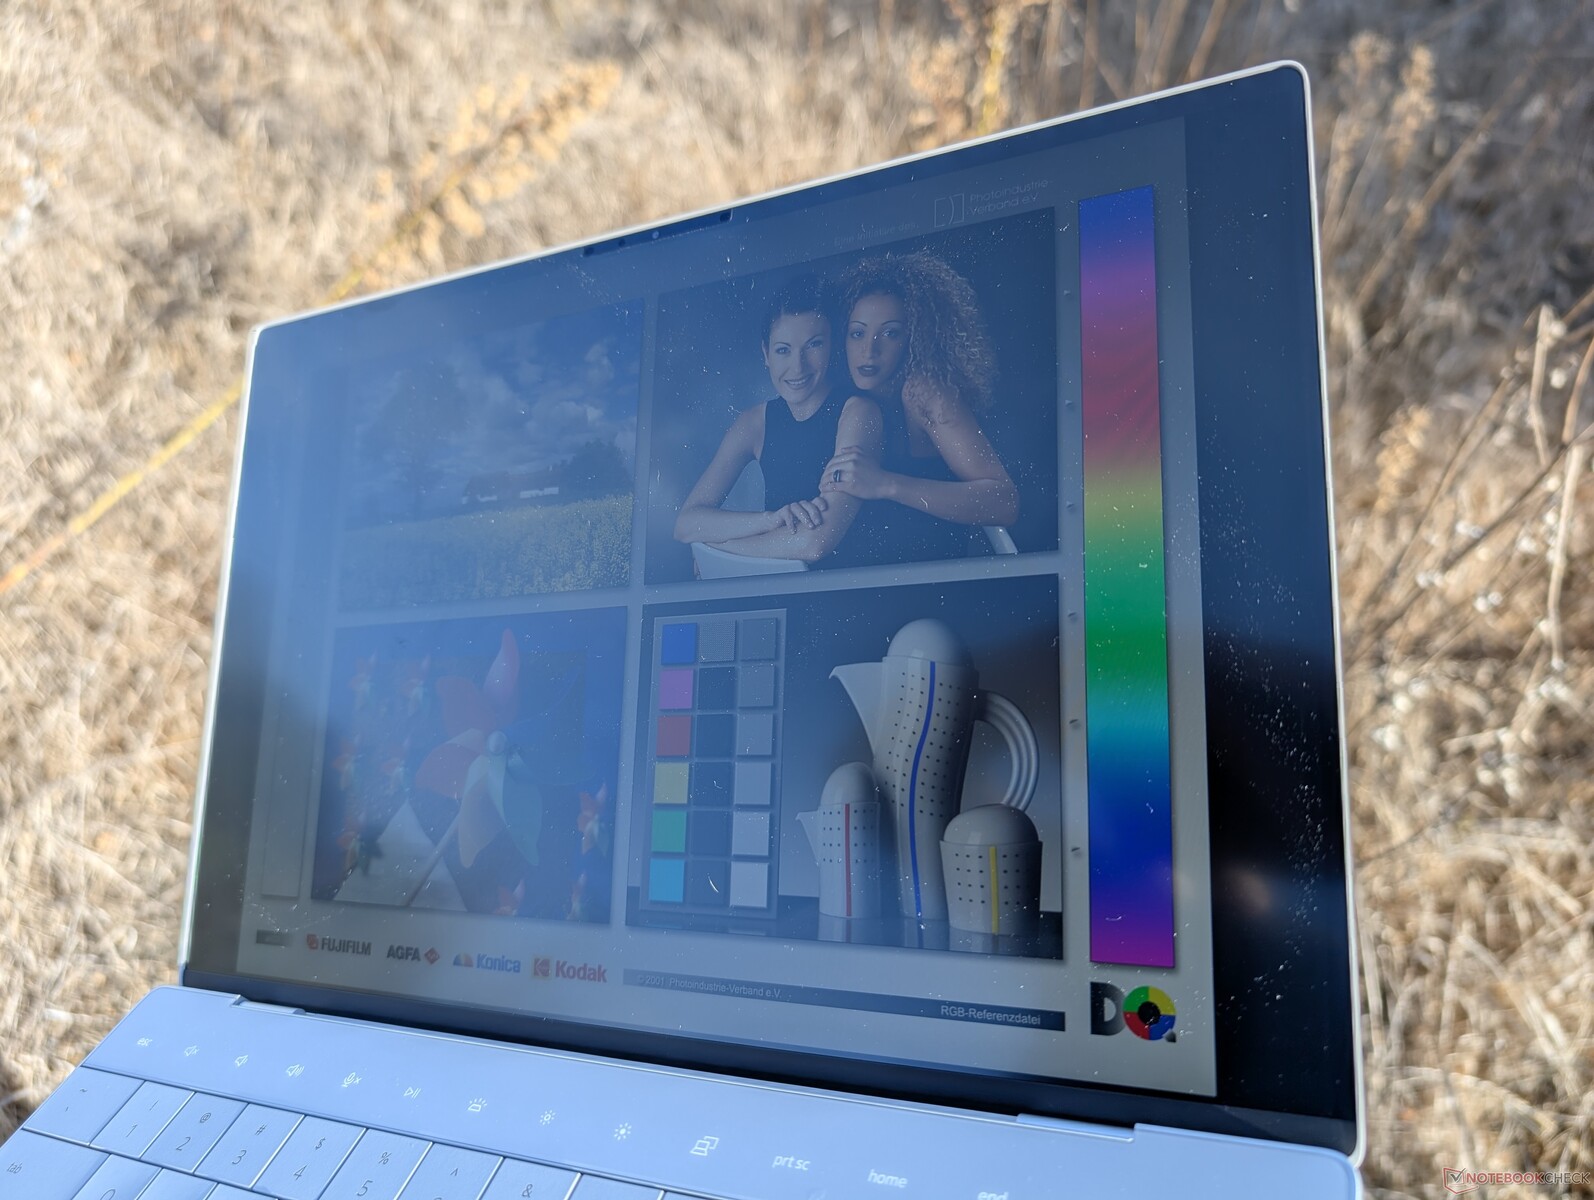
Outdoor visibility is not bad but still slightly worse than the MacBook Air 13 which can reach just over 500 nits compared to ~435 nits on our Dell. Glare on our matte panel is much less distracting that on the OLED configuration, but colors will still look washed out when working under bright conditions.
Performance — Steadier And More Reliable


Testing Conditions
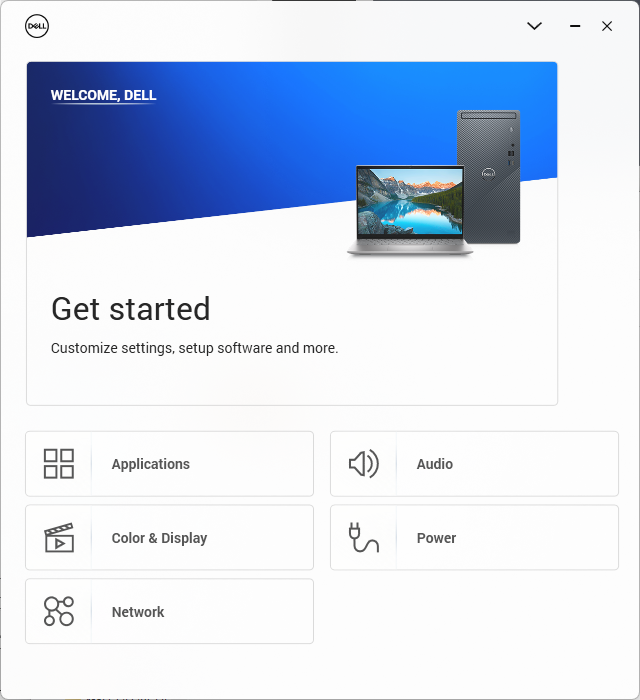
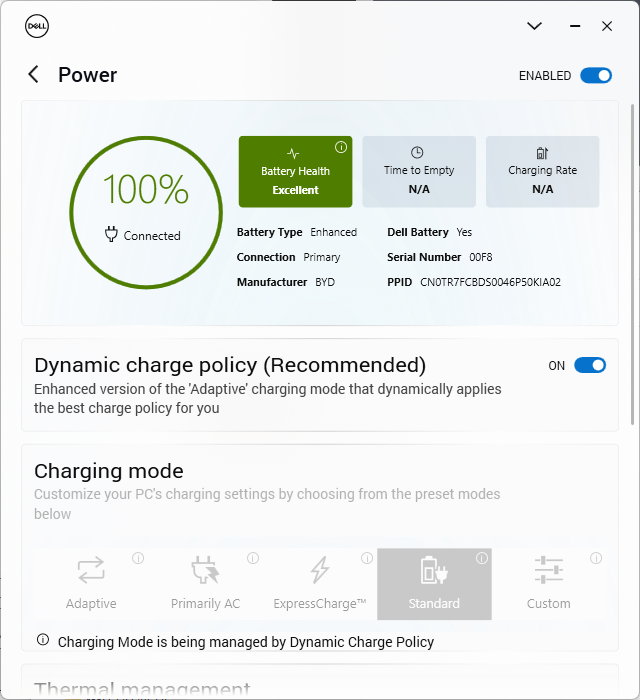
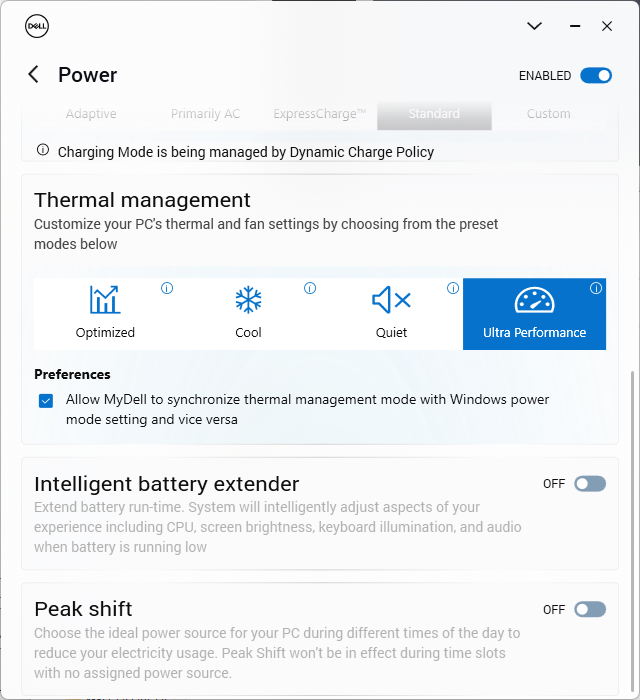
We set MyDell to Ultra Performance mode prior to running the benchmarks below. The MyDell power settings can conveniently sync with the Windows power settings unlike on most other laptops. This avoids awkward scenarios where Windows can be set to Power Saver while the manufacturer power setting is set to Performance
Processor
Processor performance is interesting especially when compared to the XPS 13 9340 and its Core Ultra 7 155H. Our Core Ultra 7 256V performs slower as expected by up to 20 to 30 percent according to most multi-thread benchmarks since its Turbo Boost potential and core count are both lower than that of the Core Ultra 7 155H. However, our Core Ultra 7 256V would also throttle significantly less than the Core Ultra 7 155H in the XPS 9340. Once throttling is accounted for, multi-thread performance between the XPS 13 9340 and 9350 becomes almost the same as exemplified by our CineBench R15 xT loop test results below.
It's worth noting that it takes at least a dozen runs of CineBench R15 xT before the Core Ultra 7 155H would throttle down to perform more like our Core Ultra 7 256V. The performance advantage of Meteor Lake-H is therefore still significant in the short-to-medium term.
Cinebench R15 Multi Loop
Cinebench R23: Multi Core | Single Core
Cinebench R20: CPU (Multi Core) | CPU (Single Core)
Cinebench R15: CPU Multi 64Bit | CPU Single 64Bit
Blender: v2.79 BMW27 CPU
7-Zip 18.03: 7z b 4 | 7z b 4 -mmt1
Geekbench 6.7: Multi-Core | Single-Core
Geekbench 5.5: Multi-Core | Single-Core
HWBOT x265 Benchmark v2.2: 4k Preset
LibreOffice : 20 Documents To PDF
R Benchmark 2.5: Overall mean
| Geekbench 6.7 / Multi-Core | |
| HP EliteBook x360 1040 G11 | |
| Dell XPS 13 9340 Core Ultra 7 | |
| Framework Laptop 13.5 Ryzen 7 7840U | |
| Lenovo ThinkBook 13x G4 21KR0008GE | |
| Dell XPS 13 9350 | |
| Average Intel Core Ultra 7 256V (9852 - 11085, n=8) | |
| Asus Zenbook S 14 UX5406 | |
| MSI Prestige 13 AI Evo | |
| Geekbench 6.7 / Single-Core | |
| Dell XPS 13 9350 | |
| Average Intel Core Ultra 7 256V (2680 - 2784, n=8) | |
| Asus Zenbook S 14 UX5406 | |
| Framework Laptop 13.5 Ryzen 7 7840U | |
| MSI Prestige 13 AI Evo | |
| HP EliteBook x360 1040 G11 | |
| Dell XPS 13 9340 Core Ultra 7 | |
| Lenovo ThinkBook 13x G4 21KR0008GE | |
Cinebench R23: Multi Core | Single Core
Cinebench R20: CPU (Multi Core) | CPU (Single Core)
Cinebench R15: CPU Multi 64Bit | CPU Single 64Bit
Blender: v2.79 BMW27 CPU
7-Zip 18.03: 7z b 4 | 7z b 4 -mmt1
Geekbench 6.7: Multi-Core | Single-Core
Geekbench 5.5: Multi-Core | Single-Core
HWBOT x265 Benchmark v2.2: 4k Preset
LibreOffice : 20 Documents To PDF
R Benchmark 2.5: Overall mean
* ... smaller is better
AIDA64: FP32 Ray-Trace | FPU Julia | CPU SHA3 | CPU Queen | FPU SinJulia | FPU Mandel | CPU AES | CPU ZLib | FP64 Ray-Trace | CPU PhotoWorxx
| Performance rating | |
| Dell XPS 13 Plus 9320 i7-1280P OLED | |
| Average Intel Core Ultra 7 256V | |
| Dell XPS 13 9350 | |
| Lenovo ThinkBook 13x G4 21KR0008GE | |
| MSI Prestige 13 AI Evo | |
| HP Dragonfly G4 | |
| Asus ZenBook S13 OLED UX5304 | |
| AIDA64 / FP32 Ray-Trace | |
| Dell XPS 13 9350 | |
| Average Intel Core Ultra 7 256V (10524 - 12898, n=7) | |
| Dell XPS 13 Plus 9320 i7-1280P OLED | |
| Lenovo ThinkBook 13x G4 21KR0008GE | |
| HP Dragonfly G4 | |
| MSI Prestige 13 AI Evo | |
| Asus ZenBook S13 OLED UX5304 | |
| AIDA64 / FPU Julia | |
| Dell XPS 13 9350 | |
| Average Intel Core Ultra 7 256V (52443 - 62522, n=7) | |
| Dell XPS 13 Plus 9320 i7-1280P OLED | |
| MSI Prestige 13 AI Evo | |
| Lenovo ThinkBook 13x G4 21KR0008GE | |
| HP Dragonfly G4 | |
| Asus ZenBook S13 OLED UX5304 | |
| AIDA64 / CPU SHA3 | |
| Dell XPS 13 9350 | |
| Dell XPS 13 Plus 9320 i7-1280P OLED | |
| Average Intel Core Ultra 7 256V (2364 - 2915, n=7) | |
| Lenovo ThinkBook 13x G4 21KR0008GE | |
| MSI Prestige 13 AI Evo | |
| HP Dragonfly G4 | |
| Asus ZenBook S13 OLED UX5304 | |
| AIDA64 / CPU Queen | |
| Dell XPS 13 Plus 9320 i7-1280P OLED | |
| Lenovo ThinkBook 13x G4 21KR0008GE | |
| HP Dragonfly G4 | |
| Asus ZenBook S13 OLED UX5304 | |
| MSI Prestige 13 AI Evo | |
| Average Intel Core Ultra 7 256V (49622 - 49794, n=6) | |
| Dell XPS 13 9350 | |
| AIDA64 / FPU SinJulia | |
| Dell XPS 13 Plus 9320 i7-1280P OLED | |
| Lenovo ThinkBook 13x G4 21KR0008GE | |
| MSI Prestige 13 AI Evo | |
| HP Dragonfly G4 | |
| Dell XPS 13 9350 | |
| Average Intel Core Ultra 7 256V (4401 - 4434, n=7) | |
| Asus ZenBook S13 OLED UX5304 | |
| AIDA64 / FPU Mandel | |
| Dell XPS 13 9350 | |
| Average Intel Core Ultra 7 256V (27382 - 33019, n=7) | |
| Dell XPS 13 Plus 9320 i7-1280P OLED | |
| MSI Prestige 13 AI Evo | |
| Lenovo ThinkBook 13x G4 21KR0008GE | |
| HP Dragonfly G4 | |
| Asus ZenBook S13 OLED UX5304 | |
| AIDA64 / CPU AES | |
| Dell XPS 13 Plus 9320 i7-1280P OLED | |
| Lenovo ThinkBook 13x G4 21KR0008GE | |
| MSI Prestige 13 AI Evo | |
| Average Intel Core Ultra 7 256V (38495 - 75938, n=7) | |
| Dell XPS 13 9350 | |
| HP Dragonfly G4 | |
| Asus ZenBook S13 OLED UX5304 | |
| AIDA64 / CPU ZLib | |
| Dell XPS 13 Plus 9320 i7-1280P OLED | |
| Lenovo ThinkBook 13x G4 21KR0008GE | |
| Average Intel Core Ultra 7 256V (536 - 632, n=7) | |
| MSI Prestige 13 AI Evo | |
| Dell XPS 13 9350 | |
| HP Dragonfly G4 | |
| Asus ZenBook S13 OLED UX5304 | |
| AIDA64 / FP64 Ray-Trace | |
| Dell XPS 13 9350 | |
| Average Intel Core Ultra 7 256V (5655 - 6878, n=7) | |
| Dell XPS 13 Plus 9320 i7-1280P OLED | |
| Lenovo ThinkBook 13x G4 21KR0008GE | |
| MSI Prestige 13 AI Evo | |
| HP Dragonfly G4 | |
| Asus ZenBook S13 OLED UX5304 | |
| AIDA64 / CPU PhotoWorxx | |
| Average Intel Core Ultra 7 256V (49906 - 57060, n=7) | |
| Dell XPS 13 9350 | |
| Dell XPS 13 Plus 9320 i7-1280P OLED | |
| Lenovo ThinkBook 13x G4 21KR0008GE | |
| MSI Prestige 13 AI Evo | |
| Asus ZenBook S13 OLED UX5304 | |
| HP Dragonfly G4 | |
Stress Test

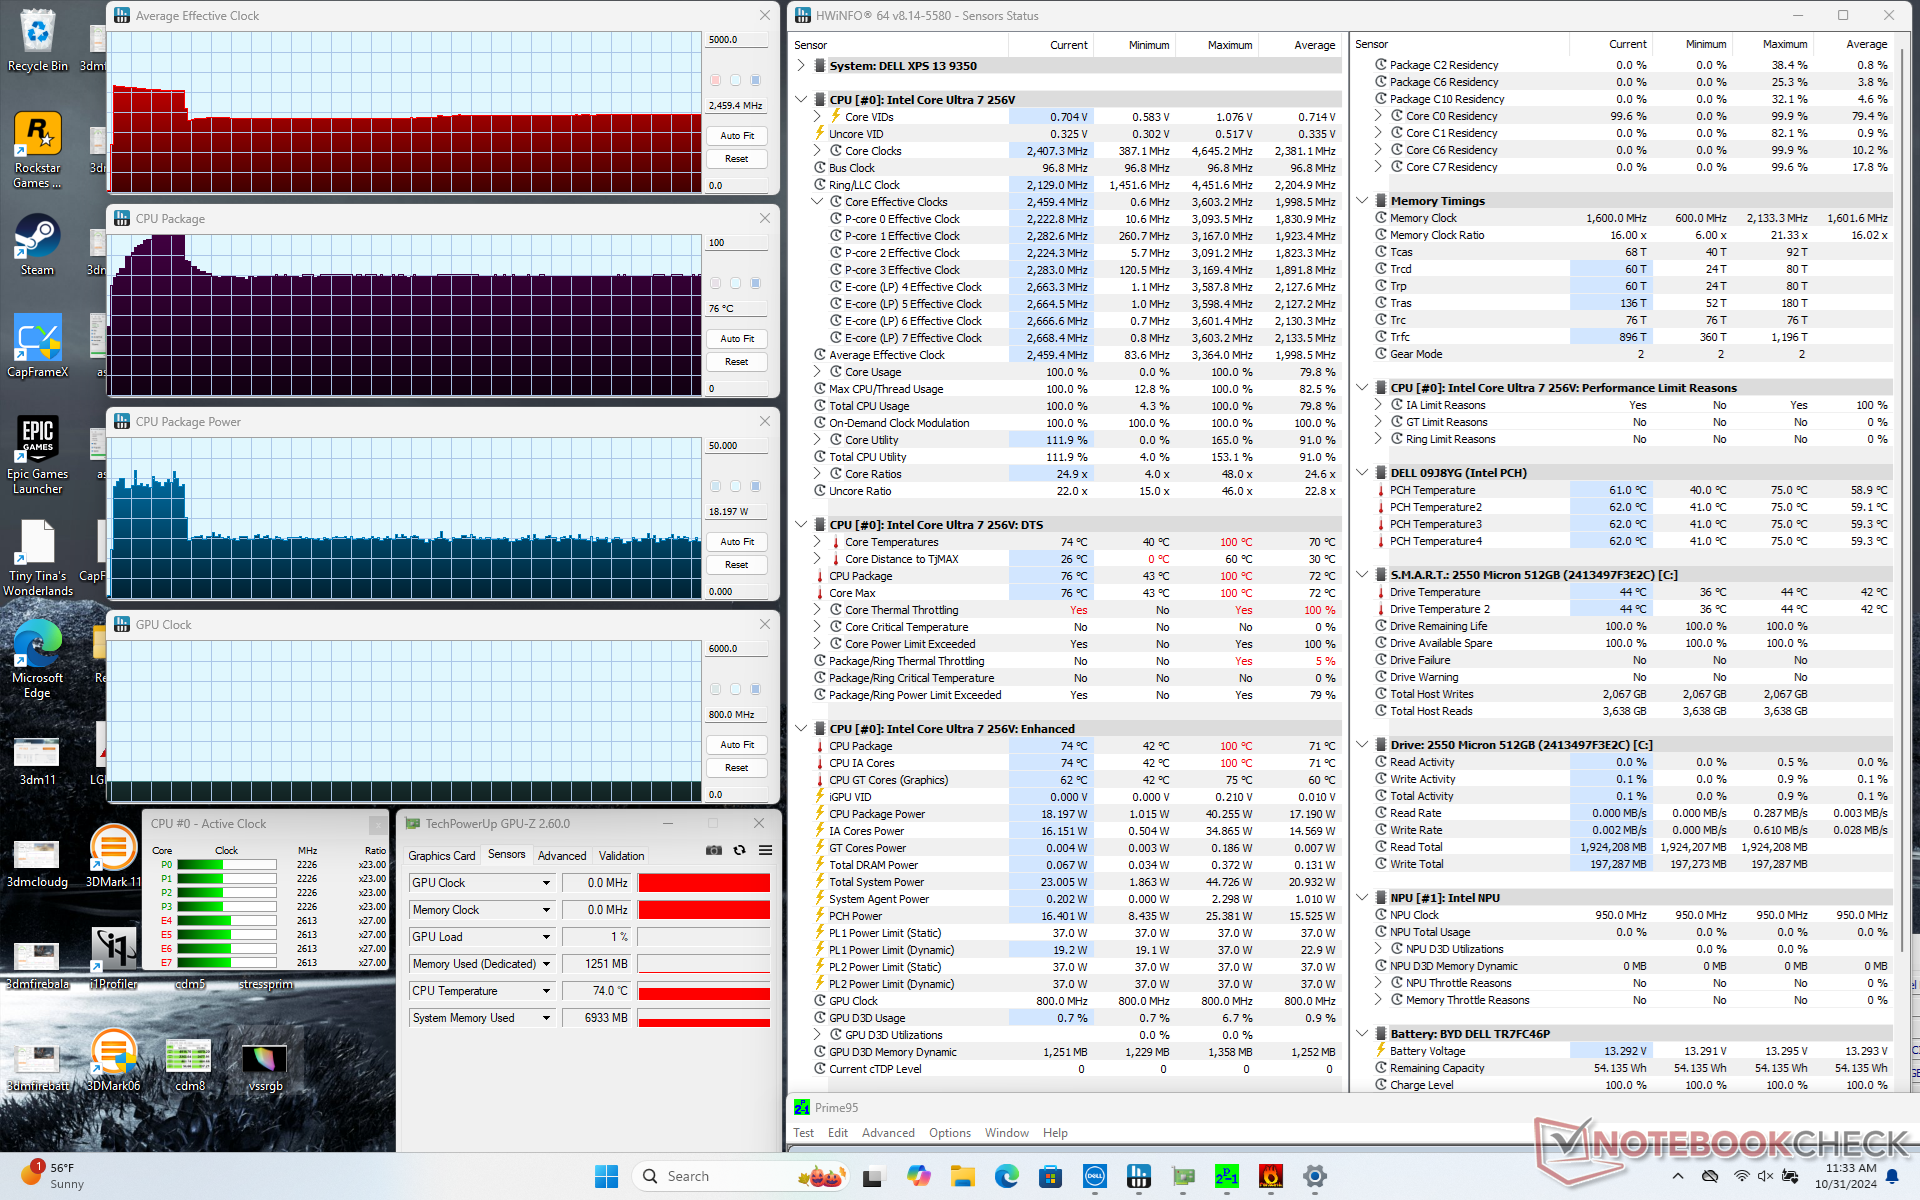
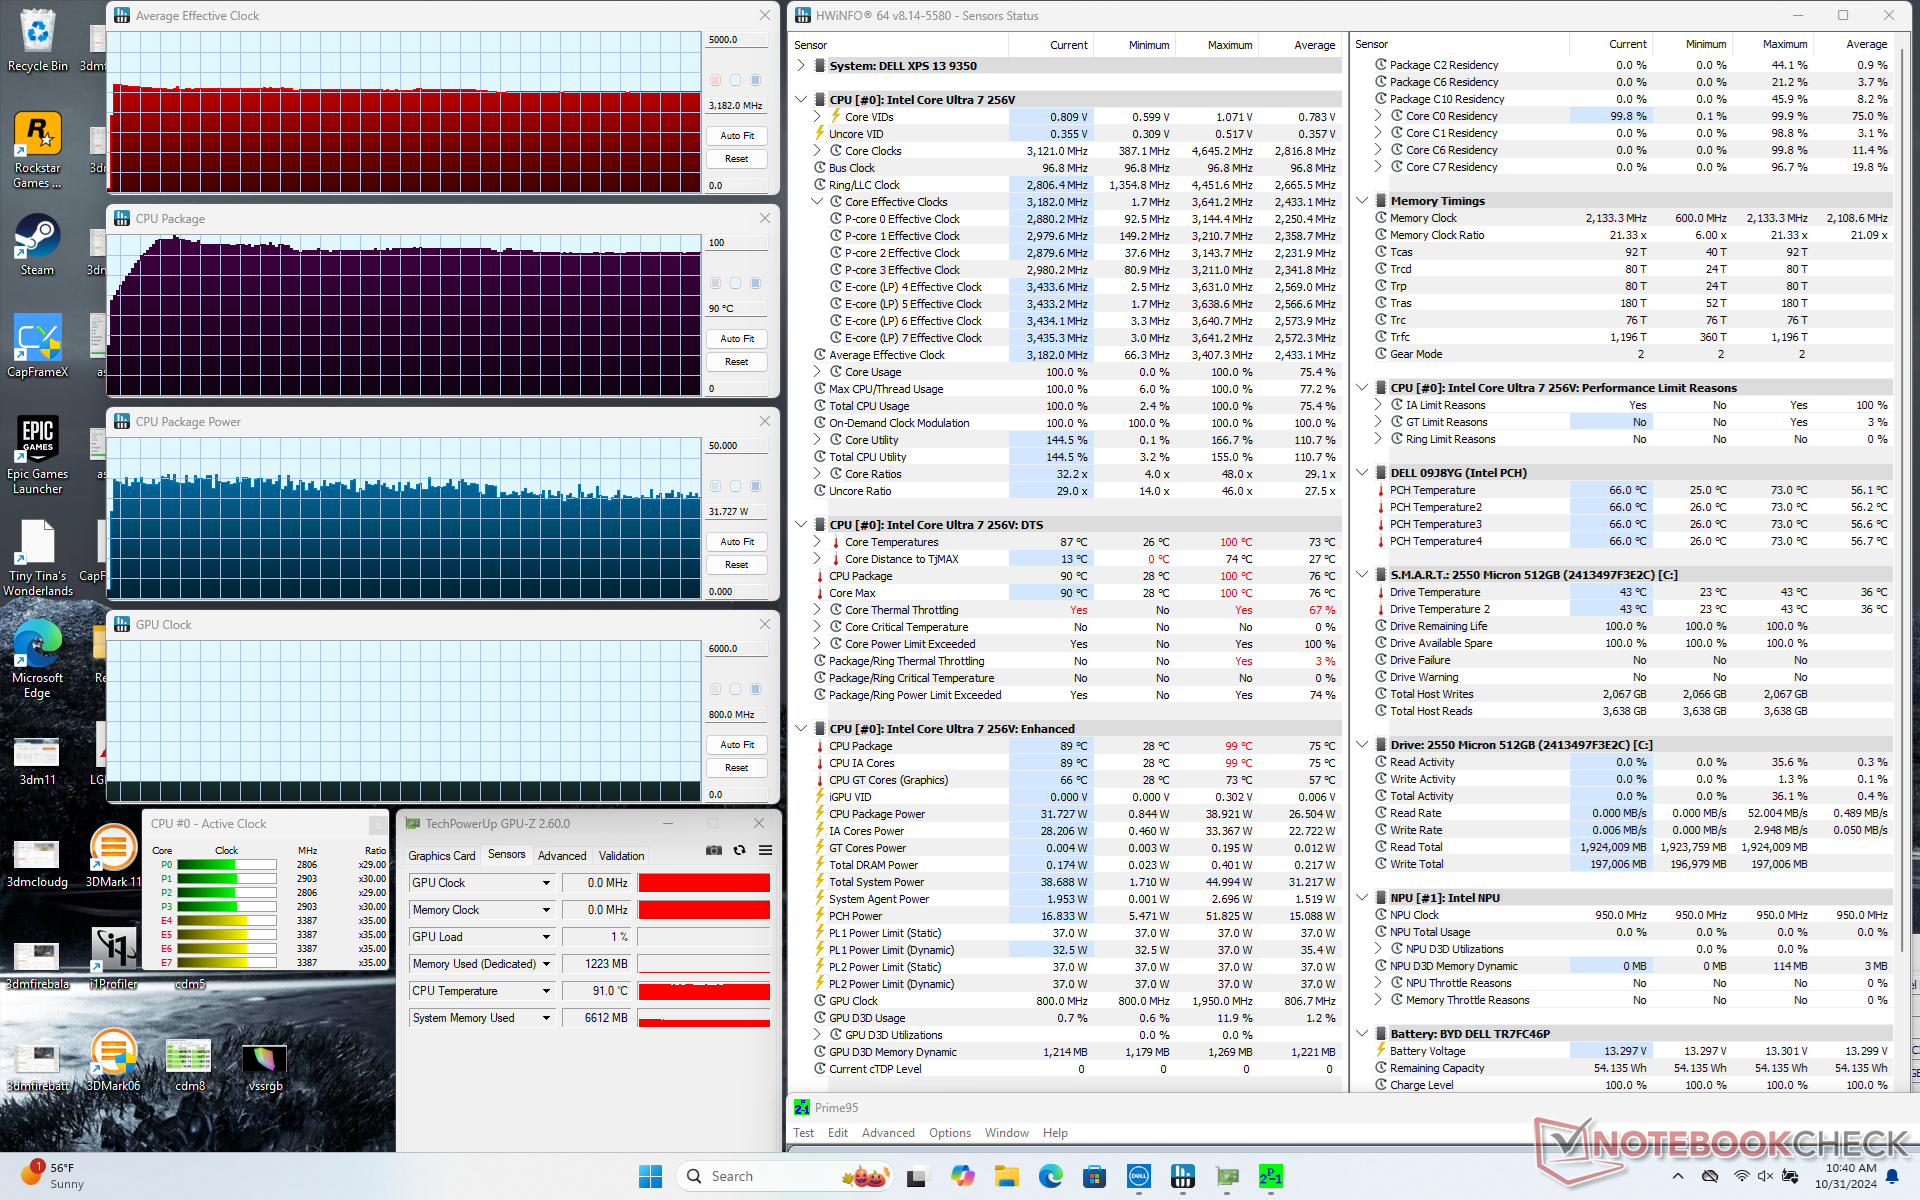
When initiating Prime95 stress, the CPU would boost to 3.4 GHz and 38 W for about a minute until reaching a core temperature of 100 C. It would then stabilize at 3.2 GHz and 32 W in order to maintain a slightly cooler core temperature of 90 C. If on Balanced mode instead, the CPU would stabilize at much lower values of 2.5 GHz, 76 C, and 18 W to correlate with our slower processor performance as noted in our GPU Performance section below.
Core temperature when running Prime95 on Performance mode is warmer than what we recorded on the older XPS 13 9320 when running the same stress test. On the other hand, core temperature when running games appears to be cooler on our newer XPS 13 9350 by almost 10 C.
| Average CPU Clock (GHz) | GPU Clock (MHz) | Average CPU Temperature (°C) | |
| System Idle | -- | -- | 29 |
| Prime95 Stress (Performance mode) | 3.2 | -- | 90 |
| Prime95 Stress (Balanced mode) | 2.5 | -- | 76 |
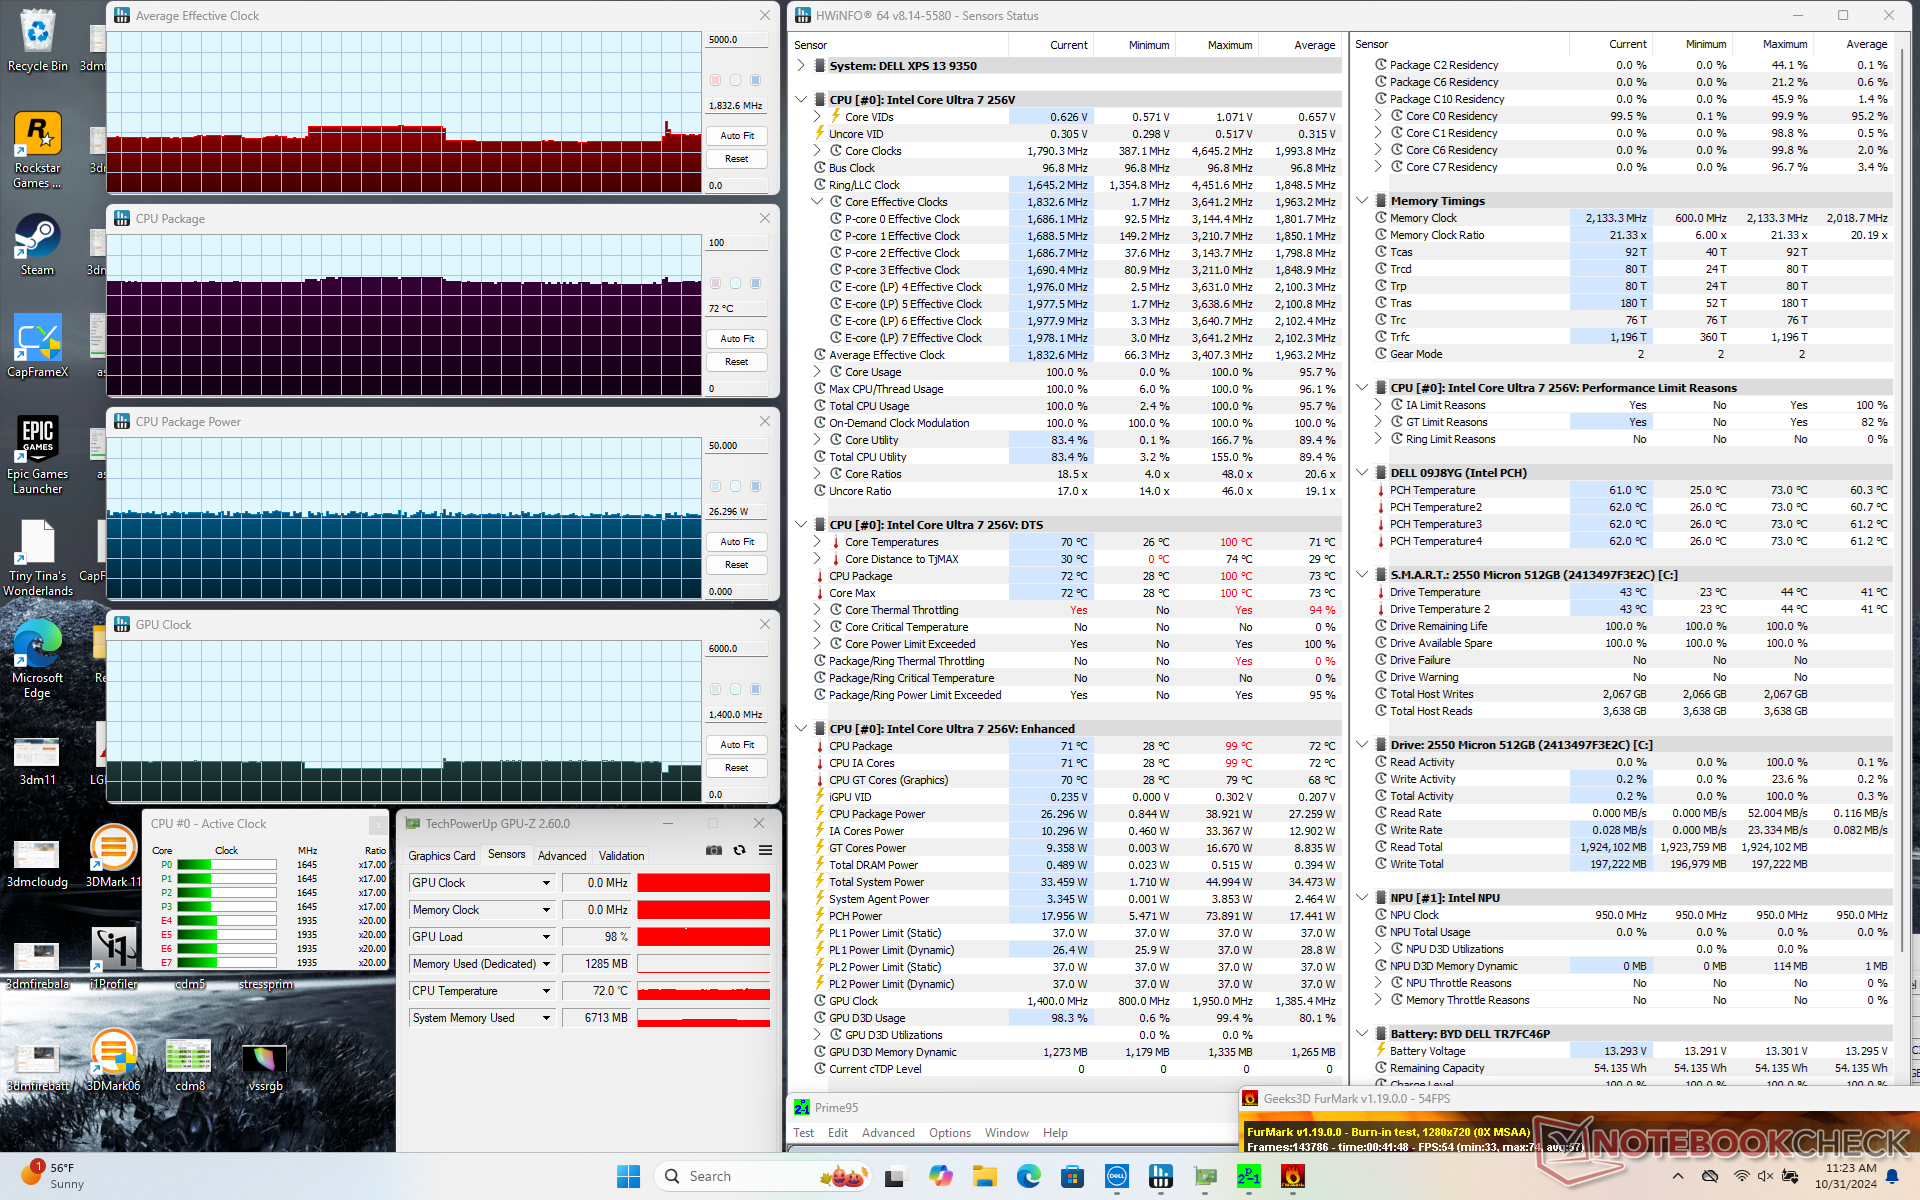
| Prime95 + FurMark Stress | ~1.8 | ~1400 | 72 |
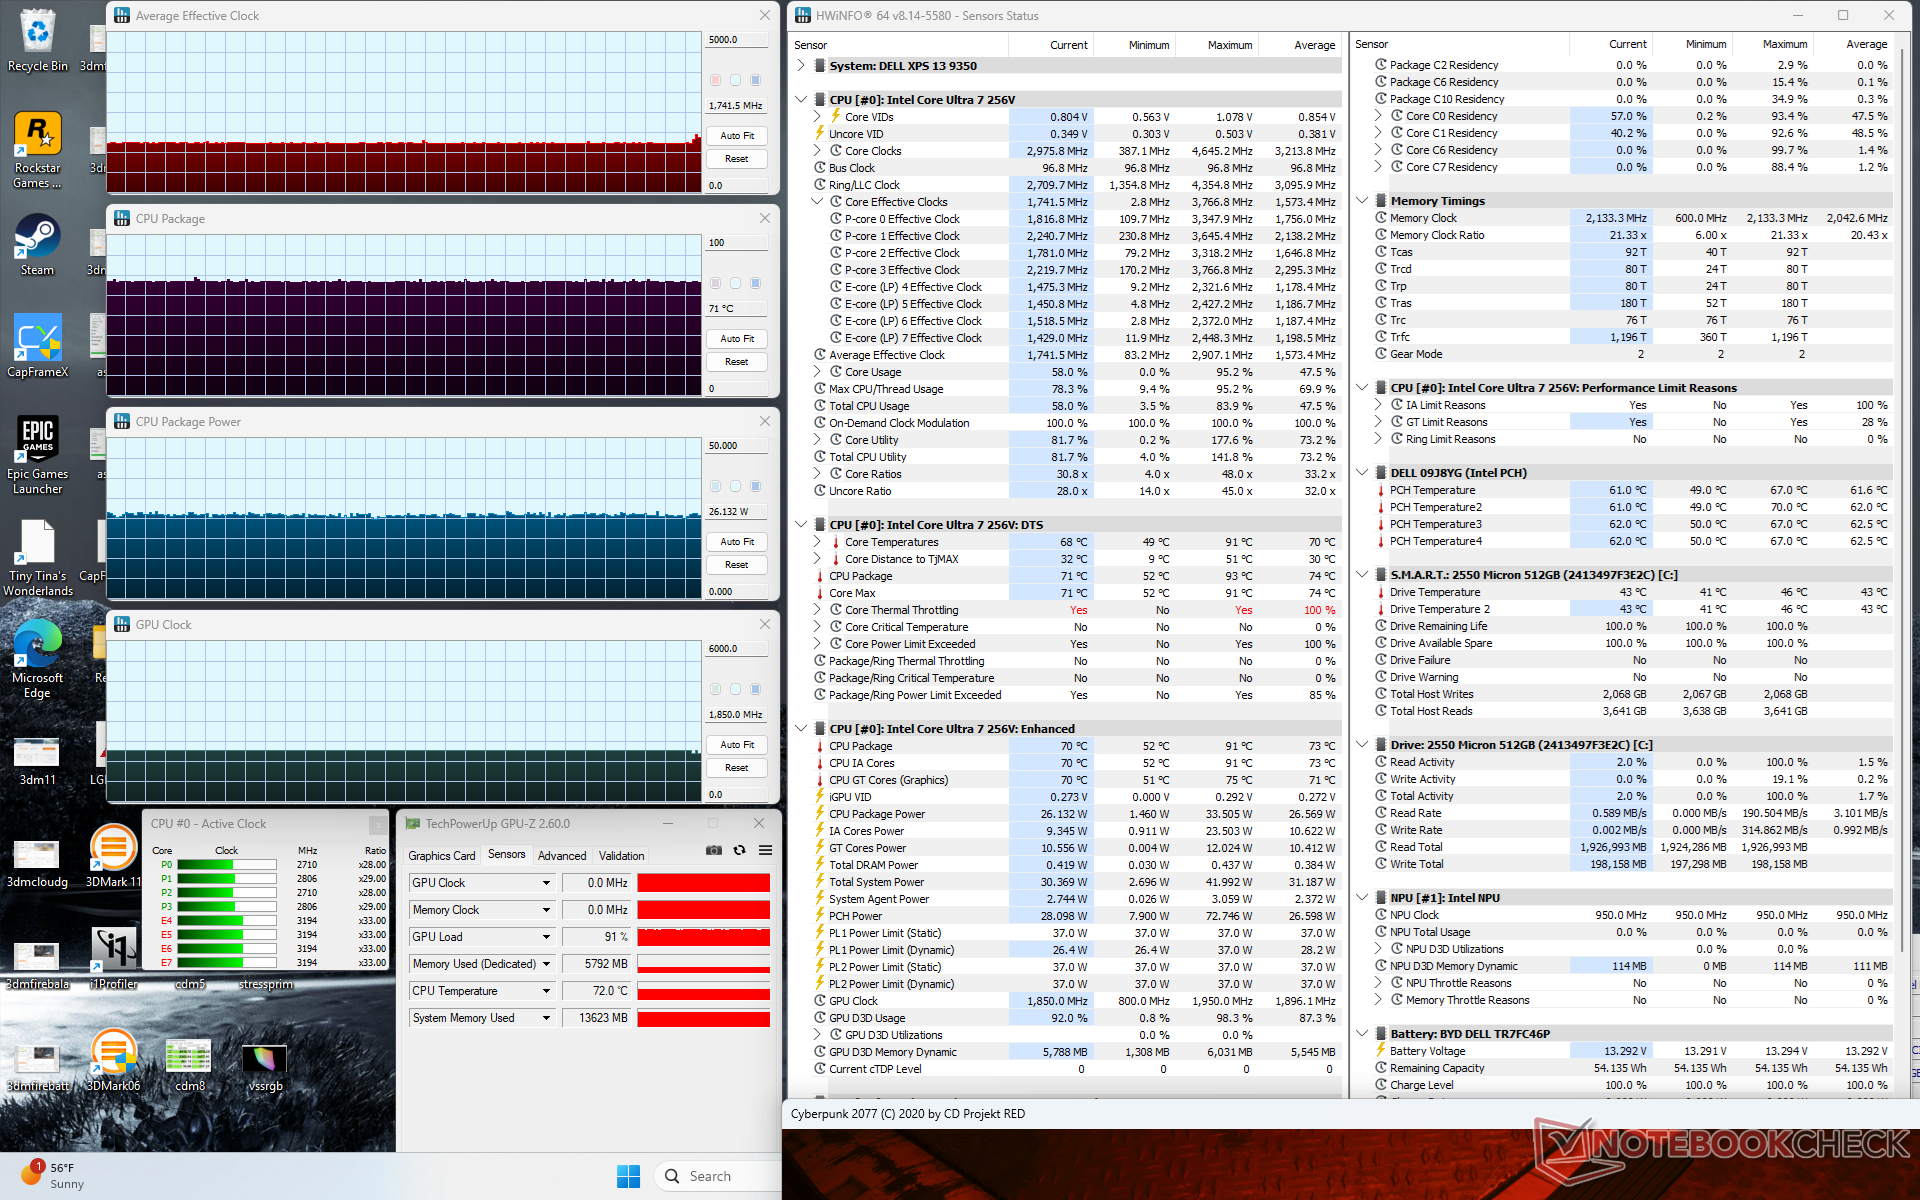
| Cyberpunk 2077 Stress | 1.7 | 1850 | 71 |
System Performance
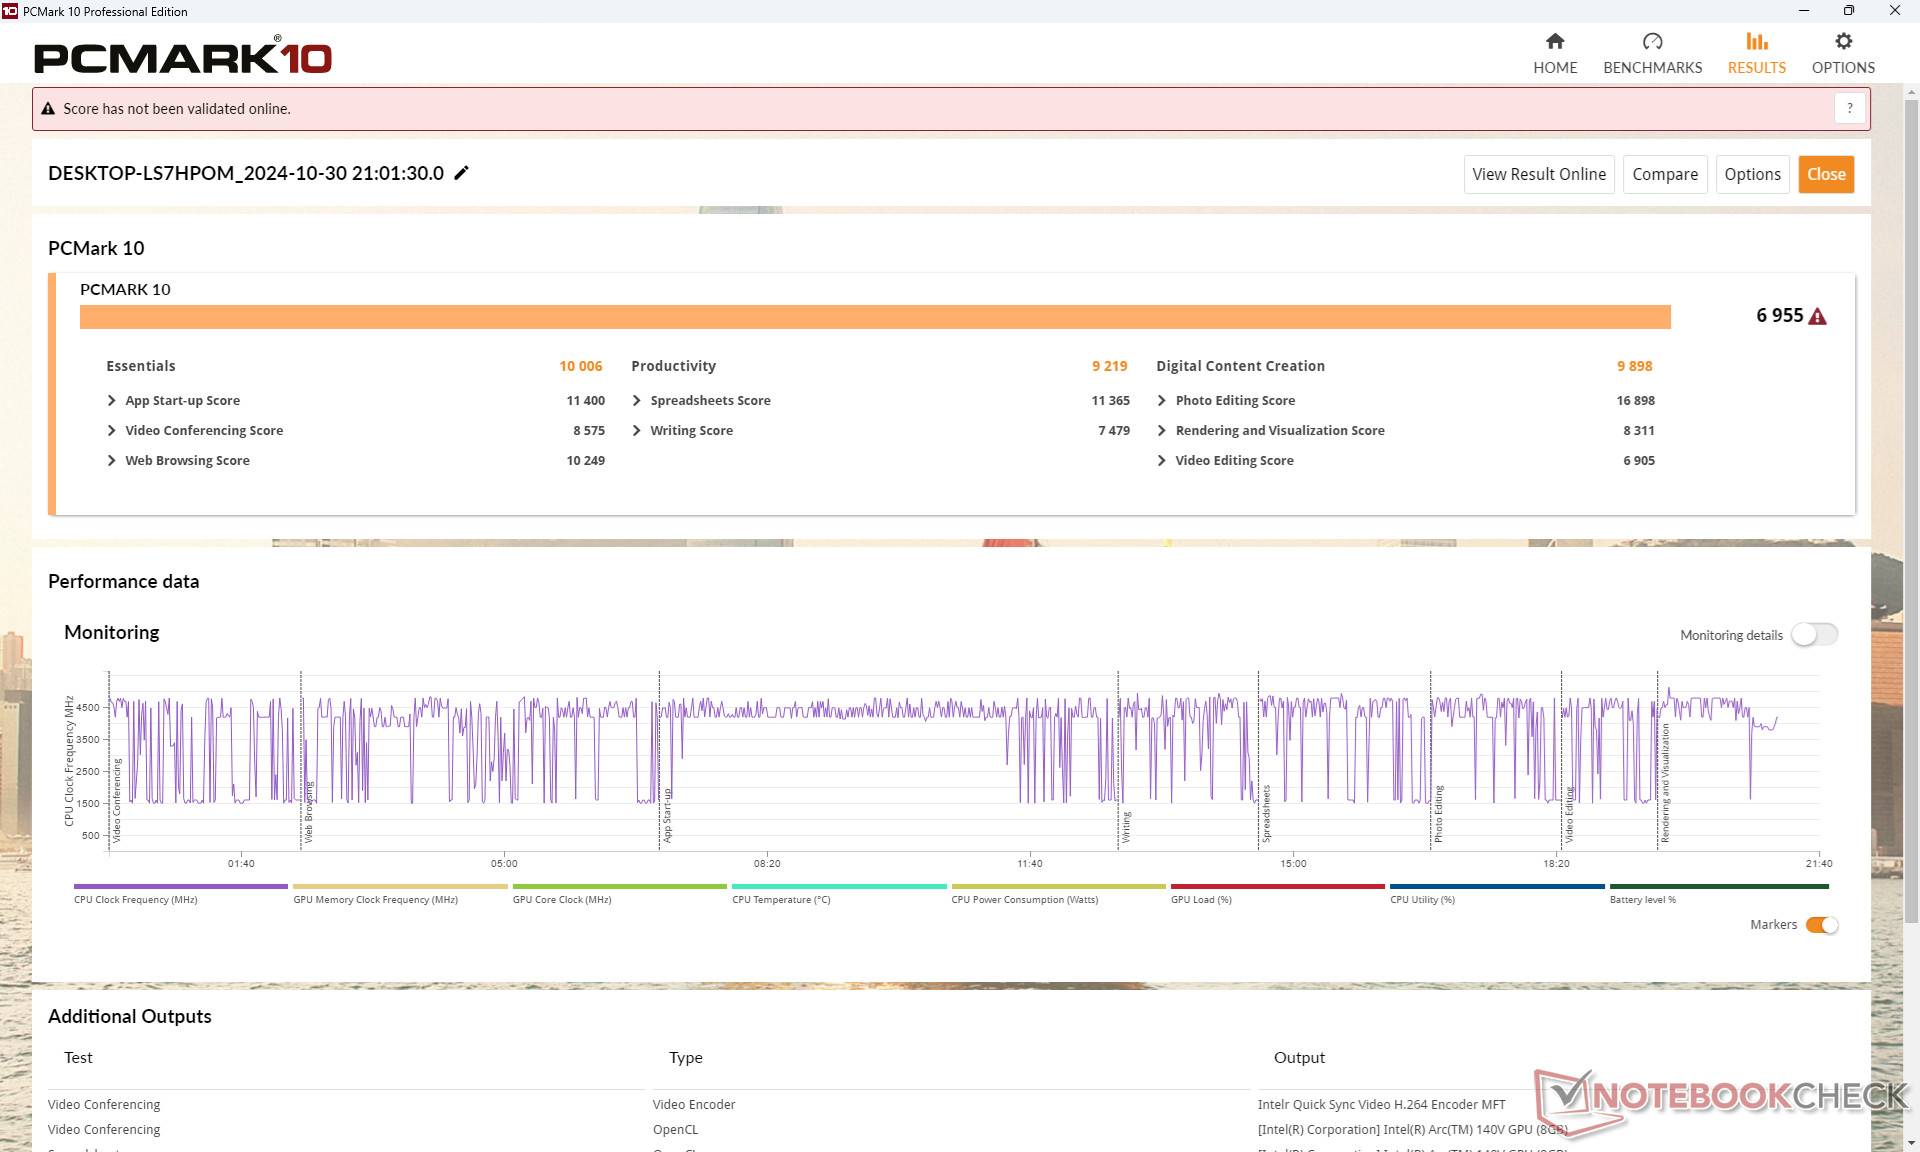
Average PCMark results are comfortably higher than any previous XPS 13 configuration despite the slower CPU benchmark results when compared to the Core Ultra 7 155H as noted above. This can be attributed to both the faster RAM and integrated GPU to balance out the processor deficit. AIDA64 memory results, for example, are notably faster than most other subnotebooks as RAM performance and efficiency were priorities during the development of Lunar Lake.
CrossMark: Overall | Productivity | Creativity | Responsiveness
WebXPRT 3: Overall
WebXPRT 4: Overall
Mozilla Kraken 1.1: Total
| PCMark 10 / Score | |
| Average Intel Core Ultra 7 256V, Intel Arc Graphics 140V (6677 - 7702, n=7) | |
| Dell XPS 13 9350 | |
| Dell XPS 13 9340 Core Ultra 7 | |
| Lenovo ThinkBook 13x G4 21KR0008GE | |
| MSI Prestige 13 AI Evo | |
| HP Dragonfly G4 | |
| Dell XPS 13 Plus 9320 i7-1280P OLED | |
| Asus ZenBook S13 OLED UX5304 | |
| PCMark 10 / Essentials | |
| HP Dragonfly G4 | |
| Dell XPS 13 9340 Core Ultra 7 | |
| Asus ZenBook S13 OLED UX5304 | |
| Dell XPS 13 Plus 9320 i7-1280P OLED | |
| Average Intel Core Ultra 7 256V, Intel Arc Graphics 140V (9627 - 11365, n=7) | |
| Lenovo ThinkBook 13x G4 21KR0008GE | |
| Dell XPS 13 9350 | |
| MSI Prestige 13 AI Evo | |
| PCMark 10 / Productivity | |
| Average Intel Core Ultra 7 256V, Intel Arc Graphics 140V (8161 - 12672, n=7) | |
| Dell XPS 13 9350 | |
| MSI Prestige 13 AI Evo | |
| Dell XPS 13 9340 Core Ultra 7 | |
| Lenovo ThinkBook 13x G4 21KR0008GE | |
| HP Dragonfly G4 | |
| Asus ZenBook S13 OLED UX5304 | |
| Dell XPS 13 Plus 9320 i7-1280P OLED | |
| PCMark 10 / Digital Content Creation | |
| Dell XPS 13 9350 | |
| Average Intel Core Ultra 7 256V, Intel Arc Graphics 140V (9481 - 10126, n=7) | |
| Dell XPS 13 9340 Core Ultra 7 | |
| Lenovo ThinkBook 13x G4 21KR0008GE | |
| Dell XPS 13 Plus 9320 i7-1280P OLED | |
| MSI Prestige 13 AI Evo | |
| HP Dragonfly G4 | |
| Asus ZenBook S13 OLED UX5304 | |
| CrossMark / Overall | |
| Dell XPS 13 Plus 9320 i7-1280P OLED | |
| Dell XPS 13 9350 | |
| Average Intel Core Ultra 7 256V, Intel Arc Graphics 140V (1636 - 1736, n=7) | |
| Dell XPS 13 9340 Core Ultra 7 | |
| HP Dragonfly G4 | |
| Asus ZenBook S13 OLED UX5304 | |
| Lenovo ThinkBook 13x G4 21KR0008GE | |
| MSI Prestige 13 AI Evo | |
| CrossMark / Productivity | |
| Dell XPS 13 9350 | |
| Dell XPS 13 Plus 9320 i7-1280P OLED | |
| Average Intel Core Ultra 7 256V, Intel Arc Graphics 140V (1563 - 1682, n=7) | |
| HP Dragonfly G4 | |
| Dell XPS 13 9340 Core Ultra 7 | |
| Asus ZenBook S13 OLED UX5304 | |
| Lenovo ThinkBook 13x G4 21KR0008GE | |
| MSI Prestige 13 AI Evo | |
| CrossMark / Creativity | |
| Dell XPS 13 9350 | |
| Dell XPS 13 Plus 9320 i7-1280P OLED | |
| Average Intel Core Ultra 7 256V, Intel Arc Graphics 140V (1862 - 1962, n=7) | |
| Dell XPS 13 9340 Core Ultra 7 | |
| HP Dragonfly G4 | |
| Lenovo ThinkBook 13x G4 21KR0008GE | |
| Asus ZenBook S13 OLED UX5304 | |
| MSI Prestige 13 AI Evo | |
| CrossMark / Responsiveness | |
| Dell XPS 13 Plus 9320 i7-1280P OLED | |
| Dell XPS 13 9340 Core Ultra 7 | |
| Asus ZenBook S13 OLED UX5304 | |
| HP Dragonfly G4 | |
| Dell XPS 13 9350 | |
| Average Intel Core Ultra 7 256V, Intel Arc Graphics 140V (1215 - 1371, n=7) | |
| MSI Prestige 13 AI Evo | |
| Lenovo ThinkBook 13x G4 21KR0008GE | |
| WebXPRT 3 / Overall | |
| Dell XPS 13 9350 | |
| HP Dragonfly G4 | |
| Average Intel Core Ultra 7 256V, Intel Arc Graphics 140V (243 - 310, n=7) | |
| Asus ZenBook S13 OLED UX5304 | |
| Dell XPS 13 Plus 9320 i7-1280P OLED | |
| Dell XPS 13 9340 Core Ultra 7 | |
| MSI Prestige 13 AI Evo | |
| Lenovo ThinkBook 13x G4 21KR0008GE | |
| WebXPRT 4 / Overall | |
| Dell XPS 13 9350 | |
| Average Intel Core Ultra 7 256V, Intel Arc Graphics 140V (282 - 286, n=7) | |
| HP Dragonfly G4 | |
| Dell XPS 13 9340 Core Ultra 7 | |
| Asus ZenBook S13 OLED UX5304 | |
| Dell XPS 13 Plus 9320 i7-1280P OLED | |
| MSI Prestige 13 AI Evo | |
| Lenovo ThinkBook 13x G4 21KR0008GE | |
| Mozilla Kraken 1.1 / Total | |
| Lenovo ThinkBook 13x G4 21KR0008GE | |
| MSI Prestige 13 AI Evo | |
| Dell XPS 13 Plus 9320 i7-1280P OLED | |
| Dell XPS 13 9340 Core Ultra 7 | |
| Asus ZenBook S13 OLED UX5304 | |
| HP Dragonfly G4 | |
| Average Intel Core Ultra 7 256V, Intel Arc Graphics 140V (470 - 480, n=7) | |
| Dell XPS 13 9350 | |
* ... smaller is better
| PCMark 10 Score | 6955 points | |
Help | ||
| AIDA64 / Memory Copy | |
| Average Intel Core Ultra 7 256V (99227 - 104459, n=7) | |
| Dell XPS 13 9350 | |
| Lenovo ThinkBook 13x G4 21KR0008GE | |
| MSI Prestige 13 AI Evo | |
| Dell XPS 13 Plus 9320 i7-1280P OLED | |
| Asus ZenBook S13 OLED UX5304 | |
| HP Dragonfly G4 | |
| AIDA64 / Memory Read | |
| Average Intel Core Ultra 7 256V (86352 - 89848, n=7) | |
| Dell XPS 13 9350 | |
| Lenovo ThinkBook 13x G4 21KR0008GE | |
| MSI Prestige 13 AI Evo | |
| Dell XPS 13 Plus 9320 i7-1280P OLED | |
| Asus ZenBook S13 OLED UX5304 | |
| HP Dragonfly G4 | |
| AIDA64 / Memory Write | |
| Average Intel Core Ultra 7 256V (108692 - 117933, n=7) | |
| Dell XPS 13 9350 | |
| MSI Prestige 13 AI Evo | |
| Asus ZenBook S13 OLED UX5304 | |
| HP Dragonfly G4 | |
| Lenovo ThinkBook 13x G4 21KR0008GE | |
| Dell XPS 13 Plus 9320 i7-1280P OLED | |
| AIDA64 / Memory Latency | |
| MSI Prestige 13 AI Evo | |
| Lenovo ThinkBook 13x G4 21KR0008GE | |
| Dell XPS 13 Plus 9320 i7-1280P OLED | |
| Dell XPS 13 9350 | |
| Average Intel Core Ultra 7 256V (96.1 - 99.6, n=7) | |
| HP Dragonfly G4 | |
| Asus ZenBook S13 OLED UX5304 | |
* ... smaller is better
DPC Latency
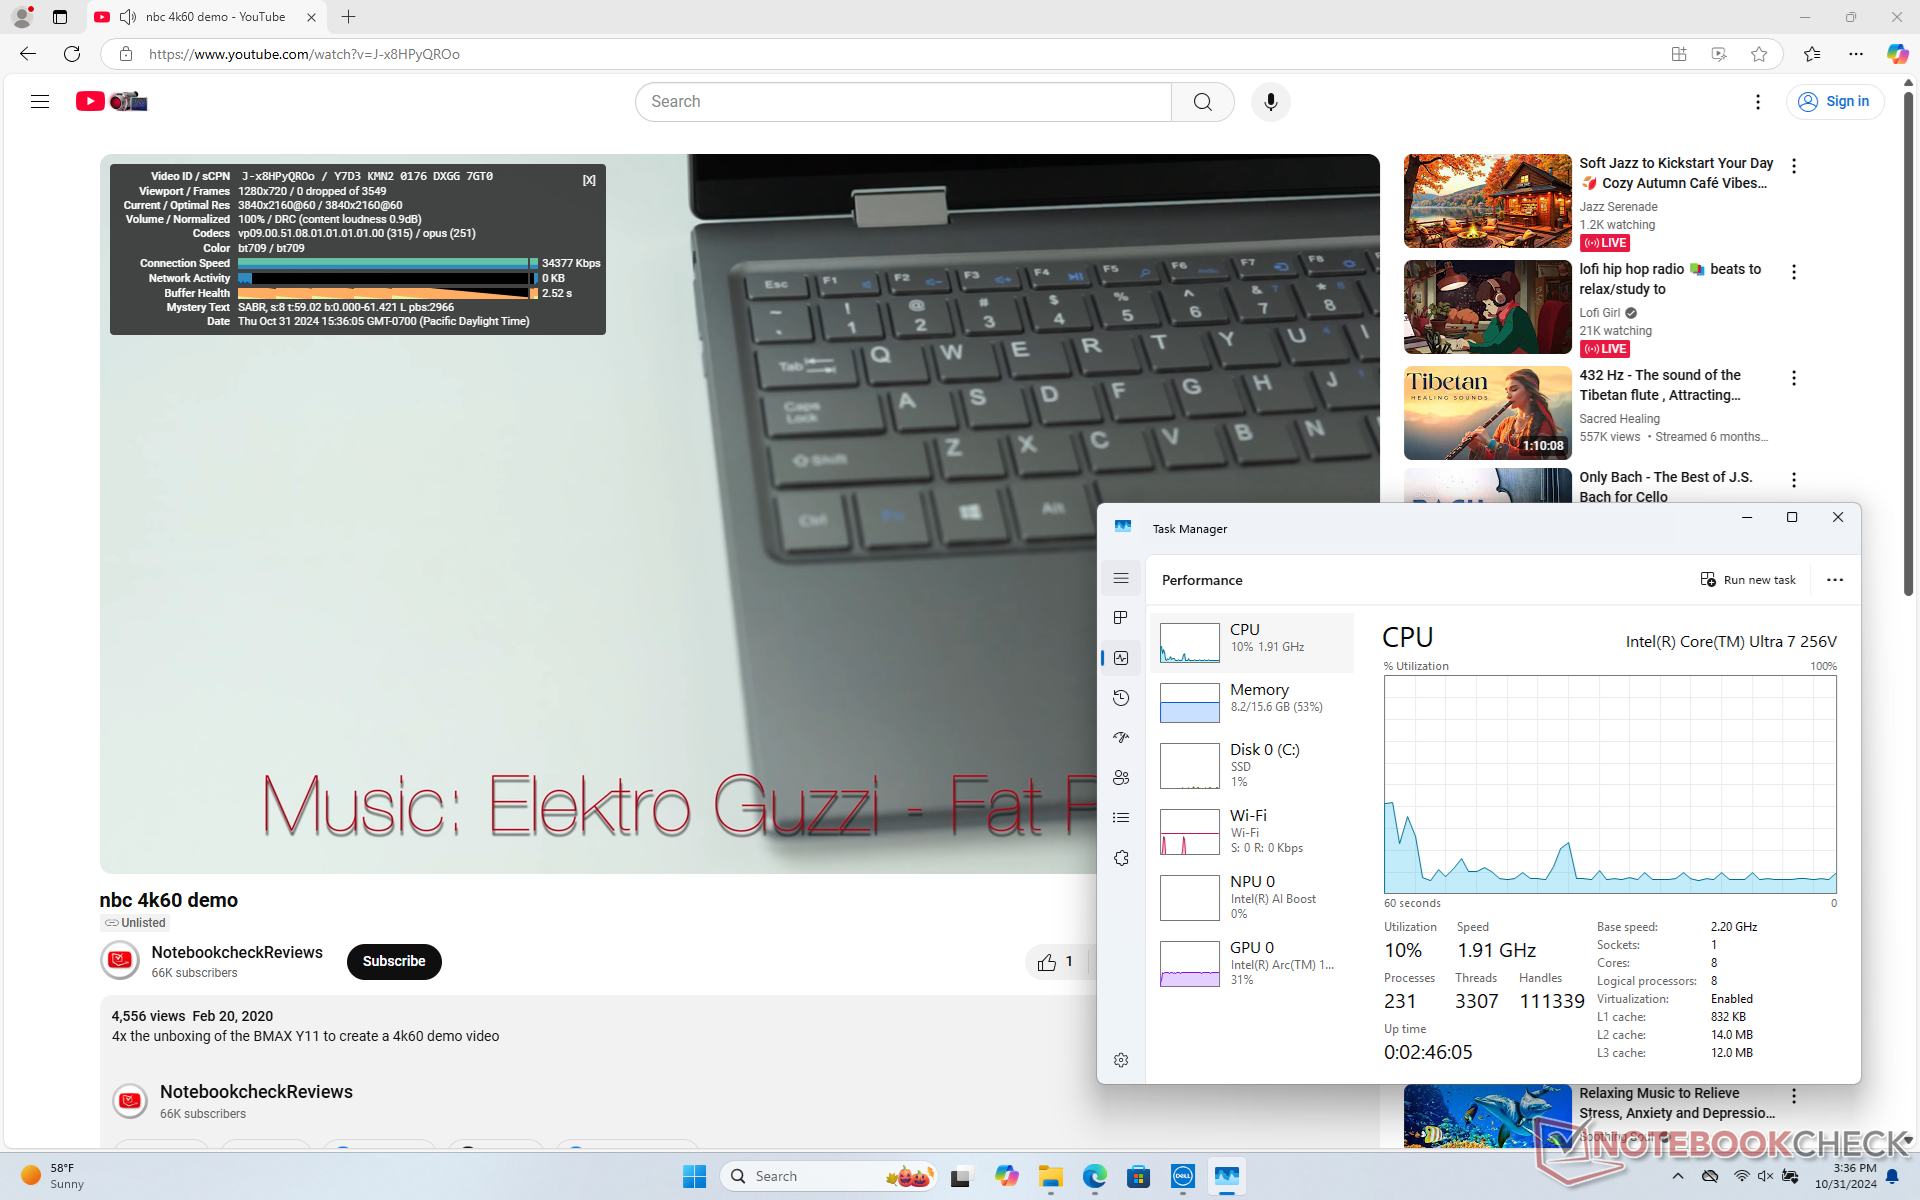
LatencyMon is incompatible with the model and its new Lunar Lake CPU. 4K video playback at 60 FPS is otherwise perfect with no dropped frames recorded.
Storage Devices
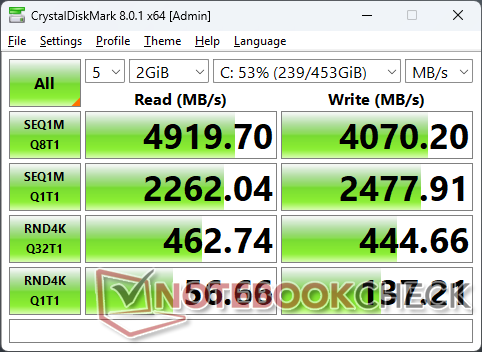
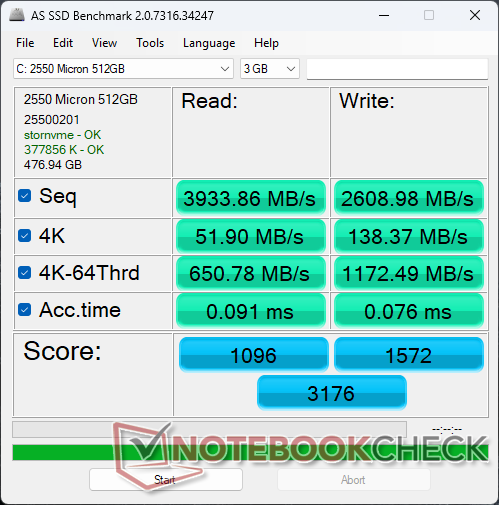
The system ships with the same Micron 2550 PCIe4 NVMe SSD as found on the XPS 13 9340 and 9345 series. Transfer rates peak at ~5000 MB/s with no signs of throttling when stressed. Nonetheless, slightly larger laptops like the Lenovo ThinkPad T14s tend to ship with the Samsung PM9A1a which can reach speeds of over 7000 MB/s.

| Drive Performance rating - Percent | |
| MSI Prestige 13 AI Evo | |
| Dell XPS 13 Plus 9320 i7-1280P OLED | |
| Asus ZenBook S13 OLED UX5304 | |
| Lenovo ThinkBook 13x G4 21KR0008GE | |
| HP Dragonfly G4 | |
| Dell XPS 13 9350 | |
* ... smaller is better
Disk Throttling: DiskSpd Read Loop, Queue Depth 8
GPU Performance
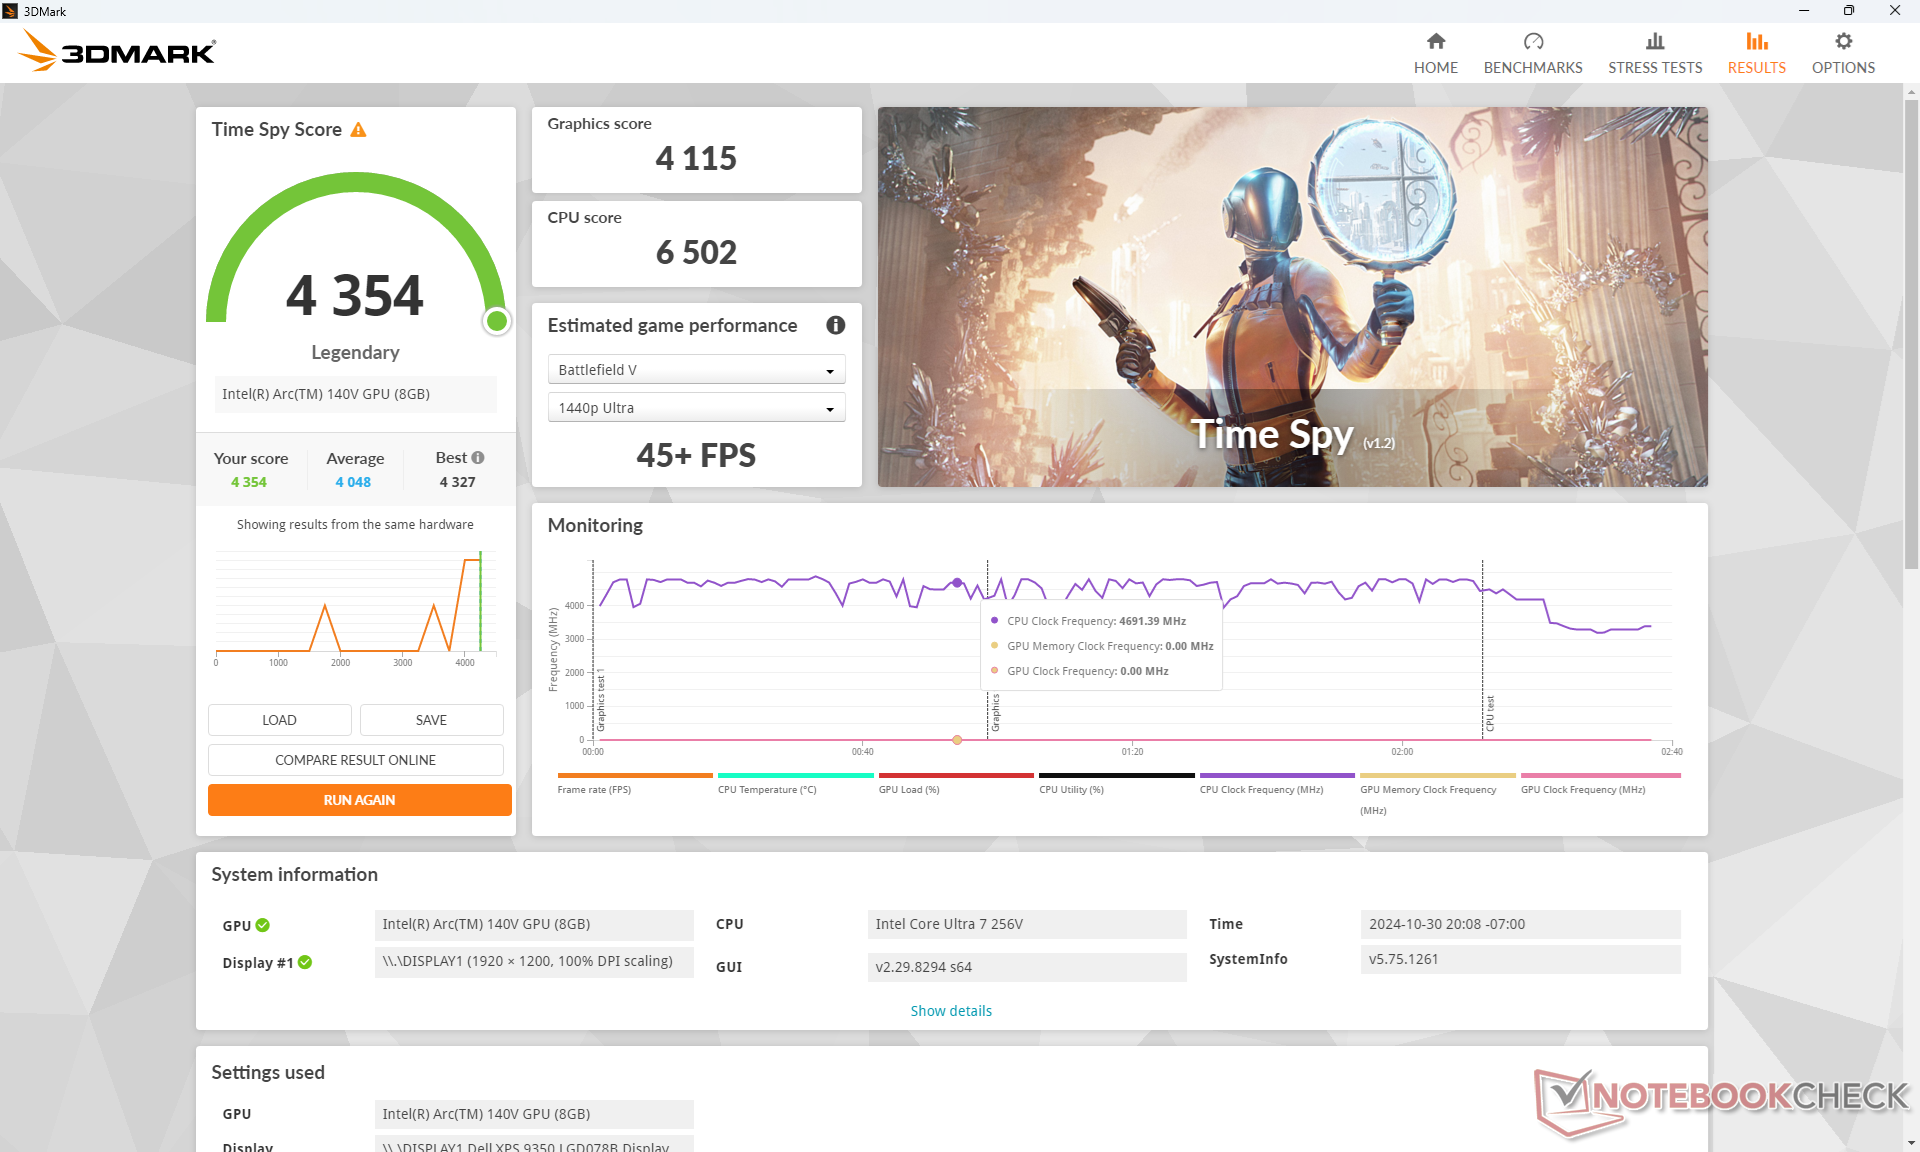
3DMark results from our Arc Graphics 140V are quite high especially for a subnotebook. Our unit outperforms most if not all other U-series-powered subnotebooks currently in the market running on integrated graphics including even those with the competing Radeon 780M GPU. Most notably, the scores are between 20 to 40 percent higher than the Arc 8 in the barely 6-month old XPS 13 9340. The results are genuinely surprising given that the XPS 13 series has historically been quite poor when it comes to graphics performance.
| Power Profile | Graphics Score | Physics Score | Combined Score |
| Performance Mode | 9492 | 22257 | 3474 |
| Balanced Mode | 9555 (-0%) | 19598 (-12%) | 2932 (-16%) |
| Battery Power | 9200 (-3%) | 17818 (-20%) | 2754 (-21%) |
Dropping to Balanced mode or battery power from Performance mode impacts CPU performance more than graphics performance as shown by our Fire Strike results table above. Thus, you'll want to be on Performance mode when running demanding applications to get the most out of the system.
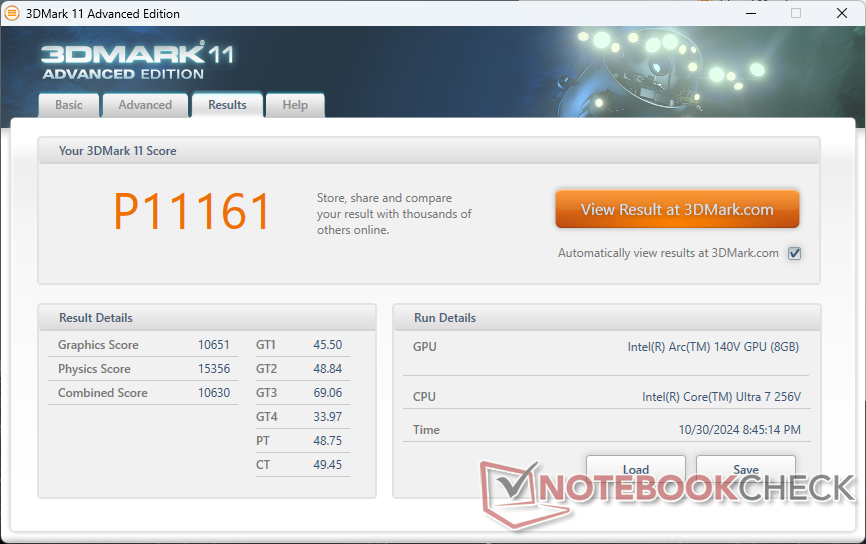

| 3DMark 11 Performance | 11161 points | |
| 3DMark Cloud Gate Standard Score | 33853 points | |
| 3DMark Fire Strike Score | 8730 points | |
| 3DMark Time Spy Score | 4354 points | |
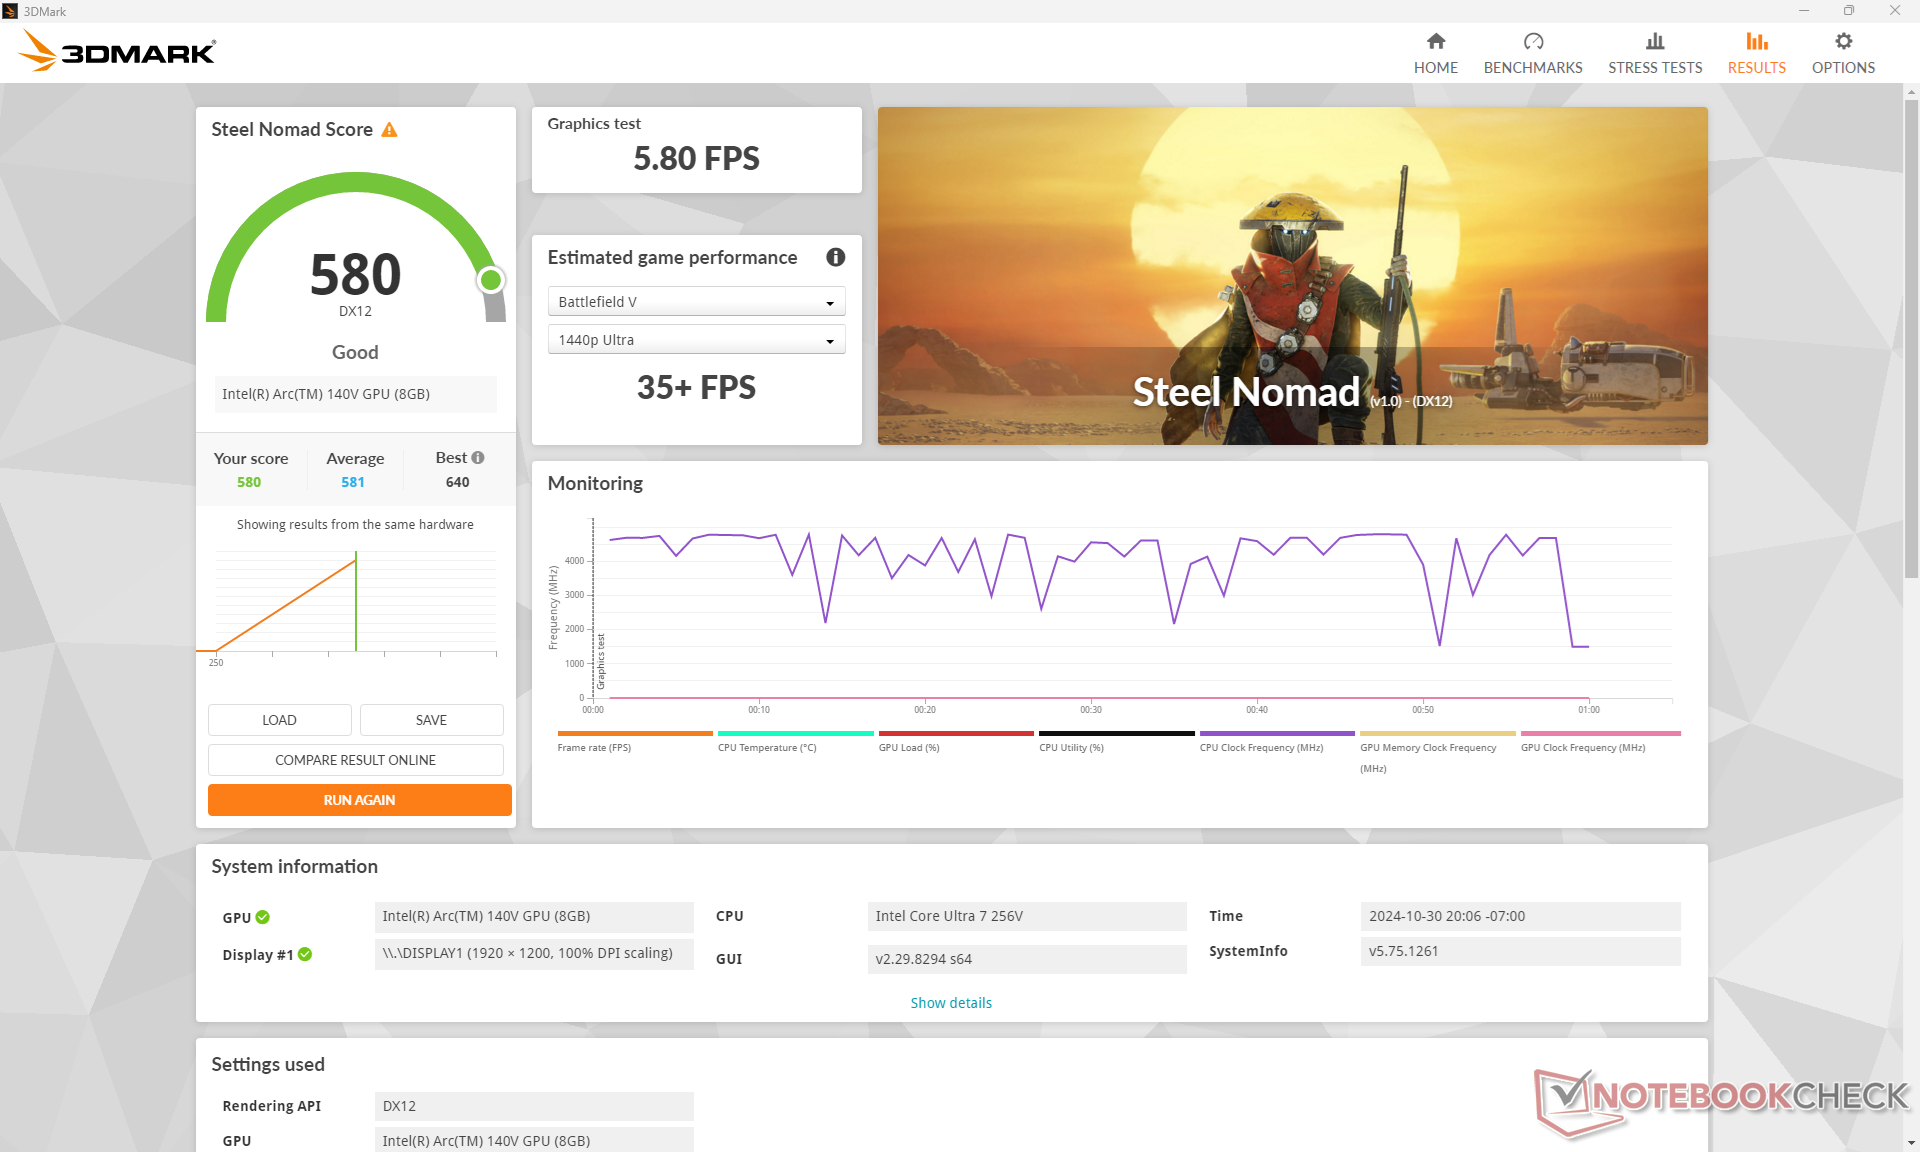
| 3DMark Steel Nomad Score | 580 points | |
Help | ||
* ... smaller is better
Gaming Performance
Performance in games has improved more than expected over the XPS 13 9340 and its Core Ultra H-series CPU with Arc 8 graphics. In this case, our Arc 140V would almost consistently outperform the XPS 13 9340 by as little as 10 percent or as high as 85 percent depending on the title and settings. The higher deltas can be observed when running games like GTA V or F1 22 on higher settings while smaller deltas can be observed when running DOTA 2 Reborn or Baldur's Gate 3. Average results are comparable to the competing Radeon 780M to be a huge leap for anyone upgrading from an older Iris Xe 96 EUs laptop.
Not all games run perfectly, however. Our system would always crash when running Tiny Tina's Wonderlands or F1 22 with certain graphical settings enabled.
| Performance rating - Percent | |
| Dell XPS 13 9350 | |
| Lenovo ThinkBook 13x G4 21KR0008GE -1! | |
| Dell XPS 13 Plus 9320 i7-1280P OLED -1! | |
| MSI Prestige 13 AI Evo -1! | |
| HP Dragonfly G4 -1! | |
| Asus ZenBook S13 OLED UX5304 -1! | |
| Baldur's Gate 3 - 1920x1080 Ultra Preset AA:T | |
| Dell XPS 13 9350 | |
| GTA V - 1920x1080 Highest AA:4xMSAA + FX AF:16x | |
| Dell XPS 13 9350 | |
| Lenovo ThinkBook 13x G4 21KR0008GE | |
| Dell XPS 13 Plus 9320 i7-1280P OLED | |
| HP Dragonfly G4 | |
| MSI Prestige 13 AI Evo | |
| Asus ZenBook S13 OLED UX5304 | |
| Final Fantasy XV Benchmark - 1920x1080 High Quality | |
| Dell XPS 13 9350 | |
| Lenovo ThinkBook 13x G4 21KR0008GE | |
| Dell XPS 13 Plus 9320 i7-1280P OLED | |
| MSI Prestige 13 AI Evo | |
| HP Dragonfly G4 | |
| Asus ZenBook S13 OLED UX5304 | |
| Strange Brigade - 1920x1080 ultra AA:ultra AF:16 | |
| Dell XPS 13 9350 | |
| Lenovo ThinkBook 13x G4 21KR0008GE | |
| MSI Prestige 13 AI Evo | |
| Dell XPS 13 Plus 9320 i7-1280P OLED | |
| HP Dragonfly G4 | |
| Asus ZenBook S13 OLED UX5304 | |
| Dota 2 Reborn - 1920x1080 ultra (3/3) best looking | |
| Dell XPS 13 9350 | |
| Lenovo ThinkBook 13x G4 21KR0008GE | |
| Dell XPS 13 Plus 9320 i7-1280P OLED | |
| HP Dragonfly G4 | |
| MSI Prestige 13 AI Evo | |
| Asus ZenBook S13 OLED UX5304 | |
| X-Plane 11.11 - 1920x1080 high (fps_test=3) | |
| Dell XPS 13 Plus 9320 i7-1280P OLED | |
| Lenovo ThinkBook 13x G4 21KR0008GE | |
| MSI Prestige 13 AI Evo | |
| Dell XPS 13 9350 | |
| HP Dragonfly G4 | |
| Asus ZenBook S13 OLED UX5304 | |
| Baldur's Gate 3 | |
| 1280x720 Low Preset AA:SM | |
| Average Intel Arc Graphics 140V (49.3 - 73.3, n=18) | |
| Dell XPS 13 9350 | |
| HP EliteBook x360 1040 G11 | |
| 1920x1080 Low Preset AA:SM | |
| Average Intel Arc Graphics 140V (23.7 - 47, n=37) | |
| Dell XPS 13 9350 | |
| Asus Zenbook S 14 UX5406 | |
| HP EliteBook x360 1040 G11 | |
| 1920x1080 Medium Preset AA:T | |
| Average Intel Arc Graphics 140V (19.6 - 37, n=37) | |
| Dell XPS 13 9350 | |
| Asus Zenbook S 14 UX5406 | |
| HP EliteBook x360 1040 G11 | |
| 1920x1080 High Preset AA:T | |
| Average Intel Arc Graphics 140V (17 - 32.9, n=38) | |
| Dell XPS 13 9350 | |
| Asus Zenbook S 14 UX5406 | |
| HP EliteBook x360 1040 G11 | |
| 1920x1080 Ultra Preset AA:T | |
| Average Intel Arc Graphics 140V (16.6 - 32.2, n=39) | |
| Dell XPS 13 9350 | |
| Asus Zenbook S 14 UX5406 | |
| HP EliteBook x360 1040 G11 | |
| Tiny Tina's Wonderlands - 1280x720 Lowest Preset (DX12) | |
| Framework Laptop 13.5 Ryzen 7 7840U | |
| Average Intel Arc Graphics 140V (96.9 - 111.4, n=5) | |
| Dell XPS 13 9350 | |
| HP EliteBook x360 1040 G11 | |
| Dell XPS 13 Plus 9320 Core i7-1360P | |
| HP Dragonfly G4 | |
| Cyberpunk 2077 | |
| 1280x720 Low Preset (FSR off) | |
| Dell XPS 13 9350 | |
| Average Intel Arc Graphics 140V (51 - 77.2, n=23) | |
| HP EliteBook x360 1040 G11 | |
| 1920x1080 Low Preset (FSR off) | |
| Dell XPS 13 9350 | |
| Average Intel Arc Graphics 140V (30.5 - 49.1, n=43) | |
| Asus Zenbook S 14 UX5406 | |
| HP EliteBook x360 1040 G11 | |
| Lenovo ThinkBook 13x G4 21KR0008GE | |
| 1920x1080 Medium Preset (FSR off) | |
| Dell XPS 13 9350 | |
| Average Intel Arc Graphics 140V (24.3 - 39.7, n=40) | |
| Asus Zenbook S 14 UX5406 | |
| HP EliteBook x360 1040 G11 | |
| Lenovo ThinkBook 13x G4 21KR0008GE | |
| 1920x1080 High Preset (FSR off) | |
| Dell XPS 13 9350 | |
| Average Intel Arc Graphics 140V (20 - 34.4, n=42) | |
| Asus Zenbook S 14 UX5406 | |
| HP EliteBook x360 1040 G11 | |
| Lenovo ThinkBook 13x G4 21KR0008GE | |
| 1920x1080 Ultra Preset (FSR off) | |
| Average Intel Arc Graphics 140V (17.5 - 30.1, n=43) | |
| Asus Zenbook S 14 UX5406 | |
| HP EliteBook x360 1040 G11 | |
| Dell XPS 13 9350 | |
| Lenovo ThinkBook 13x G4 21KR0008GE | |
Cyberpunk 2077 ultra FPS Chart
| low | med. | high | ultra | |
|---|---|---|---|---|
| GTA V (2015) | 154.9 | 149.4 | 60.8 | 25.6 |
| Dota 2 Reborn (2015) | 95.8 | 87 | 83 | 80.7 |
| Final Fantasy XV Benchmark (2018) | 79.4 | 46.1 | 31.5 | |
| X-Plane 11.11 (2018) | 47.1 | 36.1 | 30.1 | |
| Far Cry 5 (2018) | 80 | 52 | 45 | 42 |
| Strange Brigade (2018) | 201 | 84.4 | 65.2 | 58 |
| Tiny Tina's Wonderlands (2022) | ||||
| F1 22 (2022) | 79.1 | 78.8 | 64.5 | |
| Baldur's Gate 3 (2023) | 36.6 | 30.5 | 25.8 | 25.7 |
| Cyberpunk 2077 (2023) | 45.7 | 37 | 32 | 19.1 |
Emissions
System Noise
The internal fans are even quieter than before in the sense that they would remain idle for much longer when higher loads are introduced. For example, fan noise would top out at just 26.2 dB(A) after running the first benchmark scene in 3DMark 06 compared to 35 dB(A) or 37 dB(A) on the older XPS 13 9320 or XPS 13 9340, respectively.
Gaming would induce a fan noise of just 34 dB(A) even when on Performance mode, but this can go up to 45 dB(A) if the CPU is at 100 percent utilization such as when running Prime95 stress. Running on Balanced mode instead of Performance mode would lower the fan noise ceiling to the 33 to 38 dB(A) range.

Noise level
| Idle |
| 24.4 / 24.4 / 24.4 dB(A) |
| Load |
| 26.2 / 45.2 dB(A) |
 | ||
30 dB silent 40 dB(A) audible 50 dB(A) loud |
||
min: | ||
| Dell XPS 13 9350 Arc 140V, Core Ultra 7 256V, Micron 2550 512GB | Dell XPS 13 Plus 9320 i7-1280P OLED Iris Xe G7 96EUs, i7-1280P, WDC PC SN810 512GB | Lenovo ThinkBook 13x G4 21KR0008GE Arc 7-Core, Ultra 5 125H, Samsung PM9C1a MZAL8512HDLU | HP Dragonfly G4 Iris Xe G7 96EUs, i7-1365U, Micron 3400 MTFDKBA512TFH 512GB | Asus ZenBook S13 OLED UX5304 Iris Xe G7 96EUs, i7-1355U, Samsung PM9A1 MZVL21T0HCLR | MSI Prestige 13 AI Evo Arc 8-Core, Ultra 7 155H, Samsung PM9A1 MZVL21T0HCLR | |
|---|---|---|---|---|---|---|
| Noise | -1% | -5% | 3% | -3% | -4% | |
| off / environment * (dB) | 24.1 | 23.4 3% | 24.5 -2% | 23.3 3% | 23.3 3% | 23.4 3% |
| Idle Minimum * (dB) | 24.4 | 23.4 4% | 24.5 -0% | 23.5 4% | 23.3 5% | 23.4 4% |
| Idle Average * (dB) | 24.4 | 23.4 4% | 24.5 -0% | 23.5 4% | 23.3 5% | 26.9 -10% |
| Idle Maximum * (dB) | 24.4 | 23.4 4% | 27.1 -11% | 26.8 -10% | 23.3 5% | 26.9 -10% |
| Load Average * (dB) | 26.2 | 35 -34% | 33.3 -27% | 27.2 -4% | 37.7 -44% | 32 -22% |
| Cyberpunk 2077 ultra * (dB) | 34.2 | |||||
| Load Maximum * (dB) | 45.2 | 39.9 12% | 40.7 10% | 35 23% | 40.1 11% | 40.3 11% |
| Witcher 3 ultra * (dB) | 41.6 | 36.8 | 32.7 | 40.1 | 32 |
* ... smaller is better
Temperature
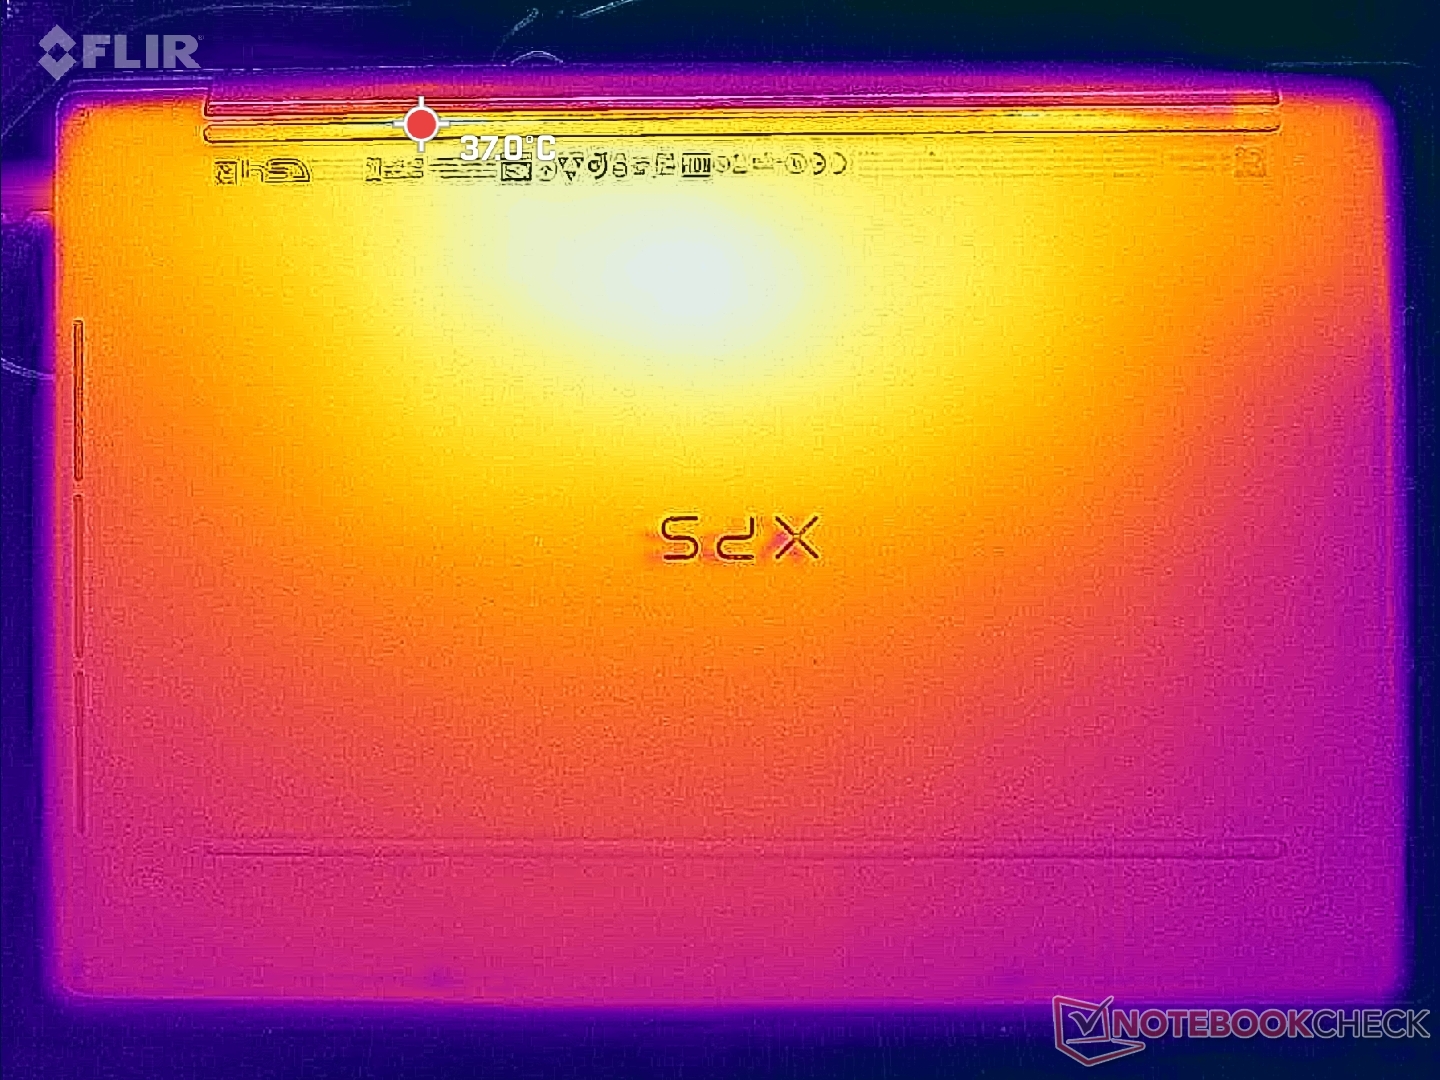
Surface temperatures are a notable improvement over older options including the recent XPS 13 9340. Hot spots on the keyboard and bottom cover would reach just 35 C and 38 C, respectively, compared to 41 C and 44 C on the XPS 13 9340 when under similar demanding loads. One of our criticisms for the new XPS 13 design was its relatively high surface temperatures, but the XPS 13 9350 is definitely one of the cooler iterations thus far.

(+) The maximum temperature on the upper side is 34.8 °C / 95 F, compared to the average of 35.9 °C / 97 F, ranging from 21.4 to 59 °C for the class Subnotebook.
(+) The bottom heats up to a maximum of 37.4 °C / 99 F, compared to the average of 39.2 °C / 103 F
(+) In idle usage, the average temperature for the upper side is 24.9 °C / 77 F, compared to the device average of 30.8 °C / 87 F.
(+) The palmrests and touchpad are cooler than skin temperature with a maximum of 27.6 °C / 81.7 F and are therefore cool to the touch.
(±) The average temperature of the palmrest area of similar devices was 28.2 °C / 82.8 F (+0.6 °C / 1.1 F).


| Dell XPS 13 9350 Intel Core Ultra 7 256V, Intel Arc Graphics 140V | Dell XPS 13 9340 Core Ultra 7 Intel Core Ultra 7 155H, Intel Arc 8-Core iGPU | Lenovo ThinkBook 13x G4 21KR0008GE Intel Core Ultra 5 125H, Intel Arc 7-Core iGPU | HP Dragonfly G4 Intel Core i7-1365U, Intel Iris Xe Graphics G7 96EUs | Asus ZenBook S13 OLED UX5304 Intel Core i7-1355U, Intel Iris Xe Graphics G7 96EUs | MSI Prestige 13 AI Evo Intel Core Ultra 7 155H, Intel Arc 8-Core iGPU | |
|---|---|---|---|---|---|---|
| Heat | -8% | -12% | -10% | -14% | -5% | |
| Maximum Upper Side * (°C) | 34.8 | 41 -18% | 43.1 -24% | 38.6 -11% | 43.1 -24% | 40.9 -18% |
| Maximum Bottom * (°C) | 37.4 | 43.5 -16% | 39.2 -5% | 40.4 -8% | 45 -20% | 40.4 -8% |
| Idle Upper Side * (°C) | 25.4 | 25.3 -0% | 28.3 -11% | 28.2 -11% | 27.3 -7% | 25 2% |
| Idle Bottom * (°C) | 26.2 | 25.5 3% | 28 -7% | 29 -11% | 27.8 -6% | 25.5 3% |
* ... smaller is better
Speakers
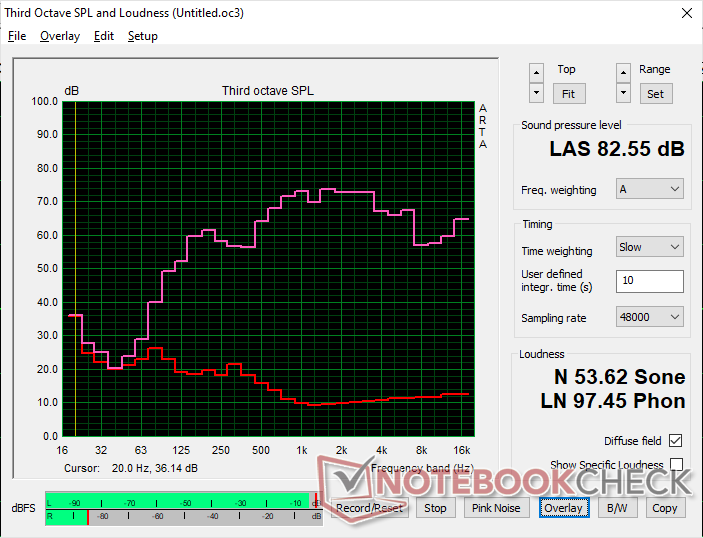
Dell XPS 13 9350 audio analysis
(+) | speakers can play relatively loud (82.6 dB)
Bass 100 - 315 Hz
(±) | reduced bass - on average 8.5% lower than median
(±) | linearity of bass is average (8.3% delta to prev. frequency)
Mids 400 - 2000 Hz
(±) | higher mids - on average 6.2% higher than median
(+) | mids are linear (5.9% delta to prev. frequency)
Highs 2 - 16 kHz
(±) | higher highs - on average 5.3% higher than median
(+) | highs are linear (5.1% delta to prev. frequency)
Overall 100 - 16.000 Hz
(+) | overall sound is linear (13% difference to median)
Compared to same class
» 21% of all tested devices in this class were better, 4% similar, 75% worse
» The best had a delta of 5%, average was 18%, worst was 53%
Compared to all devices tested
» 13% of all tested devices were better, 3% similar, 85% worse
» The best had a delta of 4%, average was 23%, worst was 134%
Apple MacBook Pro 16 2021 M1 Pro audio analysis
(+) | speakers can play relatively loud (84.7 dB)
Bass 100 - 315 Hz
(+) | good bass - only 3.8% away from median
(+) | bass is linear (5.2% delta to prev. frequency)
Mids 400 - 2000 Hz
(+) | balanced mids - only 1.3% away from median
(+) | mids are linear (2.1% delta to prev. frequency)
Highs 2 - 16 kHz
(+) | balanced highs - only 1.9% away from median
(+) | highs are linear (2.7% delta to prev. frequency)
Overall 100 - 16.000 Hz
(+) | overall sound is linear (4.6% difference to median)
Compared to same class
» 0% of all tested devices in this class were better, 0% similar, 100% worse
» The best had a delta of 5%, average was 17%, worst was 45%
Compared to all devices tested
» 0% of all tested devices were better, 0% similar, 100% worse
» The best had a delta of 4%, average was 23%, worst was 134%
Energy Management
Power Consumption
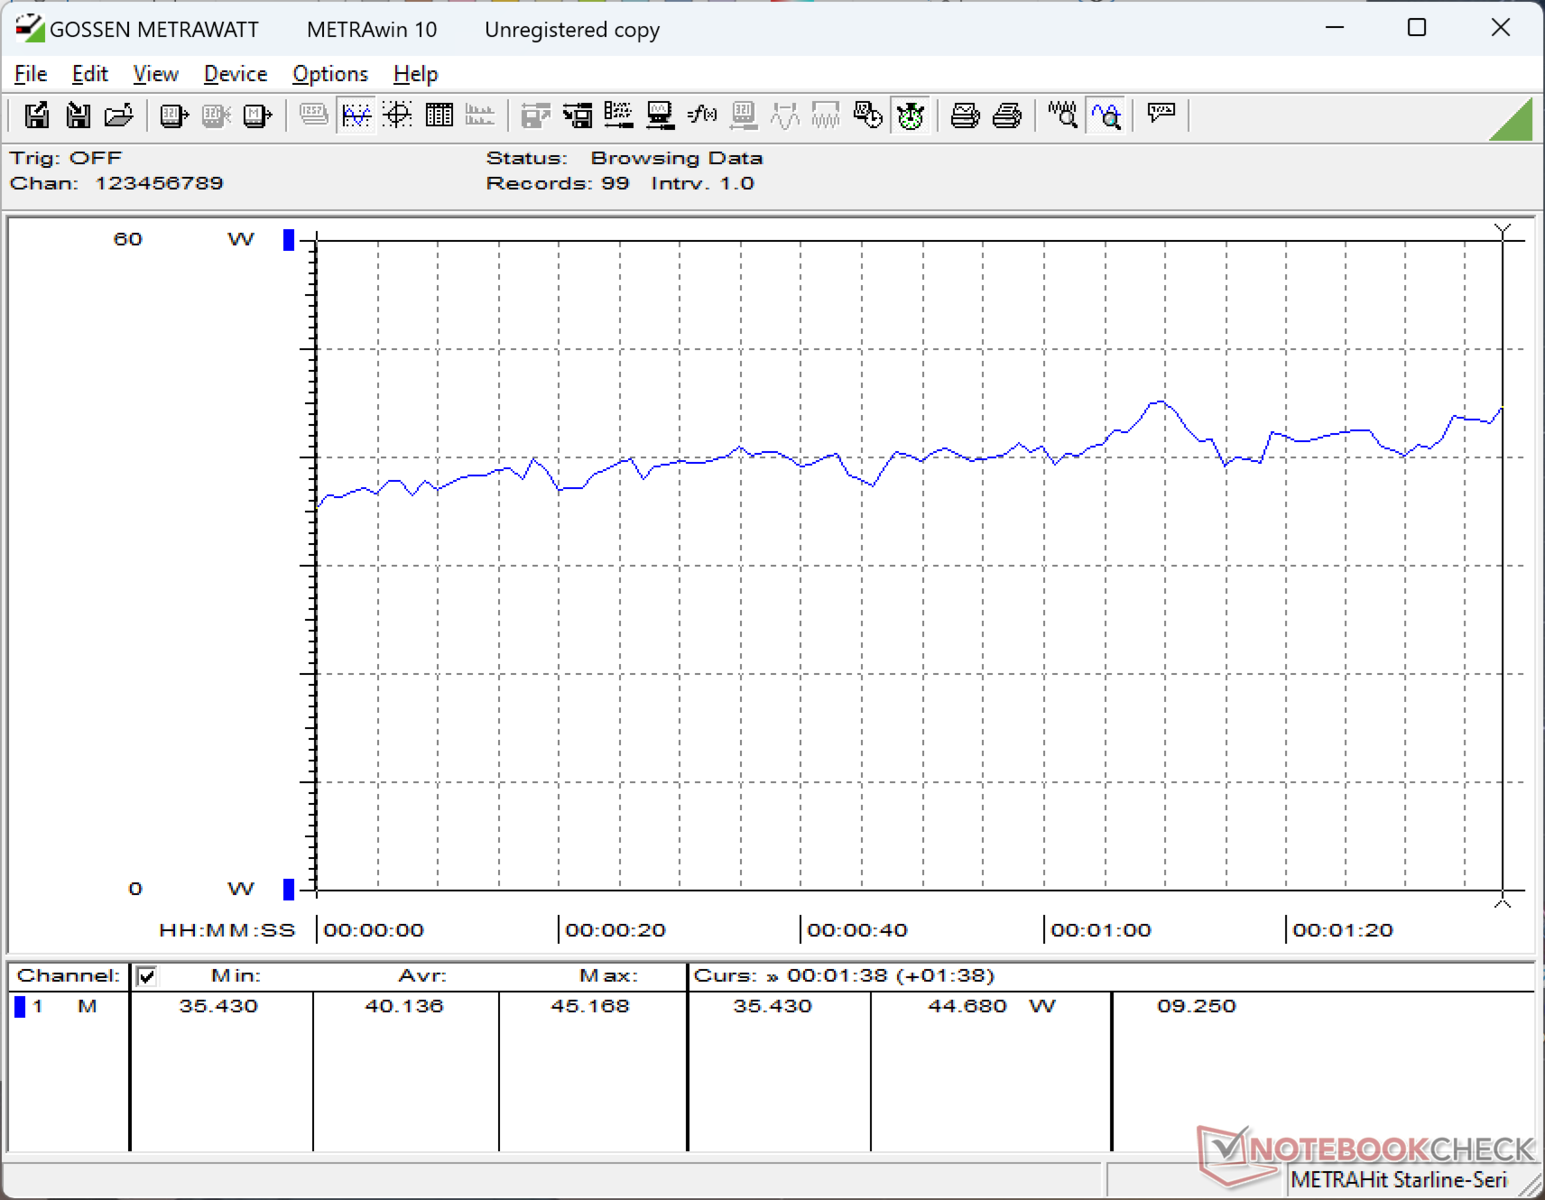
Consumption is incredibly low at only <1.4 W at the lowest brightness setting up to just 5 W if on maximum brightness and Performance mode. The low idling numbers are likely responsible for the very long WLAN runtime in our Battery Life section below. Alternative 13-inch laptops like the Lenovo ThinkBook 13x or HP Dragonfly G4 would have comparatively higher minimums and maximums by several watts.
The system demands 46 W when gaming which is almost 10 W more than competing 13-inch subnotebooks such as the ones mentioned above. However, the Dell system offers significantly faster graphics performance as noted in our GPU Performance section and so the increase in consumption is arguably worth it from a performance-per-watt perspective.
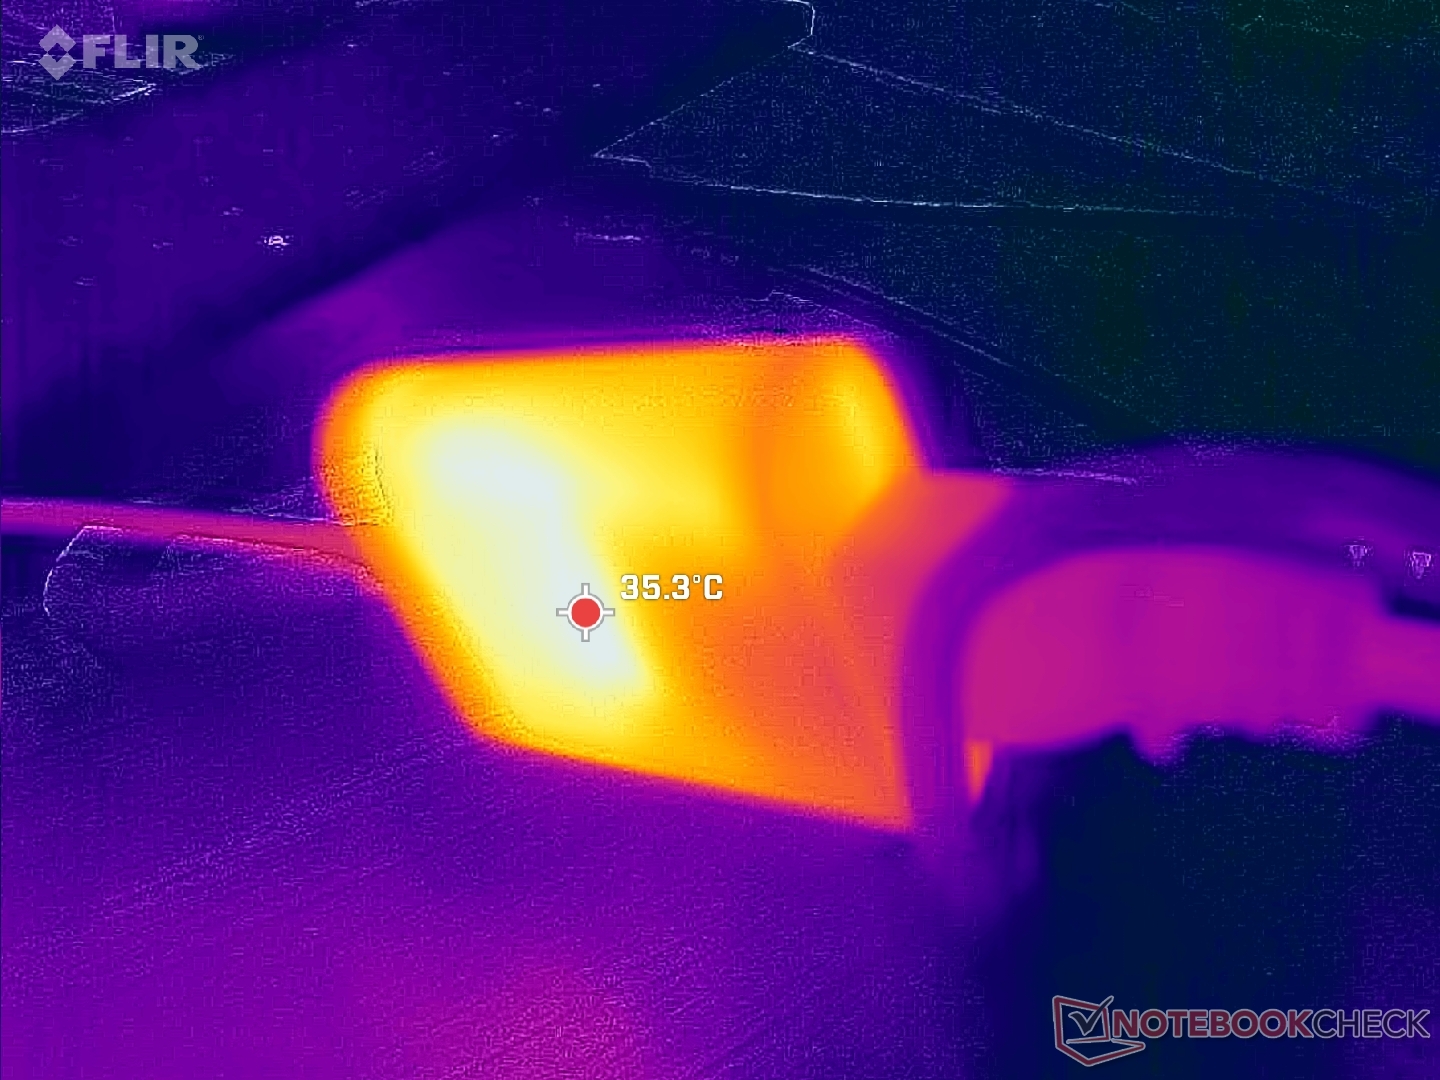
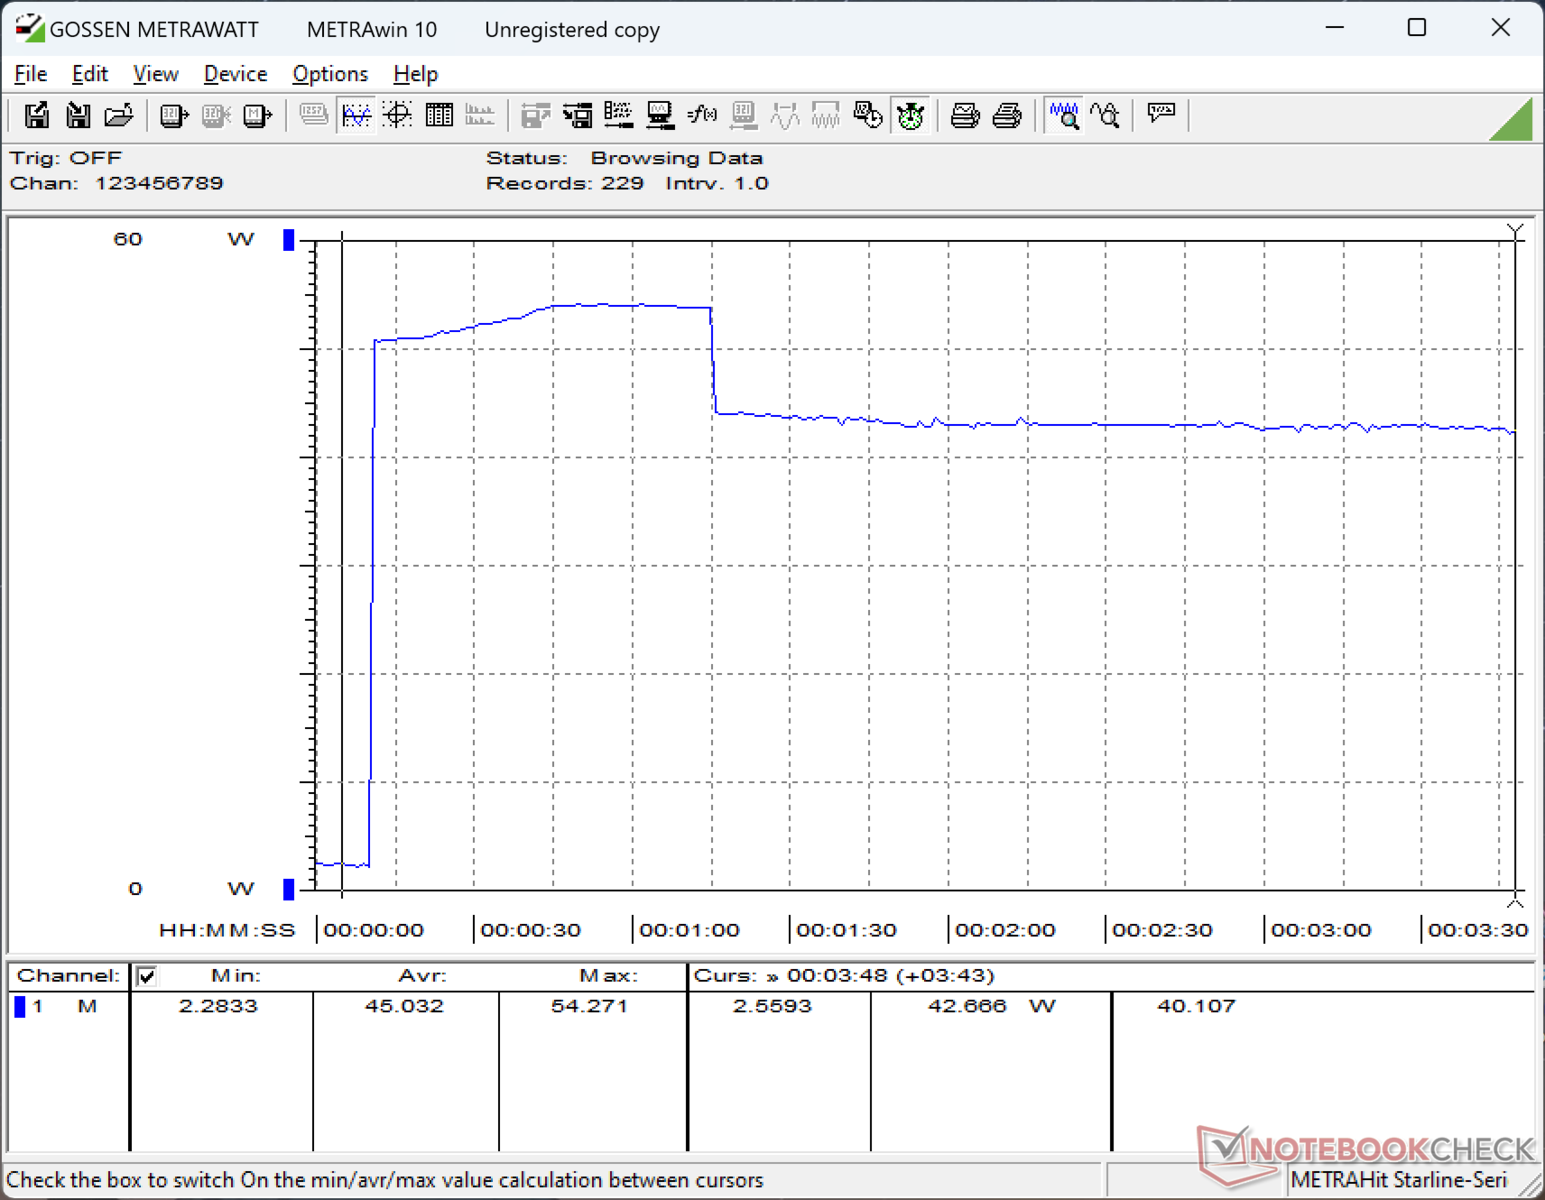
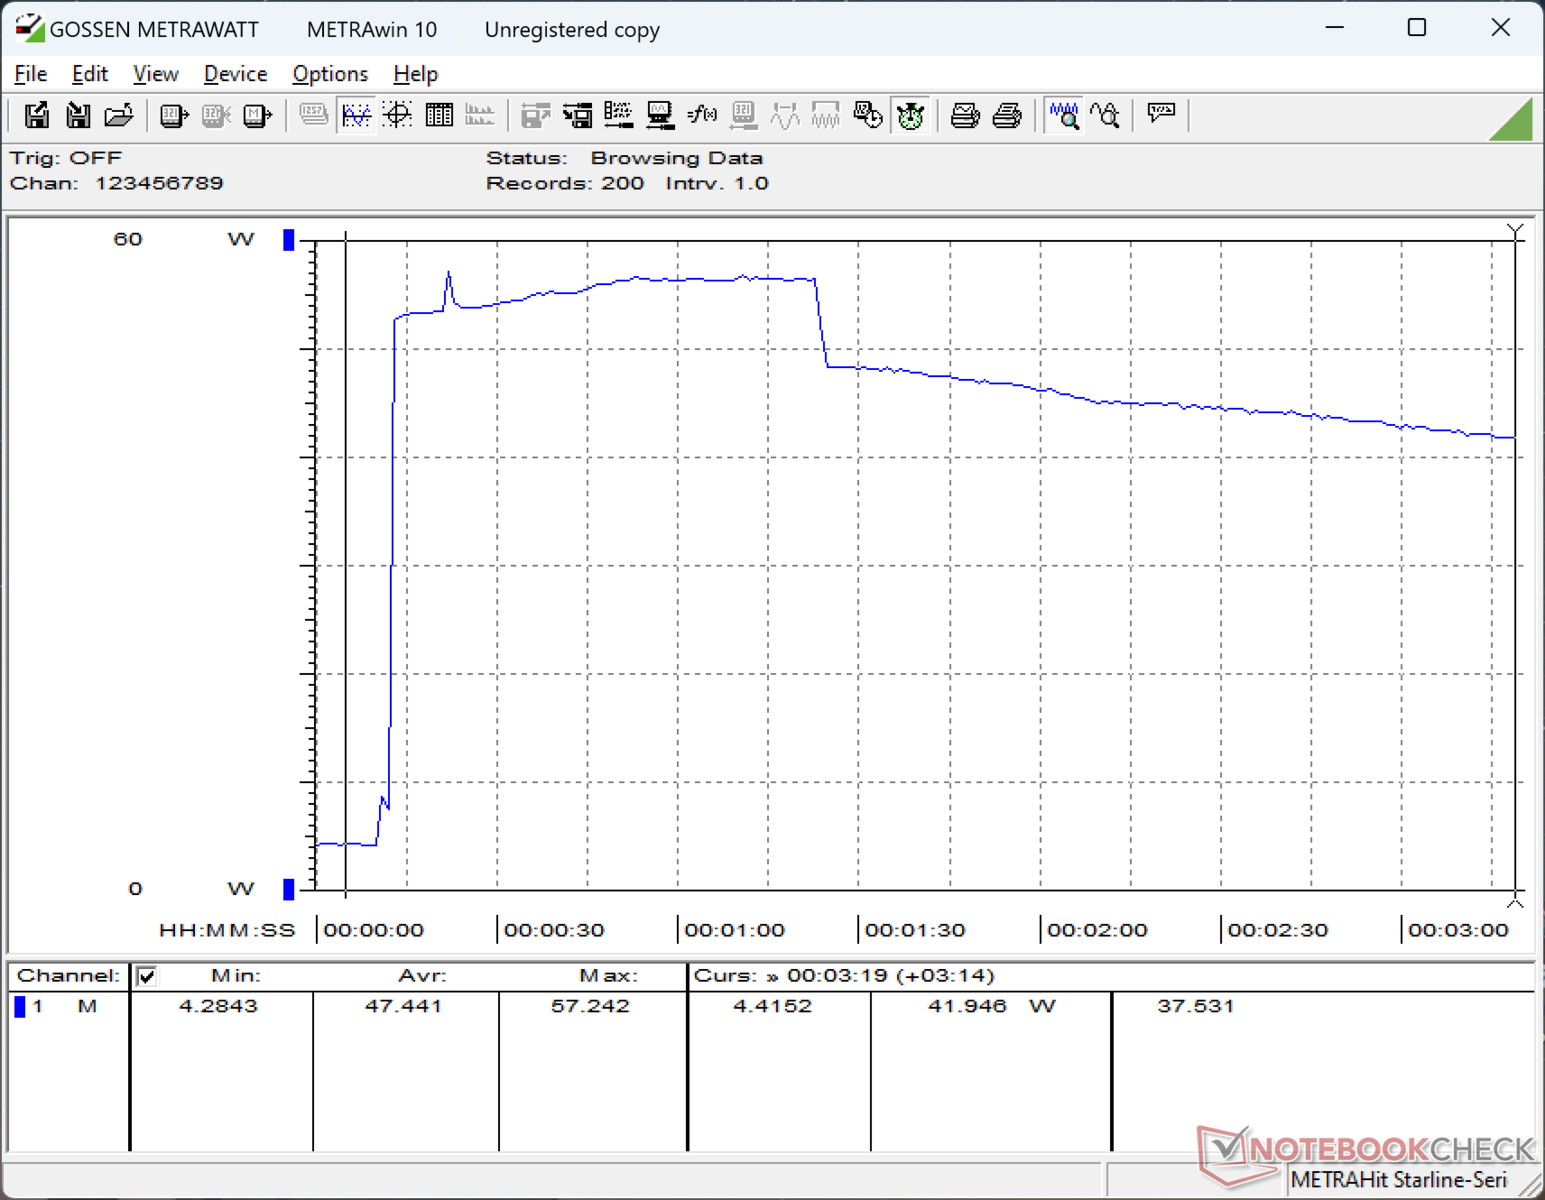
The extra-small (~6.5 x 5.5 x 2.2 cm) 60 W USB-C AC adapter can support running demanding loads and battery charging simultaneously. Consumption can reach over 55 W if the CPU is at 100 percent utilization, but this rate is only temporary as shown by the screenshots below.

| Off / Standby | |
| Idle | |
| Load |
|
Key:
min: | |
| Dell XPS 13 9350 Core Ultra 7 256V, Arc 140V, Micron 2550 512GB, IPS, 1920x1200, 13.4" | Dell XPS 13 Plus 9320 i7-1280P OLED i7-1280P, Iris Xe G7 96EUs, WDC PC SN810 512GB, OLED, 3456x2160, 13.4" | Lenovo ThinkBook 13x G4 21KR0008GE Ultra 5 125H, Arc 7-Core, Samsung PM9C1a MZAL8512HDLU, IPS, 2880x1920, 13.5" | HP Dragonfly G4 i7-1365U, Iris Xe G7 96EUs, Micron 3400 MTFDKBA512TFH 512GB, IPS, 1920x1280, 13.5" | Asus ZenBook S13 OLED UX5304 i7-1355U, Iris Xe G7 96EUs, Samsung PM9A1 MZVL21T0HCLR, OLED, 2880x1800, 13.3" | MSI Prestige 13 AI Evo Ultra 7 155H, Arc 8-Core, Samsung PM9A1 MZVL21T0HCLR, OLED, 2880x1800, 13.3" | |
|---|---|---|---|---|---|---|
| Power Consumption | -176% | -137% | -104% | -139% | -116% | |
| Idle Minimum * (Watt) | 1.3 | 6.5 -400% | 5.4 -315% | 4.1 -215% | 5.8 -346% | 4.5 -246% |
| Idle Average * (Watt) | 2.5 | 7.8 -212% | 7.8 -212% | 7.5 -200% | 8.5 -240% | 8 -220% |
| Idle Maximum * (Watt) | 4.1 | 13 -217% | 8.9 -117% | 8.2 -100% | 8.8 -115% | 8.7 -112% |
| Load Average * (Watt) | 40.1 | 56.6 -41% | 49.4 -23% | 35.5 11% | 35.1 12% | 36.1 10% |
| Cyberpunk 2077 ultra external monitor * (Watt) | 43.1 | |||||
| Cyberpunk 2077 ultra * (Watt) | 46.1 | |||||
| Load Maximum * (Watt) | 57.3 | 63 -10% | 68.8 -20% | 66.5 -16% | 59.5 -4% | 65 -13% |
| Witcher 3 ultra * (Watt) | 49.2 | 44.4 | 37.5 | 27.6 | 29.7 |
* ... smaller is better
Power Consumption Cyberpunk / Stress Test
Power Consumption external Monitor
Battery Life
Runtimes have improved significantly just like what we've been discovering on other Lunar Lake laptops. We're able to record over 20 hours of real-world WLAN browsing to easily best any prior XPS 13 configuration and most other 13-inch subnotebooks for that matter. Even more surprising is that battery capacity remains smaller than many of those same competitors despite the runtime advantage.
Charging from empty to full capacity with the included AC adapter takes slightly longer than expected at about 140 minutes.
| Dell XPS 13 9350 Core Ultra 7 256V, Arc 140V, 55 Wh | Dell XPS 13 Plus 9320 i7-1280P OLED i7-1280P, Iris Xe G7 96EUs, 55 Wh | Lenovo ThinkBook 13x G4 21KR0008GE Ultra 5 125H, Arc 7-Core, 74 Wh | HP Dragonfly G4 i7-1365U, Iris Xe G7 96EUs, 68 Wh | Asus ZenBook S13 OLED UX5304 i7-1355U, Iris Xe G7 96EUs, 63 Wh | MSI Prestige 13 AI Evo Ultra 7 155H, Arc 8-Core, 75 Wh | |
|---|---|---|---|---|---|---|
| Battery runtime | -72% | -33% | -5% | -23% | -14% | |
| Reader / Idle (h) | 56.8 | 42.5 -25% | ||||
| WiFi v1.3 (h) | 20.6 | 5.8 -72% | 11.4 -45% | 15.9 -23% | 11.3 -45% | 11.6 -44% |
| Load (h) | 2.4 | 1.9 -21% | 3.2 33% | 2.4 0% | 2.8 17% | |
| H.264 (h) | 20.5 | 13.8 | 16.7 |
Notebookcheck Rating
Lunar Lake has transformed the XPS 13 into a better contender against the MacBook Air 13 series.
Dell XPS 13 9350
- 11/05/2024 v8
Allen Ngo
 Total Sustainability Score:
 Transparency
The selection of devices to be reviewed is made by our editorial team. The test sample was provided to the author as a loan by the manufacturer or retailer for the purpose of this review. The lender had no influence on this review, nor did the manufacturer receive a copy of this review before publication. There was no obligation to publish this review. As an independent media company, Notebookcheck is not subjected to the authority of manufacturers, retailers or publishers.
This is how Notebookcheck is testing
Every year, Notebookcheck independently reviews hundreds of laptops and smartphones using standardized procedures to ensure that all results are comparable. We have continuously developed our test methods for around 20 years and set industry standards in the process. In our test labs, high-quality measuring equipment is utilized by experienced technicians and editors. These tests involve a multi-stage validation process. Our complex rating system is based on hundreds of well-founded measurements and benchmarks, which maintains objectivity. Further information on our test methods can be found here.
