MSI Prestige 13 AI Evo laptop review - Core Ultra 7 and OLED weighing under 1 kg
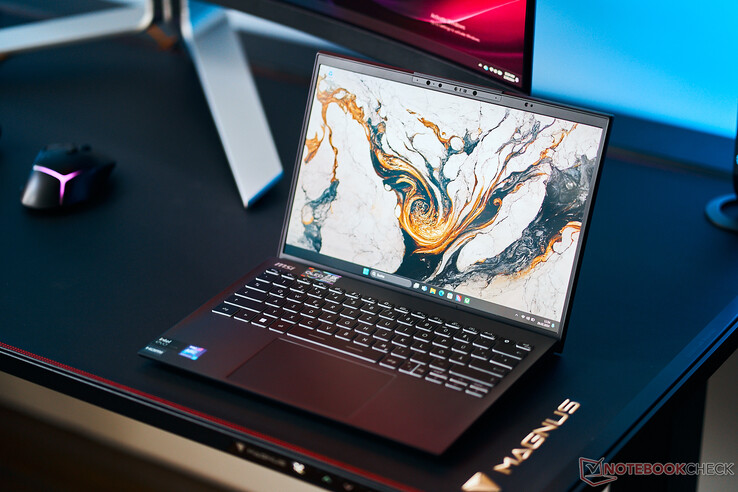
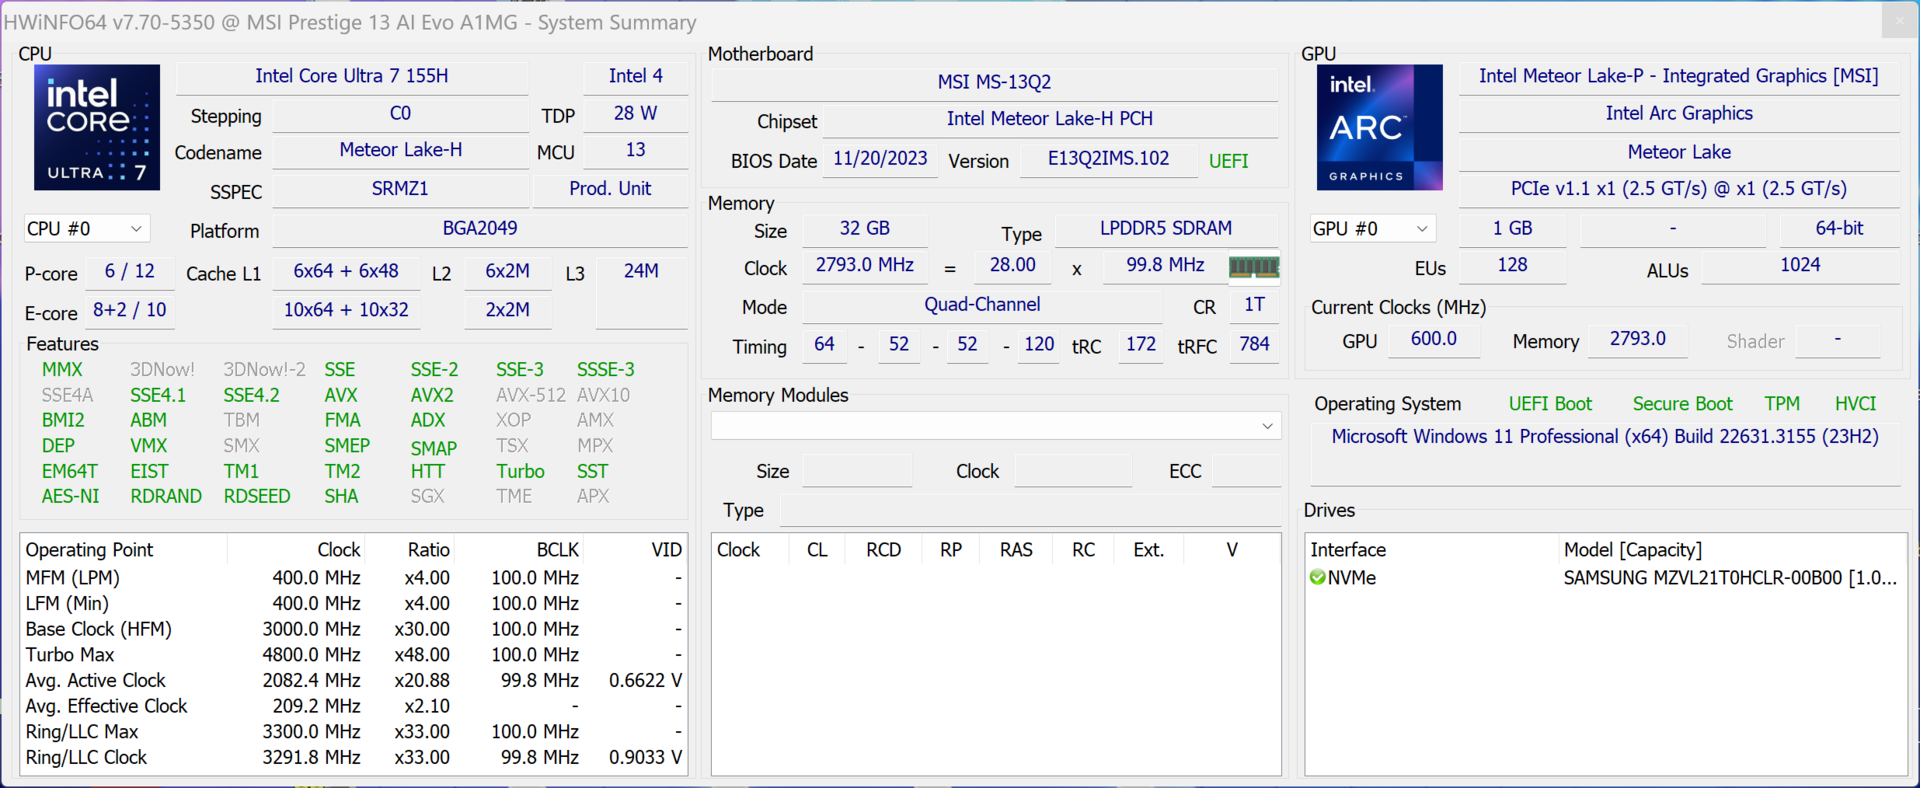
The MSI Prestige 13 AI Evo is a compact subnotebook weighing less than 1 kilogram. The new 2024 model has received a Meteor Lake processor from Intel as well as a Wi-Fi 7 module. Our test device is the variant with the Core Ultra 7 155H, Intel Arc Graphics, 32 GB RAM, a 1-TB SSD and a 2.8K OLED display for around US$1,300.
Possible competitors compared
Rating | Date | Model | Weight | Height | Size | Resolution | Price |
|---|---|---|---|---|---|---|---|
| 86.6 % v7 (old) | 03 / 2024 | MSI Prestige 13 AI Evo Ultra 7 155H, Arc 8-Core | 967 g | 16.9 mm | 13.30" | 2880x1800 | |
| 89.5 % v7 (old) | 08 / 2023 | Lenovo ThinkPad X1 Nano Gen 3 i7-1360P, Iris Xe G7 96EUs | 989 g | 14.8 mm | 13.00" | 2160x1350 | |
| 90.2 % v7 (old) | 10 / 2023 | Dell Latitude 13 7340 i5-1345U i5-1345U, Iris Xe G7 80EUs | 1.1 kg | 18.2 mm | 13.30" | 1920x1200 | |
| 91.9 % v7 (old) | 07 / 2023 | HP Dragonfly G4 i7-1365U, Iris Xe G7 96EUs | 1.1 kg | 16.3 mm | 13.50" | 1920x1280 | |
| 85.4 % v7 (old) | 05 / 2023 | Asus ZenBook S13 OLED UX5304 i7-1355U, Iris Xe G7 96EUs | 1 kg | 11.8 mm | 13.30" | 2880x1800 |
Case - The Prestige 13 with a magnesium-alloy case
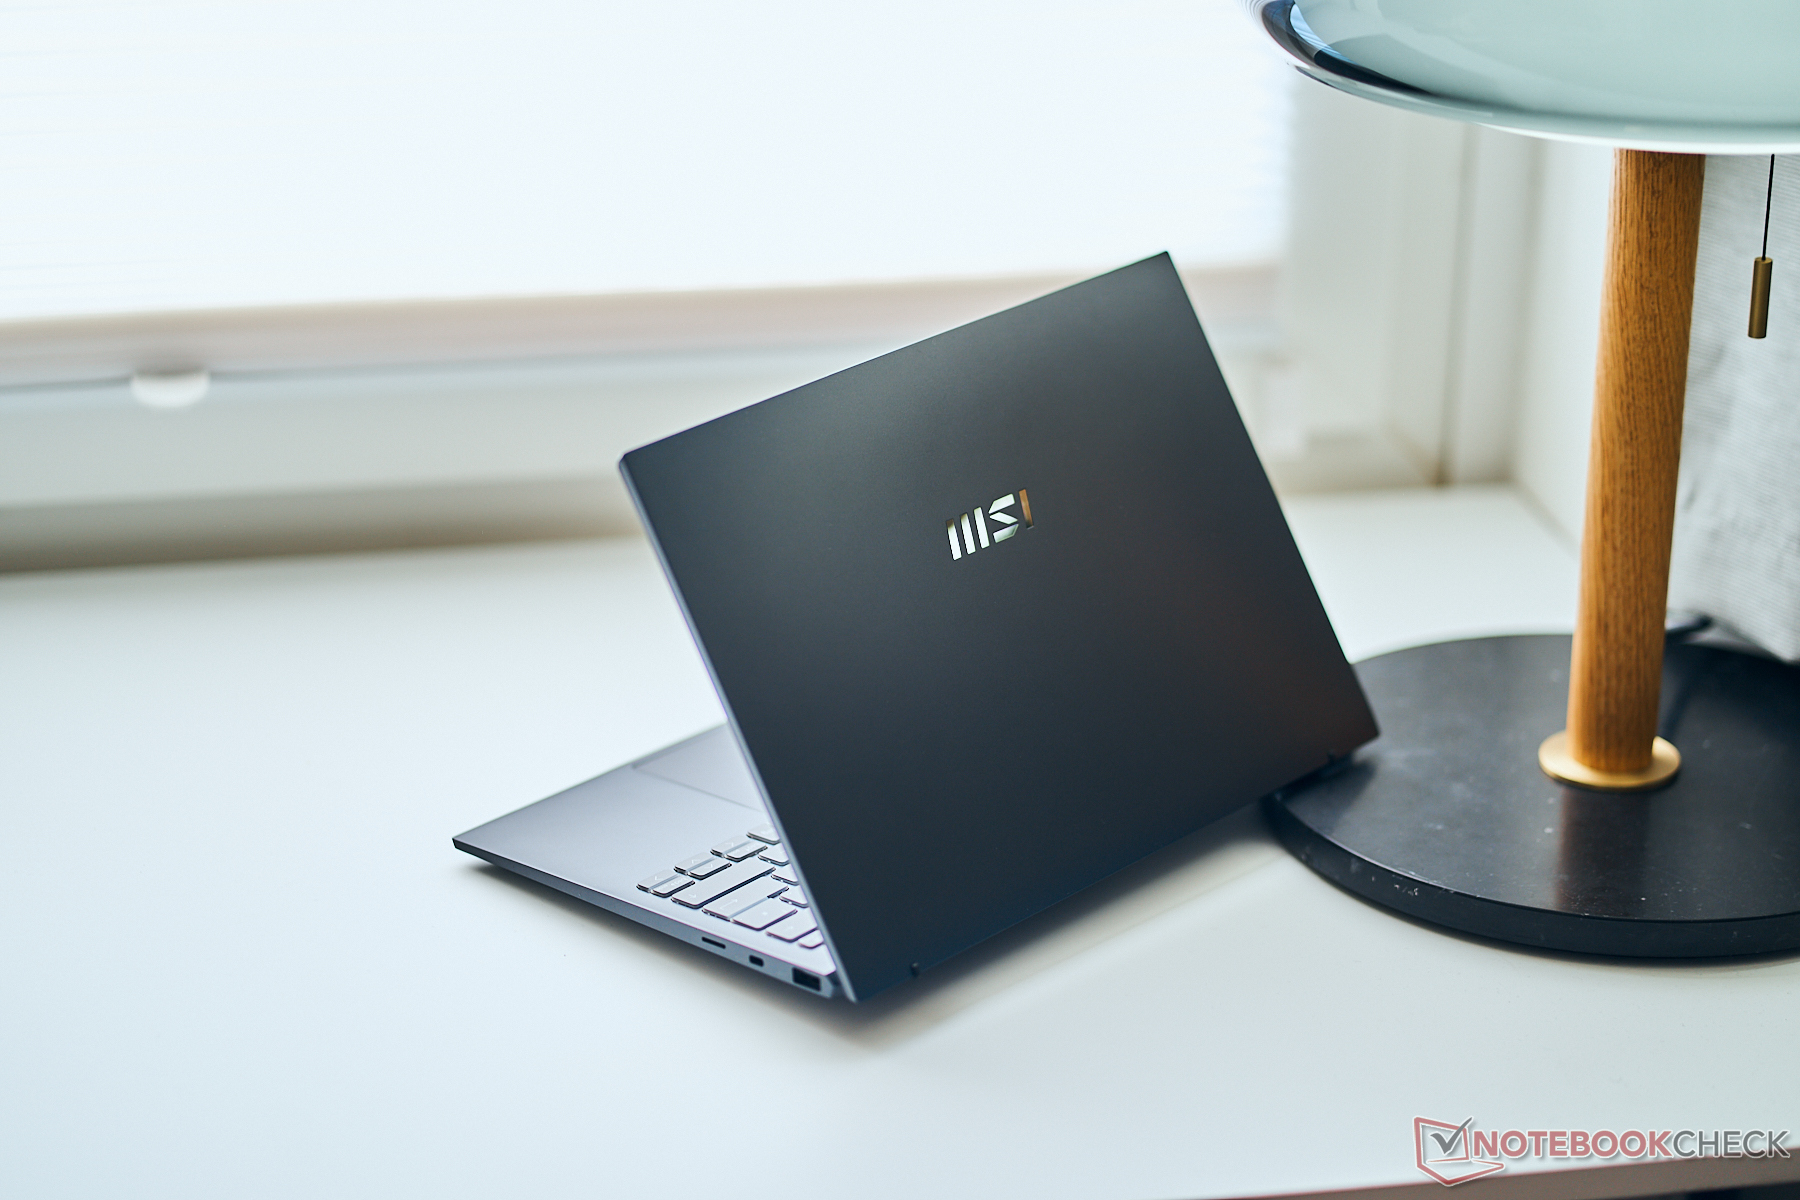
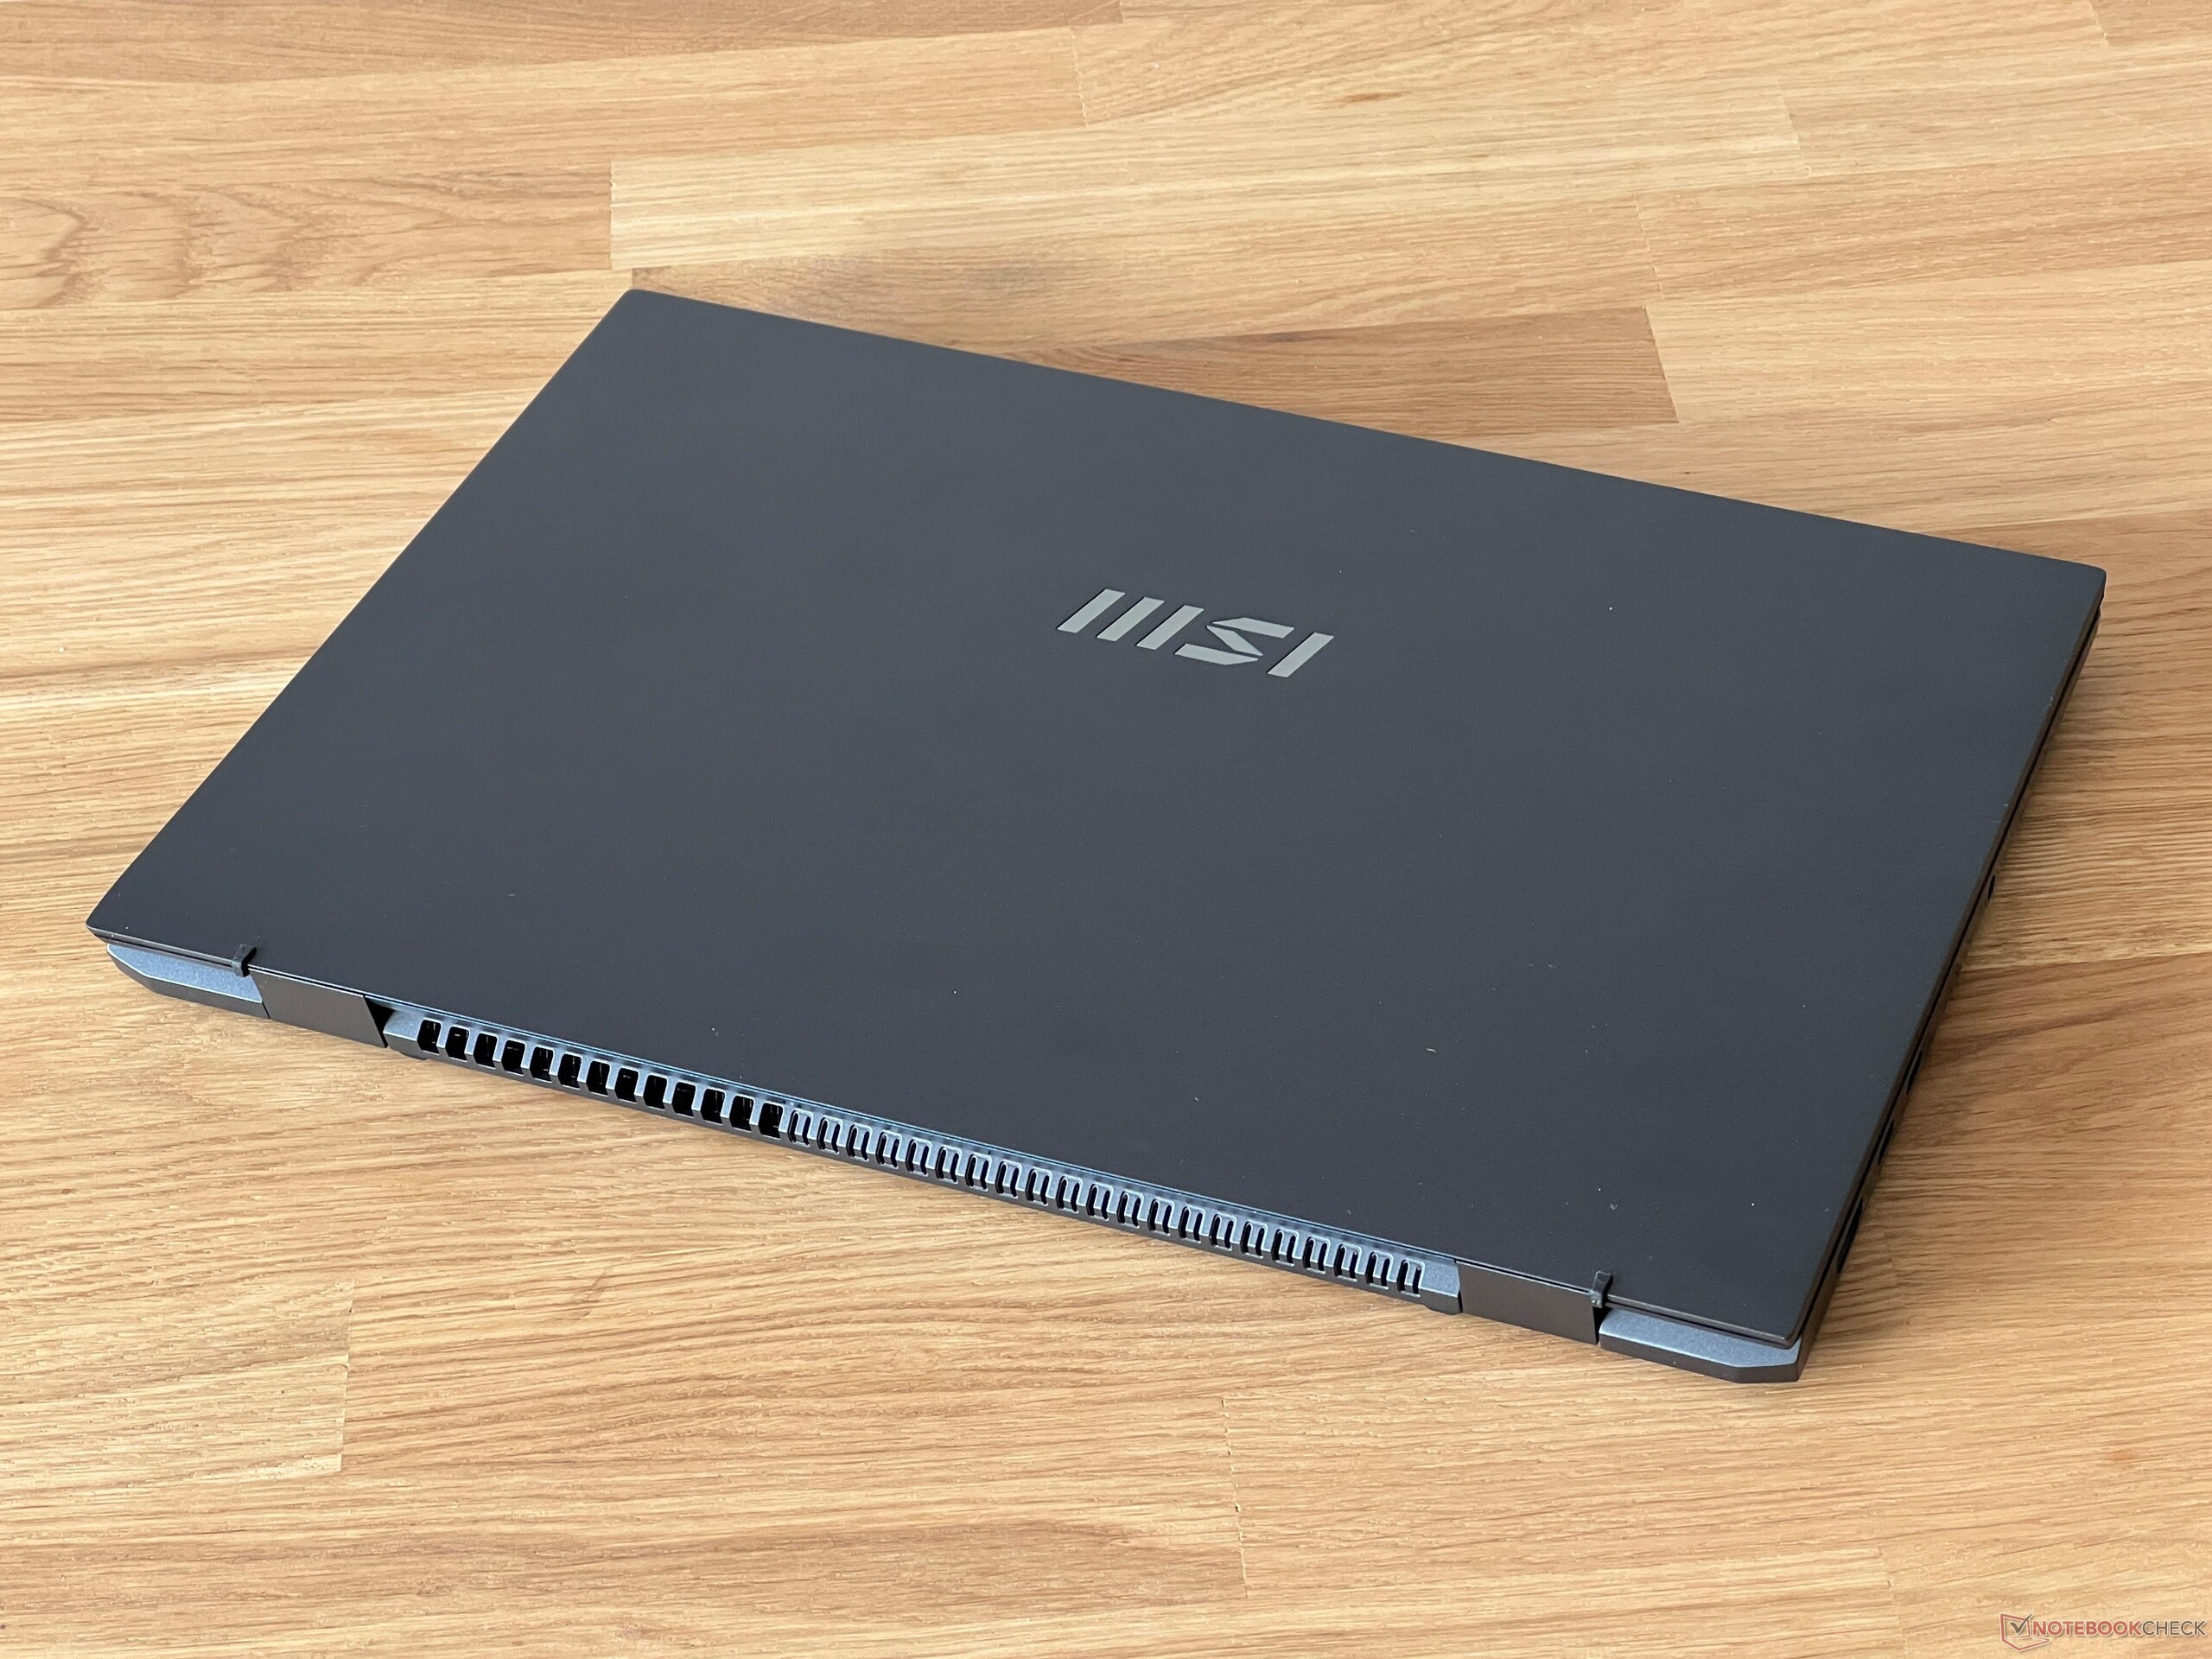
MSI offers the Prestige 13 either in dark gray (Stellar Gray)—the same as our test device—or alternatively in white (Pure White). Both versions make use of a magnesium-aluminum alloy, which presumably also contributes to the device's low weight of 976 grams. When you first come into contact with the laptop, you are immediately surprised by how light it truly is. Its surfaces feel high-quality and even on the dark model, fingerprint marks don't seem to be too big an issue. Aside from the MSI logo, the Prestige 13 doesn't feature any additional design elements. The bezels are quite slim on both sides but the frame along the top edge is quite wide due to the installed webcam.
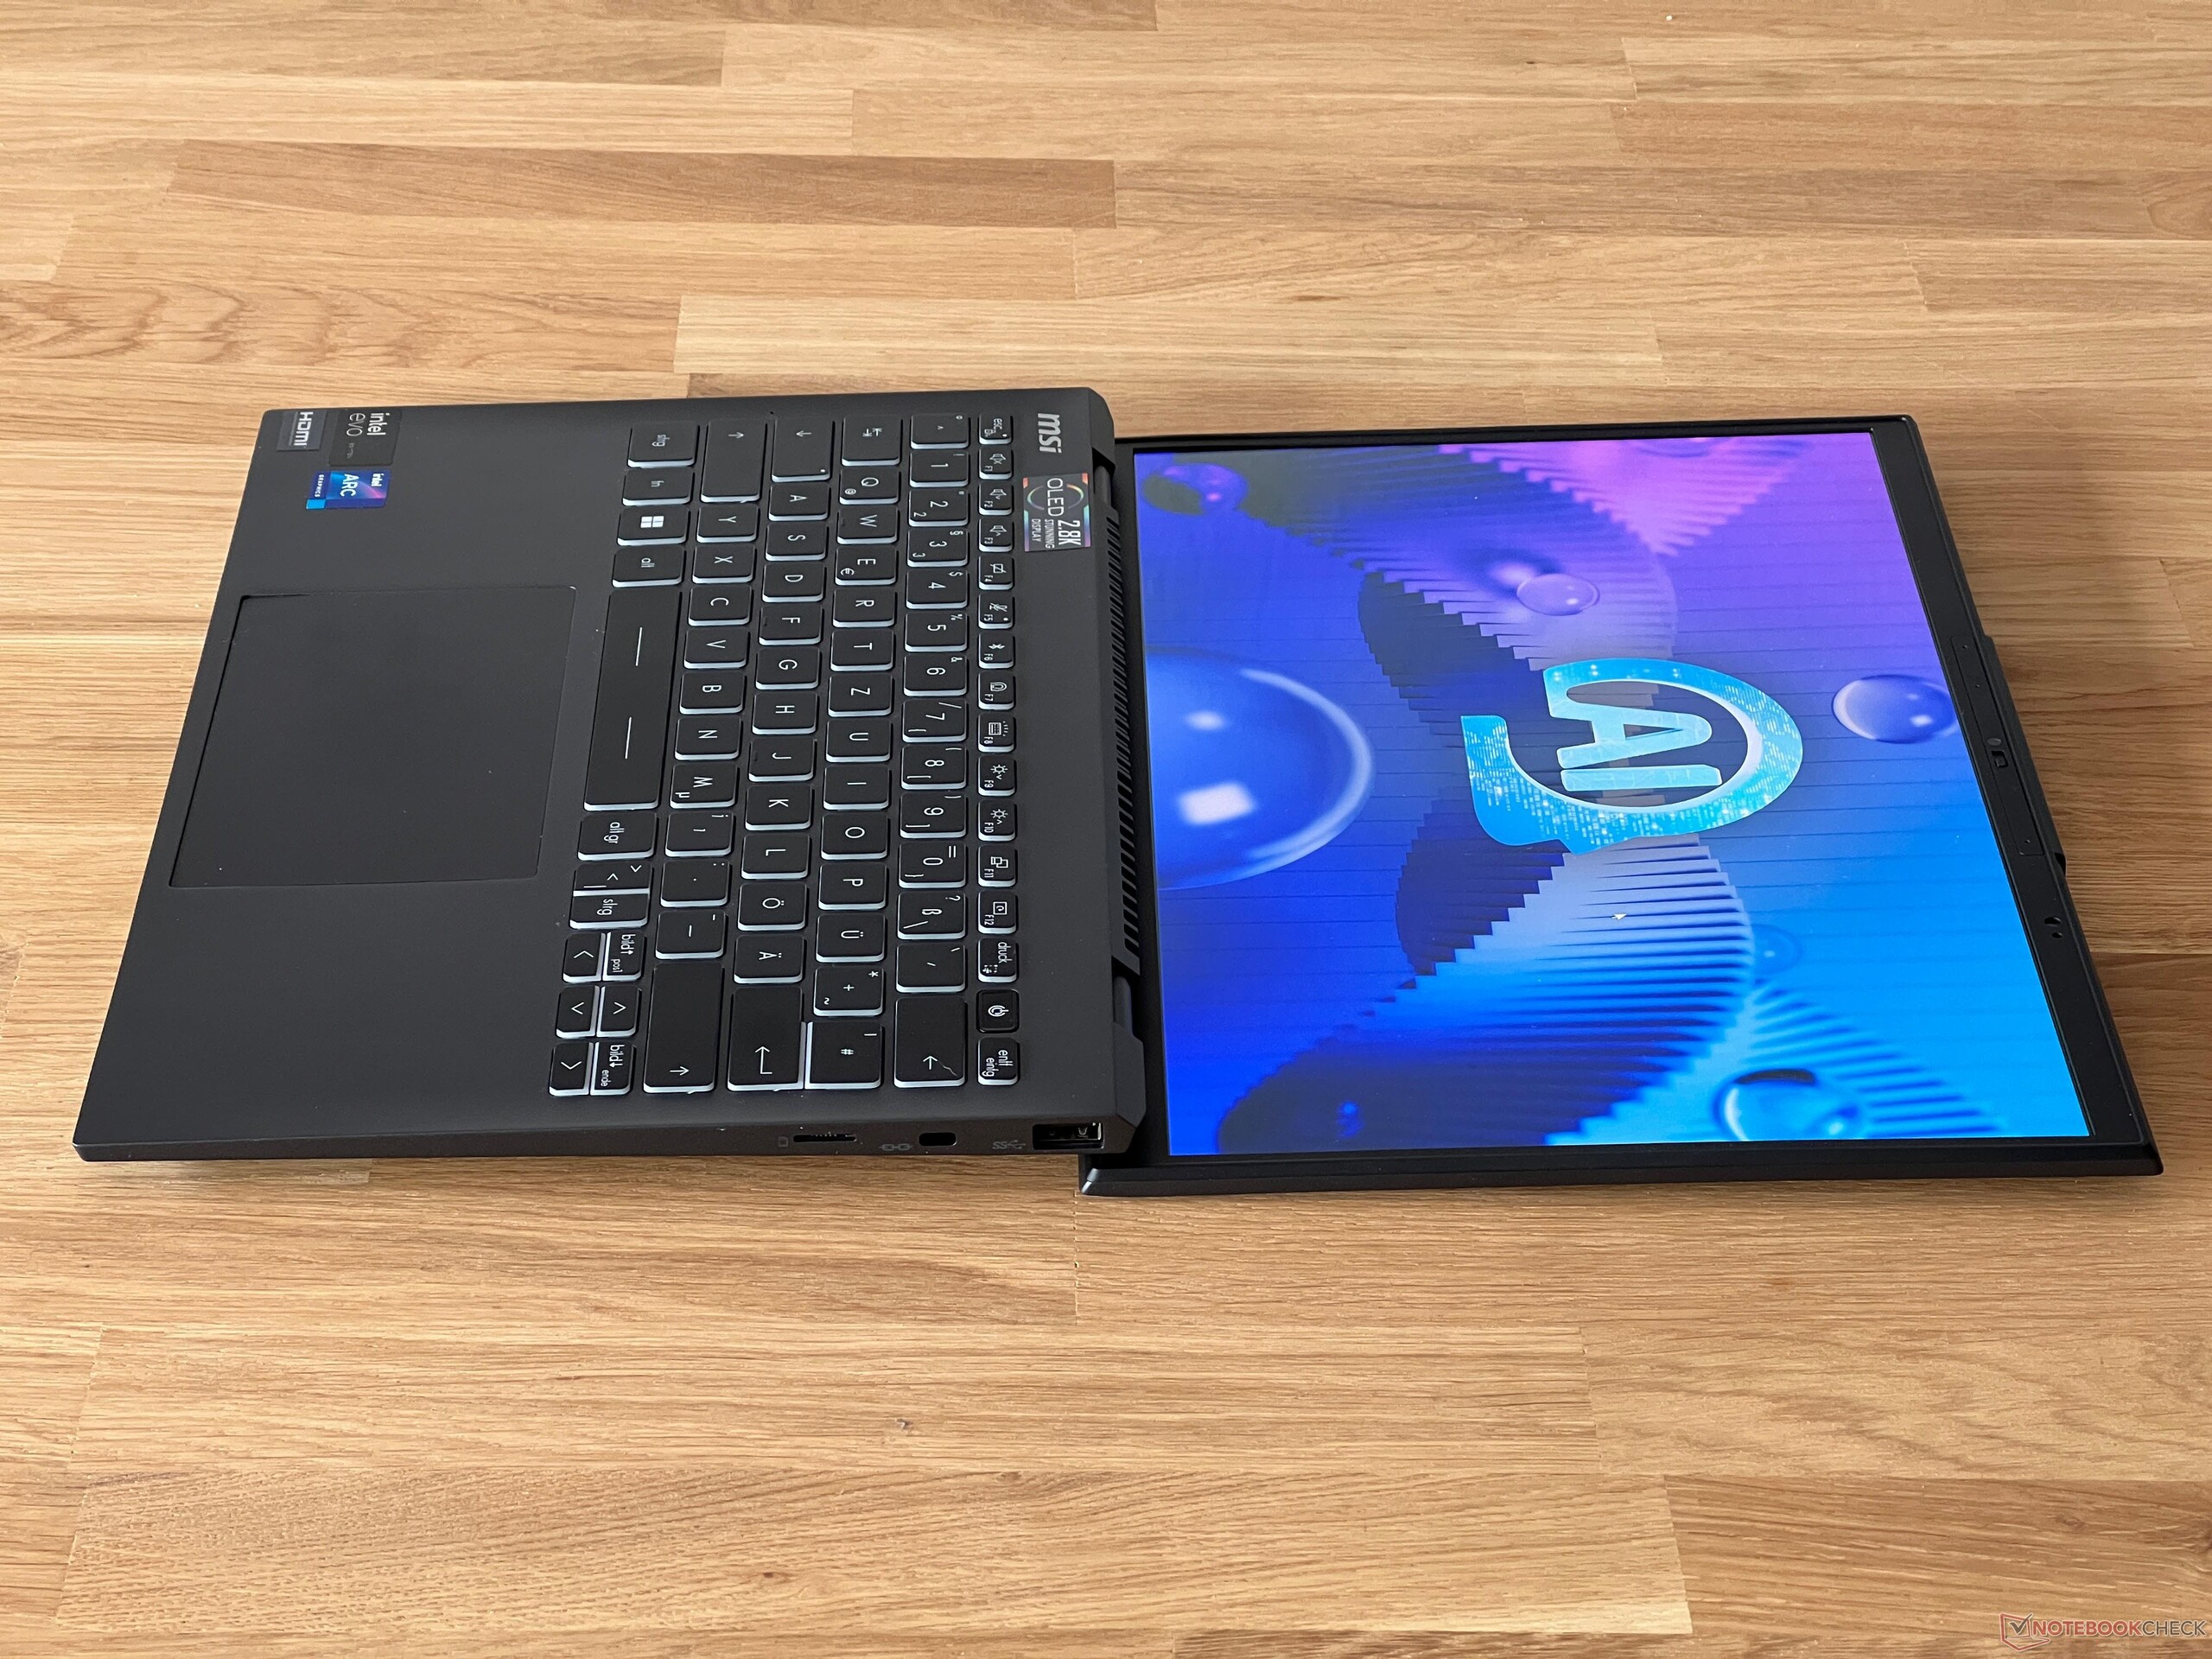
It is constructed well, however, it suffers from some stability issues. The back area of the base unit is lifted slightly when you open the lid and the middle part of the keyboard can be warped inwards using a bit of pressure. Still, when typing normally, this shouldn't be too big a problem. If you twist the base unit slightly, the laptop makes noticeable creaking noises. The display hinges are set very tightly and effectively prevent the lid from wobbling—this just makes it a bit difficult to open with one hand. Its maximum opening angle is 180 degrees and the lid itself is very stable.
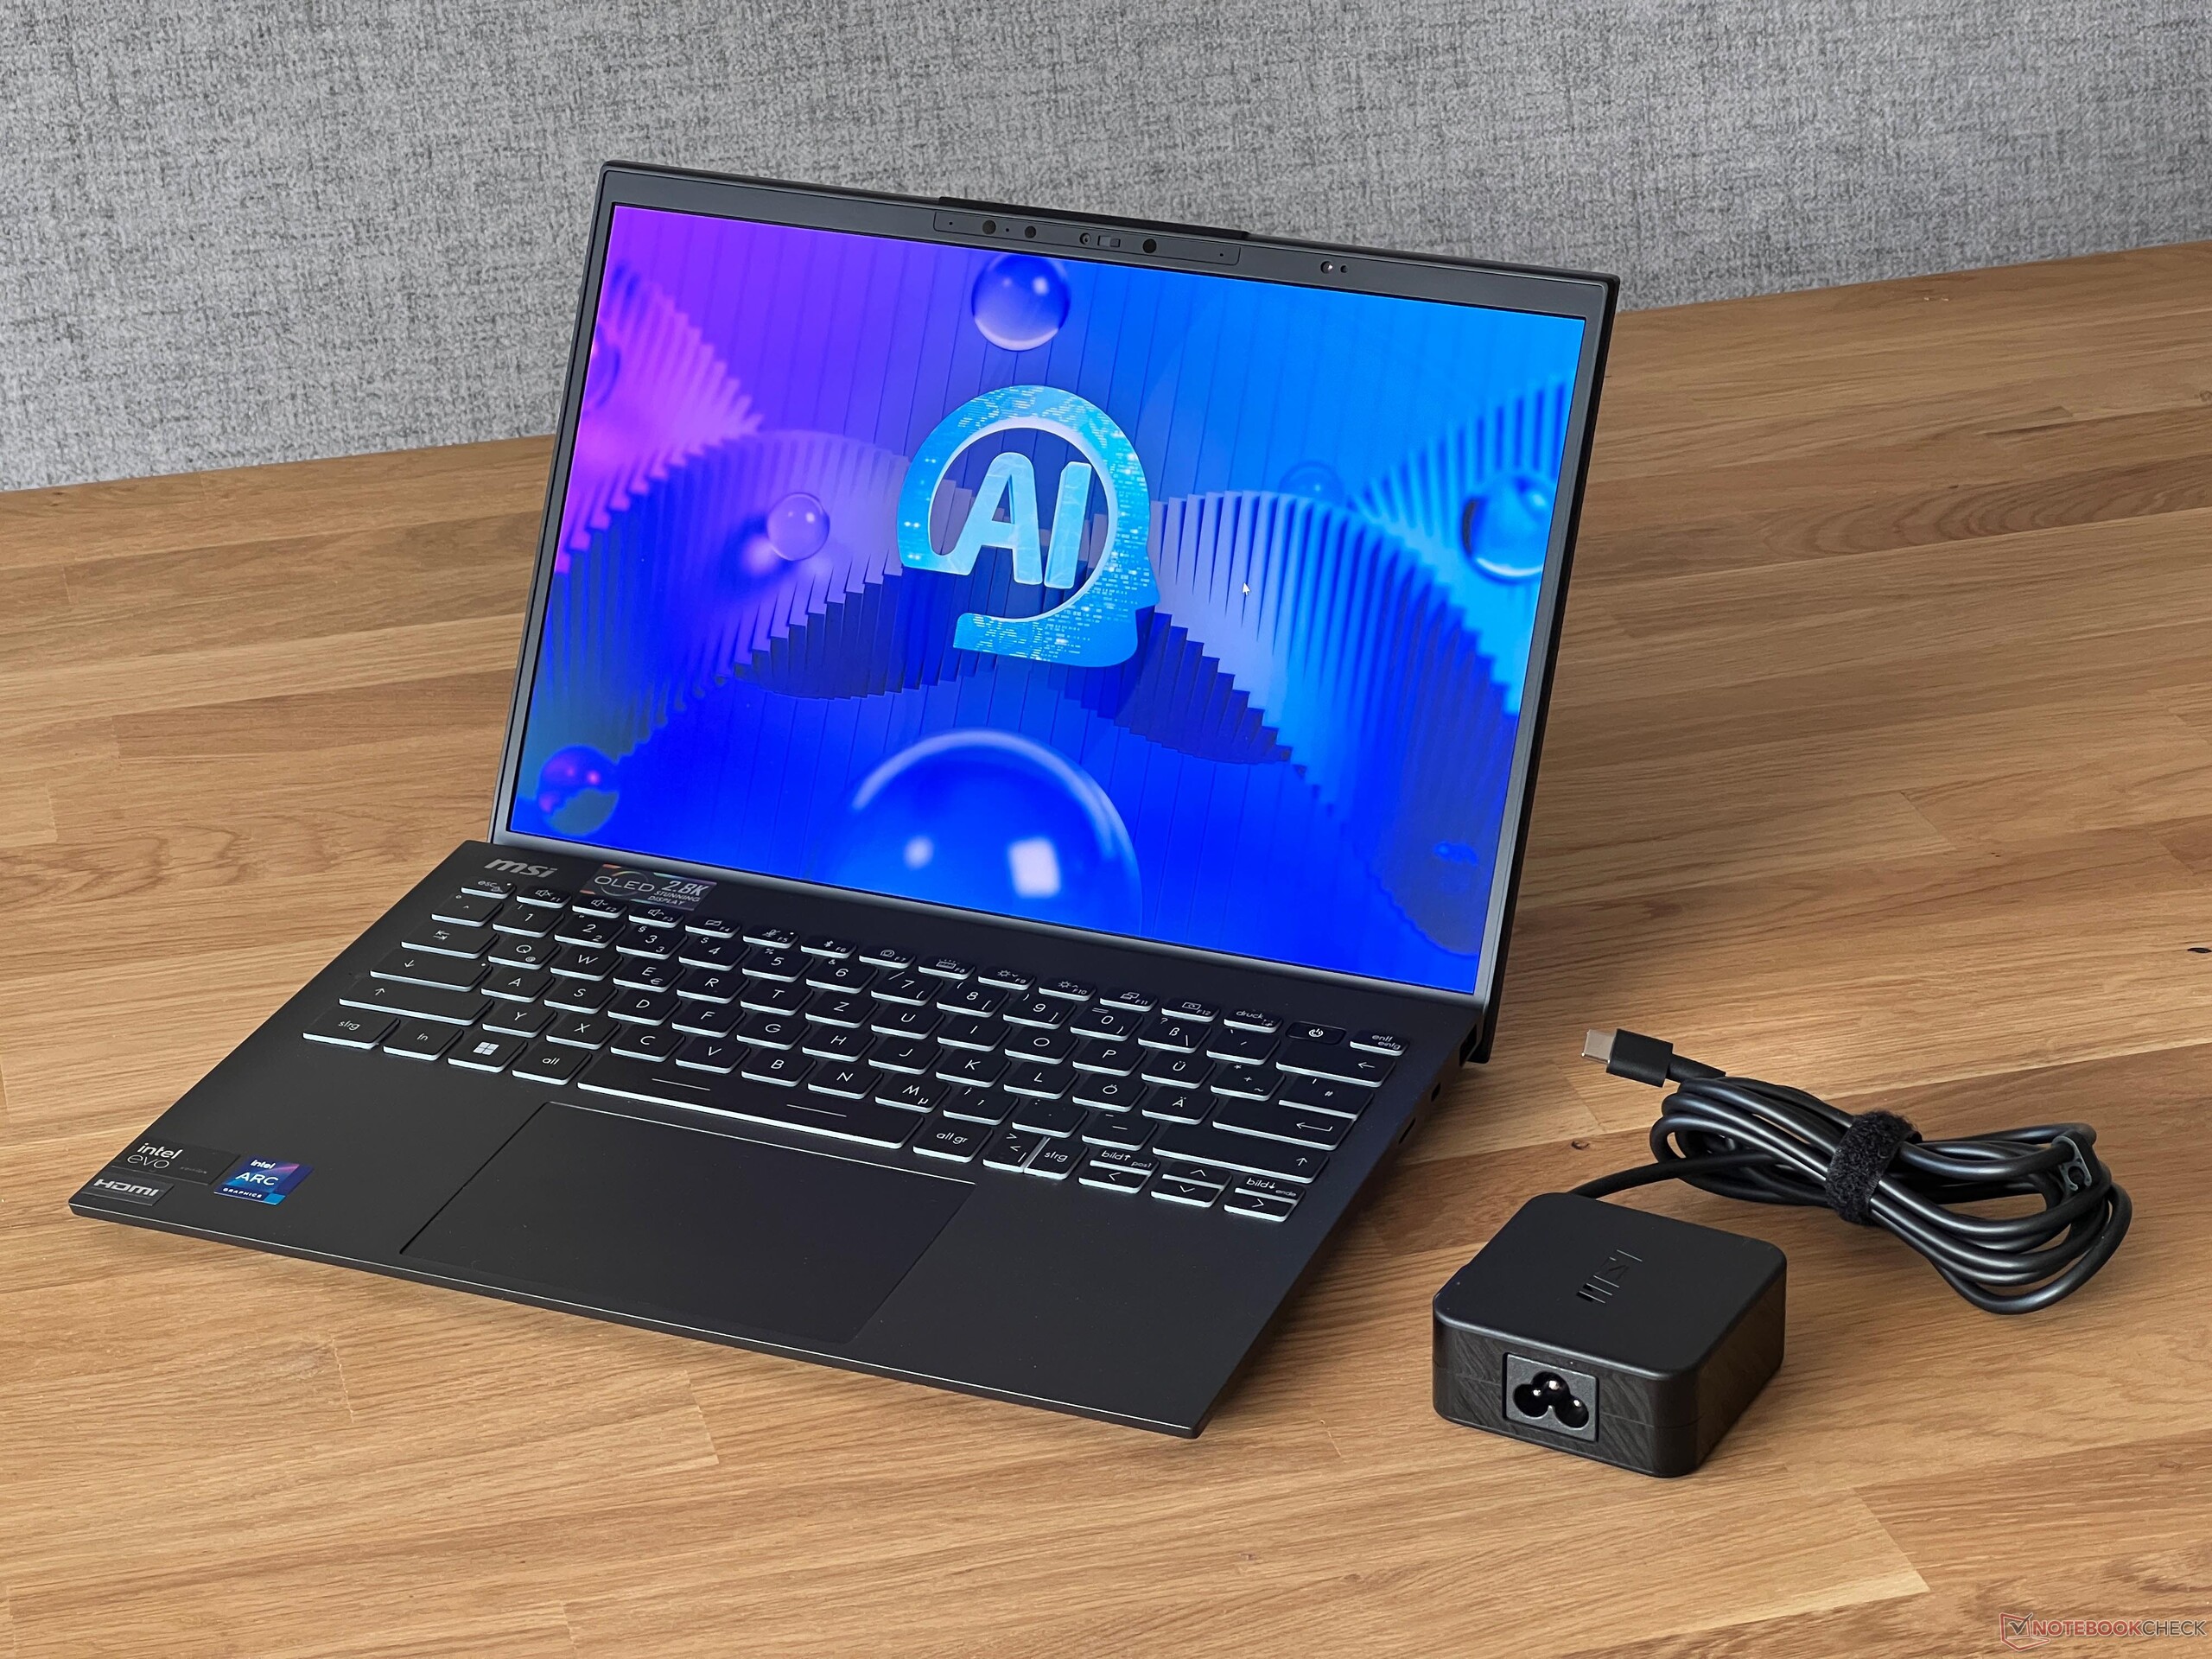
At under 1 kilogram, the Prestige 13 is extremely lightweight, but the same can be said for the other comparison devices. When it comes to footprints, the competitors don't take up much space, either. The Prestige can easily be stored away in any bag. MSI makes use of a compact 65-watt power supply, however, it isn't a plug-in power supply, which is why it is quite heavy at 341 grams.
Connectivity - The MSI with Thunderbolt 4 and HDMI 2.1
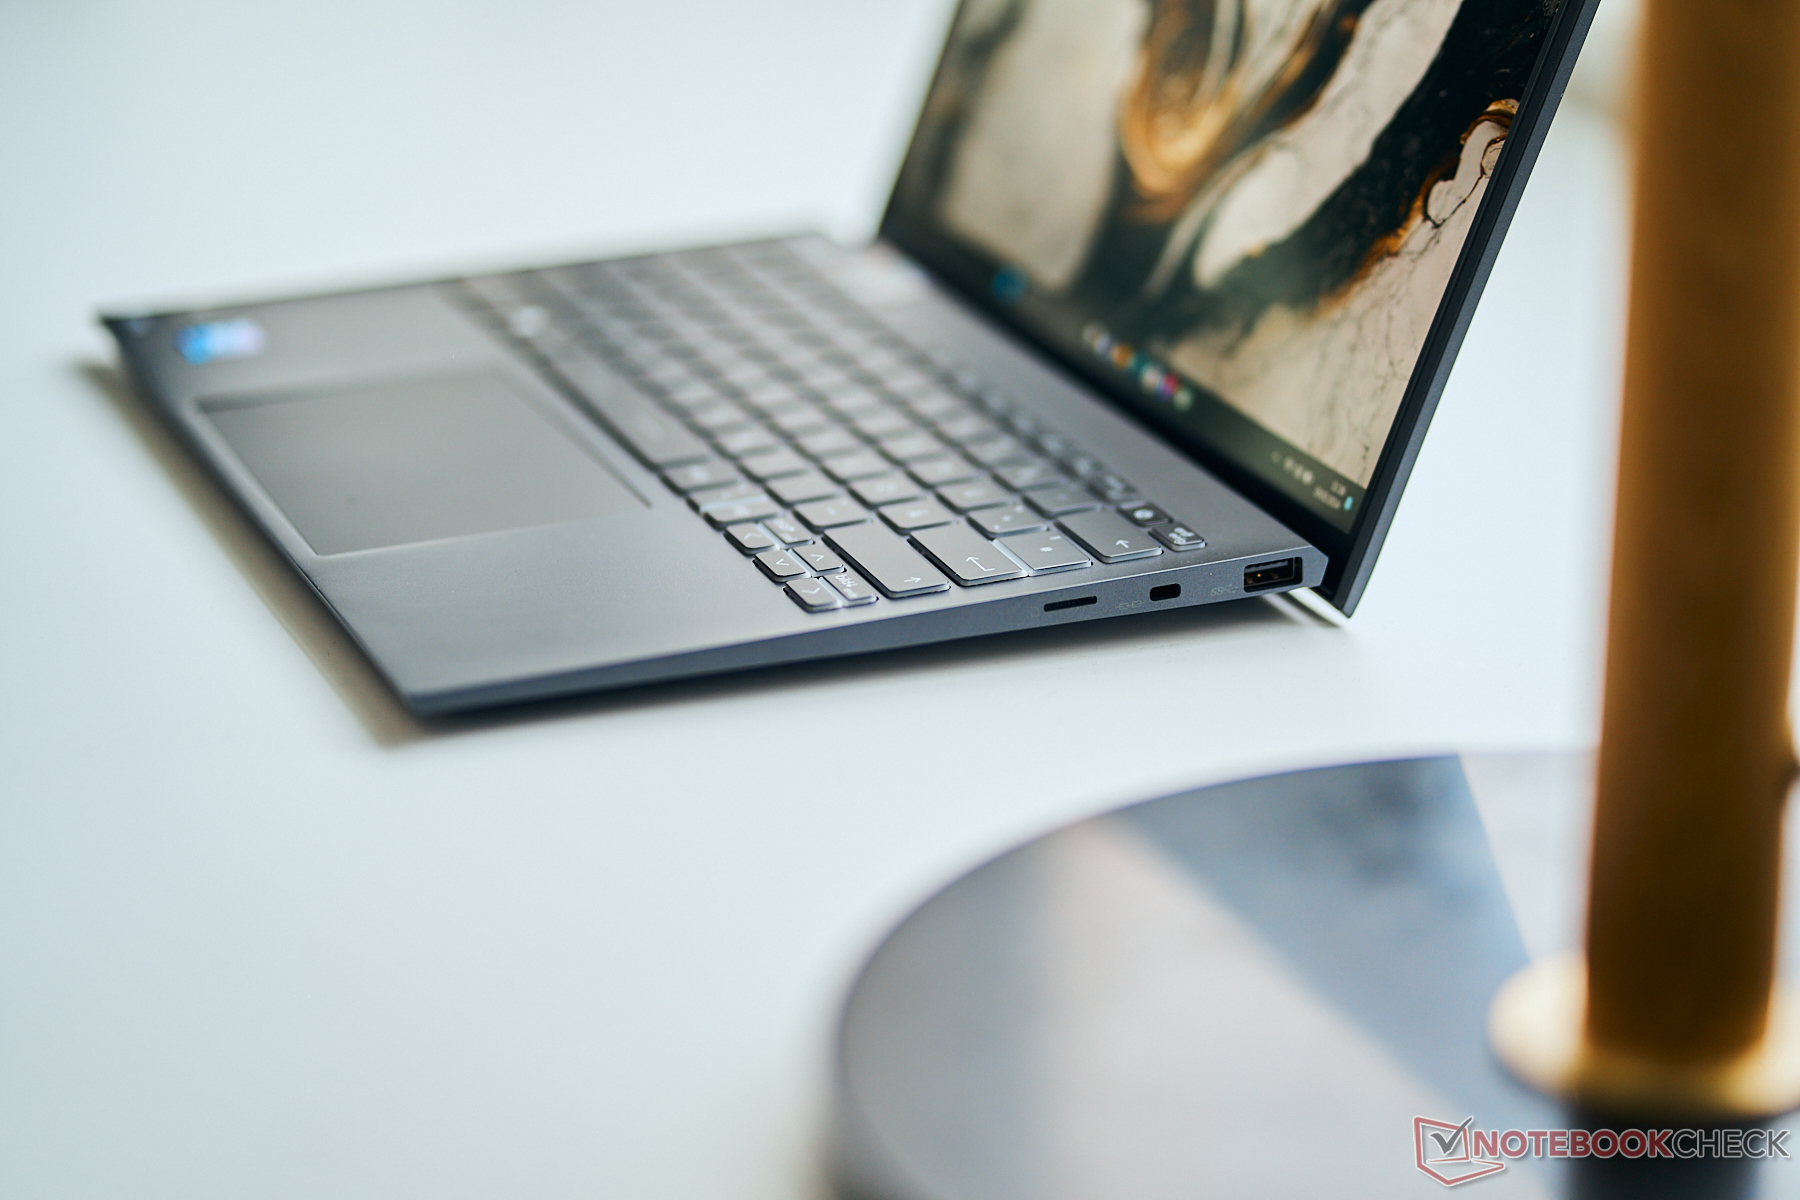
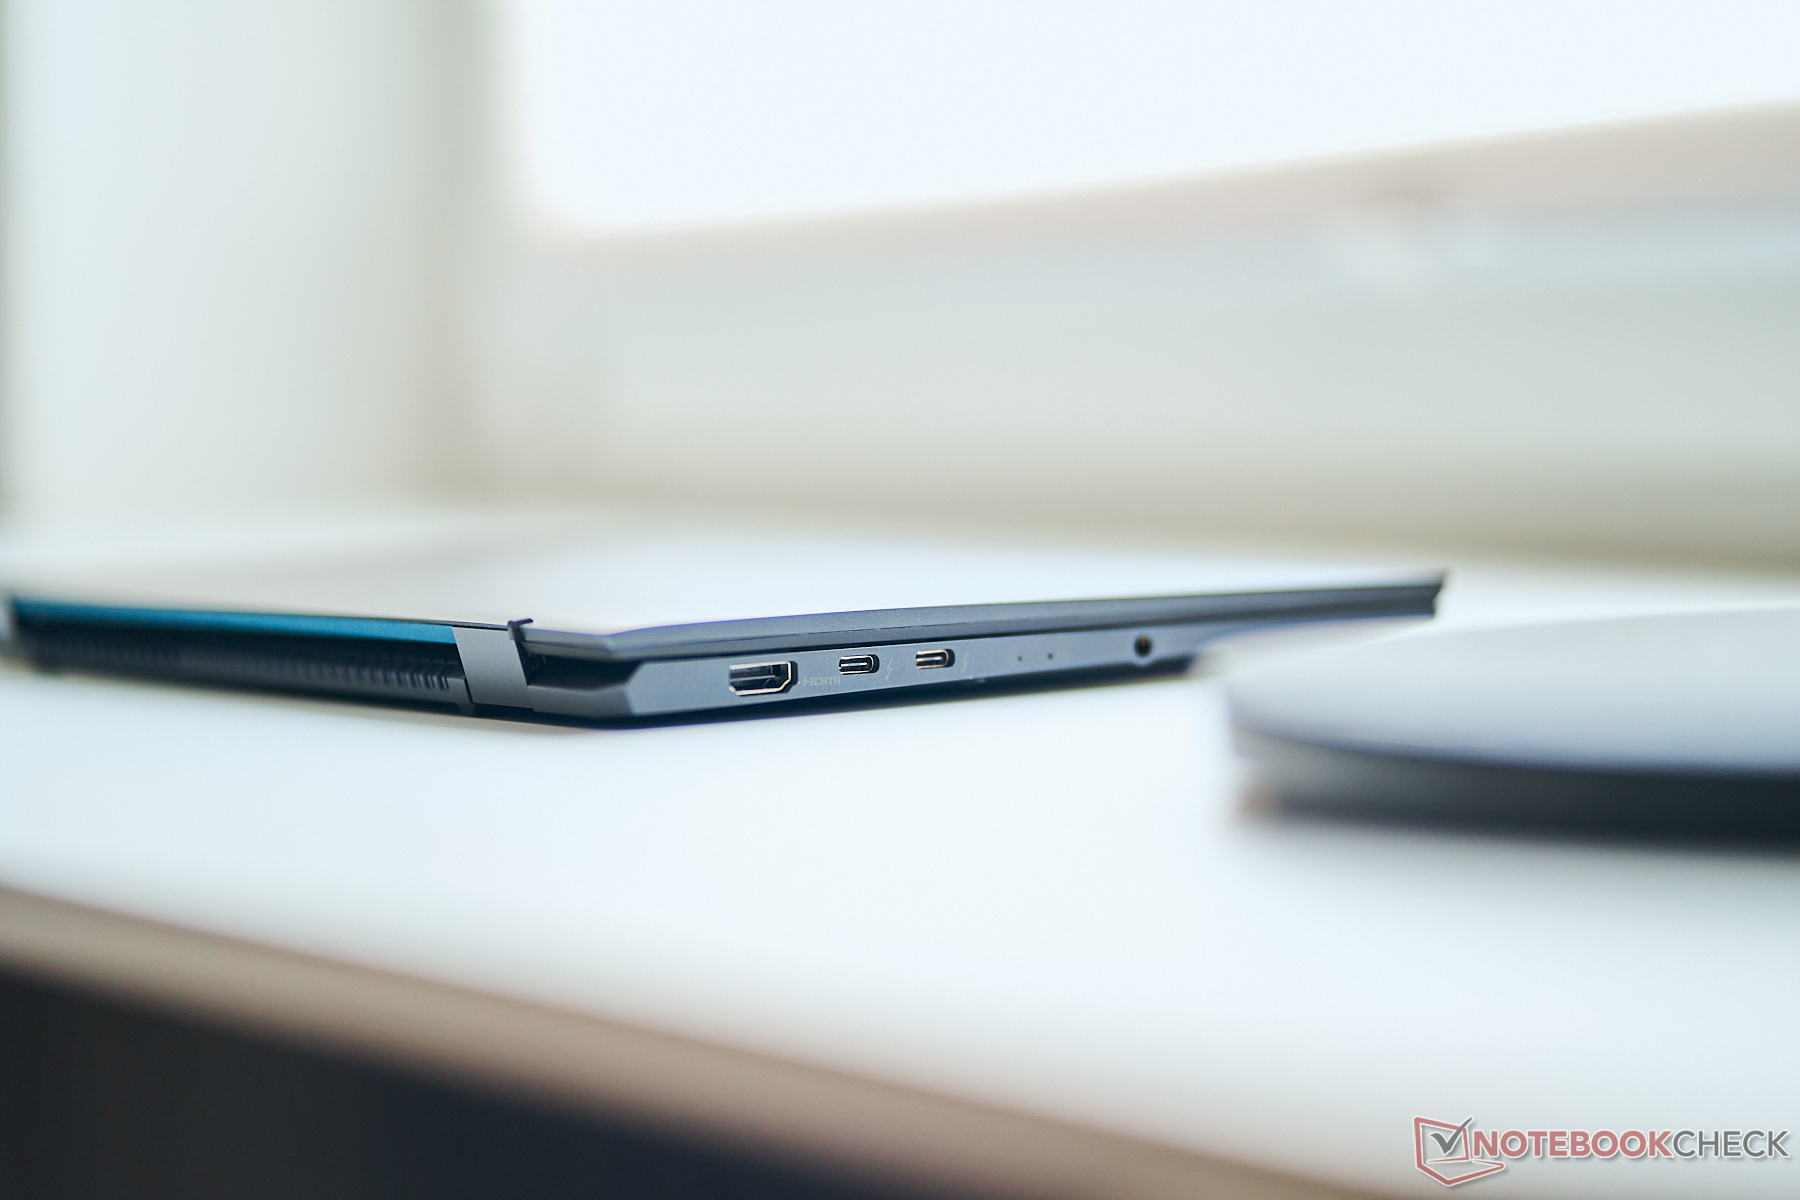
The Prestige 13 may be compact, but it also still features all the important connections, including USB-C, USB-A and a full-featured HDMI output. We also like how the ports are spread out across the laptop and don't have much to critique.
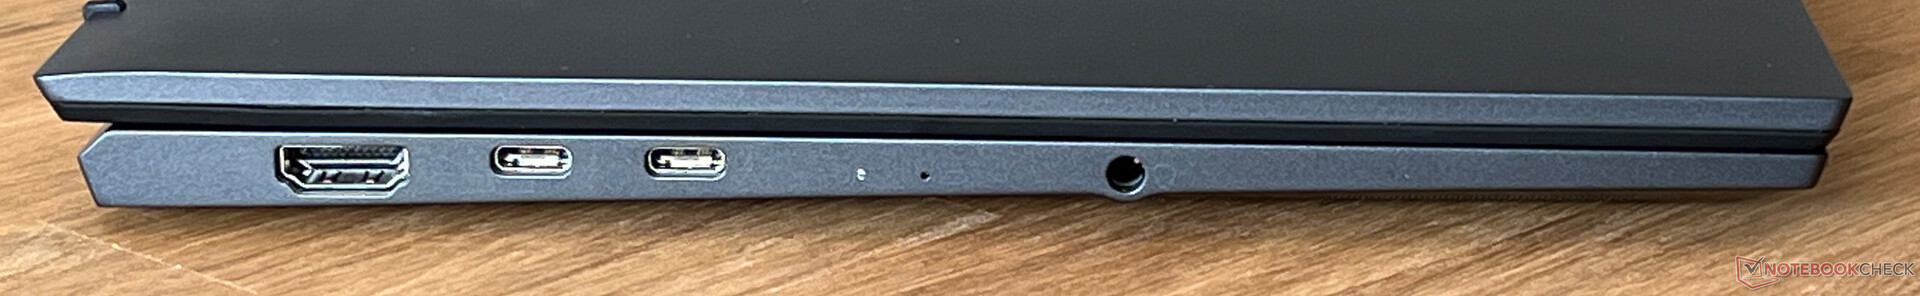
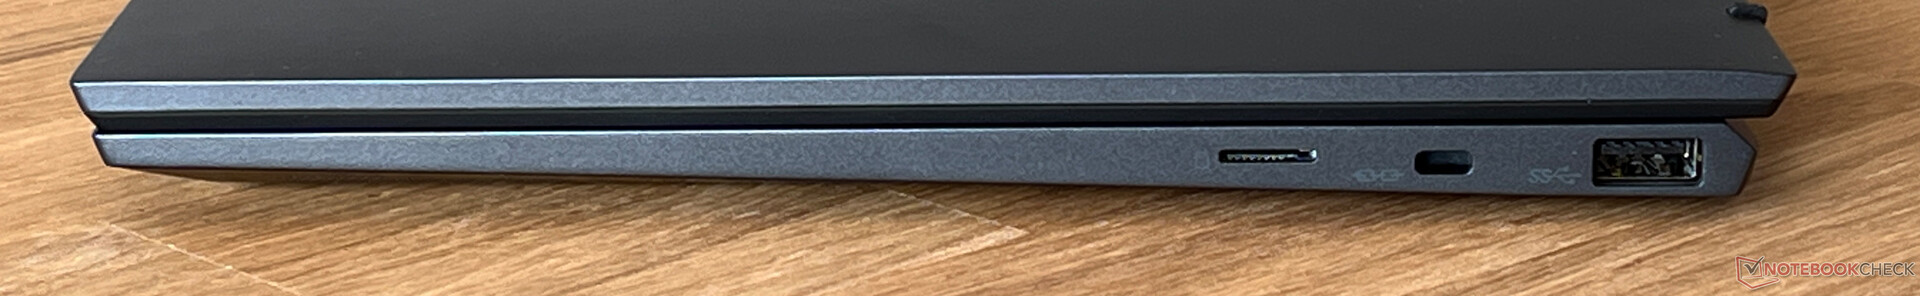
SD card reader
The right side of the device houses a microSD card reader (spring mechanism) which, in combination with our reference card (Angelbird AV Pro V60), achieved very good transfer rates. When copying images, we noted an average of over 140 MB/s and a maximum of over 200 MB/s. None of the other comparison devices feature a card reader.
| SD Card Reader | |
| average JPG Copy Test (av. of 3 runs) | |
| MSI Prestige 13 AI Evo (Angelbird AV Pro V60) | |
| Average of class Subnotebook (23.7 - 188, n=9, last 2 years) | |
| maximum AS SSD Seq Read Test (1GB) | |
| MSI Prestige 13 AI Evo (Angelbird AV Pro V60) | |
| Average of class Subnotebook (24.9 - 195, n=8, last 2 years) | |
Communication
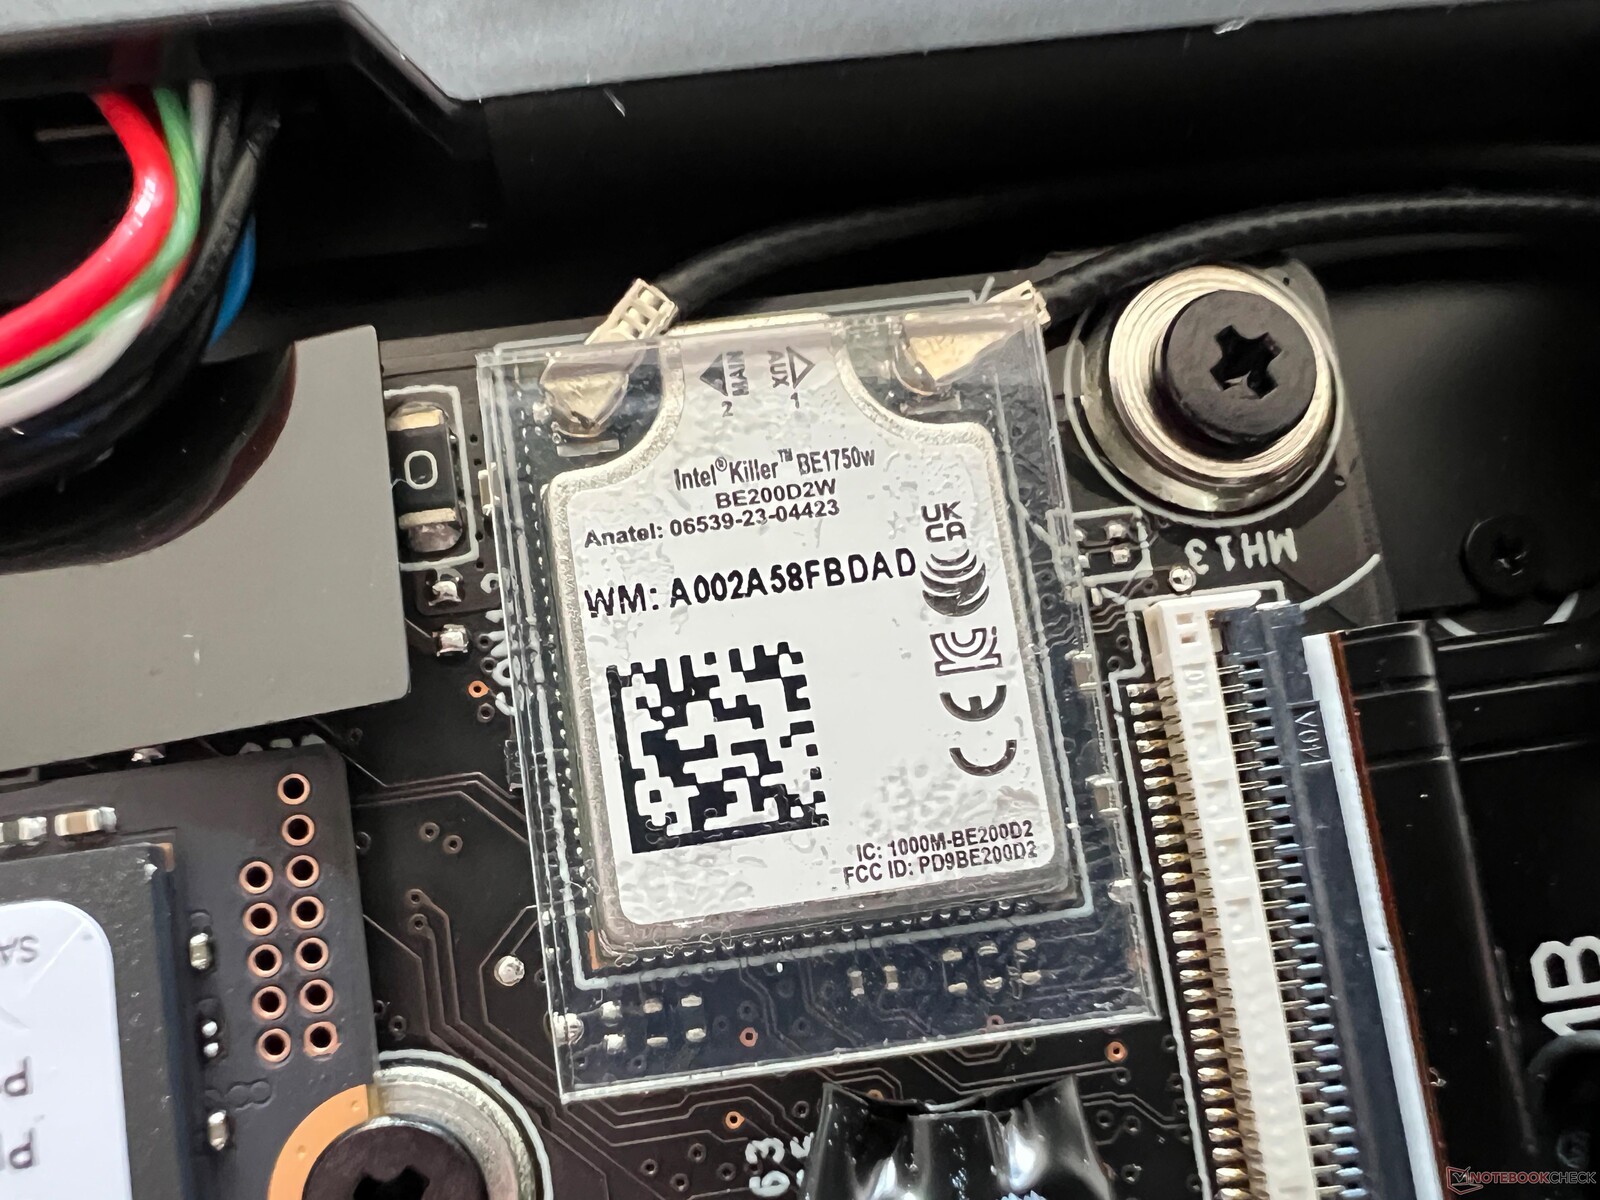
MSI has installed the new BE1750W (320 MHz) Wi-Fi 7 module from Intel into the laptop. Unfortunately, we can't yet make use of the new standard using our current reference router. However, its transfer rates via Wi-Fi 6 were very stable and high.
| Networking | |
| MSI Prestige 13 AI Evo | |
| iperf3 transmit AXE11000 | |
| iperf3 receive AXE11000 | |
| Lenovo ThinkPad X1 Nano Gen 3 | |
| iperf3 transmit AXE11000 | |
| iperf3 receive AXE11000 | |
| iperf3 transmit AXE11000 6GHz | |
| iperf3 receive AXE11000 6GHz | |
| Dell Latitude 13 7340 i5-1345U | |
| iperf3 transmit AXE11000 | |
| iperf3 receive AXE11000 | |
| iperf3 transmit AXE11000 6GHz | |
| iperf3 receive AXE11000 6GHz | |
| HP Dragonfly G4 | |
| iperf3 transmit AXE11000 | |
| iperf3 receive AXE11000 | |
| iperf3 transmit AXE11000 6GHz | |
| iperf3 receive AXE11000 6GHz | |
| Asus ZenBook S13 OLED UX5304 | |
| iperf3 transmit AXE11000 | |
| iperf3 receive AXE11000 | |
Webcam
The 1080p webcam offers decent picture quality in good lighting conditions and it doesn't feature a mechanical cover. It also supports Windows studio effects (soft focus background, eye contact, tracking). In addition, it has an IR camera installed for facial recognition via Windows Hello.


Maintenance
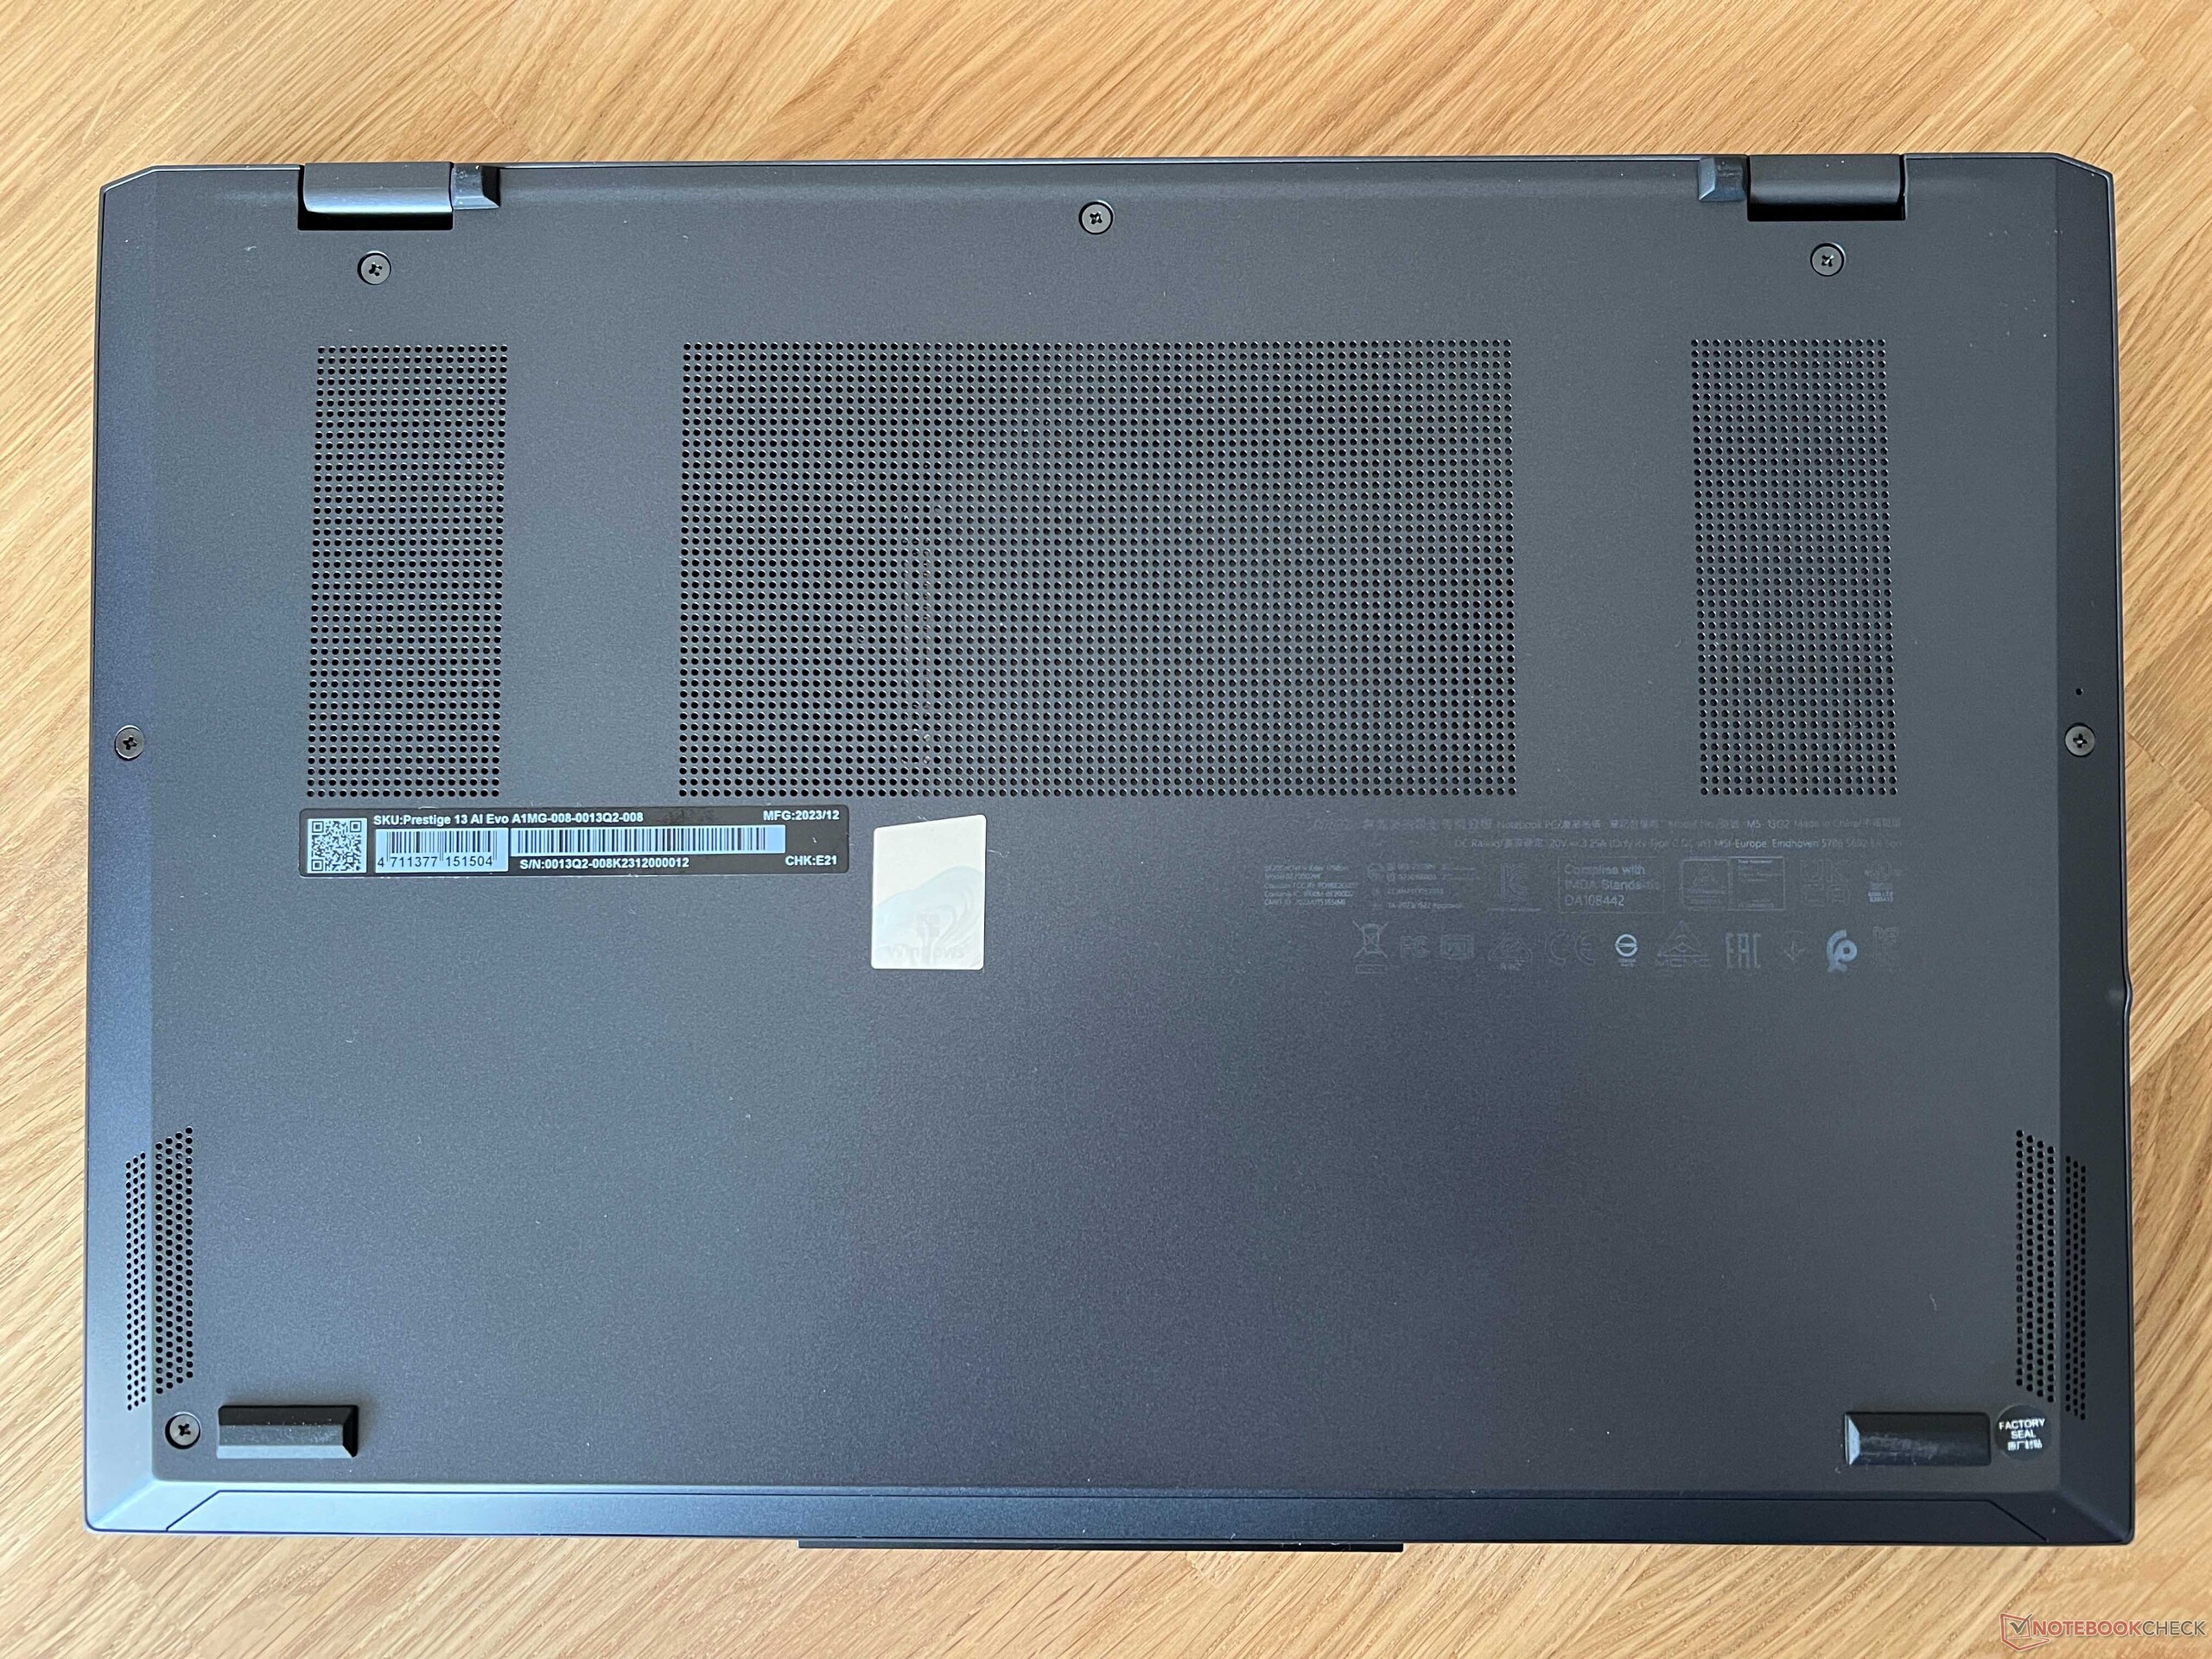
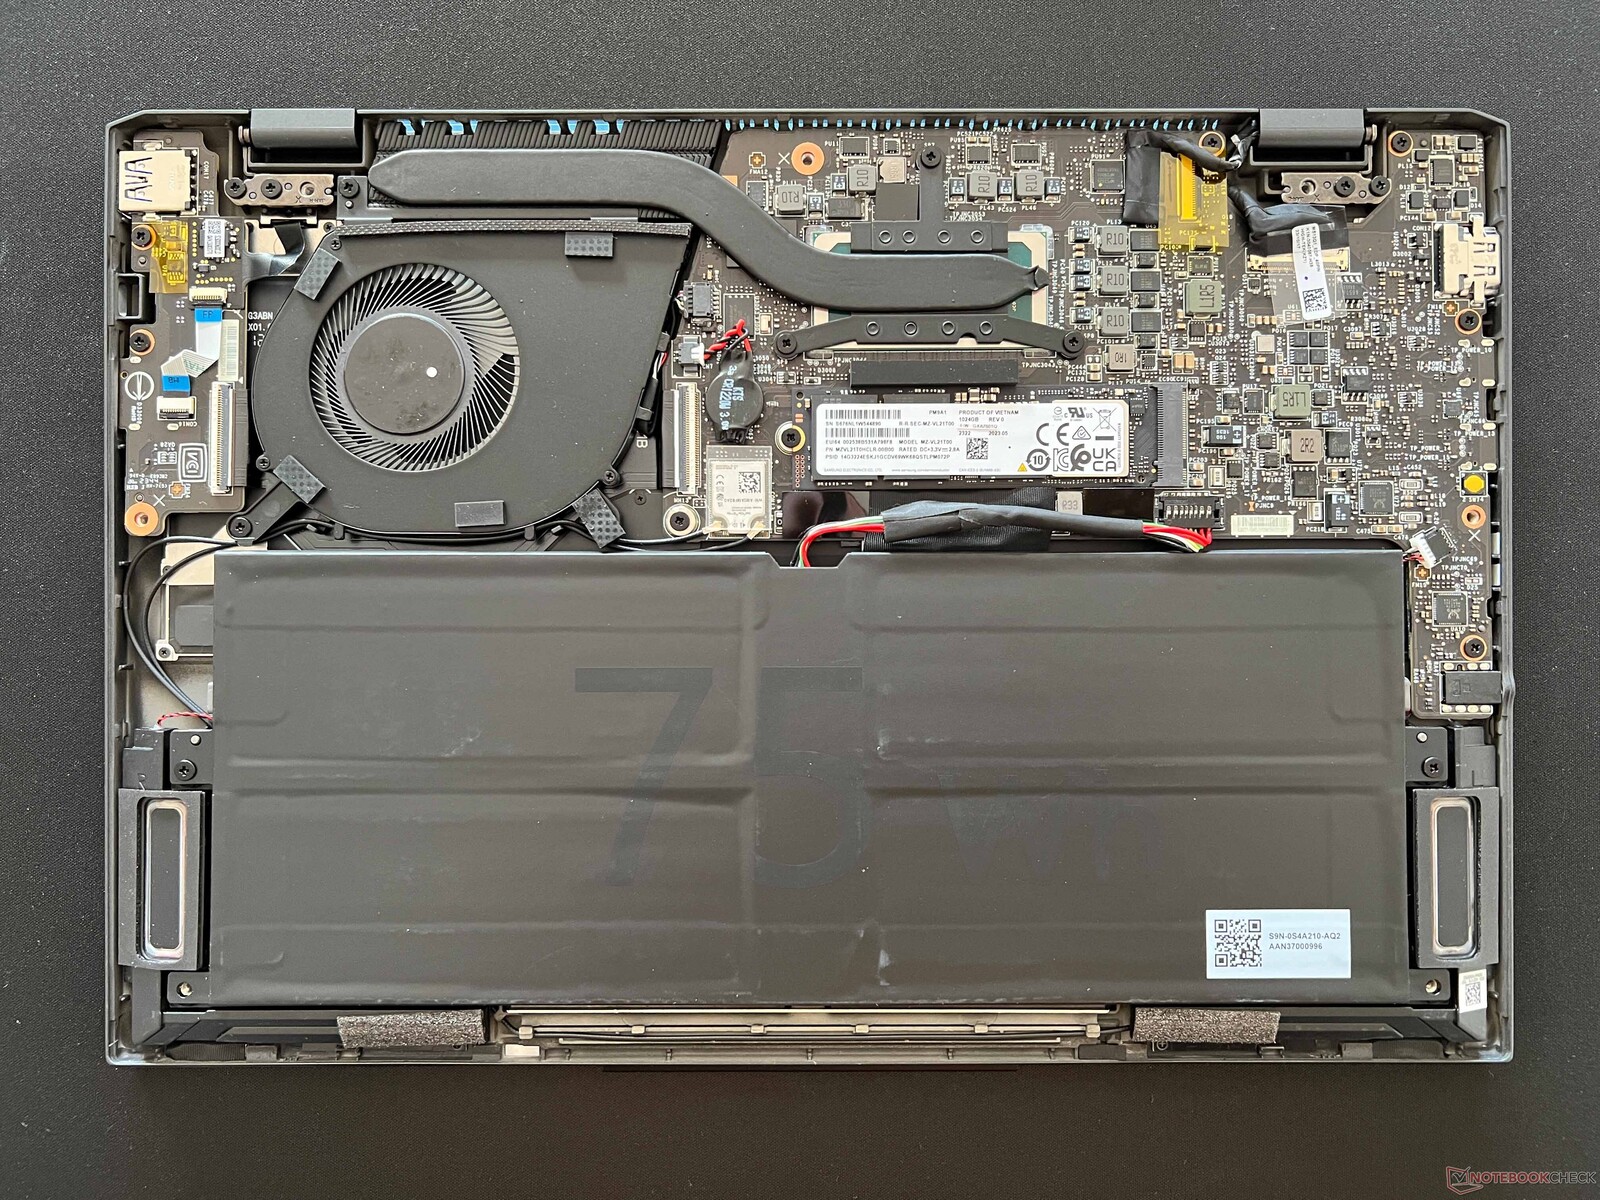
The bottom part of the case is secured via regular cross-headed screws and can be easily removed. The fan can then be cleaned and the SSD and battery can be swapped out. All the other components, on the other hand, are soldered on. This includes the RAM and WLAN modules.
Input devices - Downsized keyboard
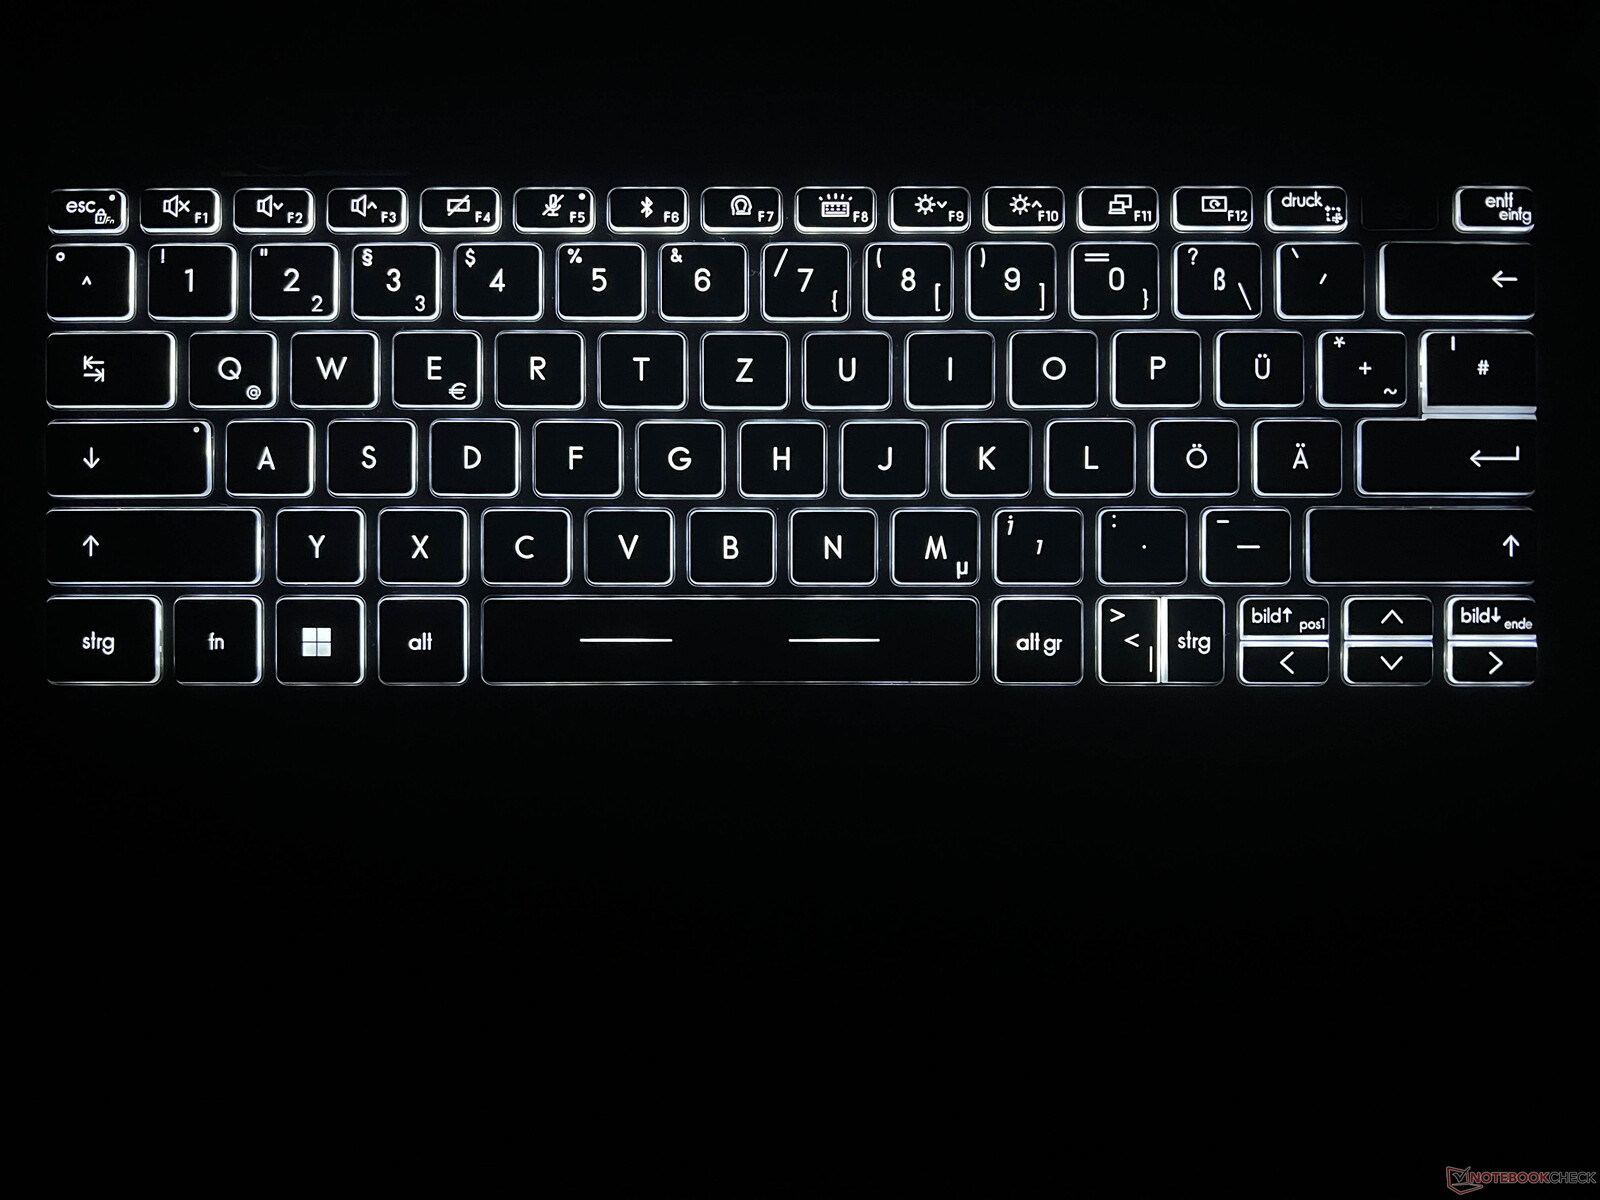
The black keyboard feels average to type on. The mechanics themselves are precise but the keys aren't terribly high (17 mm wide, 1.4 mm high), which you might have to get used to at first. Its layout in general feels quite cramped but at least MSI has installed dedicated picture-up/picture-down keys. The power button (including a fingerprint scanner) is situated on the top right and it sits deeper within the case, meaning you can feel for it easily. The delete key sits on the far right. The keyboard's white backlighting features three intensity levels.
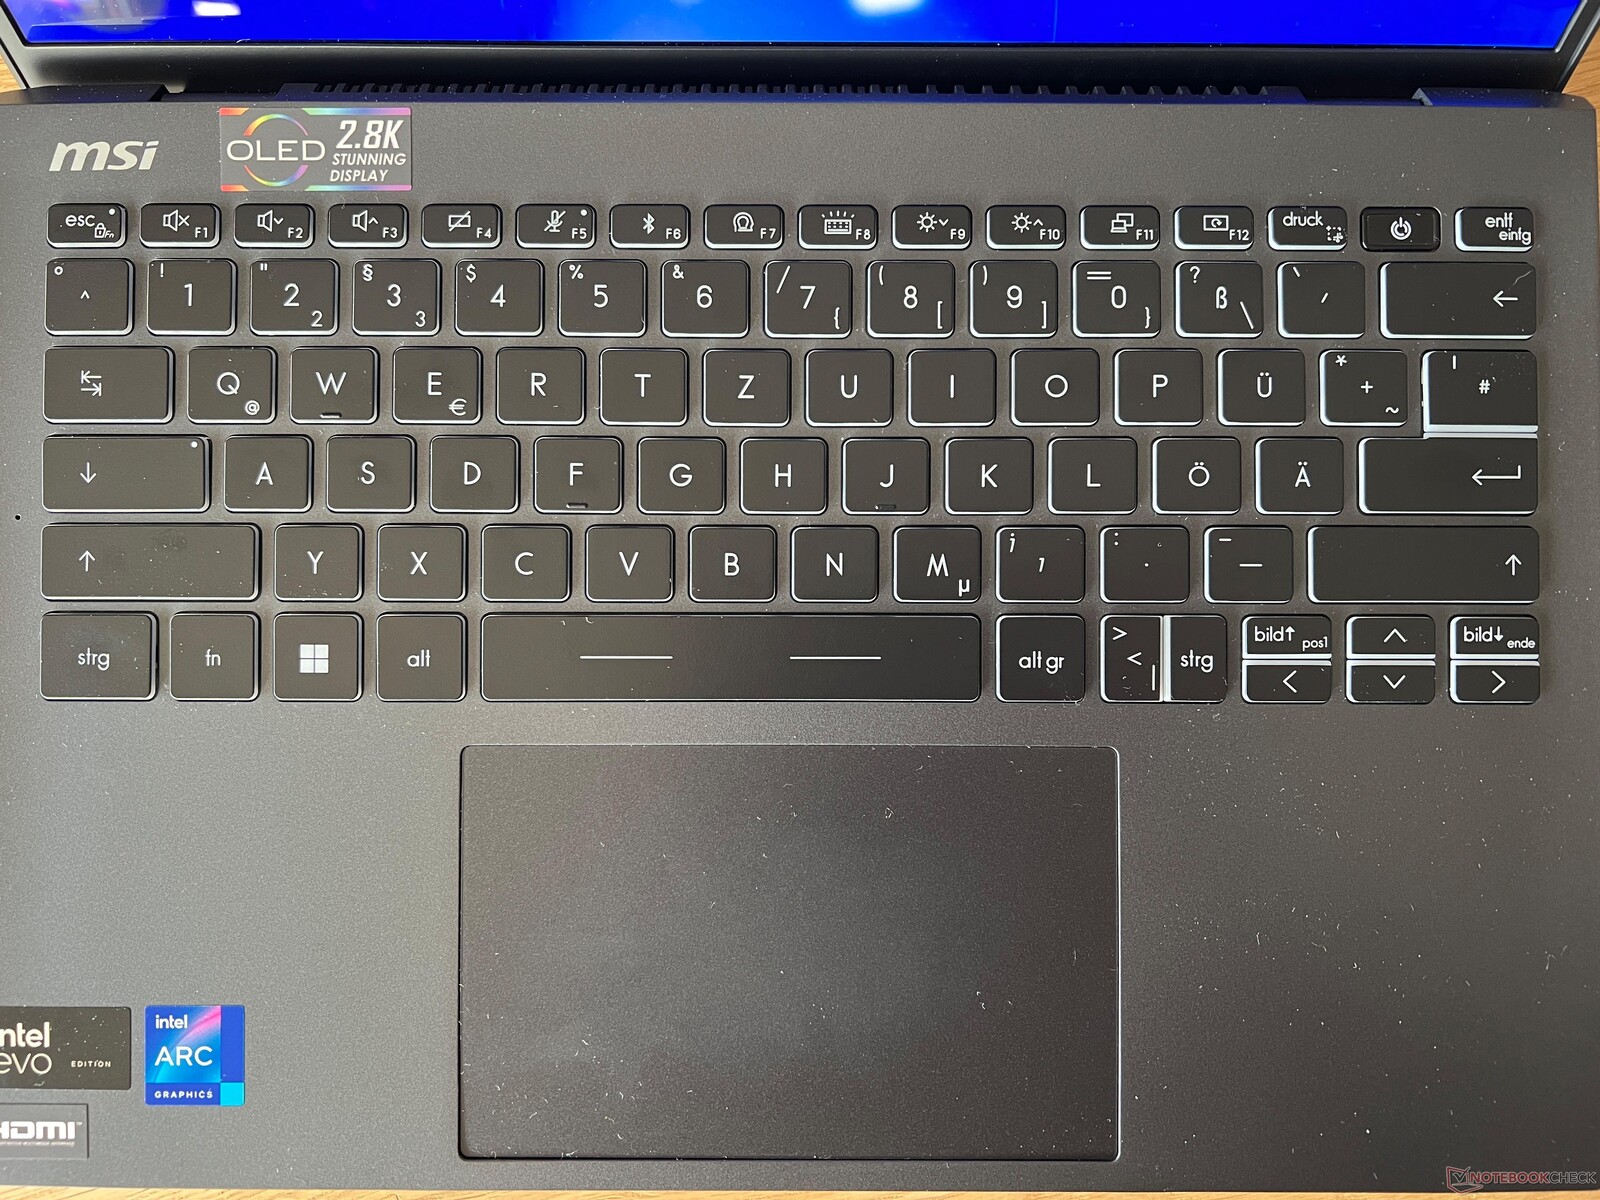
The clickpad (12 x 7.5 cm) is nice and smooth and we had no issues during use. The bottom half of the pad can be pressed down and the click noise it elicits is very even. It could be a little quieter but by no means does it sound cheap.
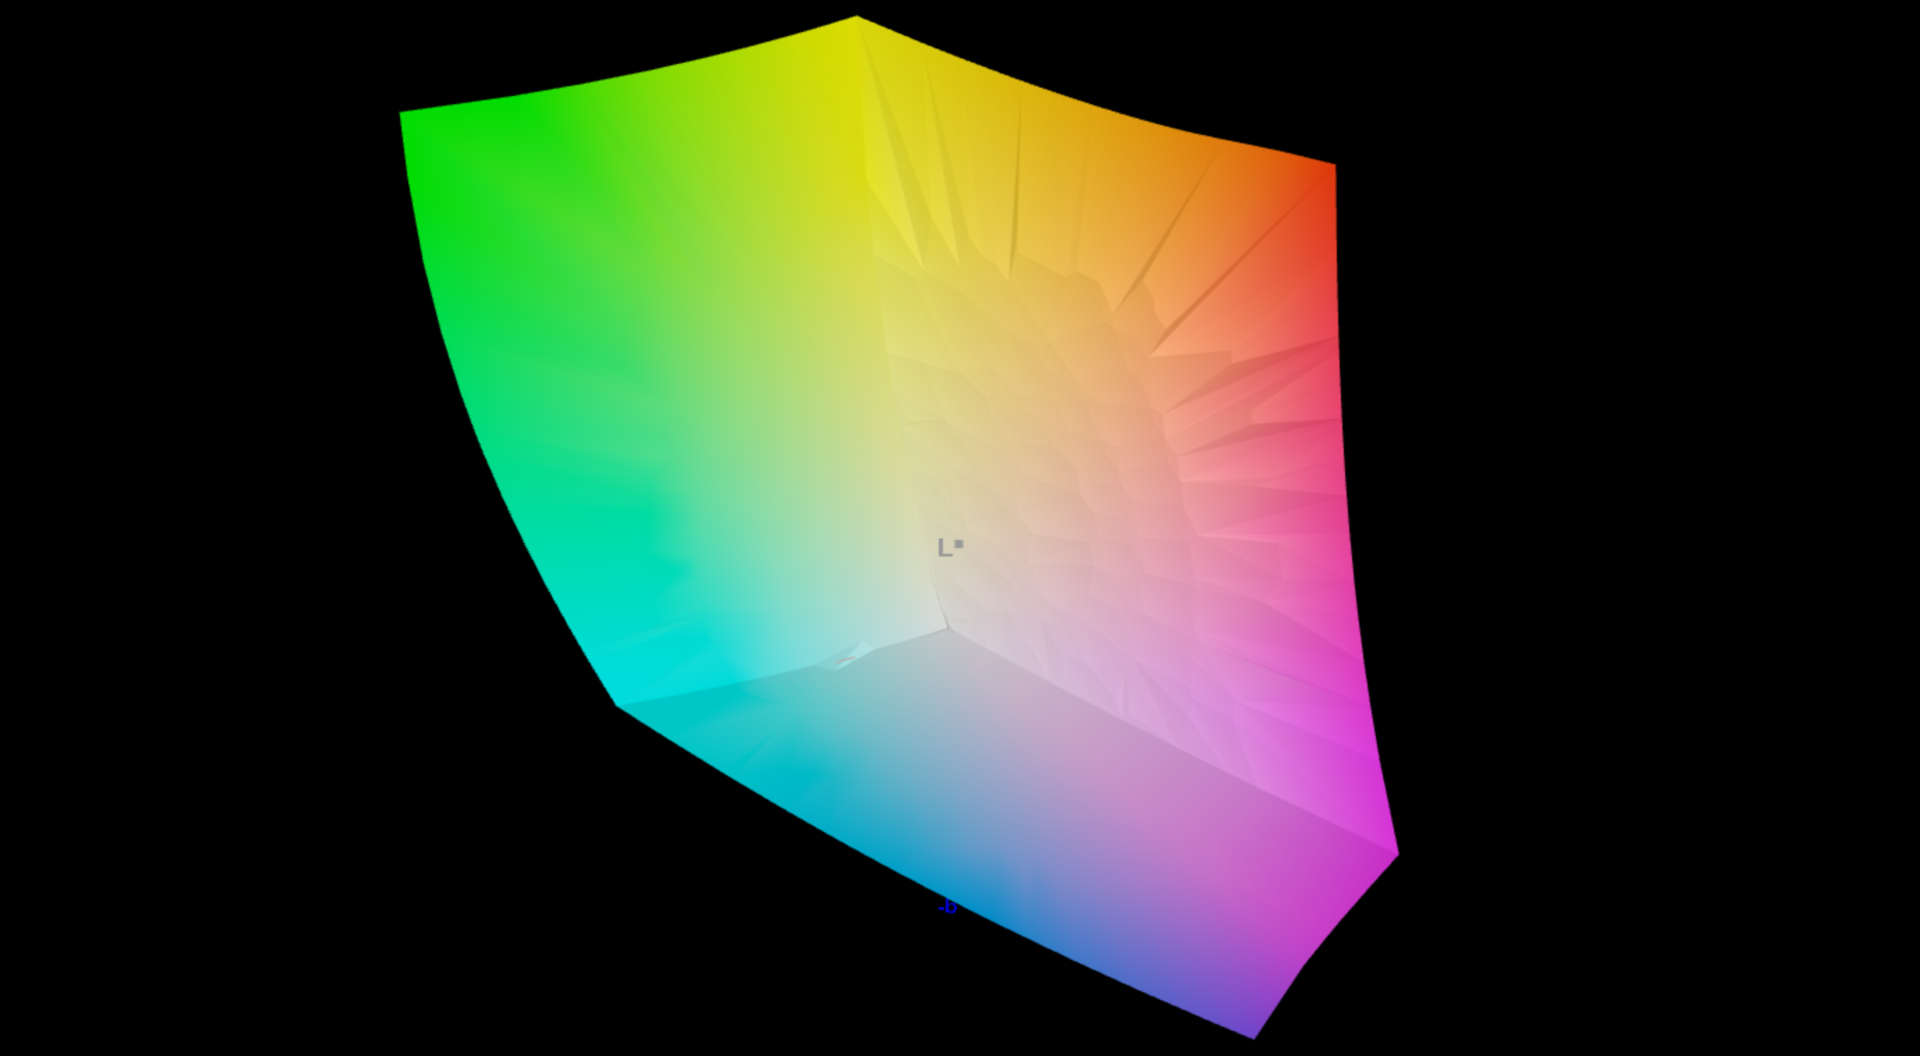
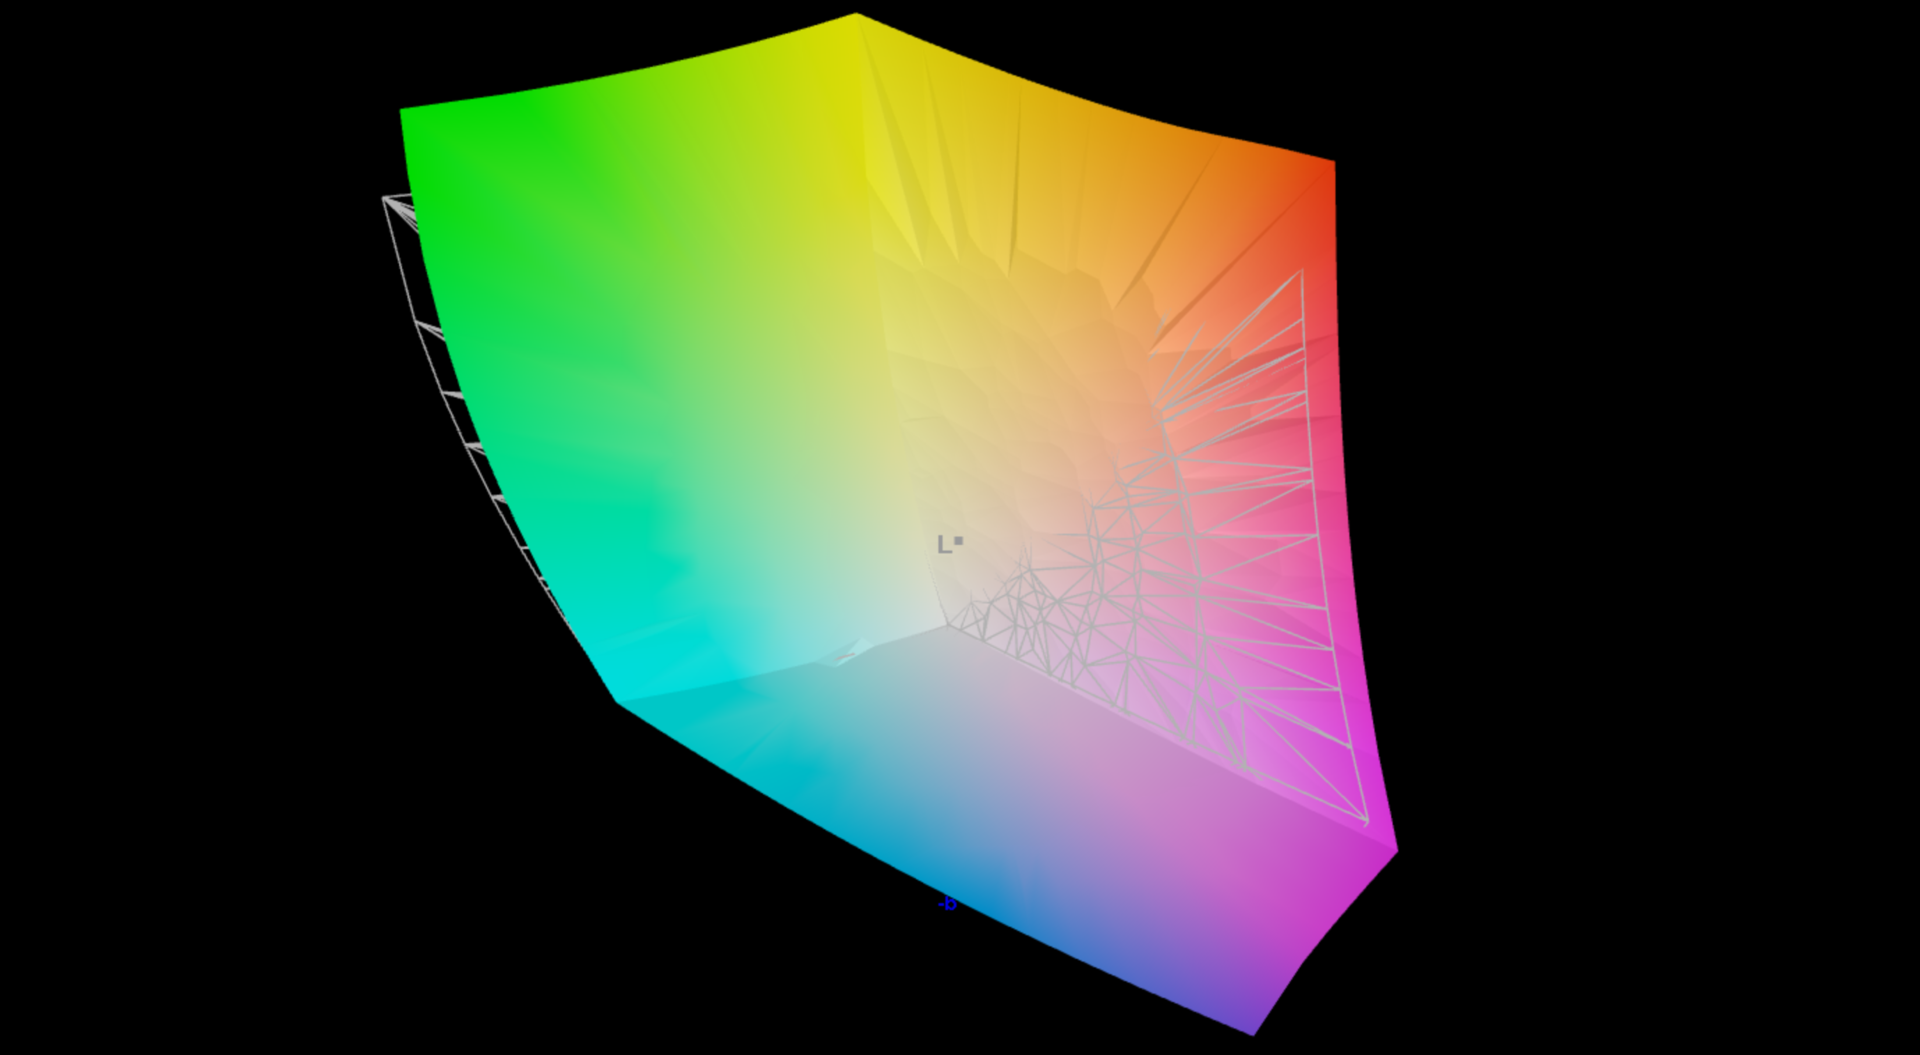
Display - 2.8K OLED without touch
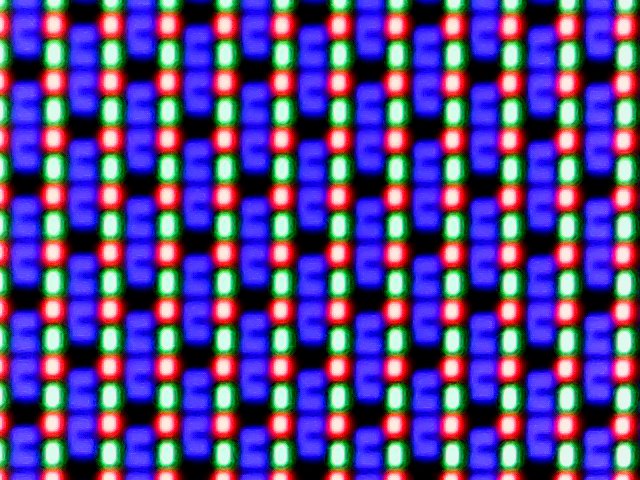
MSI has installed a reflective 16:10 13.3-inch OLED panel with a 2,880 x 1,800 pixel resolution into the device. Subjectively, its picture quality is impressive and the colors are super vivid. Furthermore, its response times are very low. Its maximum SDR brightness is just over 400 cd/m² and thanks to its low black value, it features a high contrast ratio. This also contributes to its vivid picture quality. Touch inputs are not supported but its brightness can be automatically adjusted to the ambient lighting conditions.
In HDR use, its maximum HDR brightness rises to up to 647 cd/m² when depicting small image excerpts and slightly over 500 cd/m² when depicting almost entirely white. As is also the case on all other Windows laptops, you first have to activate HDR mode manually to stop the color management from then not working correctly.
| |||||||||||||||||||||||||
Brightness Distribution: 98 %
Center on Battery: 405 cd/m²
Contrast: ∞:1 (Black: 0 cd/m²)
ΔE ColorChecker Calman: 2.1 | ∀{0.5-29.43 Ø4.73}
ΔE Greyscale Calman: 1.2 | ∀{0.09-98 Ø4.97}
97.8% AdobeRGB 1998 (Argyll 3D)
100% sRGB (Argyll 3D)
99.9% Display P3 (Argyll 3D)
Gamma: 2.16
CCT: 6465 K
| MSI Prestige 13 AI Evo ATNA33AA07-0, OLED, 2880x1800, 13.3" | Lenovo ThinkPad X1 Nano Gen 3 MND007ZA1-3, IPS, 2160x1350, 13" | Dell Latitude 13 7340 i5-1345U Chi Mei 133JCG, IPS, 1920x1200, 13.3" | HP Dragonfly G4 Chi Mei CMN13C0, IPS, 1920x1280, 13.5" | Asus ZenBook S13 OLED UX5304 SDC417B, OLED, 2880x1800, 13.3" | |
|---|---|---|---|---|---|
| Display | -20% | -23% | -21% | -0% | |
| Display P3 Coverage (%) | 99.9 | 68.5 -31% | 65.9 -34% | 68.4 -32% | 99.7 0% |
| sRGB Coverage (%) | 100 | 99.5 0% | 96.8 -3% | 98.3 -2% | 100 0% |
| AdobeRGB 1998 Coverage (%) | 97.8 | 69.7 -29% | 67.8 -31% | 70.4 -28% | 96.9 -1% |
| Response Times | -2092% | -2565% | -2572% | -21% | |
| Response Time Grey 50% / Grey 80% * (ms) | 1.54 ? | 39.9 ? -2491% | 51 ? -3212% | 48.8 ? -3069% | 2 ? -30% |
| Response Time Black / White * (ms) | 1.44 ? | 25.8 ? -1692% | 29.04 ? -1917% | 31.3 ? -2074% | 1.6 ? -11% |
| PWM Frequency (Hz) | 240 ? | 240 ? | |||
| Screen | -1% | -65% | -14% | 13% | |
| Brightness middle (cd/m²) | 404 | 461.2 14% | 471 17% | 408.8 1% | 361 -11% |
| Brightness (cd/m²) | 407 | 428 5% | 437 7% | 399 -2% | 365 -10% |
| Brightness Distribution (%) | 98 | 86 -12% | 87 -11% | 90 -8% | 98 0% |
| Black Level * (cd/m²) | 0.29 | 0.2033 | 0.32 | ||
| Colorchecker dE 2000 * | 2.1 | 1.79 15% | 3.24 -54% | 2.02 4% | 1.2 43% |
| Colorchecker dE 2000 max. * | 4.3 | 3.3 23% | 7.19 -67% | 3.84 11% | 1.9 56% |
| Greyscale dE 2000 * | 1.2 | 1.8 -50% | 4.6 -283% | 2.3 -92% | 1.2 -0% |
| Gamma | 2.16 102% | 2.24 98% | 2.2 100% | 2.27 97% | |
| CCT | 6465 101% | 6588 99% | 6520 100% | 6203 105% | 6486 100% |
| Contrast (:1) | 1590 | 2317 | 1278 | ||
| Colorchecker dE 2000 calibrated * | 0.47 | 1.08 | 0.61 | ||
| Total Average (Program / Settings) | -704% /
-386% | -884% /
-508% | -869% /
-481% | -3% /
3% |
* ... smaller is better
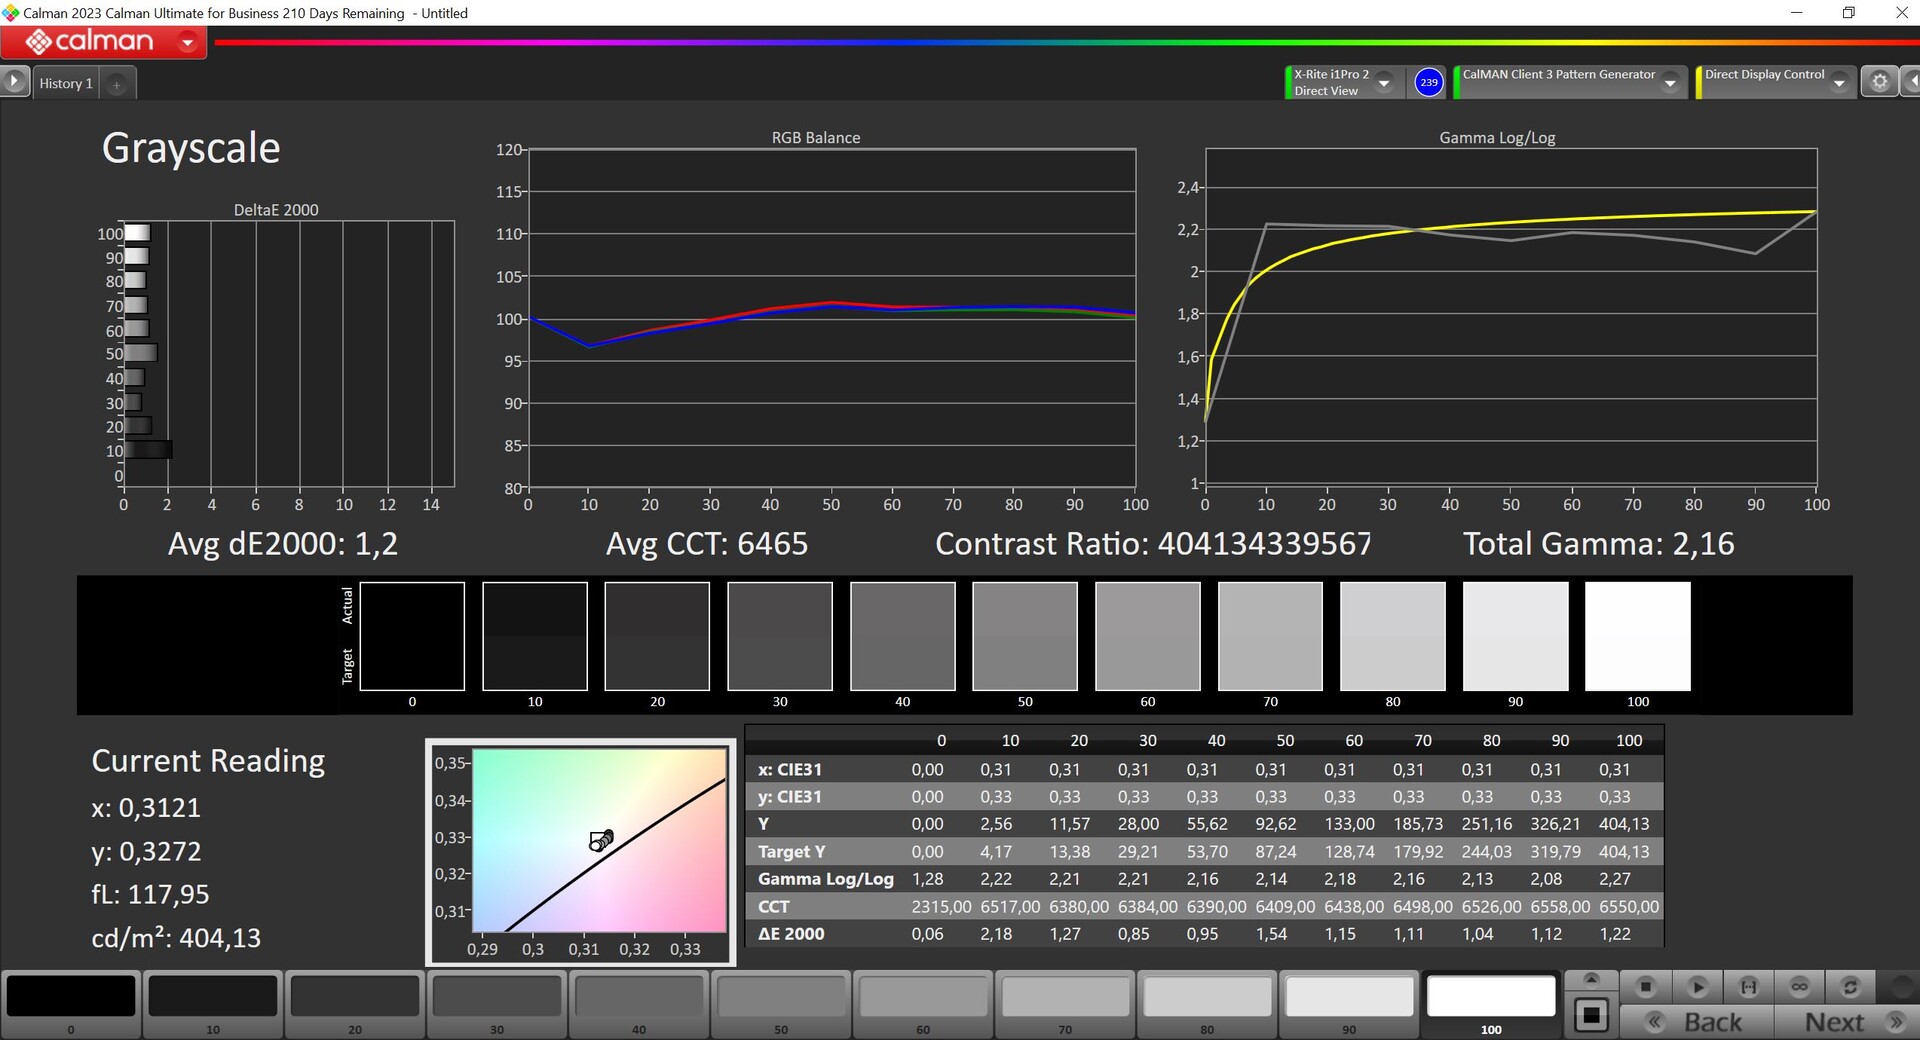
We analyzed the panel using the professional CalMAN software (X-Rite i1 Pro2) and straight out of the box, it delivered a good depiction. We noted no color tint and its color temperature was accurate, too—only some colors (100 %) were above the important DeltaE-2000 deviation of 3 (compared to the P3 reference). We weren't able to correct this through calibration, plus, MSI doesn't offer an sRGB profile. As a result, the Prestige 13 isn't best suited for picture editing.

Display Response Times
| ↔ Response Time Black to White | ||
|---|---|---|
| 1.44 ms ... rise ↗ and fall ↘ combined | ↗ 0.73 ms rise | 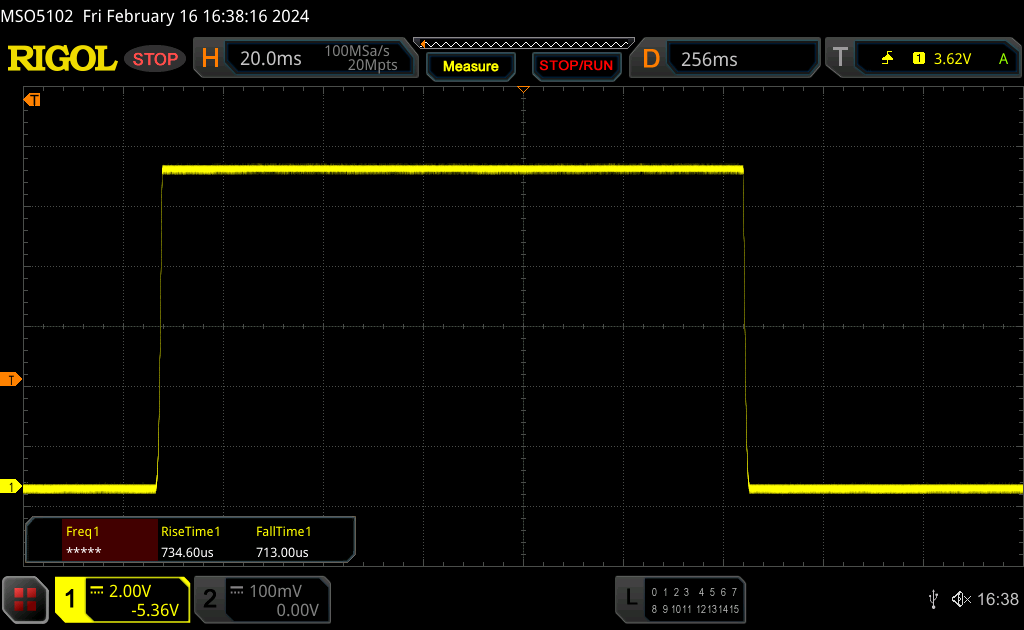 |
| ↘ 0.71 ms fall | ||
| The screen shows very fast response rates in our tests and should be very well suited for fast-paced gaming. In comparison, all tested devices range from 0.1 (minimum) to 240 (maximum) ms. » 9 % of all devices are better. This means that the measured response time is better than the average of all tested devices (19.9 ms). | ||
| ↔ Response Time 50% Grey to 80% Grey | ||
| 1.54 ms ... rise ↗ and fall ↘ combined | ↗ 0.79 ms rise | 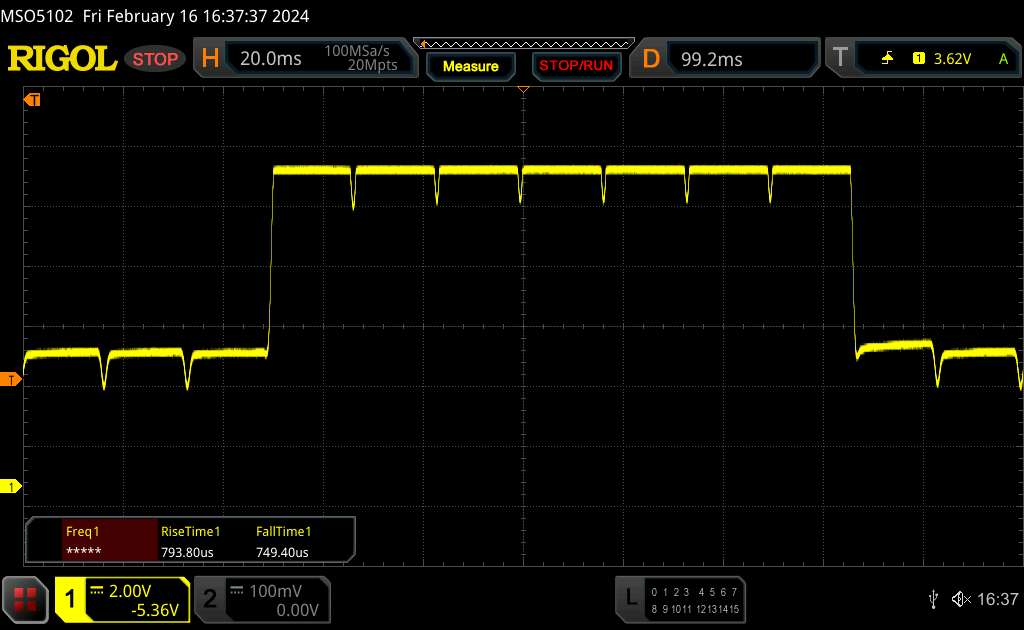 |
| ↘ 0.75 ms fall | ||
| The screen shows very fast response rates in our tests and should be very well suited for fast-paced gaming. In comparison, all tested devices range from 0.165 (minimum) to 636 (maximum) ms. » 7 % of all devices are better. This means that the measured response time is better than the average of all tested devices (31.1 ms). | ||
Screen Flickering / PWM (Pulse-Width Modulation)
| Screen flickering / PWM detected | 240 Hz | ≤ 42 % brightness setting | 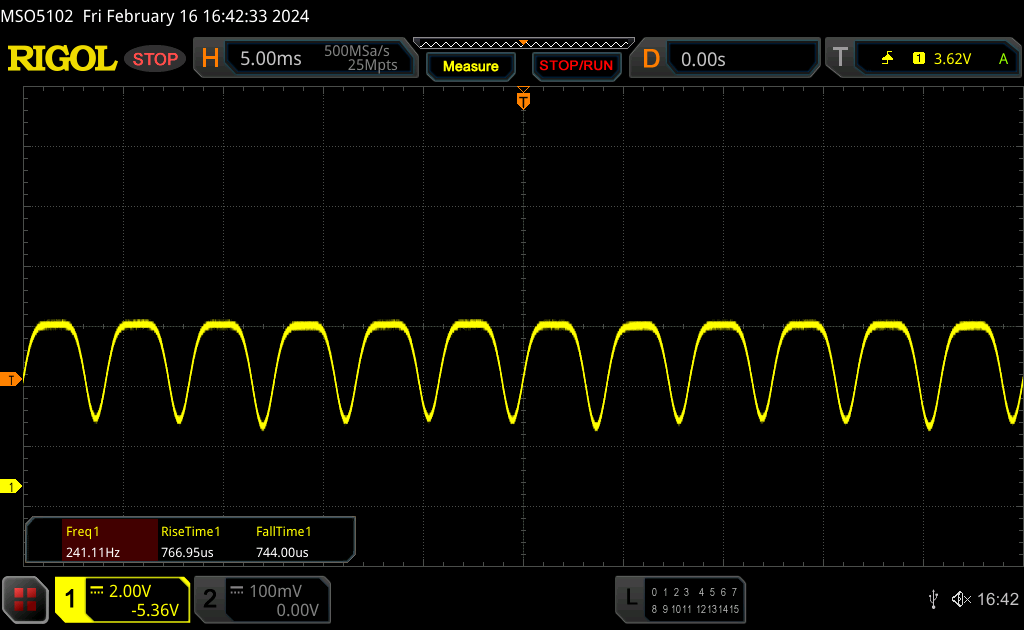 |
The display backlight flickers at 240 Hz (worst case, e.g., utilizing PWM) Flickering detected at a brightness setting of 42 % and below. There should be no flickering or PWM above this brightness setting. The frequency of 240 Hz is relatively low, so sensitive users will likely notice flickering and experience eyestrain at the stated brightness setting and below. In comparison: 52 % of all tested devices do not use PWM to dim the display. If PWM was detected, an average of 7810 (minimum: 5 - maximum: 343500) Hz was measured. | |||
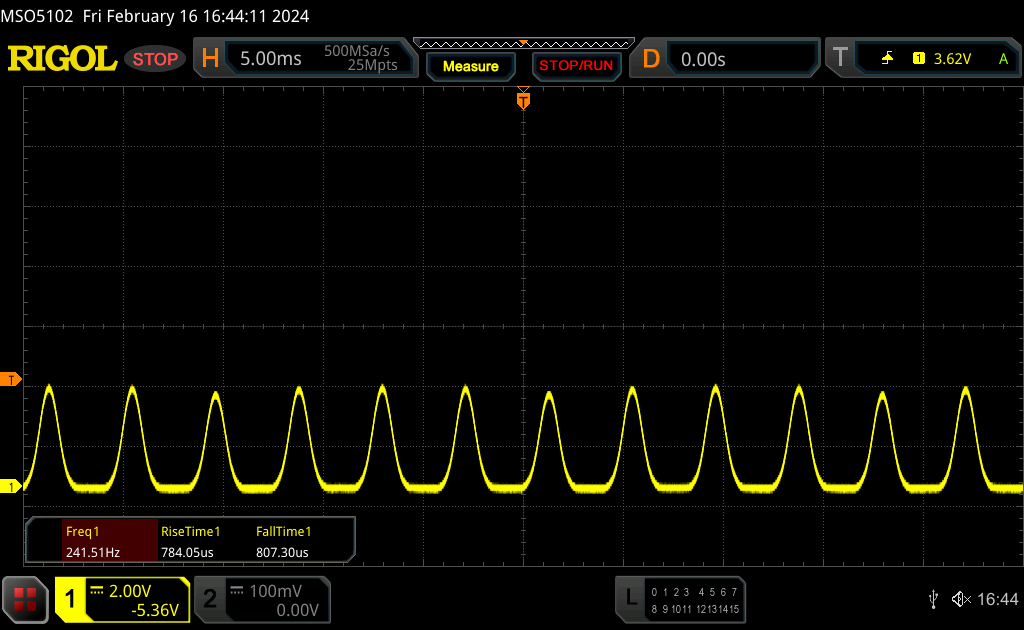
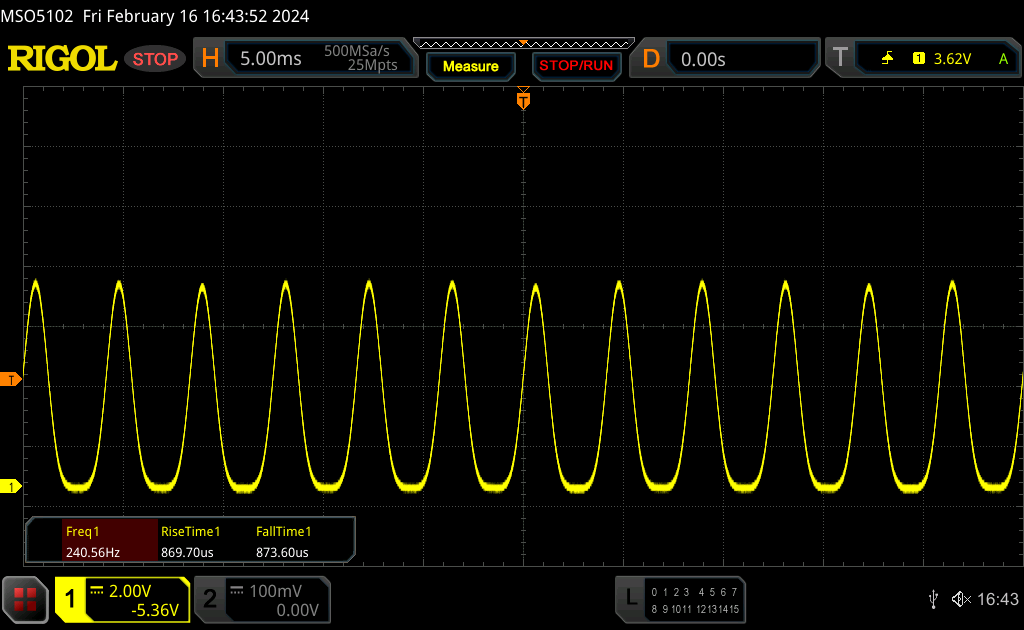
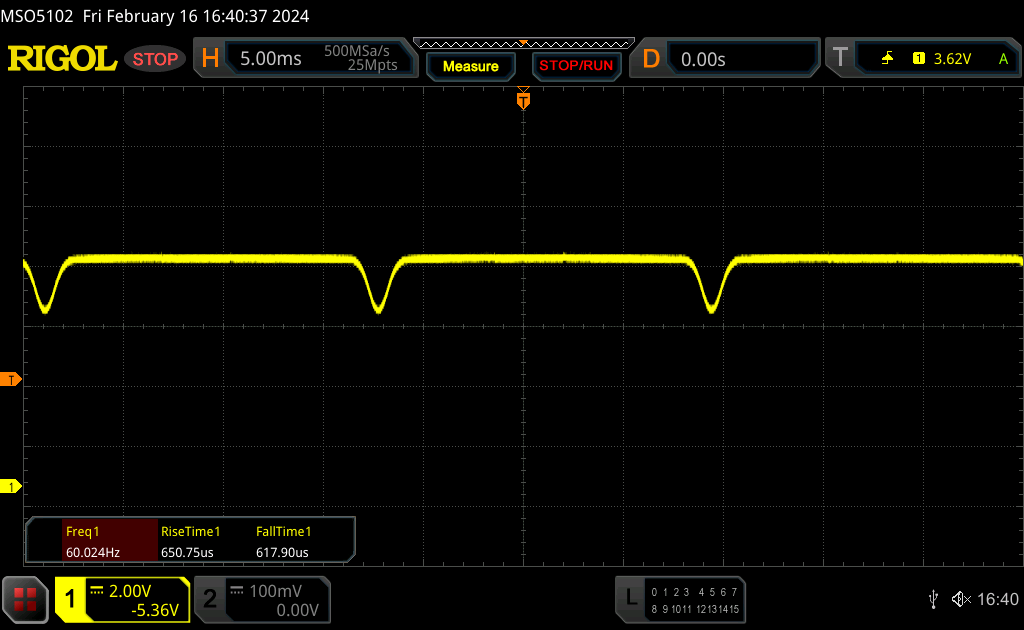
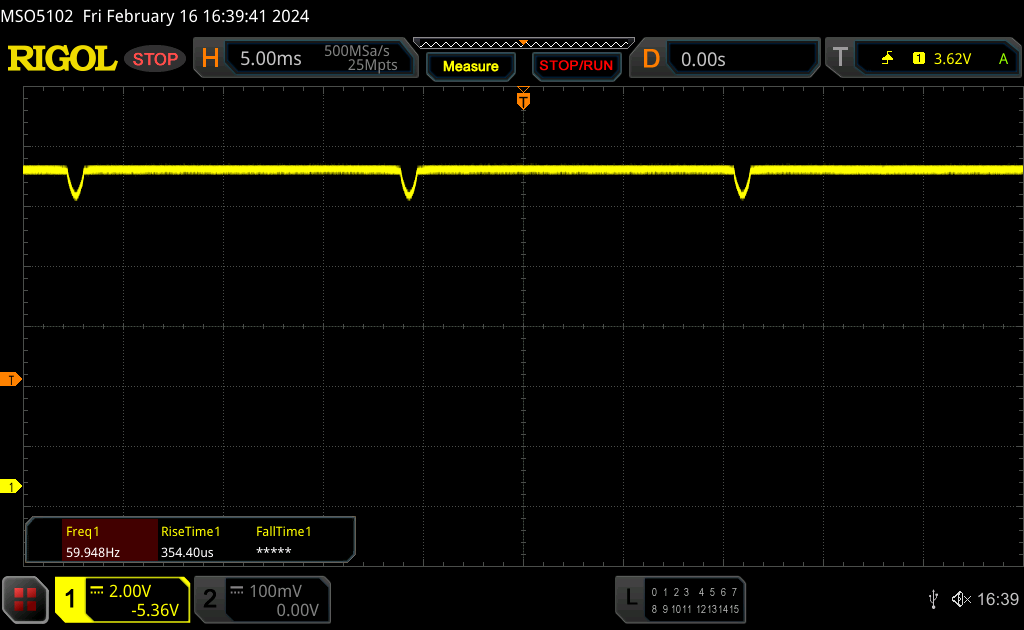
With the PWM used, we measured DC dimming at 60 Hz within the brightness range of 43-84 %; at 42 % or less, potentially more harmful PWM flickering at 240 Hz comes into play.
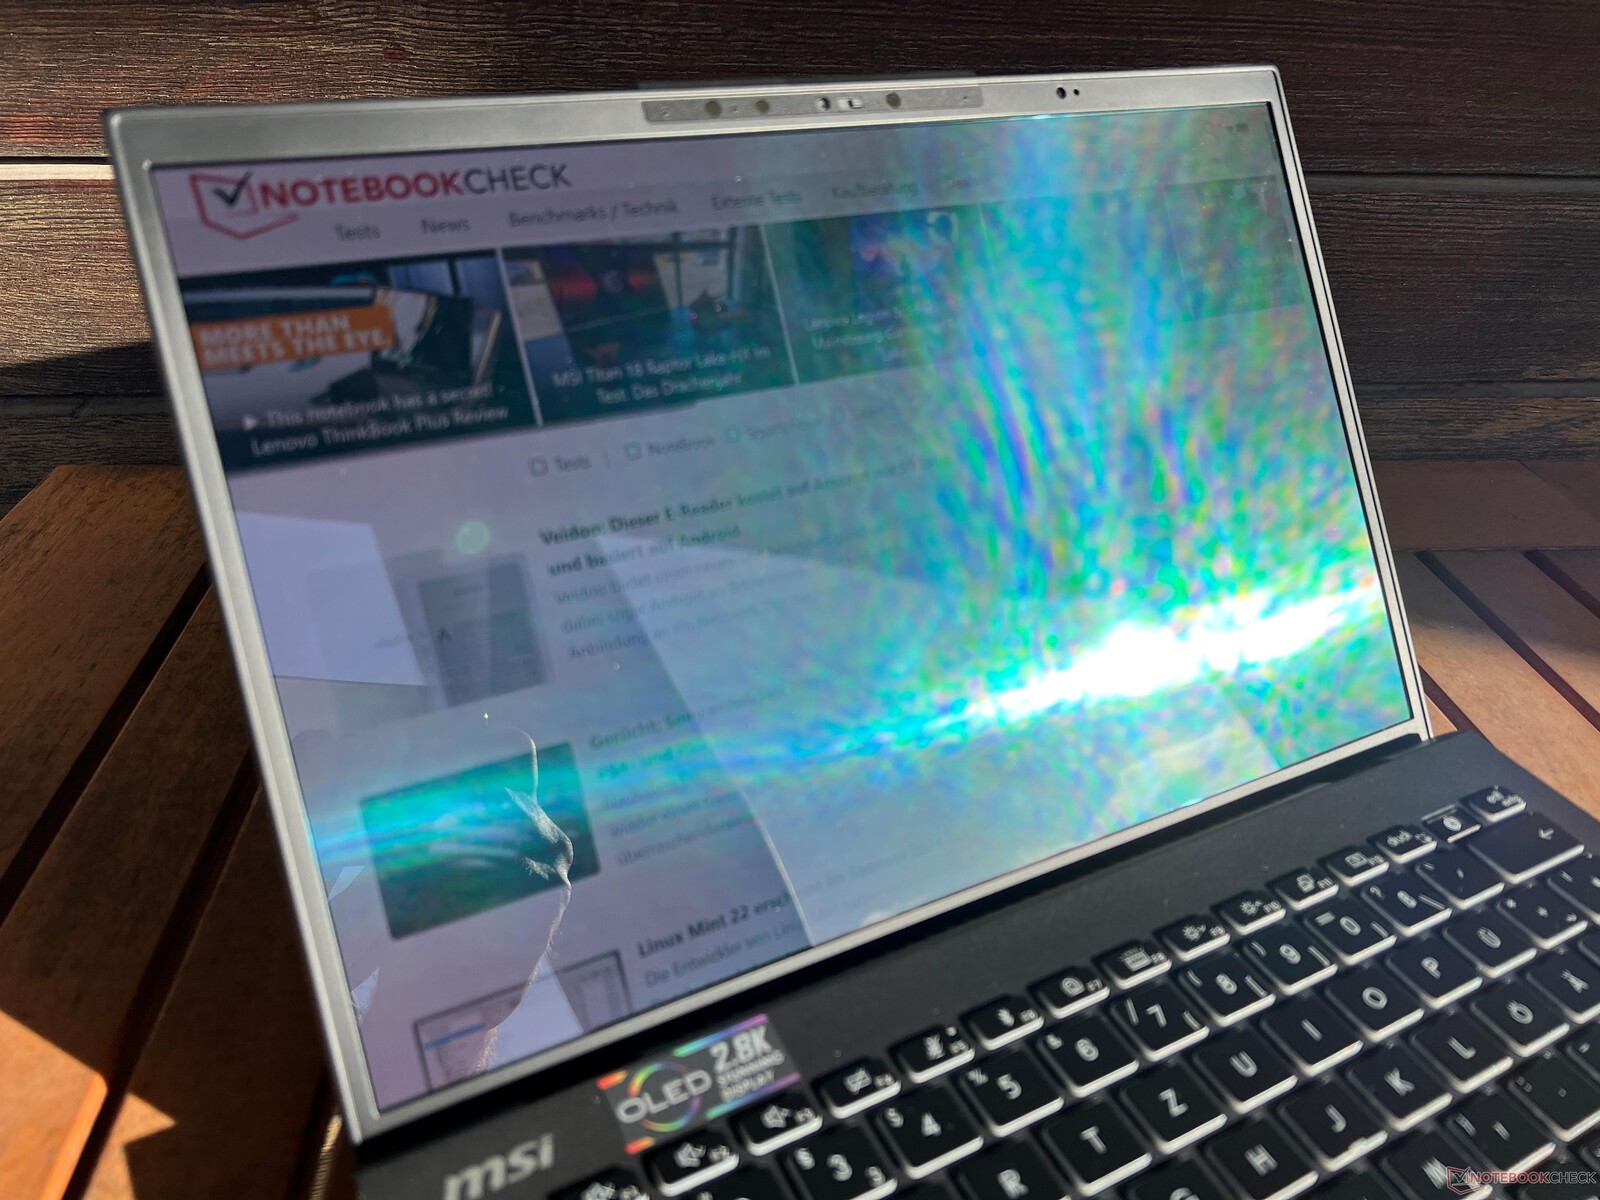
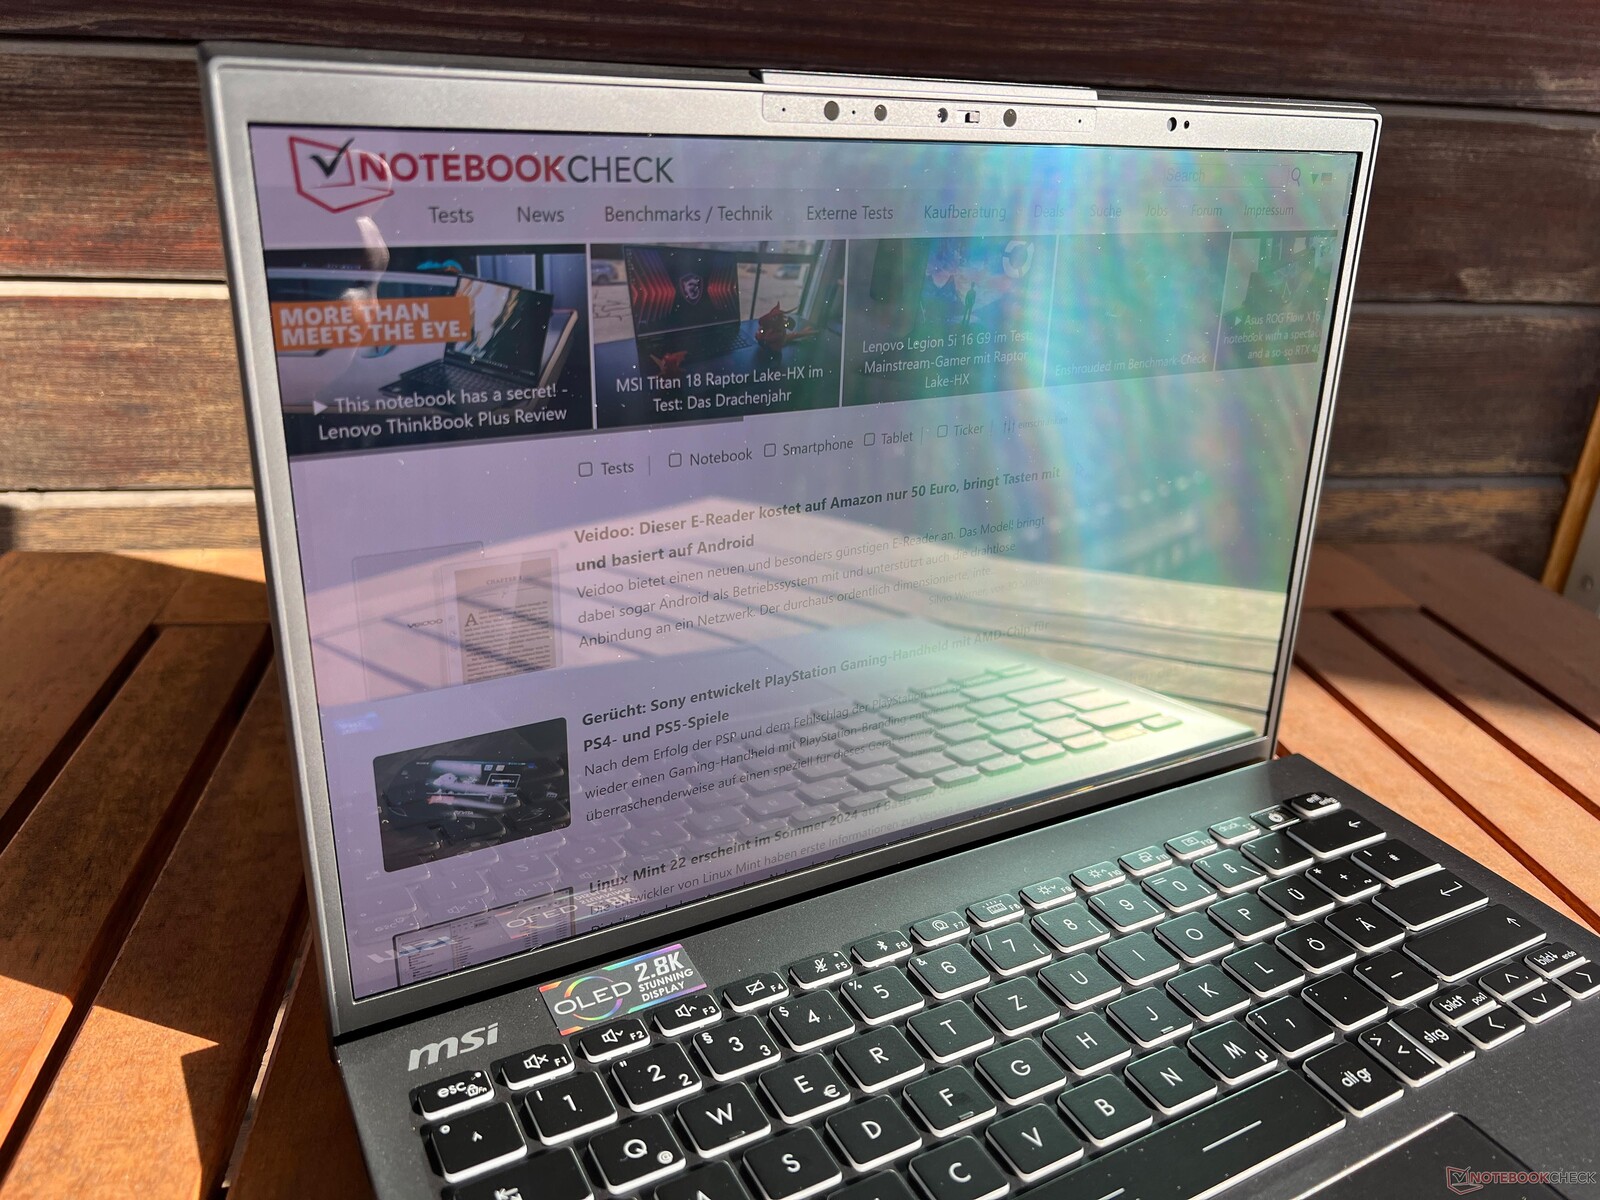

In bright surroundings, reflections quickly become a problem on the shiny display. Its viewing-angle stability is great—only extreme angles result in the OLED-typical blue shimmer.

Performance - Meteor Lake-H at 20 watts
Testing conditions
The pre-installed MSI Center offers multiple energy profiles, whereby we didn't note any big differences between the individual profiles (with the exception of silent mode). Subsequently, we performed the following benchmarks and measurements using the mode MSI AI Engine, which is also set as standard.
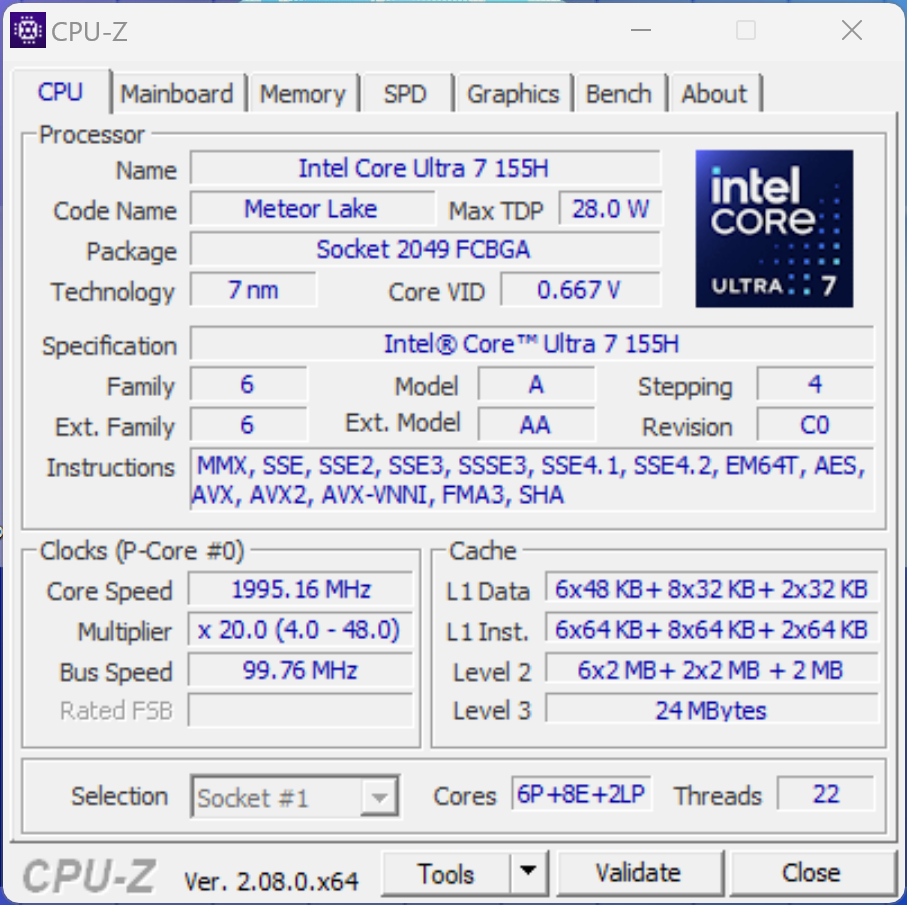
Processor - Core Ultra 7 155H
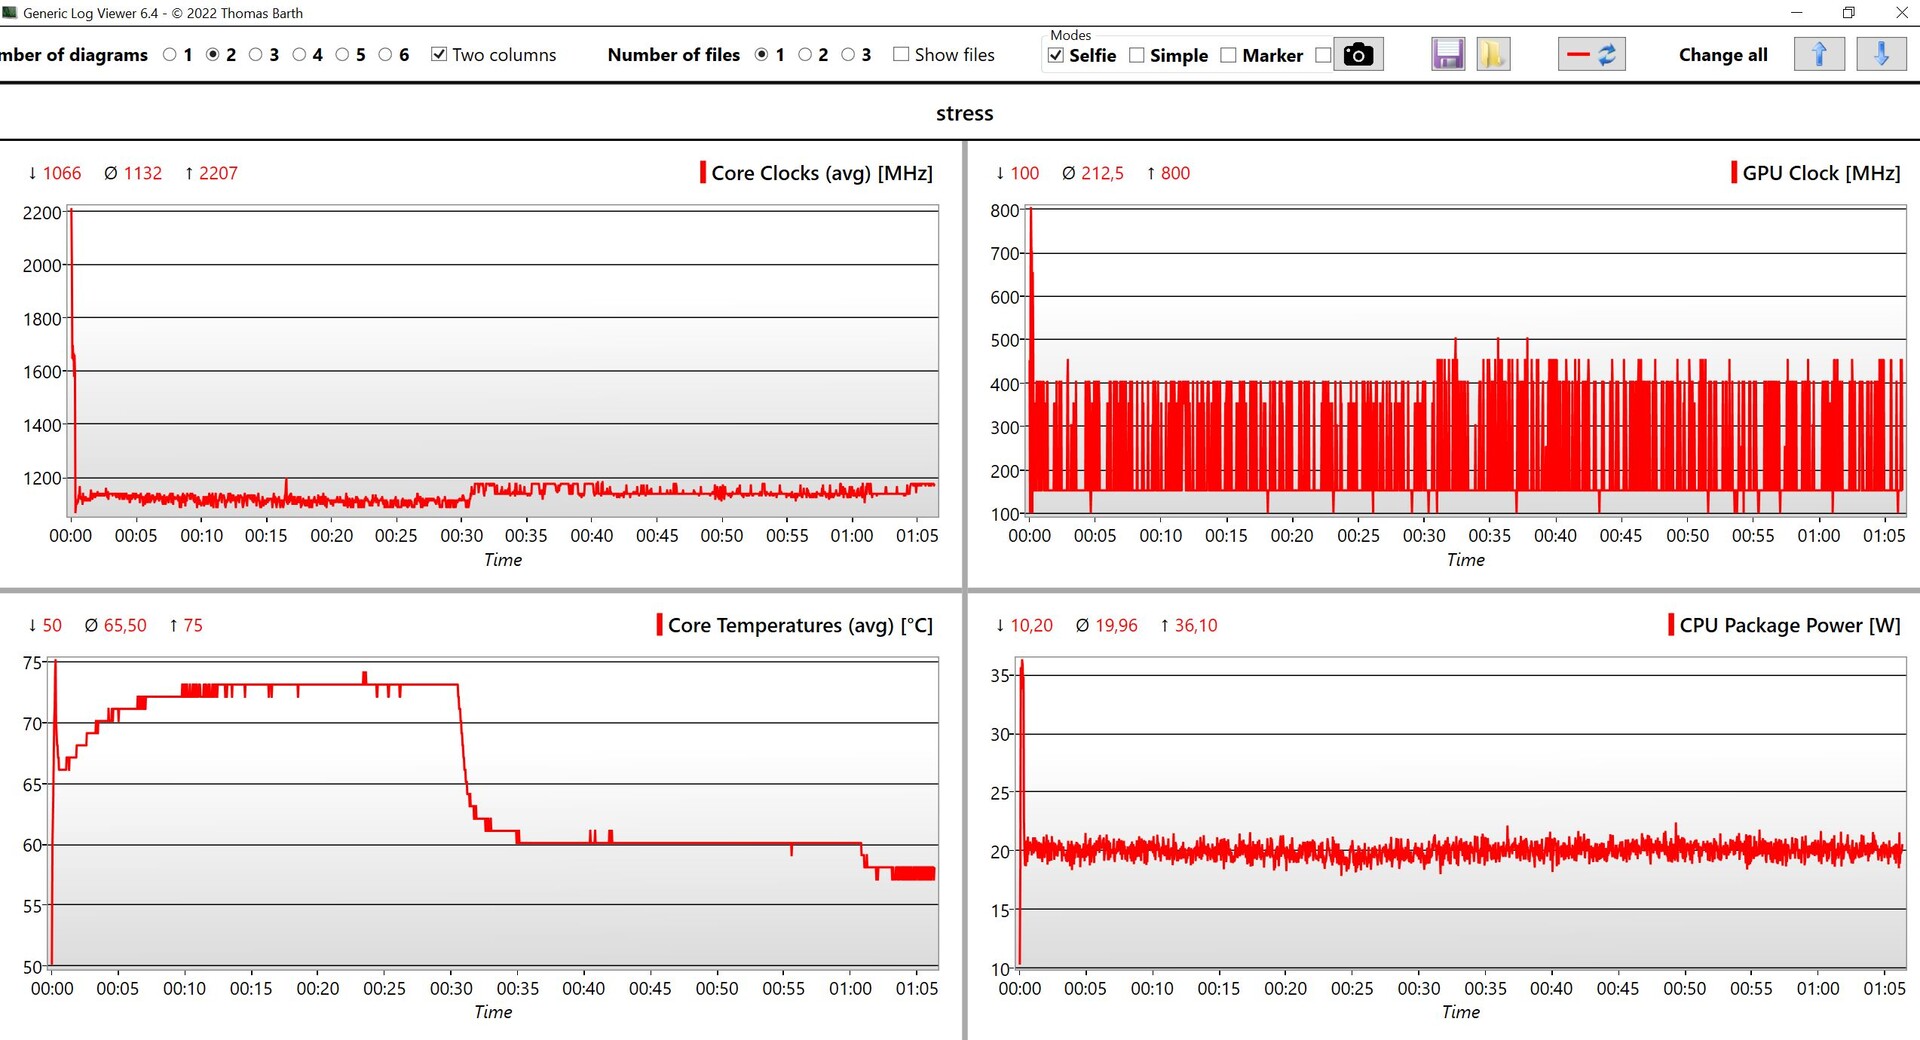
MSI has equipped the laptop with the new Meteor-Lake Core Ultra 7 155H chip from Intel, which can be used in a TDP area between 28 and 115 watts. In the case of the Prestige 13, we noted a maximum of 64 watts for about 30 seconds when the device was cool, after which its consumption sank to 20 watts. A U-series processor would likely have been a better choice but as these CPUs only feature 2 fast P-cores, their performance is rather modest. Under short-term load (which is much more likely on a subnotebook), its multi-core performance is of course very good. Its single-core performance is okay but in this aspect, the Meteor-Lake CPUs don't show any advantage over the old Raptor-Lake models. In battery use, its CPU performance remains constant. Further CPU benchmarks can be found here.
Cinebench R15 Multi continuous test
Cinebench R23: Multi Core | Single Core
Cinebench R20: CPU (Multi Core) | CPU (Single Core)
Cinebench R15: CPU Multi 64Bit | CPU Single 64Bit
Blender: v2.79 BMW27 CPU
7-Zip 18.03: 7z b 4 | 7z b 4 -mmt1
Geekbench 6.6: Multi-Core | Single-Core
Geekbench 5.5: Multi-Core | Single-Core
HWBOT x265 Benchmark v2.2: 4k Preset
LibreOffice : 20 Documents To PDF
R Benchmark 2.5: Overall mean
| CPU Performance rating | |
| Average Intel Core Ultra 7 155H | |
| Average of class Subnotebook | |
| MSI Prestige 13 AI Evo | |
| Lenovo ThinkPad X1 Nano Gen 3 | |
| HP Dragonfly G4 -2! | |
| Asus ZenBook S13 OLED UX5304 -2! | |
| Dell Latitude 13 7340 i5-1345U -2! | |
| Cinebench R23 / Multi Core | |
| Average Intel Core Ultra 7 155H (9769 - 19007, n=52) | |
| Average of class Subnotebook (1555 - 21812, n=63, last 2 years) | |
| MSI Prestige 13 AI Evo | |
| Lenovo ThinkPad X1 Nano Gen 3 | |
| Dell Latitude 13 7340 i5-1345U | |
| HP Dragonfly G4 | |
| Asus ZenBook S13 OLED UX5304 | |
| Cinebench R23 / Single Core | |
| HP Dragonfly G4 | |
| Asus ZenBook S13 OLED UX5304 | |
| Average Intel Core Ultra 7 155H (1496 - 1815, n=52) | |
| Dell Latitude 13 7340 i5-1345U | |
| Average of class Subnotebook (358 - 2213, n=64, last 2 years) | |
| Lenovo ThinkPad X1 Nano Gen 3 | |
| MSI Prestige 13 AI Evo | |
| Cinebench R20 / CPU (Multi Core) | |
| Average Intel Core Ultra 7 155H (3798 - 7409, n=50) | |
| Average of class Subnotebook (579 - 8541, n=60, last 2 years) | |
| MSI Prestige 13 AI Evo | |
| Lenovo ThinkPad X1 Nano Gen 3 | |
| Dell Latitude 13 7340 i5-1345U | |
| HP Dragonfly G4 | |
| Asus ZenBook S13 OLED UX5304 | |
| Cinebench R20 / CPU (Single Core) | |
| HP Dragonfly G4 | |
| Asus ZenBook S13 OLED UX5304 | |
| Lenovo ThinkPad X1 Nano Gen 3 | |
| Average Intel Core Ultra 7 155H (601 - 696, n=50) | |
| Dell Latitude 13 7340 i5-1345U | |
| Average of class Subnotebook (128 - 832, n=60, last 2 years) | |
| MSI Prestige 13 AI Evo | |
| Cinebench R15 / CPU Multi 64Bit | |
| Average Intel Core Ultra 7 155H (1932 - 2880, n=56) | |
| MSI Prestige 13 AI Evo | |
| Average of class Subnotebook (327 - 3345, n=60, last 2 years) | |
| Lenovo ThinkPad X1 Nano Gen 3 | |
| Asus ZenBook S13 OLED UX5304 | |
| HP Dragonfly G4 | |
| Dell Latitude 13 7340 i5-1345U | |
| Cinebench R15 / CPU Single 64Bit | |
| HP Dragonfly G4 | |
| Average of class Subnotebook (72.4 - 322, n=60, last 2 years) | |
| Average Intel Core Ultra 7 155H (99.6 - 268, n=52) | |
| Asus ZenBook S13 OLED UX5304 | |
| MSI Prestige 13 AI Evo | |
| Dell Latitude 13 7340 i5-1345U | |
| Lenovo ThinkPad X1 Nano Gen 3 | |
| Blender / v2.79 BMW27 CPU | |
| Dell Latitude 13 7340 i5-1345U | |
| Asus ZenBook S13 OLED UX5304 | |
| Asus ZenBook S13 OLED UX5304 | |
| HP Dragonfly G4 | |
| Lenovo ThinkPad X1 Nano Gen 3 | |
| Average of class Subnotebook (159 - 2271, n=61, last 2 years) | |
| MSI Prestige 13 AI Evo | |
| Average Intel Core Ultra 7 155H (175 - 381, n=47) | |
| 7-Zip 18.03 / 7z b 4 | |
| Average Intel Core Ultra 7 155H (41739 - 70254, n=50) | |
| Average of class Subnotebook (11668 - 77867, n=60, last 2 years) | |
| MSI Prestige 13 AI Evo | |
| HP Dragonfly G4 | |
| Lenovo ThinkPad X1 Nano Gen 3 | |
| Asus ZenBook S13 OLED UX5304 | |
| Dell Latitude 13 7340 i5-1345U | |
| 7-Zip 18.03 / 7z b 4 -mmt1 | |
| HP Dragonfly G4 | |
| Lenovo ThinkPad X1 Nano Gen 3 | |
| Asus ZenBook S13 OLED UX5304 | |
| Average of class Subnotebook (2643 - 6699, n=62, last 2 years) | |
| MSI Prestige 13 AI Evo | |
| Average Intel Core Ultra 7 155H (4594 - 5621, n=50) | |
| Dell Latitude 13 7340 i5-1345U | |
| Geekbench 6.6 / Multi-Core | |
| Average of class Subnotebook (2244 - 20325, n=69, last 2 years) | |
| Average Intel Core Ultra 7 155H (7732 - 13656, n=55) | |
| Lenovo ThinkPad X1 Nano Gen 3 | |
| MSI Prestige 13 AI Evo | |
| Geekbench 6.6 / Single-Core | |
| Average of class Subnotebook (960 - 4195, n=65, last 2 years) | |
| Lenovo ThinkPad X1 Nano Gen 3 | |
| MSI Prestige 13 AI Evo | |
| Average Intel Core Ultra 7 155H (1901 - 2473, n=52) | |
| Geekbench 5.5 / Multi-Core | |
| Average Intel Core Ultra 7 155H (10017 - 13556, n=52) | |
| Average of class Subnotebook (2557 - 17218, n=51, last 2 years) | |
| MSI Prestige 13 AI Evo | |
| Lenovo ThinkPad X1 Nano Gen 3 | |
| HP Dragonfly G4 | |
| Asus ZenBook S13 OLED UX5304 | |
| Dell Latitude 13 7340 i5-1345U | |
| Geekbench 5.5 / Single-Core | |
| HP Dragonfly G4 | |
| Average of class Subnotebook (726 - 2224, n=51, last 2 years) | |
| Lenovo ThinkPad X1 Nano Gen 3 | |
| Asus ZenBook S13 OLED UX5304 | |
| MSI Prestige 13 AI Evo | |
| Average Intel Core Ultra 7 155H (1462 - 1824, n=52) | |
| Dell Latitude 13 7340 i5-1345U | |
| HWBOT x265 Benchmark v2.2 / 4k Preset | |
| Average Intel Core Ultra 7 155H (9.93 - 21.2, n=50) | |
| Average of class Subnotebook (0.97 - 25.1, n=60, last 2 years) | |
| MSI Prestige 13 AI Evo | |
| Lenovo ThinkPad X1 Nano Gen 3 | |
| HP Dragonfly G4 | |
| Asus ZenBook S13 OLED UX5304 | |
| Dell Latitude 13 7340 i5-1345U | |
| LibreOffice / 20 Documents To PDF | |
| Average of class Subnotebook (39.9 - 220, n=59, last 2 years) | |
| Lenovo ThinkPad X1 Nano Gen 3 | |
| Average Intel Core Ultra 7 155H (37.5 - 79.2, n=49) | |
| Asus ZenBook S13 OLED UX5304 | |
| HP Dragonfly G4 | |
| MSI Prestige 13 AI Evo | |
| Dell Latitude 13 7340 i5-1345U | |
| R Benchmark 2.5 / Overall mean | |
| Average of class Subnotebook (0.4024 - 1.456, n=61, last 2 years) | |
| Dell Latitude 13 7340 i5-1345U | |
| Lenovo ThinkPad X1 Nano Gen 3 | |
| Average Intel Core Ultra 7 155H (0.4457 - 0.53, n=49) | |
| Asus ZenBook S13 OLED UX5304 | |
| MSI Prestige 13 AI Evo | |
| HP Dragonfly G4 | |
* ... smaller is better
AIDA64: FP32 Ray-Trace | FPU Julia | CPU SHA3 | CPU Queen | FPU SinJulia | FPU Mandel | CPU AES | CPU ZLib | FP64 Ray-Trace | CPU PhotoWorxx
| Performance rating | |
| Average Intel Core Ultra 7 155H | |
| Average of class Subnotebook | |
| MSI Prestige 13 AI Evo | |
| Lenovo ThinkPad X1 Nano Gen 3 | |
| HP Dragonfly G4 | |
| Asus ZenBook S13 OLED UX5304 | |
| Dell Latitude 13 7340 i5-1345U | |
| AIDA64 / FP32 Ray-Trace | |
| Average of class Subnotebook (1135 - 32888, n=61, last 2 years) | |
| Average Intel Core Ultra 7 155H (6670 - 18470, n=50) | |
| Lenovo ThinkPad X1 Nano Gen 3 | |
| HP Dragonfly G4 | |
| MSI Prestige 13 AI Evo | |
| Asus ZenBook S13 OLED UX5304 | |
| Dell Latitude 13 7340 i5-1345U | |
| AIDA64 / FPU Julia | |
| Average Intel Core Ultra 7 155H (40905 - 93181, n=50) | |
| Average of class Subnotebook (5218 - 123315, n=61, last 2 years) | |
| MSI Prestige 13 AI Evo | |
| Lenovo ThinkPad X1 Nano Gen 3 | |
| HP Dragonfly G4 | |
| Asus ZenBook S13 OLED UX5304 | |
| Dell Latitude 13 7340 i5-1345U | |
| AIDA64 / CPU SHA3 | |
| Average Intel Core Ultra 7 155H (1940 - 4436, n=50) | |
| Average of class Subnotebook (444 - 5287, n=61, last 2 years) | |
| MSI Prestige 13 AI Evo | |
| Lenovo ThinkPad X1 Nano Gen 3 | |
| HP Dragonfly G4 | |
| Asus ZenBook S13 OLED UX5304 | |
| Dell Latitude 13 7340 i5-1345U | |
| AIDA64 / CPU Queen | |
| Lenovo ThinkPad X1 Nano Gen 3 | |
| Average Intel Core Ultra 7 155H (64698 - 94181, n=50) | |
| HP Dragonfly G4 | |
| Asus ZenBook S13 OLED UX5304 | |
| MSI Prestige 13 AI Evo | |
| Dell Latitude 13 7340 i5-1345U | |
| Average of class Subnotebook (10579 - 95002, n=54, last 2 years) | |
| AIDA64 / FPU SinJulia | |
| Average Intel Core Ultra 7 155H (5639 - 10647, n=50) | |
| Average of class Subnotebook (744 - 18418, n=61, last 2 years) | |
| MSI Prestige 13 AI Evo | |
| Lenovo ThinkPad X1 Nano Gen 3 | |
| HP Dragonfly G4 | |
| Asus ZenBook S13 OLED UX5304 | |
| Dell Latitude 13 7340 i5-1345U | |
| AIDA64 / FPU Mandel | |
| Average Intel Core Ultra 7 155H (18236 - 47685, n=50) | |
| Average of class Subnotebook (3341 - 65433, n=61, last 2 years) | |
| MSI Prestige 13 AI Evo | |
| Lenovo ThinkPad X1 Nano Gen 3 | |
| HP Dragonfly G4 | |
| Asus ZenBook S13 OLED UX5304 | |
| Dell Latitude 13 7340 i5-1345U | |
| AIDA64 / CPU AES | |
| Average Intel Core Ultra 7 155H (45713 - 152179, n=50) | |
| Average of class Subnotebook (638 - 96917, n=61, last 2 years) | |
| MSI Prestige 13 AI Evo | |
| Lenovo ThinkPad X1 Nano Gen 3 | |
| HP Dragonfly G4 | |
| Asus ZenBook S13 OLED UX5304 | |
| Dell Latitude 13 7340 i5-1345U | |
| AIDA64 / CPU ZLib | |
| Average Intel Core Ultra 7 155H (557 - 1250, n=50) | |
| Average of class Subnotebook (164.9 - 1379, n=61, last 2 years) | |
| MSI Prestige 13 AI Evo | |
| Lenovo ThinkPad X1 Nano Gen 3 | |
| HP Dragonfly G4 | |
| Asus ZenBook S13 OLED UX5304 | |
| Dell Latitude 13 7340 i5-1345U | |
| AIDA64 / FP64 Ray-Trace | |
| Average of class Subnotebook (610 - 17495, n=61, last 2 years) | |
| Average Intel Core Ultra 7 155H (3569 - 9802, n=50) | |
| Lenovo ThinkPad X1 Nano Gen 3 | |
| MSI Prestige 13 AI Evo | |
| HP Dragonfly G4 | |
| Asus ZenBook S13 OLED UX5304 | |
| Dell Latitude 13 7340 i5-1345U | |
| AIDA64 / CPU PhotoWorxx | |
| Average of class Subnotebook (6569 - 85600, n=61, last 2 years) | |
| Average Intel Core Ultra 7 155H (32719 - 54223, n=50) | |
| Lenovo ThinkPad X1 Nano Gen 3 | |
| MSI Prestige 13 AI Evo | |
| Asus ZenBook S13 OLED UX5304 | |
| HP Dragonfly G4 | |
| Dell Latitude 13 7340 i5-1345U | |
System performance
In everyday use, the compact Prestige 13 is a speedy and fast-reacting companion, which is in part thanks to its SSD storage. Our test sample's RAM configuration is 32 GB, which should be more than enough for users in the coming years. During our tests, we never had any issues surrounding the system's stability.
CrossMark: Overall | Productivity | Creativity | Responsiveness
WebXPRT 3: Overall
WebXPRT 4: Overall
Mozilla Kraken 1.1: Total
| PCMark 10 / Score | |
| Average of class Subnotebook (4920 - 9939, n=46, last 2 years) | |
| Average Intel Core Ultra 7 155H, Intel Arc 8-Core iGPU (4809 - 7529, n=34) | |
| MSI Prestige 13 AI Evo | |
| Lenovo ThinkPad X1 Nano Gen 3 | |
| HP Dragonfly G4 | |
| Asus ZenBook S13 OLED UX5304 | |
| Dell Latitude 13 7340 i5-1345U | |
| PCMark 10 / Essentials | |
| HP Dragonfly G4 | |
| Lenovo ThinkPad X1 Nano Gen 3 | |
| Asus ZenBook S13 OLED UX5304 | |
| Average Intel Core Ultra 7 155H, Intel Arc 8-Core iGPU (7605 - 11289, n=34) | |
| Average of class Subnotebook (8552 - 11646, n=46, last 2 years) | |
| Dell Latitude 13 7340 i5-1345U | |
| MSI Prestige 13 AI Evo | |
| PCMark 10 / Productivity | |
| Average of class Subnotebook (5435 - 16606, n=46, last 2 years) | |
| Average Intel Core Ultra 7 155H, Intel Arc 8-Core iGPU (6042 - 10591, n=34) | |
| MSI Prestige 13 AI Evo | |
| Lenovo ThinkPad X1 Nano Gen 3 | |
| HP Dragonfly G4 | |
| Asus ZenBook S13 OLED UX5304 | |
| Dell Latitude 13 7340 i5-1345U | |
| PCMark 10 / Digital Content Creation | |
| Average of class Subnotebook (5722 - 13779, n=46, last 2 years) | |
| Average Intel Core Ultra 7 155H, Intel Arc 8-Core iGPU (4985 - 10709, n=34) | |
| MSI Prestige 13 AI Evo | |
| Lenovo ThinkPad X1 Nano Gen 3 | |
| HP Dragonfly G4 | |
| Asus ZenBook S13 OLED UX5304 | |
| Dell Latitude 13 7340 i5-1345U | |
| CrossMark / Overall | |
| Lenovo ThinkPad X1 Nano Gen 3 | |
| Average Intel Core Ultra 7 155H, Intel Arc 8-Core iGPU (1366 - 1903, n=34) | |
| HP Dragonfly G4 | |
| Average of class Subnotebook (365 - 2356, n=63, last 2 years) | |
| Asus ZenBook S13 OLED UX5304 | |
| Dell Latitude 13 7340 i5-1345U | |
| MSI Prestige 13 AI Evo | |
| CrossMark / Productivity | |
| Lenovo ThinkPad X1 Nano Gen 3 | |
| HP Dragonfly G4 | |
| Average Intel Core Ultra 7 155H, Intel Arc 8-Core iGPU (1291 - 1798, n=33) | |
| Asus ZenBook S13 OLED UX5304 | |
| Average of class Subnotebook (364 - 2277, n=63, last 2 years) | |
| Dell Latitude 13 7340 i5-1345U | |
| MSI Prestige 13 AI Evo | |
| CrossMark / Creativity | |
| Lenovo ThinkPad X1 Nano Gen 3 | |
| Average of class Subnotebook (372 - 2743, n=63, last 2 years) | |
| Average Intel Core Ultra 7 155H, Intel Arc 8-Core iGPU (1519 - 1929, n=33) | |
| HP Dragonfly G4 | |
| Asus ZenBook S13 OLED UX5304 | |
| Dell Latitude 13 7340 i5-1345U | |
| MSI Prestige 13 AI Evo | |
| CrossMark / Responsiveness | |
| Lenovo ThinkPad X1 Nano Gen 3 | |
| Average Intel Core Ultra 7 155H, Intel Arc 8-Core iGPU (939 - 1802, n=33) | |
| Asus ZenBook S13 OLED UX5304 | |
| HP Dragonfly G4 | |
| Average of class Subnotebook (312 - 1854, n=63, last 2 years) | |
| Dell Latitude 13 7340 i5-1345U | |
| MSI Prestige 13 AI Evo | |
| WebXPRT 3 / Overall | |
| Average of class Subnotebook (156 - 530, n=59, last 2 years) | |
| Lenovo ThinkPad X1 Nano Gen 3 | |
| HP Dragonfly G4 | |
| Asus ZenBook S13 OLED UX5304 | |
| Average Intel Core Ultra 7 155H, Intel Arc 8-Core iGPU (252 - 299, n=34) | |
| MSI Prestige 13 AI Evo | |
| WebXPRT 4 / Overall | |
| Average of class Subnotebook (132 - 378, n=64, last 2 years) | |
| Lenovo ThinkPad X1 Nano Gen 3 | |
| HP Dragonfly G4 | |
| Asus ZenBook S13 OLED UX5304 | |
| Average Intel Core Ultra 7 155H, Intel Arc 8-Core iGPU (166.4 - 309, n=29) | |
| MSI Prestige 13 AI Evo | |
| Mozilla Kraken 1.1 / Total | |
| Dell Latitude 13 7340 i5-1345U | |
| MSI Prestige 13 AI Evo | |
| Average Intel Core Ultra 7 155H, Intel Arc 8-Core iGPU (517 - 614, n=35) | |
| Asus ZenBook S13 OLED UX5304 | |
| Lenovo ThinkPad X1 Nano Gen 3 | |
| HP Dragonfly G4 | |
| Average of class Subnotebook (234 - 1104, n=64, last 2 years) | |
* ... smaller is better
| PCMark 10 Score | 5952 points | |
Help | ||
| AIDA64 / Memory Copy | |
| Average of class Subnotebook (14554 - 131023, n=61, last 2 years) | |
| Average Intel Core Ultra 7 155H (62397 - 96791, n=50) | |
| MSI Prestige 13 AI Evo | |
| Lenovo ThinkPad X1 Nano Gen 3 | |
| Asus ZenBook S13 OLED UX5304 | |
| HP Dragonfly G4 | |
| Dell Latitude 13 7340 i5-1345U | |
| AIDA64 / Memory Read | |
| Average of class Subnotebook (15948 - 127174, n=61, last 2 years) | |
| Average Intel Core Ultra 7 155H (60544 - 90647, n=50) | |
| MSI Prestige 13 AI Evo | |
| Lenovo ThinkPad X1 Nano Gen 3 | |
| Asus ZenBook S13 OLED UX5304 | |
| HP Dragonfly G4 | |
| Dell Latitude 13 7340 i5-1345U | |
| AIDA64 / Memory Write | |
| Lenovo ThinkPad X1 Nano Gen 3 | |
| Average of class Subnotebook (15709 - 135141, n=61, last 2 years) | |
| MSI Prestige 13 AI Evo | |
| Average Intel Core Ultra 7 155H (58692 - 93451, n=50) | |
| Asus ZenBook S13 OLED UX5304 | |
| Dell Latitude 13 7340 i5-1345U | |
| HP Dragonfly G4 | |
| AIDA64 / Memory Latency | |
| MSI Prestige 13 AI Evo | |
| Average Intel Core Ultra 7 155H (116.2 - 233, n=50) | |
| Dell Latitude 13 7340 i5-1345U | |
| Average of class Subnotebook (6.1 - 159.9, n=59, last 2 years) | |
| Lenovo ThinkPad X1 Nano Gen 3 | |
| HP Dragonfly G4 | |
| Asus ZenBook S13 OLED UX5304 | |
* ... smaller is better
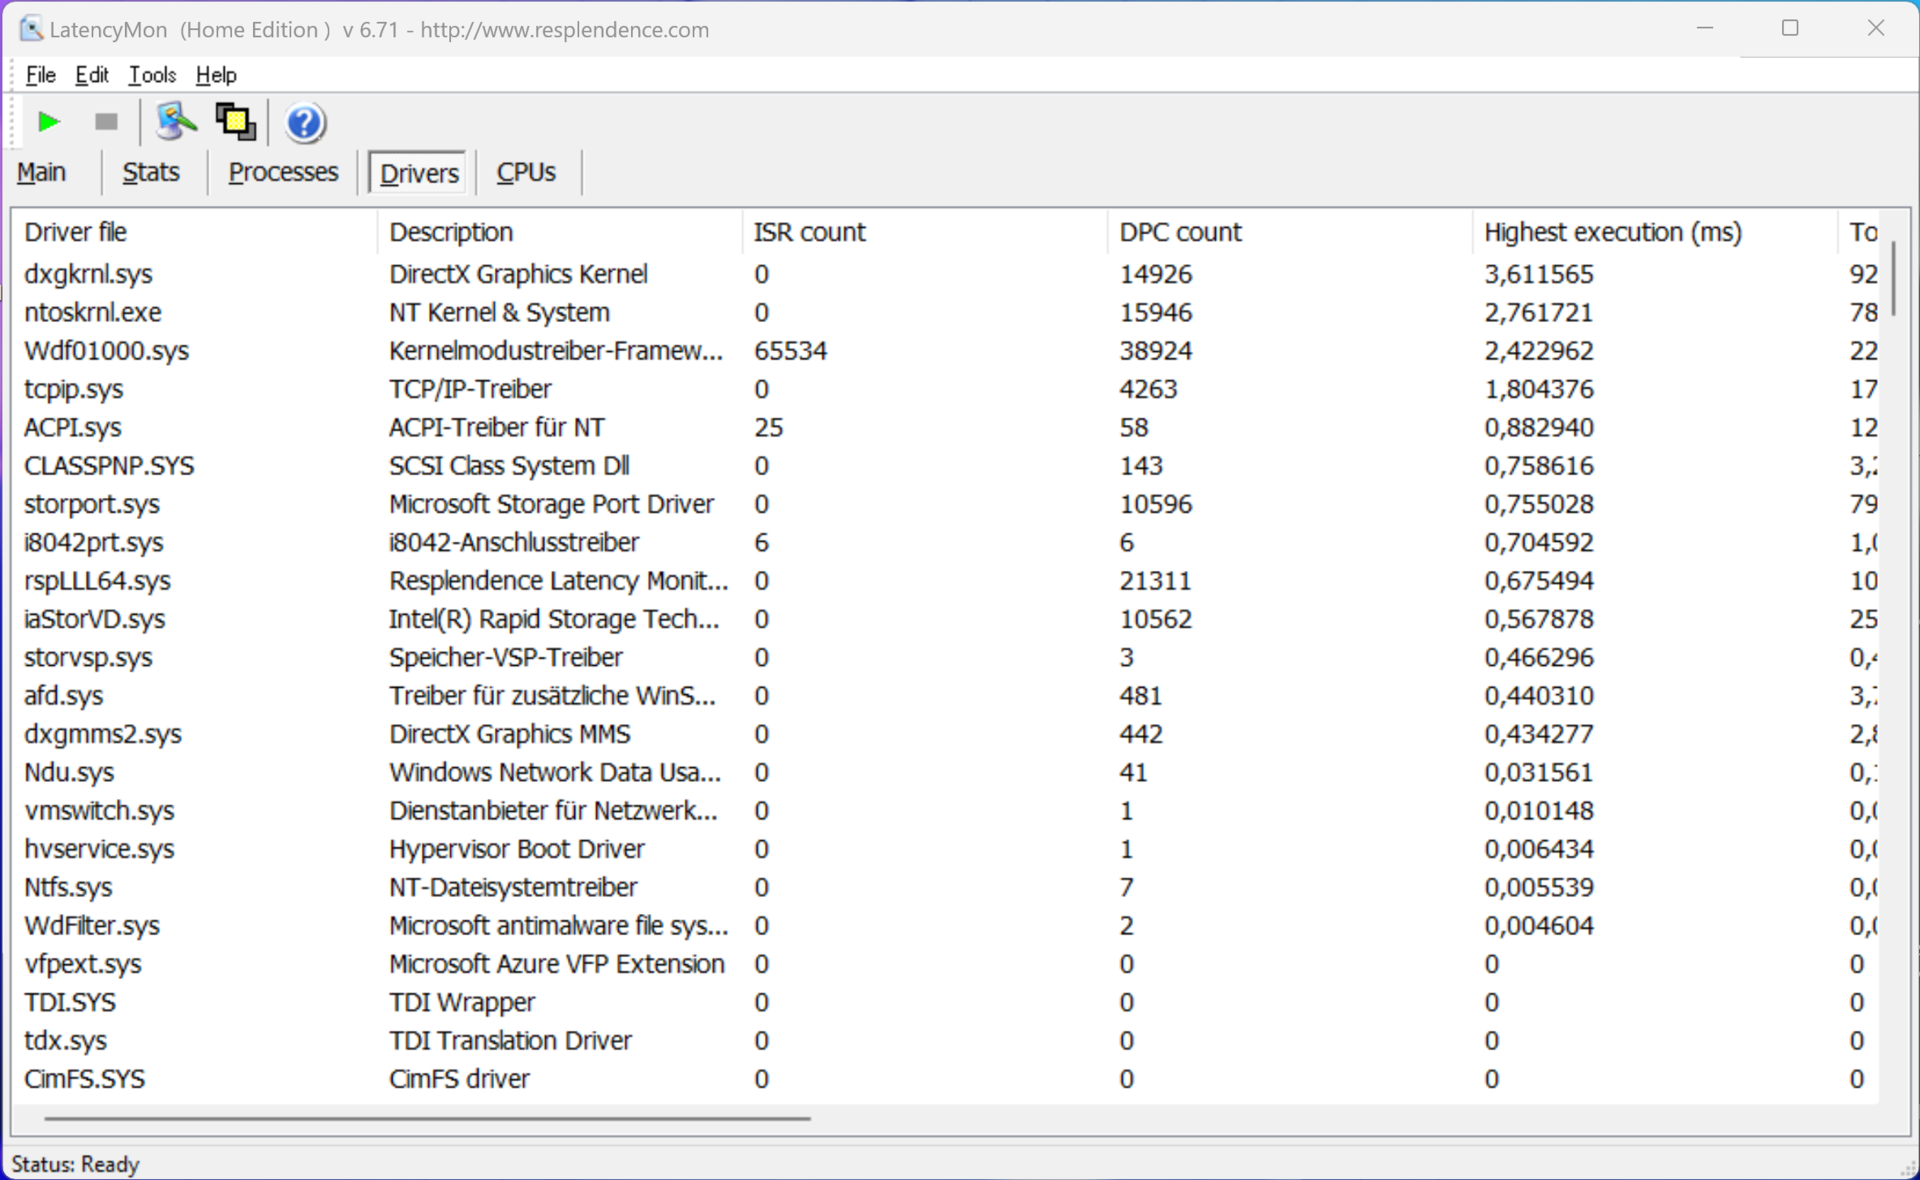
DPC latency
In our standardized latency test (surfing the web, 4K YouTube playback, CPU load), the test device with the current BIOS version showed some limitations when using real-time audio applications.
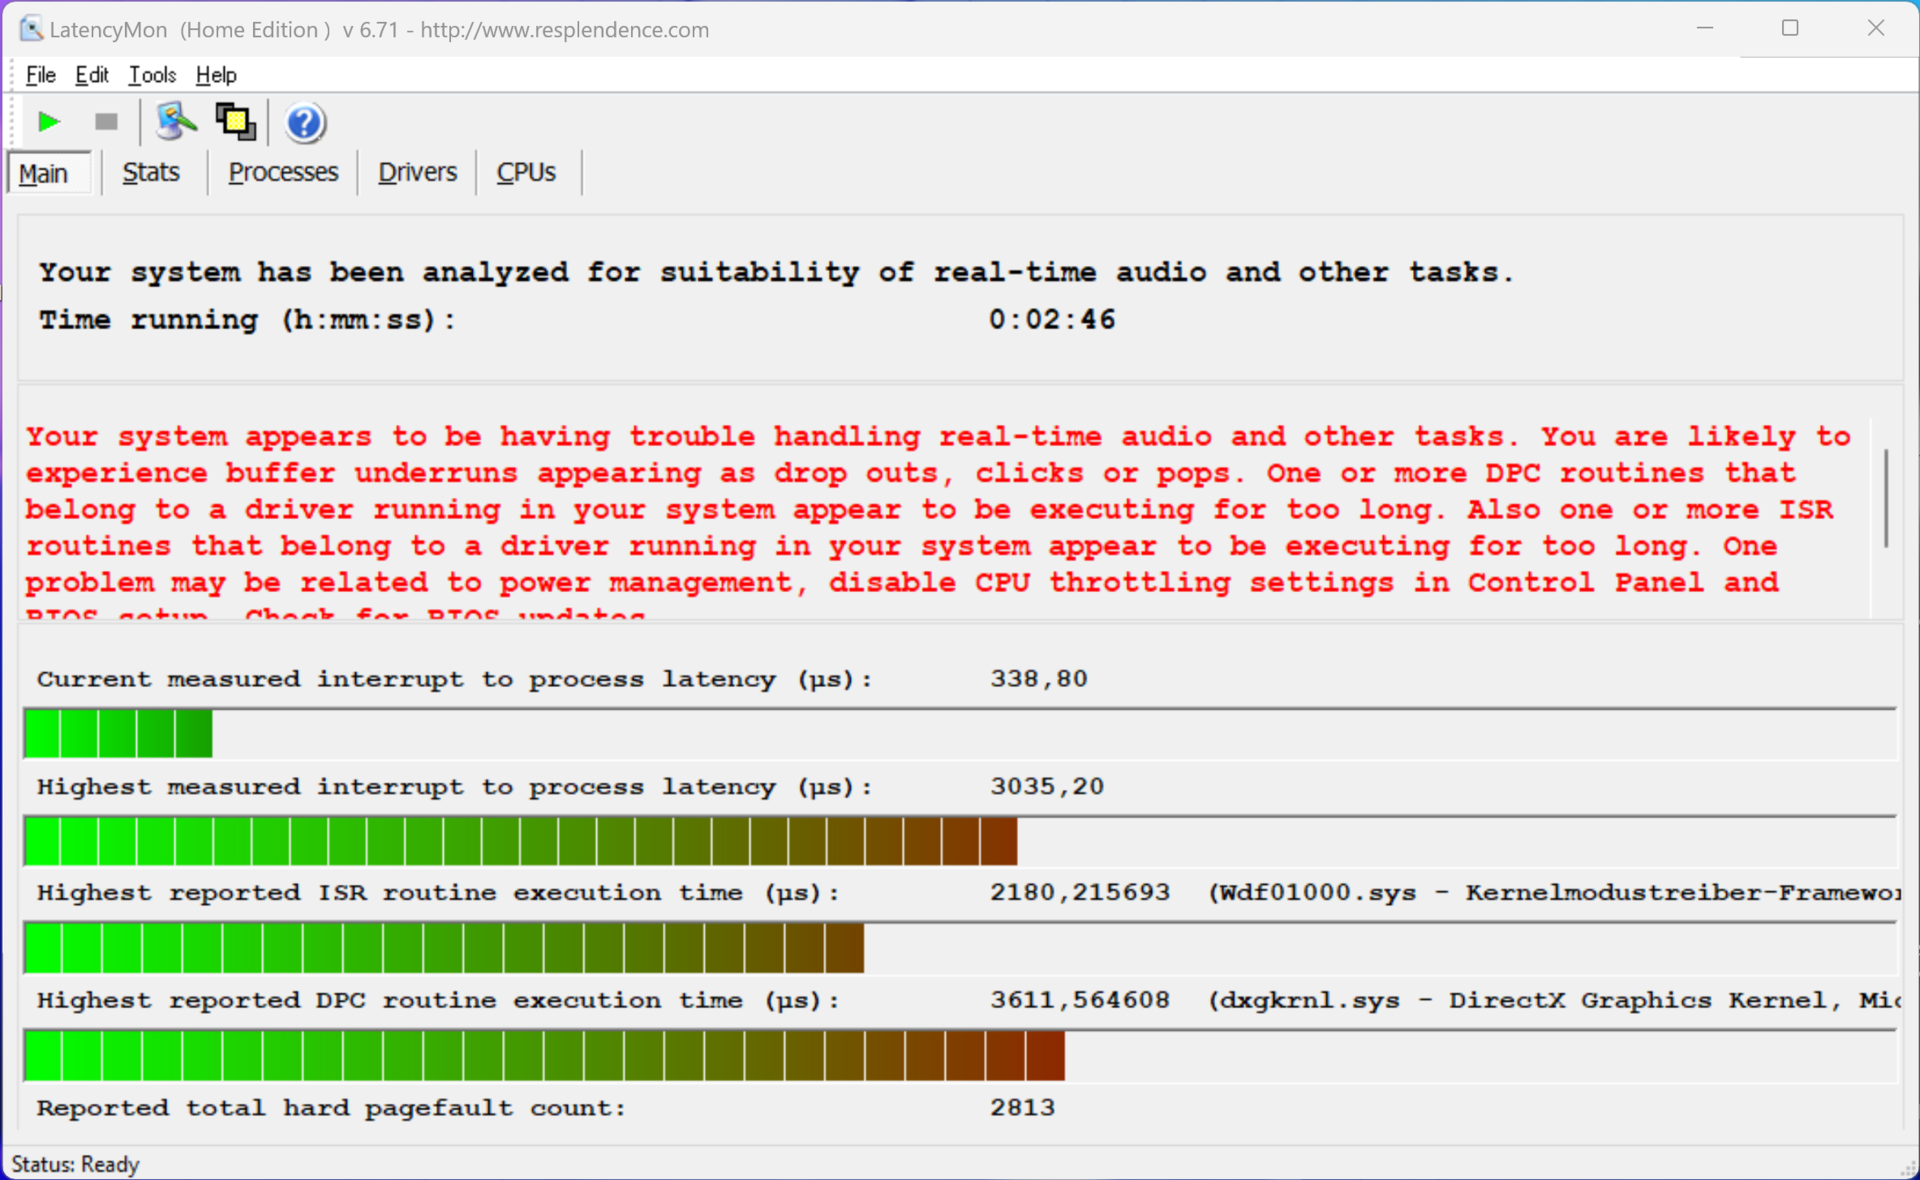
| DPC Latencies / LatencyMon - interrupt to process latency (max), Web, Youtube, Prime95 | |
| MSI Prestige 13 AI Evo | |
| Lenovo ThinkPad X1 Nano Gen 3 | |
| Dell Latitude 13 7340 i5-1345U | |
| Asus ZenBook S13 OLED UX5304 | |
| HP Dragonfly G4 | |
* ... smaller is better
Storage devices
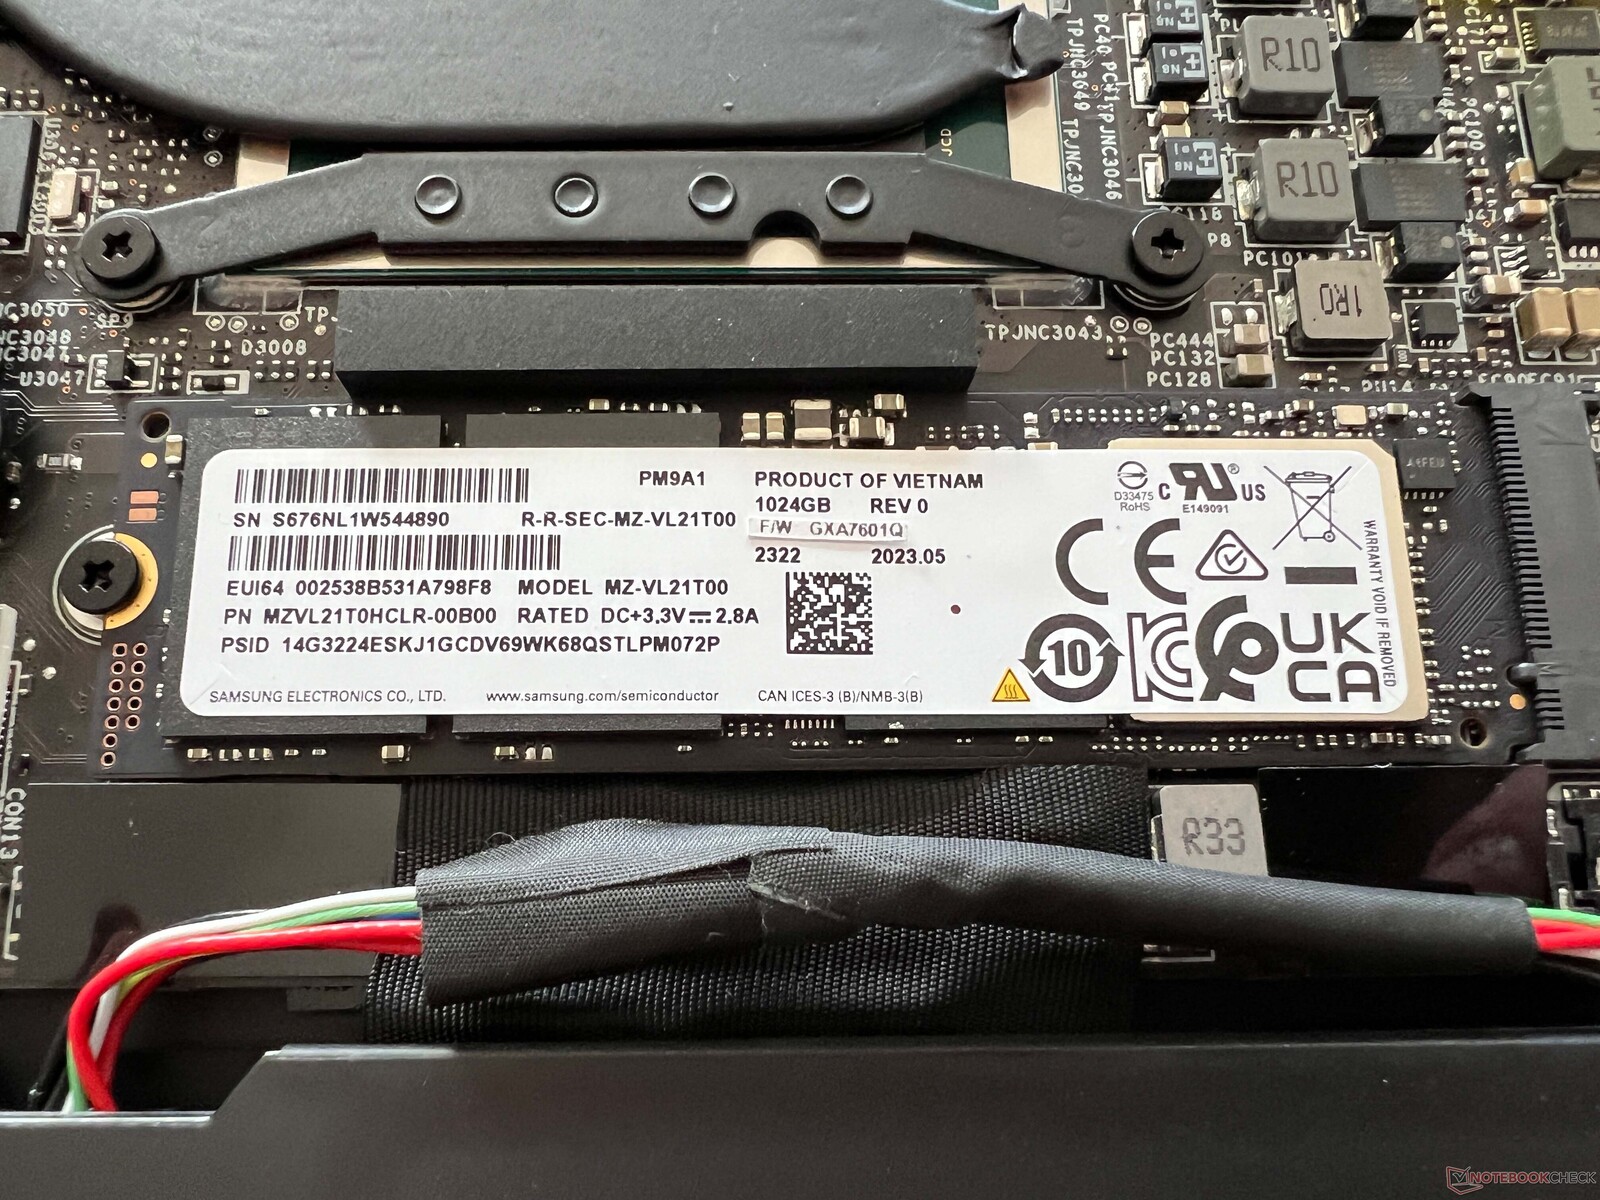
Our test device is fitted with the 1-TB version of the Samsung PM9A1 (OEM version of the 980 Pro), which is a very fast storage device. However, its performance doesn't remain constant under permanent load, but this shouldn't pose any issues during everyday use. After first booting up the device, users have 864 GB free to use. Further SSD benchmarks can be found here.

* ... smaller is better
Reading continuous performance: DiskSpd Read Loop, Queue Depth 8
Graphics card
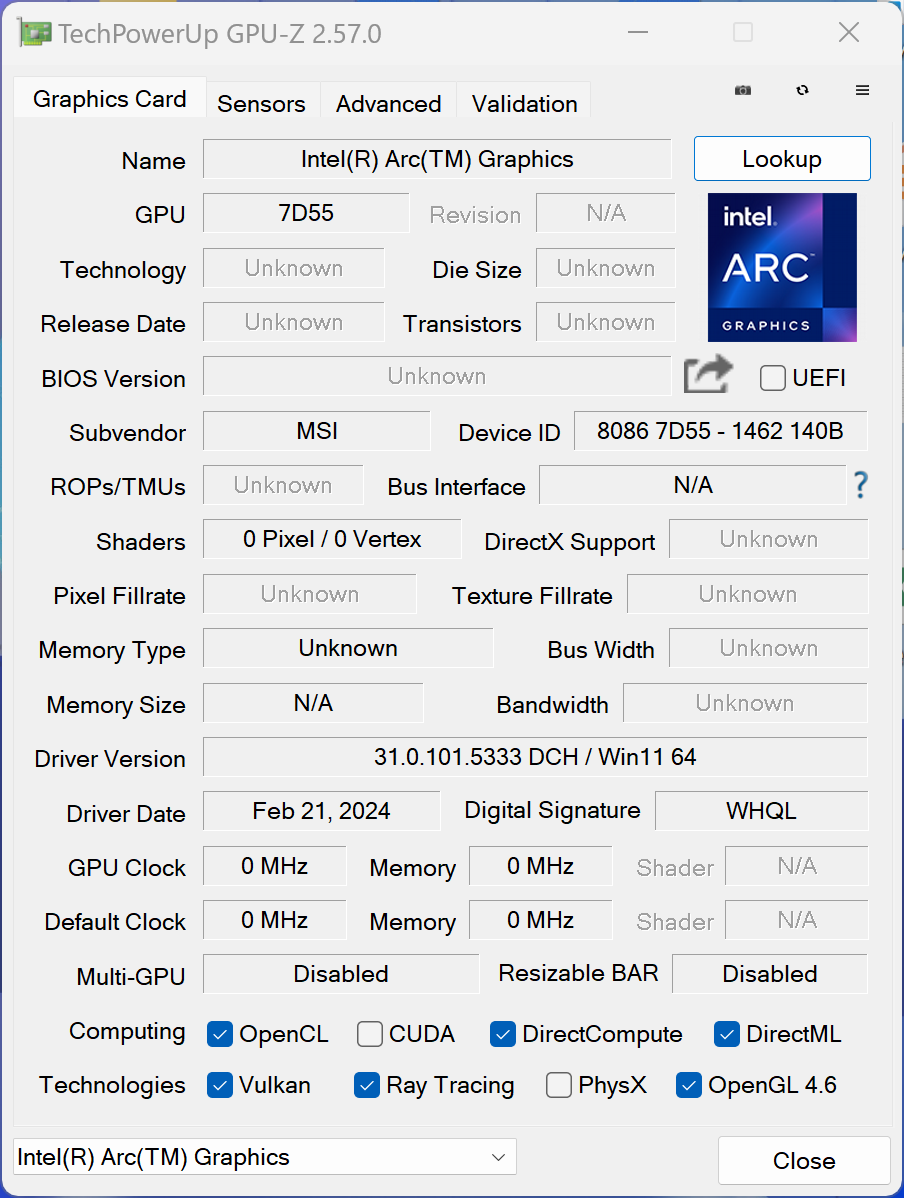
In combination with the Core Ultra 7 155H, the new Intel Arc Graphics offers 8 Xe-cores, however, its total graphics performance within the MSI Prestige 13 was the worst out of all the new Meteor-Lake laptops which we have tested so far (-32 % compared to the average in our database). Even during the synthetic benchmarks, the MSI only came slightly ahead of the old Iris Xe Graphics G7. When it comes to everyday tasks such as playing high-resolution videos, the MSI doesn't have any issues, but it simply can't use the new iGPU to its full potential.
We do want to mention one positive, namely that the MSI didn't suffer the same frame drops during the gaming tests as the Zenbook 14 or the HP Spectre x360 14 did, for example. Its gaming performance is pretty low in general, but it is at least stable. In battery use, its performance also remains constant and further benchmarks can be found here.
| 3DMark 11 Performance | 8505 points | |
| 3DMark Fire Strike Score | 5203 points | |
| 3DMark Time Spy Score | 2178 points | |
Help | ||
| Blender / v3.3 Classroom CPU | |
| Dell Latitude 13 7340 i5-1345U | |
| Asus ZenBook S13 OLED UX5304 | |
| HP Dragonfly G4 | |
| Lenovo ThinkPad X1 Nano Gen 3 | |
| MSI Prestige 13 AI Evo | |
| Average of class Subnotebook (241 - 861, n=63, last 2 years) | |
| Average Intel Arc 8-Core iGPU (294 - 692, n=42) | |
* ... smaller is better
| Performance rating - Percent | |
| Average of class Subnotebook | |
| MSI Prestige 13 AI Evo | |
| HP Dragonfly G4 | |
| Lenovo ThinkPad X1 Nano Gen 3 -1! | |
| Asus ZenBook S13 OLED UX5304 | |
| Dell Latitude 13 7340 i5-1345U | |
| The Witcher 3 - 1920x1080 Ultra Graphics & Postprocessing (HBAO+) | |
| Average of class Subnotebook (13.9 - 34.6, n=16, last 2 years) | |
| HP Dragonfly G4 | |
| MSI Prestige 13 AI Evo | |
| Lenovo ThinkPad X1 Nano Gen 3 | |
| Asus ZenBook S13 OLED UX5304 | |
| Dell Latitude 13 7340 i5-1345U | |
| GTA V - 1920x1080 Highest AA:4xMSAA + FX AF:16x | |
| Average of class Subnotebook (10.7 - 43.7, n=57, last 2 years) | |
| HP Dragonfly G4 | |
| MSI Prestige 13 AI Evo | |
| Asus ZenBook S13 OLED UX5304 | |
| Dell Latitude 13 7340 i5-1345U | |
| Final Fantasy XV Benchmark - 1920x1080 High Quality | |
| Average of class Subnotebook (11.6 - 54.5, n=57, last 2 years) | |
| MSI Prestige 13 AI Evo | |
| HP Dragonfly G4 | |
| Asus ZenBook S13 OLED UX5304 | |
| Lenovo ThinkPad X1 Nano Gen 3 | |
| Dell Latitude 13 7340 i5-1345U | |
| Strange Brigade - 1920x1080 ultra AA:ultra AF:16 | |
| Average of class Subnotebook (19 - 101.3, n=53, last 2 years) | |
| MSI Prestige 13 AI Evo | |
| HP Dragonfly G4 | |
| Asus ZenBook S13 OLED UX5304 | |
| Dell Latitude 13 7340 i5-1345U | |
| Lenovo ThinkPad X1 Nano Gen 3 | |
| Dota 2 Reborn - 1920x1080 ultra (3/3) best looking | |
| Average of class Subnotebook (13 - 97, n=64, last 2 years) | |
| HP Dragonfly G4 | |
| MSI Prestige 13 AI Evo | |
| Asus ZenBook S13 OLED UX5304 | |
| Dell Latitude 13 7340 i5-1345U | |
| Lenovo ThinkPad X1 Nano Gen 3 | |
| X-Plane 11.11 - 1920x1080 high (fps_test=3) | |
| Average of class Subnotebook (20.7 - 50.5, n=53, last 2 years) | |
| MSI Prestige 13 AI Evo | |
| Lenovo ThinkPad X1 Nano Gen 3 | |
| HP Dragonfly G4 | |
| Asus ZenBook S13 OLED UX5304 | |
| Dell Latitude 13 7340 i5-1345U | |
Witcher 3 FPS diagram
| low | med. | high | ultra | |
|---|---|---|---|---|
| GTA V (2015) | 99.1 | 93.8 | 26.2 | 9.97 |
| The Witcher 3 (2015) | 92 | 59 | 36 | 14.5 |
| Dota 2 Reborn (2015) | 89.9 | 75.9 | 57.7 | 53.3 |
| Final Fantasy XV Benchmark (2018) | 43.8 | 28 | 17 | |
| X-Plane 11.11 (2018) | 47.4 | 37.7 | 32.1 | |
| Far Cry 5 (2018) | 47 | 33 | 31 | 28 |
| Strange Brigade (2018) | 121 | 53 | 41 | 32 |
| F1 2021 (2021) | 94.8 | 50.8 | 41.3 | 20.3 |
| F1 22 (2022) | 59.1 | 49.6 | 36.8 | 9.33 |
| F1 23 (2023) | 44.1 | 36.3 | 27.1 | 7.45 |
Emissions - Weak speakers
Noise emissions
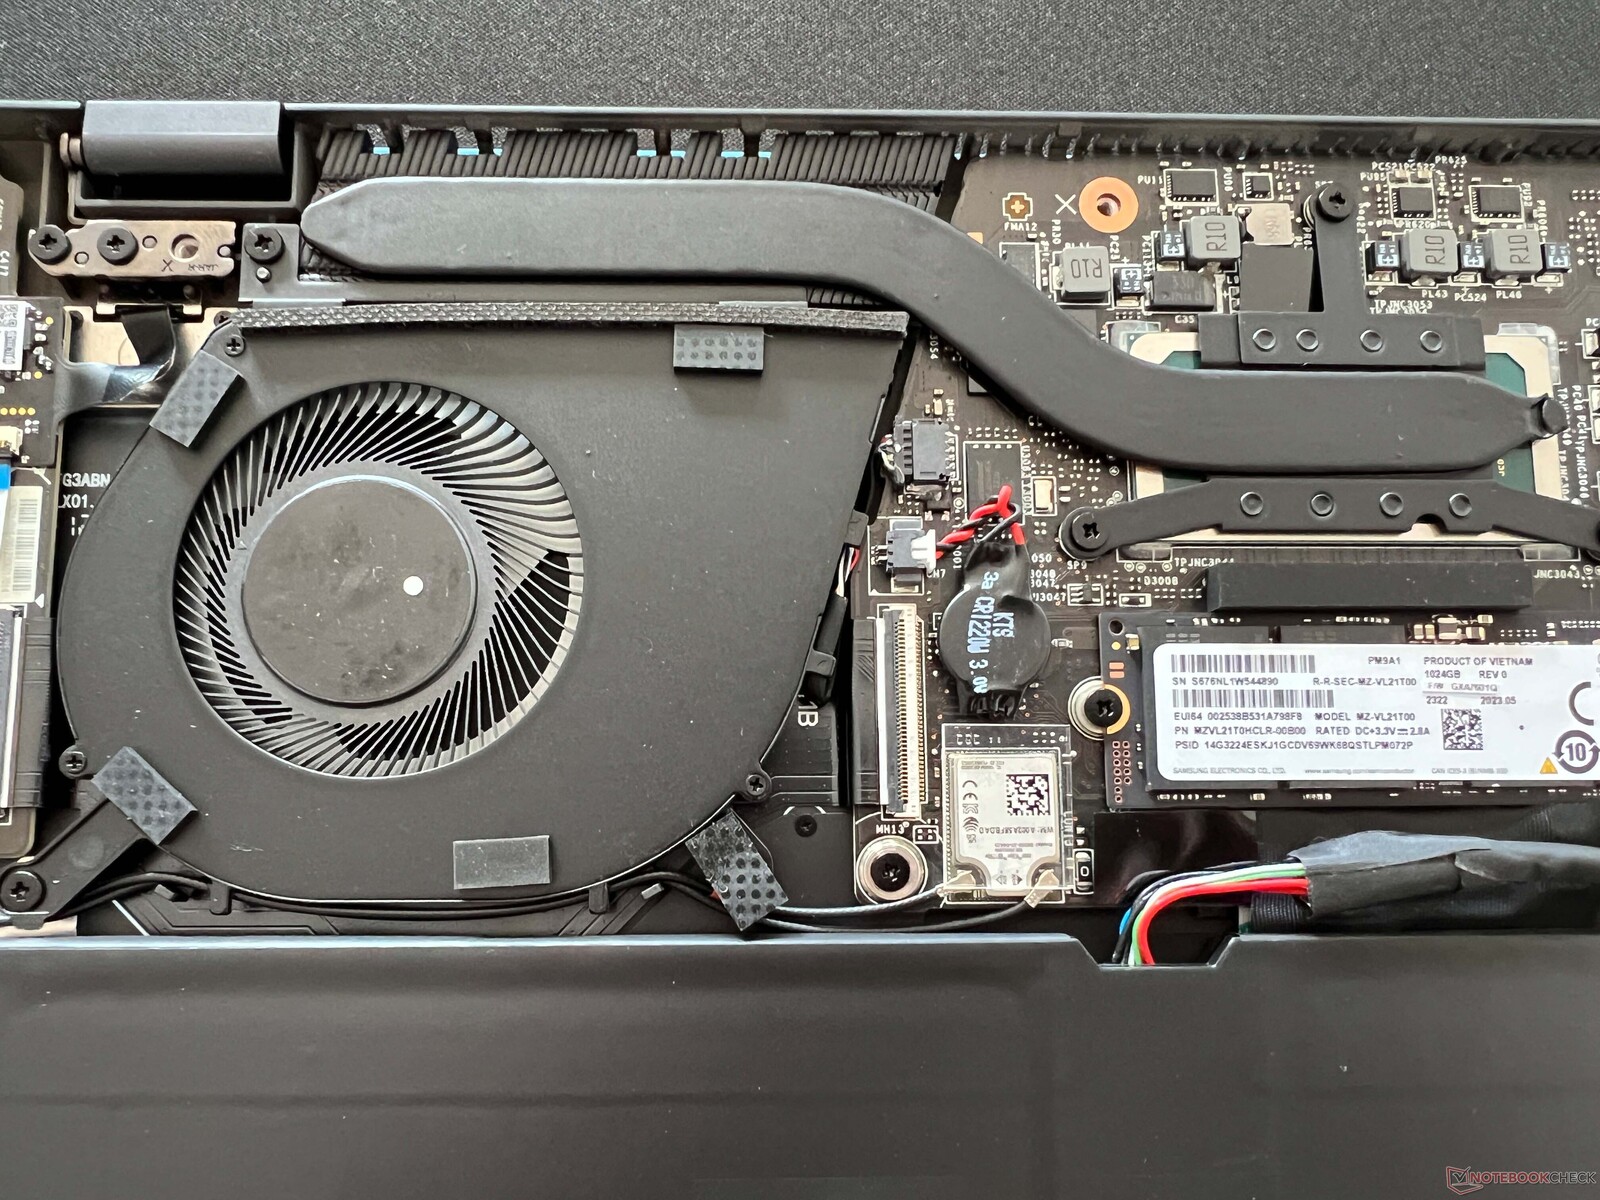
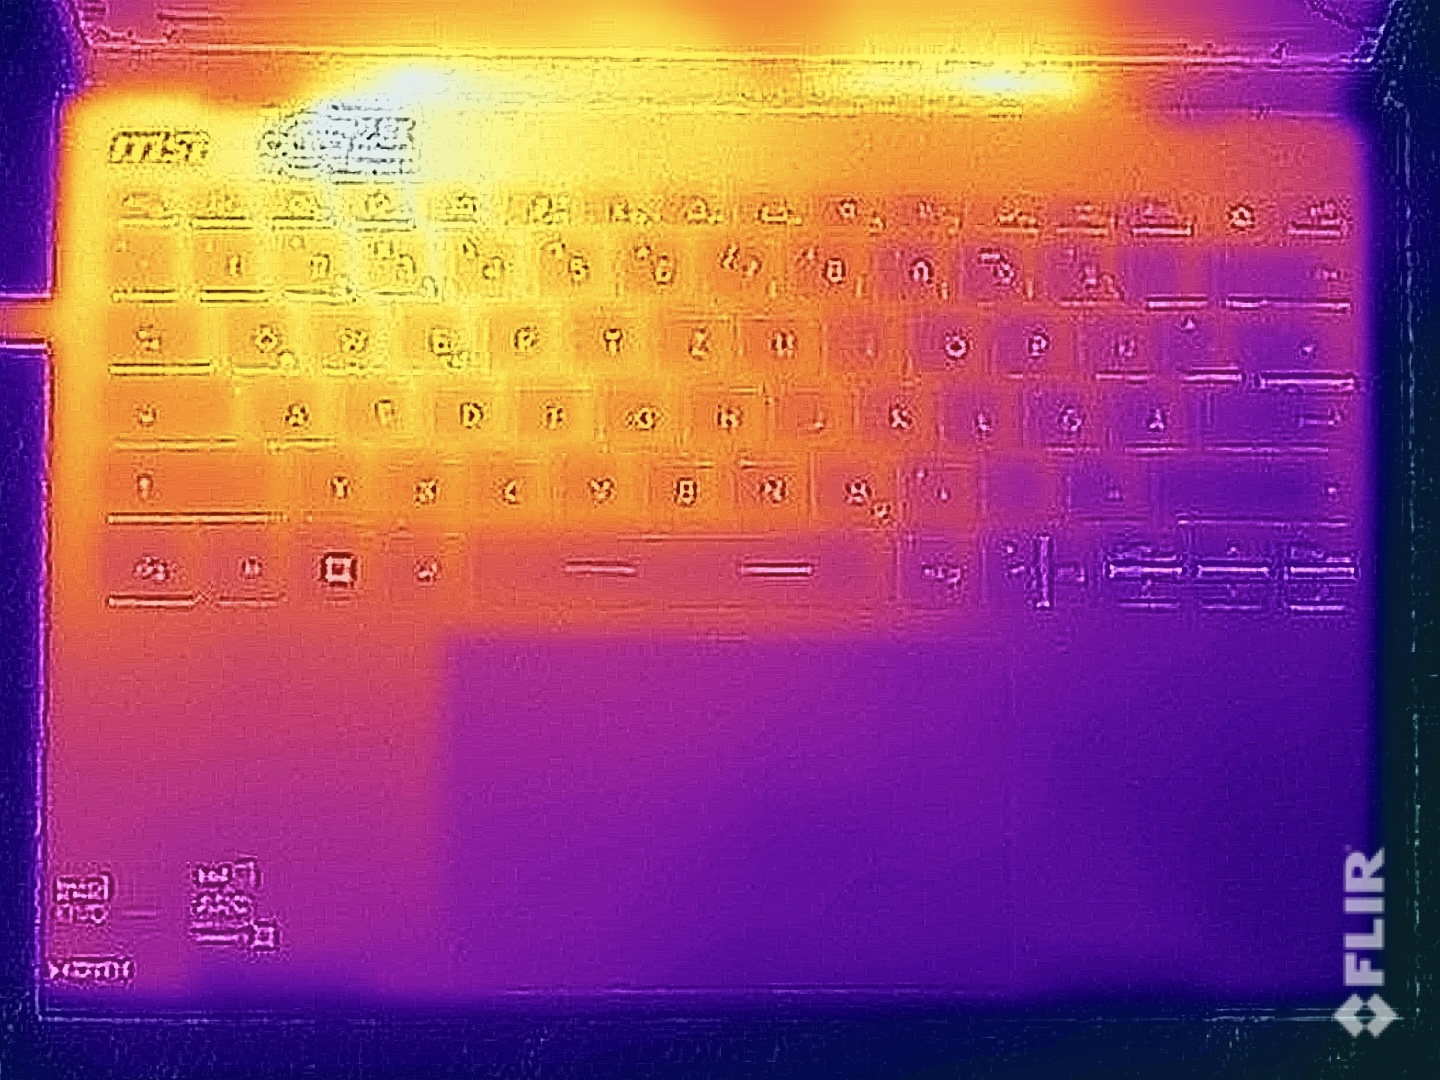
The MSI laptop features a cooling unit consisting of one heat pipe and one fan which unfortunately often runs at a low speed even when the device is idling. Although the whirring noise isn't annoying, you can definitely hear it in quieter surroundings. Under load, the fan quickly hit 32 dB(A) and during the stress test, we noted 40 dB(A). This is anything but quiet and, as it turned out, our test sample was the loudest in the comparison field. Using the CoolerBooster function, the small fan even reached 51 dB(A). We didn't note any additional electronic noises.
Noise level
| Idle |
| 23.4 / 26.9 / 26.9 dB(A) |
| Load |
| 32 / 40.3 dB(A) |
 | ||
30 dB silent 40 dB(A) audible 50 dB(A) loud |
||
min: | ||
| MSI Prestige 13 AI Evo Arc 8-Core, Ultra 7 155H, Samsung PM9A1 MZVL21T0HCLR | Lenovo ThinkPad X1 Nano Gen 3 Iris Xe G7 96EUs, i7-1360P, Lenovo UMIS AM6A0 RPJTJ512MKP1QDQ | Dell Latitude 13 7340 i5-1345U Iris Xe G7 80EUs, i5-1345U, Kioxia BG5 KBG50ZNS512G | HP Dragonfly G4 Iris Xe G7 96EUs, i7-1365U, Micron 3400 MTFDKBA512TFH 512GB | Asus ZenBook S13 OLED UX5304 Iris Xe G7 96EUs, i7-1355U, Samsung PM9A1 MZVL21T0HCLR | |
|---|---|---|---|---|---|
| Noise | 3% | -1% | 6% | -2% | |
| off / environment * (dB) | 23.4 | 22.9 2% | 25.02 -7% | 23.3 -0% | 23.3 -0% |
| Idle Minimum * (dB) | 23.4 | 23 2% | 25.02 -7% | 23.5 -0% | 23.3 -0% |
| Idle Average * (dB) | 26.9 | 23 14% | 25.02 7% | 23.5 13% | 23.3 13% |
| Idle Maximum * (dB) | 26.9 | 23 14% | 25.02 7% | 26.8 -0% | 23.3 13% |
| Load Average * (dB) | 32 | 32.8 -2% | 35.07 -10% | 27.2 15% | 37.7 -18% |
| Witcher 3 ultra * (dB) | 32 | 36.9 -15% | 32.7 -2% | 40.1 -25% | |
| Load Maximum * (dB) | 40.3 | 36.9 8% | 38.2 5% | 35 13% | 40.1 -0% |
* ... smaller is better
Temperature
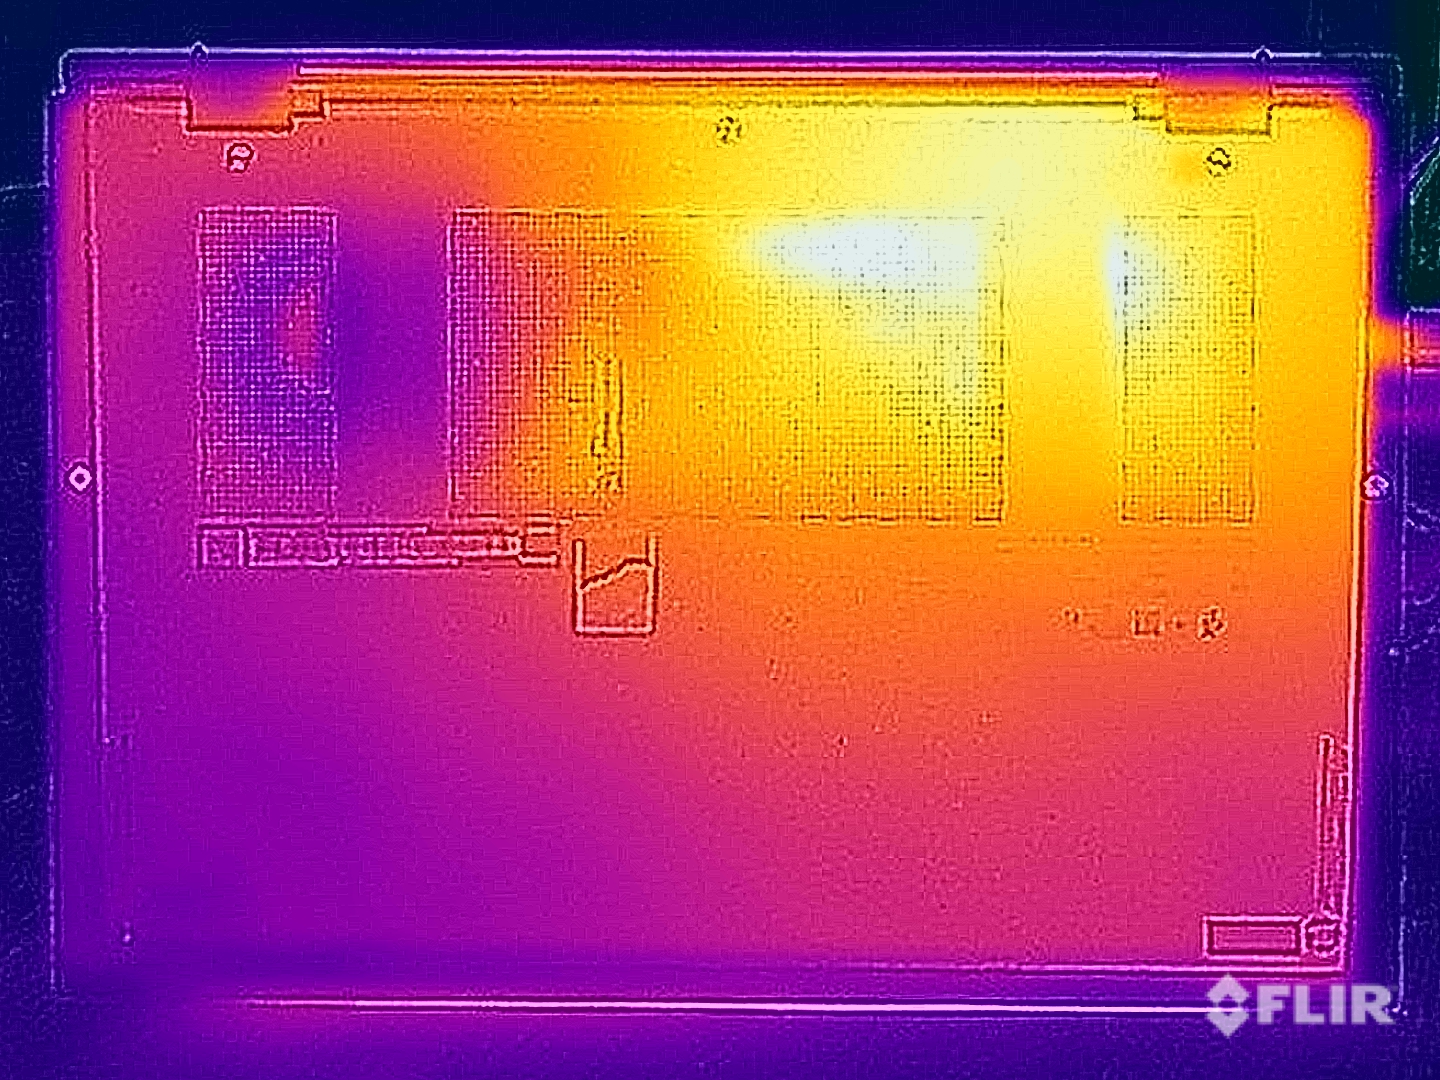
In everyday use, the Prestige 13 mostly stays cool and even during the stress test, we measured a maximum of 40 °C on the top and bottom of the base unit. The cooler is situated on the left side, which is why this area heats up the most. During the stress test, the CPU's power consumption quickly balanced out at 20 watts and then stayed at this level.
(±) The maximum temperature on the upper side is 40.9 °C / 106 F, compared to the average of 35.9 °C / 97 F, ranging from 21.4 to 59 °C for the class Subnotebook.
(±) The bottom heats up to a maximum of 40.4 °C / 105 F, compared to the average of 39.2 °C / 103 F
(+) In idle usage, the average temperature for the upper side is 23.3 °C / 74 F, compared to the device average of 30.8 °C / 87 F.
(+) Playing The Witcher 3, the average temperature for the upper side is 30.9 °C / 88 F, compared to the device average of 30.8 °C / 87 F.
(+) The palmrests and touchpad are cooler than skin temperature with a maximum of 27.9 °C / 82.2 F and are therefore cool to the touch.
(±) The average temperature of the palmrest area of similar devices was 28.2 °C / 82.8 F (+0.3 °C / 0.6 F).
| MSI Prestige 13 AI Evo Intel Core Ultra 7 155H, Intel Arc 8-Core iGPU | Lenovo ThinkPad X1 Nano Gen 3 Intel Core i7-1360P, Intel Iris Xe Graphics G7 96EUs | Dell Latitude 13 7340 i5-1345U Intel Core i5-1345U, Intel Iris Xe Graphics G7 80EUs | HP Dragonfly G4 Intel Core i7-1365U, Intel Iris Xe Graphics G7 96EUs | Asus ZenBook S13 OLED UX5304 Intel Core i7-1355U, Intel Iris Xe Graphics G7 96EUs | |
|---|---|---|---|---|---|
| Heat | -4% | -1% | -5% | -9% | |
| Maximum Upper Side * (°C) | 40.9 | 44 -8% | 34.3 16% | 38.6 6% | 43.1 -5% |
| Maximum Bottom * (°C) | 40.4 | 43.2 -7% | 37.6 7% | 40.4 -0% | 45 -11% |
| Idle Upper Side * (°C) | 25 | 25.6 -2% | 28.4 -14% | 28.2 -13% | 27.3 -9% |
| Idle Bottom * (°C) | 25.5 | 25.6 -0% | 28.8 -13% | 29 -14% | 27.8 -9% |
* ... smaller is better
Speakers
The stereo speakers belong to the weaker aspects of the compact subnotebook. Their maximum volume may be decent, but their sound itself doesn't have much dimension and they are clearly missing what a lot of the device's competitors are able to offer.
MSI Prestige 13 AI Evo audio analysis
(±) | speaker loudness is average but good (81.8 dB)
Bass 100 - 315 Hz
(-) | nearly no bass - on average 20.5% lower than median
(±) | linearity of bass is average (8.4% delta to prev. frequency)
Mids 400 - 2000 Hz
(±) | higher mids - on average 6.1% higher than median
(+) | mids are linear (5.9% delta to prev. frequency)
Highs 2 - 16 kHz
(+) | balanced highs - only 4.7% away from median
(+) | highs are linear (5.4% delta to prev. frequency)
Overall 100 - 16.000 Hz
(±) | linearity of overall sound is average (19% difference to median)
Compared to same class
» 58% of all tested devices in this class were better, 6% similar, 36% worse
» The best had a delta of 5%, average was 18%, worst was 53%
Compared to all devices tested
» 45% of all tested devices were better, 7% similar, 48% worse
» The best had a delta of 4%, average was 24%, worst was 134%
Dell Latitude 13 7340 i5-1345U audio analysis
(+) | speakers can play relatively loud (83 dB)
Bass 100 - 315 Hz
(±) | reduced bass - on average 6.2% lower than median
(±) | linearity of bass is average (9.6% delta to prev. frequency)
Mids 400 - 2000 Hz
(+) | balanced mids - only 2.3% away from median
(+) | mids are linear (5.1% delta to prev. frequency)
Highs 2 - 16 kHz
(±) | higher highs - on average 5.6% higher than median
(±) | linearity of highs is average (7.9% delta to prev. frequency)
Overall 100 - 16.000 Hz
(+) | overall sound is linear (9% difference to median)
Compared to same class
» 4% of all tested devices in this class were better, 1% similar, 95% worse
» The best had a delta of 5%, average was 18%, worst was 53%
Compared to all devices tested
» 3% of all tested devices were better, 1% similar, 96% worse
» The best had a delta of 4%, average was 24%, worst was 134%
HP Dragonfly G4 audio analysis
(+) | speakers can play relatively loud (84.4 dB)
Bass 100 - 315 Hz
(±) | reduced bass - on average 8.4% lower than median
(±) | linearity of bass is average (11.6% delta to prev. frequency)
Mids 400 - 2000 Hz
(+) | balanced mids - only 2.3% away from median
(+) | mids are linear (4.8% delta to prev. frequency)
Highs 2 - 16 kHz
(+) | balanced highs - only 3.2% away from median
(+) | highs are linear (4.6% delta to prev. frequency)
Overall 100 - 16.000 Hz
(+) | overall sound is linear (9.1% difference to median)
Compared to same class
» 4% of all tested devices in this class were better, 1% similar, 95% worse
» The best had a delta of 5%, average was 18%, worst was 53%
Compared to all devices tested
» 3% of all tested devices were better, 1% similar, 96% worse
» The best had a delta of 4%, average was 24%, worst was 134%
Power management - Good stamina with a 75-Wh battery
Power consumption
We didn't note any inconspicuousies during the consumption measurements and the laptop's maximum idle consumption is about 9 watts. As is the case with all OLED panels, you should make sure to set darker background images and make use of Windows' dark mode to help minimise its power consumption. Under load, the power supply reaches its limit of 65 watts for a short period, then it quickly balances out at 33 watts and during the stress test, it remained at this level.
| Off / Standby | |
| Idle | |
| Load |
|
Key:
min: | |
| MSI Prestige 13 AI Evo Ultra 7 155H, Arc 8-Core, Samsung PM9A1 MZVL21T0HCLR, OLED, 2880x1800, 13.3" | Lenovo ThinkPad X1 Nano Gen 3 i7-1360P, Iris Xe G7 96EUs, Lenovo UMIS AM6A0 RPJTJ512MKP1QDQ, IPS, 2160x1350, 13" | Dell Latitude 13 7340 i5-1345U i5-1345U, Iris Xe G7 80EUs, Kioxia BG5 KBG50ZNS512G, IPS, 1920x1200, 13.3" | HP Dragonfly G4 i7-1365U, Iris Xe G7 96EUs, Micron 3400 MTFDKBA512TFH 512GB, IPS, 1920x1280, 13.5" | Asus ZenBook S13 OLED UX5304 i7-1355U, Iris Xe G7 96EUs, Samsung PM9A1 MZVL21T0HCLR, OLED, 2880x1800, 13.3" | Average Intel Arc 8-Core iGPU | Average of class Subnotebook | |
|---|---|---|---|---|---|---|---|
| Power Consumption | 6% | 3% | -1% | -3% | -28% | 5% | |
| Idle Minimum * (Watt) | 4.5 | 3.3 27% | 2.37 47% | 4.1 9% | 5.8 -29% | 5.36 ? -19% | 3.78 ? 16% |
| Idle Average * (Watt) | 8 | 6.5 19% | 6.19 23% | 7.5 6% | 8.5 -6% | 8.53 ? -7% | 6.6 ? 17% |
| Idle Maximum * (Watt) | 8.7 | 7.1 18% | 14.1 -62% | 8.2 6% | 8.8 -1% | 11.8 ? -36% | 7.93 ? 9% |
| Load Average * (Watt) | 36.1 | 40.7 -13% | 36.3 -1% | 35.5 2% | 35.1 3% | 53.7 ? -49% | 41.8 ? -16% |
| Witcher 3 ultra * (Watt) | 29.7 | 37 -25% | 24.9 16% | 37.5 -26% | 27.6 7% | ||
| Load Maximum * (Watt) | 65 | 58.6 10% | 69.13 -6% | 66.5 -2% | 59.5 8% | 84.4 ? -30% | 64.7 ? -0% |
* ... smaller is better
Power consumption Witcher 3 / stress test
Power consumption with external monitor
Runtimes
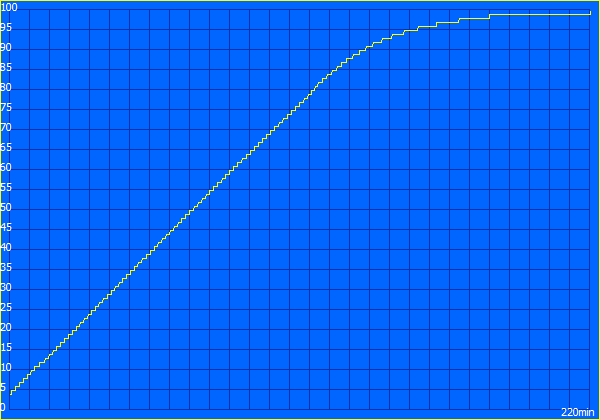
Despite its low weight, MSI has installed a 75-Wh battery, which delivers good runtimes despite the laptop's OLED panel. Although its IPS counterparts generally run for even longer, it was able to beat the Zenbook S13 OLED from Asus by a short distance. During our WLAN test at 150 cd/m² (57 % of the device's maximum SDR brightness), the test sample ran for ~11.5 hours, and at full brightness for ~7.5 hours. It is possible to play videos for 16.5 hours (150 cd/m²), while an HDR video at full brightness can be run for 6 hours. One full charge takes 220 minutes with the device switched on, whereby 80 % of its capacity is available after 114 minutes.
| MSI Prestige 13 AI Evo Ultra 7 155H, Arc 8-Core, 75 Wh | Lenovo ThinkPad X1 Nano Gen 3 i7-1360P, Iris Xe G7 96EUs, 49.5 Wh | Dell Latitude 13 7340 i5-1345U i5-1345U, Iris Xe G7 80EUs, 57 Wh | HP Dragonfly G4 i7-1365U, Iris Xe G7 96EUs, 68 Wh | Asus ZenBook S13 OLED UX5304 i7-1355U, Iris Xe G7 96EUs, 63 Wh | Average of class Subnotebook | |
|---|---|---|---|---|---|---|
| Battery runtime | -33% | 17% | 26% | -11% | -5% | |
| H.264 (h) | 16.7 | 13.8 -17% | 15.8 ? -5% | |||
| WiFi v1.3 (h) | 11.6 | 7.8 -33% | 15 29% | 15.9 37% | 11.3 -3% | 14 ? 21% |
| Load (h) | 2.8 | 2.9 4% | 3.2 14% | 2.4 -14% | 1.942 ? -31% |
Pros
Cons
Verdict - The MSI Prestige 13 impresses with its low weight and OLED panel


The focus of the new MSI Prestige 13 AI Evo clearly lies on portability and in this aspect, our test device with its lightweight build and good runtimes proves to be a success. Furthermore, its OLED panel offers exceptional picture quality including some advantages compared to many IPS models—however, it is by no means perfect if your aim is to edit photos. If you often work on the go, then the shiny panel's reflections may also get in your way.
Its technical data in the shape of the new Core Ultra 7 155H promises lots of performance but in reality, this is the slowest Meteor-Lake-H model we have tested so far. For everyday use, it should be sufficient in lots of cases, but you shouldn't forget how far away the device remains from its actual performance potential (CPU and GPU). Its RAM can't be upgraded but even so, 32 GB should be more than enough for most users (after all, this isn't a workstation).
The MSI Prestige 13 AI Evo weighs less than 1 kilogram and even so, you don't have to make do without great runtimes, lots of ports and an OLED panel. Despite its Meteor Lake processor, the device's performance still isn't the best—plus, its cooler is almost always active in everyday use.
When it comes to the laptop's ports and connectivity including Wi-Fi 7 and a speedy card reader, we don't have much to complain about, although its compact case does also demand some compromises to be made. This includes its cooling unit consisting of only one single fan that is also almost always active, making a truly silent device a rarity. In addition, its keyboard feels a little cramped, even if the mechanics themselves are fine. Lastly, its weak speakers leave more to be desired and the competition offers some clear advantages in this respect.
The HP Dragonfly G4 is likely the Prestige 13's biggest competitor and aside from its better speakers, it also features a better keyboard and longer runtimes—but in turn, it has an IPS panel (without PWM) with a lower resolution and subjectively worse picture quality. Its MRSP is higher but you might be able to find it for lower online by now.
Price and availability
The MSI Prestige 13 AI Evo can currently be found on Amazon for US$1,280.71.
MSI Prestige 13 AI Evo
- 03/06/2024 v7 (old)
Andreas Osthoff
Transparency
The selection of devices to be reviewed is made by our editorial team. The test sample was provided to the author as a loan by the manufacturer or retailer for the purpose of this review. The lender had no influence on this review, nor did the manufacturer receive a copy of this review before publication. There was no obligation to publish this review. As an independent media company, Notebookcheck is not subjected to the authority of manufacturers, retailers or publishers.
This is how Notebookcheck is testing
Every year, Notebookcheck independently reviews hundreds of laptops and smartphones using standardized procedures to ensure that all results are comparable. We have continuously developed our test methods for around 20 years and set industry standards in the process. In our test labs, high-quality measuring equipment is utilized by experienced technicians and editors. These tests involve a multi-stage validation process. Our complex rating system is based on hundreds of well-founded measurements and benchmarks, which maintains objectivity. Further information on our test methods can be found here.
Price comparison

