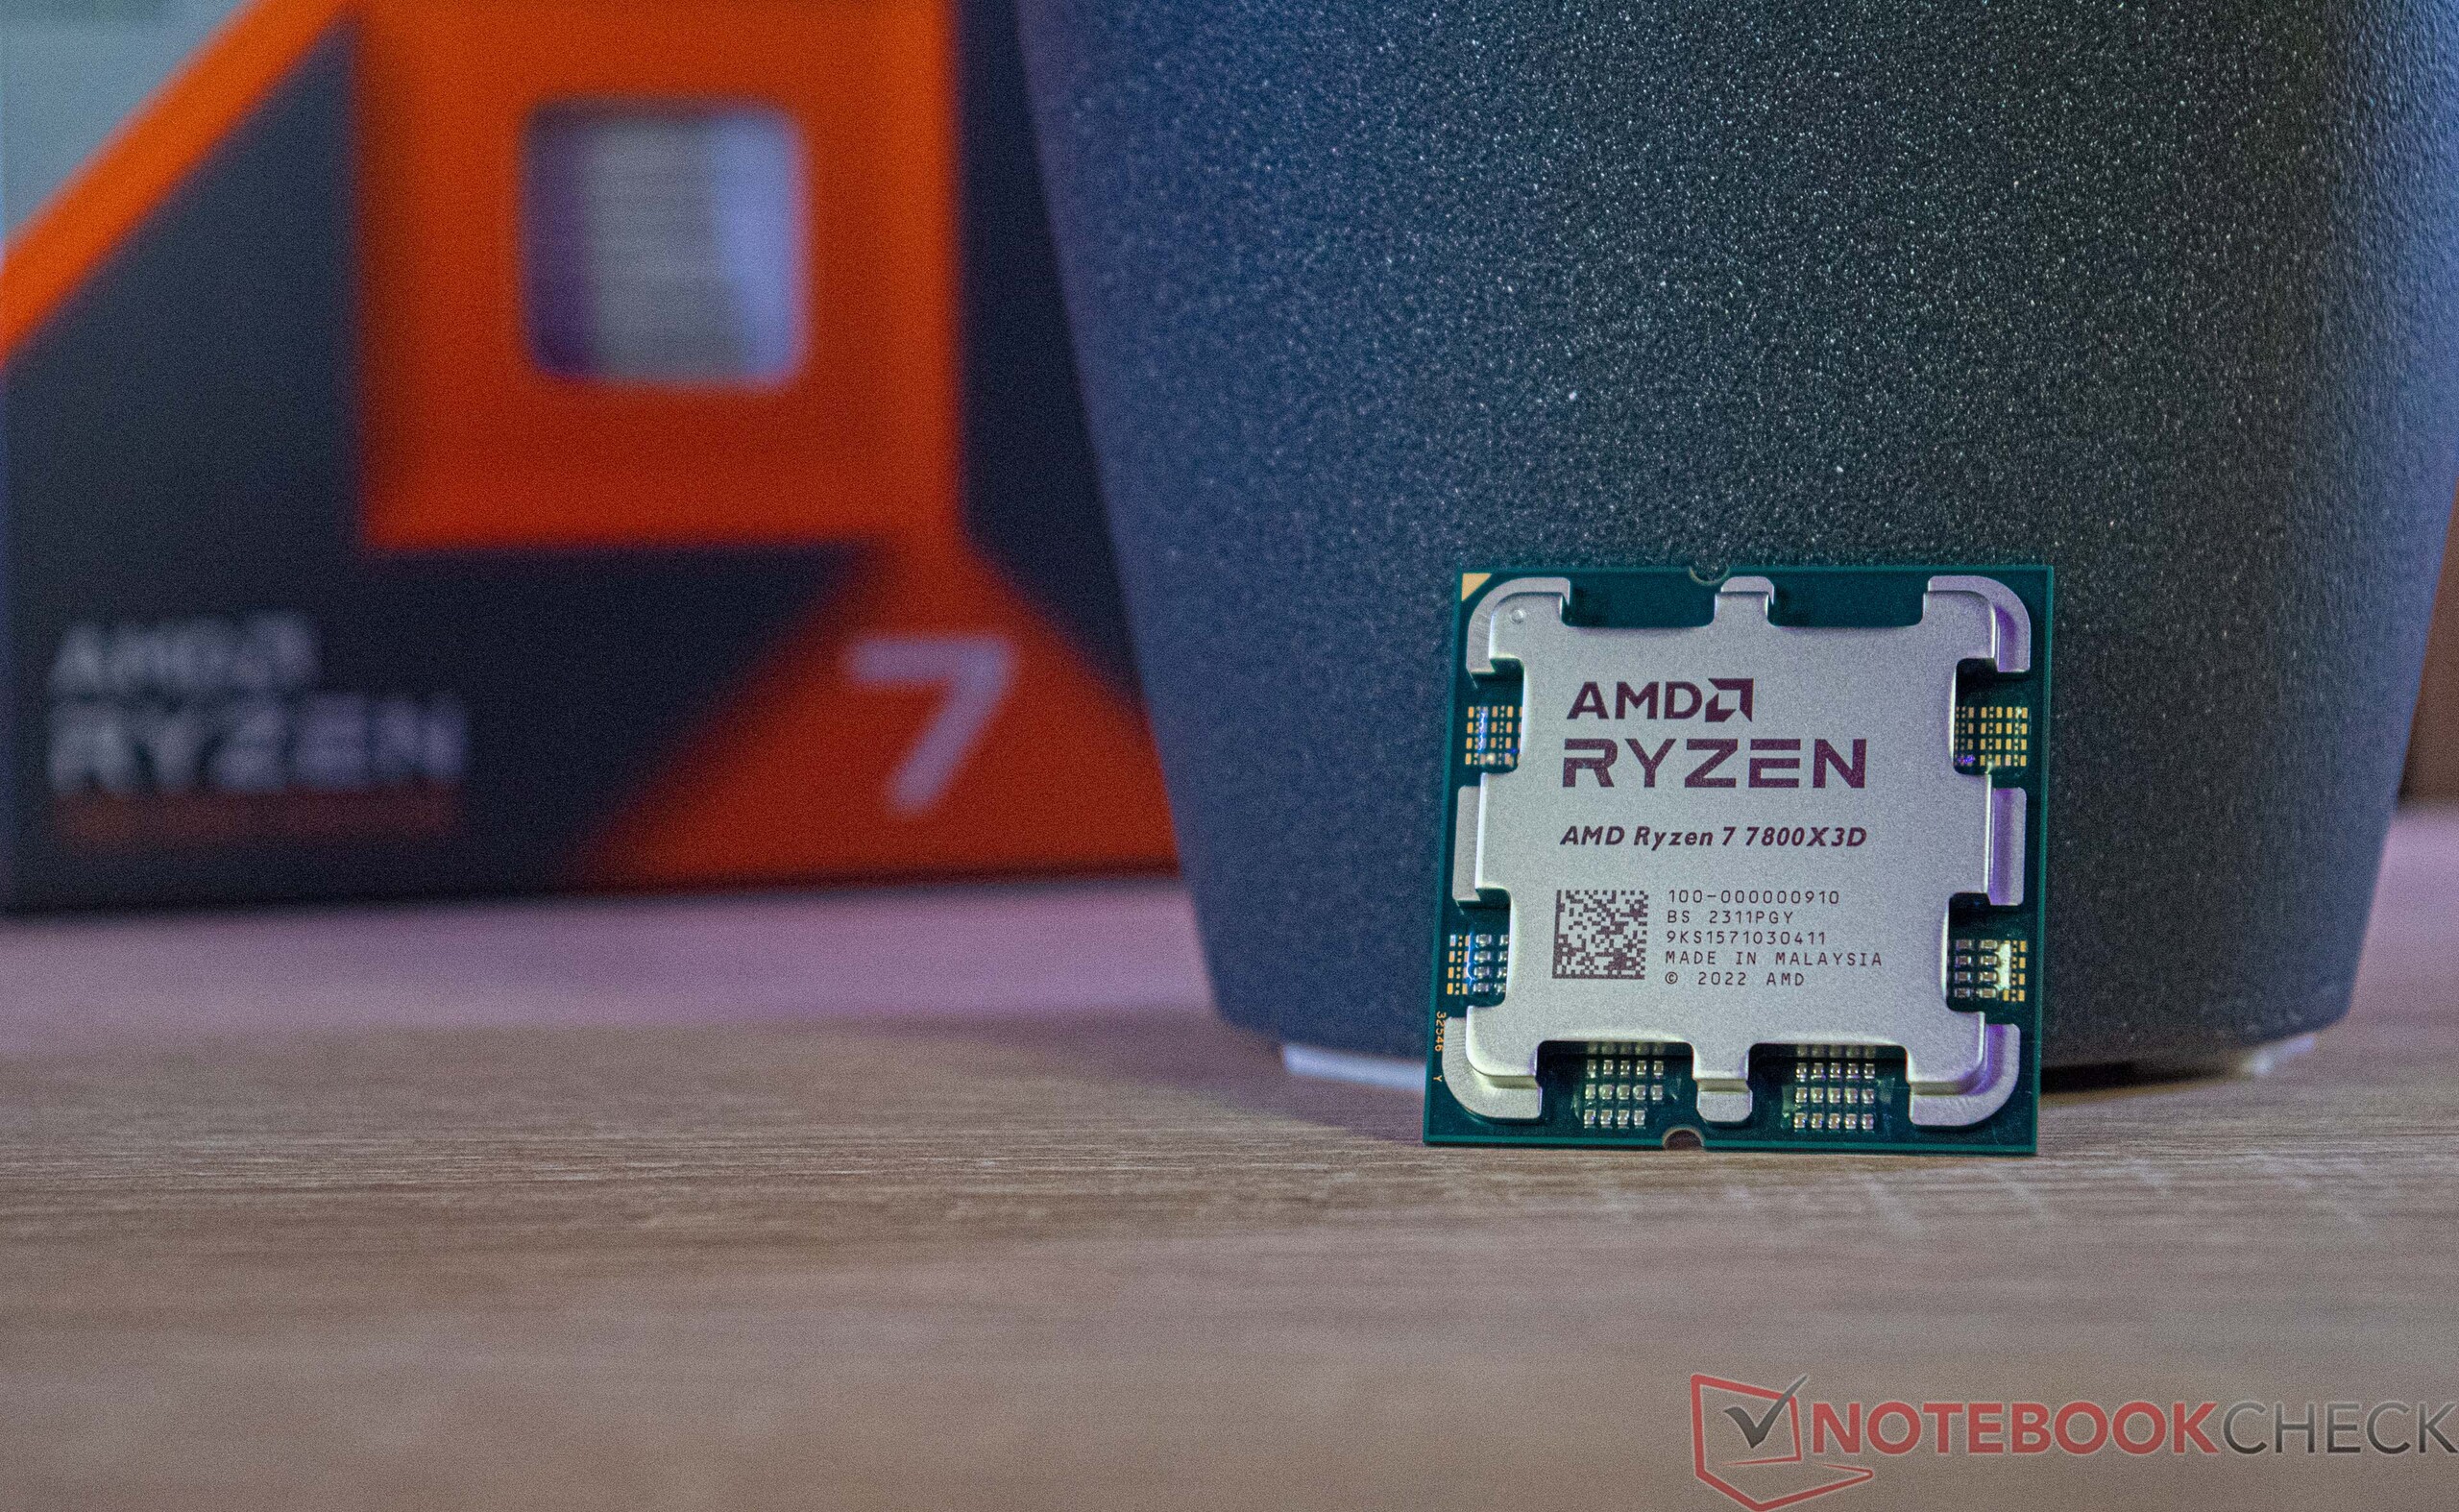
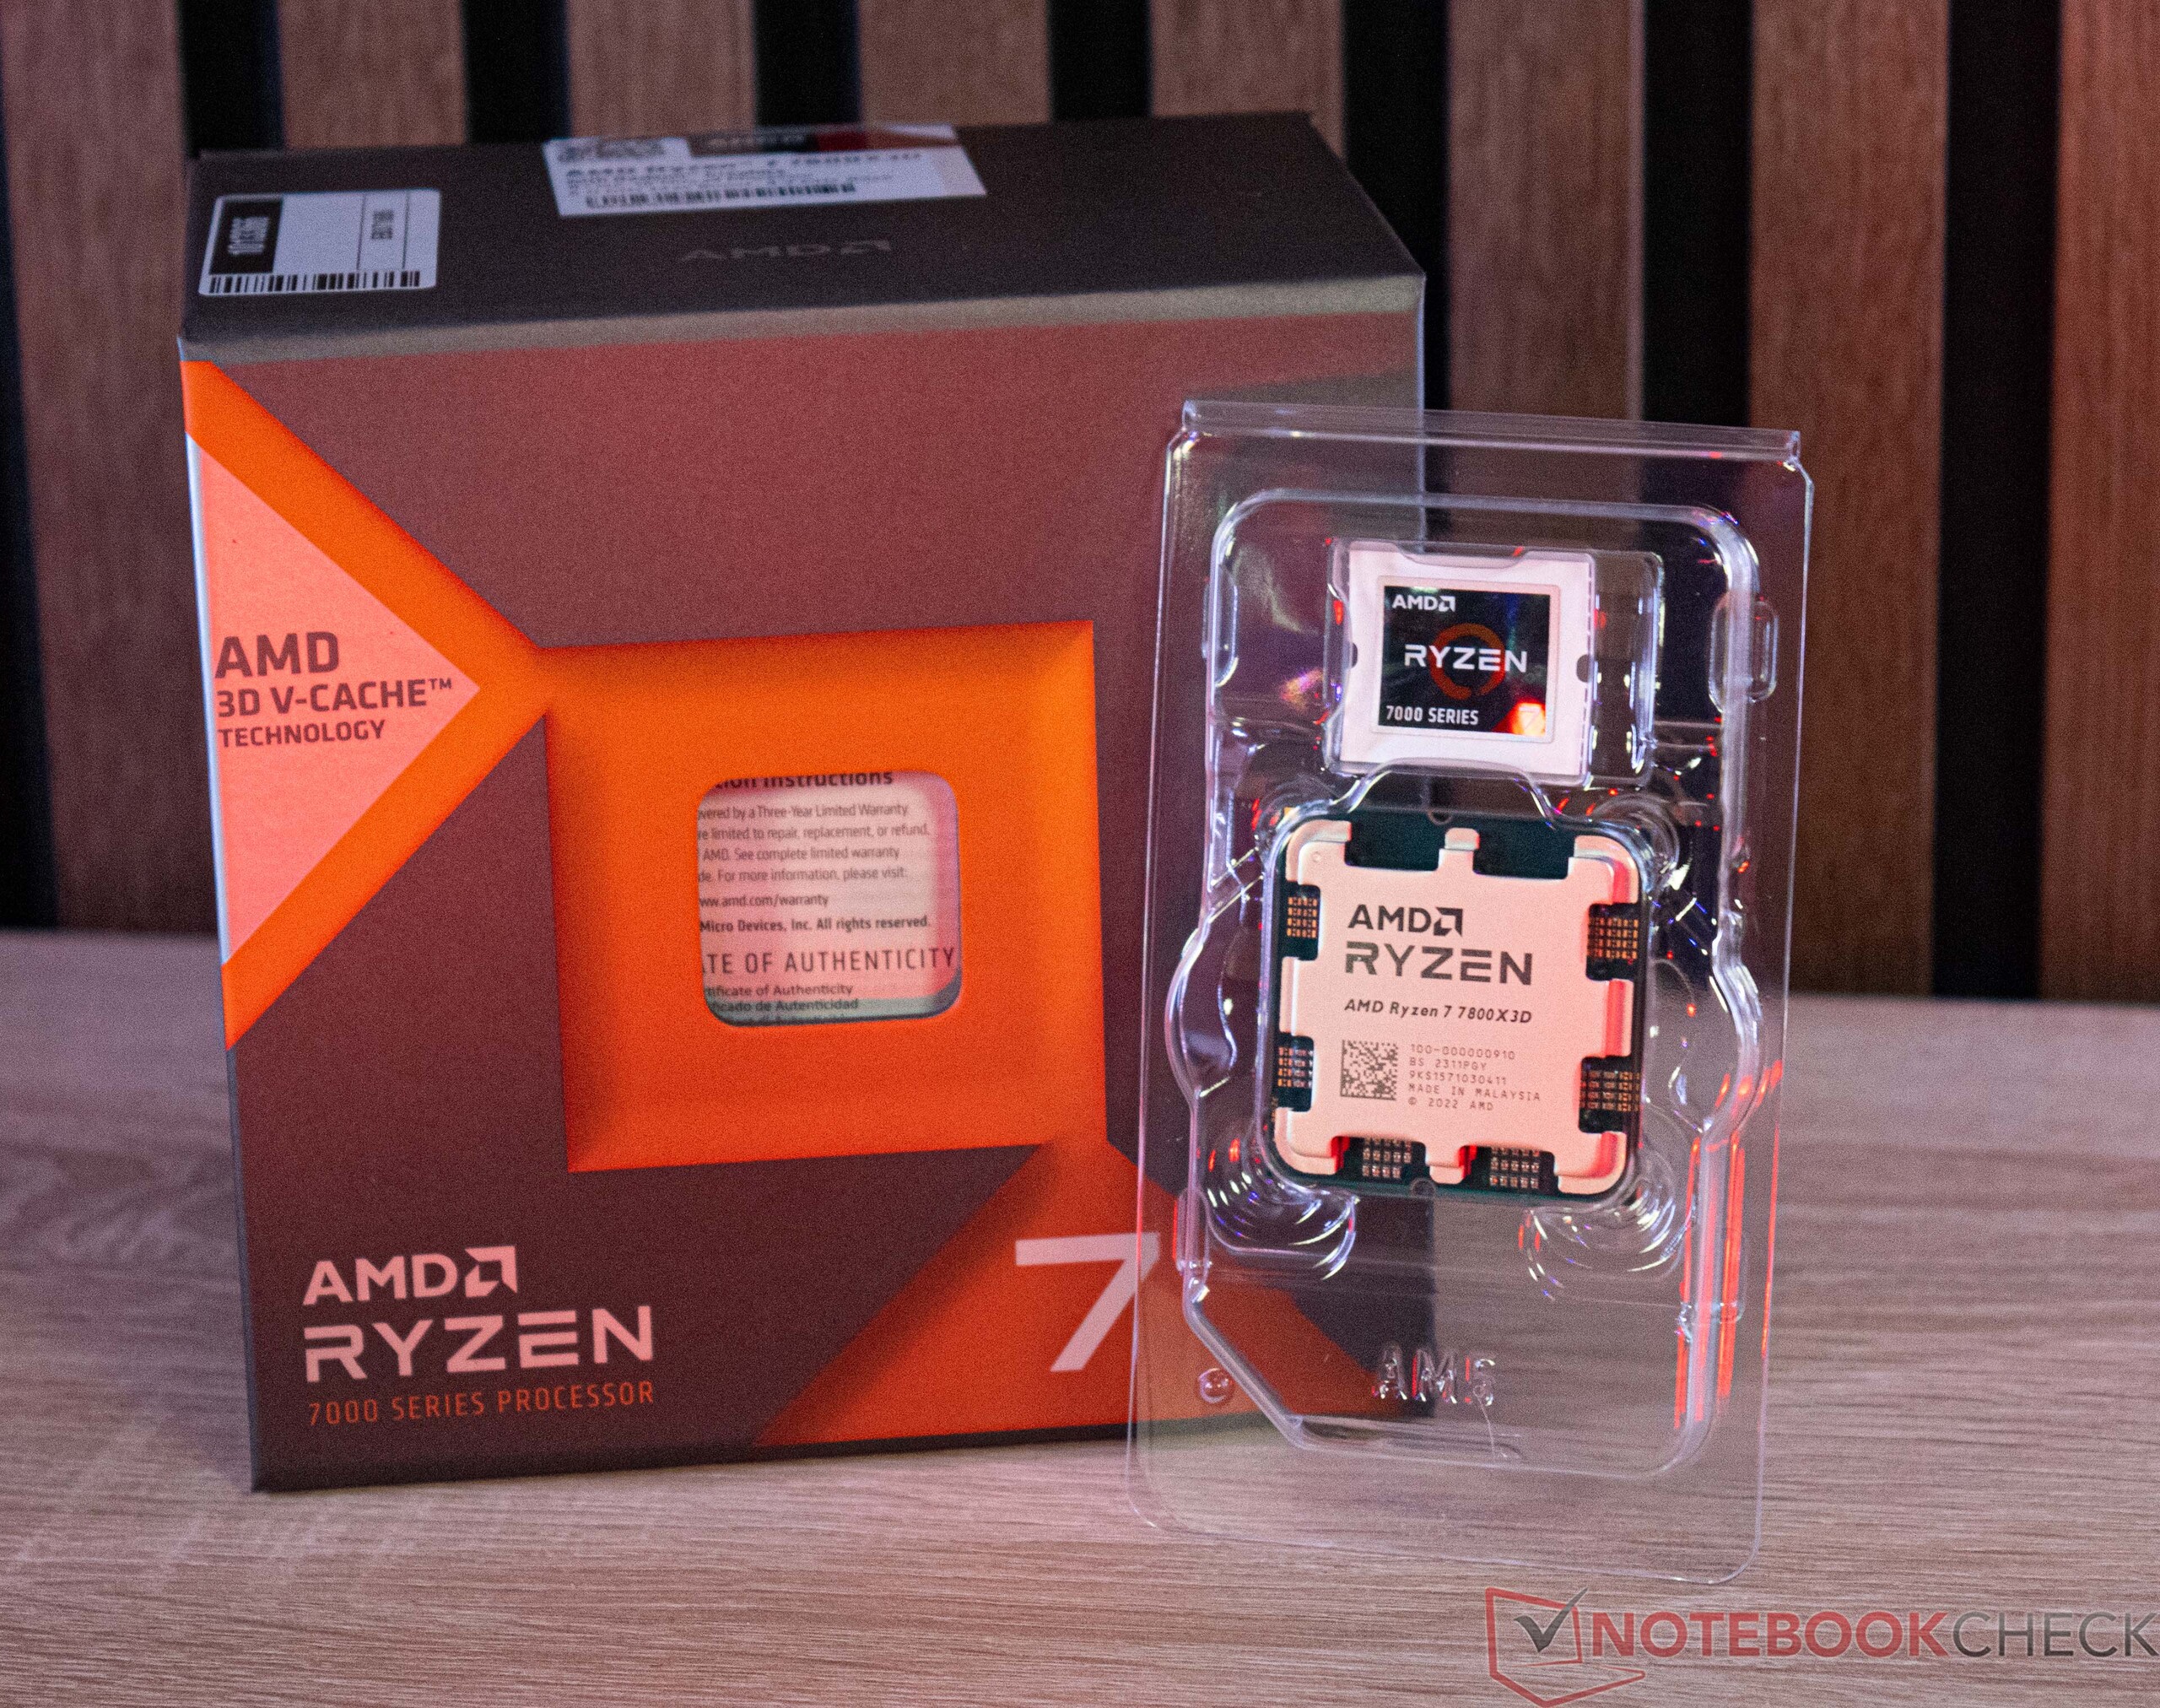
AMD Ryzen 7 7800X3D desktop CPU review: Faster than a Core i9-13900K thanks to 3D V-Cache and only 8 cores
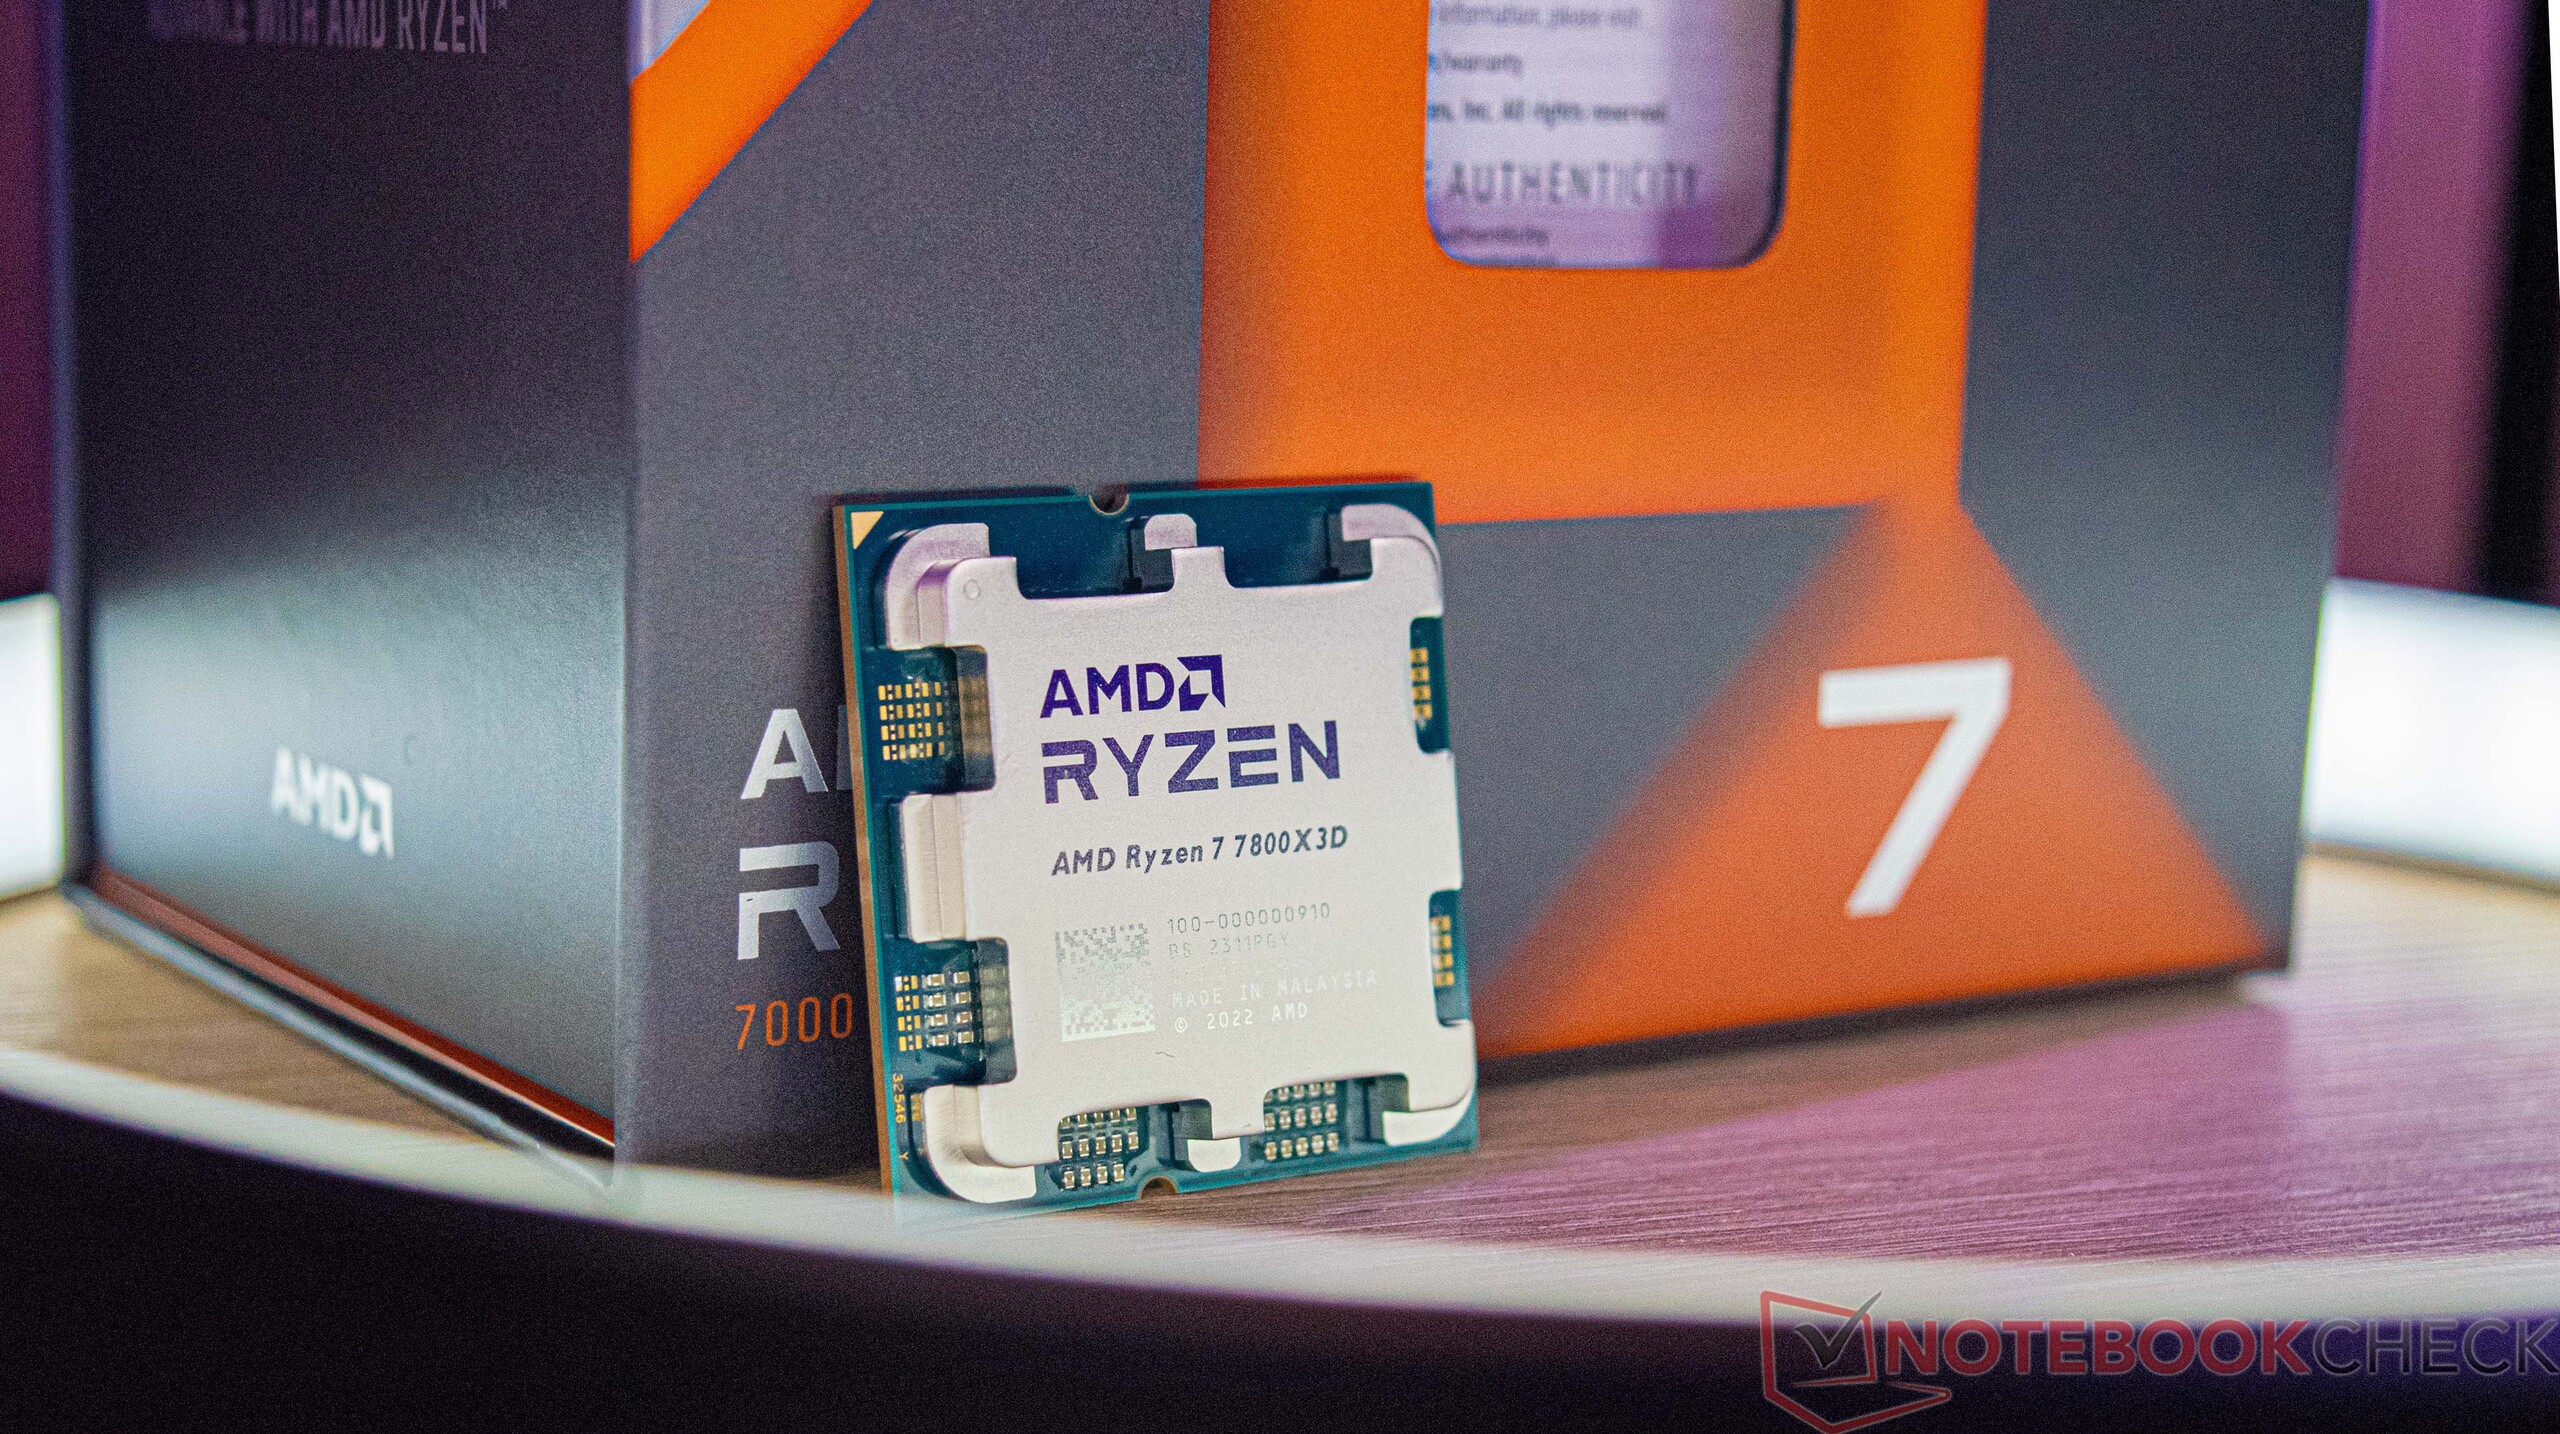
The AMD Ryzen 7 7800X3D is now AMD's third processor based on AM5 with 3D V-Cache - after both of the Ryzen 9 models (AMD Ryzen 9 7950X3D and AMD Ryzen 9 7900X3D). Together with the two larger models, the native 8-core processor was presented this past January at CES in Las Vegas. Although, you had quite a while to wait until the component was finally released onto the market on 6th April 2023.
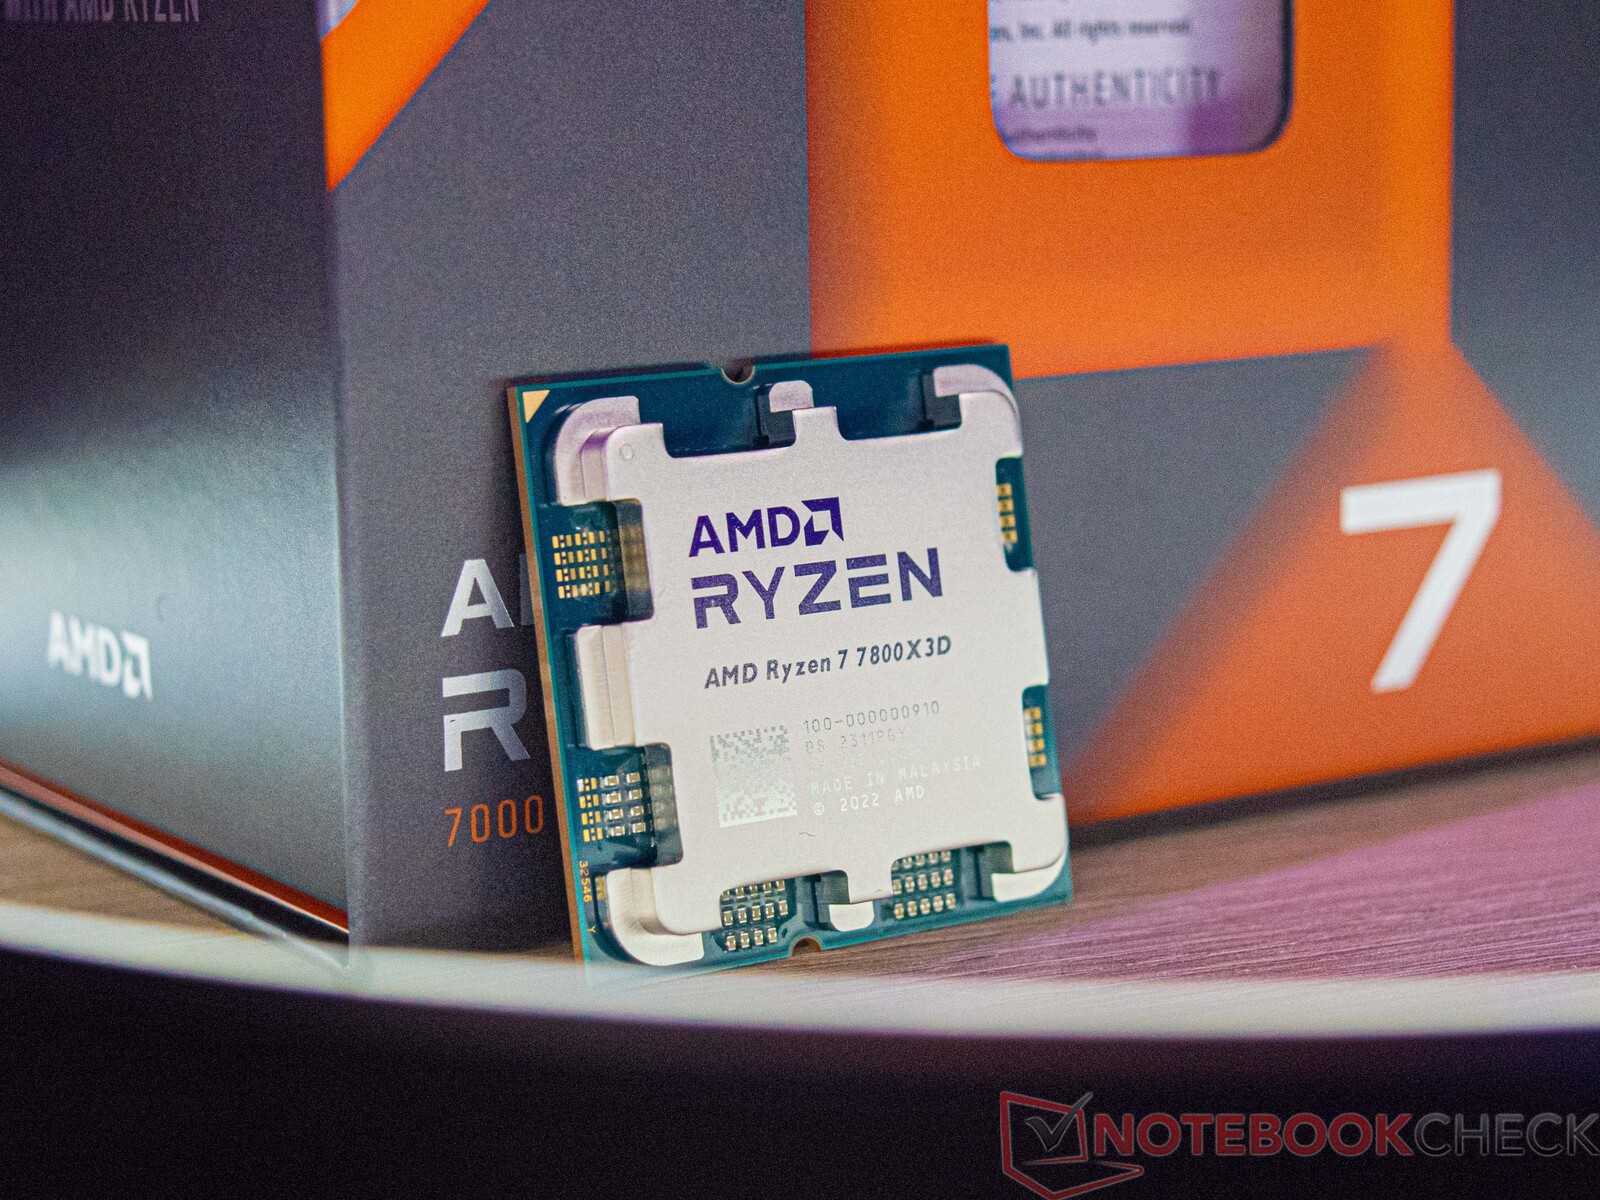
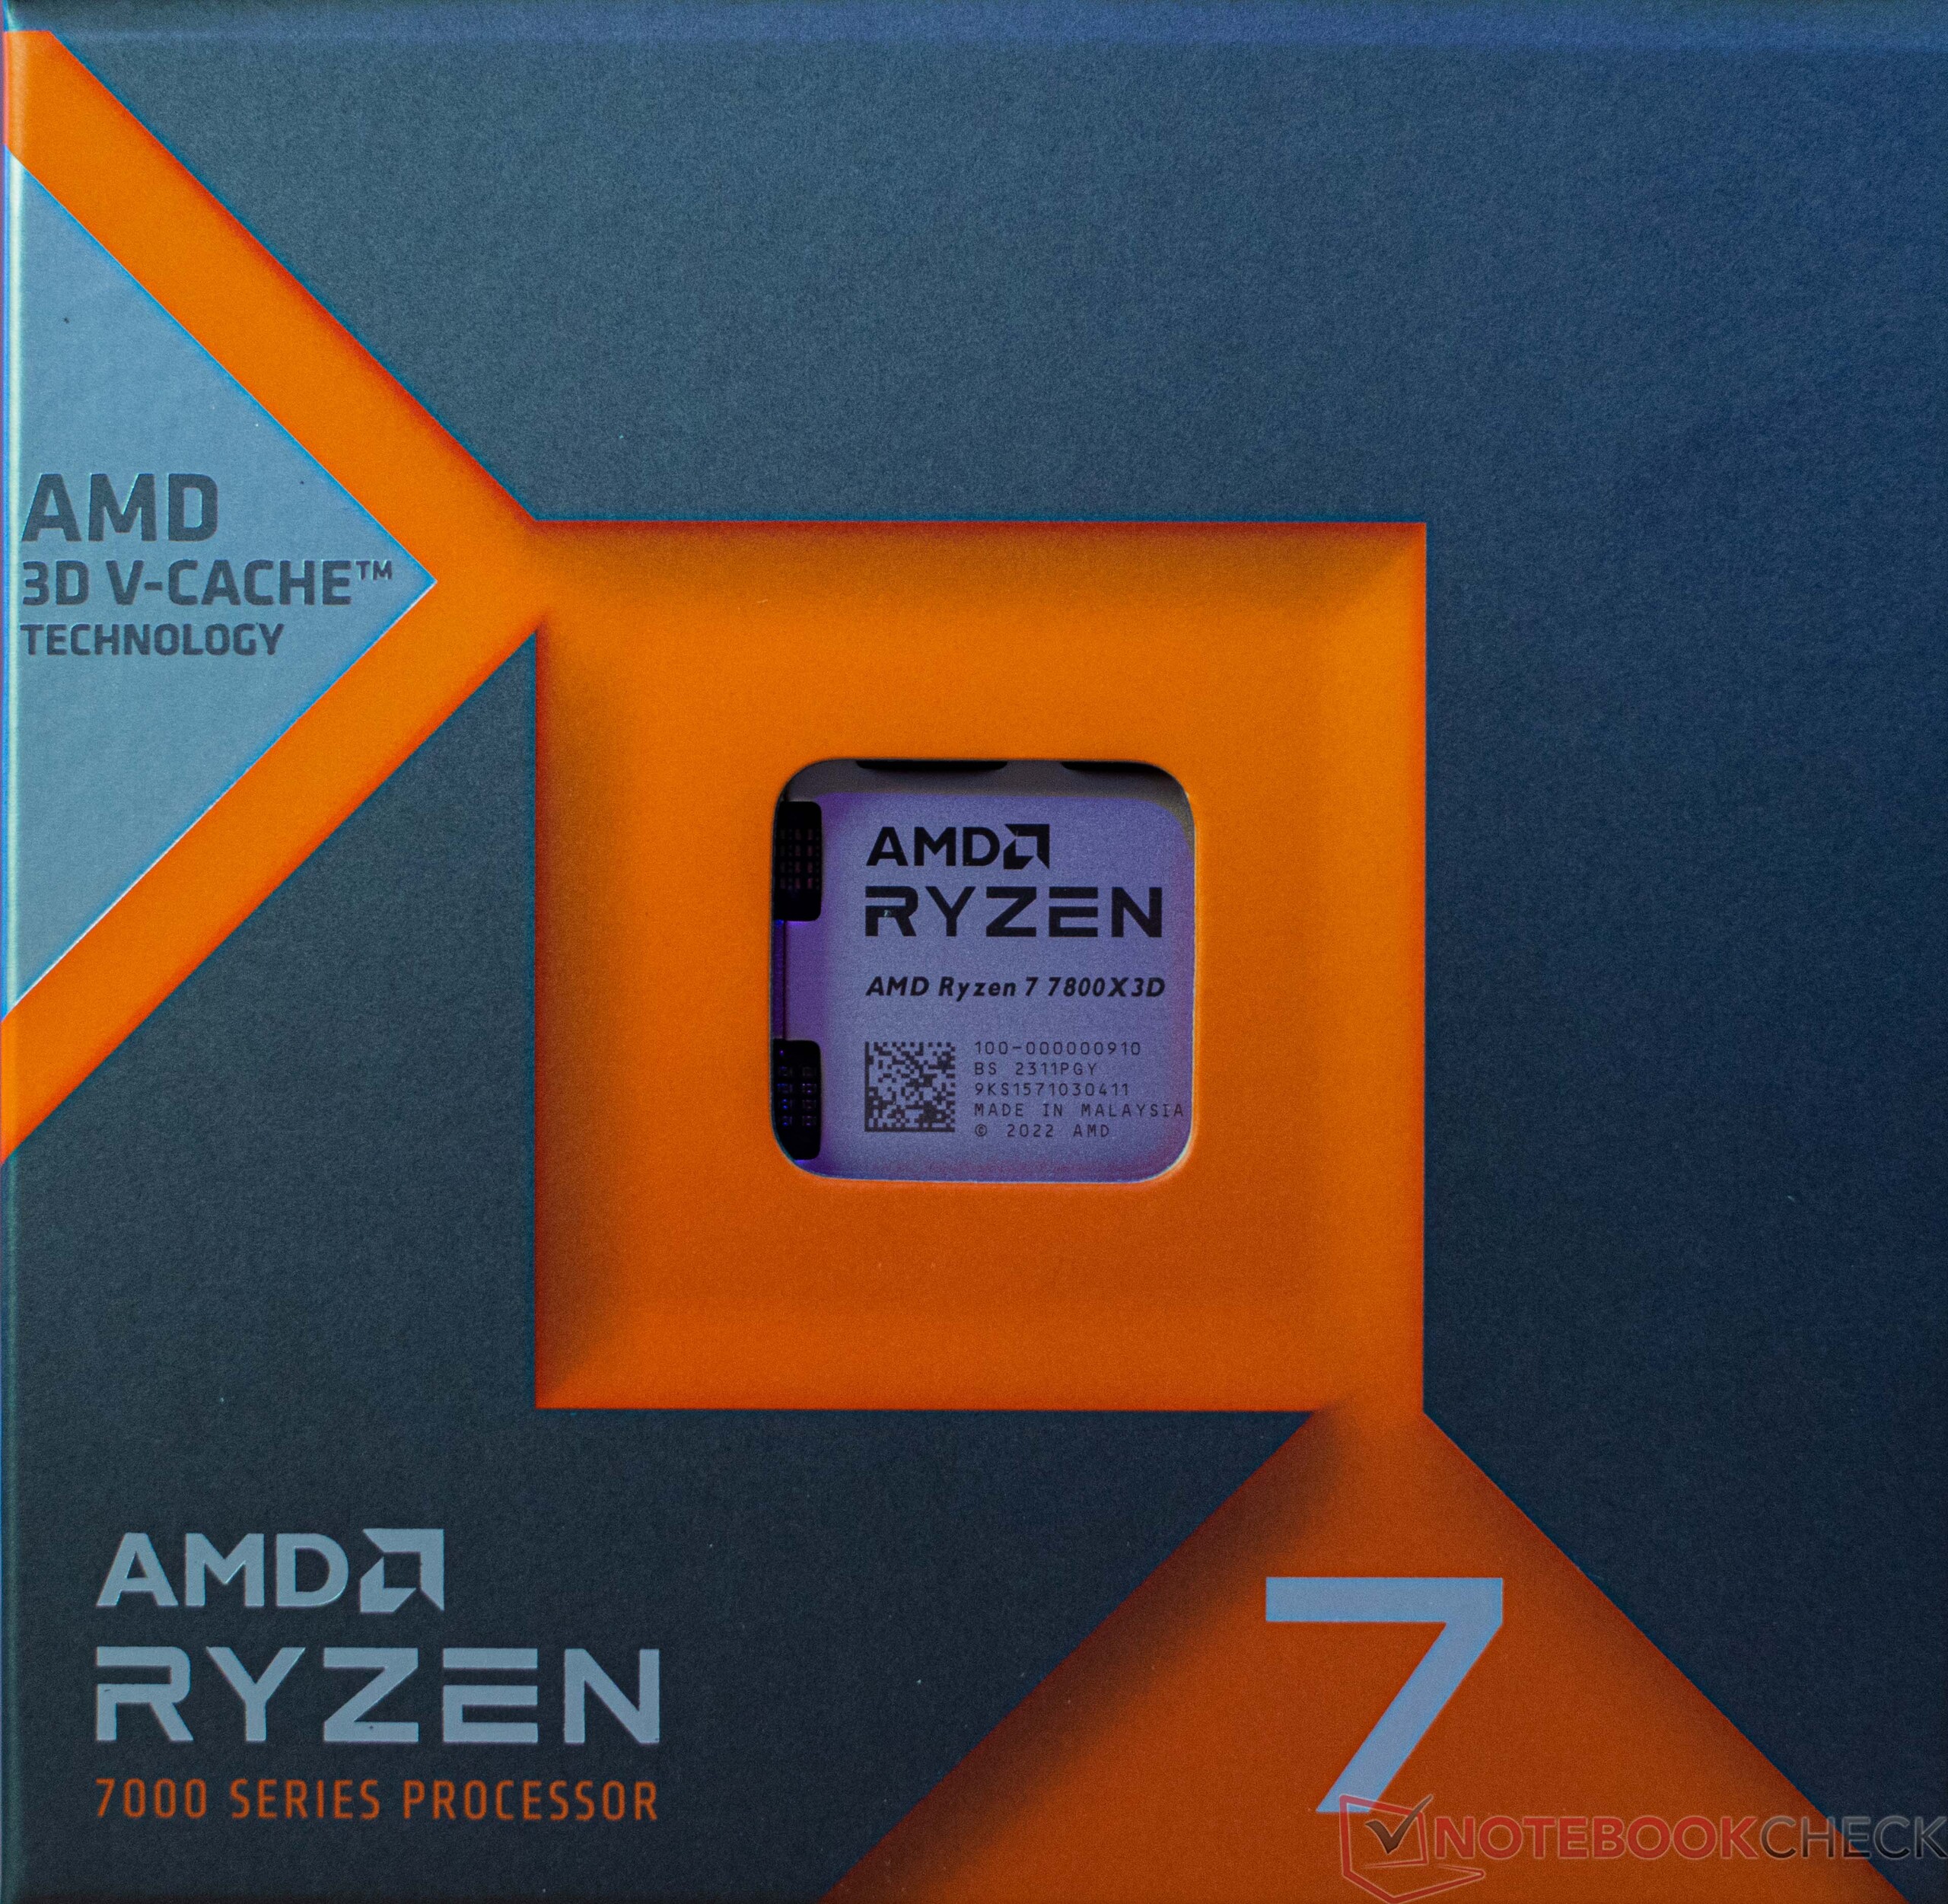
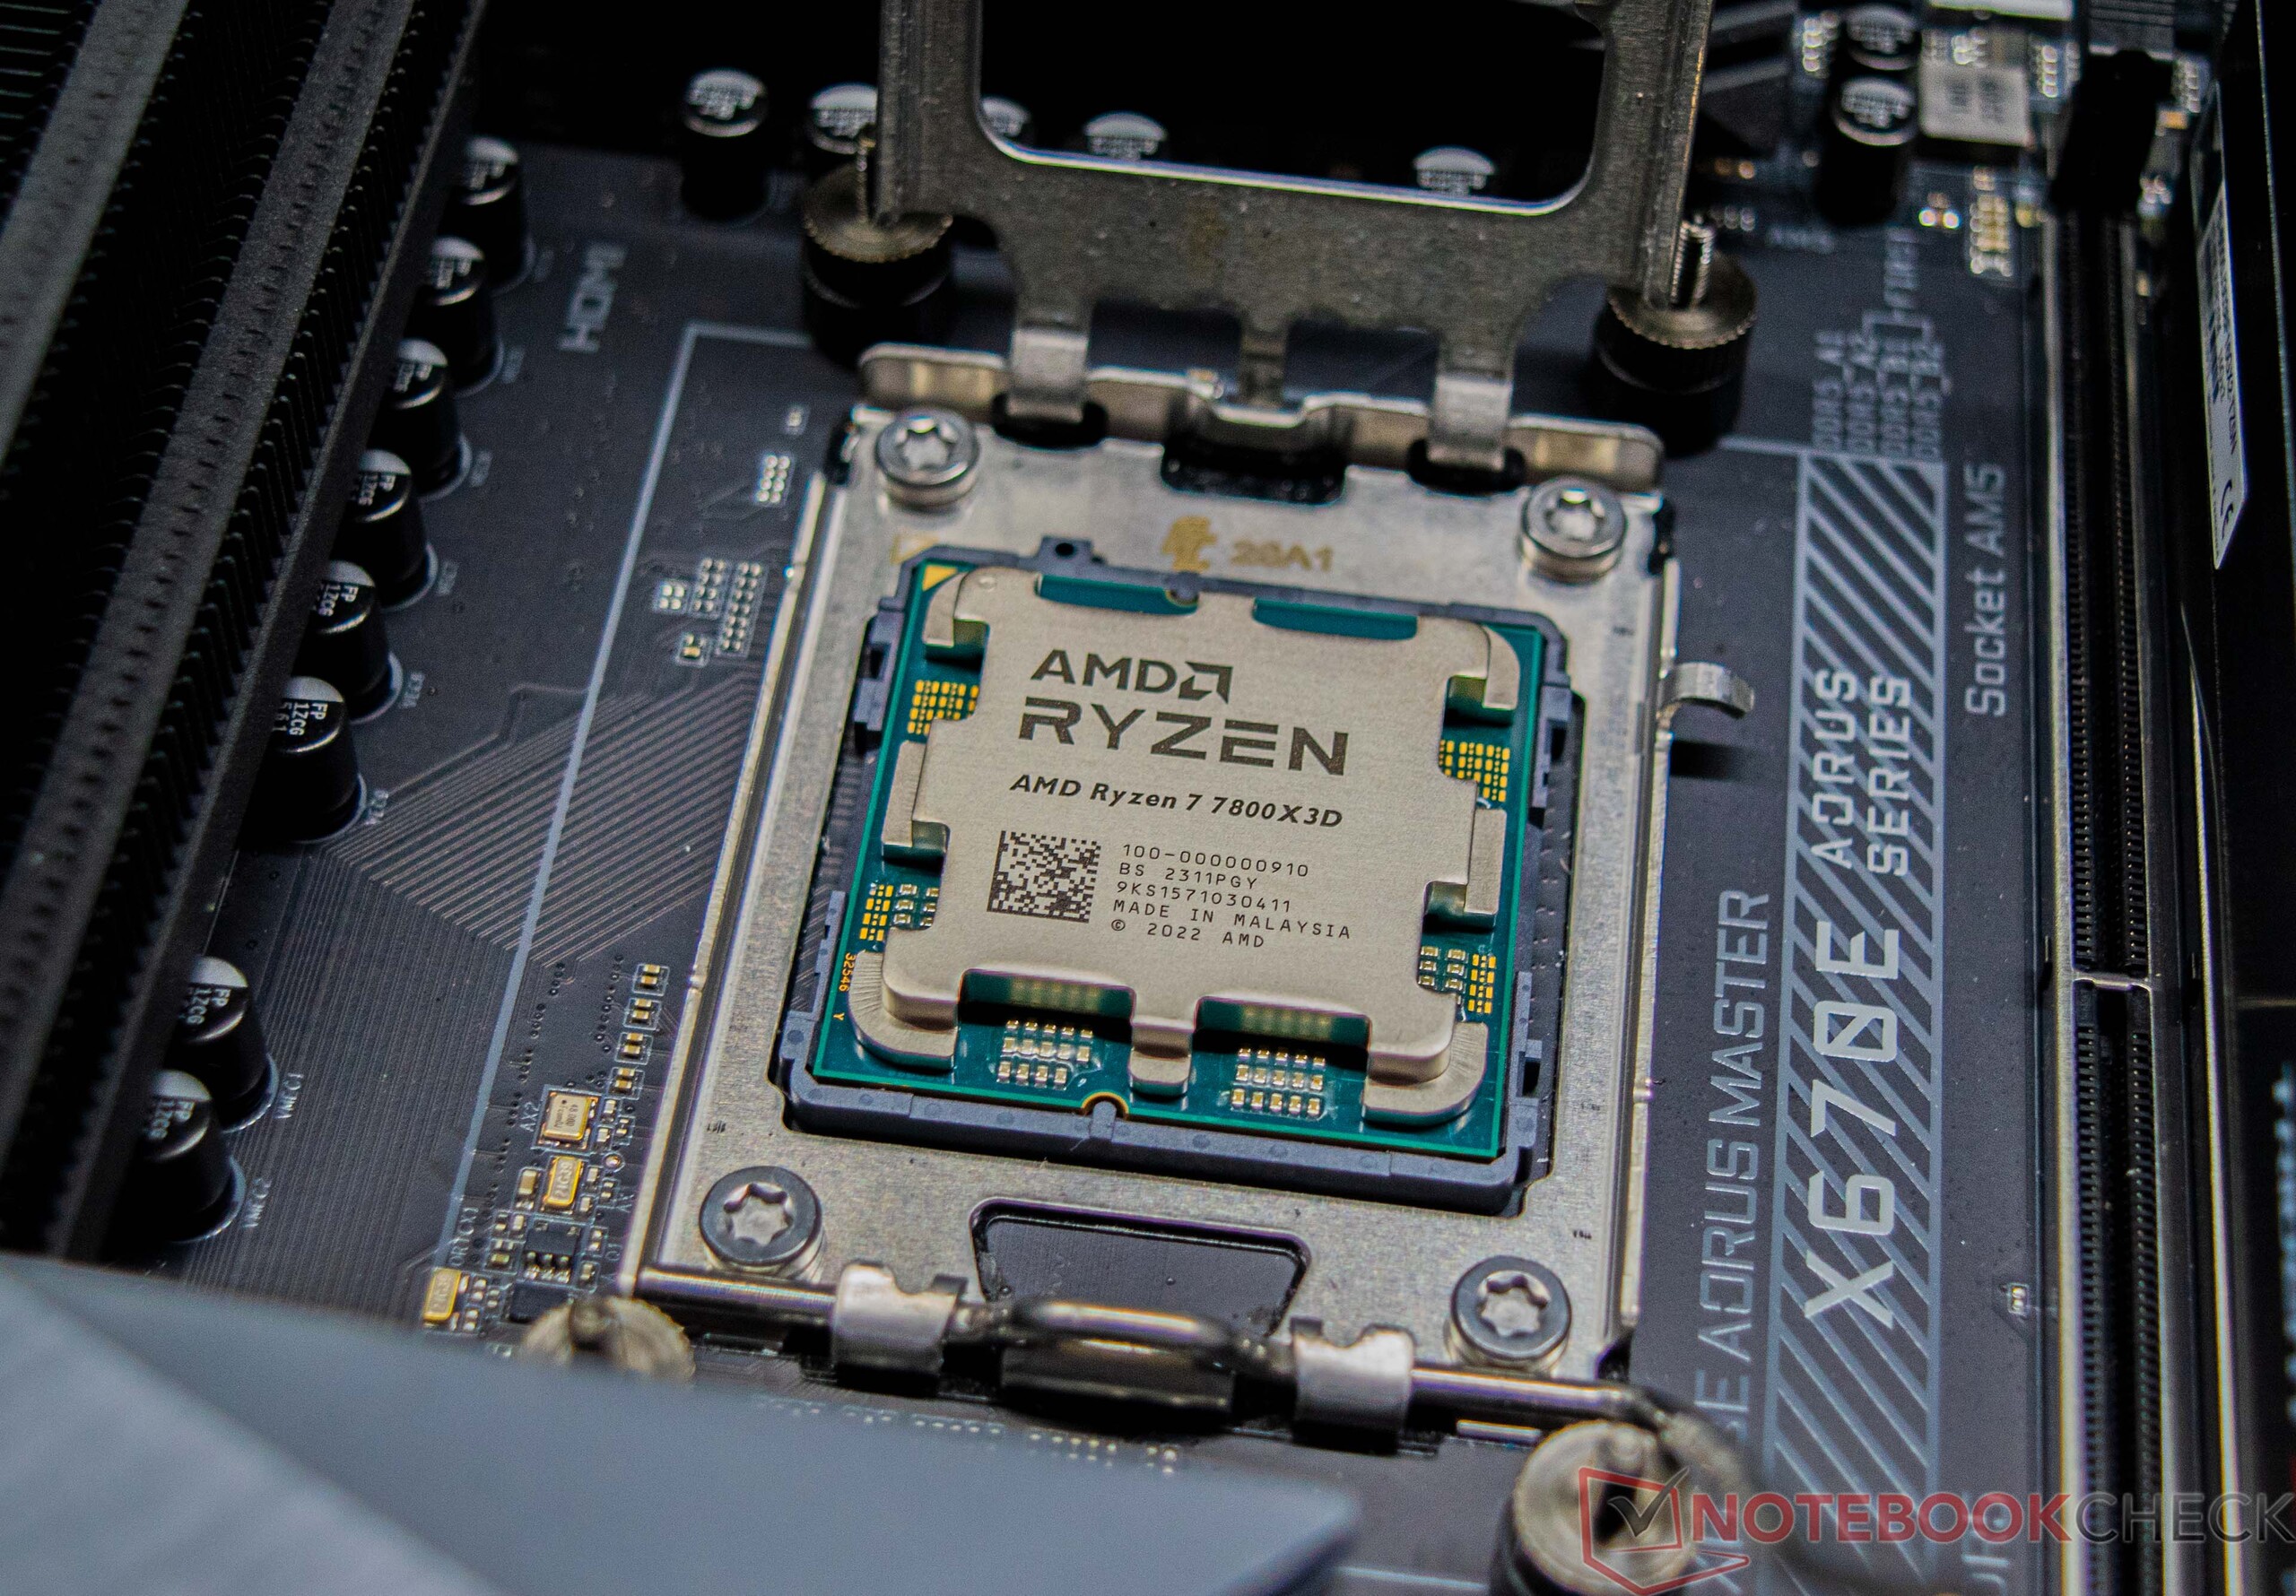
We already tested the AMD Ryzen 9 7950X3D thoroughly and were impressed by its great performance and low power consumption. We will see how well the AMD Ryzen 7 7800X3D fares in comparison. In general, its 3D V-Cache should result in an increase in performance, meaning the AMD Ryzen 7 5800X3D based on AM4 should still be quite popular. However, its internal build is different compared to both of the Ryzen 9 models which have this 3D V-Cache. The AMD Ryzen 7 7800X3D only has one CCD with 8 cores including fast cache, and in turn, the Ryzen 9 models have two CCDs with 6 and 8 CPU cores, respectively. But, only one of the CCDs is equipped with the 3D V-Cache, whereas the other CCD is well-known from the AMD Ryzen 9 7950X. A CCD is the actual CPU die underneath the heat spreader, which combines a maximum of eight cores.
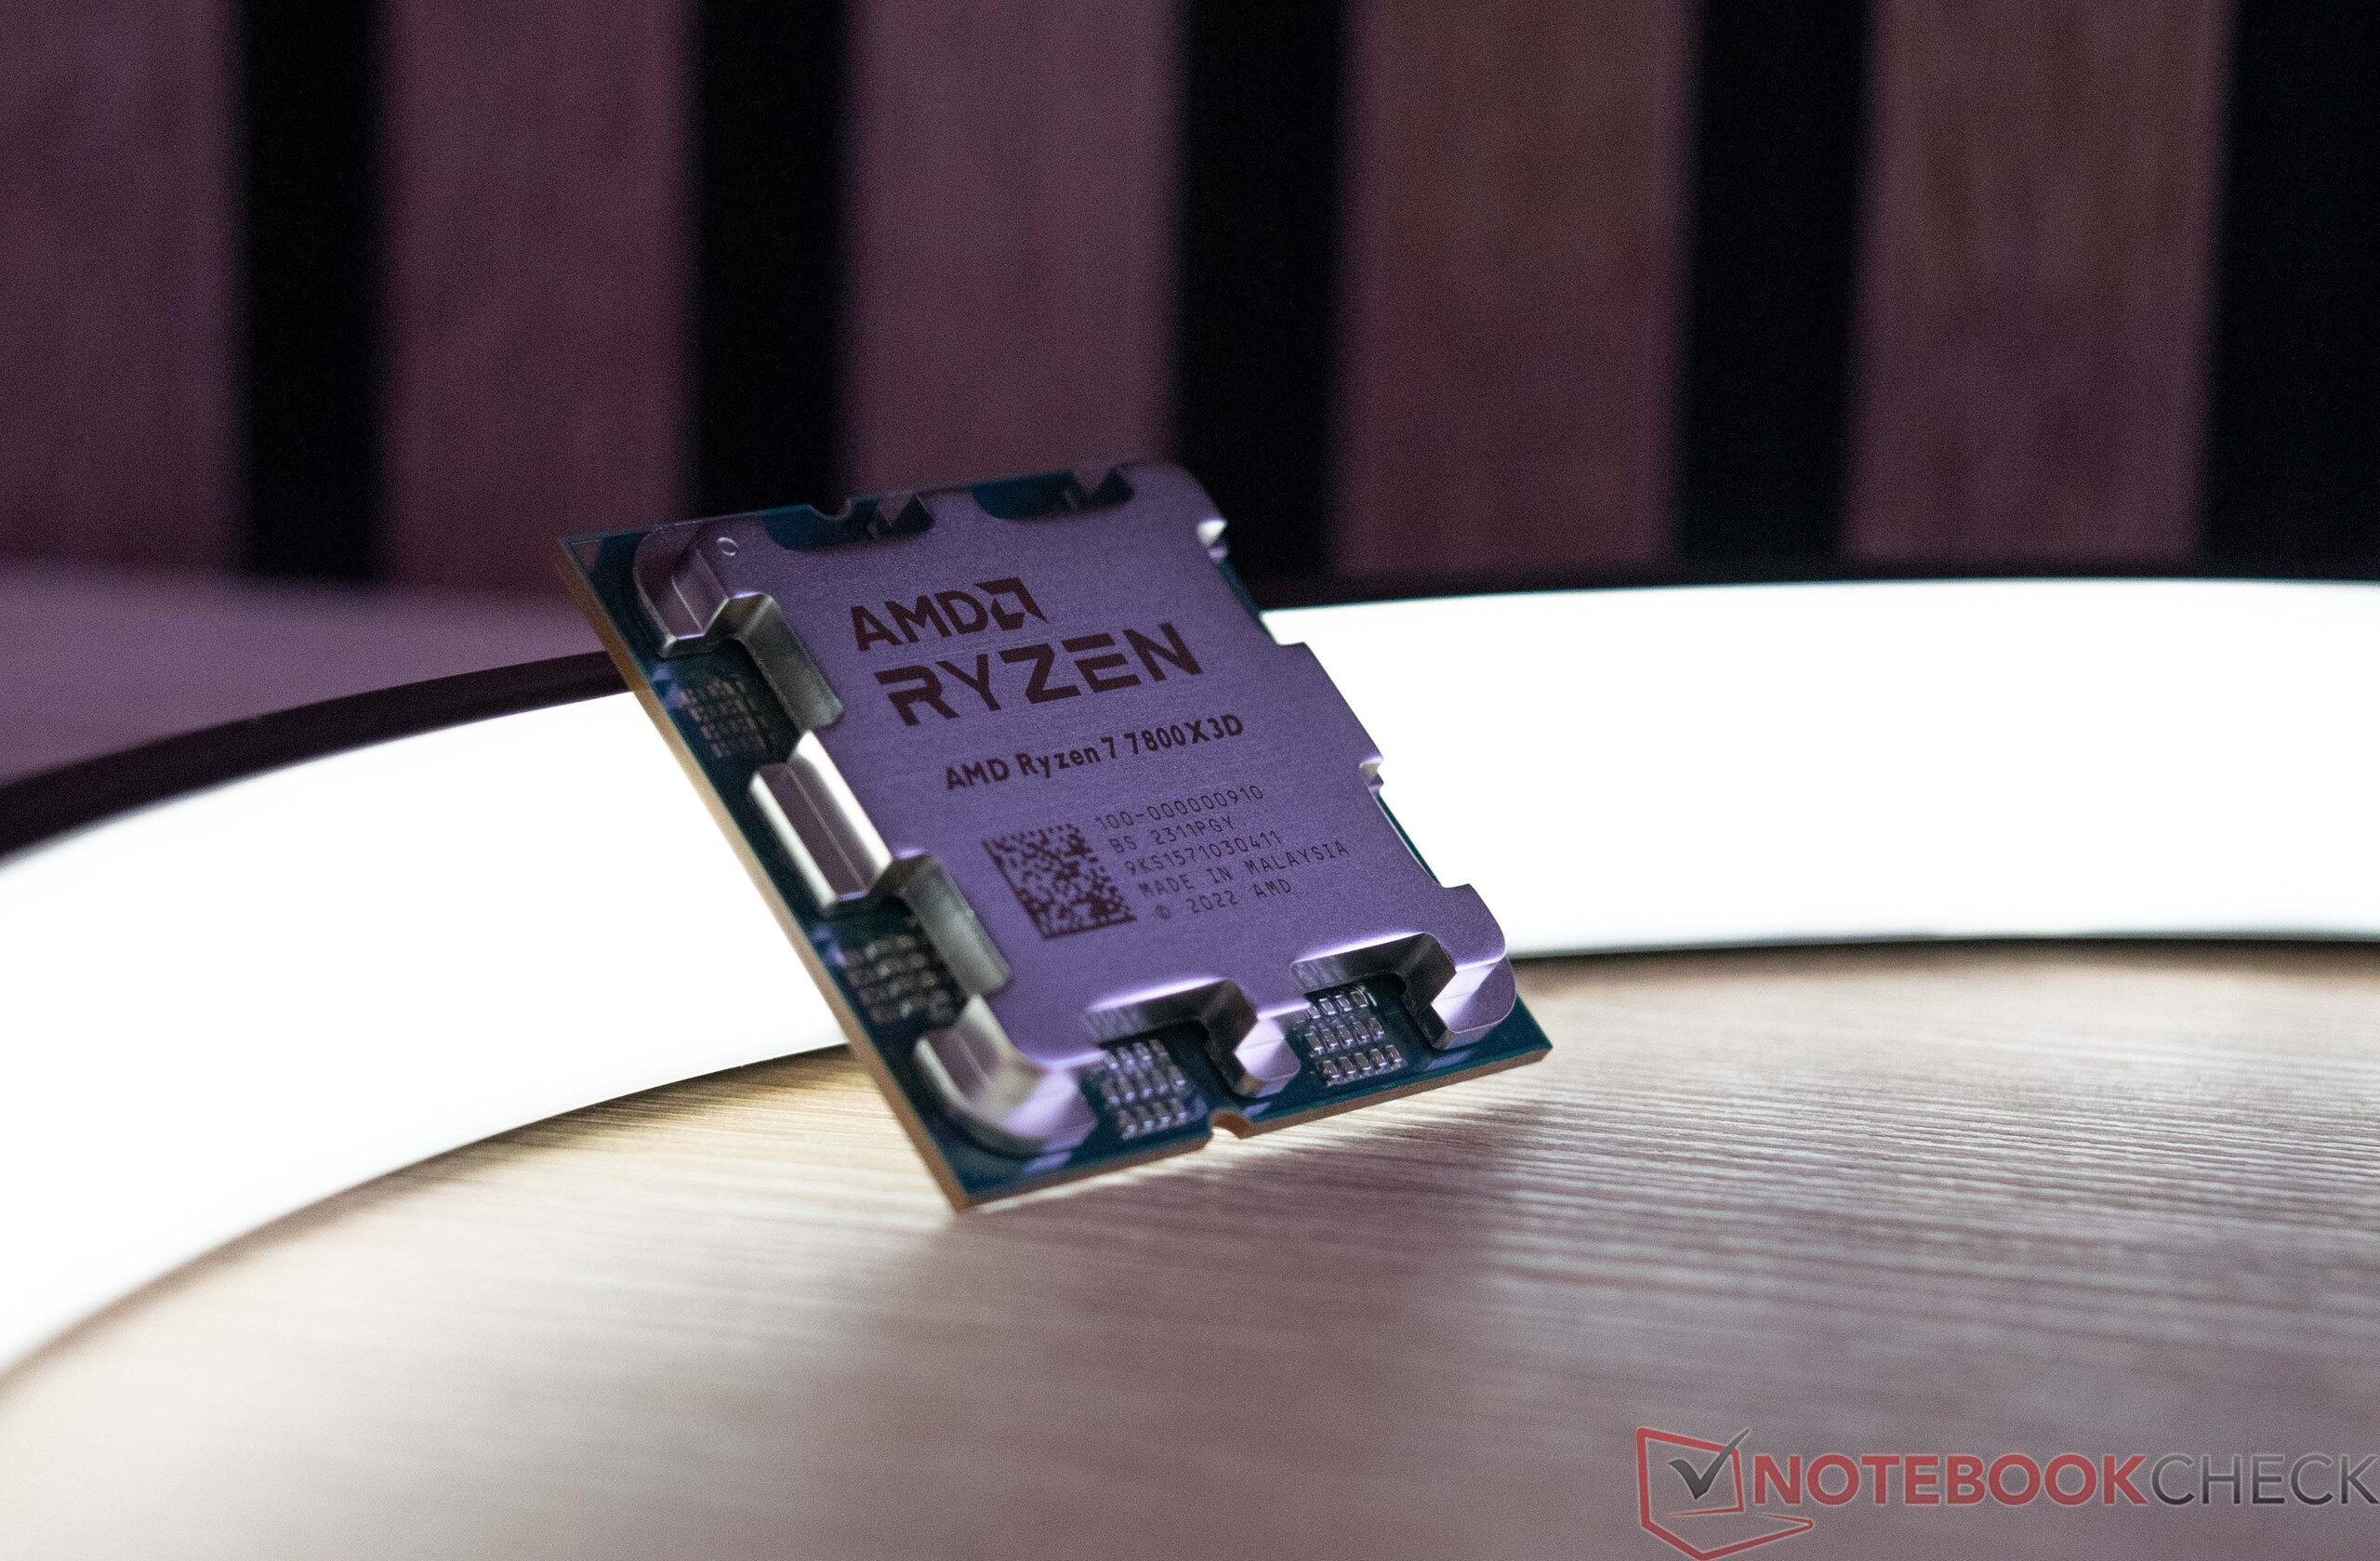
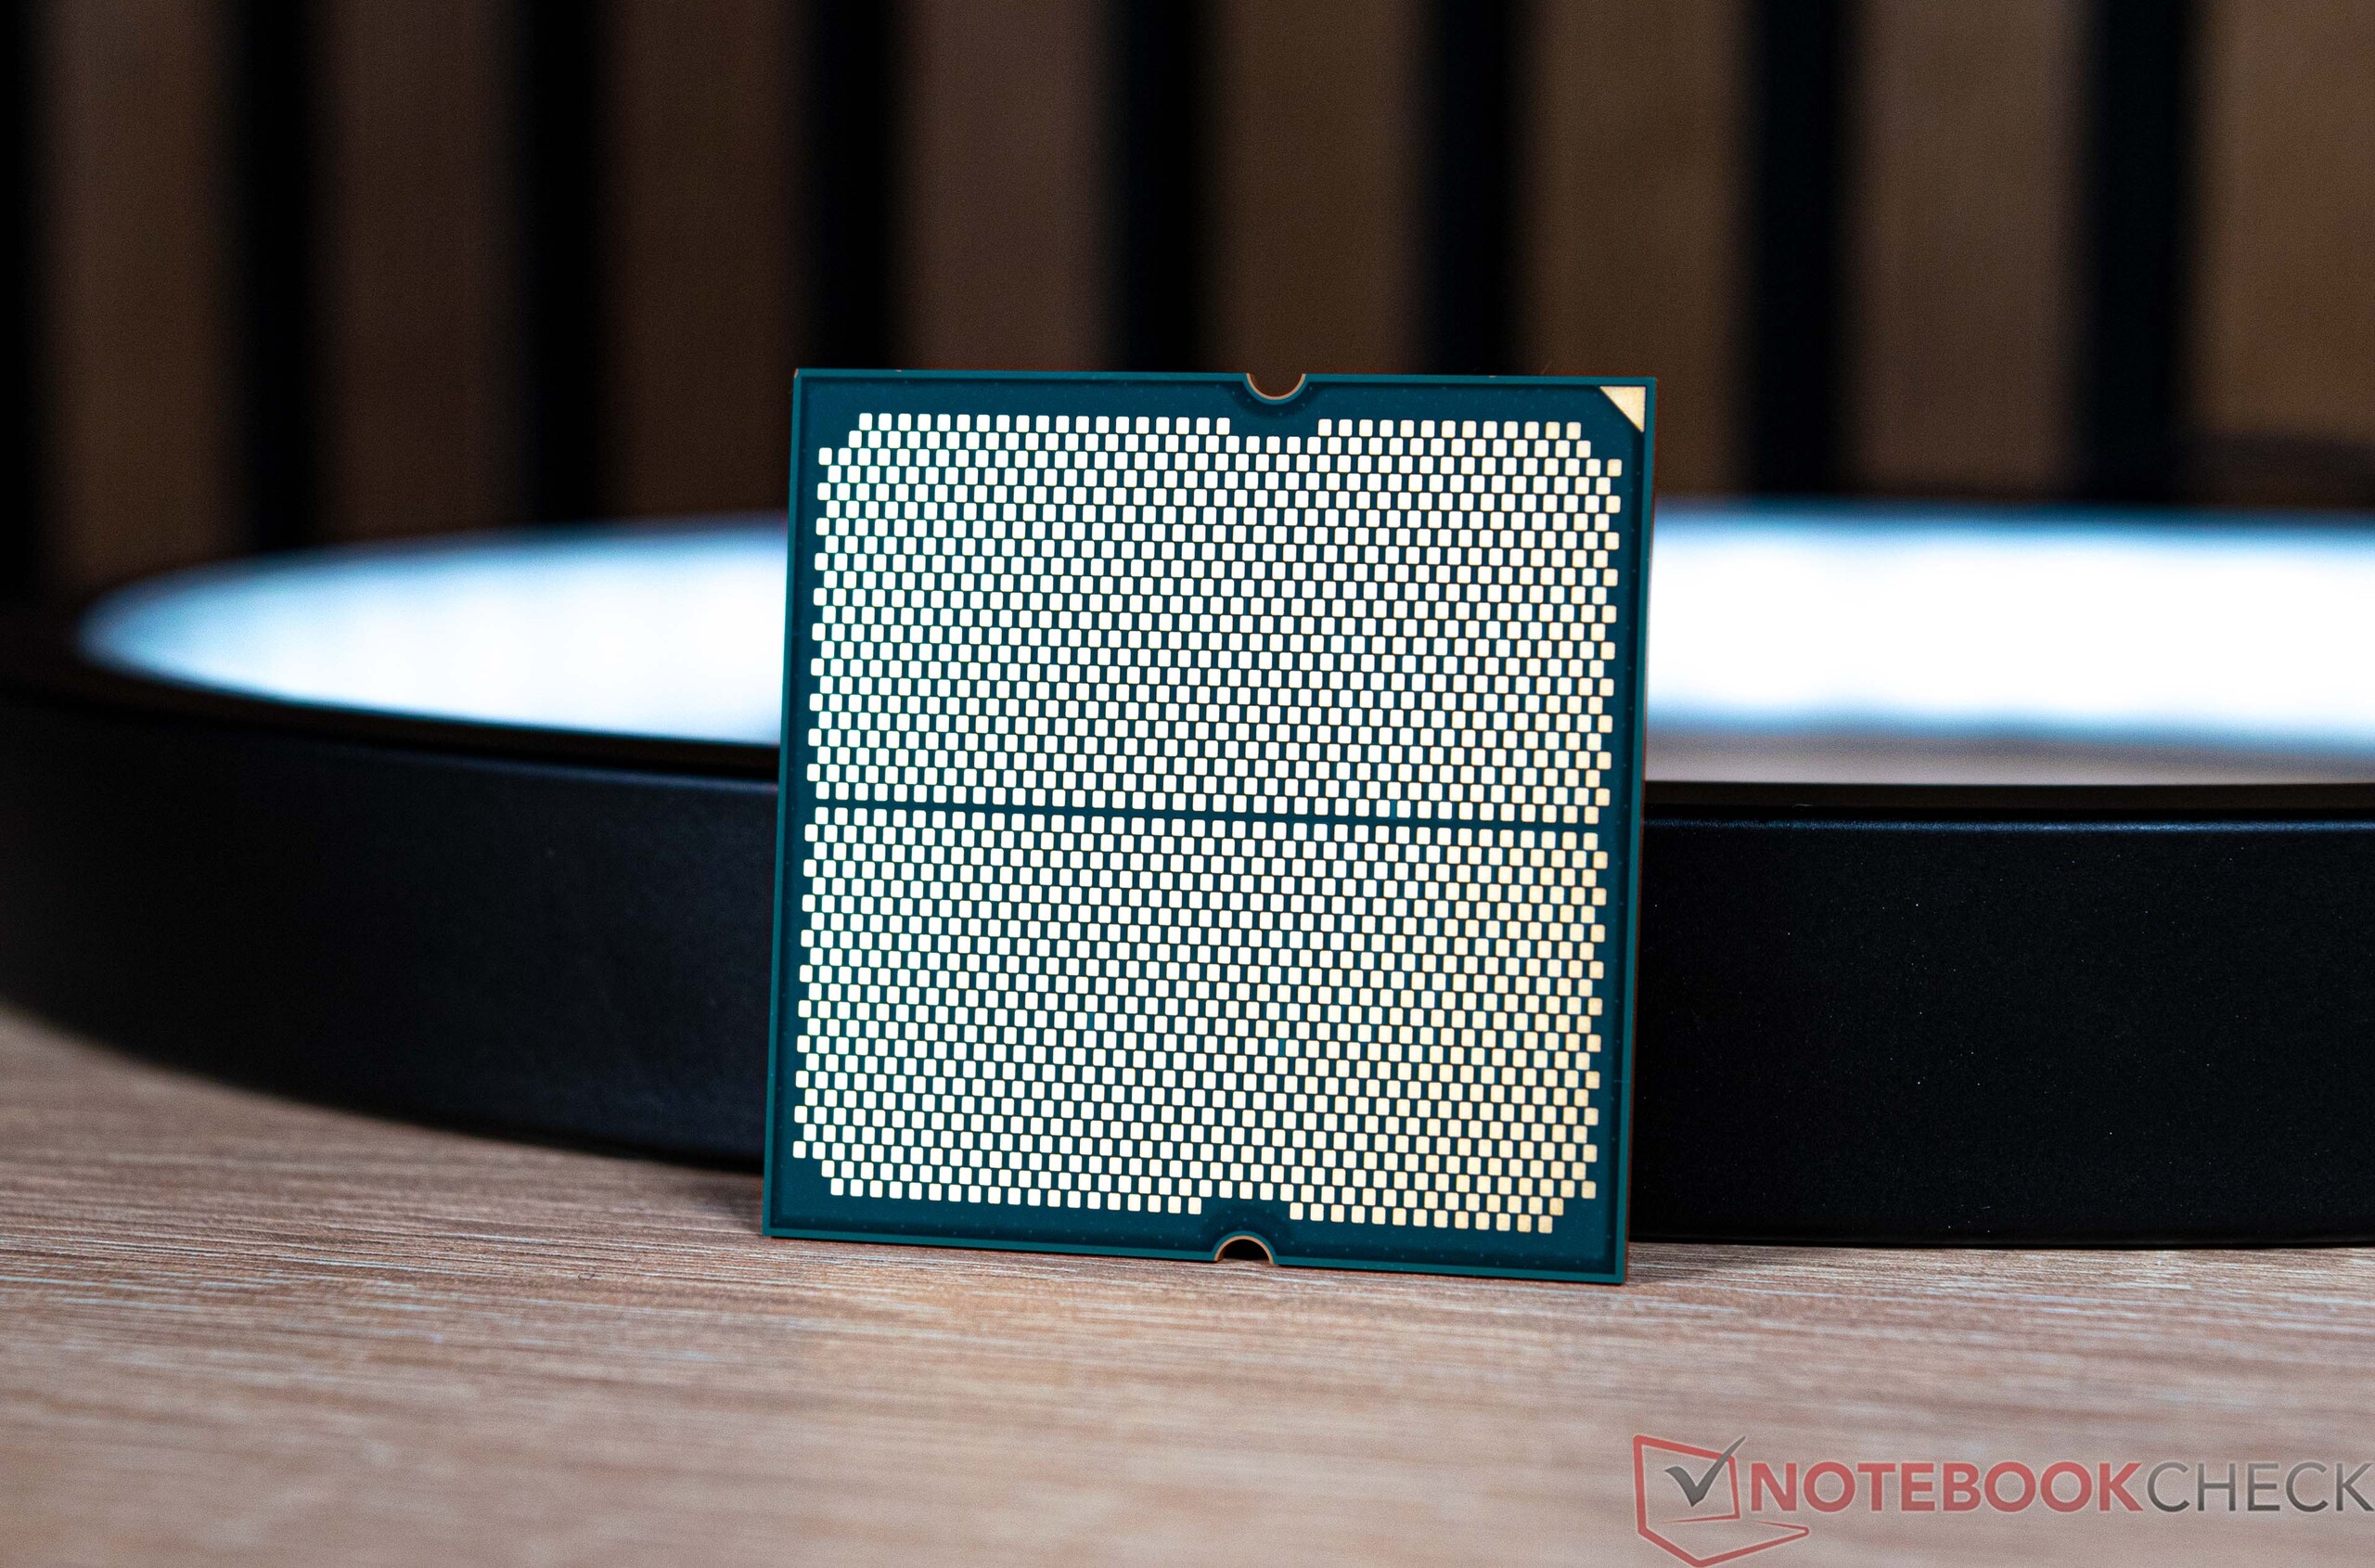
The AMD Ryzen 7 7800X3D, like all processors of the Ryzen 7000 series, requires the socket AM5 (1,718 contacts). Upgrading from a 5000-series Ryzen or older means buying a new motherboard and having to invest in new RAM. With regard to power consumption, the manufacturer notes a TDP of 120 watts. Its maximum power consumption, however, is limited to 162 watts by the PPT (Package Power Tracking).
Die AMD-Ryzen-7000-Familie im Überblick
| Model | Cores/Threads | Base clock | Turbo clock | L2-Cache | L3-Cache | TDP | PPT | Launch price |
|---|---|---|---|---|---|---|---|---|
| Ryzen 9 7950X3D | 16/32 | 4.2 GHz | 5.7 GHz | 16x 1 MB | 128 MB | 120 watts | 162 watts | 699 USD |
| Ryzen 9 7950X | 16/32 | 4.5 GHz | 5.7 GHz | 16x 1 MB | 64 MB | 170 watts | 230 watts | 699 USD |
| Ryzen 9 7900X3D | 12/24 | 4.4 GHz | 5.6 GHz | 12x 1 MB | 128 MB | 120 watts | 162 watts | 599 USD |
| Ryzen 9 7900X | 12/24 | 4.7 GHz | 5.6 GHz | 12x 1 MB | 64 MB | 170 watts | 230 watts | 549 USD |
| Ryzen 7 7800X3D | 8/16 | 4.2 GHz | 5.0 GHz | 8x 1 MB | 96 MB | 120 watts | 162 watts | 549 USD |
| Ryzen 7 7700X | 8/16 | 4.5 GHz | 5.4 GHz | 8x 1 MB | 32 MB | 105 watts | 142 watts | 399 USD |
| Ryzen 5 7600X | 6/12 | 4.7 GHz | 5.3 GHz | 6x 1 MB | 32 MB | 105 watts | 142 watts | 299 USD |
Our test system in detail
We used this system for the following benchmarks and tests:
- Lian Li O11 Dynamic
- AMD Ryzen 7 7800X3D
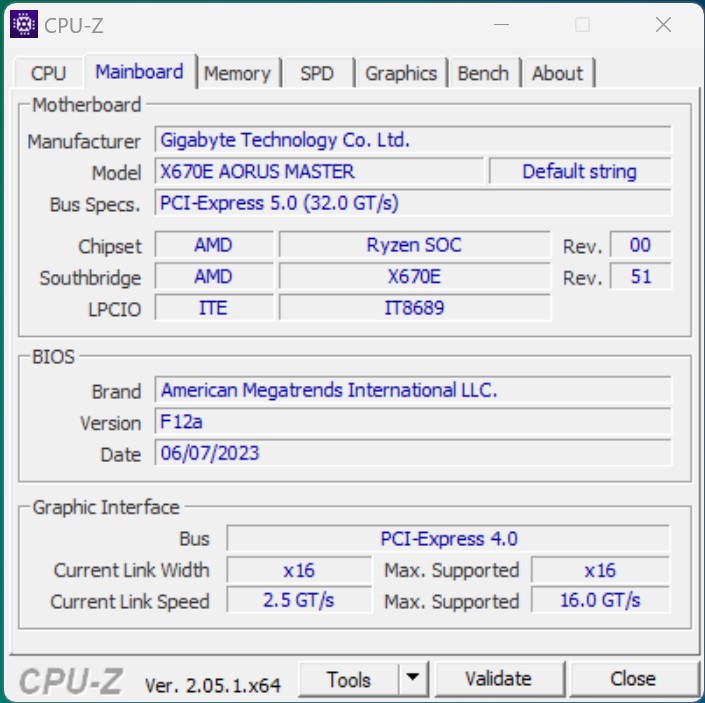
- Gigabyte X670E Aorus Master, BIOS: F12a
- Palit GeForce RTX 4090 GameRock OC
- DeepCool LT360
- Corsair HX1200i
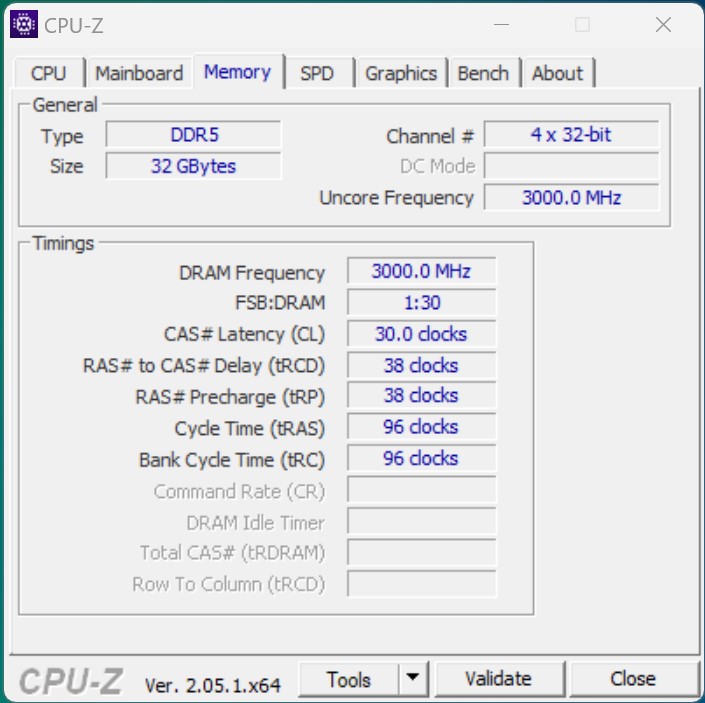
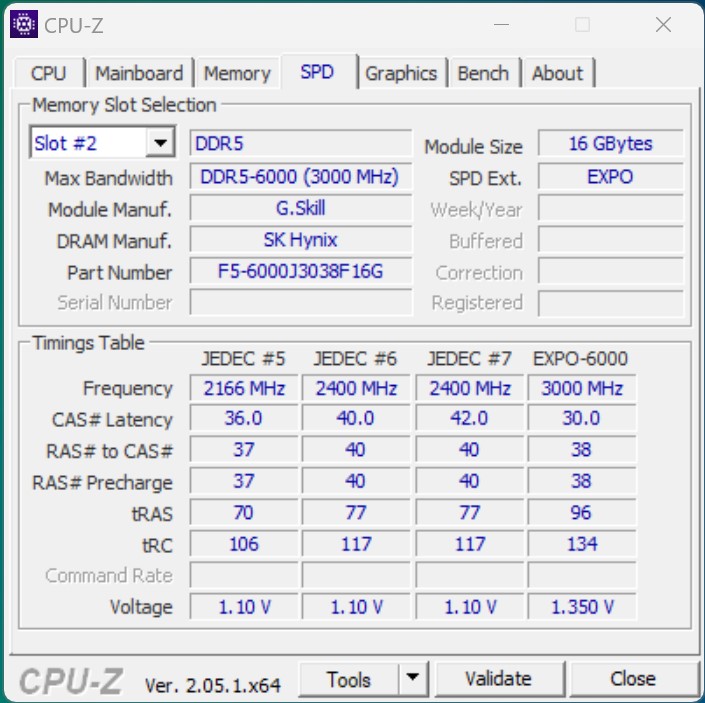
- G.Skill Trident Z5 Neo DDR5-6000 2x 16 GB, EXPO (DDR5-6000 CL30-38-38-96)
- Corsair MP600
- Microsoft Windows 11 Professional 64 Bit (Version 22H2)

Testing conditions
We performed all performance tests using the energy profile "Highest Performance". We only deviated from this during the power consumption measurements. A DeepCool LT360 AiO solution was used as the cooling unit in this test. According to the manufacturer, this is listed among the compatible cooling units for the AMD Ryzen 7000 processors. Subsequently, you will be on the safe side using this so as to not violate the manufacturer's specifications.
Processor benchmarks - An average Ryzen 7 7800X3D
Before we take a look at the gaming benchmarks, we will first cast a glance at the processor's pure CPU performance. With the help of a variety of benchmarks, we noted that the AMD Ryzen 7 7800X3D achieved about as good a performance rating as an AMD Ryzen 9 5950X. Compared to Intel, this was enough to defeat the AMD Ryzen 9 5950X. At this point, we would like to reiterate that the AMD Ryzen 7 7800X3D is an 8-core processor. This means it is considerably worse off in the multi-thread benchmarks than a lot of its competitors.
Compared to the AMD Ryzen 9 7950X3D, the smaller Ryzen 7 7800X3D lay around 24 per cent behind. At this stage, the Intel Core i9-13900K did the best, coming in at one percentage point better than the previously top-of-the-range model from AMD.
Further processor benchmarks can be found here.
| Performance rating - Percent | |
| Intel Core i9-13900K | |
| AMD Ryzen 9 7950X | |
| AMD Ryzen 9 7950X3D | |
| Intel Core i7-13700K | |
| AMD Ryzen 9 7900X | |
| AMD Ryzen 9 5950X | |
| Intel Core i5-13600K | |
| AMD Ryzen 7 7800X3D | |
| Intel Core i7-12700 | |
| Intel Core i5-12600K | |
| Intel Core i5-13400 | |
| Cinebench R15 | |
| CPU Single 64Bit | |
| Intel Core i9-13900K | |
| AMD Ryzen 9 7950X3D | |
| AMD Ryzen 9 7900X | |
| AMD Ryzen 9 7950X | |
| Intel Core i7-13700K | |
| AMD Ryzen 7 7800X3D | |
| Intel Core i5-13600K | |
| Intel Core i5-12600K | |
| AMD Ryzen 9 5950X | |
| Intel Core i7-12700 | |
| Intel Core i5-13400 | |
| CPU Multi 64Bit | |
| AMD Ryzen 9 7950X | |
| Intel Core i9-13900K | |
| AMD Ryzen 9 7950X3D | |
| AMD Ryzen 9 7900X | |
| Intel Core i7-13700K | |
| AMD Ryzen 9 5950X | |
| Intel Core i5-13600K | |
| Intel Core i7-12700 | |
| AMD Ryzen 7 7800X3D | |
| Intel Core i5-12600K | |
| Intel Core i5-13400 | |
| Cinebench R20 | |
| CPU (Single Core) | |
| Intel Core i9-13900K | |
| Intel Core i7-13700K | |
| AMD Ryzen 9 7950X3D | |
| AMD Ryzen 9 7900X | |
| AMD Ryzen 9 7950X | |
| Intel Core i5-13600K | |
| Intel Core i5-12600K | |
| Intel Core i7-12700 | |
| AMD Ryzen 7 7800X3D | |
| Intel Core i5-13400 | |
| AMD Ryzen 9 5950X | |
| CPU (Multi Core) | |
| Intel Core i9-13900K | |
| AMD Ryzen 9 7950X | |
| AMD Ryzen 9 7950X3D | |
| Intel Core i7-13700K | |
| AMD Ryzen 9 7900X | |
| AMD Ryzen 9 5950X | |
| Intel Core i5-13600K | |
| Intel Core i7-12700 | |
| AMD Ryzen 7 7800X3D | |
| Intel Core i5-12600K | |
| Intel Core i5-13400 | |
| Cinebench R23 | |
| Single Core | |
| Intel Core i9-13900K | |
| Intel Core i7-13700K | |
| AMD Ryzen 9 7950X3D | |
| AMD Ryzen 9 7900X | |
| AMD Ryzen 9 7950X | |
| Intel Core i5-13600K | |
| Intel Core i5-12600K | |
| Intel Core i7-12700 | |
| AMD Ryzen 7 7800X3D | |
| Intel Core i5-13400 | |
| AMD Ryzen 9 5950X | |
| Multi Core | |
| Intel Core i9-13900K | |
| AMD Ryzen 9 7950X | |
| AMD Ryzen 9 7950X3D | |
| Intel Core i7-13700K | |
| AMD Ryzen 9 7900X | |
| AMD Ryzen 9 5950X | |
| Intel Core i5-13600K | |
| Intel Core i7-12700 | |
| AMD Ryzen 7 7800X3D | |
| Intel Core i5-12600K | |
| Intel Core i5-13400 | |
| Cinebench R11.5 | |
| CPU Single 64Bit | |
| Intel Core i9-13900K | |
| AMD Ryzen 9 7950X3D | |
| AMD Ryzen 9 7900X | |
| AMD Ryzen 9 7950X | |
| Intel Core i7-13700K | |
| Intel Core i5-13600K | |
| AMD Ryzen 7 7800X3D | |
| Intel Core i5-12600K | |
| Intel Core i7-12700 | |
| AMD Ryzen 9 5950X | |
| Intel Core i5-13400 | |
| CPU Multi 64Bit | |
| Intel Core i9-13900K | |
| AMD Ryzen 9 7950X | |
| AMD Ryzen 9 7950X3D | |
| AMD Ryzen 9 7900X | |
| Intel Core i7-13700K | |
| AMD Ryzen 9 5950X | |
| Intel Core i5-13600K | |
| Intel Core i7-12700 | |
| AMD Ryzen 7 7800X3D | |
| Intel Core i5-12600K | |
| Intel Core i5-13400 | |
| Blender - v2.79 BMW27 CPU | |
| Intel Core i5-13400 | |
| Intel Core i5-12600K | |
| AMD Ryzen 7 7800X3D | |
| Intel Core i7-12700 | |
| Intel Core i5-13600K | |
| AMD Ryzen 9 5950X | |
| AMD Ryzen 9 7900X | |
| Intel Core i7-13700K | |
| AMD Ryzen 9 7950X3D | |
| AMD Ryzen 9 7950X | |
| Intel Core i9-13900K | |
| wPrime 2.10 | |
| 32m | |
| Intel Core i5-12600K | |
| Intel Core i5-13400 | |
| Intel Core i7-12700 | |
| AMD Ryzen 9 5950X | |
| Intel Core i5-13600K | |
| AMD Ryzen 7 7800X3D | |
| Intel Core i7-13700K | |
| AMD Ryzen 9 7950X3D | |
| Intel Core i9-13900K | |
| AMD Ryzen 9 7900X | |
| AMD Ryzen 9 7950X | |
| 1024m | |
| Intel Core i5-13400 | |
| Intel Core i7-12700 | |
| Intel Core i5-12600K | |
| Intel Core i5-13600K | |
| Intel Core i7-13700K | |
| Intel Core i9-13900K | |
| AMD Ryzen 9 5950X | |
| AMD Ryzen 7 7800X3D | |
| AMD Ryzen 9 7900X | |
| AMD Ryzen 9 7950X3D | |
| AMD Ryzen 9 7950X | |
| X264 HD Benchmark 4.0 | |
| Pass 1 | |
| Intel Core i9-13900K | |
| Intel Core i7-13700K | |
| AMD Ryzen 9 7950X3D | |
| Intel Core i5-13600K | |
| AMD Ryzen 9 7950X | |
| AMD Ryzen 9 7900X | |
| Intel Core i7-12700 | |
| AMD Ryzen 7 7800X3D | |
| AMD Ryzen 9 5950X | |
| Intel Core i5-12600K | |
| Intel Core i5-13400 | |
| Pass 2 | |
| AMD Ryzen 9 7950X | |
| Intel Core i9-13900K | |
| AMD Ryzen 9 7950X3D | |
| AMD Ryzen 9 7900X | |
| Intel Core i7-13700K | |
| AMD Ryzen 9 5950X | |
| Intel Core i5-13600K | |
| Intel Core i7-12700 | |
| AMD Ryzen 7 7800X3D | |
| Intel Core i5-12600K | |
| Intel Core i5-13400 | |
| WinRAR - Result | |
| AMD Ryzen 9 7900X | |
| AMD Ryzen 7 7800X3D | |
| AMD Ryzen 9 7950X3D | |
| AMD Ryzen 9 7950X | |
| Intel Core i9-13900K | |
| Intel Core i7-13700K | |
| AMD Ryzen 9 5950X | |
| Intel Core i5-13600K | |
| Intel Core i7-12700 | |
| Intel Core i5-13400 | |
| Intel Core i5-12600K | |
| TrueCrypt | |
| AES Mean 100MB | |
| AMD Ryzen 9 7950X | |
| Intel Core i9-13900K | |
| AMD Ryzen 9 5950X | |
| AMD Ryzen 9 7950X3D | |
| Intel Core i5-13600K | |
| Intel Core i7-13700K | |
| AMD Ryzen 7 7800X3D | |
| AMD Ryzen 9 7900X | |
| Intel Core i7-12700 | |
| Intel Core i5-12600K | |
| Intel Core i5-13400 | |
| Twofish Mean 100MB | |
| Intel Core i9-13900K | |
| AMD Ryzen 9 7950X | |
| AMD Ryzen 9 7950X3D | |
| Intel Core i7-13700K | |
| AMD Ryzen 9 5950X | |
| Intel Core i5-13600K | |
| AMD Ryzen 9 7900X | |
| Intel Core i7-12700 | |
| Intel Core i5-12600K | |
| AMD Ryzen 7 7800X3D | |
| Intel Core i5-13400 | |
| Serpent Mean 100MB | |
| Intel Core i9-13900K | |
| AMD Ryzen 9 7950X | |
| AMD Ryzen 9 7950X3D | |
| AMD Ryzen 9 5950X | |
| Intel Core i7-13700K | |
| Intel Core i5-13600K | |
| AMD Ryzen 9 7900X | |
| Intel Core i7-12700 | |
| Intel Core i5-12600K | |
| AMD Ryzen 7 7800X3D | |
| Intel Core i5-13400 | |
| Geekbench 5.5 | |
| Multi-Core | |
| AMD Ryzen 9 7950X3D | |
| Intel Core i9-13900K | |
| AMD Ryzen 9 7950X | |
| AMD Ryzen 9 7900X | |
| Intel Core i7-13700K | |
| AMD Ryzen 9 5950X | |
| Intel Core i5-13600K | |
| Intel Core i7-12700 | |
| AMD Ryzen 7 7800X3D | |
| Intel Core i5-12600K | |
| Intel Core i5-13400 | |
| Single-Core | |
| AMD Ryzen 9 7950X3D | |
| Intel Core i9-13900K | |
| AMD Ryzen 9 7900X | |
| AMD Ryzen 9 7950X | |
| Intel Core i7-13700K | |
| AMD Ryzen 7 7800X3D | |
| Intel Core i5-13600K | |
| Intel Core i7-12700 | |
| Intel Core i5-12600K | |
| Intel Core i5-13400 | |
| AMD Ryzen 9 5950X | |
| Geekbench 5.0 | |
| 5.0 Multi-Core | |
| Intel Core i9-13900K | |
| AMD Ryzen 9 7950X3D | |
| AMD Ryzen 9 7950X | |
| AMD Ryzen 9 7900X | |
| Intel Core i7-13700K | |
| Intel Core i5-13600K | |
| AMD Ryzen 9 5950X | |
| Intel Core i7-12700 | |
| AMD Ryzen 7 7800X3D | |
| Intel Core i5-12600K | |
| Intel Core i5-13400 | |
| 5.0 Single-Core | |
| Intel Core i9-13900K | |
| AMD Ryzen 9 7900X | |
| AMD Ryzen 9 7950X3D | |
| AMD Ryzen 9 7950X | |
| Intel Core i7-13700K | |
| AMD Ryzen 7 7800X3D | |
| Intel Core i5-13600K | |
| Intel Core i7-12700 | |
| Intel Core i5-12600K | |
| Intel Core i5-13400 | |
| AMD Ryzen 9 5950X | |
| Geekbench 4.4 | |
| 64 Bit Single-Core Score | |
| Intel Core i9-13900K | |
| AMD Ryzen 9 7950X3D | |
| AMD Ryzen 9 7900X | |
| AMD Ryzen 7 7800X3D | |
| AMD Ryzen 9 7950X | |
| Intel Core i7-13700K | |
| Intel Core i5-13600K | |
| Intel Core i5-12600K | |
| Intel Core i7-12700 | |
| Intel Core i5-13400 | |
| AMD Ryzen 9 5950X | |
| 64 Bit Multi-Core Score | |
| AMD Ryzen 9 7950X3D | |
| Intel Core i9-13900K | |
| AMD Ryzen 9 7950X | |
| AMD Ryzen 9 7900X | |
| Intel Core i7-13700K | |
| AMD Ryzen 9 5950X | |
| Intel Core i5-13600K | |
| AMD Ryzen 7 7800X3D | |
| Intel Core i7-12700 | |
| Intel Core i5-12600K | |
| Intel Core i5-13400 | |
| 3DMark 11 - 1280x720 Performance Physics | |
| AMD Ryzen 9 7950X3D | |
| AMD Ryzen 7 7800X3D | |
| AMD Ryzen 9 7950X | |
| Intel Core i9-13900K | |
| Intel Core i7-13700K | |
| Intel Core i5-13600K | |
| AMD Ryzen 9 7900X | |
| Intel Core i7-12700 | |
| AMD Ryzen 9 5950X | |
| Intel Core i5-12600K | |
| Intel Core i5-13400 | |
| 7-Zip 18.03 | |
| 7z b 4 | |
| AMD Ryzen 9 7950X3D | |
| AMD Ryzen 9 7950X | |
| Intel Core i9-13900K | |
| AMD Ryzen 9 5950X | |
| AMD Ryzen 9 7900X | |
| Intel Core i7-13700K | |
| Intel Core i5-13600K | |
| AMD Ryzen 7 7800X3D | |
| Intel Core i7-12700 | |
| Intel Core i5-12600K | |
| Intel Core i5-13400 | |
| 7z b 4 -mmt1 | |
| AMD Ryzen 9 7950X3D | |
| AMD Ryzen 9 7900X | |
| AMD Ryzen 7 7800X3D | |
| AMD Ryzen 9 7950X | |
| Intel Core i9-13900K | |
| Intel Core i7-13700K | |
| AMD Ryzen 9 5950X | |
| Intel Core i5-13600K | |
| Intel Core i7-12700 | |
| Intel Core i5-12600K | |
| Intel Core i5-13400 | |
| HWBOT x265 Benchmark v2.2 - 4k Preset | |
| AMD Ryzen 9 7950X | |
| Intel Core i9-13900K | |
| AMD Ryzen 9 7950X3D | |
| AMD Ryzen 9 7900X | |
| Intel Core i7-13700K | |
| AMD Ryzen 9 5950X | |
| Intel Core i5-12600K | |
| Intel Core i5-13600K | |
| Intel Core i7-12700 | |
| AMD Ryzen 7 7800X3D | |
| Intel Core i5-13400 | |
| R Benchmark 2.5 - Overall mean | |
| Intel Core i5-13400 | |
| AMD Ryzen 9 5950X | |
| Intel Core i5-12600K | |
| Intel Core i7-12700 | |
| AMD Ryzen 7 7800X3D | |
| Intel Core i5-13600K | |
| Intel Core i7-13700K | |
| AMD Ryzen 9 7950X | |
| AMD Ryzen 9 7900X | |
| AMD Ryzen 9 7950X3D | |
| Intel Core i9-13900K | |
| LibreOffice - 20 Documents To PDF | |
| Intel Core i5-12600K | |
| AMD Ryzen 9 5950X | |
| AMD Ryzen 7 7800X3D | |
| Intel Core i5-13400 | |
| AMD Ryzen 9 7950X3D | |
| Intel Core i7-12700 | |
| Intel Core i9-13900K | |
| AMD Ryzen 9 7950X | |
| Intel Core i5-13600K | |
| AMD Ryzen 9 7900X | |
| Intel Core i7-13700K | |
| WebXPRT 3 - Overall | |
| AMD Ryzen 9 7950X3D | |
| AMD Ryzen 9 7900X | |
| Intel Core i9-13900K | |
| AMD Ryzen 9 7950X | |
| AMD Ryzen 7 7800X3D | |
| Intel Core i7-13700K | |
| Intel Core i5-13600K | |
| Intel Core i7-12700 | |
| Intel Core i5-13400 | |
| Intel Core i5-12600K | |
| AMD Ryzen 9 5950X | |
| Mozilla Kraken 1.1 - Total | |
| AMD Ryzen 9 5950X | |
| Intel Core i5-13400 | |
| Intel Core i5-12600K | |
| Intel Core i7-12700 | |
| AMD Ryzen 7 7800X3D | |
| Intel Core i5-13600K | |
| Intel Core i7-13700K | |
| AMD Ryzen 9 7950X | |
| AMD Ryzen 9 7950X3D | |
| Intel Core i9-13900K | |
| AMD Ryzen 9 7900X | |
| 3DMark | |
| 1920x1080 Fire Strike Physics | |
| Intel Core i9-13900K | |
| AMD Ryzen 9 7950X | |
| Intel Core i7-13700K | |
| AMD Ryzen 9 7950X3D | |
| AMD Ryzen 9 7900X | |
| AMD Ryzen 9 5950X | |
| Intel Core i5-13600K | |
| Intel Core i7-12700 | |
| AMD Ryzen 7 7800X3D | |
| Intel Core i5-12600K | |
| Intel Core i5-13400 | |
| 2560x1440 Time Spy CPU | |
| Intel Core i9-13900K | |
| Intel Core i7-13700K | |
| AMD Ryzen 9 7950X3D | |
| Intel Core i5-13600K | |
| AMD Ryzen 9 7900X | |
| Intel Core i7-12700 | |
| AMD Ryzen 9 7950X | |
| AMD Ryzen 7 7800X3D | |
| Intel Core i5-12600K | |
| AMD Ryzen 9 5950X | |
| Intel Core i5-13400 | |
* ... smaller is better
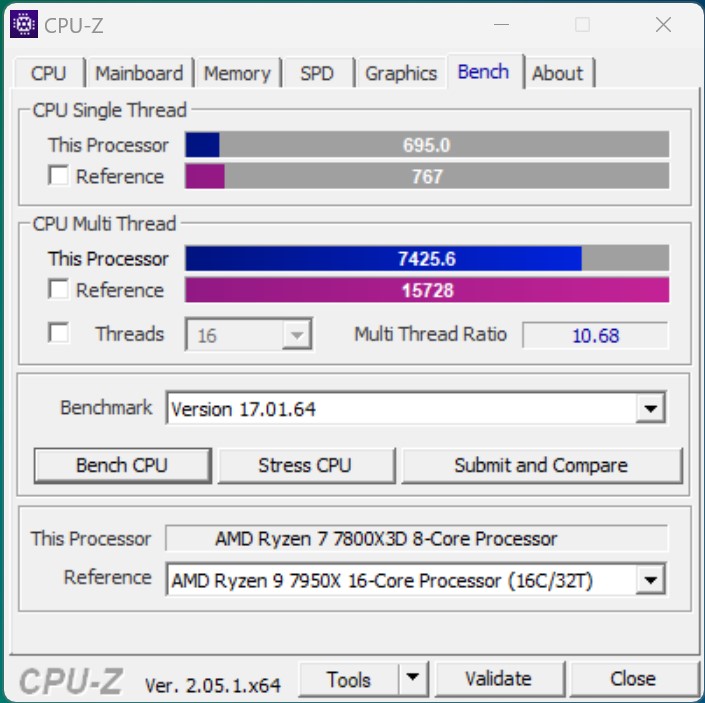
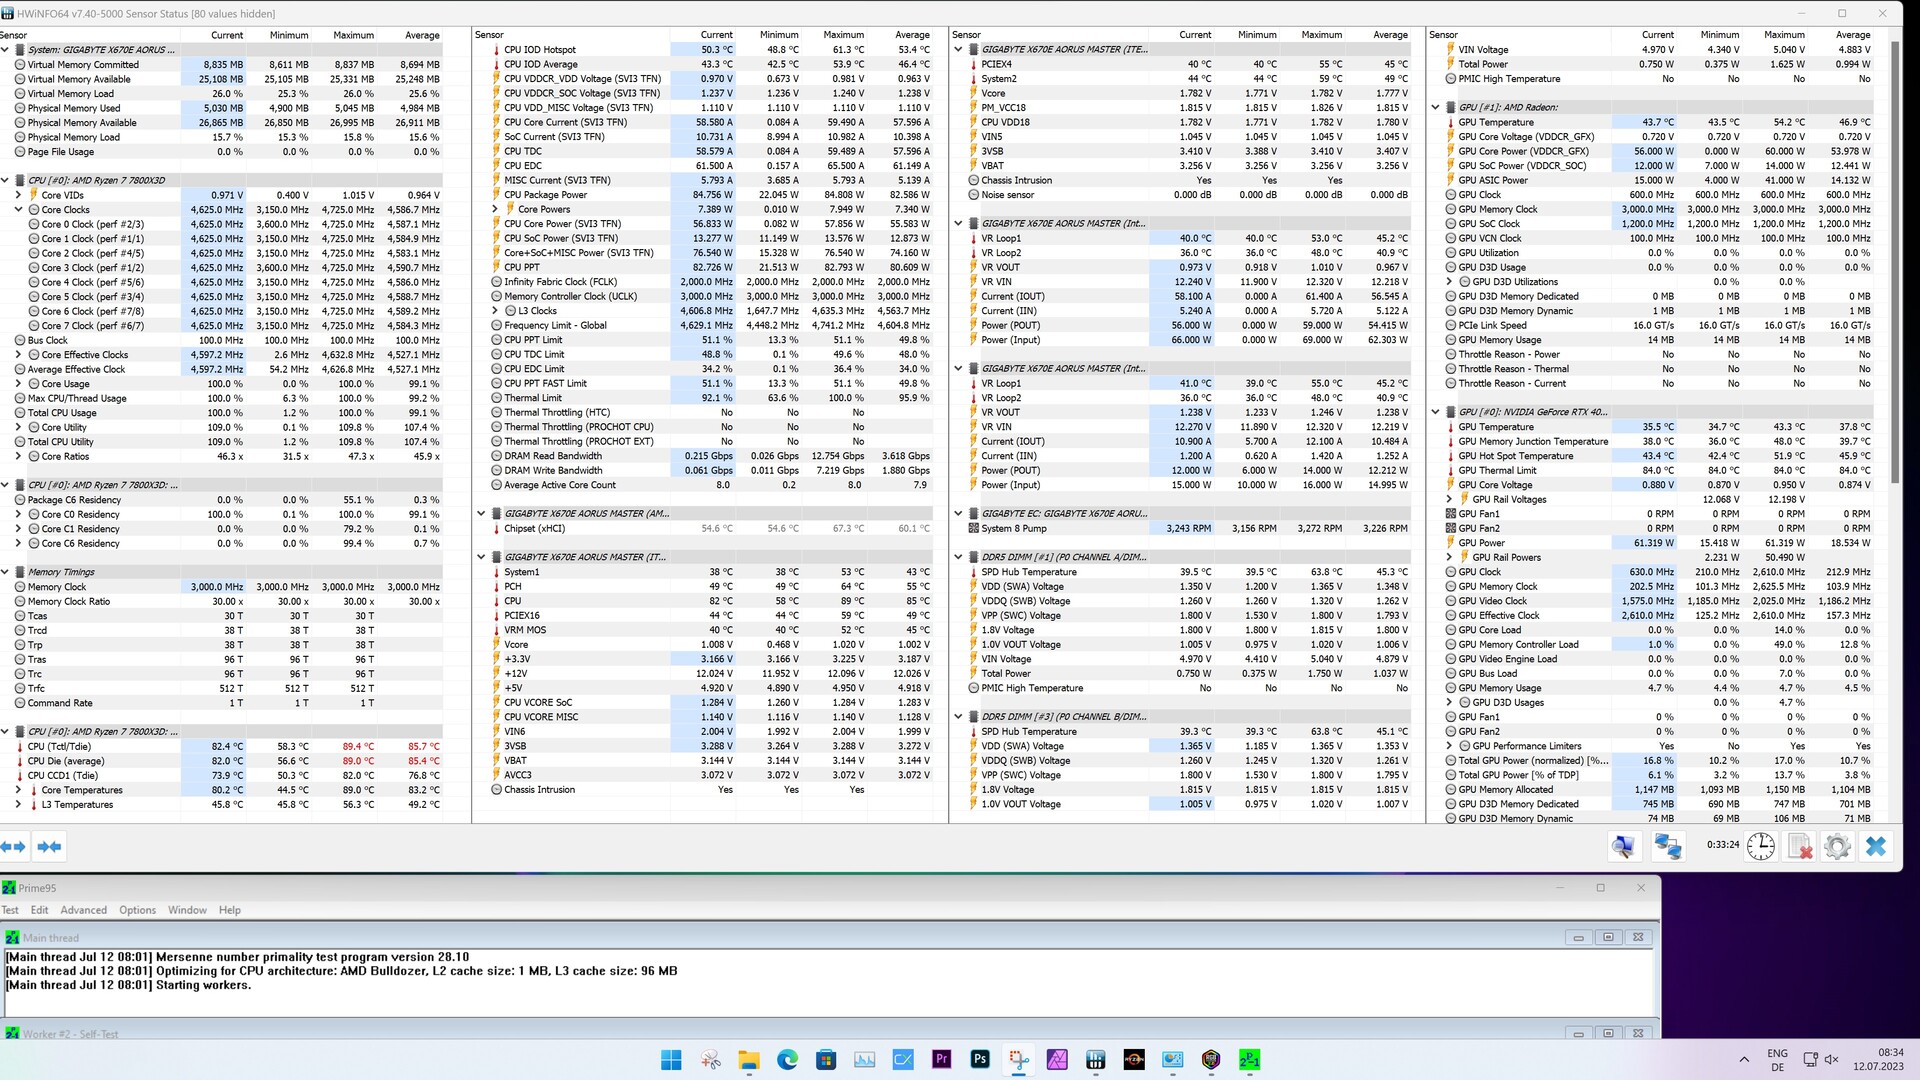
AMD Ryzen 7 7800X3D vs. Cinebench R15 Multi Loop
With the help of the Cinebench R15 Multi Loop, we can at this point see that the DeepCool cooling system is enough to cool the AMD Ryzen 7 7800X3D reliably. For full disclosure, we should note that all of the tests were run with the case closed. The air circulation in the Lian Li O11 Dynamic wasn't the best in our test system, as there were no fans installed that had access to fresh air.
Synthetic benchmarks and application performance
The AMD Ryzen 7 7800X3D's synthetic application benchmarks already look a little better than its CPU benchmarks. It didn't come in far behind the Intel Core i5-13600K and the AMD Ryzen 9 5950X was clearly able to be outperformed.
During the RAM tests, we would have expected similar results to the AMD Ryzen 9 7950X3D, as the test platform is the same and its RAM clock rate of 6,000 MT/s also remains the same. However, you should be aware that the AMD Ryzen 7 7800X3D runs outside the manufacturer's specifications when the EXPO profile is enabled. The AMD Ryzen 7 7800X3D's usual clock rate is 5,200 MT/s.
| Performance rating - Percent | |
| Intel Core i9-13900K | |
| AMD Ryzen 9 7950X | |
| AMD Ryzen 9 7950X3D | |
| Intel Core i7-13700K | |
| AMD Ryzen 9 7900X | |
| Intel Core i5-13600K | |
| AMD Ryzen 7 7800X3D | |
| Intel Core i7-12700 | |
| AMD Ryzen 9 5950X | |
| Intel Core i5-13400 | |
| PCMark 10 | |
| Productivity | |
| AMD Ryzen 9 7950X3D | |
| AMD Ryzen 9 7950X | |
| Intel Core i7-13700K | |
| AMD Ryzen 7 7800X3D | |
| AMD Ryzen 9 7900X | |
| Intel Core i5-13600K | |
| Intel Core i9-13900K | |
| Intel Core i7-12700 | |
| AMD Ryzen 9 5950X | |
| Intel Core i5-13400 | |
| Essentials | |
| Intel Core i9-13900K | |
| AMD Ryzen 9 7900X | |
| AMD Ryzen 9 7950X | |
| Intel Core i5-13600K | |
| AMD Ryzen 9 7950X3D | |
| Intel Core i7-13700K | |
| AMD Ryzen 7 7800X3D | |
| AMD Ryzen 9 5950X | |
| Intel Core i7-12700 | |
| Intel Core i5-13400 | |
| 3DMark | |
| 1920x1080 Fire Strike Physics | |
| Intel Core i9-13900K | |
| AMD Ryzen 9 7950X | |
| Intel Core i7-13700K | |
| AMD Ryzen 9 7950X3D | |
| AMD Ryzen 9 7900X | |
| AMD Ryzen 9 5950X | |
| Intel Core i5-13600K | |
| Intel Core i7-12700 | |
| AMD Ryzen 7 7800X3D | |
| Intel Core i5-13400 | |
| 2560x1440 Time Spy CPU | |
| Intel Core i9-13900K | |
| Intel Core i7-13700K | |
| AMD Ryzen 9 7950X3D | |
| Intel Core i5-13600K | |
| AMD Ryzen 9 7900X | |
| Intel Core i7-12700 | |
| AMD Ryzen 9 7950X | |
| AMD Ryzen 7 7800X3D | |
| AMD Ryzen 9 5950X | |
| Intel Core i5-13400 | |
| 3DMark 11 - 1280x720 Performance Physics | |
| AMD Ryzen 9 7950X3D | |
| AMD Ryzen 7 7800X3D | |
| AMD Ryzen 9 7950X | |
| Intel Core i9-13900K | |
| Intel Core i7-13700K | |
| Intel Core i5-13600K | |
| AMD Ryzen 9 7900X | |
| Intel Core i7-12700 | |
| AMD Ryzen 9 5950X | |
| Intel Core i5-13400 | |
| CrossMark - Overall | |
| Intel Core i9-13900K | |
| AMD Ryzen 9 7950X | |
| AMD Ryzen 9 7900X | |
| Intel Core i7-13700K | |
| Intel Core i5-13600K | |
| AMD Ryzen 7 7800X3D | |
| AMD Ryzen 9 7950X3D | |
| Intel Core i7-12700 | |
| Intel Core i5-13400 | |
| AMD Ryzen 9 5950X | |
| AIDA64 / Memory Copy | |
| Intel Core i9-13900K | |
| AMD Ryzen 9 7950X3D | |
| Intel Core i7-13700K | |
| Intel Core i7-12700 | |
| Intel Core i5-13400 | |
| Intel Core i5-13600K | |
| Intel Core i5-12600K | |
| AMD Ryzen 9 7900X | |
| AMD Ryzen 9 7950X | |
| AMD Ryzen 7 7800X3D | |
| AMD Ryzen 9 5950X | |
| Average of class (4514 - 234662, n=2212) | |
| AIDA64 / Memory Read | |
| Intel Core i9-13900K | |
| Intel Core i7-13700K | |
| Intel Core i7-12700 | |
| AMD Ryzen 9 7950X3D | |
| Intel Core i5-13400 | |
| Intel Core i5-12600K | |
| Intel Core i5-13600K | |
| AMD Ryzen 9 7950X | |
| AMD Ryzen 9 7900X | |
| AMD Ryzen 9 5950X | |
| AMD Ryzen 7 7800X3D | |
| Average of class (4031 - 271066, n=2174) | |
| AIDA64 / Memory Write | |
| AMD Ryzen 7 7800X3D | |
| Intel Core i7-12700 | |
| AMD Ryzen 9 7950X3D | |
| AMD Ryzen 9 7900X | |
| AMD Ryzen 9 7950X | |
| Intel Core i9-13900K | |
| Intel Core i5-13400 | |
| Intel Core i5-12600K | |
| Intel Core i5-13600K | |
| Intel Core i7-13700K | |
| Average of class (3506 - 242868, n=2179) | |
| AMD Ryzen 9 5950X | |
| AIDA64 / Memory Latency | |
| Average of class (6.1 - 536, n=2240) | |
| Intel Core i5-13600K | |
| Intel Core i5-13400 | |
| Intel Core i9-13900K | |
| Intel Core i7-12700 | |
| Intel Core i7-13700K | |
| AMD Ryzen 7 7800X3D | |
| AMD Ryzen 9 5950X | |
| AMD Ryzen 9 7950X3D | |
| AMD Ryzen 9 7950X | |
| AMD Ryzen 9 7900X | |
* ... smaller is better
Gaming benchmarks - Really fast for only having 8 cores
During our gaming tests, we noted that the AMD Ryzen 7 7800X3D excelled in doing its main job. The 8-core processor was even able to knock the in-house flagship off the first place, moving it down to the second spot. Of course, its lead is minimal and not noticeable in everyday use - but when it comes to crowning the king of performance, we have to stick to pure numbers. Our test sample won its comparison to the Intel Core i9-13900K quite easily and took a lead of 13 percentage points.
The AMD Ryzen 9 7950X3D sometimes struggled with load distribution problems between the two CCDs in some of the games we tested because, as we know, only one CCD of the 16-core component features the 3D-V cache. The AMD Ryzen 7 7800X3D doesn't have this problem, which is probably why it achieved slightly better gaming performance. Due to its CPU benchmarks, we can compare our test sample with an Intel Core i7-12700 at this stage. It was on par with the AMD Ryzen 7 7800X3D before, but now we can document a gap of a good 30 per cent.
In combination with the Palit GeForce RTX 4090 GameRock OC, the AM5 platform based on the AMD Ryzen 7 7800X3D currently offers the best combination when it comes to pure gaming. The overview of all the games we tested with this platform shows that all of them are currently smoothly playable in 2,160p with maximum details. In principle, this is also possible with an Intel Core i9-13900K or an AMD Ryzen 9 7590X3D. However, you will have to pay more for these two.
| Performance rating - Percent | |
| AMD Ryzen 7 7800X3D | |
| AMD Ryzen 9 7950X3D | |
| Intel Core i9-13900K | |
| Intel Core i7-13700K | |
| Intel Core i7-13700 | |
| Intel Core i7-12700 | |
| Intel Core i5-13400 | |
| Intel Core i5-12400F | |
| F1 22 | |
| 1920x1080 Low Preset AA:T AF:16x | |
| AMD Ryzen 7 7800X3D | |
| AMD Ryzen 9 7950X3D | |
| Intel Core i9-13900K | |
| Intel Core i7-13700K | |
| Intel Core i7-13700 | |
| Intel Core i7-12700 | |
| Intel Core i5-12400F | |
| Intel Core i5-13400 | |
| 3840x2160 Ultra High Preset AA:T AF:16x | |
| AMD Ryzen 7 7800X3D | |
| Intel Core i7-13700K | |
| AMD Ryzen 9 7950X3D | |
| Intel Core i5-12400F | |
| Intel Core i7-13700 | |
| Intel Core i7-12700 | |
| Intel Core i5-13400 | |
| Intel Core i9-13900K | |
| Far Cry 5 | |
| 1280x720 Low Preset AA:T | |
| AMD Ryzen 7 7800X3D | |
| AMD Ryzen 9 7950X3D | |
| Intel Core i7-13700K | |
| Intel Core i9-13900K | |
| Intel Core i7-13700 | |
| Intel Core i7-12700 | |
| Intel Core i5-13400 | |
| Intel Core i5-12400F | |
| 3840x2160 Ultra Preset AA:T | |
| AMD Ryzen 7 7800X3D | |
| AMD Ryzen 9 7950X3D | |
| Intel Core i9-13900K | |
| Intel Core i7-13700K | |
| Intel Core i7-13700 | |
| Intel Core i7-12700 | |
| Intel Core i5-13400 | |
| Intel Core i5-12400F | |
| X-Plane 11.11 | |
| 1280x720 low (fps_test=1) | |
| Intel Core i9-13900K | |
| AMD Ryzen 9 7950X3D | |
| Intel Core i7-13700K | |
| AMD Ryzen 7 7800X3D | |
| Intel Core i7-13700 | |
| Intel Core i7-12700 | |
| Intel Core i5-13400 | |
| Intel Core i5-12400F | |
| 3840x2160 high (fps_test=3) | |
| AMD Ryzen 7 7800X3D | |
| AMD Ryzen 9 7950X3D | |
| Intel Core i9-13900K | |
| Intel Core i7-13700K | |
| Intel Core i7-13700 | |
| Intel Core i7-12700 | |
| Intel Core i5-13400 | |
| Intel Core i5-12400F | |
| Final Fantasy XV Benchmark | |
| 1280x720 Lite Quality | |
| Intel Core i7-13700 | |
| Intel Core i7-13700K | |
| AMD Ryzen 7 7800X3D | |
| Intel Core i9-13900K | |
| AMD Ryzen 9 7950X3D | |
| Intel Core i7-12700 | |
| Intel Core i5-12400F | |
| Intel Core i5-13400 | |
| 3840x2160 High Quality | |
| AMD Ryzen 7 7800X3D | |
| Intel Core i7-13700 | |
| AMD Ryzen 9 7950X3D | |
| Intel Core i7-13700K | |
| Intel Core i9-13900K | |
| Intel Core i7-12700 | |
| Intel Core i5-12400F | |
| Intel Core i5-13400 | |
| Dota 2 Reborn | |
| 1280x720 min (0/3) fastest | |
| AMD Ryzen 7 7800X3D | |
| AMD Ryzen 9 7950X3D | |
| Intel Core i9-13900K | |
| Intel Core i7-13700K | |
| Intel Core i7-13700 | |
| Intel Core i7-12700 | |
| Intel Core i5-12400F | |
| Intel Core i5-13400 | |
| 3840x2160 ultra (3/3) best looking | |
| AMD Ryzen 7 7800X3D | |
| AMD Ryzen 9 7950X3D | |
| Intel Core i9-13900K | |
| Intel Core i7-13700K | |
| Intel Core i7-13700 | |
| Intel Core i7-12700 | |
| Intel Core i5-12400F | |
| Intel Core i5-13400 | |
| The Witcher 3 | |
| 1024x768 Low Graphics & Postprocessing | |
| AMD Ryzen 9 7950X3D | |
| AMD Ryzen 7 7800X3D | |
| Intel Core i9-13900K | |
| Intel Core i7-13700K | |
| Intel Core i7-13700 | |
| Intel Core i7-12700 | |
| Intel Core i5-13400 | |
| Intel Core i5-12400F | |
| 3840x2160 High Graphics & Postprocessing (Nvidia HairWorks Off) | |
| Intel Core i5-13400 | |
| Intel Core i7-13700 | |
| Intel Core i7-12700 | |
| Intel Core i9-13900K | |
| AMD Ryzen 7 7800X3D | |
| Intel Core i7-13700K | |
| AMD Ryzen 9 7950X3D | |
| Intel Core i5-12400F | |
| F1 2021 | |
| 3840x2160 Ultra High Preset + Raytracing AA:T AF:16x | |
| AMD Ryzen 7 7800X3D | |
| AMD Ryzen 9 7950X3D | |
| Intel Core i7-13700K | |
| Intel Core i7-13700 | |
| Intel Core i9-13900K | |
| Intel Core i7-12700 | |
| Intel Core i5-12400F | |
| Intel Core i5-13400 | |
| 1280x720 Ultra Low Preset | |
| AMD Ryzen 7 7800X3D | |
| AMD Ryzen 9 7950X3D | |
| Intel Core i9-13900K | |
| Intel Core i7-13700K | |
| Intel Core i7-13700 | |
| Intel Core i7-12700 | |
| Intel Core i5-12400F | |
| Intel Core i5-13400 | |
| Shadow of the Tomb Raider | |
| 1280x720 Lowest Preset | |
| AMD Ryzen 7 7800X3D | |
| AMD Ryzen 9 7950X3D | |
| Intel Core i9-13900K | |
| Intel Core i7-13700 | |
| Intel Core i7-13700K | |
| Intel Core i7-12700 | |
| Intel Core i5-13400 | |
| Intel Core i5-12400F | |
| 3840x2160 Highest Preset AA:T | |
| Intel Core i7-13700K | |
| AMD Ryzen 7 7800X3D | |
| Intel Core i7-13700 | |
| AMD Ryzen 9 7950X3D | |
| Intel Core i9-13900K | |
| Intel Core i7-12700 | |
| Intel Core i5-13400 | |
| Intel Core i5-12400F | |
| Borderlands 3 | |
| 1280x720 Very Low Overall Quality (DX11) | |
| AMD Ryzen 7 7800X3D | |
| AMD Ryzen 9 7950X3D | |
| Intel Core i9-13900K | |
| Intel Core i7-13700 | |
| Intel Core i7-13700K | |
| Intel Core i7-12700 | |
| Intel Core i5-13400 | |
| Intel Core i5-12400F | |
| 3840x2160 Badass Overall Quality (DX11) | |
| Intel Core i7-13700K | |
| AMD Ryzen 7 7800X3D | |
| AMD Ryzen 9 7950X3D | |
| Intel Core i9-13900K | |
| Intel Core i7-13700 | |
| Intel Core i7-12700 | |
| Intel Core i5-13400 | |
| Intel Core i5-12400F | |
| Tiny Tina's Wonderlands | |
| 1280x720 Lowest Preset (DX12) | |
| AMD Ryzen 7 7800X3D | |
| AMD Ryzen 9 7950X3D | |
| Intel Core i9-13900K | |
| Intel Core i7-13700 | |
| Intel Core i7-13700K | |
| Intel Core i7-12700 | |
| Intel Core i5-13400 | |
| Intel Core i5-12400F | |
| 3840x2160 Badass Preset (DX12) | |
| AMD Ryzen 9 7950X3D | |
| Intel Core i7-13700 | |
| AMD Ryzen 7 7800X3D | |
| Intel Core i7-12700 | |
| Intel Core i5-13400 | |
| Intel Core i7-13700K | |
| Intel Core i9-13900K | |
| Intel Core i5-12400F | |
| God of War | |
| 1280x720 Low Preset | |
| AMD Ryzen 9 7950X3D | |
| AMD Ryzen 7 7800X3D | |
| Intel Core i9-13900K | |
| Intel Core i7-13700K | |
| Intel Core i7-13700 | |
| Intel Core i7-12700 | |
| Intel Core i5-13400 | |
| Intel Core i5-12400F | |
| 3840x2160 Ultra Preset | |
| AMD Ryzen 7 7800X3D | |
| AMD Ryzen 9 7950X3D | |
| Intel Core i7-13700 | |
| Intel Core i5-13400 | |
| Intel Core i7-13700K | |
| Intel Core i9-13900K | |
| Intel Core i7-12700 | |
| Intel Core i5-12400F | |
| Far Cry New Dawn | |
| 1280x720 Low Preset | |
| AMD Ryzen 7 7800X3D | |
| AMD Ryzen 9 7950X3D | |
| Intel Core i9-13900K | |
| Intel Core i7-13700 | |
| Intel Core i7-13700K | |
| Intel Core i7-12700 | |
| Intel Core i5-13400 | |
| Intel Core i5-12400F | |
| 3840x2160 Ultra Preset | |
| AMD Ryzen 7 7800X3D | |
| AMD Ryzen 9 7950X3D | |
| Intel Core i9-13900K | |
| Intel Core i7-13700 | |
| Intel Core i7-13700K | |
| Intel Core i7-12700 | |
| Intel Core i5-13400 | |
| Intel Core i5-12400F | |
| Far Cry 6 | |
| 1280x720 Low Graphics Quality | |
| AMD Ryzen 7 7800X3D | |
| AMD Ryzen 9 7950X3D | |
| Intel Core i9-13900K | |
| Intel Core i7-13700 | |
| Intel Core i7-13700K | |
| Intel Core i7-12700 | |
| Intel Core i5-13400 | |
| Intel Core i5-12400F | |
| 3840x2160 Ultra Graphics Quality + HD Textures AA:T | |
| AMD Ryzen 7 7800X3D | |
| AMD Ryzen 9 7950X3D | |
| Intel Core i7-13700K | |
| Intel Core i7-13700 | |
| Intel Core i9-13900K | |
| Intel Core i7-12700 | |
| Intel Core i5-13400 | |
| Intel Core i5-12400F | |
AMD Ryzen 7 78003D with an Nvidia GeForce RTX 4090
| low | med. | high | ultra | QHD | 4K DLSS | 4K | |
|---|---|---|---|---|---|---|---|
| GTA V (2015) | 188.5 | 188.5 | 188.1 | 182 | 181.1 | 188 | |
| The Witcher 3 (2015) | 858.4 | 820.4 | 658.8 | 314.3 | 281 | ||
| Dota 2 Reborn (2015) | 322.9 | 299.6 | 288.9 | 267.5 | 258.2 | ||
| Final Fantasy XV Benchmark (2018) | 236 | 234 | 233 | 231 | 158.2 | ||
| X-Plane 11.11 (2018) | 219 | 214 | 188.1 | 160.5 | |||
| Far Cry 5 (2018) | 344 | 303 | 303 | 278 | 268 | 187 | |
| Strange Brigade (2018) | 760 | 618 | 601 | 589 | 534 | 289 | |
| Shadow of the Tomb Raider (2018) | 407 | 383 | 387 | 375 | 322 | 187.7 | |
| Far Cry New Dawn (2019) | 291 | 258 | 253 | 226 | 223 | 180 | |
| Metro Exodus (2019) | 374 | 326 | 268 | 219 | 199.8 | 141.6 | |
| Control (2019) | 240 | 240 | 240 | 220 | 137.5 | 114 | |
| Borderlands 3 (2019) | 310 | 271 | 252 | 241 | 224 | 137.4 | |
| F1 2020 (2020) | 681 | 571 | 563 | 503 | 446 | 288 | |
| F1 2021 (2021) | 830 | 763 | 667 | 369 | 324 | 207 | |
| Far Cry 6 (2021) | 285 | 256 | 230 | 223 | 211 | 141.4 | |
| Guardians of the Galaxy (2021) | 268 | 266 | 267 | 267 | 263 | 194 | |
| God of War (2022) | 315 | 313 | 287 | 212 | 181.5 | 132 | |
| Cyberpunk 2077 1.6 (2022) | 272 | 268 | 251 | 241 | 166.6 | 82.3 | |
| Tiny Tina's Wonderlands (2022) | 506 | 434 | 371 | 309 | 233 | 129.8 | |
| F1 22 (2022) | 533 | 483 | 477 | 221 | 162.9 | 84.5 | |
| The Quarry (2022) | 462 | 355 | 309 | 267 | 198.1 | 82.6 | |
| A Plague Tale Requiem (2022) | 231 | 209 | 189.9 | 168.8 | 132.5 | 148.3 | 76.3 |
| Uncharted Legacy of Thieves Collection (2022) | 159.8 | 164.5 | 163 | 156.9 | 155.8 | 103.5 | |
| Spider-Man Miles Morales (2022) | 233 | 233 | 196.7 | 191.6 | 245 | 134.9 | |
| The Callisto Protocol (2022) | 279.1 | 279.7 | 280.8 | 281.1 | 274.5 | 237.1 | |
| High On Life (2023) | 446 | 404 | 345 | 312 | 225 | 107.8 | |
| The Witcher 3 v4 (2023) | 367 | 300 | 279 | 261 | 260 | 169.9 | |
| Dead Space Remake (2023) | 291 | 282 | 262 | 259 | 201 | 106.7 | |
| Hogwarts Legacy (2023) | 218 | 200 | 164.4 | 163.3 | 146.7 | 82.4 | |
| Returnal (2023) | 262 | 256 | 237 | 211 | 172 | 112 | |
| Atomic Heart (2023) | 360 | 306 | 274 | 228 | 184.1 | 112.4 | |
| Company of Heroes 3 (2023) | 465.1 | 429.6 | 376.5 | 373.3 | 314.6 | 215.4 | |
| Sons of the Forest (2023) | 184.7 | 176.4 | 171.4 | 165.4 | 159.1 | 132.1 | |
| Resident Evil 4 Remake (2023) | 383 | 344 | 336 | 237 | 199.9 | 124.2 | |
| The Last of Us (2023) | 241 | 215 | 202 | 191.1 | 146 | 122.9 | 82.6 |
| Dead Island 2 (2023) | 379 | 369 | 336 | 315 | 284 | 161.6 | |
| Star Wars Jedi Survivor (2023) | 197.7 | 197.3 | 196.1 | 193.8 | 157.6 | 82.3 | |
| Diablo 4 (2023) | 399 | 399 | 398 | 397 | 390 | 238 | 216 |
| F1 23 (2023) | 576 | 594 | 542 | 226 | 152 | 80 |
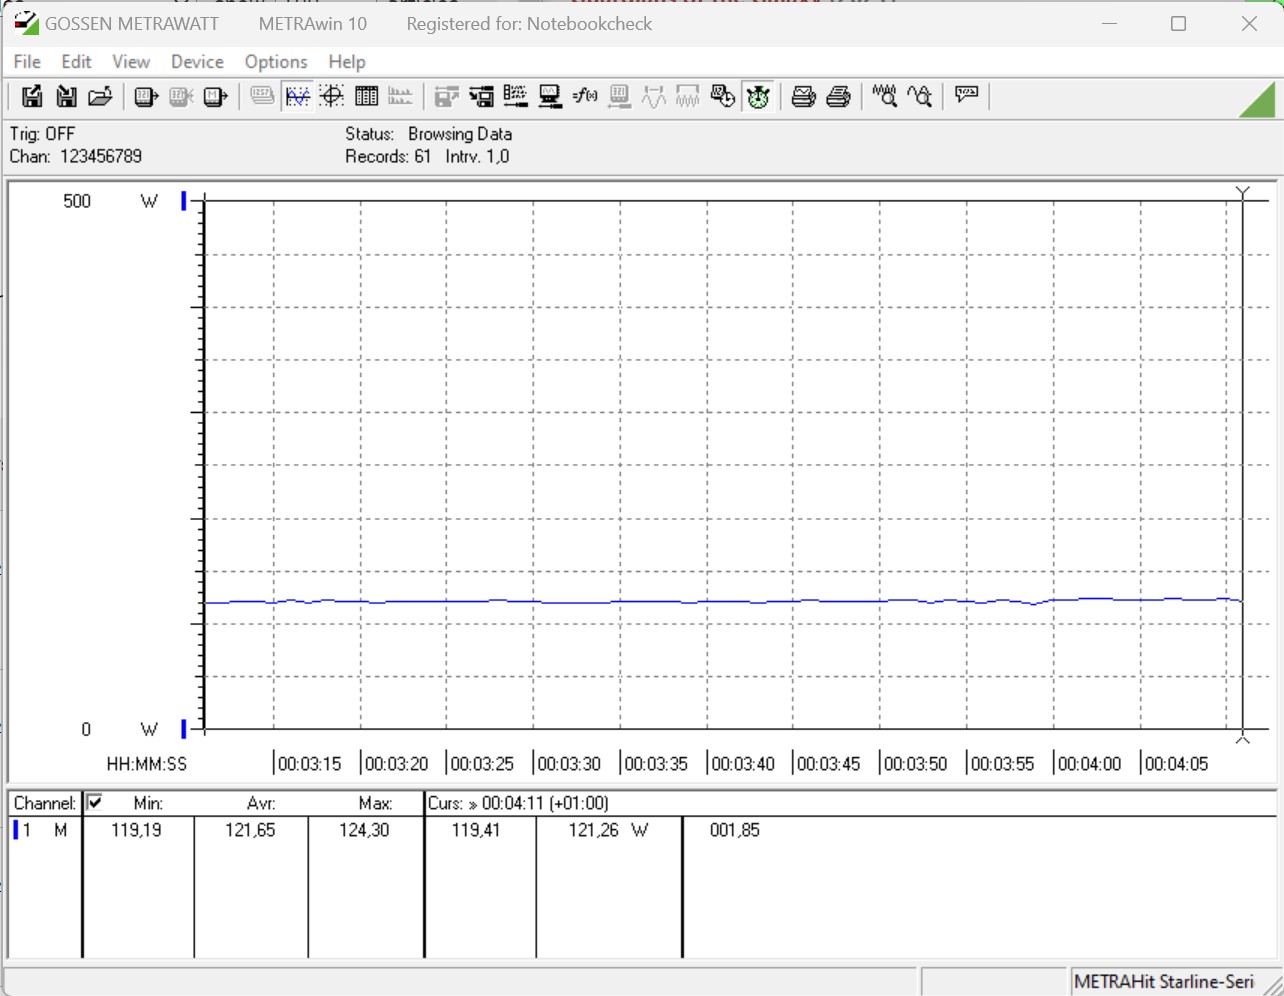
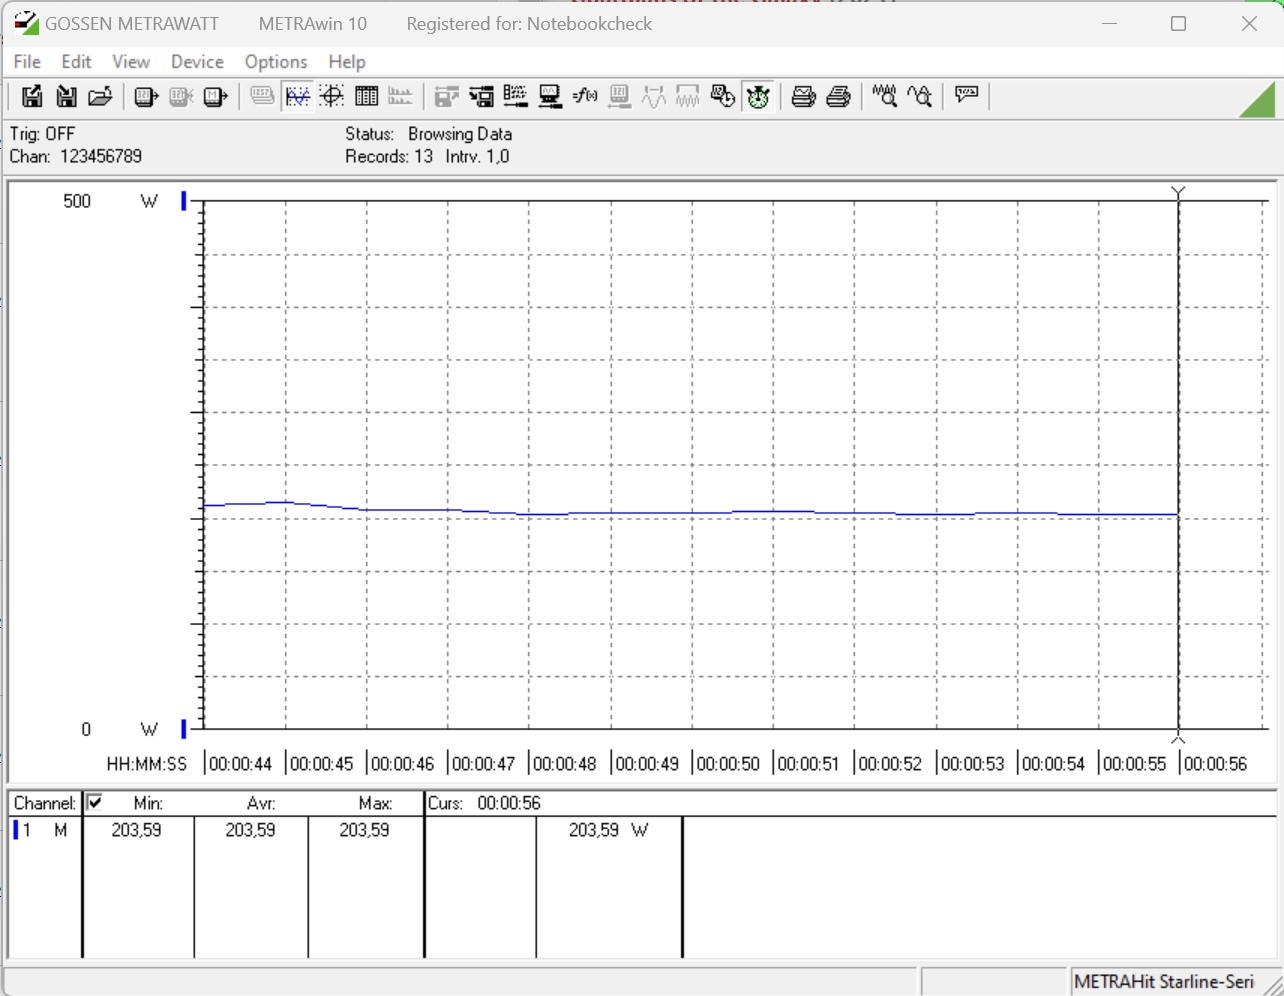
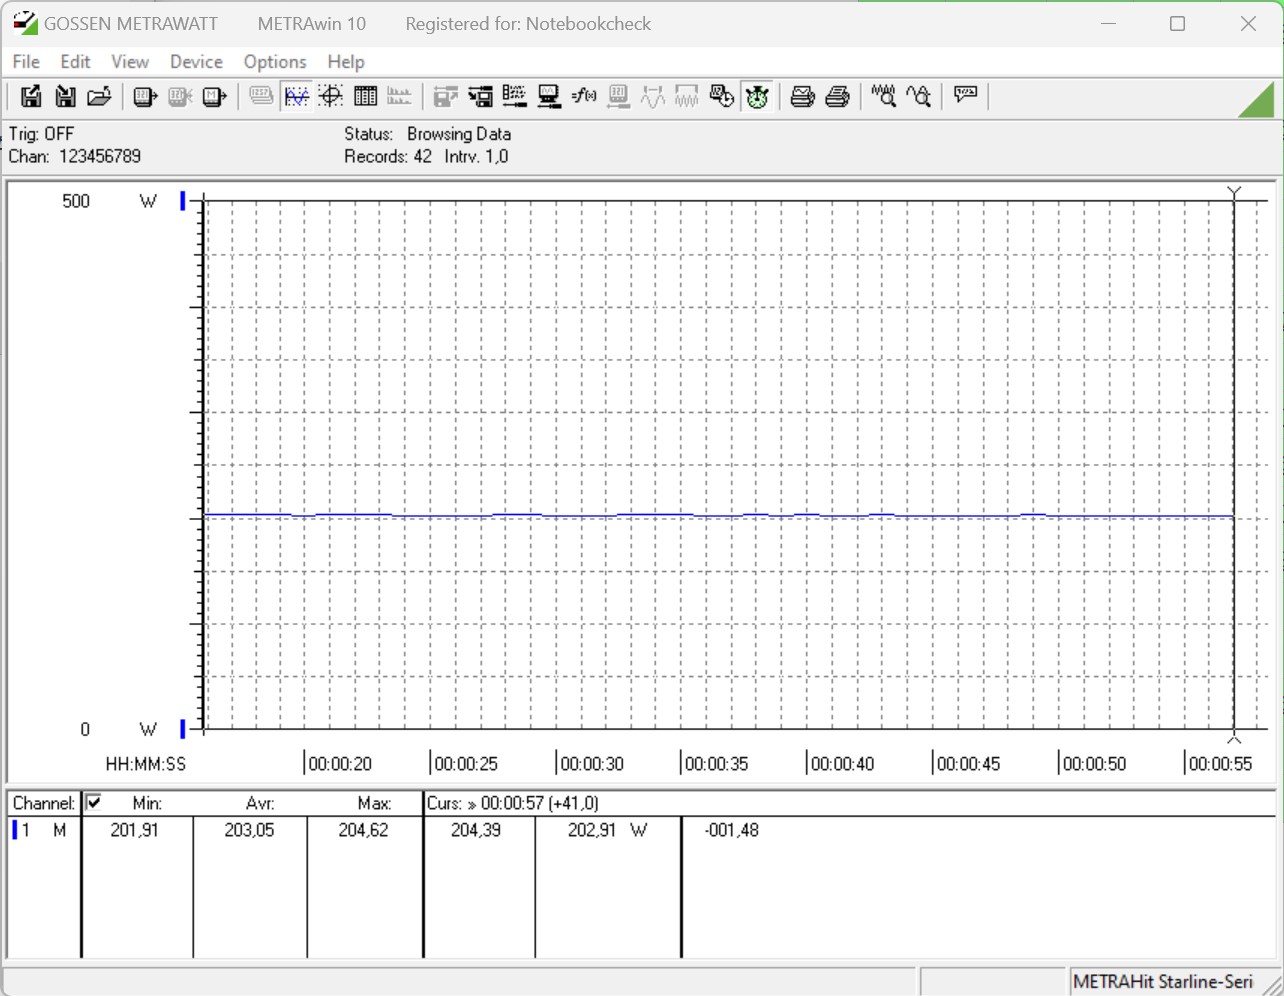
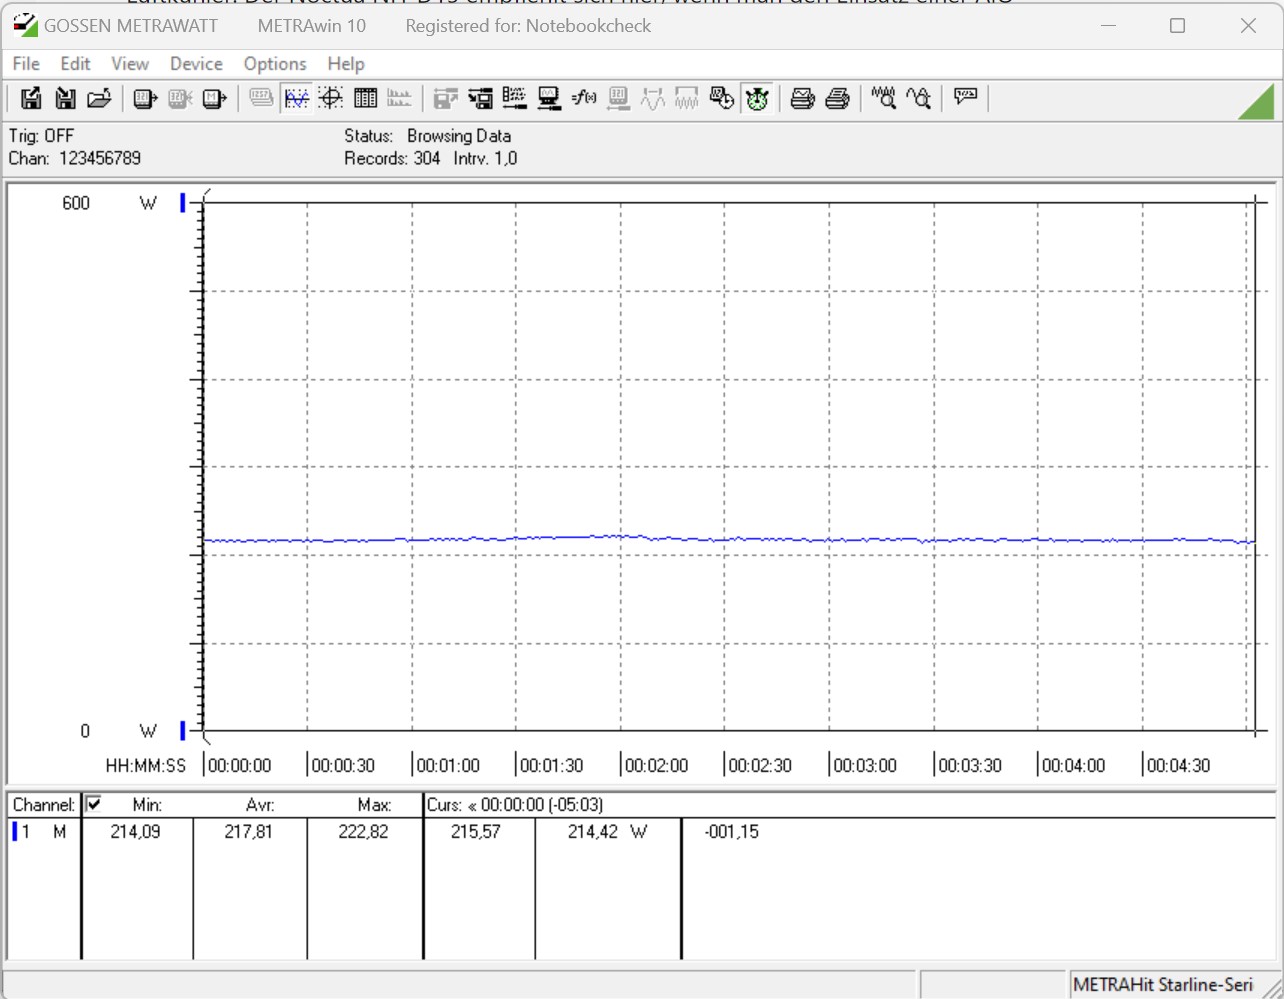
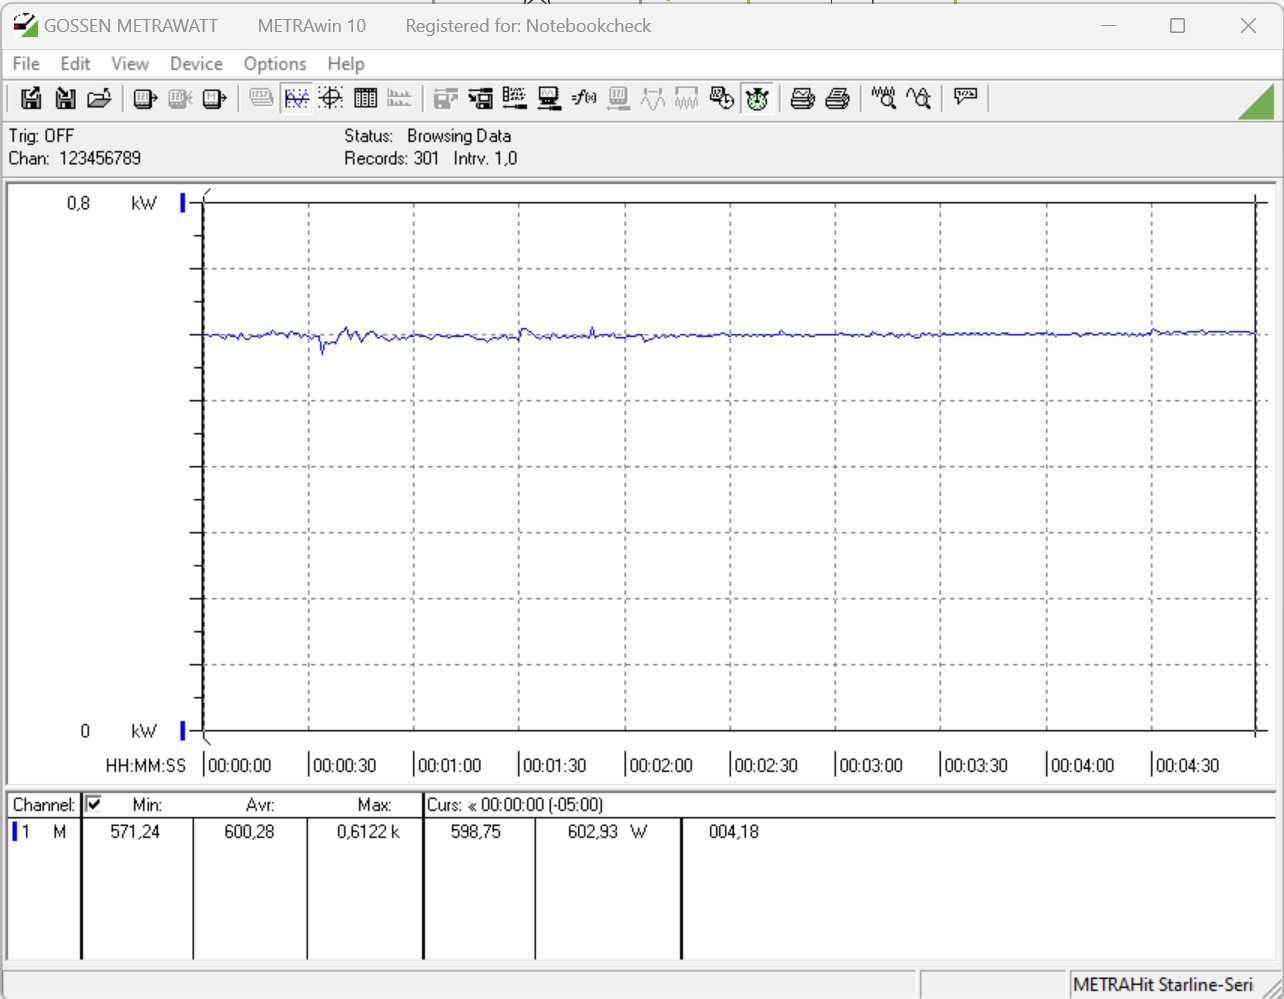
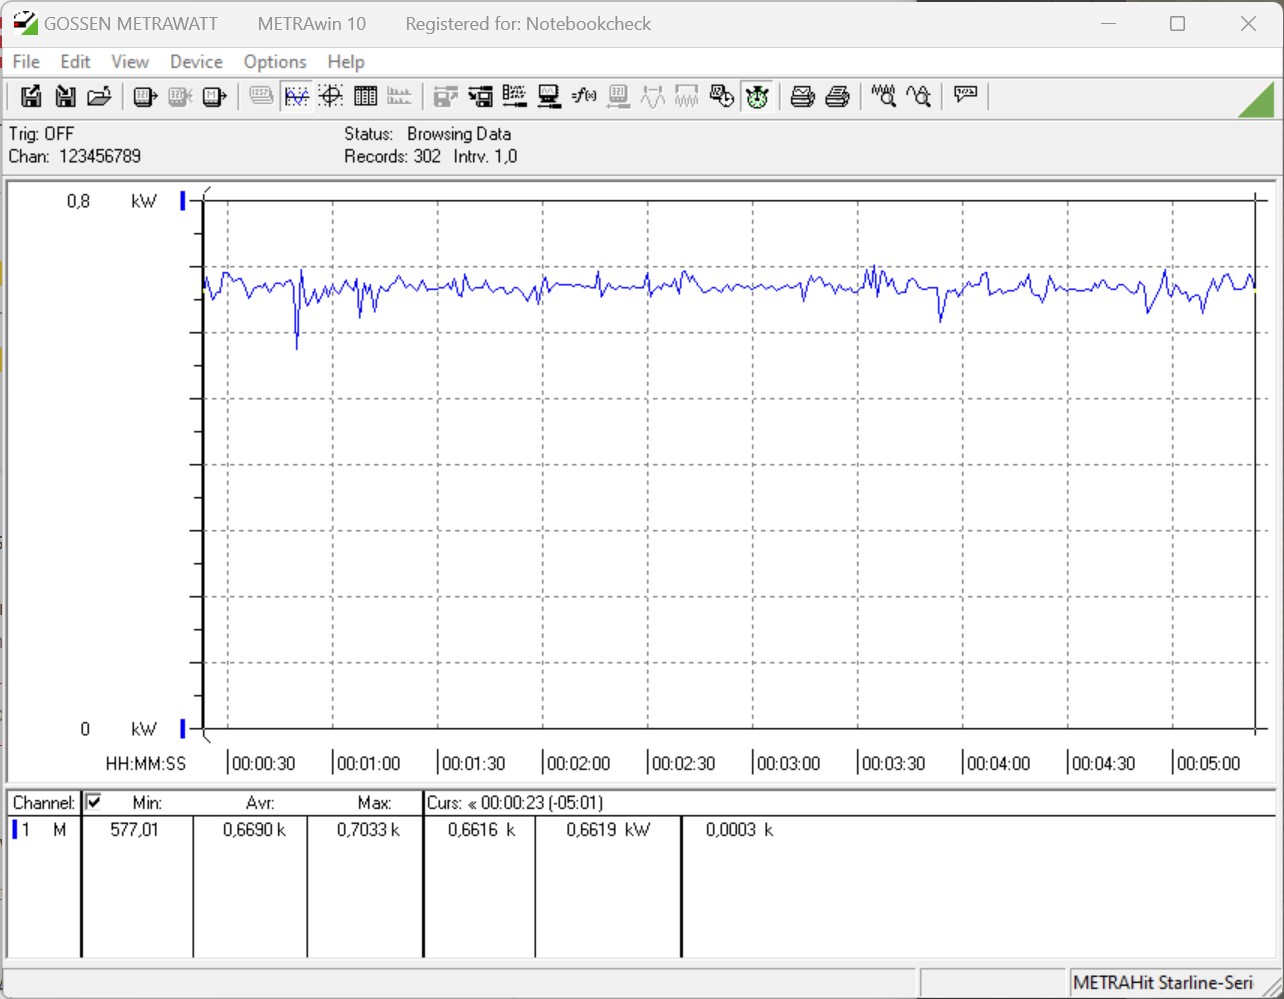
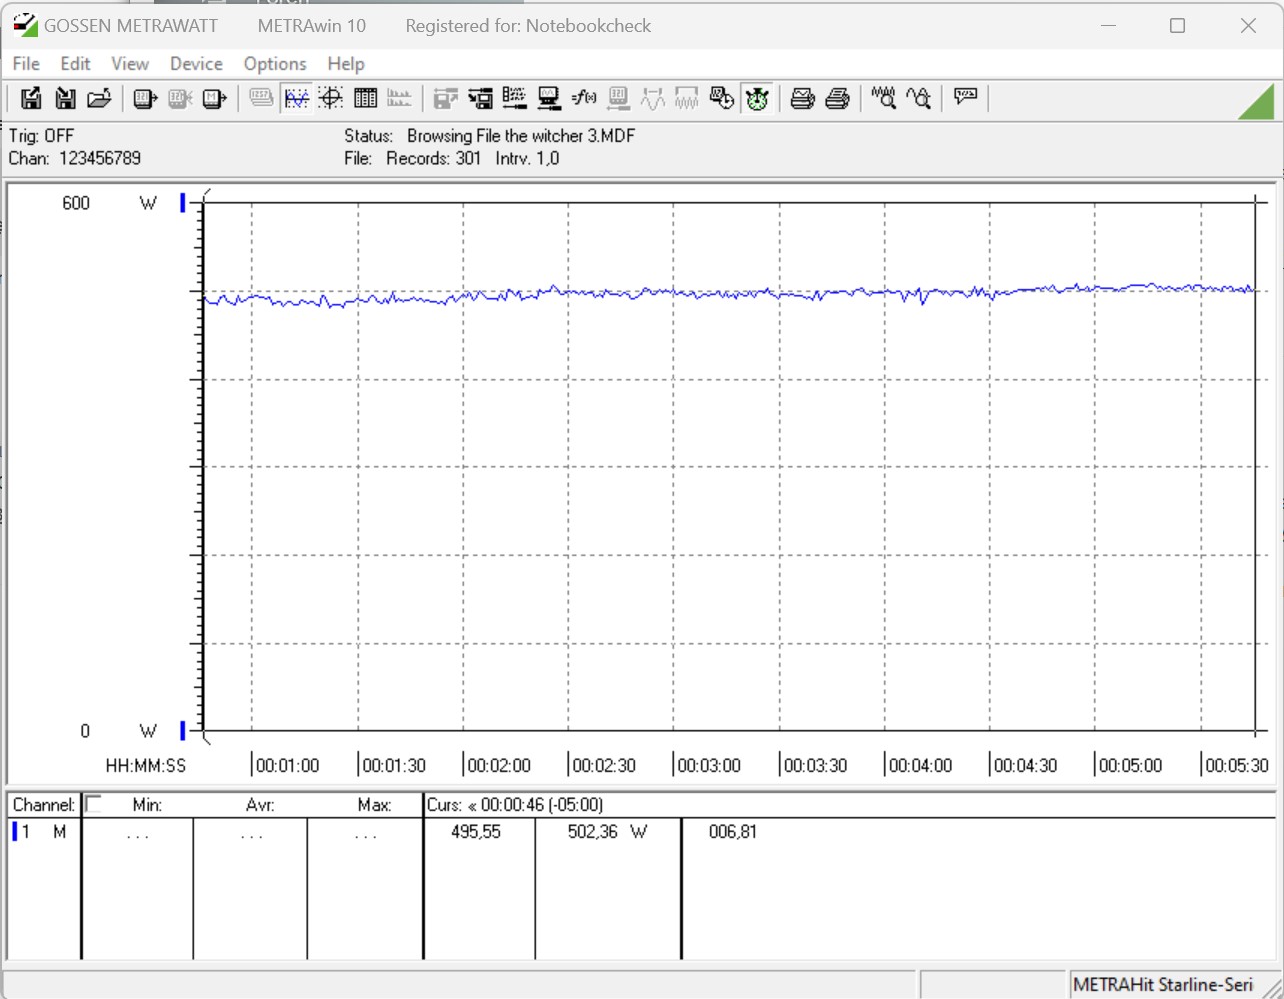
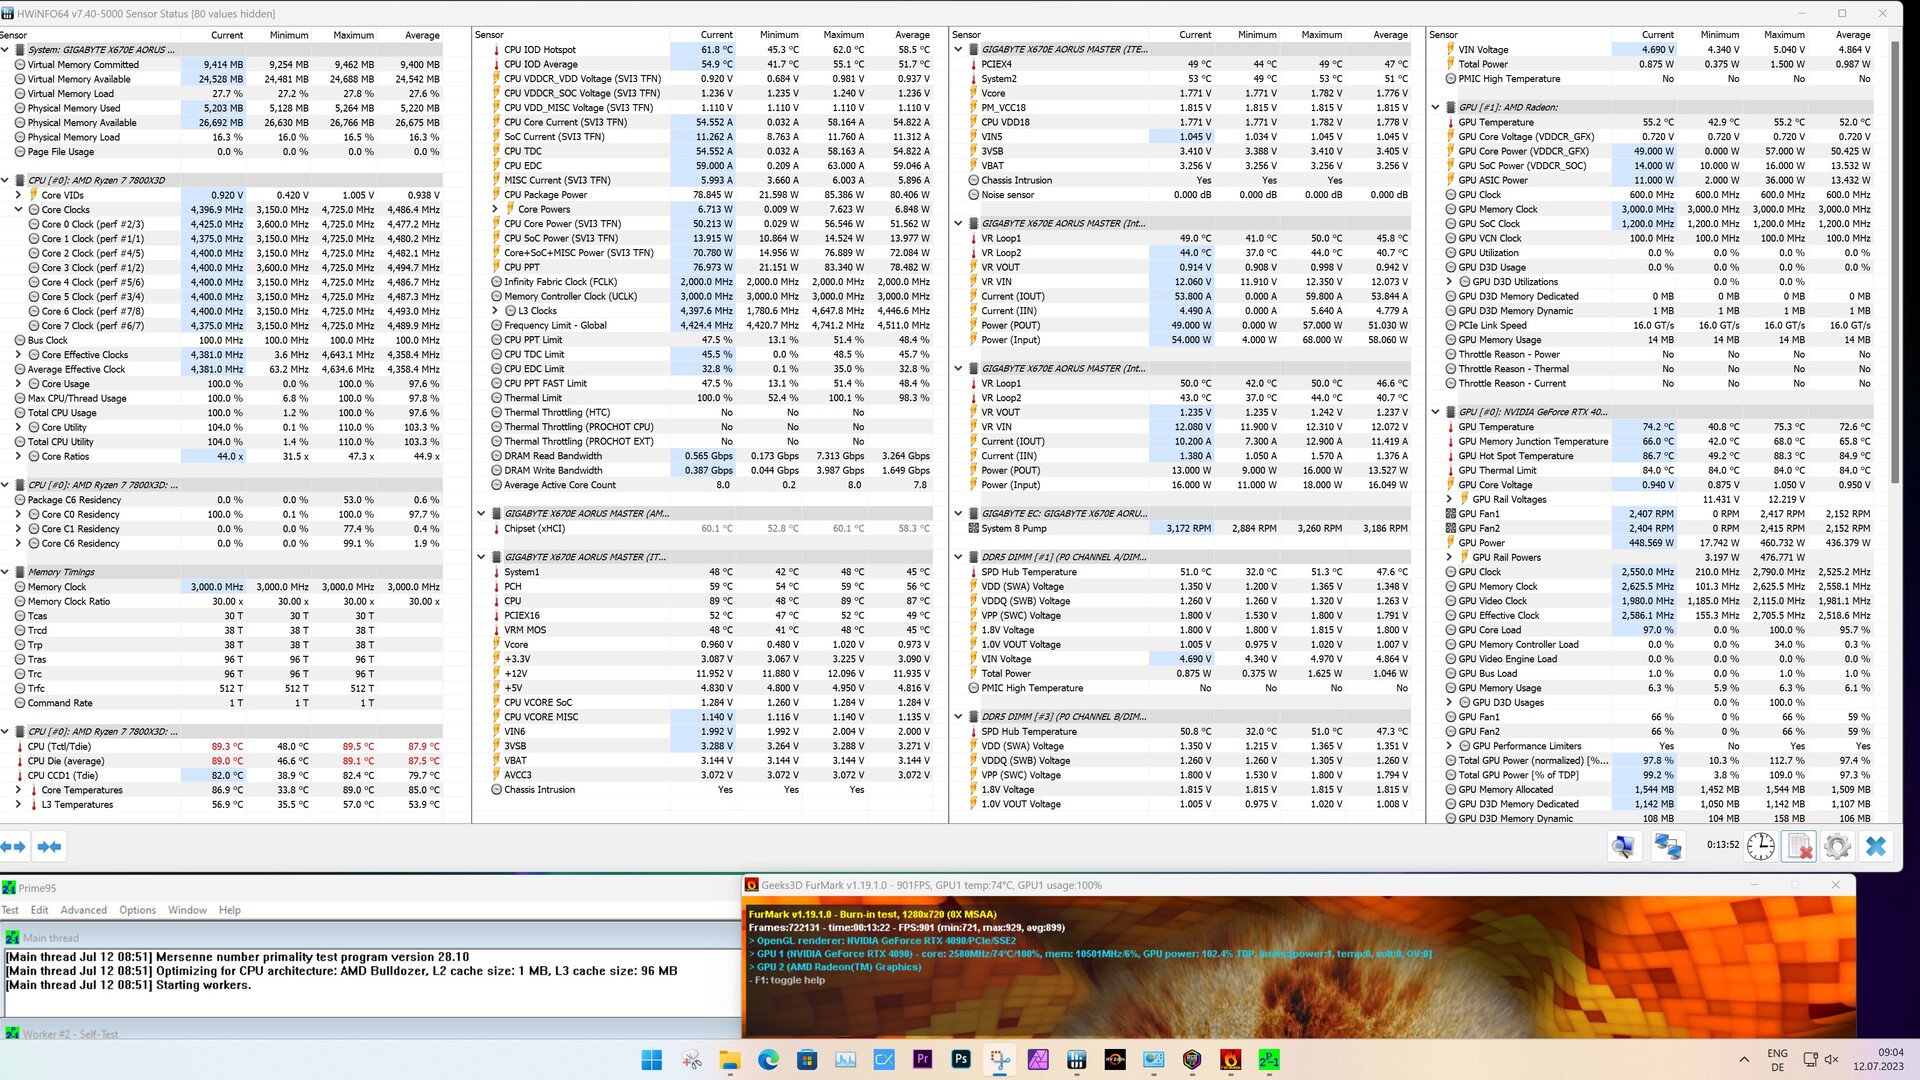
Power consumption - Frugal, but good air flow is a must
All 7000-series X3D processors are limited to a maximum power consumption of 162 watts (PPT). As a result, the same can be said for our AMD Ryzen 7 7800X3D. In idle mode, we noted no record values at 120 watts, but in comparison to the AMD Ryzen 9 7950X3D, our measured values were almost identical. While gaming, we documented an average of 497 watts during our Witcher 3 game scene. This means our test system is about on the same level as one based on an Intel Core i5-13400. During our Prime95 stress test, the system based on an AMD Ryzen 7 7800X3D was actually the most frugal. Its median value was only 218 watts.
For our measurements under load, you have to take into account the graphics card's power consumption. The Palit GeForce RTX 4090 GameRock OC alone already uses 450 watts.
We noted quite high temperatures which result from the bad case cooling. In this worst-case scenario, the AMD Ryzen 7 7800X3D hit its thermal limit and had to be throttled. In order to not falsify our measurements, we didn't run this test with the case open. We removed the side part, which led to CPU temperatures dropping quite quickly to uncritical values. A case with good air circulation cools the 8-core processor well. However, we wouldn't recommend forgoing an AiO. At this stage, we would advise to take a look at the manufacturer's list of recommended coolers for the AMD Ryzen 7000 processors.
| Power Consumption / Cinebench R15 Multi (external Monitor) | |
| Schenker XMG SECTOR, i9 13900K, RTX 4090 | |
| Intel Core i7-13700 | |
| Intel Core i7-13700K | |
| Intel Core i7-12700 | |
| AMD Ryzen 9 7950X3D | |
| AMD Ryzen 7 7800X3D | |
| Intel Core i5-13400 | |
| Intel Core i5-12400F | |
| Power Consumption / Cinebench R15 Multi Efficiency (external Monitor) | |
| AMD Ryzen 9 7950X3D | |
| AMD Ryzen 7 7800X3D | |
| Power Consumption / Prime95 V2810 Stress (external Monitor) | |
| Intel Core i7-13700 | |
| Schenker XMG SECTOR, i9 13900K, RTX 4090 | |
| Intel Core i7-13700K | |
| Intel Core i7-12700 | |
| AMD Ryzen 9 7950X3D | |
| Intel Core i5-12400F | |
| Intel Core i5-13400 | |
| AMD Ryzen 7 7800X3D | |
| Power Consumption / The Witcher 3 ultra (external Monitor) | |
| Intel Core i7-13700 | |
| Intel Core i7-13700K | |
| AMD Ryzen 9 7950X3D | |
| Schenker XMG SECTOR, i9 13900K, RTX 4090 | |
| Intel Core i7-12700 | |
| Intel Core i5-13400 | |
| AMD Ryzen 7 7800X3D | |
| Intel Core i5-12400F | |
* ... smaller is better
| Power Consumption - Cinebench R15 Multi Efficiency (external Monitor) | |
| AMD Ryzen 9 7950X3D | |
| AMD Ryzen 9 5950X | |
| AMD Ryzen 9 7950X | |
| AMD Ryzen 9 7900X | |
| AMD Ryzen 7 7800X3D | |
| Intel Core i9-13900K | |
Power consumption with external monitor
Pros
Cons
Verdict - Great gaming CPU for the demanding gamer
In this review, we took a closer look at the AMD Ryzen 7 7800X3D - the first full X3D processor from the new AM5 platform. What we mean by this is that this is a new processor that isn't built on a hybrid design - instead, it only has one CCD die in the form of its 3D V-Cache. This is an advantage for lots of games and as a result, the 8-core processor is able to jump ahead of the AMD Ryzen 9 7950X3D ever so slightly.
This doesn't mean the AMD Ryzen 7 7800X3D can pass as a jack-of-all-trades. The 8-core processor didn't do nearly well enough in the CPU performance tests and due to its limited multi-core performance, the component couldn't keep up with the high-end models. But, it doesn't have to. As a pure gaming CPU, the 7800X3D can do exactly what it was developed for. A positive aspect is its low power consumption.
The AMD Ryzen 7 7800X3D delivers great gaming performance. Price-wise, the 8-core processor will currently still have a bit of a hard time convincing buyers to choose this model.
In summary, we can say that the AMD Ryzen 7 7800X3D is, as it stands, one of the fastest gaming CPUs on the market. We can't quite name it as being the single fastest processor - for example, the AMD Ryzen 9 7950X3D delivers just a bit better performance in quite a few games, as long as its correct thread allocation can take advantage of the CPU's full performance. Due to the Ryzen 9 models with 3D V-Cache's hybrid structure, it unfortunately isn't always guaranteed that the CCD with the 3D V-Cache will be prioritized. Here, the AMD Ryzen 7 7800X3D benefits thanks to its simpler internal build. Although, this is complaining on the highest of levels - all of the games we tested could be run, regardless of the CPU used.
The component's biggest issue at the moment is, in our eyes, its price. Currently, it sells for a minimum of $441.99. An Intel Core i7-13700K costs about the same and offers similar performance levels - but, it delivers better total CPU performance. If we take into account how future-proof these processors are, then no one can beat AMD. Believe them or not, rumors suggest the AM5 platform will continue to be supported until 2025. The 1,700 socket, which is currently the case for Intel systems, will likely be replaced by its successor next year and no further processors will be released for socket 1,700.
Price and availability
Currently, you can buy the AMD Ryzen 7 7800X3D from Amazon for $441.99.
Transparency
The selection of devices to be reviewed is made by our editorial team. The test sample was freely purchased by the author at his/her own expense. The lender had no influence on this review, nor did the manufacturer receive a copy of this review before publication. There was no obligation to publish this review. As an independent media company, Notebookcheck is not subjected to the authority of manufacturers, retailers or publishers.
This is how Notebookcheck is testing
Every year, Notebookcheck independently reviews hundreds of laptops and smartphones using standardized procedures to ensure that all results are comparable. We have continuously developed our test methods for around 20 years and set industry standards in the process. In our test labs, high-quality measuring equipment is utilized by experienced technicians and editors. These tests involve a multi-stage validation process. Our complex rating system is based on hundreds of well-founded measurements and benchmarks, which maintains objectivity. Further information on our test methods can be found here.

