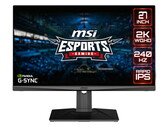
AMD Ryzen 9 5950X
The AMD Ryzen 9 5950X is a high-end 16-core, hyperthreaded (SMT) Vermeer Series desktop processor. With 32 threads, the new flagship offers as many threads as the AMD Ryzen 9 3950X. Introduced on October 8, 2020, the Ryzen 9 5950X is the fastest 16-core processor and is specified at 105 watts TDP.
The Ryzen 9 5950X runs at 3.4 GHz to 4.9 GHz (single core). Wen all 16 cores are loaded, up to 4.5 GHz are still possible.
The internal structure of the processor has not changed fundamentally at first glance. The CCX structure has changed a bit compared to Zen 2, because now a CCX consists of up to 8 CPU cores. So each individual core can access the complete L3 cache (32 MByte). Furthermore the CCX modules are connected to each other via the same I/O die, which we already know from Zen2. According to AMD, the Infinity fabric should now reach clock rates of up to 2 Ghz, which in turn allows a RAM clock of 4,000 MHz without performance loss.
Performance
The average 5950X in our database matches the Core i9-12900K , the Core i9-12900HX and also the Ryzen Threadripper 2970WX in multi-thread performance, making this Ryzen a great processor for pretty much any task imaginable as of mid 2022.
Power consumption
This Ryzen 9 series chip has a default TDP (also known as the long-term power limit) of 105 W. It will, however, happily consume much more than that as long as the cooling solution is able to handle the heat - even before one starts considering the possibility of overclocking the thing.
The Ryzen 9 5950X is built with TSMC's 7 nm process for average, as of mid 2023, energy efficiency.
Series AMD Vermeer (Ryzen 5000) Codename Vermeer (Zen 3) Series: Vermeer (Ryzen 5000) Vermeer (Zen 3) Clock Rate 3400 - 4900 MHz Level 1 Cache 1 MB Level 2 Cache 8 MB Level 3 Cache 64 MB Number of Cores / Threads 16 / 32 Power Consumption (TDP = Thermal Design Power) 105 Watt Manufacturing Technology 7 nm Die Size CPU cores: 2x 80.7 sq. mm., I/O: 125 mm2 Socket AM4 Features DDR4-3200 RAM, PCIe 4, MMX (+), SSE, SSE2, SSE3, SSSE3, SSE4.1, SSE4.2, SSE4A, AES, AVX, AVX2, FMA3, SHA 64 Bit 64 Bit support Architecture x86 Starting Price $799 U.S. Announcement Date 10/08/2020 Product Link (external) www.amd.com
Benchmarks Performance Rating - CB R15 + R20 + 7-Zip + X265 + Blender + 3DM11 CPU
50.5 pt (70%)
...
...
Cinebench R23 - Cinebench R23 Multi Core
min: 24972 avg: 26017 median: 26017 (24%) max: 27062 Points
...
Intel Core i7-12700
...
Cinebench R23 - Cinebench R23 Single Core
min: 1579 avg: 1614 median: 1614 (69%) max: 1649 Points
...
...
Cinebench R20 - Cinebench R20 CPU (Single Core)
min: 617 avg: 629 median: 629 (70%) max: 641 Points
...
...
Cinebench R20 - Cinebench R20 CPU (Multi Core)
min: 9640 avg: 10061 median: 10061 (25%) max: 10482 Points
...
...
Cinebench R15 - Cinebench R15 CPU Multi 64 Bit
min: 4156 avg: 4324 median: 4324 (27%) max: 4492 Points
...
...
0 230 460 690 920 1150 1380 1610 1840 2070 2300 2530 2760 2990 3220 3450 3680 3910 4140 4370 Tooltip AMD Radeon RX 6800 XT: Ø4133 (4002.8-4235.04)
AMD Ryzen 9 5950X: Ø4467 (4442.47-4510.09)
Cinebench R15 - Cinebench R15 CPU Single 64 Bit
min: 261 avg: 266.5 median: 266.5 (80%) max: 272 Points
...
...
Cinebench R11.5 - Cinebench R11.5 CPU Multi 64 Bit
min: 46.05 avg: 47.8 median: 47.8 (62%) max: 49.6 Points
...
...
Cinebench R11.5 - Cinebench R11.5 CPU Single 64 Bit
min: 3.02 avg: 3.1 median: 3.1 (77%) max: 3.14 Points
...
...
Cinebench R10 - Cinebench R10 Rend. Single (32bit)
min: 6564 avg: 6690 median: 6689.5 (40%) max: 6815 points
...
...
Cinebench R10 - Cinebench R10 Rend. Multi (32bit)
min: 55185 avg: 56641 median: 56640.5 (41%) max: 58096 points
...
Intel Core i7-12700
...
Cinebench R10 - Cinebench R10 Rend. Multi (64bit)
min: 99617 avg: 102128 median: 102128 (71%) max: 104638 Points
...
Intel Core i7-12700
...
Cinebench R10 - Cinebench R10 Rend. Single (64bit)
min: 12655 avg: 12967 median: 12967 (16%) max: 13279 Points
...
Intel Core i5-12400F
...
wPrime 2.10 - wPrime 2.0 1024m *
min: 52 avg: 58.5 median: 58.5 (1%) max: 64.9 s
...
...
VIA C3-M C3-M-1200
wPrime 2.10 - wPrime 2.0 32m *
min: 2.538 avg: 4.2 median: 4.2 (1%) max: 5.928 s
...
...
min: 12503 avg: 12736 median: 12735.5 (20%) max: 12968 points
...
...
7-Zip 18.03 - 7-Zip 18.03 Multli Thread 4 runs
min: 118165 avg: 122979 median: 122978 (71%) max: 127792 MIPS
...
...
7-Zip 18.03 - 7-Zip 18.03 Single Thread 4 runs
min: 6729 avg: 6852 median: 6851.5 (82%) max: 6974 MIPS
...
...
X264 HD Benchmark 4.0 - x264 Pass 2
min: 203 avg: 212 median: 212 (74%) max: 221 fps
...
...
X264 HD Benchmark 4.0 - x264 Pass 1
min: 321.5 avg: 330 median: 330 (76%) max: 338.5 fps
...
...
HWBOT x265 Benchmark v2.2 - HWBOT x265 4k Preset
min: 29.9 avg: 30.9 median: 30.9 (54%) max: 31.8 fps
...
...
0 5 10 15 20 25 30 35 Tooltip AMD Radeon RX 6800 XT: Ø29.5 (1.52-37.3)
AMD Ryzen 9 5950X: Ø31.2 (1.6-39)
TrueCrypt - TrueCrypt Serpent
min: 2.3 avg: 2.4 median: 2.4 (71%) max: 2.4 GB/s
...
...
TrueCrypt - TrueCrypt Twofish
min: 3.3 avg: 3.5 median: 3.5 (60%) max: 3.7 GB/s
...
...
TrueCrypt - TrueCrypt AES
min: 25.1 avg: 26 median: 26 (68%) max: 26.9 GB/s
...
Blender - Blender 2.79 BMW27 CPU *
min: 112.8 avg: 117.7 median: 117.7 (1%) max: 122.5 Seconds
...
...
R Benchmark 2.5 - R Benchmark 2.5 *
min: 0.4556 avg: 0.5 median: 0.5 (10%) max: 0.4698 sec
...
...
3DMark 06 - CPU - 3DMark 06 - CPU
min: 17229 avg: 17657 median: 17656.5 (38%) max: 18084 Points
...
...
Super Pi mod 1.5 XS 1M - Super Pi mod 1.5 XS 1M *
min: 7.065 avg: 7.2 median: 7.2 (2%) max: 7.405 s
...
Intel Core i5-11500B
...
VIA C3-M C3-M-1200
Super Pi mod 1.5 XS 2M - Super Pi mod 1.5 XS 2M *
min: 15.28 avg: 15.7 median: 15.7 (1%) max: 16.02 s
...
...
Super Pi Mod 1.5 XS 32M - Super Pi mod 1.5 XS 32M *
min: 349.3 avg: 361.5 median: 361.5 (2%) max: 373.7 s
...
...
VIA C3-M C3-M-1200
3DMark Vantage - 3DM Vant. Perf. CPU no Physx
min: 84237 avg: 85367 median: 85367 (76%) max: 86497 Points
...
...
3DMark 11 - 3DM11 Performance Physics
min: 23012 avg: 25067 median: 25154.5 (68%) max: 27383 Points
...
Intel Core i7-12700
...
3DMark - 3DMark Ice Storm Physics
min: 70120 avg: 77979 median: 79716 (65%) max: 84100 Points
...
...
3DMark - 3DMark Ice Storm Extreme Physics
min: 69902 avg: 78121 median: 80185 (65%) max: 84275 Points
...
...
3DMark - 3DMark Ice Storm Unlimited Physics
min: 82412 avg: 82452 median: 82452 (69%) max: 82492 Points
...
...
3DMark - 3DMark Cloud Gate Physics
min: 21419 avg: 22558 median: 22436 (57%) max: 23939 Points
...
Intel Core i7-12700
...
3DMark - 3DMark Fire Strike Standard Physics
min: 34080 avg: 37236 median: 37498.5 (67%) max: 39600 Points
...
Intel Core i7-12700
...
3DMark - 3DMark Time Spy CPU
min: 11111 avg: 12919 median: 13441 (57%) max: 14559 Points
...
...
Geekbench 5.5 - Geekbench 5.1 - 5.4 64 Bit Single-Core
min: 1621 avg: 1652 median: 1651.5 (70%) max: 1682 points
...
...
Geekbench 5.5 - Geekbench 5.1 - 5.4 64 Bit Multi-Core
min: 15605 avg: 16248 median: 16248 (29%) max: 16891 points
...
Intel Core i7-12700
...
Geekbench 5.0 - Geekbench 5.0 64 Bit Single-Core
min: 1625 avg: 1654 median: 1654 (7%) max: 1683 points
...
Intel Core i5-12400F
...
Geekbench 5.0 - Geekbench 5.0 64 Bit Multi-Core
min: 15396 avg: 15983 median: 15983 (50%) max: 16570 points
...
Intel Core i7-12700
...
Geekbench 4.4 - Geekbench 4.1 - 4.4 64 Bit Single-Core
min: 7021 avg: 7119 median: 7118.5 (71%) max: 7216 points
...
...
Geekbench 4.4 - Geekbench 4.1 - 4.4 64 Bit Multi-Core
min: 57584 avg: 60409 median: 60408.5 (67%) max: 63233 points
...
...
Mozilla Kraken 1.1 - Kraken 1.1 Total Score *
min: 558 avg: 570 median: 569.5 (1%) max: 581 ms
...
Intel Core i5-12400F
...
WebXPRT 3 - WebXPRT 3 Score
min: 288 avg: 289.5 median: 289.5 (60%) max: 291 Points
...
...
CrossMark - CrossMark Overall
1495 Points (57%)
...
...
Power Consumption - Prime95 Power Consumption - external Monitor *
min: 232.8 avg: 242.6 median: 242.6 (42%) max: 252.3 Watt
...
Intel Core i5-12400F
...
Power Consumption - Cinebench R15 Multi Power Consumption - external Monitor *
min: 226.1 avg: 227.4 median: 227.4 (41%) max: 228.7 Watt
...
...
Power Consumption - Cinebench R15 Multi Power Efficiency - external Monitor
min: 18.2 avg: 19.1 median: 19.1 (14%) max: 19.9 Points per Watt
...
...
- Range of benchmark values for this graphics card
- Average benchmark values for this graphics card
* Smaller numbers mean a higher performance
v1.26
log 17. 04:09:52
#0 no ids found in url (should be separated by "_") +0s ... 0s
#1 not redirecting to Ajax server +0s ... 0s
#2 did not recreate cache, as it is less than 5 days old! Created at Sat, 16 Mar 2024 05:37:00 +0100 +0.001s ... 0.001s
#3 composed specs +0.012s ... 0.013s
#4 did output specs +0s ... 0.013s
#5 getting avg benchmarks for device 12787 +0.019s ... 0.031s
#6 got single benchmarks 12787 +0.029s ... 0.06s
#7 got avg benchmarks for devices +0s ... 0.06s
#8 min, max, avg, median took s +1.201s ... 1.261s
#9 return log +0.033s ... 1.294s
Please share our article, every link counts!
Other CPUs of the series Vermeer (Ryzen 5000) Surrounding CPUs
Working For Notebookcheck
Are you a techie who knows how to translate? Then join our Team!
Details here
Top 10 Laptops Multimedia , Budget Multimedia , Gaming , Budget Gaming , Lightweight Gaming , Business , Budget Office , Workstation , Subnotebooks , Ultrabooks , Chromebooks
under 300 USD/Euros , under 500 USD/Euros , 1,000 USD/Euros , for University Students , Best Displays
Top 10 Smartphones Smartphones , Phablets , ≤6-inch , Camera Smartphones
Klaus Hinum (Update: 2020-12- 7)