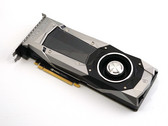
Nvidia GeForce GTX 1070 Ti Founders Edition Desktop GPU Review
Bridge the Gap. With the GTX 1070 Ti, Nvidia brings out a lower-priced alternative to the GTX 1080 and, in the process, forgoes the more expensive GDDR5X video memory. In the review, the Founders Edition card shall show how well it stacks up against the in-house competition.
Intel Core i7-4790K, NVIDIA GeForce GTX 1070 Ti (Desktop)