Reviews for the Intel Core i5-1235U processor
Schenker Work 14 Base review - The affordable office laptop with lots of ports and a bright IPS display
Schenker's Work 14 Base is a simple office laptop which features a bright IPS display, good maintenance options and lots of ports. At the same time, its Intel Core i5-1235U offers enough performance for simple tasks.
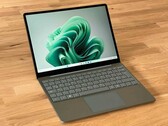
Intel Core i5-1235U, Iris Xe G7 80EUs, 14", 1.3 kgMicrosoft Surface Laptop Go 3 in review - Overpriced subnotebook without keyboard illumination
Microsoft updates the compact Surface Laptop Go and equips the 3rd generation with an Alder Lake Core i5 processor. Furthermore, there is now an optional 16 GB of RAM, but the important keyboard backlight is still missing. At the same time, the price has increased further.
Intel Core i5-1235U, Iris Xe G7 80EUs, 12.4", 1.1 kgA Chromebook for MacBook Pro 14 users: HP Dragonfly Pro Chromebook review
Chromebooks are a dime a dozen these days, but higher-end models are still relatively uncommon. The US$999 Dragonfly Pro Chromebook stands out from the crowd with its 4x Thunderbolt ports and one of the brightest displays on any consumer laptop.
Intel Core i5-1235U, Iris Xe G7 80EUs, 14", 1.5 kgLenovo IdeaPad Gaming Chromebook 16 review: Stream games while doing homework
On paper, a 16-inch Chromebook with a 1600p full sRGB 120 Hz display sounds overkill. After spending just a few minutes with one, however, we can't look back. The Lenovo lives up to its name for being both a cloud gamer and a productive Chromebook.
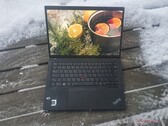
Intel Core i5-1235U, Iris Xe G7 80EUs, 16", 1.8 kgLenovo ThinkPad T14s G3 Intel laptop review: quiet, efficient and fast
The latest ThinkPad T14s G3 has finally received a 16:10 display, a surprisingly powerful Intel Alder Lake-U CPU and faster LPDDR5 RAM as part of a redesign by Lenovo. Furthermore, the 14-inch business-oriented ThinkPad showed modest power consumption and very low emissions during our testing. In this review, we’ll discuss whether all these qualities are enough for the ThinkPad T14s G3 to prevail against AMD-based laptops or Lenovo’s own ThinkPad X1 Carbon G10.
Intel Core i5-1235U, Iris Xe G7 80EUs, 14", 1.3 kgBeelink SEi12 Core i5-1235U: Intel Iris Xe Graphics G7 80EUs, 0.5 kg
Review » Beelink SEi12 mini PC review: Outperforming the Intel NUC 11
Lenovo ThinkPad X13 G3 21BN0046GE: Intel Iris Xe Graphics G7 80EUs, 13.30", 1.3 kg
Review » Lenovo ThinkPad X13 G3 laptop review: Endurance in outdoor use with Intel Alder Lake-U
Lenovo IdeaPad Flex 5i 14IAU7: Intel Iris Xe Graphics G7 80EUs, 14.00", 1.6 kg
Review » Lenovo IdeaPad Flex 5i 14IAU7 convertible review: Core i5-1235U done right
VAIO FE 14.1 VWNC51429-SL: Intel Iris Xe Graphics G7 80EUs, 14.10", 1.6 kg
Review » VAIO FE14 laptop review: Avoid the Core i5-1235U and get the Core i7-1255U
Gateway Ultra Slim 14.1 GWTC51427: Intel Iris Xe Graphics G7 80EUs, 14.10", 1.6 kg
Review » Core i5-1235U performance debut: Gateway Ultra Slim 14.1 GWTC51427 laptop review
Acer Aspire 5 A514-55, i5-1235U: Intel Iris Xe Graphics G7 80EUs, 14.00", 1.7 kg
External Review » Acer Aspire 5 A514-55, i5-1235U
Medion Akoya E16433: Intel Iris Xe Graphics G7 80EUs, 16.00", 2 kg
External Review » Medion Akoya E16433
Asus Vivobook 14 X1404ZA, i5-1235U: Intel Iris Xe Graphics G7 80EUs, 14.00", 1.4 kg
External Review » Asus Vivobook 14 X1404ZA, i5-1235U
Chuwi Corebook X 2023: Intel Iris Xe Graphics G7 80EUs, 14.00", 1.4 kg
External Review » Chuwi Corebook X 2023
Asus VivoBook 15 X1504ZA: Intel Iris Xe Graphics G7 80EUs, 15.60", 1.6 kg
External Review » Asus VivoBook 15 X1504ZA
Infinix INBook X3 Slim: Intel Iris Xe Graphics G7 80EUs, 14.20", 1.2 kg
External Review » Infinix INBook X3 Slim
Microsoft Surface Laptop Go 3: Intel Iris Xe Graphics G7 80EUs, 12.40", 1.1 kg
External Review » Microsoft Surface Laptop Go 3
HP Pavilion x360 14-ek0751nd: Intel Iris Xe Graphics G7 80EUs, 14.00", 1.5 kg
External Review » HP Pavilion x360 14-ek0751nd
HP Pavilion 15-eg2752nd: Intel Iris Xe Graphics G7 80EUs, 15.60", 1.7 kg
External Review » HP Pavilion 15-eg2752nd
Acer Aspire 5 A515-57-50Y7: Intel Iris Xe Graphics G7 80EUs, 15.60", 1.8 kg
External Review » Acer Aspire 5 A515-57-50Y7
HP 15s-fq5110ns: Intel Iris Xe Graphics G7 80EUs, 15.60", 1.7 kg
External Review » HP 15s-fq5110ns
Asus ExpertBook B1 B1402CBA: Intel Iris Xe Graphics G7 80EUs, 14.00", 1.5 kg
External Review » Asus ExpertBook B1 B1402CBA
Lenovo IdeaPad Gaming Chromebook 16: Intel Iris Xe Graphics G7 80EUs, 16.00", 1.8 kg
External Review » Lenovo IdeaPad Gaming Chromebook 16
Asus VivoBook 14 F1402ZA, i5-1235U: Intel Iris Xe Graphics G7 80EUs, 14.00", 1.5 kg
External Review » Asus VivoBook 14 F1402ZA, i5-1235U
Dell Inspiron 16 5620: Intel Iris Xe Graphics G7 80EUs, 16.00", 1.9 kg
External Review » Dell Inspiron 16 5620
Acer Aspire 3 A315-59, i5-1235U: Intel Iris Xe Graphics G7 80EUs, 15.60", 1.8 kg
External Review » Acer Aspire 3 A315-59, i5-1235U
Asus ExpertBook B1 B1502CB, i5-1235U: Intel Iris Xe Graphics G7 80EUs, 15.60", 1.7 kg
External Review » Asus ExpertBook B1 B1502CB, i5-1235U
HP Pavilion 14-dv2009ns: Intel Iris Xe Graphics G7 80EUs, 14.00", 1.4 kg
External Review » HP Pavilion 14-dv2009ns
HP Pavilion x360 14-ek0005ns: Intel Iris Xe Graphics G7 80EUs, 14.00", 1.5 kg
External Review » HP Pavilion x360 14-ek0005ns
HP 15s-fq5081ns: Intel Iris Xe Graphics G7 80EUs, 15.60", 1.7 kg
External Review » HP 15s-fq5081ns
Asus Vivobook 15 X1505ZA: Intel Iris Xe Graphics G7 80EUs, 15.60", 1.7 kg
External Review » Asus Vivobook 15 X1505ZA
Asus VivoBook 16X X1605ZA: Intel Iris Xe Graphics G7 80EUs, 16.00", 1.9 kg
External Review » Asus VivoBook 16X X1605ZA
Dell Inspiron 15 3520: Intel Iris Xe Graphics G7 80EUs, 15.60", 1.9 kg
External Review » Dell Inspiron 15 3520
Wortmann Terra Mobile 1470U: Intel Iris Xe Graphics G7 80EUs, 14.00", 1.1 kg
External Review » Wortmann Terra Mobile 1470U
HP 15s-fq5075ns: Intel Iris Xe Graphics G7 80EUs, 15.60", 1.7 kg
External Review » HP 15s-fq5075ns
Dell Vostro 3520, i5-1235U: Intel Iris Xe Graphics G7 80EUs, 15.60", 1.7 kg
External Review » Dell Vostro 3520, i5-1235U
Asus Chromebook Vibe CX3401 Flip: Intel Iris Xe Graphics G7 80EUs, 14.00", 1.8 kg
External Review » Asus Chromebook Vibe CX3401 Flip
HP 15s-fq5089ns: Intel Iris Xe Graphics G7 80EUs, 15.60", 1.7 kg
External Review » HP 15s-fq5089ns
Acer Aspire 3 A315-59-58K8: Intel Iris Xe Graphics G7 80EUs, 15.60", 1.8 kg
External Review » Acer Aspire 3 A315-59-58K8
Lenovo ThinkPad T14s G3 21BR00CDGE: Intel Iris Xe Graphics G7 80EUs, 14.00", 1.3 kg
External Review » Lenovo ThinkPad T14s G3 21BR00CDGE
Lenovo ThinkPad X13 G3 21BN0046GE: Intel Iris Xe Graphics G7 80EUs, 13.30", 1.3 kg
External Review » Lenovo ThinkPad X13 G3 21BN0046GE
HP EliteBook x360 830 G9, i5-1235U: Intel Iris Xe Graphics G7 80EUs, 13.30", 1.3 kg
External Review » HP EliteBook x360 830 G9, i5-1235U
Lenovo IdeaPad Duet 5 12IAU7, i5-1235U: Intel Iris Xe Graphics G7 80EUs, 12.40", 0.8 kg
External Review » Lenovo IdeaPad Duet 5 12IAU7, i5-1235U
Lenovo ThinkBook 14 G4 IAP, i5-1235U: Intel Iris Xe Graphics G7 80EUs, 14.00", 1.4 kg
External Review » Lenovo ThinkBook 14 G4 IAP, i5-1235U
Lenovo Thinkpad X1 Carbon G10, i5-1235U: Intel Iris Xe Graphics G7 80EUs, 14.00", 1.1 kg
External Review » Lenovo Thinkpad X1 Carbon G10, i5-1235U
Acer Spin 3 SP314-55N-55RR: Intel Iris Xe Graphics G7 80EUs, 14.00", 1.5 kg
External Review » Acer Spin 3 SP314-55N-55RR
Asus VivoBook 15 F1502ZA, i5-1235U: Intel Iris Xe Graphics G7 80EUs, 15.60", 1.7 kg
External Review » Asus VivoBook 15 F1502ZA, i5-1235U
HP 15s-fq5022ns: Intel Iris Xe Graphics G7 80EUs, 15.60", 1.7 kg
External Review » HP 15s-fq5022ns
HP 15s-fq5071ns: Intel Iris Xe Graphics G7 80EUs, 15.60", 1.7 kg
External Review » HP 15s-fq5071ns
HP Dragonfly Pro Chromebook: Intel Iris Xe Graphics G7 80EUs, 14.00", 1.5 kg
External Review » HP Dragonfly Pro Chromebook
Asus Chromebook Flip CX5601, i5-1235U: Intel Iris Xe Graphics G7 80EUs, 16.00", 2.2 kg
External Review » Asus Chromebook Flip CX5601, i5-1235U
HP Spectre x360 14, i5-1235U: Intel Iris Xe Graphics G7 80EUs, 13.50", 1.4 kg
External Review » HP Spectre x360 14, i5-1235U
Lenovo ThinkBook 14s Yoga G2 IAP 21DM0005GE: Intel Iris Xe Graphics G7 80EUs, 14.00", 1.5 kg
External Review » Lenovo ThinkBook 14s Yoga G2 IAP 21DM0005GE
HP ProBook 440 G9, i5-1235U: Intel Iris Xe Graphics G7 80EUs, 14.00", 1.4 kg
External Review » HP ProBook 440 G9, i5-1235U
Lenovo ThinkPad L15 G3, i5-1235: Intel Iris Xe Graphics G7 80EUs, 15.60", 1.8 kg
External Review » Lenovo ThinkPad L15 G3, i5-1235
Fujitsu LifeBook U7512, i5-1235U: Intel Iris Xe Graphics G7 80EUs, 15.60", 1.4 kg
External Review » Fujitsu LifeBook U7512, i5-1235U
Asus Vivobook 17 X1702, i5-1235U: Intel Iris Xe Graphics G7 80EUs, 17.30", 2.1 kg
External Review » Asus Vivobook 17 X1702, i5-1235U
Microsoft Surface Laptop 5 13, i5-1235U: Intel Iris Xe Graphics G7 80EUs, 13.50", 1.3 kg
External Review » Microsoft Surface Laptop 5 13, i5-1235U
Asus Vivobook 14 A1402, i5-1235U: Intel Iris Xe Graphics G7 80EUs, 14.00", 1.5 kg
External Review » Asus Vivobook 14 A1402, i5-1235U
Lenovo IdeaPad 3 15IAU7-82RK0092GE: Intel Iris Xe Graphics G7 80EUs, 15.60", 1.6 kg
External Review » Lenovo IdeaPad 3 15IAU7-82RK0092GE
Acer Chromebook Vero 514 CBV514-1H, i5-1235U: Intel Iris Xe Graphics G7 80EUs, 14.00", 1.5 kg
External Review » Acer Chromebook Vero 514 CBV514-1H, i5-1235U
Honor Magicbook X 16, i5-1235U: Intel Iris Xe Graphics G7 80EUs, 16.00", 1.8 kg
External Review » Honor Magicbook X 16, i5-1235U
HP Pavilion 14-dv2014TU: Intel Iris Xe Graphics G7 80EUs, 14.00", 1.4 kg
External Review » HP Pavilion 14-dv2014TU
Asus Vivobook 14 X1405ZA, i5-1235U: Intel Iris Xe Graphics G7 80EUs, 14.00", 1.6 kg
External Review » Asus Vivobook 14 X1405ZA, i5-1235U
HP 15s-fq5034ns: Intel Iris Xe Graphics G7 80EUs, 15.60", 1.7 kg
External Review » HP 15s-fq5034ns
HP 470 G9, i5-1235U: Intel Iris Xe Graphics G7 80EUs, 17.30", 2.1 kg
External Review » HP 470 G9, i5-1235U
Dell Latitude 15 3530, i5-1235U: Intel Iris Xe Graphics G7 80EUs, 15.60", 1.8 kg
External Review » Dell Latitude 15 3530, i5-1235U
Acer TravelMate P2 TMP215-54-598S: Intel Iris Xe Graphics G7 80EUs, 15.60", 1.9 kg
External Review » Acer TravelMate P2 TMP215-54-598S
HP EliteBook 650 G9, i5-1235U: Intel Iris Xe Graphics G7 80EUs, 15.60", 1.7 kg
External Review » HP EliteBook 650 G9, i5-1235U
Lenovo ThinkBook 15 G4 IAP, i5-1235U: Intel Iris Xe Graphics G7 80EUs, 15.60", 1.7 kg
External Review » Lenovo ThinkBook 15 G4 IAP, i5-1235U
Acer Aspire 5 A515-57G-57CW: NVIDIA GeForce MX550, 15.60", 1.8 kg
External Review » Acer Aspire 5 A515-57G-57CW
HP EliteBook 640 G9, i5-1235U: Intel Iris Xe Graphics G7 80EUs, 14.00", 1.4 kg
External Review » HP EliteBook 640 G9, i5-1235U
HP EliteBook 840 G9, i5-1235U: Intel Iris Xe Graphics G7 80EUs, 14.00", 1.4 kg
External Review » HP EliteBook 840 G9, i5-1235U
Lenovo ThinkPad E14 G4, i5-1235U: Intel Iris Xe Graphics G7 80EUs, 14.00", 1.6 kg
External Review » Lenovo ThinkPad E14 G4, i5-1235U
Lenovo IdeaPad Flex 5 14IAU7-82R7007XGE: Intel Iris Xe Graphics G7 80EUs, 14.00", 1.6 kg
External Review » Lenovo IdeaPad Flex 5 14IAU7-82R7007XGE
Dell Latitude 14 7430, i5-1235U: Intel Iris Xe Graphics G7 80EUs, 14.00", 1.2 kg
External Review » Dell Latitude 14 7430, i5-1235U
Samsung Galaxy Book2 15, i5-1235U: Intel Iris Xe Graphics G7 80EUs, 15.60", 1.6 kg
External Review » Samsung Galaxy Book2 15, i5-1235U
Fujitsu LifeBook U7312, i5-1235U: Intel Iris Xe Graphics G7 80EUs, 13.30", 1 kg
External Review » Fujitsu LifeBook U7312, i5-1235U
Dell Inspiron 14 5420, i5-1235U: Intel Iris Xe Graphics G7 80EUs, 14.00", 1.6 kg
External Review » Dell Inspiron 14 5420, i5-1235U
Asus ExpertBook B1 B1400CBA, i5-1235U: Intel Iris Xe Graphics G7 80EUs, 14.00", 1.5 kg
External Review » Asus ExpertBook B1 B1400CBA, i5-1235U
HP Probook 450 G9-6A179EA: Intel Iris Xe Graphics G7 80EUs, 15.60", 1.7 kg
External Review » HP Probook 450 G9-6A179EA
Microsoft Surface Pro 9, i5-1235U: Intel Iris Xe Graphics G7 80EUs, 13.00", 0.9 kg
External Review » Microsoft Surface Pro 9, i5-1235U
Lenovo IdeaPad 5 15IAL7-82SF000RGE: Intel Iris Xe Graphics G7 80EUs, 15.60", 1.9 kg
External Review » Lenovo IdeaPad 5 15IAL7-82SF000RGE
HP Pavilion Plus 14-eh0754ng: NVIDIA GeForce MX550, 14.00", 1.4 kg
External Review » HP Pavilion Plus 14-eh0754ng
Asus Expertbook B3 Flip B3402, i5-1235U: Intel Iris Xe Graphics G7 80EUs, 14.00", 1.6 kg
External Review » Asus Expertbook B3 Flip B3402, i5-1235U
Acer Aspire 5 A515-57-56UV: Intel Iris Xe Graphics G7 80EUs, 15.60", 1.8 kg
External Review » Acer Aspire 5 A515-57-56UV
Gateway GWTC51427-BK: Intel Iris Xe Graphics G7 80EUs, 14.10", 1.7 kg
External Review » Gateway GWTC51427-BK
HP 15s-fq5078TU: Intel Iris Xe Graphics G7 80EUs, 15.60", 1.7 kg
External Review » HP 15s-fq5078TU
Dell Inspiron 16 7620 2-in-1 K7JT6: Intel Iris Xe Graphics G7 80EUs, 16.00", 2.2 kg
External Review » Dell Inspiron 16 7620 2-in-1 K7JT6
VAIO FE 14.1 VWNC51429-SL: Intel Iris Xe Graphics G7 80EUs, 14.10", 1.6 kg
External Review » VAIO FE 14.1 VWNC51429-SL
Lenovo ThinkPad L14 G3 21C1003AGE: Intel Iris Xe Graphics G7 80EUs, 14.00", 1.4 kg
External Review » Lenovo ThinkPad L14 G3 21C1003AGE
Lenovo ThinkPad L13 Yoga G3 21B50043GE: Intel Iris Xe Graphics G7 80EUs, 13.30", 1.3 kg
External Review » Lenovo ThinkPad L13 Yoga G3 21B50043GE
Acer Aspire Vero AV14-51-59UW: Intel Iris Xe Graphics G7 80EUs, 14.00", 1.5 kg
External Review » Acer Aspire Vero AV14-51-59UW
MSI Modern 15 B12M, i5-1235U: Intel Iris Xe Graphics G7 80EUs, 15.60", 1.8 kg
External Review » MSI Modern 15 B12M, i5-1235U
Acer Aspire 5 A515-57-58LU: Intel Iris Xe Graphics G7 80EUs, 15.60", 1.8 kg
External Review » Acer Aspire 5 A515-57-58LU
Samsung Galaxy Book2 Pro 360 13, i5-1235U: Intel Iris Xe Graphics G7 80EUs, 13.30", 1.2 kg
External Review » Samsung Galaxy Book2 Pro 360 13, i5-1235U
Dell Inspiron 14 7420 2-in-1, i5-1235U: Intel Iris Xe Graphics G7 96EUs, 14.00", 1.6 kg
External Review » Dell Inspiron 14 7420, 2-in-1
MSI Modern 14 C12M, i5-1235U: Intel Iris Xe Graphics G7 80EUs, 14.00", 1.4 kg
External Review » MSI Modern 14 C12M, i5-1235U
Acer Chromebook Spin 714 CP714-1WN-53M9: Intel Iris Xe Graphics G7 80EUs, 14.00", 1.4 kg
External Review » Acer Chromebook Spin 714 CP714-1WN-53M9
Dell Latitude 15 5530-48J03: Intel Iris Xe Graphics G7 80EUs, 15.60", 1.6 kg
External Review » Dell Latitude 15 5530-48J03
Lenovo Thinkpad X1 Carbon G10, i5-1235U: Intel Iris Xe Graphics G7 80EUs, 14.00", 1.1 kg
» Lenovo ThinkPad X1 Carbon Gen 10 with 32GB memory is now extremely cheap in refurbished laptop sale
Microsoft Surface Pro 9, i5-1235U: Intel Iris Xe Graphics G7 80EUs, 13.00", 0.9 kg
» BestBuy clears out Surface Pro 9 with i5 CPU, 8GB RAM, 256GB SSD at $330 off MSRP
Lenovo ThinkPad L14 G3 21C1003AGE: Intel Iris Xe Graphics G7 80EUs, 14.00", 1.4 kg
» Lenovo ThinkPad L14 Gen 3 laptop with upgradable 16GB RAM is 67% off right now
Microsoft Surface Pro 9, i5-1235U: Intel Iris Xe Graphics G7 80EUs, 13.00", 0.9 kg
» Microsoft Surface Pro 9 Windows tablet with 120Hz QHD display falls to lowest price ever on Amazon
Lenovo IdeaPad Gaming Chromebook 16: Intel Iris Xe Graphics G7 80EUs, 16.00", 1.8 kg
» The Lenovo IdeaPad Gaming Chromebook 16 is now shipping, but one of its best features is still not OS wide
Lenovo ThinkPad T14s G3 21BR00CDGE: Intel Iris Xe Graphics G7 80EUs, 14.00", 1.3 kg
» Lenovo ThinkPad T14s G3 Intel reviewed: quiet mobile companion with great performance
Lenovo IdeaPad Flex 5i 14IAU7: Intel Iris Xe Graphics G7 80EUs, 14.00", 1.6 kg
» The Core i5-1235U had a terrible launch until the Lenovo IdeaPad Flex i5 14 saved it
VAIO FE 14.1 VWNC51429-SL: Intel Iris Xe Graphics G7 80EUs, 14.10", 1.6 kg
» 2022 Vaio FE 14 is new on the inside but old on the outside