Microsoft Surface Laptop Go 3 in review - Overpriced subnotebook without keyboard illumination
Together with the new Surface Laptop Studio 2 (here in review), Microsoft has also introduced a new version of the Surface Laptop Go. In the third generation, the manufacturer from Redmond swaps the old Tiger Lake processor for last year's Alder Lake chip and optionally offers 16 GB of RAM. While at least a few other things have been changed in the Surface Laptop Studio (e.g. more ports), the Surface Laptop Go 3 is exactly the same as its predecessor in all other aspects, including the missing keyboard backlight. In return, however, the cheaper models have been eliminated and the base model with the Core i5-1235U, 8 GB RAM and a 256 GB SSD will cost 899 Euros. If you want 16 GB of RAM, you will have to pay 1,149 Euros (US$999 in the States) with the same configuration.
In the end, the Apple MacBook Air M1 which is still available in stores for around 900 Euros (~$900), is the biggest competitor for the compact Microsoft computer. In the Windows camp, there is the Dell XPS 13 is already available for less than 1,000 Euros, and the 13.3-inch convertible Lenovo Yoga 6 is also in this price range.
Possible competitors in comparison
Rating | Date | Model | Weight | Height | Size | Resolution | Price |
|---|---|---|---|---|---|---|---|
| 83.3 % v7 (old) | 10 / 2023 | Microsoft Surface Laptop Go 3 i5-1235U, Iris Xe G7 80EUs | 1.1 kg | 15.7 mm | 12.40" | 1536x1024 | |
| 91.1 % v7 (old) | 12 / 2020 | Apple MacBook Air 2020 M1 Entry M1, M1 7-Core GPU | 1.3 kg | 16.1 mm | 13.30" | 2560x1600 | |
| 88.2 % v7 (old) | 08 / 2022 | Dell XPS 13 9315, i5-1230U i5-1230U, Iris Xe G7 80EUs | 1.2 kg | 14 mm | 13.40" | 1920x1200 | |
| 88 % v7 (old) | 03 / 2023 | Lenovo Yoga 6 13 83B2001SGE R7 7730U, Vega 8 | 1.4 kg | 18.6 mm | 13.30" | 1920x1200 |
Case & Equipment
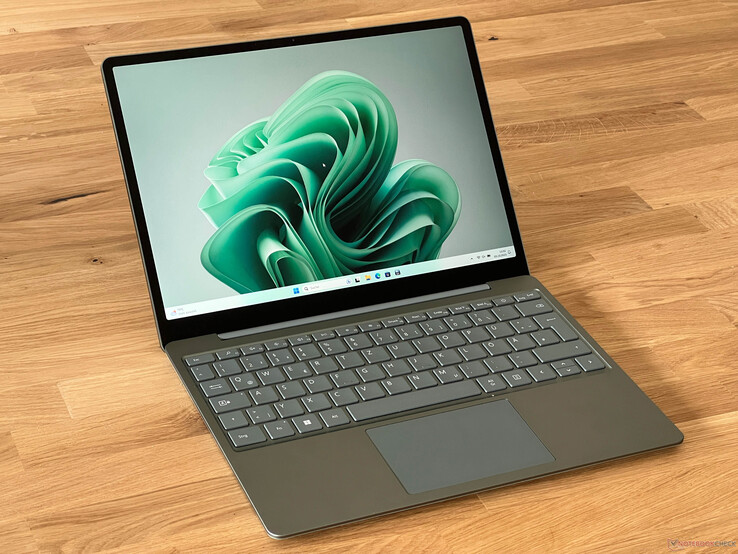
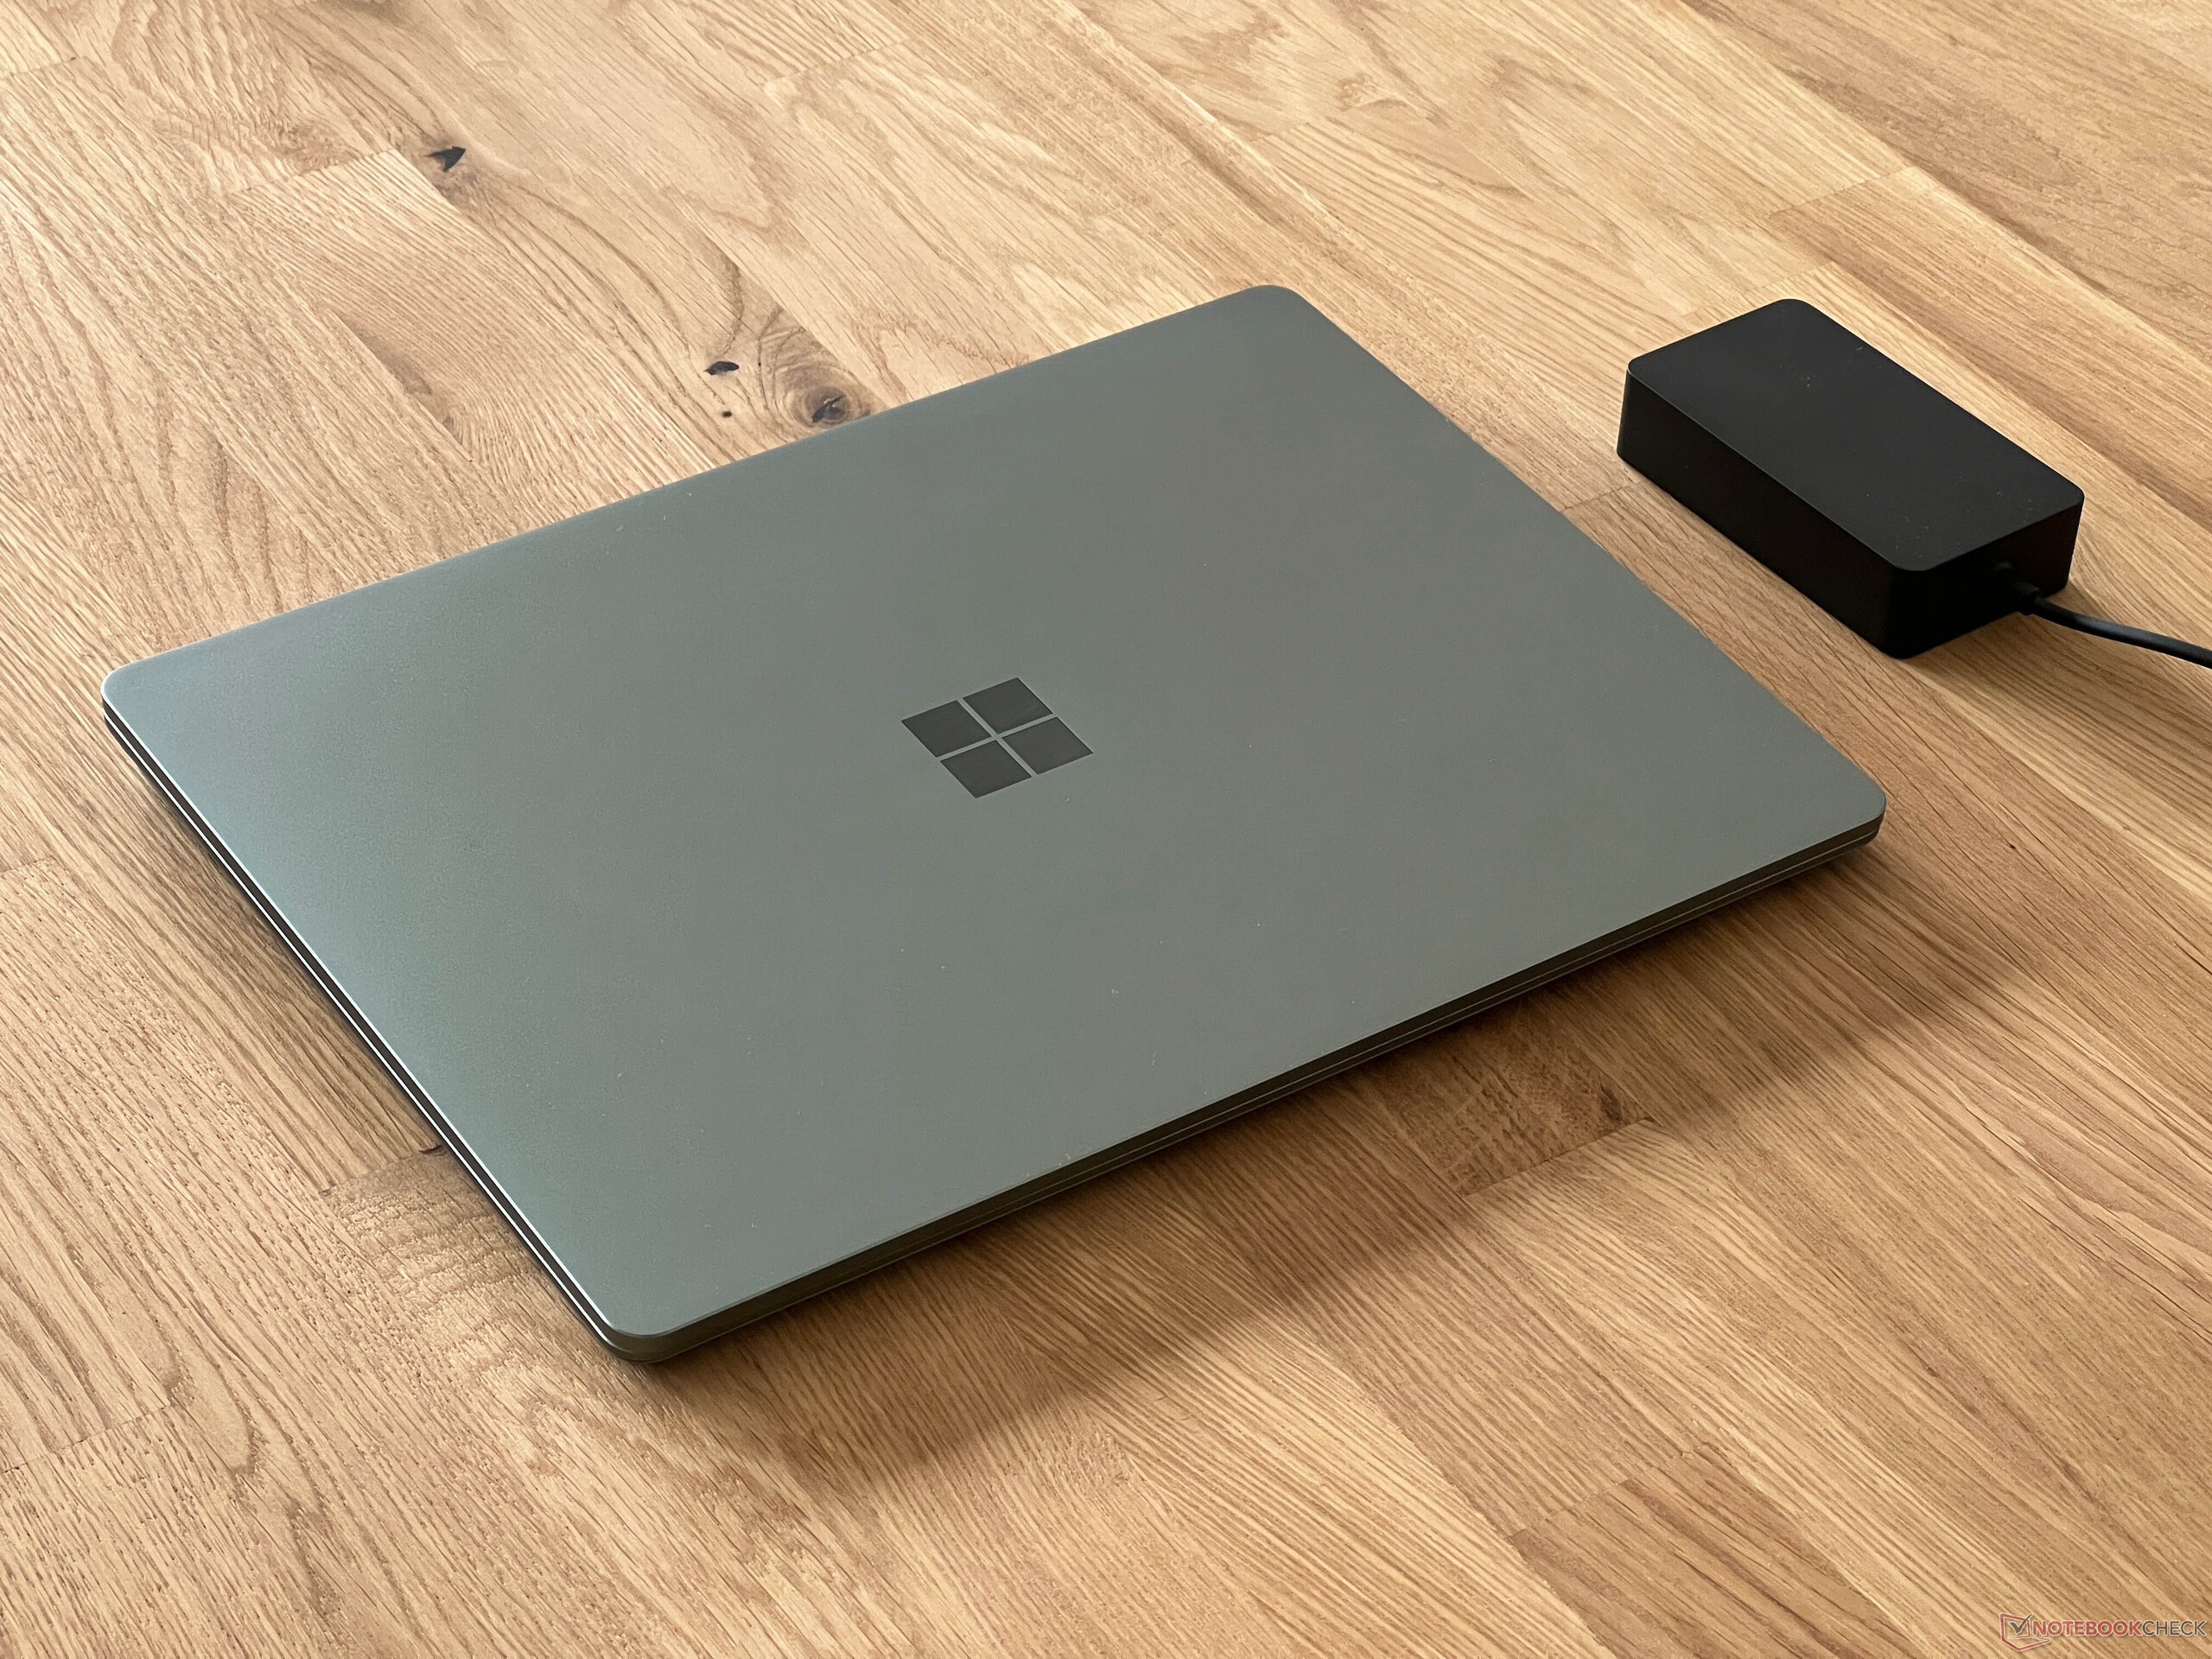
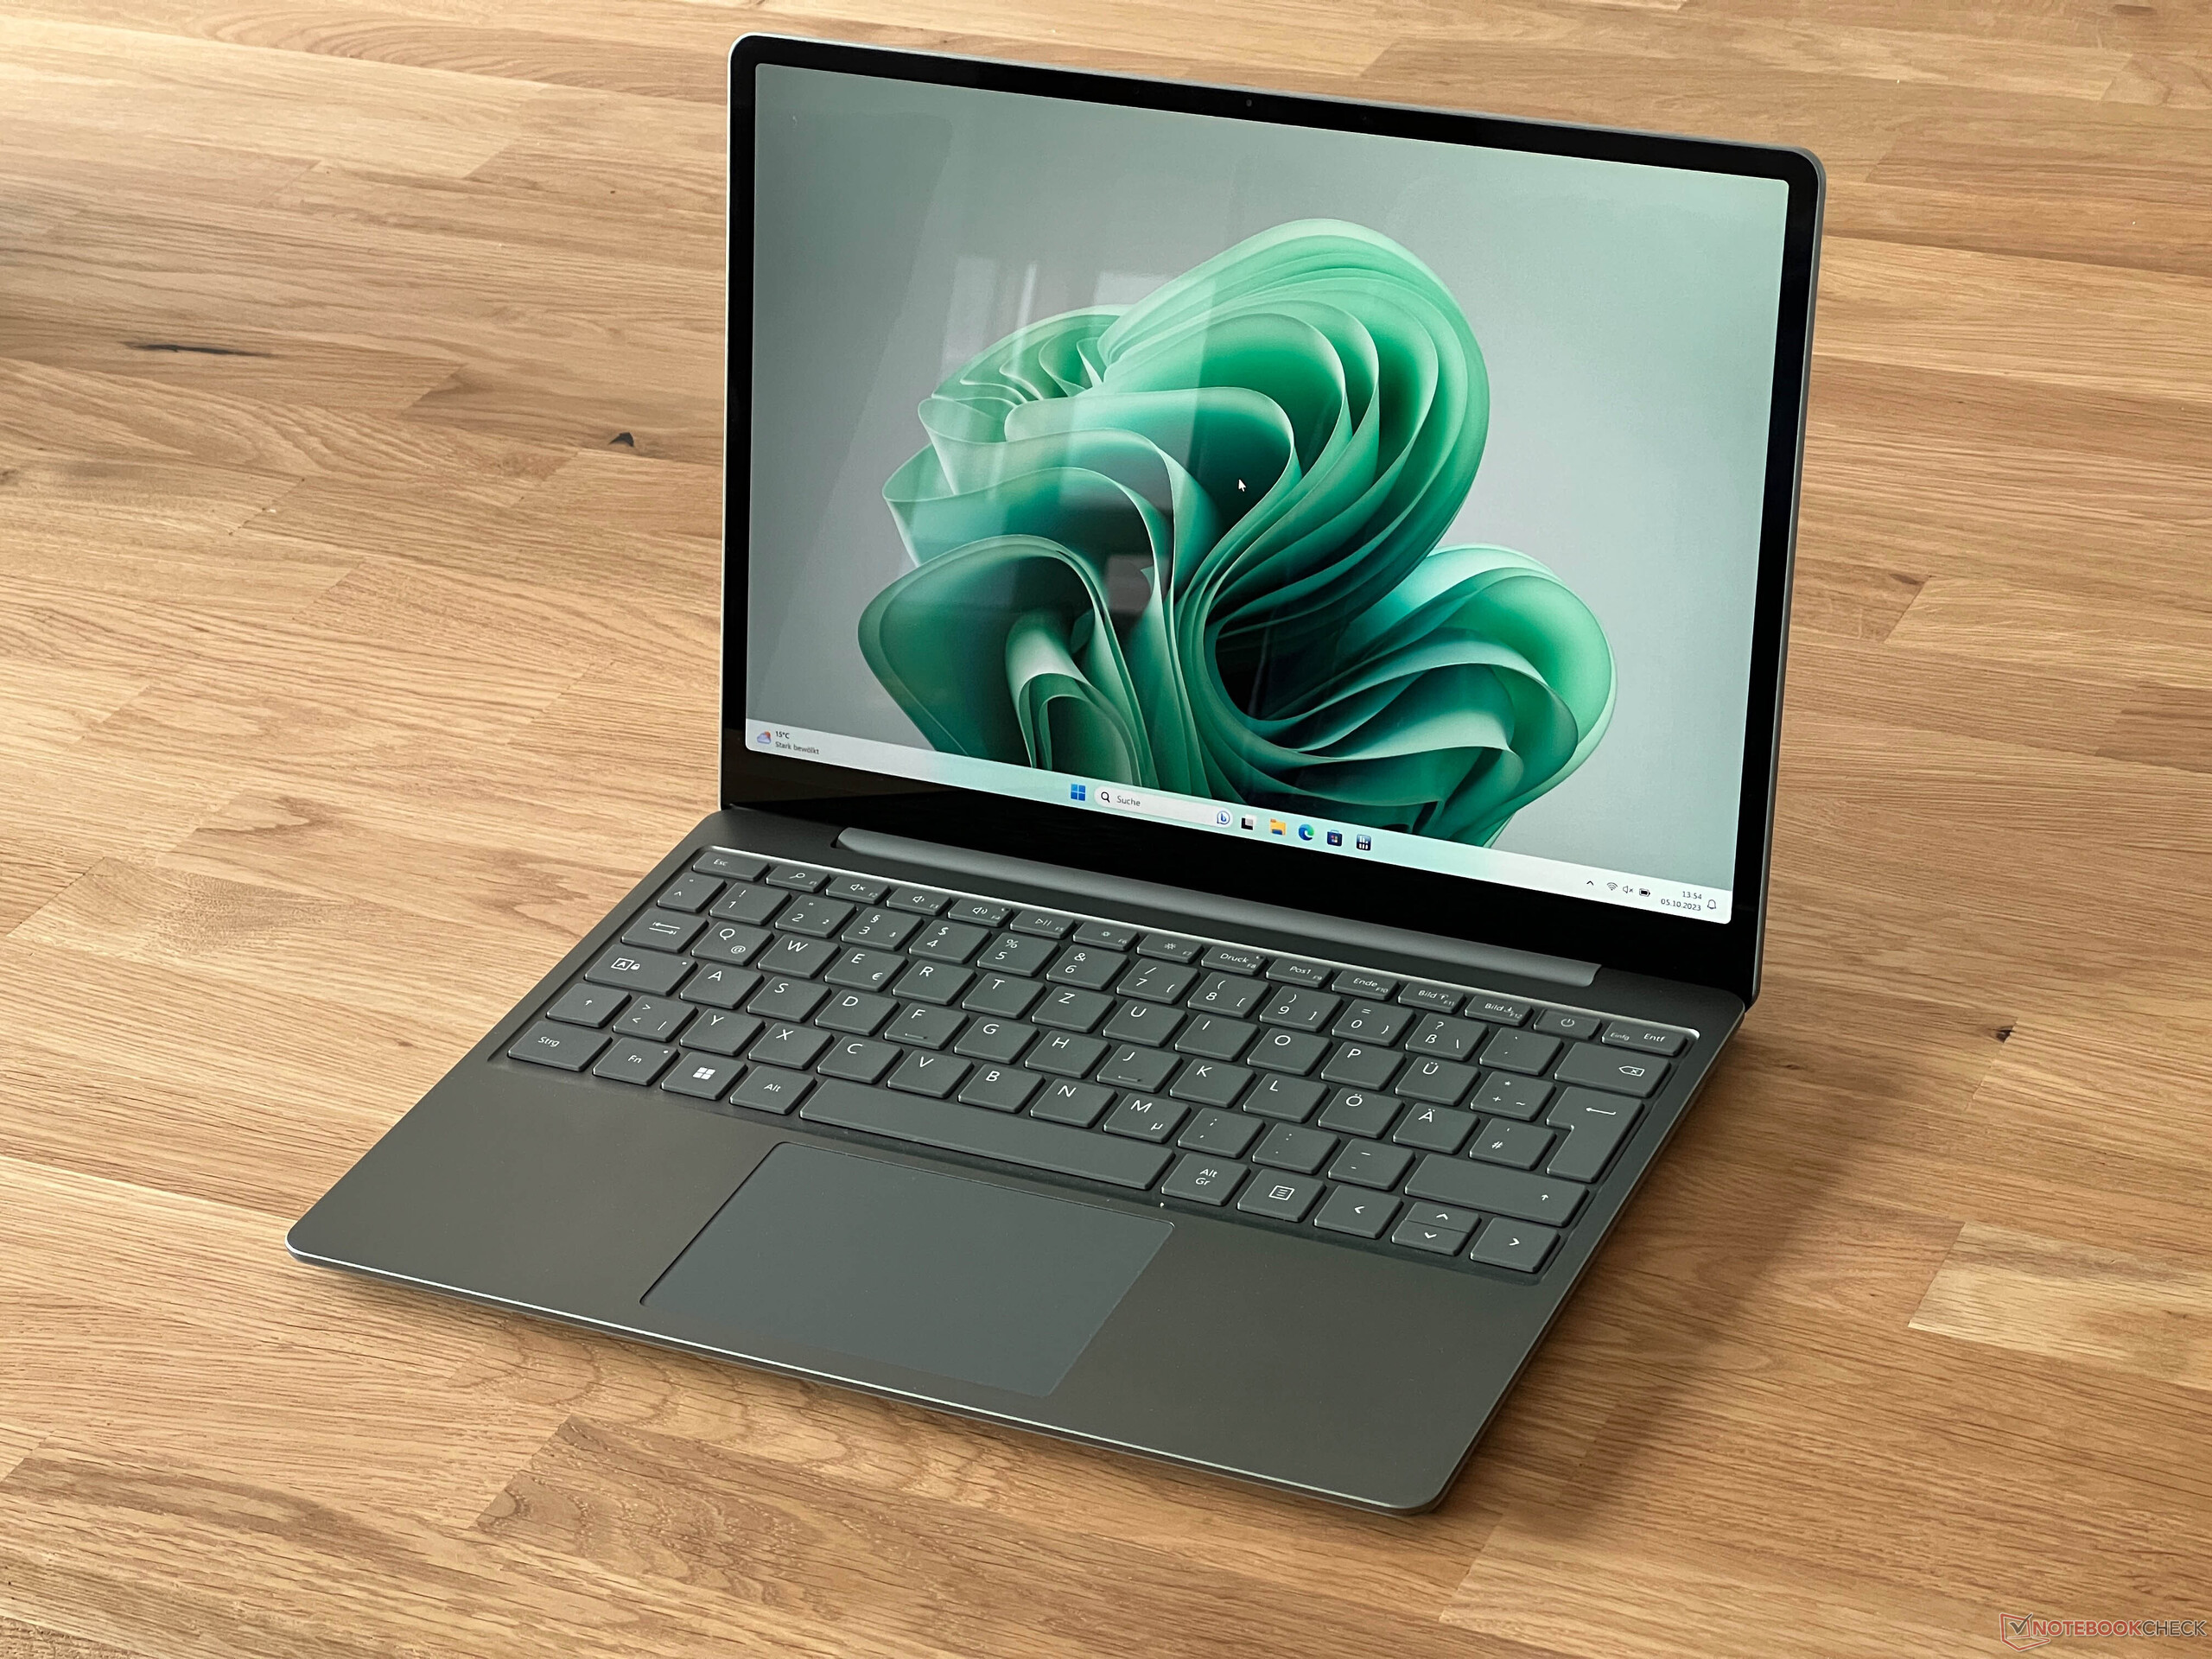
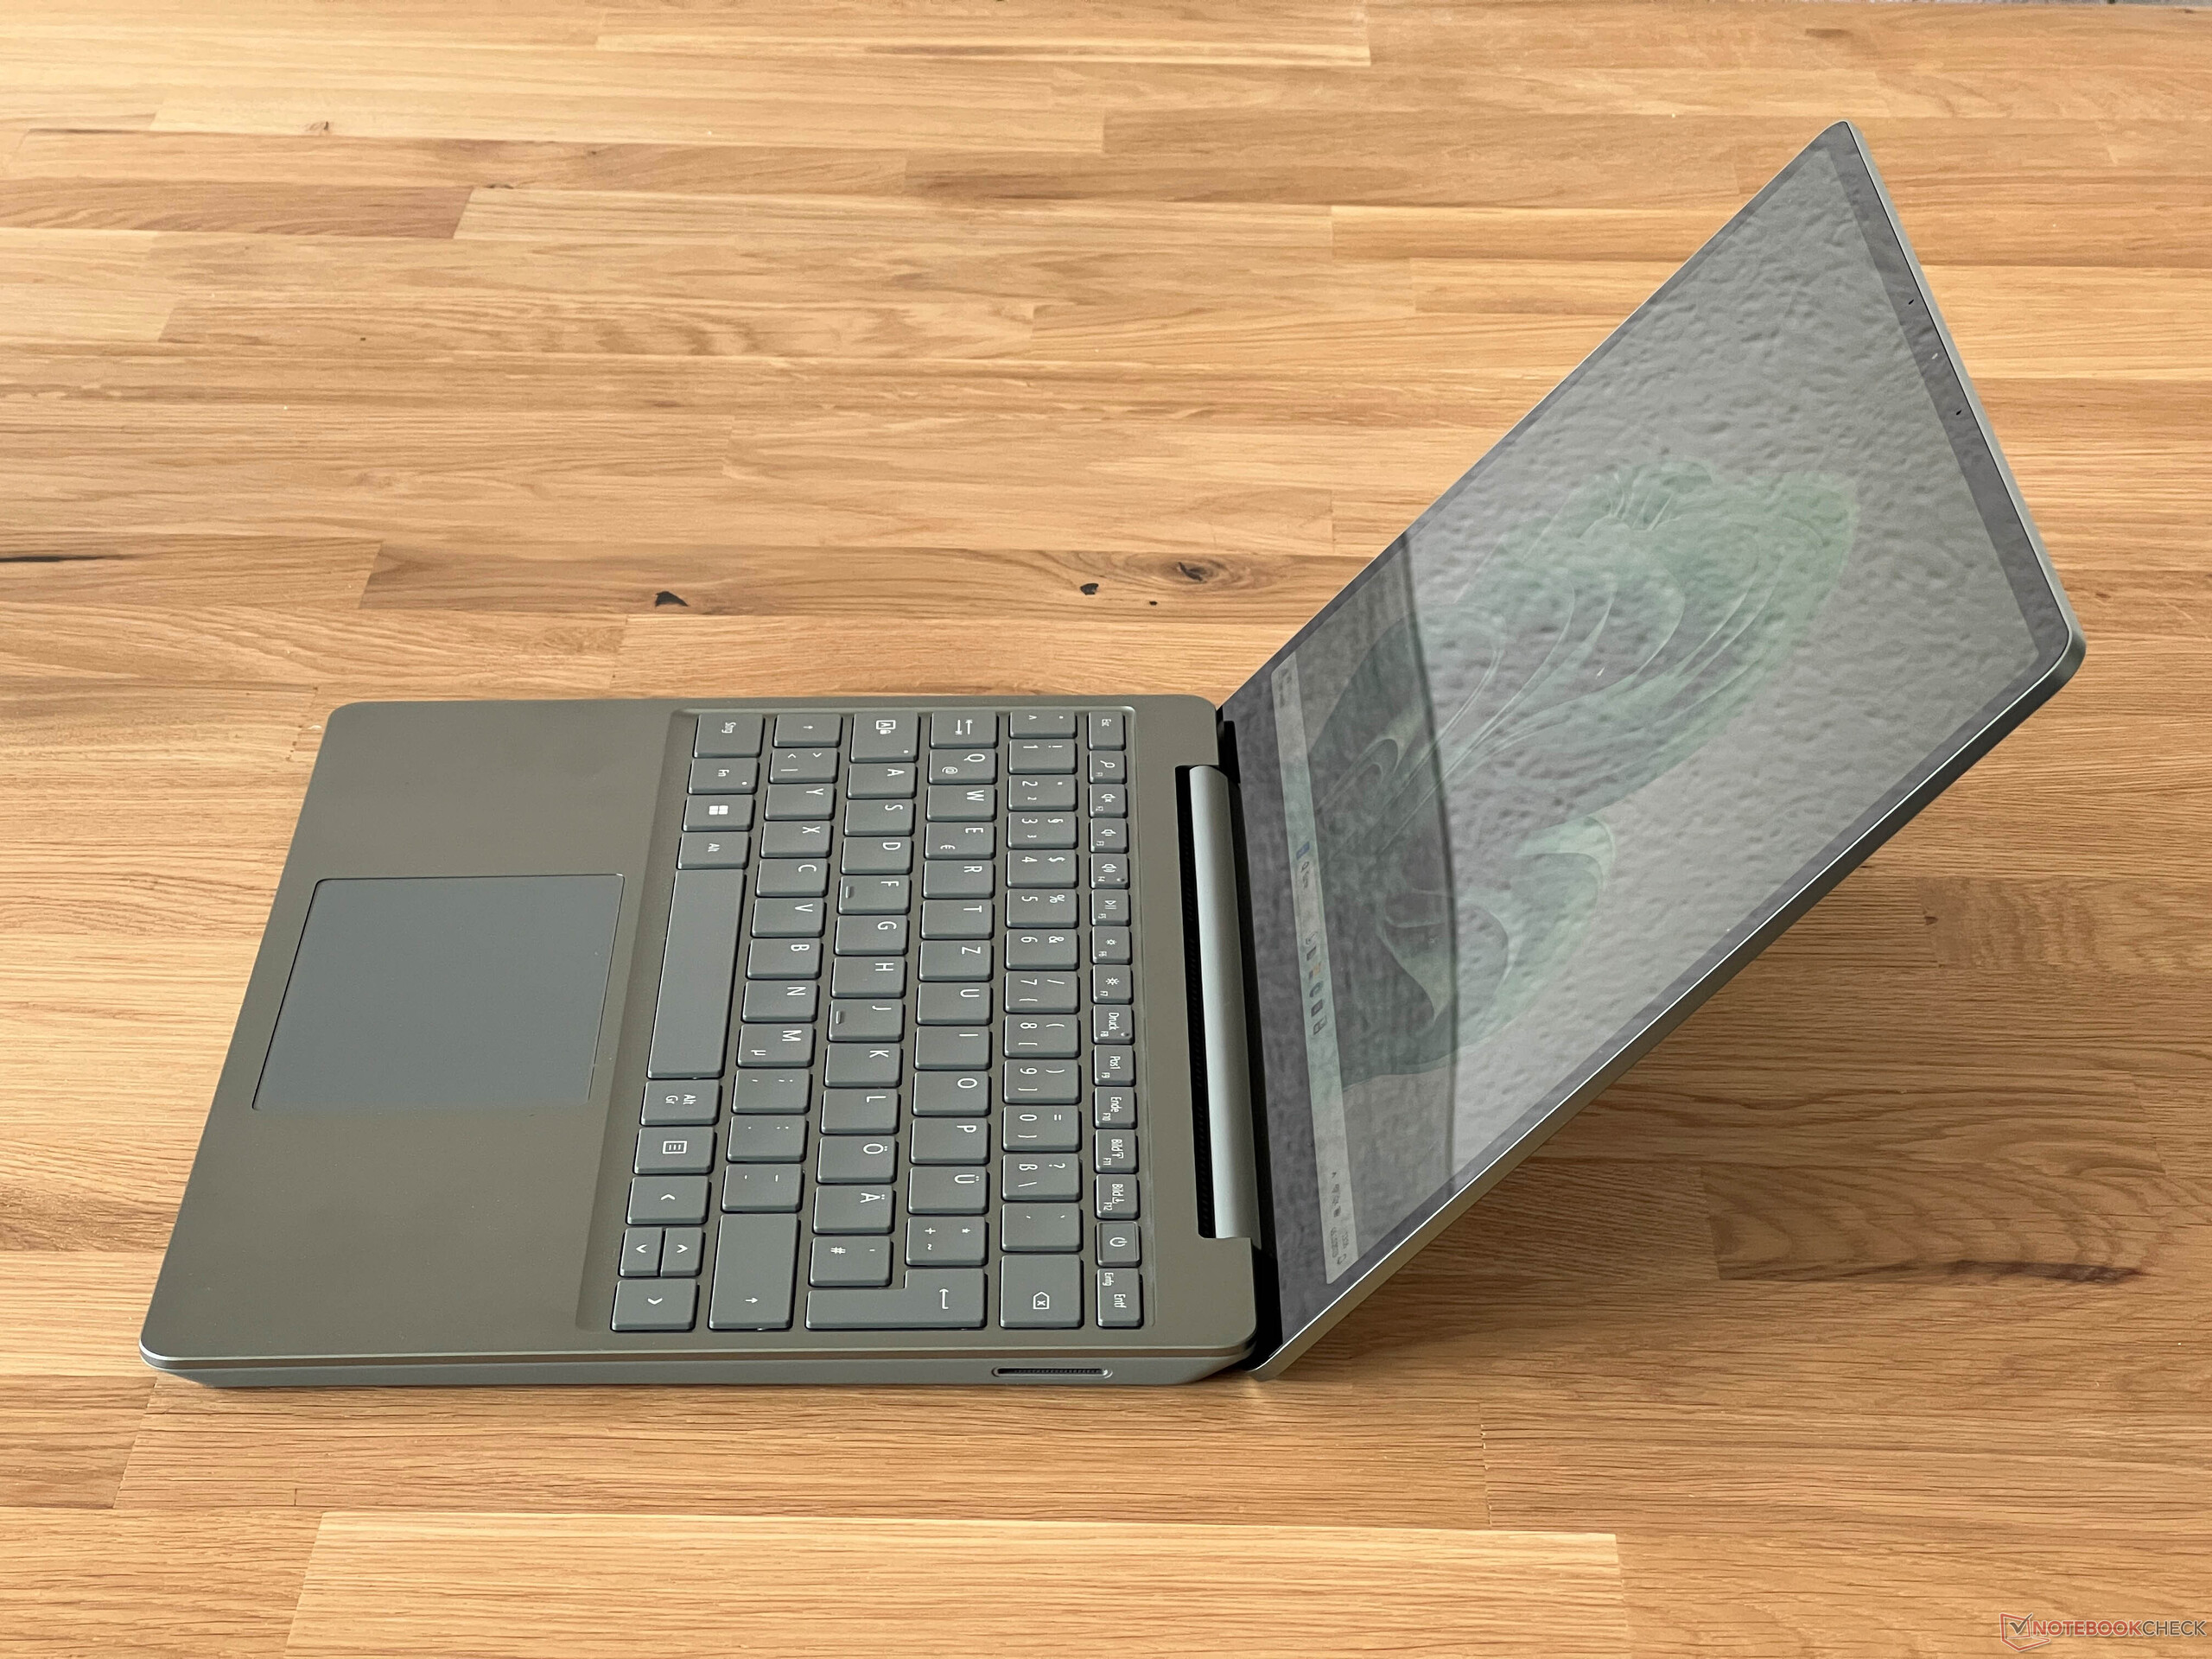
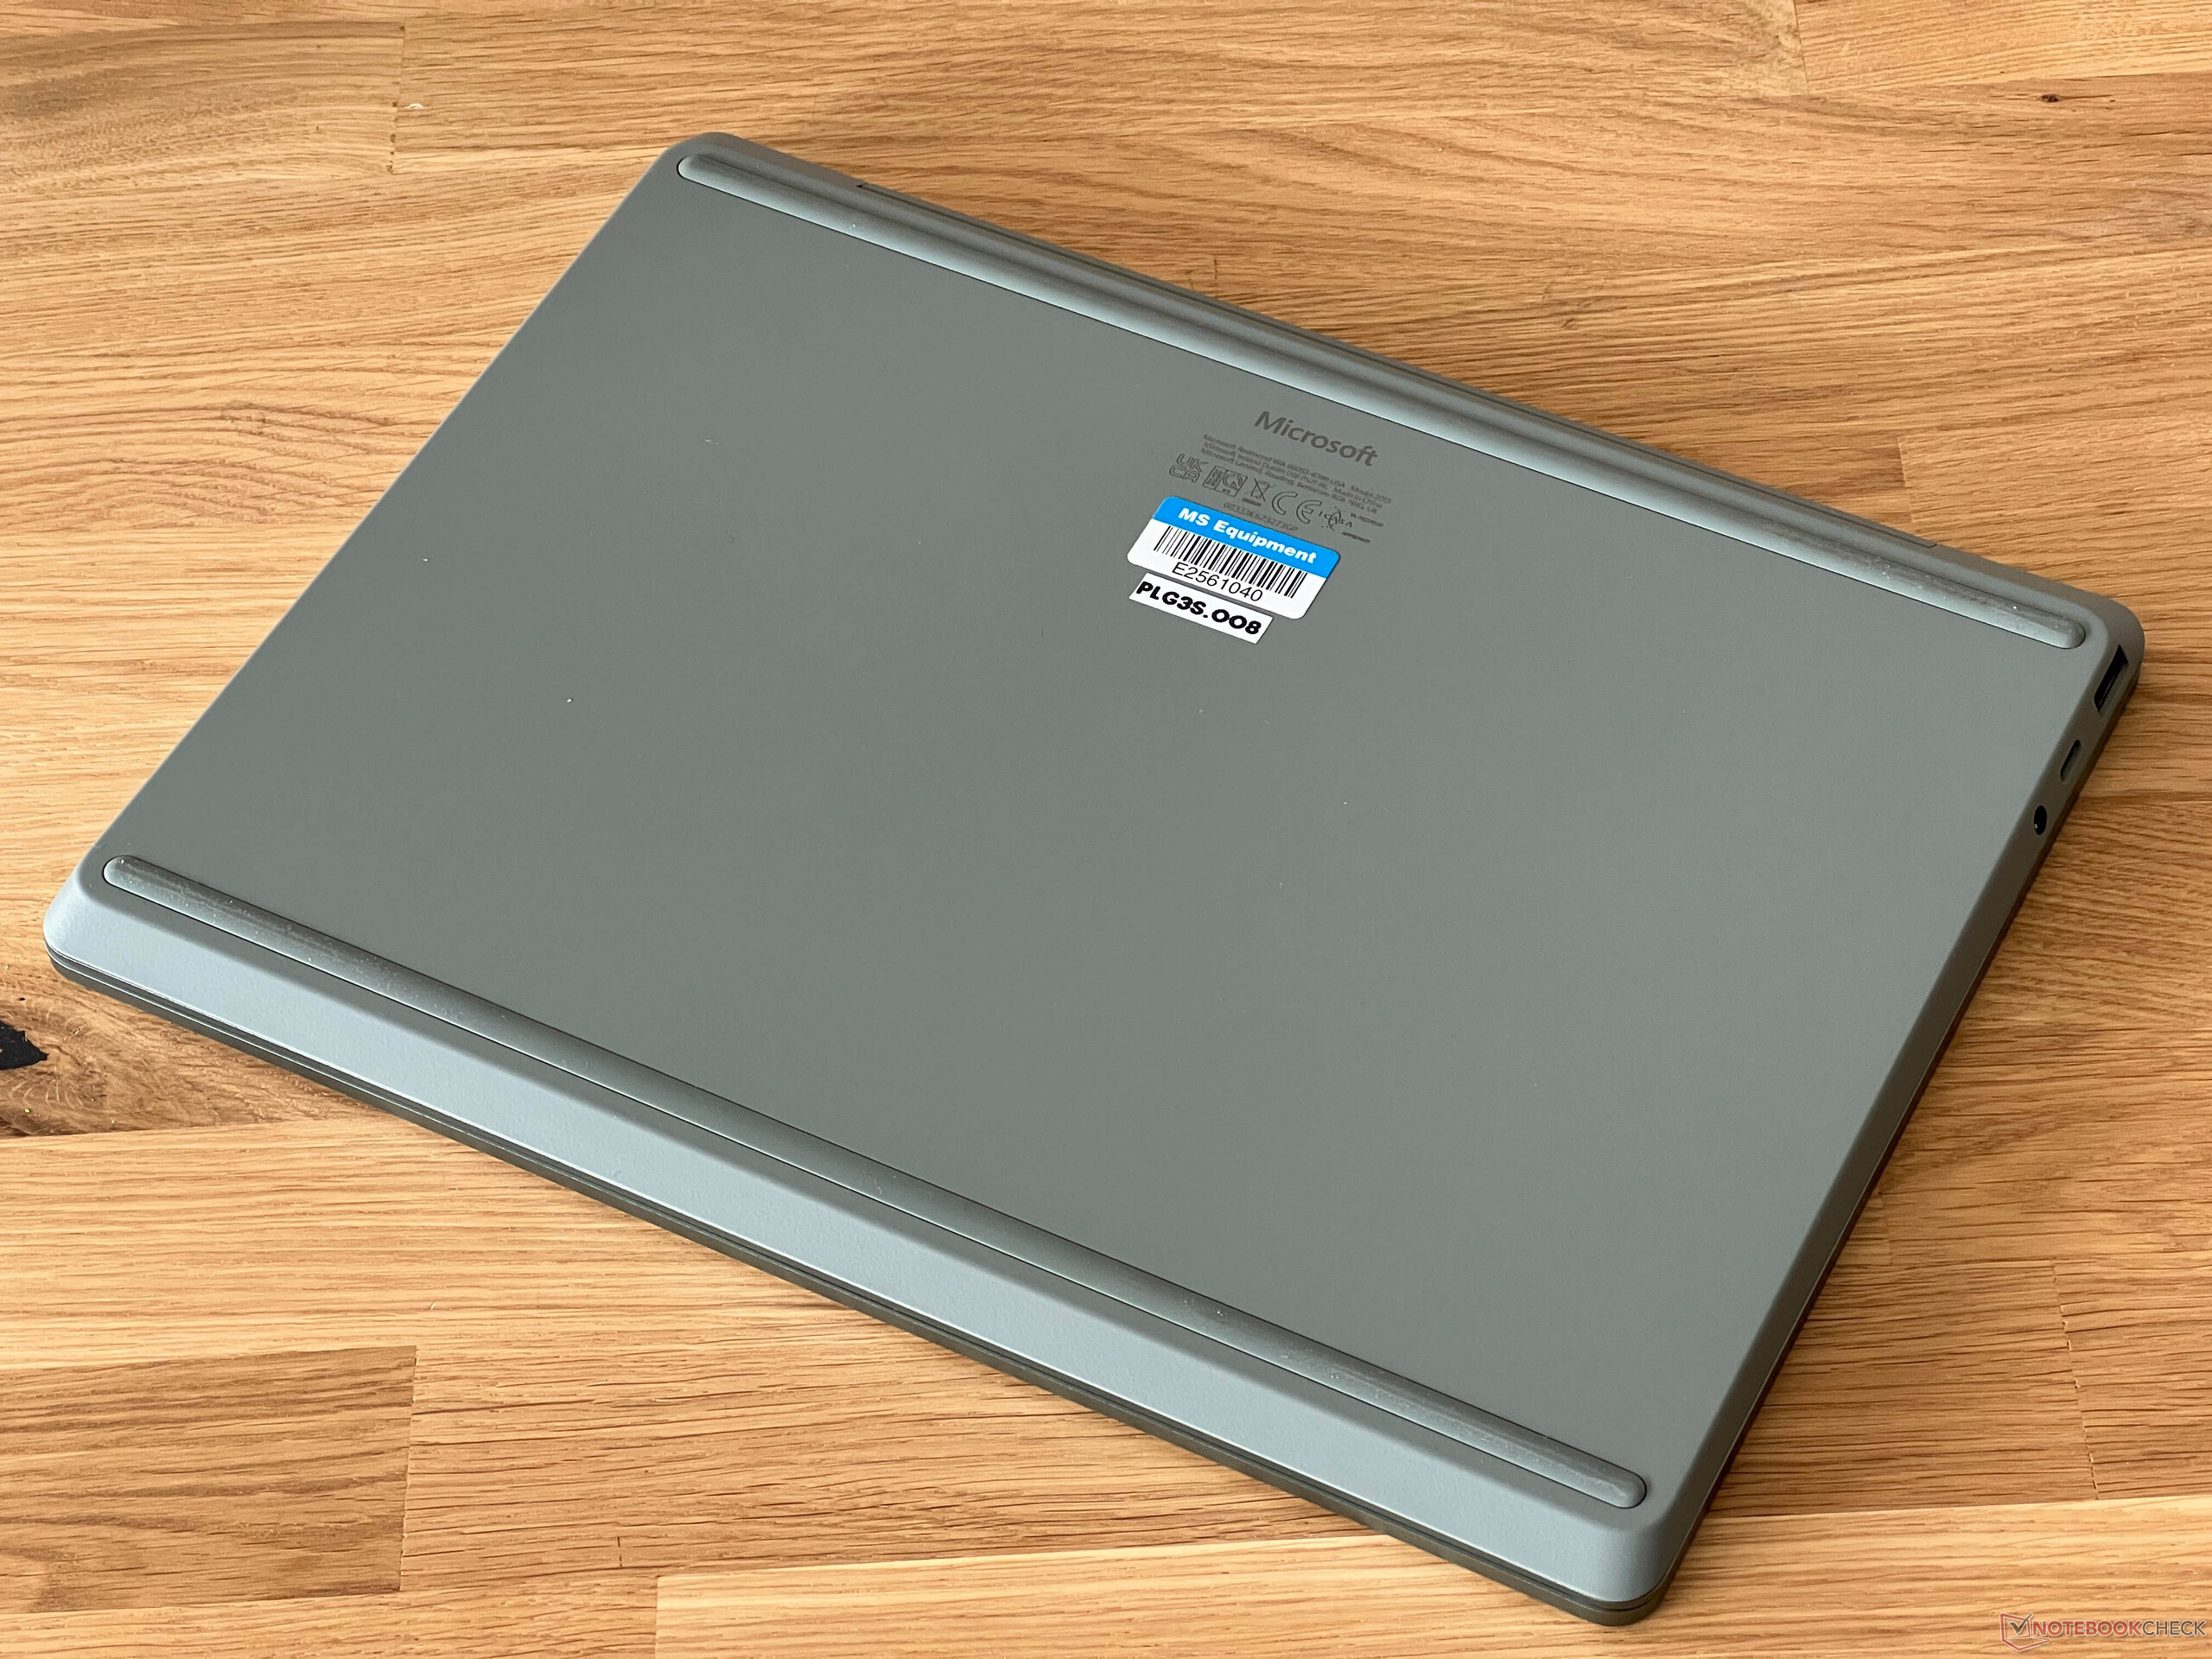
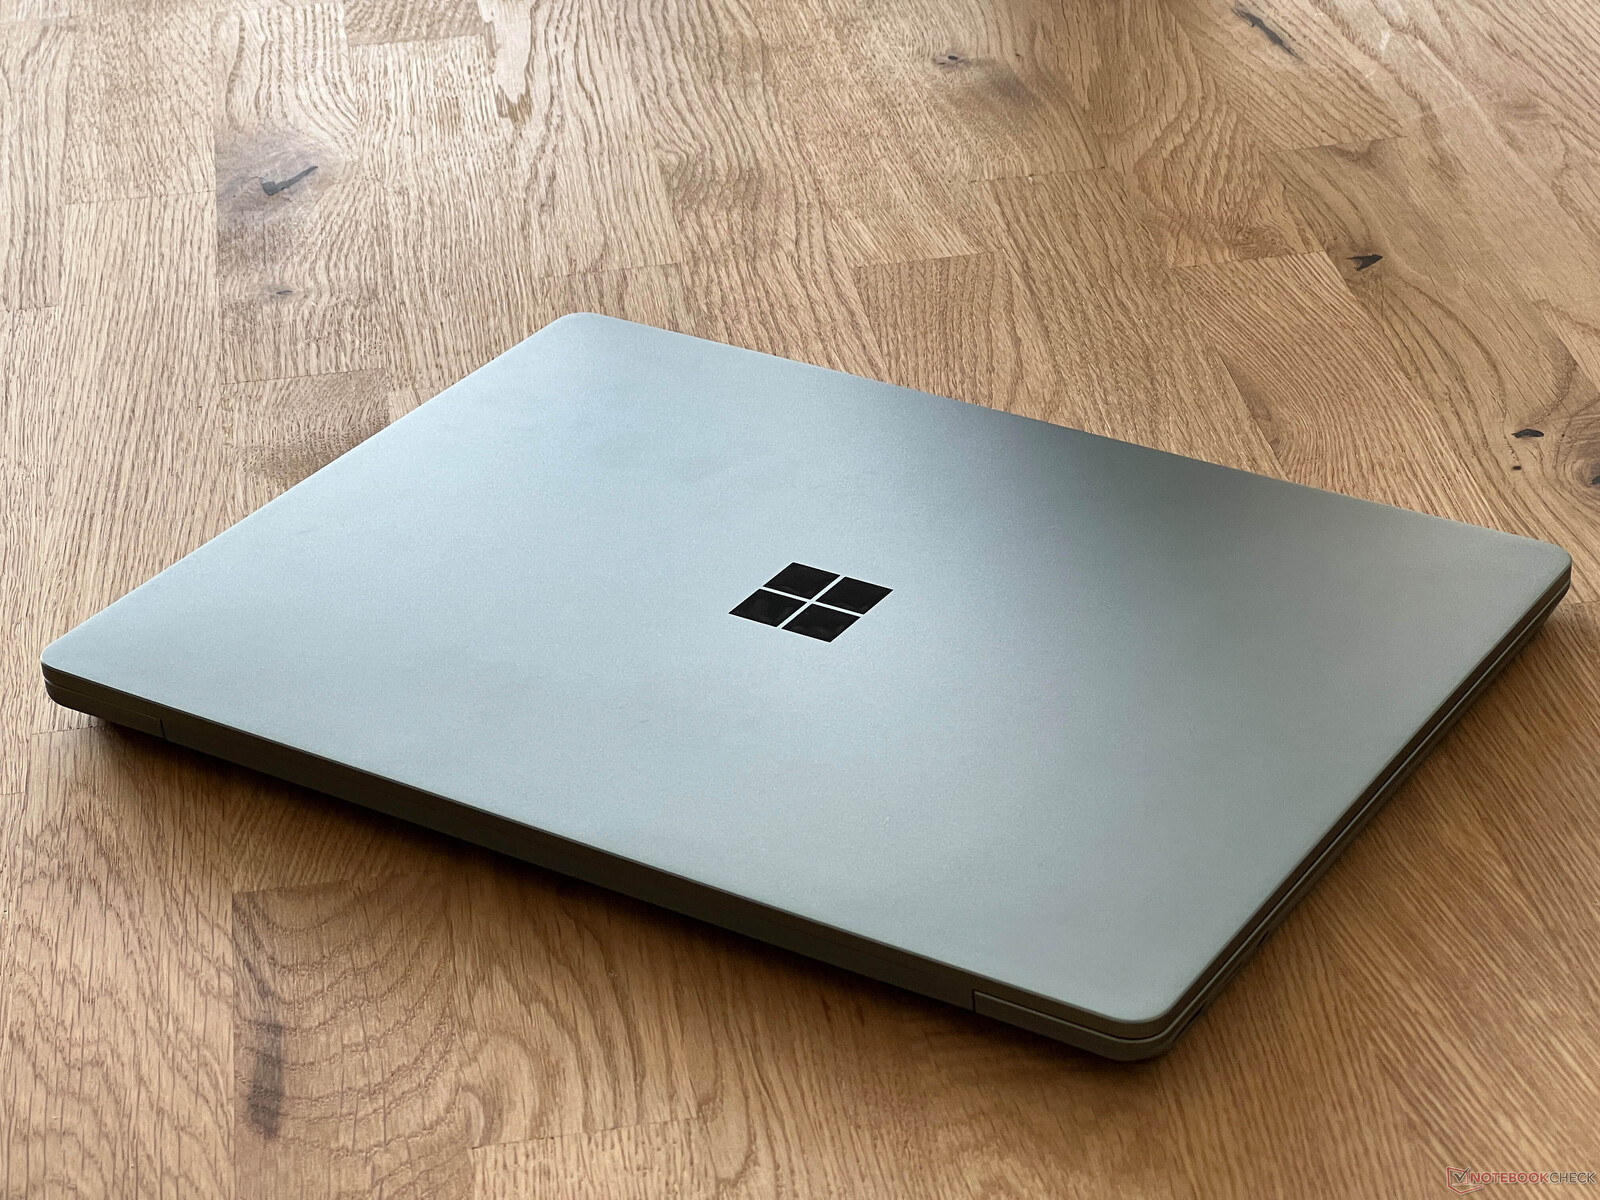
There are no changes in the casing, so customers still have the choice of four different colors: Platinum, Sage, Ice Blue, and Sandstone. The casing's quality is still a highlight of the compact device because the casing made of an aluminum-plastic combination looks very high-quality and stable. The maximum opening angle of the display is 135 degrees and in the end, there are only two points of criticism here: the screen edges are quite wide and there are no maintenance options, which means no access to the fan.
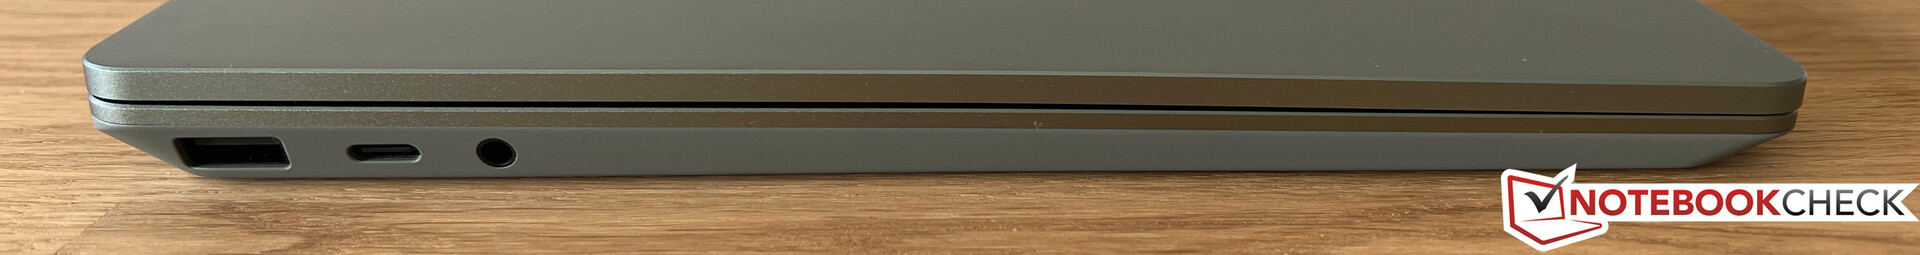
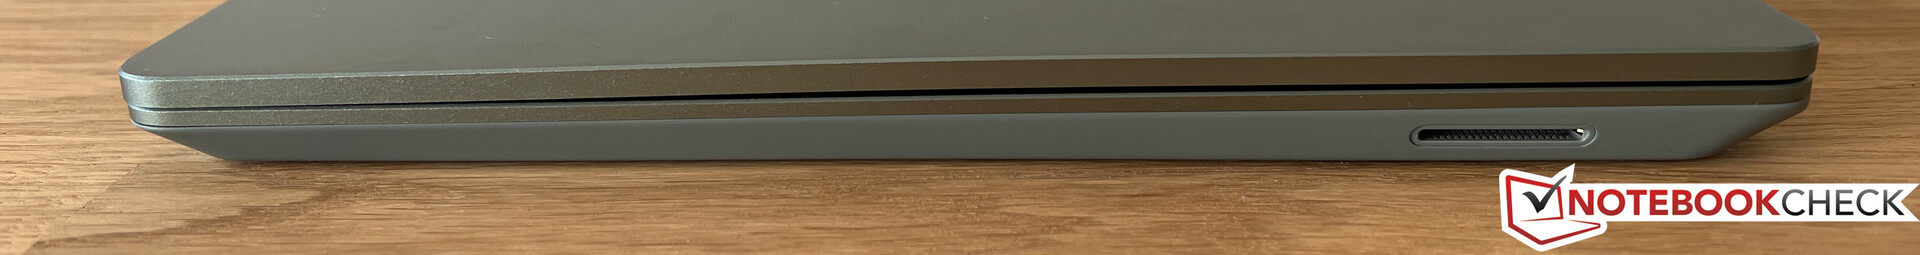
The rest of the equipment is the same as usual, so you get the most important ports and connectivity options for everyday use, but the old standards and the 720p webcam are questionable in view of the MSRP of 1,149 Euros.
| Networking | |
| Microsoft Surface Laptop Go 3 | |
| iperf3 transmit AXE11000 | |
| iperf3 receive AXE11000 | |
| Apple MacBook Air 2020 M1 Entry | |
| iperf3 transmit AX12 | |
| iperf3 receive AX12 | |
| Dell XPS 13 9315, i5-1230U | |
| iperf3 transmit AXE11000 6GHz | |
| iperf3 receive AXE11000 6GHz | |
| Lenovo Yoga 6 13 83B2001SGE | |
| iperf3 transmit AXE11000 | |
| iperf3 receive AXE11000 | |
| Microsoft Surface Laptop Go 2 Core i5 | |
| iperf3 transmit AXE11000 | |
| iperf3 receive AXE11000 | |


Input devices - Still no keyboard illumination
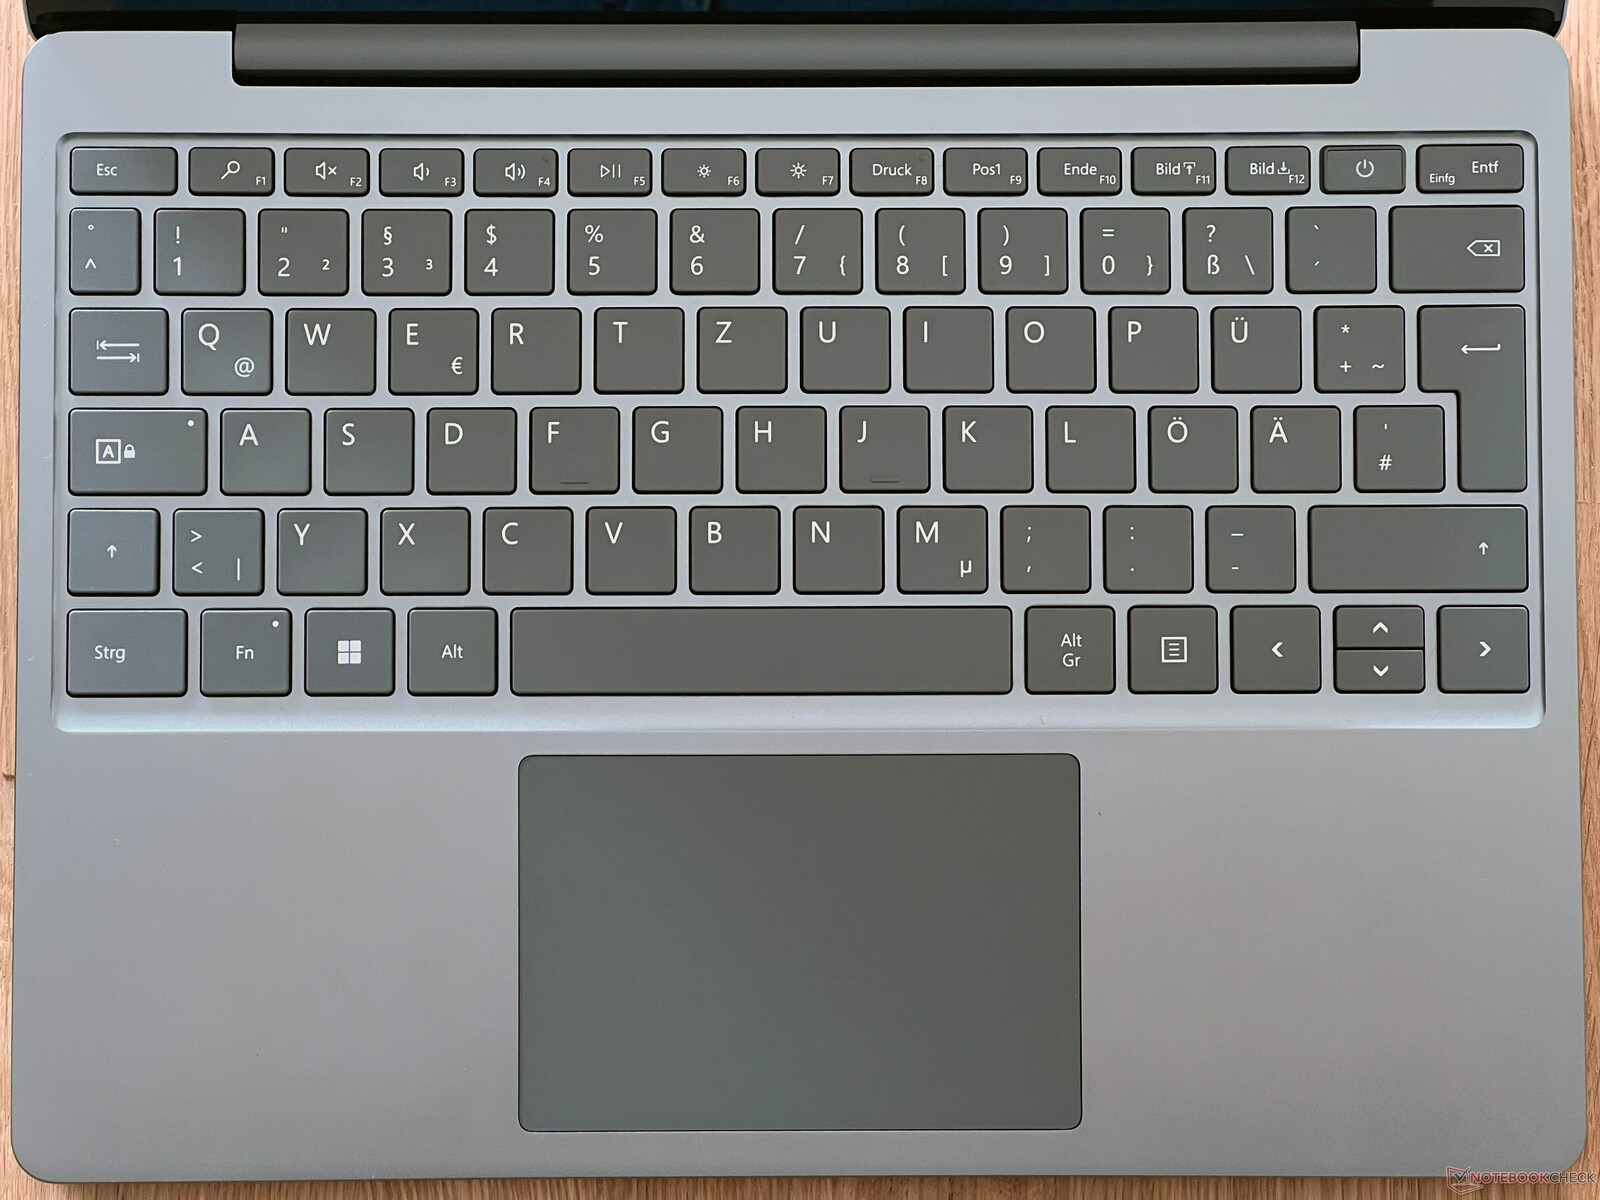
Basically, the input devices of the Surface Laptop Go 3 are very good. The keyboard offers a precise and crisp typing feel, and the ClickPad is also fully convincing apart from the somewhat loud clicking noise in everyday use. Furthermore, the power button offers a built-in fingerprint scanner. However, we still cannot understand why Microsoft does not finally equip the compact laptop with a keyboard illumination.
Display - 12.4-inch touchscreen

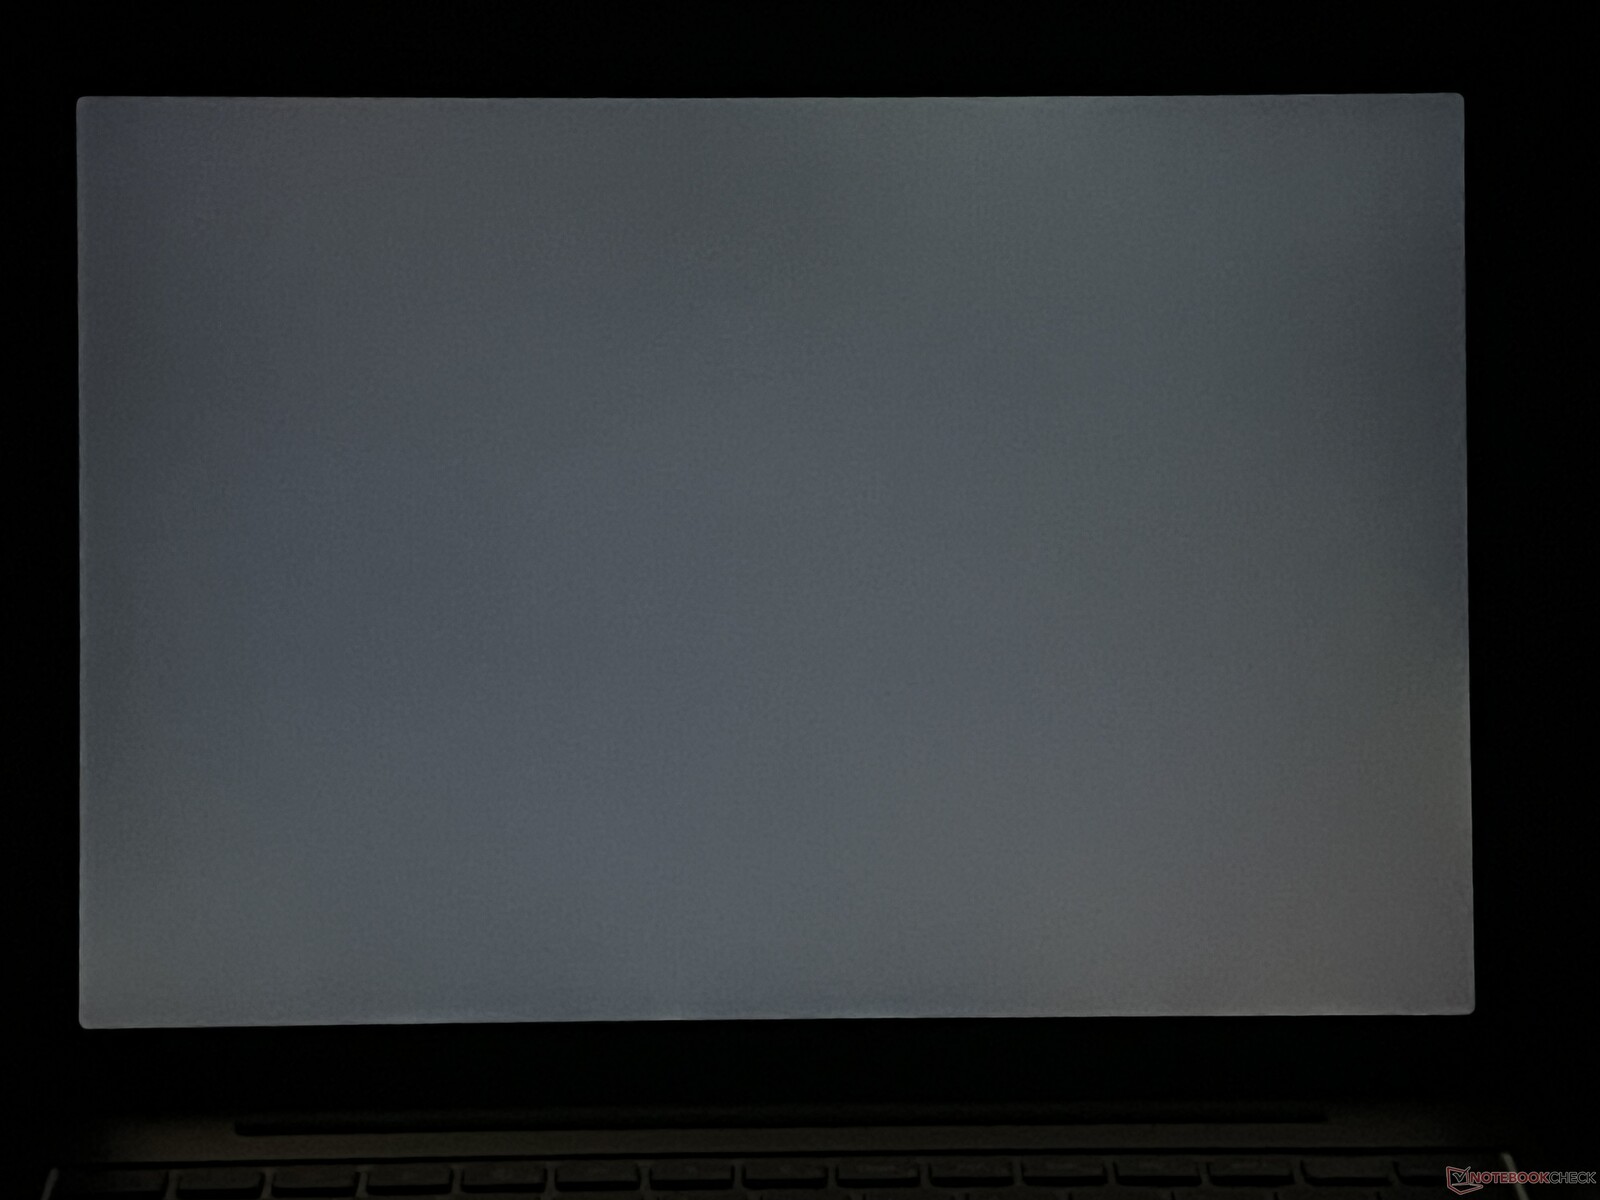
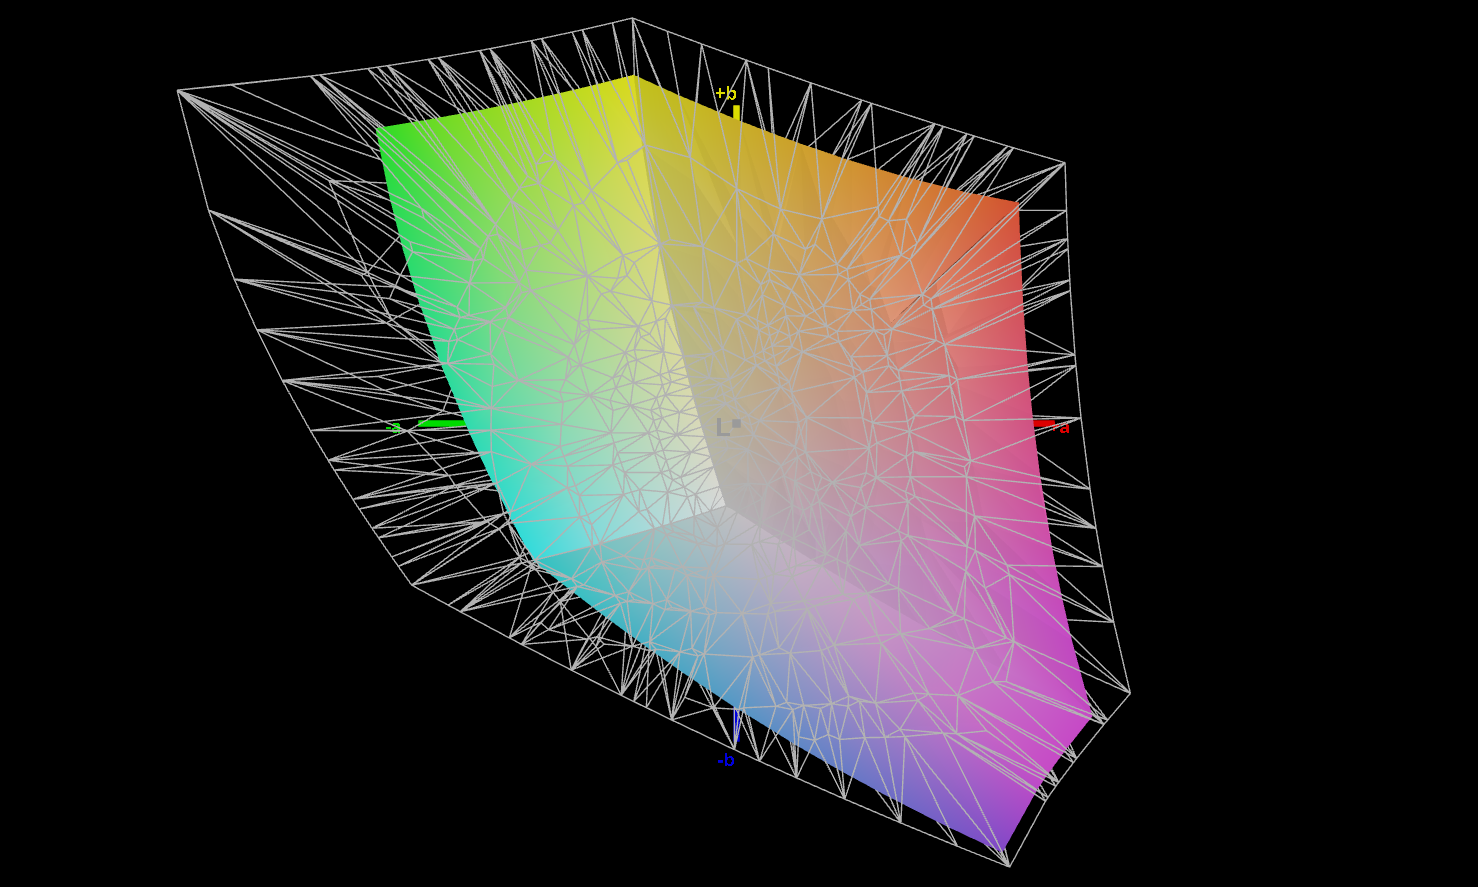
The 12.4-inch IPS touchscreen is basically unchanged and offers decent picture quality despite the low resolution (1,536 x 1,024 pixels, 3:2 format). The content still looks sufficiently sharp on the small screen diagonal and the colors are also vivid. There are no problems with halos, but we measured flickering at 60 kHz. However, this is not classic PWM and the high frequency should not cause any problems for most users.
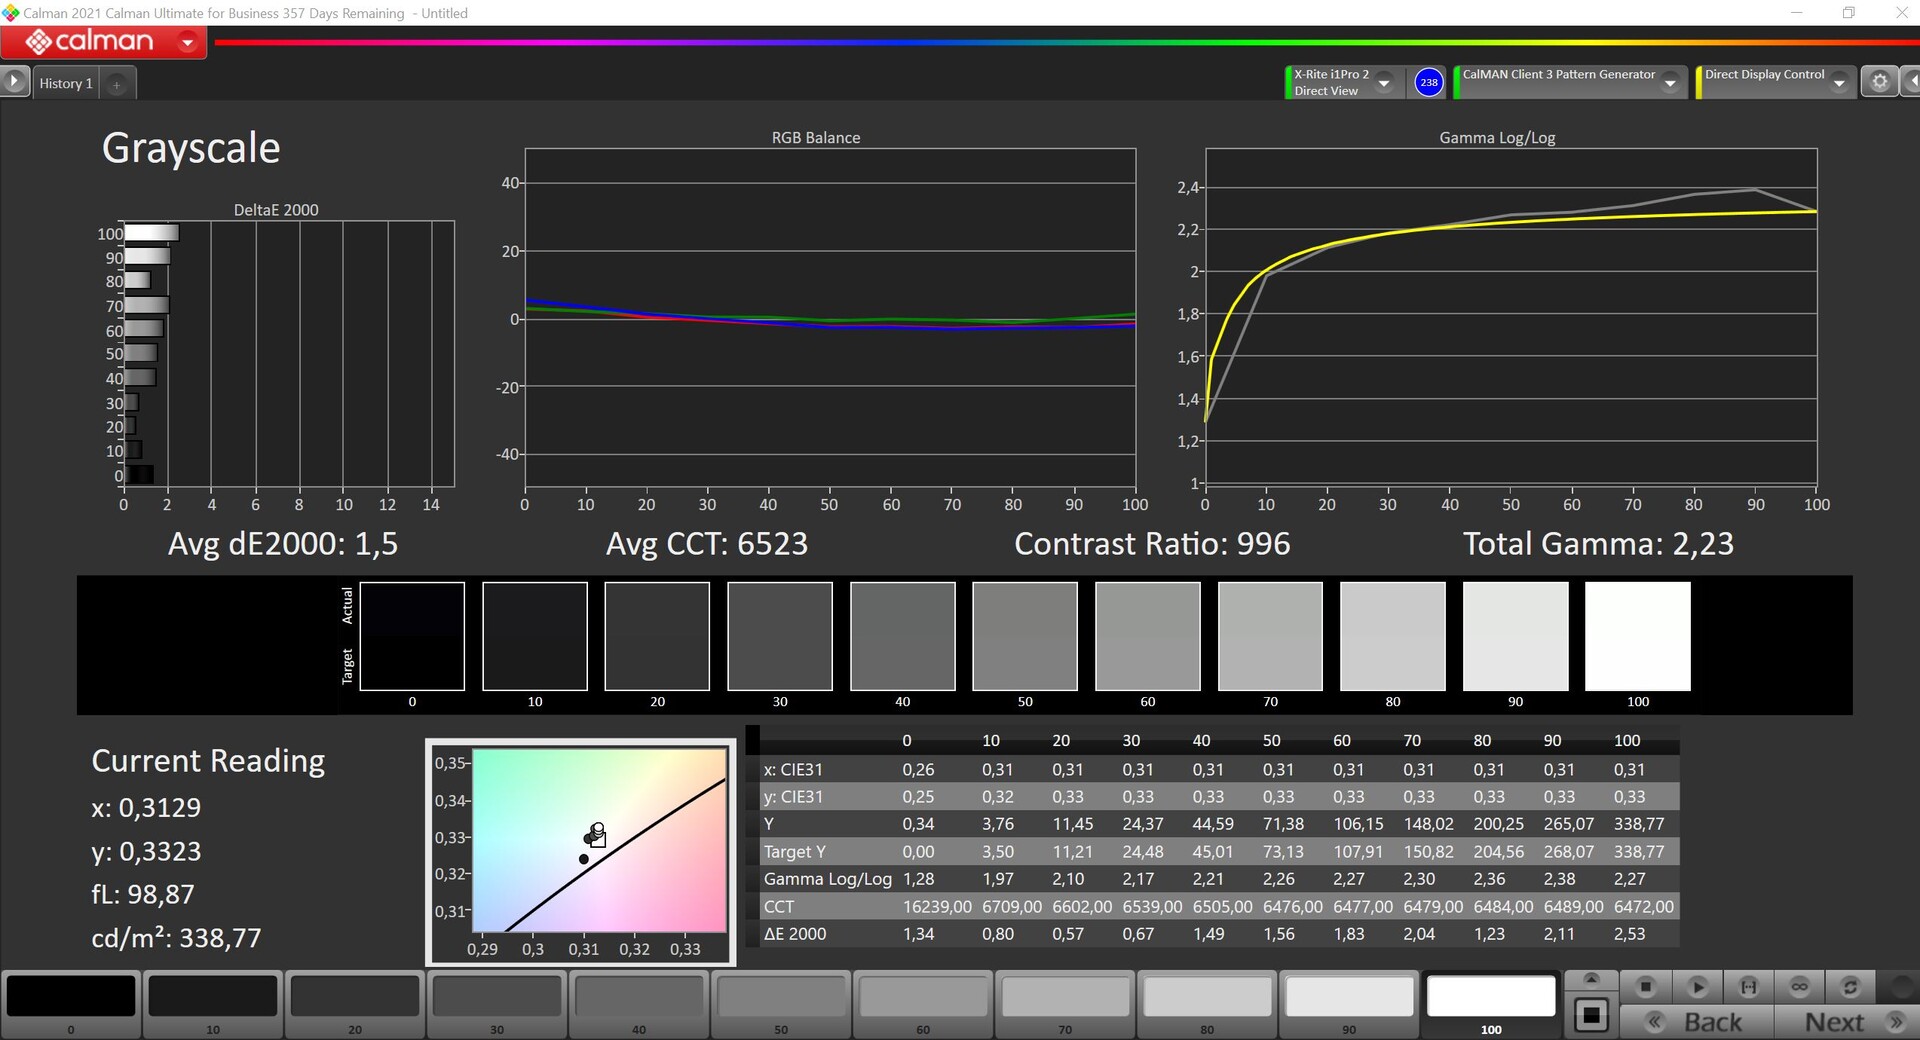
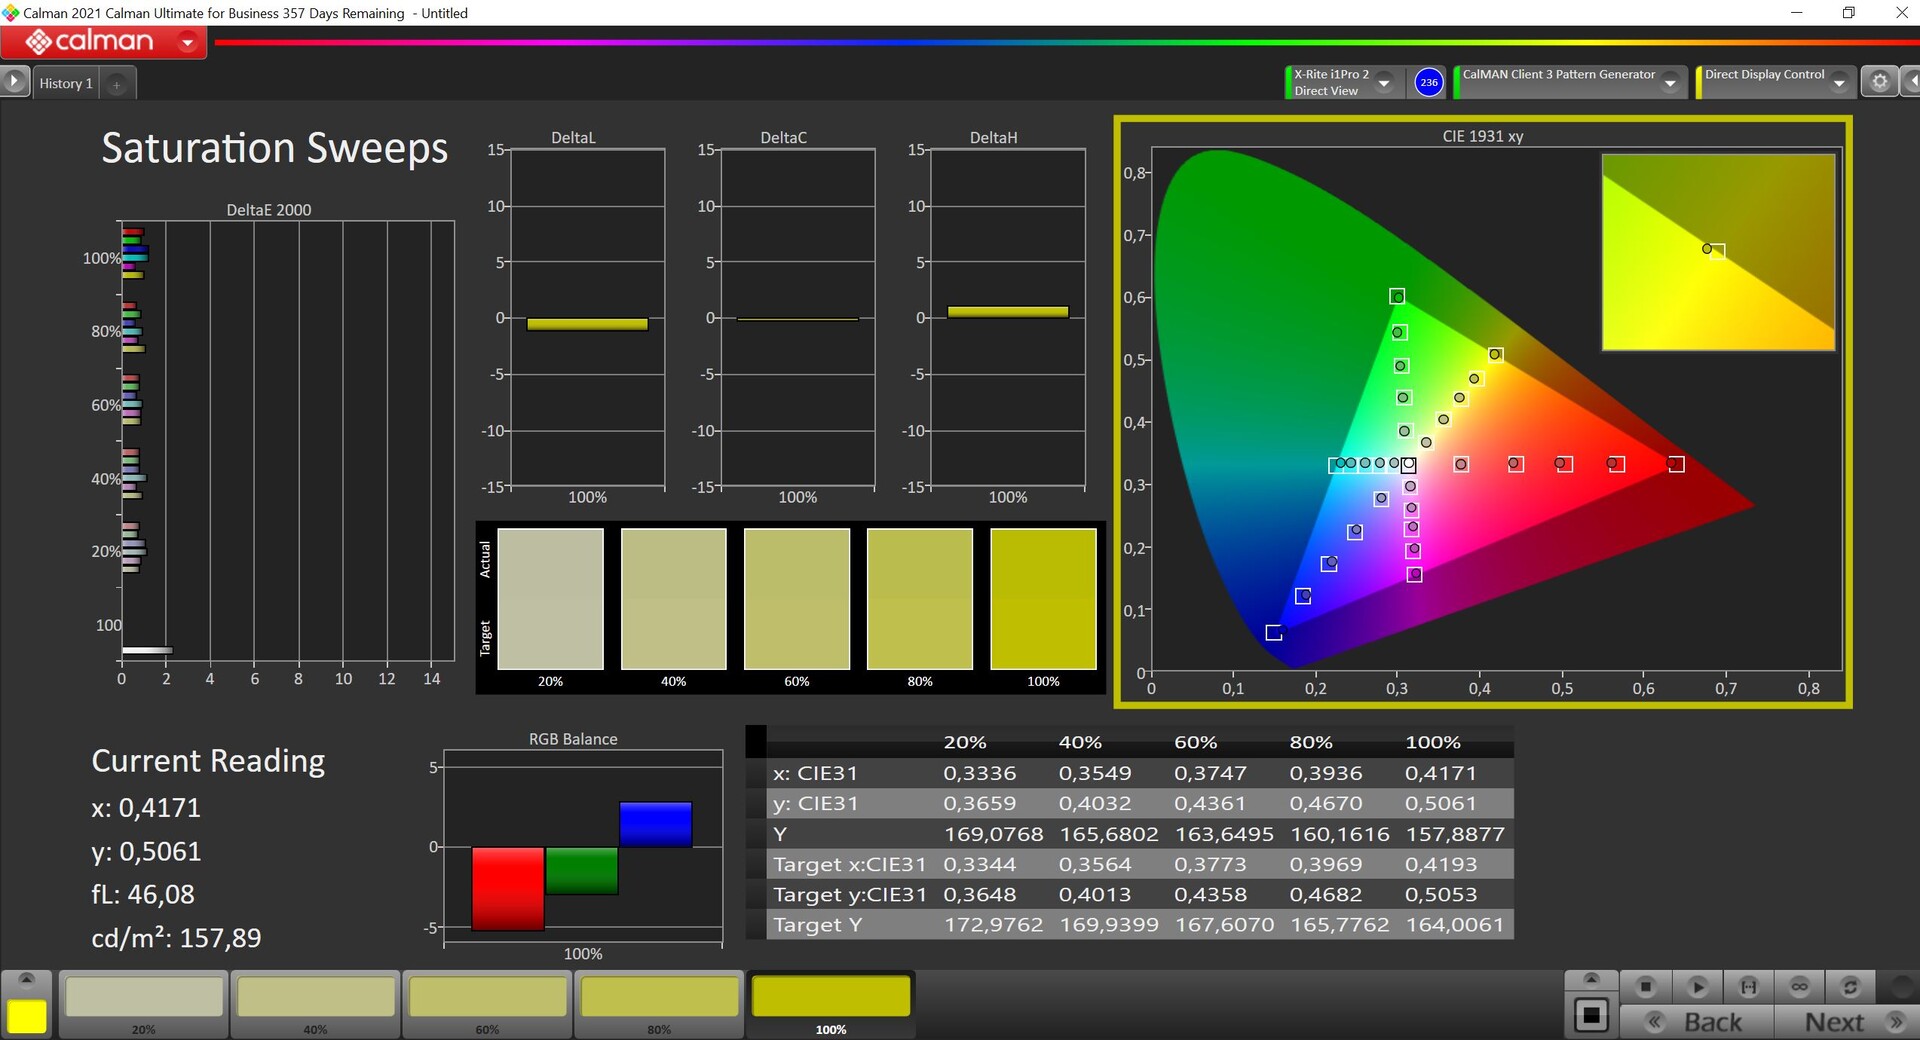
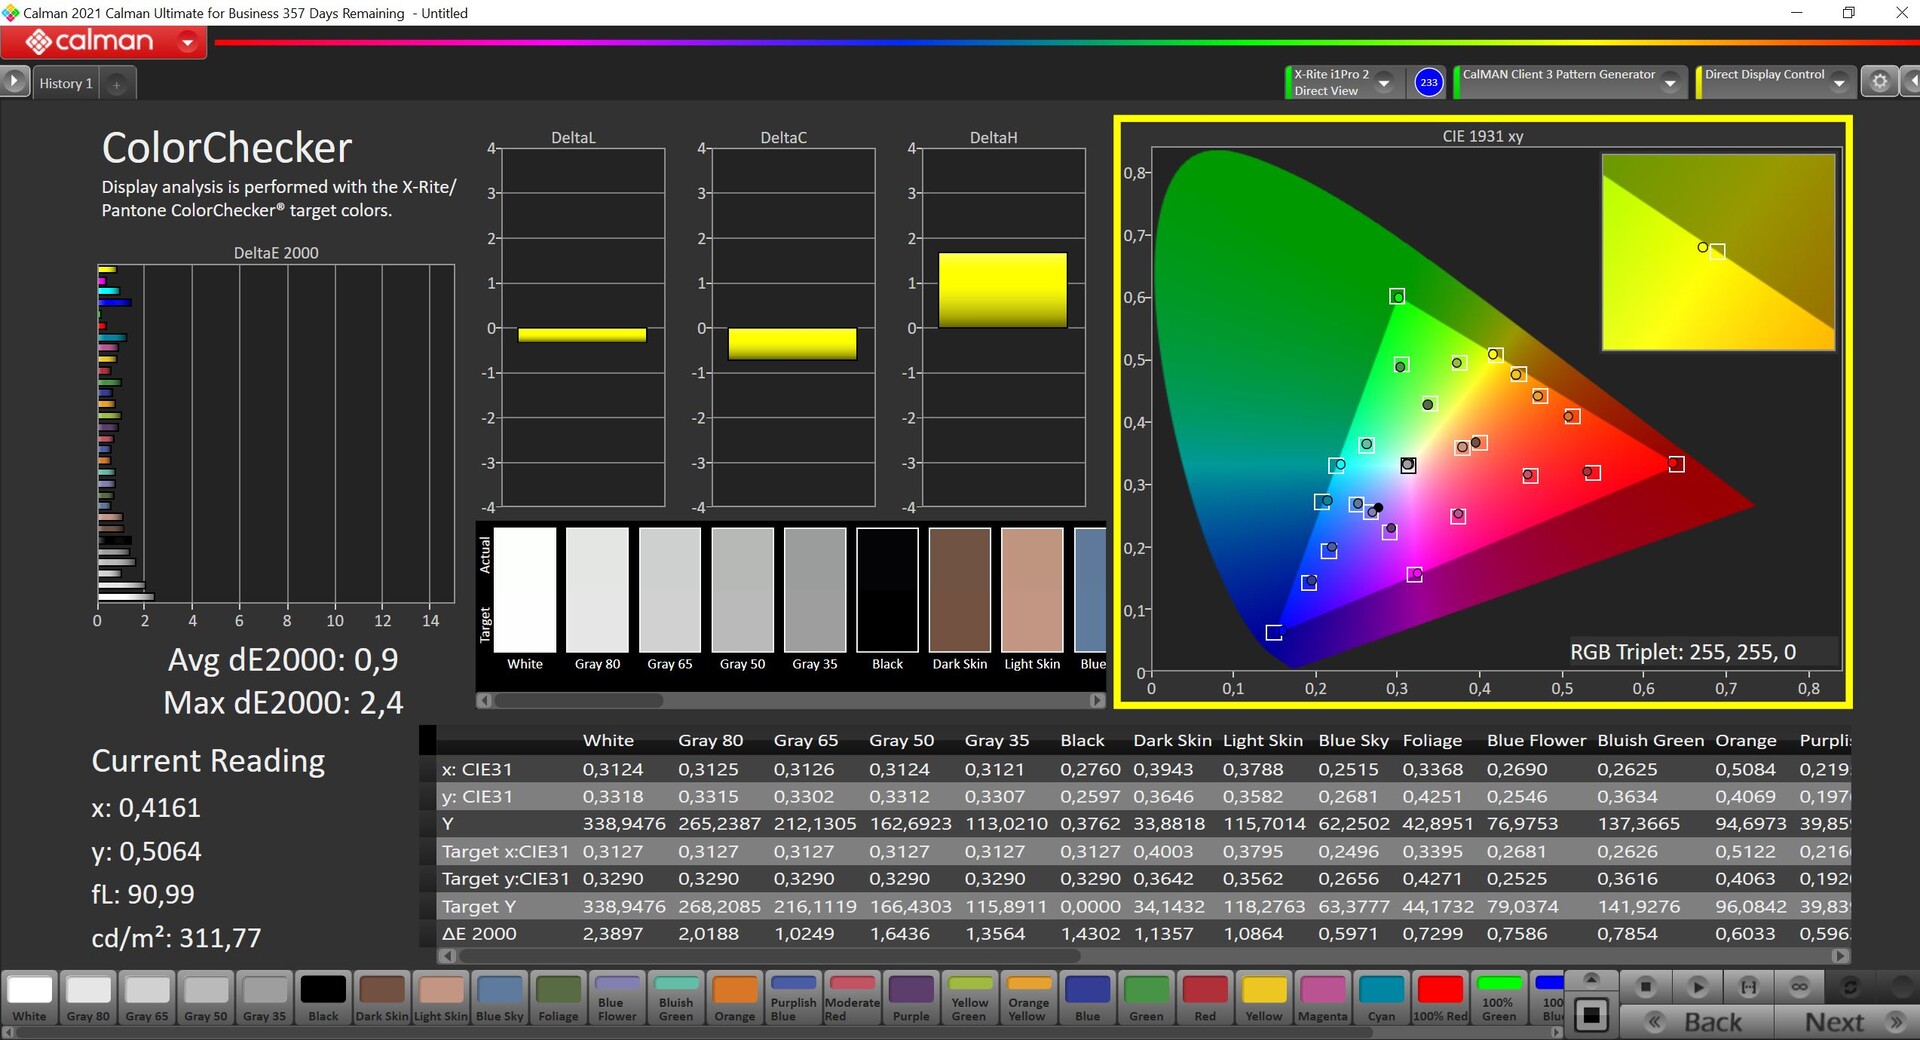
Microsoft specifies a brightness of 320 cd/m², which the screen also surpasses with an average of almost 340 cd/m². However, the old model was quite a bit brighter here with around 400 cd/m², and with the exception of Lenovo's Yoga 6, the rivals are brighter as well. The black value is slightly higher at 0.34 cd/m², which "only" results in a contrast ratio of just under 1,000:1. There are two color profiles, with Enhanced active by default. Here, the colors are slightly oversaturated, which leads to a somewhat gaudier picture in everyday use. We performed our measurements with the professional CalMAN software using the sRGB profile, where the color accuracy is already very good. So, together with the almost complete sRGB coverage, you can definitely edit some pictures. Our own calibration did not improve the representation, which is why we do not offer a corresponding profile for download.
| |||||||||||||||||||||||||
Brightness Distribution: 96 %
Center on Battery: 339 cd/m²
Contrast: 997:1 (Black: 0.34 cd/m²)
ΔE ColorChecker Calman: 0.9 | ∀{0.5-29.43 Ø4.72}
ΔE Greyscale Calman: 1.5 | ∀{0.09-98 Ø4.97}
66.6% AdobeRGB 1998 (Argyll 3D)
96.9% sRGB (Argyll 3D)
64.5% Display P3 (Argyll 3D)
Gamma: 2.23
CCT: 6523 K
| Microsoft Surface Laptop Go 3 LP125WX172403, IPS, 1536x1024, 12.4" | Apple MacBook Air 2020 M1 Entry IPS, 2560x1600, 13.3" | Dell XPS 13 9315, i5-1230U Sharp SHP1548 LQ134N1, IPS, 1920x1200, 13.4" | Lenovo Yoga 6 13 83B2001SGE LEN133WUXGA, IPS, 1920x1200, 13.3" | Microsoft Surface Laptop Go 2 Core i5 LP125WX112403, IPS, 1536x1024, 12.4" | |
|---|---|---|---|---|---|
| Display | 28% | 6% | 5% | -2% | |
| Display P3 Coverage (%) | 64.5 | 98.6 53% | 69 7% | 69.9 8% | 63.6 -1% |
| sRGB Coverage (%) | 96.9 | 100 3% | 100 3% | 99.5 3% | 93.8 -3% |
| AdobeRGB 1998 Coverage (%) | 66.6 | 85.9 29% | 71 7% | 70 5% | 65 -2% |
| Response Times | 10% | 5% | 66% | -3% | |
| Response Time Grey 50% / Grey 80% * (ms) | 36.7 ? | 31 ? 16% | 40 ? -9% | 14 ? 62% | 39 ? -6% |
| Response Time Black / White * (ms) | 27.1 ? | 26.1 ? 4% | 22 ? 19% | 8 ? 70% | 26.9 ? 1% |
| PWM Frequency (Hz) | 60000 ? | 118000 ? | 9700 ? | ||
| Screen | -3% | -58% | -87% | -13% | |
| Brightness middle (cd/m²) | 339 | 417 23% | 466 37% | 278 -18% | 406 20% |
| Brightness (cd/m²) | 337 | 395 17% | 442 31% | 271 -20% | 401 19% |
| Brightness Distribution (%) | 96 | 91 -5% | 89 -7% | 94 -2% | 95 -1% |
| Black Level * (cd/m²) | 0.34 | 0.39 -15% | 0.4 -18% | 0.25 26% | 0.41 -21% |
| Contrast (:1) | 997 | 1069 7% | 1165 17% | 1112 12% | 990 -1% |
| Colorchecker dE 2000 * | 0.9 | 1.12 -24% | 3.03 -237% | 3 -233% | 1.8 -100% |
| Colorchecker dE 2000 max. * | 2.4 | 2.71 -13% | 6.68 -178% | 7.86 -228% | 3.3 -38% |
| Greyscale dE 2000 * | 1.5 | 1.7 -13% | 3.12 -108% | 5.04 -236% | 1.2 20% |
| Gamma | 2.23 99% | 2207 0% | 2.41 91% | 2.46 89% | 2.29 96% |
| CCT | 6523 100% | 6870 95% | 6418 101% | 6068 107% | 6662 98% |
| Colorchecker dE 2000 calibrated * | 0.77 | 2.34 | 0.62 | 1.3 | |
| Total Average (Program / Settings) | 12% /
6% | -16% /
-34% | -5% /
-42% | -6% /
-9% |
* ... smaller is better


Display Response Times
| ↔ Response Time Black to White | ||
|---|---|---|
| 27.1 ms ... rise ↗ and fall ↘ combined | ↗ 16.2 ms rise | 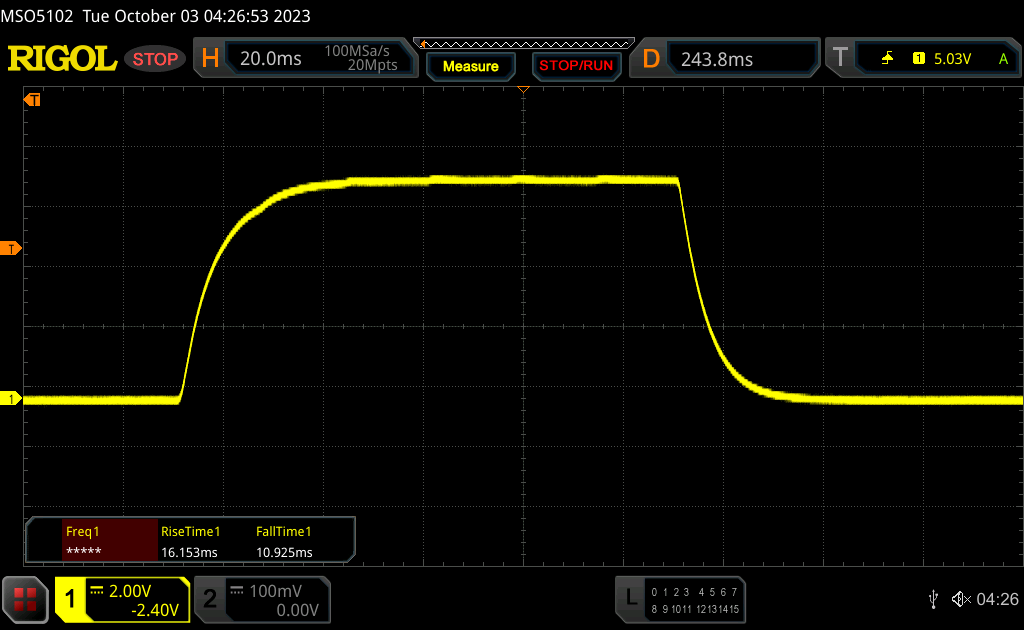 |
| ↘ 10.9 ms fall | ||
| The screen shows relatively slow response rates in our tests and may be too slow for gamers. In comparison, all tested devices range from 0.1 (minimum) to 240 (maximum) ms. » 69 % of all devices are better. This means that the measured response time is worse than the average of all tested devices (19.8 ms). | ||
| ↔ Response Time 50% Grey to 80% Grey | ||
| 36.7 ms ... rise ↗ and fall ↘ combined | ↗ 18.1 ms rise | 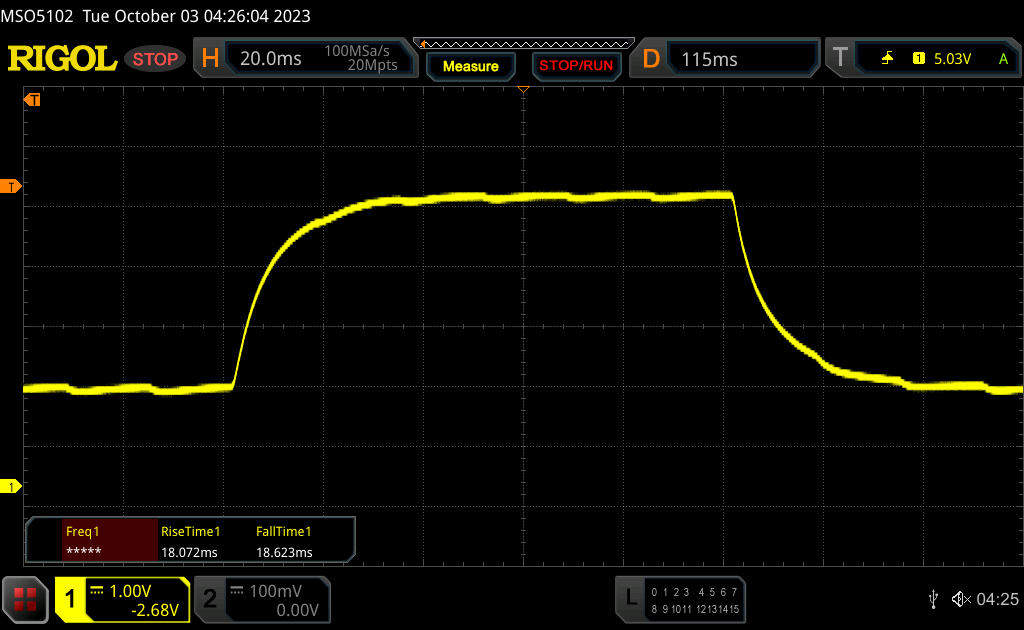 |
| ↘ 18.6 ms fall | ||
| The screen shows slow response rates in our tests and will be unsatisfactory for gamers. In comparison, all tested devices range from 0.165 (minimum) to 636 (maximum) ms. » 53 % of all devices are better. This means that the measured response time is worse than the average of all tested devices (31 ms). | ||
Screen Flickering / PWM (Pulse-Width Modulation)
| Screen flickering / PWM detected | 60000 Hz | ≤ 100 % brightness setting | 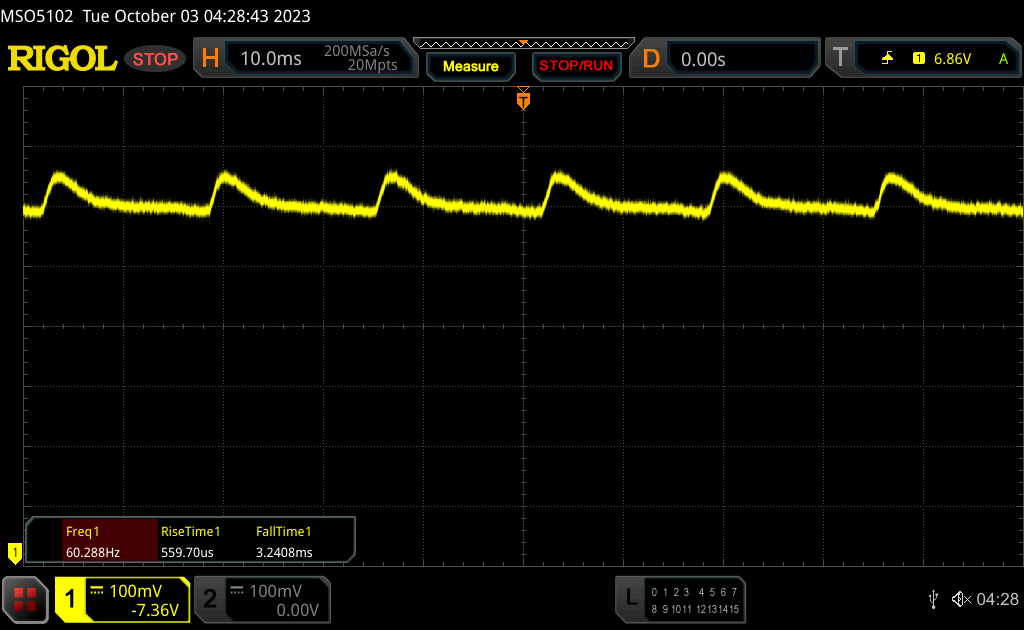 |
The display backlight flickers at 60000 Hz (worst case, e.g., utilizing PWM) Flickering detected at a brightness setting of 100 % and below. There should be no flickering or PWM above this brightness setting. The frequency of 60000 Hz is quite high, so most users sensitive to PWM should not notice any flickering. In comparison: 52 % of all tested devices do not use PWM to dim the display. If PWM was detected, an average of 7750 (minimum: 5 - maximum: 343500) Hz was measured. | |||


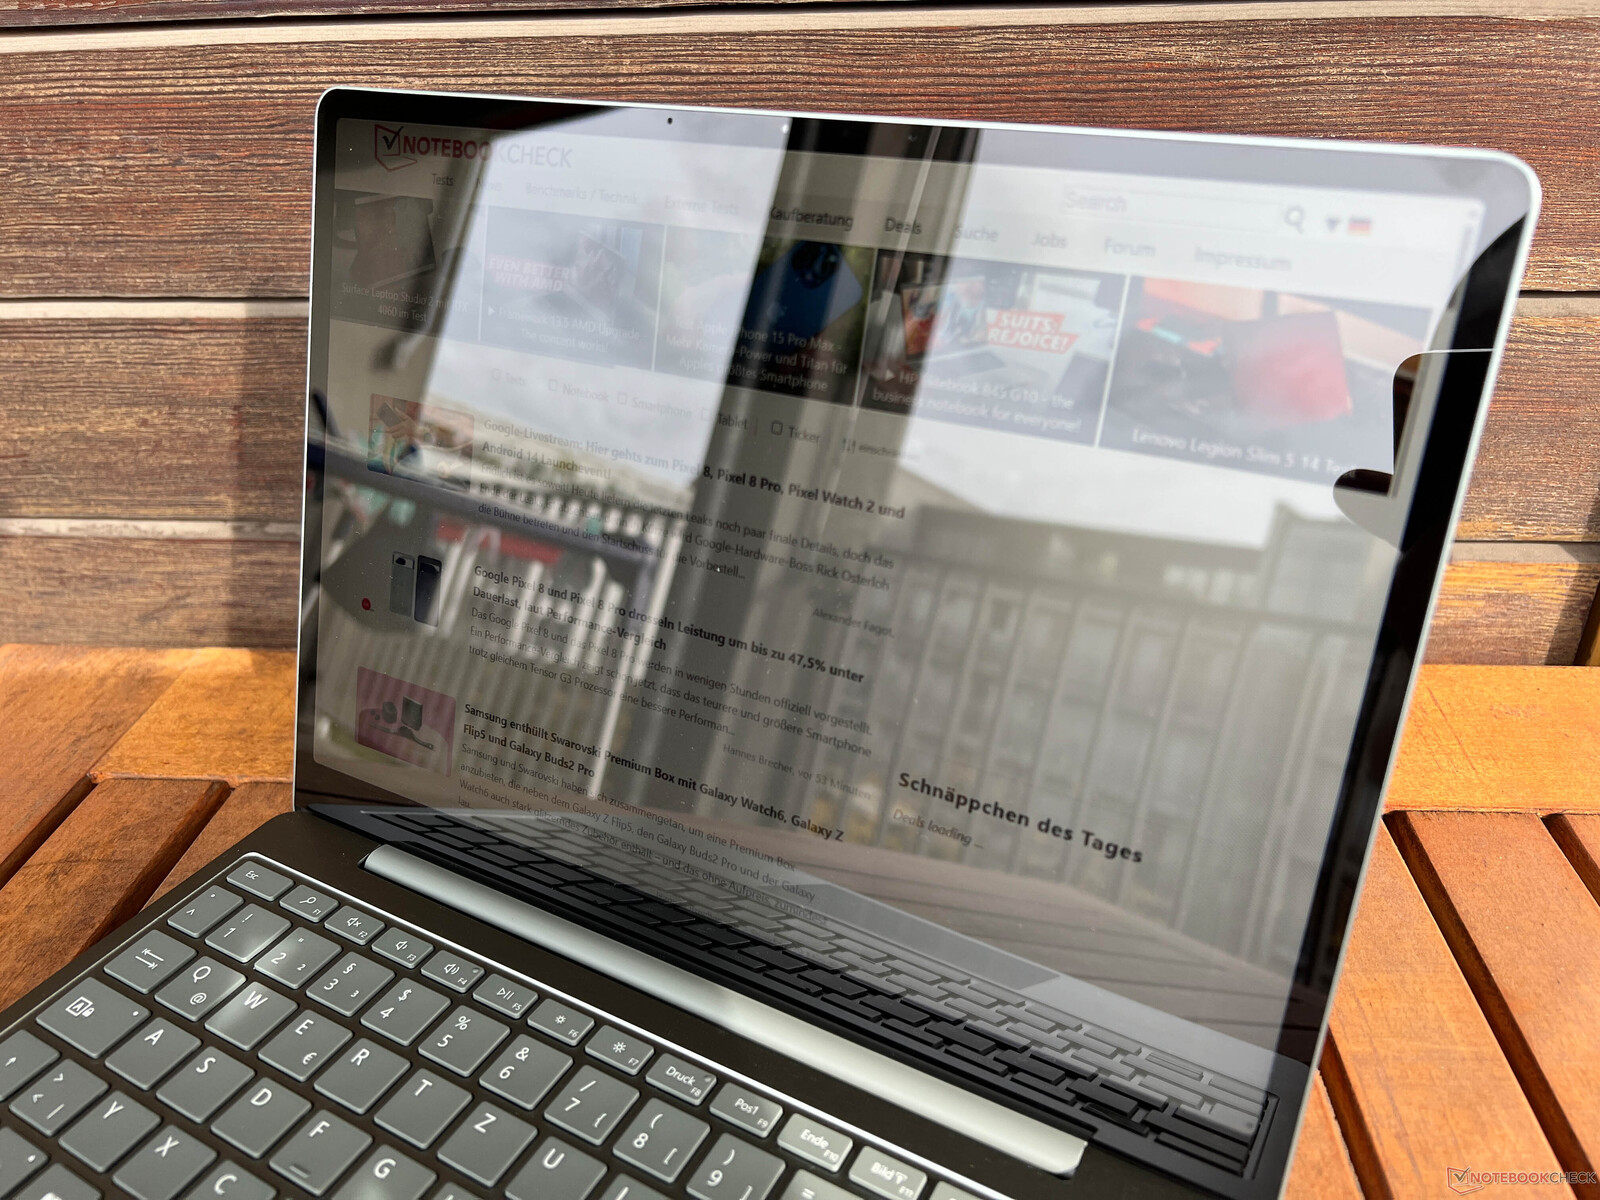
Outdoors, the usability is limited due to the highly reflective touchscreen. However, the viewing angle stability is good.

Performance - Alder Lake Core i5
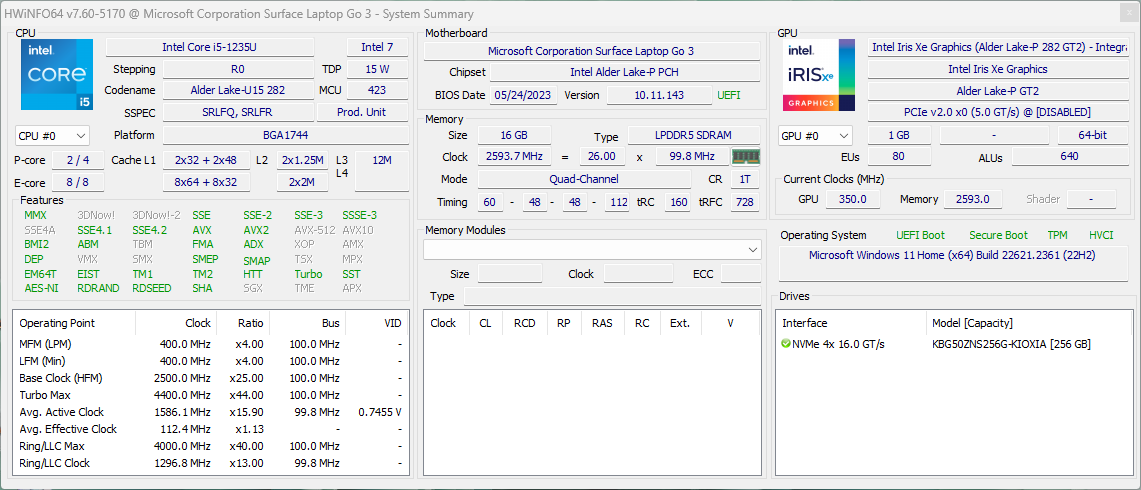
Microsoft now relies on last year's 12th generation Alder Lake Core i5-1235U. The successor Raptor Lake is already available, but it does not really offer more performance. 8 GB of RAM is installed as standard, but the upgrade to 16 GB RAM is available for 250 Euros (~$250).
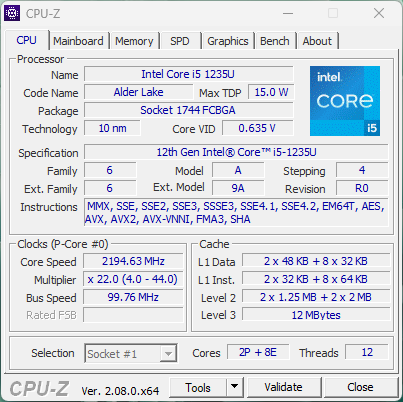


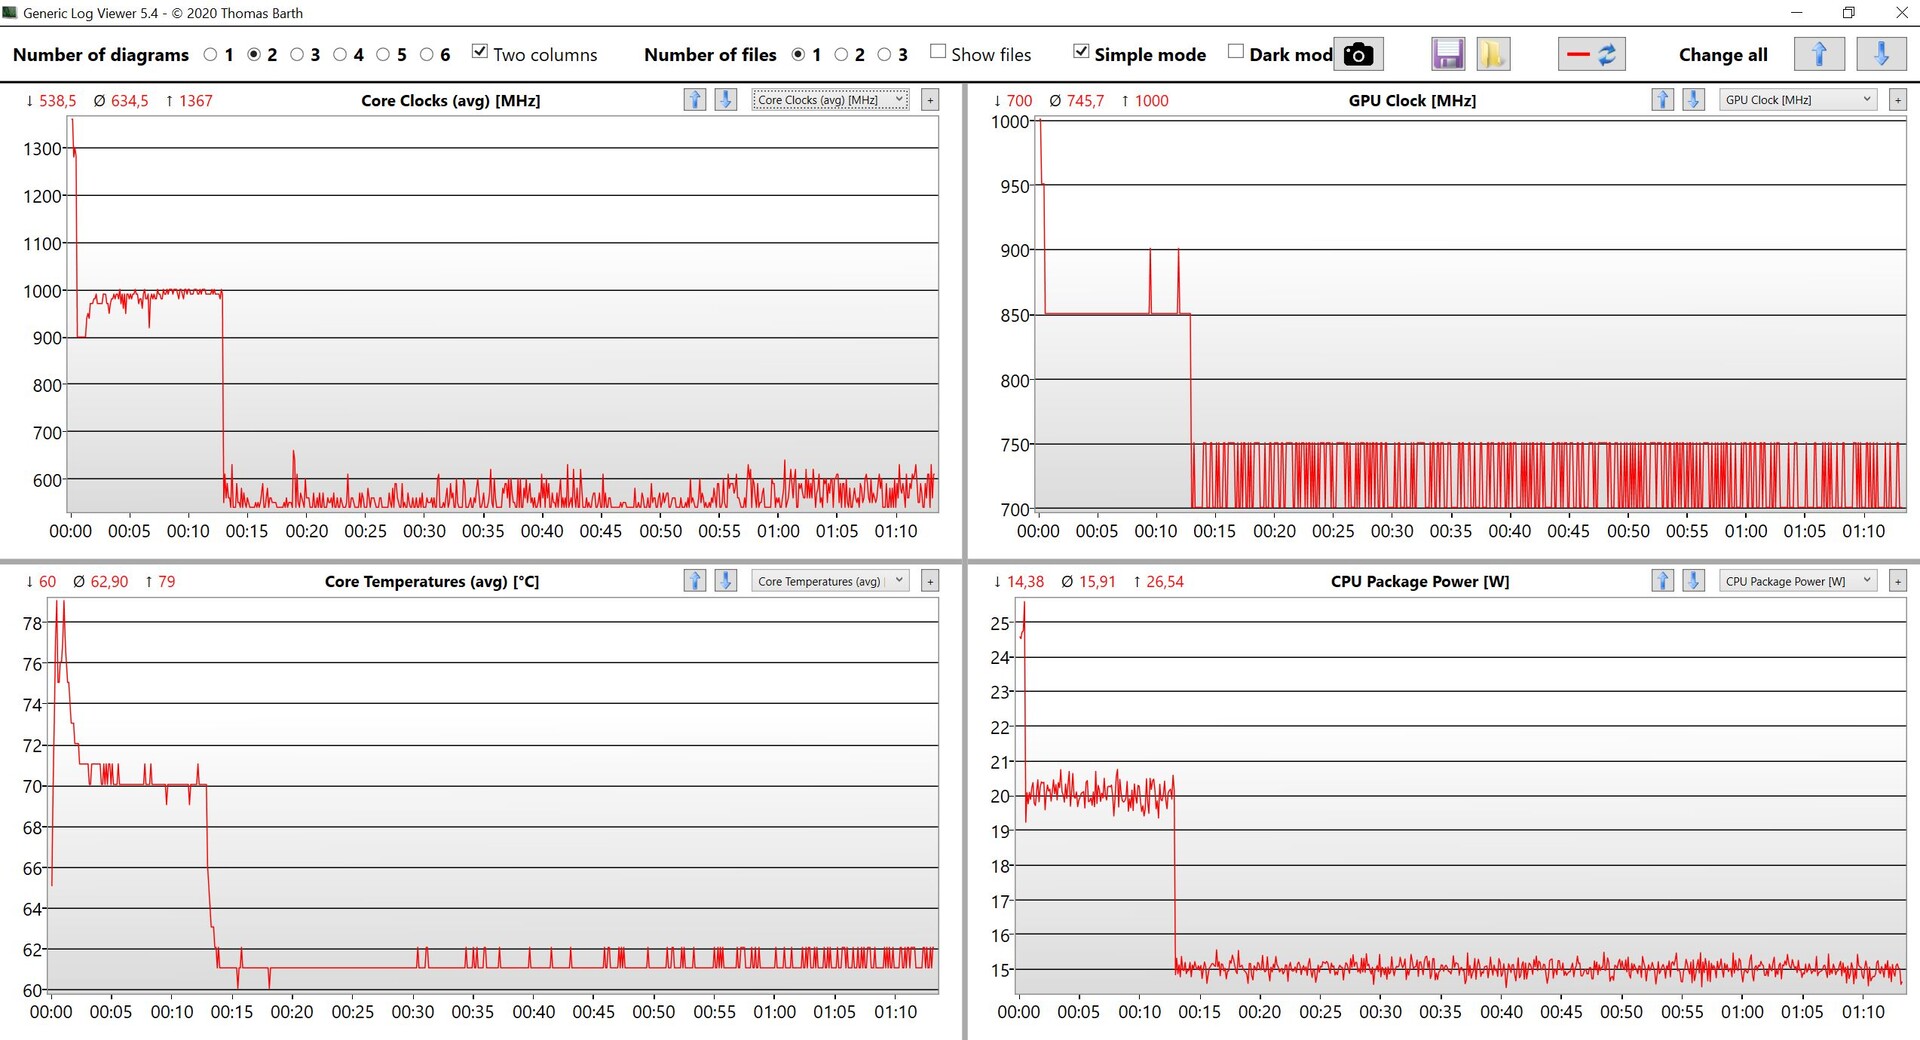
The Core i5-1235U from the Alder Lake generation relies on a hybrid architecture with two fast performance and eight efficiency cores. In the Surface Laptop Go 3, the processor is allowed to consume 25 watts for a short time, but quickly drops to 20 and later to 15 watts. The performance is, therefore, better than in the predecessor. However, under permanent load, the two (as well as the XPS 13 9315) are very close to each other. The performance is definitely sufficient for simple things. However, the processor's power consumption is limited to 12 watts in battery mode, which is why the multi-core performance drops by more than 50% here.
Cinebench R15 Multi loop
Cinebench R20: CPU (Multi Core) | CPU (Single Core)
Cinebench R15: CPU Multi 64Bit | CPU Single 64Bit
Blender: v2.79 BMW27 CPU
7-Zip 18.03: 7z b 4 | 7z b 4 -mmt1
Geekbench 5.5: Multi-Core | Single-Core
HWBOT x265 Benchmark v2.2: 4k Preset
LibreOffice : 20 Documents To PDF
R Benchmark 2.5: Overall mean
| Cinebench R23 / Multi Core | |
| Average of class Subnotebook (1555 - 21812, n=59, last 2 years) | |
| Apple MacBook Air 2020 M1 Entry | |
| Lenovo Yoga 6 13 83B2001SGE | |
| Average Intel Core i5-1235U (2485 - 9208, n=8) | |
| Microsoft Surface Laptop Go 3 | |
| Dell XPS 13 9315, i5-1230U | |
| Microsoft Surface Laptop Go 2 Core i5 | |
| Cinebench R23 / Single Core | |
| Average of class Subnotebook (358 - 2213, n=60, last 2 years) | |
| Average Intel Core i5-1235U (1444 - 1698, n=8) | |
| Microsoft Surface Laptop Go 3 | |
| Apple MacBook Air 2020 M1 Entry | |
| Lenovo Yoga 6 13 83B2001SGE | |
| Microsoft Surface Laptop Go 2 Core i5 | |
| Dell XPS 13 9315, i5-1230U | |
| Cinebench R20 / CPU (Multi Core) | |
| Average of class Subnotebook (579 - 8541, n=56, last 2 years) | |
| Lenovo Yoga 6 13 83B2001SGE | |
| Average Intel Core i5-1235U (1783 - 3537, n=8) | |
| Microsoft Surface Laptop Go 3 | |
| Apple MacBook Air 2020 M1 Entry | |
| Dell XPS 13 9315, i5-1230U | |
| Microsoft Surface Laptop Go 2 Core i5 | |
| Cinebench R20 / CPU (Single Core) | |
| Average of class Subnotebook (128 - 832, n=56, last 2 years) | |
| Average Intel Core i5-1235U (566 - 651, n=8) | |
| Microsoft Surface Laptop Go 3 | |
| Lenovo Yoga 6 13 83B2001SGE | |
| Microsoft Surface Laptop Go 2 Core i5 | |
| Dell XPS 13 9315, i5-1230U | |
| Apple MacBook Air 2020 M1 Entry | |
| Cinebench R15 / CPU Multi 64Bit | |
| Average of class Subnotebook (327 - 3345, n=56, last 2 years) | |
| Lenovo Yoga 6 13 83B2001SGE | |
| Average Intel Core i5-1235U (785 - 1587, n=8) | |
| Apple MacBook Air 2020 M1 Entry | |
| Microsoft Surface Laptop Go 3 | |
| Microsoft Surface Laptop Go 2 Core i5 | |
| Dell XPS 13 9315, i5-1230U | |
| Cinebench R15 / CPU Single 64Bit | |
| Average of class Subnotebook (72.4 - 322, n=56, last 2 years) | |
| Lenovo Yoga 6 13 83B2001SGE | |
| Microsoft Surface Laptop Go 3 | |
| Average Intel Core i5-1235U (151.5 - 242, n=8) | |
| Apple MacBook Air 2020 M1 Entry | |
| Microsoft Surface Laptop Go 2 Core i5 | |
| Dell XPS 13 9315, i5-1230U | |
| Blender / v2.79 BMW27 CPU | |
| Microsoft Surface Laptop Go 2 Core i5 | |
| Apple MacBook Air 2020 M1 Entry | |
| Microsoft Surface Laptop Go 3 | |
| Average Intel Core i5-1235U (366 - 662, n=8) | |
| Average of class Subnotebook (159 - 2271, n=57, last 2 years) | |
| Lenovo Yoga 6 13 83B2001SGE | |
| 7-Zip 18.03 / 7z b 4 | |
| Average of class Subnotebook (11668 - 77867, n=56, last 2 years) | |
| Lenovo Yoga 6 13 83B2001SGE | |
| Apple MacBook Air 2020 M1 Entry | |
| Average Intel Core i5-1235U (20166 - 38643, n=8) | |
| Microsoft Surface Laptop Go 3 | |
| Dell XPS 13 9315, i5-1230U | |
| Microsoft Surface Laptop Go 2 Core i5 | |
| 7-Zip 18.03 / 7z b 4 -mmt1 | |
| Average of class Subnotebook (2643 - 6699, n=58, last 2 years) | |
| Apple MacBook Air 2020 M1 Entry | |
| Lenovo Yoga 6 13 83B2001SGE | |
| Average Intel Core i5-1235U (4371 - 5233, n=8) | |
| Microsoft Surface Laptop Go 3 | |
| Microsoft Surface Laptop Go 2 Core i5 | |
| Dell XPS 13 9315, i5-1230U | |
| Geekbench 5.5 / Multi-Core | |
| Average of class Subnotebook (2557 - 17218, n=47, last 2 years) | |
| Apple MacBook Air 2020 M1 Entry | |
| Lenovo Yoga 6 13 83B2001SGE | |
| Average Intel Core i5-1235U (5528 - 8571, n=10) | |
| Dell XPS 13 9315, i5-1230U | |
| Microsoft Surface Laptop Go 3 | |
| Microsoft Surface Laptop Go 2 Core i5 | |
| Geekbench 5.5 / Single-Core | |
| Average of class Subnotebook (726 - 2224, n=47, last 2 years) | |
| Apple MacBook Air 2020 M1 Entry | |
| Dell XPS 13 9315, i5-1230U | |
| Microsoft Surface Laptop Go 3 | |
| Average Intel Core i5-1235U (1426 - 1643, n=10) | |
| Lenovo Yoga 6 13 83B2001SGE | |
| Microsoft Surface Laptop Go 2 Core i5 | |
| HWBOT x265 Benchmark v2.2 / 4k Preset | |
| Average of class Subnotebook (0.97 - 25.1, n=56, last 2 years) | |
| Lenovo Yoga 6 13 83B2001SGE | |
| Average Intel Core i5-1235U (4.99 - 9.43, n=8) | |
| Microsoft Surface Laptop Go 3 | |
| Microsoft Surface Laptop Go 2 Core i5 | |
| LibreOffice / 20 Documents To PDF | |
| Microsoft Surface Laptop Go 2 Core i5 | |
| Average of class Subnotebook (39.9 - 220, n=55, last 2 years) | |
| Microsoft Surface Laptop Go 3 | |
| Average Intel Core i5-1235U (42.4 - 65.5, n=8) | |
| Lenovo Yoga 6 13 83B2001SGE | |
| Apple MacBook Air 2020 M1 Entry | |
| R Benchmark 2.5 / Overall mean | |
| Apple MacBook Air 2020 M1 Entry | |
| Microsoft Surface Laptop Go 2 Core i5 | |
| Lenovo Yoga 6 13 83B2001SGE | |
| Microsoft Surface Laptop Go 3 | |
| Average of class Subnotebook (0.4024 - 1.456, n=57, last 2 years) | |
| Average Intel Core i5-1235U (0.4986 - 0.603, n=8) | |
* ... smaller is better
AIDA64: FP32 Ray-Trace | FPU Julia | CPU SHA3 | CPU Queen | FPU SinJulia | FPU Mandel | CPU AES | CPU ZLib | FP64 Ray-Trace | CPU PhotoWorxx
| Performance rating | |
| Average of class Subnotebook | |
| Lenovo Yoga 6 13 83B2001SGE | |
| Average Intel Core i5-1235U | |
| Microsoft Surface Laptop Go 3 | |
| Microsoft Surface Laptop Go 2 Core i5 | |
| Dell XPS 13 9315, i5-1230U | |
| AIDA64 / FP32 Ray-Trace | |
| Average of class Subnotebook (1135 - 32888, n=57, last 2 years) | |
| Lenovo Yoga 6 13 83B2001SGE | |
| Average Intel Core i5-1235U (3078 - 7457, n=8) | |
| Microsoft Surface Laptop Go 2 Core i5 | |
| Microsoft Surface Laptop Go 3 | |
| Dell XPS 13 9315, i5-1230U | |
| AIDA64 / FPU Julia | |
| Lenovo Yoga 6 13 83B2001SGE | |
| Average of class Subnotebook (5218 - 123315, n=57, last 2 years) | |
| Average Intel Core i5-1235U (15838 - 37760, n=8) | |
| Microsoft Surface Laptop Go 3 | |
| Microsoft Surface Laptop Go 2 Core i5 | |
| Dell XPS 13 9315, i5-1230U | |
| AIDA64 / CPU SHA3 | |
| Average of class Subnotebook (444 - 5287, n=57, last 2 years) | |
| Lenovo Yoga 6 13 83B2001SGE | |
| Average Intel Core i5-1235U (978 - 2072, n=8) | |
| Microsoft Surface Laptop Go 2 Core i5 | |
| Microsoft Surface Laptop Go 3 | |
| Dell XPS 13 9315, i5-1230U | |
| AIDA64 / CPU Queen | |
| Lenovo Yoga 6 13 83B2001SGE | |
| Average of class Subnotebook (10579 - 95002, n=49, last 2 years) | |
| Average Intel Core i5-1235U (45680 - 62404, n=8) | |
| Microsoft Surface Laptop Go 3 | |
| Dell XPS 13 9315, i5-1230U | |
| Microsoft Surface Laptop Go 2 Core i5 | |
| AIDA64 / FPU SinJulia | |
| Lenovo Yoga 6 13 83B2001SGE | |
| Average of class Subnotebook (744 - 18418, n=57, last 2 years) | |
| Average Intel Core i5-1235U (3099 - 4644, n=8) | |
| Microsoft Surface Laptop Go 2 Core i5 | |
| Microsoft Surface Laptop Go 3 | |
| Dell XPS 13 9315, i5-1230U | |
| AIDA64 / FPU Mandel | |
| Lenovo Yoga 6 13 83B2001SGE | |
| Average of class Subnotebook (3341 - 65433, n=57, last 2 years) | |
| Average Intel Core i5-1235U (8046 - 18819, n=8) | |
| Microsoft Surface Laptop Go 2 Core i5 | |
| Microsoft Surface Laptop Go 3 | |
| Dell XPS 13 9315, i5-1230U | |
| AIDA64 / CPU AES | |
| Average of class Subnotebook (638 - 96917, n=57, last 2 years) | |
| Lenovo Yoga 6 13 83B2001SGE | |
| Average Intel Core i5-1235U (23386 - 67140, n=8) | |
| Microsoft Surface Laptop Go 2 Core i5 | |
| Microsoft Surface Laptop Go 3 | |
| Dell XPS 13 9315, i5-1230U | |
| AIDA64 / CPU ZLib | |
| Average of class Subnotebook (164.9 - 1379, n=57, last 2 years) | |
| Lenovo Yoga 6 13 83B2001SGE | |
| Average Intel Core i5-1235U (329 - 633, n=8) | |
| Microsoft Surface Laptop Go 3 | |
| Microsoft Surface Laptop Go 2 Core i5 | |
| Dell XPS 13 9315, i5-1230U | |
| AIDA64 / FP64 Ray-Trace | |
| Average of class Subnotebook (610 - 17495, n=57, last 2 years) | |
| Lenovo Yoga 6 13 83B2001SGE | |
| Average Intel Core i5-1235U (1670 - 3928, n=8) | |
| Microsoft Surface Laptop Go 2 Core i5 | |
| Microsoft Surface Laptop Go 3 | |
| Dell XPS 13 9315, i5-1230U | |
| AIDA64 / CPU PhotoWorxx | |
| Average of class Subnotebook (6569 - 85600, n=57, last 2 years) | |
| Microsoft Surface Laptop Go 3 | |
| Microsoft Surface Laptop Go 2 Core i5 | |
| Average Intel Core i5-1235U (15933 - 41909, n=8) | |
| Dell XPS 13 9315, i5-1230U | |
| Lenovo Yoga 6 13 83B2001SGE | |
System performance
Overall, the subjective performance is good, which is also due to the NVMe SSD. It is not one of the fastest, but it is sufficient for everyday use. In our latency test, however, the review sample with the current BIOS version shows limitations for using real-time audio applications.
CrossMark: Overall | Productivity | Creativity | Responsiveness
| PCMark 10 / Score | |
| Average of class Subnotebook (4920 - 9939, n=44, last 2 years) | |
| Lenovo Yoga 6 13 83B2001SGE | |
| Average Intel Core i5-1235U, Intel Iris Xe Graphics G7 80EUs (4528 - 5543, n=8) | |
| Microsoft Surface Laptop Go 3 | |
| Dell XPS 13 9315, i5-1230U | |
| Microsoft Surface Laptop Go 2 Core i5 | |
| PCMark 10 / Essentials | |
| Average of class Subnotebook (8552 - 11646, n=44, last 2 years) | |
| Lenovo Yoga 6 13 83B2001SGE | |
| Average Intel Core i5-1235U, Intel Iris Xe Graphics G7 80EUs (9143 - 11273, n=8) | |
| Microsoft Surface Laptop Go 3 | |
| Dell XPS 13 9315, i5-1230U | |
| Microsoft Surface Laptop Go 2 Core i5 | |
| PCMark 10 / Productivity | |
| Average of class Subnotebook (5435 - 16606, n=44, last 2 years) | |
| Lenovo Yoga 6 13 83B2001SGE | |
| Average Intel Core i5-1235U, Intel Iris Xe Graphics G7 80EUs (6440 - 7354, n=8) | |
| Dell XPS 13 9315, i5-1230U | |
| Microsoft Surface Laptop Go 3 | |
| Microsoft Surface Laptop Go 2 Core i5 | |
| PCMark 10 / Digital Content Creation | |
| Average of class Subnotebook (5722 - 13779, n=44, last 2 years) | |
| Microsoft Surface Laptop Go 3 | |
| Average Intel Core i5-1235U, Intel Iris Xe Graphics G7 80EUs (4220 - 5839, n=8) | |
| Lenovo Yoga 6 13 83B2001SGE | |
| Dell XPS 13 9315, i5-1230U | |
| Microsoft Surface Laptop Go 2 Core i5 | |
| CrossMark / Overall | |
| Average of class Subnotebook (365 - 2356, n=59, last 2 years) | |
| Average Intel Core i5-1235U, Intel Iris Xe Graphics G7 80EUs (983 - 1644, n=8) | |
| Apple MacBook Air 2020 M1 Entry | |
| Lenovo Yoga 6 13 83B2001SGE | |
| Dell XPS 13 9315, i5-1230U | |
| Microsoft Surface Laptop Go 3 | |
| Microsoft Surface Laptop Go 2 Core i5 | |
| CrossMark / Productivity | |
| Average of class Subnotebook (364 - 2277, n=59, last 2 years) | |
| Average Intel Core i5-1235U, Intel Iris Xe Graphics G7 80EUs (1026 - 1676, n=8) | |
| Lenovo Yoga 6 13 83B2001SGE | |
| Dell XPS 13 9315, i5-1230U | |
| Microsoft Surface Laptop Go 3 | |
| Apple MacBook Air 2020 M1 Entry | |
| Microsoft Surface Laptop Go 2 Core i5 | |
| CrossMark / Creativity | |
| Average of class Subnotebook (372 - 2743, n=59, last 2 years) | |
| Apple MacBook Air 2020 M1 Entry | |
| Average Intel Core i5-1235U, Intel Iris Xe Graphics G7 80EUs (1032 - 1618, n=8) | |
| Lenovo Yoga 6 13 83B2001SGE | |
| Microsoft Surface Laptop Go 3 | |
| Dell XPS 13 9315, i5-1230U | |
| Microsoft Surface Laptop Go 2 Core i5 | |
| CrossMark / Responsiveness | |
| Average of class Subnotebook (312 - 1854, n=59, last 2 years) | |
| Average Intel Core i5-1235U, Intel Iris Xe Graphics G7 80EUs (746 - 1867, n=8) | |
| Dell XPS 13 9315, i5-1230U | |
| Lenovo Yoga 6 13 83B2001SGE | |
| Microsoft Surface Laptop Go 3 | |
| Microsoft Surface Laptop Go 2 Core i5 | |
| Apple MacBook Air 2020 M1 Entry | |
| PCMark 10 Score | 4993 points | |
Help | ||
| AIDA64 / Memory Copy | |
| Average of class Subnotebook (14554 - 131023, n=57, last 2 years) | |
| Microsoft Surface Laptop Go 3 | |
| Dell XPS 13 9315, i5-1230U | |
| Microsoft Surface Laptop Go 2 Core i5 | |
| Average Intel Core i5-1235U (24653 - 61921, n=8) | |
| Lenovo Yoga 6 13 83B2001SGE | |
| AIDA64 / Memory Read | |
| Average of class Subnotebook (15948 - 127174, n=57, last 2 years) | |
| Microsoft Surface Laptop Go 3 | |
| Dell XPS 13 9315, i5-1230U | |
| Microsoft Surface Laptop Go 2 Core i5 | |
| Average Intel Core i5-1235U (24441 - 66108, n=8) | |
| Lenovo Yoga 6 13 83B2001SGE | |
| AIDA64 / Memory Write | |
| Average of class Subnotebook (15709 - 135141, n=57, last 2 years) | |
| Microsoft Surface Laptop Go 3 | |
| Dell XPS 13 9315, i5-1230U | |
| Microsoft Surface Laptop Go 2 Core i5 | |
| Average Intel Core i5-1235U (25156 - 75808, n=8) | |
| Lenovo Yoga 6 13 83B2001SGE | |
| AIDA64 / Memory Latency | |
| Lenovo Yoga 6 13 83B2001SGE | |
| Microsoft Surface Laptop Go 3 | |
| Microsoft Surface Laptop Go 2 Core i5 | |
| Average of class Subnotebook (6.1 - 159.9, n=55, last 2 years) | |
| Average Intel Core i5-1235U (76.3 - 119, n=8) | |
| Dell XPS 13 9315, i5-1230U | |
* ... smaller is better
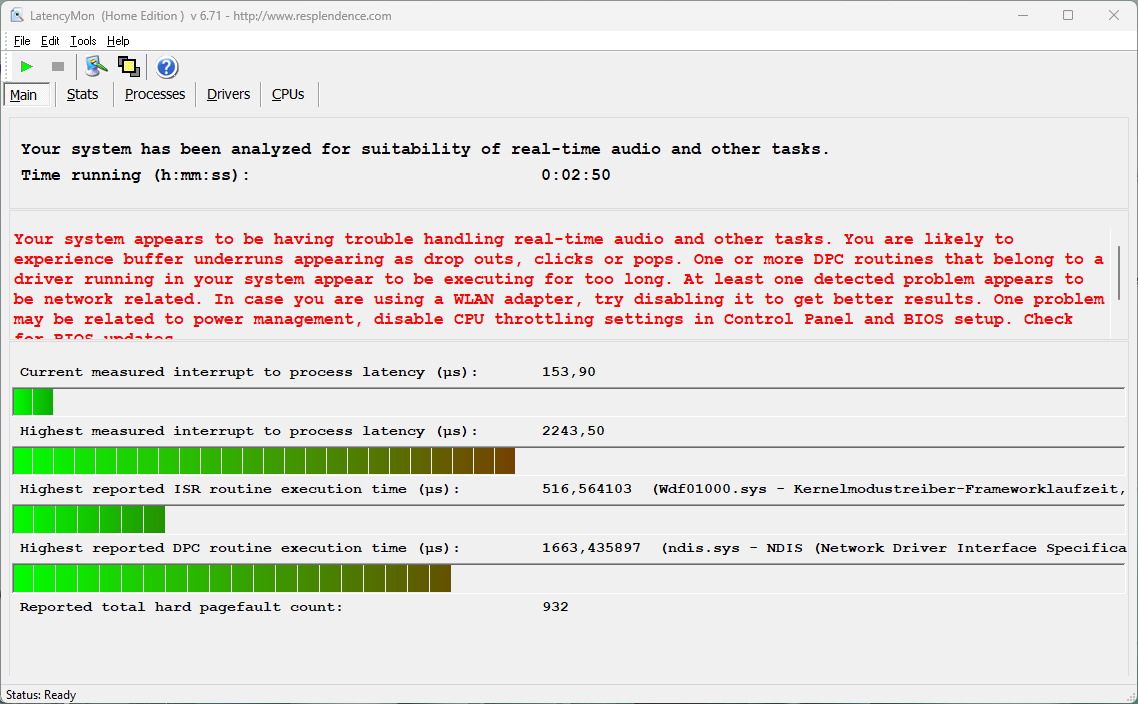

| DPC Latencies / LatencyMon - interrupt to process latency (max), Web, Youtube, Prime95 | |
| Dell XPS 13 9315, i5-1230U | |
| Microsoft Surface Laptop Go 3 | |
| Lenovo Yoga 6 13 83B2001SGE | |
| Microsoft Surface Laptop Go 2 Core i5 | |
* ... smaller is better

* ... smaller is better
Dauerleistung Lesen: DiskSpd Read Loop, Queue Depth 8
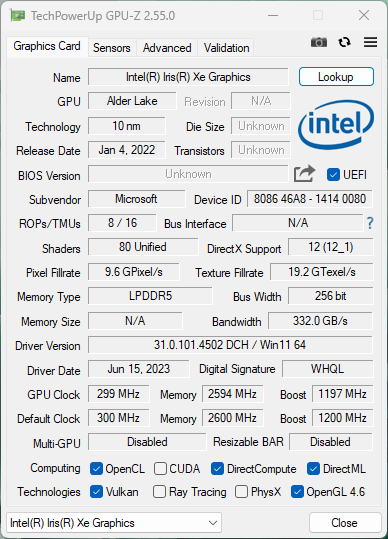
Nothing has changed in terms of graphics performance, as the integrated Iris Xe Graphics G7 with 80 EUs takes care of the graphics calculations. Thus, the overall performance remains at a very low level. Playing high-resolution videos works smoothly thanks to the video decoder, but the compact subnotebook quickly reaches its limits when gaming. Even at low resolutions, you usually have to make do with the minimum details. The performance is about 30% lower on battery power.
| 3DMark 11 Performance | 5282 points | |
| 3DMark Fire Strike Score | 3938 points | |
| 3DMark Time Spy Score | 1371 points | |
Help | ||
| Blender / v3.3 Classroom METAL | |
| Apple MacBook Air 2020 M1 Entry | |
| Average of class Subnotebook (76.3 - 227, n=5, last 2 years) | |
| Blender / v3.3 Classroom HIP/AMD | |
| Lenovo Yoga 6 13 83B2001SGE | |
| Blender / v3.3 Classroom CPU | |
| Microsoft Surface Laptop Go 2 Core i5 | |
| Microsoft Surface Laptop Go 3 | |
| Apple MacBook Air 2020 M1 Entry | |
| Average Intel Iris Xe Graphics G7 80EUs (463 - 3047, n=53) | |
| Lenovo Yoga 6 13 83B2001SGE | |
| Average of class Subnotebook (241 - 861, n=59, last 2 years) | |
* ... smaller is better
| Performance rating - Percent | |
| Average of class Subnotebook | |
| Lenovo Yoga 6 13 83B2001SGE | |
| Microsoft Surface Laptop Go 2 Core i5 -3! | |
| Microsoft Surface Laptop Go 3 | |
| Dell XPS 13 9315, i5-1230U -4! | |
| The Witcher 3 - 1920x1080 Ultra Graphics & Postprocessing (HBAO+) | |
| Average of class Subnotebook (13.9 - 34.6, n=13, last 2 years) | |
| Lenovo Yoga 6 13 83B2001SGE | |
| Microsoft Surface Laptop Go 3 | |
| Dell XPS 13 9315, i5-1230U | |
| GTA V - 1920x1080 Highest AA:4xMSAA + FX AF:16x | |
| Average of class Subnotebook (10.7 - 43.7, n=55, last 2 years) | |
| Lenovo Yoga 6 13 83B2001SGE | |
| Microsoft Surface Laptop Go 3 | |
| Final Fantasy XV Benchmark - 1920x1080 High Quality | |
| Average of class Subnotebook (11.6 - 54.5, n=53, last 2 years) | |
| Lenovo Yoga 6 13 83B2001SGE | |
| Microsoft Surface Laptop Go 3 | |
| Microsoft Surface Laptop Go 2 Core i5 | |
| Dell XPS 13 9315, i5-1230U | |
| Strange Brigade - 1920x1080 ultra AA:ultra AF:16 | |
| Average of class Subnotebook (19 - 101.3, n=49, last 2 years) | |
| Lenovo Yoga 6 13 83B2001SGE | |
| Microsoft Surface Laptop Go 3 | |
| Dota 2 Reborn - 1920x1080 ultra (3/3) best looking | |
| Average of class Subnotebook (13 - 97, n=60, last 2 years) | |
| Lenovo Yoga 6 13 83B2001SGE | |
| Microsoft Surface Laptop Go 3 | |
| Microsoft Surface Laptop Go 2 Core i5 | |
| X-Plane 11.11 - 1920x1080 high (fps_test=3) | |
| Average of class Subnotebook (20.7 - 50.5, n=52, last 2 years) | |
| Lenovo Yoga 6 13 83B2001SGE | |
| Microsoft Surface Laptop Go 2 Core i5 | |
| Microsoft Surface Laptop Go 3 | |
| low | med. | high | ultra | |
|---|---|---|---|---|
| GTA V (2015) | 63.8 | 64.4 | 17.7 | 8.38 |
| The Witcher 3 (2015) | 74 | 48 | 17 | 9.83 |
| Dota 2 Reborn (2015) | 93.1 | 59.5 | 45.9 | 40.2 |
| Final Fantasy XV Benchmark (2018) | 29.9 | 16.3 | 11.9 | |
| X-Plane 11.11 (2018) | 38.6 | 28.8 | 26.4 | |
| Strange Brigade (2018) | 69.6 | 32.8 | 25.5 | 19.8 |
| F1 2021 (2021) | 77 | 34.3 | 26.5 | 18.8 |
Emissions & Energy
Noise emissions
The Surface Laptop Go 3 still has a small fan, but it is usually deactivated in everyday use. However, it becomes noticeable as soon as the system is put under more load, and it is also quite high-frequency. With almost 40 dB(A) under permanent load, the compact device is too loud in view of the low performance. Here the MacBook Air with its passive cooling definitely has a big advantage. We could not hear any other electronic noise.
Noise level
| Idle |
| 22.5 / 22.5 / 22.5 dB(A) |
| Load |
| 31.3 / 39.1 dB(A) |
 | ||
30 dB silent 40 dB(A) audible 50 dB(A) loud |
||
min: | ||
| Microsoft Surface Laptop Go 3 Iris Xe G7 80EUs, i5-1235U, Kioxia BG5 KBG50ZNS256G | Dell XPS 13 9315, i5-1230U Iris Xe G7 80EUs, i5-1230U, Micron 3460 256 GB Soldered | Lenovo Yoga 6 13 83B2001SGE Vega 8, R7 7730U, WD PC SN740 512GB SDDPMQD-512G-1101 | Microsoft Surface Laptop Go 2 Core i5 Iris Xe G7 80EUs, i5-1135G7, Toshiba KBG40ZNS256G NVMe | |
|---|---|---|---|---|
| Noise | -15% | -16% | -6% | |
| off / environment * (dB) | 22.5 | 26 -16% | 27 -20% | 24.3 -8% |
| Idle Minimum * (dB) | 22.5 | 26 -16% | 27 -20% | 24.3 -8% |
| Idle Average * (dB) | 22.5 | 26 -16% | 27 -20% | 24.3 -8% |
| Idle Maximum * (dB) | 22.5 | 27.5 -22% | 27 -20% | 24.3 -8% |
| Load Average * (dB) | 31.3 | 39.5 -26% | 37.6 -20% | 33.1 -6% |
| Witcher 3 ultra * (dB) | 37.8 | 39.6 -5% | 36.7 3% | |
| Load Maximum * (dB) | 39.1 | 39.6 -1% | 37.6 4% | 41.8 -7% |
* ... smaller is better
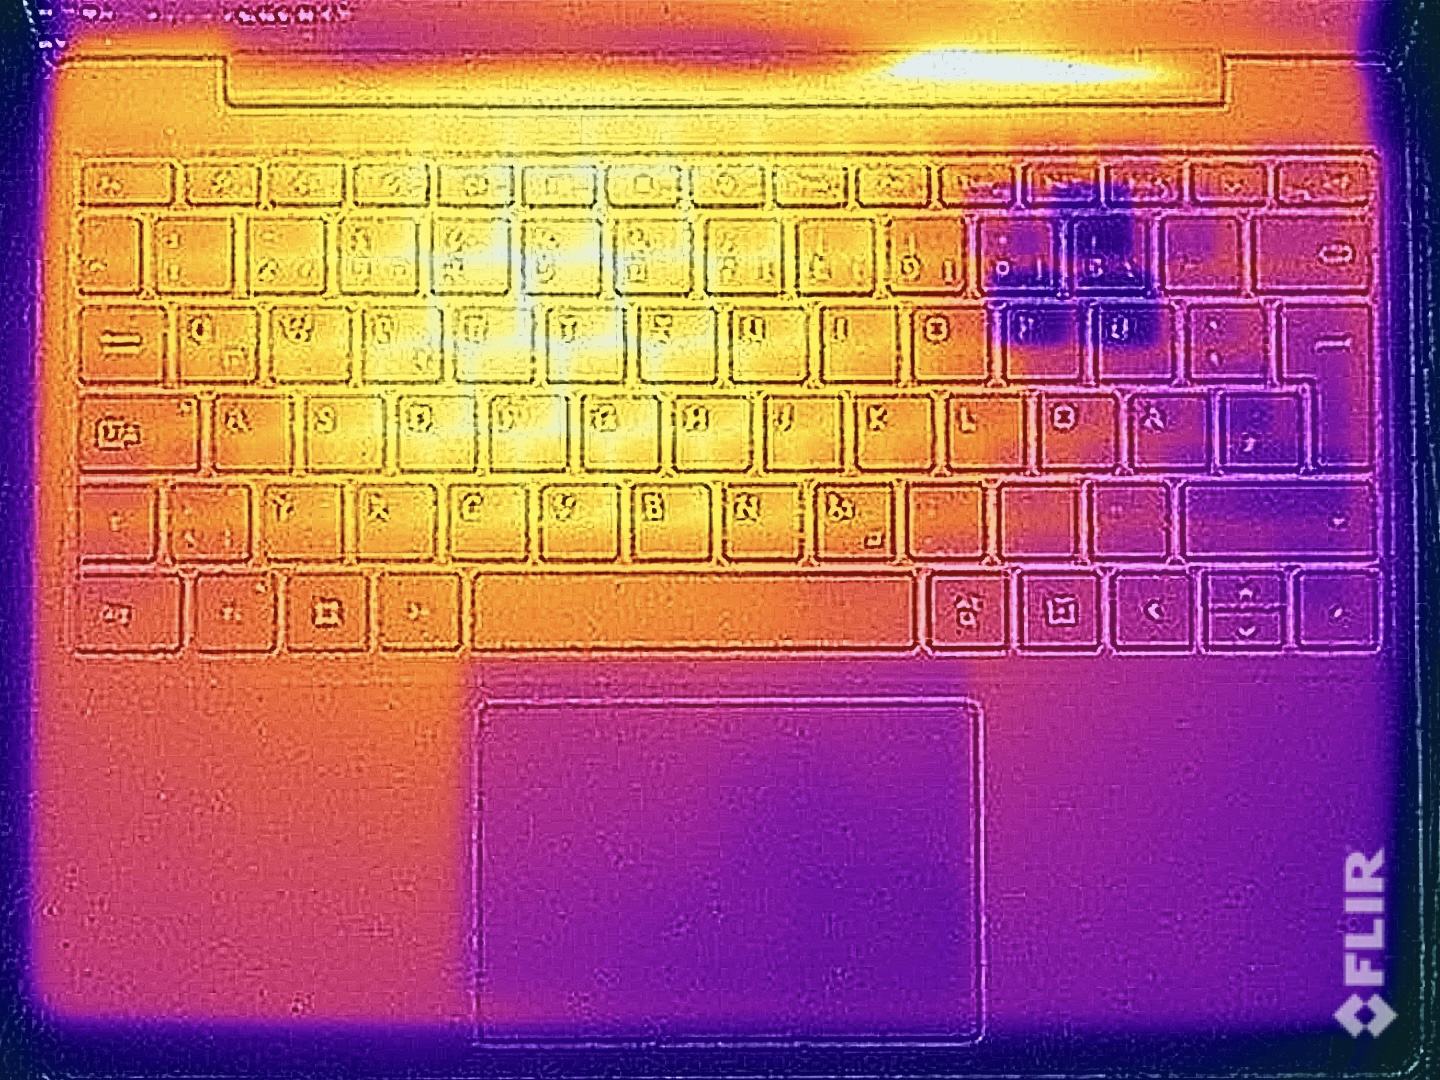
The compact device stays pleasantly cool in everyday use, but we measured up to 47 °C in the rear area of the underside under load. In the stress test, the processor's TDP first settles at 20 watts and a few minutes later at 15 watts.
(±) The maximum temperature on the upper side is 40.9 °C / 106 F, compared to the average of 35.9 °C / 97 F, ranging from 21.4 to 59 °C for the class Subnotebook.
(-) The bottom heats up to a maximum of 47.2 °C / 117 F, compared to the average of 39.2 °C / 103 F
(+) In idle usage, the average temperature for the upper side is 24.1 °C / 75 F, compared to the device average of 30.8 °C / 87 F.
(+) The palmrests and touchpad are cooler than skin temperature with a maximum of 31.8 °C / 89.2 F and are therefore cool to the touch.
(-) The average temperature of the palmrest area of similar devices was 28.2 °C / 82.8 F (-3.6 °C / -6.4 F).

| Microsoft Surface Laptop Go 3 Intel Core i5-1235U, Intel Iris Xe Graphics G7 80EUs | Apple MacBook Air 2020 M1 Entry Apple M1, Apple M1 7-Core GPU | Dell XPS 13 9315, i5-1230U Intel Core i5-1230U, Intel Iris Xe Graphics G7 80EUs | Lenovo Yoga 6 13 83B2001SGE AMD Ryzen 7 7730U, AMD Radeon RX Vega 8 (Ryzen 4000/5000) | Microsoft Surface Laptop Go 2 Core i5 Intel Core i5-1135G7, Intel Iris Xe Graphics G7 80EUs | |
|---|---|---|---|---|---|
| Heat | -3% | -19% | -18% | -9% | |
| Maximum Upper Side * (°C) | 40.9 | 44 -8% | 42.3 -3% | 43.8 -7% | 41.4 -1% |
| Maximum Bottom * (°C) | 47.2 | 44 7% | 44.9 5% | 48.2 -2% | 46.7 1% |
| Idle Upper Side * (°C) | 24.9 | 27 -8% | 32.5 -31% | 32.9 -32% | 28.5 -14% |
| Idle Bottom * (°C) | 25.9 | 27 -4% | 38.2 -47% | 34.1 -32% | 31.5 -22% |
* ... smaller is better
Speaker
The speakers still offer a decent performance, but fall behind the MacBook Air M1.
Microsoft Surface Laptop Go 3 audio analysis
(±) | speaker loudness is average but good (79 dB)
Bass 100 - 315 Hz
(-) | nearly no bass - on average 18.7% lower than median
(±) | linearity of bass is average (9.8% delta to prev. frequency)
Mids 400 - 2000 Hz
(+) | balanced mids - only 4.8% away from median
(+) | mids are linear (5.2% delta to prev. frequency)
Highs 2 - 16 kHz
(+) | balanced highs - only 1.1% away from median
(+) | highs are linear (2.7% delta to prev. frequency)
Overall 100 - 16.000 Hz
(±) | linearity of overall sound is average (15.4% difference to median)
Compared to same class
» 35% of all tested devices in this class were better, 6% similar, 60% worse
» The best had a delta of 5%, average was 18%, worst was 53%
Compared to all devices tested
» 23% of all tested devices were better, 4% similar, 73% worse
» The best had a delta of 4%, average was 23%, worst was 134%
Apple MacBook Air 2020 M1 Entry audio analysis
(±) | speaker loudness is average but good (79.6 dB)
Bass 100 - 315 Hz
(±) | reduced bass - on average 7.1% lower than median
(±) | linearity of bass is average (9.5% delta to prev. frequency)
Mids 400 - 2000 Hz
(+) | balanced mids - only 2.2% away from median
(+) | mids are linear (5.3% delta to prev. frequency)
Highs 2 - 16 kHz
(+) | balanced highs - only 2.3% away from median
(+) | highs are linear (4% delta to prev. frequency)
Overall 100 - 16.000 Hz
(+) | overall sound is linear (8.7% difference to median)
Compared to same class
» 3% of all tested devices in this class were better, 1% similar, 96% worse
» The best had a delta of 5%, average was 18%, worst was 53%
Compared to all devices tested
» 3% of all tested devices were better, 1% similar, 97% worse
» The best had a delta of 4%, average was 23%, worst was 134%
| Off / Standby | |
| Idle | |
| Load |
|
Key:
min: | |
Power consumption Witcher 3 / Stresstest
Power consumption with external monitor
Battery life
The battery capacity of 41 Wh has not changed and we can see improvements compared to the old model. In the WLAN test at 150 cd/m² (corresponds to 70% of the maximum brightness in the test device), it is now just under 8 hours and a bit more than 5.5 hours at full brightness. These are not bad results by themselves, but they are not the best rates in view of the low screen brightness. Furthermore, all rivals offer considerably more endurance.
| Battery Runtime | |
| WiFi Websurfing | |
| Apple MacBook Air 2020 M1 Entry | |
| Apple MacBook Air 2020 M1 Entry (Fullscreen) | |
| Dell XPS 13 9315, i5-1230U | |
| Average of class Subnotebook (7.25 - 26.4, n=59, last 2 years) | |
| Lenovo Yoga 6 13 83B2001SGE | |
| Microsoft Surface Laptop Go 3 (Edge 117) | |
| Microsoft Surface Laptop Go 2 Core i5 (Edge 101) | |
| WiFi Websurfing max. Brightness | |
| Dell XPS 13 9315, i5-1230U | |
| Average of class Subnotebook (4.82 - 15.8, n=33, last 2 years) | |
| Apple MacBook Air 2020 M1 Entry | |
| Lenovo Yoga 6 13 83B2001SGE | |
| Microsoft Surface Laptop Go 3 (Edge 117) | |
| Microsoft Surface Laptop Go 2 Core i5 (Edge 101) | |
Pros
Cons
Verdict - Surface Laptop Go 3 is outdated and far too expensive
In principle, we can confirm the conclusion from our review of the Surface Laptop Go 2 because there are no real developments in the third generation. The new Alder Lake processor offers a bit more performance for a short time, and the battery runtimes are a bit better, but the competition simply offers more in terms of endurance.
At the same time, the compact device also clearly has positive features: first and foremost the high-quality metal casing and the good keyboard. The typing feel is very good, but it cannot be that Microsoft still does not offer a keyboard backlight here. The 3:2-inch touchscreen also offers a decent picture quality and is already calibrated very accurately ex-factory, but it also reflects very strongly and the brightness is lower than in the predecessor, which makes outdoor use more difficult. The cooling is also problematic because the small fan has a lot to do despite the low performance and the surfaces get warm when the device is pushed a bit harder.
The new Microsoft Surface Laptop Go 3 has become a bit faster and is now optionally available with 16 GB RAM, but its price has increased at the same time. The compact laptop is much too expensive at 1,149 Euros, and the competition offers much better overall packages.
However, we now come to the actual problem - the price. We already criticized this in the last model, and now it is even higher. In addition, Microsoft has completely eliminated the cheaper (and thus more interesting for many customers) configurations. For 500-600 Euros you could certainly overlook some deficits, but there are already really good devices on the market for more than 1000 Euros, which are, however, also a bit bigger. If you don't necessarily need Windows and are looking for a device for everyday tasks, you should take a look at the Apple MacBook Air M1 which is already available for around 900 Euros and is superior in practically every respect apart from the touchscreen (if used) and the lack of a USB-A port.
Price and availability
At the time of writing, the Microsoft Surface Laptop Go 3 is available from various retailers. In the US, users can get the laptop on Amazon as well as directly from Microsoft.
Microsoft Surface Laptop Go 3
- 10/09/2023 v7 (old)
Andreas Osthoff
Transparency
The selection of devices to be reviewed is made by our editorial team. The test sample was provided to the author as a loan by the manufacturer or retailer for the purpose of this review. The lender had no influence on this review, nor did the manufacturer receive a copy of this review before publication. There was no obligation to publish this review. As an independent media company, Notebookcheck is not subjected to the authority of manufacturers, retailers or publishers.
This is how Notebookcheck is testing
Every year, Notebookcheck independently reviews hundreds of laptops and smartphones using standardized procedures to ensure that all results are comparable. We have continuously developed our test methods for around 20 years and set industry standards in the process. In our test labs, high-quality measuring equipment is utilized by experienced technicians and editors. These tests involve a multi-stage validation process. Our complex rating system is based on hundreds of well-founded measurements and benchmarks, which maintains objectivity. Further information on our test methods can be found here.
Price comparison

