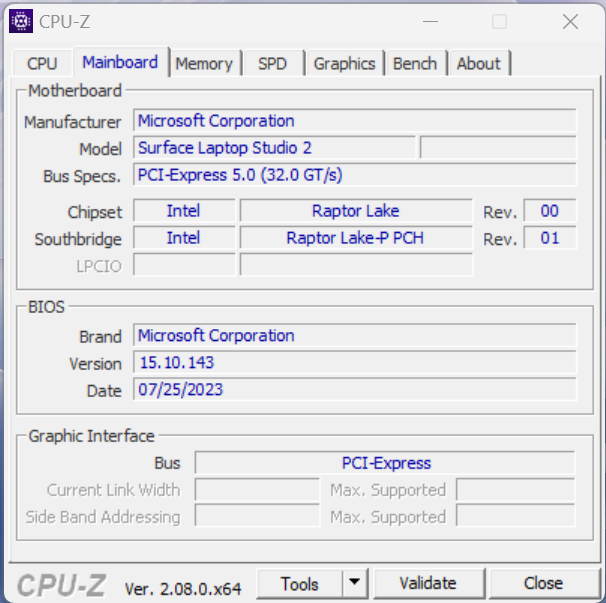
Microsoft Surface Laptop Studio 2 Review - Multimedia Convertible with faster components
Microsoft launched the Surface Laptop Studio in the beginning of 2022 as successor to the Surface Book. Thanks to its folding mechanism the multimedia laptop can be used as a regular laptop or a tablet, and there is even a special presentation mode. The biggest issue of the first generation was the rather slow quad-core processor from Intel. Microsoft fixed that for the second generation and now uses the Raptor Lake Core i7-13700H CPU combined with modern Nvidia GPUs all the way up to the professional RTX 2000 ADA. The manufacturer also includes a dedicated AI chip, which is supposed to accelerate new Windows functions like the Copilot.
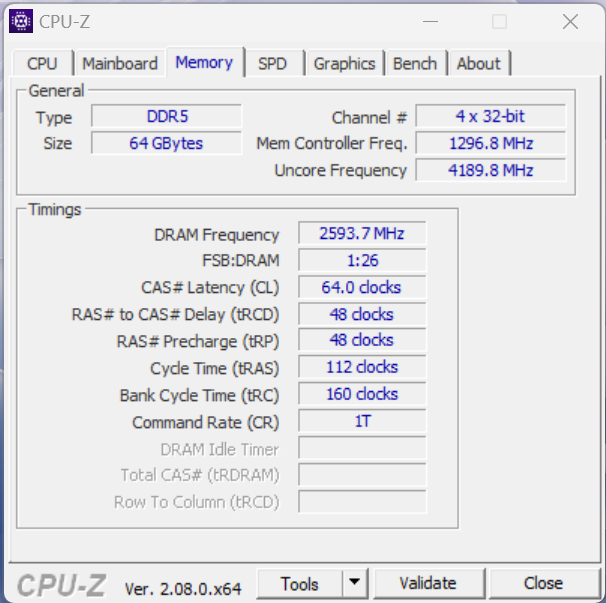
The new Surface Laptop Studio 2 starts at $1999 with the Core i7-13700H, 16 GB RAM as well as a 512 GB SSD, but no Nvidia GPU. Our review unit is the version with the GeForce RTX 4060, which is automatically combined with a 1 TB SSD as well as 64 GB RAM for $3299. The current models are pretty limited in terms of SSD and RAM capacity. The following table shows the available models right now:
| CPU | Core i7-13700H | Core i7-13700H | Core i7-13700H | Core i7-13700H | Core i7-13700H | Core i7-13700H |
|---|---|---|---|---|---|---|
| GPU | Iris Xe Graphics G7 | Nvidia GeForce RTX 4050 Laptop | Nvidia GeForce RTX 4050 Laptop | Nvidia GeForce RTX 4060 Laptop | Nvidia RTX 2000 Ada | Nvidia GeForce RTX 4060 Laptop |
| Display | 14.4-inch PixelSense Flow 120 Hz | 14.4-inch PixelSense Flow 120 Hz | 14.4-inch PixelSense Flow 120 Hz | 14.4-inch PixelSense Flow 120 Hz | 14.4-inch PixelSense Flow 120 Hz | 14.4-inch PixelSense Flow 120 Hz |
| RAM | 16 GB | 16 GB | 32 GB | 64 GB | 32 GB | 64 GB |
| SSD | 512 GB | 512 GB | 1 TB | 1 TB | 1 TB | 2 TB |
| Price | $1999 | $2399 | $2799 | $3299 | $3599 | $3699 |
According to Microsoft, the device is primarily targeted at content creators, but this can be said about many models in the 14-inch segment that are categorized as multimedia or gaming laptops. The latter often offer faster components in combination with very good screens (OLED, Mini-LED).
Potential Rivals
Rating | Date | Model | Weight | Height | Size | Resolution | Price |
|---|---|---|---|---|---|---|---|
| 85.5 % v7 (old) | 10 / 2023 | Microsoft Surface Laptop Studio 2 RTX 4060 i7-13700H, GeForce RTX 4060 Laptop GPU | 2 kg | 22 mm | 14.40" | 2400x1600 | |
| 93.9 % v7 (old) | 03 / 2023 | Apple MacBook Pro 14 2023 M2 Pro M2 Pro, M2 Pro 19-Core GPU | 1.6 kg | 15.5 mm | 14.20" | 3024x1964 | |
| 89.8 % v7 (old) | 07 / 2023 | Lenovo Yoga Pro 9-14IRP G8 i7-13705H, GeForce RTX 4050 Laptop GPU | 1.7 kg | 17.6 mm | 14.50" | 3072x1920 | |
| 89.3 % v7 (old) | 06 / 2023 | Asus Zenbook Pro 14 OLED UX6404VI i9-13900H, GeForce RTX 4070 Laptop GPU | 1.7 kg | 17.9 mm | 14.50" | 2880x1800 | |
| 87 % v7 (old) | 06 / 2023 | Asus ZenBook Pro 14 Duo UX8402VV-P1021W i9-13900H, GeForce RTX 4060 Laptop GPU | 1.8 kg | 21 mm | 14.50" | 2880x1800 | |
| 90 % v7 (old) | 04 / 2023 | Asus ROG Zephyrus G14 GA402XY R9 7940HS, GeForce RTX 4090 Laptop GPU | 1.7 kg | 20.5 mm | 14.00" | 2560x1600 | |
| 87.7 % v7 (old) | 09 / 2023 | Lenovo Legion Slim 5 14APH8 R7 7840HS, GeForce RTX 4060 Laptop GPU | 1.7 kg | 20.79 mm | 14.50" | 2880x1600 |
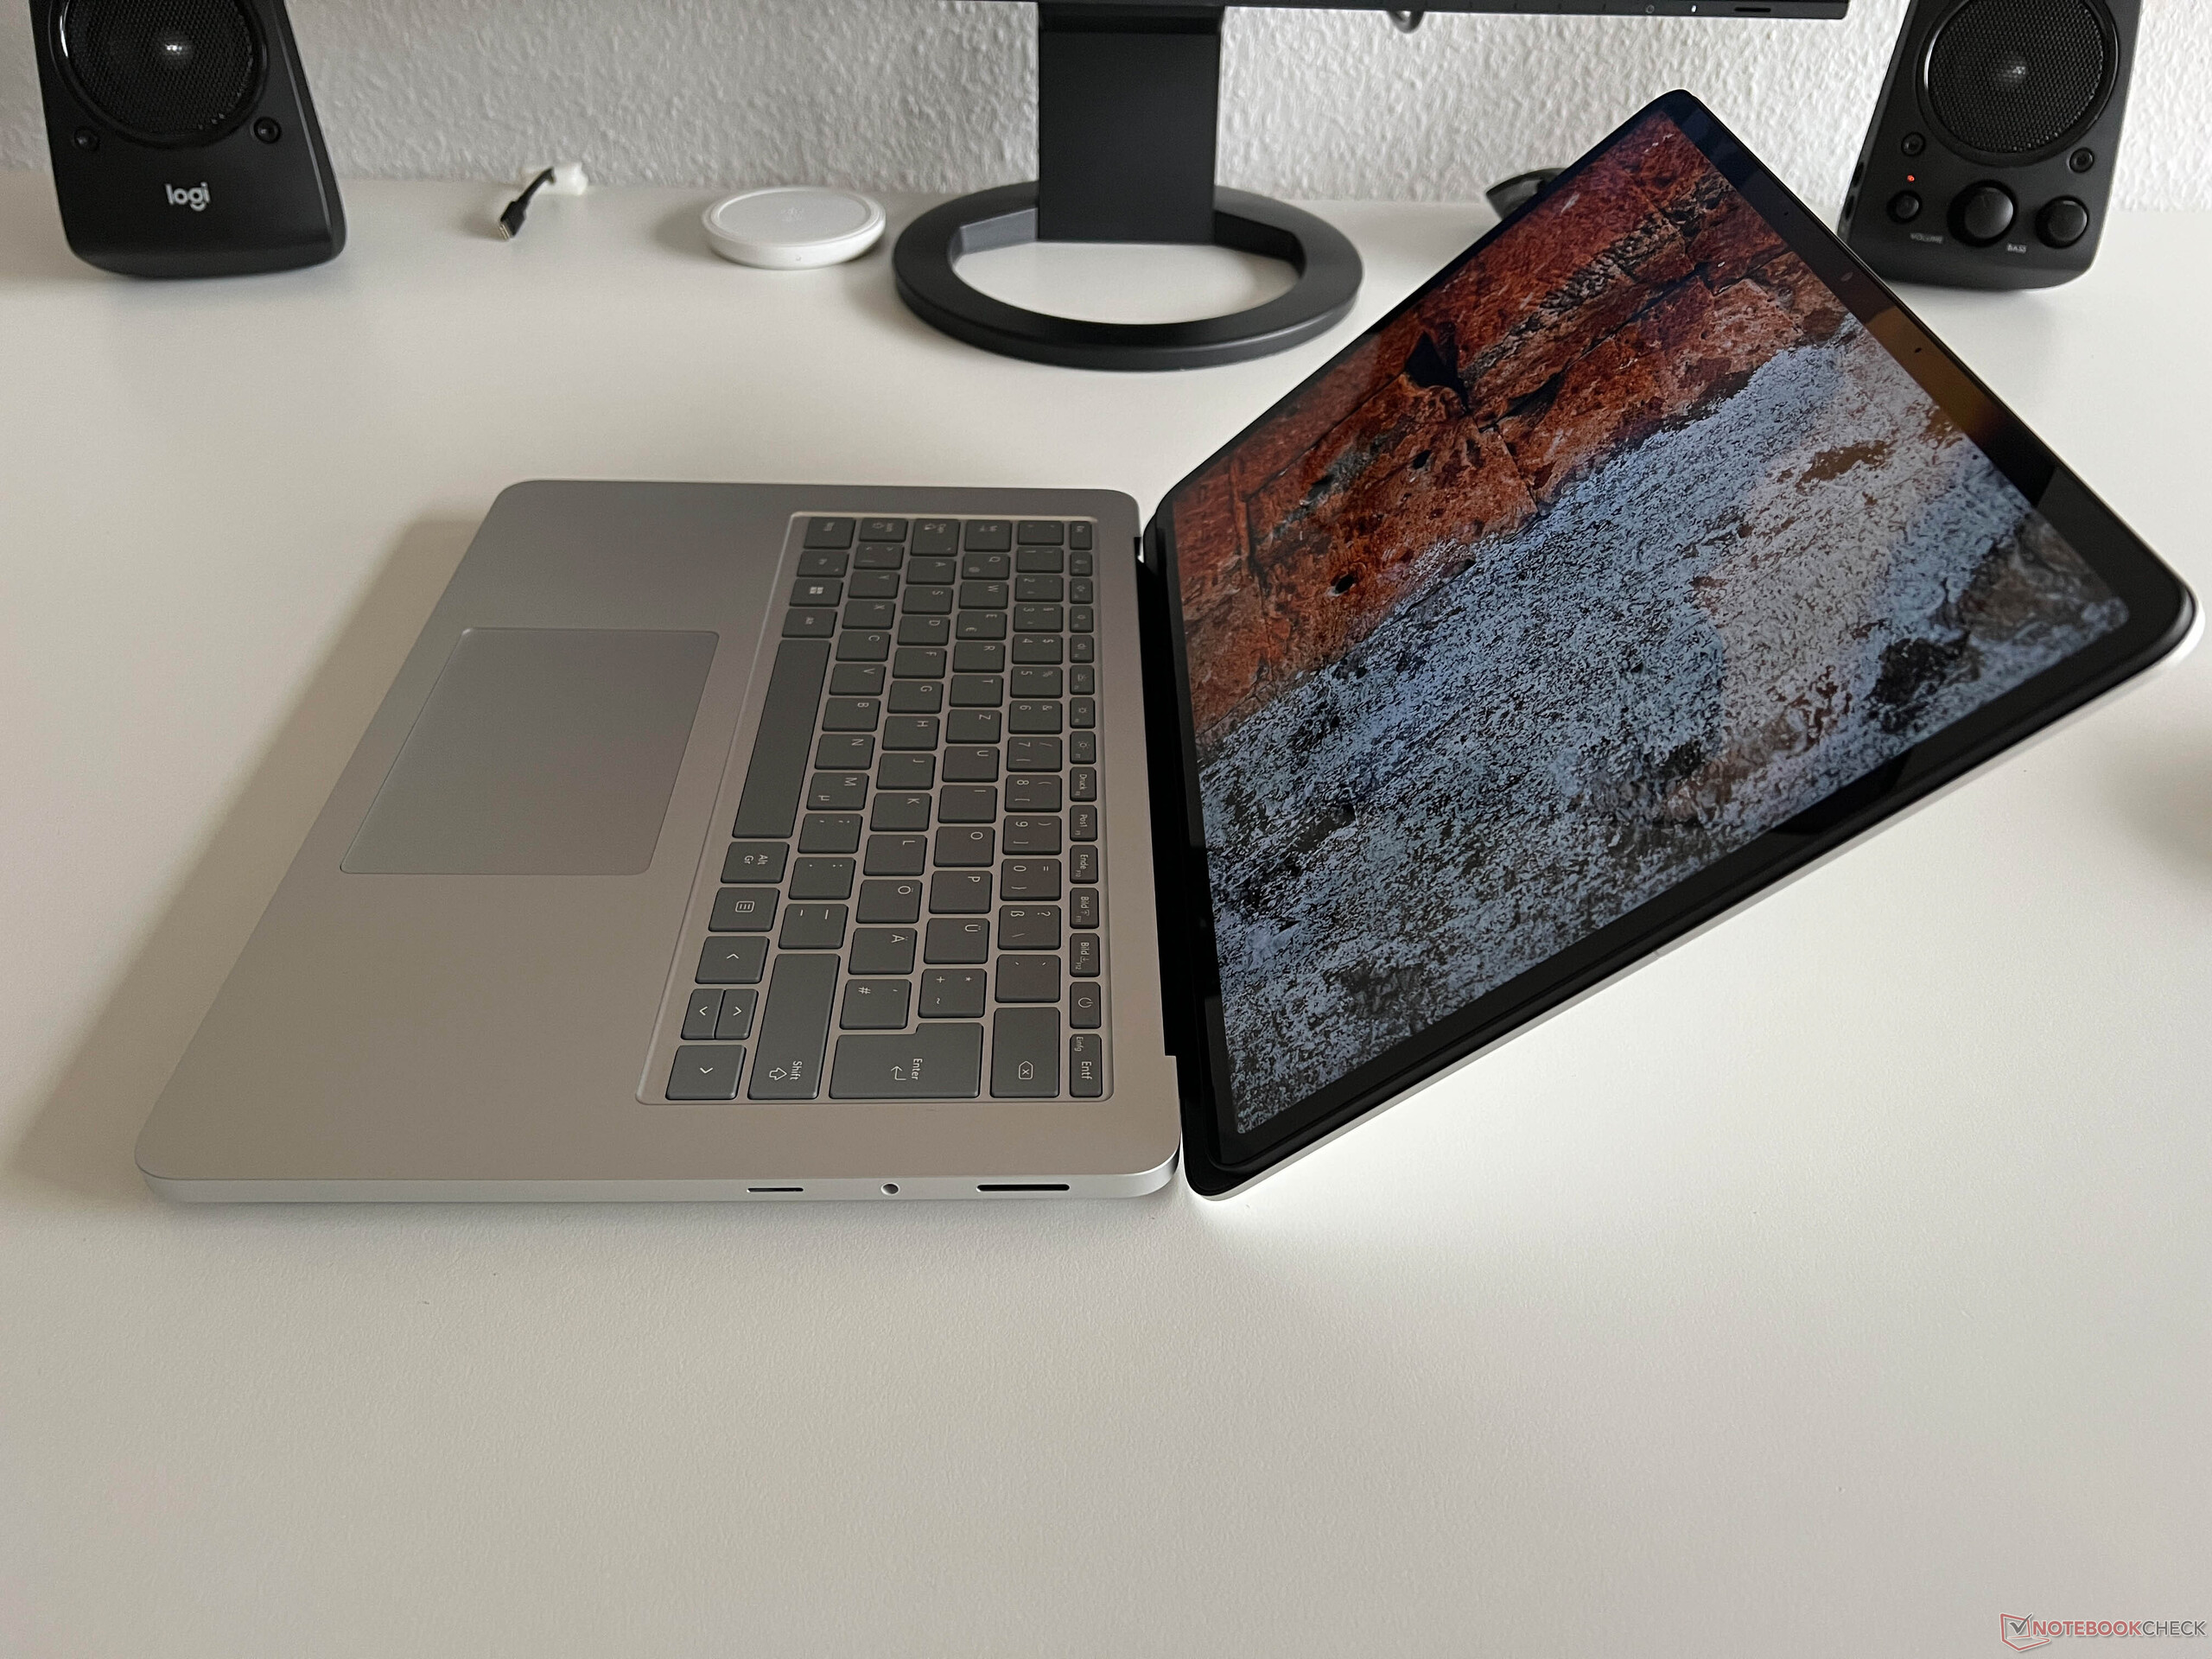
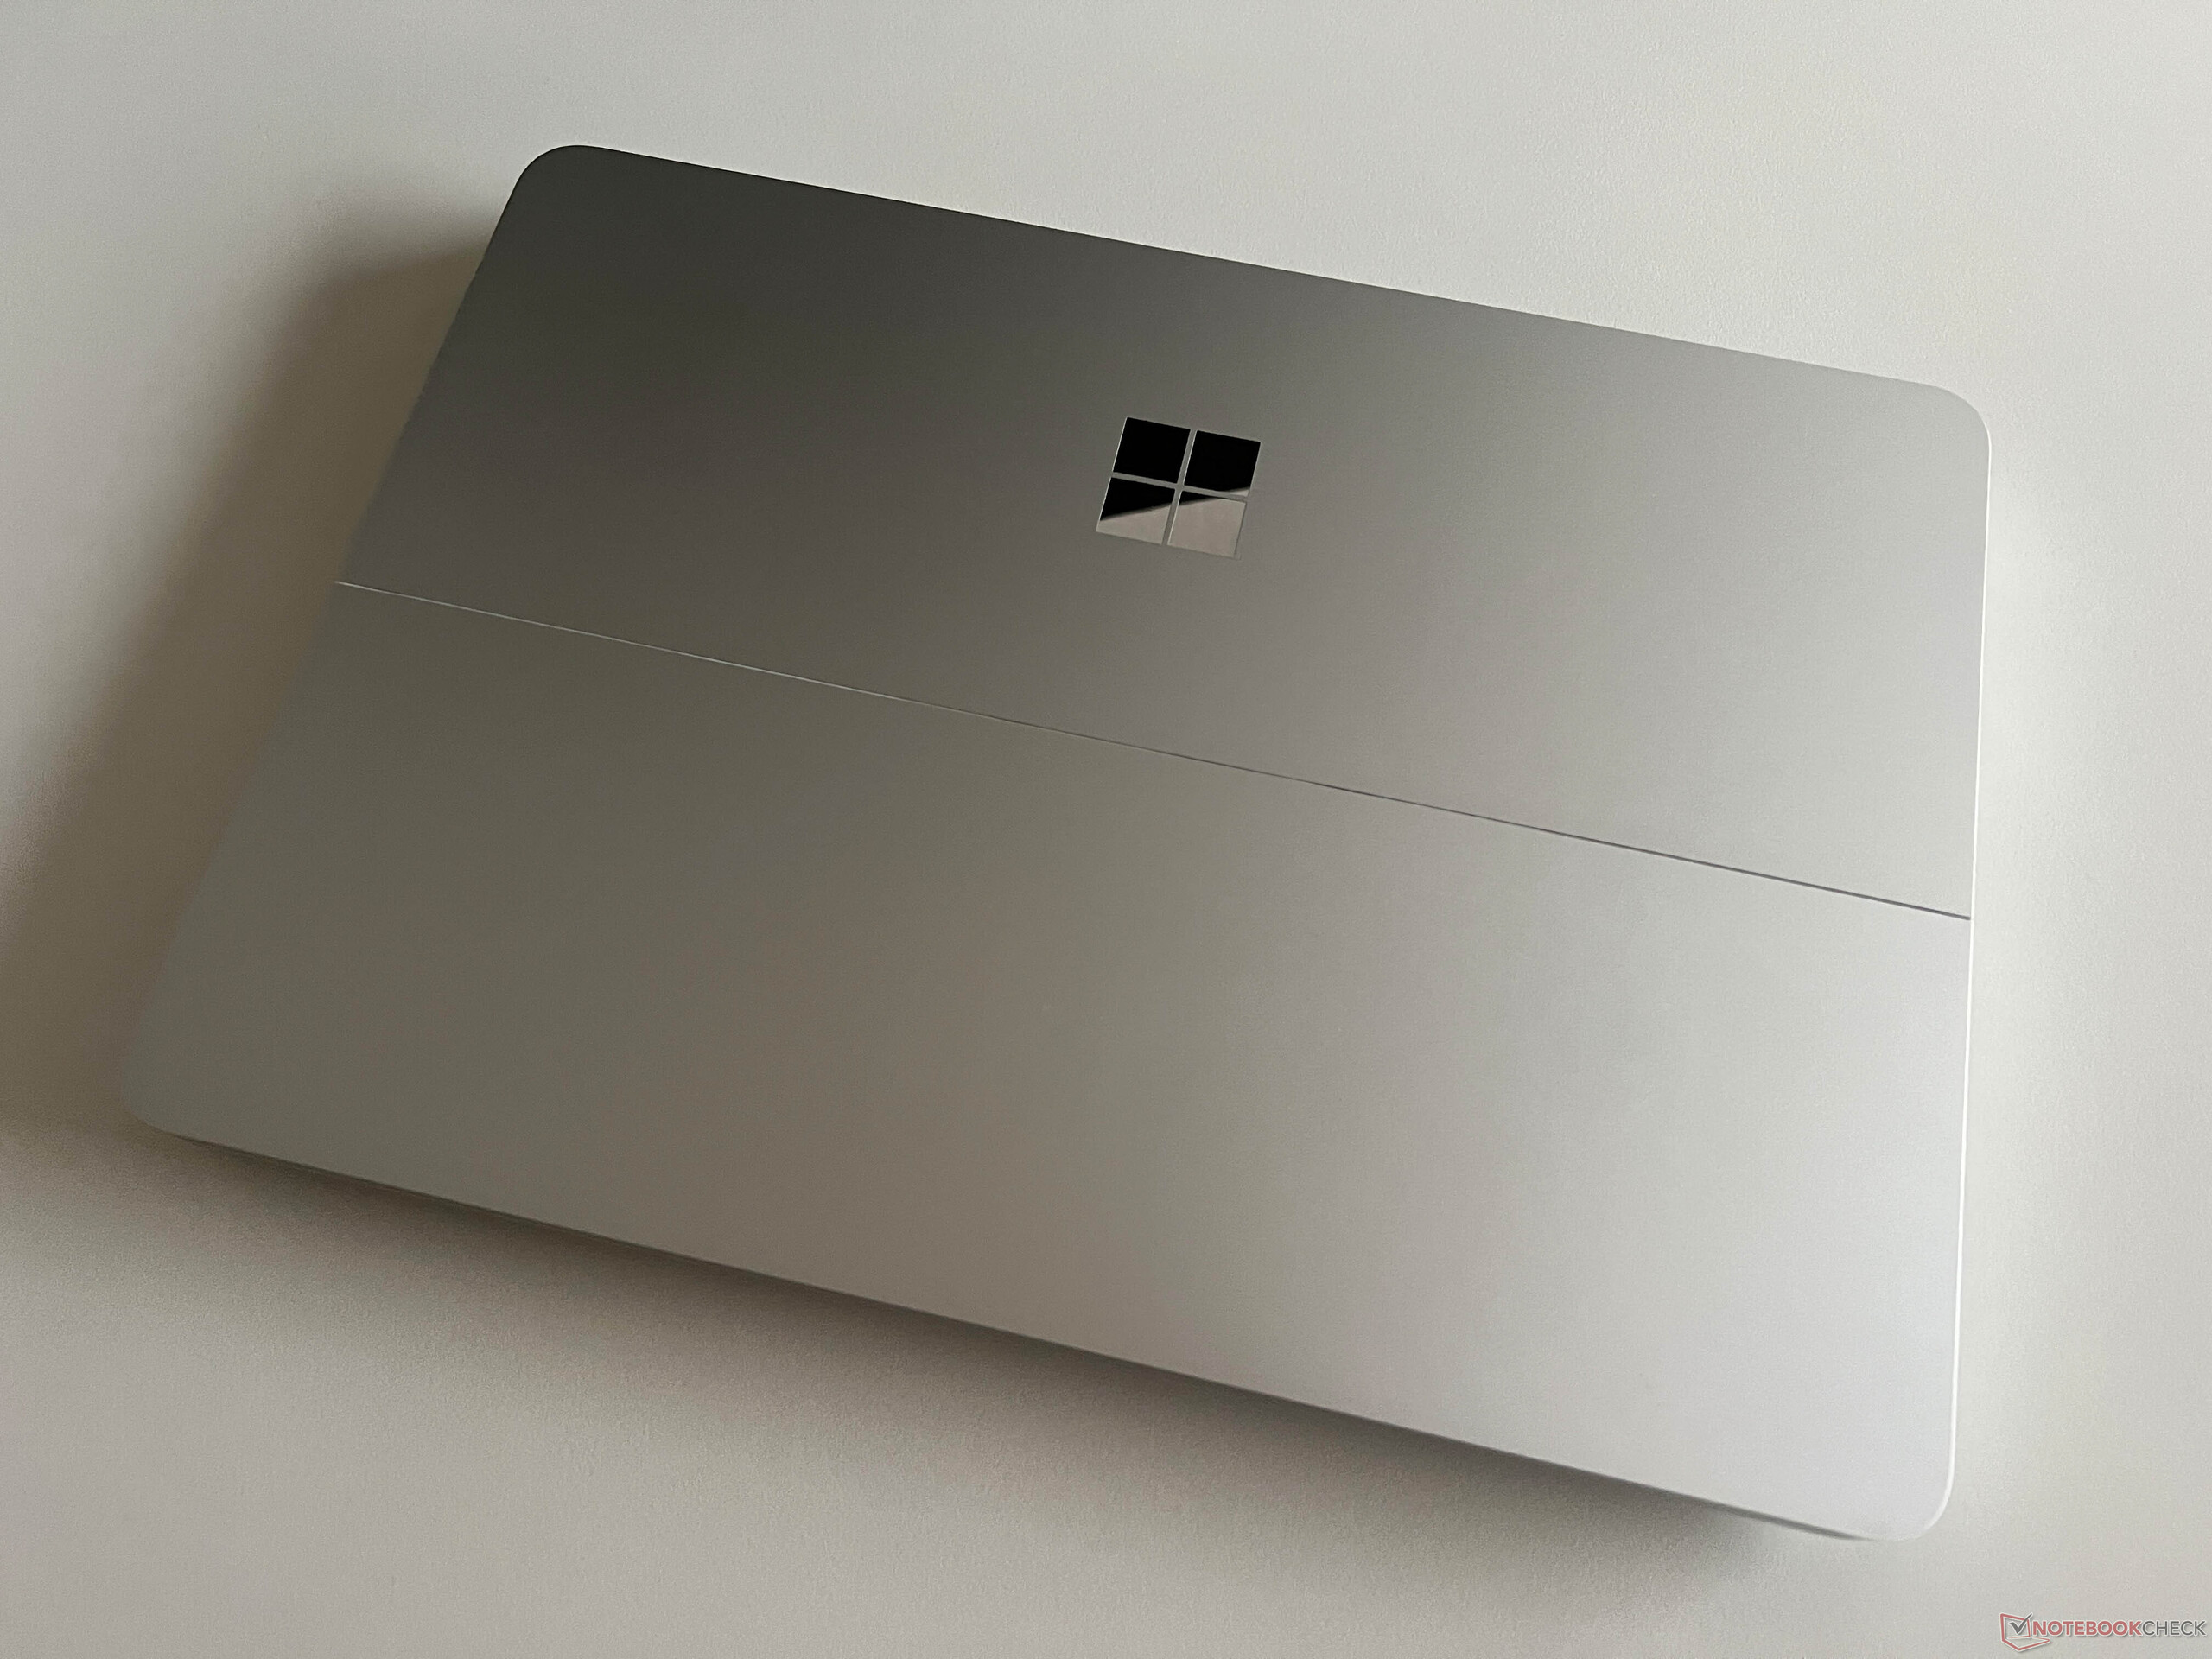
Case - Anodized aluminum and foldable display
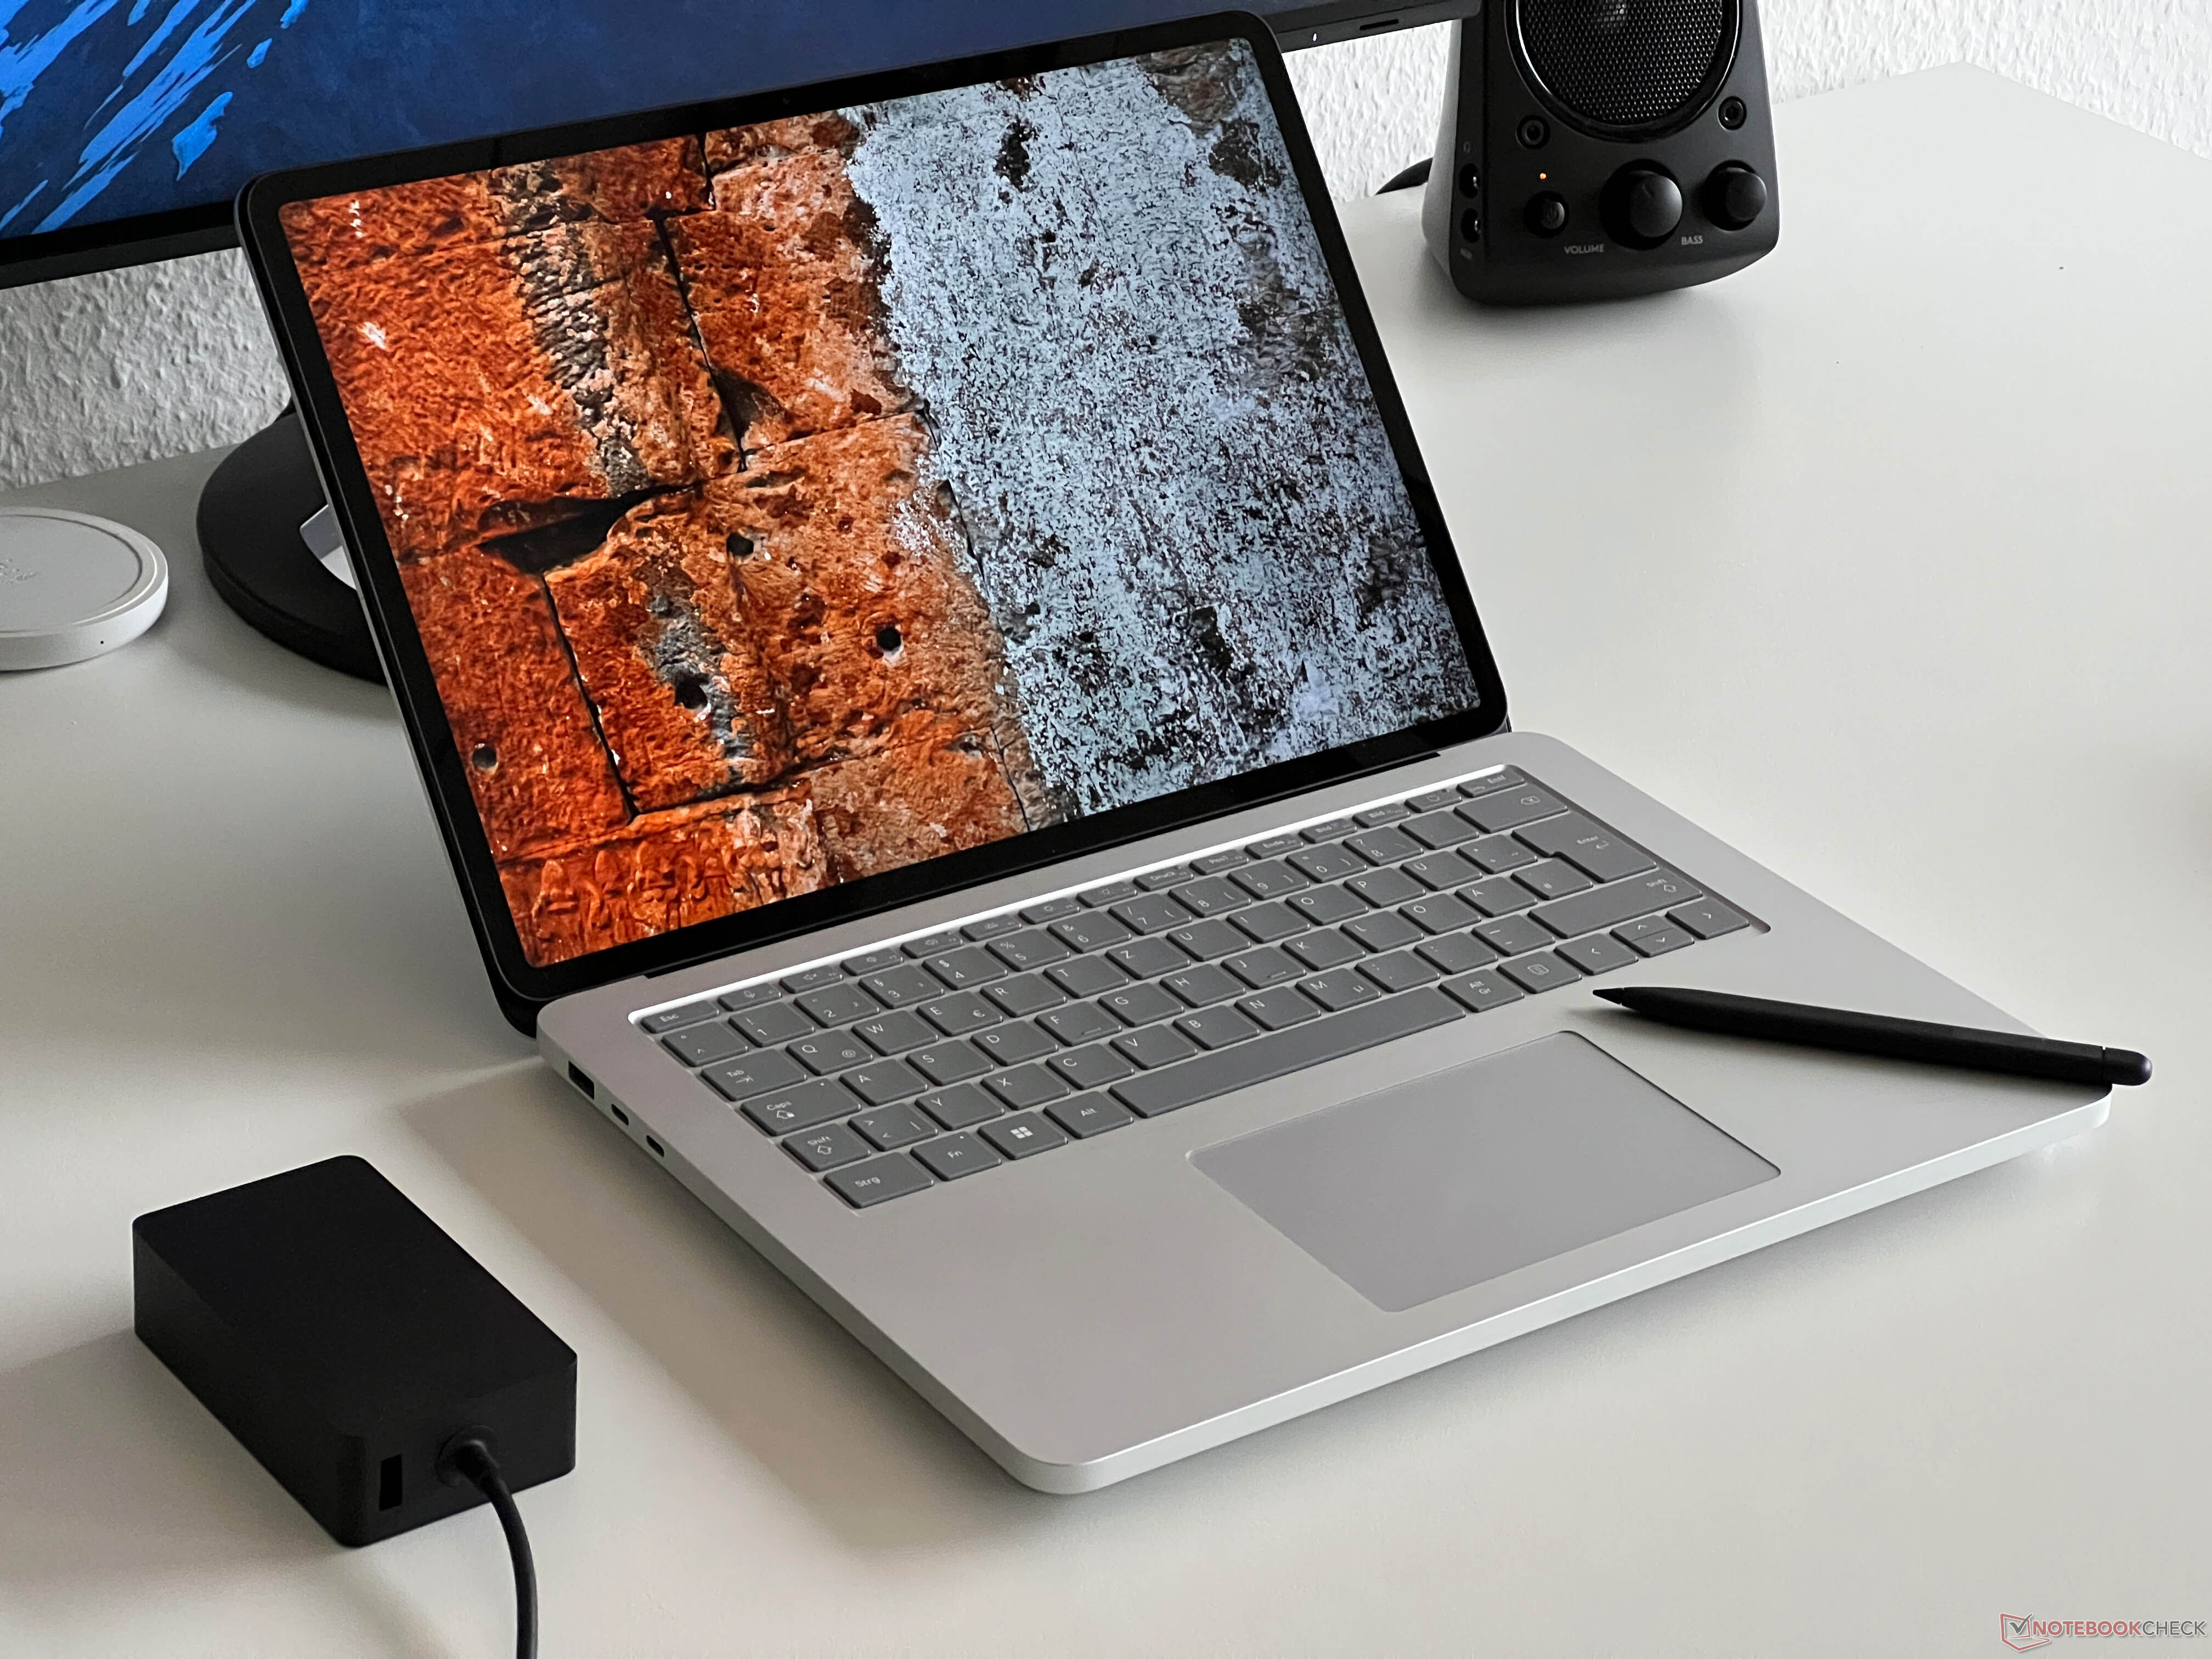
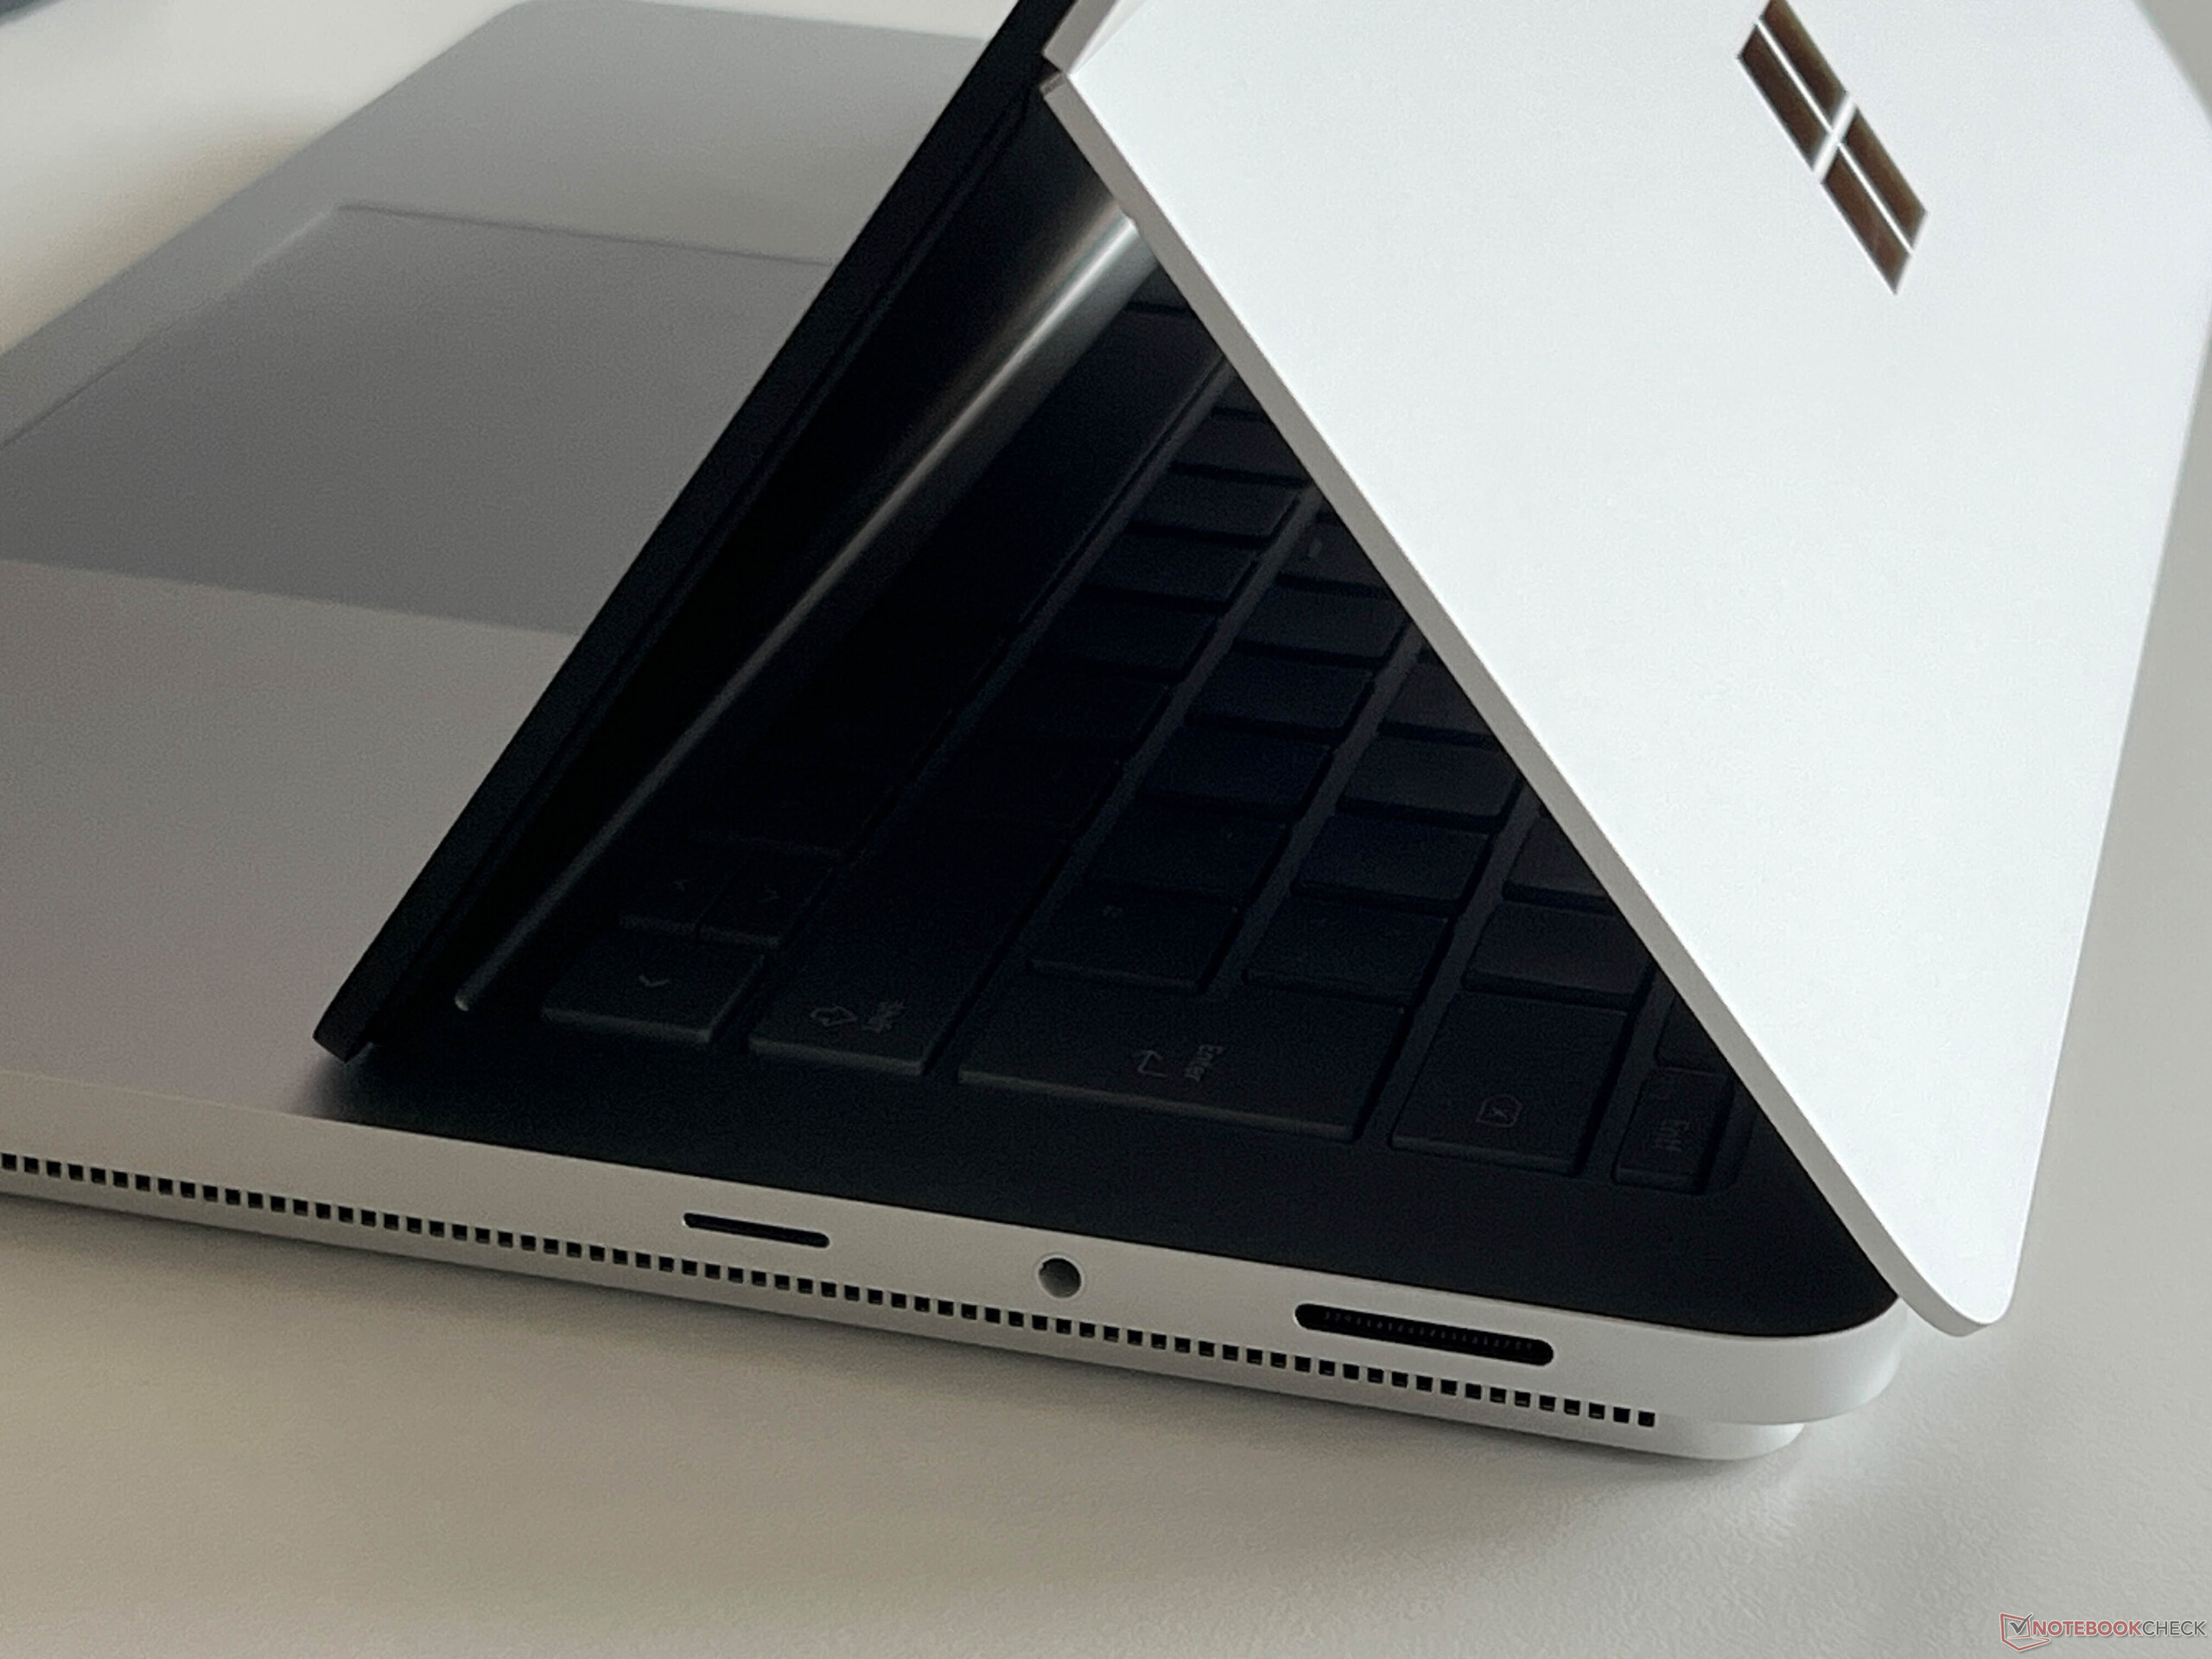
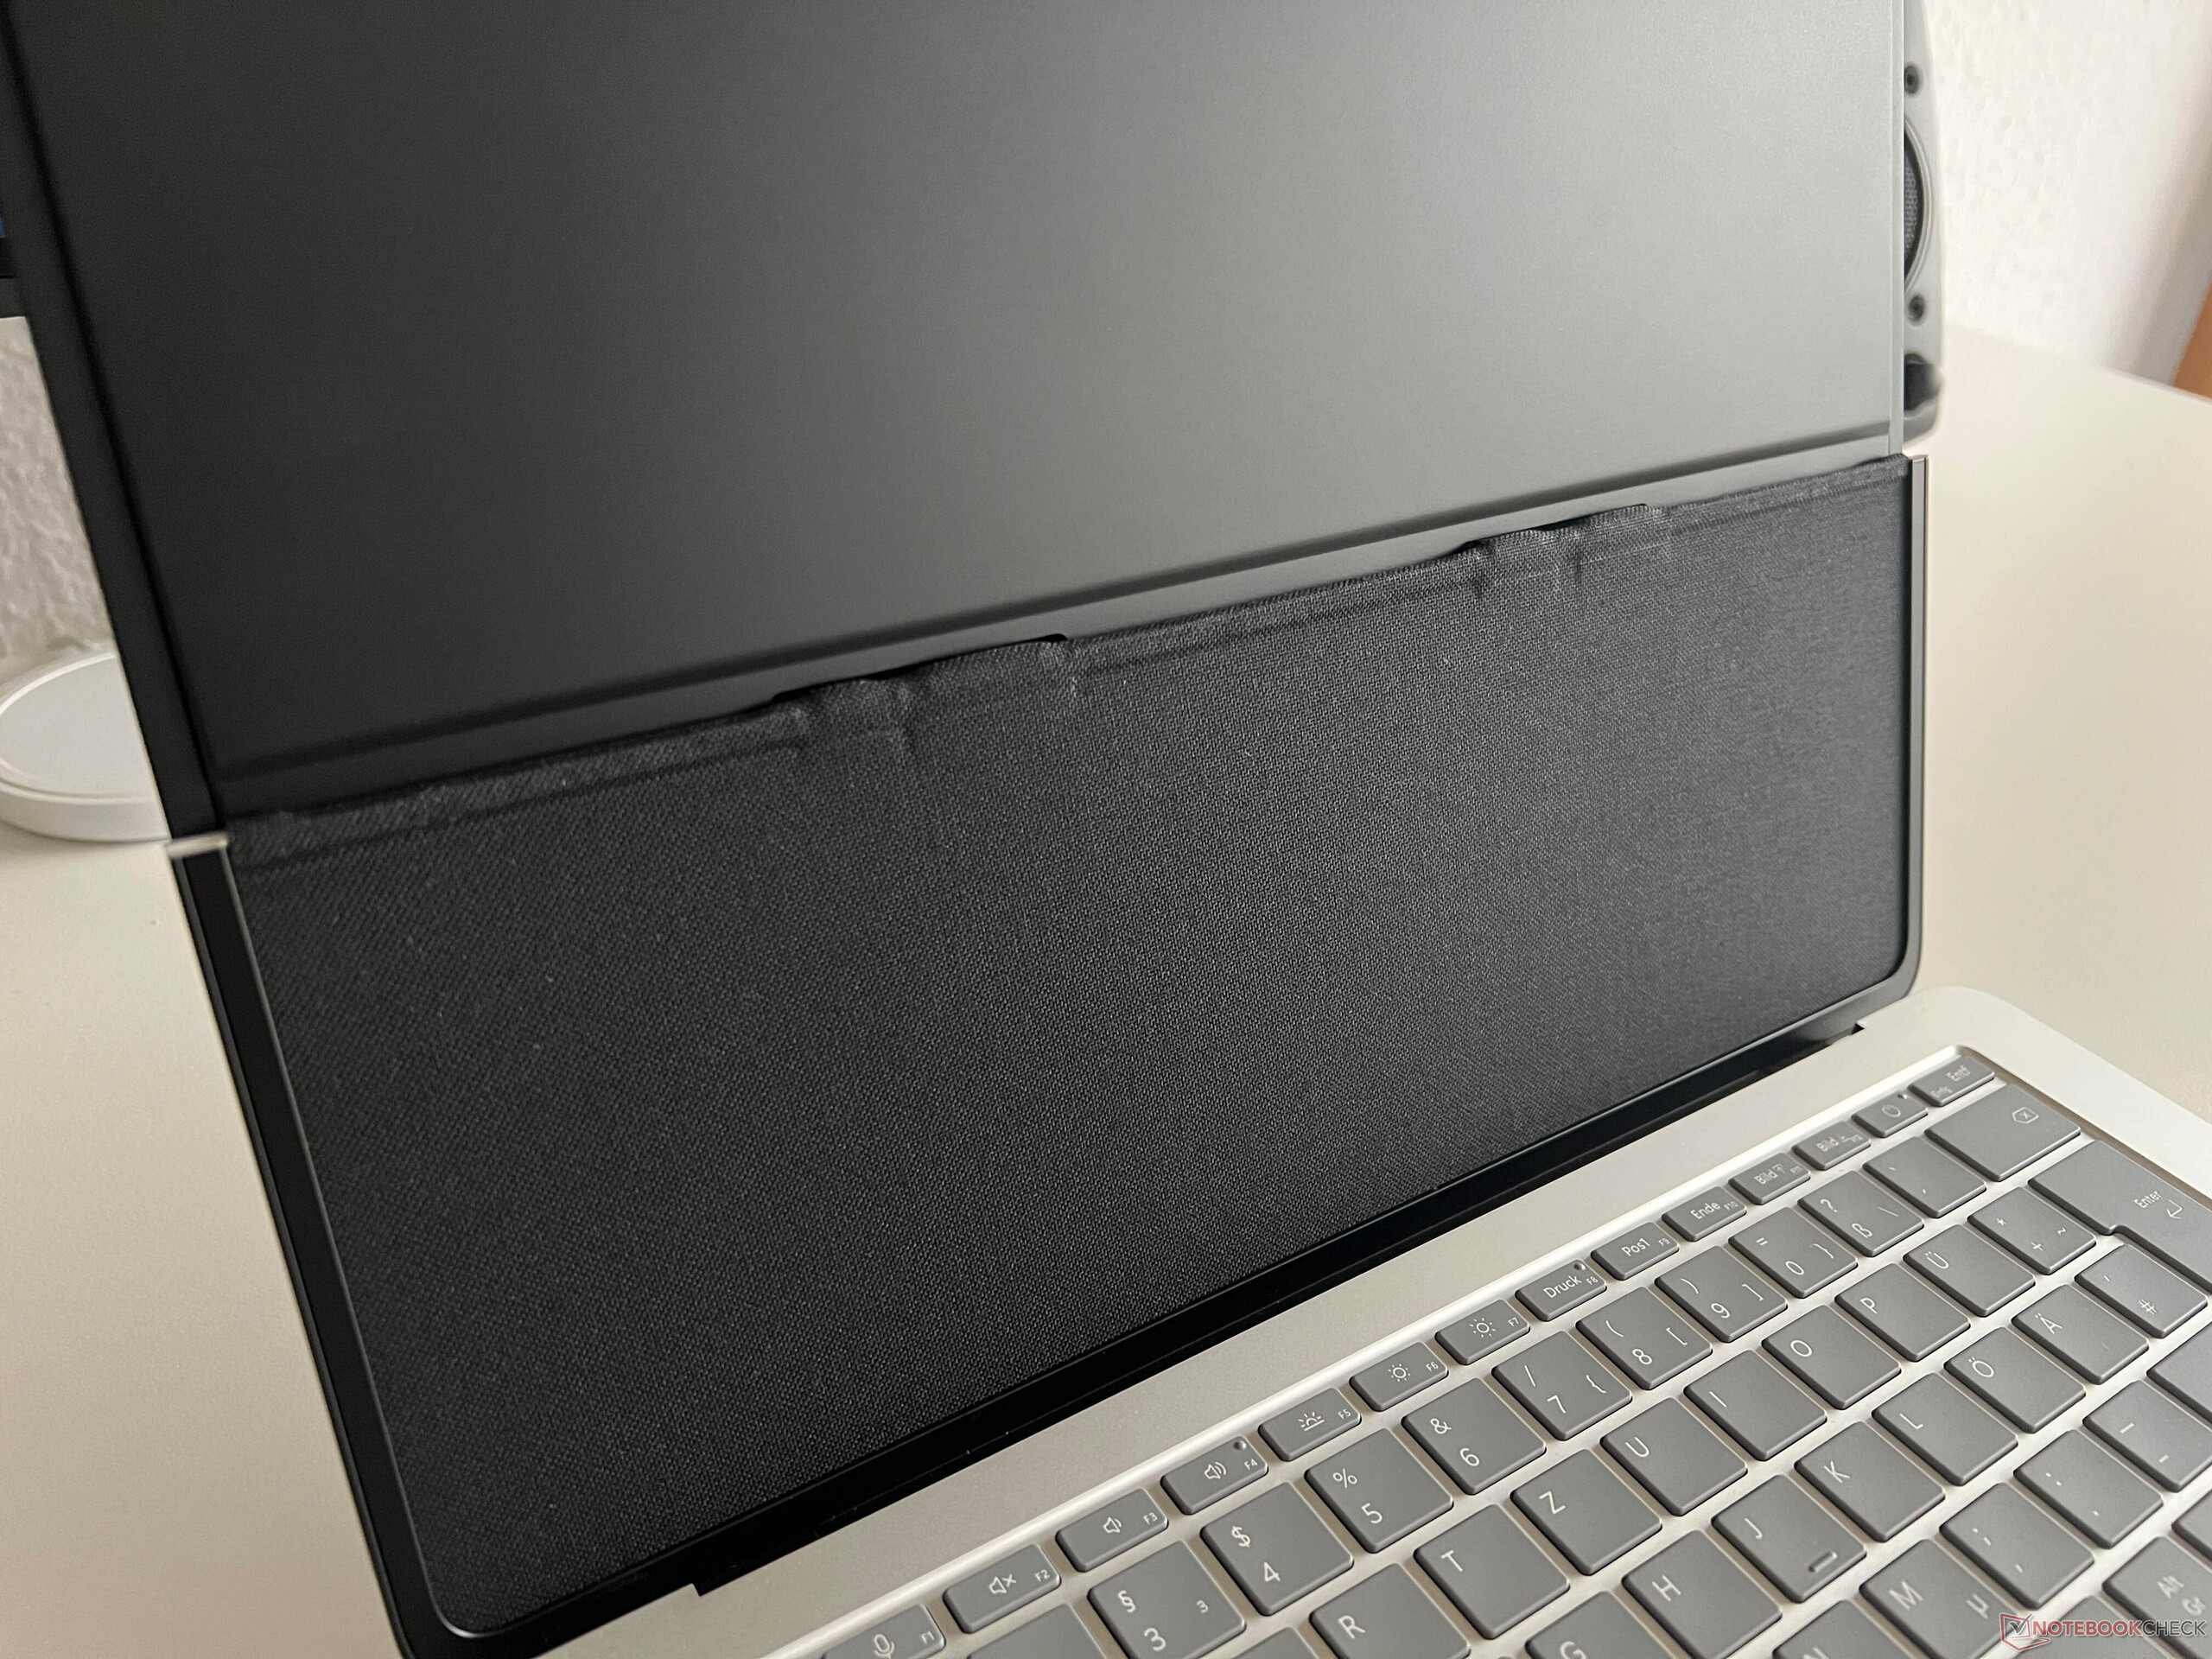
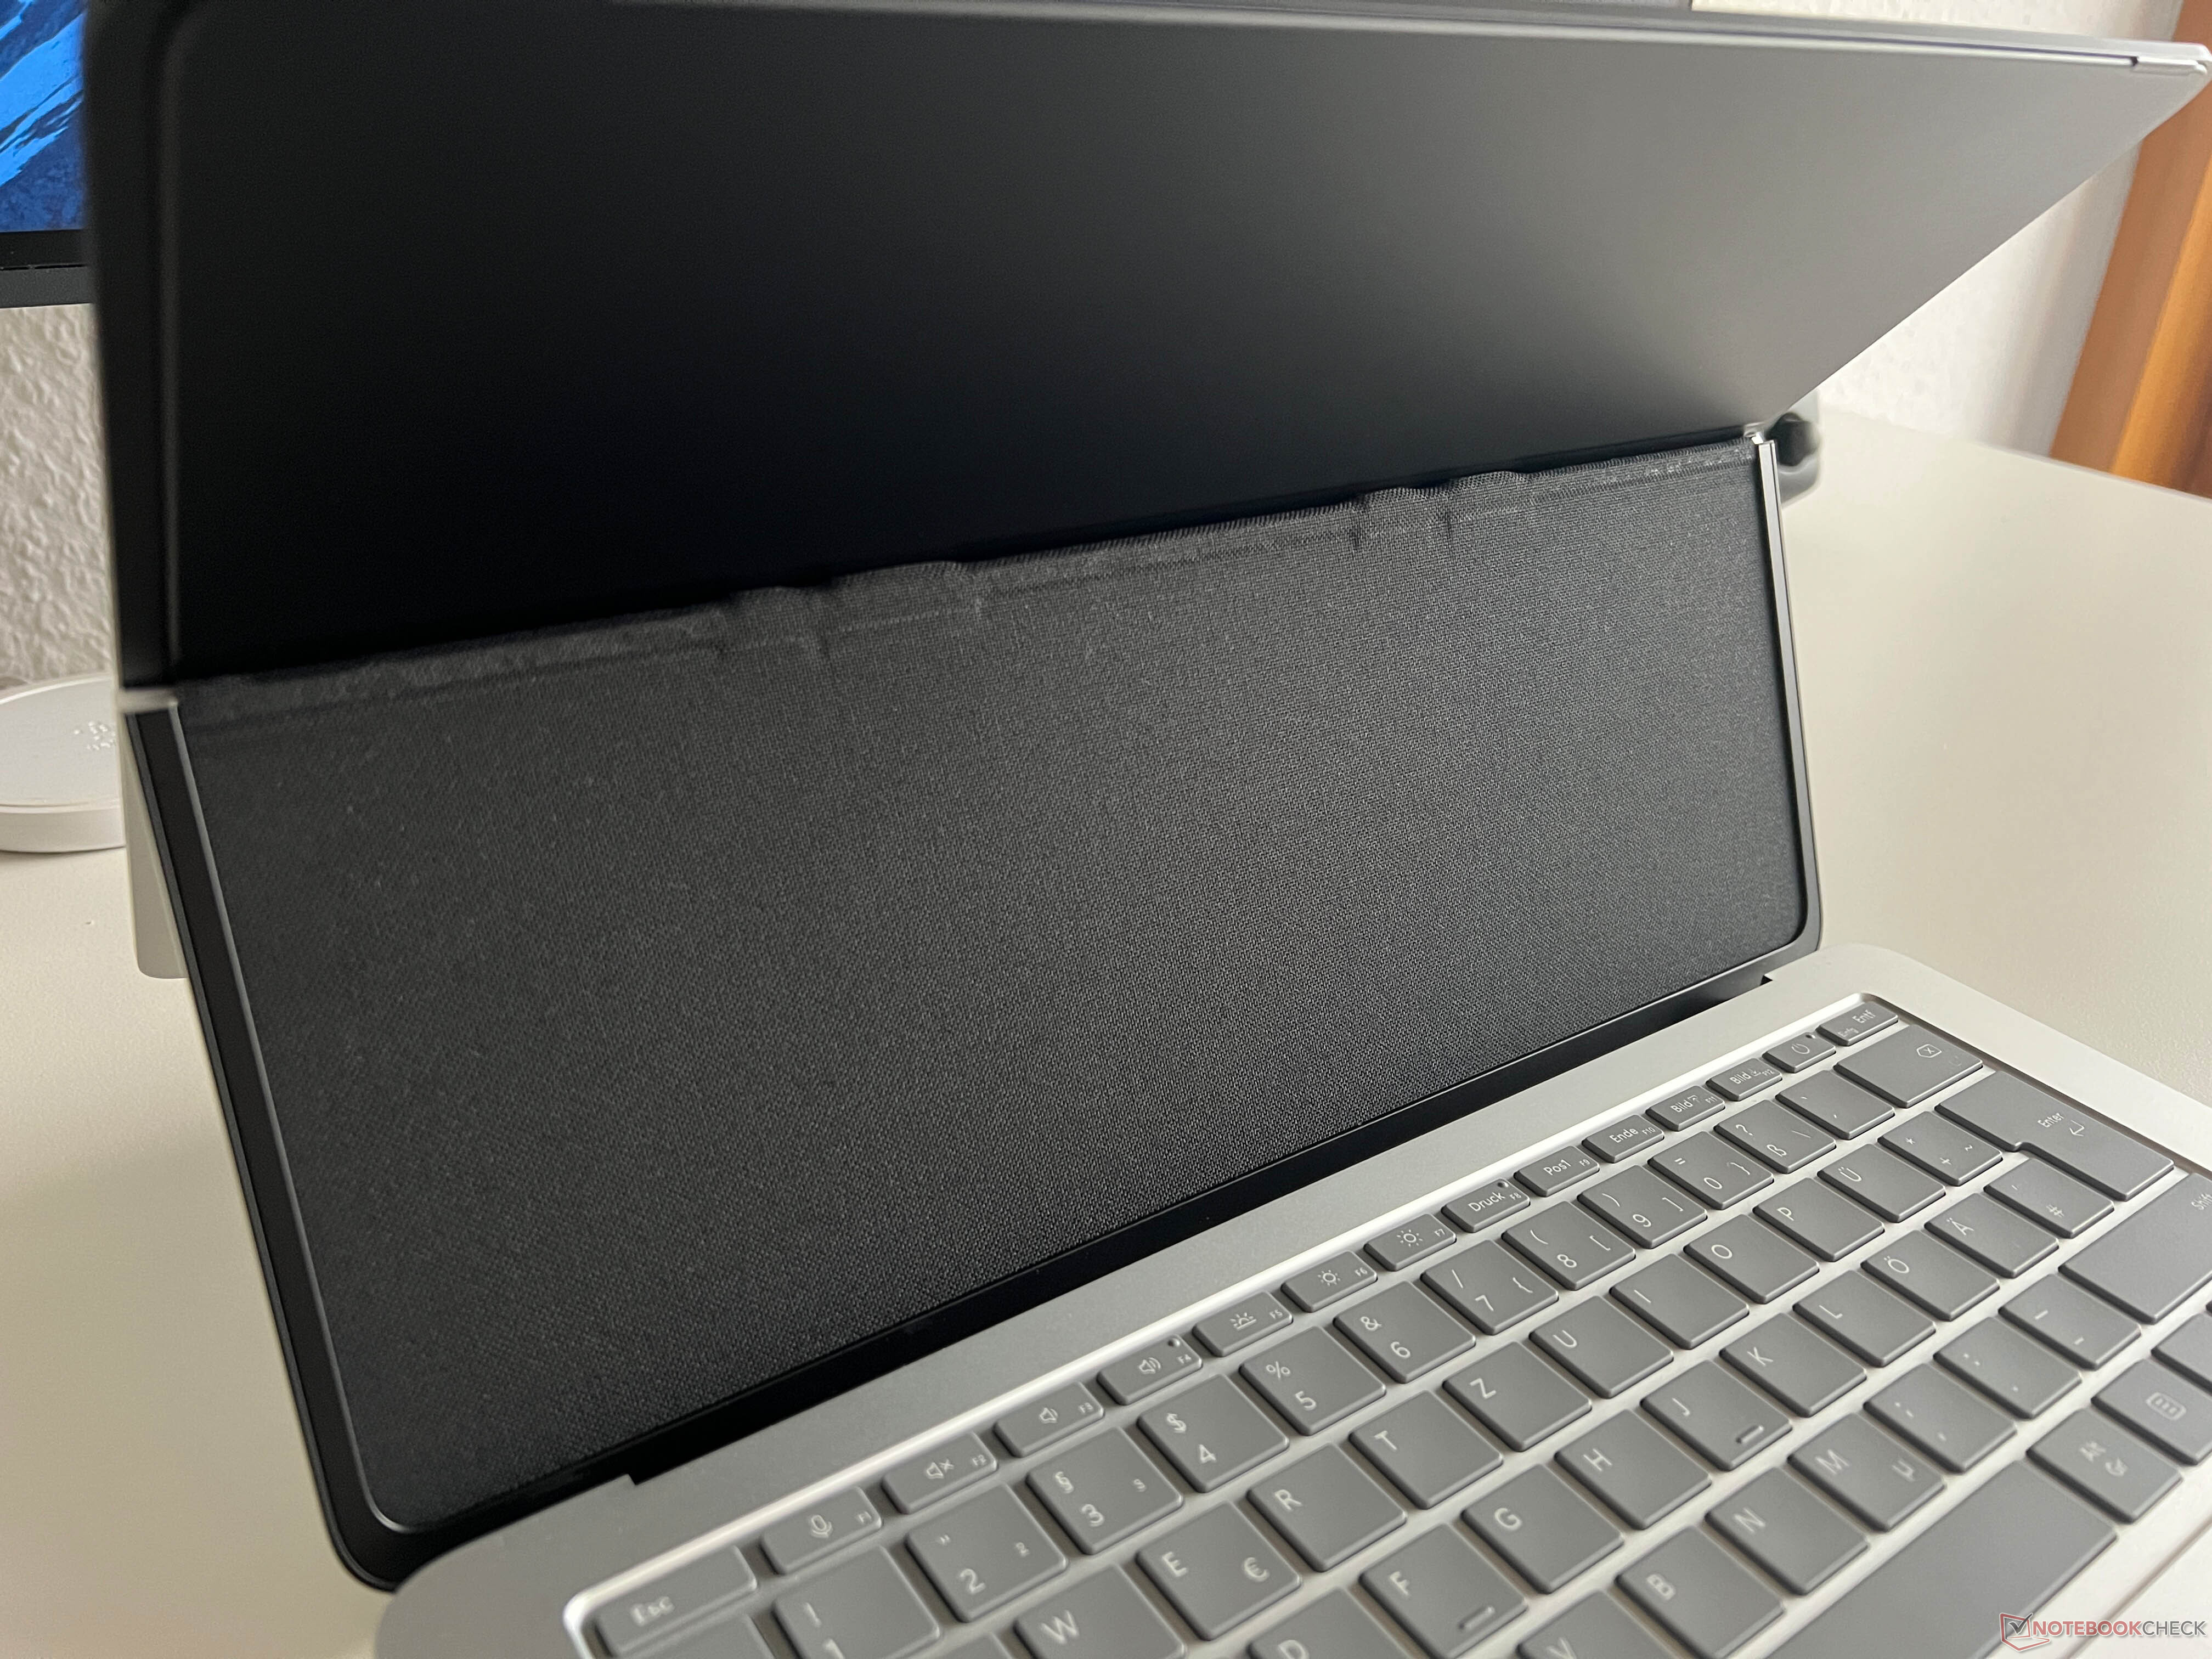
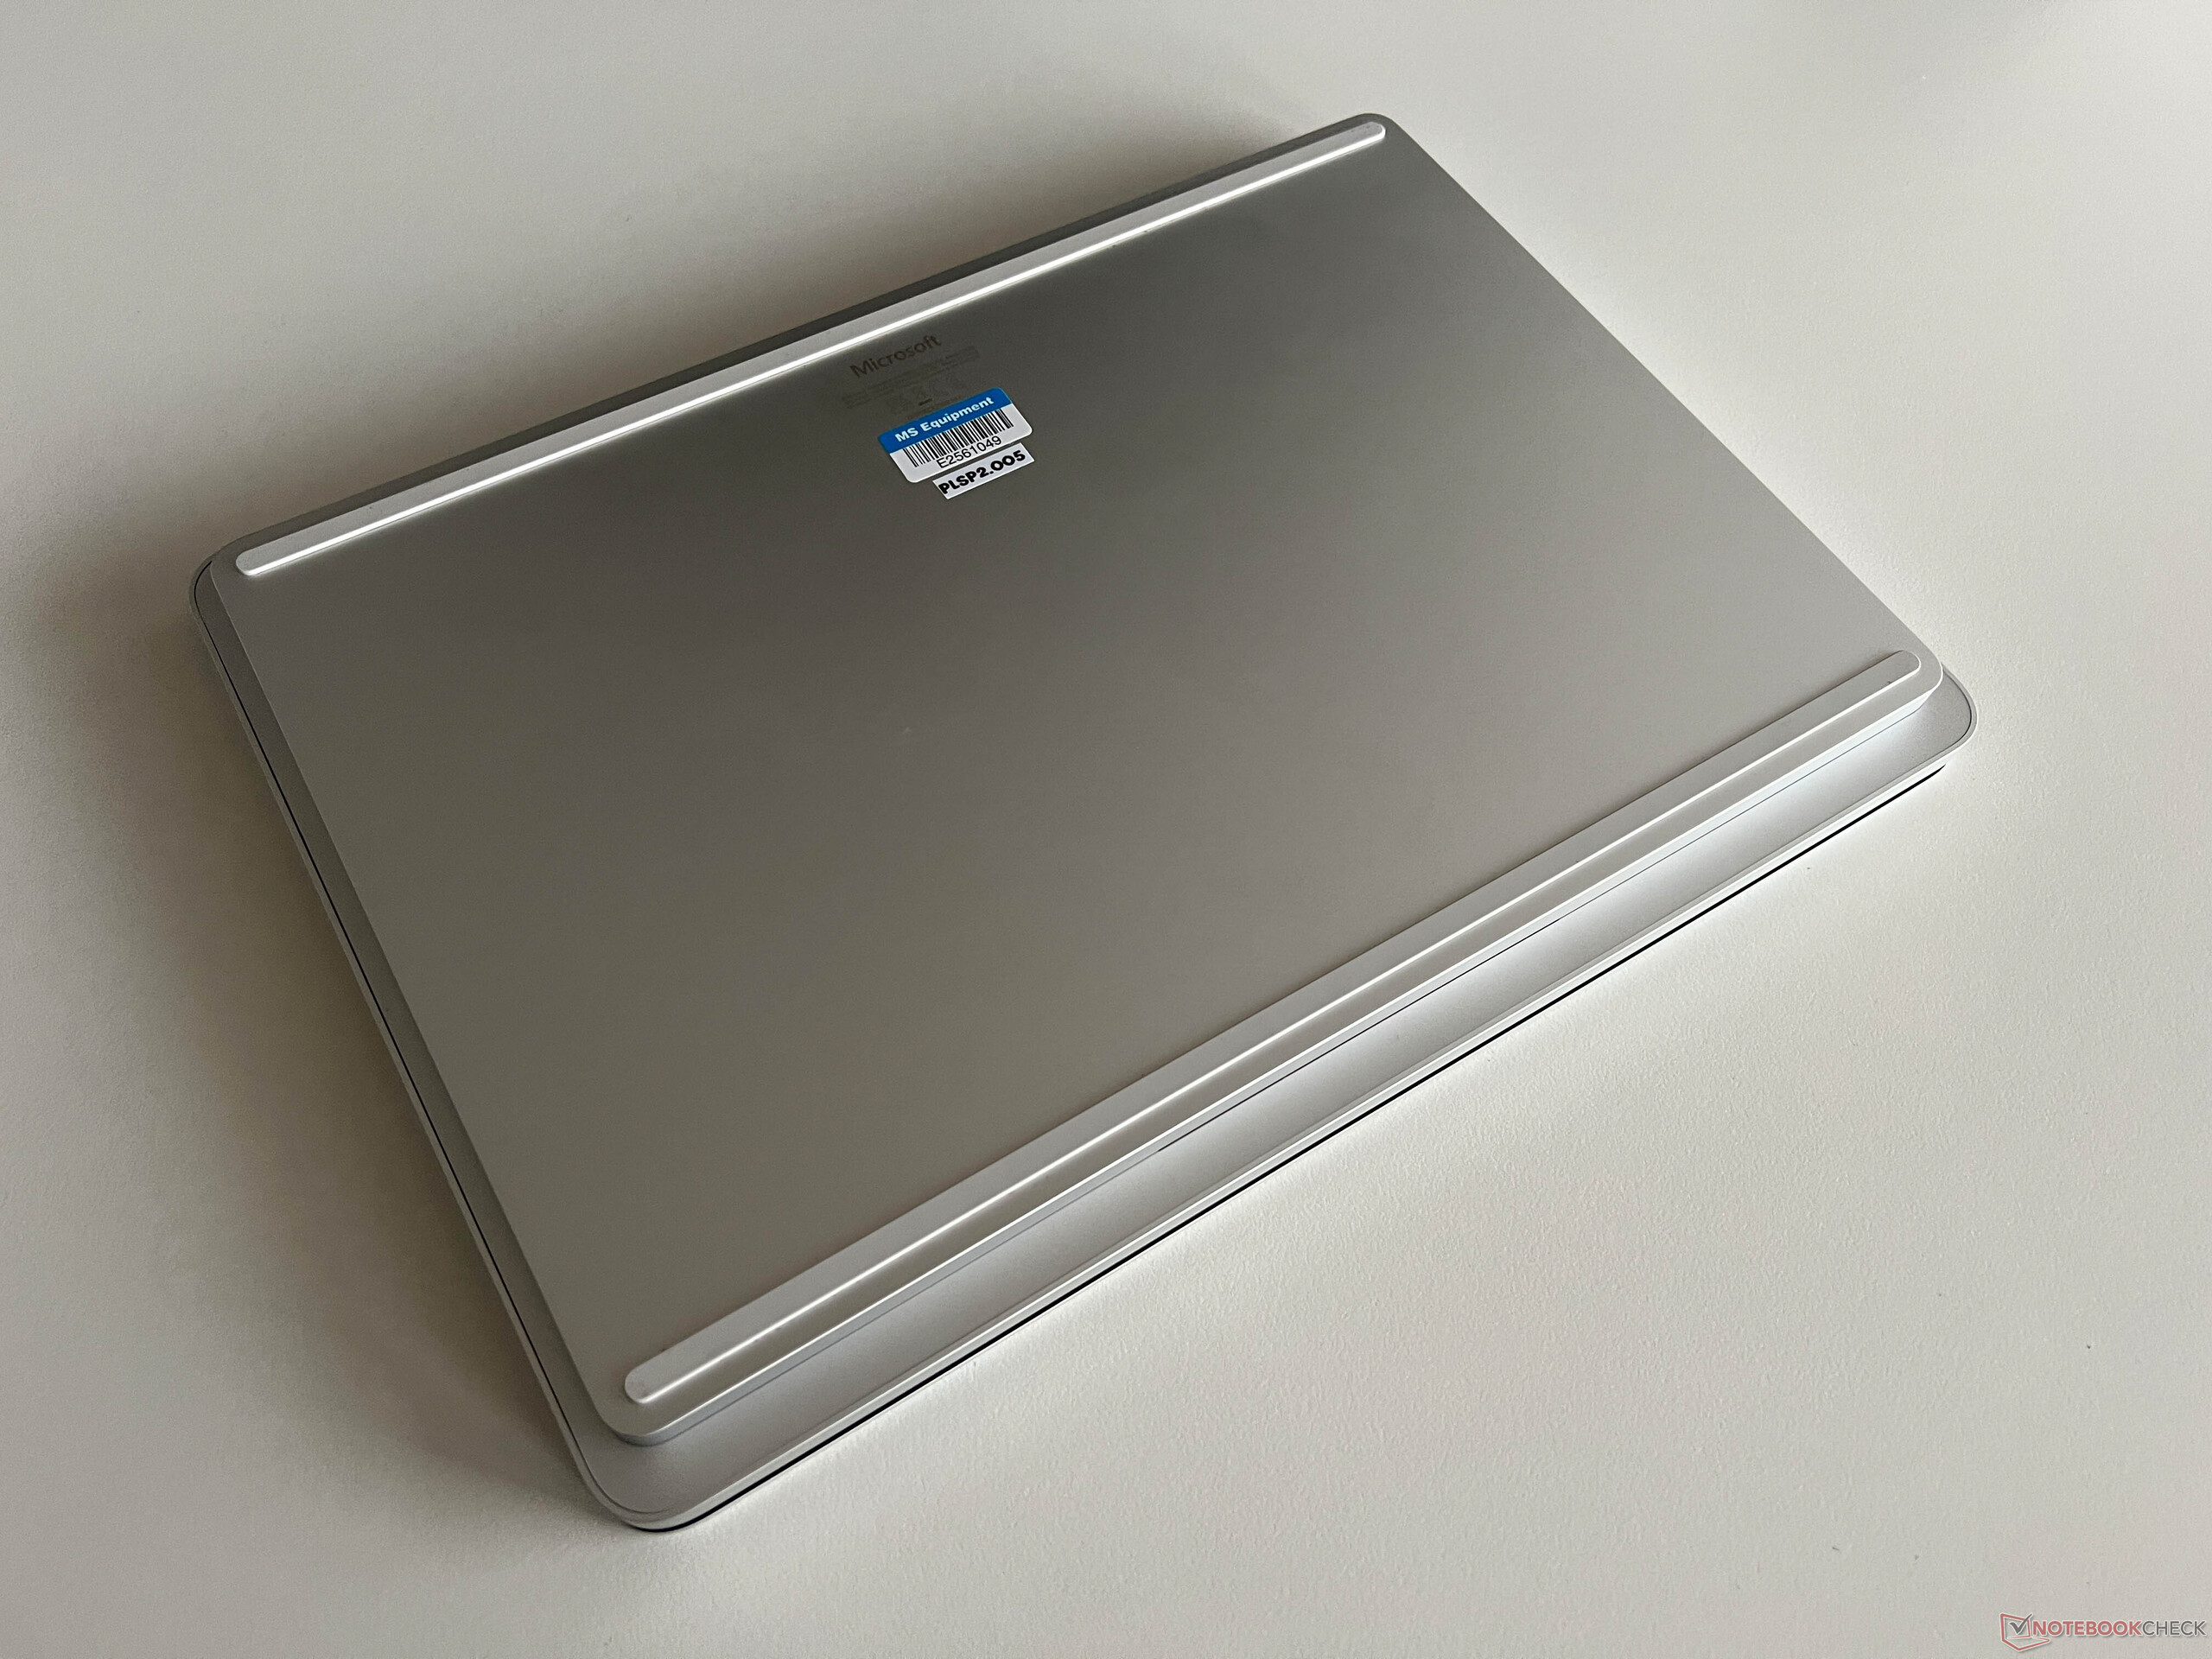
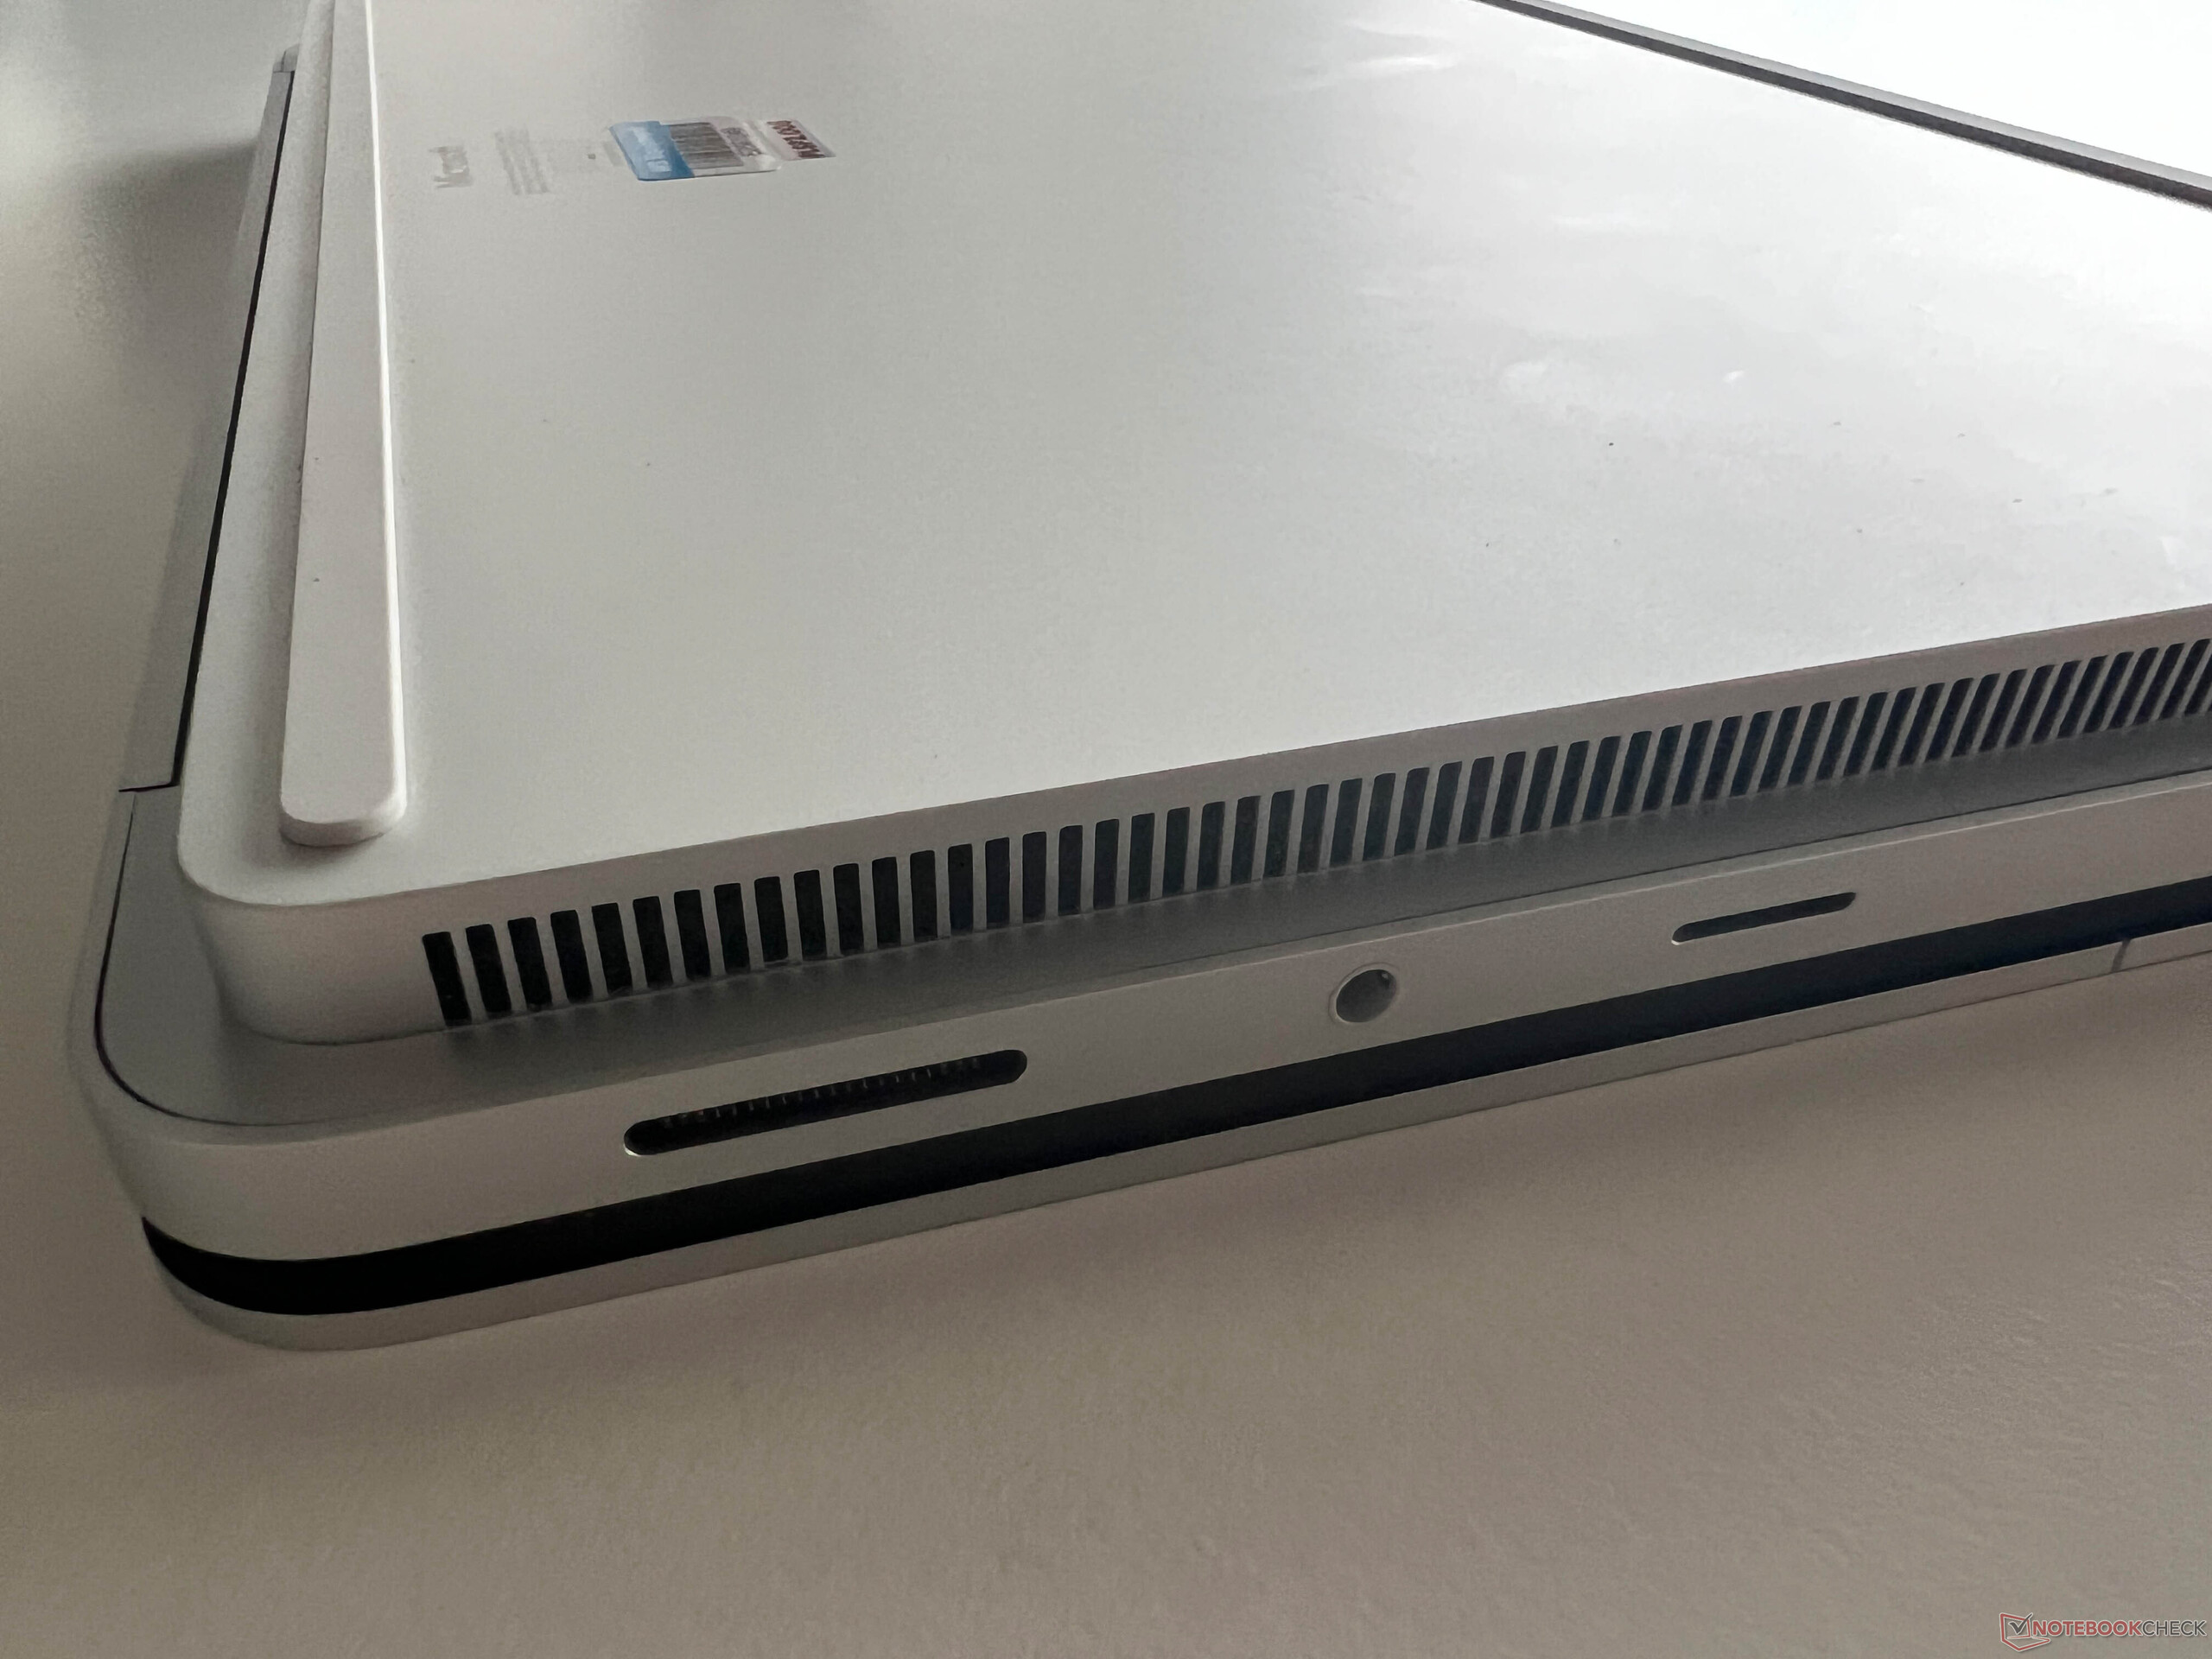
The chassis design did not change compared to the first-generation Surface Laptop Studio. The base unit consists of two levels and the upper deck with the keyboard is wider on all sides, so the device appears sleeker than it actually is with 15 mm. Microsoft uses anodized aluminum and both the stability as well as the build quality are excellent. The display bezels are still very wide at ~1 cm, which does not appear very modern.
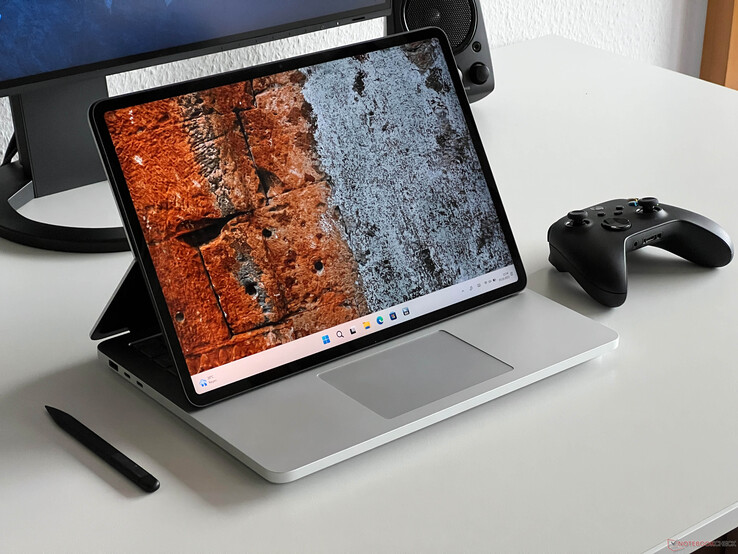
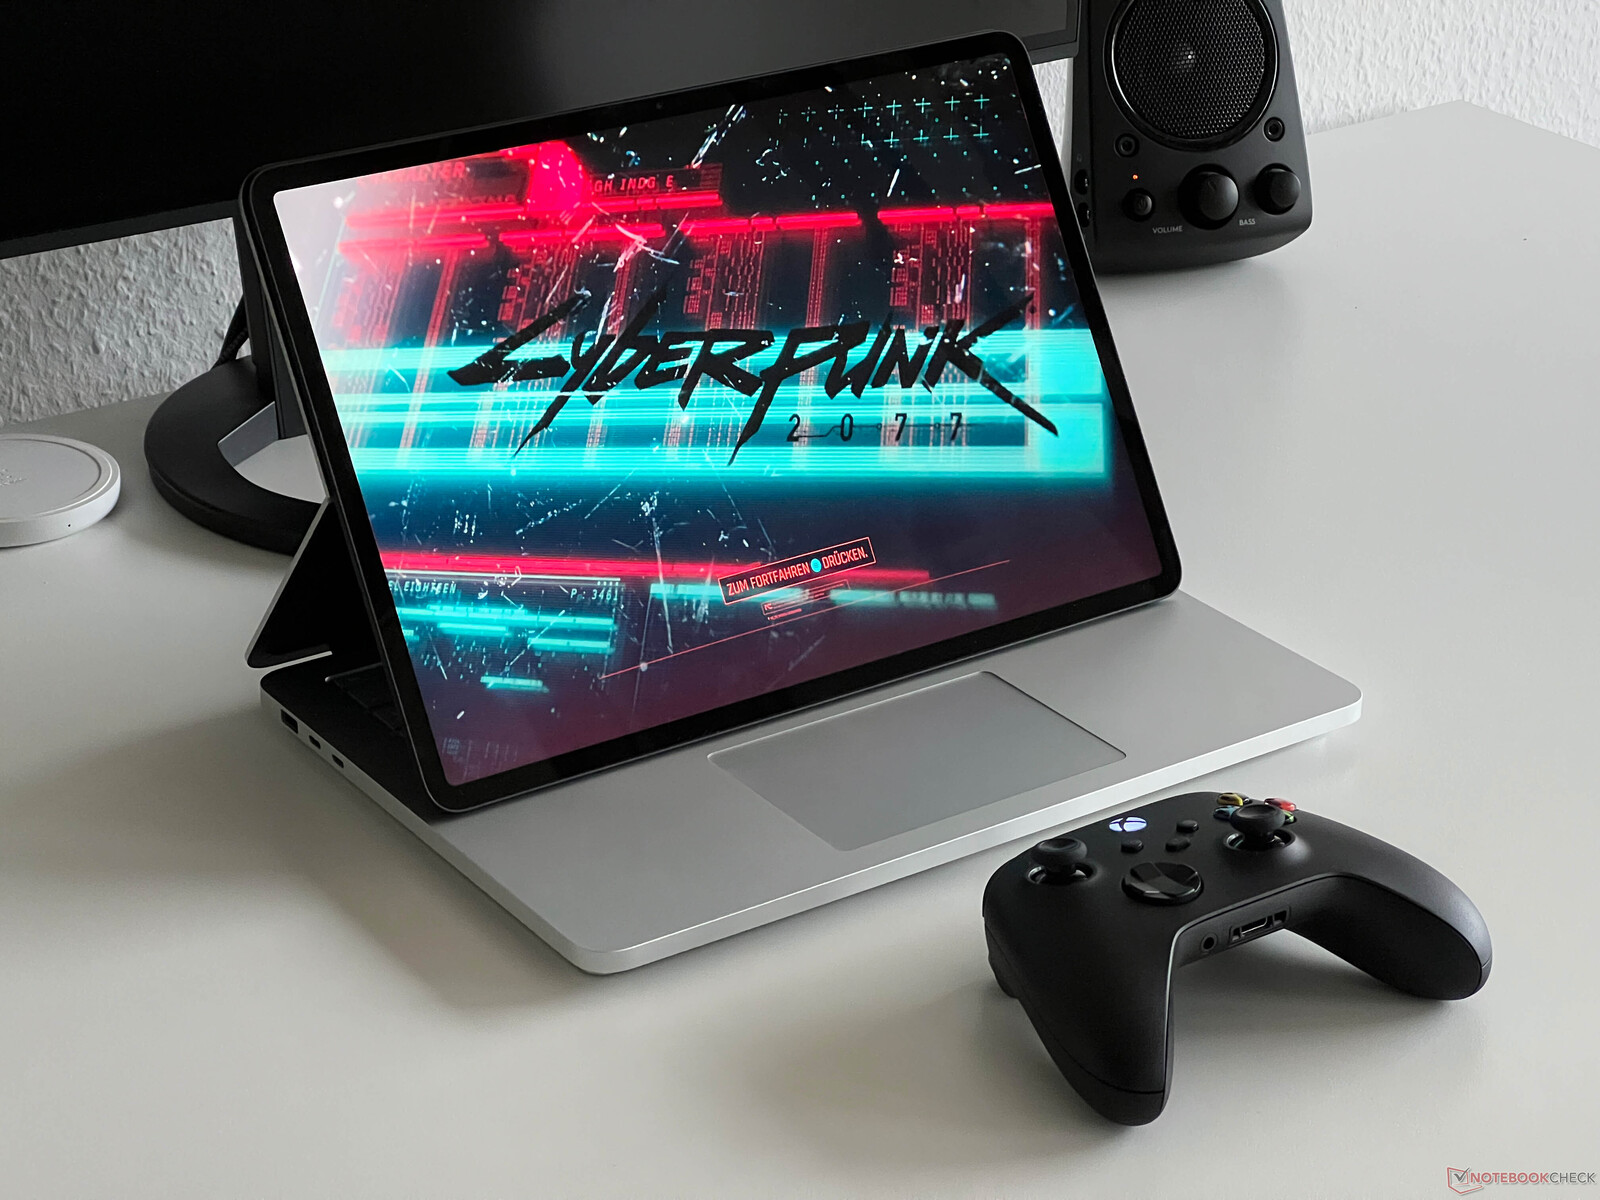
The highlight is still the foldable display with a secondary hinge at the back of the screen. In addition to the regular laptop use, you can put the display on the base unit with a slight angle, which can be useful for touch inputs. It is also possible to use it as a regular tablet, but there are handling issues like the high weight and the sharp edges of the base unit. There is another mode where the display is put on the area between the clickpad and the keyboard. The clickpad is still accessible and you can obviously still use the touchscreen. This mode is best suited for media playback or gaming with a gamepad.
One of the biggest issues with the chassis is still the lack of maintenance options for users. There are no visible screws (they are hidden underneath the glued rubber feet), which you cannot even clean the fans or upgrade the M.2-2280 SSD. RAM and other components are soldered.
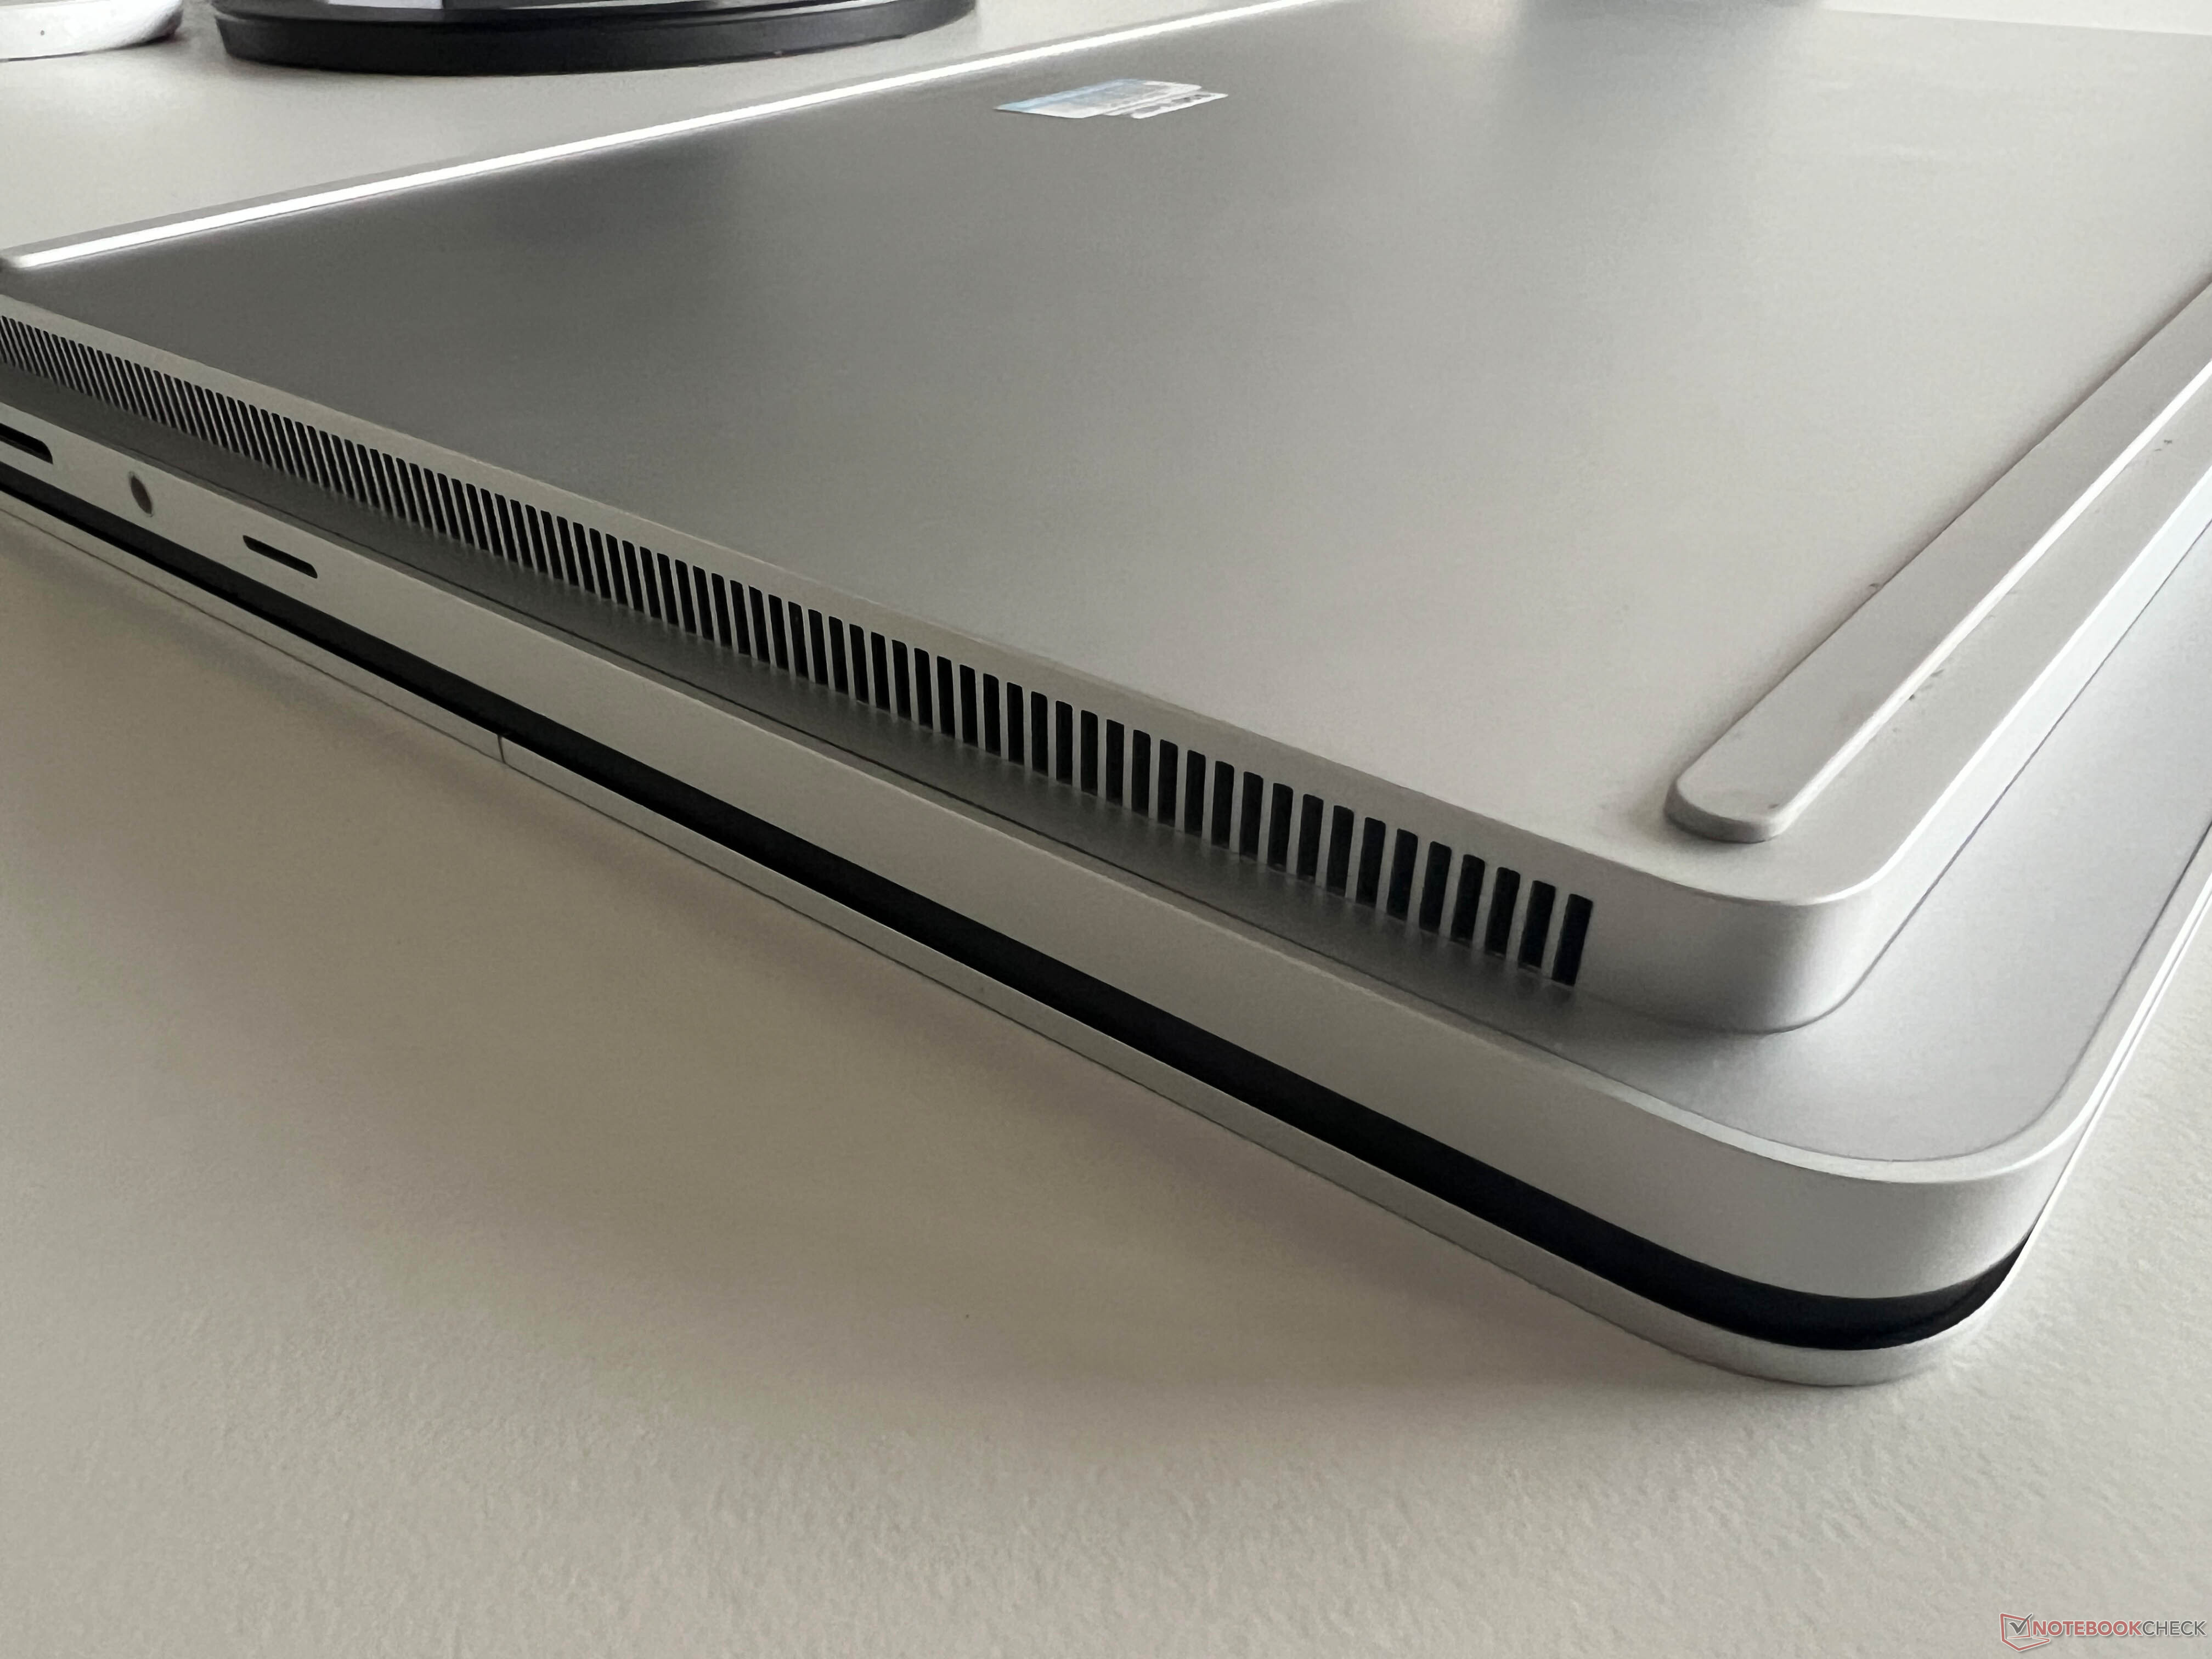
The Surface Laptop Studio 2 is among the largest devices within our comparison group, even though the differences in terms of footprint are not huge. However, the review unit is also the thickest device here and this is noticeable. It is also much heavier than the rivals at 2 kg sharp. The new 127W PSU with the Surface connector tips the scale at around 450 grams.
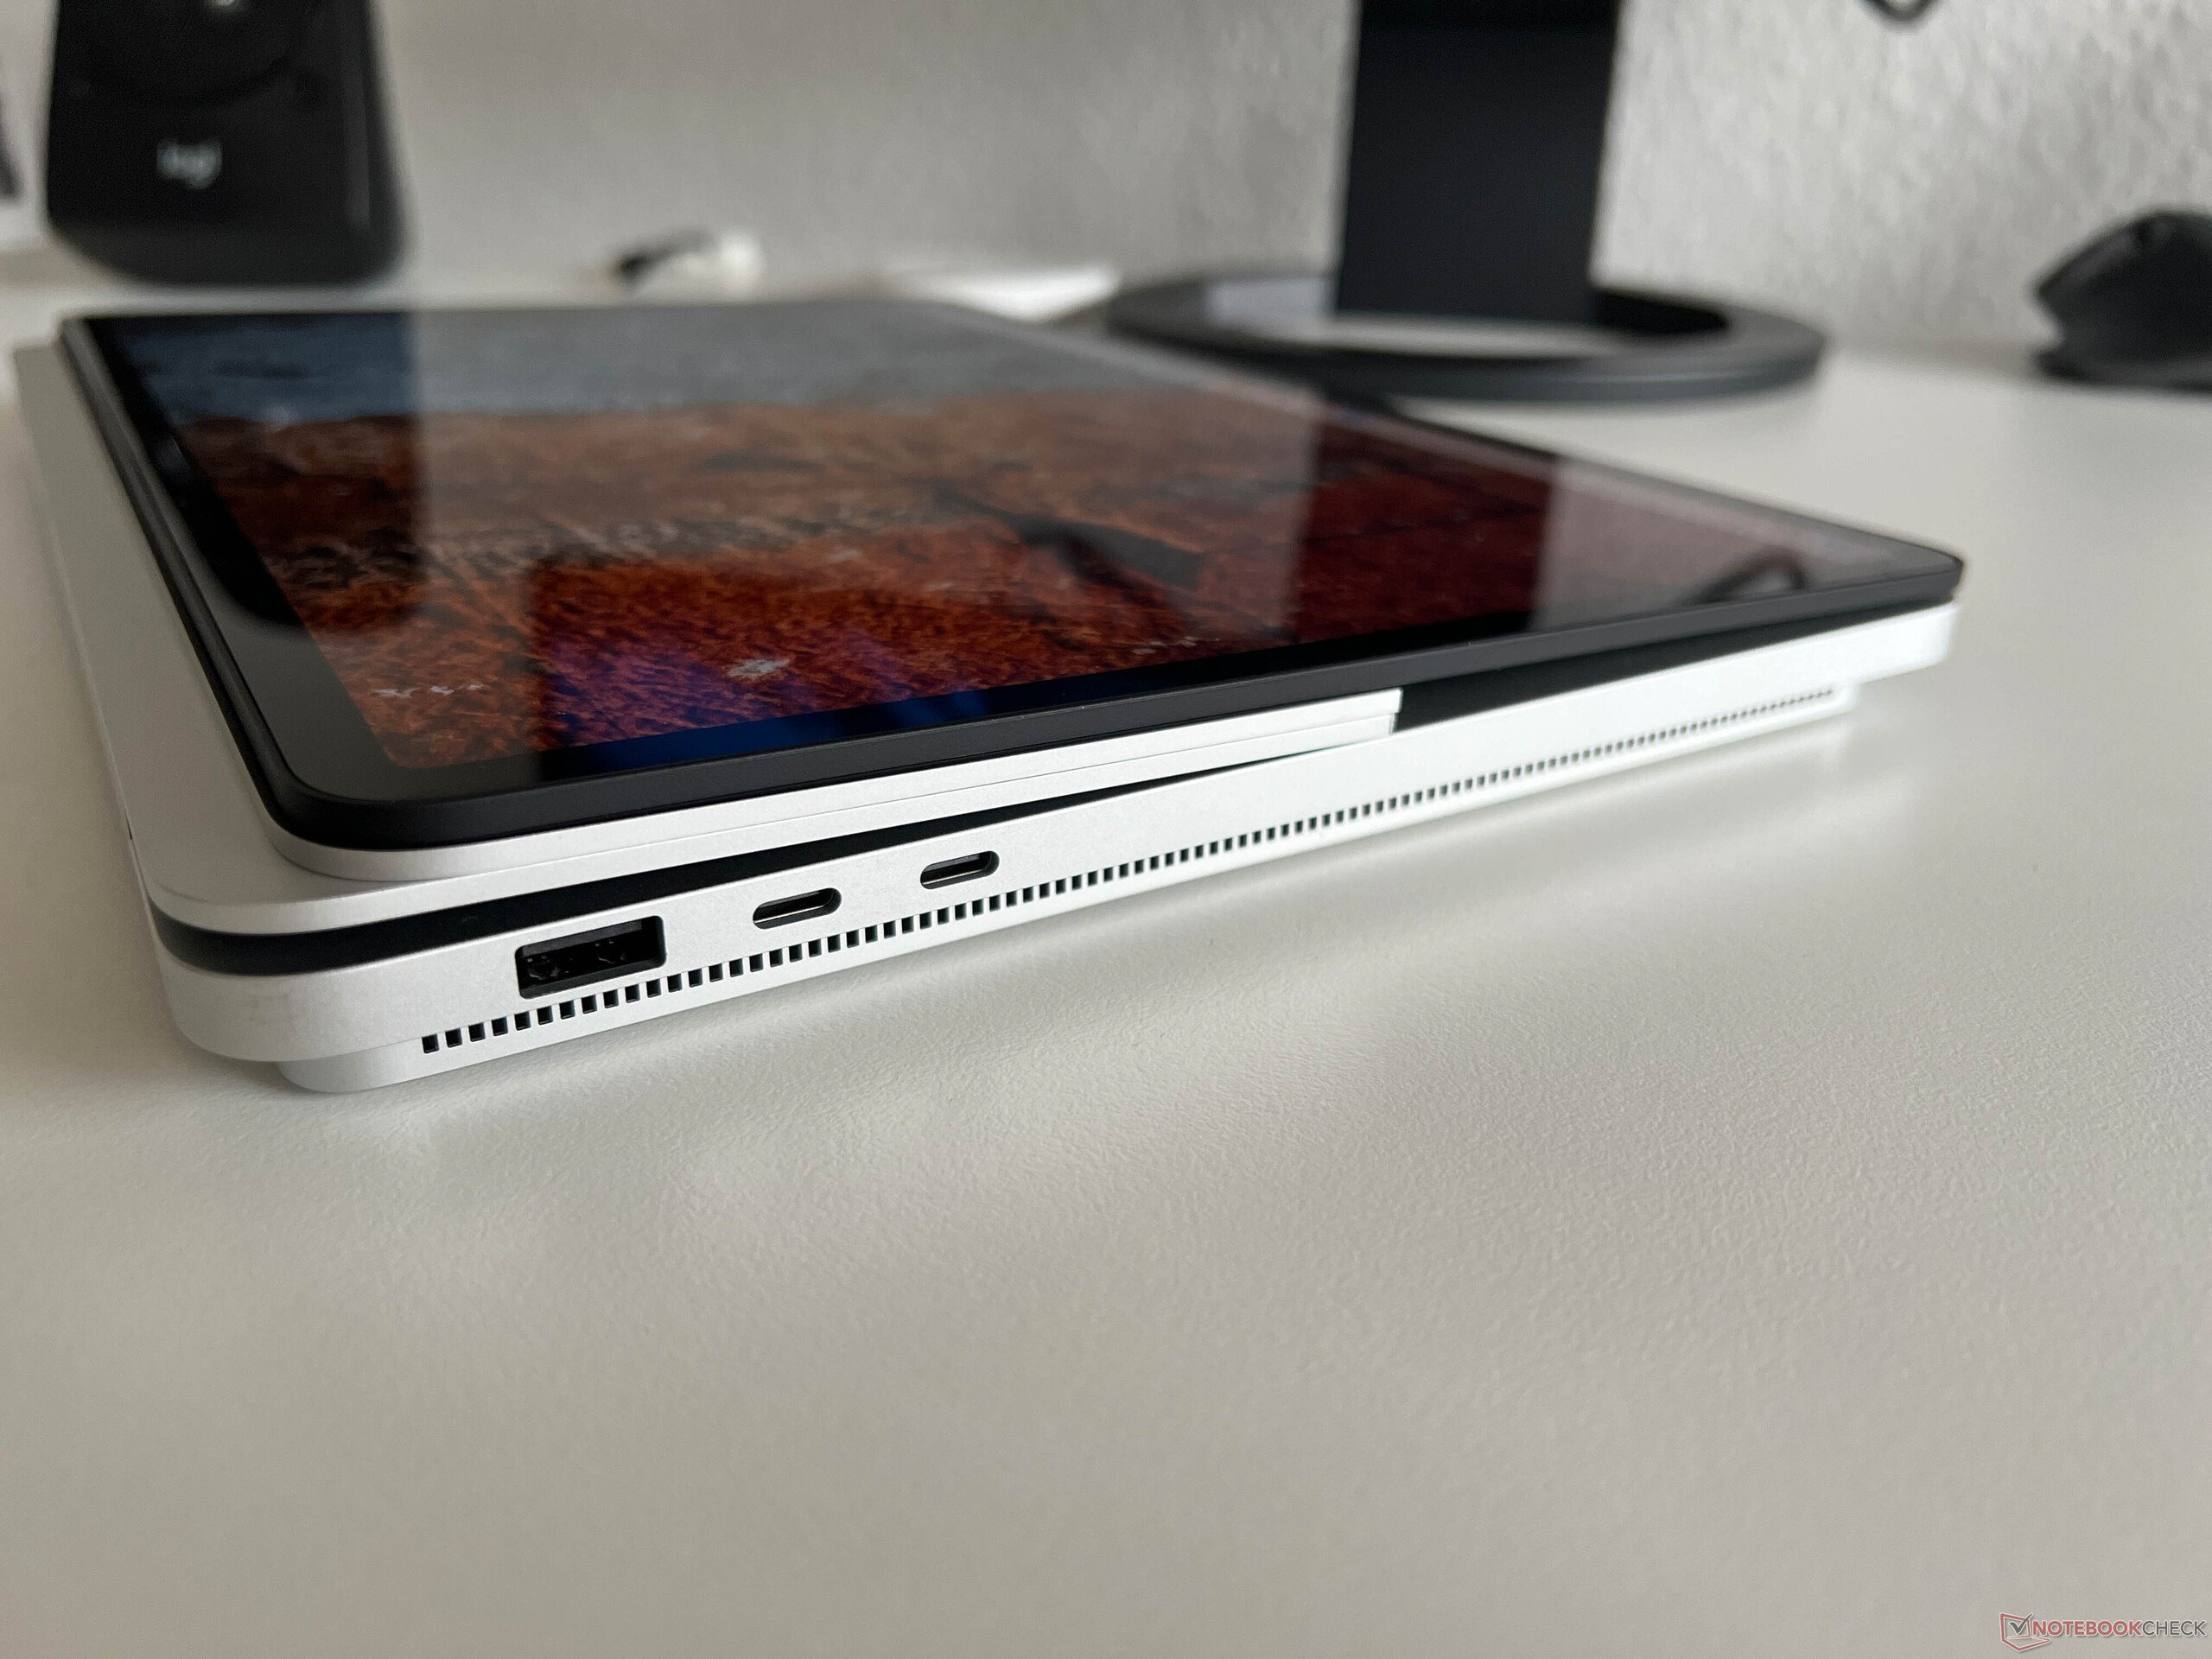
Connectivity - Microsoft includes more ports
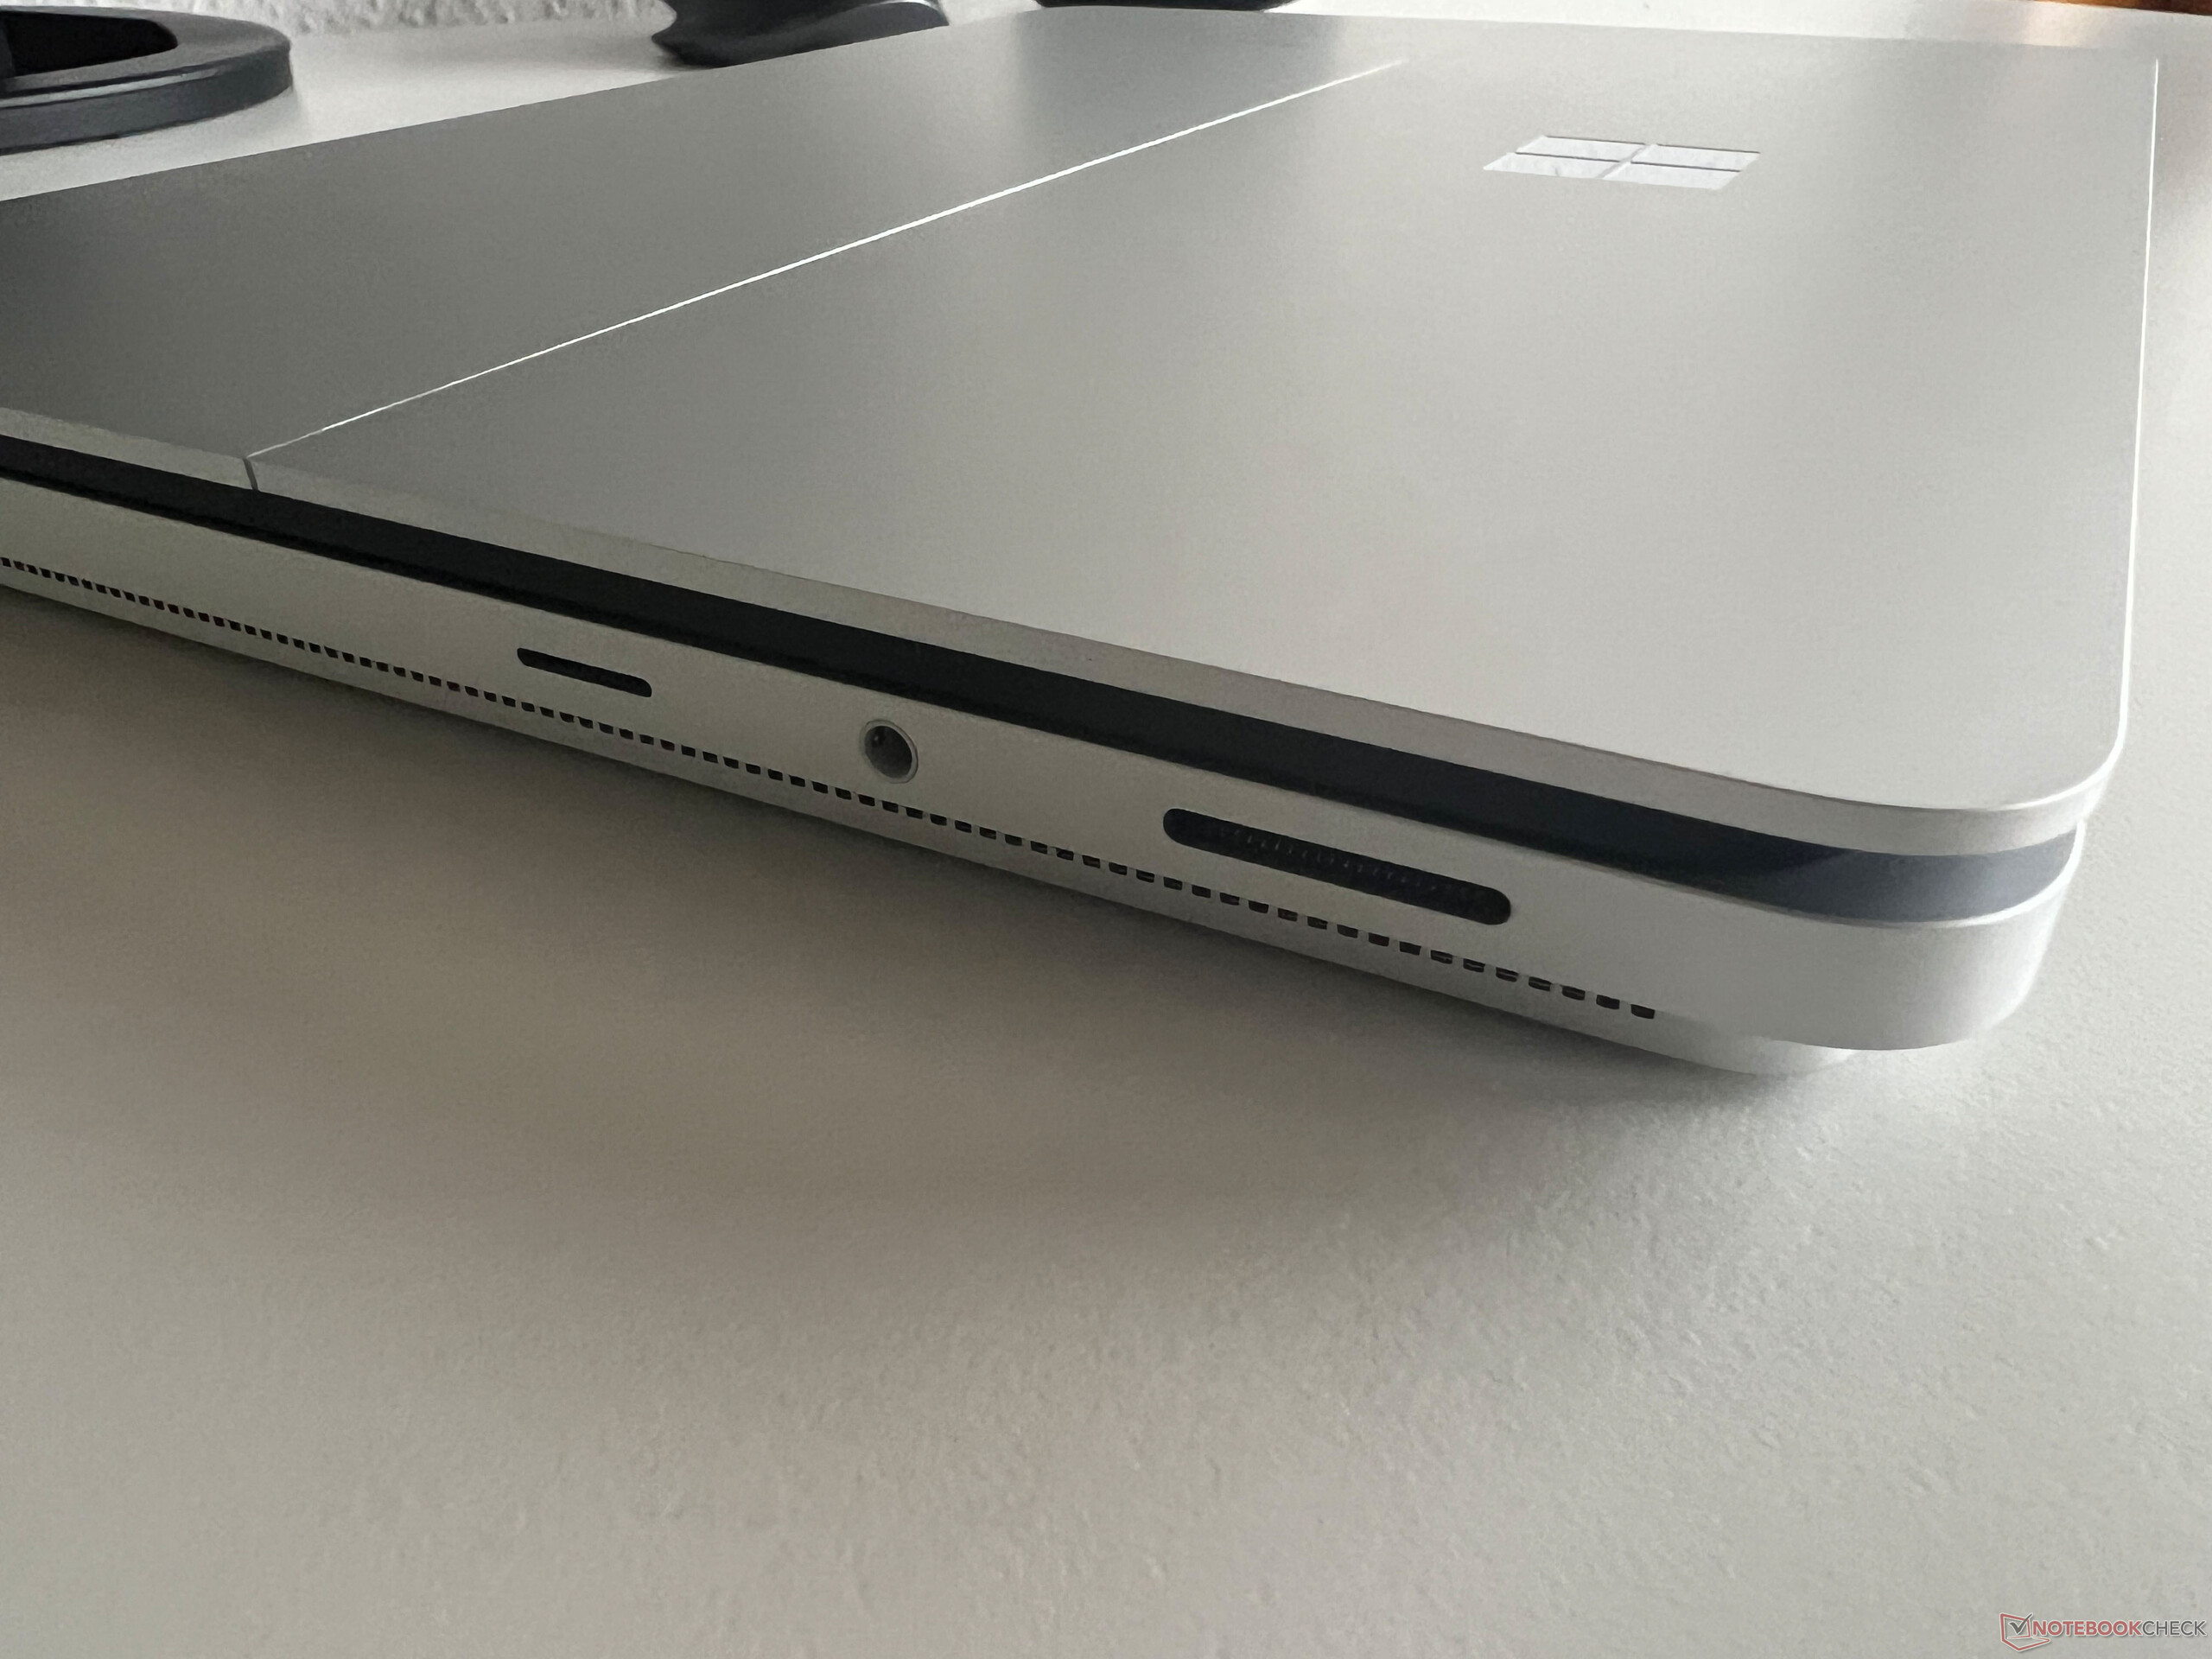
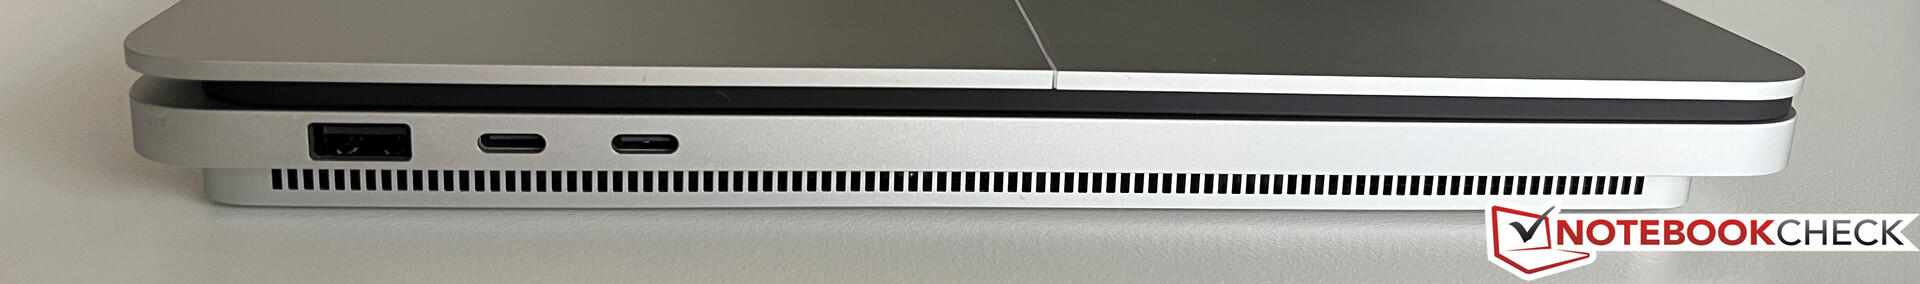
The port situation was one of our criticisms on the first-gen Surface Laptop Studio and it seems like Microsoft listened. In addition to the USB-C ports with Thunderbolt 4 as well as the Surface Connect port, customers now also get a regular USB-A port as well as a microSD-card reader. We still think the Surface Connect port is a bit cumbersome, but Microsoft is at least sticking to it and continues to offer accessories.
SD Card Reader
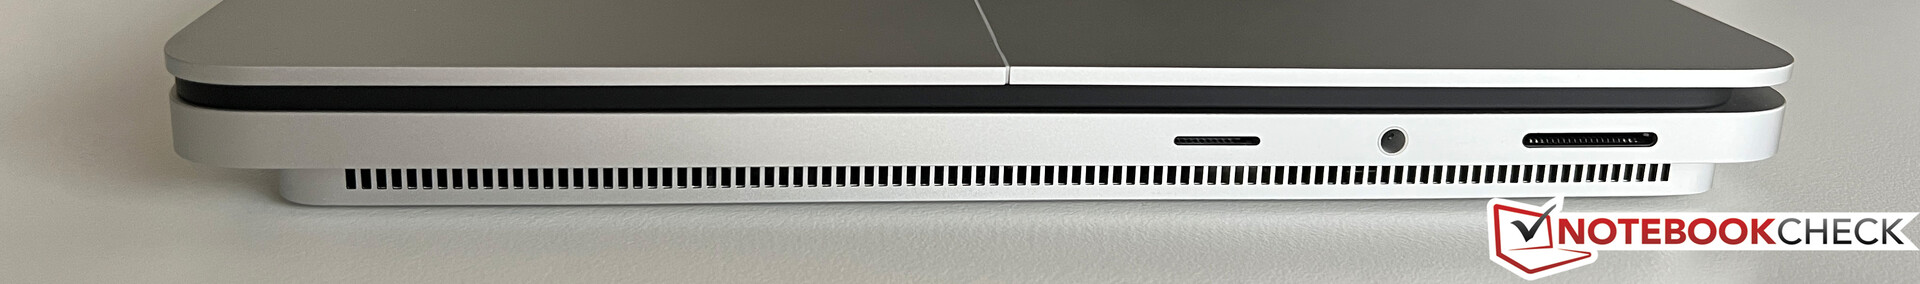
The right side now accommodates a microSD-card reader with a spring mechanism. Inserted cards only protrude slightly, so you could leave the card inserted for longer periods. Combined with our reference card (Angelbird AV Pro V60) we measure high transfer rates of 190 MB/s.
Communication
Microsoft uses a modern Wi-Fi 6E module from Intel (AX210), which also supports modern 6 GHz networks as well as Bluetooth 5.3. The transfer rates are good, but could be even better in terms of sending data. However, this is not really noticeable in practice.
| Networking | |
| Microsoft Surface Laptop Studio 2 RTX 4060 | |
| iperf3 transmit AXE11000 | |
| iperf3 receive AXE11000 | |
| Apple MacBook Pro 14 2023 M2 Pro | |
| iperf3 transmit AXE11000 6GHz | |
| iperf3 receive AXE11000 6GHz | |
| Lenovo Yoga Pro 9-14IRP G8 | |
| iperf3 transmit AXE11000 | |
| iperf3 receive AXE11000 | |
| Asus Zenbook Pro 14 OLED UX6404VI | |
| iperf3 transmit AXE11000 | |
| iperf3 receive AXE11000 | |
| Asus ZenBook Pro 14 Duo UX8402VV-P1021W | |
| iperf3 transmit AXE11000 | |
| iperf3 receive AXE11000 | |
| iperf3 transmit AXE11000 6GHz | |
| iperf3 receive AXE11000 6GHz | |
| Asus ROG Zephyrus G14 GA402XY | |
| iperf3 transmit AXE11000 | |
| iperf3 receive AXE11000 | |
| Lenovo Legion Slim 5 14APH8 | |
| iperf3 transmit AXE11000 | |
| iperf3 receive AXE11000 | |
| iperf3 transmit AXE11000 6GHz | |
| iperf3 receive AXE11000 6GHz | |
| Microsoft Surface Laptop Studio i7 RTX 3050 Ti | |
| iperf3 transmit AX12 | |
| iperf3 receive AX12 | |
Webcam
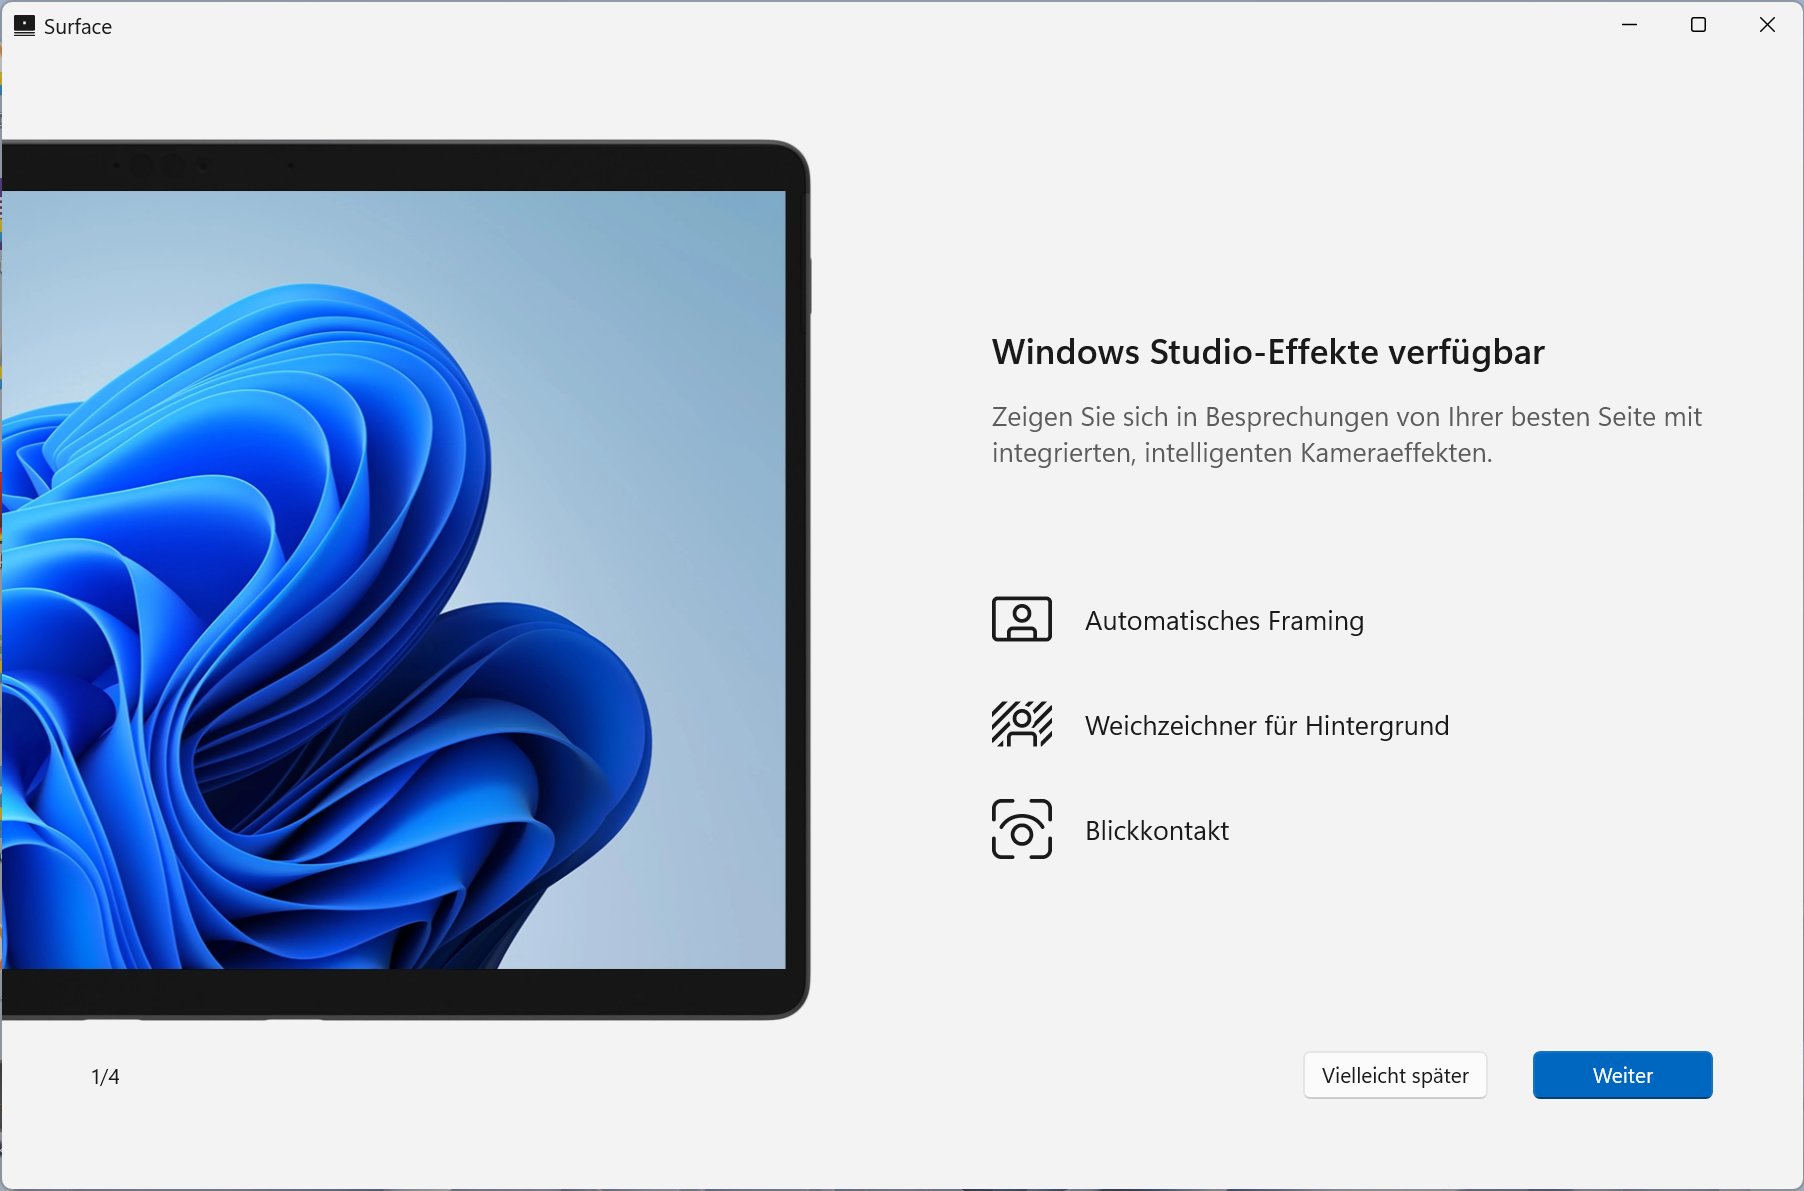
The quality of the 1080p webcam is decent in good lighting conditions, but the Surface Pro models are quipped with much better cameras. Microsoft now uses a wide-angle lens, which results in heavy distortions when you get to close to the lens (see test chart picture below). The camera supports studio effects like soft focus, automatic framing and eye contact, which works well. You can also use facial recognition via Windows Hello thanks to an IR module.


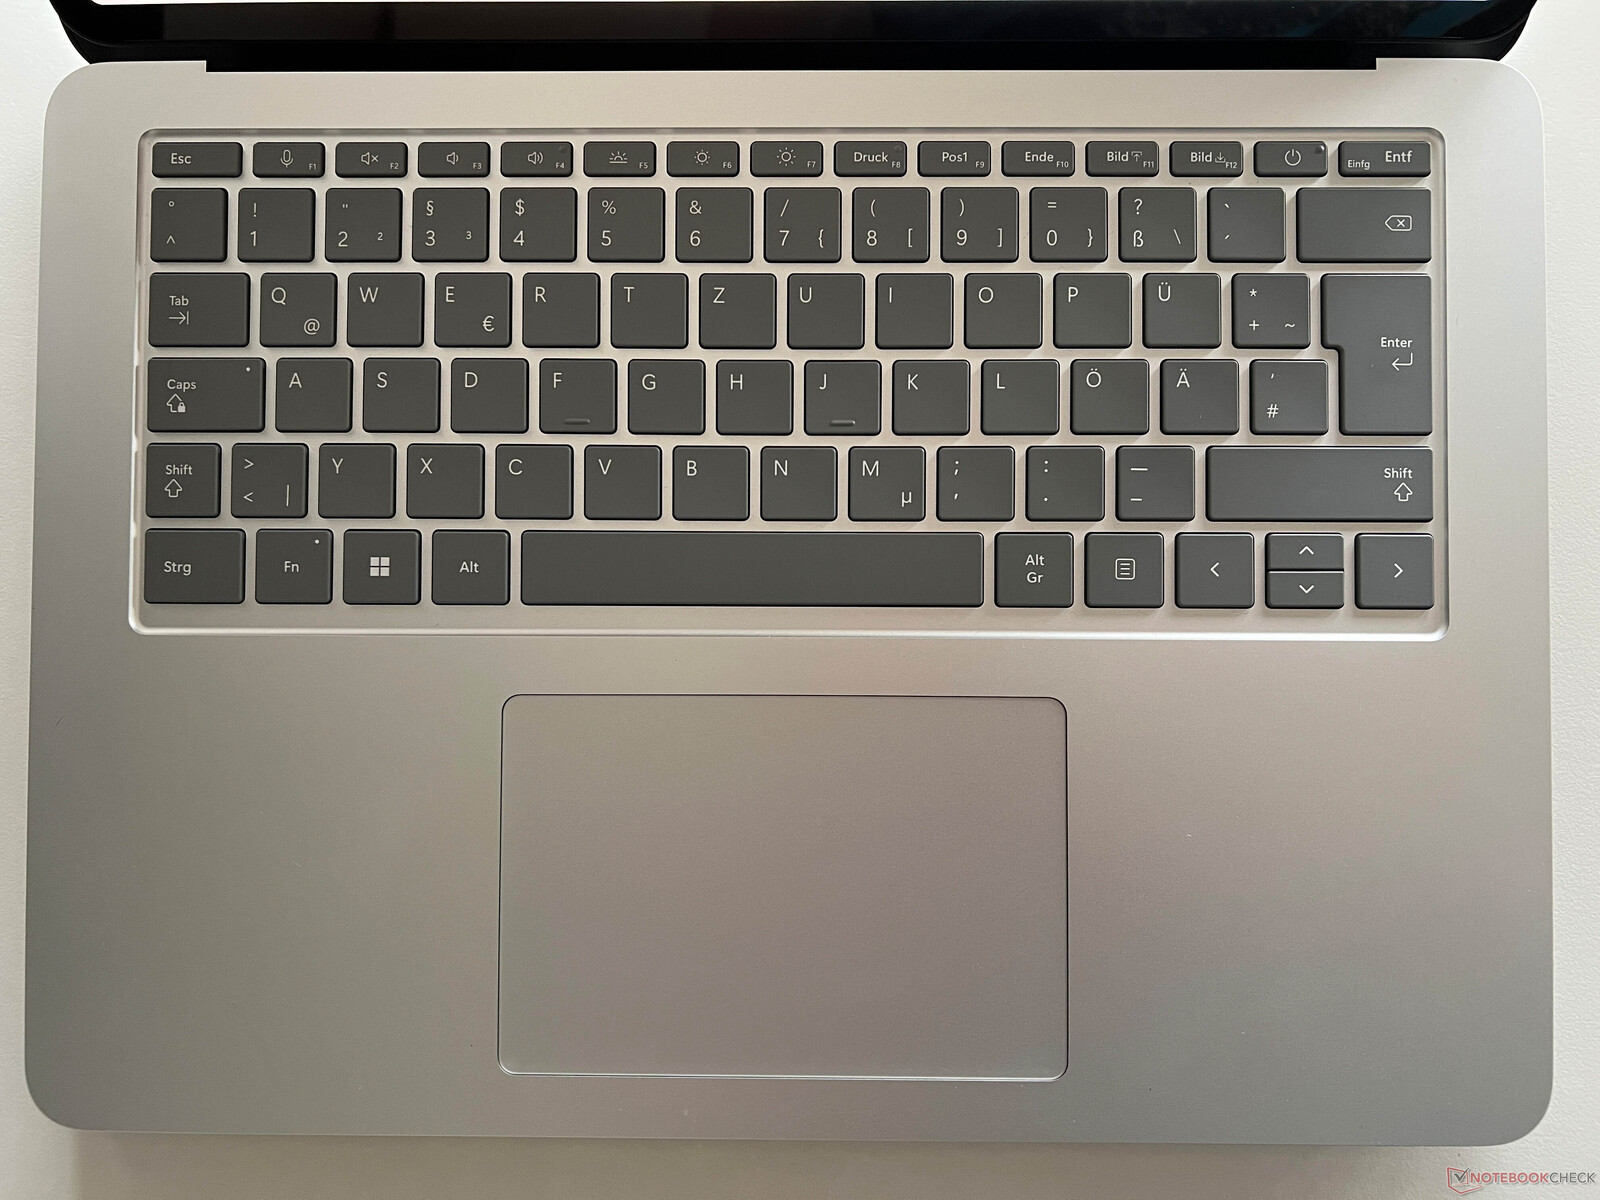
Input Devices - Surface Pen with haptic feedback
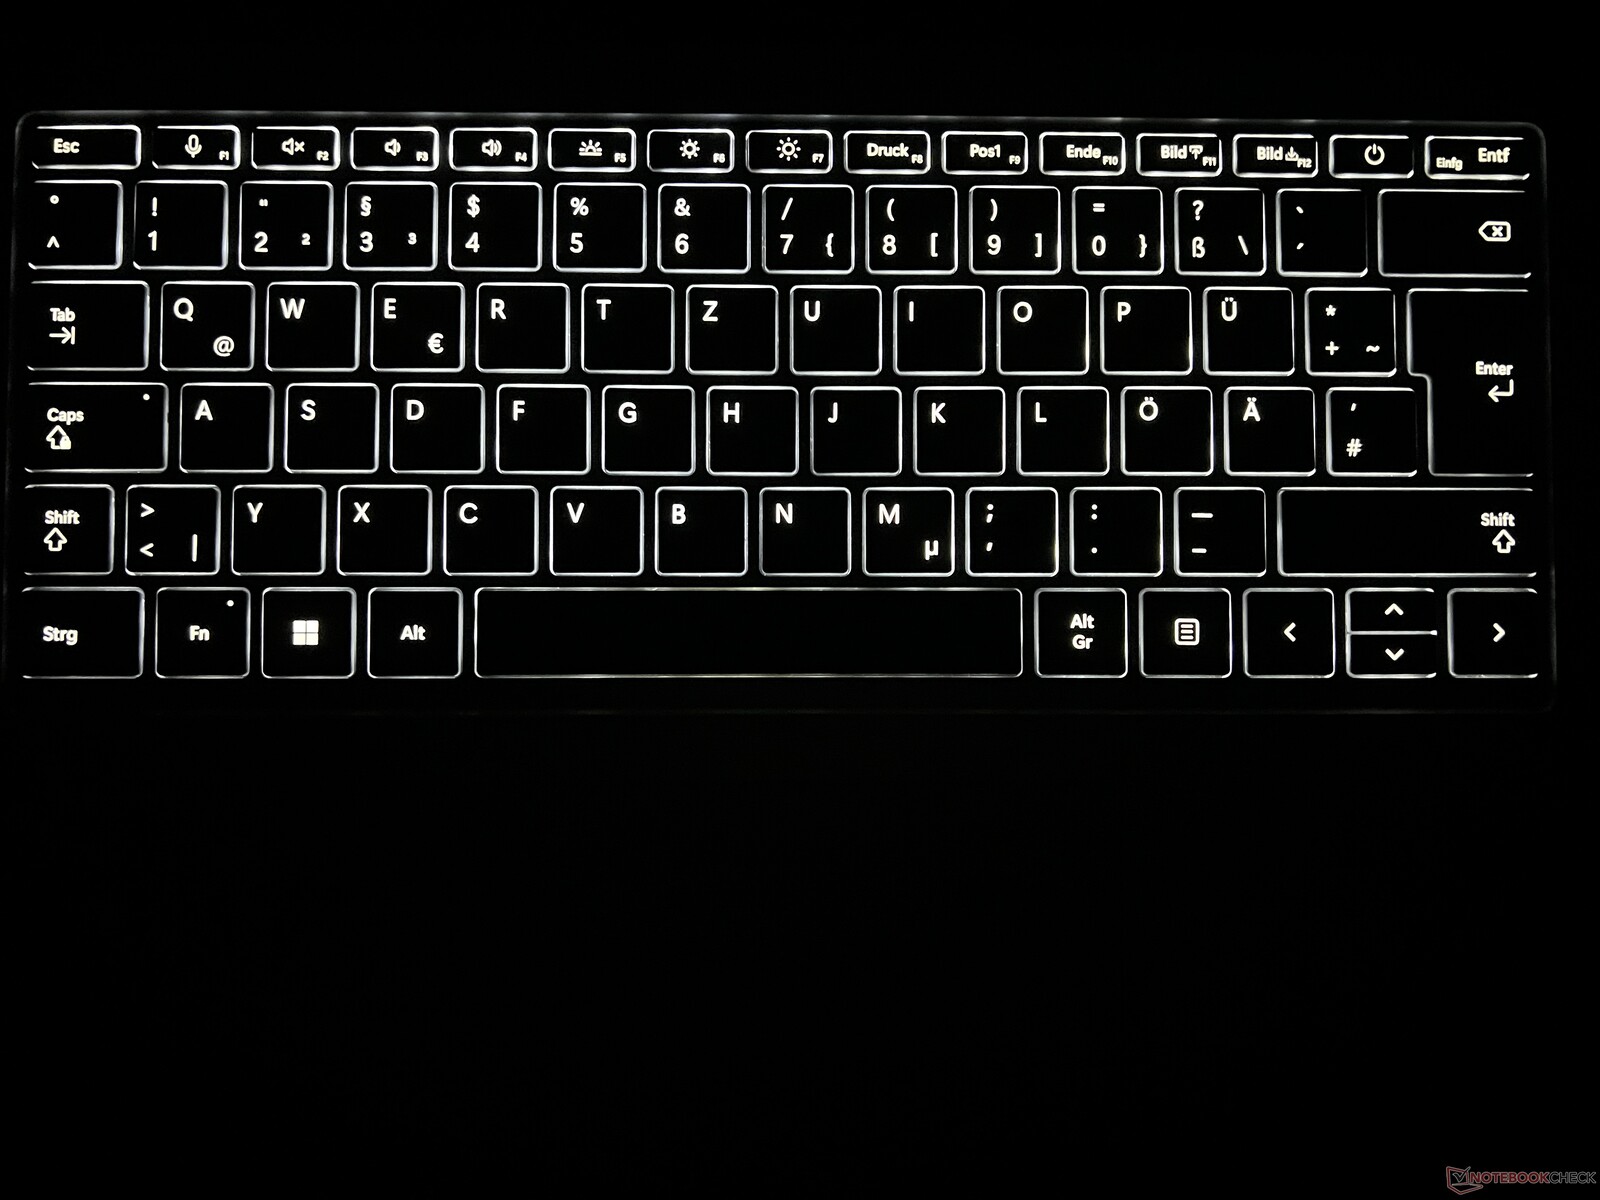
The keyboard is unchanged from the previous model. The keys are dark grey and easy to see and there is also a three-stage background illumination for darker environments, even though it cannot automatically be turned on via sensor. The keyboard itself offers a comfortable typing experience with sufficient travel, so longer texts are no problem.
Similar to Apple’s MacBooks, the Surface Laptop Studio 2 uses a so-called Precision Haptic Touchpad, which means there are no movable parts. Instead, the feedback while clicking is provided by vibration. This means the click experience is always identical everywhere on the pad, but you can also deactivate the haptic feedback if you prefer it. We had no issues with the pad at all and the occasional sensitivity issues we experienced with the first-gen model were no problem here.
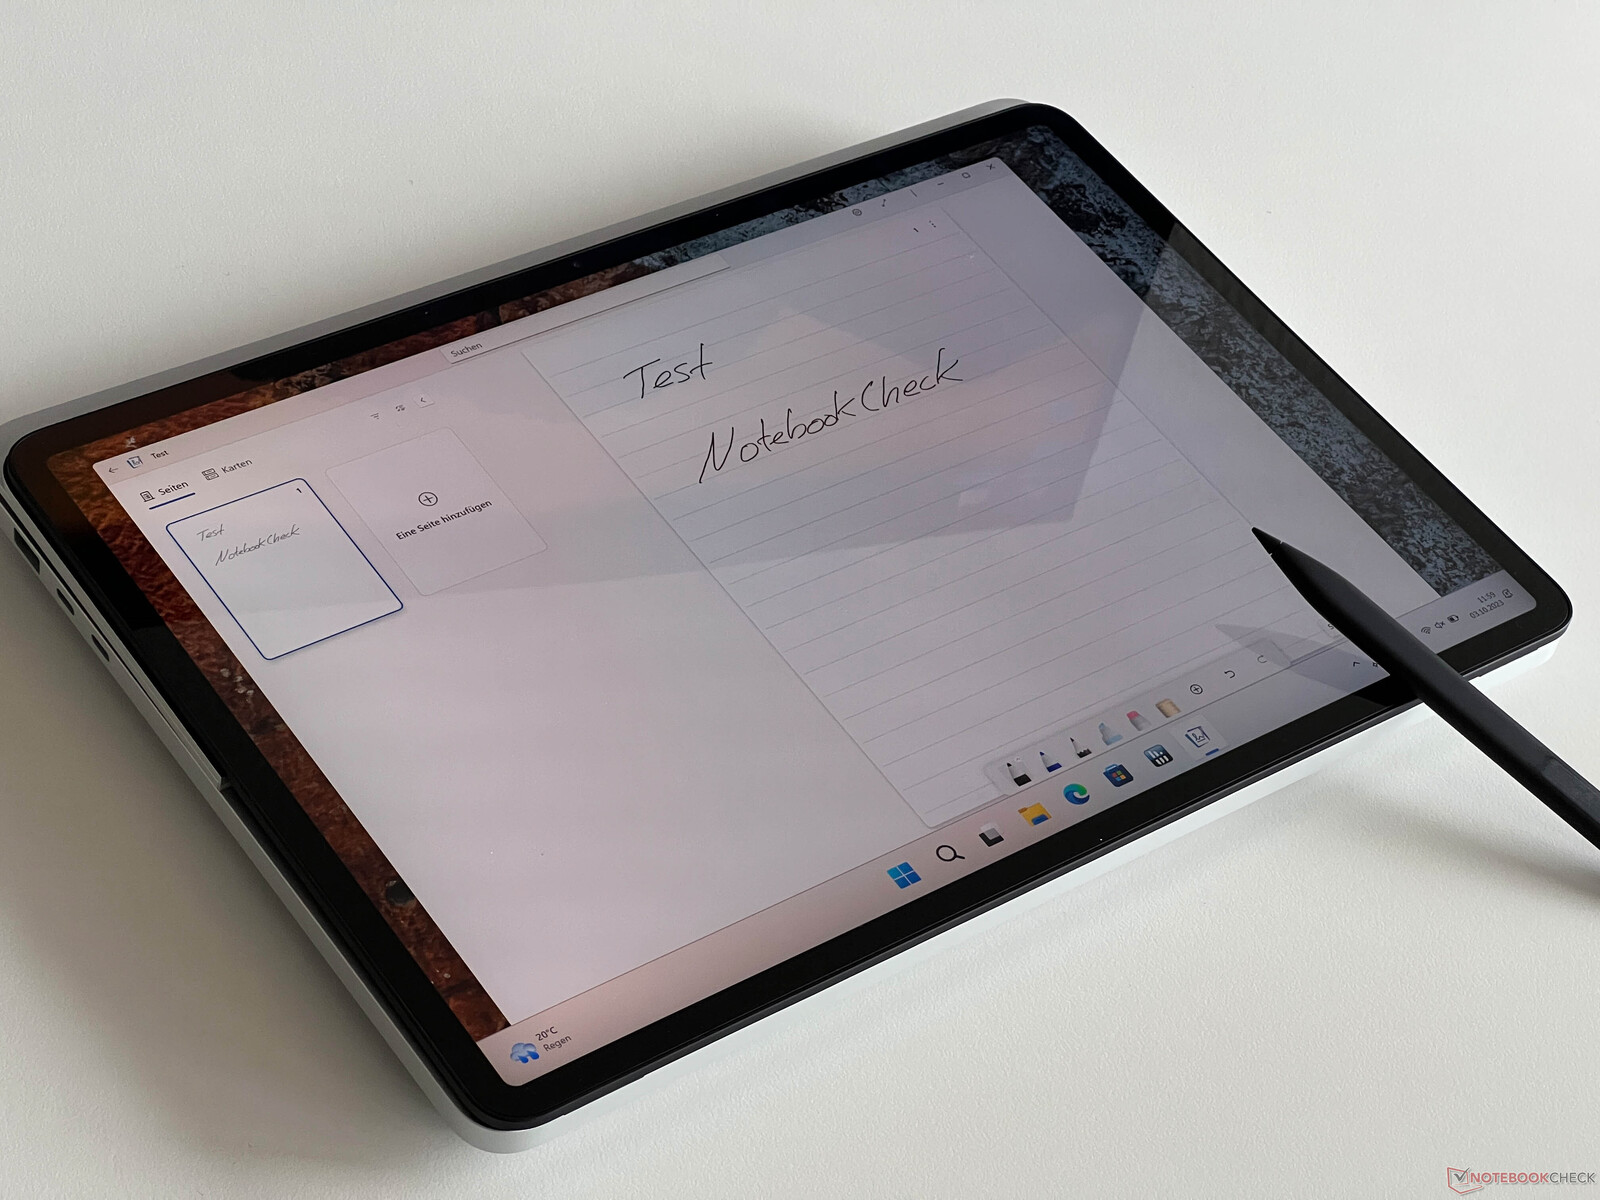
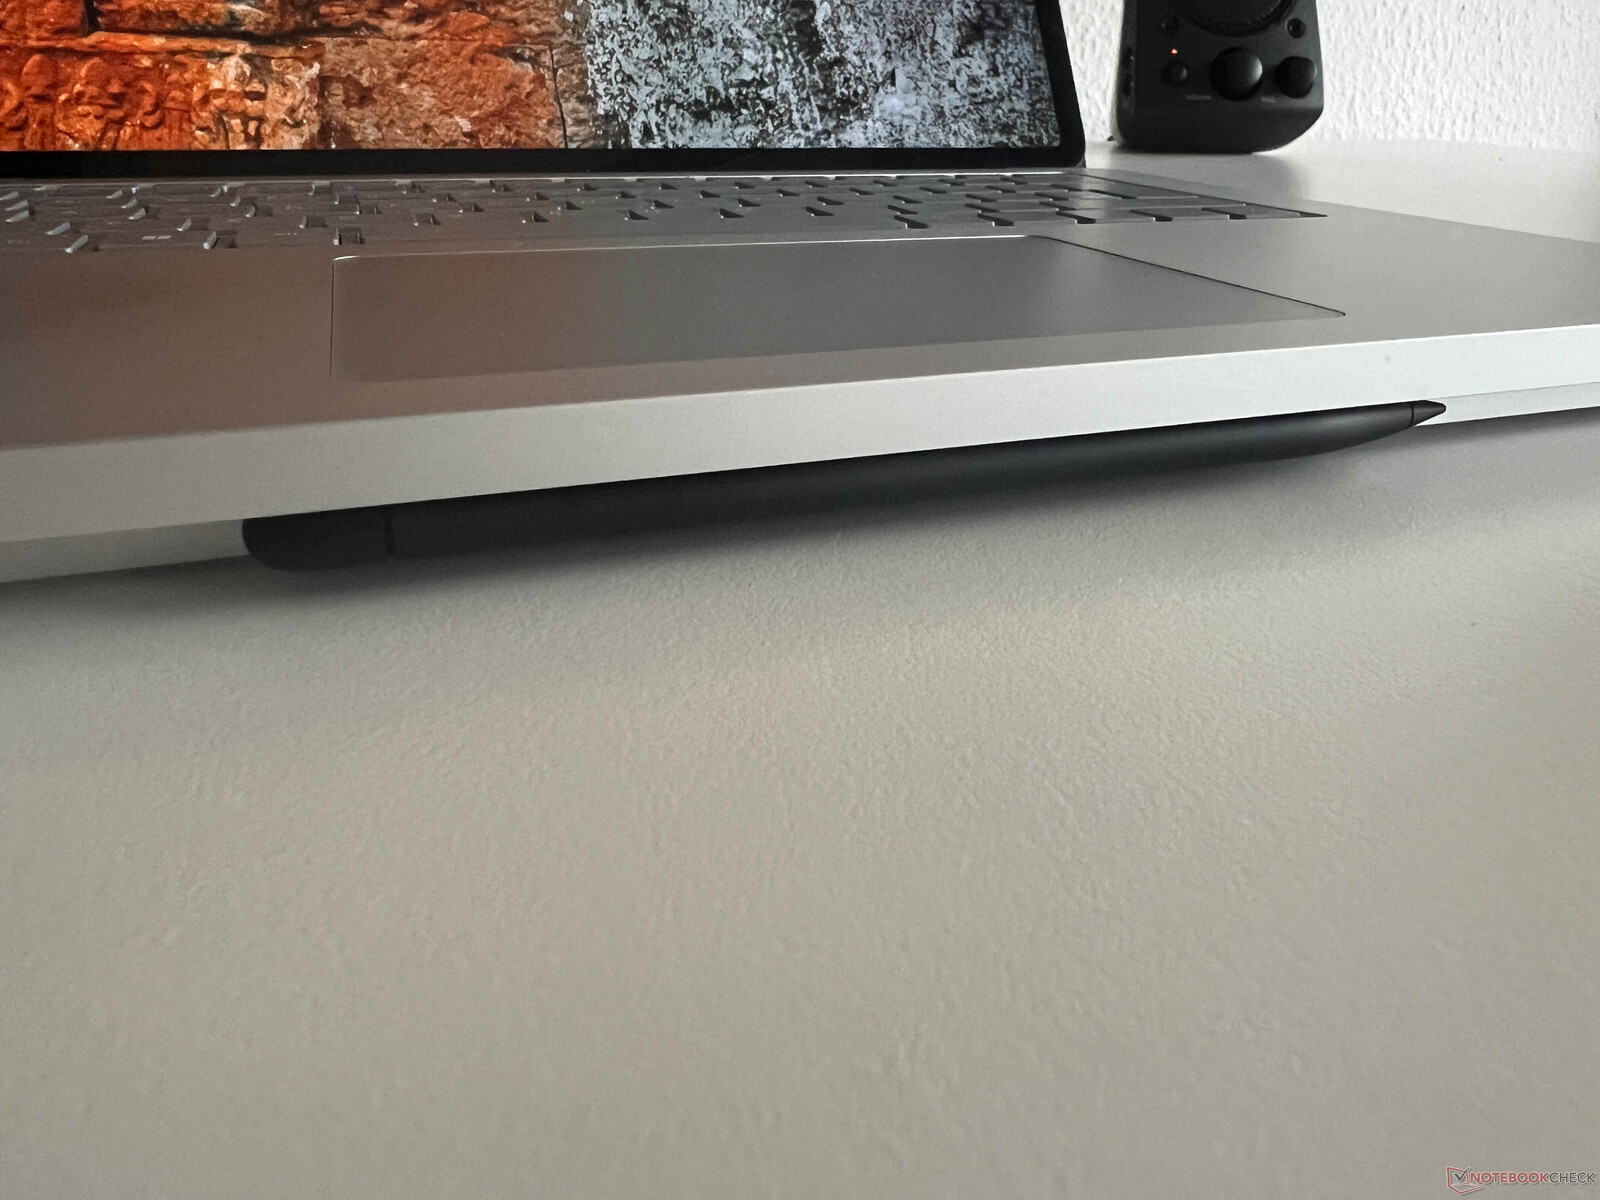
This time we had the chance to the Slim Pen 2 as well (optional accessory for ~$100), which is attached magnetically at the front of the chassis. The pen supports haptic feedback in compatible apps (like Whiteboard or Journal). The harder you press the pen onto the touchscreen, the stronger the vibration and therefore the perceptible resistance. If you only glide it gently across the surface, however, there is no haptic feedback. All in all, the pen inputs work very well and we had no issues with wrong inputs, even during more comprehensive notes. The capacitive touchscreen also works really well.
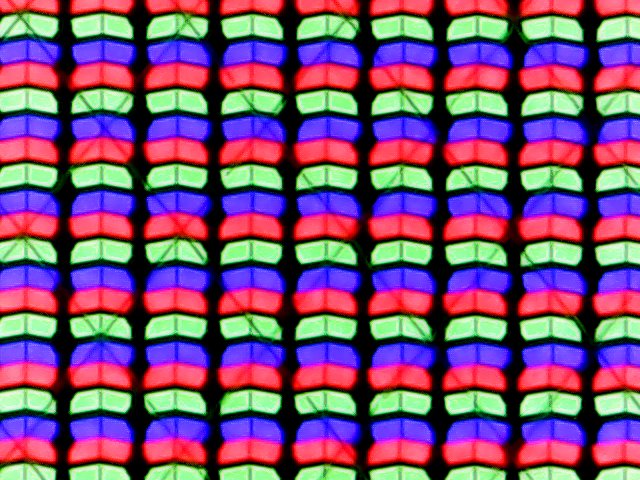
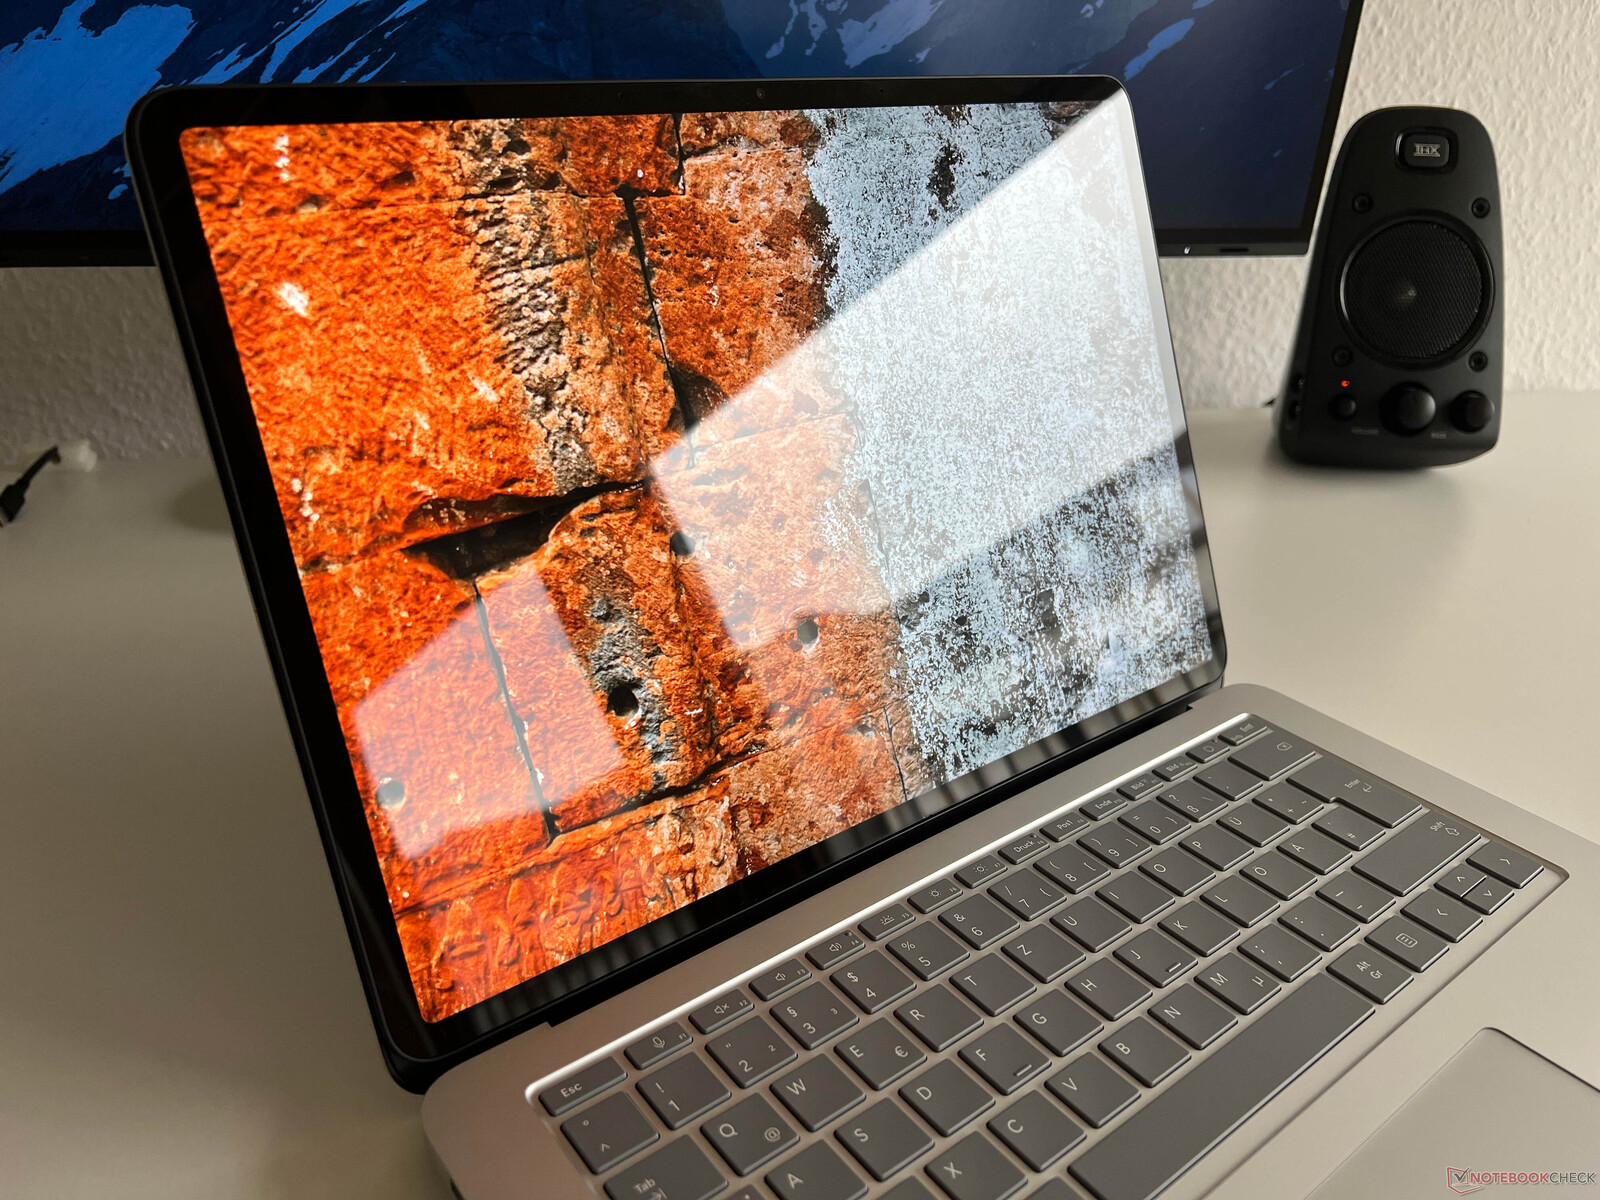
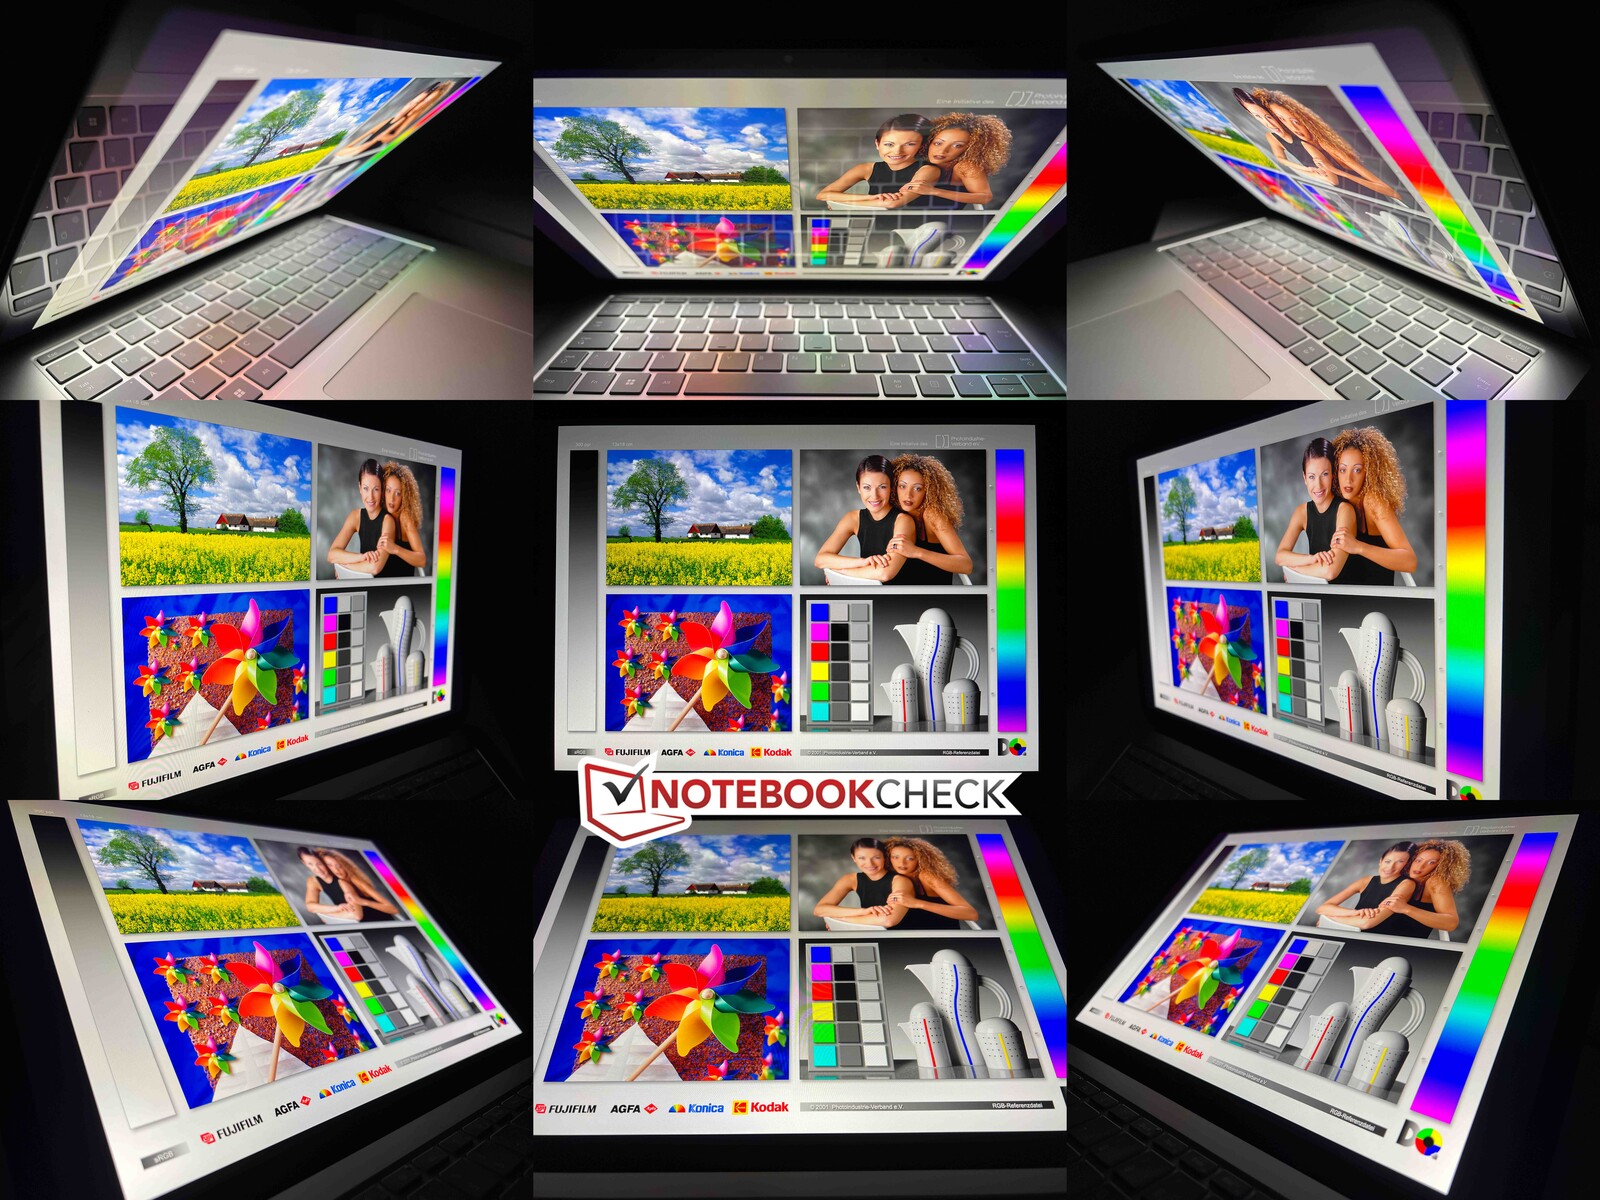
Display - 120 Hz and HDR, but only sRGB
The 14.4-inch screen did not change. It still offers the 2400 x 1600 resolution with a 3:2 aspect ratio as well as a very glossy surface, which can also be an issue indoors. The subjective picture quality is excellent with very sharp contents and rich colors. Thanks to the higher frequency of 120 Hz, movements are very smooth and there are no major issues with ghosting, even though the response times are pretty slow.
Microsoft advertises a brightness of 500 nits for SDR contents and our own measurements confirm that (up to 529 nits & 503 nits on average). The black value is pretty low at 0.26, which results in an excellent maximum contrast ratio of almost 2000:1.
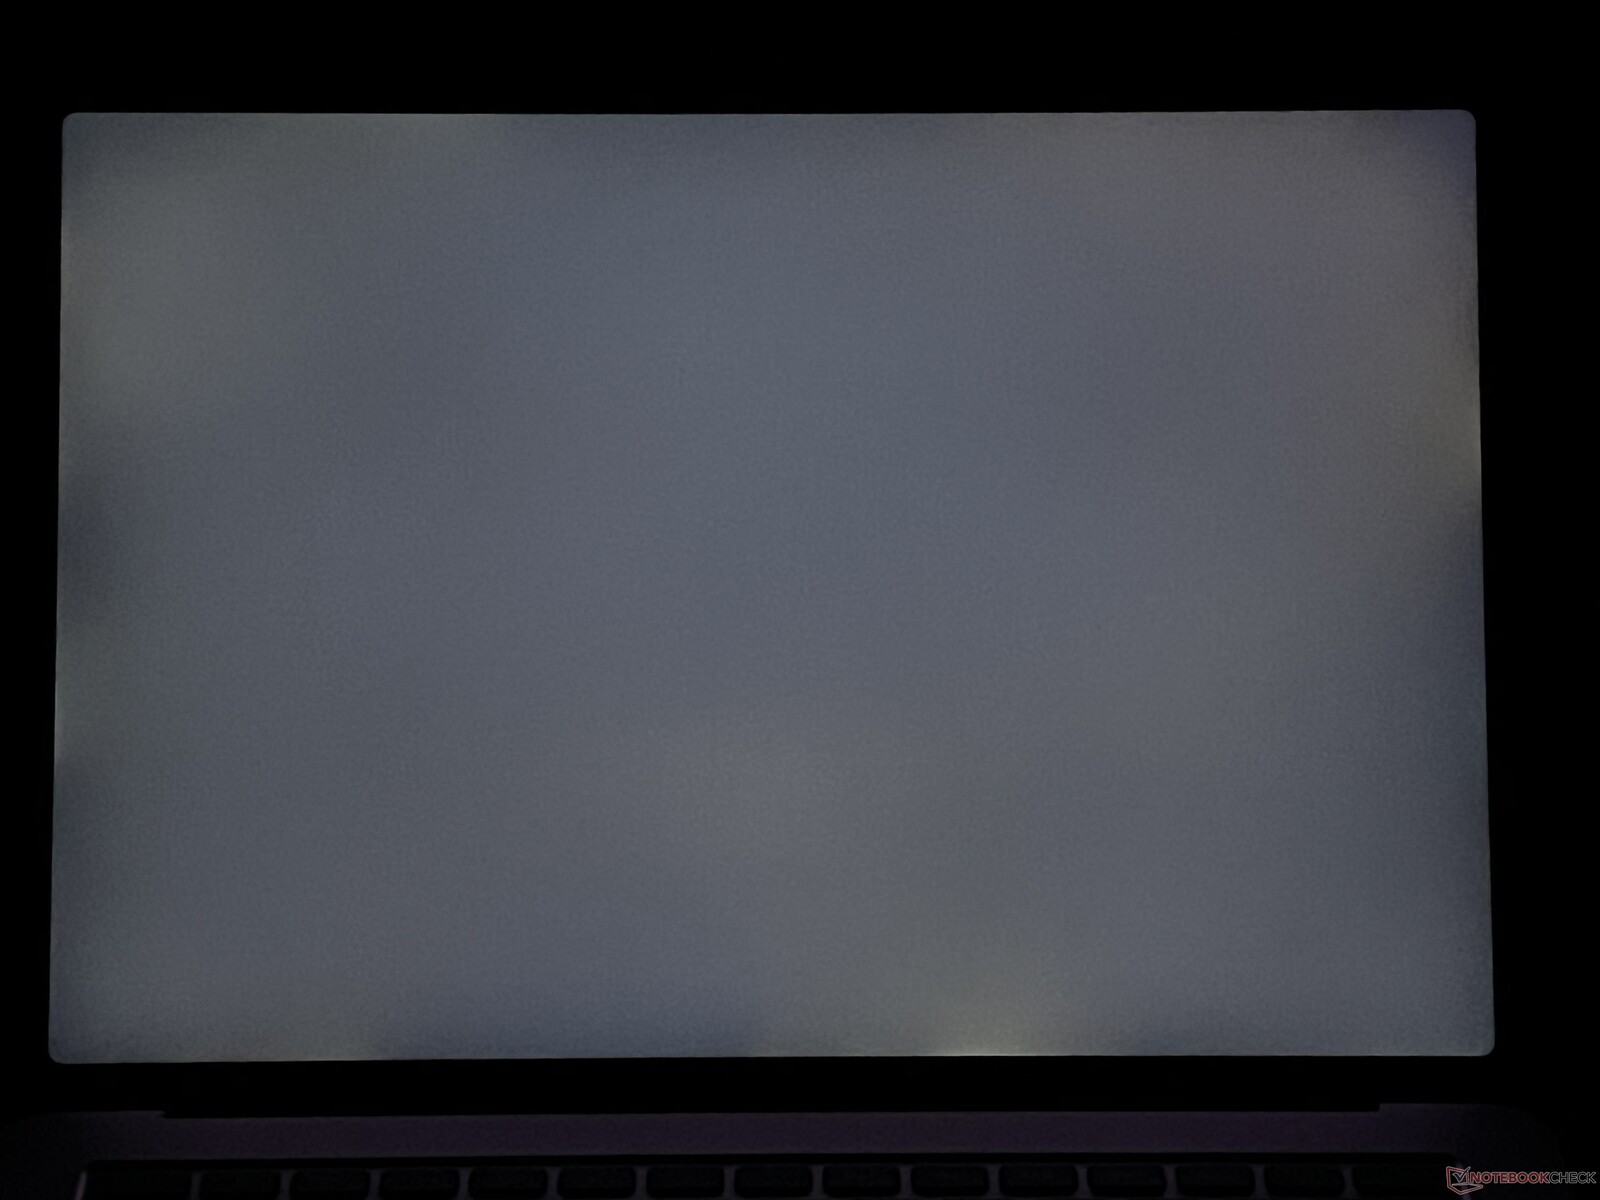
The peak brightness in HDR mode is rated at 650 nits and this behavior is common for OLED and Mini-LED panels, but it is pretty unusual for IPS screens. We measured up to 647 nits and can confirm the claim. Only the Mini-LED screen of the Apple MacBook Pro 14 (up to 1600 nits) has a significant advantage in this respect. The HDR implementation of Windows is still an issue since it has to be activated manually (which results in a black screen for a second) and the color management does not work properly, either. Apple’s implementation in macOS is just superior.
| |||||||||||||||||||||||||
Brightness Distribution: 89 %
Center on Battery: 501 cd/m²
Contrast: 1965:1 (Black: 0.26 cd/m²)
ΔE ColorChecker Calman: 0.5 | ∀{0.5-29.43 Ø4.72}
ΔE Greyscale Calman: 0.8 | ∀{0.09-98 Ø4.97}
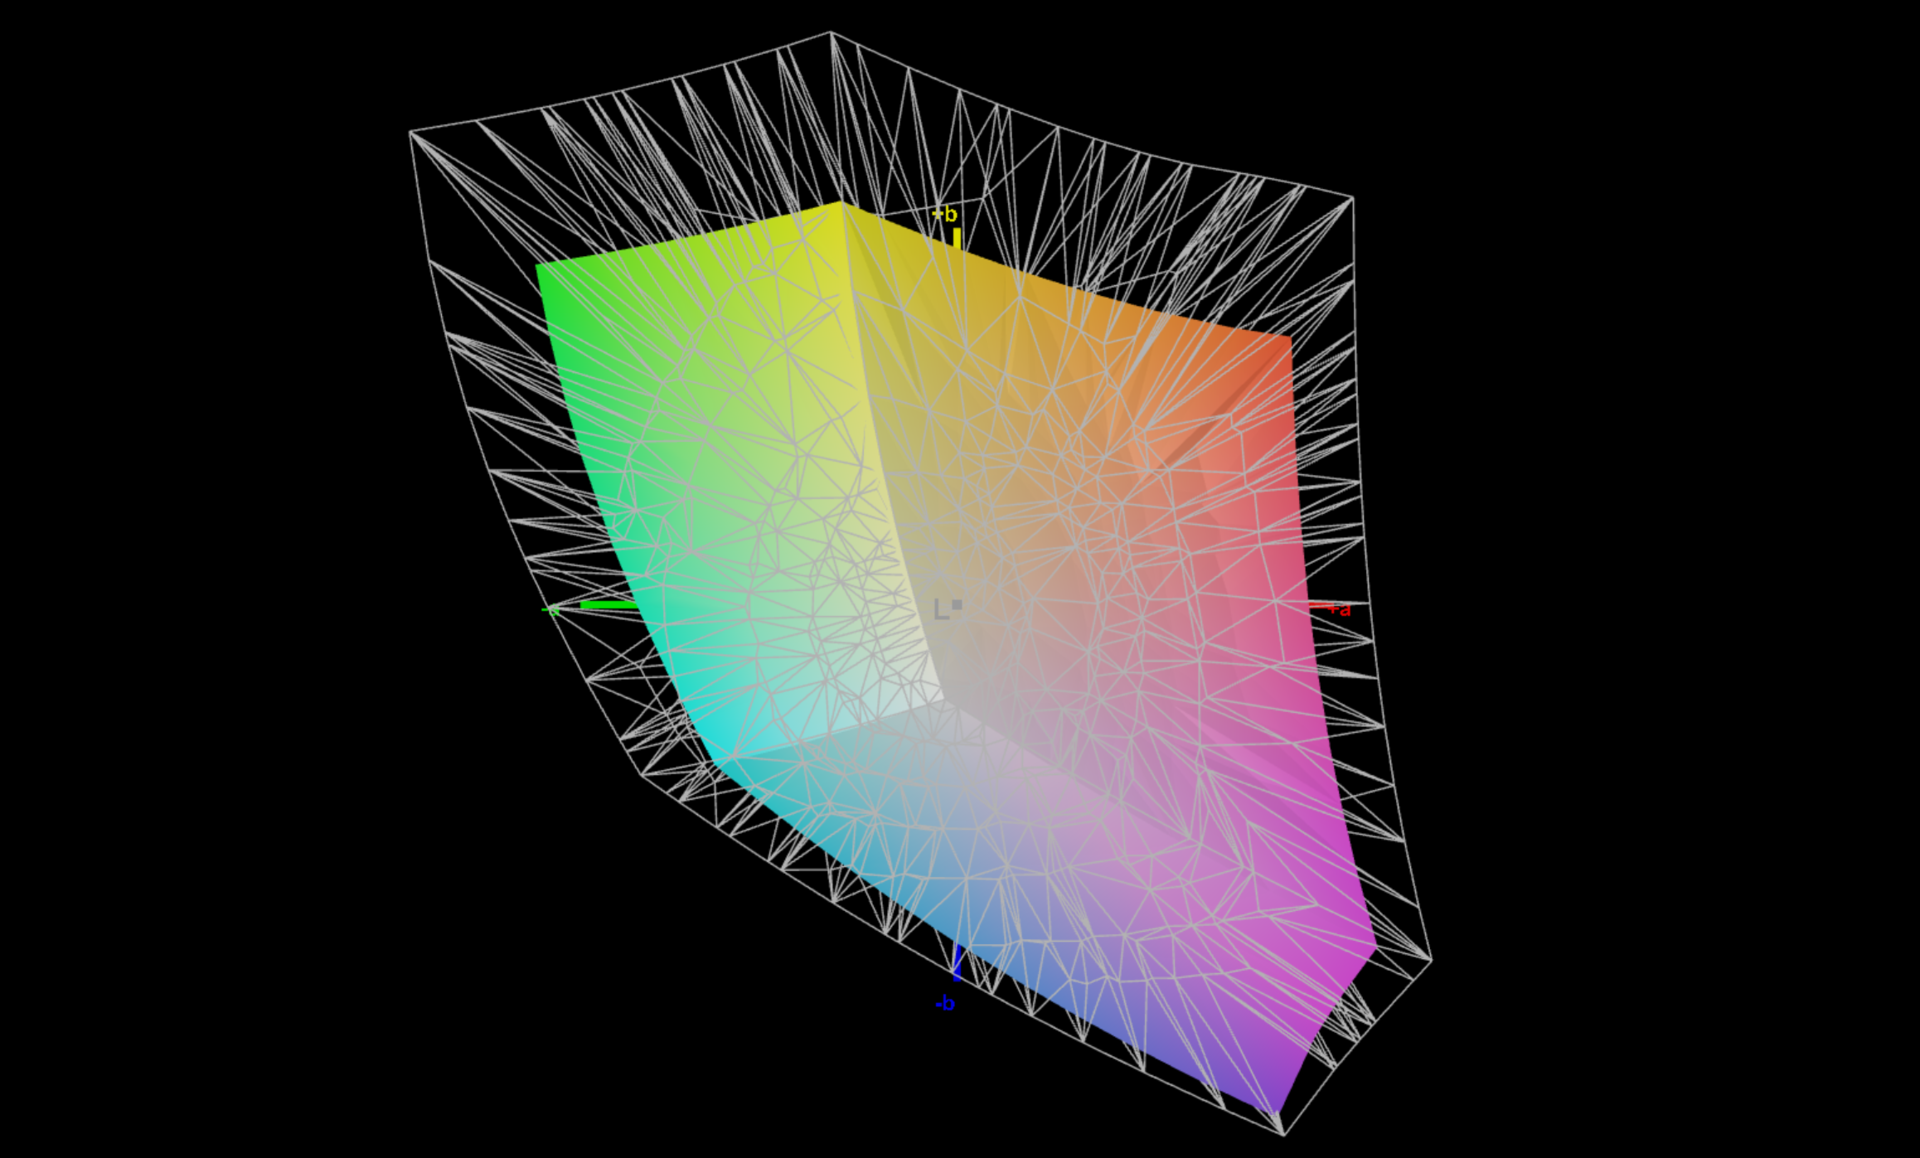
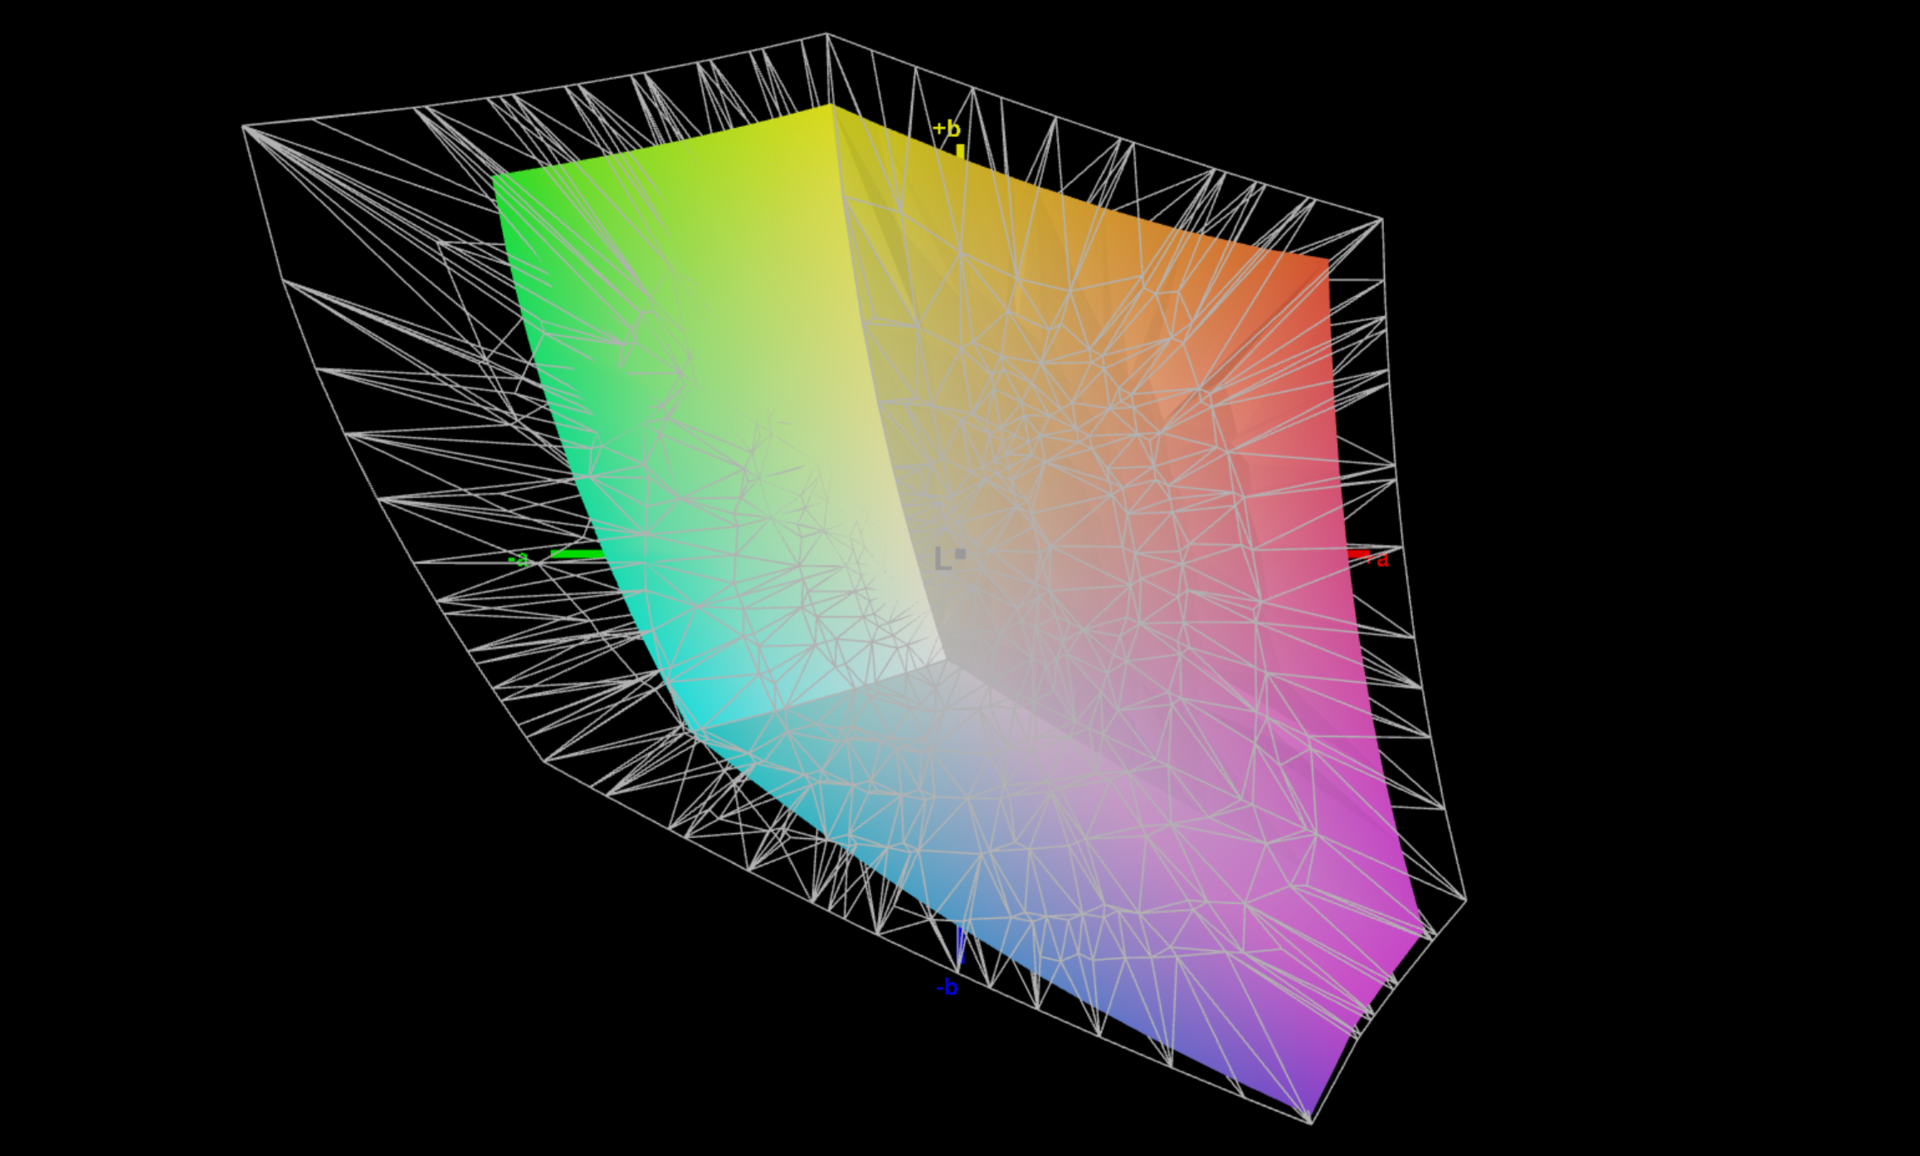
68.9% AdobeRGB 1998 (Argyll 3D)
99% sRGB (Argyll 3D)
66.7% Display P3 (Argyll 3D)
Gamma: 2.19
CCT: 6650 K
| Microsoft Surface Laptop Studio 2 RTX 4060 LQ144P1JX01, IPS, 2400x1600, 14.4" | Apple MacBook Pro 14 2023 M2 Pro Mini-LED, 3024x1964, 14.2" | Lenovo Yoga Pro 9-14IRP G8 CSOT T3 MNE507HZ2-1, Mini-LED, 3072x1920, 14.5" | Asus Zenbook Pro 14 OLED UX6404VI SDC4190, OLED, 2880x1800, 14.5" | Asus ZenBook Pro 14 Duo UX8402VV-P1021W ATNA45AF04-0 , OLED, 2880x1800, 14.5" | Asus ROG Zephyrus G14 GA402XY B140QAN06.S, Mini-LED, 2560x1600, 14" | Lenovo Legion Slim 5 14APH8 Samsung SDC ATNA45AF02-2, OLED, 2880x1600, 14.5" | Microsoft Surface Laptop Studio i7 RTX 3050 Ti LQ144P1JX01, IPS, 2400x1600, 14.4" | |
|---|---|---|---|---|---|---|---|---|
| Display | 49% | 27% | 31% | 30% | 29% | 30% | 12% | |
| Display P3 Coverage (%) | 66.7 | 99.2 49% | 92 38% | 99.6 49% | 99.91 50% | 99.6 49% | 99.9 50% | 80.6 21% |
| sRGB Coverage (%) | 99 | 99.7 1% | 100 1% | 100 1% | 100 1% | 100 1% | 99.9 1% | |
| AdobeRGB 1998 Coverage (%) | 68.9 | 96.9 41% | 97.5 42% | 95.35 38% | 93.4 36% | 96.5 40% | 78.5 14% | |
| Response Times | 39% | 76% | 98% | 96% | 75% | 98% | 28% | |
| Response Time Grey 50% / Grey 80% * (ms) | 77.6 ? | 35.2 ? 55% | 12.7 ? 84% | 0.67 ? 99% | 2 ? 97% | 17.2 ? 78% | 0.79 ? 99% | 58.4 ? 25% |
| Response Time Black / White * (ms) | 34.3 ? | 26.4 ? 23% | 11.4 ? 67% | 0.9 ? 97% | 2 ? 94% | 9.9 ? 71% | 1.01 ? 97% | 24 ? 30% |
| PWM Frequency (Hz) | 17600 ? | 14880 ? | 6000 ? | 240 | 240 | 5430 | 240.5 ? | 5000 ? |
| Screen | 110% | -169% | -28% | 1014% | -60% | -228% | -57% | |
| Brightness middle (cd/m²) | 511 | 500 -2% | 670 31% | 356 -30% | 340 -33% | 535 5% | 377.5 -26% | 497 -3% |
| Brightness (cd/m²) | 503 | 489 -3% | 680 35% | 358 -29% | 340 -32% | 563 12% | 381 -24% | 491 -2% |
| Brightness Distribution (%) | 89 | 94 6% | 89 0% | 99 11% | 99 11% | 91 2% | 97 9% | 92 3% |
| Black Level * (cd/m²) | 0.26 | 0.02 92% | 0.19 27% | 0.002 99% | 0.29 -12% | |||
| Contrast (:1) | 1965 | 25000 1172% | 3526 79% | 170000 8551% | 1714 -13% | |||
| Colorchecker dE 2000 * | 0.5 | 1.2 -140% | 4 -700% | 0.8 -60% | 1.76 -252% | 1 -100% | 4.19 -738% | 1.2 -140% |
| Colorchecker dE 2000 max. * | 1.1 | 2.6 -136% | 4.5 -309% | 1.6 -45% | 3.2 -191% | 2.8 -155% | 7.02 -538% | 2.8 -155% |
| Greyscale dE 2000 * | 0.8 | 1.7 -113% | 4.9 -513% | 0.9 -13% | 1.16 -45% | 1.8 -125% | 1.2 -50% | 1.9 -137% |
| Gamma | 2.19 100% | 2.24 98% | 2.22 99% | 2.19 100% | 2.43 91% | 2.24 98% | 2.22 99% | 2.14 103% |
| CCT | 6650 98% | 6791 96% | 5735 113% | 6590 99% | 6418 101% | 6337 103% | 6296 103% | 6821 95% |
| Colorchecker dE 2000 calibrated * | 1.3 | 1.62 | 0.81 | 0.8 | ||||
| Total Average (Program / Settings) | 66% /
91% | -22% /
-86% | 34% /
11% | 380% /
645% | 15% /
-11% | -33% /
-98% | -6% /
-28% |
* ... smaller is better
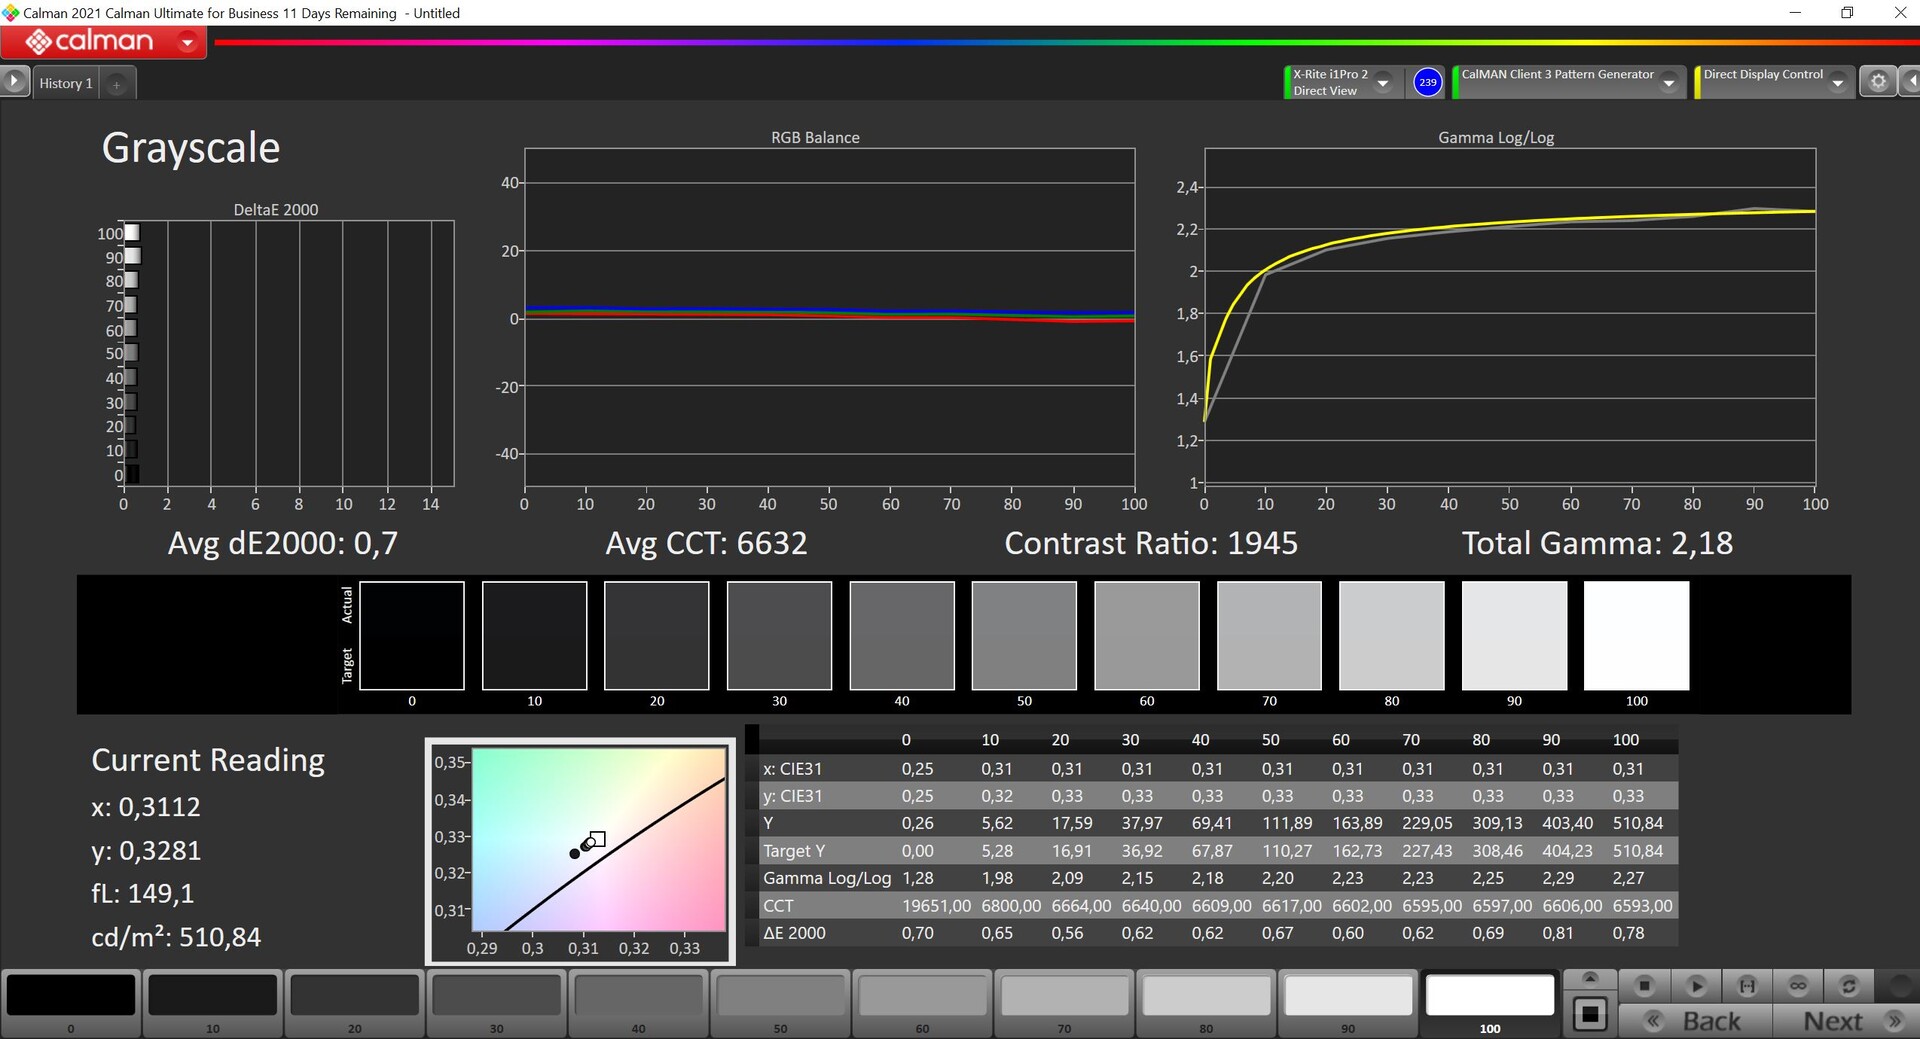
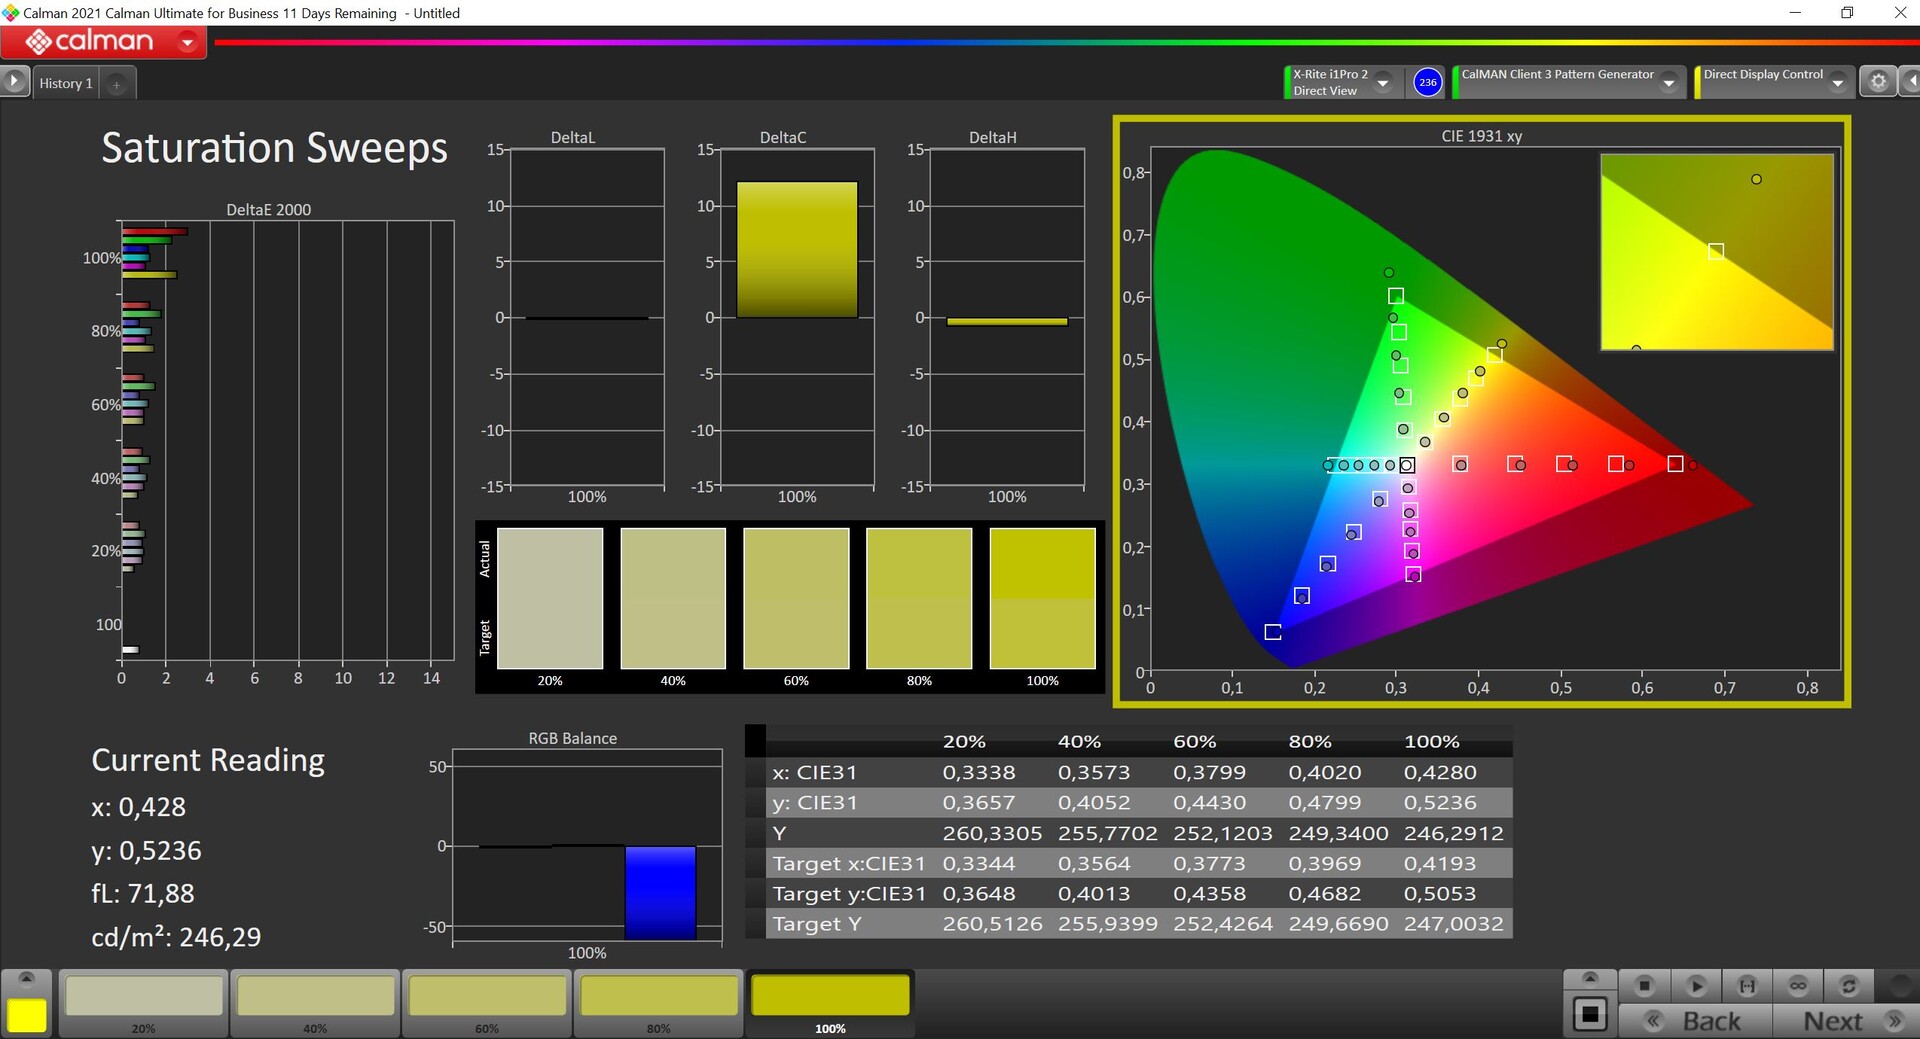
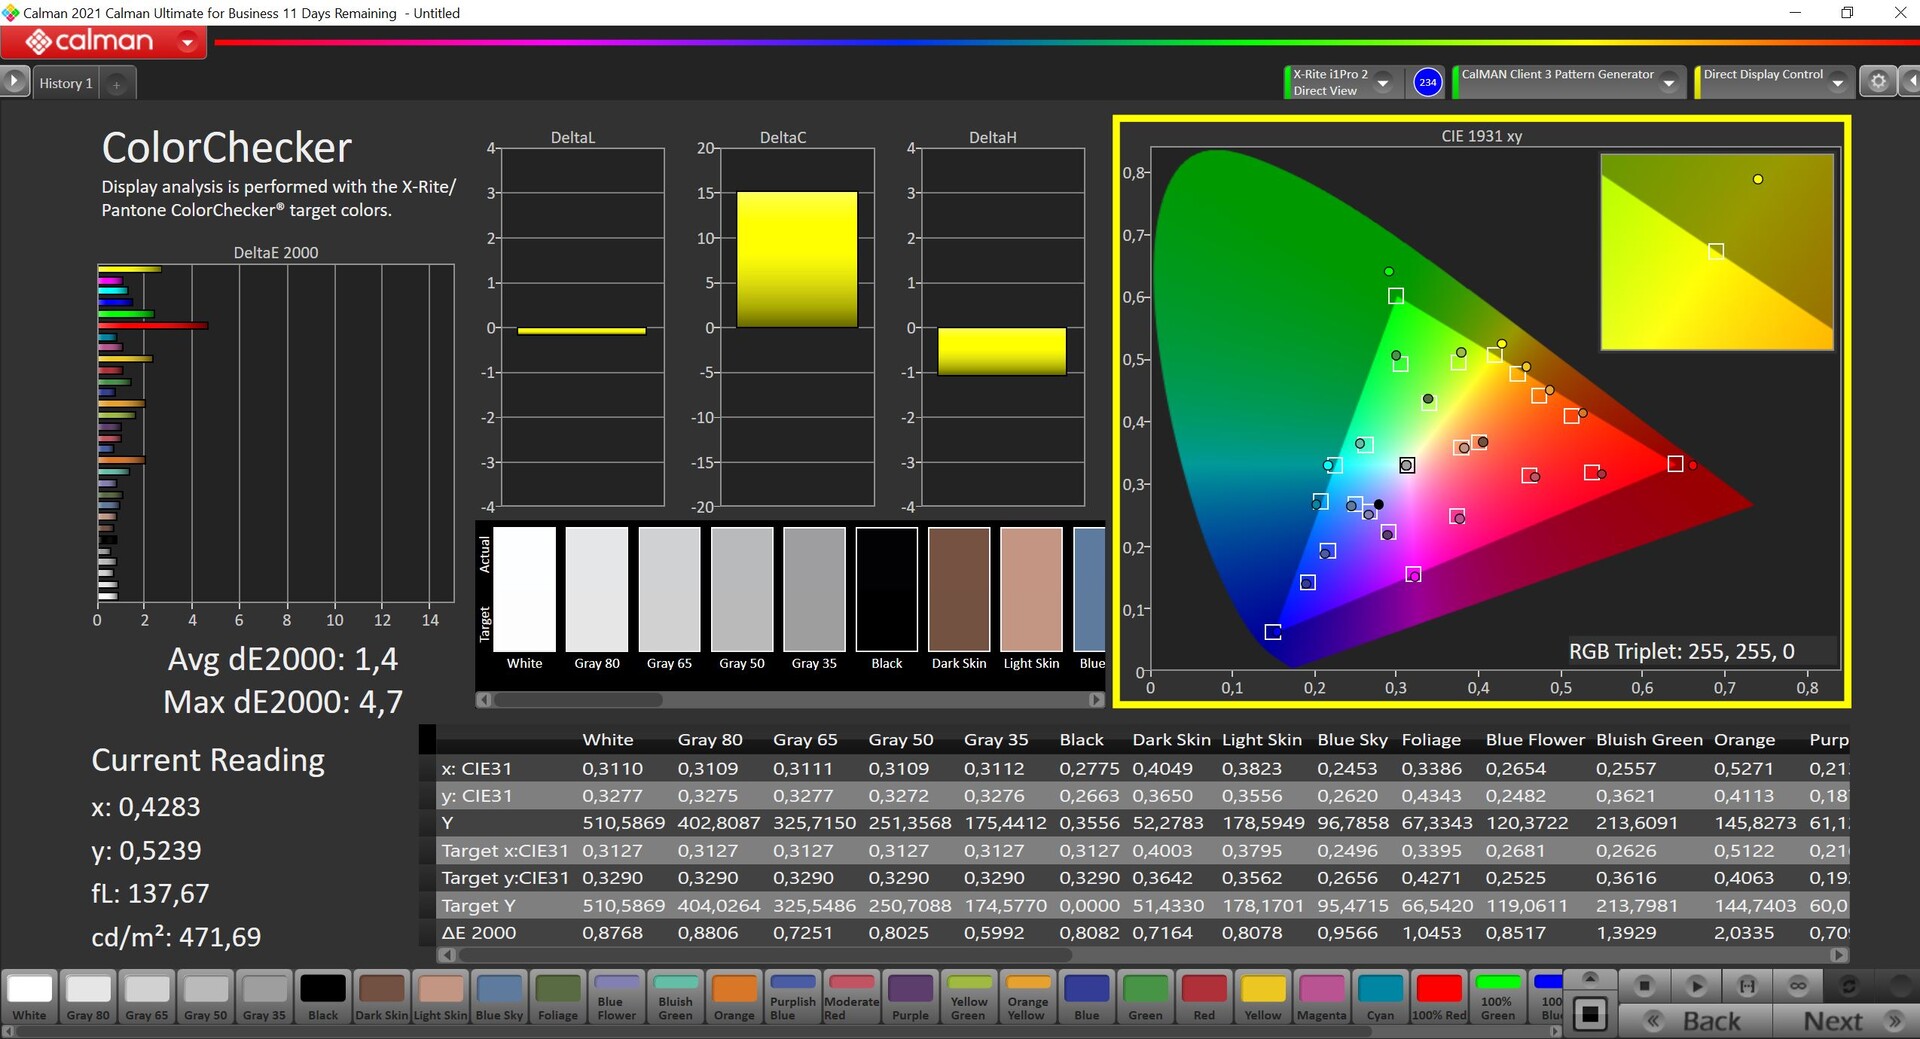

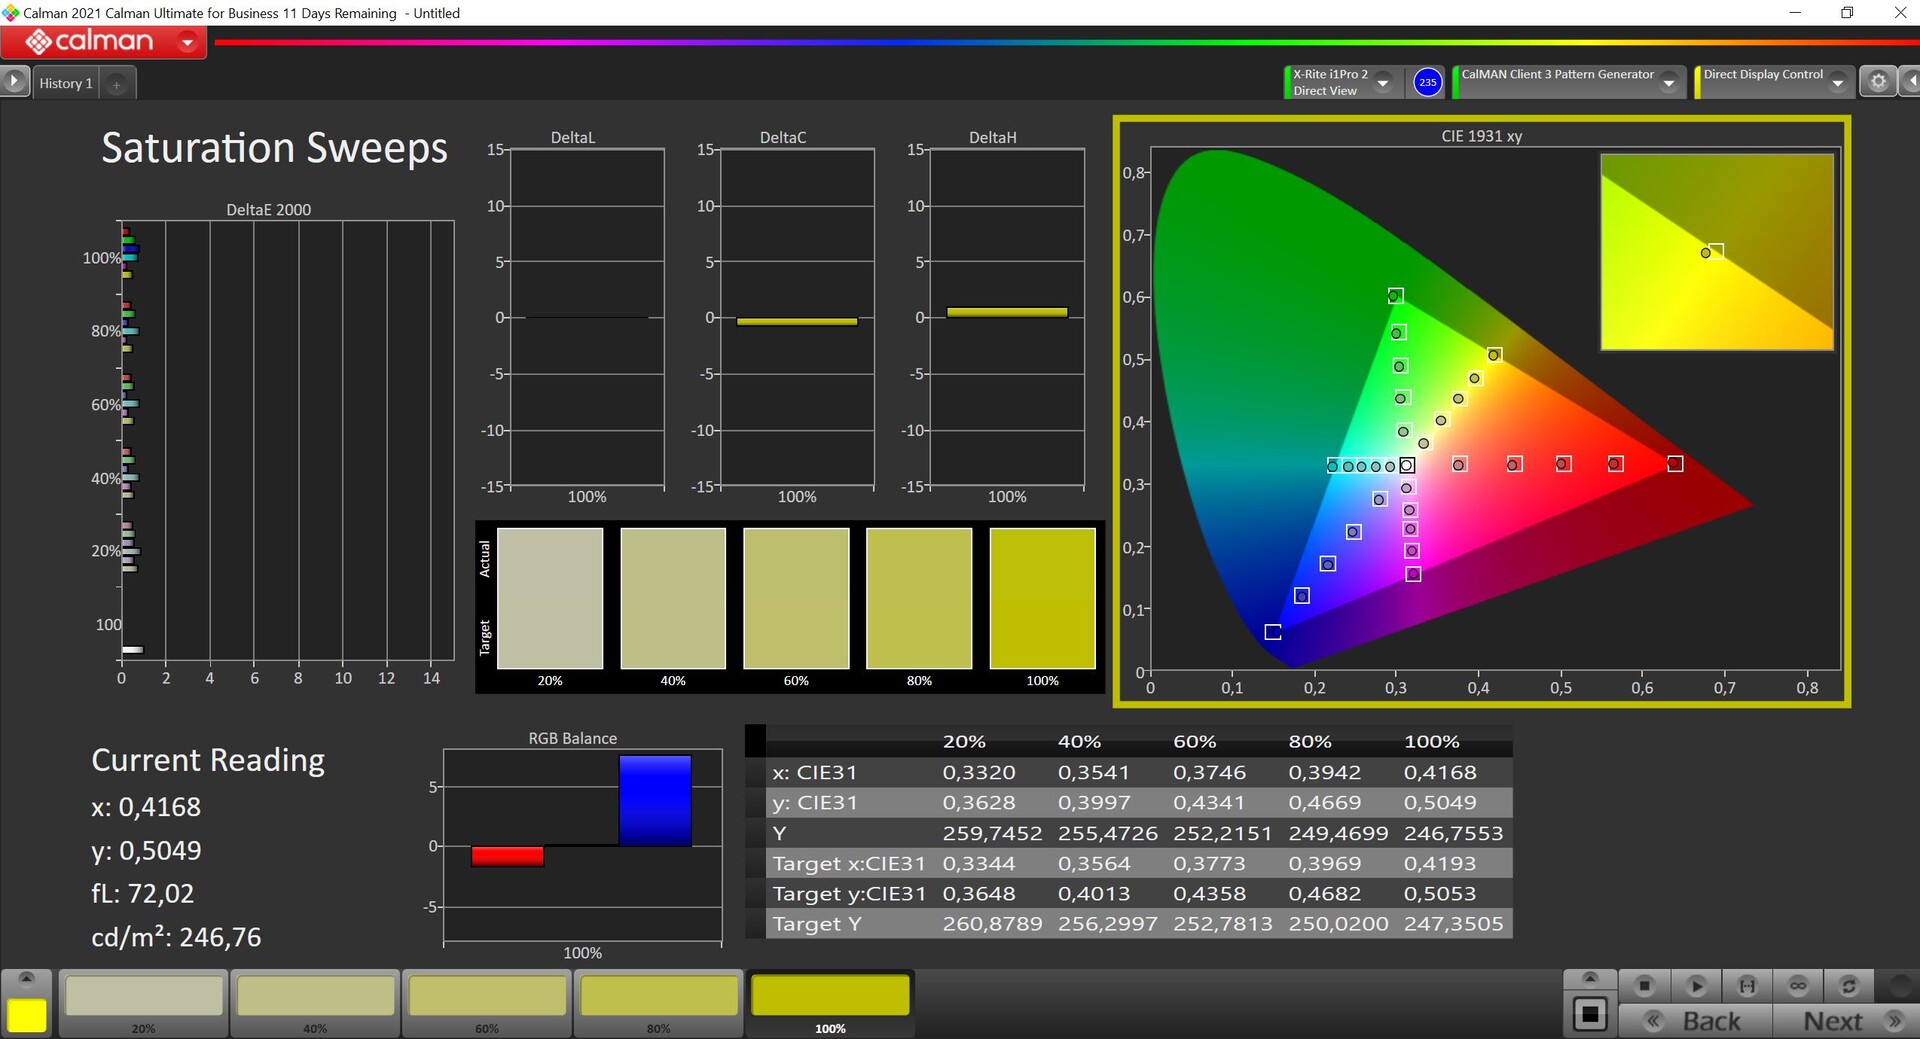

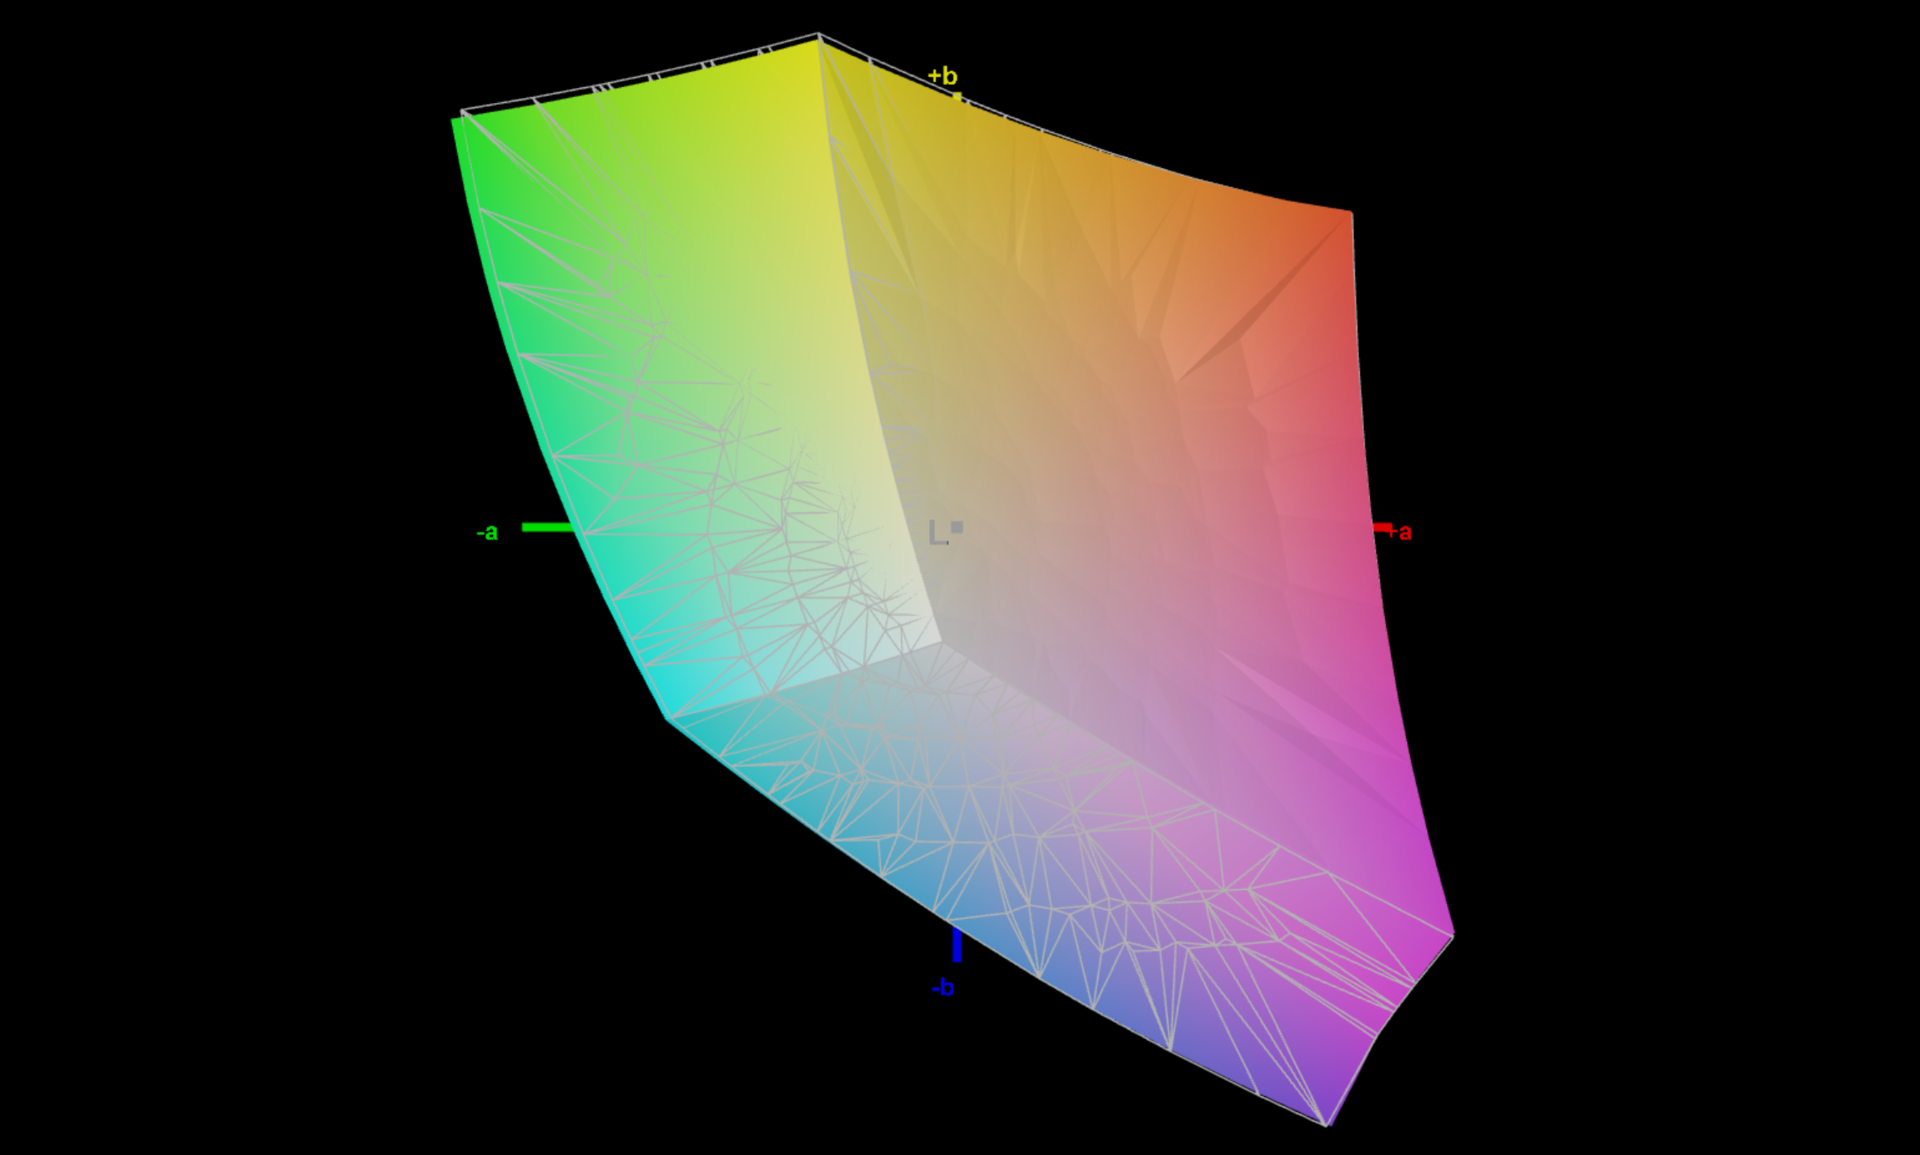
Microsoft ships the Surface Laptop Studio 2 with two color profiles for SDR contents: Vivid and sRGB. The Vivid profile is active by default and the colors are a bit oversaturated, but the accuracy is still okay. We checked both profiles with the professional CalMAN software and the sRGB profile is extremely well calibrated without any color deviations. If you want to edit pictures or videos, you should definitely select the sRGB profile. However, this brings us to one of the biggest issues, because the screen only covers the small sRGB gamut, which is a pretty big drawback considering the price. By the way, we were not able to improve the color accuracy even further with our own calibration, so we do not offer a profile at this point.
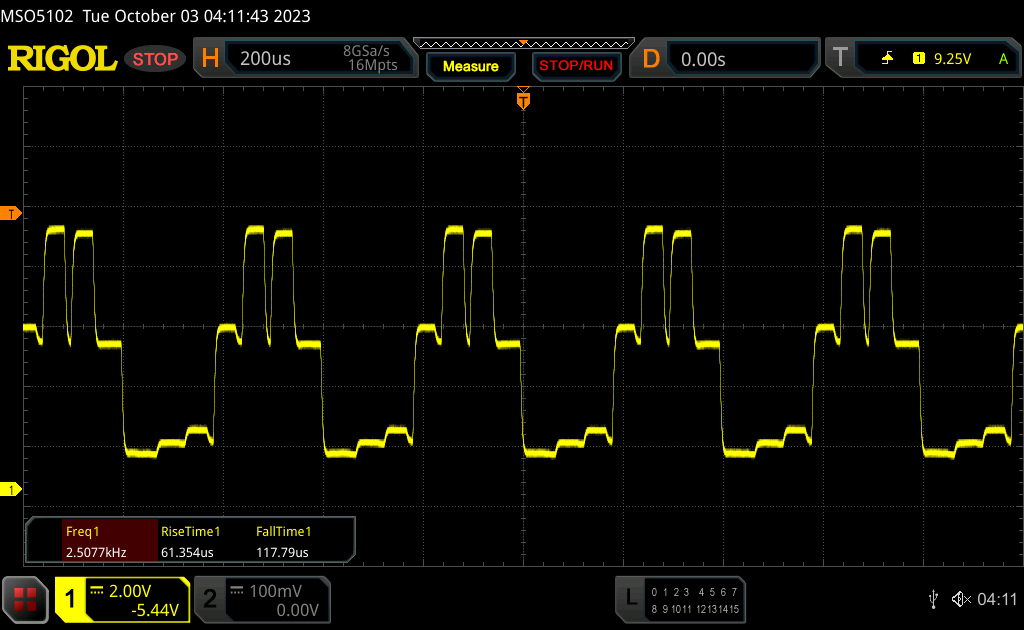
Display Response Times
| ↔ Response Time Black to White | ||
|---|---|---|
| 34.3 ms ... rise ↗ and fall ↘ combined | ↗ 7.7 ms rise | 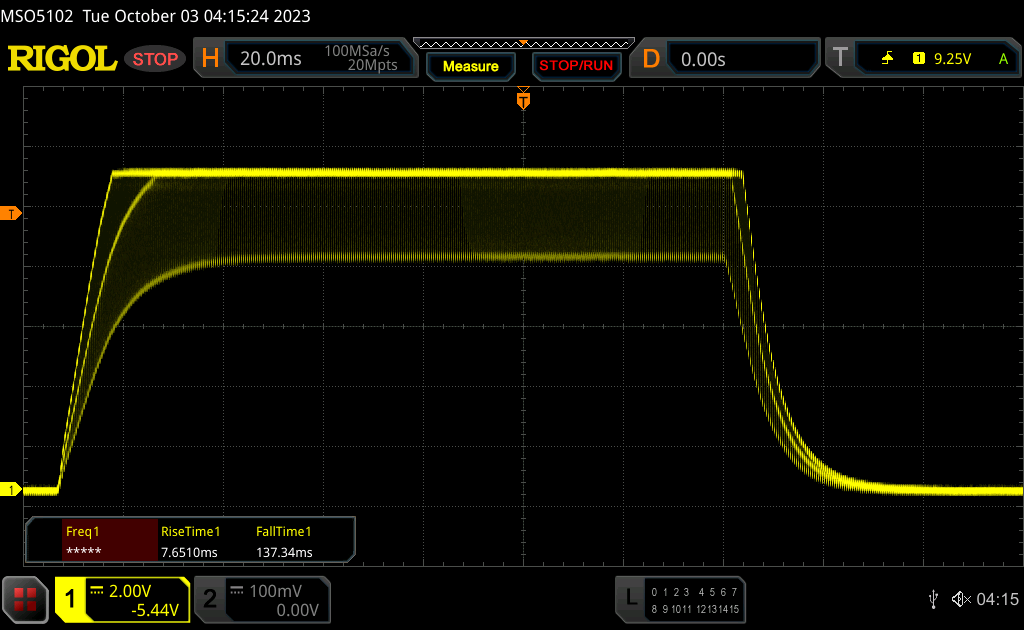 |
| ↘ 26.6 ms fall | ||
| The screen shows slow response rates in our tests and will be unsatisfactory for gamers. In comparison, all tested devices range from 0.1 (minimum) to 240 (maximum) ms. » 92 % of all devices are better. This means that the measured response time is worse than the average of all tested devices (19.8 ms). | ||
| ↔ Response Time 50% Grey to 80% Grey | ||
| 77.6 ms ... rise ↗ and fall ↘ combined | ↗ 35.4 ms rise | 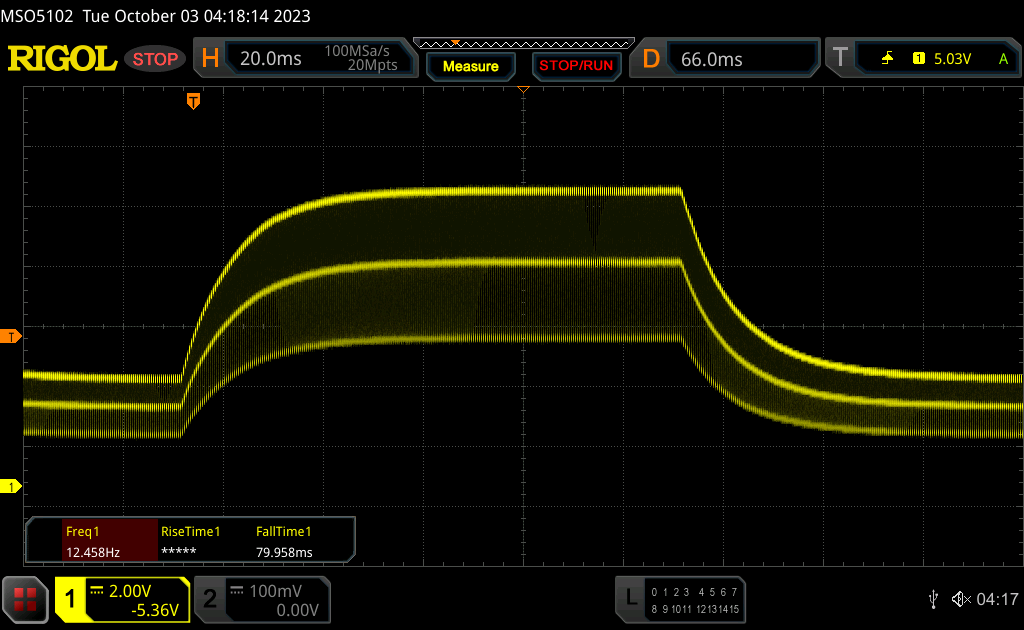 |
| ↘ 42.2 ms fall | ||
| The screen shows slow response rates in our tests and will be unsatisfactory for gamers. In comparison, all tested devices range from 0.165 (minimum) to 636 (maximum) ms. » 99 % of all devices are better. This means that the measured response time is worse than the average of all tested devices (31 ms). | ||
Screen Flickering / PWM (Pulse-Width Modulation)
| Screen flickering / PWM detected | 17600 Hz | ≤ 100 % brightness setting | 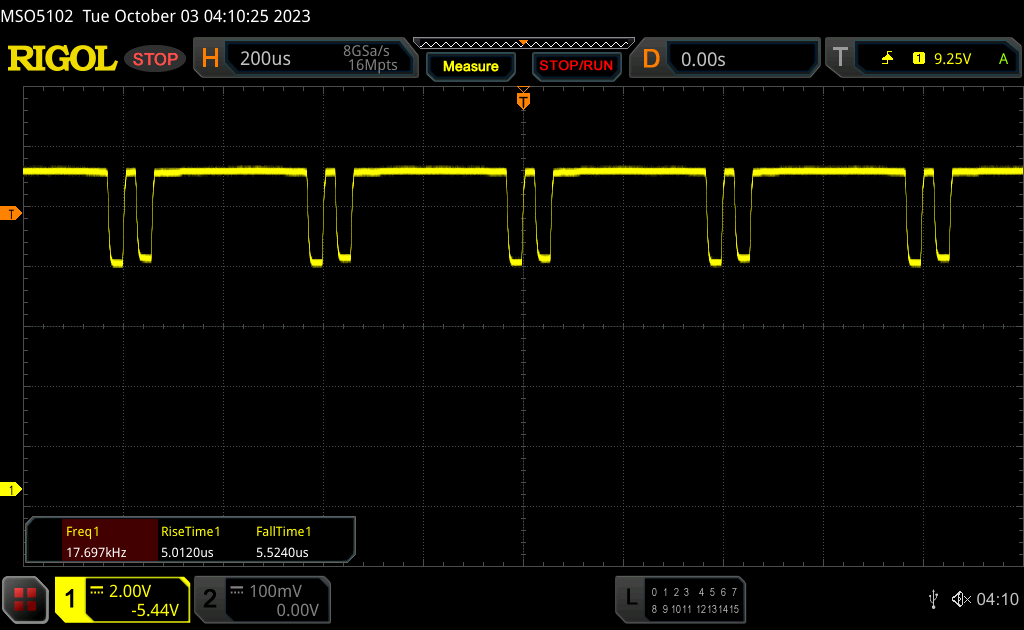 |
The display backlight flickers at 17600 Hz (worst case, e.g., utilizing PWM) Flickering detected at a brightness setting of 100 % and below. There should be no flickering or PWM above this brightness setting. The frequency of 17600 Hz is quite high, so most users sensitive to PWM should not notice any flickering. In comparison: 52 % of all tested devices do not use PWM to dim the display. If PWM was detected, an average of 7750 (minimum: 5 - maximum: 343500) Hz was measured. | |||

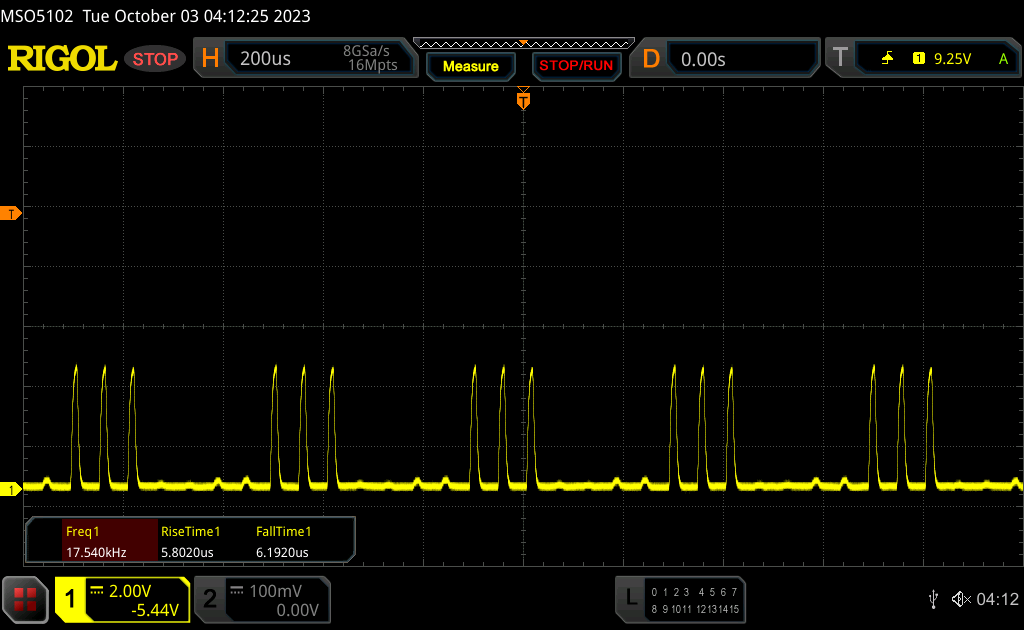
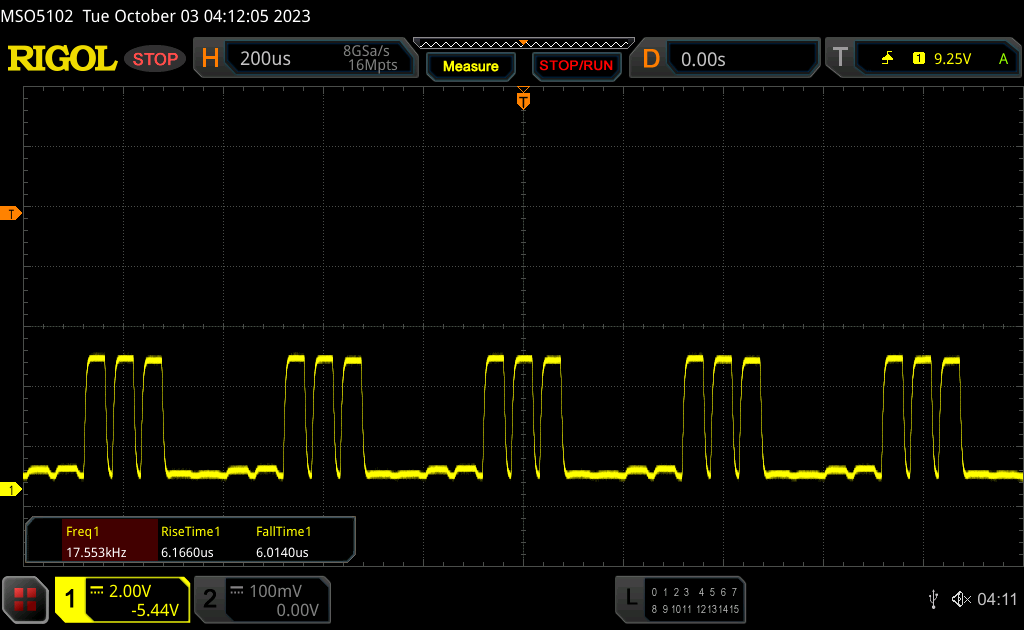
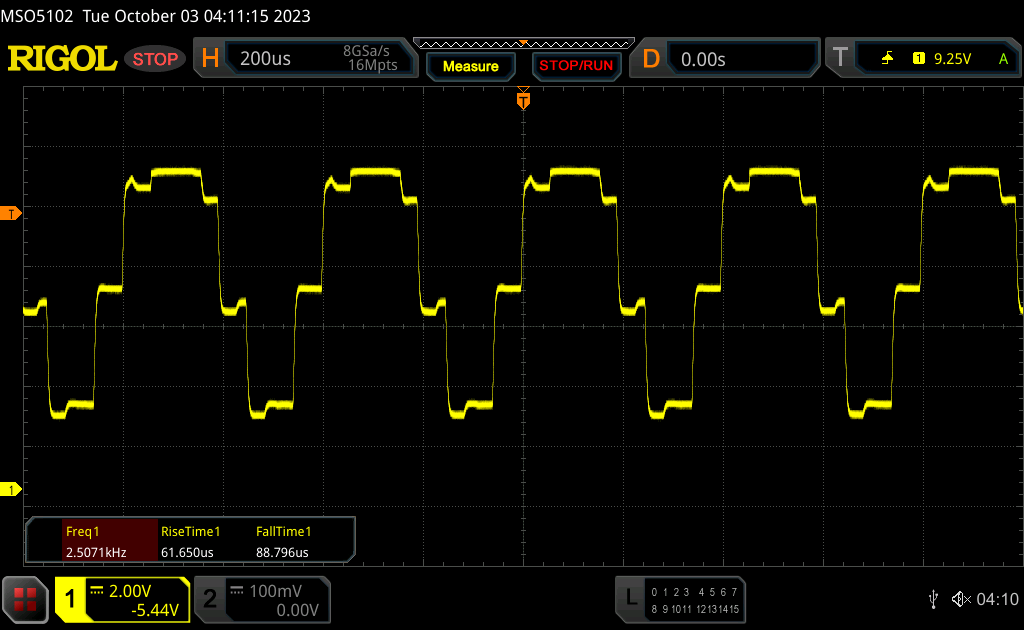
The PWM behavior changed compared to last year’s model and we can now measure flickering at full brightness. However, the frequency is very high at 17 kHz, so there should not be any issues.
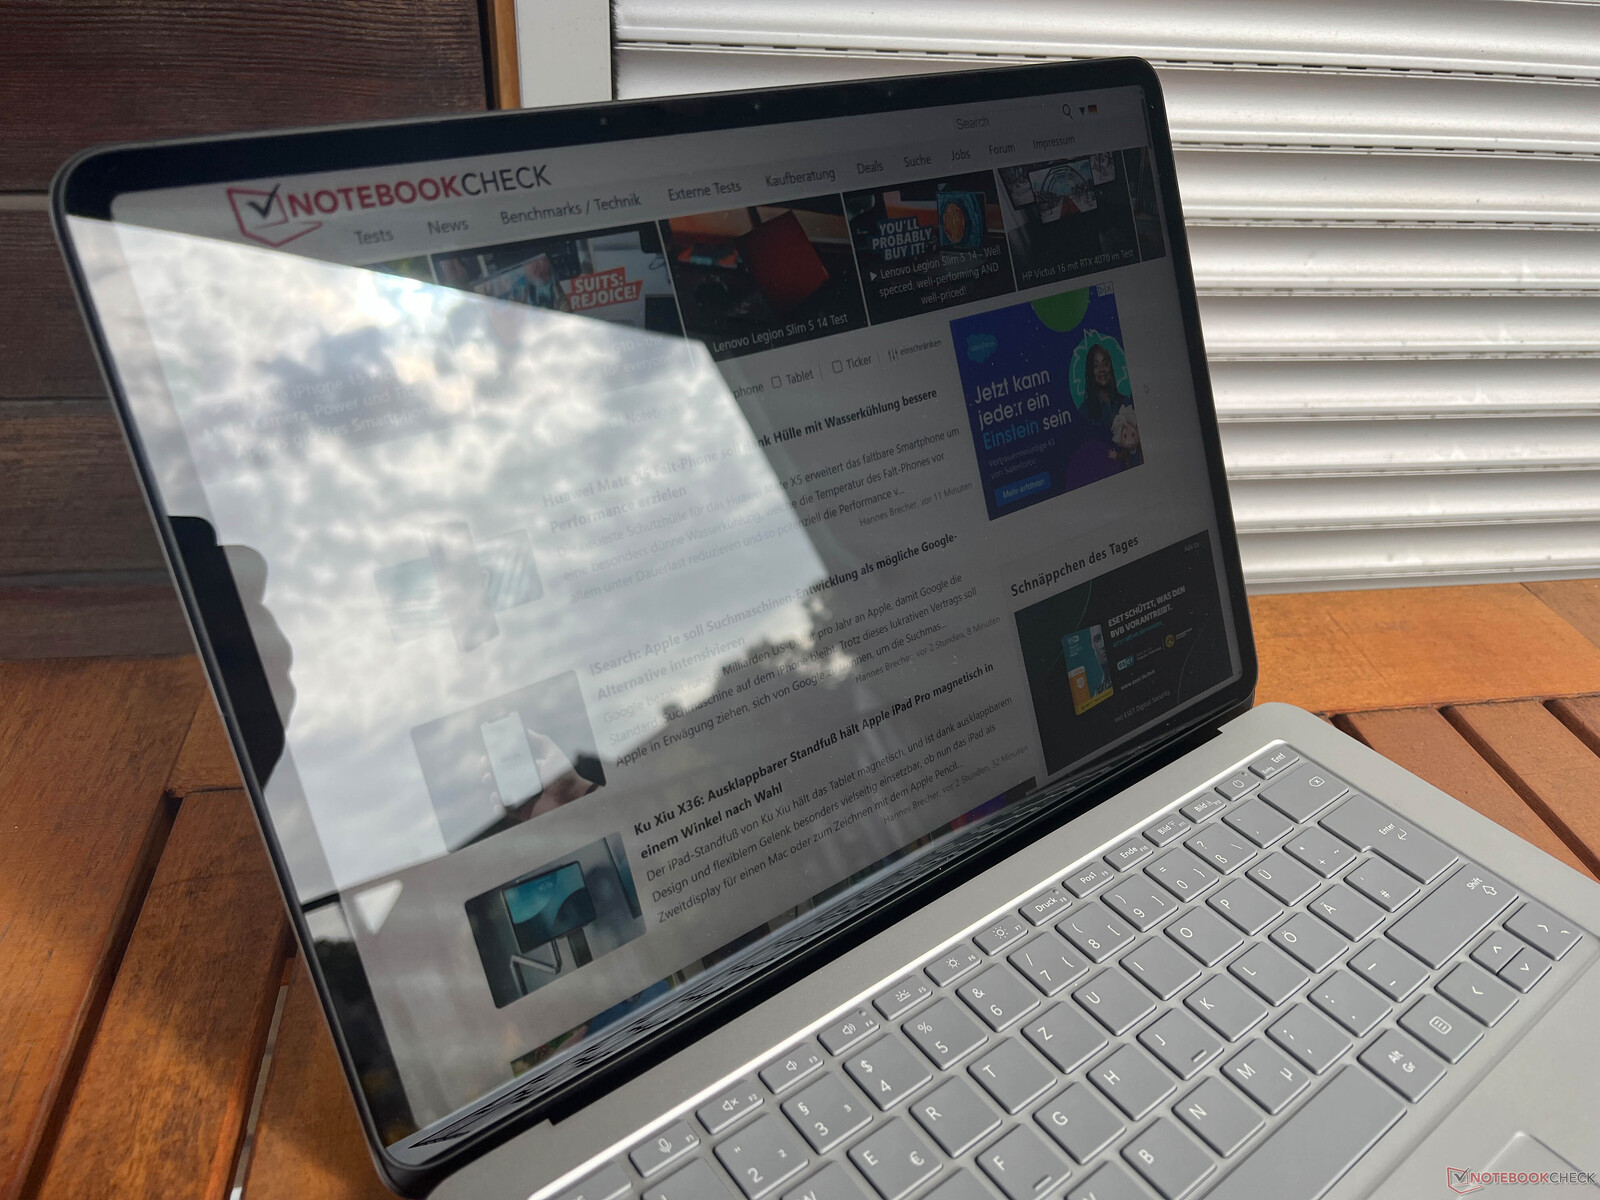
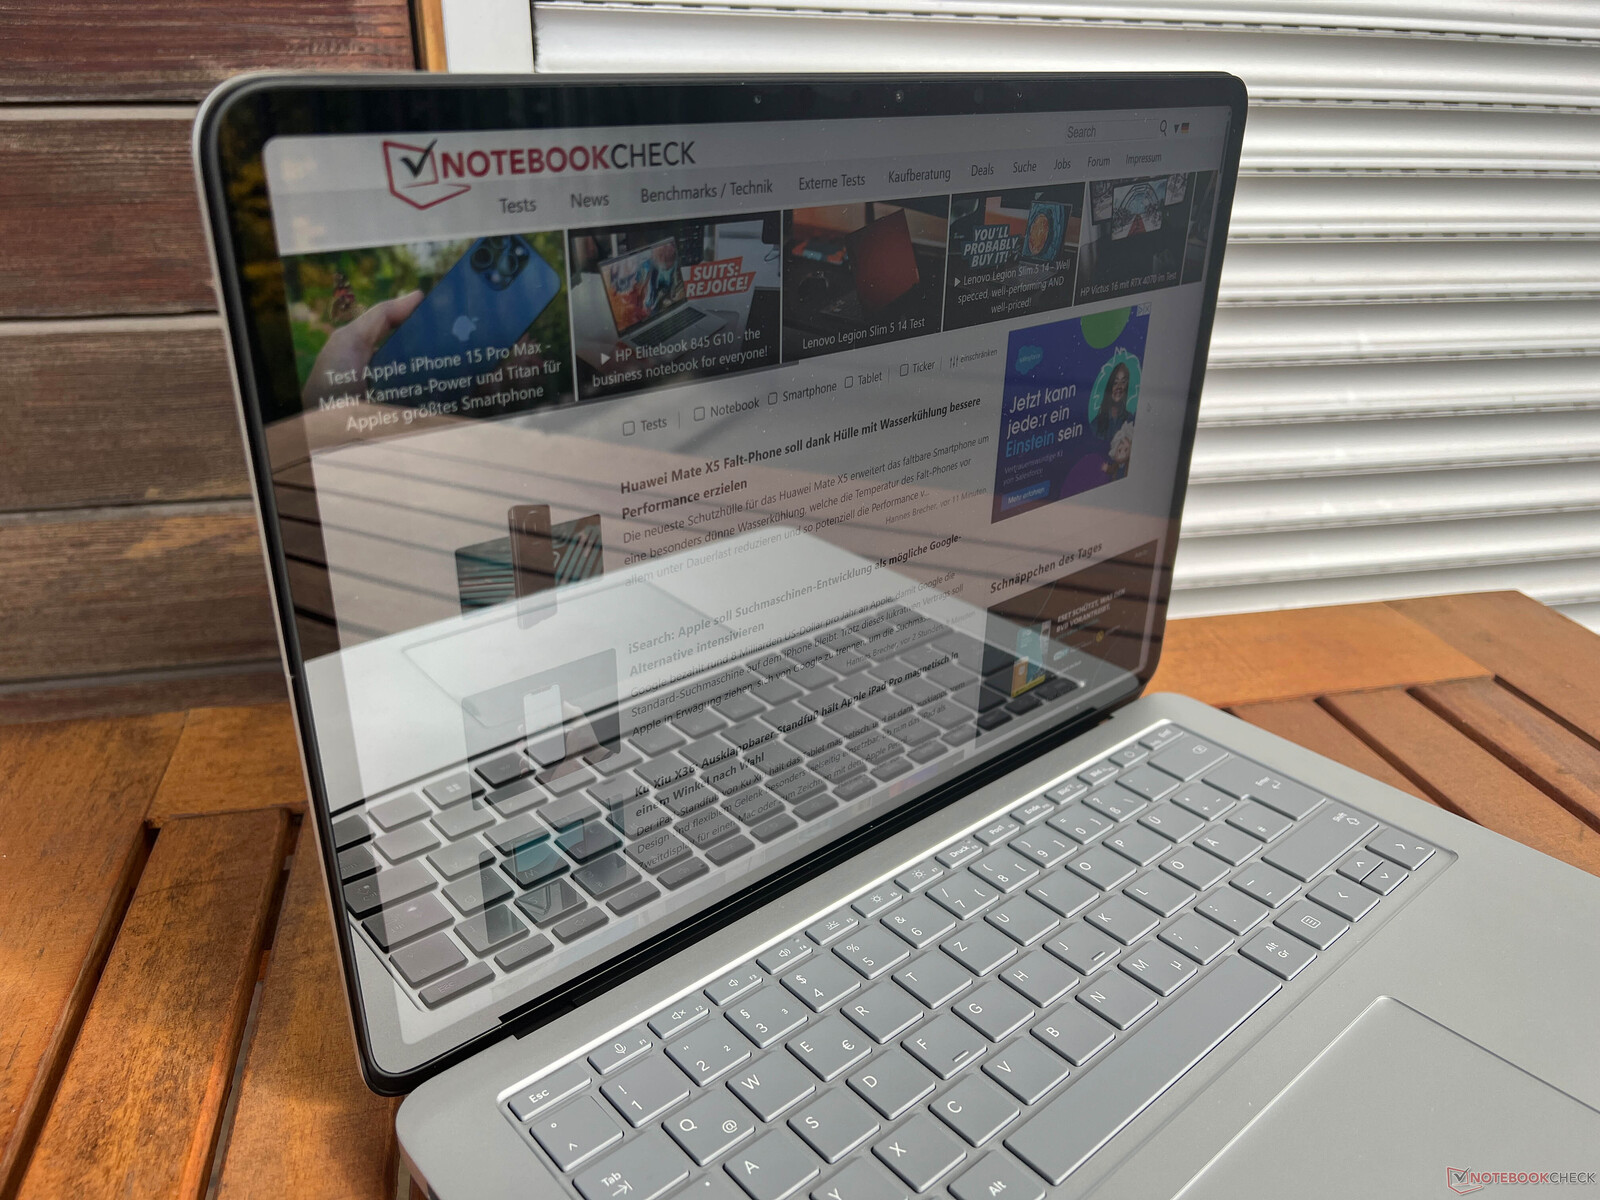
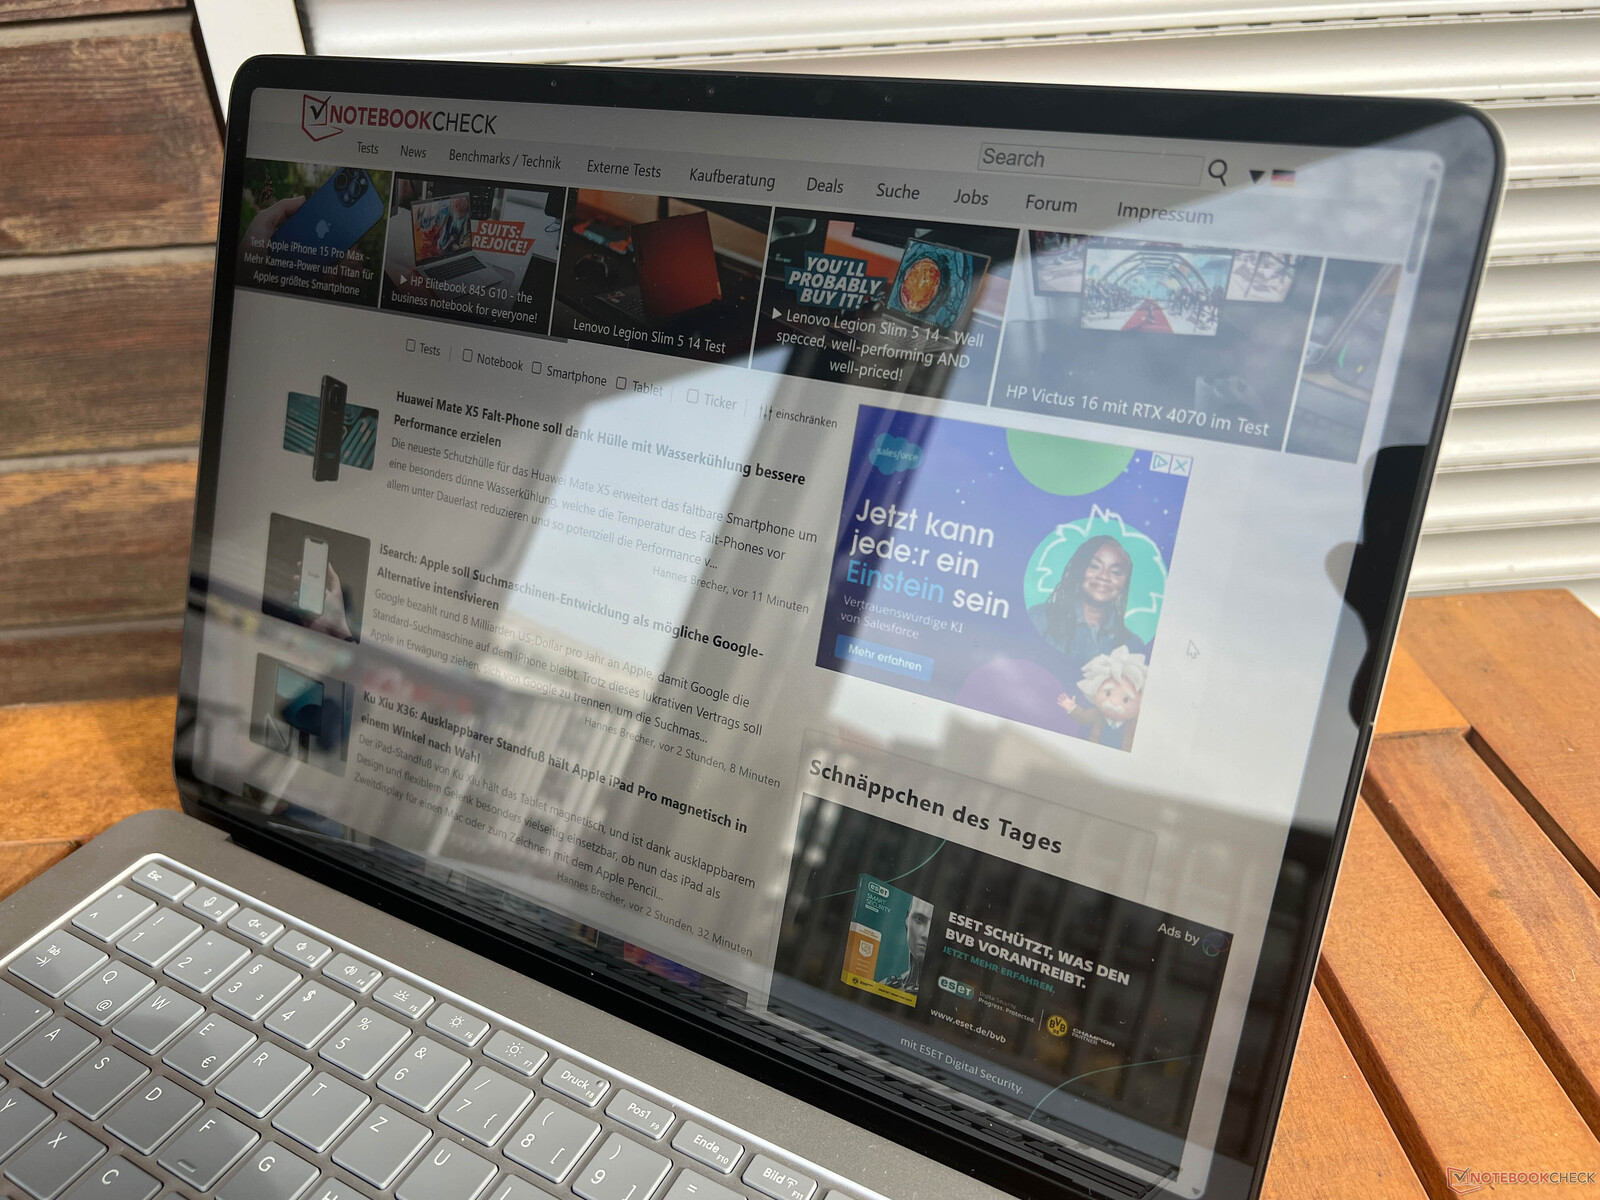
The brightness is good, but you have to avoid reflections on the glossy touchscreen when you want to use it outdoors. The viewing angle stability of the IPS screen is very good.
Performance - Raptor Lake and ADA-Lovelace
Review Settings
As per usual for Microsoft devices, you only get the Windows power profiles, but they have different names compared to other Windows devices. Users can choose between Recommended, Better Performance as well as Best Performance. We listed the corresponding TDP/TGP values in the following table. Our measurements and benchmarks were performed with the profile Best Performance, but you can easily use the Recommended profile for everyday tasks.
| CPU load | GPU load | Stress test | |
|---|---|---|---|
| Recommended | 35 Watts | 60 Watts | CPU: 16 Watts GPU: 32 Watts |
| Better Performance | 45 -> 35 Watts | 70 Watts | CPU: 18 Watts GPU: 37 Watts |
| Best Performance | 82 -> 50 Watts | 80 Watts | CPU: 23 Watts GPU: 57 Watts |
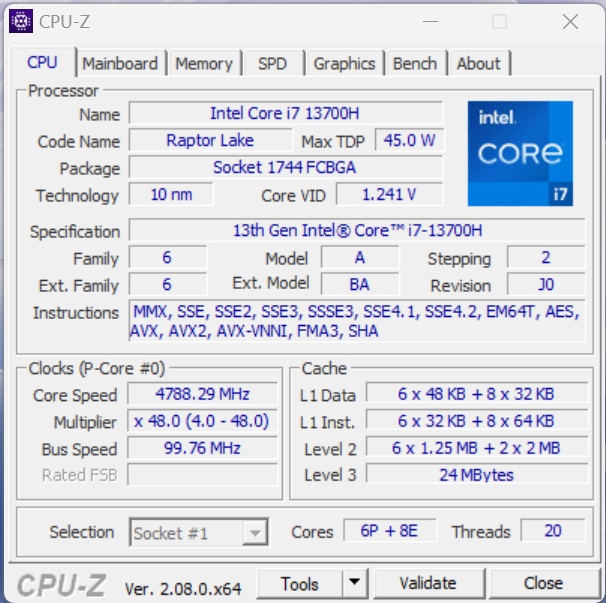
Processor - Core i7-13700H
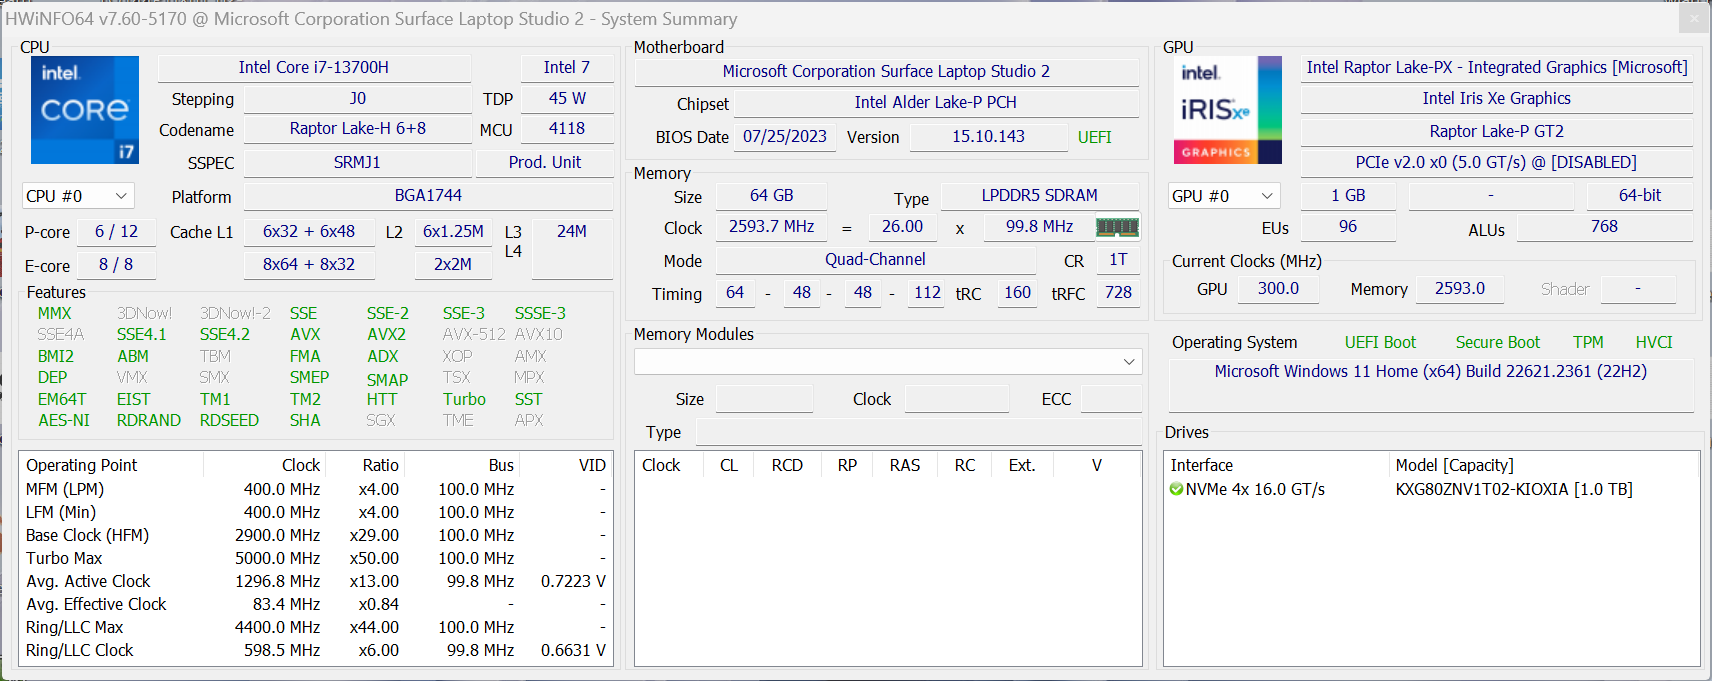
Microsoft replaced the Tiger Lake processor Core i7-11370H (four cores) by the current Raptor Lake Core i7-13700H, which uses a hybrid architecture with six performance and eight efficiency cores, so it can execute up to 20 threads simultaneously. The 45W processor can consume up to 82 Watts for a brief period and then levels off at 52 Watts.
Cinebench R15 Multi Loop
The advantage over the old Surface Laptop Studio is huge (+150% in multi-core tests) and the single-core performance is also very good, but the chip cannot maintain the performance for very long as seen in our Cinebench R15 Multi loop. It even drops to the level of the Apple M2 Pro (where Cinebench R15 is emulated, which costs performance). Competitors with AMD processor offer better and more stable performance figures.
The performance drops even further on battery power since the consumption is limited to 55/40 Watts. This does not affect the single-core performance, but the multi-core performance is around 18 % lower. More CPU benchmarks are available in our tech section.
Cinebench R20: CPU (Multi Core) | CPU (Single Core)
Cinebench R15: CPU Multi 64Bit | CPU Single 64Bit
Blender: v2.79 BMW27 CPU
7-Zip 18.03: 7z b 4 | 7z b 4 -mmt1
Geekbench 5.5: Multi-Core | Single-Core
HWBOT x265 Benchmark v2.2: 4k Preset
LibreOffice : 20 Documents To PDF
R Benchmark 2.5: Overall mean
| Cinebench R23 / Multi Core | |
| Asus Zenbook Pro 14 OLED UX6404VI | |
| Asus ROG Zephyrus G14 GA402XY | |
| Lenovo Yoga Pro 9-14IRP G8 | |
| Asus ZenBook Pro 14 Duo UX8402VV-P1021W | |
| Lenovo Legion Slim 5 14APH8 | |
| Average of class Multimedia (4861 - 33362, n=78, last 2 years) | |
| Microsoft Surface Laptop Studio 2 RTX 4060 | |
| Average Intel Core i7-13700H (5890 - 20034, n=29) | |
| Apple MacBook Pro 14 2023 M2 Pro | |
| Microsoft Surface Laptop Studio i7 RTX 3050 Ti | |
| Cinebench R23 / Single Core | |
| Asus Zenbook Pro 14 OLED UX6404VI | |
| Asus ZenBook Pro 14 Duo UX8402VV-P1021W | |
| Average of class Multimedia (1128 - 2459, n=70, last 2 years) | |
| Microsoft Surface Laptop Studio 2 RTX 4060 | |
| Lenovo Yoga Pro 9-14IRP G8 | |
| Average Intel Core i7-13700H (1323 - 1914, n=29) | |
| Lenovo Legion Slim 5 14APH8 | |
| Asus ROG Zephyrus G14 GA402XY | |
| Apple MacBook Pro 14 2023 M2 Pro | |
| Microsoft Surface Laptop Studio i7 RTX 3050 Ti | |
| Cinebench R20 / CPU (Multi Core) | |
| Asus Zenbook Pro 14 OLED UX6404VI | |
| Asus ROG Zephyrus G14 GA402XY | |
| Lenovo Yoga Pro 9-14IRP G8 | |
| Asus ZenBook Pro 14 Duo UX8402VV-P1021W | |
| Lenovo Legion Slim 5 14APH8 | |
| Average of class Multimedia (1887 - 12912, n=61, last 2 years) | |
| Microsoft Surface Laptop Studio 2 RTX 4060 | |
| Average Intel Core i7-13700H (2322 - 7674, n=29) | |
| Apple MacBook Pro 14 2023 M2 Pro | |
| Microsoft Surface Laptop Studio i7 RTX 3050 Ti | |
| Cinebench R20 / CPU (Single Core) | |
| Asus Zenbook Pro 14 OLED UX6404VI | |
| Asus ZenBook Pro 14 Duo UX8402VV-P1021W | |
| Microsoft Surface Laptop Studio 2 RTX 4060 | |
| Average of class Multimedia (425 - 853, n=61, last 2 years) | |
| Lenovo Yoga Pro 9-14IRP G8 | |
| Asus ROG Zephyrus G14 GA402XY | |
| Average Intel Core i7-13700H (508 - 741, n=29) | |
| Lenovo Legion Slim 5 14APH8 | |
| Microsoft Surface Laptop Studio i7 RTX 3050 Ti | |
| Apple MacBook Pro 14 2023 M2 Pro | |
| Cinebench R15 / CPU Multi 64Bit | |
| Asus Zenbook Pro 14 OLED UX6404VI | |
| Asus ROG Zephyrus G14 GA402XY | |
| Lenovo Yoga Pro 9-14IRP G8 | |
| Lenovo Legion Slim 5 14APH8 | |
| Asus ZenBook Pro 14 Duo UX8402VV-P1021W | |
| Microsoft Surface Laptop Studio 2 RTX 4060 | |
| Average of class Multimedia (856 - 5224, n=65, last 2 years) | |
| Average Intel Core i7-13700H (905 - 2982, n=29) | |
| Apple MacBook Pro 14 2023 M2 Pro | |
| Microsoft Surface Laptop Studio i7 RTX 3050 Ti | |
| Cinebench R15 / CPU Single 64Bit | |
| Asus Zenbook Pro 14 OLED UX6404VI | |
| Asus ZenBook Pro 14 Duo UX8402VV-P1021W | |
| Asus ROG Zephyrus G14 GA402XY | |
| Average of class Multimedia (184.8 - 326, n=63, last 2 years) | |
| Lenovo Legion Slim 5 14APH8 | |
| Microsoft Surface Laptop Studio 2 RTX 4060 | |
| Lenovo Yoga Pro 9-14IRP G8 | |
| Average Intel Core i7-13700H (213 - 278, n=29) | |
| Apple MacBook Pro 14 2023 M2 Pro | |
| Microsoft Surface Laptop Studio i7 RTX 3050 Ti | |
| Blender / v2.79 BMW27 CPU | |
| Microsoft Surface Laptop Studio i7 RTX 3050 Ti | |
| Average of class Multimedia (100 - 557, n=62, last 2 years) | |
| Microsoft Surface Laptop Studio 2 RTX 4060 | |
| Average Intel Core i7-13700H (169 - 555, n=29) | |
| Lenovo Yoga Pro 9-14IRP G8 | |
| Lenovo Legion Slim 5 14APH8 | |
| Asus ZenBook Pro 14 Duo UX8402VV-P1021W | |
| Asus ROG Zephyrus G14 GA402XY | |
| Asus Zenbook Pro 14 OLED UX6404VI | |
| 7-Zip 18.03 / 7z b 4 | |
| Asus Zenbook Pro 14 OLED UX6404VI | |
| Asus ROG Zephyrus G14 GA402XY | |
| Lenovo Yoga Pro 9-14IRP G8 | |
| Asus ZenBook Pro 14 Duo UX8402VV-P1021W | |
| Lenovo Legion Slim 5 14APH8 | |
| Microsoft Surface Laptop Studio 2 RTX 4060 | |
| Average Intel Core i7-13700H (27322 - 76344, n=29) | |
| Average of class Multimedia (26062 - 130368, n=59, last 2 years) | |
| Microsoft Surface Laptop Studio i7 RTX 3050 Ti | |
| 7-Zip 18.03 / 7z b 4 -mmt1 | |
| Asus ROG Zephyrus G14 GA402XY | |
| Asus Zenbook Pro 14 OLED UX6404VI | |
| Asus ZenBook Pro 14 Duo UX8402VV-P1021W | |
| Microsoft Surface Laptop Studio 2 RTX 4060 | |
| Lenovo Legion Slim 5 14APH8 | |
| Lenovo Yoga Pro 9-14IRP G8 | |
| Average of class Multimedia (3666 - 7545, n=60, last 2 years) | |
| Average Intel Core i7-13700H (4825 - 6238, n=29) | |
| Microsoft Surface Laptop Studio i7 RTX 3050 Ti | |
| Geekbench 5.5 / Multi-Core | |
| Apple MacBook Pro 14 2023 M2 Pro | |
| Asus Zenbook Pro 14 OLED UX6404VI | |
| Lenovo Yoga Pro 9-14IRP G8 | |
| Average of class Multimedia (4652 - 20422, n=60, last 2 years) | |
| Microsoft Surface Laptop Studio 2 RTX 4060 | |
| Asus ZenBook Pro 14 Duo UX8402VV-P1021W | |
| Asus ROG Zephyrus G14 GA402XY | |
| Average Intel Core i7-13700H (6165 - 14215, n=29) | |
| Lenovo Legion Slim 5 14APH8 | |
| Microsoft Surface Laptop Studio i7 RTX 3050 Ti | |
| Geekbench 5.5 / Single-Core | |
| Asus ROG Zephyrus G14 GA402XY | |
| Asus Zenbook Pro 14 OLED UX6404VI | |
| Average of class Multimedia (805 - 2974, n=60, last 2 years) | |
| Apple MacBook Pro 14 2023 M2 Pro | |
| Lenovo Legion Slim 5 14APH8 | |
| Asus ZenBook Pro 14 Duo UX8402VV-P1021W | |
| Lenovo Yoga Pro 9-14IRP G8 | |
| Microsoft Surface Laptop Studio 2 RTX 4060 | |
| Average Intel Core i7-13700H (1362 - 1919, n=29) | |
| Microsoft Surface Laptop Studio i7 RTX 3050 Ti | |
| HWBOT x265 Benchmark v2.2 / 4k Preset | |
| Asus ROG Zephyrus G14 GA402XY | |
| Lenovo Legion Slim 5 14APH8 | |
| Asus Zenbook Pro 14 OLED UX6404VI | |
| Lenovo Yoga Pro 9-14IRP G8 | |
| Average of class Multimedia (5.26 - 36.1, n=60, last 2 years) | |
| Asus ZenBook Pro 14 Duo UX8402VV-P1021W | |
| Microsoft Surface Laptop Studio 2 RTX 4060 | |
| Average Intel Core i7-13700H (6.72 - 21.2, n=29) | |
| Microsoft Surface Laptop Studio i7 RTX 3050 Ti | |
| LibreOffice / 20 Documents To PDF | |
| Microsoft Surface Laptop Studio i7 RTX 3050 Ti | |
| Average of class Multimedia (23.9 - 146.7, n=61, last 2 years) | |
| Average Intel Core i7-13700H (31.3 - 62.4, n=29) | |
| Lenovo Yoga Pro 9-14IRP G8 | |
| Microsoft Surface Laptop Studio 2 RTX 4060 | |
| Asus Zenbook Pro 14 OLED UX6404VI | |
| Lenovo Legion Slim 5 14APH8 | |
| Asus ZenBook Pro 14 Duo UX8402VV-P1021W | |
| Asus ROG Zephyrus G14 GA402XY | |
| R Benchmark 2.5 / Overall mean | |
| Microsoft Surface Laptop Studio i7 RTX 3050 Ti | |
| Average Intel Core i7-13700H (0.4308 - 0.607, n=29) | |
| Average of class Multimedia (0.3604 - 0.947, n=60, last 2 years) | |
| Lenovo Legion Slim 5 14APH8 | |
| Microsoft Surface Laptop Studio 2 RTX 4060 | |
| Asus ZenBook Pro 14 Duo UX8402VV-P1021W | |
| Lenovo Yoga Pro 9-14IRP G8 | |
| Asus ROG Zephyrus G14 GA402XY | |
| Asus Zenbook Pro 14 OLED UX6404VI | |
* ... smaller is better
AIDA64: FP32 Ray-Trace | FPU Julia | CPU SHA3 | CPU Queen | FPU SinJulia | FPU Mandel | CPU AES | CPU ZLib | FP64 Ray-Trace | CPU PhotoWorxx
| Performance rating | |
| Lenovo Legion Slim 5 14APH8 | |
| Asus Zenbook Pro 14 OLED UX6404VI | |
| Lenovo Yoga Pro 9-14IRP G8 | |
| Average of class Multimedia | |
| Asus ZenBook Pro 14 Duo UX8402VV-P1021W | |
| Average Intel Core i7-13700H | |
| Microsoft Surface Laptop Studio 2 RTX 4060 | |
| Microsoft Surface Laptop Studio i7 RTX 3050 Ti | |
| AIDA64 / FP32 Ray-Trace | |
| Lenovo Legion Slim 5 14APH8 | |
| Average of class Multimedia (2214 - 50388, n=57, last 2 years) | |
| Lenovo Yoga Pro 9-14IRP G8 | |
| Asus Zenbook Pro 14 OLED UX6404VI | |
| Asus ZenBook Pro 14 Duo UX8402VV-P1021W | |
| Average Intel Core i7-13700H (4986 - 18908, n=29) | |
| Microsoft Surface Laptop Studio 2 RTX 4060 | |
| Microsoft Surface Laptop Studio i7 RTX 3050 Ti | |
| AIDA64 / FPU Julia | |
| Lenovo Legion Slim 5 14APH8 | |
| Asus Zenbook Pro 14 OLED UX6404VI | |
| Average of class Multimedia (12867 - 201874, n=58, last 2 years) | |
| Lenovo Yoga Pro 9-14IRP G8 | |
| Asus ZenBook Pro 14 Duo UX8402VV-P1021W | |
| Microsoft Surface Laptop Studio 2 RTX 4060 | |
| Average Intel Core i7-13700H (25360 - 92359, n=29) | |
| Microsoft Surface Laptop Studio i7 RTX 3050 Ti | |
| AIDA64 / CPU SHA3 | |
| Lenovo Legion Slim 5 14APH8 | |
| Asus Zenbook Pro 14 OLED UX6404VI | |
| Average of class Multimedia (626 - 8623, n=58, last 2 years) | |
| Lenovo Yoga Pro 9-14IRP G8 | |
| Microsoft Surface Laptop Studio 2 RTX 4060 | |
| Average Intel Core i7-13700H (1339 - 4224, n=29) | |
| Asus ZenBook Pro 14 Duo UX8402VV-P1021W | |
| Microsoft Surface Laptop Studio i7 RTX 3050 Ti | |
| AIDA64 / CPU Queen | |
| Lenovo Legion Slim 5 14APH8 | |
| Asus Zenbook Pro 14 OLED UX6404VI | |
| Asus ZenBook Pro 14 Duo UX8402VV-P1021W | |
| Lenovo Yoga Pro 9-14IRP G8 | |
| Microsoft Surface Laptop Studio 2 RTX 4060 | |
| Average Intel Core i7-13700H (59324 - 107159, n=29) | |
| Average of class Multimedia (13483 - 181505, n=45, last 2 years) | |
| Microsoft Surface Laptop Studio i7 RTX 3050 Ti | |
| AIDA64 / FPU SinJulia | |
| Lenovo Legion Slim 5 14APH8 | |
| Lenovo Yoga Pro 9-14IRP G8 | |
| Asus Zenbook Pro 14 OLED UX6404VI | |
| Asus ZenBook Pro 14 Duo UX8402VV-P1021W | |
| Average of class Multimedia (886 - 28794, n=58, last 2 years) | |
| Average Intel Core i7-13700H (4800 - 11050, n=29) | |
| Microsoft Surface Laptop Studio 2 RTX 4060 | |
| Microsoft Surface Laptop Studio i7 RTX 3050 Ti | |
| AIDA64 / FPU Mandel | |
| Lenovo Legion Slim 5 14APH8 | |
| Average of class Multimedia (6395 - 105740, n=57, last 2 years) | |
| Lenovo Yoga Pro 9-14IRP G8 | |
| Asus Zenbook Pro 14 OLED UX6404VI | |
| Asus ZenBook Pro 14 Duo UX8402VV-P1021W | |
| Average Intel Core i7-13700H (12321 - 45118, n=29) | |
| Microsoft Surface Laptop Studio 2 RTX 4060 | |
| Microsoft Surface Laptop Studio i7 RTX 3050 Ti | |
| AIDA64 / CPU AES | |
| Asus Zenbook Pro 14 OLED UX6404VI | |
| Lenovo Yoga Pro 9-14IRP G8 | |
| Average Intel Core i7-13700H (28769 - 151254, n=29) | |
| Lenovo Legion Slim 5 14APH8 | |
| Microsoft Surface Laptop Studio 2 RTX 4060 | |
| Average of class Multimedia (8171 - 126790, n=58, last 2 years) | |
| Asus ZenBook Pro 14 Duo UX8402VV-P1021W | |
| Microsoft Surface Laptop Studio i7 RTX 3050 Ti | |
| AIDA64 / CPU ZLib | |
| Asus Zenbook Pro 14 OLED UX6404VI | |
| Lenovo Yoga Pro 9-14IRP G8 | |
| Lenovo Legion Slim 5 14APH8 | |
| Average of class Multimedia (143.8 - 2022, n=58, last 2 years) | |
| Microsoft Surface Laptop Studio 2 RTX 4060 | |
| Average Intel Core i7-13700H (389 - 1215, n=29) | |
| Asus ZenBook Pro 14 Duo UX8402VV-P1021W | |
| Microsoft Surface Laptop Studio i7 RTX 3050 Ti | |
| AIDA64 / FP64 Ray-Trace | |
| Lenovo Legion Slim 5 14APH8 | |
| Average of class Multimedia (1014 - 26875, n=58, last 2 years) | |
| Lenovo Yoga Pro 9-14IRP G8 | |
| Asus Zenbook Pro 14 OLED UX6404VI | |
| Asus ZenBook Pro 14 Duo UX8402VV-P1021W | |
| Average Intel Core i7-13700H (2540 - 10135, n=29) | |
| Microsoft Surface Laptop Studio 2 RTX 4060 | |
| Microsoft Surface Laptop Studio i7 RTX 3050 Ti | |
| AIDA64 / CPU PhotoWorxx | |
| Lenovo Yoga Pro 9-14IRP G8 | |
| Average of class Multimedia (8187 - 88154, n=58, last 2 years) | |
| Microsoft Surface Laptop Studio 2 RTX 4060 | |
| Asus Zenbook Pro 14 OLED UX6404VI | |
| Asus ZenBook Pro 14 Duo UX8402VV-P1021W | |
| Average Intel Core i7-13700H (12872 - 52727, n=29) | |
| Microsoft Surface Laptop Studio i7 RTX 3050 Ti | |
| Lenovo Legion Slim 5 14APH8 | |
System Performance
The Surface Laptop Studio 2 is a very responsive device, but this is hardly a surprise considering the powerful components. It also performs well in the synthetic benchmarks and we did not notice any issues during our review period.
CrossMark: Overall | Productivity | Creativity | Responsiveness
| PCMark 10 / Score | |
| Asus ROG Zephyrus G14 GA402XY | |
| Lenovo Legion Slim 5 14APH8 | |
| Average of class Multimedia (4325 - 10386, n=56, last 2 years) | |
| Asus ZenBook Pro 14 Duo UX8402VV-P1021W | |
| Asus Zenbook Pro 14 OLED UX6404VI | |
| Average Intel Core i7-13700H, NVIDIA GeForce RTX 4060 Laptop GPU (7157 - 7661, n=5) | |
| Lenovo Yoga Pro 9-14IRP G8 | |
| Microsoft Surface Laptop Studio 2 RTX 4060 | |
| Microsoft Surface Laptop Studio i7 RTX 3050 Ti | |
| PCMark 10 / Essentials | |
| Asus ZenBook Pro 14 Duo UX8402VV-P1021W | |
| Lenovo Yoga Pro 9-14IRP G8 | |
| Lenovo Legion Slim 5 14APH8 | |
| Asus Zenbook Pro 14 OLED UX6404VI | |
| Average Intel Core i7-13700H, NVIDIA GeForce RTX 4060 Laptop GPU (10179 - 11200, n=5) | |
| Microsoft Surface Laptop Studio 2 RTX 4060 | |
| Asus ROG Zephyrus G14 GA402XY | |
| Average of class Multimedia (8025 - 11664, n=55, last 2 years) | |
| Microsoft Surface Laptop Studio i7 RTX 3050 Ti | |
| PCMark 10 / Productivity | |
| Average of class Multimedia (7323 - 18233, n=55, last 2 years) | |
| Asus ROG Zephyrus G14 GA402XY | |
| Asus ZenBook Pro 14 Duo UX8402VV-P1021W | |
| Lenovo Legion Slim 5 14APH8 | |
| Asus Zenbook Pro 14 OLED UX6404VI | |
| Average Intel Core i7-13700H, NVIDIA GeForce RTX 4060 Laptop GPU (8238 - 10249, n=5) | |
| Microsoft Surface Laptop Studio 2 RTX 4060 | |
| Lenovo Yoga Pro 9-14IRP G8 | |
| Microsoft Surface Laptop Studio i7 RTX 3050 Ti | |
| PCMark 10 / Digital Content Creation | |
| Asus ROG Zephyrus G14 GA402XY | |
| Lenovo Legion Slim 5 14APH8 | |
| Average Intel Core i7-13700H, NVIDIA GeForce RTX 4060 Laptop GPU (10308 - 11862, n=5) | |
| Asus Zenbook Pro 14 OLED UX6404VI | |
| Lenovo Yoga Pro 9-14IRP G8 | |
| Microsoft Surface Laptop Studio 2 RTX 4060 | |
| Asus ZenBook Pro 14 Duo UX8402VV-P1021W | |
| Average of class Multimedia (3651 - 16240, n=55, last 2 years) | |
| Microsoft Surface Laptop Studio i7 RTX 3050 Ti | |
| CrossMark / Overall | |
| Asus Zenbook Pro 14 OLED UX6404VI | |
| Asus ZenBook Pro 14 Duo UX8402VV-P1021W | |
| Average of class Multimedia (866 - 2728, n=64, last 2 years) | |
| Lenovo Yoga Pro 9-14IRP G8 | |
| Lenovo Legion Slim 5 14APH8 | |
| Asus ROG Zephyrus G14 GA402XY | |
| Apple MacBook Pro 14 2023 M2 Pro | |
| Microsoft Surface Laptop Studio 2 RTX 4060 | |
| Average Intel Core i7-13700H, NVIDIA GeForce RTX 4060 Laptop GPU (1629 - 1849, n=5) | |
| Microsoft Surface Laptop Studio i7 RTX 3050 Ti | |
| CrossMark / Productivity | |
| Lenovo Legion Slim 5 14APH8 | |
| Asus Zenbook Pro 14 OLED UX6404VI | |
| Asus ZenBook Pro 14 Duo UX8402VV-P1021W | |
| Asus ROG Zephyrus G14 GA402XY | |
| Average of class Multimedia (931 - 2489, n=64, last 2 years) | |
| Lenovo Yoga Pro 9-14IRP G8 | |
| Average Intel Core i7-13700H, NVIDIA GeForce RTX 4060 Laptop GPU (1561 - 1743, n=5) | |
| Microsoft Surface Laptop Studio 2 RTX 4060 | |
| Apple MacBook Pro 14 2023 M2 Pro | |
| Microsoft Surface Laptop Studio i7 RTX 3050 Ti | |
| CrossMark / Creativity | |
| Apple MacBook Pro 14 2023 M2 Pro | |
| Asus Zenbook Pro 14 OLED UX6404VI | |
| Lenovo Yoga Pro 9-14IRP G8 | |
| Average of class Multimedia (907 - 3465, n=64, last 2 years) | |
| Asus ZenBook Pro 14 Duo UX8402VV-P1021W | |
| Asus ROG Zephyrus G14 GA402XY | |
| Microsoft Surface Laptop Studio 2 RTX 4060 | |
| Lenovo Legion Slim 5 14APH8 | |
| Average Intel Core i7-13700H, NVIDIA GeForce RTX 4060 Laptop GPU (1691 - 2064, n=5) | |
| Microsoft Surface Laptop Studio i7 RTX 3050 Ti | |
| CrossMark / Responsiveness | |
| Lenovo Legion Slim 5 14APH8 | |
| Asus Zenbook Pro 14 OLED UX6404VI | |
| Asus ZenBook Pro 14 Duo UX8402VV-P1021W | |
| Lenovo Yoga Pro 9-14IRP G8 | |
| Average of class Multimedia (605 - 2024, n=64, last 2 years) | |
| Average Intel Core i7-13700H, NVIDIA GeForce RTX 4060 Laptop GPU (1381 - 1656, n=5) | |
| Asus ROG Zephyrus G14 GA402XY | |
| Microsoft Surface Laptop Studio 2 RTX 4060 | |
| Apple MacBook Pro 14 2023 M2 Pro | |
| Microsoft Surface Laptop Studio i7 RTX 3050 Ti | |
| PCMark 10 Score | 7351 points | |
Help | ||
| AIDA64 / Memory Copy | |
| Average of class Multimedia (11299 - 132135, n=58, last 2 years) | |
| Lenovo Yoga Pro 9-14IRP G8 | |
| Lenovo Legion Slim 5 14APH8 | |
| Microsoft Surface Laptop Studio 2 RTX 4060 | |
| Asus Zenbook Pro 14 OLED UX6404VI | |
| Average Intel Core i7-13700H (24334 - 78081, n=29) | |
| Asus ZenBook Pro 14 Duo UX8402VV-P1021W | |
| Microsoft Surface Laptop Studio i7 RTX 3050 Ti | |
| AIDA64 / Memory Read | |
| Average of class Multimedia (11624 - 174586, n=58, last 2 years) | |
| Lenovo Yoga Pro 9-14IRP G8 | |
| Asus Zenbook Pro 14 OLED UX6404VI | |
| Average Intel Core i7-13700H (23681 - 79656, n=29) | |
| Microsoft Surface Laptop Studio 2 RTX 4060 | |
| Asus ZenBook Pro 14 Duo UX8402VV-P1021W | |
| Microsoft Surface Laptop Studio i7 RTX 3050 Ti | |
| Lenovo Legion Slim 5 14APH8 | |
| AIDA64 / Memory Write | |
| Lenovo Legion Slim 5 14APH8 | |
| Lenovo Yoga Pro 9-14IRP G8 | |
| Average of class Multimedia (11755 - 134998, n=58, last 2 years) | |
| Microsoft Surface Laptop Studio 2 RTX 4060 | |
| Asus ZenBook Pro 14 Duo UX8402VV-P1021W | |
| Average Intel Core i7-13700H (22986 - 99898, n=29) | |
| Asus Zenbook Pro 14 OLED UX6404VI | |
| Microsoft Surface Laptop Studio i7 RTX 3050 Ti | |
| AIDA64 / Memory Latency | |
| Average of class Multimedia (7 - 535, n=57, last 2 years) | |
| Lenovo Legion Slim 5 14APH8 | |
| Microsoft Surface Laptop Studio i7 RTX 3050 Ti | |
| Average Intel Core i7-13700H (82.4 - 136.8, n=29) | |
| Lenovo Yoga Pro 9-14IRP G8 | |
| Asus ZenBook Pro 14 Duo UX8402VV-P1021W | |
| Microsoft Surface Laptop Studio 2 RTX 4060 | |
| Asus Zenbook Pro 14 OLED UX6404VI | |
* ... smaller is better
DPC Latency
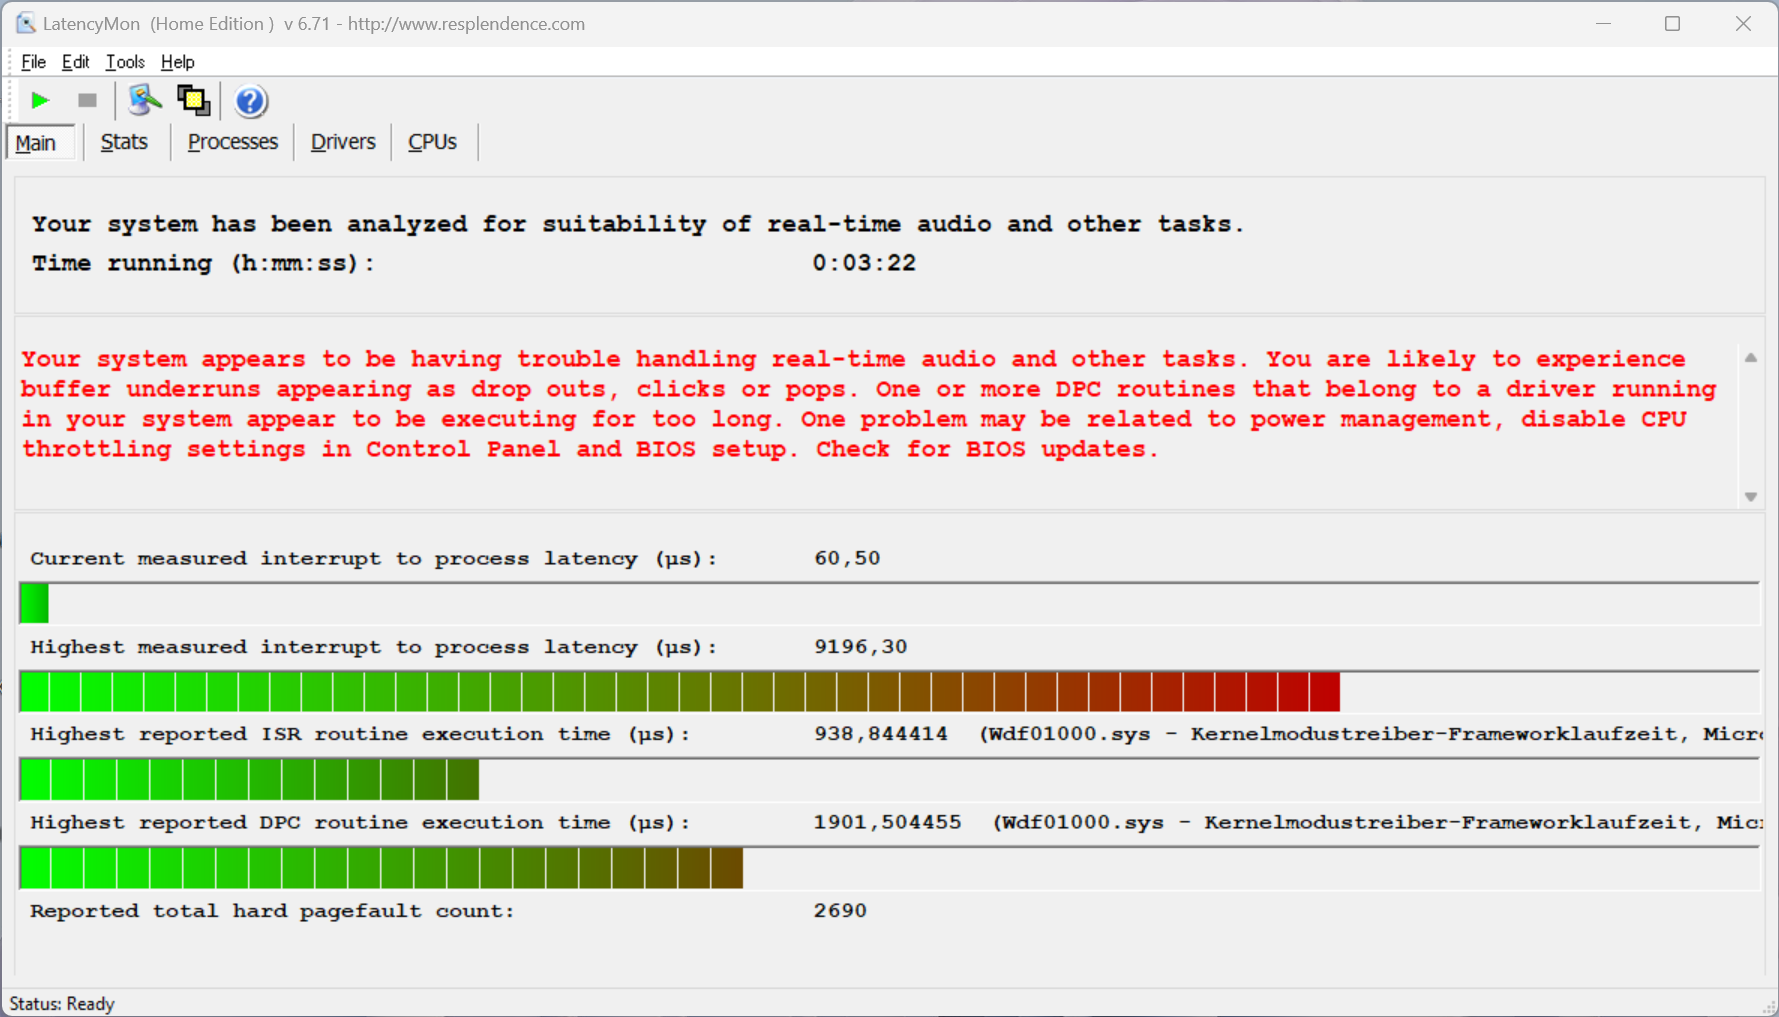
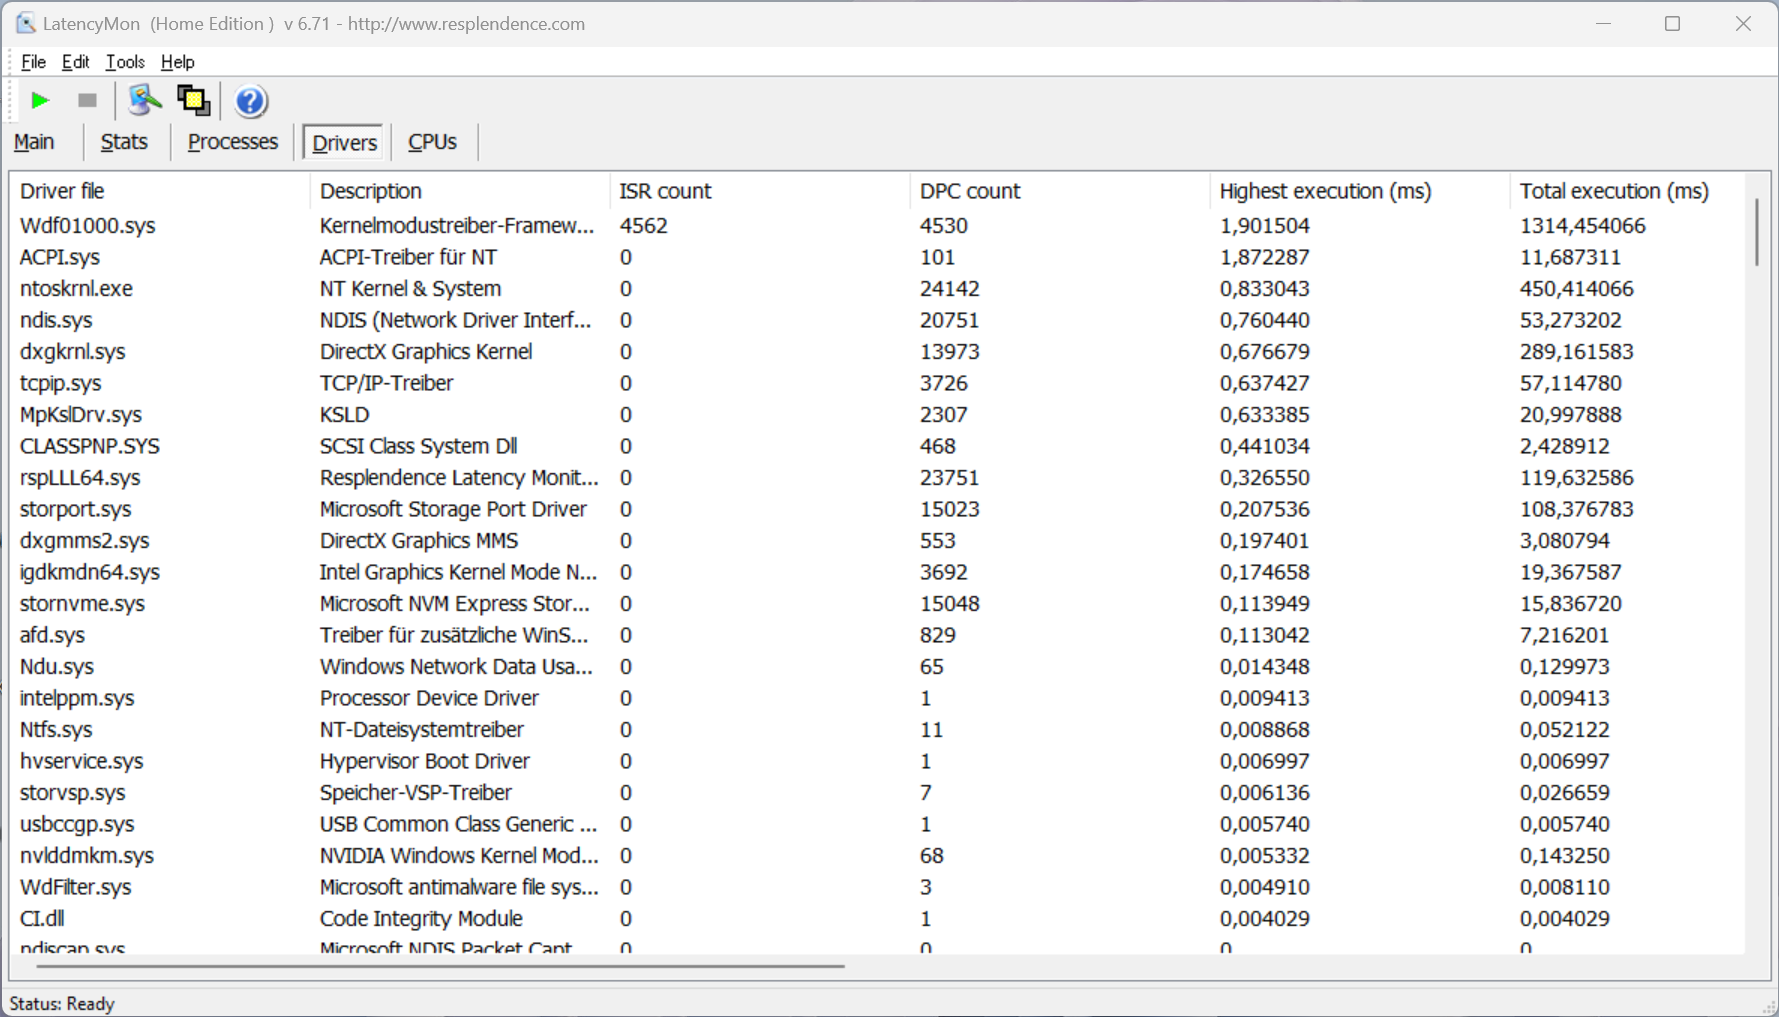
Our standardized latency test (web browsing, 4K YouTube playback, CPU load) shows massive limitations for the review unit with the current BIOS version if you want to use real-time audio applications.
| DPC Latencies / LatencyMon - interrupt to process latency (max), Web, Youtube, Prime95 | |
| Microsoft Surface Laptop Studio 2 RTX 4060 | |
| Lenovo Legion Slim 5 14APH8 | |
| Asus Zenbook Pro 14 OLED UX6404VI | |
| Asus ZenBook Pro 14 Duo UX8402VV-P1021W | |
| Lenovo Yoga Pro 9-14IRP G8 | |
| Asus ROG Zephyrus G14 GA402XY | |
| Microsoft Surface Laptop Studio i7 RTX 3050 Ti | |
* ... smaller is better
Storage Devices
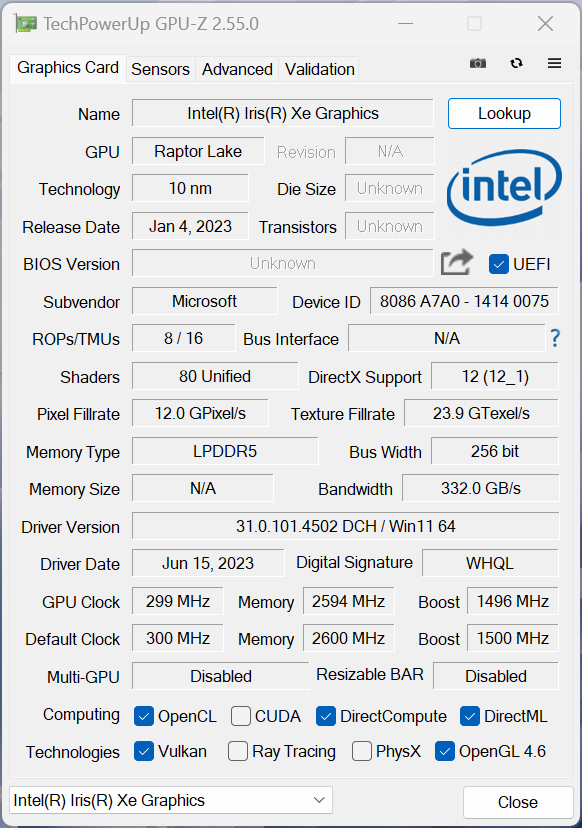
Microsoft uses M.2-2280 PCIe-4.0 SSDs for the Surface Laptop Studio 2. Our unit is equipped with the 1 TB version of the Kioxia XG8, which leaves a good impression with transfer rates of up to 7 GB/s. The performance is also stable during longer workloads. You can use 863 GB for your own apps and files after the initial set-up. More SSD benchmarks are listed here.

* ... smaller is better
Disk Throttling: DiskSpd Read Loop, Queue Depth 8
GPU Performance - GeForce RTX 4060 Laptop
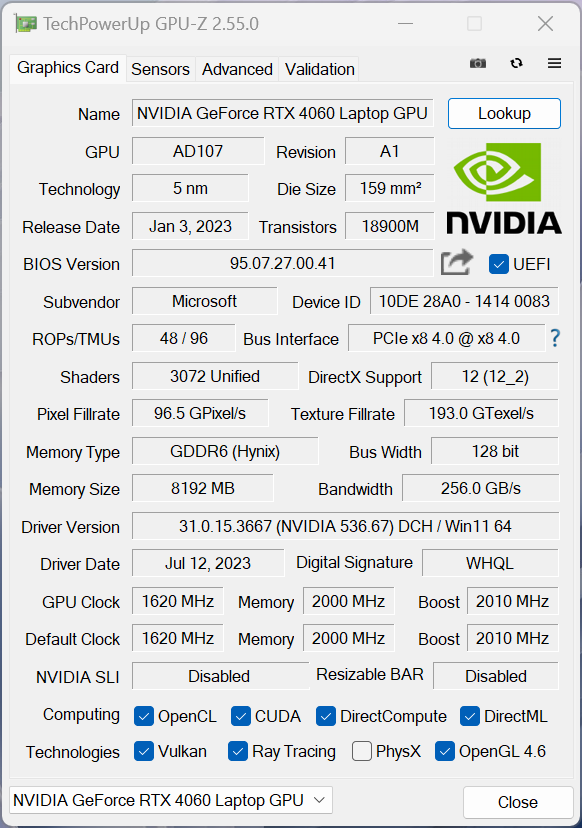
Light workloads are handled by the integrated Iris Xe Graphics G7 of the processor, but the system automatically switches to the Nvidia GeForce RTX 4060 Laptop for more demanding apps like games. The graphics switching is handled by the standard Optimus technology, which is fine for a multimedia laptop. It is the 80W variant (including 20W Dynamic Boost from the CPU) of the RTX 4060 laptop and the performance is much higher compared to the old GeForce RTX 3050 Ti from the first-gen Studio. The RTX 4060 is also 18 % faster than the M2 Pro GPU of the MacBook Pro 14 in the WildLife Extreme Unlimited test.
You should know, however, that this is not the fastest RTX 4060 Laptop and the Legion Slim 5 14 is around 12 % faster in the Time Spy test. The GPU performance is not steady, either, and drops from 80 to just 68 Watts after a couple of minutes. The corresponding Time Spy stress test is therefore not passed at 72.9 %. The battery performance is limited to 40 Watts, which results in a performance deficit of ~20 %. More GPU benchmarks are available in our tech section.
| 3DMark 11 Performance | 25182 points | |
| 3DMark Fire Strike Score | 17076 points | |
| 3DMark Time Spy Score | 9541 points | |
Help | ||
| Blender / v3.3 Classroom OPTIX/RTX | |
| Average of class Multimedia (12 - 105, n=24, last 2 years) | |
| Lenovo Yoga Pro 9-14IRP G8 | |
| Asus ZenBook Pro 14 Duo UX8402VV-P1021W | |
| Microsoft Surface Laptop Studio 2 RTX 4060 | |
| Asus Zenbook Pro 14 OLED UX6404VI | |
| Average NVIDIA GeForce RTX 4060 Laptop GPU (19 - 28, n=53) | |
| Lenovo Legion Slim 5 14APH8 | |
| Asus ROG Zephyrus G14 GA402XY | |
| Blender / v3.3 Classroom CUDA | |
| Average of class Multimedia (20 - 186, n=24, last 2 years) | |
| Asus ZenBook Pro 14 Duo UX8402VV-P1021W | |
| Lenovo Yoga Pro 9-14IRP G8 | |
| Average NVIDIA GeForce RTX 4060 Laptop GPU (39 - 53, n=53) | |
| Microsoft Surface Laptop Studio 2 RTX 4060 | |
| Lenovo Legion Slim 5 14APH8 | |
| Asus Zenbook Pro 14 OLED UX6404VI | |
| Asus ROG Zephyrus G14 GA402XY | |
| Blender / v3.3 Classroom METAL | |
| Apple MacBook Pro 14 2023 M2 Pro | |
| Average of class Multimedia (17.8 - 68, n=5, last 2 years) | |
| Blender / v3.3 Classroom CPU | |
| Average of class Multimedia (134.5 - 1042, n=65, last 2 years) | |
| Microsoft Surface Laptop Studio 2 RTX 4060 | |
| Lenovo Yoga Pro 9-14IRP G8 | |
| Apple MacBook Pro 14 2023 M2 Pro | |
| Asus ZenBook Pro 14 Duo UX8402VV-P1021W | |
| Average NVIDIA GeForce RTX 4060 Laptop GPU (189 - 452, n=53) | |
| Asus Zenbook Pro 14 OLED UX6404VI | |
| Lenovo Legion Slim 5 14APH8 | |
| Asus ROG Zephyrus G14 GA402XY | |
* ... smaller is better
Gaming Performance
The gaming performance is once again much better compared to the old RTX 3050 Ti (50% faster in our default gaming tests), but the direct competitors are usually faster. Our Witcher 3 loop also shows that the GPU performance is not stable and the TGP of 80 Watts cannot be maintained. It drops below 70 Watts after a few minutes, which is also clearly visible in the data graphs. Overall, you can still play modern games with the highest settings in 1080p. More gaming benchmarks are listed here.
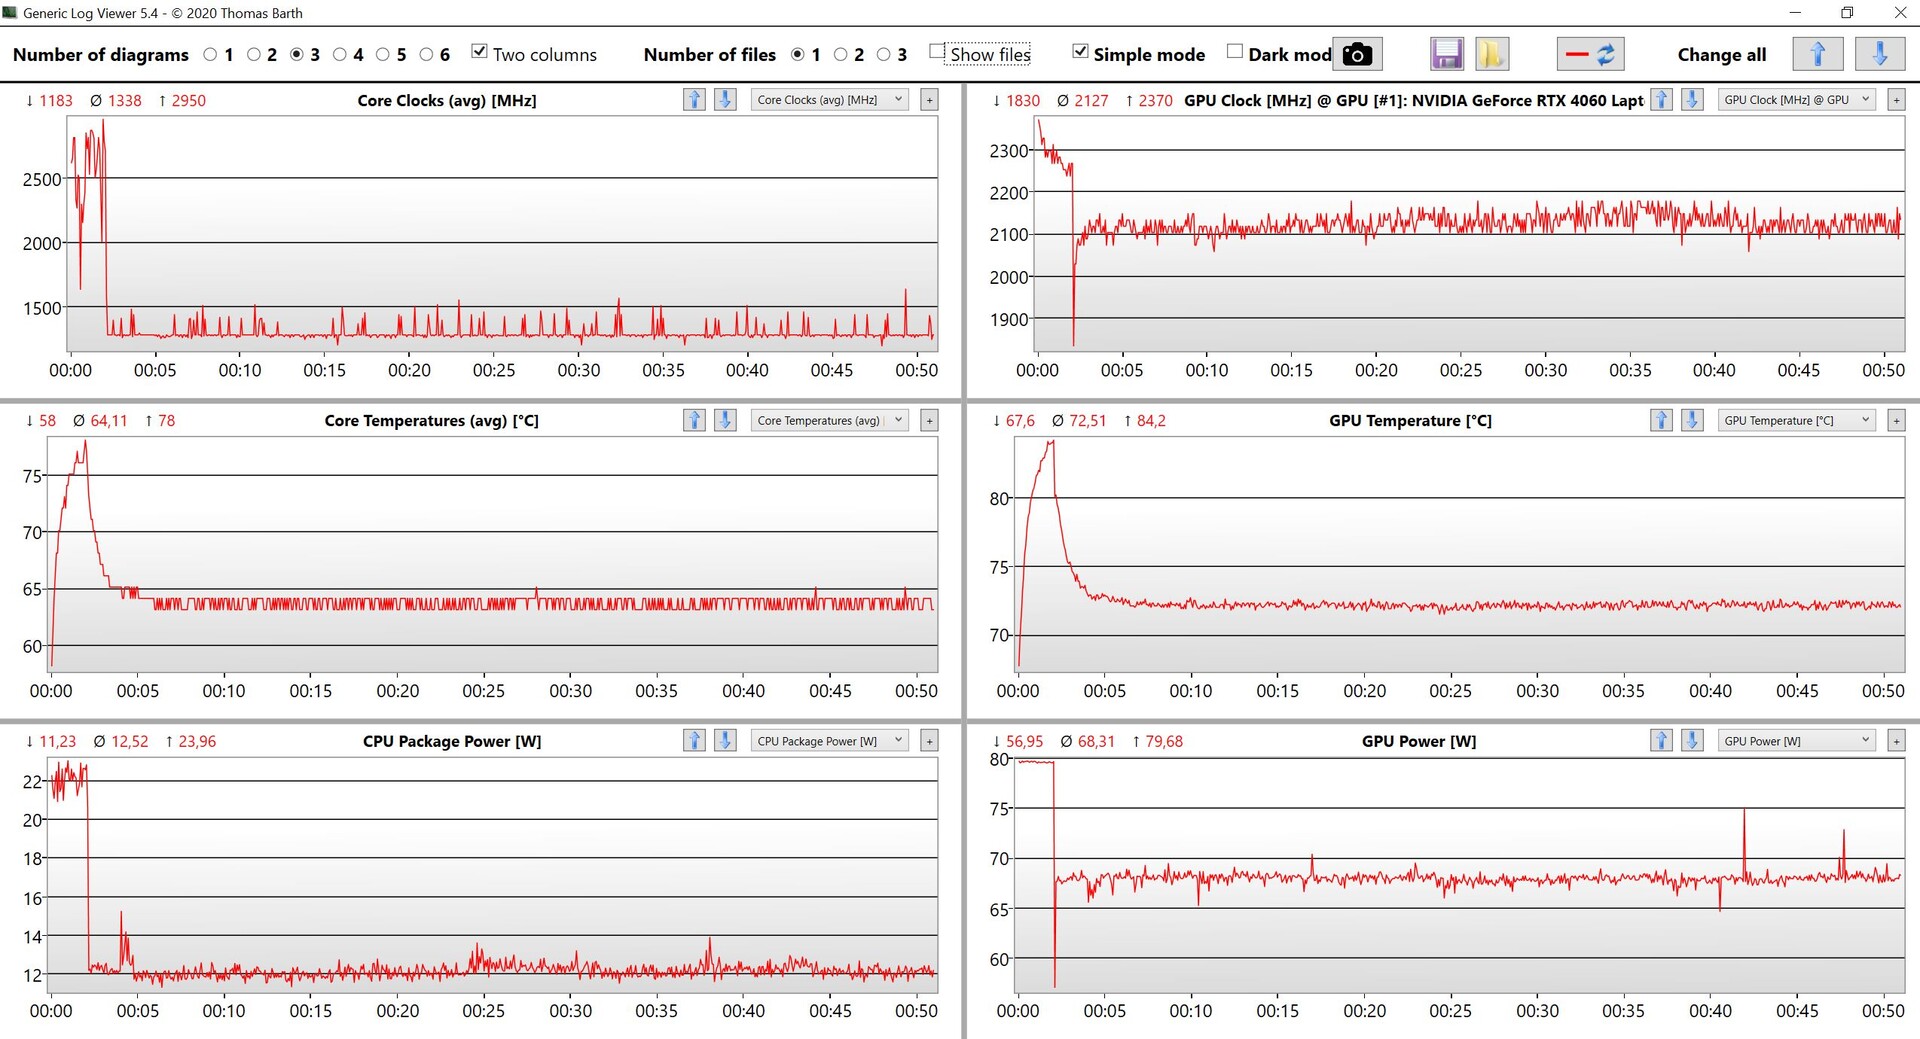
Witcher 3 FPS Chart
| low | med. | high | ultra | |
|---|---|---|---|---|
| GTA V (2015) | 180 | 172.2 | 160.4 | 94.6 |
| The Witcher 3 (2015) | 181 | 81.4 | ||
| Dota 2 Reborn (2015) | 168.7 | 153.7 | 145.4 | 135 |
| Final Fantasy XV Benchmark (2018) | 109.9 | 84.2 | ||
| X-Plane 11.11 (2018) | 138.9 | 107 | 86.9 | |
| Far Cry 5 (2018) | 137 | 113 | 104 | 99 |
| Strange Brigade (2018) | 372 | 195.4 | 199.4 | 169.3 |
| Shadow of the Tomb Raider (2018) | 122 | 109 | ||
| F1 2021 (2021) | 298 | 249 | 208 | 113.2 |
| Cyberpunk 2077 1.6 (2022) | 95 | 82 | 72 | 68 |
| F1 22 (2022) | 198.3 | 199.2 | 148.7 | 56.7 |
| Call of Duty Modern Warfare 2 2022 (2022) | 88 | 80 | ||
| F1 23 (2023) | 177.9 | 180.7 | 143.7 | 43.8 |
| Cyberpunk 2077 (2023) | 67.11 | 60.59 |
Emissions - Noisier fans
System Noise
Like the previous model, the new Surface Laptop Studio is usually silent in light workloads, at least in terms of fan noise. Our test unit suffered from almost constant electronic sounds (crackling). The fans are audible very quickly once you start to stress the CPU and particularly the GPU and the overall fan noise is louder compared to the old model. We measured almost 52 dB(A) during gaming and our stress test, which is not great considering the average performance numbers. The two more efficient profiles are quieter at up to 41.4 and 42.8 dB(A), respectively. We also noticed coil whining in some games.
Noise level
| Idle |
| 23.9 / 24.4 / 26.9 dB(A) |
| Load |
| 48.5 / 51.8 dB(A) |
 | ||
30 dB silent 40 dB(A) audible 50 dB(A) loud |
||
min: | ||
| Microsoft Surface Laptop Studio 2 RTX 4060 GeForce RTX 4060 Laptop GPU, i7-13700H, Kioxia XG8 KXG80ZNV1T02 | Apple MacBook Pro 14 2023 M2 Pro M2 Pro 19-Core GPU, M2 Pro, Apple SSD AP2048Z | Lenovo Yoga Pro 9-14IRP G8 GeForce RTX 4050 Laptop GPU, i7-13705H, Samsung PM9A1 MZVL21T0HCLR | Asus Zenbook Pro 14 OLED UX6404VI GeForce RTX 4070 Laptop GPU, i9-13900H, Micron 3400 2TB MTFDKBA2T0TFH | Asus ZenBook Pro 14 Duo UX8402VV-P1021W GeForce RTX 4060 Laptop GPU, i9-13900H, Samsung PM9A1 MZVL22T0HBLB | Asus ROG Zephyrus G14 GA402XY GeForce RTX 4090 Laptop GPU, R9 7940HS, Samsung PM9A1 MZVL21T0HCLR | Lenovo Legion Slim 5 14APH8 GeForce RTX 4060 Laptop GPU, R7 7840HS, SK Hynix HFS001TEJ9X115N | Microsoft Surface Laptop Studio i7 RTX 3050 Ti GeForce RTX 3050 Ti Laptop GPU, i7-11370H, SK Hynix PC711 1TB HFS001TDE9X084N | |
|---|---|---|---|---|---|---|---|---|
| Noise | 13% | -1% | 8% | -13% | -3% | -1% | 8% | |
| off / environment * (dB) | 23.9 | 23.9 -0% | 24.8 -4% | 23.3 3% | 25.2 -5% | 23.3 3% | 22.8 5% | 24.7 -3% |
| Idle Minimum * (dB) | 23.9 | 23.9 -0% | 24.8 -4% | 23.3 3% | 25.2 -5% | 23.6 1% | 22.8 5% | 24.7 -3% |
| Idle Average * (dB) | 24.4 | 23.9 2% | 24.8 -2% | 23.3 5% | 25.2 -3% | 23.6 3% | 27.3 -12% | 24.7 -1% |
| Idle Maximum * (dB) | 26.9 | 23.9 11% | 24.8 8% | 23.3 13% | 32.5 -21% | 33 -23% | 30.7 -14% | 24.7 8% |
| Load Average * (dB) | 48.5 | 26 46% | 47.4 2% | 39.3 19% | 59.7 -23% | 49.5 -2% | 41.6 14% | 33.2 32% |
| Witcher 3 ultra * (dB) | 51.8 | 52.9 -2% | 48.8 6% | 52.2 -1% | 52.8 -2% | 44.5 14% | ||
| Load Maximum * (dB) | 51.8 | 43.2 17% | 52.9 -2% | 48.8 6% | 60.9 -18% | 52.2 -1% | 52.6 -2% | 46.7 10% |
* ... smaller is better
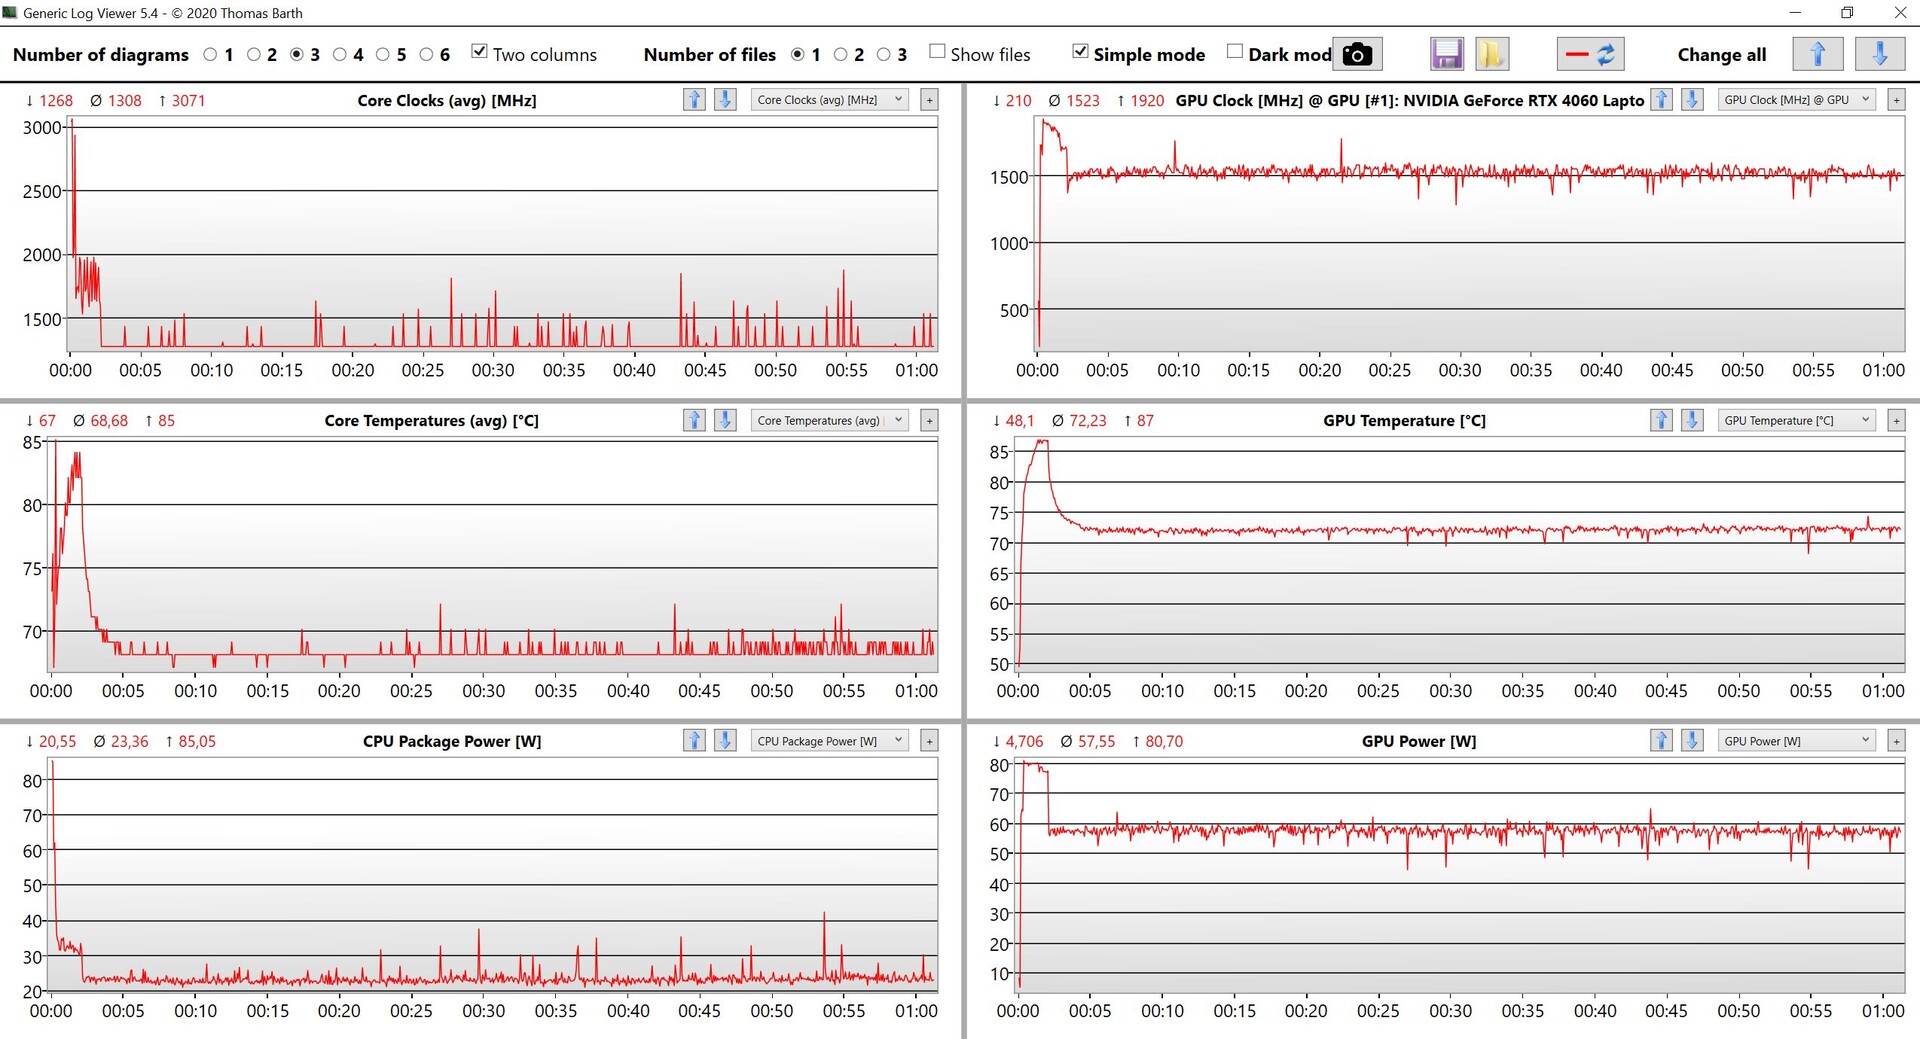
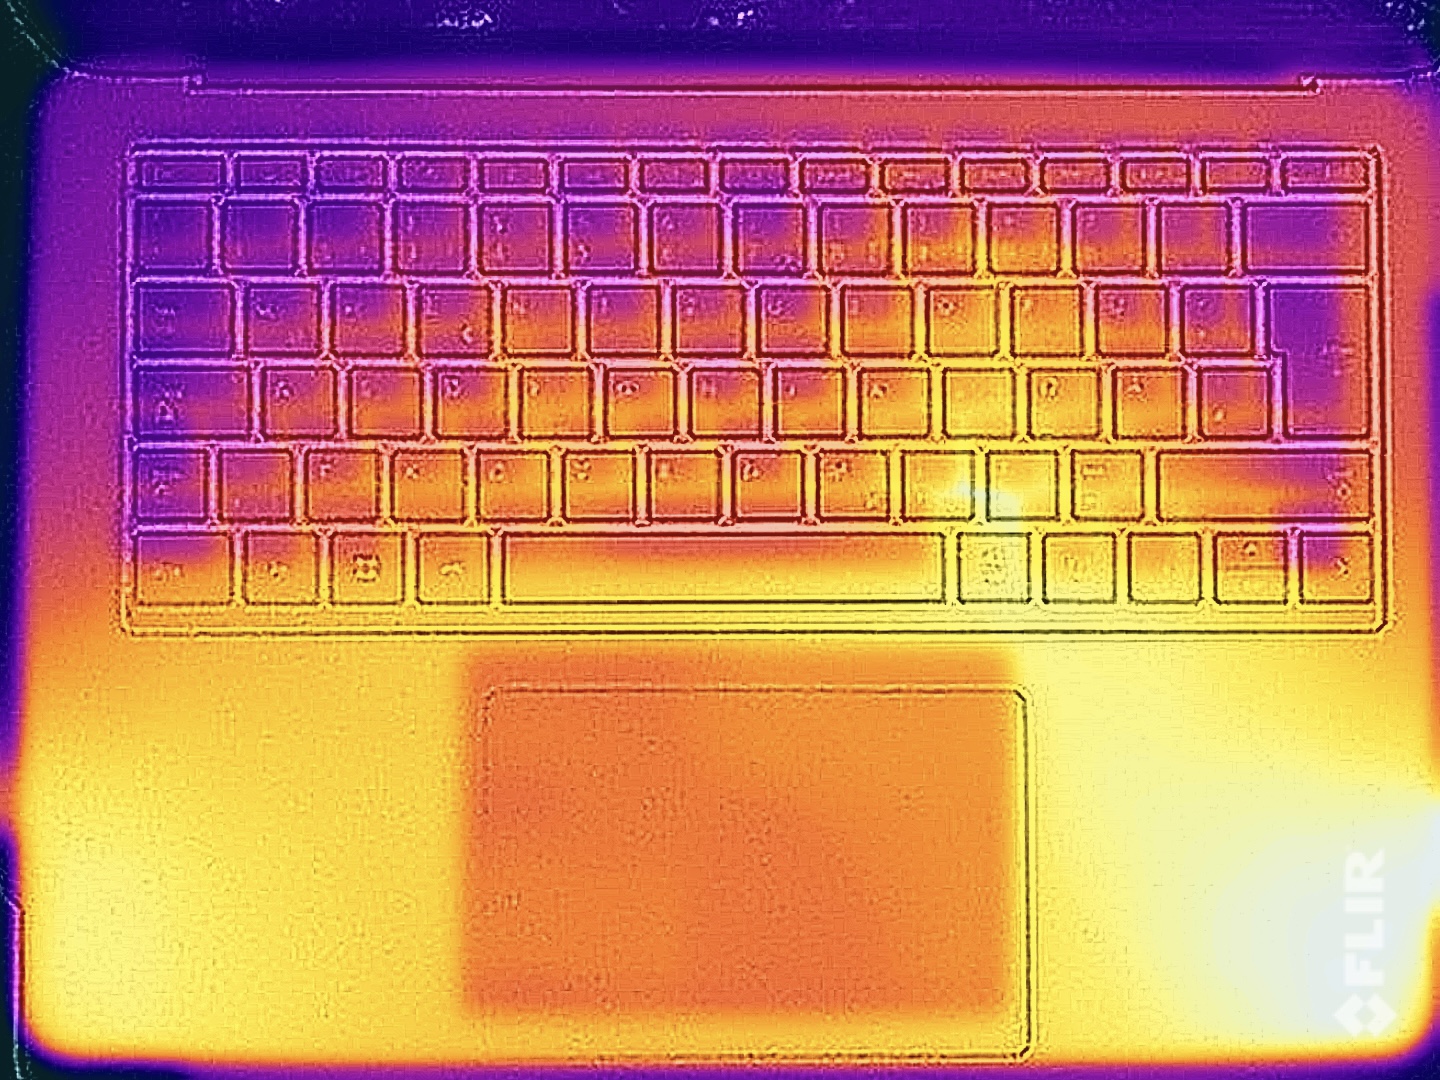
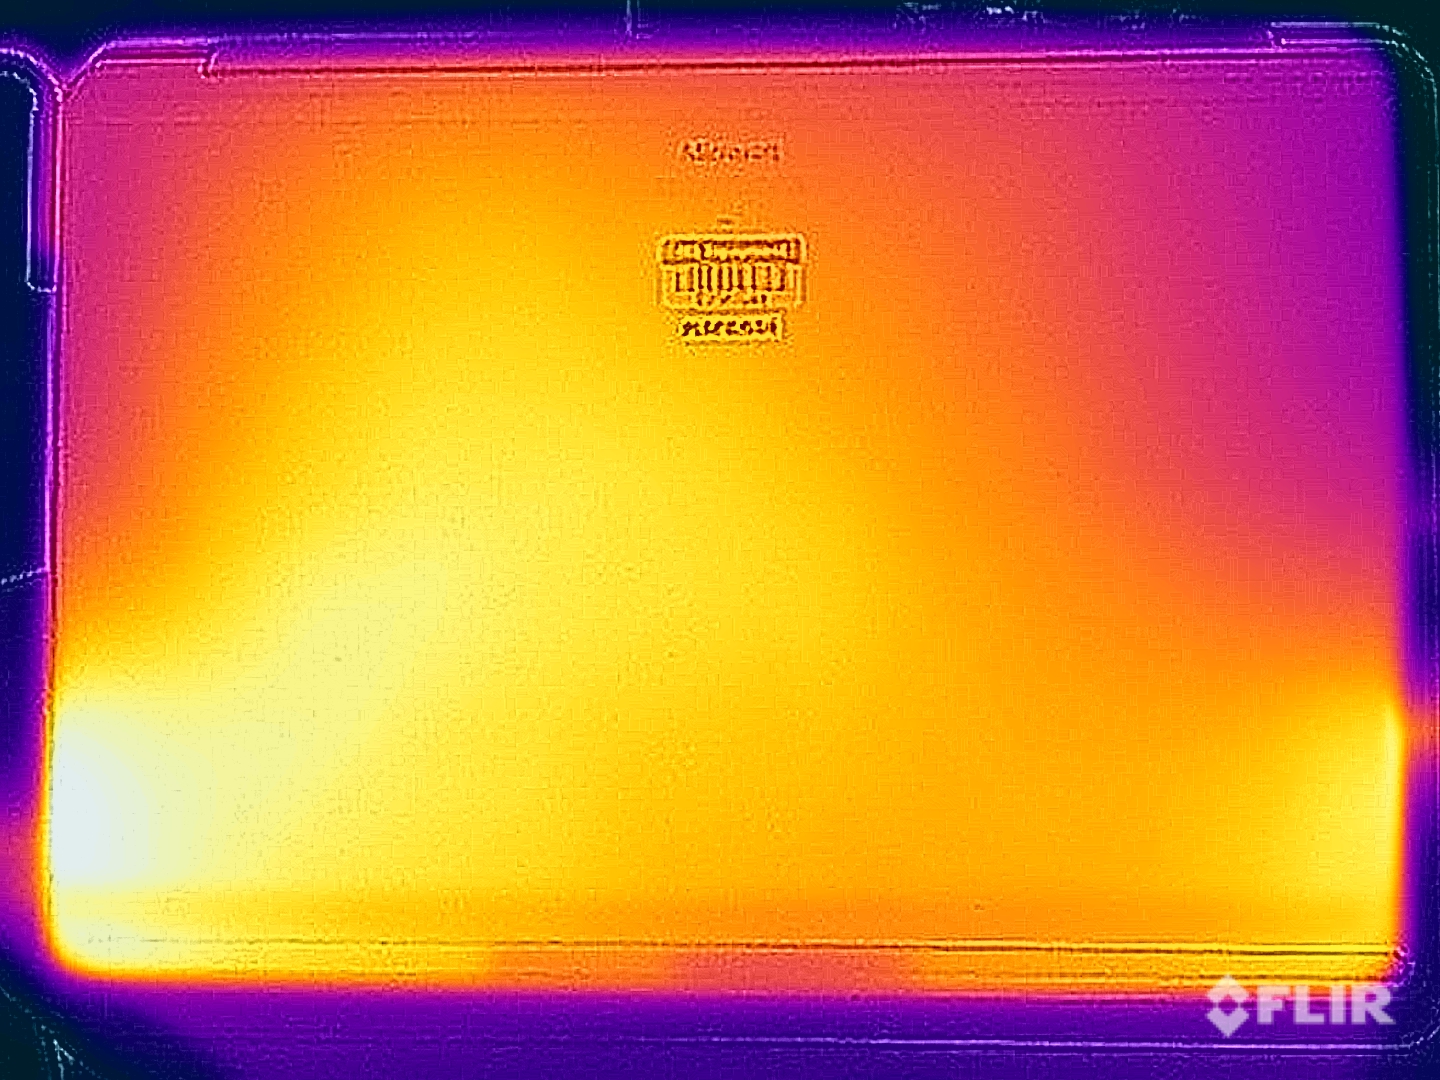
Temperature
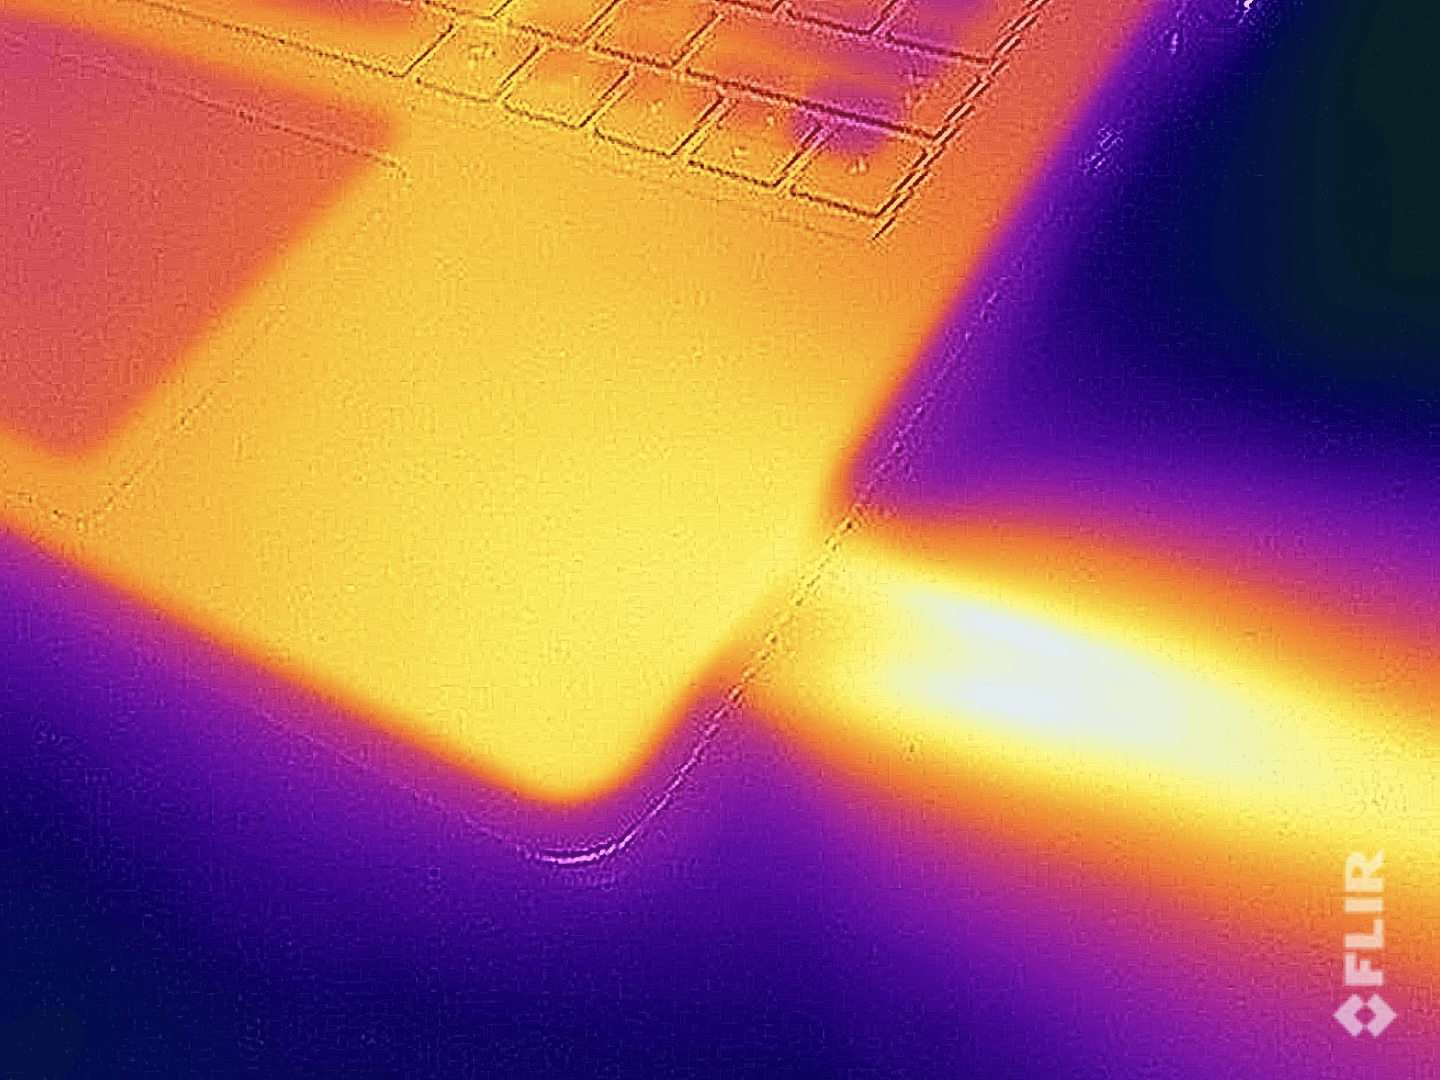
Our temperature measurements reveal the issue of the cooling solution. Everything is fine during light workloads, but the palm rest area quickly warms up under load since the fans are located at the front of the base unit. We already know this behavior from the old model, but the temperatures on the Surface Laptop Studio 2 are higher. We measured around 40 °C on the palm rest area, which is quickly uncomfortable in combination with the metal surfaces. It does not really help that the rest of the chassis stays cooler. The position of the fan exhausts at the front area of the two sides is another problem, especially when you use an external mouse.
Our stress test with combined CPU/GPU load shows that the CPU performance drops significantly after a few minutes and levels off at just 23 Watts. The GPU is favored by the system with a consumption of around 58 Watts.
(±) The maximum temperature on the upper side is 40.4 °C / 105 F, compared to the average of 36.8 °C / 98 F, ranging from 21 to 71 °C for the class Multimedia.
(±) The bottom heats up to a maximum of 42.2 °C / 108 F, compared to the average of 39.1 °C / 102 F
(+) In idle usage, the average temperature for the upper side is 26.4 °C / 80 F, compared to the device average of 31.3 °C / 88 F.
(±) Playing The Witcher 3, the average temperature for the upper side is 37 °C / 99 F, compared to the device average of 31.3 °C / 88 F.
(-) The palmrests and touchpad can get very hot to the touch with a maximum of 40.4 °C / 104.7 F.
(-) The average temperature of the palmrest area of similar devices was 28.7 °C / 83.7 F (-11.7 °C / -21 F).
| Microsoft Surface Laptop Studio 2 RTX 4060 Intel Core i7-13700H, NVIDIA GeForce RTX 4060 Laptop GPU | Apple MacBook Pro 14 2023 M2 Pro Apple M2 Pro, Apple M2 Pro 19-Core GPU | Lenovo Yoga Pro 9-14IRP G8 Intel Core i7-13705H, NVIDIA GeForce RTX 4050 Laptop GPU | Asus Zenbook Pro 14 OLED UX6404VI Intel Core i9-13900H, NVIDIA GeForce RTX 4070 Laptop GPU | Asus ZenBook Pro 14 Duo UX8402VV-P1021W Intel Core i9-13900H, NVIDIA GeForce RTX 4060 Laptop GPU | Asus ROG Zephyrus G14 GA402XY AMD Ryzen 9 7940HS, NVIDIA GeForce RTX 4090 Laptop GPU | Lenovo Legion Slim 5 14APH8 AMD Ryzen 7 7840HS, NVIDIA GeForce RTX 4060 Laptop GPU | Microsoft Surface Laptop Studio i7 RTX 3050 Ti Intel Core i7-11370H, NVIDIA GeForce RTX 3050 Ti Laptop GPU | |
|---|---|---|---|---|---|---|---|---|
| Heat | 7% | -12% | -9% | -11% | -7% | -8% | 7% | |
| Maximum Upper Side * (°C) | 40.4 | 46.9 -16% | 41 -1% | 40.6 -0% | 37.1 8% | 47 -16% | 40.4 -0% | 42.3 -5% |
| Maximum Bottom * (°C) | 42.2 | 41.7 1% | 56.7 -34% | 49.5 -17% | 49.4 -17% | 46.5 -10% | 49.4 -17% | 38.2 9% |
| Idle Upper Side * (°C) | 26.6 | 21.4 20% | 27.4 -3% | 28.2 -6% | 30 -13% | 25.9 3% | 28.2 -6% | 23.4 12% |
| Idle Bottom * (°C) | 27 | 21.4 21% | 29.1 -8% | 30.6 -13% | 32.4 -20% | 28 -4% | 29.8 -10% | 23.5 13% |
* ... smaller is better
Speakers
The speakers are a bit worse compared to last year’s model according to our audio analysis. The maximum volume is slightly weaker and the bass is not as powerful. Rivals like the Lenovo Yoga Pro 9i 14 and Apple MacBook Pro 14 have a slight advantage, but you will hardly be disappointed by the sound system without a direct comparison.
Microsoft Surface Laptop Studio 2 RTX 4060 audio analysis
(±) | speaker loudness is average but good (81.8 dB)
Bass 100 - 315 Hz
(±) | reduced bass - on average 12% lower than median
(±) | linearity of bass is average (10% delta to prev. frequency)
Mids 400 - 2000 Hz
(±) | higher mids - on average 6.1% higher than median
(+) | mids are linear (2.3% delta to prev. frequency)
Highs 2 - 16 kHz
(+) | balanced highs - only 2.3% away from median
(+) | highs are linear (4.1% delta to prev. frequency)
Overall 100 - 16.000 Hz
(+) | overall sound is linear (13.9% difference to median)
Compared to same class
» 31% of all tested devices in this class were better, 4% similar, 65% worse
» The best had a delta of 5%, average was 17%, worst was 45%
Compared to all devices tested
» 16% of all tested devices were better, 4% similar, 80% worse
» The best had a delta of 4%, average was 23%, worst was 134%
Apple MacBook Pro 14 2023 M2 Pro audio analysis
(+) | speakers can play relatively loud (84.3 dB)
Bass 100 - 315 Hz
(+) | good bass - only 3.8% away from median
(+) | bass is linear (6.9% delta to prev. frequency)
Mids 400 - 2000 Hz
(+) | balanced mids - only 2.1% away from median
(+) | mids are linear (2.2% delta to prev. frequency)
Highs 2 - 16 kHz
(+) | balanced highs - only 2.7% away from median
(+) | highs are linear (4.8% delta to prev. frequency)
Overall 100 - 16.000 Hz
(+) | overall sound is linear (6% difference to median)
Compared to same class
» 3% of all tested devices in this class were better, 0% similar, 97% worse
» The best had a delta of 5%, average was 17%, worst was 45%
Compared to all devices tested
» 0% of all tested devices were better, 0% similar, 100% worse
» The best had a delta of 4%, average was 23%, worst was 134%
Lenovo Yoga Pro 9-14IRP G8 audio analysis
(±) | speaker loudness is average but good (81.8 dB)
Bass 100 - 315 Hz
(±) | reduced bass - on average 5.9% lower than median
(±) | linearity of bass is average (7.8% delta to prev. frequency)
Mids 400 - 2000 Hz
(+) | balanced mids - only 2.3% away from median
(+) | mids are linear (3.2% delta to prev. frequency)
Highs 2 - 16 kHz
(+) | balanced highs - only 2.5% away from median
(+) | highs are linear (3.4% delta to prev. frequency)
Overall 100 - 16.000 Hz
(+) | overall sound is linear (7.3% difference to median)
Compared to same class
» 6% of all tested devices in this class were better, 1% similar, 94% worse
» The best had a delta of 5%, average was 17%, worst was 45%
Compared to all devices tested
» 1% of all tested devices were better, 0% similar, 99% worse
» The best had a delta of 4%, average was 23%, worst was 134%
Energy Management - Decent stamina with small battery
Power Consumption
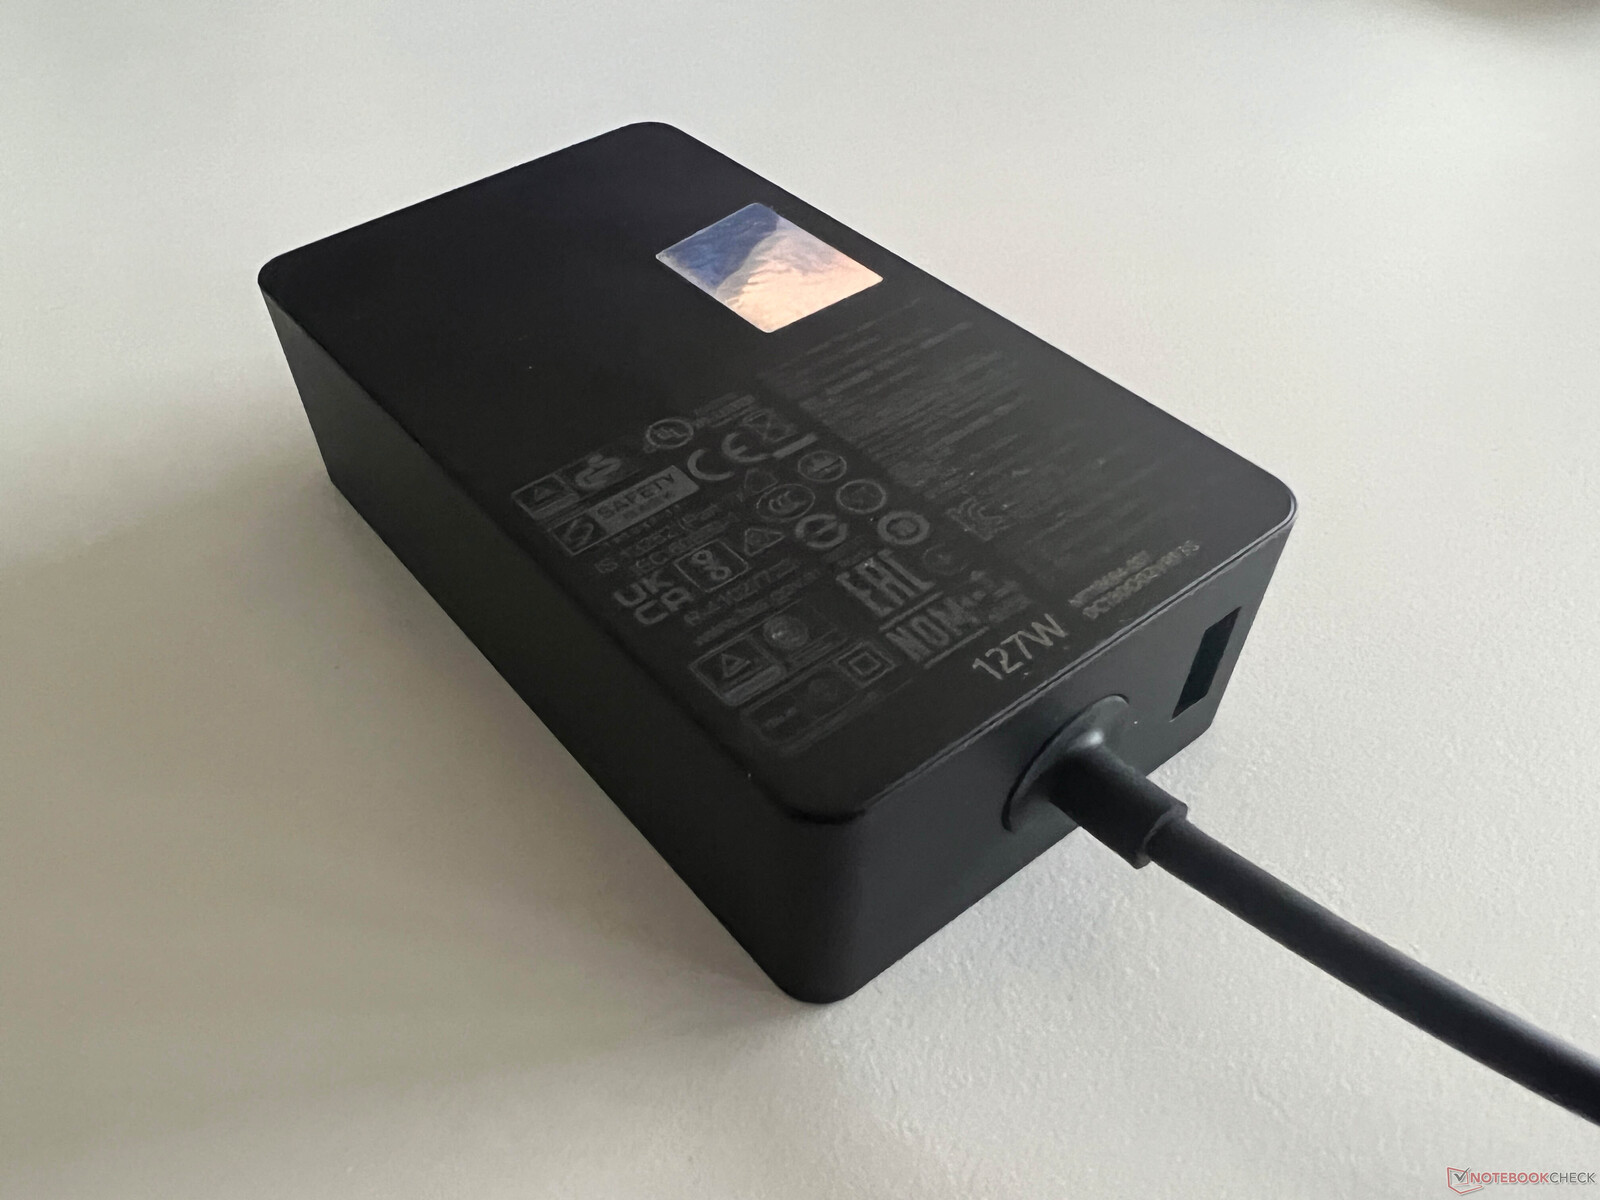
Our consumption measurements do not reveal any surprises and the idle values are pretty much on par with the predecessor. We notice the more powerful components under load with a short-term maximum consumption of 128 Watts, but it quickly levels off at around 110 Watts. The included 127W power adapter is therefore sufficient. It also offers an additional USB-A port to charge accessories like smartphones.
| Off / Standby | |
| Idle | |
| Load |
|
Key:
min: | |
| Microsoft Surface Laptop Studio 2 RTX 4060 i7-13700H, GeForce RTX 4060 Laptop GPU, Kioxia XG8 KXG80ZNV1T02, IPS, 2400x1600, 14.4" | Apple MacBook Pro 14 2023 M2 Pro M2 Pro, M2 Pro 19-Core GPU, Apple SSD AP2048Z, Mini-LED, 3024x1964, 14.2" | Lenovo Yoga Pro 9-14IRP G8 i7-13705H, GeForce RTX 4050 Laptop GPU, Samsung PM9A1 MZVL21T0HCLR, Mini-LED, 3072x1920, 14.5" | Asus Zenbook Pro 14 OLED UX6404VI i9-13900H, GeForce RTX 4070 Laptop GPU, Micron 3400 2TB MTFDKBA2T0TFH, OLED, 2880x1800, 14.5" | Asus ZenBook Pro 14 Duo UX8402VV-P1021W i9-13900H, GeForce RTX 4060 Laptop GPU, Samsung PM9A1 MZVL22T0HBLB, OLED, 2880x1800, 14.5" | Asus ROG Zephyrus G14 GA402XY R9 7940HS, GeForce RTX 4090 Laptop GPU, Samsung PM9A1 MZVL21T0HCLR, Mini-LED, 2560x1600, 14" | Lenovo Legion Slim 5 14APH8 R7 7840HS, GeForce RTX 4060 Laptop GPU, SK Hynix HFS001TEJ9X115N, OLED, 2880x1600, 14.5" | Microsoft Surface Laptop Studio i7 RTX 3050 Ti i7-11370H, GeForce RTX 3050 Ti Laptop GPU, SK Hynix PC711 1TB HFS001TDE9X084N, IPS, 2400x1600, 14.4" | Average NVIDIA GeForce RTX 4060 Laptop GPU | Average of class Multimedia | |
|---|---|---|---|---|---|---|---|---|---|---|
| Power Consumption | 0% | -104% | -61% | -60% | -89% | -62% | 9% | -133% | -34% | |
| Idle Minimum * (Watt) | 3 | 2.4 20% | 10.9 -263% | 7.5 -150% | 8.5 -183% | 9.4 -213% | 7.3 -143% | 2.6 13% | 11.5 ? -283% | 5.67 ? -89% |
| Idle Average * (Watt) | 7.1 | 11.3 -59% | 17.7 -149% | 11.1 -56% | 8.8 -24% | 14.2 -100% | 9.6 -35% | 7.1 -0% | 16 ? -125% | 10.1 ? -42% |
| Idle Maximum * (Watt) | 7.6 | 11.5 -51% | 19.3 -154% | 11.6 -53% | 16.5 -117% | 14.5 -91% | 17.3 -128% | 7.9 -4% | 20.3 ? -167% | 12.3 ? -62% |
| Load Average * (Watt) | 73.1 | 59.6 18% | 93.3 -28% | 91.9 -26% | 102 -40% | 79 -8% | 76.6 -5% | 76.8 -5% | 92.9 ? -27% | 65.6 ? 10% |
| Witcher 3 ultra * (Watt) | 113.9 | 55.9 51% | 129.5 -14% | 132.2 -16% | 101.2 11% | 172 -51% | 152 -33% | 83 27% | ||
| Load Maximum * (Watt) | 128.5 | 100 22% | 150.2 -17% | 208 -62% | 140 -9% | 220.8 -72% | 160.9 -25% | 97.3 24% | 210 ? -63% | 113.2 ? 12% |
* ... smaller is better
Energieaufnahme Witcher 3 / Stresstest
Energieaufnahme mit externem Monitor
Battery Runtime
Microsoft uses the same 58 Wh battery like on the previous model, which means it is the smallest battery within our comparison group. If you exclude the MacBook Pro 14, the results are still competitive. Our video test at 150 nits (62 % of the maximum SDR brightness) runs for 11:15 hours and the Wi-Fi test for 8:18 hours, which are good results. The Wi-Fi test at maximum SDR brightness runs for almost 6 hours (all tests with 120 Hz). A full recharge takes 126 minutes when the device is turned on; 80 % of the capacity are ready after 65 minutes.
Update 10/06: We have performed additional battery runtime tests with a lower frequency of 60 Hz and we saw improvements. Both the Wi-Fi test at full brightness (6:51h) as well as 150 nits (9:35h) lasted around one hour longer; our video test at 150 nits ran half an hour longer (11:45h). A YouTube HDR video at full brightness ran for little more than 3.5 hours (3:38h) before the battery was dead.
| Microsoft Surface Laptop Studio 2 RTX 4060 i7-13700H, GeForce RTX 4060 Laptop GPU, 58 Wh | Apple MacBook Pro 14 2023 M2 Pro M2 Pro, M2 Pro 19-Core GPU, 70 Wh | Lenovo Yoga Pro 9-14IRP G8 i7-13705H, GeForce RTX 4050 Laptop GPU, 75 Wh | Asus Zenbook Pro 14 OLED UX6404VI i9-13900H, GeForce RTX 4070 Laptop GPU, 76 Wh | Asus ZenBook Pro 14 Duo UX8402VV-P1021W i9-13900H, GeForce RTX 4060 Laptop GPU, 76 Wh | Asus ROG Zephyrus G14 GA402XY R9 7940HS, GeForce RTX 4090 Laptop GPU, 76 Wh | Lenovo Legion Slim 5 14APH8 R7 7840HS, GeForce RTX 4060 Laptop GPU, 73.6 Wh | Microsoft Surface Laptop Studio i7 RTX 3050 Ti i7-11370H, GeForce RTX 3050 Ti Laptop GPU, 58 Wh | Average of class Multimedia | |
|---|---|---|---|---|---|---|---|---|---|
| Battery runtime | 18% | -23% | -29% | 34% | -34% | -26% | -17% | 22% | |
| H.264 (h) | 11.3 | 15.3 35% | 9.1 -19% | 8.5 -25% | 7.2 -36% | 12.3 9% | 16.3 ? 44% | ||
| WiFi v1.3 (h) | 8.3 | 13.5 63% | 8 -4% | 7.6 -8% | 9 8% | 7.5 -10% | 7.5 -10% | 8 -4% | 12.1 ? 46% |
| Load (h) | 2.2 | 1.2 -45% | 1.2 -45% | 1 -55% | 3.5 59% | 1 -55% | 1.3 -41% | 1 -55% | 1.654 ? -25% |
Pros
Cons
Verdict - Surface Laptop Studio 2 is better and worse

Microsoft has removed two big problems we had with the original Surface Laptop Studio, and the second generation gets additional ports (USB-A and a fast card reader) as well as a current processor. The graphics card was updated as well and the performance is decent for a multimedia laptop. However, the increased performance is a big challenge for the cooling concept with the fans at the front of the base unit. The palm rest area gets uncomfortably warm and the hot air is dissipated ate the front area of the sides, which is an issue when you use a mouse. There are also slight electronic noises pretty much all the time, which is annoying.
The construction with the two levels of the base unit also has the disadvantage that it is rather bulky and not very comfortable when you want to use it as a tablet. The chassis quality itself, however, is excellent and the folding mechanism of the display also leaves a good impression. The display itself is very good with accurate colors, but it is very glossy and only covers the small sRGB color gamut, which is surprising at this price point.
Microsoft ships the new Surface Laptop Studio 2 with more ports and faster components, but the cooling solution has reached its limits. There are still no maintenance options and the prices are very high.
The Surface Laptop Studio 2 still offers an interesting concept, but the price-performance ratio is not good. We also do not understand why Microsoft only offers a limited number of models and users have to get 64 GB RAM when they want the faster RTX 4060 Laptop GPU. There are once again no maintenance options (you cannot even open the chassis) and upgrades are not possible.
Looking at the rivals, we doubt the new Surface Laptop Studio 2 will be very successful. Apple’s MacBook Pro 14 does not have a touchscreen or USB-A, but the system is quitter, the battery lasts much longer and the display is superior, especially in terms of HDR. And you can clean the fans. An interesting Windows alternative with a focus on touch inputs is the Asus Zenbook Pro Duo. The Lenovo Yoga Pro 9i 14 is also a better alternative overall and if you do not have a problem with a gaming machine, you will get the Lenovo Legion Slim 5 14 with more performance and an OLED Panel for not even half the price.
Price and Availability
You can order the new Surface Laptop Studio 2 directly from Microsoft starting at $1999. Our review configuration with the RTX 4060 Laptop is available for $3299 at BestBuy.
Microsoft Surface Laptop Studio 2 RTX 4060
- 10/03/2023 v7 (old)
Andreas Osthoff
