Lenovo Legion Slim 5 14APH8 laptop review: 120 Hz 2.8K OLED sweet spot ↺

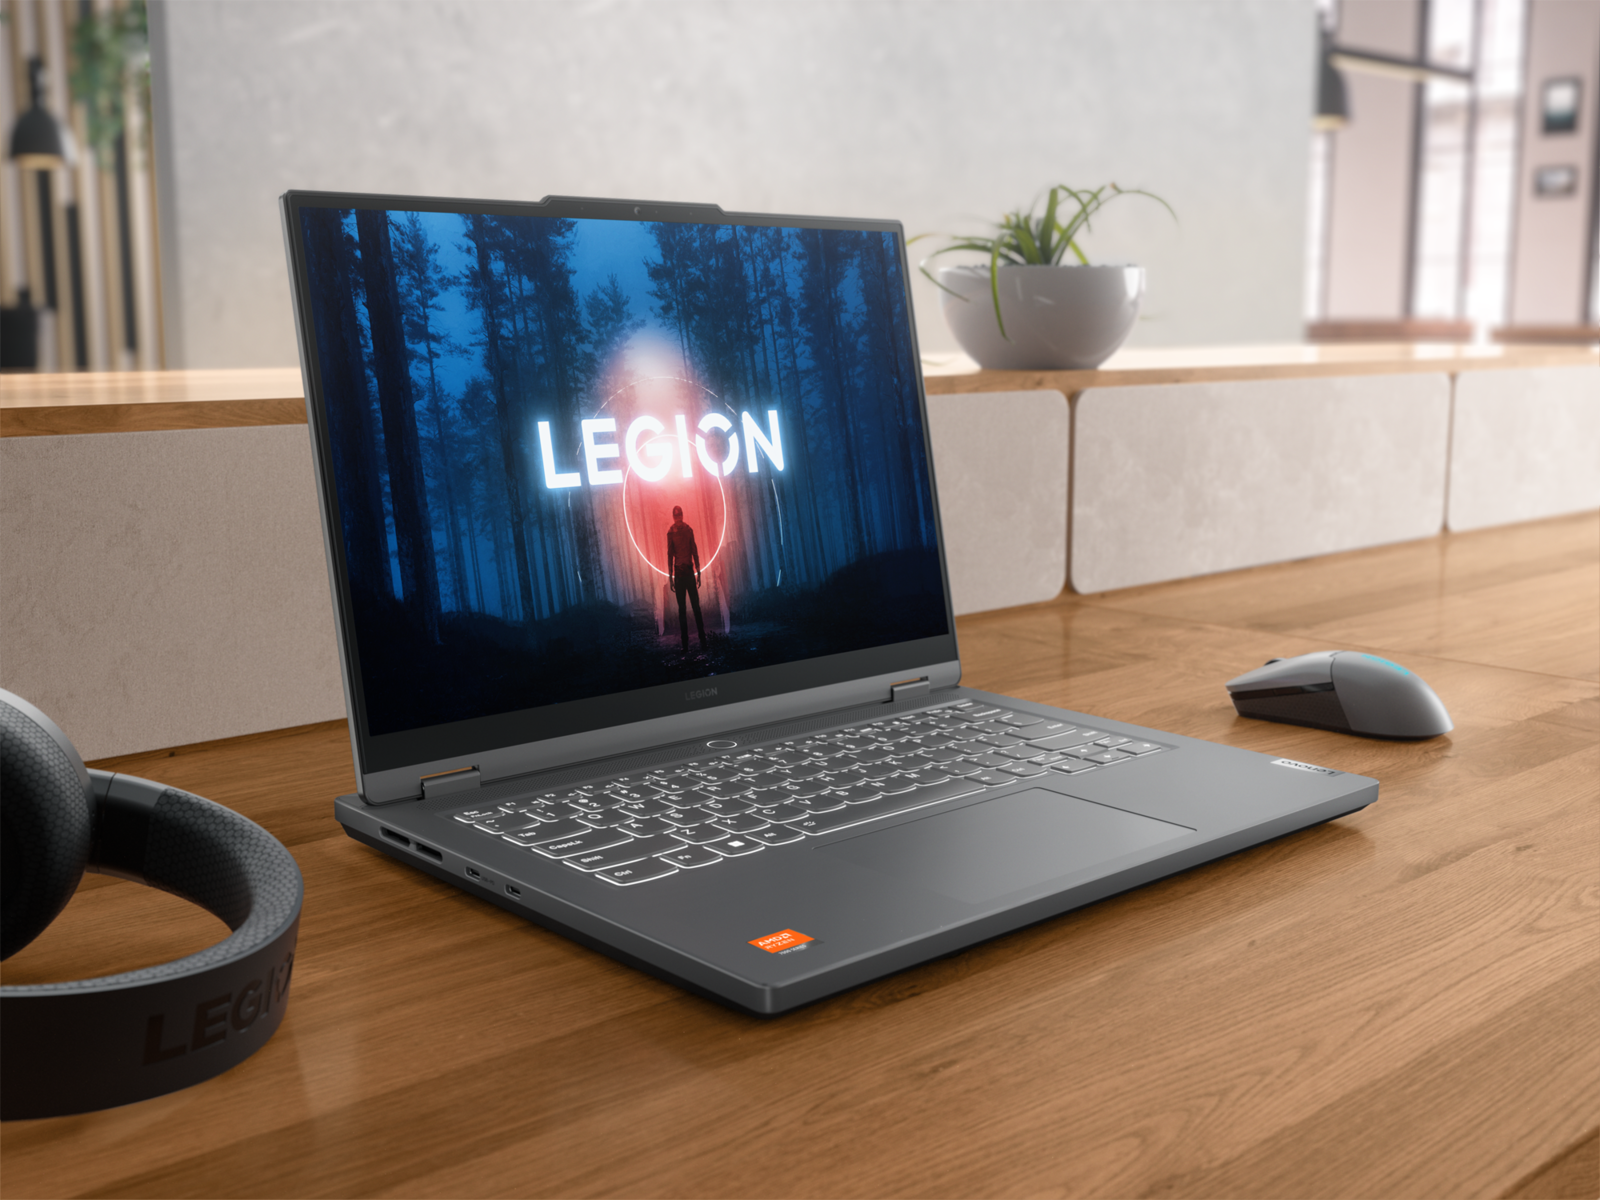
The Legion Slim 5 14 is the first and smallest 14-inch Legion laptop in the family. It distinguishes itself from others in the market with its 120 Hz OLED display and slightly larger 14.5-inch screen size whereas alternatives from Razer, Acer, or Asus tend to come with 14.0-inch IPS panels.
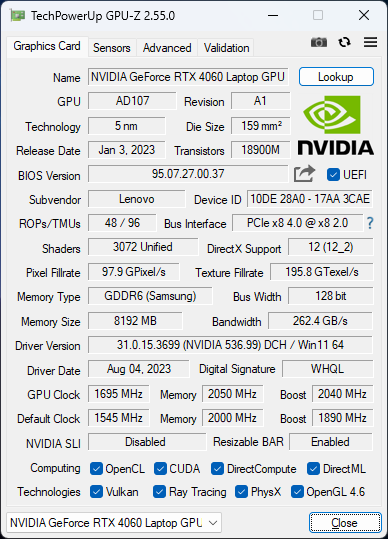
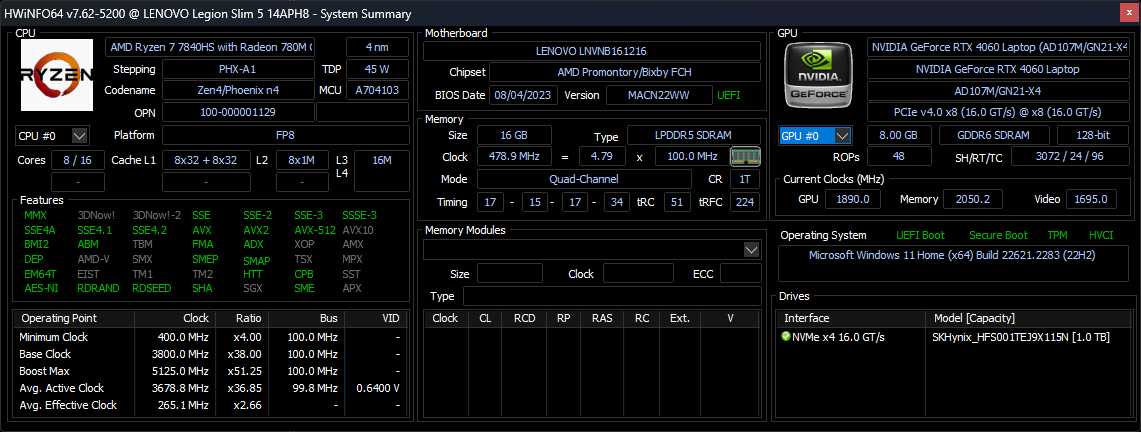
Our review configuration a mid-range SKU with the Zen 4 Ryzen 7 7840HS CPU and 105 W GeForce RTX 4060 graphics for approximately $1500 USD retail. Other SKUs include the faster Ryzen 9 7940HS or slower RTX 4050, but the 14.5-inch 2.8K 120 Hz OLED non-touch display is fixed across all options. No Intel variants have been announced at the time of publishing.
The Lenovo model competes directly with other 14-inch gaming laptops like the Acer Predator Triton 14, Razer Blade 14, Asus ROG Zephyrus G14, or Alienware x14.
More Lenovo reviews:
Potential Competitors in Comparison
Rating | Date | Model | Weight | Height | Size | Resolution | Price |
|---|---|---|---|---|---|---|---|
| 87.7 % v7 (old) | 09 / 2023 | Lenovo Legion Slim 5 14APH8 R7 7840HS, GeForce RTX 4060 Laptop GPU | 1.7 kg | 20.79 mm | 14.50" | 2880x1600 | |
| 87.3 % v7 (old) | 07 / 2023 | Acer Predator Triton 14 PT14-51 i7-13700H, GeForce RTX 4050 Laptop GPU | 1.7 kg | 19.81 mm | 14.00" | 2560x1600 | |
| 88.7 % v7 (old) | 06 / 2023 | Razer Blade 14 RTX 4070 R9 7940HS, GeForce RTX 4070 Laptop GPU | 1.8 kg | 17.99 mm | 14.00" | 2560x1600 | |
| 90 % v7 (old) | 04 / 2023 | Asus ROG Zephyrus G14 GA402XY R9 7940HS, GeForce RTX 4090 Laptop GPU | 1.7 kg | 20.5 mm | 14.00" | 2560x1600 | |
| 86.7 % v7 (old) | 03 / 2022 | Alienware x14 i7 RTX 3060 i7-12700H, GeForce RTX 3060 Laptop GPU | 1.8 kg | 14.5 mm | 14.00" | 1920x1080 | |
| 85.7 % v7 (old) | 07 / 2023 | Lenovo LOQ 15APH8 R7 7840HS, GeForce RTX 4050 Laptop GPU | 2.5 kg | 25.2 mm | 15.60" | 1920x1080 |
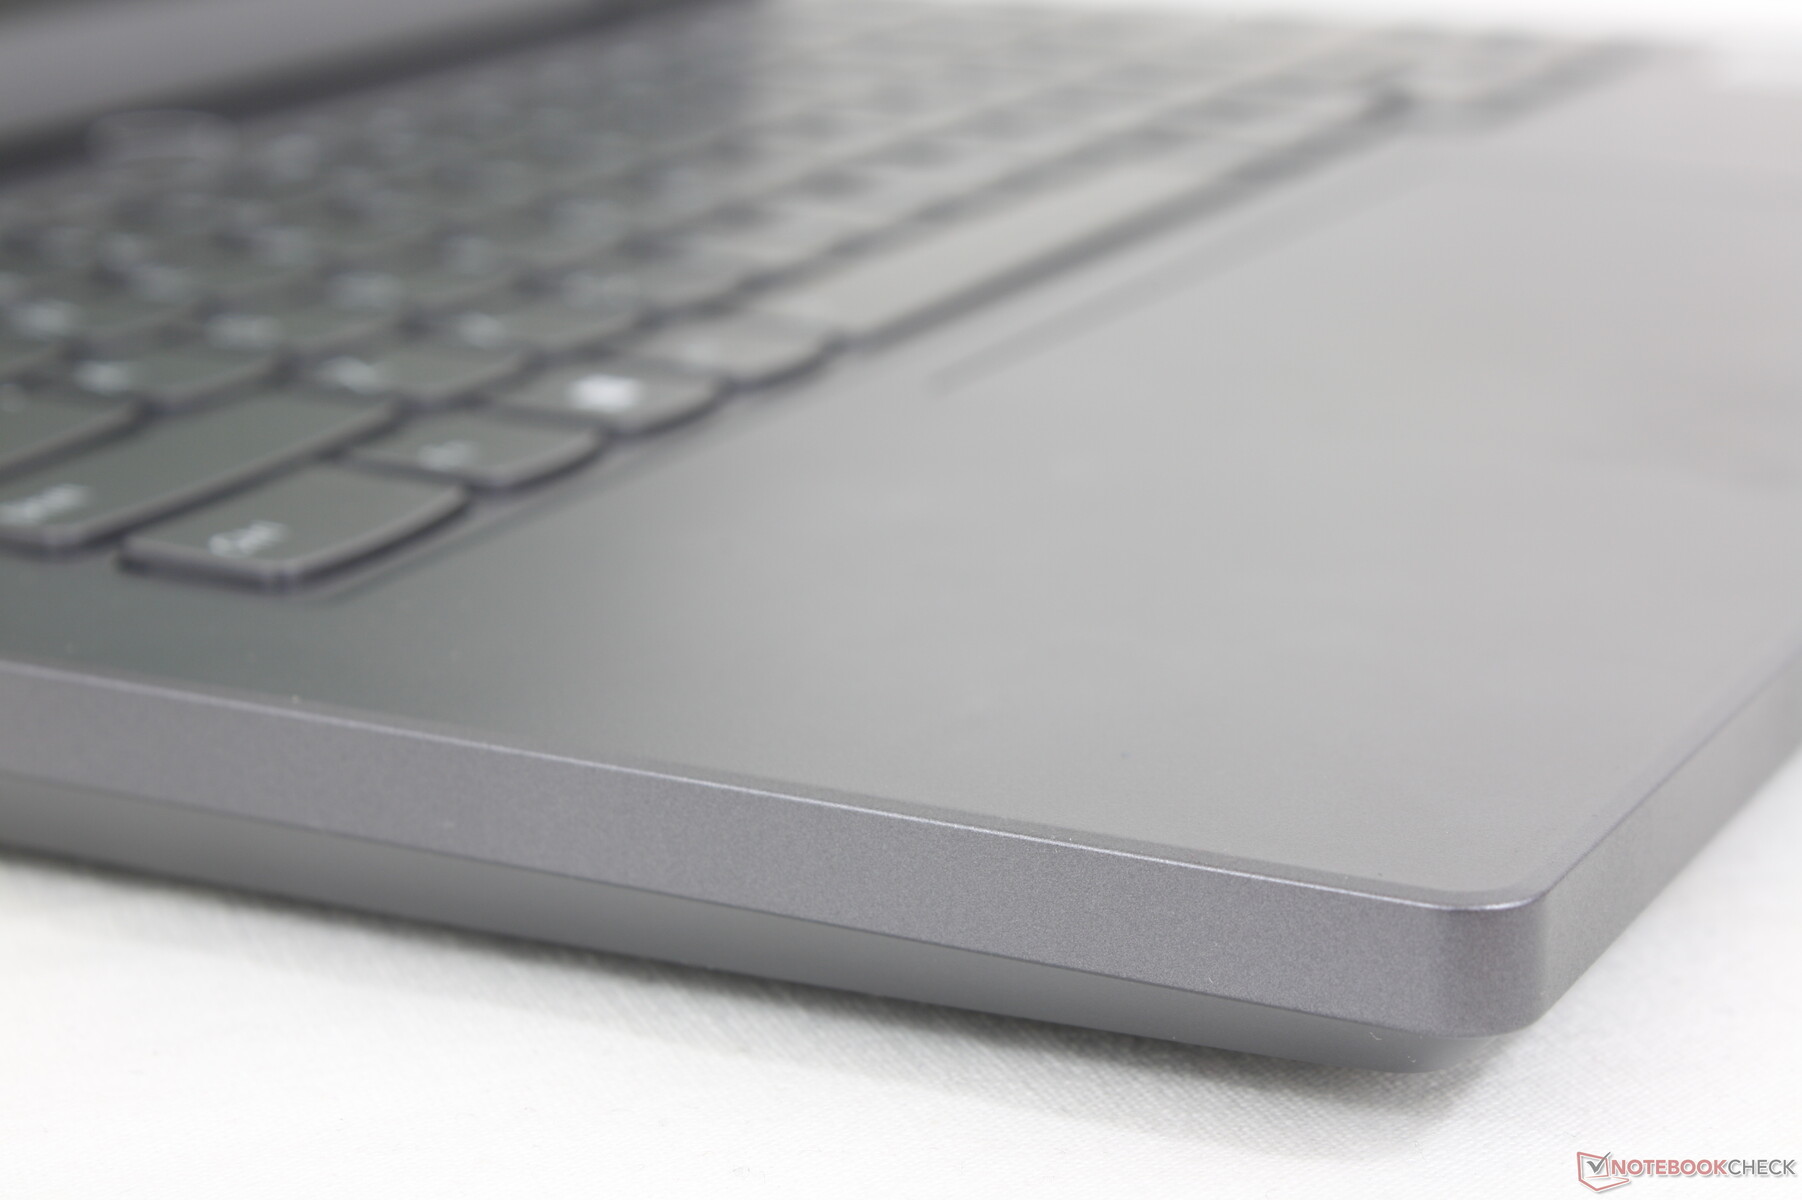
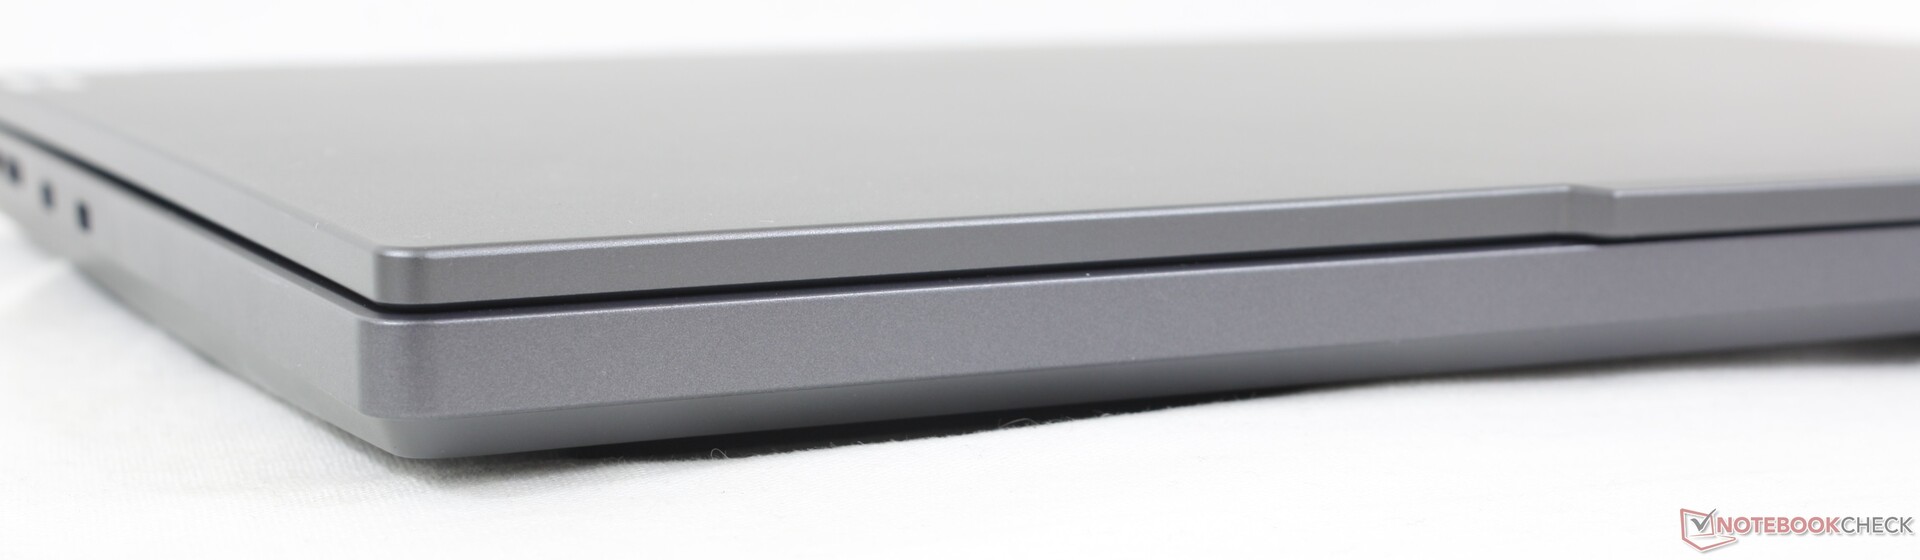
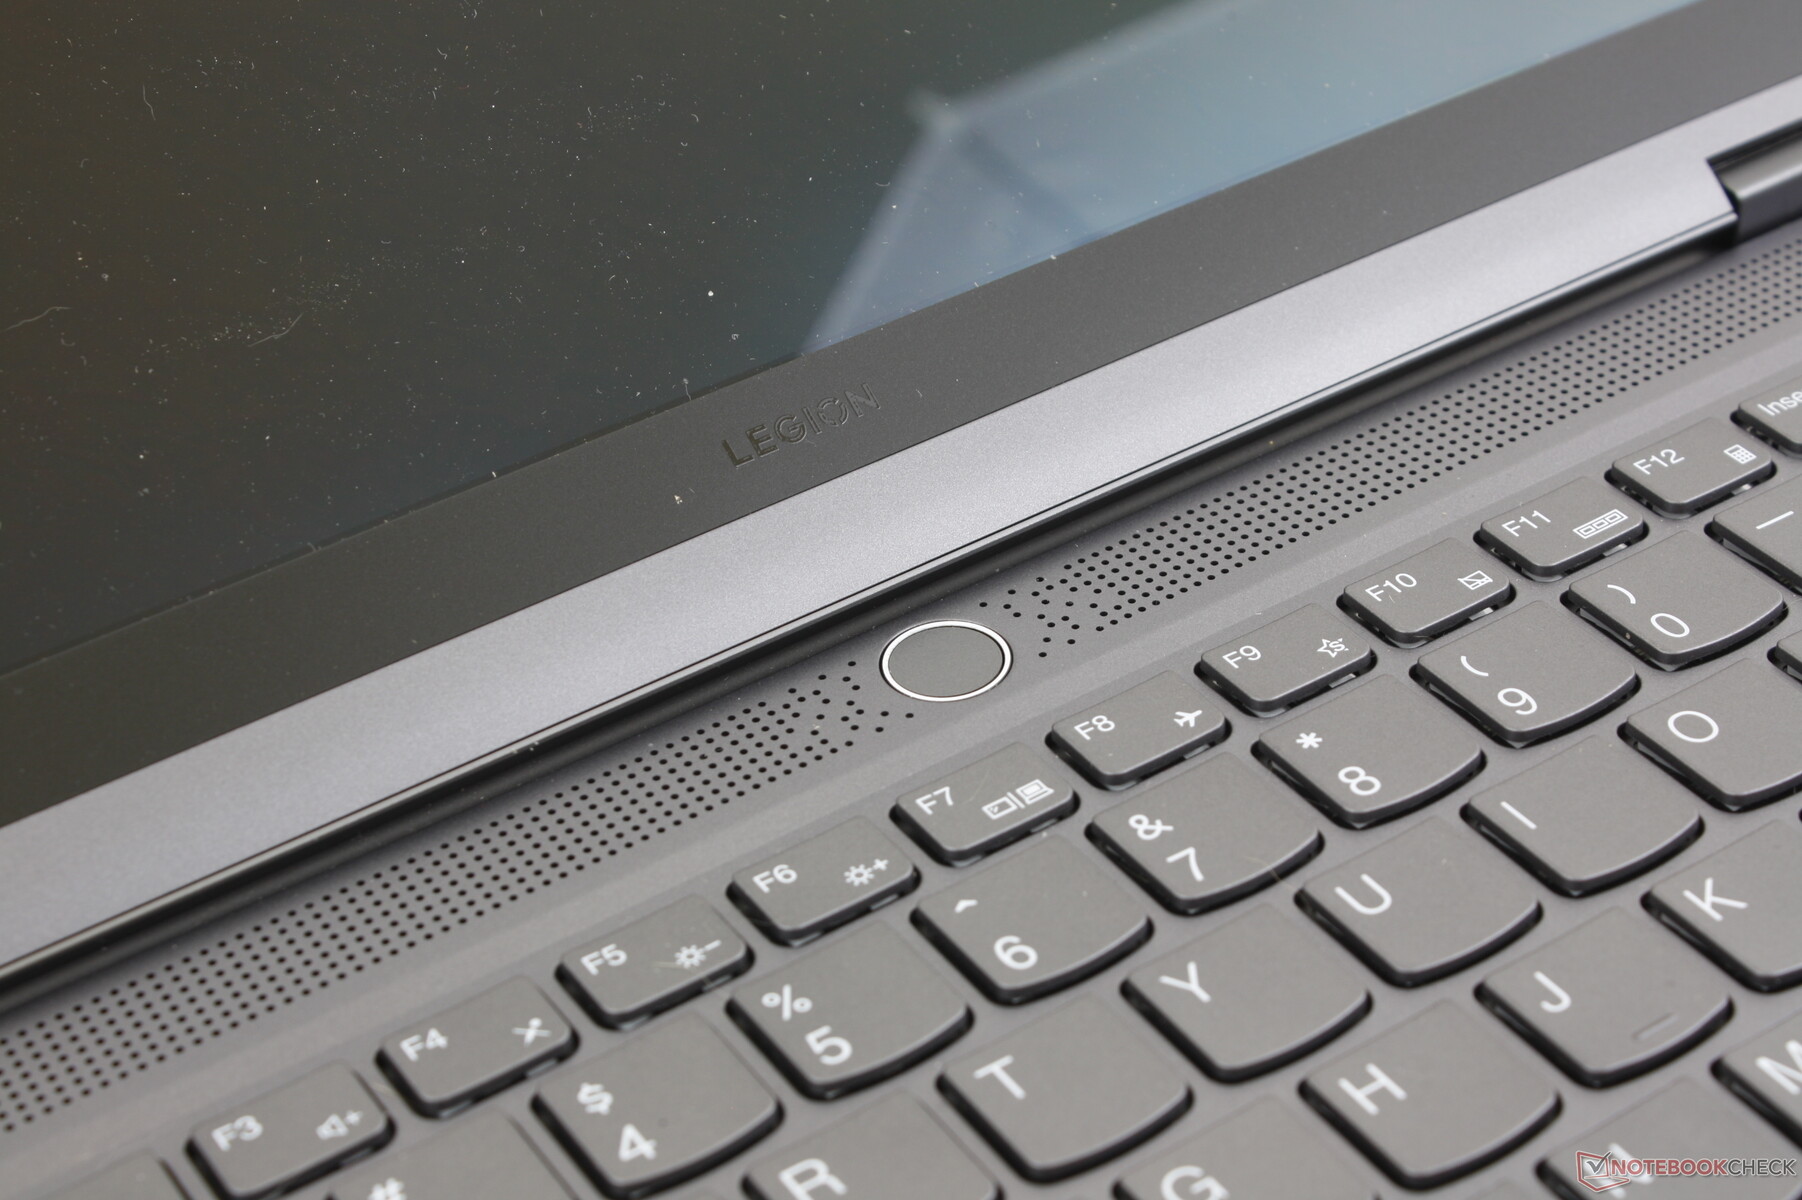
Case — Look Like A ThinkBook, Game Like A Legion
Lenovo employs similar smooth metal materials in monotone gray across many of its Legion and ThinkBook models. Gamers who aren't drawn to the eccentric designs of Alienware or Asus ROG laptops might find the flatter and RGB-free design of the Legion Slim 5 14 to be more appealing especially for classrooms and non-gaming environments.
Chassis quality is strong from top to bottom for solid first impressions. Surfaces aren't as rigid as on the Blade 14 or Alienware x14 and this is most noticeable when applying pressure down the keyboard center or palm rests or when twisting the lid, but any flexing is still minimal.
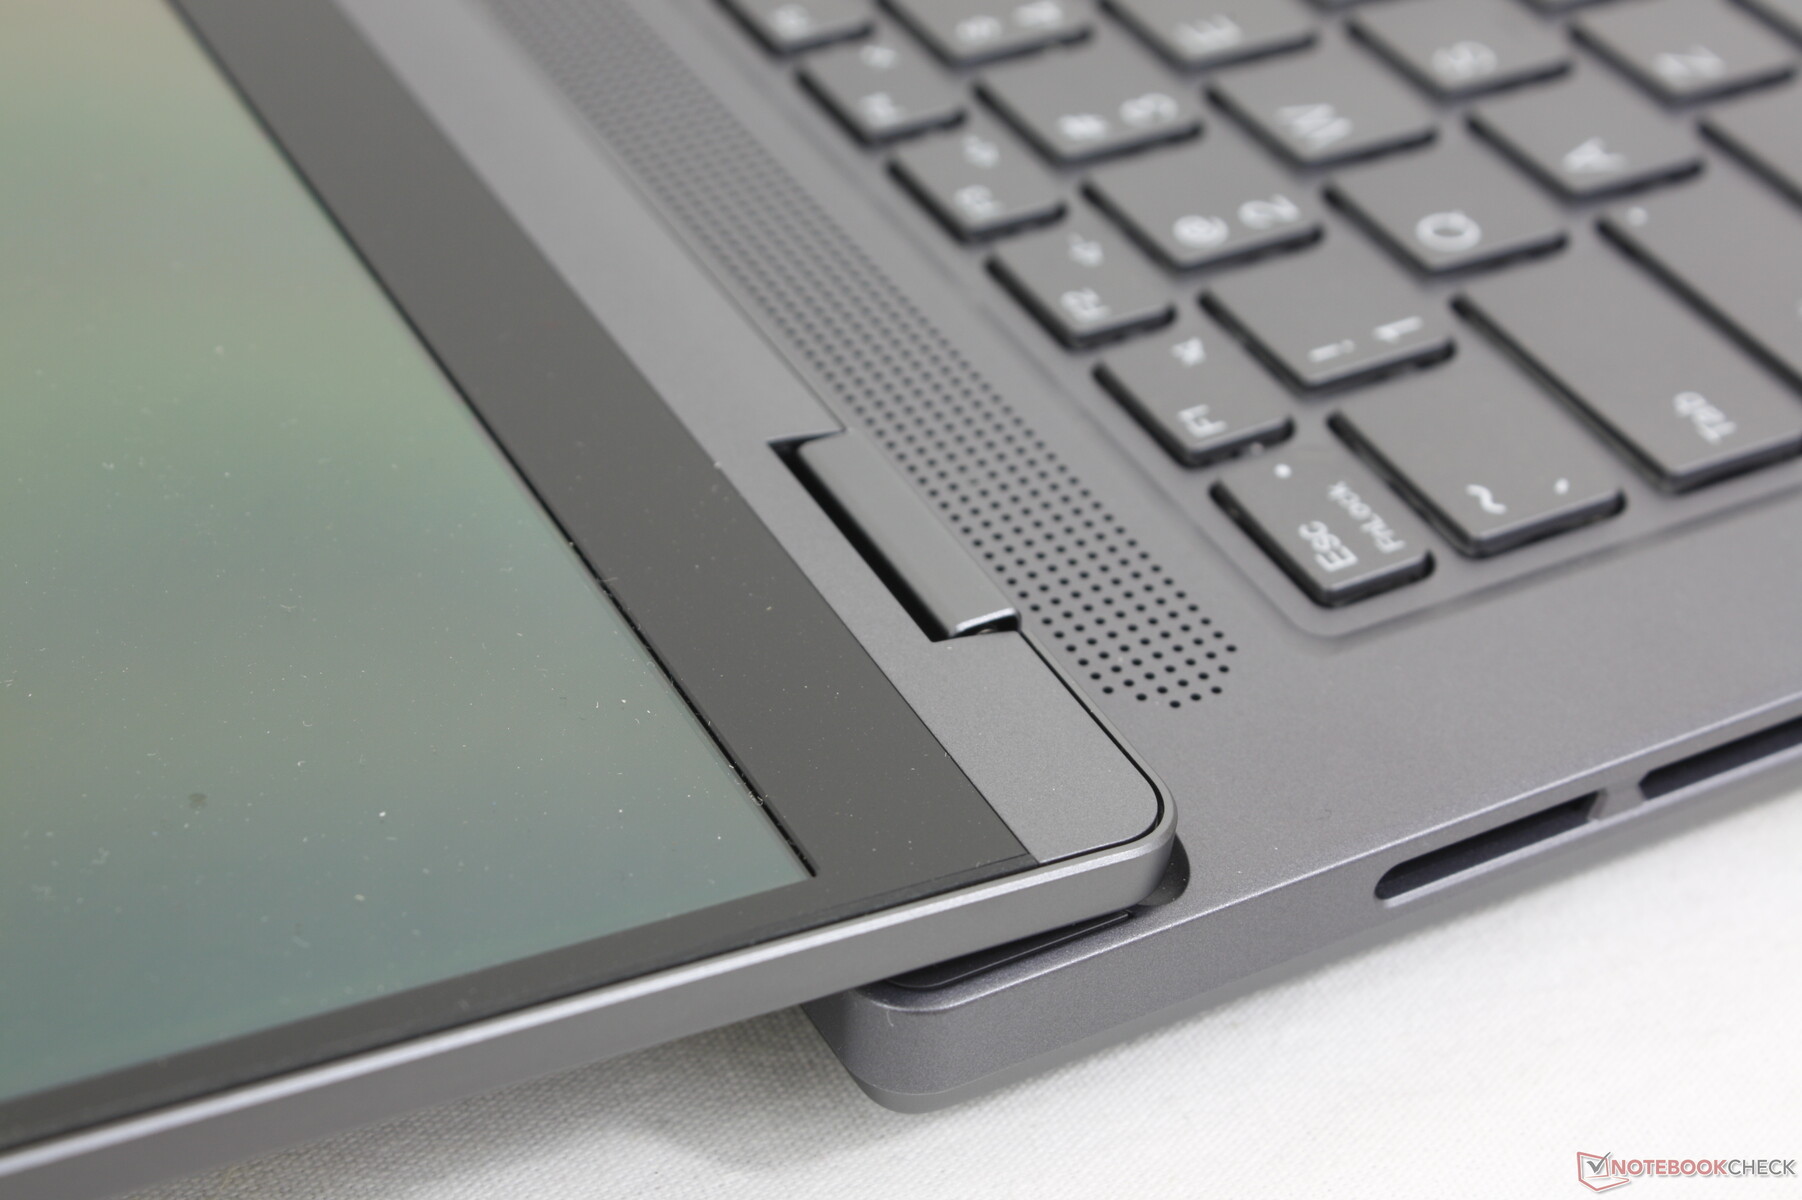
The hinges deserve a mention as they can open the full 180 degrees unlike on other 14-inch gaming laptops. Hinge rigidity is satisfactory, but it could have been stiffer at wider angles for a better sense of longevity.
The larger 14.5-inch screen size and extended rear of the Legion design give our Legion Slim 5 14 a larger footprint than competitors like the Blade 14, Zephyrus G14, or Predator Triton 14. They all still weigh about the same, however, and so the Legion Slim 5 14 is simply not as dense.
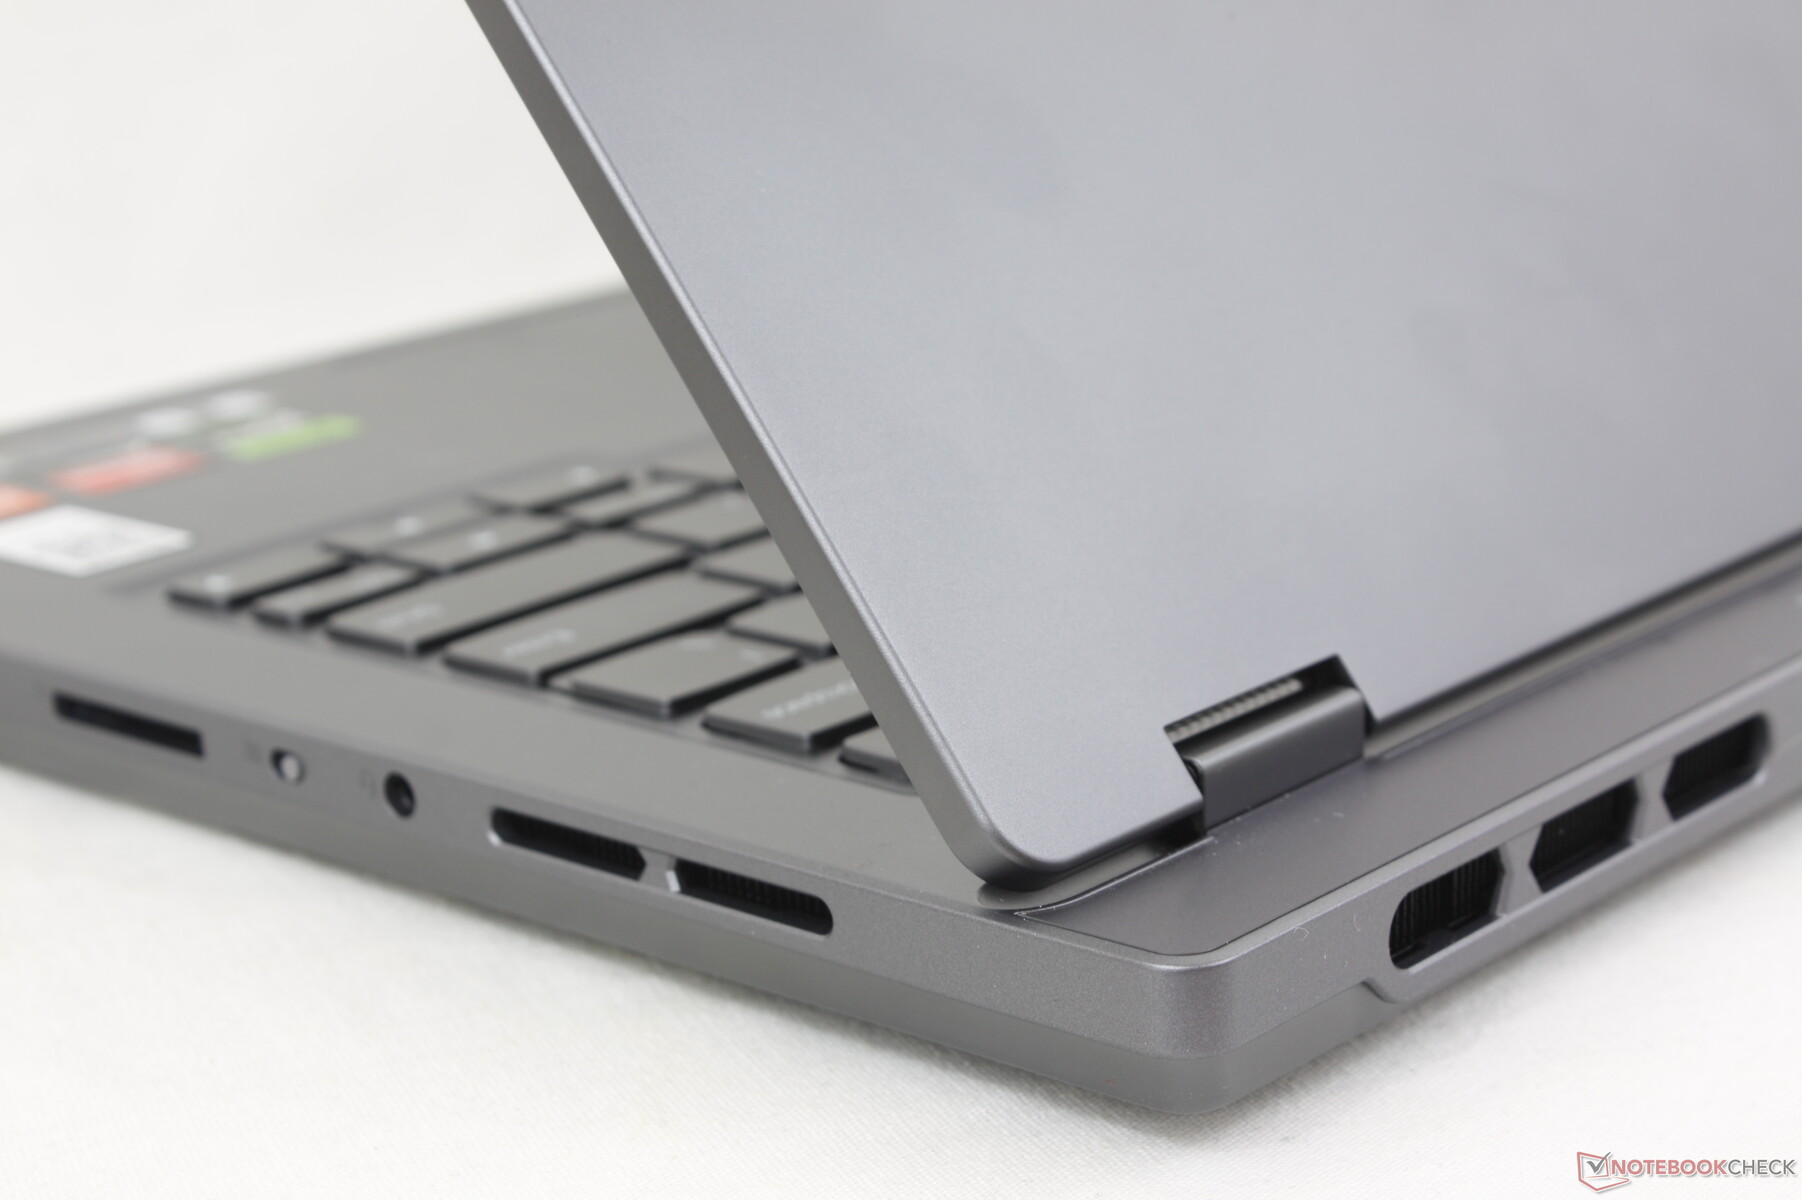
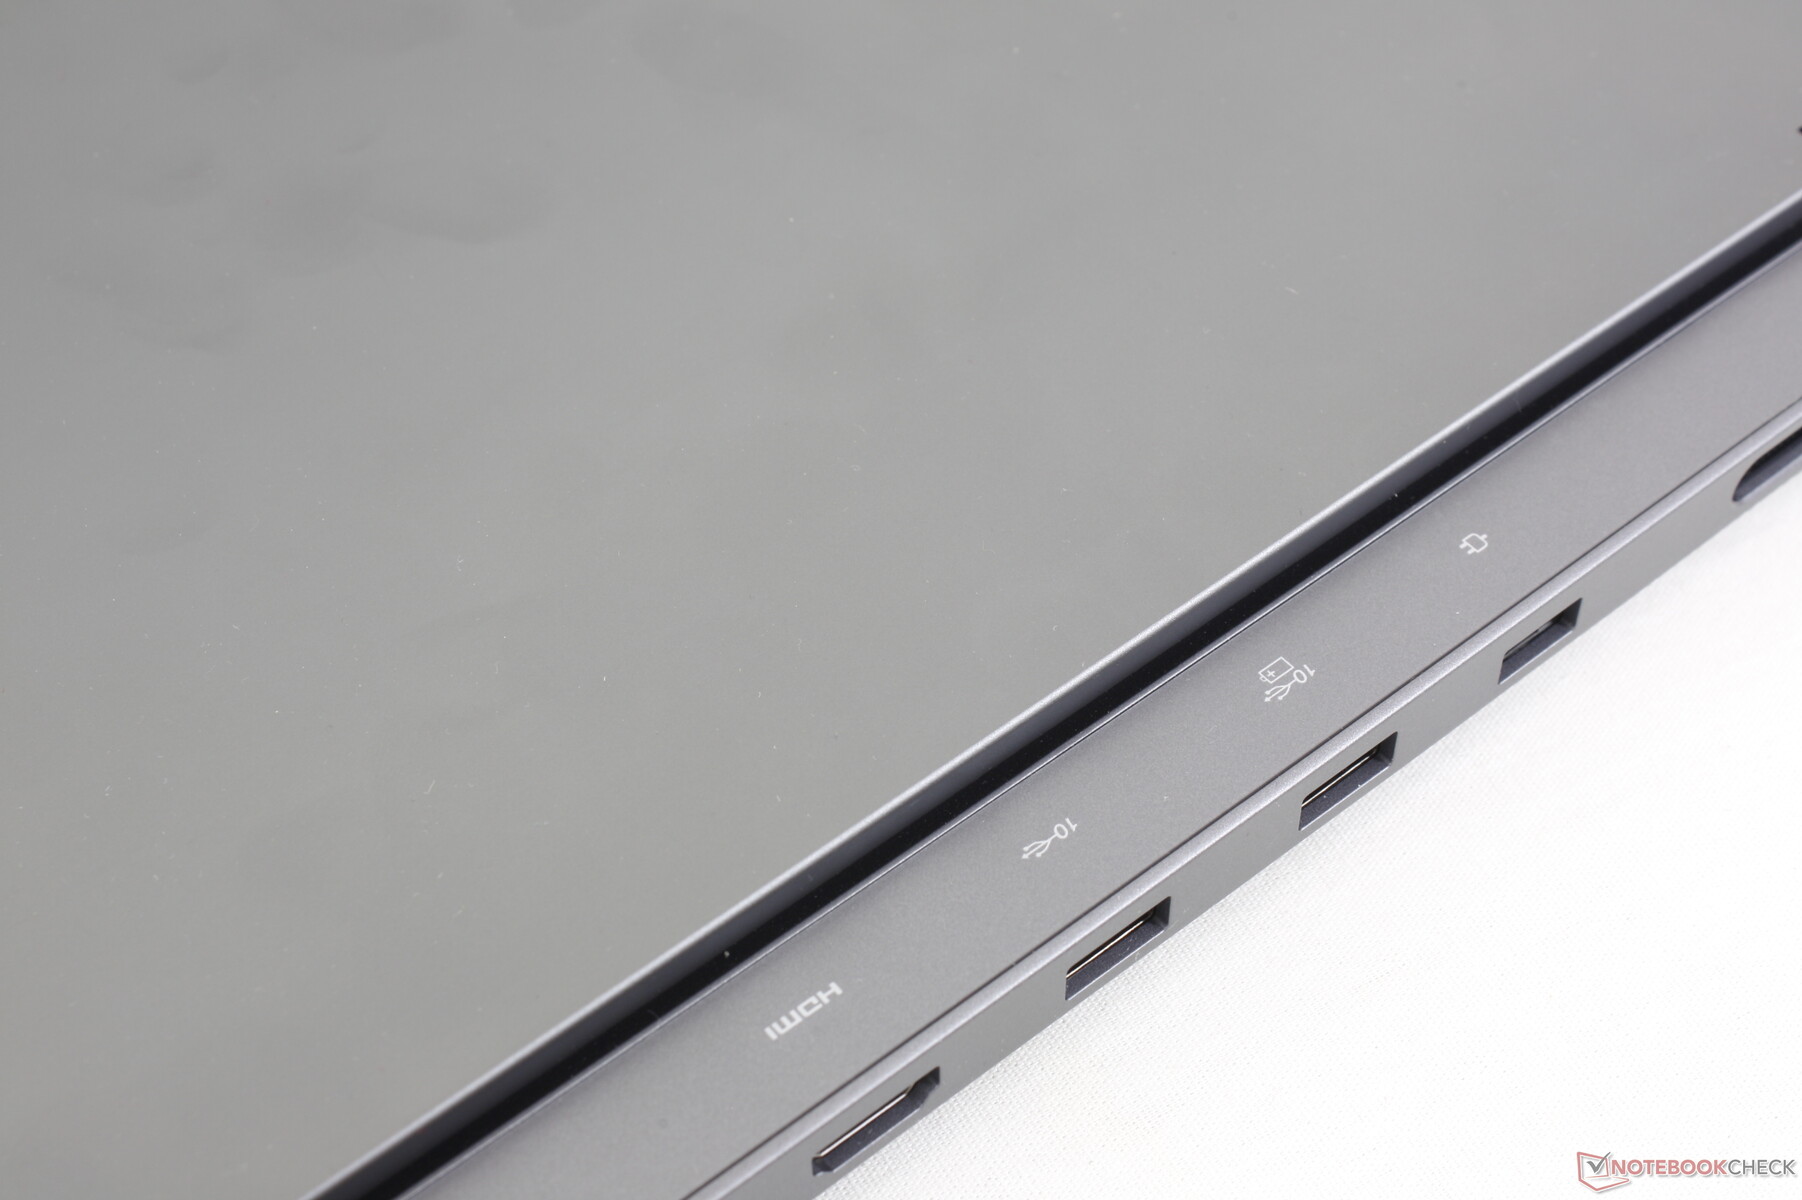
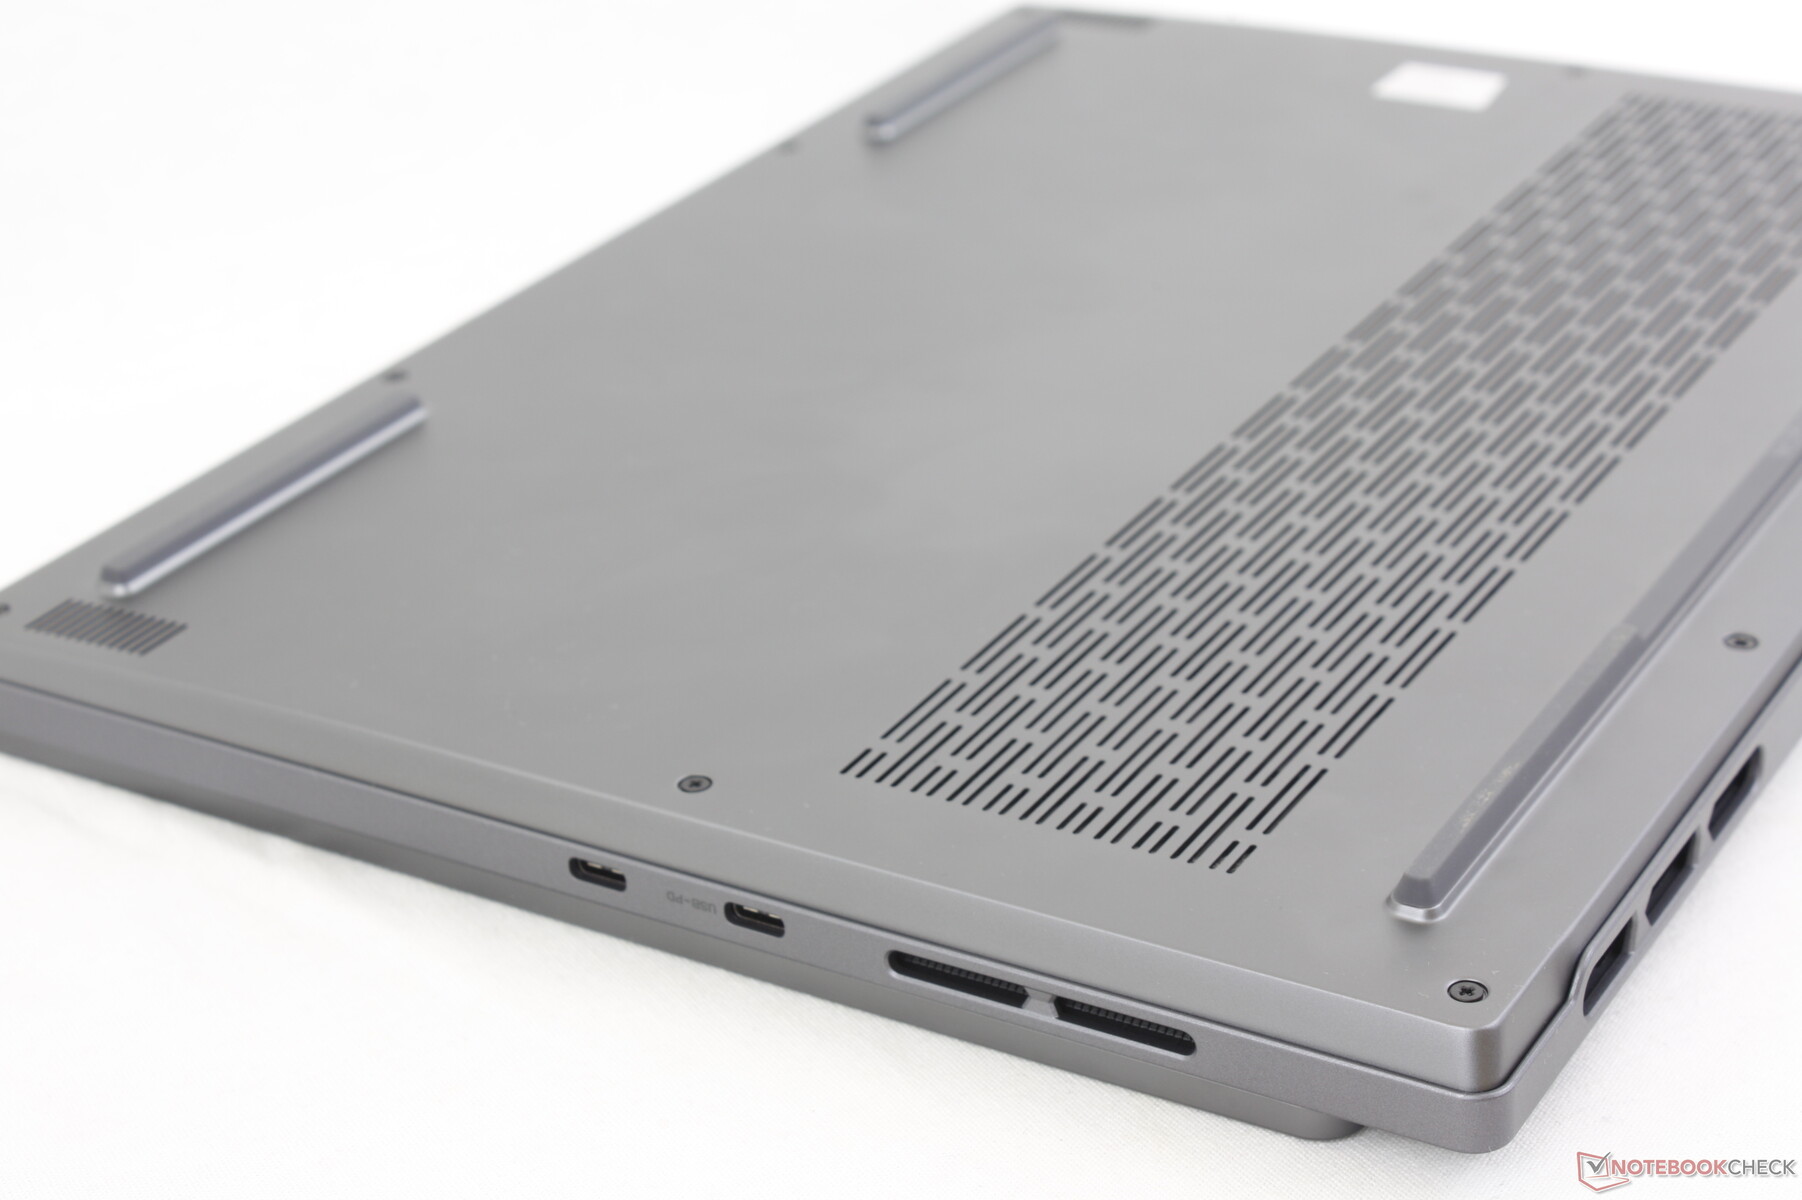
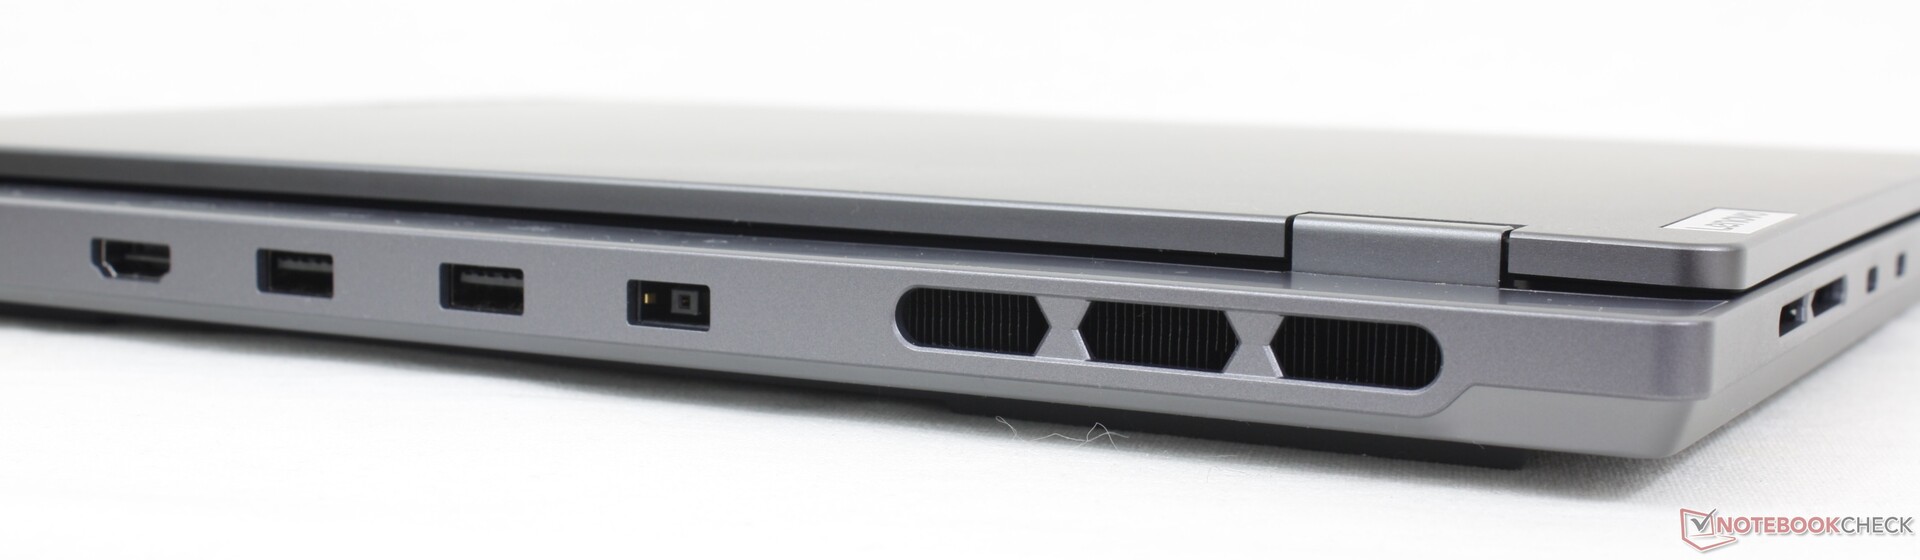
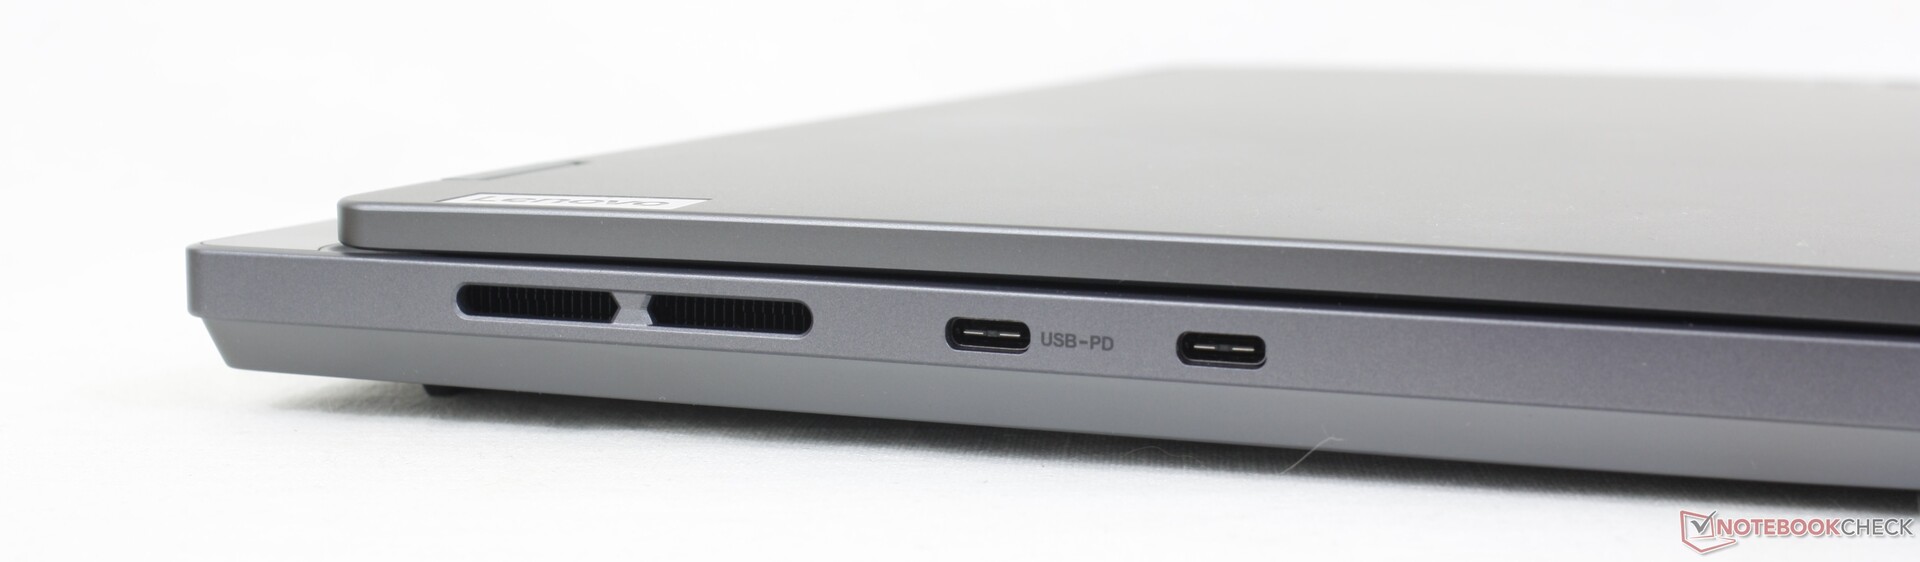
Connectivity — Where Is USB4?
Port options are most similar to the Blade 14 albeit with very different positioning. We find the positioning to be unfavorable on the Legion Slim 5 since the ports are not evenly distributed and most of them are along the rear including the USB-A ports.
The model unfortunately lacks USB4 and Thunderbolt support. There is no Kensington lock as well.
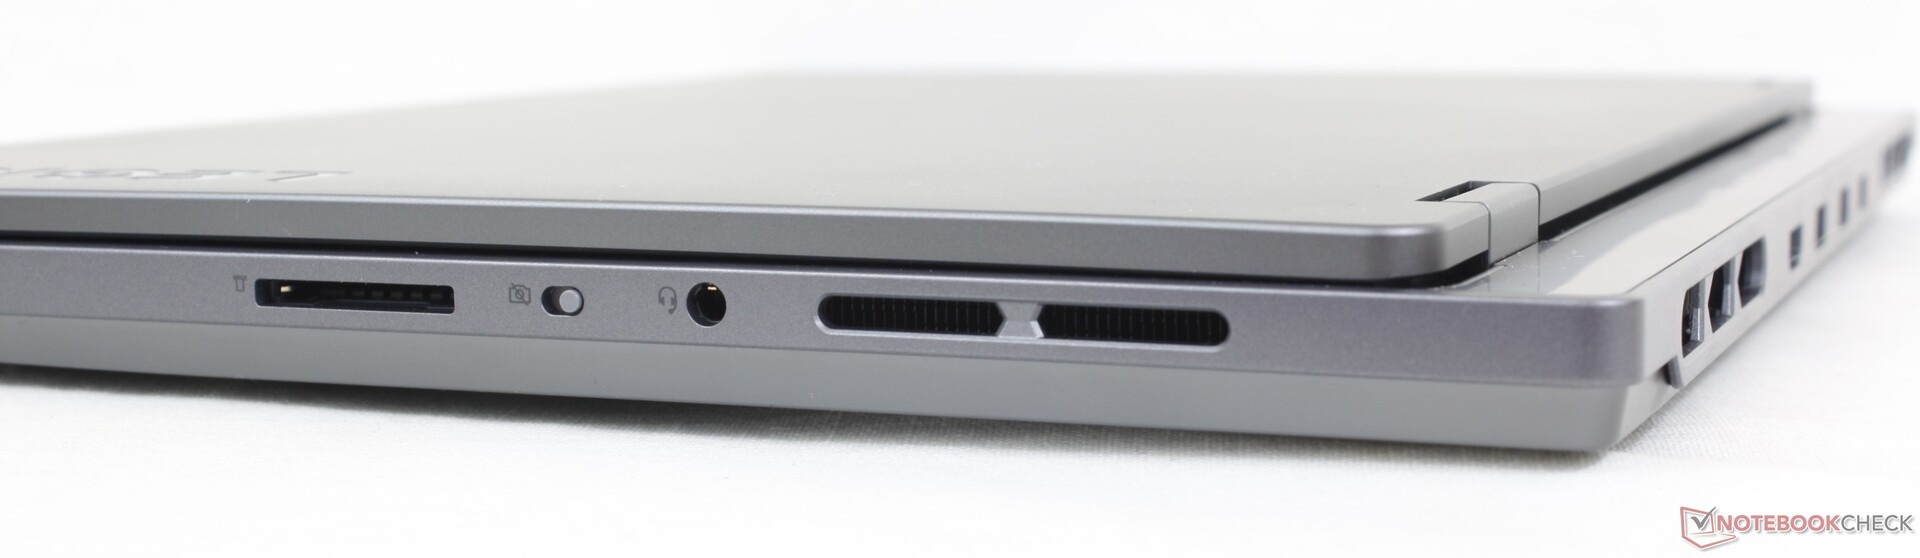
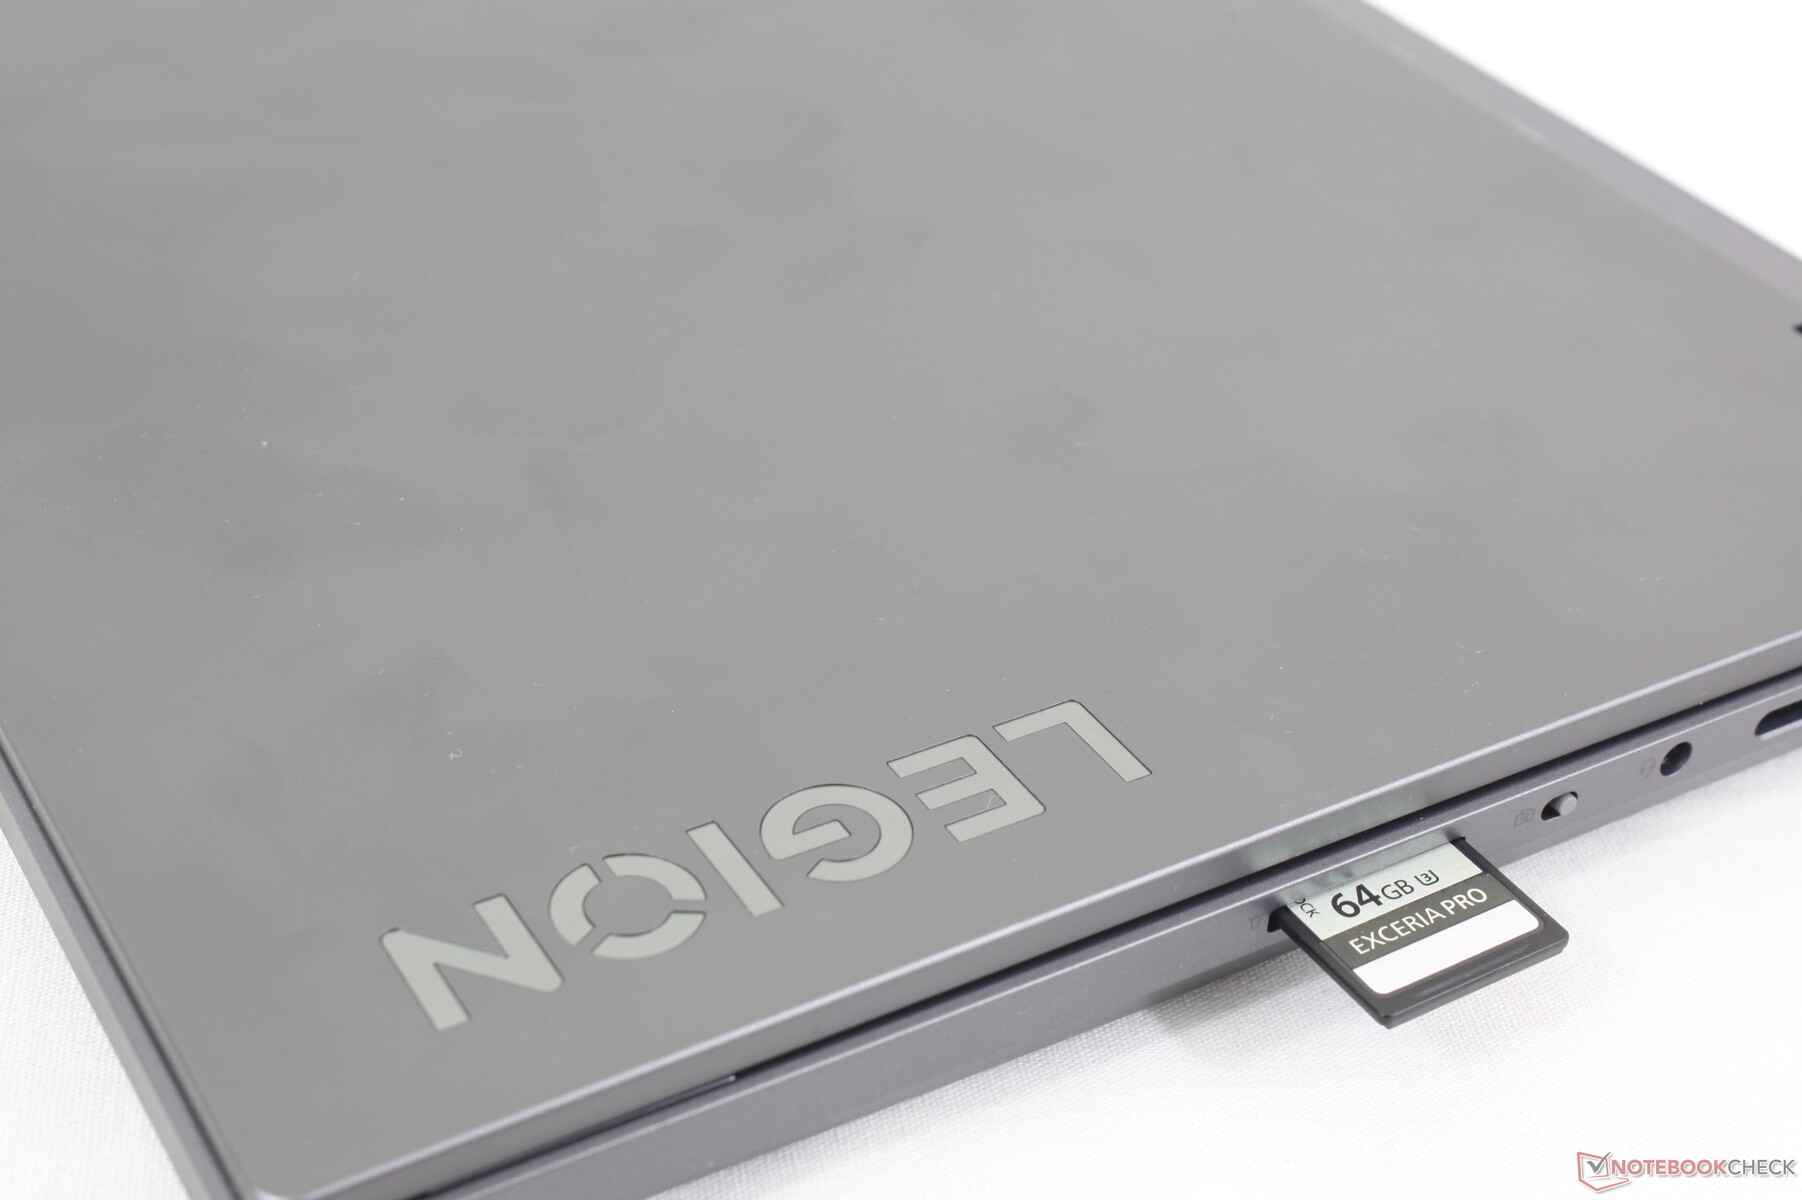
SD Card Reader
The integrated SD reader is much faster than the one on the Predator Triton 14 but not as fast as the ones on the Zephyrus G14 or Alienware x14. Moving 1 GB of pictures from our UHS-II test card to desktop takes about 12 seconds compared to just half that on the Alienware x14.
| SD Card Reader | |
| average JPG Copy Test (av. of 3 runs) | |
| Alienware x14 i7 RTX 3060 (Angelbird AV Pro V60) | |
| Asus ROG Zephyrus G14 GA402XY (Angelibrid AV Pro V60) | |
| Lenovo Legion Slim 5 14APH8 (Toshiba Exceria Pro SDXC 64 GB UHS-II) | |
| Acer Predator Triton 14 PT14-51 (AV PRO microSD 128 GB V60) | |
| maximum AS SSD Seq Read Test (1GB) | |
| Asus ROG Zephyrus G14 GA402XY (Angelibrid AV Pro V60) | |
| Alienware x14 i7 RTX 3060 (Angelbird AV Pro V60) | |
| Lenovo Legion Slim 5 14APH8 (Toshiba Exceria Pro SDXC 64 GB UHS-II) | |
| Acer Predator Triton 14 PT14-51 (AV PRO microSD 128 GB V60) | |
Communication
A MediaTek MT7922 comes standard instead of the more common Intel AX211 for Wi-Fi 6E and Bluetooth 5.2 connectivity. We experienced steady performance and no issues when paired to our 6 GHz AXE11000 network.
| Networking | |
| iperf3 transmit AX12 | |
| Alienware x14 i7 RTX 3060 | |
| iperf3 receive AX12 | |
| Alienware x14 i7 RTX 3060 | |
| iperf3 transmit AXE11000 | |
| Asus ROG Zephyrus G14 GA402XY | |
| Acer Predator Triton 14 PT14-51 | |
| Lenovo Legion Slim 5 14APH8 | |
| Razer Blade 14 RTX 4070 | |
| Lenovo LOQ 15APH8 | |
| iperf3 receive AXE11000 | |
| Acer Predator Triton 14 PT14-51 | |
| Asus ROG Zephyrus G14 GA402XY | |
| Razer Blade 14 RTX 4070 | |
| Lenovo Legion Slim 5 14APH8 | |
| Lenovo LOQ 15APH8 | |
| iperf3 transmit AXE11000 6GHz | |
| Lenovo Legion Slim 5 14APH8 | |
| Razer Blade 14 RTX 4070 | |
| iperf3 receive AXE11000 6GHz | |
| Razer Blade 14 RTX 4070 | |
| Lenovo Legion Slim 5 14APH8 | |
Webcam
The 2 MP webcam is standard on gaming laptops. Both IR and a camera kill switch are built-in.


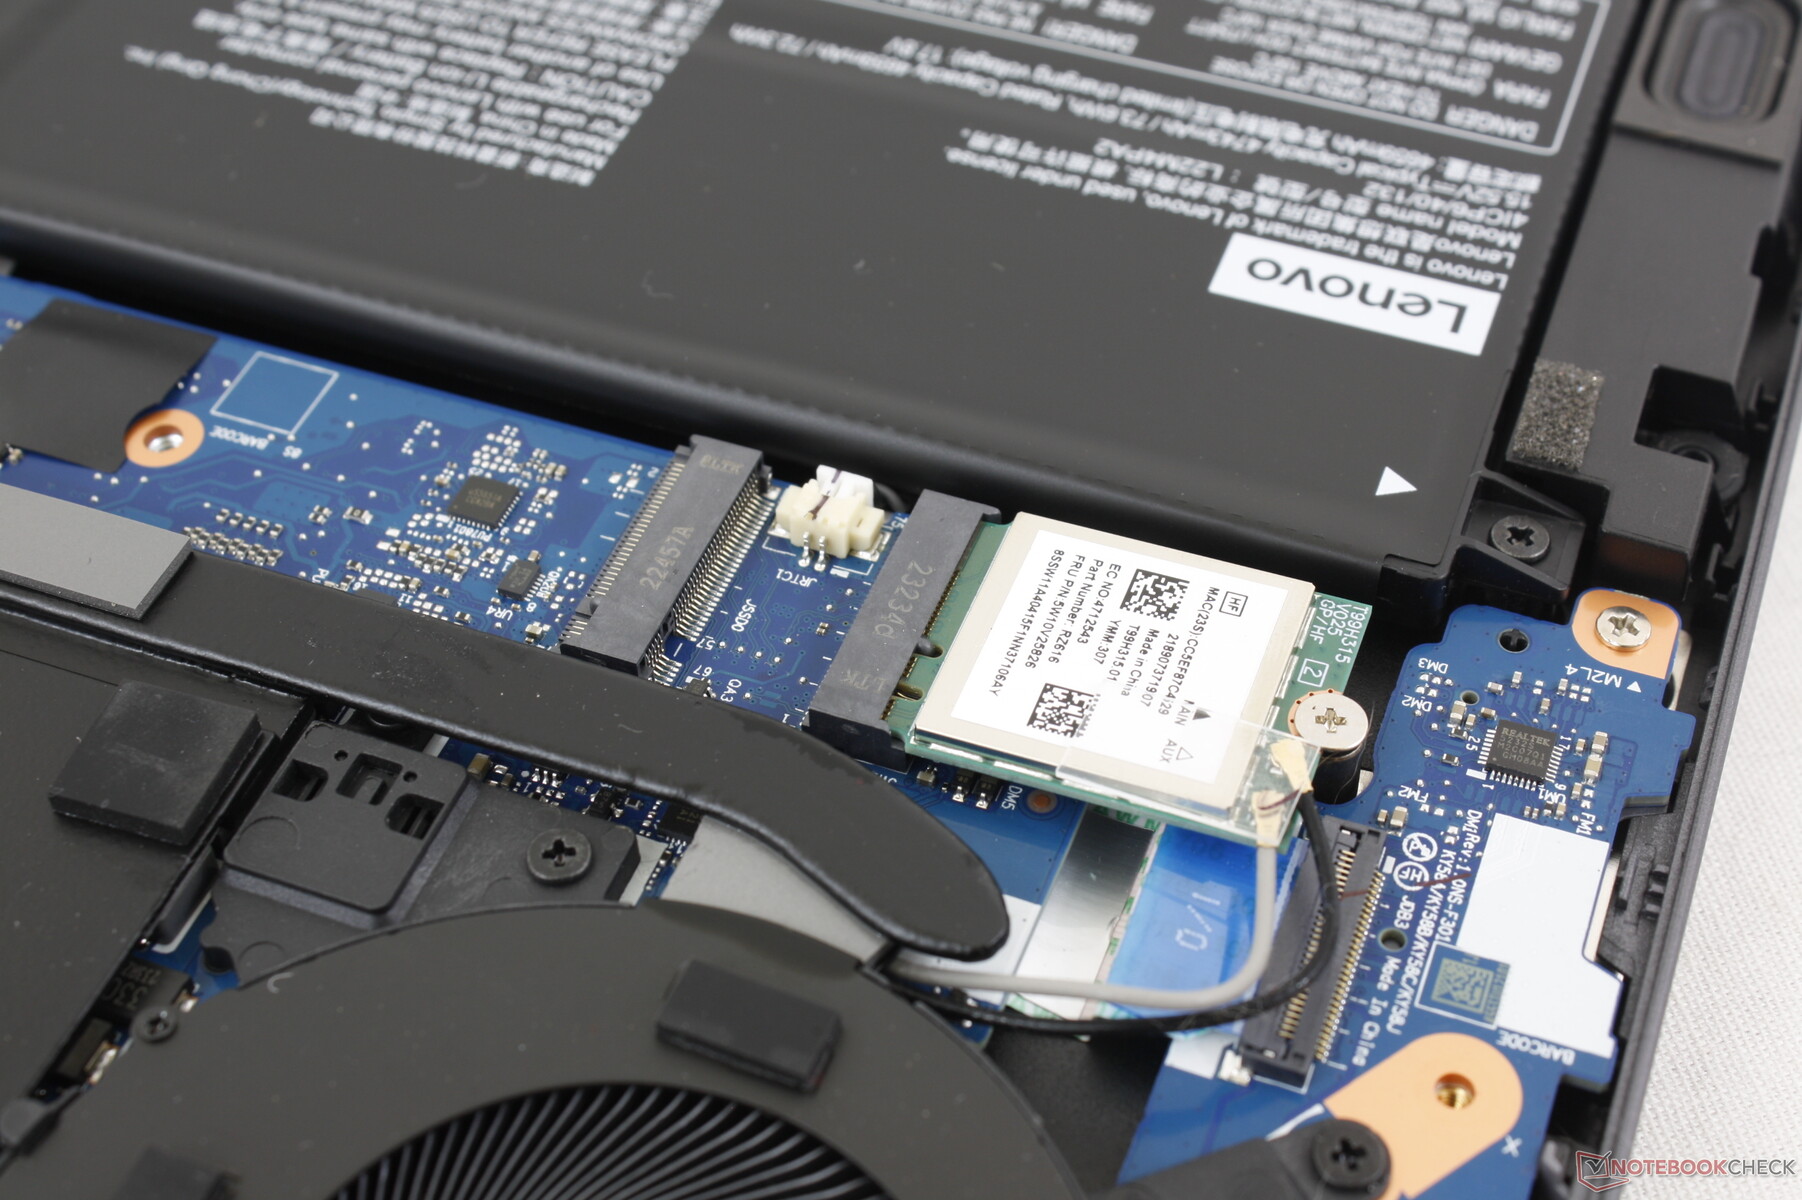
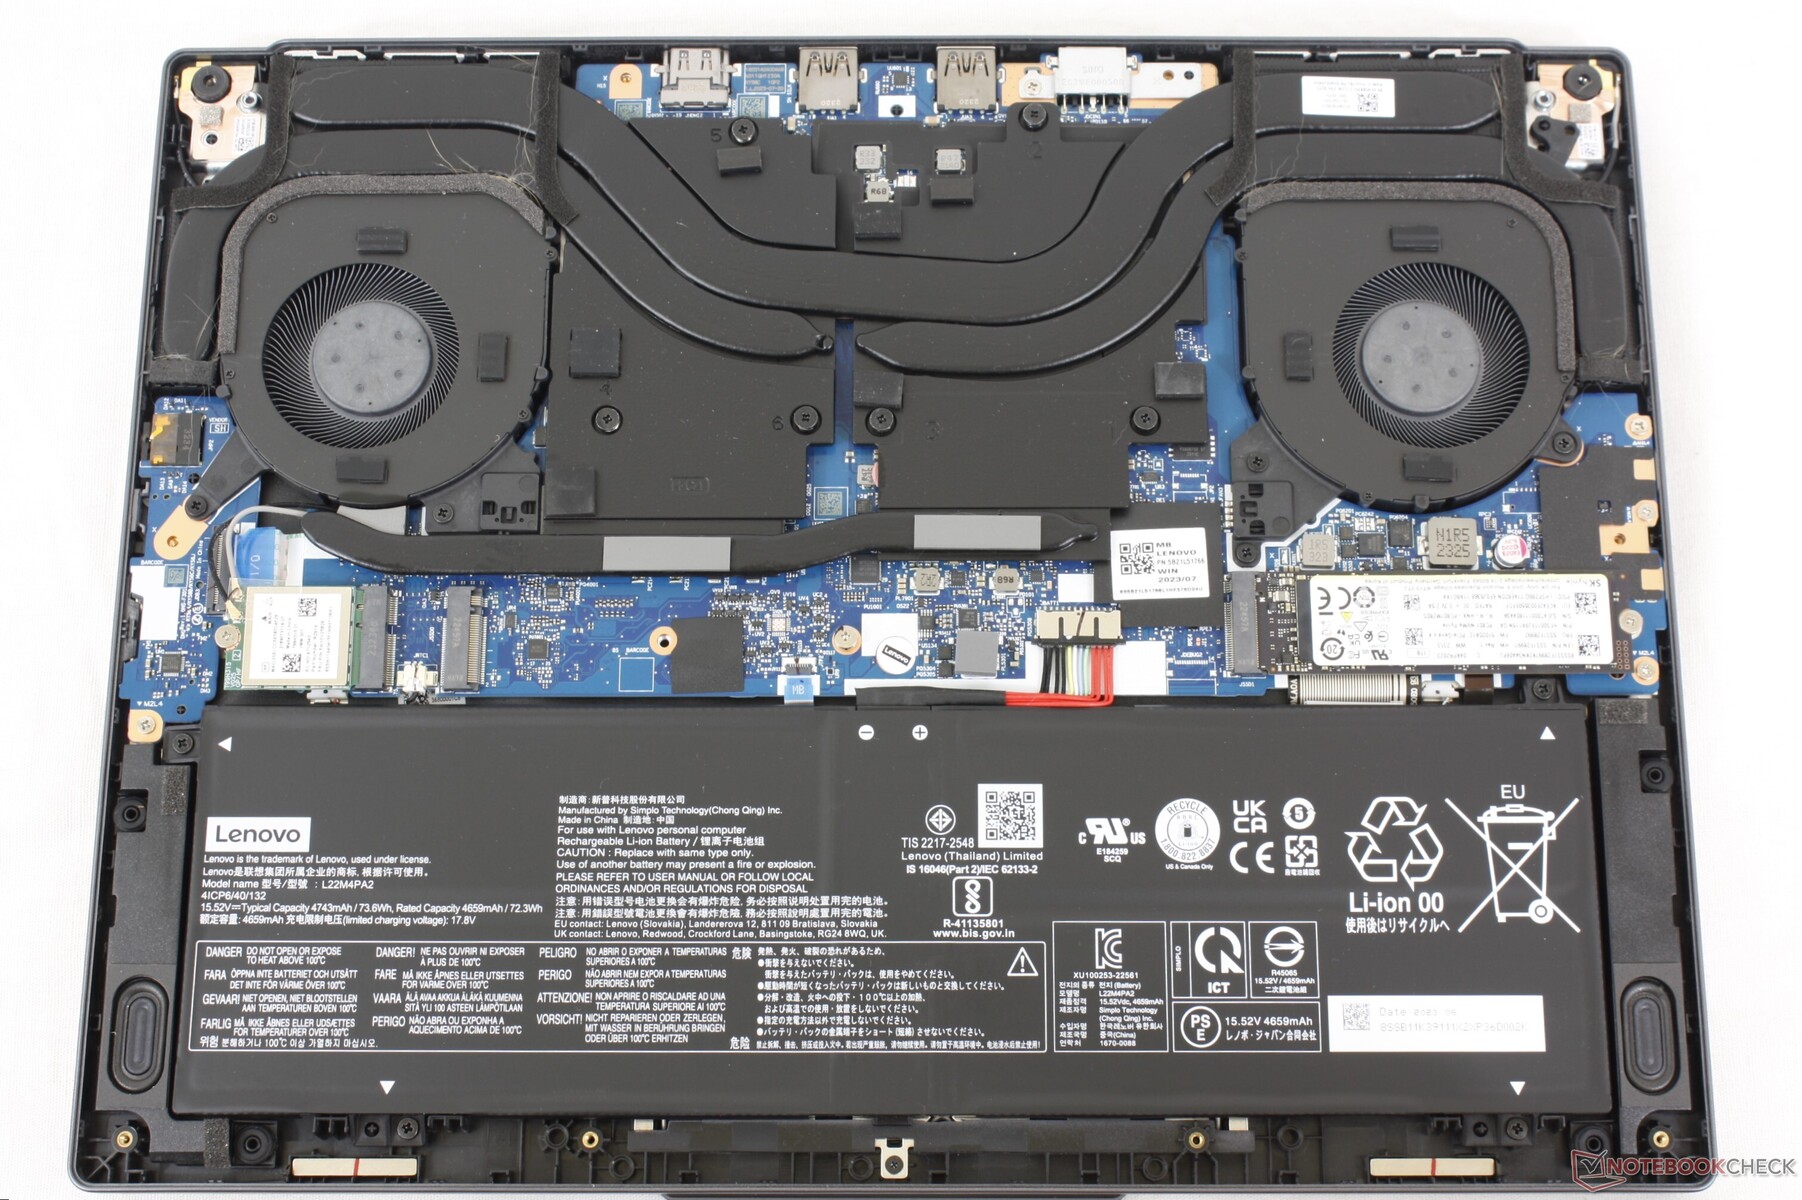
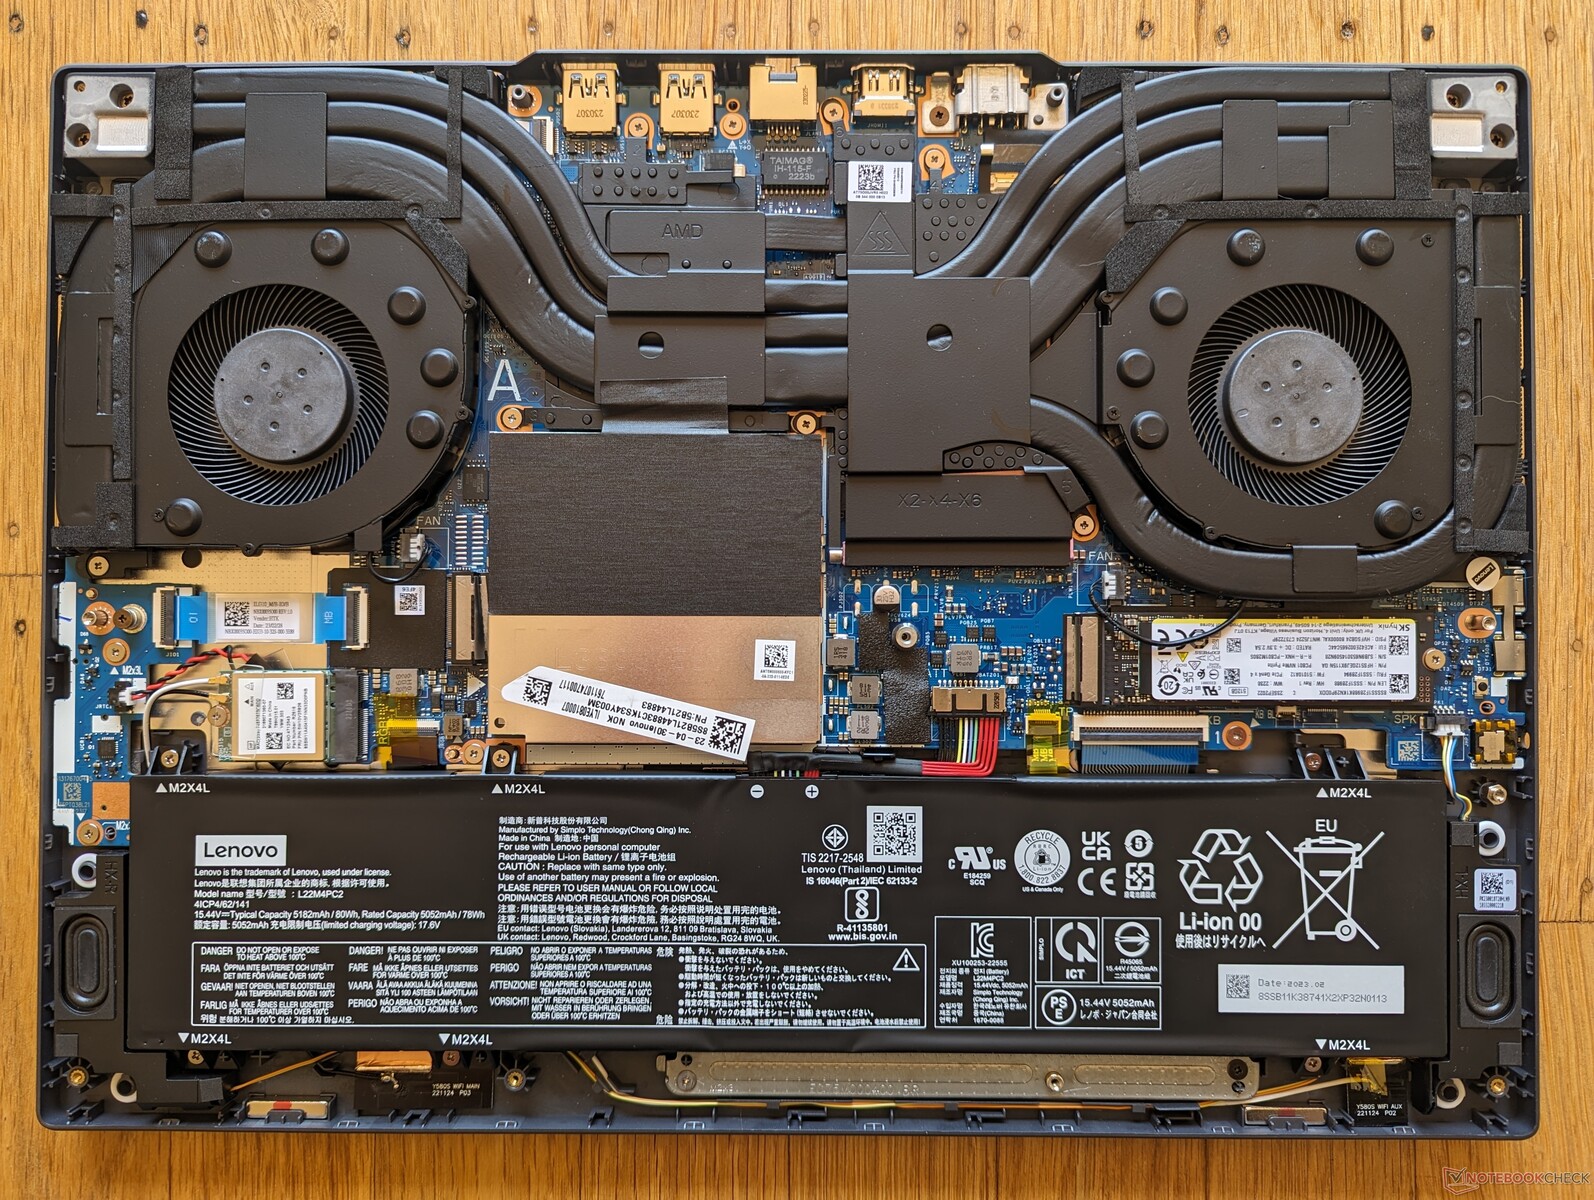
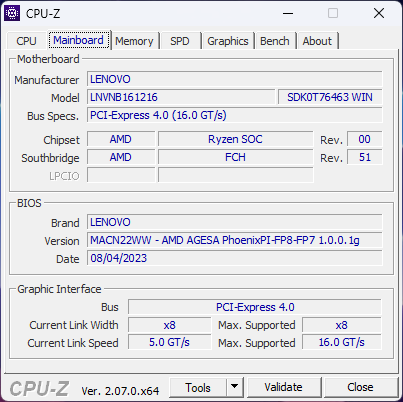
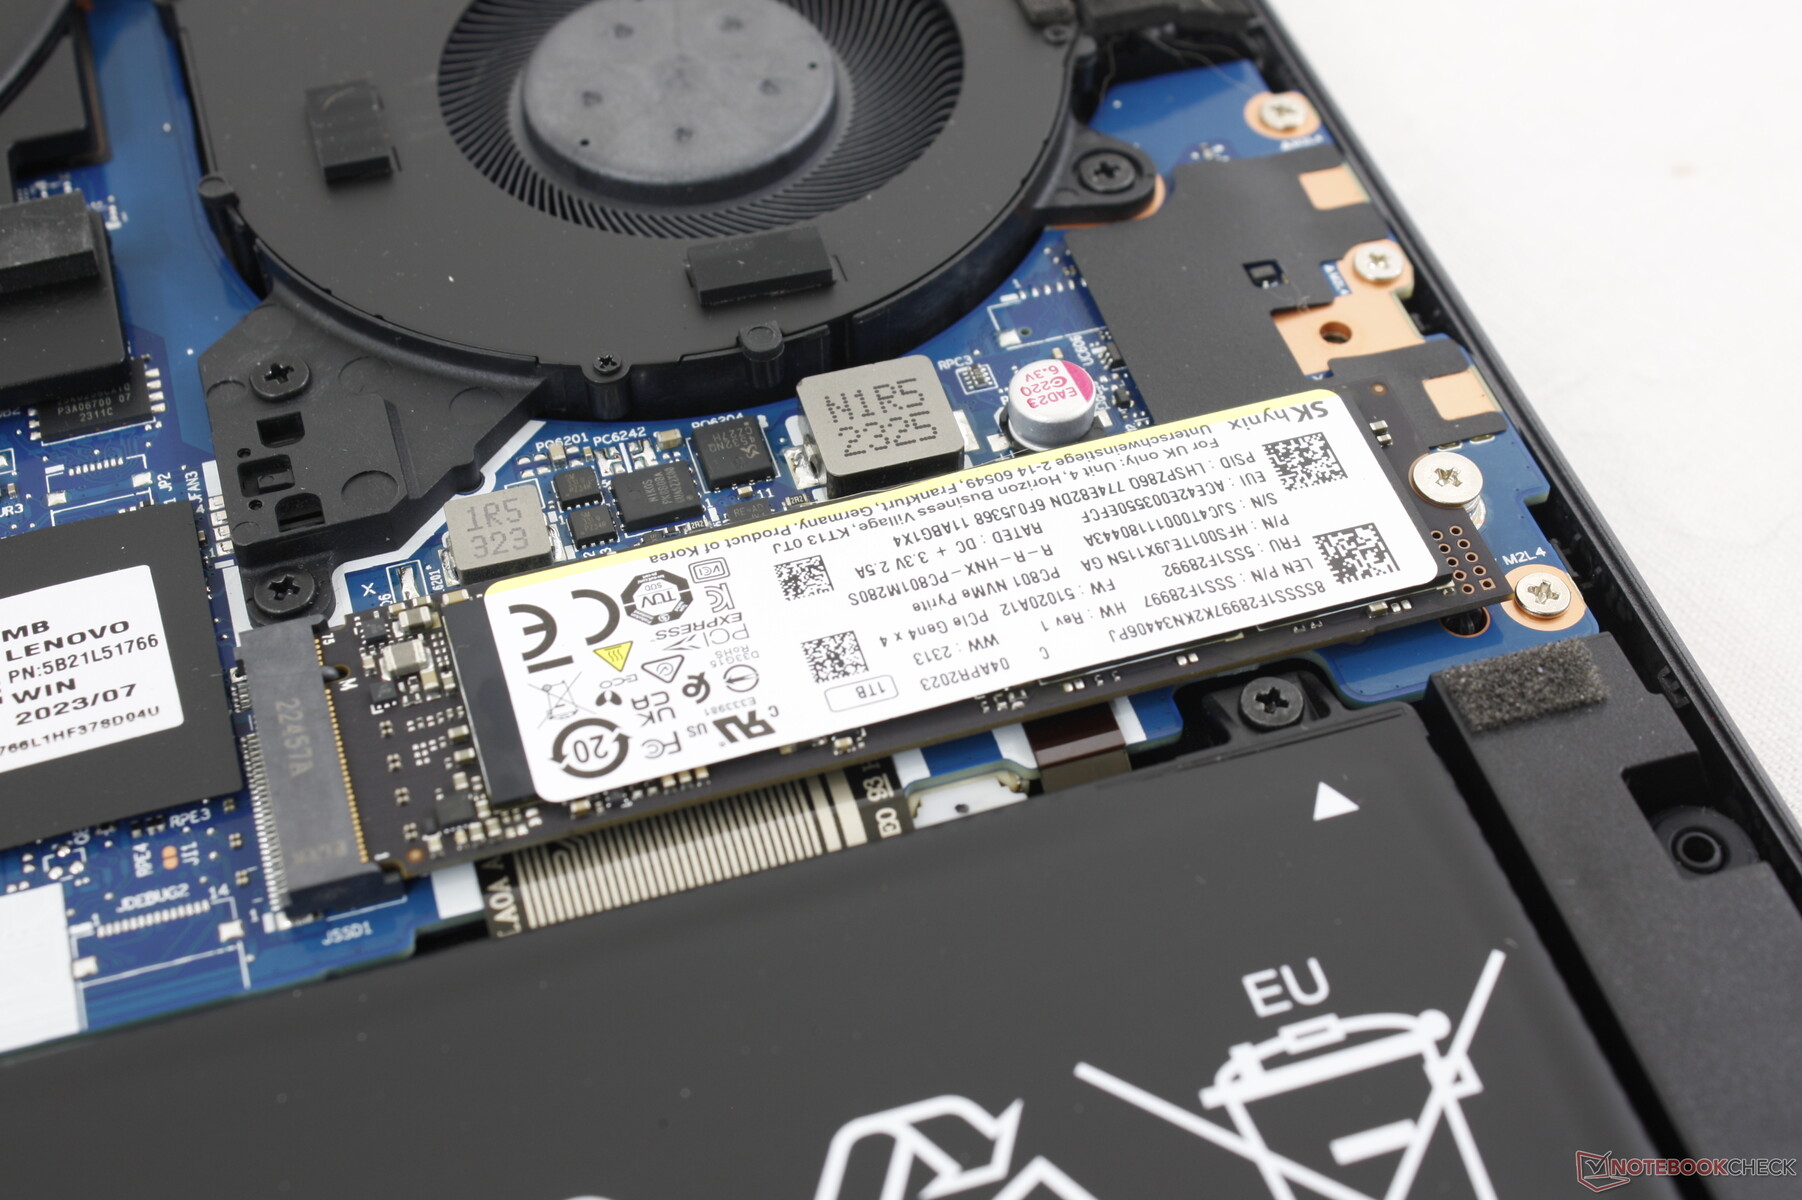
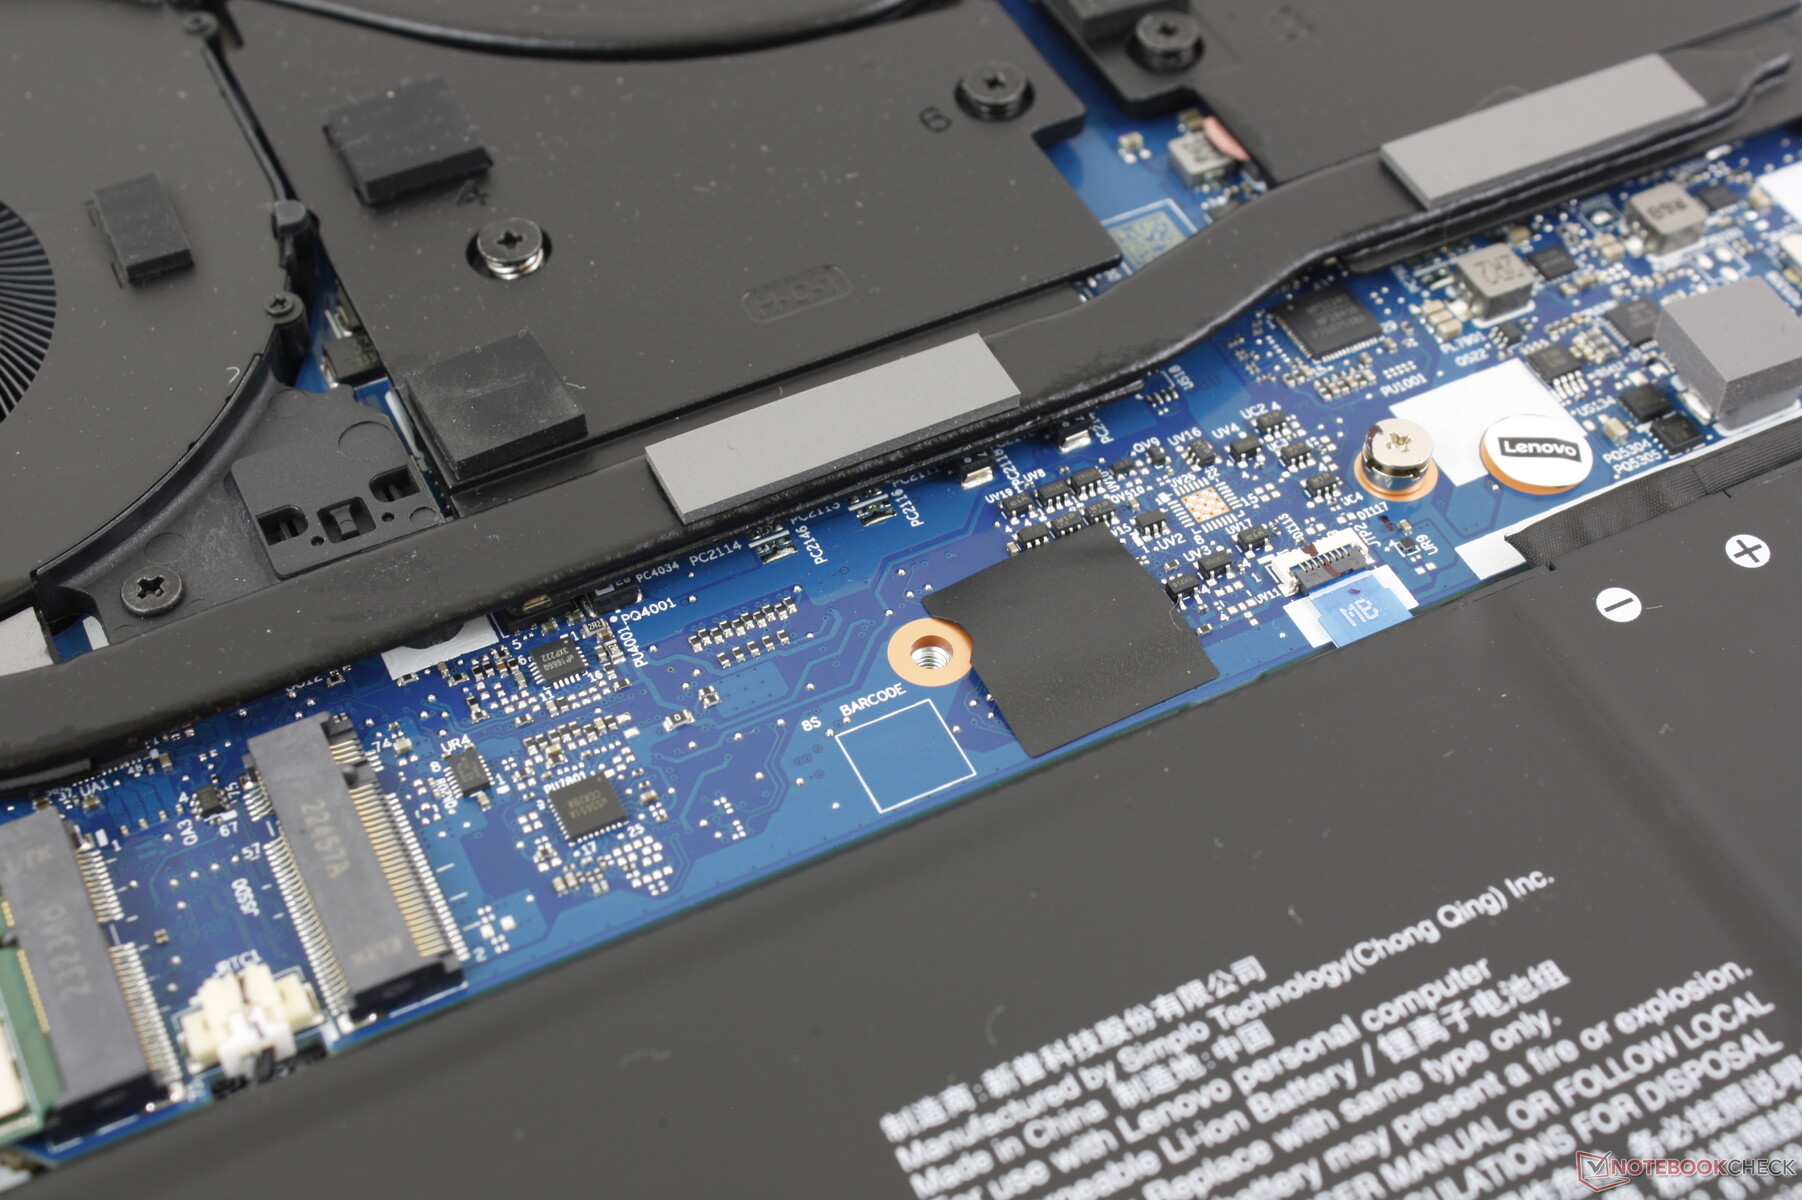
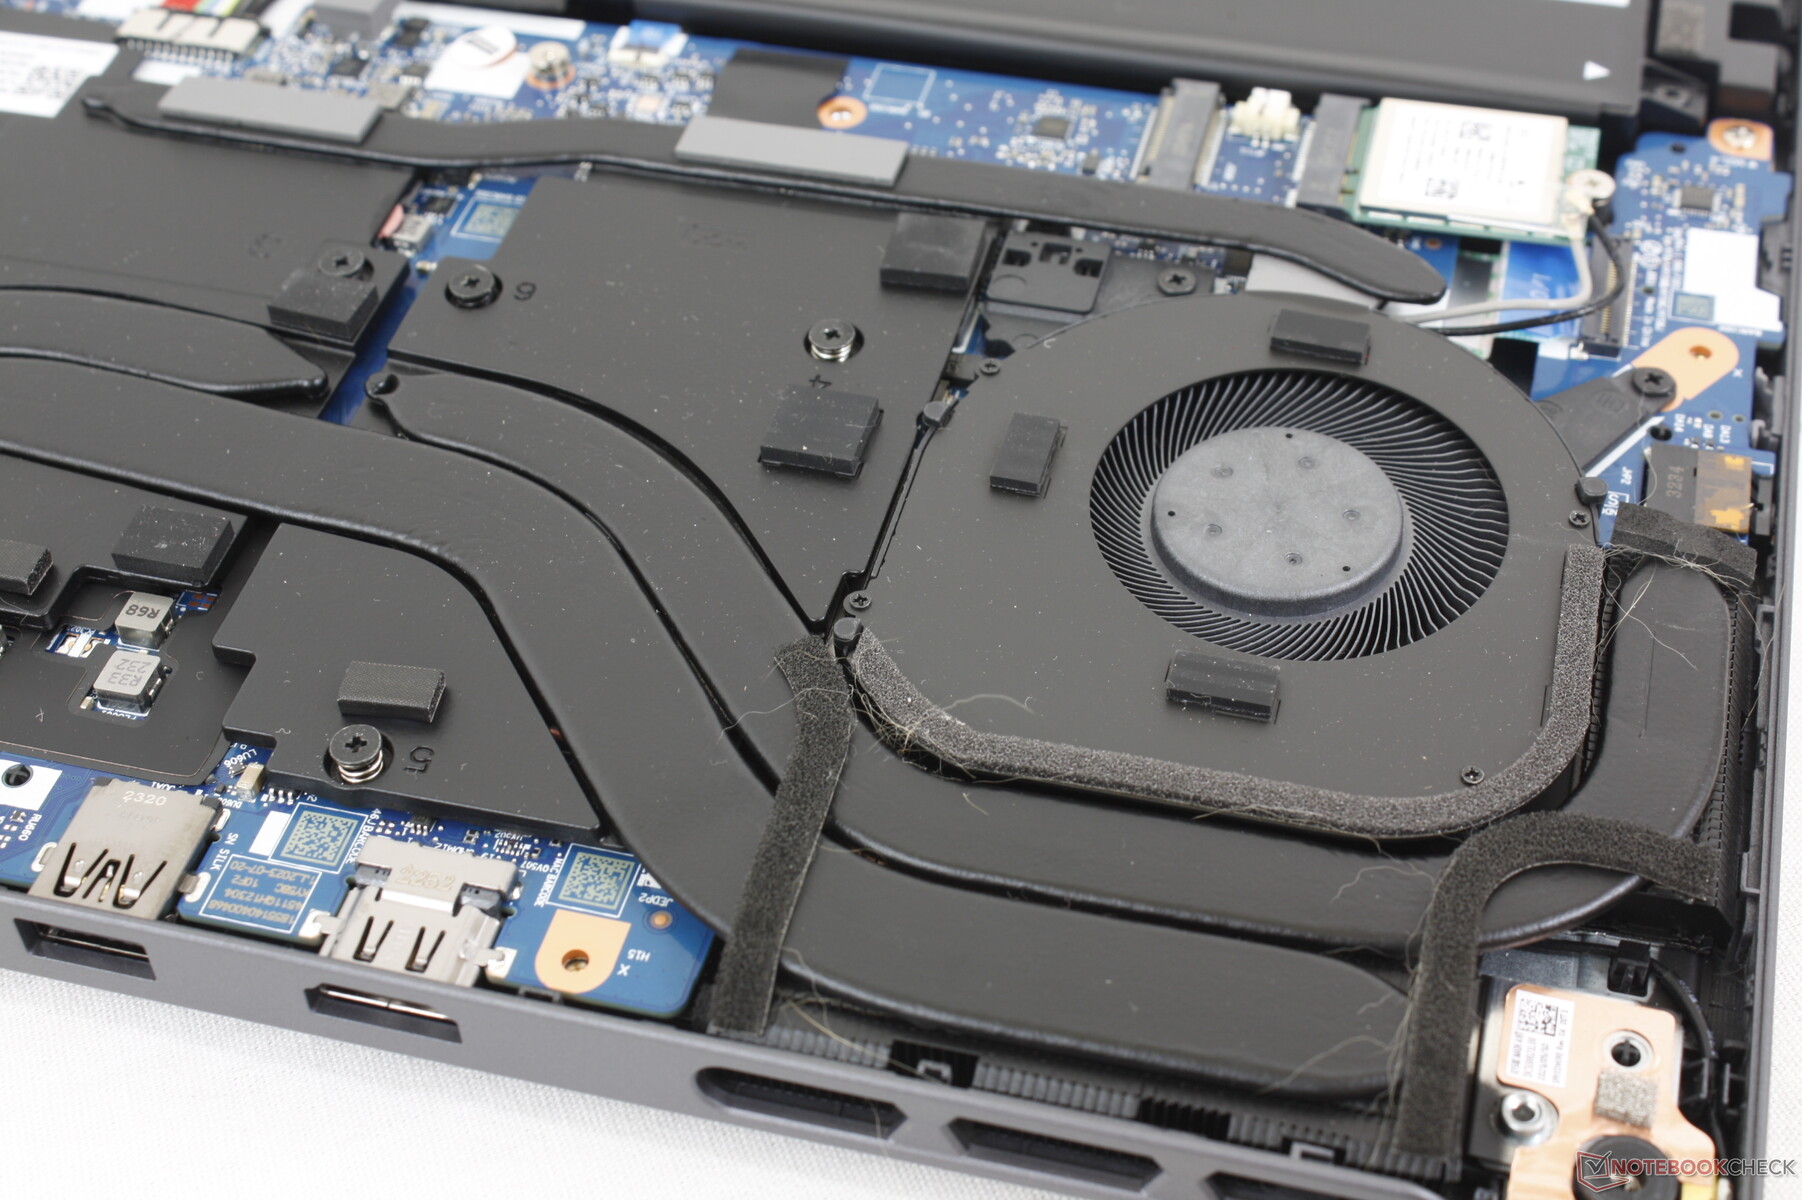
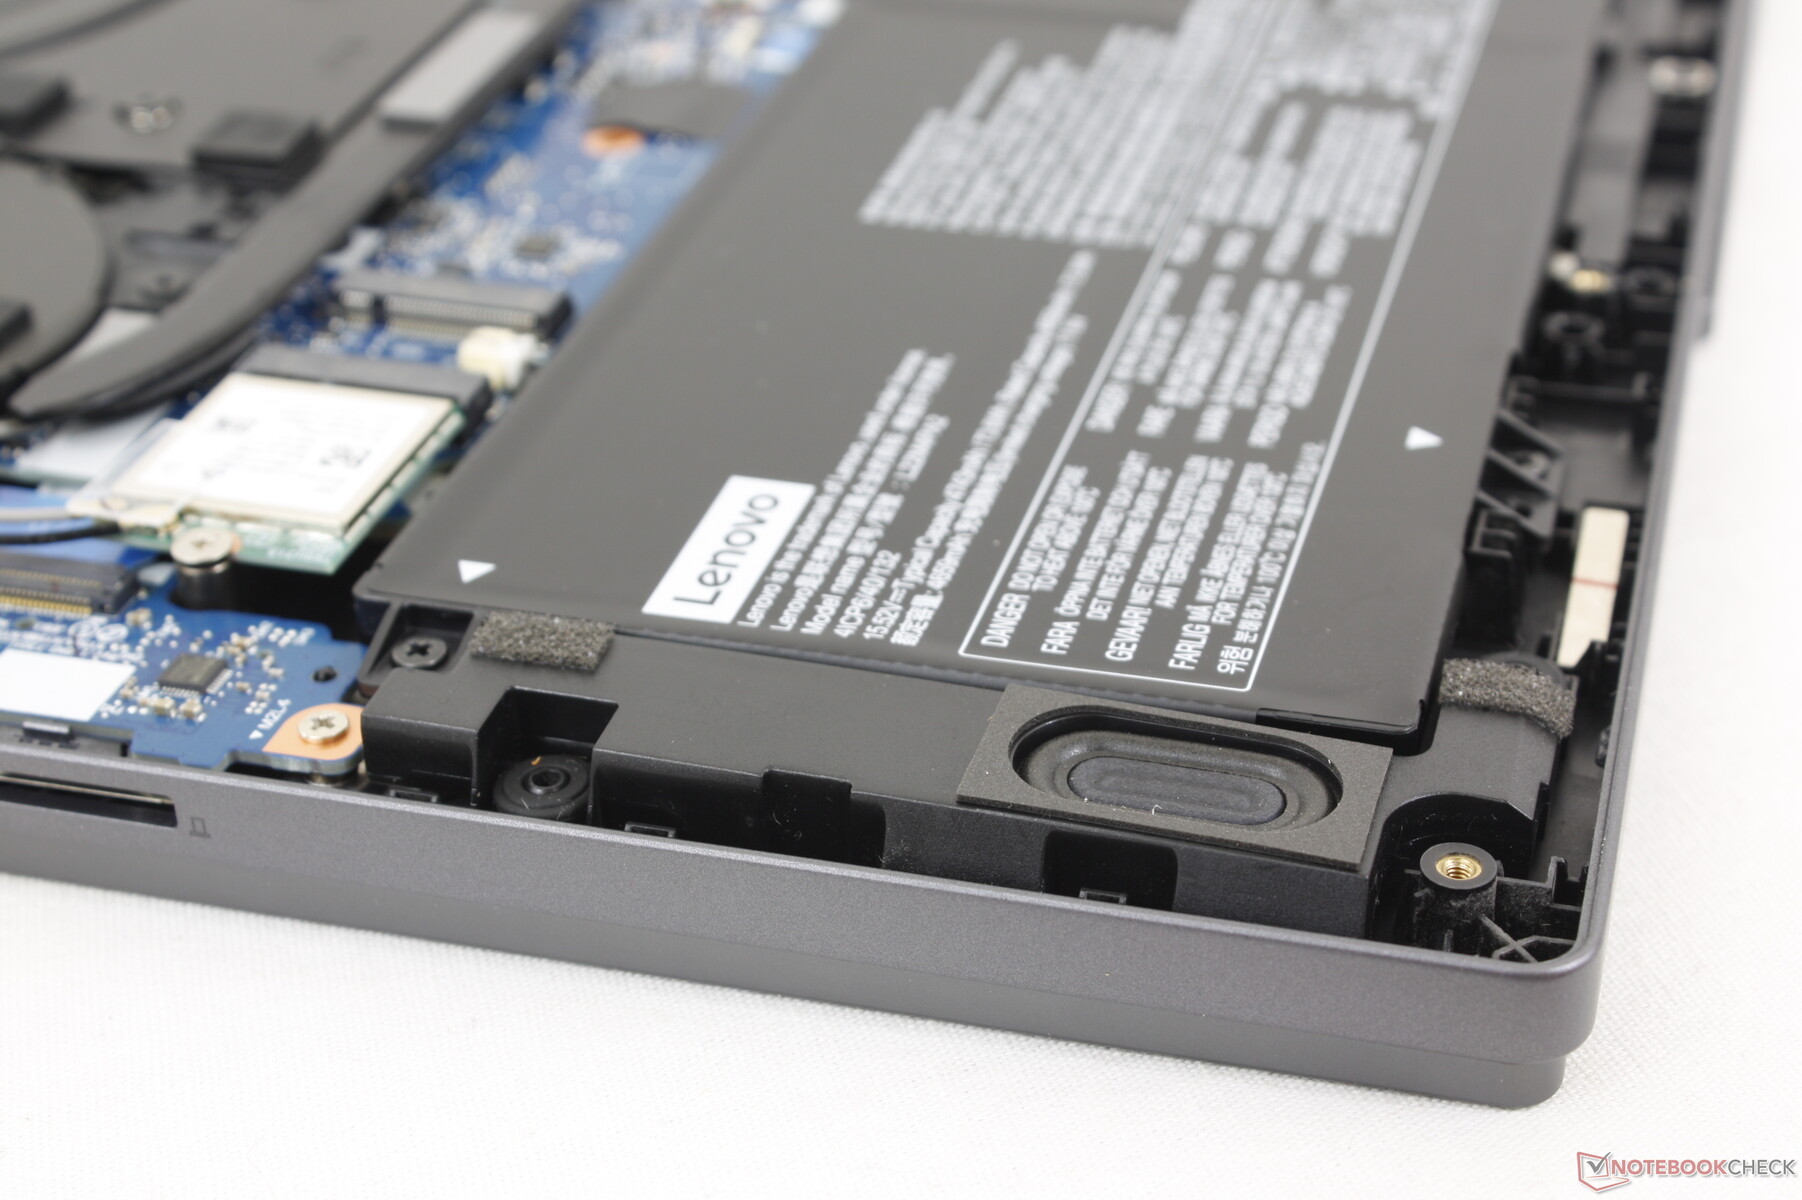
Maintenance
The bottom panel is secured by 10 Phillips screws for easy removal. RAM is soldered leaving the two M.2 2280 SSD slots and the WLAN module as the only upgradeable components. In comparison, RAM is user-upgradeable on the 2023 Blade 14 and Zephyrus G14.
Accessories And Warranty
The retail box includes the AC adapter and paperwork with no extras. The standard one-year limited manufacturer warranty applies if purchased in the US.
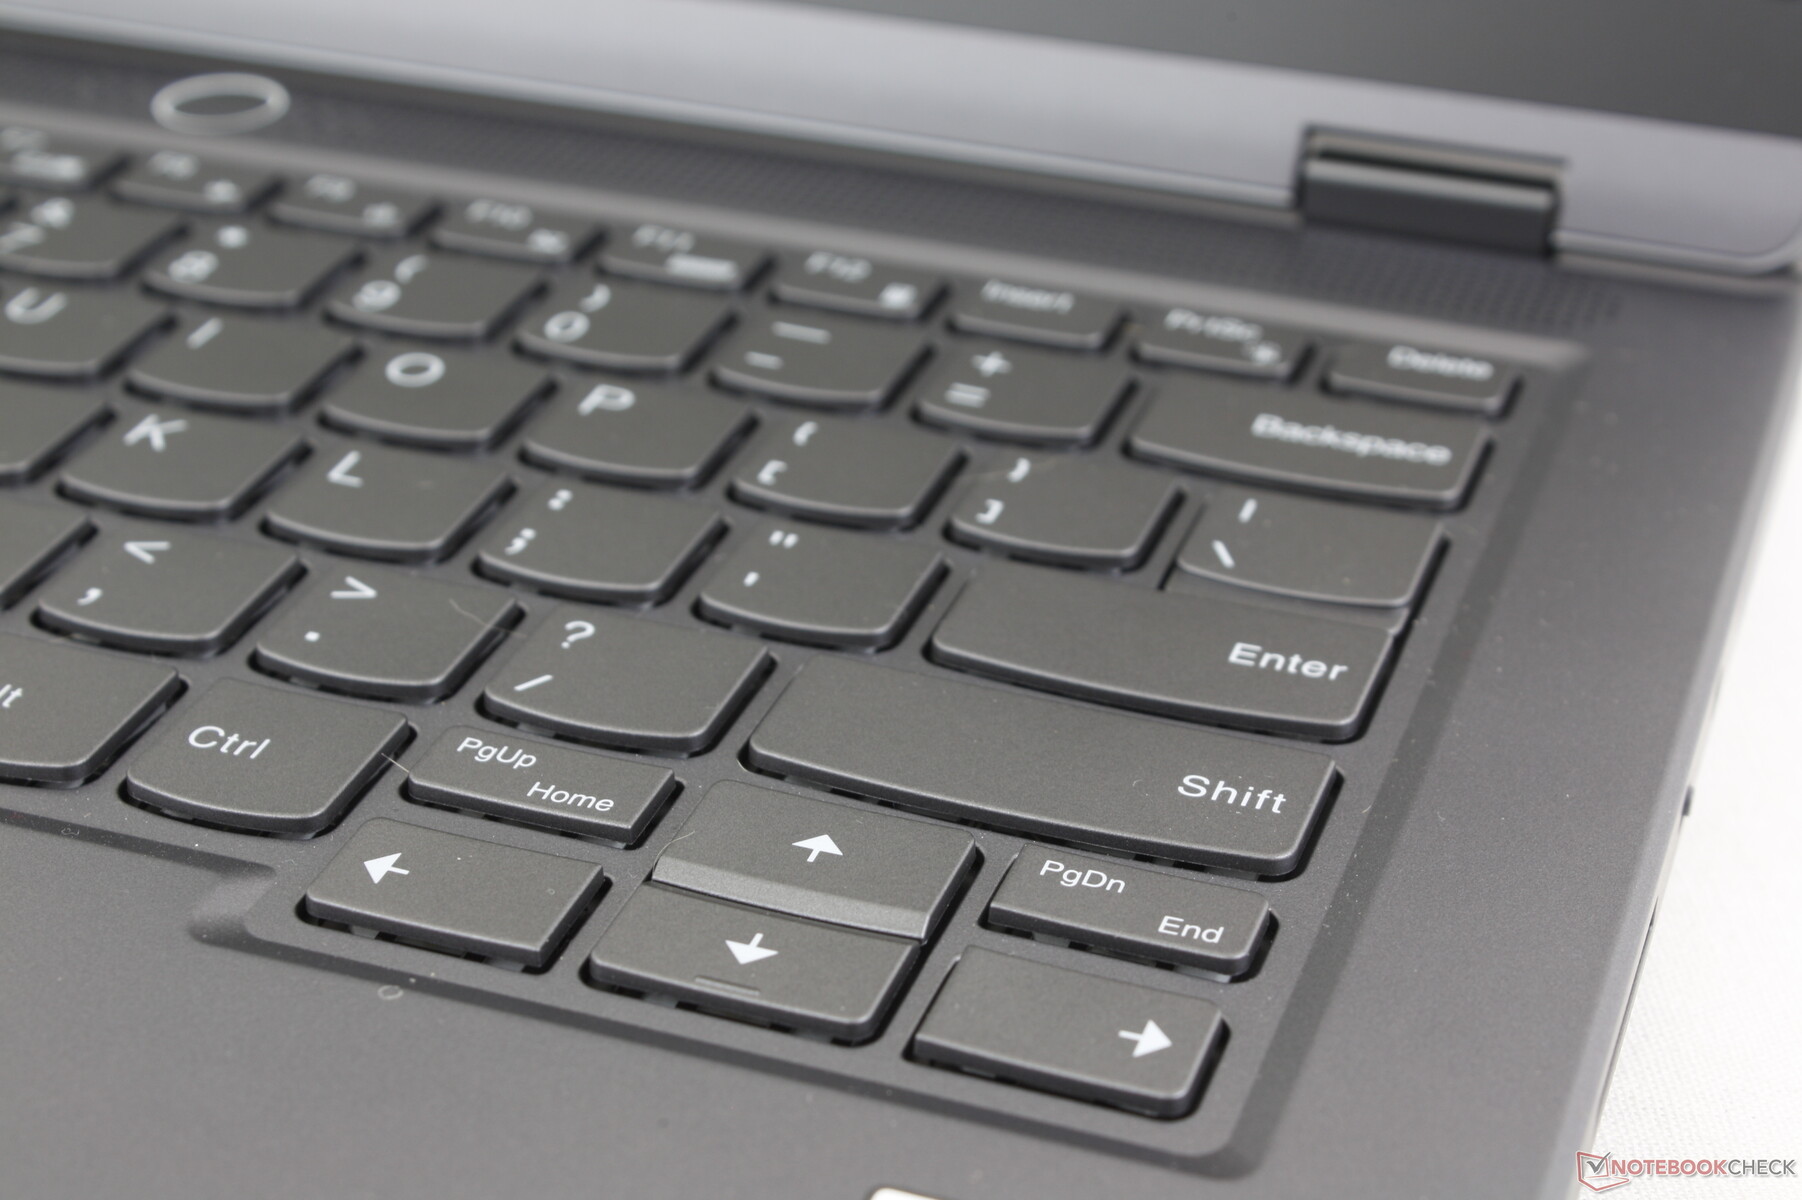
Input Devices — No RGB Lighting
Keyboard
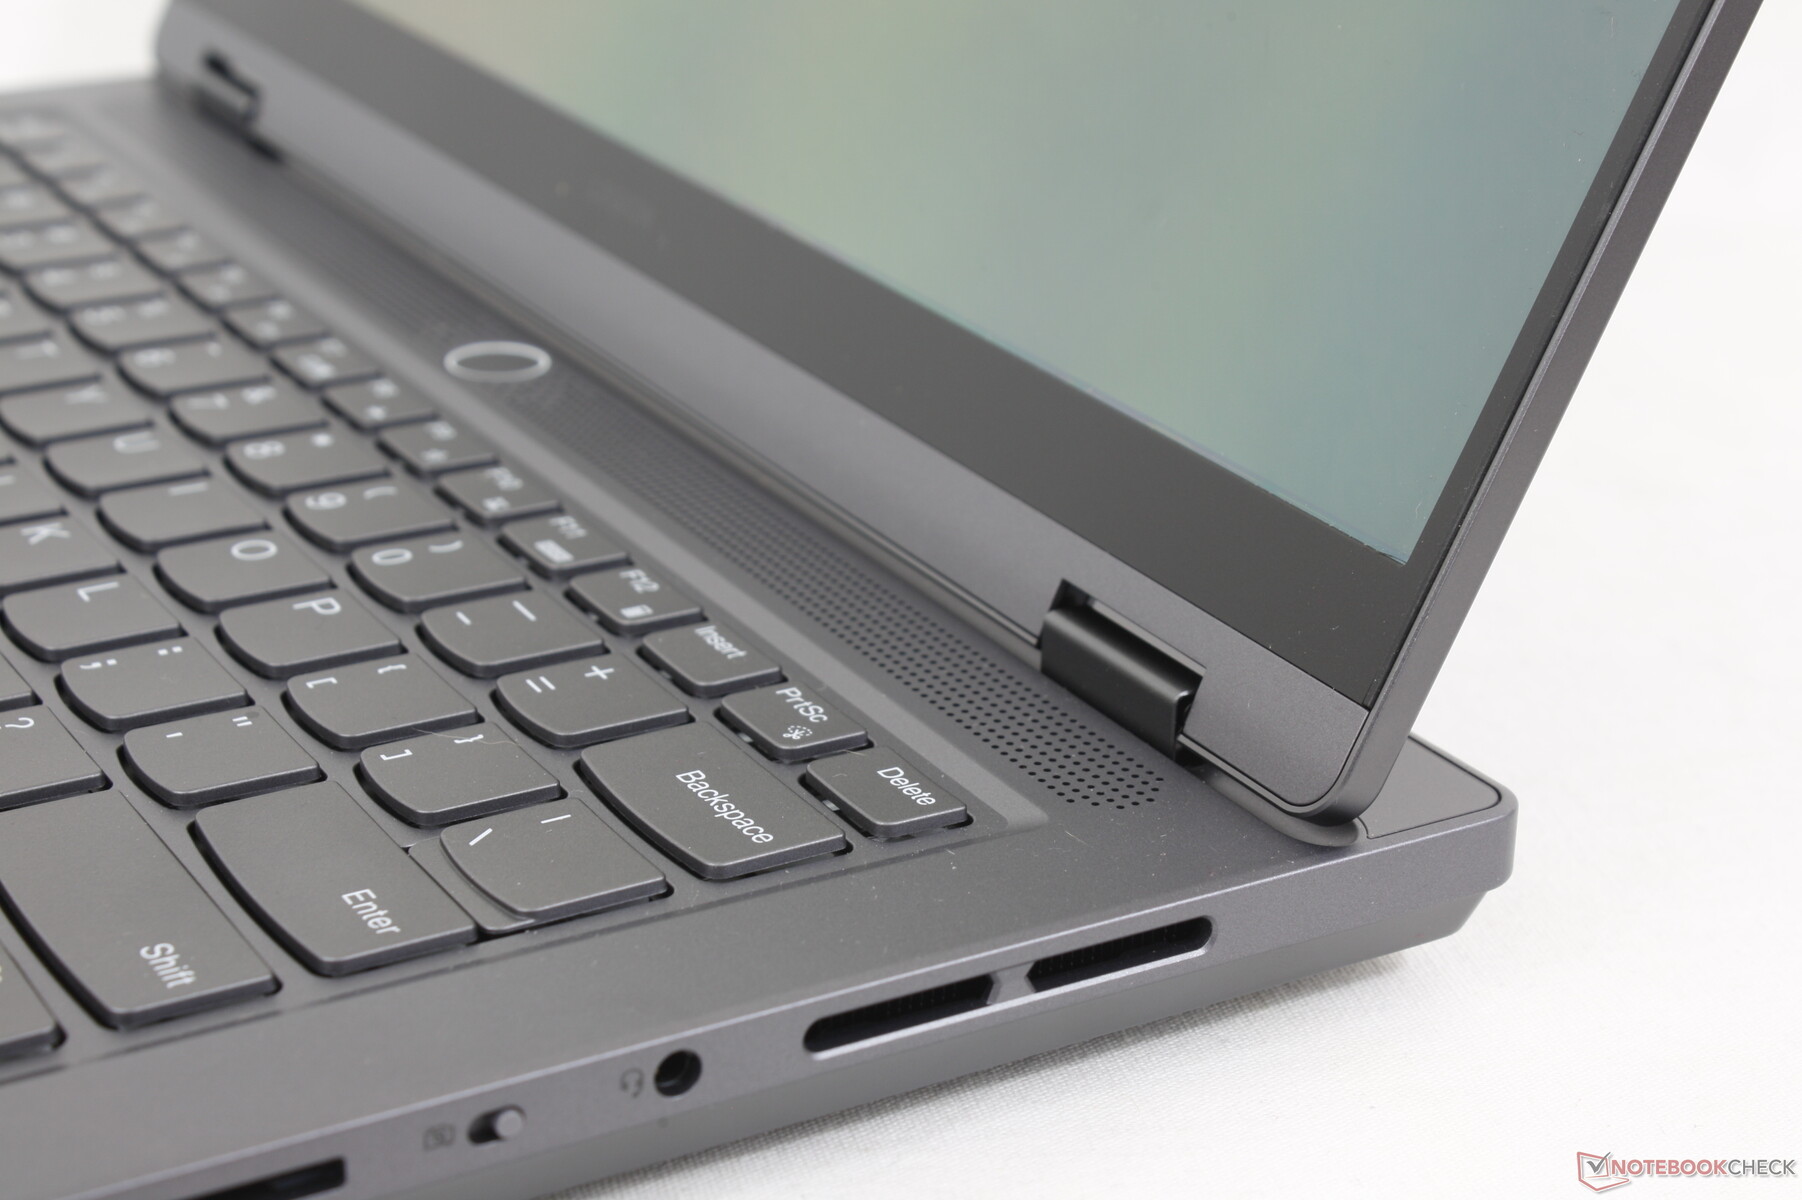
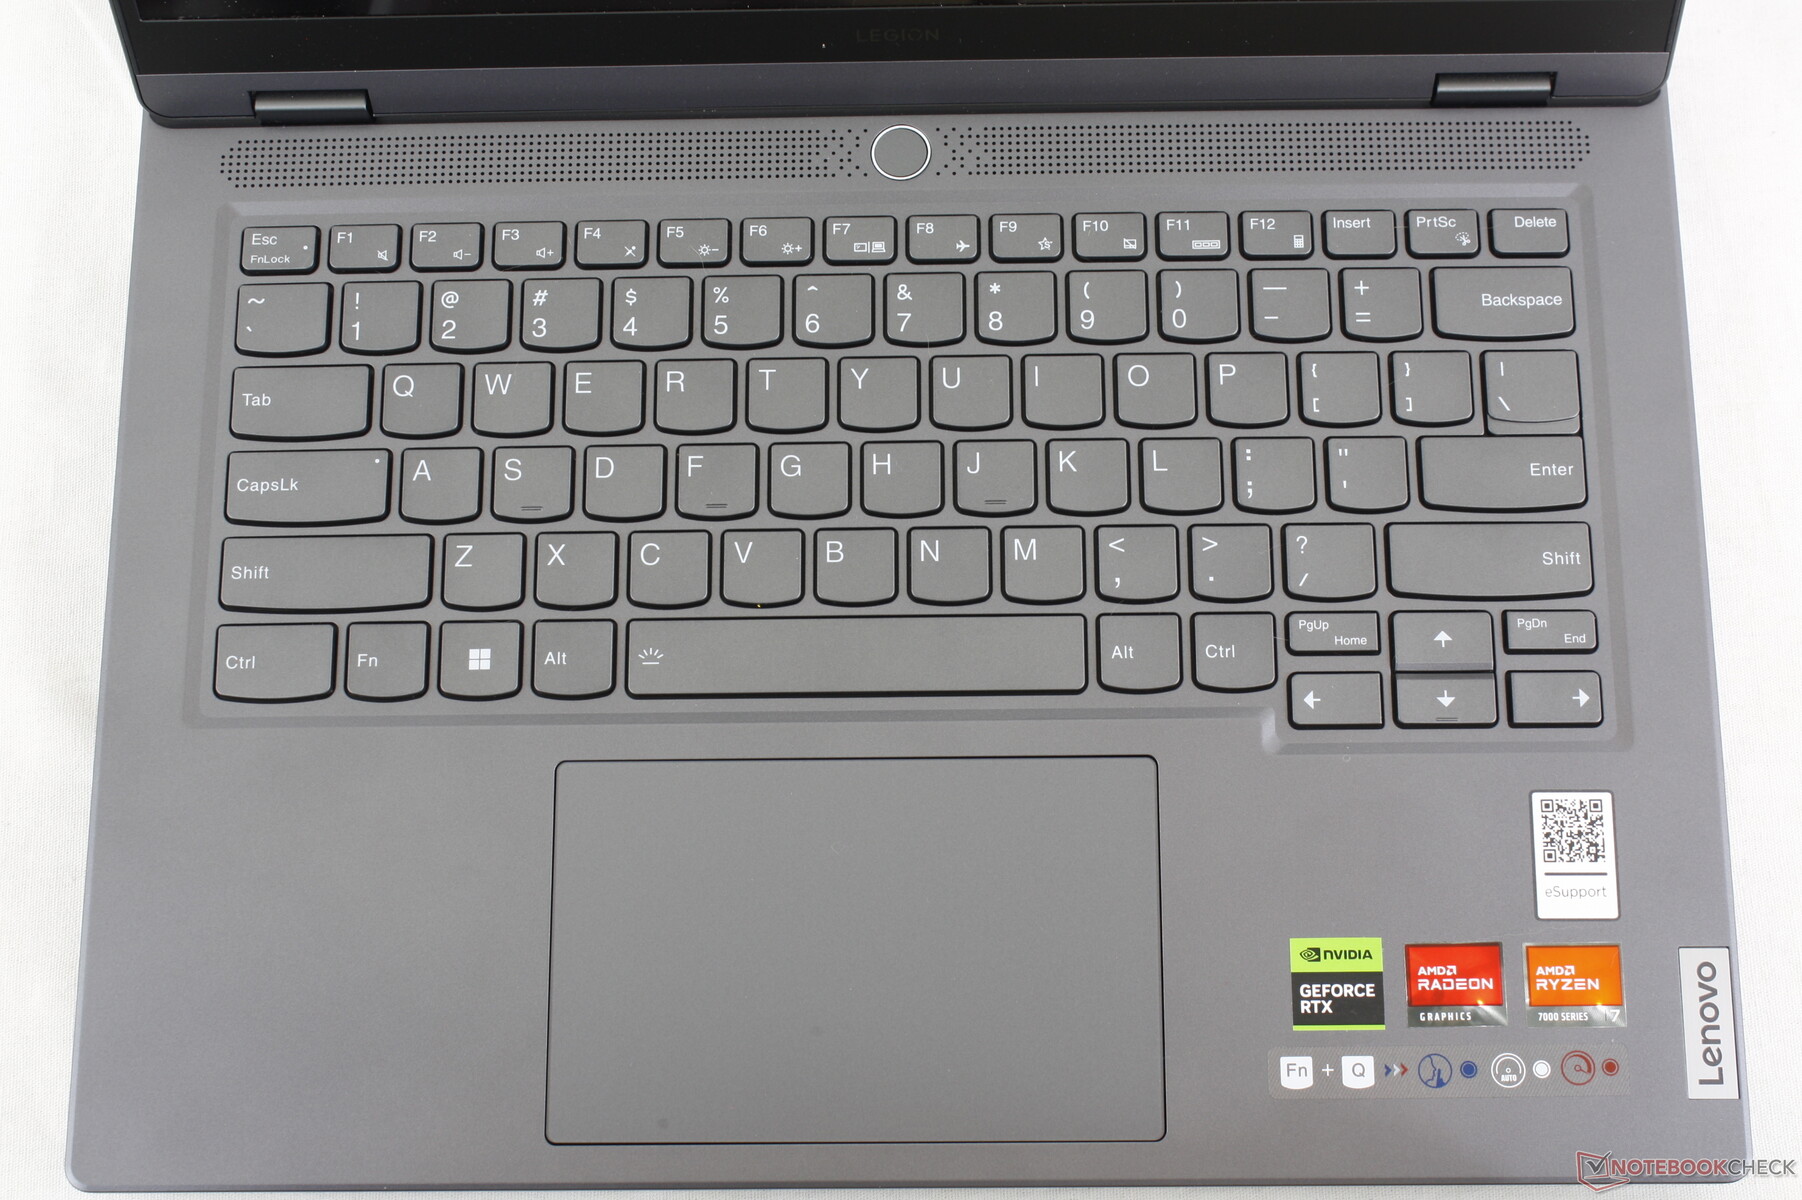
The keyboard maintains the feel and size of the main QWERTY keys on the larger Legion Slim 5 16 but with smaller arrow keys and an omitted numpad due to surface area constraints. The typing experience feels firm and with stronger feedback from each key when compared to the softer keys of the Blade 14. However, the narrow PgUp and PgDn keys are squeezed in between the arrow keys and they are uncomfortable to press.
Lenovo offers only a single-zone white backlight while models from Razer, Asus, and Alienware all have multi-zone RGB lighting.
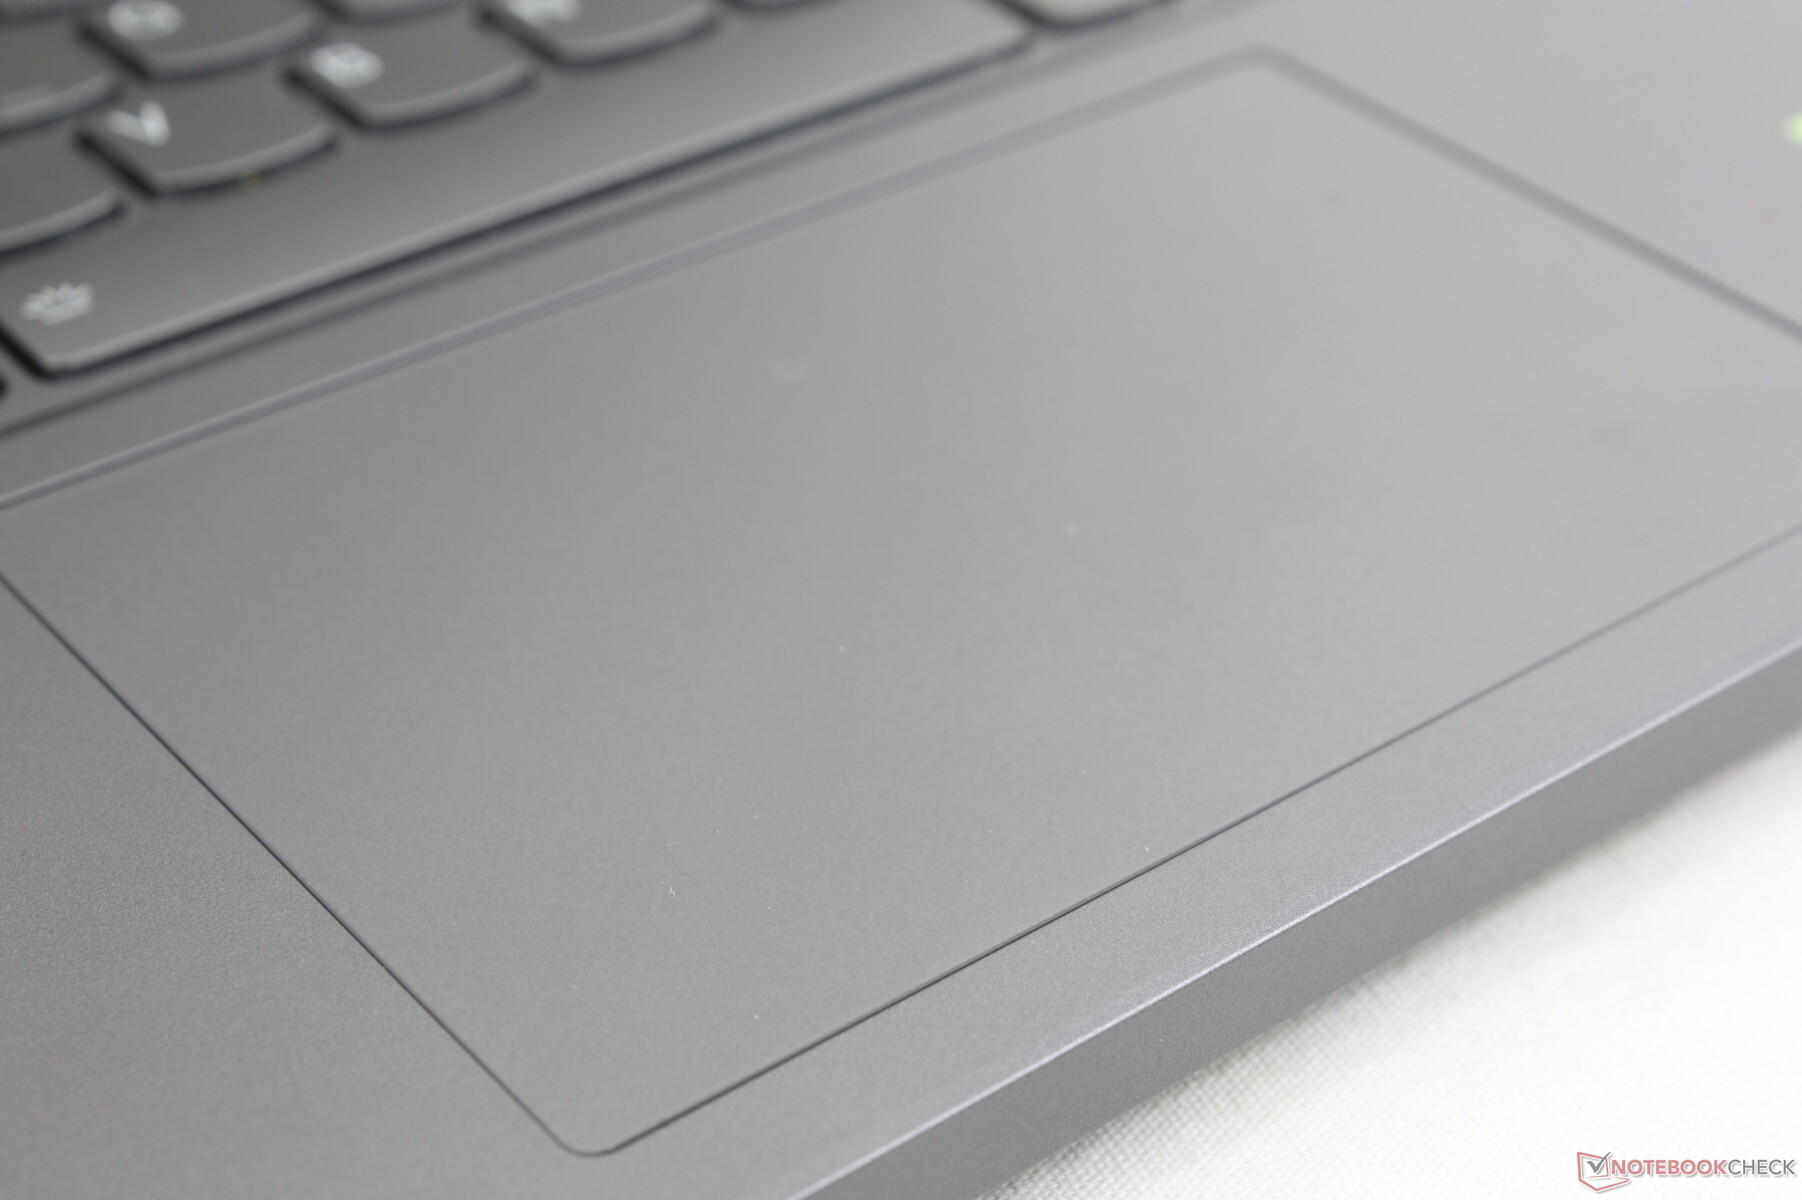
Touchpad
The clickpad (12 x 7.5 cm) is larger than on the Alienware x14 (10.8 x 5.5 cm) but smaller than on the Blade 14 (15 x 8.5 cm). It's nonetheless smooth and reliable with quiet clatter when pressed. Feedback when inputting a click could be a bit firmer as it is on the softer side.
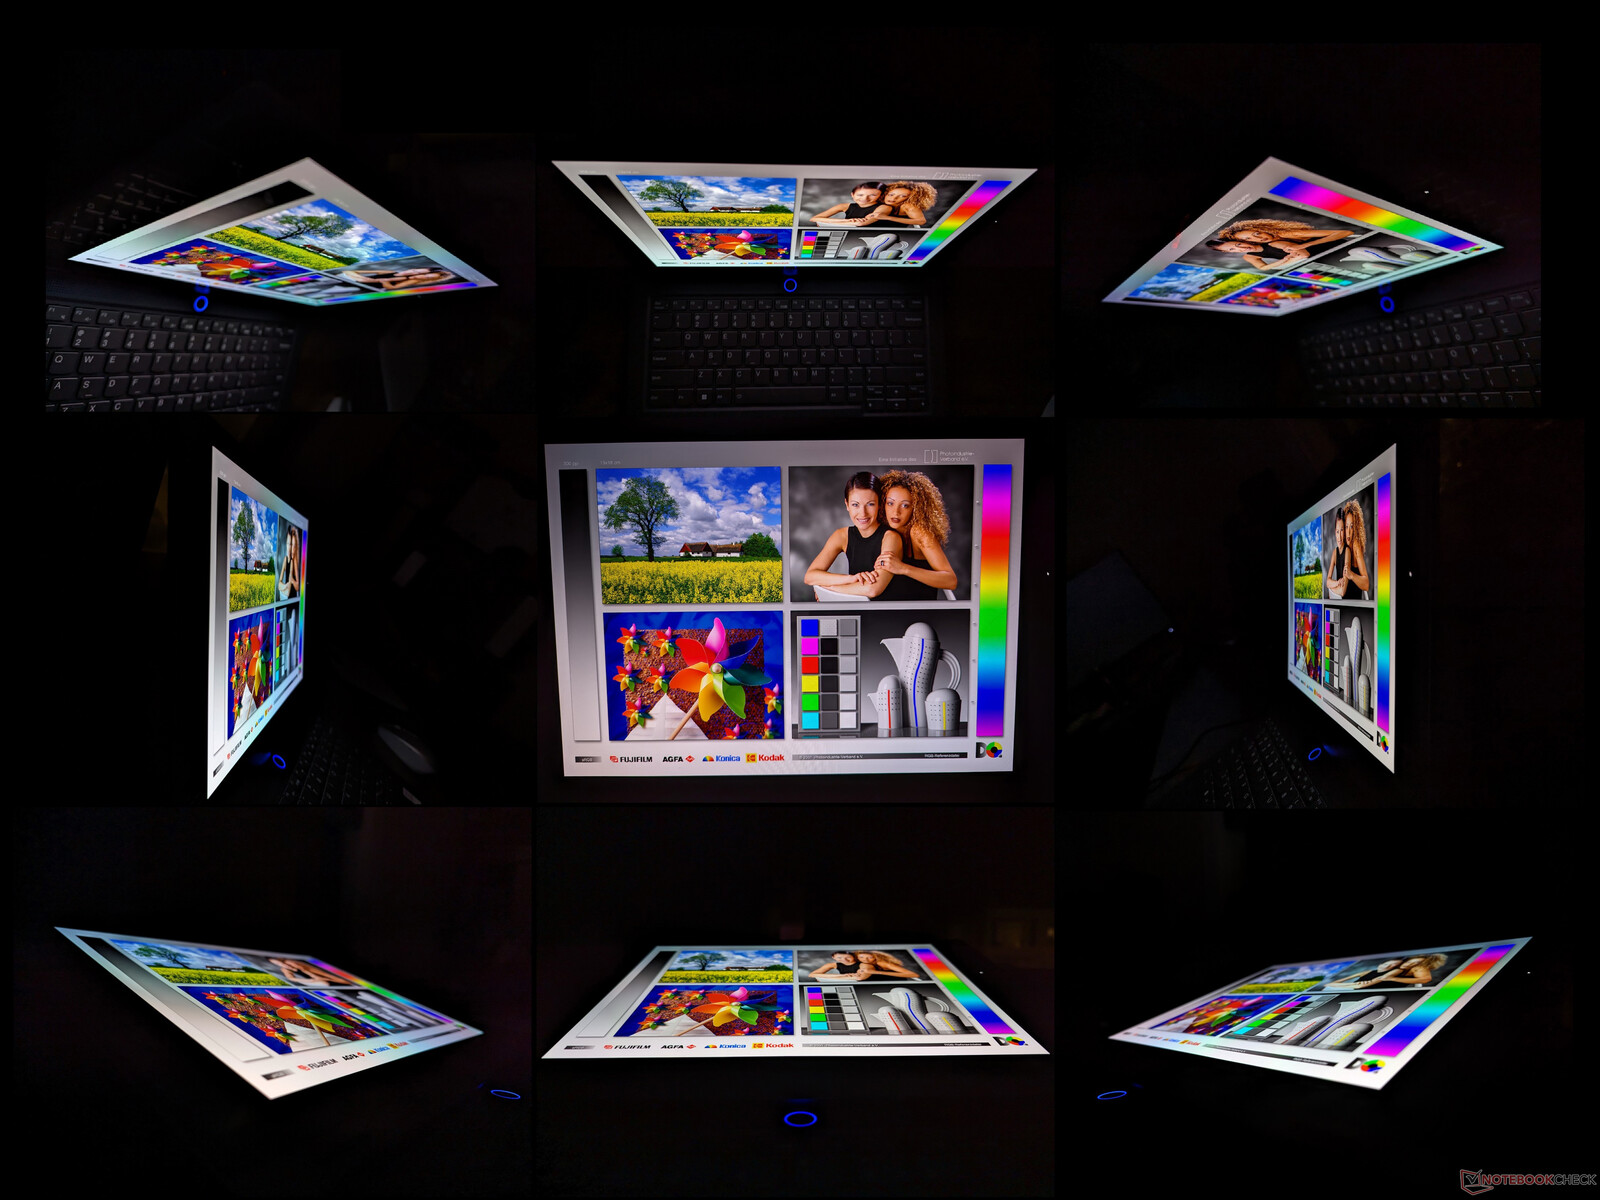
Display — Missing One Important Feature
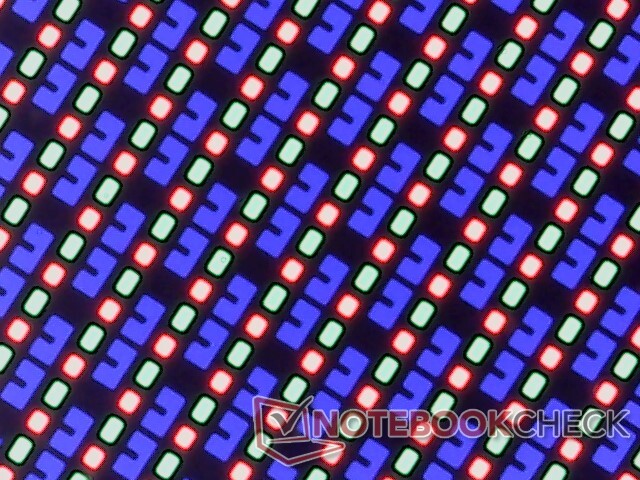
The OLED display is the highlight of the Legion Slim 5 14 as it can be found on no other 14-inch gaming laptop at the moment. it offers a native 120 Hz refresh rate, dense 2.8K resolution, and full DCI-P3 colors to be fit for both gaming and content creation purposes. Most other OLED panels like the ones for the cheaper Asus VivoBook series are limited to 60 Hz or 90 Hz in comparison. The panel here even ships Pantone certified which we would not have expected from a Legion laptop designed primarily for gaming.
The biggest drawback to the display is its lack of G-Sync support which is a bummer for an expensive gaming laptop.

| |||||||||||||||||||||||||
Brightness Distribution: 97 %
Center on Battery: 377.5 cd/m²
Contrast: ∞:1 (Black: 0 cd/m²)
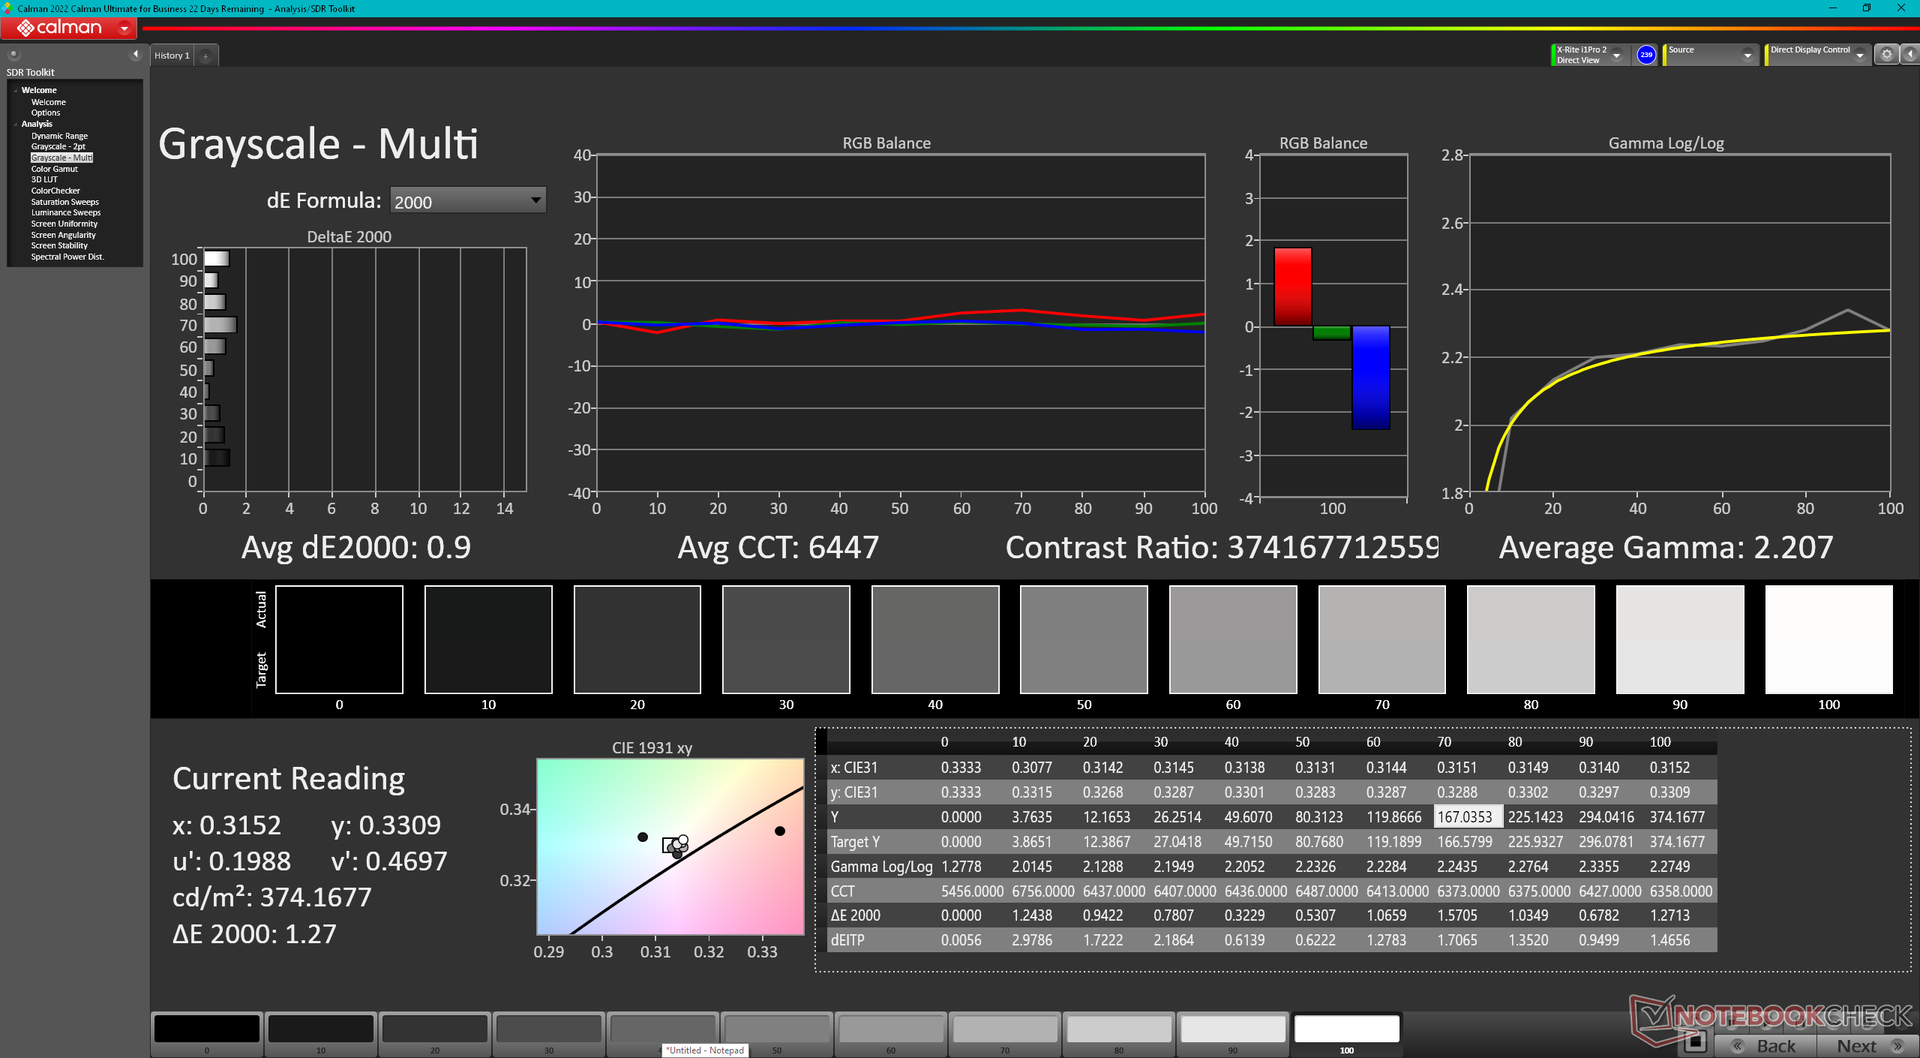
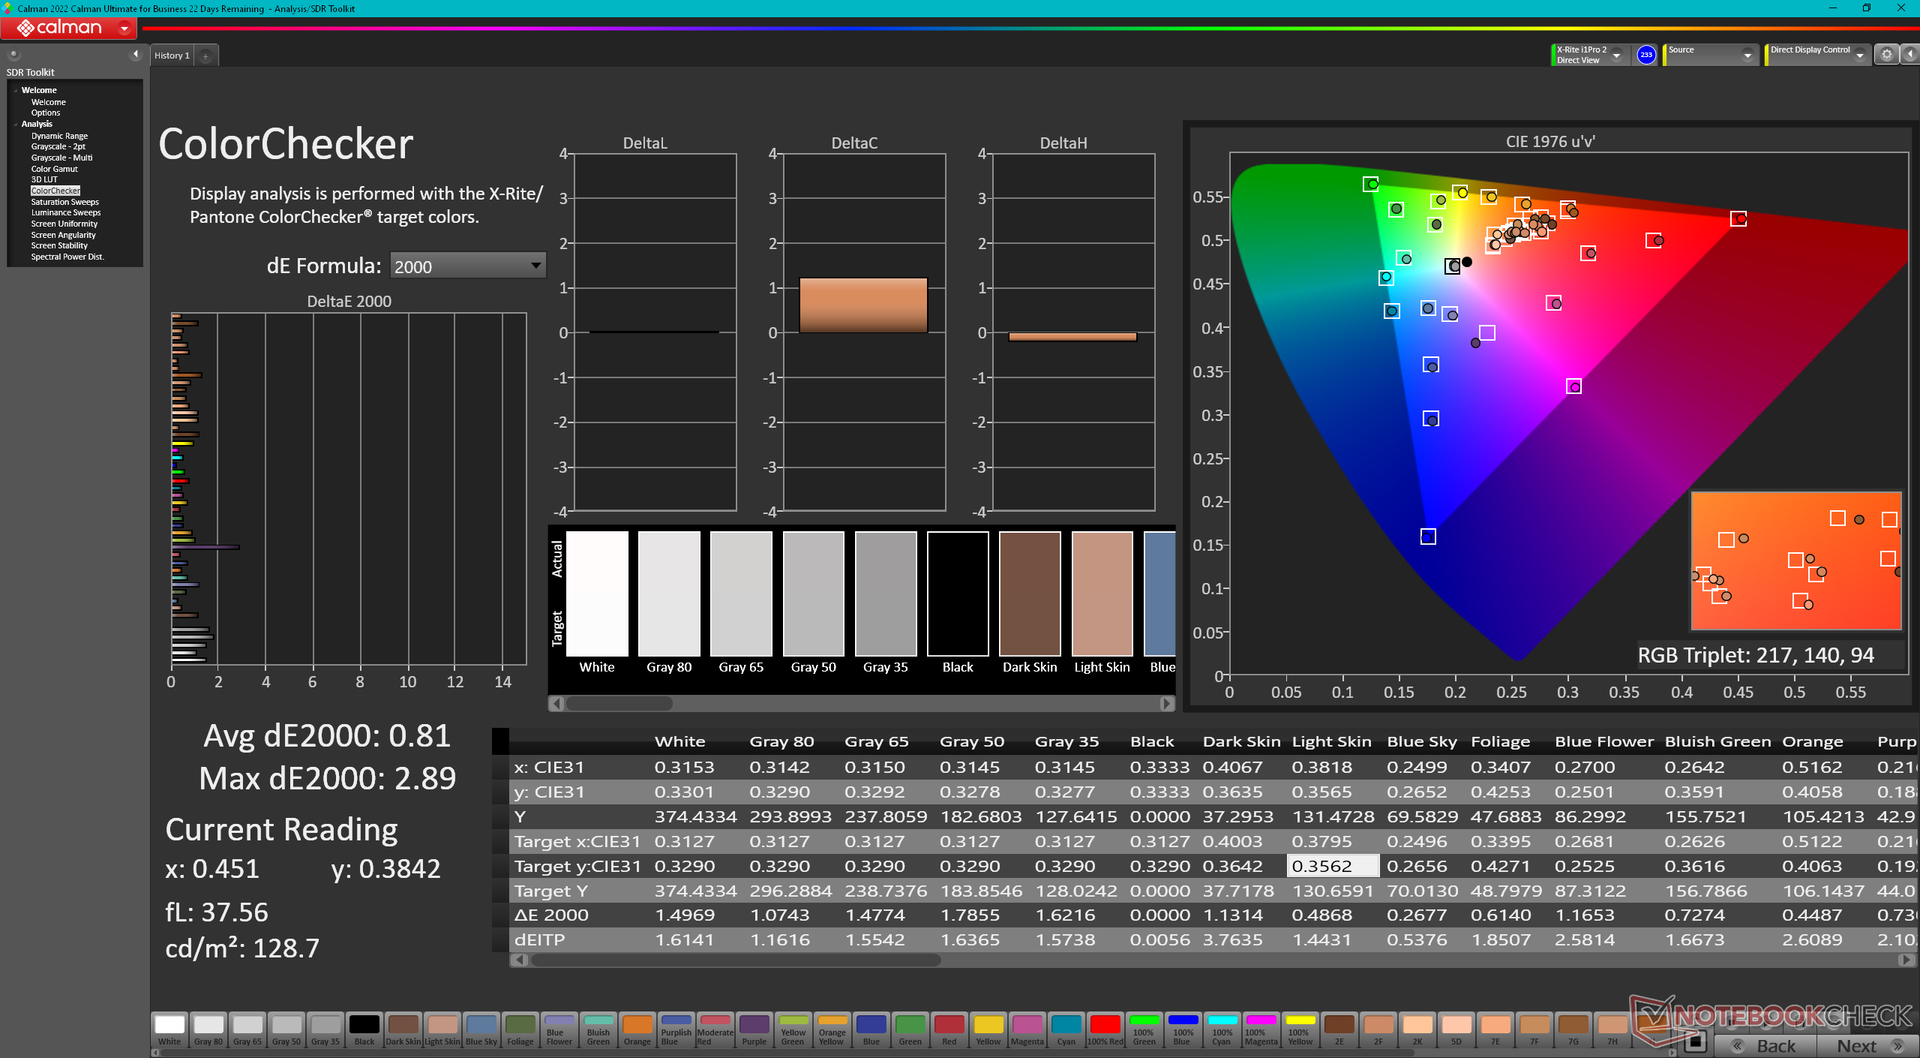
ΔE ColorChecker Calman: 4.19 | ∀{0.5-29.43 Ø4.71}
calibrated: 0.81
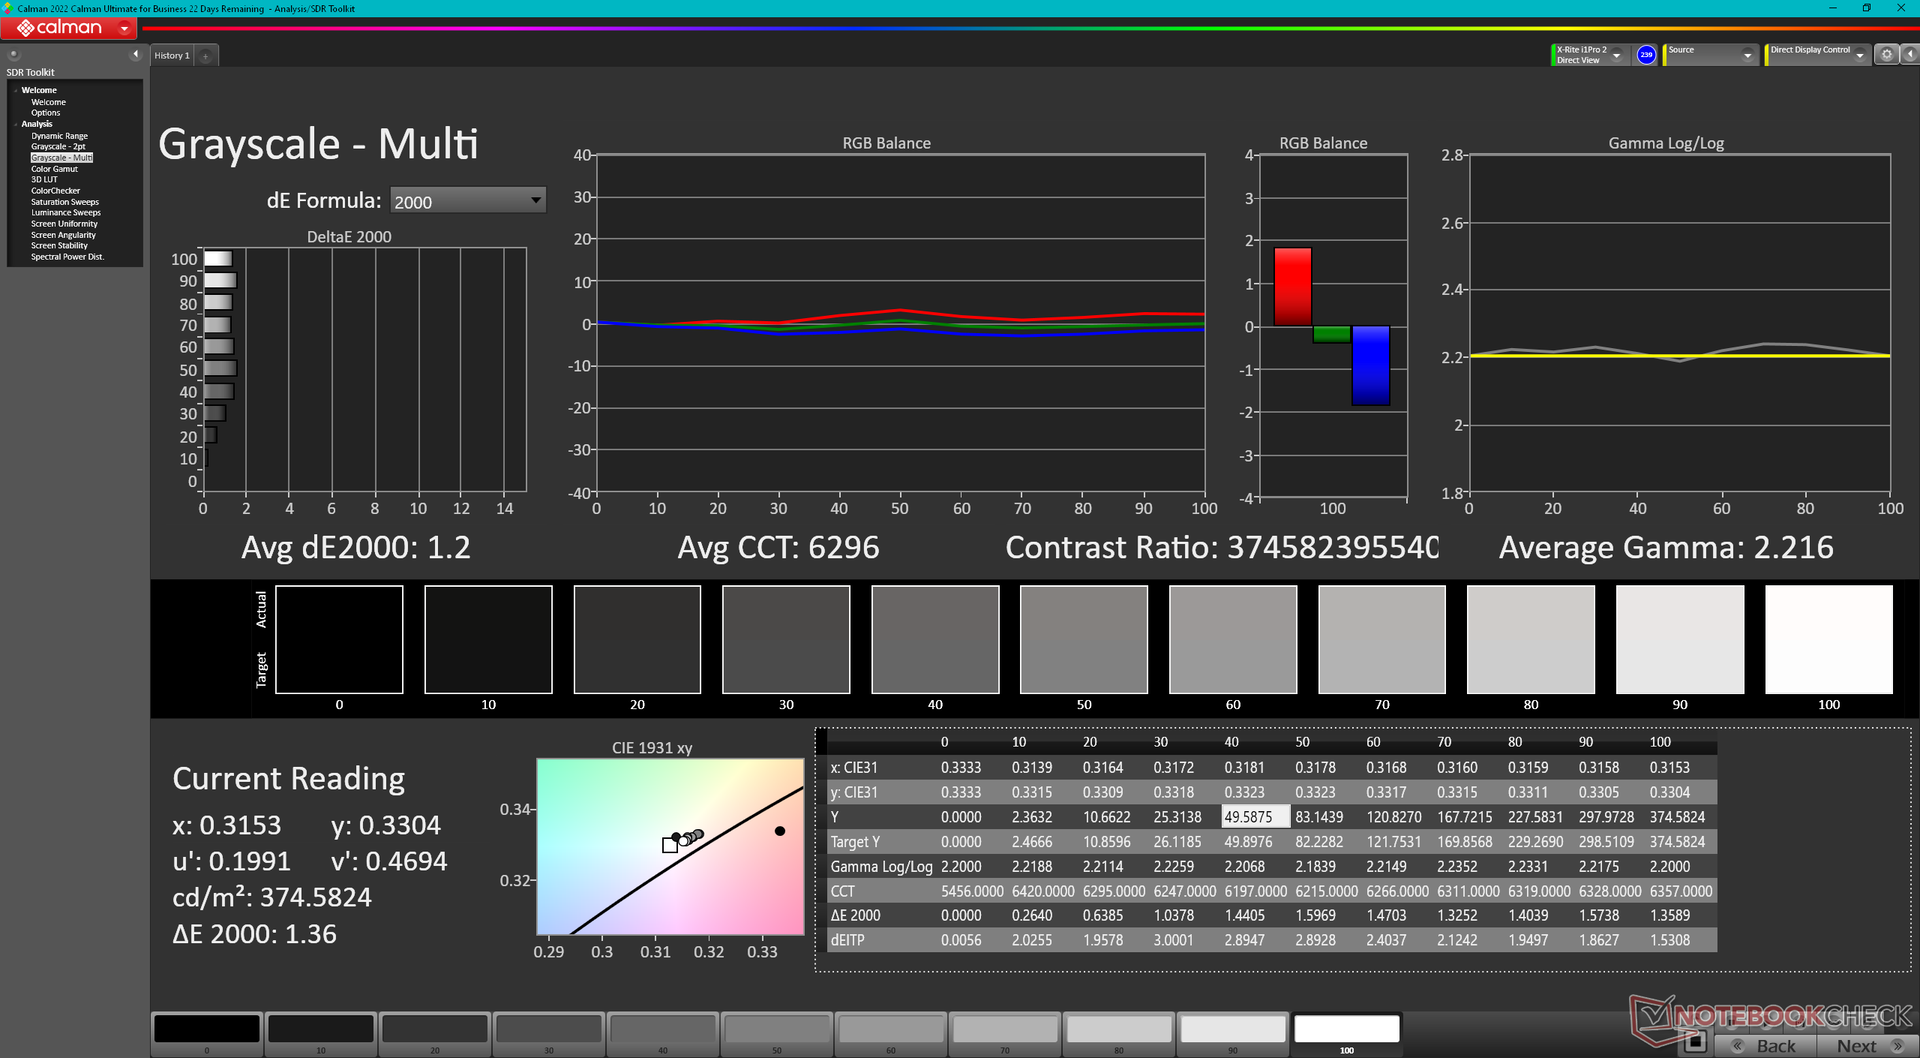
ΔE Greyscale Calman: 1.2 | ∀{0.09-98 Ø4.96}
96.5% AdobeRGB 1998 (Argyll 3D)
100% sRGB (Argyll 3D)
99.9% Display P3 (Argyll 3D)
Gamma: 2.22
CCT: 6296 K
| Lenovo Legion Slim 5 14APH8 Samsung SDC ATNA45AF02-2, OLED, 2880x1600, 14.5" | Acer Predator Triton 14 PT14-51 BOE NE140QDM-NY1, IPS, 2560x1600, 14" | Razer Blade 14 RTX 4070 AU Optronics B140QAN06.U, IPS, 2560x1600, 14" | Asus ROG Zephyrus G14 GA402XY B140QAN06.S, Mini-LED, 2560x1600, 14" | Alienware x14 i7 RTX 3060 SHP154D, IPS, 1920x1080, 14" | Lenovo LOQ 15APH8 BOE NJ NE156FHM-NX3, IPS, 1920x1080, 15.6" | |
|---|---|---|---|---|---|---|
| Display | -5% | -5% | -1% | -3% | -52% | |
| Display P3 Coverage (%) | 99.9 | 96.9 -3% | 97.3 -3% | 99.6 0% | 99.6 0% | 40.2 -60% |
| sRGB Coverage (%) | 100 | 99.9 0% | 99.8 0% | 100 0% | 100 0% | 60.2 -40% |
| AdobeRGB 1998 Coverage (%) | 96.5 | 85.5 -11% | 85.3 -12% | 93.4 -3% | 87.6 -9% | 41.5 -57% |
| Response Times | -1143% | -1049% | -1479% | -884% | -3816% | |
| Response Time Grey 50% / Grey 80% * (ms) | 0.79 ? | 15.1 ? -1811% | 11.9 ? -1406% | 17.2 ? -2077% | 9.6 ? -1115% | 42.7 ? -5305% |
| Response Time Black / White * (ms) | 1.01 ? | 5.8 ? -474% | 8 ? -692% | 9.9 ? -880% | 7.6 ? -652% | 24.5 ? -2326% |
| PWM Frequency (Hz) | 240.5 ? | 5430 | ||||
| Screen | -33% | -52% | 28% | -38% | -62% | |
| Brightness middle (cd/m²) | 377.5 | 547 45% | 559.3 48% | 535 42% | 434 15% | 346.2 -8% |
| Brightness (cd/m²) | 381 | 516 35% | 560 47% | 563 48% | 411 8% | 329 -14% |
| Brightness Distribution (%) | 97 | 88 -9% | 88 -9% | 91 -6% | 89 -8% | 81 -16% |
| Black Level * (cd/m²) | 0.56 | 0.44 | 0.25 | 0.31 | ||
| Colorchecker dE 2000 * | 4.19 | 3.28 22% | 4.44 -6% | 1 76% | 3 28% | 4.19 -0% |
| Colorchecker dE 2000 max. * | 7.02 | 8.57 -22% | 9.3 -32% | 2.8 60% | 7.1 -1% | 19.19 -173% |
| Colorchecker dE 2000 calibrated * | 0.81 | 1.09 -35% | 0.39 52% | 0.7 14% | 1.66 -105% | |
| Greyscale dE 2000 * | 1.2 | 4.4 -267% | 6.8 -467% | 1.8 -50% | 5.1 -325% | 2.6 -117% |
| Gamma | 2.22 99% | 2.168 101% | 2.3 96% | 2.24 98% | 2.19 100% | 2.19 100% |
| CCT | 6296 103% | 7767 84% | 6242 104% | 6337 103% | 6204 105% | 6749 96% |
| Contrast (:1) | 977 | 1271 | 1736 | 1117 | ||
| Total Average (Program / Settings) | -394% /
-211% | -369% /
-207% | -484% /
-254% | -308% /
-170% | -1310% /
-685% |
* ... smaller is better
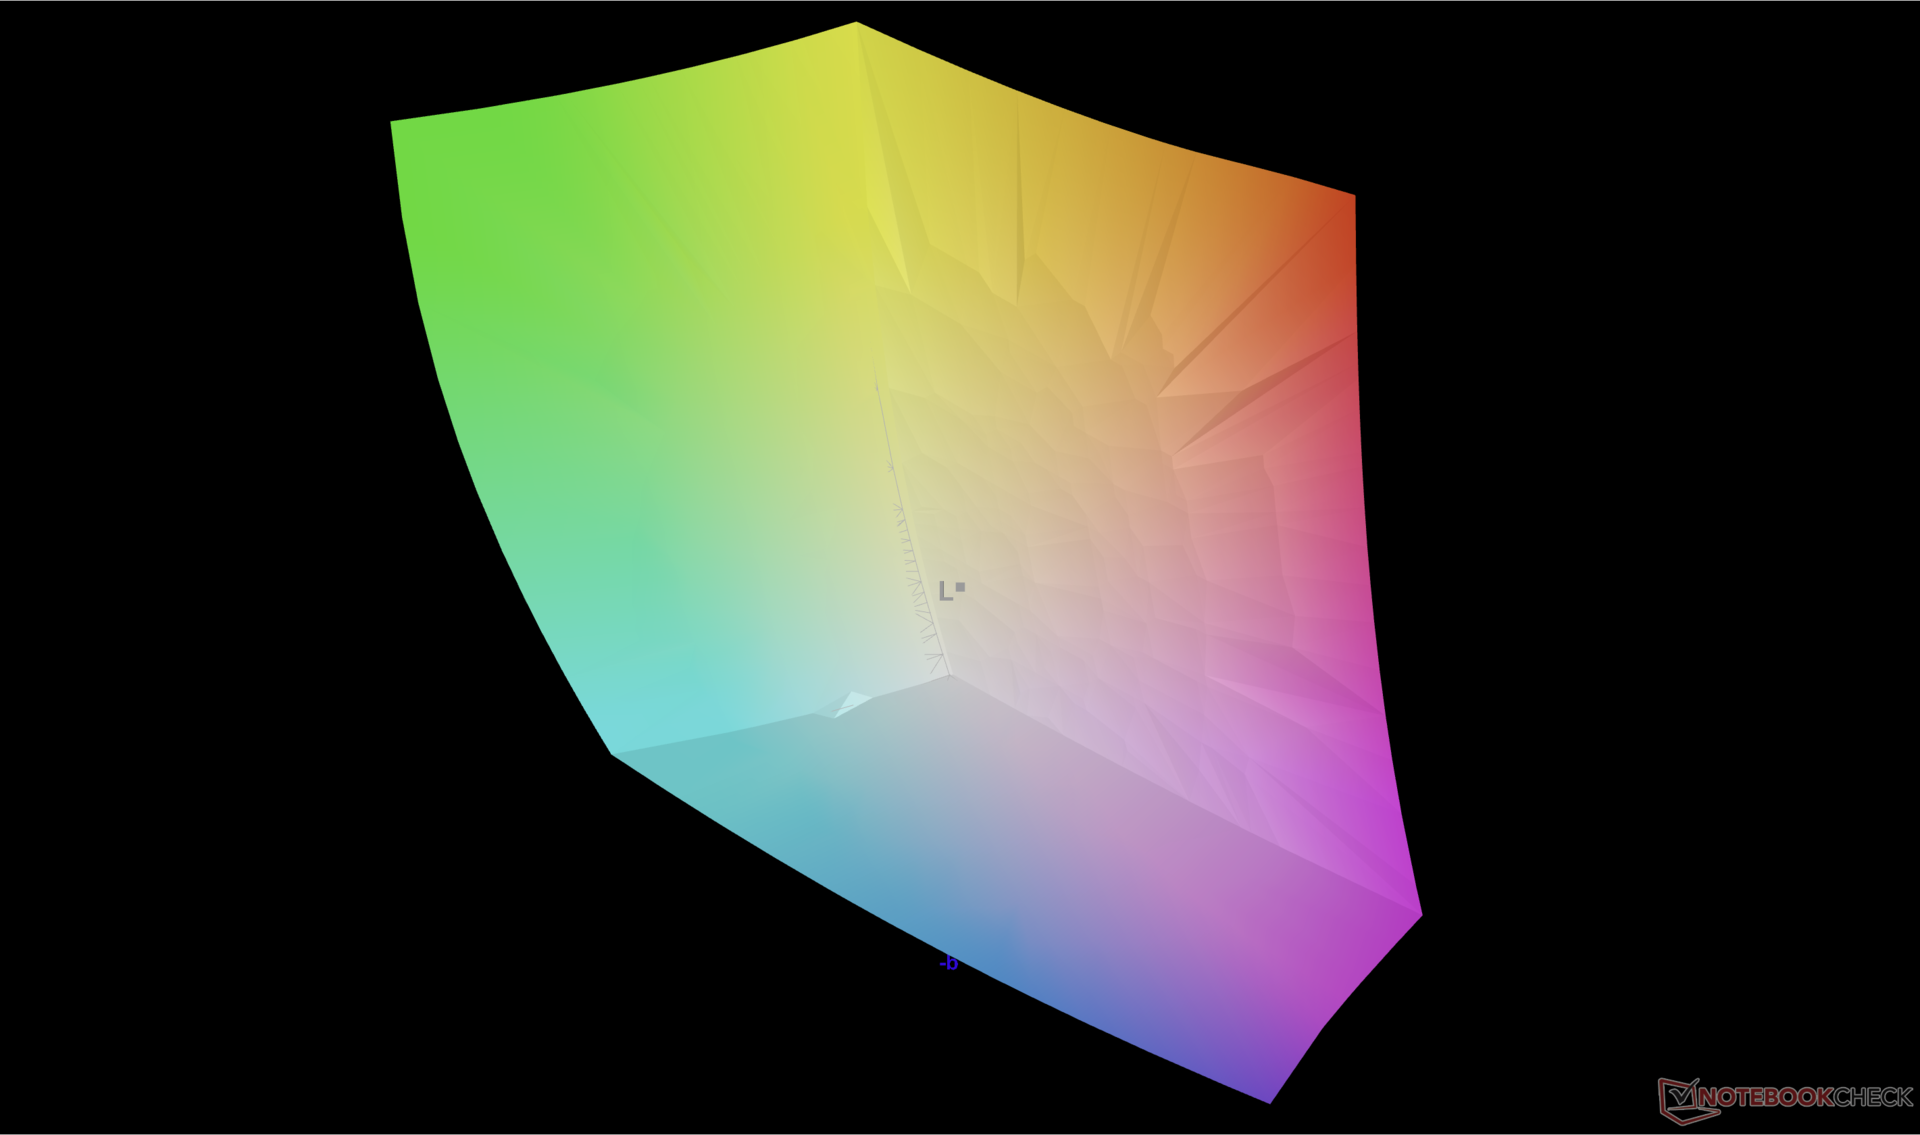
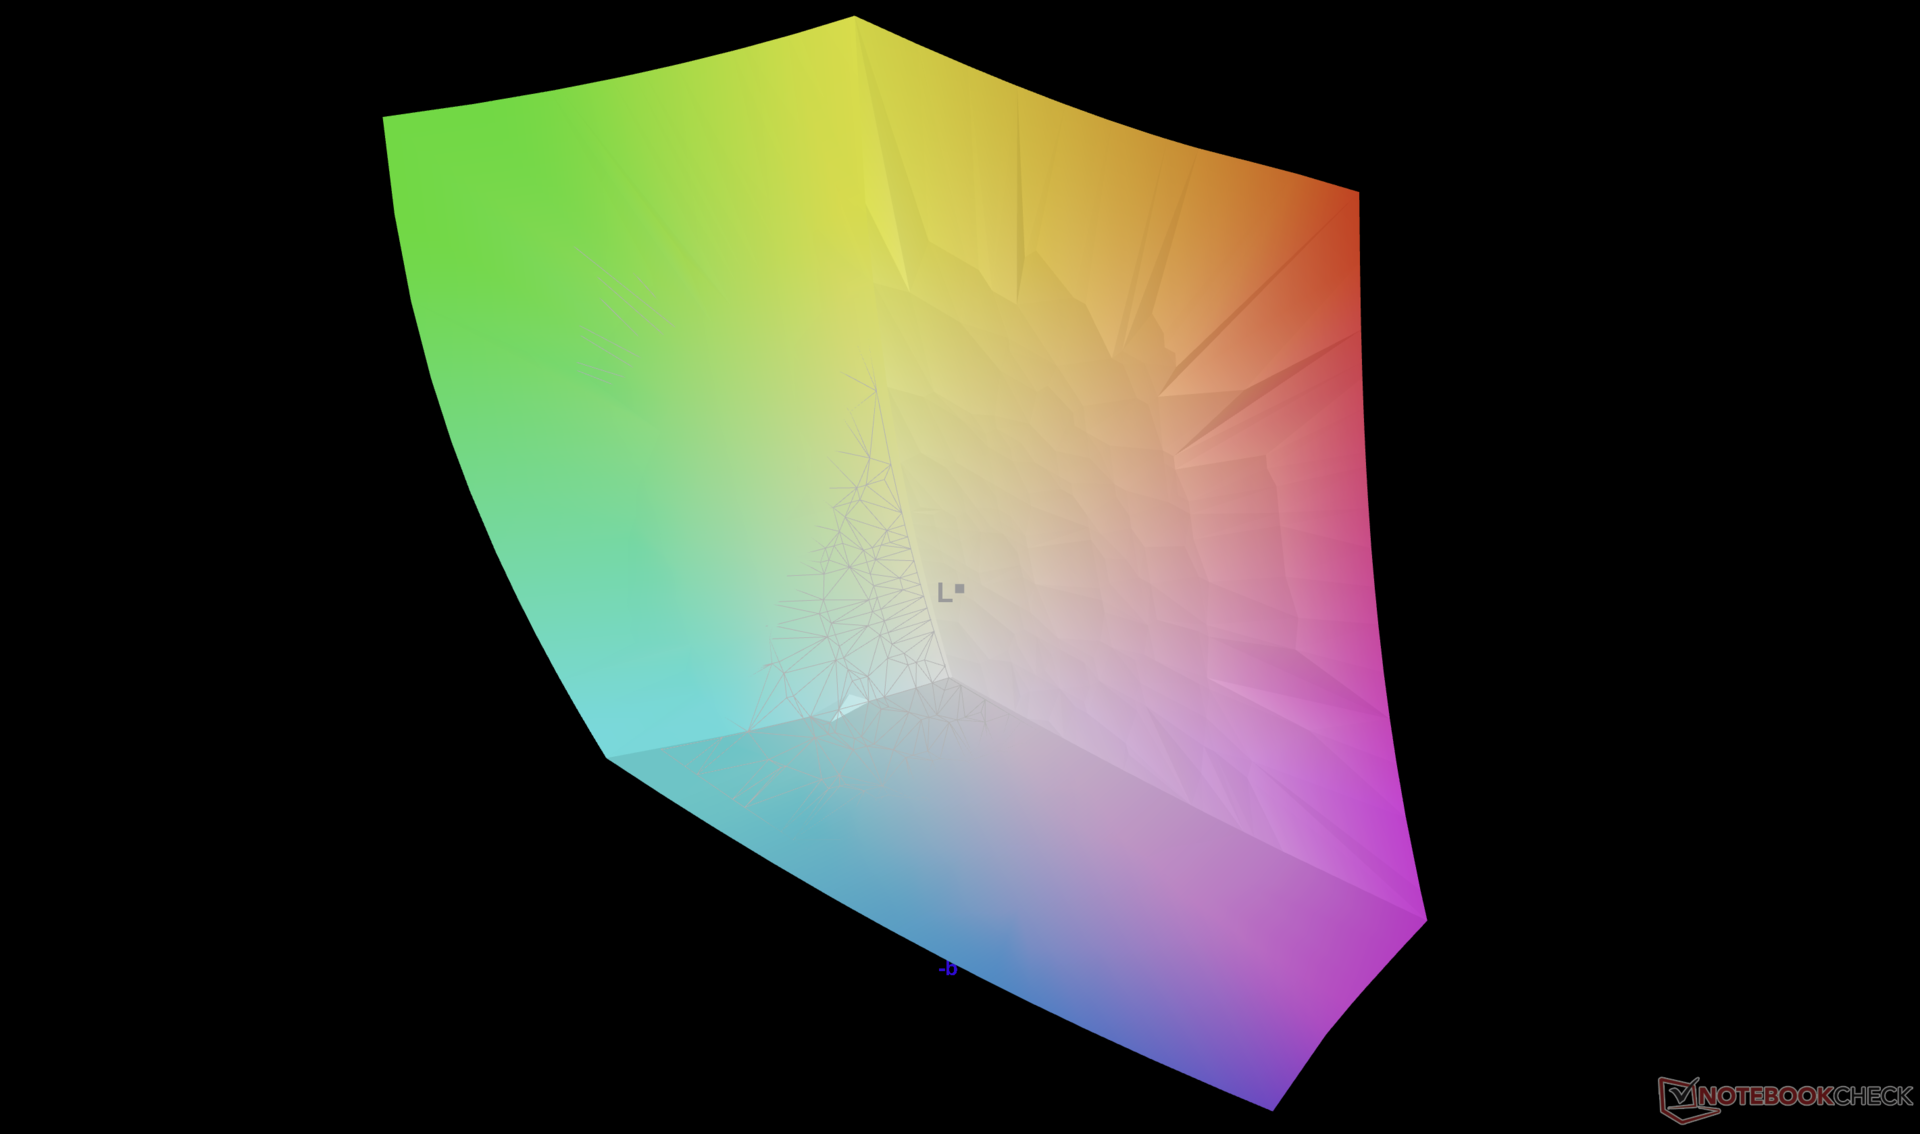
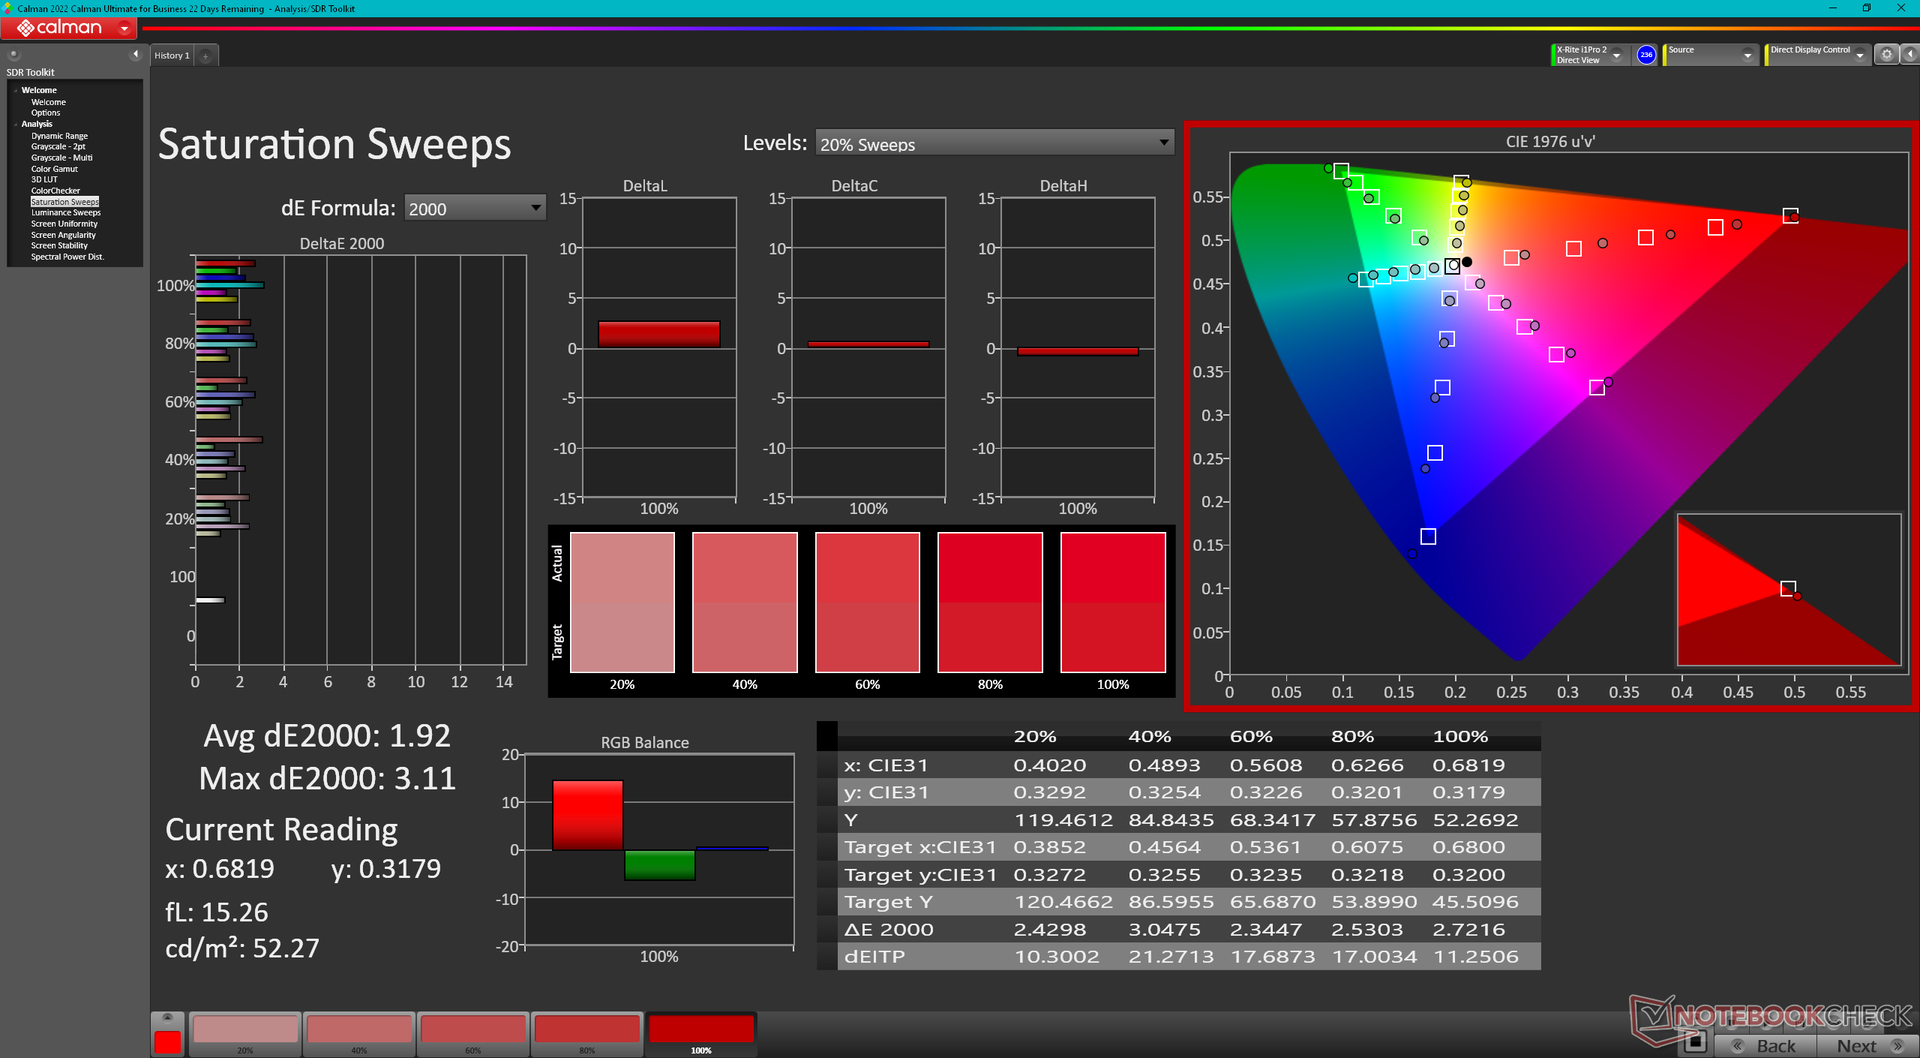
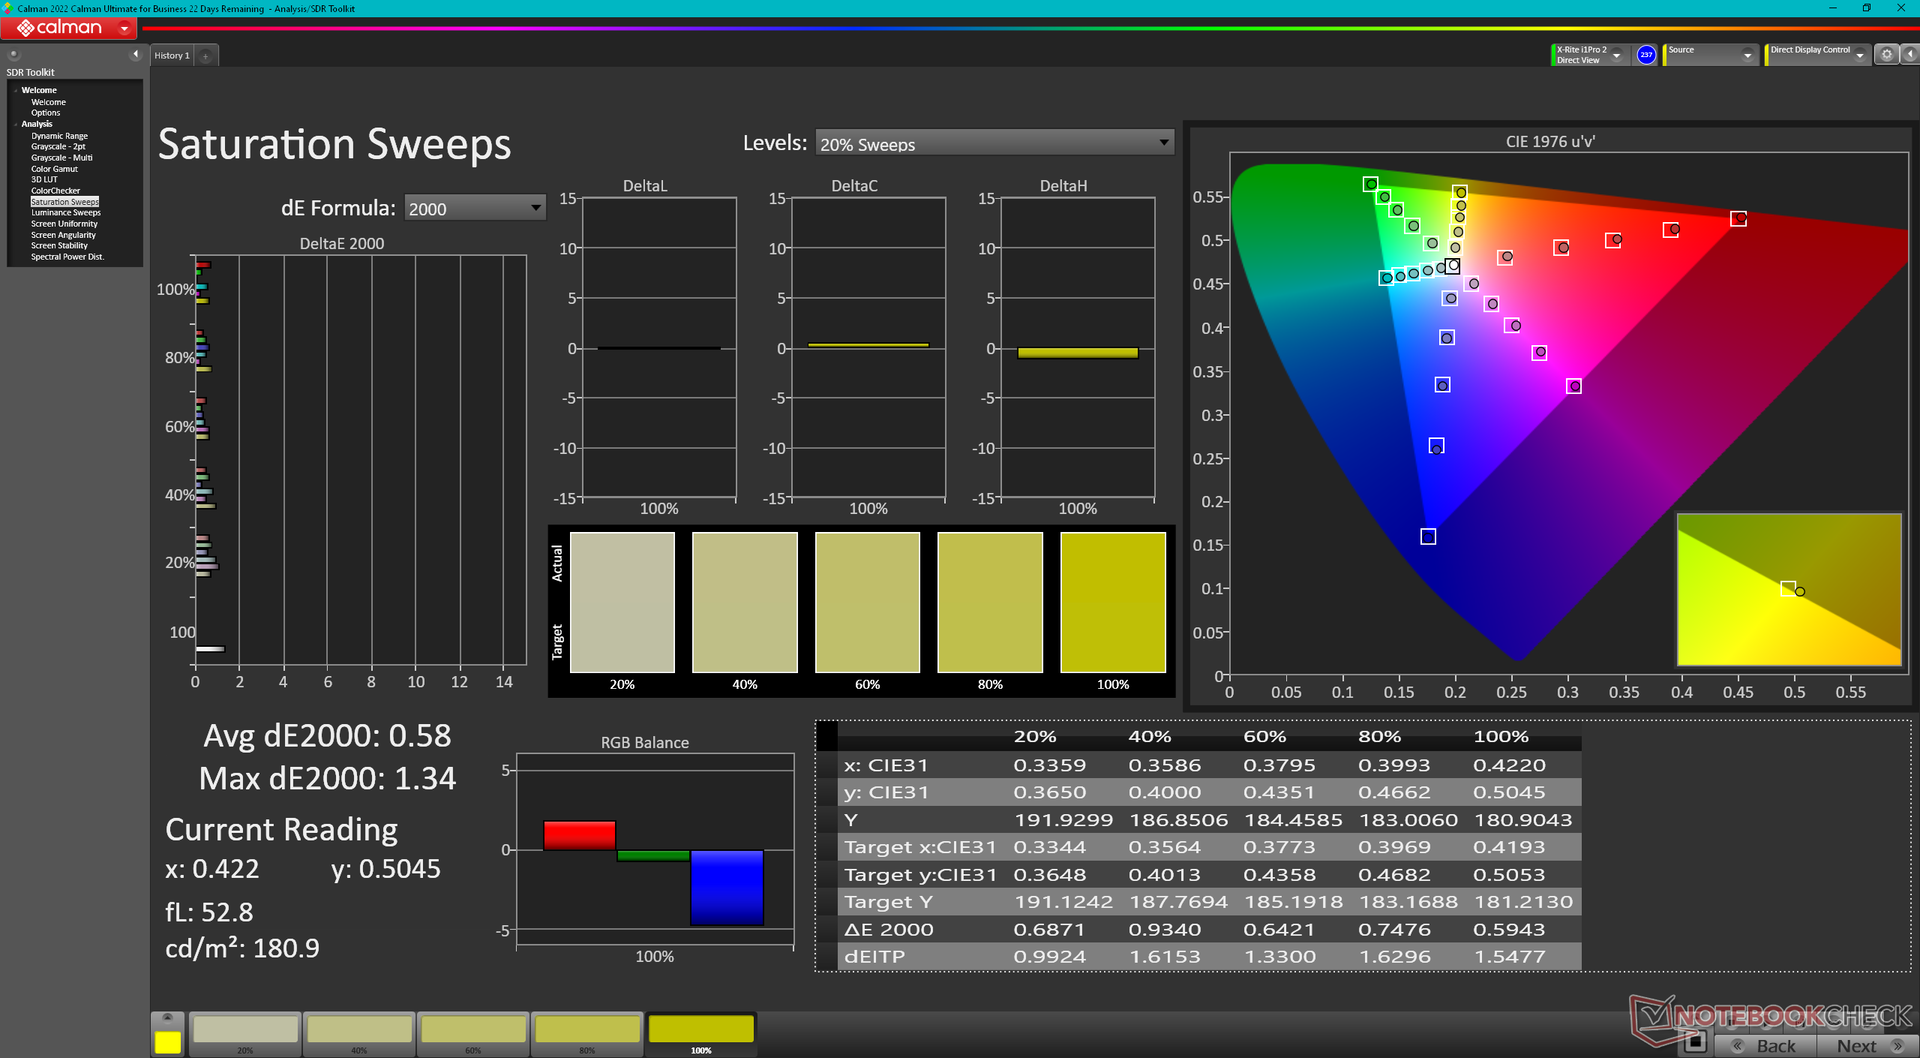
The display is well-calibrated out of the box against the DCI-P3 standard and so an end-user calibration won't be necessary for most users. Color temperature is slightly too warm at 6300K, however, but that is only a small nitpick. Our ICM profile is available to download above for free.

Display Response Times
| ↔ Response Time Black to White | ||
|---|---|---|
| 1.01 ms ... rise ↗ and fall ↘ combined | ↗ 0.64 ms rise | 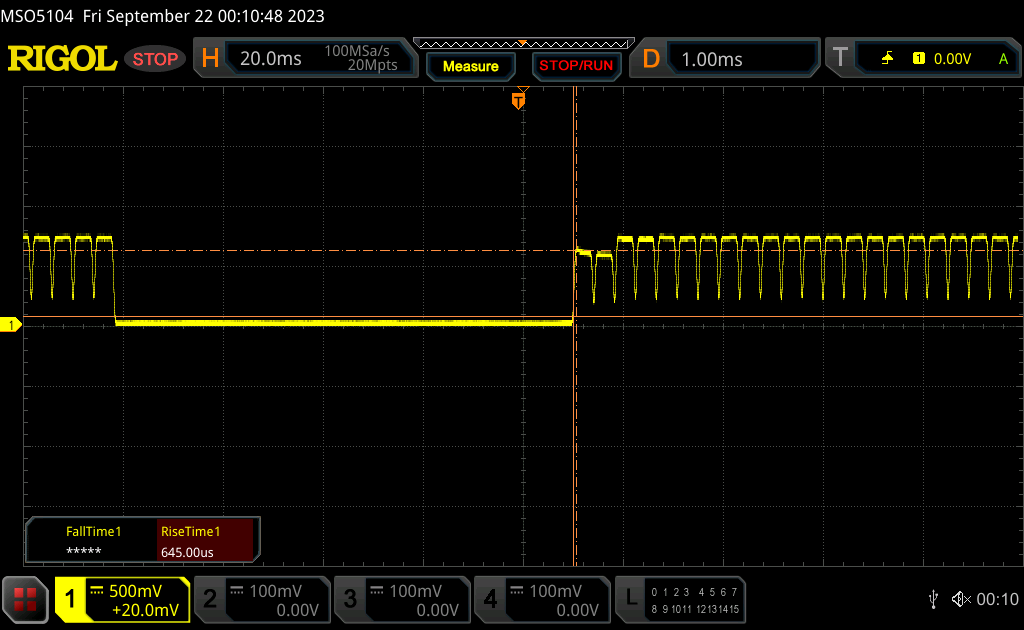 |
| ↘ 0.37 ms fall | ||
| The screen shows very fast response rates in our tests and should be very well suited for fast-paced gaming. In comparison, all tested devices range from 0.1 (minimum) to 240 (maximum) ms. » 4 % of all devices are better. This means that the measured response time is better than the average of all tested devices (19.8 ms). | ||
| ↔ Response Time 50% Grey to 80% Grey | ||
| 0.79 ms ... rise ↗ and fall ↘ combined | ↗ 0.46 ms rise | 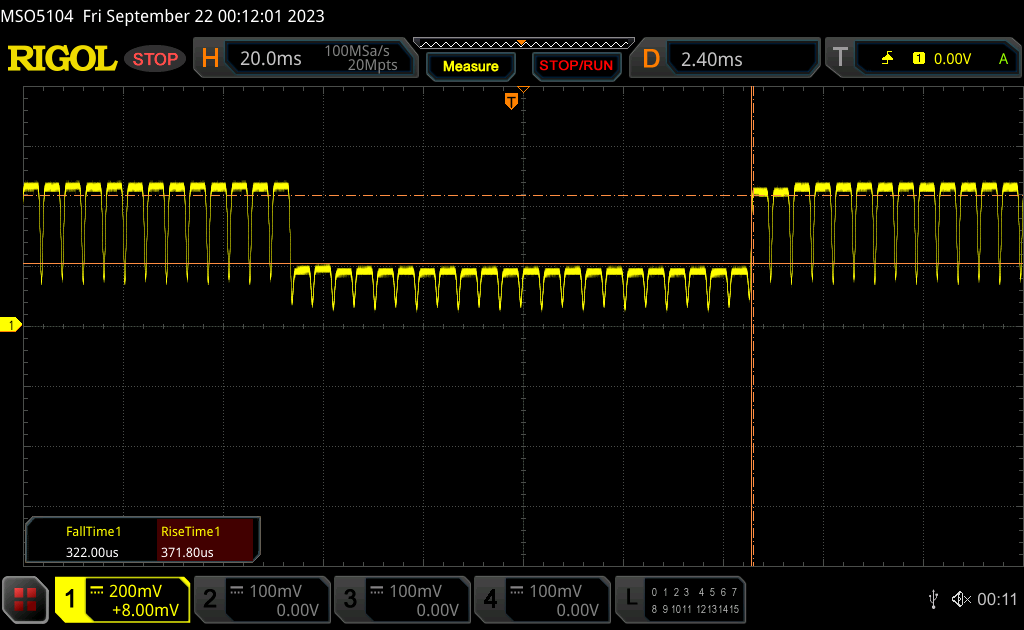 |
| ↘ 0.33 ms fall | ||
| The screen shows very fast response rates in our tests and should be very well suited for fast-paced gaming. In comparison, all tested devices range from 0.165 (minimum) to 636 (maximum) ms. » 3 % of all devices are better. This means that the measured response time is better than the average of all tested devices (31 ms). | ||
Screen Flickering / PWM (Pulse-Width Modulation)
| Screen flickering / PWM detected | 240.5 Hz | ≤ 100 % brightness setting | 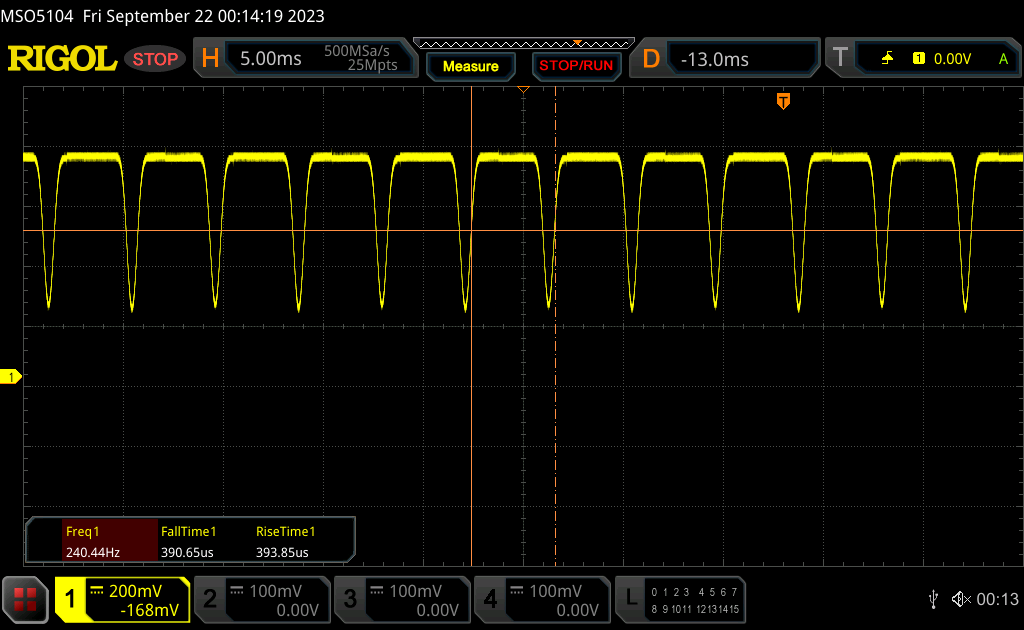 |
The display backlight flickers at 240.5 Hz (worst case, e.g., utilizing PWM) Flickering detected at a brightness setting of 100 % and below. There should be no flickering or PWM above this brightness setting. The frequency of 240.5 Hz is relatively low, so sensitive users will likely notice flickering and experience eyestrain at the stated brightness setting and below. In comparison: 52 % of all tested devices do not use PWM to dim the display. If PWM was detected, an average of 7757 (minimum: 5 - maximum: 343500) Hz was measured. | |||
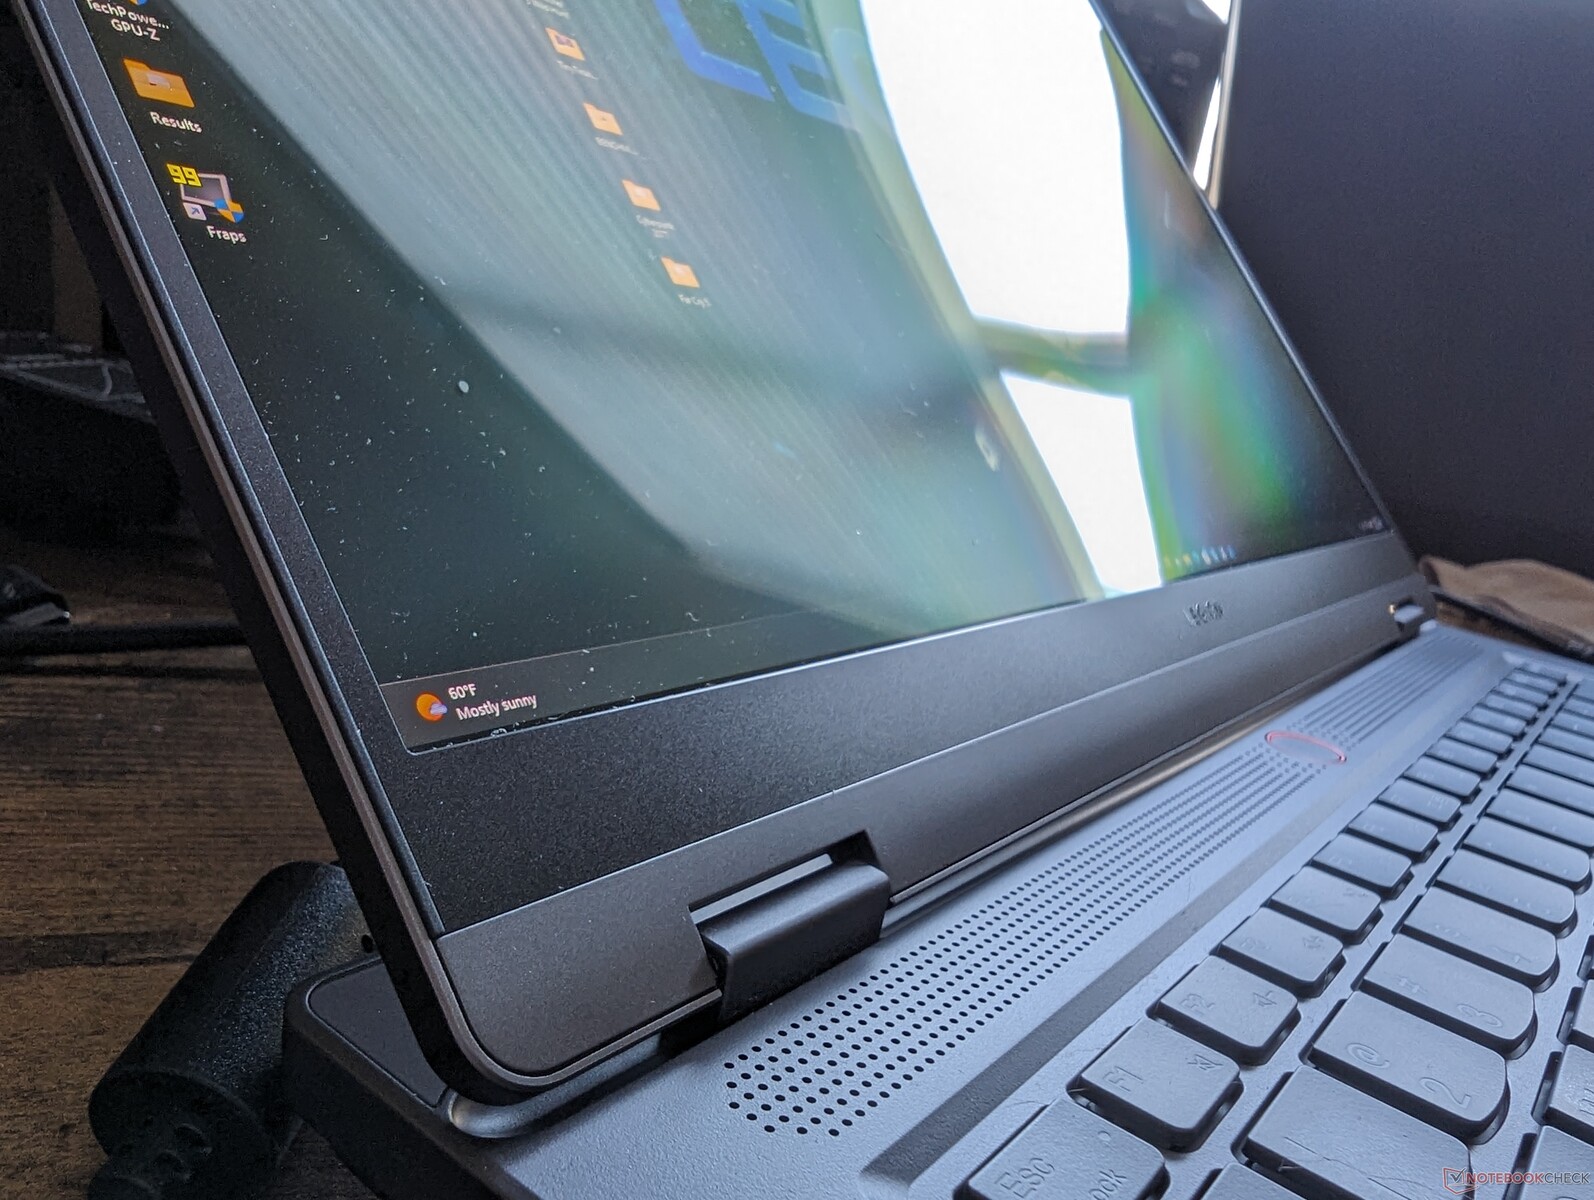
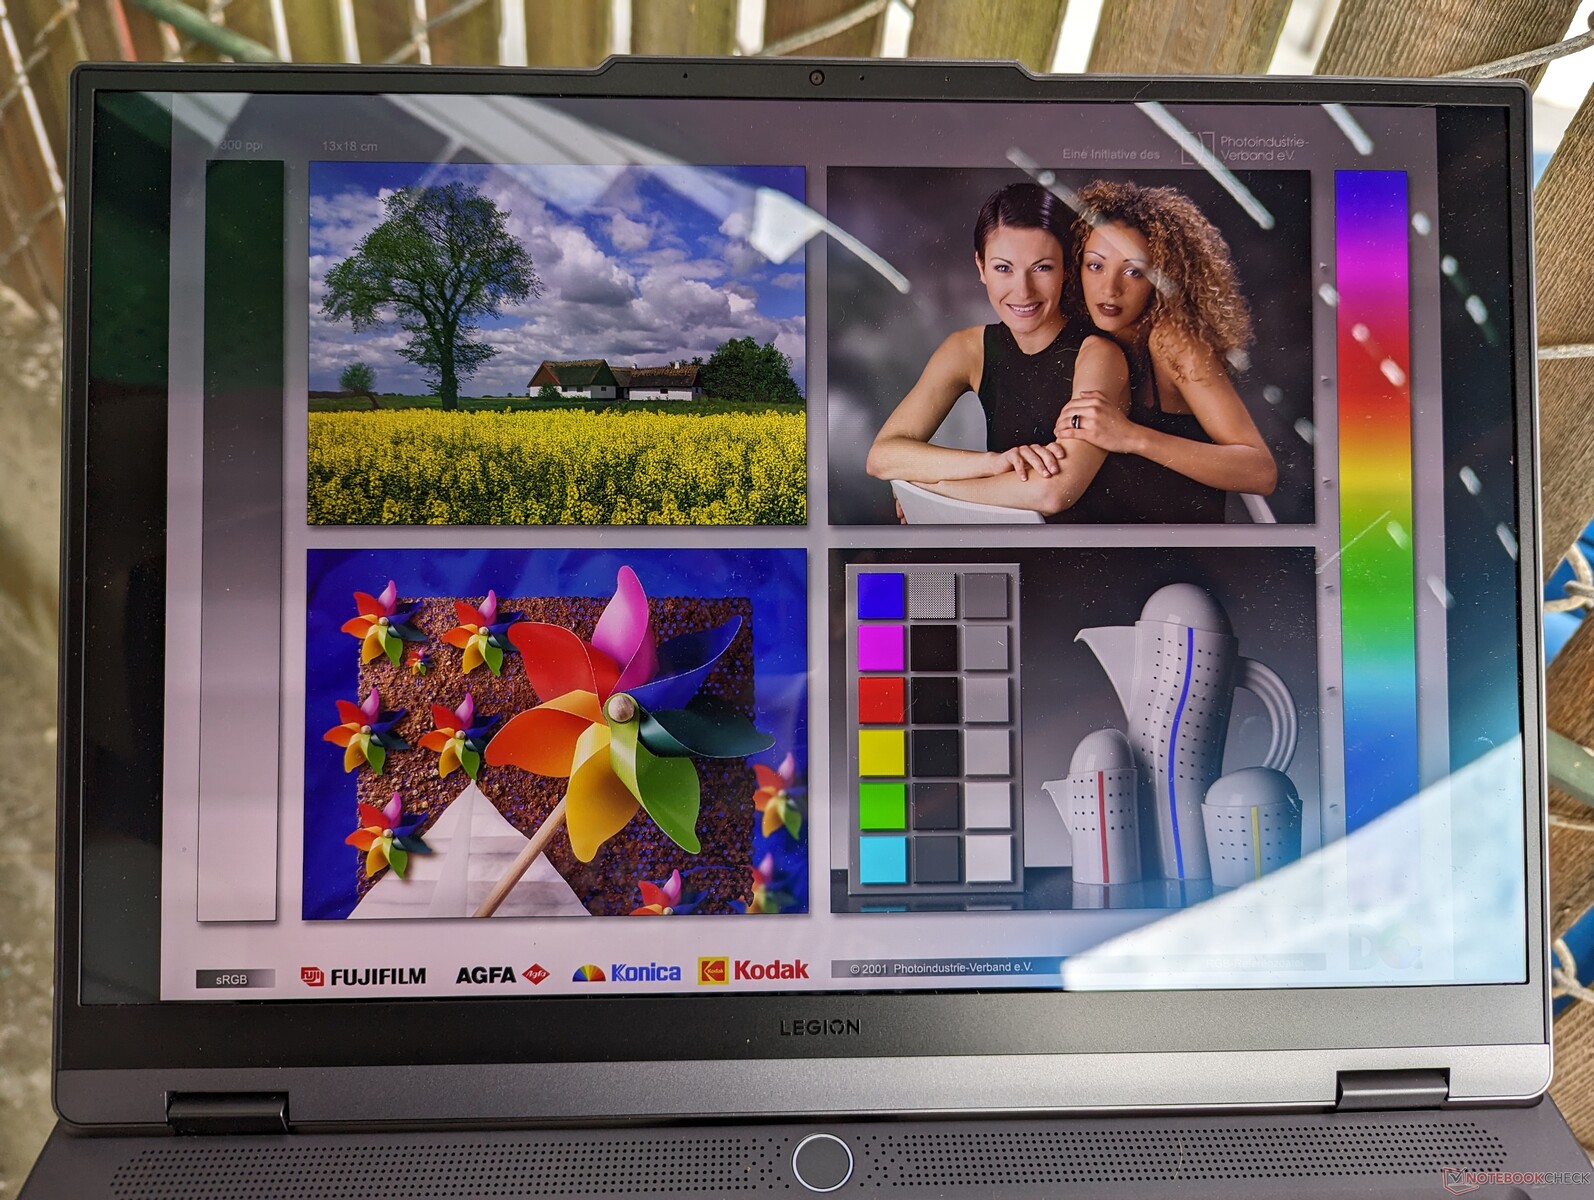
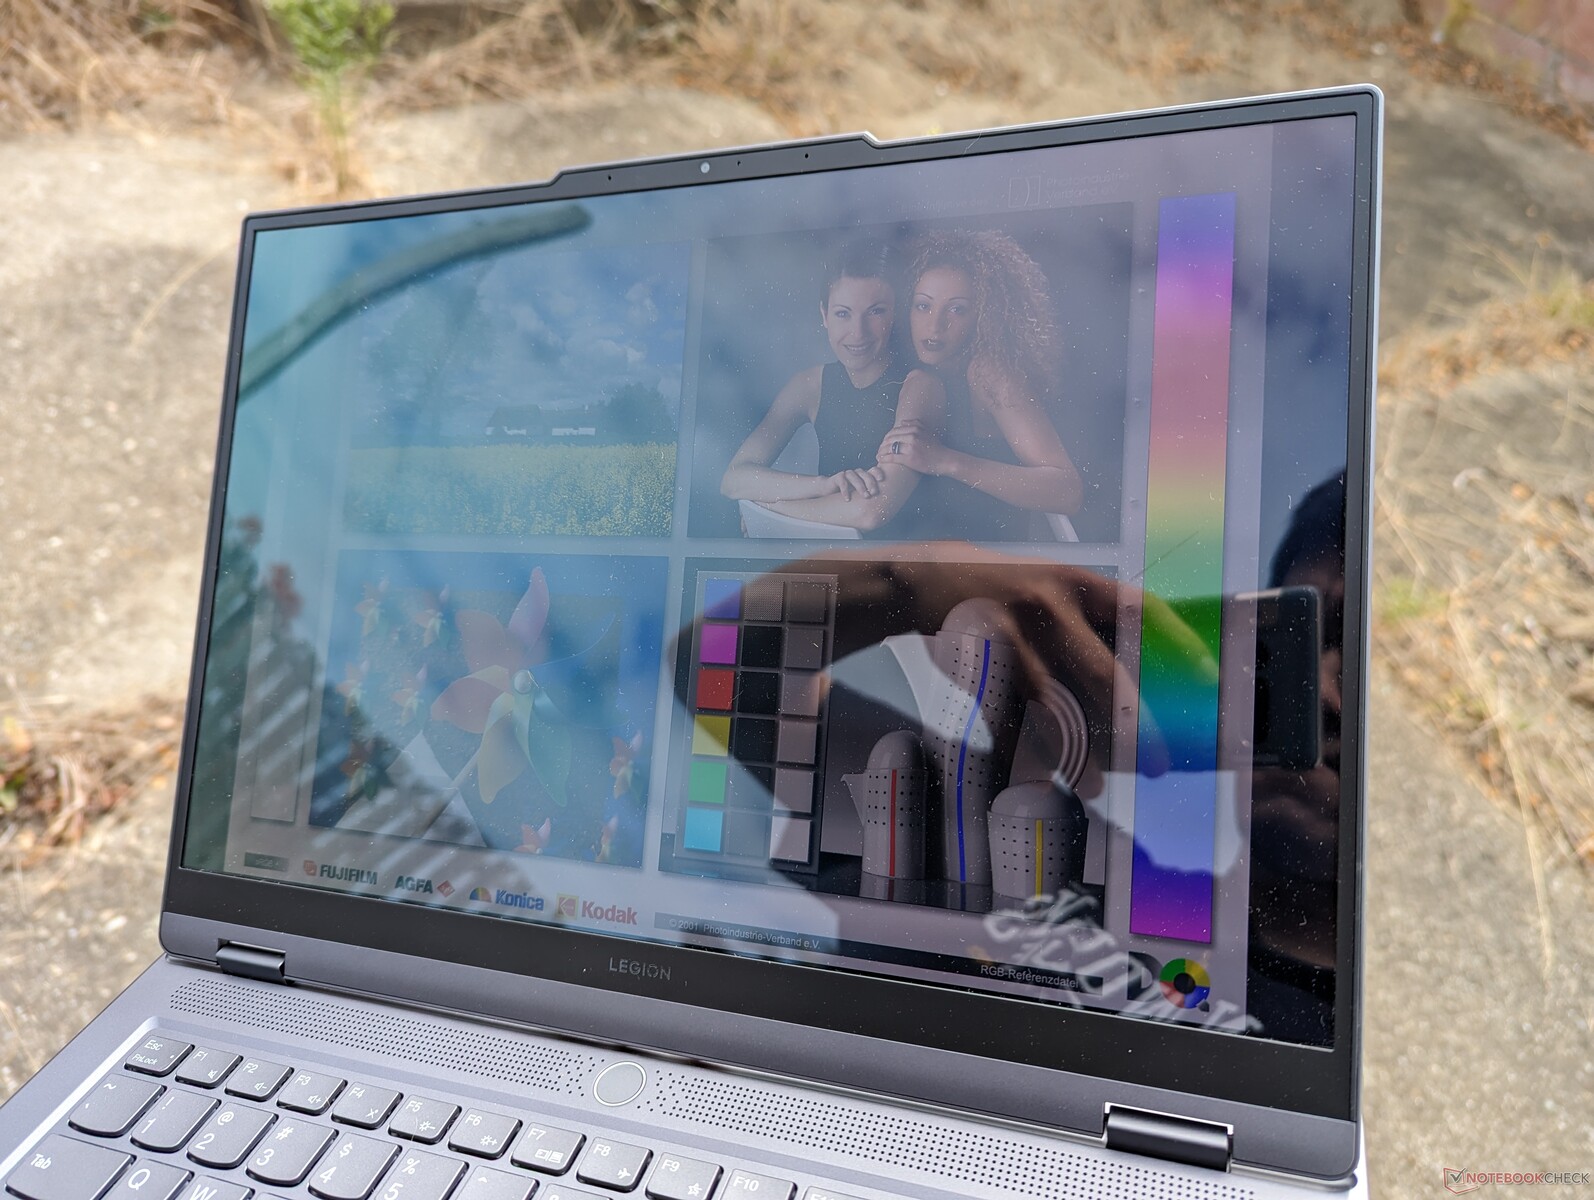
Real-world maximum brightness is around 386 nits compared to Lenovo's claim of 400 nits for SDR content. If HDR is enabled, maximum brightness would be as high as 515 nits which would match Lenovo's claim of HDR500 compatibility. The matte IPS panels on the Blade 14 or Zephyrus G14 are noticeably brighter at around 550 nits each for SDR content for better outdoor visibility when compared to our very glossy Lenovo model.

Performance — Zen 4 Pairs Well With Nvidia RTX
Testing Conditions
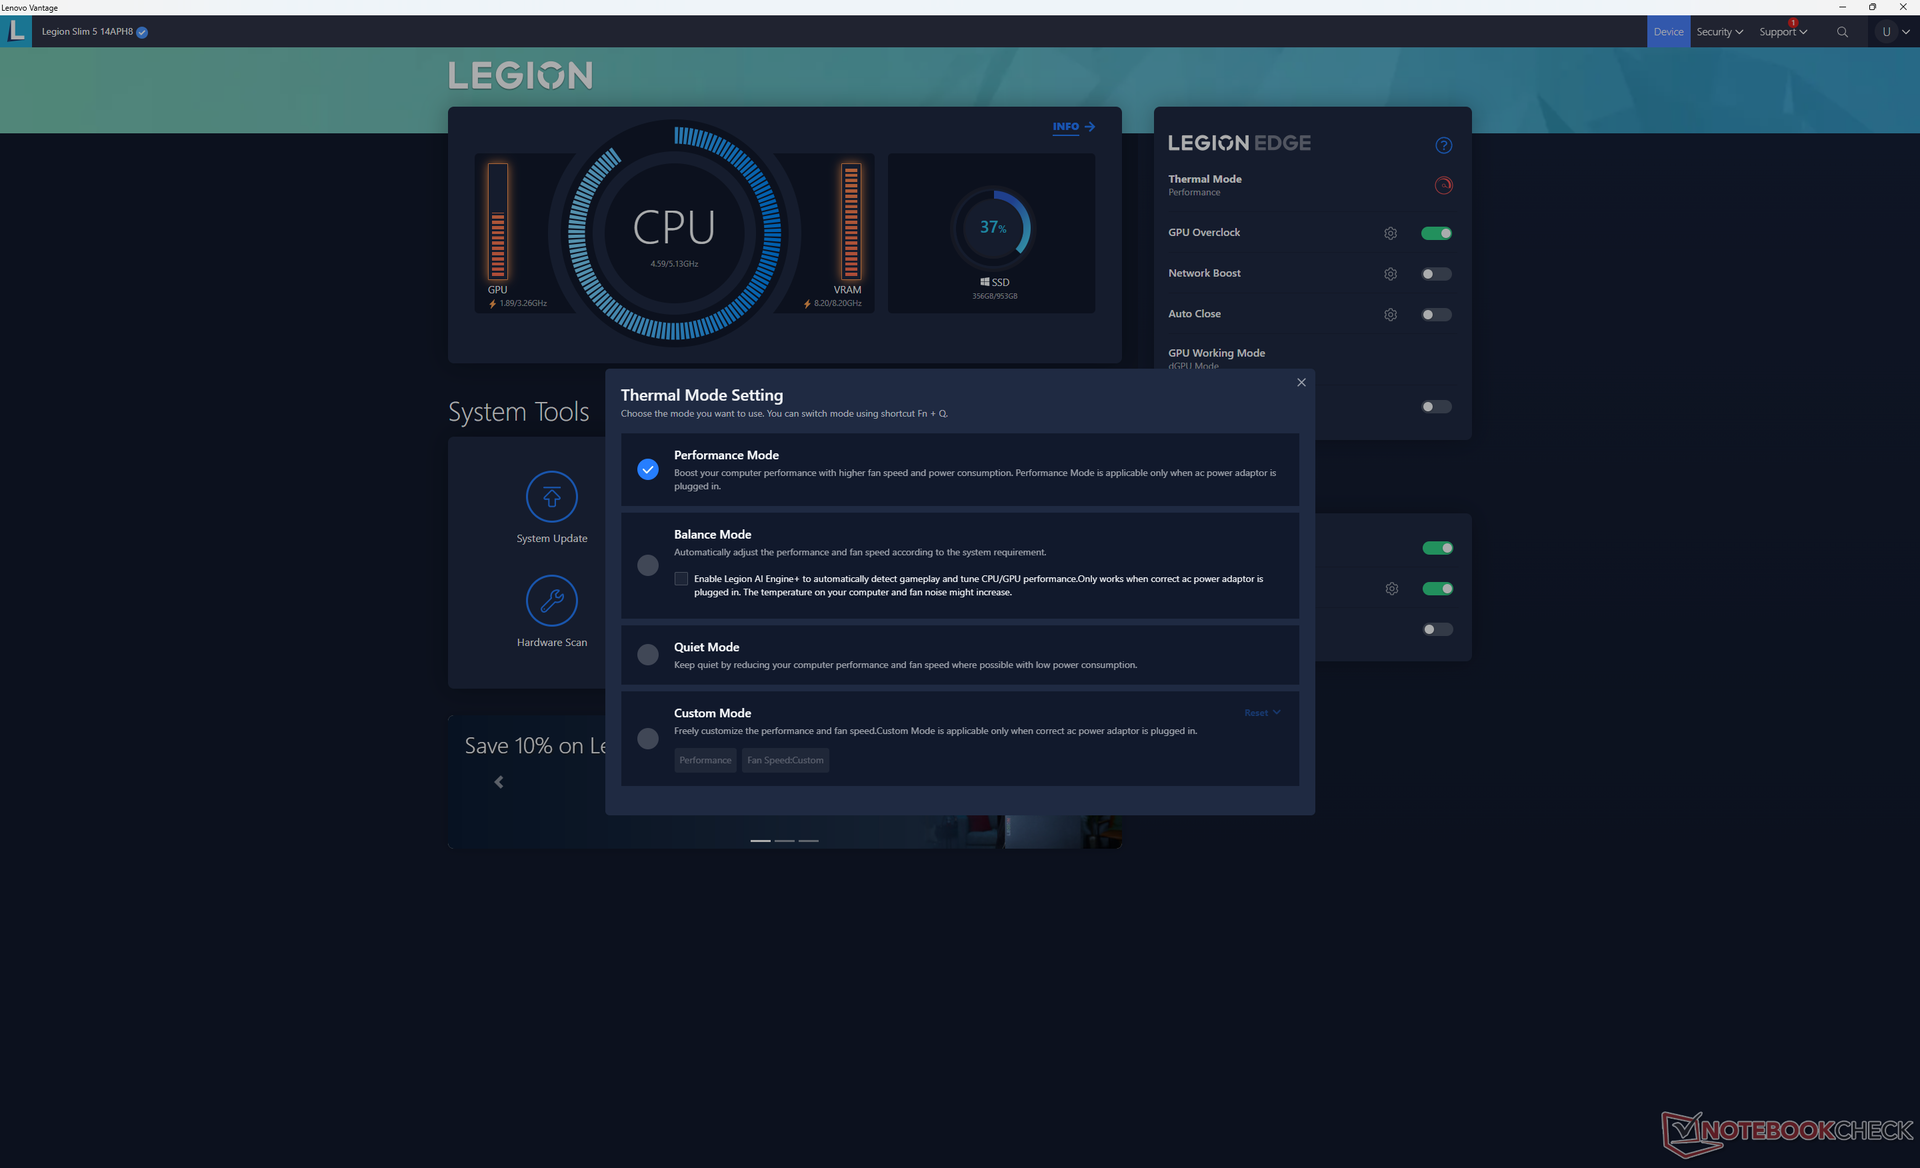
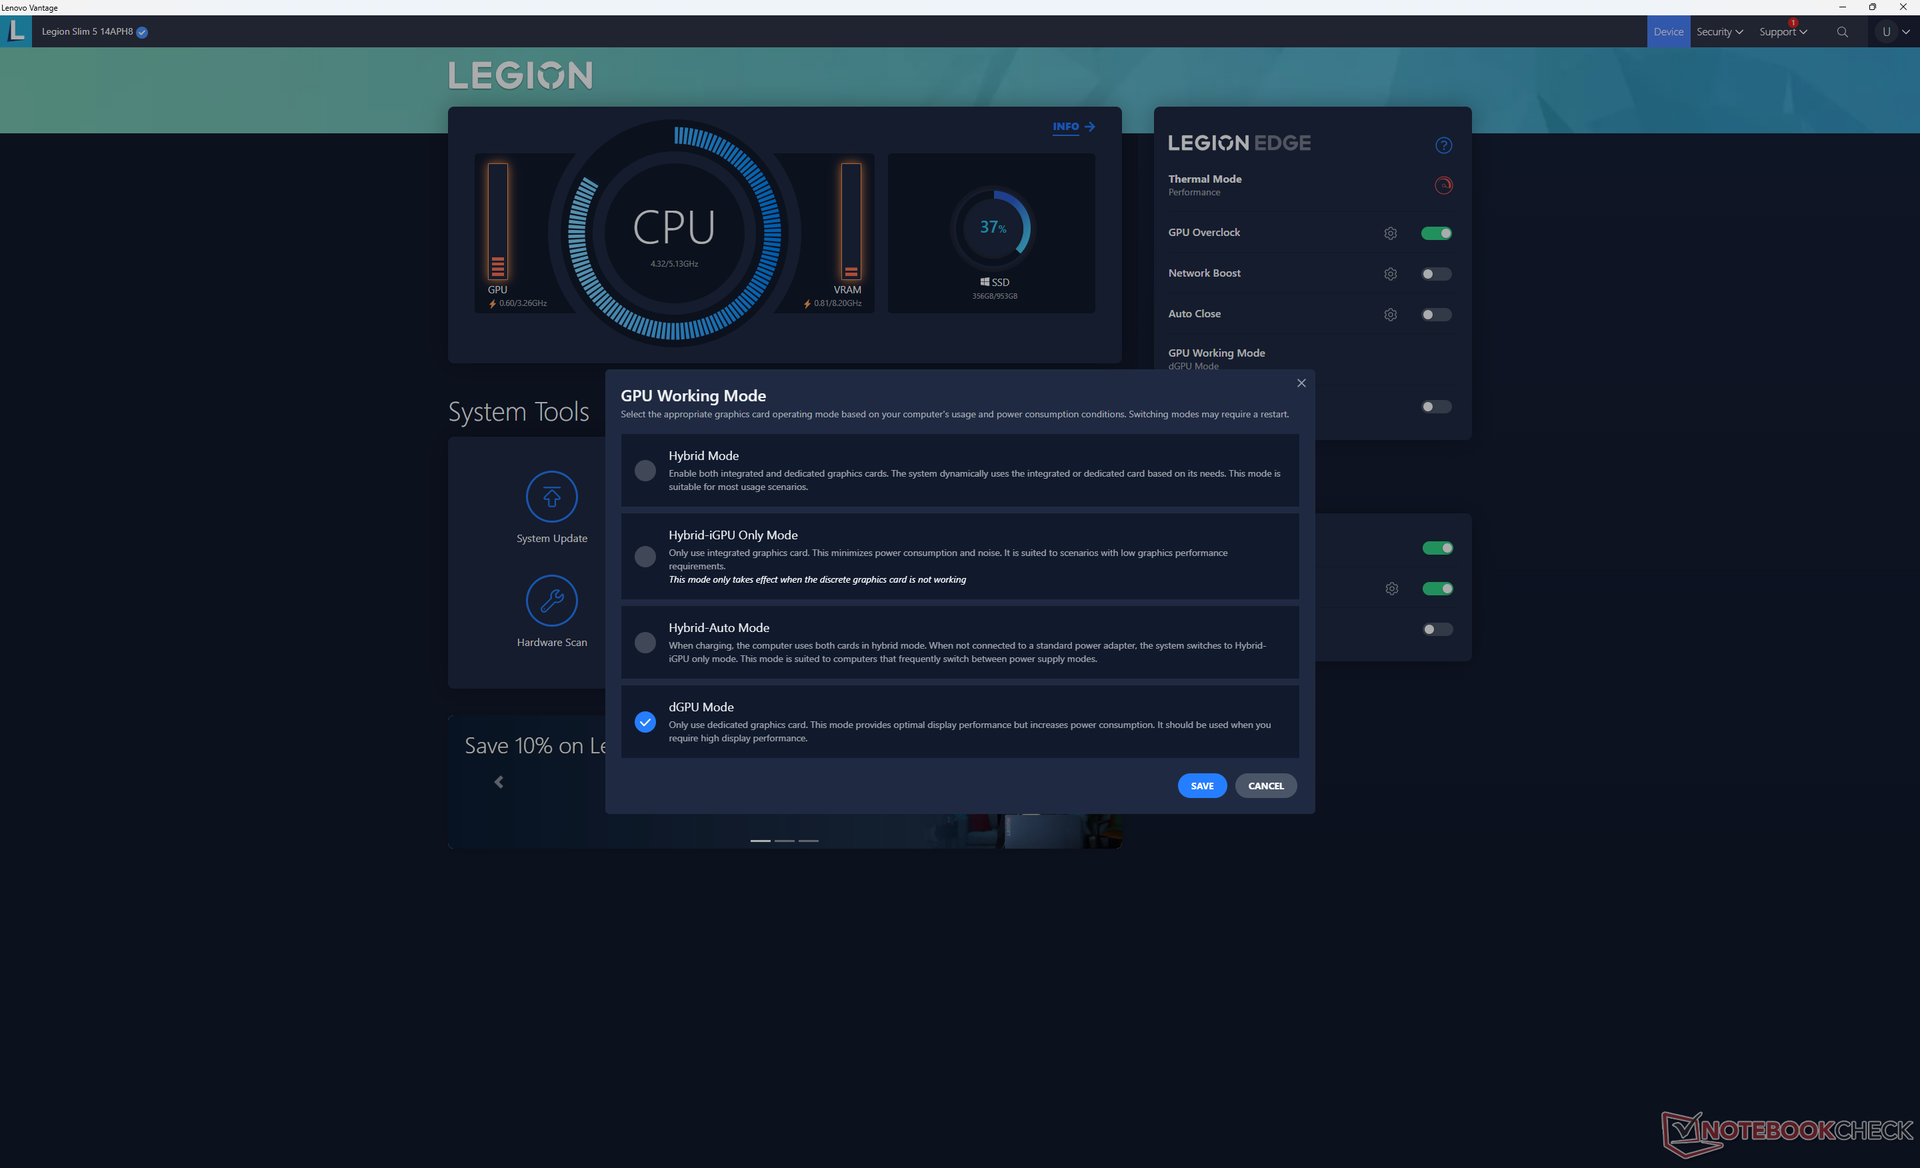
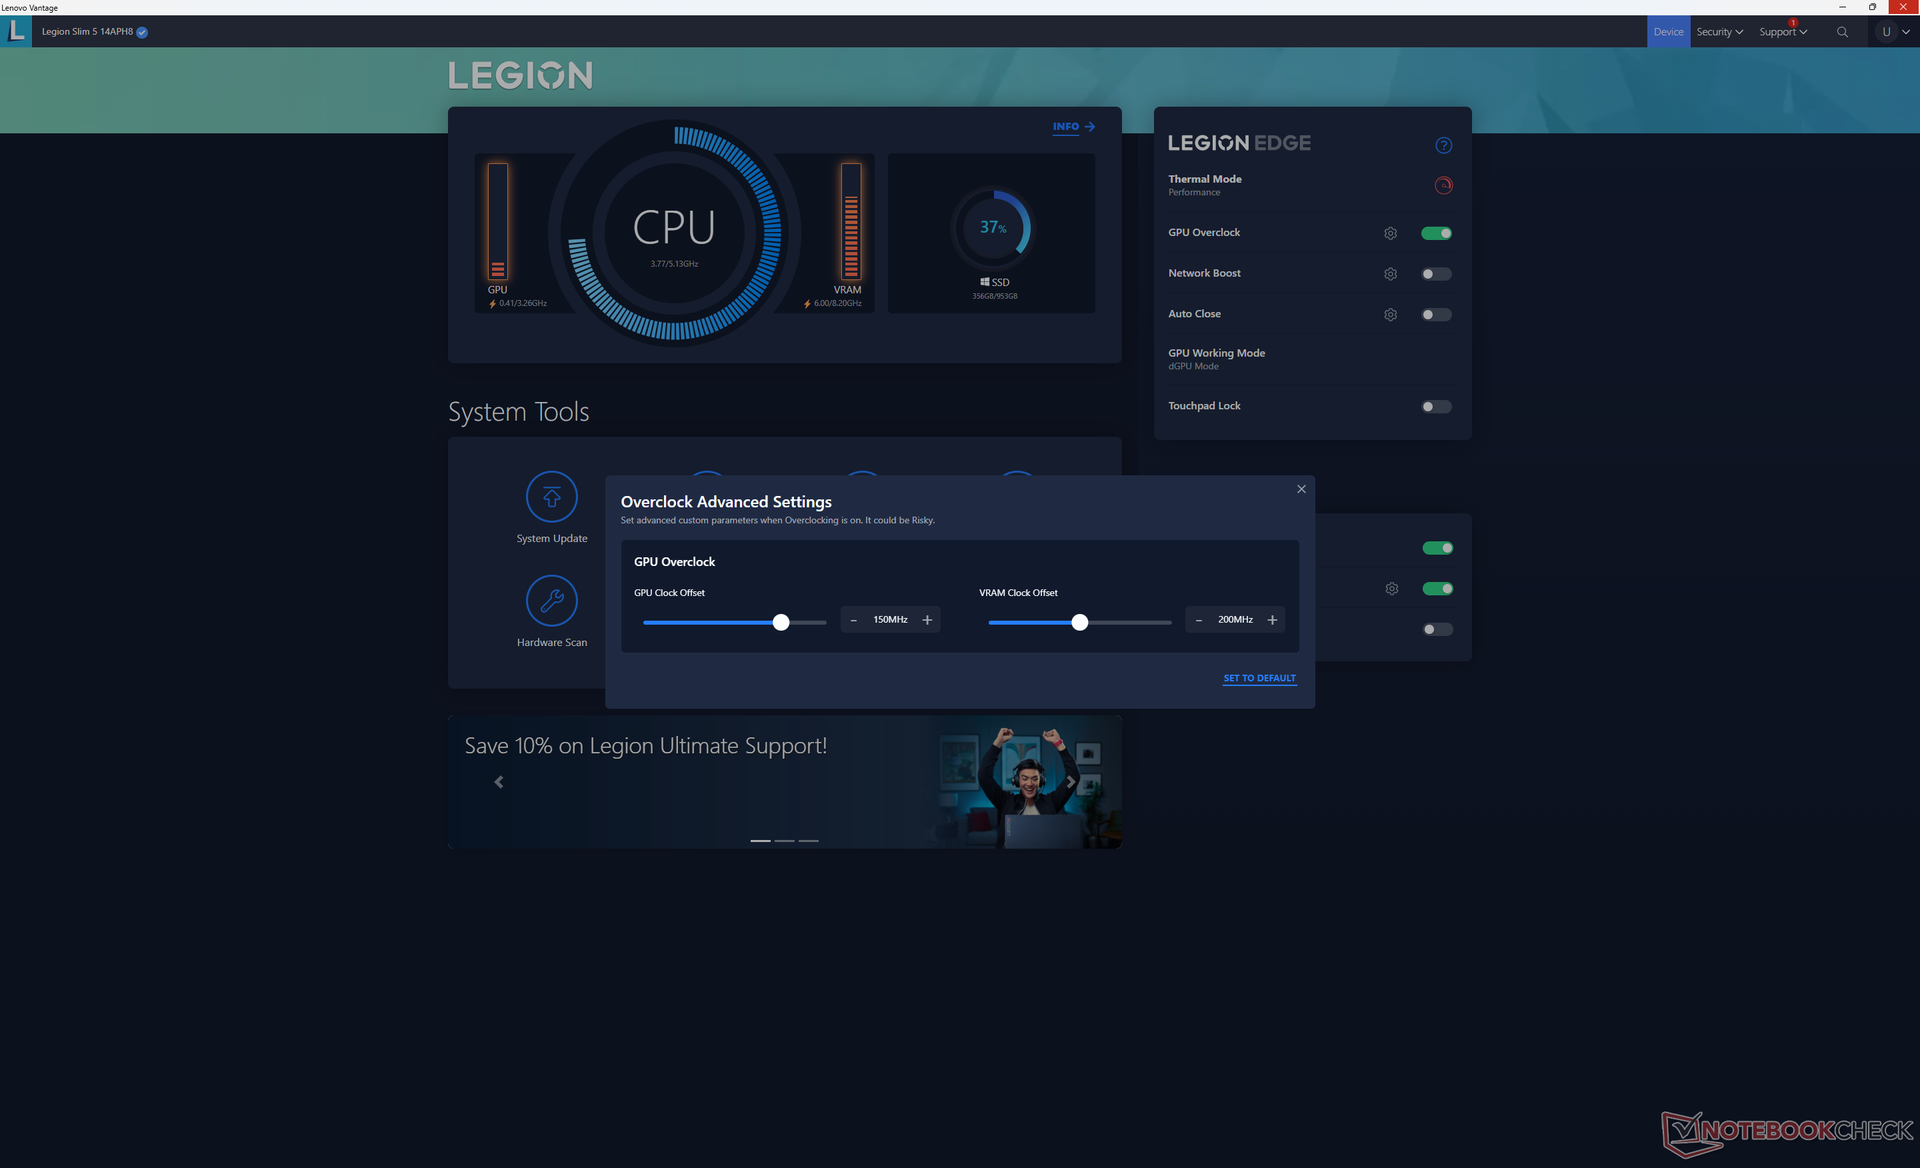
We set Lenovo Vantage to Performance mode and dGPU mode with GPU Overclock active prior to running the benchmarks below. It's recommended that users become familiar with Vantage as it the control hub for adjusting performance profiles and dGPU/iGPU settings.
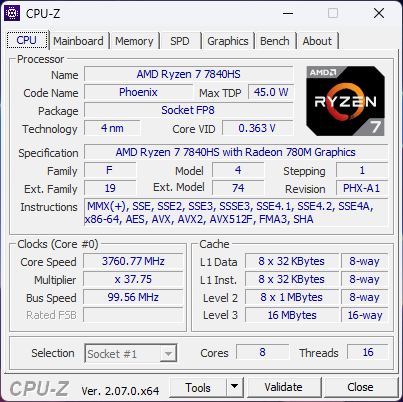
Processor
The Ryzen 7 7840HS performs well with no major throttling issues and with multi-thread results that are just 10 percent behind the common 13th gen Core i7-13700H. Upgrading to the Ryzen 9 7940HS configuration is expected to boost performance by 10 percent which would effectively close that gap. In other words, you'd have to upgrade to the Ryzen 9 configuration if you want the same processing power as the Intel Core i7.
More powerful Ryzen HX-class CPUs like the Ryzen 9 7945HX are only available on larger screen sizes.
Cinebench R15 Multi Loop
Cinebench R23: Multi Core | Single Core
Cinebench R20: CPU (Multi Core) | CPU (Single Core)
Cinebench R15: CPU Multi 64Bit | CPU Single 64Bit
Blender: v2.79 BMW27 CPU
7-Zip 18.03: 7z b 4 | 7z b 4 -mmt1
Geekbench 5.5: Multi-Core | Single-Core
HWBOT x265 Benchmark v2.2: 4k Preset
LibreOffice : 20 Documents To PDF
R Benchmark 2.5: Overall mean
| CPU Performance rating | |
| Schenker XMG Pro 15 (E23) | |
| Dell G15 5530 | |
| Asus ROG Zephyrus G14 GA402XY | |
| Lenovo Legion Slim 5 14APH8 | |
| Acer Predator Triton 14 PT14-51 | |
| Average AMD Ryzen 7 7840HS | |
| Acer Predator Triton 300 SE | |
| Alienware x14 i7 RTX 3060 | |
| Asus TUF A15 FA507 | |
| Asus ROG Zephyrus G14 GA402RK | |
| Asus Zephyrus G14 GA401QEC | |
| Asus ROG Strix G15 G513RW | |
| Asus Zephyrus G14 GA401IV -4! | |
| Cinebench R23 / Multi Core | |
| Schenker XMG Pro 15 (E23) | |
| Dell G15 5530 | |
| Acer Predator Triton 14 PT14-51 | |
| Asus ROG Zephyrus G14 GA402XY | |
| Lenovo Legion Slim 5 14APH8 | |
| Average AMD Ryzen 7 7840HS (14784 - 17214, n=19) | |
| Acer Predator Triton 300 SE | |
| Alienware x14 i7 RTX 3060 | |
| Asus TUF A15 FA507 | |
| Asus ROG Strix G15 G513RW | |
| Asus Zephyrus G14 GA401QEC | |
| Asus ROG Zephyrus G14 GA402RK | |
| Cinebench R23 / Single Core | |
| Acer Predator Triton 300 SE | |
| Schenker XMG Pro 15 (E23) | |
| Dell G15 5530 | |
| Lenovo Legion Slim 5 14APH8 | |
| Asus ROG Zephyrus G14 GA402XY | |
| Average AMD Ryzen 7 7840HS (1718 - 1812, n=19) | |
| Alienware x14 i7 RTX 3060 | |
| Acer Predator Triton 14 PT14-51 | |
| Asus ROG Zephyrus G14 GA402RK | |
| Asus TUF A15 FA507 | |
| Asus ROG Strix G15 G513RW | |
| Asus Zephyrus G14 GA401QEC | |
| Cinebench R20 / CPU (Multi Core) | |
| Schenker XMG Pro 15 (E23) | |
| Dell G15 5530 | |
| Acer Predator Triton 14 PT14-51 | |
| Asus ROG Zephyrus G14 GA402XY | |
| Lenovo Legion Slim 5 14APH8 | |
| Average AMD Ryzen 7 7840HS (5761 - 6744, n=19) | |
| Acer Predator Triton 300 SE | |
| Alienware x14 i7 RTX 3060 | |
| Asus TUF A15 FA507 | |
| Asus Zephyrus G14 GA401QEC | |
| Asus ROG Strix G15 G513RW | |
| Asus ROG Zephyrus G14 GA402RK | |
| Asus Zephyrus G14 GA401IV | |
| Cinebench R20 / CPU (Single Core) | |
| Acer Predator Triton 300 SE | |
| Schenker XMG Pro 15 (E23) | |
| Dell G15 5530 | |
| Asus ROG Zephyrus G14 GA402XY | |
| Average AMD Ryzen 7 7840HS (661 - 705, n=19) | |
| Alienware x14 i7 RTX 3060 | |
| Lenovo Legion Slim 5 14APH8 | |
| Acer Predator Triton 14 PT14-51 | |
| Asus ROG Zephyrus G14 GA402RK | |
| Asus TUF A15 FA507 | |
| Asus ROG Strix G15 G513RW | |
| Asus Zephyrus G14 GA401QEC | |
| Asus Zephyrus G14 GA401IV | |
| Cinebench R15 / CPU Multi 64Bit | |
| Schenker XMG Pro 15 (E23) | |
| Dell G15 5530 | |
| Acer Predator Triton 14 PT14-51 | |
| Asus ROG Zephyrus G14 GA402XY | |
| Lenovo Legion Slim 5 14APH8 | |
| Average AMD Ryzen 7 7840HS (2300 - 2729, n=19) | |
| Alienware x14 i7 RTX 3060 | |
| Acer Predator Triton 300 SE | |
| Asus TUF A15 FA507 | |
| Asus Zephyrus G14 GA401QEC | |
| Asus ROG Strix G15 G513RW | |
| Asus ROG Zephyrus G14 GA402RK | |
| Asus Zephyrus G14 GA401IV | |
| Cinebench R15 / CPU Single 64Bit | |
| Asus ROG Zephyrus G14 GA402XY | |
| Average AMD Ryzen 7 7840HS (270 - 286, n=19) | |
| Lenovo Legion Slim 5 14APH8 | |
| Dell G15 5530 | |
| Acer Predator Triton 300 SE | |
| Asus ROG Zephyrus G14 GA402RK | |
| Alienware x14 i7 RTX 3060 | |
| Asus TUF A15 FA507 | |
| Schenker XMG Pro 15 (E23) | |
| Asus ROG Strix G15 G513RW | |
| Acer Predator Triton 14 PT14-51 | |
| Asus Zephyrus G14 GA401QEC | |
| Asus Zephyrus G14 GA401IV | |
| Blender / v2.79 BMW27 CPU | |
| Asus Zephyrus G14 GA401IV | |
| Asus ROG Zephyrus G14 GA402RK | |
| Asus ROG Strix G15 G513RW | |
| Asus Zephyrus G14 GA401QEC | |
| Alienware x14 i7 RTX 3060 | |
| Asus TUF A15 FA507 | |
| Acer Predator Triton 300 SE | |
| Average AMD Ryzen 7 7840HS (185 - 231, n=20) | |
| Lenovo Legion Slim 5 14APH8 | |
| Acer Predator Triton 14 PT14-51 | |
| Asus ROG Zephyrus G14 GA402XY | |
| Dell G15 5530 | |
| Schenker XMG Pro 15 (E23) | |
| 7-Zip 18.03 / 7z b 4 | |
| Schenker XMG Pro 15 (E23) | |
| Dell G15 5530 | |
| Asus ROG Zephyrus G14 GA402XY | |
| Acer Predator Triton 14 PT14-51 | |
| Average AMD Ryzen 7 7840HS (59538 - 73035, n=20) | |
| Lenovo Legion Slim 5 14APH8 | |
| Alienware x14 i7 RTX 3060 | |
| Acer Predator Triton 300 SE | |
| Asus TUF A15 FA507 | |
| Asus ROG Zephyrus G14 GA402RK | |
| Asus ROG Strix G15 G513RW | |
| Asus Zephyrus G14 GA401QEC | |
| Asus Zephyrus G14 GA401IV | |
| 7-Zip 18.03 / 7z b 4 -mmt1 | |
| Asus ROG Zephyrus G14 GA402XY | |
| Average AMD Ryzen 7 7840HS (6049 - 6754, n=20) | |
| Schenker XMG Pro 15 (E23) | |
| Lenovo Legion Slim 5 14APH8 | |
| Asus ROG Zephyrus G14 GA402RK | |
| Asus ROG Strix G15 G513RW | |
| Dell G15 5530 | |
| Asus Zephyrus G14 GA401QEC | |
| Asus TUF A15 FA507 | |
| Alienware x14 i7 RTX 3060 | |
| Acer Predator Triton 300 SE | |
| Acer Predator Triton 14 PT14-51 | |
| Asus Zephyrus G14 GA401IV | |
| Geekbench 5.5 / Multi-Core | |
| Schenker XMG Pro 15 (E23) | |
| Acer Predator Triton 14 PT14-51 | |
| Dell G15 5530 | |
| Alienware x14 i7 RTX 3060 | |
| Acer Predator Triton 300 SE | |
| Asus ROG Zephyrus G14 GA402XY | |
| Average AMD Ryzen 7 7840HS (8446 - 12339, n=23) | |
| Lenovo Legion Slim 5 14APH8 | |
| Asus ROG Zephyrus G14 GA402RK | |
| Asus ROG Strix G15 G513RW | |
| Asus TUF A15 FA507 | |
| Asus Zephyrus G14 GA401QEC | |
| Asus Zephyrus G14 GA401IV | |
| Geekbench 5.5 / Single-Core | |
| Asus ROG Zephyrus G14 GA402XY | |
| Lenovo Legion Slim 5 14APH8 | |
| Average AMD Ryzen 7 7840HS (1837 - 2017, n=23) | |
| Acer Predator Triton 300 SE | |
| Dell G15 5530 | |
| Schenker XMG Pro 15 (E23) | |
| Alienware x14 i7 RTX 3060 | |
| Acer Predator Triton 14 PT14-51 | |
| Asus ROG Zephyrus G14 GA402RK | |
| Asus ROG Strix G15 G513RW | |
| Asus Zephyrus G14 GA401QEC | |
| Asus TUF A15 FA507 | |
| Asus Zephyrus G14 GA401IV | |
| HWBOT x265 Benchmark v2.2 / 4k Preset | |
| Schenker XMG Pro 15 (E23) | |
| Dell G15 5530 | |
| Asus ROG Zephyrus G14 GA402XY | |
| Lenovo Legion Slim 5 14APH8 | |
| Acer Predator Triton 14 PT14-51 | |
| Average AMD Ryzen 7 7840HS (11.7 - 21.8, n=20) | |
| Acer Predator Triton 300 SE | |
| Alienware x14 i7 RTX 3060 | |
| Asus TUF A15 FA507 | |
| Asus ROG Strix G15 G513RW | |
| Asus ROG Zephyrus G14 GA402RK | |
| Asus Zephyrus G14 GA401QEC | |
| Asus Zephyrus G14 GA401IV | |
| LibreOffice / 20 Documents To PDF | |
| Asus ROG Strix G15 G513RW | |
| Asus Zephyrus G14 GA401QEC | |
| Schenker XMG Pro 15 (E23) | |
| Asus TUF A15 FA507 | |
| Average AMD Ryzen 7 7840HS (38.3 - 68.3, n=20) | |
| Asus ROG Zephyrus G14 GA402RK | |
| Acer Predator Triton 14 PT14-51 | |
| Dell G15 5530 | |
| Lenovo Legion Slim 5 14APH8 | |
| Acer Predator Triton 300 SE | |
| Alienware x14 i7 RTX 3060 | |
| Asus ROG Zephyrus G14 GA402XY | |
| R Benchmark 2.5 / Overall mean | |
| Asus Zephyrus G14 GA401QEC | |
| Asus TUF A15 FA507 | |
| Asus ROG Strix G15 G513RW | |
| Acer Predator Triton 14 PT14-51 | |
| Asus ROG Zephyrus G14 GA402RK | |
| Alienware x14 i7 RTX 3060 | |
| Schenker XMG Pro 15 (E23) | |
| Lenovo Legion Slim 5 14APH8 | |
| Average AMD Ryzen 7 7840HS (0.4184 - 0.4739, n=20) | |
| Acer Predator Triton 300 SE | |
| Dell G15 5530 | |
| Asus ROG Zephyrus G14 GA402XY | |
Cinebench R23: Multi Core | Single Core
Cinebench R20: CPU (Multi Core) | CPU (Single Core)
Cinebench R15: CPU Multi 64Bit | CPU Single 64Bit
Blender: v2.79 BMW27 CPU
7-Zip 18.03: 7z b 4 | 7z b 4 -mmt1
Geekbench 5.5: Multi-Core | Single-Core
HWBOT x265 Benchmark v2.2: 4k Preset
LibreOffice : 20 Documents To PDF
R Benchmark 2.5: Overall mean
* ... smaller is better
AIDA64: FP32 Ray-Trace | FPU Julia | CPU SHA3 | CPU Queen | FPU SinJulia | FPU Mandel | CPU AES | CPU ZLib | FP64 Ray-Trace | CPU PhotoWorxx
| Performance rating | |
| Razer Blade 14 RTX 4070 | |
| Lenovo Legion Slim 5 14APH8 | |
| Average AMD Ryzen 7 7840HS | |
| Lenovo LOQ 15APH8 | |
| Acer Predator Triton 14 PT14-51 | |
| Alienware x14 i7 RTX 3060 | |
| AIDA64 / FP32 Ray-Trace | |
| Razer Blade 14 RTX 4070 | |
| Lenovo Legion Slim 5 14APH8 | |
| Lenovo LOQ 15APH8 | |
| Average AMD Ryzen 7 7840HS (22845 - 28921, n=21) | |
| Acer Predator Triton 14 PT14-51 | |
| Alienware x14 i7 RTX 3060 | |
| AIDA64 / FPU Julia | |
| Lenovo LOQ 15APH8 | |
| Razer Blade 14 RTX 4070 | |
| Lenovo Legion Slim 5 14APH8 | |
| Average AMD Ryzen 7 7840HS (97164 - 123167, n=21) | |
| Acer Predator Triton 14 PT14-51 | |
| Alienware x14 i7 RTX 3060 | |
| AIDA64 / CPU SHA3 | |
| Razer Blade 14 RTX 4070 | |
| Lenovo Legion Slim 5 14APH8 | |
| Lenovo LOQ 15APH8 | |
| Average AMD Ryzen 7 7840HS (4293 - 5155, n=21) | |
| Acer Predator Triton 14 PT14-51 | |
| Alienware x14 i7 RTX 3060 | |
| AIDA64 / CPU Queen | |
| Razer Blade 14 RTX 4070 | |
| Lenovo Legion Slim 5 14APH8 | |
| Lenovo LOQ 15APH8 | |
| Average AMD Ryzen 7 7840HS (102271 - 125820, n=21) | |
| Alienware x14 i7 RTX 3060 | |
| Acer Predator Triton 14 PT14-51 | |
| AIDA64 / FPU SinJulia | |
| Razer Blade 14 RTX 4070 | |
| Lenovo Legion Slim 5 14APH8 | |
| Lenovo LOQ 15APH8 | |
| Average AMD Ryzen 7 7840HS (13767 - 15525, n=21) | |
| Acer Predator Triton 14 PT14-51 | |
| Alienware x14 i7 RTX 3060 | |
| AIDA64 / FPU Mandel | |
| Razer Blade 14 RTX 4070 | |
| Lenovo LOQ 15APH8 | |
| Lenovo Legion Slim 5 14APH8 | |
| Average AMD Ryzen 7 7840HS (52084 - 65812, n=21) | |
| Acer Predator Triton 14 PT14-51 | |
| Alienware x14 i7 RTX 3060 | |
| AIDA64 / CPU AES | |
| Acer Predator Triton 14 PT14-51 | |
| Average AMD Ryzen 7 7840HS (67389 - 177158, n=21) | |
| Alienware x14 i7 RTX 3060 | |
| Razer Blade 14 RTX 4070 | |
| Lenovo Legion Slim 5 14APH8 | |
| Lenovo LOQ 15APH8 | |
| AIDA64 / CPU ZLib | |
| Acer Predator Triton 14 PT14-51 | |
| Razer Blade 14 RTX 4070 | |
| Lenovo LOQ 15APH8 | |
| Lenovo Legion Slim 5 14APH8 | |
| Average AMD Ryzen 7 7840HS (944 - 1123, n=21) | |
| Alienware x14 i7 RTX 3060 | |
| AIDA64 / FP64 Ray-Trace | |
| Razer Blade 14 RTX 4070 | |
| Lenovo LOQ 15APH8 | |
| Lenovo Legion Slim 5 14APH8 | |
| Average AMD Ryzen 7 7840HS (12248 - 15599, n=21) | |
| Acer Predator Triton 14 PT14-51 | |
| Alienware x14 i7 RTX 3060 | |
| AIDA64 / CPU PhotoWorxx | |
| Acer Predator Triton 14 PT14-51 | |
| Alienware x14 i7 RTX 3060 | |
| Average AMD Ryzen 7 7840HS (17615 - 41516, n=21) | |
| Lenovo Legion Slim 5 14APH8 | |
| Razer Blade 14 RTX 4070 | |
| Lenovo LOQ 15APH8 | |
System Performance
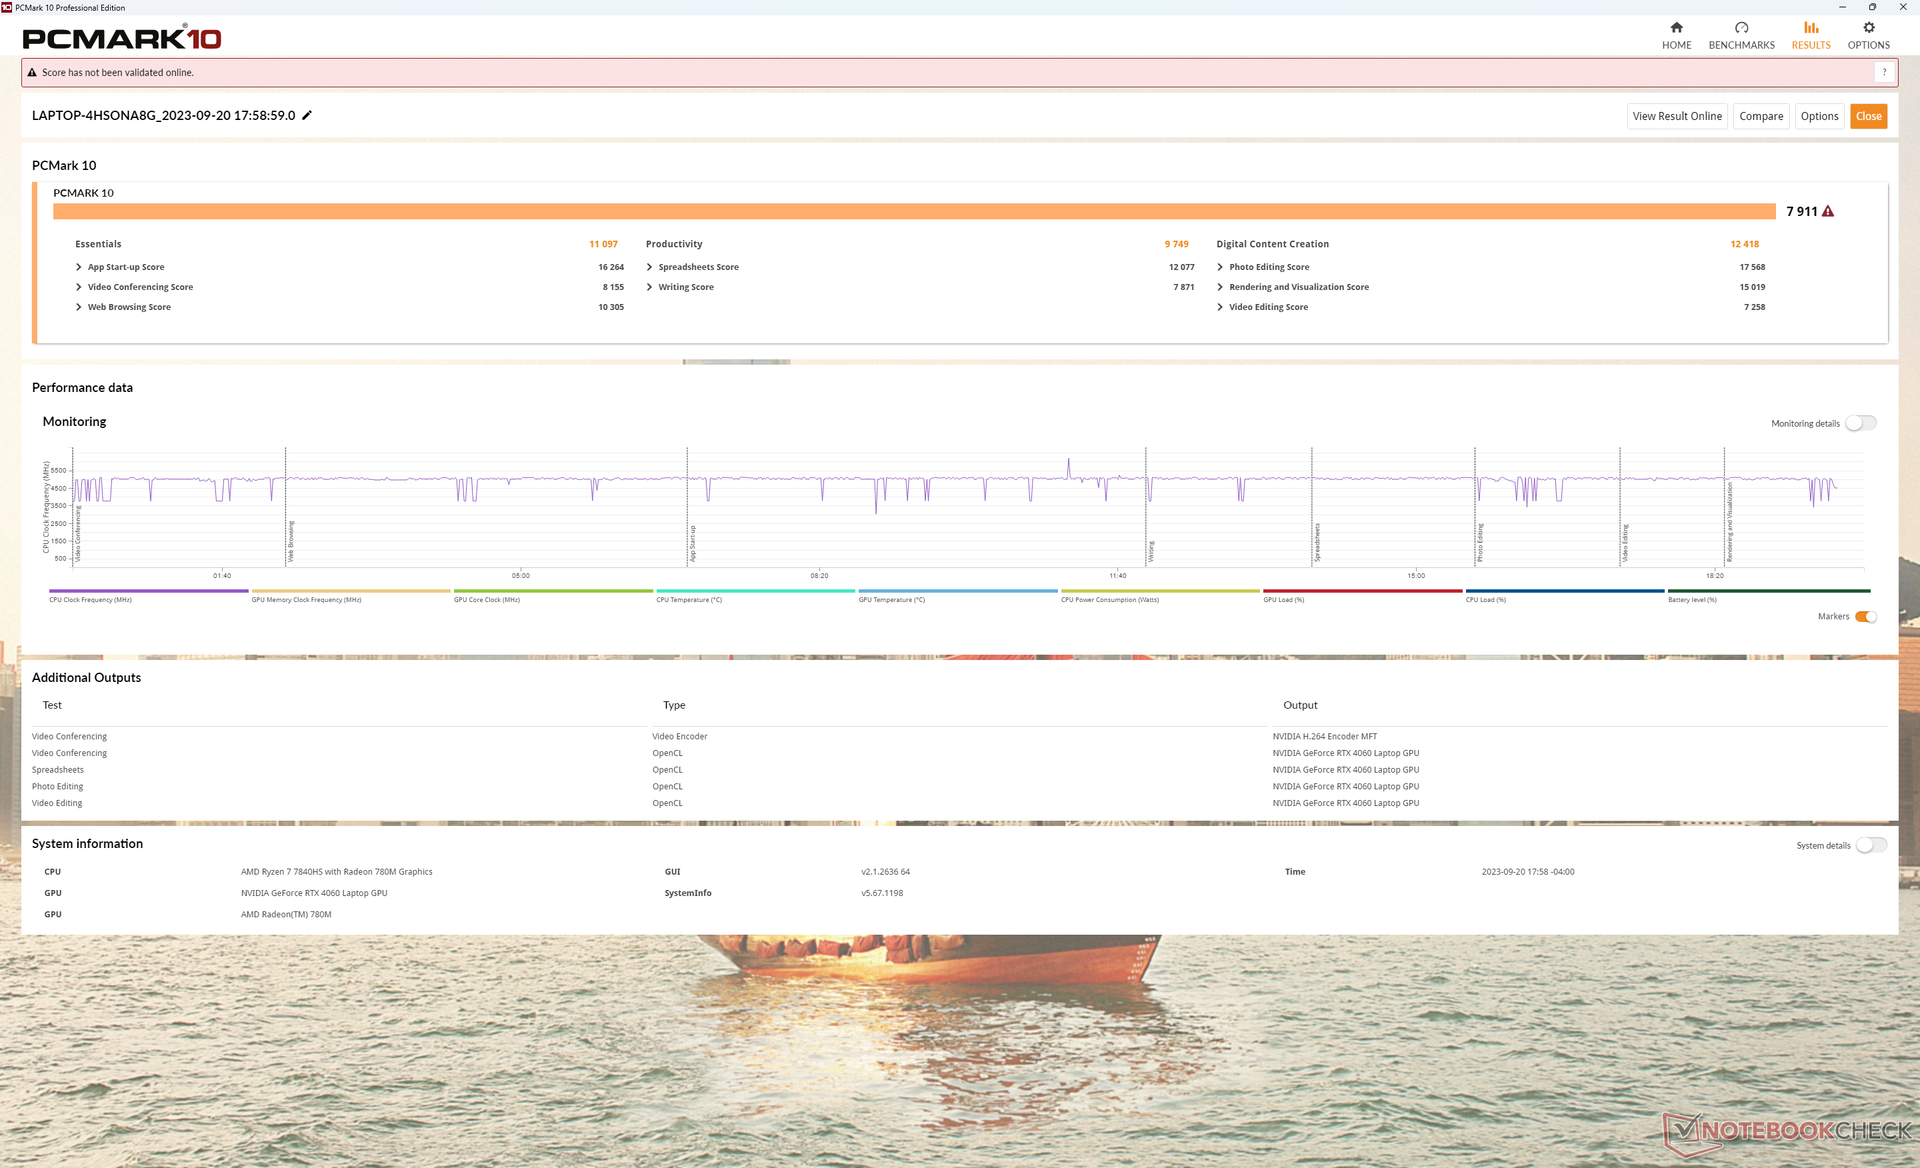
PCMark scores are comparable to other competing 14-inch gaming laptops by mere single-digit percentage points. We experienced no notable issues during our time with the test unit unlike on the recent Legion Slim 5 16 or Alienware m16 R1.
CrossMark: Overall | Productivity | Creativity | Responsiveness
| PCMark 10 / Score | |
| Asus ROG Zephyrus G14 GA402XY | |
| Razer Blade 14 RTX 4070 | |
| Lenovo Legion Slim 5 14APH8 | |
| Average AMD Ryzen 7 7840HS, NVIDIA GeForce RTX 4060 Laptop GPU (7502 - 7946, n=4) | |
| Lenovo LOQ 15APH8 | |
| Acer Predator Triton 14 PT14-51 | |
| Alienware x14 i7 RTX 3060 | |
| PCMark 10 / Essentials | |
| Lenovo Legion Slim 5 14APH8 | |
| Razer Blade 14 RTX 4070 | |
| Average AMD Ryzen 7 7840HS, NVIDIA GeForce RTX 4060 Laptop GPU (10441 - 11169, n=4) | |
| Asus ROG Zephyrus G14 GA402XY | |
| Lenovo LOQ 15APH8 | |
| Acer Predator Triton 14 PT14-51 | |
| Alienware x14 i7 RTX 3060 | |
| PCMark 10 / Productivity | |
| Razer Blade 14 RTX 4070 | |
| Asus ROG Zephyrus G14 GA402XY | |
| Lenovo LOQ 15APH8 | |
| Average AMD Ryzen 7 7840HS, NVIDIA GeForce RTX 4060 Laptop GPU (9575 - 10273, n=4) | |
| Acer Predator Triton 14 PT14-51 | |
| Lenovo Legion Slim 5 14APH8 | |
| Alienware x14 i7 RTX 3060 | |
| PCMark 10 / Digital Content Creation | |
| Asus ROG Zephyrus G14 GA402XY | |
| Razer Blade 14 RTX 4070 | |
| Lenovo Legion Slim 5 14APH8 | |
| Average AMD Ryzen 7 7840HS, NVIDIA GeForce RTX 4060 Laptop GPU (11464 - 12418, n=4) | |
| Lenovo LOQ 15APH8 | |
| Acer Predator Triton 14 PT14-51 | |
| Alienware x14 i7 RTX 3060 | |
| CrossMark / Overall | |
| Alienware x14 i7 RTX 3060 | |
| Lenovo Legion Slim 5 14APH8 | |
| Acer Predator Triton 14 PT14-51 | |
| Asus ROG Zephyrus G14 GA402XY | |
| Average AMD Ryzen 7 7840HS, NVIDIA GeForce RTX 4060 Laptop GPU (1800 - 1866, n=3) | |
| Razer Blade 14 RTX 4070 | |
| Lenovo LOQ 15APH8 | |
| CrossMark / Productivity | |
| Lenovo Legion Slim 5 14APH8 | |
| Alienware x14 i7 RTX 3060 | |
| Average AMD Ryzen 7 7840HS, NVIDIA GeForce RTX 4060 Laptop GPU (1743 - 1821, n=3) | |
| Razer Blade 14 RTX 4070 | |
| Asus ROG Zephyrus G14 GA402XY | |
| Acer Predator Triton 14 PT14-51 | |
| Lenovo LOQ 15APH8 | |
| CrossMark / Creativity | |
| Asus ROG Zephyrus G14 GA402XY | |
| Alienware x14 i7 RTX 3060 | |
| Acer Predator Triton 14 PT14-51 | |
| Razer Blade 14 RTX 4070 | |
| Lenovo Legion Slim 5 14APH8 | |
| Average AMD Ryzen 7 7840HS, NVIDIA GeForce RTX 4060 Laptop GPU (1908 - 1966, n=3) | |
| Lenovo LOQ 15APH8 | |
| CrossMark / Responsiveness | |
| Alienware x14 i7 RTX 3060 | |
| Lenovo Legion Slim 5 14APH8 | |
| Acer Predator Triton 14 PT14-51 | |
| Average AMD Ryzen 7 7840HS, NVIDIA GeForce RTX 4060 Laptop GPU (1522 - 1776, n=3) | |
| Razer Blade 14 RTX 4070 | |
| Asus ROG Zephyrus G14 GA402XY | |
| Lenovo LOQ 15APH8 | |
| PCMark 10 Score | 7911 points | |
Help | ||
| AIDA64 / Memory Copy | |
| Alienware x14 i7 RTX 3060 | |
| Acer Predator Triton 14 PT14-51 | |
| Lenovo Legion Slim 5 14APH8 | |
| Average AMD Ryzen 7 7840HS (30937 - 72158, n=21) | |
| Razer Blade 14 RTX 4070 | |
| Lenovo LOQ 15APH8 | |
| AIDA64 / Memory Read | |
| Alienware x14 i7 RTX 3060 | |
| Acer Predator Triton 14 PT14-51 | |
| Razer Blade 14 RTX 4070 | |
| Average AMD Ryzen 7 7840HS (30497 - 62147, n=21) | |
| Lenovo Legion Slim 5 14APH8 | |
| Lenovo LOQ 15APH8 | |
| AIDA64 / Memory Write | |
| Lenovo Legion Slim 5 14APH8 | |
| Acer Predator Triton 14 PT14-51 | |
| Average AMD Ryzen 7 7840HS (34590 - 93323, n=21) | |
| Razer Blade 14 RTX 4070 | |
| Alienware x14 i7 RTX 3060 | |
| Lenovo LOQ 15APH8 | |
| AIDA64 / Memory Latency | |
| Lenovo Legion Slim 5 14APH8 | |
| Alienware x14 i7 RTX 3060 | |
| Acer Predator Triton 14 PT14-51 | |
| Lenovo LOQ 15APH8 | |
| Average AMD Ryzen 7 7840HS (85.1 - 112, n=21) | |
| Razer Blade 14 RTX 4070 | |
* ... smaller is better
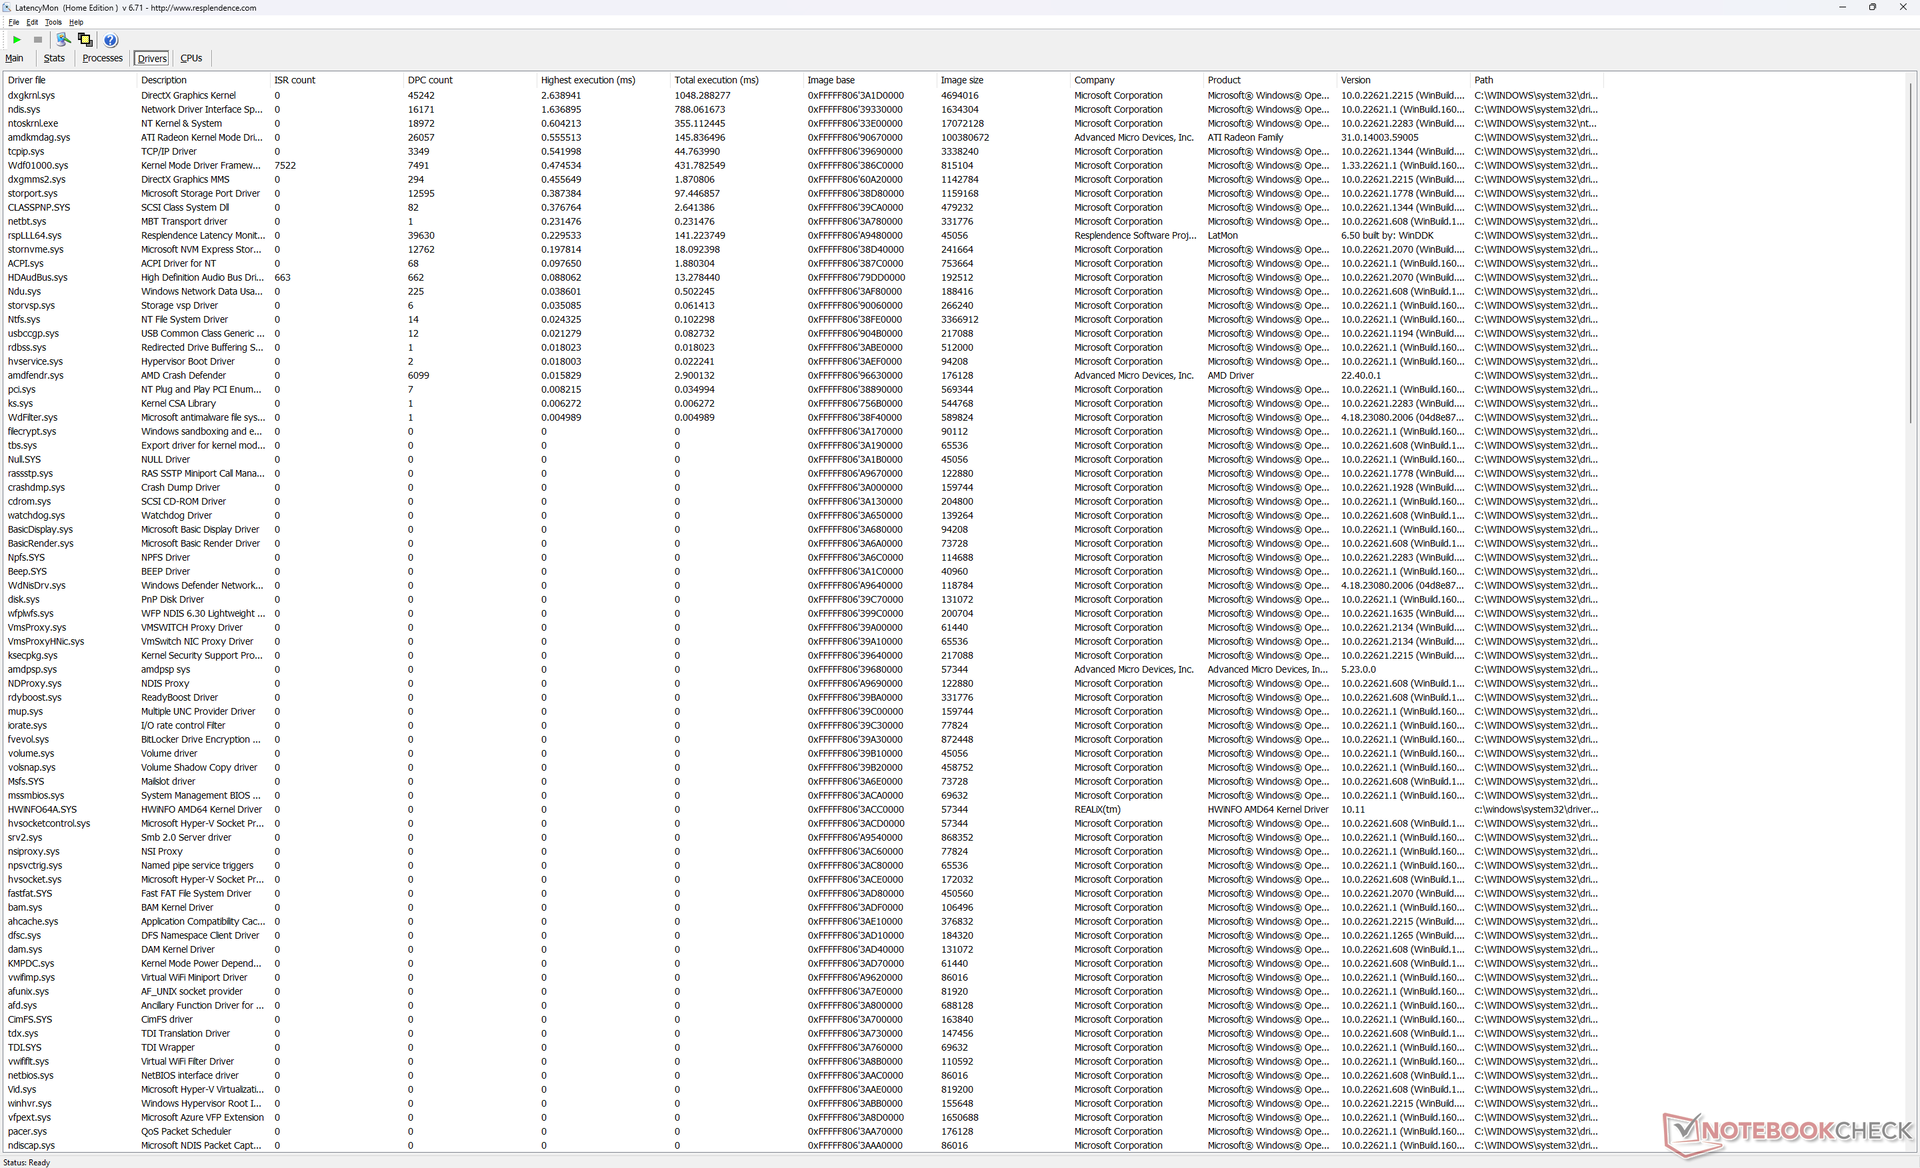
DPC Latency
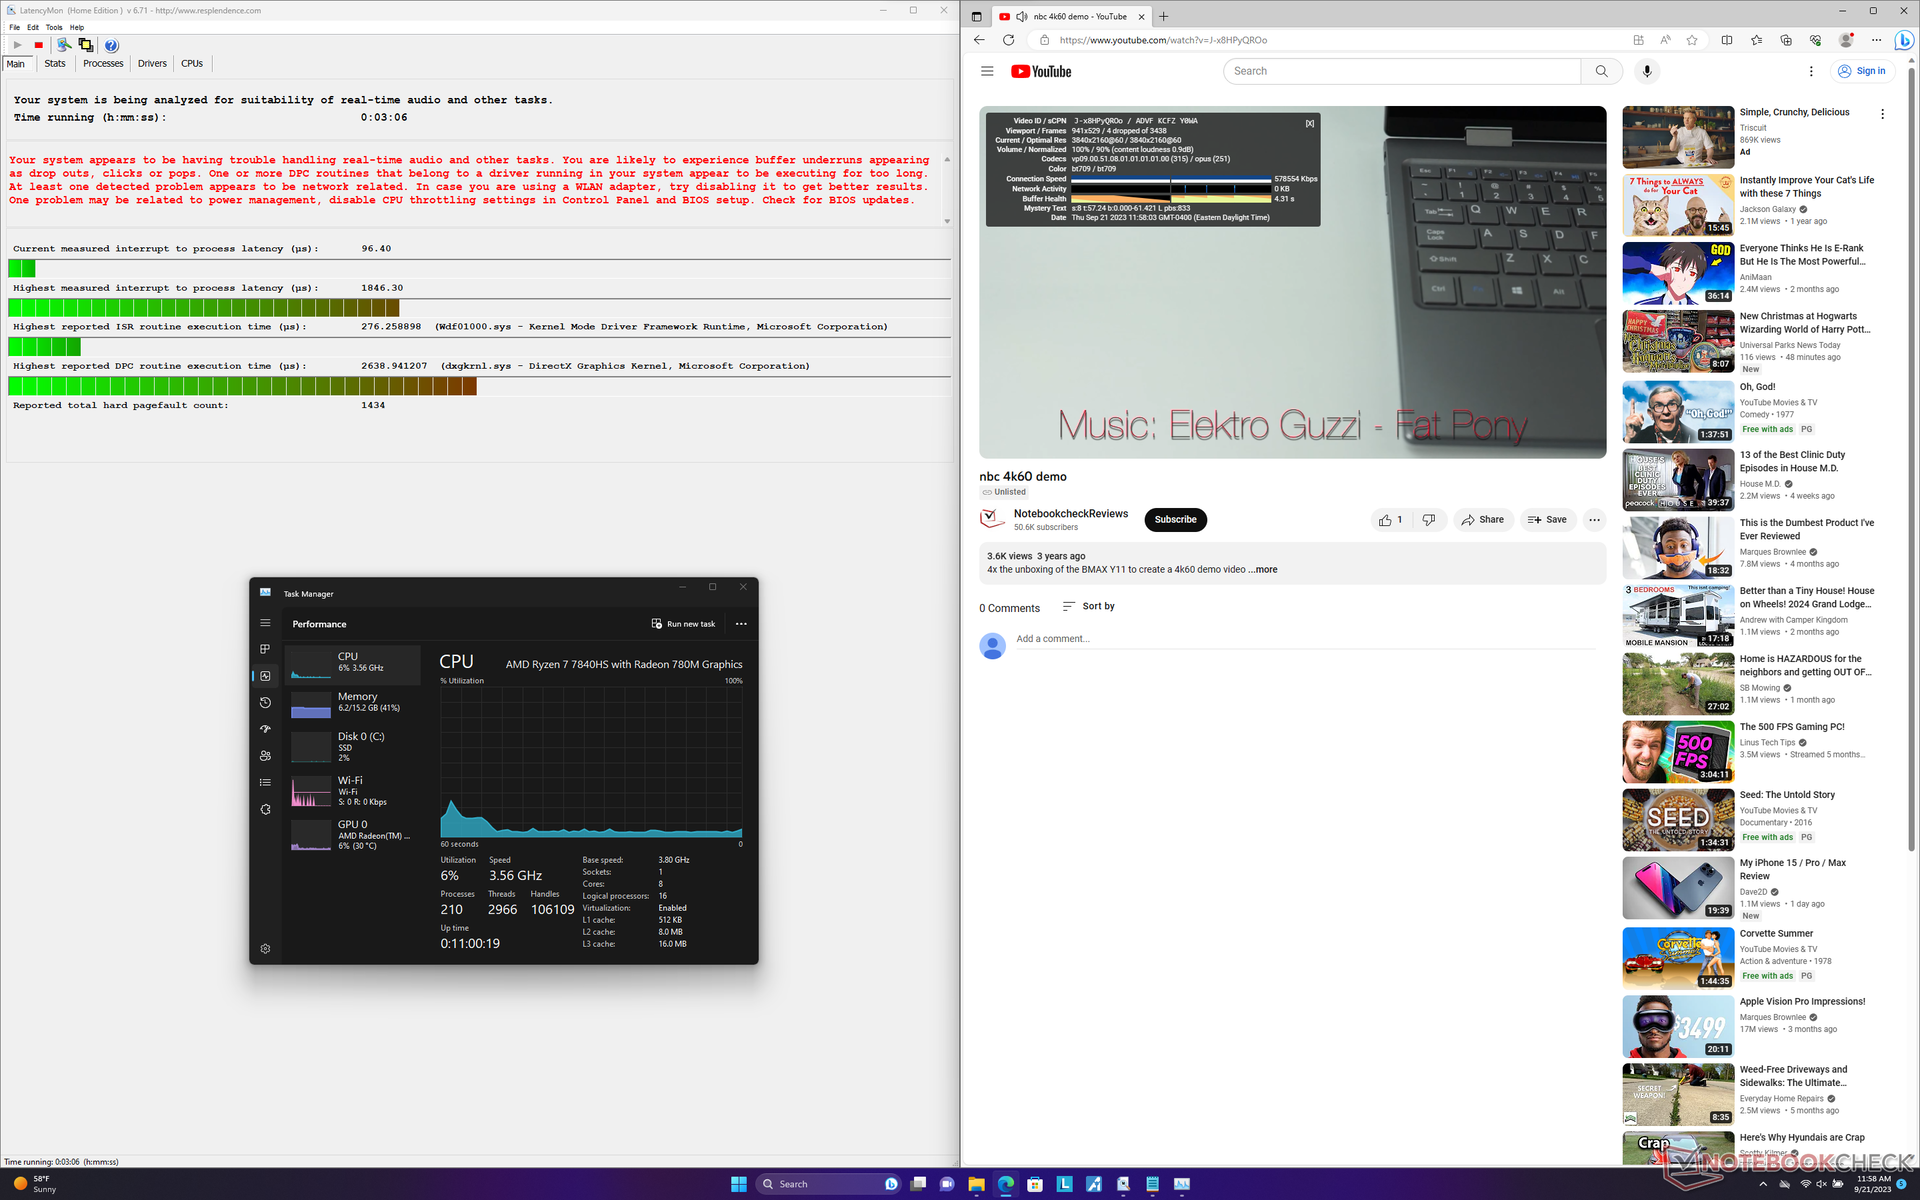
LatencyMon shows DPC issues when opening multiple browser tabs of our homepage. 4K video playback at 60 FPS is also imperfect with 4 dropped frames recorded within a one-minute timespan.
| DPC Latencies / LatencyMon - interrupt to process latency (max), Web, Youtube, Prime95 | |
| Lenovo Legion Slim 5 14APH8 | |
| Acer Predator Triton 14 PT14-51 | |
| Lenovo LOQ 15APH8 | |
| Alienware x14 i7 RTX 3060 | |
| Asus ROG Zephyrus G14 GA402XY | |
| Razer Blade 14 RTX 4070 | |
* ... smaller is better
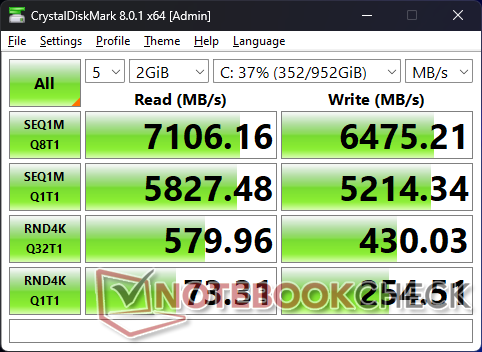
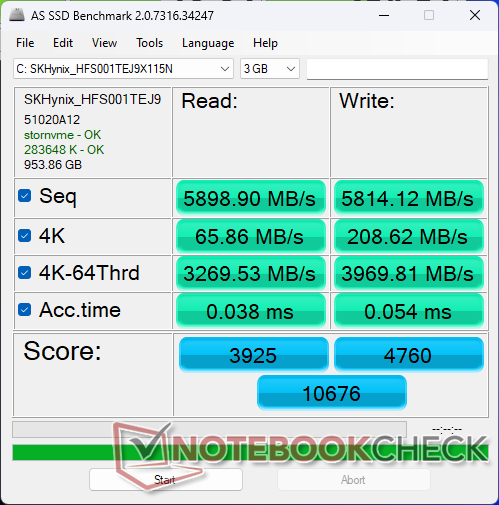
Storage Devices
Our unit ships with a 1 TB SK hynix HFS001TEJ9X115N SSD which is a high-end PCIe4 x4 drive. The drive would have no issues maintaining very fast transfer rates of almost 7100 MB/s when under stress to demonstrate no throttling issues despite the smaller Legion Slim form factor.

| Drive Performance rating - Percent | |
| Lenovo Legion Slim 5 14APH8 | |
| Razer Blade 14 RTX 4070 | |
| Alienware x14 i7 RTX 3060 | |
| Asus ROG Zephyrus G14 GA402XY | |
| Acer Predator Triton 14 PT14-51 | |
| Lenovo LOQ 15APH8 | |
* ... smaller is better
Disk Throttling: DiskSpd Read Loop, Queue Depth 8
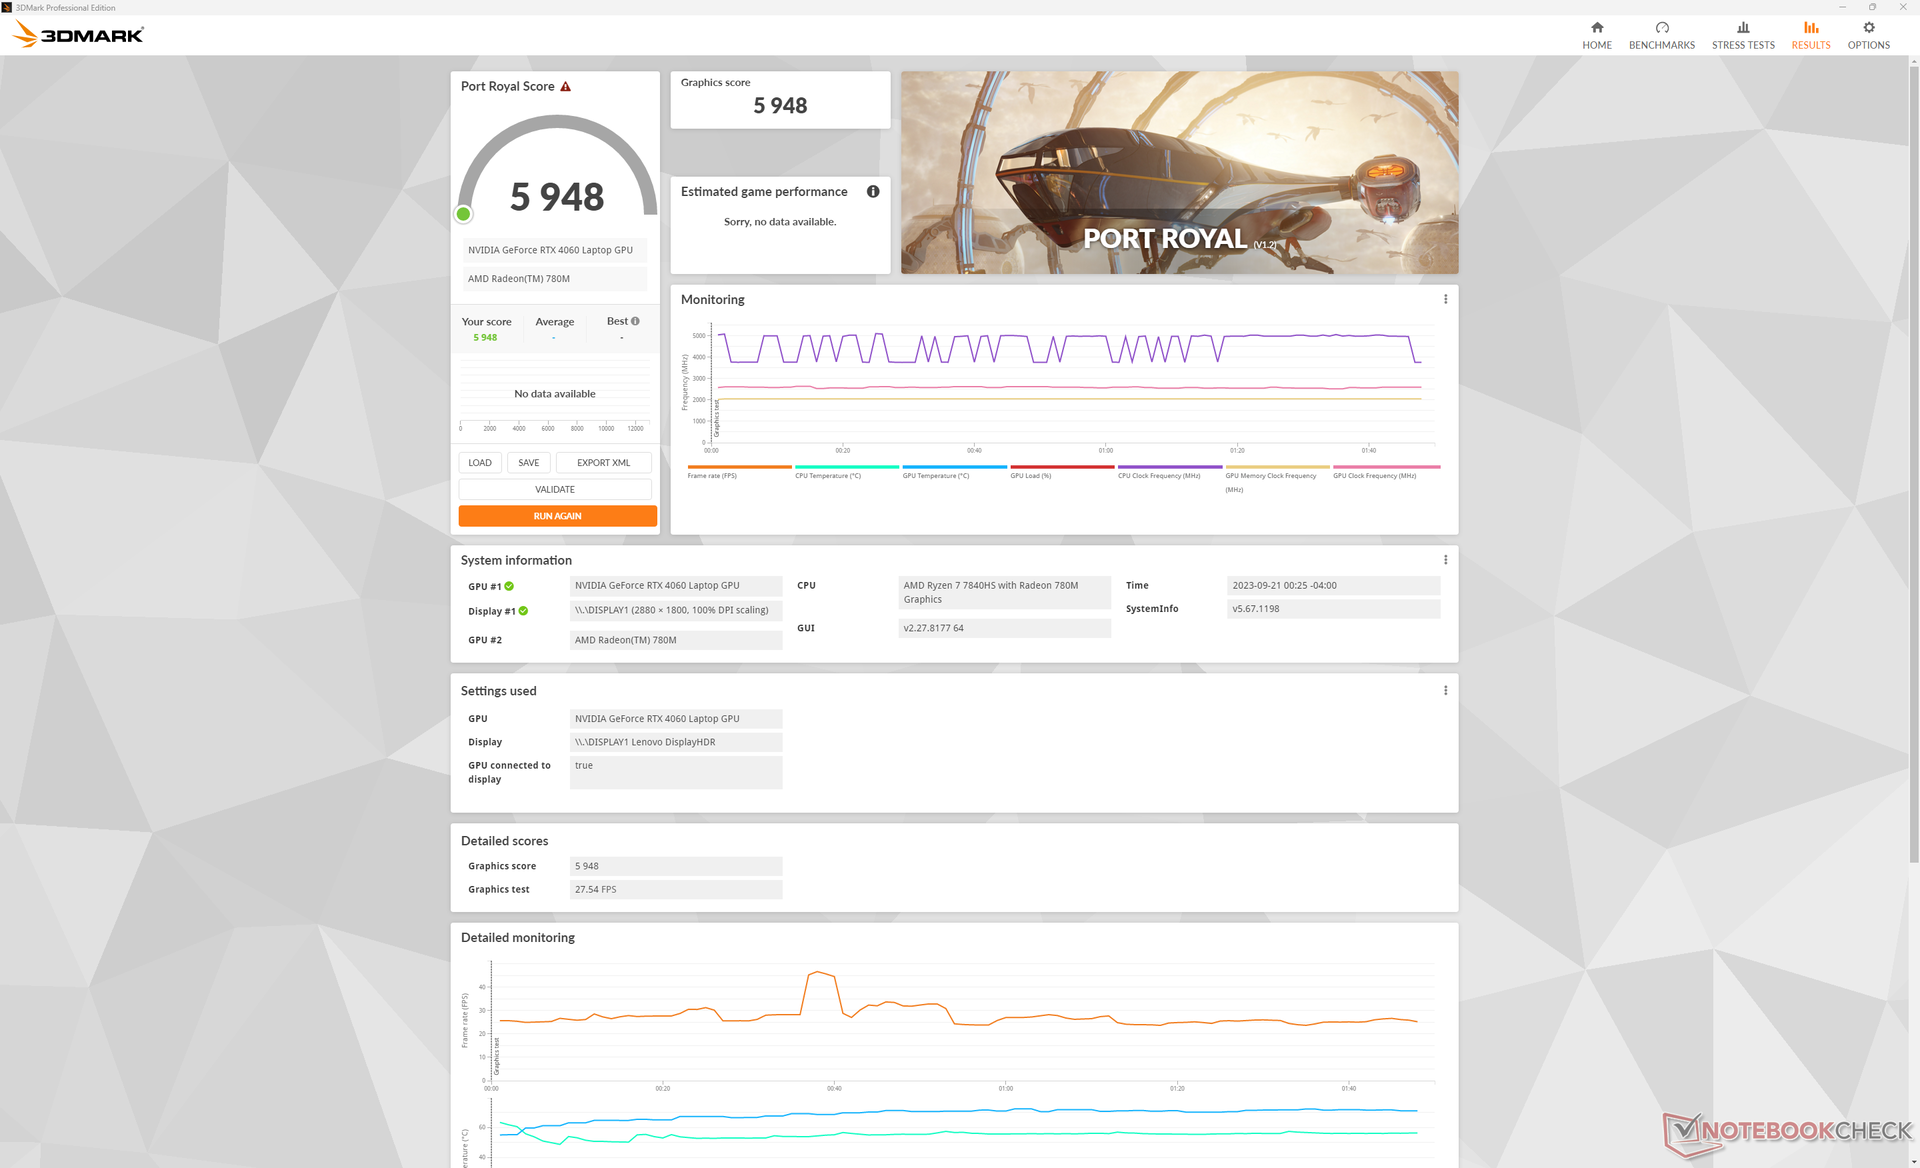
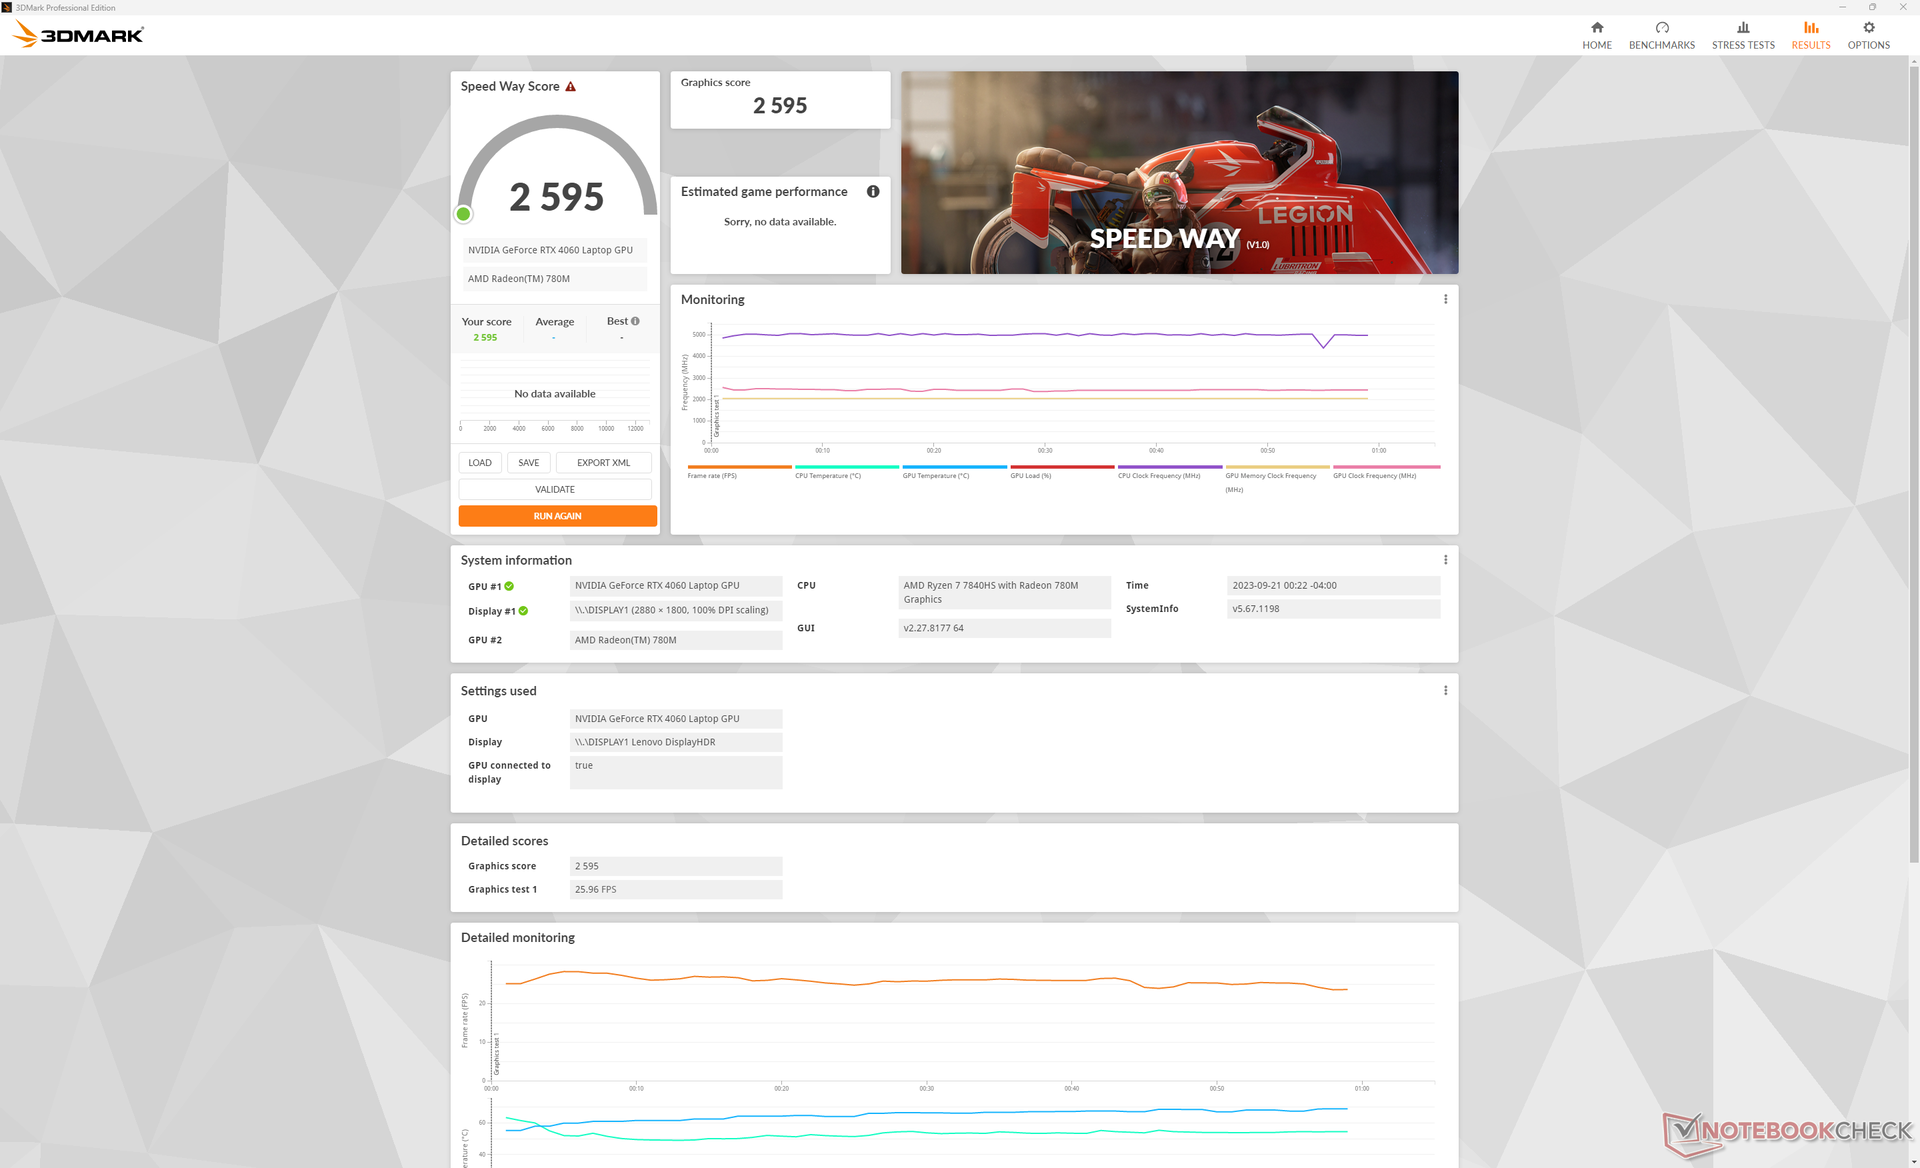
GPU Performance — 105 W GeForce RTX 4060
Graphics performance is excellent with results that are in line with other laptops equipped with the same RTX 4060 GPU to suggest no major throttling issues. The RTX 4070 in the Blade 14 runs 15 percent faster, but such an option is not available for the current Legion Slim 5 14 model.
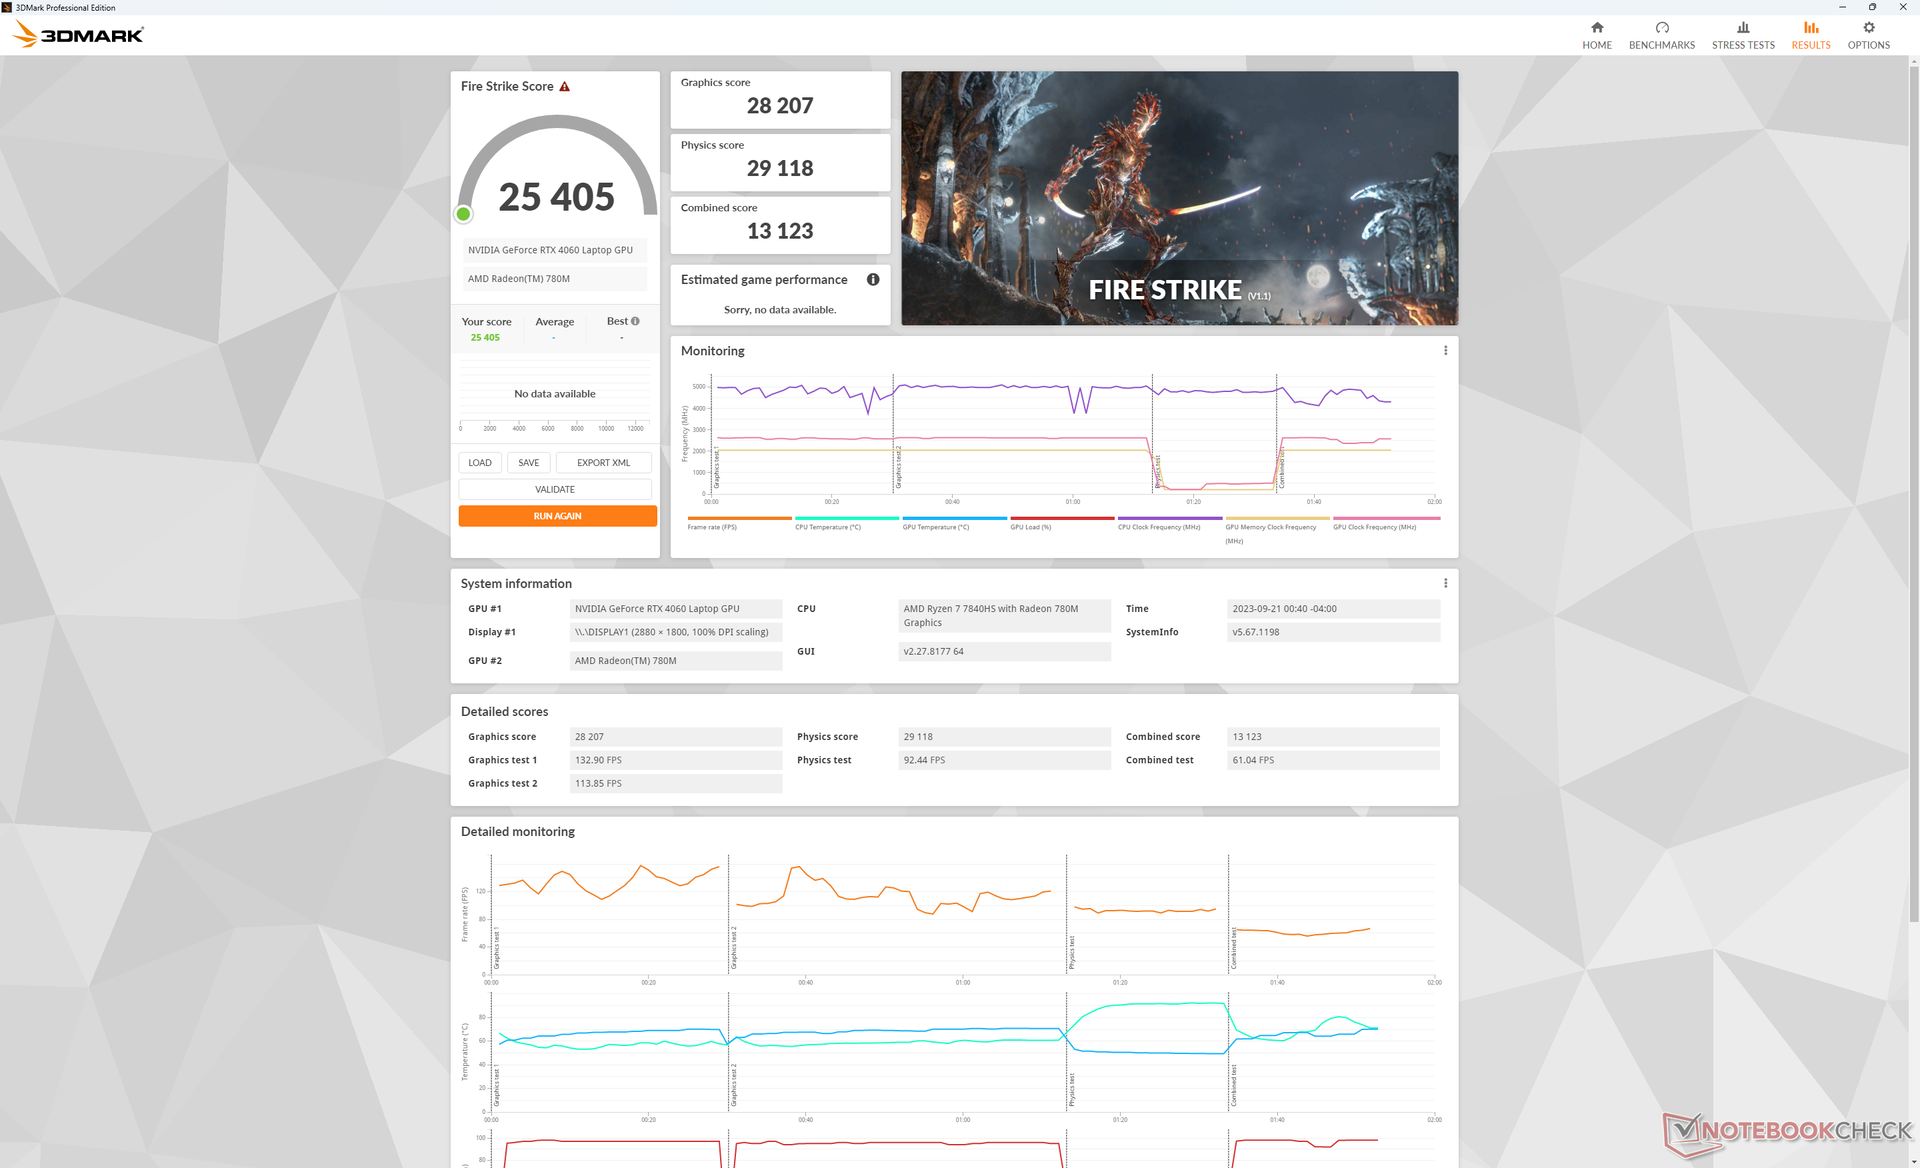
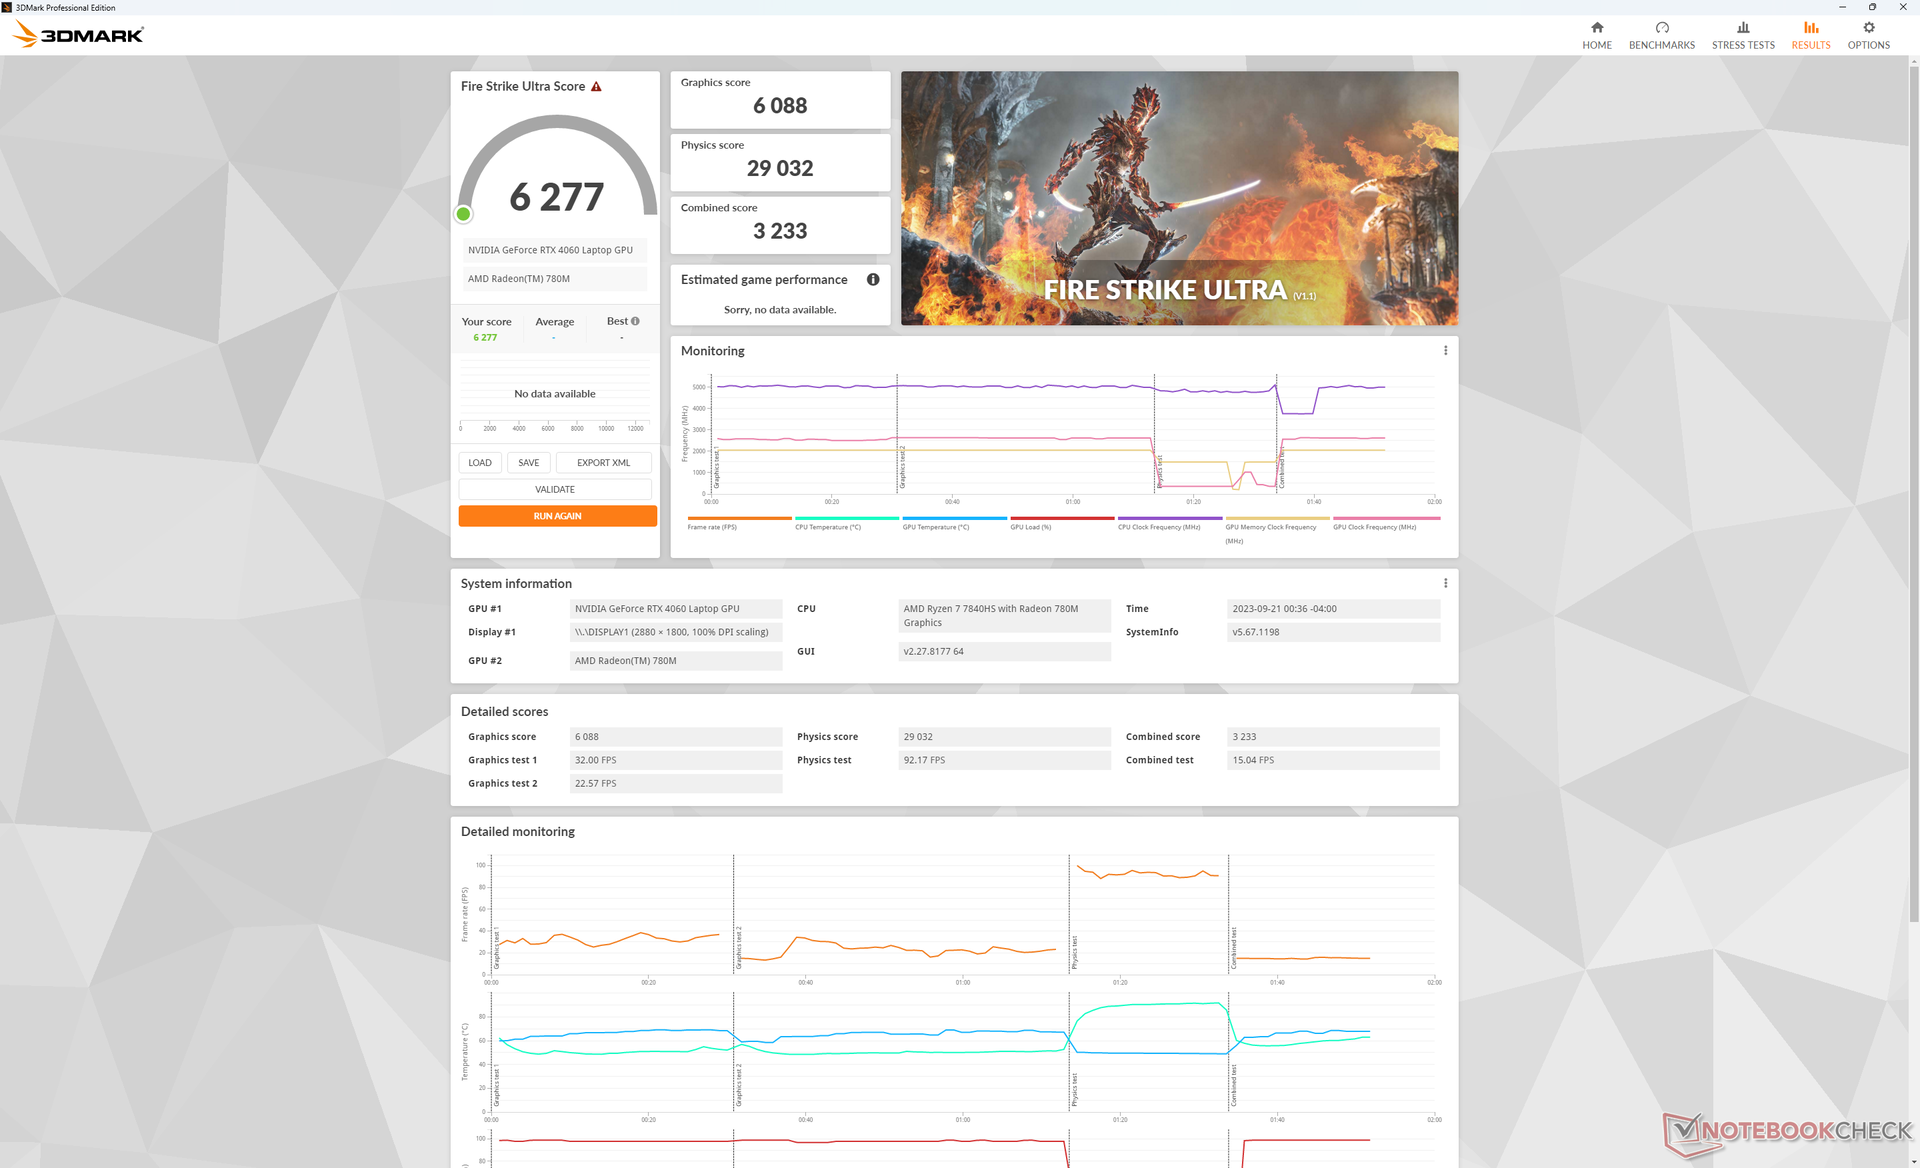
Downgrading to the RTX 4050 configuration will impact performance by about 20 to 25 percent based on our time with the Acer Predator Triton 14. Running on Balanced mode instead of Performance mode would also impact graphics performance by up to 15 percent as shown by our Fire Strike results table below. However, Balanced mode runs a little quieter to compensate for the reduced performance.
| Power Profile | Graphics Score | Physics Score | Combined Score |
| Performance Mode | 28207 | 29118 | 13123 |
| Balanced Mode (w/ Turbo off) | 24505 (-13%) | 28015 (-4%) | 11701 (-11%) |
| Battery Power | 22396 (-21%) | 26867 (-8%) | 10136 (-23%) |
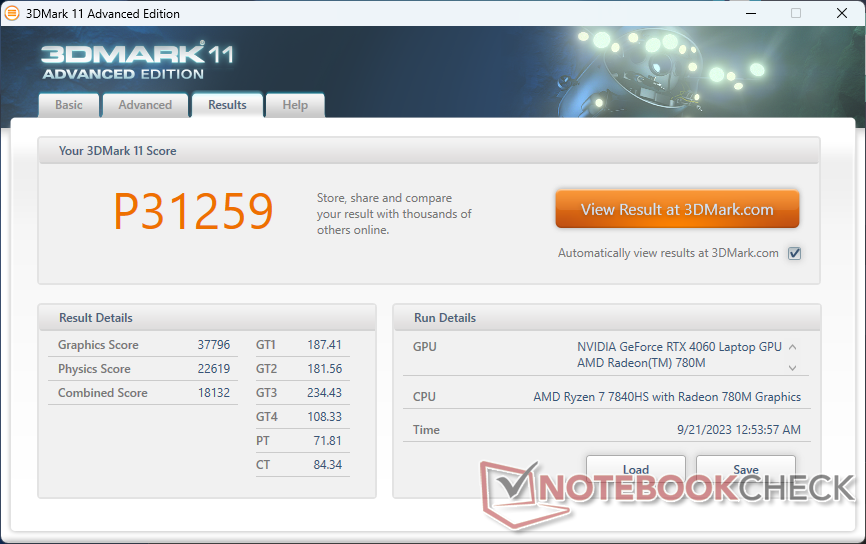
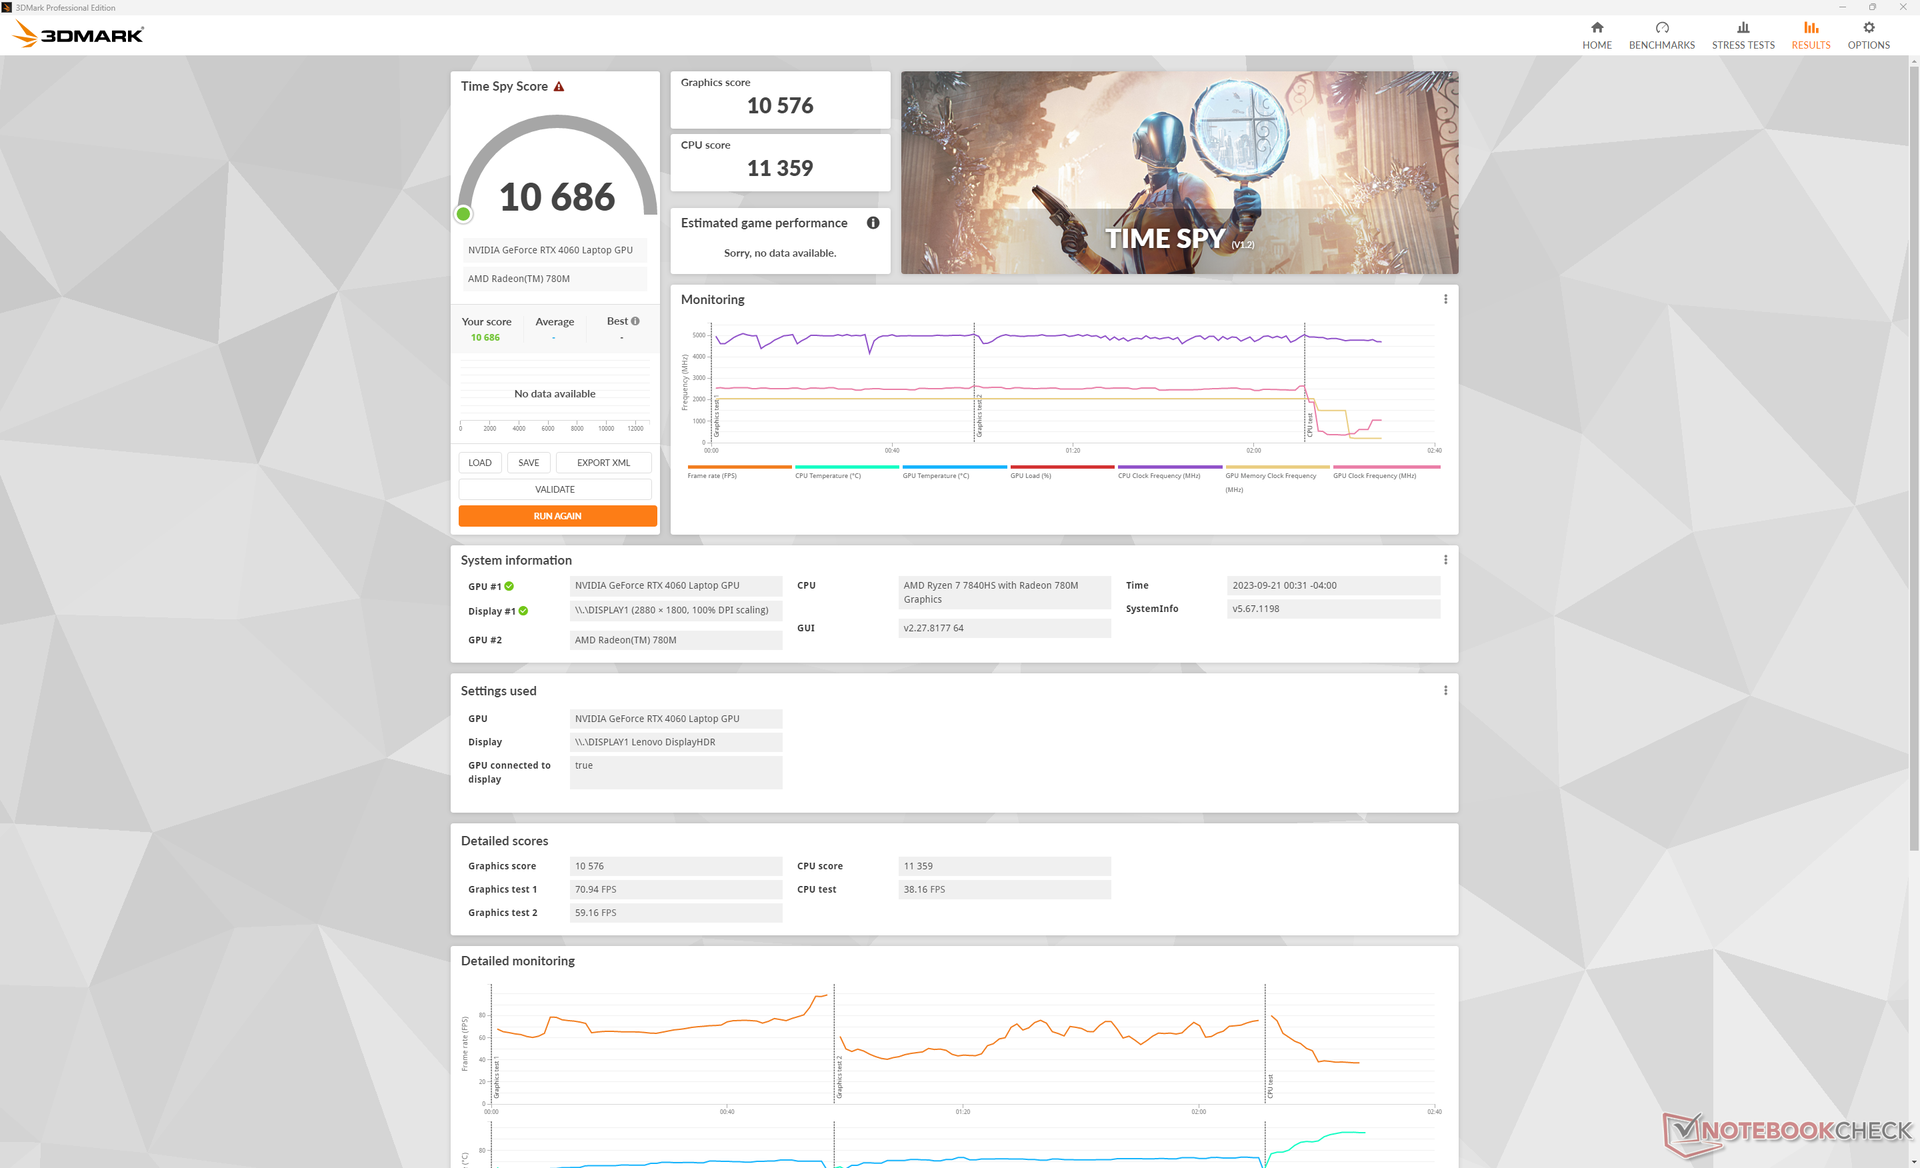
| 3DMark 11 Performance | 31259 points | |
| 3DMark Fire Strike Score | 24304 points | |
| 3DMark Time Spy Score | 10514 points | |
Help | ||
* ... smaller is better
Gaming Performance
All tested games run well on the Legion Slim 5 14 even when set to the native 2.8K resolution. However, we recommend tuning the settings to Medium if playing demanding titles like Star Wars Jedi Survivor or Returnal to keep frame rates at or above 60 FPS especially since the main display lacks G-Sync.
| Far Cry 6 | |
| 1920x1080 High Graphics Quality AA:T | |
| Average NVIDIA GeForce RTX 4060 Laptop GPU (101 - 120, n=2) | |
| Asus ROG Zephyrus G14 GA402RK | |
| Asus ROG Zephyrus G14 GA402XY | |
| Inno3D GeForce RTX 3060 Twin X2 | |
| Lenovo Legion Slim 5 14APH8 | |
| 1920x1080 Ultra Graphics Quality + HD Textures AA:T | |
| Razer Blade 14 RTX 4070 | |
| Average NVIDIA GeForce RTX 4060 Laptop GPU (76 - 117, n=5) | |
| Asus ROG Zephyrus G14 GA402RK | |
| Asus ROG Zephyrus G14 GA402XY | |
| Lenovo Legion Slim 5 14APH8 | |
| Inno3D GeForce RTX 3060 Twin X2 | |
| 2560x1440 Ultra Graphics Quality + HD Textures AA:T | |
| Asus ROG Zephyrus G14 GA402XY | |
| Razer Blade 14 RTX 4070 | |
| Lenovo Legion Slim 5 14APH8 | |
| Asus ROG Zephyrus G14 GA402RK | |
| Inno3D GeForce RTX 3060 Twin X2 | |
| Average NVIDIA GeForce RTX 4060 Laptop GPU (32.6 - 83, n=5) | |
| Call of Duty Modern Warfare 2 2022 | |
| 1920x1080 Ultra Quality Preset AA:T2X Filmic SM | |
| Asus ROG Zephyrus G14 GA402XY | |
| Lenovo Legion Slim 5 14APH8 | |
| Average NVIDIA GeForce RTX 4060 Laptop GPU (70 - 104, n=4) | |
| 1920x1080 Extreme Quality Preset AA:T2X Filmic SM | |
| Asus ROG Zephyrus G14 GA402XY | |
| Razer Blade 14 RTX 4070 | |
| Lenovo Legion Slim 5 14APH8 | |
| Average NVIDIA GeForce RTX 4060 Laptop GPU (68 - 94, n=9) | |
| 2560x1440 Extreme Quality Preset AA:T2X Filmic SM | |
| Asus ROG Zephyrus G14 GA402XY | |
| Razer Blade 14 RTX 4070 | |
| Lenovo Legion Slim 5 14APH8 | |
| Average NVIDIA GeForce RTX 4060 Laptop GPU (49 - 66, n=7) | |
Witcher 3 FPS Chart
| low | med. | high | ultra | QHD | |
|---|---|---|---|---|---|
| GTA V (2015) | 178.9 | 171.6 | 162.3 | 102.1 | 86.6 |
| The Witcher 3 (2015) | 355 | 313.5 | 209.8 | 101.4 | |
| Dota 2 Reborn (2015) | 146 | 141.9 | 137.2 | 131.8 | |
| Final Fantasy XV Benchmark (2018) | 199.9 | 145.9 | 104.3 | 76.3 | |
| X-Plane 11.11 (2018) | 124.4 | 107.8 | 84.9 | ||
| Strange Brigade (2018) | 353 | 282 | 230 | 197.9 | 131.7 |
| Shadow of the Tomb Raider (2018) | 144 | 132 | 93 | ||
| Assassin´s Creed Valhalla (2020) | 117 | 99 | 72 | ||
| Far Cry 6 (2021) | 101 | 94 | 79 | ||
| Cyberpunk 2077 1.6 (2022) | 83.68 | 78.08 | 48.54 | ||
| Tiny Tina's Wonderlands (2022) | 114.65 | 88.15 | 59.69 | ||
| F1 22 (2022) | 218 | 217 | 193.1 | 65.8 | 42.4 |
| Call of Duty Modern Warfare 2 2022 (2022) | 104 | 94 | 65 | ||
| Returnal (2023) | 73 | 67 | 45 | ||
| Star Wars Jedi Survivor (2023) | 67.6 | 65 | 39.9 |
Emissions — Loud Little Gamer
System Noise
The internal fans are prone to pulsing even when set to Balanced mode. Fan noise would range between 23 and 31 dB(A) from simply web browsing or video streaming. It's therefore recommended to run the system on Quiet mode if lower fan noise is desired.
Gaming on Balanced mode instead of Performance mode would reduce fan noise slightly from 52.8 dB(A) to 49.3 dB(A). In either case, the Legion Slim 5 14 is still a very loud gaming machine similar to the Blade 14, Zephyrus G14, or Alienware x14.
Noise level
| Idle |
| 22.8 / 27.3 / 30.7 dB(A) |
| Load |
| 41.6 / 52.6 dB(A) |
 | ||
30 dB silent 40 dB(A) audible 50 dB(A) loud |
||
min: | ||
| Lenovo Legion Slim 5 14APH8 GeForce RTX 4060 Laptop GPU, R7 7840HS, SK Hynix HFS001TEJ9X115N | Acer Predator Triton 14 PT14-51 GeForce RTX 4050 Laptop GPU, i7-13700H, Micron 3400 MTFDKBA512TFH 512GB | Razer Blade 14 RTX 4070 GeForce RTX 4070 Laptop GPU, R9 7940HS, Samsung PM9A1 MZVL21T0HCLR | Asus ROG Zephyrus G14 GA402XY GeForce RTX 4090 Laptop GPU, R9 7940HS, Samsung PM9A1 MZVL21T0HCLR | Alienware x14 i7 RTX 3060 GeForce RTX 3060 Laptop GPU, i7-12700H, WDC PC SN810 1TB | Lenovo LOQ 15APH8 GeForce RTX 4050 Laptop GPU, R7 7840HS, Micron 2450 512GB MTFDKCD512TFK | |
|---|---|---|---|---|---|---|
| Noise | -0% | 7% | -2% | 0% | 6% | |
| off / environment * (dB) | 22.8 | 25 -10% | 22.7 -0% | 23.3 -2% | 24.7 -8% | 23.1 -1% |
| Idle Minimum * (dB) | 22.8 | 27 -18% | 23.4 -3% | 23.6 -4% | 24.7 -8% | 23.1 -1% |
| Idle Average * (dB) | 27.3 | 29 -6% | 23.4 14% | 23.6 14% | 24.7 10% | 23.1 15% |
| Idle Maximum * (dB) | 30.7 | 31 -1% | 23.4 24% | 33 -7% | 30.9 -1% | 25.2 18% |
| Load Average * (dB) | 41.6 | 42 -1% | 33 21% | 49.5 -19% | 40 4% | 44.3 -6% |
| Witcher 3 ultra * (dB) | 52.8 | 43 19% | 51.8 2% | 52.2 1% | 51.5 2% | 45.8 13% |
| Load Maximum * (dB) | 52.6 | 45 14% | 55.6 -6% | 52.2 1% | 51.5 2% | 52 1% |
* ... smaller is better
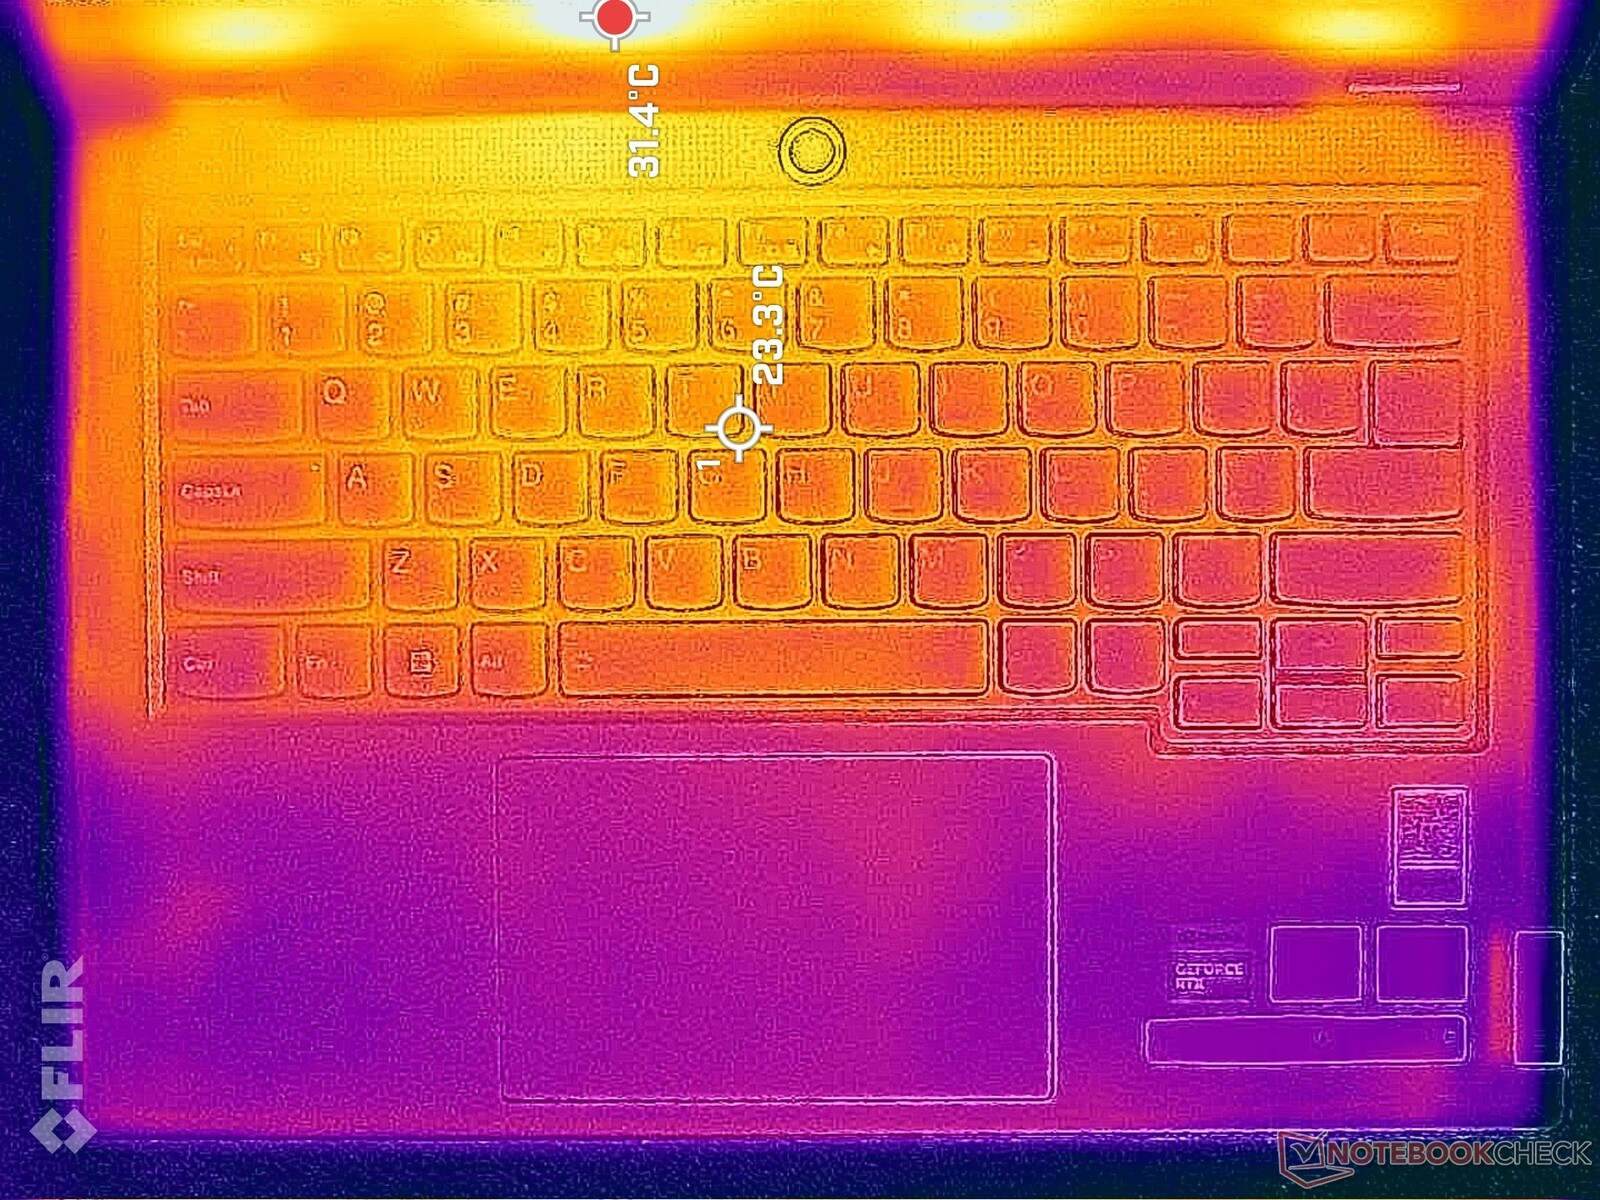
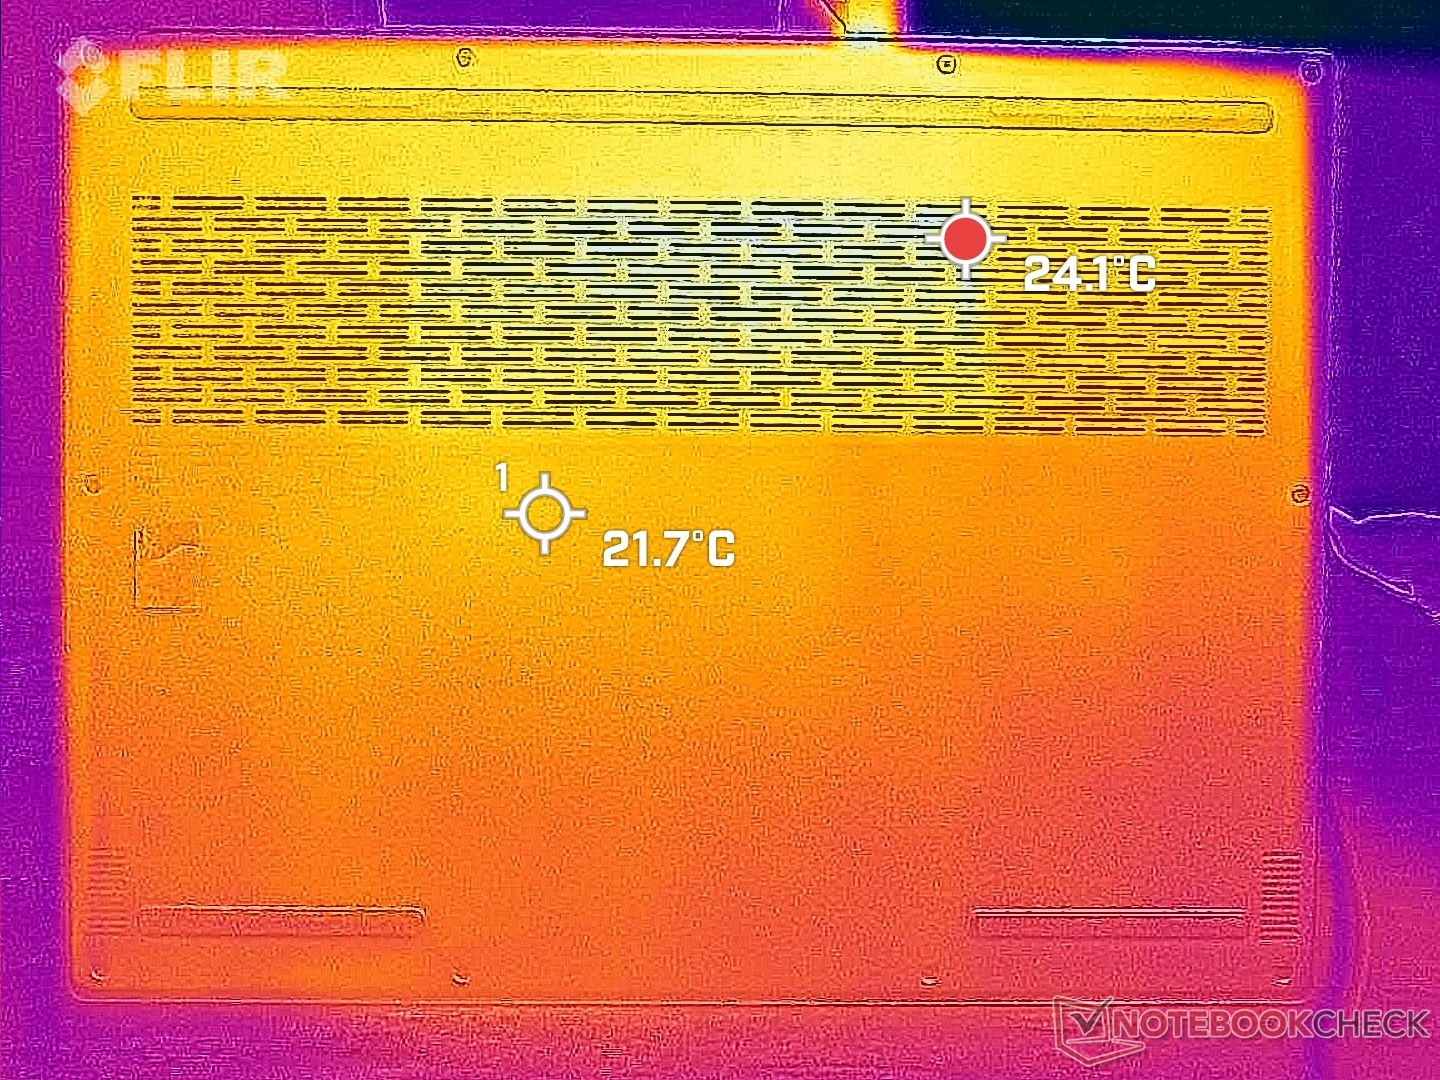
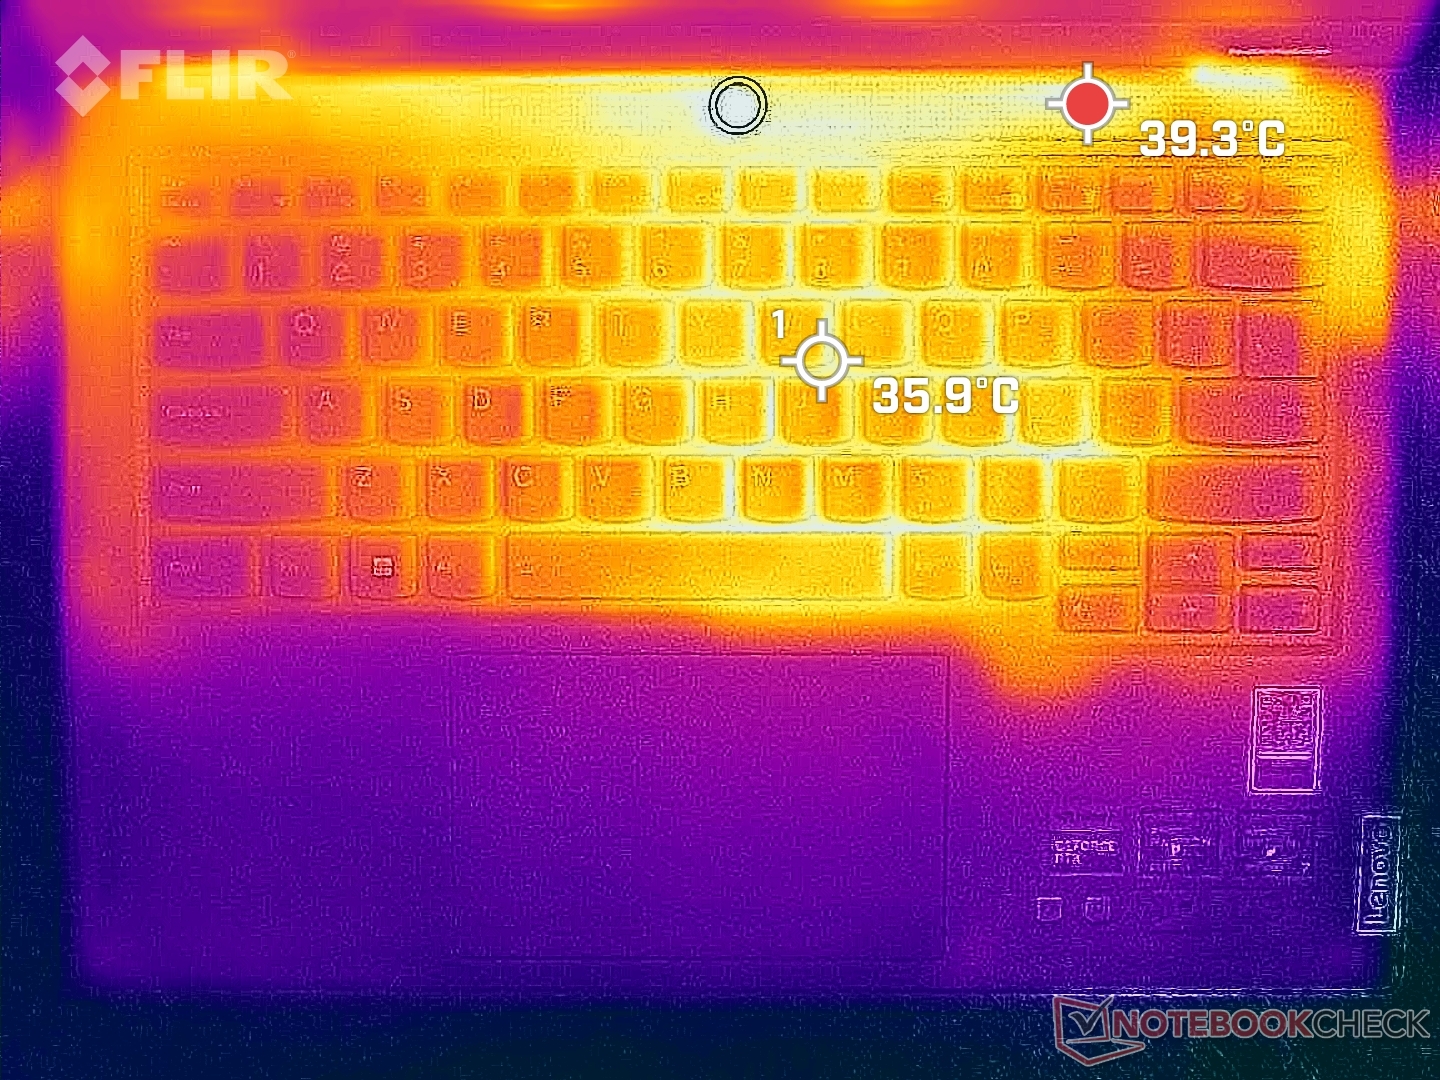
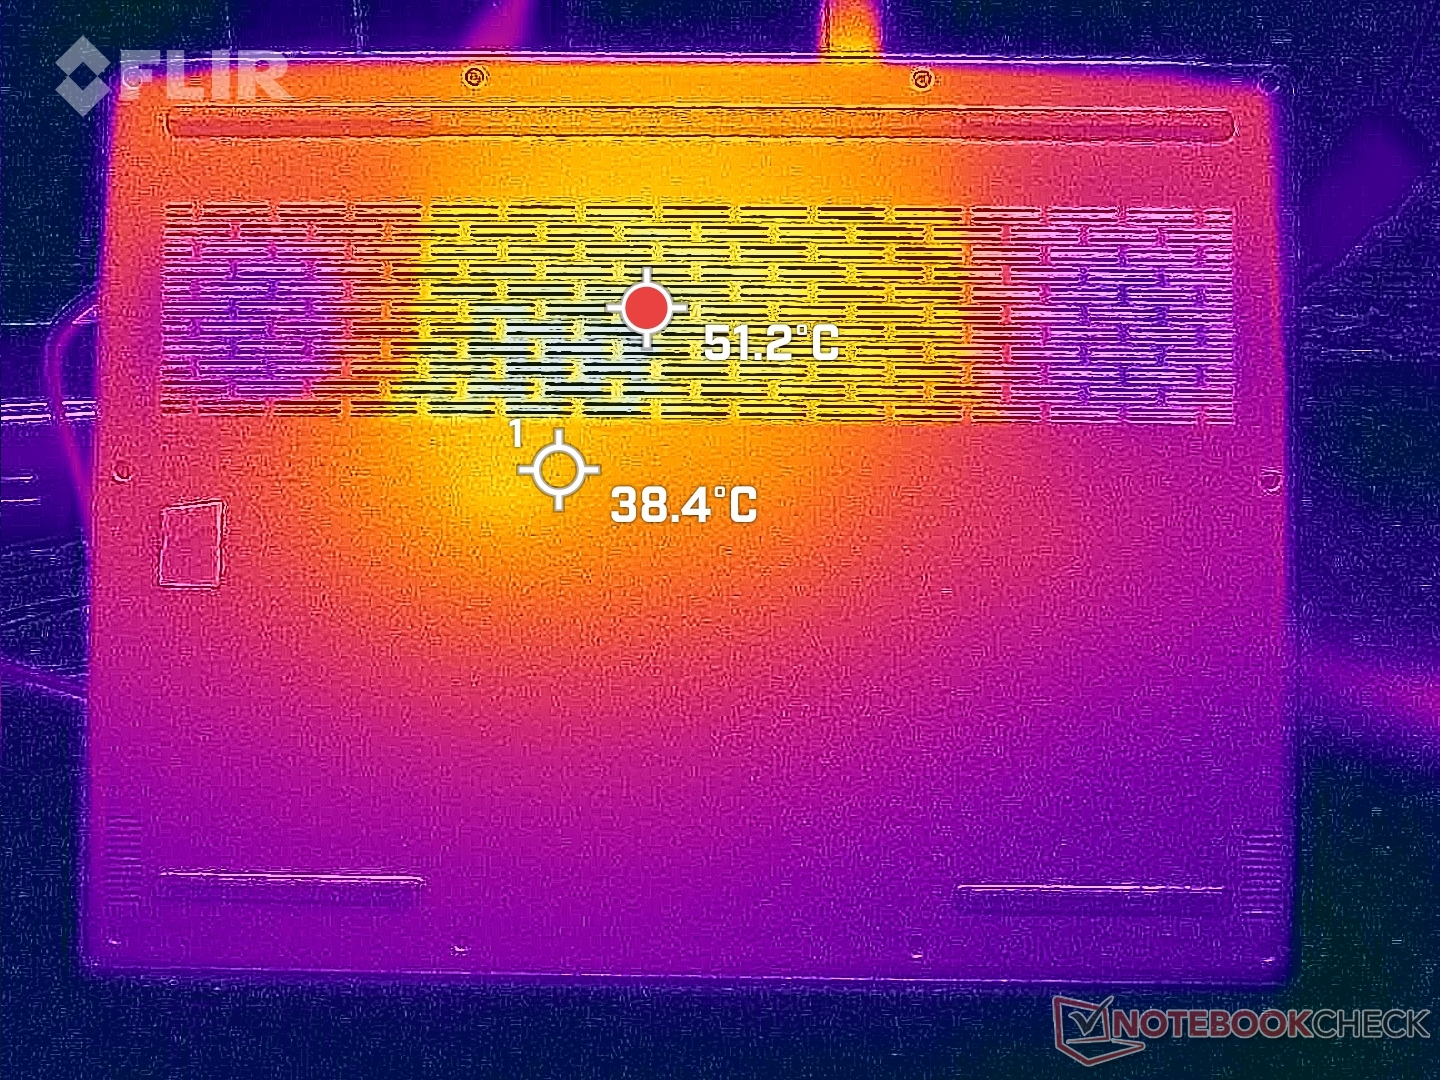
Temperature
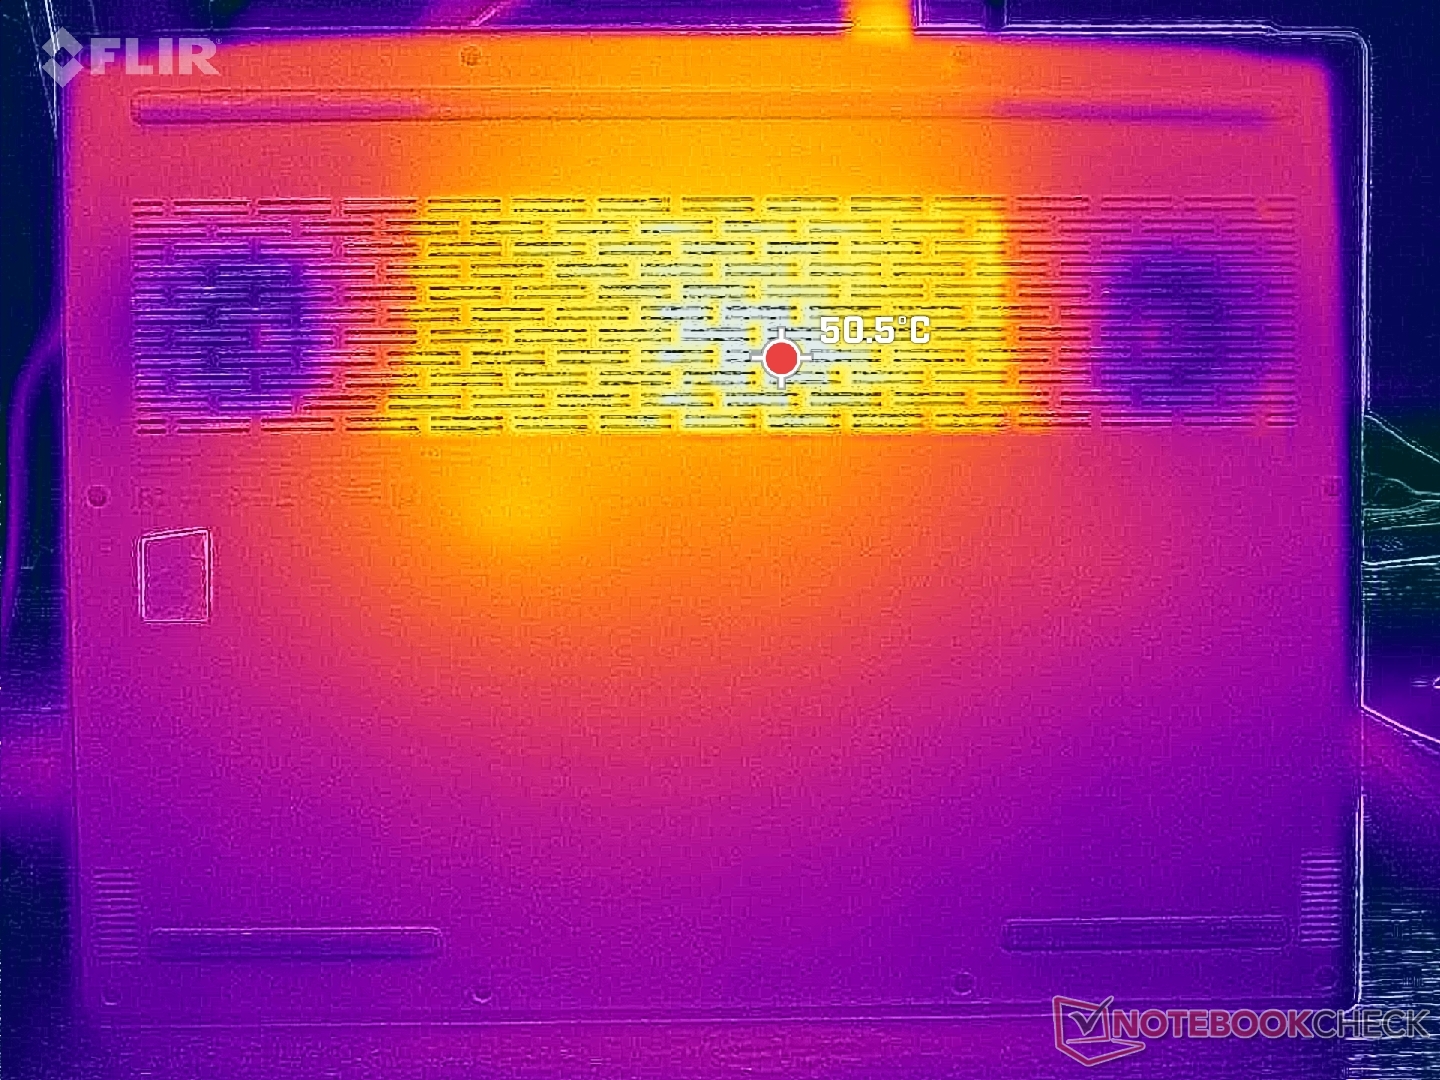
Surface temperatures are warmest toward the keyboard center and rear where they can reach up to 36 C and 52 C, respectively, when running demanding loads like games. The system is slightly warmer than the Blade 14 on average even though the Lenovo design incorporates more ventilation grilles. The palm rests and clickpad remain cooler and more comfortable to the touch.
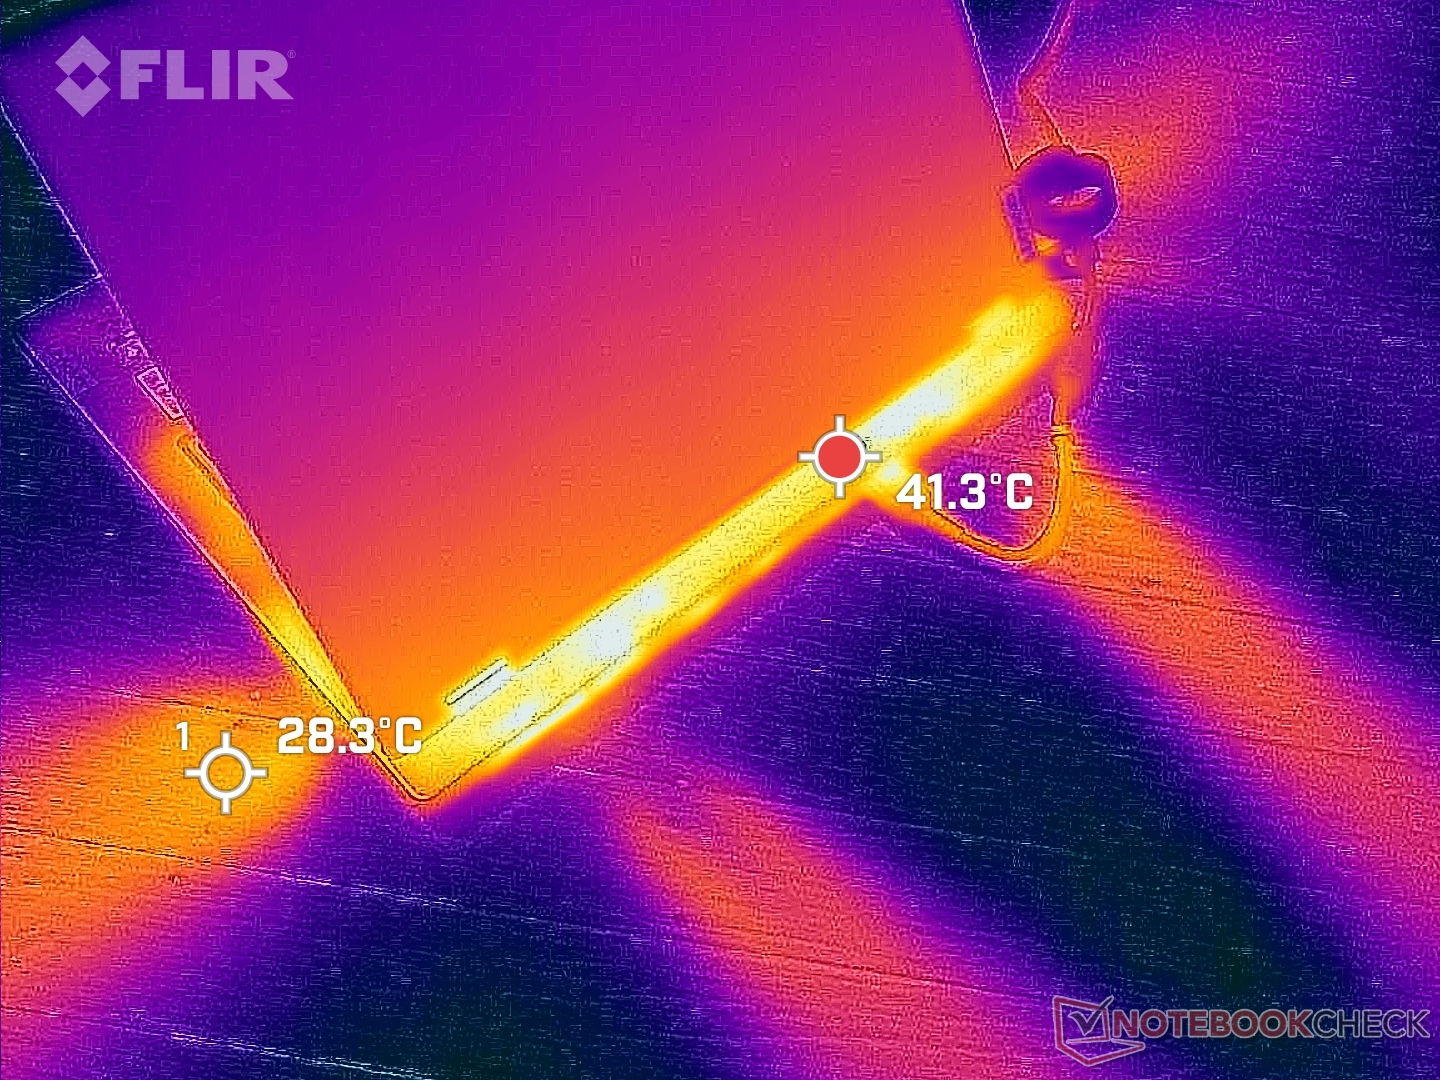
(±) The maximum temperature on the upper side is 40.4 °C / 105 F, compared to the average of 40.4 °C / 105 F, ranging from 21.2 to 68.8 °C for the class Gaming.
(-) The bottom heats up to a maximum of 49.4 °C / 121 F, compared to the average of 43.2 °C / 110 F
(+) In idle usage, the average temperature for the upper side is 26.7 °C / 80 F, compared to the device average of 33.9 °C / 93 F.
(±) Playing The Witcher 3, the average temperature for the upper side is 34.8 °C / 95 F, compared to the device average of 33.9 °C / 93 F.
(+) The palmrests and touchpad are cooler than skin temperature with a maximum of 29.2 °C / 84.6 F and are therefore cool to the touch.
(±) The average temperature of the palmrest area of similar devices was 28.8 °C / 83.8 F (-0.4 °C / -0.8 F).

| Lenovo Legion Slim 5 14APH8 AMD Ryzen 7 7840HS, NVIDIA GeForce RTX 4060 Laptop GPU | Acer Predator Triton 14 PT14-51 Intel Core i7-13700H, NVIDIA GeForce RTX 4050 Laptop GPU | Razer Blade 14 RTX 4070 AMD Ryzen 9 7940HS, NVIDIA GeForce RTX 4070 Laptop GPU | Asus ROG Zephyrus G14 GA402XY AMD Ryzen 9 7940HS, NVIDIA GeForce RTX 4090 Laptop GPU | Alienware x14 i7 RTX 3060 Intel Core i7-12700H, NVIDIA GeForce RTX 3060 Laptop GPU | Lenovo LOQ 15APH8 AMD Ryzen 7 7840HS, NVIDIA GeForce RTX 4050 Laptop GPU | |
|---|---|---|---|---|---|---|
| Heat | -15% | -1% | 1% | -1% | -3% | |
| Maximum Upper Side * (°C) | 40.4 | 54 -34% | 37.4 7% | 47 -16% | 51.3 -27% | 44.4 -10% |
| Maximum Bottom * (°C) | 49.4 | 56 -13% | 35.2 29% | 46.5 6% | 44.4 10% | 52 -5% |
| Idle Upper Side * (°C) | 28.2 | 31 -10% | 33.2 -18% | 25.9 8% | 27.2 4% | 28 1% |
| Idle Bottom * (°C) | 29.8 | 31 -4% | 36.2 -21% | 28 6% | 26.6 11% | 29.6 1% |
* ... smaller is better
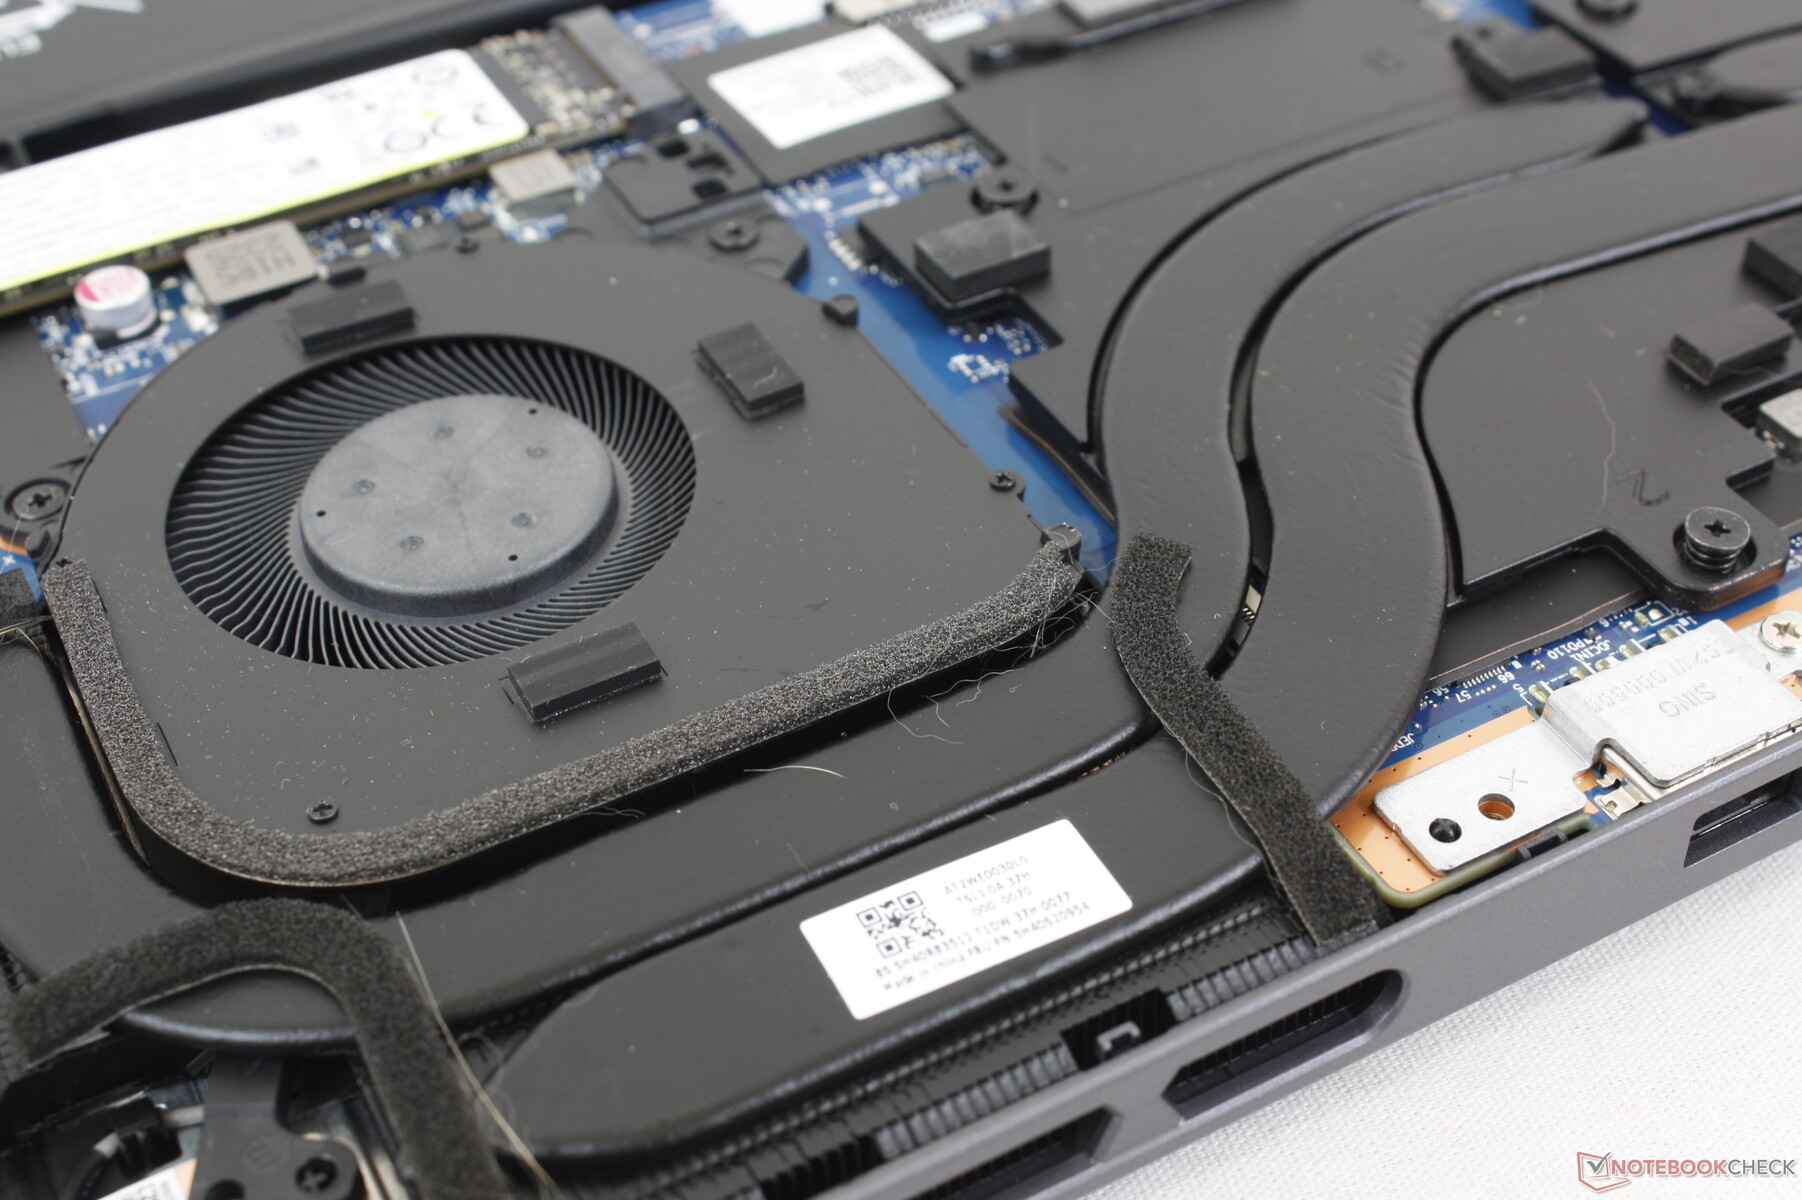
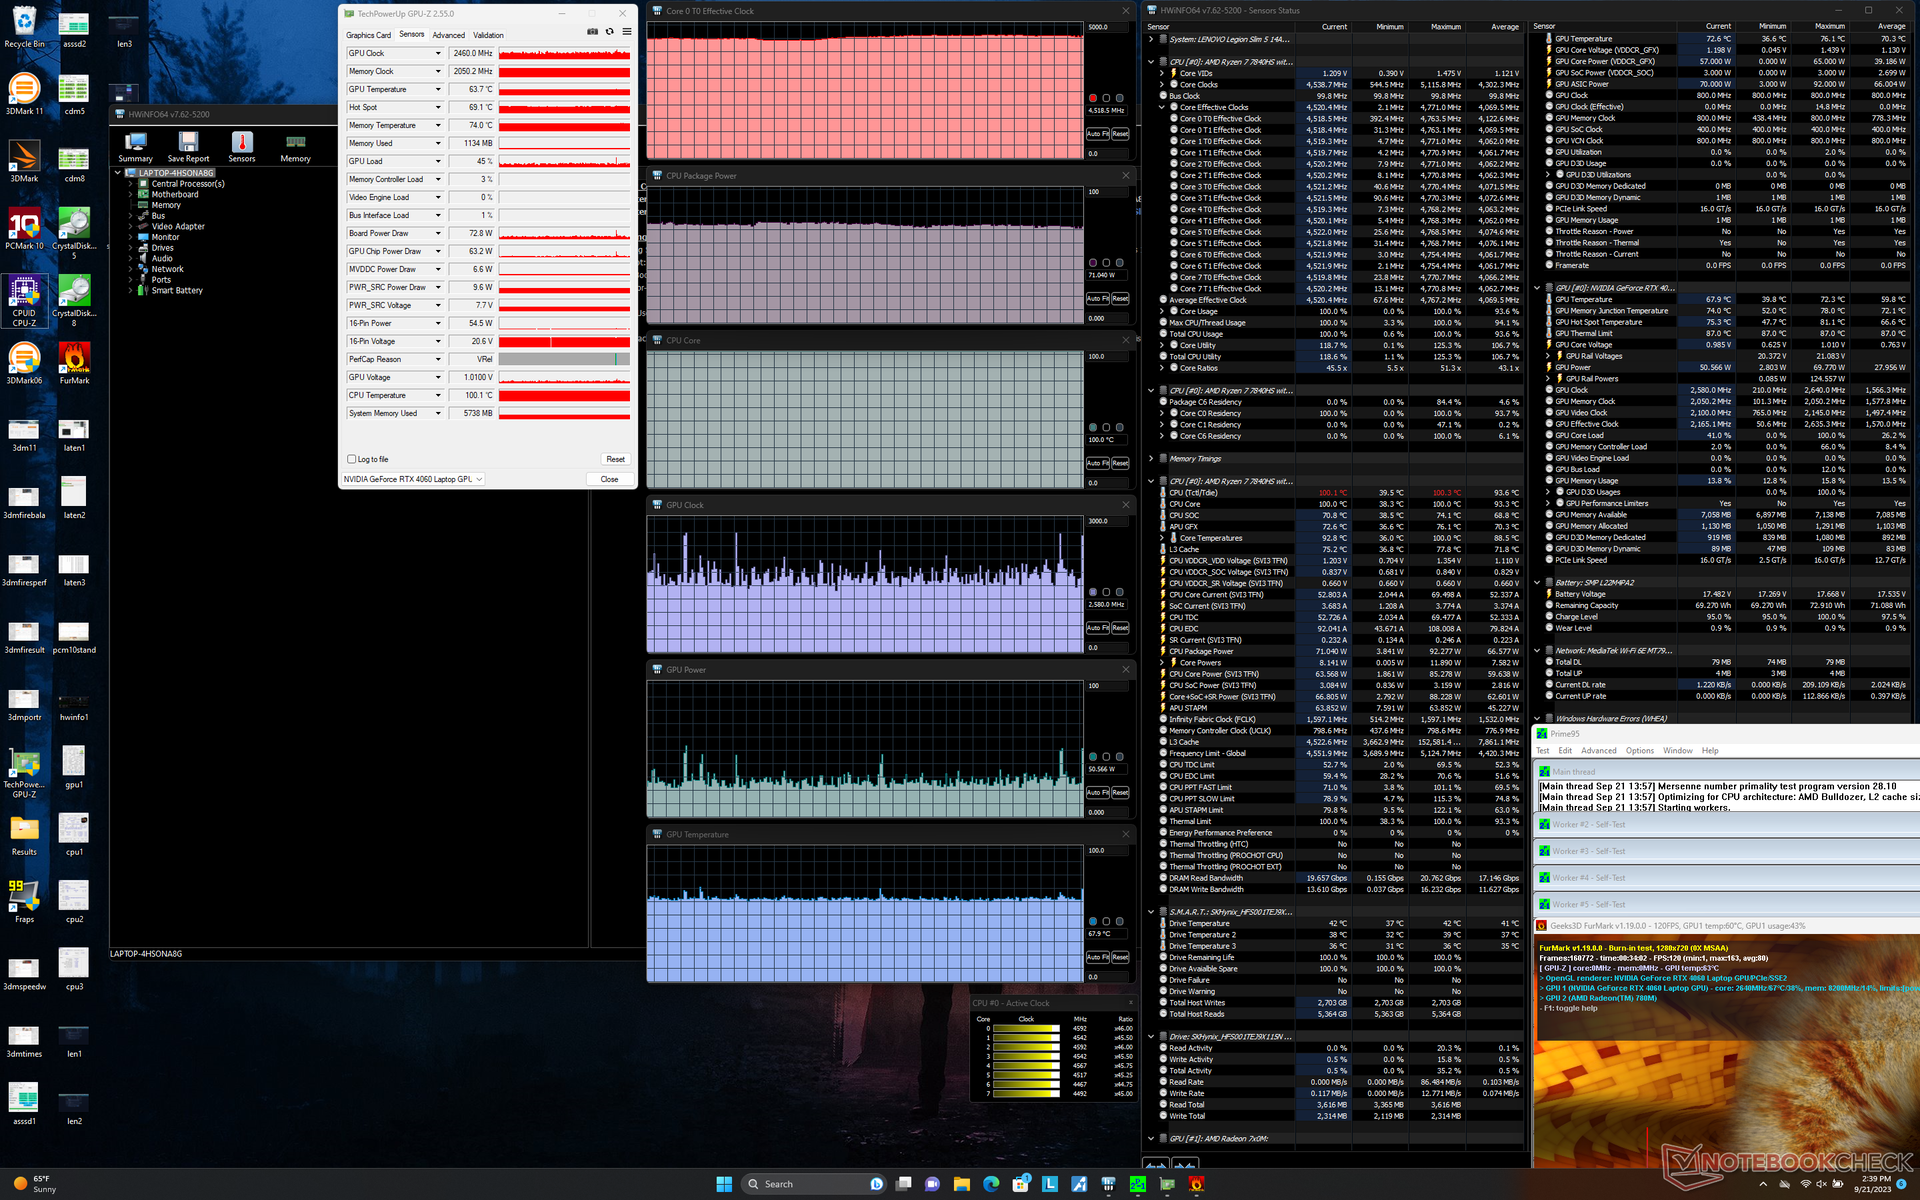
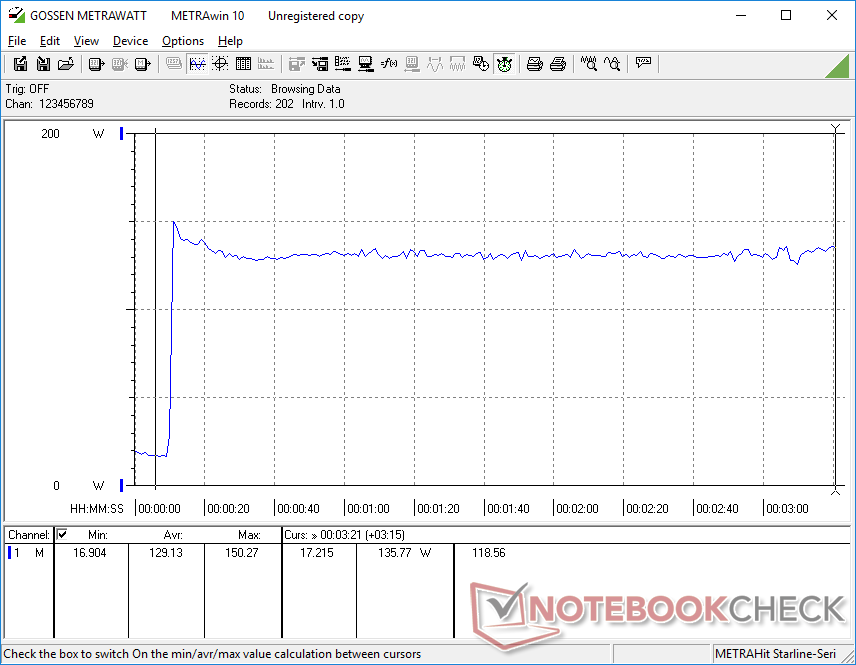
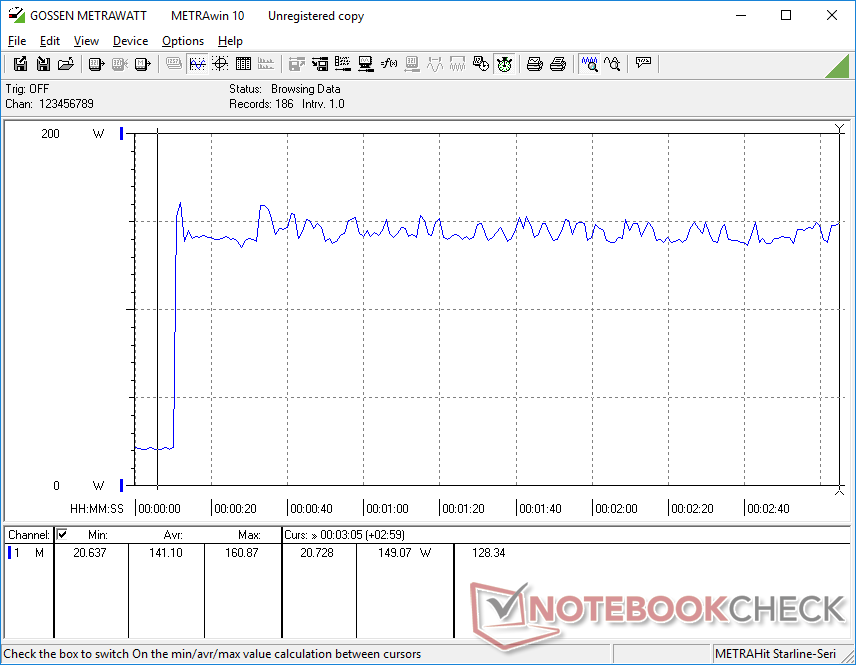
Stress Test
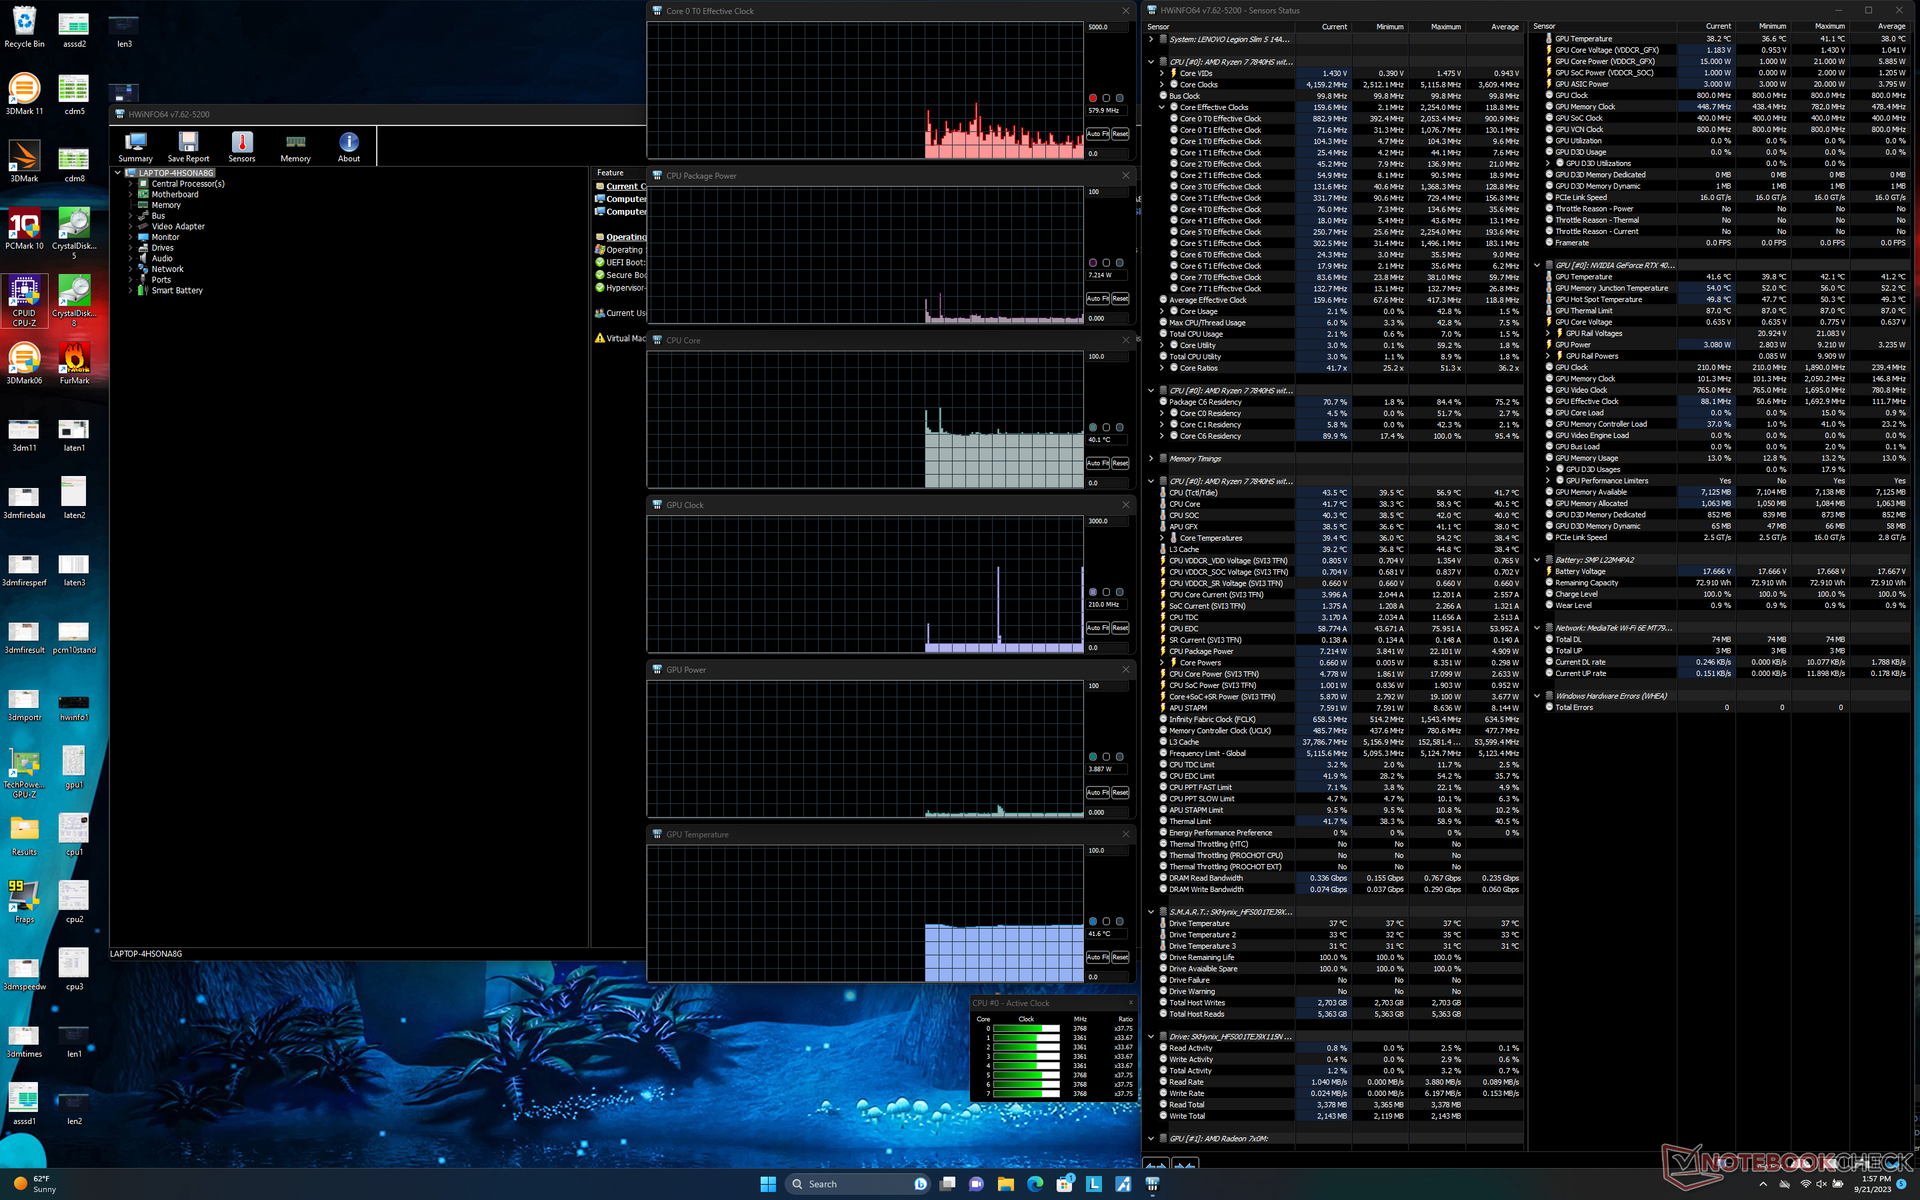
The CPU would spike to 3.8 GHz and 92 W when initiating Prime95 stress before falling and stabilizing at 4.6 GHz and 84 W a few seconds later. Core temperature would be very warm at 100 C to suggest that the AMD processor is pushing the cooling abilities of the Legion Slim 5 14 to its limits. Repeating this test on the Blade 14 with a similar Zen 4-class CPU would result is a cooler core temperature of 90 C in comparison.
The Nvidia GPU would stabilize at 2625 MHz, 78 C, and 99 W board power draw when running Witcher 3 on Performance mode compared to just 2160 MHz, 69 C, and 69 W when running the same game on Balanced mode. The reduced performance comes with reduced fan noise as mentioned above.
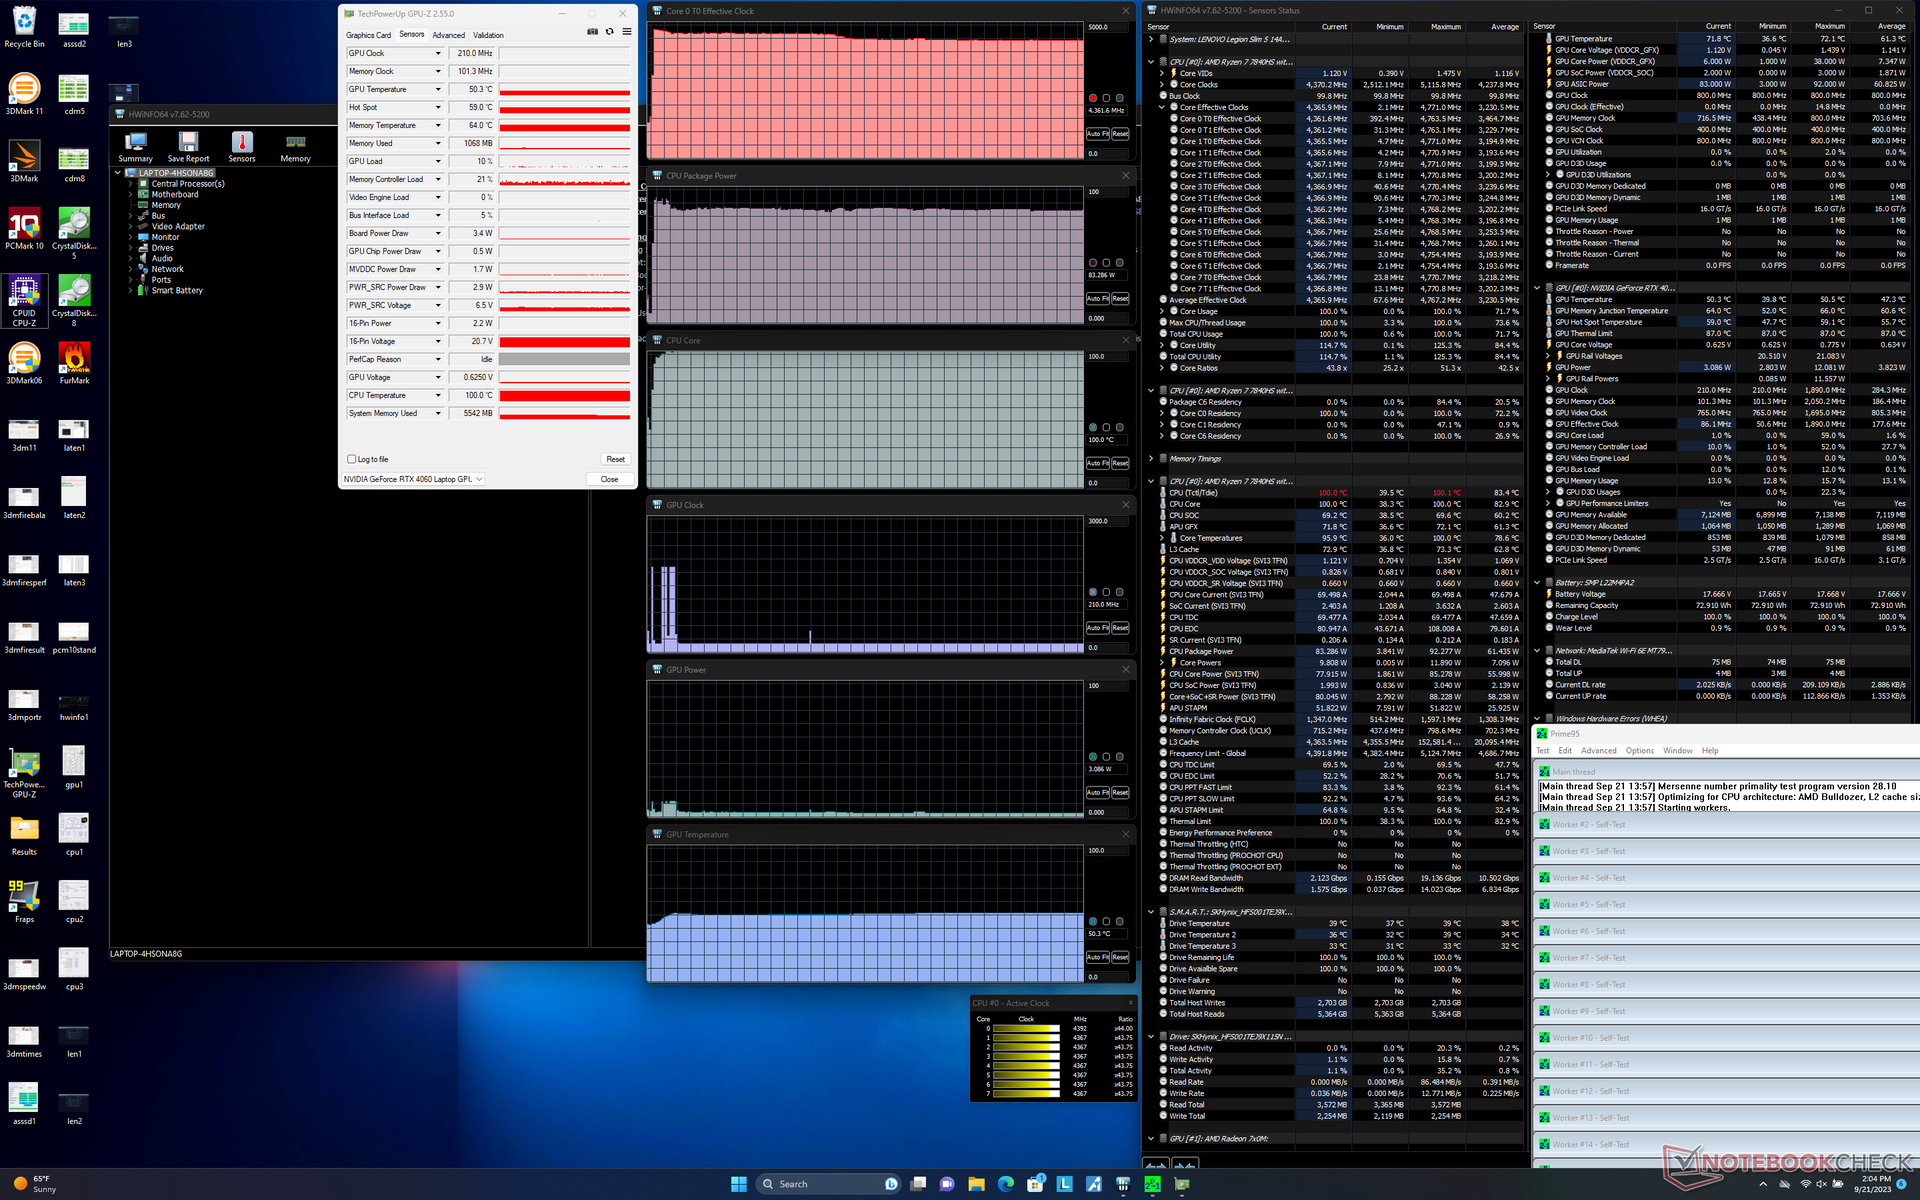

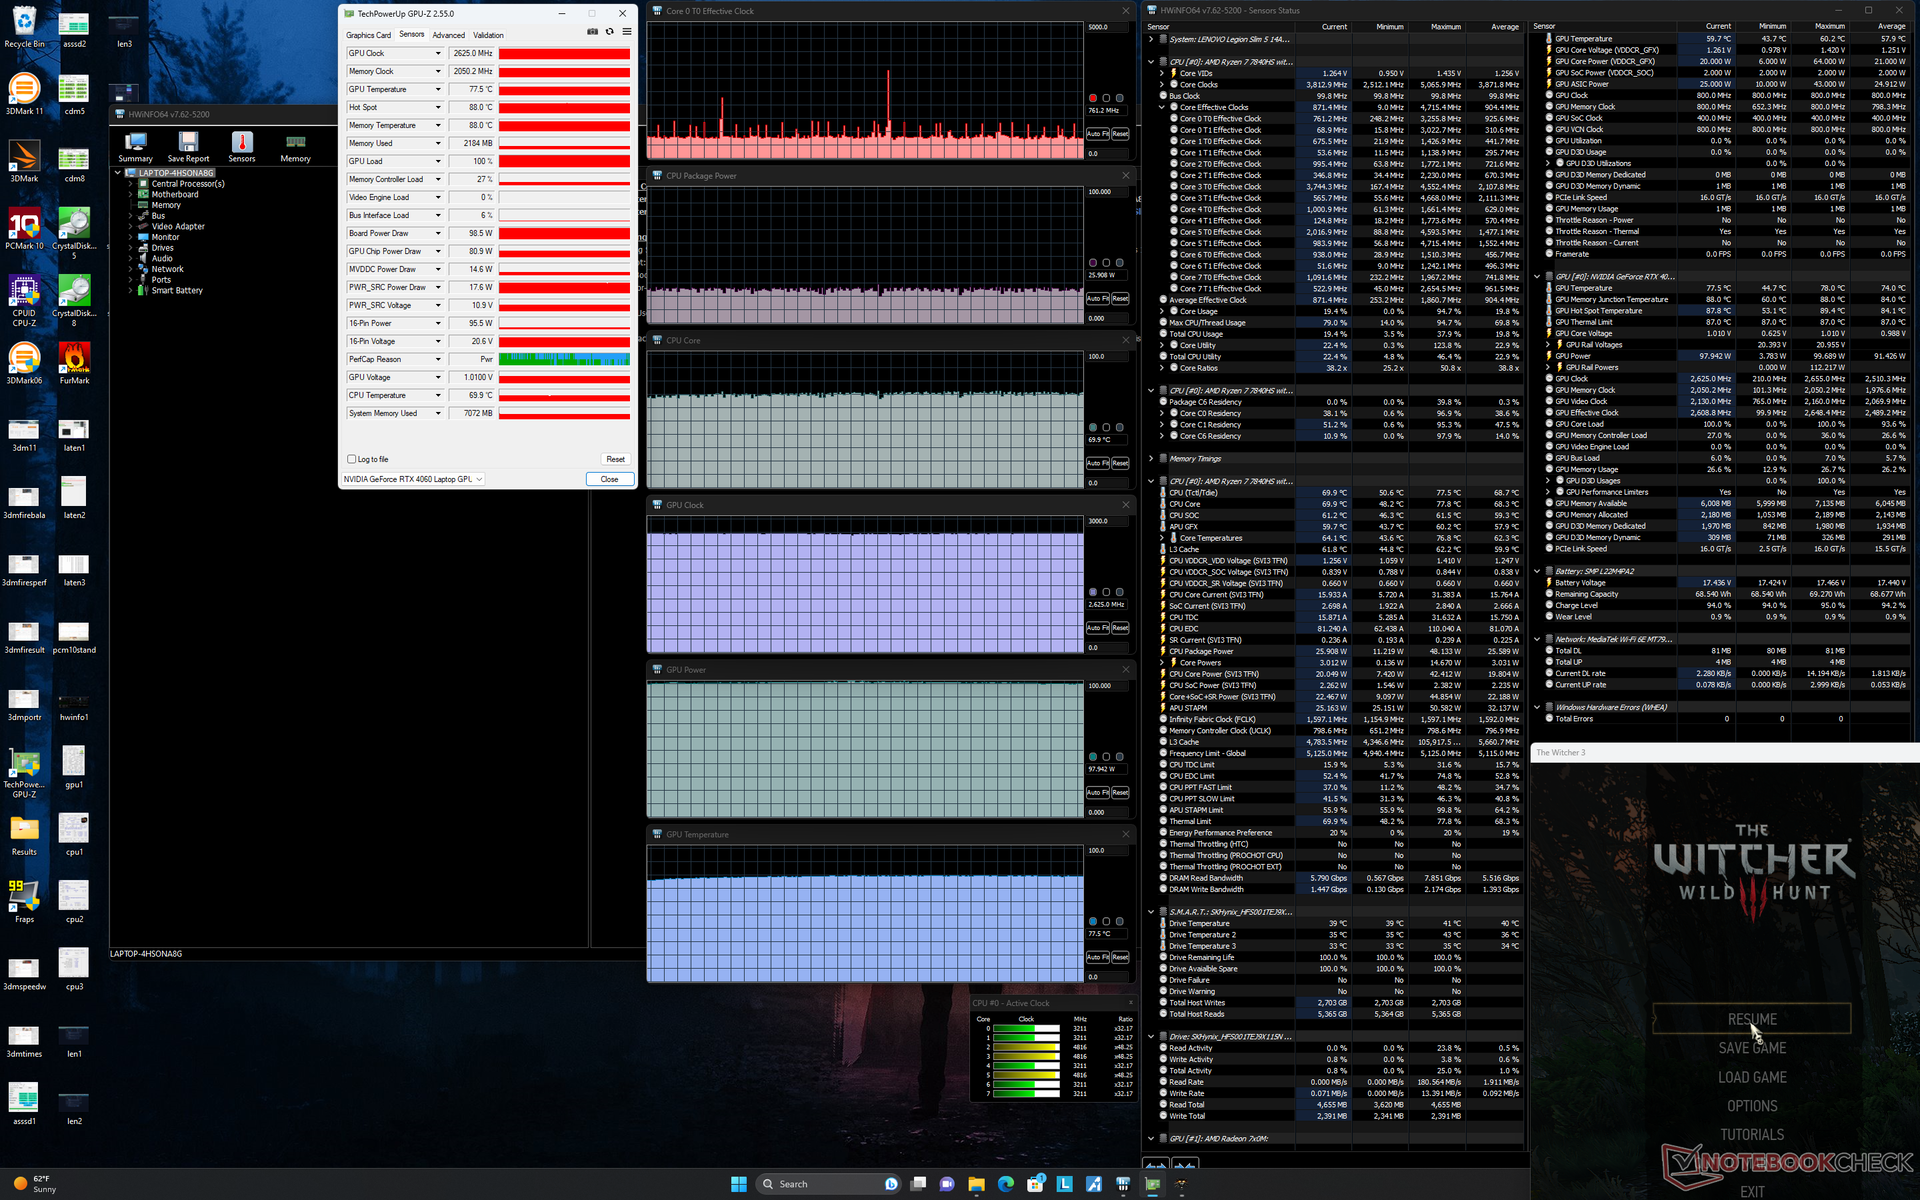
| CPU Clock (GHz) | GPU Clock (MHz) | Average CPU Temperature (°C) | Average GPU Temperature (°C) | |
| System Idle | ||||
| Prime95 Stress | 4.4 | -- | 100 | 50 |
| Prime95 + FurMark Stress | 4.5 | ~2460 | 100 | 68 |
| Witcher 3 Stress (Balanced mode) | ~0.8 | 2160 | 69 | 69 |
| Witcher 3 Stress (Performance mode) | ~0.8 | 2625 | 70 | 78 |
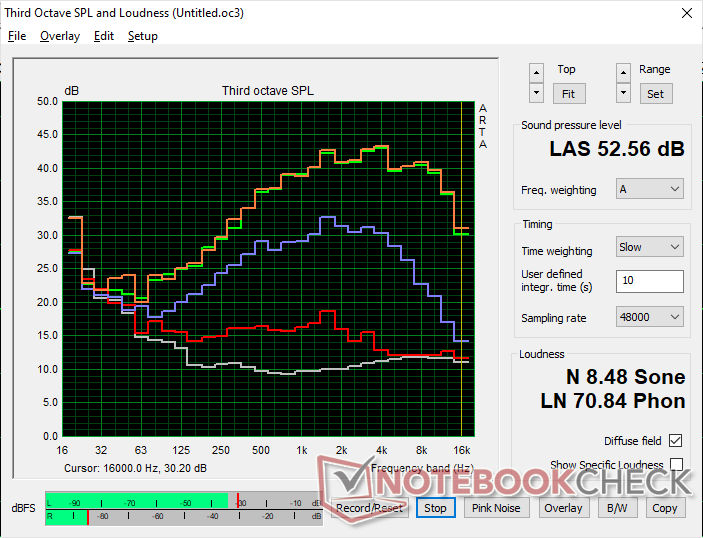
Speakers
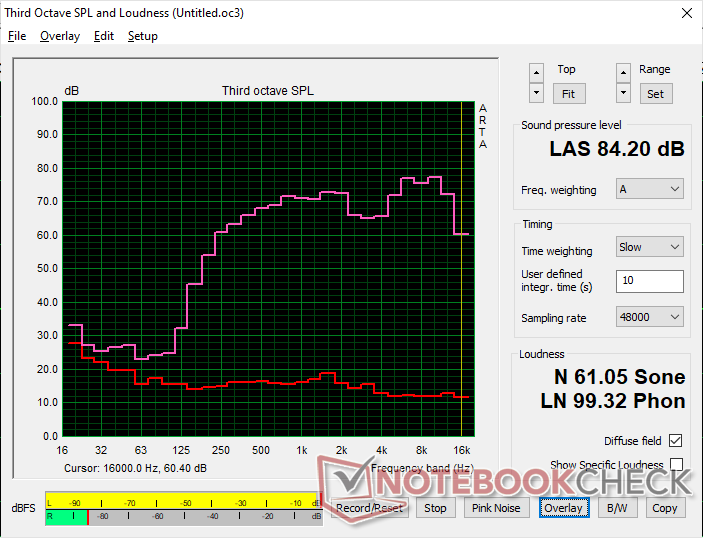
Lenovo Legion Slim 5 14APH8 audio analysis
(+) | speakers can play relatively loud (84.2 dB)
Bass 100 - 315 Hz
(-) | nearly no bass - on average 21.4% lower than median
(±) | linearity of bass is average (12.4% delta to prev. frequency)
Mids 400 - 2000 Hz
(+) | balanced mids - only 2.7% away from median
(+) | mids are linear (2.9% delta to prev. frequency)
Highs 2 - 16 kHz
(±) | higher highs - on average 5.3% higher than median
(+) | highs are linear (6.1% delta to prev. frequency)
Overall 100 - 16.000 Hz
(±) | linearity of overall sound is average (16.9% difference to median)
Compared to same class
» 44% of all tested devices in this class were better, 11% similar, 44% worse
» The best had a delta of 6%, average was 18%, worst was 132%
Compared to all devices tested
» 30% of all tested devices were better, 8% similar, 62% worse
» The best had a delta of 4%, average was 23%, worst was 134%
Apple MacBook Pro 16 2021 M1 Pro audio analysis
(+) | speakers can play relatively loud (84.7 dB)
Bass 100 - 315 Hz
(+) | good bass - only 3.8% away from median
(+) | bass is linear (5.2% delta to prev. frequency)
Mids 400 - 2000 Hz
(+) | balanced mids - only 1.3% away from median
(+) | mids are linear (2.1% delta to prev. frequency)
Highs 2 - 16 kHz
(+) | balanced highs - only 1.9% away from median
(+) | highs are linear (2.7% delta to prev. frequency)
Overall 100 - 16.000 Hz
(+) | overall sound is linear (4.6% difference to median)
Compared to same class
» 0% of all tested devices in this class were better, 0% similar, 100% worse
» The best had a delta of 5%, average was 17%, worst was 45%
Compared to all devices tested
» 0% of all tested devices were better, 0% similar, 100% worse
» The best had a delta of 4%, average was 23%, worst was 134%
Energy Management — High Performance-Per-Watt
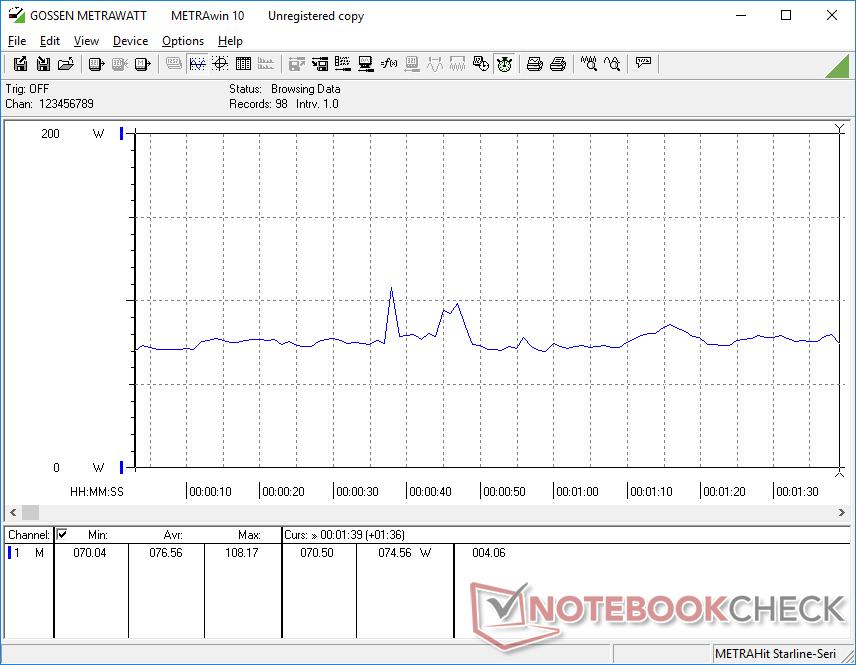
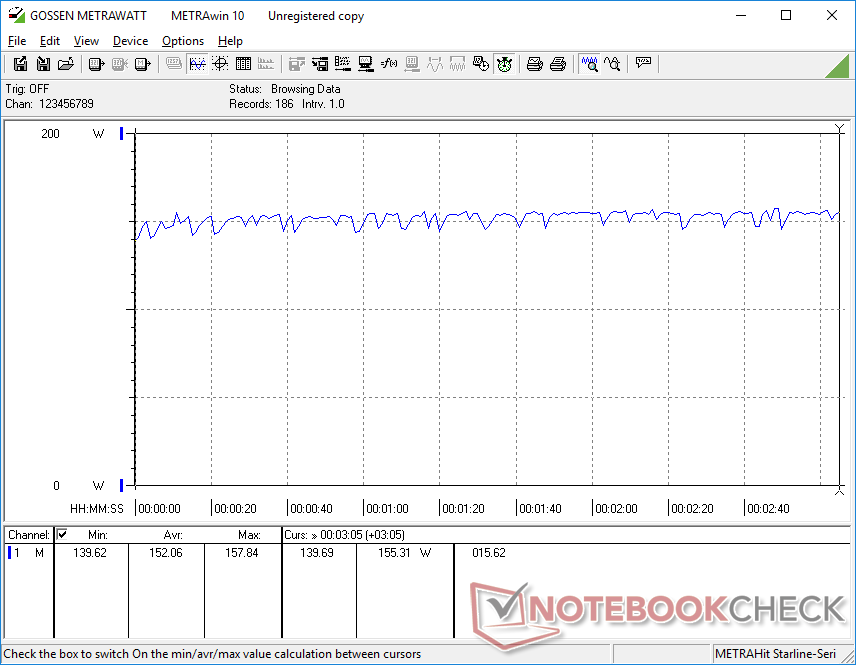
Power Consumption
Our Legion Slim 5 14 consumes slightly less power than our Blade 14 which comes with a faster Ryzen 9 CPU and RTX 4070 GPU. Performance-per-watt remains excellent especially when compared to Intel-powered gaming laptops with the same RTX 4060 GPU like the Legion Pro 5 16 which demands noticeably more power despite it performing just slightly faster.
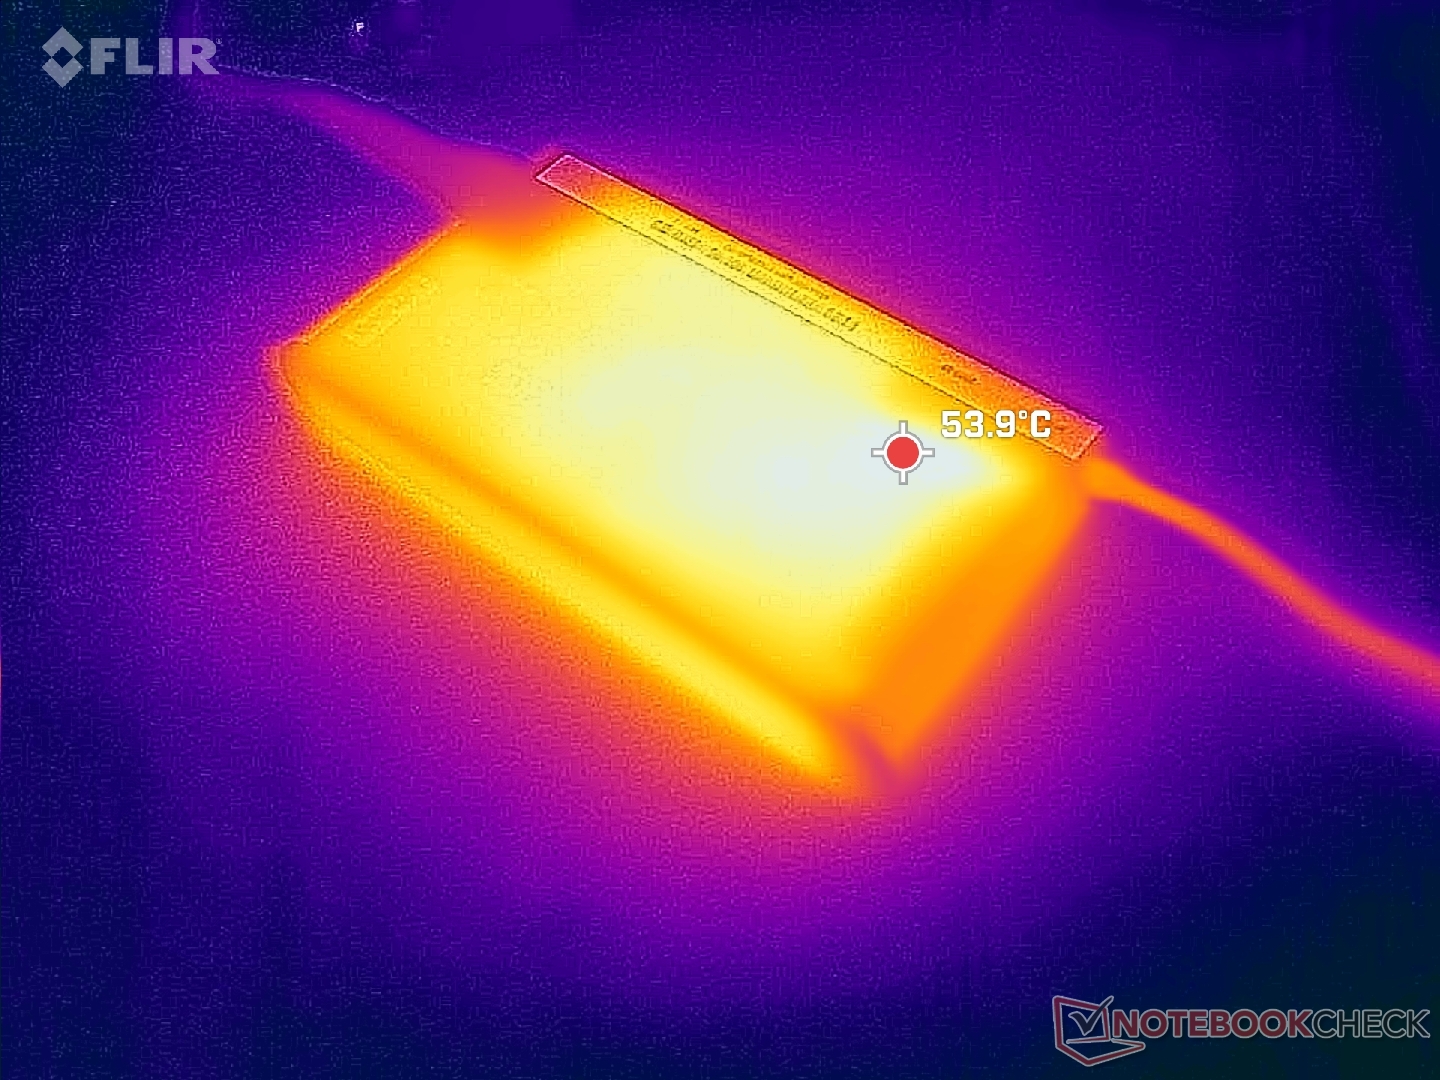
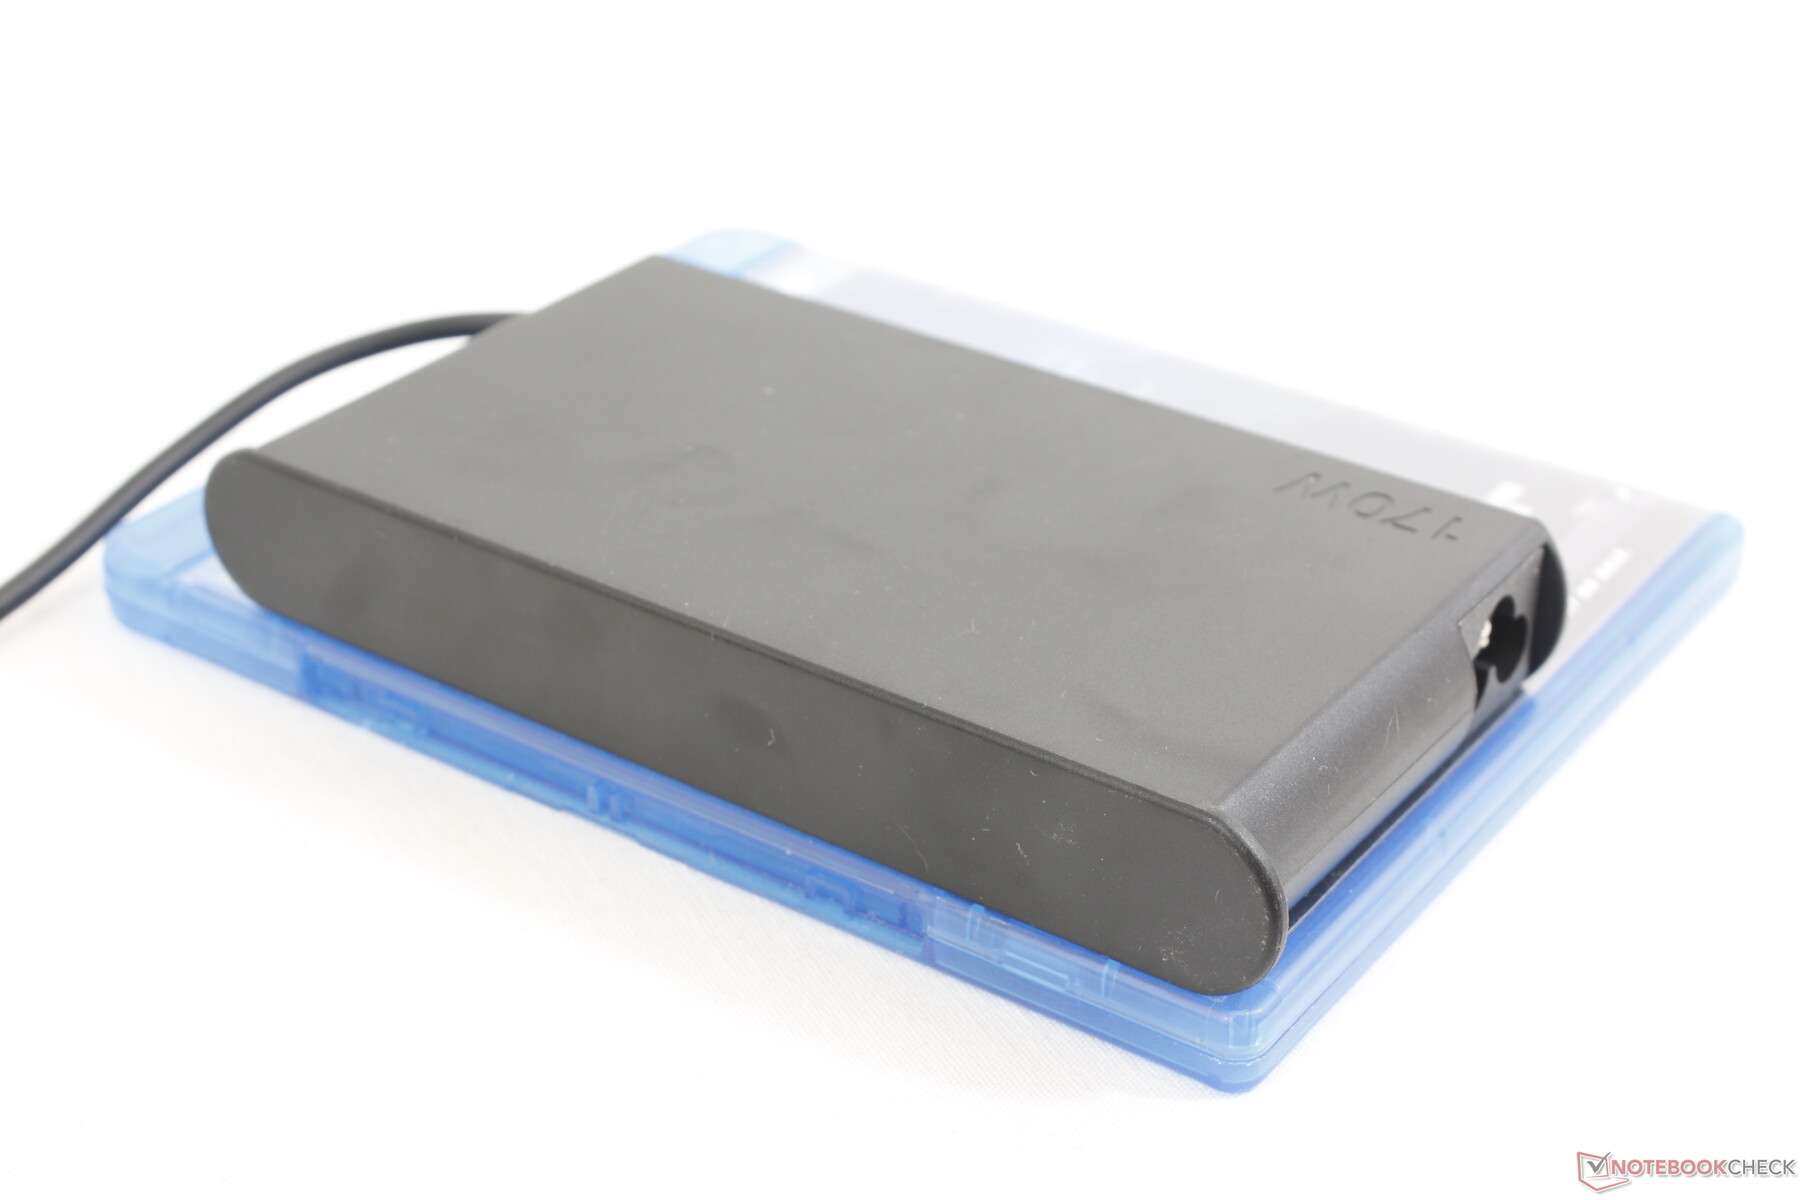
We're able to record a maximum draw of 161 W from the medium-sized (17 x 7.6 x 2.1 cm) 170 W AC adapter. The competing Blade 14 and Zephyrus G14 ship with larger and more capable 230 W and 240 W AC adapters, respectively. The Lenovo model charges more slowly if running demanding loads simultaneously.
| Off / Standby | |
| Idle | |
| Load |
|
Key:
min: | |
| Lenovo Legion Slim 5 14APH8 R7 7840HS, GeForce RTX 4060 Laptop GPU, SK Hynix HFS001TEJ9X115N, OLED, 2880x1600, 14.5" | Acer Predator Triton 14 PT14-51 i7-13700H, GeForce RTX 4050 Laptop GPU, Micron 3400 MTFDKBA512TFH 512GB, IPS, 2560x1600, 14" | Razer Blade 14 RTX 4070 R9 7940HS, GeForce RTX 4070 Laptop GPU, Samsung PM9A1 MZVL21T0HCLR, IPS, 2560x1600, 14" | Asus ROG Zephyrus G14 GA402XY R9 7940HS, GeForce RTX 4090 Laptop GPU, Samsung PM9A1 MZVL21T0HCLR, Mini-LED, 2560x1600, 14" | Alienware x14 i7 RTX 3060 i7-12700H, GeForce RTX 3060 Laptop GPU, WDC PC SN810 1TB, IPS, 1920x1080, 14" | Lenovo LOQ 15APH8 R7 7840HS, GeForce RTX 4050 Laptop GPU, Micron 2450 512GB MTFDKCD512TFK, IPS, 1920x1080, 15.6" | |
|---|---|---|---|---|---|---|
| Power Consumption | -31% | -71% | -19% | 1% | -35% | |
| Idle Minimum * (Watt) | 7.3 | 12 -64% | 19.5 -167% | 9.4 -29% | 7.9 -8% | 15 -105% |
| Idle Average * (Watt) | 9.6 | 14 -46% | 24.7 -157% | 14.2 -48% | 11.1 -16% | 17.7 -84% |
| Idle Maximum * (Watt) | 17.3 | 26 -50% | 27 -56% | 14.5 16% | 11.8 32% | 21.5 -24% |
| Load Average * (Watt) | 76.6 | 88 -15% | 83.2 -9% | 79 -3% | 107.4 -40% | 73.5 4% |
| Witcher 3 ultra * (Watt) | 152 | 114.9 24% | 165.8 -9% | 172 -13% | 111 27% | 138.6 9% |
| Load Maximum * (Watt) | 160.9 | 213 -32% | 204.5 -27% | 220.8 -37% | 140.4 13% | 176.5 -10% |
* ... smaller is better
Power Consumption Witcher 3 / Stresstest
Power Consumption external Monitor
Battery Life
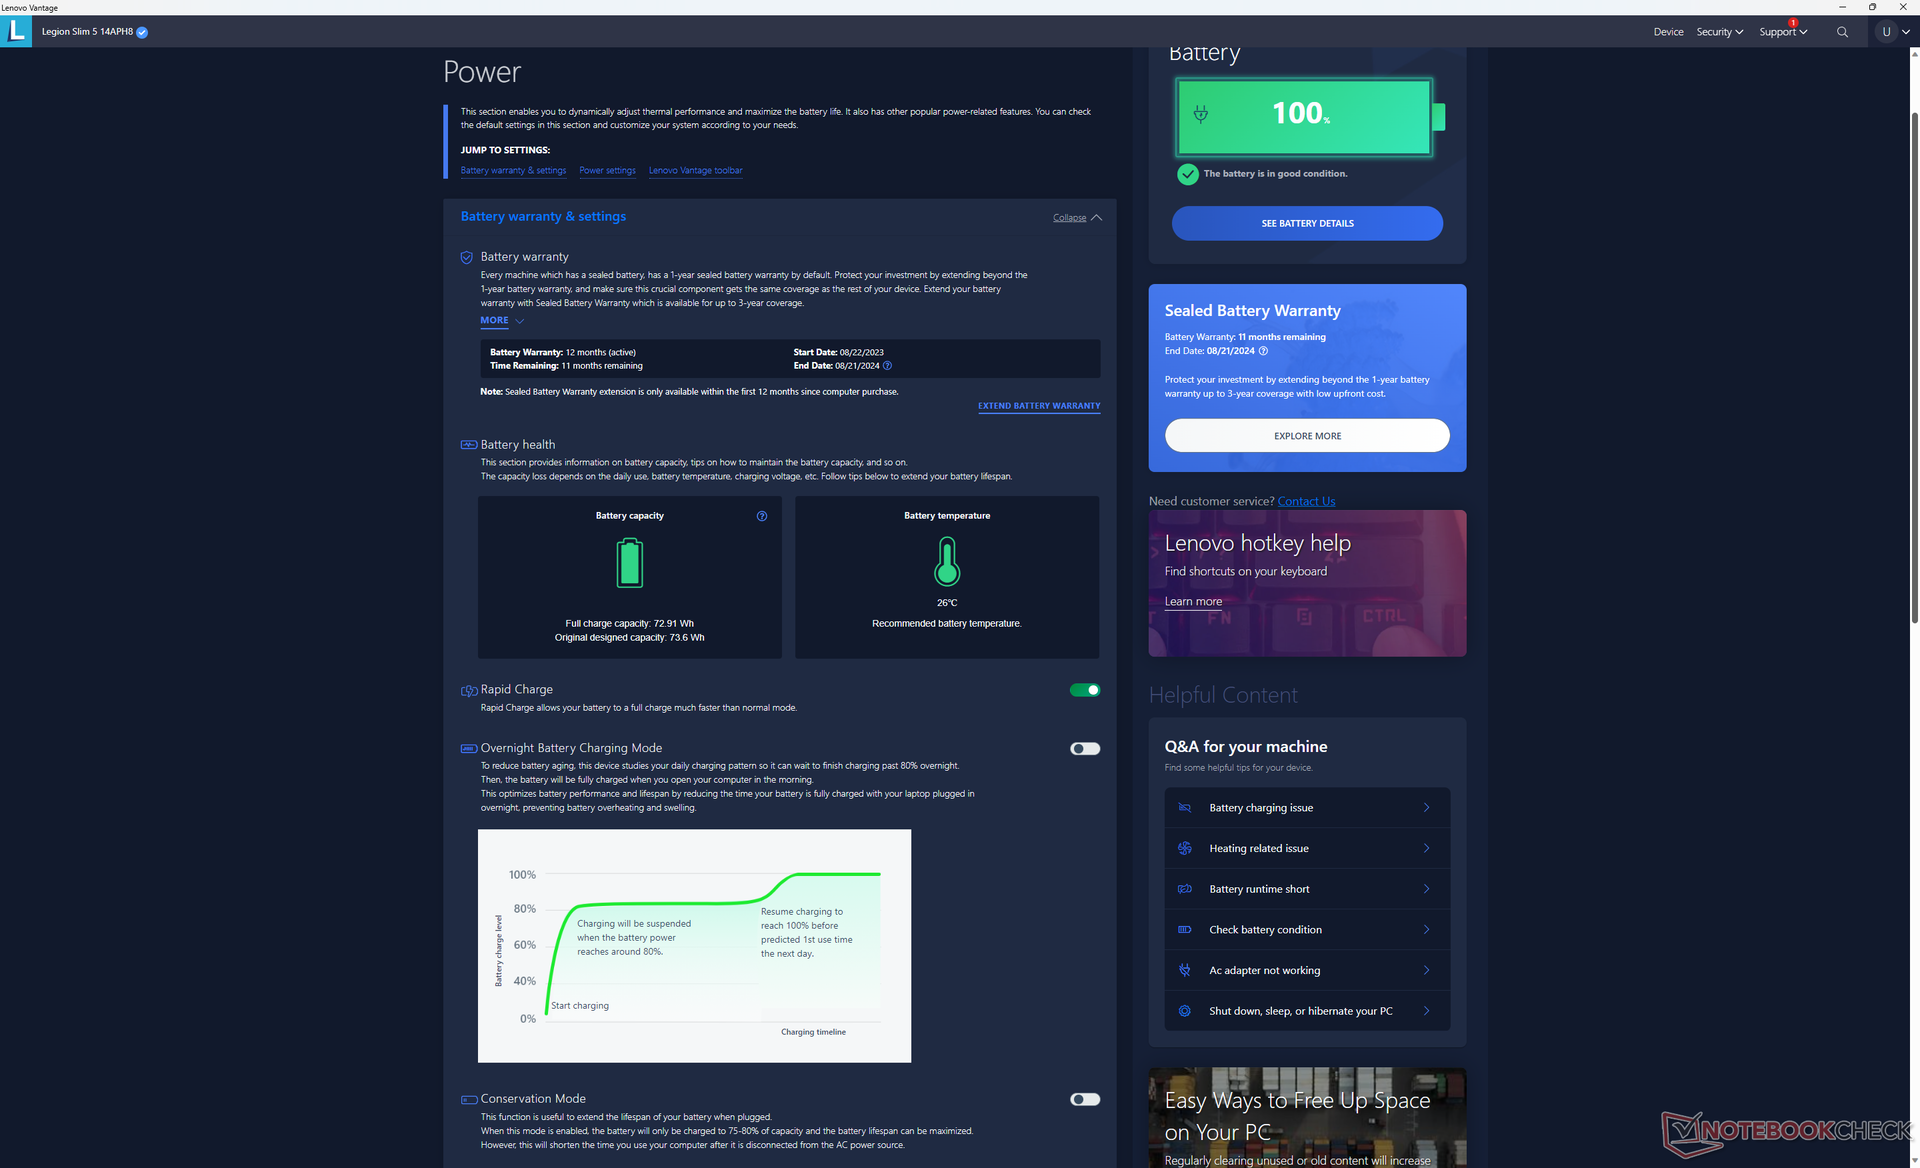
Battery capacity is large for a 14-inch laptop at 74 Wh. Runtimes are subsequently long at almost 7.5 hours of real-world browsing on Balanced mode to be most similar to the Zephyrus G14.
Charging from empty to full capacity is very fast at just 45 minutes when Lenovo Rapid Charge is enabled. Most other laptops take twice as long or even longer to fully charge. The system can also be charged via USB-C, but Lenovo recommends charging with an optional Lenovo-branded 140 W USB-C AC adapter as most other adapters are not compatible.
| Lenovo Legion Slim 5 14APH8 R7 7840HS, GeForce RTX 4060 Laptop GPU, 73.6 Wh | Acer Predator Triton 14 PT14-51 i7-13700H, GeForce RTX 4050 Laptop GPU, 76.3 Wh | Razer Blade 14 RTX 4070 R9 7940HS, GeForce RTX 4070 Laptop GPU, 68 Wh | Asus ROG Zephyrus G14 GA402XY R9 7940HS, GeForce RTX 4090 Laptop GPU, 76 Wh | Alienware x14 i7 RTX 3060 i7-12700H, GeForce RTX 3060 Laptop GPU, 80 Wh | Lenovo LOQ 15APH8 R7 7840HS, GeForce RTX 4050 Laptop GPU, 60 Wh | |
|---|---|---|---|---|---|---|
| Battery runtime | 4% | -19% | -12% | -10% | -8% | |
| Reader / Idle (h) | 10.5 | 11.2 7% | 8.6 -18% | 9.8 -7% | ||
| WiFi v1.3 (h) | 7.5 | 5 -33% | 6.2 -17% | 7.5 0% | 8.9 19% | 7.4 -1% |
| Load (h) | 1.3 | 1.8 38% | 1 -23% | 1 -23% | 0.8 -38% | 1.1 -15% |
| H.264 (h) | 9 | 7.2 | 9.4 | |||
| Witcher 3 ultra (h) | 0.8 |
Pros
Cons
Verdict — Not Just Good For Gaming
A couple of aspects help the Legion Slim 5 14 stand out from the competition. Firstly, its ThinkBook-like design and RGB-free exterior give a more professional aesthetic than the aggressive stylings of the Acer Predator Triton or Zephyrus G14. Users who like to have one laptop for both gaming and business meetings may therefore prefer the design of the Legion Slim 5 14 over others. Secondly, its 120 Hz OLED display easily outclasses the IPS displays on other 14-inch gaming laptops when it comes to black levels, response times, and image quality.
Lenovo's first 14-inch Legion gaming laptop is off to a strong start with its 2.8K 120 Hz OLED display. Its lack of G-Sync and RGB keyboard backlight, however, are strange omissions on a gaming laptop retailing for well over a grand.
There are a handful of disadvantages that potential buyers should be aware of. The most egregious is the lack of G-Sync support for the OLED display meaning that it's recommended to engage v-sync or aim for a steady 120 FPS with reduced settings to limit screen tearing. The next step down is the absence of RGB keyboard lighting and GPU options greater than the RTX 4060. While the RTX 4060 is still very good, Lenovo is losing out on the enthusiasts who might want the RTX 4070 or faster. The Asus Zephyrus G14 and Razer Blade 14 are each smaller and come with both upgradeable RAM and faster GPU options.
The loud fan noise and high core temperatures are other notable disadvantages, but such traits are shared across other 14-inch gaming laptops.
The Legion Slim 5 14 is best as a powerful travel companion for gaming, graphics processing, and editing. For pure gaming purposes, however, alternatives from Razer, Asus, or Alienware tend to offer higher-end GPUs and auxiliary features that hardcore gamers can appreciate.
Price and Availability
Lenovo is currently shipping its Legion Slim 5 14 Gen 8 model starting at $1440 USD for the base Ryzen 7 and RTX 4050 configuration up to over $1700 if configured with the Ryzen 9 and RTX 4060.
Lenovo Legion Slim 5 14APH8
- 09/25/2023 v7 (old)
Allen Ngo
