Lenovo Legion Pro 5 16ARX8 review: Gaming laptop with RTX 4050 in great form
The Lenovo Legion Pro 5 16ARX8 has enough performance to place it somewhere between an entry-level and an upper mid-range laptop. It can be configured with a Ryzen 5 7645HX or a Ryzen 7 7745HX as well as Nividia’s RTX 4050, 4060 or 4070. The device will set you back somewhere around €1,500 to slightly above €2,000 (approx. US$1,655 to US$2,200), depending on the specs. The display, SSD and RAM can likewise be configured.
We have previously reviewed two other variants of this Lenovo laptop: the Legion Pro 5 16IRX8 with an Intel Core i7-13700HX and RTX 4060 as well as the Pro 5 16ARX8 with an AMD Ryzen 7 7745HX and RTX 4070. We'll therefore only briefly cover the chassis, features and input devices here. You can refer to the two earlier reviews for more information.
Now it’s time to put the base configuration of the Legion Pro 5 through its paces. Featuring the same cooling system and chassis as the more powerful variants, the Pro 5 16ARX8 should have a few advantages over them, at least when it comes to thermals. Of course, the base-spec Legion Pro 5 will also be pushed to its limits more easily in terms of performance. Nevertheless, these limits are not as low as the entry-level GPU might suggest.
The Legion Pro 5 is competing against the likes of the Asus TUF Gaming A16 featuring an AMD Radeon RX 7600S as well as the Medion Erazer Scout E20, which also comes with an RTX 4050.
Comparison with possible competitors
Rating | Date | Model | Weight | Height | Size | Resolution | Price |
|---|---|---|---|---|---|---|---|
| 89 % v7 (old) | 08 / 2023 | Lenovo Legion Pro 5 16ARX8 (R5 7645HX, RTX 4050) R5 7645HX, GeForce RTX 4050 Laptop GPU | 2.5 kg | 27.3 mm | 16.00" | 2560x1600 | |
| 87.9 % v7 (old) | 05 / 2023 | Lenovo Legion Pro 5 16IRX8 i7-13700HX, GeForce RTX 4060 Laptop GPU | 2.5 kg | 26.8 mm | 16.00" | 2560x1600 | |
| 86.3 % v7 (old) | 06 / 2023 | Asus TUF A15 FA507 R7 7735HS, GeForce RTX 4050 Laptop GPU | 2.2 kg | 24.9 mm | 15.60" | 1920x1080 | |
| 86.2 % v7 (old) | 02 / 2023 | Asus TUF Gaming A16 FA617 R7 7735HS, Radeon RX 7600S | 2.2 kg | 27 mm | 16.00" | 1920x1200 | |
| 85.5 % v7 (old) | 06 / 2023 | Acer Nitro 5 AN517-55-5552 i5-12500H, GeForce RTX 4050 Laptop GPU | 3 kg | 28.9 mm | 17.30" | 1920x1080 | |
| 83 % v7 (old) | 05 / 2023 | Medion Erazer Scout E20 i7-13700H, GeForce RTX 4050 Laptop GPU | 2.8 kg | 29 mm | 17.30" | 1920x1080 |
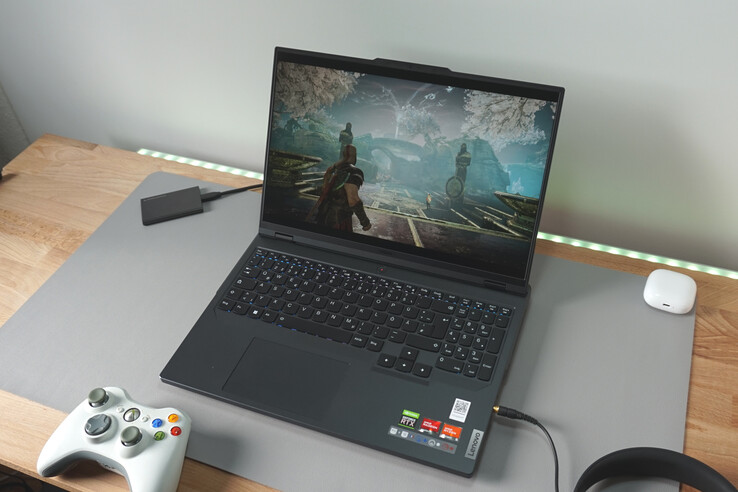
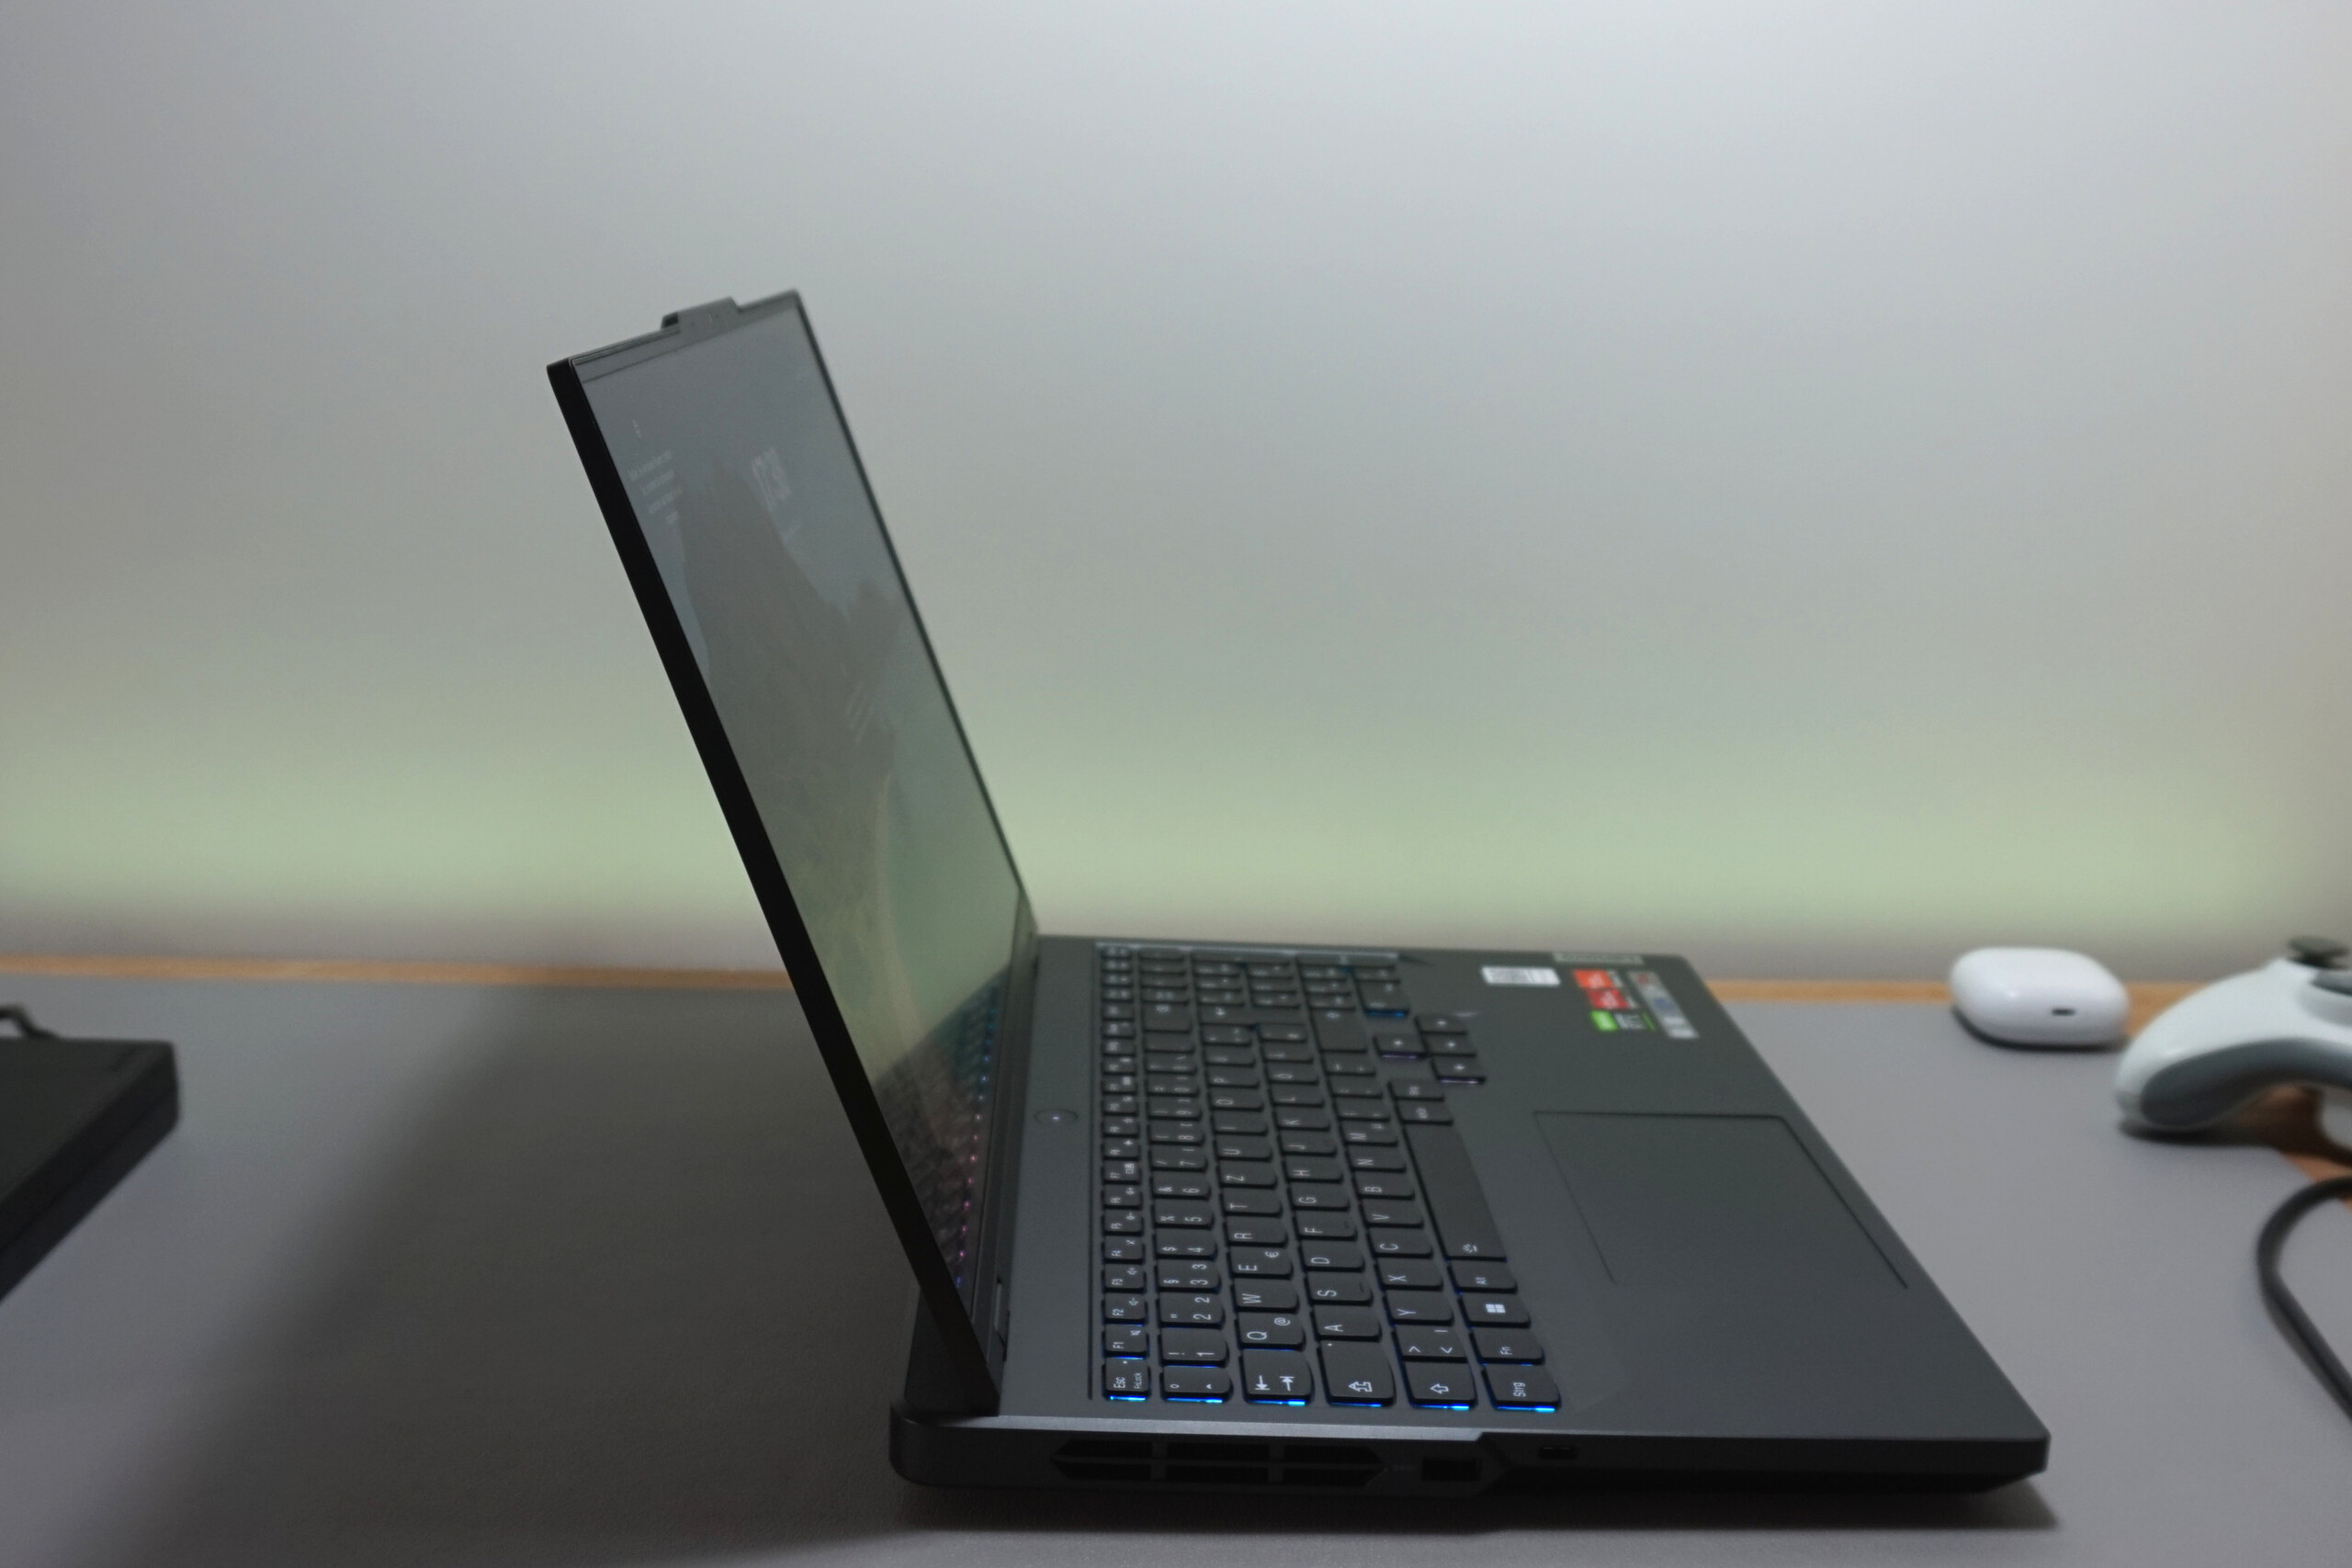
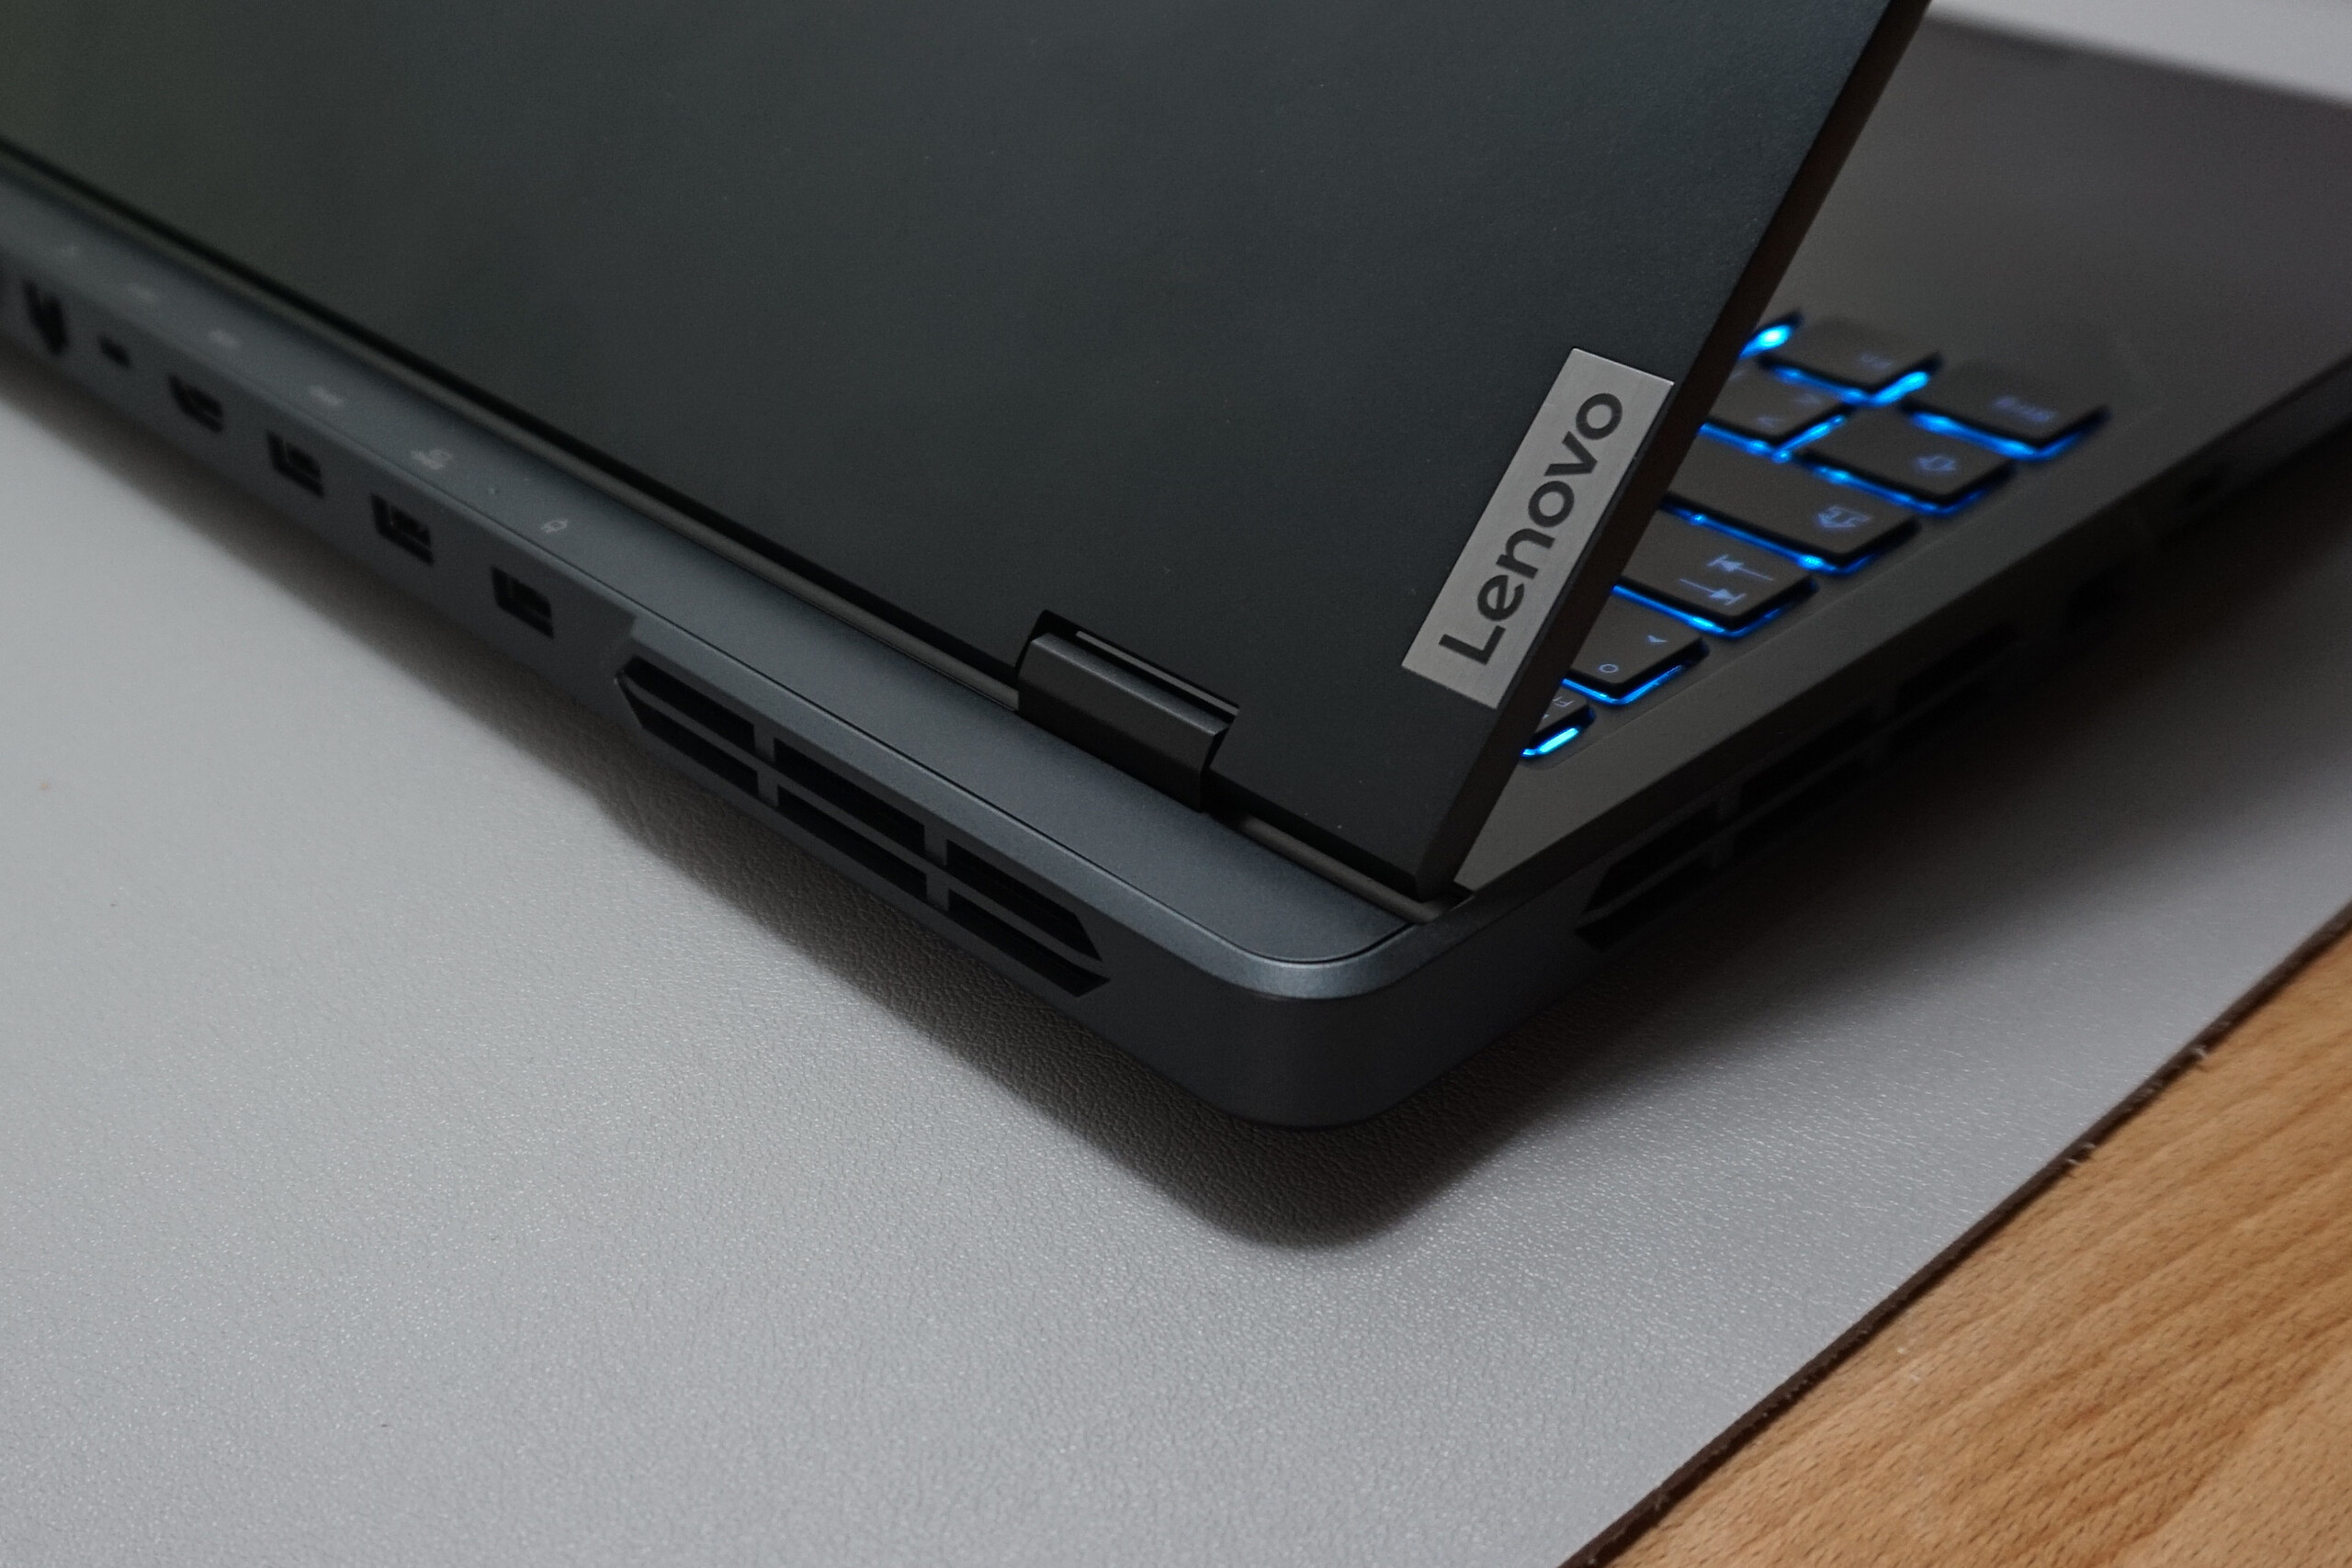
Case - Compact Legion with muted design
The clean, black chassis forgoes any splashes of colour and lighting effects. But it is equipped with pleasantly stiff hinges and an exceptionally solid metal bezel. The base section is also sufficiently sturdy.

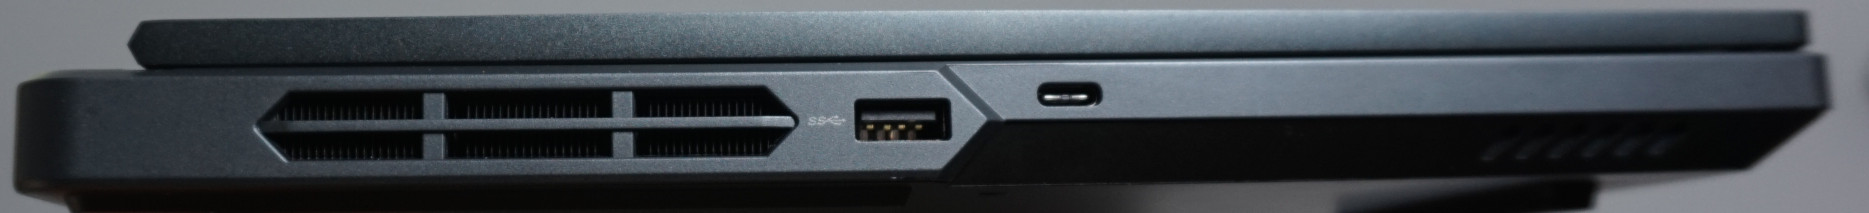
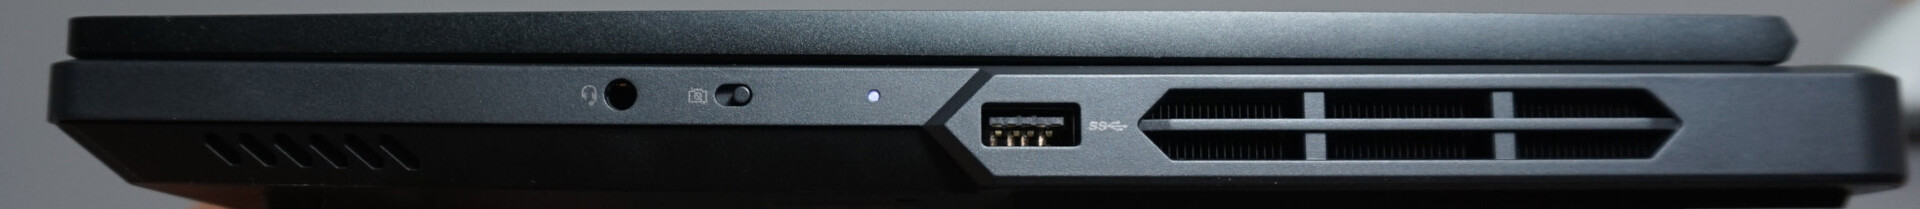
Specifications - Only missing those blazing fast ports
As with the Legion Pro 5 16IRX8, there are no Thunderbolt ports on the laptop. But this is to be expected from an AMD-based model. That said, the device offers three video outputs and can be charged via the USB-C port on the back, though this charging method doesn’t provide the full power required for gaming. Apart from that, the Legion Pro 5 comes with a good number and variety of ports. There is no card reader on board.
Another interesting feature is the mechanical switch on the right side that cuts off power to the webcam.

Webcam
The Full HD webcam delivers good enough image quality for video calls and adjusts brightness well to changing lighting conditions. The microphone is less compelling for a dual-array model. Voices sound slightly tinny, and you’ll only get decent volume when speaking directly into the microphone.

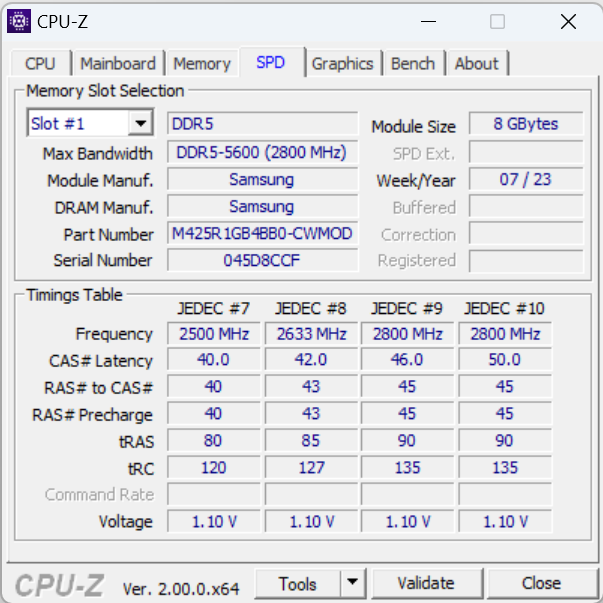
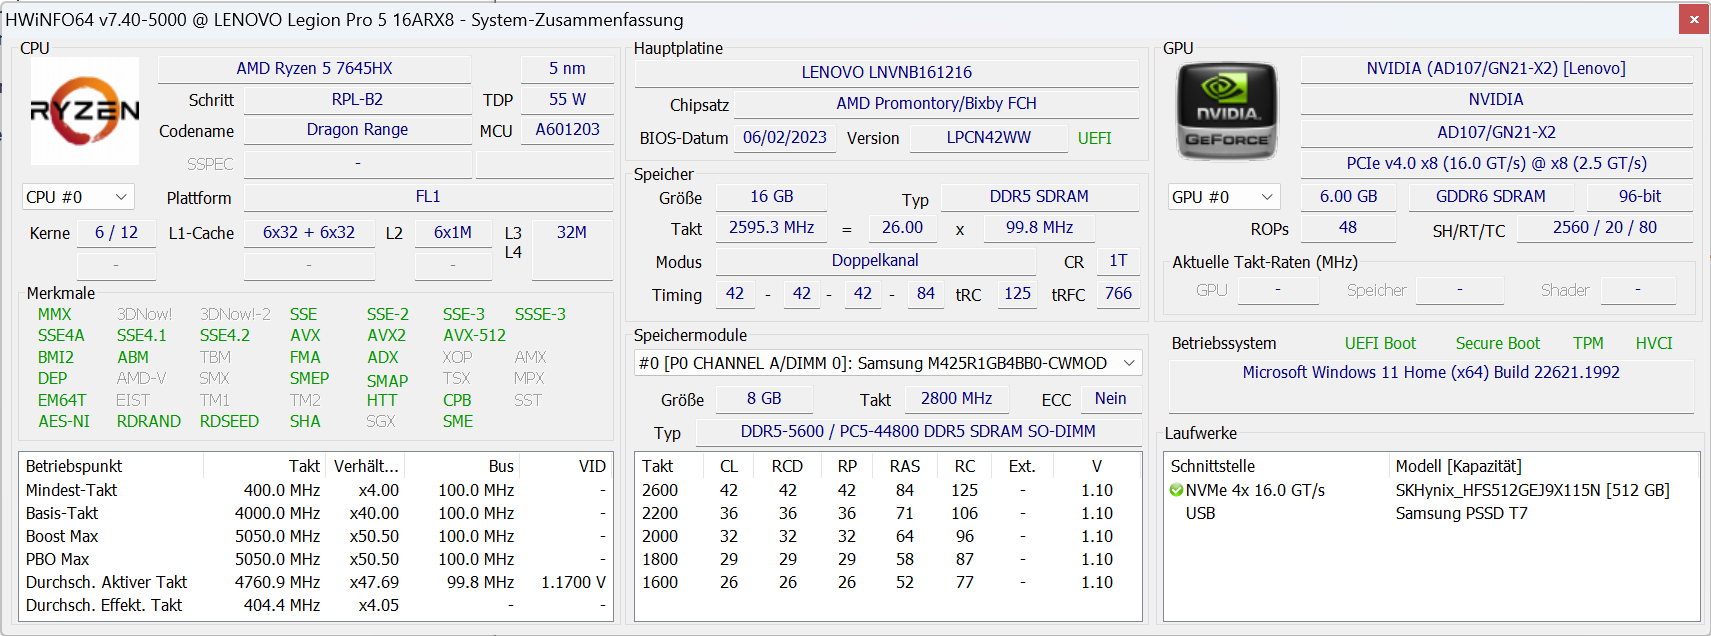
 GeForce RTX 4050 Laptop GPU, R5 7645HX, SK hynix PC801 HFS512GEJ9X115N")
 GeForce RTX 4050 Laptop GPU, R5 7645HX, SK hynix PC801 HFS512GEJ9X115N")
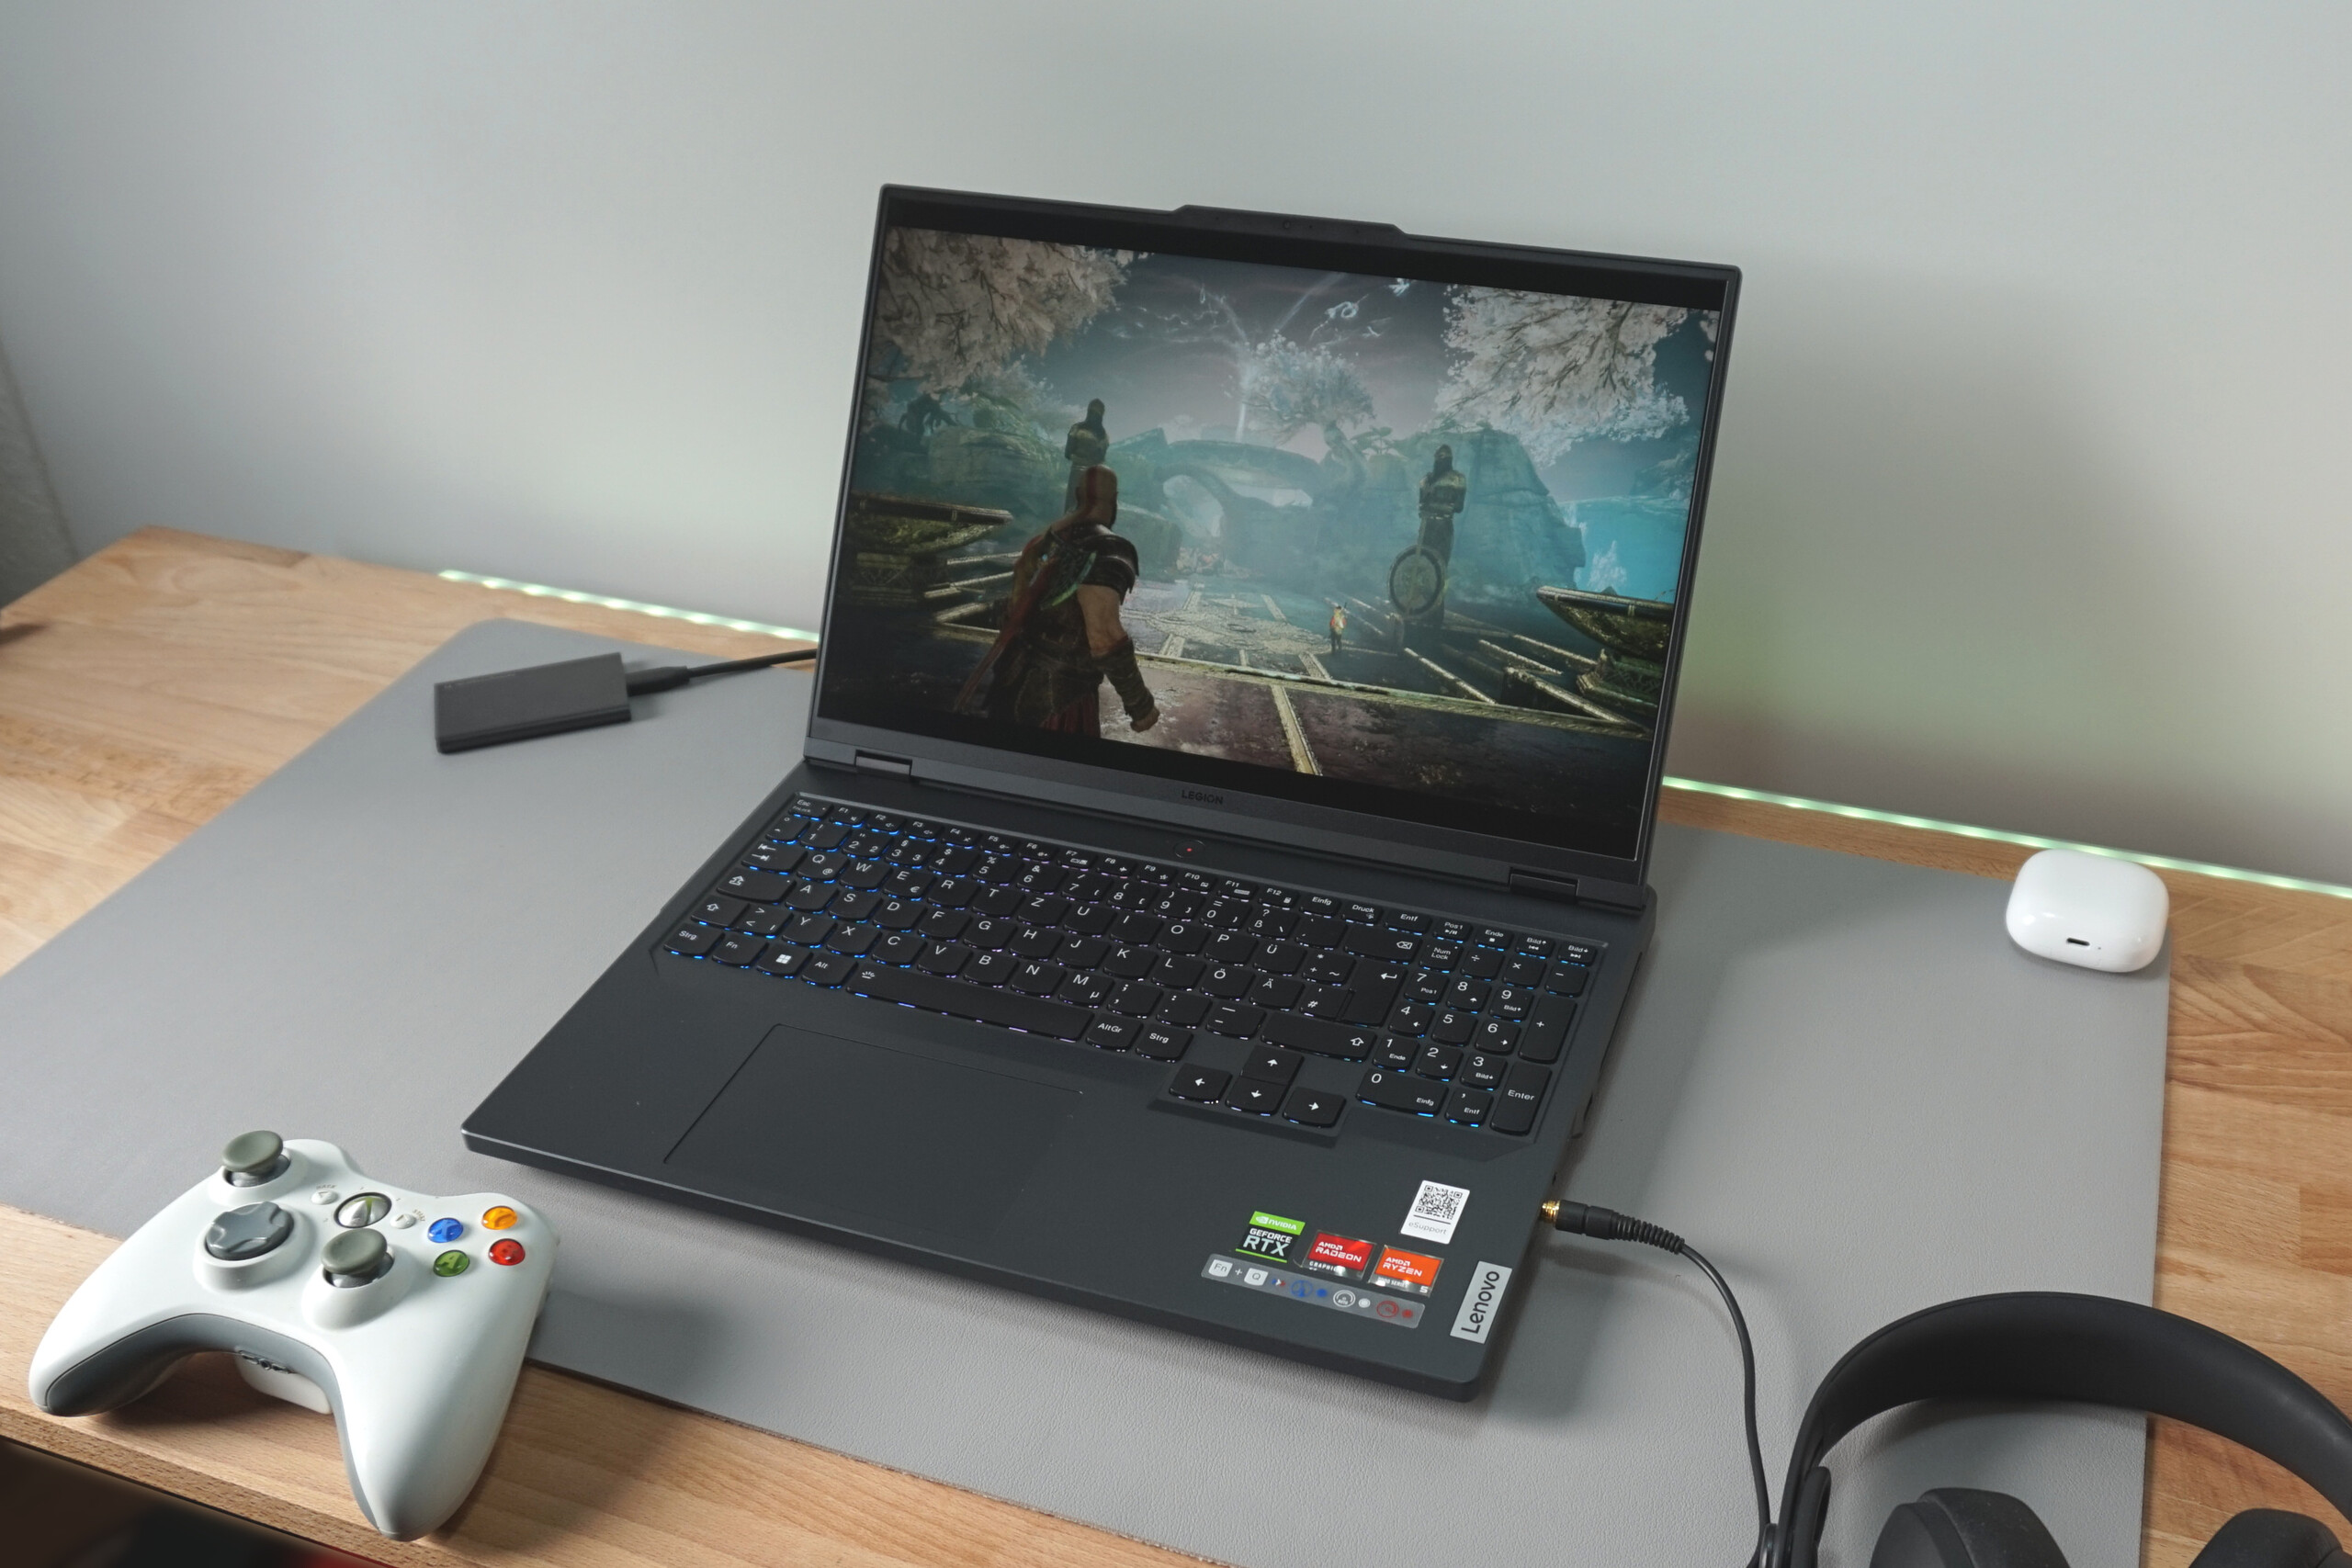
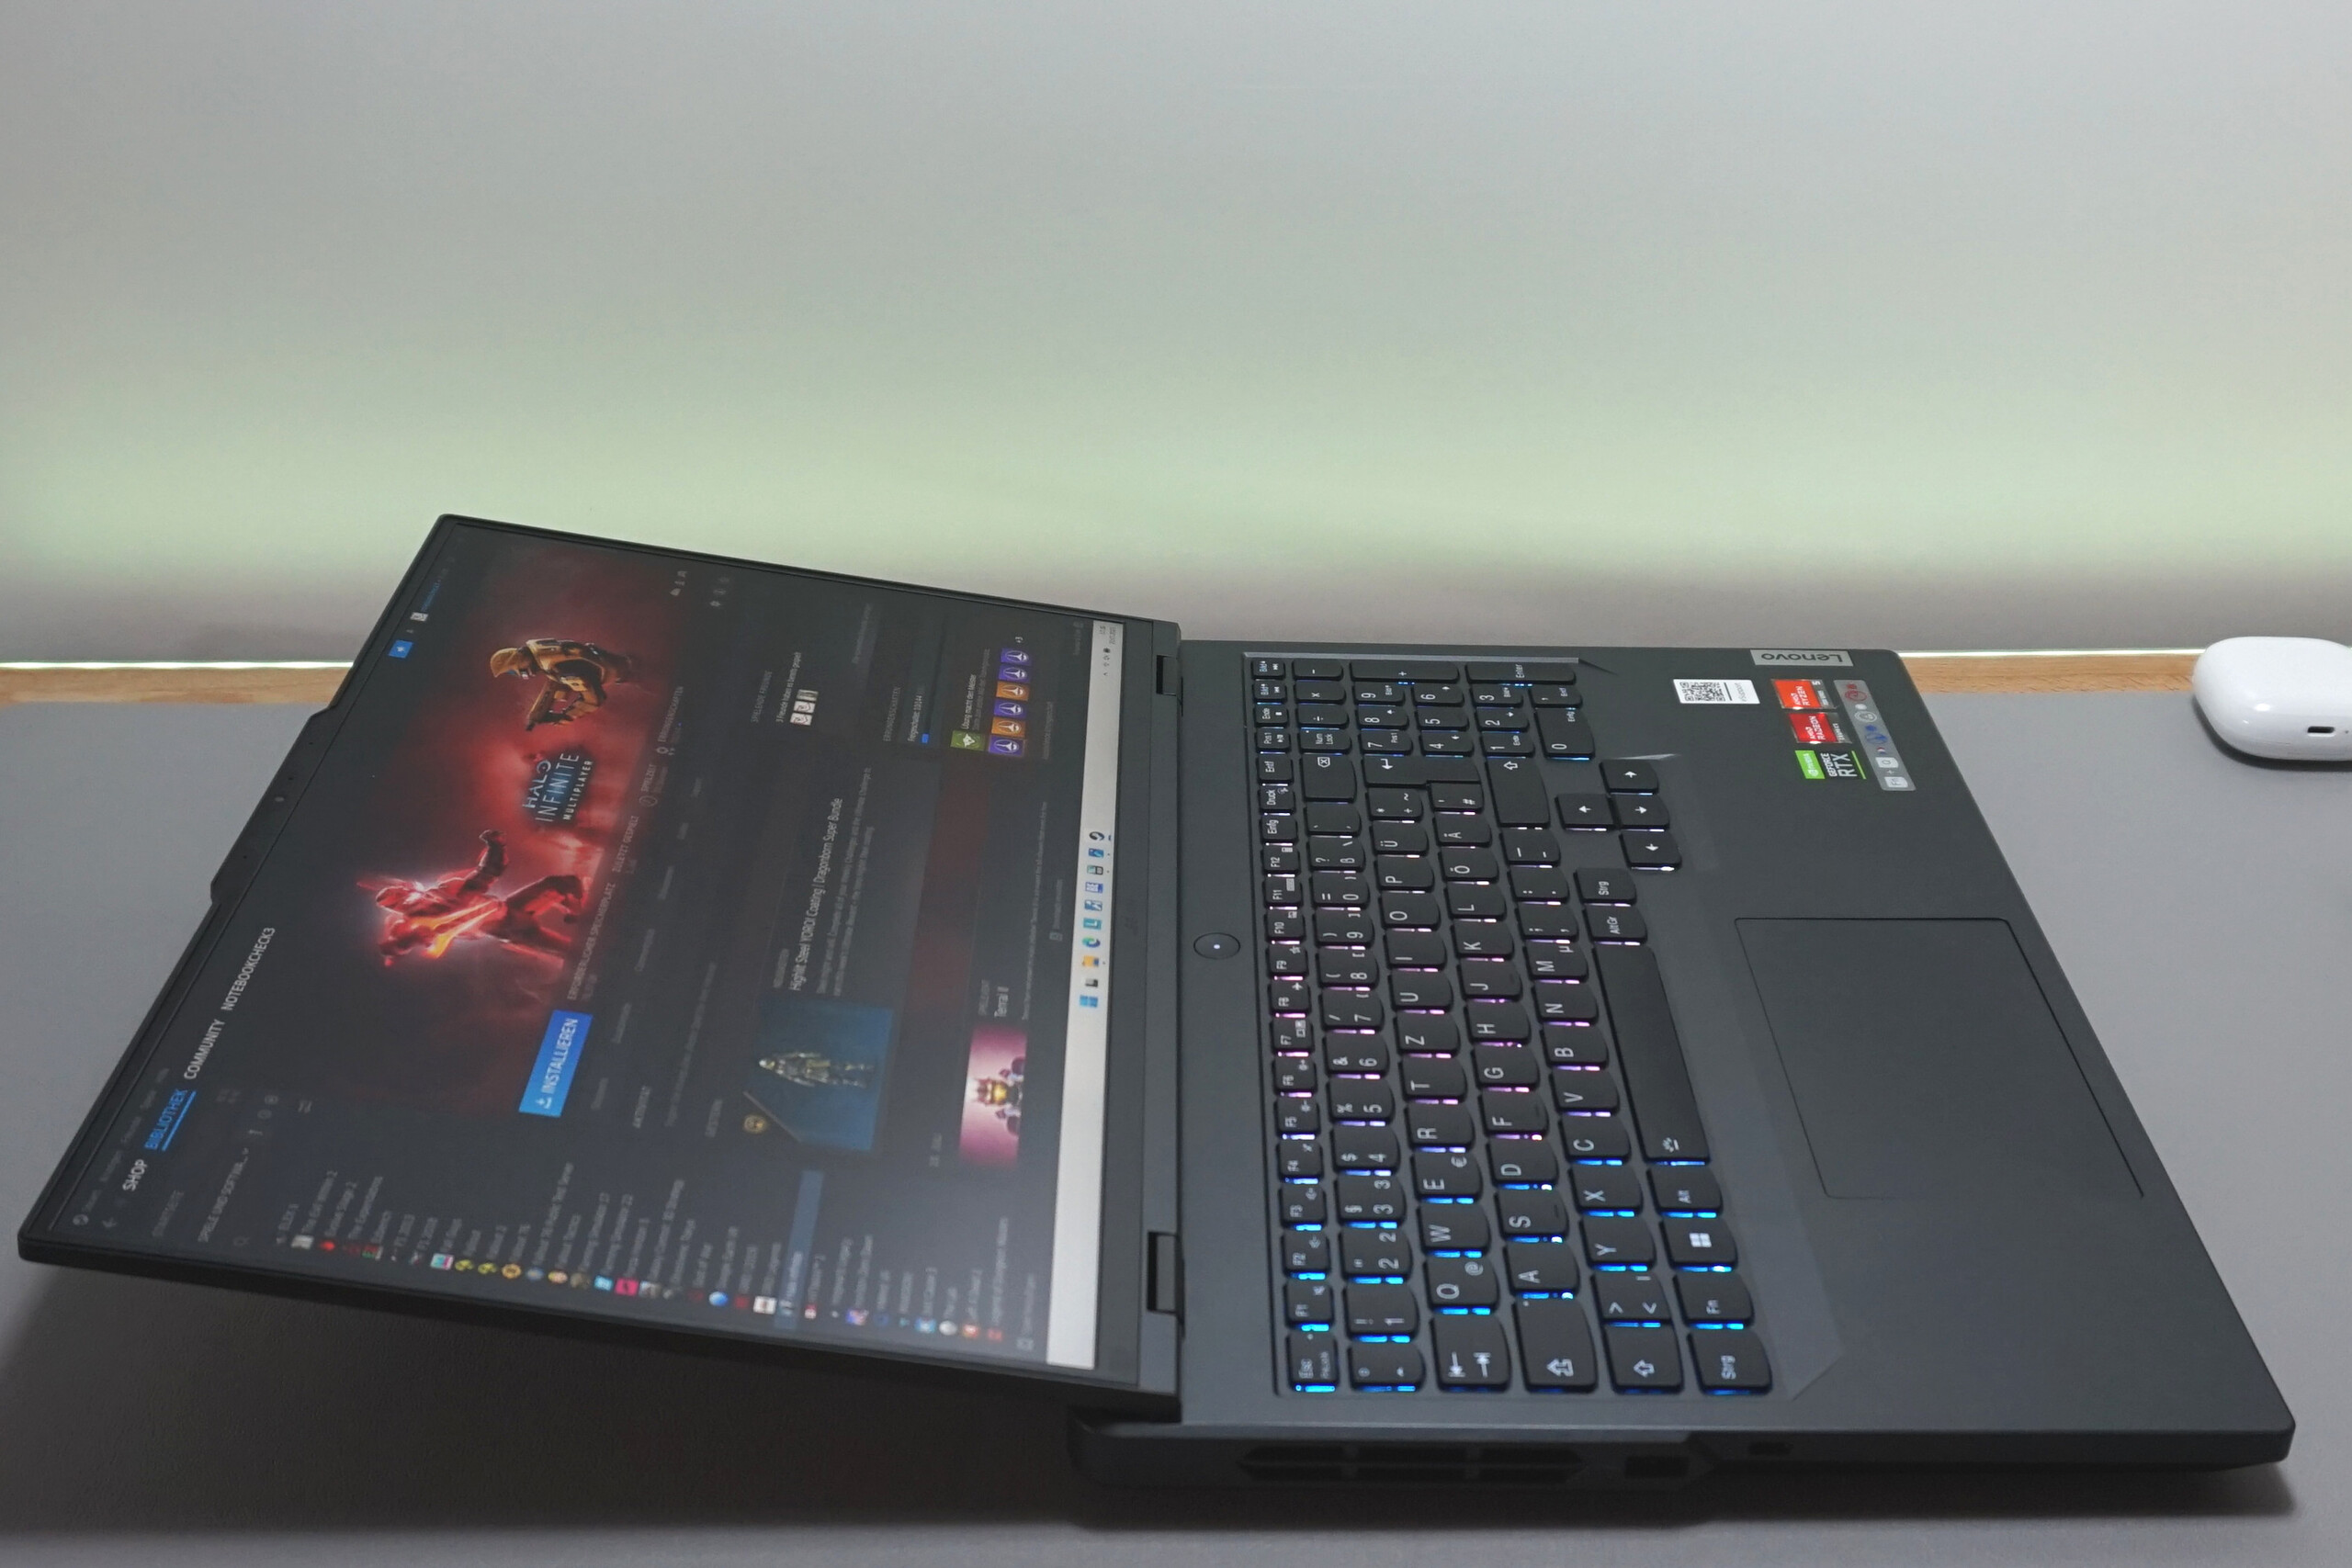
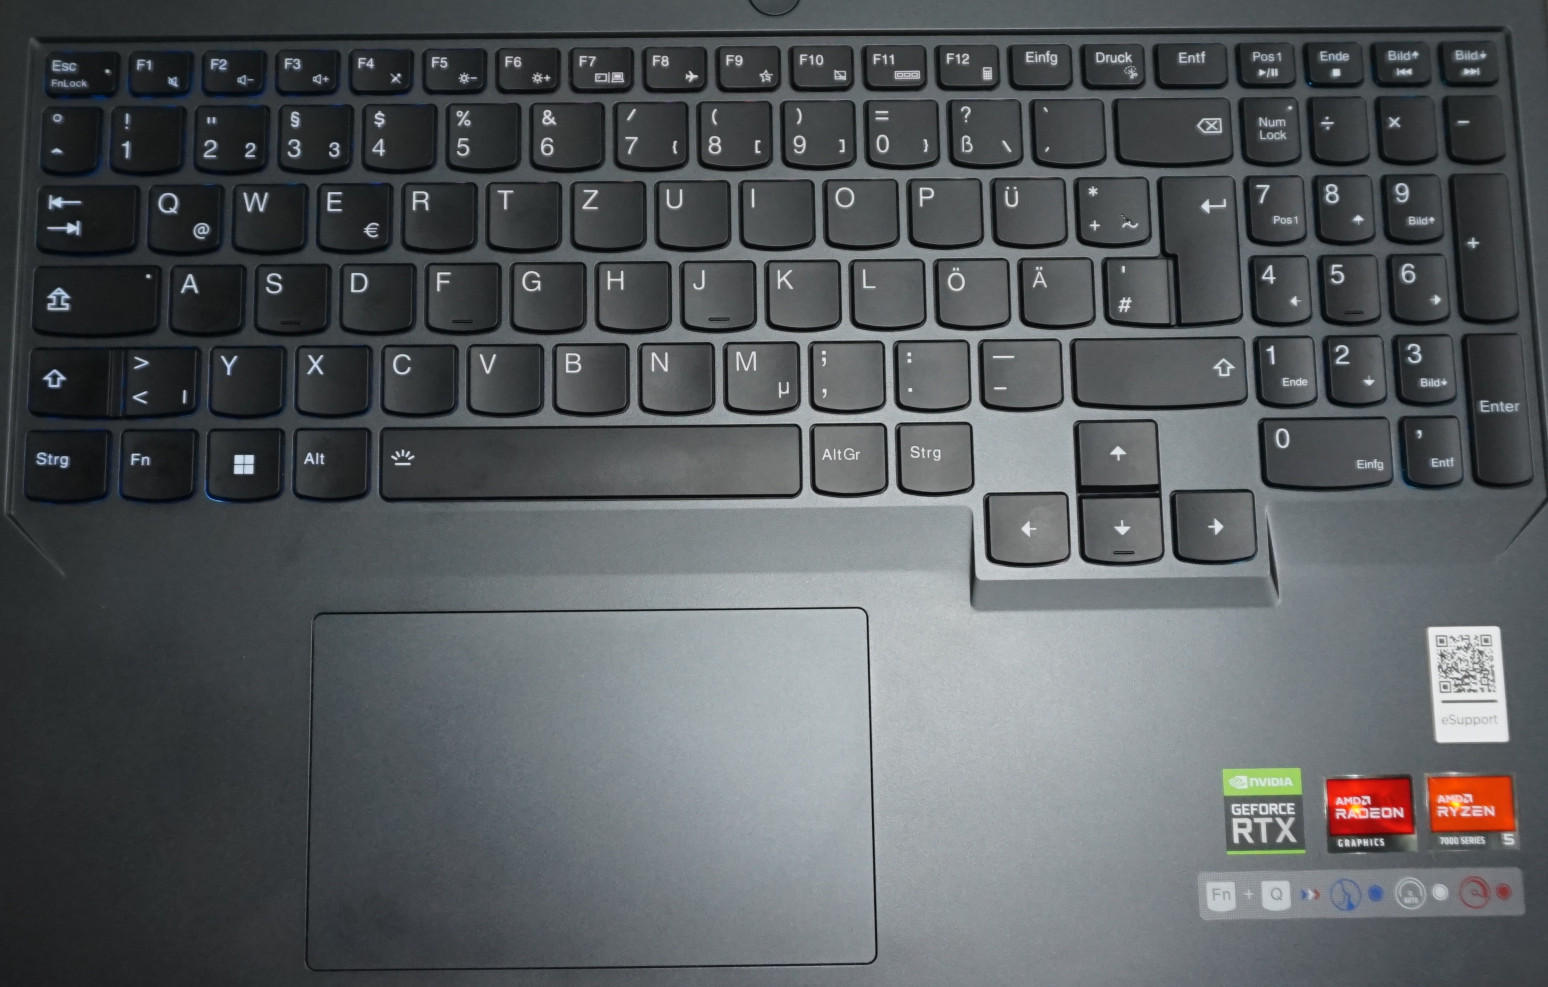
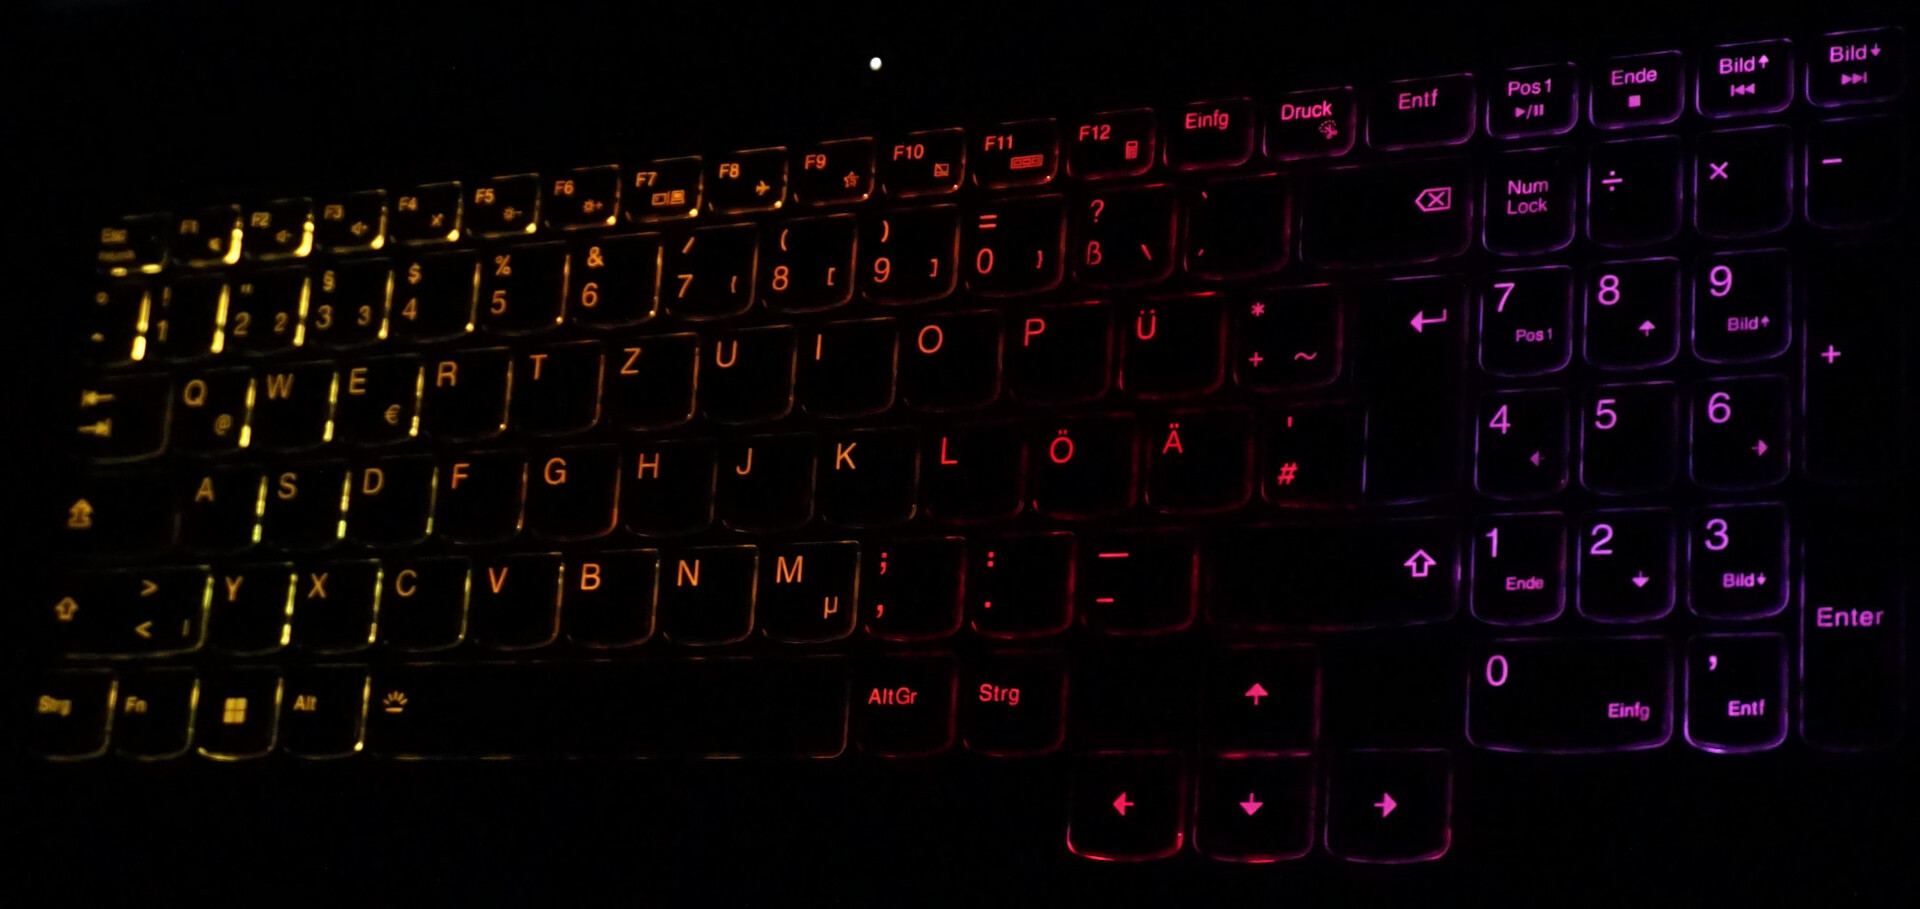
Input devices - Gaming notebook with comfy keyboard
Other than the slightly narrower numpad, the rest of the keyboard (including the arrow keys) is as large as a typical desktop keyboard. The keys could use a little more travel but provide a nice feedback. We didn’t like the touchpad as much. It sometimes doesn’t register a click input when we tap on the surface and only does so when we press down on the button physically.
The keyboard backlight offers limited customisation. There are only four zones, a handful of colours and even fewer effects available.
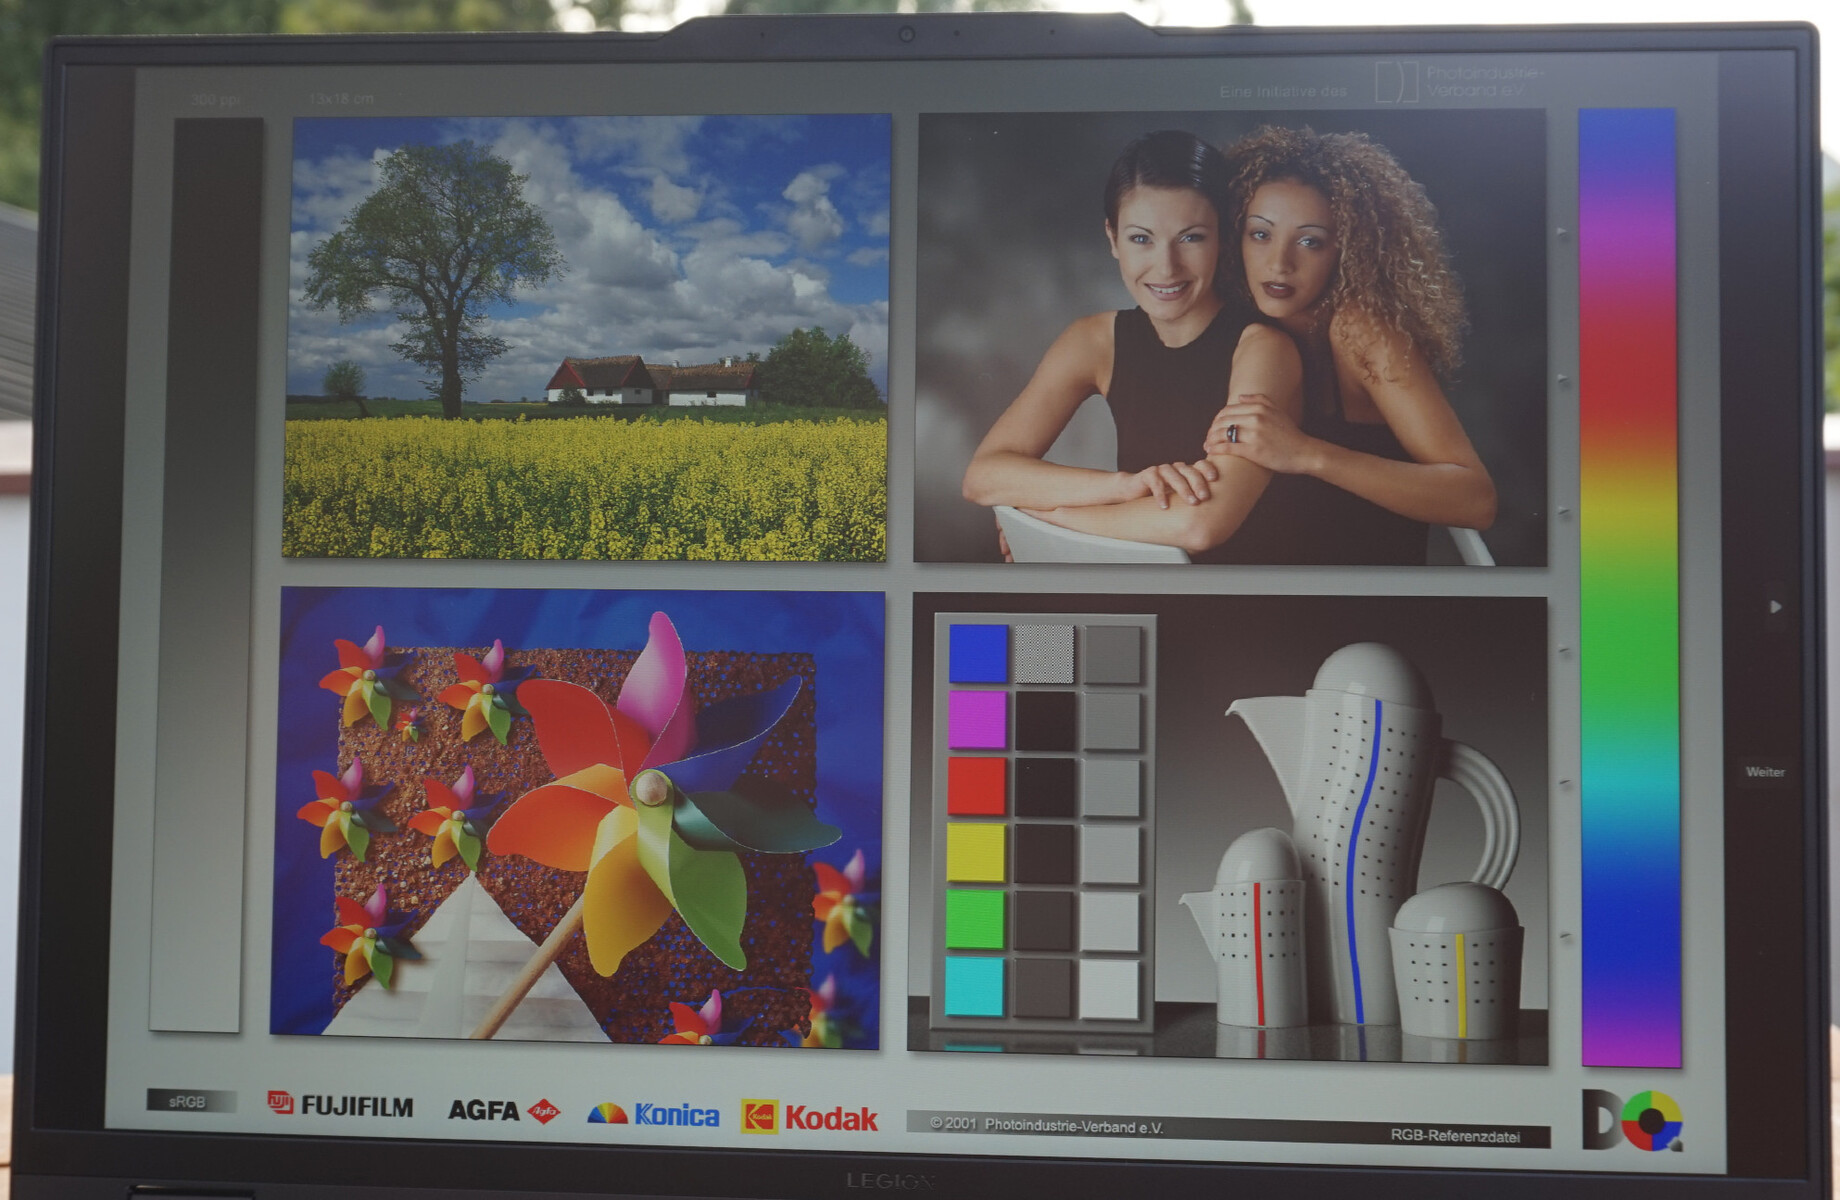
Display - Bright, accurate, fast

The screen on the Legion Pro 5 ticks all the essential boxes for a gaming display: 240Hz refresh rate, a resolution of 2,560 by 1,600 pixels and full sRGB coverage. The high pixel count along with the 16:10 aspect ratio also enables you to edit videos and images comfortably. The Legion Pro 5 packs enough computing power for such applications. That said, the refresh rate and resolution do feel somewhat too ambitious for the entry-level model with an RTX 4050, which you’ll see later in the “Gaming Performance” section.
Another thing worth noting is the high peak brightness of over 500 cd/m². This means the display can produce bright and vibrant images that pop even in bright environments. During evening gaming sessions, though, this particular quality has less of an impact on how images look on screen. In a dim environment, the display’s relatively poor black level (which results in a merely average contrast ratio) doesn’t allow for very deep blacks during darker scenes. An OLED display would probably have been more suitable.
But in this price bracket, and especially for gaming, the IPS panel on board seems to be an excellent choice due to its great overall image quality. We didn’t detect any PWM flicker and only noticed a minimal amount of screen bleeding.
| |||||||||||||||||||||||||
Brightness Distribution: 87 %
Center on Battery: 534 cd/m²
Contrast: 936:1 (Black: 0.58 cd/m²)
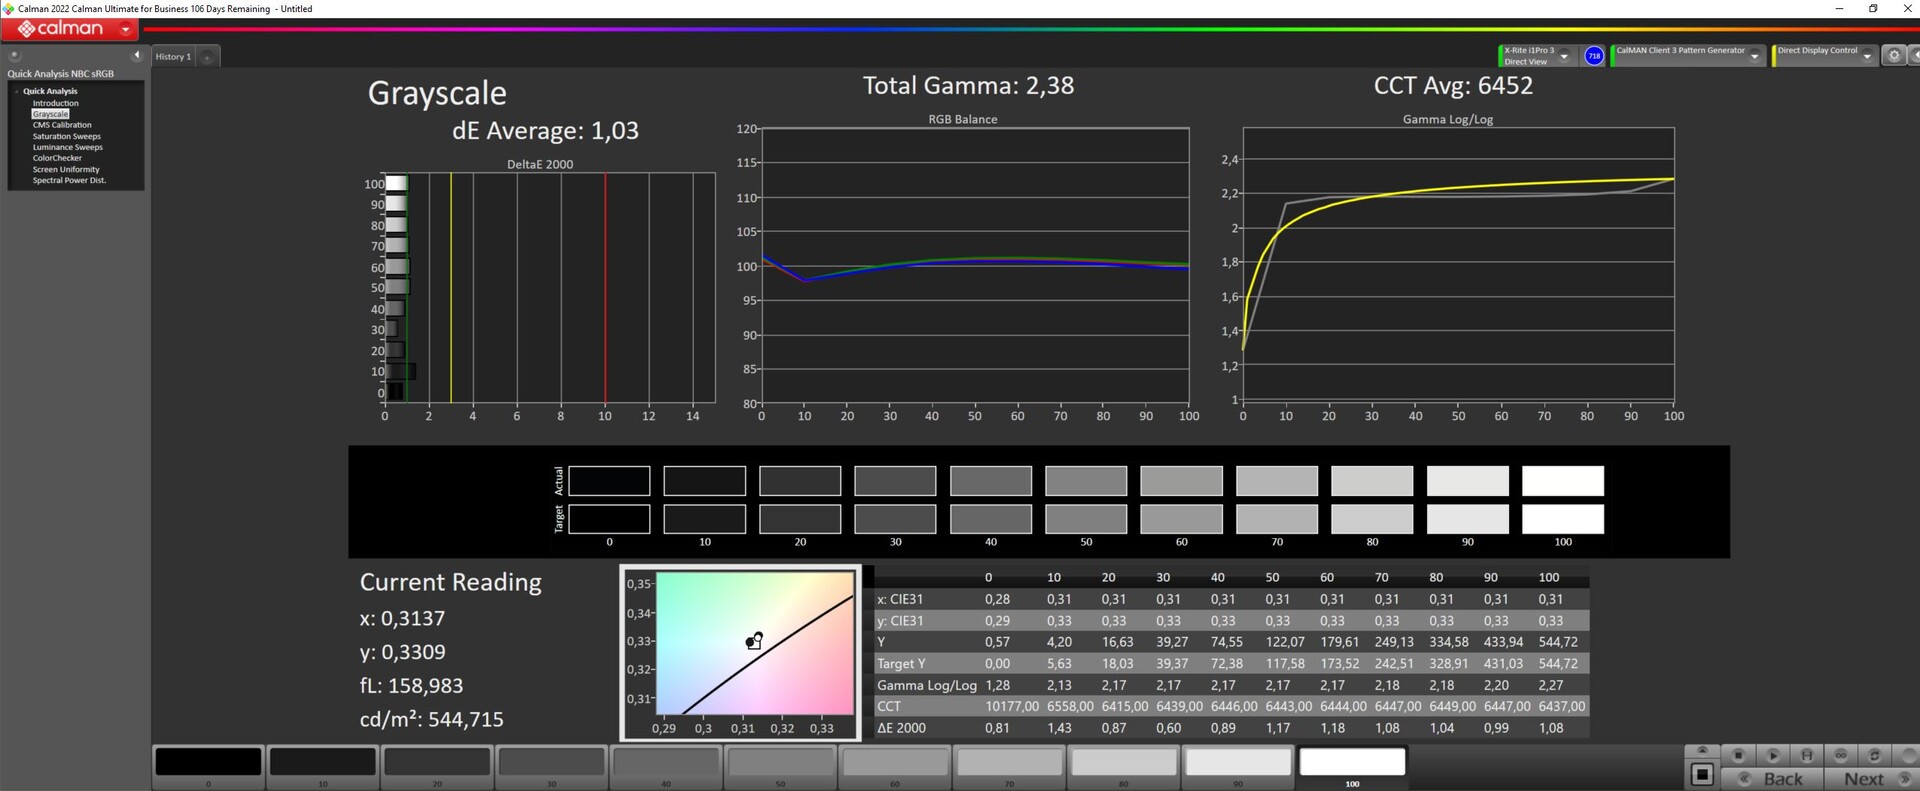
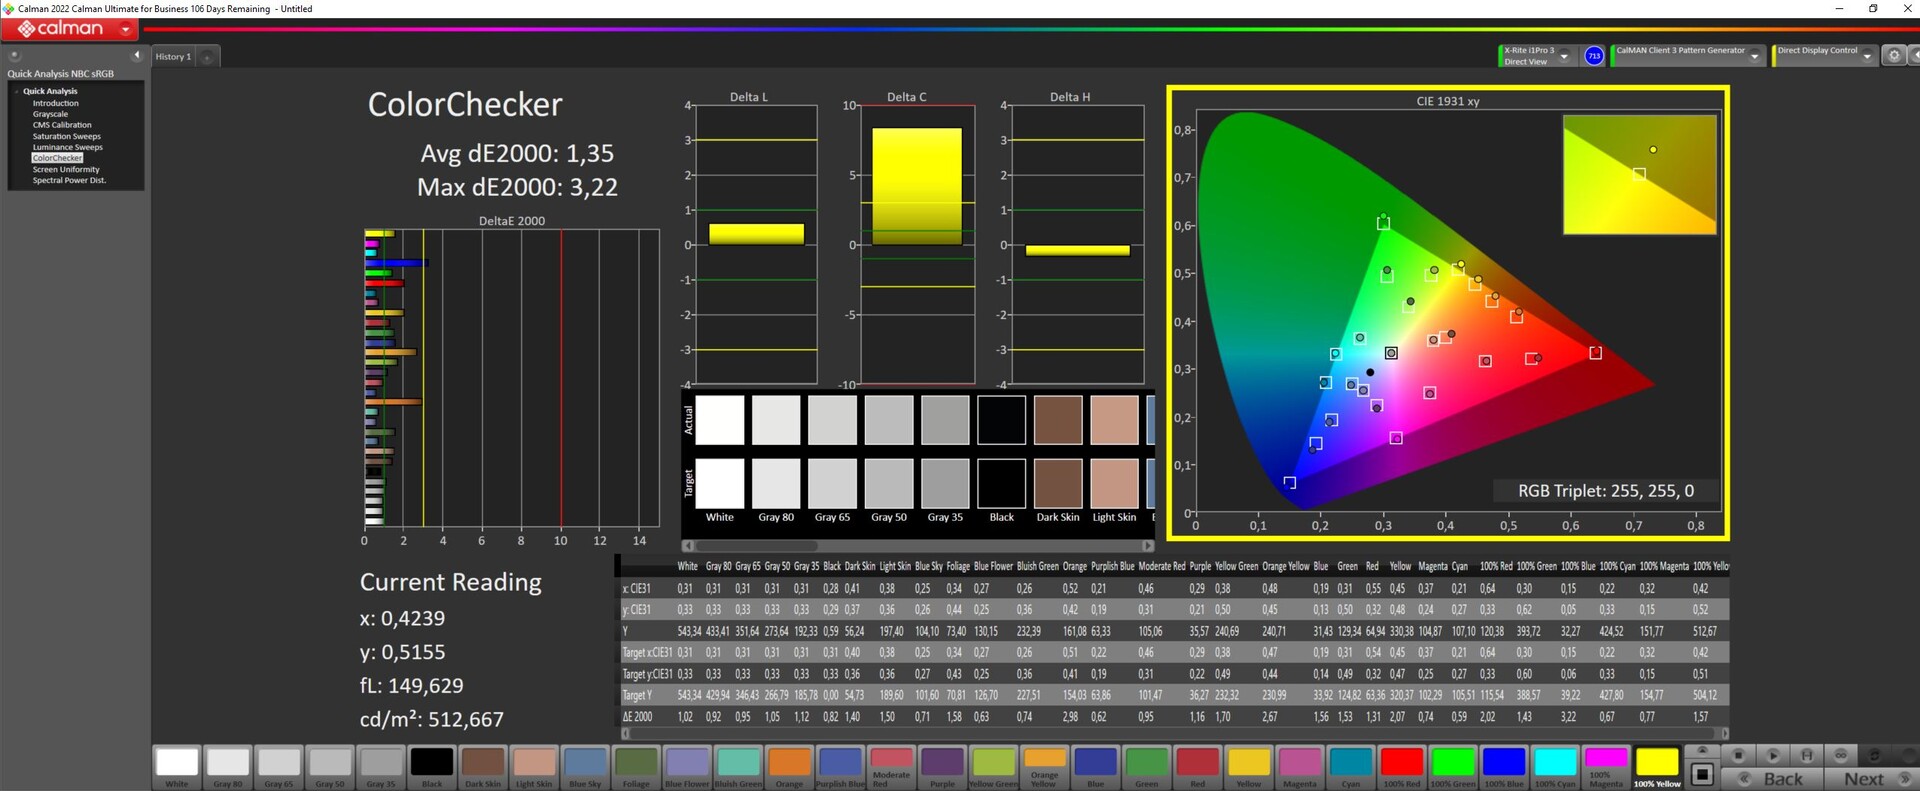
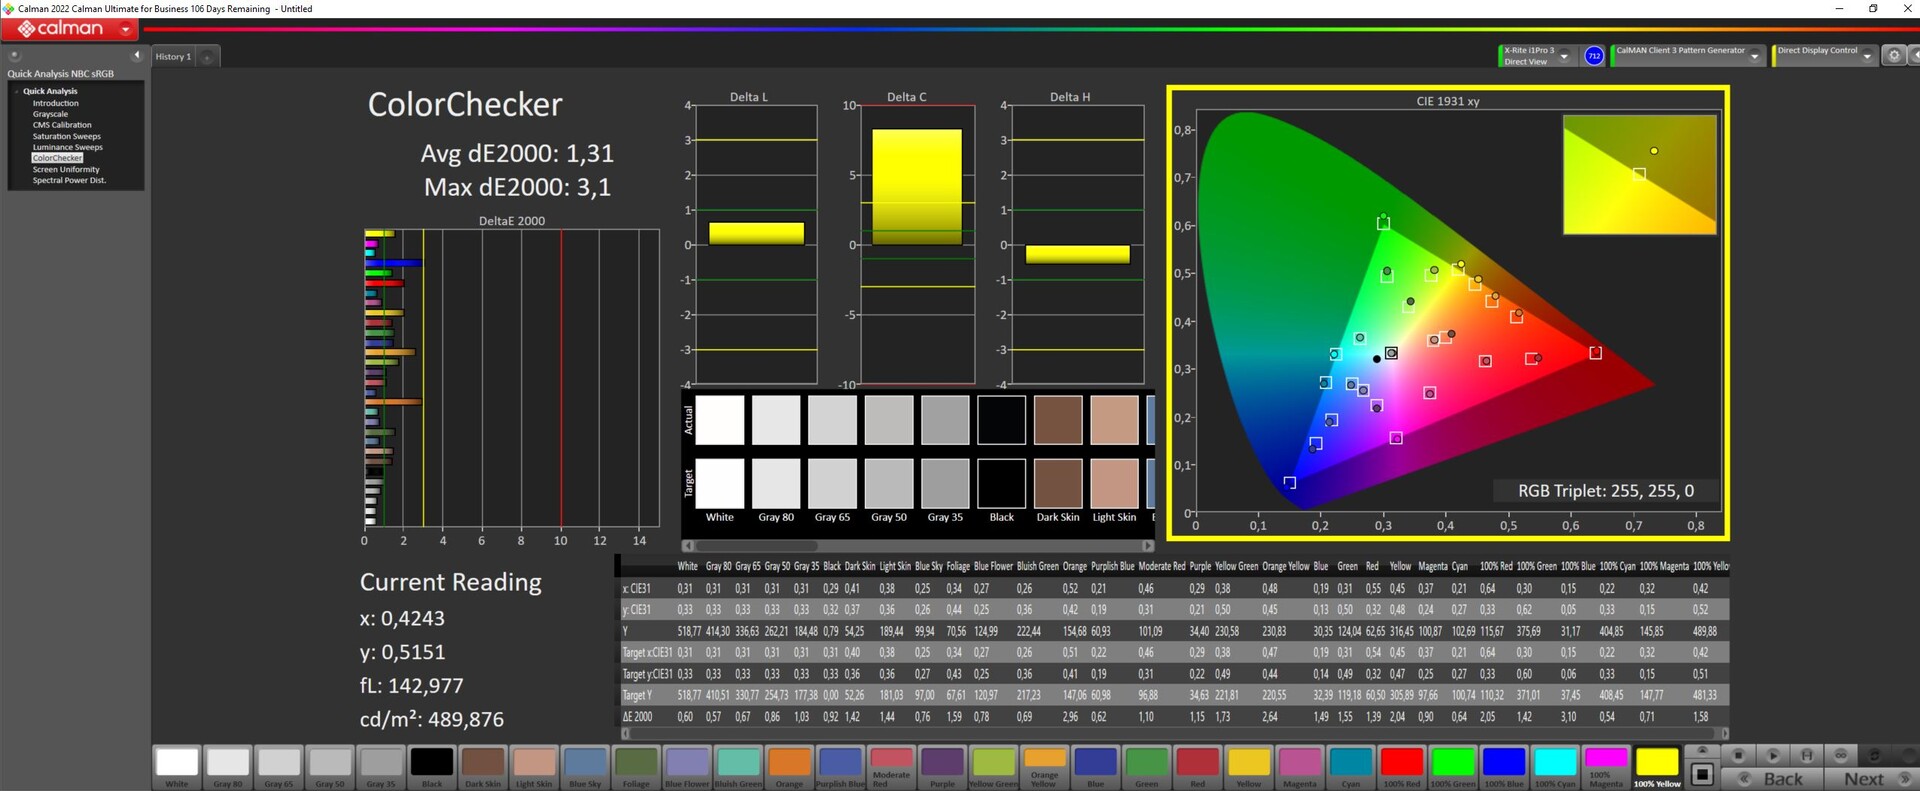
ΔE ColorChecker Calman: 1.35 | ∀{0.5-29.43 Ø4.71}
calibrated: 1.31
ΔE Greyscale Calman: 1.03 | ∀{0.09-98 Ø4.96}
72.9% AdobeRGB 1998 (Argyll 3D)
99.8% sRGB (Argyll 3D)
71.6% Display P3 (Argyll 3D)
Gamma: 2.38
CCT: 6452 K
| Lenovo Legion Pro 5 16ARX8 (R5 7645HX, RTX 4050) CSOT T3 MNG007DA2-2, IPS, 2560x1600, 16" | Lenovo Legion Pro 5 16IRX8 AU Optronics B160QAN03.1, IPS, 2560x1600, 16" | Acer Nitro 5 AN517-55-5552 BOE0A6F NV173FHM-NX4, IPS, 1920x1080, 17.3" | Asus TUF A15 FA507 N156HMA-GA1, IPS, 1920x1080, 15.6" | Medion Erazer Scout E20 LG Philips LGD0611, IPS, 1920x1080, 17.3" | Asus TUF Gaming A16 FA617 NE160WUM-NX2 (BOE0B33), IPS-Level, 1920x1200, 16" | |
|---|---|---|---|---|---|---|
| Display | -0% | -46% | -7% | -7% | -3% | |
| Display P3 Coverage (%) | 71.6 | 71.2 -1% | 37.6 -47% | 64.9 -9% | 65.1 -9% | 69.4 -3% |
| sRGB Coverage (%) | 99.8 | 98.8 -1% | 56.4 -43% | 96.5 -3% | 96.7 -3% | 97.8 -2% |
| AdobeRGB 1998 Coverage (%) | 72.9 | 73.3 1% | 38.9 -47% | 66.6 -9% | 66.5 -9% | 70.9 -3% |
| Response Times | -61% | -110% | -227% | -62% | -68% | |
| Response Time Grey 50% / Grey 80% * (ms) | 12 ? | 14.5 ? -21% | 18 ? -50% | 30.4 ? -153% | 14.8 ? -23% | 17 ? -42% |
| Response Time Black / White * (ms) | 5.2 ? | 10.4 ? -100% | 14 ? -169% | 20.8 ? -300% | 10.4 ? -100% | 10.1 ? -94% |
| PWM Frequency (Hz) | ||||||
| Screen | -2% | -107% | -12% | -41% | -8% | |
| Brightness middle (cd/m²) | 543 | 405.7 -25% | 285 -48% | 288 -47% | 312 -43% | 308 -43% |
| Brightness (cd/m²) | 516 | 368 -29% | 257 -50% | 271 -47% | 303 -41% | 293 -43% |
| Brightness Distribution (%) | 87 | 87 0% | 81 -7% | 91 5% | 91 5% | 90 3% |
| Black Level * (cd/m²) | 0.58 | 0.38 34% | 0.58 -0% | 0.17 71% | 0.25 57% | 0.23 60% |
| Contrast (:1) | 936 | 1068 14% | 491 -48% | 1694 81% | 1248 33% | 1339 43% |
| Colorchecker dE 2000 * | 1.35 | 1.65 -22% | 4.59 -240% | 1.9 -41% | 2.65 -96% | 1.47 -9% |
| Colorchecker dE 2000 max. * | 3.22 | 4.2 -30% | 6.98 -117% | 3.3 -2% | 6.44 -100% | 2.98 7% |
| Colorchecker dE 2000 calibrated * | 1.31 | 0.53 60% | 4.82 -268% | 0.9 31% | 0.96 27% | 1.02 22% |
| Greyscale dE 2000 * | 1.03 | 1.2 -17% | 2.89 -181% | 2.7 -162% | 3.2 -211% | 2.2 -114% |
| Gamma | 2.38 92% | 2.3 96% | 2.38 92% | 2.32 95% | 2.246 98% | 2.228 99% |
| CCT | 6452 101% | 6453 101% | 7000 93% | 6535 99% | 7258 90% | 6228 104% |
| Total Average (Program / Settings) | -21% /
-10% | -88% /
-94% | -82% /
-42% | -37% /
-37% | -26% /
-16% |
* ... smaller is better
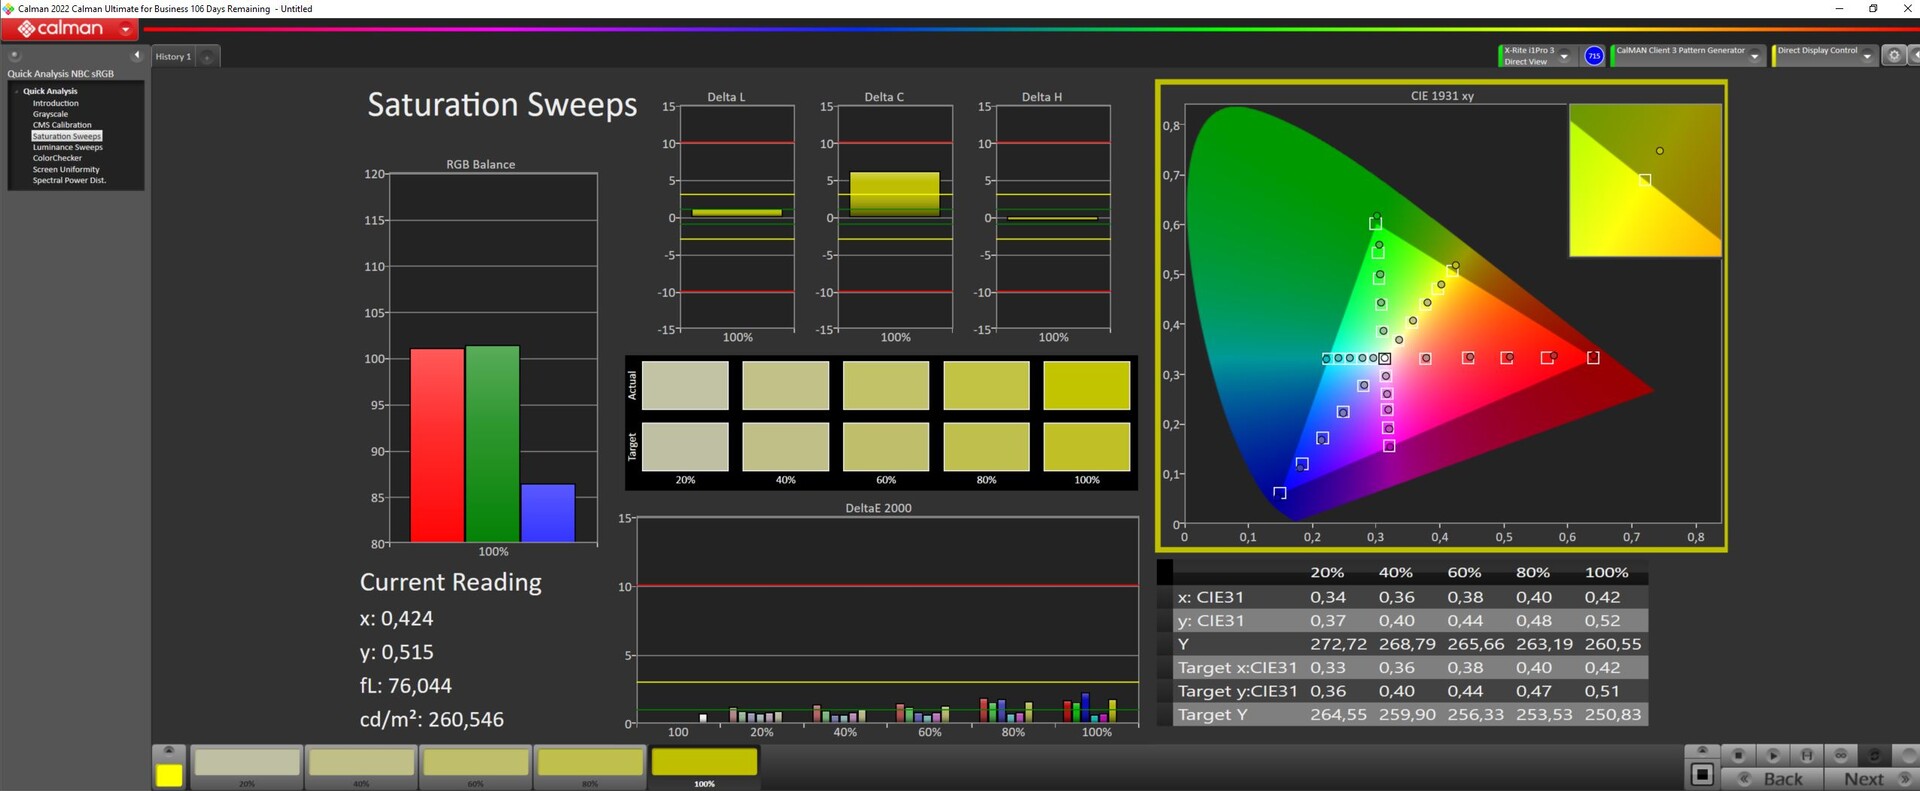
As with the displays on similarly spec’d competitors, the panel on the Legion Pro 5 can almost reproduce the entire sRGB gamut and is only a fraction away from 100% coverage based on our measurements. Full AdobeRGB and Display-P3 reproduction is beyond the display's capabilities. However, this doesn’t present any disadvantage on a gaming laptop. It is even possible to edit photos very well on the device, provided you aren't expecting it to meet professional standards.
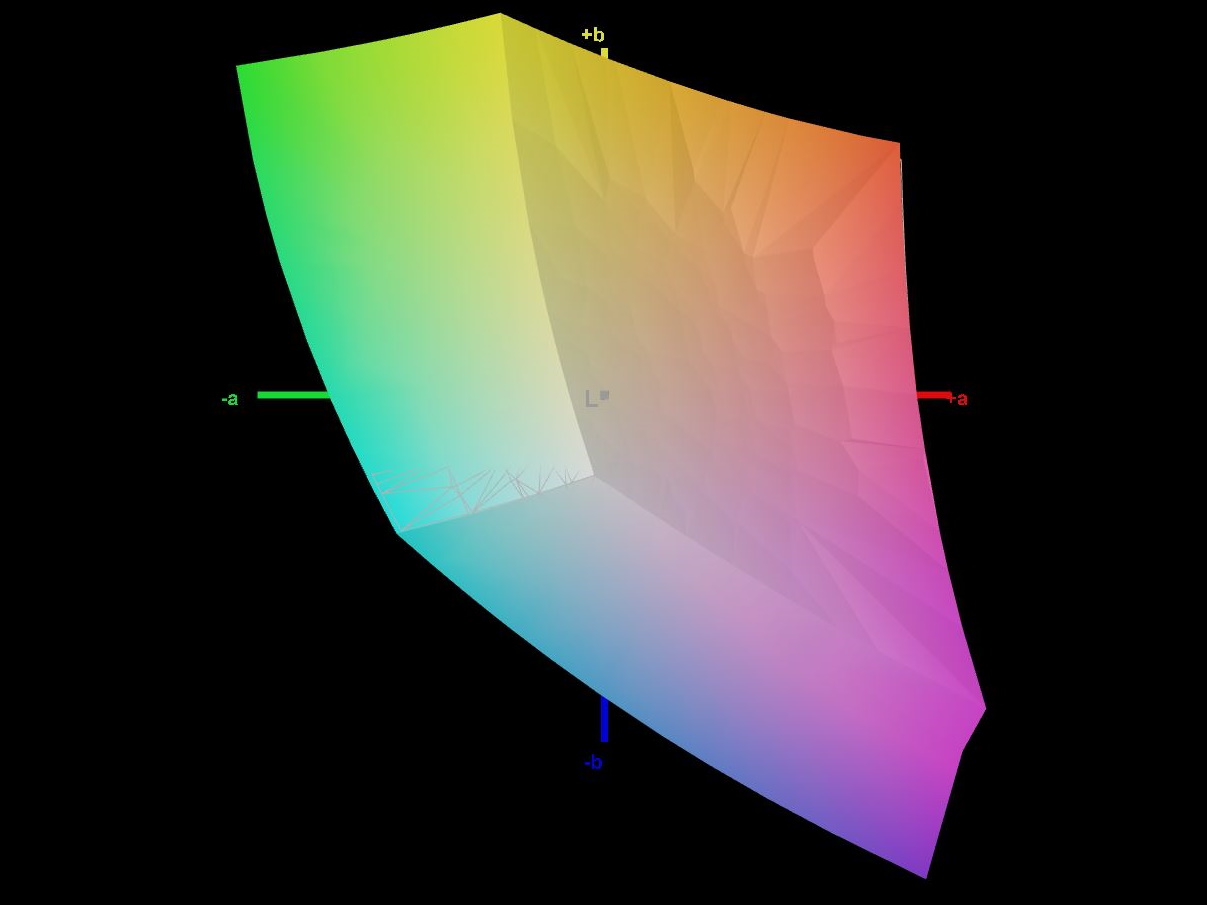
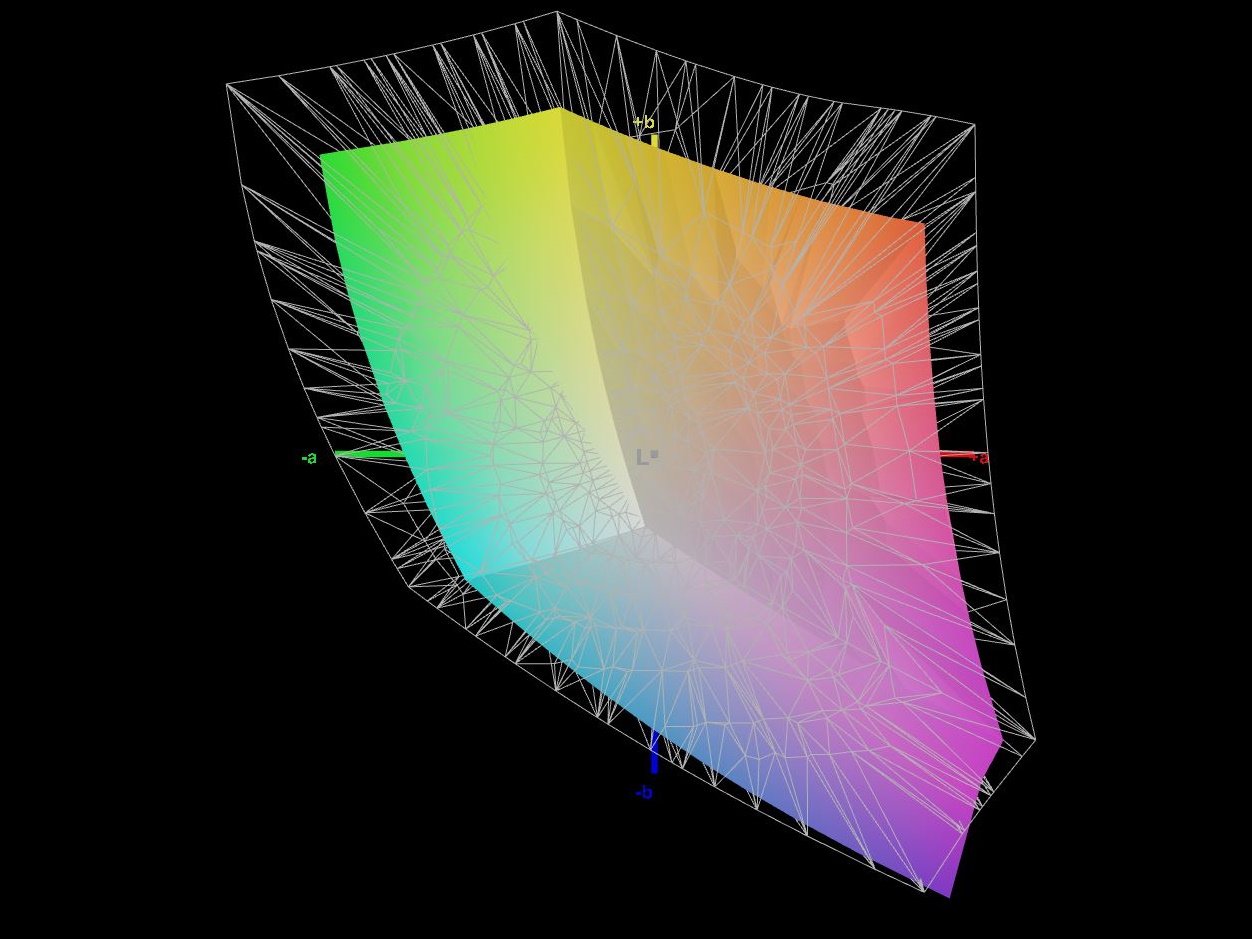
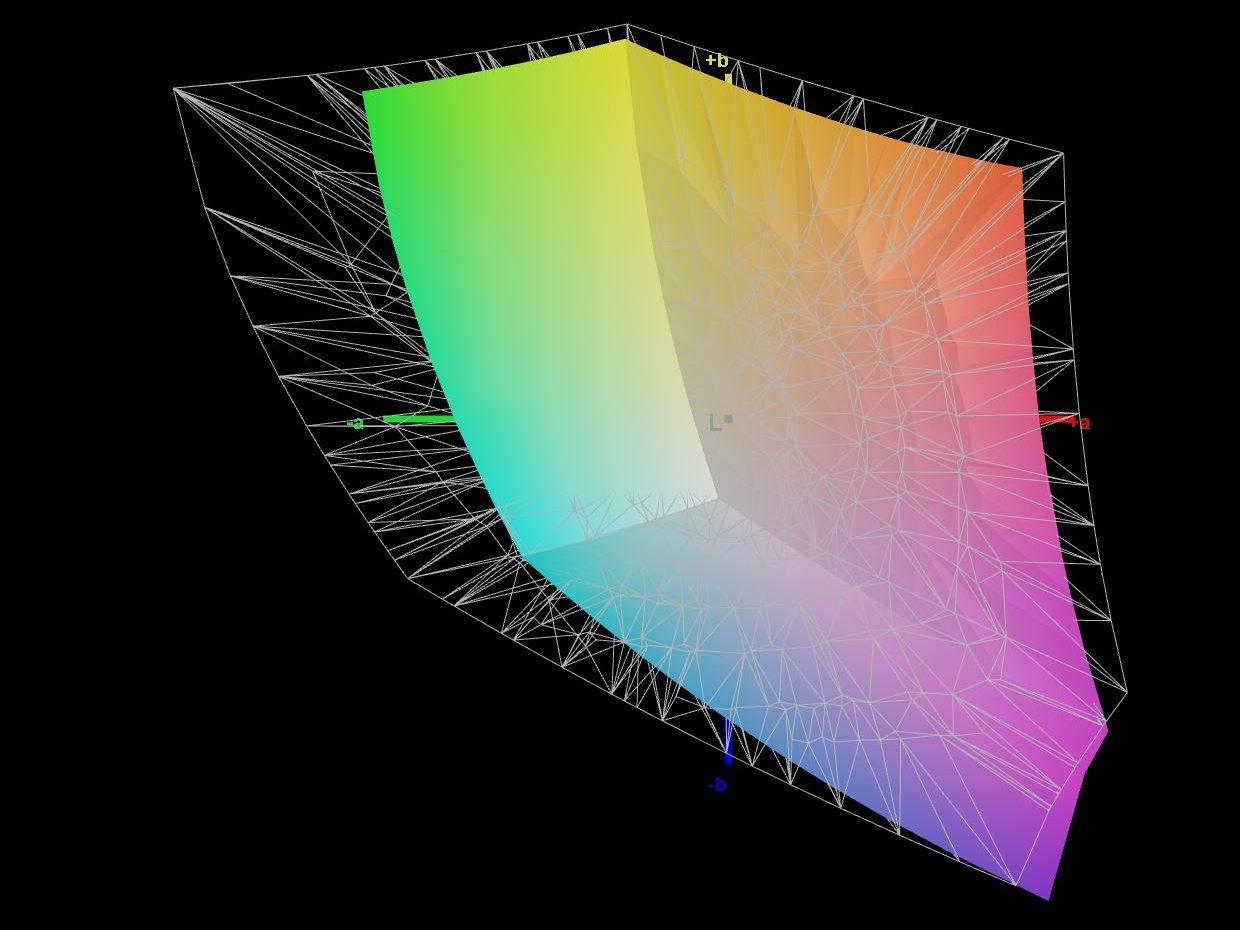
According to our measurements, blue had the highest Delta E of all the colours. But even so, only a pair of well-trained eyes can perceive this max Delta E. The overall colour difference is so low that even professional monitors wouldn’t perform much better either. Unsurprisingly, our calibration didn’t produce any significant improvement.


Display Response Times
| ↔ Response Time Black to White | ||
|---|---|---|
| 5.2 ms ... rise ↗ and fall ↘ combined | ↗ 1.8 ms rise | 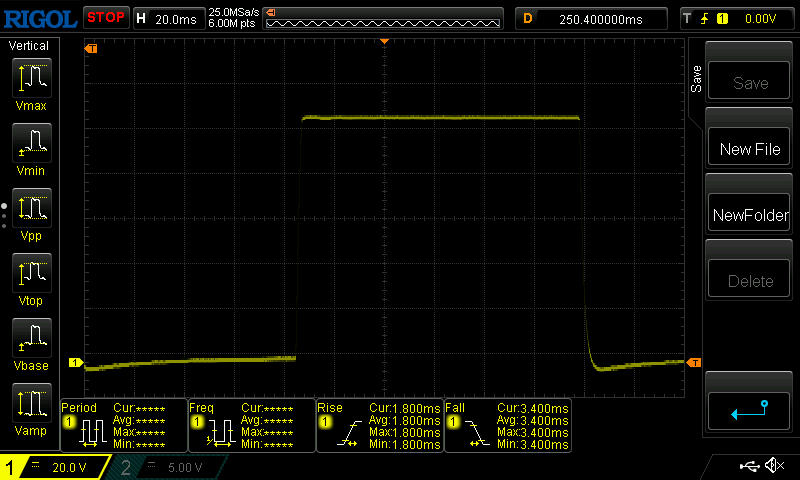 |
| ↘ 3.4 ms fall | ||
| The screen shows very fast response rates in our tests and should be very well suited for fast-paced gaming. In comparison, all tested devices range from 0.1 (minimum) to 240 (maximum) ms. » 18 % of all devices are better. This means that the measured response time is better than the average of all tested devices (19.8 ms). | ||
| ↔ Response Time 50% Grey to 80% Grey | ||
| 12 ms ... rise ↗ and fall ↘ combined | ↗ 5.4 ms rise | 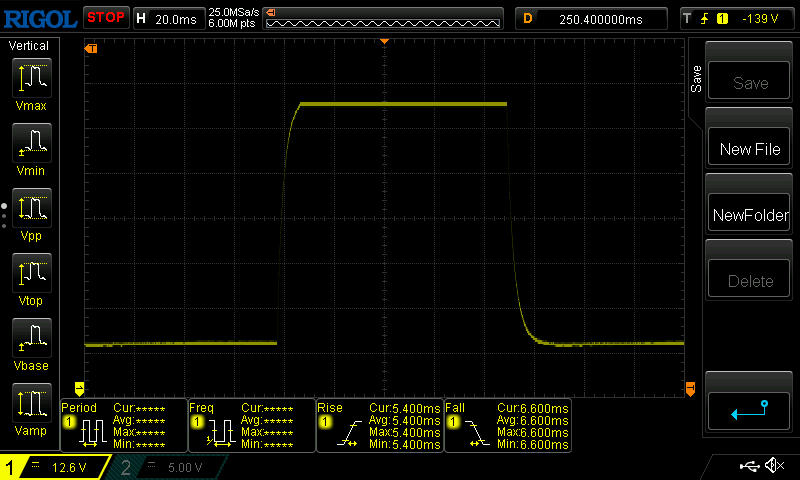 |
| ↘ 6.6 ms fall | ||
| The screen shows good response rates in our tests, but may be too slow for competitive gamers. In comparison, all tested devices range from 0.165 (minimum) to 636 (maximum) ms. » 25 % of all devices are better. This means that the measured response time is better than the average of all tested devices (31 ms). | ||
Screen Flickering / PWM (Pulse-Width Modulation)
| Screen flickering / PWM not detected | 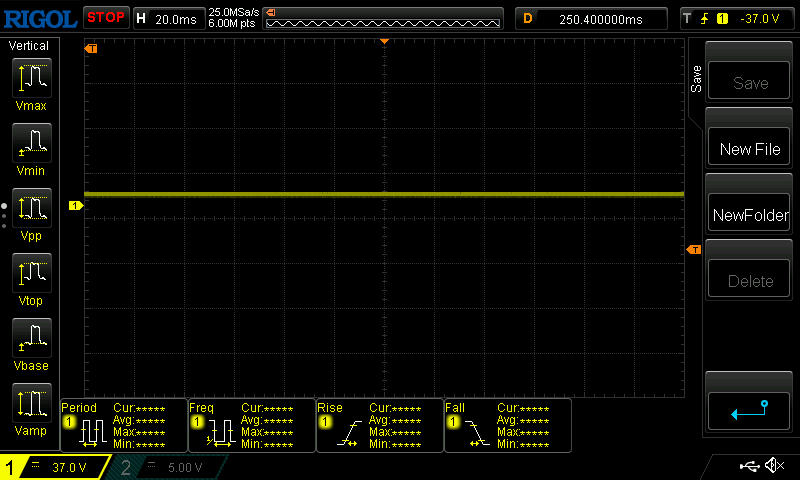 | ||
In comparison: 52 % of all tested devices do not use PWM to dim the display. If PWM was detected, an average of 7757 (minimum: 5 - maximum: 343500) Hz was measured. | |||
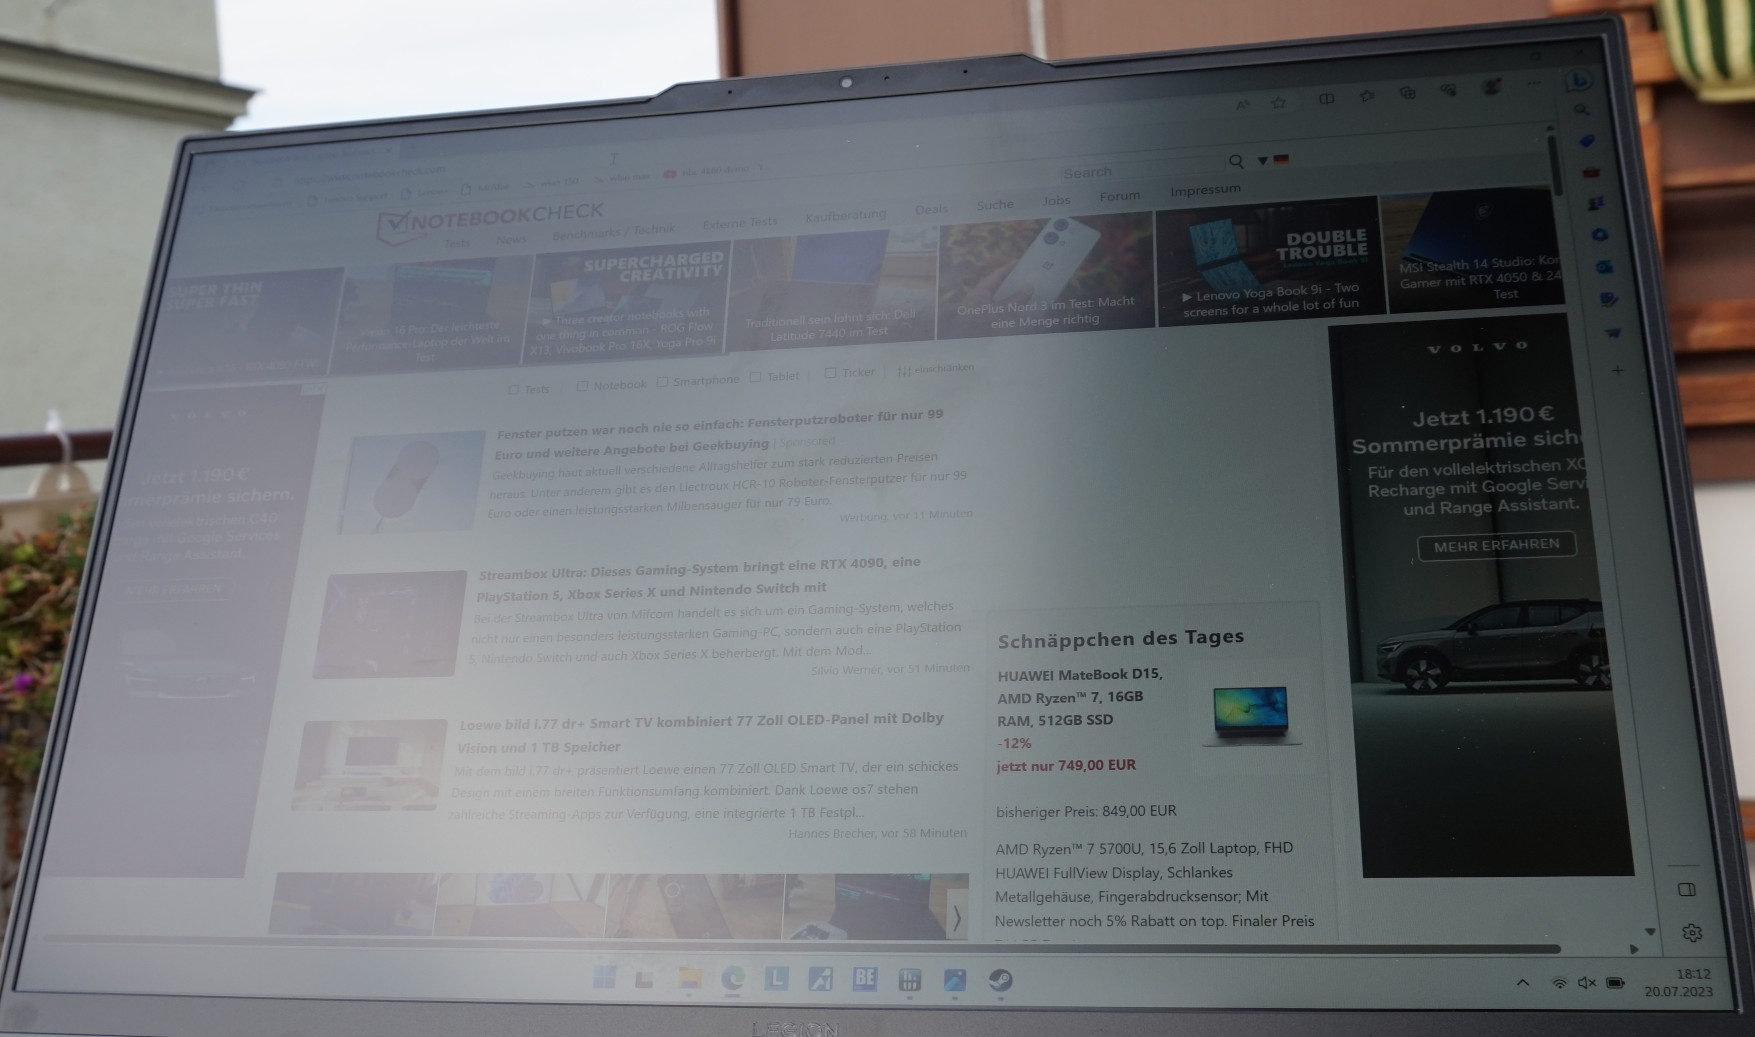
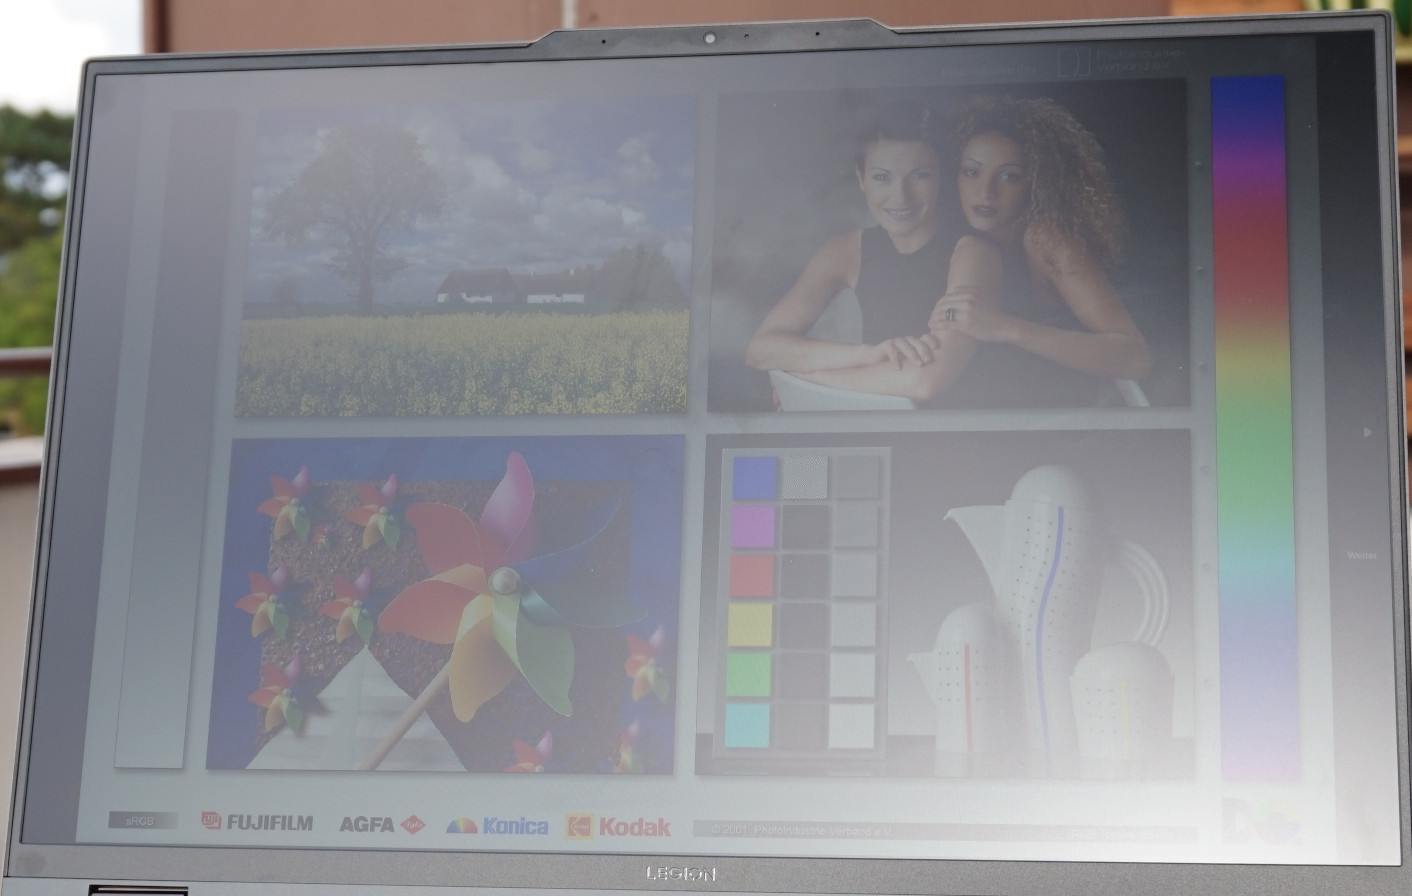
Thanks to the display's matt surface and high brightness, colours and text are easily readable outdoors, even in daylight. But colours do suffer in direct sunlight. Other than that, there is nothing standing in the way of you using the laptop on a balcony or in a garden.
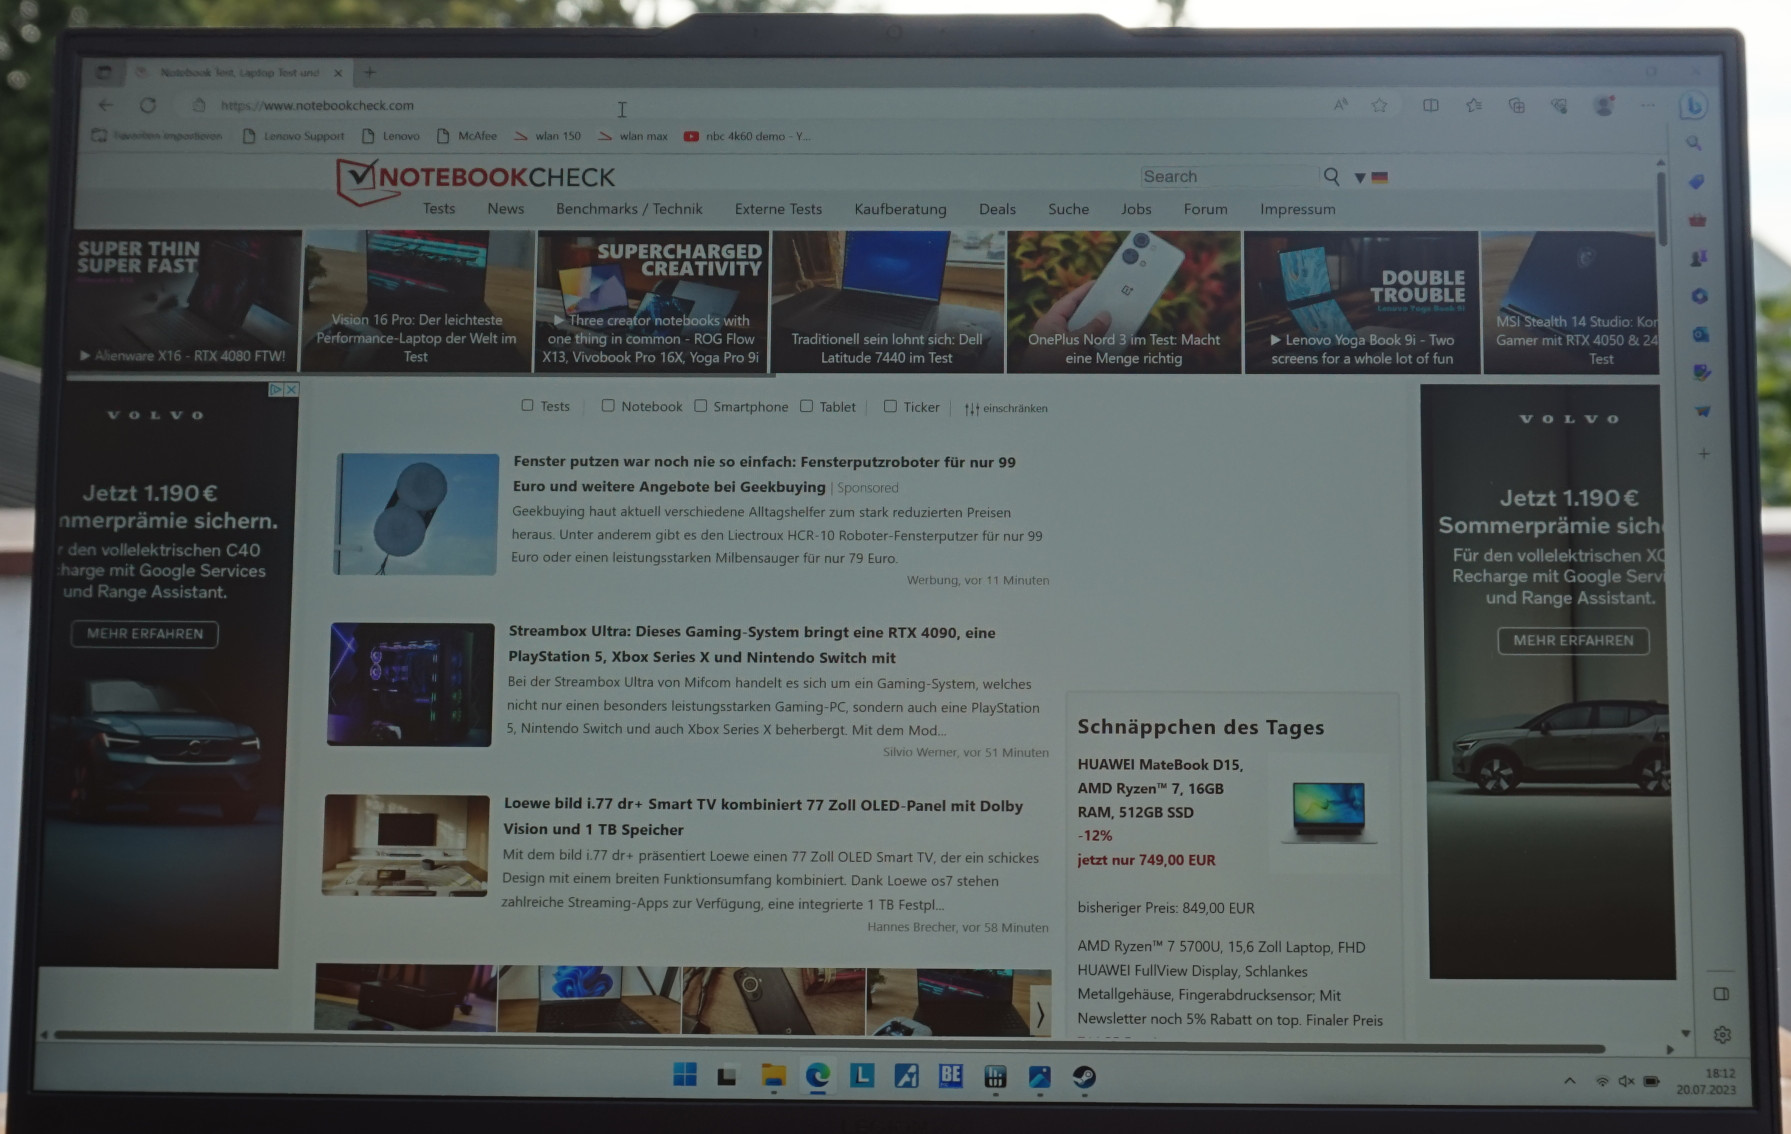
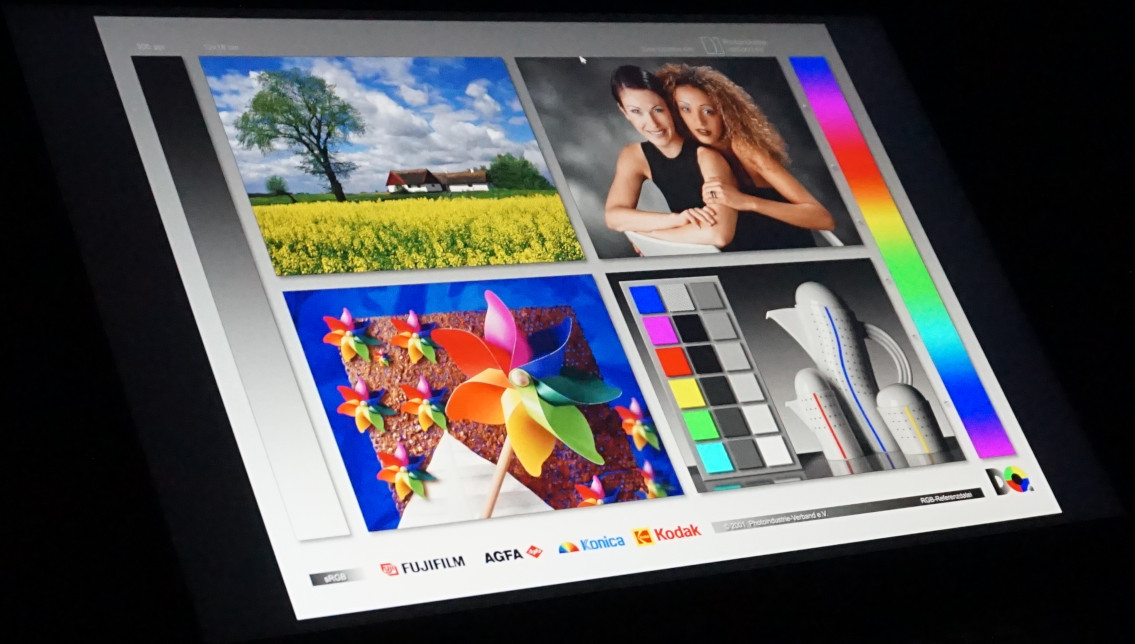
The IPS panel doesn't exhibit any shifts in colour or brightness even when viewed from a very sharp angle.

Performance - Highly customisable Legion
The configuration as spec’d is fairly typical for an entry-level laptop. Equipped with an AMD Ryzen 5 7645HX, an RTX 4050 and 16 GB of RAM, the Legion Pro 5 isn’t necessarily able to run modern games at max settings. But by turning down a few quality settings and, ideally, dropping resolution to Full HD, you can almost always get 100 FPS or more from the laptop.
Test conditions
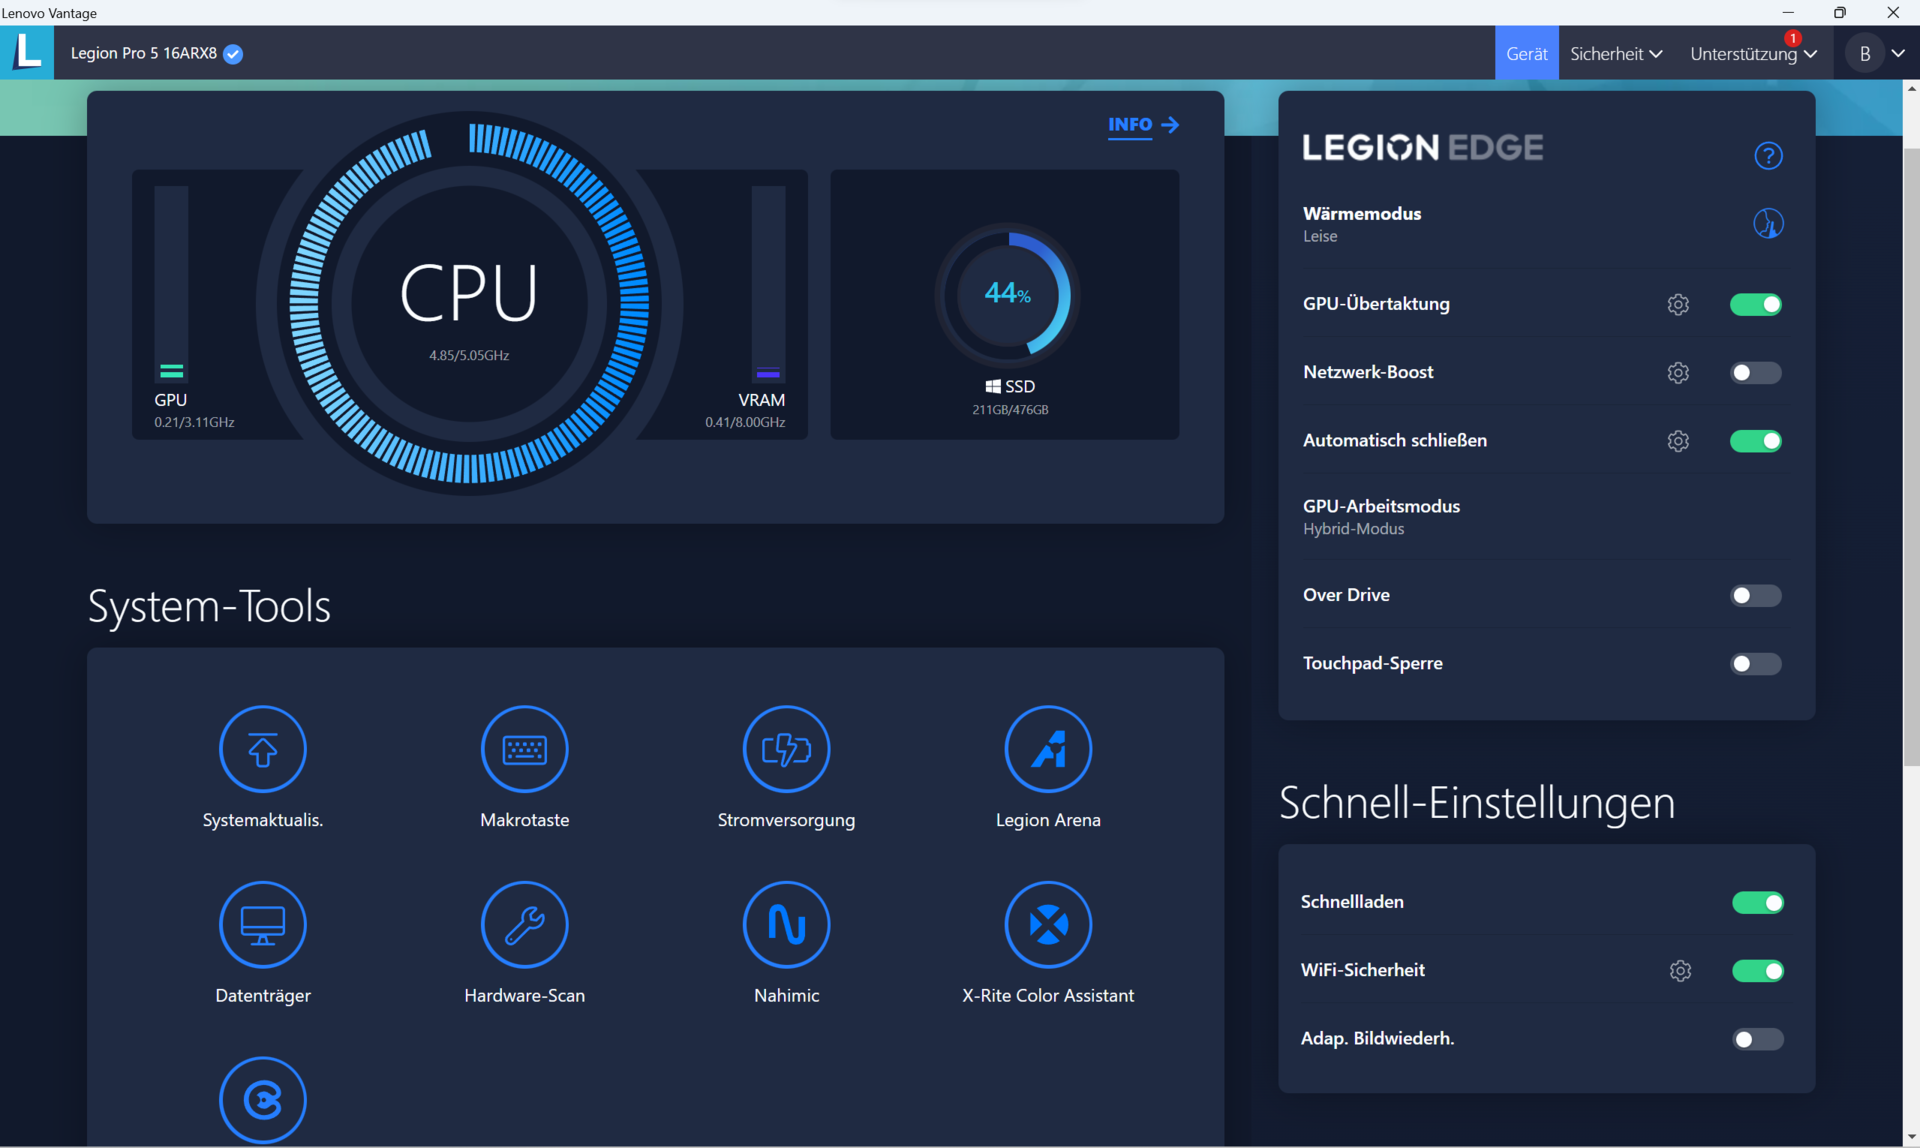
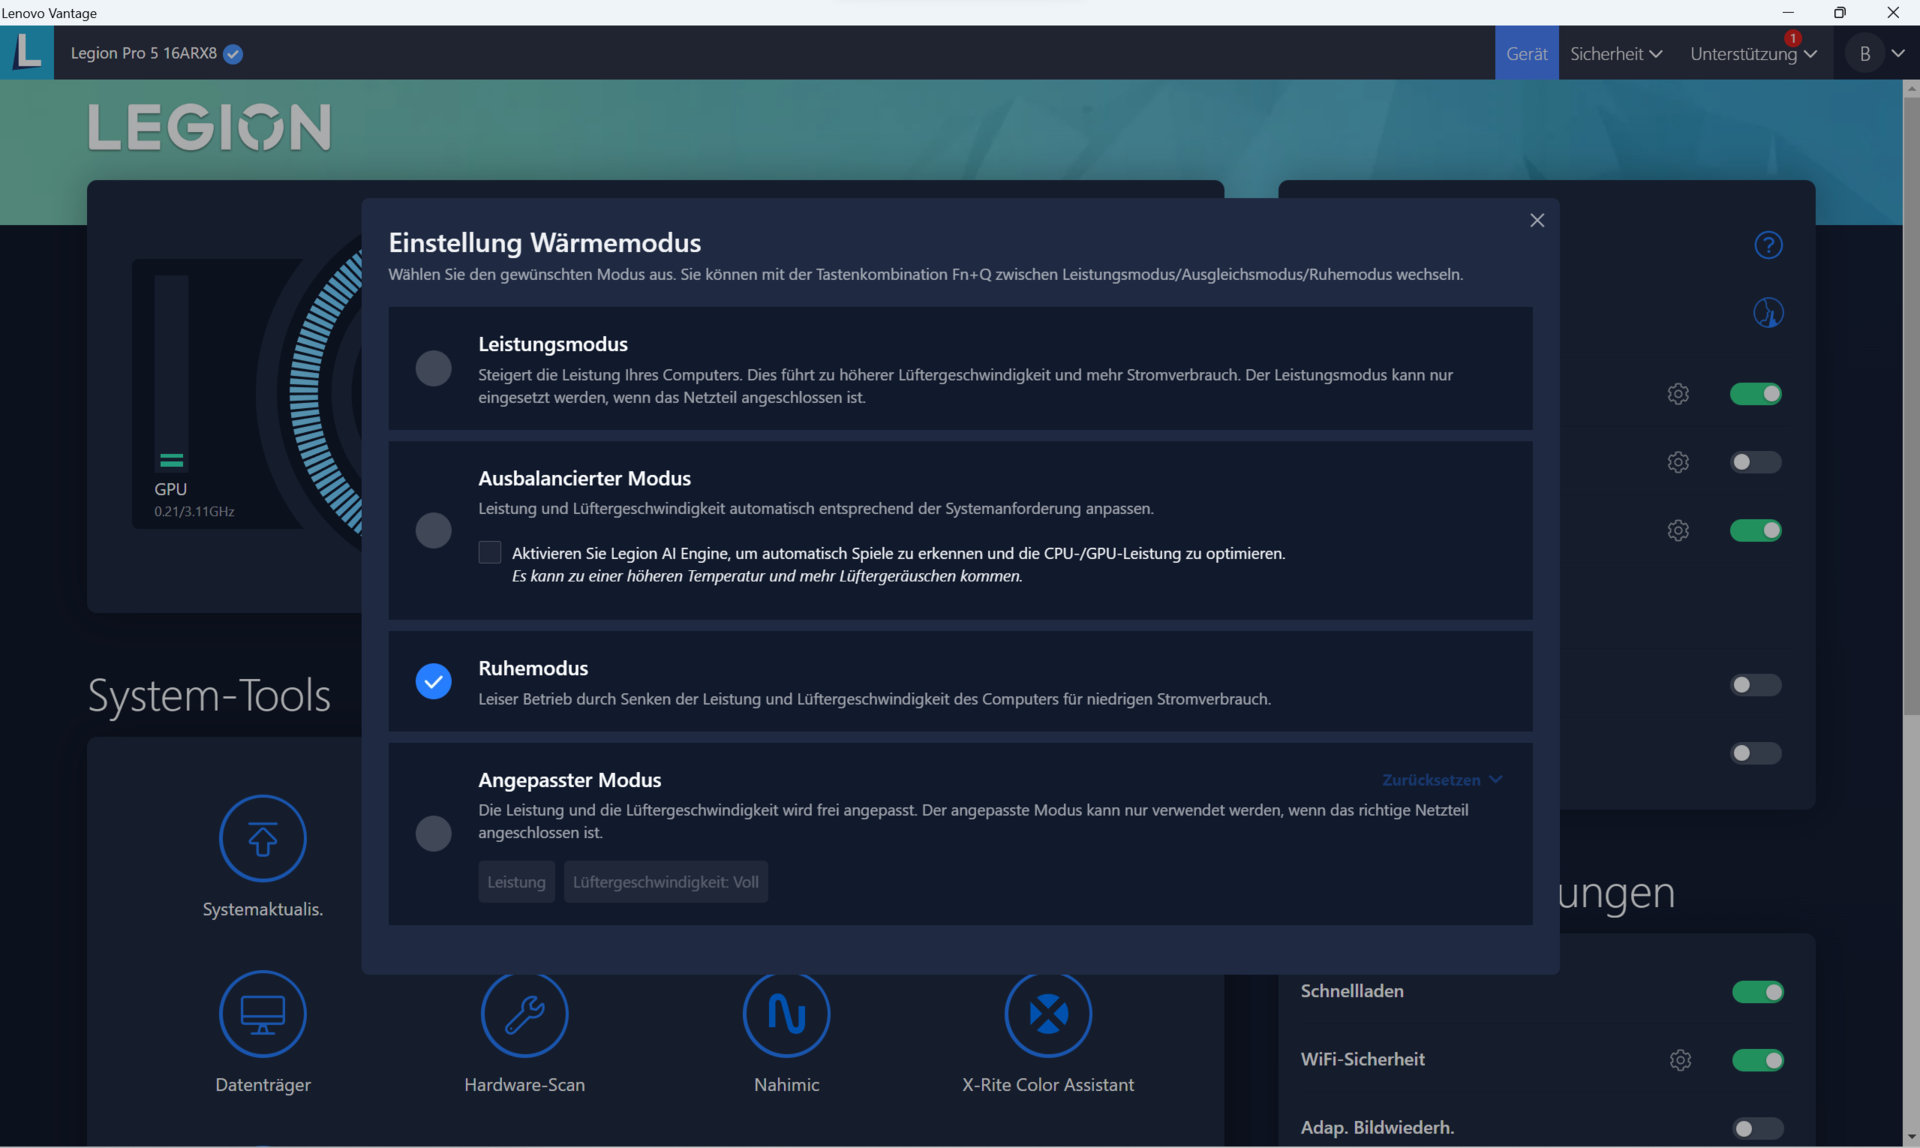
You can cycle between three performance modes using the Fn+Q key combination commonly found on Lenovo laptops. We used “Performance” mode for our benchmarks and gaming tests. There is also “Silent” mode, which typically lowers benchmark results by 20% but also more than halves the amount of fan noise. The last preset is an intelligent “Balanced” mode that automatically adjusts settings as required. During our testing, this mode never quite matched the settings in “Performance” mode.
However, these three modes only make up a fraction of the options available. Lenovo Vantage lets you manually tune all sorts of CPU and GPU parameters in conjunction with a personalised fan profile. For instance, you can manually define the processor’s short- and long-term power limits, the max power supply to the graphics card, the dynamic boost and even the max temperature limits.
Between passive cooling and customised power allocation to the GPU and CPU, there are countless options to let you personalise the gaming laptop to your needs. All you need to do is to accept Lenovo’s warning that doing so may cause damage to your device. Besides, not every setting will result in every application running stably. That said, it is very feasible to obtain good results if you roughly know what each setting does and adjust the fans accordingly.

| Power profile | CPU draw (measured) | GPU draw (measured) | max. fan noise |
|---|---|---|---|
| Silent | 75/65 Watt | 50 Watt | 33 dB(A) |
| Performance | 90/90 Watt | 55 Watt | 39 dB(A) |
| Battery | 54/45 Watt | 50 Watt | 36 dB(A) |
| Maximum | 145/145 Watt | 140 Watt | 50 dB(A) |
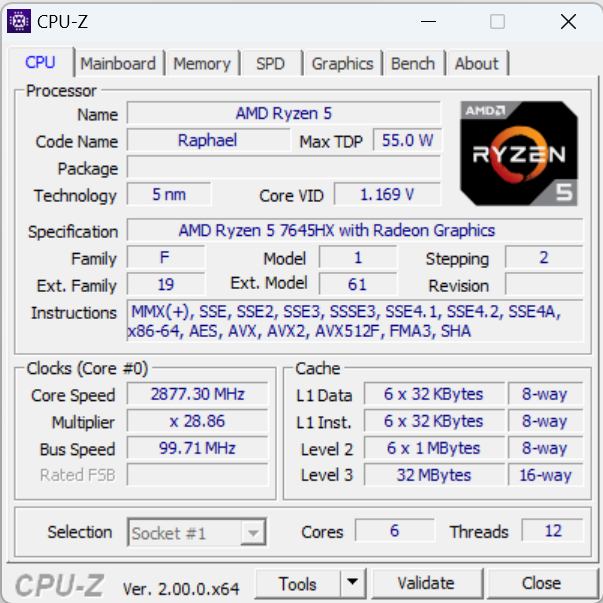
Processor
Staying true to the lineup, the 7th gen AMD Ryzen 5 7645HX continues to focus on features optimised for gaming. It contains six cores and twelve threads and boasts a generous 32 MB of L3 cache. The cores have a decent max clock speed of 5.0GHz.
The processor is thus not that far off from the higher-tier Intel Core i7-13700H found in the Medion Erazer Scout E20. Whilst the Ryzen can’t fully keep pace in multi-core tasks, it truly shines and makes up for this shortcoming in single-core tests. Across the various benchmarks, its overall score lines up perfectly with the average score obtained from all the gaming laptops we’ve tested in the past two years.
Because the processor isn’t receiving the maximum power possible and the cooling system is sufficiently sized, the laptop’s Cinebench R15 score remained almost perfectly consistent throughout the 25 runs. By comparison, the i7-13700H scored lower than the Ryzen 5 at the end of the loop test. Even in Silent mode (pink line), the Legion Pro 5 managed to outperform the Scout E20 over an extended period.
Performance is also superb when the Legion is on battery power. Amongst other things, Cinebench R23 multi-core score decreased from 14,000 to 12,700, which is less than a 10% drop.
For more information and results, you can refer to our CPU benchmark list.
Cinebench R15 Multi Sustained load
Cinebench R23: Multi Core | Single Core
Cinebench R20: CPU (Multi Core) | CPU (Single Core)
Cinebench R15: CPU Multi 64Bit | CPU Single 64Bit
Blender: v2.79 BMW27 CPU
7-Zip 18.03: 7z b 4 | 7z b 4 -mmt1
Geekbench 5.5: Multi-Core | Single-Core
HWBOT x265 Benchmark v2.2: 4k Preset
LibreOffice : 20 Documents To PDF
R Benchmark 2.5: Overall mean
| CPU Performance rating | |
| Average of class Gaming | |
| Lenovo Legion Pro 5 16IRX8 | |
| Medion Erazer Scout E20 | |
| Lenovo Legion Pro 5 16ARX8 (R5 7645HX, RTX 4050) | |
| Average AMD Ryzen 5 7645HX | |
| Asus TUF A15 FA507 | |
| Asus TUF Gaming A16 FA617 | |
| Acer Nitro 5 AN517-55-5552 | |
| Cinebench R23 / Multi Core | |
| Average of class Gaming (10488 - 42661, n=107, last 2 years) | |
| Lenovo Legion Pro 5 16IRX8 | |
| Medion Erazer Scout E20 | |
| Acer Nitro 5 AN517-55-5552 | |
| Asus TUF Gaming A16 FA617 | |
| Lenovo Legion Pro 5 16ARX8 (R5 7645HX, RTX 4050) | |
| Average AMD Ryzen 5 7645HX (n=1) | |
| Asus TUF A15 FA507 | |
| Cinebench R23 / Single Core | |
| Average of class Gaming (1166 - 2415, n=107, last 2 years) | |
| Medion Erazer Scout E20 | |
| Lenovo Legion Pro 5 16ARX8 (R5 7645HX, RTX 4050) | |
| Average AMD Ryzen 5 7645HX (n=1) | |
| Lenovo Legion Pro 5 16IRX8 | |
| Acer Nitro 5 AN517-55-5552 | |
| Asus TUF Gaming A16 FA617 | |
| Asus TUF A15 FA507 | |
| Cinebench R20 / CPU (Multi Core) | |
| Average of class Gaming (4029 - 16433, n=106, last 2 years) | |
| Lenovo Legion Pro 5 16IRX8 | |
| Medion Erazer Scout E20 | |
| Lenovo Legion Pro 5 16ARX8 (R5 7645HX, RTX 4050) | |
| Average AMD Ryzen 5 7645HX (n=1) | |
| Asus TUF Gaming A16 FA617 | |
| Asus TUF A15 FA507 | |
| Acer Nitro 5 AN517-55-5552 | |
| Cinebench R20 / CPU (Single Core) | |
| Average of class Gaming (442 - 913, n=106, last 2 years) | |
| Medion Erazer Scout E20 | |
| Lenovo Legion Pro 5 16ARX8 (R5 7645HX, RTX 4050) | |
| Average AMD Ryzen 5 7645HX (n=1) | |
| Lenovo Legion Pro 5 16IRX8 | |
| Acer Nitro 5 AN517-55-5552 | |
| Asus TUF Gaming A16 FA617 | |
| Asus TUF A15 FA507 | |
| Cinebench R15 / CPU Multi 64Bit | |
| Average of class Gaming (1578 - 6330, n=105, last 2 years) | |
| Lenovo Legion Pro 5 16IRX8 | |
| Medion Erazer Scout E20 | |
| Asus TUF Gaming A16 FA617 | |
| Lenovo Legion Pro 5 16ARX8 (R5 7645HX, RTX 4050) | |
| Asus TUF A15 FA507 | |
| Average AMD Ryzen 5 7645HX (2148 - 2276, n=3) | |
| Acer Nitro 5 AN517-55-5552 | |
| Cinebench R15 / CPU Single 64Bit | |
| Average of class Gaming (188.8 - 350, n=106, last 2 years) | |
| Lenovo Legion Pro 5 16ARX8 (R5 7645HX, RTX 4050) | |
| Average AMD Ryzen 5 7645HX (281 - 289, n=3) | |
| Medion Erazer Scout E20 | |
| Lenovo Legion Pro 5 16IRX8 | |
| Asus TUF A15 FA507 | |
| Asus TUF Gaming A16 FA617 | |
| Acer Nitro 5 AN517-55-5552 | |
| Blender / v2.79 BMW27 CPU | |
| Acer Nitro 5 AN517-55-5552 | |
| Asus TUF Gaming A16 FA617 | |
| Lenovo Legion Pro 5 16ARX8 (R5 7645HX, RTX 4050) | |
| Average AMD Ryzen 5 7645HX (n=1) | |
| Asus TUF A15 FA507 | |
| Medion Erazer Scout E20 | |
| Lenovo Legion Pro 5 16IRX8 | |
| Average of class Gaming (79 - 330, n=104, last 2 years) | |
| 7-Zip 18.03 / 7z b 4 | |
| Average of class Gaming (33491 - 148086, n=105, last 2 years) | |
| Lenovo Legion Pro 5 16IRX8 | |
| Medion Erazer Scout E20 | |
| Asus TUF Gaming A16 FA617 | |
| Asus TUF A15 FA507 | |
| Lenovo Legion Pro 5 16ARX8 (R5 7645HX, RTX 4050) | |
| Average AMD Ryzen 5 7645HX (n=1) | |
| Acer Nitro 5 AN517-55-5552 | |
| 7-Zip 18.03 / 7z b 4 -mmt1 | |
| Lenovo Legion Pro 5 16ARX8 (R5 7645HX, RTX 4050) | |
| Average AMD Ryzen 5 7645HX (n=1) | |
| Average of class Gaming (4199 - 7436, n=105, last 2 years) | |
| Medion Erazer Scout E20 | |
| Asus TUF A15 FA507 | |
| Asus TUF Gaming A16 FA617 | |
| Lenovo Legion Pro 5 16IRX8 | |
| Acer Nitro 5 AN517-55-5552 | |
| Geekbench 5.5 / Multi-Core | |
| Average of class Gaming (6460 - 28263, n=105, last 2 years) | |
| Lenovo Legion Pro 5 16IRX8 | |
| Medion Erazer Scout E20 | |
| Lenovo Legion Pro 5 16ARX8 (R5 7645HX, RTX 4050) | |
| Average AMD Ryzen 5 7645HX (n=1) | |
| Acer Nitro 5 AN517-55-5552 | |
| Asus TUF Gaming A16 FA617 | |
| Asus TUF A15 FA507 | |
| Geekbench 5.5 / Single-Core | |
| Average of class Gaming (986 - 2474, n=105, last 2 years) | |
| Lenovo Legion Pro 5 16ARX8 (R5 7645HX, RTX 4050) | |
| Average AMD Ryzen 5 7645HX (n=1) | |
| Medion Erazer Scout E20 | |
| Lenovo Legion Pro 5 16IRX8 | |
| Asus TUF Gaming A16 FA617 | |
| Acer Nitro 5 AN517-55-5552 | |
| Asus TUF A15 FA507 | |
| HWBOT x265 Benchmark v2.2 / 4k Preset | |
| Average of class Gaming (11.5 - 44.4, n=105, last 2 years) | |
| Lenovo Legion Pro 5 16IRX8 | |
| Lenovo Legion Pro 5 16ARX8 (R5 7645HX, RTX 4050) | |
| Average AMD Ryzen 5 7645HX (n=1) | |
| Asus TUF Gaming A16 FA617 | |
| Asus TUF A15 FA507 | |
| Medion Erazer Scout E20 | |
| Acer Nitro 5 AN517-55-5552 | |
| LibreOffice / 20 Documents To PDF | |
| Asus TUF Gaming A16 FA617 | |
| Lenovo Legion Pro 5 16ARX8 (R5 7645HX, RTX 4050) | |
| Average AMD Ryzen 5 7645HX (n=1) | |
| Acer Nitro 5 AN517-55-5552 | |
| Asus TUF A15 FA507 | |
| Average of class Gaming (33.2 - 88.8, n=105, last 2 years) | |
| Medion Erazer Scout E20 | |
| Lenovo Legion Pro 5 16IRX8 | |
| R Benchmark 2.5 / Overall mean | |
| Acer Nitro 5 AN517-55-5552 | |
| Asus TUF Gaming A16 FA617 | |
| Asus TUF A15 FA507 | |
| Lenovo Legion Pro 5 16IRX8 | |
| Medion Erazer Scout E20 | |
| Lenovo Legion Pro 5 16ARX8 (R5 7645HX, RTX 4050) | |
| Average AMD Ryzen 5 7645HX (n=1) | |
| Average of class Gaming (0.3439 - 0.759, n=106, last 2 years) | |
* ... smaller is better
AIDA64: FP32 Ray-Trace | FPU Julia | CPU SHA3 | CPU Queen | FPU SinJulia | FPU Mandel | CPU AES | CPU ZLib | FP64 Ray-Trace | CPU PhotoWorxx
| Performance rating | |
| Average of class Gaming | |
| Lenovo Legion Pro 5 16IRX8 | |
| Lenovo Legion Pro 5 16ARX8 (R5 7645HX, RTX 4050) | |
| Average AMD Ryzen 5 7645HX | |
| Asus TUF Gaming A16 FA617 | |
| Asus TUF A15 FA507 | |
| Medion Erazer Scout E20 | |
| Acer Nitro 5 AN517-55-5552 | |
| AIDA64 / FP32 Ray-Trace | |
| Average of class Gaming (10227 - 85542, n=105, last 2 years) | |
| Lenovo Legion Pro 5 16ARX8 (R5 7645HX, RTX 4050) | |
| Average AMD Ryzen 5 7645HX (n=1) | |
| Lenovo Legion Pro 5 16IRX8 | |
| Asus TUF Gaming A16 FA617 | |
| Asus TUF A15 FA507 | |
| Medion Erazer Scout E20 | |
| Acer Nitro 5 AN517-55-5552 | |
| AIDA64 / FPU Julia | |
| Average of class Gaming (51376 - 238426, n=105, last 2 years) | |
| Lenovo Legion Pro 5 16IRX8 | |
| Asus TUF A15 FA507 | |
| Asus TUF Gaming A16 FA617 | |
| Lenovo Legion Pro 5 16ARX8 (R5 7645HX, RTX 4050) | |
| Average AMD Ryzen 5 7645HX (n=1) | |
| Medion Erazer Scout E20 | |
| Acer Nitro 5 AN517-55-5552 | |
| AIDA64 / CPU SHA3 | |
| Average of class Gaming (2180 - 10115, n=105, last 2 years) | |
| Lenovo Legion Pro 5 16IRX8 | |
| Lenovo Legion Pro 5 16ARX8 (R5 7645HX, RTX 4050) | |
| Average AMD Ryzen 5 7645HX (n=1) | |
| Asus TUF Gaming A16 FA617 | |
| Asus TUF A15 FA507 | |
| Medion Erazer Scout E20 | |
| Acer Nitro 5 AN517-55-5552 | |
| AIDA64 / CPU Queen | |
| Average of class Gaming (49785 - 173351, n=90, last 2 years) | |
| Lenovo Legion Pro 5 16IRX8 | |
| Medion Erazer Scout E20 | |
| Asus TUF Gaming A16 FA617 | |
| Asus TUF A15 FA507 | |
| Lenovo Legion Pro 5 16ARX8 (R5 7645HX, RTX 4050) | |
| Average AMD Ryzen 5 7645HX (n=1) | |
| Acer Nitro 5 AN517-55-5552 | |
| AIDA64 / FPU SinJulia | |
| Average of class Gaming (4424 - 33636, n=105, last 2 years) | |
| Lenovo Legion Pro 5 16IRX8 | |
| Asus TUF Gaming A16 FA617 | |
| Asus TUF A15 FA507 | |
| Lenovo Legion Pro 5 16ARX8 (R5 7645HX, RTX 4050) | |
| Average AMD Ryzen 5 7645HX (n=1) | |
| Medion Erazer Scout E20 | |
| Acer Nitro 5 AN517-55-5552 | |
| AIDA64 / FPU Mandel | |
| Average of class Gaming (25115 - 128721, n=105, last 2 years) | |
| Asus TUF A15 FA507 | |
| Asus TUF Gaming A16 FA617 | |
| Lenovo Legion Pro 5 16IRX8 | |
| Lenovo Legion Pro 5 16ARX8 (R5 7645HX, RTX 4050) | |
| Average AMD Ryzen 5 7645HX (n=1) | |
| Medion Erazer Scout E20 | |
| Acer Nitro 5 AN517-55-5552 | |
| AIDA64 / CPU AES | |
| Average of class Gaming (39258 - 247074, n=105, last 2 years) | |
| Lenovo Legion Pro 5 16IRX8 | |
| Medion Erazer Scout E20 | |
| Asus TUF A15 FA507 | |
| Asus TUF Gaming A16 FA617 | |
| Acer Nitro 5 AN517-55-5552 | |
| Lenovo Legion Pro 5 16ARX8 (R5 7645HX, RTX 4050) | |
| Average AMD Ryzen 5 7645HX (n=1) | |
| AIDA64 / CPU ZLib | |
| Average of class Gaming (574 - 2531, n=105, last 2 years) | |
| Lenovo Legion Pro 5 16IRX8 | |
| Medion Erazer Scout E20 | |
| Acer Nitro 5 AN517-55-5552 | |
| Asus TUF Gaming A16 FA617 | |
| Lenovo Legion Pro 5 16ARX8 (R5 7645HX, RTX 4050) | |
| Average AMD Ryzen 5 7645HX (n=1) | |
| Asus TUF A15 FA507 | |
| AIDA64 / FP64 Ray-Trace | |
| Average of class Gaming (5509 - 45446, n=105, last 2 years) | |
| Lenovo Legion Pro 5 16ARX8 (R5 7645HX, RTX 4050) | |
| Average AMD Ryzen 5 7645HX (n=1) | |
| Lenovo Legion Pro 5 16IRX8 | |
| Asus TUF Gaming A16 FA617 | |
| Asus TUF A15 FA507 | |
| Medion Erazer Scout E20 | |
| Acer Nitro 5 AN517-55-5552 | |
| AIDA64 / CPU PhotoWorxx | |
| Average of class Gaming (12271 - 89891, n=105, last 2 years) | |
| Medion Erazer Scout E20 | |
| Lenovo Legion Pro 5 16IRX8 | |
| Acer Nitro 5 AN517-55-5552 | |
| Lenovo Legion Pro 5 16ARX8 (R5 7645HX, RTX 4050) | |
| Average AMD Ryzen 5 7645HX (n=1) | |
| Asus TUF A15 FA507 | |
| Asus TUF Gaming A16 FA617 | |
System performance
The Legion Pro 5 16ARX8 had a fantastic showing in terms of system performance. In PCMark 10 and CrossMark, it scored considerably higher than the Legion with an Intel Core processor whilst having an even greater lead over many similarly spec'd gaming laptops.
You'll readily notice this when using the Legion Pro 5. Installing, launching and running programs feel snappy and immediate. At no point did the system exhibit any noticeable stutters. Instead, it continued to work smoothly even when many programs were running at the same time.
CrossMark: Overall | Productivity | Creativity | Responsiveness
| PCMark 10 / Score | |
| Average of class Gaming (5828 - 12414, n=93, last 2 years) | |
| Lenovo Legion Pro 5 16ARX8 (R5 7645HX, RTX 4050) | |
| Average AMD Ryzen 5 7645HX, NVIDIA GeForce RTX 4050 Laptop GPU (n=1) | |
| Lenovo Legion Pro 5 16IRX8 | |
| Medion Erazer Scout E20 | |
| Asus TUF Gaming A16 FA617 | |
| Asus TUF A15 FA507 | |
| Acer Nitro 5 AN517-55-5552 | |
| PCMark 10 / Essentials | |
| Lenovo Legion Pro 5 16ARX8 (R5 7645HX, RTX 4050) | |
| Average AMD Ryzen 5 7645HX, NVIDIA GeForce RTX 4050 Laptop GPU (n=1) | |
| Medion Erazer Scout E20 | |
| Lenovo Legion Pro 5 16IRX8 | |
| Average of class Gaming (8810 - 11935, n=97, last 2 years) | |
| Asus TUF Gaming A16 FA617 | |
| Asus TUF A15 FA507 | |
| Acer Nitro 5 AN517-55-5552 | |
| PCMark 10 / Productivity | |
| Average of class Gaming (6845 - 25323, n=95, last 2 years) | |
| Lenovo Legion Pro 5 16ARX8 (R5 7645HX, RTX 4050) | |
| Average AMD Ryzen 5 7645HX, NVIDIA GeForce RTX 4050 Laptop GPU (n=1) | |
| Medion Erazer Scout E20 | |
| Asus TUF Gaming A16 FA617 | |
| Asus TUF A15 FA507 | |
| Lenovo Legion Pro 5 16IRX8 | |
| Acer Nitro 5 AN517-55-5552 | |
| PCMark 10 / Digital Content Creation | |
| Average of class Gaming (7602 - 19954, n=95, last 2 years) | |
| Lenovo Legion Pro 5 16IRX8 | |
| Lenovo Legion Pro 5 16ARX8 (R5 7645HX, RTX 4050) | |
| Average AMD Ryzen 5 7645HX, NVIDIA GeForce RTX 4050 Laptop GPU (n=1) | |
| Asus TUF Gaming A16 FA617 | |
| Medion Erazer Scout E20 | |
| Asus TUF A15 FA507 | |
| Acer Nitro 5 AN517-55-5552 | |
| CrossMark / Overall | |
| Average of class Gaming (1366 - 2409, n=94, last 2 years) | |
| Lenovo Legion Pro 5 16ARX8 (R5 7645HX, RTX 4050) | |
| Average AMD Ryzen 5 7645HX, NVIDIA GeForce RTX 4050 Laptop GPU (n=1) | |
| Medion Erazer Scout E20 | |
| Acer Nitro 5 AN517-55-5552 | |
| Lenovo Legion Pro 5 16IRX8 | |
| Asus TUF A15 FA507 | |
| CrossMark / Productivity | |
| Lenovo Legion Pro 5 16ARX8 (R5 7645HX, RTX 4050) | |
| Average AMD Ryzen 5 7645HX, NVIDIA GeForce RTX 4050 Laptop GPU (n=1) | |
| Medion Erazer Scout E20 | |
| Average of class Gaming (1386 - 2254, n=94, last 2 years) | |
| Acer Nitro 5 AN517-55-5552 | |
| Lenovo Legion Pro 5 16IRX8 | |
| Asus TUF A15 FA507 | |
| CrossMark / Creativity | |
| Average of class Gaming (1343 - 2786, n=94, last 2 years) | |
| Lenovo Legion Pro 5 16ARX8 (R5 7645HX, RTX 4050) | |
| Average AMD Ryzen 5 7645HX, NVIDIA GeForce RTX 4050 Laptop GPU (n=1) | |
| Medion Erazer Scout E20 | |
| Acer Nitro 5 AN517-55-5552 | |
| Lenovo Legion Pro 5 16IRX8 | |
| Asus TUF A15 FA507 | |
| CrossMark / Responsiveness | |
| Medion Erazer Scout E20 | |
| Lenovo Legion Pro 5 16ARX8 (R5 7645HX, RTX 4050) | |
| Average AMD Ryzen 5 7645HX, NVIDIA GeForce RTX 4050 Laptop GPU (n=1) | |
| Acer Nitro 5 AN517-55-5552 | |
| Average of class Gaming (1226 - 2334, n=94, last 2 years) | |
| Lenovo Legion Pro 5 16IRX8 | |
| Asus TUF A15 FA507 | |
| PCMark 10 Score | 8105 points | |
Help | ||
| AIDA64 / Memory Copy | |
| Average of class Gaming (21750 - 129946, n=105, last 2 years) | |
| Medion Erazer Scout E20 | |
| Lenovo Legion Pro 5 16IRX8 | |
| Asus TUF Gaming A16 FA617 | |
| Asus TUF A15 FA507 | |
| Lenovo Legion Pro 5 16ARX8 (R5 7645HX, RTX 4050) | |
| Average AMD Ryzen 5 7645HX (n=1) | |
| Acer Nitro 5 AN517-55-5552 | |
| AIDA64 / Memory Read | |
| Average of class Gaming (22956 - 118858, n=105, last 2 years) | |
| Lenovo Legion Pro 5 16IRX8 | |
| Medion Erazer Scout E20 | |
| Acer Nitro 5 AN517-55-5552 | |
| Asus TUF Gaming A16 FA617 | |
| Lenovo Legion Pro 5 16ARX8 (R5 7645HX, RTX 4050) | |
| Average AMD Ryzen 5 7645HX (n=1) | |
| Asus TUF A15 FA507 | |
| AIDA64 / Memory Write | |
| Average of class Gaming (22297 - 135096, n=105, last 2 years) | |
| Lenovo Legion Pro 5 16IRX8 | |
| Medion Erazer Scout E20 | |
| Asus TUF Gaming A16 FA617 | |
| Asus TUF A15 FA507 | |
| Lenovo Legion Pro 5 16ARX8 (R5 7645HX, RTX 4050) | |
| Average AMD Ryzen 5 7645HX (n=1) | |
| Acer Nitro 5 AN517-55-5552 | |
| AIDA64 / Memory Latency | |
| Average of class Gaming (75.3 - 259, n=105, last 2 years) | |
| Acer Nitro 5 AN517-55-5552 | |
| Medion Erazer Scout E20 | |
| Asus TUF Gaming A16 FA617 | |
| Lenovo Legion Pro 5 16ARX8 (R5 7645HX, RTX 4050) | |
| Average AMD Ryzen 5 7645HX (n=1) | |
| Asus TUF A15 FA507 | |
| Lenovo Legion Pro 5 16IRX8 | |
* ... smaller is better
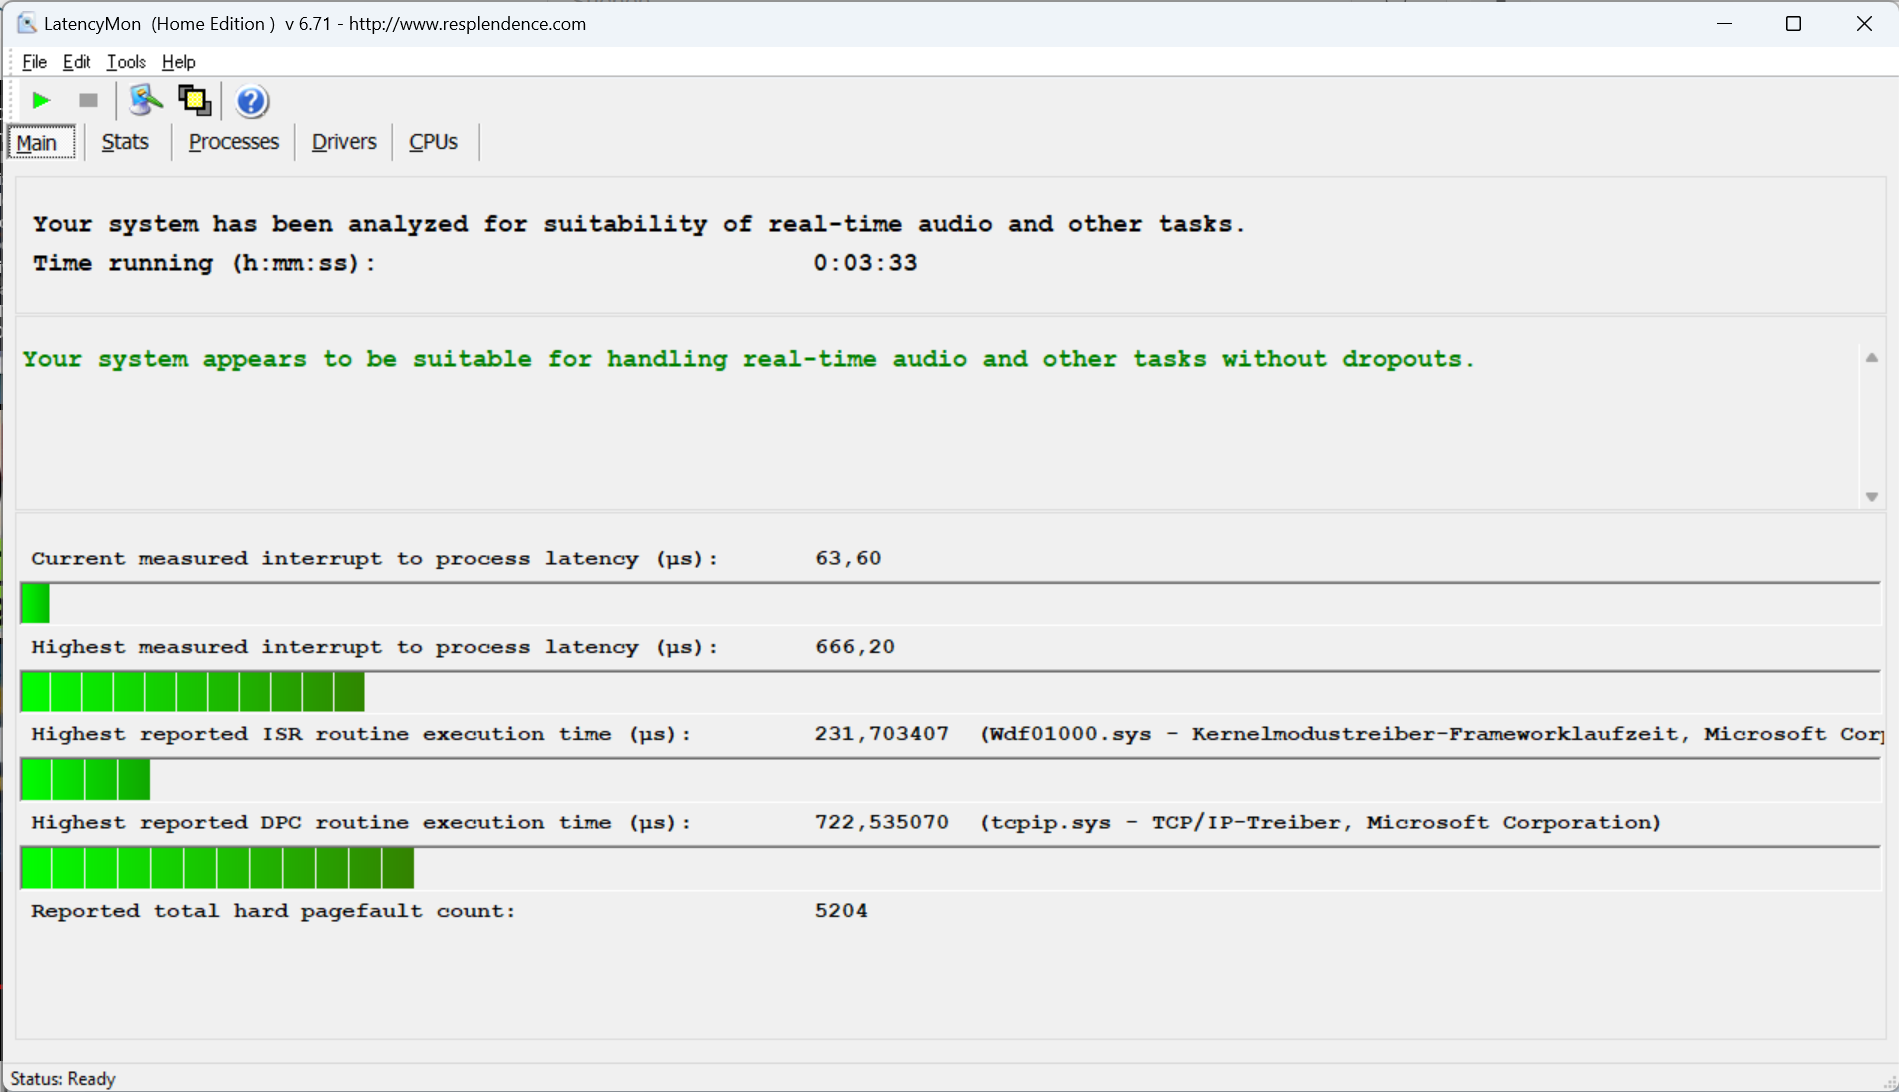
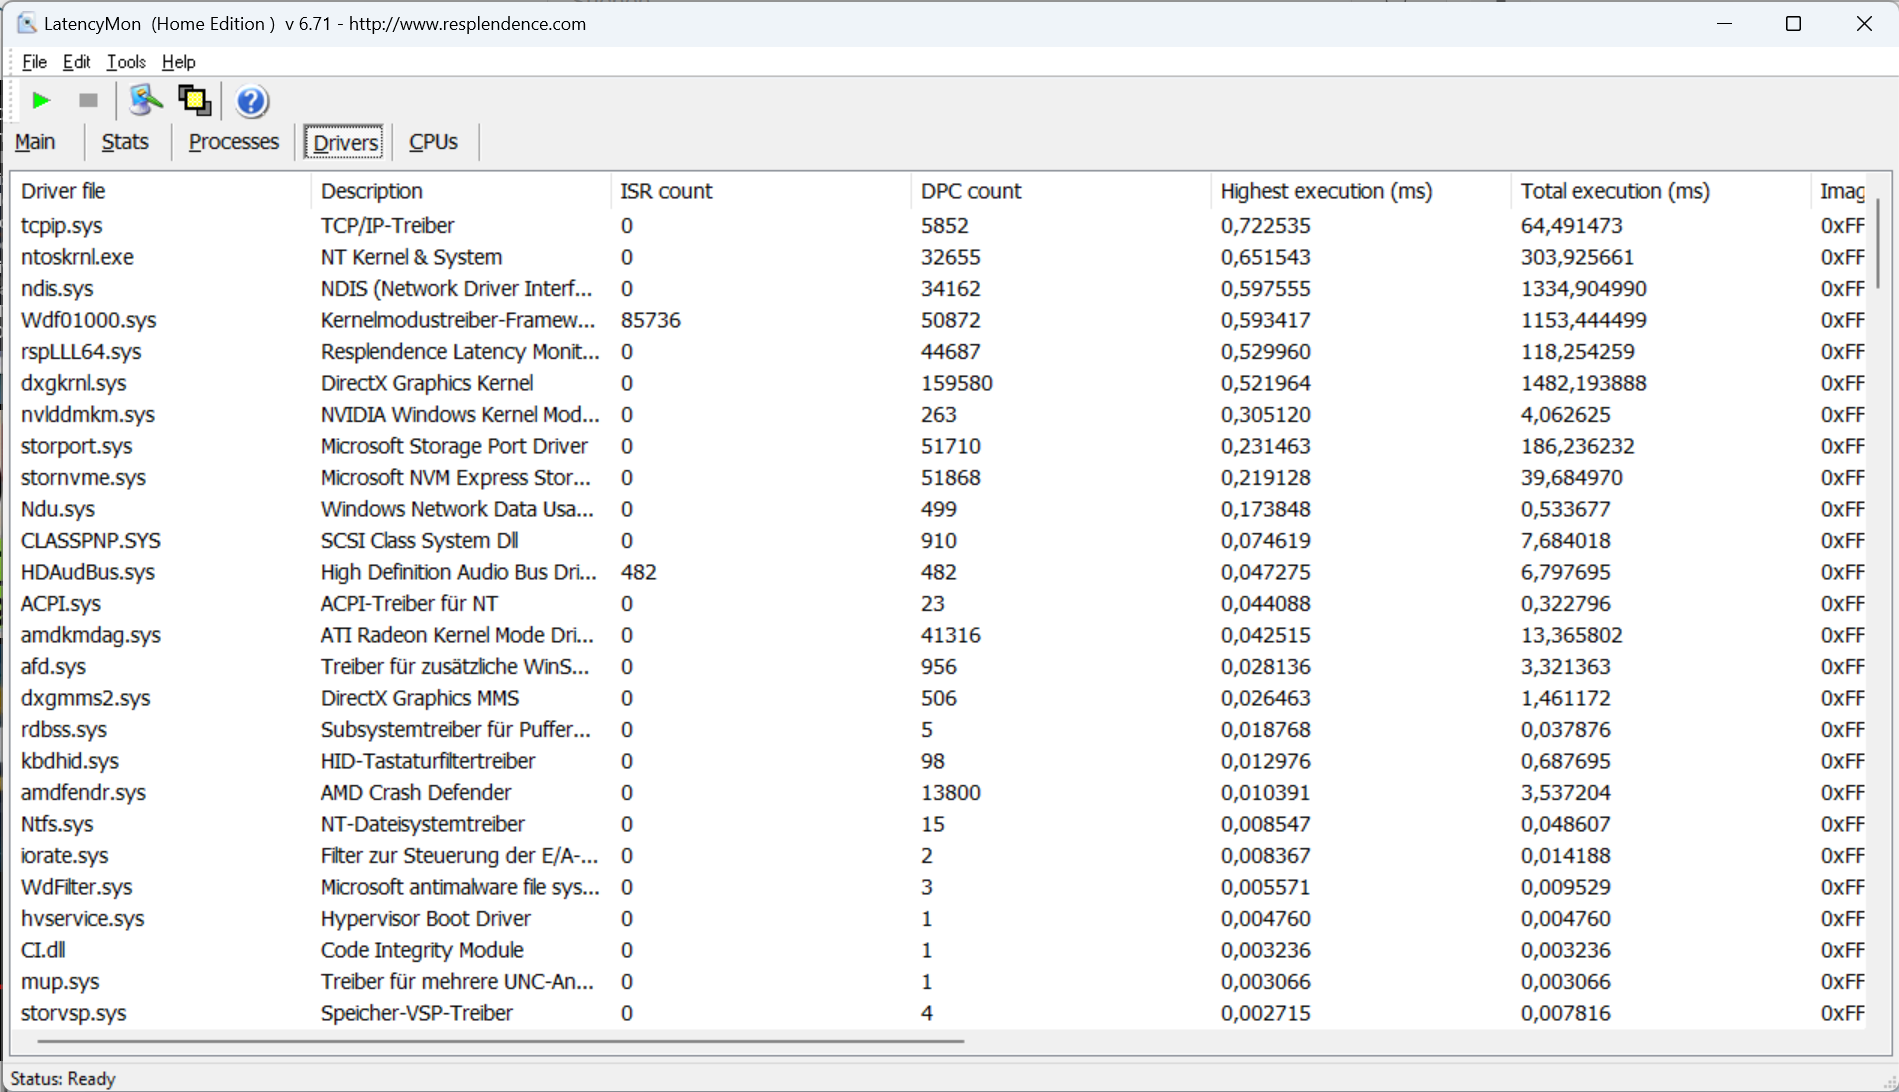
DPC latency
Our positive overall impression continues with the device’s latencies. Unlike most other notebooks, the Legion Pro 5 is capable of handling real-time audio tasks according to LatencyMon. Although probably a handful people have plans to do real-time audio processing, it demonstrates that the drivers are well configured. That said, installing any updates or additional software may change the results significantly.
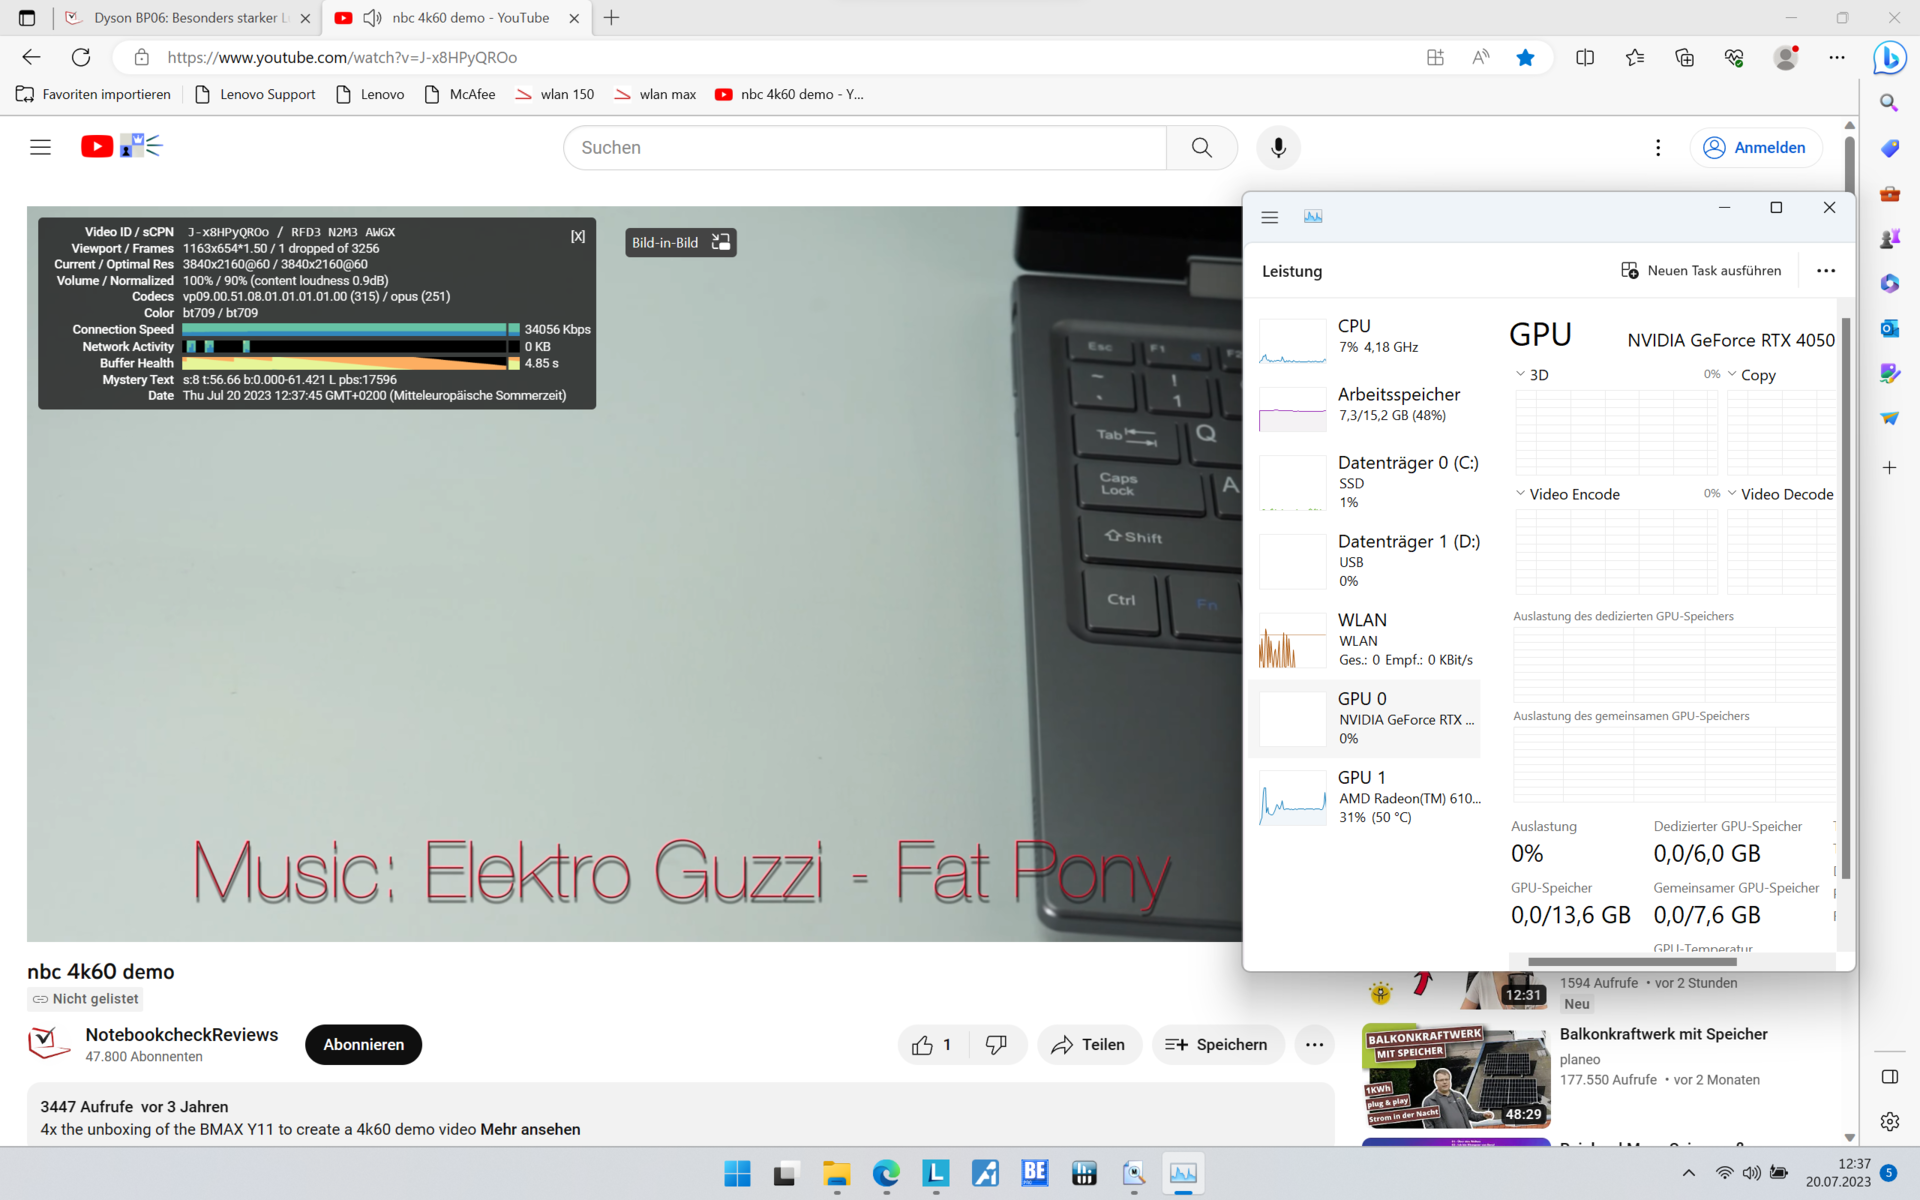
Though not perfect, the few dropped frames during 4K video streaming are acceptable for a gaming laptop. The iGPU (up to 30% usage) had nonetheless plenty to do during the test.
| DPC Latencies / LatencyMon - interrupt to process latency (max), Web, Youtube, Prime95 | |
| Medion Erazer Scout E20 | |
| Acer Nitro 5 AN517-55-5552 | |
| Lenovo Legion Pro 5 16IRX8 | |
| Lenovo Legion Pro 5 16ARX8 (R5 7645HX, RTX 4050) | |
| Asus TUF Gaming A16 FA617 | |
* ... smaller is better
Mass storage
The included SK Hynix SSD delivered above-average read and write speeds throughout. The M.2 NVMe drive is able to make good use of the PCIe 4.0 interface. The only issue is that the 512 GB capacity is quite paltry. Even a small game collection can quickly require more storage than this. The good news is the Legion Pro 5 has a second SSD slot to let you easily expand the amount of storage in the system.

* ... smaller is better
Sustained load Read: DiskSpd Read Loop, Queue Depth 8
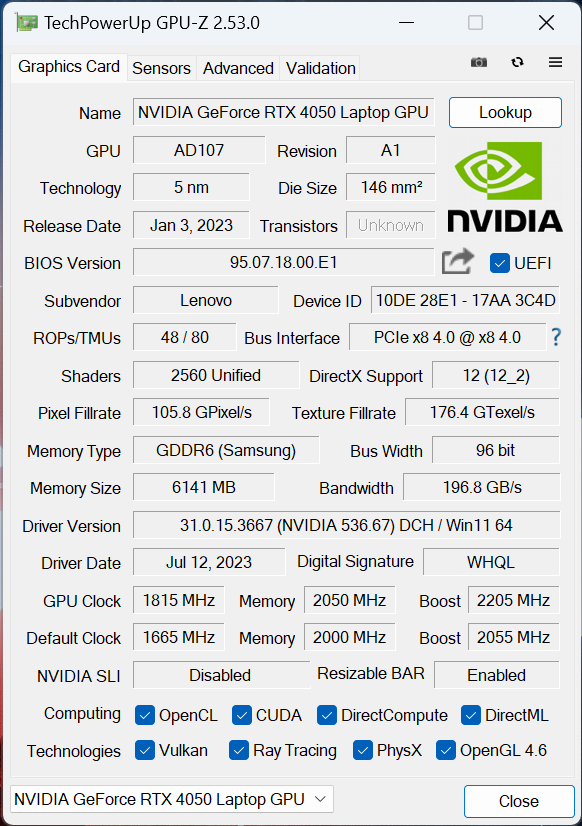
Graphics card
The Nvidia GeForce RTX 4050 is a typical entry-level GPU that is comparable with an RTX 3060 in terms of performance. Nonetheless, with 30 RT cores and 80 Tensor core, it is significantly less well-spec’d by comparison. Despite its lower power draw, the GPU is still able to keep games running smoothly. Increasing its wattage to the max allowable level doesn't offer any substantial boost in performance either, as we've demonstrated in this article.
One major benefit of having a lower power draw is that the GPU produces much less heat, meaning the fans don’t have work as hard and the laptop can remain cooler.
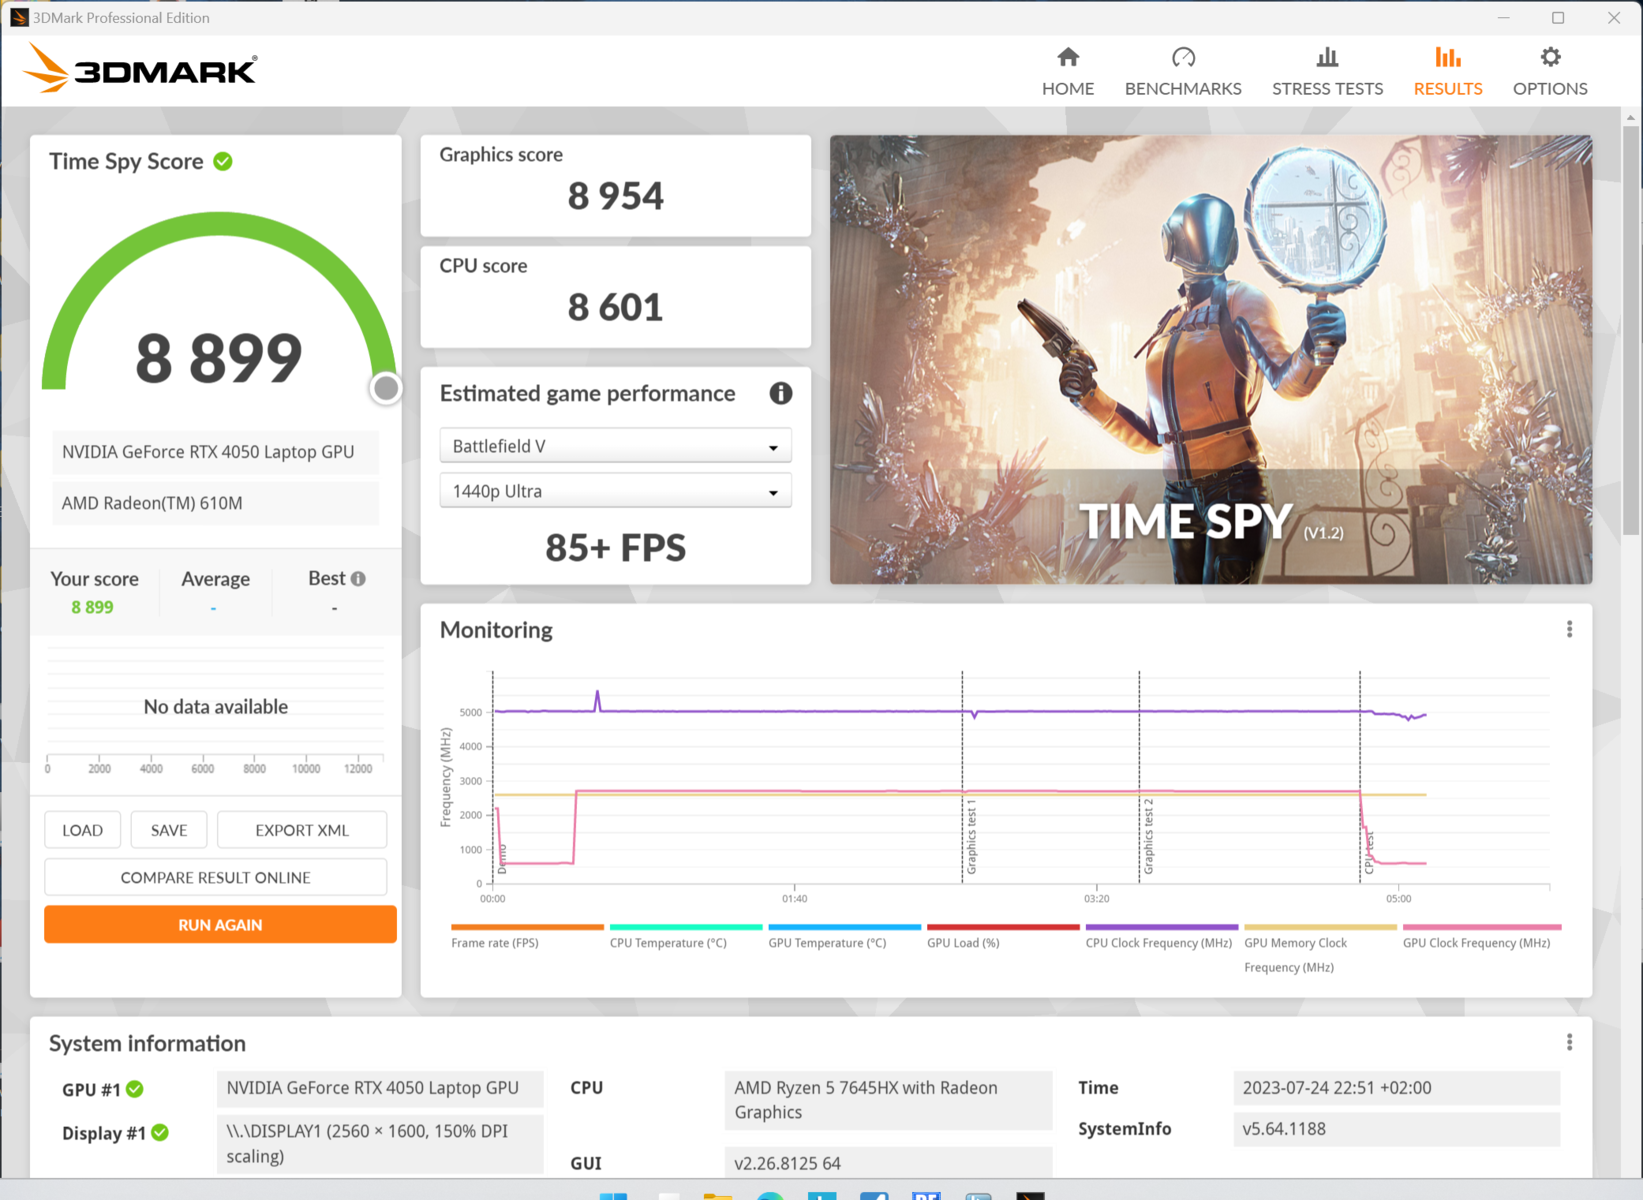
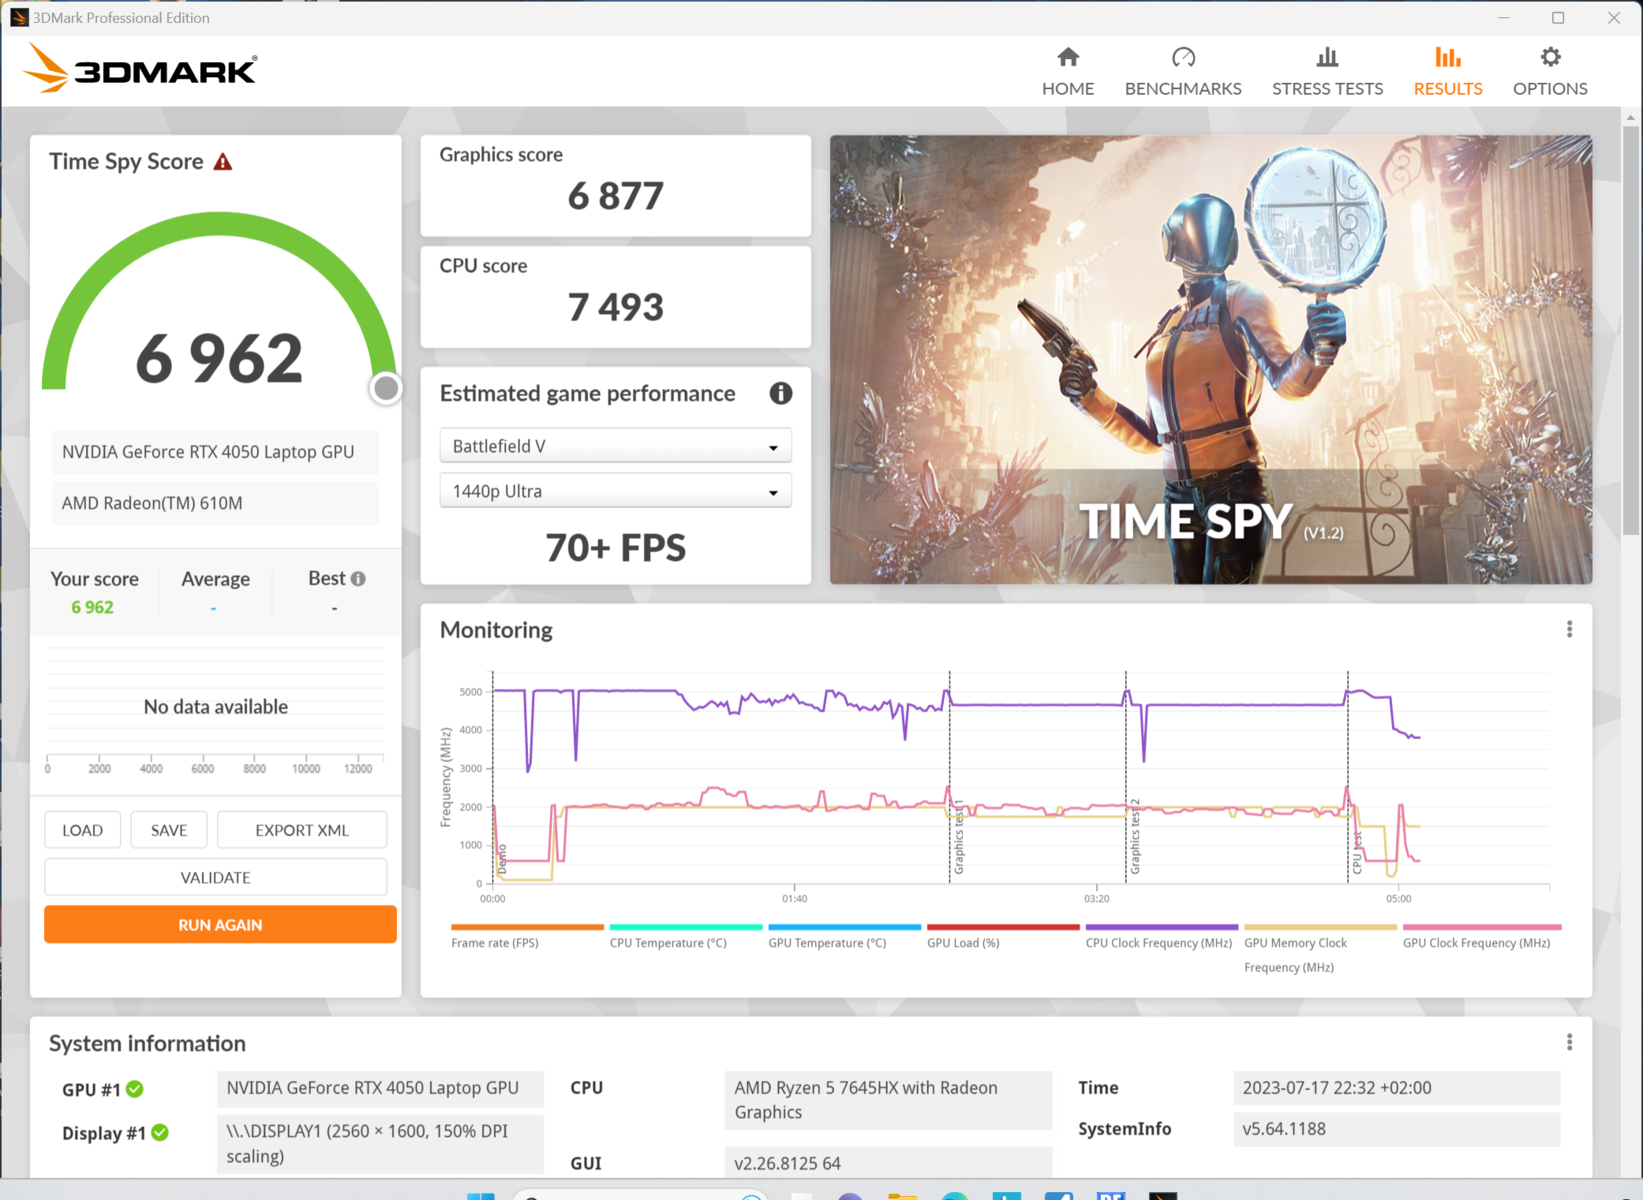
Based on our testing, the Legion Pro allocates 50 W of power to the graphics card in Silent mode; this figure is even higher at 60 W on battery power. HWiNFO indicated the GPU has nearly 130 W at its disposal in Performance mode. Performance in 3Dmark is exceptional for an RTX 4050. The Lenovo Legion Pro 5 16ARX8 managed to outclass the Medion Erazer Scout E20 by roughly 20% in 3Dmark Time Spy – whilst keeping fan noise at a moderate level.
The Lenovo Vantage software lets you further customise performance. Without limiting the GPU’s performance, it is possible to lower the processor’s power draw so as to reduce fan noise. After testing out various settings, we were unable to obtain better results than what we saw in Performance mode.

| 3DMark 11 Performance | 27506 points | |
| 3DMark Cloud Gate Standard Score | 54487 points | |
| 3DMark Fire Strike Score | 21537 points | |
| 3DMark Time Spy Score | 8899 points | |
Help | ||
* ... smaller is better
Gaming performance
Running modern games at max settings and native resolution pushes the Lenovo Legion Pro 5 to its limits. Compared with the Asus TUF A15 or Medion Erazer Scout, both of which equipped with the RTX 4050, the Legion Pro 5 had a much better showing in our gaming benchmarks. Lenovo has managed to extract 20% more FPS from the graphics card in some cases.
The results vary slightly depending on the game. For instance, Star Wars Jedi: Survivor ran consistently at very high FPS, but frame rates were below average in Hogwarts Legacy. That said, we need to state that these two newer titles are very smooth and playable at high settings.
In the table below, we used F1 23 benchmark results to illustrate the difference between Performance and Silent modes. Silent mode decreases performance by roughly 20% whilst lowering peak fan noise from 50 to 33 decibels. In other words: the gaming laptop is around 70% quieter in Silent mode and yet still allows most games to run smoothly.
F1 23 in Silent and Performance modes
| High/FHD | Ultra/FHD | Ultra/QHD | max. fan noise | |
|---|---|---|---|---|
| Silent | 133 FPS | 39 FPS | 34 FPS | 33 dB(A) |
| Performance | 165 FPS | 51 FPS | 41 FPS | 50 dB(A) |
| The Witcher 3 - 1920x1080 Ultra Graphics & Postprocessing (HBAO+) | |
| Average of class Gaming (104.7 - 240, n=7, last 2 years) | |
| Lenovo Legion Pro 5 16IRX8 | |
| Acer Nitro 17 AN17-51-71ER | |
| Asus TUF Gaming A16 FA617 | |
| Lenovo Legion Pro 5 16ARX8 (R5 7645HX, RTX 4050) | |
| Acer Nitro 5 AN517-55-5552 | |
| Medion Erazer Scout E20 | |
| Asus TUF A15 FA507 | |
| The Witcher 3 | |
| 1920x1080 High Graphics & Postprocessing (Nvidia HairWorks Off) | |
| Average of class Gaming (341 - 404, n=2, last 2 years) | |
| Lenovo Legion Pro 5 16IRX8 | |
| Lenovo Legion Pro 5 16ARX8 (R5 7645HX, RTX 4050) | |
| Asus TUF A15 FA507 | |
| Acer Nitro 5 AN517-55-5552 | |
| Asus TUF Gaming A16 FA617 | |
| Medion Erazer Scout E20 | |
| Average NVIDIA GeForce RTX 4050 Laptop GPU (87 - 177, n=28) | |
| 1920x1080 Ultra Graphics & Postprocessing (HBAO+) | |
| Average of class Gaming (104.7 - 240, n=7, last 2 years) | |
| Lenovo Legion Pro 5 16IRX8 | |
| Asus TUF Gaming A16 FA617 | |
| Lenovo Legion Pro 5 16ARX8 (R5 7645HX, RTX 4050) | |
| Acer Nitro 5 AN517-55-5552 | |
| Medion Erazer Scout E20 | |
| Asus TUF A15 FA507 | |
| Average NVIDIA GeForce RTX 4050 Laptop GPU (18.5 - 94.7, n=40) | |
| Hogwarts Legacy | |
| 1920x1080 High Preset AA:High T | |
| Asus TUF A15 FA507 | |
| Acer Nitro 5 AN517-55-5552 | |
| Average NVIDIA GeForce RTX 4050 Laptop GPU (44.8 - 93.6, n=8) | |
| Lenovo Legion Pro 5 16ARX8 (R5 7645HX, RTX 4050) | |
| 1920x1080 Ultra Preset AA:High T | |
| Average of class Gaming (n=1last 2 years) | |
| Average NVIDIA GeForce RTX 4050 Laptop GPU (39 - 77.3, n=8) | |
| Acer Nitro 5 AN517-55-5552 | |
| Lenovo Legion Pro 5 16ARX8 (R5 7645HX, RTX 4050) | |
| Asus TUF A15 FA507 | |
The system’s performance remained perfectly stable during our Witcher 3 stress test. The fluctuations you see were caused by the day-night cycle in the game. Like in many other benchmarks, the Legion Pro 5 is marginally ahead of competitors with the same GPU.
Witcher 3 FPS chart
| low | med. | high | ultra | QHD | |
|---|---|---|---|---|---|
| GTA V (2015) | 174.6 | 101.7 | 63 | ||
| The Witcher 3 (2015) | 177 | 89 | |||
| Dota 2 Reborn (2015) | 191.8 | 175.6 | |||
| Final Fantasy XV Benchmark (2018) | 86.3 | 62.3 | |||
| X-Plane 11.11 (2018) | 110 | ||||
| Far Cry 5 (2018) | 131 | 119 | 88 | ||
| Strange Brigade (2018) | 174.8 | 152.8 | 100.7 | ||
| Hogwarts Legacy (2023) | 64 | 52 | 35 | ||
| Sons of the Forest (2023) | 76 | 76 | 56 | ||
| Star Wars Jedi Survivor (2023) | 60 | 56 | 35 | ||
| F1 23 (2023) | 165.2 | 50.5 | 40.8 |
Emissions - Quiet and warm gaming notebook
Noise emissions
The Lenovo laptop is effectively inaudible when used for Internet browsing, media streaming and other less-demanding tasks. At just 24 dB, the noise level we measured is indistinguishable from very quiet background noise.
Noise level increased to 44 dB under heavy load. In the same scenario (Witcher 3 at Ultra/FHD), the Medion Erazer Scout E20 was 50% louder whilst delivering worse frame rates. In Silent mode, the Legion Pro is not even half as noisy as the Scout E20 and yet can hit almost 80 FPS in Witcher 3. The laptop only reached the peak noise level of 50 dB during the stress test.
If you want, the Legion Pro 5 can run games without any distracting fan noise; you’ll hear a quiet whirring at most. This can be easily achieved by tinkering with the various settings available. The laptop also never gets louder than a quiet work environment in Silent mode.
Noise level
| Idle |
| 23 / 23 / 24.42 dB(A) |
| Load |
| 34.94 / 50 dB(A) |
 | ||
30 dB silent 40 dB(A) audible 50 dB(A) loud |
||
min: | ||
| Lenovo Legion Pro 5 16ARX8 (R5 7645HX, RTX 4050) GeForce RTX 4050 Laptop GPU, R5 7645HX, SK hynix PC801 HFS512GEJ9X115N | Lenovo Legion Pro 5 16IRX8 GeForce RTX 4060 Laptop GPU, i7-13700HX, SK hynix PC801 HFS512GEJ9X115N | Asus TUF A15 FA507 GeForce RTX 4050 Laptop GPU, R7 7735HS, Micron 2400 MTFDKBA512QFM | Asus TUF Gaming A16 FA617 Radeon RX 7600S, R7 7735HS, Micron 2400 MTFDKBA1T0QFM | Acer Nitro 5 AN517-55-5552 GeForce RTX 4050 Laptop GPU, i5-12500H, WDC PC SN810 512GB | Medion Erazer Scout E20 GeForce RTX 4050 Laptop GPU, i7-13700H, Phison PS5021-E21 1TB | |
|---|---|---|---|---|---|---|
| Noise | -4% | 5% | -9% | -34% | -23% | |
| off / environment * (dB) | 23 | 23 -0% | 23.3 -1% | 24 -4% | 25.7 -12% | 25 -9% |
| Idle Minimum * (dB) | 23 | 23.1 -0% | 23.3 -1% | 24 -4% | 25.7 -12% | 26 -13% |
| Idle Average * (dB) | 23 | 23.1 -0% | 23.3 -1% | 25 -9% | 31.5 -37% | 27 -17% |
| Idle Maximum * (dB) | 24.42 | 26.6 -9% | 23.3 5% | 28 -15% | 31.2 -28% | 32 -31% |
| Load Average * (dB) | 34.94 | 34.7 1% | 29.6 15% | 42 -20% | 62.9 -80% | 57 -63% |
| Witcher 3 ultra * (dB) | 43.79 | 47.6 -9% | 43 2% | 50 -14% | 50 -14% | |
| Load Maximum * (dB) | 50 | 54.8 -10% | 43 14% | 50 -0% | 67.5 -35% | 57 -14% |
* ... smaller is better
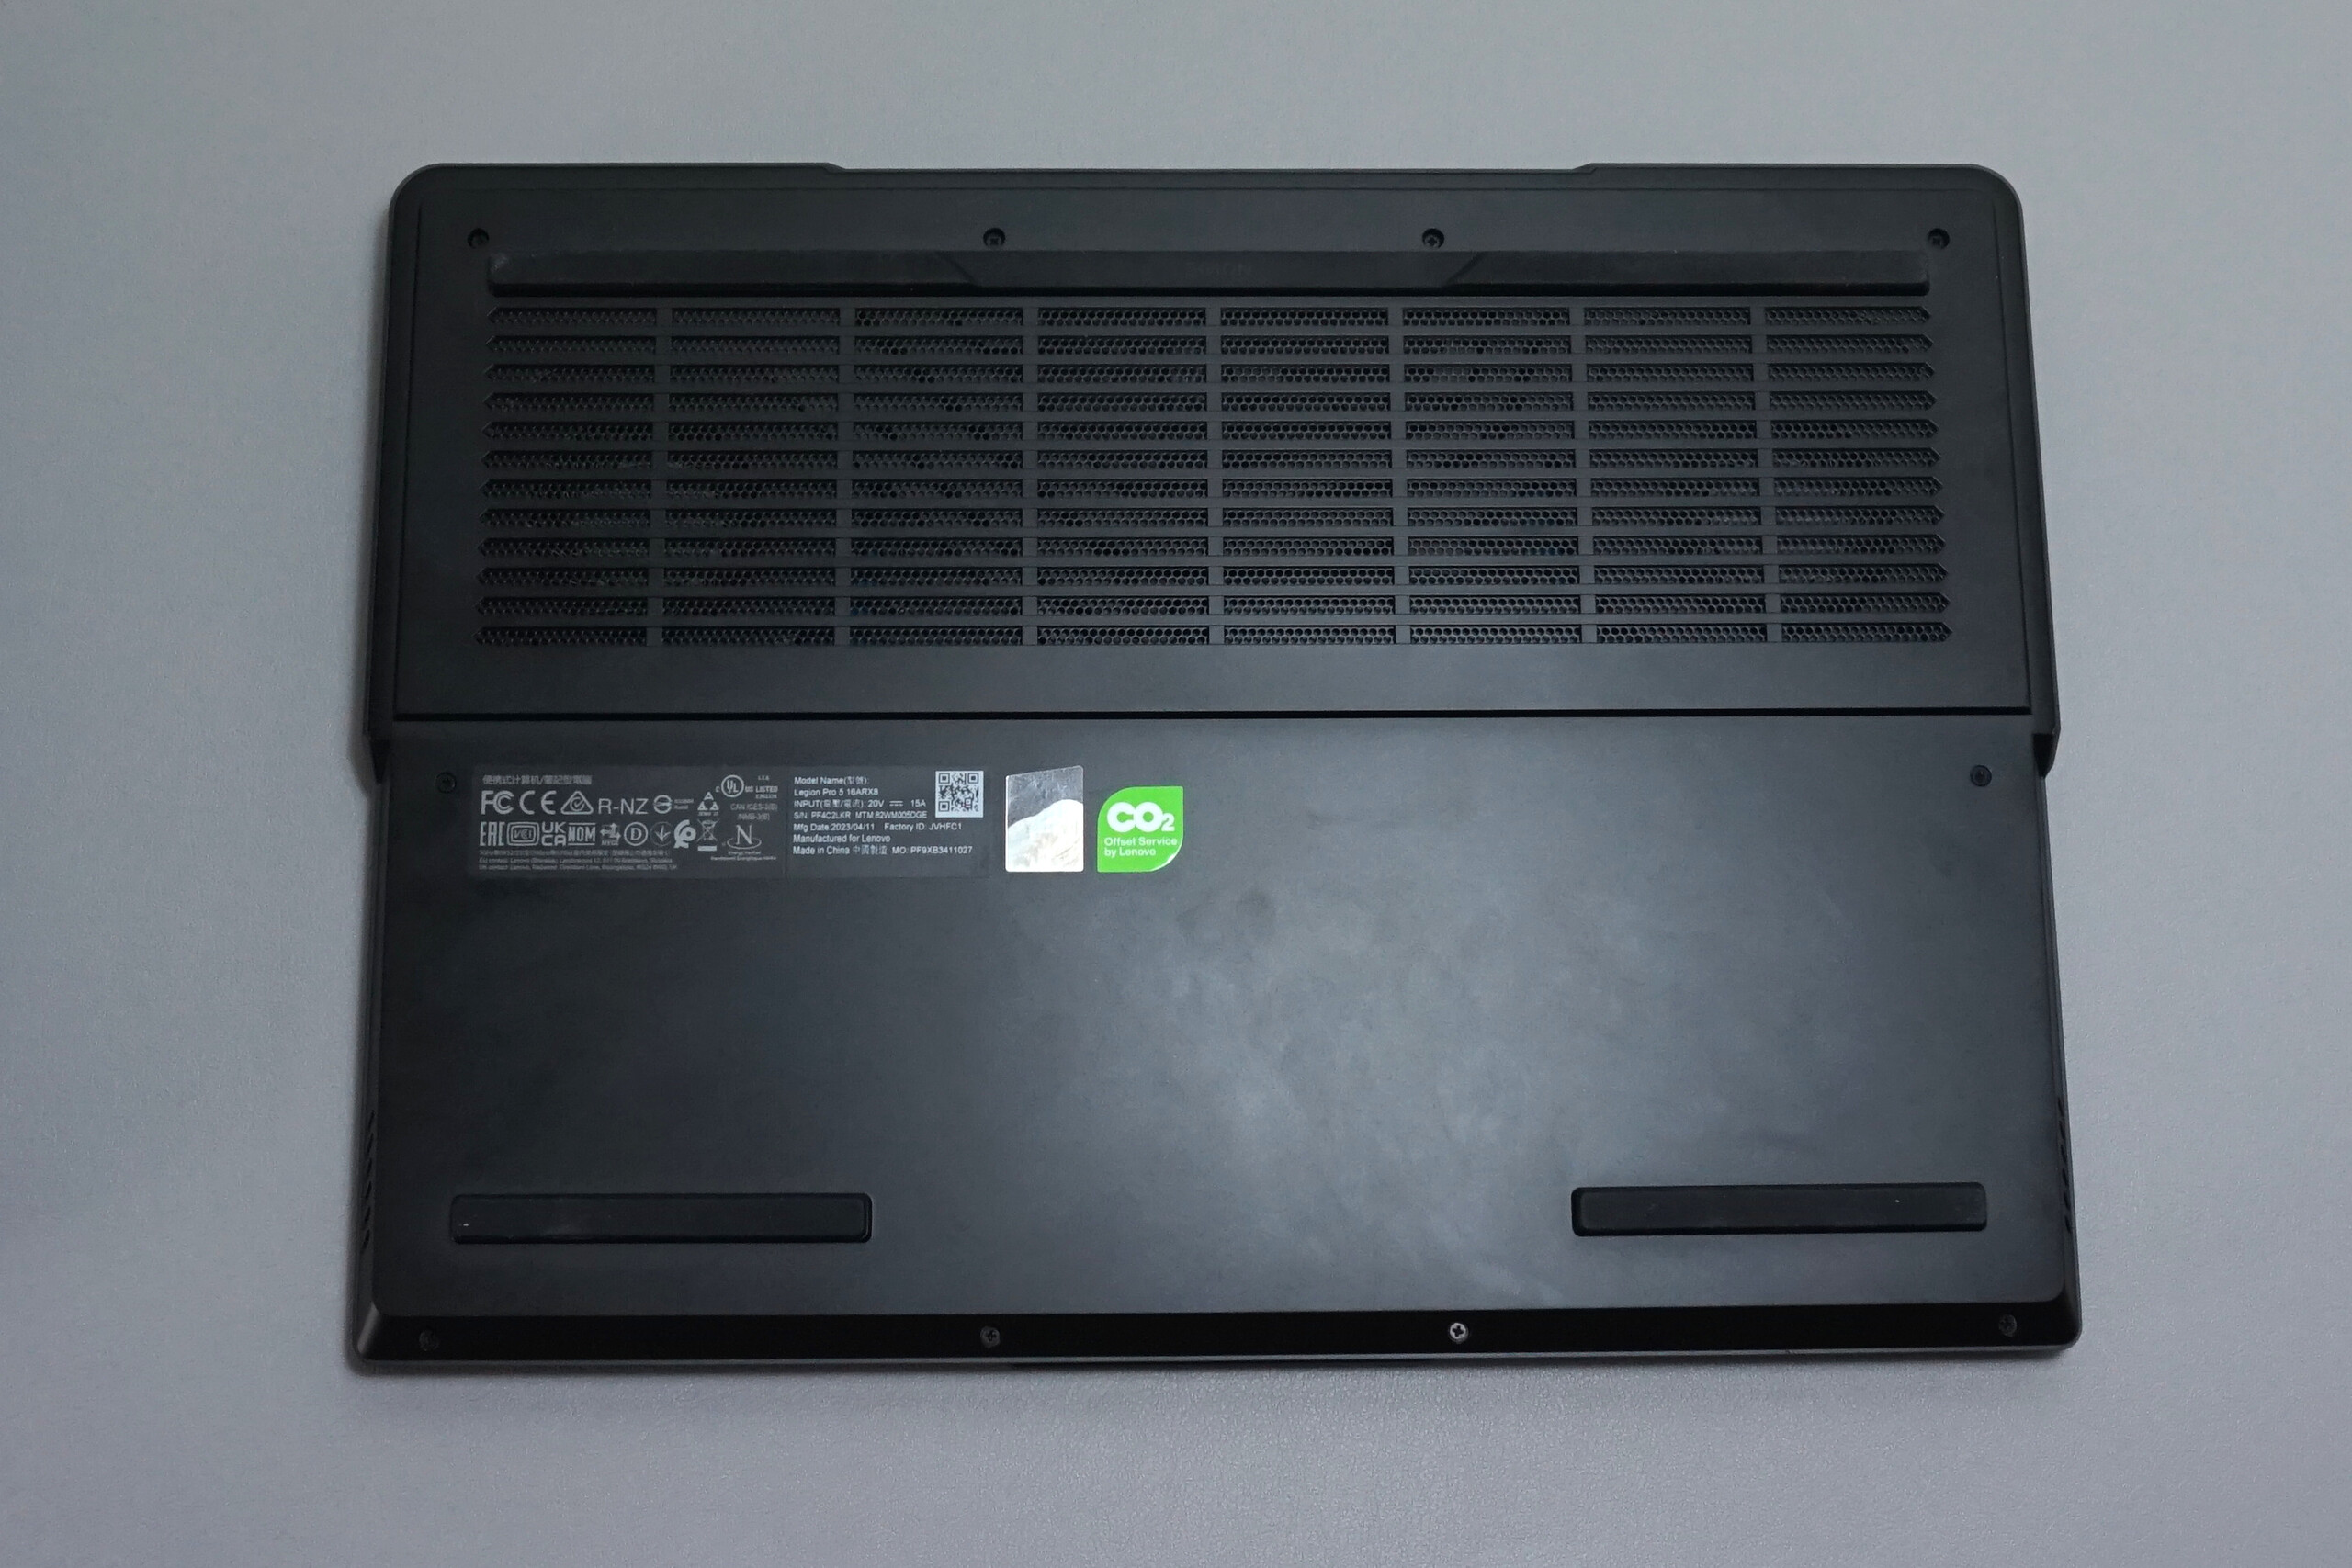
Temperature
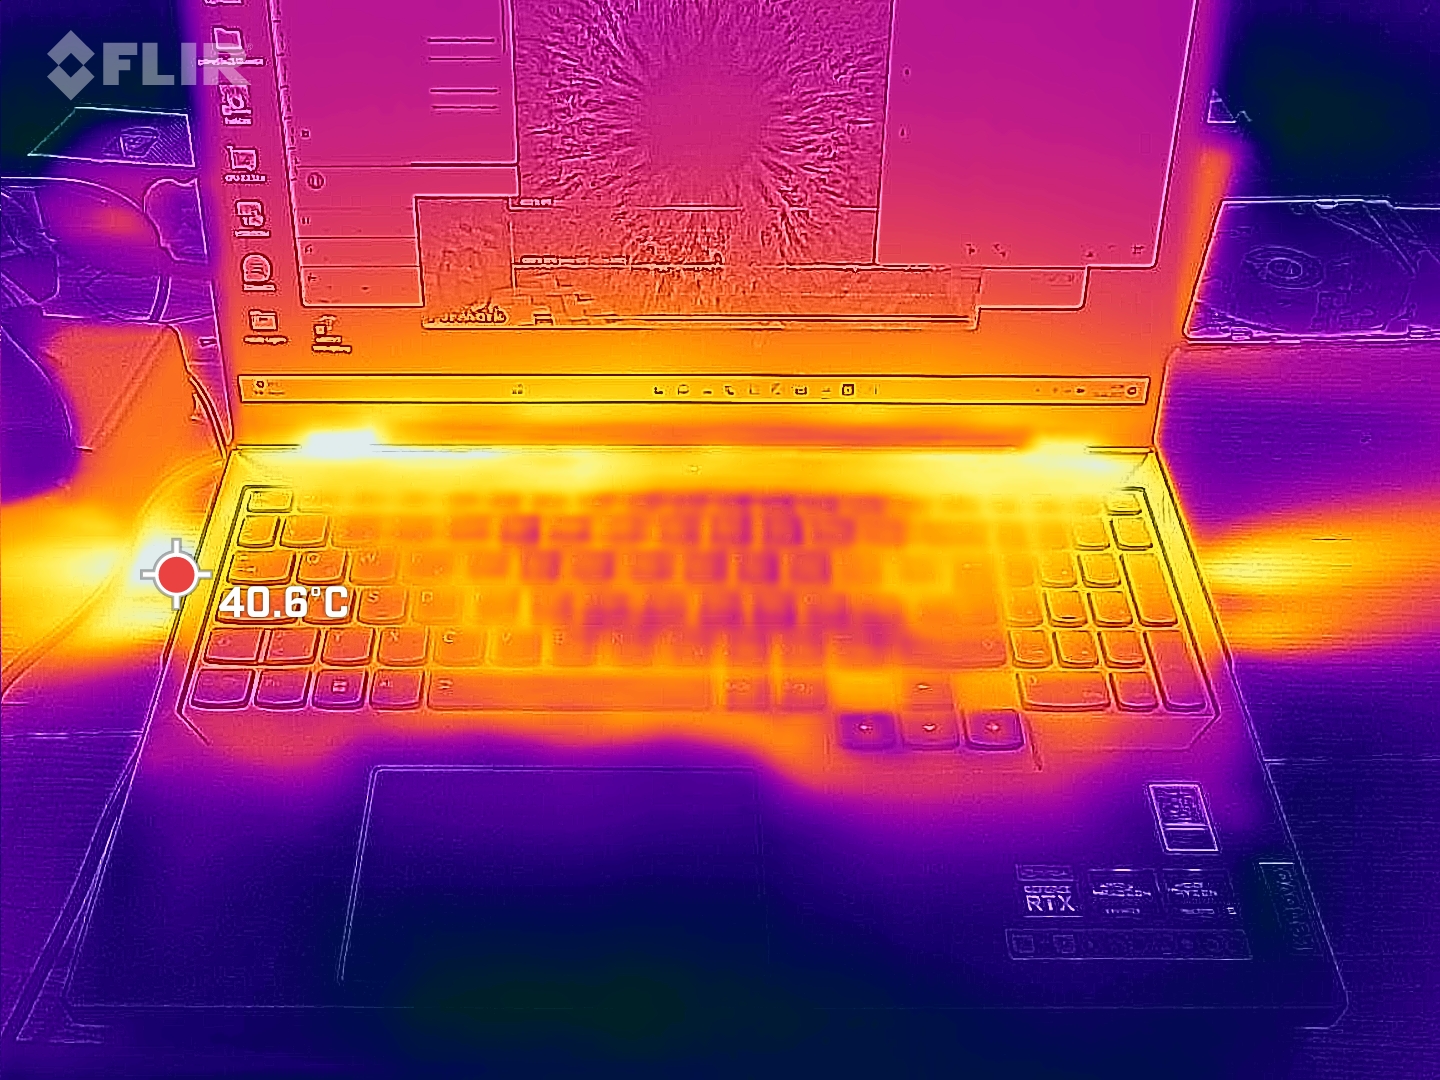
Things are less pleasants when it comes to thermals. Because the fans are almost inaudible during simple tasks, the laptop also has weak heat dissipation. At idle, we measured temperatures as high as 36°C (96.8°F) on the keyboard – much too warm. It should ideally be around 30°C (86°F).
That said, we think it is still acceptable for the upper side to hit 45°C (113°F) at max load. And the palm rests managed to keep cool throughout. Only the bottom of the laptop became unpleasantly warm at 54°C (129°F).
(±) The maximum temperature on the upper side is 45 °C / 113 F, compared to the average of 40.4 °C / 105 F, ranging from 21.2 to 68.8 °C for the class Gaming.
(-) The bottom heats up to a maximum of 54 °C / 129 F, compared to the average of 43.2 °C / 110 F
(±) In idle usage, the average temperature for the upper side is 32.3 °C / 90 F, compared to the device average of 33.9 °C / 93 F.
(±) Playing The Witcher 3, the average temperature for the upper side is 35.2 °C / 95 F, compared to the device average of 33.9 °C / 93 F.
(+) The palmrests and touchpad are cooler than skin temperature with a maximum of 31 °C / 87.8 F and are therefore cool to the touch.
(-) The average temperature of the palmrest area of similar devices was 28.8 °C / 83.8 F (-2.2 °C / -4 F).


| Lenovo Legion Pro 5 16ARX8 (R5 7645HX, RTX 4050) AMD Ryzen 5 7645HX, NVIDIA GeForce RTX 4050 Laptop GPU | Lenovo Legion Pro 5 16IRX8 Intel Core i7-13700HX, NVIDIA GeForce RTX 4060 Laptop GPU | Asus TUF A15 FA507 AMD Ryzen 7 7735HS, NVIDIA GeForce RTX 4050 Laptop GPU | Asus TUF Gaming A16 FA617 AMD Ryzen 7 7735HS, AMD Radeon RX 7600S | Acer Nitro 5 AN517-55-5552 Intel Core i5-12500H, NVIDIA GeForce RTX 4050 Laptop GPU | Medion Erazer Scout E20 Intel Core i7-13700H, NVIDIA GeForce RTX 4050 Laptop GPU | |
|---|---|---|---|---|---|---|
| Heat | 10% | 15% | -6% | 11% | 19% | |
| Maximum Upper Side * (°C) | 45 | 42.8 5% | 48.9 -9% | 54 -20% | 42.4 6% | 41 9% |
| Maximum Bottom * (°C) | 54 | 50 7% | 44.6 17% | 47 13% | 48.2 11% | 39 28% |
| Idle Upper Side * (°C) | 36 | 29.6 18% | 27.1 25% | 40 -11% | 31.6 12% | 31 14% |
| Idle Bottom * (°C) | 38 | 34 11% | 27.5 28% | 40 -5% | 33.1 13% | 29 24% |
* ... smaller is better
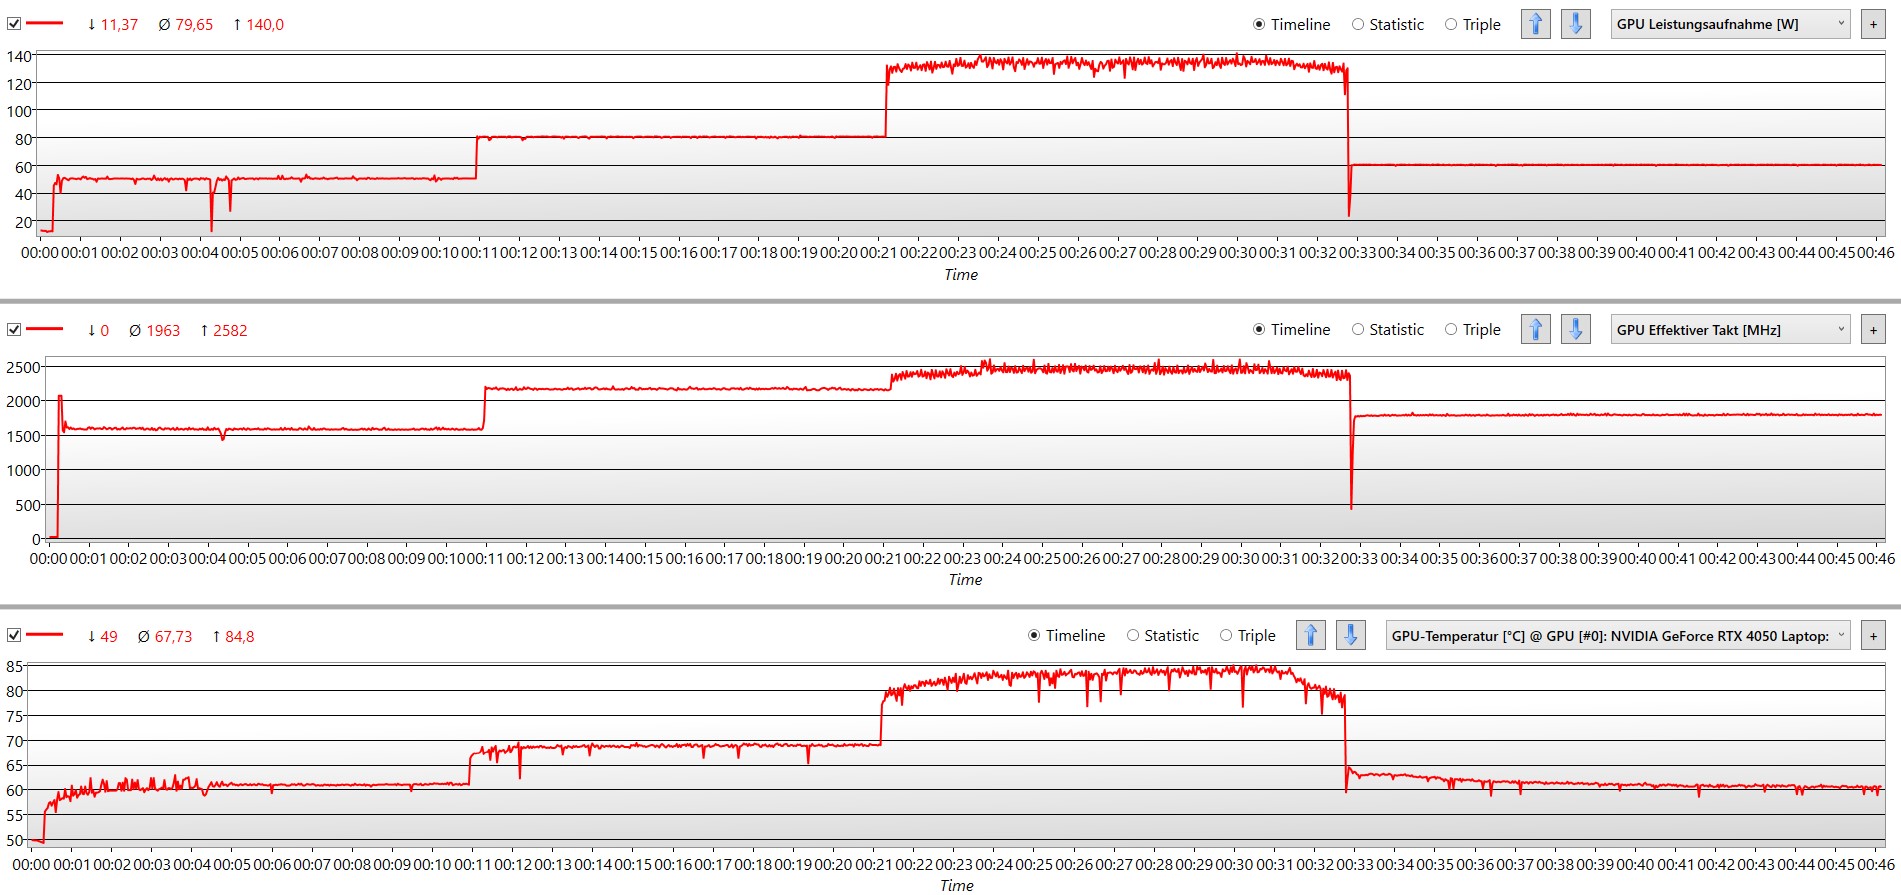
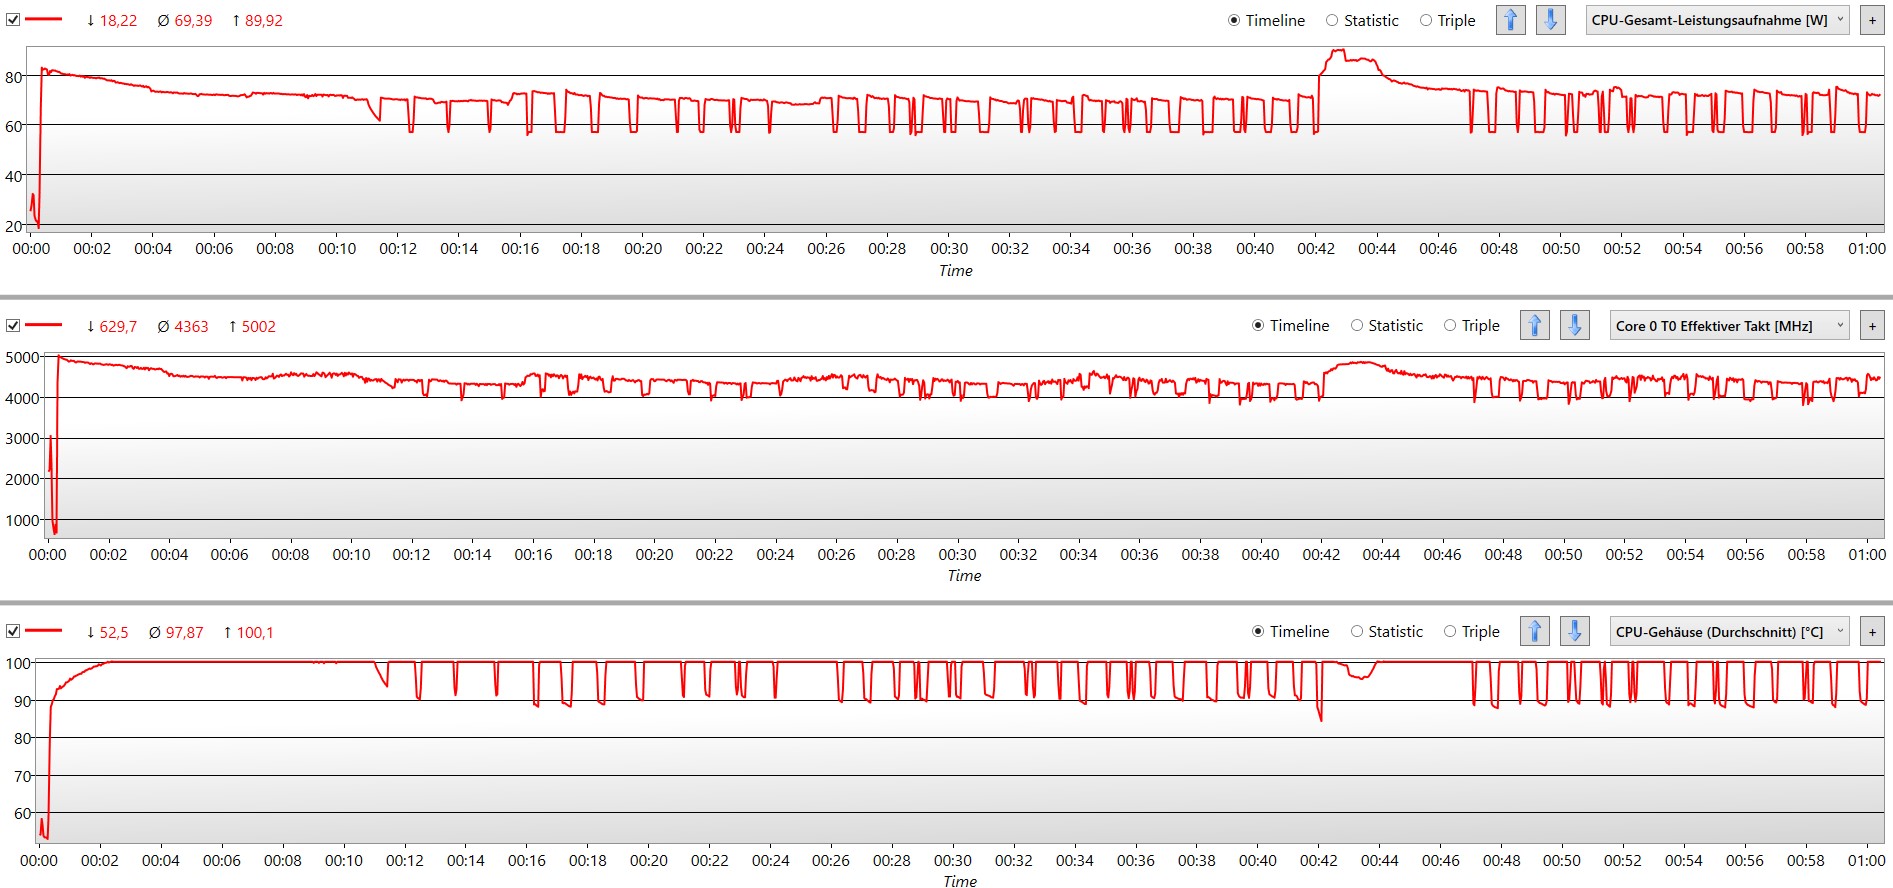
Stress test
During our stress test, which is carried out in Performance mode, the laptop’s performance stabilised at a high level after dropping marginally at the beginning. The CPU was even able to temporarily hit the max allowable clock speed of 5.0GHz once more. It is likewise remarkable that the processor managed to stay above 4.0GHz consistently.
The Lenovo Pro 5 has been configured in such a way that the max allowable power draw is slightly lower than what is specified by the hardware manufacturers. This, coupled with the overall impressive cooling, helps the laptop constantly take full advantage of the parameters specified in Performance mode.
Speakers
The stereo speakers can get loud. Their low bass even carries a little bit more power than what you might be used to from a laptop. In contrast, upper bass and low mids are almost completely non-existent. This unfortunately makes music sound rather anaemic, especially the sound of electric guitars or drums.
On the other hand, the speaker drivers are able to reproduce voices and vocals fairly well, albeit not at the quality level of good speakers. But this is fine for gaming.
Lenovo Legion Pro 5 16ARX8 (R5 7645HX, RTX 4050) audio analysis
(±) | speaker loudness is average but good (78.06 dB)
Bass 100 - 315 Hz
(-) | nearly no bass - on average 20.9% lower than median
(±) | linearity of bass is average (11.7% delta to prev. frequency)
Mids 400 - 2000 Hz
(±) | higher mids - on average 6.8% higher than median
(+) | mids are linear (5.7% delta to prev. frequency)
Highs 2 - 16 kHz
(+) | balanced highs - only 2.8% away from median
(±) | linearity of highs is average (7.5% delta to prev. frequency)
Overall 100 - 16.000 Hz
(±) | linearity of overall sound is average (21.5% difference to median)
Compared to same class
» 77% of all tested devices in this class were better, 5% similar, 18% worse
» The best had a delta of 6%, average was 18%, worst was 132%
Compared to all devices tested
» 61% of all tested devices were better, 7% similar, 32% worse
» The best had a delta of 4%, average was 23%, worst was 134%
Apple MacBook Pro 16 2021 M1 Pro audio analysis
(+) | speakers can play relatively loud (84.7 dB)
Bass 100 - 315 Hz
(+) | good bass - only 3.8% away from median
(+) | bass is linear (5.2% delta to prev. frequency)
Mids 400 - 2000 Hz
(+) | balanced mids - only 1.3% away from median
(+) | mids are linear (2.1% delta to prev. frequency)
Highs 2 - 16 kHz
(+) | balanced highs - only 1.9% away from median
(+) | highs are linear (2.7% delta to prev. frequency)
Overall 100 - 16.000 Hz
(+) | overall sound is linear (4.6% difference to median)
Compared to same class
» 0% of all tested devices in this class were better, 0% similar, 100% worse
» The best had a delta of 5%, average was 17%, worst was 45%
Compared to all devices tested
» 0% of all tested devices were better, 0% similar, 100% worse
» The best had a delta of 4%, average was 23%, worst was 134%
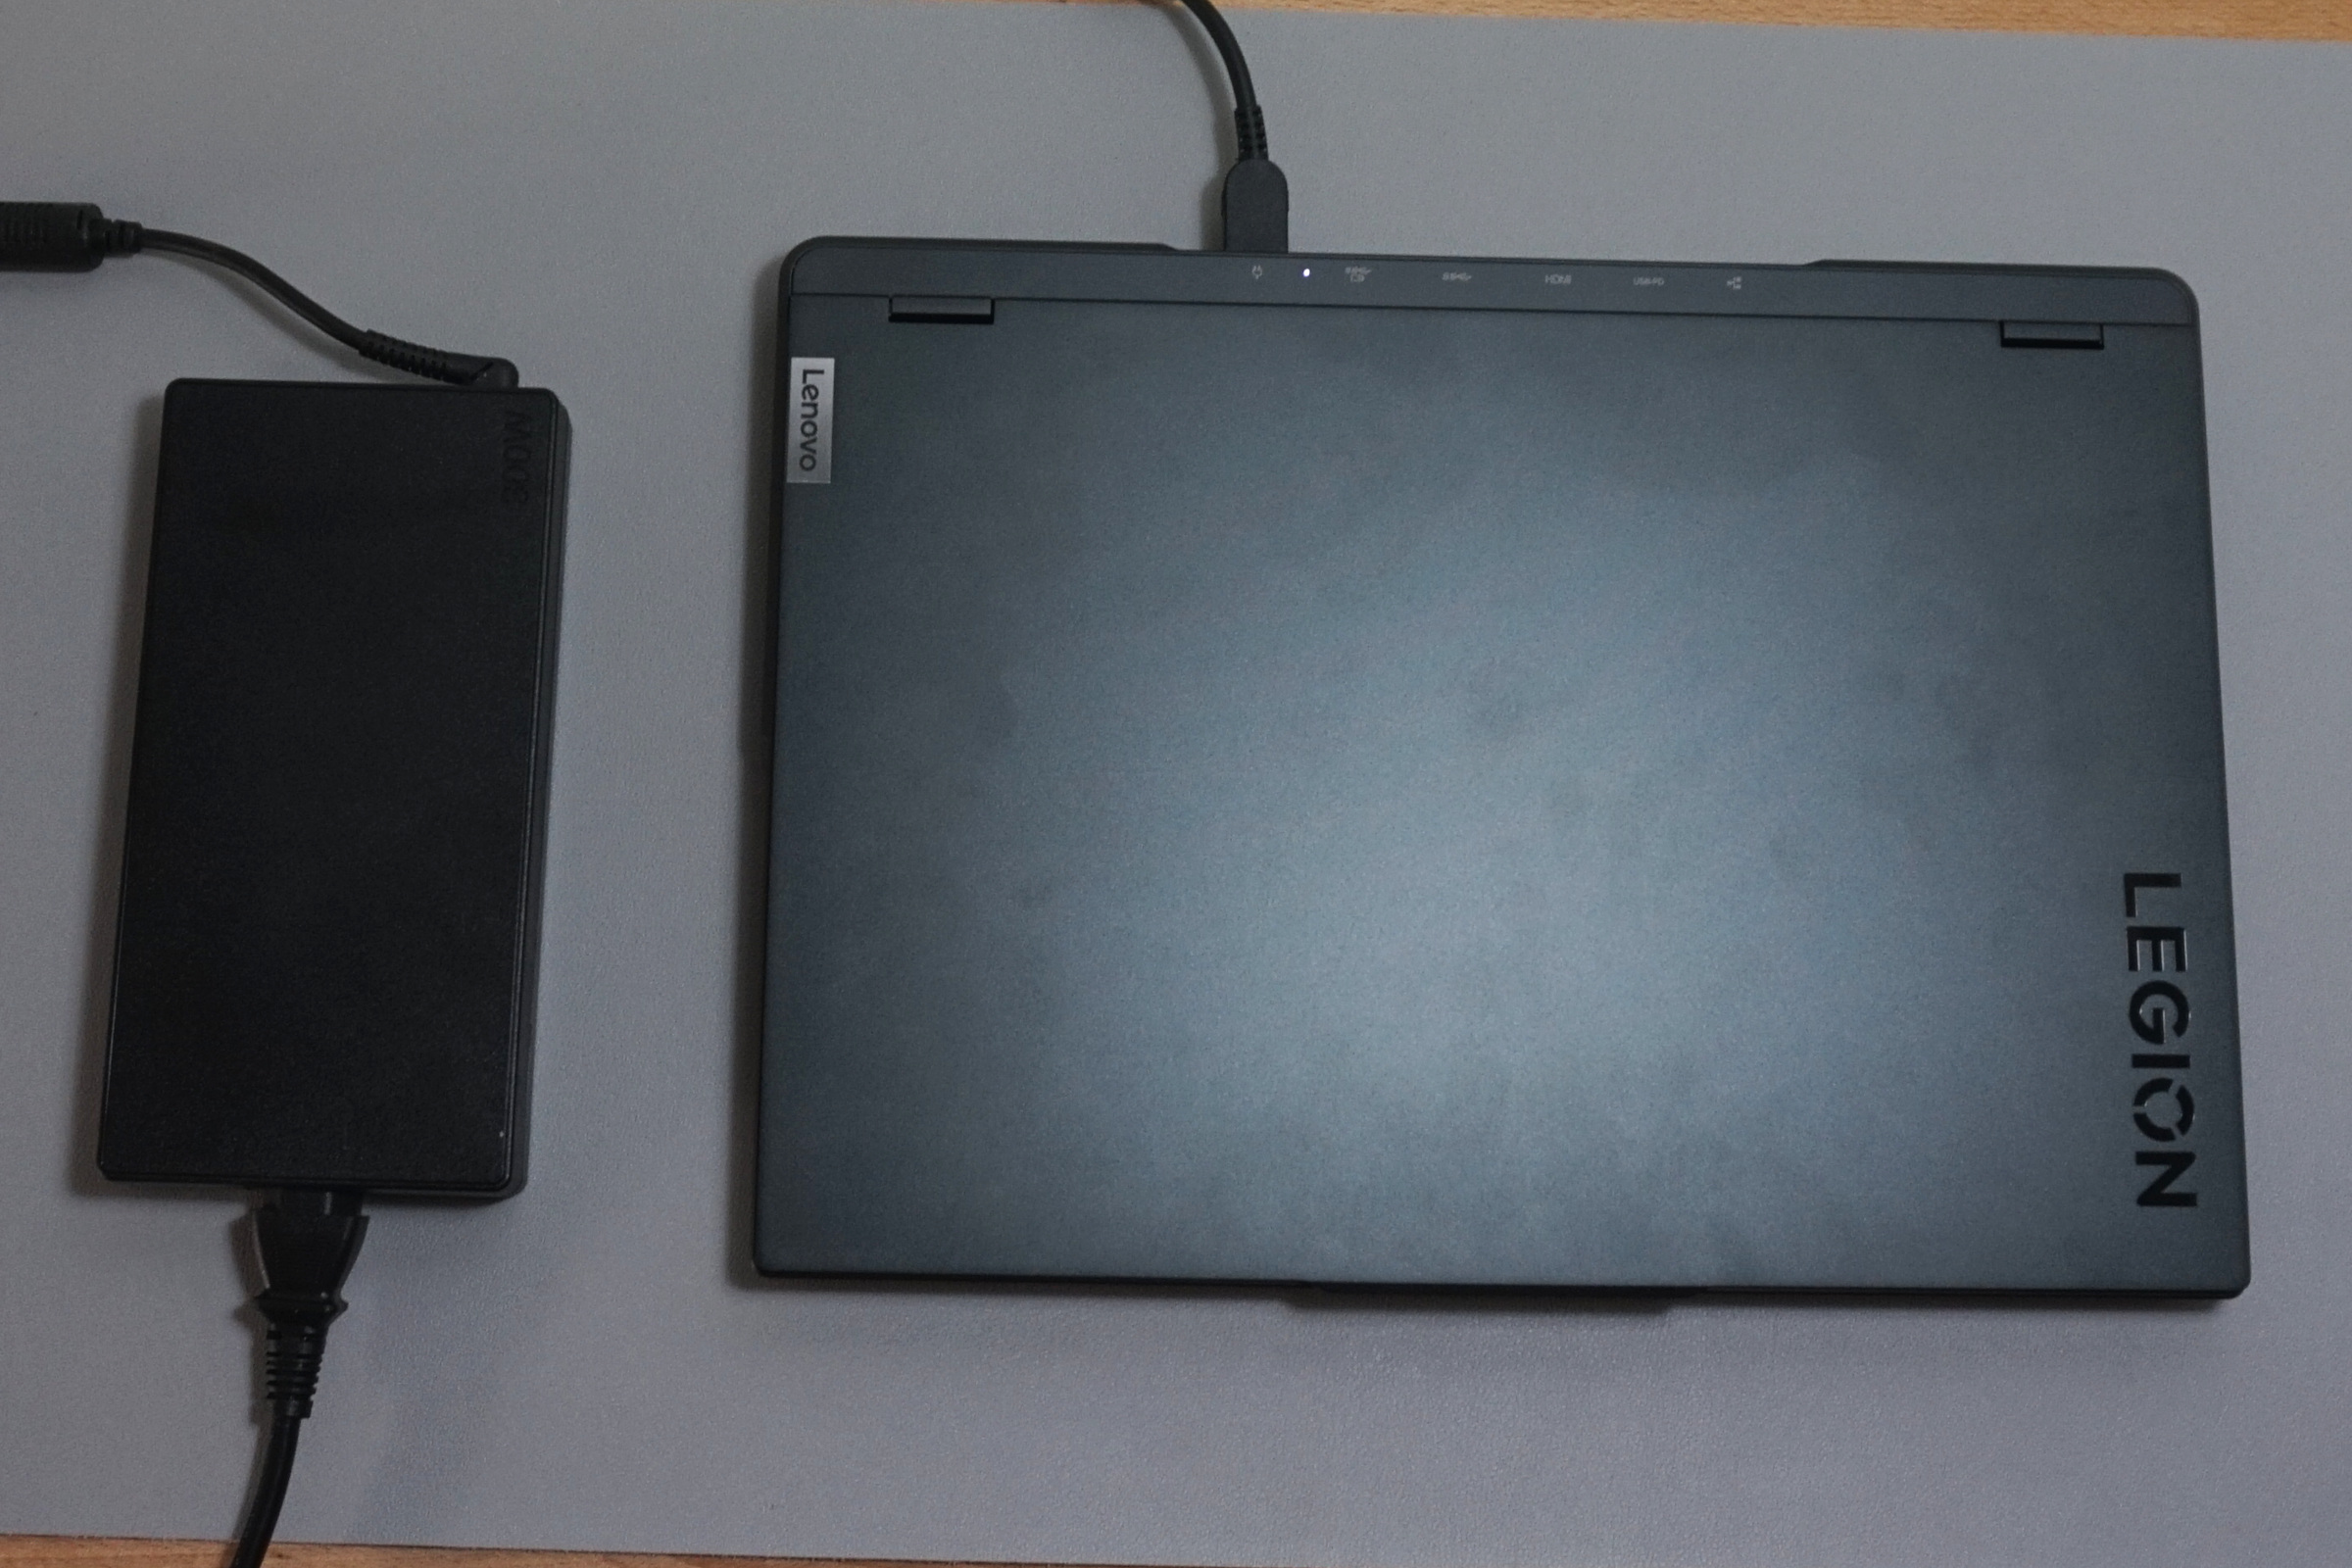
Power management - Efficient under load
Power consumption
AMD's “HX” series processors aren’t quite able to deliver on their promise of high efficiency. Consuming at least 13 W at idle is too much for a moderately spec’d laptop. The Asus TUF A15 with a Ryzen 7 7735HS uses only 8 W in the same situation, and the likewise powerful Medion Erazer Scout E20 draws only 5 W. Compared with these similarly configured gaming laptops, the Legion seems to use too much power at idle.
However, it is capable of beating many of its competitors when handling demanding tasks. For example, it only consumed about 125 W running Witcher 3. During our testing, we measured a max power draw of 204 W, meaning the 300 W adapter should be adequate for the device.
One thing to remember is that the processor and graphics card alone can draw 145 W and 115 W of power respectively, and concurrently at that. Though users have to explicitly enable this and acknowledge a safety warning, it also make sense that Lenovo has included such a beast of a charger.
| Off / Standby | |
| Idle | |
| Load |
|
Key:
min: | |
| Lenovo Legion Pro 5 16ARX8 (R5 7645HX, RTX 4050) R5 7645HX, GeForce RTX 4050 Laptop GPU, SK hynix PC801 HFS512GEJ9X115N, IPS, 2560x1600, 16" | Lenovo Legion Pro 5 16IRX8 i7-13700HX, GeForce RTX 4060 Laptop GPU, SK hynix PC801 HFS512GEJ9X115N, IPS, 2560x1600, 16" | Asus TUF A15 FA507 R7 7735HS, GeForce RTX 4050 Laptop GPU, Micron 2400 MTFDKBA512QFM, IPS, 1920x1080, 15.6" | Asus TUF Gaming A16 FA617 R7 7735HS, Radeon RX 7600S, Micron 2400 MTFDKBA1T0QFM, IPS-Level, 1920x1200, 16" | Acer Nitro 5 AN517-55-5552 i5-12500H, GeForce RTX 4050 Laptop GPU, WDC PC SN810 512GB, IPS, 1920x1080, 17.3" | Medion Erazer Scout E20 i7-13700H, GeForce RTX 4050 Laptop GPU, Phison PS5021-E21 1TB, IPS, 1920x1080, 17.3" | Average NVIDIA GeForce RTX 4050 Laptop GPU | Average of class Gaming | |
|---|---|---|---|---|---|---|---|---|
| Power Consumption | -47% | 22% | 15% | 3% | 14% | 13% | -13% | |
| Idle Minimum * (Watt) | 13 | 24.5 -88% | 8 38% | 8 38% | 7.6 42% | 5 62% | 9.95 ? 23% | 13 ? -0% |
| Idle Average * (Watt) | 17.4 | 29.2 -68% | 12.1 30% | 11 37% | 11.3 35% | 11 37% | 15.8 ? 9% | 19 ? -9% |
| Idle Maximum * (Watt) | 21.8 | 34.3 -57% | 12.5 43% | 16 27% | 15.4 29% | 22 -1% | 20.1 ? 8% | 24.6 ? -13% |
| Load Average * (Watt) | 96.4 | 98.7 -2% | 74.9 22% | 97 -1% | 151 -57% | 96 -0% | 88 ? 9% | 110.7 ? -15% |
| Witcher 3 ultra * (Watt) | 125 | 178.6 -43% | 136.6 -9% | 161.5 -29% | 137.8 -10% | 145.2 -16% | ||
| Load Maximum * (Watt) | 204 | 249.6 -22% | 185 9% | 168 18% | 244 -20% | 201 1% | 176.3 ? 14% | 259 ? -27% |
* ... smaller is better
Power consumption Witcher 3 / Stress test
Power consumption with external monitor
Battery life

The 80 Wh battery doesn't really deliver spectacular battery life due to the generally high power consumption of the CPU. With its screen brightness lowered to 150 cd/m², the laptop lasted around 6.5 hours in both our video playback test and Wi-Fi web browsing test. Turning screen brightness all the way up cut battery life by half.
Even though 47 minutes of battery life is extremely short in Witcher 3, the gaming performance is only a few percentage points below what the Legion is capable of when plugged in.
| Lenovo Legion Pro 5 16ARX8 (R5 7645HX, RTX 4050) R5 7645HX, GeForce RTX 4050 Laptop GPU, 80 Wh | Lenovo Legion Pro 5 16IRX8 i7-13700HX, GeForce RTX 4060 Laptop GPU, 80 Wh | Asus TUF A15 FA507 R7 7735HS, GeForce RTX 4050 Laptop GPU, 90 Wh | Asus TUF Gaming A16 FA617 R7 7735HS, Radeon RX 7600S, 90 Wh | Acer Nitro 5 AN517-55-5552 i5-12500H, GeForce RTX 4050 Laptop GPU, 90 Wh | Medion Erazer Scout E20 i7-13700H, GeForce RTX 4050 Laptop GPU, 53.35 Wh | Average of class Gaming | |
|---|---|---|---|---|---|---|---|
| Battery runtime | -39% | 120% | 116% | 53% | -16% | 41% | |
| H.264 (h) | 5.4 | 12.5 131% | 7.4 37% | 4.6 -15% | 8.32 ? 54% | ||
| WiFi v1.3 (h) | 5.6 | 3.4 -39% | 11.7 109% | 12.1 116% | 9.4 68% | 4.7 -16% | 7.11 ? 27% |
| Witcher 3 ultra (h) | 0.8 |
Pros
Cons
Verdict - Quiet, fast or both

The Lenovo Legion Pro 4 16ARX8 doesn’t have any serious weaknesses and managed to wow us with its stable gaming performance, bright display and decent specs. Sure, it is not powerful enough to run the latest games at the highest settings, but it is almost always capable of churning out decent frame rates. What’s more, fan noise is consistently kept at an acceptable level, meaning you don’t necessarily need to use a pair of headphones when gaming. This seems to be an attractive combination for casual gamers.
Furthermore, the Lenovo Vantage software offers additional customisation options. With a bit of work, you can optimise the laptop’s performance for your favourite games. Thanks to the Legion's great graphics performance, it is conceivable to have a near-passive mode geared towards photo and video editing. The superb display also facilitates these kinds of editing work, albeit not at a professional level.
Versatility is its strength: the laptop is quiet during gaming and yet, with just one click, can easily hold its own against the best laptops with the same hardware
The combination of a WQXGA resolution (2,560 x 1,600) and a 240Hz refresh rate is a bit of an overkill. The GPU doesn’t have the performance required to take full advantage of the display. Another underwhelming thing is the lacklustre battery life. Similarly, a USB4 port and a card reader would also have been nice to see on the laptop. However, these weaknesses are easy to overlook considering the Legion’s modest price (additional discount is available if you can present a valid ID from an educational institution).
The Medion Erazer Scout E20 and Asus TUF Gaming A16 Advantage both offer similar performance but are a few percentage points behind the Legion Pro 5 in nearly all areas. Both laptops also have poorer displays and are less customisable, louder under load and, at least for students and educators, more expensive. The competitors still can learn a thing or two from Lenovo’s entry-level gaming laptop.
Price and availability
In Germany, you can buy the Lenovo Legion Pro 5 16ARX8 (R5 7645HX, RTX 4050) straight from Lenovo or from Campuspoint for €1,500 (US$1,640). Those with a valid ID can get it at a discounted price of €1,200 (US$1,312). For those in the United States, a similar model with 1 TB of storage can had for US$1,419 from amazon.com.
Lenovo Legion Pro 5 16ARX8 (R5 7645HX, RTX 4050)
- 07/29/2023 v7 (old)
Mario Petzold
Transparency
The selection of devices to be reviewed is made by our editorial team. The test sample was provided to the author as a loan by the manufacturer or retailer for the purpose of this review. The lender had no influence on this review, nor did the manufacturer receive a copy of this review before publication. There was no obligation to publish this review. As an independent media company, Notebookcheck is not subjected to the authority of manufacturers, retailers or publishers.
This is how Notebookcheck is testing
Every year, Notebookcheck independently reviews hundreds of laptops and smartphones using standardized procedures to ensure that all results are comparable. We have continuously developed our test methods for around 20 years and set industry standards in the process. In our test labs, high-quality measuring equipment is utilized by experienced technicians and editors. These tests involve a multi-stage validation process. Our complex rating system is based on hundreds of well-founded measurements and benchmarks, which maintains objectivity. Further information on our test methods can be found here.
Price comparison

