Verdict – is the €500 price gap justified?
The RTX 5070 Ti version was one of the fastest laptops with that GPU, and the same can largely be said about the standard RTX 5070 model—though the lead over rivals isn’t quite as big. Alienware’s 16X Aurora even manages to edge it out slightly.
There’s roughly a €500–700 difference between the two Legion variants, and in return you get up to 25 percent more GPU performance. That sounds significant on paper, but the real-world impact varies widely depending on the game. The Ti model also benefits from extra video memory, which helps with future-proofing. On the other hand, the “smaller” version runs quieter, cooler, and draws less power.
Even without the more powerful GPU, this is still a very capable, high-quality gaming laptop at a relatively moderate price.
Pros
Cons
- $1,849.00Lenovo Legion Pro 5 16IAX10 Gaming Laptop 2025 16” WQXGA 2560 x 1600 Display IPS Intel Core Ultra 7 255HX NVIDIA GeForce RTX 5070 8GB GDDR7 16GB DDR5 1TB SSD Backlit KB Wi-Fi 7 Windows 11 Home
- $2,129.00Lenovo 2025 Gaming Laptop | Legion Pro 5 | Intel 20-Core Ultra 7 255HX | NVIDIA GeForce RTX 5070 | 32GB DDR5 | 1TB SSD | 16" 2560x1600 165Hz | Win11 Pro - Wi-Fi 7 - BT 5.4 - RGB Backlit KB - Grey
- $2,199.00Lenovo Legion Pro 5 16IAX10 Gaming Laptop 2025 16” WQXGA 2560 x 1600 Display IPS Intel Core Ultra 7 255HX NVIDIA GeForce RTX 5070 8GB GDDR7 32GB DDR5 2TB SSD Backlit KB Wi-Fi 7 Windows 11 Home
Table of Contents
- Verdict – is the €500 price gap justified?
- Specifications
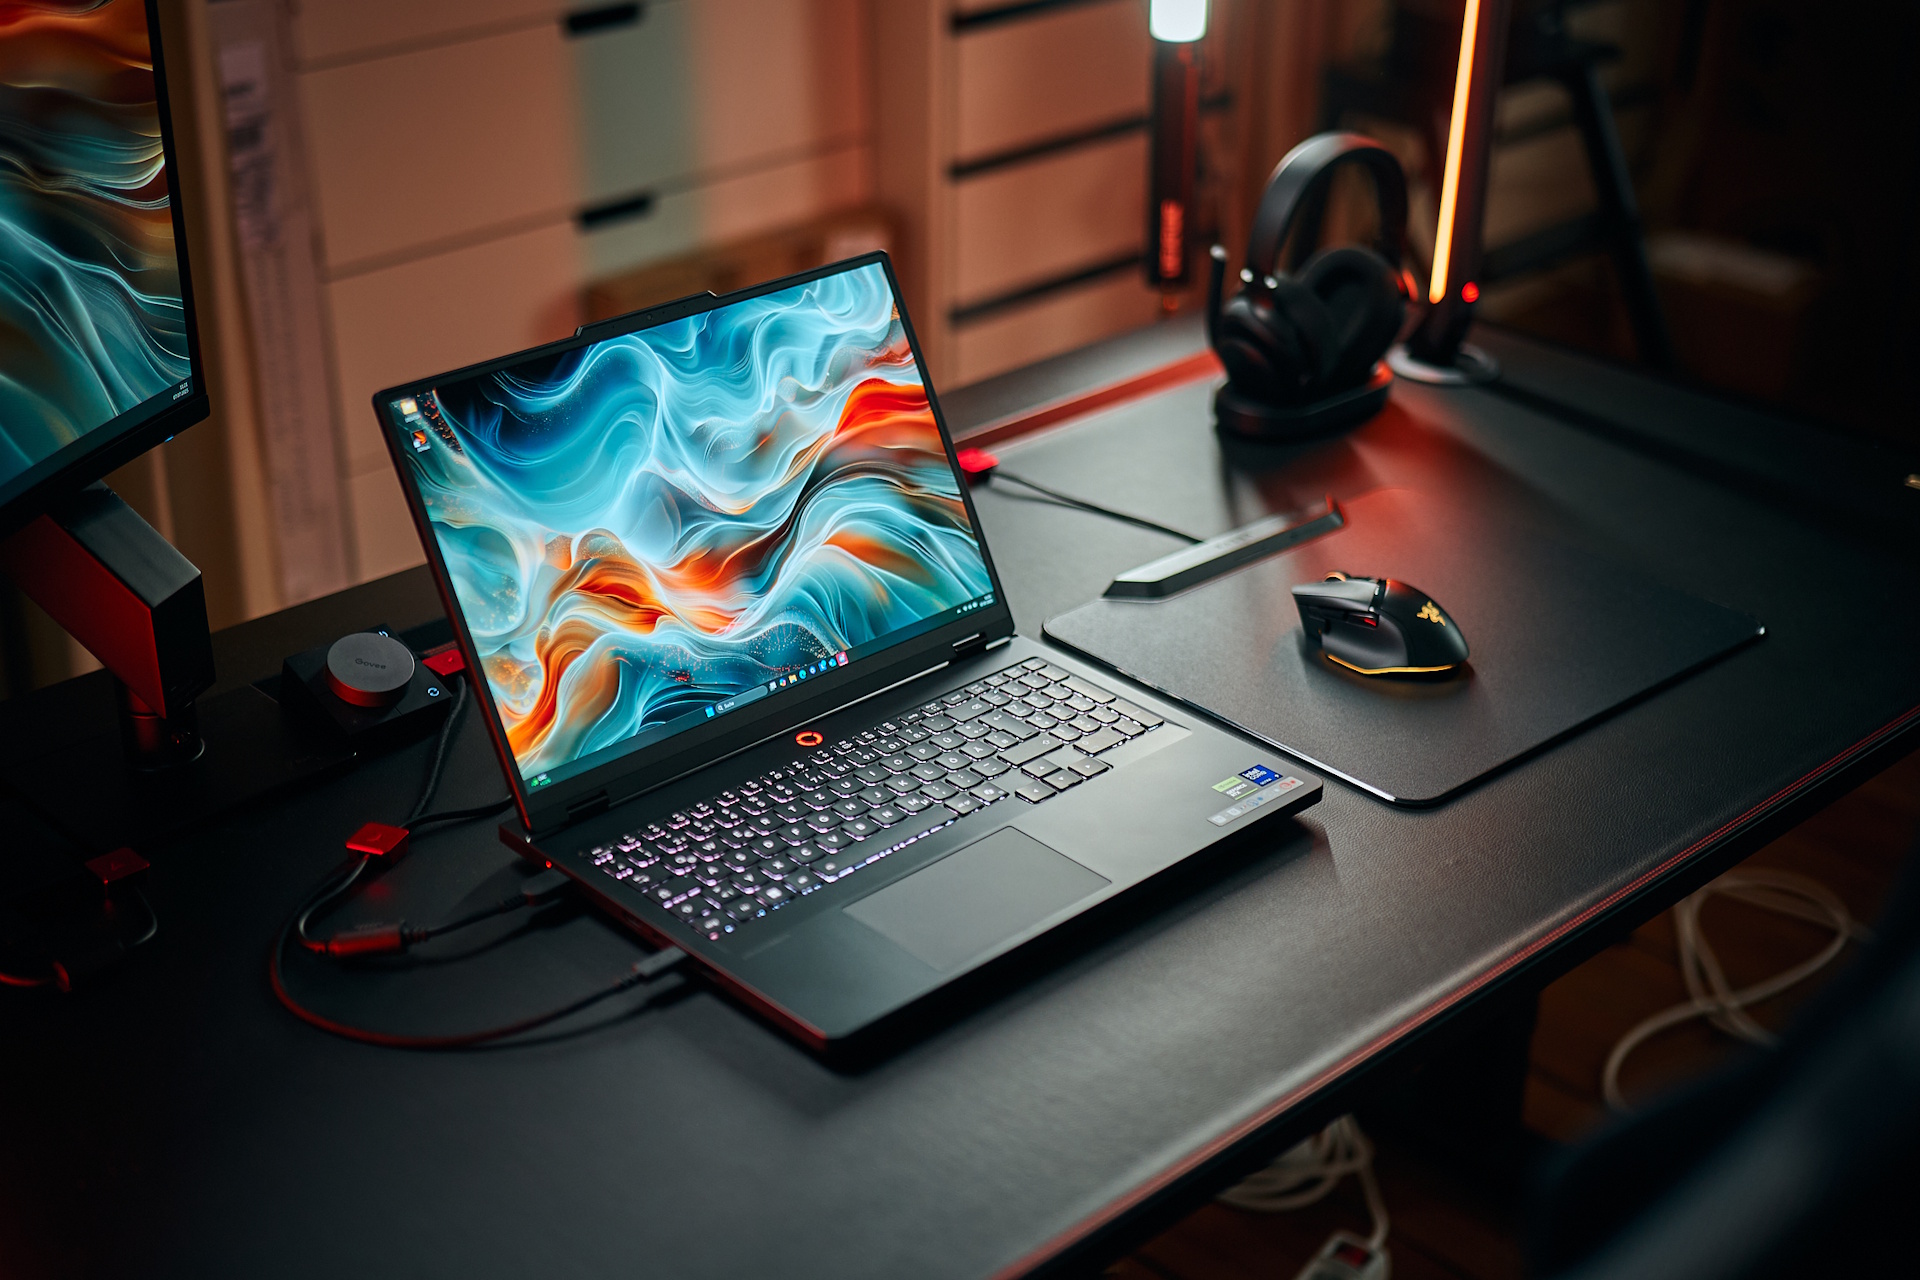
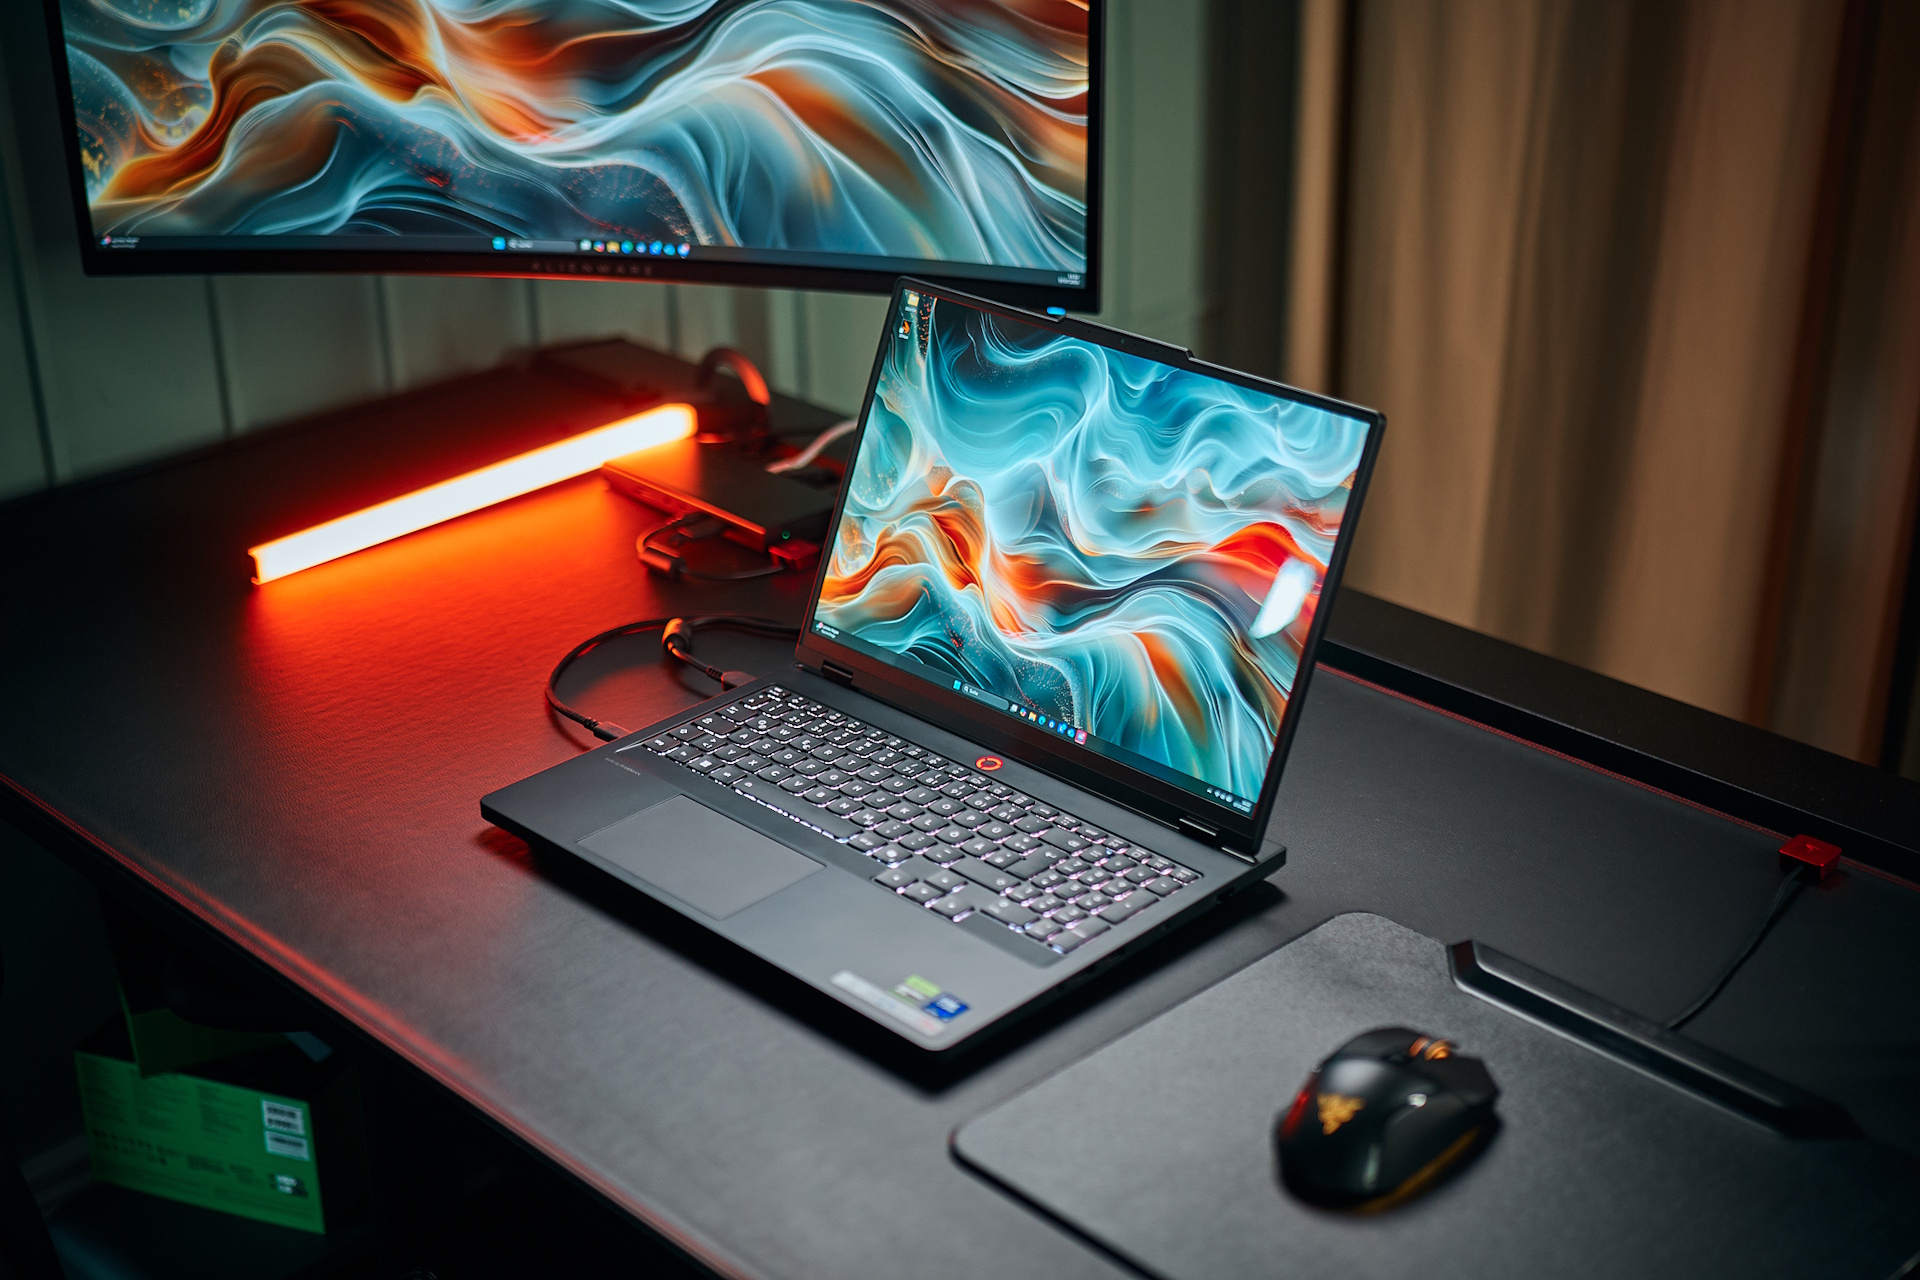
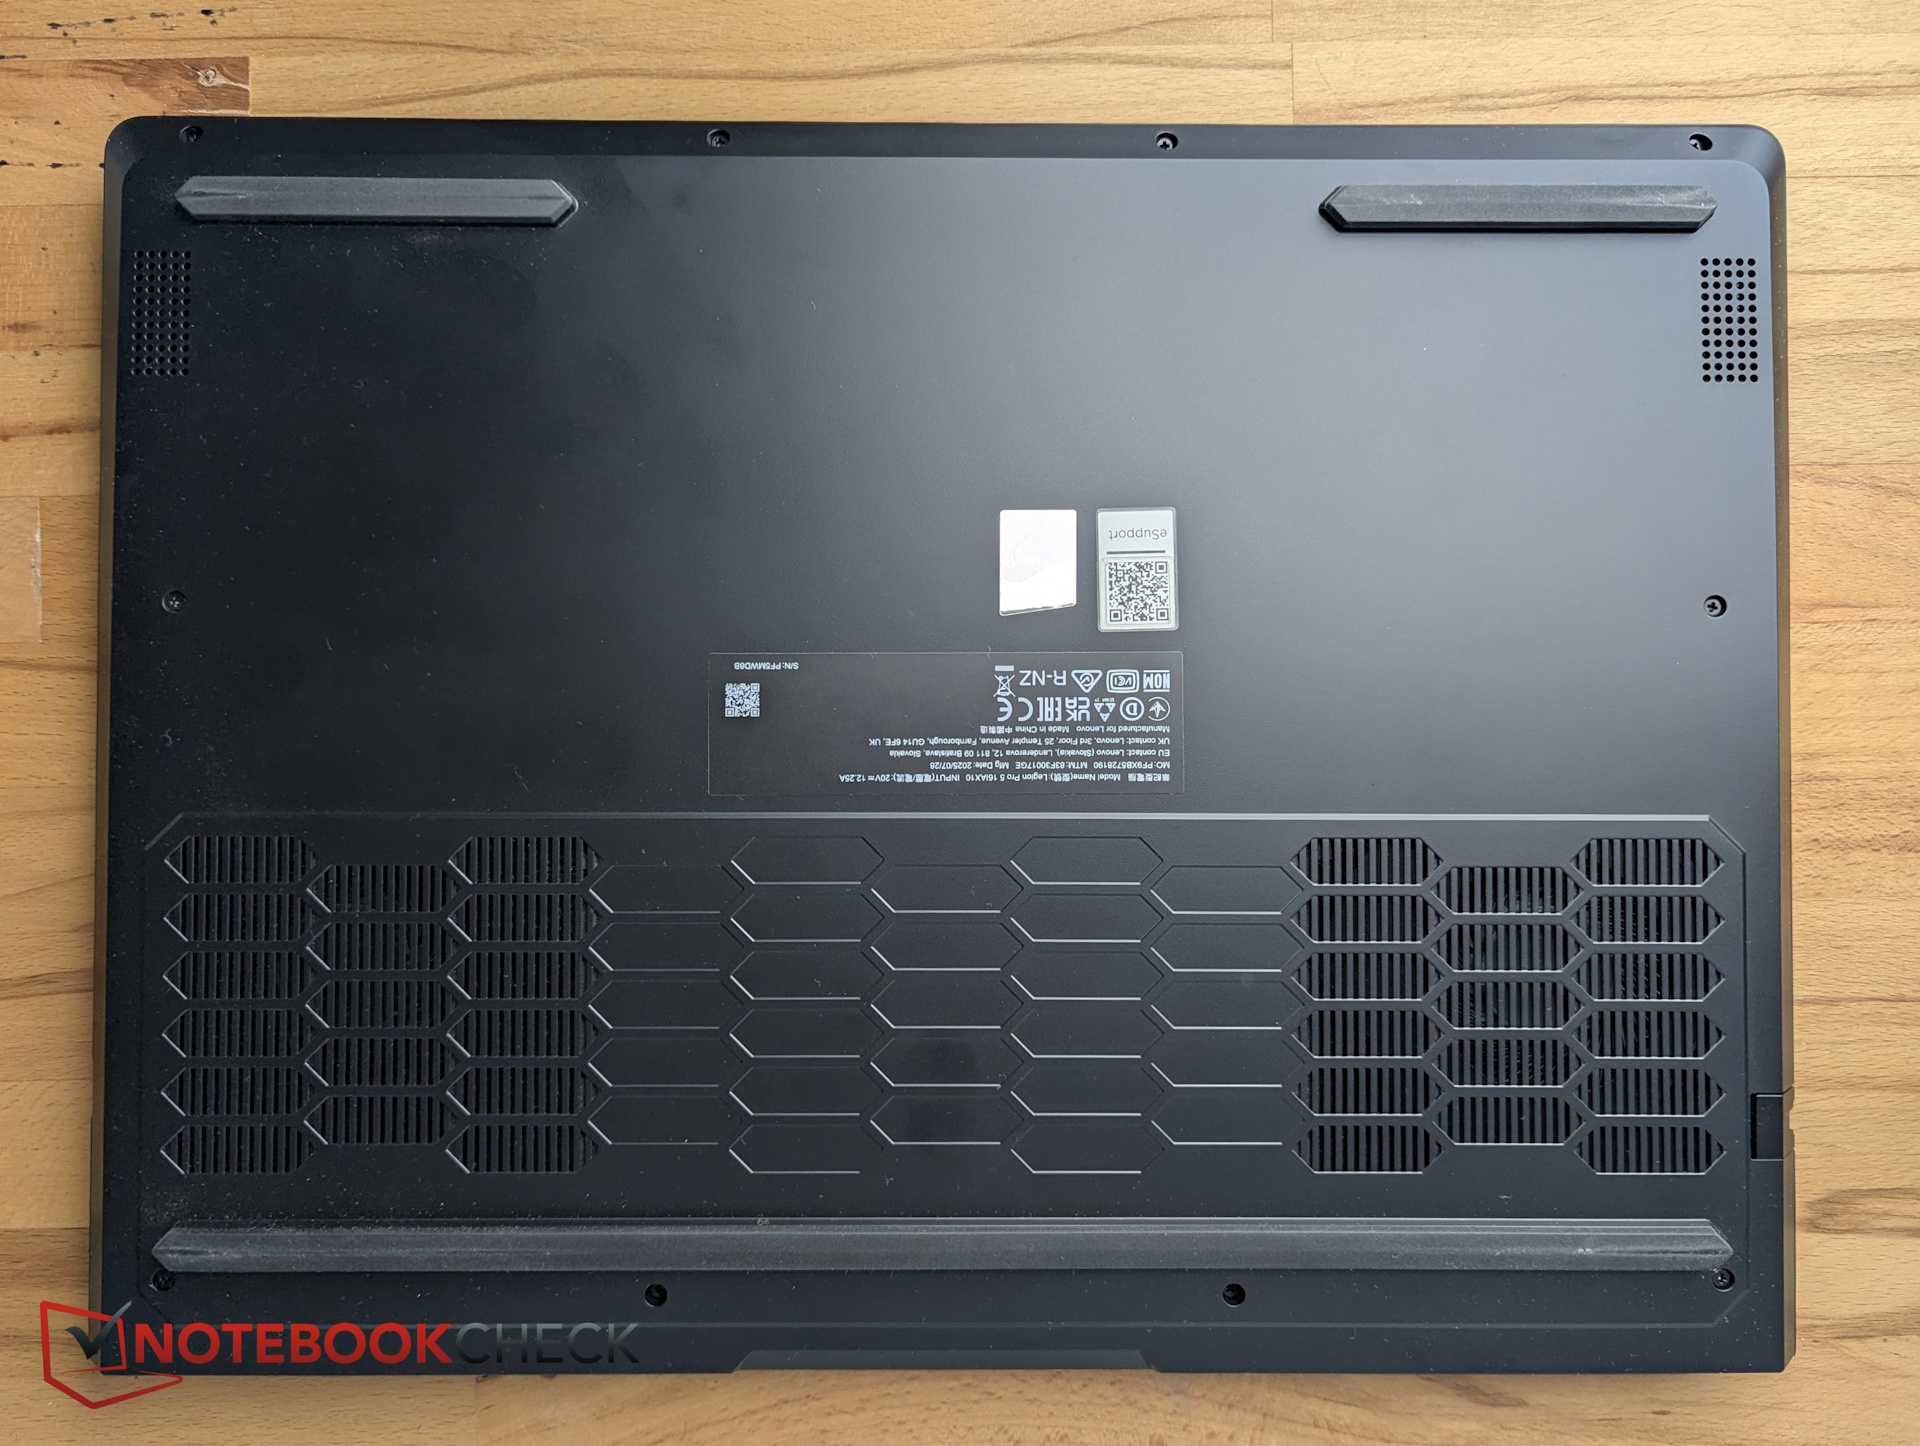
- Chassis & features – sleek, but a fingerprint magnet
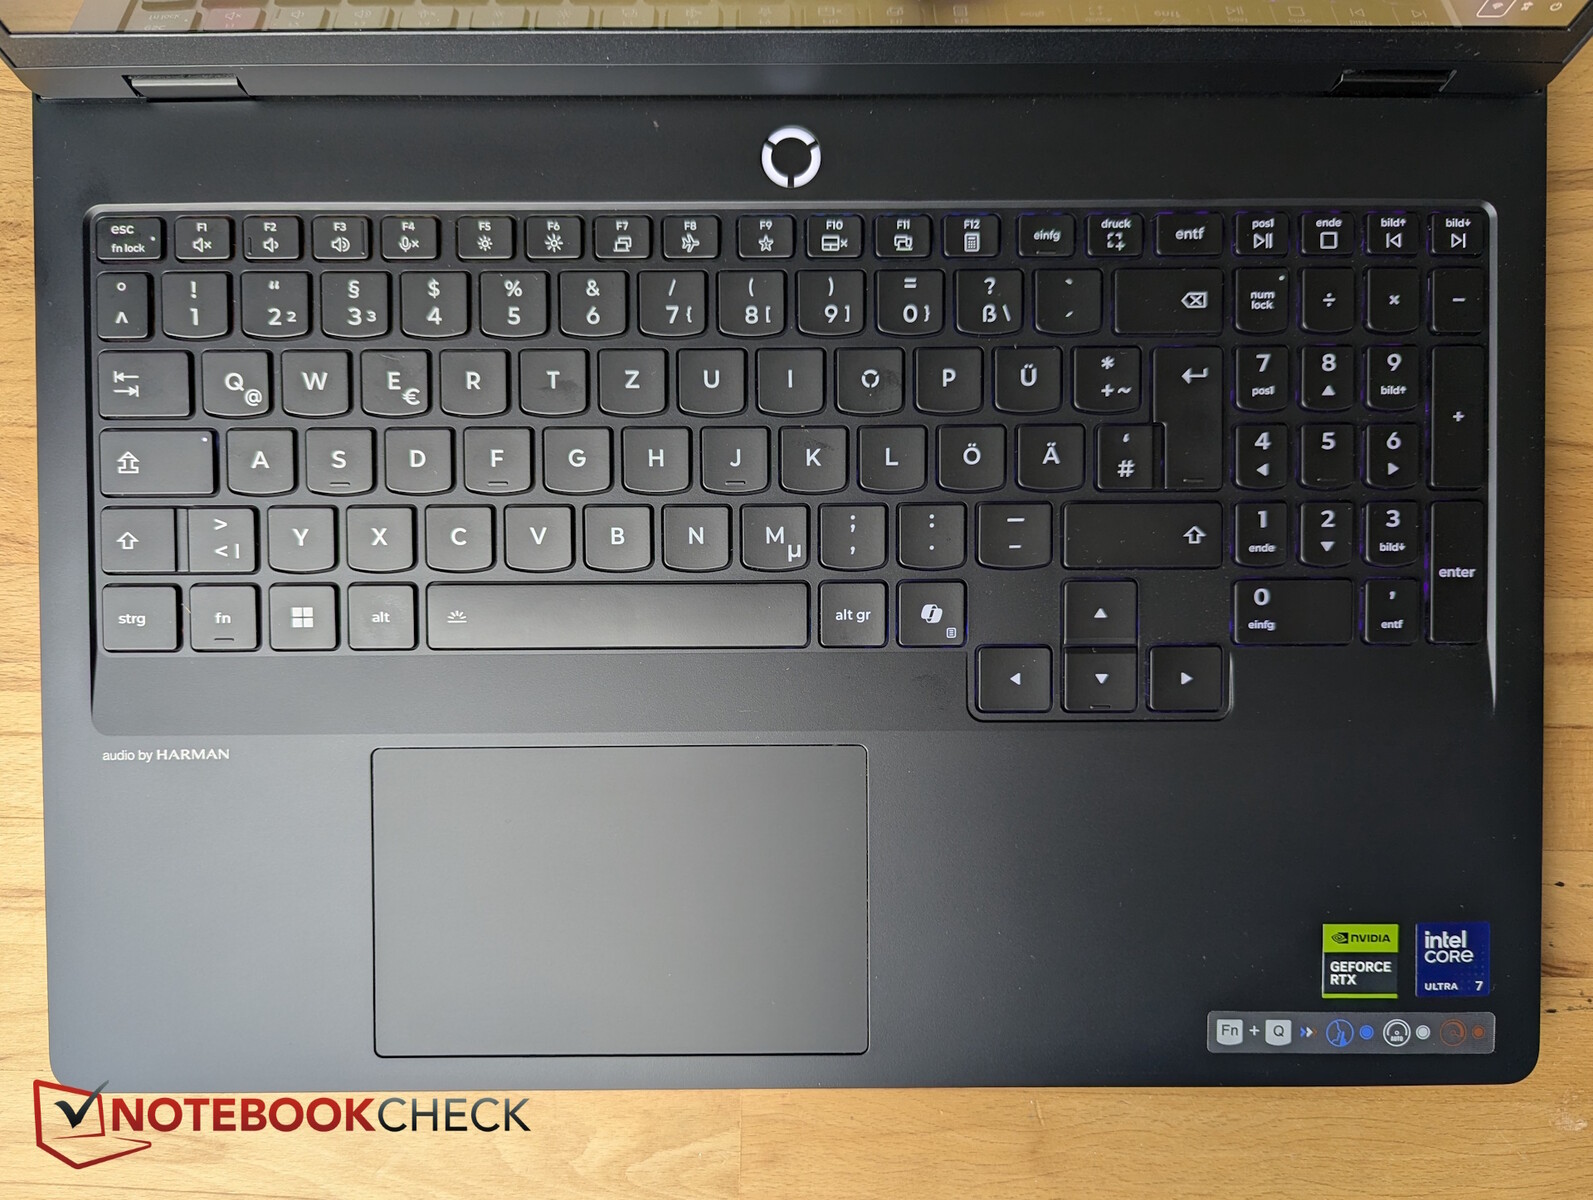
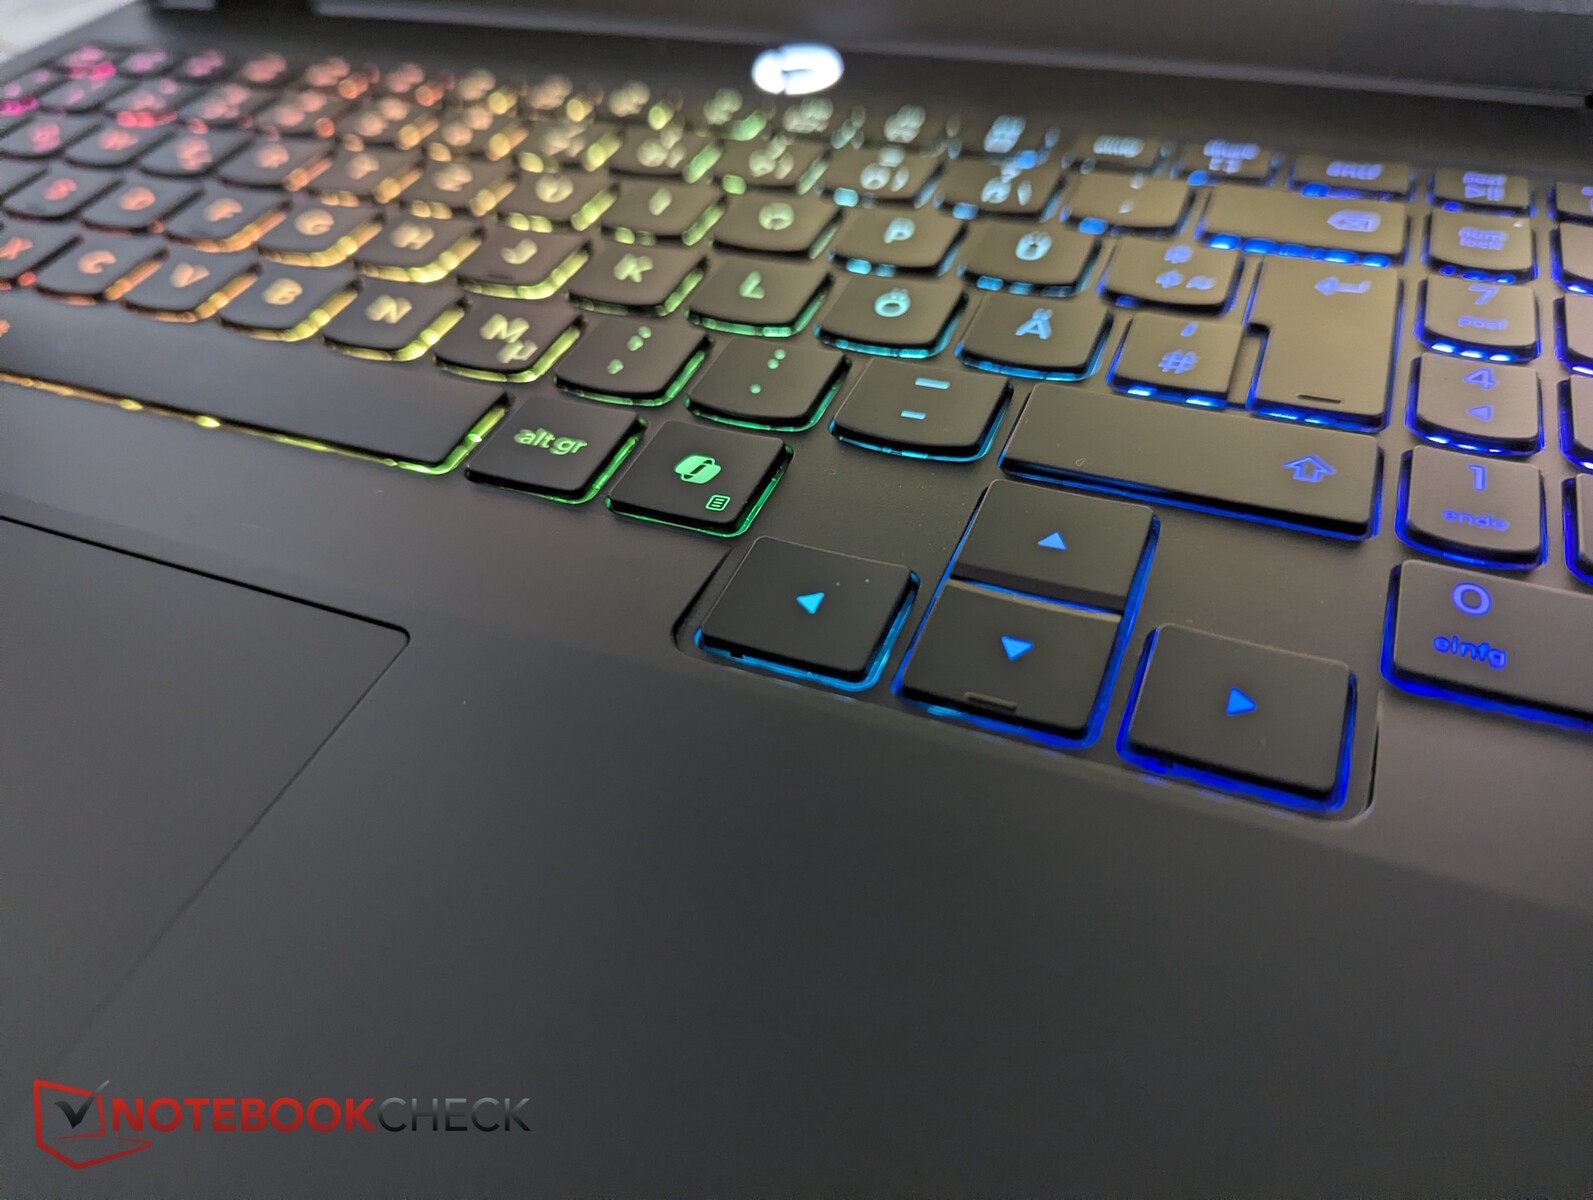
- Input devices – solid, for a gaming laptop
- Display - brilliant OLED
- Performance – RTX 5070 keeps the Legion fast
- Emissions and energy – quieter, cooler, more efficient
- Notebookcheck's overall impressions
- Potential alternatives in comparison
Alongside the RTX 5070 Ti model, Lenovo also offers the Legion Pro 5 16 with a standard RTX 5070. But can users actually feel the difference—aside from in their wallets? How close are the RTX 5070 Ti and RTX 5070 versions in practice? Since the rest of the system is almost identical, we’ll focus on performance, noise, and thermals and refer back to our original review for chassis, input devices, and similar sections.
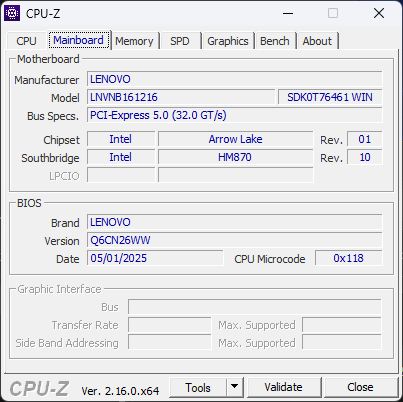
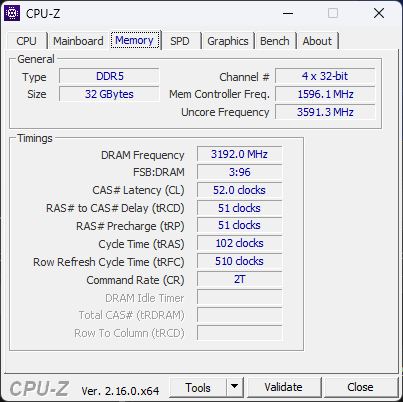
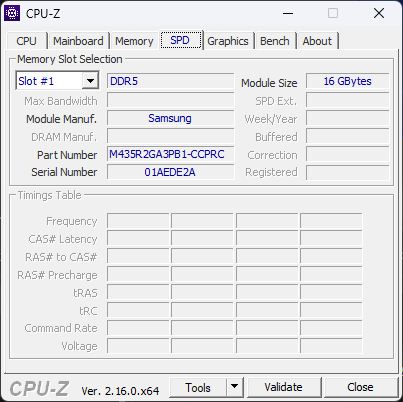
Specifications
Chassis & features – sleek, but a fingerprint magnet


Input devices – solid, for a gaming laptop
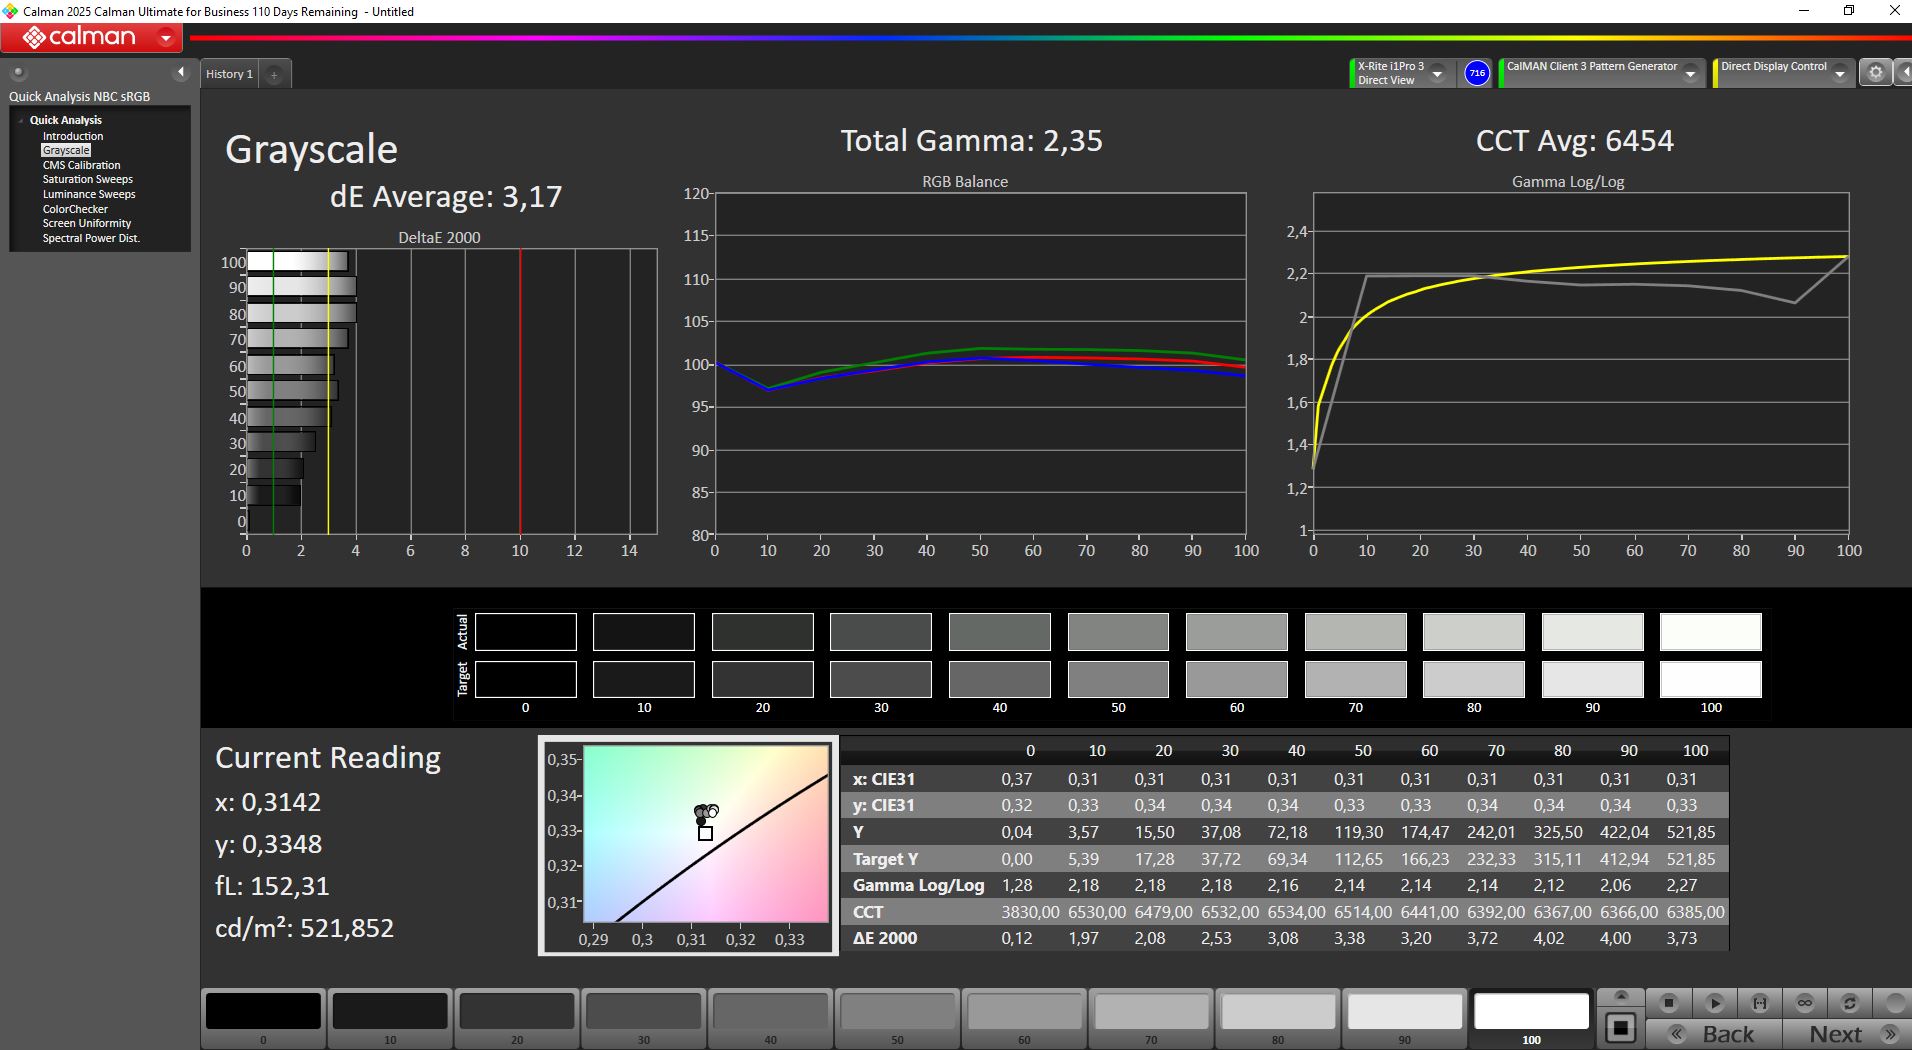
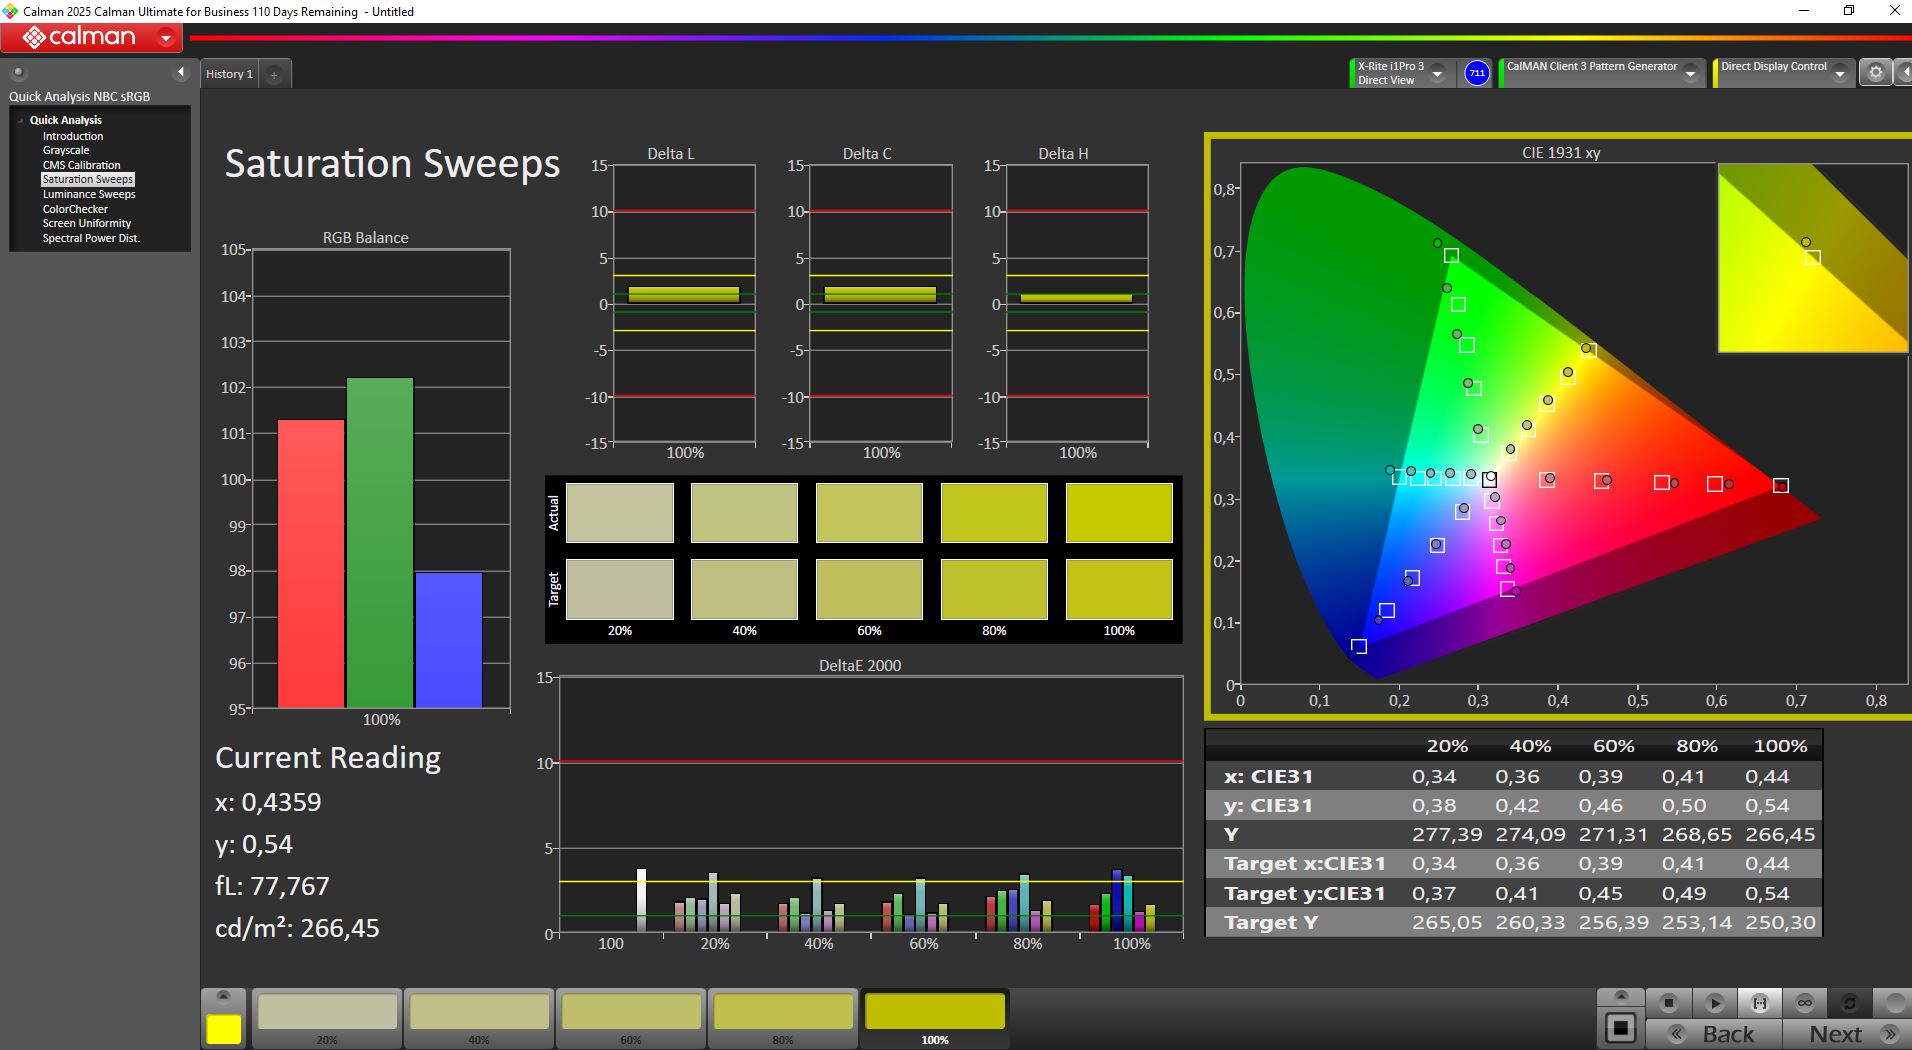
Display - brilliant OLED

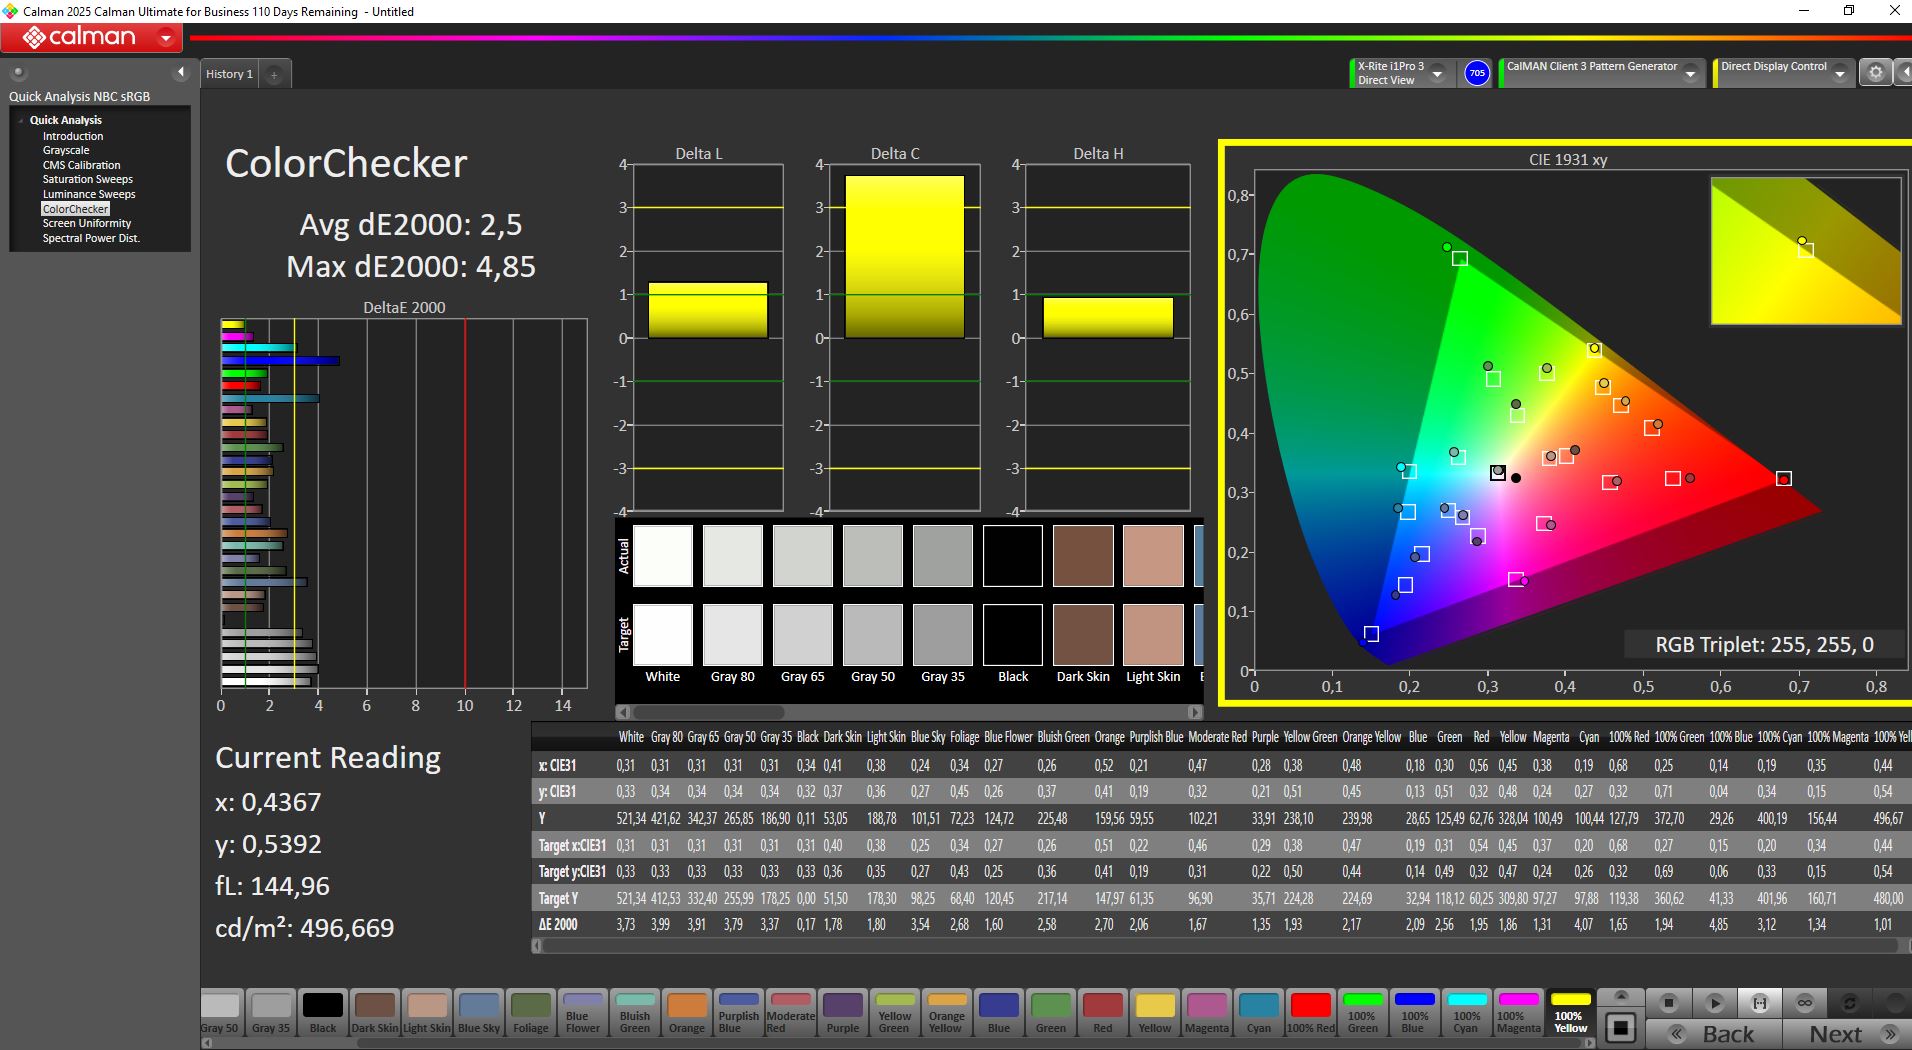
The 16-inch OLED panel (2560 × 1600 px, DisplayHDR True Black 1000, Dolby Vision, G-SYNC) is one of the Legion Pro 5’s standout features.
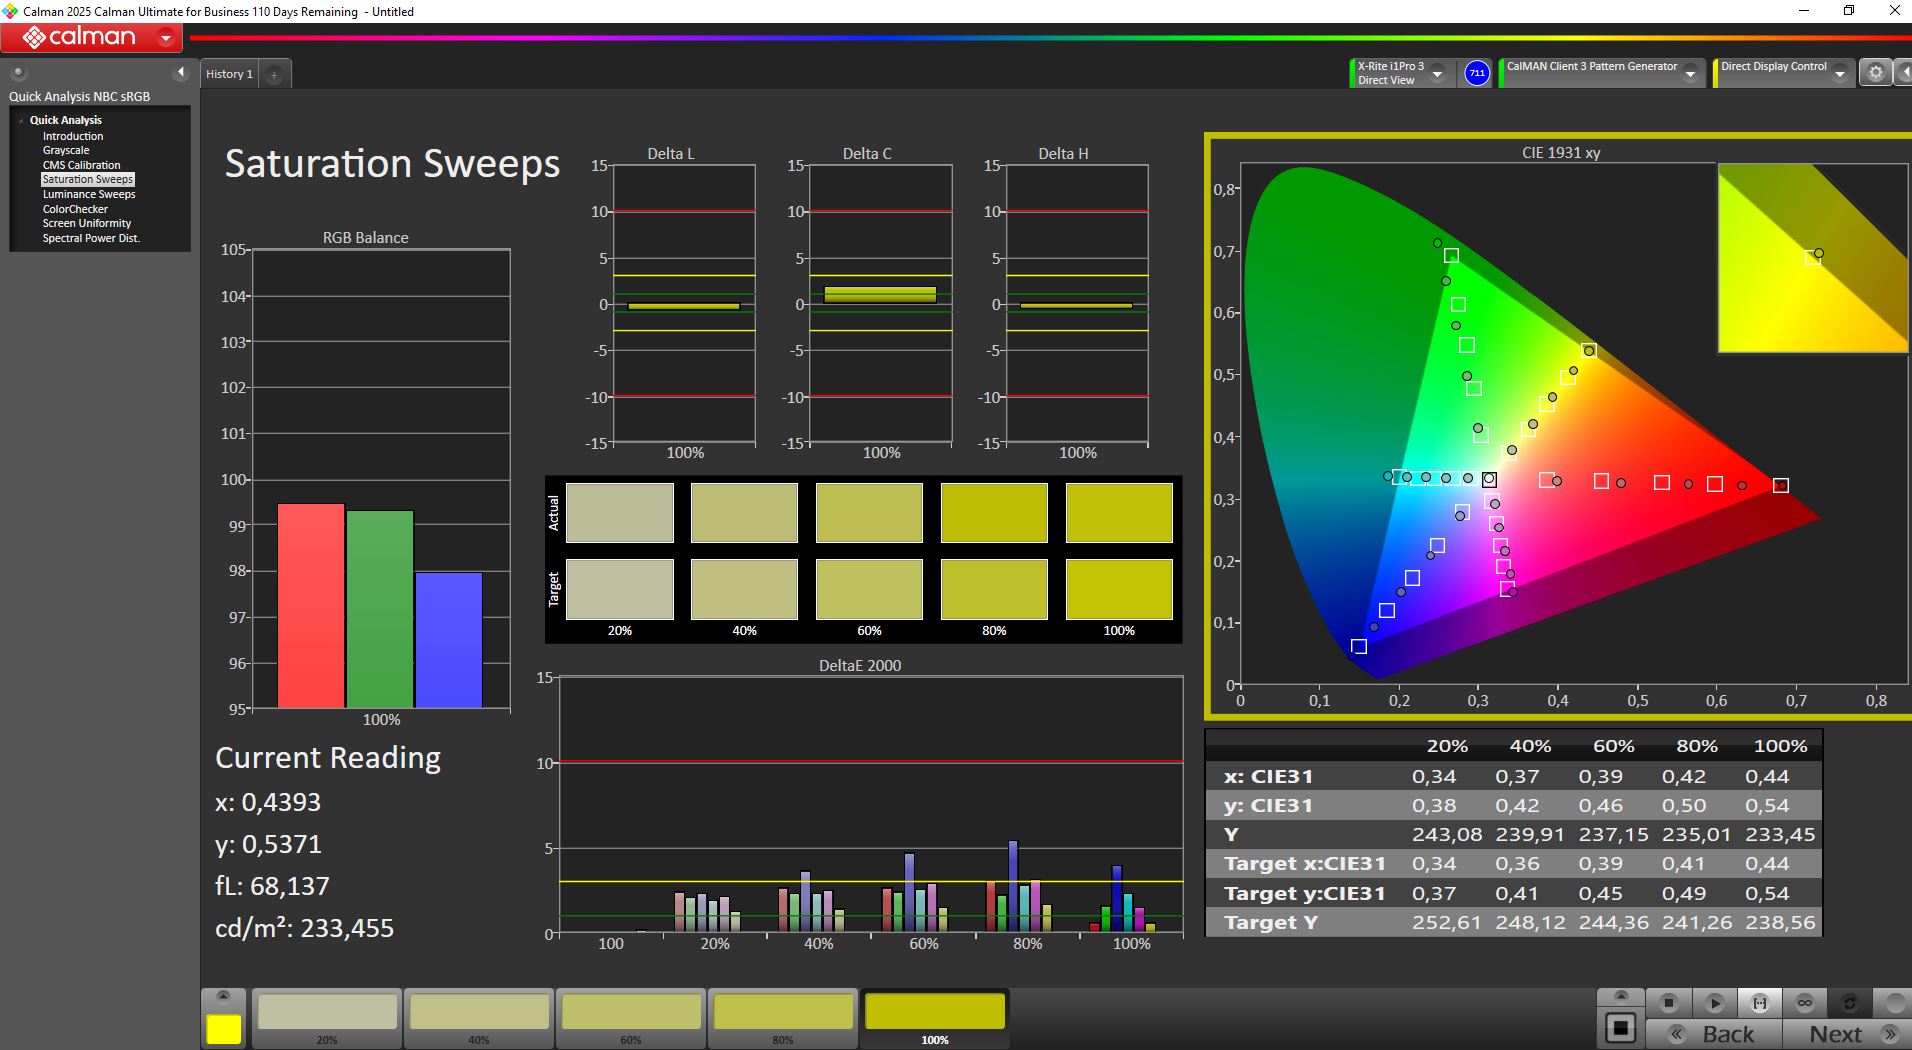
Among competitors, the OLED Legion offers one of the best displays in this class: over 500 nits brightness, quick response times, wide color coverage, and deep contrast—something few gaming laptops deliver at this price.
| |||||||||||||||||||||||||
Brightness Distribution: 98 %
Center on Battery: 521 cd/m²
Contrast: 6947:1 (Black: 0.075 cd/m²)
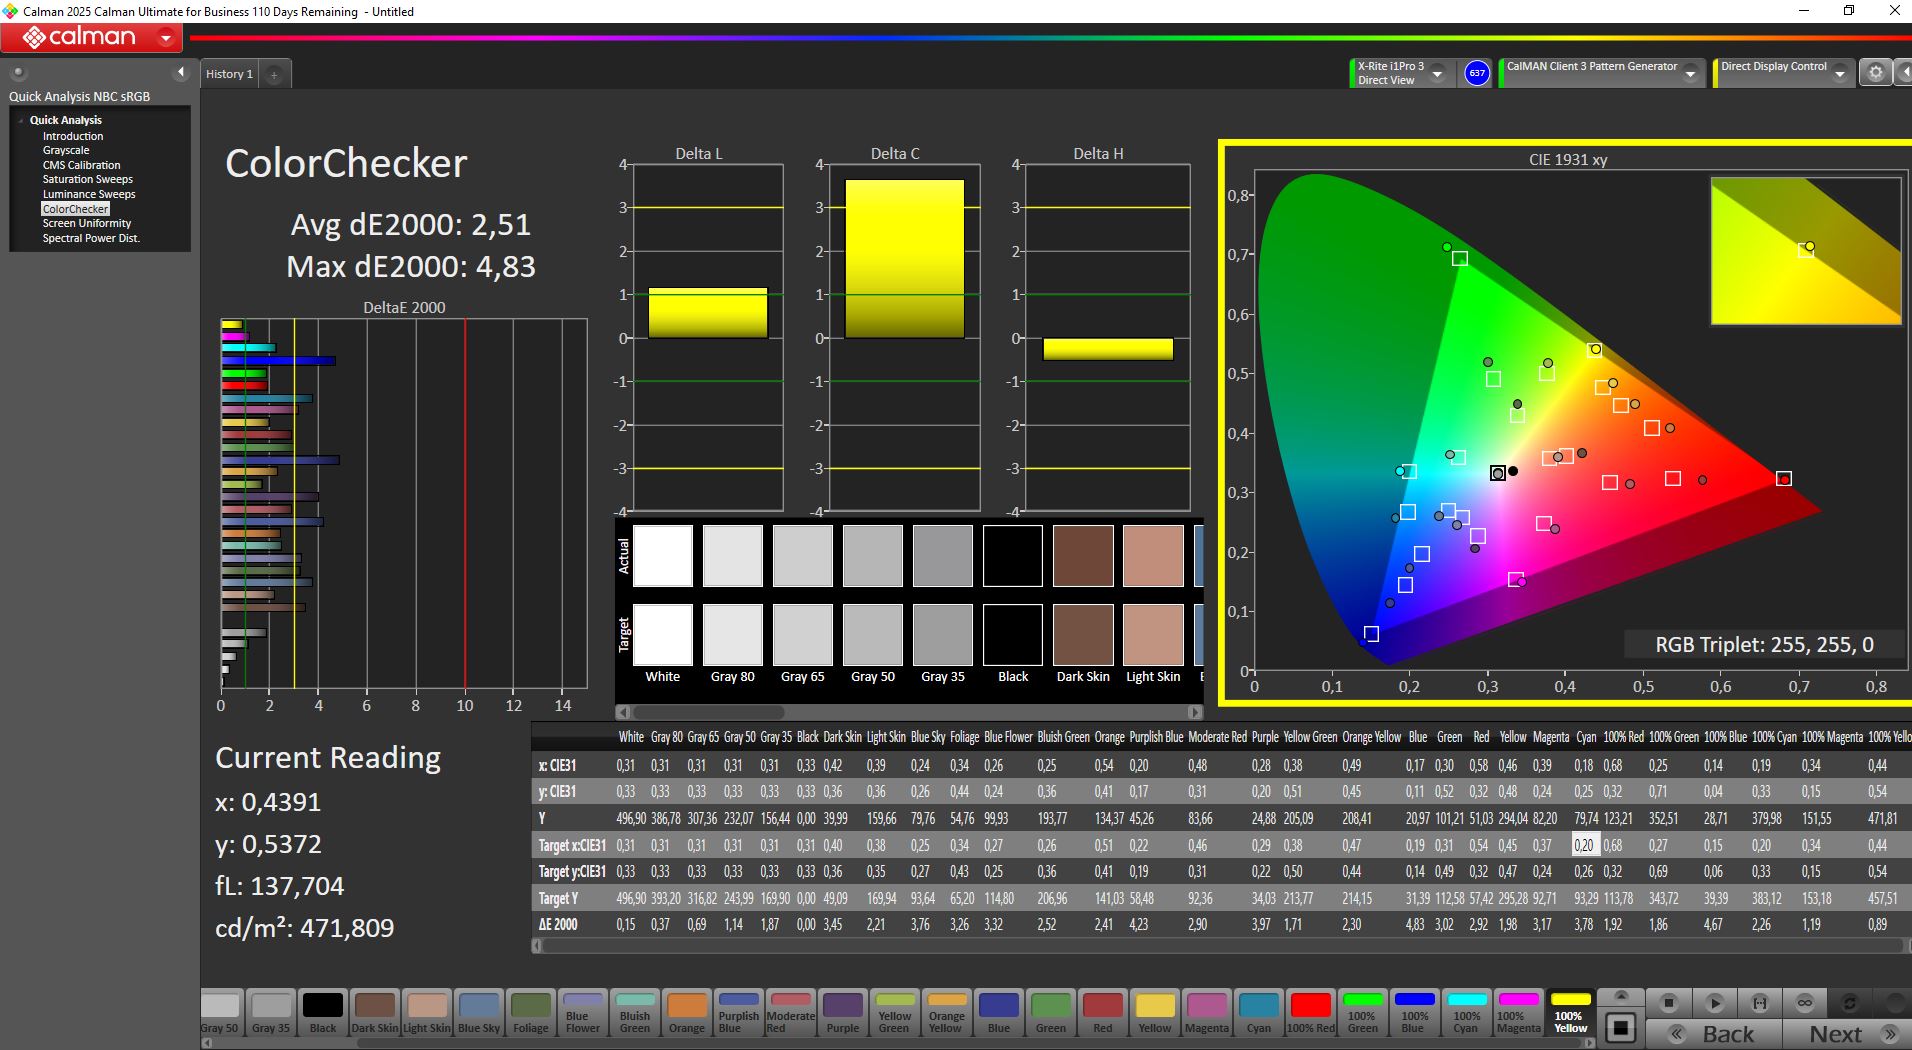
ΔE ColorChecker Calman: 2.5 | ∀{0.5-29.43 Ø4.71}
calibrated: 2.5
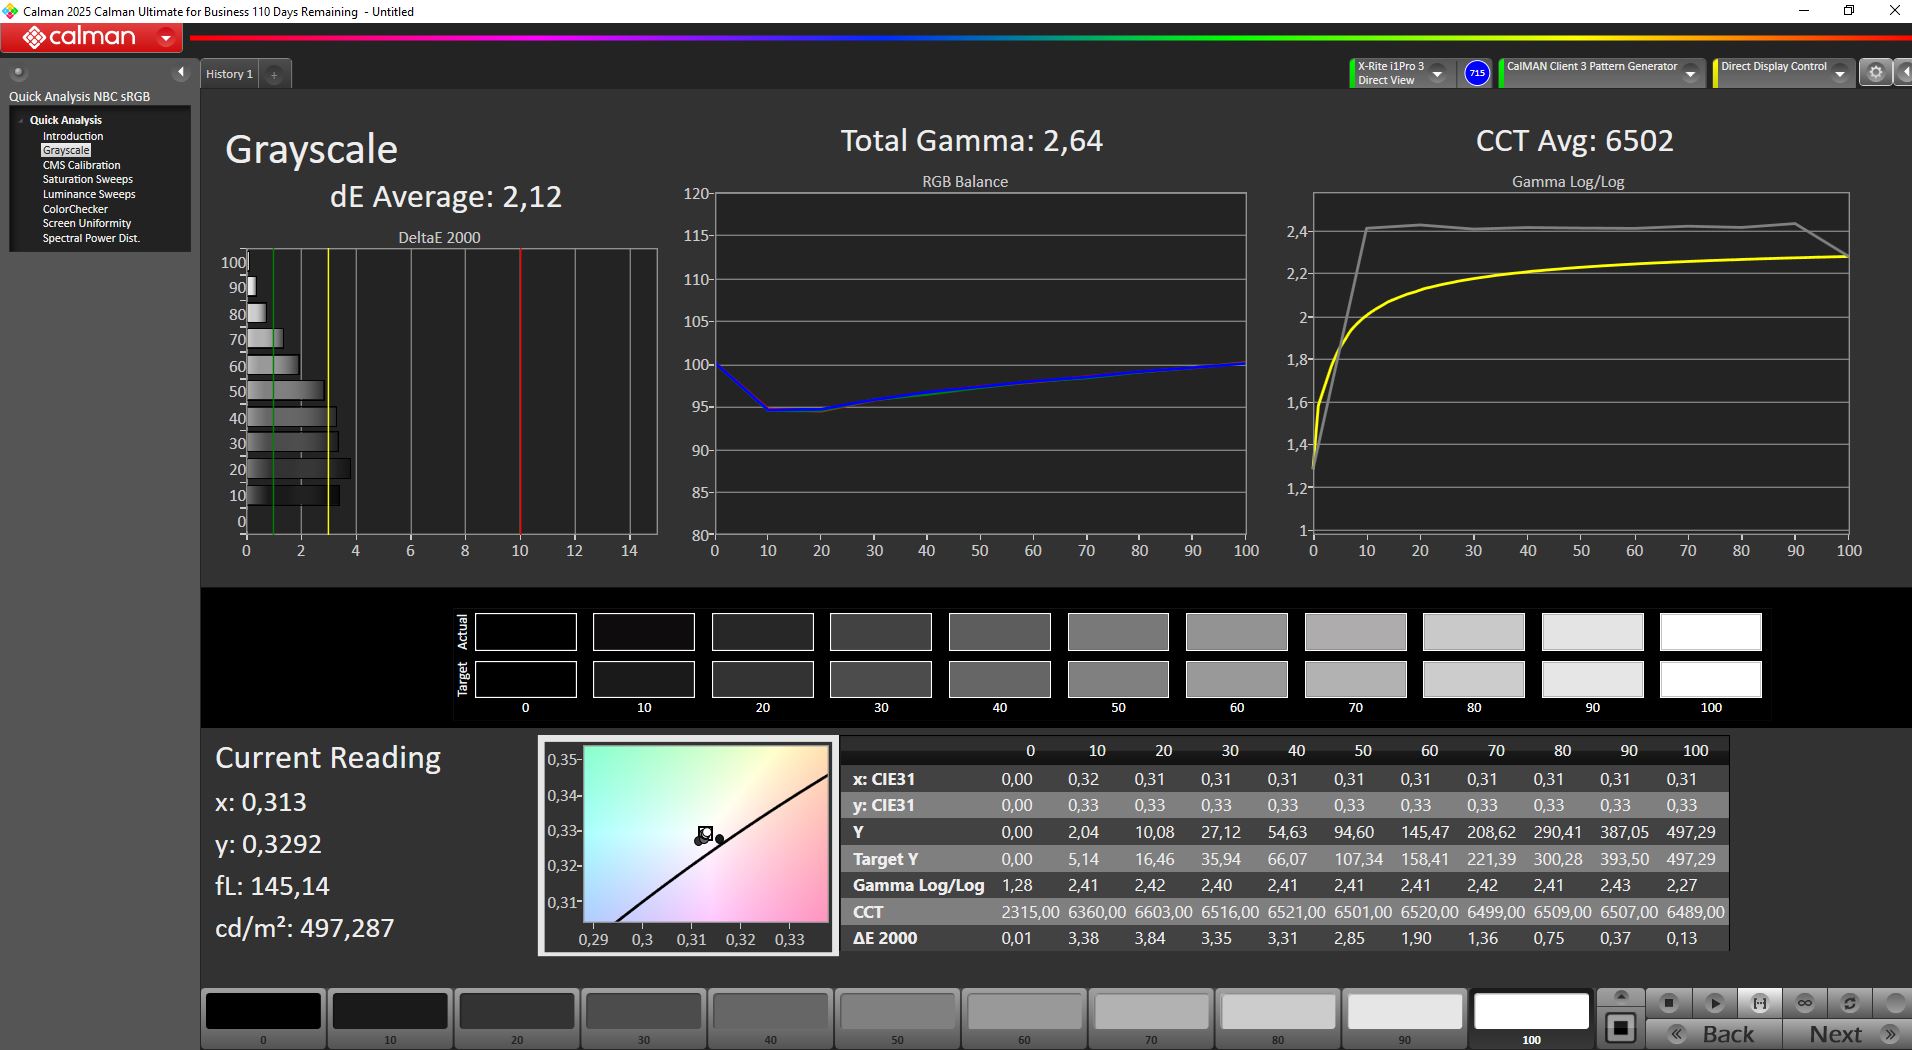
ΔE Greyscale Calman: 3.17 | ∀{0.09-98 Ø4.96}
93.9% AdobeRGB 1998 (Argyll 3D)
100% sRGB (Argyll 3D)
99.3% Display P3 (Argyll 3D)
Gamma: 2.35
CCT: 6454 K
| Lenovo Legion Pro 5 16IAX10, RTX 5070 ATNA60HS01-0 (Samsung SDC420A), OLED, 2650x1600, 16", 165 Hz | Lenovo Legion 5 Pro 16IAX10H ATNA60HS01-0 (Samsung SDC420A), OLED, 2560x1600, 16", 165 Hz | Alienware 16X Aurora, RTX 5070 LG Philips 160WQG, IPS, 2560x1600, 16", 240 Hz | Gigabyte Aero X16 1WH MNG007DA5-1, IPS, 2560x1600, 16", 165 Hz | Asus TUF Gaming A16 FA608UP MNG007DA5-3, IPS, 2560x1600, 16", 165 Hz | Schenker XMG Core 16 M25 MNG007DA6-4, IPS, 2560x1600, 16", 300 Hz | Gigabyte Gaming A16 GA6H NE160QDM-NYJ (BOE0C80), IPS, 2560x1600, 16", 165 Hz | |
|---|---|---|---|---|---|---|---|
| Display | 0% | -2% | -20% | -19% | -2% | -18% | |
| Display P3 Coverage (%) | 99.3 | 99.9 1% | 96.9 -2% | 68.7 -31% | 69.4 -30% | 98.8 -1% | 69.4 -30% |
| sRGB Coverage (%) | 100 | 100 0% | 99.8 0% | 96.1 -4% | 97.2 -3% | 100 0% | 99.5 0% |
| AdobeRGB 1998 Coverage (%) | 93.9 | 94.1 0% | 89.7 -4% | 71.2 -24% | 71.9 -23% | 88.4 -6% | 71.6 -24% |
| Response Times | 0% | -318% | -400% | -229% | -343% | -508% | |
| Response Time Grey 50% / Grey 80% * (ms) | 2 ? | 2 ? -0% | 4.3 ? -115% | 12 ? -500% | 6.3 ? -215% | 10.7 ? -435% | 14.3 ? -615% |
| Response Time Black / White * (ms) | 1.4 ? | 1.4 ? -0% | 8.7 ? -521% | 5.6 ? -300% | 4.8 ? -243% | 4.9 ? -250% | 7 ? -400% |
| PWM Frequency (Hz) | 1300 | 1300 | |||||
| PWM Amplitude * (%) | 16.7 | 16.7 -0% | |||||
| Screen | 1% | -78% | -31% | -26% | -53% | -81% | |
| Brightness middle (cd/m²) | 521 | 518 -1% | 493.2 -5% | 395 -24% | 480 -8% | 512 -2% | 432 -17% |
| Brightness (cd/m²) | 519 | 522 1% | 477 -8% | 398 -23% | 456 -12% | 483 -7% | 425 -18% |
| Brightness Distribution (%) | 98 | 97 -1% | 93 -5% | 97 -1% | 91 -7% | 91 -7% | 91 -7% |
| Black Level * (cd/m²) | 0.075 | 0.5 -567% | 0.32 -327% | 0.32 -327% | 0.43 -473% | 0.37 -393% | |
| Contrast (:1) | 6947 | 986 -86% | 1234 -82% | 1500 -78% | 1191 -83% | 1168 -83% | |
| Colorchecker dE 2000 * | 2.5 | 2.49 -0% | 3.57 -43% | 1.3 48% | 1.4 44% | 2.4 4% | 4.76 -90% |
| Colorchecker dE 2000 max. * | 4.85 | 5.25 -8% | 7.03 -45% | 2.8 42% | 2.5 48% | 3.8 22% | 8.59 -77% |
| Colorchecker dE 2000 calibrated * | 2.5 | 2.15 14% | 0.68 73% | 1.4 44% | 1.3 48% | 0.9 64% | 1.18 53% |
| Greyscale dE 2000 * | 3.17 | 3.02 5% | 3.7 -17% | 1.8 43% | 1.2 62% | 3.1 2% | 6.2 -96% |
| Gamma | 2.35 94% | 2.37 93% | 2.16 102% | 2.2 100% | 2.16 102% | 2.41 91% | 2.079 106% |
| CCT | 6454 101% | 6426 101% | 5876 111% | 6842 95% | 6620 98% | 6534 99% | 6690 97% |
| Total Average (Program / Settings) | 0% /
1% | -133% /
-96% | -150% /
-81% | -91% /
-53% | -133% /
-84% | -202% /
-128% |
* ... smaller is better
Factory calibration is already excellent; our manual fine-tuning improved grayscale slightly, with color deviations remaining low to moderate.
Display Response Times
| ↔ Response Time Black to White | ||
|---|---|---|
| 1.4 ms ... rise ↗ and fall ↘ combined | ↗ 0.8 ms rise | 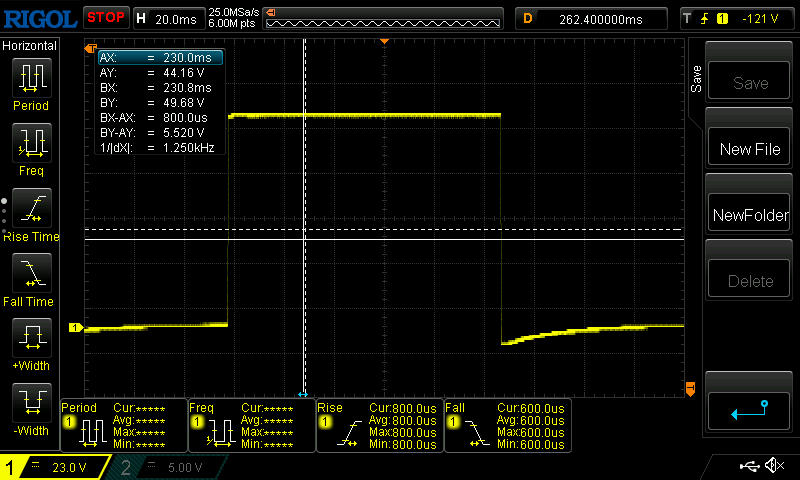 |
| ↘ 0.6 ms fall | ||
| The screen shows very fast response rates in our tests and should be very well suited for fast-paced gaming. In comparison, all tested devices range from 0.1 (minimum) to 240 (maximum) ms. » 8 % of all devices are better. This means that the measured response time is better than the average of all tested devices (19.8 ms). | ||
| ↔ Response Time 50% Grey to 80% Grey | ||
| 2 ms ... rise ↗ and fall ↘ combined | ↗ 1 ms rise | 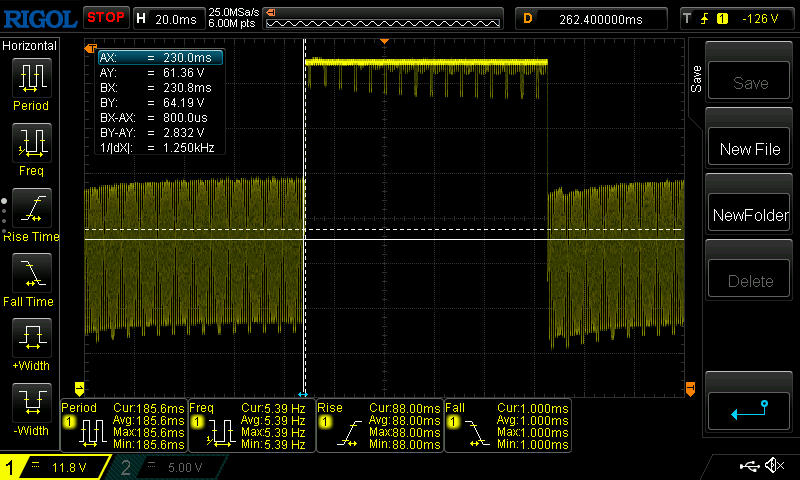 |
| ↘ 1 ms fall | ||
| The screen shows very fast response rates in our tests and should be very well suited for fast-paced gaming. In comparison, all tested devices range from 0.165 (minimum) to 636 (maximum) ms. » 10 % of all devices are better. This means that the measured response time is better than the average of all tested devices (31 ms). | ||
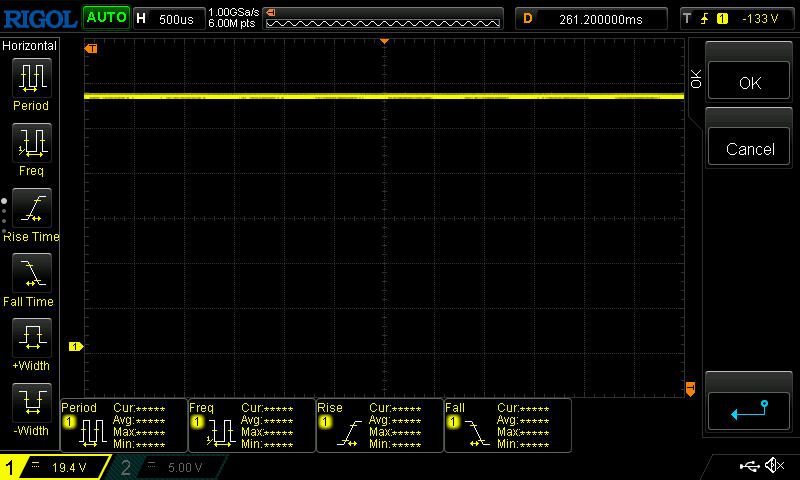
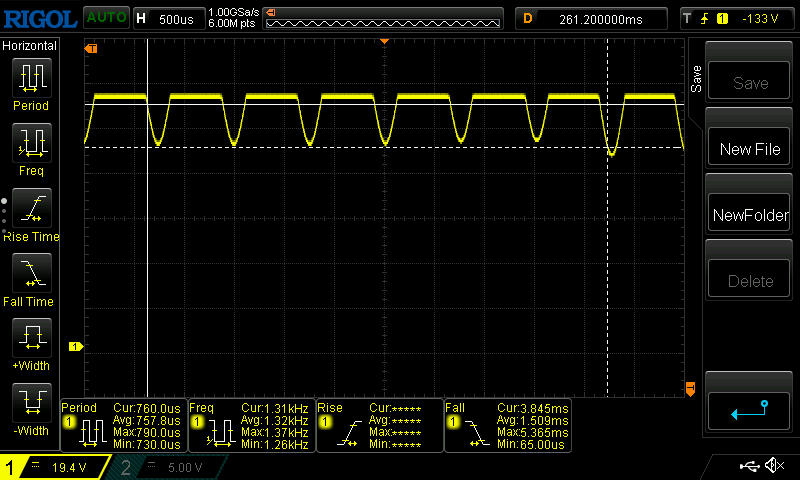
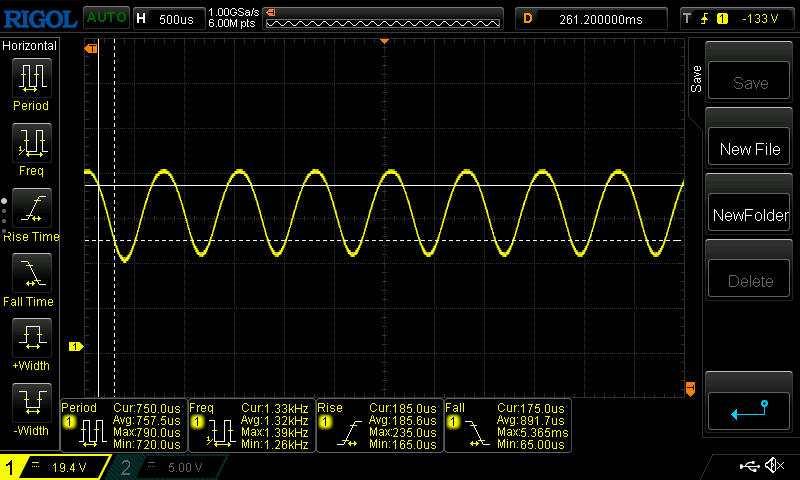
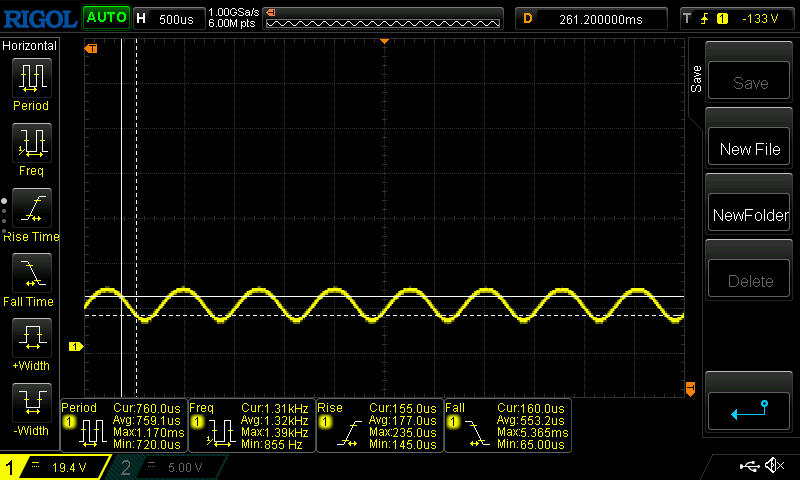
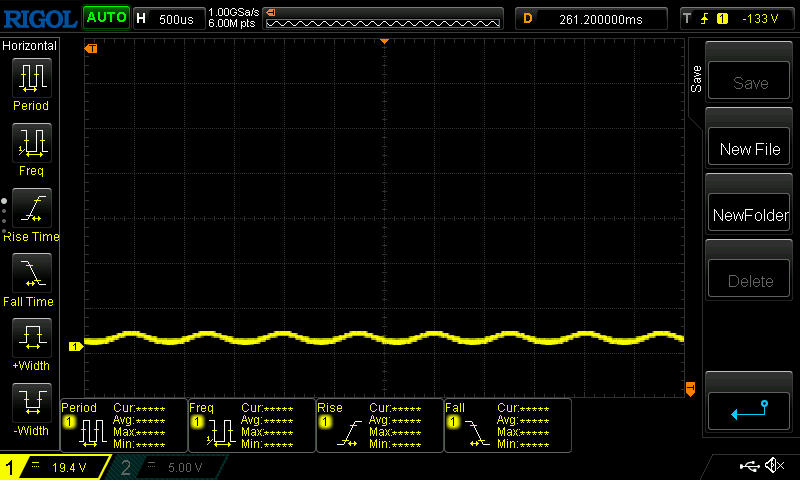
Screen Flickering / PWM (Pulse-Width Modulation)
| Screen flickering / PWM detected | 1300 Hz Amplitude: 16.7 % | 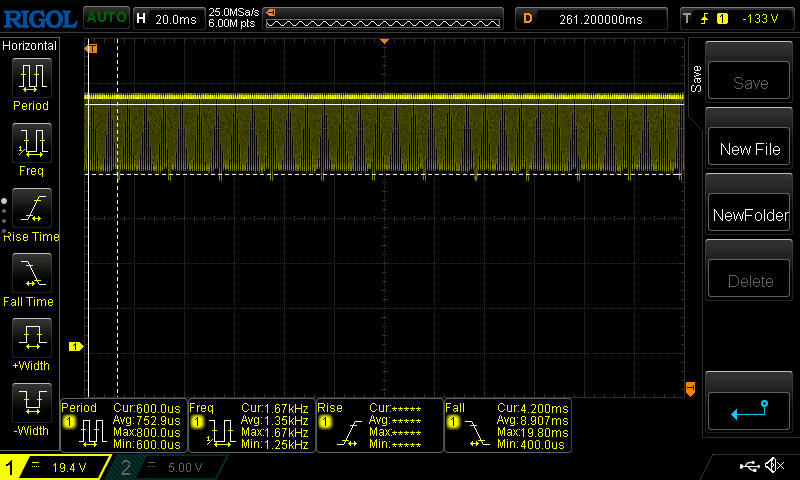 | |
The display backlight flickers at 1300 Hz (worst case, e.g., utilizing PWM) . The frequency of 1300 Hz is quite high, so most users sensitive to PWM should not notice any flickering. In comparison: 52 % of all tested devices do not use PWM to dim the display. If PWM was detected, an average of 7747 (minimum: 5 - maximum: 343500) Hz was measured. | |||
The 500-nit brightness helps outdoors, though the glossy surface doesn’t. Stay in the shade and keep direct reflections minimal, and outdoor use works fine.


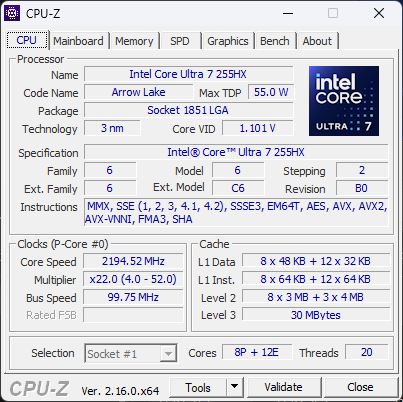
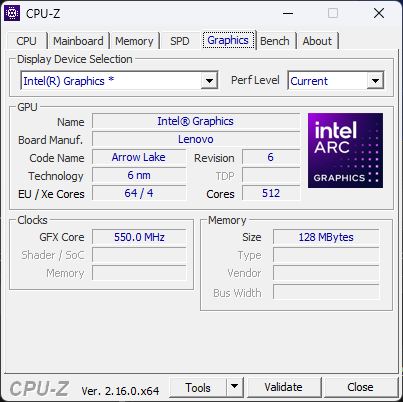
Performance – RTX 5070 keeps the Legion fast
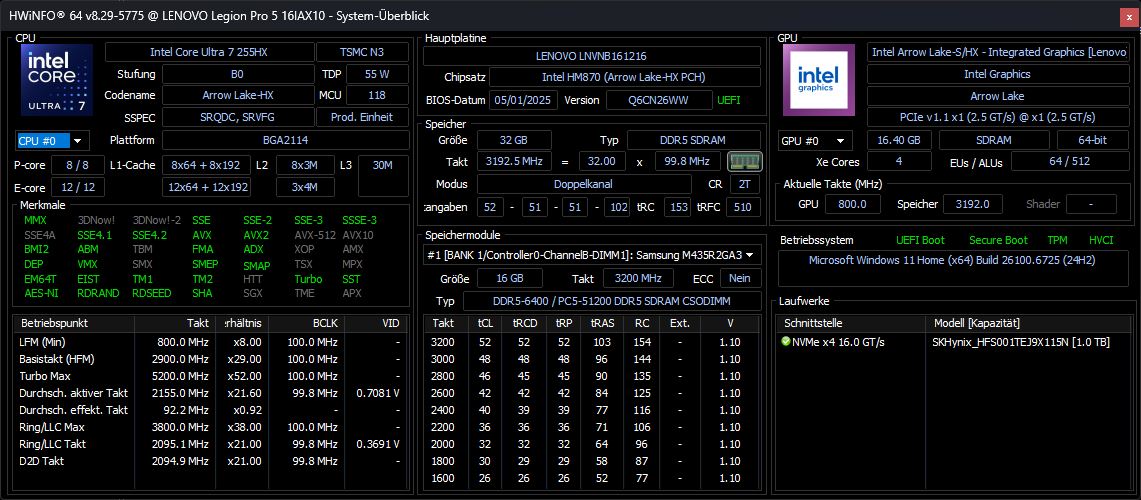
With an RTX 5070, Core Ultra 7 255HX, and 32 GB RAM, the Legion Pro 5 16 positions itself as a strong mid-range gamer that, thanks to its great display, performance, and understated design, could also appeal to content creators.
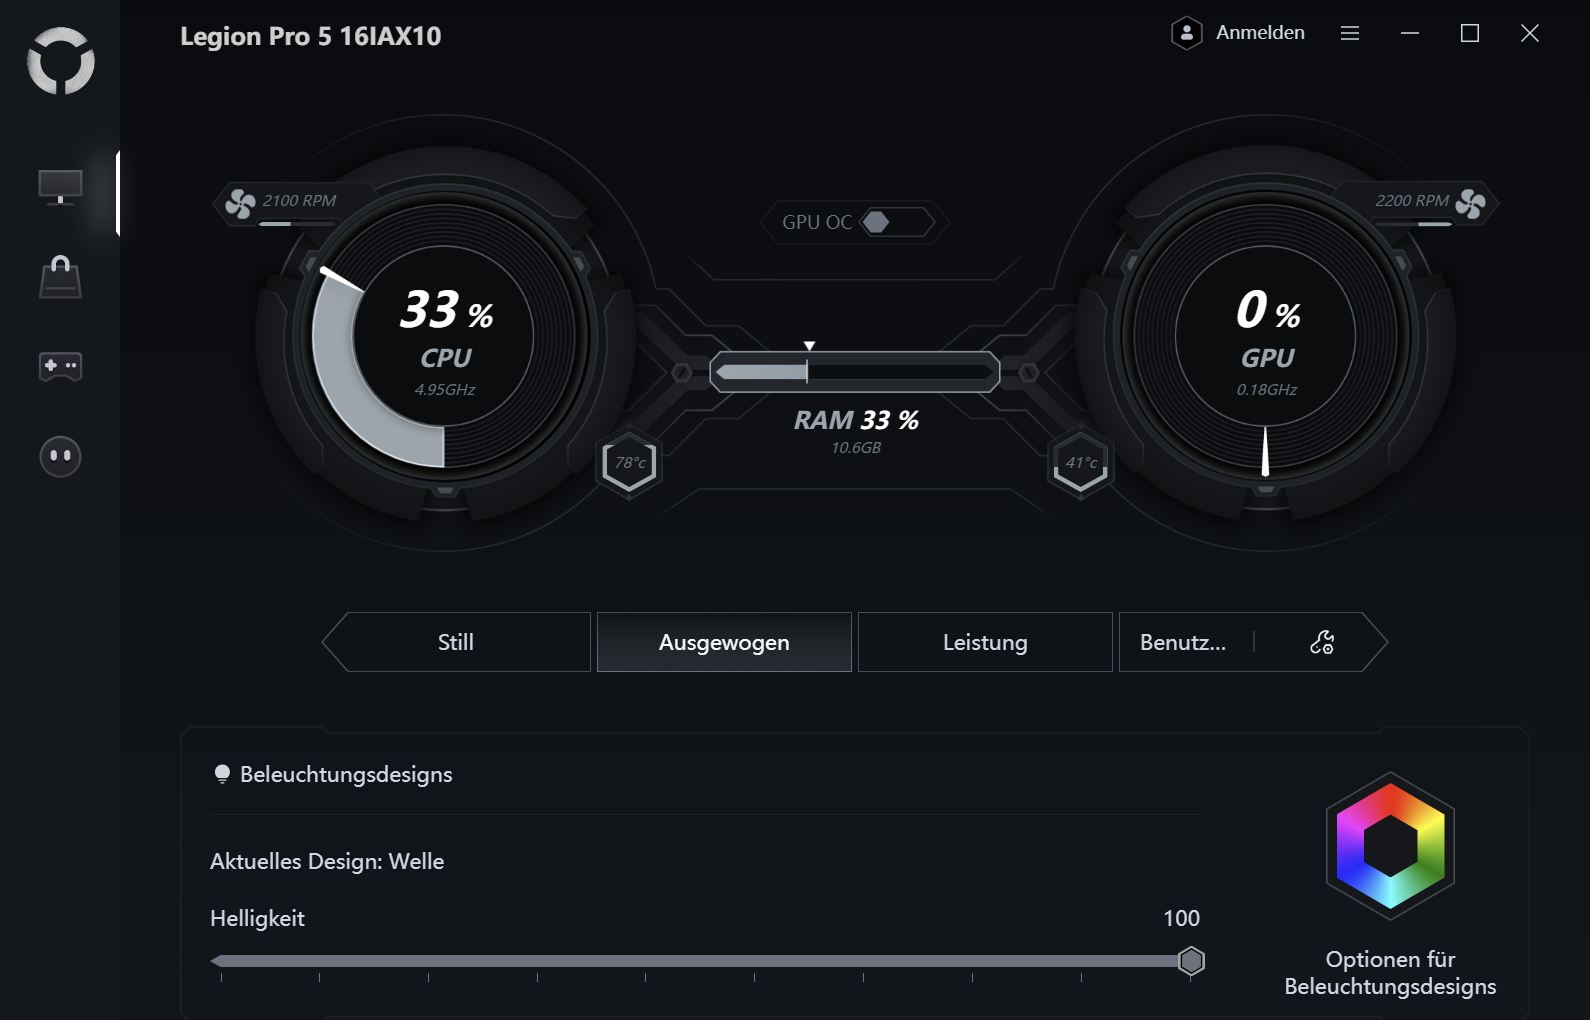
Test conditions
Lenovo preinstalls two key utilities: Vantage for system management, hardware scans, and general settings, and Legion Space, the gaming hub with performance modes and MUX control. Both apps include ads, and Vantage can be intrusive with frequent pop-ups. Lenovo Now, another app, is almost entirely promotional—best to uninstall it.
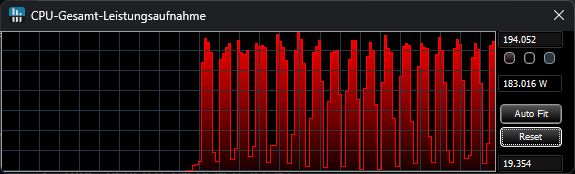
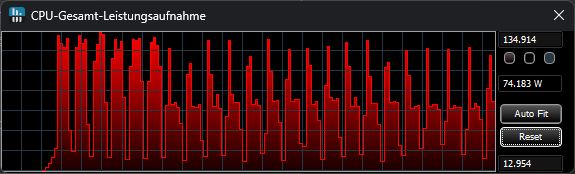
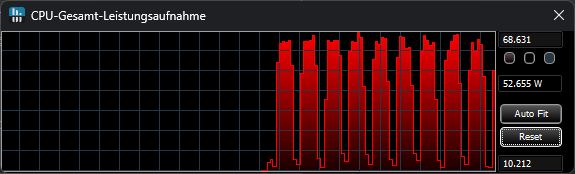
All benchmarks were run in Performance mode.

| Mode | Cinebench R15 | CPU power | Cyberpunk 2077 Ultra | GPU power | Noise Level (Cyberpunk) |
|---|---|---|---|---|---|
| Performance | 5190 | 194 → 183 W | 107 fps | 103 W | 50.27 dB |
| Balanced | 4463 | 135 → 75 W | 94.2 fps | 93 W | 47.34 dB |
| Eco | 3731 | 65 W | 72 fps | 55 W | 38.44 dB |
Processor
The Intel Core Ultra 7 255HX has four fewer E-cores than the Ultra 9 275HX and slightly lower clock speeds.
Across our CPU benchmarks, performance is above average—just a few percent behind the Ultra 9 275HX. In the Cinebench loop, it maintains stable output with only a minor (~7 %) drop over time.
Running on battery reduces CPU performance by about 43 percent.
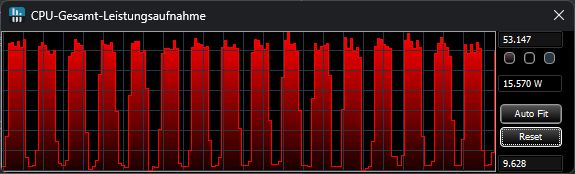
Cinebench R15 Multi stress test
Cinebench R23: Multi Core | Single Core
Cinebench R20: CPU (Multi Core) | CPU (Single Core)
Cinebench R15: CPU Multi 64Bit | CPU Single 64Bit
Blender: v2.79 BMW27 CPU
7-Zip 18.03: 7z b 4 | 7z b 4 -mmt1
Geekbench 6.7: Multi-Core | Single-Core
Geekbench 5.5: Multi-Core | Single-Core
HWBOT x265 Benchmark v2.2: 4k Preset
LibreOffice : 20 Documents To PDF
R Benchmark 2.5: Overall mean
| CPU Performance rating | |
| Lenovo Legion 5 Pro 16IAX10H | |
| Alienware 16X Aurora, RTX 5070 | |
| Lenovo Legion Pro 5 16IAX10, RTX 5070 | |
| Average Intel Core Ultra 7 255HX | |
| Average of class Gaming | |
| Schenker XMG Core 16 M25 | |
| Gigabyte Aero X16 1WH | |
| Asus TUF Gaming A16 FA608UP | |
| Gigabyte Gaming A16 GA6H | |
| Cinebench R23 / Multi Core | |
| Lenovo Legion 5 Pro 16IAX10H | |
| Alienware 16X Aurora, RTX 5070 | |
| Lenovo Legion Pro 5 16IAX10, RTX 5070 | |
| Average Intel Core Ultra 7 255HX (27129 - 34005, n=5) | |
| Average of class Gaming (10488 - 42661, n=107, last 2 years) | |
| Schenker XMG Core 16 M25 | |
| Gigabyte Aero X16 1WH | |
| Asus TUF Gaming A16 FA608UP | |
| Gigabyte Gaming A16 GA6H | |
| Cinebench R23 / Single Core | |
| Lenovo Legion 5 Pro 16IAX10H | |
| Alienware 16X Aurora, RTX 5070 | |
| Lenovo Legion Pro 5 16IAX10, RTX 5070 | |
| Average Intel Core Ultra 7 255HX (2111 - 2171, n=5) | |
| Schenker XMG Core 16 M25 | |
| Average of class Gaming (1166 - 2415, n=107, last 2 years) | |
| Gigabyte Aero X16 1WH | |
| Gigabyte Gaming A16 GA6H | |
| Asus TUF Gaming A16 FA608UP | |
| Cinebench R20 / CPU (Multi Core) | |
| Lenovo Legion 5 Pro 16IAX10H | |
| Alienware 16X Aurora, RTX 5070 | |
| Lenovo Legion Pro 5 16IAX10, RTX 5070 | |
| Average Intel Core Ultra 7 255HX (10626 - 13056, n=5) | |
| Average of class Gaming (4029 - 16433, n=106, last 2 years) | |
| Schenker XMG Core 16 M25 | |
| Asus TUF Gaming A16 FA608UP | |
| Gigabyte Aero X16 1WH | |
| Gigabyte Gaming A16 GA6H | |
| Cinebench R20 / CPU (Single Core) | |
| Lenovo Legion 5 Pro 16IAX10H | |
| Alienware 16X Aurora, RTX 5070 | |
| Lenovo Legion Pro 5 16IAX10, RTX 5070 | |
| Average Intel Core Ultra 7 255HX (822 - 835, n=5) | |
| Schenker XMG Core 16 M25 | |
| Average of class Gaming (442 - 913, n=106, last 2 years) | |
| Gigabyte Aero X16 1WH | |
| Gigabyte Gaming A16 GA6H | |
| Asus TUF Gaming A16 FA608UP | |
| Cinebench R15 / CPU Multi 64Bit | |
| Lenovo Legion 5 Pro 16IAX10H | |
| Alienware 16X Aurora, RTX 5070 | |
| Lenovo Legion Pro 5 16IAX10, RTX 5070 | |
| Average Intel Core Ultra 7 255HX (4114 - 5190, n=5) | |
| Average of class Gaming (1578 - 6330, n=105, last 2 years) | |
| Schenker XMG Core 16 M25 | |
| Asus TUF Gaming A16 FA608UP | |
| Gigabyte Aero X16 1WH | |
| Gigabyte Gaming A16 GA6H | |
| Cinebench R15 / CPU Single 64Bit | |
| Lenovo Legion 5 Pro 16IAX10H | |
| Alienware 16X Aurora, RTX 5070 | |
| Lenovo Legion Pro 5 16IAX10, RTX 5070 | |
| Average Intel Core Ultra 7 255HX (322 - 328, n=5) | |
| Average of class Gaming (188.8 - 350, n=106, last 2 years) | |
| Asus TUF Gaming A16 FA608UP | |
| Gigabyte Gaming A16 GA6H | |
| Gigabyte Aero X16 1WH | |
| Schenker XMG Core 16 M25 | |
| Blender / v2.79 BMW27 CPU | |
| Gigabyte Gaming A16 GA6H | |
| Gigabyte Aero X16 1WH | |
| Asus TUF Gaming A16 FA608UP | |
| Average of class Gaming (79 - 330, n=104, last 2 years) | |
| Schenker XMG Core 16 M25 | |
| Average Intel Core Ultra 7 255HX (104 - 122, n=5) | |
| Lenovo Legion Pro 5 16IAX10, RTX 5070 | |
| Alienware 16X Aurora, RTX 5070 | |
| Lenovo Legion 5 Pro 16IAX10H | |
| 7-Zip 18.03 / 7z b 4 | |
| Lenovo Legion 5 Pro 16IAX10H | |
| Alienware 16X Aurora, RTX 5070 | |
| Lenovo Legion Pro 5 16IAX10, RTX 5070 | |
| Average Intel Core Ultra 7 255HX (87806 - 104055, n=5) | |
| Average of class Gaming (33491 - 148086, n=105, last 2 years) | |
| Schenker XMG Core 16 M25 | |
| Asus TUF Gaming A16 FA608UP | |
| Gigabyte Aero X16 1WH | |
| Gigabyte Gaming A16 GA6H | |
| 7-Zip 18.03 / 7z b 4 -mmt1 | |
| Lenovo Legion 5 Pro 16IAX10H | |
| Alienware 16X Aurora, RTX 5070 | |
| Lenovo Legion Pro 5 16IAX10, RTX 5070 | |
| Average Intel Core Ultra 7 255HX (6407 - 6576, n=5) | |
| Schenker XMG Core 16 M25 | |
| Average of class Gaming (4199 - 7436, n=105, last 2 years) | |
| Asus TUF Gaming A16 FA608UP | |
| Gigabyte Aero X16 1WH | |
| Gigabyte Gaming A16 GA6H | |
| Geekbench 6.7 / Multi-Core | |
| Lenovo Legion 5 Pro 16IAX10H | |
| Lenovo Legion Pro 5 16IAX10, RTX 5070 | |
| Alienware 16X Aurora, RTX 5070 | |
| Average Intel Core Ultra 7 255HX (16396 - 19623, n=6) | |
| Schenker XMG Core 16 M25 | |
| Average of class Gaming (6625 - 22850, n=106, last 2 years) | |
| Gigabyte Aero X16 1WH | |
| Asus TUF Gaming A16 FA608UP | |
| Gigabyte Gaming A16 GA6H | |
| Geekbench 6.7 / Single-Core | |
| Lenovo Legion 5 Pro 16IAX10H | |
| Alienware 16X Aurora, RTX 5070 | |
| Lenovo Legion Pro 5 16IAX10, RTX 5070 | |
| Average Intel Core Ultra 7 255HX (2917 - 3028, n=6) | |
| Schenker XMG Core 16 M25 | |
| Gigabyte Aero X16 1WH | |
| Average of class Gaming (1490 - 3259, n=106, last 2 years) | |
| Asus TUF Gaming A16 FA608UP | |
| Gigabyte Gaming A16 GA6H | |
| Geekbench 5.5 / Multi-Core | |
| Lenovo Legion 5 Pro 16IAX10H | |
| Alienware 16X Aurora, RTX 5070 | |
| Lenovo Legion Pro 5 16IAX10, RTX 5070 | |
| Average Intel Core Ultra 7 255HX (18263 - 21014, n=5) | |
| Average of class Gaming (6460 - 28263, n=105, last 2 years) | |
| Schenker XMG Core 16 M25 | |
| Gigabyte Aero X16 1WH | |
| Asus TUF Gaming A16 FA608UP | |
| Gigabyte Gaming A16 GA6H | |
| Geekbench 5.5 / Single-Core | |
| Lenovo Legion 5 Pro 16IAX10H | |
| Alienware 16X Aurora, RTX 5070 | |
| Lenovo Legion Pro 5 16IAX10, RTX 5070 | |
| Average Intel Core Ultra 7 255HX (2112 - 2211, n=5) | |
| Gigabyte Aero X16 1WH | |
| Schenker XMG Core 16 M25 | |
| Average of class Gaming (986 - 2474, n=105, last 2 years) | |
| Asus TUF Gaming A16 FA608UP | |
| Gigabyte Gaming A16 GA6H | |
| HWBOT x265 Benchmark v2.2 / 4k Preset | |
| Lenovo Legion 5 Pro 16IAX10H | |
| Alienware 16X Aurora, RTX 5070 | |
| Lenovo Legion Pro 5 16IAX10, RTX 5070 | |
| Average Intel Core Ultra 7 255HX (30.4 - 36.9, n=5) | |
| Average of class Gaming (11.5 - 44.4, n=105, last 2 years) | |
| Schenker XMG Core 16 M25 | |
| Gigabyte Aero X16 1WH | |
| Asus TUF Gaming A16 FA608UP | |
| Gigabyte Gaming A16 GA6H | |
| LibreOffice / 20 Documents To PDF | |
| Asus TUF Gaming A16 FA608UP | |
| Gigabyte Gaming A16 GA6H | |
| Gigabyte Aero X16 1WH | |
| Schenker XMG Core 16 M25 | |
| Average of class Gaming (33.2 - 88.8, n=105, last 2 years) | |
| Lenovo Legion Pro 5 16IAX10, RTX 5070 | |
| Average Intel Core Ultra 7 255HX (35.4 - 45.9, n=5) | |
| Alienware 16X Aurora, RTX 5070 | |
| Lenovo Legion 5 Pro 16IAX10H | |
| R Benchmark 2.5 / Overall mean | |
| Gigabyte Gaming A16 GA6H | |
| Asus TUF Gaming A16 FA608UP | |
| Average of class Gaming (0.3439 - 0.759, n=106, last 2 years) | |
| Lenovo Legion Pro 5 16IAX10, RTX 5070 | |
| Average Intel Core Ultra 7 255HX (0.4209 - 0.4287, n=5) | |
| Alienware 16X Aurora, RTX 5070 | |
| Lenovo Legion 5 Pro 16IAX10H | |
| Gigabyte Aero X16 1WH | |
| Schenker XMG Core 16 M25 | |
* ... smaller is better
AIDA64: FP32 Ray-Trace | FPU Julia | CPU SHA3 | CPU Queen | FPU SinJulia | FPU Mandel | CPU AES | CPU ZLib | FP64 Ray-Trace | CPU PhotoWorxx
| Performance rating | |
| Lenovo Legion 5 Pro 16IAX10H | |
| Lenovo Legion Pro 5 16IAX10, RTX 5070 | |
| Alienware 16X Aurora, RTX 5070 | |
| Schenker XMG Core 16 M25 | |
| Average Intel Core Ultra 7 255HX | |
| Average of class Gaming | |
| Asus TUF Gaming A16 FA608UP | |
| Gigabyte Aero X16 1WH | |
| Gigabyte Gaming A16 GA6H | |
| AIDA64 / FP32 Ray-Trace | |
| Schenker XMG Core 16 M25 | |
| Lenovo Legion 5 Pro 16IAX10H | |
| Lenovo Legion Pro 5 16IAX10, RTX 5070 | |
| Alienware 16X Aurora, RTX 5070 | |
| Average of class Gaming (10227 - 85542, n=105, last 2 years) | |
| Average Intel Core Ultra 7 255HX (27732 - 34250, n=5) | |
| Asus TUF Gaming A16 FA608UP | |
| Gigabyte Aero X16 1WH | |
| Gigabyte Gaming A16 GA6H | |
| AIDA64 / FPU Julia | |
| Lenovo Legion 5 Pro 16IAX10H | |
| Lenovo Legion Pro 5 16IAX10, RTX 5070 | |
| Alienware 16X Aurora, RTX 5070 | |
| Average Intel Core Ultra 7 255HX (140290 - 167758, n=5) | |
| Schenker XMG Core 16 M25 | |
| Average of class Gaming (51376 - 238426, n=105, last 2 years) | |
| Asus TUF Gaming A16 FA608UP | |
| Gigabyte Aero X16 1WH | |
| Gigabyte Gaming A16 GA6H | |
| AIDA64 / CPU SHA3 | |
| Lenovo Legion 5 Pro 16IAX10H | |
| Alienware 16X Aurora, RTX 5070 | |
| Lenovo Legion Pro 5 16IAX10, RTX 5070 | |
| Average Intel Core Ultra 7 255HX (6445 - 7694, n=5) | |
| Average of class Gaming (2180 - 10115, n=105, last 2 years) | |
| Schenker XMG Core 16 M25 | |
| Asus TUF Gaming A16 FA608UP | |
| Gigabyte Aero X16 1WH | |
| Gigabyte Gaming A16 GA6H | |
| AIDA64 / CPU Queen | |
| Lenovo Legion 5 Pro 16IAX10H | |
| Lenovo Legion Pro 5 16IAX10, RTX 5070 | |
| Alienware 16X Aurora, RTX 5070 | |
| Average Intel Core Ultra 7 255HX (115802 - 135237, n=5) | |
| Asus TUF Gaming A16 FA608UP | |
| Average of class Gaming (49785 - 173351, n=90, last 2 years) | |
| Schenker XMG Core 16 M25 | |
| Gigabyte Aero X16 1WH | |
| Gigabyte Gaming A16 GA6H | |
| AIDA64 / FPU SinJulia | |
| Schenker XMG Core 16 M25 | |
| Asus TUF Gaming A16 FA608UP | |
| Average of class Gaming (4424 - 33636, n=105, last 2 years) | |
| Lenovo Legion 5 Pro 16IAX10H | |
| Gigabyte Aero X16 1WH | |
| Alienware 16X Aurora, RTX 5070 | |
| Lenovo Legion Pro 5 16IAX10, RTX 5070 | |
| Average Intel Core Ultra 7 255HX (11066 - 12286, n=5) | |
| Gigabyte Gaming A16 GA6H | |
| AIDA64 / FPU Mandel | |
| Lenovo Legion 5 Pro 16IAX10H | |
| Lenovo Legion Pro 5 16IAX10, RTX 5070 | |
| Alienware 16X Aurora, RTX 5070 | |
| Average Intel Core Ultra 7 255HX (72938 - 87947, n=5) | |
| Schenker XMG Core 16 M25 | |
| Average of class Gaming (25115 - 128721, n=105, last 2 years) | |
| Asus TUF Gaming A16 FA608UP | |
| Gigabyte Aero X16 1WH | |
| Gigabyte Gaming A16 GA6H | |
| AIDA64 / CPU AES | |
| Lenovo Legion 5 Pro 16IAX10H | |
| Alienware 16X Aurora, RTX 5070 | |
| Schenker XMG Core 16 M25 | |
| Lenovo Legion Pro 5 16IAX10, RTX 5070 | |
| Average Intel Core Ultra 7 255HX (96832 - 116158, n=5) | |
| Average of class Gaming (39258 - 247074, n=105, last 2 years) | |
| Asus TUF Gaming A16 FA608UP | |
| Gigabyte Aero X16 1WH | |
| Gigabyte Gaming A16 GA6H | |
| AIDA64 / CPU ZLib | |
| Lenovo Legion 5 Pro 16IAX10H | |
| Alienware 16X Aurora, RTX 5070 | |
| Lenovo Legion Pro 5 16IAX10, RTX 5070 | |
| Average Intel Core Ultra 7 255HX (1510 - 1850, n=5) | |
| Average of class Gaming (574 - 2531, n=105, last 2 years) | |
| Schenker XMG Core 16 M25 | |
| Gigabyte Aero X16 1WH | |
| Asus TUF Gaming A16 FA608UP | |
| Gigabyte Gaming A16 GA6H | |
| AIDA64 / FP64 Ray-Trace | |
| Schenker XMG Core 16 M25 | |
| Lenovo Legion 5 Pro 16IAX10H | |
| Lenovo Legion Pro 5 16IAX10, RTX 5070 | |
| Alienware 16X Aurora, RTX 5070 | |
| Average of class Gaming (5509 - 45446, n=105, last 2 years) | |
| Average Intel Core Ultra 7 255HX (15137 - 18315, n=5) | |
| Asus TUF Gaming A16 FA608UP | |
| Gigabyte Aero X16 1WH | |
| Gigabyte Gaming A16 GA6H | |
| AIDA64 / CPU PhotoWorxx | |
| Lenovo Legion Pro 5 16IAX10, RTX 5070 | |
| Schenker XMG Core 16 M25 | |
| Lenovo Legion 5 Pro 16IAX10H | |
| Alienware 16X Aurora, RTX 5070 | |
| Average Intel Core Ultra 7 255HX (39697 - 54070, n=5) | |
| Average of class Gaming (12271 - 89891, n=105, last 2 years) | |
| Gigabyte Aero X16 1WH | |
| Asus TUF Gaming A16 FA608UP | |
| Gigabyte Gaming A16 GA6H | |
System performance
The Legion Pro 5 16 delivers excellent overall system performance, leading most competitors and trailing its Ti sibling by only a small margin.
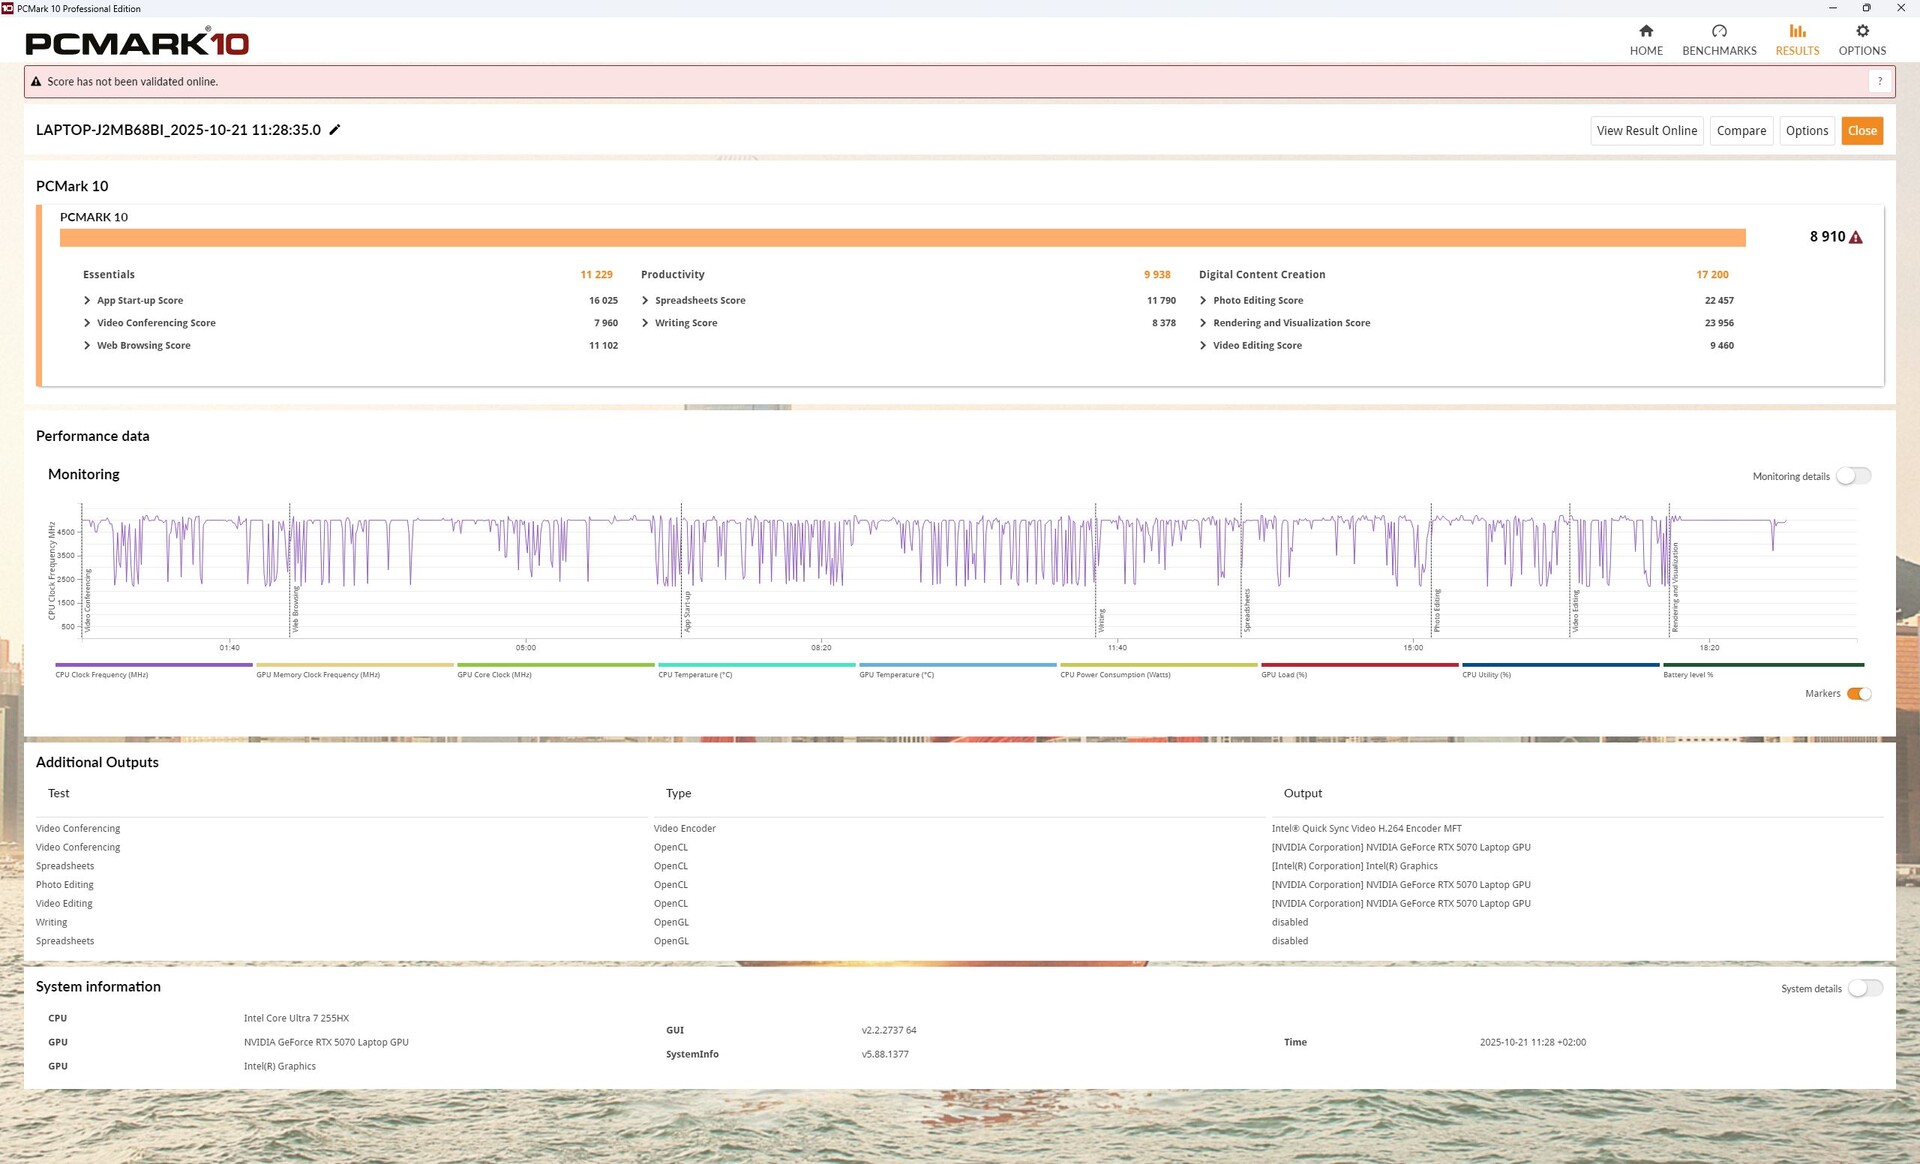
PCMark 10: Score | Essentials | Productivity | Digital Content Creation
CrossMark: Overall | Productivity | Creativity | Responsiveness
WebXPRT 3: Overall
WebXPRT 4: Overall
Mozilla Kraken 1.1: Total
| Performance rating | |
| Lenovo Legion 5 Pro 16IAX10H | |
| Alienware 16X Aurora, RTX 5070 -4! | |
| Lenovo Legion Pro 5 16IAX10, RTX 5070 | |
| Average Intel Core Ultra 7 255HX, NVIDIA GeForce RTX 5070 Laptop | |
| Average of class Gaming | |
| Schenker XMG Core 16 M25 -4! | |
| Gigabyte Aero X16 1WH | |
| Gigabyte Gaming A16 GA6H | |
| Asus TUF Gaming A16 FA608UP -4! | |
| PCMark 10 / Score | |
| Lenovo Legion Pro 5 16IAX10, RTX 5070 | |
| Average Intel Core Ultra 7 255HX, NVIDIA GeForce RTX 5070 Laptop (n=1) | |
| Average of class Gaming (5828 - 12414, n=93, last 2 years) | |
| Lenovo Legion 5 Pro 16IAX10H | |
| Gigabyte Aero X16 1WH | |
| Gigabyte Gaming A16 GA6H | |
| PCMark 10 / Essentials | |
| Lenovo Legion Pro 5 16IAX10, RTX 5070 | |
| Average Intel Core Ultra 7 255HX, NVIDIA GeForce RTX 5070 Laptop (n=1) | |
| Lenovo Legion 5 Pro 16IAX10H | |
| Average of class Gaming (8810 - 11935, n=97, last 2 years) | |
| Gigabyte Aero X16 1WH | |
| Gigabyte Gaming A16 GA6H | |
| PCMark 10 / Productivity | |
| Average of class Gaming (6845 - 25323, n=95, last 2 years) | |
| Gigabyte Aero X16 1WH | |
| Lenovo Legion Pro 5 16IAX10, RTX 5070 | |
| Average Intel Core Ultra 7 255HX, NVIDIA GeForce RTX 5070 Laptop (n=1) | |
| Lenovo Legion 5 Pro 16IAX10H | |
| Gigabyte Gaming A16 GA6H | |
| PCMark 10 / Digital Content Creation | |
| Lenovo Legion Pro 5 16IAX10, RTX 5070 | |
| Average Intel Core Ultra 7 255HX, NVIDIA GeForce RTX 5070 Laptop (n=1) | |
| Lenovo Legion 5 Pro 16IAX10H | |
| Average of class Gaming (7602 - 19954, n=95, last 2 years) | |
| Gigabyte Aero X16 1WH | |
| Gigabyte Gaming A16 GA6H | |
| CrossMark / Overall | |
| Alienware 16X Aurora, RTX 5070 | |
| Lenovo Legion 5 Pro 16IAX10H | |
| Lenovo Legion Pro 5 16IAX10, RTX 5070 | |
| Average Intel Core Ultra 7 255HX, NVIDIA GeForce RTX 5070 Laptop (n=1) | |
| Schenker XMG Core 16 M25 | |
| Average of class Gaming (1366 - 2409, n=94, last 2 years) | |
| Gigabyte Gaming A16 GA6H | |
| Gigabyte Aero X16 1WH | |
| Asus TUF Gaming A16 FA608UP | |
| CrossMark / Productivity | |
| Alienware 16X Aurora, RTX 5070 | |
| Lenovo Legion 5 Pro 16IAX10H | |
| Lenovo Legion Pro 5 16IAX10, RTX 5070 | |
| Average Intel Core Ultra 7 255HX, NVIDIA GeForce RTX 5070 Laptop (n=1) | |
| Average of class Gaming (1386 - 2254, n=94, last 2 years) | |
| Schenker XMG Core 16 M25 | |
| Gigabyte Gaming A16 GA6H | |
| Gigabyte Aero X16 1WH | |
| Asus TUF Gaming A16 FA608UP | |
| CrossMark / Creativity | |
| Lenovo Legion 5 Pro 16IAX10H | |
| Schenker XMG Core 16 M25 | |
| Alienware 16X Aurora, RTX 5070 | |
| Lenovo Legion Pro 5 16IAX10, RTX 5070 | |
| Average Intel Core Ultra 7 255HX, NVIDIA GeForce RTX 5070 Laptop (n=1) | |
| Average of class Gaming (1343 - 2786, n=94, last 2 years) | |
| Gigabyte Aero X16 1WH | |
| Asus TUF Gaming A16 FA608UP | |
| Gigabyte Gaming A16 GA6H | |
| CrossMark / Responsiveness | |
| Alienware 16X Aurora, RTX 5070 | |
| Lenovo Legion 5 Pro 16IAX10H | |
| Gigabyte Gaming A16 GA6H | |
| Lenovo Legion Pro 5 16IAX10, RTX 5070 | |
| Average Intel Core Ultra 7 255HX, NVIDIA GeForce RTX 5070 Laptop (n=1) | |
| Average of class Gaming (1226 - 2334, n=94, last 2 years) | |
| Schenker XMG Core 16 M25 | |
| Gigabyte Aero X16 1WH | |
| Asus TUF Gaming A16 FA608UP | |
| WebXPRT 3 / Overall | |
| Lenovo Legion 5 Pro 16IAX10H | |
| Alienware 16X Aurora, RTX 5070 | |
| Schenker XMG Core 16 M25 | |
| Gigabyte Aero X16 1WH | |
| Lenovo Legion Pro 5 16IAX10, RTX 5070 | |
| Average Intel Core Ultra 7 255HX, NVIDIA GeForce RTX 5070 Laptop (n=1) | |
| Average of class Gaming (220 - 532, n=98, last 2 years) | |
| Asus TUF Gaming A16 FA608UP | |
| Gigabyte Gaming A16 GA6H | |
| WebXPRT 4 / Overall | |
| Schenker XMG Core 16 M25 | |
| Alienware 16X Aurora, RTX 5070 | |
| Lenovo Legion Pro 5 16IAX10, RTX 5070 | |
| Average Intel Core Ultra 7 255HX, NVIDIA GeForce RTX 5070 Laptop (n=1) | |
| Lenovo Legion 5 Pro 16IAX10H | |
| Average of class Gaming (165 - 354, n=98, last 2 years) | |
| Gigabyte Aero X16 1WH | |
| Gigabyte Gaming A16 GA6H | |
| Asus TUF Gaming A16 FA608UP | |
| Mozilla Kraken 1.1 / Total | |
| Asus TUF Gaming A16 FA608UP | |
| Gigabyte Gaming A16 GA6H | |
| Average of class Gaming (391 - 590, n=100, last 2 years) | |
| Gigabyte Aero X16 1WH | |
| Lenovo Legion Pro 5 16IAX10, RTX 5070 | |
| Average Intel Core Ultra 7 255HX, NVIDIA GeForce RTX 5070 Laptop (n=1) | |
| Schenker XMG Core 16 M25 | |
| Lenovo Legion 5 Pro 16IAX10H | |
| Alienware 16X Aurora, RTX 5070 | |
* ... smaller is better
| PCMark 10 Score | 8910 points | |
Help | ||
| AIDA64 / Memory Copy | |
| Lenovo Legion Pro 5 16IAX10, RTX 5070 | |
| Average Intel Core Ultra 7 255HX (68939 - 104987, n=5) | |
| Lenovo Legion 5 Pro 16IAX10H | |
| Alienware 16X Aurora, RTX 5070 | |
| Schenker XMG Core 16 M25 | |
| Gigabyte Aero X16 1WH | |
| Average of class Gaming (21750 - 129946, n=105, last 2 years) | |
| Asus TUF Gaming A16 FA608UP | |
| Gigabyte Gaming A16 GA6H | |
| AIDA64 / Memory Read | |
| Lenovo Legion Pro 5 16IAX10, RTX 5070 | |
| Average Intel Core Ultra 7 255HX (82336 - 95821, n=5) | |
| Lenovo Legion 5 Pro 16IAX10H | |
| Alienware 16X Aurora, RTX 5070 | |
| Schenker XMG Core 16 M25 | |
| Average of class Gaming (22956 - 118858, n=105, last 2 years) | |
| Gigabyte Aero X16 1WH | |
| Asus TUF Gaming A16 FA608UP | |
| Gigabyte Gaming A16 GA6H | |
| AIDA64 / Memory Write | |
| Average Intel Core Ultra 7 255HX (66479 - 133486, n=5) | |
| Asus TUF Gaming A16 FA608UP | |
| Gigabyte Aero X16 1WH | |
| Lenovo Legion Pro 5 16IAX10, RTX 5070 | |
| Schenker XMG Core 16 M25 | |
| Alienware 16X Aurora, RTX 5070 | |
| Lenovo Legion 5 Pro 16IAX10H | |
| Average of class Gaming (22297 - 135096, n=105, last 2 years) | |
| Gigabyte Gaming A16 GA6H | |
| AIDA64 / Memory Latency | |
| Alienware 16X Aurora, RTX 5070 | |
| Lenovo Legion 5 Pro 16IAX10H | |
| Average of class Gaming (75.3 - 259, n=105, last 2 years) | |
| Average Intel Core Ultra 7 255HX (104.2 - 110, n=5) | |
| Lenovo Legion Pro 5 16IAX10, RTX 5070 | |
| Gigabyte Gaming A16 GA6H | |
| Gigabyte Aero X16 1WH | |
| Asus TUF Gaming A16 FA608UP | |
| Schenker XMG Core 16 M25 | |
* ... smaller is better
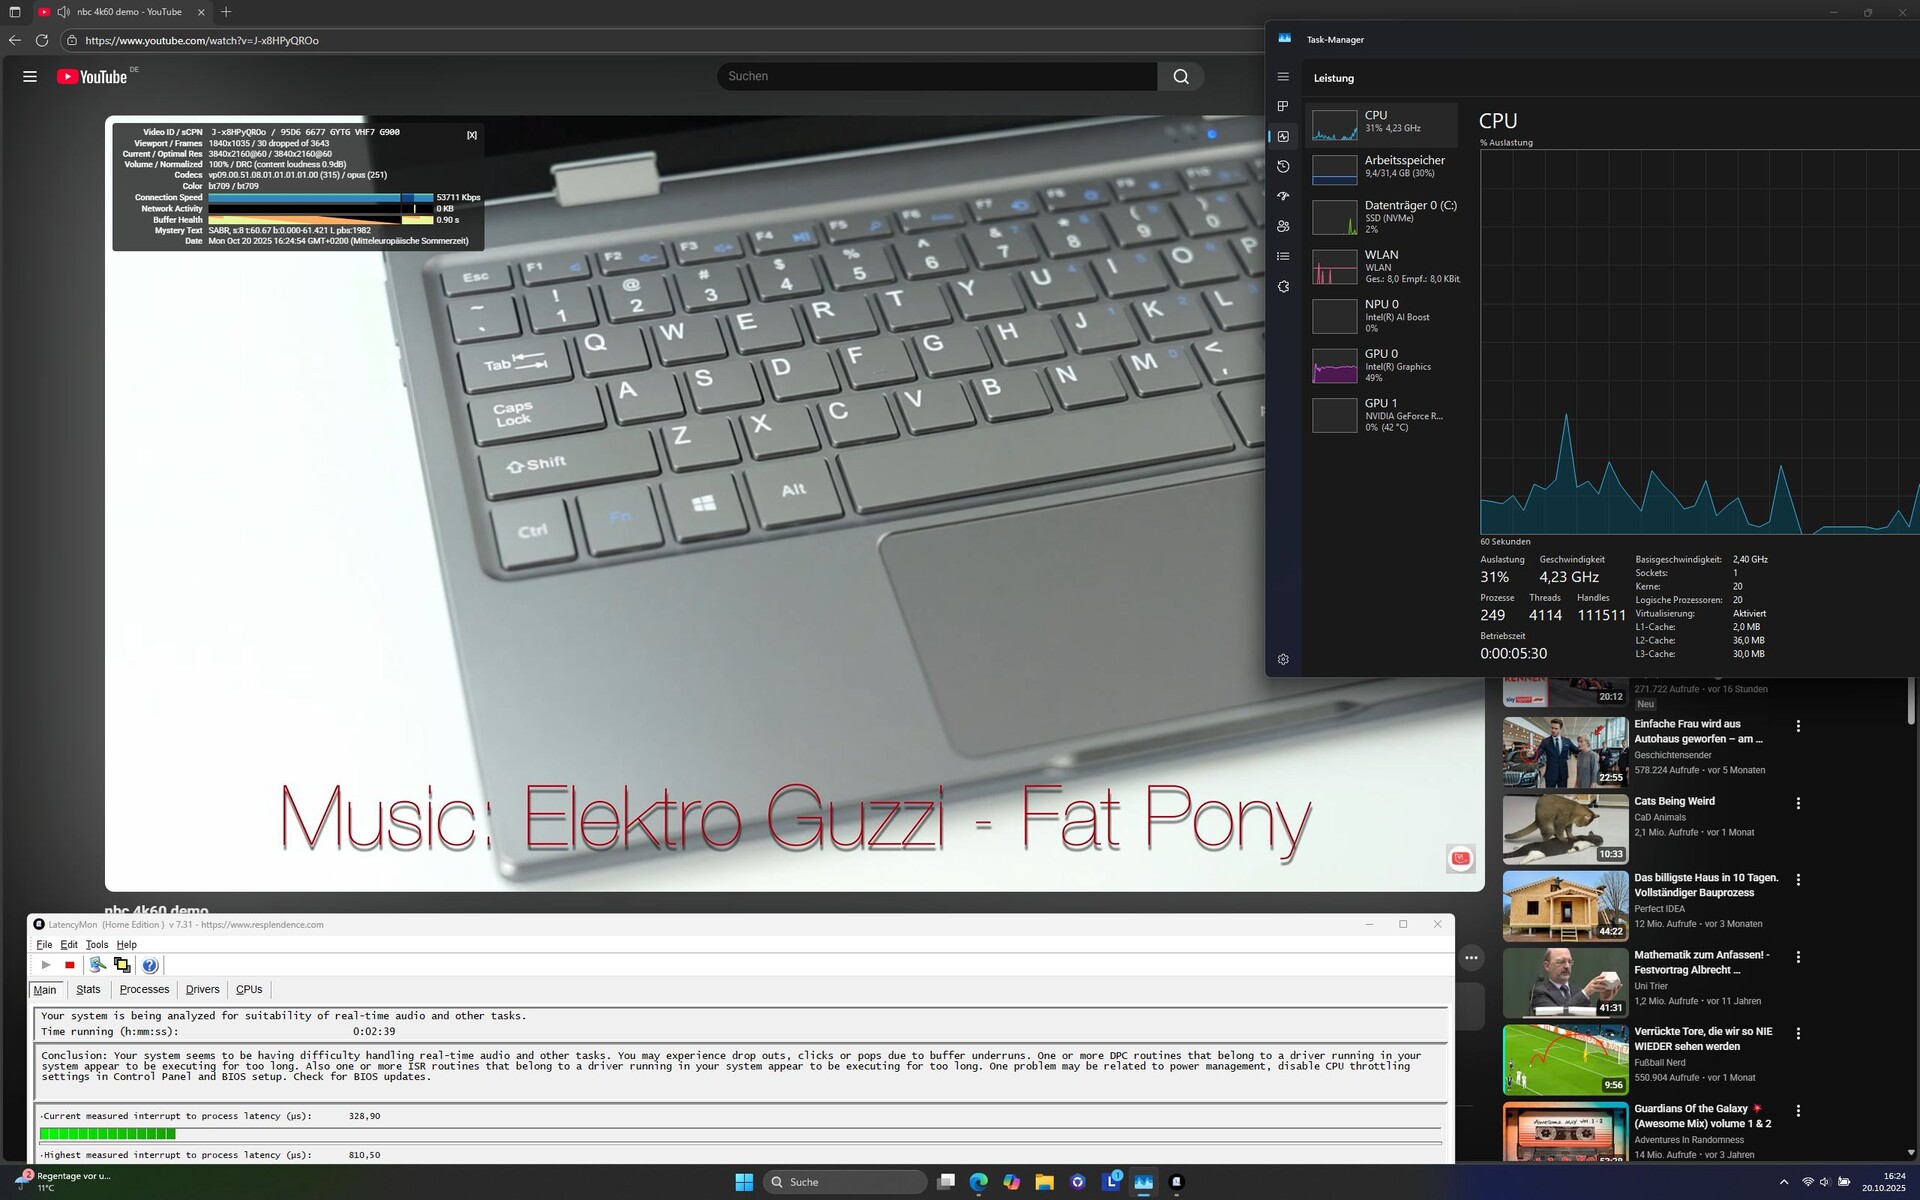
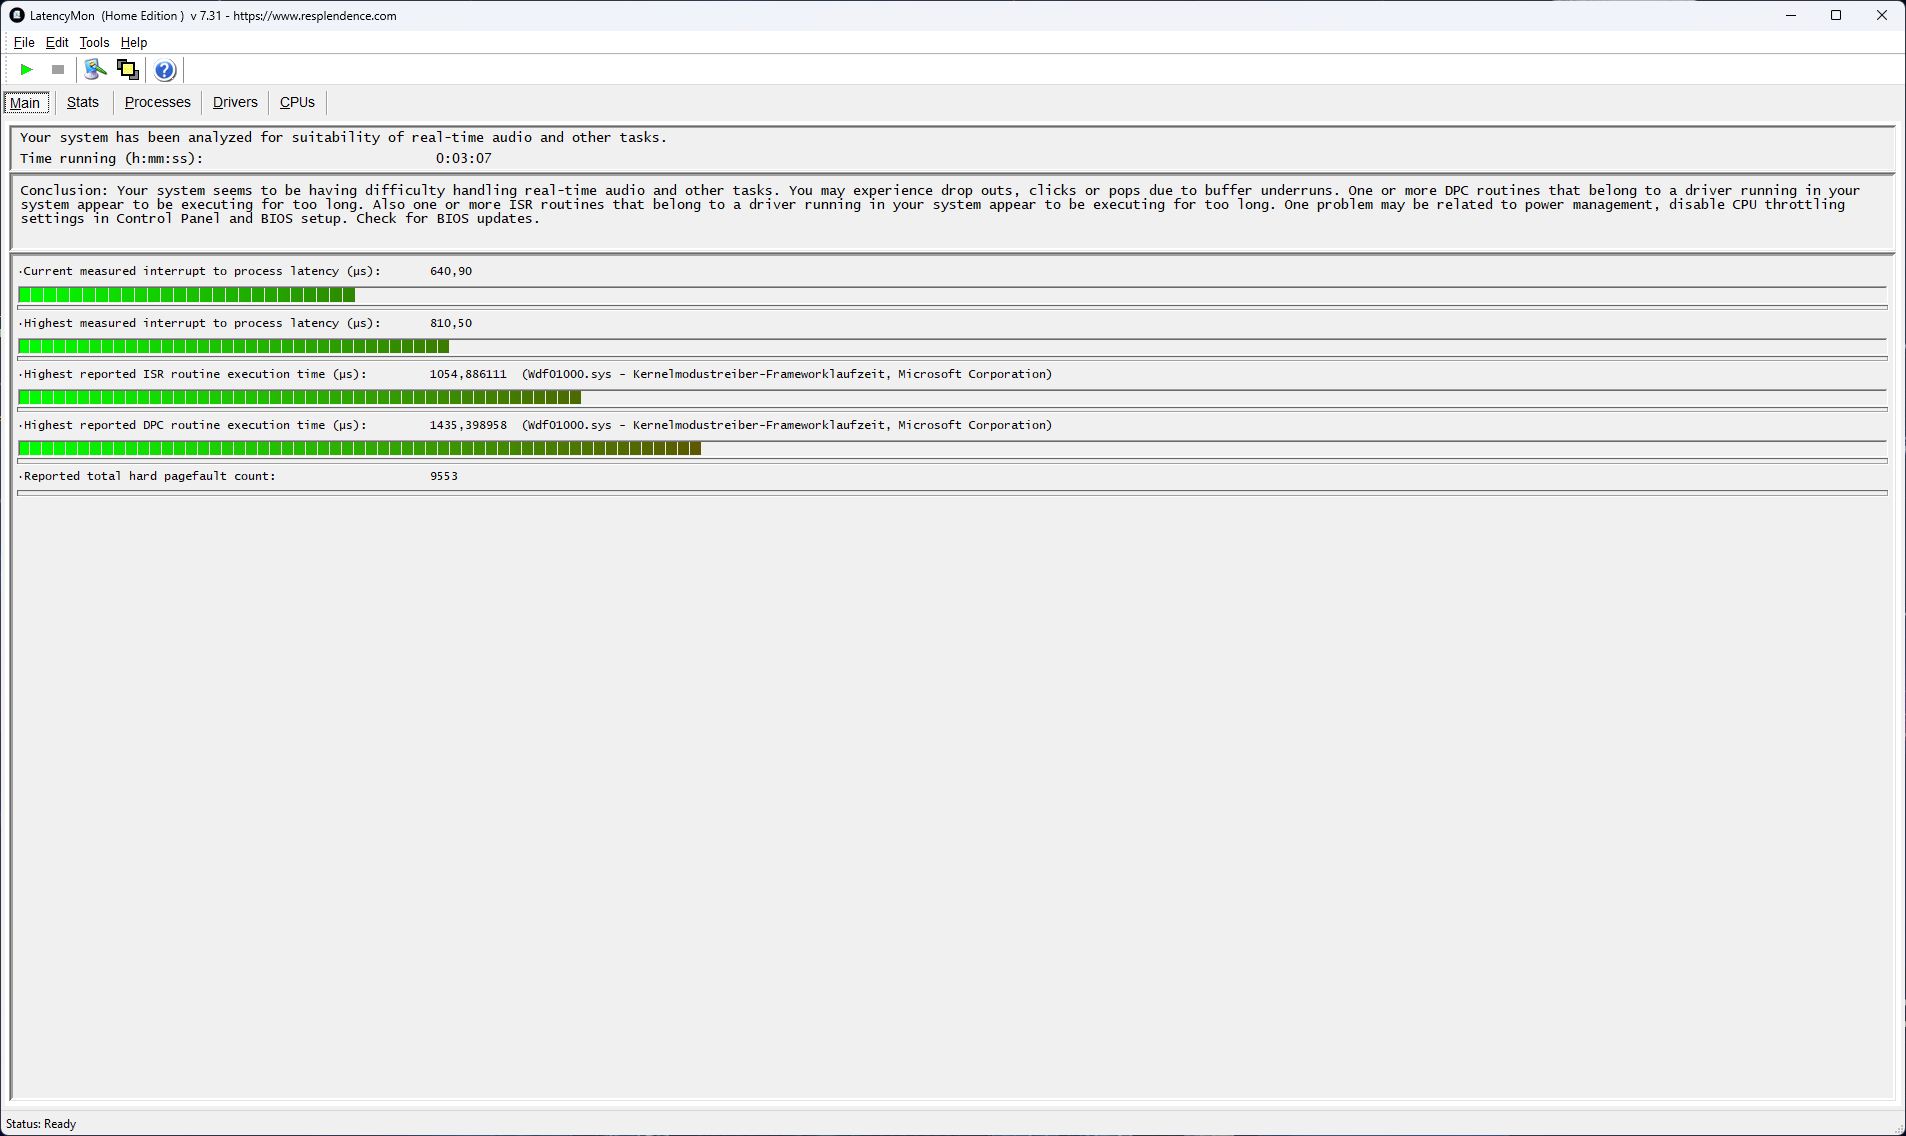
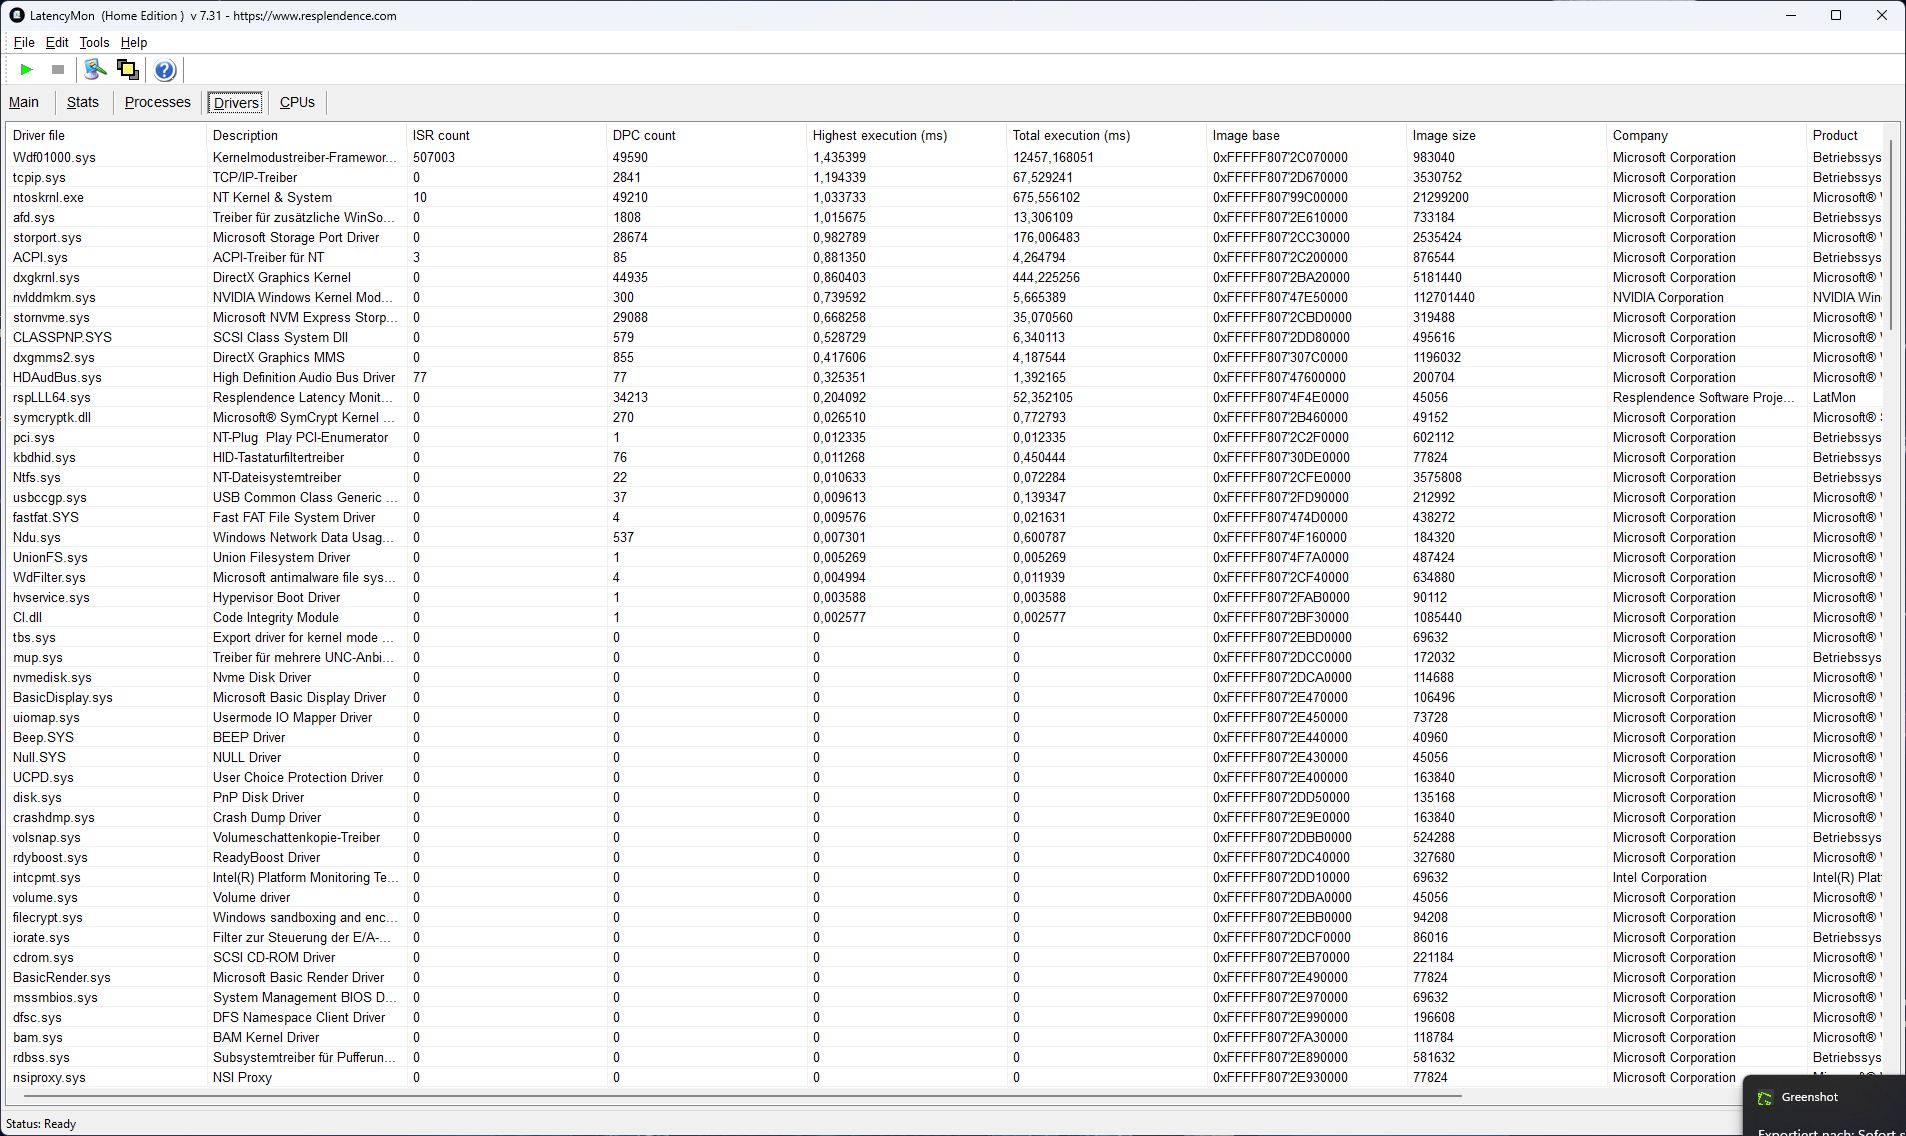
DPC latency
Minor latency spikes appear when launching the browser, but opening multiple tabs doesn’t worsen them. Playing a YouTube test video causes about 30 dropped frames, though overall latency remains low compared with other systems.
| DPC Latencies / LatencyMon - interrupt to process latency (max), Web, Youtube, Prime95 | |
| Gigabyte Gaming A16 GA6H | |
| Gigabyte Aero X16 1WH | |
| Alienware 16X Aurora, RTX 5070 | |
| Lenovo Legion 5 Pro 16IAX10H | |
| Lenovo Legion Pro 5 16IAX10, RTX 5070 | |
| Schenker XMG Core 16 M25 | |
| Asus TUF Gaming A16 FA608UP | |
* ... smaller is better
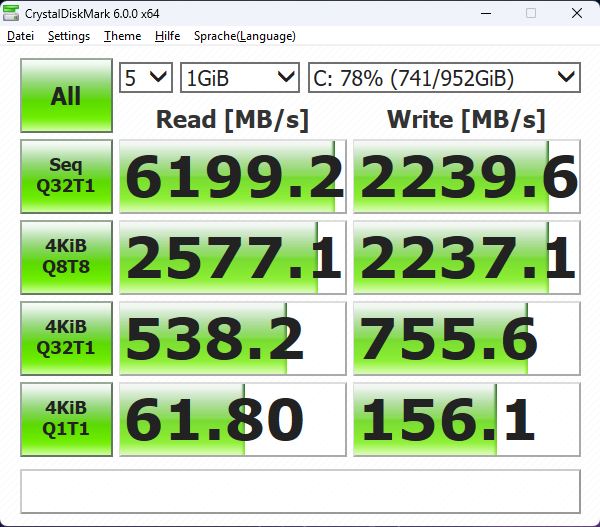
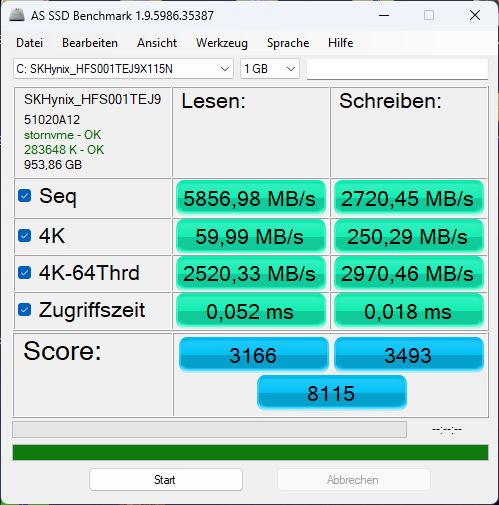
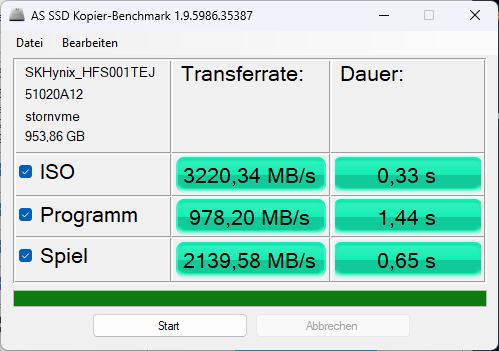
Mass storage
Our unit uses an SK Hynix PCIe 4.0 SSD; the Ti model used a Western Digital drive. The Hynix is slightly faster overall but begins to throttle thermally toward the end of our long stress test.


* ... smaller is better
Read continuous performance: DiskSpd Read Loop, Queue Depth 8
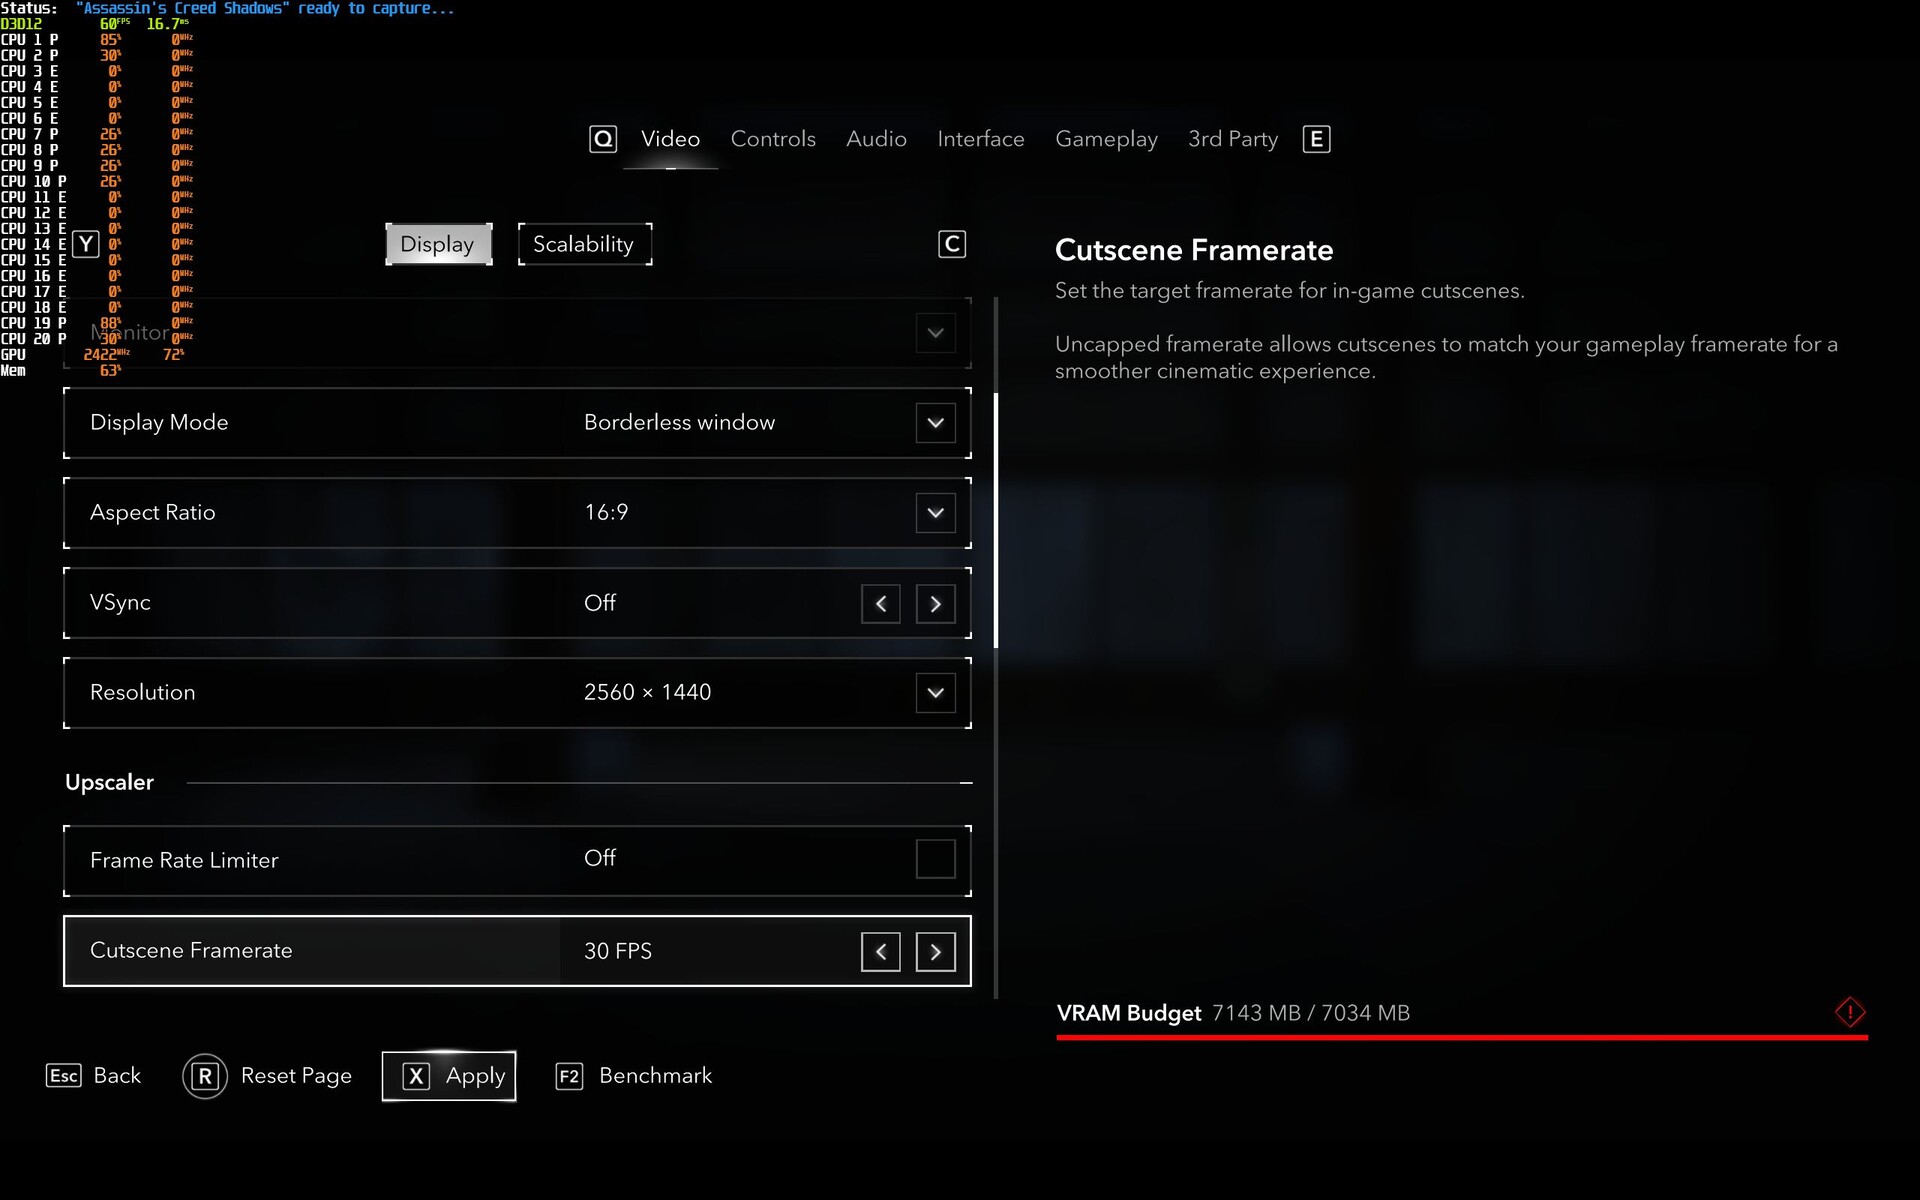
GPU performance
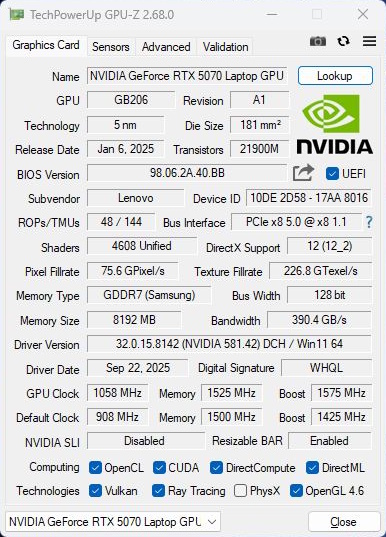
The RTX 5070 comes with 8 GB VRAM versus 12 GB on the RTX 5070 Ti. In certain games at higher resolutions or settings, that can become a limitation (see screenshot below), though in our tests it caused no stutters—frame times were mostly consistent.
In Indiana Jones and the Great Circle, the game already flags a VRAM overflow in Full HD at low settings; gameplay remains smooth up to medium details, but at high or ultra settings it repeatedly crashed on launch.
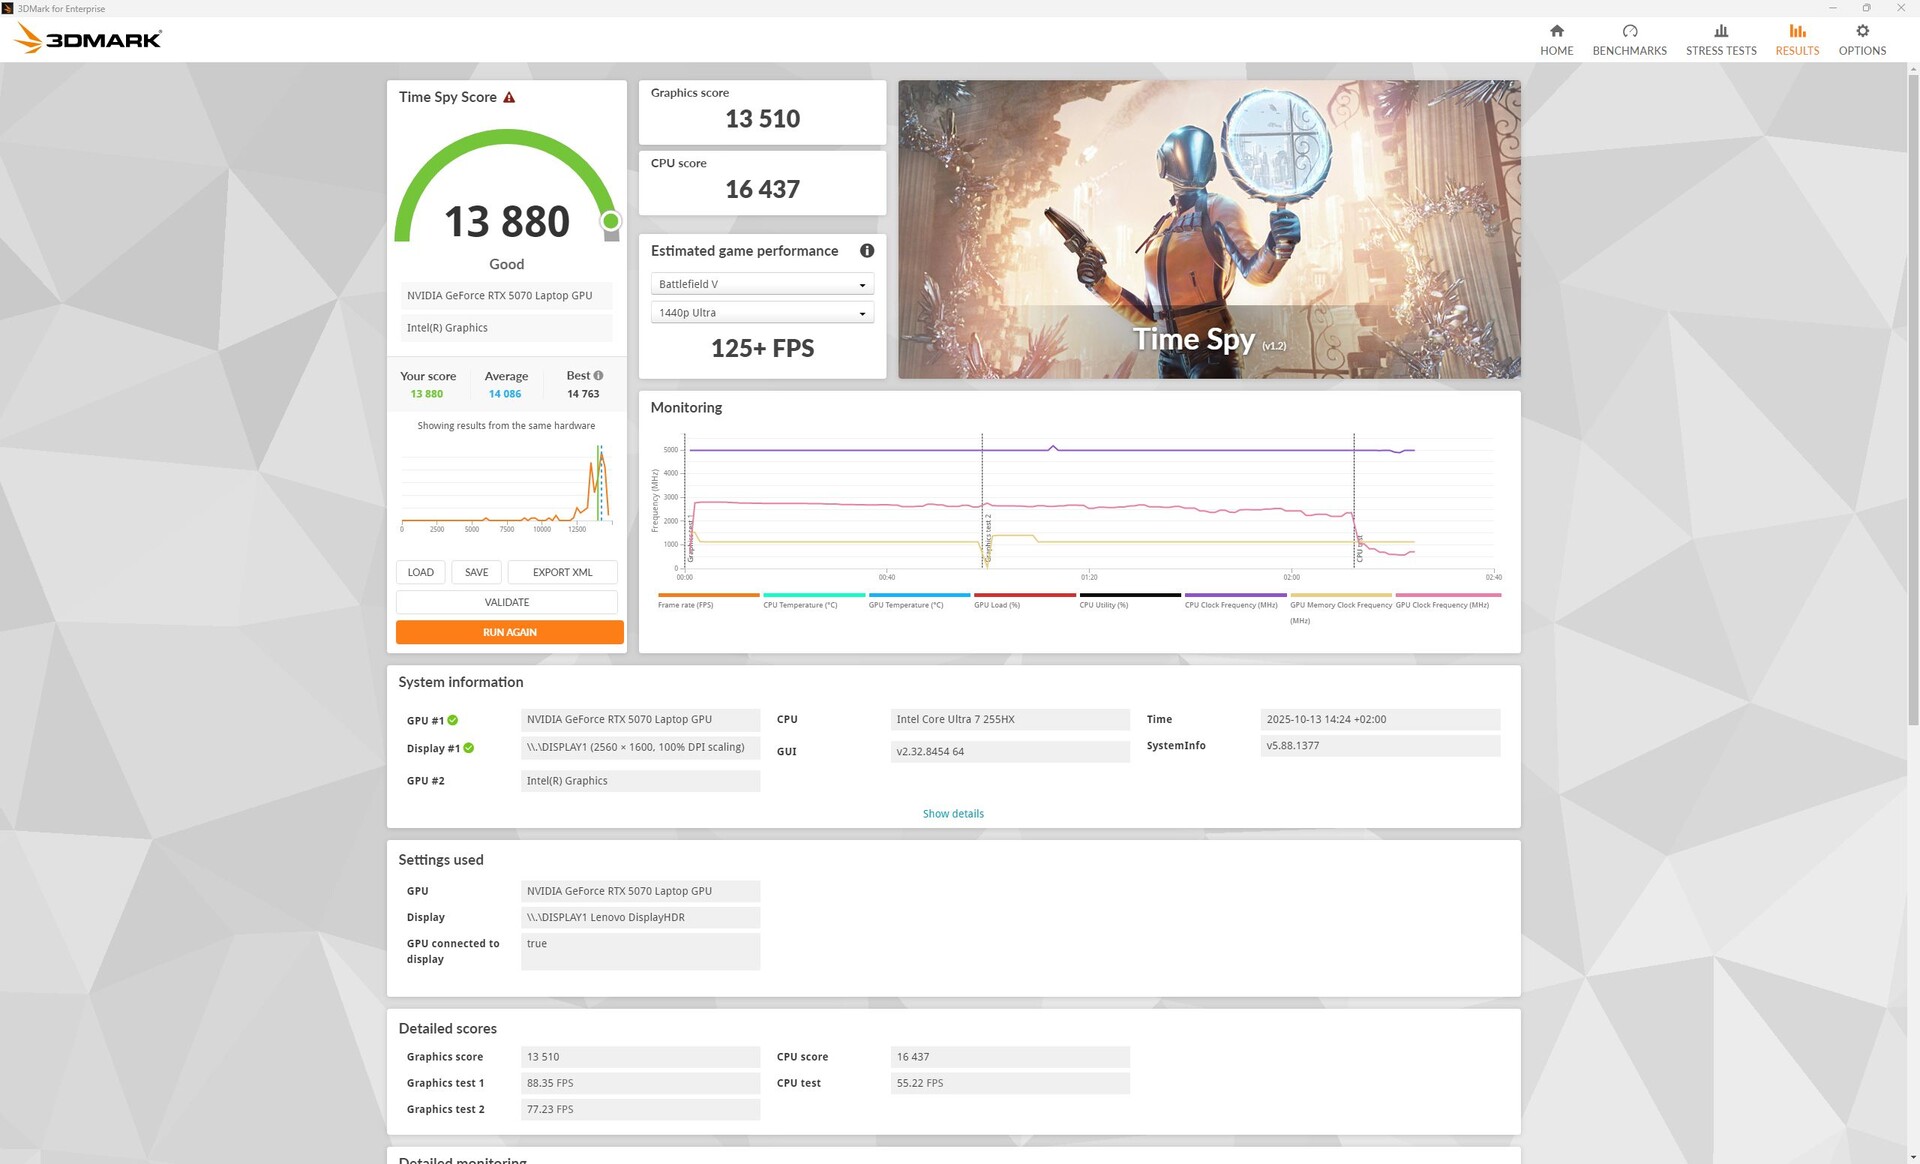
Synthetic 3DMark tests show about 25 percent higher scores for the Ti variant.
Game-to-game comparisons vary: CPU-bound titles like Dota 2 Reborn barely benefit, while GPU-heavy titles such as Cyberpunk 2077 or Strange Brigade reflect the full Ti-advantage seen in 3DMark.
Even so, the RTX 5070 handles most modern games smoothly at high settings—QHD is barely a problem, and even 4K is playable in many cases. The Ti version just squeezes out a few extra frames in ultra-demanding titles (Cyberpunk 2077 without DLSS, F1 25). Below 30 fps, we didn’t measure further, e.g. F1 25 in QHD was no longer smoothly playable.
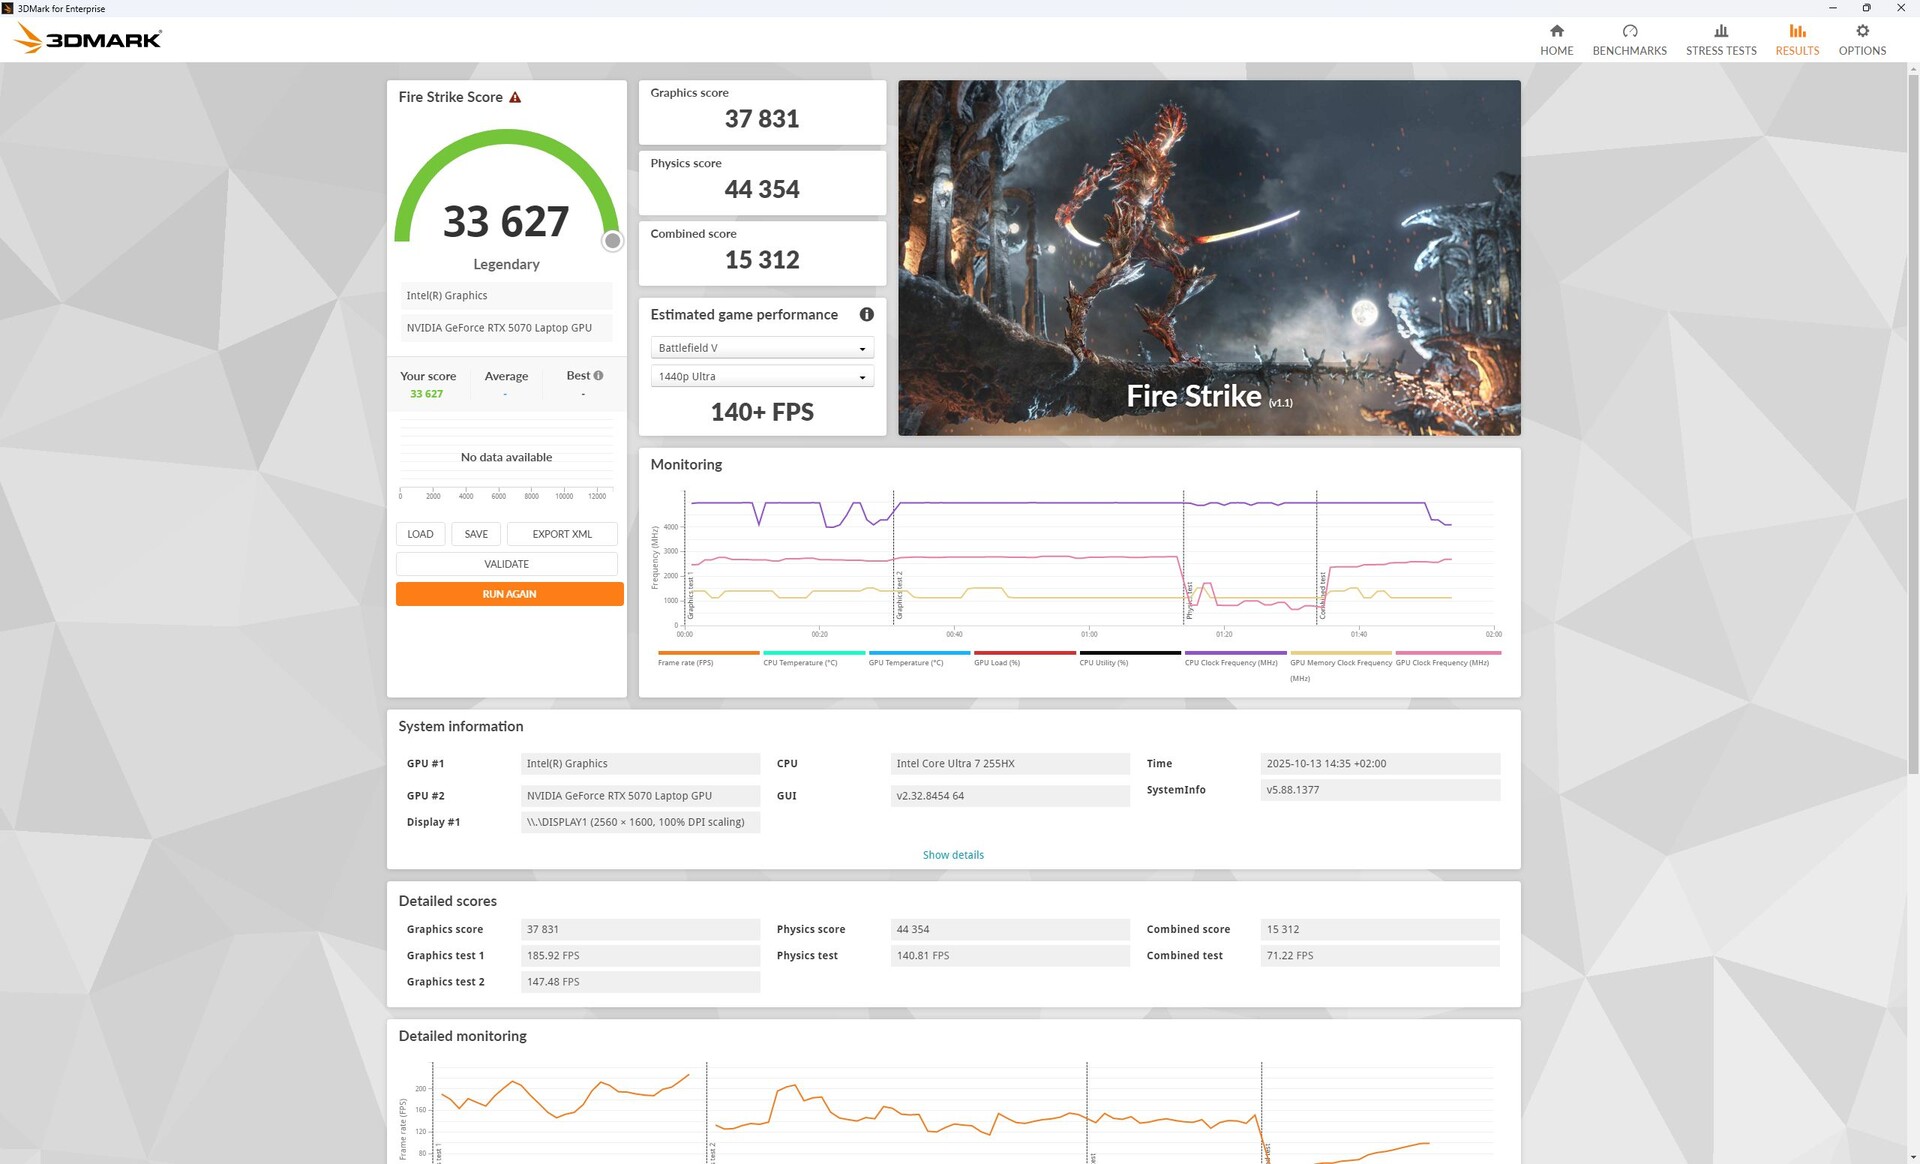
Unplugged, 3D performance drops sharply—by 82 percent (Fire Strike).
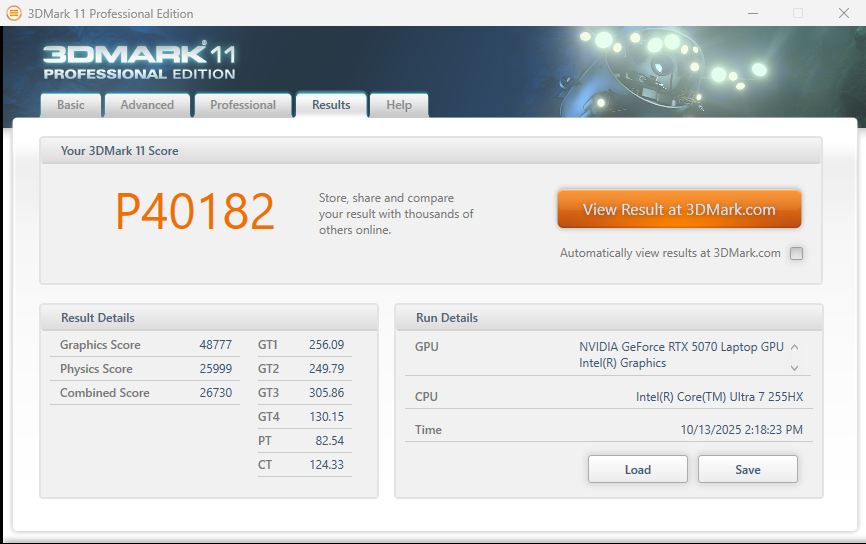
| 3DMark 11 Performance | 40182 points | |
| 3DMark Fire Strike Score | 33627 points | |
| 3DMark Time Spy Score | 13880 points | |
Help | ||
* ... smaller is better
| F1 25 | |
| 1920x1080 Ultra High Preset AA:T AF:16x | |
| Average of class Gaming (46.3 - 123.2, n=27, last 2 years) | |
| Lenovo Legion Pro 5 16IAX10, RTX 5070 | |
| Lenovo Legion 5 Pro 16IAX10H | |
| Average NVIDIA GeForce RTX 5070 Laptop (48.5 - 64.5, n=10) | |
| 1920x1080 Ultra Max Preset AA:T AF:16x | |
| Average of class Gaming (12.5 - 65.3, n=34, last 2 years) | |
| Lenovo Legion 5 Pro 16IAX10H | |
| Lenovo Legion Pro 5 16IAX10, RTX 5070 | |
| Average NVIDIA GeForce RTX 5070 Laptop (25.8 - 31.6, n=11) | |
Cyberpunk 2077 ultra fps chart
| low | med. | high | ultra | QHD DLSS | QHD | 4K DLSS | 4K | |
|---|---|---|---|---|---|---|---|---|
| GTA V (2015) | 187.6 | 186.4 | 184.1 | 153.2 | 126 | 119 | ||
| Dota 2 Reborn (2015) | 203 | 184.2 | 178.1 | 162.4 | 131 | |||
| Final Fantasy XV Benchmark (2018) | 232 | 191.3 | 144.5 | 106.8 | 59.1 | |||
| X-Plane 11.11 (2018) | 135.5 | 117.6 | 101.6 | 80 | ||||
| Strange Brigade (2018) | 560 | 349 | 295 | 246 | 177.4 | 95.8 | ||
| Baldur's Gate 3 (2023) | 192.4 | 153.1 | 134.6 | 130.6 | 135.8 | 90 | 77.6 | 46 |
| Cyberpunk 2077 (2023) | 171.8 | 146.4 | 122 | 107 | 80.7 | 68.3 | 30.2 | |
| Indiana Jones and the Great Circle (2024) | 131.6 | |||||||
| Assassin's Creed Shadows (2025) | 75 | 70 | 60 | 46 | 45 | 38 | ||
| Doom: The Dark Ages (2025) | 96.2 | 88.4 | 74.2 | 72.2 | 70 | 49.4 | 33.2 | |
| F1 25 (2025) | 242 | 227 | 191.9 | 31.6 |
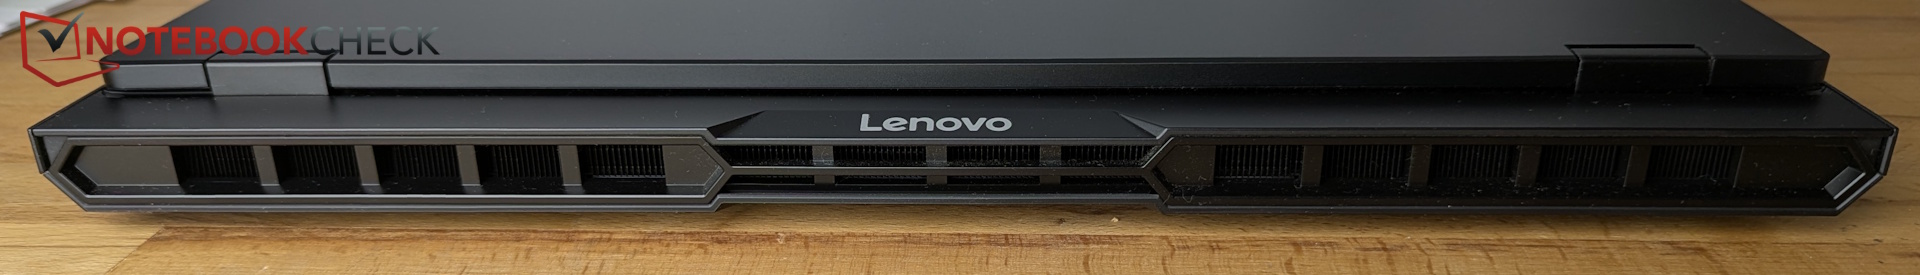
Emissions and energy – quieter, cooler, more efficient
Noise
In idle, fans usually stay off, though they’ll spin up quietly even under light loads like web browsing.
Under sustained load, they’re somewhat quieter than on the Ti model, while rivals show similar numbers. For roughly 12 percent less GPU power in balanced mode, fan noise in Cyberpunk 2077 is about half as loud (remember: +3 dB ≈ double perceived loudness).
Noise level
| Idle |
| 23 / 23 / 23 dB(A) |
| Load |
| 43.85 / 52.9 dB(A) |
 | ||
30 dB silent 40 dB(A) audible 50 dB(A) loud |
||
min: | ||
| Lenovo Legion Pro 5 16IAX10, RTX 5070 Ultra 7 255HX, GeForce RTX 5070 Laptop | Lenovo Legion 5 Pro 16IAX10H Ultra 9 275HX, GeForce RTX 5070 Ti Laptop | Alienware 16X Aurora, RTX 5070 Ultra 9 275HX, GeForce RTX 5070 Laptop | Gigabyte Aero X16 1WH Ryzen AI 7 350, GeForce RTX 5070 Laptop | Asus TUF Gaming A16 FA608UP R7 260, GeForce RTX 5070 Laptop | Schenker XMG Core 16 M25 Ryzen AI 9 HX 370, GeForce RTX 5070 Laptop | Gigabyte Gaming A16 GA6H i7-13620H, GeForce RTX 5070 Laptop | |
|---|---|---|---|---|---|---|---|
| Noise | -13% | 0% | 2% | -19% | -4% | -11% | |
| off / environment * (dB) | 23 | 24 -4% | 23.7 -3% | 23.9 -4% | 25.1 -9% | 24.8 -8% | 24 -4% |
| Idle Minimum * (dB) | 23 | 24 -4% | 23.9 -4% | 23.9 -4% | 32.2 -40% | 24.8 -8% | 25 -9% |
| Idle Average * (dB) | 23 | 24 -4% | 23.9 -4% | 23.9 -4% | 32.2 -40% | 24.8 -8% | 26 -13% |
| Idle Maximum * (dB) | 23 | 30.9 -34% | 26.1 -13% | 23.9 -4% | 32.2 -40% | 27.1 -18% | 27 -17% |
| Load Average * (dB) | 43.85 | 55.9 -27% | 26.8 39% | 33.2 24% | 38.1 13% | 40.2 8% | 54 -23% |
| Cyberpunk 2077 ultra * (dB) | 50.27 | 56.72 -13% | 51.8 -3% | 50.2 -0% | 53.9 -7% | 49.2 2% | 54 -7% |
| Load Maximum * (dB) | 52.9 | 56.72 -7% | 58 -10% | 50.2 5% | 57.1 -8% | 49.2 7% | 55 -4% |
* ... smaller is better
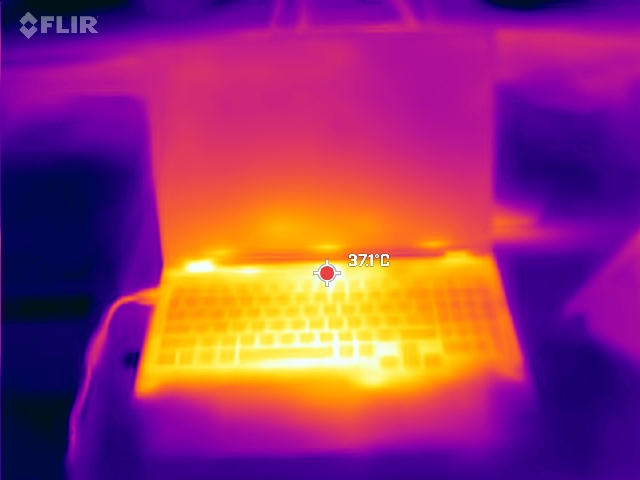
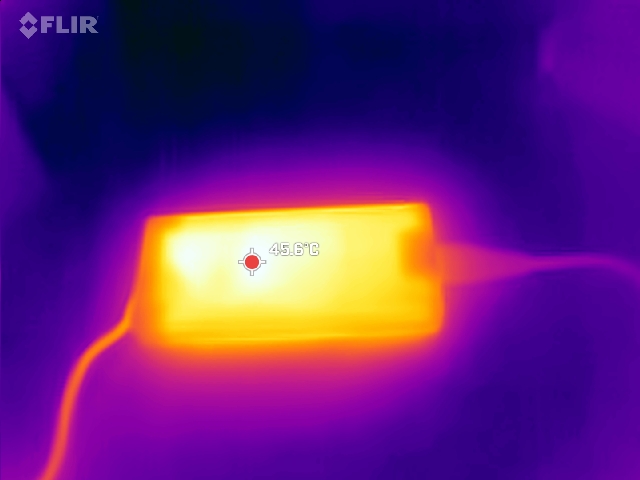
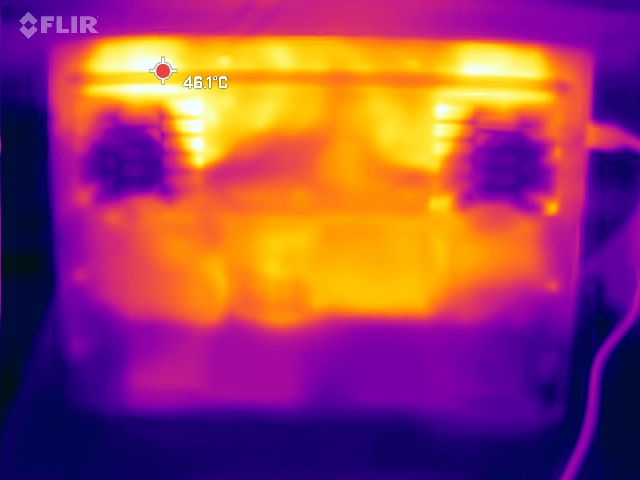
Temperature
Under load, this model runs cooler than the Ti variant. We measured hotspots of 44 °C on the bottom rear (vs. 50 °C on the Ti). The WASD keys stay at 37 °C, and the palm rests remain comfortable.
(±) The maximum temperature on the upper side is 42 °C / 108 F, compared to the average of 40.4 °C / 105 F, ranging from 21.2 to 68.8 °C for the class Gaming.
(±) The bottom heats up to a maximum of 44 °C / 111 F, compared to the average of 43.2 °C / 110 F
(+) In idle usage, the average temperature for the upper side is 29.8 °C / 86 F, compared to the device average of 33.9 °C / 93 F.
(±) 3: The average temperature for the upper side is 34.3 °C / 94 F, compared to the average of 33.9 °C / 93 F for the class Gaming.
(+) The palmrests and touchpad are cooler than skin temperature with a maximum of 31 °C / 87.8 F and are therefore cool to the touch.
(-) The average temperature of the palmrest area of similar devices was 28.8 °C / 83.8 F (-2.2 °C / -4 F).
| Lenovo Legion Pro 5 16IAX10, RTX 5070 Ultra 7 255HX, GeForce RTX 5070 Laptop | Lenovo Legion 5 Pro 16IAX10H Ultra 9 275HX, GeForce RTX 5070 Ti Laptop | Alienware 16X Aurora, RTX 5070 Ultra 9 275HX, GeForce RTX 5070 Laptop | Gigabyte Aero X16 1WH Ryzen AI 7 350, GeForce RTX 5070 Laptop | Asus TUF Gaming A16 FA608UP R7 260, GeForce RTX 5070 Laptop | Schenker XMG Core 16 M25 Ryzen AI 9 HX 370, GeForce RTX 5070 Laptop | Gigabyte Gaming A16 GA6H i7-13620H, GeForce RTX 5070 Laptop | |
|---|---|---|---|---|---|---|---|
| Heat | -17% | 1% | 5% | 13% | -5% | -9% | |
| Maximum Upper Side * (°C) | 42 | 48 -14% | 51 -21% | 43.3 -3% | 39.5 6% | 46.7 -11% | 50 -19% |
| Maximum Bottom * (°C) | 44 | 50 -14% | 45.6 -4% | 50.3 -14% | 45.1 -3% | 58.5 -33% | 49 -11% |
| Idle Upper Side * (°C) | 33 | 38 -15% | 29.8 10% | 27 18% | 25.7 22% | 28.3 14% | 35 -6% |
| Idle Bottom * (°C) | 34 | 42 -24% | 27.4 19% | 28.3 17% | 25.5 25% | 29.9 12% | 34 -0% |
* ... smaller is better
Speakers
As noted in our original review, the speakers are somewhat quiet and lack bass, though highs are balanced. There’s a 3.5 mm jack for external audio devices.
Lenovo Legion Pro 5 16IAX10, RTX 5070 audio analysis
(±) | speaker loudness is average but good (75.73 dB)
Bass 100 - 315 Hz
(-) | nearly no bass - on average 20% lower than median
(±) | linearity of bass is average (9.3% delta to prev. frequency)
Mids 400 - 2000 Hz
(±) | higher mids - on average 6.1% higher than median
(±) | linearity of mids is average (7.9% delta to prev. frequency)
Highs 2 - 16 kHz
(+) | balanced highs - only 2.2% away from median
(+) | highs are linear (6.3% delta to prev. frequency)
Overall 100 - 16.000 Hz
(±) | linearity of overall sound is average (19.4% difference to median)
Compared to same class
» 67% of all tested devices in this class were better, 7% similar, 26% worse
» The best had a delta of 6%, average was 18%, worst was 132%
Compared to all devices tested
» 48% of all tested devices were better, 7% similar, 45% worse
» The best had a delta of 4%, average was 23%, worst was 134%
Apple MacBook Pro 16 2021 M1 Pro audio analysis
(+) | speakers can play relatively loud (84.7 dB)
Bass 100 - 315 Hz
(+) | good bass - only 3.8% away from median
(+) | bass is linear (5.2% delta to prev. frequency)
Mids 400 - 2000 Hz
(+) | balanced mids - only 1.3% away from median
(+) | mids are linear (2.1% delta to prev. frequency)
Highs 2 - 16 kHz
(+) | balanced highs - only 1.9% away from median
(+) | highs are linear (2.7% delta to prev. frequency)
Overall 100 - 16.000 Hz
(+) | overall sound is linear (4.6% difference to median)
Compared to same class
» 0% of all tested devices in this class were better, 0% similar, 100% worse
» The best had a delta of 5%, average was 17%, worst was 45%
Compared to all devices tested
» 0% of all tested devices were better, 0% similar, 100% worse
» The best had a delta of 4%, average was 23%, worst was 134%
Power consumption
As expected, power draw is lower than the Ti version’s. Among competitors, the Legion Pro 5 still consumes quite a bit during gaming—but it’s also among the top performers.
Connecting an external monitor via DisplayPort/Thunderbolt keeps the RTX 5070 active, raising idle power use.
| Off / Standby | |
| Idle | |
| Load |
|
Key:
min: | |
| Lenovo Legion Pro 5 16IAX10, RTX 5070 Ultra 7 255HX, GeForce RTX 5070 Laptop, SK Hynix HFS001TEJ9X115N, OLED, 2650x1600, 16" | Lenovo Legion 5 Pro 16IAX10H Ultra 9 275HX, GeForce RTX 5070 Ti Laptop, Western Digital PC SN8000S SDEPNRK-1T00, OLED, 2560x1600, 16" | Alienware 16X Aurora, RTX 5070 Ultra 9 275HX, GeForce RTX 5070 Laptop, , IPS, 2560x1600, 16" | Gigabyte Aero X16 1WH Ryzen AI 7 350, GeForce RTX 5070 Laptop, Kingston OM8PGP41024Q-A0, IPS, 2560x1600, 16" | Asus TUF Gaming A16 FA608UP R7 260, GeForce RTX 5070 Laptop, Western Digital PC SN5000S SDEQNSJ-1T00, IPS, 2560x1600, 16" | Schenker XMG Core 16 M25 Ryzen AI 9 HX 370, GeForce RTX 5070 Laptop, Samsung 990 Pro 2 TB MZVL72T0HDLB, IPS, 2560x1600, 16" | Gigabyte Gaming A16 GA6H i7-13620H, GeForce RTX 5070 Laptop, Kingston OM8PGP41024Q-A0, IPS, 2560x1600, 16" | Average NVIDIA GeForce RTX 5070 Laptop | Average of class Gaming | |
|---|---|---|---|---|---|---|---|---|---|
| Power Consumption | -24% | -40% | 34% | 26% | 10% | 20% | -5% | -23% | |
| Idle Minimum * (Watt) | 10.6 | 14 -32% | 20.1 -90% | 5.8 45% | 4.6 57% | 7.4 30% | 9 15% | 10.8 ? -2% | 13 ? -23% |
| Idle Average * (Watt) | 12.3 | 14.3 -16% | 27.6 -124% | 10.9 11% | 9.8 20% | 14.9 -21% | 11 11% | 15.4 ? -25% | 18.7 ? -52% |
| Idle Maximum * (Watt) | 18.6 | 20.1 -8% | 31.8 -71% | 11.2 40% | 10.2 45% | 15.2 18% | 23 -24% | 21 ? -13% | 24.3 ? -31% |
| Load Average * (Watt) | 104 | 177 -70% | 102.7 1% | 91.3 12% | 76.1 27% | 100.8 3% | 91 12% | 98.7 ? 5% | 110.2 ? -6% |
| Cyberpunk 2077 ultra * (Watt) | 231 | 255 -10% | 217 6% | 123.8 46% | 198.9 14% | 184.8 20% | 132.5 43% | ||
| Cyberpunk 2077 ultra external monitor * (Watt) | 227 | 255 -12% | 192.3 15% | 117.9 48% | 198.1 13% | 181.4 20% | 130 43% | ||
| Load Maximum * (Watt) | 248 | 294 -19% | 292 -18% | 155.3 37% | 235.2 5% | 251.1 -1% | 155 37% | 218 ? 12% | 258 ? -4% |
* ... smaller is better
Power consumption Cyberpunk / stress test
Power consumption with external monitor
Battery life
The 80 Wh battery remains unchanged. The laptop lasts about 6 hours in our Wi-Fi and video playback tests—roughly an hour longer than the Ti model.
| Lenovo Legion Pro 5 16IAX10, RTX 5070 Ultra 7 255HX, GeForce RTX 5070 Laptop, 80 Wh | Lenovo Legion 5 Pro 16IAX10H Ultra 9 275HX, GeForce RTX 5070 Ti Laptop, 80 Wh | Alienware 16X Aurora, RTX 5070 Ultra 9 275HX, GeForce RTX 5070 Laptop, 96 Wh | Gigabyte Aero X16 1WH Ryzen AI 7 350, GeForce RTX 5070 Laptop, 76 Wh | Asus TUF Gaming A16 FA608UP R7 260, GeForce RTX 5070 Laptop, 90 Wh | Schenker XMG Core 16 M25 Ryzen AI 9 HX 370, GeForce RTX 5070 Laptop, 99.8 Wh | Gigabyte Gaming A16 GA6H i7-13620H, GeForce RTX 5070 Laptop, 76 Wh | Average of class Gaming | |
|---|---|---|---|---|---|---|---|---|
| Battery runtime | -16% | -31% | 39% | 110% | 76% | 24% | 13% | |
| H.264 (h) | 6.1 | 4.8 -21% | 8.64 ? 42% | |||||
| WiFi v1.3 (h) | 6.2 | 4.9 -21% | 4.3 -31% | 8.6 39% | 13 110% | 10.9 76% | 7.7 24% | 7.11 ? 15% |
| Load (h) | 1.8 | 1.7 -6% | 1.502 ? -17% |
Notebookcheck's overall impressions
Even with the non-Ti RTX 5070, the Lenovo Legion Pro 5 16 is a powerful gaming laptop—and at €500–700 less than the Ti variant, it’s a very compelling deal.
Lenovo Legion Pro 5 16IAX10, RTX 5070
- 10/22/2025 v8
Christian Hintze
 Total Sustainability Score:
 Potential alternatives in comparison
Image | Model / Review | Price | Weight | Height | Display |
|---|---|---|---|---|---|
1. 86.2%  | Lenovo Legion Pro 5 16IAX10, RTX 5070 Intel Core Ultra 7 255HX ⎘ NVIDIA GeForce RTX 5070 Laptop ⎘ 32 GB Memory, 1024 GB SSD | Amazon: List Price: 1800 Euro | 2.3 kg | 25.95 mm | 16.00" 2650x1600 189 PPI OLED |
2. 84.5%  | Lenovo Legion 5 Pro 16IAX10H Intel Core Ultra 9 275HX ⎘ NVIDIA GeForce RTX 5070 Ti Laptop ⎘ 32 GB Memory, 1024 GB SSD | Amazon: 1. $2,999.00 Lenovo Legion Pro 5i Gen 10 ... 2. $3,369.00 Lenovo Legion Pro 7 16IAX10H... 3. $3,489.99 Lenovo Legion Pro 7 16IAX10H... List Price: 2500 Euro | 2.4 kg | 25.95 mm | 16.00" 2560x1600 189 PPI OLED |
3. 84.9%  | Alienware 16X Aurora, RTX 5070 Intel Core Ultra 9 275HX ⎘ NVIDIA GeForce RTX 5070 Laptop ⎘ 32 GB Memory | Amazon: List Price: 1800 USD | 2.5 kg | 23.4 mm | 16.00" 2560x1600 189 PPI IPS |
4. 83.7%  | Gigabyte Aero X16 1WH AMD Ryzen AI 7 350 ⎘ NVIDIA GeForce RTX 5070 Laptop ⎘ 32 GB Memory, 1024 GB SSD | Amazon: List Price: 1799€ | 2 kg | 19.9 mm | 16.00" 2560x1600 189 PPI IPS |
5. 83.8%  | Asus TUF Gaming A16 FA608UP AMD Ryzen 7 260 ⎘ NVIDIA GeForce RTX 5070 Laptop ⎘ 32 GB Memory, 1024 GB SSD | Amazon: List Price: 2199€ | 2.2 kg | 25.7 mm | 16.00" 2560x1600 189 PPI IPS |
6. 86.2%  | Schenker XMG Core 16 M25 AMD Ryzen AI 9 HX 370 ⎘ NVIDIA GeForce RTX 5070 Laptop ⎘ 64 GB Memory, 2048 GB SSD | Amazon: List Price: 2100€ | 2.1 kg | 23 mm | 16.00" 2560x1600 189 PPI IPS |
7. 80.1%  | Gigabyte Gaming A16 GA6H Intel Core i7-13620H ⎘ NVIDIA GeForce RTX 5070 Laptop ⎘ 16 GB Memory, 1024 GB SSD | Amazon: 1. $1,047.49 GIGABYTE - Gaming A16 Gaming... 2. $1,065.00 GIGABYTE - Gaming A16 Gaming... 3. $1,232.70 GIGABYTE - Gaming A16 Gaming... List Price: 1700 EUR | 2.3 kg | 23 mm | 16.00" 2560x1600 189 PPI IPS |
Transparency
The selection of devices to be reviewed is made by our editorial team. The test sample was provided to the author as a loan by the manufacturer or retailer for the purpose of this review. The lender had no influence on this review, nor did the manufacturer receive a copy of this review before publication. There was no obligation to publish this review. As an independent media company, Notebookcheck is not subjected to the authority of manufacturers, retailers or publishers.
This is how Notebookcheck is testing
Every year, Notebookcheck independently reviews hundreds of laptops and smartphones using standardized procedures to ensure that all results are comparable. We have continuously developed our test methods for around 20 years and set industry standards in the process. In our test labs, high-quality measuring equipment is utilized by experienced technicians and editors. These tests involve a multi-stage validation process. Our complex rating system is based on hundreds of well-founded measurements and benchmarks, which maintains objectivity. Further information on our test methods can be found here.
