Asus ROG Strix G17 G713PI: Gaming laptop impresses in the test with the new Ryzen 9
With the ROG Strix G17, Asus presents a gaming laptop that is supposed to make an impression particularly with its processor. And indeed, 16 cores, 32 threads, a huge 64-MB L3 cache, and the Zen4 architecture of the AMD Ryzen 9 7945HX at least sound impressive. It turns out that this not only goes for the technical spec sheet, but the CPU also does quite a job in our benchmarks.
You can also select among the three smaller mobile graphics chips of the RTX 4000 series, which all ensure that the 240 Hertz of the otherwise simple 17-inch display are provided with a sufficient number of frames. They also keep the price within acceptable limits, starting in the 2,000 Euro (~$2,123) range for ROG Strix. Aside from the convincing gaming performance and worthy visuals, there are also some smaller savings that don't mar the overall impression and impede on the gaming performance at most minimally.
Our G713PI-LL005W test configuration with 32 GB of RAM, the Nvidia GeForce RTX 4070, and 1-TB M.2 SSD stands in direct competition to the slightly larger Asus ROG Strix G18 and Razer Blade 18, which are also equipped with the identical Nvidia GeForce RTX 4070 and Intel processors. The comparison with the preceding generation of graphics cards should also be interesting. Our benchmarks should show how much it is able to outpace an impressively equipped Asus ROG Strix Scar 17 SE with the RTX 3080 Ti or an Alienware m17 R5 with the AMD Radeon RX 6850M XT.
Possible Competitors in Comparison
Rating | Date | Model | Weight | Height | Size | Resolution | Price |
|---|---|---|---|---|---|---|---|
| 88.4 % v7 (old) | 04 / 2023 | Asus ROG Strix G17 G713PI R9 7945HX, GeForce RTX 4070 Laptop GPU | 2.8 kg | 30.7 mm | 17.30" | 2560x1440 | |
| 87.4 % v7 (old) | 03 / 2023 | Asus ROG Strix G18 G814JI i7-13650HX, GeForce RTX 4070 Laptop GPU | 3 kg | 31 mm | 18.00" | 2560x1600 | |
| 91.4 % v7 (old) | 02 / 2023 | Razer Blade 18 RTX 4070 i9-13950HX, GeForce RTX 4070 Laptop GPU | 3 kg | 21.9 mm | 18.00" | 2560x1600 | |
| 86.9 % v7 (old) | 11 / 2022 | Asus ROG Strix Scar 17 SE G733CX-LL014W i9-12950HX, GeForce RTX 3080 Ti Laptop GPU | 2.9 kg | 28.3 mm | 17.30" | 2560x1440 | |
| 88 % v7 (old) | 04 / 2023 | Asus Zephyrus Duo 16 GX650PY-NM006W R9 7945HX, GeForce RTX 4090 Laptop GPU | 2.7 kg | 29.7 mm | 16.00" | 2560x1600 | |
| 86.1 % v7 (old) | 01 / 2023 | Alienware m17 R5 (R9 6900HX, RX 6850M XT) R9 6900HX, Radeon RX 6850M XT | 3.4 kg | 26.7 mm | 17.00" | 3840x2160 | |
| 88.4 % v7 (old) | 03 / 2023 | Asus ROG Strix G16 G614JZ i9-13980HX, GeForce RTX 4080 Laptop GPU | 2.4 kg | 30.4 mm | 16.00" | 2560x1600 |
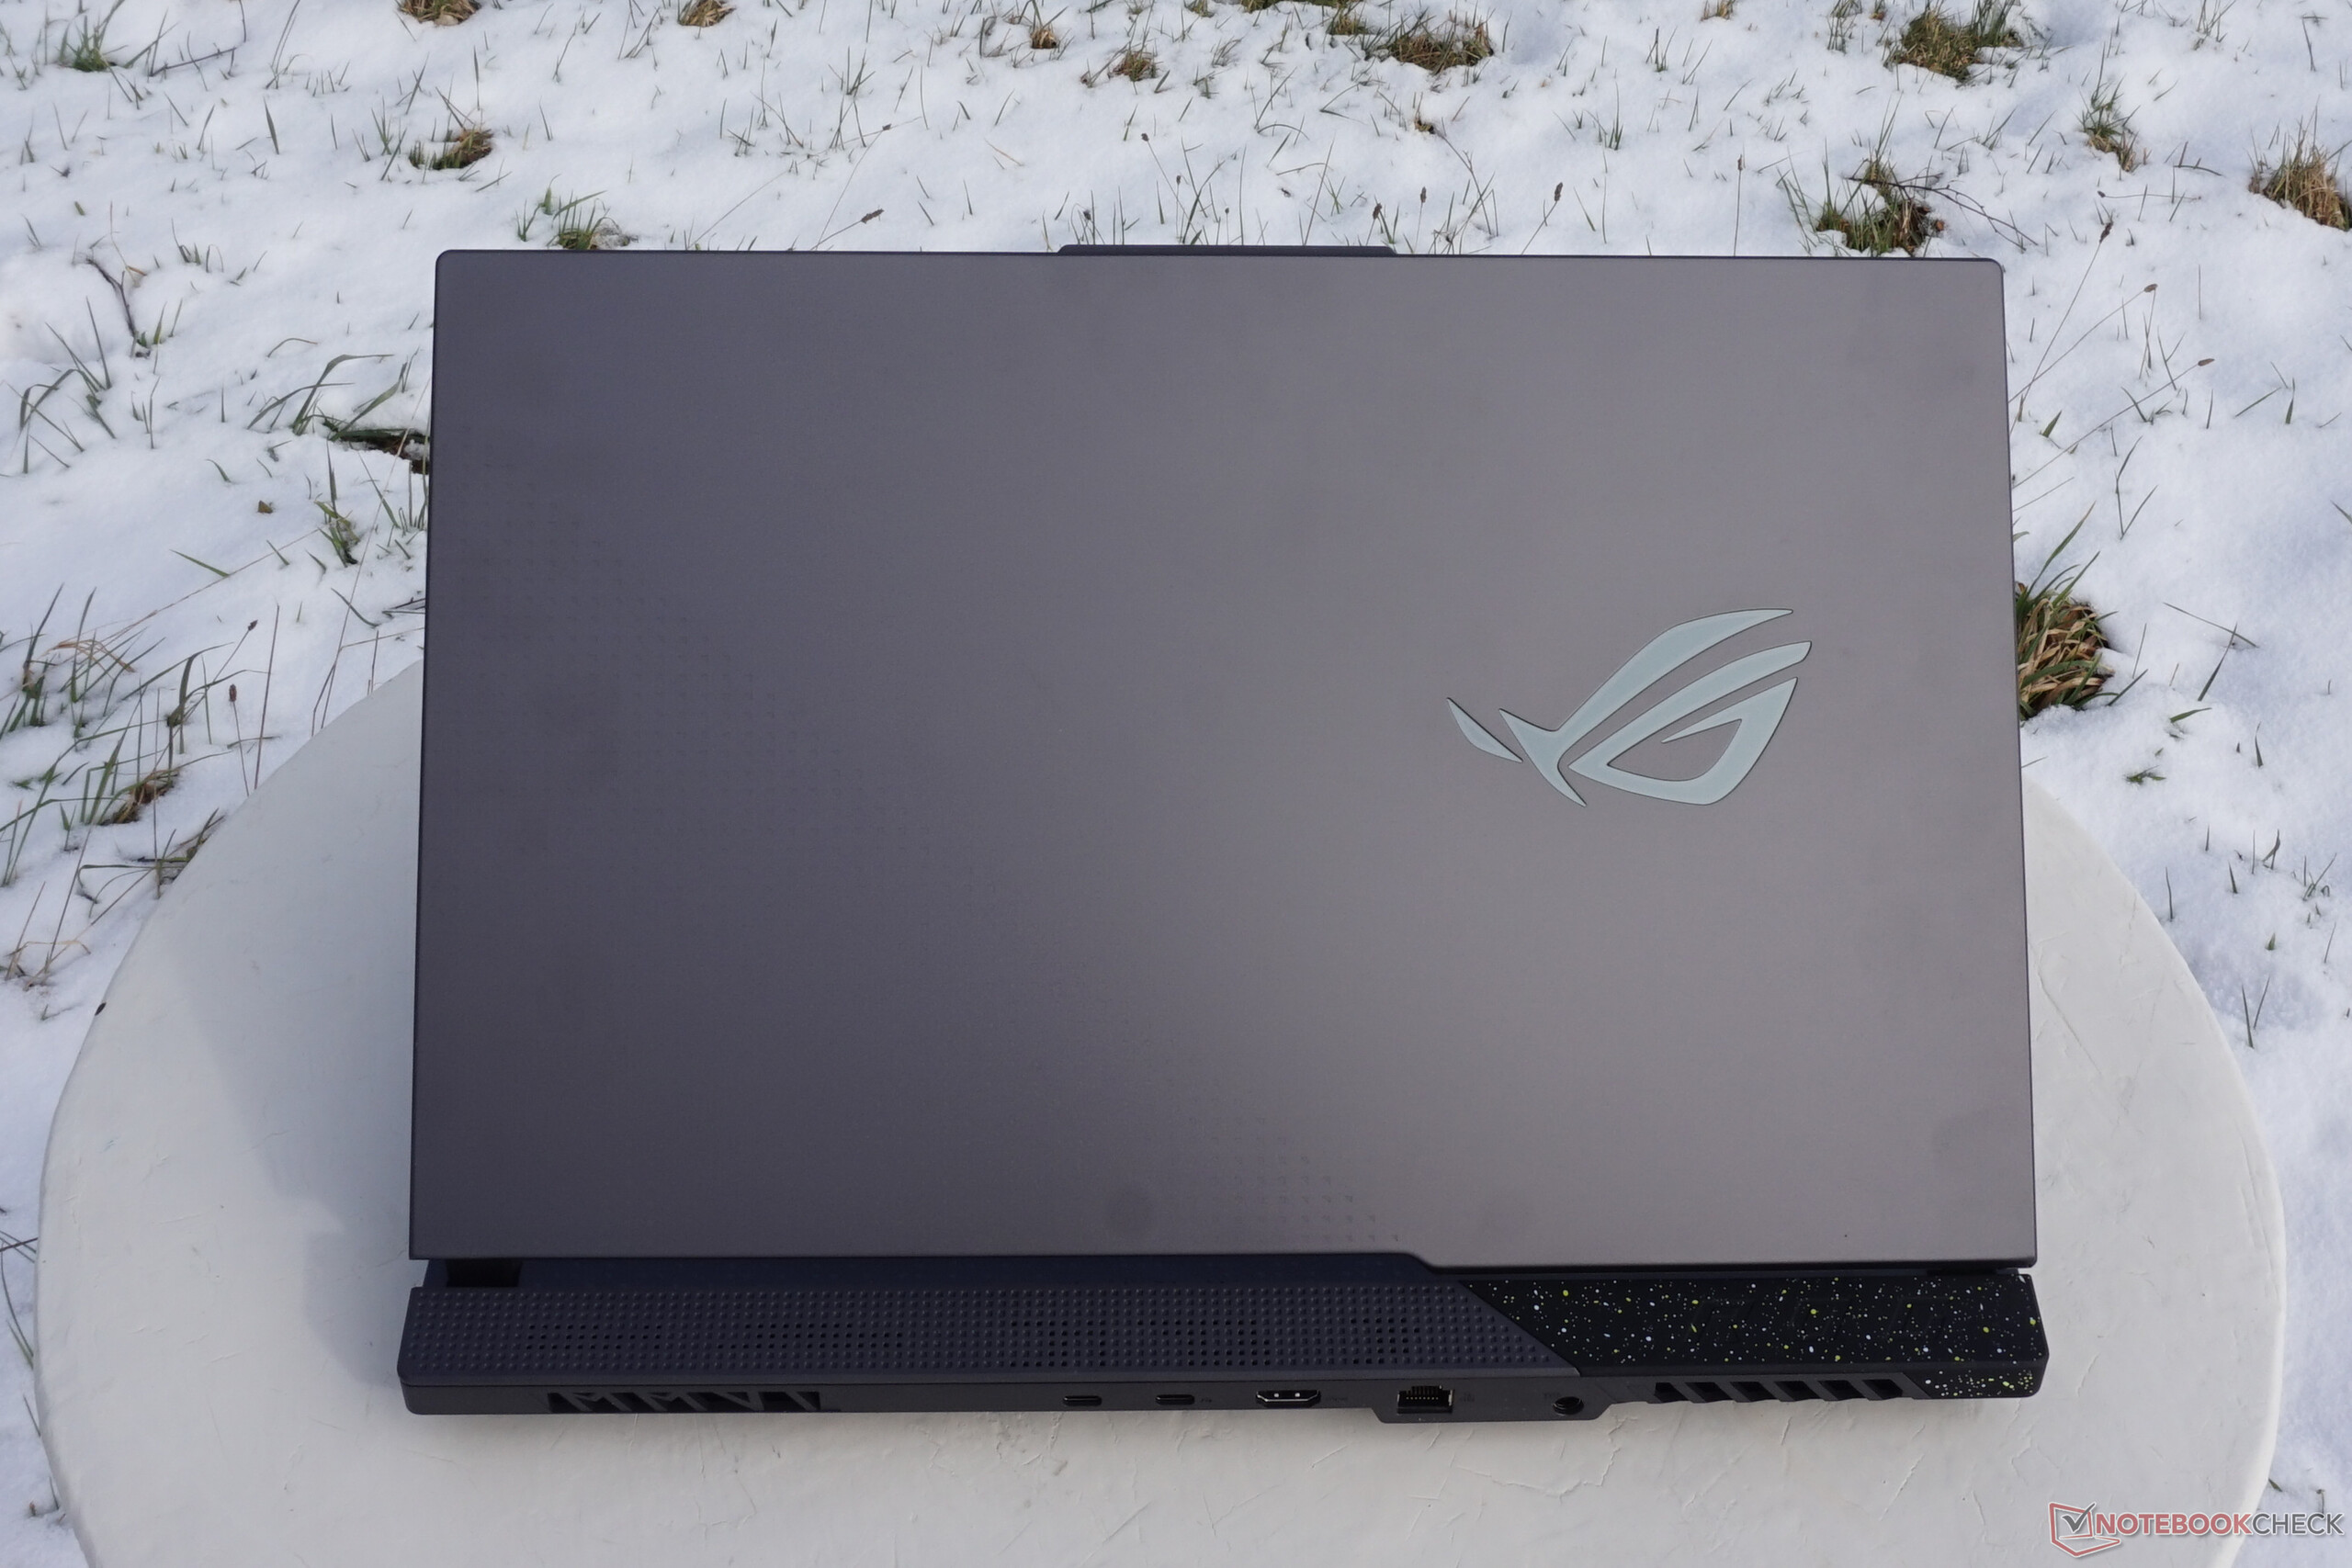
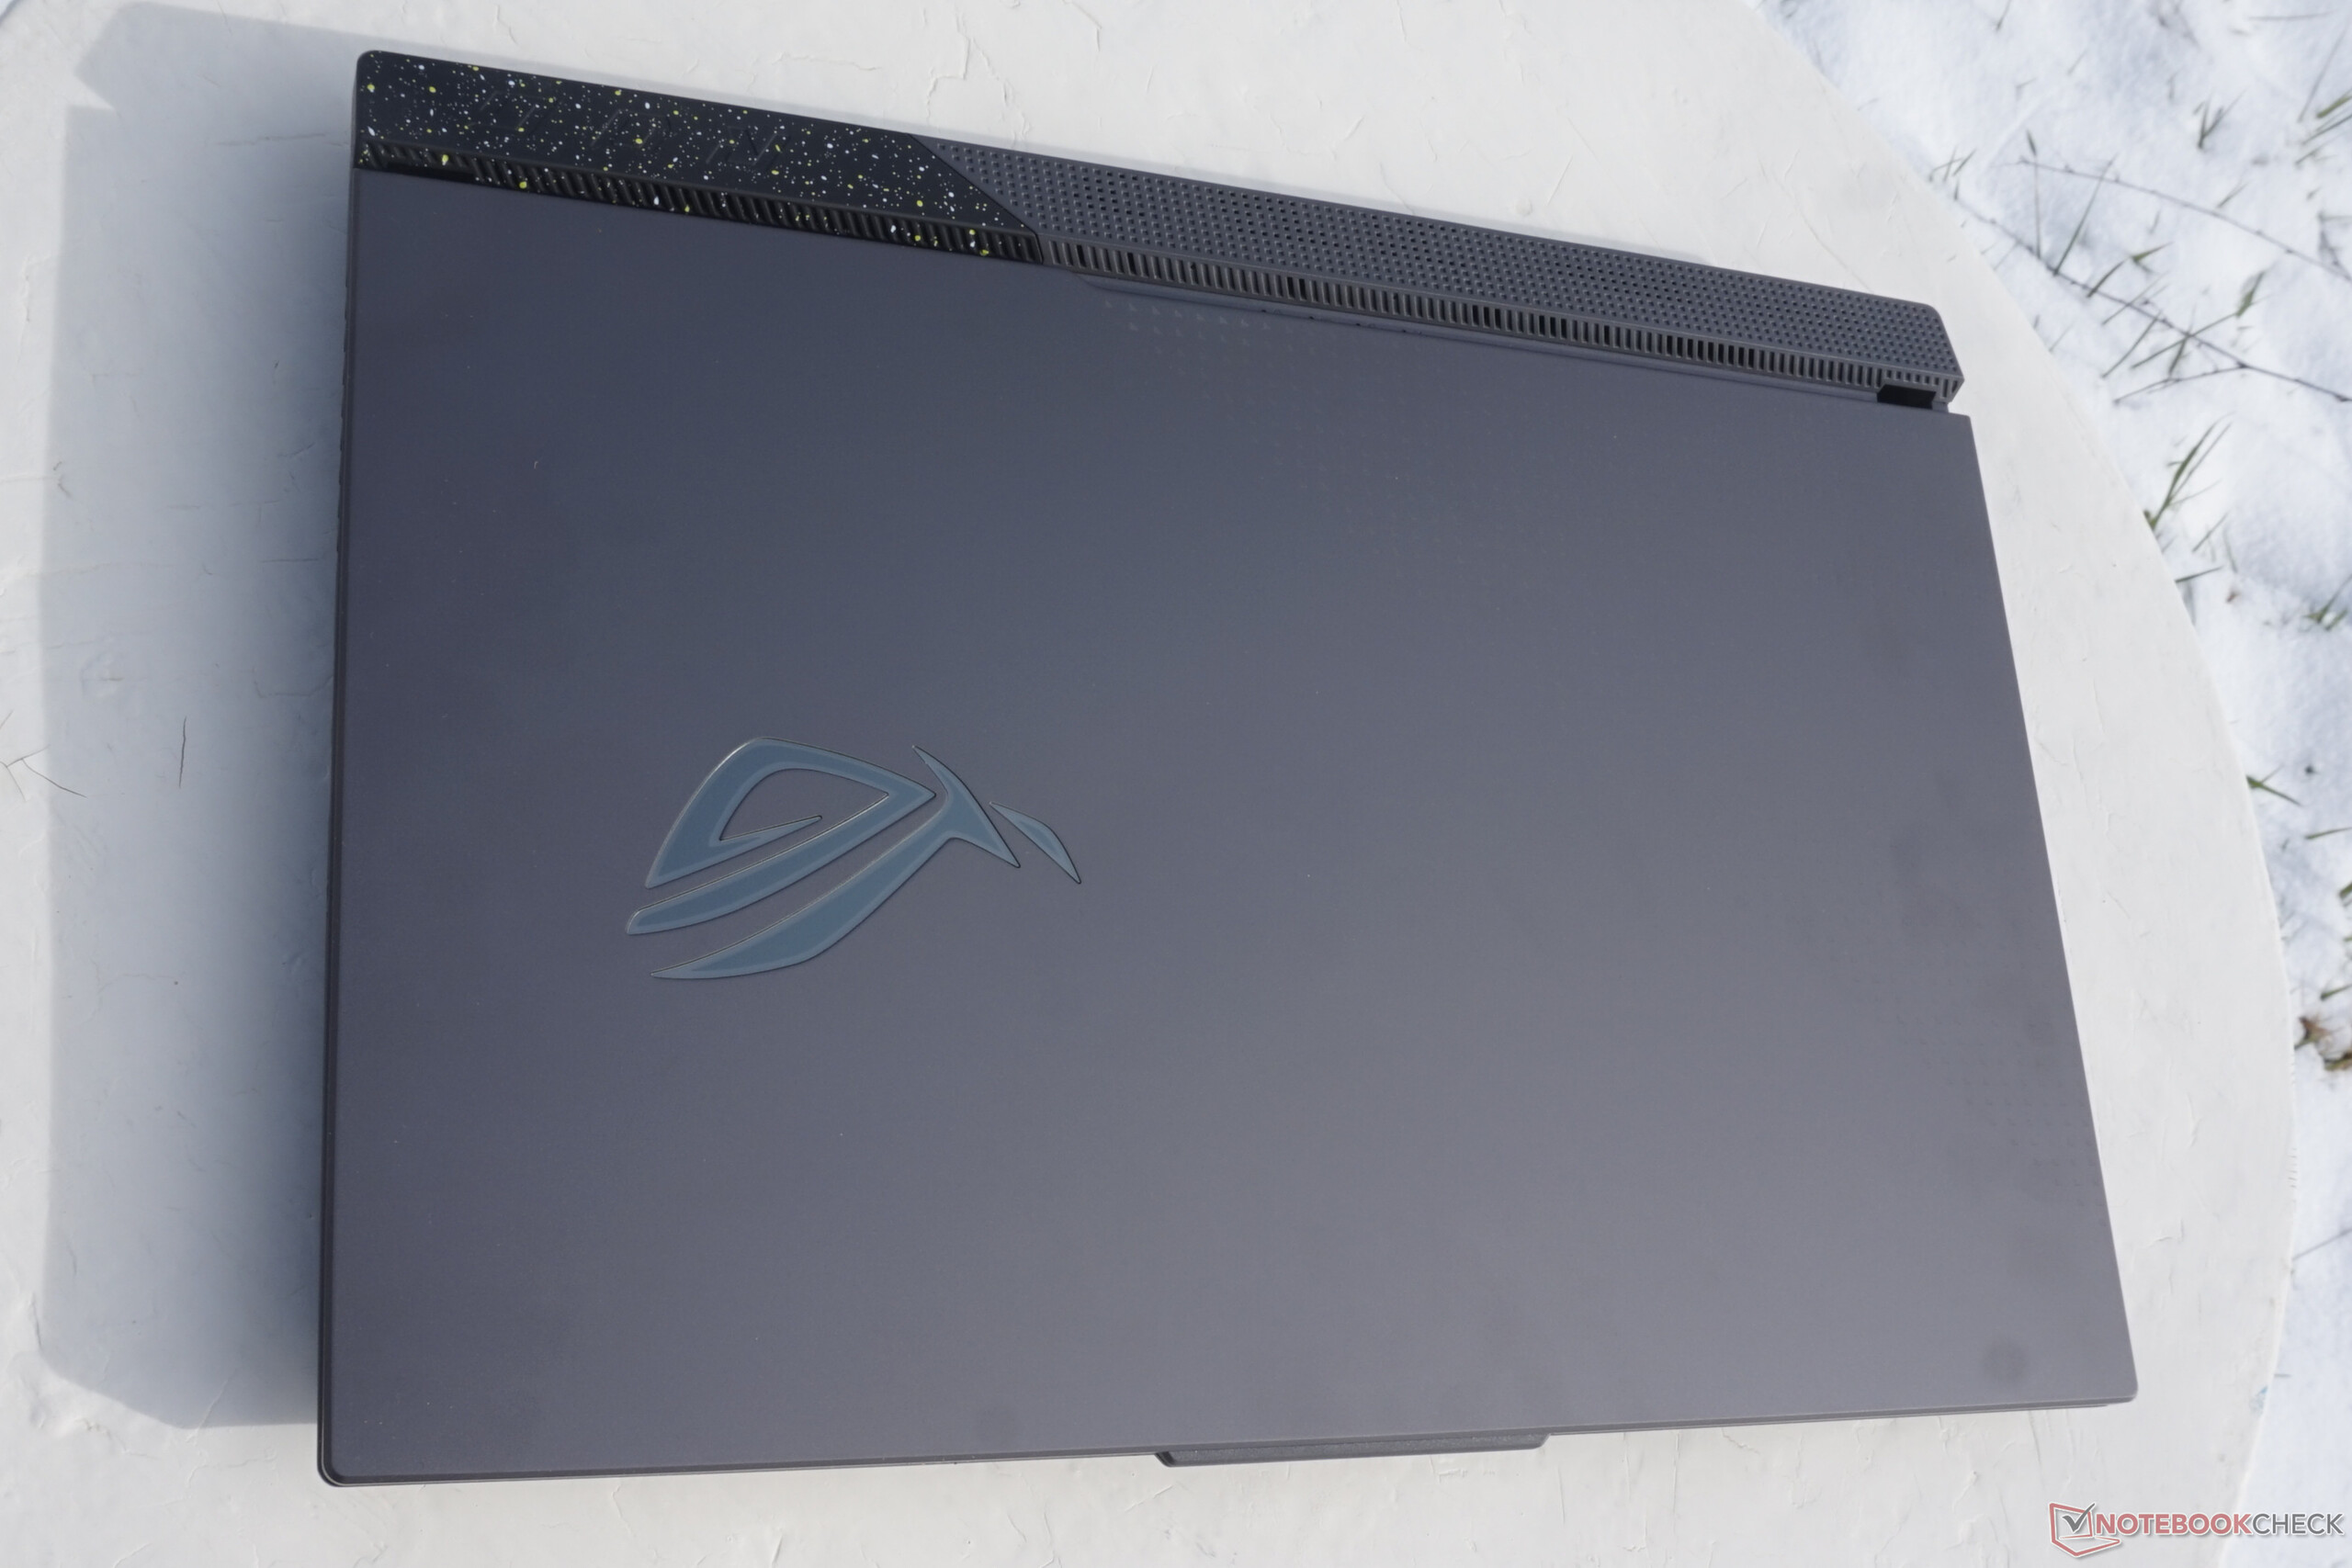
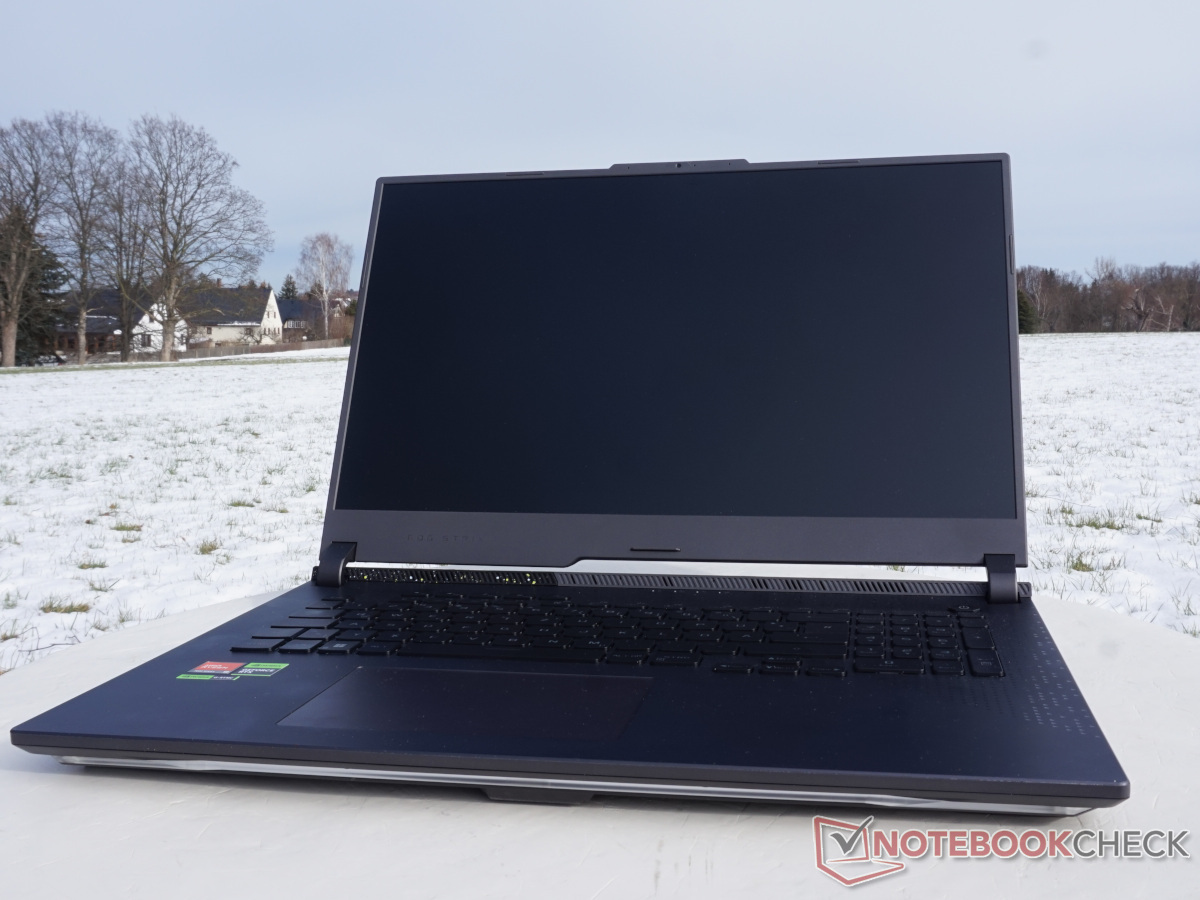
Case - Robust and playful ROG Strix
The massive case of the gaming laptop shows an excellent stability. Despite its hefty weight of almost 3 kg (~6.6 lb), we are unable to detect any warping, even though the whole base unit is exclusively made from plastic. In contrast, the large 17.3-inch display is framed in a metal lid. The overall construction appears correspondingly robust, without giving any reason for complaint.
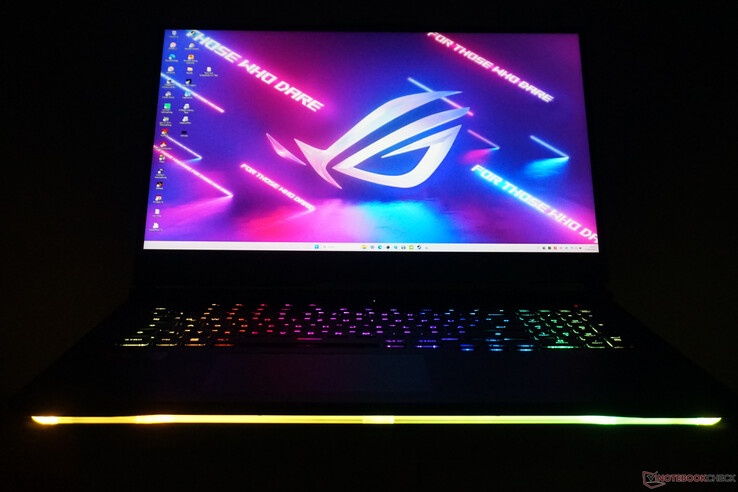
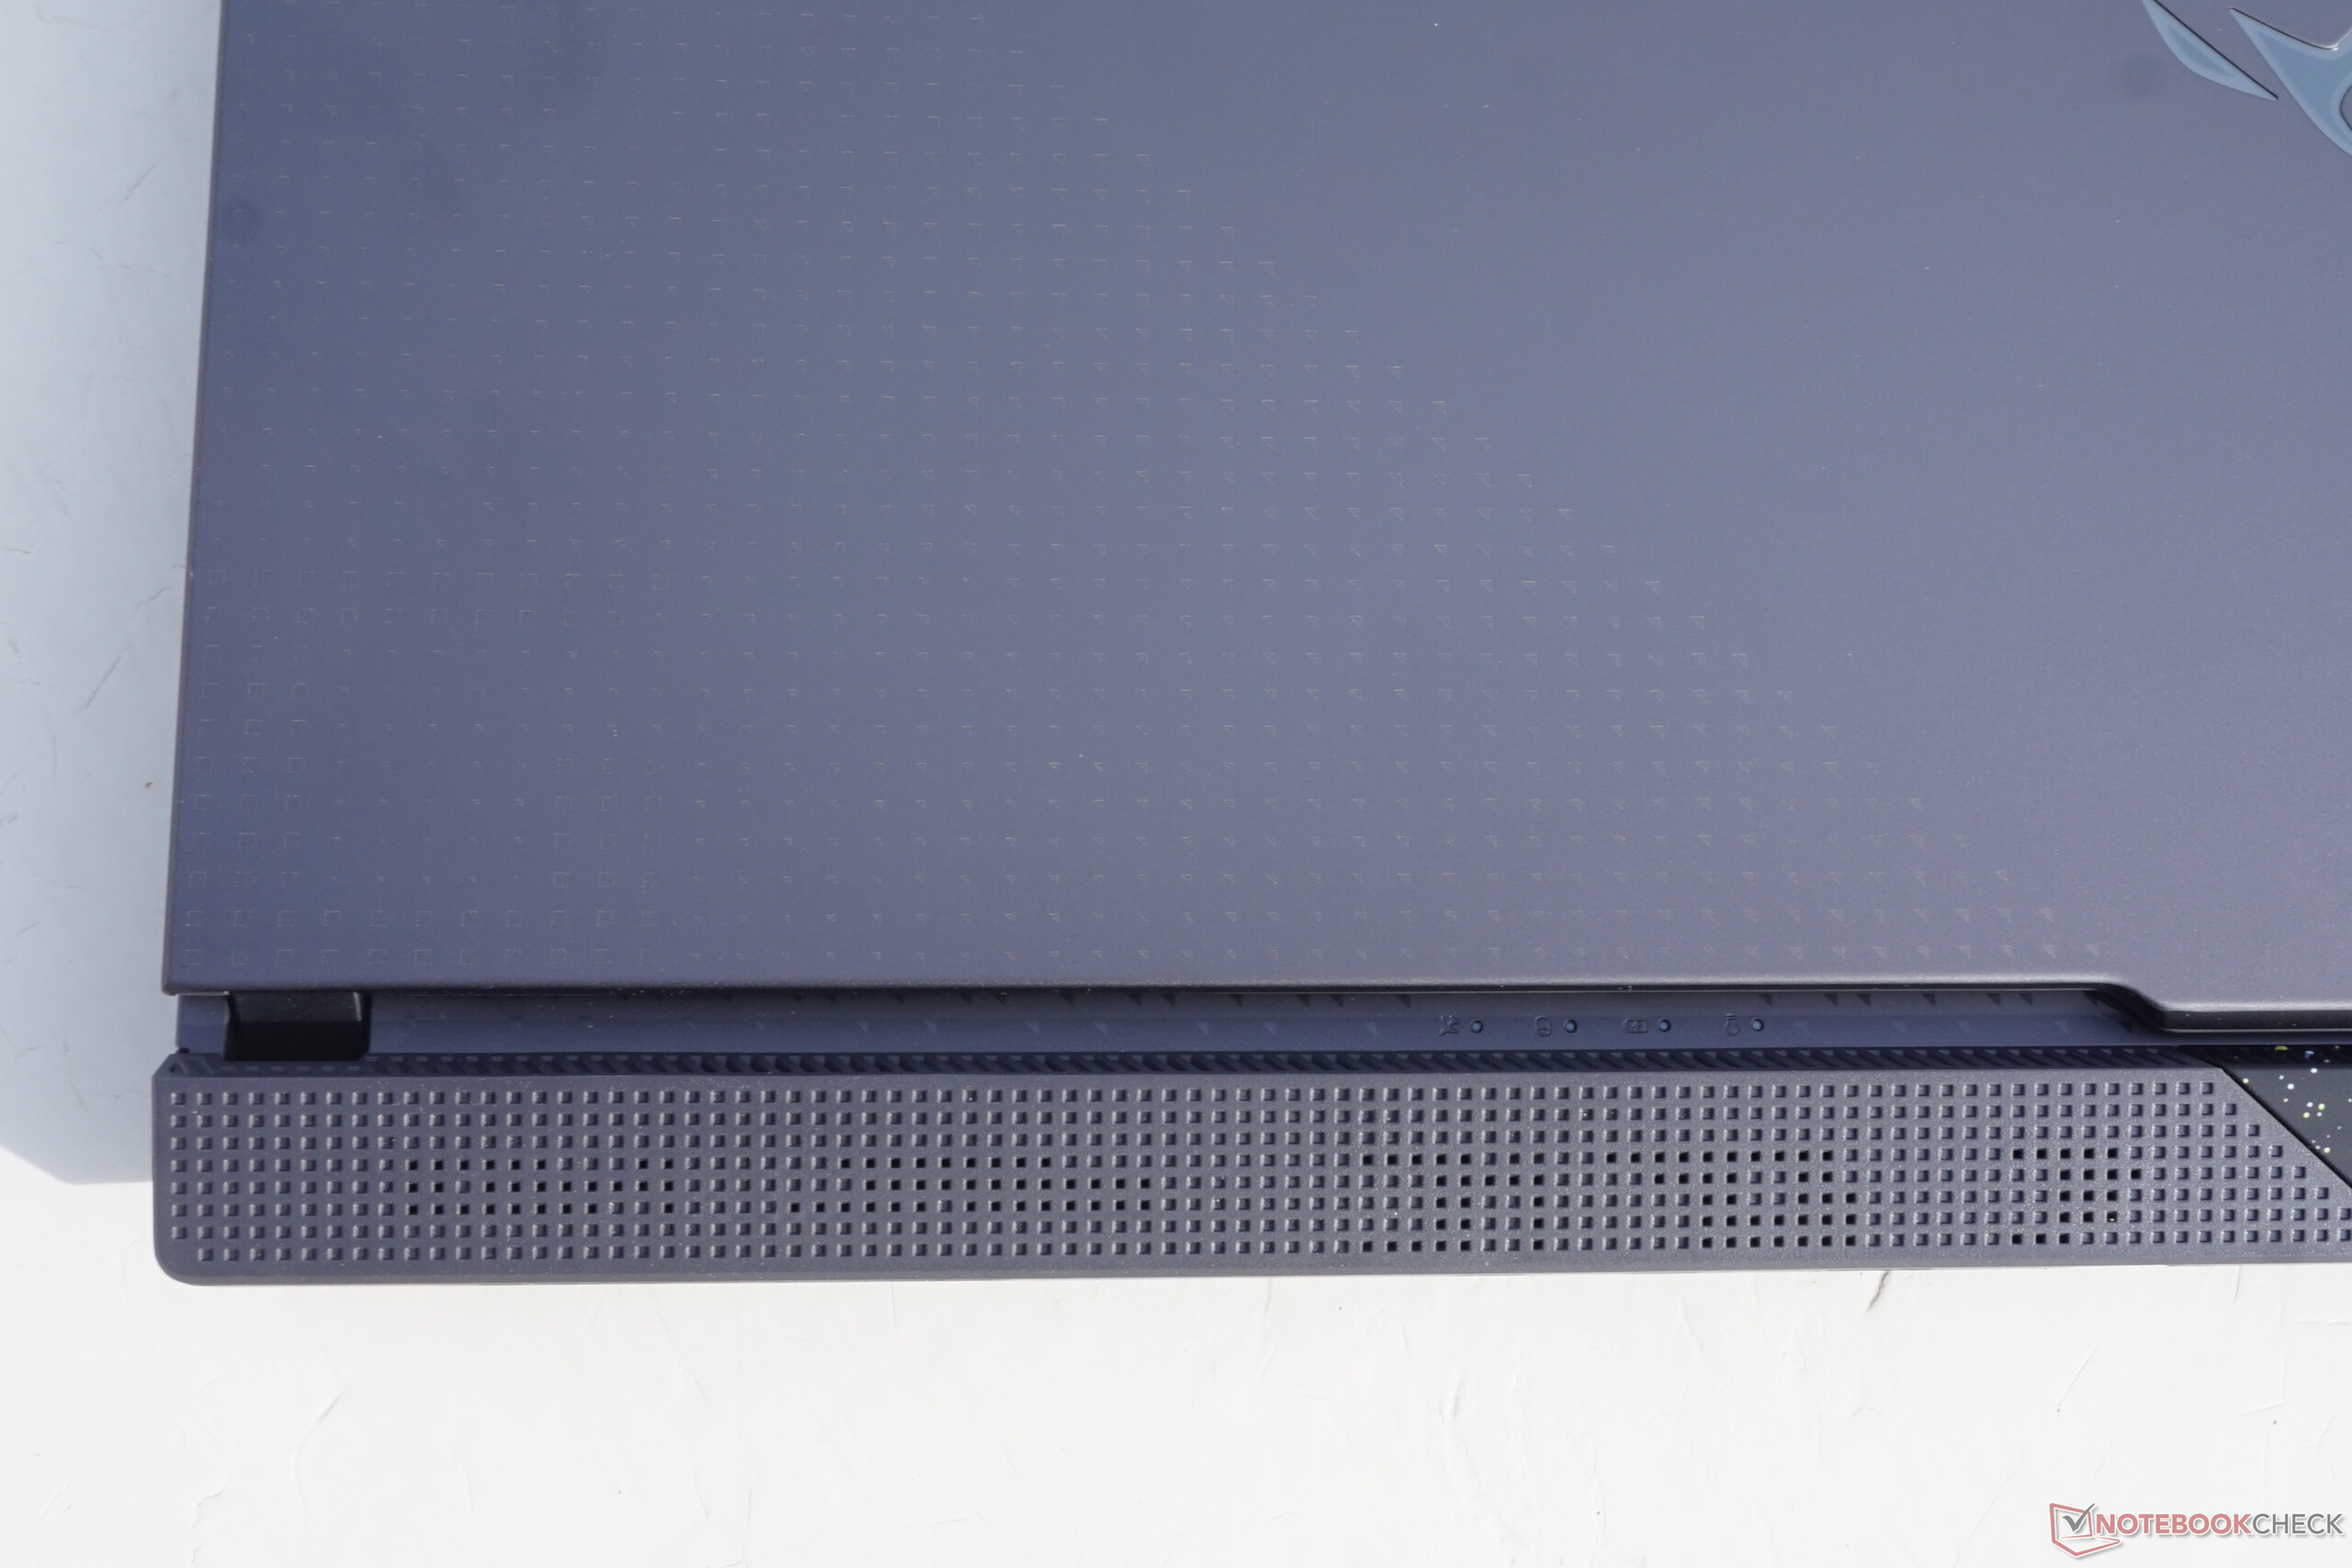
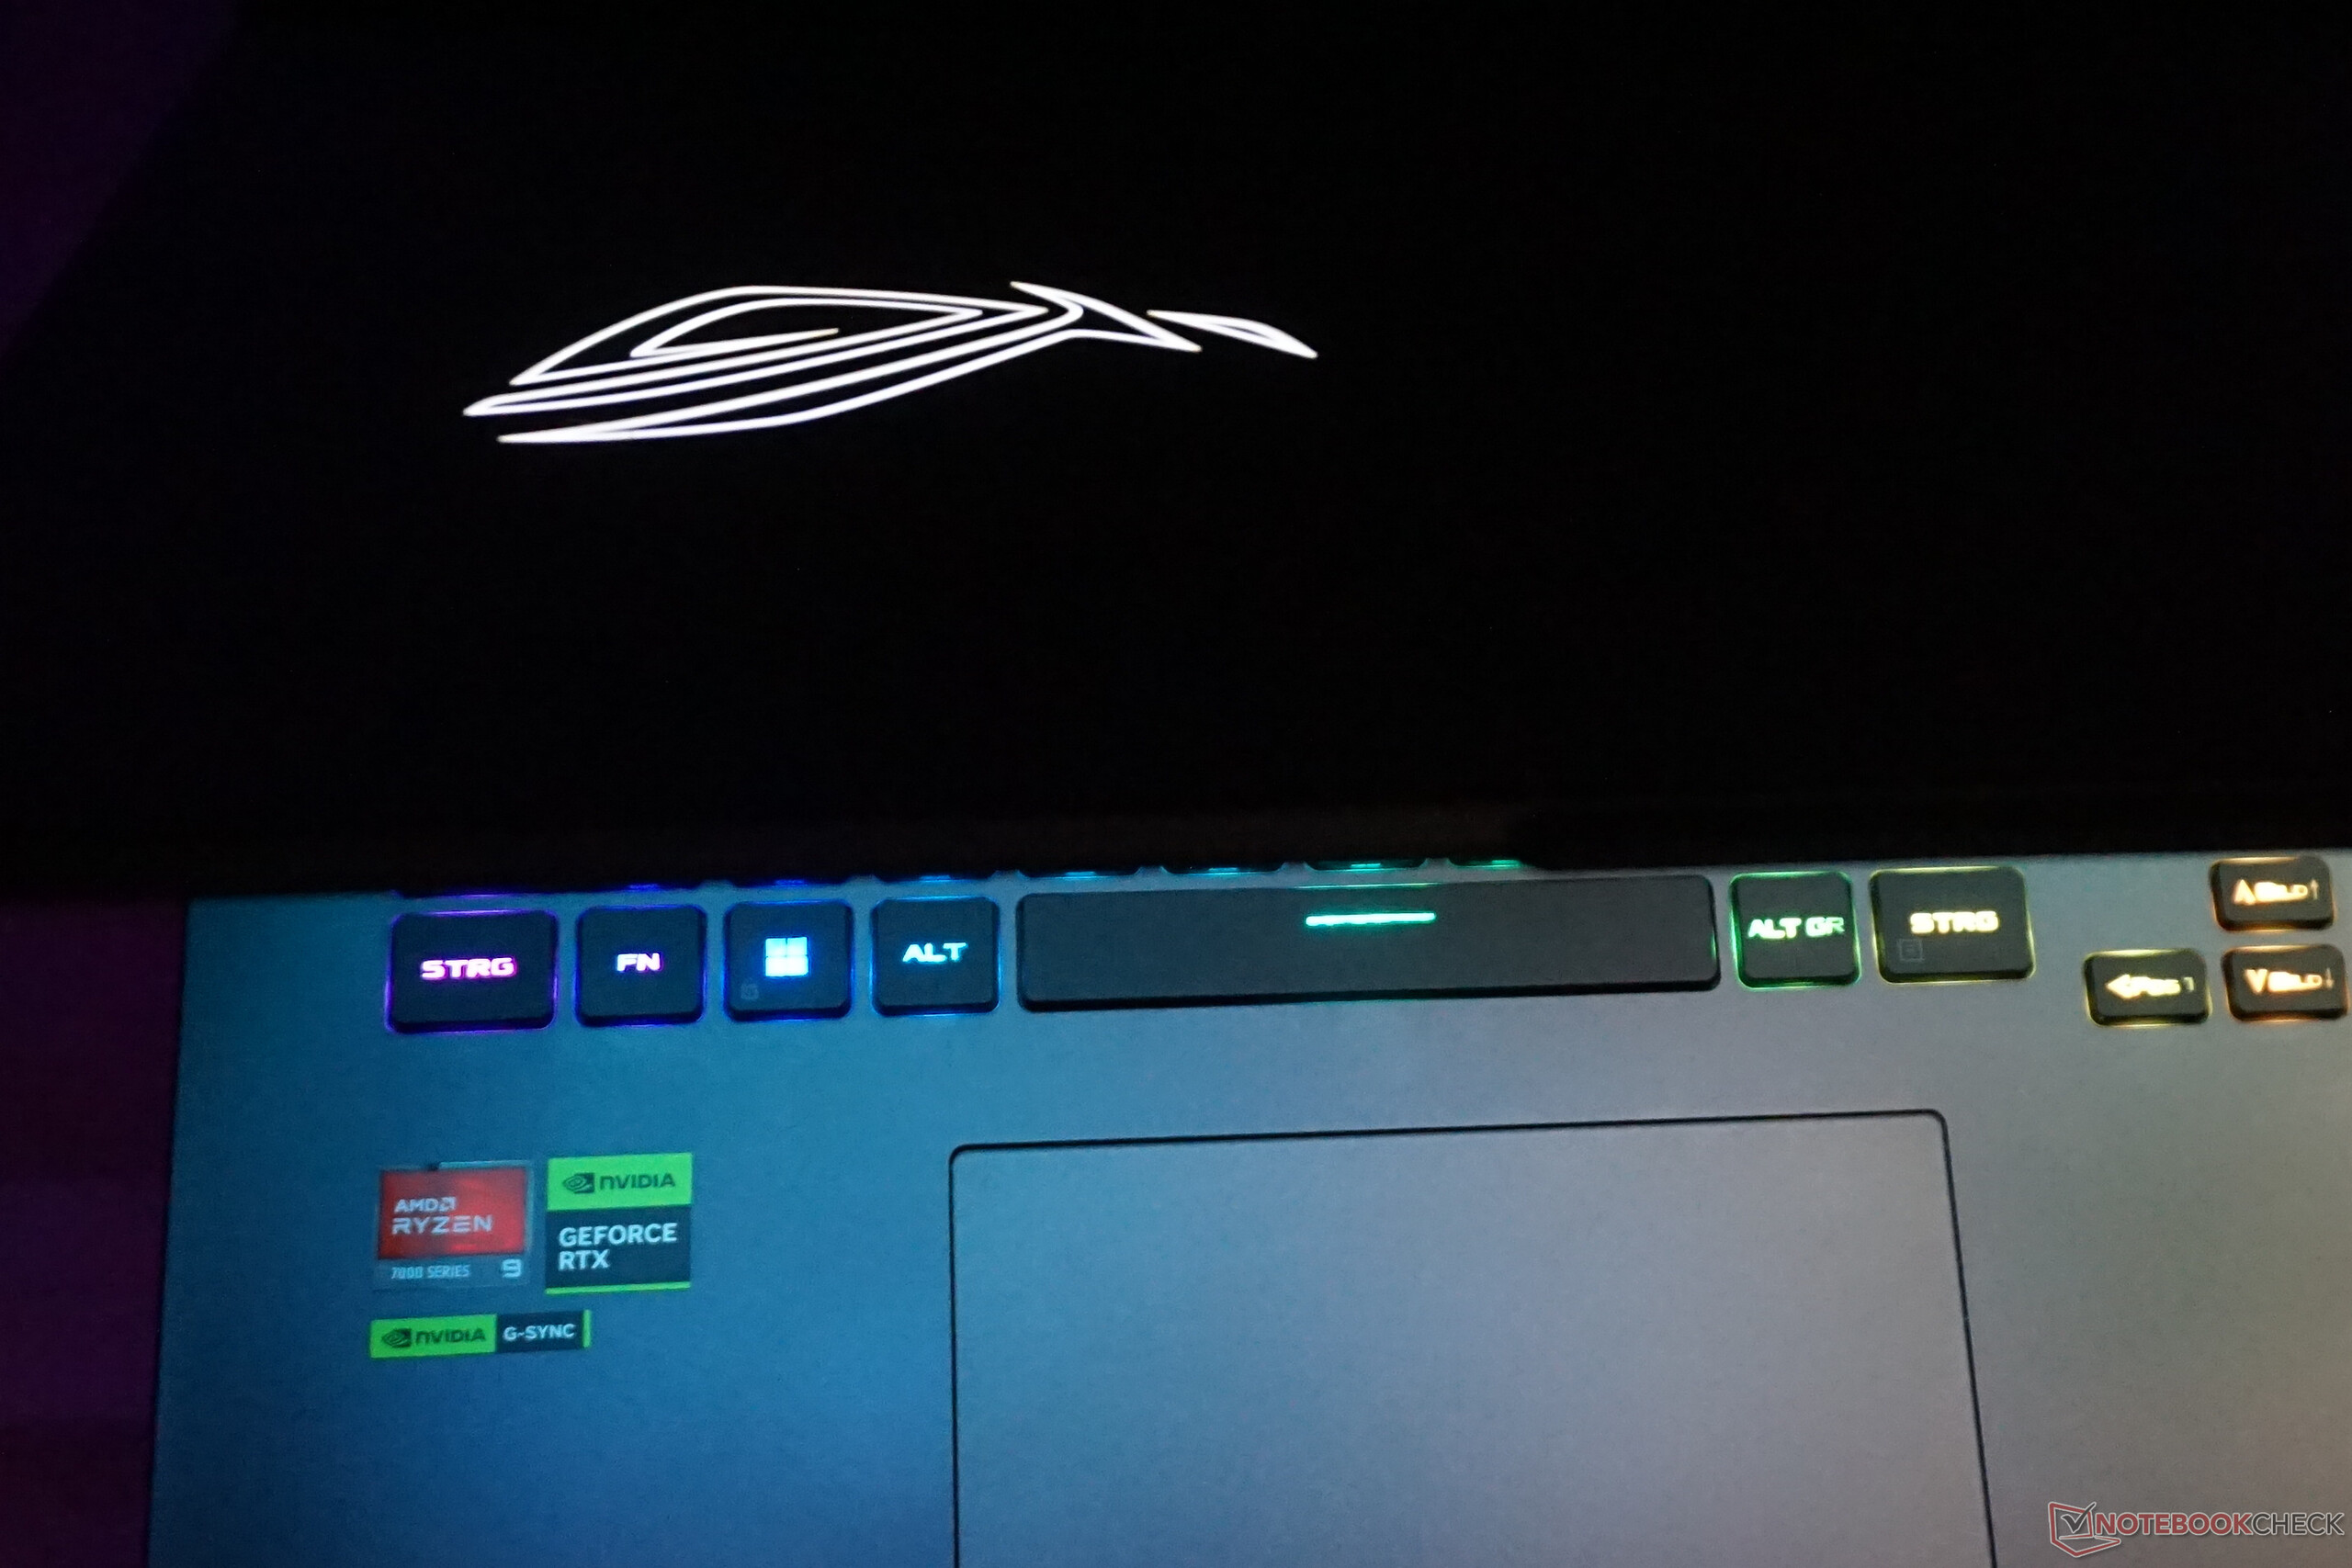
The many large and small accent elements stand out. The lid contains a bright logo that always remains illuminated in white. The bottom also houses a freely configurable RGB bar that can be illuminated together with or independent from the RGB keyboard. In addition, there are letterings and slogans around the case.
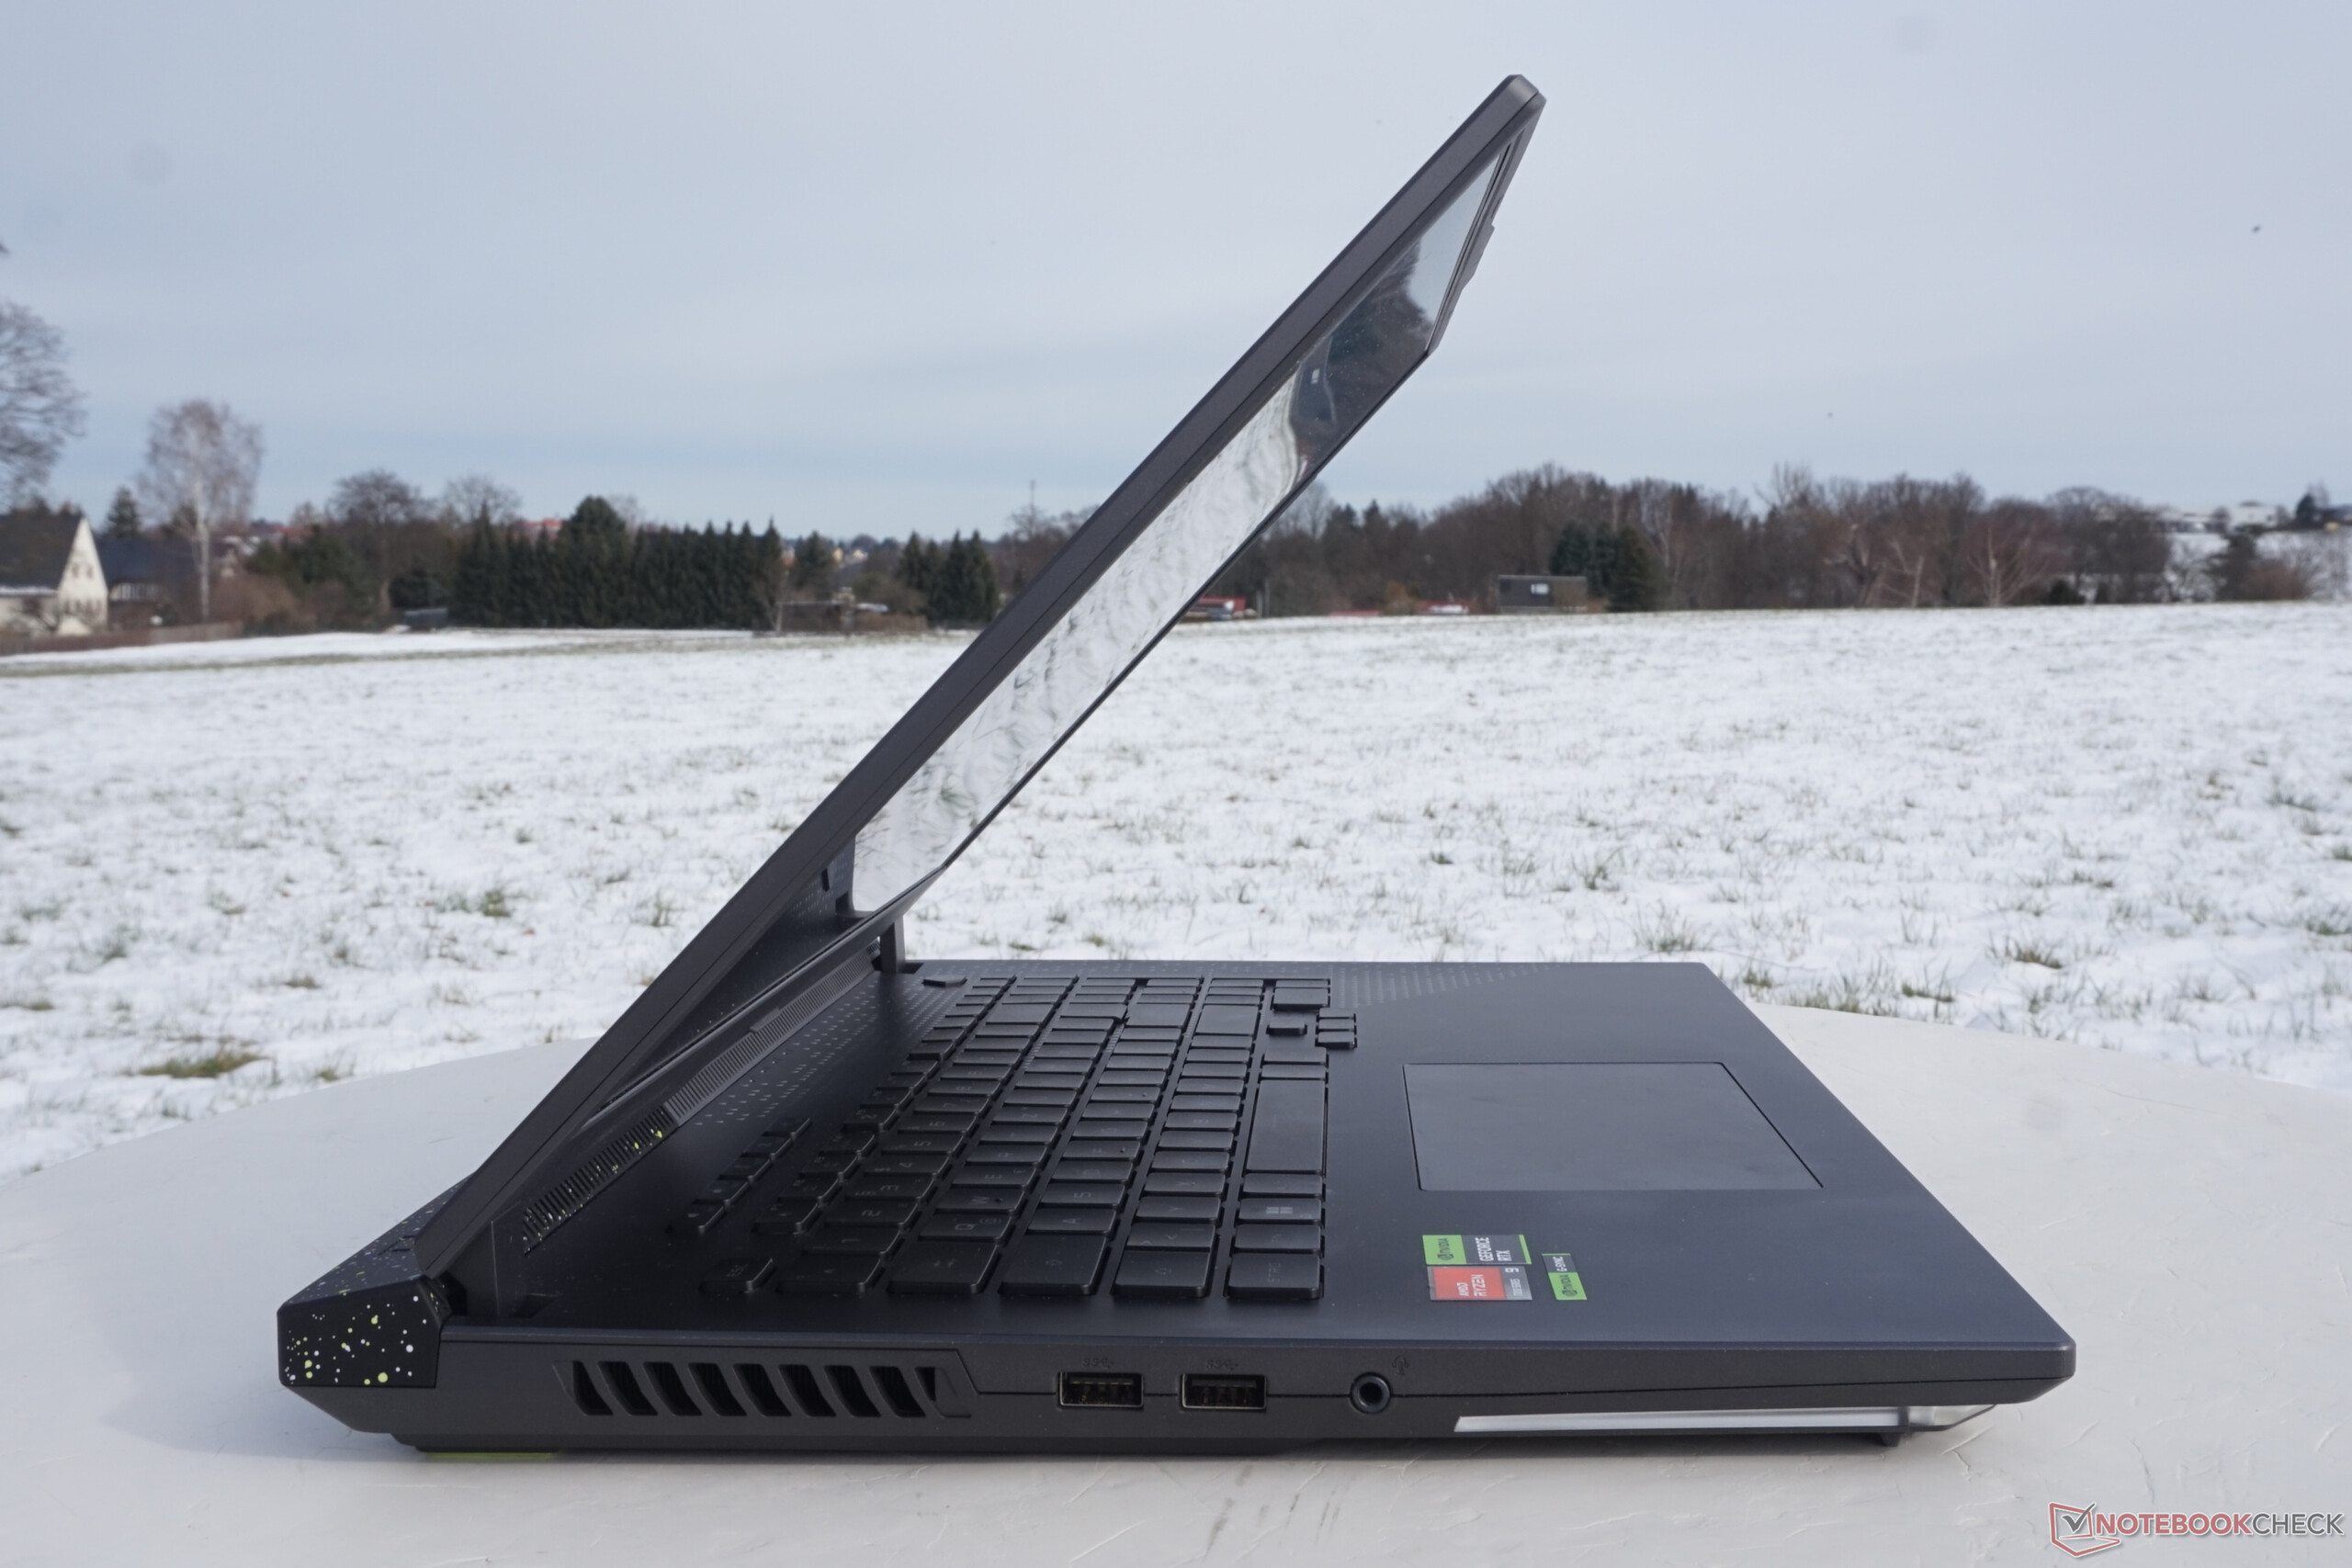
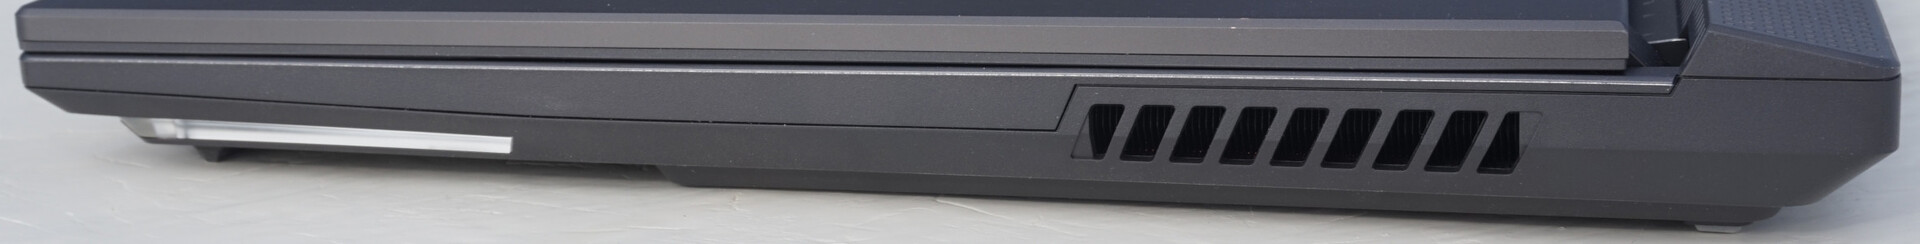
The large distance between the display and the back of the case with the fan vents appears well thought-out. When the case is closed, all the status LEDs remain visible and the fans continue to work without any hindrance, while you can continue playing your game using an external monitor and desktop keyboard.
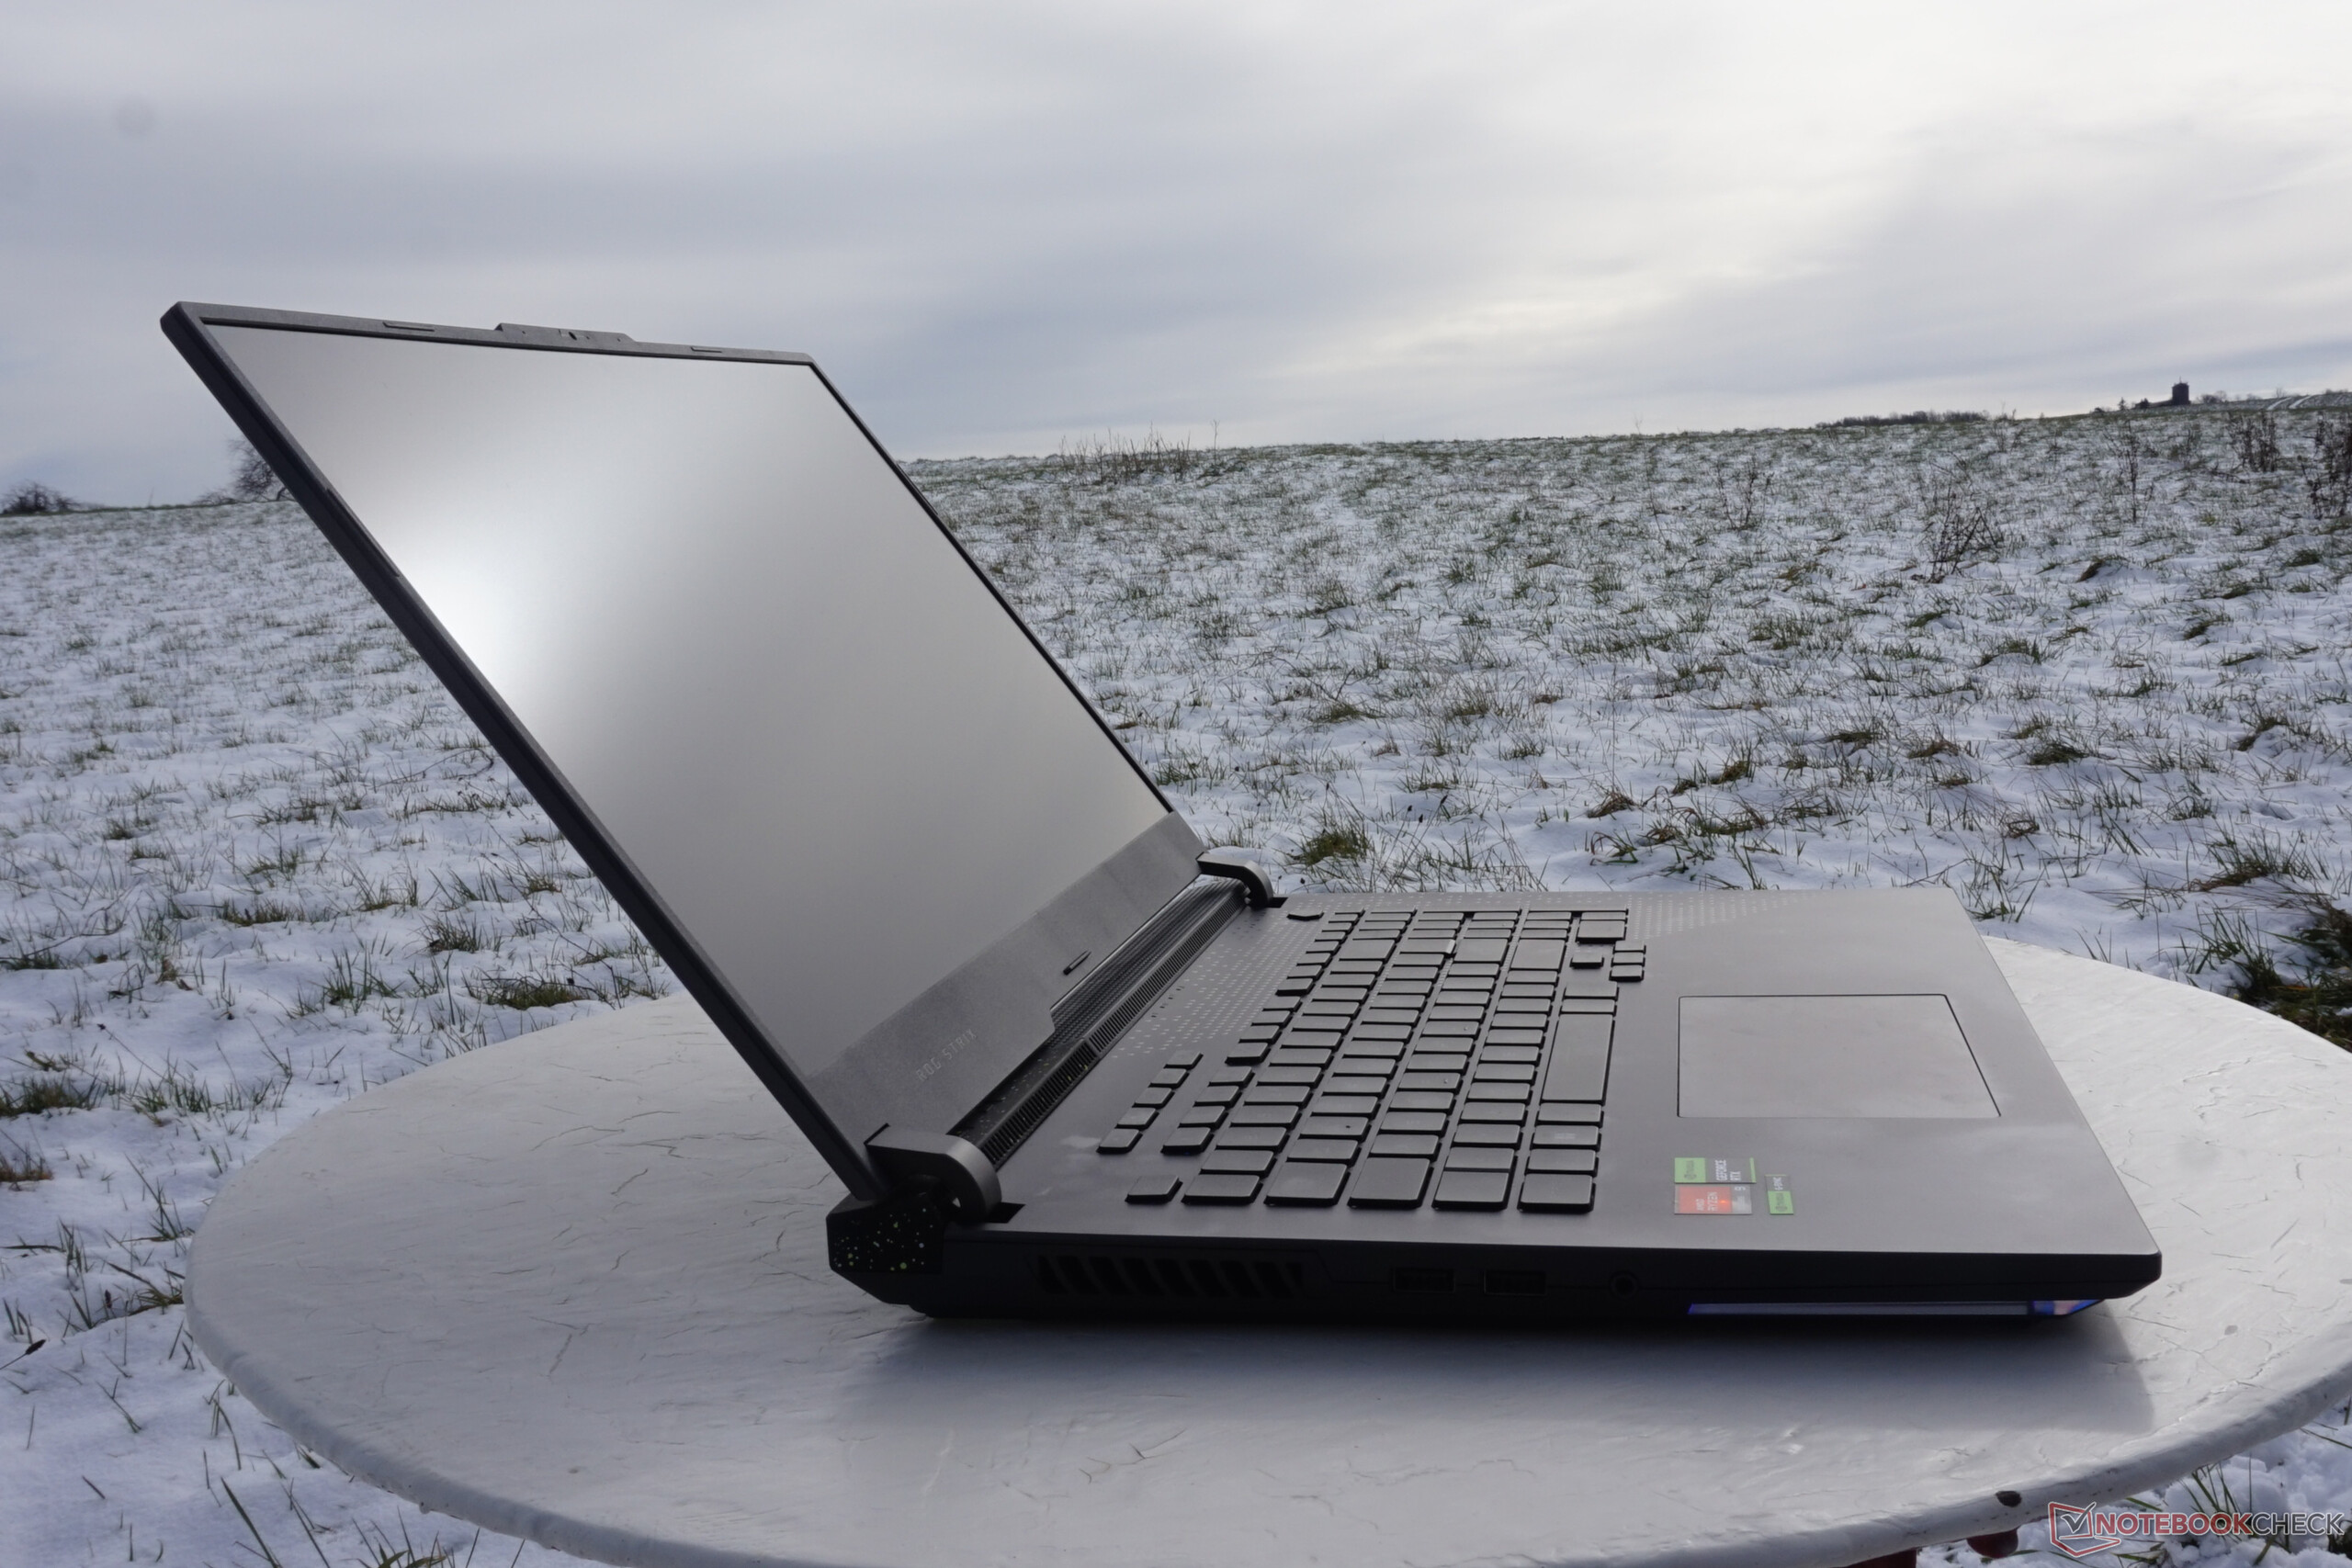
Considering the 17-inch display, the Asus ROG Strix is one of the larger laptops. Compared to the predecessor generation of the ROG Strix Scar 17 SE, the case thickness increased by almost 2 mm (~0.08 in). Despite the attractively slim 5-mm (~0.2 in) display bezels, the large areas for the cooling make it a large laptop. However, the competitors are within a similar size range, and the same goes for the weight of almost 3 kg (~6.6 lb).
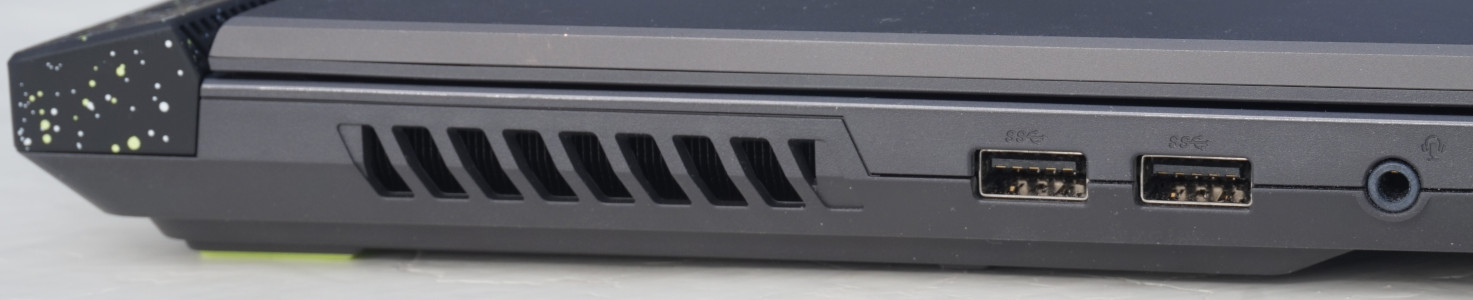
Connection Equipment - Nothing special in the gaming laptop
Only what is absolutely necessary and then also with just barely sufficient speed - the connection equipment is very limited. Merely two USB-A connections on the left side allow you to connect a gaming mouse, printer, and so forth. In addition, there is a simple but sufficient audio port for a headset.
Since the rest of the connections are placed in the back, your desk can be kept comfortably clutter free, even though the ROG Strix can rarely get along completely without any wired connections, as we will show below. The two USB-C connections barely reach 10 Gbit/s, which is just barely sufficient to also start games from an external SSD. We would have liked at least one USB port offering twice or even four times the speed. We see a similar picture with the LAN port: While we currently often find 2.5-Gbit ports, Asus only offers 1 Gbit. This is sufficient, but nothing more.
At least there are three video output ports, but only the first USB-C port supports G-Sync. While a gaming laptop doesn't need a large variety of connections, the transfer rates of the few connections that are available could have at least turned out higher.

Communication
Looking at the transfer rates reached by the WLAN module helps us to quickly forget the weak LAN port. The Asus ROG Strix G17 is able to surpass all the competitors here, placing at the top and impressive in our measurements of the 5-GHz range. At least at close distance from the router, you can get wireless transfer rates far higher than 1 Gbit/s. In addition, Wi-Fi 6E is supported, whose large communication range ensures less interference in areas with many different WLAN networks.
With this, it falls within the range of most Intel laptops, while significantly surpassing the AMD competitors with CPUs from the previous generation. For example, the sending and receiving performance of the Alienware m17 R5 is 40% slower.
Webcam
The small camera appears to have an unfortunate placement, since the fingers tend to touch directly on the camera lens when trying to open the laptop. With an HD resolution, the images show a weak resolution, but are still easily recognizable even at low light conditions, even if they appear slightly grainy. While this should be sufficient for simple video calls, if your conversation partner uses Full-HD or higher, the quality differences are immediately apparent.
The microphone turns out significantly better. We did not notice any tinny sounds or audible distortions. Recorded voices sound natural and are registered evenly from various directions and changing distances. These are the best requisites for an in-game chat.


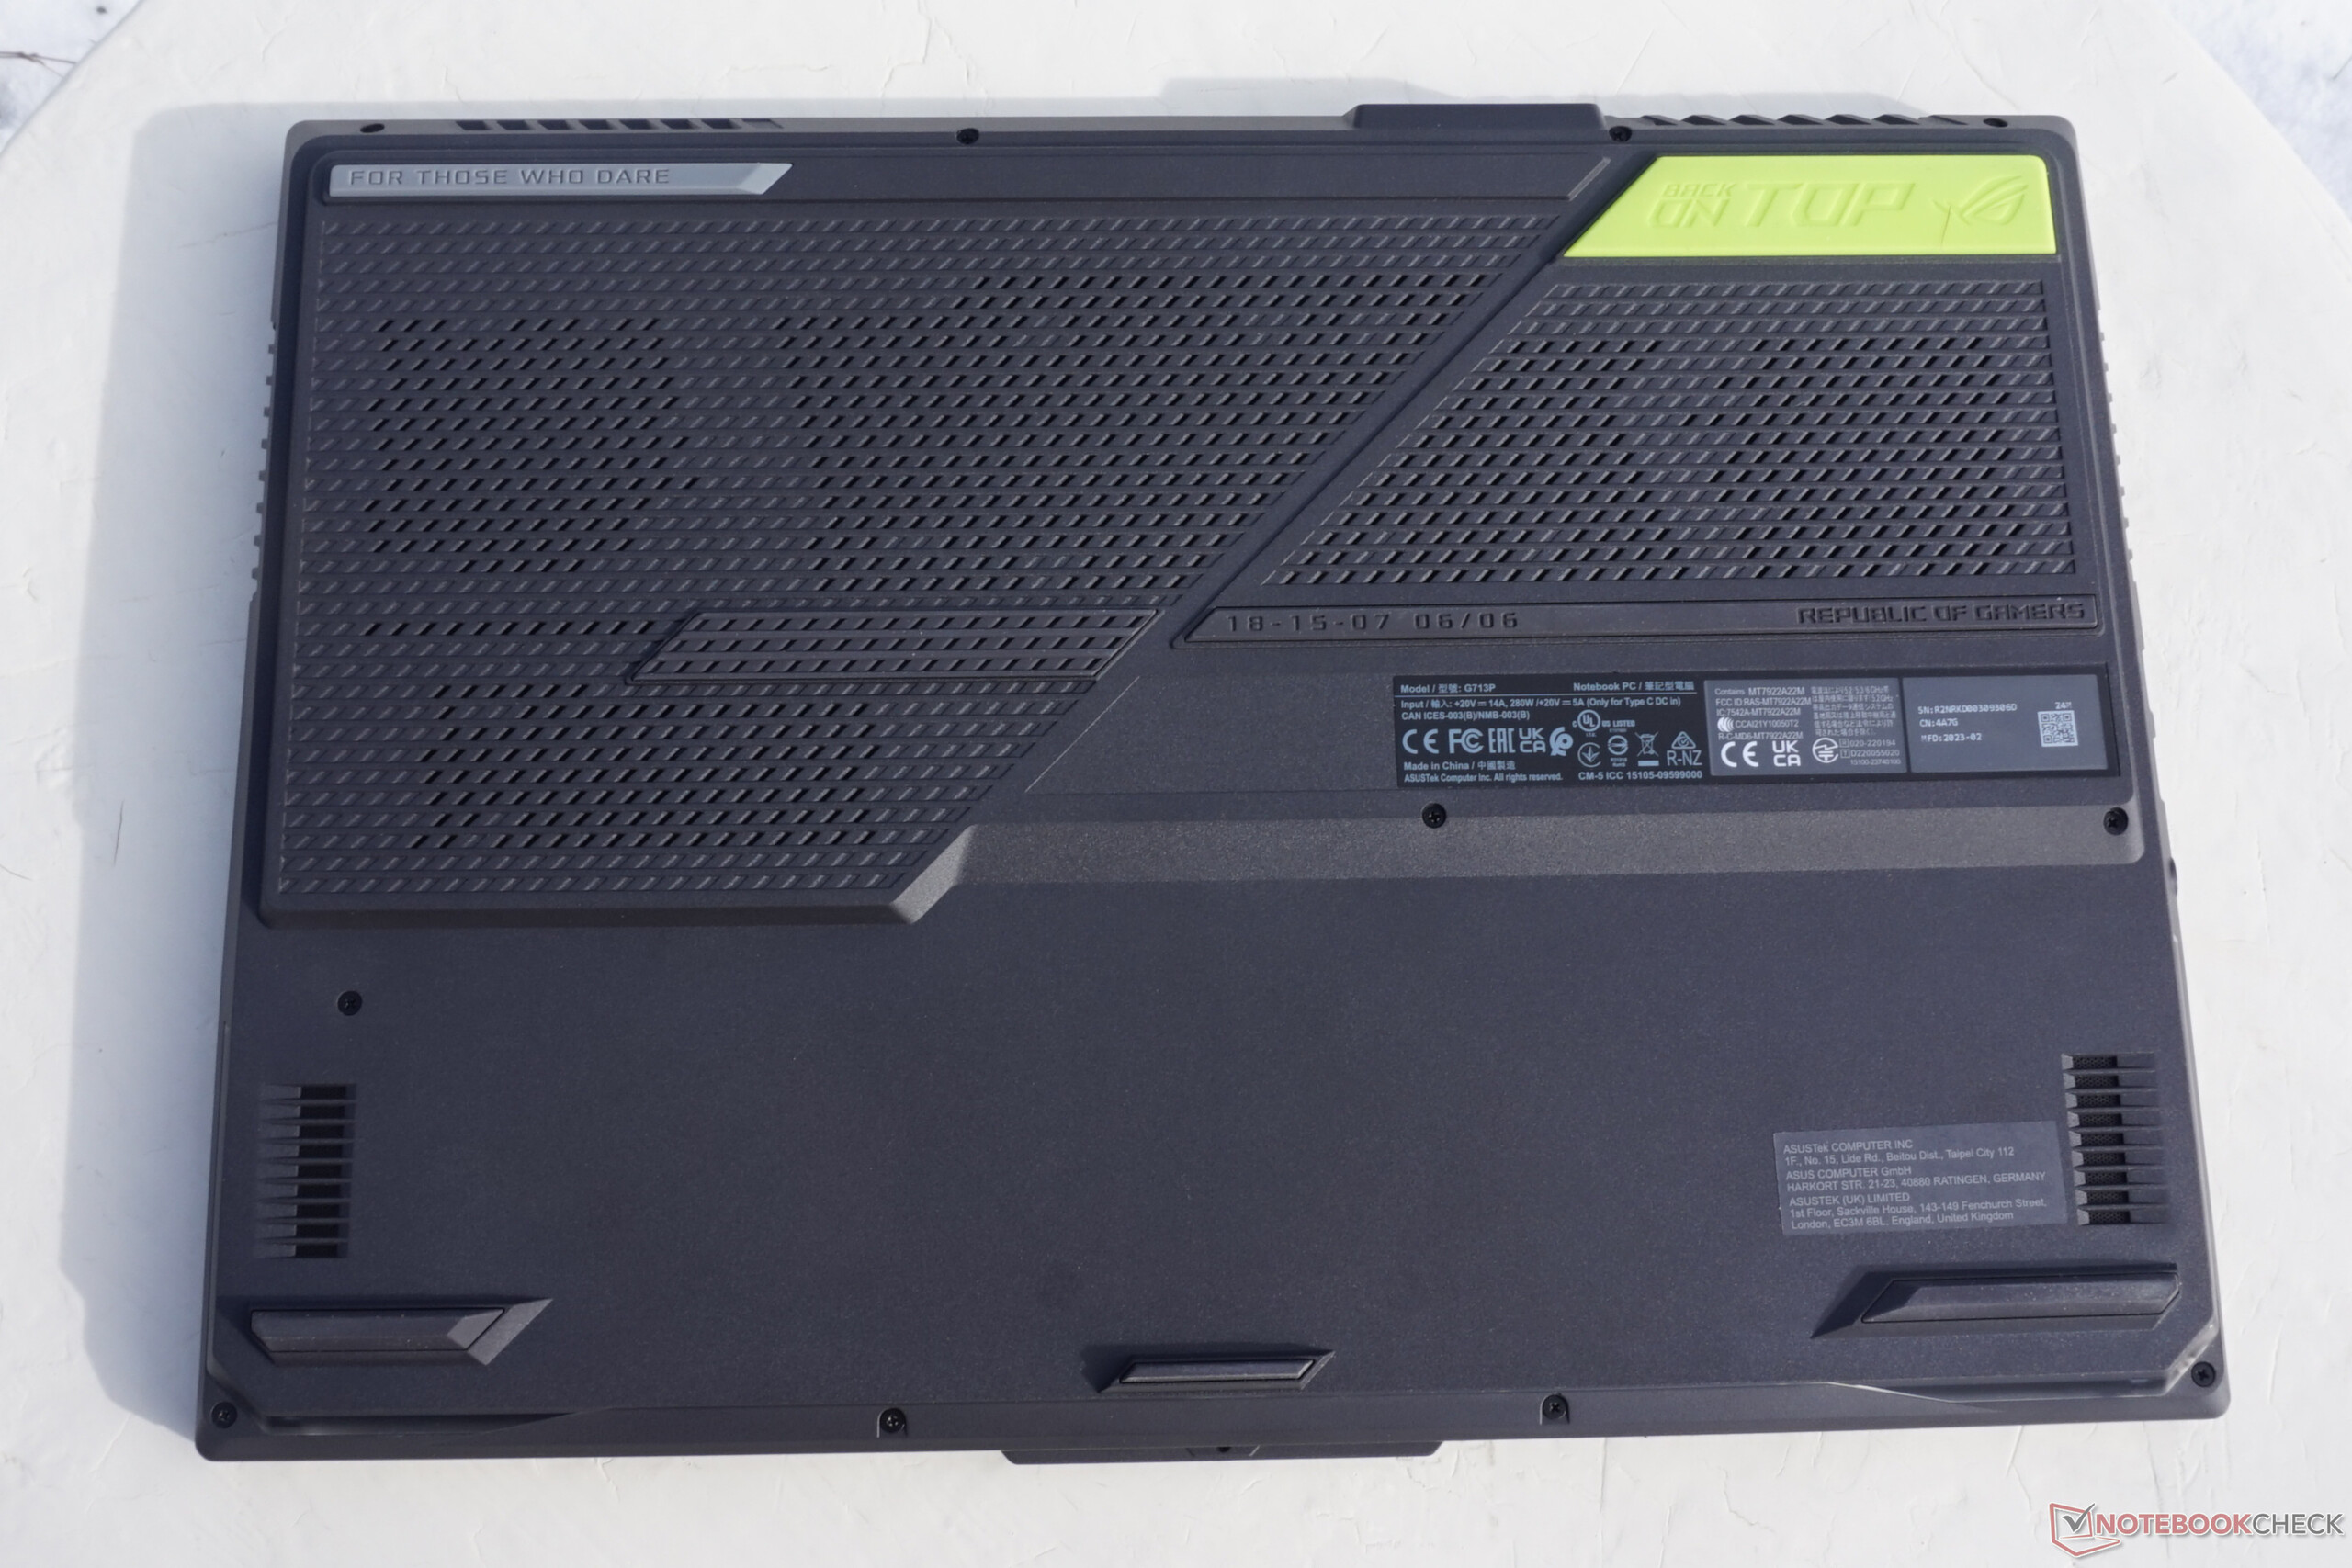
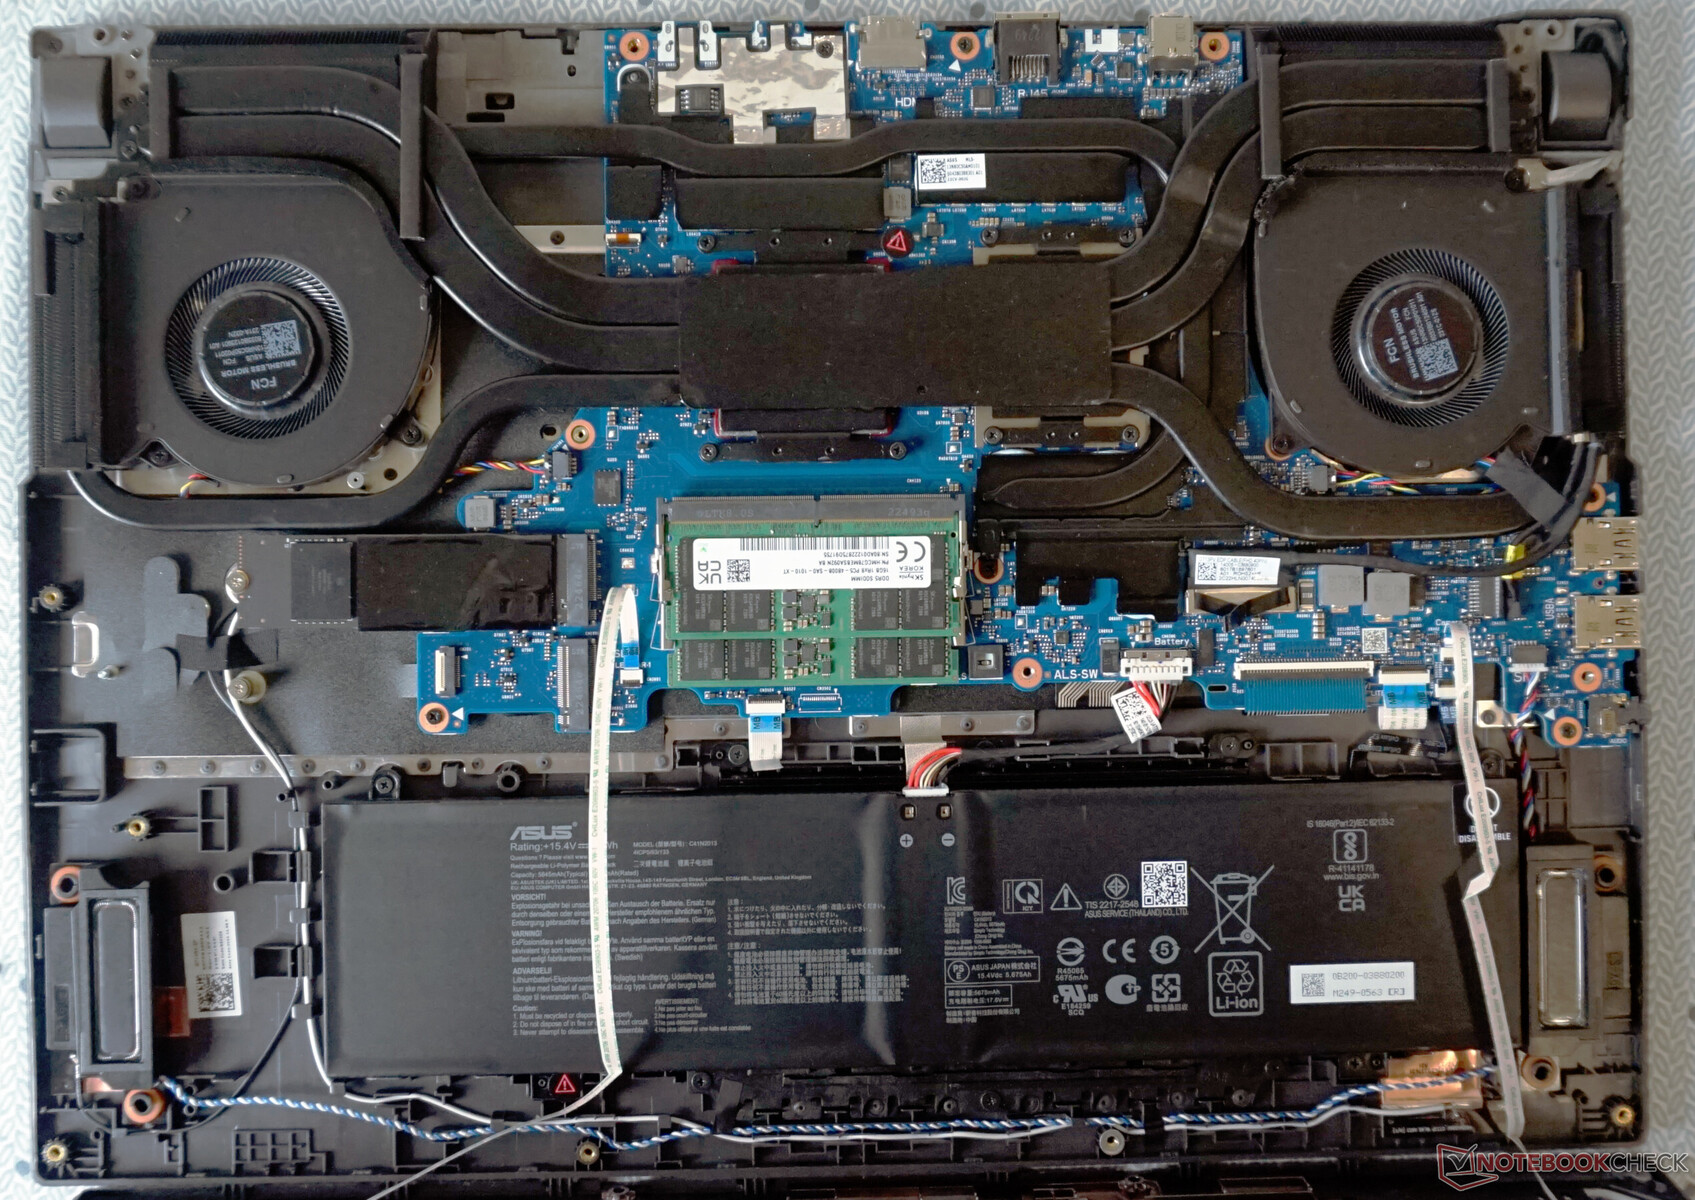
Maintenance
Asus makes it easy to open the gaming laptop. After removing eleven Philips screws, you don't need a lot of force but only a delicate touch to remove the bottom plate.
But be careful: due to the RGB illumination, the bottom plate is connected to the case with two cables. However, the cables are still placed so that you can open the bottom without unplugging them.
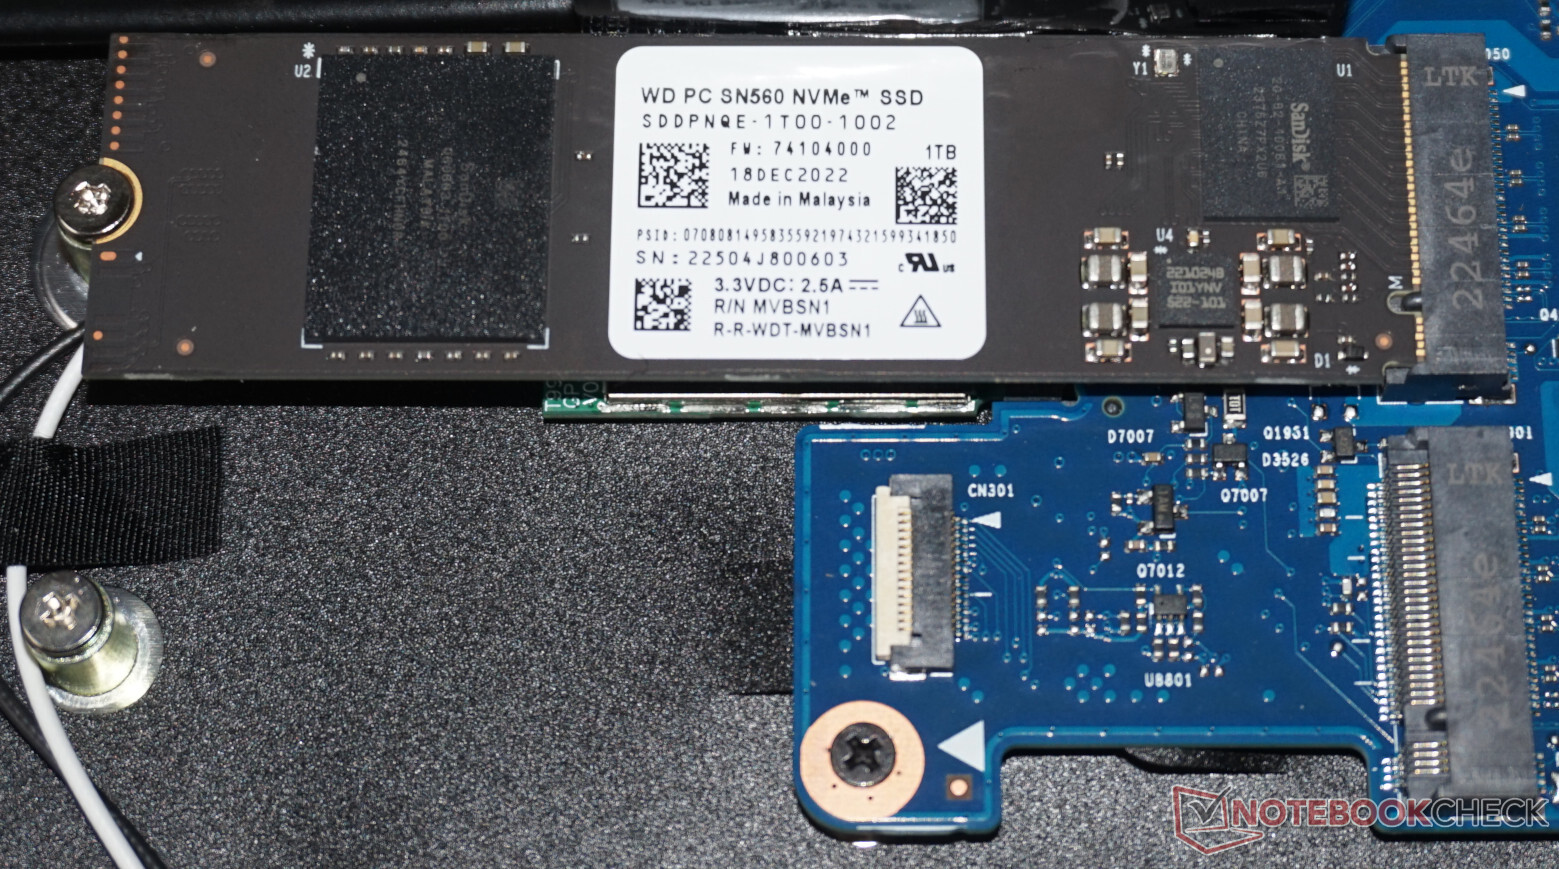
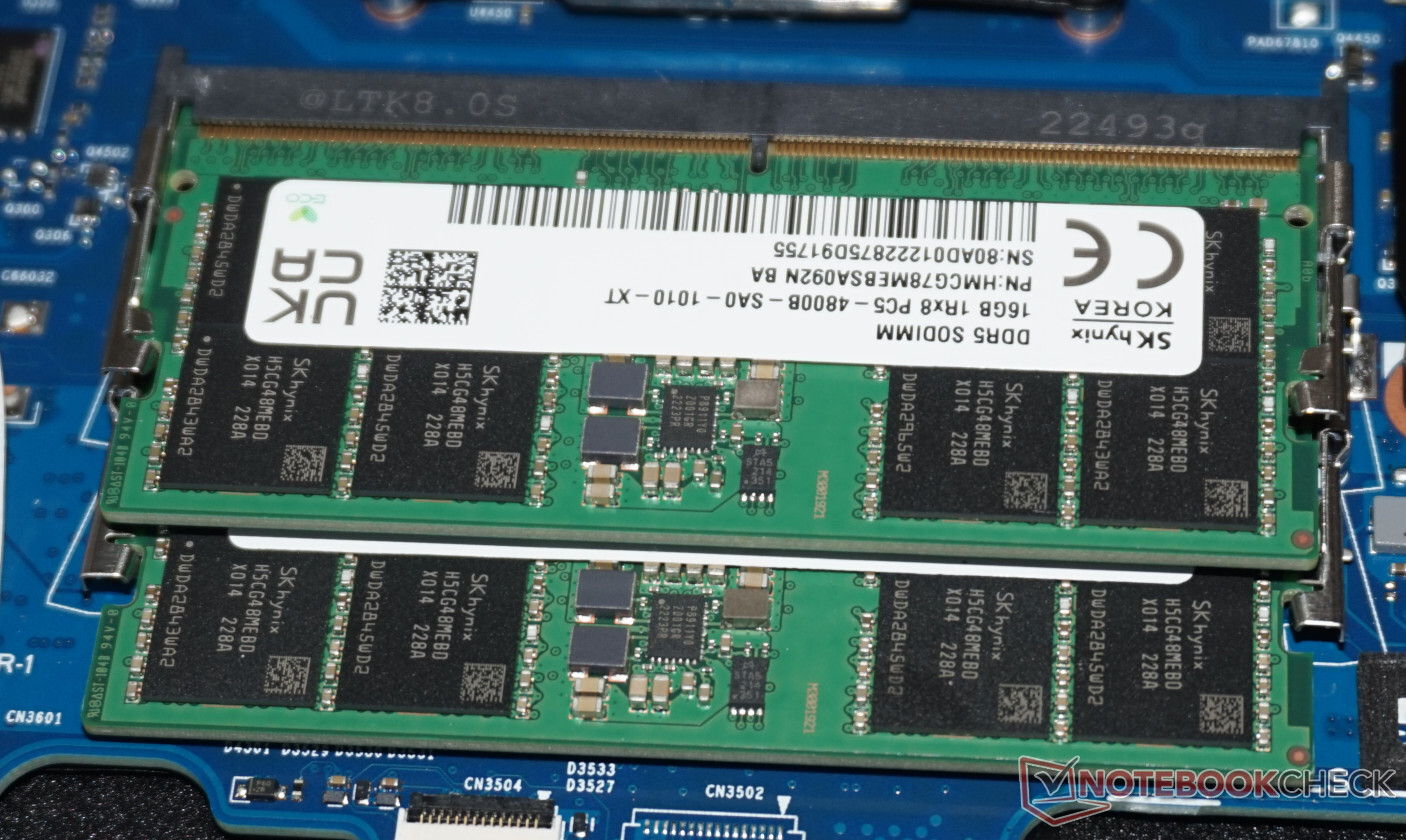
The insides of the ROG Strix are well-arranged and especially spacious. The fans can be accessed easily and the battery replaced quickly. There is a free slot to expand the storage, allowing you to insert a new SSD very simply. It is also easy to replace the RAM and WLAN module (hidden underneath the SSD).
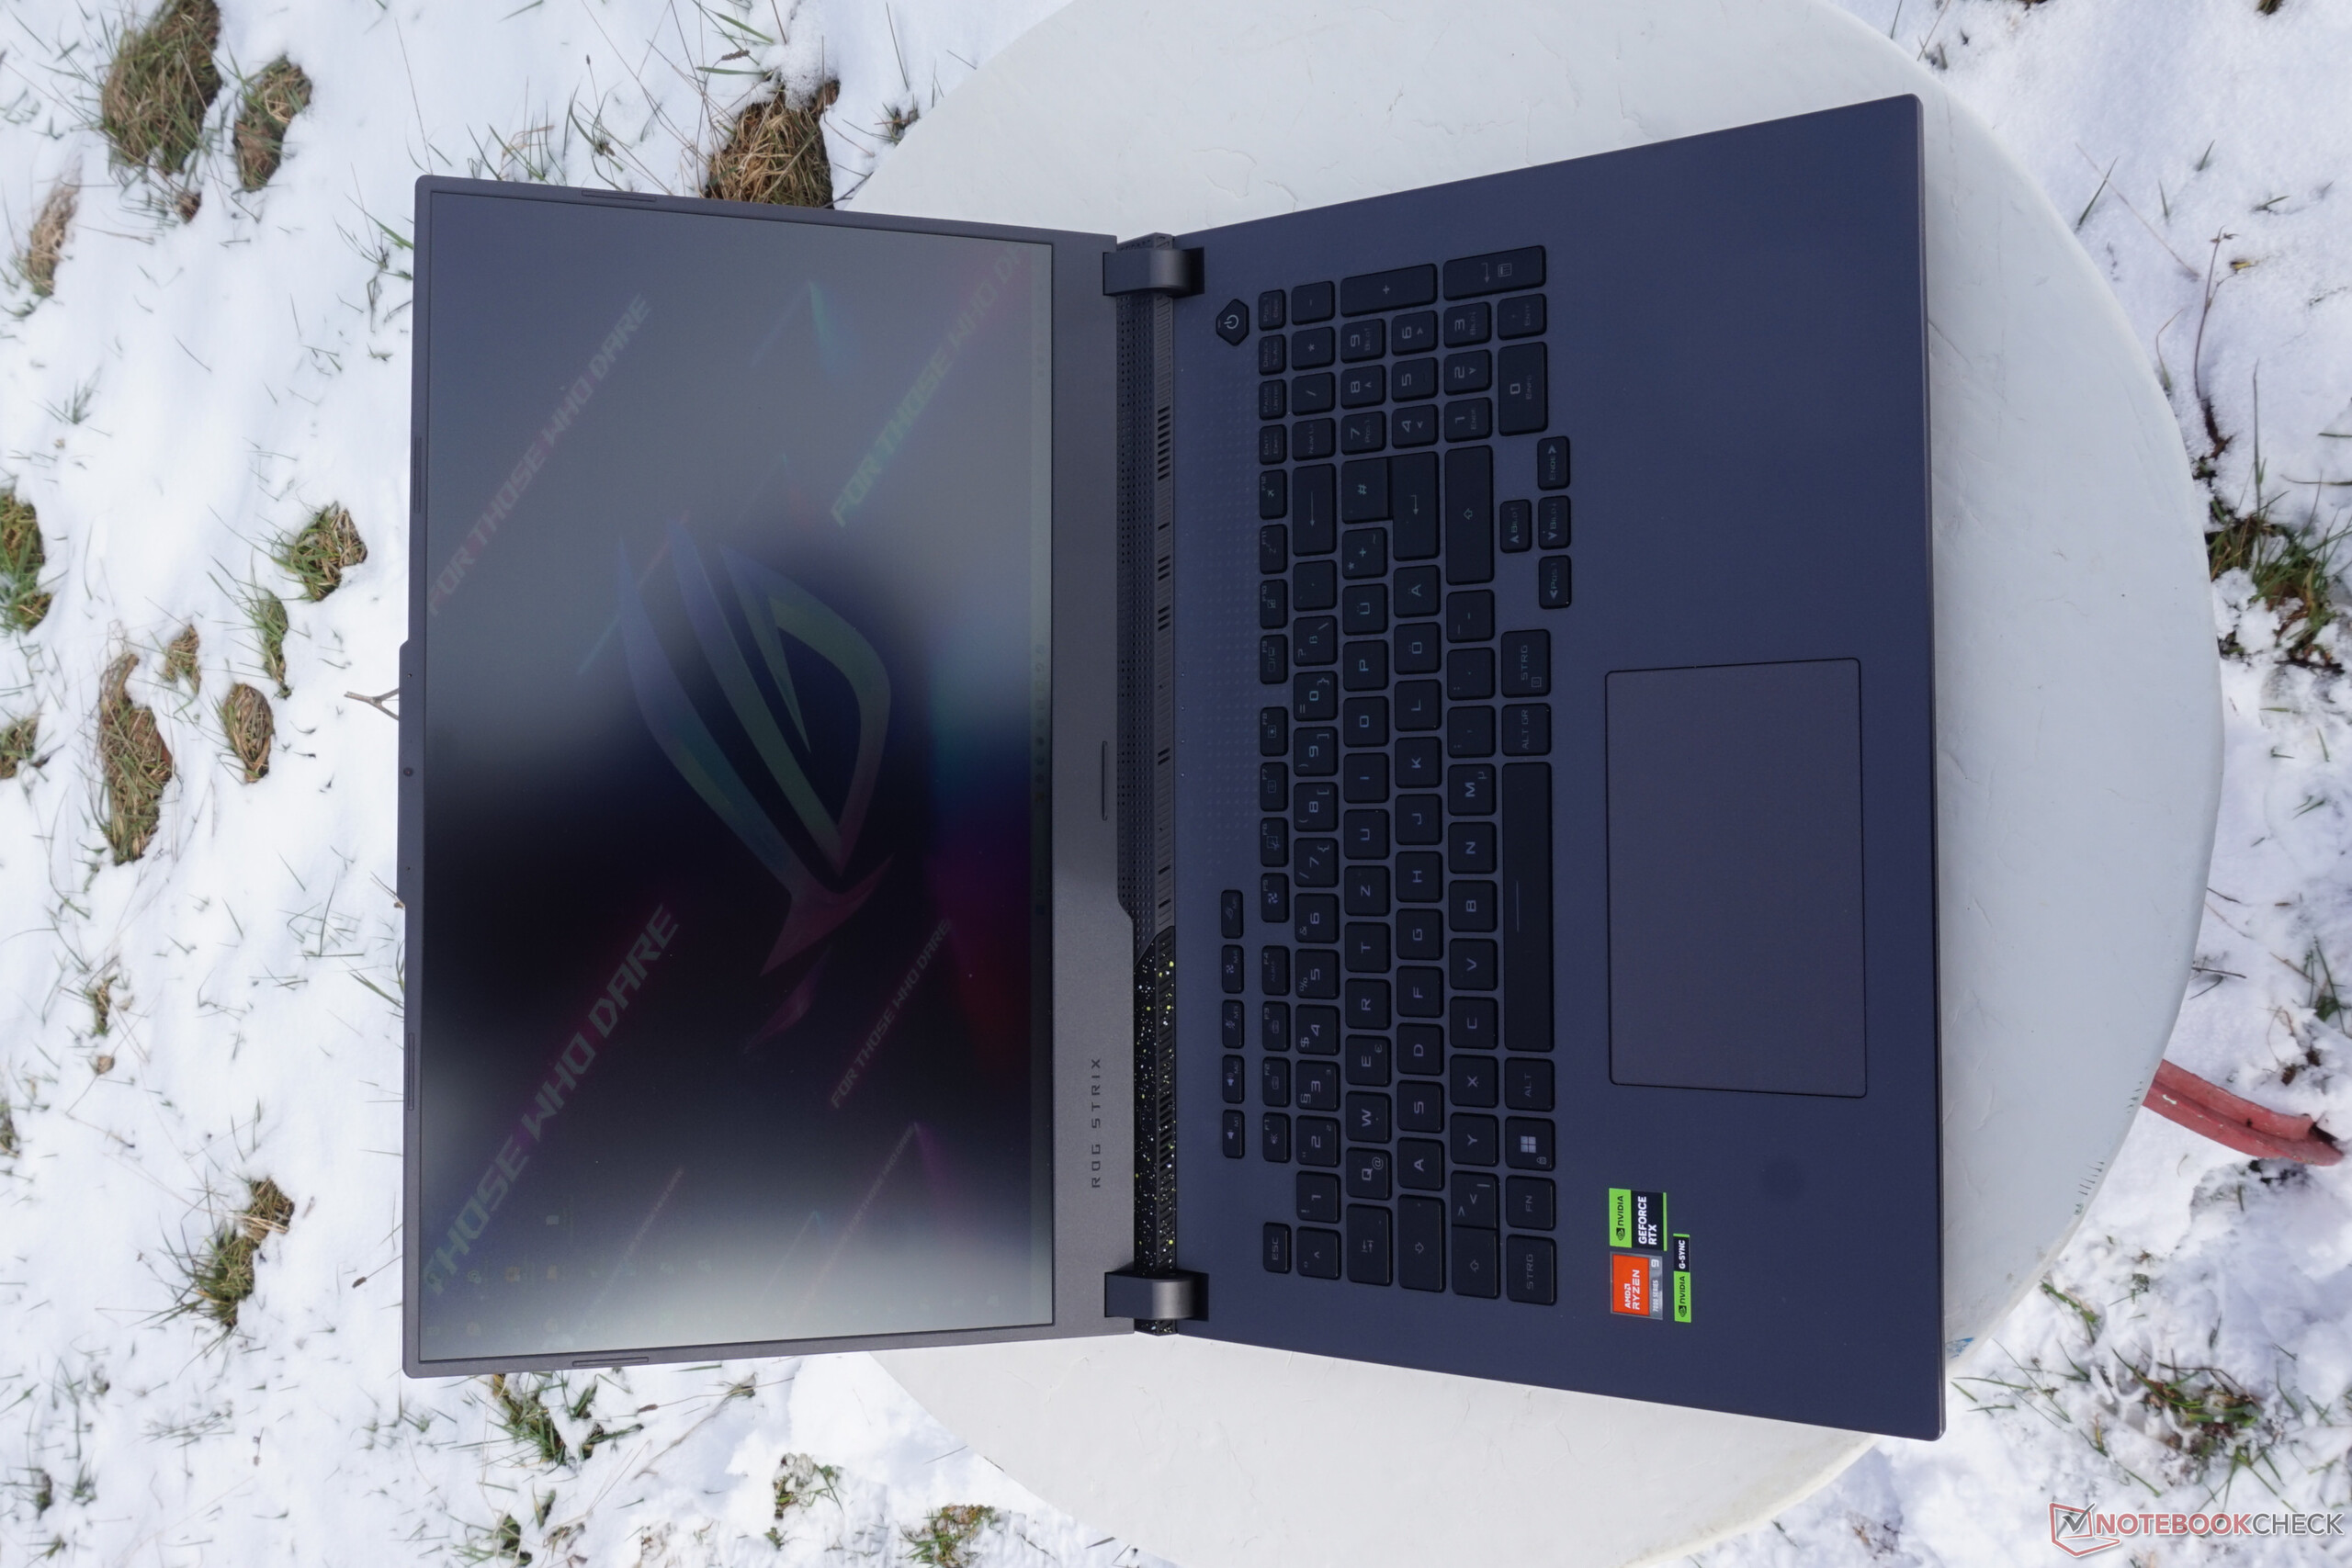
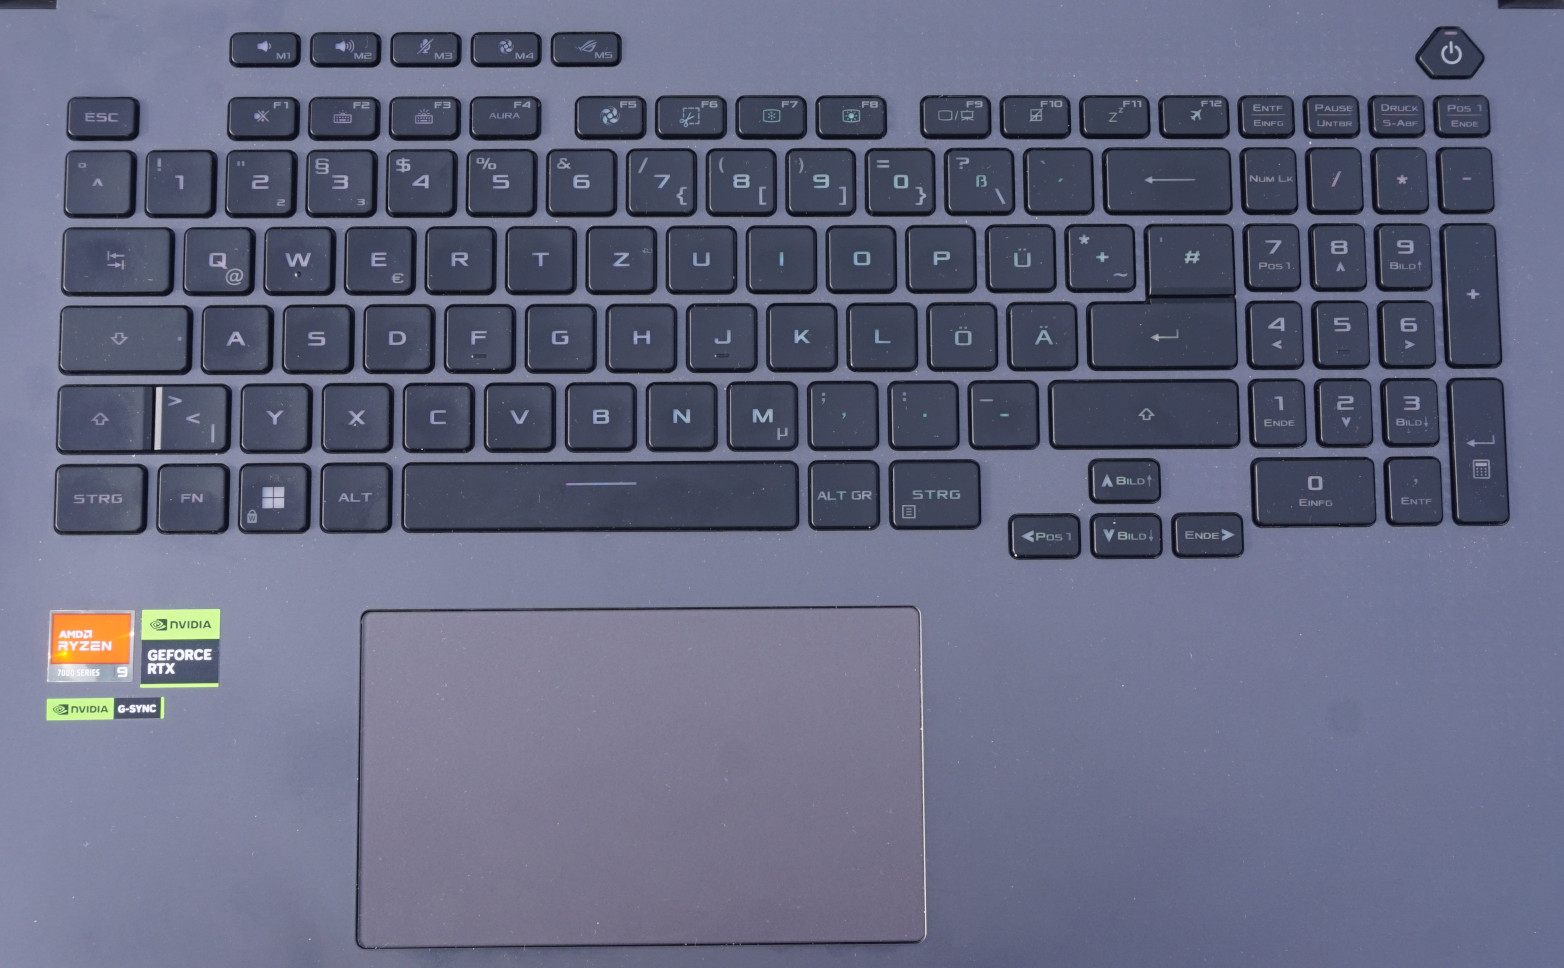
Input Devices - A keyboard focused on gaming
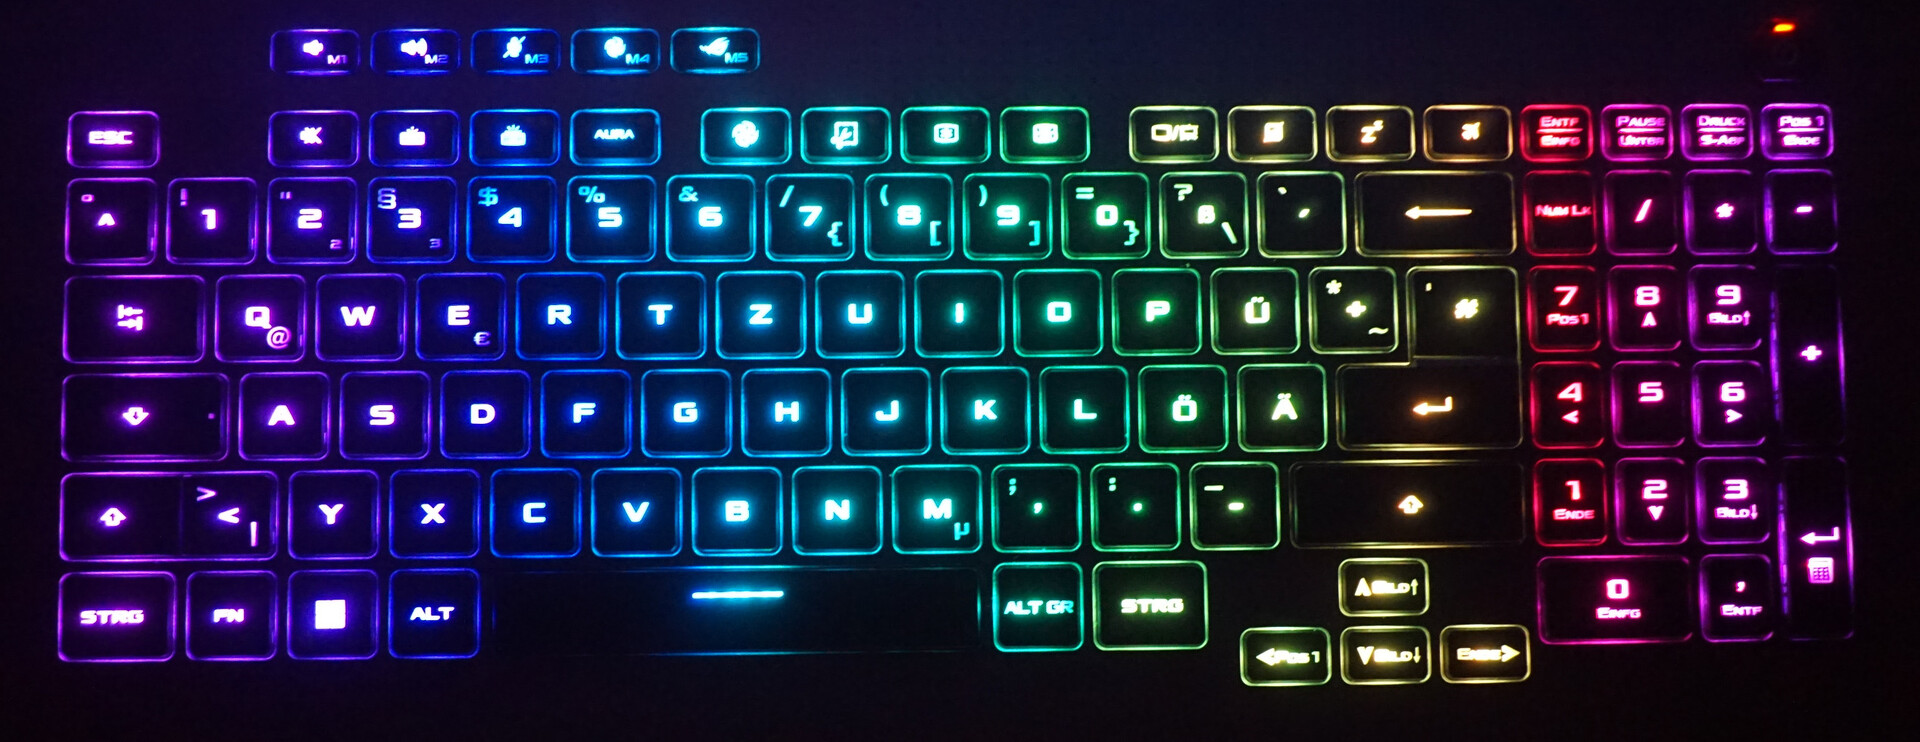
The keyboard presents itself as very suitable for gaming. In addition to the full-sized number block and F-keys that are indeed defaulting to their basic functions, the ROG Strix offers five additional keys, which control the performance modes, volume, and microphone. However, you can also configure them with your own macros.
The key stroke of almost 1.5 mm (~0.06 in) makes typing very comfortable. We also like the well-adjusted pressure point.
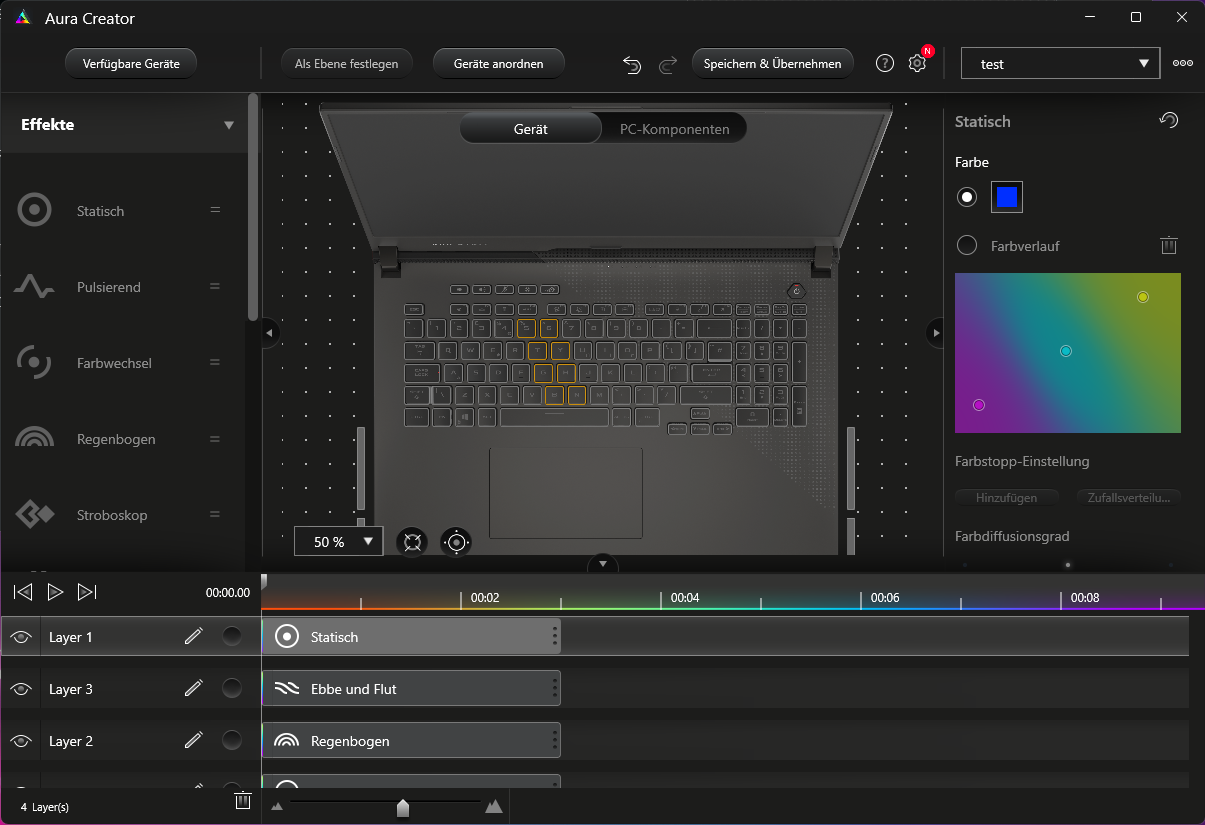
The keyboard illumination doesn't leave anything to be desired. From the classic rainbow effect up to connecting individual keys to sensor values, to music played, or to colors on the display, the Aura Creator allows you to program any behavior you can think of, even individually for each key and the six elements on the bottom. With the corresponding accessories, you can also extend this to your whole desktop.
The touchpad is large, and its hidden keys respond accurately and with well-adjusted pressure points. But usually this won't matter much as soon as you connect a mouse.
Display - Gaming laptop with a high frame rate
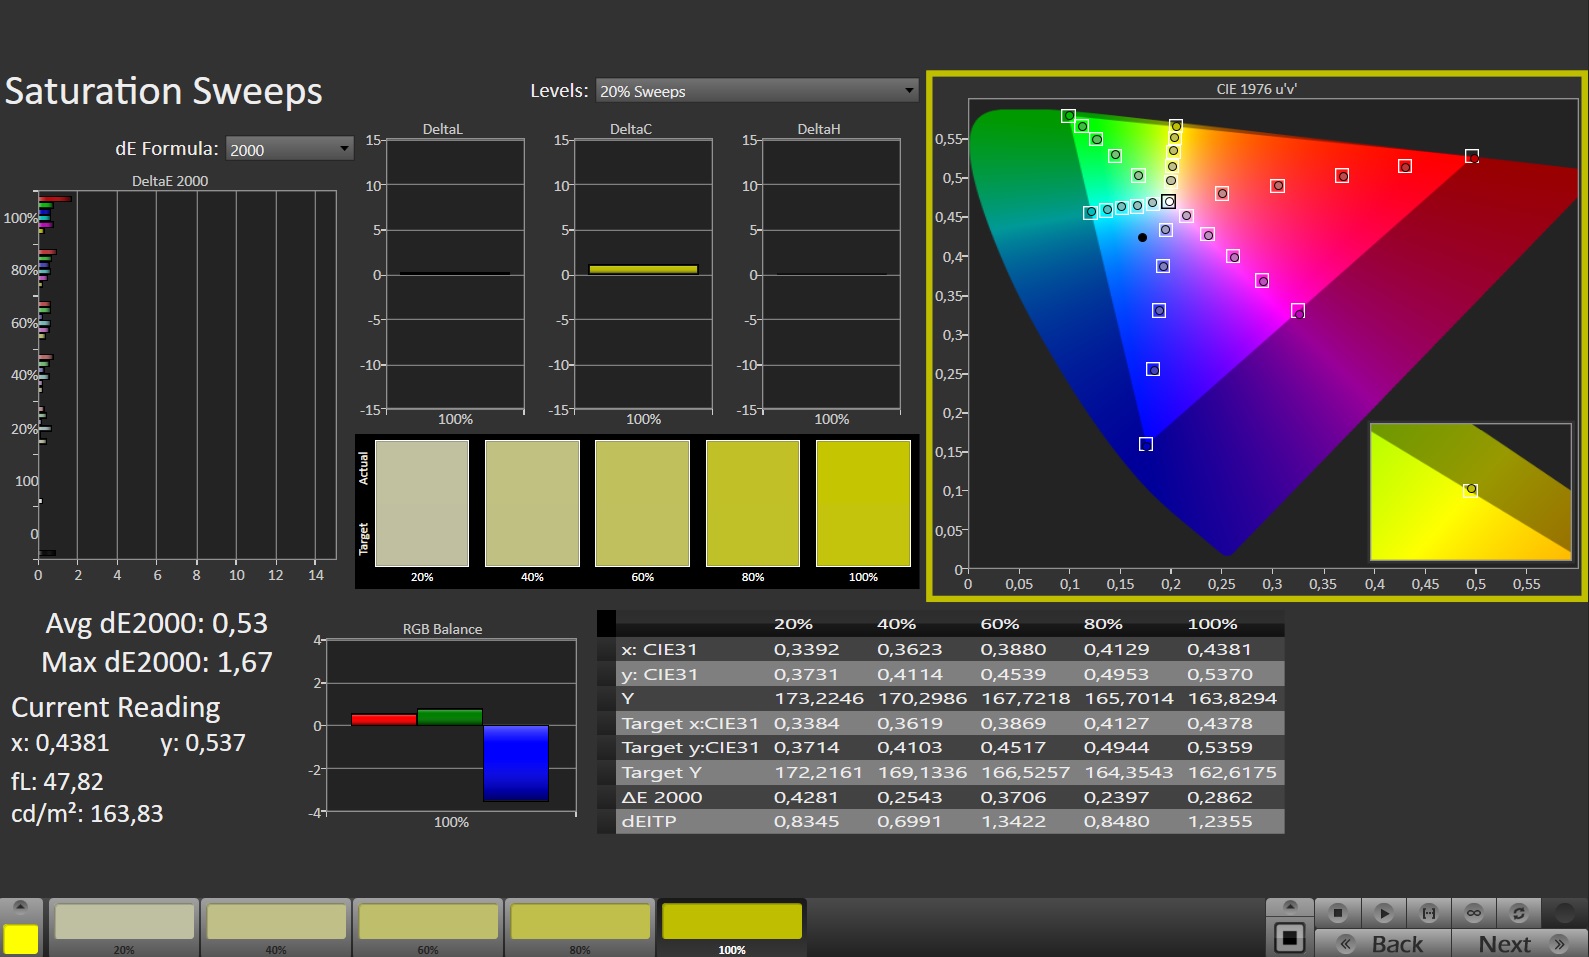
Aside from the high refresh rate and very large color space coverage that covers at least the Display-P3 almost completely, the display of the ROG Strix G17 offers average values. The limited brightness and at most average contrast aren't particularly attractive. However, the competitors are hardly any better here. But if the gaming laptop sits on your desk at home and your surroundings aren't flooded by sunlight, this shouldn't matter much anyways.
On the other hand, the large 17-inch diagonal, extensive color space, QHD resolution, and of course the 240-Hz refresh rate fully show their advantages when gaming.
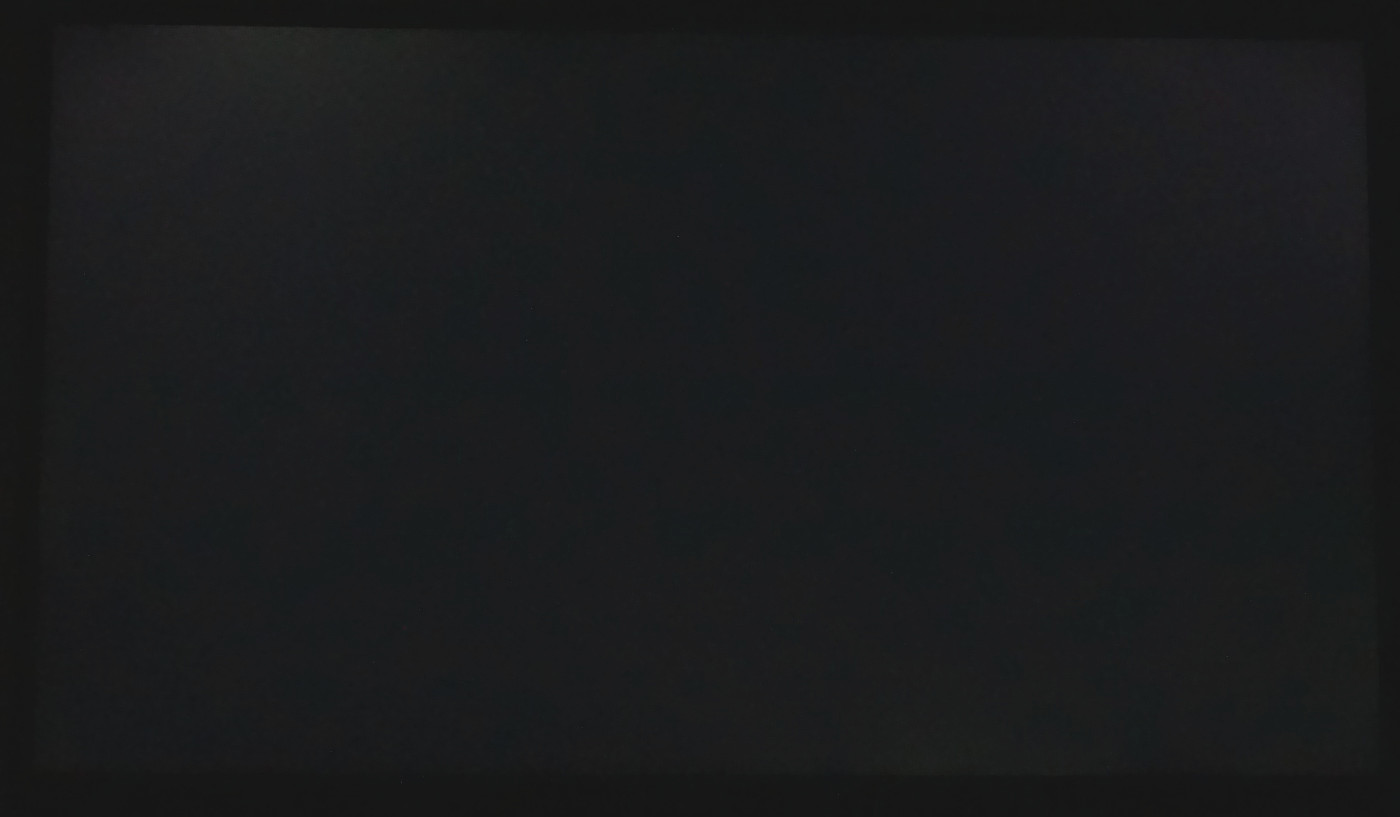
With some very dark images, the screen bleeding might become a hindrance. Our test unit is affected by this in the top left corner, and it is visible even without long exposures. However, as soon as the images or scenes are slightly brighter, it is not noticeable anymore.
| |||||||||||||||||||||||||
Brightness Distribution: 89 %
Center on Battery: 327 cd/m²
Contrast: 861:1 (Black: 0.38 cd/m²)
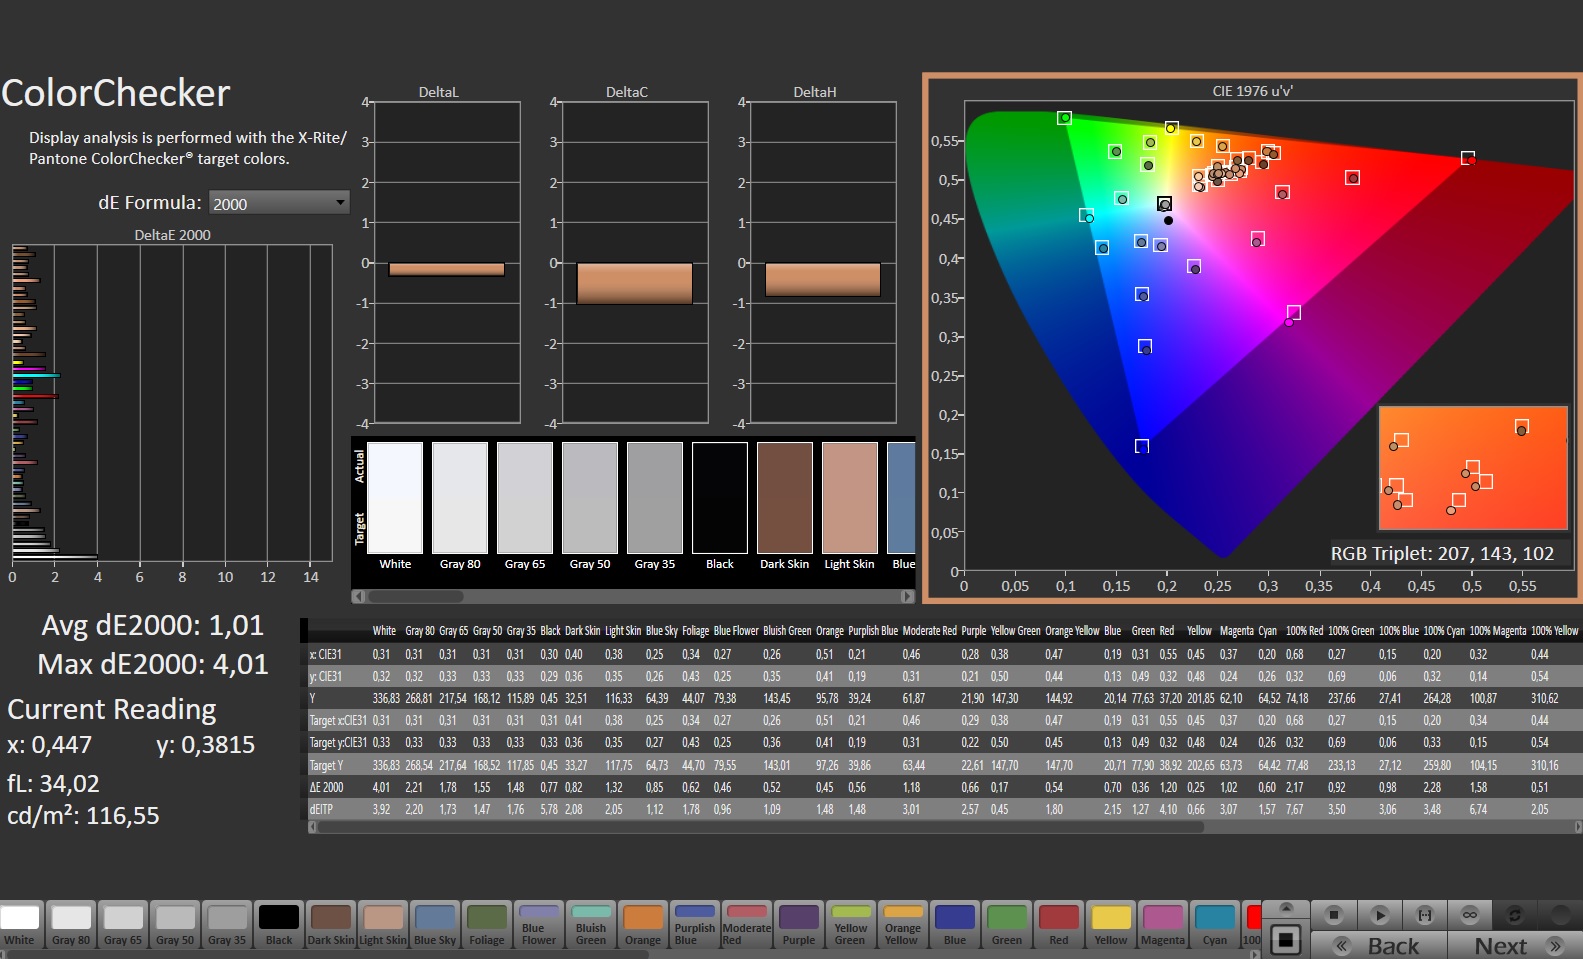
ΔE ColorChecker Calman: 1.01 | ∀{0.5-29.43 Ø4.73}
calibrated: 0.41
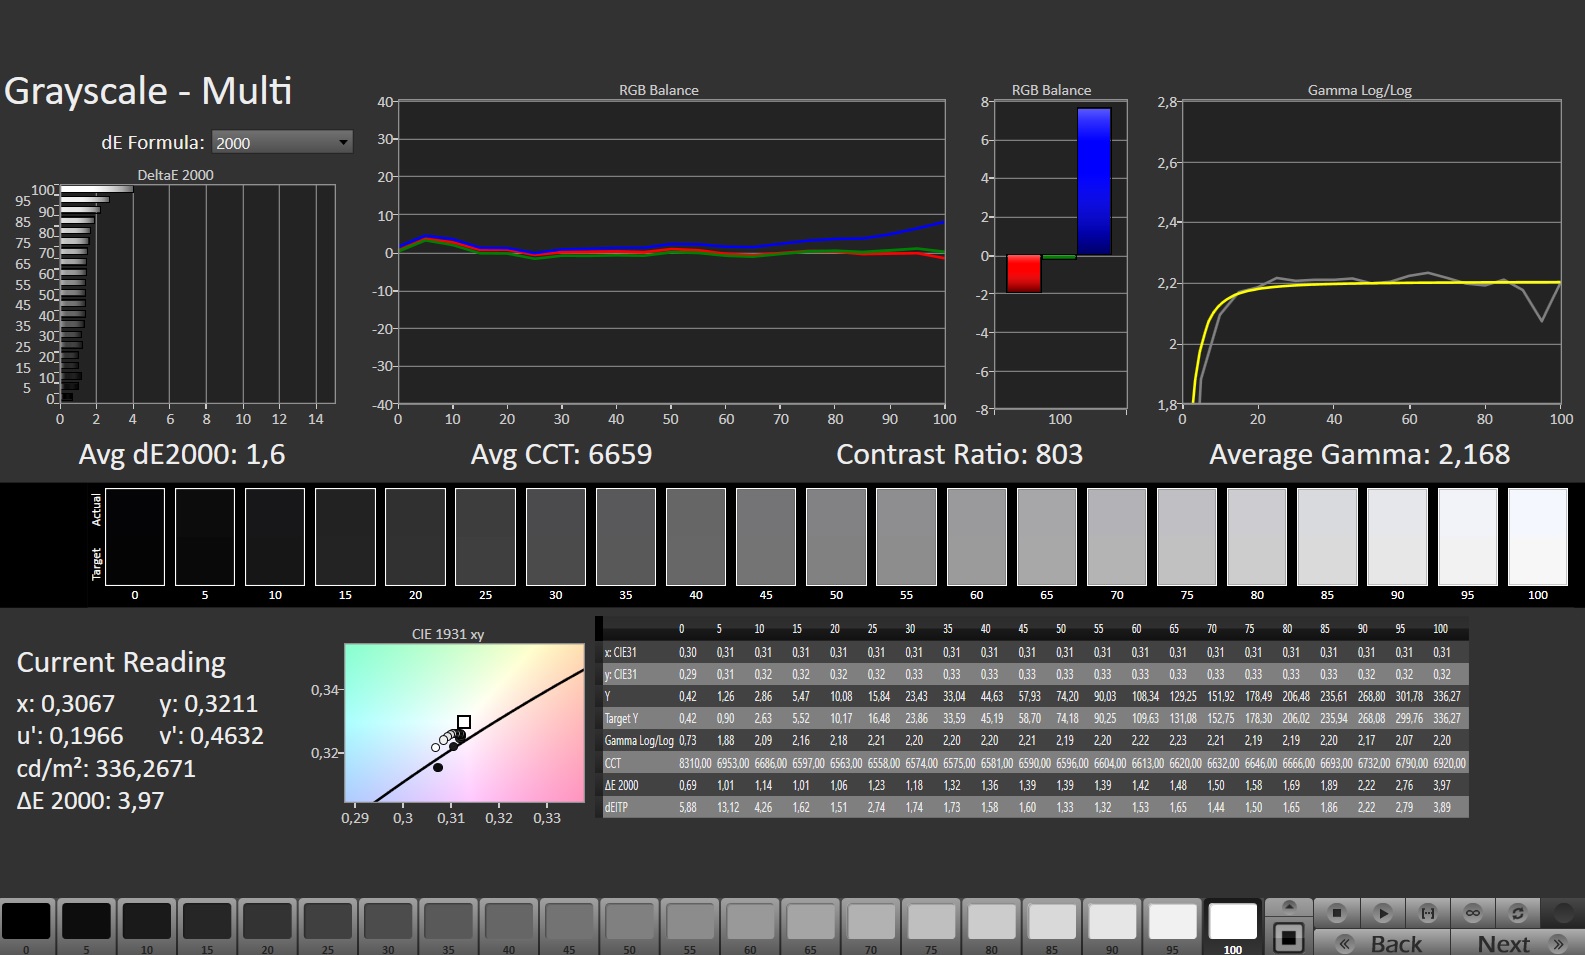
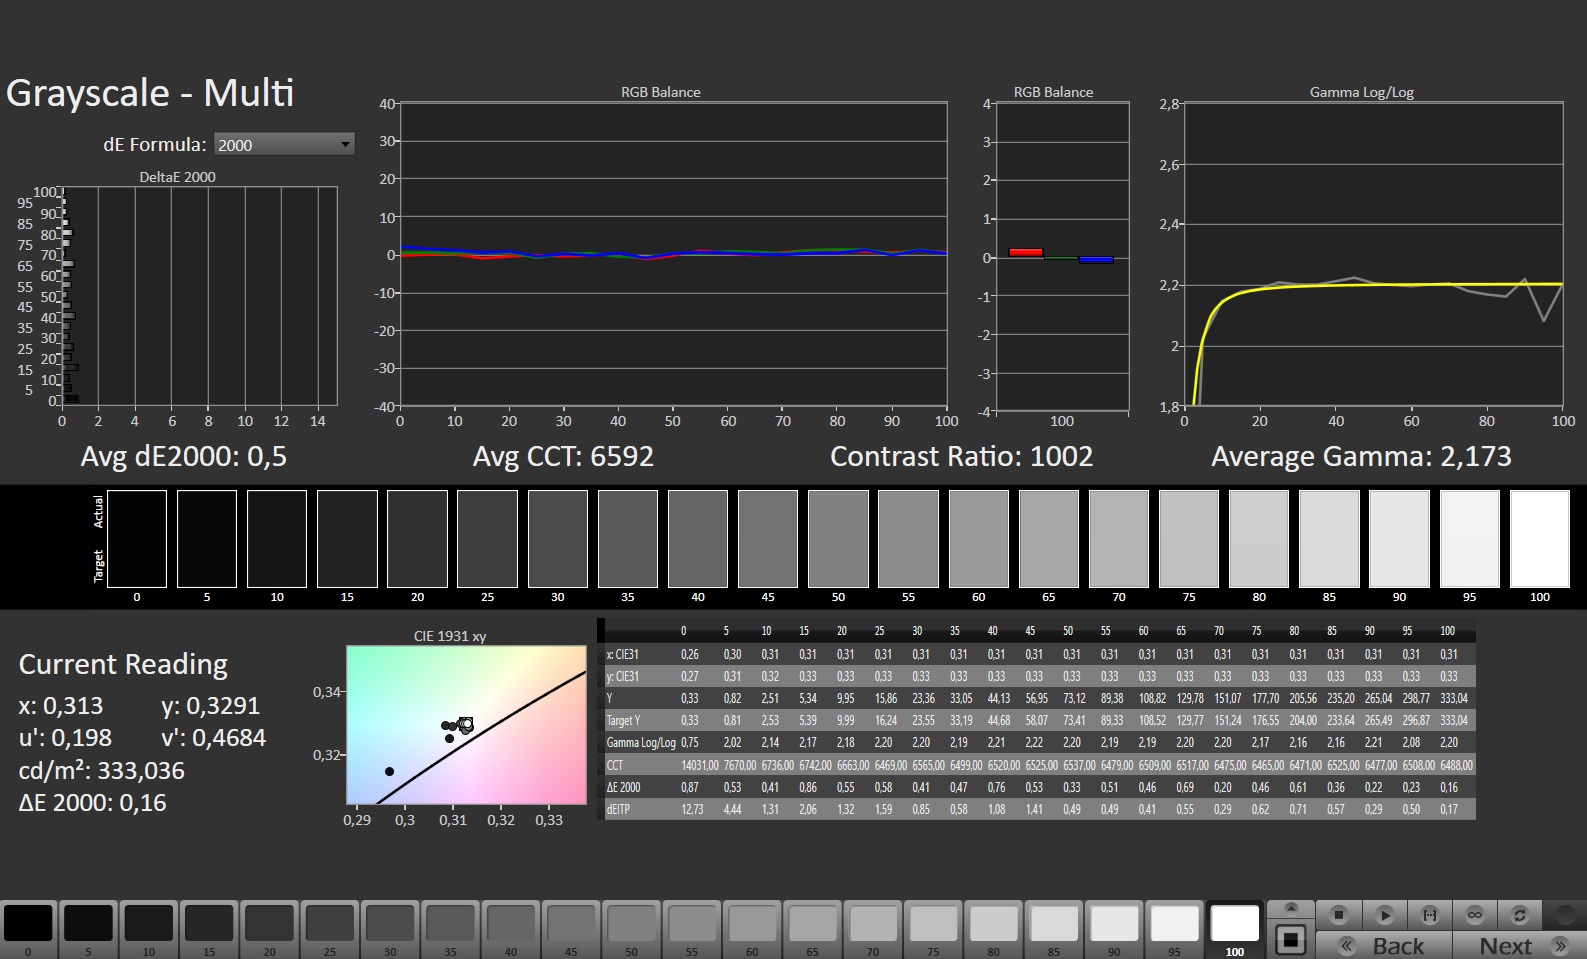
ΔE Greyscale Calman: 1.6 | ∀{0.09-98 Ø4.97}
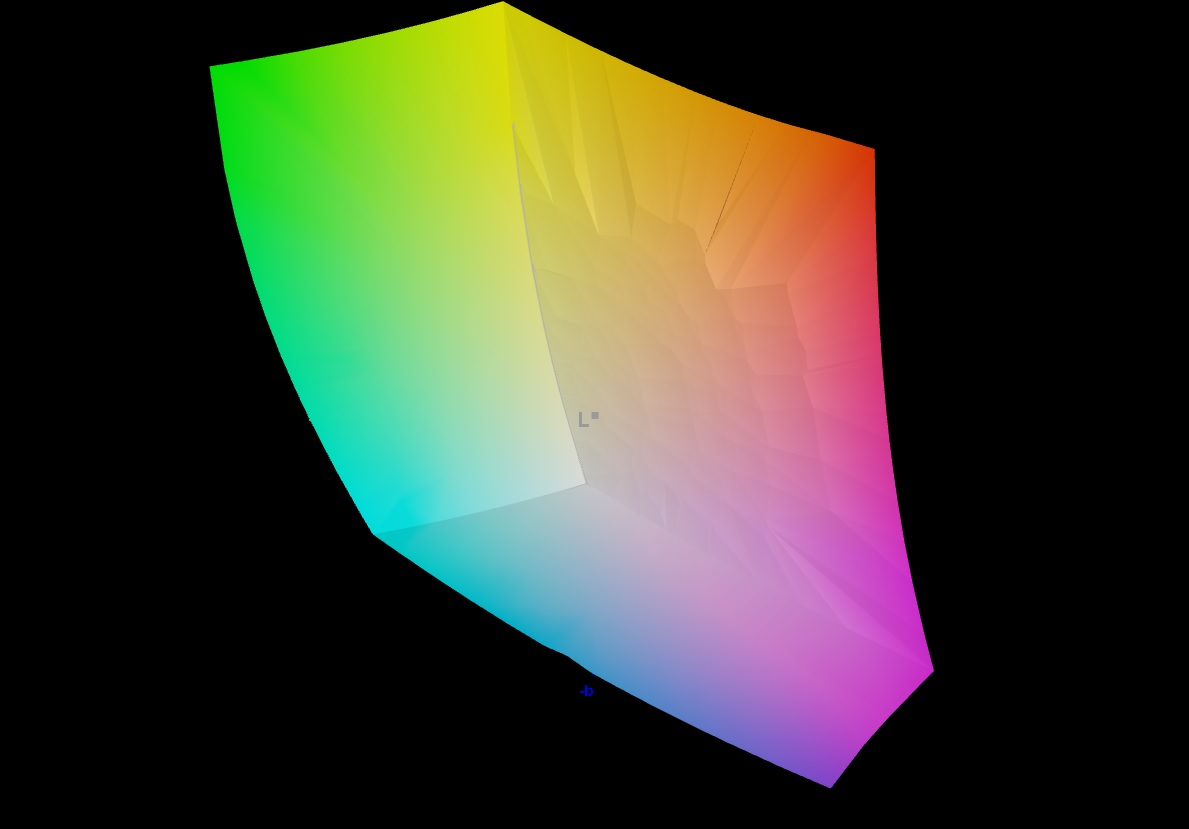
85.9% AdobeRGB 1998 (Argyll 3D)
100% sRGB (Argyll 3D)
98.3% Display P3 (Argyll 3D)
Gamma: 2.168
CCT: 6659 K
| Asus ROG Strix G17 G713PI BOE0B69, IPS, 2560x1440, 17.3" | Asus ROG Strix G18 G814JI NE180QDM-NZ2 (BOE0B35), IPS, 2560x1600, 18" | Razer Blade 18 RTX 4070 AU Optronics B180QAN01.0, IPS, 2560x1600, 18" | Asus ROG Strix Scar 17 SE G733CX-LL014W NE173QHM-NZ2, IPS, 2560x1440, 17.3" | Asus Zephyrus Duo 16 GX650PY-NM006W NE160QDM-NM4, MiniLED, 2560x1600, 16" | Alienware m17 R5 (R9 6900HX, RX 6850M XT) AU Optronics AUODBA3, IPS, 3840x2160, 17" | Asus ROG Strix G16 G614JZ TL160ADMP03-0, IPS, 2560x1600, 16" | |
|---|---|---|---|---|---|---|---|
| Display | 0% | -1% | -1% | 2% | 1% | -1% | |
| Display P3 Coverage (%) | 98.3 | 98.1 0% | 96.9 -1% | 97.1 -1% | 99.4 1% | 97.2 -1% | 97 -1% |
| sRGB Coverage (%) | 100 | 99.9 0% | 99.8 0% | 99.9 0% | 100 0% | 99.6 0% | 99.9 0% |
| AdobeRGB 1998 Coverage (%) | 85.9 | 85.6 0% | 85.3 -1% | 84.8 -1% | 90.8 6% | 88.4 3% | 84.9 -1% |
| Response Times | -6% | 14% | -13% | -154% | -122% | 14% | |
| Response Time Grey 50% / Grey 80% * (ms) | 5.3 ? | 5.6 ? -6% | 4.2 ? 21% | 5.7 ? -8% | 15.2 ? -187% | 16.4 ? -209% | 5.1 ? 4% |
| Response Time Black / White * (ms) | 8.6 ? | 9 ? -5% | 8 ? 7% | 10.1 ? -17% | 19 ? -121% | 11.6 ? -35% | 6.6 ? 23% |
| PWM Frequency (Hz) | 12000 ? | ||||||
| Screen | -24% | -85% | 11% | 119% | -191% | -19% | |
| Brightness middle (cd/m²) | 327 | 471 44% | 549.6 68% | 320 -2% | 712 118% | 484 48% | 470 44% |
| Brightness (cd/m²) | 320 | 422 32% | 524 64% | 303 -5% | 703 120% | 449 40% | 459 43% |
| Brightness Distribution (%) | 89 | 83 -7% | 89 0% | 87 -2% | 95 7% | 87 -2% | 93 4% |
| Black Level * (cd/m²) | 0.38 | 0.47 -24% | 0.53 -39% | 0.3 21% | 0.07 82% | 0.55 -45% | 0.42 -11% |
| Contrast (:1) | 861 | 1002 16% | 1037 20% | 1067 24% | 10171 1081% | 880 2% | 1119 30% |
| Colorchecker dE 2000 * | 1.01 | 2.05 -103% | 3.32 -229% | 1.1 -9% | 1.7 -68% | 4.8 -375% | 1.86 -84% |
| Colorchecker dE 2000 max. * | 4.01 | 4.15 -3% | 6.63 -65% | 2.7 33% | 4 -0% | 7.48 -87% | 3.87 3% |
| Colorchecker dE 2000 calibrated * | 0.41 | 0.8 -95% | 2.7 -559% | 1.2 -193% | 4.74 -1056% | 0.93 -127% | |
| Greyscale dE 2000 * | 1.6 | 2.8 -75% | 2 -25% | 1.1 31% | 2.8 -75% | 5.5 -244% | 2.7 -69% |
| Gamma | 2.168 101% | 2.204 100% | 2.29 96% | 2.13 103% | 2.21 100% | 2.42 91% | 2.246 98% |
| CCT | 6659 98% | 7122 91% | 6319 103% | 6599 98% | 6978 93% | 6148 106% | 6711 97% |
| Total Average (Program / Settings) | -10% /
-16% | -24% /
-53% | -1% /
5% | -11% /
55% | -104% /
-140% | -2% /
-10% |
* ... smaller is better
The color display is very accurate even without an additional calibration. Deviations are hardly noticeable with the bare eye. After a calibration, all the deviations drop below perceptible limits. With this, the display is also suitable for image processing. You can download the corresponding color profile from the link above in the area with the display values.

The short response times that are significantly lower than 10 ms, the lack of PWM flickering, and the large color space make this display very suitable for a gaming laptop.
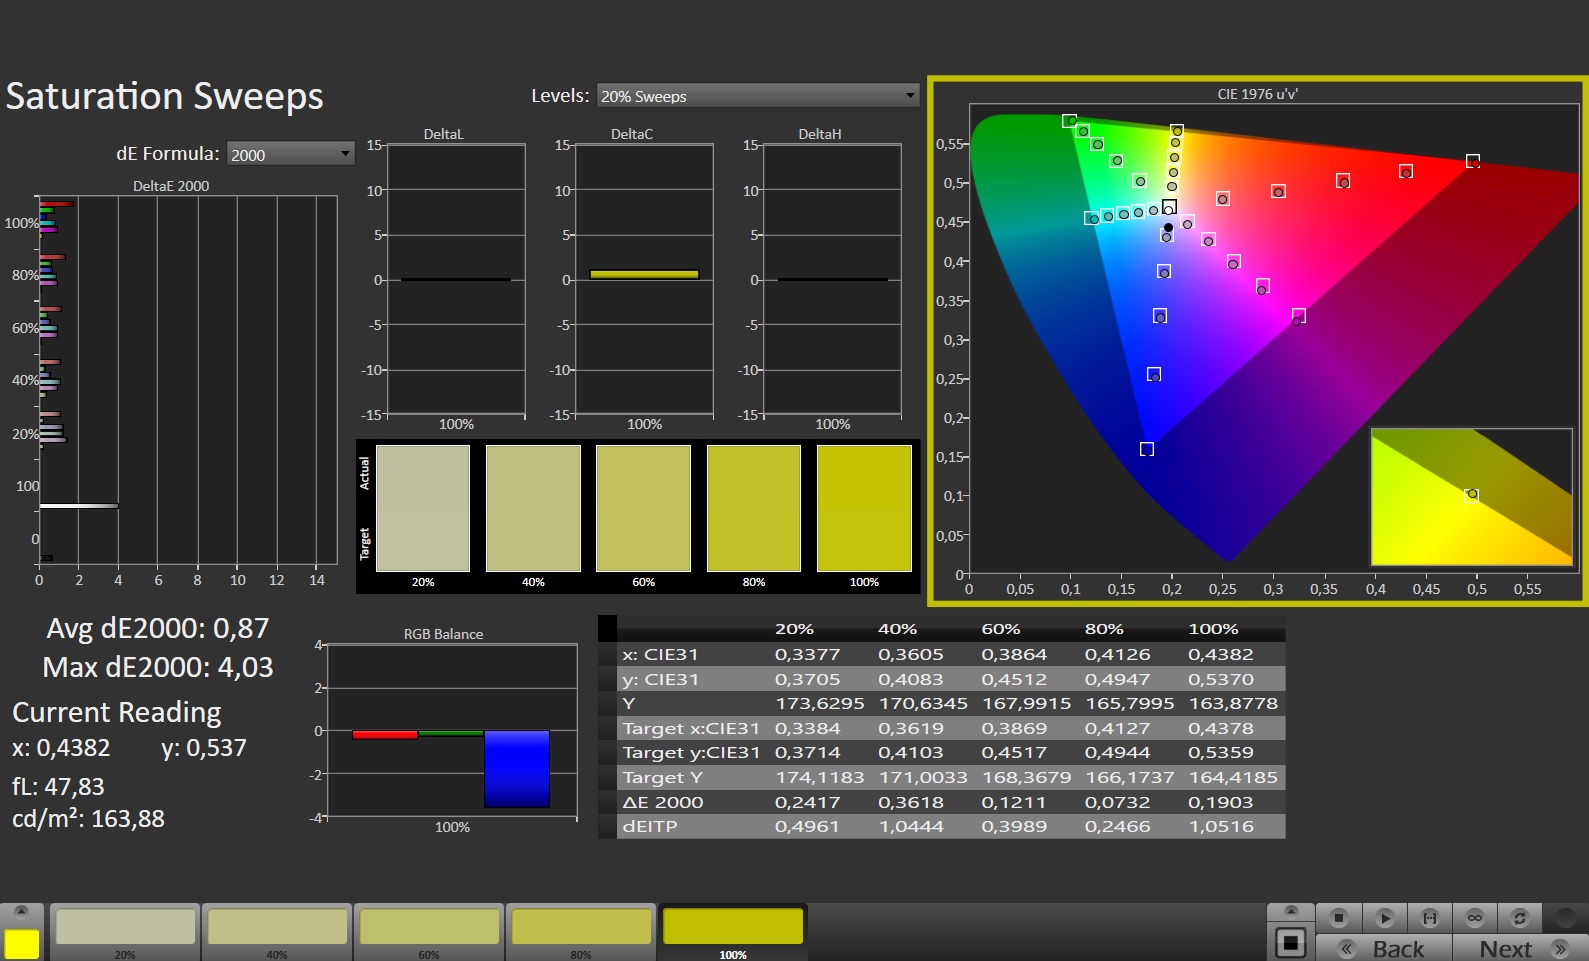
The color reproduction also gives no reason for complaint. Our measurements of the color reproduction result in an almost perfect 100% sRGB, 98% DCI-P3, and at least 86% AdobeRGB. In addition to correspondingly gorgeous gaming sequences, creators will also get what they need. Only for professional demands on image processing would you need to use a screen with complete AdobeRGB color space coverage.


Display Response Times
| ↔ Response Time Black to White | ||
|---|---|---|
| 8.6 ms ... rise ↗ and fall ↘ combined | ↗ 3.7 ms rise | 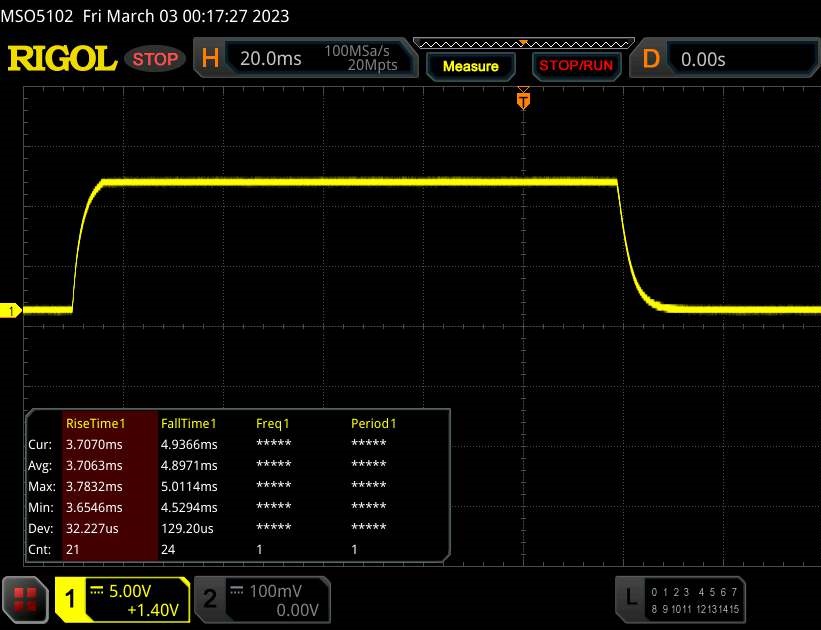 |
| ↘ 4.9 ms fall | ||
| The screen shows fast response rates in our tests and should be suited for gaming. In comparison, all tested devices range from 0.1 (minimum) to 240 (maximum) ms. » 24 % of all devices are better. This means that the measured response time is better than the average of all tested devices (19.9 ms). | ||
| ↔ Response Time 50% Grey to 80% Grey | ||
| 5.3 ms ... rise ↗ and fall ↘ combined | ↗ 2.4 ms rise | 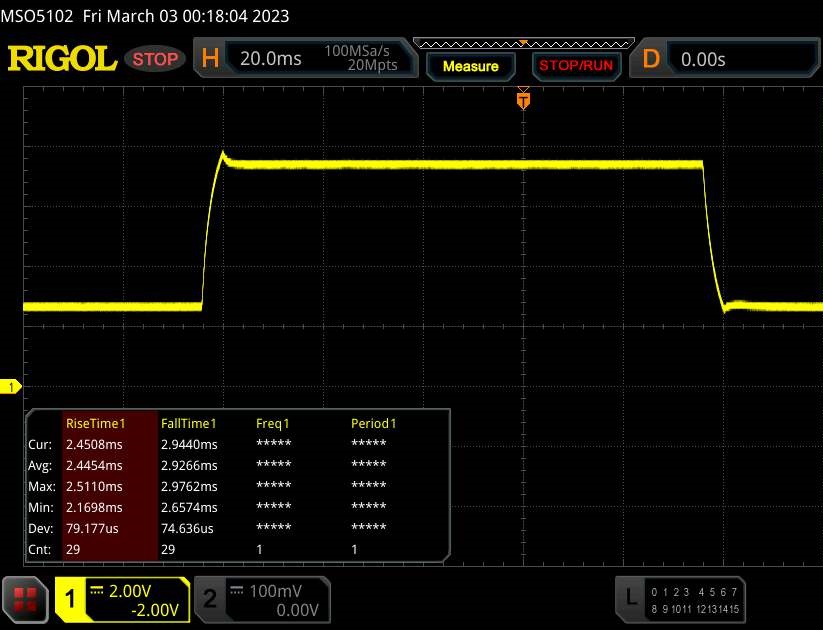 |
| ↘ 2.9 ms fall | ||
| The screen shows very fast response rates in our tests and should be very well suited for fast-paced gaming. In comparison, all tested devices range from 0.165 (minimum) to 636 (maximum) ms. » 17 % of all devices are better. This means that the measured response time is better than the average of all tested devices (31.1 ms). | ||
Screen Flickering / PWM (Pulse-Width Modulation)
| Screen flickering / PWM not detected | 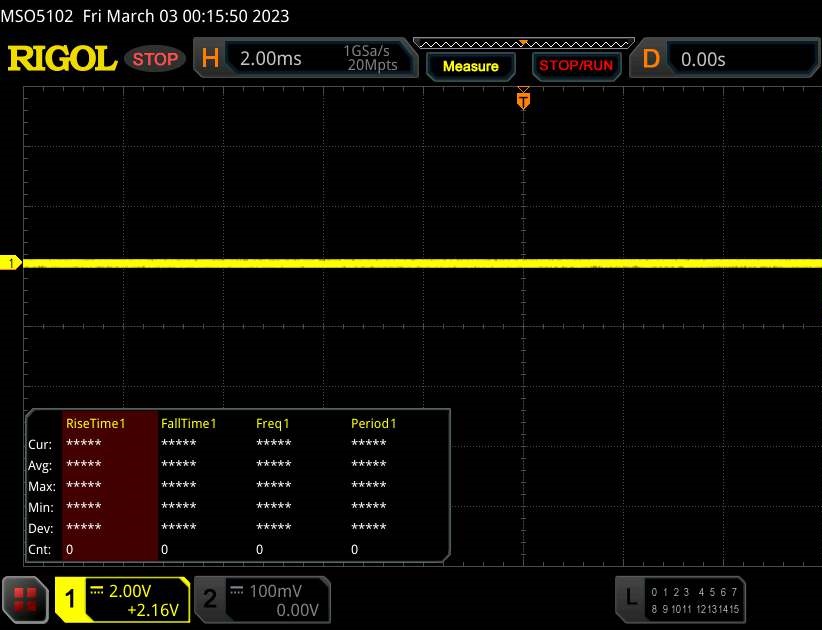 | ||
In comparison: 52 % of all tested devices do not use PWM to dim the display. If PWM was detected, an average of 7798 (minimum: 5 - maximum: 343500) Hz was measured. | |||
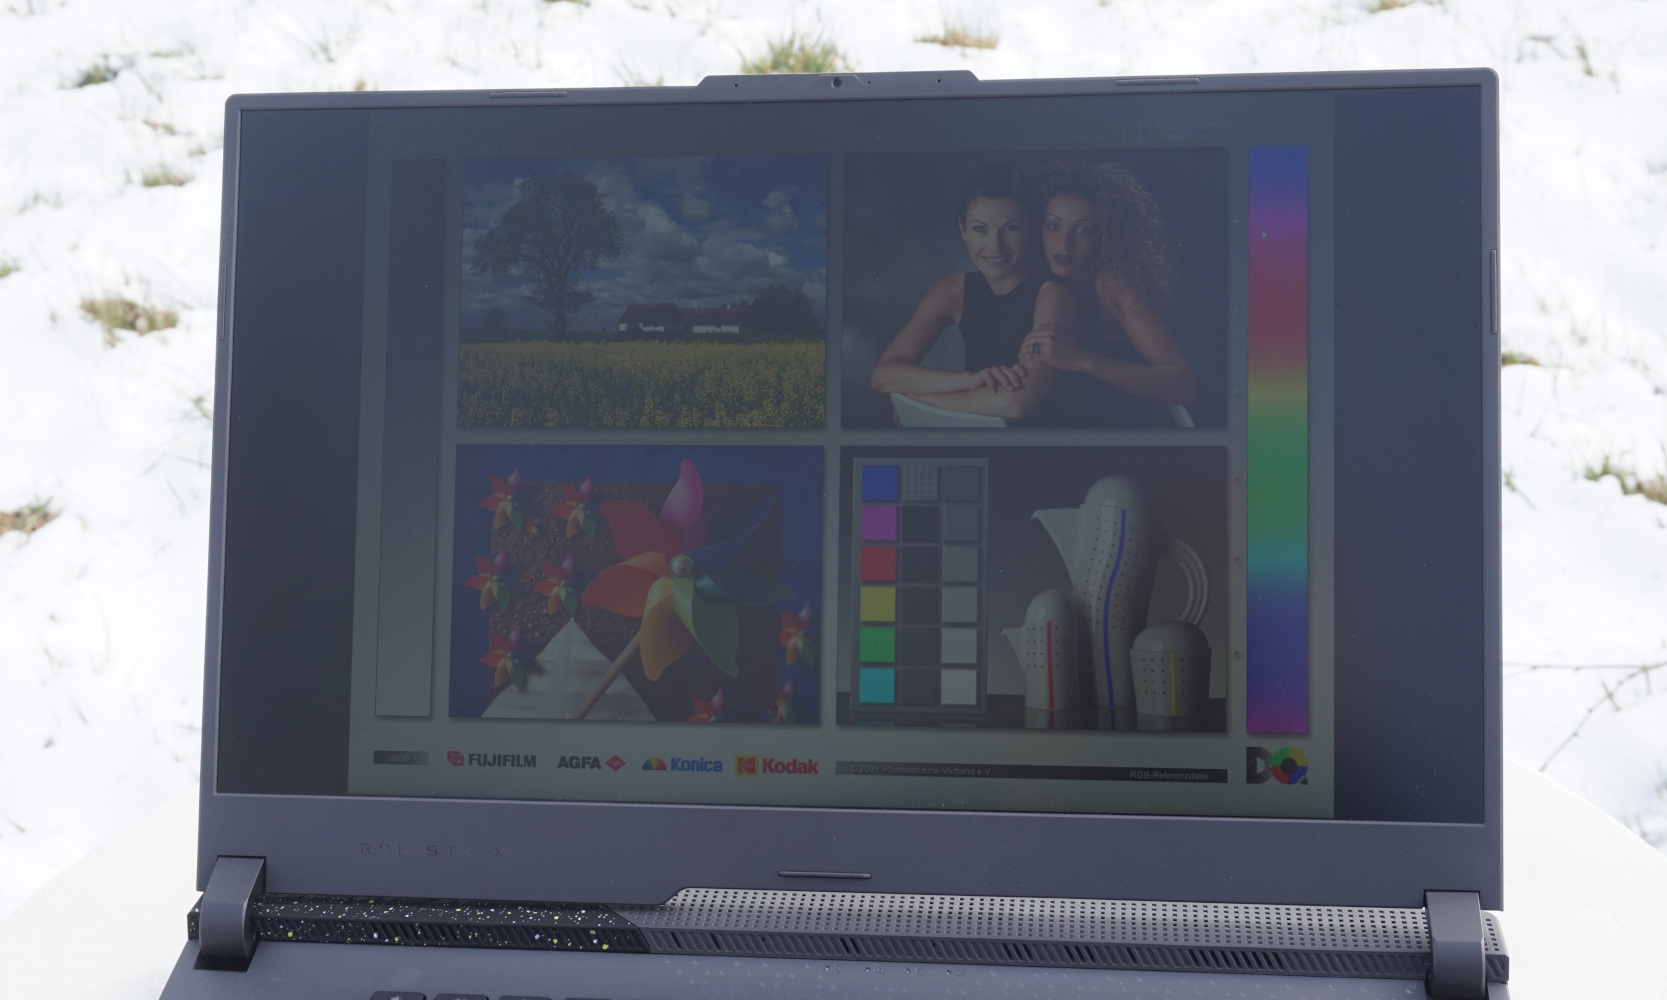
The relatively low brightness and limited contrast make it almost impossible to use the laptop outdoors. In a sunny spot, even if there is a bit of shade, particularly the colors are hardly recognizable anymore, even if you can still read the text.

There is only as much viewing angle stability as is necessary for a gaming laptop such as the ROG Strix G17. Since usually you almost always look directly at the display from the front, it should hardly matter that from angles significantly steeper than 45°, any black areas are covered by a gray veil and the colors also appear slightly pale.


Performance - ROG Strix in the upper midrange
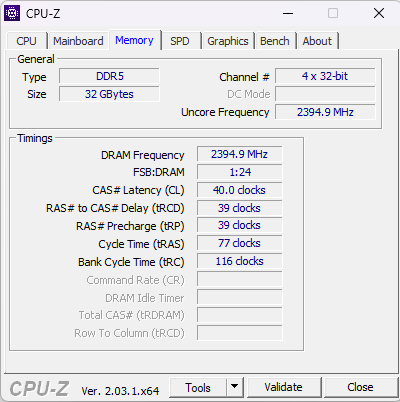
The Asus ROG Strix G17 just barely misses a placement in the high-end segment, but this is surely not the fault of the CPU, which is currently one of the most powerful models. Together with the 32 GB of DDR5-RAM in our G713PI-LL005W test unit, this leaves no doubts in the high computing performance. The graphics card, on the other hand, still leaves some room for improvement.
However, the RTX 4070 should still allow you to comfortably play most games, even more complex ones, at the highest detail levels and in full resolution. If you want frame rates that are as high as possible, you are more likely to achieve that in Full-HD resolution. With the models with the RTX 4060 and RTX 4050, you correspondingly have to expect a few more compromises.

Test Conditions
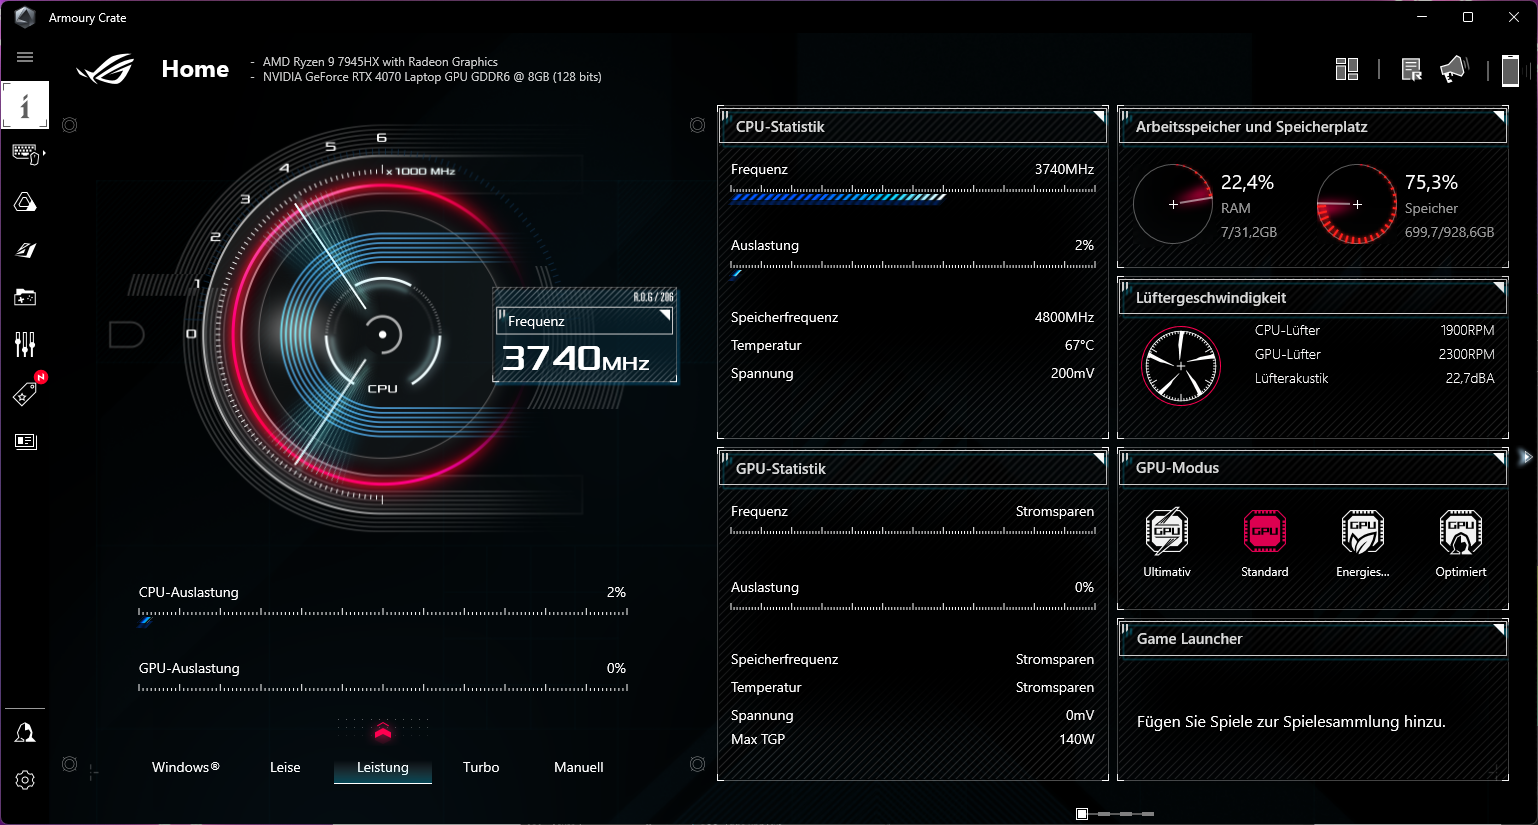
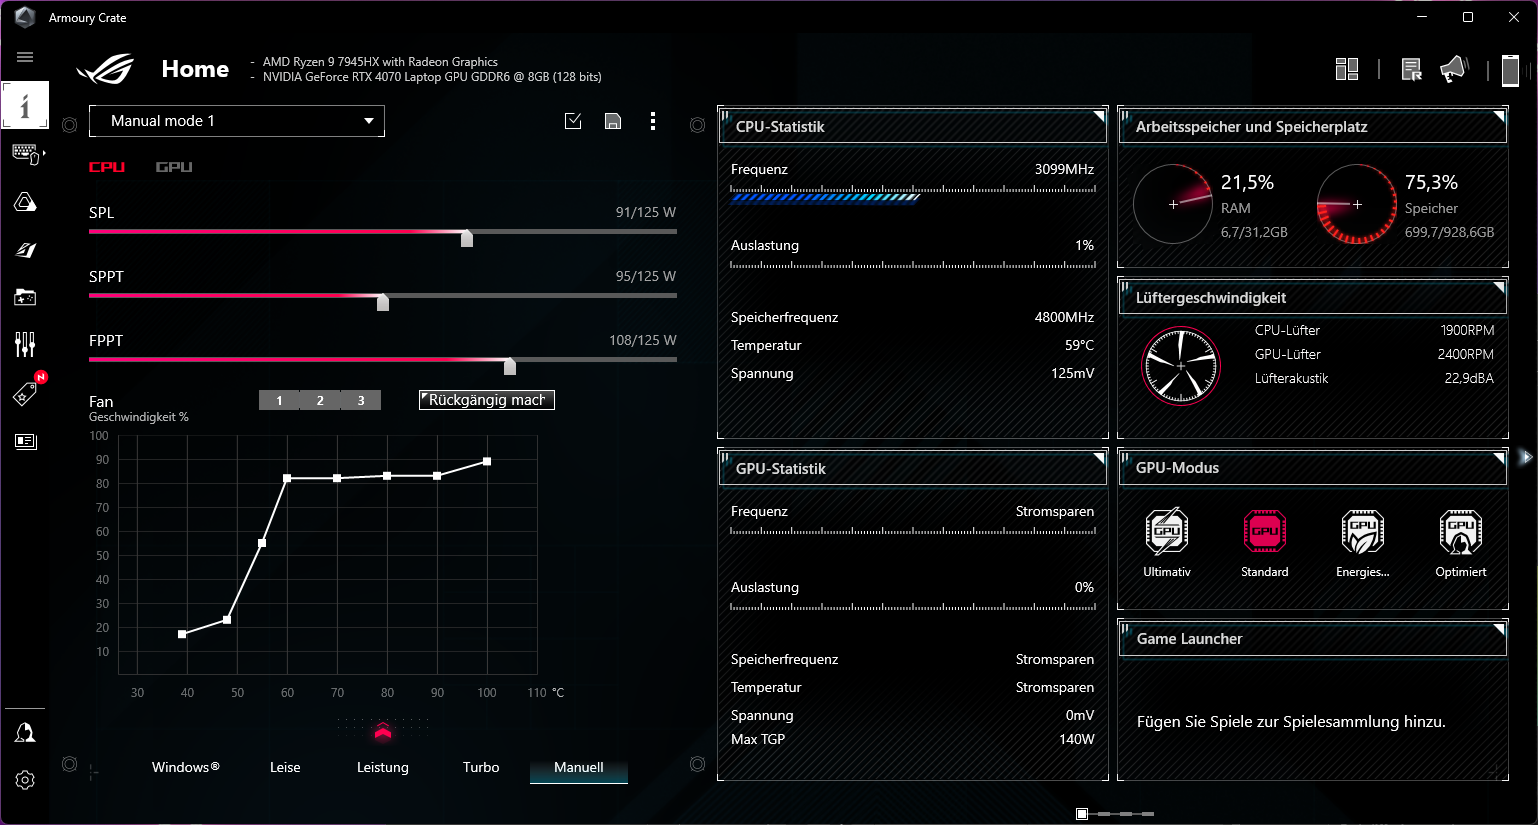
Asus includes a series of power profiles in the ROG Strix G17 that offer adjustments of the system performance as well as emissions for various situations. Using the manual setting options, you can adjust them further or even completely change them.
We performed all our benchmarks using the "Performance" mode. According to Asus, this mode offers a high computing performance, while limiting at least the noise development. For comparison, we also include an additional measurement with the "Turbo" mode in the Cinebench-R15 constant load test, to show the maximum possible performance. However, without using headphones or in high environment temperatures, this mode doesn't recommend itself.
The processor is run with different power limits in almost all situations, but the power consumption is always considerable, although it still remains appropriate for the high computing performance.
| PL2 | PL1 | |
| Performance mode | 120 W | 90 W |
| Turbo mode | 125 W | 125 W |
| Quiet mode | 100 W | 65 W |
| Performance (battery) | 120 W | 60 W |
| Quiet (battery) | 100 W | 40 W |
Processor
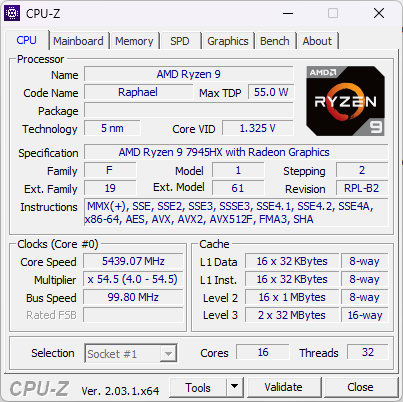
The AMD Ryzen 9 7945HX with the current Zen4 architecture is able to deliver considerable performance values. Its 16 cores and 32 threads alone ensure a large amount of performance reserves, allowing for maximum clock speeds of up to 5.4 GHz. There is also no lack in terms of the cache, and 16 MB of L2 cache and particularly 64 MB of L3 cache ensure minimum load times.
Our performance rating across various CPU benchmarks shows what this means in practice. The Zen4 processor from AMD places on top almost throughout. Only in the tasks that are performed by only a single computing core, the CPUs from Intel remain ahead. In the constant load test with Cinebench R15, the 7945HX in Turbo mode is able to surpass the values of an Intel Core i9-13980HX (also in Turbo mode) by about 20%. In the Cinebench R23, this is at least still 5%. The performance difference to AMD's preceding processor generation with the Zen3 architecture is even more remarkable. The AMD Ryzen 9 6900HX reaches barely half the points, with the Intel Core i9-12950HX not doing much better either.
The power consumption remains at about the same level. With this, AMD was able to achieve a huge increase in the efficiency of its computing cores. You currently can hardly achieve a much higher performance with any mobile processor.
You can find additional performance data and comparisons in our CPU benchmark list.
Cinebench R15 Multi Constant Load Test
Cinebench R23: Multi Core | Single Core
Cinebench R20: CPU (Multi Core) | CPU (Single Core)
Cinebench R15: CPU Multi 64Bit | CPU Single 64Bit
Blender: v2.79 BMW27 CPU
7-Zip 18.03: 7z b 4 | 7z b 4 -mmt1
Geekbench 5.5: Multi-Core | Single-Core
HWBOT x265 Benchmark v2.2: 4k Preset
LibreOffice : 20 Documents To PDF
R Benchmark 2.5: Overall mean
| CPU Performance rating | |
| Average AMD Ryzen 9 7945HX | |
| Asus Zephyrus Duo 16 GX650PY-NM006W | |
| Asus ROG Strix G16 G614JZ | |
| Asus ROG Strix G17 G713PI | |
| Razer Blade 18 RTX 4070 | |
| Average of class Gaming | |
| Asus ROG Strix Scar 17 SE G733CX-LL014W | |
| Asus ROG Strix G18 G814JI | |
| Alienware m17 R5 (R9 6900HX, RX 6850M XT) | |
| Cinebench R23 / Multi Core | |
| Asus Zephyrus Duo 16 GX650PY-NM006W | |
| Average AMD Ryzen 9 7945HX (30783 - 34613, n=9) | |
| Asus ROG Strix G17 G713PI | |
| Asus ROG Strix G16 G614JZ | |
| Razer Blade 18 RTX 4070 | |
| Average of class Gaming (10488 - 40970, n=113, last 2 years) | |
| Asus ROG Strix G18 G814JI | |
| Asus ROG Strix Scar 17 SE G733CX-LL014W | |
| Alienware m17 R5 (R9 6900HX, RX 6850M XT) | |
| Cinebench R23 / Single Core | |
| Asus ROG Strix G16 G614JZ | |
| Razer Blade 18 RTX 4070 | |
| Average of class Gaming (1166 - 2356, n=113, last 2 years) | |
| Asus Zephyrus Duo 16 GX650PY-NM006W | |
| Average AMD Ryzen 9 7945HX (1861 - 1957, n=9) | |
| Asus ROG Strix Scar 17 SE G733CX-LL014W | |
| Asus ROG Strix G18 G814JI | |
| Asus ROG Strix G17 G713PI | |
| Alienware m17 R5 (R9 6900HX, RX 6850M XT) | |
| Cinebench R20 / CPU (Multi Core) | |
| Asus Zephyrus Duo 16 GX650PY-NM006W | |
| Average AMD Ryzen 9 7945HX (10025 - 13769, n=9) | |
| Asus ROG Strix G16 G614JZ | |
| Razer Blade 18 RTX 4070 | |
| Asus ROG Strix G17 G713PI | |
| Average of class Gaming (4029 - 16108, n=112, last 2 years) | |
| Asus ROG Strix G18 G814JI | |
| Asus ROG Strix Scar 17 SE G733CX-LL014W | |
| Alienware m17 R5 (R9 6900HX, RX 6850M XT) | |
| Cinebench R20 / CPU (Single Core) | |
| Asus ROG Strix G16 G614JZ | |
| Razer Blade 18 RTX 4070 | |
| Average of class Gaming (442 - 895, n=112, last 2 years) | |
| Asus Zephyrus Duo 16 GX650PY-NM006W | |
| Average AMD Ryzen 9 7945HX (712 - 760, n=9) | |
| Asus ROG Strix Scar 17 SE G733CX-LL014W | |
| Asus ROG Strix G18 G814JI | |
| Asus ROG Strix G17 G713PI | |
| Alienware m17 R5 (R9 6900HX, RX 6850M XT) | |
| Cinebench R15 / CPU Multi 64Bit | |
| Asus Zephyrus Duo 16 GX650PY-NM006W | |
| Average AMD Ryzen 9 7945HX (4998 - 5663, n=10) | |
| Asus ROG Strix G17 G713PI | |
| Asus ROG Strix G16 G614JZ | |
| Asus ROG Strix G16 G614JZ | |
| Razer Blade 18 RTX 4070 | |
| Average of class Gaming (1578 - 6271, n=113, last 2 years) | |
| Asus ROG Strix G18 G814JI | |
| Asus ROG Strix Scar 17 SE G733CX-LL014W | |
| Alienware m17 R5 (R9 6900HX, RX 6850M XT) | |
| Cinebench R15 / CPU Single 64Bit | |
| Asus Zephyrus Duo 16 GX650PY-NM006W | |
| Asus ROG Strix G16 G614JZ | |
| Asus ROG Strix G16 G614JZ | |
| Average AMD Ryzen 9 7945HX (290 - 311, n=10) | |
| Razer Blade 18 RTX 4070 | |
| Average of class Gaming (188.8 - 343, n=112, last 2 years) | |
| Asus ROG Strix G17 G713PI | |
| Asus ROG Strix G18 G814JI | |
| Asus ROG Strix Scar 17 SE G733CX-LL014W | |
| Alienware m17 R5 (R9 6900HX, RX 6850M XT) | |
| Blender / v2.79 BMW27 CPU | |
| Alienware m17 R5 (R9 6900HX, RX 6850M XT) | |
| Asus ROG Strix Scar 17 SE G733CX-LL014W | |
| Asus ROG Strix G18 G814JI | |
| Average of class Gaming (80 - 330, n=110, last 2 years) | |
| Razer Blade 18 RTX 4070 | |
| Asus ROG Strix G16 G614JZ | |
| Asus ROG Strix G17 G713PI | |
| Average AMD Ryzen 9 7945HX (87 - 100, n=9) | |
| Asus Zephyrus Duo 16 GX650PY-NM006W | |
| 7-Zip 18.03 / 7z b 4 | |
| Asus Zephyrus Duo 16 GX650PY-NM006W | |
| Average AMD Ryzen 9 7945HX (123364 - 140932, n=9) | |
| Asus ROG Strix G17 G713PI | |
| Razer Blade 18 RTX 4070 | |
| Asus ROG Strix G16 G614JZ | |
| Average of class Gaming (33491 - 148086, n=111, last 2 years) | |
| Asus ROG Strix G18 G814JI | |
| Asus ROG Strix Scar 17 SE G733CX-LL014W | |
| Alienware m17 R5 (R9 6900HX, RX 6850M XT) | |
| 7-Zip 18.03 / 7z b 4 -mmt1 | |
| Average AMD Ryzen 9 7945HX (7319 - 7711, n=9) | |
| Asus ROG Strix G17 G713PI | |
| Asus Zephyrus Duo 16 GX650PY-NM006W | |
| Asus ROG Strix G16 G614JZ | |
| Razer Blade 18 RTX 4070 | |
| Average of class Gaming (4199 - 7436, n=111, last 2 years) | |
| Asus ROG Strix Scar 17 SE G733CX-LL014W | |
| Asus ROG Strix G18 G814JI | |
| Alienware m17 R5 (R9 6900HX, RX 6850M XT) | |
| Geekbench 5.5 / Multi-Core | |
| Razer Blade 18 RTX 4070 | |
| Average AMD Ryzen 9 7945HX (18372 - 20394, n=9) | |
| Asus Zephyrus Duo 16 GX650PY-NM006W | |
| Asus ROG Strix G16 G614JZ | |
| Asus ROG Strix G17 G713PI | |
| Average of class Gaming (6460 - 27010, n=111, last 2 years) | |
| Asus ROG Strix Scar 17 SE G733CX-LL014W | |
| Asus ROG Strix G18 G814JI | |
| Alienware m17 R5 (R9 6900HX, RX 6850M XT) | |
| Geekbench 5.5 / Single-Core | |
| Asus Zephyrus Duo 16 GX650PY-NM006W | |
| Average AMD Ryzen 9 7945HX (1960 - 2158, n=9) | |
| Asus ROG Strix G17 G713PI | |
| Asus ROG Strix G16 G614JZ | |
| Average of class Gaming (986 - 2474, n=111, last 2 years) | |
| Razer Blade 18 RTX 4070 | |
| Asus ROG Strix Scar 17 SE G733CX-LL014W | |
| Asus ROG Strix G18 G814JI | |
| Alienware m17 R5 (R9 6900HX, RX 6850M XT) | |
| HWBOT x265 Benchmark v2.2 / 4k Preset | |
| Average AMD Ryzen 9 7945HX (33.8 - 37.6, n=8) | |
| Asus Zephyrus Duo 16 GX650PY-NM006W | |
| Asus ROG Strix G17 G713PI | |
| Razer Blade 18 RTX 4070 | |
| Asus ROG Strix G16 G614JZ | |
| Average of class Gaming (11.5 - 44.3, n=111, last 2 years) | |
| Asus ROG Strix G18 G814JI | |
| Asus ROG Strix Scar 17 SE G733CX-LL014W | |
| Alienware m17 R5 (R9 6900HX, RX 6850M XT) | |
| LibreOffice / 20 Documents To PDF | |
| Asus Zephyrus Duo 16 GX650PY-NM006W | |
| Asus ROG Strix G18 G814JI | |
| Alienware m17 R5 (R9 6900HX, RX 6850M XT) | |
| Average of class Gaming (19 - 88.8, n=111, last 2 years) | |
| Asus ROG Strix G16 G614JZ | |
| Asus ROG Strix G17 G713PI | |
| Average AMD Ryzen 9 7945HX (35.5 - 60.4, n=8) | |
| Razer Blade 18 RTX 4070 | |
| Asus ROG Strix Scar 17 SE G733CX-LL014W | |
| R Benchmark 2.5 / Overall mean | |
| Alienware m17 R5 (R9 6900HX, RX 6850M XT) | |
| Asus ROG Strix G18 G814JI | |
| Average of class Gaming (0.3439 - 0.759, n=112, last 2 years) | |
| Asus ROG Strix Scar 17 SE G733CX-LL014W | |
| Asus ROG Strix G17 G713PI | |
| Average AMD Ryzen 9 7945HX (0.3884 - 0.4159, n=8) | |
| Asus Zephyrus Duo 16 GX650PY-NM006W | |
| Razer Blade 18 RTX 4070 | |
| Asus ROG Strix G16 G614JZ | |
* ... smaller is better
AIDA64: FP32 Ray-Trace | FPU Julia | CPU SHA3 | CPU Queen | FPU SinJulia | FPU Mandel | CPU AES | CPU ZLib | FP64 Ray-Trace | CPU PhotoWorxx
| Performance rating | |
| Average AMD Ryzen 9 7945HX | |
| Asus ROG Strix G17 G713PI | |
| Razer Blade 18 RTX 4070 | |
| Asus ROG Strix G16 G614JZ | |
| Average of class Gaming | |
| Asus ROG Strix Scar 17 SE G733CX-LL014W | |
| Asus ROG Strix G18 G814JI | |
| AIDA64 / FP32 Ray-Trace | |
| Average AMD Ryzen 9 7945HX (50388 - 60169, n=7) | |
| Asus ROG Strix G17 G713PI | |
| Average of class Gaming (10227 - 85542, n=110, last 2 years) | |
| Asus ROG Strix G16 G614JZ | |
| Razer Blade 18 RTX 4070 | |
| Asus ROG Strix G18 G814JI | |
| Asus ROG Strix Scar 17 SE G733CX-LL014W | |
| AIDA64 / FPU Julia | |
| Asus ROG Strix G17 G713PI | |
| Average AMD Ryzen 9 7945HX (201874 - 252486, n=7) | |
| Average of class Gaming (51376 - 238426, n=110, last 2 years) | |
| Asus ROG Strix G16 G614JZ | |
| Razer Blade 18 RTX 4070 | |
| Asus ROG Strix G18 G814JI | |
| Asus ROG Strix Scar 17 SE G733CX-LL014W | |
| AIDA64 / CPU SHA3 | |
| Average AMD Ryzen 9 7945HX (8525 - 10389, n=7) | |
| Asus ROG Strix G17 G713PI | |
| Asus ROG Strix G16 G614JZ | |
| Razer Blade 18 RTX 4070 | |
| Average of class Gaming (2180 - 9817, n=110, last 2 years) | |
| Asus ROG Strix G18 G814JI | |
| Asus ROG Strix Scar 17 SE G733CX-LL014W | |
| AIDA64 / CPU Queen | |
| Average AMD Ryzen 9 7945HX (175041 - 200651, n=7) | |
| Asus ROG Strix G17 G713PI | |
| Asus ROG Strix G16 G614JZ | |
| Razer Blade 18 RTX 4070 | |
| Average of class Gaming (49785 - 173351, n=101, last 2 years) | |
| Asus ROG Strix G18 G814JI | |
| Asus ROG Strix Scar 17 SE G733CX-LL014W | |
| AIDA64 / FPU SinJulia | |
| Average AMD Ryzen 9 7945HX (28794 - 32988, n=7) | |
| Asus ROG Strix G17 G713PI | |
| Asus ROG Strix G16 G614JZ | |
| Razer Blade 18 RTX 4070 | |
| Average of class Gaming (4424 - 33636, n=110, last 2 years) | |
| Asus ROG Strix Scar 17 SE G733CX-LL014W | |
| Asus ROG Strix G18 G814JI | |
| AIDA64 / FPU Mandel | |
| Average AMD Ryzen 9 7945HX (105740 - 134044, n=7) | |
| Asus ROG Strix G17 G713PI | |
| Average of class Gaming (25115 - 128721, n=110, last 2 years) | |
| Asus ROG Strix G16 G614JZ | |
| Razer Blade 18 RTX 4070 | |
| Asus ROG Strix G18 G814JI | |
| Asus ROG Strix Scar 17 SE G733CX-LL014W | |
| AIDA64 / CPU AES | |
| Average AMD Ryzen 9 7945HX (126790 - 325960, n=7) | |
| Asus ROG Strix G17 G713PI | |
| Asus ROG Strix Scar 17 SE G733CX-LL014W | |
| Asus ROG Strix G16 G614JZ | |
| Razer Blade 18 RTX 4070 | |
| Average of class Gaming (39258 - 247074, n=110, last 2 years) | |
| Asus ROG Strix G18 G814JI | |
| AIDA64 / CPU ZLib | |
| Average AMD Ryzen 9 7945HX (2022 - 2409, n=7) | |
| Asus ROG Strix G17 G713PI | |
| Asus ROG Strix G16 G614JZ | |
| Razer Blade 18 RTX 4070 | |
| Average of class Gaming (574 - 2531, n=110, last 2 years) | |
| Asus ROG Strix G18 G814JI | |
| Asus ROG Strix Scar 17 SE G733CX-LL014W | |
| AIDA64 / FP64 Ray-Trace | |
| Average AMD Ryzen 9 7945HX (26875 - 31796, n=7) | |
| Asus ROG Strix G17 G713PI | |
| Average of class Gaming (5509 - 45446, n=110, last 2 years) | |
| Asus ROG Strix G16 G614JZ | |
| Razer Blade 18 RTX 4070 | |
| Asus ROG Strix G18 G814JI | |
| Asus ROG Strix Scar 17 SE G733CX-LL014W | |
| AIDA64 / CPU PhotoWorxx | |
| Razer Blade 18 RTX 4070 | |
| Average of class Gaming (12271 - 89891, n=110, last 2 years) | |
| Asus ROG Strix Scar 17 SE G733CX-LL014W | |
| Asus ROG Strix G18 G814JI | |
| Asus ROG Strix G16 G614JZ | |
| Average AMD Ryzen 9 7945HX (31421 - 40095, n=7) | |
| Asus ROG Strix G17 G713PI | |
System Performance
Basically, everything works fast with the Asus ROG Strix. Installing programs, deleting, and easily running several applications in parallel doesn't pose any problems at all for the gaming laptop. There are almost no wait times at all, particularly since the processor operates at a high level throughout.
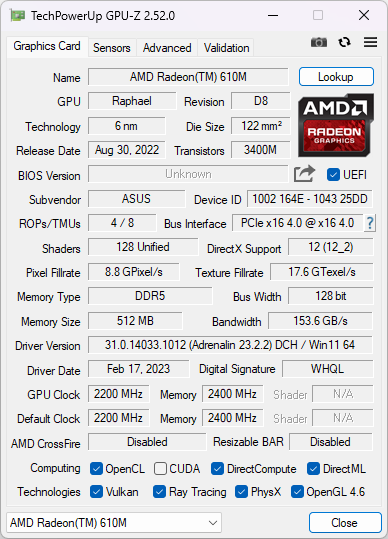
On the other hand, switching between the internal AMD Radeon 610M and the Nvidia GeForce RTX 4070 doesn't work without any problems. Occasionally, you will see a black screen when starting some program, and that not only while gaming. This is also the case when activating Nvidia Optimus. We also have to note that the dGPU is repeatedly given some tasks, for example while surfing. This unnecessarily increases the power consumption or decreases the runtime during battery operation.
However, we should hope that some additional driver updates will remedy these behaviors. But until then, it is probably advisable to turn off the integrated graphics in mains operation via Armoury Crate. This will improve the user experience, particularly when often switching between programs. A frictionless cooperation between the two graphics chips would have been better.
CrossMark: Overall | Productivity | Creativity | Responsiveness
| PCMark 10 / Score | |
| Asus Zephyrus Duo 16 GX650PY-NM006W | |
| Average of class Gaming (5828 - 11574, n=96, last 2 years) | |
| Average AMD Ryzen 9 7945HX, NVIDIA GeForce RTX 4070 Laptop GPU (7449 - 8334, n=2) | |
| Razer Blade 18 RTX 4070 | |
| Asus ROG Strix G17 G713PI | |
| Alienware m17 R5 (R9 6900HX, RX 6850M XT) | |
| Asus ROG Strix G16 G614JZ | |
| Asus ROG Strix Scar 17 SE G733CX-LL014W | |
| Asus ROG Strix G18 G814JI | |
| PCMark 10 / Essentials | |
| Asus Zephyrus Duo 16 GX650PY-NM006W | |
| Asus ROG Strix G16 G614JZ | |
| Razer Blade 18 RTX 4070 | |
| Average AMD Ryzen 9 7945HX, NVIDIA GeForce RTX 4070 Laptop GPU (11166 - 11364, n=2) | |
| Asus ROG Strix G17 G713PI | |
| Average of class Gaming (8810 - 12600, n=100, last 2 years) | |
| Asus ROG Strix Scar 17 SE G733CX-LL014W | |
| Alienware m17 R5 (R9 6900HX, RX 6850M XT) | |
| Asus ROG Strix G18 G814JI | |
| PCMark 10 / Productivity | |
| Asus Zephyrus Duo 16 GX650PY-NM006W | |
| Asus ROG Strix G17 G713PI | |
| Average AMD Ryzen 9 7945HX, NVIDIA GeForce RTX 4070 Laptop GPU (10441 - 11087, n=2) | |
| Average of class Gaming (6845 - 18766, n=98, last 2 years) | |
| Asus ROG Strix Scar 17 SE G733CX-LL014W | |
| Razer Blade 18 RTX 4070 | |
| Alienware m17 R5 (R9 6900HX, RX 6850M XT) | |
| Asus ROG Strix G18 G814JI | |
| Asus ROG Strix G16 G614JZ | |
| PCMark 10 / Digital Content Creation | |
| Asus Zephyrus Duo 16 GX650PY-NM006W | |
| Average of class Gaming (7602 - 19657, n=98, last 2 years) | |
| Alienware m17 R5 (R9 6900HX, RX 6850M XT) | |
| Average AMD Ryzen 9 7945HX, NVIDIA GeForce RTX 4070 Laptop GPU (9062 - 13239, n=2) | |
| Asus ROG Strix G16 G614JZ | |
| Razer Blade 18 RTX 4070 | |
| Asus ROG Strix Scar 17 SE G733CX-LL014W | |
| Asus ROG Strix G17 G713PI | |
| Asus ROG Strix G18 G814JI | |
| CrossMark / Overall | |
| Asus ROG Strix G16 G614JZ | |
| Razer Blade 18 RTX 4070 | |
| Asus ROG Strix Scar 17 SE G733CX-LL014W | |
| Asus Zephyrus Duo 16 GX650PY-NM006W | |
| Average AMD Ryzen 9 7945HX, NVIDIA GeForce RTX 4070 Laptop GPU (2037 - 2044, n=2) | |
| Asus ROG Strix G17 G713PI | |
| Average of class Gaming (1366 - 2409, n=98, last 2 years) | |
| Alienware m17 R5 (R9 6900HX, RX 6850M XT) | |
| CrossMark / Productivity | |
| Asus ROG Strix G16 G614JZ | |
| Razer Blade 18 RTX 4070 | |
| Asus ROG Strix Scar 17 SE G733CX-LL014W | |
| Asus Zephyrus Duo 16 GX650PY-NM006W | |
| Asus ROG Strix G17 G713PI | |
| Average AMD Ryzen 9 7945HX, NVIDIA GeForce RTX 4070 Laptop GPU (1909 - 1917, n=2) | |
| Average of class Gaming (1386 - 2254, n=98, last 2 years) | |
| Alienware m17 R5 (R9 6900HX, RX 6850M XT) | |
| CrossMark / Creativity | |
| Asus ROG Strix G16 G614JZ | |
| Razer Blade 18 RTX 4070 | |
| Asus Zephyrus Duo 16 GX650PY-NM006W | |
| Asus ROG Strix Scar 17 SE G733CX-LL014W | |
| Average AMD Ryzen 9 7945HX, NVIDIA GeForce RTX 4070 Laptop GPU (2313 - 2335, n=2) | |
| Asus ROG Strix G17 G713PI | |
| Average of class Gaming (1343 - 2729, n=98, last 2 years) | |
| Alienware m17 R5 (R9 6900HX, RX 6850M XT) | |
| CrossMark / Responsiveness | |
| Asus ROG Strix G16 G614JZ | |
| Asus ROG Strix Scar 17 SE G733CX-LL014W | |
| Razer Blade 18 RTX 4070 | |
| Average of class Gaming (1226 - 2334, n=98, last 2 years) | |
| Asus Zephyrus Duo 16 GX650PY-NM006W | |
| Average AMD Ryzen 9 7945HX, NVIDIA GeForce RTX 4070 Laptop GPU (1671 - 1682, n=2) | |
| Asus ROG Strix G17 G713PI | |
| Alienware m17 R5 (R9 6900HX, RX 6850M XT) | |
| PCMark 10 Score | 7449 points | |
Help | ||
| AIDA64 / Memory Copy | |
| Razer Blade 18 RTX 4070 | |
| Average of class Gaming (21750 - 129946, n=110, last 2 years) | |
| Asus ROG Strix G18 G814JI | |
| Asus ROG Strix Scar 17 SE G733CX-LL014W | |
| Asus ROG Strix G16 G614JZ | |
| Average AMD Ryzen 9 7945HX (48948 - 57953, n=7) | |
| Alienware m17 R5 (R9 6900HX, RX 6850M XT) | |
| Asus ROG Strix G17 G713PI | |
| AIDA64 / Memory Read | |
| Razer Blade 18 RTX 4070 | |
| Average of class Gaming (22956 - 118858, n=110, last 2 years) | |
| Asus ROG Strix G16 G614JZ | |
| Asus ROG Strix Scar 17 SE G733CX-LL014W | |
| Asus ROG Strix G18 G814JI | |
| Average AMD Ryzen 9 7945HX (56910 - 67753, n=7) | |
| Asus ROG Strix G17 G713PI | |
| Alienware m17 R5 (R9 6900HX, RX 6850M XT) | |
| AIDA64 / Memory Write | |
| Average of class Gaming (22297 - 135096, n=110, last 2 years) | |
| Razer Blade 18 RTX 4070 | |
| Asus ROG Strix Scar 17 SE G733CX-LL014W | |
| Average AMD Ryzen 9 7945HX (58602 - 70063, n=7) | |
| Asus ROG Strix G18 G814JI | |
| Asus ROG Strix G16 G614JZ | |
| Asus ROG Strix G17 G713PI | |
| Alienware m17 R5 (R9 6900HX, RX 6850M XT) | |
| AIDA64 / Memory Latency | |
| Average of class Gaming (75.3 - 259, n=110, last 2 years) | |
| Alienware m17 R5 (R9 6900HX, RX 6850M XT) | |
| Asus ROG Strix G16 G614JZ | |
| Asus ROG Strix G17 G713PI | |
| Asus ROG Strix Scar 17 SE G733CX-LL014W | |
| Razer Blade 18 RTX 4070 | |
| Average AMD Ryzen 9 7945HX (77.1 - 91.3, n=7) | |
| Asus ROG Strix G18 G814JI | |
* ... smaller is better
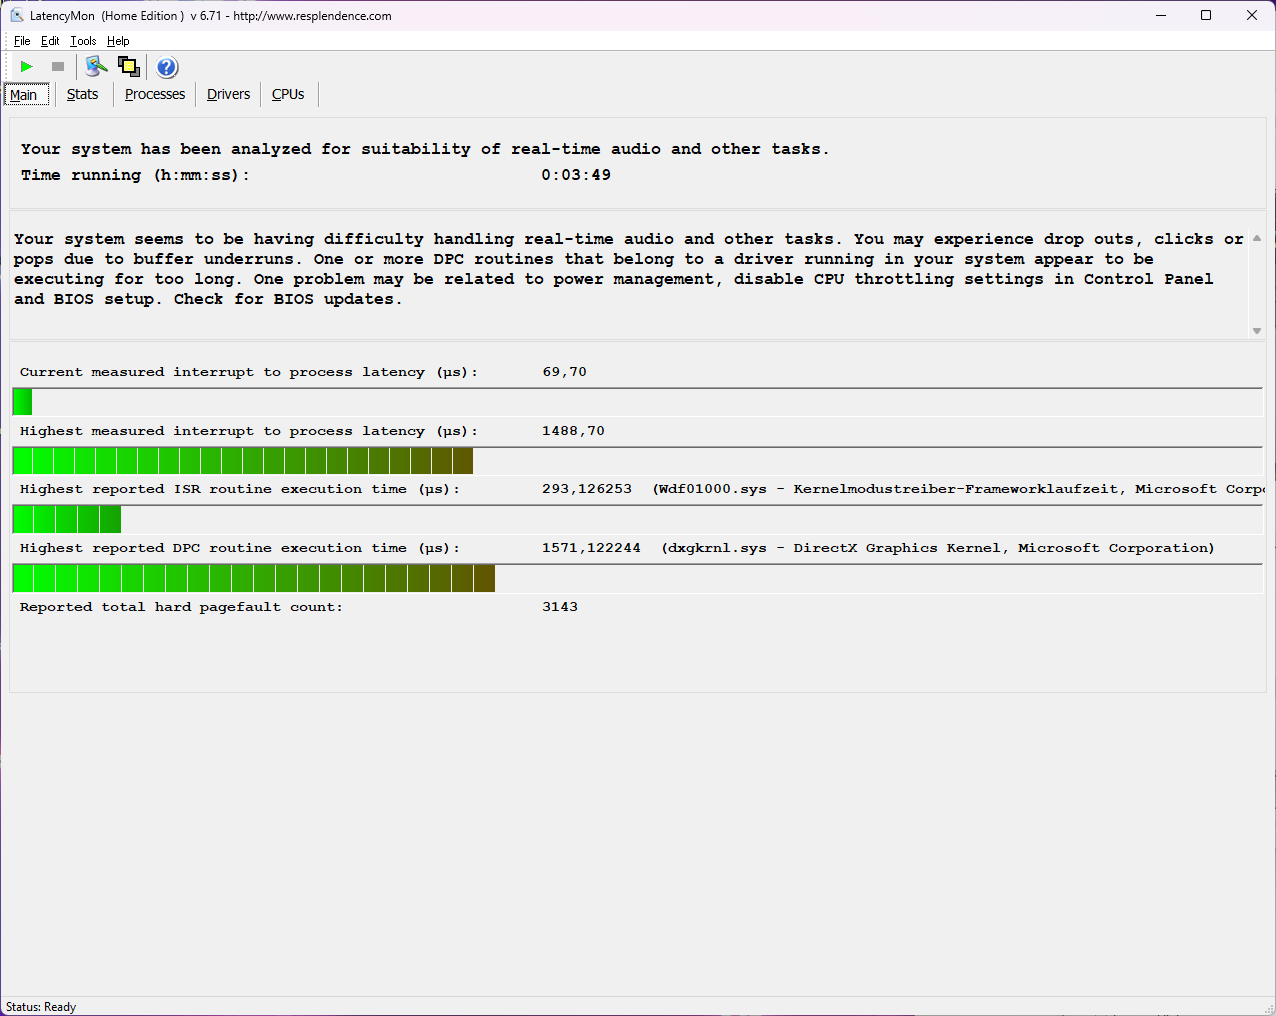
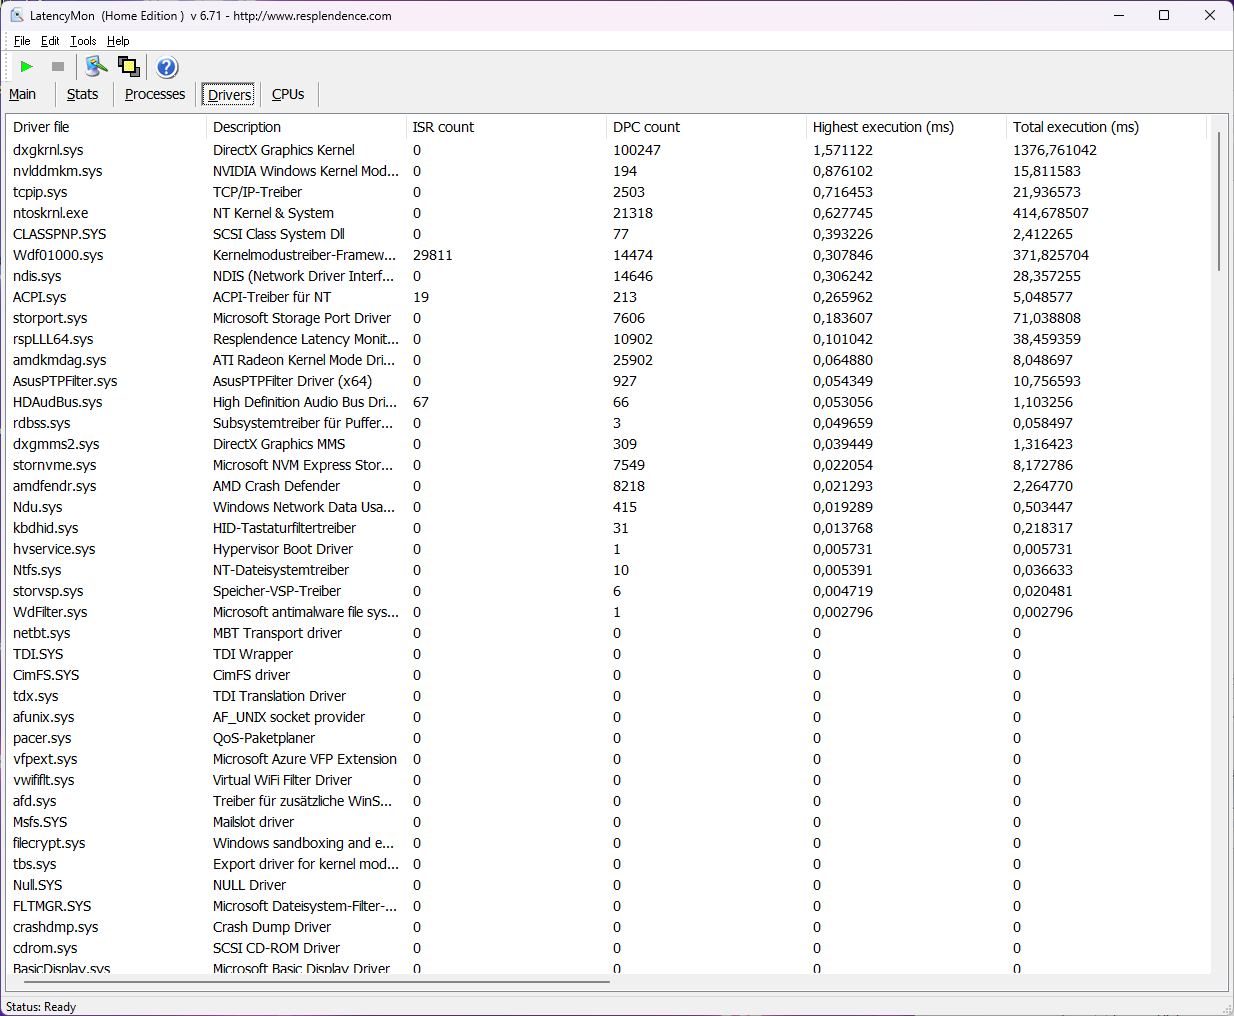
DPC Latencies
The evaluation of the latencies turns out neither particularly good nor really bad. However, the LatencyMon program warns that there might be some problems with real-time audio processing. But only very few laptops can prevent this anyways.
Currently, Nvidia warns of problems with increased latencies with its drivers. Actually, the driver list of LatencyMon shows just that particular DirectX driver as the main culprit for the less than optimal evaluation. Updating some other drivers might also change the result positively or negatively.
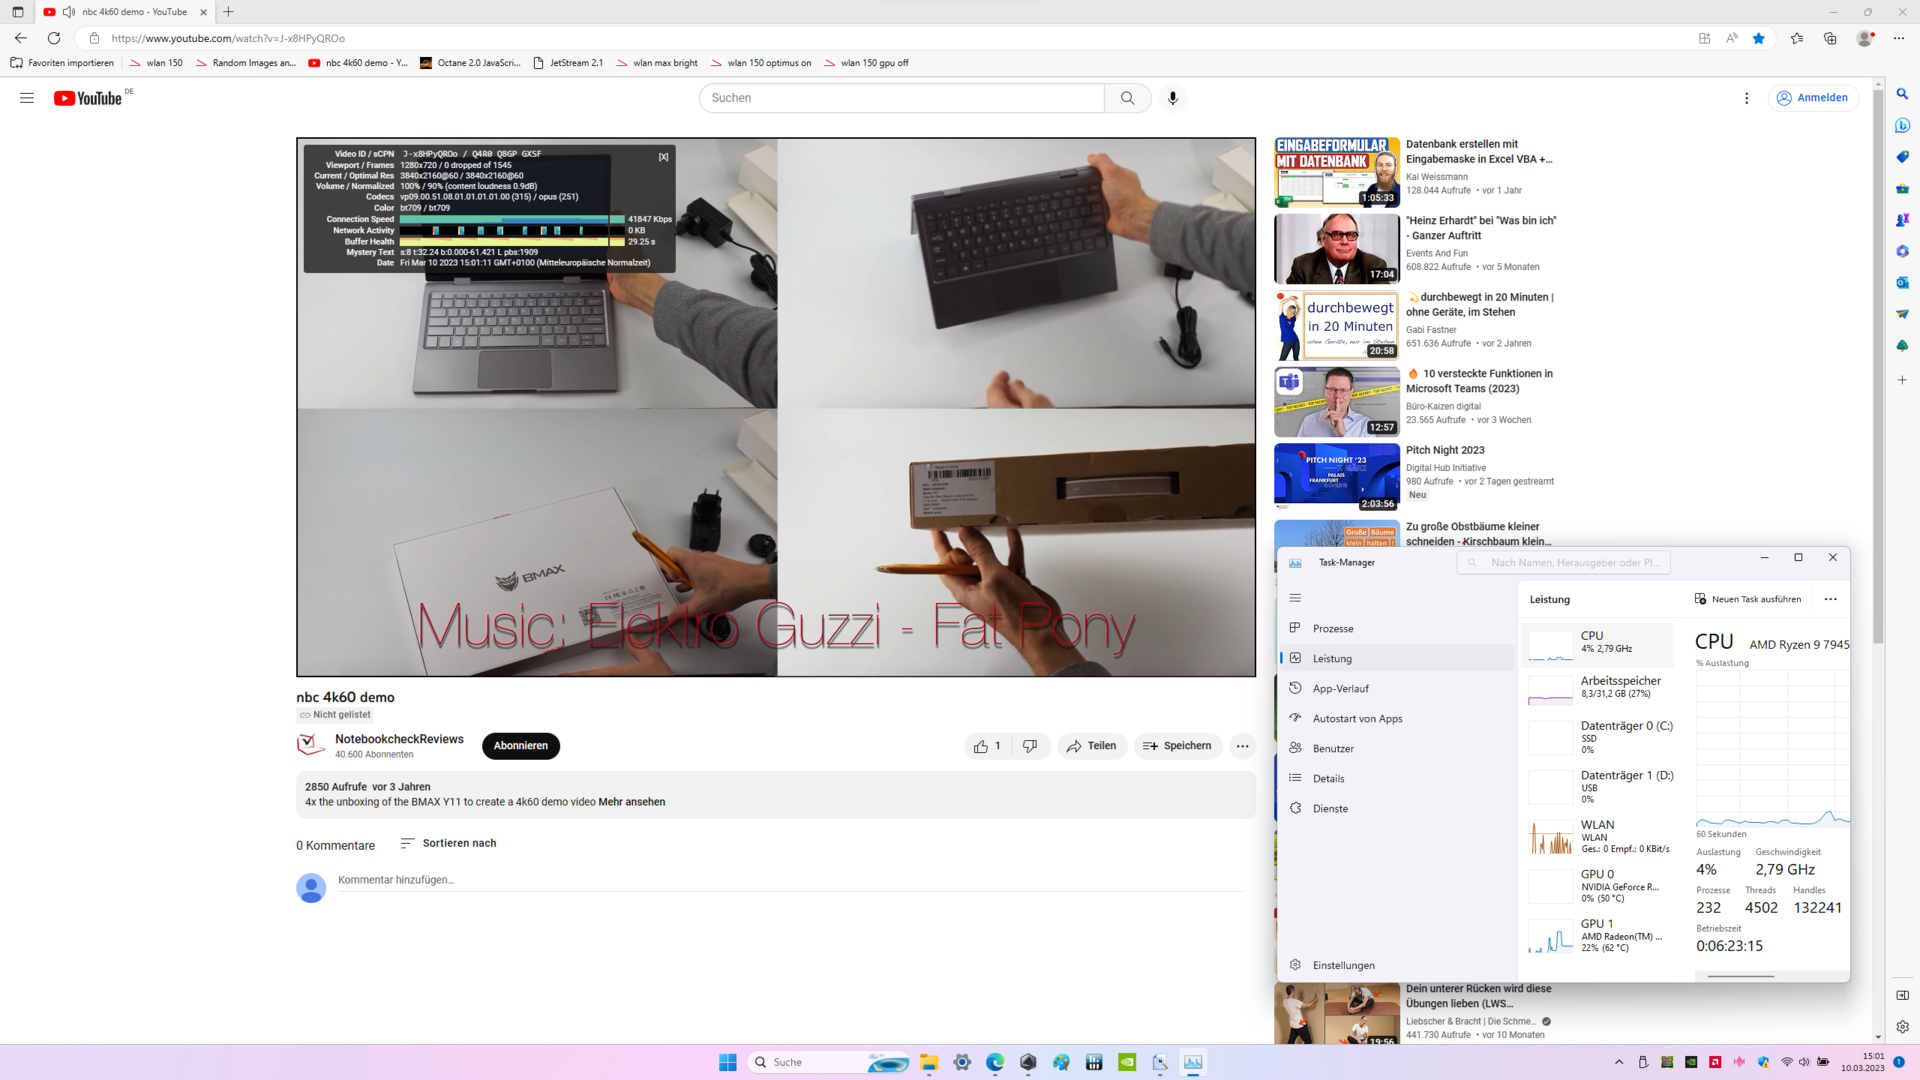
The ROG Strix G17 turns out very good but not quite perfect in the 4K video streaming test. The CPU is only loaded to 4%, and there is only a single dropped frame in the video reproduction.
| DPC Latencies / LatencyMon - interrupt to process latency (max), Web, Youtube, Prime95 | |
| Asus Zephyrus Duo 16 GX650PY-NM006W | |
| Asus ROG Strix Scar 17 SE G733CX-LL014W | |
| Asus ROG Strix G16 G614JZ | |
| Asus ROG Strix G17 G713PI | |
| Alienware m17 R5 (R9 6900HX, RX 6850M XT) | |
| Razer Blade 18 RTX 4070 | |
| Asus ROG Strix G18 G814JI | |
* ... smaller is better
Storage solution
The SSD turns out a bit weak. Compared to the competitors, the read and write performance is unable to keep up. But at least in the test for the constant stable transfer rates, the result turns out positive, since the speed doesn't have to be throttled due to high temperatures. A negative example here is the Asus ROG Strix Scar 17 with M.2 SSD RAID, whose extreme transfer rates drop to the value of a SATA SSD in the long run.
However, in practical use while gaming, rendering, or surfing, the slightly lower performance of the SSD has no noticeable effect.

* ... smaller is better
Disk Throttling: DiskSpd Read Loop, Queue Depth 8
Graphics Card
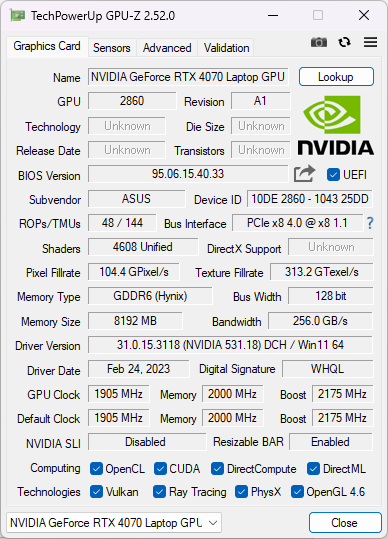
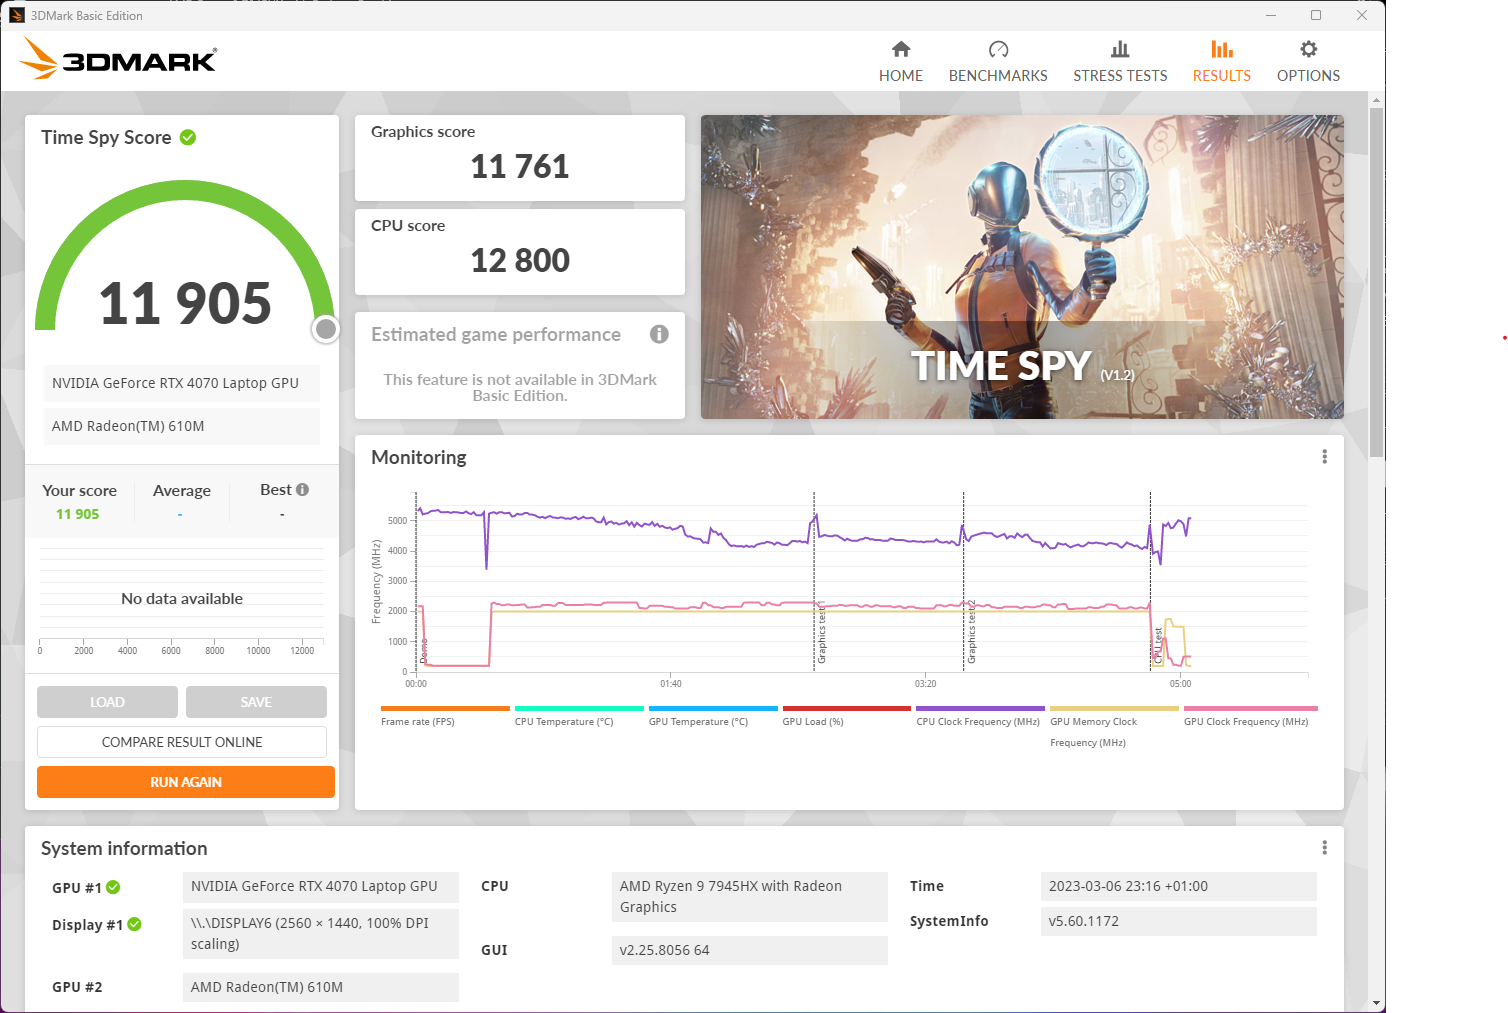
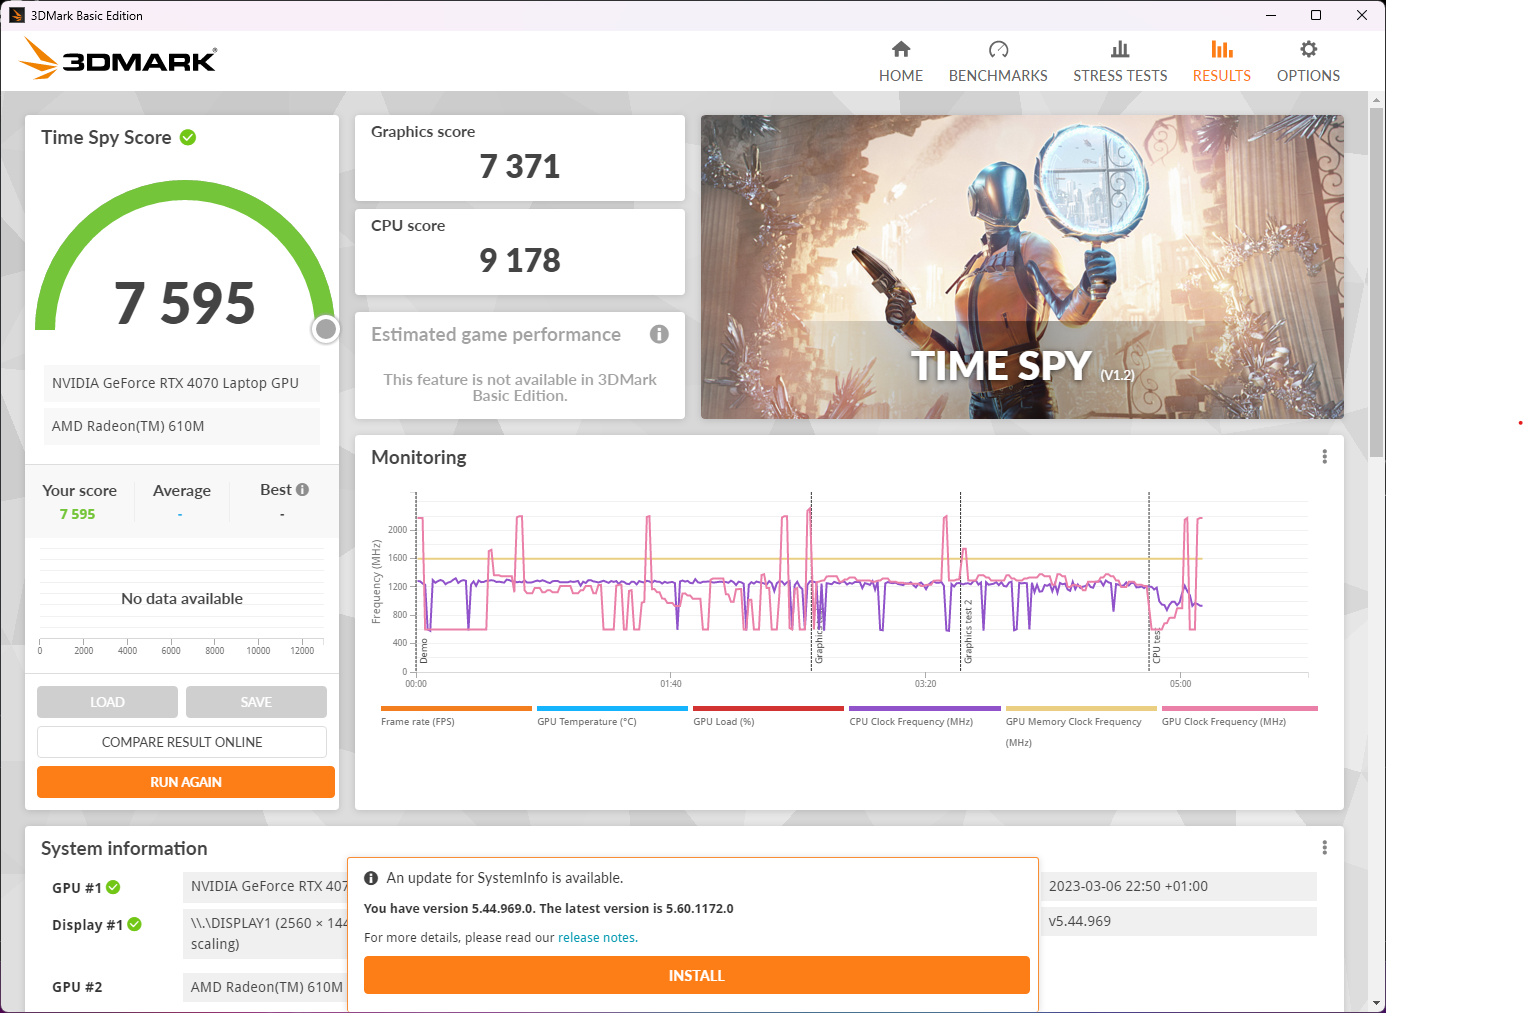
The Nvidia GeForce RTX 4070 runs in the ROG Strix G17 with the 115 W maximum power consumption allowed by the manufacturer. In addition, another 25 W can be shifted from the processor, providing a total of 140 W for the GPU. Asus increased the clock speed slightly. The system specifies 2,225 MHz, while 2,175 MHz are possible according to Nvidia. This is an increase of slightly more than 2%, which hardly makes any difference.
The GPU behaves as expected across our benchmarks. It is able to reach approximately the level of the RTX 3080 Ti, although that is able to consume 35 W more power in the concrete case. So it remains to be noted that the RTX-4000 series achieved a noticeable jump, not only in terms of the performance but also the efficiency. You can find additional results we collected in our GPU benchmark list.
| 3DMark 11 Performance | 34661 points | |
| 3DMark Cloud Gate Standard Score | 68557 points | |
| 3DMark Fire Strike Score | 28377 points | |
| 3DMark Time Spy Score | 11905 points | |
Help | ||
* ... smaller is better
Gaming Performance
Even current games can be played smoothly in native QHD resolution at maximum detail settings. If the amount of pixels that have to be computed is cut in half as is the case in Full-HD resolution, the frame rates can be doubled almost throughout.
The result is considerable. The 240-Hz display makes the high frame rates shine, while the loss in detail from QHD to Full-HD is easy to bear. But the high refresh rate also has advantages at 60 frames per second, since the input delay is still reduced significantly. This means that the display always does justice to its tasks, even at significantly less than 240 fps.
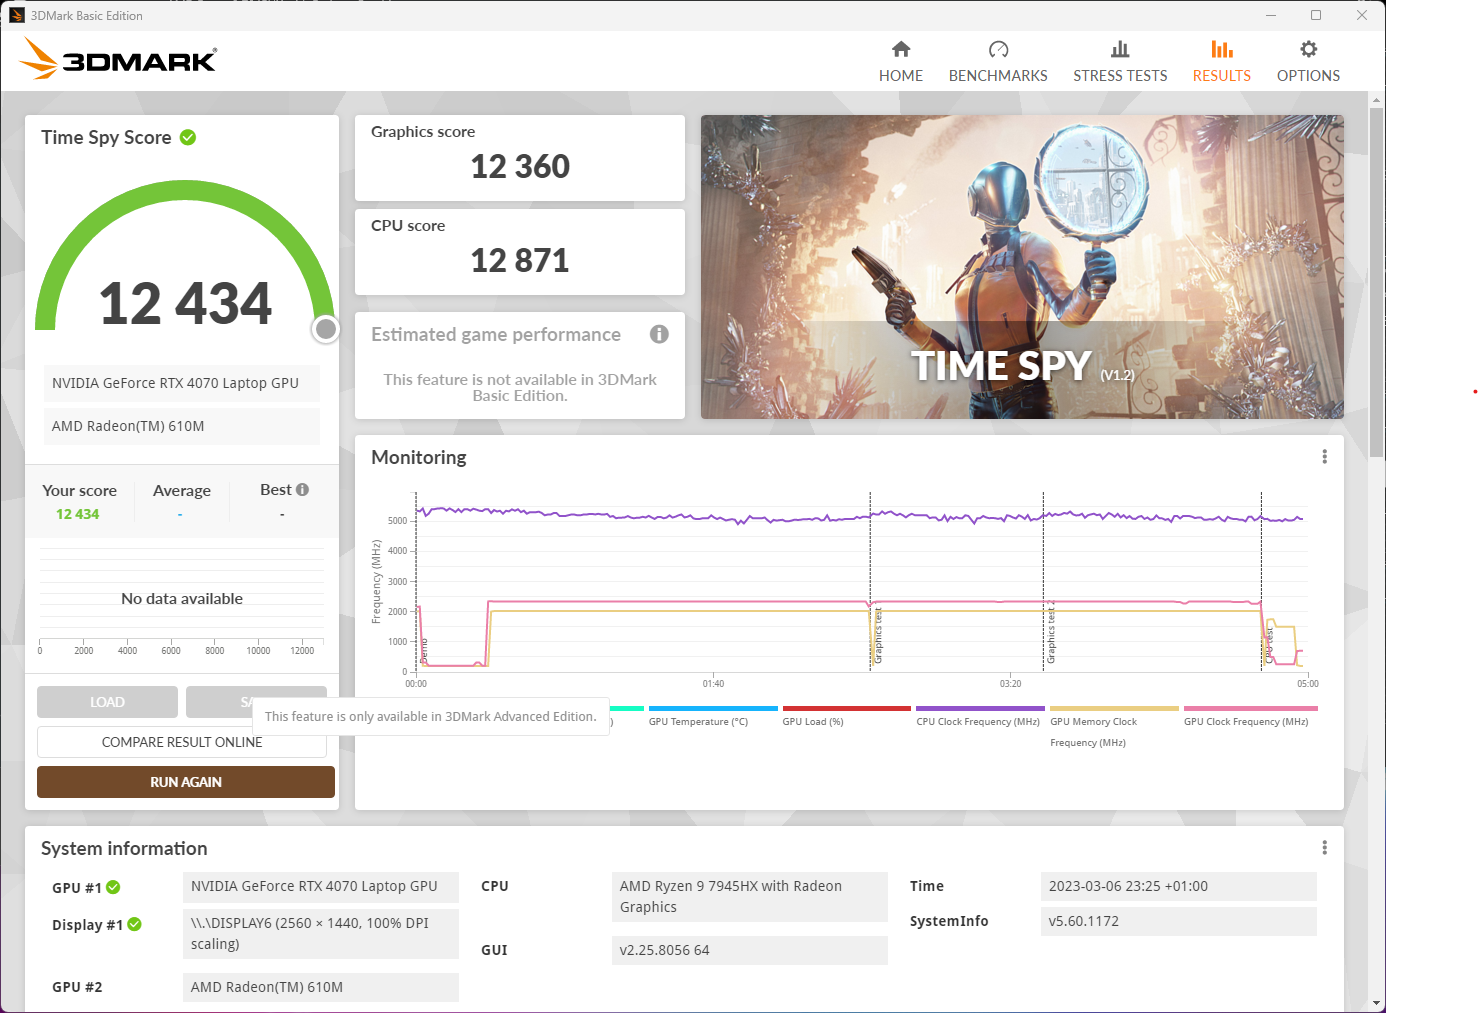
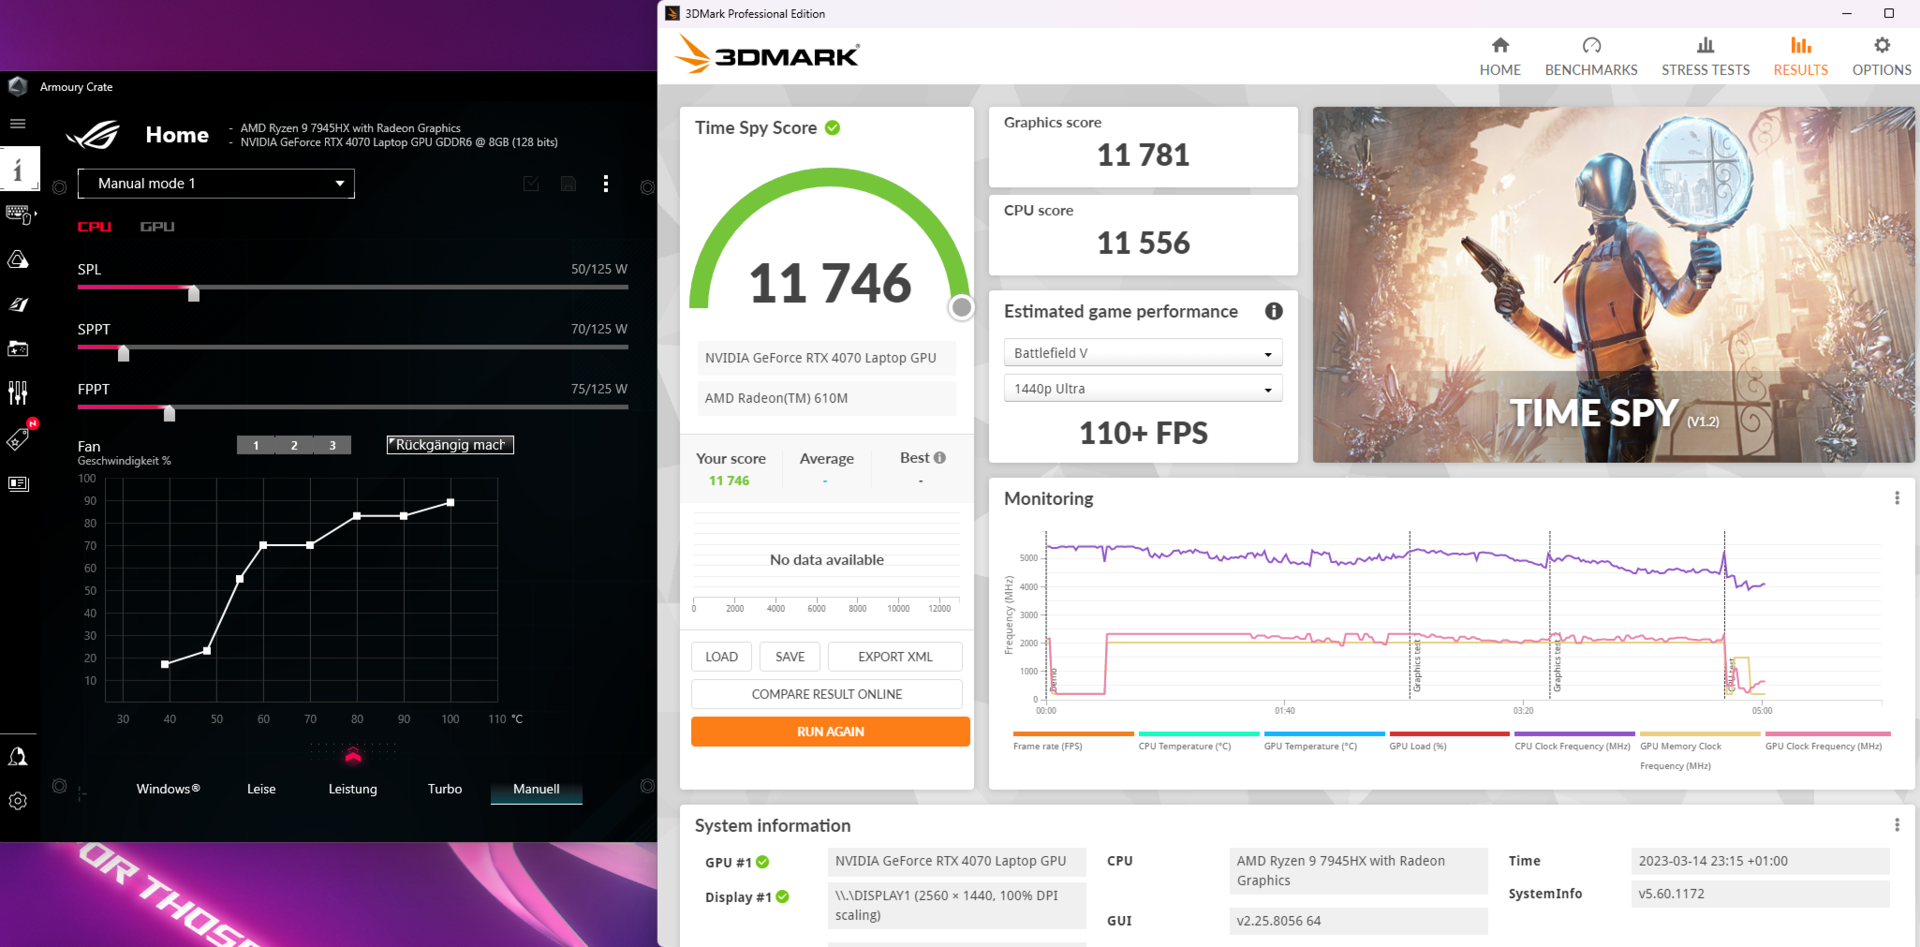
The Turbo mode hardly brings any improvements (5% in the Time-Spy benchmark), while the noise level increases hugely. The system doesn't fare too bad in battery operation. Although the power consumption is reduced significantly, it still reaches 65% of the performance in mains operation.
The powerful processor is unable to contribute much to the results here. The manual power settings allow you to reduce its power consumption to a maximum of 75 W and constant 50 W, without causing a worse benchmark result with this. But this procedure isn't really necessary, since the CPU is only allowed a significantly lower power consumption under constant load anyways. If a similar model with a weaker processor becomes available at some time in the future, it would probably perform only minimally worse in games, so it correspondingly might be the better choice.
| The Witcher 3 - 1920x1080 Ultra Graphics & Postprocessing (HBAO+) | |
| Asus Zephyrus Duo 16 GX650PY-NM006W | |
| Asus ROG Strix G16 G614JZ | |
| Average of class Gaming (95 - 240, n=8, last 2 years) | |
| Alienware m17 R5 (R9 6900HX, RX 6850M XT) | |
| Asus ROG Strix G17 G713PI | |
| Asus ROG Strix G18 G814JI | |
| Asus ROG Strix Scar 17 SE G733CX-LL014W | |
| Razer Blade 18 RTX 4070 | |
| Hogwarts Legacy | |
| 1920x1080 Ultra Preset AA:High T | |
| Asus ROG Strix G16 G614JZ | |
| Asus ROG Strix G17 G713PI | |
| Asus ROG Strix G18 G814JI | |
| Average of class Gaming (76 - 108.3, n=2, last 2 years) | |
| Average NVIDIA GeForce RTX 4070 Laptop GPU (41 - 107, n=7) | |
| 2560x1440 Ultra Preset AA:High T | |
| Asus ROG Strix G16 G614JZ | |
| Average of class Gaming (52 - 96.8, n=2, last 2 years) | |
| Asus ROG Strix G18 G814JI | |
| Average NVIDIA GeForce RTX 4070 Laptop GPU (35 - 71, n=7) | |
| Asus ROG Strix G17 G713PI | |
The Witcher 3 runs stably at a high level in the constant load test. The values of the Asus ROG Strix Scar 17 SE with the RTX 3080 Ti are almost identical. At the same time, the distance behind the RTX 4090 is very large, but that also goes for the financial costs.
The Witcher 3 FPS Chart
| low | med. | high | ultra | QHD DLSS | QHD FSR | QHD | 4K DLSS | 4K FSR | 4K | |
|---|---|---|---|---|---|---|---|---|---|---|
| GTA V (2015) | 178.1 | 114 | ||||||||
| The Witcher 3 (2015) | 216 | 121 | ||||||||
| Dota 2 Reborn (2015) | 169.8 | 163.4 | ||||||||
| Final Fantasy XV Benchmark (2018) | 114.3 | 83.3 | ||||||||
| X-Plane 11.11 (2018) | 128.5 | |||||||||
| Far Cry 5 (2018) | 141 | 132 | 114 | |||||||
| Strange Brigade (2018) | 249 | 210 | 138.1 | |||||||
| Cyberpunk 2077 1.6 (2022) | 86 | 83.3 | 53.1 | |||||||
| F1 22 (2022) | 195.2 | 76.6 | 48.4 | |||||||
| Hogwarts Legacy (2023) | 123 | 107 | 50 | |||||||
| Baldur's Gate 3 (2023) | 164.2 | 129.3 | 114.4 | 109.4 | 110.5 | 60 | 104.7 | 71.5 | 37.2 | |
| Cyberpunk 2077 (2023) | 154.7 | 123.7 | 100.4 | 87.5 | 58.6 | 49.1 | 21.2 | 20.3 | ||
| F1 24 (2024) | 284 | 269 | 220 | 77.4 | 76.1 | 77.3 | 47.7 | 27.3 | 36.3 | 21.3 |
| Star Wars Outlaws (2024) | 40.5 | 40.2 | 29.4 | 25.5 | 15.6 | |||||
| Space Marine 2 (2024) | 84 | 79.9 | 60.7 | 45.5 | 28.9 | |||||
| Call of Duty Black Ops 6 (2024) | 91 | 73 | 96 | 67 | 41 | 38 | 38 | |||
| Stalker 2 (2024) | 49.8 | 47.2 | 35.5 | 1.358 | 1.845 | |||||
| Indiana Jones and the Great Circle (2024) | 71.5 | 28.9 | 24.7 | 15.6 | ||||||
| Kingdom Come Deliverance 2 (2025) | 58.9 | 44.6 | 35.5 | 23.4 | ||||||
| Monster Hunter Wilds (2025) | 82.4 | 63.1 | 35.6 | 35.3 | 22.9 | 16.4 | 12.5 | |||
| Civilization 7 (2025) | 121.2 | 131.8 | 72.8 | 56.4 | 30.3 | |||||
| Assassin's Creed Shadows (2025) | 63 | 55 | 48 | 31 | 37 | 35 | 26 | 22 | 22 | 16 |
Emissions - The gaming laptop remains mostly subdued
Noise Levels
The fan noise turns out moderate. The Asus Zephyrus Duo 16, for example, can become noticeably louder. However, if you turn on Turbo mode, the ROG Strix G17 also shows its loud side. But we did not notice any spontaneous howling when revving up or sudden speed changes during our tests.
On the other hand, what we did notice was some coil whine in our test unit, although this remains relatively quiet and disappears when the fans turn on. When the sound is turned on, most people should not notice it, but it is easily audible in very quiet surroundings.
Noise level
| Idle |
| 26 / 29 / 30 dB(A) |
| Load |
| 46 / 47 dB(A) |
 | ||
30 dB silent 40 dB(A) audible 50 dB(A) loud |
||
min: | ||
| Asus ROG Strix G17 G713PI R9 7945HX, GeForce RTX 4070 Laptop GPU | Asus ROG Strix G18 G814JI i7-13650HX, GeForce RTX 4070 Laptop GPU | Razer Blade 18 RTX 4070 i9-13950HX, GeForce RTX 4070 Laptop GPU | Asus ROG Strix Scar 17 SE G733CX-LL014W i9-12950HX, GeForce RTX 3080 Ti Laptop GPU | Asus Zephyrus Duo 16 GX650PY-NM006W R9 7945HX, GeForce RTX 4090 Laptop GPU | Alienware m17 R5 (R9 6900HX, RX 6850M XT) R9 6900HX, Radeon RX 6850M XT | Asus ROG Strix G16 G614JZ i9-13980HX, GeForce RTX 4080 Laptop GPU | |
|---|---|---|---|---|---|---|---|
| Noise | 3% | 6% | 13% | -7% | 7% | -3% | |
| off / environment * (dB) | 25 | 25 -0% | 23.5 6% | 23.9 4% | 23.9 4% | 23 8% | 25 -0% |
| Idle Minimum * (dB) | 26 | 26 -0% | 23.8 8% | 23.9 8% | 23.9 8% | 23 12% | 26 -0% |
| Idle Average * (dB) | 29 | 28 3% | 23.8 18% | 23.9 18% | 32.9 -13% | 28.11 3% | 28 3% |
| Idle Maximum * (dB) | 30 | 29 3% | 26.8 11% | 23.9 20% | 36.5 -22% | 28.11 6% | 30 -0% |
| Load Average * (dB) | 46 | 41 11% | 37.3 19% | 34.3 25% | 42.9 7% | 30.62 33% | 48 -4% |
| Witcher 3 ultra * (dB) | 46 | 44 4% | 48 -4% | 51.2 -11% | 49.75 -8% | 49 -7% | |
| Load Maximum * (dB) | 47 | 46 2% | 53.5 -14% | 45.9 2% | 56 -19% | 50.17 -7% | 52 -11% |
* ... smaller is better
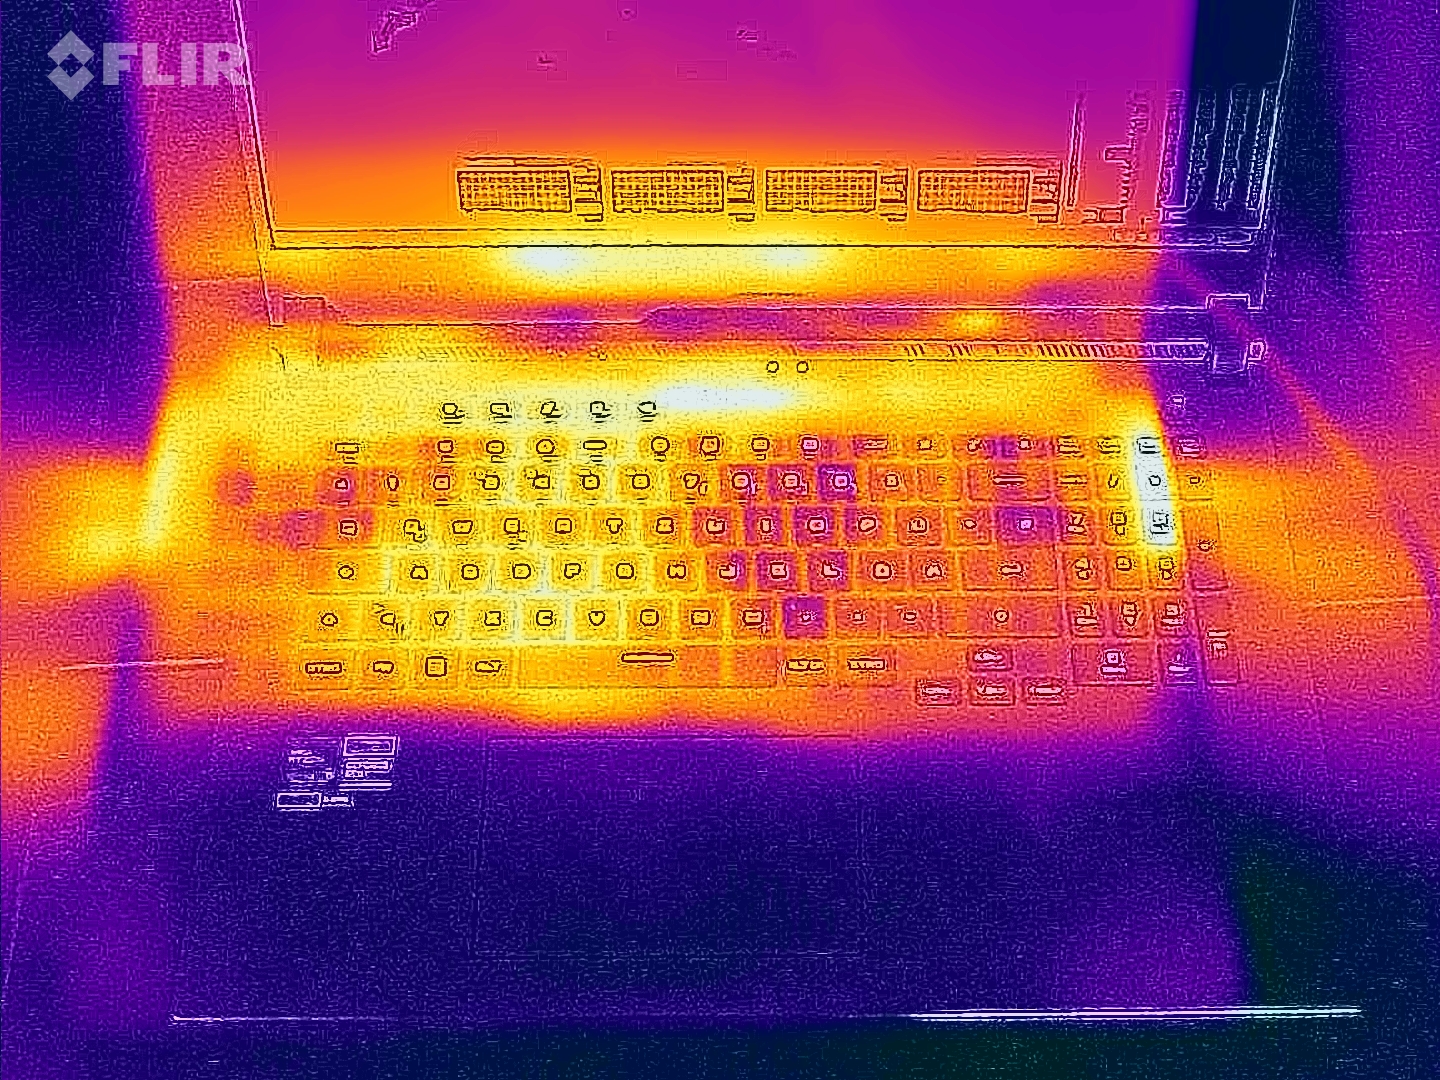
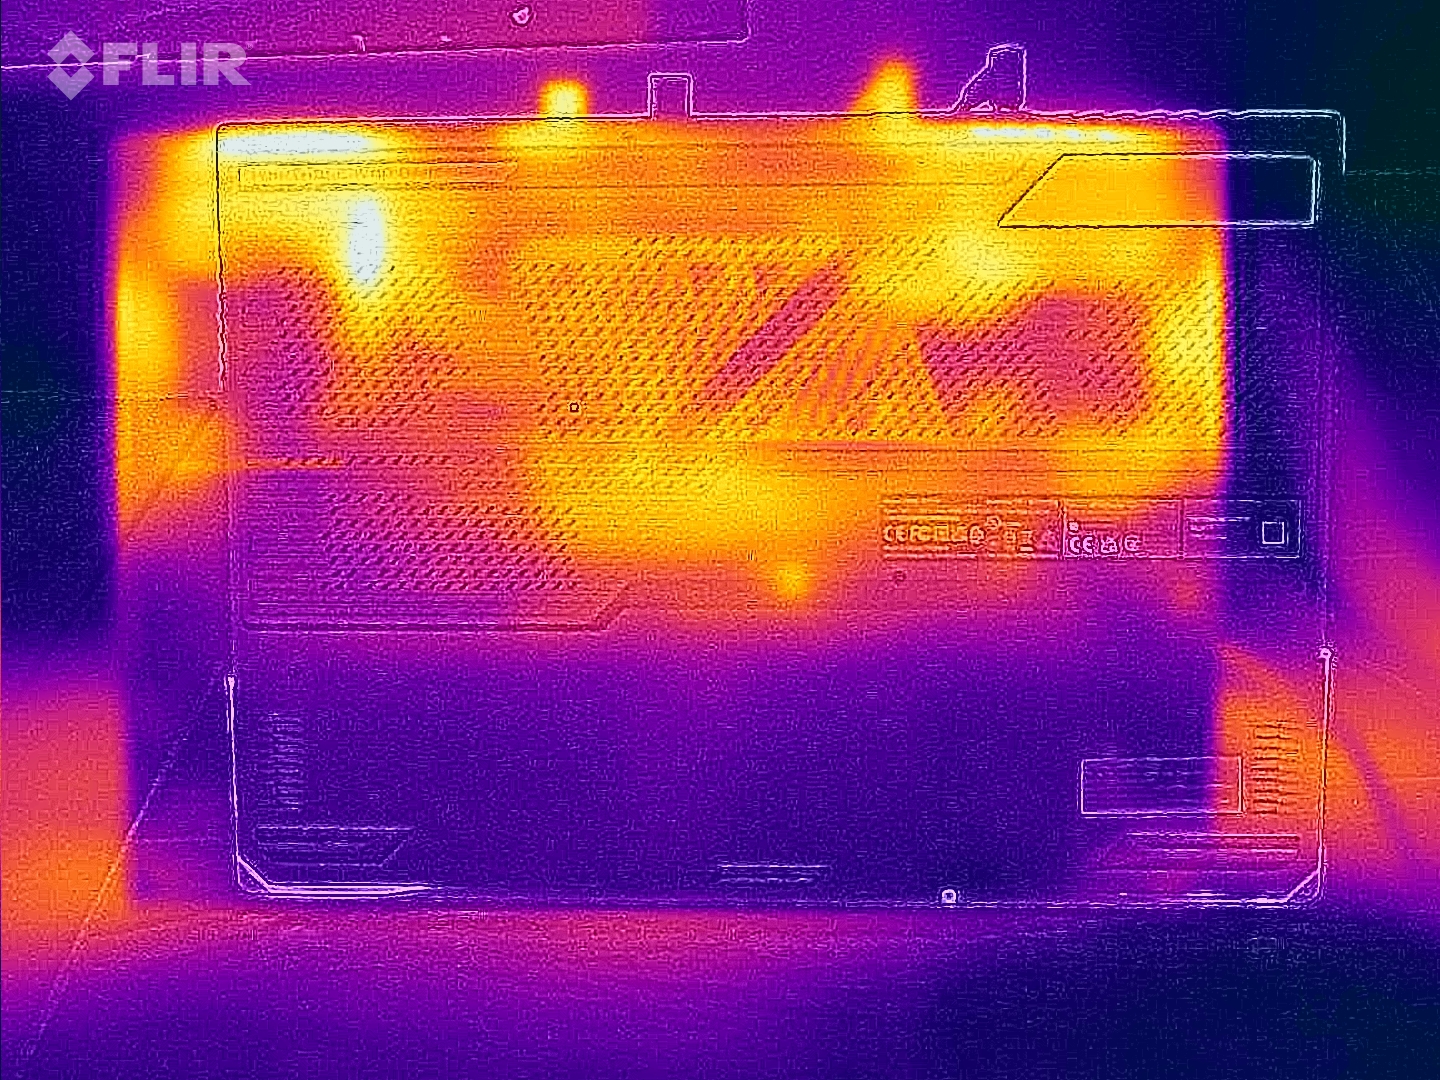
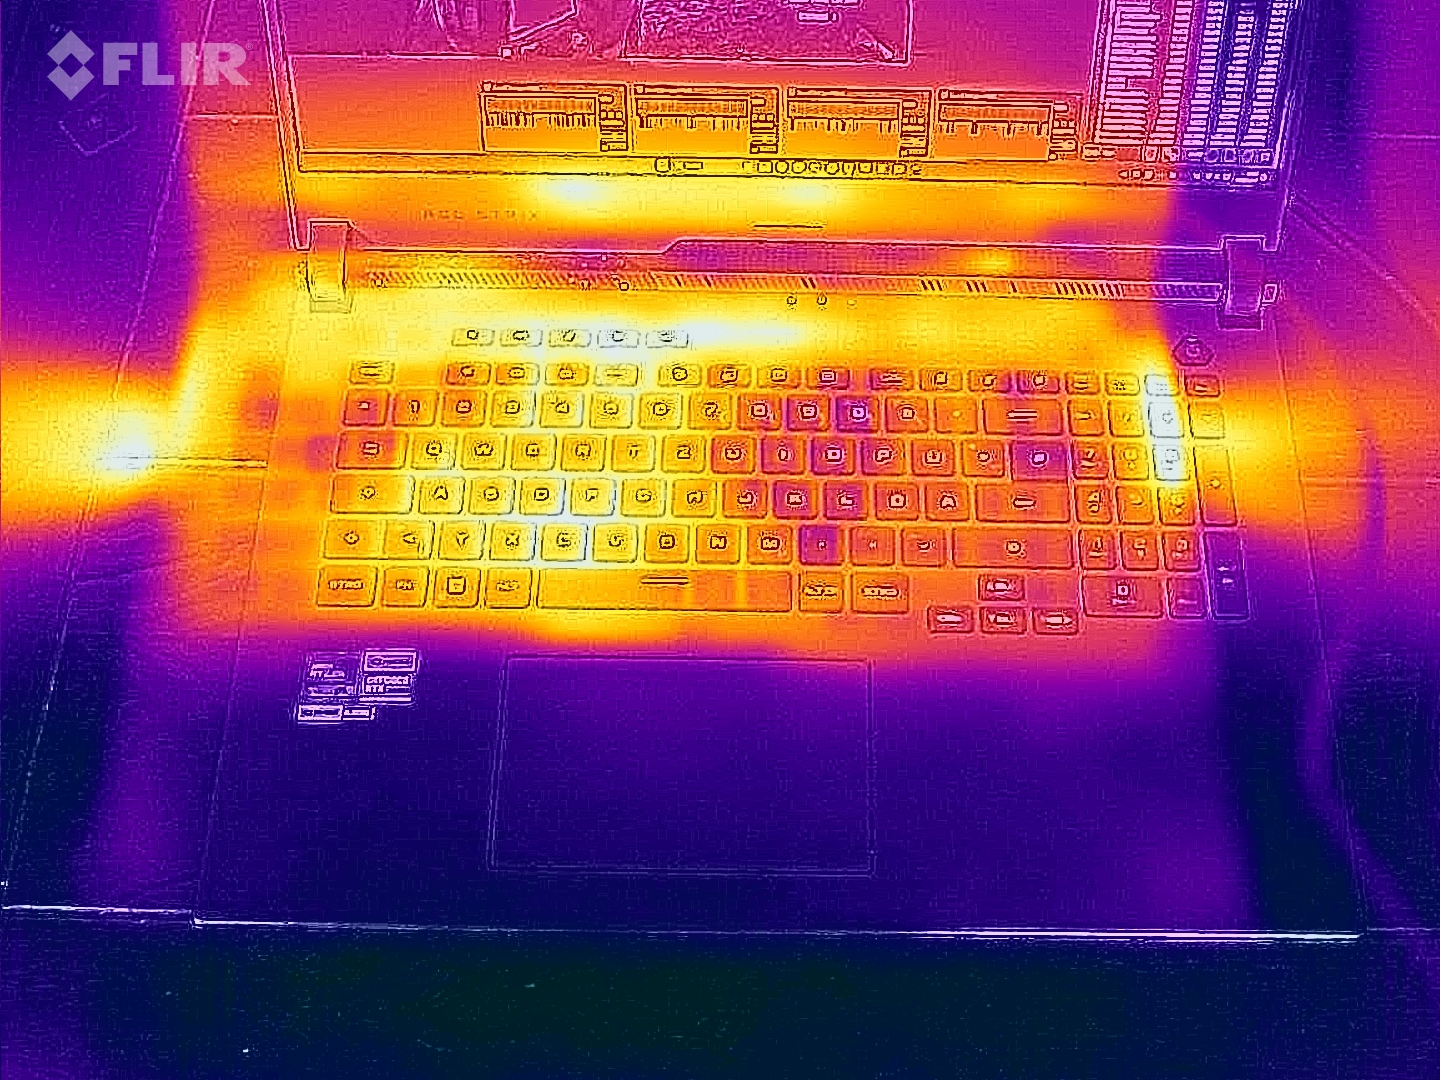
Temperatures
The gaming laptop is almost always warm. Just surfing is sufficient to lead to a noticeable temperature increase in the area of the keyboard.
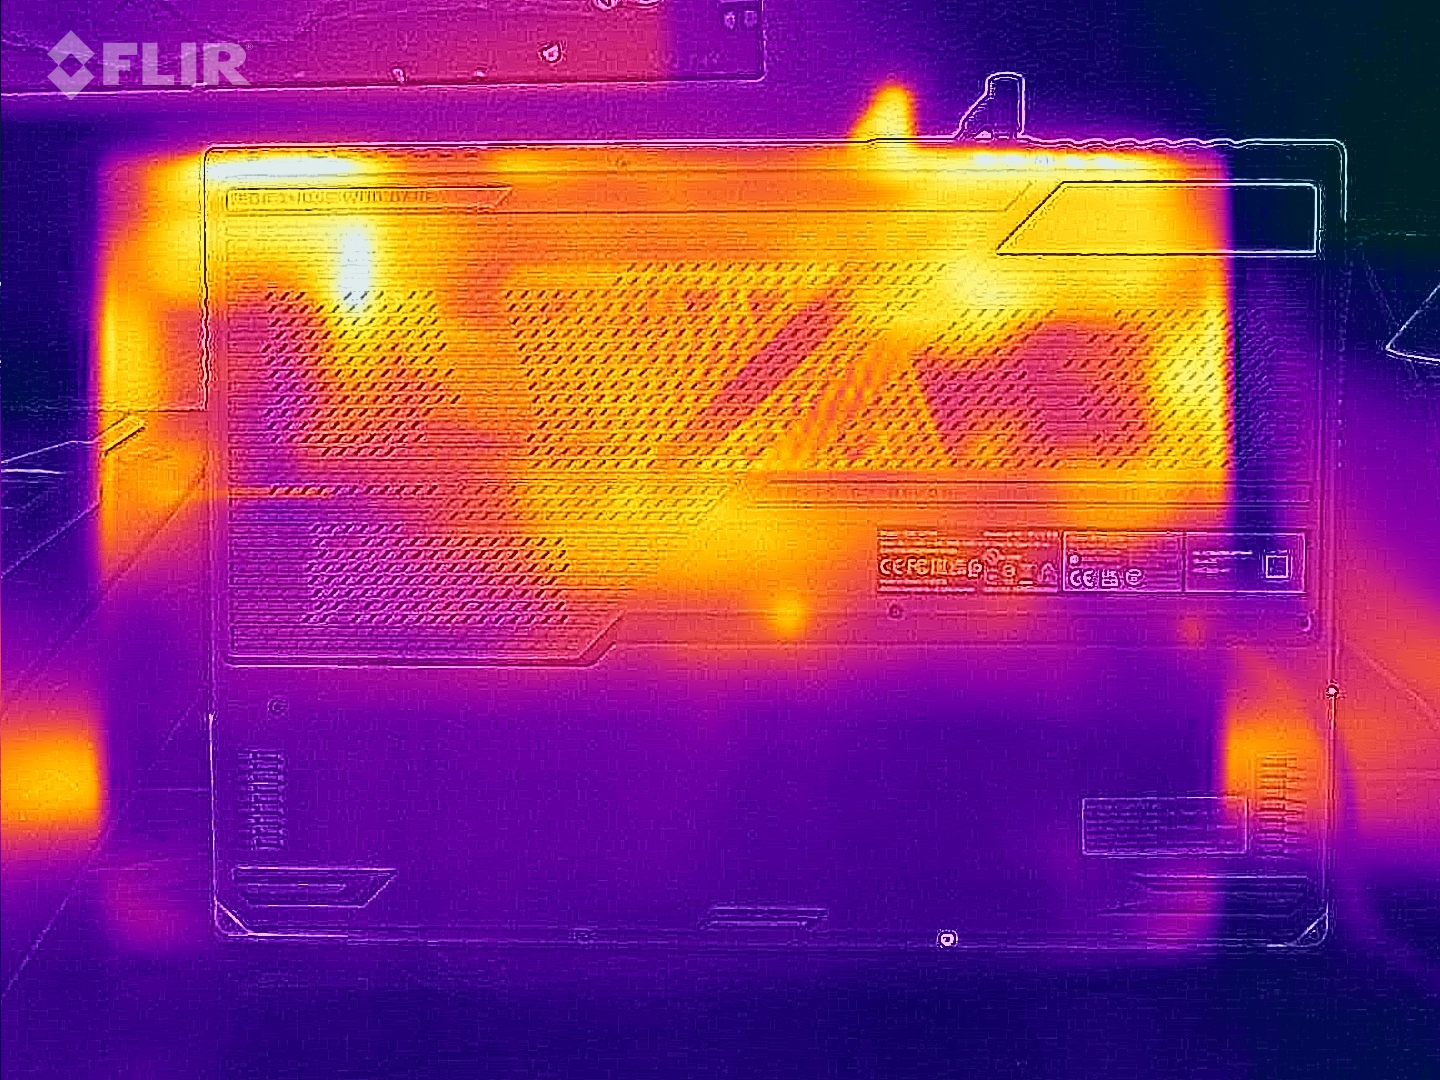
However, there is no uncomfortable surprise in the maximum values. Even under load, the surface temperatures reach only slightly more than 40 °C (104 °F), with the palm rests even remaining below 30 °C (86 °F). The heat transfer to the back of the case succeeds very well.
(±) The maximum temperature on the upper side is 42 °C / 108 F, compared to the average of 40.4 °C / 105 F, ranging from 21.2 to 68.8 °C for the class Gaming.
(±) The bottom heats up to a maximum of 41 °C / 106 F, compared to the average of 43.2 °C / 110 F
(+) In idle usage, the average temperature for the upper side is 28.8 °C / 84 F, compared to the device average of 33.9 °C / 93 F.
(±) Playing The Witcher 3, the average temperature for the upper side is 36.6 °C / 98 F, compared to the device average of 33.9 °C / 93 F.
(+) The palmrests and touchpad are cooler than skin temperature with a maximum of 28 °C / 82.4 F and are therefore cool to the touch.
(±) The average temperature of the palmrest area of similar devices was 28.8 °C / 83.8 F (+0.8 °C / 1.4 F).
| Asus ROG Strix G17 G713PI AMD Ryzen 9 7945HX, NVIDIA GeForce RTX 4070 Laptop GPU | Asus ROG Strix G18 G814JI Intel Core i7-13650HX, NVIDIA GeForce RTX 4070 Laptop GPU | Razer Blade 18 RTX 4070 Intel Core i9-13950HX, NVIDIA GeForce RTX 4070 Laptop GPU | Asus ROG Strix Scar 17 SE G733CX-LL014W Intel Core i9-12950HX, NVIDIA GeForce RTX 3080 Ti Laptop GPU | Asus Zephyrus Duo 16 GX650PY-NM006W AMD Ryzen 9 7945HX, NVIDIA GeForce RTX 4090 Laptop GPU | Alienware m17 R5 (R9 6900HX, RX 6850M XT) AMD Ryzen 9 6900HX, AMD Radeon RX 6850M XT | Asus ROG Strix G16 G614JZ Intel Core i9-13980HX, NVIDIA GeForce RTX 4080 Laptop GPU | |
|---|---|---|---|---|---|---|---|
| Heat | 1% | 7% | -9% | 1% | -10% | -12% | |
| Maximum Upper Side * (°C) | 42 | 45 -7% | 39.2 7% | 48.8 -16% | 44.2 -5% | 53 -26% | 54 -29% |
| Maximum Bottom * (°C) | 41 | 47 -15% | 35.6 13% | 52.4 -28% | 46.8 -14% | 56 -37% | 55 -34% |
| Idle Upper Side * (°C) | 33 | 28 15% | 31.8 4% | 30.4 8% | 29.2 12% | 30 9% | 29 12% |
| Idle Bottom * (°C) | 34 | 31 9% | 33.2 2% | 34.1 -0% | 30.2 11% | 29 15% | 33 3% |
* ... smaller is better
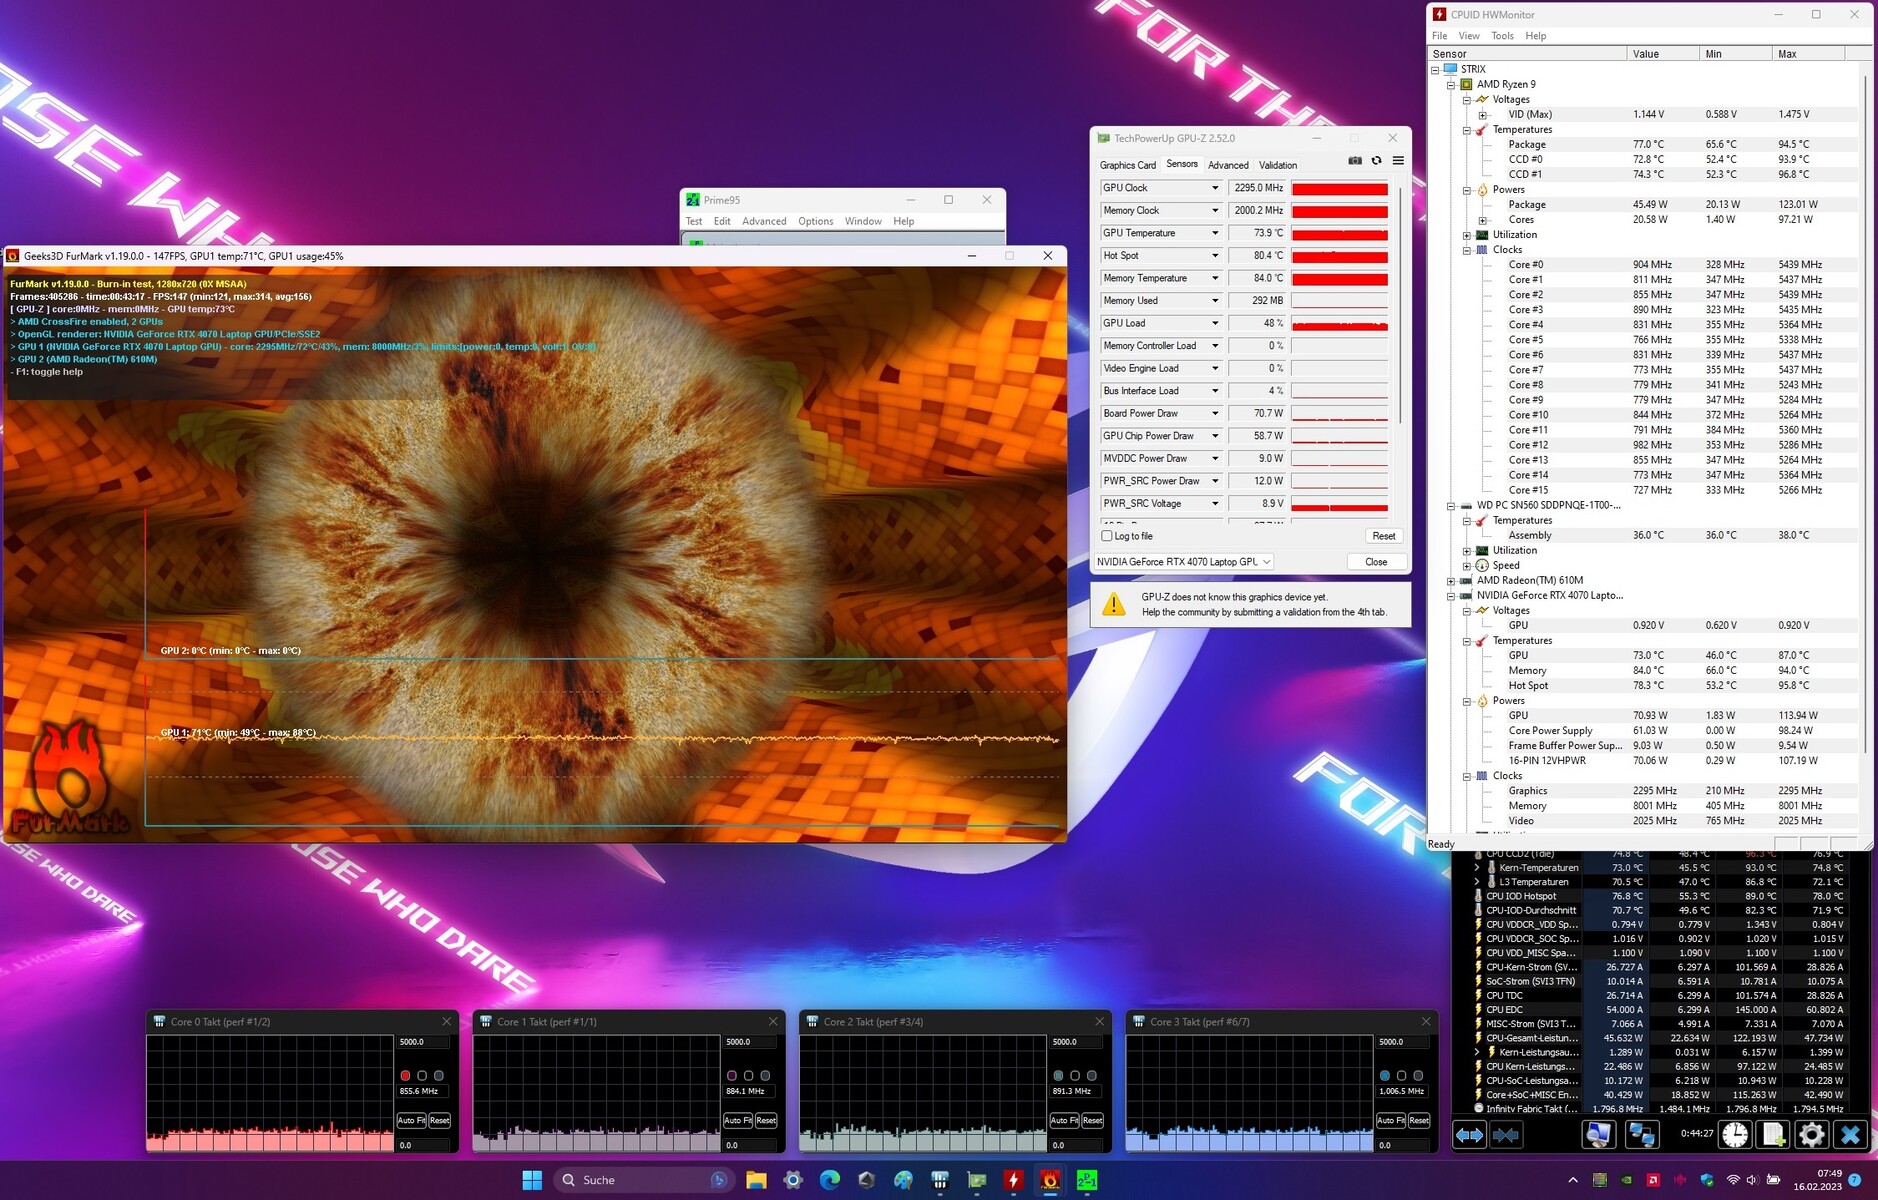
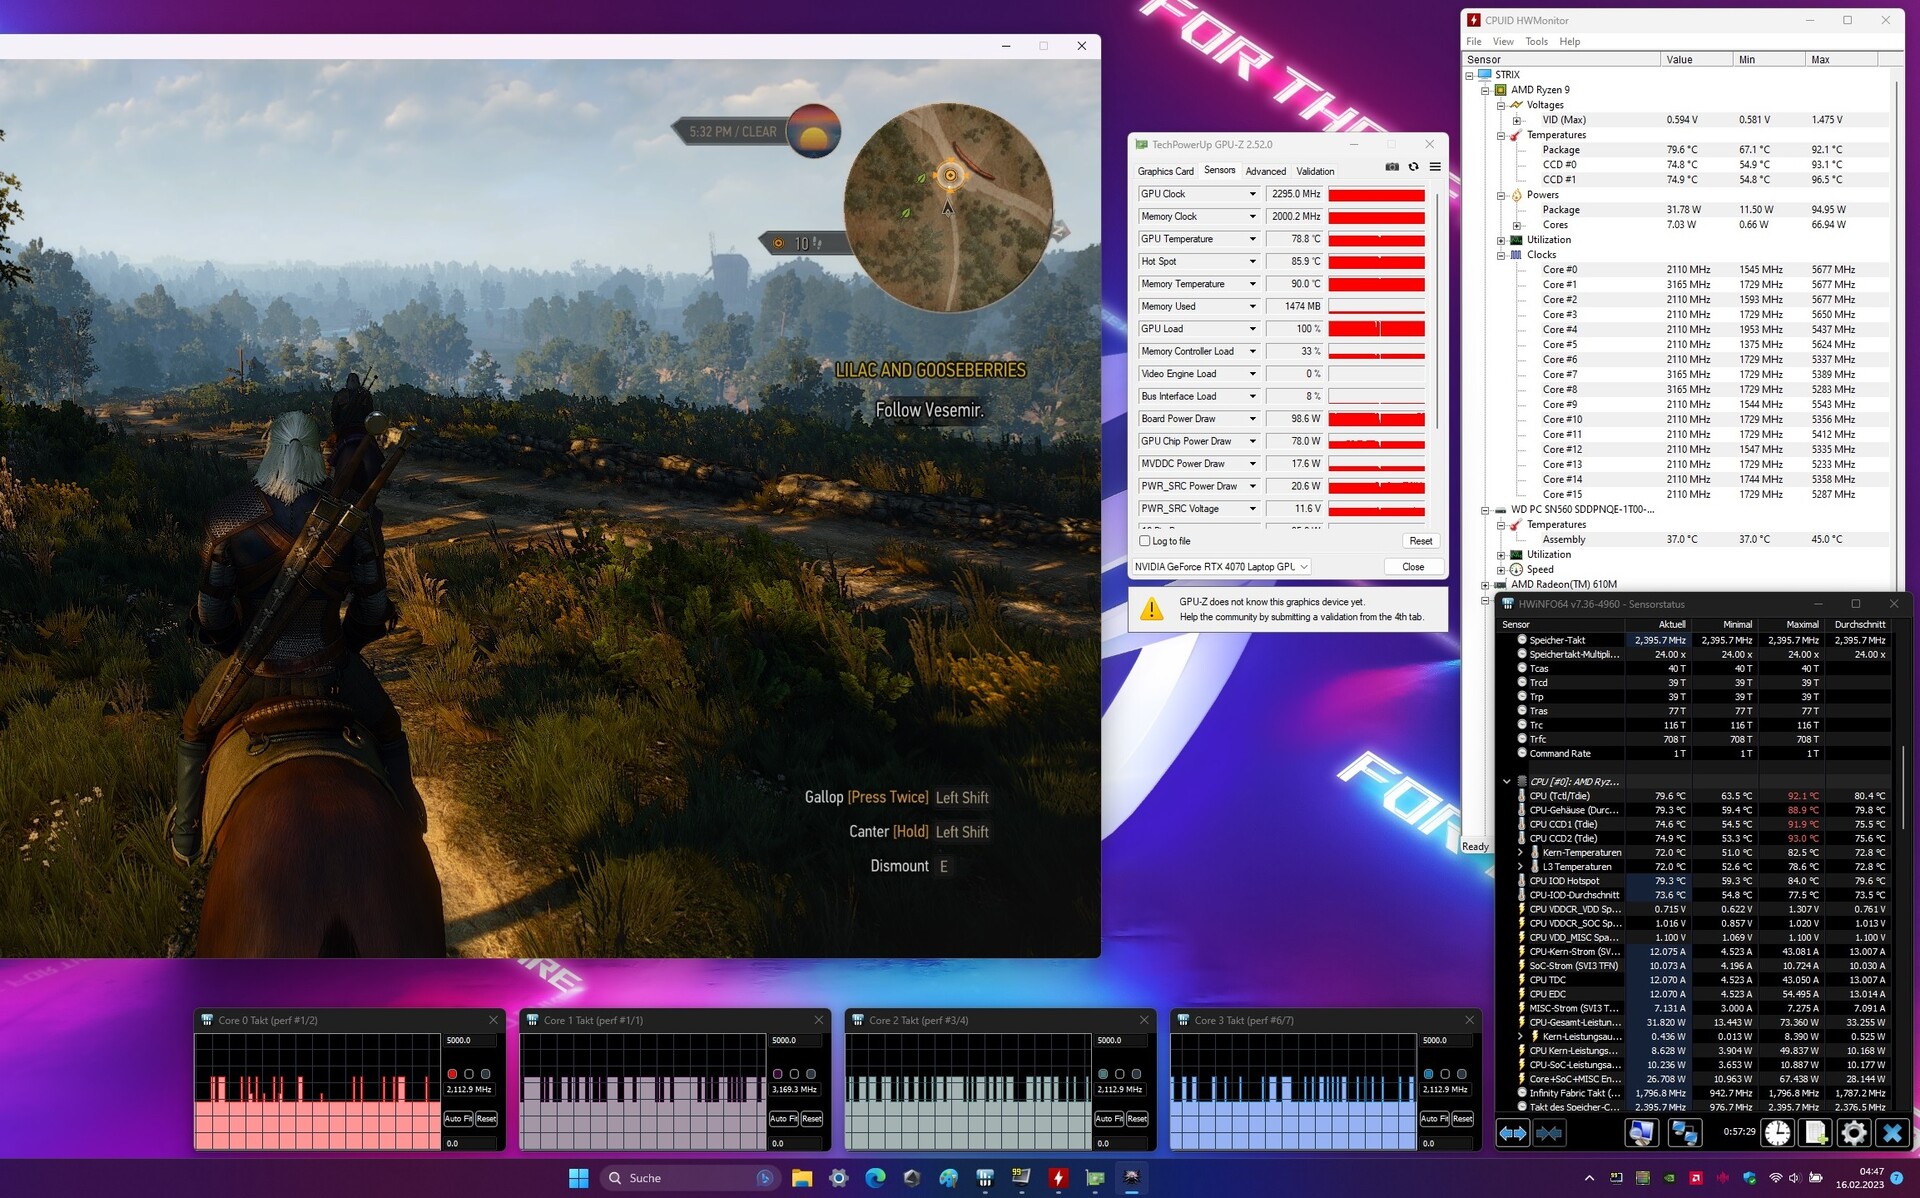
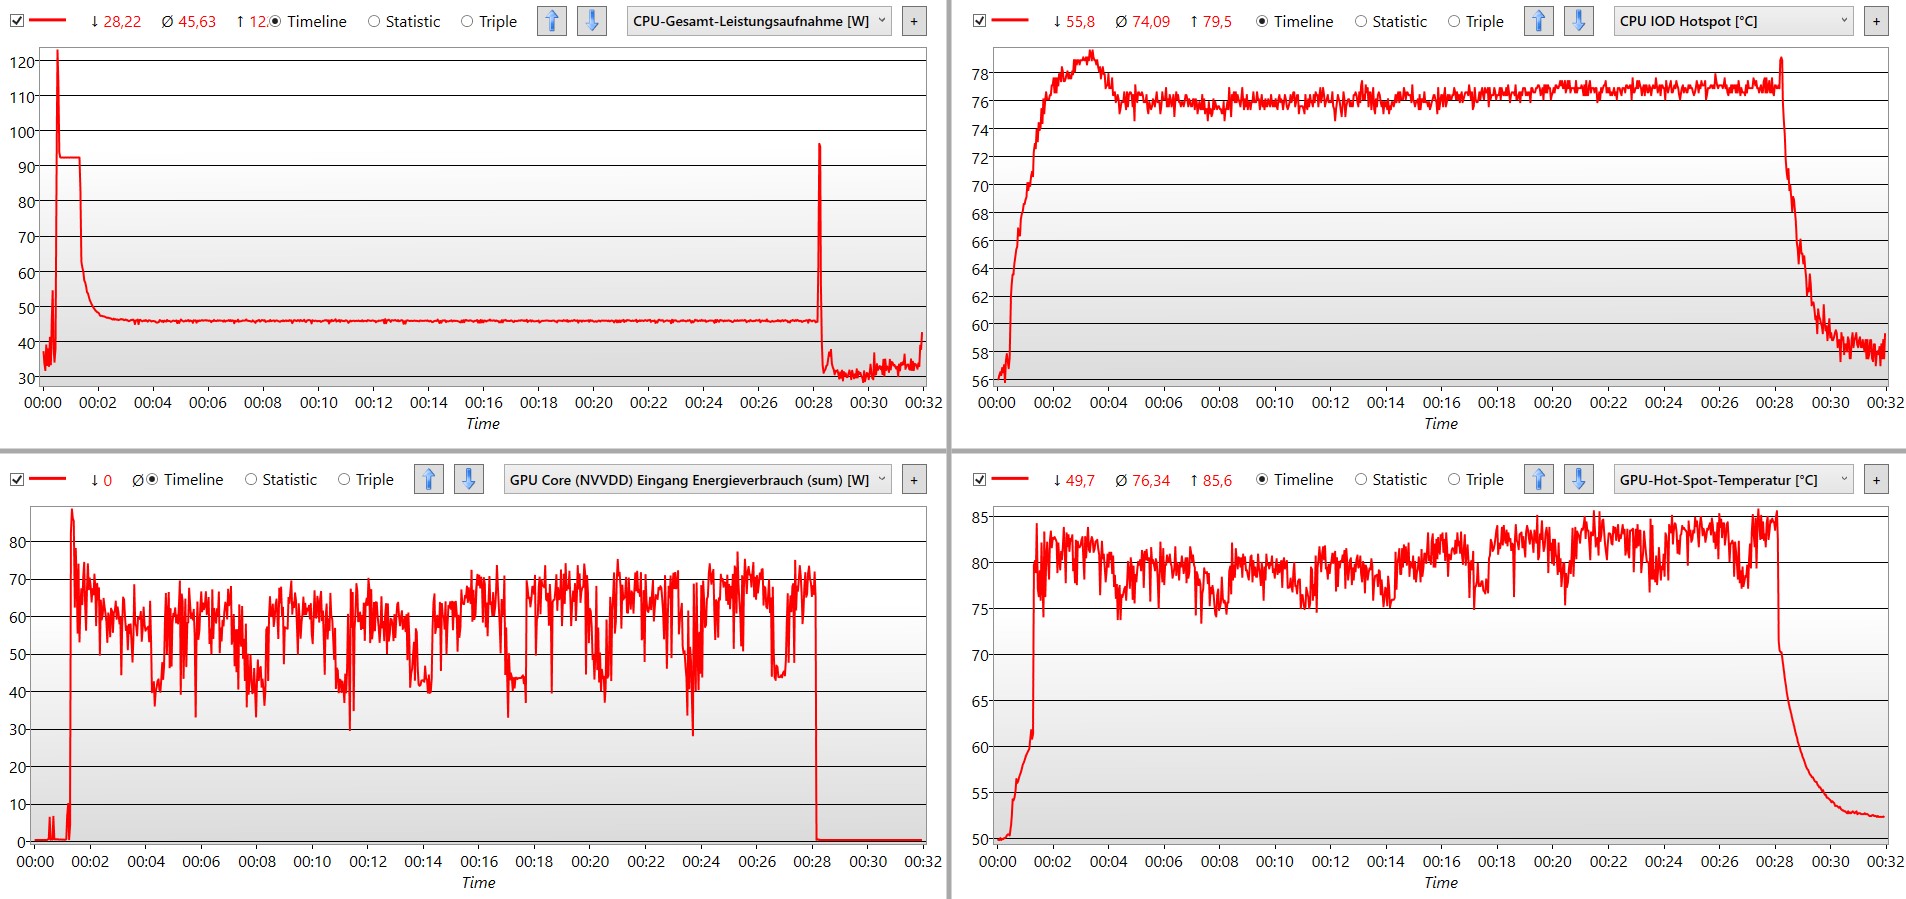
Stress Test
After barely 1 min, the power consumption of the CPU is reduced drastically. After that, the temperatures of the CPU and GPU remain around 70 to 80 °C (158 - 176 °F) and can be kept reliably at this level. The initial power consumption of the processor and graphics chip together is reduced from about 220 W to almost 100 W under constant load.
Speakers
The built-in speakers sound really good, without showing any weaknesses across the whole frequency spectrum. They even produce particularly impressive bass. You can also hear some fine details. If we want to complain at a very high level, we could say that the lower mids lack some punch.
You can use the speakers for listening to music from rock to classical, for watching movies, and of course also for gaming. However, during the latter, the audible fans might become annoying. The result is remarkable for a laptop, whose sound quality usually isn't predestined for playing music in most cases. Asus shows with the ROG Strix G17 that this can be done significantly better.
Asus ROG Strix G17 G713PI audio analysis
(±) | speaker loudness is average but good (81 dB)
Bass 100 - 315 Hz
(+) | good bass - only 4.6% away from median
(+) | bass is linear (6.5% delta to prev. frequency)
Mids 400 - 2000 Hz
(+) | balanced mids - only 3.1% away from median
(+) | mids are linear (5.9% delta to prev. frequency)
Highs 2 - 16 kHz
(+) | balanced highs - only 3.5% away from median
(+) | highs are linear (6.8% delta to prev. frequency)
Overall 100 - 16.000 Hz
(+) | overall sound is linear (9.5% difference to median)
Compared to same class
» 3% of all tested devices in this class were better, 1% similar, 95% worse
» The best had a delta of 6%, average was 18%, worst was 132%
Compared to all devices tested
» 4% of all tested devices were better, 1% similar, 95% worse
» The best had a delta of 4%, average was 24%, worst was 134%
Apple MacBook Pro 16 2021 M1 Pro audio analysis
(+) | speakers can play relatively loud (84.7 dB)
Bass 100 - 315 Hz
(+) | good bass - only 3.8% away from median
(+) | bass is linear (5.2% delta to prev. frequency)
Mids 400 - 2000 Hz
(+) | balanced mids - only 1.3% away from median
(+) | mids are linear (2.1% delta to prev. frequency)
Highs 2 - 16 kHz
(+) | balanced highs - only 1.9% away from median
(+) | highs are linear (2.7% delta to prev. frequency)
Overall 100 - 16.000 Hz
(+) | overall sound is linear (4.6% difference to median)
Compared to same class
» 0% of all tested devices in this class were better, 0% similar, 100% worse
» The best had a delta of 5%, average was 17%, worst was 45%
Compared to all devices tested
» 0% of all tested devices were better, 0% similar, 100% worse
» The best had a delta of 4%, average was 24%, worst was 134%
Power Management - ROG Strix always with a high consumption
Power Consumption
At no time is the gaming laptop really efficient. Even without performing any explicit tasks, it consumes almost 20 W. The peak of the power consumption increases to about 250 W. With this, the fairly large 280-W power supply offers sufficient reserves in all cases.
Taking a look at the Asus ROG Strix Scar 17 SE, which performs at about eye level in our performance tests even though its CPU and GPU aren't quite current anymore, is also interesting: When running The Witcher 3, where it also reaches almost identical fps, its power consumption is 25% higher. So at least under higher load, our ROG Strix G17 test unit is efficient.
| Off / Standby | |
| Idle | |
| Load |
|
Key:
min: | |
| Asus ROG Strix G17 G713PI R9 7945HX, GeForce RTX 4070 Laptop GPU | Asus ROG Strix G18 G814JI i7-13650HX, GeForce RTX 4070 Laptop GPU | Razer Blade 18 RTX 4070 i9-13950HX, GeForce RTX 4070 Laptop GPU | Asus ROG Strix Scar 17 SE G733CX-LL014W i9-12950HX, GeForce RTX 3080 Ti Laptop GPU | Alienware m17 R5 (R9 6900HX, RX 6850M XT) R9 6900HX, Radeon RX 6850M XT | Asus ROG Strix G16 G614JZ i9-13980HX, GeForce RTX 4080 Laptop GPU | Average of class Gaming | |
|---|---|---|---|---|---|---|---|
| Power Consumption | 15% | -39% | -20% | 10% | -4% | 8% | |
| Idle Minimum * (Watt) | 15 | 8 47% | 24.5 -63% | 19.3 -29% | 13 13% | 10 33% | 13.3 ? 11% |
| Idle Average * (Watt) | 20 | 15 25% | 34.1 -71% | 26.5 -33% | 16.5 17% | 16 20% | 19 ? 5% |
| Idle Maximum * (Watt) | 29 | 26 10% | 47.7 -64% | 27.1 7% | 17 41% | 27 7% | 24.5 ? 16% |
| Load Average * (Watt) | 121 | 102 16% | 140 -16% | 141 -17% | 93 23% | 129 -7% | 108.1 ? 11% |
| Witcher 3 ultra * (Watt) | 179.8 | 178.6 1% | 202 -12% | 225 -25% | 239 -33% | 247 -37% | |
| Load Maximum * (Watt) | 246 | 267 -9% | 261 -6% | 307.9 -25% | 251 -2% | 342 -39% | 254 ? -3% |
* ... smaller is better
Power Consumption The Witcher 3 / Stress Test
Power Consumption with External Monitor
Battery Life
Long periods of battery operation are definitely not part of the plan, despite the large 90-Wh battery. The ROG Strix G17 even remains below the average values of the class of gaming laptops, which are already very low, lasting barely 4 hours in our WLAN test with a limited display brightness.
It might be possible to reach a halfway usable runtime with some manual setting adjustments. At least, Asus shows that much longer runtimes are possible with the ROG Strix G16, which is similarly powerful and offers the same battery capacity.
By the way, turning of the dGPU did not lead to a noticeable improvement of the results. With the settings used here, mobile usage of the laptop hardly makes any sense, particularly since it was only able to play a Full-HD video in airplane mode for less than 3 hours.
| Asus ROG Strix G17 G713PI R9 7945HX, GeForce RTX 4070 Laptop GPU, 90 Wh | Asus ROG Strix G18 G814JI i7-13650HX, GeForce RTX 4070 Laptop GPU, 90 Wh | Razer Blade 18 RTX 4070 i9-13950HX, GeForce RTX 4070 Laptop GPU, 91.7 Wh | Asus ROG Strix Scar 17 SE G733CX-LL014W i9-12950HX, GeForce RTX 3080 Ti Laptop GPU, 90 Wh | Alienware m17 R5 (R9 6900HX, RX 6850M XT) R9 6900HX, Radeon RX 6850M XT, 97 Wh | Asus ROG Strix G16 G614JZ i9-13980HX, GeForce RTX 4080 Laptop GPU, 90 Wh | Average of class Gaming | |
|---|---|---|---|---|---|---|---|
| Battery runtime | 54% | 12% | -2% | 56% | 68% | 102% | |
| H.264 (h) | 2.8 | 4.9 75% | 8.26 ? 195% | ||||
| WiFi v1.3 (h) | 4.3 | 8.1 88% | 4 -7% | 4.2 -2% | 4.8 12% | 9.7 126% | 7.01 ? 63% |
| Witcher 3 ultra (h) | 1.1 | ||||||
| Load (h) | 1 | 1.2 20% | 1.3 30% | 1.8 80% | 1.1 10% | 1.47 ? 47% |
Pros
Cons
Verdict - A well-rounded package for gaming
From the outstanding CPU performance to the solid though-out gaming benchmarks at the level of an RTX 3080 Ti, the ROG Strix G17 doesn't show any weaknesses. With this, the expectations on the new Nvidia GeForce RTX 4070 are fulfilled. The powerful midrange chip computes at the level of a premium graphics card of the previous generation (but because of only 8 GB VRAM it isn't very future proof). Thanks to the R9 7945HX, the gaming laptop is able to play at the very top with its high computing performance.
The display also fits this performance. With its accurate color reproduction, the QHD resolution, and 240-Hz refresh rate fitting the system performance, it appears almost custom tailored. The weak brightness hardly makes any difference when using it on the desk. The illumination is also visually appealing. It won't take much time to find an individual illumination option that even gives some information on the system status.
Its main weaknesses don't make any difference when gaming. This makes the Asus ROG Strix G17 a gaming laptop that is successful throughout, but it also should only be used that way.
The construction of the laptop also appears well thought-out. The fan noise and heat development are moderate for the gaming segment. With a free slot for an SSD and uncomplicated accessibility of the insides, there is nothing in the way of performing maintenance tasks or replacing important components.
Fortunately, we find the weaknesses only in areas that don't impact the gaming performance. The USB connections are disappointing, since a maximum of 10 Gbit/s remains far below the current possibilities of USB4 (which is also not supported). The HD webcam doesn't appear up to date anymore. In addition, despite a sufficient battery capacity, the battery life remains below-average even for a gaming laptop.
Even though this reduces the qualities of the ROG Strix G17 as an allrounder, it doesn't change anything about the suitability for playing current games. In comparison, the Razer Blade 18 looks more suitable overall, offering Thunderbolt 4, a brighter display, and an otherwise comparable performance and identical graphics chip. At the same time, that is also much more expensive without offering any gains in the system performance, so it really only represents an alternative if you need a more versatile laptop.
On the other hand, if the Asus ROG Strix G17 would become available with a slightly smaller processor in the future, that would in all likelihood be the closest competitor, as long as the system is used almost exclusively for gaming.
Price and Availability
In the US, the Asus ROG Strix G17 (2023) G713 is available from the Asus web shop starting from $1799.99.
Asus ROG Strix G17 G713PI
- 03/16/2023 v7 (old)
Mario Petzold
Transparency
The selection of devices to be reviewed is made by our editorial team. The test sample was provided to the author as a loan by the manufacturer or retailer for the purpose of this review. The lender had no influence on this review, nor did the manufacturer receive a copy of this review before publication. There was no obligation to publish this review. As an independent media company, Notebookcheck is not subjected to the authority of manufacturers, retailers or publishers.
This is how Notebookcheck is testing
Every year, Notebookcheck independently reviews hundreds of laptops and smartphones using standardized procedures to ensure that all results are comparable. We have continuously developed our test methods for around 20 years and set industry standards in the process. In our test labs, high-quality measuring equipment is utilized by experienced technicians and editors. These tests involve a multi-stage validation process. Our complex rating system is based on hundreds of well-founded measurements and benchmarks, which maintains objectivity. Further information on our test methods can be found here.
Price comparison

