Alienware m17 R5 laptop review: All-AMD gamer with great potential, but driver problems
In 2021, we reviewed the predecessor Alienware m17 R4 with its Comet Lake CPU and RTX 3080. In doing so, some weaknesses were uncovered, which were well reflected in the review title ("Burned up in the atmosphere"). We now have the m17 R5, but complete with AMD hardware this time, in the test lab and we are naturally interested in whether the successor has finally gotten the temperature problems of the predecessor under control.
Our all-AMD model is heavily equipped with a Ryzen 9 6900HX, a Radeon RX 6850M XT and 32 GB of RAM, and costs an equally strong US$2550. For this price, you can certainly expect various optimizations. Of course, we are also interested in how the combination of AMD CPU and AMD GPU performs against various Intel/Nvidia combinations.
We compare the R5 against its predecessor, the R4, but also against similarly equipped competitors such as the Asus ROG Strix Scar 17 SE, the Acer Predator Helios 300, the Schenker XMG Neo 17 M22 and the Gigabyte Aorus 17X XES.
Possible Competitors in Comparison
Rating | Date | Model | Weight | Height | Size | Resolution | Price |
|---|---|---|---|---|---|---|---|
| 86.1 % v7 (old) | 01 / 2023 | Alienware m17 R5 (R9 6900HX, RX 6850M XT) R9 6900HX, Radeon RX 6850M XT | 3.4 kg | 26.7 mm | 17.00" | 3840x2160 | |
| 85.3 % v7 (old) | 04 / 2021 | Alienware m17 R4 i9-10980HK, GeForce RTX 3080 Laptop GPU | 3 kg | 22 mm | 17.30" | 1920x1080 | |
| 86.9 % v7 (old) | 11 / 2022 | Asus ROG Strix Scar 17 SE G733CX-LL014W i9-12950HX, GeForce RTX 3080 Ti Laptop GPU | 2.9 kg | 28.3 mm | 17.30" | 2560x1440 | |
| 86.5 % v7 (old) | 11 / 2022 | Acer Predator Helios 300 (i7-12700H, RTX 3070 Ti) i7-12700H, GeForce RTX 3070 Ti Laptop GPU | 3 kg | 27.65 mm | 17.30" | 2560x1440 | |
| 87.6 % v7 (old) | 08 / 2022 | Schenker XMG Neo 17 M22 R9 6900HX, GeForce RTX 3080 Ti Laptop GPU | 2.8 kg | 27 mm | 17.00" | 2560x1600 | |
| 83.7 % v7 (old) | 08 / 2022 | Aorus 17X XES i9-12900HX, GeForce RTX 3070 Ti Laptop GPU | 2.7 kg | 30 mm | 17.30" | 1920x1080 |
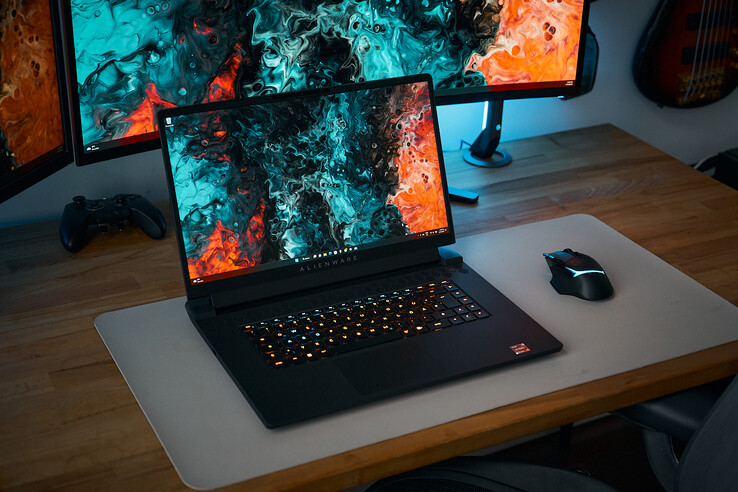
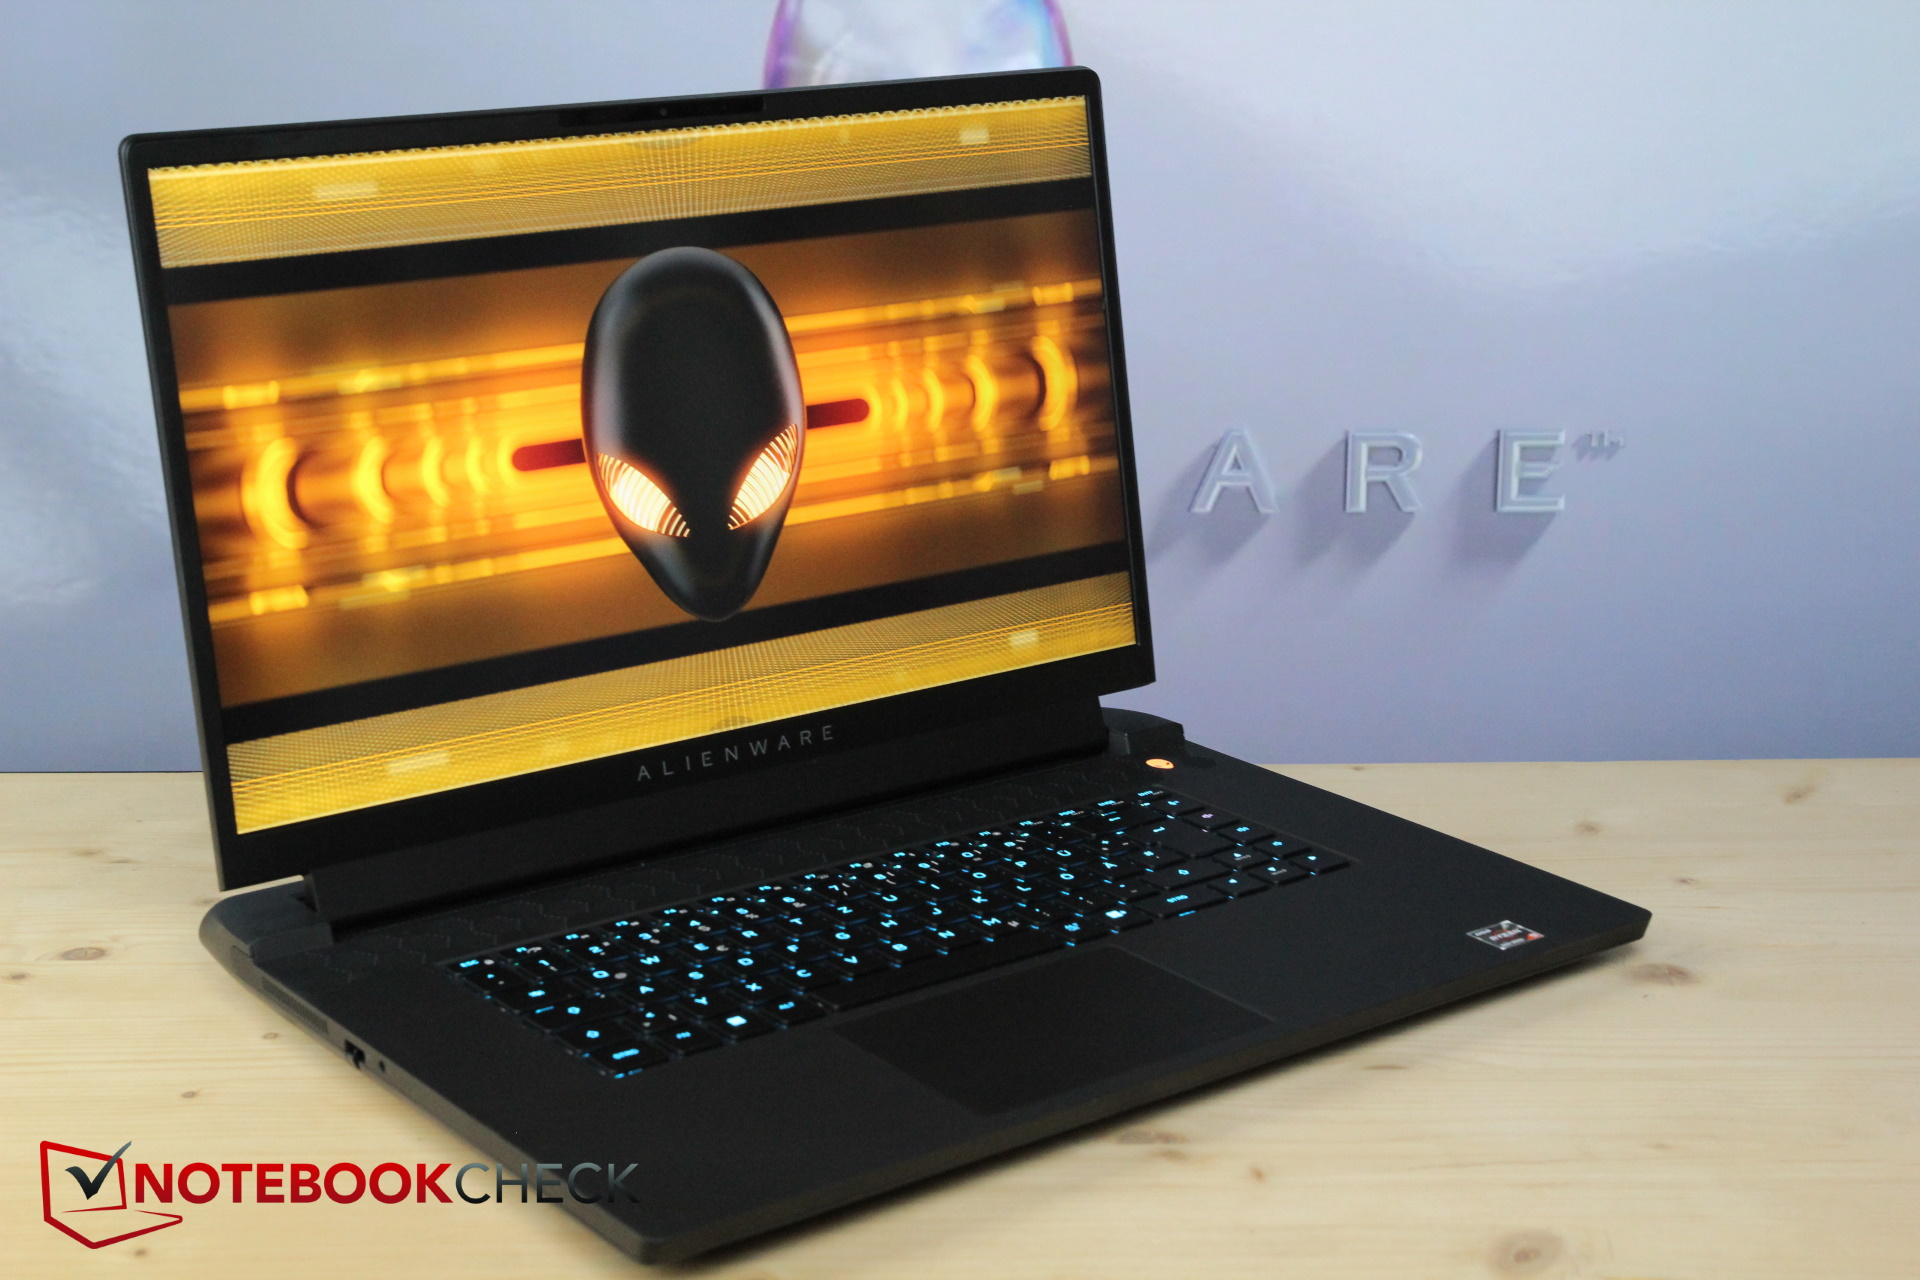
Case - Revamped design in the m17 R5
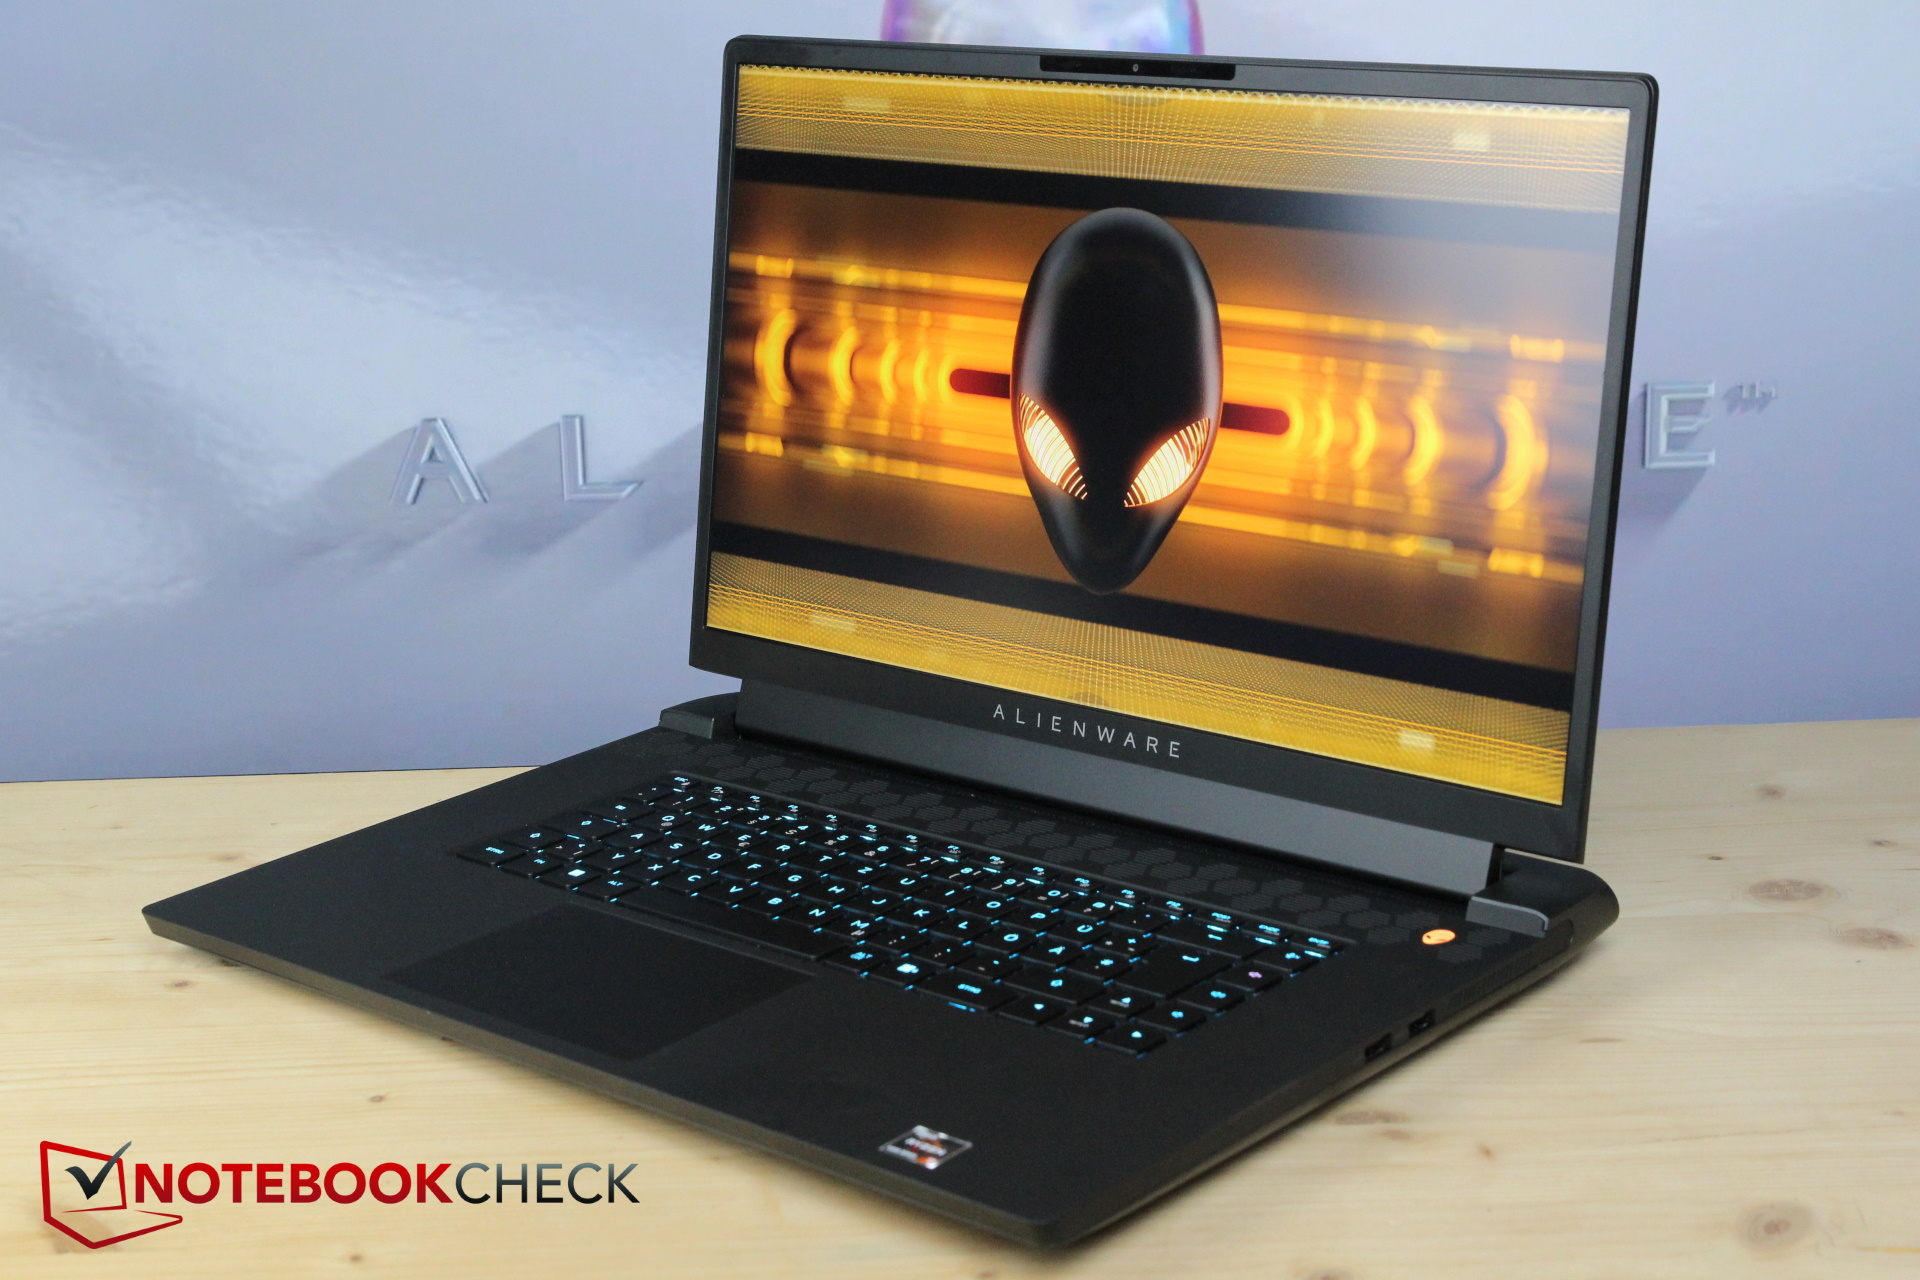
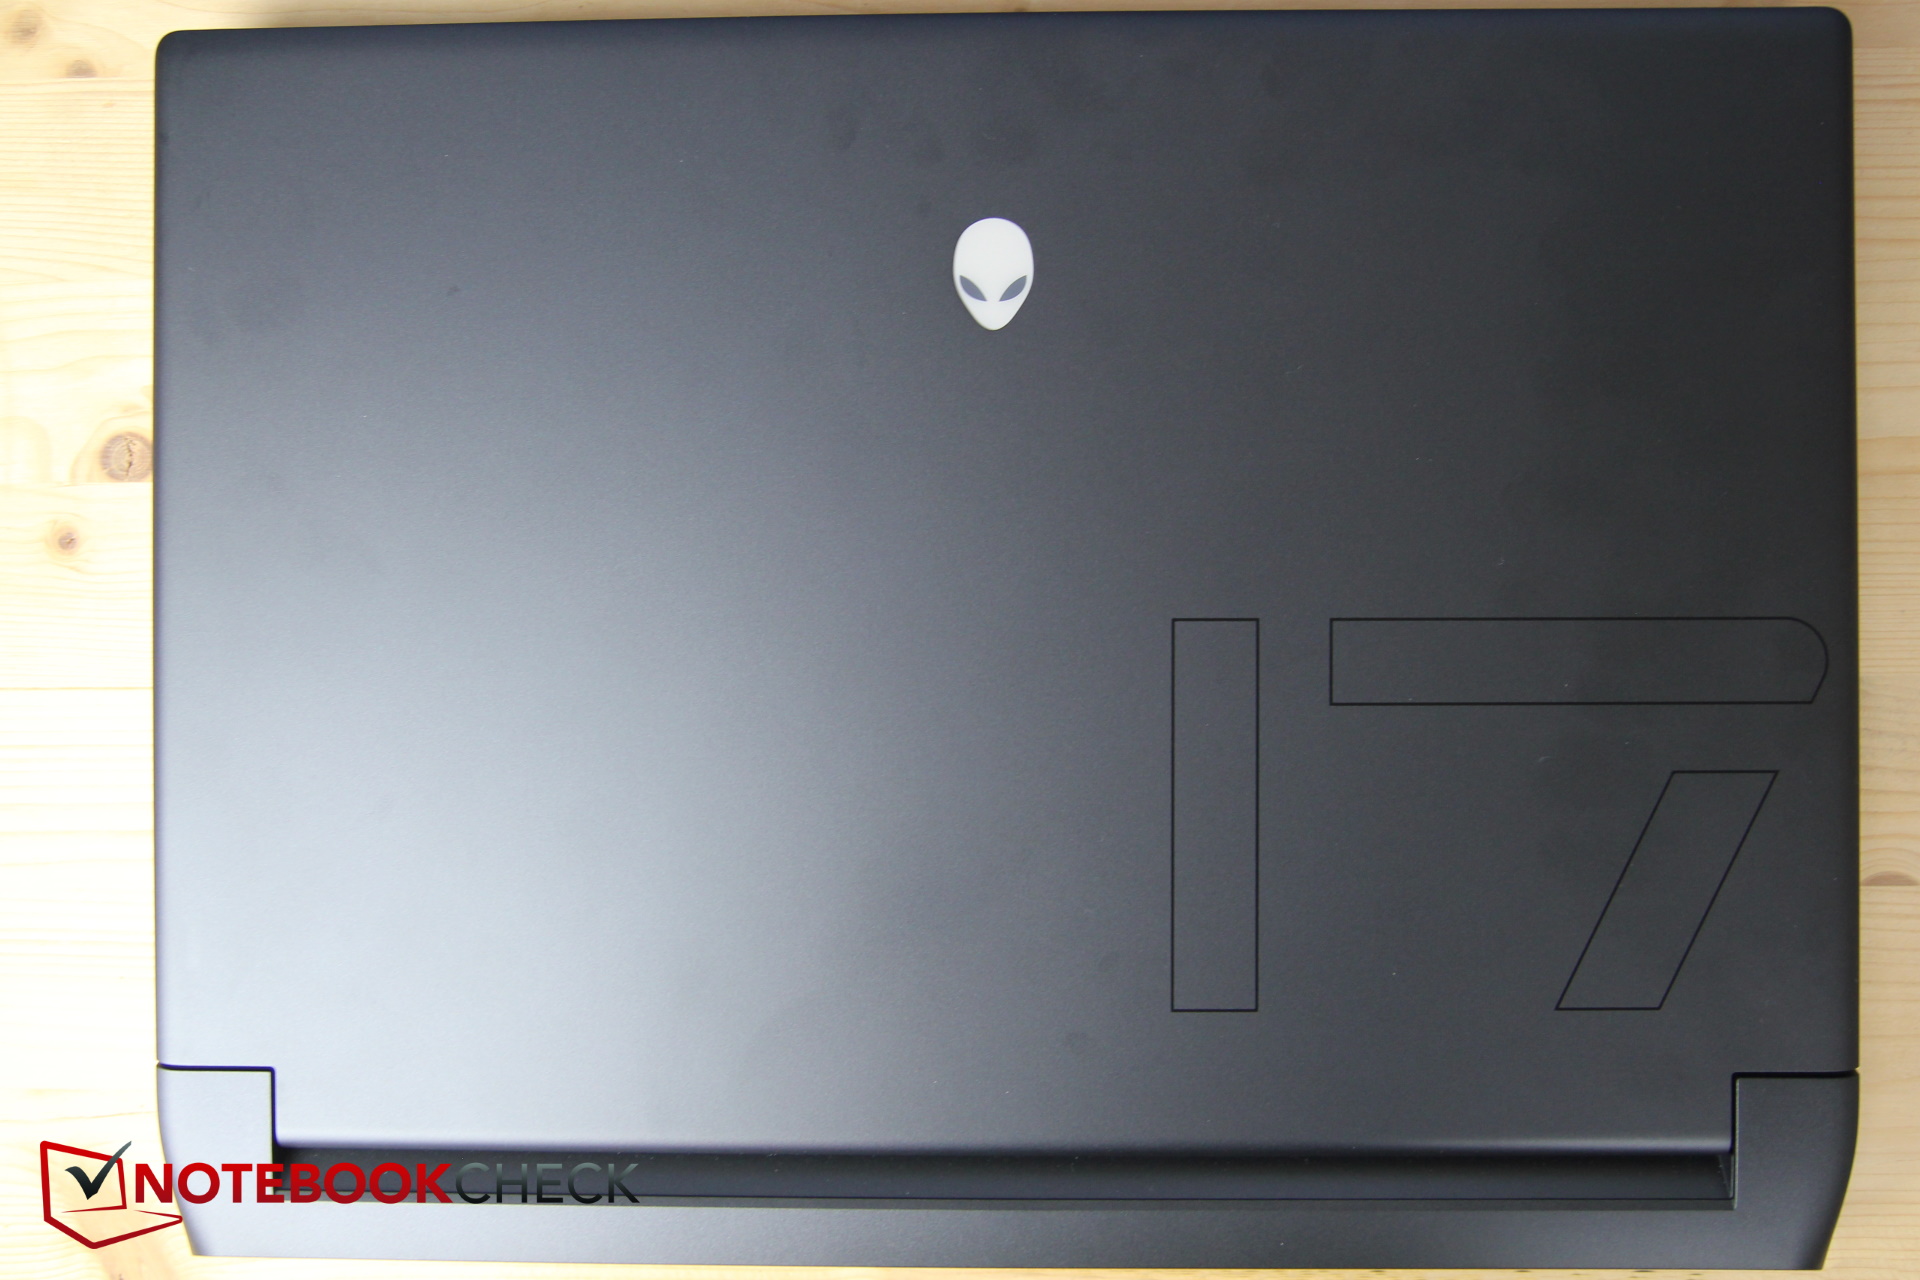
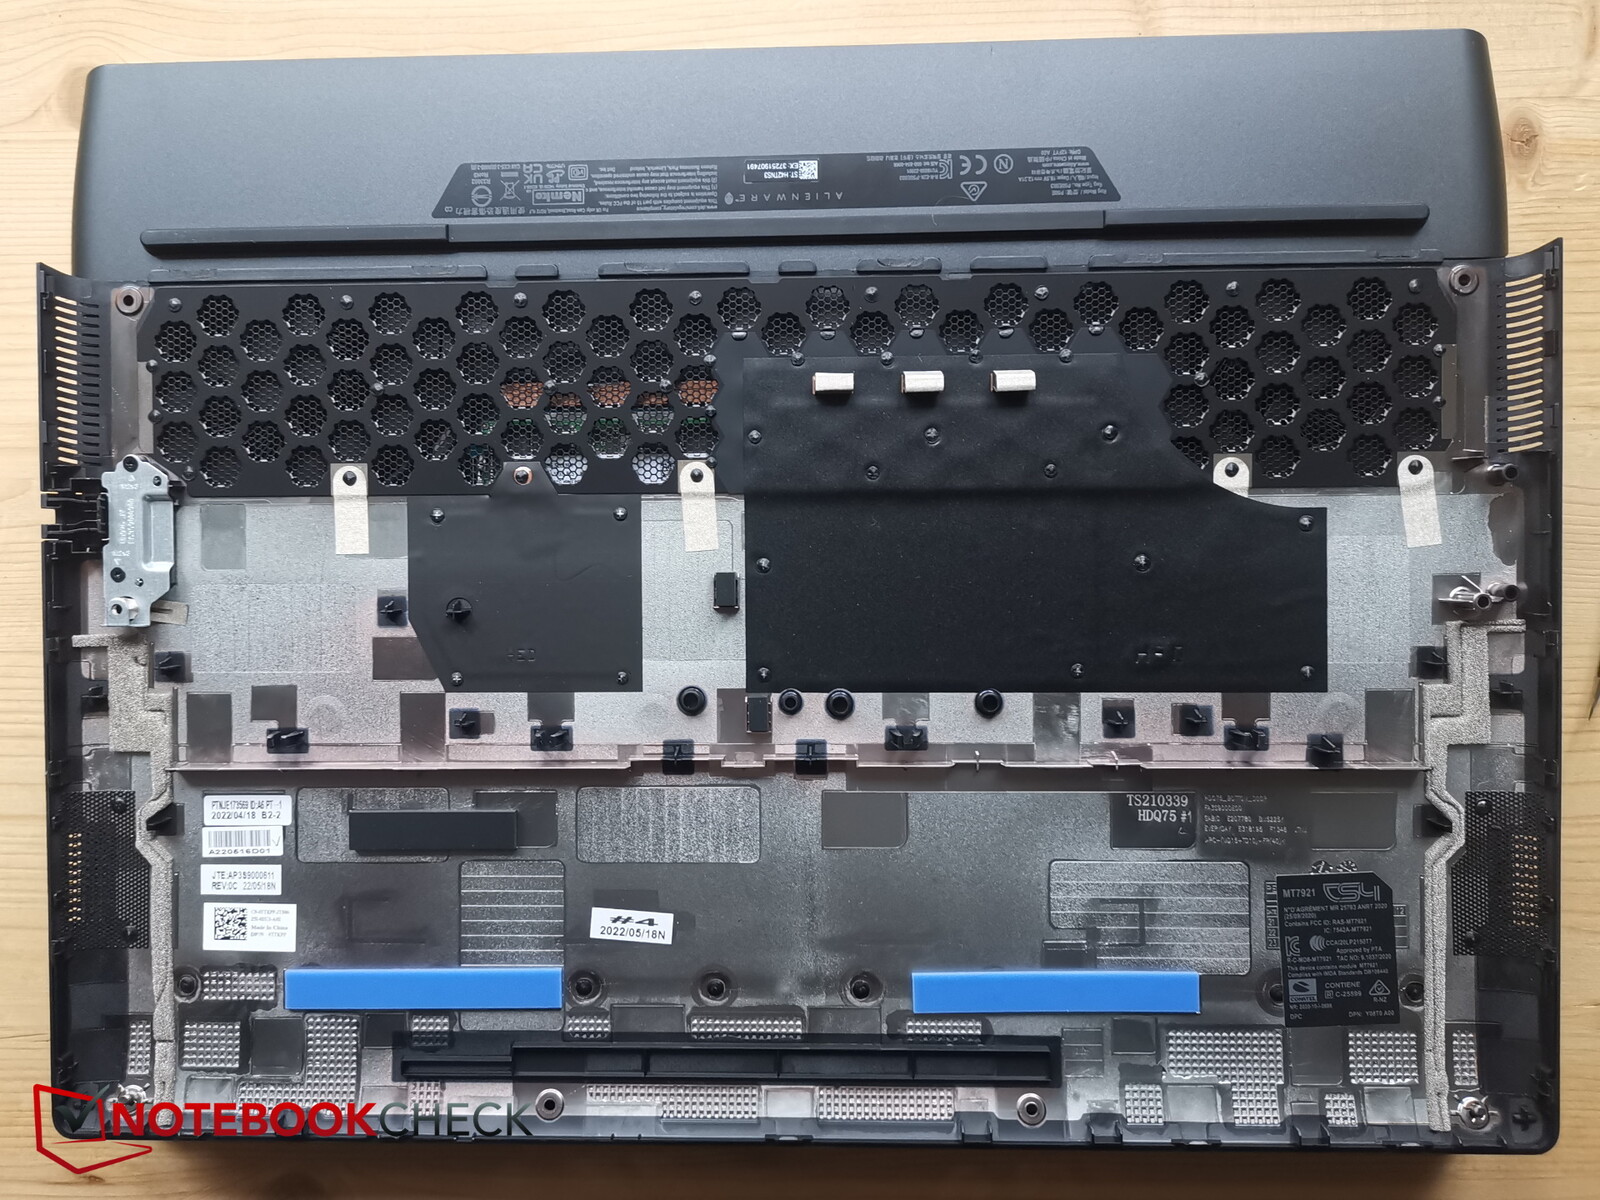
The case has been heavily revamped, even if the difference is only visible at first glance from the color scheme and the underside. After the white R4, the new m17 now once again has a dark grey metal body, and the grilles on the baseplate are now honeycomb instead of striped. Overall, the design is almost plain for an Alienware, at least when switched off. If you switch it on, various LEDs remind you that you have an Alien gaming laptop before you.
On the other hand, the internal layout is also new, the keyboard no longer has a numpad, the arrow keys no longer protrude downwards, the ports have been changed and so on.
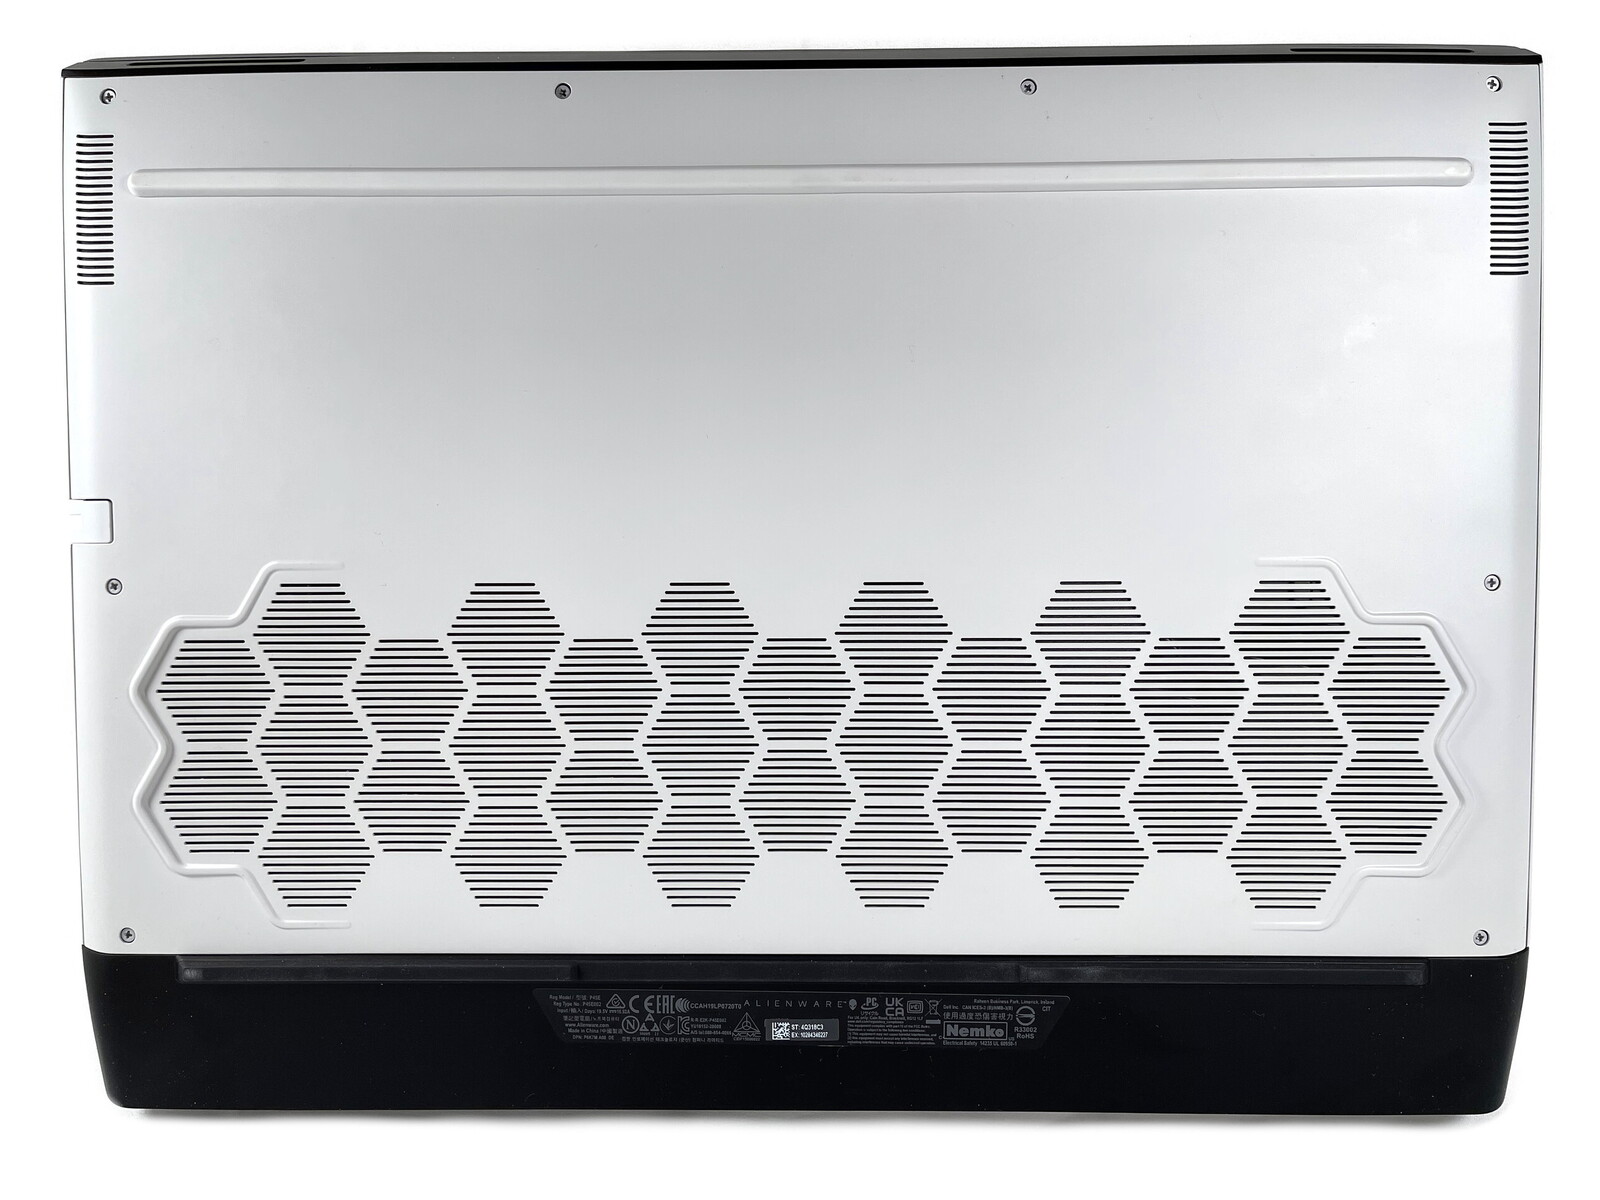
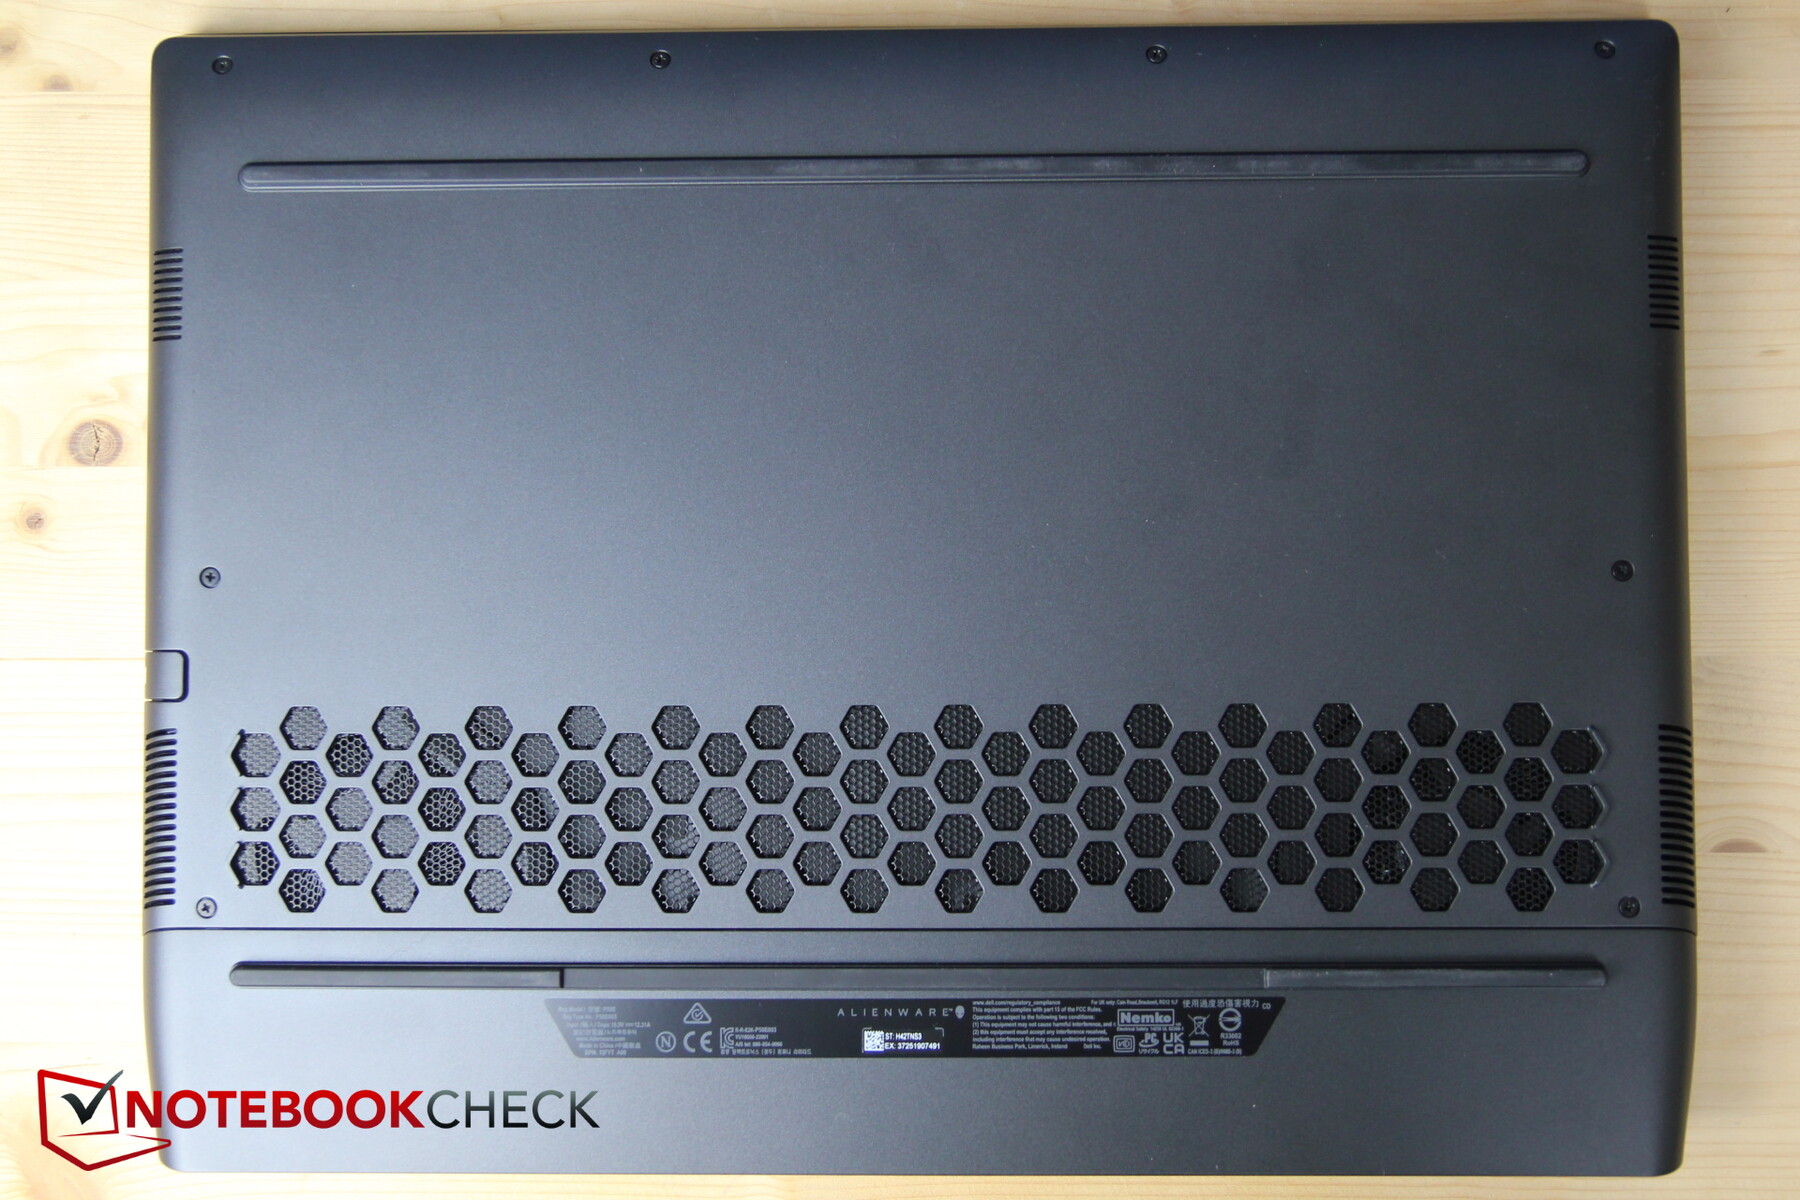
As before, the outer case is made of sturdy metal, while the edges of the display are made of plastic. The baseplate is also made of plastic, but has also been rubberized as an addition.
Overall, the laptop is very torsion-resistant and cracks only slightly when placed under torsional stress. The lid is also unusually stable and the overall build quality is on a high level.
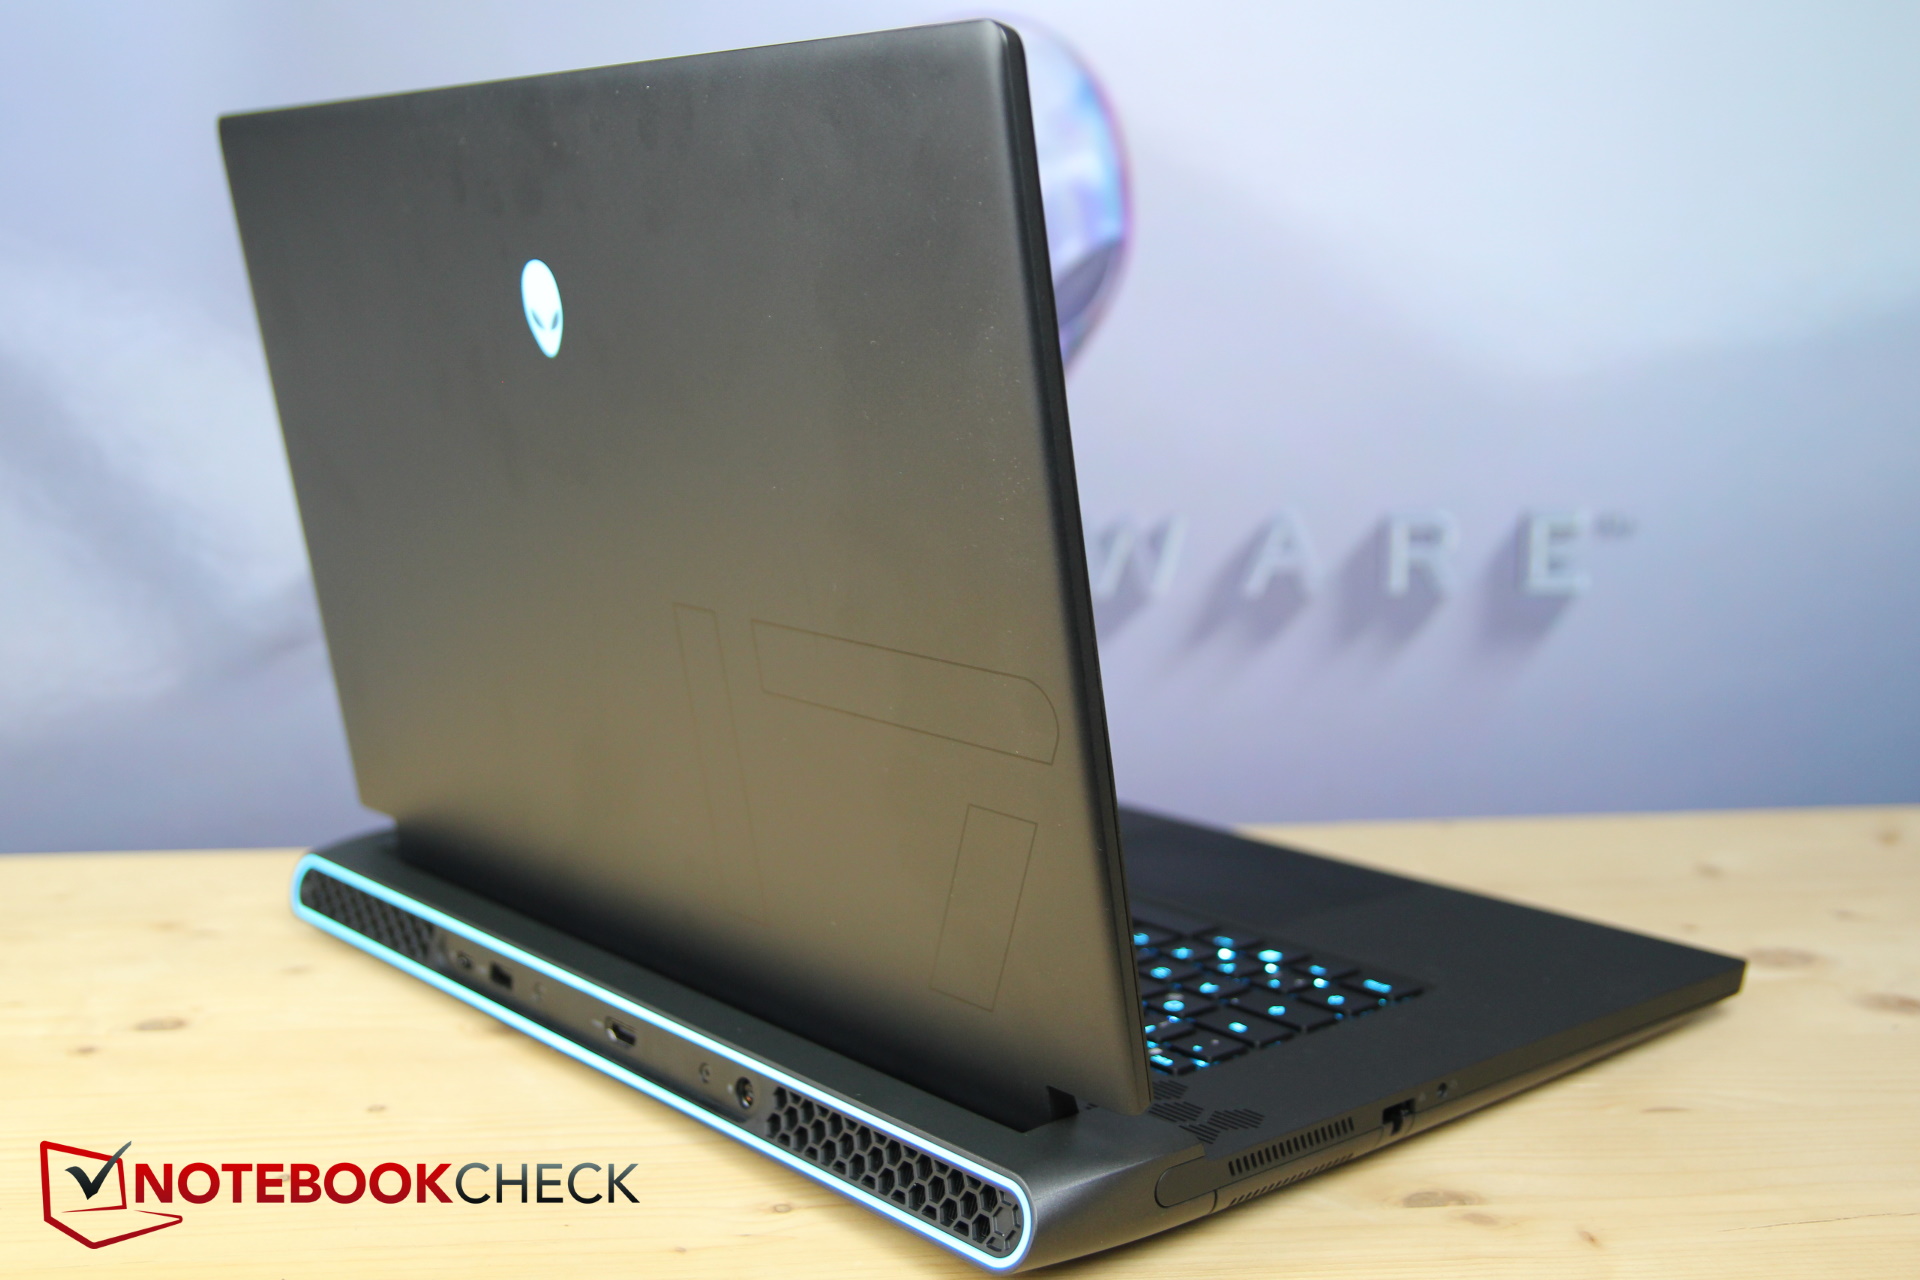

It is well known that Alienware laptops are quite large due to their expansive cooling system, although competitors such as the Acer Predator have meanwhile "followed suit" in this regard.
What is striking, however, is that the m17 R5 has gained a lot of weight. The gamer now weighs a full 400 g more than its predecessor, making it the heaviest device in the comparison field. The predecessor was also thinner, even if many competitors are thicker.
Overall, the m17 is very large and, above all, heavy for its class.
Equipment - Fewer ports on the m17 R5
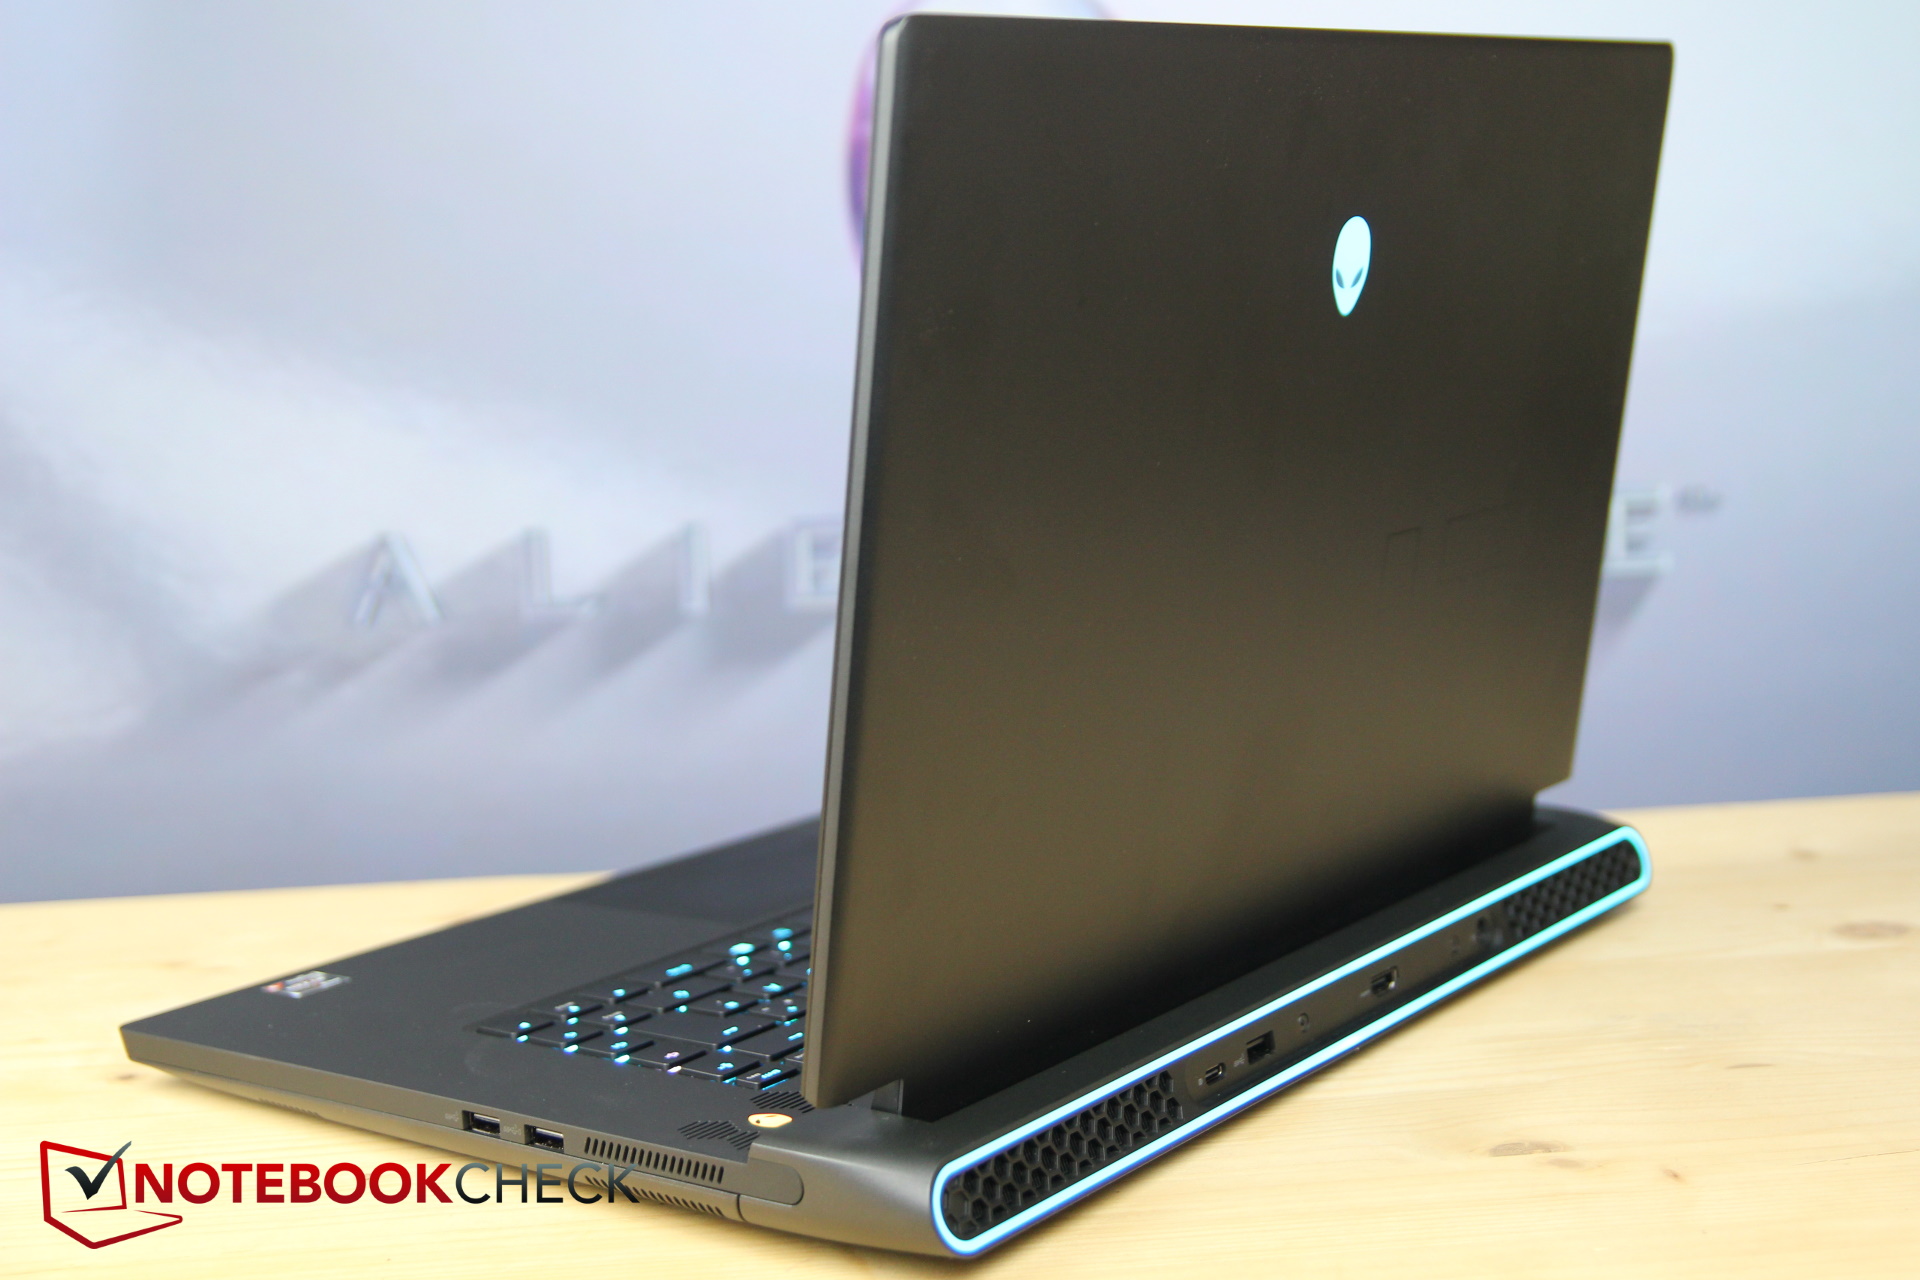
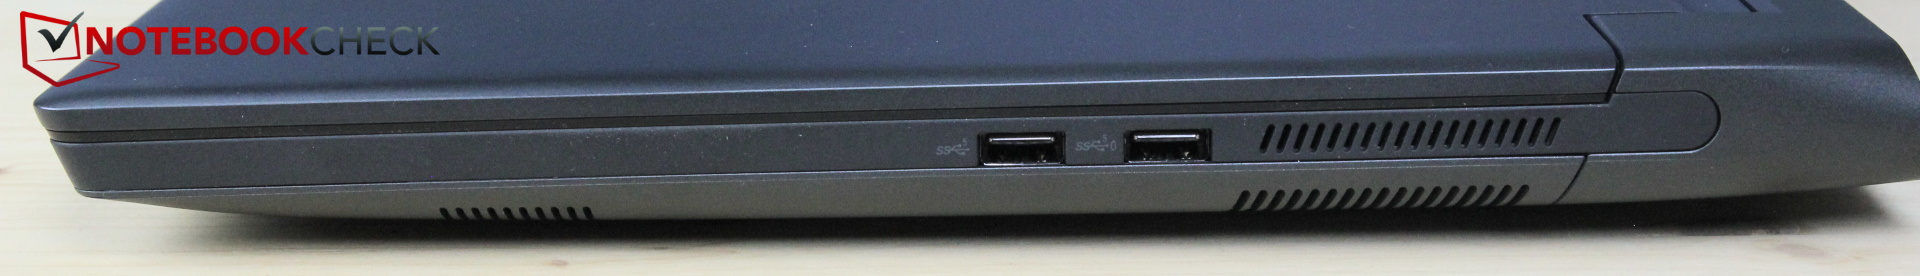
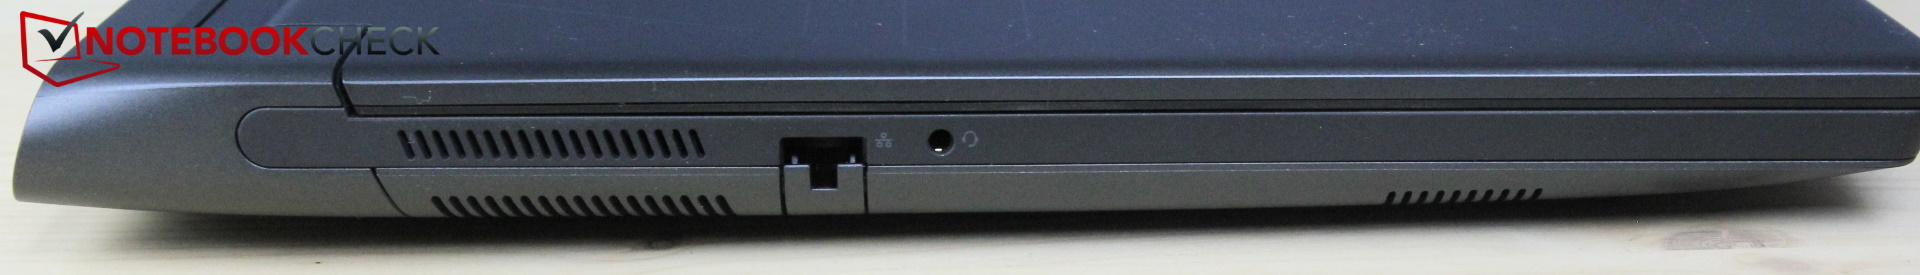
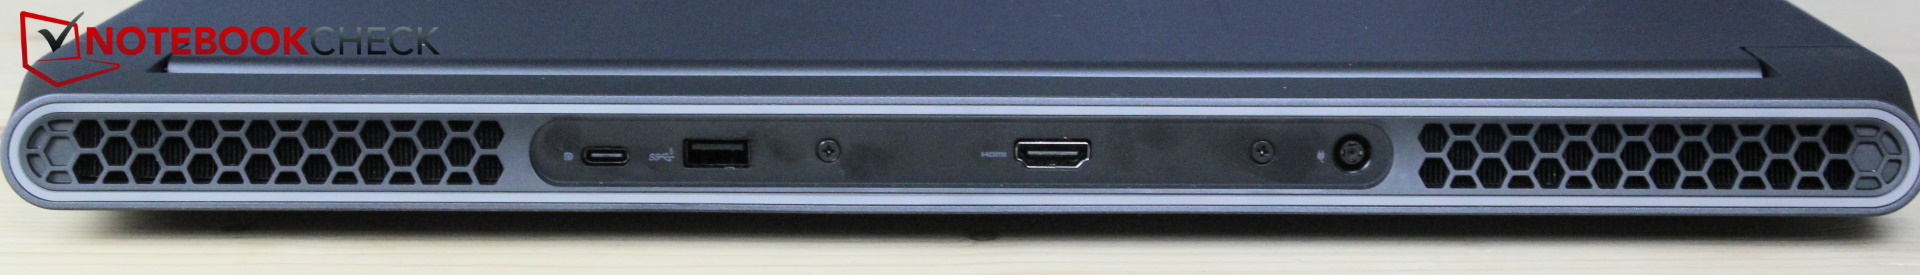
The variety of ports has by no means developed in a positive way; various ports of the R4 have simply been omitted in the R5. These include the Alienwareport for external graphics cards, the microSD reader, and the dedicated DisplayPort. Dell simply "squeezes" the latter into the functionality of the one USB-C port. This port, in turn, does not yet support Thunderbolt or USB 4 in this year's AMD version.
The fact that there are no USB ports on the left side and that you have to connect all USB devices to the mouse side quickly proved annoying during our review. Otherwise, most of the ports are at the back with enough space between them.
Communication
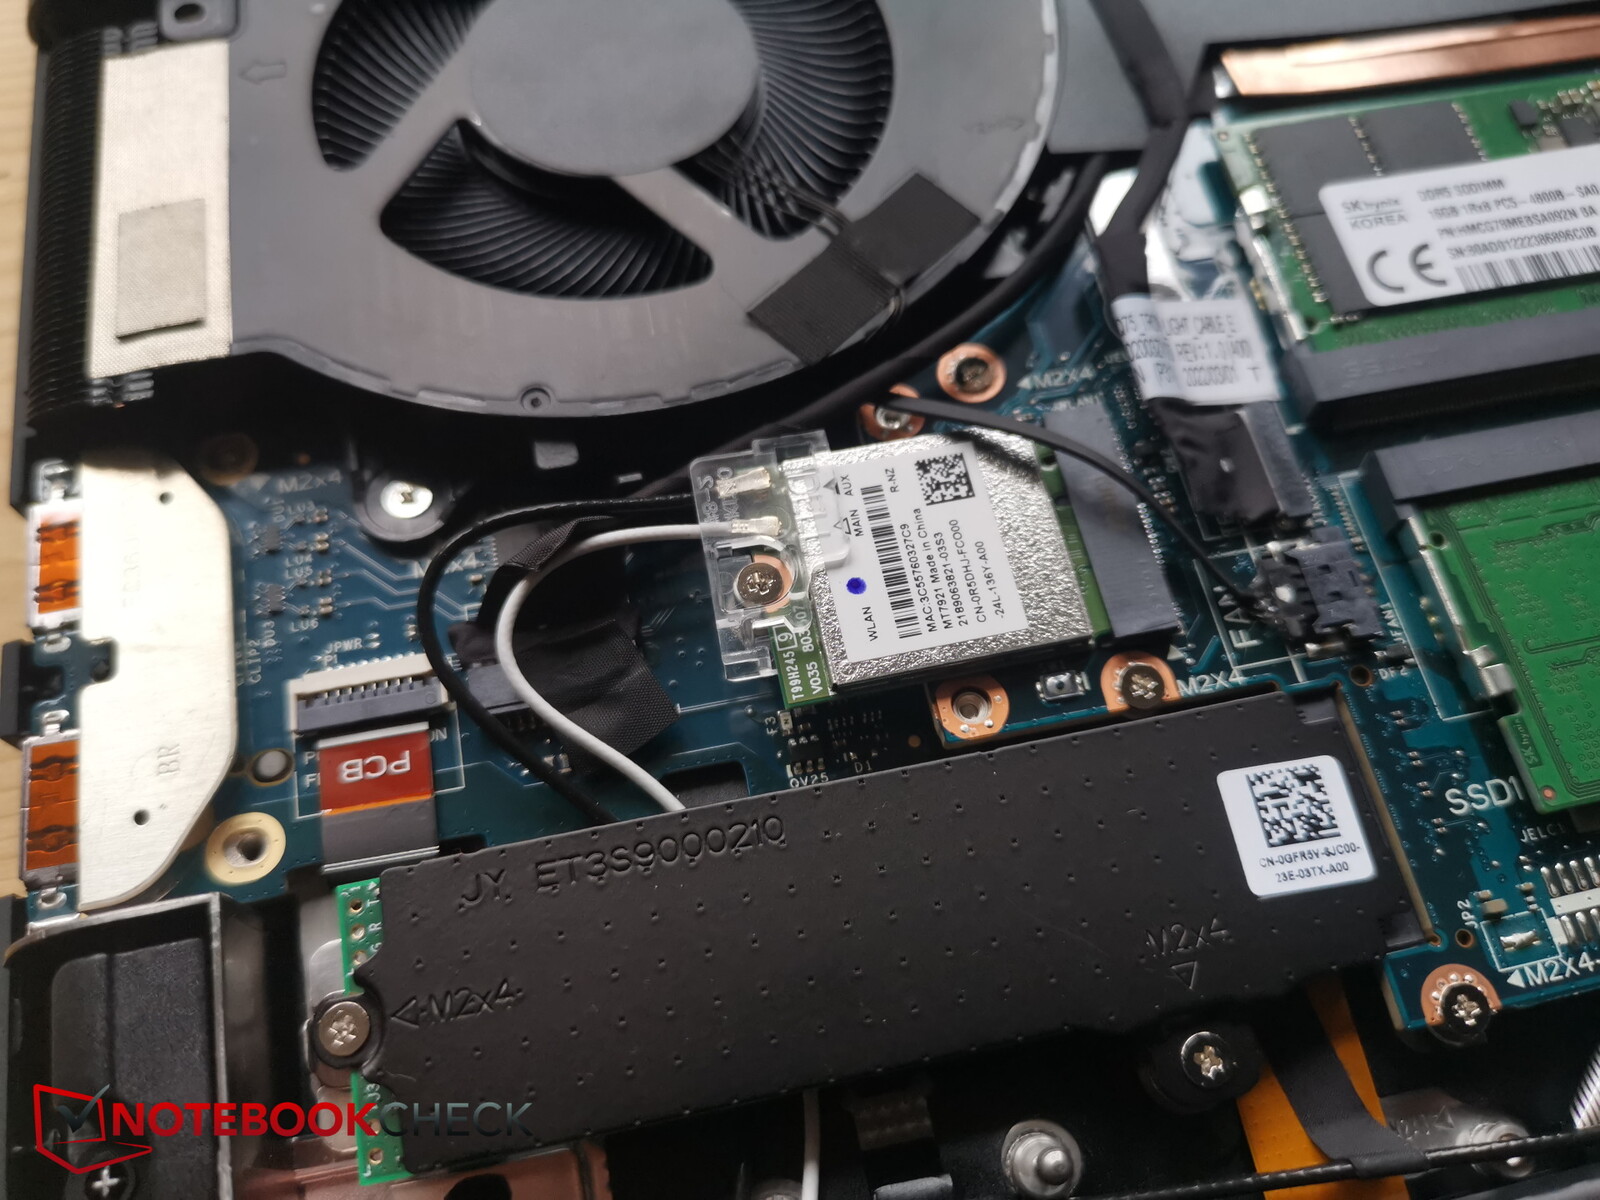
Instead of an Intel AX or Killer Wireless module, typical for this class, Dell uses a MediaTek MT7921. Its possibilities are exhausted by the m17, but are generally limited. Rival laptops are mostly faster.
Webcam
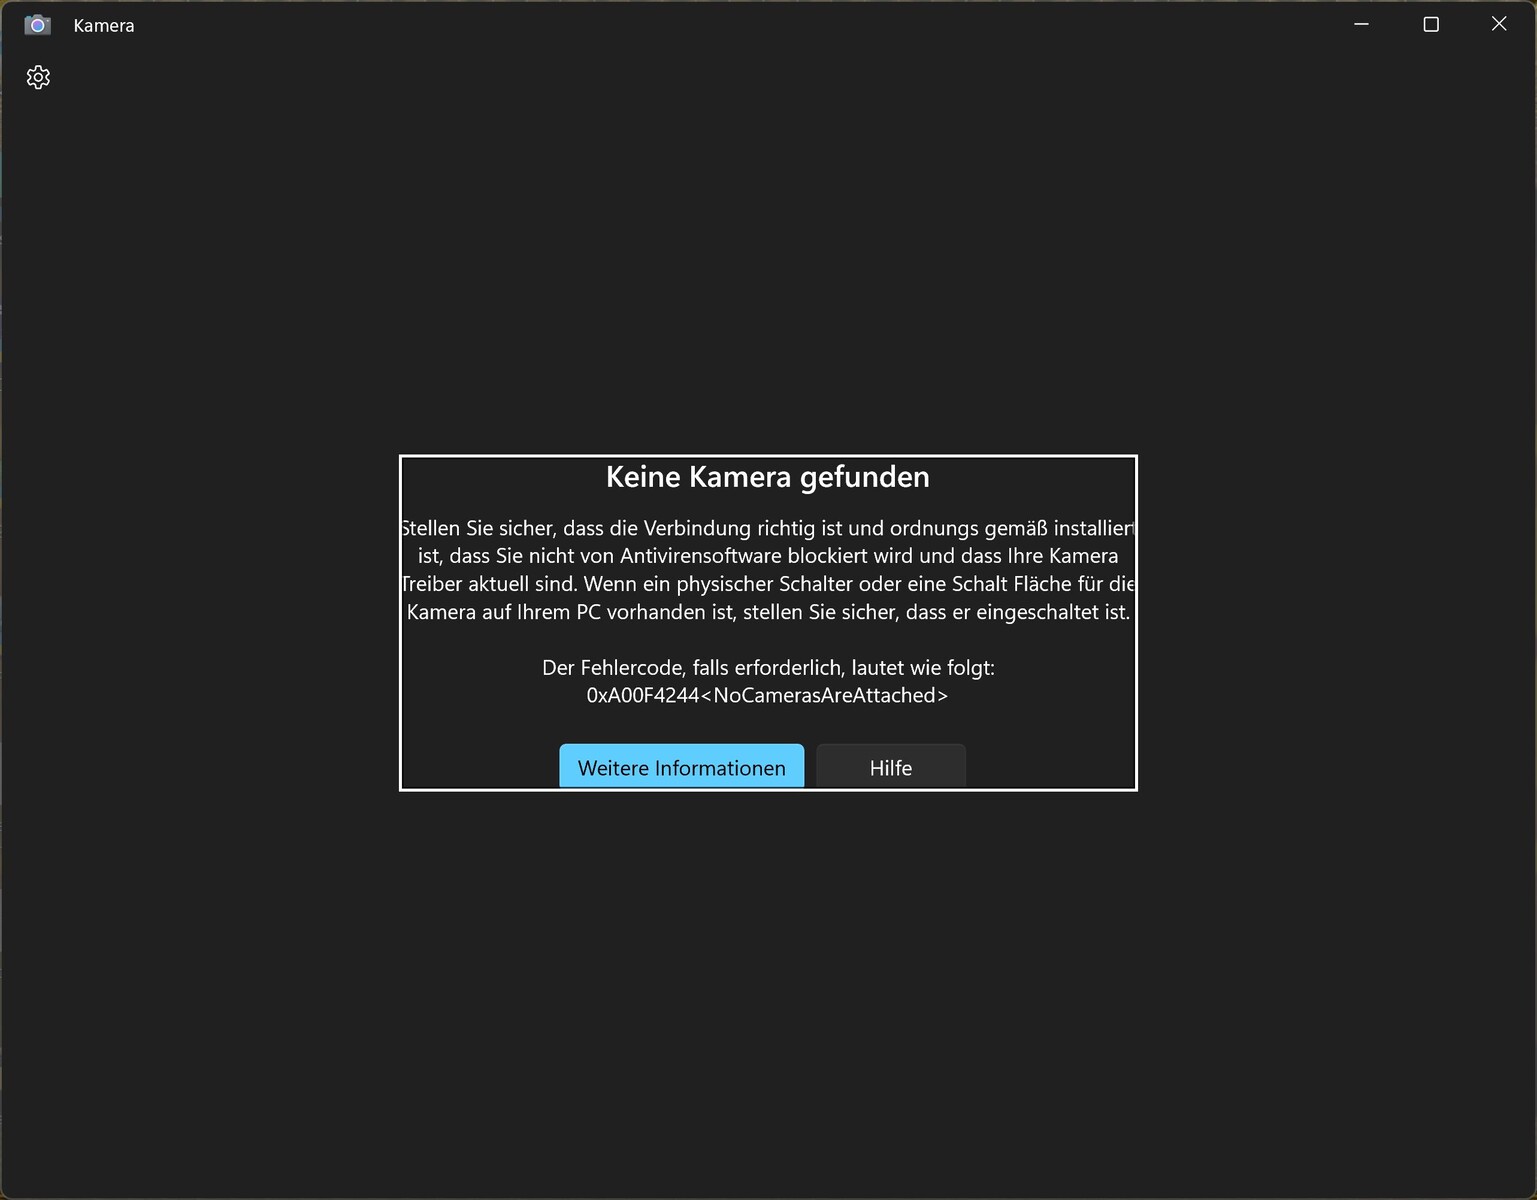
While many competitors have a Full HD webcam installed, users of the m17 have to make do with a 720p camera.
In our review model, this does not work properly. When we start it up, we get the message that no webcam is found, we click around senselessly, then suddenly a video image appears, then the error message pops up again, later another image.
On the other hand, the webcam works on another m17-R5 model, which is currently enjoying a film career with our YouTuber Alex. We suspect that something is loose in the hardware of our review model. At least we were lucky enough to be able to take our two test photos.

 Radeon RX 6850M XT, R9 6900HX, SSSTC CA6-8D1024")
 Radeon RX 6850M XT, R9 6900HX, SSSTC CA6-8D1024")
Security
Gaming laptops often skimp on security features, and so does the Alienware. A fingerprint sensor is missing, and you won't find a Kensington slot here either. The 720p camera is capable of IR for facial recognition in Windows Hello.
Accessories and Warranty
Dell does not pack any accessories in the box.
The warranty in Germany only amounts to 12 months. This may differ depending on your location, so interested buyers should double-check before purchase.
Maintenance
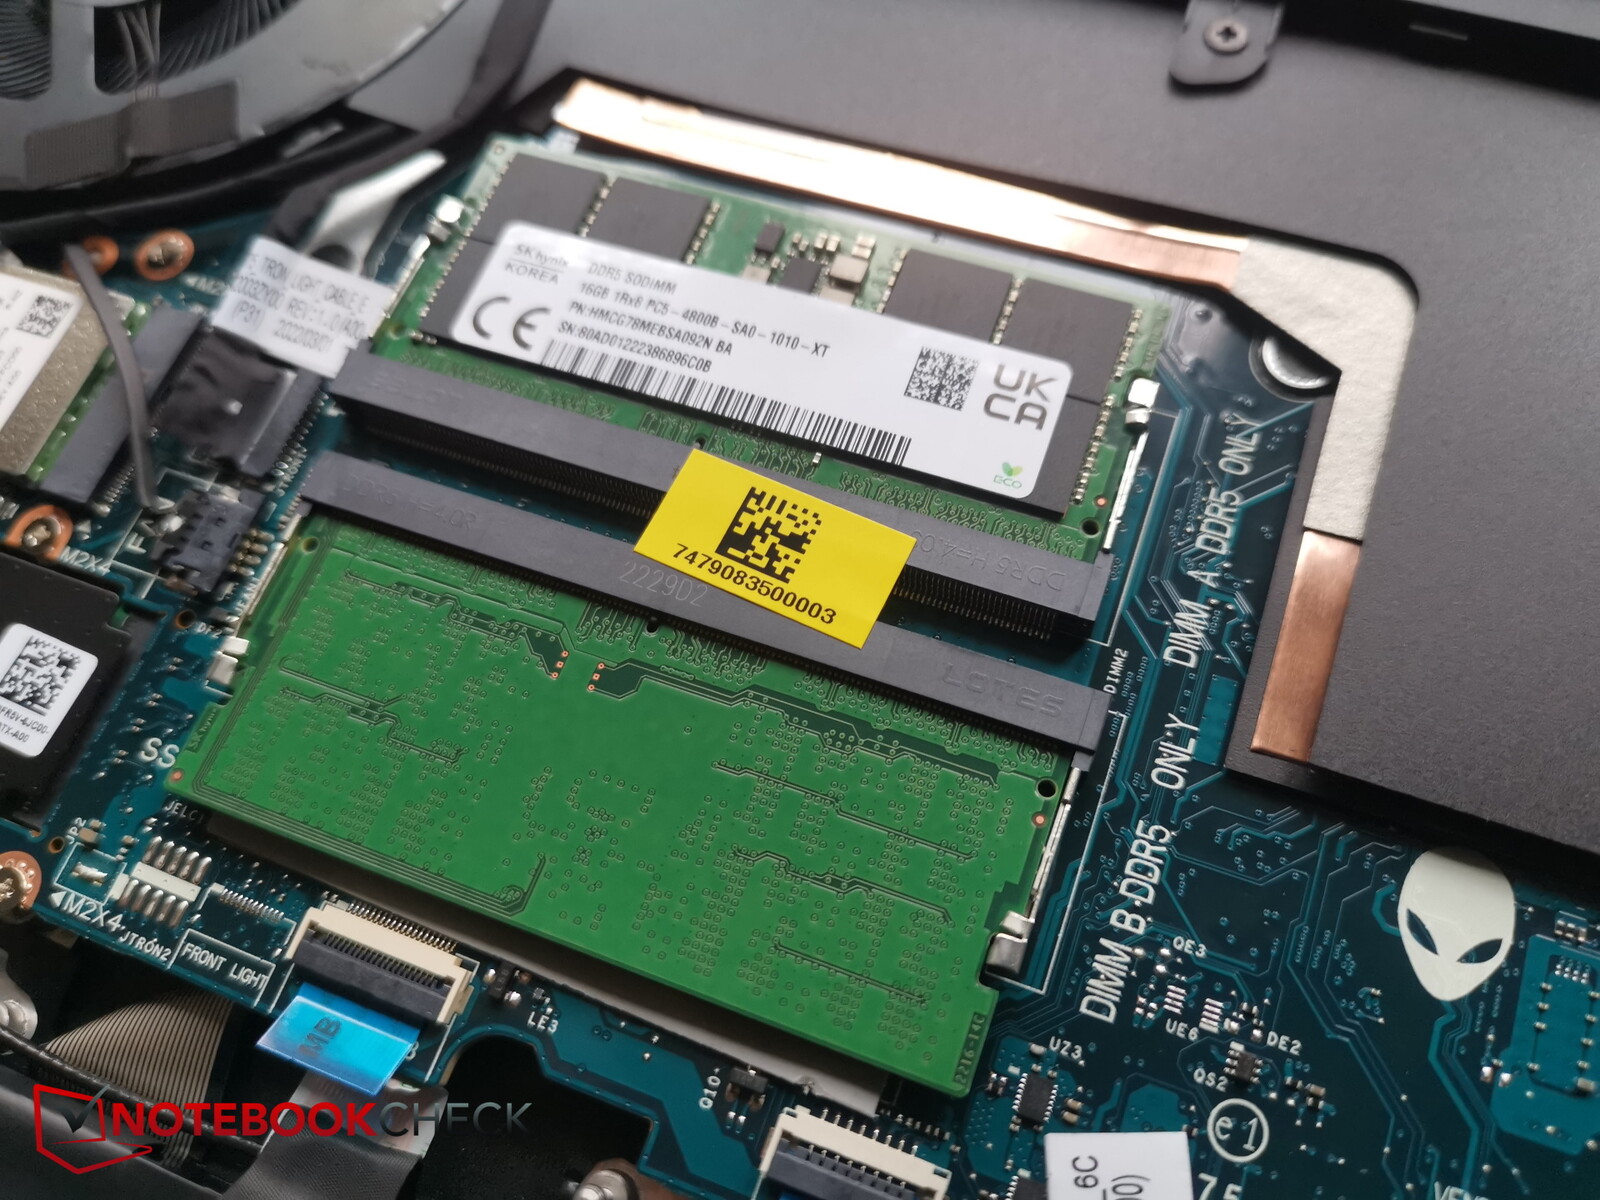
To loosen the underside, 8 cross-head screws need to be unscrewed. Two of them are much longer, so you should remember which screws go into which thread.
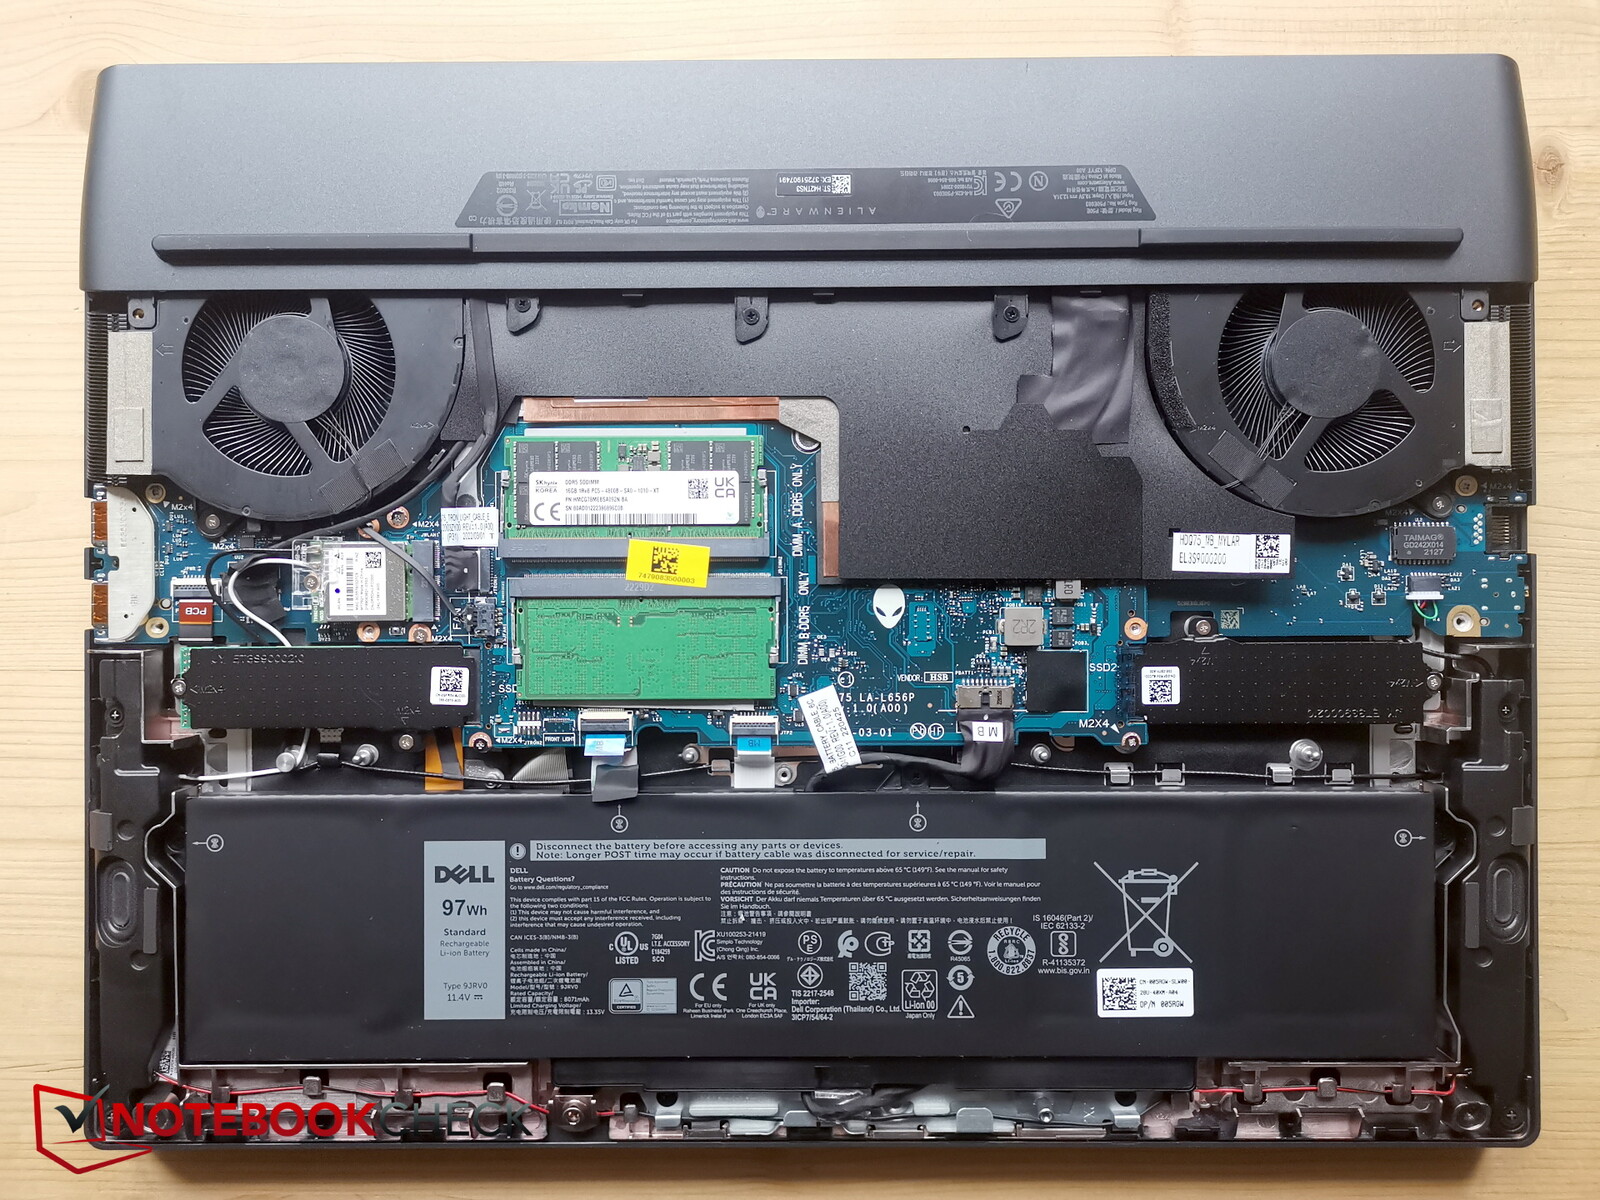
Once unscrewed, the underside can be levered open almost without tools. You then have access to the fans, two RAM slots, two M.2 SSD slots, the battery, and the replaceable Wifi module.
Input Devices - 17 inches without numpad
Keyboard
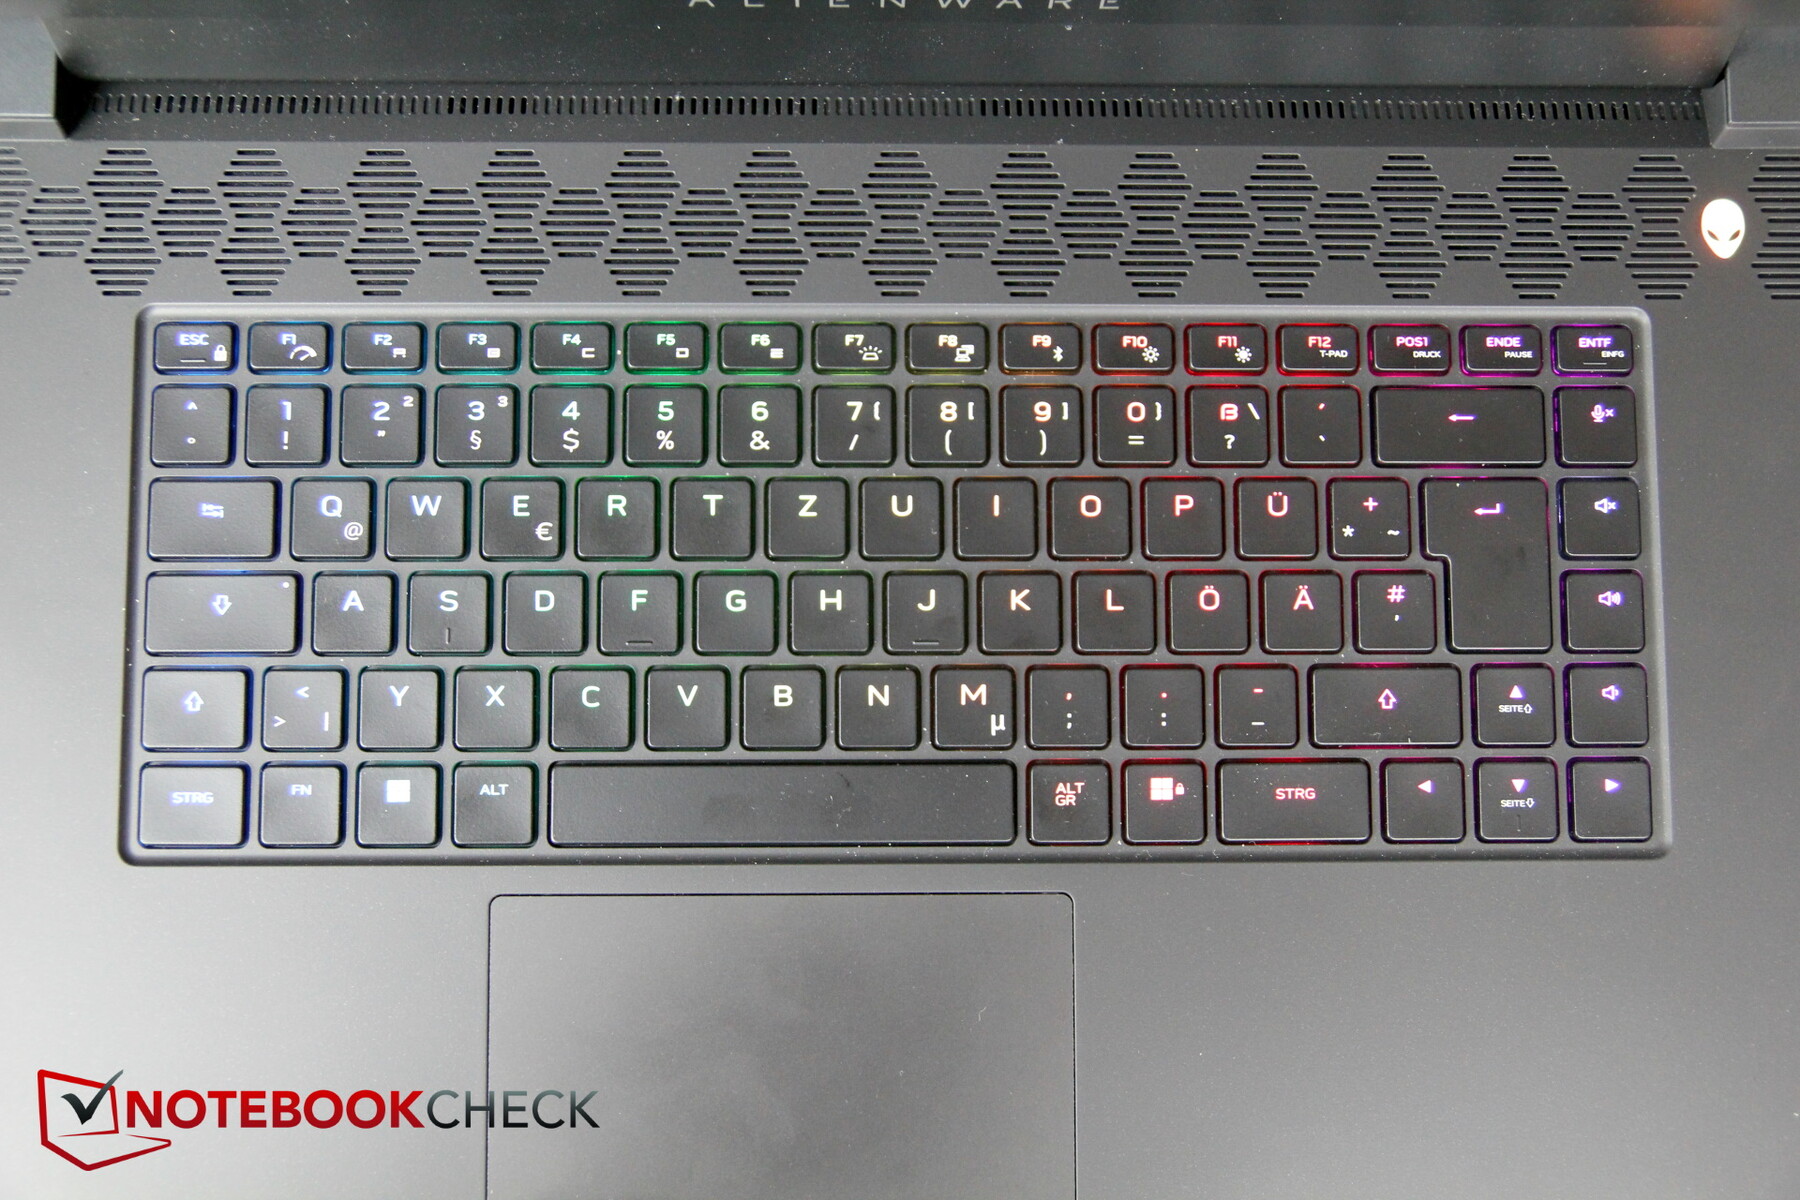
The keyboard layout has also been revamped. Despite the 17-inch size, the numpad has been dropped, but the arrow keys are now of normal size and the layout looks very tidy. The enter key is now also normal in size, but the shift keys are somewhat shorter.
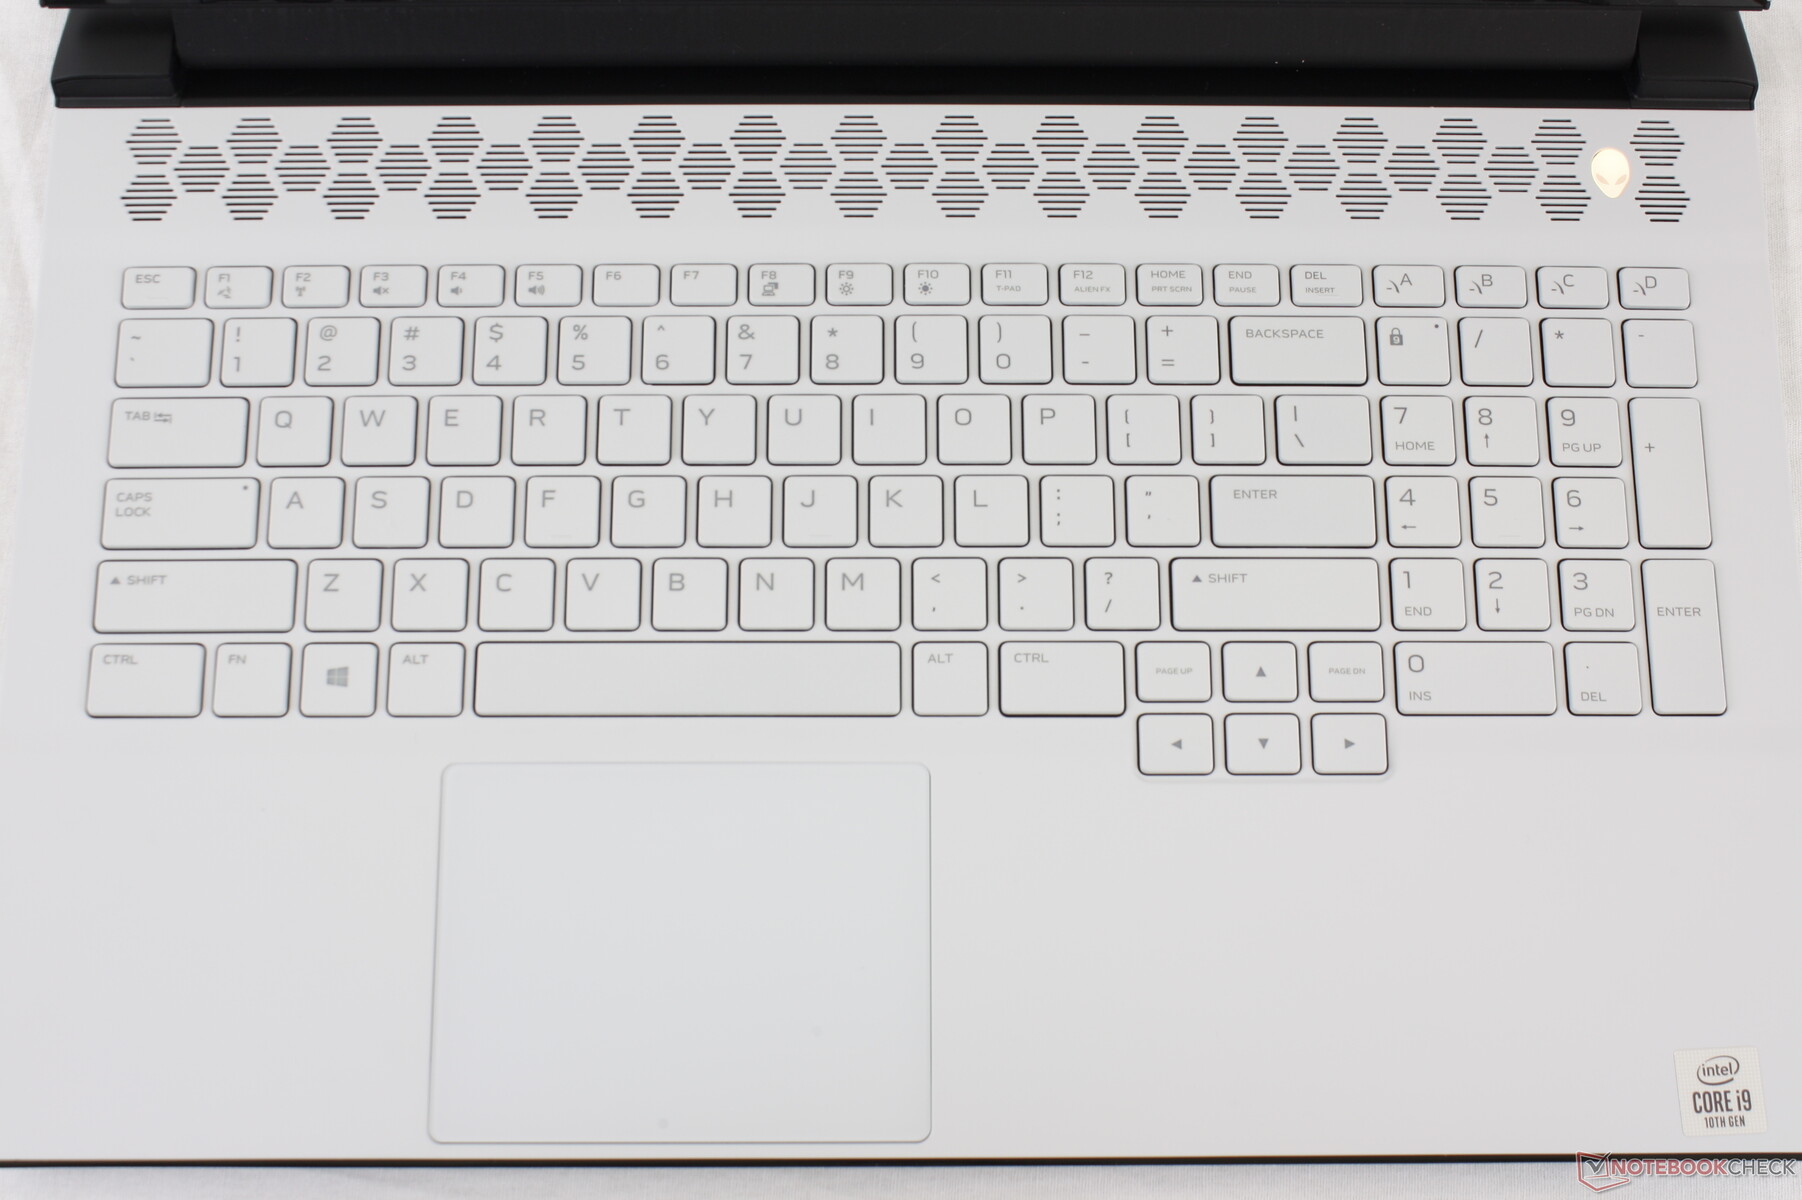
The keys themselves have a medium travel and the feedback is clearly noticeable. Overall, the typing experience is very good and typing noise is moderate.
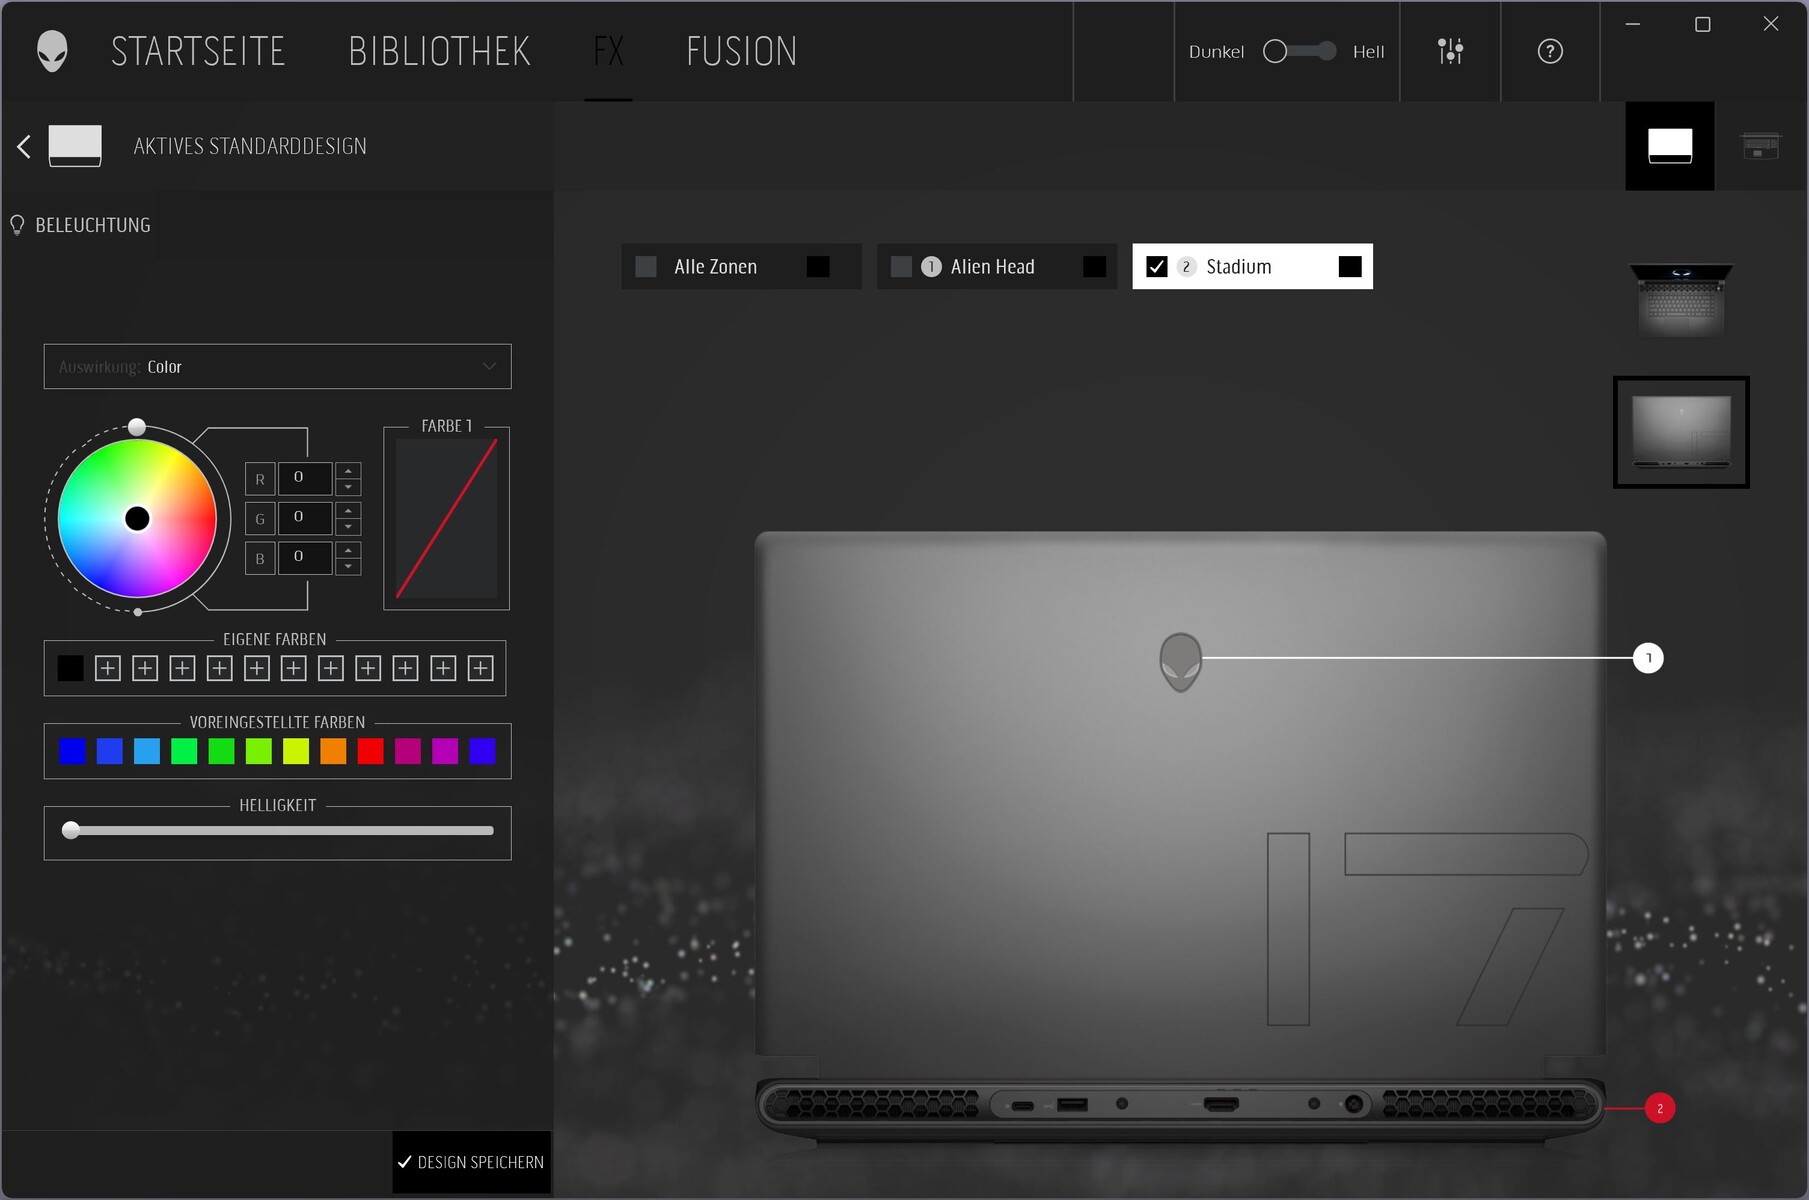
Nowadays, a backlight is indispensable and it has to be colorful in a gaming laptop. And so the m17 allows all kinds of LED gimmicks. In addition to the RGB-per-key effects, you can also configure the Alien logos on the front and back as well as the LED bar on the back.

Touchpad
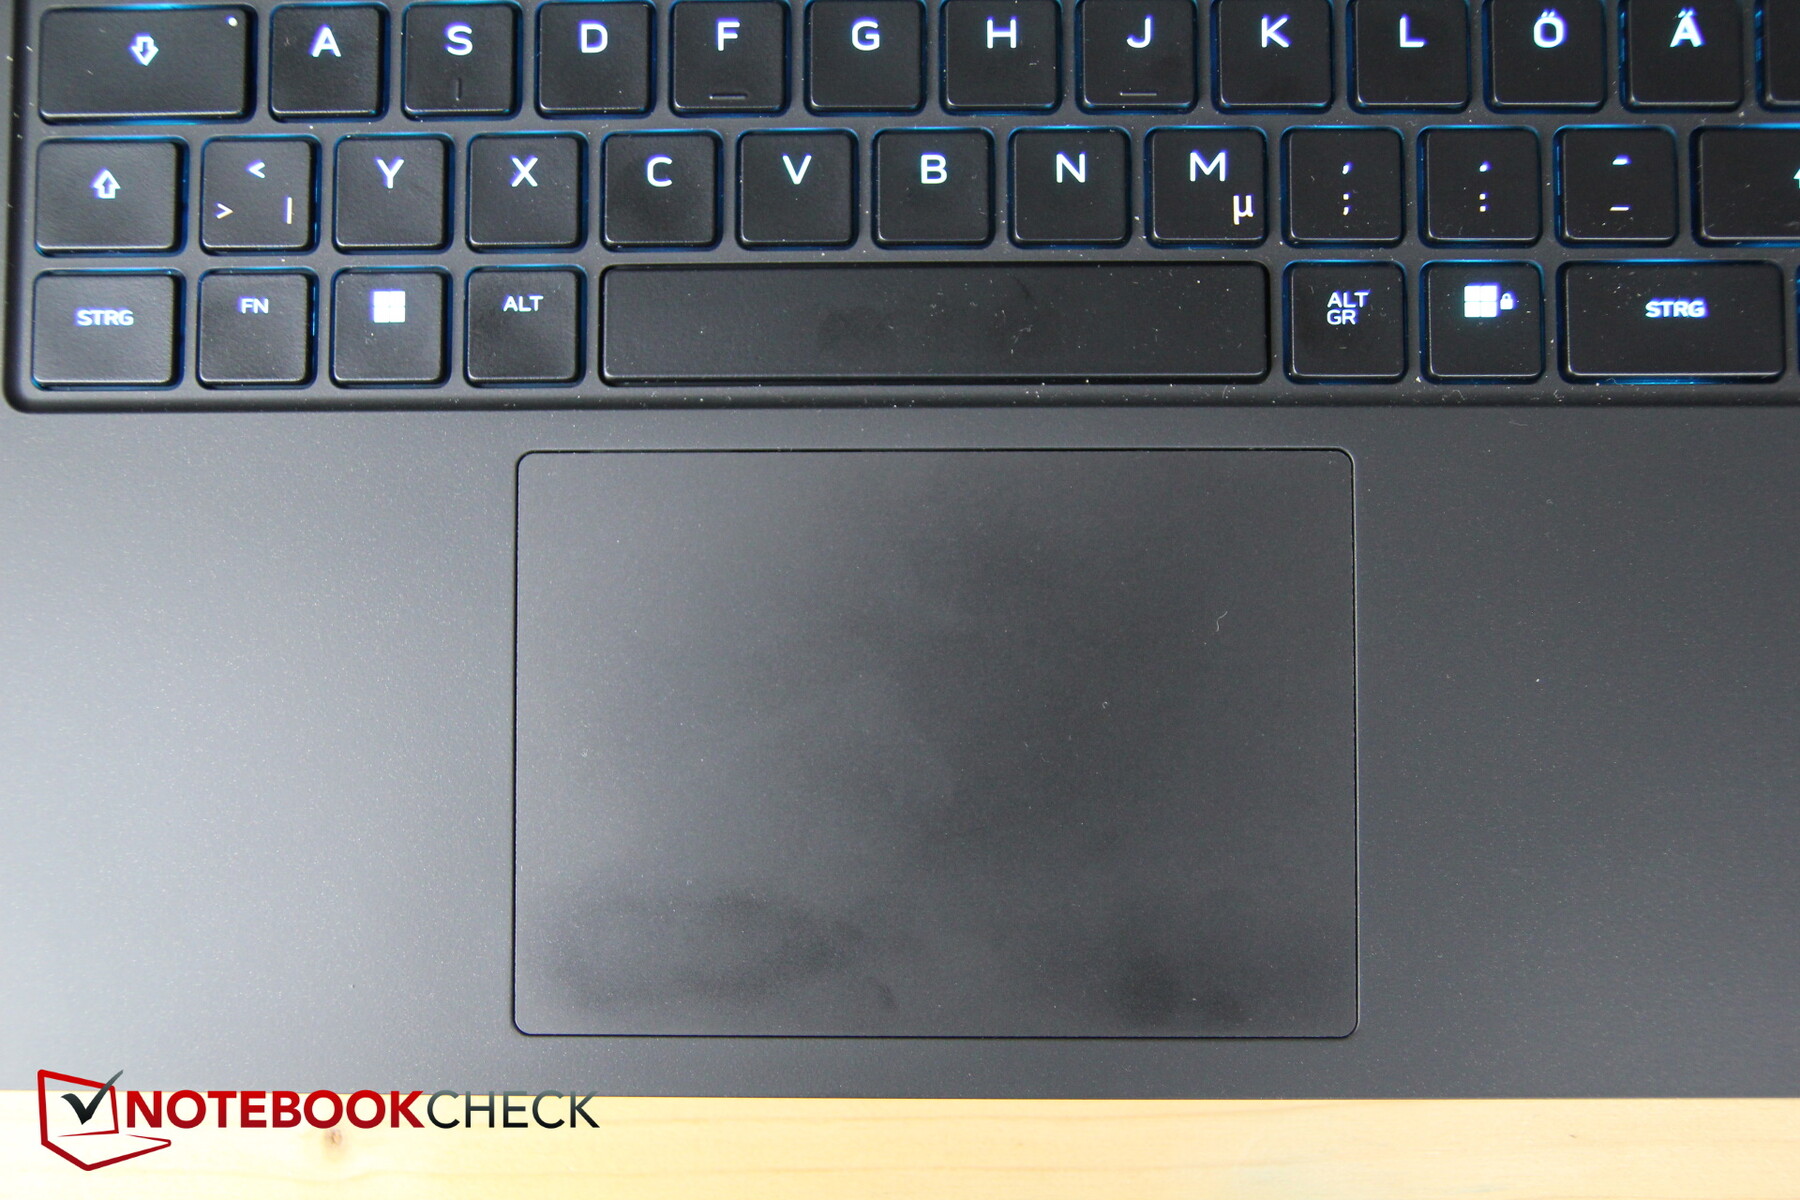
The average-sized (11.5 x 8 cm) touchpad has good gliding properties; it only falters slightly during very slow movements.
The integrated click buttons have a good pressure point and provide clear feedback. In our review model, however, clicks occasionally became "stuck", i.e. a button did not spring back up after being clicked down. The clicking noise is moderate.
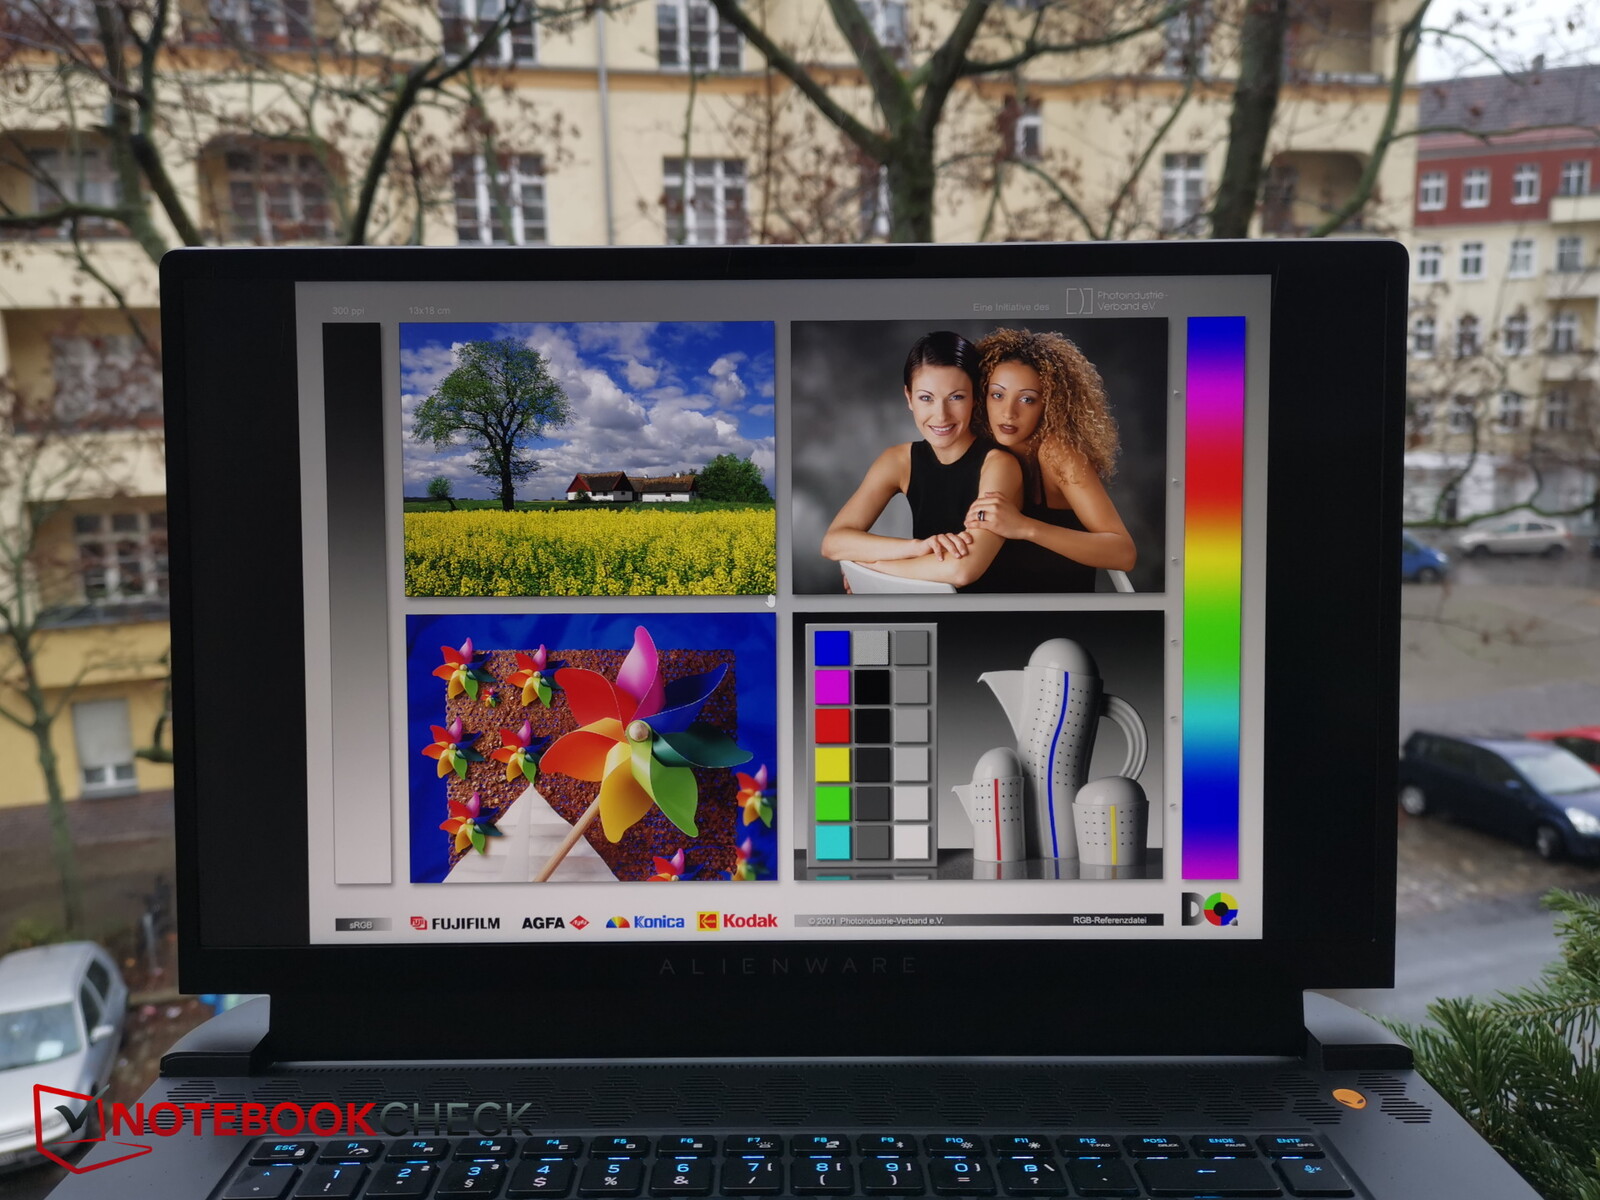
Display - Bright 4K panel in the Alienware

Dell installs a matte UHD IPS panel (3,840 x 2,160 pixels) from AU Optronics with a refresh rate of 120 Hz.
There are numerous alternative options, starting with three Full HD displays, which differ primarily in the refresh rate (165, 360, 480 Hz!), but also in the support of FreeSync vs G-Sync. Then there is a QHD display (2,560 x 1,440) with 165 Hz.
Our measurements are somewhat far removed from the advertised 3 ms response time; we measured between 11.6 and 16.4 ms. Screen bleeding is minimal, especially on the lower right edge. PWM is not used.
In a class comparison, the brightness of almost 450 nits is very good, and the illumination is also good. The black level, on the other hand, drops sharply, which means the contrast suffers somewhat.
| |||||||||||||||||||||||||
Brightness Distribution: 87 %
Center on Battery: 481 cd/m²
Contrast: 880:1 (Black: 0.55 cd/m²)
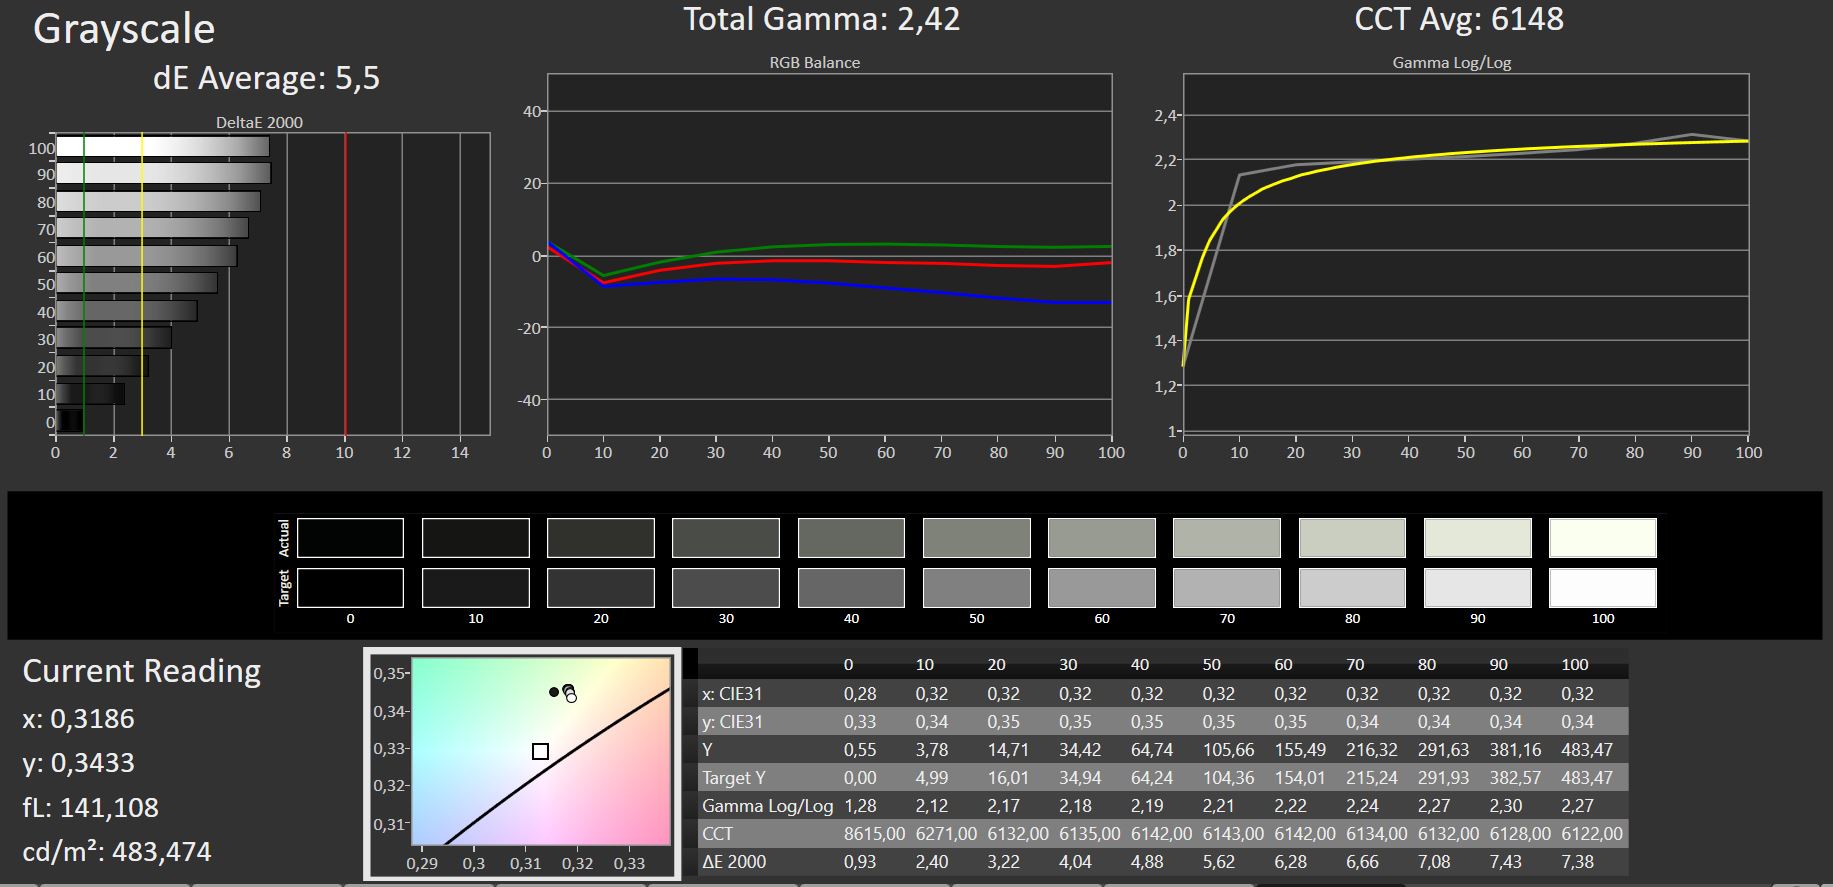
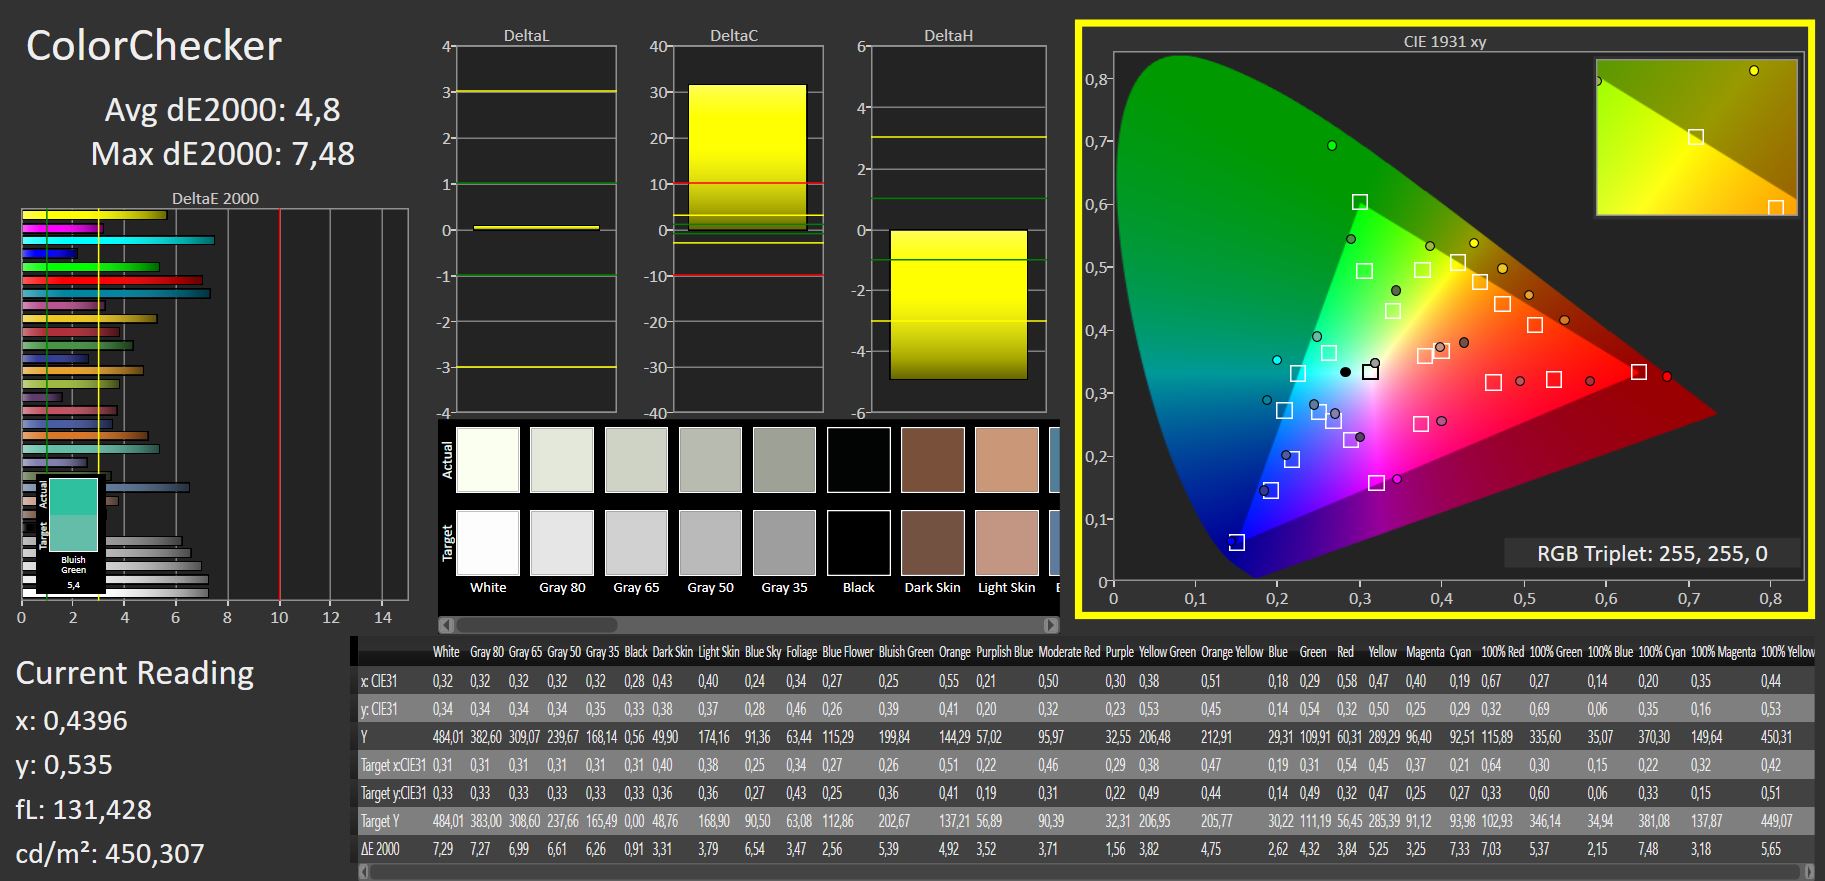
ΔE ColorChecker Calman: 4.8 | ∀{0.5-29.43 Ø4.72}
calibrated: 4.74
ΔE Greyscale Calman: 5.5 | ∀{0.09-98 Ø4.97}
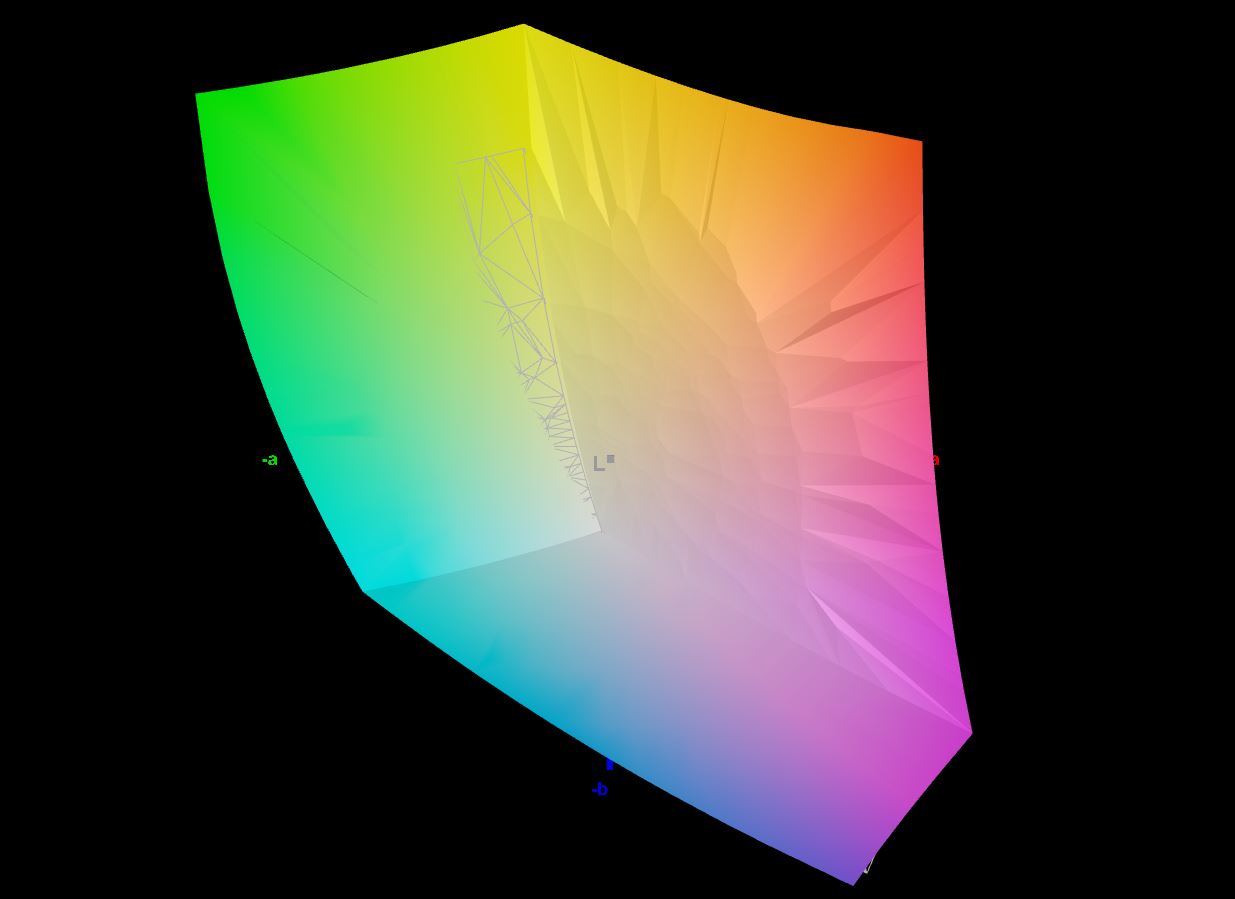
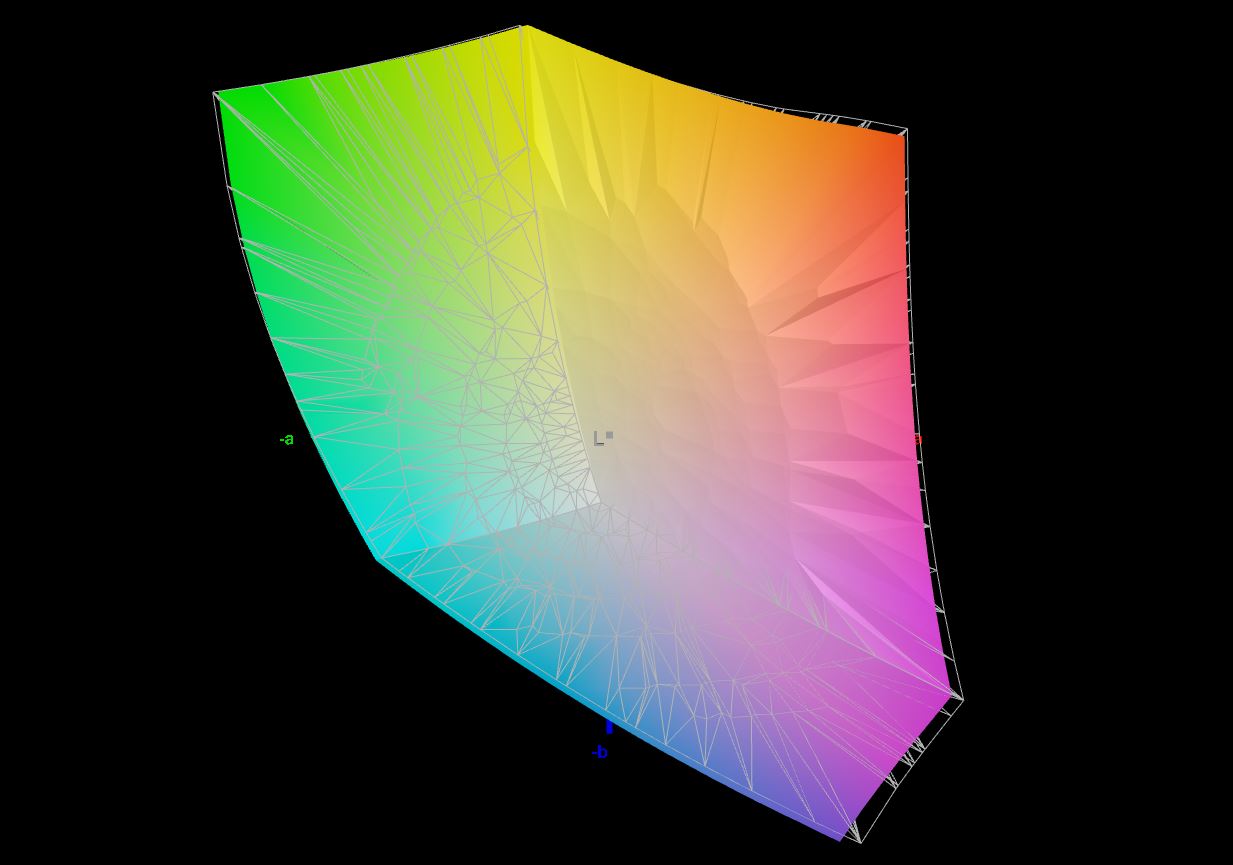
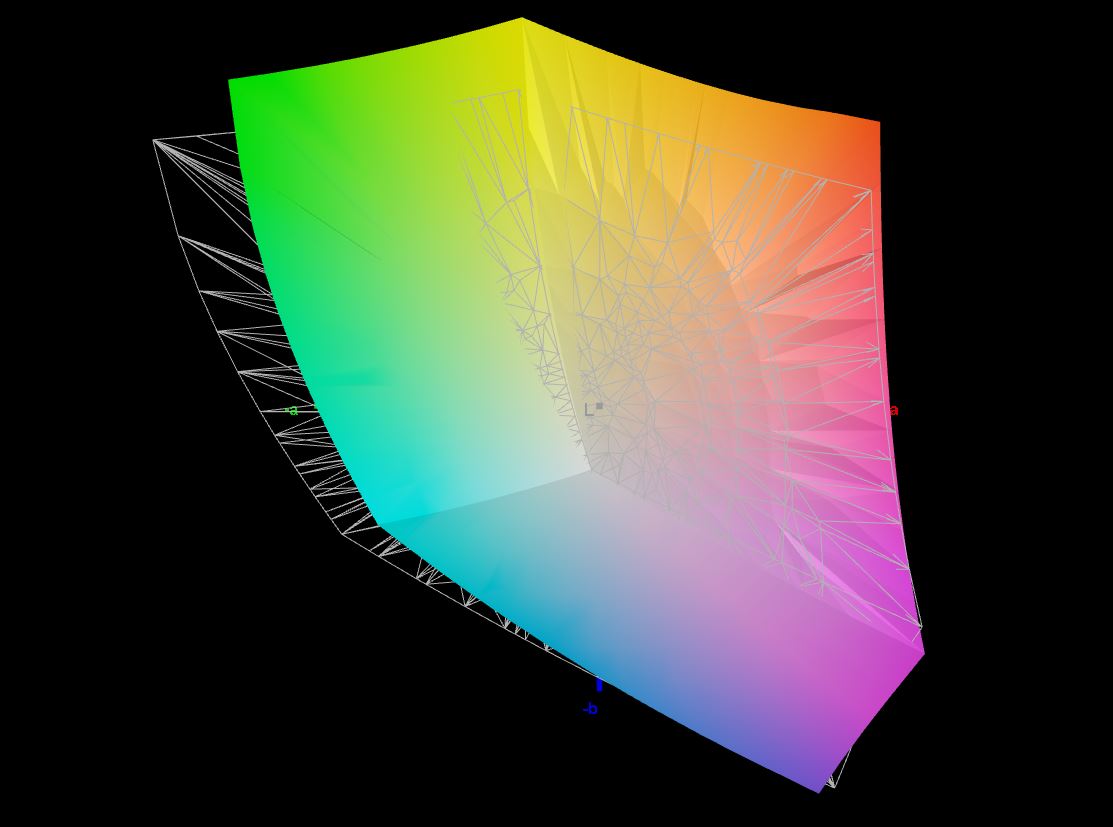
88.4% AdobeRGB 1998 (Argyll 3D)
99.6% sRGB (Argyll 3D)
97.2% Display P3 (Argyll 3D)
Gamma: 2.42
CCT: 6148 K
| Alienware m17 R5 (R9 6900HX, RX 6850M XT) AU Optronics AUODBA3, IPS, 3840x2160, 17" | Alienware m17 R4 AU Optronics AUOEC91, IPS, 1920x1080, 17.3" | Asus ROG Strix Scar 17 SE G733CX-LL014W NE173QHM-NZ2, IPS, 2560x1440, 17.3" | Acer Predator Helios 300 (i7-12700H, RTX 3070 Ti) BOE0A1A, IPS, 2560x1440, 17.3" | Schenker XMG Neo 17 M22 BOE0A99, IPS, 2560x1600, 17" | Aorus 17X XES Sharp SHP1563, IPS, 1920x1080, 17.3" | |
|---|---|---|---|---|---|---|
| Display | -16% | -1% | -1% | -17% | -16% | |
| Display P3 Coverage (%) | 97.2 | 69.8 -28% | 97.1 0% | 96.8 0% | 69 -29% | 70.1 -28% |
| sRGB Coverage (%) | 99.6 | 99.7 0% | 99.9 0% | 99.9 0% | 99.8 0% | 99.9 0% |
| AdobeRGB 1998 Coverage (%) | 88.4 | 71.6 -19% | 84.8 -4% | 84.8 -4% | 69.6 -21% | 71.9 -19% |
| Response Times | 21% | 39% | 2% | 41% | 65% | |
| Response Time Grey 50% / Grey 80% * (ms) | 16.4 ? | 13.2 ? 20% | 5.7 ? 65% | 16.4 ? -0% | 10.8 ? 34% | 3.4 ? 79% |
| Response Time Black / White * (ms) | 11.6 ? | 9.2 ? 21% | 10.1 ? 13% | 11.2 ? 3% | 6.1 ? 47% | 5.8 ? 50% |
| PWM Frequency (Hz) | ||||||
| Screen | 41% | 28% | 17% | 33% | 1% | |
| Brightness middle (cd/m²) | 484 | 305 -37% | 320 -34% | 366 -24% | 415 -14% | 278 -43% |
| Brightness (cd/m²) | 449 | 301 -33% | 303 -33% | 340 -24% | 399 -11% | 273 -39% |
| Brightness Distribution (%) | 87 | 93 7% | 87 0% | 85 -2% | 90 3% | 79 -9% |
| Black Level * (cd/m²) | 0.55 | 0.19 65% | 0.3 45% | 0.31 44% | 0.43 22% | 0.26 53% |
| Contrast (:1) | 880 | 1605 82% | 1067 21% | 1181 34% | 965 10% | 1069 21% |
| Colorchecker dE 2000 * | 4.8 | 1.31 73% | 1.1 77% | 3.56 26% | 1.44 70% | 3.96 17% |
| Colorchecker dE 2000 max. * | 7.48 | 2.32 69% | 2.7 64% | 5.66 24% | 2.33 69% | 10.78 -44% |
| Colorchecker dE 2000 calibrated * | 4.74 | 0.91 81% | 3.31 30% | 0.89 81% | 1.07 77% | |
| Greyscale dE 2000 * | 5.5 | 2.3 58% | 1.1 80% | 2.84 48% | 1.8 67% | 6.8 -24% |
| Gamma | 2.42 91% | 2.281 96% | 2.13 103% | 2.29 96% | 2.132 103% | 2.224 99% |
| CCT | 6148 106% | 6449 101% | 6599 98% | 6835 95% | 6327 103% | 7651 85% |
| Color Space (Percent of AdobeRGB 1998) (%) | 72 | |||||
| Color Space (Percent of sRGB) (%) | 94 | |||||
| Total Average (Program / Settings) | 15% /
26% | 22% /
23% | 6% /
11% | 19% /
23% | 17% /
7% |
* ... smaller is better
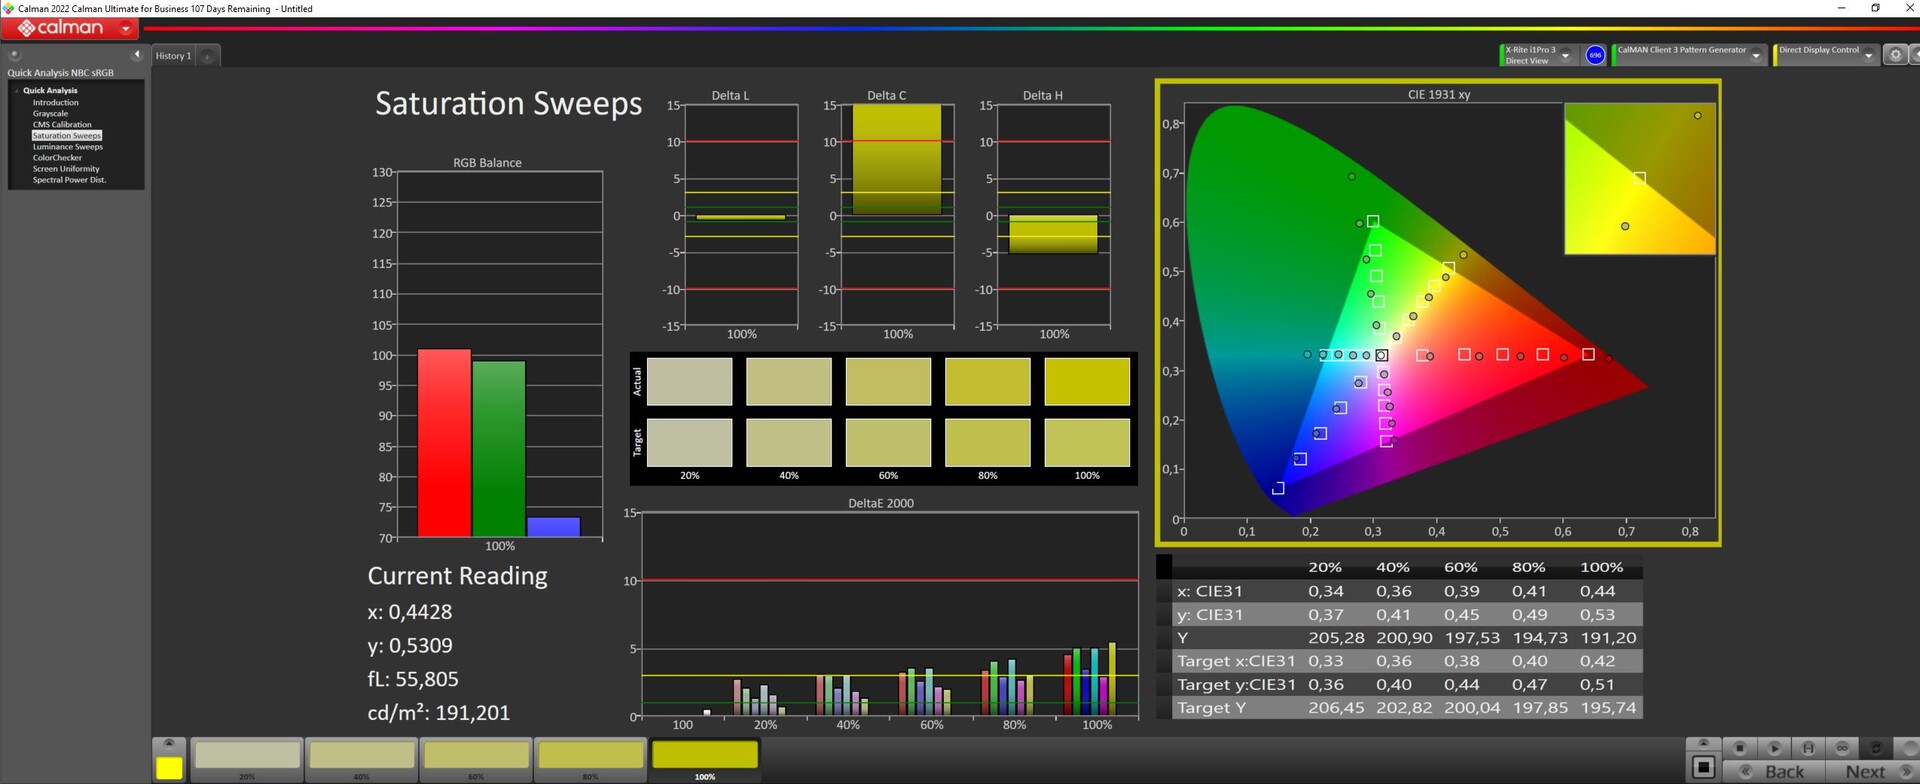
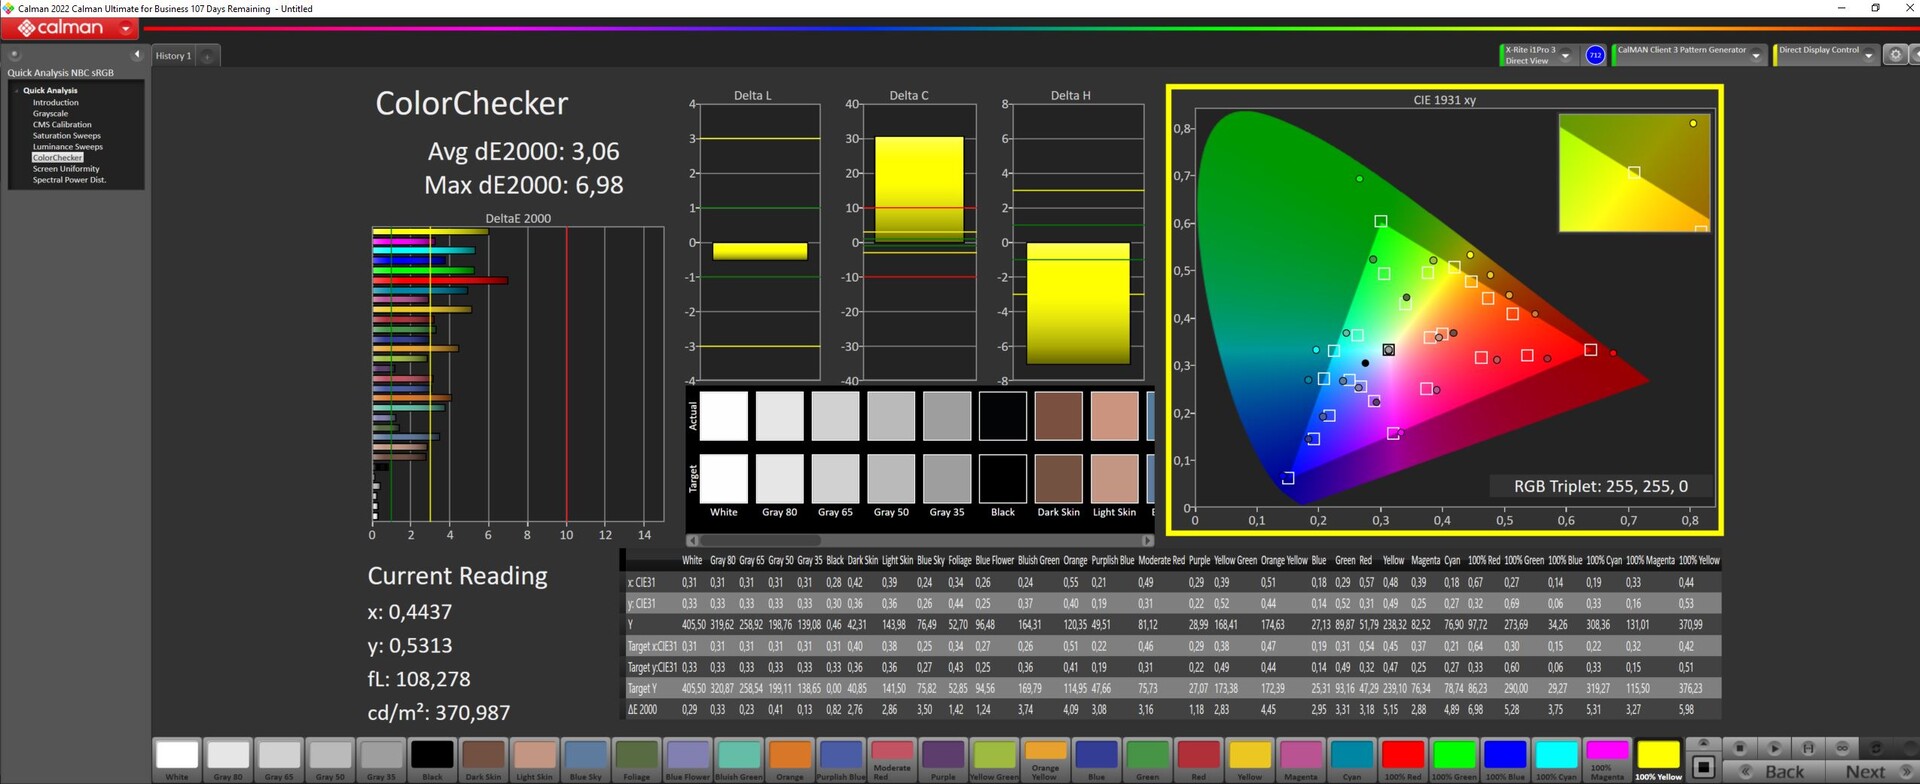
The Alienware offers decent color space coverage: sRGB is fully reproduced, DisplayP3 is 97 percent and AdobeRGB 88 percent. This makes the screen suitable for professional image- and video editing.
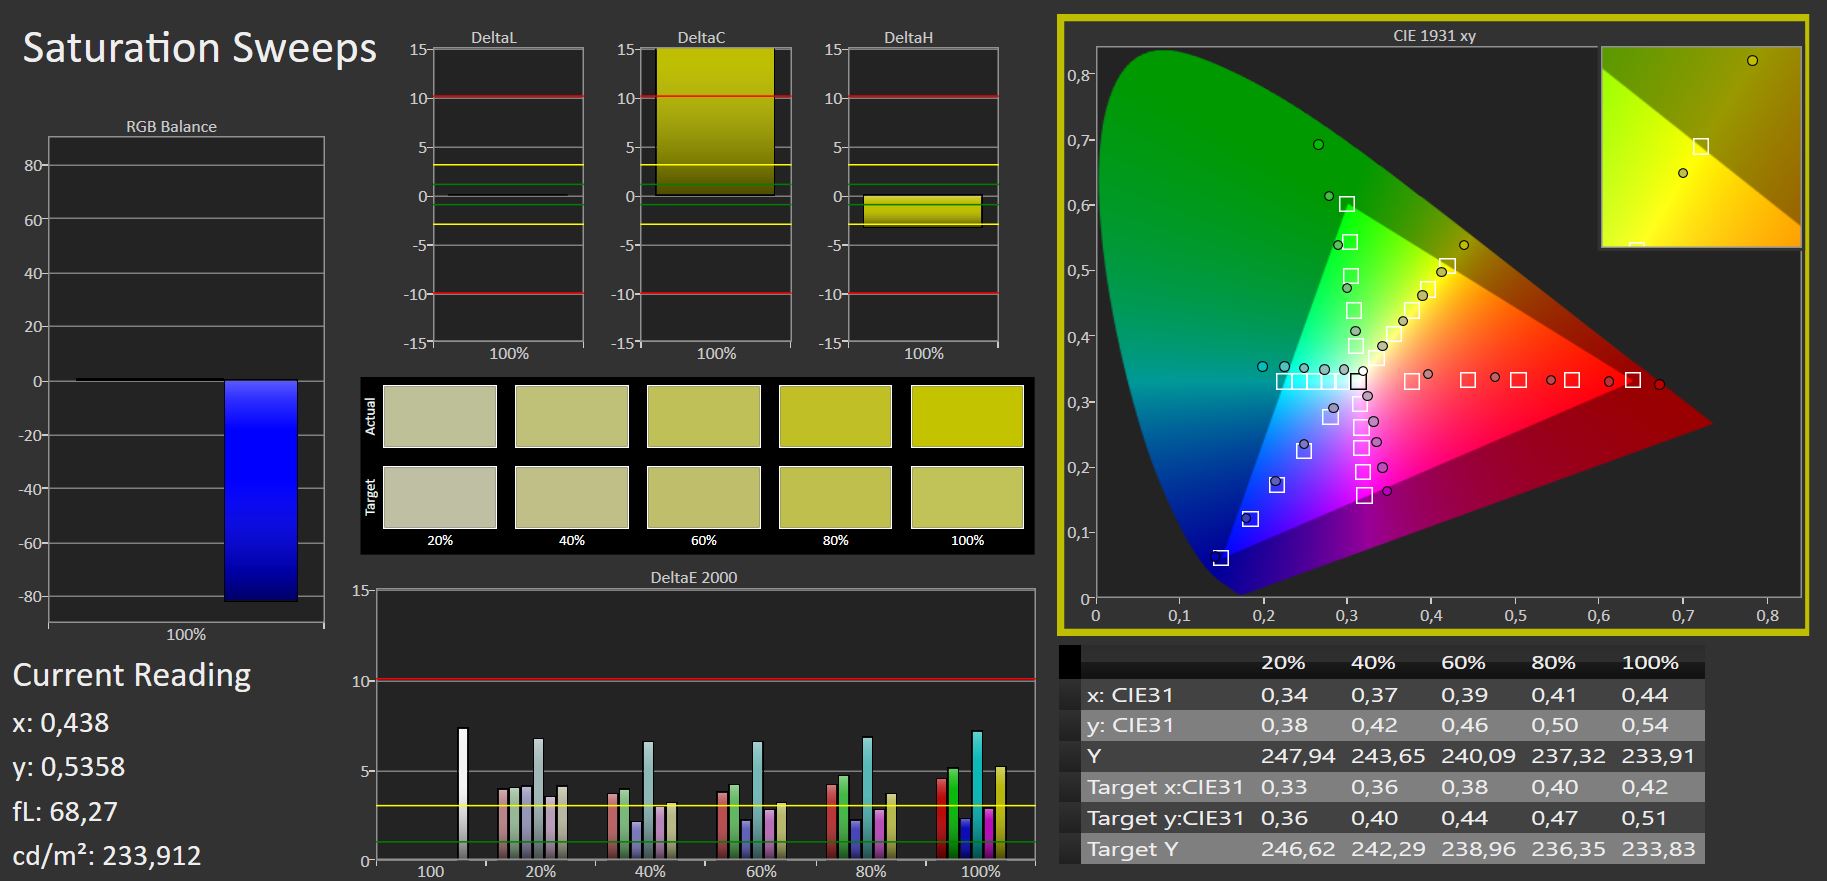
Despite the good colour space coverage, the DeltaE values are not particularly low. A DeltaE value of close to 5 is a little too high for both the colors and the grayscales.
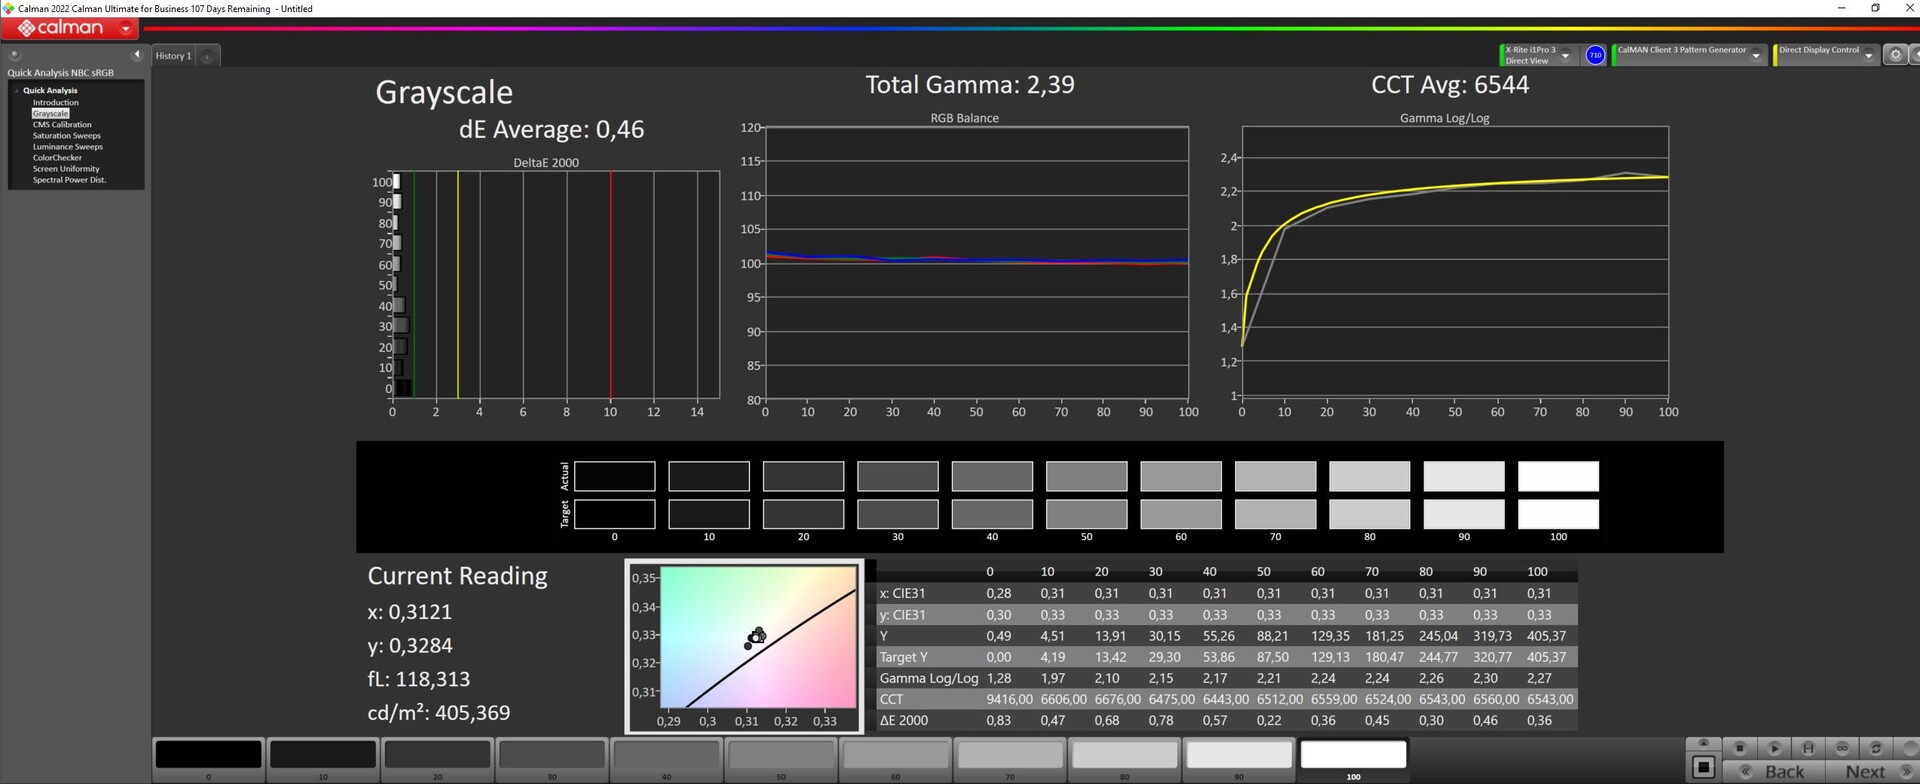
Our manual calibration brings the DeltaE value down to 0.46 for the grayscale and the color deviations to 3.06. The profile can be downloaded above.
Display Response Times
| ↔ Response Time Black to White | ||
|---|---|---|
| 11.6 ms ... rise ↗ and fall ↘ combined | ↗ 6.2 ms rise | 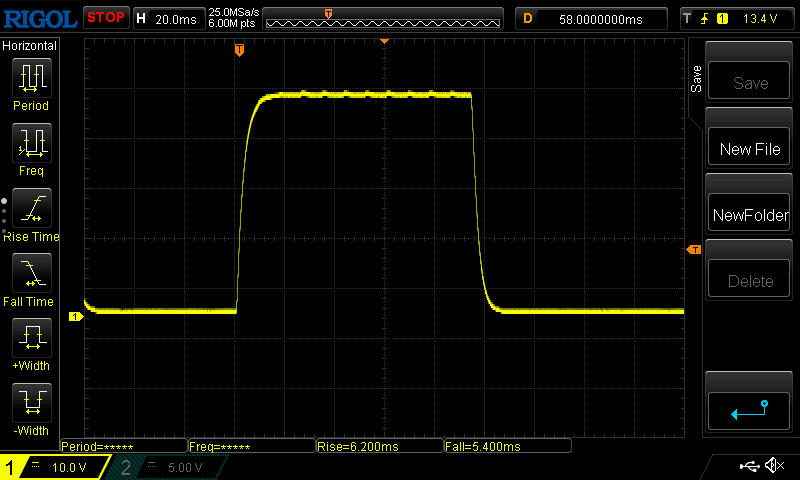 |
| ↘ 5.4 ms fall | ||
| The screen shows good response rates in our tests, but may be too slow for competitive gamers. In comparison, all tested devices range from 0.1 (minimum) to 240 (maximum) ms. » 31 % of all devices are better. This means that the measured response time is better than the average of all tested devices (19.8 ms). | ||
| ↔ Response Time 50% Grey to 80% Grey | ||
| 16.4 ms ... rise ↗ and fall ↘ combined | ↗ 7.8 ms rise | 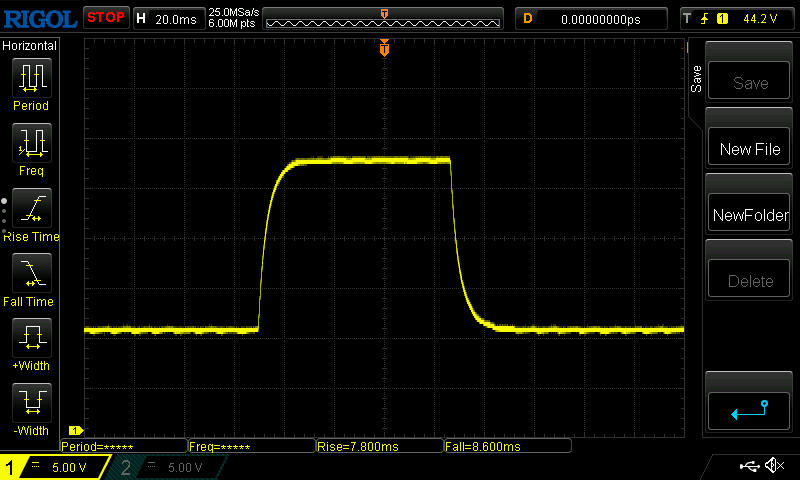 |
| ↘ 8.6 ms fall | ||
| The screen shows good response rates in our tests, but may be too slow for competitive gamers. In comparison, all tested devices range from 0.165 (minimum) to 636 (maximum) ms. » 30 % of all devices are better. This means that the measured response time is better than the average of all tested devices (31 ms). | ||
Screen Flickering / PWM (Pulse-Width Modulation)
| Screen flickering / PWM not detected |  | ||
In comparison: 52 % of all tested devices do not use PWM to dim the display. If PWM was detected, an average of 7781 (minimum: 5 - maximum: 343500) Hz was measured. | |||
Outdoors, the 450 nits together with the matte surface are helpful in reducing most reflections. However, the weak contrast prohibits use in direct sunlight.
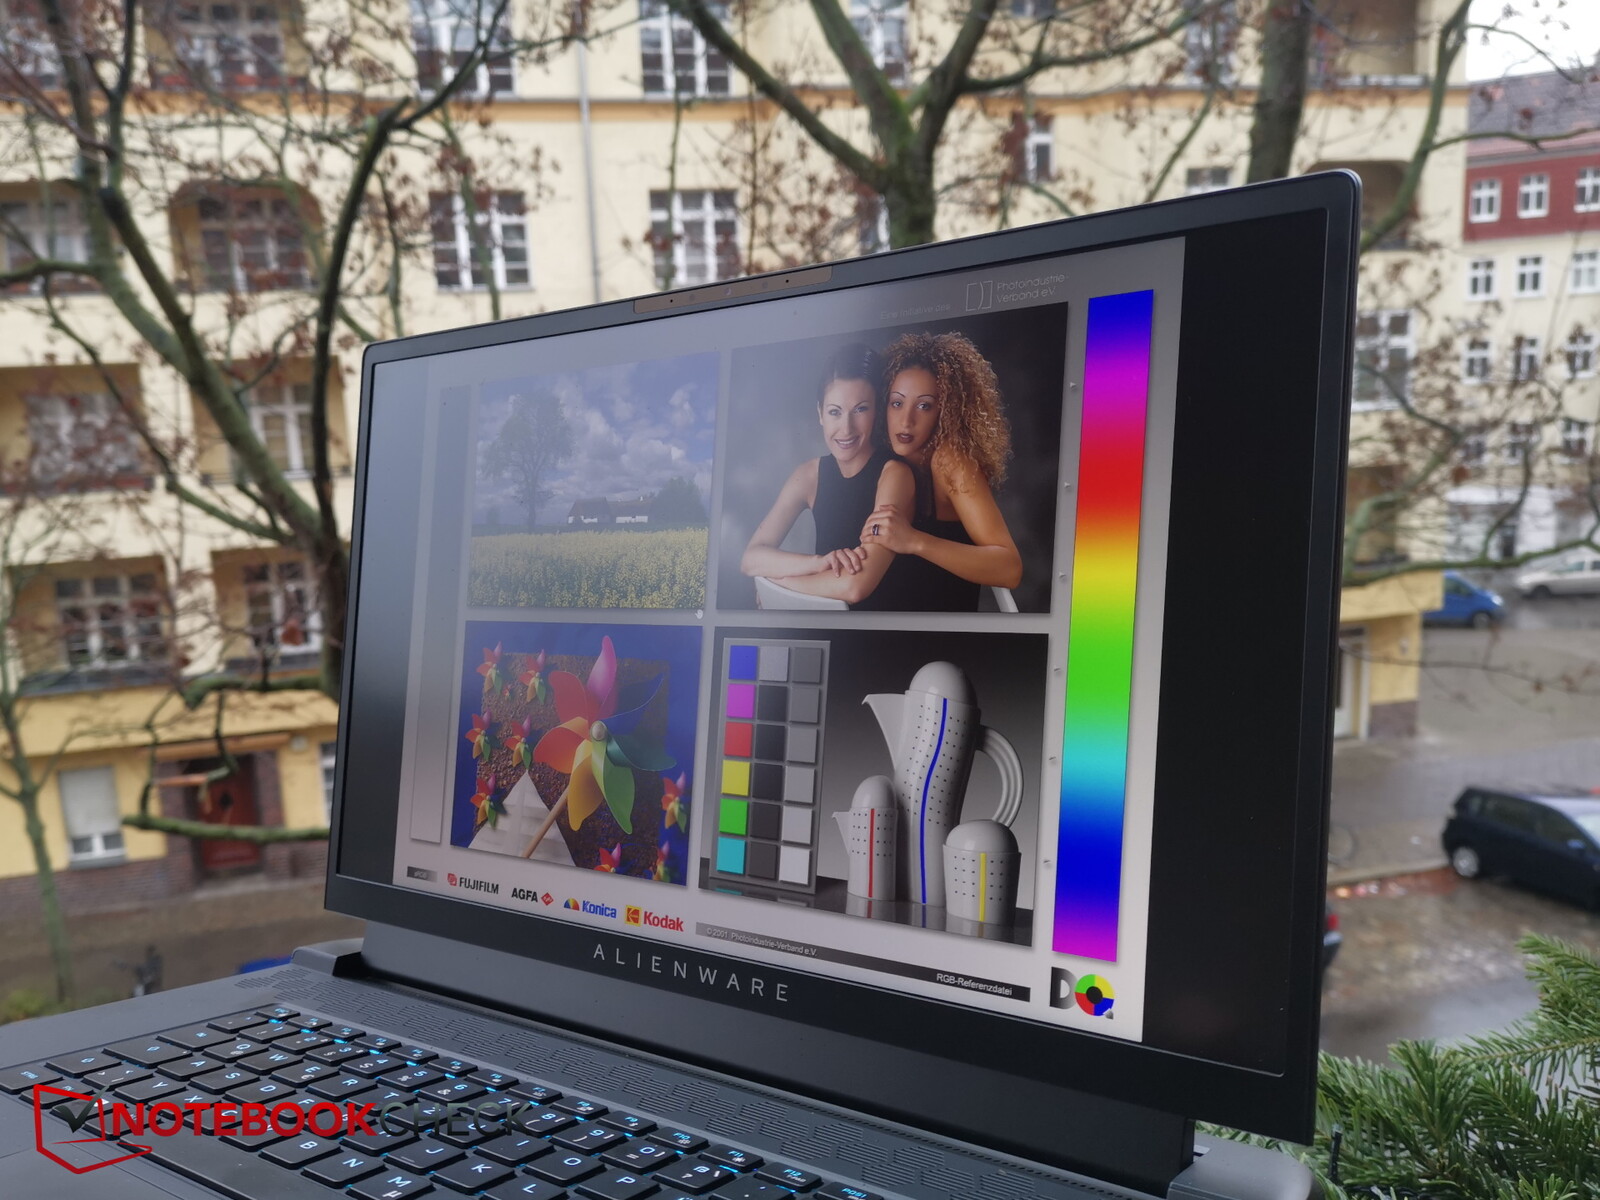
The viewing-angle stability is acceptable, but not great compared to the IPS standard. When viewed from extreme angles, a considerable amount of brightness is lost.

Performance - Drivers hinder true potential
Both the AMD Ryzen 9 6900HX with its eight cores and the AMD Radeon RX 6850M XT as well as the generous 32 GB of RAM place the device in the high-performance gamer category. This means that the device should be able to run all current games smoothly on the integrated display, even if not always in native 4K resolution.
Alternatively, you can go one size smaller in the configurator with the Ryzen 7 6800H and a Radeon RX 6700M. The RAM can be varied between 8 and 64 GB.
Testing Conditions
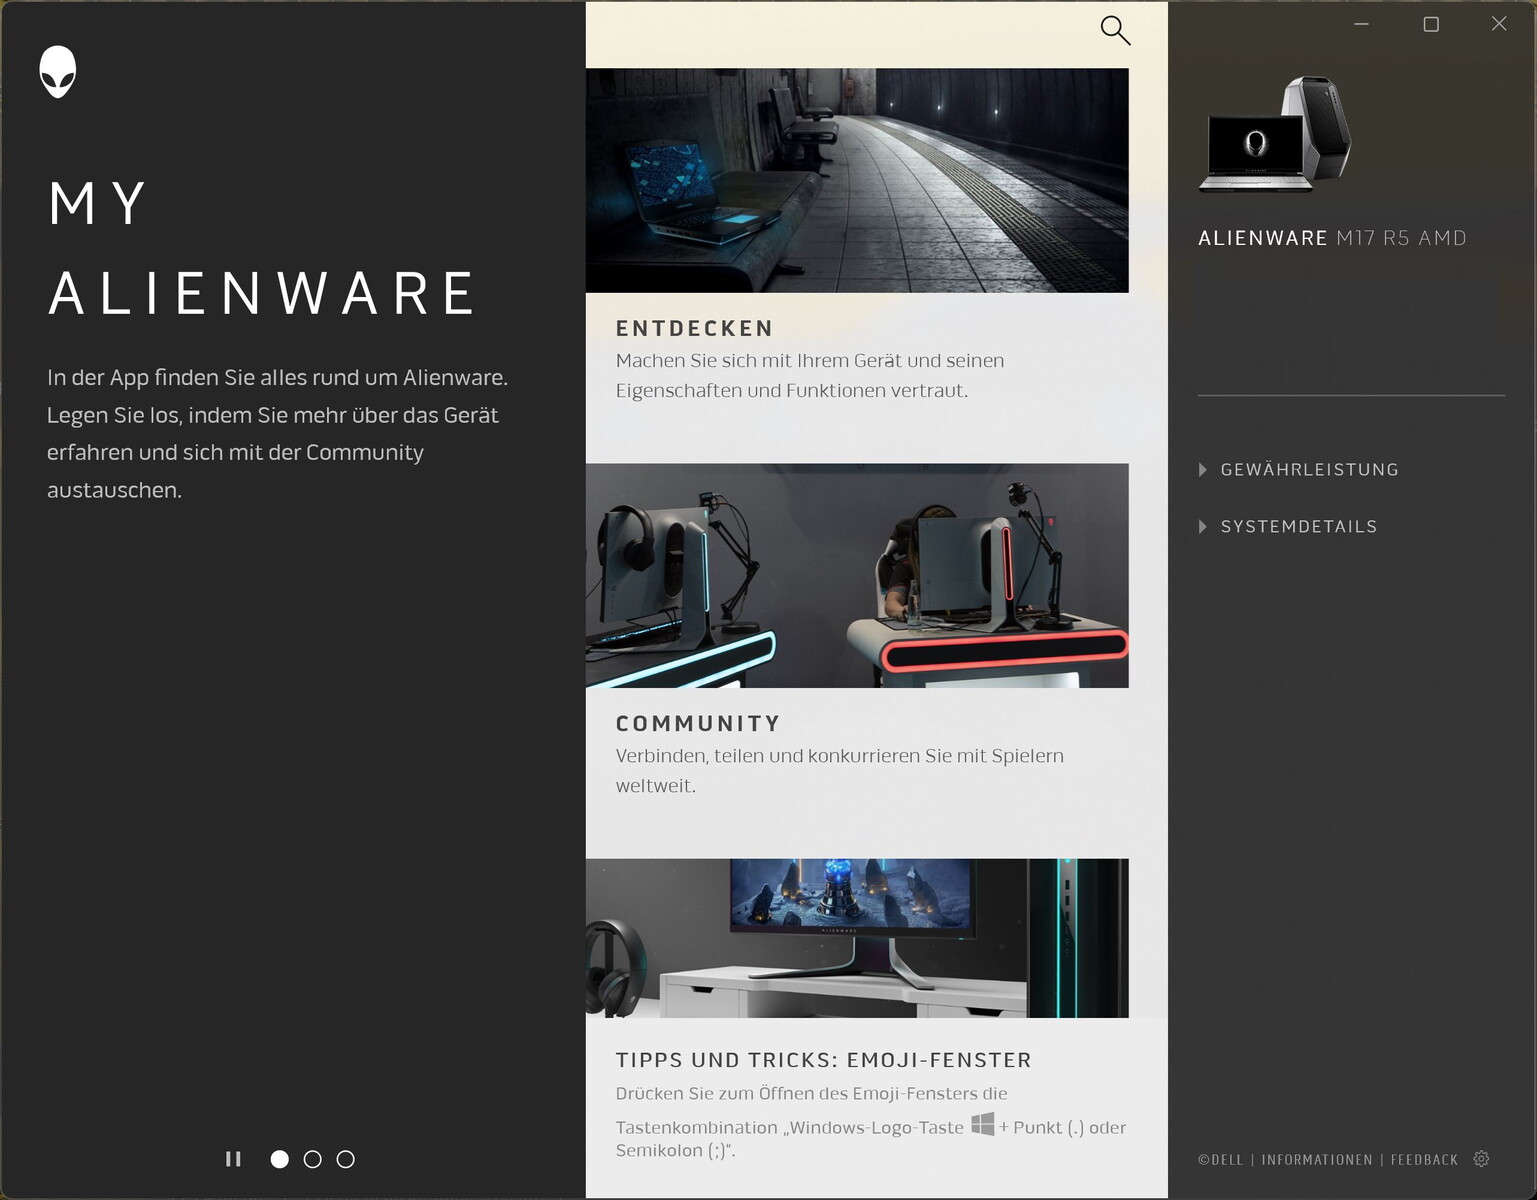
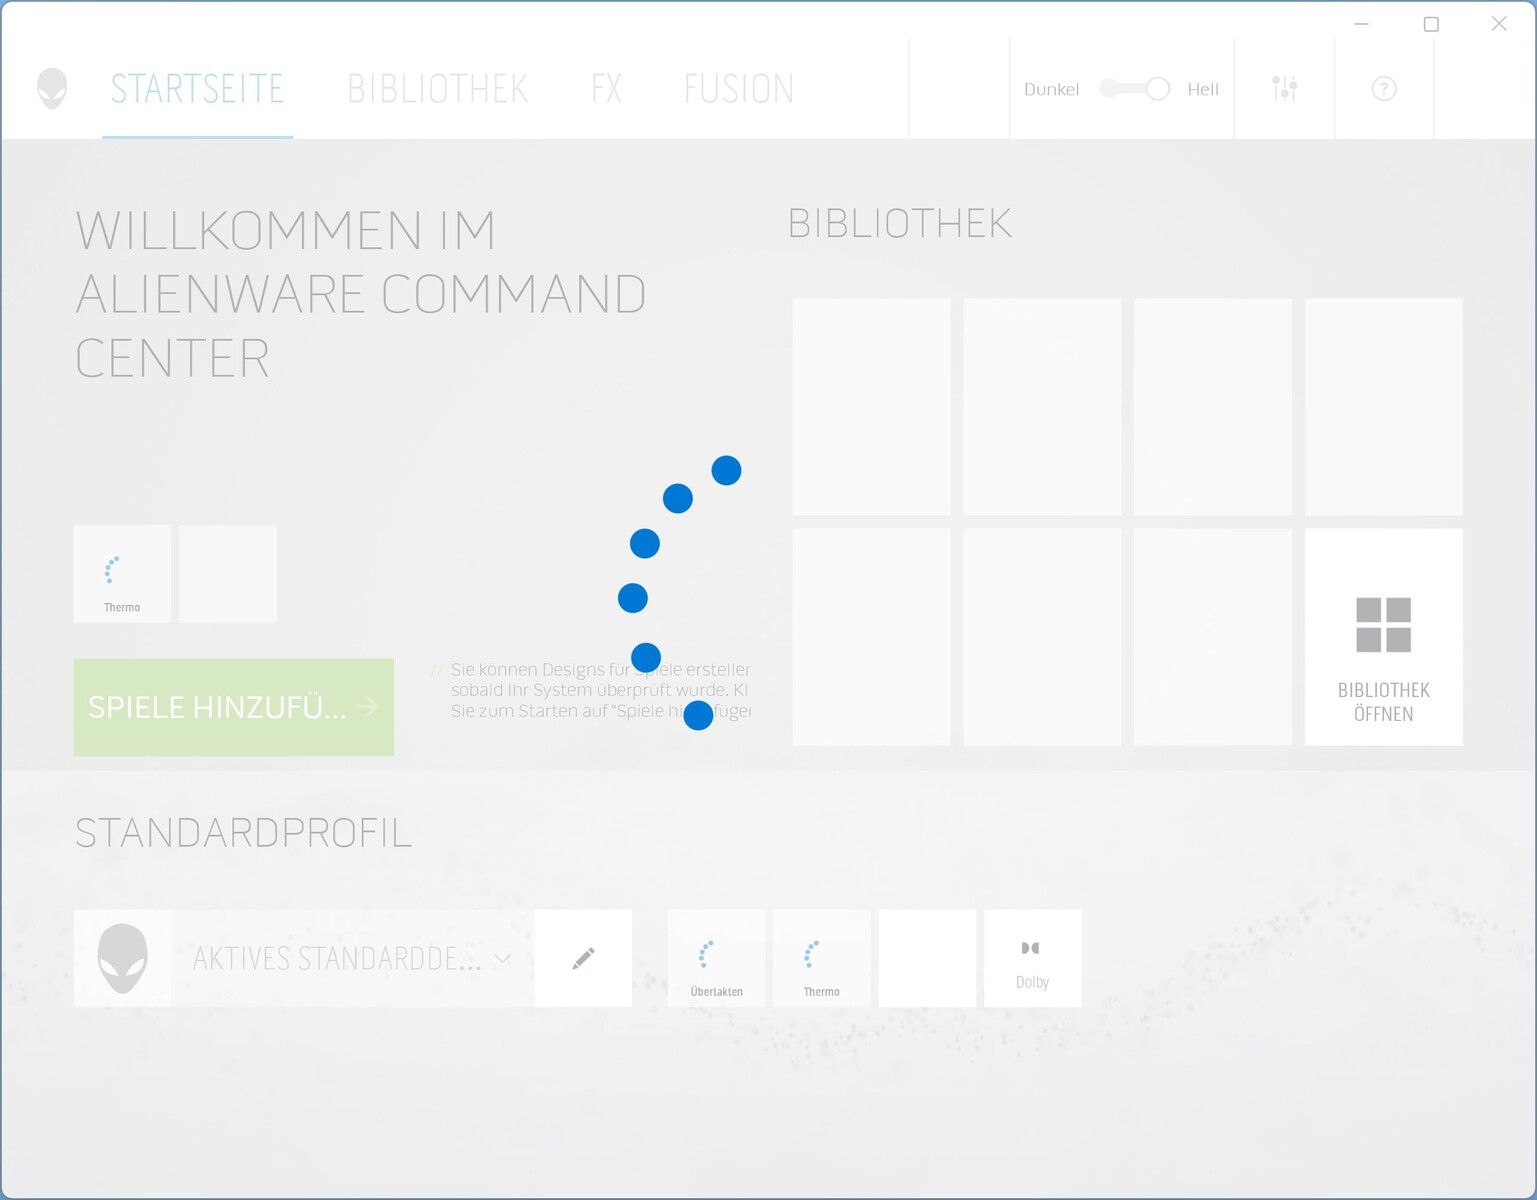
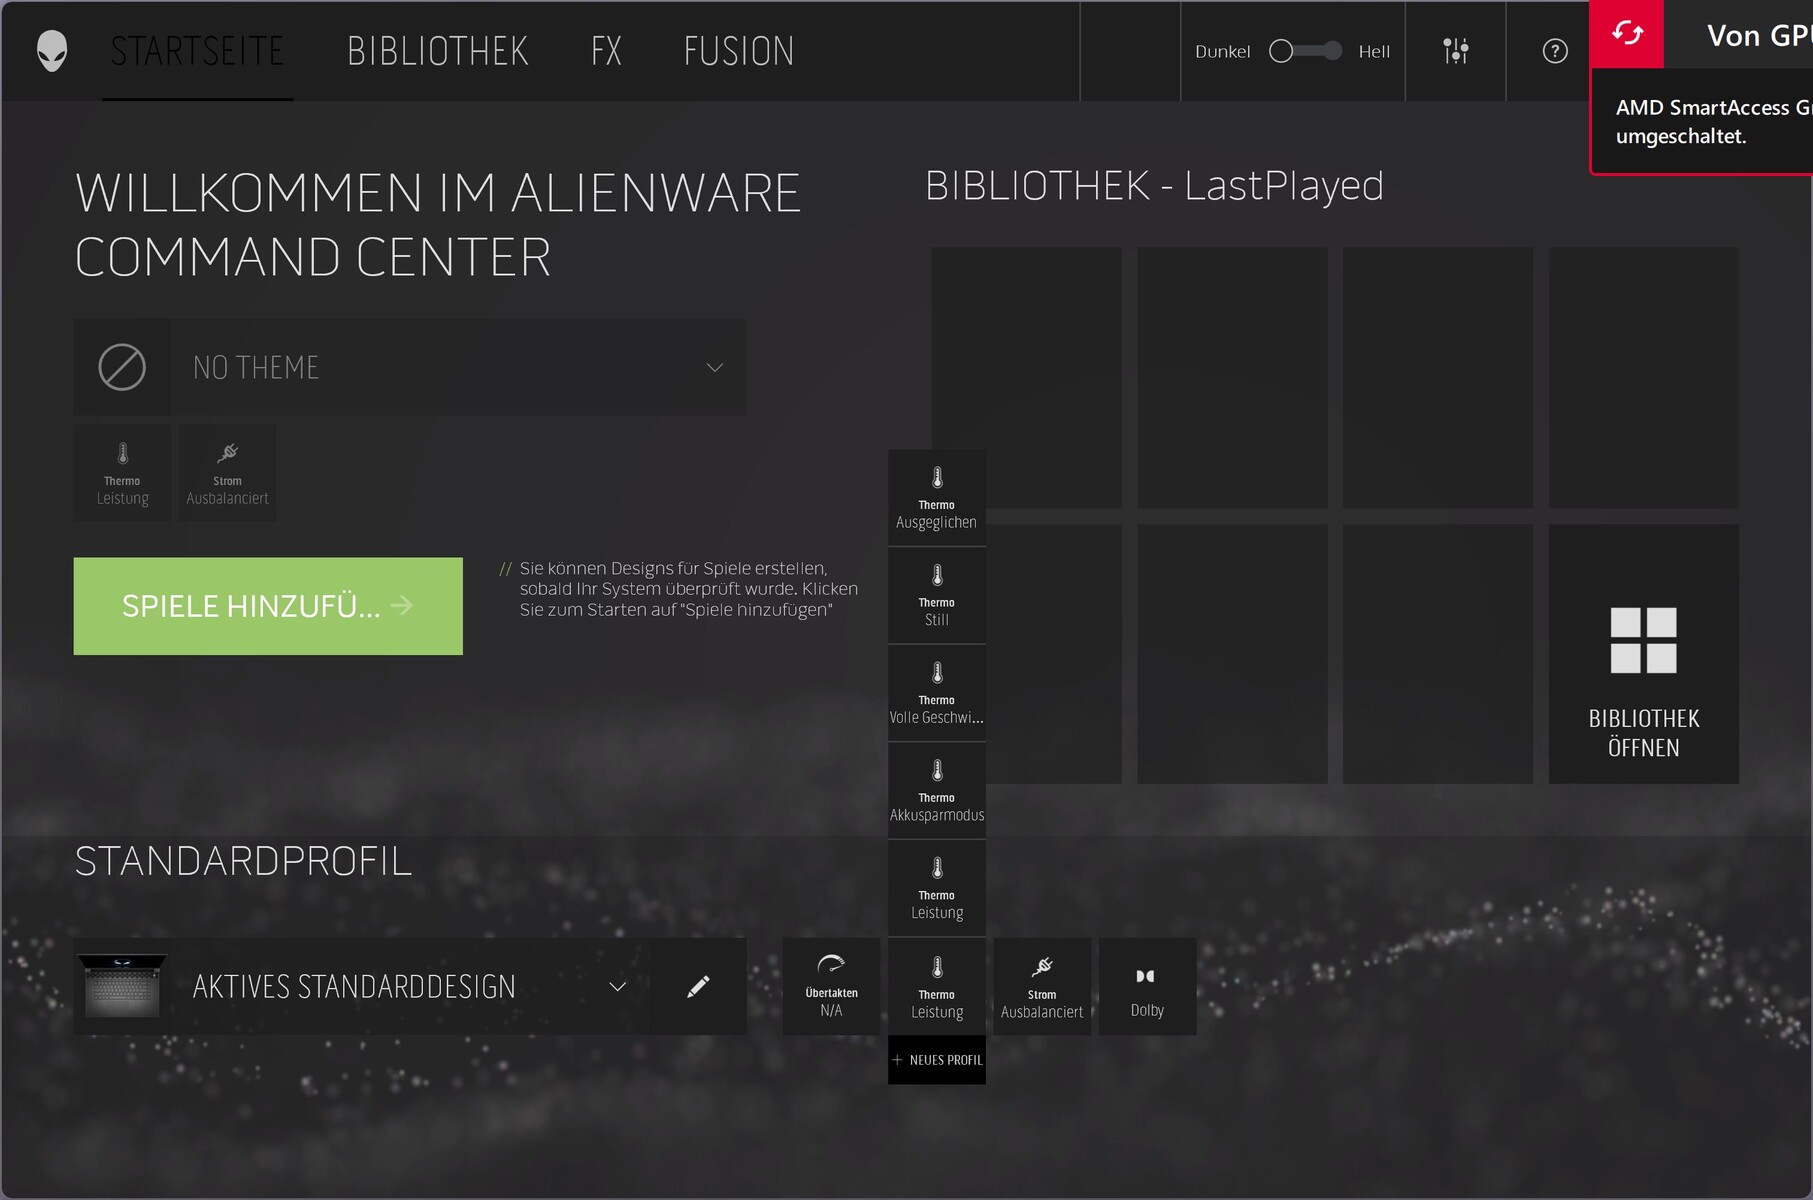
Unfortunately, Dell always has two manufacturer apps pre-installed on Alienware laptops, namely "My Alienware" and the "Alienware Command Center". While the former is primarily dedicated to support, the latter is the control center. In the Command Center, you set the lighting and the performance modes, of which there are a total of five. In addition, certain values can be overclocked manually.

We chose Performance mode for the benchmarks. Only Full Speed squeezes out even more performance, but here the fans are always maxed out.
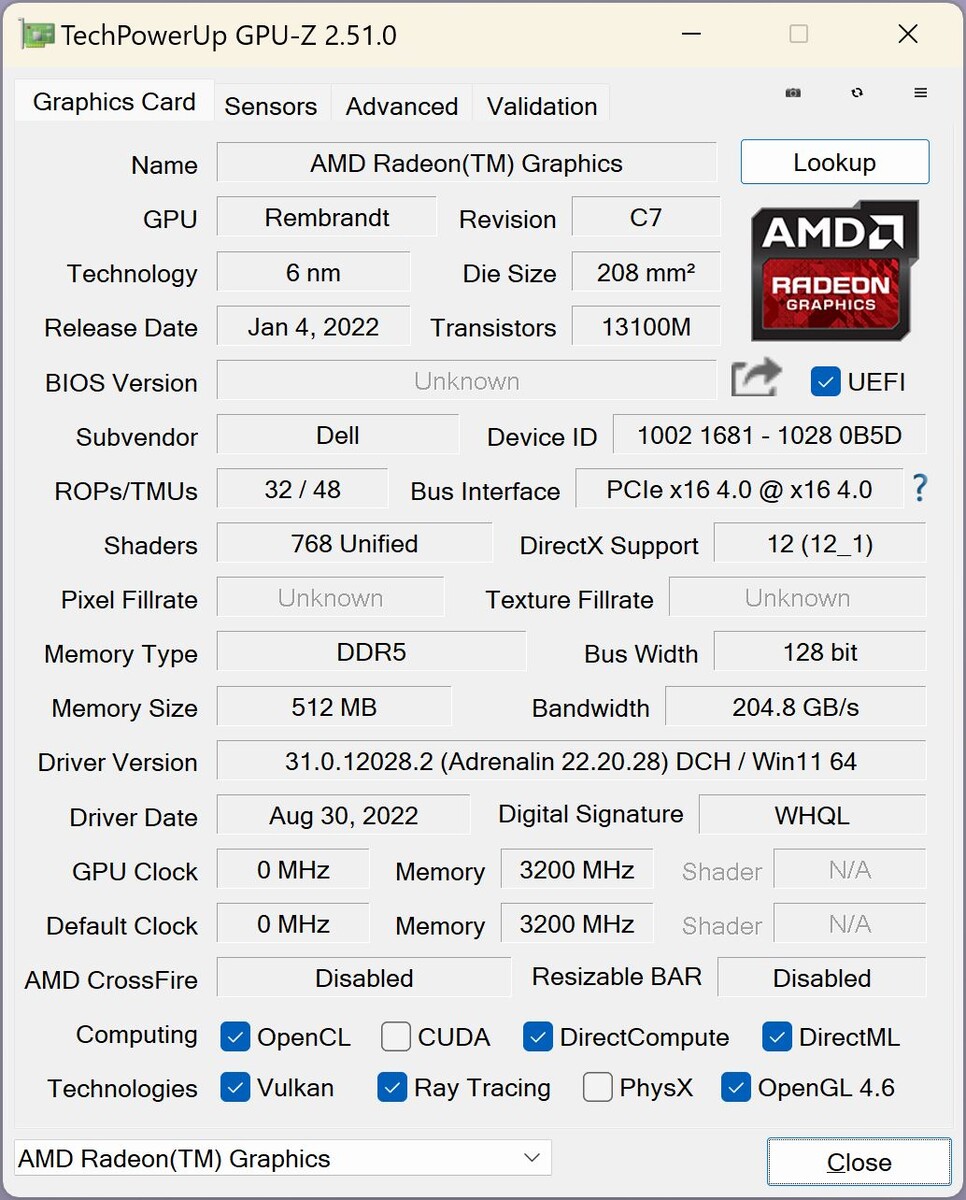
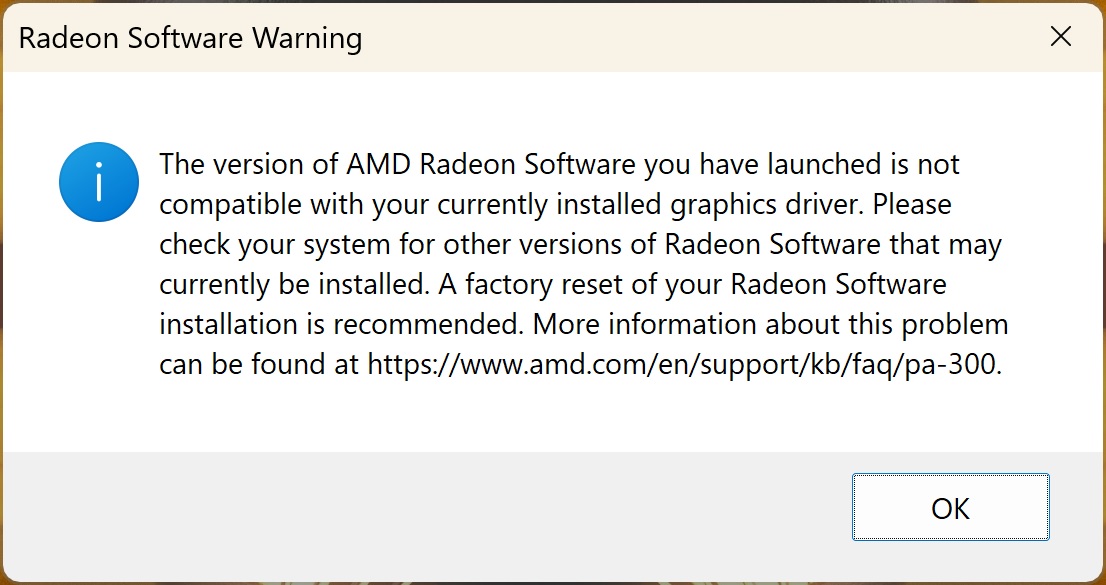
During testing, we repeatedly encountered problems with the all-AMD configuration. At first, we couldn't access the Radeon software in the Dell preconfigured system.
Installing the latest drivers led to considerable stability issues, whereupon we installed an older, stable driver on Dell's advice. Nevertheless, a blue screen occurred once on our review model and the m17 crashed completely during a standard gaming benchmark. The same occured also in sleep mode. And this was a replacement device!
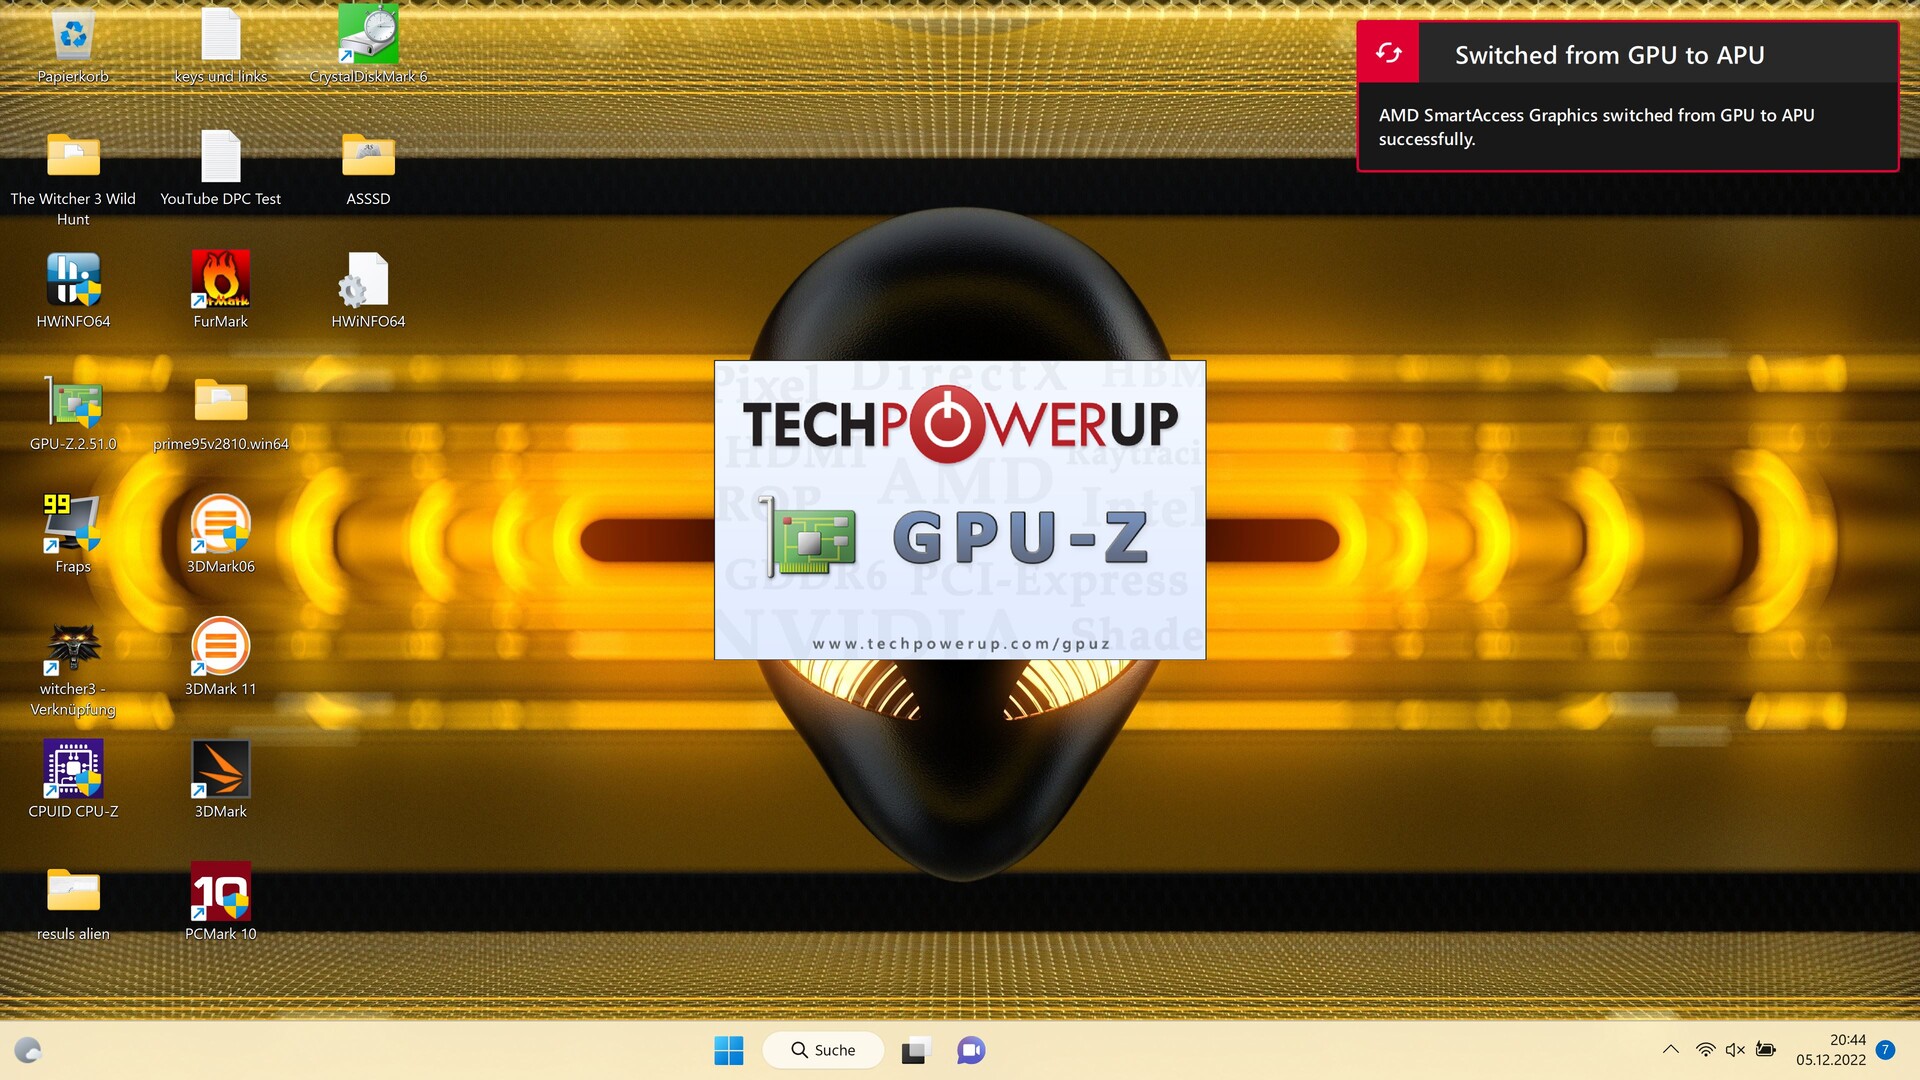
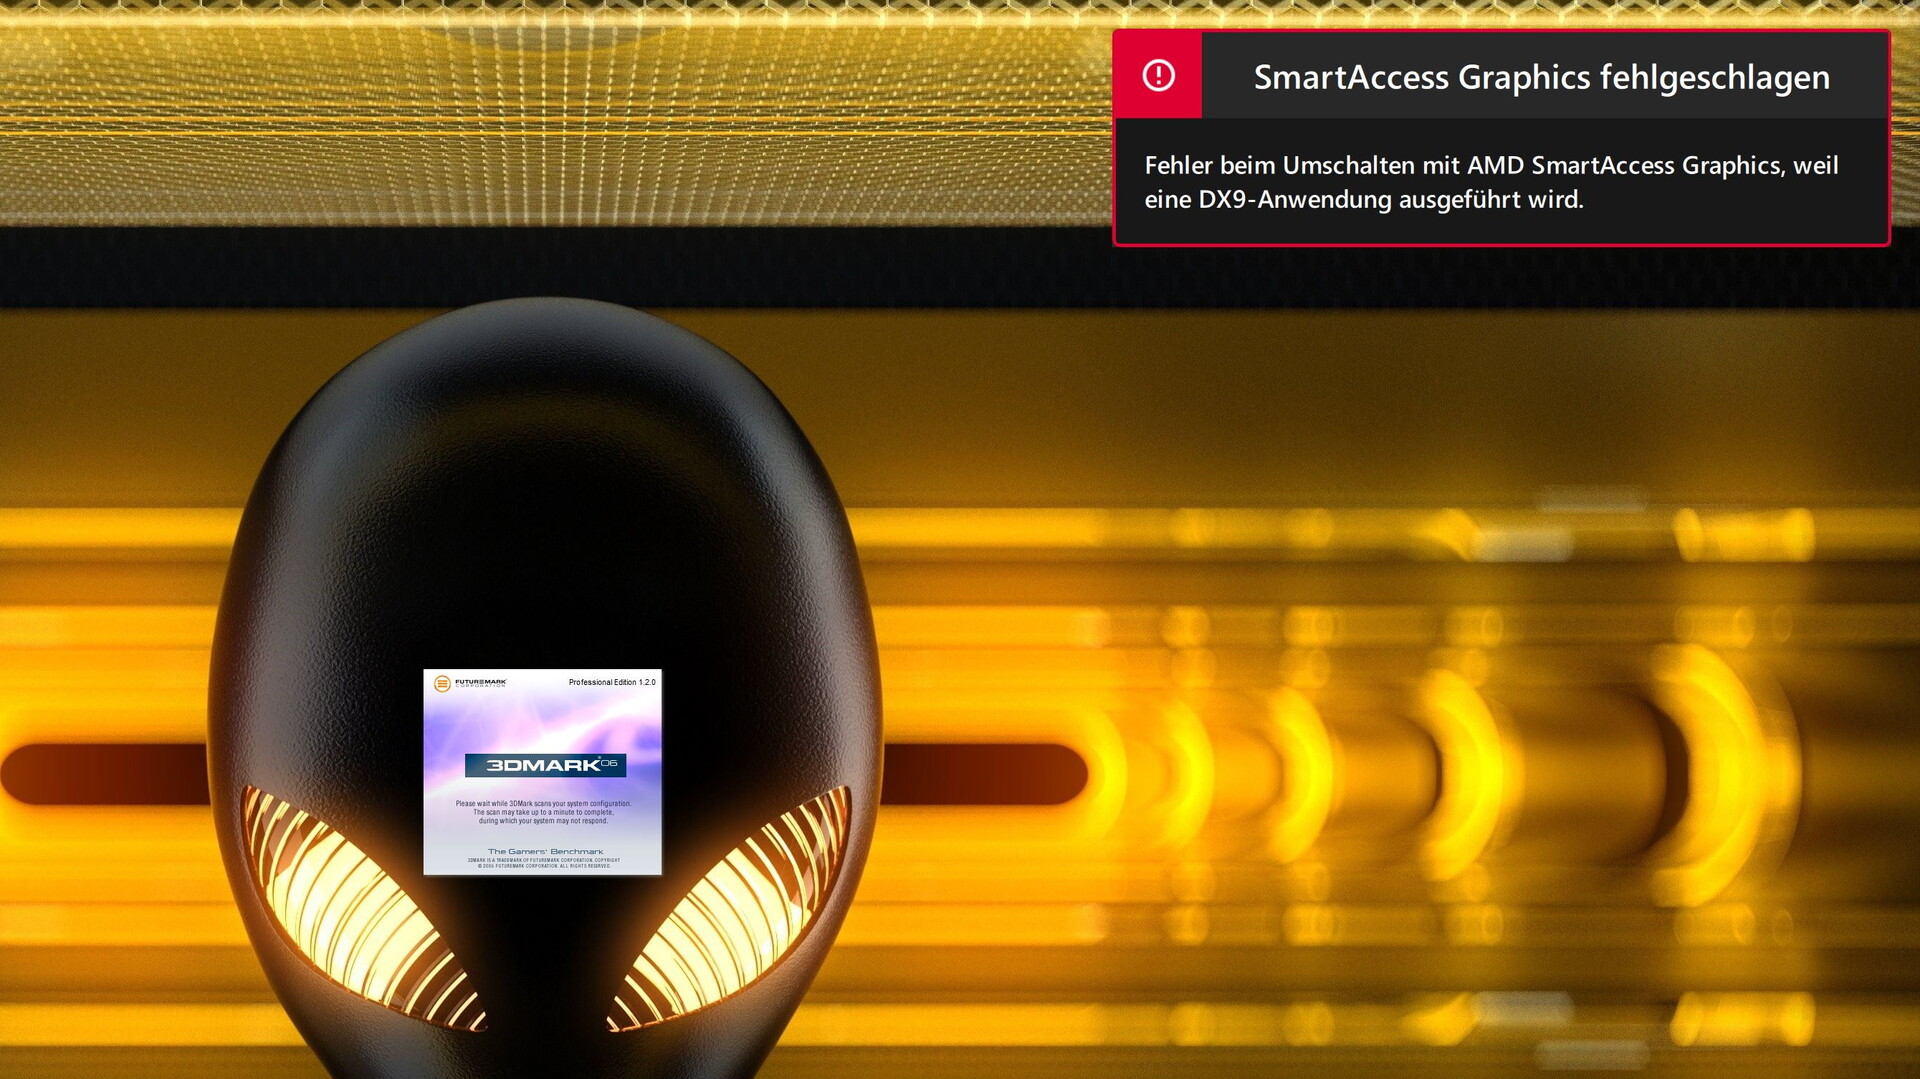
Moreover, AMD's automatic graphics switching doesn't seem to work perfectly. Unlike Nvidia's Optimus, AMD's SmartAccess always caused the system to hang for a few seconds when switching between the integrated and dedicated GPU, which was really annoying. Hopefully, more stable driver solutions will appear for this soon.
Processor
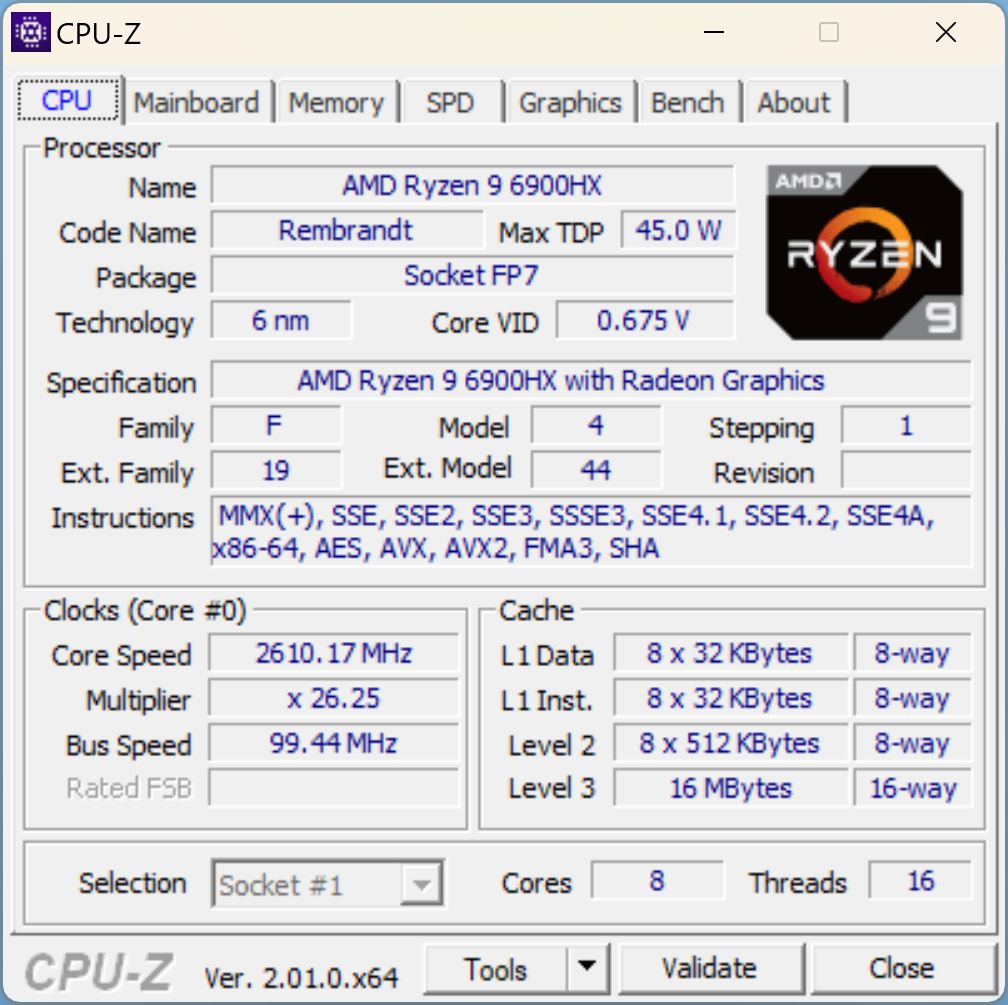
The AMD Ryzen 9 6900HX has 8 Zen3+ cores that clock from 3.3 to 4.9 GHz and can process 16 threads simultaneously.
In our CPU tests, the AMD processor performs pretty much as expected. It always remains within the 1-2 percent deviation range compared to the average of all tested laptops with the same CPU.
The Cinebench R15 loop shows that performance is very consistent. However, it fall short of its Intel i9-12900HX counterpart, and the i7-12700H in the Acer Predator Helios 300 is also faster.
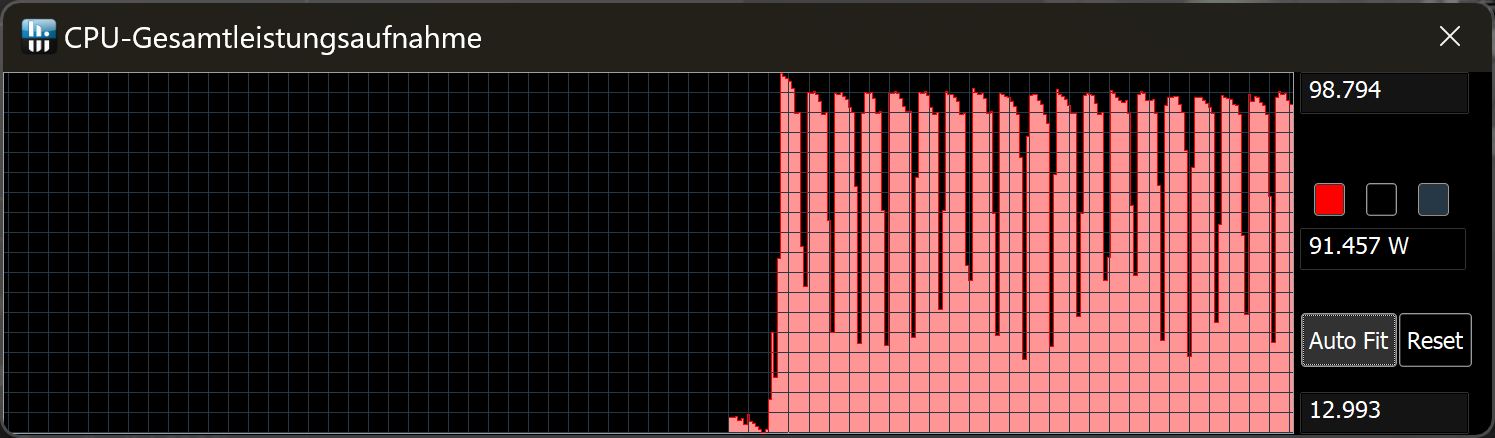
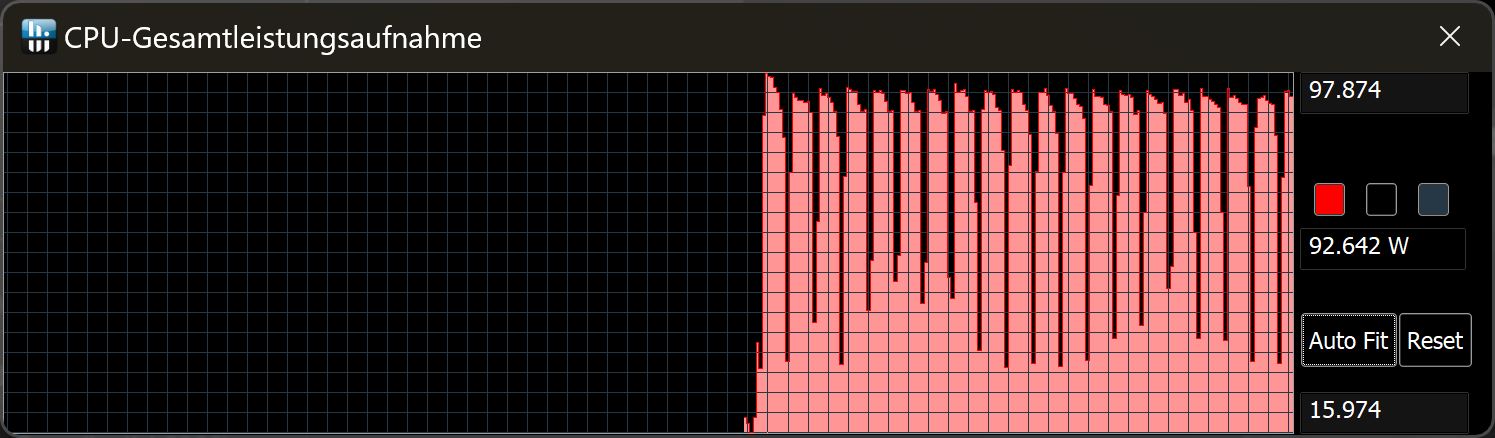
Performance mode in the Control Center hardly makes a difference. Whether Balanced, Performance or Full Speed, the TDP is almost the same in all CB-15 runs.
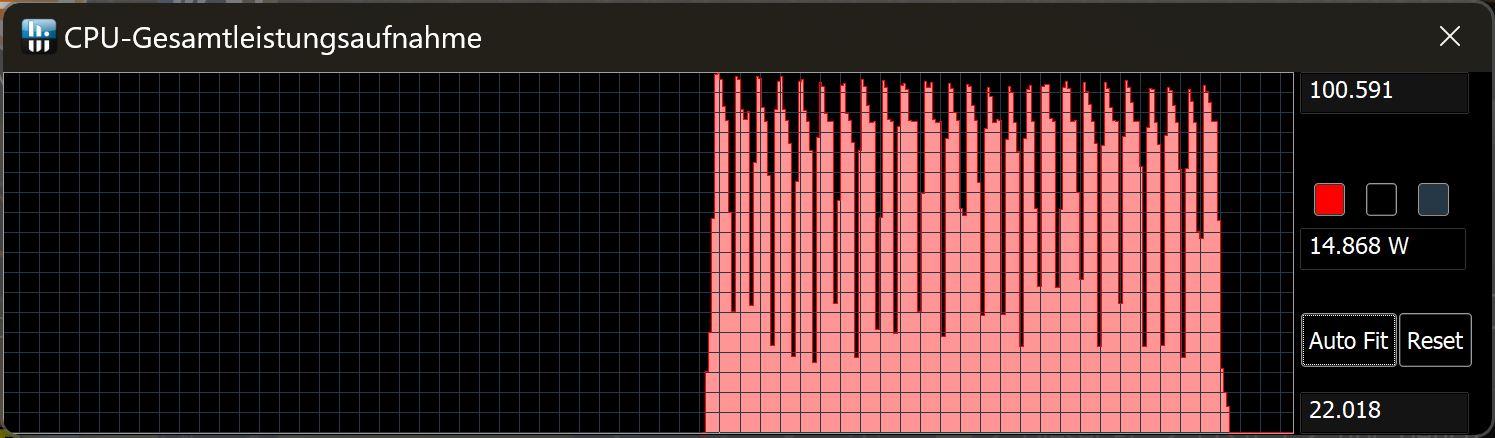
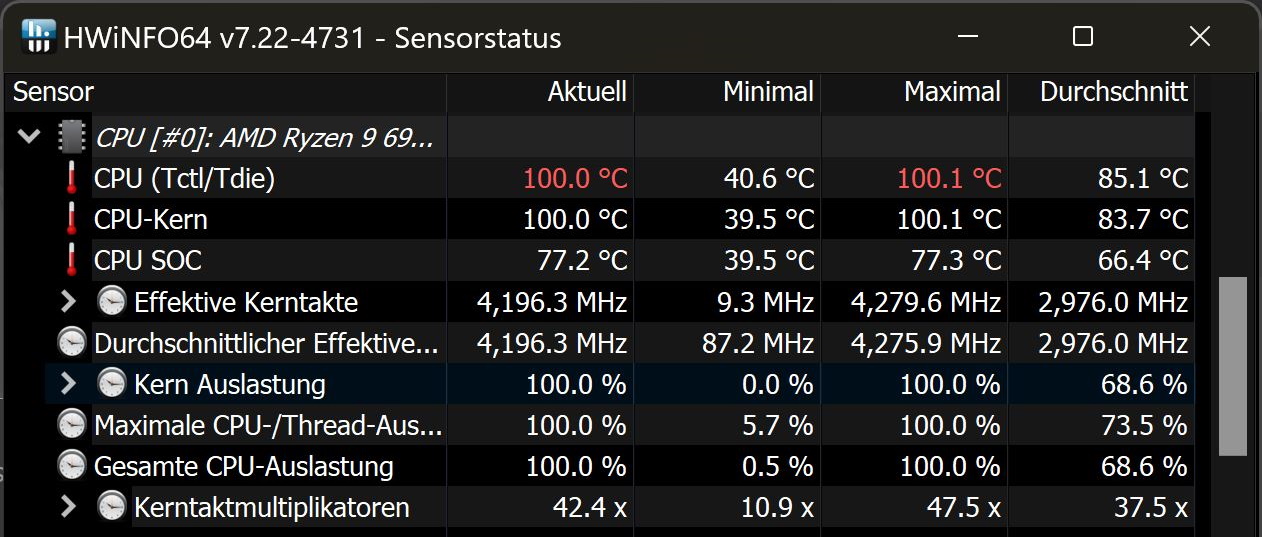
According to HWinfo, the CPU almost constantly reached 100 °C during a Cinebench run, which is very high.
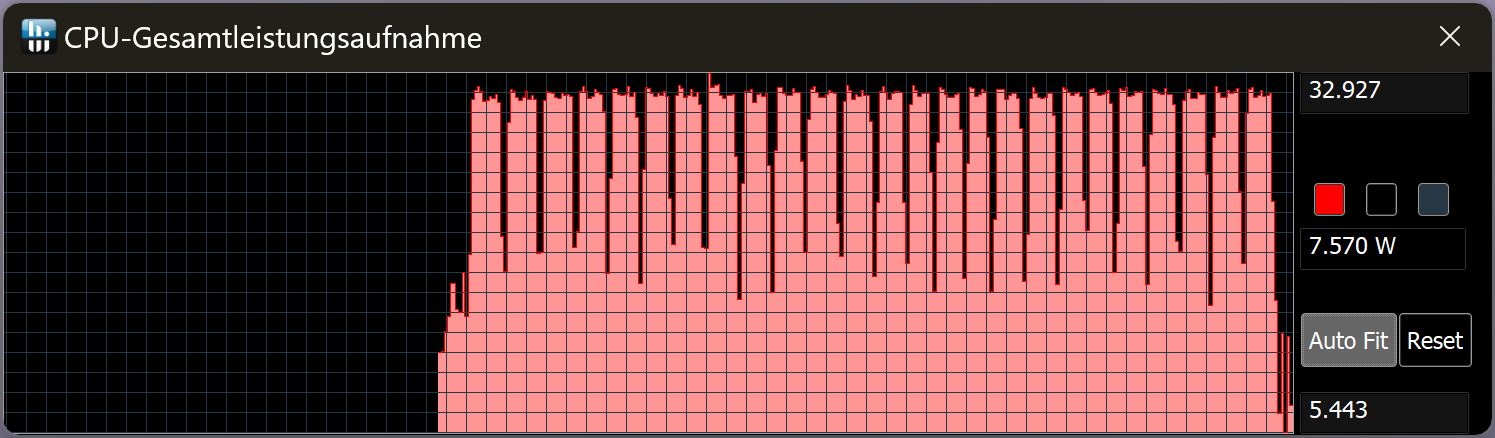
Away from the power socket, CPU performance drops by about 38 percent in Cinebench R15. Here the TDP is only a maximum of 32 W.
Cinebench R15 Multi Sustained Load
Cinebench R23: Multi Core | Single Core
Cinebench R20: CPU (Multi Core) | CPU (Single Core)
Cinebench R15: CPU Multi 64Bit | CPU Single 64Bit
Blender: v2.79 BMW27 CPU
7-Zip 18.03: 7z b 4 | 7z b 4 -mmt1
Geekbench 5.5: Multi-Core | Single-Core
HWBOT x265 Benchmark v2.2: 4k Preset
LibreOffice : 20 Documents To PDF
R Benchmark 2.5: Overall mean
| CPU Performance rating | |
| Average of class Gaming | |
| Asus ROG Strix Scar 17 SE G733CX-LL014W | |
| Aorus 17X XES | |
| Acer Predator Helios 300 (i7-12700H, RTX 3070 Ti) | |
| Schenker XMG Neo 17 M22 | |
| Alienware m17 R5 (R9 6900HX, RX 6850M XT) | |
| Average AMD Ryzen 9 6900HX | |
| Alienware m17 R4 | |
| Cinebench R23 / Multi Core | |
| Average of class Gaming (10488 - 40970, n=110, last 2 years) | |
| Asus ROG Strix Scar 17 SE G733CX-LL014W | |
| Aorus 17X XES | |
| Acer Predator Helios 300 (i7-12700H, RTX 3070 Ti) | |
| Schenker XMG Neo 17 M22 | |
| Alienware m17 R5 (R9 6900HX, RX 6850M XT) | |
| Average AMD Ryzen 9 6900HX (9709 - 15100, n=19) | |
| Alienware m17 R4 | |
| Cinebench R23 / Single Core | |
| Average of class Gaming (1166 - 2356, n=110, last 2 years) | |
| Aorus 17X XES | |
| Asus ROG Strix Scar 17 SE G733CX-LL014W | |
| Acer Predator Helios 300 (i7-12700H, RTX 3070 Ti) | |
| Average AMD Ryzen 9 6900HX (1516 - 1616, n=19) | |
| Schenker XMG Neo 17 M22 | |
| Alienware m17 R5 (R9 6900HX, RX 6850M XT) | |
| Alienware m17 R4 | |
| Cinebench R20 / CPU (Multi Core) | |
| Average of class Gaming (4029 - 16108, n=109, last 2 years) | |
| Asus ROG Strix Scar 17 SE G733CX-LL014W | |
| Aorus 17X XES | |
| Acer Predator Helios 300 (i7-12700H, RTX 3070 Ti) | |
| Schenker XMG Neo 17 M22 | |
| Alienware m17 R5 (R9 6900HX, RX 6850M XT) | |
| Average AMD Ryzen 9 6900HX (3742 - 5813, n=19) | |
| Alienware m17 R4 | |
| Cinebench R20 / CPU (Single Core) | |
| Average of class Gaming (442 - 895, n=109, last 2 years) | |
| Asus ROG Strix Scar 17 SE G733CX-LL014W | |
| Aorus 17X XES | |
| Acer Predator Helios 300 (i7-12700H, RTX 3070 Ti) | |
| Alienware m17 R5 (R9 6900HX, RX 6850M XT) | |
| Average AMD Ryzen 9 6900HX (595 - 631, n=19) | |
| Schenker XMG Neo 17 M22 | |
| Alienware m17 R4 | |
| Cinebench R15 / CPU Multi 64Bit | |
| Average of class Gaming (1578 - 6271, n=109, last 2 years) | |
| Asus ROG Strix Scar 17 SE G733CX-LL014W | |
| Acer Predator Helios 300 (i7-12700H, RTX 3070 Ti) | |
| Aorus 17X XES | |
| Alienware m17 R5 (R9 6900HX, RX 6850M XT) | |
| Schenker XMG Neo 17 M22 | |
| Average AMD Ryzen 9 6900HX (1588 - 2411, n=19) | |
| Alienware m17 R4 | |
| Cinebench R15 / CPU Single 64Bit | |
| Average of class Gaming (188.8 - 343, n=109, last 2 years) | |
| Aorus 17X XES | |
| Asus ROG Strix Scar 17 SE G733CX-LL014W | |
| Acer Predator Helios 300 (i7-12700H, RTX 3070 Ti) | |
| Alienware m17 R5 (R9 6900HX, RX 6850M XT) | |
| Average AMD Ryzen 9 6900HX (241 - 261, n=19) | |
| Schenker XMG Neo 17 M22 | |
| Alienware m17 R4 | |
| Blender / v2.79 BMW27 CPU | |
| Alienware m17 R4 | |
| Average AMD Ryzen 9 6900HX (212 - 357, n=21) | |
| Alienware m17 R5 (R9 6900HX, RX 6850M XT) | |
| Schenker XMG Neo 17 M22 | |
| Acer Predator Helios 300 (i7-12700H, RTX 3070 Ti) | |
| Aorus 17X XES | |
| Asus ROG Strix Scar 17 SE G733CX-LL014W | |
| Average of class Gaming (80 - 330, n=107, last 2 years) | |
| 7-Zip 18.03 / 7z b 4 | |
| Average of class Gaming (33491 - 148086, n=108, last 2 years) | |
| Asus ROG Strix Scar 17 SE G733CX-LL014W | |
| Aorus 17X XES | |
| Acer Predator Helios 300 (i7-12700H, RTX 3070 Ti) | |
| Schenker XMG Neo 17 M22 | |
| Alienware m17 R5 (R9 6900HX, RX 6850M XT) | |
| Average AMD Ryzen 9 6900HX (49526 - 65336, n=20) | |
| Alienware m17 R4 | |
| 7-Zip 18.03 / 7z b 4 -mmt1 | |
| Average of class Gaming (4199 - 7436, n=108, last 2 years) | |
| Aorus 17X XES | |
| Asus ROG Strix Scar 17 SE G733CX-LL014W | |
| Schenker XMG Neo 17 M22 | |
| Average AMD Ryzen 9 6900HX (5090 - 6070, n=20) | |
| Acer Predator Helios 300 (i7-12700H, RTX 3070 Ti) | |
| Alienware m17 R5 (R9 6900HX, RX 6850M XT) | |
| Alienware m17 R4 | |
| Geekbench 5.5 / Multi-Core | |
| Average of class Gaming (6460 - 27010, n=108, last 2 years) | |
| Asus ROG Strix Scar 17 SE G733CX-LL014W | |
| Aorus 17X XES | |
| Acer Predator Helios 300 (i7-12700H, RTX 3070 Ti) | |
| Schenker XMG Neo 17 M22 | |
| Alienware m17 R5 (R9 6900HX, RX 6850M XT) | |
| Average AMD Ryzen 9 6900HX (8313 - 10490, n=21) | |
| Alienware m17 R4 | |
| Geekbench 5.5 / Single-Core | |
| Average of class Gaming (986 - 2474, n=108, last 2 years) | |
| Aorus 17X XES | |
| Asus ROG Strix Scar 17 SE G733CX-LL014W | |
| Acer Predator Helios 300 (i7-12700H, RTX 3070 Ti) | |
| Schenker XMG Neo 17 M22 | |
| Average AMD Ryzen 9 6900HX (1523 - 1652, n=21) | |
| Alienware m17 R5 (R9 6900HX, RX 6850M XT) | |
| Alienware m17 R4 | |
| HWBOT x265 Benchmark v2.2 / 4k Preset | |
| Average of class Gaming (11.5 - 44.3, n=108, last 2 years) | |
| Asus ROG Strix Scar 17 SE G733CX-LL014W | |
| Aorus 17X XES | |
| Schenker XMG Neo 17 M22 | |
| Alienware m17 R5 (R9 6900HX, RX 6850M XT) | |
| Average AMD Ryzen 9 6900HX (12.6 - 18.7, n=20) | |
| Acer Predator Helios 300 (i7-12700H, RTX 3070 Ti) | |
| Alienware m17 R4 | |
| LibreOffice / 20 Documents To PDF | |
| Acer Predator Helios 300 (i7-12700H, RTX 3070 Ti) | |
| Alienware m17 R5 (R9 6900HX, RX 6850M XT) | |
| Schenker XMG Neo 17 M22 | |
| Average AMD Ryzen 9 6900HX (44.8 - 81.7, n=20) | |
| Alienware m17 R4 | |
| Average of class Gaming (19 - 88.8, n=108, last 2 years) | |
| Aorus 17X XES | |
| Asus ROG Strix Scar 17 SE G733CX-LL014W | |
| R Benchmark 2.5 / Overall mean | |
| Alienware m17 R4 | |
| Alienware m17 R5 (R9 6900HX, RX 6850M XT) | |
| Average AMD Ryzen 9 6900HX (0.4627 - 0.4974, n=20) | |
| Schenker XMG Neo 17 M22 | |
| Acer Predator Helios 300 (i7-12700H, RTX 3070 Ti) | |
| Average of class Gaming (0.3439 - 0.759, n=109, last 2 years) | |
| Asus ROG Strix Scar 17 SE G733CX-LL014W | |
| Aorus 17X XES | |
* ... smaller is better
AIDA64: FP32 Ray-Trace | FPU Julia | CPU SHA3 | CPU Queen | FPU SinJulia | FPU Mandel | CPU AES | CPU ZLib | FP64 Ray-Trace | CPU PhotoWorxx
| Performance rating | |
| Average of class Gaming | |
| Asus ROG Strix Scar 17 SE G733CX-LL014W | |
| Schenker XMG Neo 17 M22 | |
| Acer Predator Helios 300 (i7-12700H, RTX 3070 Ti) | |
| Aorus 17X XES | |
| Average AMD Ryzen 9 6900HX | |
| Alienware m17 R5 (R9 6900HX, RX 6850M XT) | |
| Alienware m17 R4 | |
| AIDA64 / FP32 Ray-Trace | |
| Average of class Gaming (10227 - 85542, n=107, last 2 years) | |
| Asus ROG Strix Scar 17 SE G733CX-LL014W | |
| Acer Predator Helios 300 (i7-12700H, RTX 3070 Ti) | |
| Alienware m17 R5 (R9 6900HX, RX 6850M XT) | |
| Schenker XMG Neo 17 M22 | |
| Average AMD Ryzen 9 6900HX (10950 - 17963, n=20) | |
| Aorus 17X XES | |
| Alienware m17 R4 | |
| AIDA64 / FPU Julia | |
| Average of class Gaming (51376 - 238426, n=107, last 2 years) | |
| Alienware m17 R5 (R9 6900HX, RX 6850M XT) | |
| Schenker XMG Neo 17 M22 | |
| Average AMD Ryzen 9 6900HX (71414 - 110797, n=20) | |
| Acer Predator Helios 300 (i7-12700H, RTX 3070 Ti) | |
| Asus ROG Strix Scar 17 SE G733CX-LL014W | |
| Aorus 17X XES | |
| Alienware m17 R4 | |
| AIDA64 / CPU SHA3 | |
| Average of class Gaming (2180 - 9817, n=107, last 2 years) | |
| Asus ROG Strix Scar 17 SE G733CX-LL014W | |
| Acer Predator Helios 300 (i7-12700H, RTX 3070 Ti) | |
| Alienware m17 R4 | |
| Aorus 17X XES | |
| Alienware m17 R5 (R9 6900HX, RX 6850M XT) | |
| Schenker XMG Neo 17 M22 | |
| Average AMD Ryzen 9 6900HX (2471 - 3804, n=20) | |
| AIDA64 / CPU Queen | |
| Average of class Gaming (49785 - 173351, n=98, last 2 years) | |
| Alienware m17 R5 (R9 6900HX, RX 6850M XT) | |
| Aorus 17X XES | |
| Asus ROG Strix Scar 17 SE G733CX-LL014W | |
| Acer Predator Helios 300 (i7-12700H, RTX 3070 Ti) | |
| Schenker XMG Neo 17 M22 | |
| Average AMD Ryzen 9 6900HX (84185 - 107544, n=20) | |
| Alienware m17 R4 | |
| AIDA64 / FPU SinJulia | |
| Average of class Gaming (4424 - 33636, n=107, last 2 years) | |
| Alienware m17 R5 (R9 6900HX, RX 6850M XT) | |
| Schenker XMG Neo 17 M22 | |
| Average AMD Ryzen 9 6900HX (10970 - 13205, n=20) | |
| Asus ROG Strix Scar 17 SE G733CX-LL014W | |
| Aorus 17X XES | |
| Alienware m17 R4 | |
| Acer Predator Helios 300 (i7-12700H, RTX 3070 Ti) | |
| AIDA64 / FPU Mandel | |
| Average of class Gaming (25115 - 128721, n=107, last 2 years) | |
| Alienware m17 R5 (R9 6900HX, RX 6850M XT) | |
| Schenker XMG Neo 17 M22 | |
| Average AMD Ryzen 9 6900HX (39164 - 61370, n=20) | |
| Acer Predator Helios 300 (i7-12700H, RTX 3070 Ti) | |
| Asus ROG Strix Scar 17 SE G733CX-LL014W | |
| Aorus 17X XES | |
| Alienware m17 R4 | |
| AIDA64 / CPU AES | |
| Asus ROG Strix Scar 17 SE G733CX-LL014W | |
| Schenker XMG Neo 17 M22 | |
| Aorus 17X XES | |
| Average AMD Ryzen 9 6900HX (54613 - 142360, n=20) | |
| Average of class Gaming (39258 - 247074, n=107, last 2 years) | |
| Acer Predator Helios 300 (i7-12700H, RTX 3070 Ti) | |
| Alienware m17 R5 (R9 6900HX, RX 6850M XT) | |
| Alienware m17 R4 | |
| AIDA64 / CPU ZLib | |
| Average of class Gaming (574 - 2531, n=107, last 2 years) | |
| Asus ROG Strix Scar 17 SE G733CX-LL014W | |
| Acer Predator Helios 300 (i7-12700H, RTX 3070 Ti) | |
| Aorus 17X XES | |
| Alienware m17 R5 (R9 6900HX, RX 6850M XT) | |
| Schenker XMG Neo 17 M22 | |
| Average AMD Ryzen 9 6900HX (578 - 911, n=20) | |
| Alienware m17 R4 | |
| AIDA64 / FP64 Ray-Trace | |
| Average of class Gaming (5509 - 45446, n=107, last 2 years) | |
| Acer Predator Helios 300 (i7-12700H, RTX 3070 Ti) | |
| Asus ROG Strix Scar 17 SE G733CX-LL014W | |
| Alienware m17 R5 (R9 6900HX, RX 6850M XT) | |
| Schenker XMG Neo 17 M22 | |
| Aorus 17X XES | |
| Average AMD Ryzen 9 6900HX (5798 - 9540, n=20) | |
| Alienware m17 R4 | |
| AIDA64 / CPU PhotoWorxx | |
| Average of class Gaming (12271 - 89891, n=107, last 2 years) | |
| Asus ROG Strix Scar 17 SE G733CX-LL014W | |
| Aorus 17X XES | |
| Acer Predator Helios 300 (i7-12700H, RTX 3070 Ti) | |
| Alienware m17 R5 (R9 6900HX, RX 6850M XT) | |
| Schenker XMG Neo 17 M22 | |
| Average AMD Ryzen 9 6900HX (26873 - 30604, n=20) | |
| Alienware m17 R4 | |
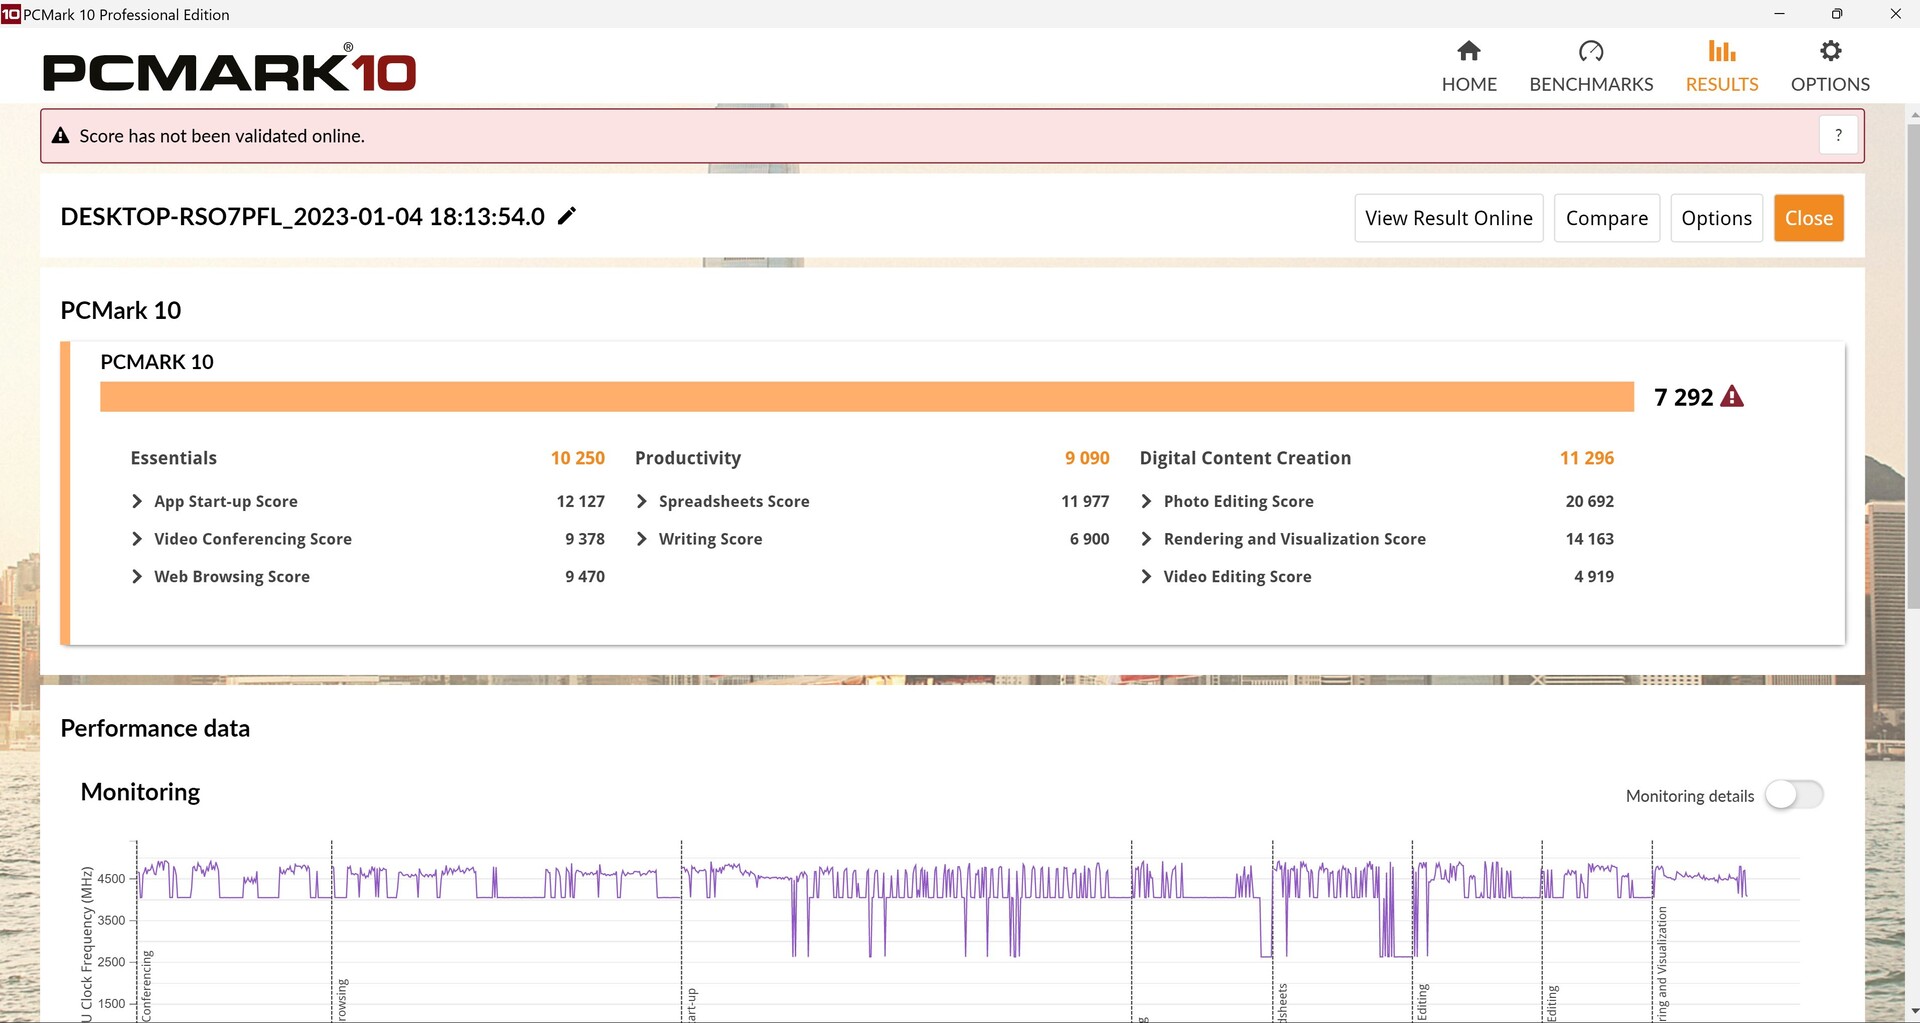
System Performance
Performance in PCMark 10 is also nearly exactly as expected. In the "Productivity" section, AMD cards generally perform worse than laptops with Nvidia GPUs, but overall the m17 R5 falls in the middle between its competitors.
CrossMark: Overall | Productivity | Creativity | Responsiveness
| PCMark 10 / Score | |
| Average of class Gaming (5828 - 11574, n=95, last 2 years) | |
| Aorus 17X XES | |
| Acer Predator Helios 300 (i7-12700H, RTX 3070 Ti) | |
| Average AMD Ryzen 9 6900HX, AMD Radeon RX 6850M XT (7292 - 7377, n=2) | |
| Alienware m17 R5 (R9 6900HX, RX 6850M XT) | |
| Asus ROG Strix Scar 17 SE G733CX-LL014W | |
| Schenker XMG Neo 17 M22 | |
| Alienware m17 R4 | |
| PCMark 10 / Essentials | |
| Acer Predator Helios 300 (i7-12700H, RTX 3070 Ti) | |
| Average of class Gaming (8810 - 12600, n=99, last 2 years) | |
| Aorus 17X XES | |
| Average AMD Ryzen 9 6900HX, AMD Radeon RX 6850M XT (10250 - 10521, n=2) | |
| Asus ROG Strix Scar 17 SE G733CX-LL014W | |
| Alienware m17 R5 (R9 6900HX, RX 6850M XT) | |
| Schenker XMG Neo 17 M22 | |
| Alienware m17 R4 | |
| PCMark 10 / Productivity | |
| Average of class Gaming (6845 - 18766, n=97, last 2 years) | |
| Aorus 17X XES | |
| Acer Predator Helios 300 (i7-12700H, RTX 3070 Ti) | |
| Asus ROG Strix Scar 17 SE G733CX-LL014W | |
| Schenker XMG Neo 17 M22 | |
| Average AMD Ryzen 9 6900HX, AMD Radeon RX 6850M XT (9090 - 9097, n=2) | |
| Alienware m17 R5 (R9 6900HX, RX 6850M XT) | |
| Alienware m17 R4 | |
| PCMark 10 / Digital Content Creation | |
| Average of class Gaming (7602 - 19657, n=97, last 2 years) | |
| Acer Predator Helios 300 (i7-12700H, RTX 3070 Ti) | |
| Aorus 17X XES | |
| Average AMD Ryzen 9 6900HX, AMD Radeon RX 6850M XT (11296 - 11385, n=2) | |
| Alienware m17 R5 (R9 6900HX, RX 6850M XT) | |
| Asus ROG Strix Scar 17 SE G733CX-LL014W | |
| Schenker XMG Neo 17 M22 | |
| Alienware m17 R4 | |
| CrossMark / Overall | |
| Aorus 17X XES | |
| Asus ROG Strix Scar 17 SE G733CX-LL014W | |
| Average of class Gaming (1366 - 2409, n=96, last 2 years) | |
| Acer Predator Helios 300 (i7-12700H, RTX 3070 Ti) | |
| Schenker XMG Neo 17 M22 | |
| Alienware m17 R5 (R9 6900HX, RX 6850M XT) | |
| Average AMD Ryzen 9 6900HX, AMD Radeon RX 6850M XT (1596 - 1597, n=2) | |
| CrossMark / Productivity | |
| Aorus 17X XES | |
| Asus ROG Strix Scar 17 SE G733CX-LL014W | |
| Average of class Gaming (1386 - 2254, n=96, last 2 years) | |
| Acer Predator Helios 300 (i7-12700H, RTX 3070 Ti) | |
| Schenker XMG Neo 17 M22 | |
| Alienware m17 R5 (R9 6900HX, RX 6850M XT) | |
| Average AMD Ryzen 9 6900HX, AMD Radeon RX 6850M XT (1551 - 1565, n=2) | |
| CrossMark / Creativity | |
| Asus ROG Strix Scar 17 SE G733CX-LL014W | |
| Aorus 17X XES | |
| Average of class Gaming (1343 - 2729, n=96, last 2 years) | |
| Acer Predator Helios 300 (i7-12700H, RTX 3070 Ti) | |
| Schenker XMG Neo 17 M22 | |
| Average AMD Ryzen 9 6900HX, AMD Radeon RX 6850M XT (1738 - 1754, n=2) | |
| Alienware m17 R5 (R9 6900HX, RX 6850M XT) | |
| CrossMark / Responsiveness | |
| Aorus 17X XES | |
| Asus ROG Strix Scar 17 SE G733CX-LL014W | |
| Acer Predator Helios 300 (i7-12700H, RTX 3070 Ti) | |
| Average of class Gaming (1226 - 2334, n=96, last 2 years) | |
| Schenker XMG Neo 17 M22 | |
| Alienware m17 R5 (R9 6900HX, RX 6850M XT) | |
| Average AMD Ryzen 9 6900HX, AMD Radeon RX 6850M XT (1310 - 1315, n=2) | |
| PCMark 10 Score | 7292 points | |
Help | ||
| AIDA64 / Memory Copy | |
| Average of class Gaming (21750 - 129946, n=107, last 2 years) | |
| Asus ROG Strix Scar 17 SE G733CX-LL014W | |
| Aorus 17X XES | |
| Acer Predator Helios 300 (i7-12700H, RTX 3070 Ti) | |
| Average AMD Ryzen 9 6900HX (47938 - 53345, n=20) | |
| Alienware m17 R5 (R9 6900HX, RX 6850M XT) | |
| Schenker XMG Neo 17 M22 | |
| Alienware m17 R4 | |
| AIDA64 / Memory Read | |
| Average of class Gaming (22956 - 118858, n=107, last 2 years) | |
| Asus ROG Strix Scar 17 SE G733CX-LL014W | |
| Aorus 17X XES | |
| Acer Predator Helios 300 (i7-12700H, RTX 3070 Ti) | |
| Schenker XMG Neo 17 M22 | |
| Average AMD Ryzen 9 6900HX (43892 - 53321, n=20) | |
| Alienware m17 R5 (R9 6900HX, RX 6850M XT) | |
| Alienware m17 R4 | |
| AIDA64 / Memory Write | |
| Average of class Gaming (22297 - 135096, n=107, last 2 years) | |
| Asus ROG Strix Scar 17 SE G733CX-LL014W | |
| Aorus 17X XES | |
| Acer Predator Helios 300 (i7-12700H, RTX 3070 Ti) | |
| Schenker XMG Neo 17 M22 | |
| Alienware m17 R5 (R9 6900HX, RX 6850M XT) | |
| Average AMD Ryzen 9 6900HX (51085 - 57202, n=20) | |
| Alienware m17 R4 | |
| AIDA64 / Memory Latency | |
| Average of class Gaming (75.3 - 259, n=107, last 2 years) | |
| Alienware m17 R5 (R9 6900HX, RX 6850M XT) | |
| Acer Predator Helios 300 (i7-12700H, RTX 3070 Ti) | |
| Schenker XMG Neo 17 M22 | |
| Average AMD Ryzen 9 6900HX (80.7 - 120.6, n=20) | |
| Aorus 17X XES | |
| Asus ROG Strix Scar 17 SE G733CX-LL014W | |
| Alienware m17 R4 | |
* ... smaller is better
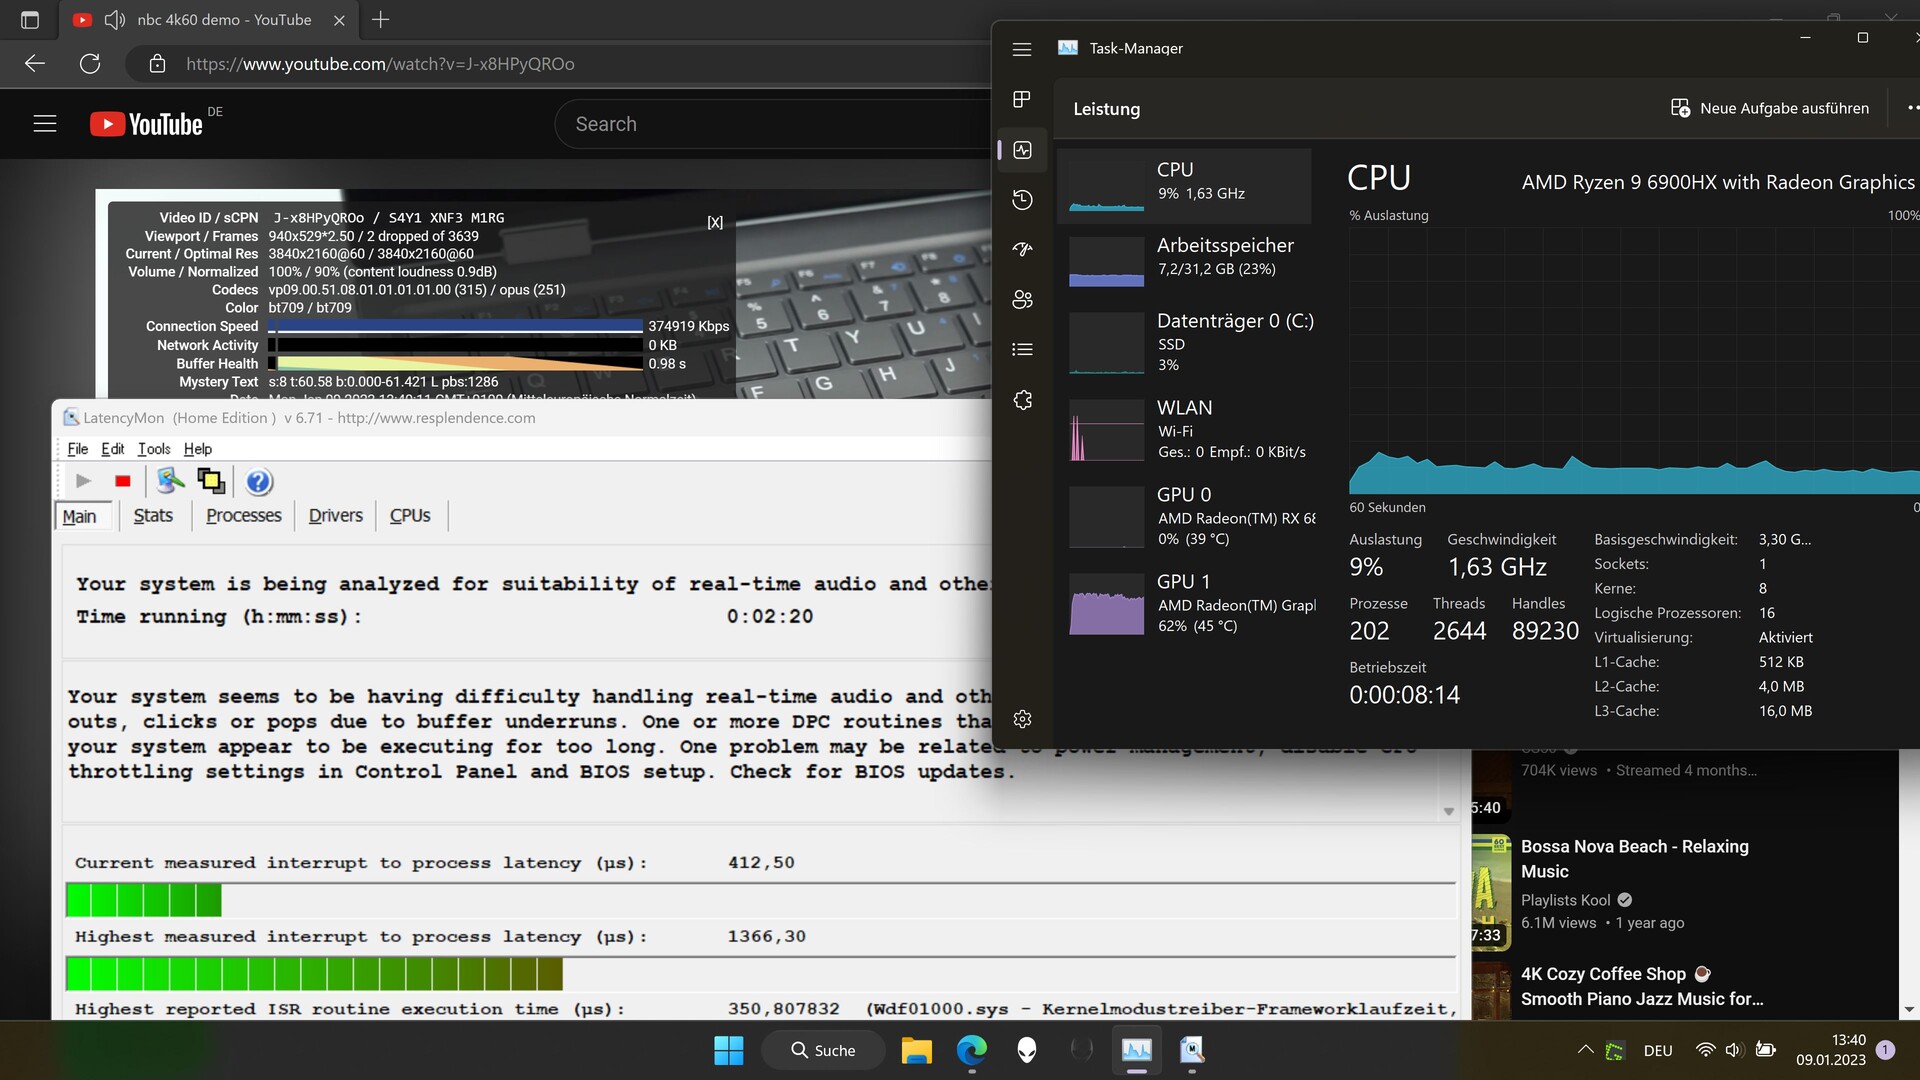
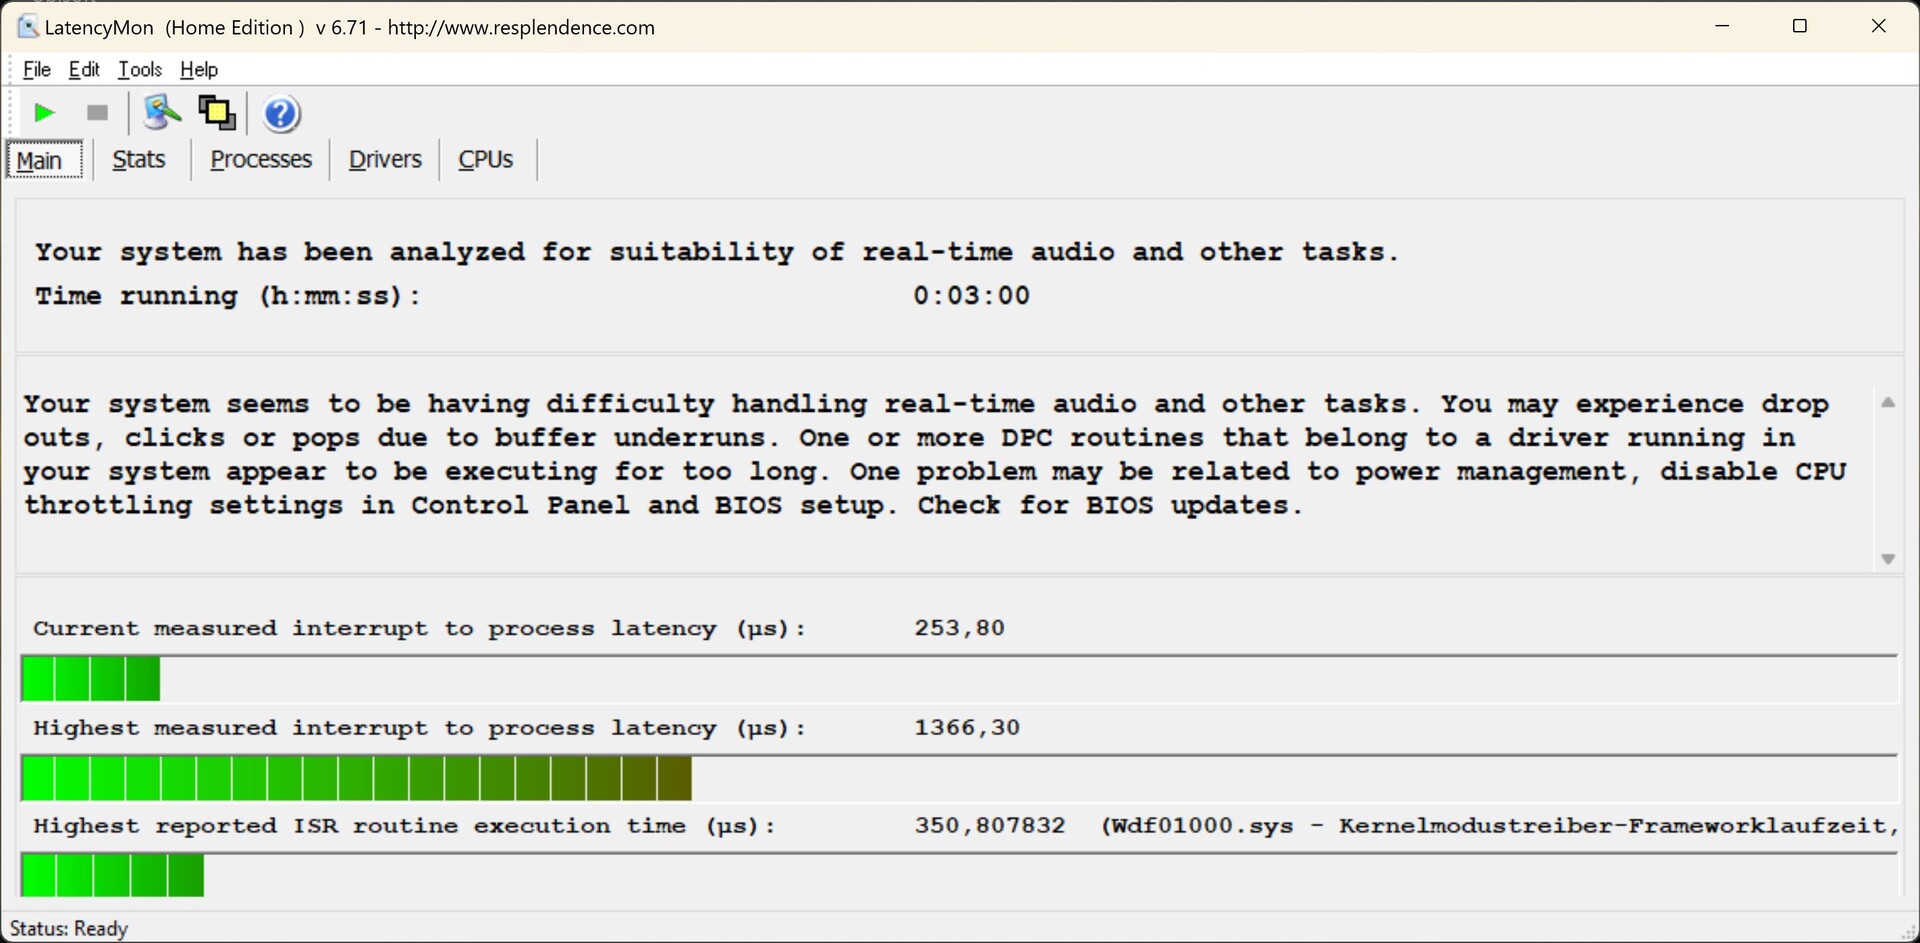
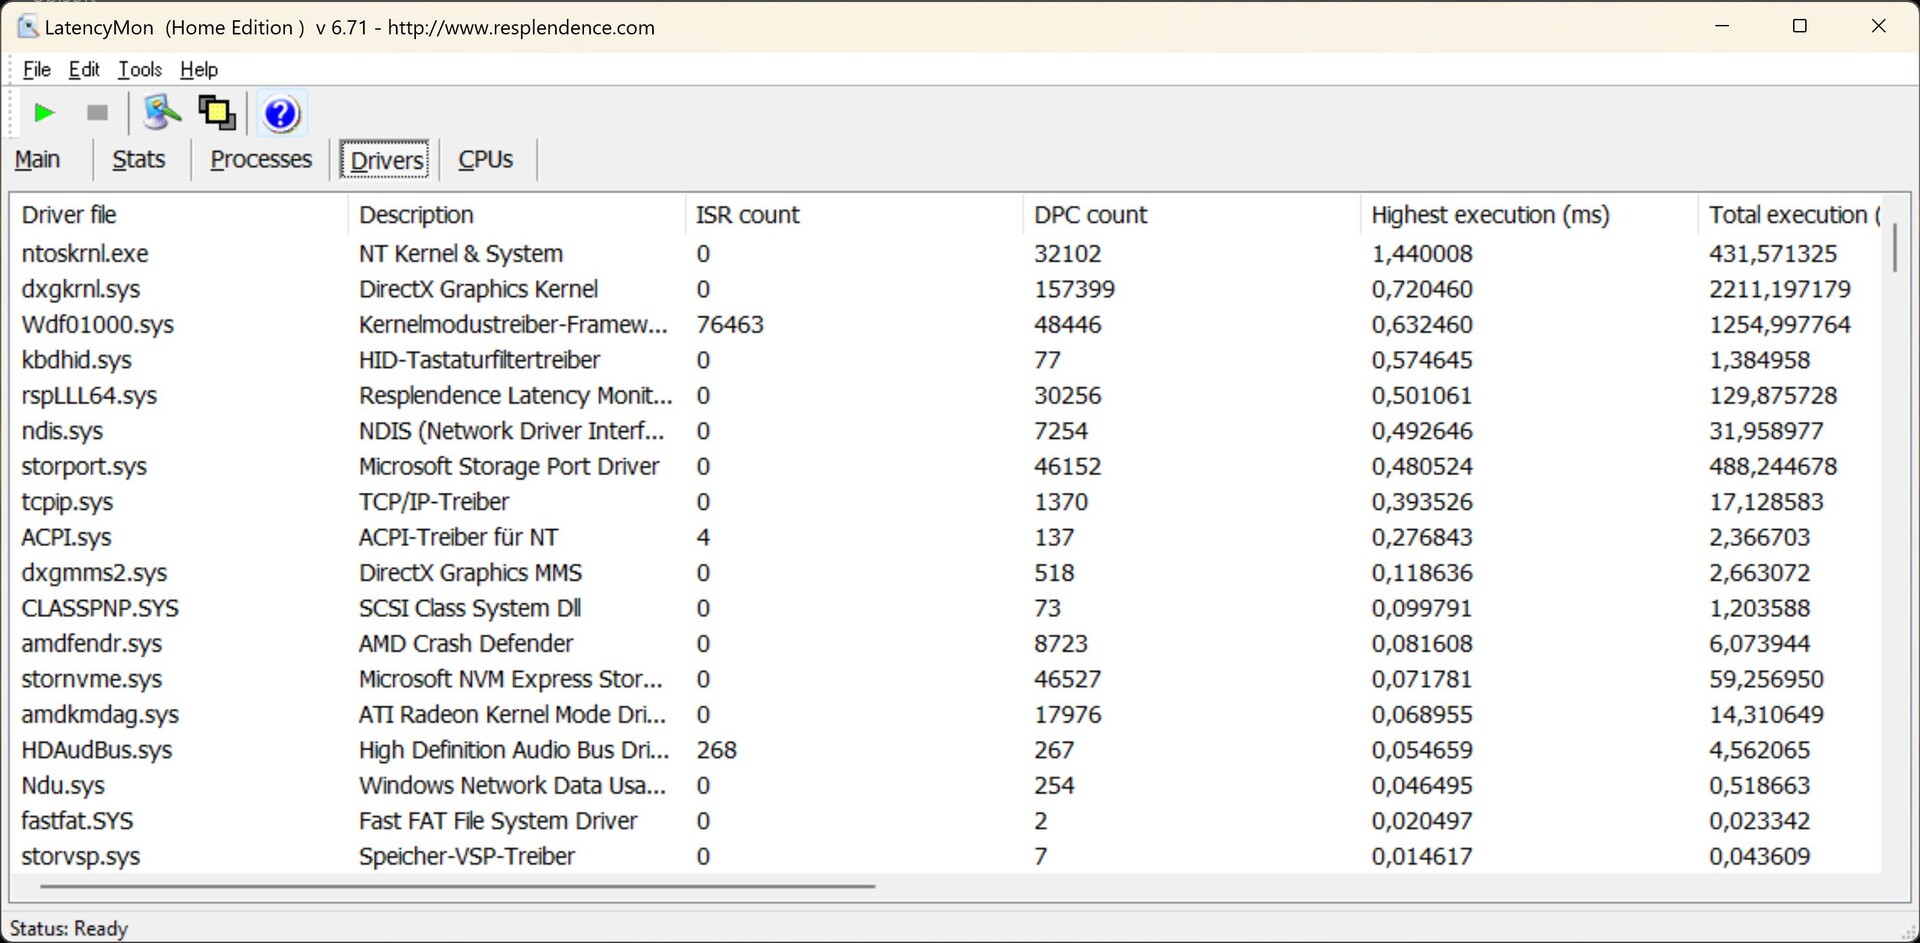
DPC Latency
The Alienware didn't break a sweat when opening the Edge browser, but even opening our Notebookcheck homepage led to latencies on the laptop. The kernel and the DirectX drivers seem to be to blame, among other things. Then again, some competitors have even higher latency values.
When playing our 4K/60 fps YouTube video, there were 2 dropped frames and quite a high load on the internal GPU.
| DPC Latencies / LatencyMon - interrupt to process latency (max), Web, Youtube, Prime95 | |
| Schenker XMG Neo 17 M22 | |
| Asus ROG Strix Scar 17 SE G733CX-LL014W | |
| Acer Predator Helios 300 (i7-12700H, RTX 3070 Ti) | |
| Alienware m17 R5 (R9 6900HX, RX 6850M XT) | |
| Aorus 17X XES | |
| Alienware m17 R4 | |
* ... smaller is better
Storage Devices
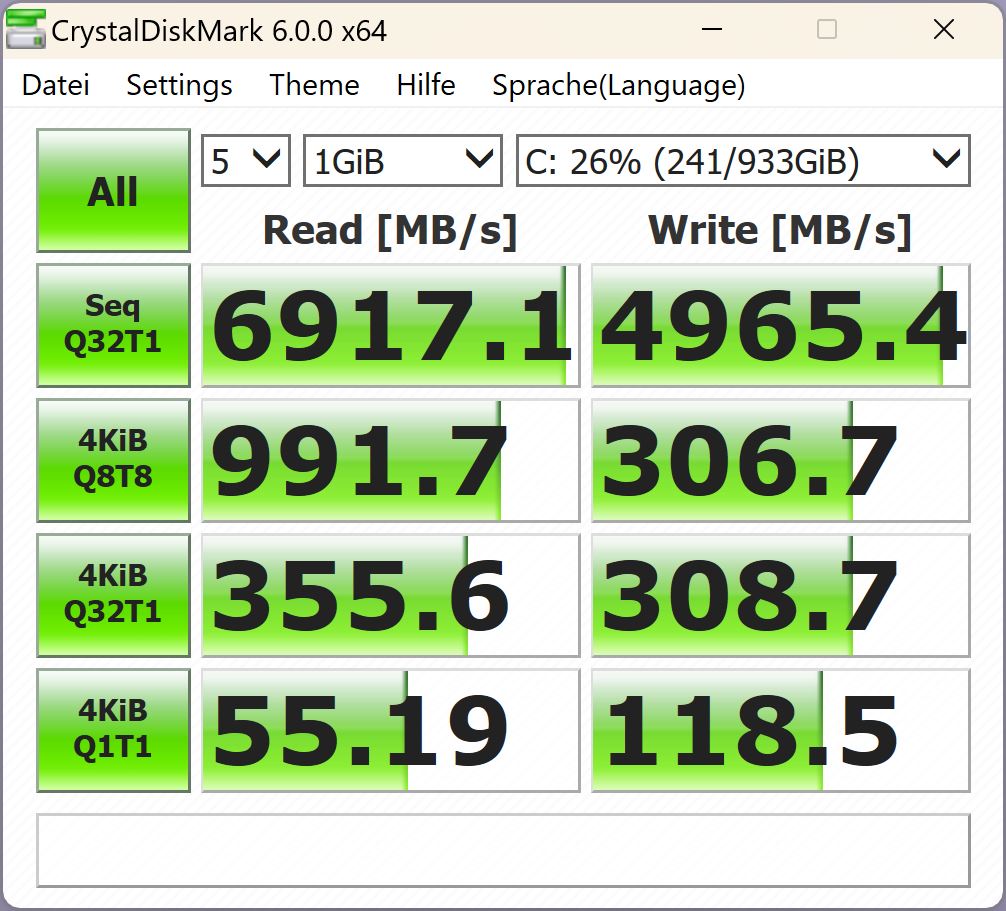
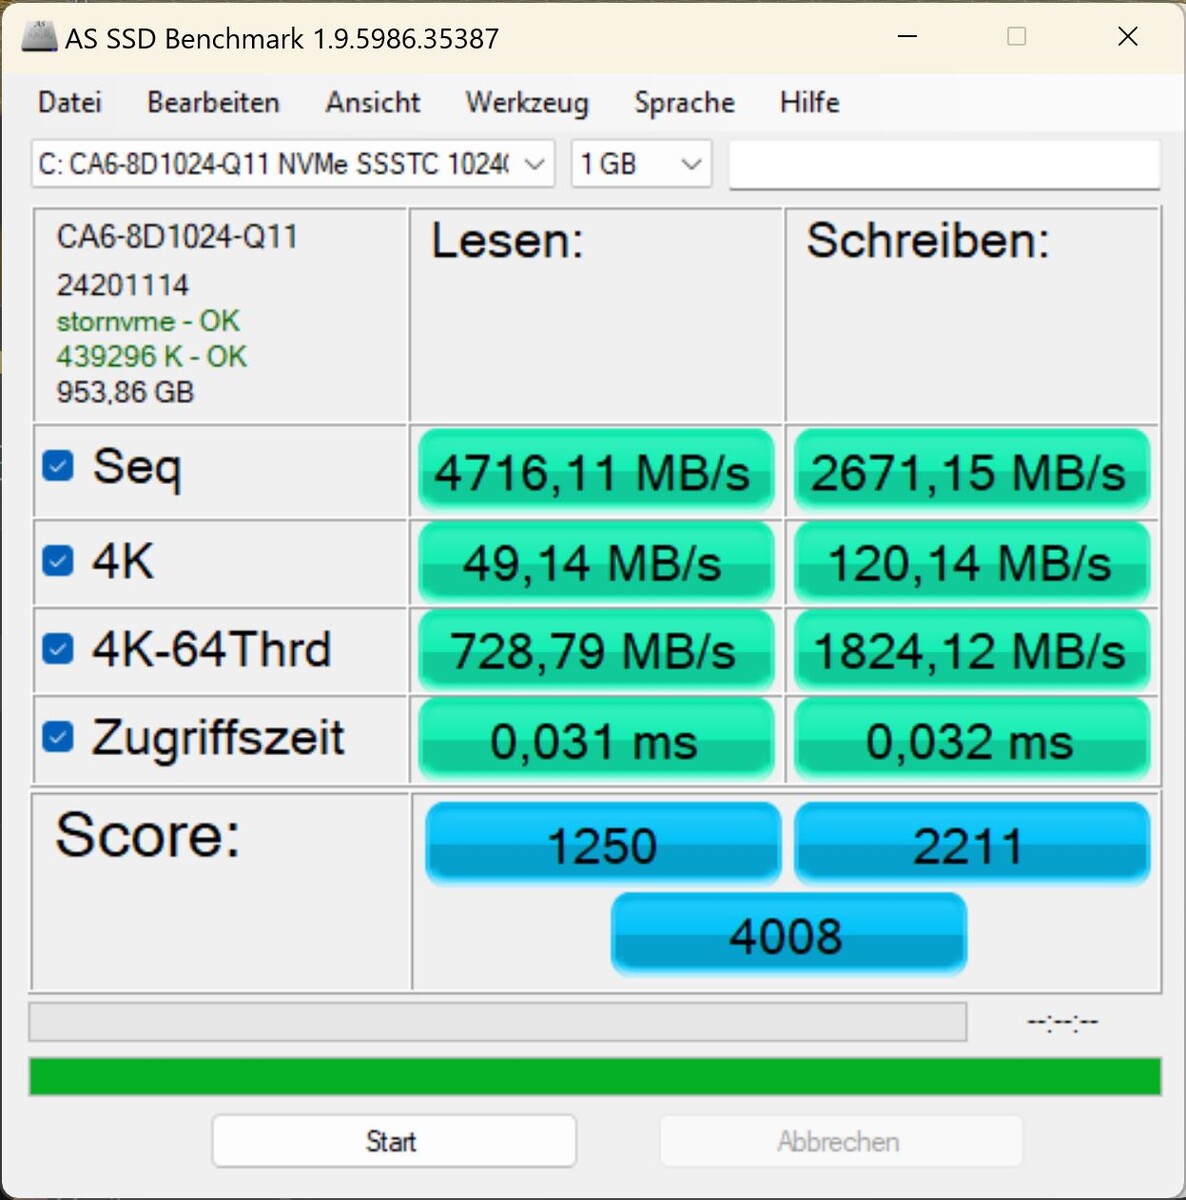
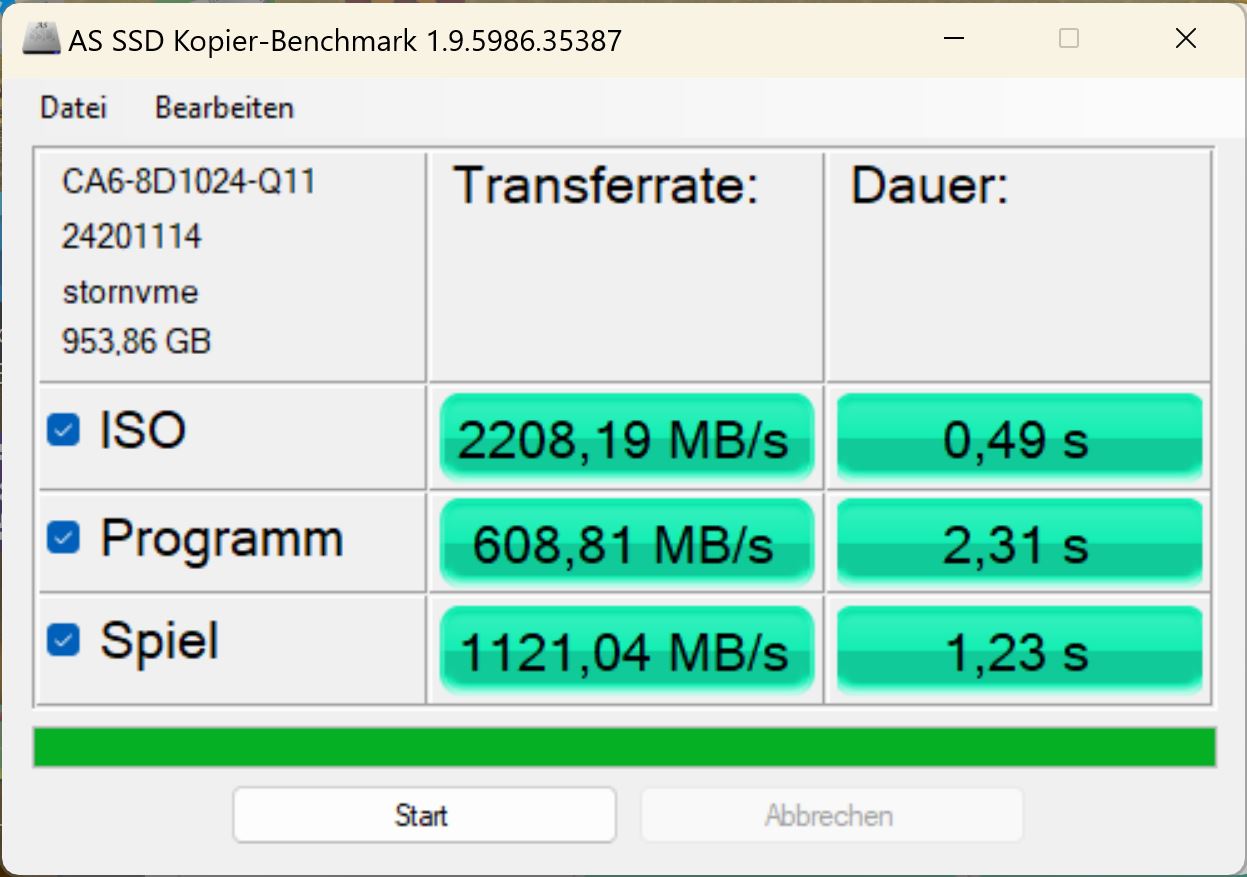
Dell installs a 1 TB NVMe Gen4 SSD from Solid State Storage Technology Corporation (SSSTC). It ranks 20th in our HDD/SSD best list, so it should be fast enough.
However, the installed unit does not come close to the performance of the reference model. It remains clearly below its capabilities, and the storage devices of competitors mostly run much faster.
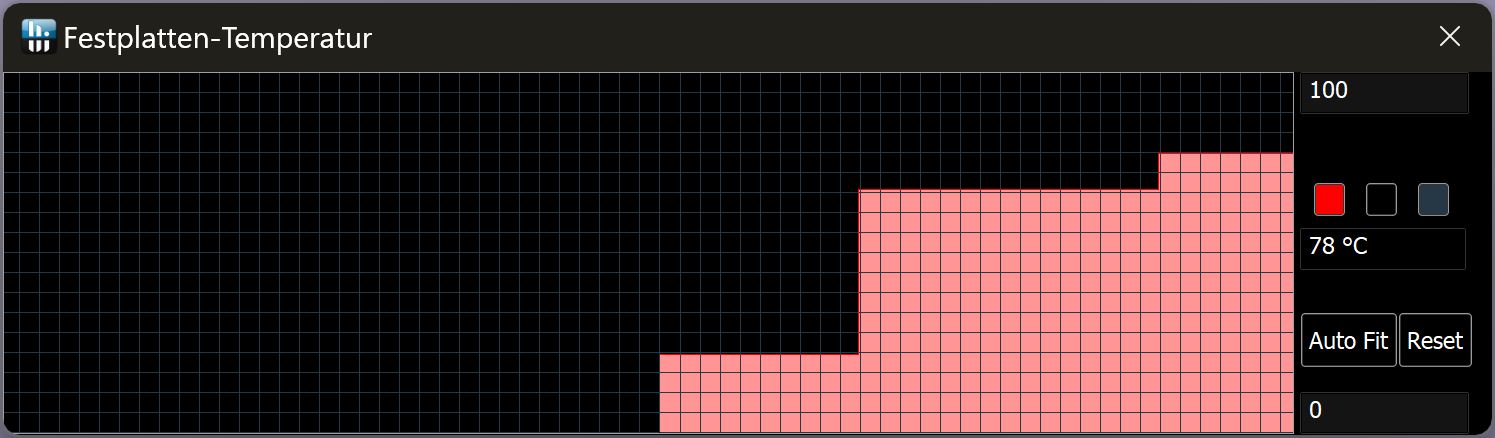
An unsteady progression during the sustained load test reveals that the drive cannot maintain the strong performance of which it is theoretically capable. According to HWinfo, cooling is not the problem.
Storage Devices

* ... smaller is better
Sustained Read Performance: DiskSpd Read Loop, Queue Depth 8
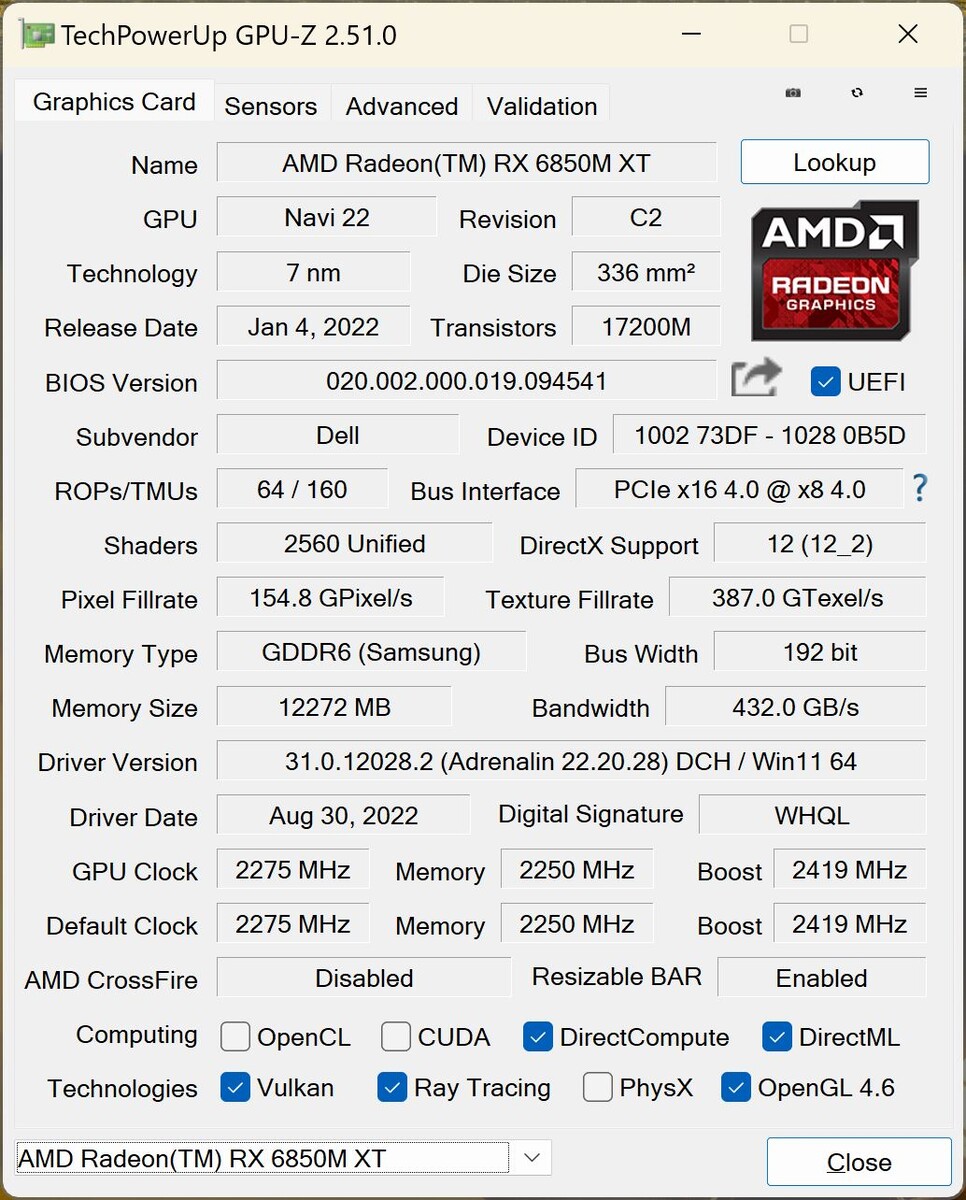
Graphics Card
A dedicated AMD Radeon RX 6850M XT aims to provide gaming pleasure, and its performance is generally classified between that of an RTX 3070 and an RTX 3080.
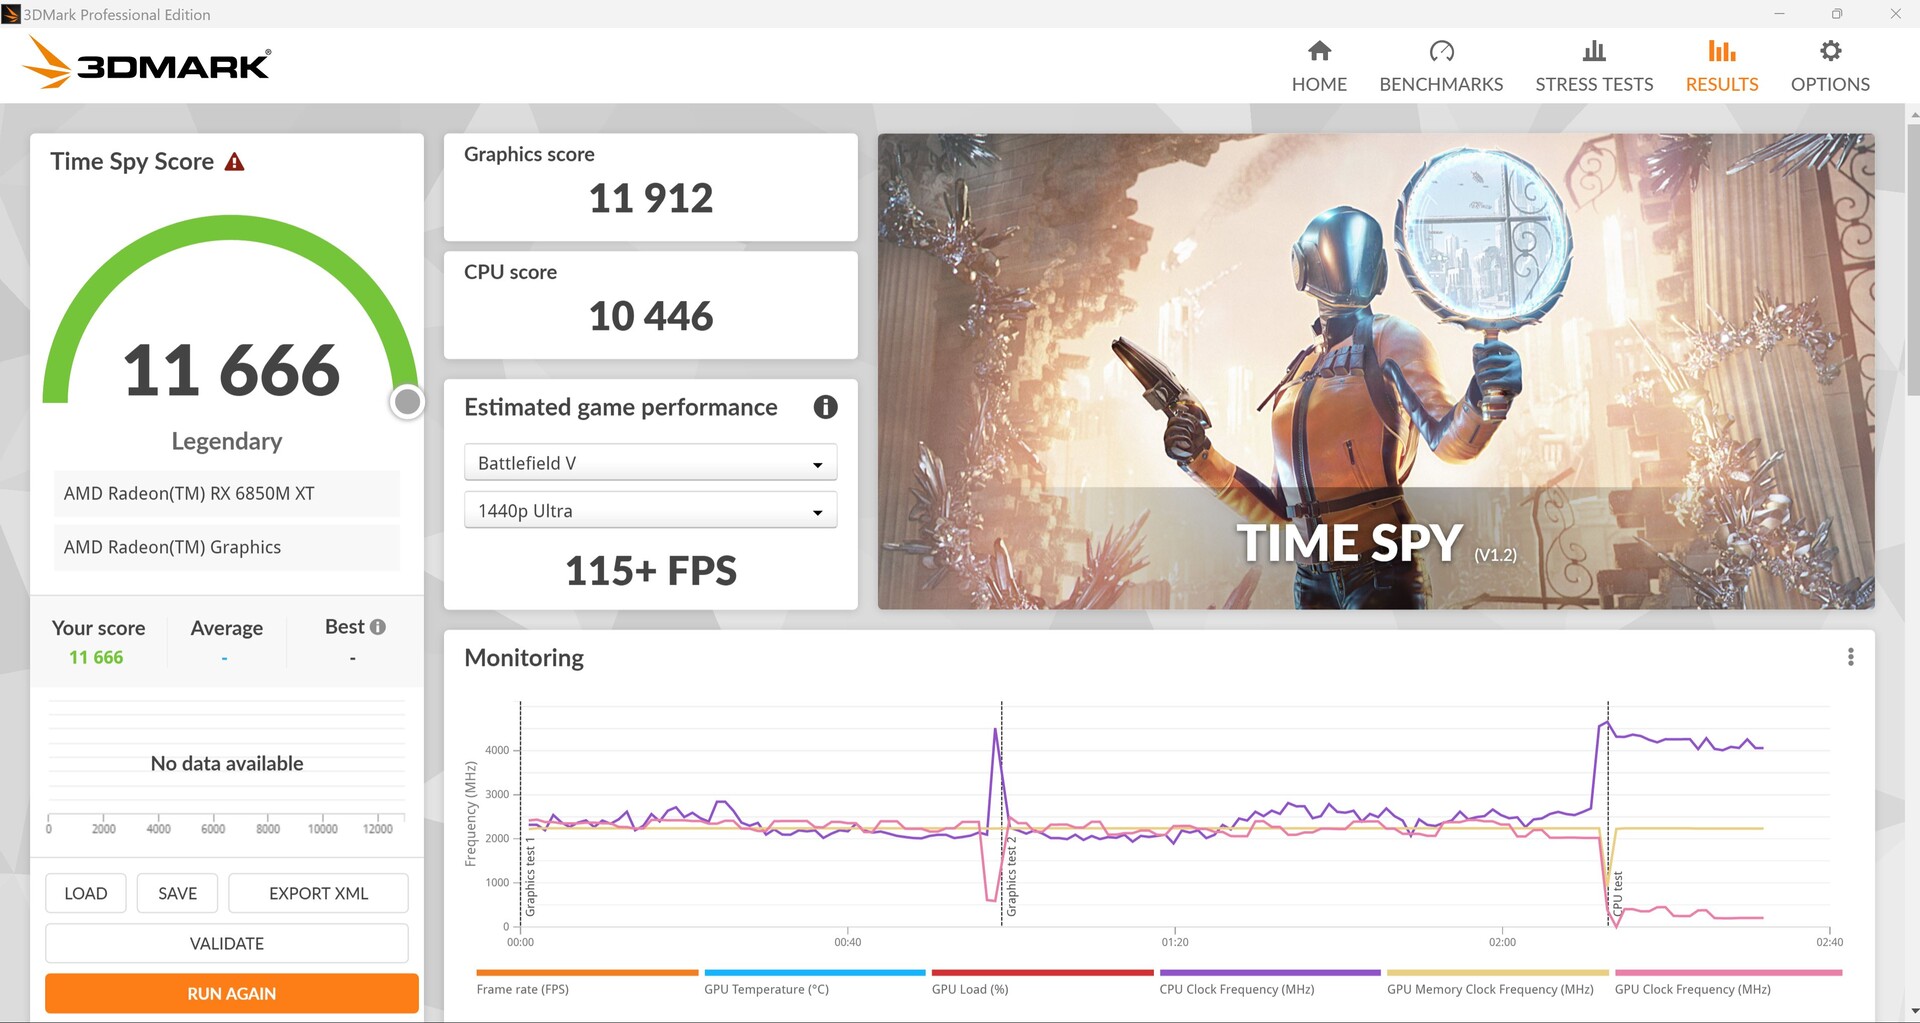
The GPU does a decent job in the 3DMark tests and leaves its competitors with the RTX 3070 Ti behind by a significant margin. The m17 R4 predecessor with its RTX 3080 is more or less on par with the R5 and even the competition with RTX 3080 Ti is within reach.
In battery mode, 3D performance drops by 43 percent.
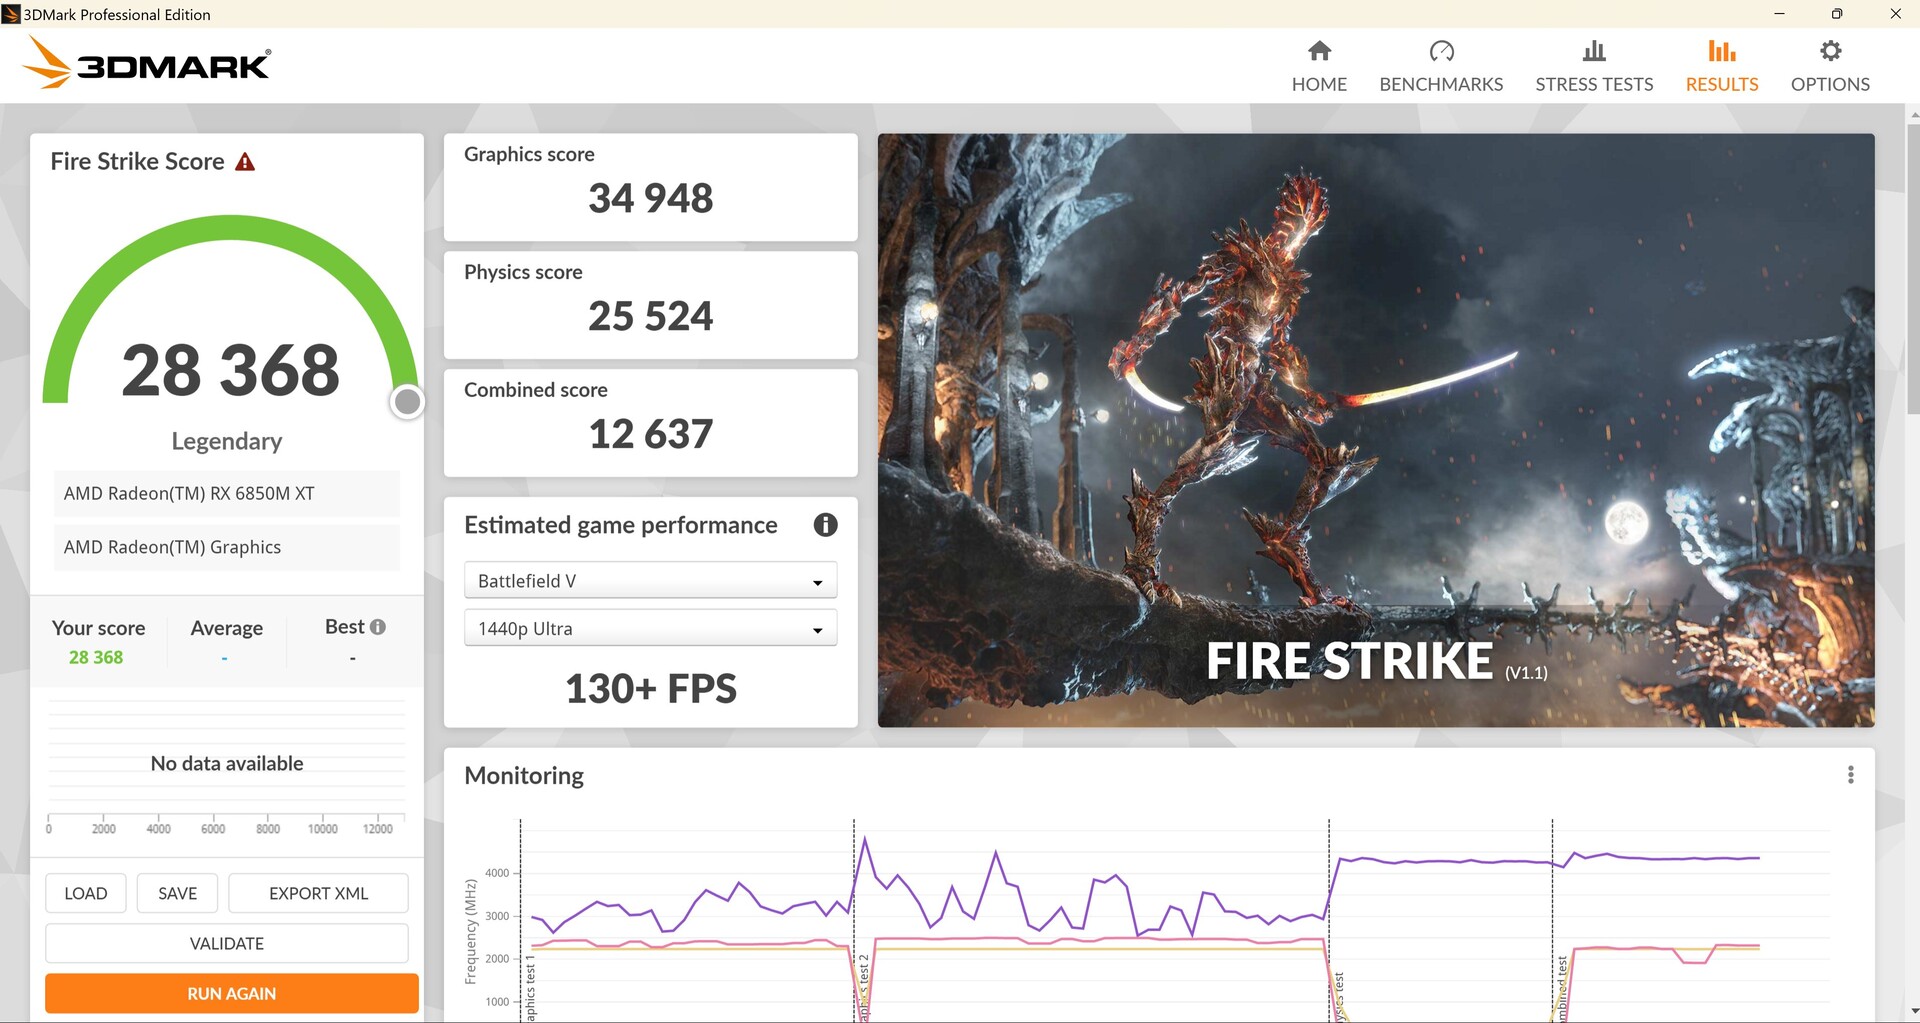
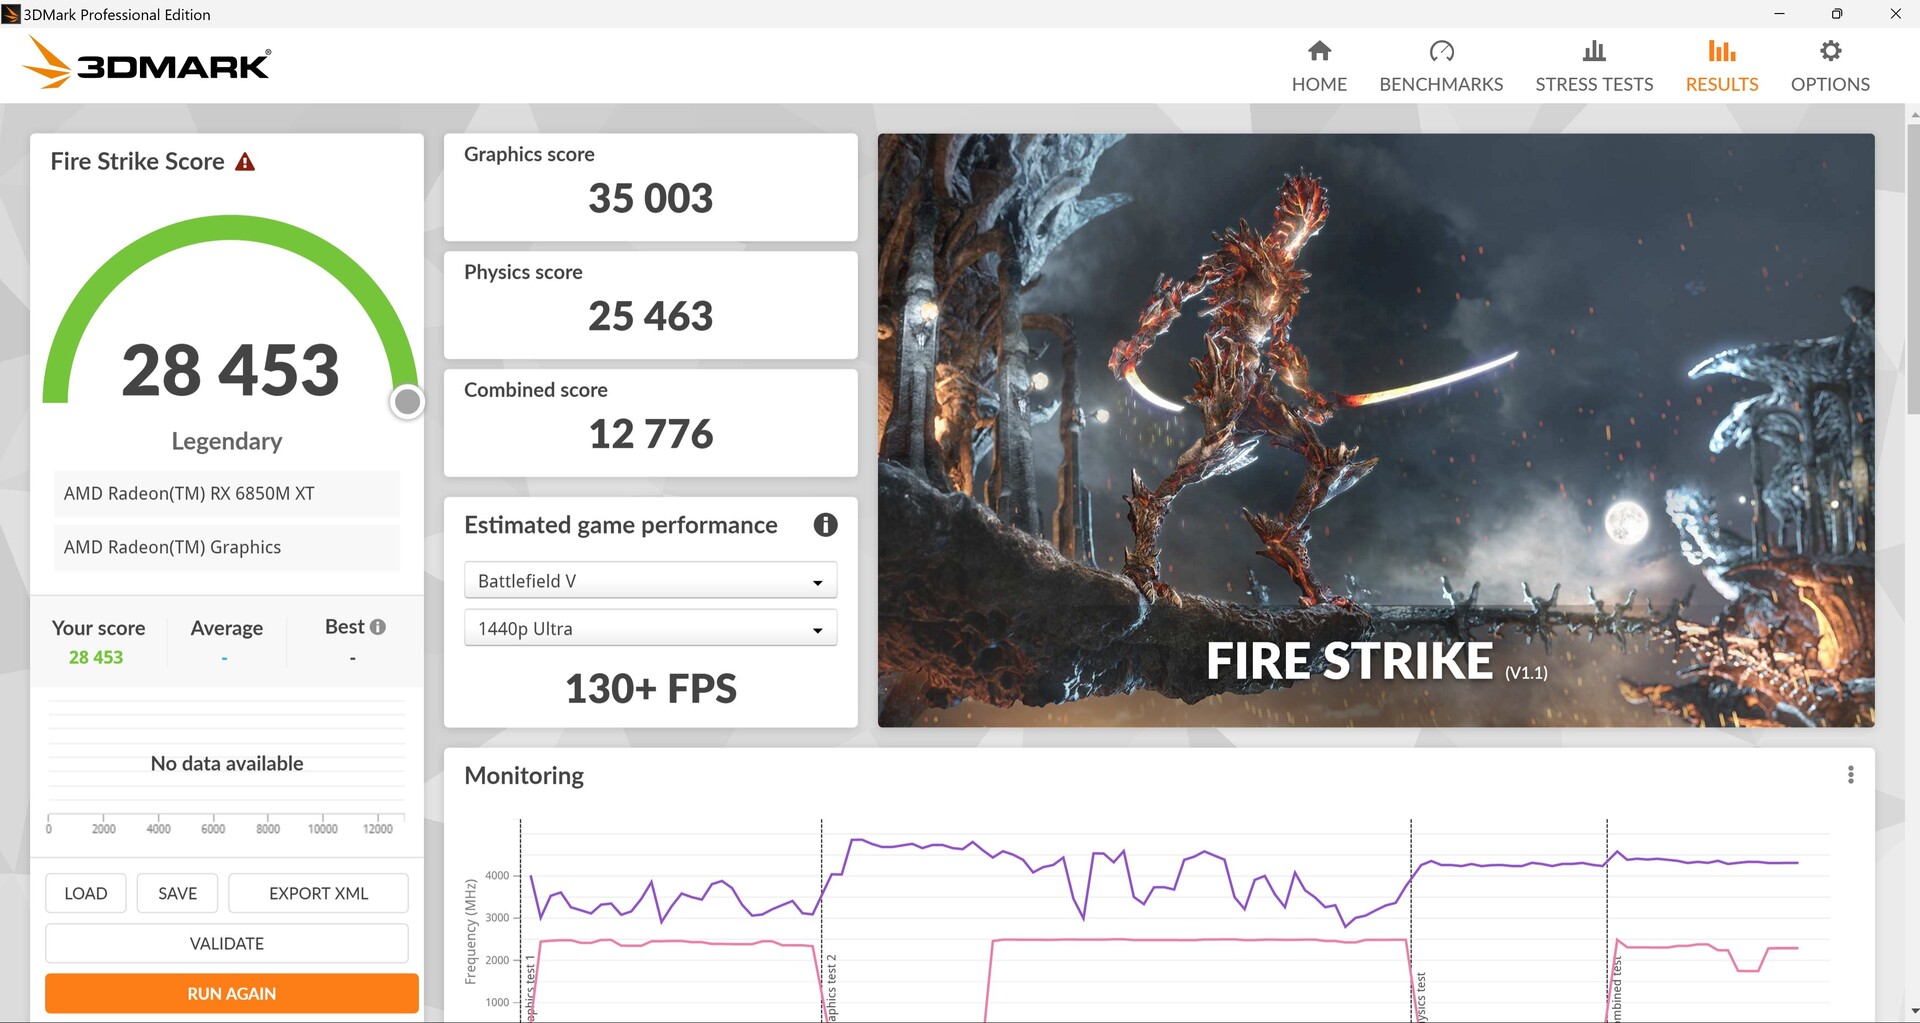
Once again, similar to Cinebench, the performance modes in the Control Center don't seem to have any effect on the Fire Strike score (see images below). Whether Balanced, Performance or Full Speed, the score remains almost identical. Possibly, the drivers are not interacting with the settings in the Control Center here either.
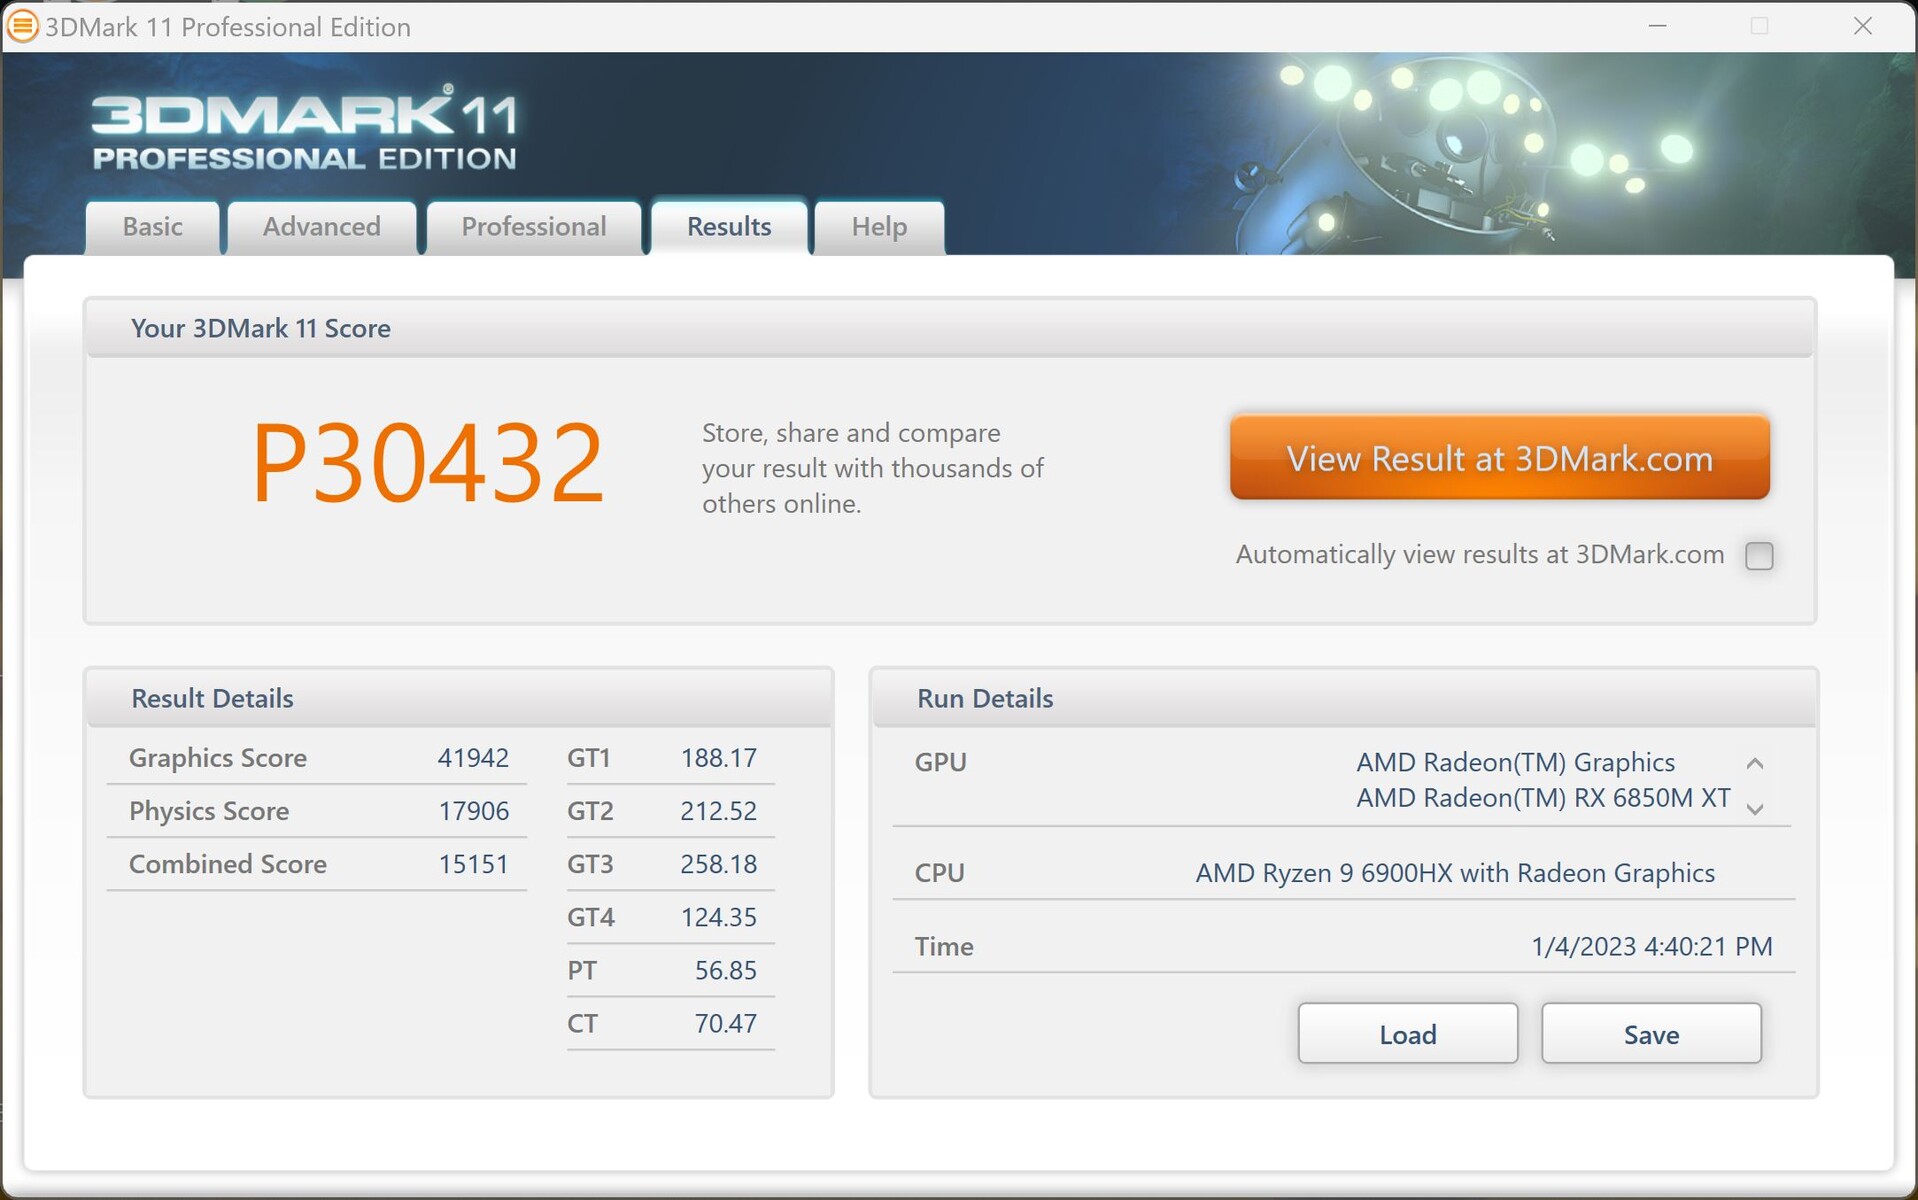


| 3DMark 11 Performance | 30432 points | |
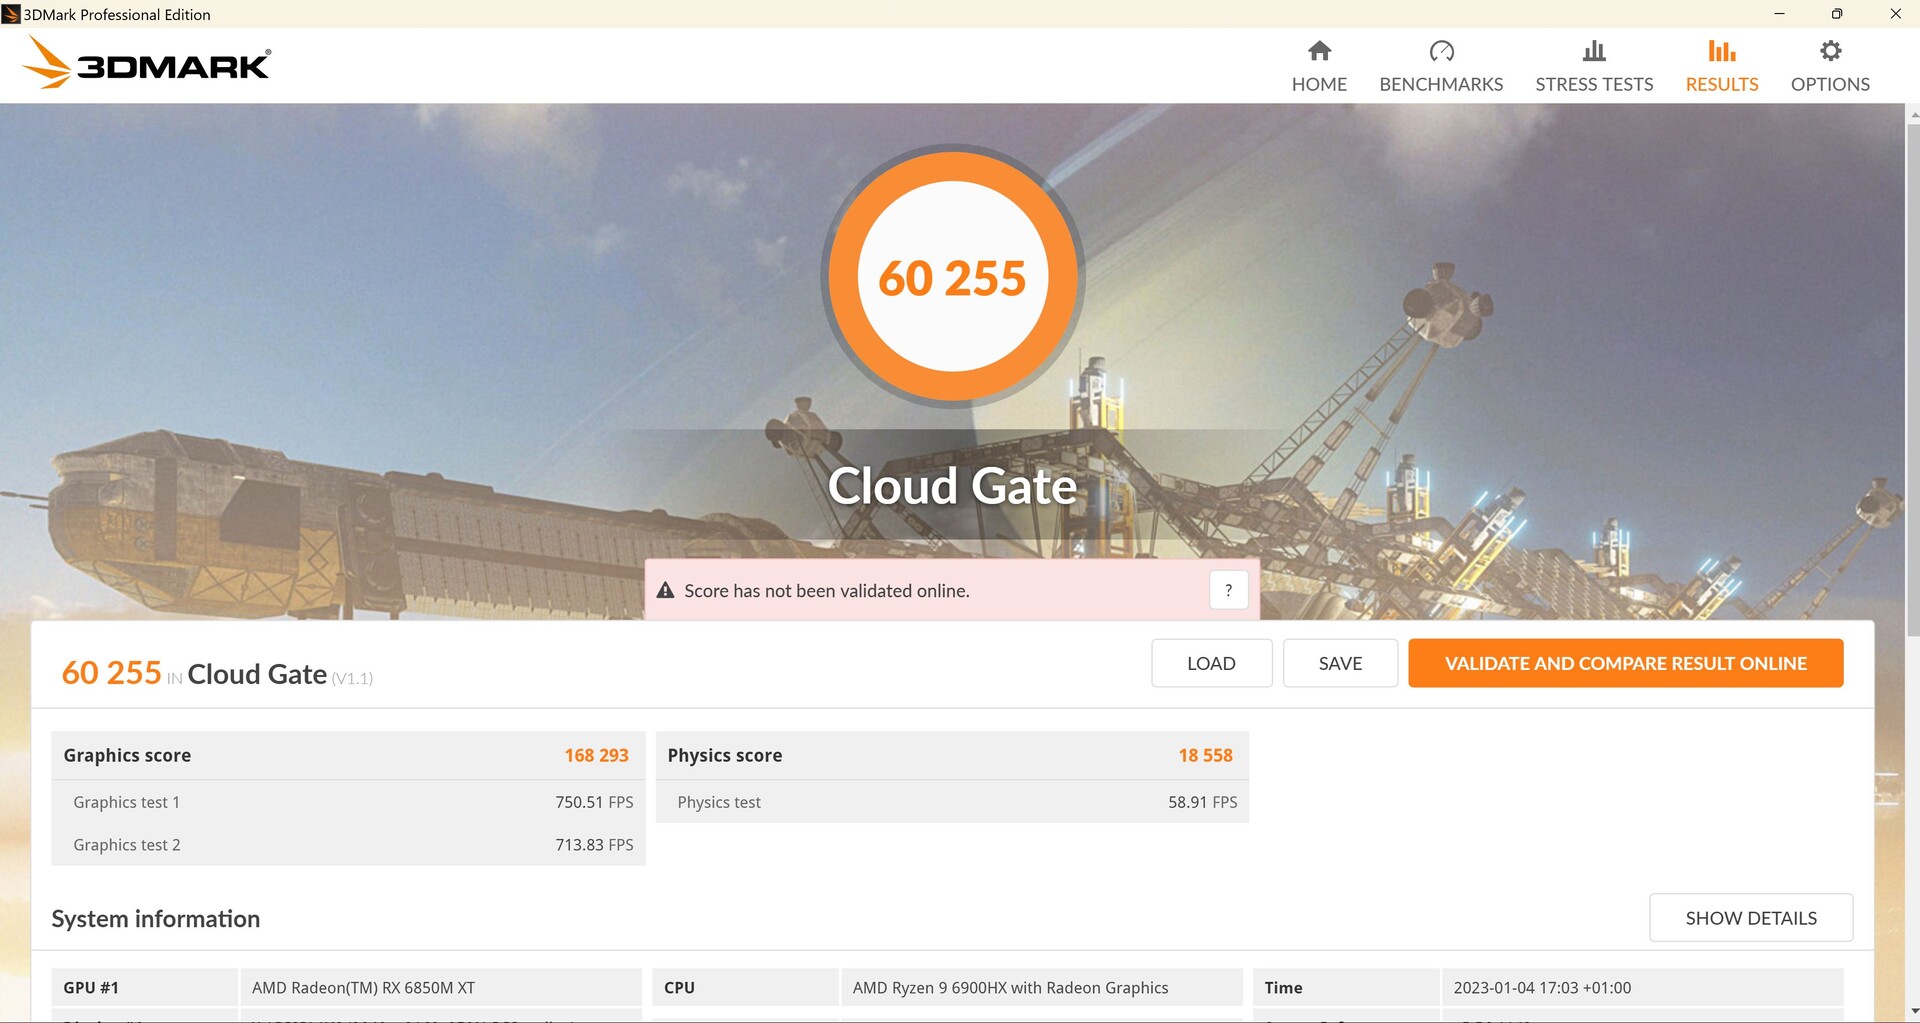
| 3DMark Cloud Gate Standard Score | 60255 points | |
| 3DMark Fire Strike Score | 28368 points | |
| 3DMark Time Spy Score | 11666 points | |
Help | ||
* ... smaller is better
Gaming Performance
In gaming, the AMD Alienware's performance depends heavily on the game played. In CPU-heavy games, the entire Intel competition is ahead, such as in DOTA 2 Reborn.
In GPU-heavy games, the tides can turn and the m17 R5 can be found in the top positions (Witcher 3), despite strong competition from the RTX 3080 Ti. However, there are always games (GTA V) in which the performance is below average. This may also be due to the drivers.
The results in X-Plane indicate that the graphics switching did not work. The results are reproducible.
Ray tracing performance in Dying Light 2 and Cyberpunk 2077 is weaker than competing Nvidia 3000 series cards.
| The Witcher 3 - 1920x1080 Ultra Graphics & Postprocessing (HBAO+) | |
| Average of class Gaming (95 - 240, n=8, last 2 years) | |
| Alienware m17 R5 (R9 6900HX, RX 6850M XT) | |
| Schenker XMG Neo 17 M22 | |
| Acer Predator Helios 300 (i7-12700H, RTX 3070 Ti) | |
| Asus ROG Strix Scar 17 SE G733CX-LL014W | |
| Alienware m17 R4 | |
| Aorus 17X XES | |
| Dying Light 2 | |
| 1920x1080 High Quality | |
| Alienware m17 R5 (R9 6900HX, RX 6850M XT) | |
| Average AMD Radeon RX 6850M XT (n=1) | |
| Acer Predator Helios 300 (i7-12700H, RTX 3070 Ti) | |
| 3840x2160 High Quality | |
| Alienware m17 R5 (R9 6900HX, RX 6850M XT) | |
| Average AMD Radeon RX 6850M XT (n=1) | |
| 1920x1080 High Quality Raytracing | |
| Acer Predator Helios 300 (i7-12700H, RTX 3070 Ti) | |
| Alienware m17 R5 (R9 6900HX, RX 6850M XT) | |
| Average AMD Radeon RX 6850M XT (n=1) | |
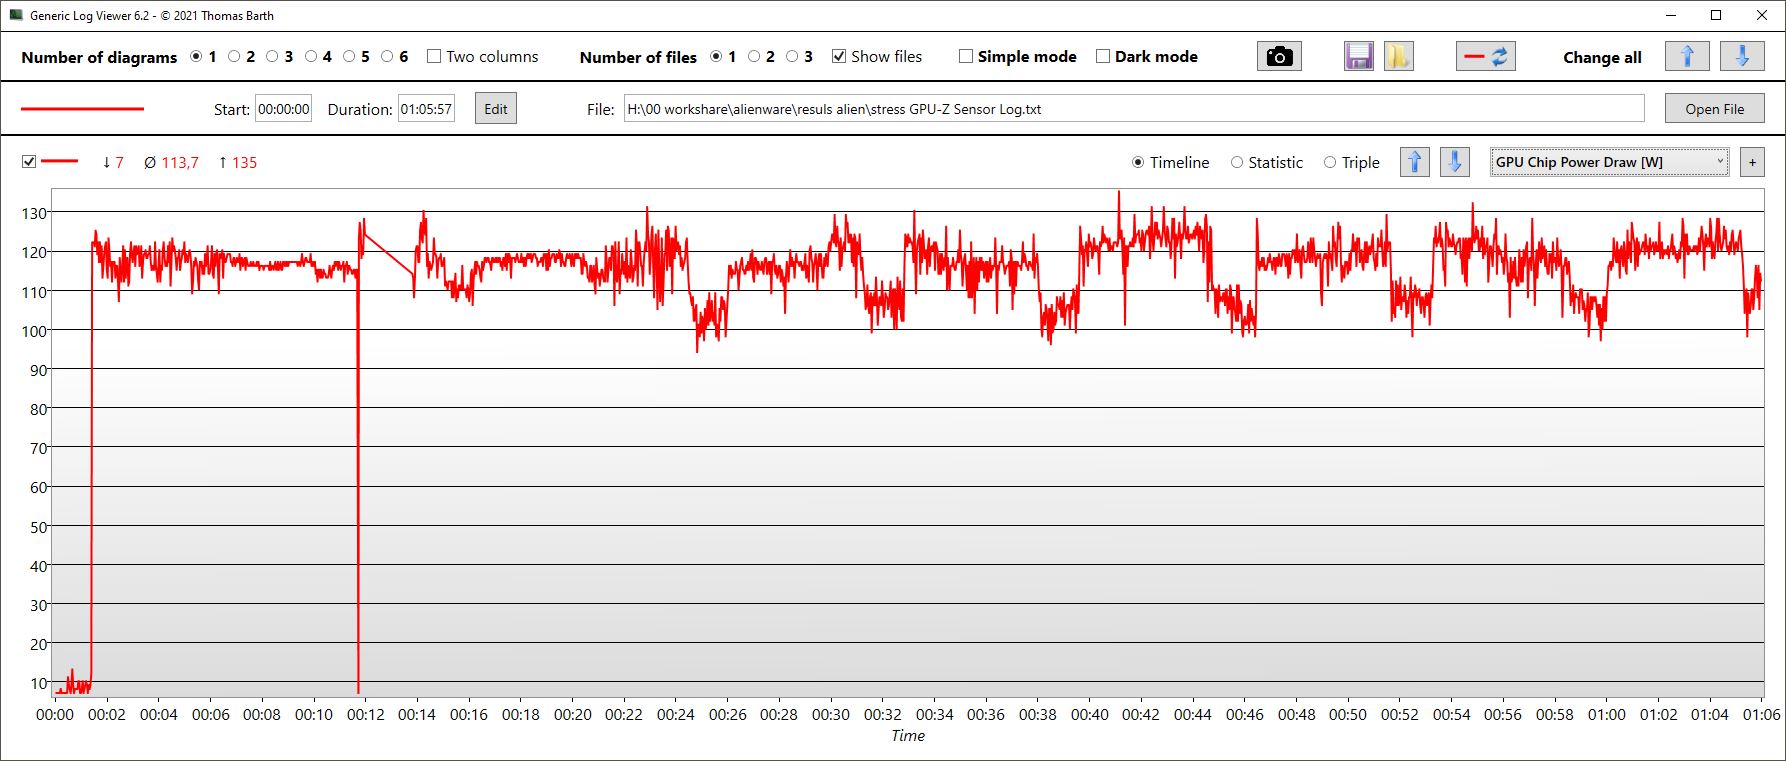
In our one-hour long Witcher 3 loop, the overall frame rate is quite stable, with performance values that rival the RTX 3070 Ti in the Acer Predator and even the RTX 3080 Ti in the XMG Neo 17.
The GPU clock is almost constant at 2.4 to 2.5 GHz, and the card heats up to around 75 °C. GPU power consumption is around 164 W.
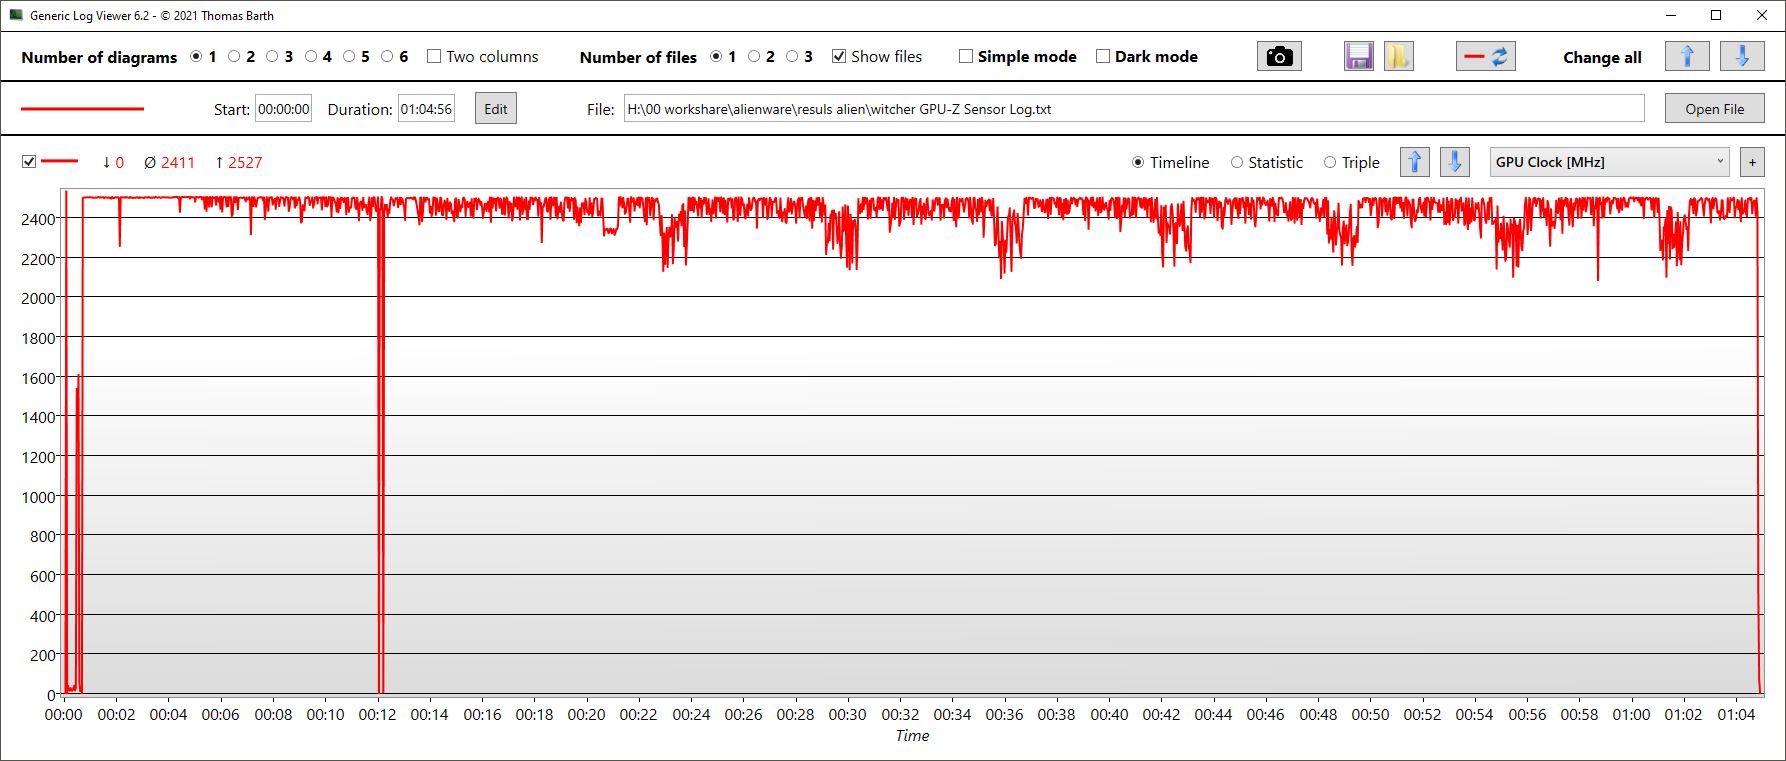
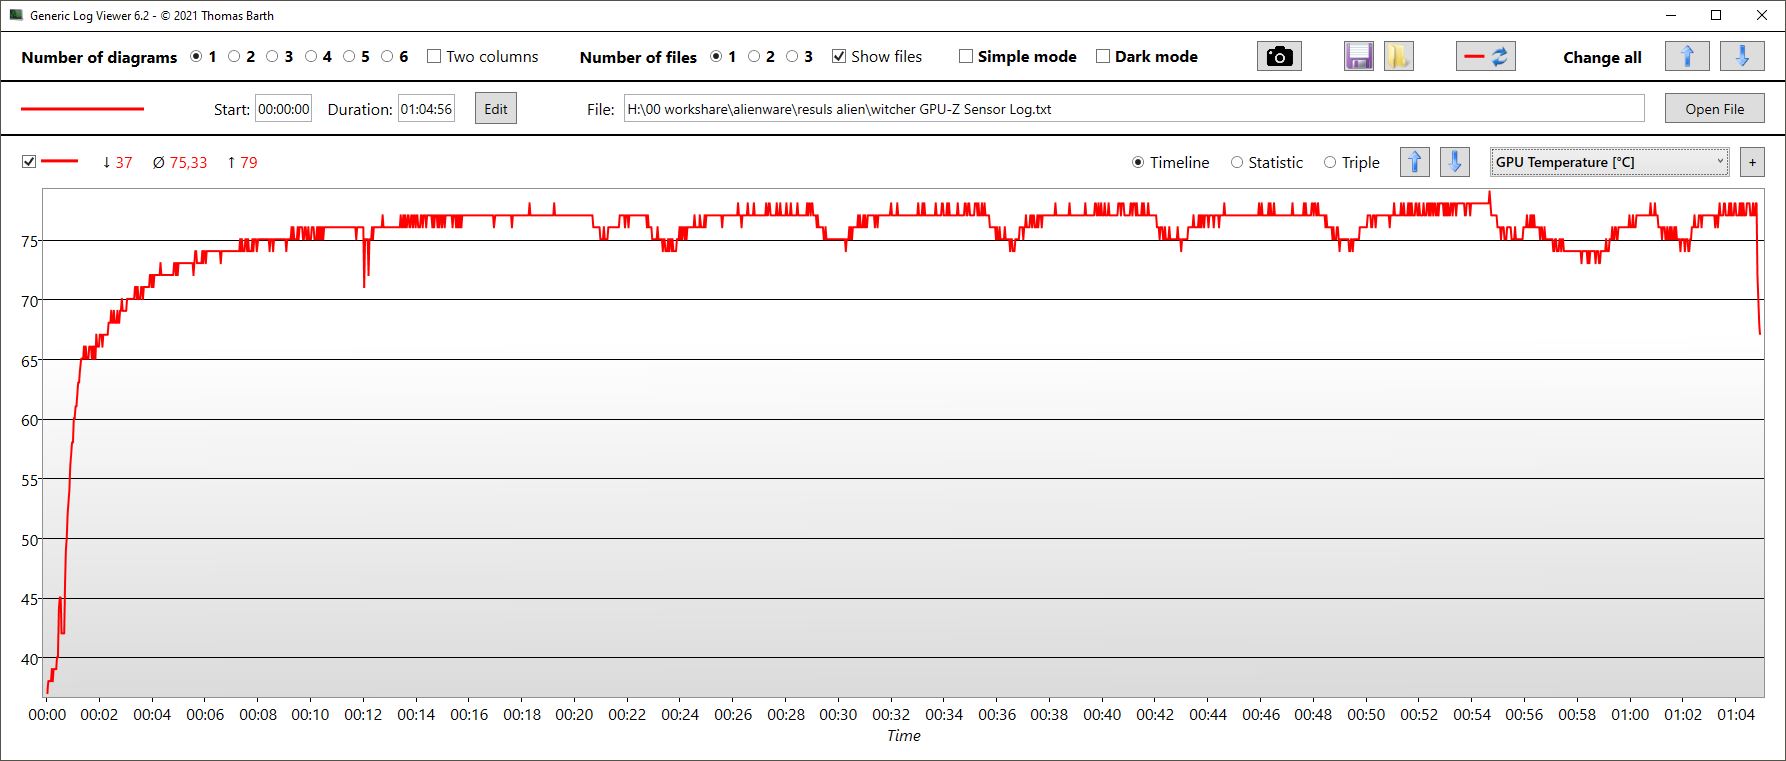
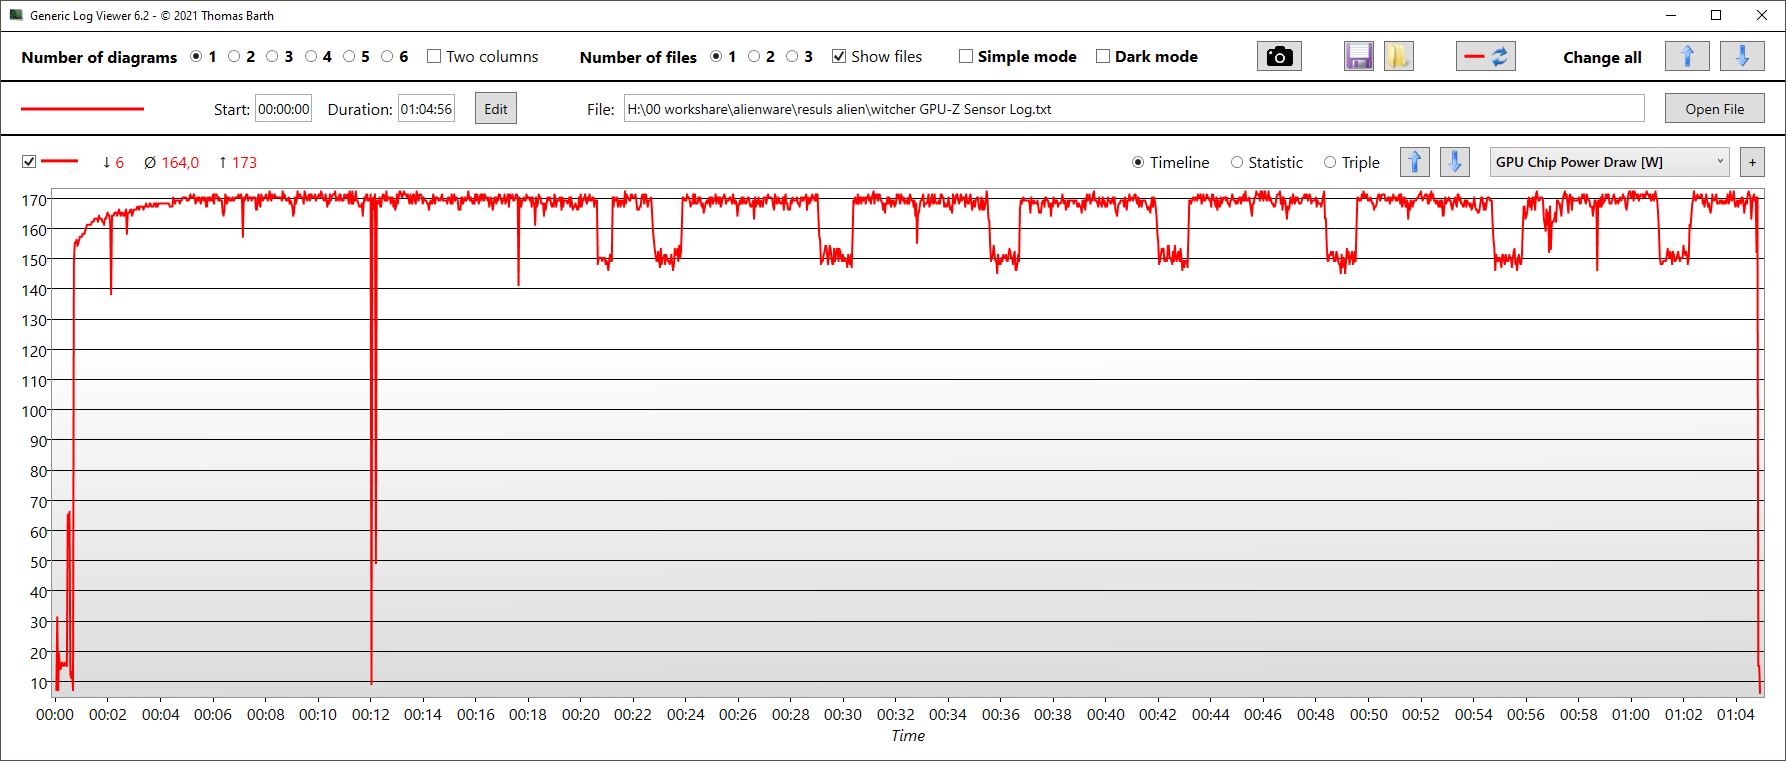
Witcher 3 FPS chart
| low | med. | high | ultra | QHD | 4K | |
|---|---|---|---|---|---|---|
| GTA V (2015) | 173.2 | 168.3 | 152 | 92.6 | 88.7 | 98.5 |
| The Witcher 3 (2015) | 222 | 198.2 | 188.6 | 126.2 | 72.2 | |
| Dota 2 Reborn (2015) | 134.7 | 116.5 | 112.5 | 94 | 77.5 | |
| Final Fantasy XV Benchmark (2018) | 113.6 | 84.5 | 48.8 | |||
| X-Plane 11.11 (2018) | 66.9 | 51 | 43.3 | 27.5 | ||
| Far Cry 5 (2018) | 126 | 109 | 105 | 102 | 99 | 68 |
| Strange Brigade (2018) | 375 | 291 | 256 | 230 | 171 | 92.1 |
| Assassin´s Creed Valhalla (2020) | 87 | 47 | ||||
| Dying Light 2 (2022) | 136 | 107 | 86 | 60 | 30 | |
| Cyberpunk 2077 1.6 (2022) | 57 | 26 | ||||
| Call of Duty Modern Warfare 2 2022 (2022) | 86 | 54 |
Emissions - High CPU core temperatures, otherwise inconspicuous
Noise
In idle, the fans remain mostly silent outside Full Speed mode. However, they periodically rev up briefly for one to three seconds, which makes no sense. This even happens in sleep mode with the screen closed, which is quite annoying. So here, too, the drivers are not perfectly adjusted.
When gaming in Performance mode, the new m17 becomes slightly louder than its predecessor, but remains relatively quiet compared to the rest of the competition, making it one of the quietest high-performance gamers.
Noise level
| Idle |
| 23 / 28.11 / 28.11 dB(A) |
| Load |
| 30.62 / 50.17 dB(A) |
 | ||
30 dB silent 40 dB(A) audible 50 dB(A) loud |
||
min: | ||
| Alienware m17 R5 (R9 6900HX, RX 6850M XT) Radeon RX 6850M XT, R9 6900HX, SSSTC CA6-8D1024 | Alienware m17 R4 GeForce RTX 3080 Laptop GPU, i9-10980HK, 2x Micron 2300 512 GB (RAID 0) | Asus ROG Strix Scar 17 SE G733CX-LL014W GeForce RTX 3080 Ti Laptop GPU, i9-12950HX, Samsung PM9A1 MZVL22T0HBLB | Acer Predator Helios 300 (i7-12700H, RTX 3070 Ti) GeForce RTX 3070 Ti Laptop GPU, i7-12700H, Samsung PM9A1 MZVL21T0HCLR | Schenker XMG Neo 17 M22 GeForce RTX 3080 Ti Laptop GPU, R9 6900HX, Samsung SSD 980 Pro 1TB MZ-V8P1T0BW | Aorus 17X XES GeForce RTX 3070 Ti Laptop GPU, i9-12900HX, Gigabyte AG470S1TB-SI B10 | |
|---|---|---|---|---|---|---|
| Noise | -9% | 3% | -18% | -20% | -25% | |
| off / environment * (dB) | 23 | 24 -4% | 23.9 -4% | 23 -0% | 26 -13% | 26 -13% |
| Idle Minimum * (dB) | 23 | 24 -4% | 23.9 -4% | 23 -0% | 26 -13% | 28 -22% |
| Idle Average * (dB) | 28.11 | 25 11% | 23.9 15% | 25.92 8% | 29 -3% | 32 -14% |
| Idle Maximum * (dB) | 28.11 | 36 -28% | 23.9 15% | 40.67 -45% | 40 -42% | 38 -35% |
| Load Average * (dB) | 30.62 | 45 -47% | 34.3 -12% | 42.7 -39% | 47 -53% | 53 -73% |
| Witcher 3 ultra * (dB) | 49.75 | 47 6% | 62.48 -26% | 52 -5% | 54 -9% | |
| Load Maximum * (dB) | 50.17 | 50 -0% | 45.9 9% | 62.67 -25% | 54 -8% | 55 -10% |
* ... smaller is better
Temperature
The m17 always stays cool when idling, so the unusually high idle temperatures of its predecessor are a thing of the past.
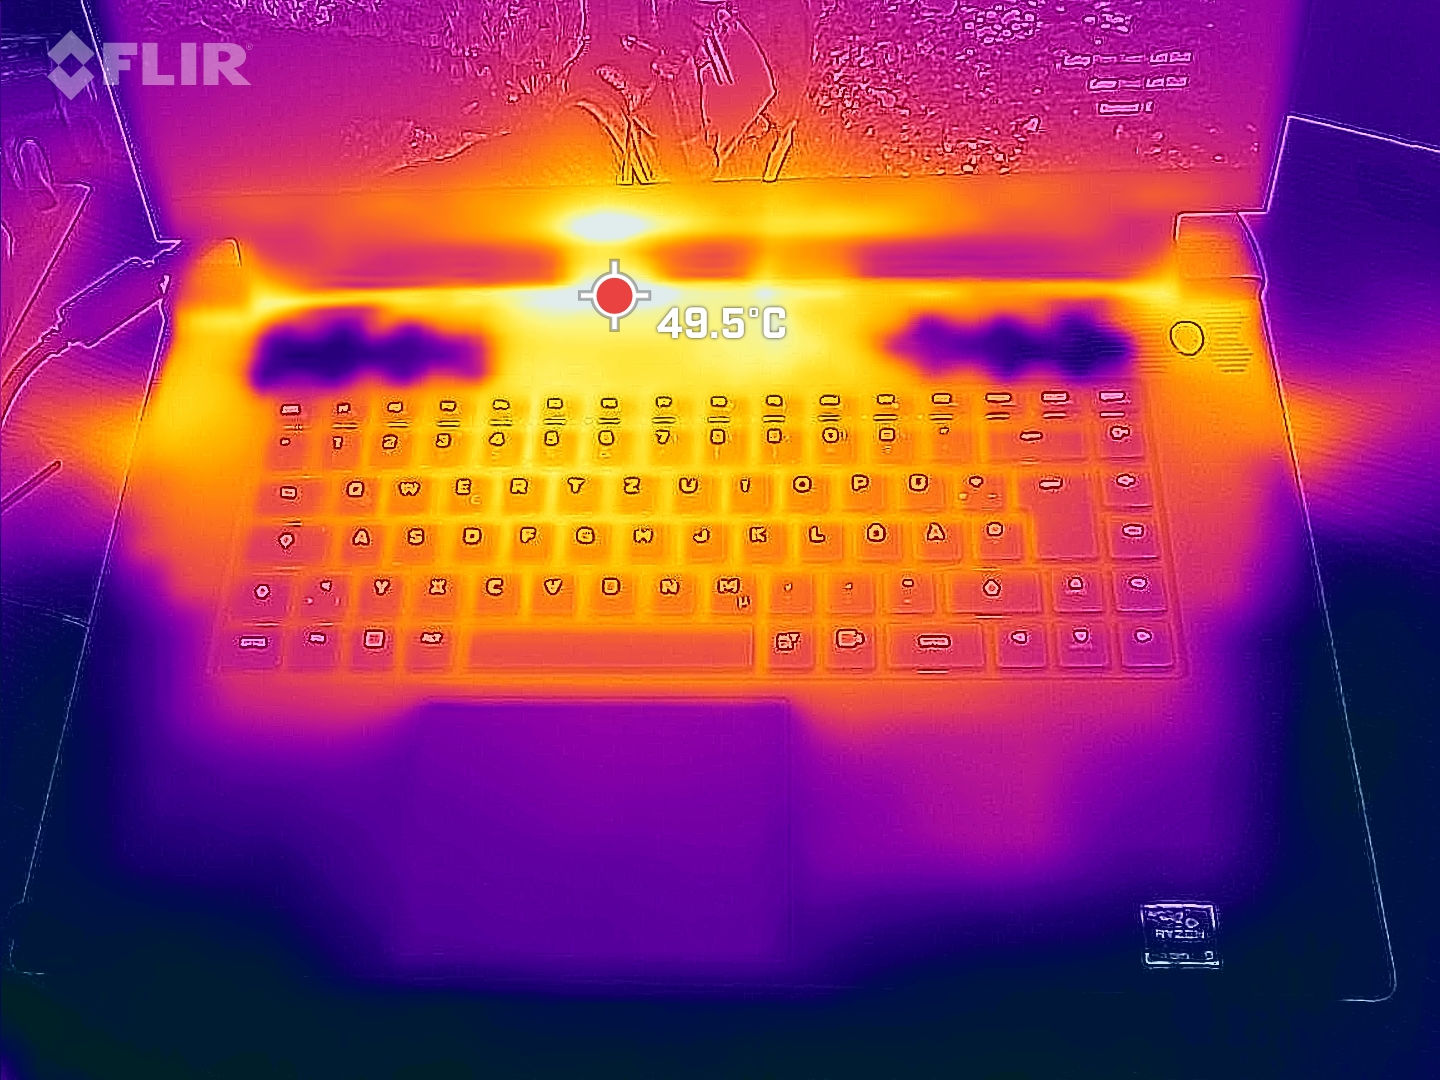
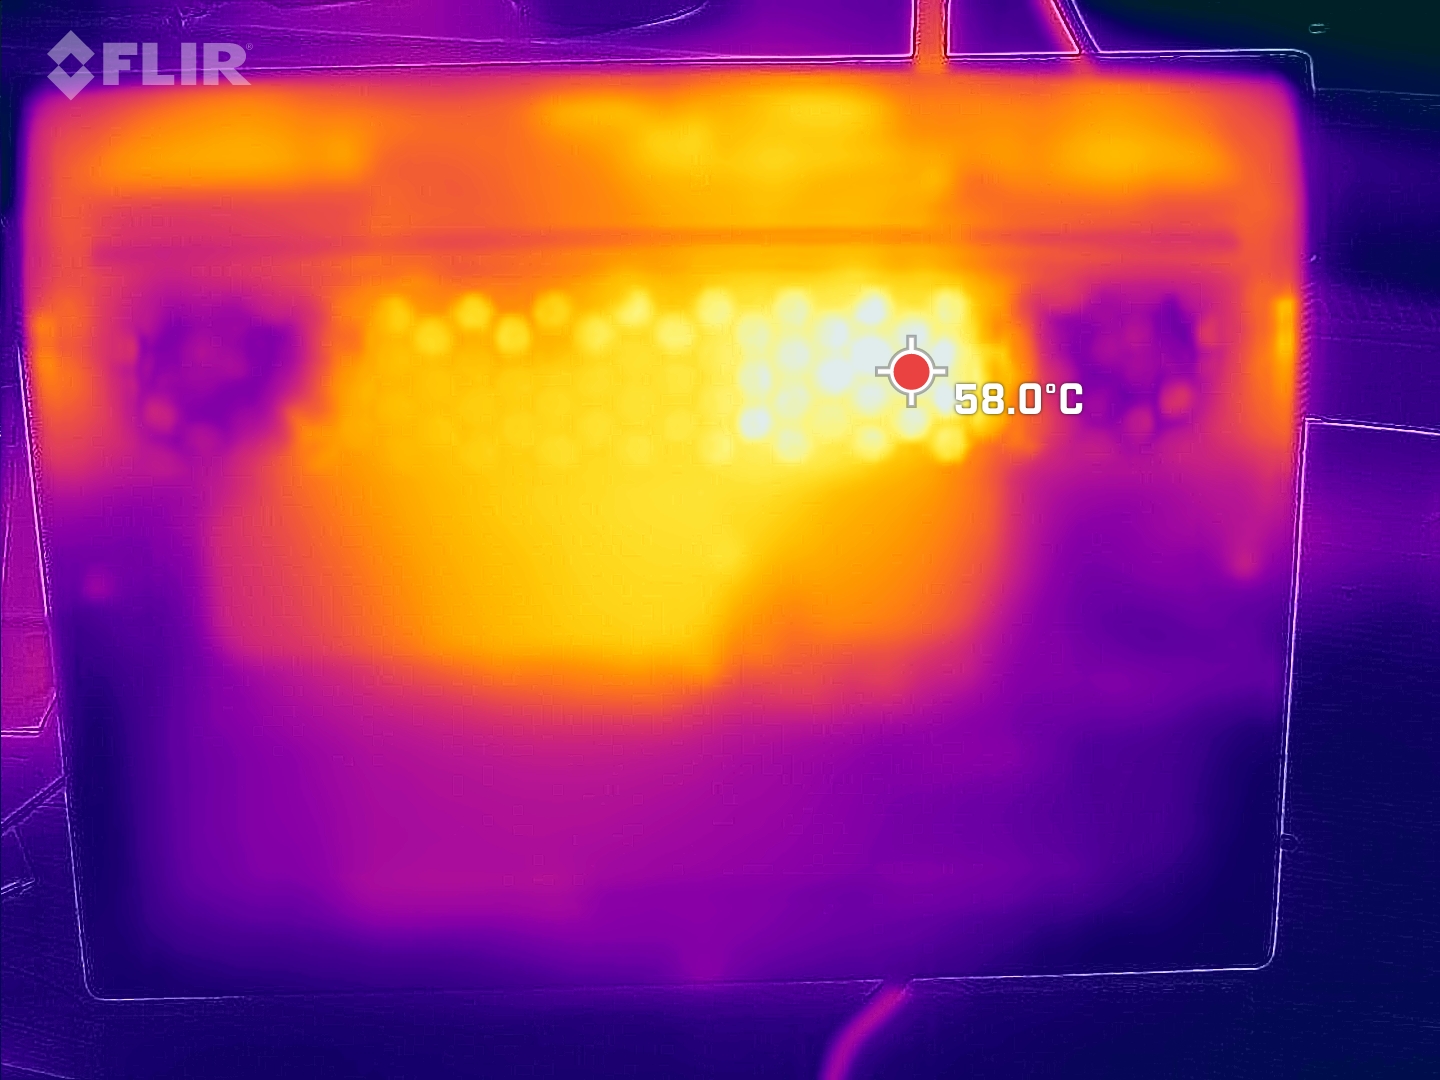
The palm rests also remain cool under load. However, hot spots of up to 56 °C develop, especially on the underside in the center towards the display. There are competitors that keep a little cooler, but the Alienware doesn't fall behind either; at least one device (Aorus 17) reaches similar temperatures.
(-) The maximum temperature on the upper side is 53 °C / 127 F, compared to the average of 40.4 °C / 105 F, ranging from 21.2 to 68.8 °C for the class Gaming.
(-) The bottom heats up to a maximum of 56 °C / 133 F, compared to the average of 43.2 °C / 110 F
(+) In idle usage, the average temperature for the upper side is 25.3 °C / 78 F, compared to the device average of 33.9 °C / 93 F.
(±) Playing The Witcher 3, the average temperature for the upper side is 36.4 °C / 98 F, compared to the device average of 33.9 °C / 93 F.
(+) The palmrests and touchpad are cooler than skin temperature with a maximum of 29 °C / 84.2 F and are therefore cool to the touch.
(±) The average temperature of the palmrest area of similar devices was 28.8 °C / 83.8 F (-0.2 °C / -0.4 F).
| Alienware m17 R5 (R9 6900HX, RX 6850M XT) AMD Ryzen 9 6900HX, AMD Radeon RX 6850M XT | Alienware m17 R4 Intel Core i9-10980HK, NVIDIA GeForce RTX 3080 Laptop GPU | Asus ROG Strix Scar 17 SE G733CX-LL014W Intel Core i9-12950HX, NVIDIA GeForce RTX 3080 Ti Laptop GPU | Acer Predator Helios 300 (i7-12700H, RTX 3070 Ti) Intel Core i7-12700H, NVIDIA GeForce RTX 3070 Ti Laptop GPU | Schenker XMG Neo 17 M22 AMD Ryzen 9 6900HX, NVIDIA GeForce RTX 3080 Ti Laptop GPU | Aorus 17X XES Intel Core i9-12900HX, NVIDIA GeForce RTX 3070 Ti Laptop GPU | |
|---|---|---|---|---|---|---|
| Heat | -25% | -1% | 6% | 0% | -16% | |
| Maximum Upper Side * (°C) | 53 | 58 -9% | 48.8 8% | 35 34% | 49 8% | 54 -2% |
| Maximum Bottom * (°C) | 56 | 46 18% | 52.4 6% | 53 5% | 52 7% | 58 -4% |
| Idle Upper Side * (°C) | 30 | 45 -50% | 30.4 -1% | 29 3% | 30 -0% | 37 -23% |
| Idle Bottom * (°C) | 29 | 46 -59% | 34.1 -18% | 34 -17% | 33 -14% | 39 -34% |
* ... smaller is better
Stress Testing
The cores start our stress test at around 4.3 GHz. Over time, this clock is maintained quite well, dropping only minimally. Core temperatures repeatedly reach the high 100 °C!
The GPU has somewhat more tolerable temperatures of around 75 °C. The GPU clock rate is 1.6 GHz on average.
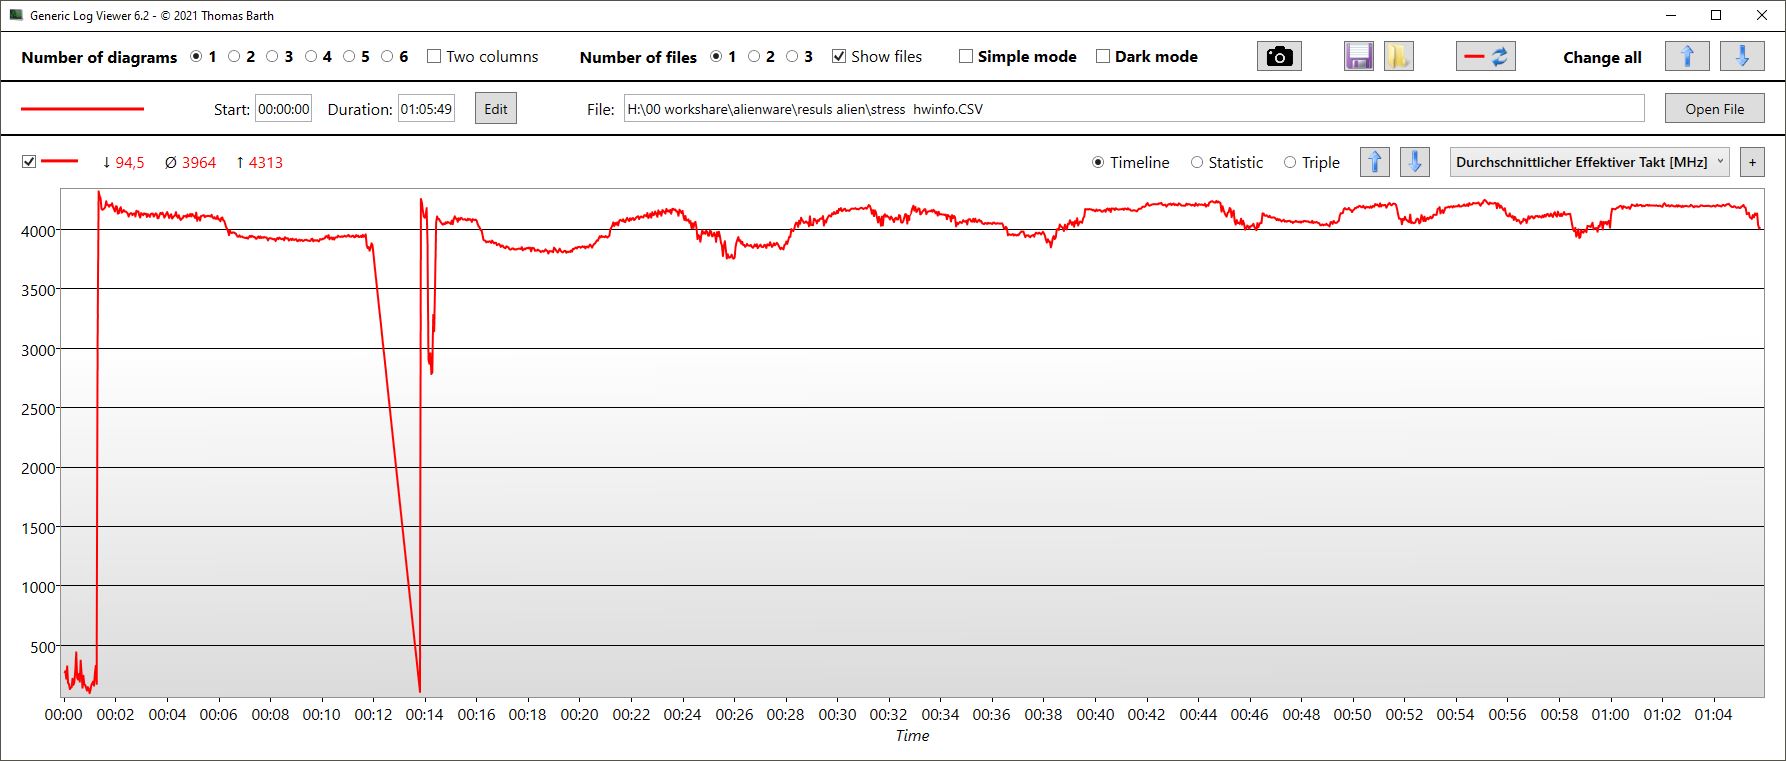
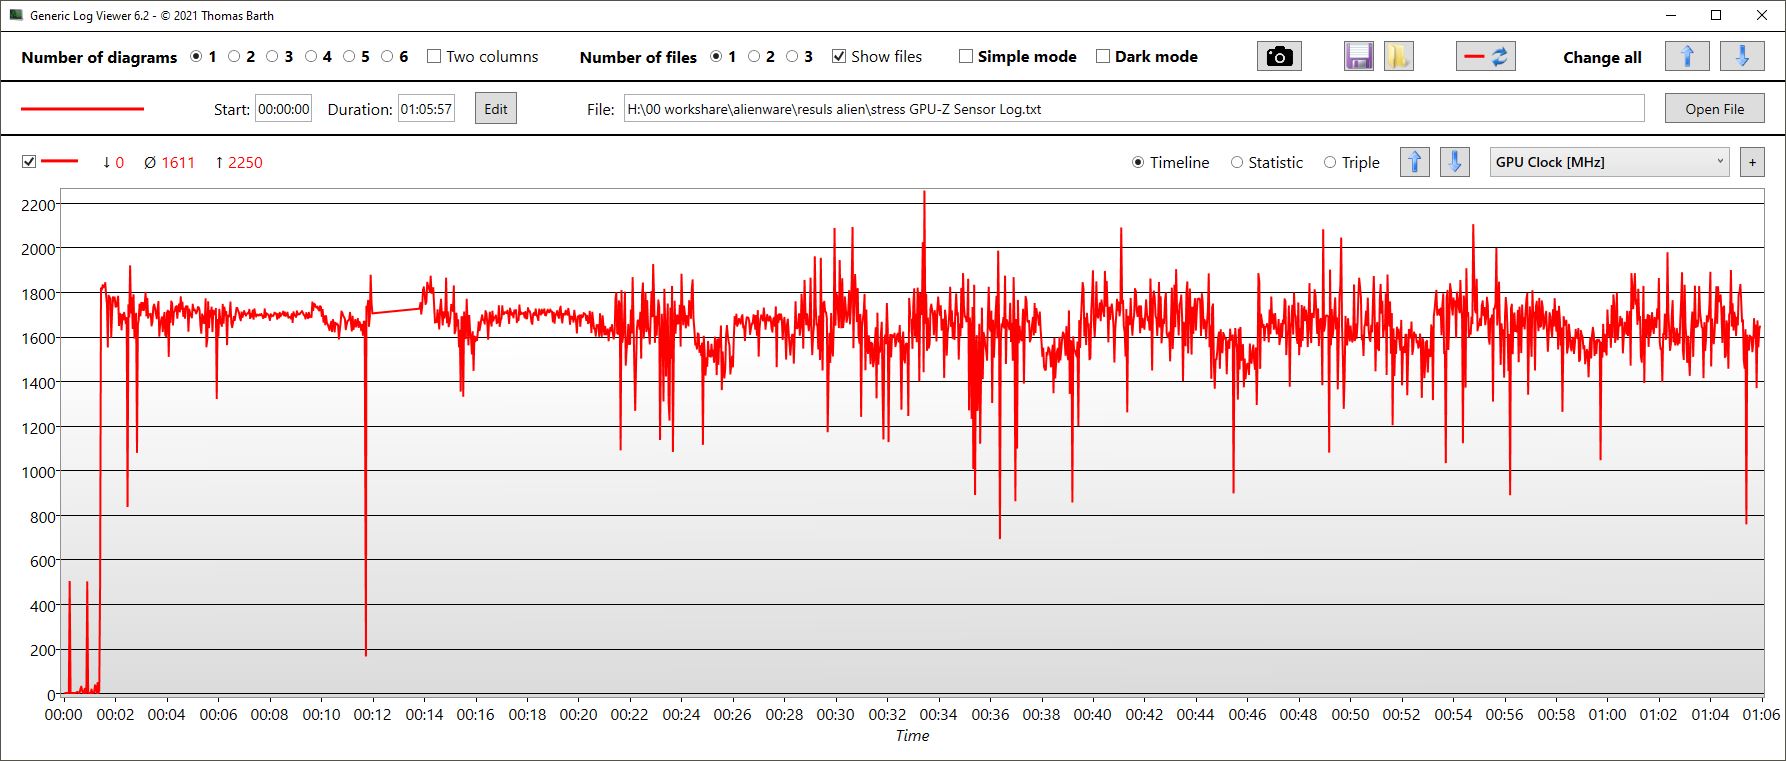
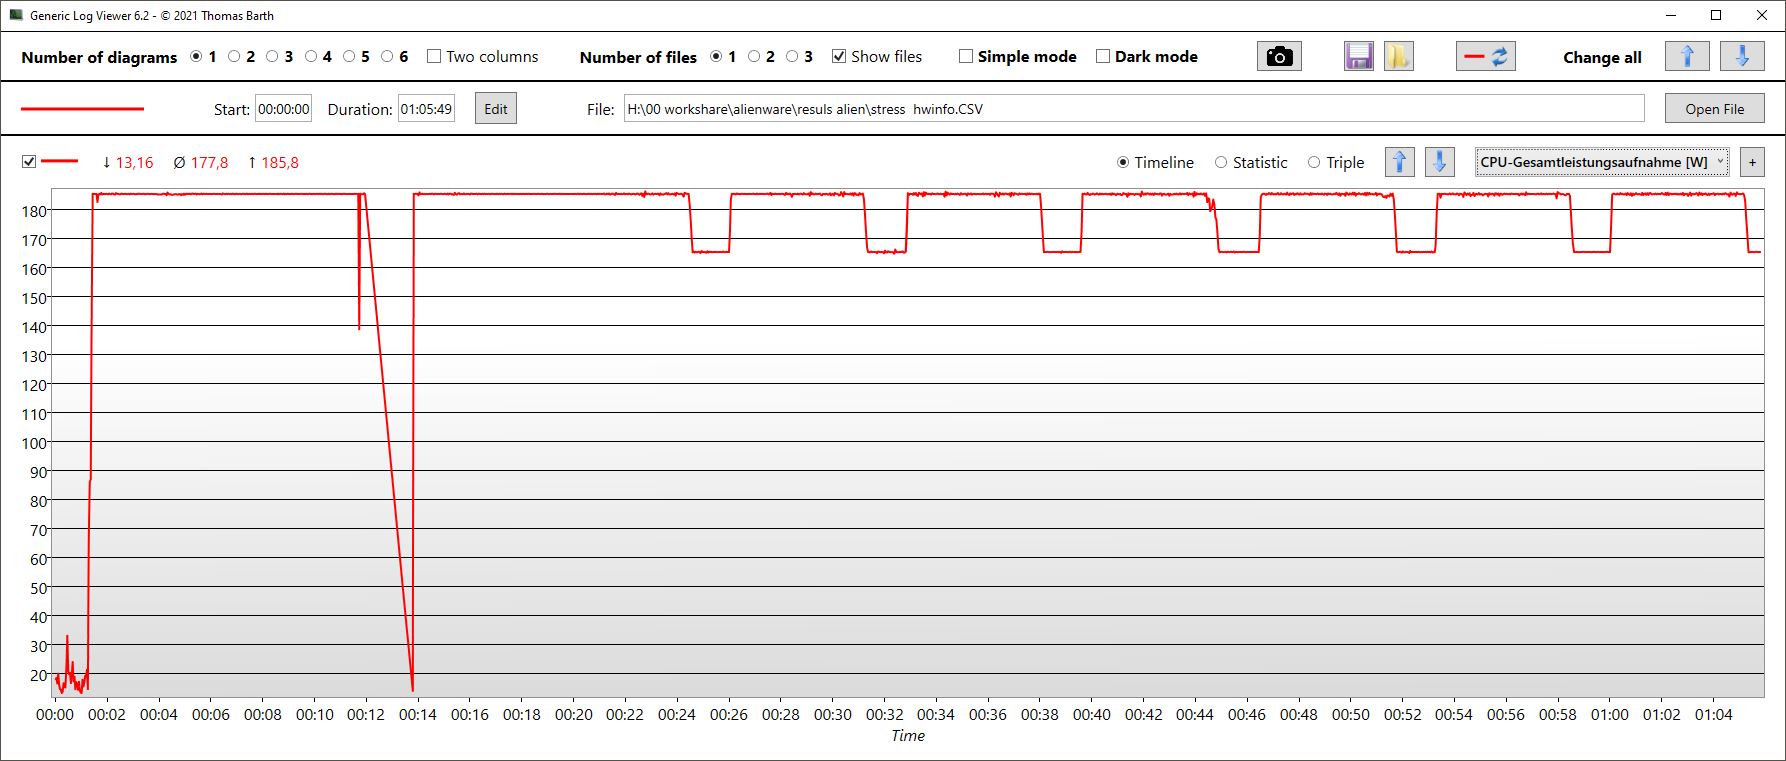
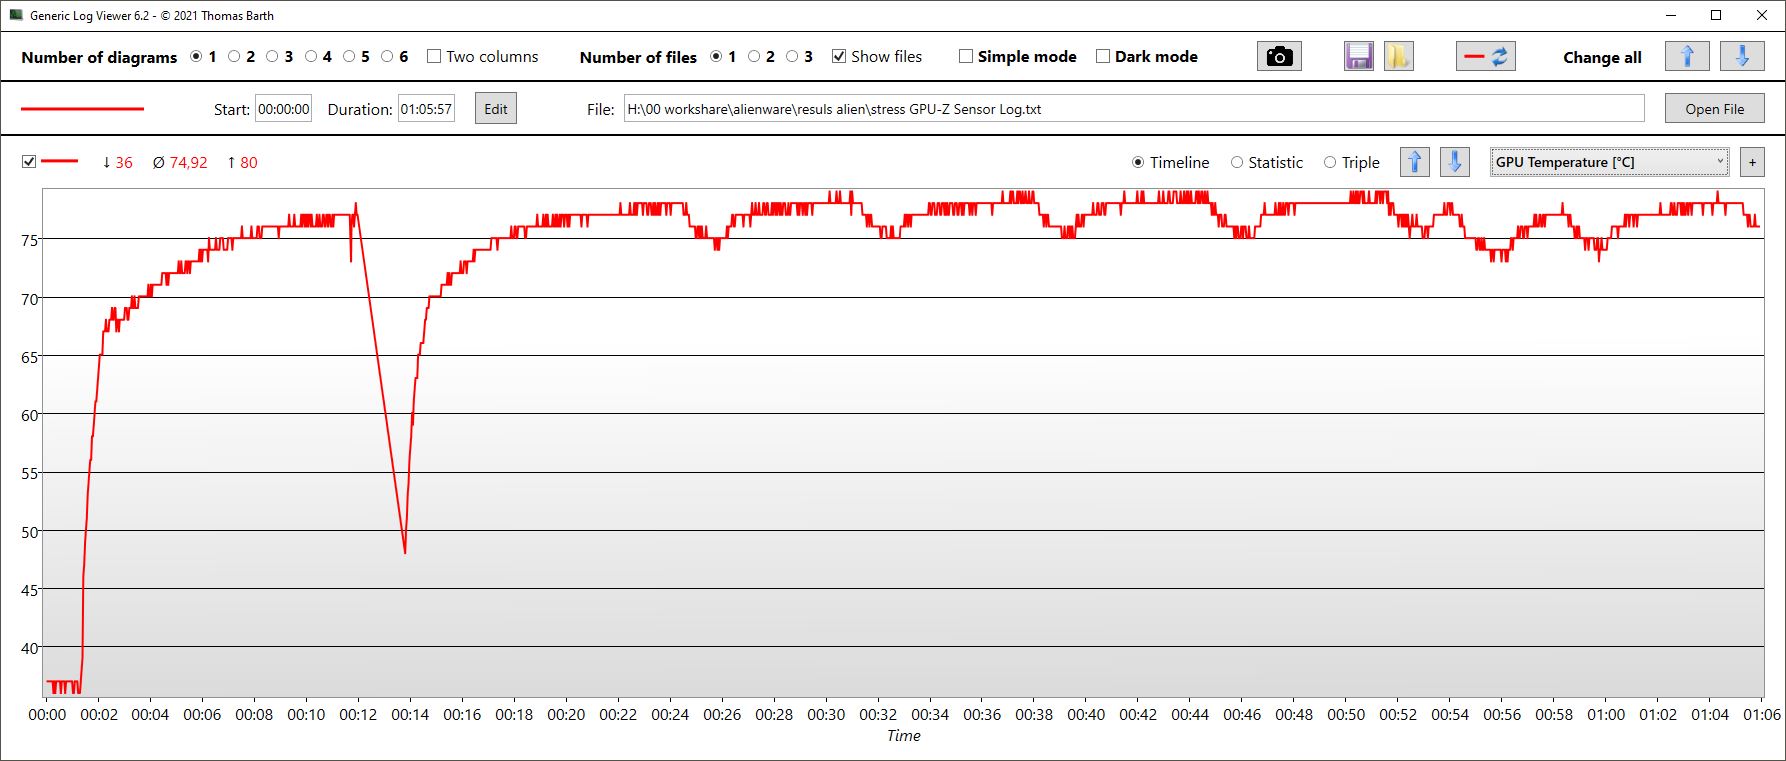
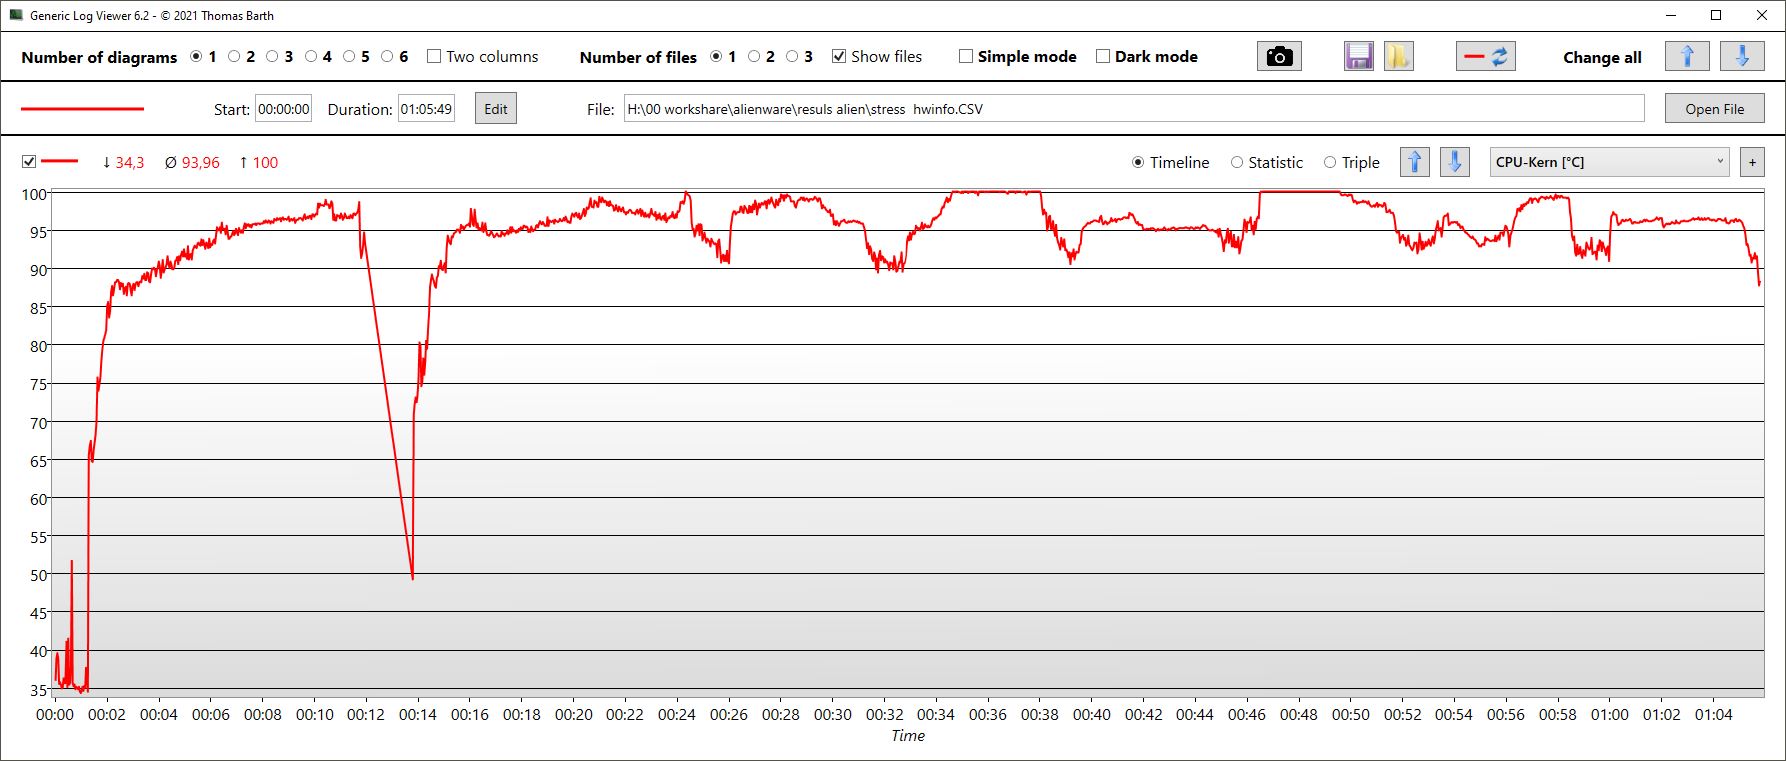
| CPU Clock (GHz) | GPU Clock (MHz) | Average CPU Temperature (°C) | Average GPU Temperature (°C) | |
| System Idle | ||||
| Prime95 + FurMark Stress | 4 | 1,6 | 94 | 75 |
| Witcher 3 Stress | 0,71 | 2,4 | 70 | 75 |
Speakers
The stereo speakers are comparatively loud and have balanced highs and mids. The bass is clearly underrepresented, which is why connecting external audio devices via headset jack, Bluetooth or HDMI is recommended.
Alienware m17 R5 (R9 6900HX, RX 6850M XT) audio analysis
(+) | speakers can play relatively loud (82.64 dB)
Bass 100 - 315 Hz
(-) | nearly no bass - on average 20.5% lower than median
(±) | linearity of bass is average (14.1% delta to prev. frequency)
Mids 400 - 2000 Hz
(+) | balanced mids - only 4.8% away from median
(+) | mids are linear (5.9% delta to prev. frequency)
Highs 2 - 16 kHz
(+) | balanced highs - only 1.6% away from median
(+) | highs are linear (4.1% delta to prev. frequency)
Overall 100 - 16.000 Hz
(±) | linearity of overall sound is average (15.7% difference to median)
Compared to same class
» 36% of all tested devices in this class were better, 7% similar, 57% worse
» The best had a delta of 6%, average was 18%, worst was 132%
Compared to all devices tested
» 24% of all tested devices were better, 5% similar, 71% worse
» The best had a delta of 4%, average was 24%, worst was 134%
Acer Predator Helios 300 (i7-12700H, RTX 3070 Ti) audio analysis
(±) | speaker loudness is average but good (73.83 dB)
Bass 100 - 315 Hz
(±) | reduced bass - on average 12.7% lower than median
(±) | linearity of bass is average (11.2% delta to prev. frequency)
Mids 400 - 2000 Hz
(±) | higher mids - on average 5.5% higher than median
(±) | linearity of mids is average (7.9% delta to prev. frequency)
Highs 2 - 16 kHz
(+) | balanced highs - only 2.1% away from median
(+) | highs are linear (3.5% delta to prev. frequency)
Overall 100 - 16.000 Hz
(±) | linearity of overall sound is average (15.8% difference to median)
Compared to same class
» 37% of all tested devices in this class were better, 7% similar, 56% worse
» The best had a delta of 6%, average was 18%, worst was 132%
Compared to all devices tested
» 24% of all tested devices were better, 5% similar, 71% worse
» The best had a delta of 4%, average was 24%, worst was 134%
Power Management - Average runtimes
Power Consumption
The m17 R5 is quite economical when idling and is also "outperformed" by most of the competition during peak loads. However, the laptop is less economical when gaming: in Witcher 3, it consumes the most of all comparison devices. This is hardly surprising, since it also performs the best in our Witcher 3 stress test.
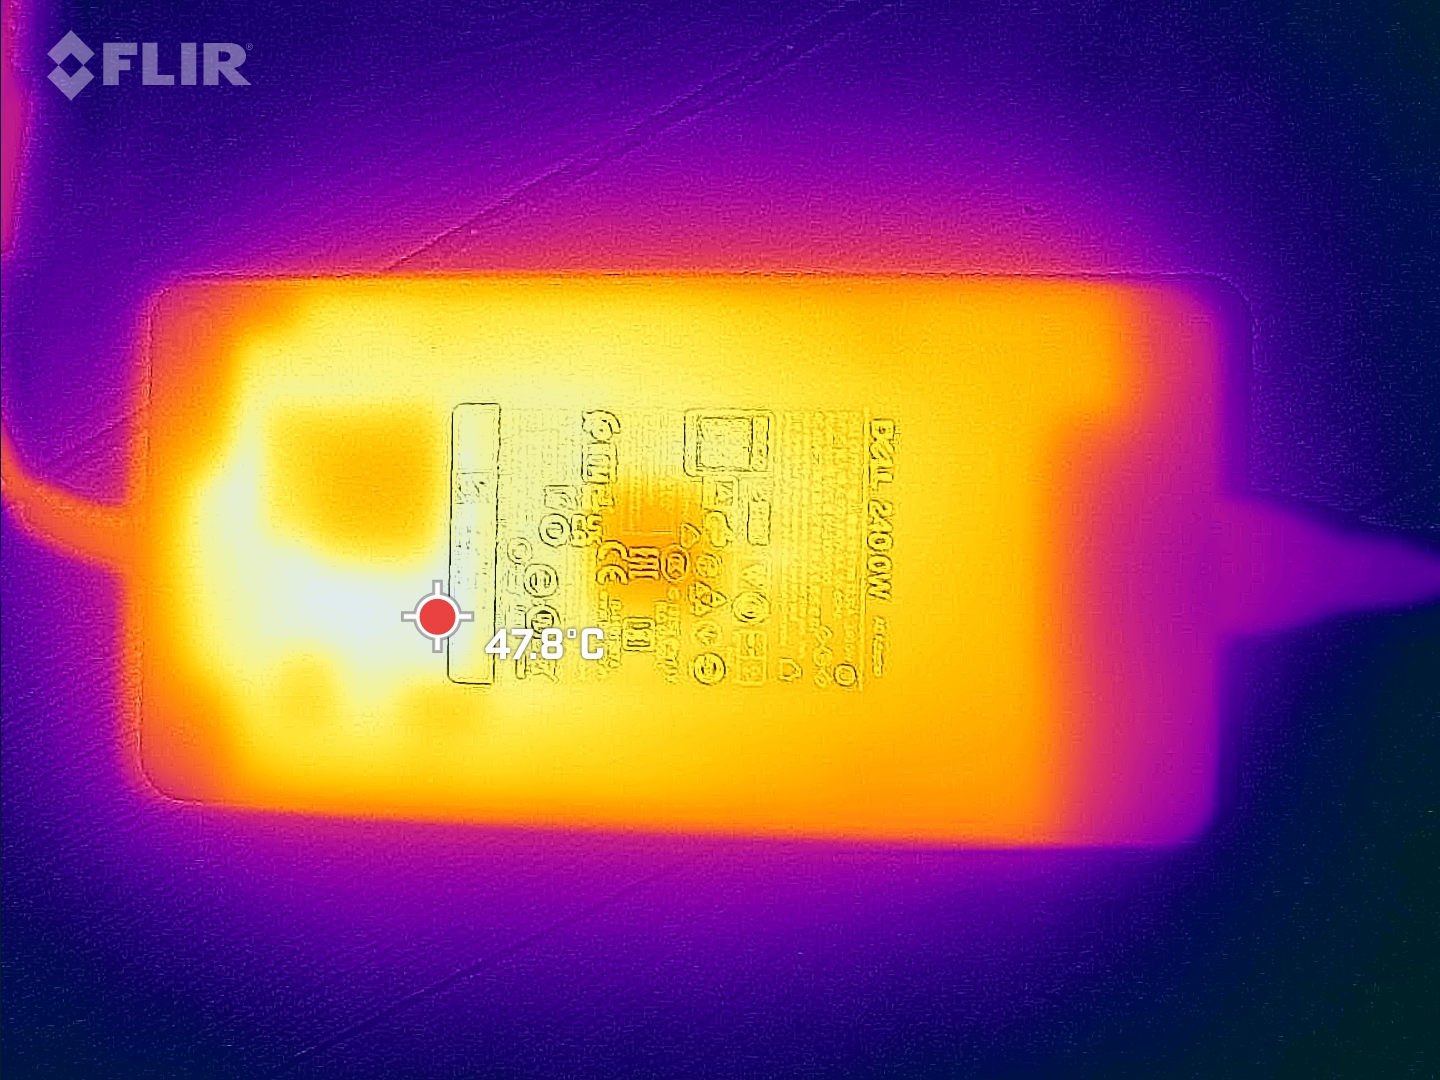
The flat but wide power supply unit is designed for an output of 240 W and is thus practically maxed out. The difference in input/output power should ensure that it does not become overwhelmed and can cope with the occasional 250 W load peak.
| Idle | |
| Load |
|
Key:
min: | |
| Alienware m17 R5 (R9 6900HX, RX 6850M XT) R9 6900HX, Radeon RX 6850M XT, SSSTC CA6-8D1024, IPS, 3840x2160, 17" | Alienware m17 R4 i9-10980HK, GeForce RTX 3080 Laptop GPU, 2x Micron 2300 512 GB (RAID 0), IPS, 1920x1080, 17.3" | Asus ROG Strix Scar 17 SE G733CX-LL014W i9-12950HX, GeForce RTX 3080 Ti Laptop GPU, Samsung PM9A1 MZVL22T0HBLB, IPS, 2560x1440, 17.3" | Acer Predator Helios 300 (i7-12700H, RTX 3070 Ti) i7-12700H, GeForce RTX 3070 Ti Laptop GPU, Samsung PM9A1 MZVL21T0HCLR, IPS, 2560x1440, 17.3" | Schenker XMG Neo 17 M22 R9 6900HX, GeForce RTX 3080 Ti Laptop GPU, Samsung SSD 980 Pro 1TB MZ-V8P1T0BW, IPS, 2560x1600, 17" | Aorus 17X XES i9-12900HX, GeForce RTX 3070 Ti Laptop GPU, Gigabyte AG470S1TB-SI B10, IPS, 1920x1080, 17.3" | Average AMD Radeon RX 6850M XT | Average of class Gaming | |
|---|---|---|---|---|---|---|---|---|
| Power Consumption | -119% | -40% | -21% | 11% | -49% | -6% | -15% | |
| Idle Minimum * (Watt) | 13 | 42 -223% | 19.3 -48% | 15 -15% | 7 46% | 18 -38% | 11.5 ? 12% | 13.2 ? -2% |
| Idle Average * (Watt) | 16.5 | 48 -191% | 26.5 -61% | 20 -21% | 11 33% | 28 -70% | 19.3 ? -17% | 18.9 ? -15% |
| Idle Maximum * (Watt) | 17 | 58 -241% | 27.1 -59% | 22.3 -31% | 17 -0% | 36 -112% | 20.1 ? -18% | 24.3 ? -43% |
| Load Average * (Watt) | 93 | 124 -33% | 141 -52% | 133 -43% | 92 1% | 153 -65% | 93.7 ? -1% | 108.3 ? -16% |
| Witcher 3 ultra * (Watt) | 239 | 219 8% | 225 6% | 231 3% | 221 8% | 221 8% | ||
| Load Maximum * (Watt) | 251 | 337 -34% | 307.9 -23% | 290 -16% | 306 -22% | 290 -16% | 264 ? -5% | 254 ? -1% |
* ... smaller is better
Power consumption Witcher 3 / Stress test
Power consumption with an external monitor
Battery Life
Unfortunately, the m17 does not automatically switch to 60 Hz to save energy when you pull the power plug out of the socket. This applies to all modes, but hardly had a negative impact in our battery test.
With a capacity of 97 Wh, the battery is one of the larger ones compared to the competition. Nevertheless, two rivals perform better. The Schenker XMG Neo 17 in particular is able to squeeze even more time out of its battery of roughly the same size, thanks to clever energy-saving modes. Perhaps the urgently needed driver improvements described above will make a difference for the m17.
The laptop lasted between 3.7 to 4.7 hours in the WiFi test, depending on the display brightness. A movie night can be planned for just under 5 hours. These are solid values for a 17-inch device.
| Alienware m17 R5 (R9 6900HX, RX 6850M XT) R9 6900HX, Radeon RX 6850M XT, 97 Wh | Alienware m17 R4 i9-10980HK, GeForce RTX 3080 Laptop GPU, 86 Wh | Asus ROG Strix Scar 17 SE G733CX-LL014W i9-12950HX, GeForce RTX 3080 Ti Laptop GPU, 90 Wh | Acer Predator Helios 300 (i7-12700H, RTX 3070 Ti) i7-12700H, GeForce RTX 3070 Ti Laptop GPU, 90 Wh | Schenker XMG Neo 17 M22 R9 6900HX, GeForce RTX 3080 Ti Laptop GPU, 99 Wh | Aorus 17X XES i9-12900HX, GeForce RTX 3070 Ti Laptop GPU, 99 Wh | Average of class Gaming | |
|---|---|---|---|---|---|---|---|
| Battery runtime | -46% | -12% | 15% | 41% | -17% | 33% | |
| H.264 (h) | 4.9 | 2.2 -55% | 5.9 20% | 6.6 35% | 3.8 -22% | 8.26 ? 69% | |
| WiFi v1.3 (h) | 4.8 | 2.4 -50% | 4.2 -12% | 6 25% | 9 88% | 4.4 -8% | 7.04 ? 47% |
| Load (h) | 1.8 | 1.2 -33% | 1.8 0% | 1.8 0% | 1.4 -22% | 1.47 ? -18% | |
| Reader / Idle (h) | 12 | 8.71 ? |
Pros
Cons
Conclusion: Incomplete AMD gamer with great potential
Overall, the all-AMD system in the Alienware m17 R5 is impressive, especially the graphics performance. However, various driver issues and unnecessary inconsistencies prevent us from truly enjoying such a potent gaming machine.
In addition to strong 3D performance, we particularly like the build quality, the fairly bright UHD display with high color space coverage, and the fact that the gamer is often quiet when not under load and also rather quieter than some competitors under load.
But this is where the (driver) problems start, because even in sleep mode, the fans suddenly rev up for 1-3 seconds for no reason. The SmartAccess graphics switch always freezes the system for several seconds, random crashes occur, the performance modes in the Control Center hardly bring about any changes in performance and could certainly squeeze a little more battery life out of the Alien in energy saving mode.
The Alienware m17 R5 with AMD CPU and GPU is a strong gamer, but unfortunately still has a lot of untapped potential and need for optimization when it comes to the drivers.
A real pity that the otherwise powerful gamer is currently being thwarted in its potential by such problems. If you are looking for a stable alternative until these are fixed, you have wide selection before you: The Razer Blade 17 is also a solid machine, while the XMG Neo 17 offers high performance in combination with liquid cooling. The Asus ROG Strix Scar 17 provides better hardware as well as brute performance.
Price and Availability
In Dell's USA shop, the configurations of the Alienware m17 R5 start at US$1399,99. A configuration identical to our review device costs US$2549.99.
Alienware m17 R5 (R9 6900HX, RX 6850M XT)
- 01/13/2023 v7 (old)
Christian Hintze
Price comparison

