AMD Radeon RX 7900M performance debut: Alienware m18 R1 laptop review

(November 28, 2023 update: Major display issues mentioned in this review can be addressed by installing the older display driver v31.0.14076.3, A01. Newer displays drivers were accidentally pushed and should be avoided for now. See our dedicated page here to learn more. Our original review is as follows.)
As the first 18-inch gaming laptop from Alienware in over a decade, Dell is going all-in on its Alienware M18 R1 series by offering Intel, AMD, and Nvidia options across the board to appeal to as many gamers as possible. Users can mix and match between Intel-Nvidia, AMD-Nvidia, or AMD-AMD when it comes to CPUs and GPUs which is very uncommon for a gaming laptop.
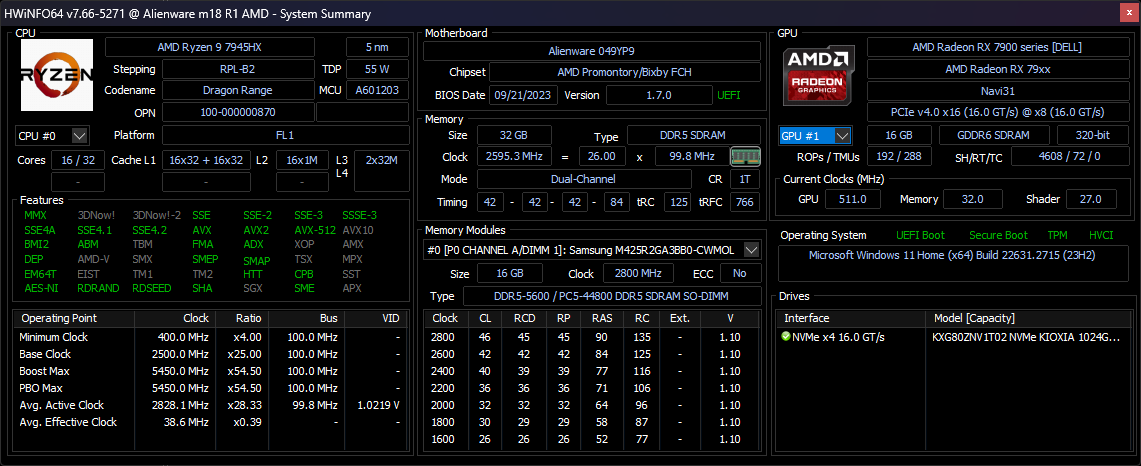
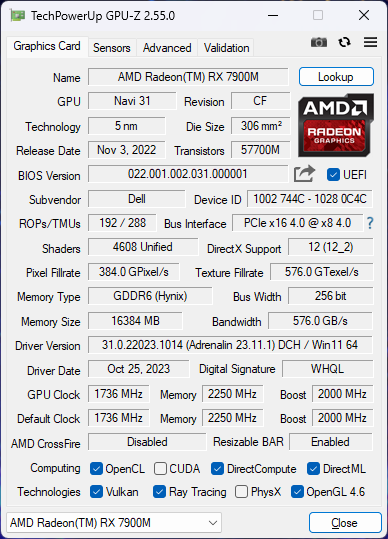
Our unit in review is the latest AMD-AMD configuration and one of the first available to offer the 180 W RNDA3 Radeon RX 7900M as an alternative to the reigning mobile GeForce RTX 4080. Perhaps most notably, the new AMD GPU undercuts the RTX 4090 configuration by $1200 USD with all other options held equal for a final price of $2300 USD as reviewed.
Alternatives to the Alienware m18 R1 include other high-end 18-inch gaming laptops like the Asus ROG Strix Scar 18, Razer Blade 18, or Acer Predator Helios 18. MSI does not yet offer any modern 18-inch gaming laptops at the moment.
More Dell reviews:
Potential Competitors in Comparison
Rating | Date | Model | Weight | Height | Size | Resolution | Price |
|---|---|---|---|---|---|---|---|
| 89.2 % v7 (old) | 11 / 2023 | Alienware m18 R1 AMD R9 7945HX, Radeon RX 7900M | 3.9 kg | 26.7 mm | 18.00" | 1920x1200 | |
| 90.7 % v7 (old) | 04 / 2023 | Alienware m18 R1 i9-13980HX, GeForce RTX 4090 Laptop GPU | 3.9 kg | 26.7 mm | 18.00" | 1920x1200 | |
| 88.3 % v7 (old) | 10 / 2023 | Acer Predator Helios 18 N23Q2 i9-13900HX, GeForce RTX 4080 Laptop GPU | 3.2 kg | 29.15 mm | 18.00" | 2560x1600 | |
| 91.4 % v7 (old) | 02 / 2023 | Razer Blade 18 RTX 4070 i9-13950HX, GeForce RTX 4070 Laptop GPU | 3 kg | 21.9 mm | 18.00" | 2560x1600 | |
| 86.6 % v7 (old) | 02 / 2023 | Asus ROG Strix Scar 18 2023 G834JY-N6005W i9-13980HX, GeForce RTX 4090 Laptop GPU | 3.1 kg | 30.8 mm | 18.00" | 2560x1600 | |
v (old) | MSI Raider GE78 HX 13VI i9-13980HX, GeForce RTX 4090 Laptop GPU | 17.30" | 2560x1600 |
Case
The Intel and AMD versions of the Alienware m18 R1 share the same chassis design and color options. Thus, the only quick and easy way to visually distinguish between the two models is to look for the Thunderbolt logos next to the USB-C ports along the rear. See our review on the Intel-Nvidia configuration to learn more about the physical features of the Alienware m18 R1.
USB4 is disappointingly not supported.
SD Card Reader
| SD Card Reader | |
| average JPG Copy Test (av. of 3 runs) | |
| Razer Blade 18 RTX 4070 (Angelibird AV Pro V60) | |
| Alienware m18 R1 (Angelibird AV Pro V60) | |
| Alienware m18 R1 AMD (Toshiba Exceria Pro SDXC 64 GB UHS-II) | |
| Acer Predator Helios 18 N23Q2 | |
| MSI GE78HX 13VH-070US (Angelibird AV Pro V60) | |
| maximum AS SSD Seq Read Test (1GB) | |
| Alienware m18 R1 AMD (Toshiba Exceria Pro SDXC 64 GB UHS-II) | |
| Alienware m18 R1 (Angelibird AV Pro V60) | |
| Razer Blade 18 RTX 4070 (Angelibird AV Pro V60) | |
| MSI GE78HX 13VH-070US (Angelibird AV Pro V60) | |
| Acer Predator Helios 18 N23Q2 | |
Communication
Webcam


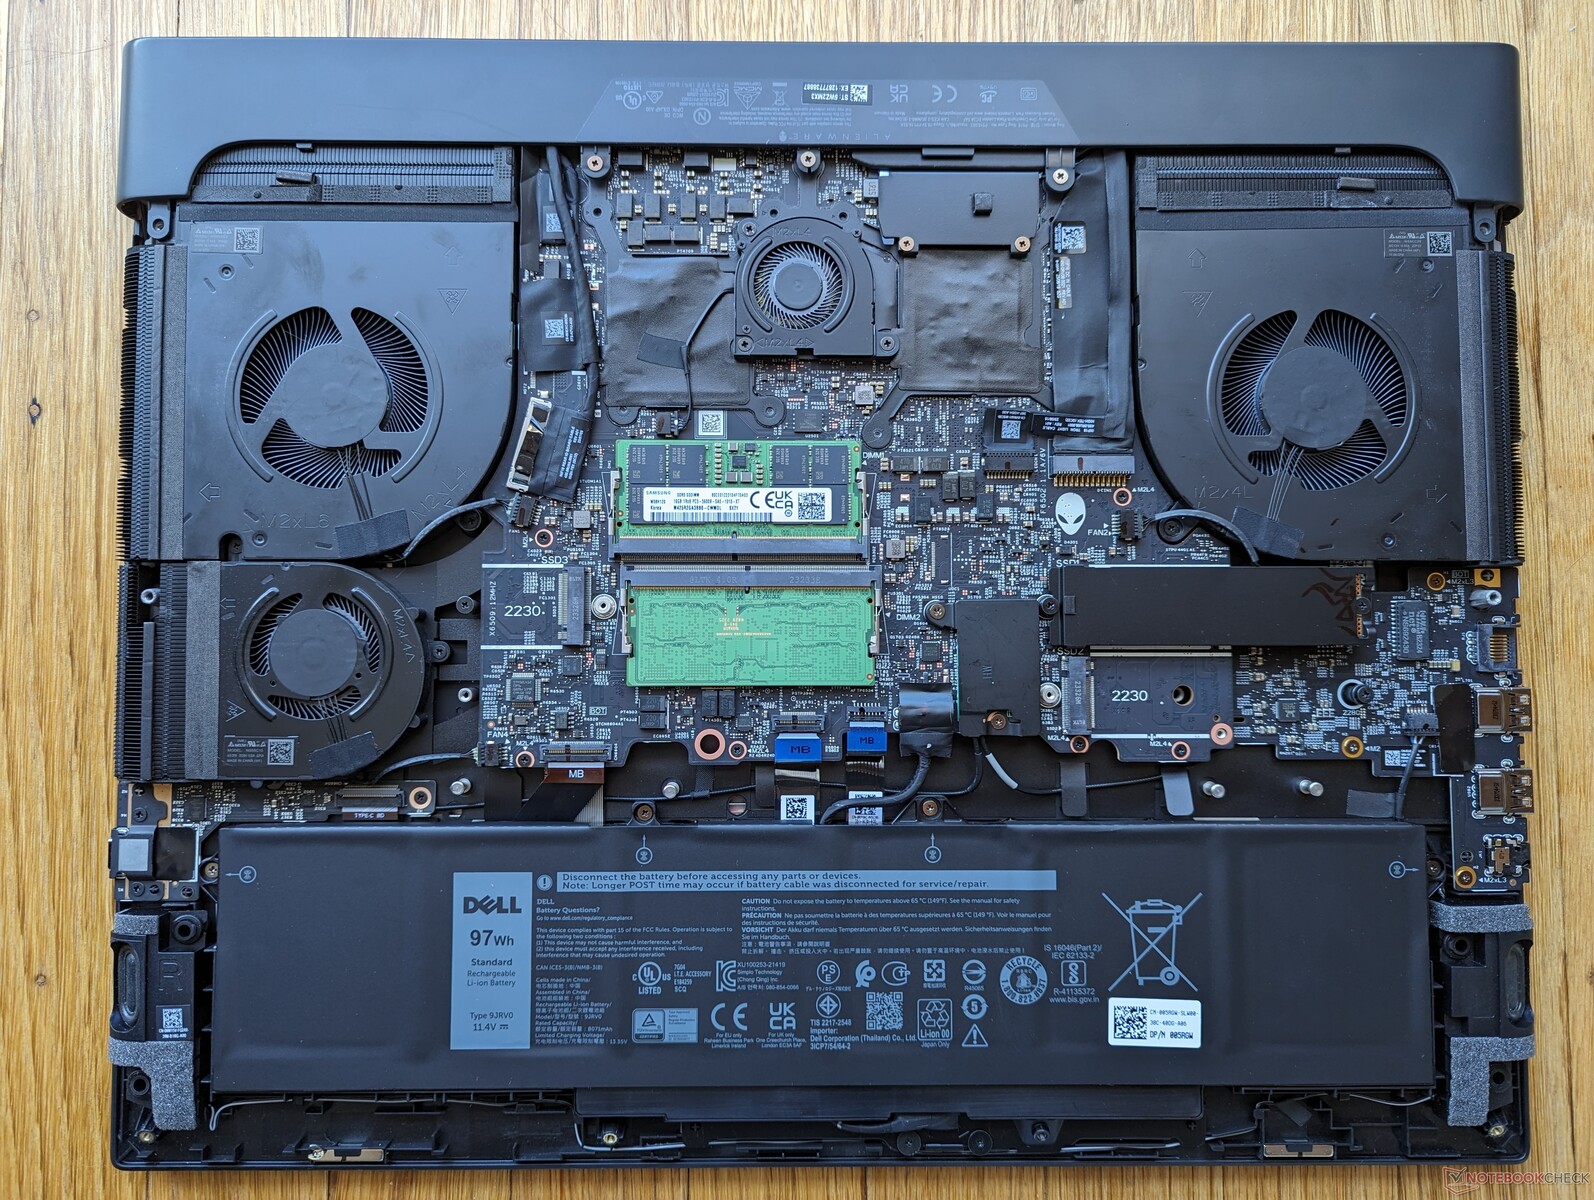
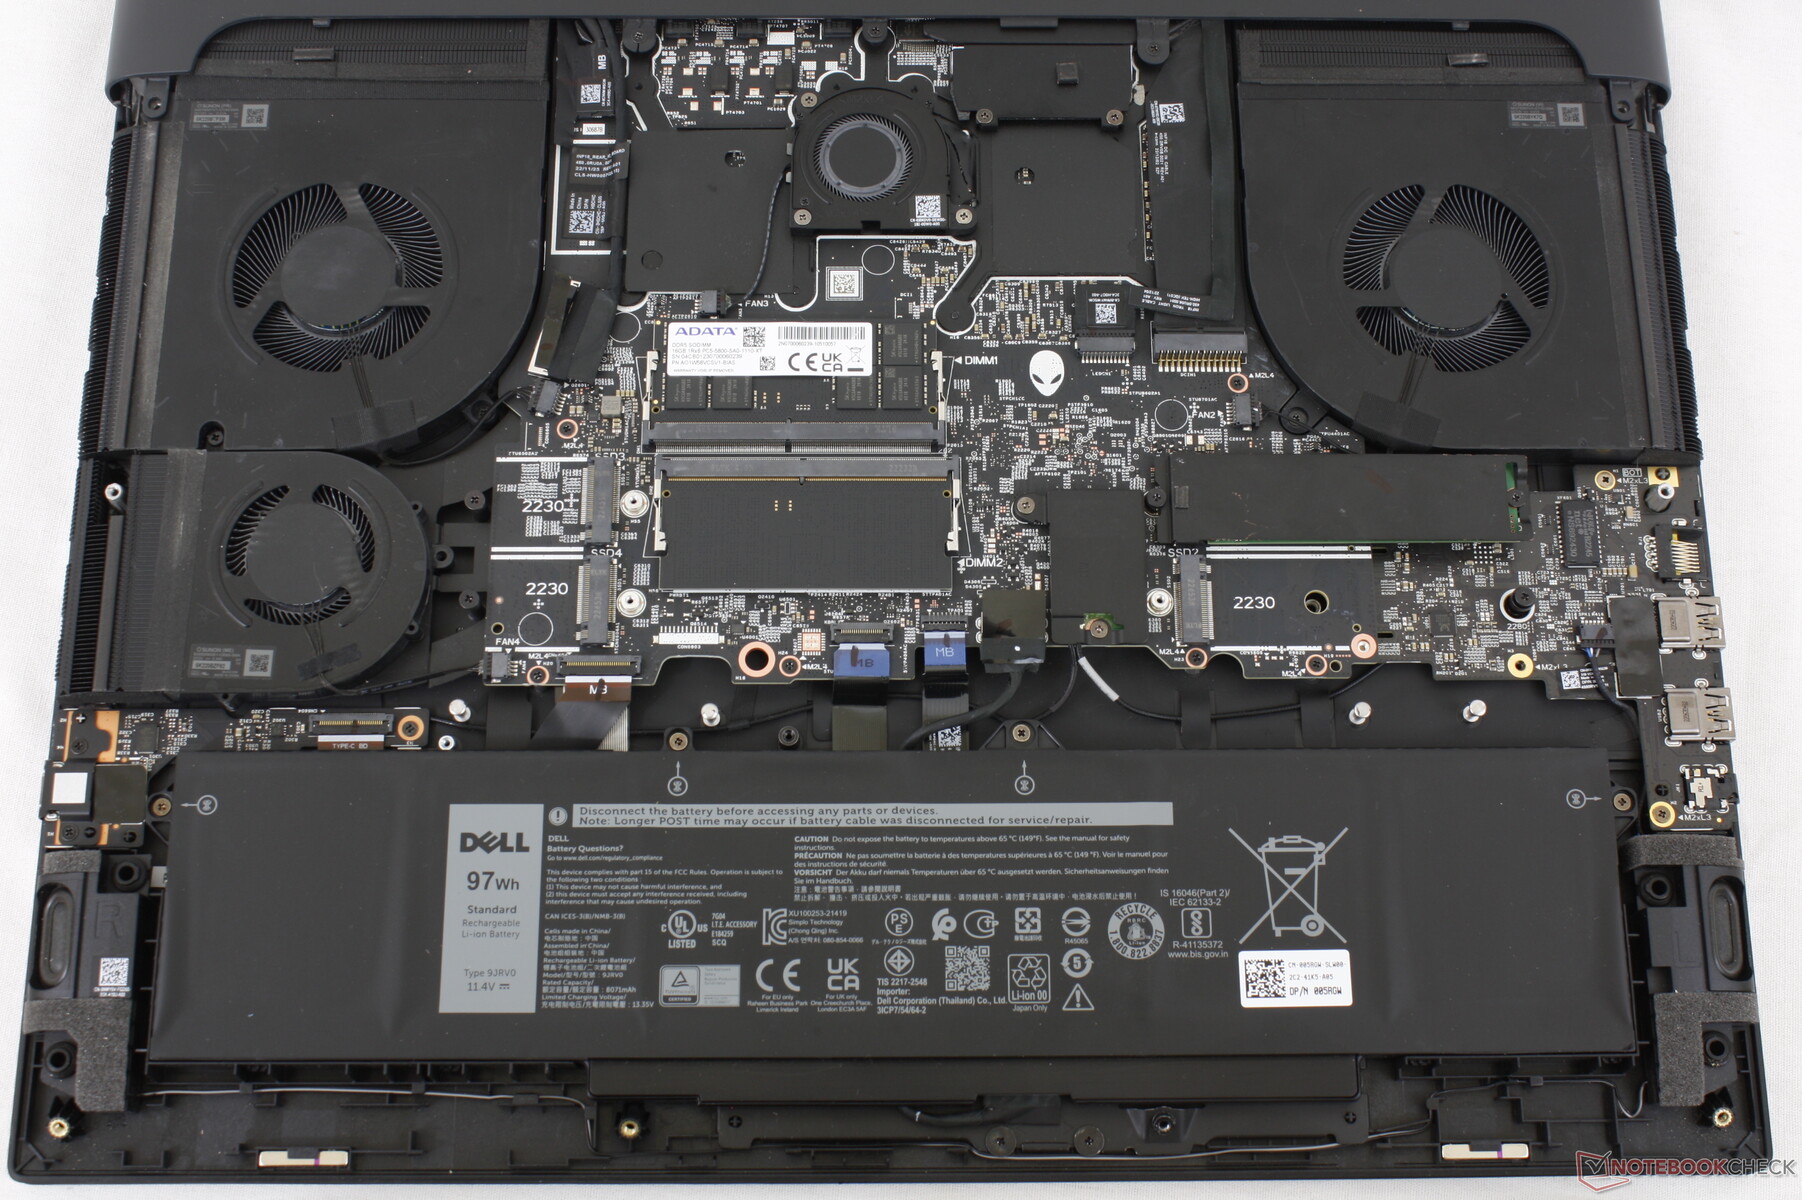
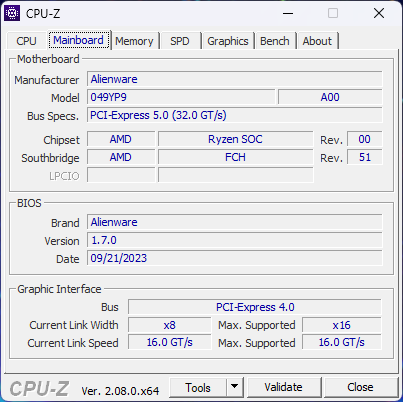
Maintenance
The AMD-AMD configuration only supports up to three M.2 NVMe SSDs whereas the Intel-Nvidia configuration supports up to four as shown by the comparison images below. Their internal features are otherwise identical.
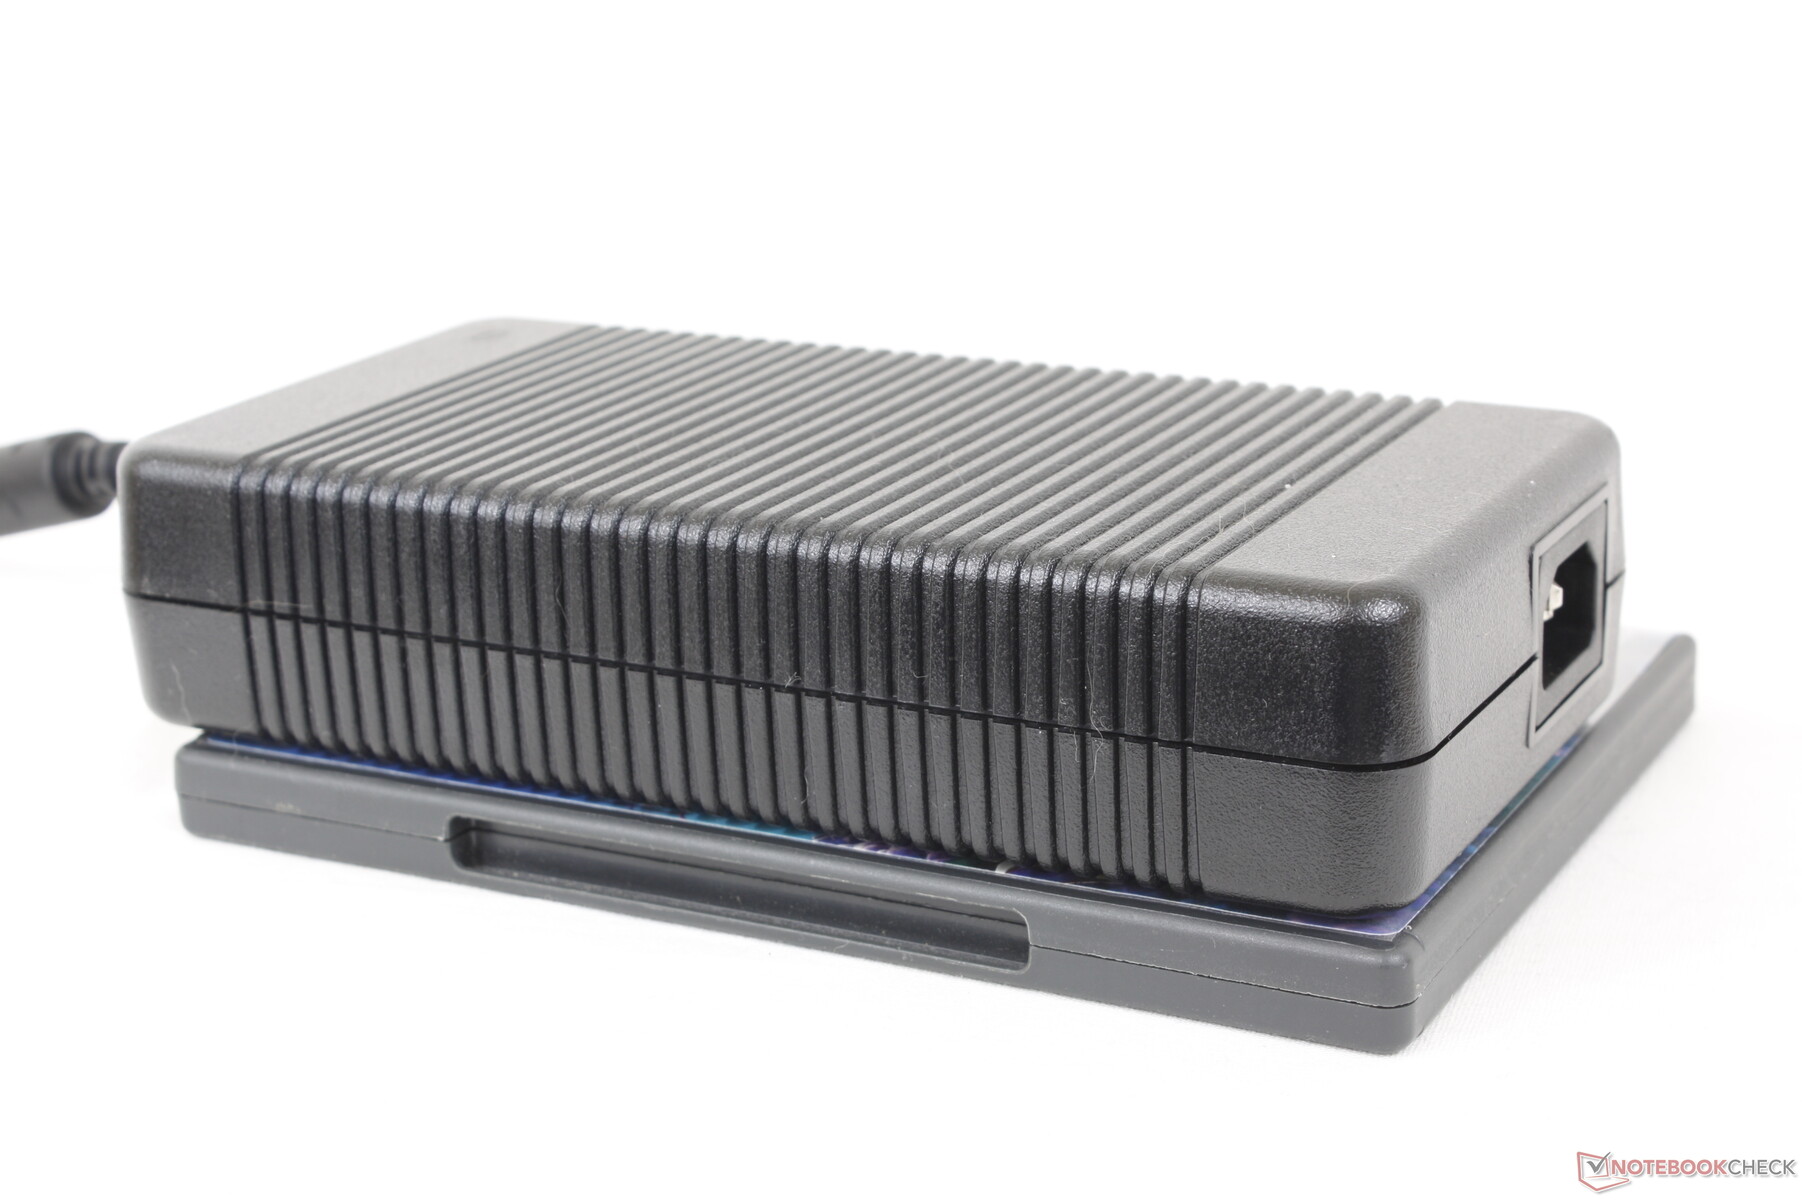
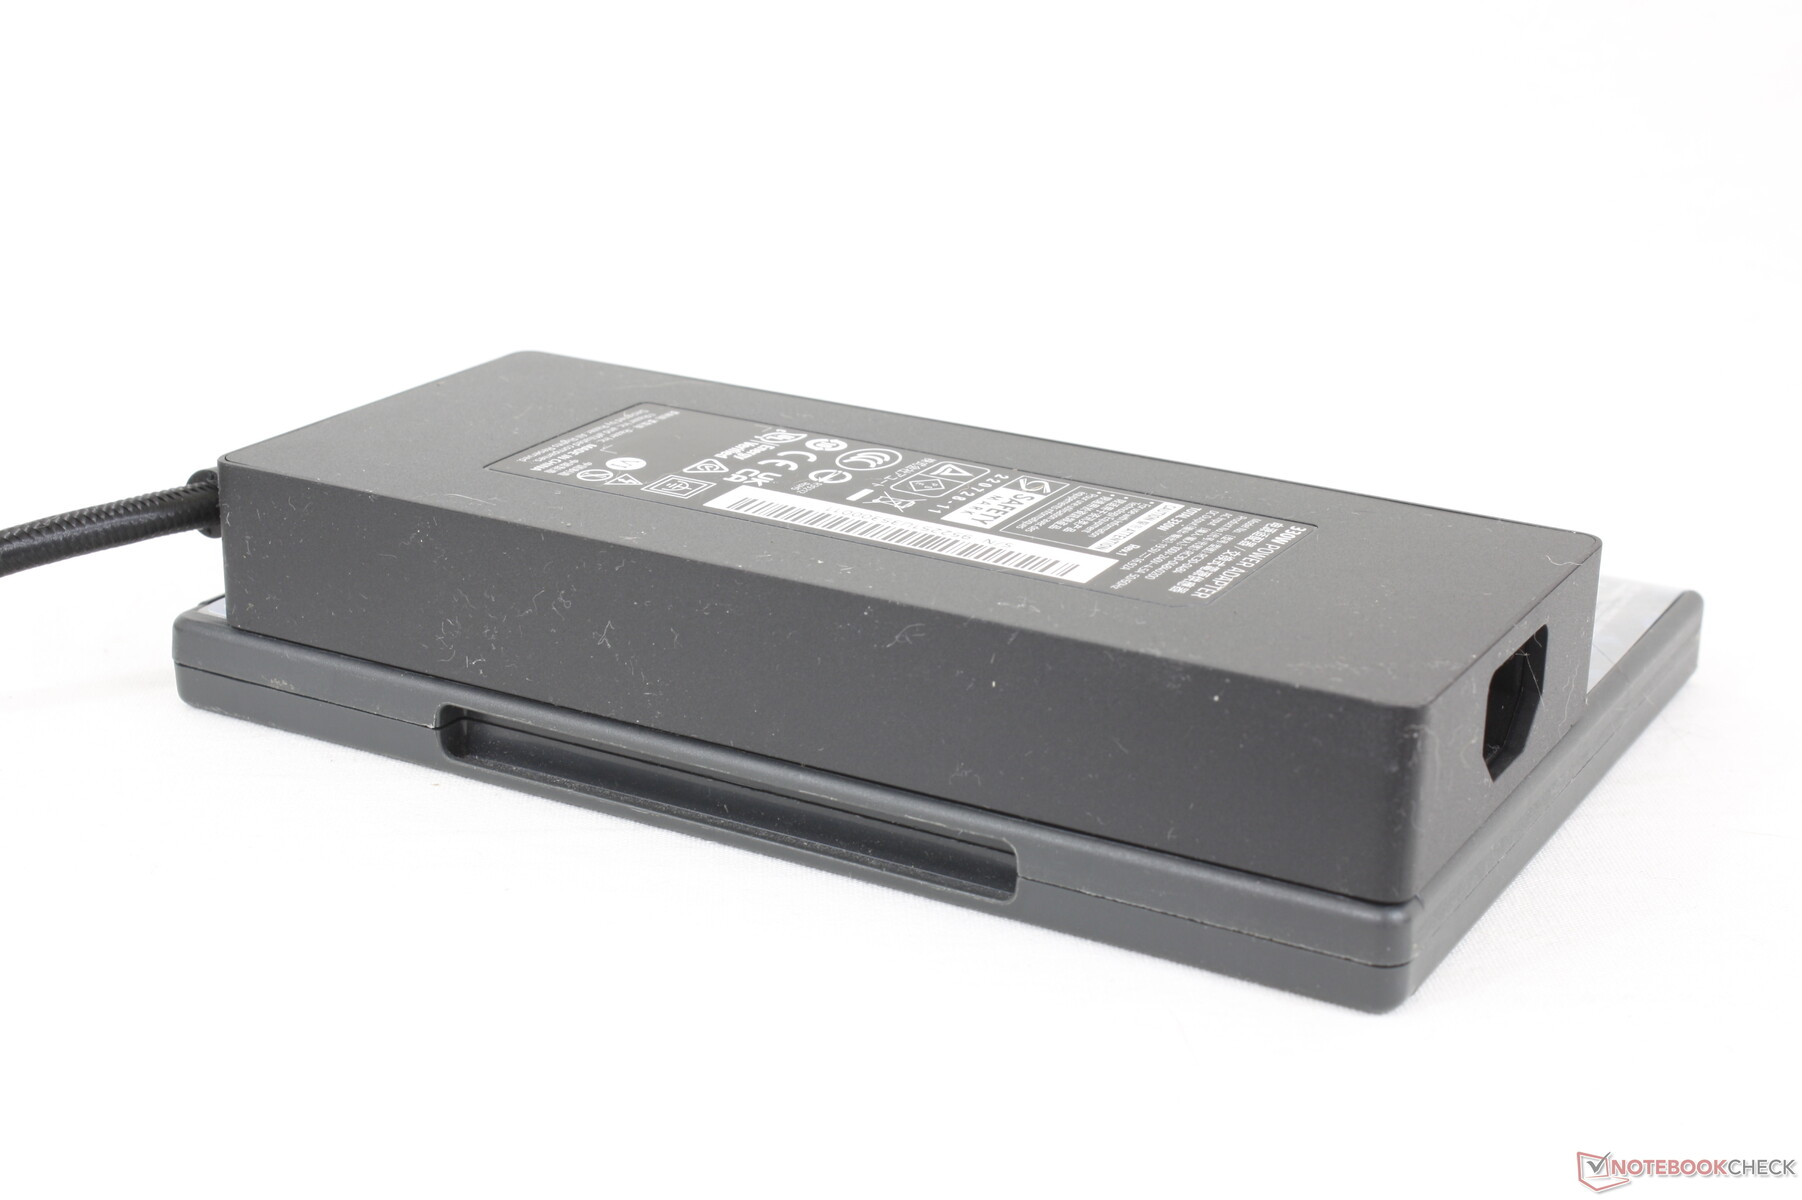
Accessories And Warranty
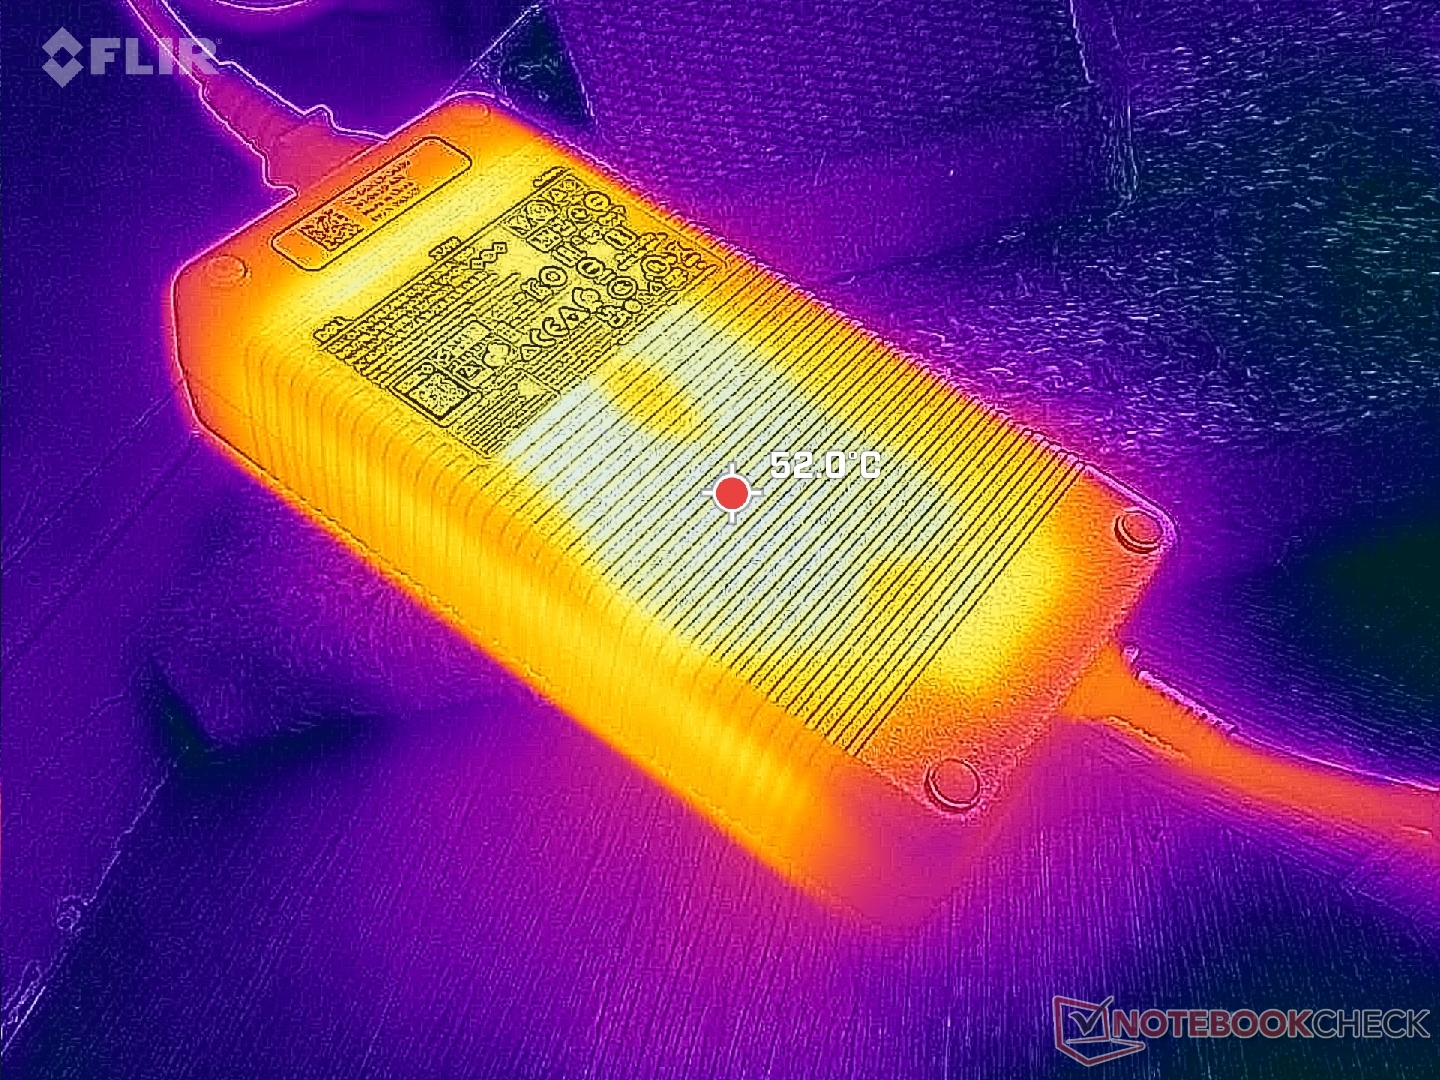
Dell has yet to transition to GaN AC adapters which can offer higher power-per-volume than traditional AC adapters. The included 330 W AC adapter is therefore very bulky when compared to the 330 W GaN AC adapters that currently ship with most Razer Blade laptops.
The standard one-year limited warranty applies if purchased in the US.
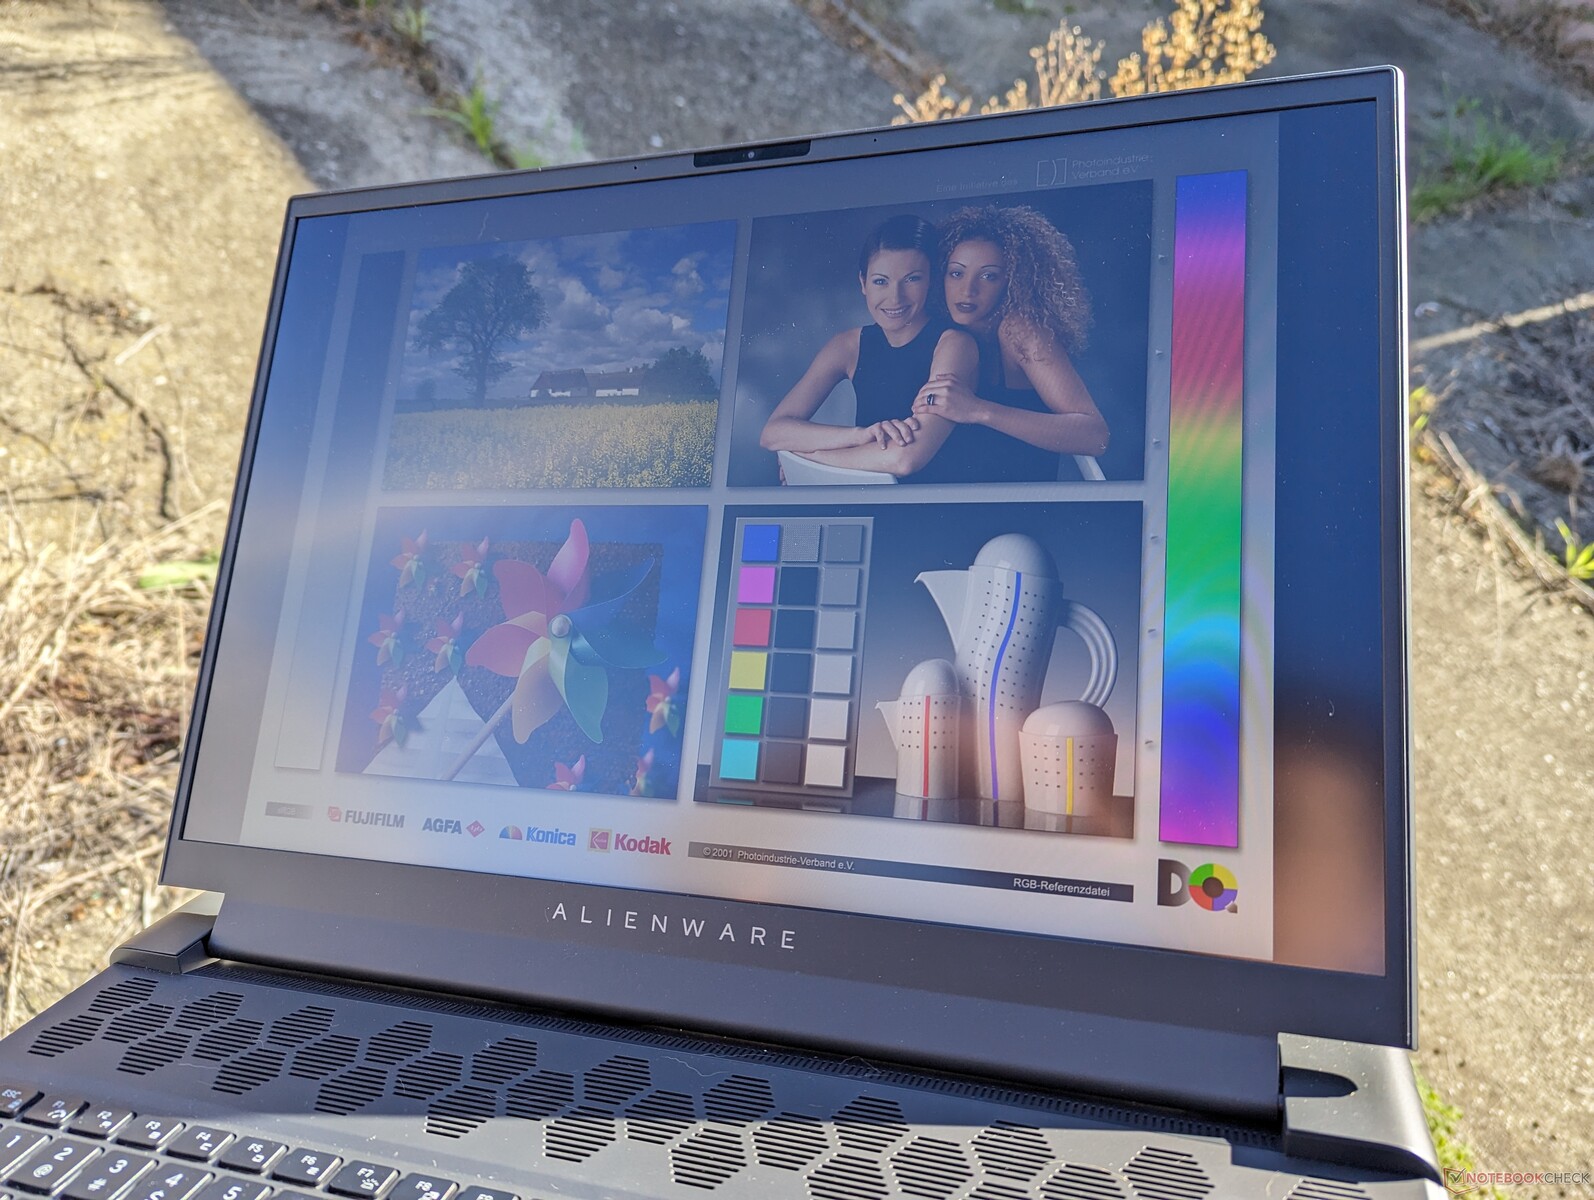
Display
Two FreeSync display options are available as follows:
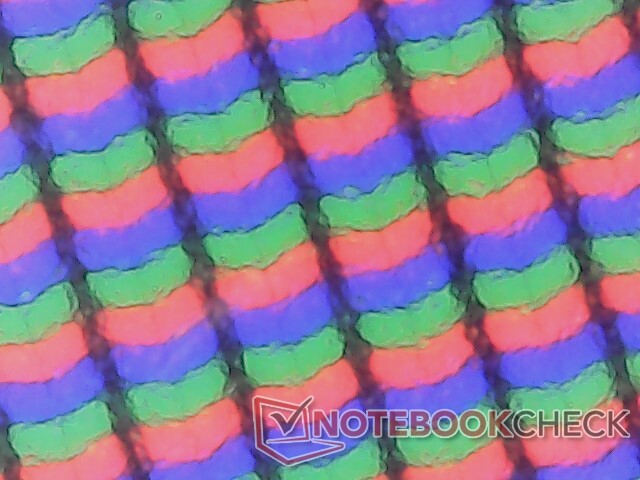
- 1920 x 1200, 480 Hz, 100% DCI-P3, IPS
- 2560 x 1600, 165 Hz, 100% DCI-P3, IPS
Our configuration utilizes the bolded panel above much like on our previous Intel-Nvidia configuration. However, the panel provider is different this time around (BOE vs. Chi Mei) to suggest that Dell is sourcing 480 Hz panels from multiple vendors for its Alienware m18 series. There are thankfully no major differences between them in terms of color coverage, response times, or contrast for a very similar viewing experience.
The 480 Hz refresh rate is the fastest available on laptops as of this writing for extremely smooth motion with minimal ghosting. Nonetheless, the benefits of fast refresh rates become increasingly marginal the higher you go. It may therefore be worth considering the higher resolution 1600p option instead even if the refresh rate is slower as 165 Hz is still a silky smooth experience.
It's worth noting that the native 480 Hz refresh rate can be set to 240 Hz or 120 Hz via Windows, but not any lower. It's too bad that there is no 60 Hz option as high refresh rates impact power consumption as our Energy Management section below will show.
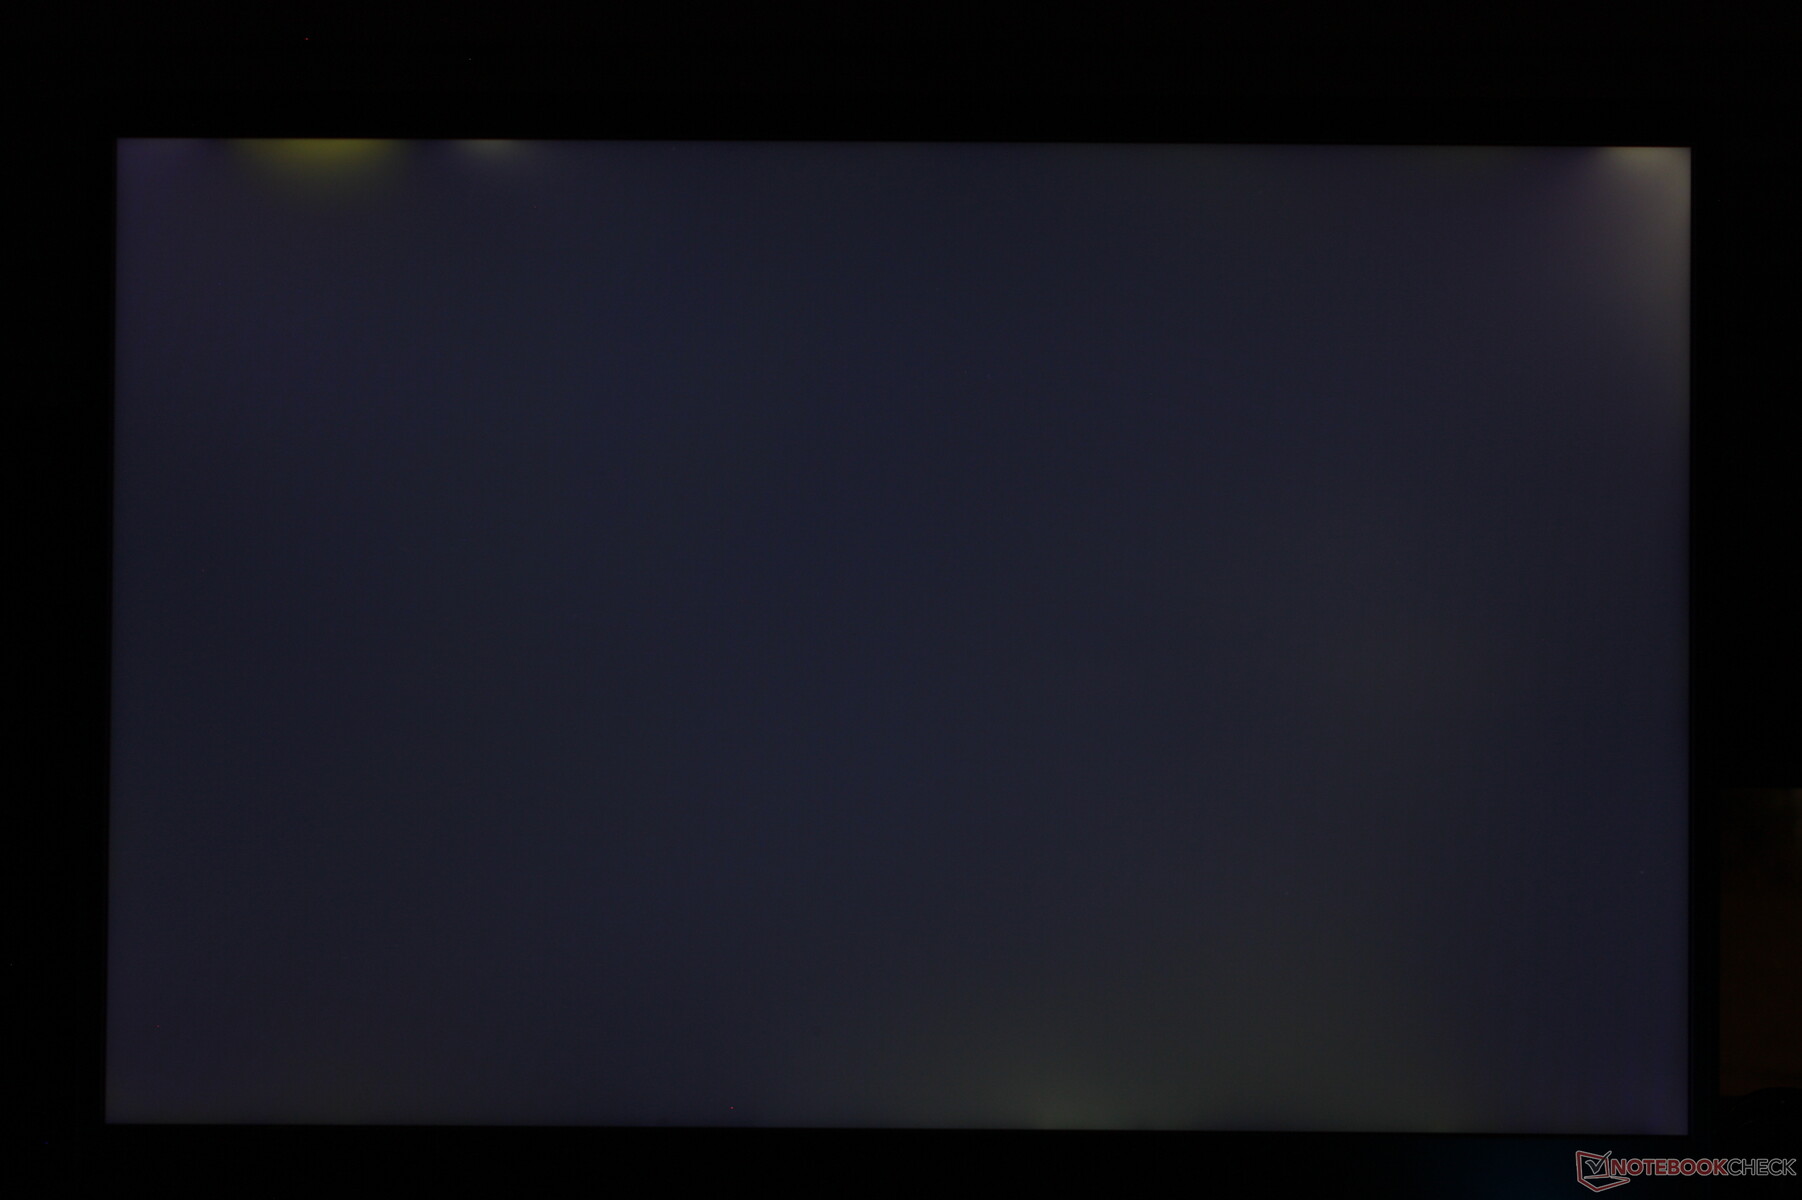
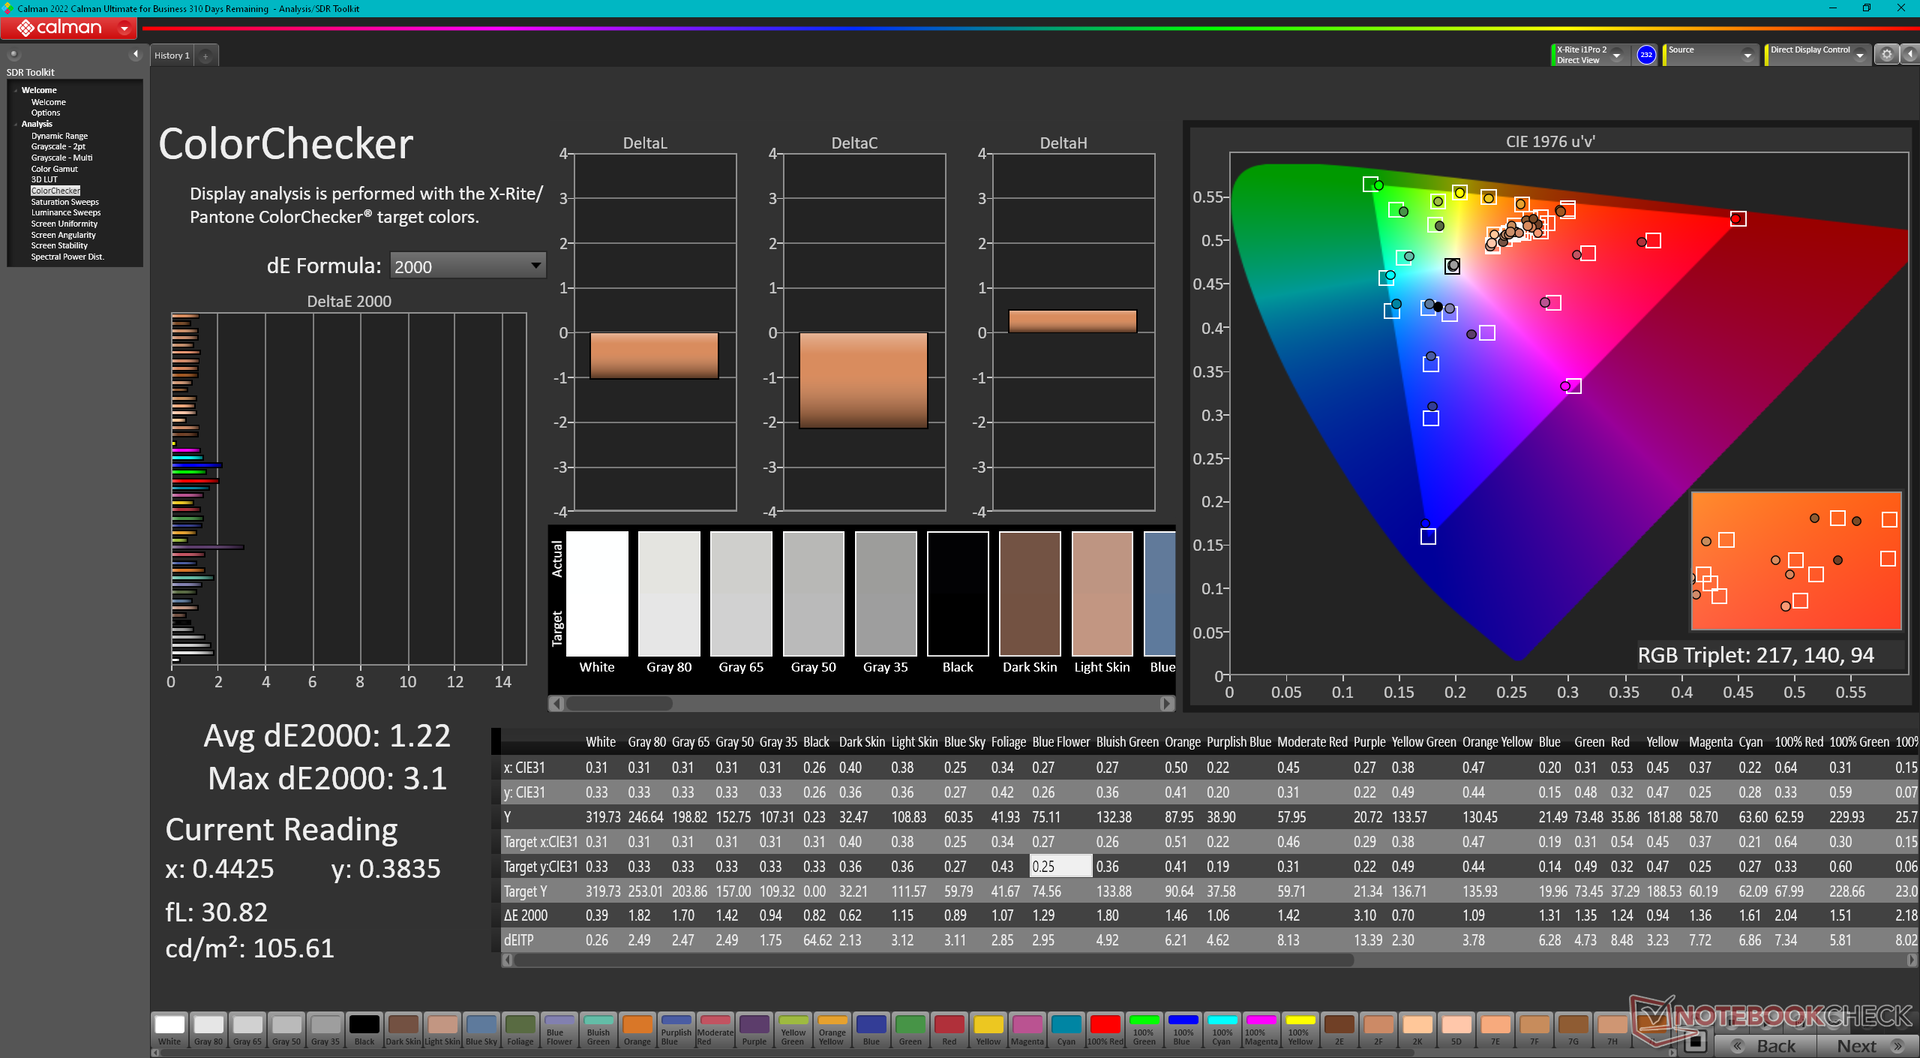
Strangely, the model comes calibrated against the sRGB spectrum out-of-the-box even though it supports full DCI-P3 colors. This would occur on our Intel-Nvidia configuration as well.
| |||||||||||||||||||||||||
Brightness Distribution: 87 %
Center on Battery: 319.6 cd/m²
Contrast: 1278:1 (Black: 0.25 cd/m²)
ΔE ColorChecker Calman: 1.22 | ∀{0.5-29.43 Ø4.72}
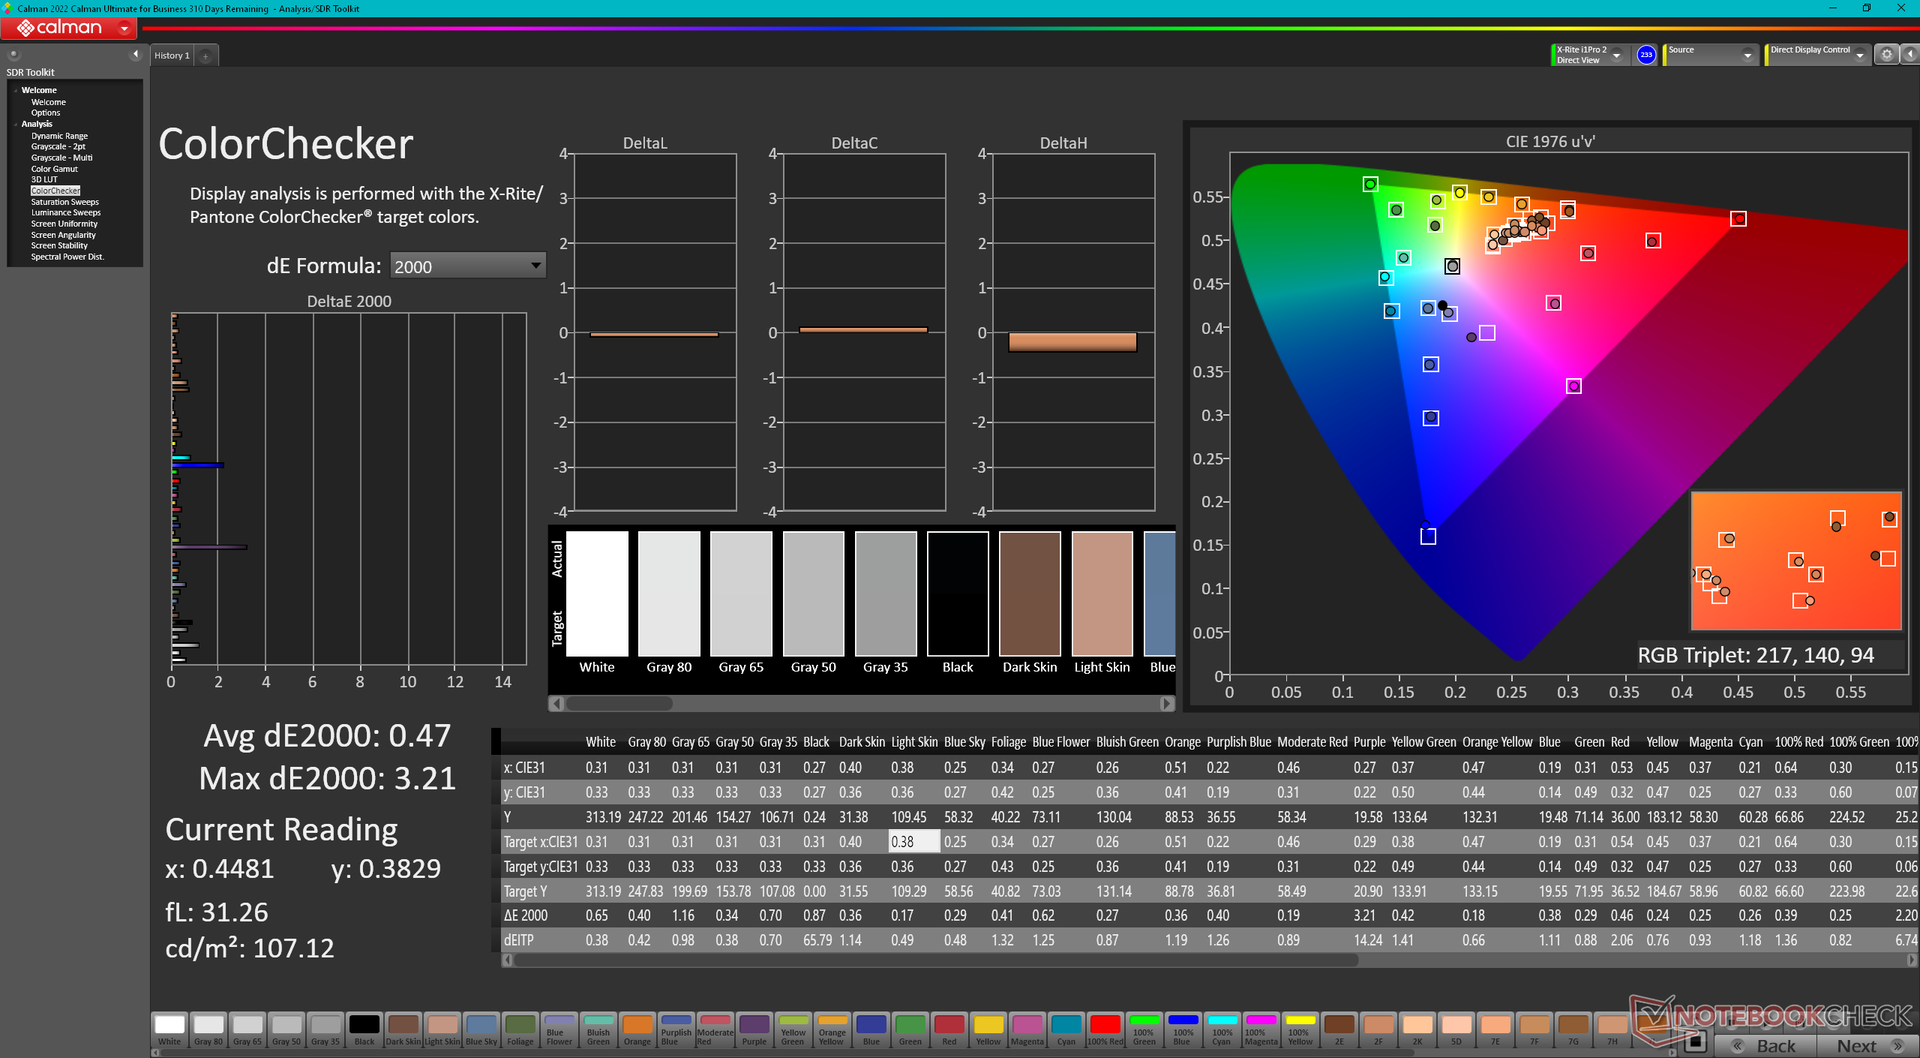
calibrated: 0.47
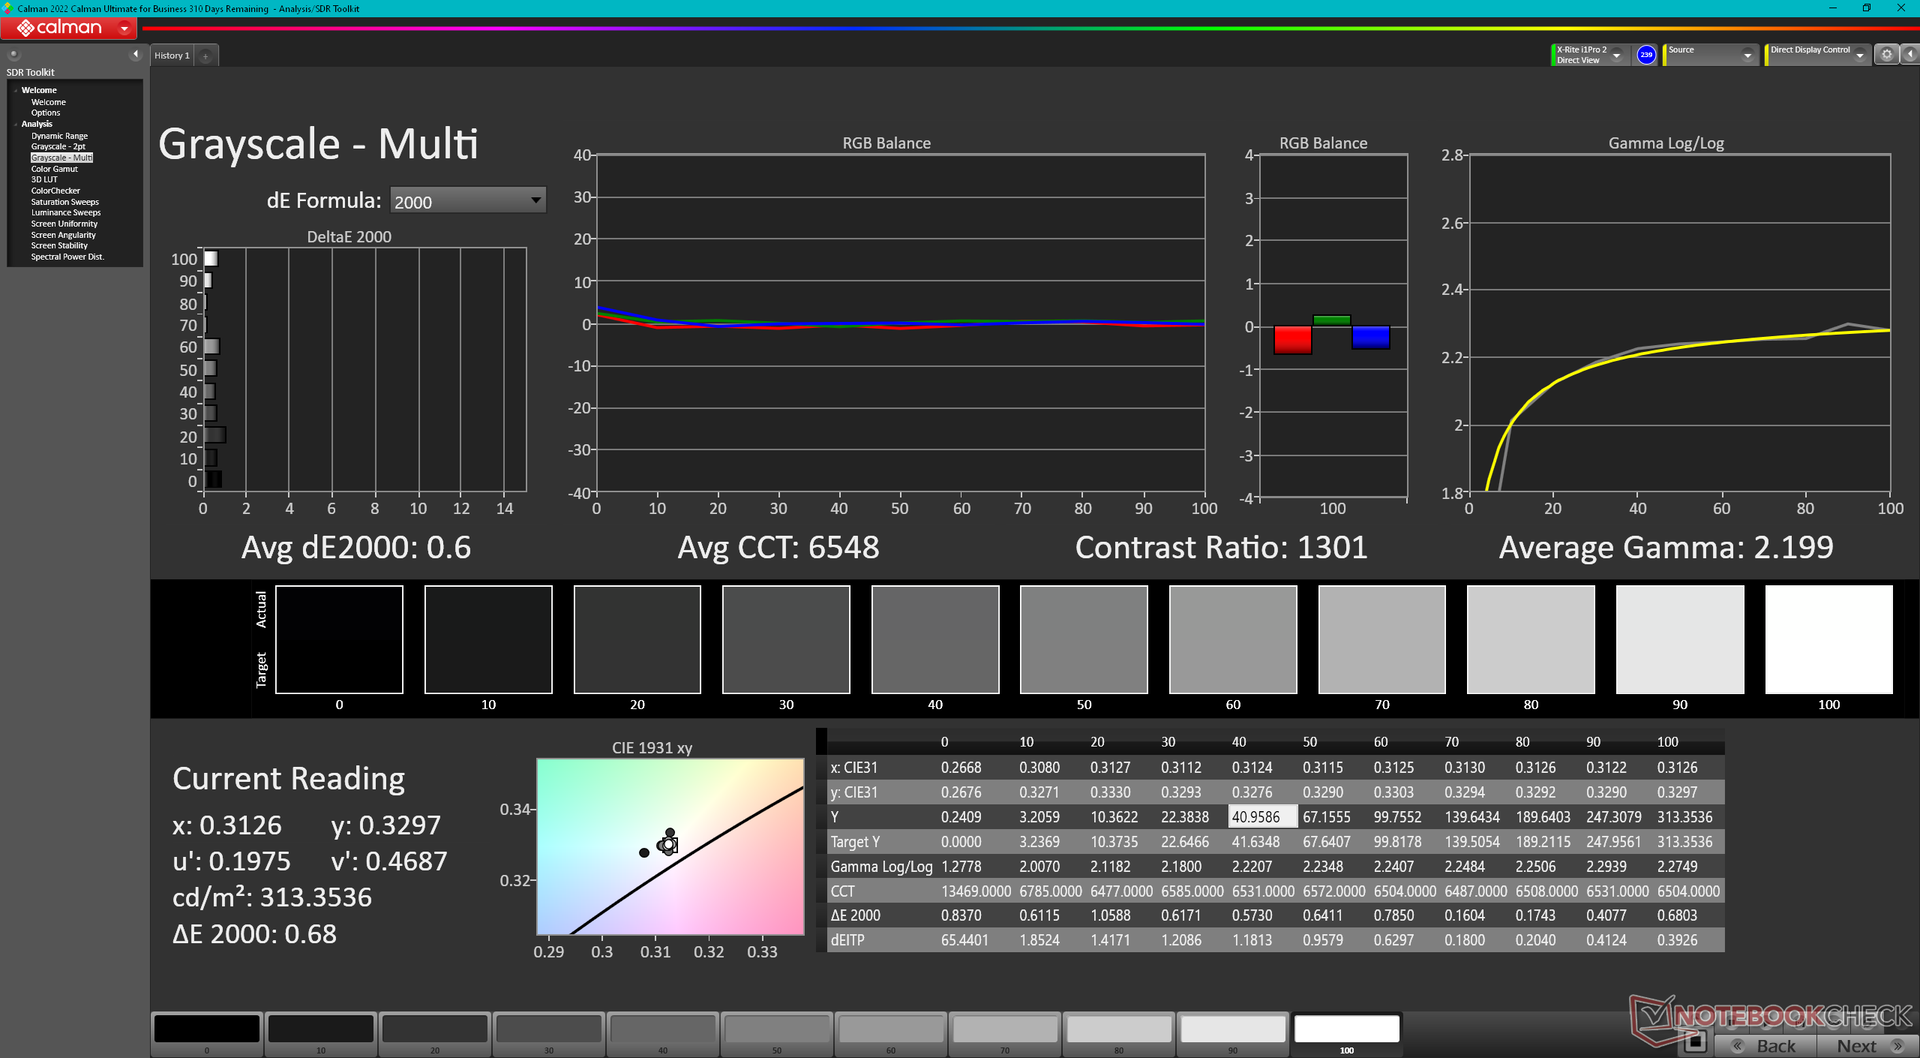
ΔE Greyscale Calman: 0.8 | ∀{0.09-98 Ø4.97}
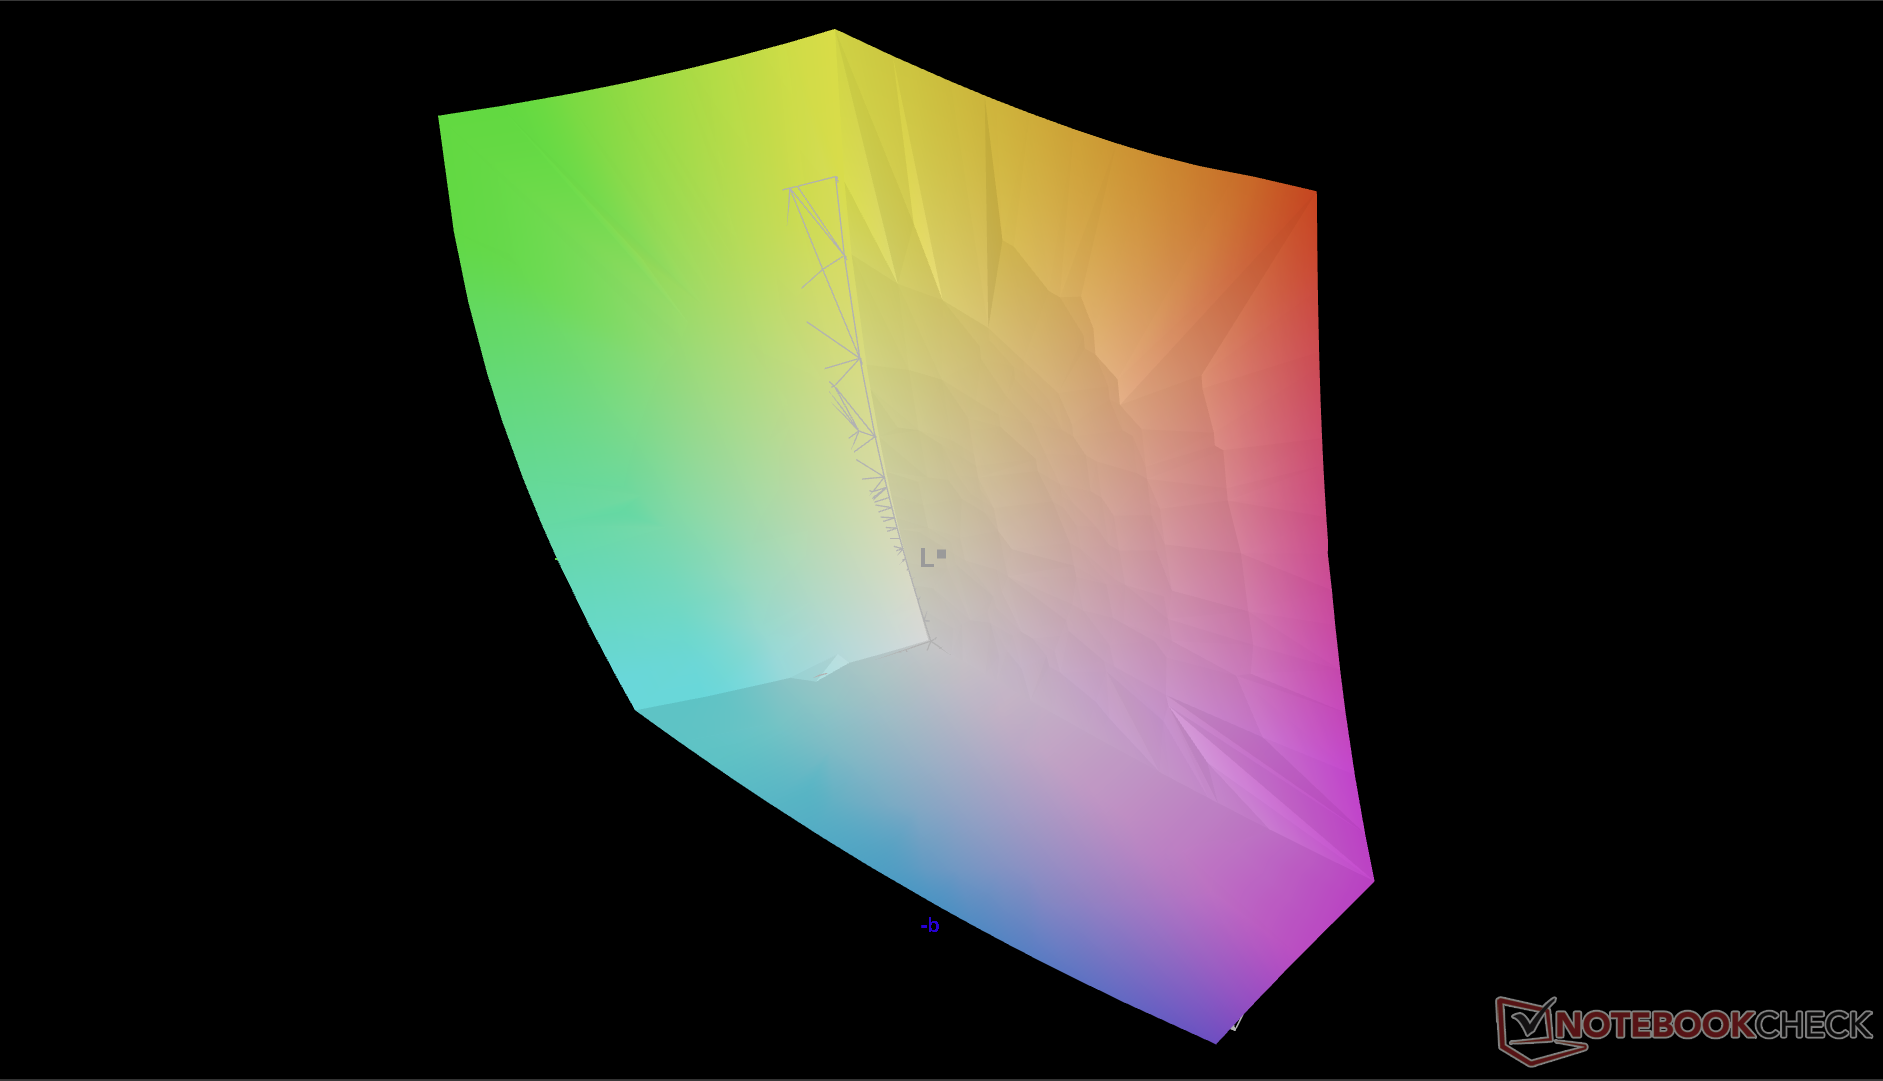
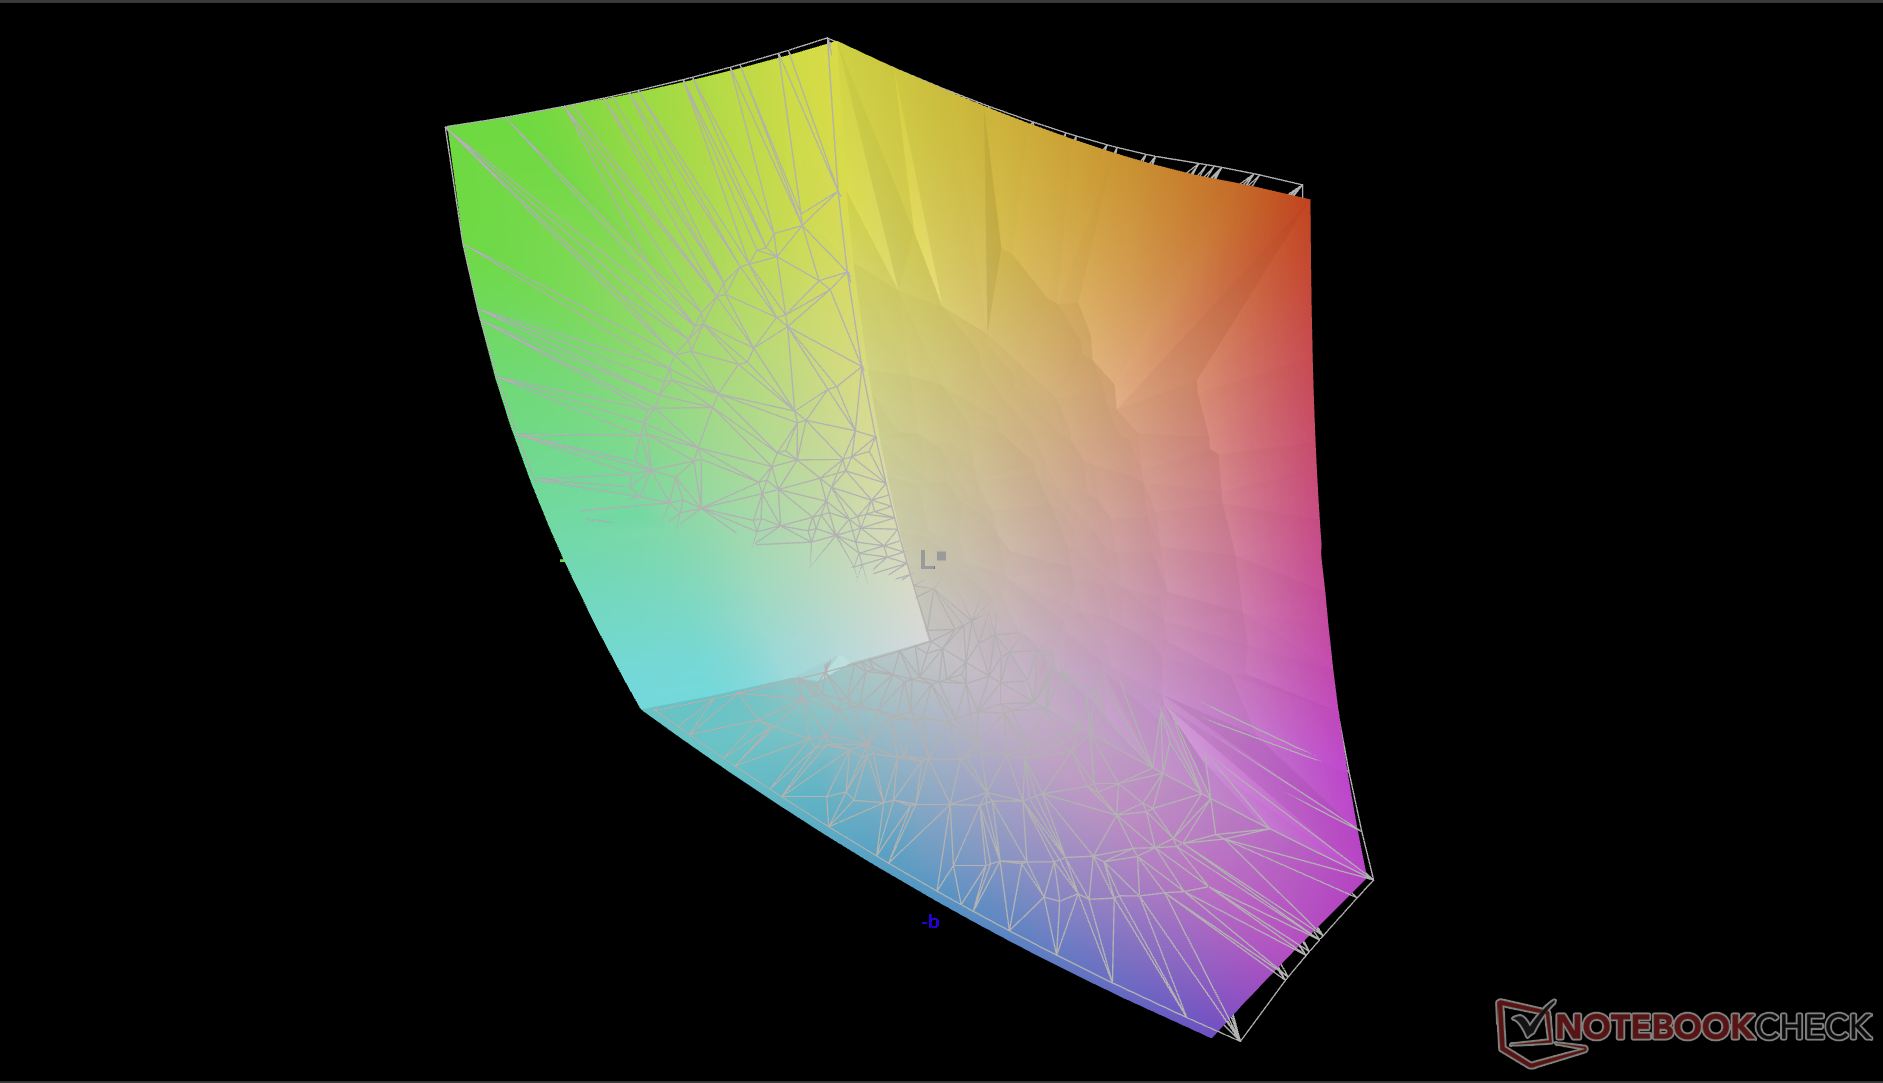
88.7% AdobeRGB 1998 (Argyll 3D)
99.7% sRGB (Argyll 3D)
98.5% Display P3 (Argyll 3D)
Gamma: 2.23
CCT: 6471 K
| Alienware m18 R1 AMD BOE NE18NZ1, IPS, 1920x1200, 18" | Alienware m18 R1 Chi Mei 180JME, IPS, 1920x1200, 18" | Acer Predator Helios 18 N23Q2 AUO45A8 (B180QAN01.2), IPS, 2560x1600, 18" | Razer Blade 18 RTX 4070 AU Optronics B180QAN01.0, IPS, 2560x1600, 18" | Asus ROG Strix Scar 18 2023 G834JY-N6005W NE180QDM-NZ2, IPS, 2560x1600, 18" | MSI GE78HX 13VH-070US AU Optronics B170QAN01.2, IPS, 2560x1600, 17" | |
|---|---|---|---|---|---|---|
| Display | 0% | 1% | -2% | -2% | -1% | |
| Display P3 Coverage (%) | 98.5 | 97.7 -1% | 99.8 1% | 96.9 -2% | 97.2 -1% | 97.6 -1% |
| sRGB Coverage (%) | 99.7 | 100 0% | 100 0% | 99.8 0% | 99.9 0% | 99.9 0% |
| AdobeRGB 1998 Coverage (%) | 88.7 | 89.8 1% | 91.8 3% | 85.3 -4% | 84.9 -4% | 86.5 -2% |
| Response Times | -5% | -128% | -17% | -42% | -9% | |
| Response Time Grey 50% / Grey 80% * (ms) | 2.8 ? | 3 ? -7% | 7.6 ? -171% | 4.2 ? -50% | 5.41 ? -93% | 4.2 ? -50% |
| Response Time Black / White * (ms) | 9.6 ? | 9.9 ? -3% | 17.8 ? -85% | 8 ? 17% | 8.62 ? 10% | 6.4 ? 33% |
| PWM Frequency (Hz) | 2509 | |||||
| Screen | -18% | -130% | -99% | -215% | -145% | |
| Brightness middle (cd/m²) | 319.6 | 372.8 17% | 360 13% | 549.6 72% | 490 53% | 398.6 25% |
| Brightness (cd/m²) | 304 | 367 21% | 355 17% | 524 72% | 468 54% | 384 26% |
| Brightness Distribution (%) | 87 | 97 11% | 92 6% | 89 2% | 86 -1% | 89 2% |
| Black Level * (cd/m²) | 0.25 | 0.32 -28% | 0.21 16% | 0.53 -112% | 0.54 -116% | 0.46 -84% |
| Contrast (:1) | 1278 | 1165 -9% | 1714 34% | 1037 -19% | 907 -29% | 867 -32% |
| Colorchecker dE 2000 * | 1.22 | 1.92 -57% | 3.82 -213% | 3.32 -172% | 4.97 -307% | 4.05 -232% |
| Colorchecker dE 2000 max. * | 3.1 | 3.65 -18% | 7.38 -138% | 6.63 -114% | 11.02 -255% | 8.68 -180% |
| Colorchecker dE 2000 calibrated * | 0.47 | 0.51 -9% | 2.24 -377% | 2.7 -474% | 2.97 -532% | 1.02 -117% |
| Greyscale dE 2000 * | 0.8 | 1.5 -88% | 5.06 -532% | 2 -150% | 7.2 -800% | 6.5 -713% |
| Gamma | 2.23 99% | 2.34 94% | 2.52 87% | 2.29 96% | 2.161 102% | 2.11 104% |
| CCT | 6471 100% | 6607 98% | 5657 115% | 6319 103% | 6515 100% | 7518 86% |
| Total Average (Program / Settings) | -8% /
-12% | -86% /
-102% | -39% /
-67% | -86% /
-144% | -52% /
-95% |
* ... smaller is better
Average DeltaE values are well below 2 to suggest that end-user calibration will be not necessary for most users.


Display Response Times
| ↔ Response Time Black to White | ||
|---|---|---|
| 9.6 ms ... rise ↗ and fall ↘ combined | ↗ 4.9 ms rise | 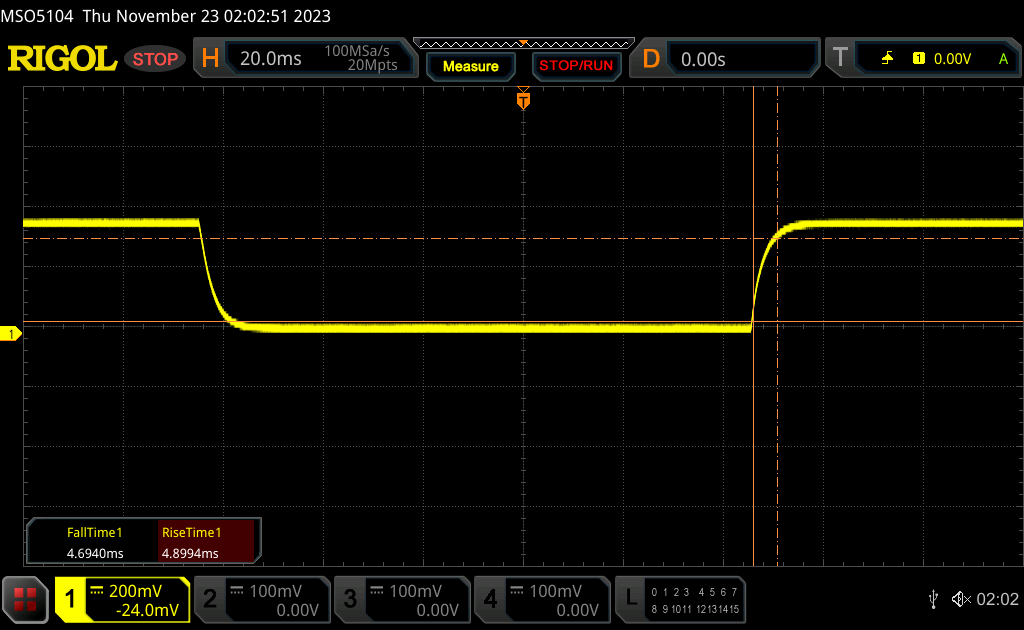 |
| ↘ 4.7 ms fall | ||
| The screen shows fast response rates in our tests and should be suited for gaming. In comparison, all tested devices range from 0.1 (minimum) to 240 (maximum) ms. » 26 % of all devices are better. This means that the measured response time is better than the average of all tested devices (19.8 ms). | ||
| ↔ Response Time 50% Grey to 80% Grey | ||
| 2.8 ms ... rise ↗ and fall ↘ combined | ↗ 1.2 ms rise | 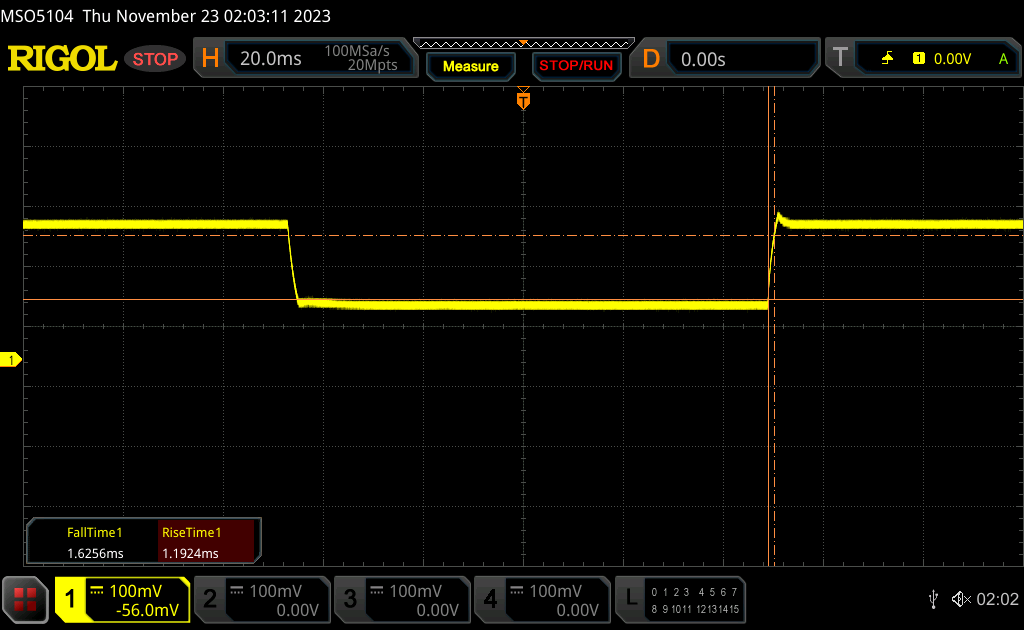 |
| ↘ 1.6 ms fall | ||
| The screen shows very fast response rates in our tests and should be very well suited for fast-paced gaming. In comparison, all tested devices range from 0.165 (minimum) to 636 (maximum) ms. » 12 % of all devices are better. This means that the measured response time is better than the average of all tested devices (31 ms). | ||
Screen Flickering / PWM (Pulse-Width Modulation)
| Screen flickering / PWM not detected |  | ||
In comparison: 52 % of all tested devices do not use PWM to dim the display. If PWM was detected, an average of 7750 (minimum: 5 - maximum: 343500) Hz was measured. | |||
Performance
Testing Conditions
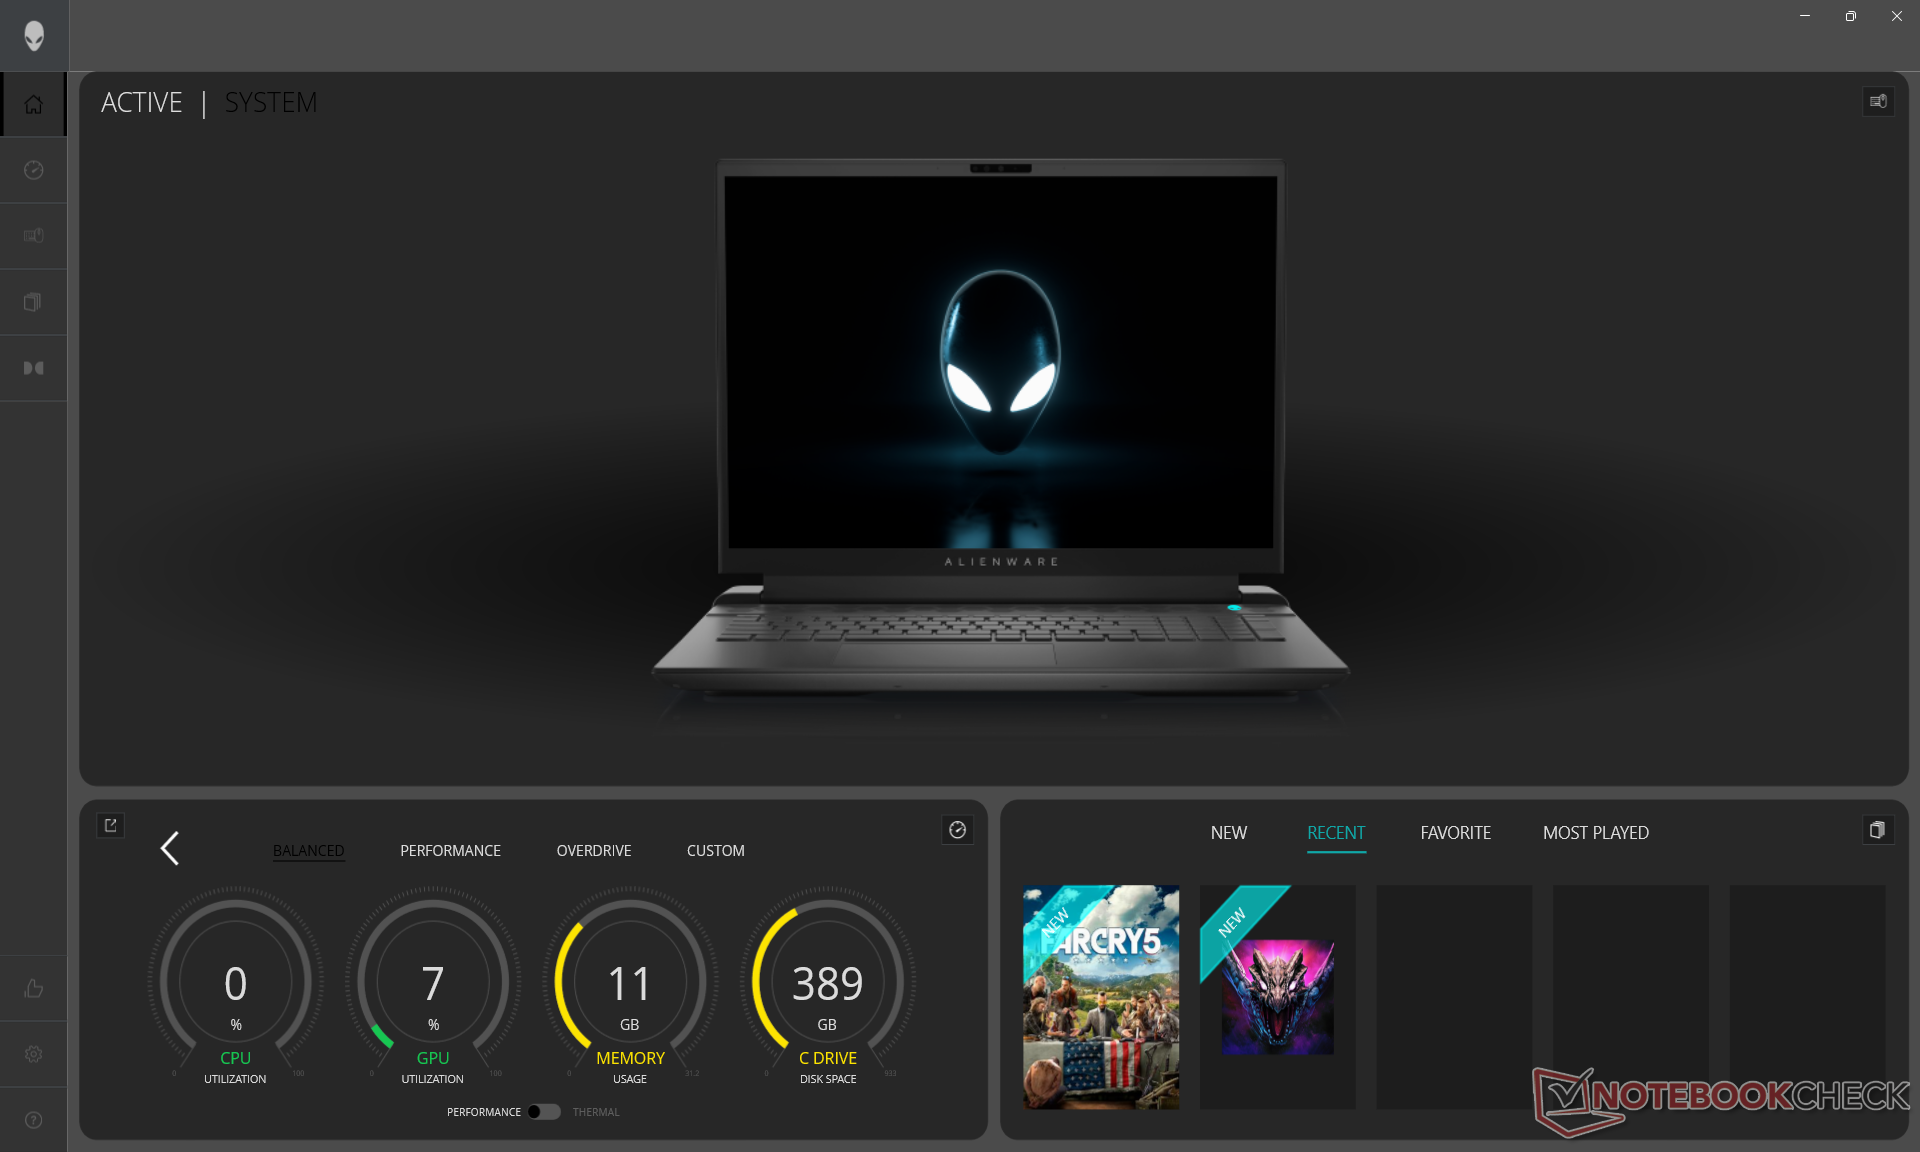
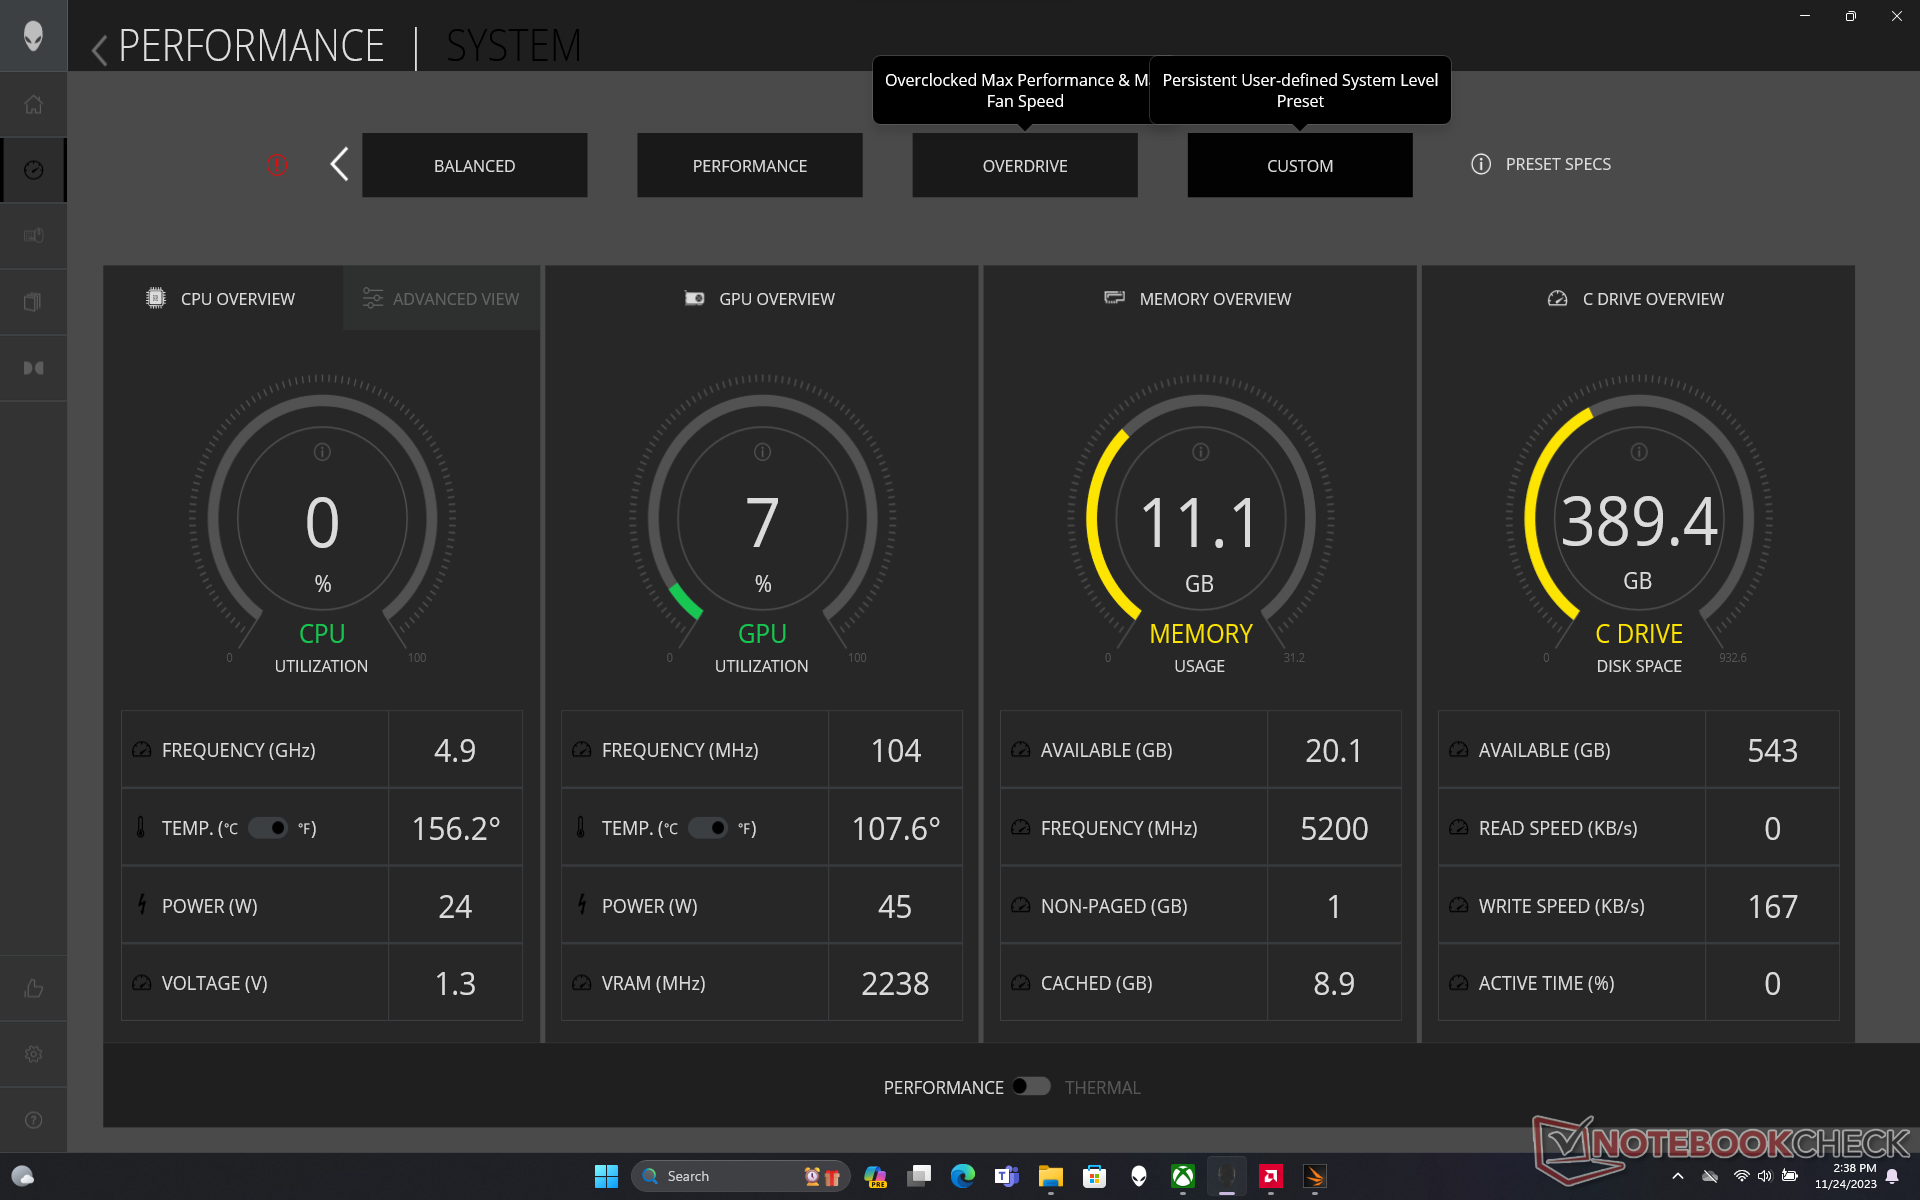
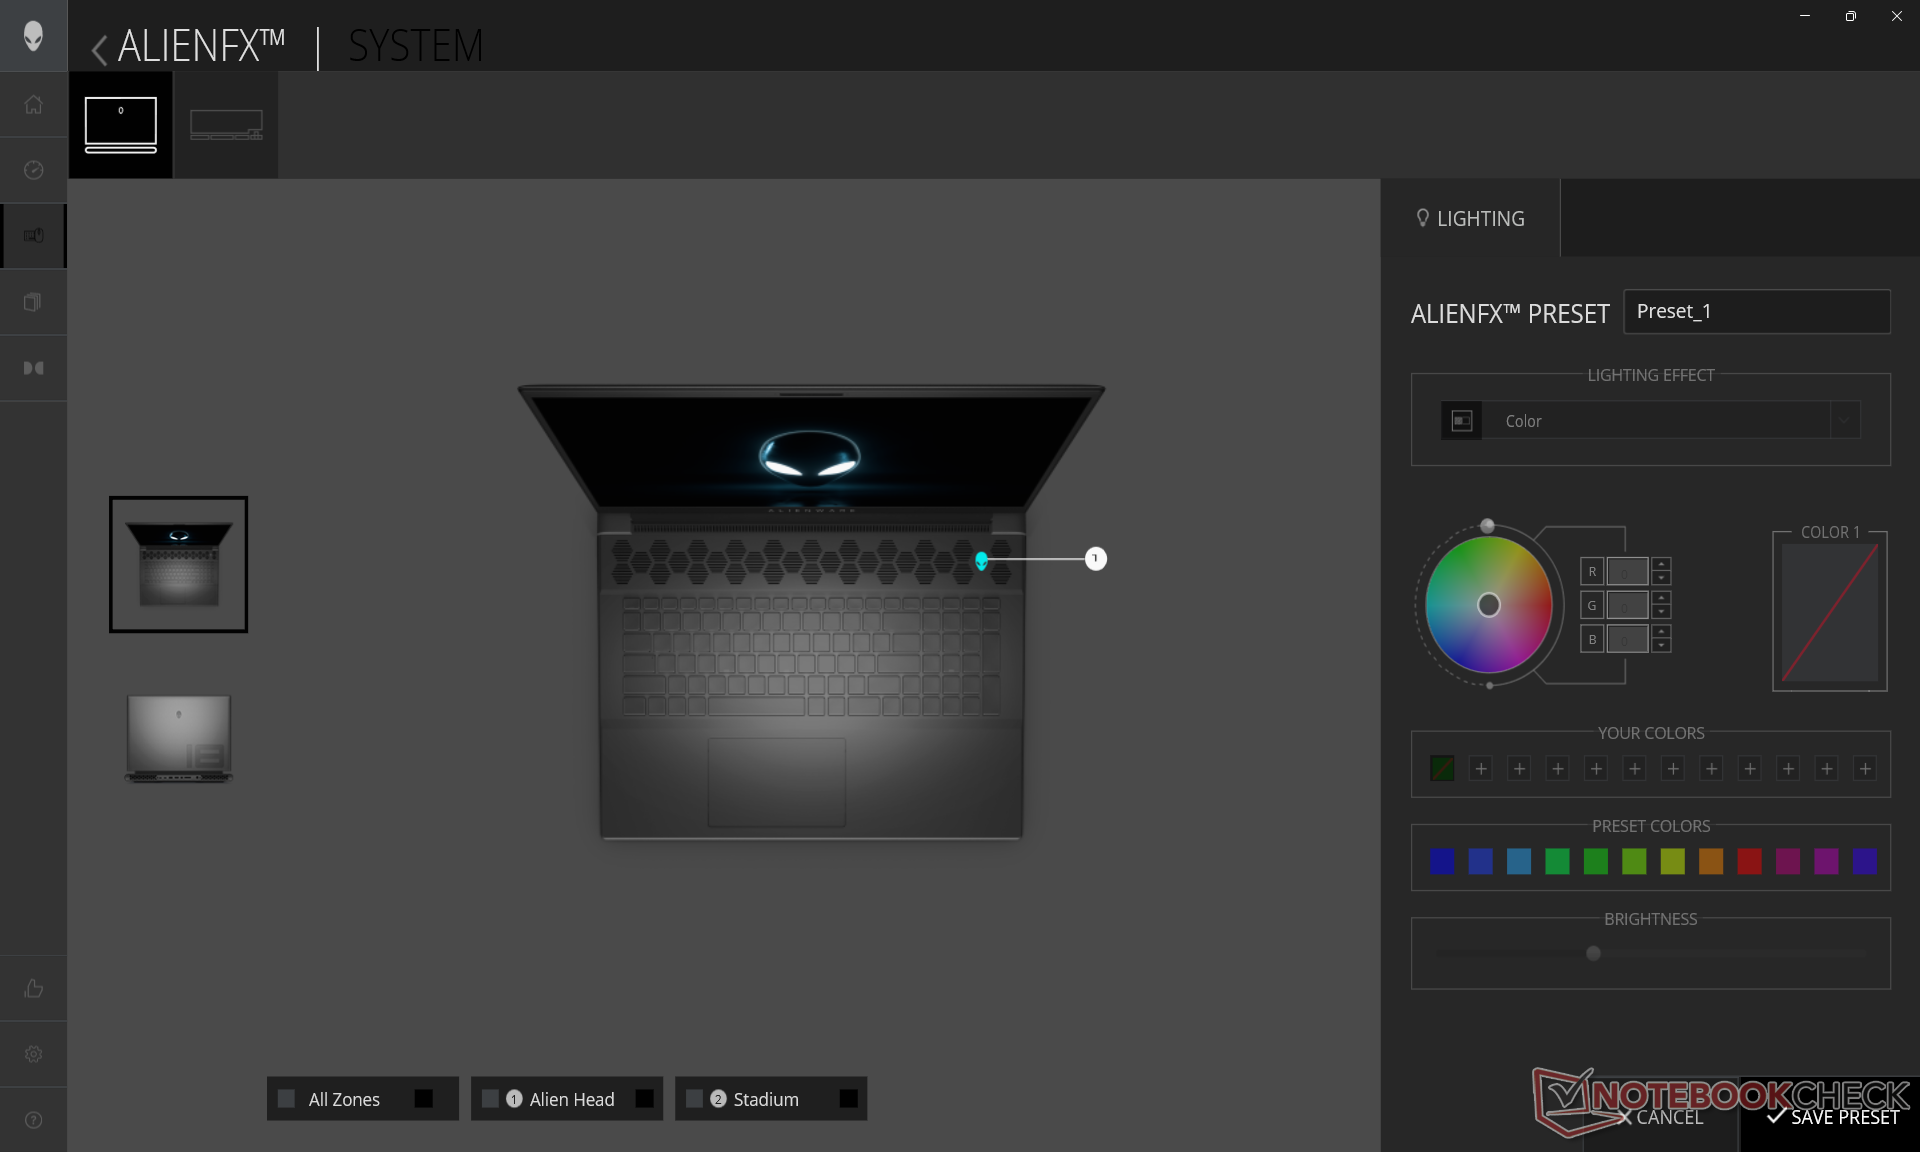
We set Alienware Command Center to Overdrive mode prior to running the benchmarks below. Familiarity with Command Center is vital for controlling specific features of the laptop including RGB lighting, power profiles, and game-specific profiles.
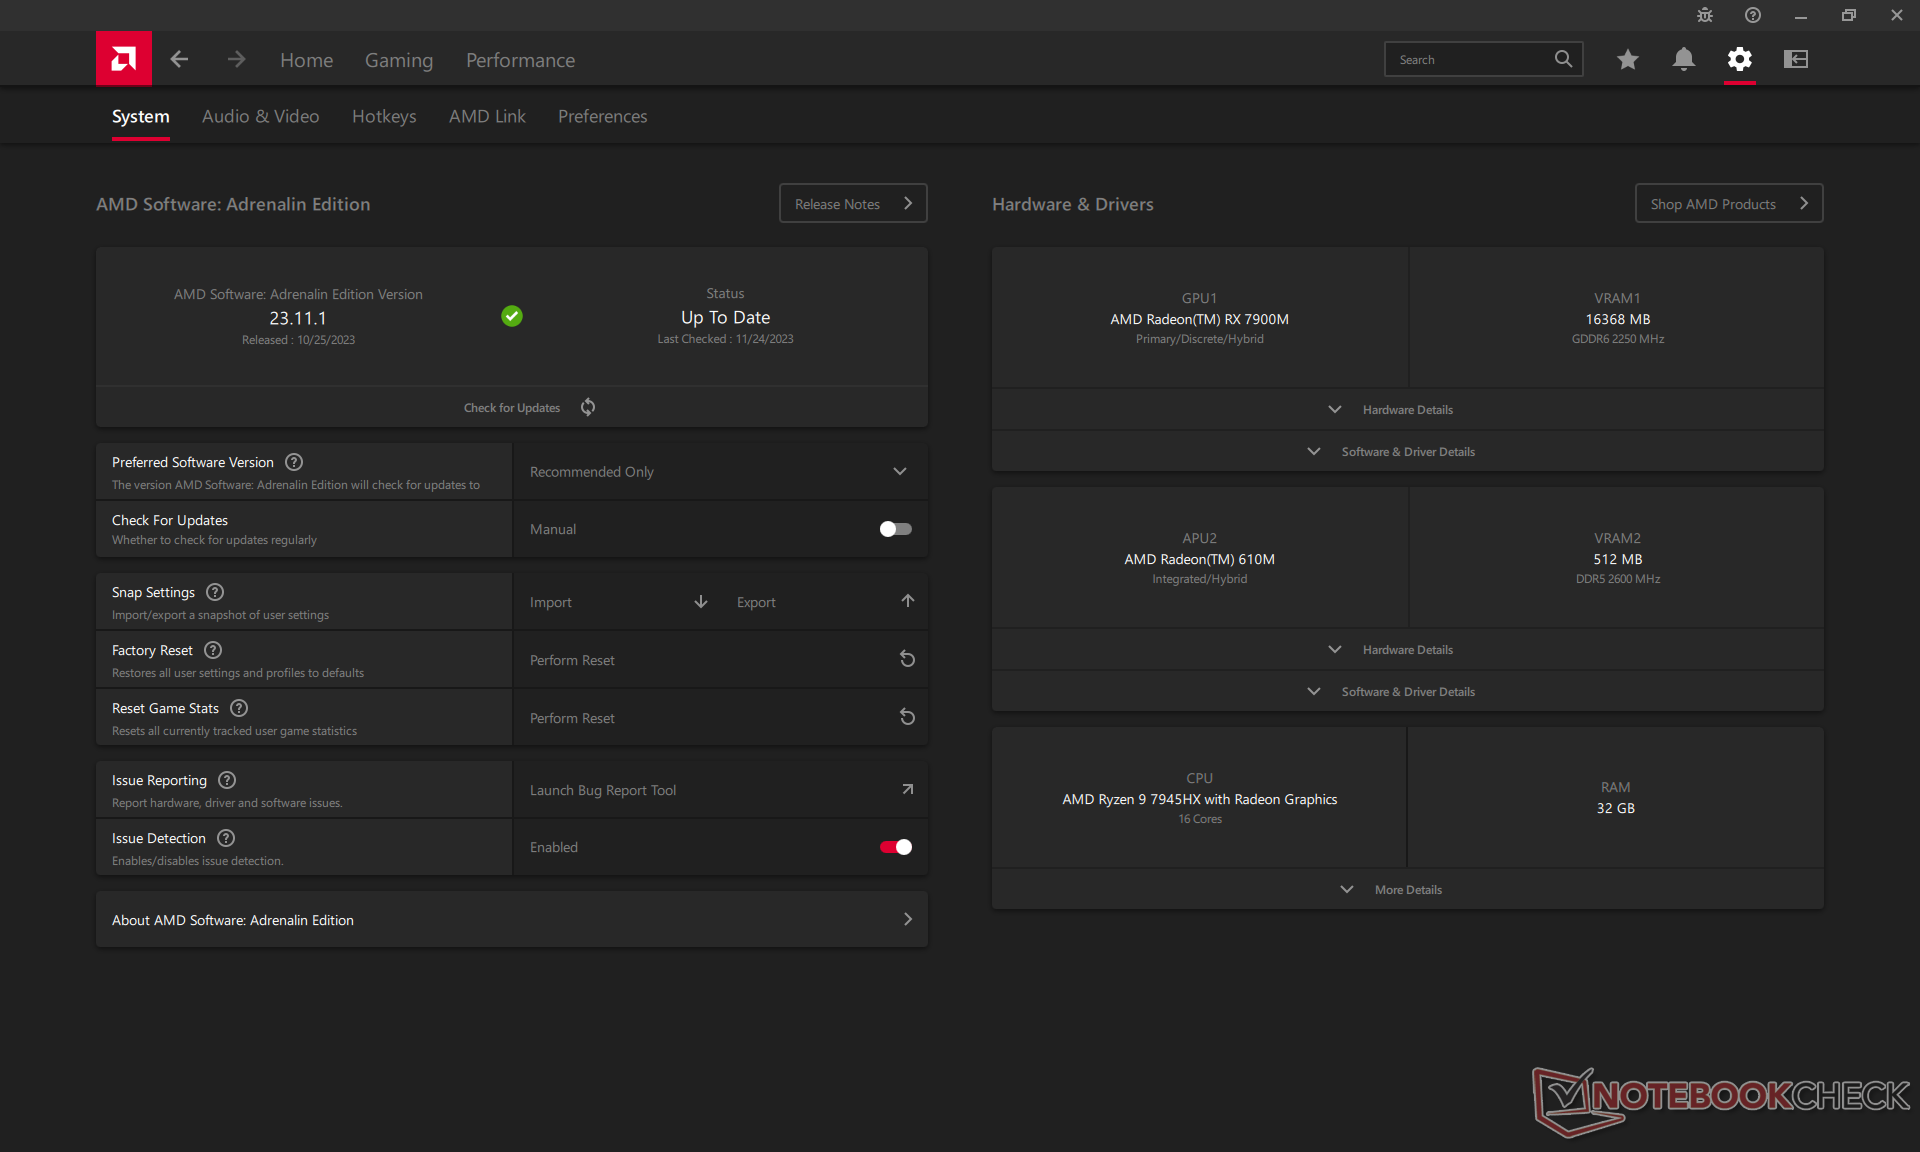
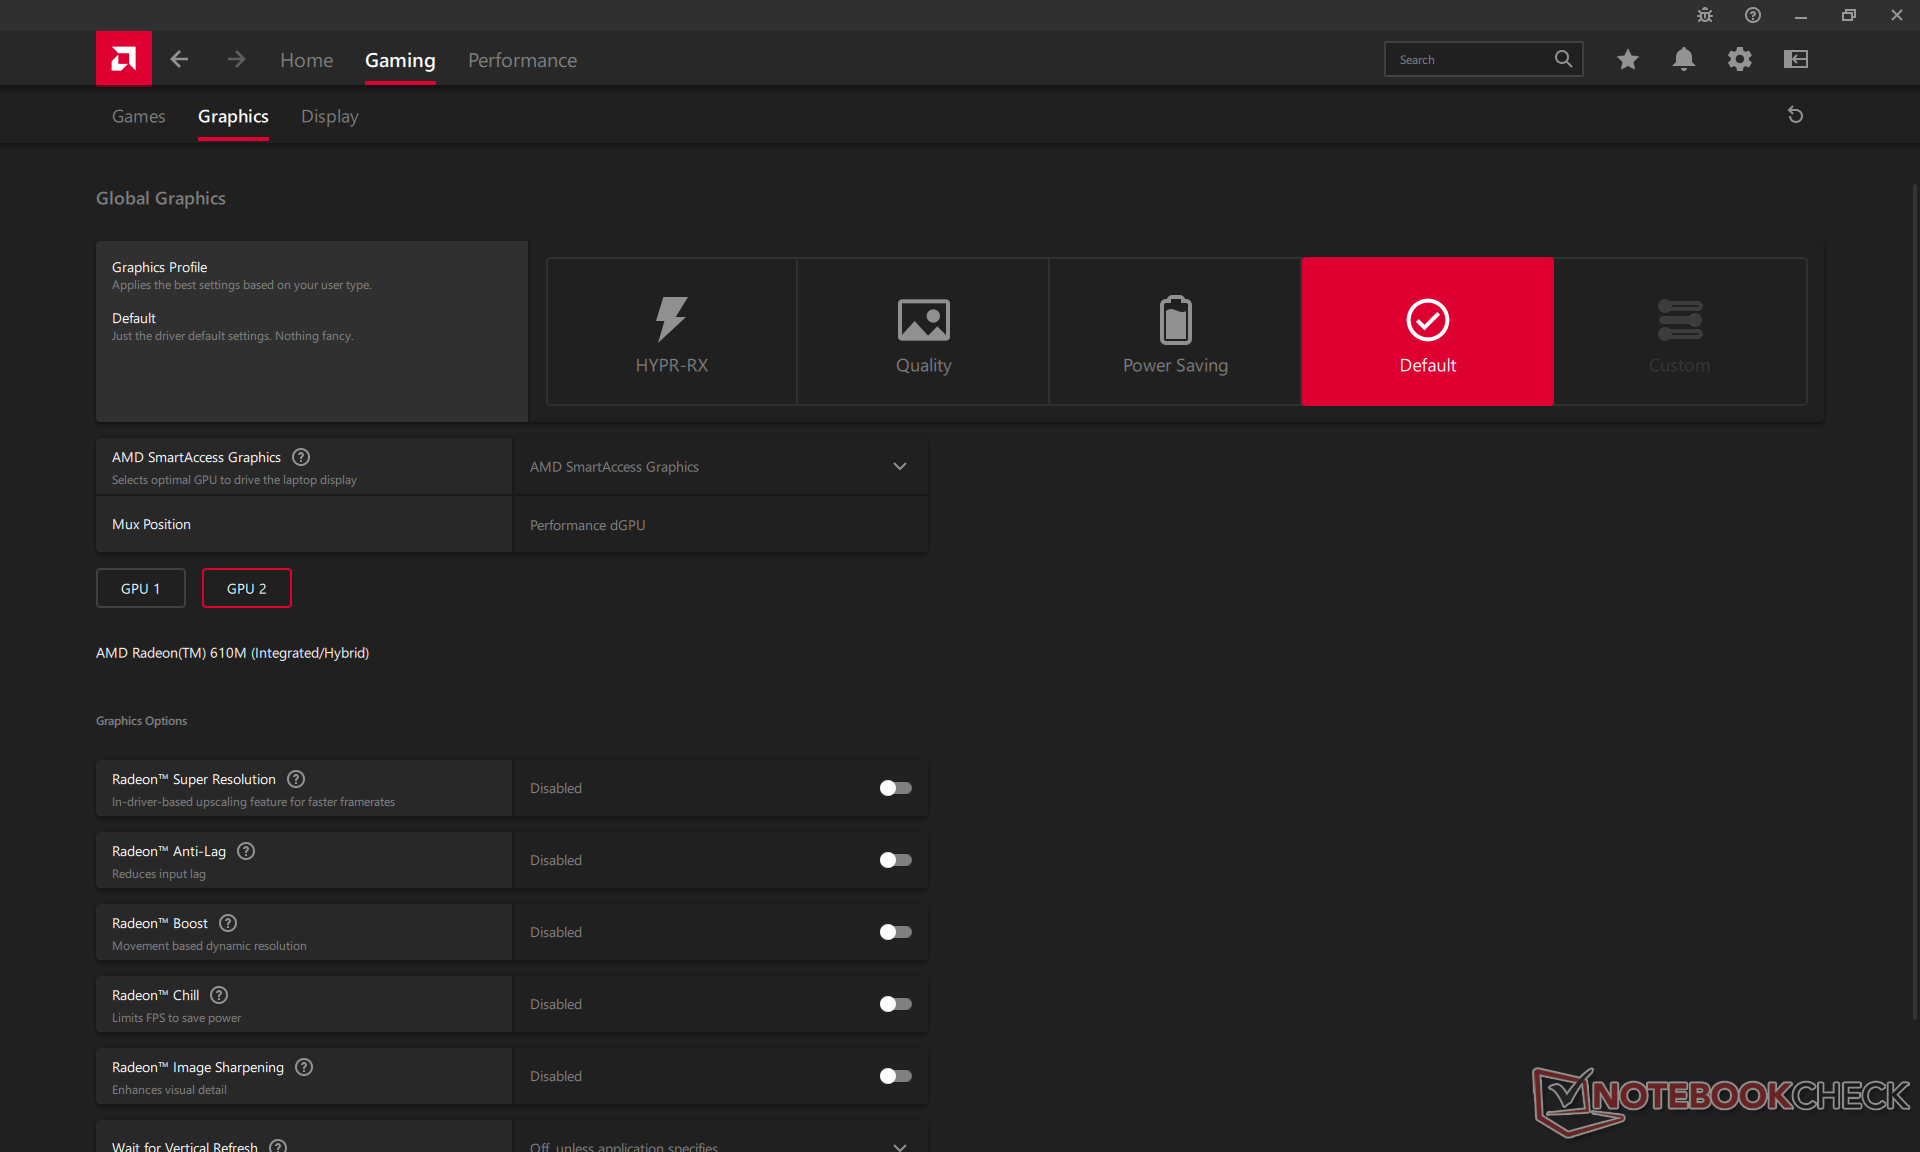
It's also recommended to download AMD Adrenalin to get the latest GPU drivers and for toggling on/off all the features of the GPU.
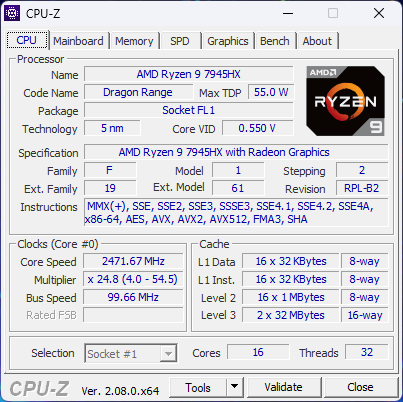
Processor
CPU performance is the classic AMD vs. Intel affair where our Ryzen 9 7945HX offers 5 to 10 percent faster raw multi-thread performance than the competing Core i9-13980HX while being 5 to 10 percent slower in single-thread performance. It's essentially on par with the recent Ryzen 9 7945HX3D to be one of the fastest mobile processors available. Downgrading to the Ryzen 9 7845HX or Ryzen 7 7745HX is expected to reduce processor performance by about 20 to 25 percent and 40 to 50 percent, respectively.
Performance sustainability is excellent as exemplified by the steady scores when running CineBench R15 xT in a loop.
Cinebench R15 Multi Loop
Cinebench R23: Multi Core | Single Core
Cinebench R20: CPU (Multi Core) | CPU (Single Core)
Cinebench R15: CPU Multi 64Bit | CPU Single 64Bit
Blender: v2.79 BMW27 CPU
7-Zip 18.03: 7z b 4 | 7z b 4 -mmt1
Geekbench 5.5: Multi-Core | Single-Core
HWBOT x265 Benchmark v2.2: 4k Preset
LibreOffice : 20 Documents To PDF
R Benchmark 2.5: Overall mean
* ... smaller is better
AIDA64: FP32 Ray-Trace | FPU Julia | CPU SHA3 | CPU Queen | FPU SinJulia | FPU Mandel | CPU AES | CPU ZLib | FP64 Ray-Trace | CPU PhotoWorxx
| Performance rating | |
| Alienware m18 R1 AMD | |
| Average AMD Ryzen 9 7945HX | |
| Acer Predator Helios 18 N23Q2 | |
| Alienware m18 R1 | |
| MSI GE78HX 13VH-070US | |
| Asus ROG Strix Scar 18 2023 G834JY-N6005W | |
| Razer Blade 18 RTX 4070 | |
| AIDA64 / FP32 Ray-Trace | |
| Alienware m18 R1 AMD | |
| Average AMD Ryzen 9 7945HX (50388 - 60169, n=7) | |
| Alienware m18 R1 | |
| Asus ROG Strix Scar 18 2023 G834JY-N6005W | |
| MSI GE78HX 13VH-070US | |
| Acer Predator Helios 18 N23Q2 | |
| Razer Blade 18 RTX 4070 | |
| AIDA64 / FPU Julia | |
| Alienware m18 R1 AMD | |
| Average AMD Ryzen 9 7945HX (201874 - 252486, n=7) | |
| Alienware m18 R1 | |
| MSI GE78HX 13VH-070US | |
| Asus ROG Strix Scar 18 2023 G834JY-N6005W | |
| Acer Predator Helios 18 N23Q2 | |
| Razer Blade 18 RTX 4070 | |
| AIDA64 / CPU SHA3 | |
| Alienware m18 R1 AMD | |
| Average AMD Ryzen 9 7945HX (8525 - 10389, n=7) | |
| Alienware m18 R1 | |
| Asus ROG Strix Scar 18 2023 G834JY-N6005W | |
| MSI GE78HX 13VH-070US | |
| Acer Predator Helios 18 N23Q2 | |
| Razer Blade 18 RTX 4070 | |
| AIDA64 / CPU Queen | |
| Alienware m18 R1 AMD | |
| Average AMD Ryzen 9 7945HX (175041 - 200651, n=7) | |
| Alienware m18 R1 | |
| Asus ROG Strix Scar 18 2023 G834JY-N6005W | |
| MSI GE78HX 13VH-070US | |
| Razer Blade 18 RTX 4070 | |
| Acer Predator Helios 18 N23Q2 | |
| AIDA64 / FPU SinJulia | |
| Alienware m18 R1 AMD | |
| Average AMD Ryzen 9 7945HX (28794 - 32988, n=7) | |
| Asus ROG Strix Scar 18 2023 G834JY-N6005W | |
| MSI GE78HX 13VH-070US | |
| Alienware m18 R1 | |
| Razer Blade 18 RTX 4070 | |
| Acer Predator Helios 18 N23Q2 | |
| AIDA64 / FPU Mandel | |
| Alienware m18 R1 AMD | |
| Average AMD Ryzen 9 7945HX (105740 - 134044, n=7) | |
| Alienware m18 R1 | |
| Asus ROG Strix Scar 18 2023 G834JY-N6005W | |
| MSI GE78HX 13VH-070US | |
| Acer Predator Helios 18 N23Q2 | |
| Razer Blade 18 RTX 4070 | |
| AIDA64 / CPU AES | |
| Acer Predator Helios 18 N23Q2 | |
| Average AMD Ryzen 9 7945HX (126790 - 325960, n=7) | |
| Alienware m18 R1 AMD | |
| Alienware m18 R1 | |
| MSI GE78HX 13VH-070US | |
| Asus ROG Strix Scar 18 2023 G834JY-N6005W | |
| Razer Blade 18 RTX 4070 | |
| AIDA64 / CPU ZLib | |
| Alienware m18 R1 AMD | |
| Average AMD Ryzen 9 7945HX (2022 - 2409, n=7) | |
| MSI GE78HX 13VH-070US | |
| Asus ROG Strix Scar 18 2023 G834JY-N6005W | |
| Alienware m18 R1 | |
| Acer Predator Helios 18 N23Q2 | |
| Razer Blade 18 RTX 4070 | |
| AIDA64 / FP64 Ray-Trace | |
| Alienware m18 R1 AMD | |
| Average AMD Ryzen 9 7945HX (26875 - 31796, n=7) | |
| Alienware m18 R1 | |
| Asus ROG Strix Scar 18 2023 G834JY-N6005W | |
| MSI GE78HX 13VH-070US | |
| Acer Predator Helios 18 N23Q2 | |
| Razer Blade 18 RTX 4070 | |
| AIDA64 / CPU PhotoWorxx | |
| Alienware m18 R1 | |
| Acer Predator Helios 18 N23Q2 | |
| MSI GE78HX 13VH-070US | |
| Razer Blade 18 RTX 4070 | |
| Asus ROG Strix Scar 18 2023 G834JY-N6005W | |
| Average AMD Ryzen 9 7945HX (31421 - 40095, n=7) | |
| Alienware m18 R1 AMD | |
System Performance
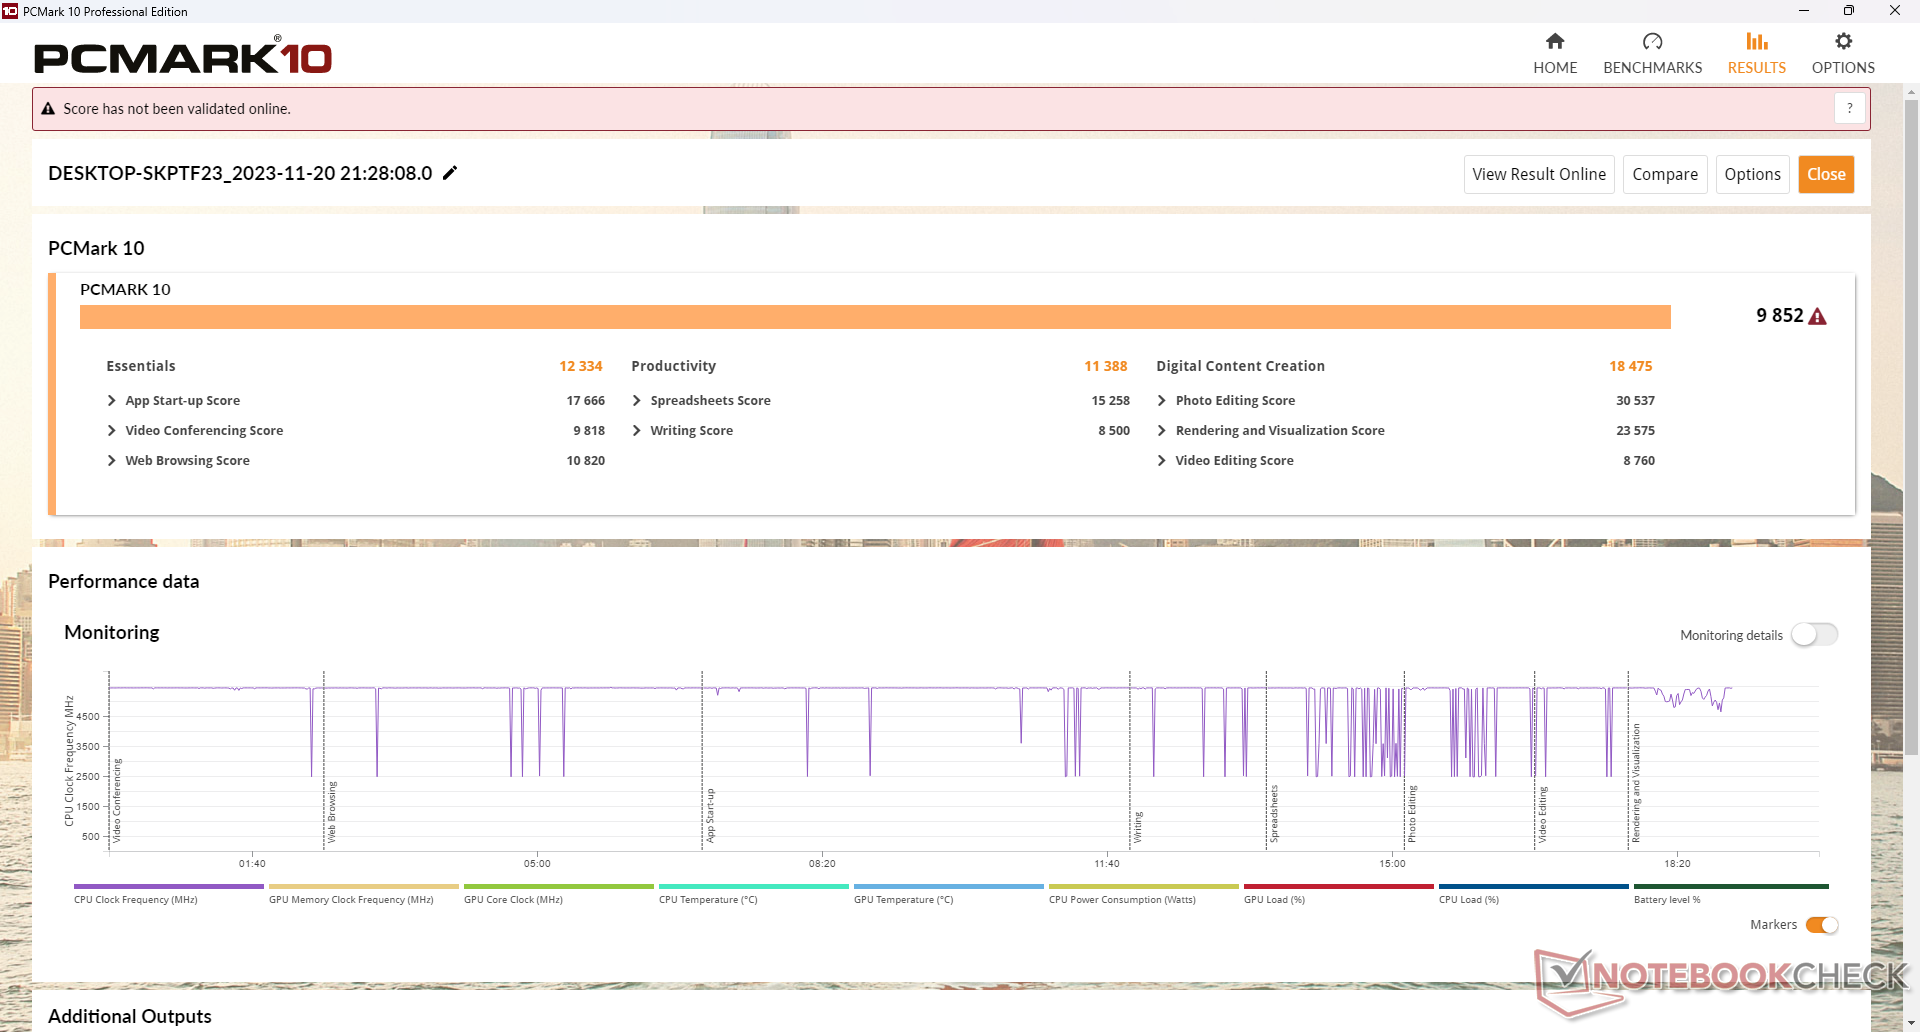
PCMark results are some of the highest of any gaming laptop to place our Alienware m18 on equal footing with some of the fastest Intel-Nvidia alternatives. Unfortunately, the user experience is less than stellar in practice due to all the bugs we observed. A few notable ones include:
- Main display would sometimes turn off for no reason and a reboot would be required
- Failure to boot if an external monitor is connected
- Failure to run 3DMark Speed Way and Blender Classroom HIP/AMD benchmarks
- Unusually high power consumption when on Standby mode
These issues would occur more than once even with the latest Windows updates and AMD drivers installed at the time of writing (31.0.22023.1014).
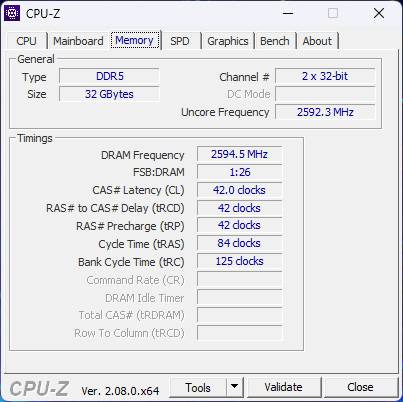
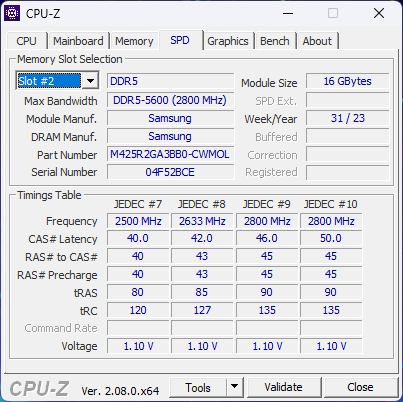
Memory performance is also noticeably slower than many Intel-based gaming laptops. This doesn't appear to be a fluke either as our Asus ROG Strix Scar 17 with the same Ryzen 9 CPU as our Alienware would also return similarly low numbers.
CrossMark: Overall | Productivity | Creativity | Responsiveness
| PCMark 10 / Score | |
| Alienware m18 R1 AMD | |
| Average AMD Ryzen 9 7945HX, AMD Radeon RX 7900M (n=1) | |
| MSI GE78HX 13VH-070US | |
| Asus ROG Strix Scar 18 2023 G834JY-N6005W | |
| Alienware m18 R1 | |
| Acer Predator Helios 18 N23Q2 | |
| Razer Blade 18 RTX 4070 | |
| PCMark 10 / Essentials | |
| Alienware m18 R1 AMD | |
| Average AMD Ryzen 9 7945HX, AMD Radeon RX 7900M (n=1) | |
| Razer Blade 18 RTX 4070 | |
| MSI GE78HX 13VH-070US | |
| Alienware m18 R1 | |
| Acer Predator Helios 18 N23Q2 | |
| PCMark 10 / Productivity | |
| Alienware m18 R1 AMD | |
| Average AMD Ryzen 9 7945HX, AMD Radeon RX 7900M (n=1) | |
| Acer Predator Helios 18 N23Q2 | |
| MSI GE78HX 13VH-070US | |
| Alienware m18 R1 | |
| Razer Blade 18 RTX 4070 | |
| PCMark 10 / Digital Content Creation | |
| Alienware m18 R1 AMD | |
| Average AMD Ryzen 9 7945HX, AMD Radeon RX 7900M (n=1) | |
| Alienware m18 R1 | |
| MSI GE78HX 13VH-070US | |
| Acer Predator Helios 18 N23Q2 | |
| Razer Blade 18 RTX 4070 | |
| CrossMark / Overall | |
| Acer Predator Helios 18 N23Q2 | |
| Alienware m18 R1 | |
| Razer Blade 18 RTX 4070 | |
| Asus ROG Strix Scar 18 2023 G834JY-N6005W | |
| Alienware m18 R1 AMD | |
| Average AMD Ryzen 9 7945HX, AMD Radeon RX 7900M (n=1) | |
| MSI GE78HX 13VH-070US | |
| CrossMark / Productivity | |
| Acer Predator Helios 18 N23Q2 | |
| Alienware m18 R1 | |
| Razer Blade 18 RTX 4070 | |
| Asus ROG Strix Scar 18 2023 G834JY-N6005W | |
| MSI GE78HX 13VH-070US | |
| Alienware m18 R1 AMD | |
| Average AMD Ryzen 9 7945HX, AMD Radeon RX 7900M (n=1) | |
| CrossMark / Creativity | |
| Alienware m18 R1 | |
| Asus ROG Strix Scar 18 2023 G834JY-N6005W | |
| Acer Predator Helios 18 N23Q2 | |
| Razer Blade 18 RTX 4070 | |
| Alienware m18 R1 AMD | |
| Average AMD Ryzen 9 7945HX, AMD Radeon RX 7900M (n=1) | |
| MSI GE78HX 13VH-070US | |
| CrossMark / Responsiveness | |
| Acer Predator Helios 18 N23Q2 | |
| Alienware m18 R1 | |
| Razer Blade 18 RTX 4070 | |
| MSI GE78HX 13VH-070US | |
| Asus ROG Strix Scar 18 2023 G834JY-N6005W | |
| Alienware m18 R1 AMD | |
| Average AMD Ryzen 9 7945HX, AMD Radeon RX 7900M (n=1) | |
| PCMark 10 Score | 9852 points | |
Help | ||
| AIDA64 / Memory Latency | |
| Alienware m18 R1 AMD | |
| Asus ROG Strix Scar 18 2023 G834JY-N6005W | |
| Asus ROG Strix Scar 17 G733PYV-LL053X | |
| Razer Blade 18 RTX 4070 | |
| MSI GE78HX 13VH-070US | |
| Average AMD Ryzen 9 7945HX (77.1 - 91.3, n=7) | |
| Acer Predator Helios 18 N23Q2 | |
| Alienware m18 R1 | |
* ... smaller is better
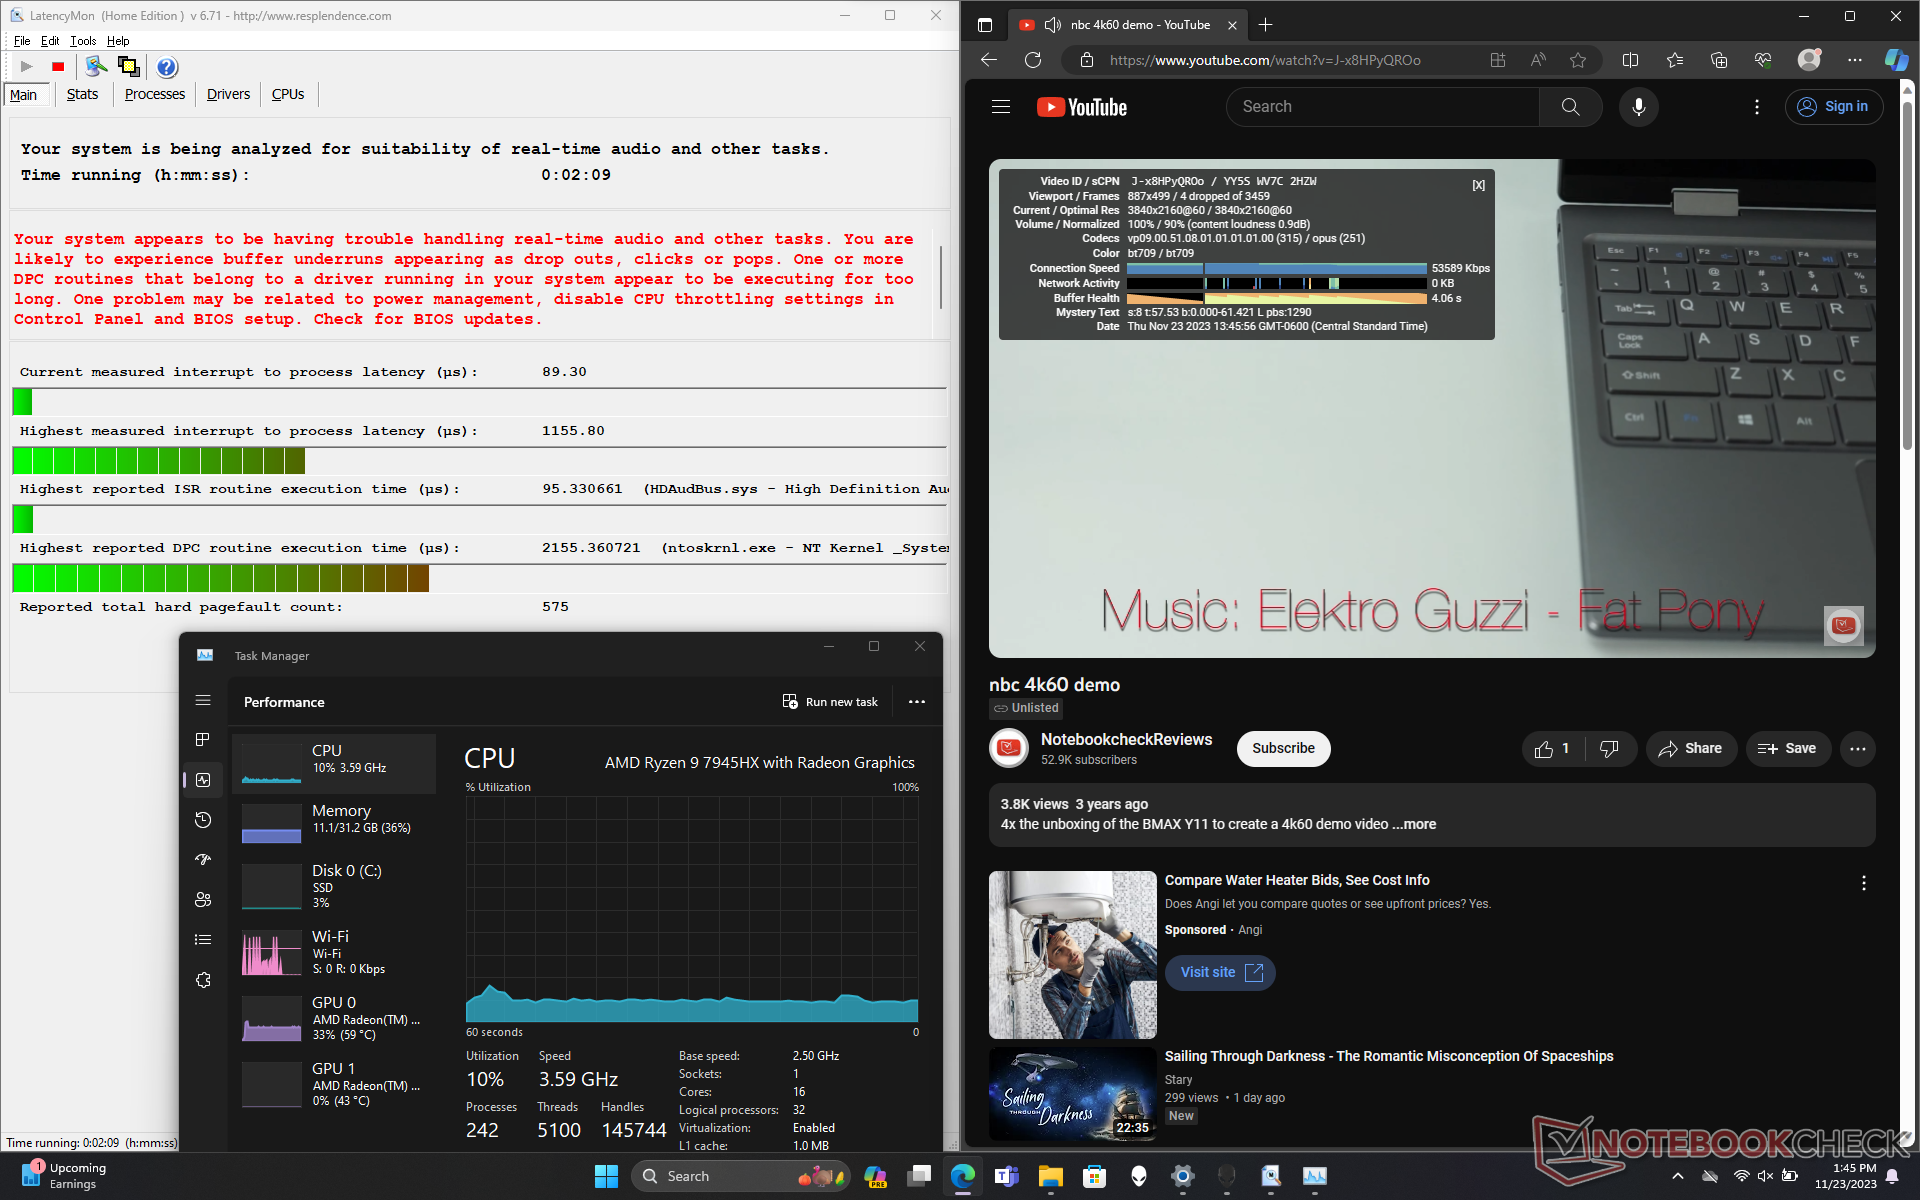
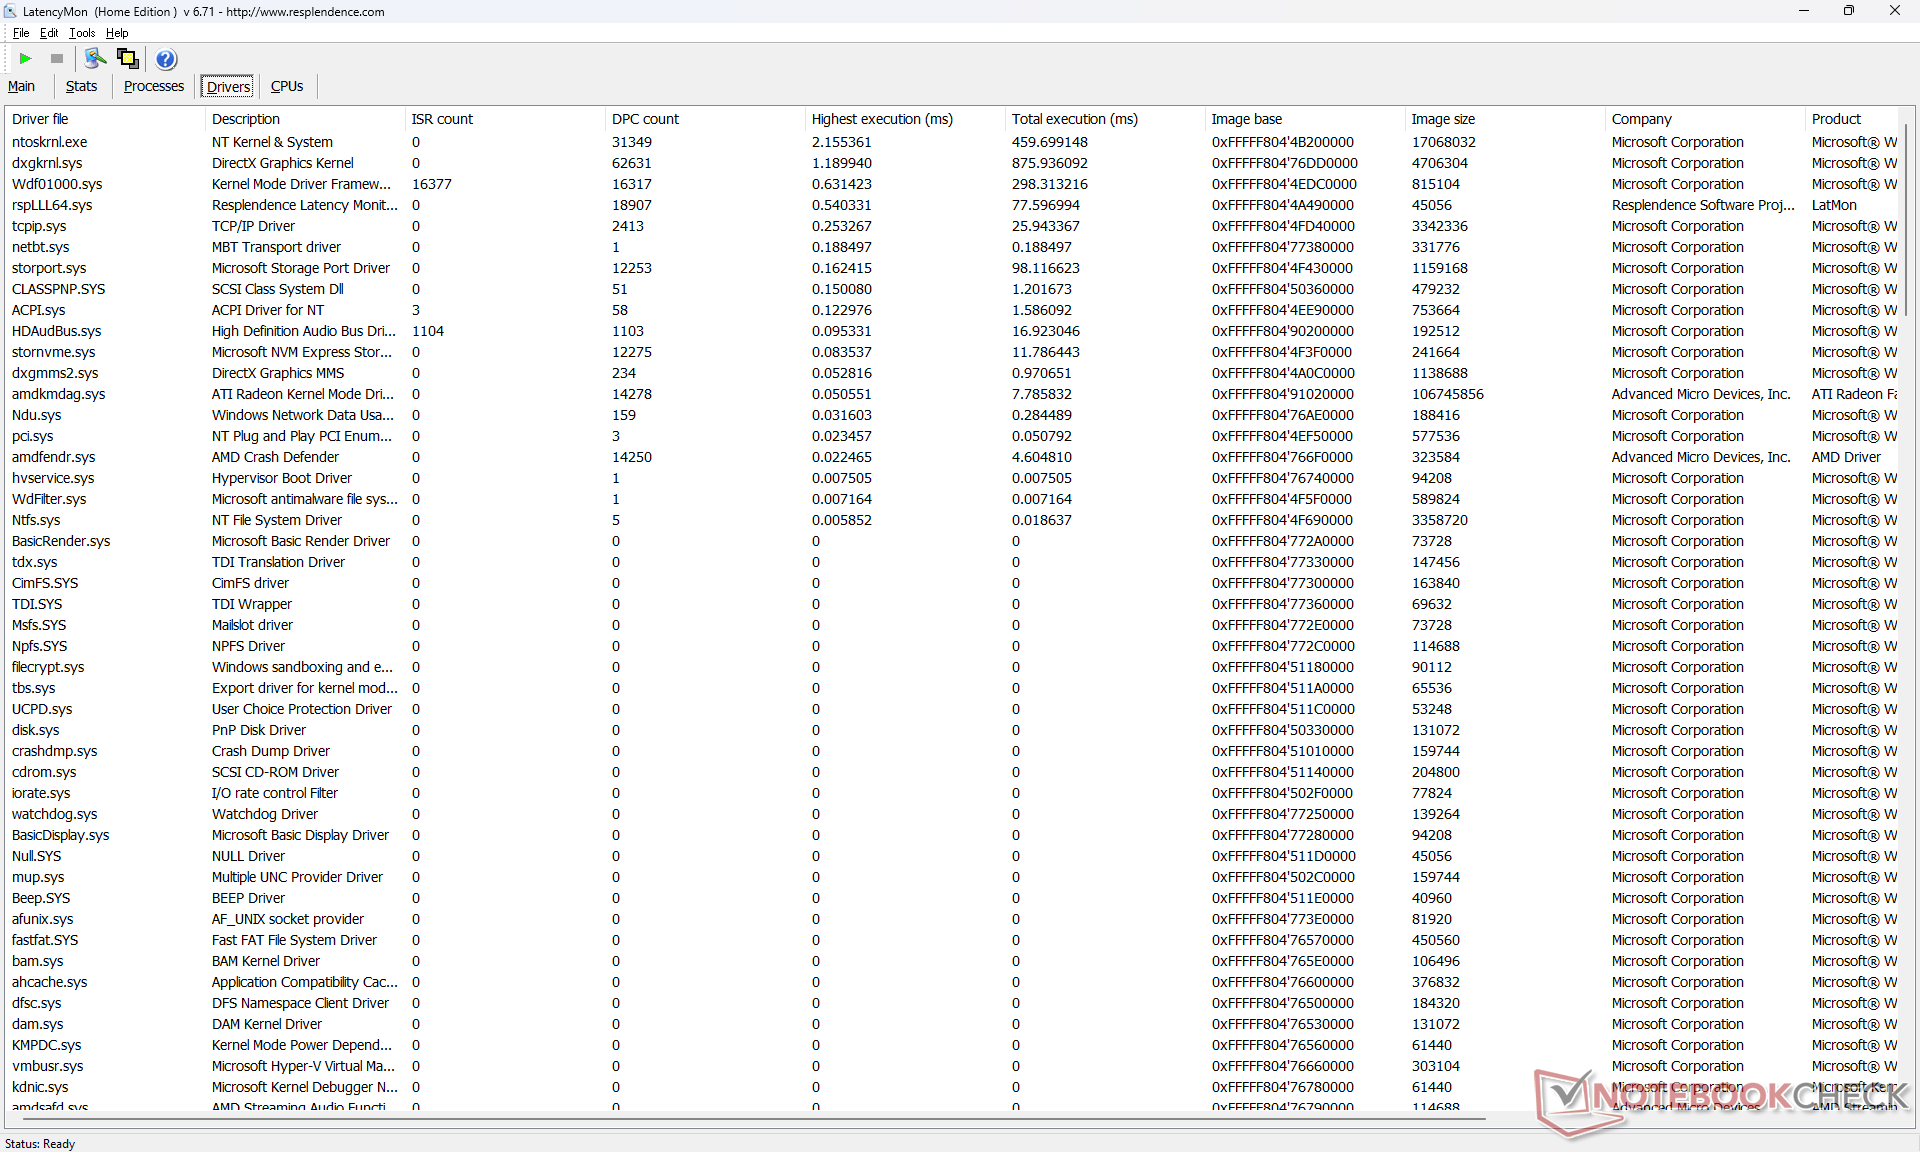
DPC Latency
LatencyMon reveals slight DPC issues when opening multiple browser tabs of our homepage which is not unusual. 4K video playback at 60 FPS could be better, however, as we're able to record 4 dropped frames within a 60-second window compared to 0 on the Blade 18.
| DPC Latencies / LatencyMon - interrupt to process latency (max), Web, Youtube, Prime95 | |
| Acer Predator Helios 18 N23Q2 | |
| MSI GE78HX 13VH-070US | |
| Alienware m18 R1 | |
| Razer Blade 18 RTX 4070 | |
| Alienware m18 R1 AMD | |
| Asus ROG Strix Scar 18 2023 G834JY-N6005W | |
* ... smaller is better
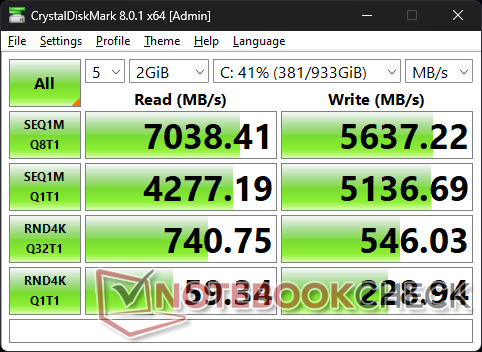
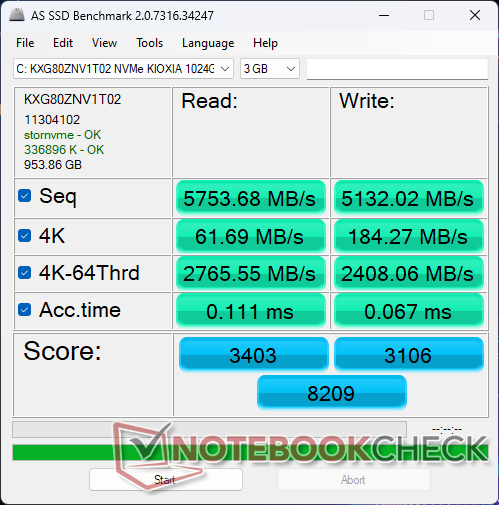
Storage Devices
The 1 TB Kioxia XG8 KXG80ZNV1T02 is a higher-end PCIe4 x4 NVMe SSD similar to the Samsung PM9A1 series. Our drive would exhibit no throttling issues maintaining high transfer rates of ~6300 MB/s for extended periods.

| Drive Performance rating - Percent | |
| Alienware m18 R1 | |
| Acer Predator Helios 18 N23Q2 | |
| MSI GE78HX 13VH-070US | |
| Razer Blade 18 RTX 4070 | |
| Alienware m18 R1 AMD | |
| Asus ROG Strix Scar 18 2023 G834JY-N6005W | |
* ... smaller is better
Disk Throttling: DiskSpd Read Loop, Queue Depth 8
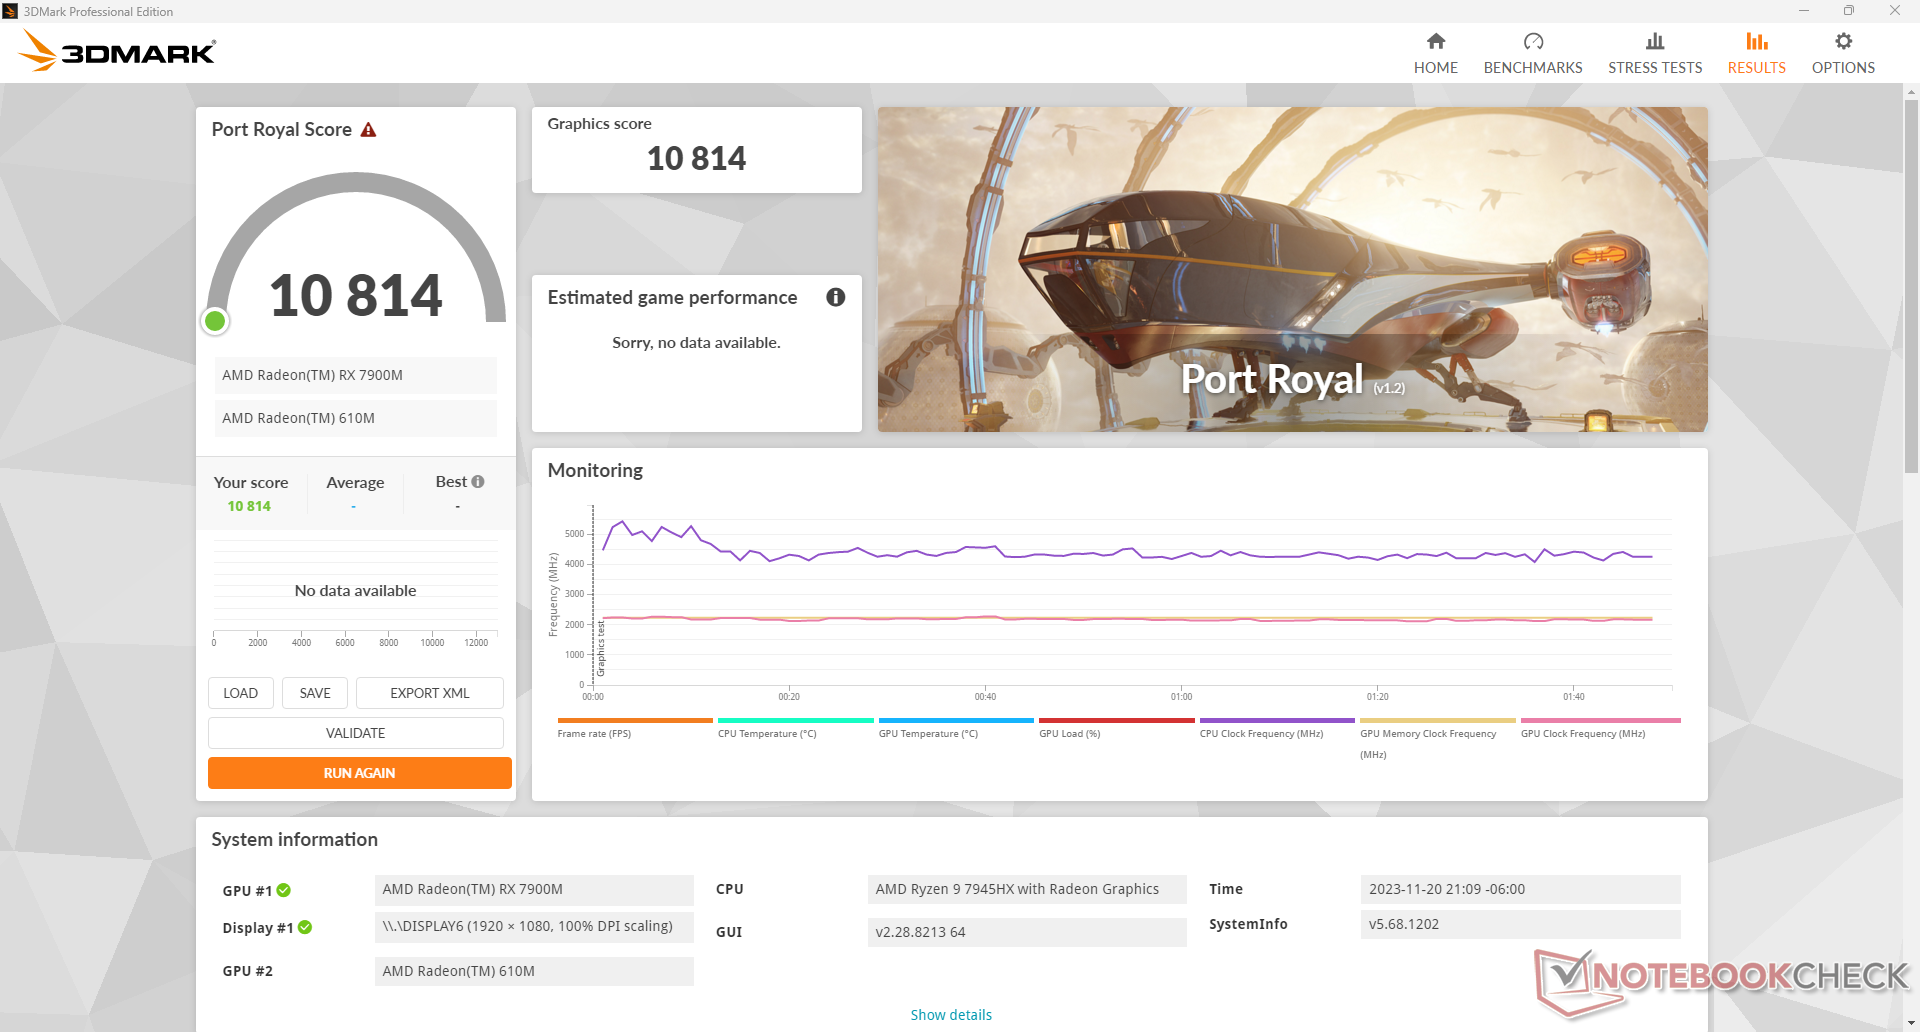
GPU Performance
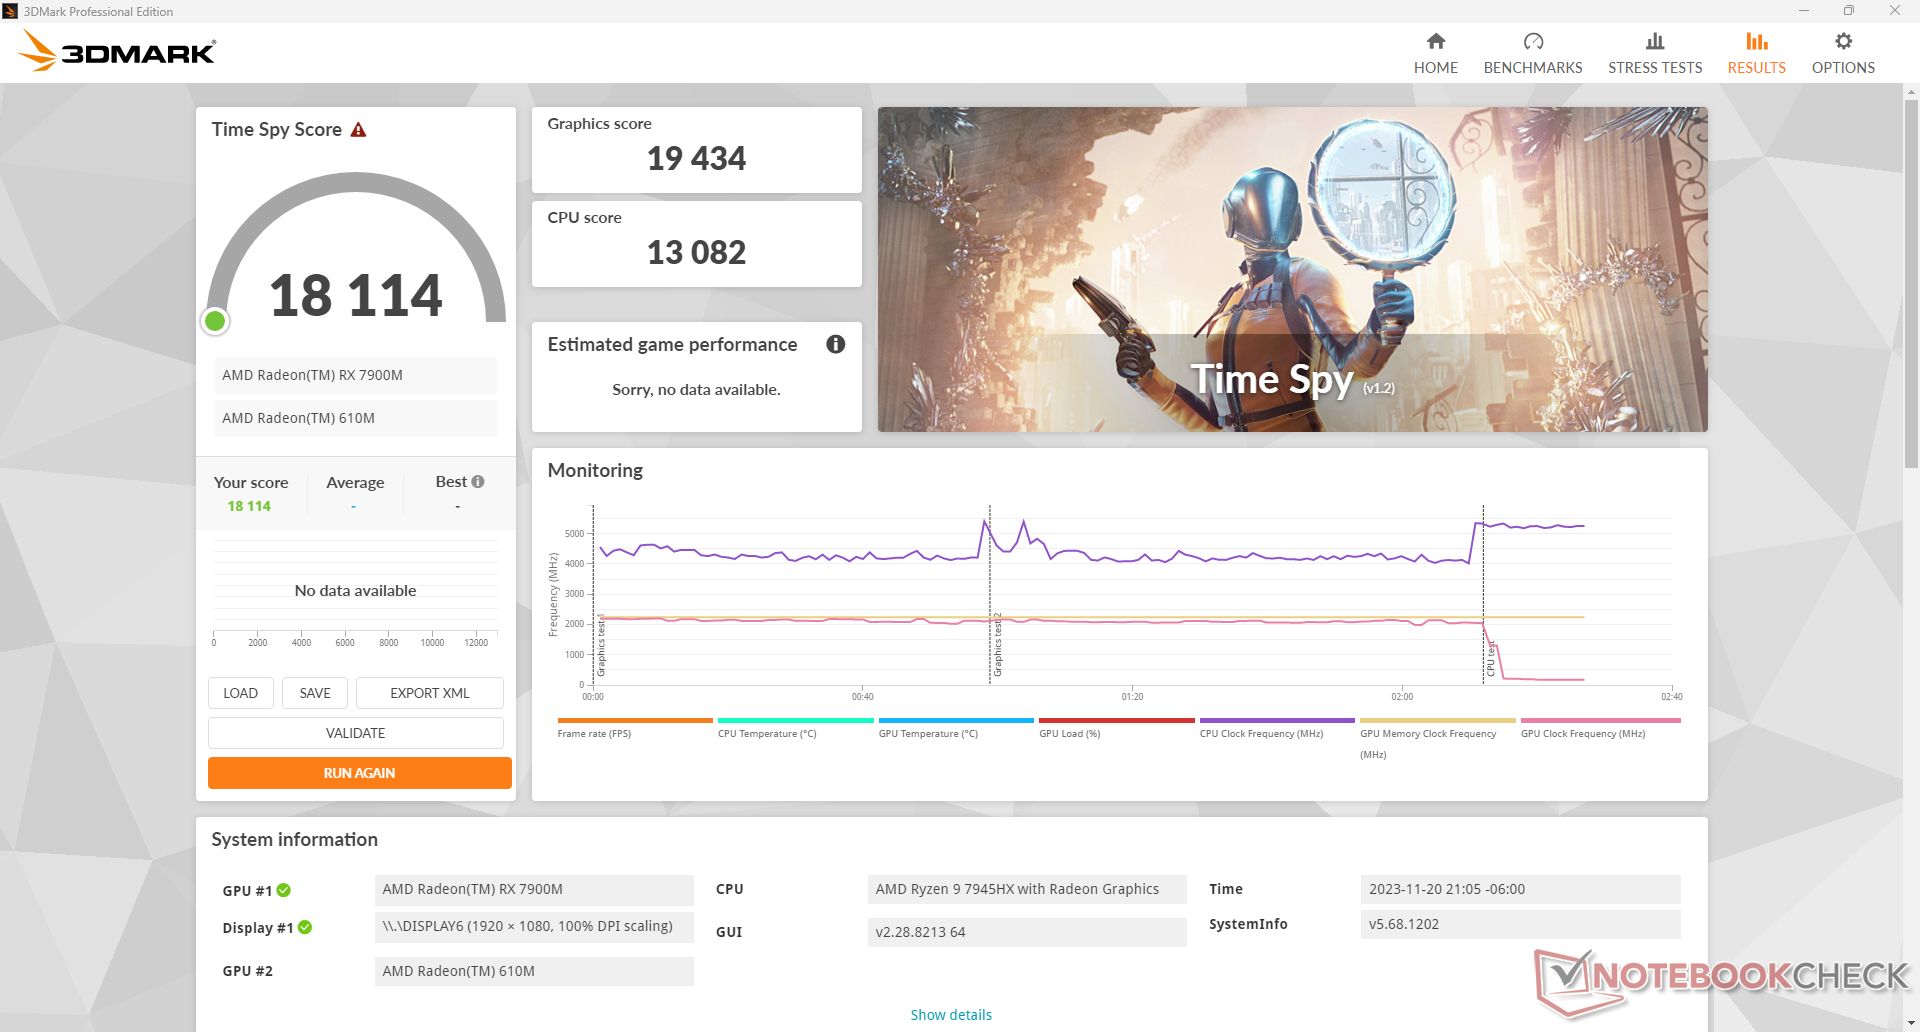
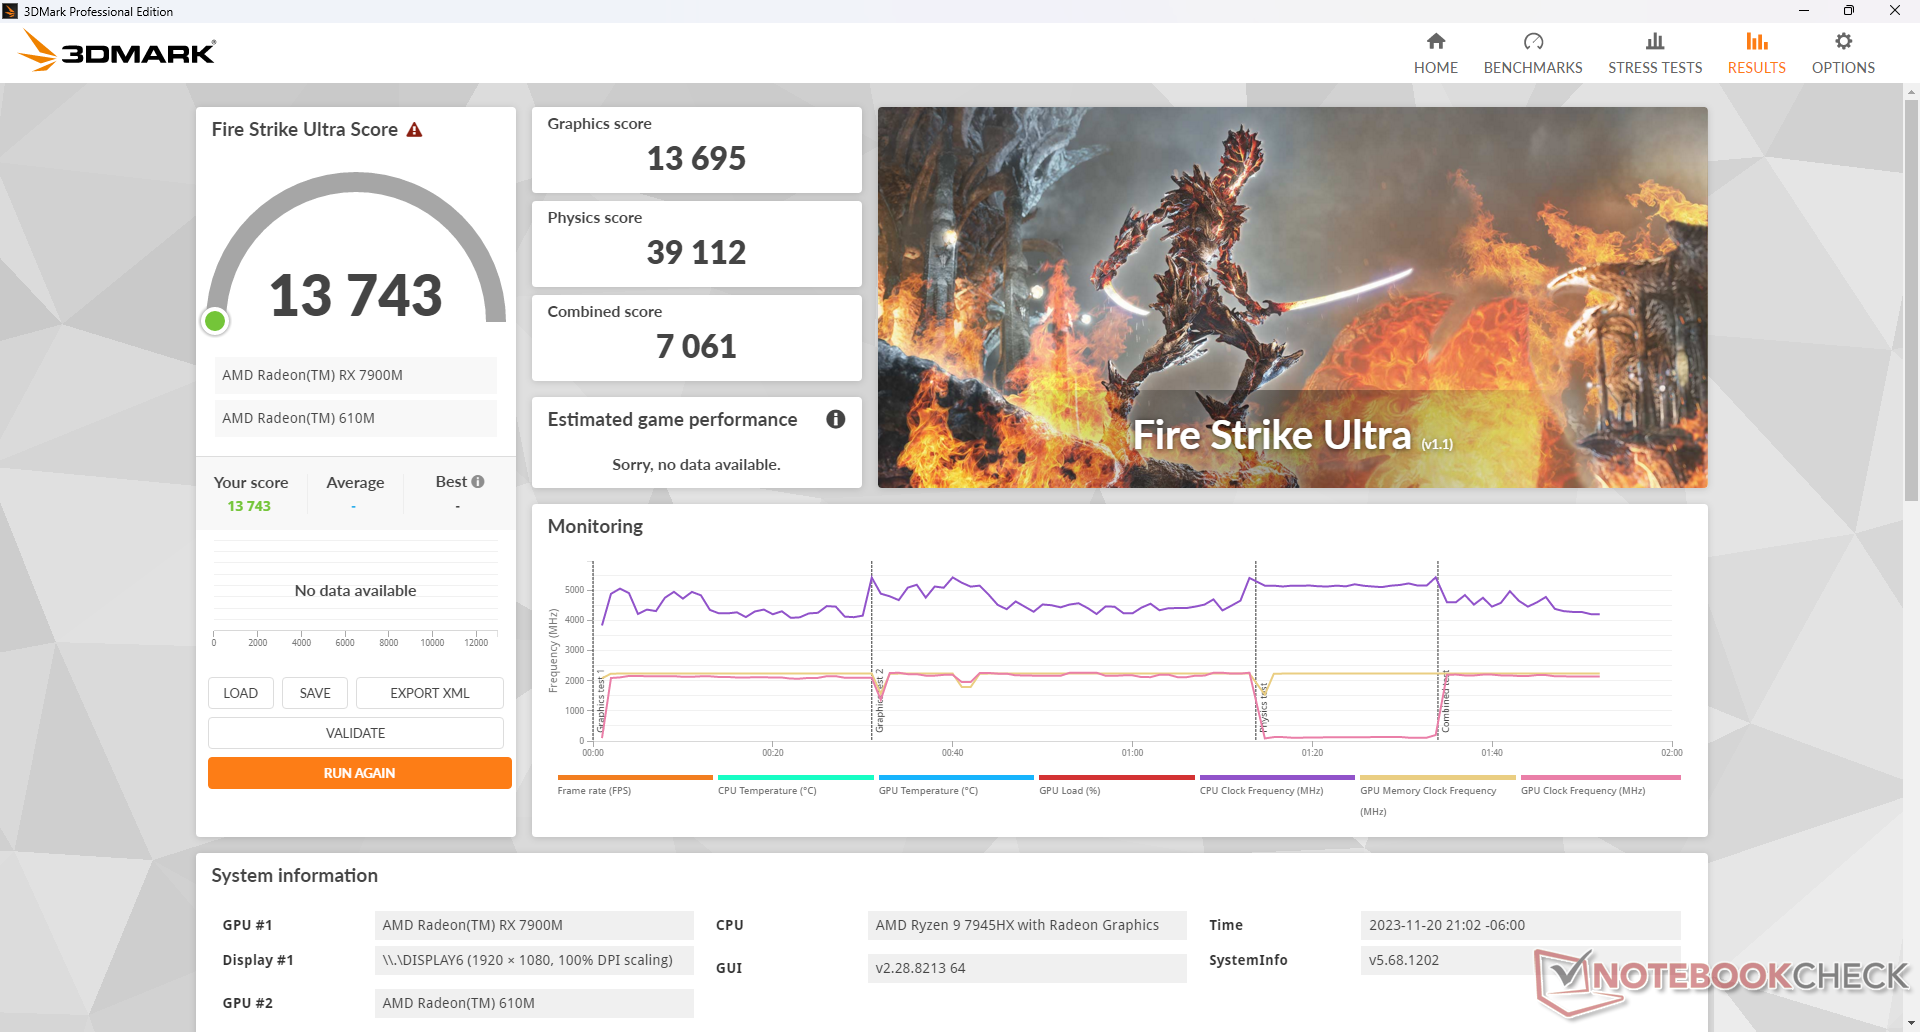
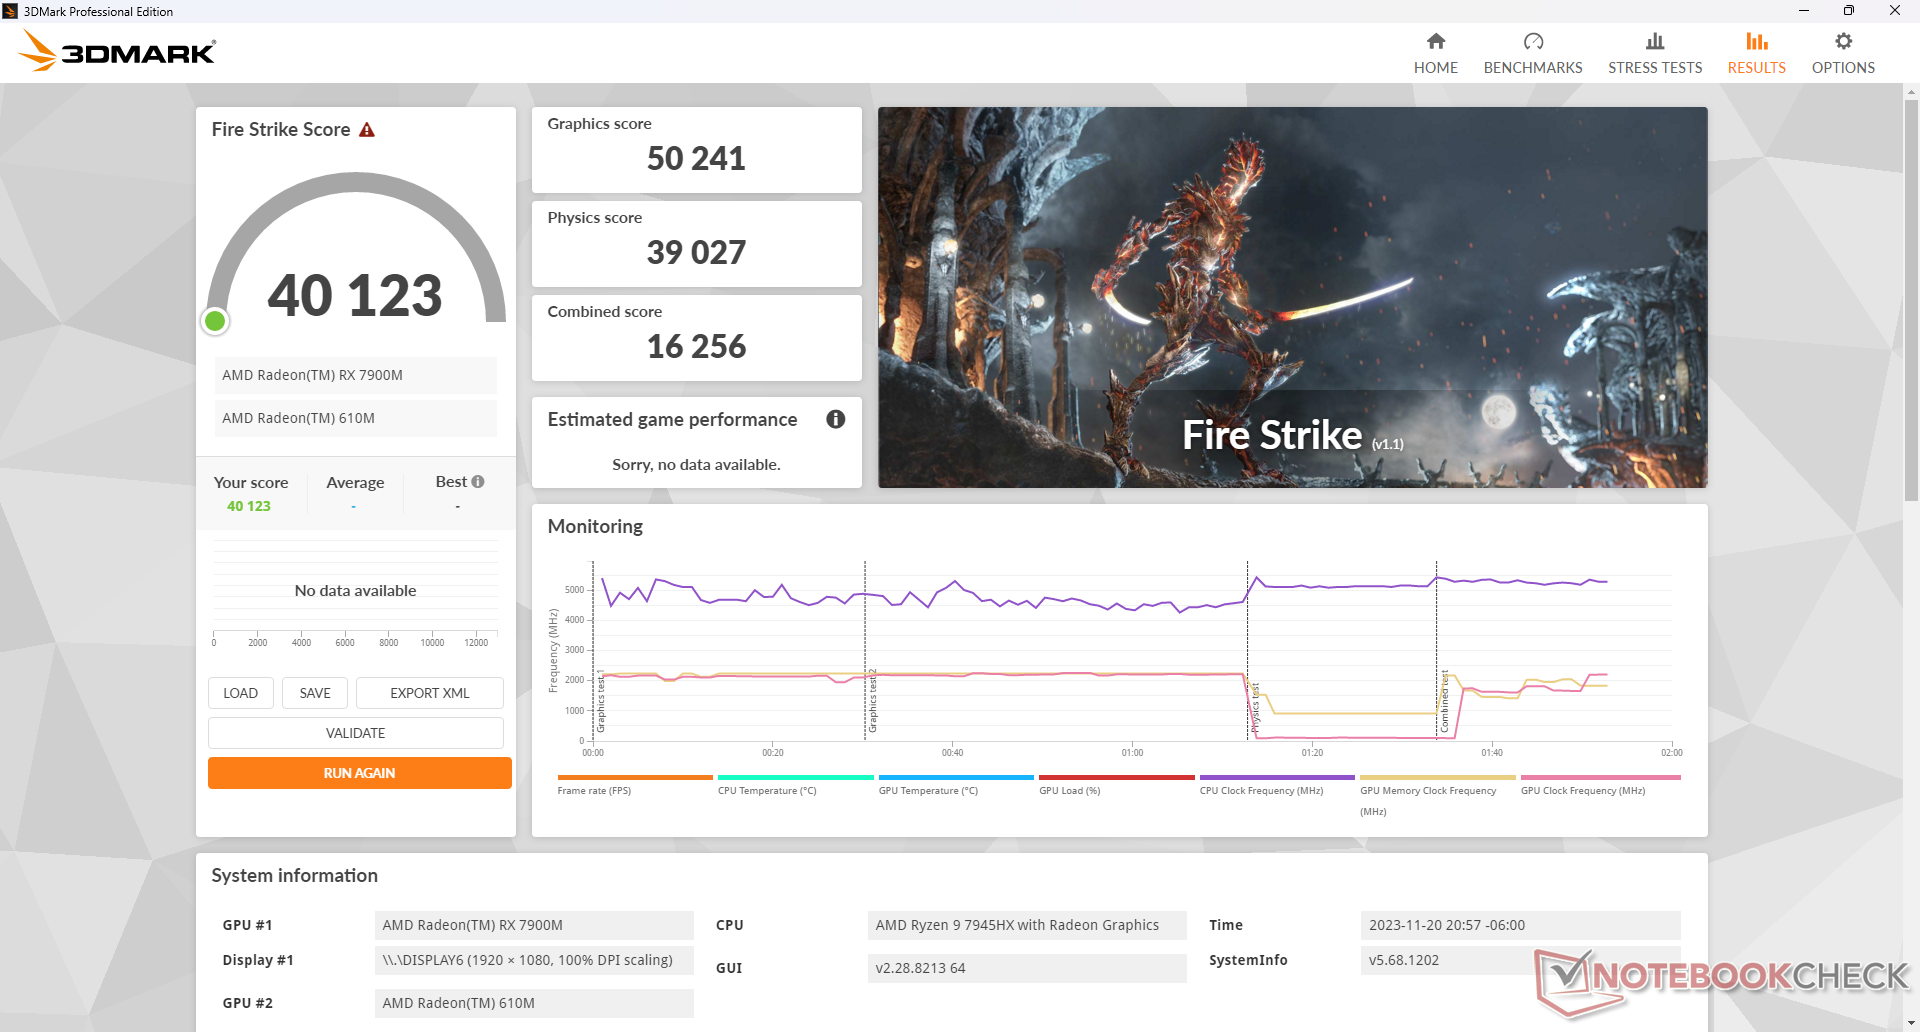
AMD is marketing the Radeon RX 7900M as a direct competitor to the mobile GeForce RTX 4080 and we think that is a very fair comparison. 3DMark results are on par with the RTX 4080 in the Alienware m16 R1 if not just slightly faster in the DX11-based Fire Strike test. The raw performance jump over last year's Radeon RX 6850M XT is significant at around 40 to 60 percent. AMD had no real answer to the mobile RTX 4070, 4080, or 4090 prior to the launch of the Radeon RX 7900M.
RT acceleration has always been a weak point of the Radeon series, but this has improved substantially for the Radeon RX 7900M. Our Port Royal score is about 10 percent behind a mobile GeForce RTX 4080 to represent a 2x to 2.5x increase over last year's Radeon RX 6800M. Enabling RT was previously never recommended on a Radeon-powered laptop due to the immense performance loss, but the Radeon RX 7900M is the turning point AMD fans have been waiting for.
Running on Performance mode or Balanced mode instead of Overdrive mode decreases performance by just a few percentage points as shown by our Fire Strike results table below. The minor differences are noteworthy as the fan noise differences between these modes are significant as detailed in our System Noise section below.
| Power Profile | Physics Score | Graphics Score | Combined Score |
| Overdrive Mode | 39027 | 50241 | 16256 |
| Performance Mode | 37979 (-3%) | 47187 (-6%) | 16523 (-0%) |
| Balanced Mode | 37590 (-4%) | 48170 (-4%) | 16382 (-0%) |
| Battery Power | 31494 (-19%) | 10735 (-79%) | 4174 (-74%) |
| 3DMark 11 Performance | 41670 points | |
| 3DMark Fire Strike Score | 40123 points | |
| 3DMark Time Spy Score | 18114 points | |
Help | ||
* ... smaller is better
Gaming Performance
The 3DMark results translate well into actual gaming performance. Frame rates when testing Cyberpunk 2077 or F1 22 would be within single-digit percentage points of the mobile RTX 4080 in most scenarios. If enabling RT, however, the performance drop will still be steeper when compared to the competing Nvidia GPU. For example, our Alienware would run 15 and 35 percent slower than the mobile RTX 4080 when enabling RT in F1 22 and Cyberpunk 2077, respectively, even though the two GPUs are otherwise very close when RT is disabled.
AMD has introduced FSR 3 alongside the launch of the Radeon RX 7900M as a direct answer to DLSS 3. Much like Nvidia's solution, the upscaling technology features both frame generation and latency reduction to offset the large performance hit when RT is enabled. Unfortunately, FSR 3 is currently in its infancy and barely any games support the feature whereas the number of games supporting DLSS 3 have had much more time to grow. Not even Cyberpunk 2077 supports FSR 3 as of this writing. More games will be updated with FSR 3 support moving into 2024 and beyond. In the meantime, owners will have to get by with the older but more widely supported FSR 2.
It's worth noting that we did not encounter any game-breaking bugs despite all the issues we noted in the System Performance section above. Additional games will be tested and added to the list below over time.
| Performance rating - Percent | |
| Alienware m18 R1 | |
| Asus ROG Strix Scar 18 2023 G834JY-N6005W -1! | |
| Acer Predator Helios 18 N23Q2 | |
| Alienware m18 R1 AMD | |
| MSI GE78HX 13VH-070US | |
| Razer Blade 18 RTX 4070 | |
| The Witcher 3 - 1920x1080 Ultra Graphics & Postprocessing (HBAO+) | |
| Alienware m18 R1 | |
| MSI GE78HX 13VH-070US | |
| Acer Predator Helios 18 N23Q2 | |
| Alienware m18 R1 AMD | |
| Razer Blade 18 RTX 4070 | |
| GTA V - 1920x1080 Highest AA:4xMSAA + FX AF:16x | |
| Acer Predator Helios 18 N23Q2 | |
| Alienware m18 R1 | |
| Asus ROG Strix Scar 18 2023 G834JY-N6005W | |
| Razer Blade 18 RTX 4070 | |
| Alienware m18 R1 AMD | |
| MSI GE78HX 13VH-070US | |
| Final Fantasy XV Benchmark - 1920x1080 High Quality | |
| Alienware m18 R1 | |
| Acer Predator Helios 18 N23Q2 | |
| Asus ROG Strix Scar 18 2023 G834JY-N6005W | |
| Alienware m18 R1 AMD | |
| MSI GE78HX 13VH-070US | |
| Razer Blade 18 RTX 4070 | |
| Strange Brigade - 1920x1080 ultra AA:ultra AF:16 | |
| Alienware m18 R1 | |
| Asus ROG Strix Scar 18 2023 G834JY-N6005W | |
| Alienware m18 R1 AMD | |
| Acer Predator Helios 18 N23Q2 | |
| MSI GE78HX 13VH-070US | |
| Razer Blade 18 RTX 4070 | |
| Dota 2 Reborn - 1920x1080 ultra (3/3) best looking | |
| Alienware m18 R1 | |
| Asus ROG Strix Scar 18 2023 G834JY-N6005W | |
| Acer Predator Helios 18 N23Q2 | |
| Razer Blade 18 RTX 4070 | |
| Alienware m18 R1 AMD | |
| MSI GE78HX 13VH-070US | |
| Tiny Tina's Wonderlands | |
| 1920x1080 Badass Preset (DX12) | |
| Alienware m18 R1 | |
| AMD Radeon RX 7900 GRE | |
| Alienware m16 R1 AMD | |
| Alienware m18 R1 AMD | |
| Average AMD Radeon RX 7900M (n=1) | |
| Asus TUF Gaming A16 FA617XS | |
| Corsair Voyager a1600 | |
| Asus ROG Zephyrus G14 GA402RJ | |
| 2560x1440 Badass Preset (DX12) | |
| Alienware m18 R1 | |
| AMD Radeon RX 7900 GRE | |
| Alienware m16 R1 AMD | |
| Alienware m18 R1 AMD | |
| Average AMD Radeon RX 7900M (n=1) | |
| Corsair Voyager a1600 | |
| Asus ROG Zephyrus G14 GA402RJ | |
| 3840x2160 Badass Preset (DX12) | |
| Alienware m18 R1 | |
| AMD Radeon RX 7900 GRE | |
| Alienware m16 R1 AMD | |
| Alienware m18 R1 AMD | |
| Average AMD Radeon RX 7900M (n=1) | |
| Corsair Voyager a1600 | |
| Ratchet & Clank Rift Apart | |
| 1920x1080 Very High Preset AA:T | |
| AMD Radeon RX 7900 GRE | |
| Alienware m18 R1 AMD | |
| Average AMD Radeon RX 7900M (n=1) | |
| 2560x1440 Very High Preset AA:T | |
| AMD Radeon RX 7900 GRE | |
| Alienware m18 R1 AMD | |
| Average AMD Radeon RX 7900M (n=1) | |
| 3840x2160 Very High Preset AA:T | |
| AMD Radeon RX 7900 GRE | |
| Alienware m18 R1 AMD | |
| Average AMD Radeon RX 7900M (n=1) | |
| 1920x1080 Very High Preset + Very High Raytracing AA:T | |
| Alienware m18 R1 AMD | |
| Average AMD Radeon RX 7900M (n=1) | |
| Cyberpunk 2077 | |
| 1920x1080 High Preset (FSR off) | |
| Alienware m18 R1 AMD | |
| Average AMD Radeon RX 7900M (n=1) | |
| 1920x1080 Ultra Preset (FSR off) | |
| Alienware m18 R1 AMD | |
| Average AMD Radeon RX 7900M (n=1) | |
| Acer Predator Helios 18 N23Q2 | |
| Razer Blade 16 Early 2023 | |
| Razer Blade 16 Early 2023 | |
| 2560x1440 Ultra Preset (FSR off) | |
| Alienware m18 R1 AMD | |
| Average AMD Radeon RX 7900M (n=1) | |
| Razer Blade 16 Early 2023 | |
| Razer Blade 16 Early 2023 | |
| Acer Predator Helios 18 N23Q2 | |
| 3840x2160 Ultra Preset (FSR off) | |
| Alienware m18 R1 AMD | |
| Average AMD Radeon RX 7900M (n=1) | |
| Razer Blade 16 Early 2023 | |
| Razer Blade 16 Early 2023 | |
| 1920x1080 Ray Tracing Ultra Preset (DLSS off) | |
| Alienware m18 R1 AMD | |
| Average AMD Radeon RX 7900M (n=1) | |
| 3840x2160 Ray Tracing Ultra Preset + DLSS3 Quality + FG | |
| Razer Blade 16 Early 2023 | |
| 1920x1080 Ultra Preset (FSR2 on) | |
| Alienware m18 R1 AMD | |
| Average AMD Radeon RX 7900M (n=1) | |
| Razer Blade 16 Early 2023 | |
Performance would occasionally drop to the low 70 FPS range from a high of ~180 FPS when idling on Witcher 3 as shown by the graph below. During gameplay, the performance dips would manifest as stutters even when there are no gameplay movements. This would occur at a distinct frequency to suggest an interrupting background issue that should be addressed.
The performance bug would not occur when repeating this test on the Intel-Nvidia configuration of the same Alienware model.
Witcher 3 FPS Chart
| low | med. | high | ultra | QHD | 4K | |
|---|---|---|---|---|---|---|
| GTA V (2015) | 172.9 | 105 | 105.6 | 146 | ||
| The Witcher 3 (2015) | 167.7 | 116 | ||||
| Dota 2 Reborn (2015) | 162.8 | 146.2 | 122.5 | |||
| Final Fantasy XV Benchmark (2018) | 152.8 | 114.6 | 69.3 | |||
| X-Plane 11.11 (2018) | 83.7 | 64.3 | ||||
| Far Cry 5 (2018) | 128 | 123 | 103 | |||
| Strange Brigade (2018) | 344 | 249 | 130.5 | |||
| Shadow of the Tomb Raider (2018) | 207 | 198 | 139 | 76 | ||
| Cyberpunk 2077 1.6 (2022) | 135 | 93.3 | 44.3 | |||
| Tiny Tina's Wonderlands (2022) | 150.2 | 106.8 | 56 | |||
| F1 22 (2022) | 296 | 102.8 | 69.3 | 36.1 | ||
| Ratchet & Clank Rift Apart (2023) | 86.2 | 83.6 | 54.8 | |||
| Baldur's Gate 3 (2023) | 152.4 | 152.6 | 118.5 | 65.8 | ||
| Cyberpunk 2077 (2023) | 130.7 | 129.6 | 85.2 | 37.7 | ||
| Alan Wake 2 (2023) | 104.8 | 71.7 | 37.3 |
Emissions
System Noise
There are no major fan noise differences between our Intel and AMD configurations. This isn't necessarily a good thing, however, as the fans in our AMD unit would pulse rather frequently and seemingly for no reason when browsing the web or streaming video. The system would run silently at 23 dB(A) and then sharply pulse up to 33.5 dB(A) even when on the Quiet or Battery power profiles.
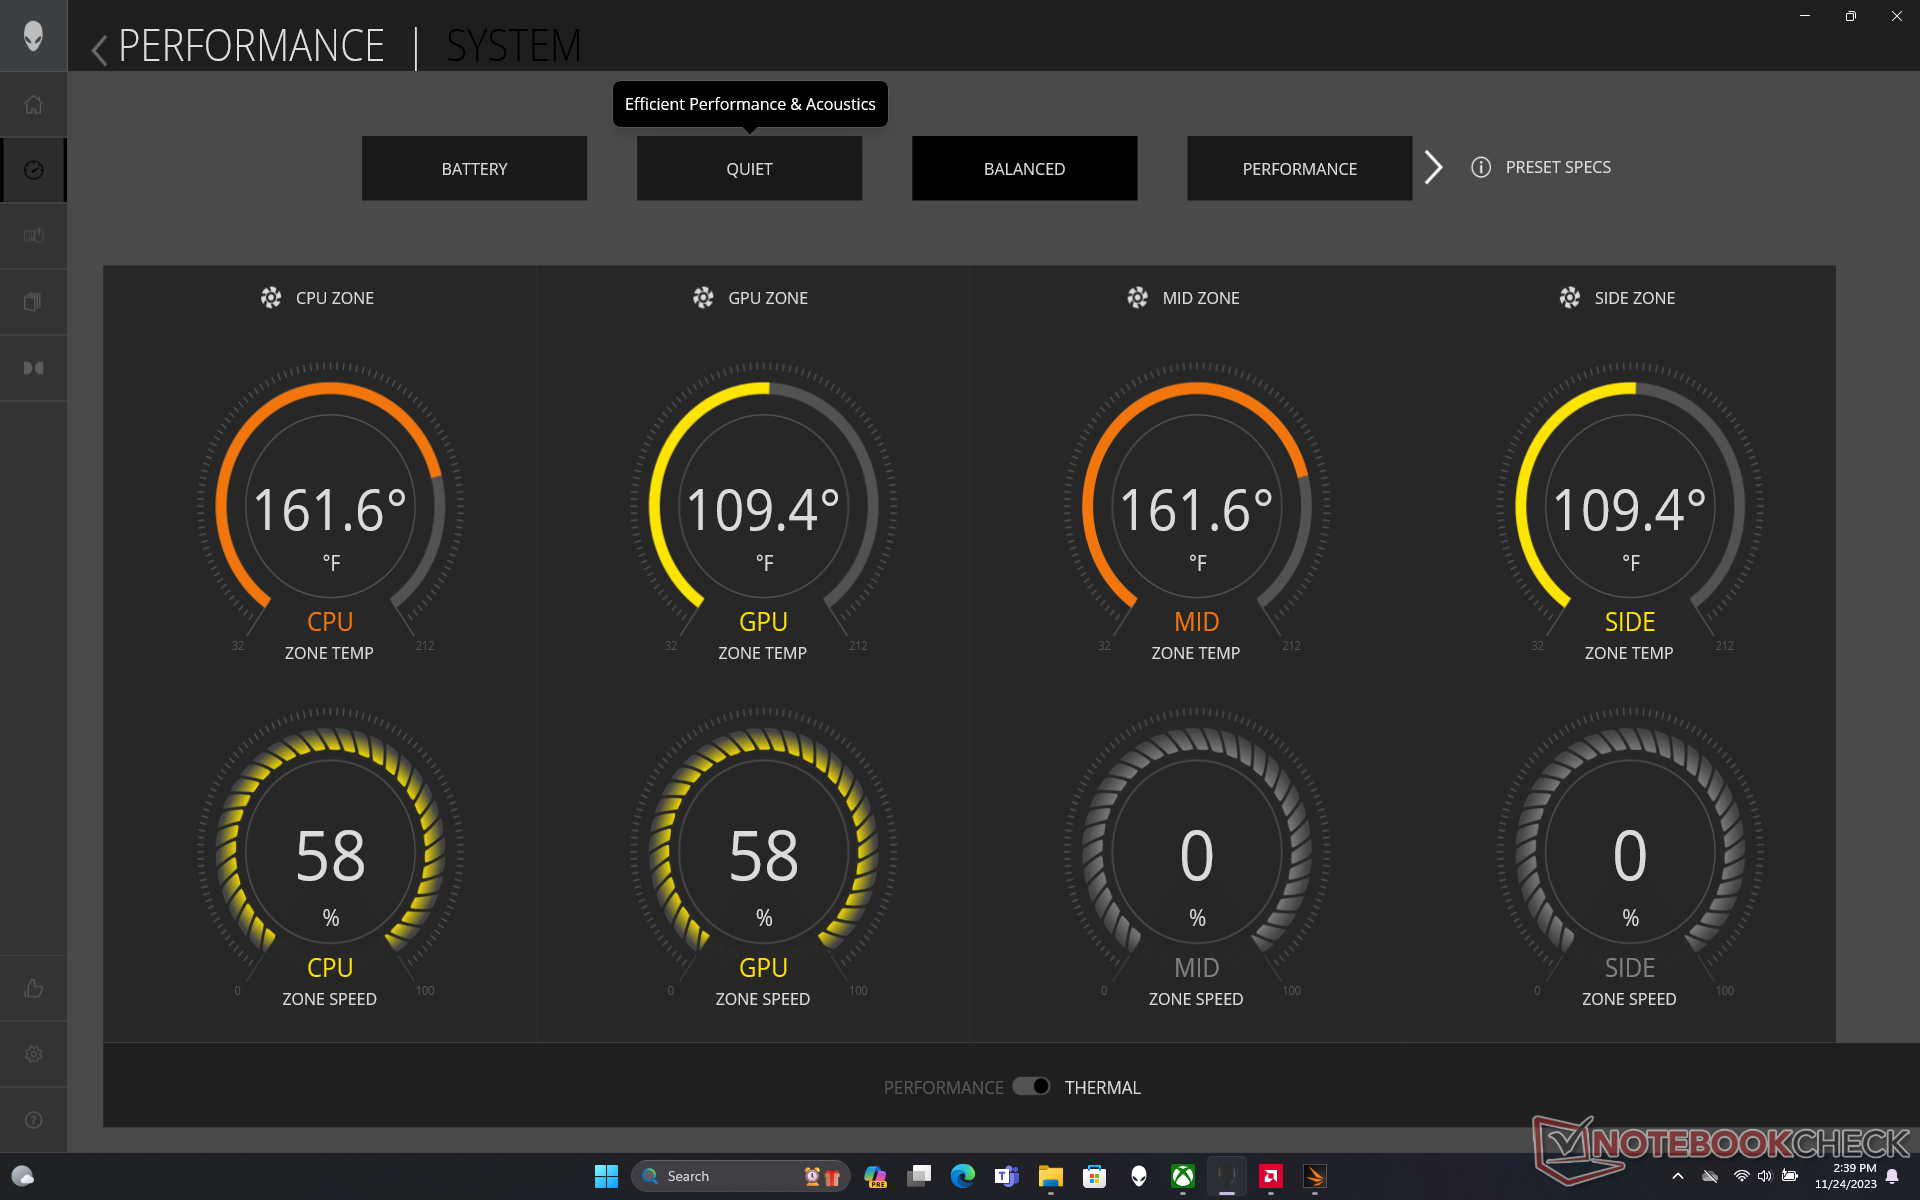
Interestingly, there are no fan noise differences between the Balanced and Performance power profiles as we're able to record a maximum of 48 dB(A) when gaming on either profile. Gaming on Overdrive mode, however, would bump fan noise up to a screeching 54 dB(A). Users may then want to consider gaming on Performance mode for noticeably quieter fans even if it means sacrificing 5 to 10 percent performance.
Don't expect the Alienware to run much quieter than other 18-inch gaming laptops despite it having two times the number of fans inside. The system still runs louder than 50 dB(A) when gaming which practically demands a good pair of headphones.

Noise level
| Idle |
| 23 / 23.4 / 33.5 dB(A) |
| Load |
| 33.5 / 53.6 dB(A) |
 | ||
30 dB silent 40 dB(A) audible 50 dB(A) loud |
||
min: | ||
| Alienware m18 R1 AMD Radeon RX 7900M, R9 7945HX, Kioxia XG8 KXG80ZNV1T02 | Alienware m18 R1 GeForce RTX 4090 Laptop GPU, i9-13980HX, SK hynix PC801 HFS001TEJ9X101N | Acer Predator Helios 18 N23Q2 GeForce RTX 4080 Laptop GPU, i9-13900HX, Samsung PM9A1 MZVL22T0HBLB | Razer Blade 18 RTX 4070 GeForce RTX 4070 Laptop GPU, i9-13950HX, SSSTC CA6-8D1024 | Asus ROG Strix Scar 18 2023 G834JY-N6005W GeForce RTX 4090 Laptop GPU, i9-13980HX, 2x Samsung PM9A1 MZVL21T0HCLR (RAID 0) | MSI GE78HX 13VH-070US GeForce RTX 4080 Laptop GPU, i9-13950HX, Samsung PM9A1 MZVL22T0HBLB | |
|---|---|---|---|---|---|---|
| Noise | 3% | -4% | 1% | -10% | -8% | |
| off / environment * (dB) | 22.4 | 22.8 -2% | 23 -3% | 23.5 -5% | 23.9 -7% | 23.4 -4% |
| Idle Minimum * (dB) | 23 | 23 -0% | 23 -0% | 23.8 -3% | 23.9 -4% | 24.2 -5% |
| Idle Average * (dB) | 23.4 | 23 2% | 23 2% | 23.8 -2% | 32.6 -39% | 25.6 -9% |
| Idle Maximum * (dB) | 33.5 | 23 31% | 23 31% | 26.8 20% | 32.6 3% | 31 7% |
| Load Average * (dB) | 33.5 | 35.6 -6% | 45.26 -35% | 37.3 -11% | 35.9 -7% | 43.3 -29% |
| Witcher 3 ultra * (dB) | 53.6 | 51.3 4% | 59.82 -12% | 48 10% | 56.3 -5% | |
| Load Maximum * (dB) | 53.6 | 56.7 -6% | 59.94 -12% | 53.5 -0% | 55.8 -4% | 59.1 -10% |
* ... smaller is better
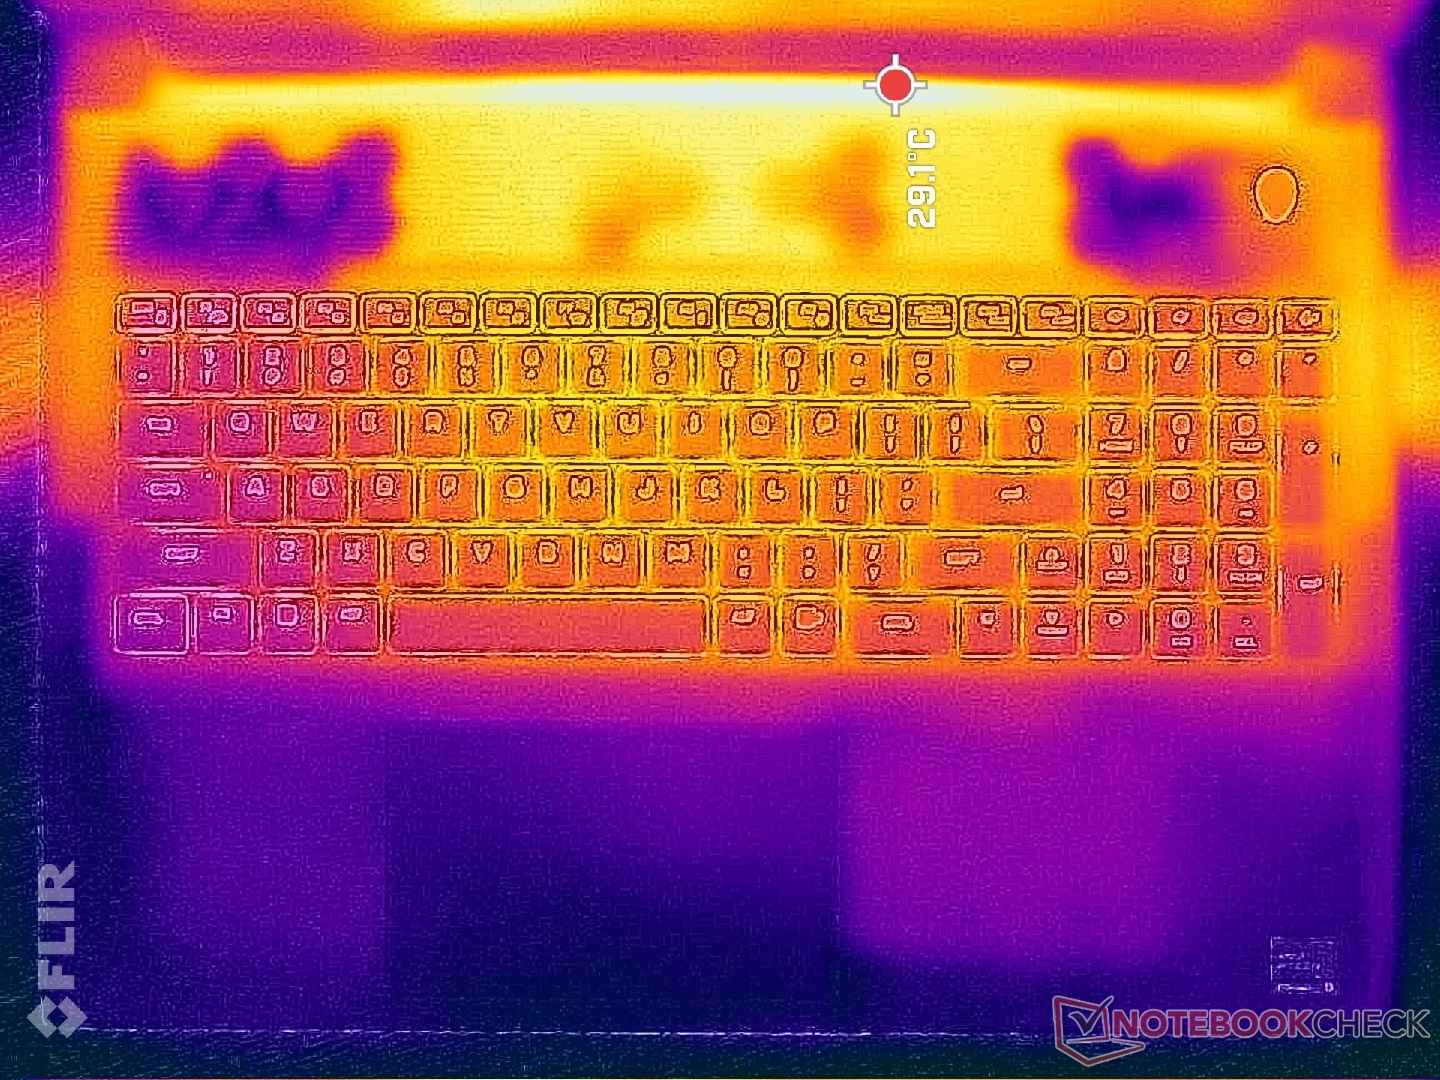
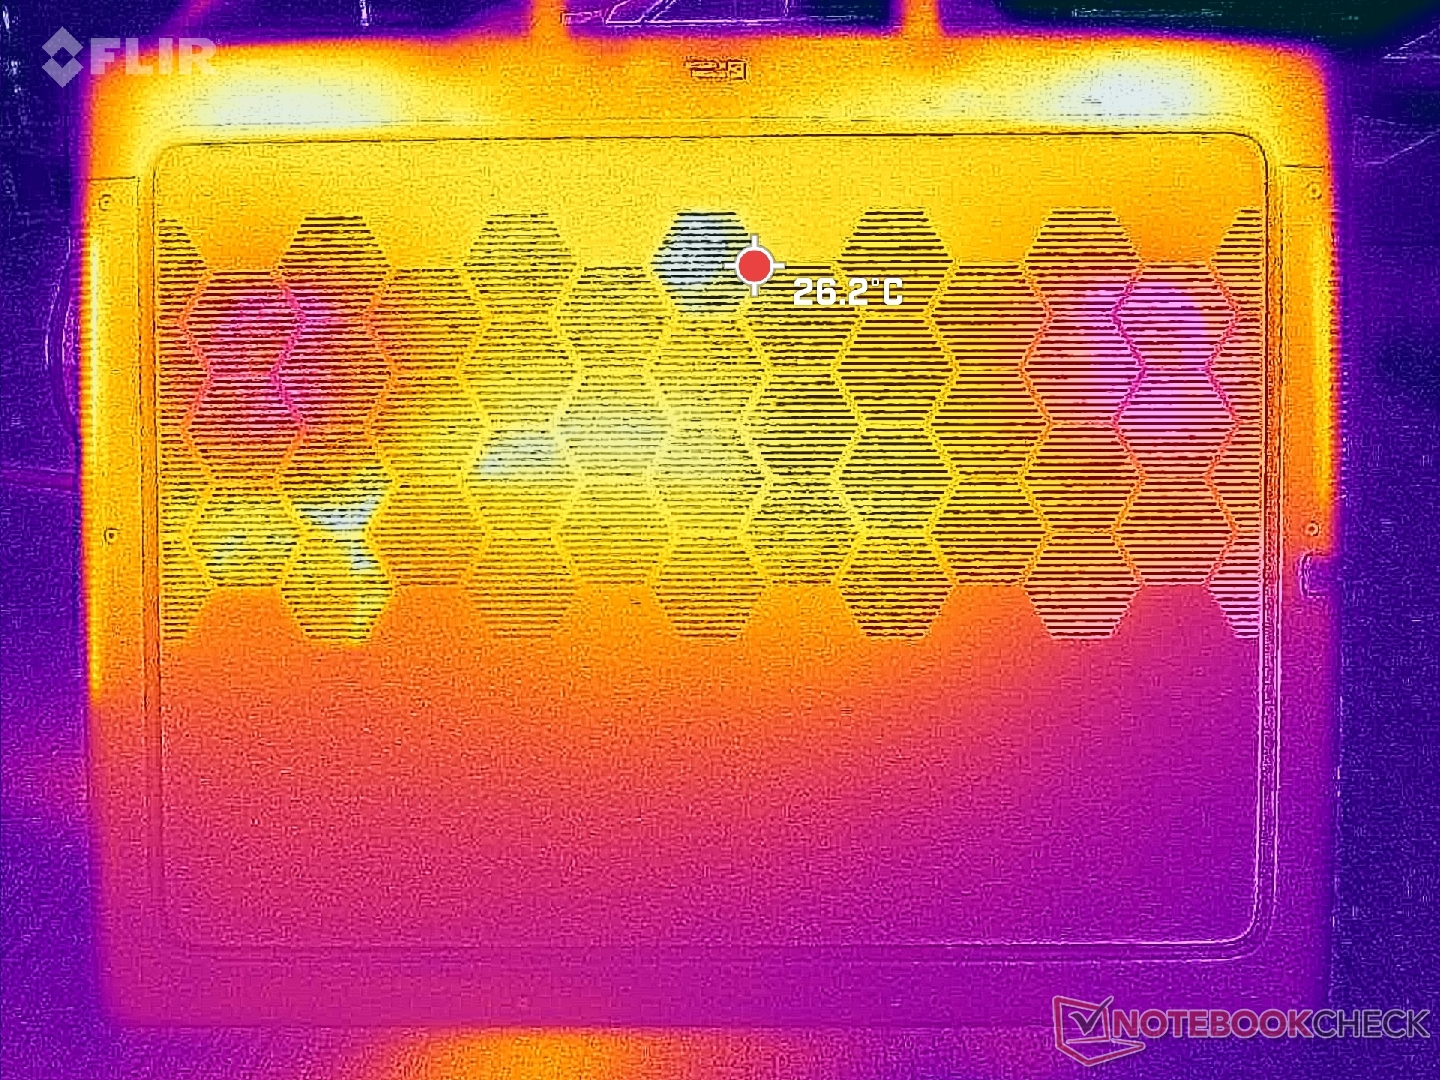
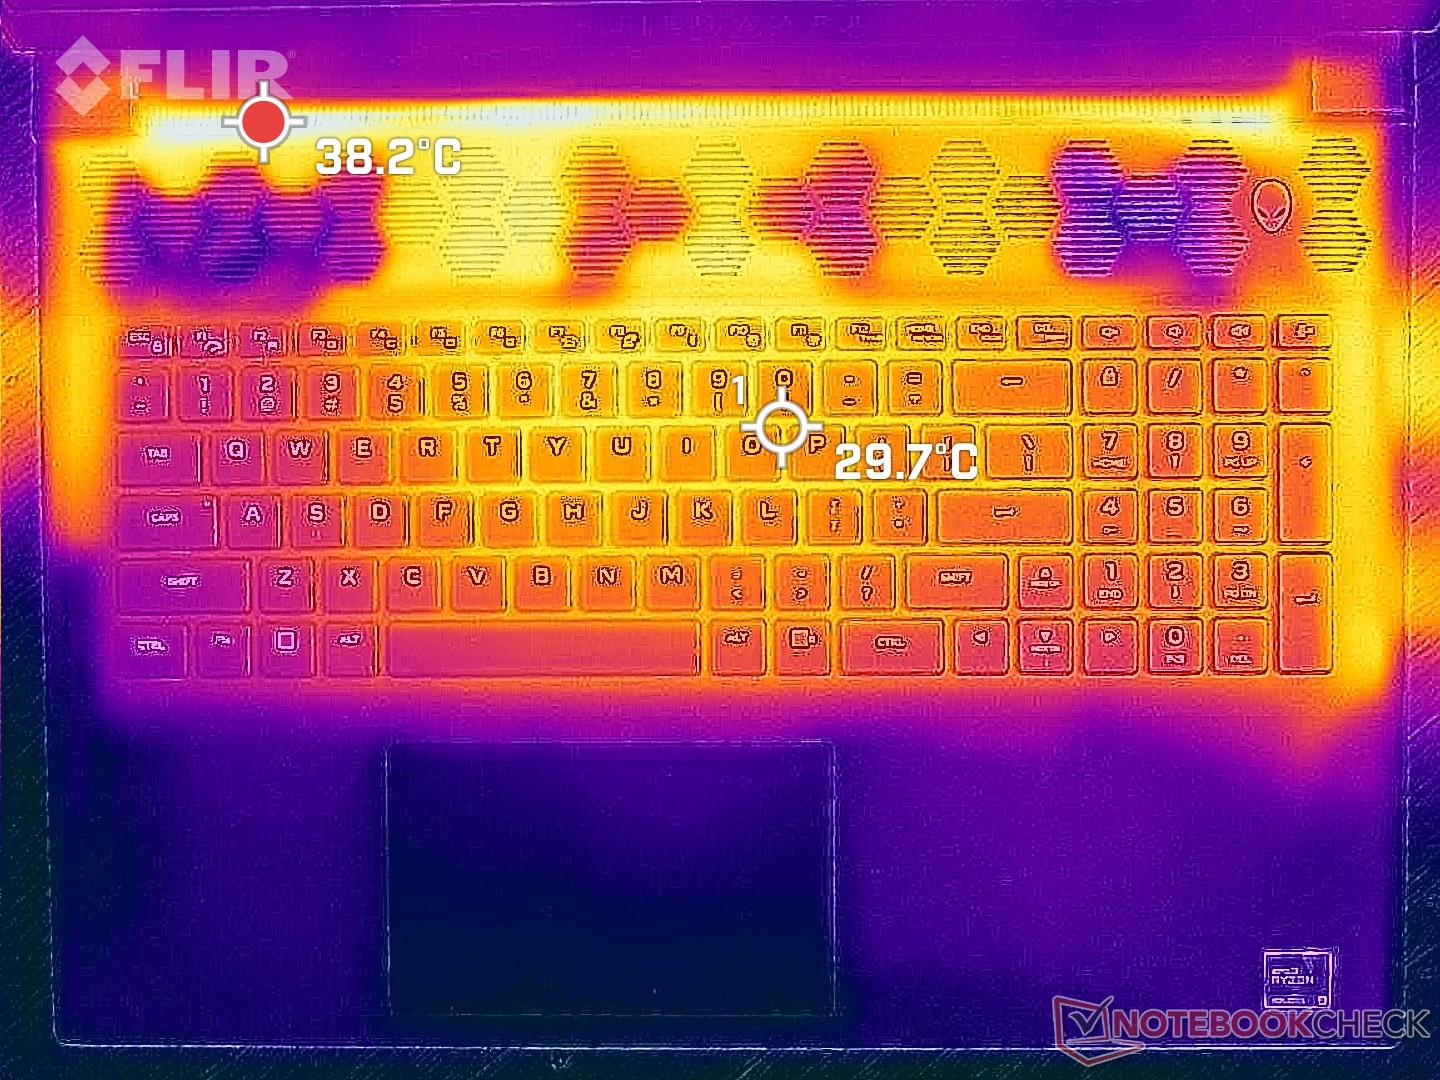
Temperature
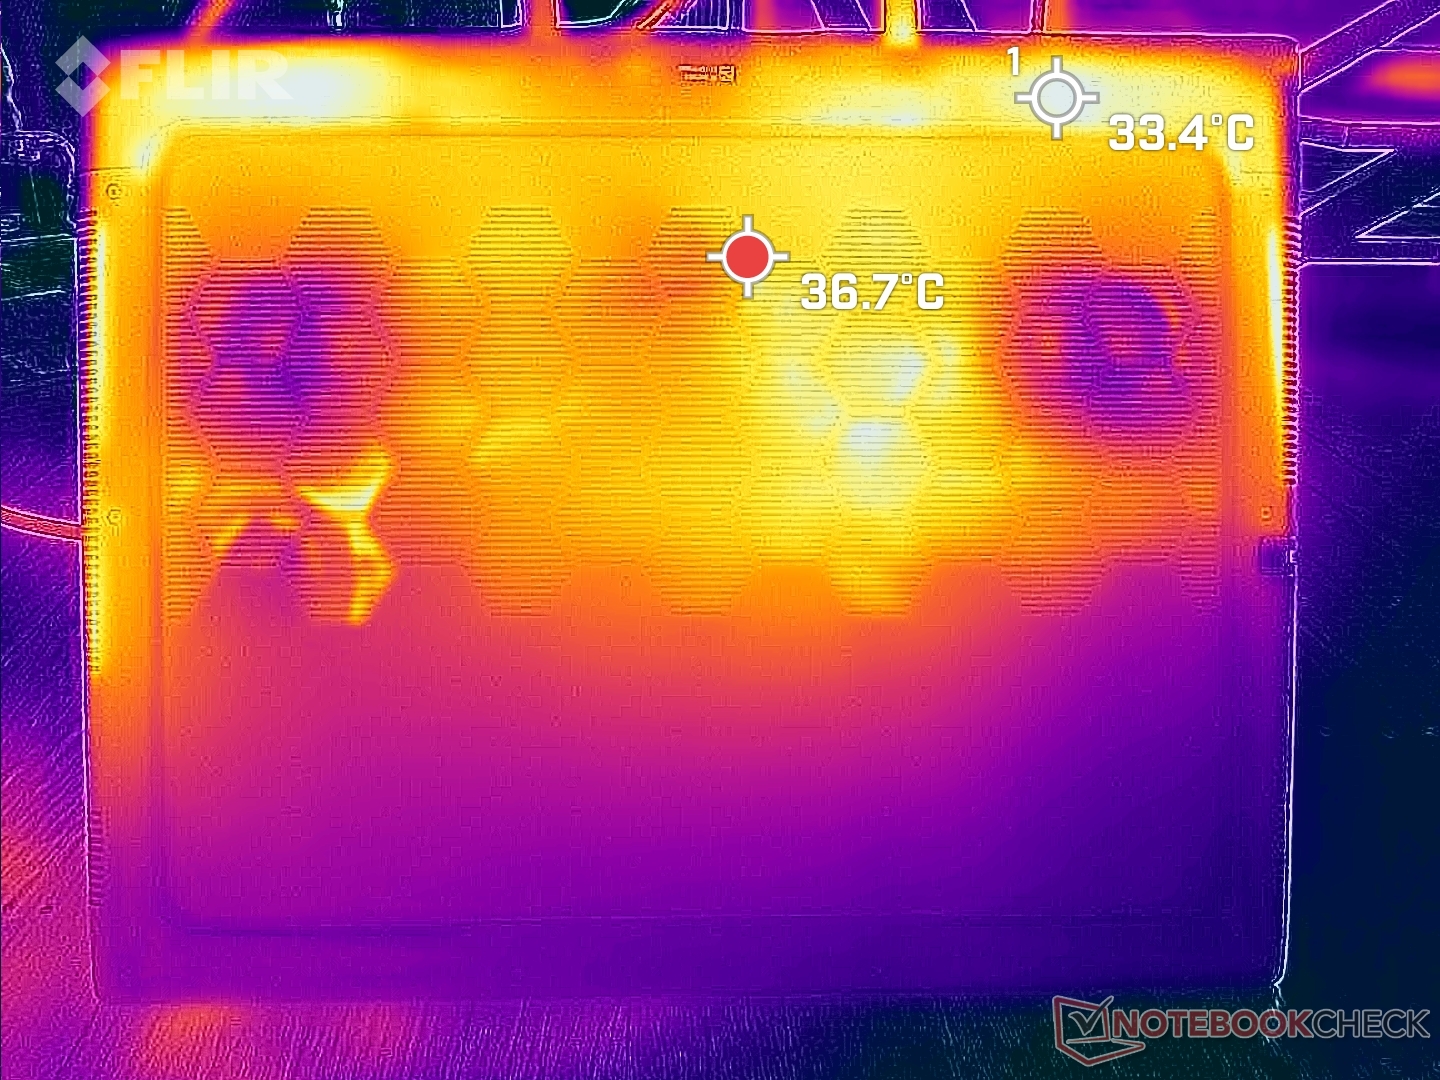
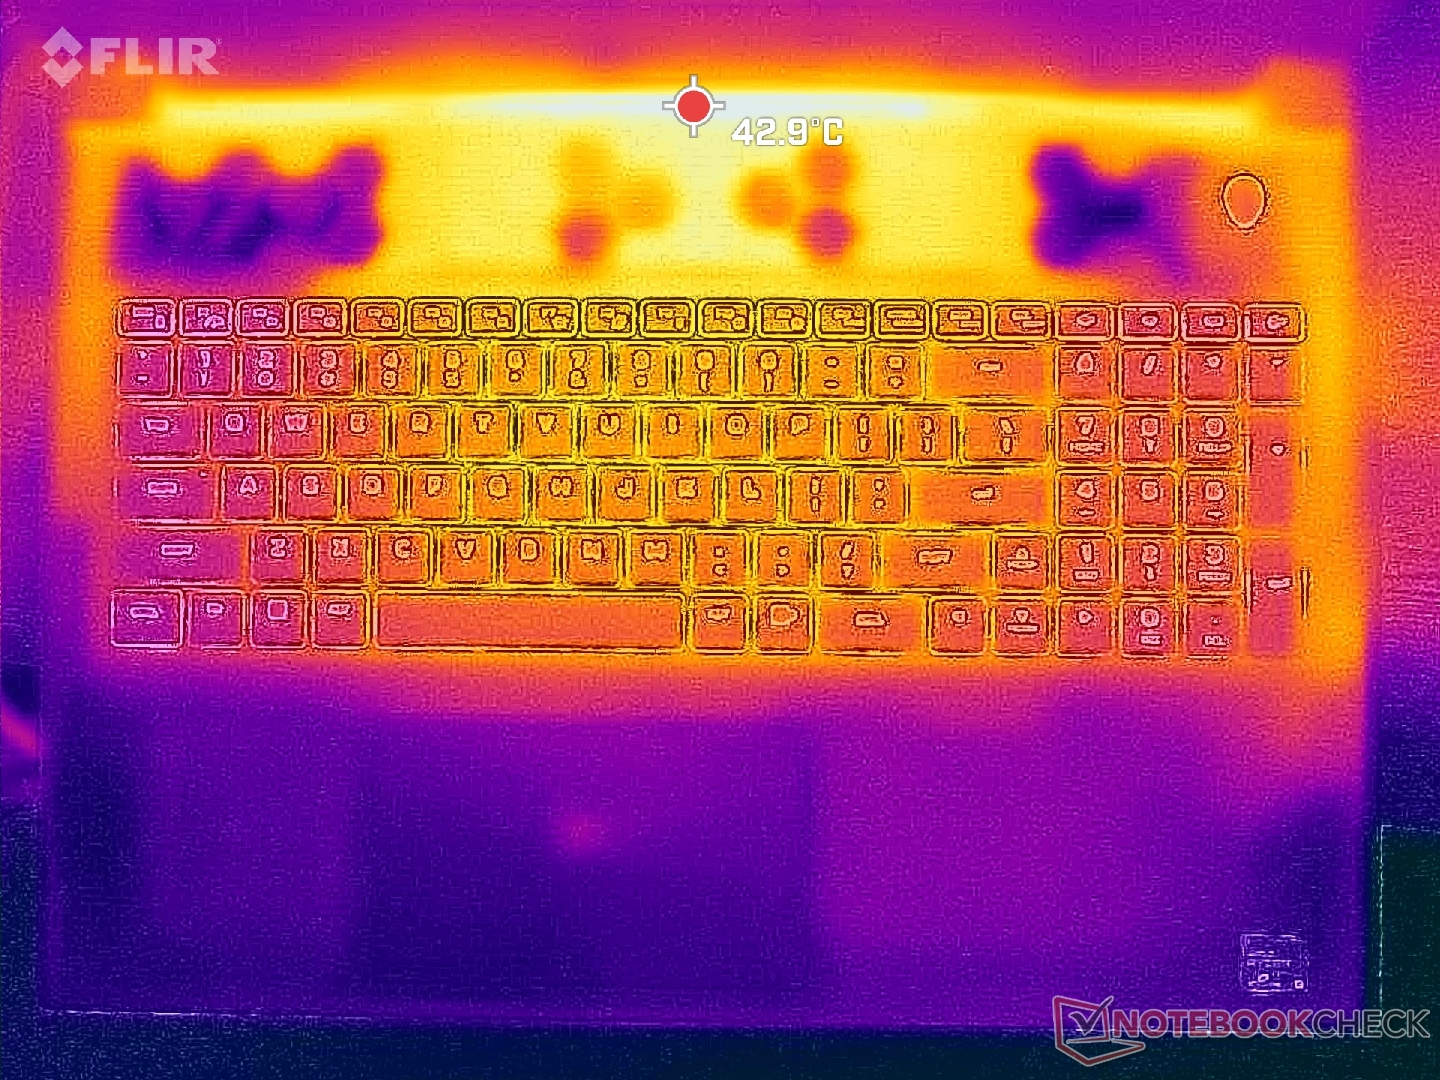
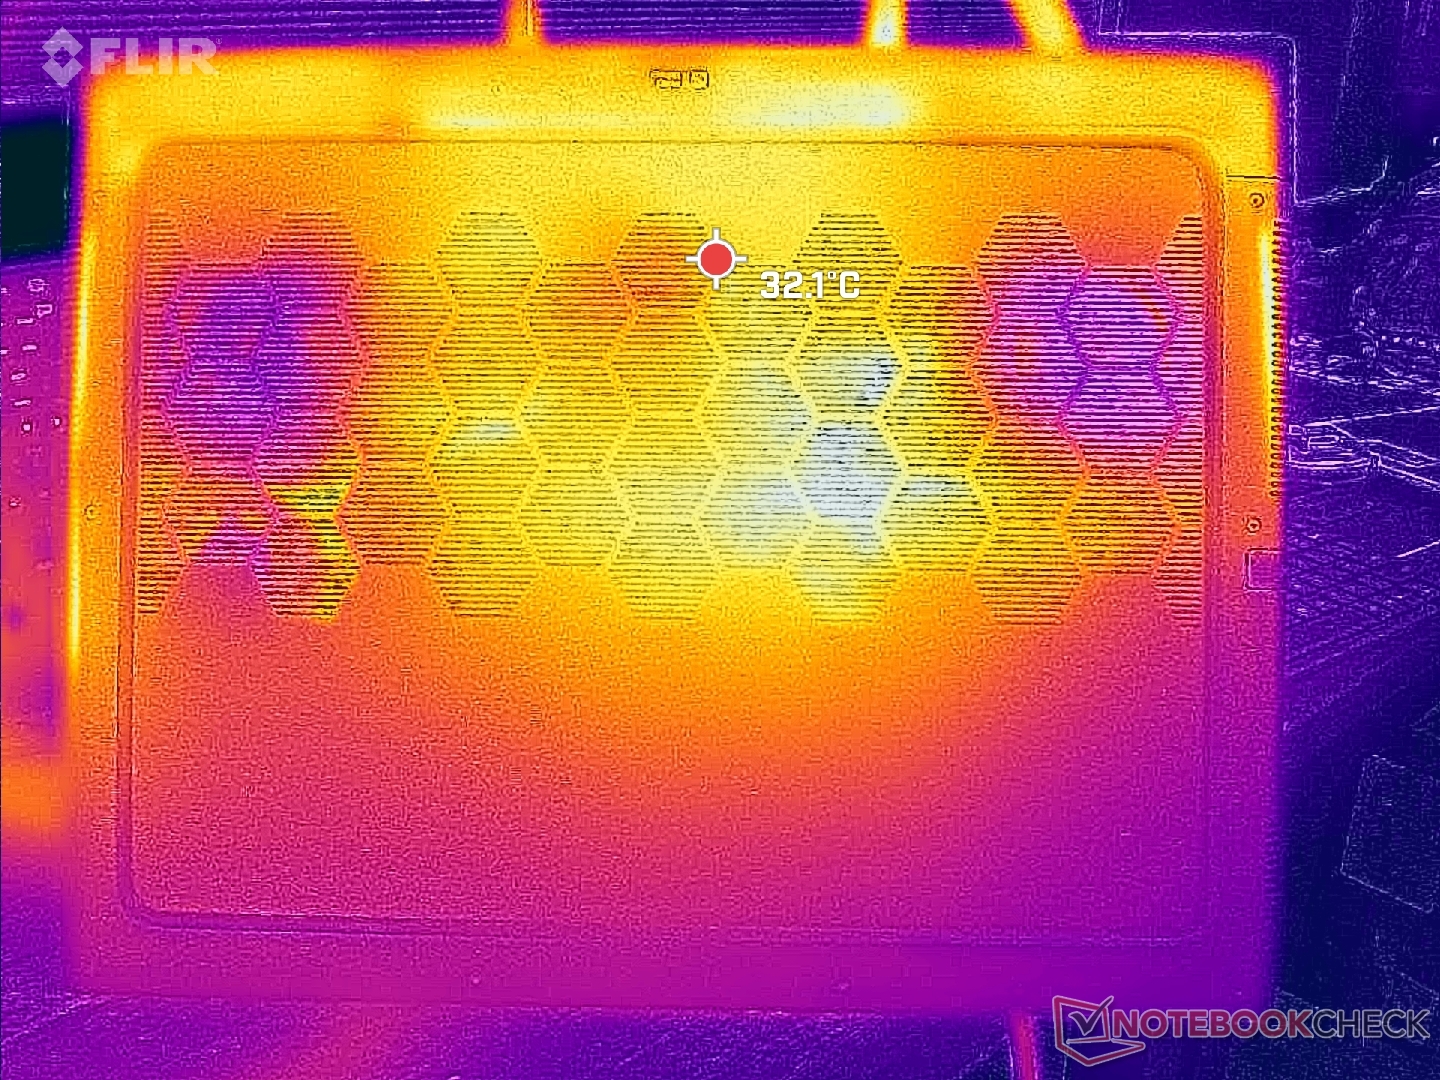
Surface temperatures are similar to what we recorded on the Intel-Nvidia configuration and so they remain cooler than one might expect due to the large screen size, large ventilation grilles, large rear design, and high number of internal fans. The palm rests and keyboard never become uncomfortably warm to the touch when gaming unlike the warmer surfaces of smaller gaming laptops like the Razer Blade 16.
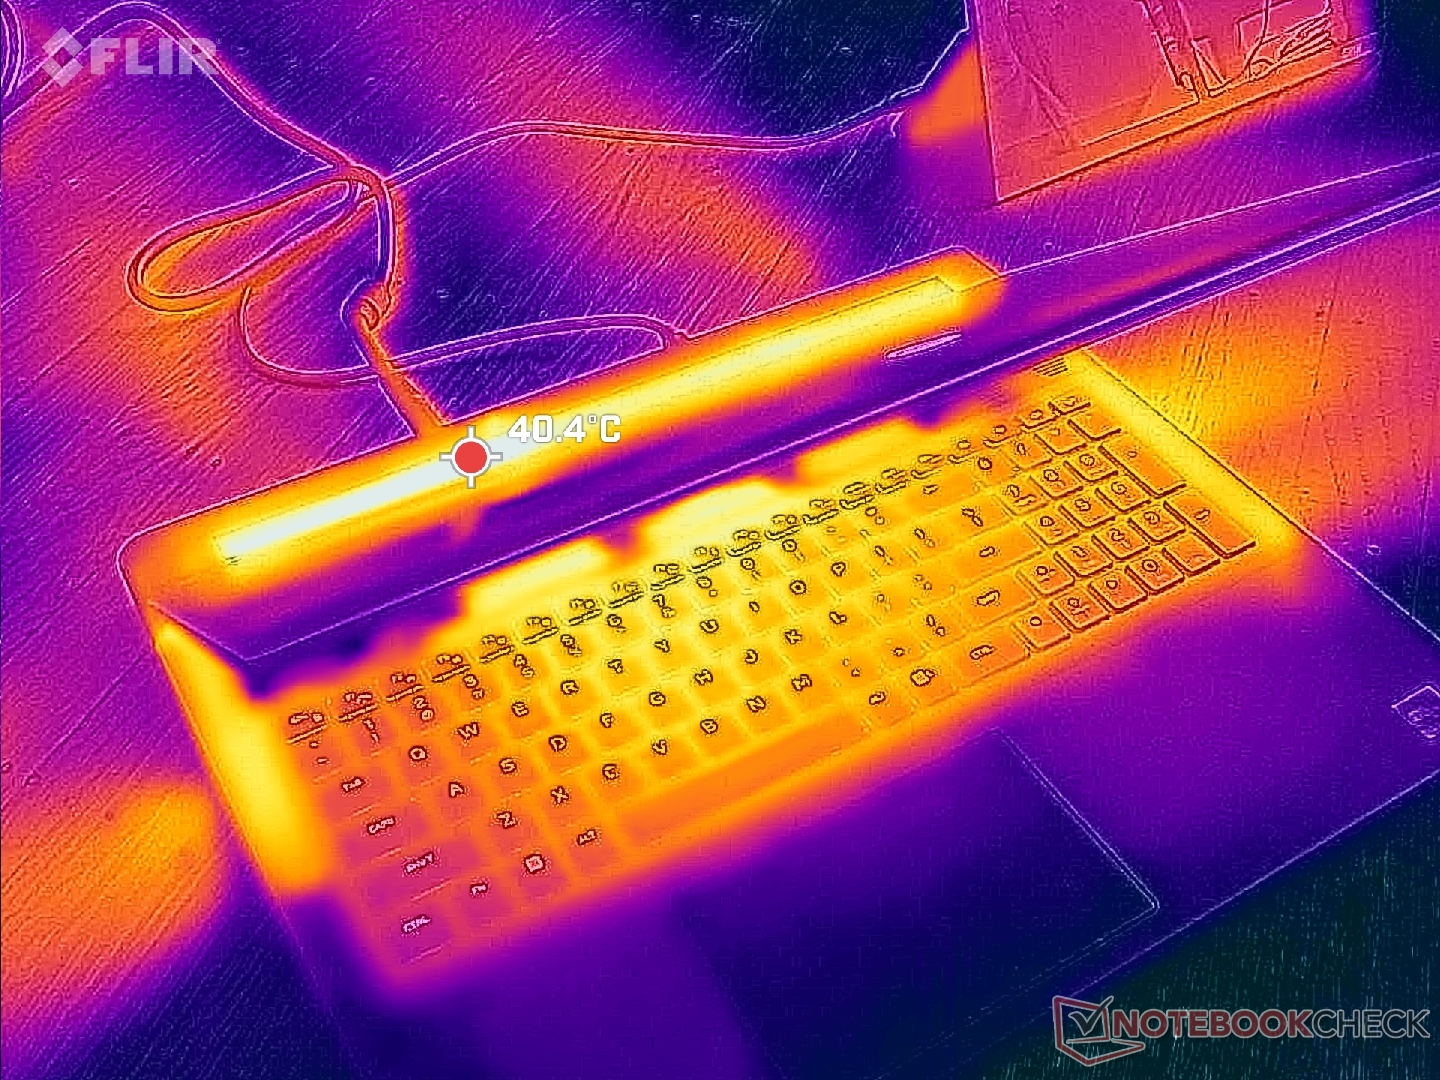
(±) The maximum temperature on the upper side is 40.2 °C / 104 F, compared to the average of 40.4 °C / 105 F, ranging from 21.2 to 68.8 °C for the class Gaming.
(+) The bottom heats up to a maximum of 37.4 °C / 99 F, compared to the average of 43.2 °C / 110 F
(+) In idle usage, the average temperature for the upper side is 26.6 °C / 80 F, compared to the device average of 33.9 °C / 93 F.
(+) Playing The Witcher 3, the average temperature for the upper side is 30.6 °C / 87 F, compared to the device average of 33.9 °C / 93 F.
(+) The palmrests and touchpad are cooler than skin temperature with a maximum of 24.6 °C / 76.3 F and are therefore cool to the touch.
(+) The average temperature of the palmrest area of similar devices was 28.8 °C / 83.8 F (+4.2 °C / 7.5 F).
| Alienware m18 R1 AMD AMD Ryzen 9 7945HX, AMD Radeon RX 7900M | Alienware m18 R1 Intel Core i9-13980HX, NVIDIA GeForce RTX 4090 Laptop GPU | Acer Predator Helios 18 N23Q2 Intel Core i9-13900HX, NVIDIA GeForce RTX 4080 Laptop GPU | Razer Blade 18 RTX 4070 Intel Core i9-13950HX, NVIDIA GeForce RTX 4070 Laptop GPU | Asus ROG Strix Scar 18 2023 G834JY-N6005W Intel Core i9-13980HX, NVIDIA GeForce RTX 4090 Laptop GPU | MSI GE78HX 13VH-070US Intel Core i9-13950HX, NVIDIA GeForce RTX 4080 Laptop GPU | |
|---|---|---|---|---|---|---|
| Heat | 6% | -18% | -1% | -13% | -3% | |
| Maximum Upper Side * (°C) | 40.2 | 39 3% | 35 13% | 39.2 2% | 54 -34% | 37.4 7% |
| Maximum Bottom * (°C) | 37.4 | 36.4 3% | 56 -50% | 35.6 5% | 46 -23% | 45 -20% |
| Idle Upper Side * (°C) | 31.6 | 29.2 8% | 34 -8% | 31.8 -1% | 30 5% | 29.8 6% |
| Idle Bottom * (°C) | 30.6 | 27.8 9% | 39 -27% | 33.2 -8% | 31 -1% | 32.4 -6% |
* ... smaller is better
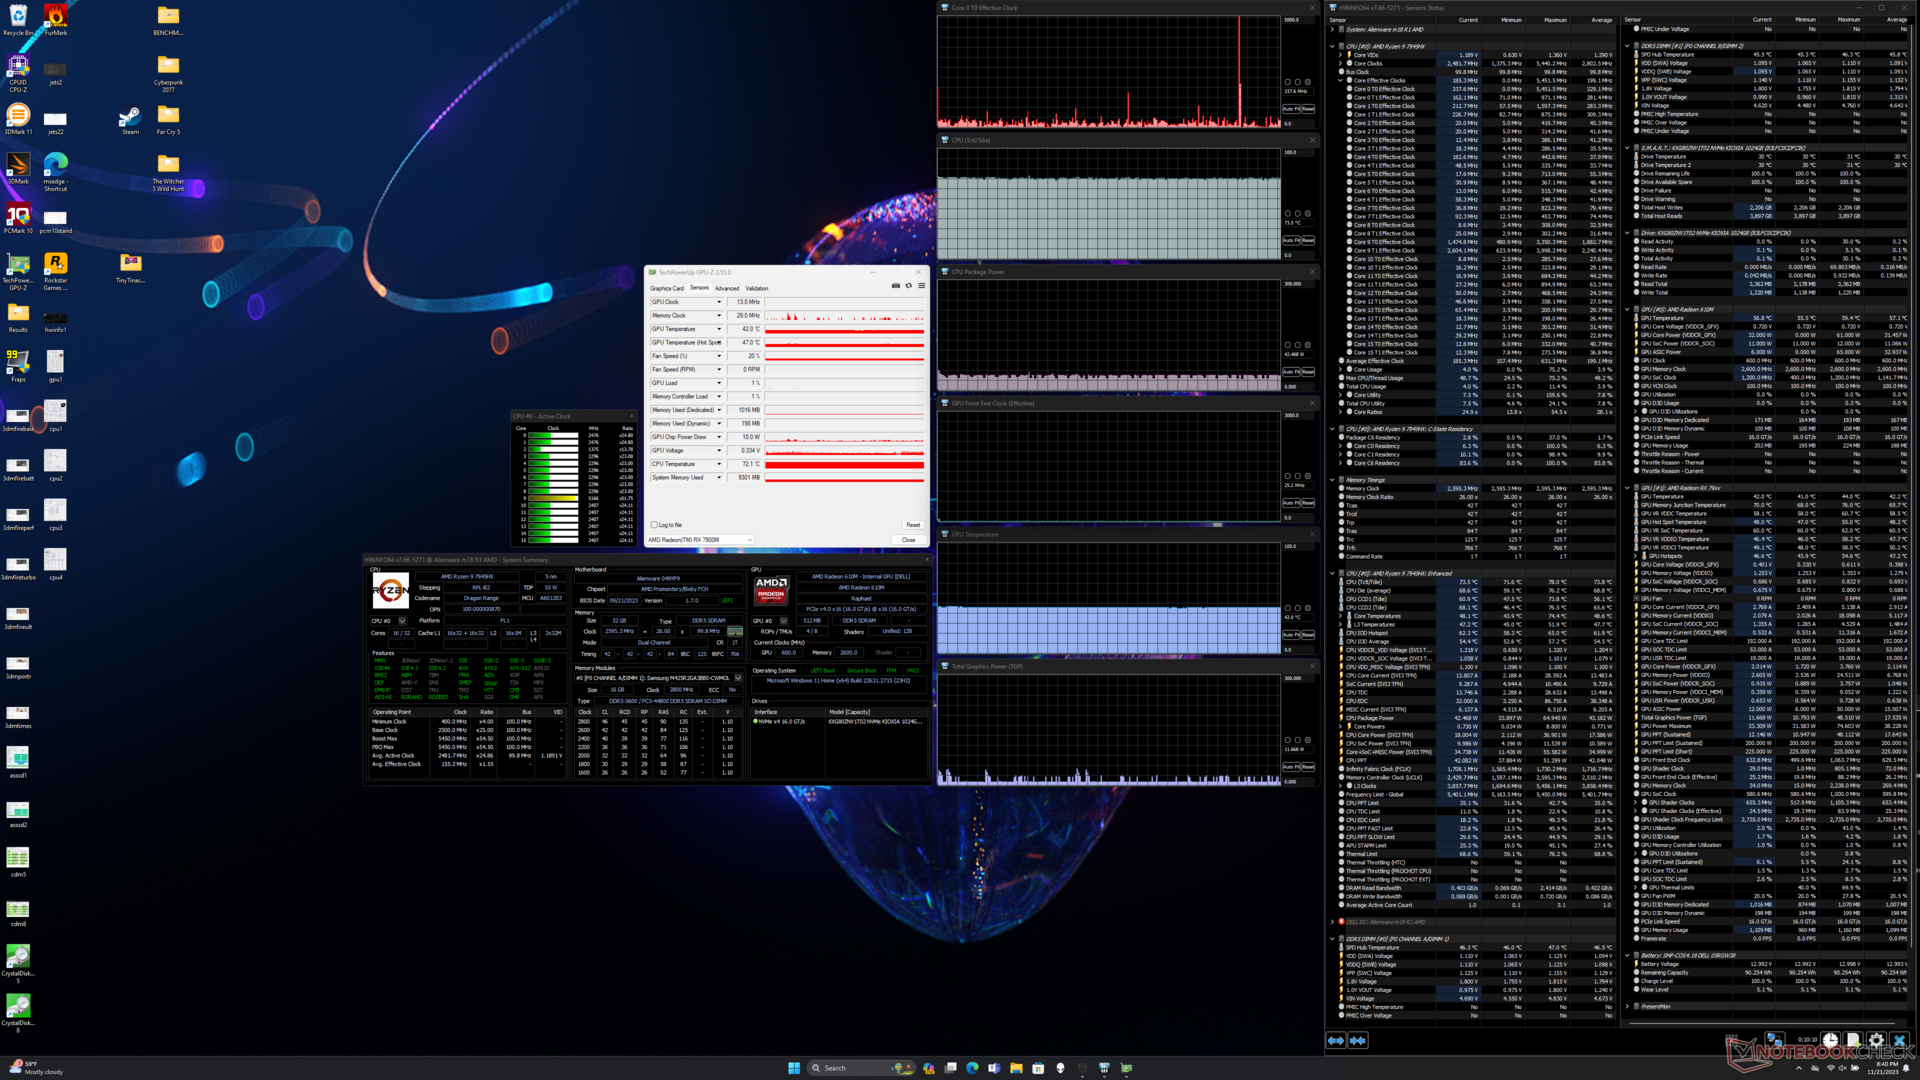
Stress Test
CPU temperature and package power draw when running Prime95 stress would settle at ~97 C and ~145 W, respectively, which is actually very similar to what we observed on the Intel configuration with the Core i9-13980HK. Turbo Boost is nonetheless higher and more aggressive with the Intel CPU during the start of the test as our Power Consumption section demonstrates.
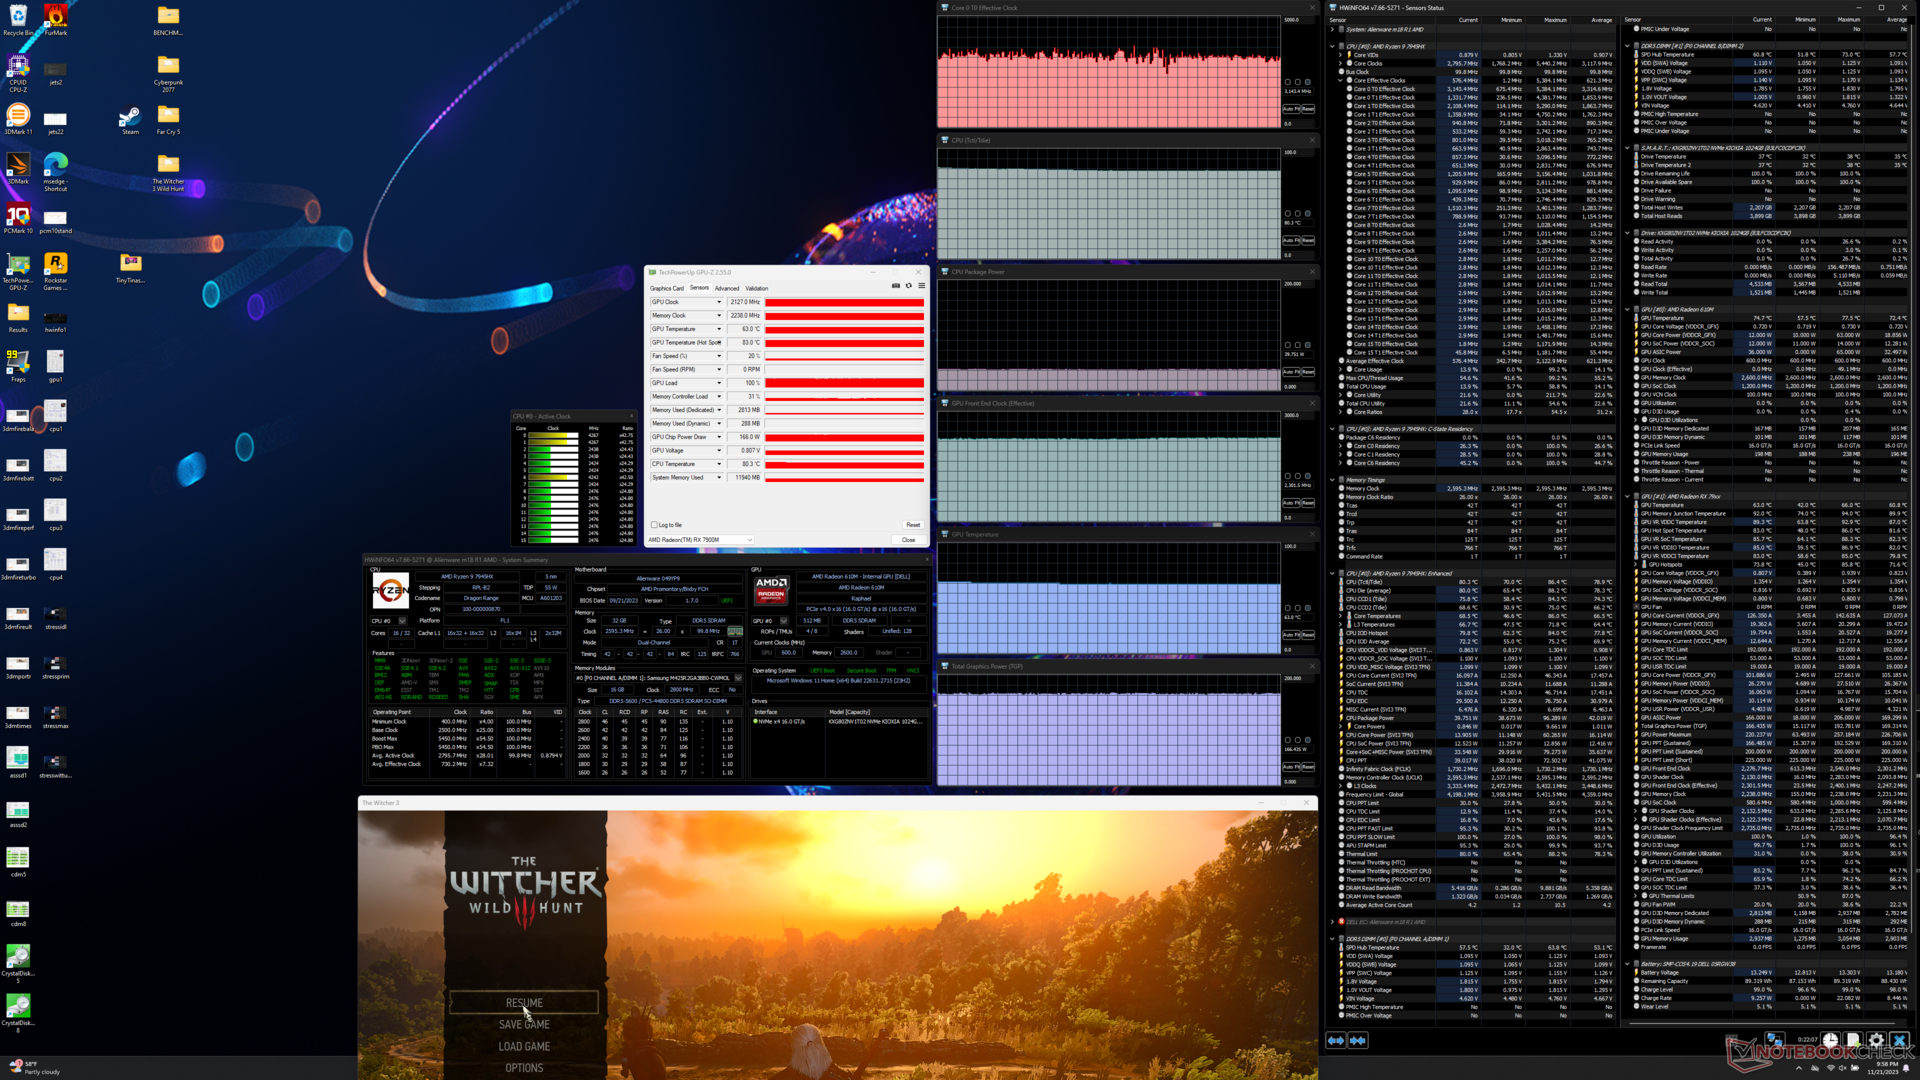
AMD advertises a TGP of 180 W which we can attain when running Witcher 3 on Overdrive mode. Dropping down to Balanced mode or Performance mode, however, lowers the TGP ceiling to 165 W as shown by the screenshots below. GPU clock rates are slightly lower as a result which correlate with our Fire Strike scores mentioned above meaning that the very loud Overdrive mode is mandatory for maximum performance.
Repeating the Witcher 3 test with our Intel-Nvidia RTX 4090 configuration would result in a comparatively lower GPU board power draw of 161 W to show superior performance-per-watt over our Radeon RX 7900M.
Note that CPU and GPU temperatures are slightly cooler when gaming on Overdrive mode versus Balanced or Performance mode since the fans run noticeably louder.
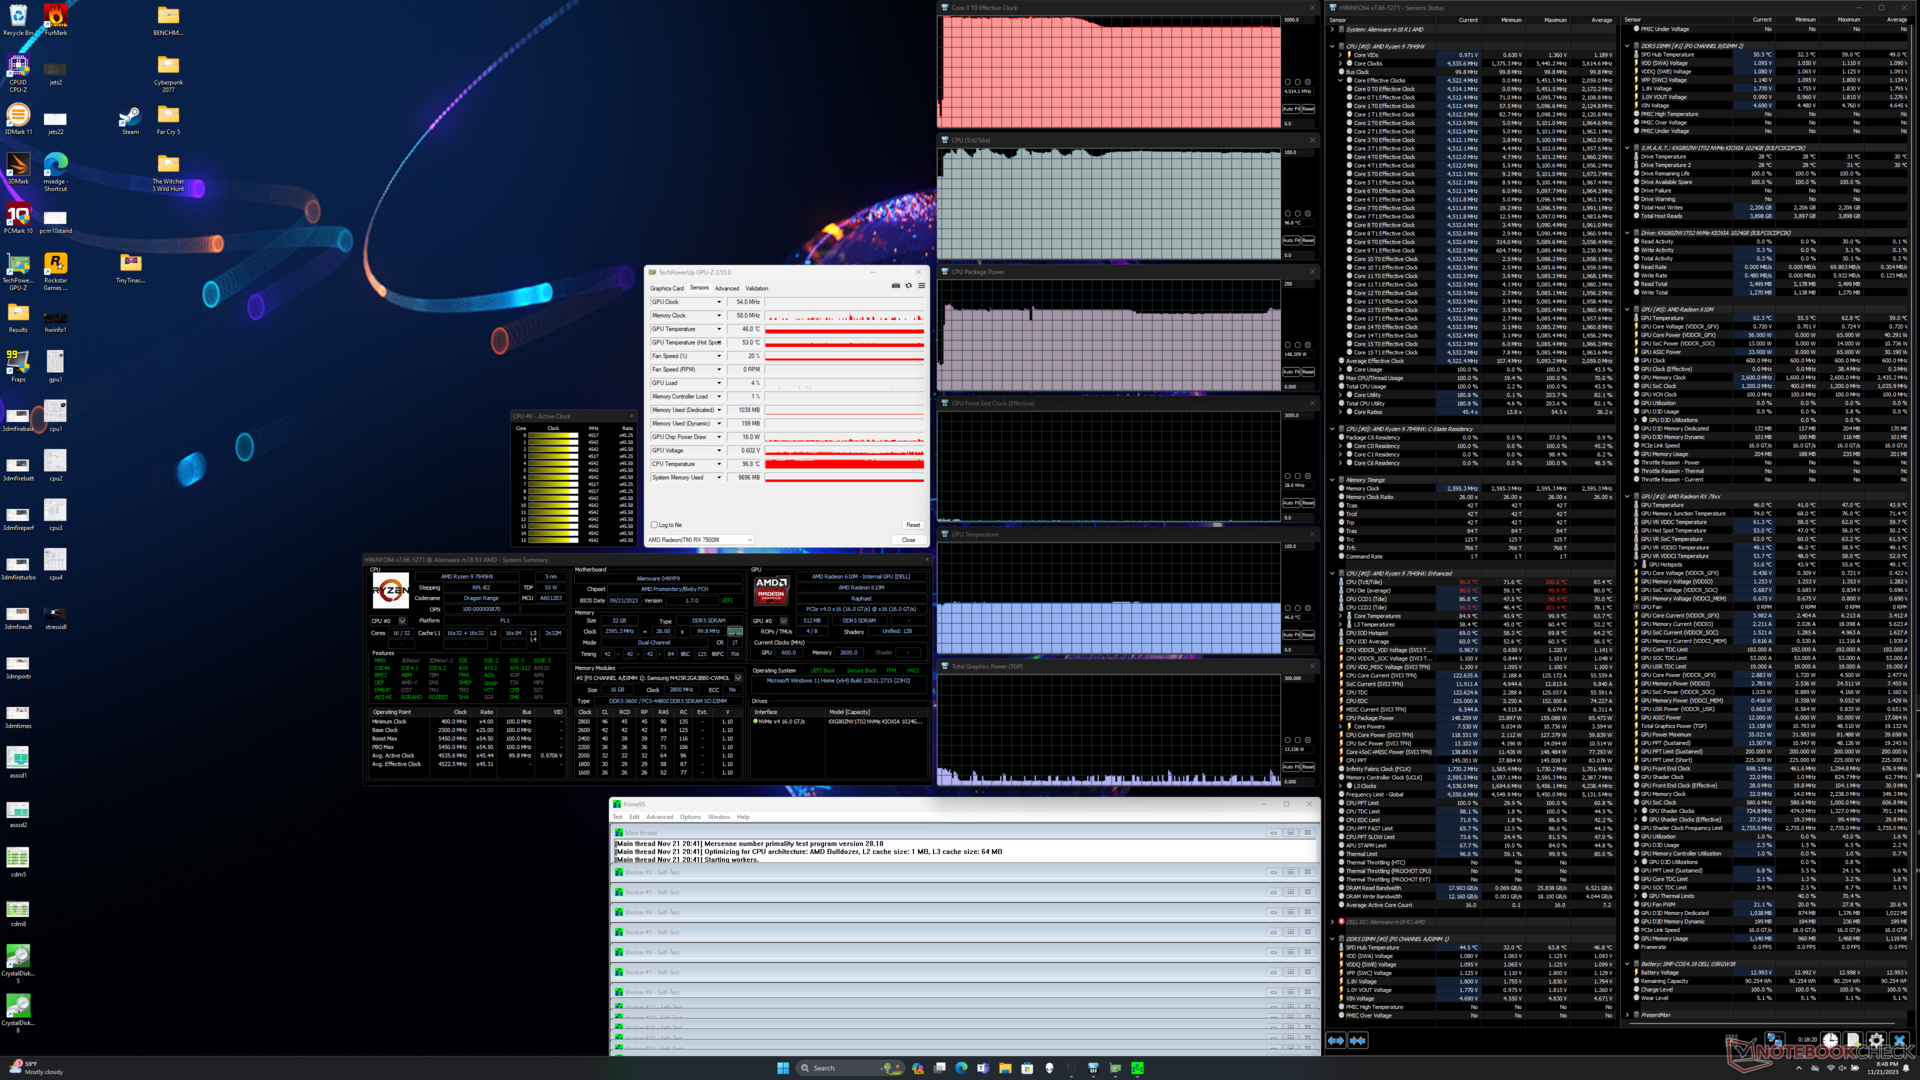
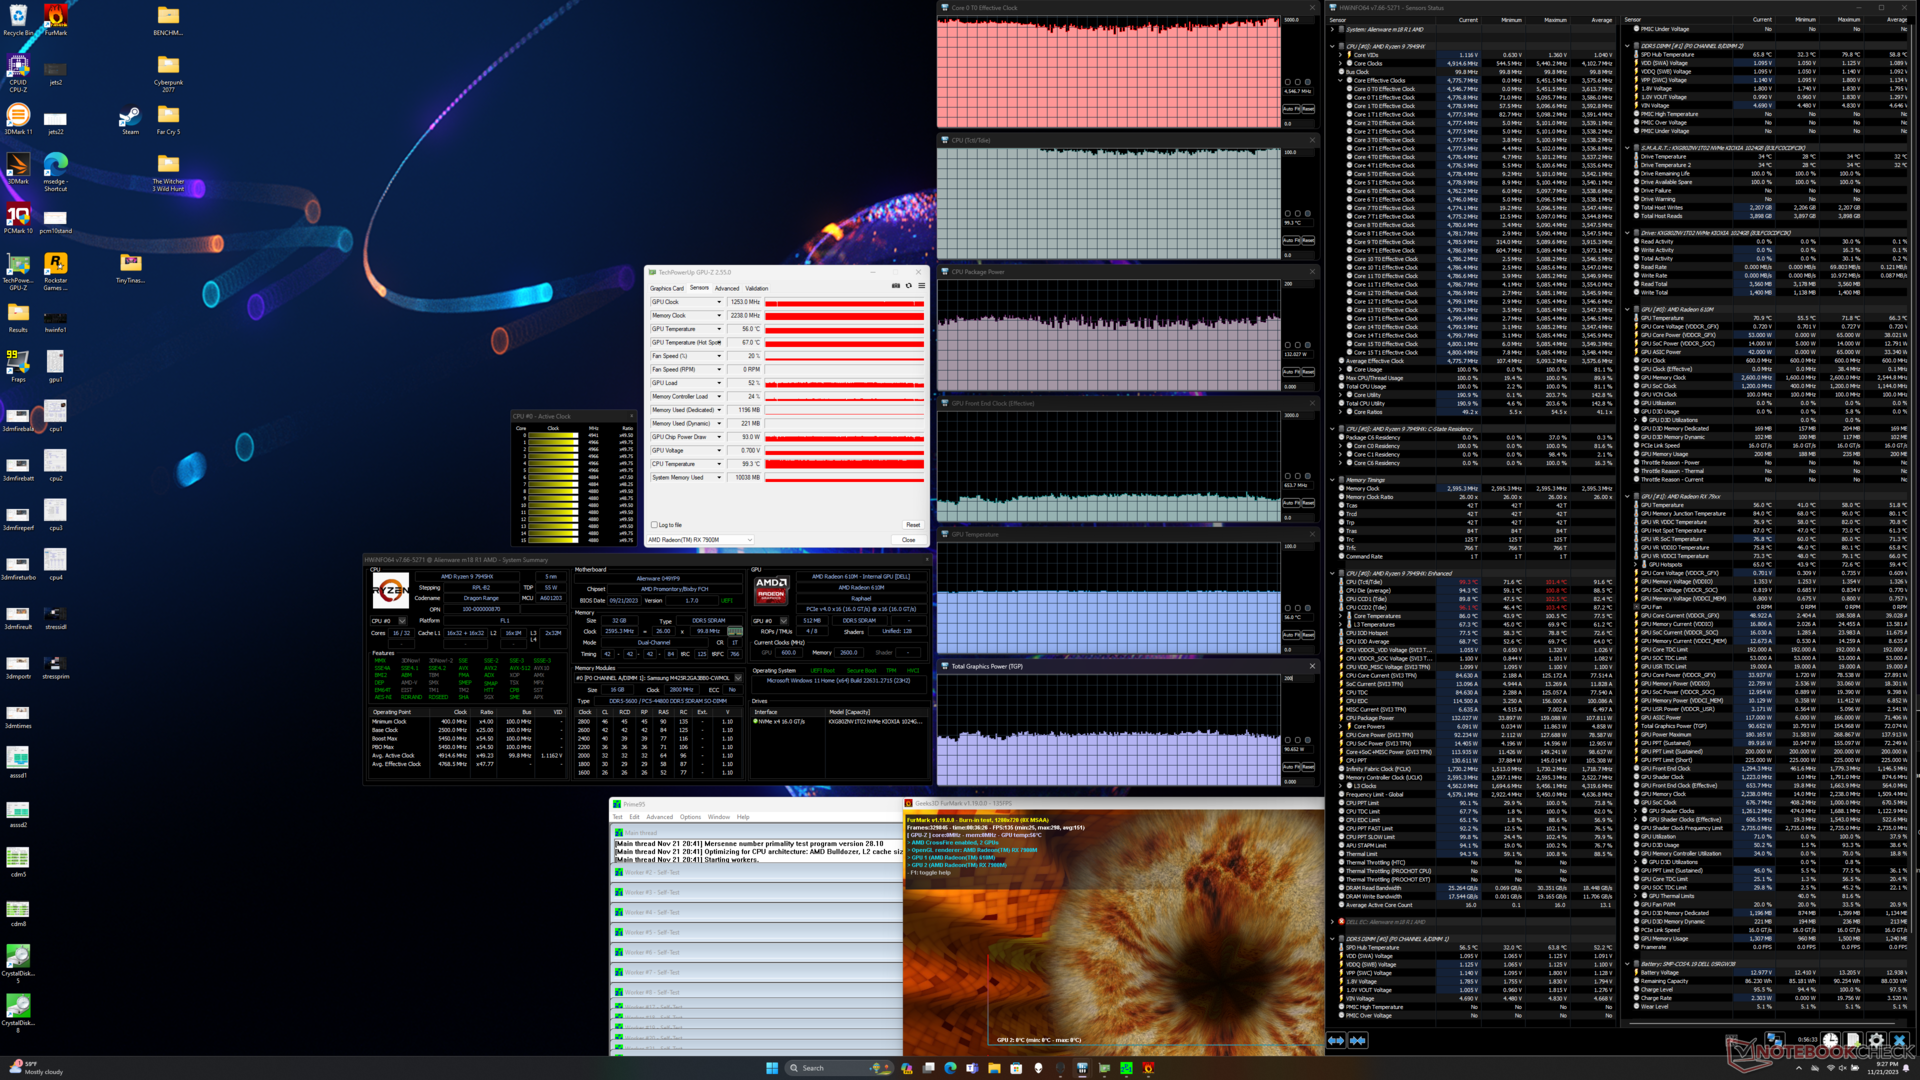
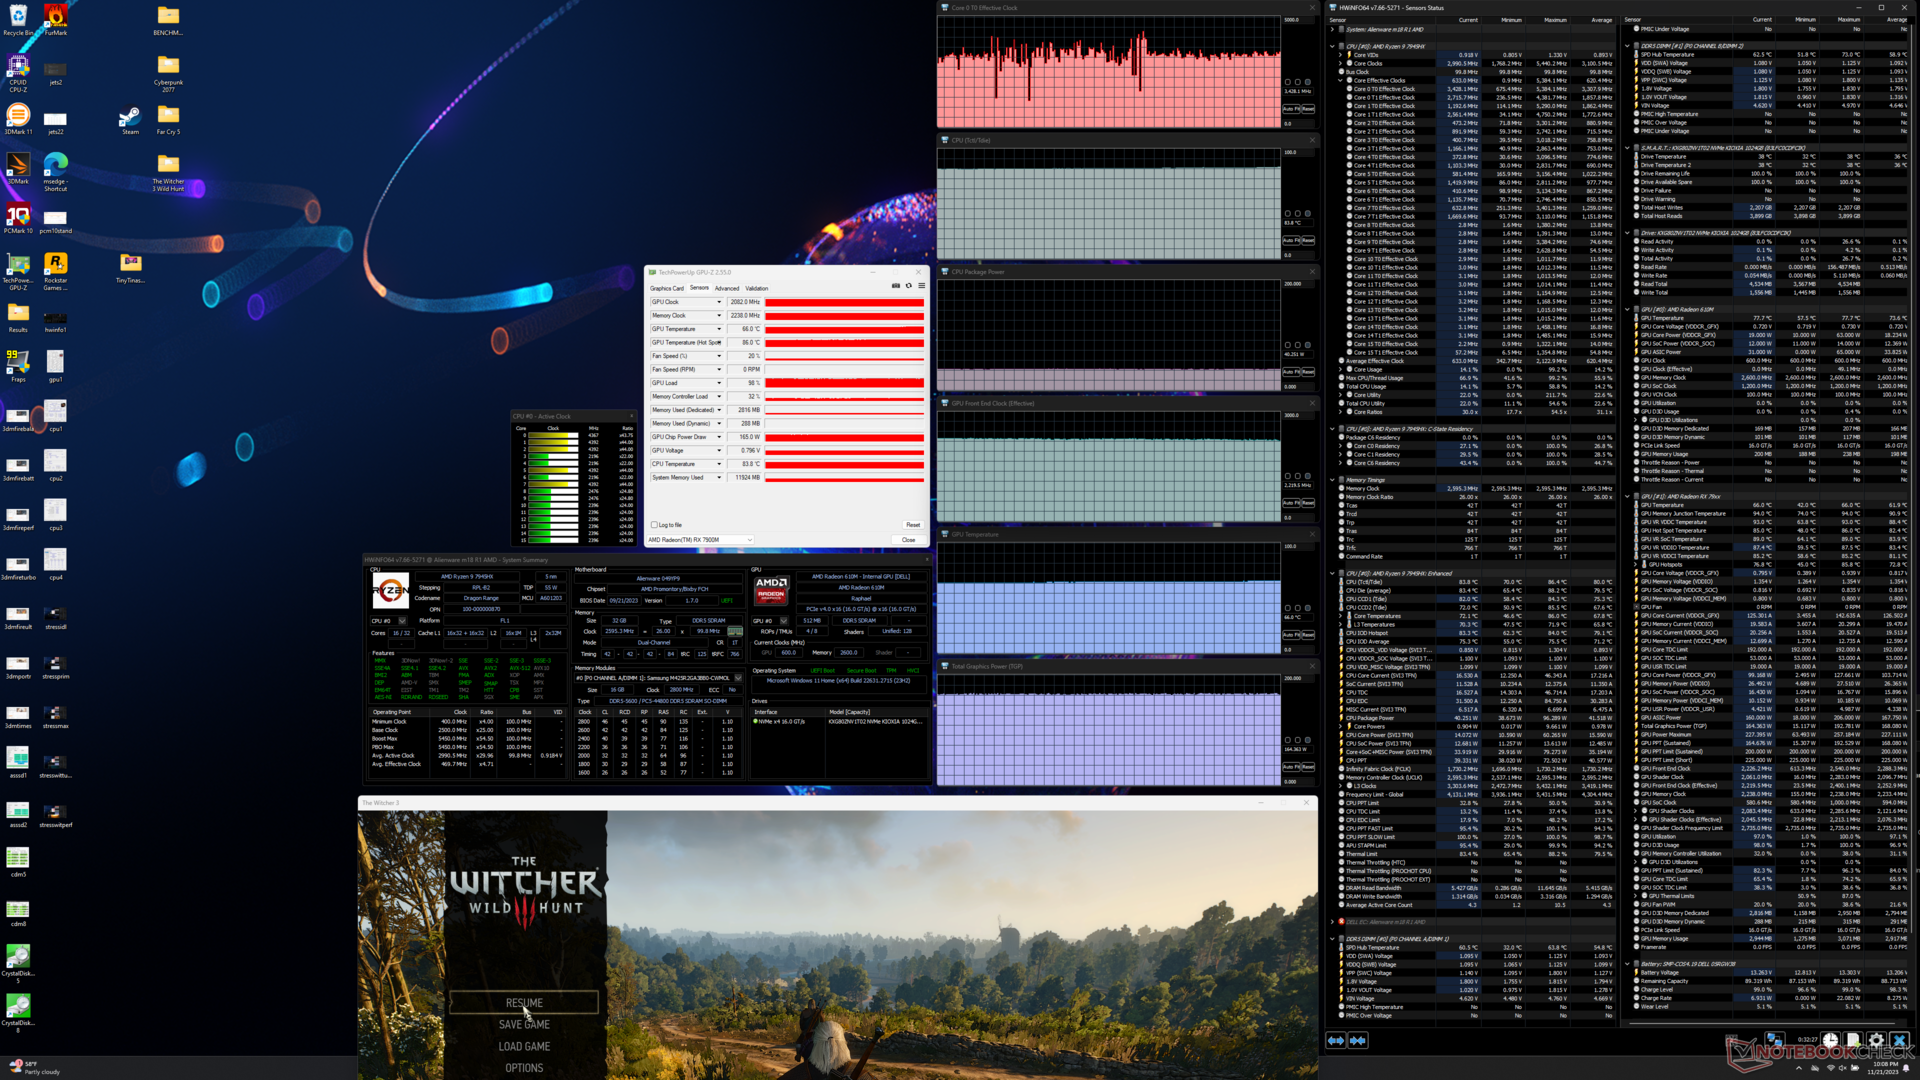
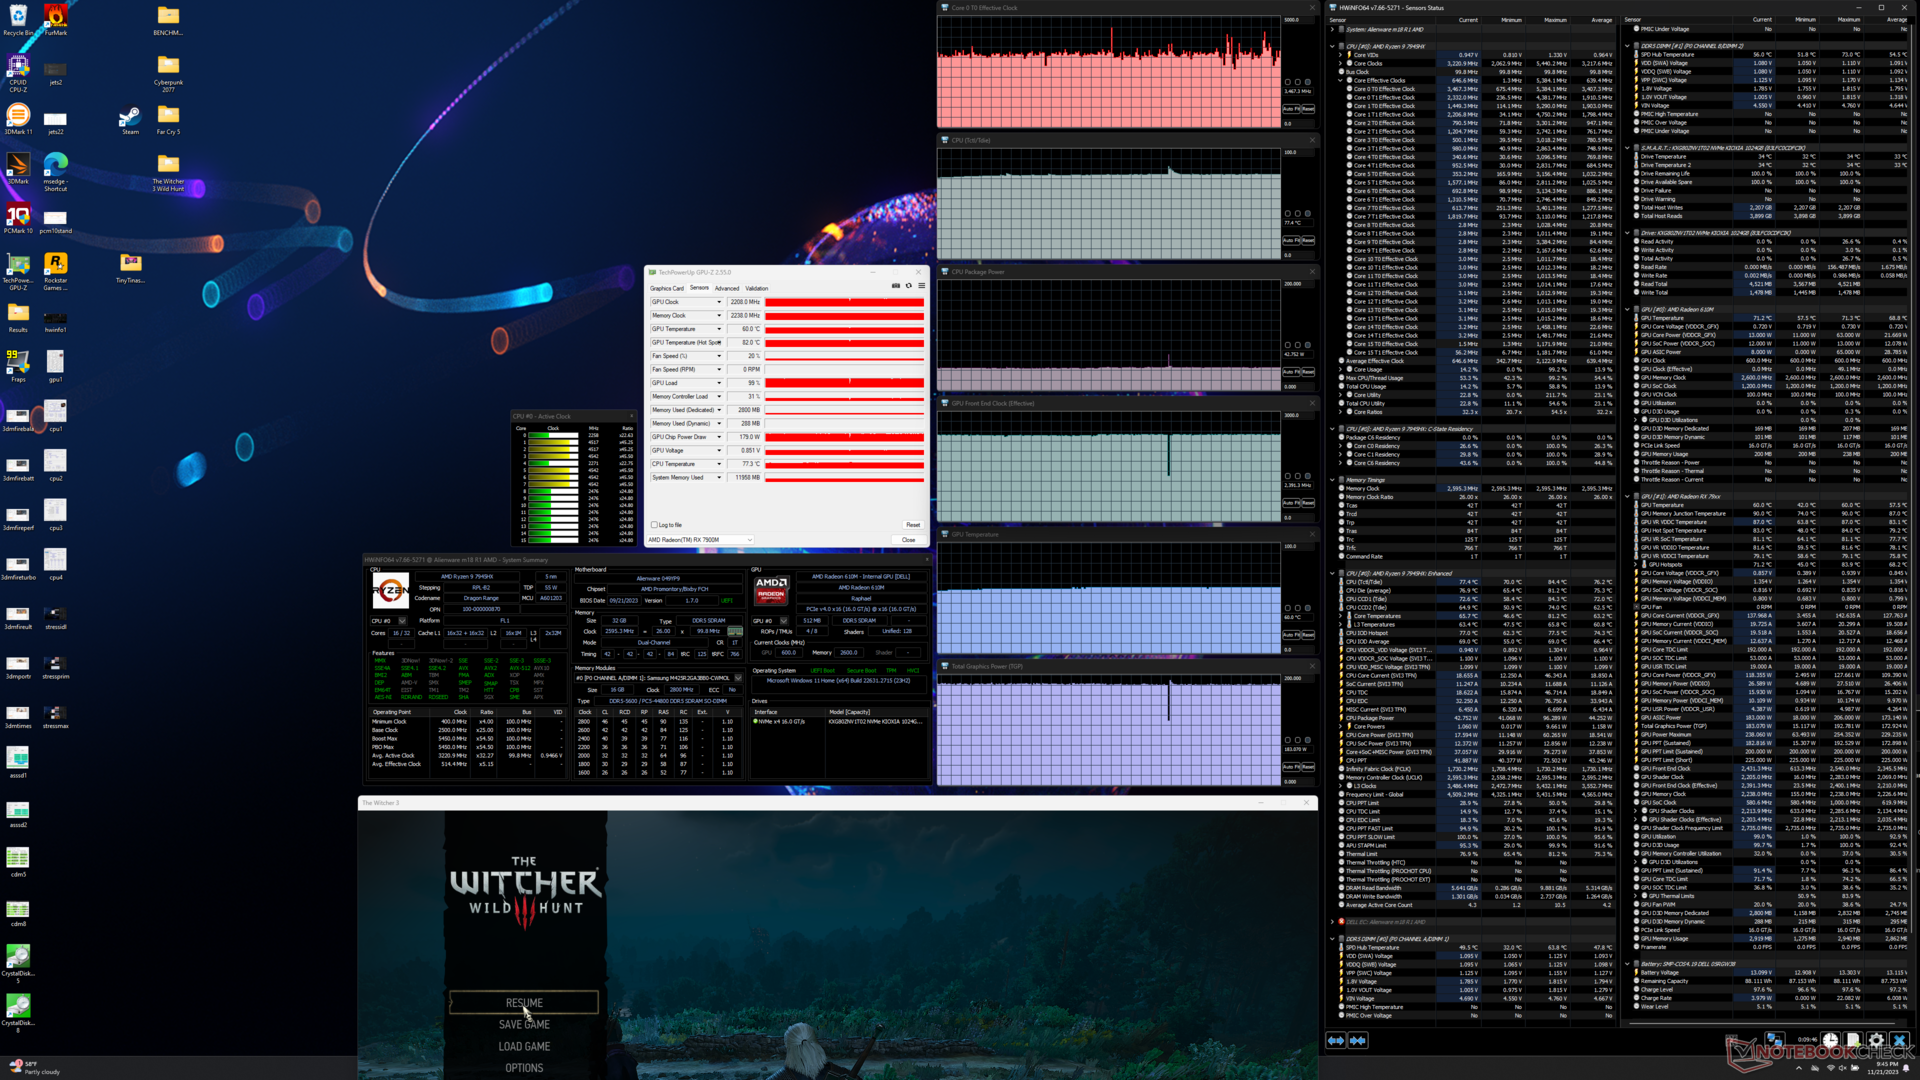
| CPU Clock (GHz) | GPU Clock (MHz) | Average CPU Temperature (°C) | Average GPU Temperature (°C) | |
| System Idle | -- | -- | 74 | 47 |
| Prime95 Stress | 4.5 - 4.9 | -- | 97 | 53 |
| Prime95 + FurMark Stress | ~4.6 | 1253 | 99 | 67 |
| Witcher 3 Stress (Overdrive mode) | ~3.5 | 2208 | 77 | 82 |
| Witcher 3 Stress (Performance mode) | ~3.2 | 2127 | 80 | 83 |
| Witcher 3 Stress (Balanced mode) | ~3.4 | 2082 | 84 | 86 |
Speakers
Alienware m18 R1 AMD audio analysis
(+) | speakers can play relatively loud (84.2 dB)
Bass 100 - 315 Hz
(-) | nearly no bass - on average 22.7% lower than median
(-) | bass is not linear (15.8% delta to prev. frequency)
Mids 400 - 2000 Hz
(+) | balanced mids - only 1.5% away from median
(+) | mids are linear (3.8% delta to prev. frequency)
Highs 2 - 16 kHz
(+) | balanced highs - only 3.6% away from median
(+) | highs are linear (5.5% delta to prev. frequency)
Overall 100 - 16.000 Hz
(±) | linearity of overall sound is average (16.5% difference to median)
Compared to same class
» 42% of all tested devices in this class were better, 7% similar, 51% worse
» The best had a delta of 6%, average was 18%, worst was 132%
Compared to all devices tested
» 28% of all tested devices were better, 6% similar, 66% worse
» The best had a delta of 4%, average was 23%, worst was 134%
Apple MacBook Pro 16 2021 M1 Pro audio analysis
(+) | speakers can play relatively loud (84.7 dB)
Bass 100 - 315 Hz
(+) | good bass - only 3.8% away from median
(+) | bass is linear (5.2% delta to prev. frequency)
Mids 400 - 2000 Hz
(+) | balanced mids - only 1.3% away from median
(+) | mids are linear (2.1% delta to prev. frequency)
Highs 2 - 16 kHz
(+) | balanced highs - only 1.9% away from median
(+) | highs are linear (2.7% delta to prev. frequency)
Overall 100 - 16.000 Hz
(+) | overall sound is linear (4.6% difference to median)
Compared to same class
» 0% of all tested devices in this class were better, 0% similar, 100% worse
» The best had a delta of 5%, average was 17%, worst was 45%
Compared to all devices tested
» 0% of all tested devices were better, 0% similar, 100% worse
» The best had a delta of 4%, average was 23%, worst was 134%
Energy Management
Power Consumption
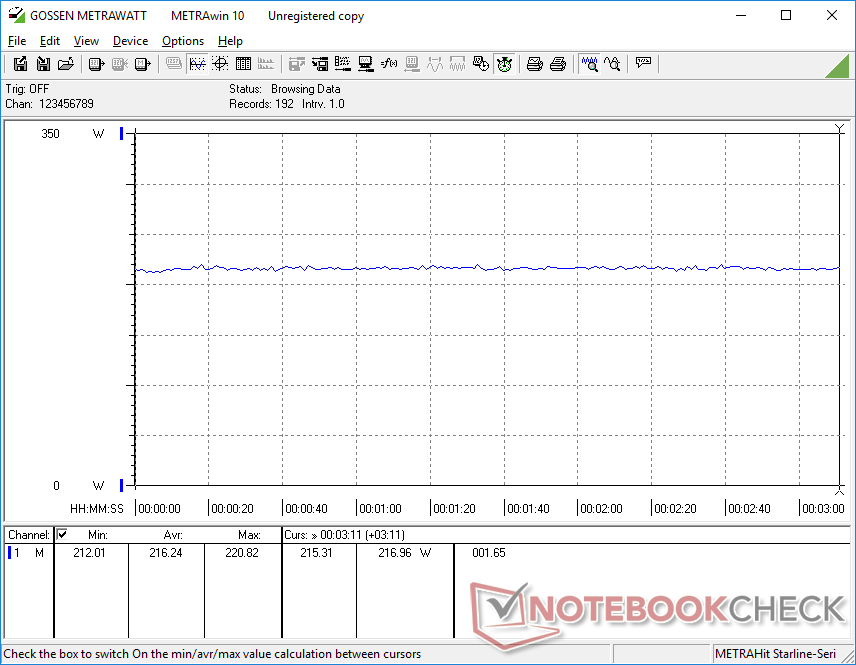
Power consumption is a back-and-forth between the AMD-AMD and Intel-Nvidia configurations of the Alienware m18 R1. On one hand, the Ryzen 7 7945HX is more efficient than the Core i9-13980HX; it is able to complete the CineBench R15 xT benchmark at around the same time as the Core i9 while demanding 50 to 60 W less power from mains. On the other hand, the Radeon RX 7900M is less efficient than the GeForce RTX 4080 or 4090; running FurMark, for example, would draw about 50 W more on our AMD configuration. Overall performance-per-watt can therefore sway towards one configuration over the other depending on how CPU- or GPU-intensive your applications may be.
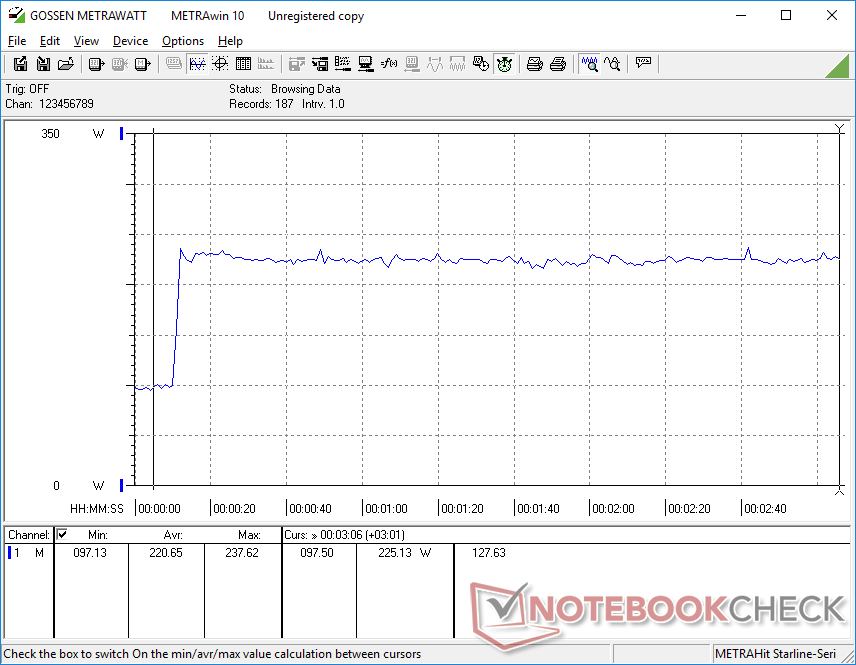
Running the CPU and GPU simultaneously each at 100 percent utilization would still draw up to 333 W from the large 330 W AC adapter much like what we observed on the Intel-Nvidia configuration. However, the Intel Core i9 CPU tends to draw more power more liberally than our Ryzen 9 and so overall power consumption tends to be higher than our all-AMD configuration when gaming. This can be observed when running Witcher 3 as shown by our table below.
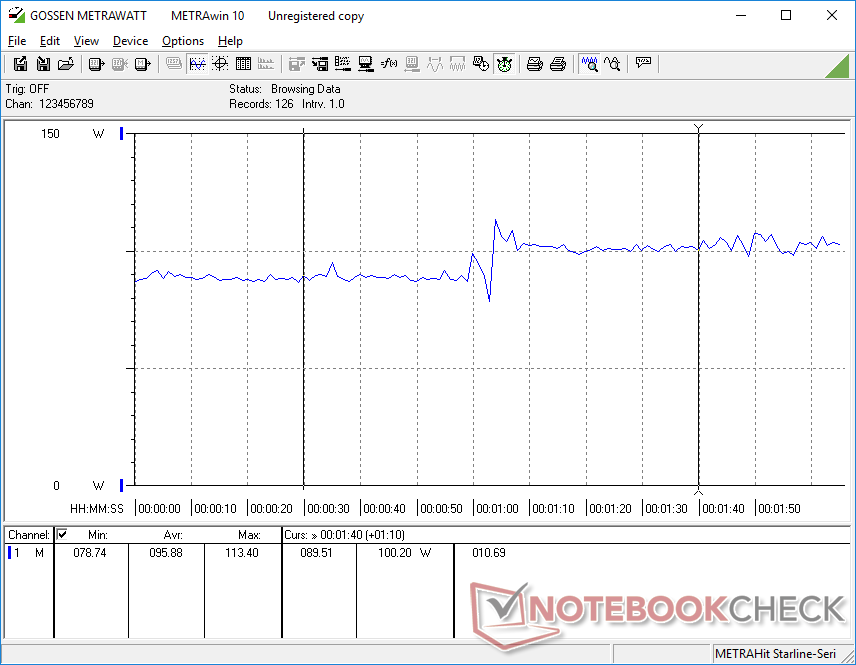
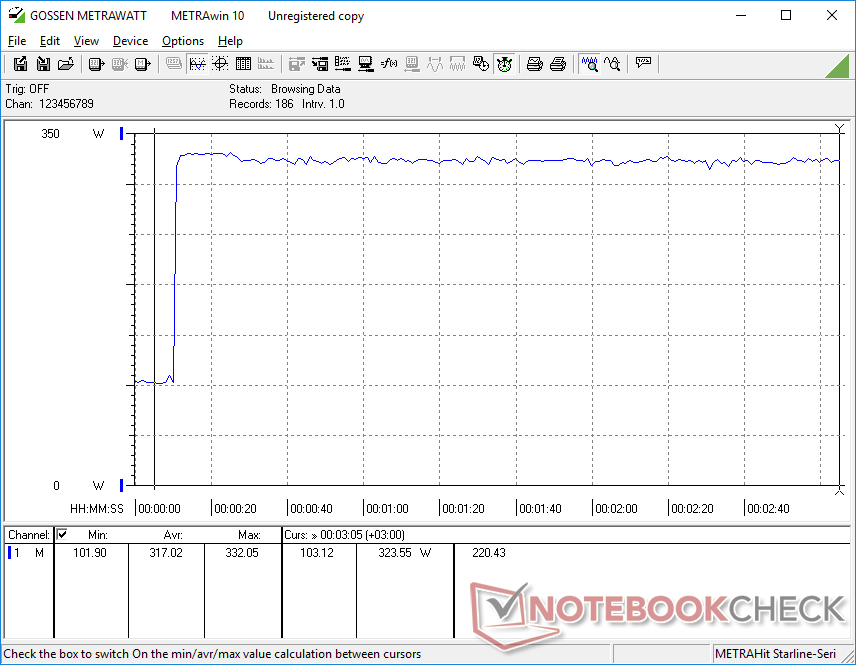
Consumption when idling on desktop is not optimized which may contribute to the very short battery life. We're sometimes able to measure a consumption level as high as 101 W even when on the Balanced power profile with no active applications running. Consumption on standby mode would also be very high at 25 W when it should be closer to just 1 or 2 watts.
We recommend reducing the refresh rate from 480 Hz to 120 Hz if power consumption is a concern as this simple change can save up to 11 W as shown by the graph below. It's too bad that this particular panel does not offer variable refresh rate options.
| Off / Standby | |
| Idle | |
| Load |
|
Key:
min: | |
| Alienware m18 R1 AMD R9 7945HX, Radeon RX 7900M, Kioxia XG8 KXG80ZNV1T02, IPS, 1920x1200, 18" | HP Omen 16-wf000 i7-13700HX, GeForce RTX 4080 Laptop GPU, SK hynix PC801 HFS002TEJ9X101N, IPS, 2560x1440, 16.1" | Alienware m18 R1 i9-13980HX, GeForce RTX 4090 Laptop GPU, SK hynix PC801 HFS001TEJ9X101N, IPS, 1920x1200, 18" | Acer Predator Helios 18 N23Q2 i9-13900HX, GeForce RTX 4080 Laptop GPU, Samsung PM9A1 MZVL22T0HBLB, IPS, 2560x1600, 18" | Razer Blade 18 RTX 4070 i9-13950HX, GeForce RTX 4070 Laptop GPU, SSSTC CA6-8D1024, IPS, 2560x1600, 18" | MSI GE78HX 13VH-070US i9-13950HX, GeForce RTX 4080 Laptop GPU, Samsung PM9A1 MZVL22T0HBLB, IPS, 2560x1600, 17" | |
|---|---|---|---|---|---|---|
| Power Consumption | 32% | 13% | 31% | 25% | 29% | |
| Idle Minimum * (Watt) | 30.3 | 21.8 28% | 21.6 29% | 16 47% | 24.5 19% | 16.1 47% |
| Idle Average * (Watt) | 55.6 | 26 53% | 25.2 55% | 19 66% | 34.1 39% | 24 57% |
| Idle Maximum * (Watt) | 101.1 | 36 64% | 56.7 44% | 21.3 79% | 47.7 53% | 34 66% |
| Load Average * (Watt) | 160.3 | 115.5 28% | 164.1 -2% | 124 23% | 140 13% | 123.6 23% |
| Witcher 3 ultra * (Watt) | 216 | 214 1% | 311 -44% | 289 -34% | 202 6% | 286 -32% |
| Load Maximum * (Watt) | 332.1 | 269.7 19% | 338.9 -2% | 319 4% | 261 21% | 285.7 14% |
* ... smaller is better
Power Consumption Witcher 3 / Stresstest
Power Consumption external Monitor
Battery Life
Runtimes are very poor even for a large gaming laptop. Even in the best case scenario with literally everything turned off or set to minimum (AlienFX off, minimum display brightness, 120 Hz refresh rate, no running applications, wireless off, Battery Saver mode), we're only able to record just under 4.5 hours of runtime before automatic shutdown. This would drop down to just 95 minutes when browsing the web compared to the Acer Predator Helios 18 or Razer Blade 18 which can each last for a few hours longer.
Charging from empty to full capacity with the included AC adapter takes about 2 to 2.5 hours. The model does not support charging via USB-C unlike on most other modern gaming laptops and so you're essentially tethered to the ginormous 330 W AC adapter when traveling.
| Alienware m18 R1 AMD R9 7945HX, Radeon RX 7900M, 97 Wh | Alienware m18 R1 i9-13980HX, GeForce RTX 4090 Laptop GPU, 97 Wh | Acer Predator Helios 18 N23Q2 i9-13900HX, GeForce RTX 4080 Laptop GPU, 90 Wh | Razer Blade 18 RTX 4070 i9-13950HX, GeForce RTX 4070 Laptop GPU, 91.7 Wh | Asus ROG Strix Scar 18 2023 G834JY-N6005W i9-13980HX, GeForce RTX 4090 Laptop GPU, 90 Wh | MSI GE78HX 13VH-070US i9-13950HX, GeForce RTX 4080 Laptop GPU, 99 Wh | |
|---|---|---|---|---|---|---|
| Battery runtime | 77% | 179% | 109% | 218% | 171% | |
| Reader / Idle (h) | 4.5 | 5.6 24% | 7 56% | 7.3 62% | ||
| WiFi v1.3 (h) | 1.4 | 4.3 207% | 4.4 214% | 4 186% | 7.1 407% | 6.1 336% |
| Load (h) | 0.7 | 0.7 0% | 1.7 143% | 1.3 86% | 0.9 29% | 1.5 114% |
| H.264 (h) | 4.8 | 7 | ||||
| Witcher 3 ultra (h) | 0.9 |
Pros
Cons
Verdict — The Mobile GeForce RTX 4080 Challenger We've Been Waiting For
As of this writing, the Core i9-13900HX/RTX 4080 configuration of the Alienware m18 R1 with 32 GB RAM, 1 TB SSD and 1200p display costs $2950 USD. Meanwhile, the Ryzen 9 7945HX/RX 7900M configuration with the exact same RAM, SSD, and display retails for $2300 USD. The all-AMD option offers faster CPU performance and nearly the same GPU performance for almost $700 less. Needless to say, performance-per-dollar is clearly the strongest selling point of the new AMD SKU and one of the biggest reasons for skipping Intel and Nvidia. The price difference is so great that one might even overlook all the issues we've experienced on our early test unit just to save hundreds of dollars.
Gaming laptops with the GeForce RTX 4080 have enjoyed bloated prices all year long. The very cost-efficient AMD Radeon RX 7900M is the proper contender to finally bring those prices back down to Earth.
Even so, the bugs are not insignificant. The display switching off, boot issues, video playback frame skips, stutters when gaming, and unusually high power consumption when idling should absolutely be addressed. As a result, there's no mad dash to go out and buy the all-AMD Alienware m18 R1 while we wait for fixes and FSR 3 support to slowly rollout over time.
There are still reasons to choose Intel-Nvidia over AMD-AMD once all the bugs are squashed. As impressive as the Radeon 7900M may be, the mobile RTX 4080 is still faster on average especially if you like to game with RT enabled. Those who want the best and fastest no matter the cost should therefore stick to the GeForce series. For the rest of us mortals with tighter budgets, the Radeon 7900M is looking like a solid alternative to the pricey RTX 4080 that many have been waiting for. Here's hoping the GPU will make an appearance on many more gaming laptops in the near future and not just a select few.
Price and Availability
Dell is now directly shipping the Alienware m18 R1 in all configuration levels. Alternatively, Best Buy is offering the Ryzen 9/7900M configuration for $2800 USD.
Alienware m18 R1 AMD
- 11/26/2023 v7 (old)
Allen Ngo
Transparency
The selection of devices to be reviewed is made by our editorial team. The test sample was provided to the author as a loan by the manufacturer or retailer for the purpose of this review. The lender had no influence on this review, nor did the manufacturer receive a copy of this review before publication. There was no obligation to publish this review. As an independent media company, Notebookcheck is not subjected to the authority of manufacturers, retailers or publishers.
This is how Notebookcheck is testing
Every year, Notebookcheck independently reviews hundreds of laptops and smartphones using standardized procedures to ensure that all results are comparable. We have continuously developed our test methods for around 20 years and set industry standards in the process. In our test labs, high-quality measuring equipment is utilized by experienced technicians and editors. These tests involve a multi-stage validation process. Our complex rating system is based on hundreds of well-founded measurements and benchmarks, which maintains objectivity. Further information on our test methods can be found here.
Price comparison
