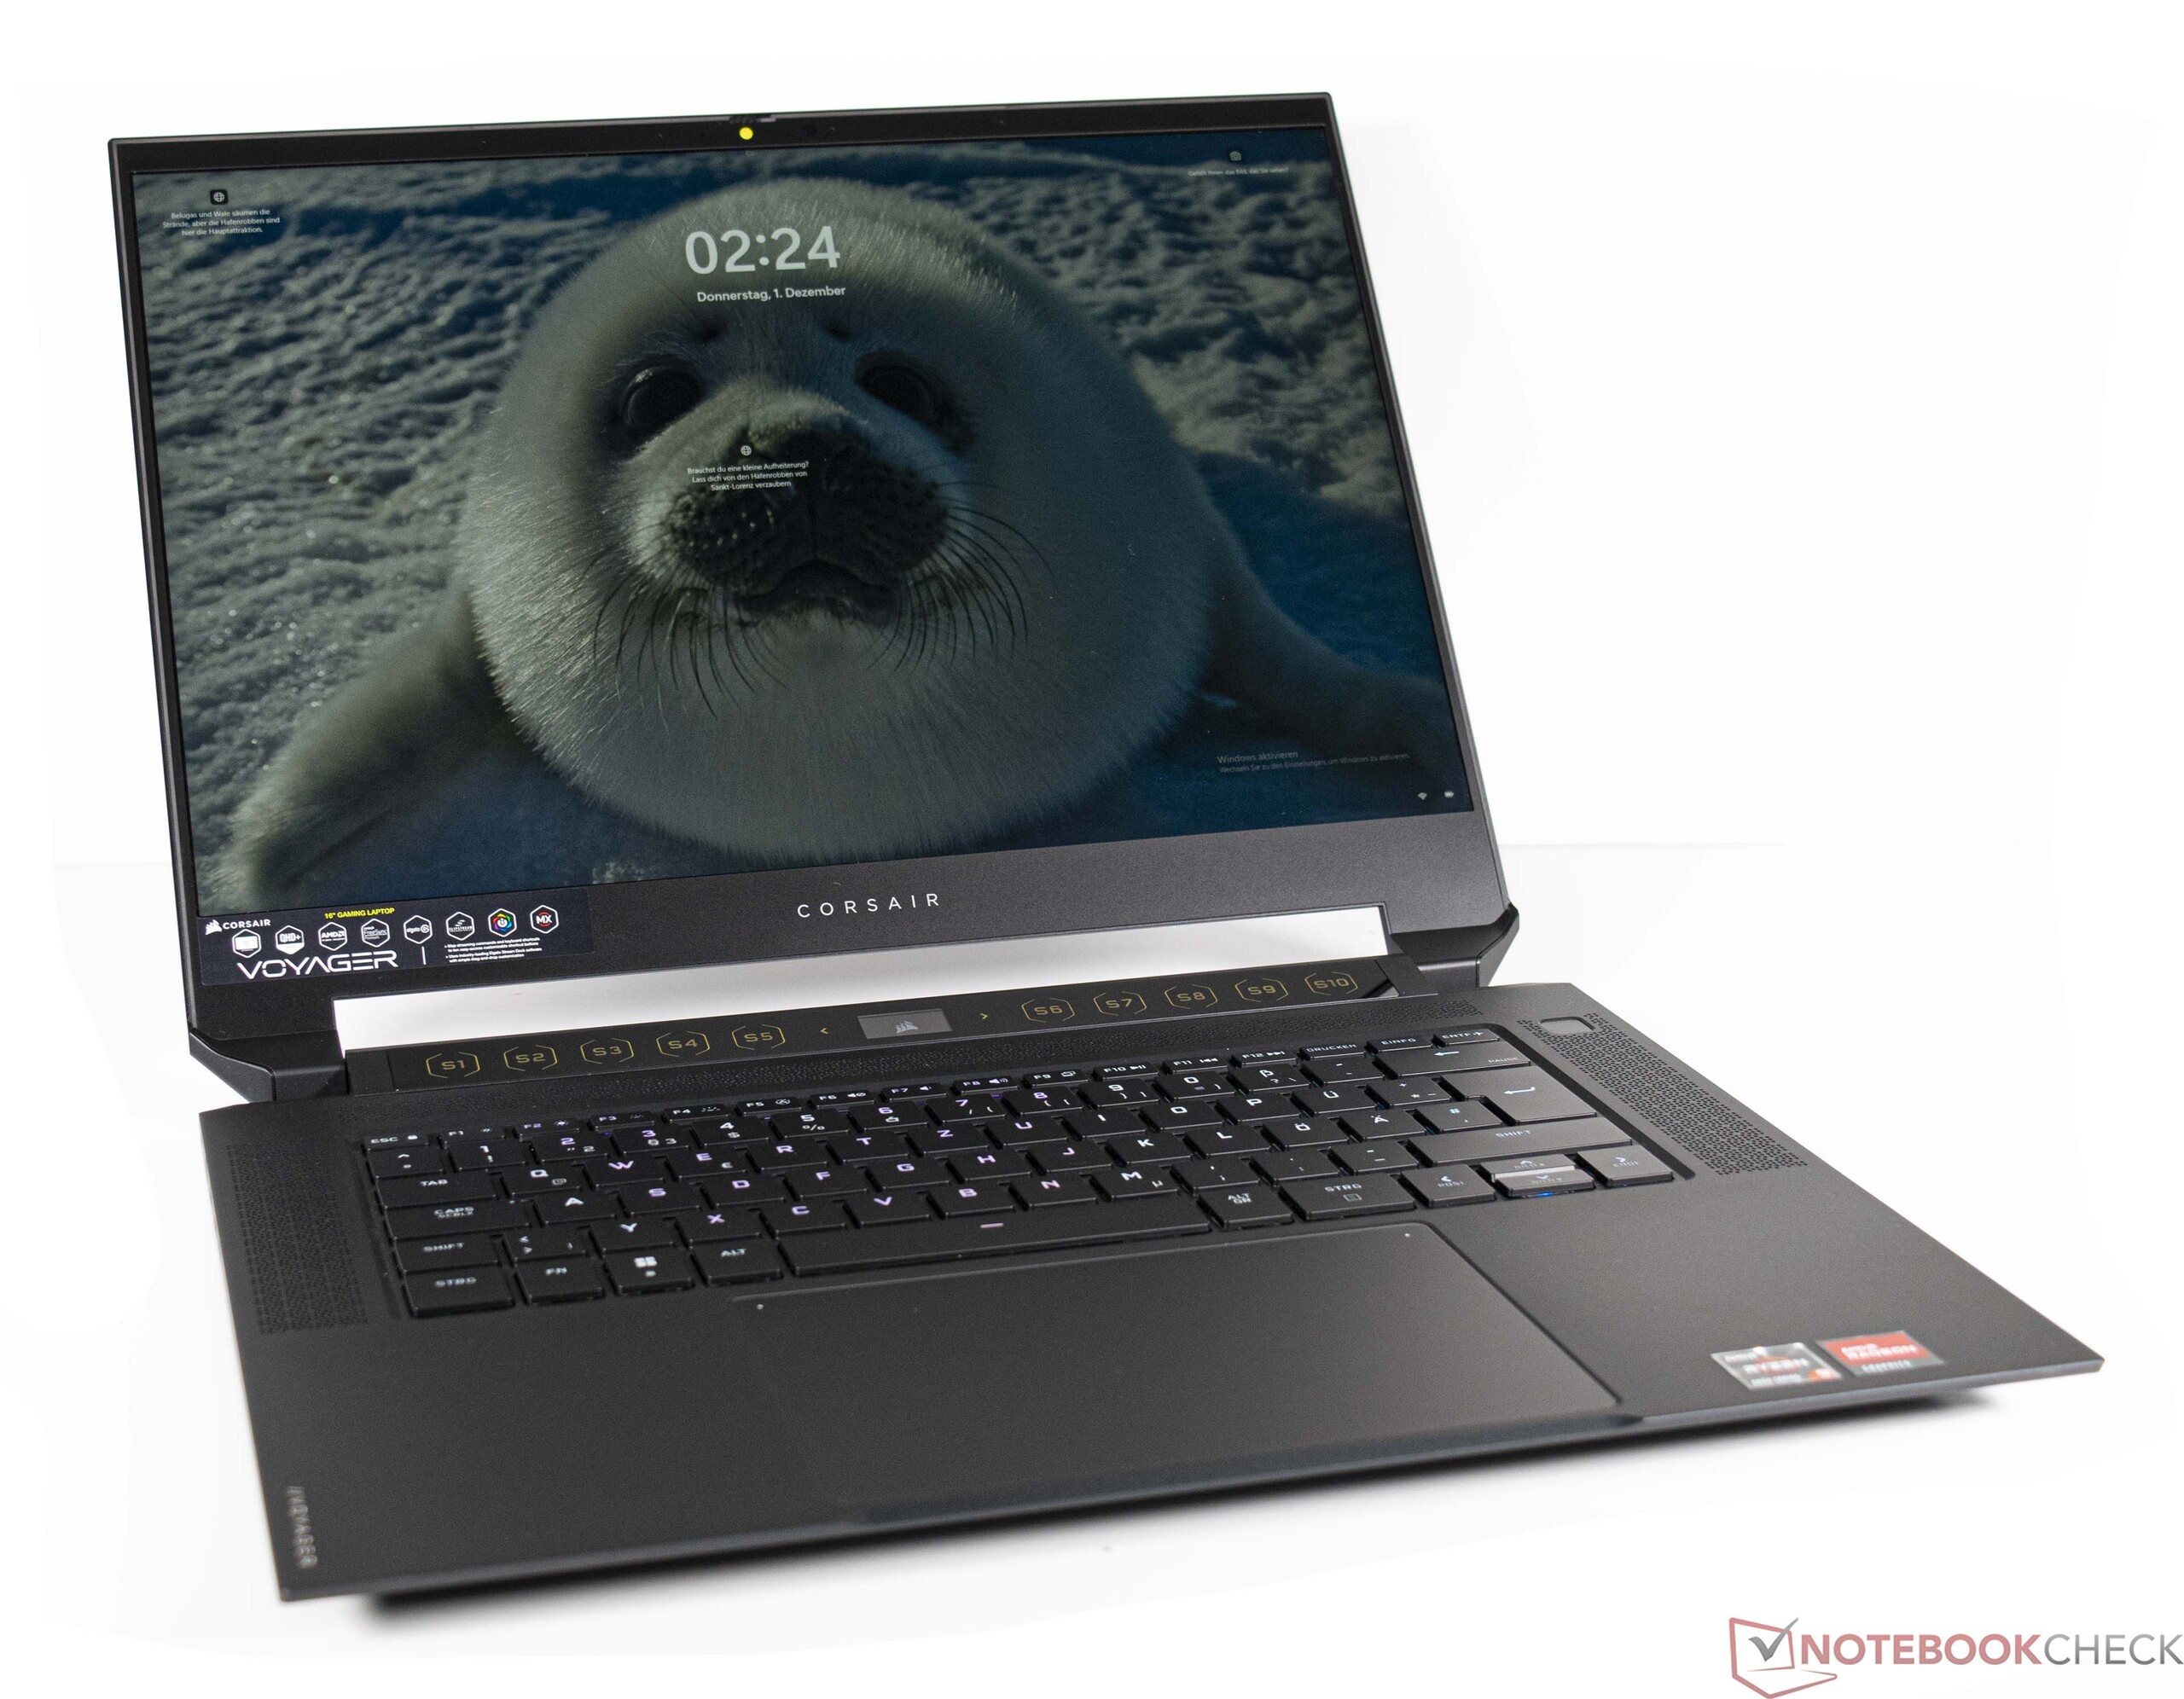
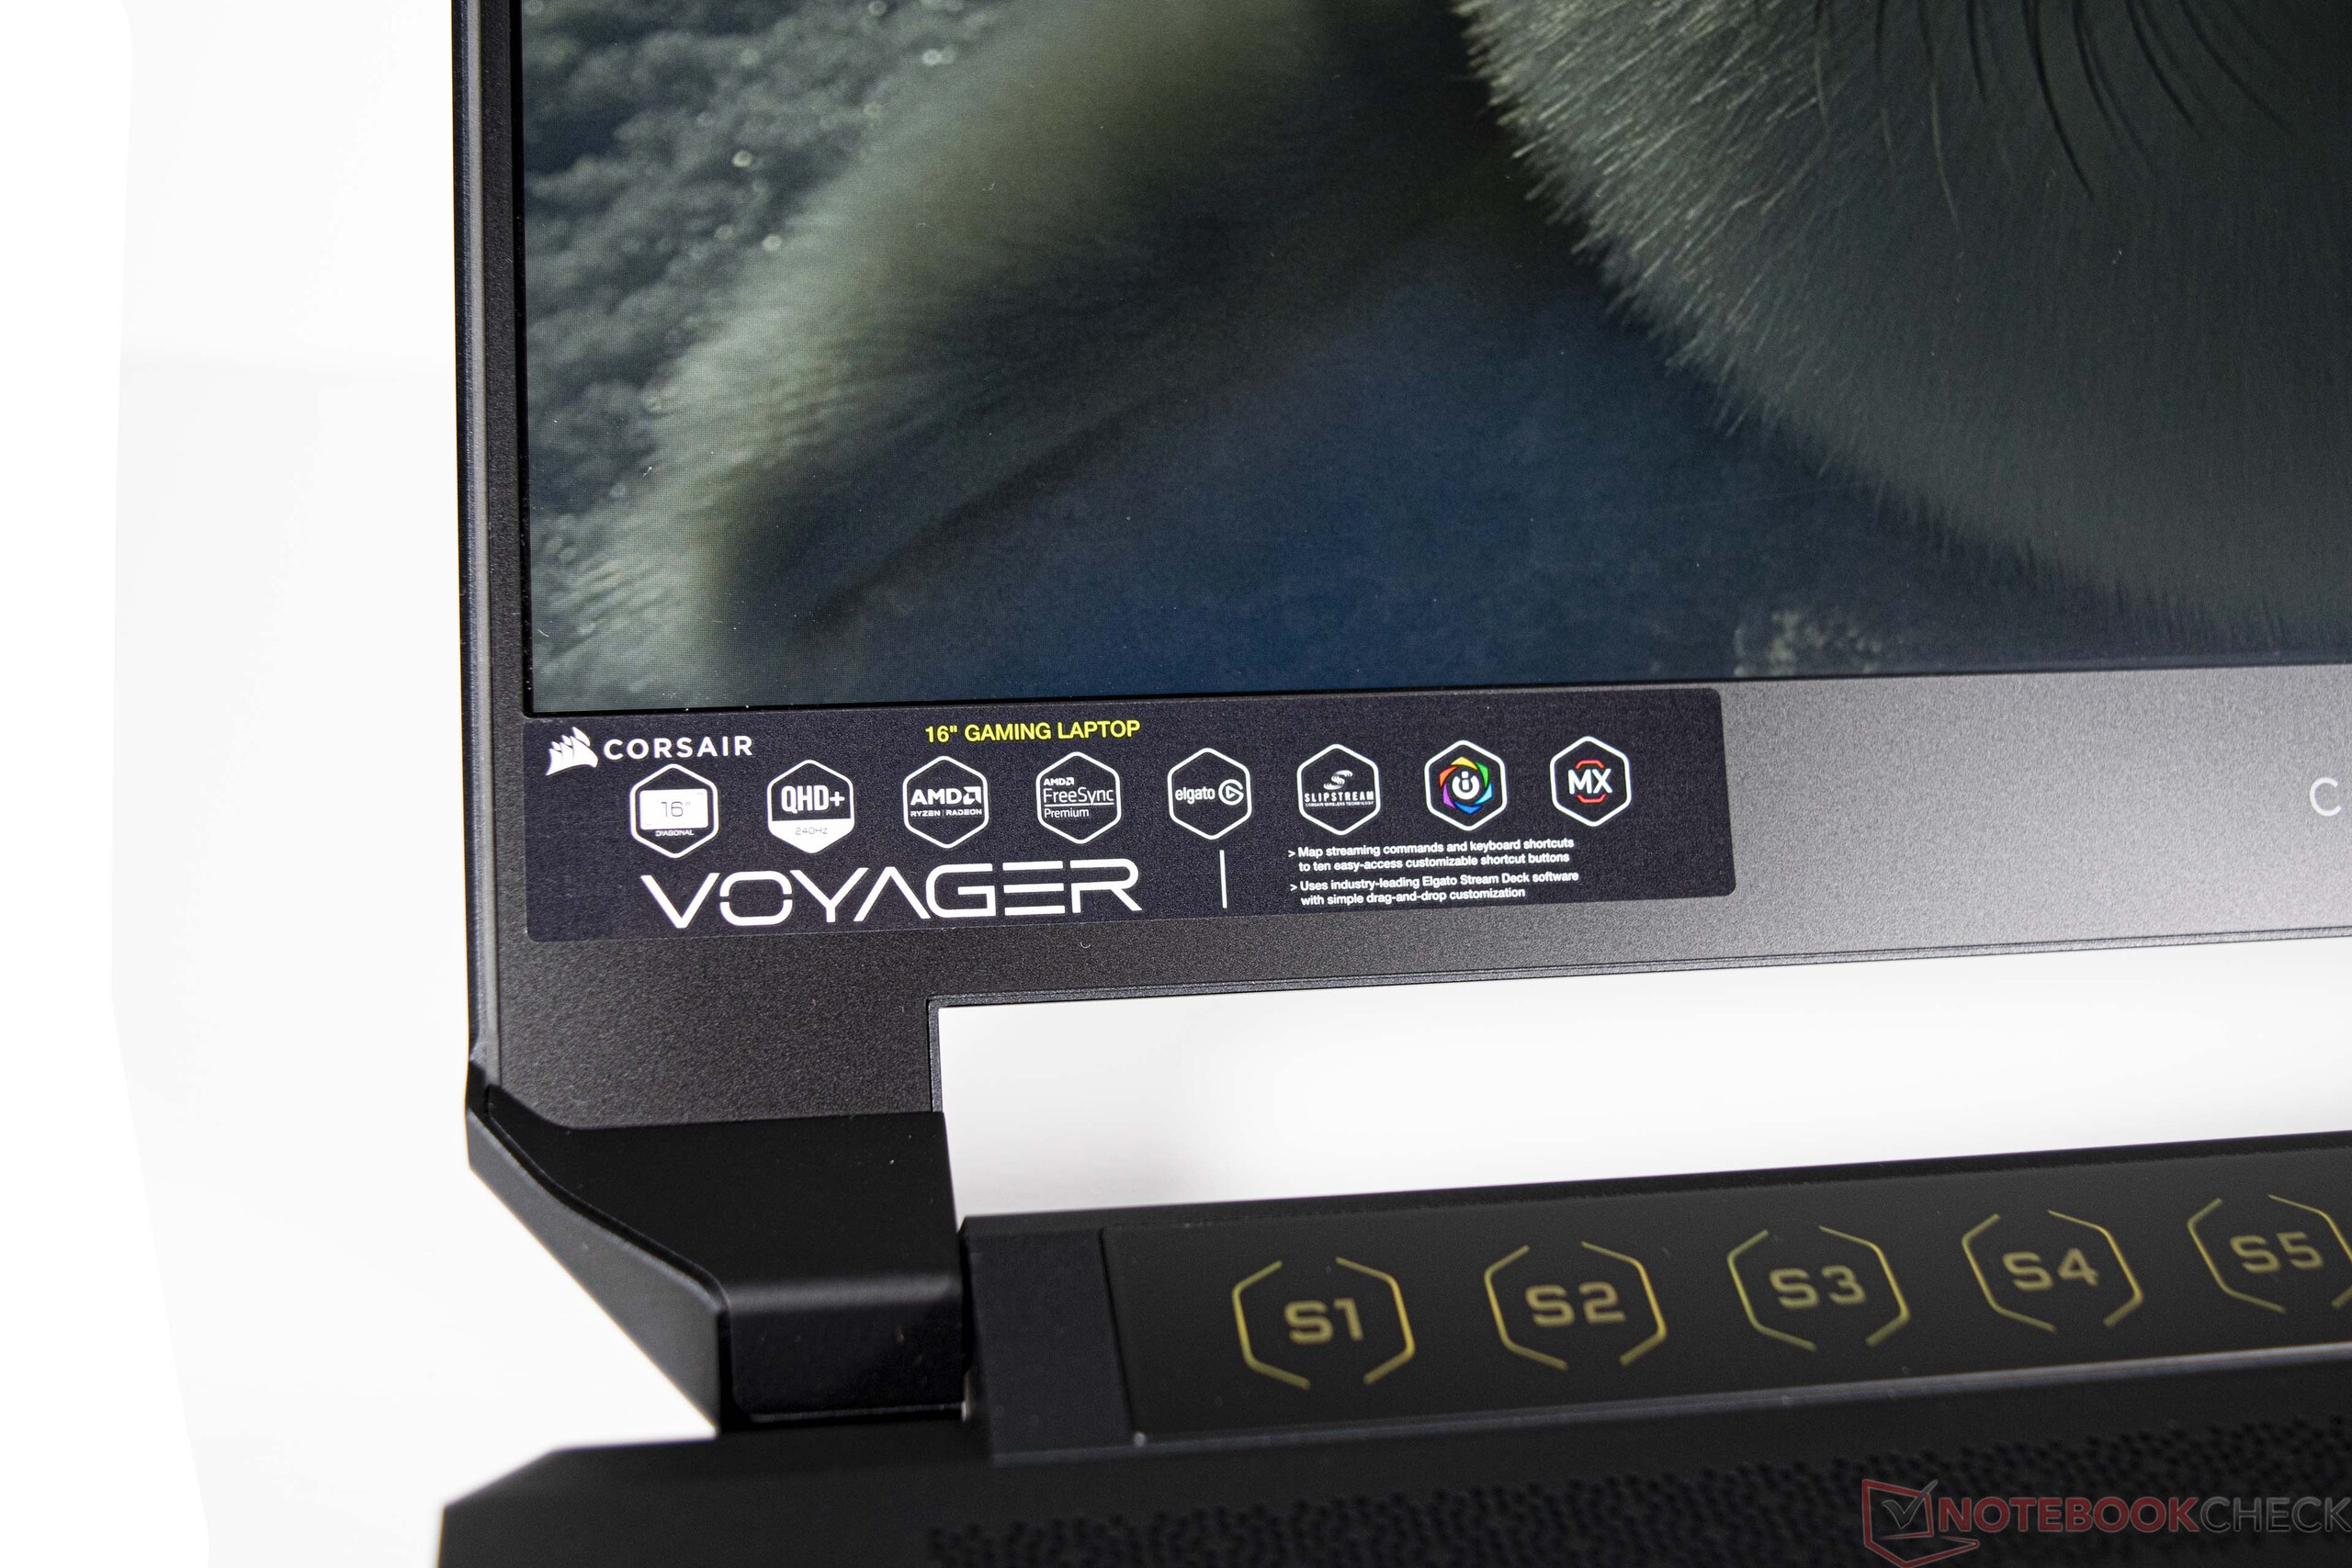
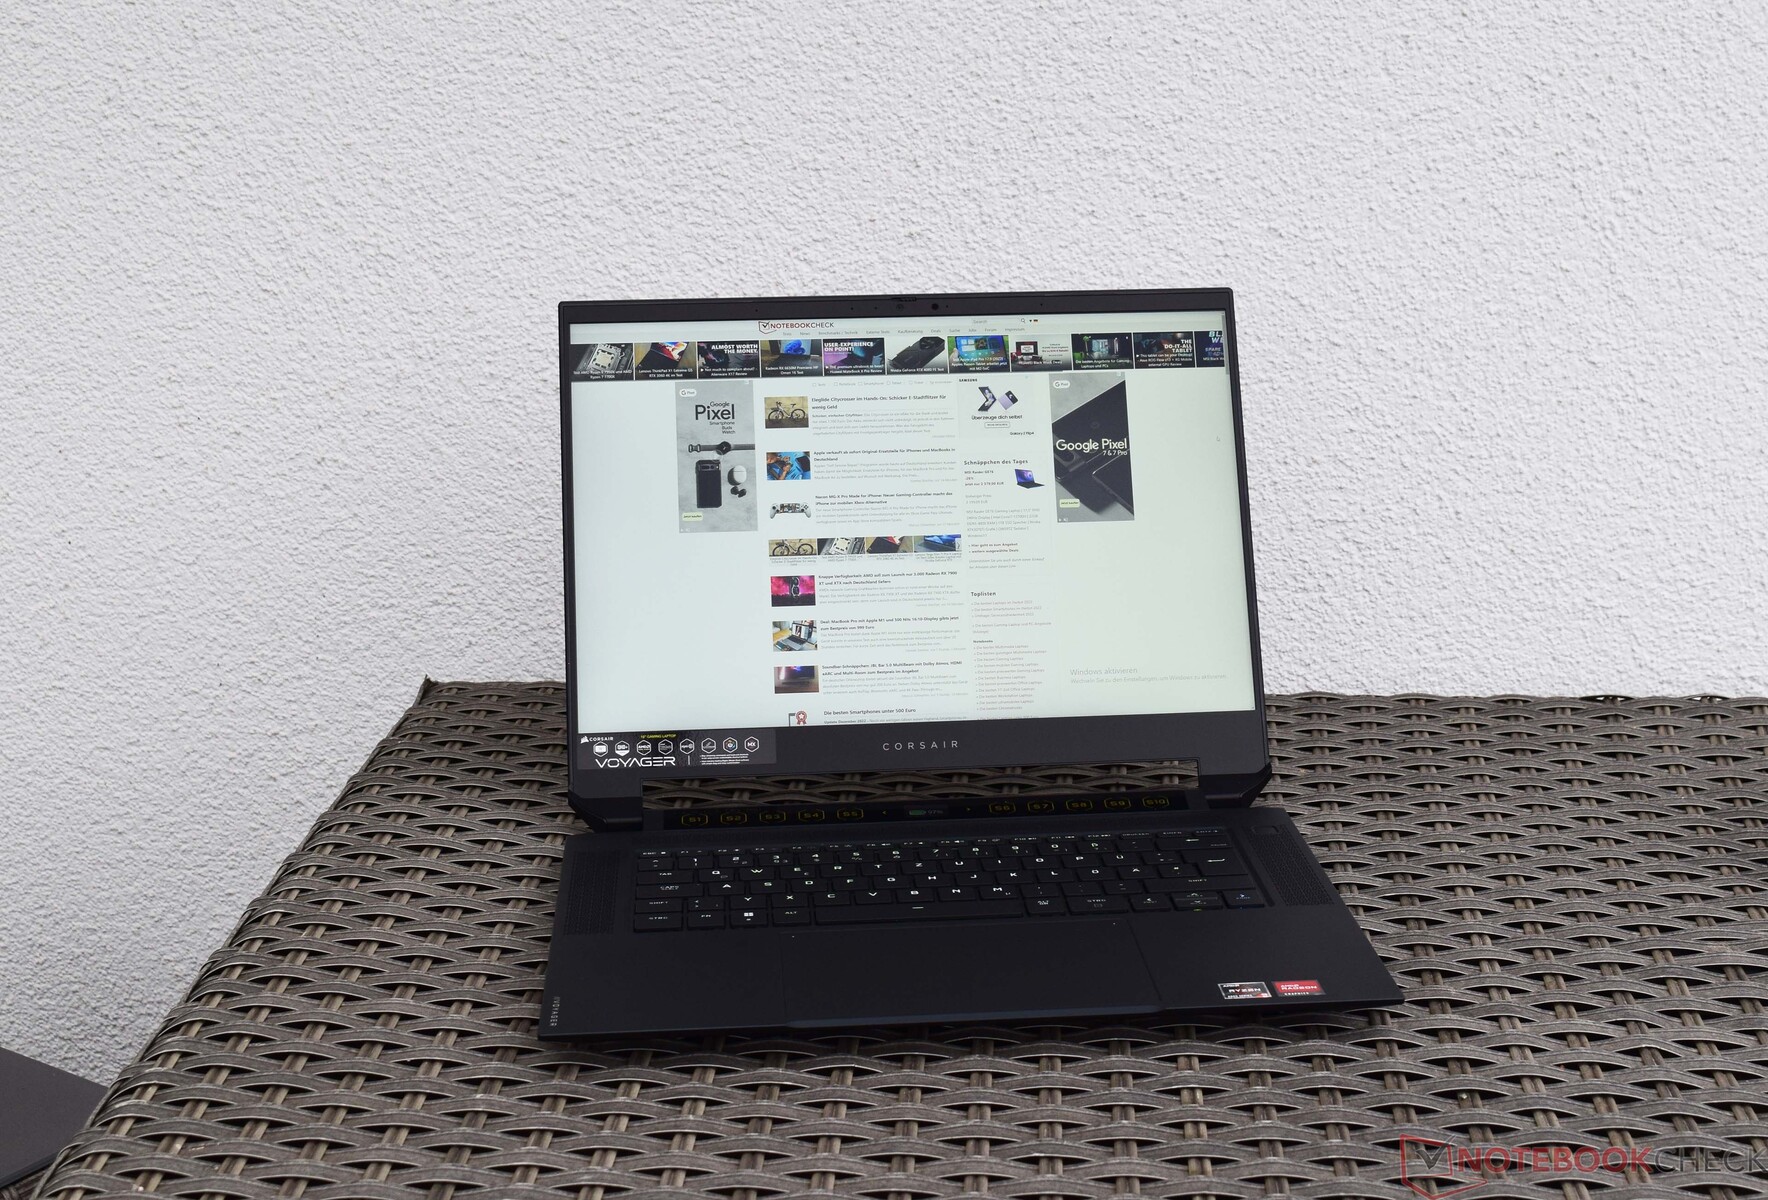
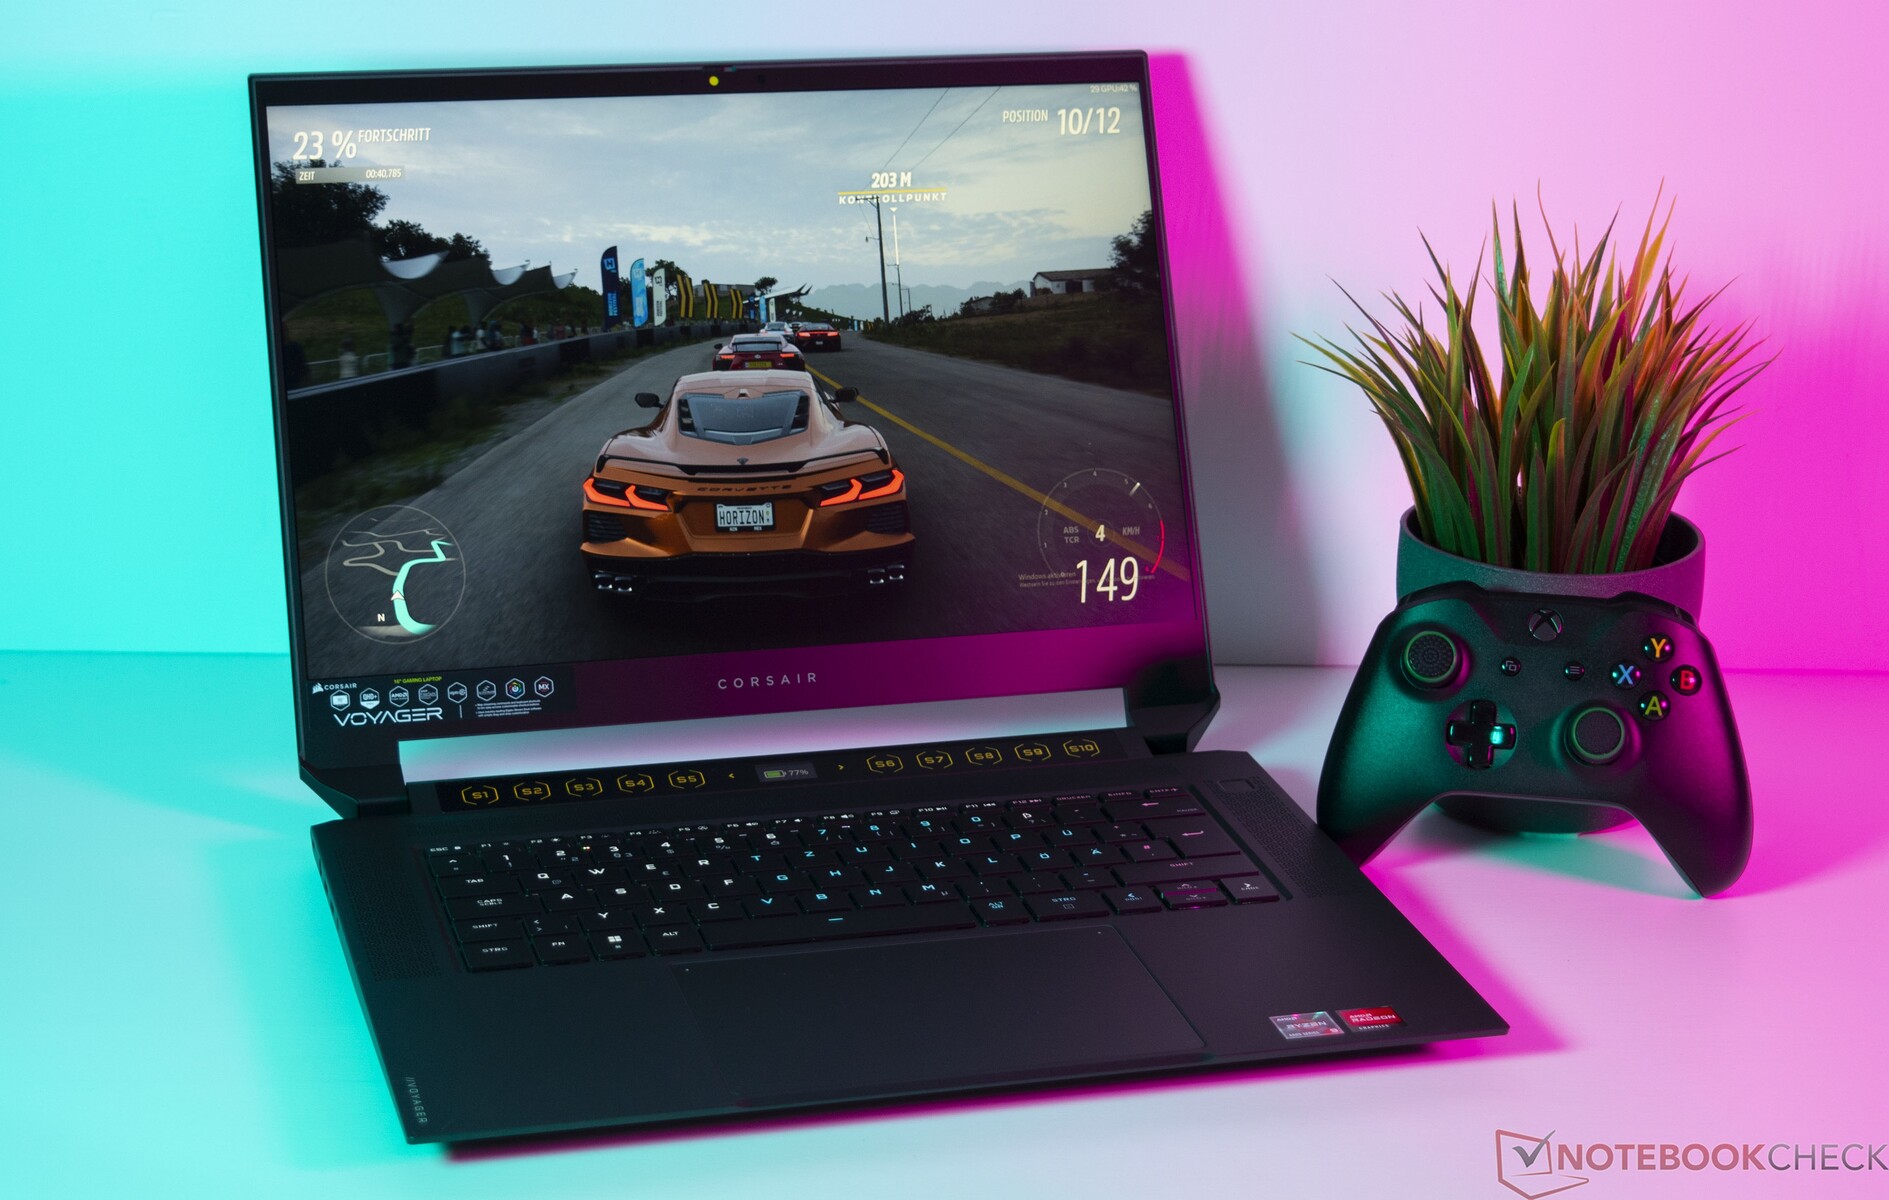
Corsair Voyager a1600 laptop in review: Full AMD power for gamers, streamers and creators

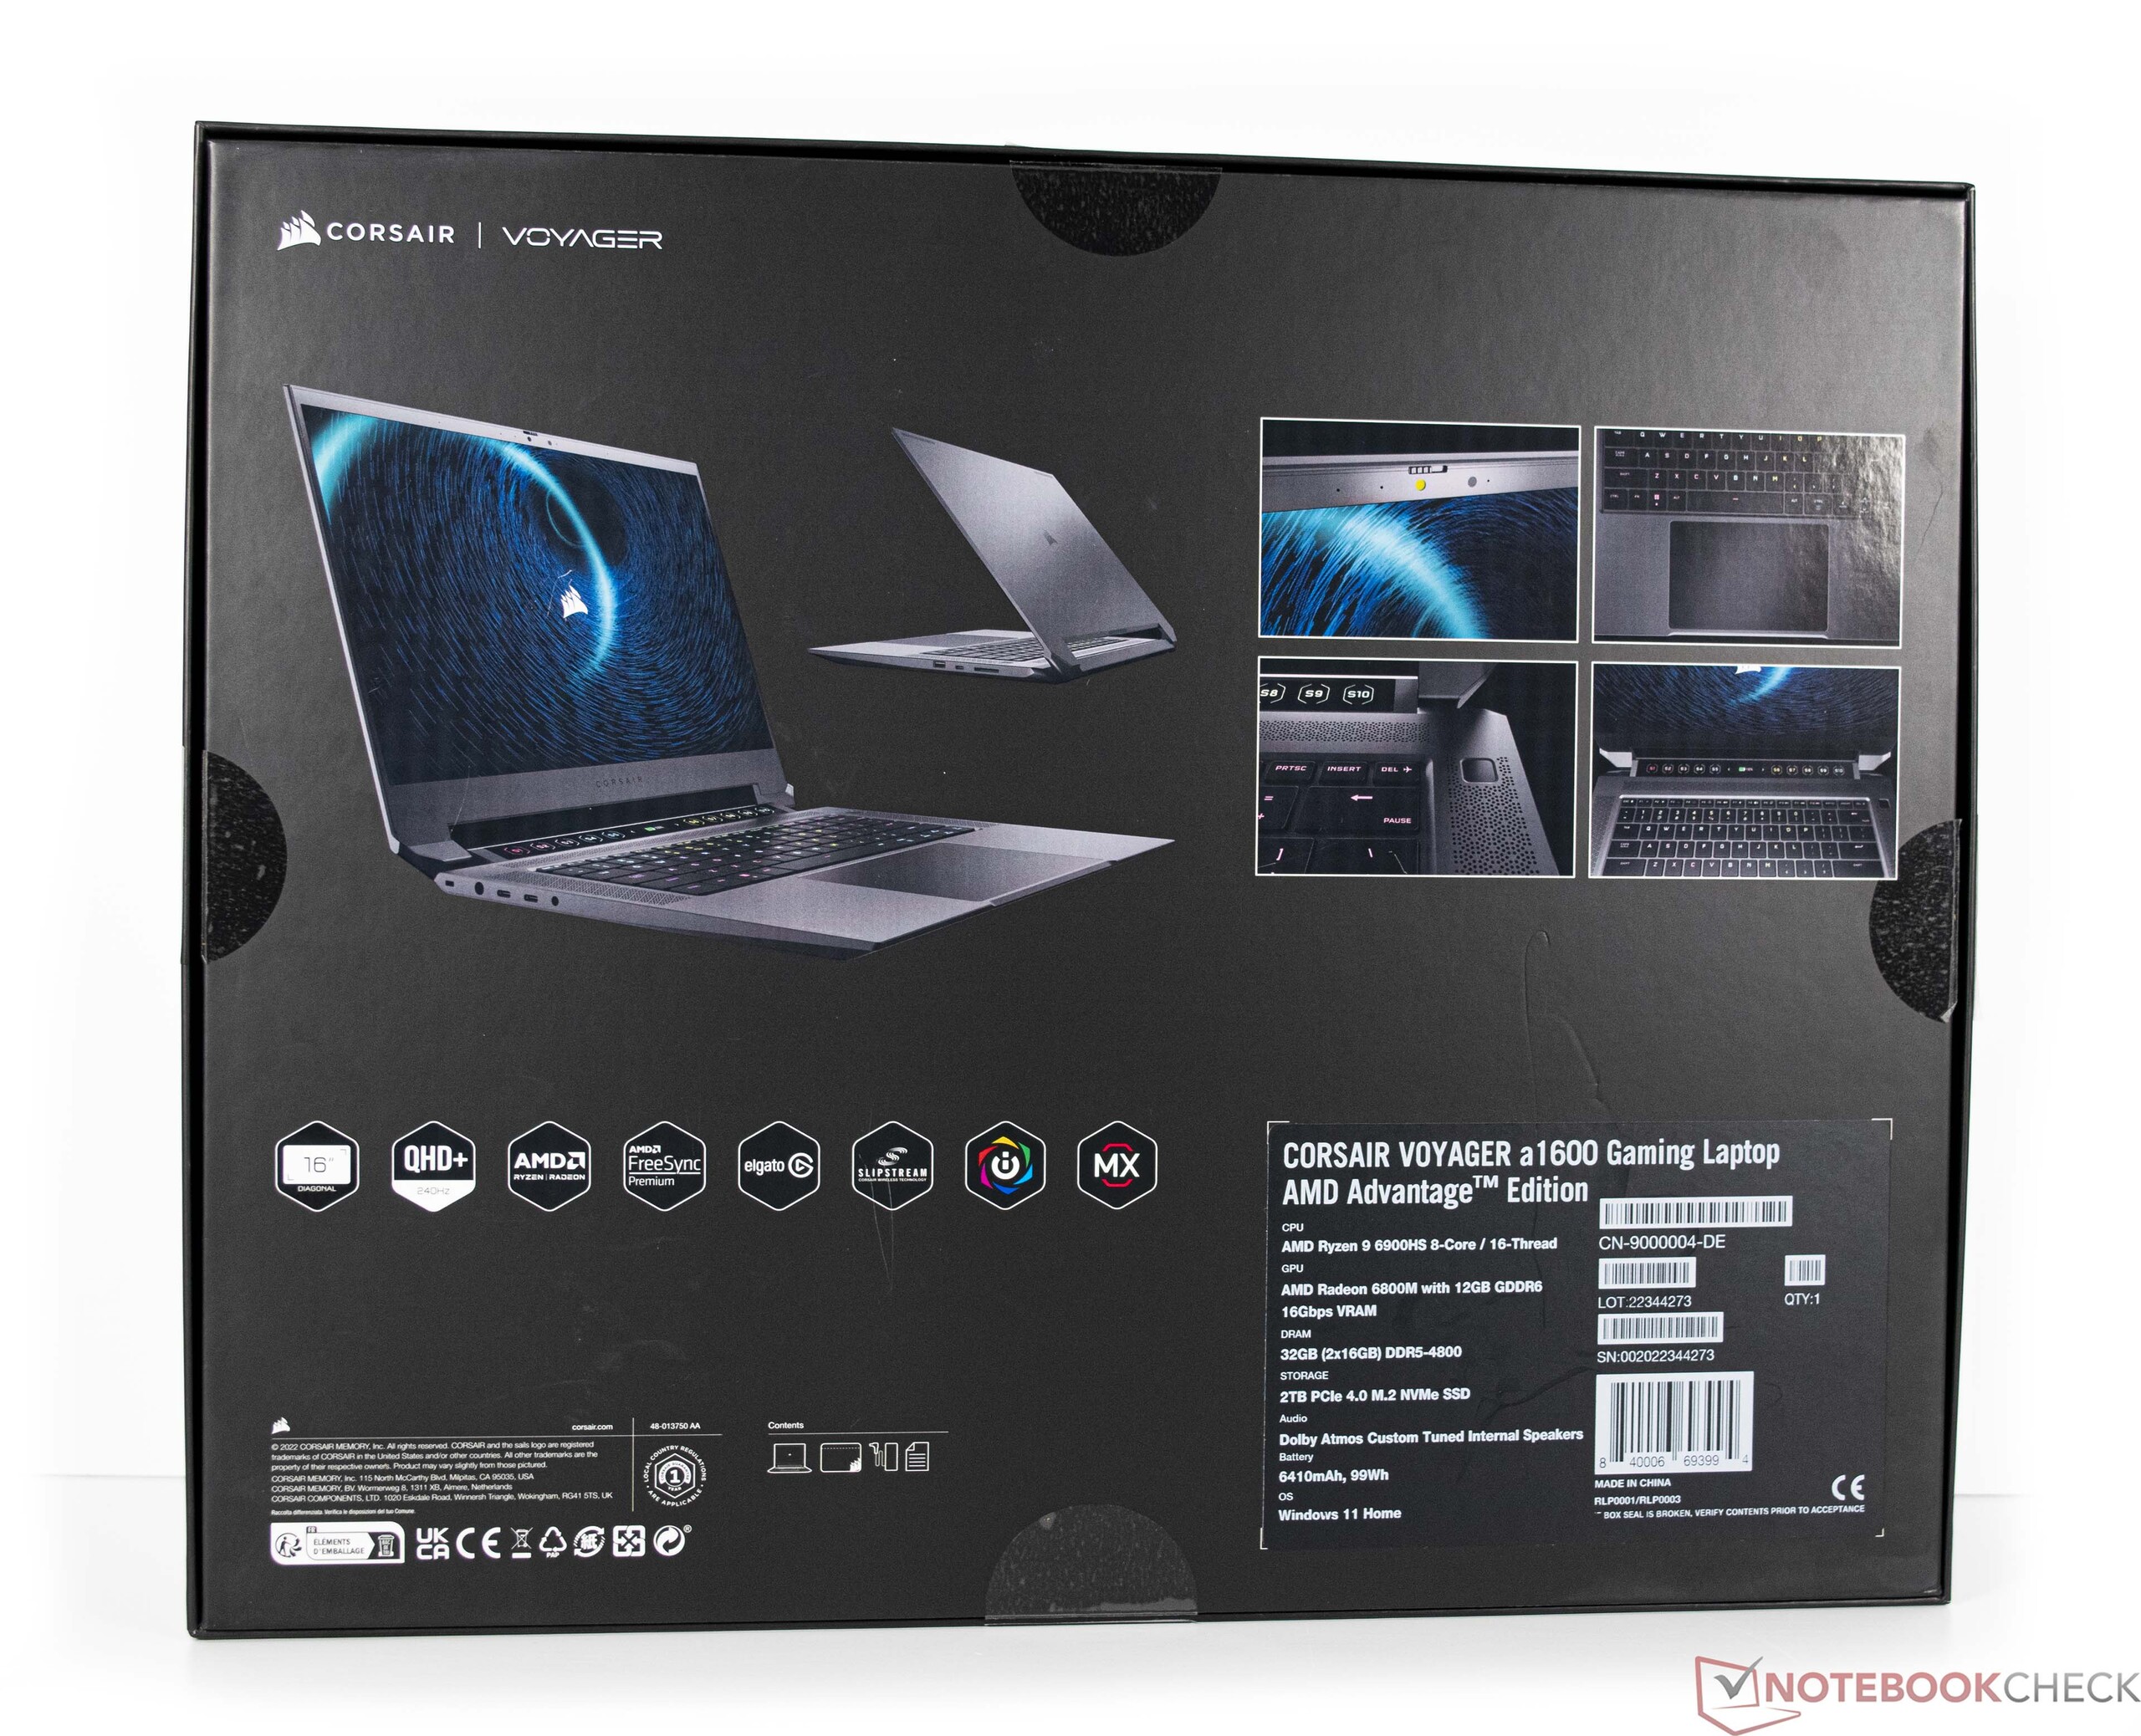
Corsair is a well-known name when it comes to accessories in the PC sector: peripherals, power supplies, SSDs, cases, monitors, and also prebuilt desktop systems, some of which we have already tested, are part of the manufacturer's current lineup. With the Voyager series, Corsair now also enters the notebook segment and wants to participate in the gaming sector with the Voyager a1600. The starting position isn't bad at all, because with the AMD Ryzen 9 6900HS and a dedicated AMD Radeon RX 6800M there is a promising basis. You can also look forward to 32 GB DDR5 RAM and an SSD with 2 TB of storage space in the top configuration. The 240 Hz QHD panel, on the other hand, is always a must. However, the price of 3,550 Euros is in the upper league.
It can be cheaper if you go with an AMD Ryzen 7 6800HS with 16 GB RAM and a 1 TB SSD. Here, 2,600 Euros are currently due. In the test, the Corsair Voyager a1600 competes against strong rivals from the field of current gaming notebooks. More details can be found in the following table.
Possible competitors in comparison
Rating | Date | Model | Weight | Height | Size | Resolution | Price |
|---|---|---|---|---|---|---|---|
| 86.6 % v7 (old) | 12 / 2022 | Corsair Voyager a1600 R9 6900HS, Radeon RX 6800M | 2.4 kg | 19.9 mm | 16.00" | 2560x1600 | |
| 89.5 % v7 (old) | 08 / 2022 | Asus ROG Flow X16 GV601RW-M5082W R9 6900HS, GeForce RTX 3070 Ti Laptop GPU | 2.1 kg | 19.4 mm | 16.10" | 2560x1600 | |
| 90.8 % v7 (old) | 09 / 2022 | Lenovo Legion 7 16ARHA7 R9 6900HX, Radeon RX 6850M XT | 2.6 kg | 19.4 mm | 16.00" | 2560x1600 | |
| 87.2 % v7 (old) | 06 / 2022 | Acer Predator Triton 500 SE PT516-52s-70KX i7-12700H, GeForce RTX 3080 Ti Laptop GPU | 2.3 kg | 19.9 mm | 16.00" | 2560x1600 | |
| 85.5 % v7 (old) | 05 / 2022 | HP Omen 16-b1090ng i7-12700H, GeForce RTX 3070 Ti Laptop GPU | 2.3 kg | 23 mm | 16.10" | 2560x1440 | |
| 88.9 % v7 (old) | 09 / 2022 | Lenovo Legion 7 16IAX7-82TD004SGE i9-12900HX, GeForce RTX 3080 Ti Laptop GPU | 2.6 kg | 20 mm | 16.00" | 2560x1600 |
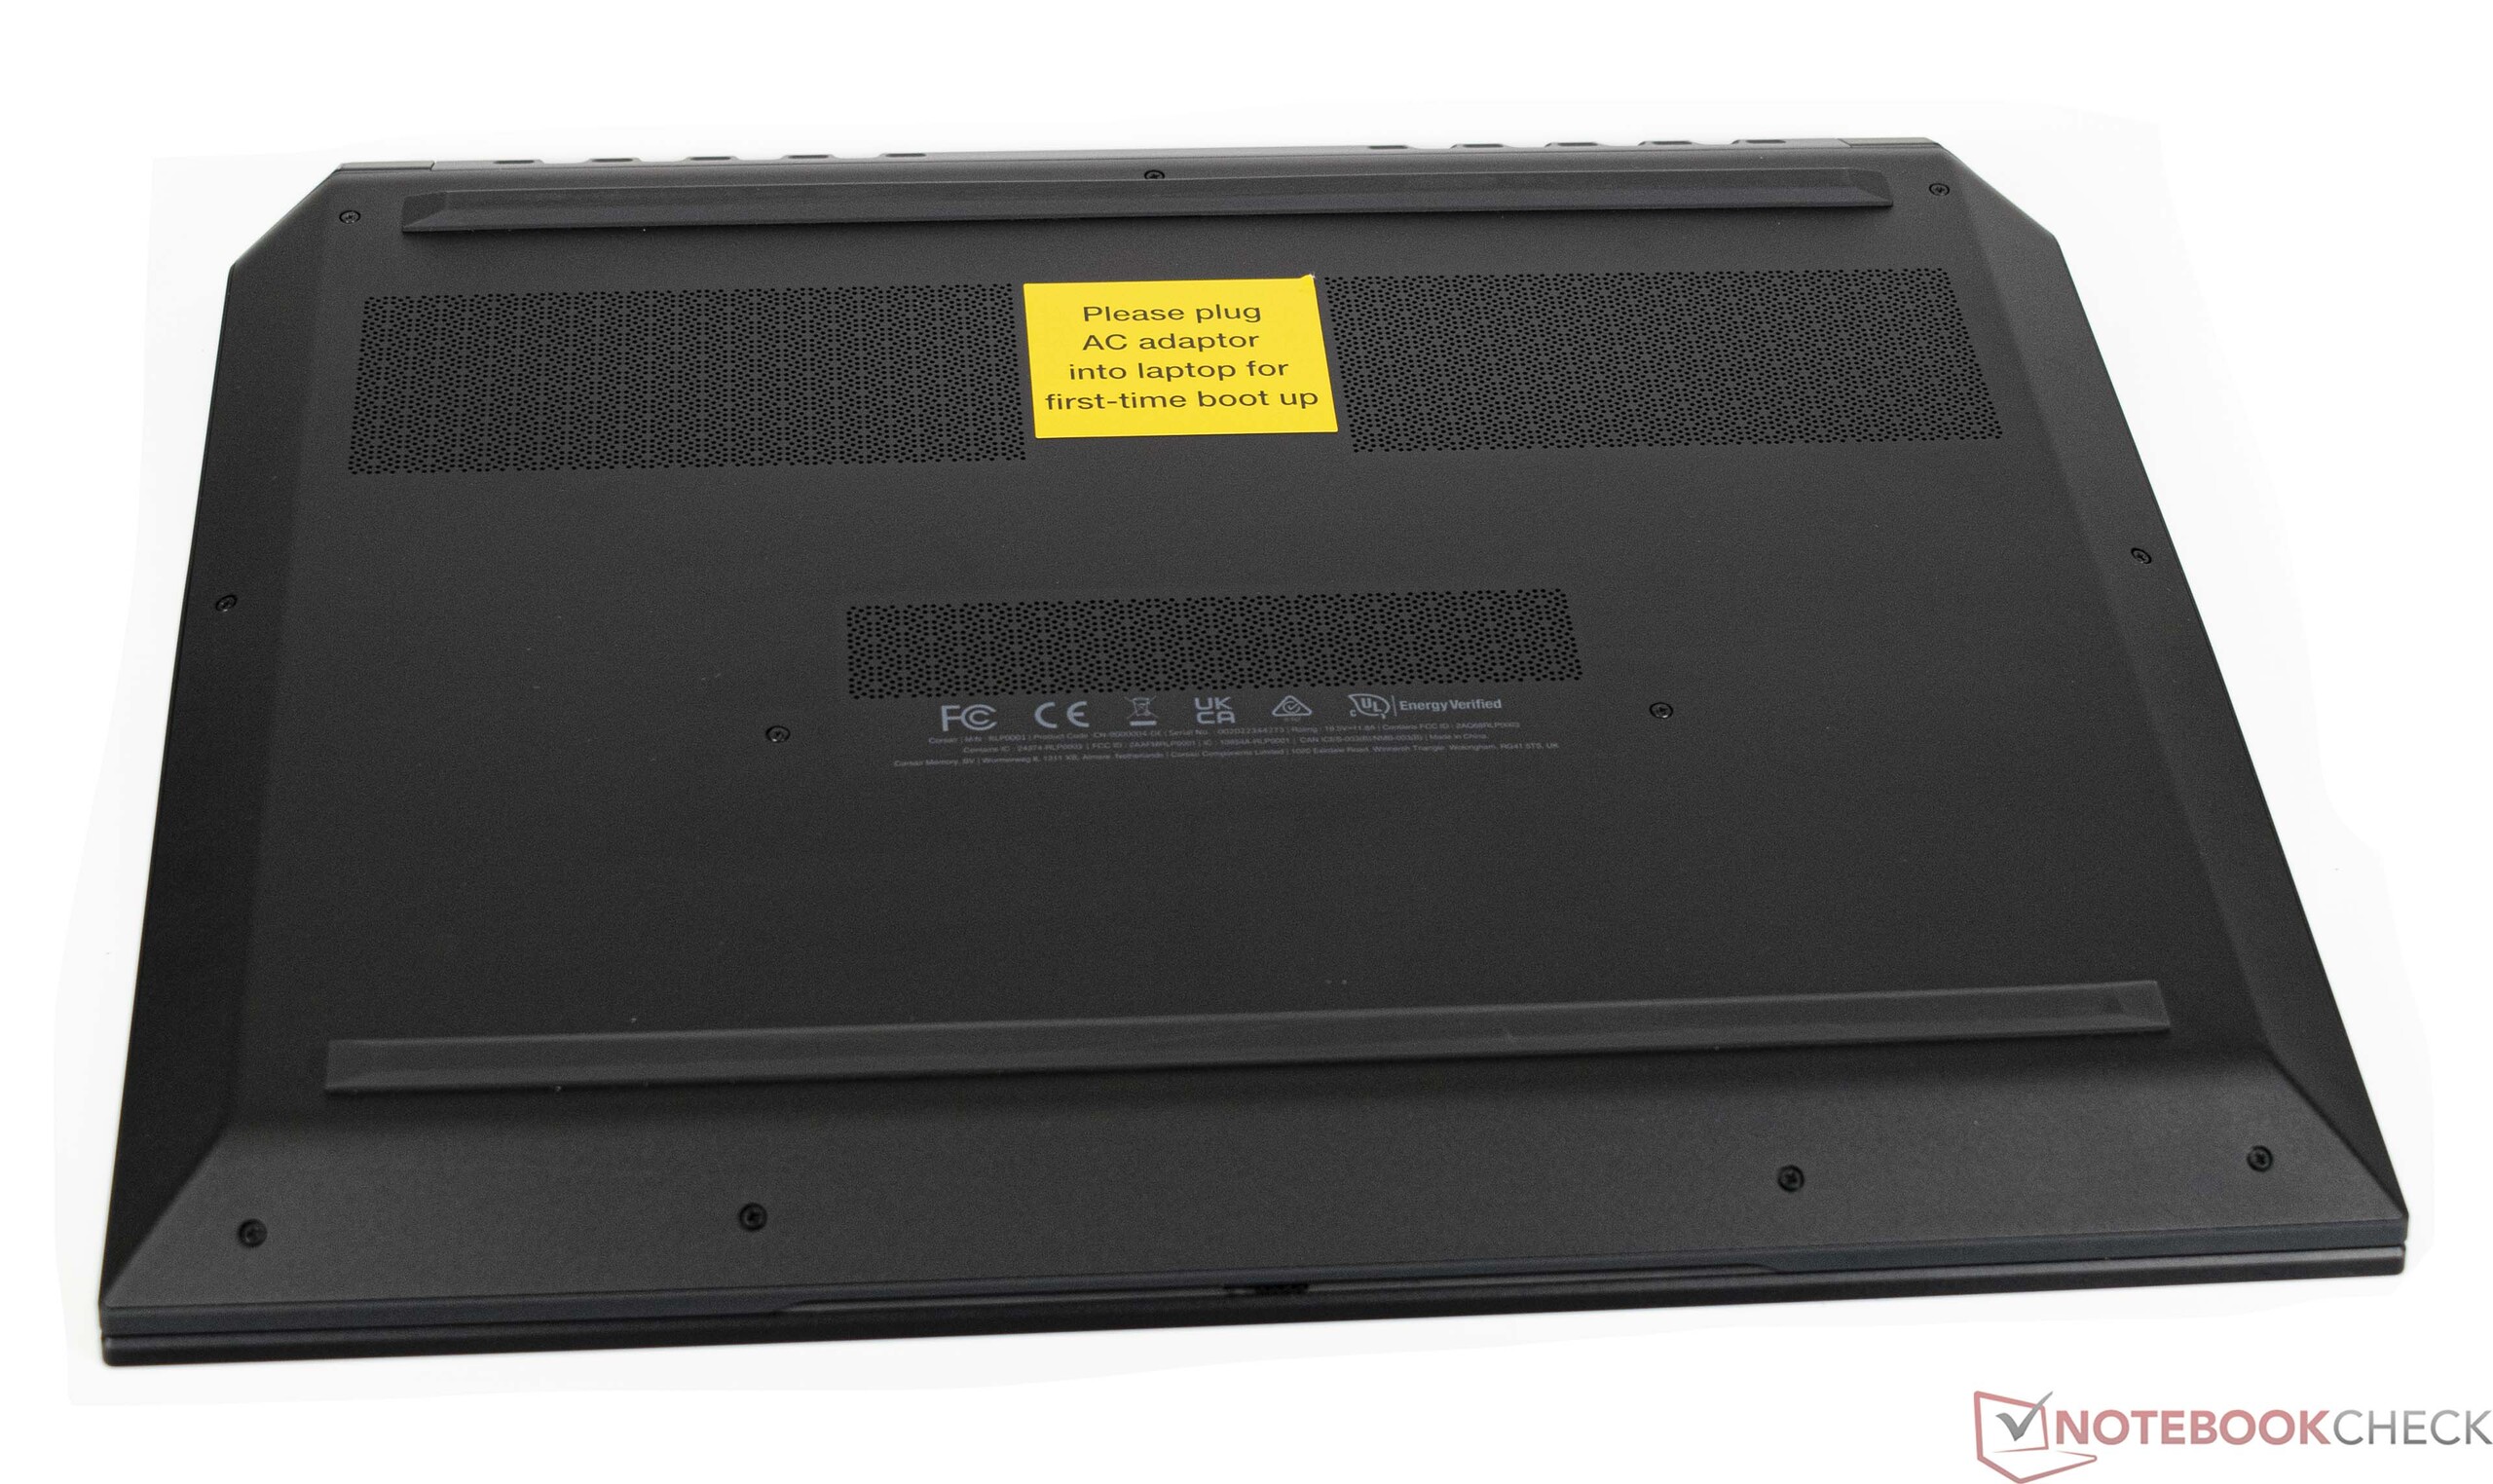
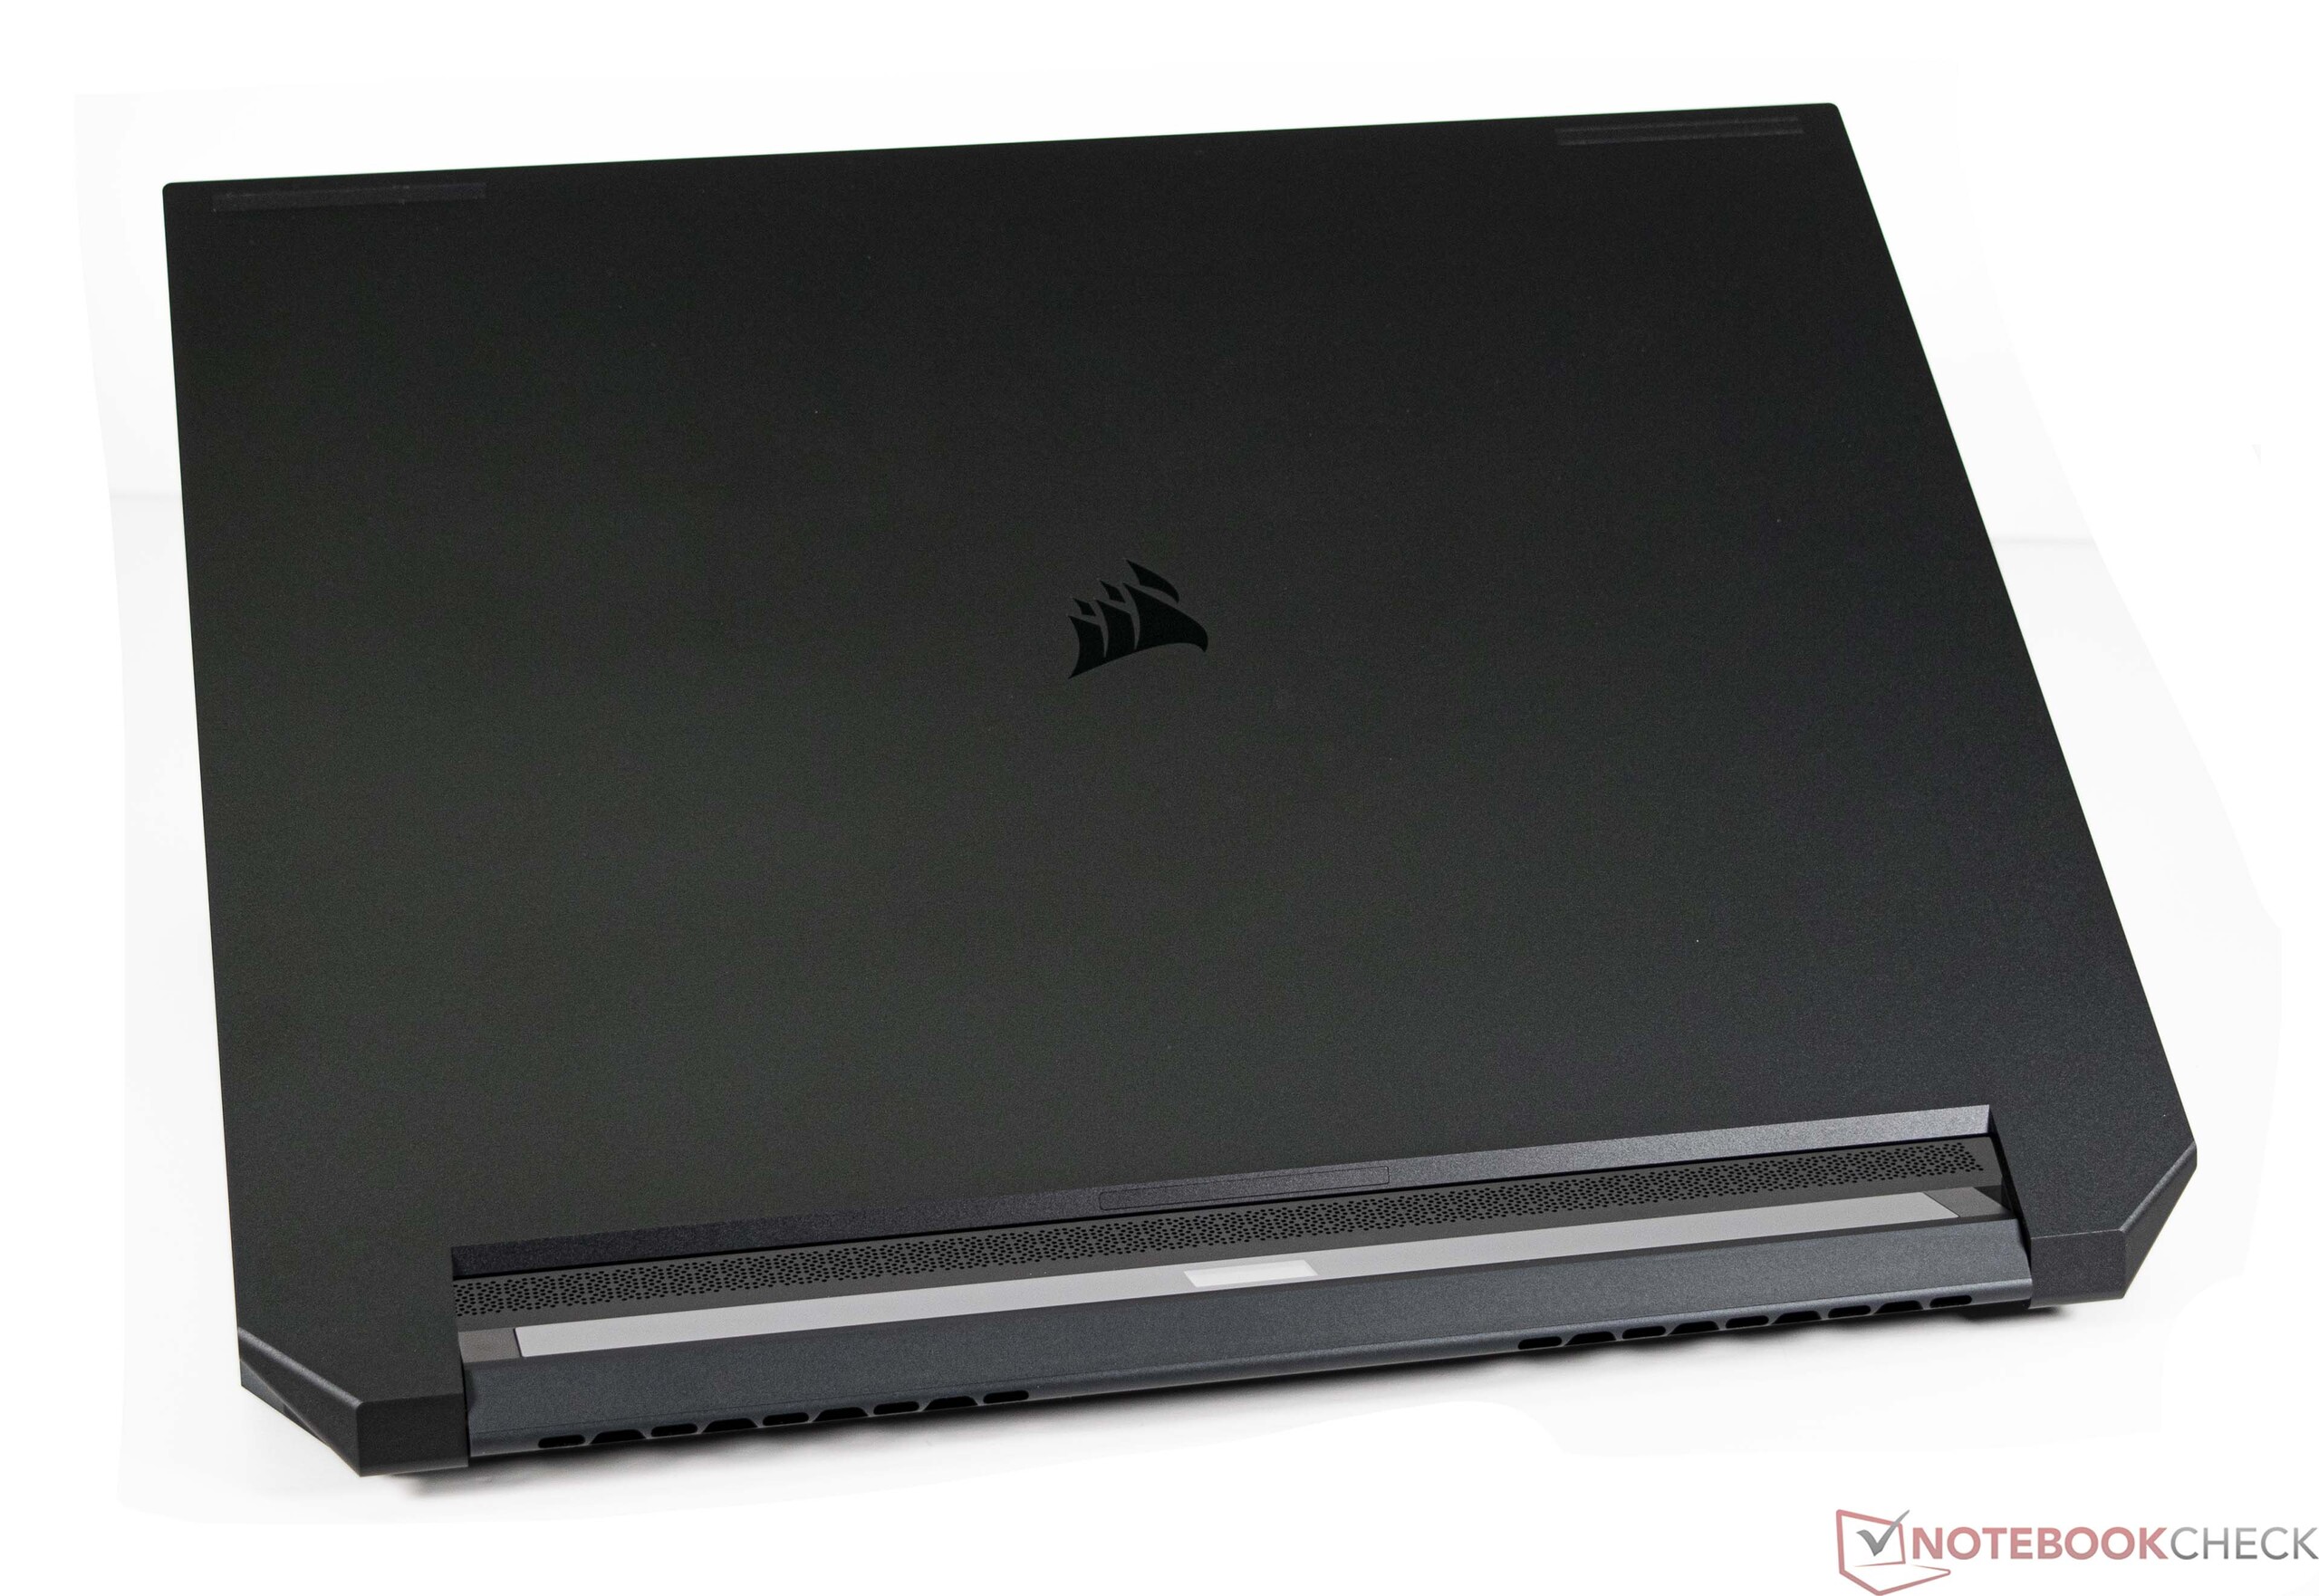
Case & features - Thin yet sturdy
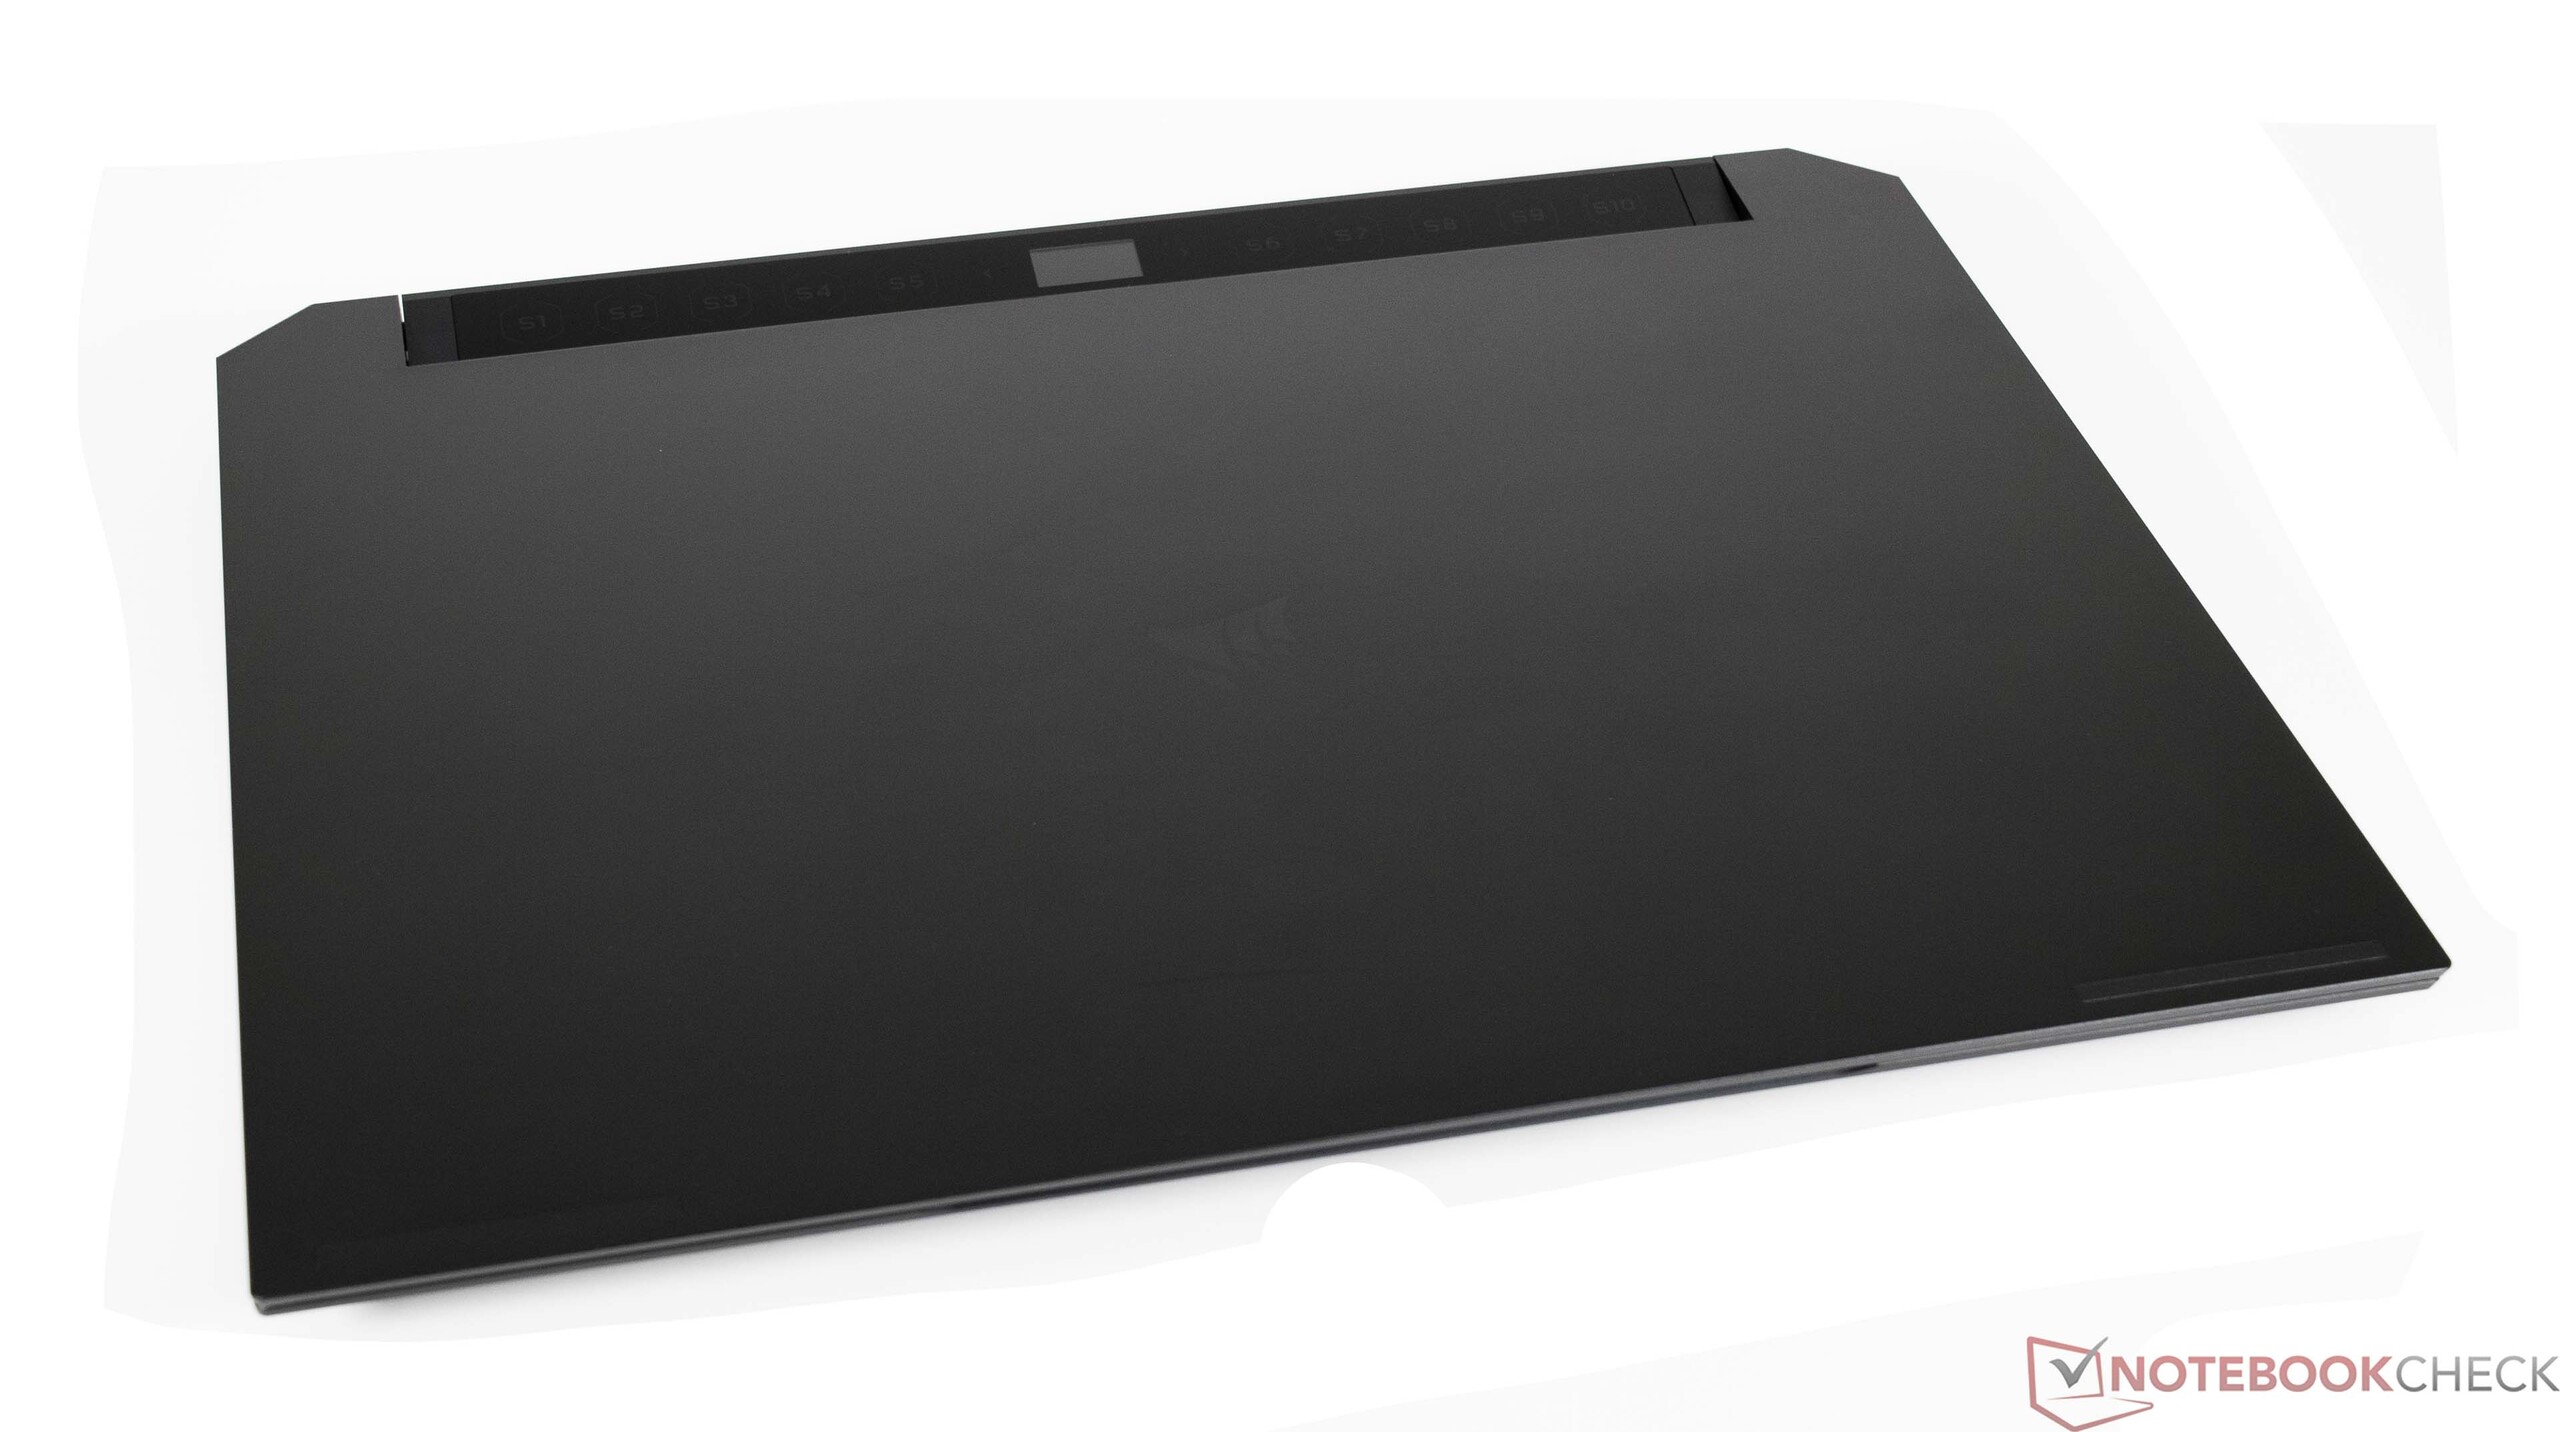
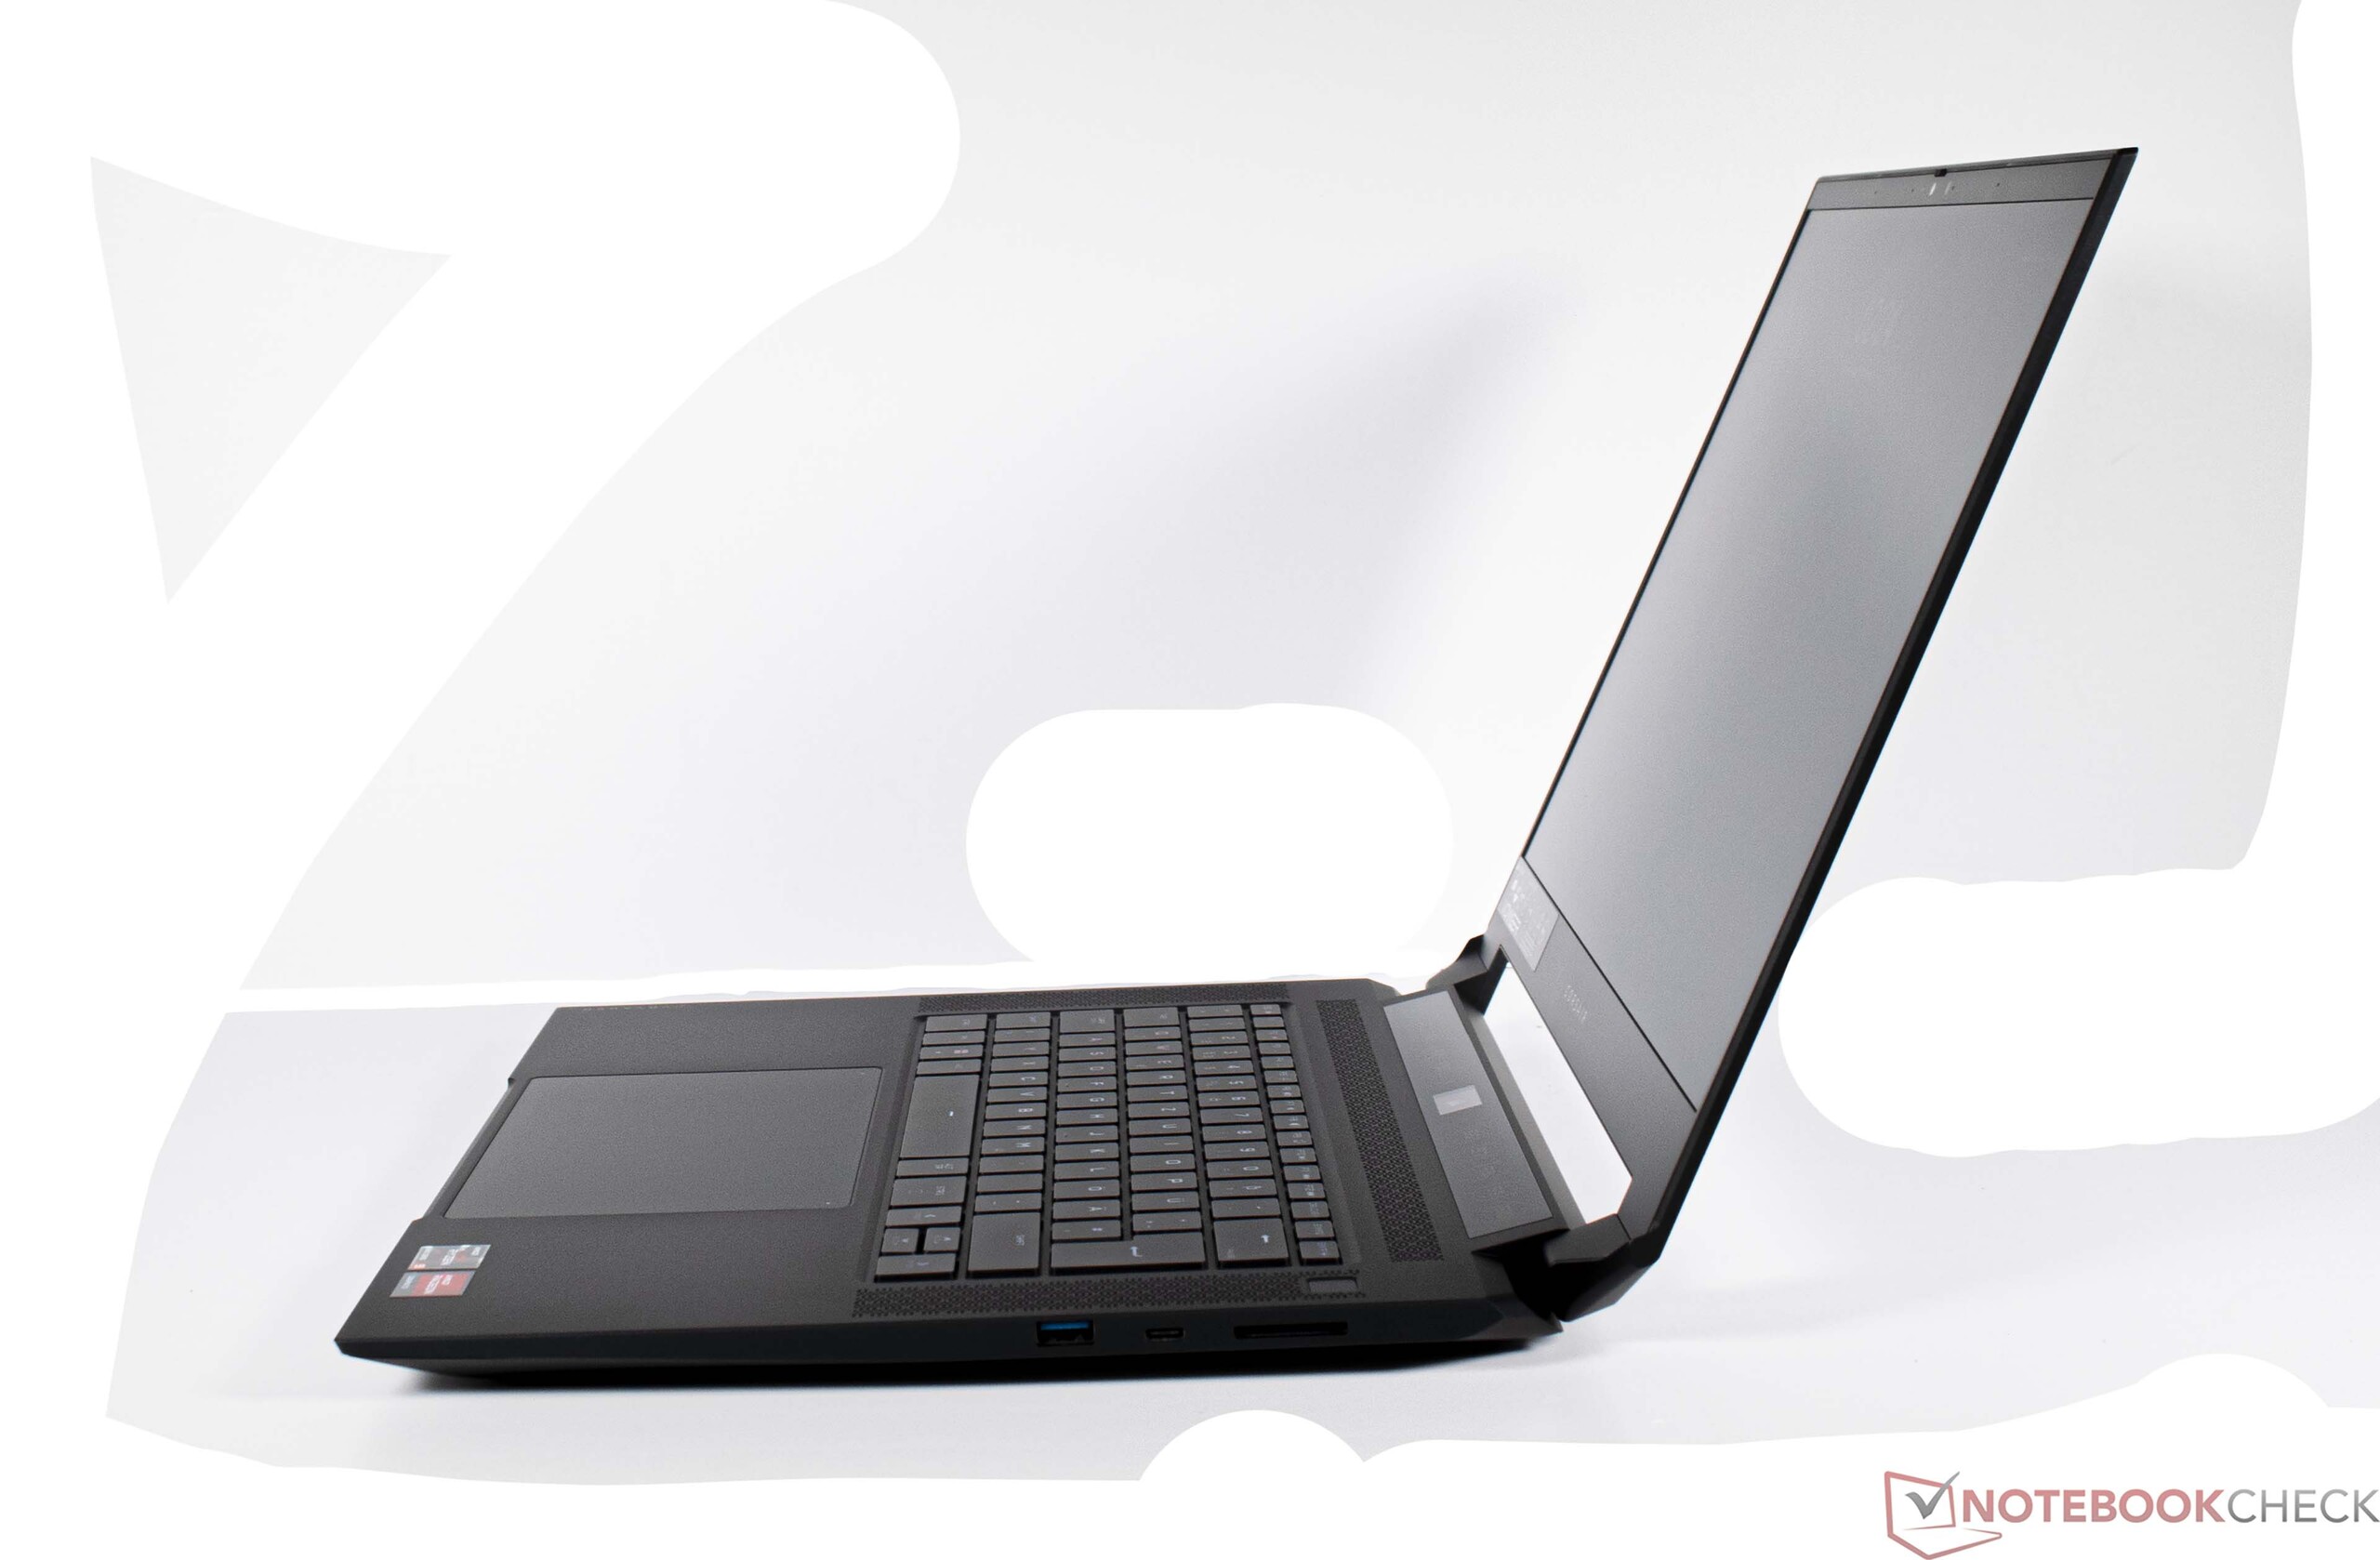
The case of the Corsair Voyager a1600 is made of aluminum and thus gives the device very good stability. Only the display lid twisted slightly during our torsion tests. Otherwise, the gaming notebook has a relatively modest appearance and does without any RGB lighting, which is quite okay. The display is held by two small hinges, which cannot completely prevent bouncing.
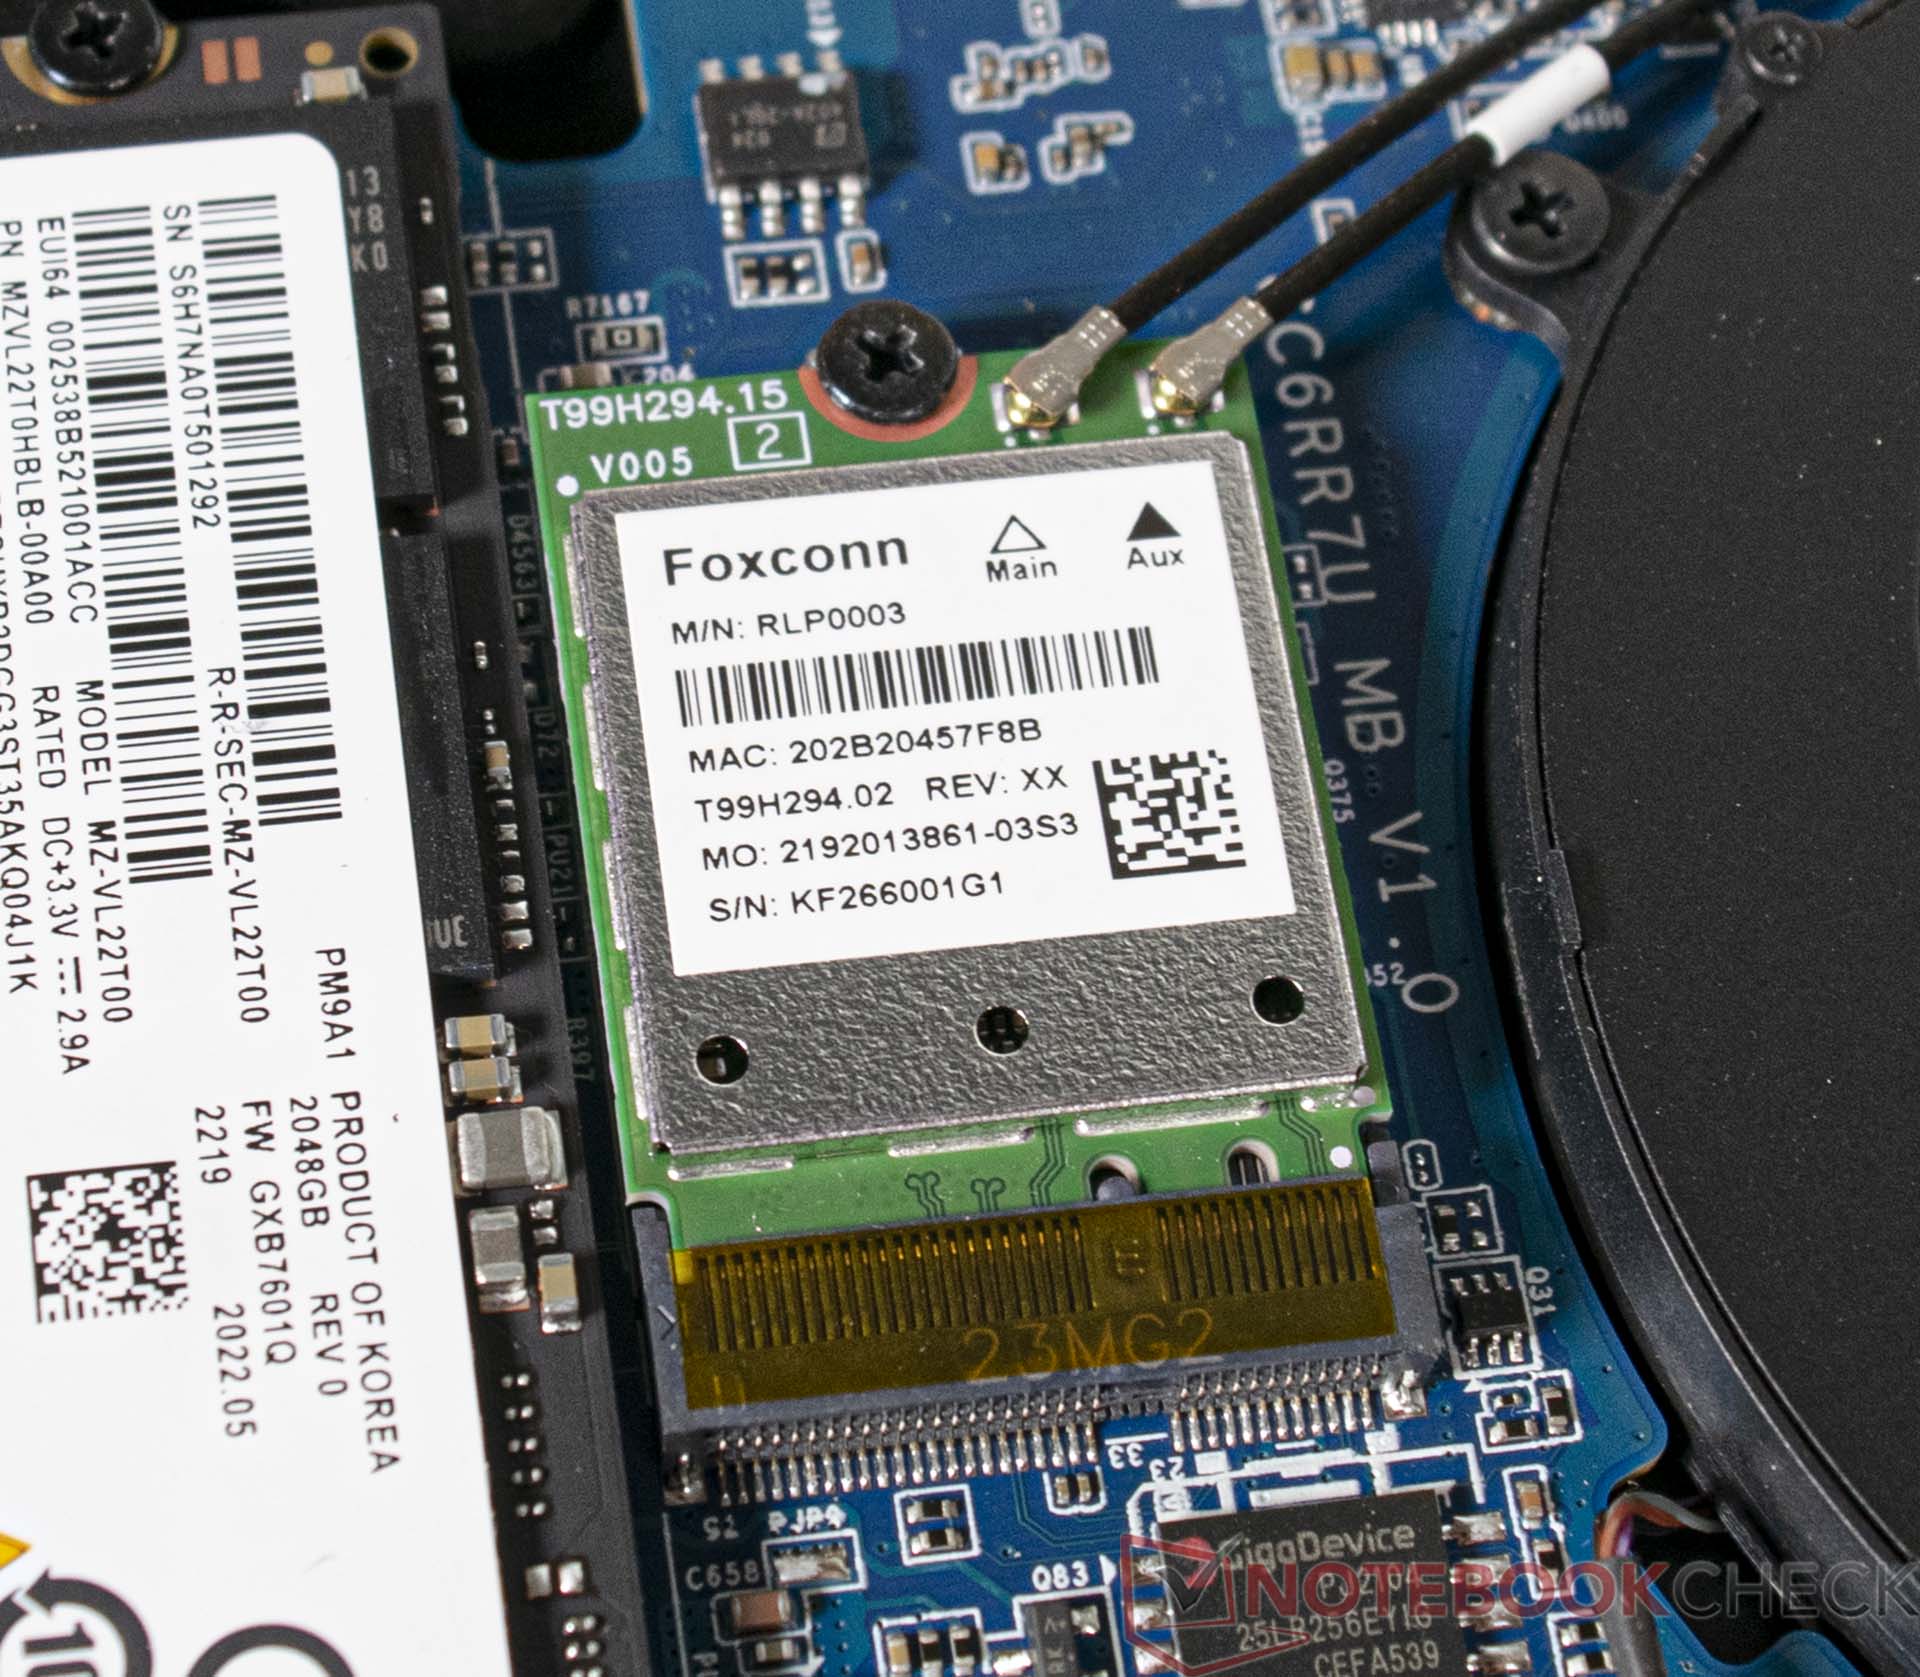
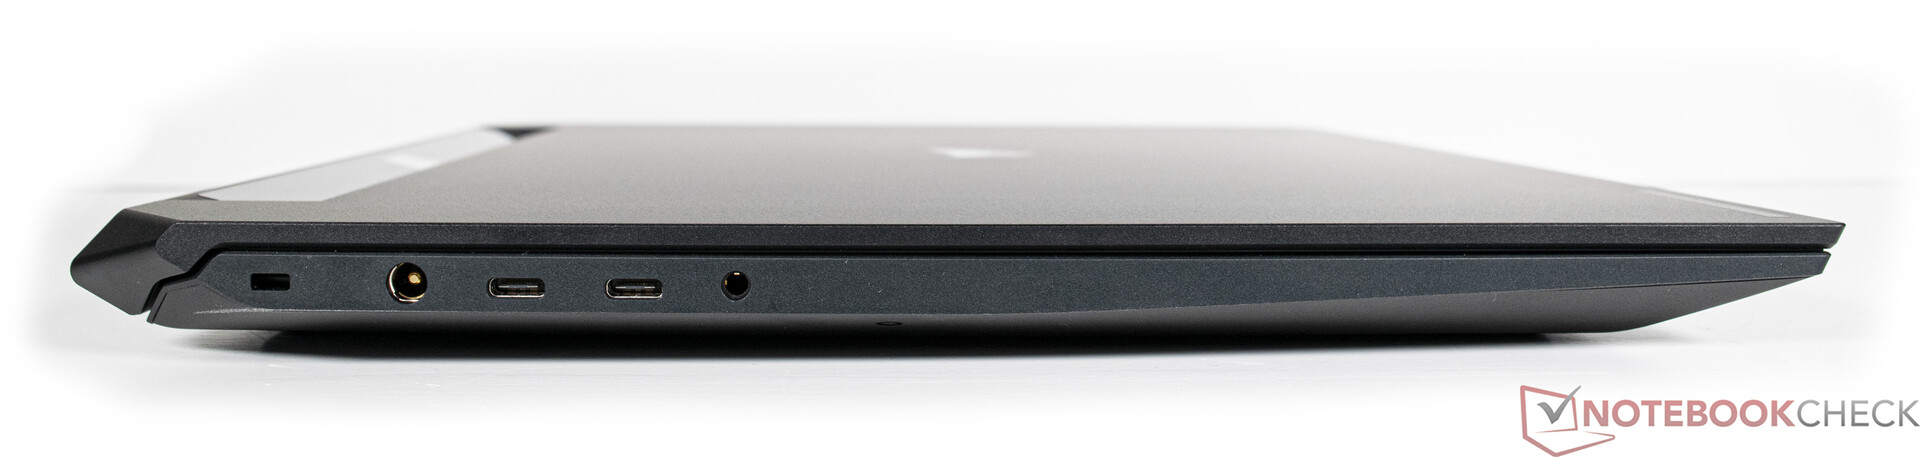
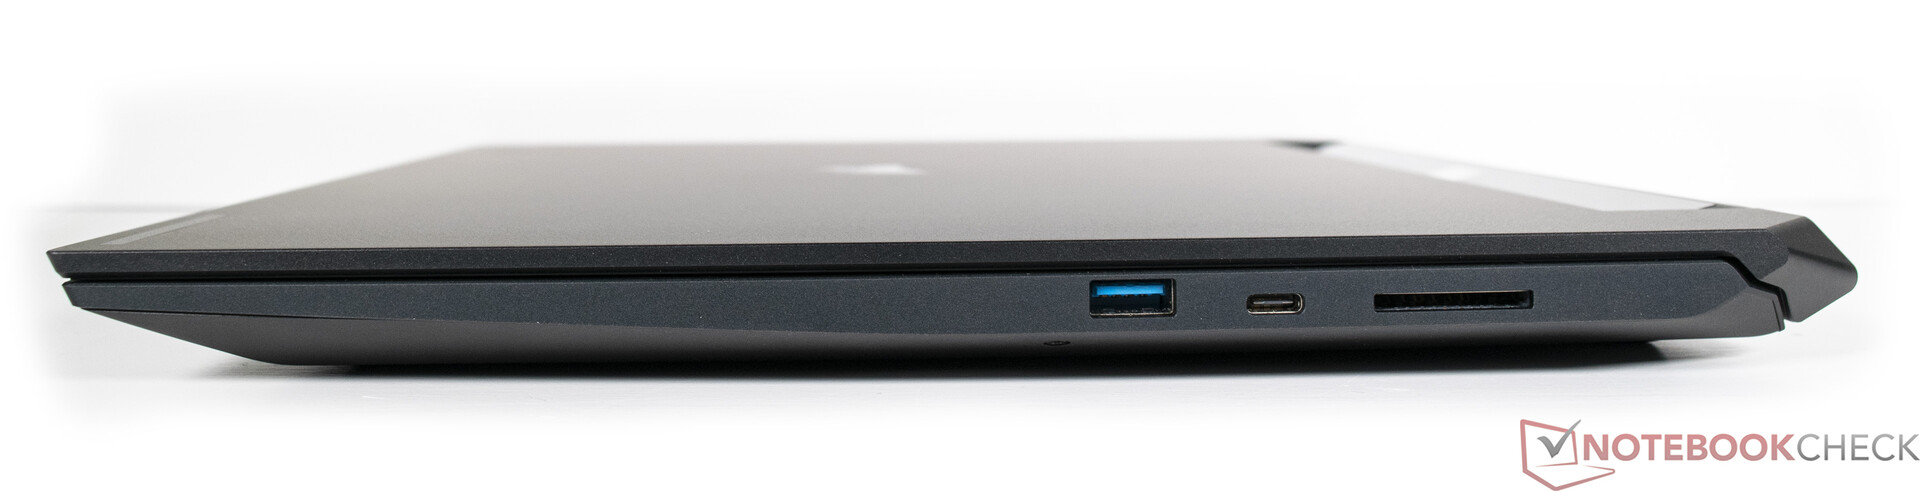
In terms of connectivity, Corsair offers modern interfaces, although the number is very manageable. It's a pity to have only one USB Type-A, but there are three USB-C ports with Thunderbolt support. Thus, the laptop is well prepared for the future. The number of interfaces is probably so sparse due to the Slipstream feature because various accessories can be connected directly to the notebook via this wireless technology without an additional dongle. Corsair itself offers its own mice, keyboards, and headsets for this. The Wi-Fi module comes from Foxconn and offers the current Wi-Fi 6E standard.
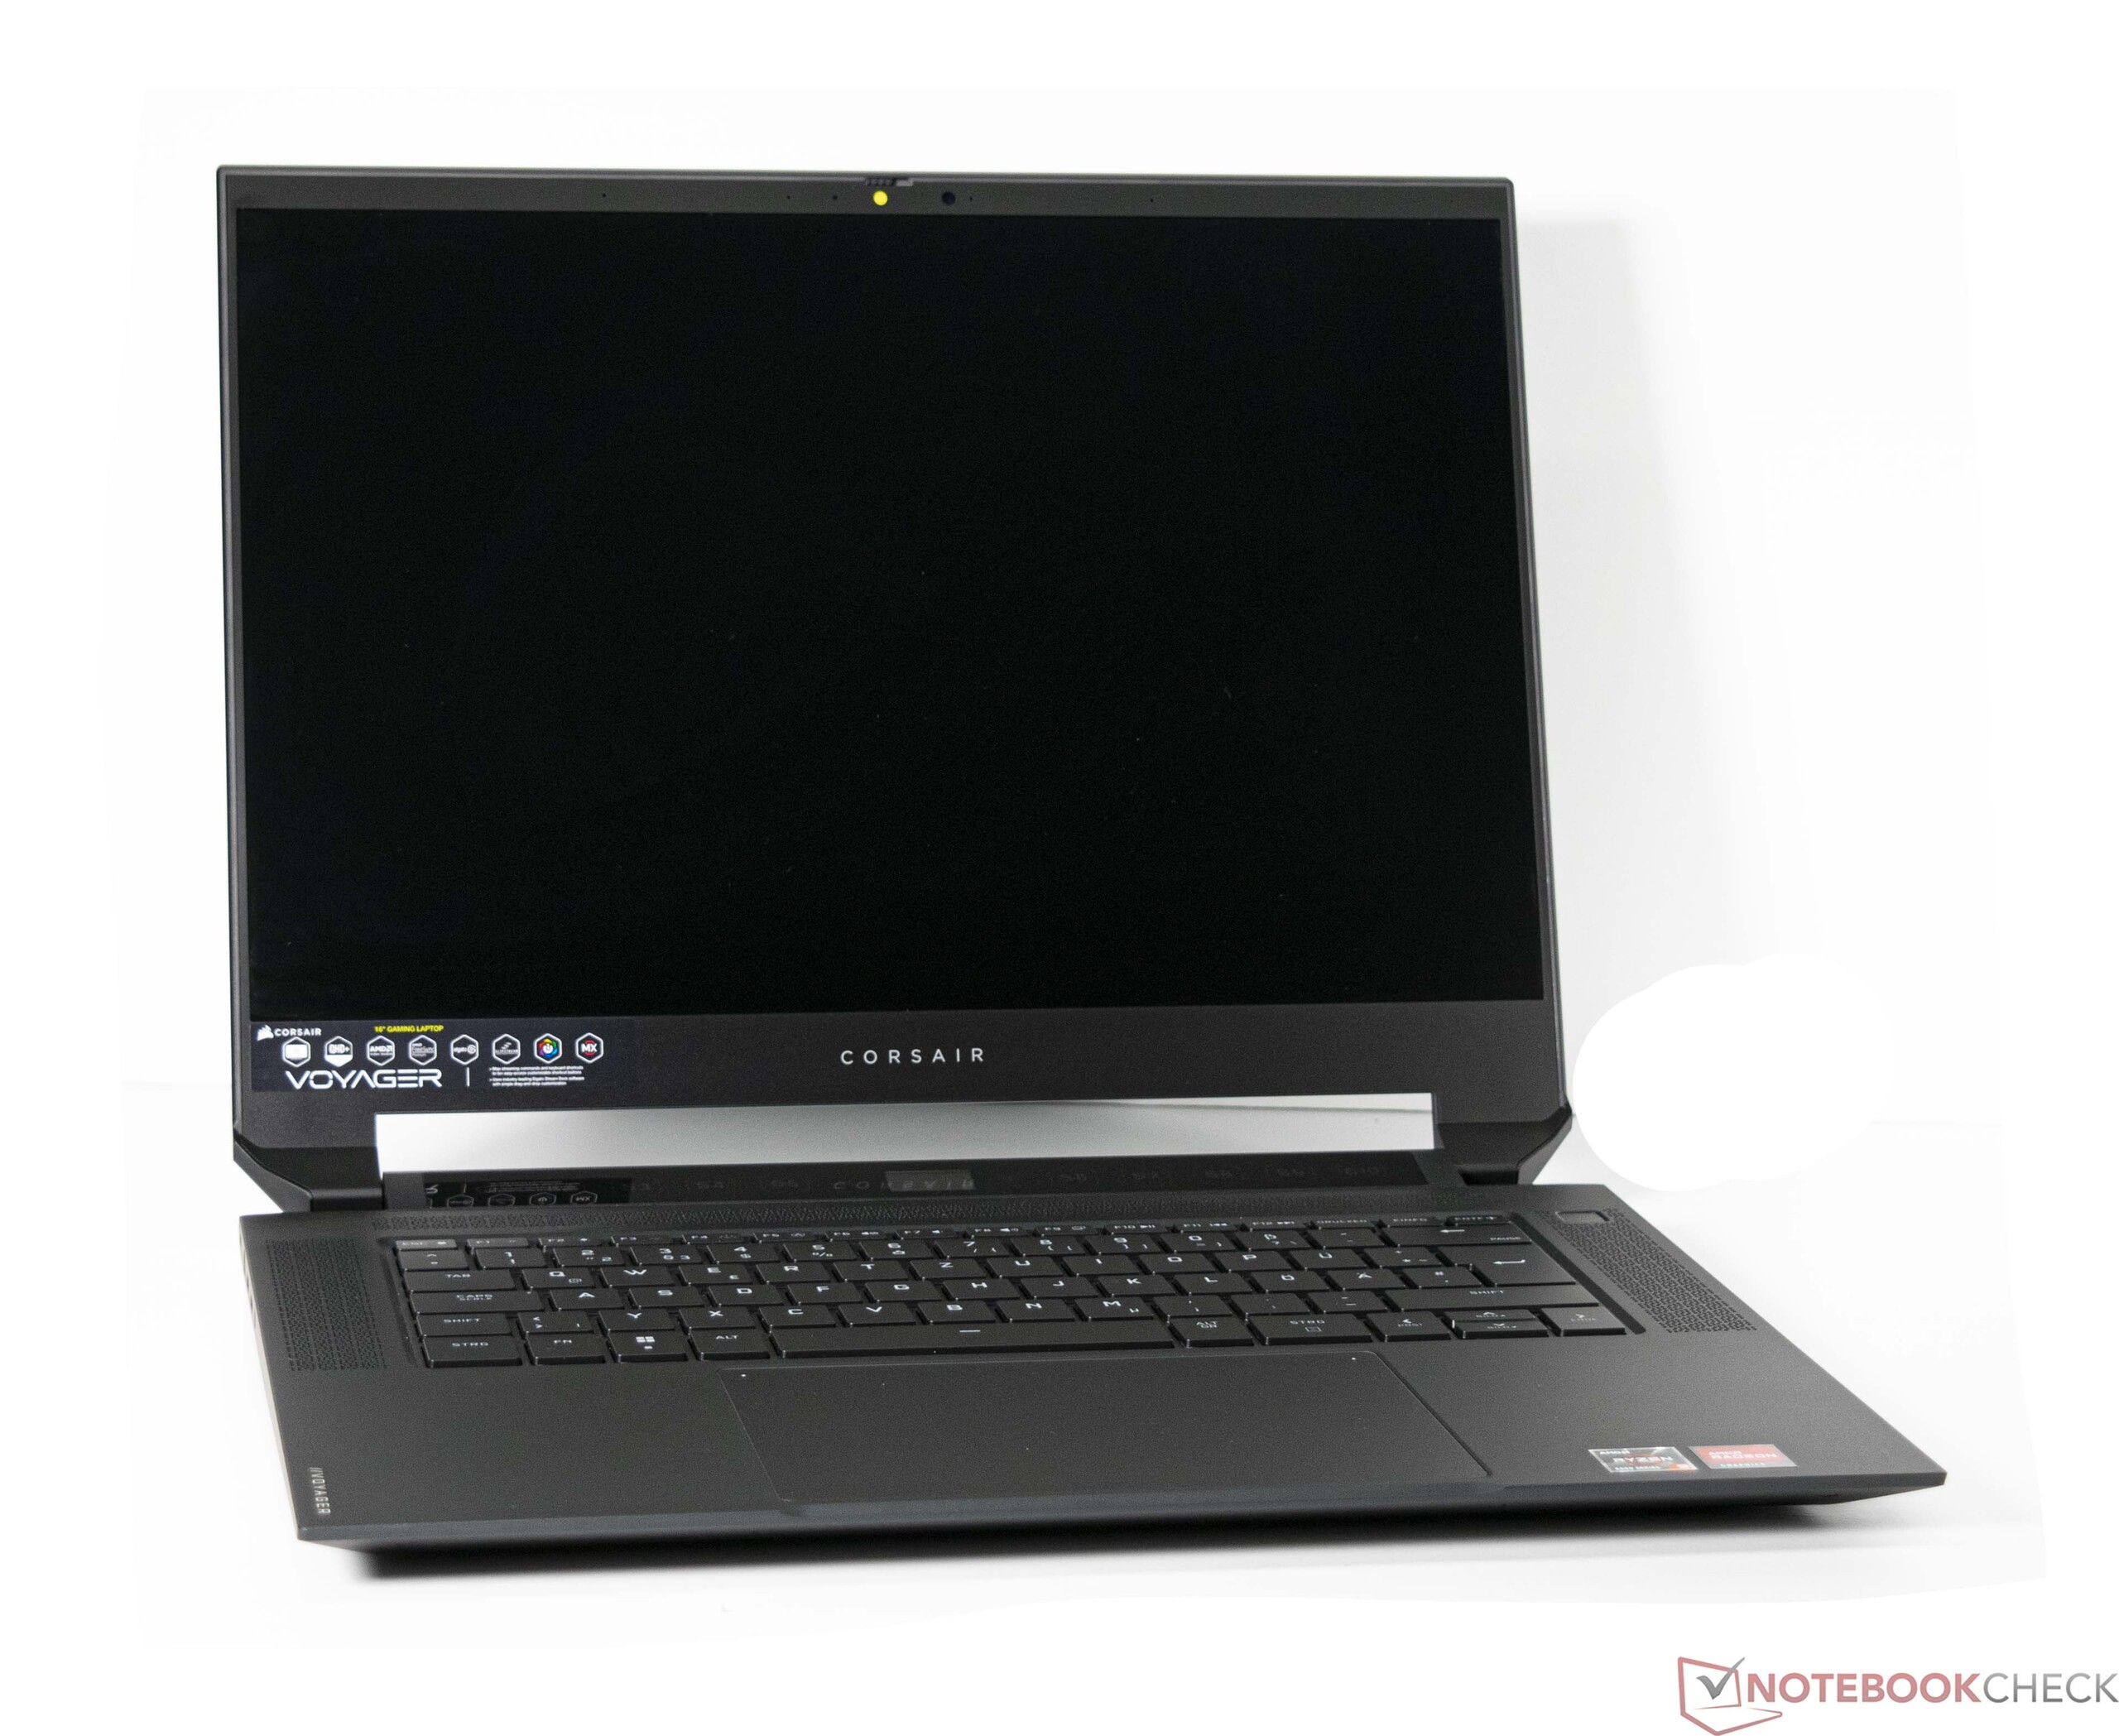
The intended use as a streaming laptop requires a good webcam. The test shows that the built-in 1080p camera performs better than the competition. Nevertheless, we recommend using an external camera for stationary use. For mobile use, you can confidently fall back on the integrated one.

| SD Card Reader | |
| average JPG Copy Test (av. of 3 runs) | |
| Asus ROG Flow X16 GV601RW-M5082W (AV Pro SD microSD 128 GB V60) | |
| Average of class Gaming (20.9 - 210, n=55, last 2 years) | |
| Corsair Voyager a1600 (AV Pro SD microSD 128 GB V60) | |
| Acer Predator Triton 500 SE PT516-52s-70KX (AV PRO microSD 128 GB V60) | |
| HP Omen 16-b1090ng (AV PRO microSD 128 GB V60) | |
| maximum AS SSD Seq Read Test (1GB) | |
| Asus ROG Flow X16 GV601RW-M5082W (AV Pro SD microSD 128 GB V60) | |
| Average of class Gaming (25.5 - 261, n=52, last 2 years) | |
| Corsair Voyager a1600 (AV Pro SD microSD 128 GB V60) | |
| Acer Predator Triton 500 SE PT516-52s-70KX (AV PRO microSD 128 GB V60) | |


Input devices
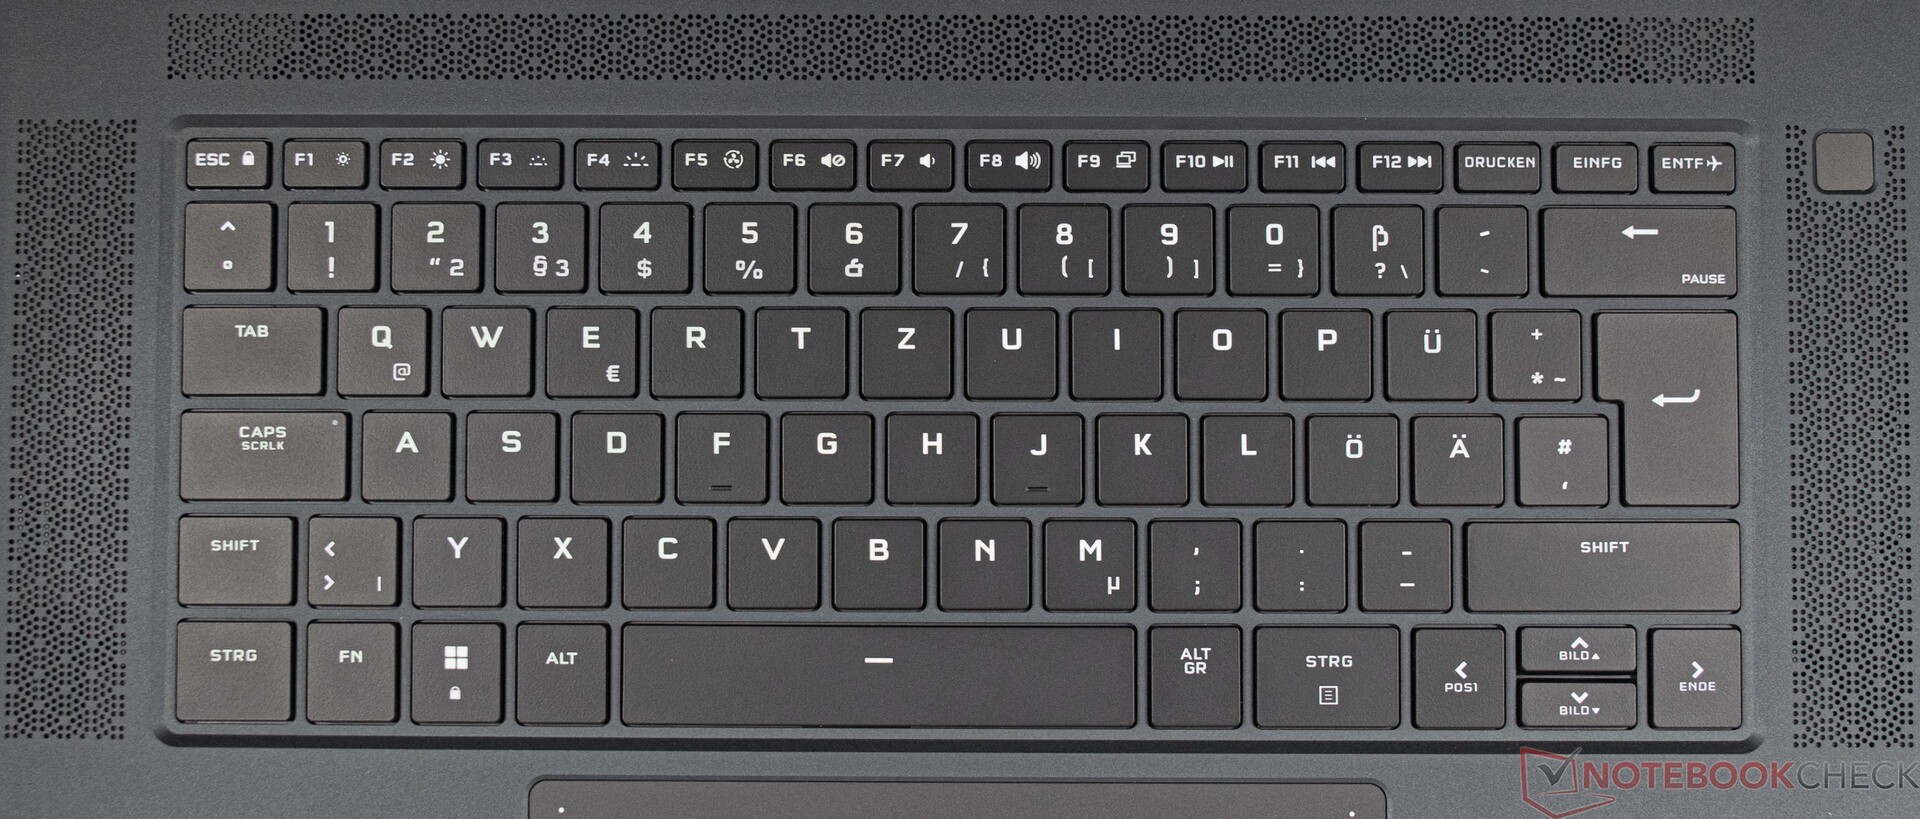
Corsair gives the Voyager a1600 a mechanical keyboard based on Cherry MX switches. These are very robust and designed for extreme longevity. The very short travel and the clearly noticeable pressure point give the user good tactile feedback. In addition, the stroke is not damped, which prevents a spongy input feeling.
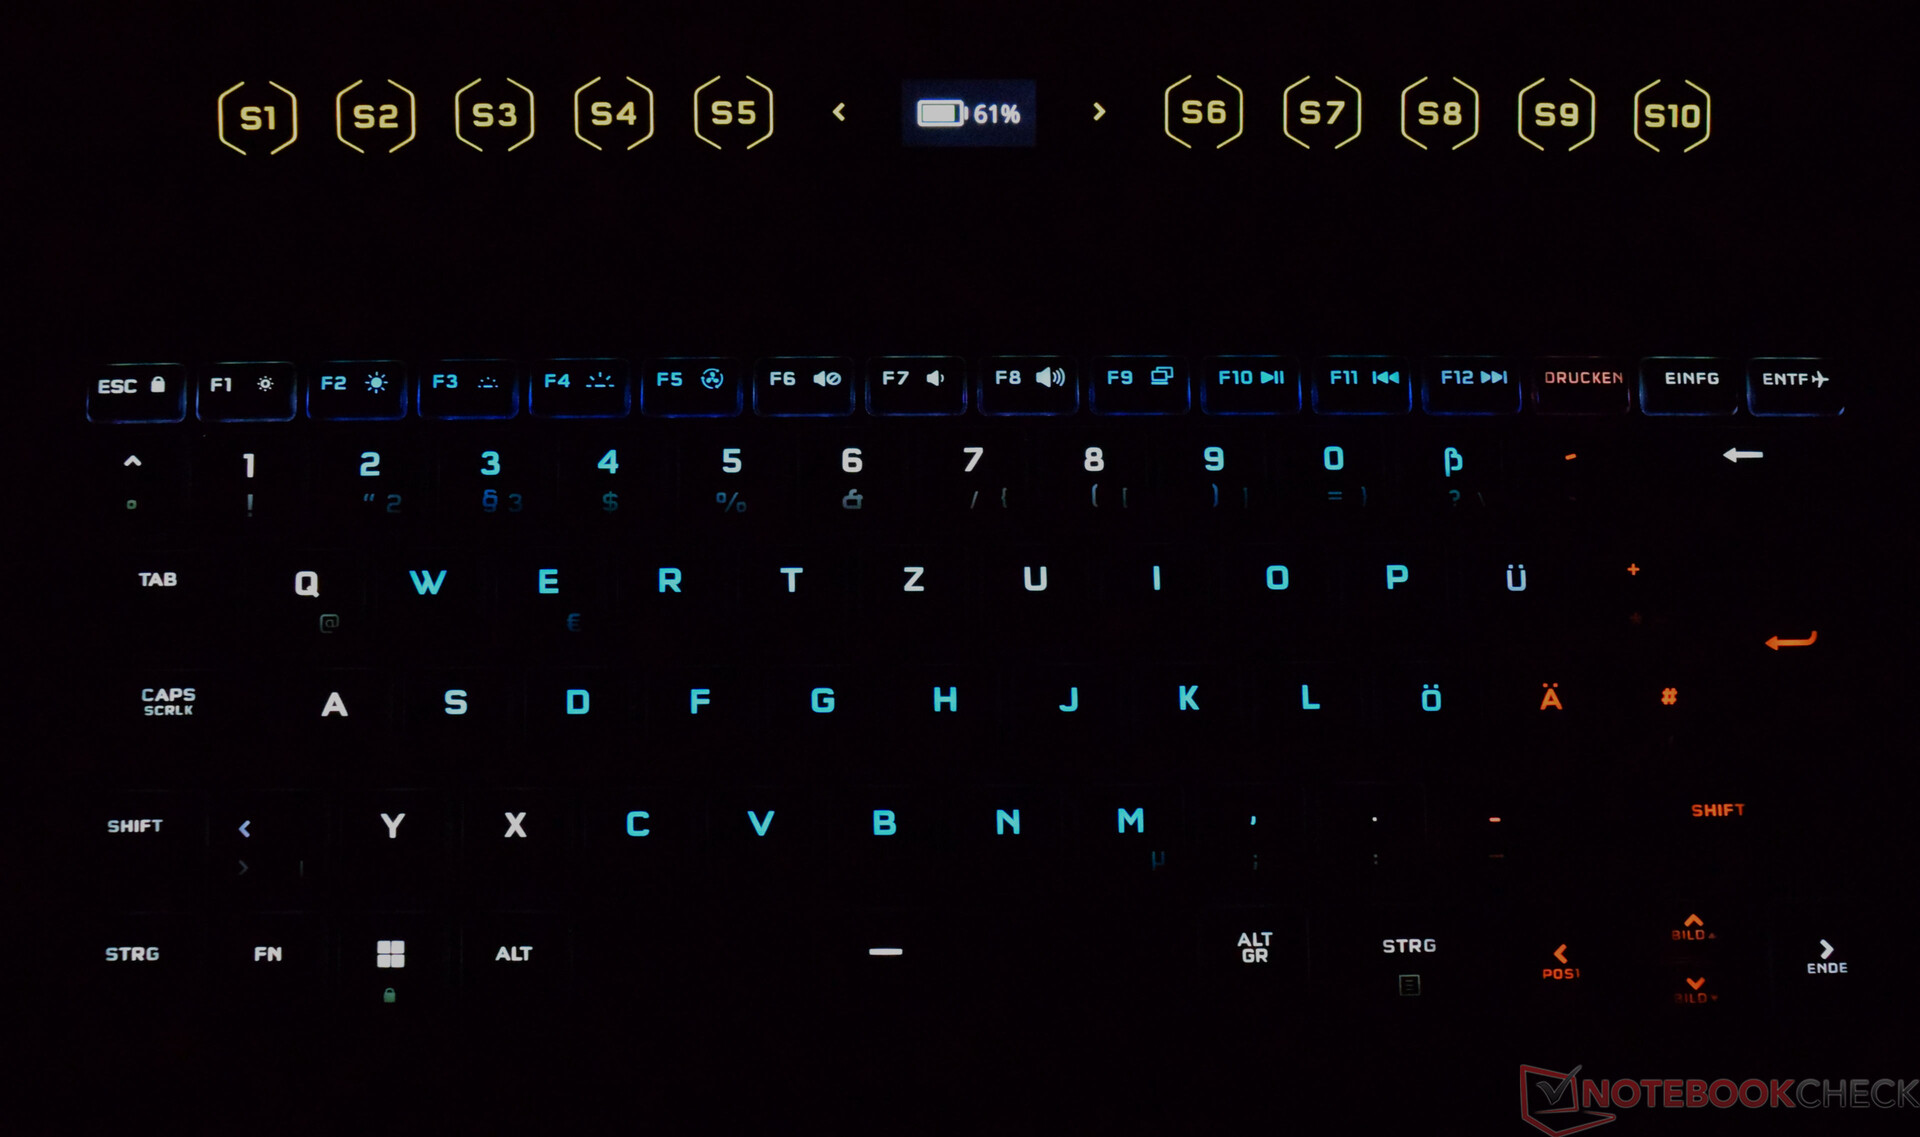
The keyboard's illumination can be configured as desired via the iCUE software. Different effects and a complete color palette are available to the user. In addition, all keys can be configured individually.
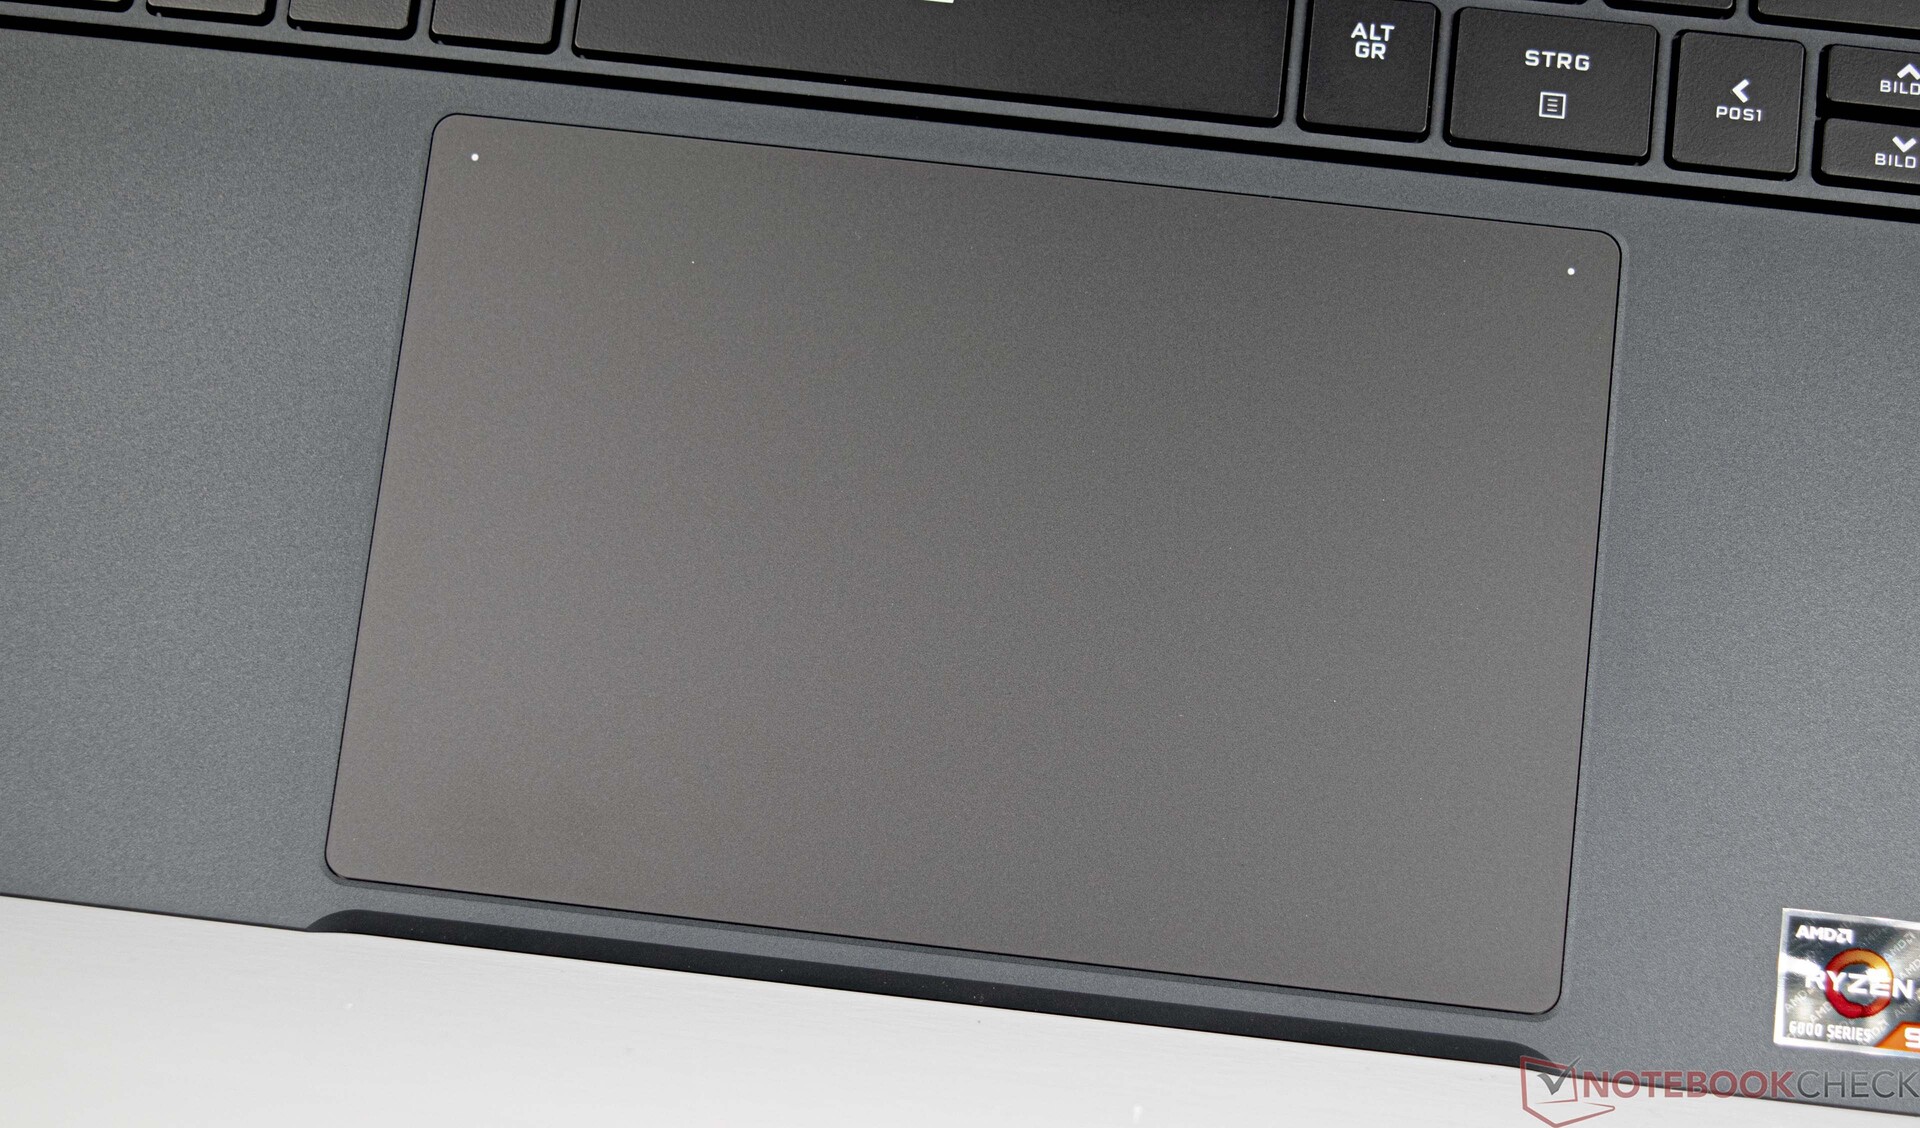
The touchpad measures a full 15.5 centimeters in width and 10 centimeters in depth. Thus, the ClickPad is very large and is best suited as a mouse replacement in practice. If you find the active input area too large, you can deactivate the right side by double-tapping the white dot in the upper left corner. There is no optical or haptic indication for this feature though. The glass surface has a subtle satin finish, which is comfortable to operate even with somewhat sweaty fingers. The two input keys in the lower area work well and are quite quiet when pressed.
Display - Fast 16:10 panel
The display of the Corsair Voyager a1600 is a 16-inch IPS panel with 240 Hz. The 16:10 format, which has a resolution of 2,560 x 1,600 pixels, provides a generous work surface. There are no alternative display variants for the Voyager a1600 so far.
In our tests, the installed panel achieves a good brightness of 340 cd/m². Nevertheless, the contenders clearly offer brighter displays in comparison. Because of the relatively high black value, the contrast ratio suffers considerably. Thus, the Voyager a1600 only achieves a contrast of 670:1 in our test.
Eye fatigue due to PWM shouldn't be a problem with the Corsair Voyager a1600. Backlight bleeding was not an issue with our device.
| |||||||||||||||||||||||||
Brightness Distribution: 91 %
Center on Battery: 328 cd/m²
Contrast: 670:1 (Black: 0.53 cd/m²)
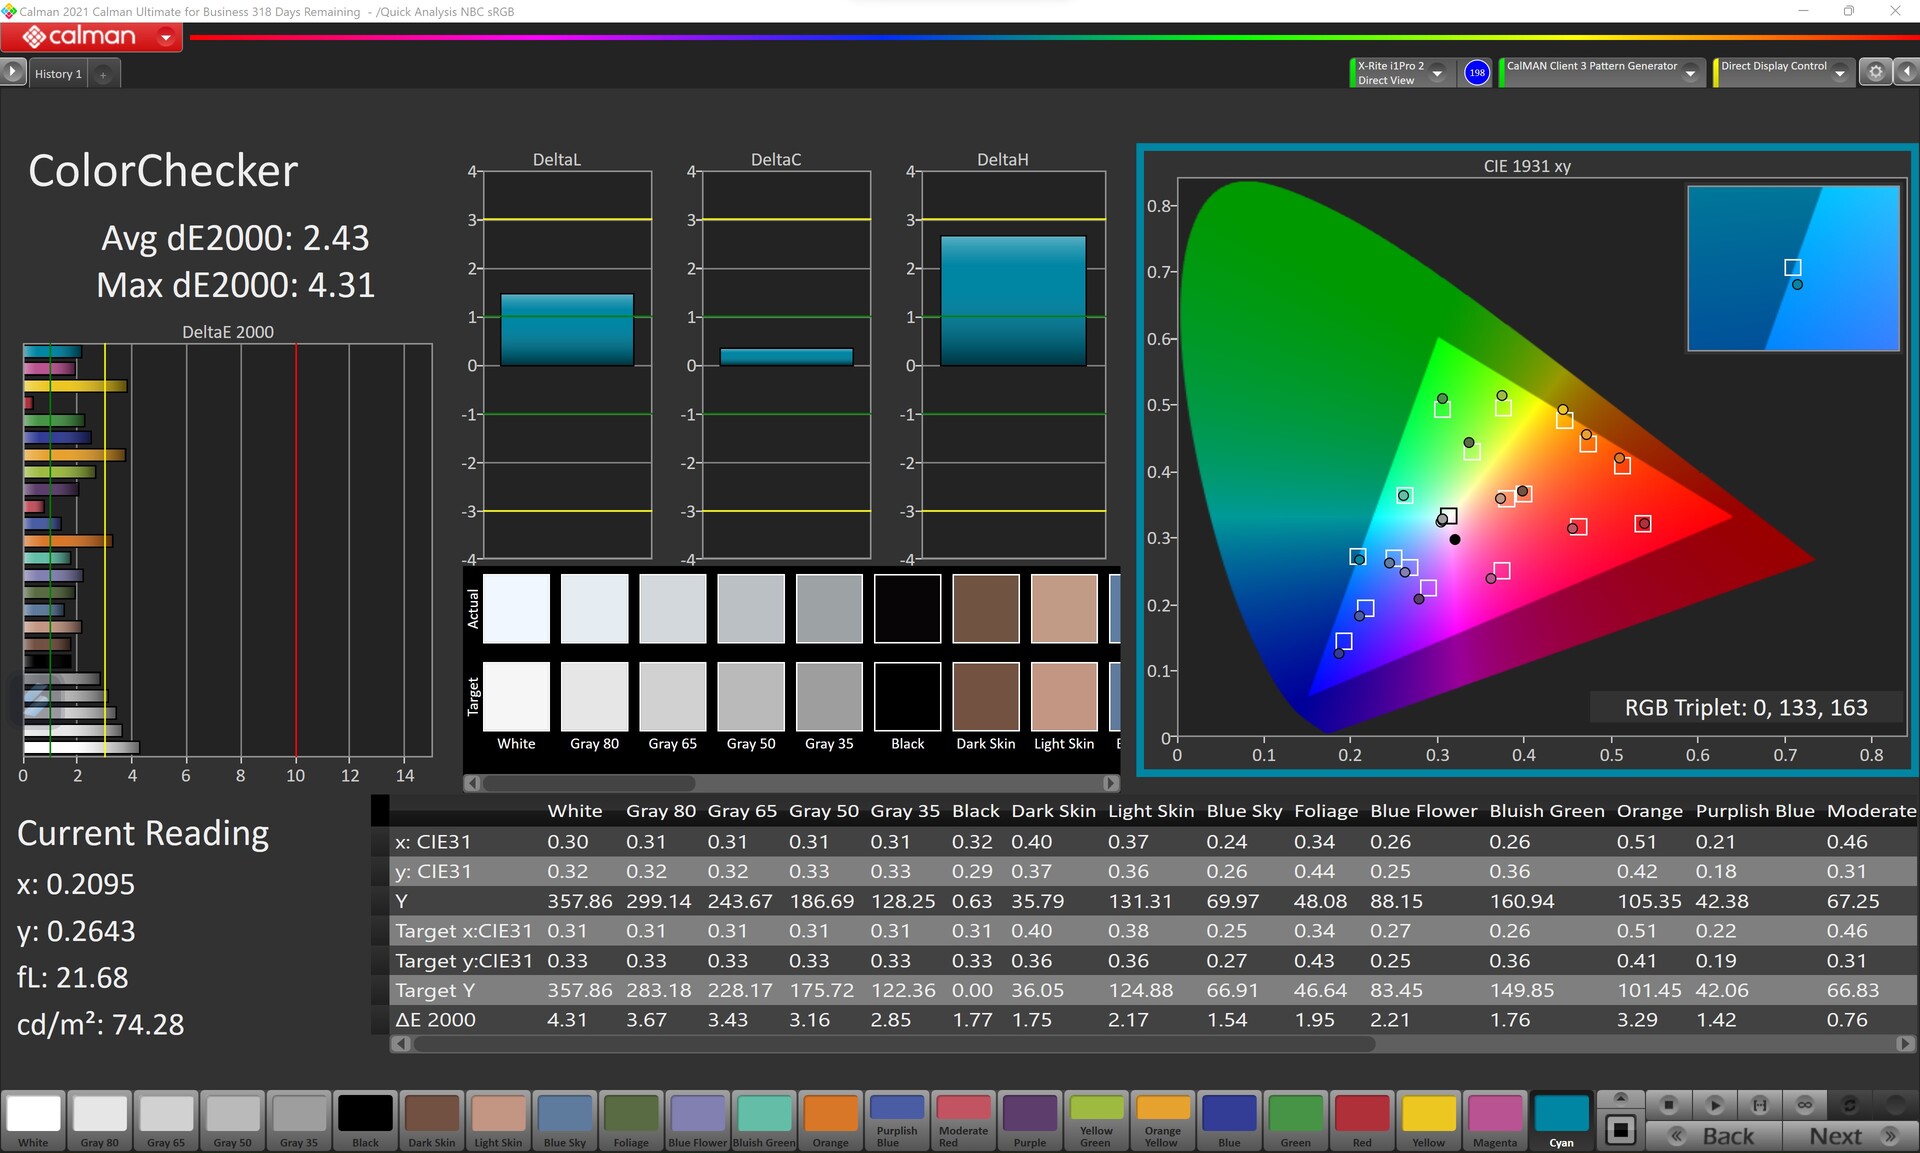
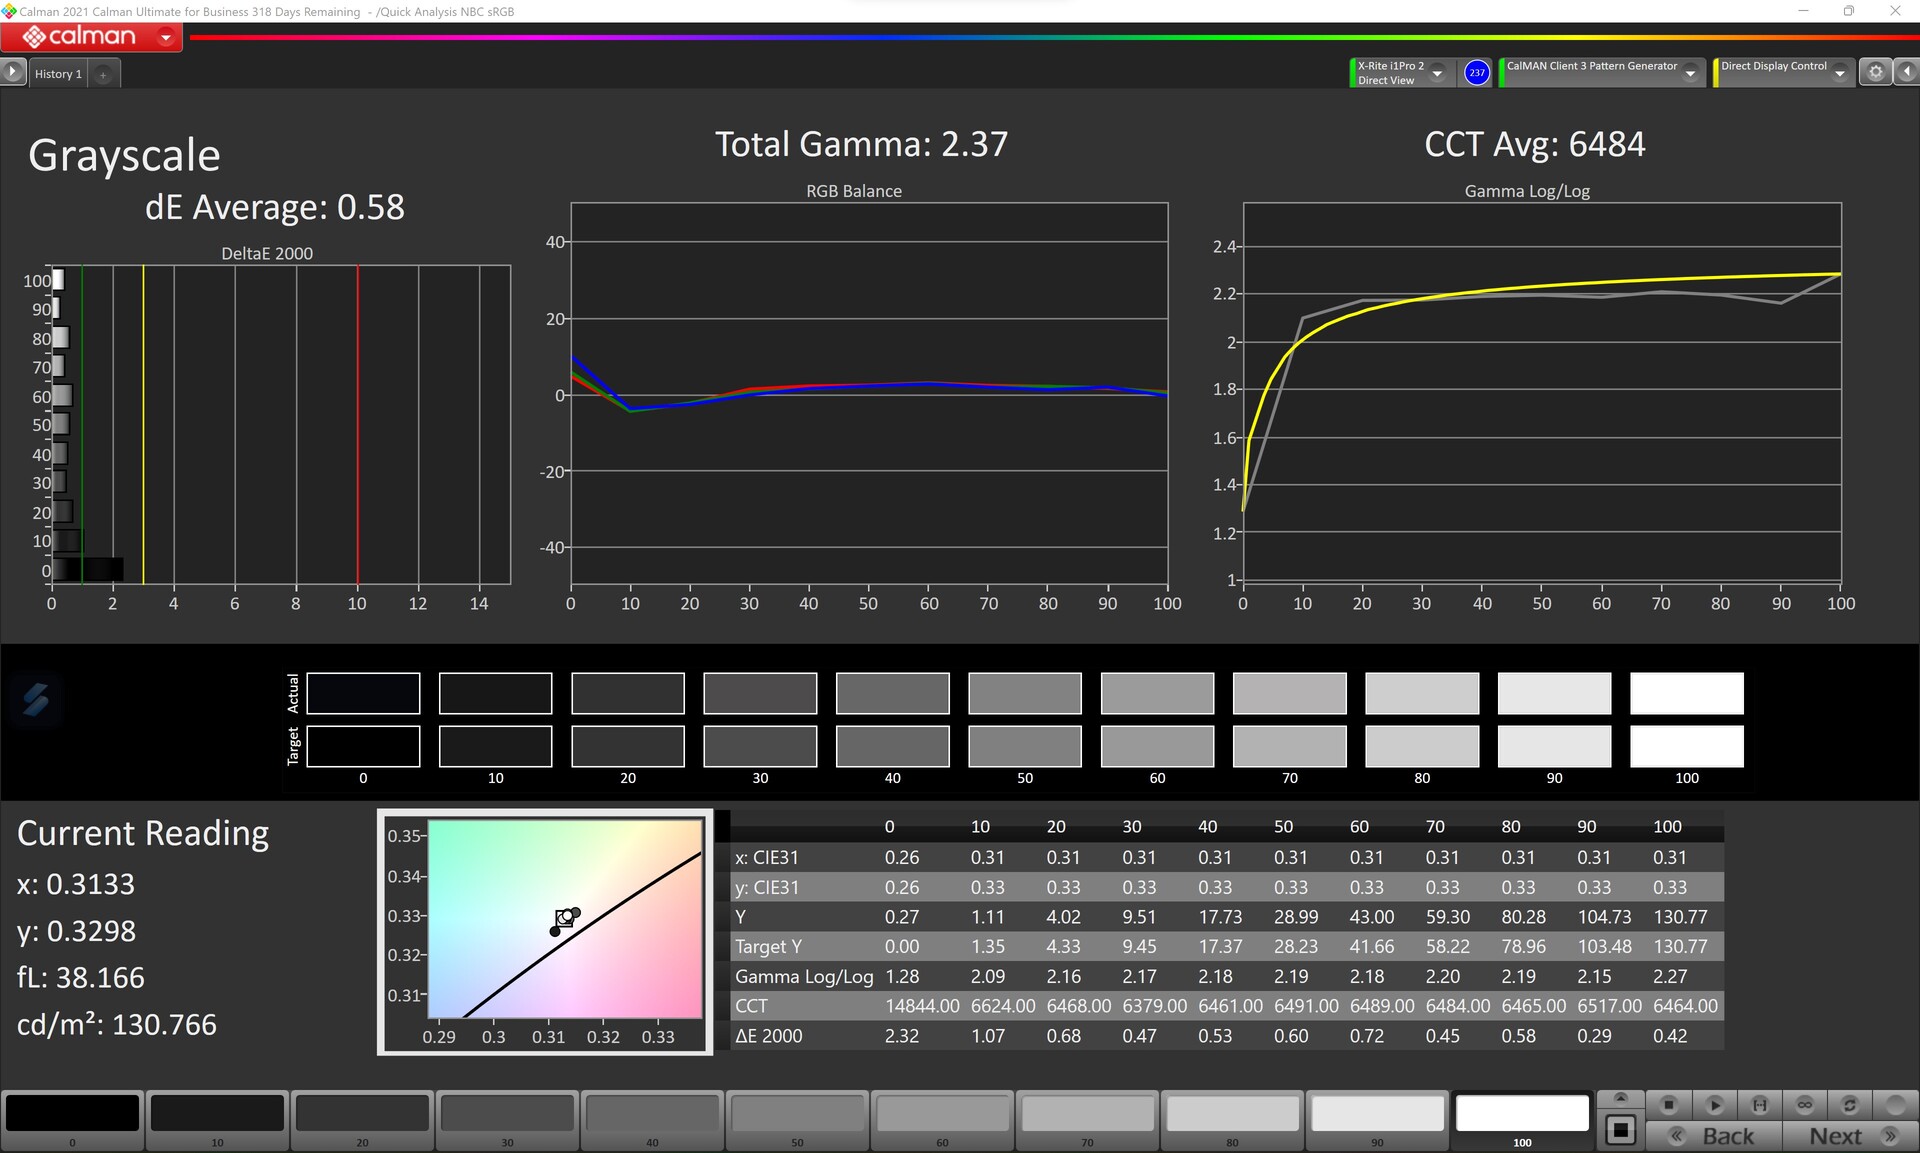
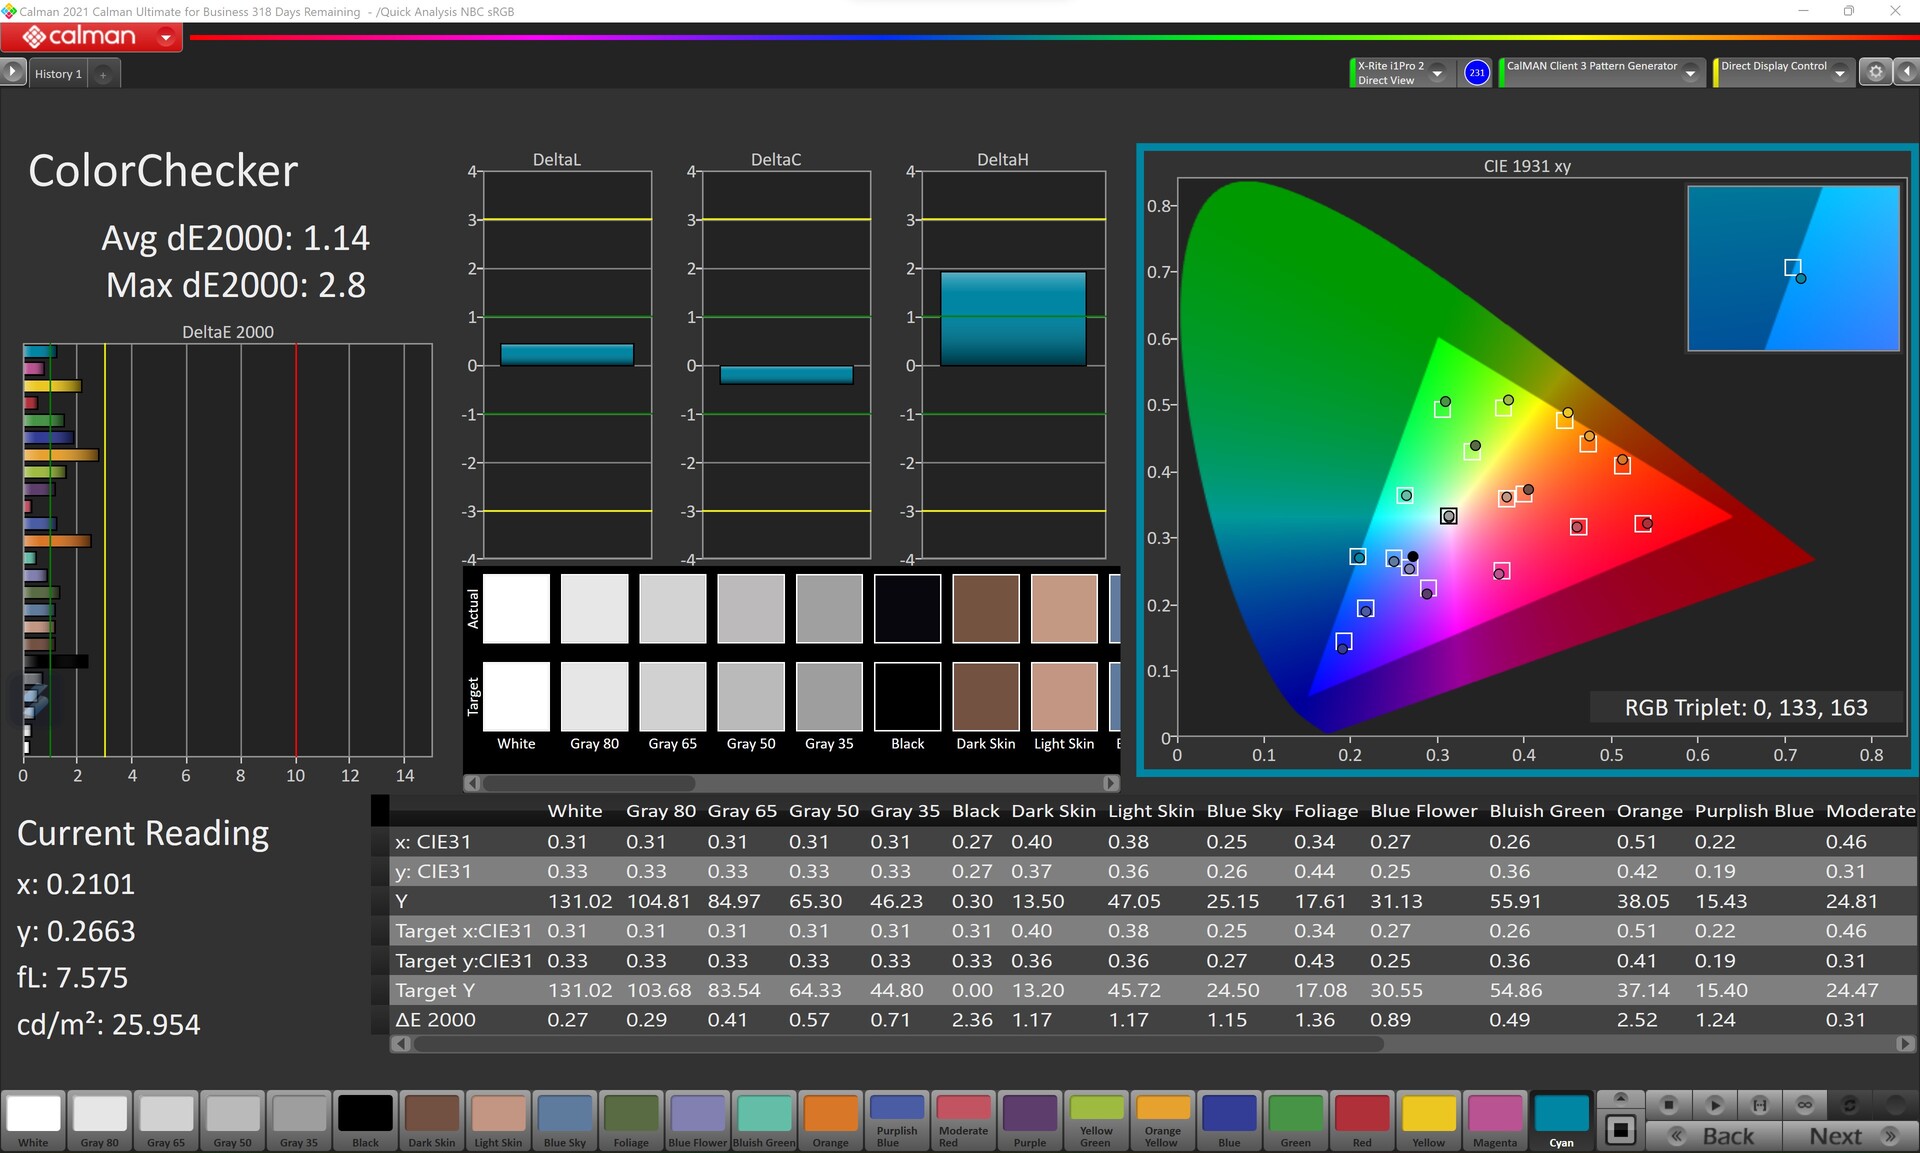
ΔE ColorChecker Calman: 2.43 | ∀{0.5-29.43 Ø4.73}
calibrated: 1.14
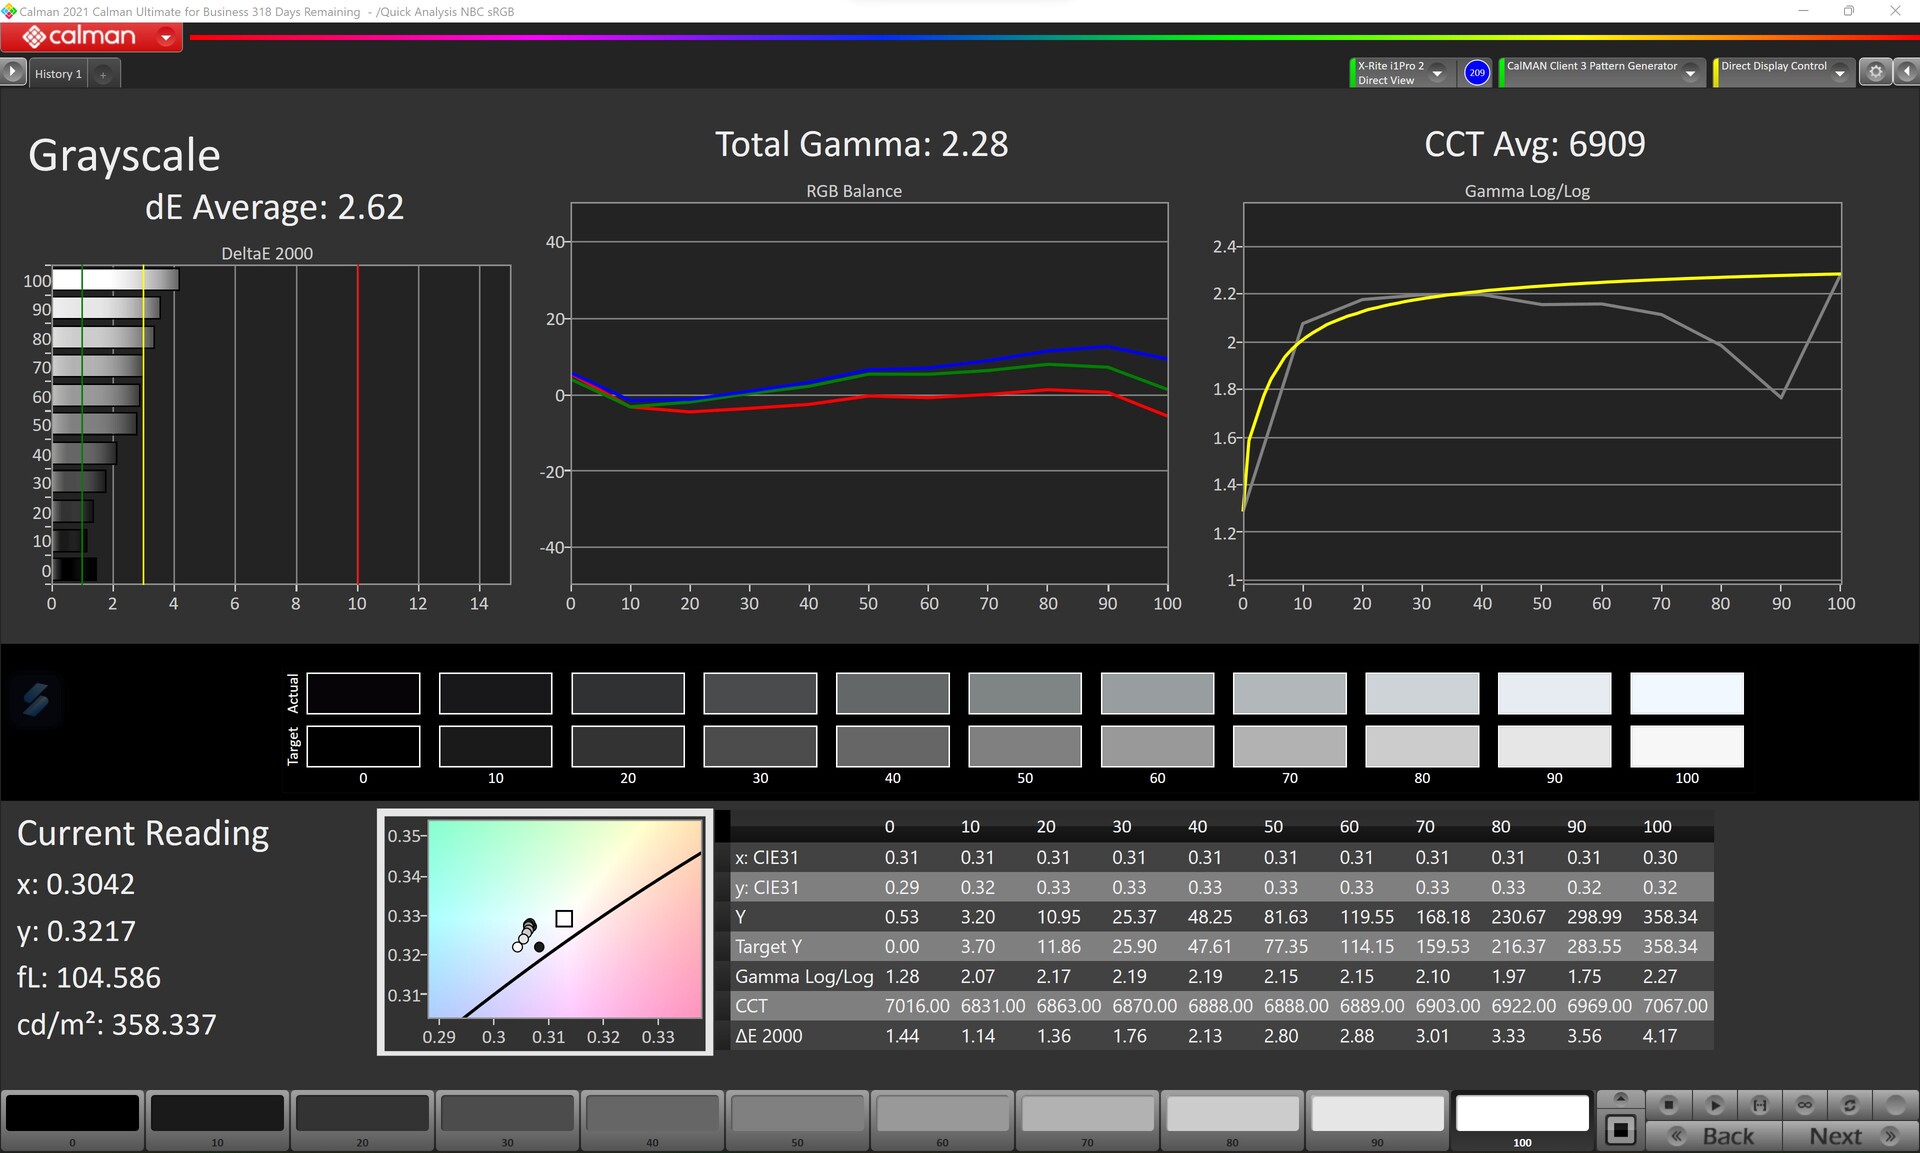
ΔE Greyscale Calman: 2.62 | ∀{0.09-98 Ø4.97}
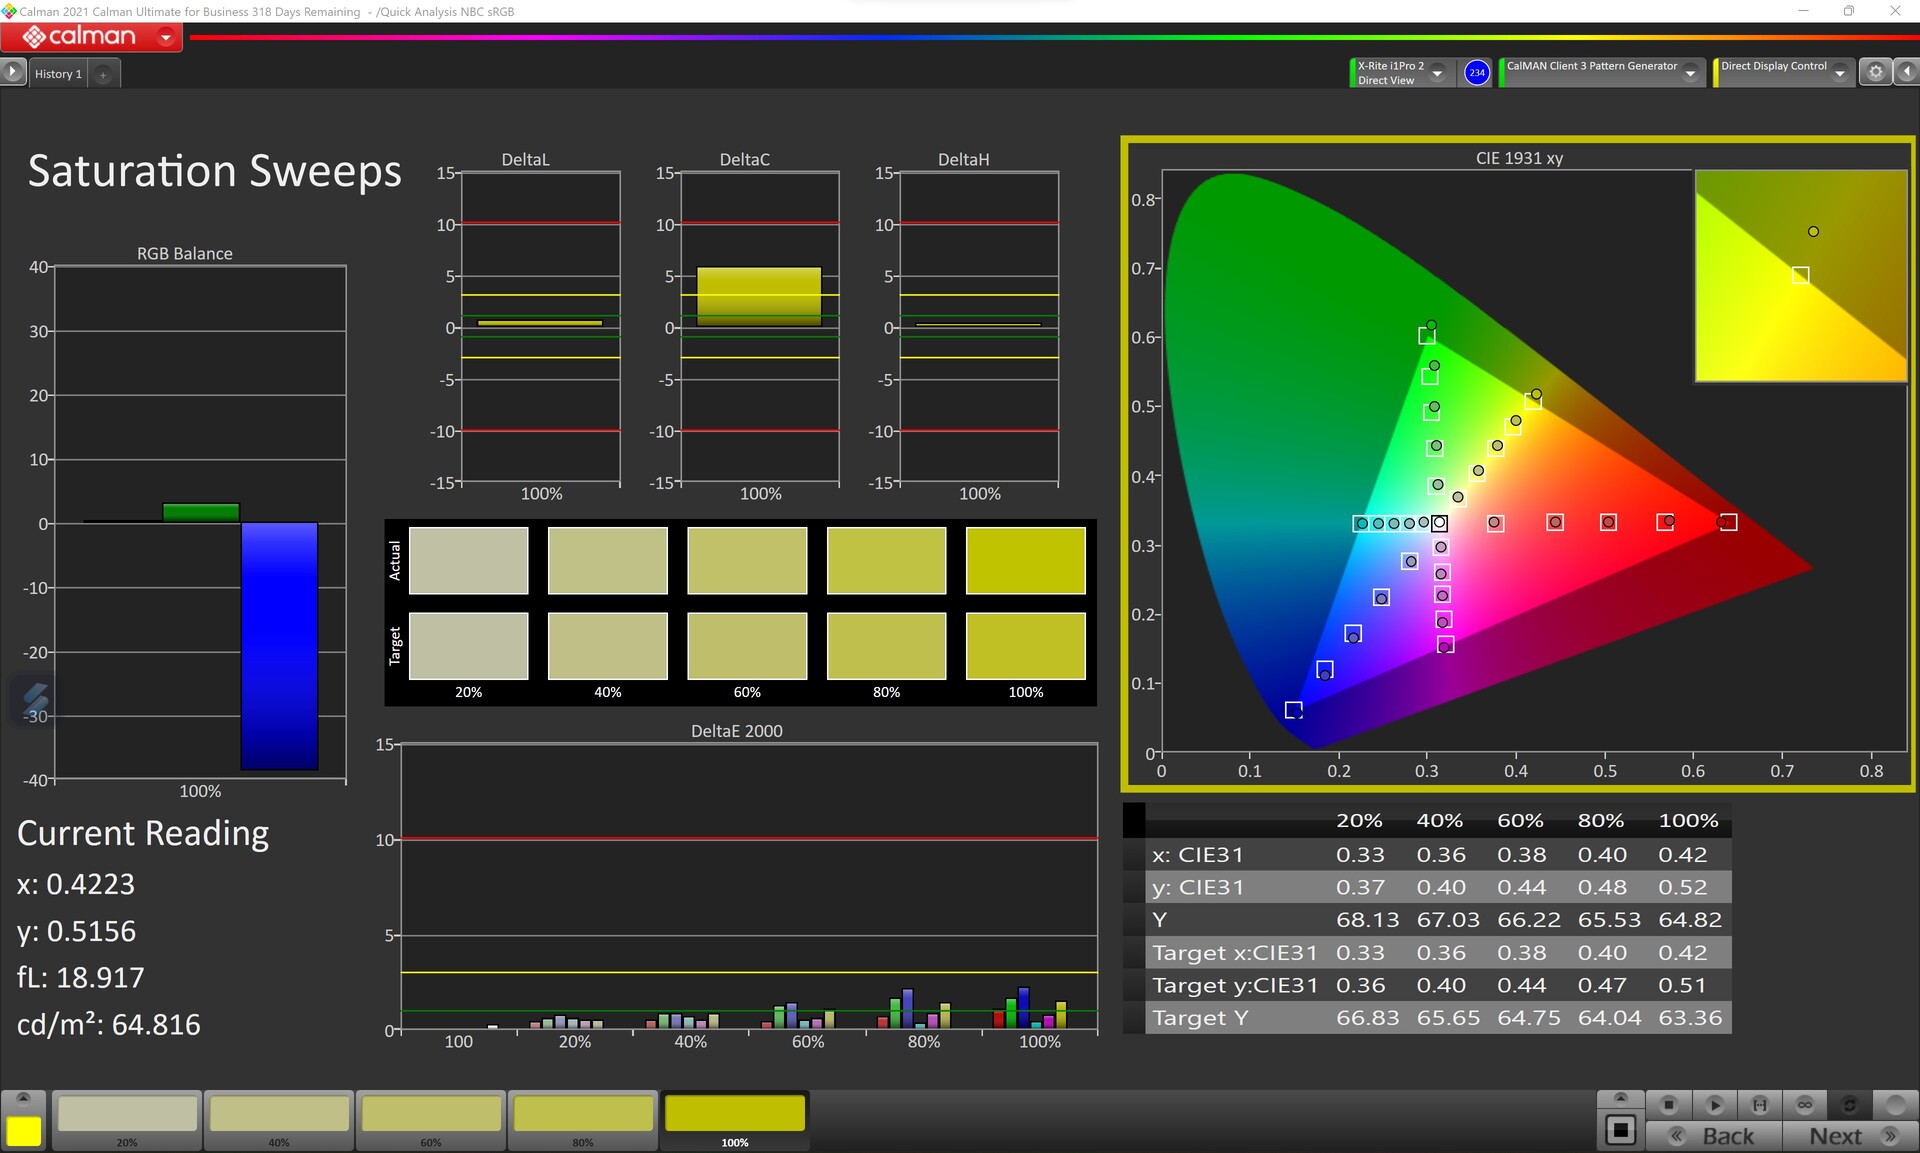
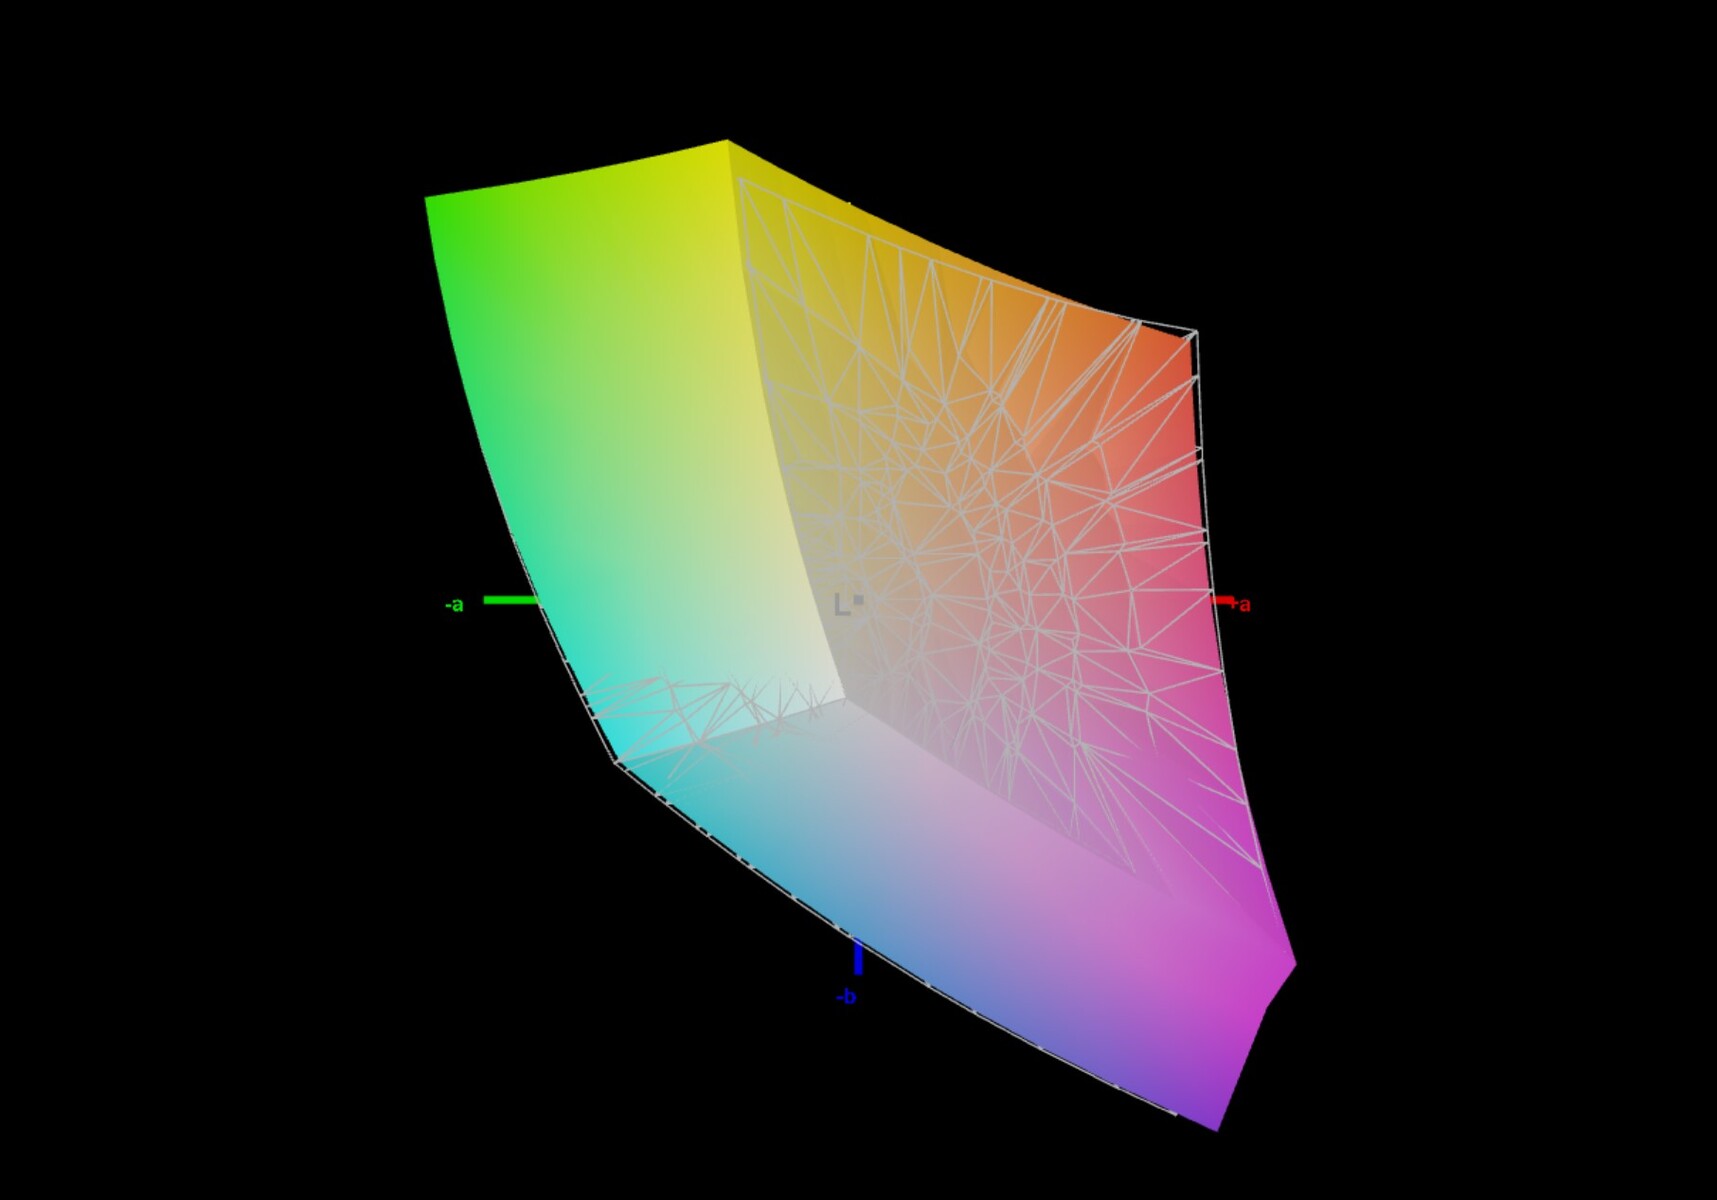
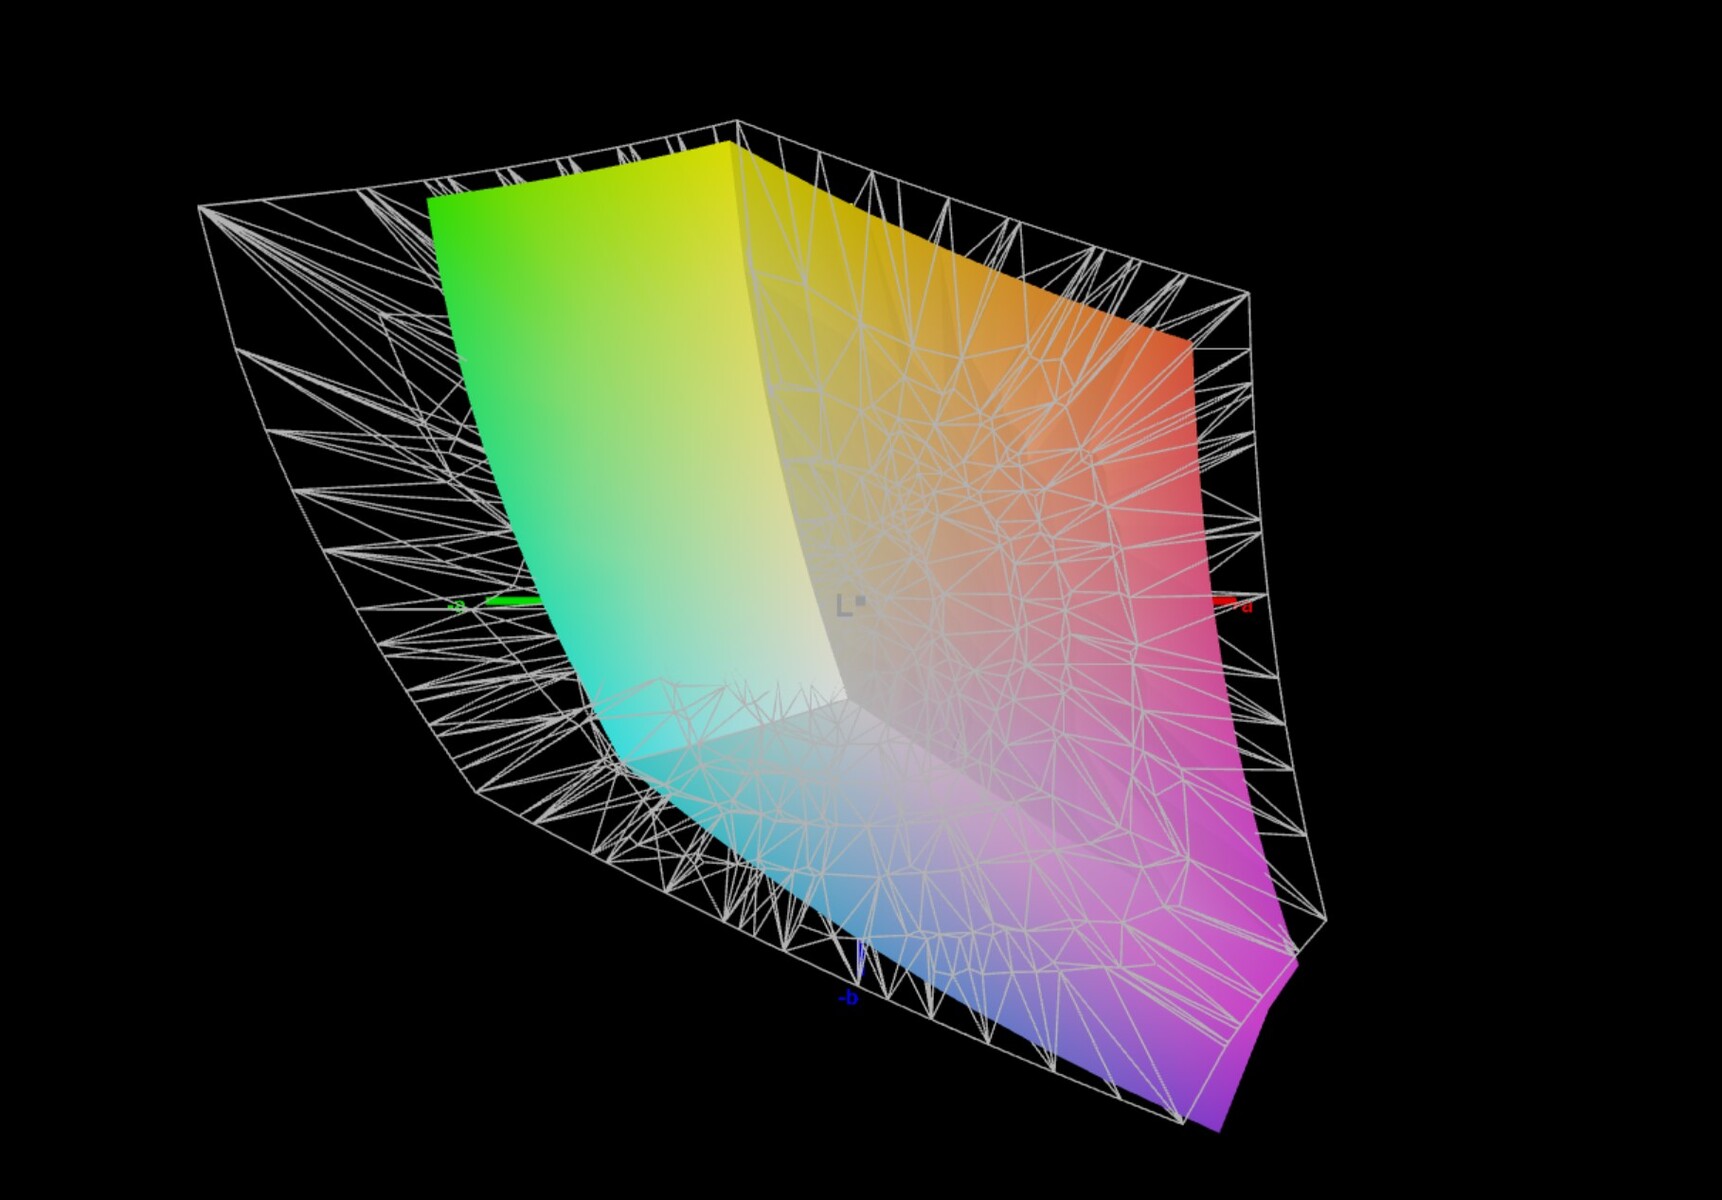
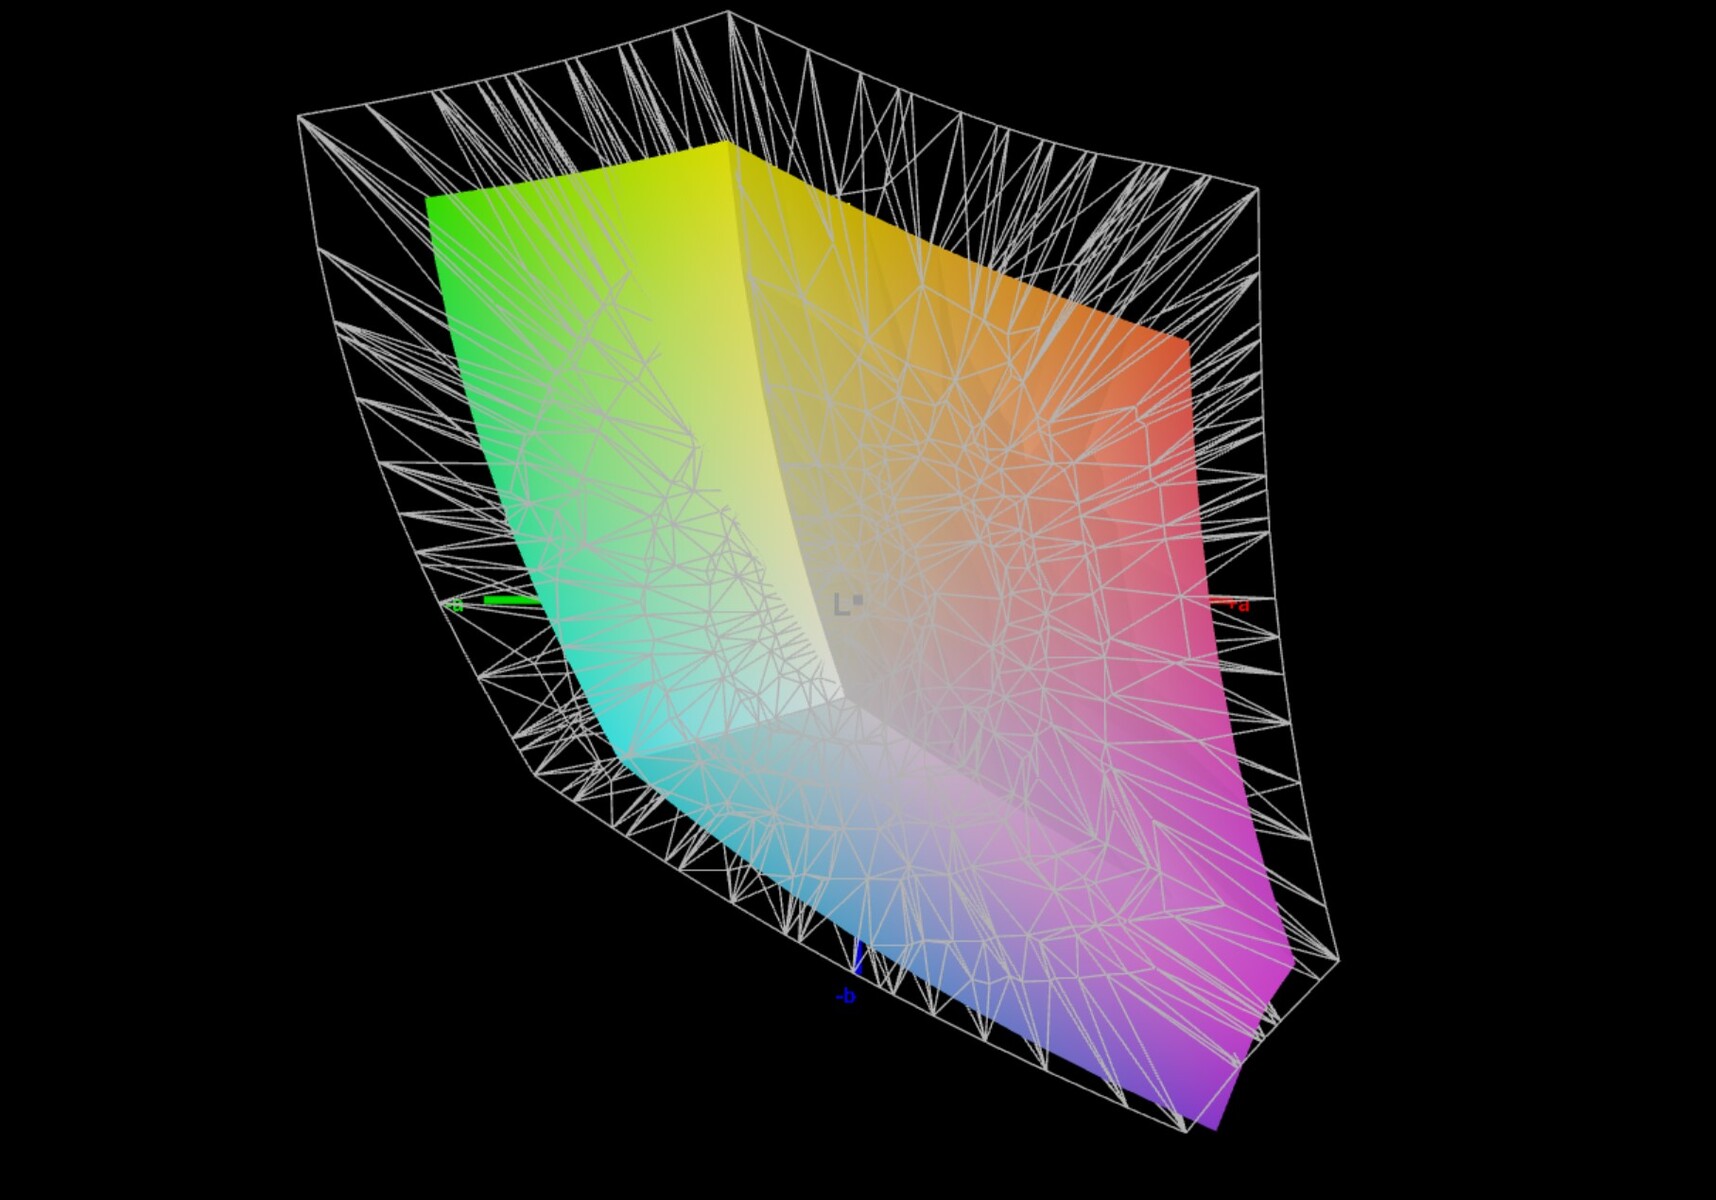
70.1% AdobeRGB 1998 (Argyll 3D)
98.2% sRGB (Argyll 3D)
68.7% Display P3 (Argyll 3D)
Gamma: 2.28
CCT: 6909 K
| Corsair Voyager a1600 BOE0A3B, IPS, 2560x1600, 16" | Asus ROG Flow X16 GV601RW-M5082W AUO B160QAN02.S, Mini LED, 2560x1600, 16.1" | Lenovo Legion 7 16ARHA7 BOE CQ NE160QDM-NY1, IPS, 2560x1600, 16" | Acer Predator Triton 500 SE PT516-52s-70KX NE160QDM-NZ2, IPS LED, 2560x1600, 16" | HP Omen 16-b1090ng BOE09E5, IPS, 2560x1440, 16.1" | Lenovo Legion 7 16IAX7-82TD004SGE NE160QDM-NY1, IPS, 2560x1600, 16" | |
|---|---|---|---|---|---|---|
| Display | 25% | -5% | 22% | 3% | 1% | |
| Display P3 Coverage (%) | 68.7 | 99.82 45% | 63.7 -7% | 97.3 42% | 71 3% | 69.3 1% |
| sRGB Coverage (%) | 98.2 | 99.99 2% | 95.3 -3% | 100 2% | 97.9 0% | 98.2 0% |
| AdobeRGB 1998 Coverage (%) | 70.1 | 90.21 29% | 65.7 -6% | 84.9 21% | 73.3 5% | 70.8 1% |
| Response Times | 3% | 17% | 15% | -3% | 24% | |
| Response Time Grey 50% / Grey 80% * (ms) | 13 ? | 11 ? 15% | 9.2 ? 29% | 13.8 ? -6% | 14.5 ? -12% | 12.6 ? 3% |
| Response Time Black / White * (ms) | 10 ? | 11 ? -10% | 9.6 ? 4% | 6.4 ? 36% | 9.4 ? 6% | 5.6 ? 44% |
| PWM Frequency (Hz) | 7400 ? | |||||
| Screen | 71% | 12% | 29% | -30% | 18% | |
| Brightness middle (cd/m²) | 355 | 498 40% | 478.8 35% | 498 40% | 335 -6% | 547 54% |
| Brightness (cd/m²) | 340 | 502 48% | 477 40% | 468 38% | 319 -6% | 523 54% |
| Brightness Distribution (%) | 91 | 94 3% | 90 -1% | 80 -12% | 90 -1% | 88 -3% |
| Black Level * (cd/m²) | 0.53 | 0.11 79% | 0.43 19% | 0.36 32% | 0.28 47% | 0.44 17% |
| Contrast (:1) | 670 | 4527 576% | 1113 66% | 1383 106% | 1196 79% | 1243 86% |
| Colorchecker dE 2000 * | 2.43 | 1.87 23% | 2.24 8% | 1.77 27% | 4.38 -80% | 2.1 14% |
| Colorchecker dE 2000 max. * | 4.31 | 6.15 -43% | 4.49 -4% | 5.24 -22% | 9.48 -120% | 7 -62% |
| Colorchecker dE 2000 calibrated * | 1.14 | 1.94 -70% | 1.89 -66% | 0.63 45% | 1.33 -17% | 0.9 21% |
| Greyscale dE 2000 * | 2.62 | 3.15 -20% | 2.3 12% | 2.4 8% | 7 -167% | 3.2 -22% |
| Gamma | 2.28 96% | 330.95 1% | 2.25 98% | 2.14 103% | 2.103 105% | 2.23 99% |
| CCT | 6909 94% | 7294 89% | 6955 93% | 7046 92% | 6244 104% | 6979 93% |
| Total Average (Program / Settings) | 33% /
51% | 8% /
9% | 22% /
26% | -10% /
-19% | 14% /
15% |
* ... smaller is better
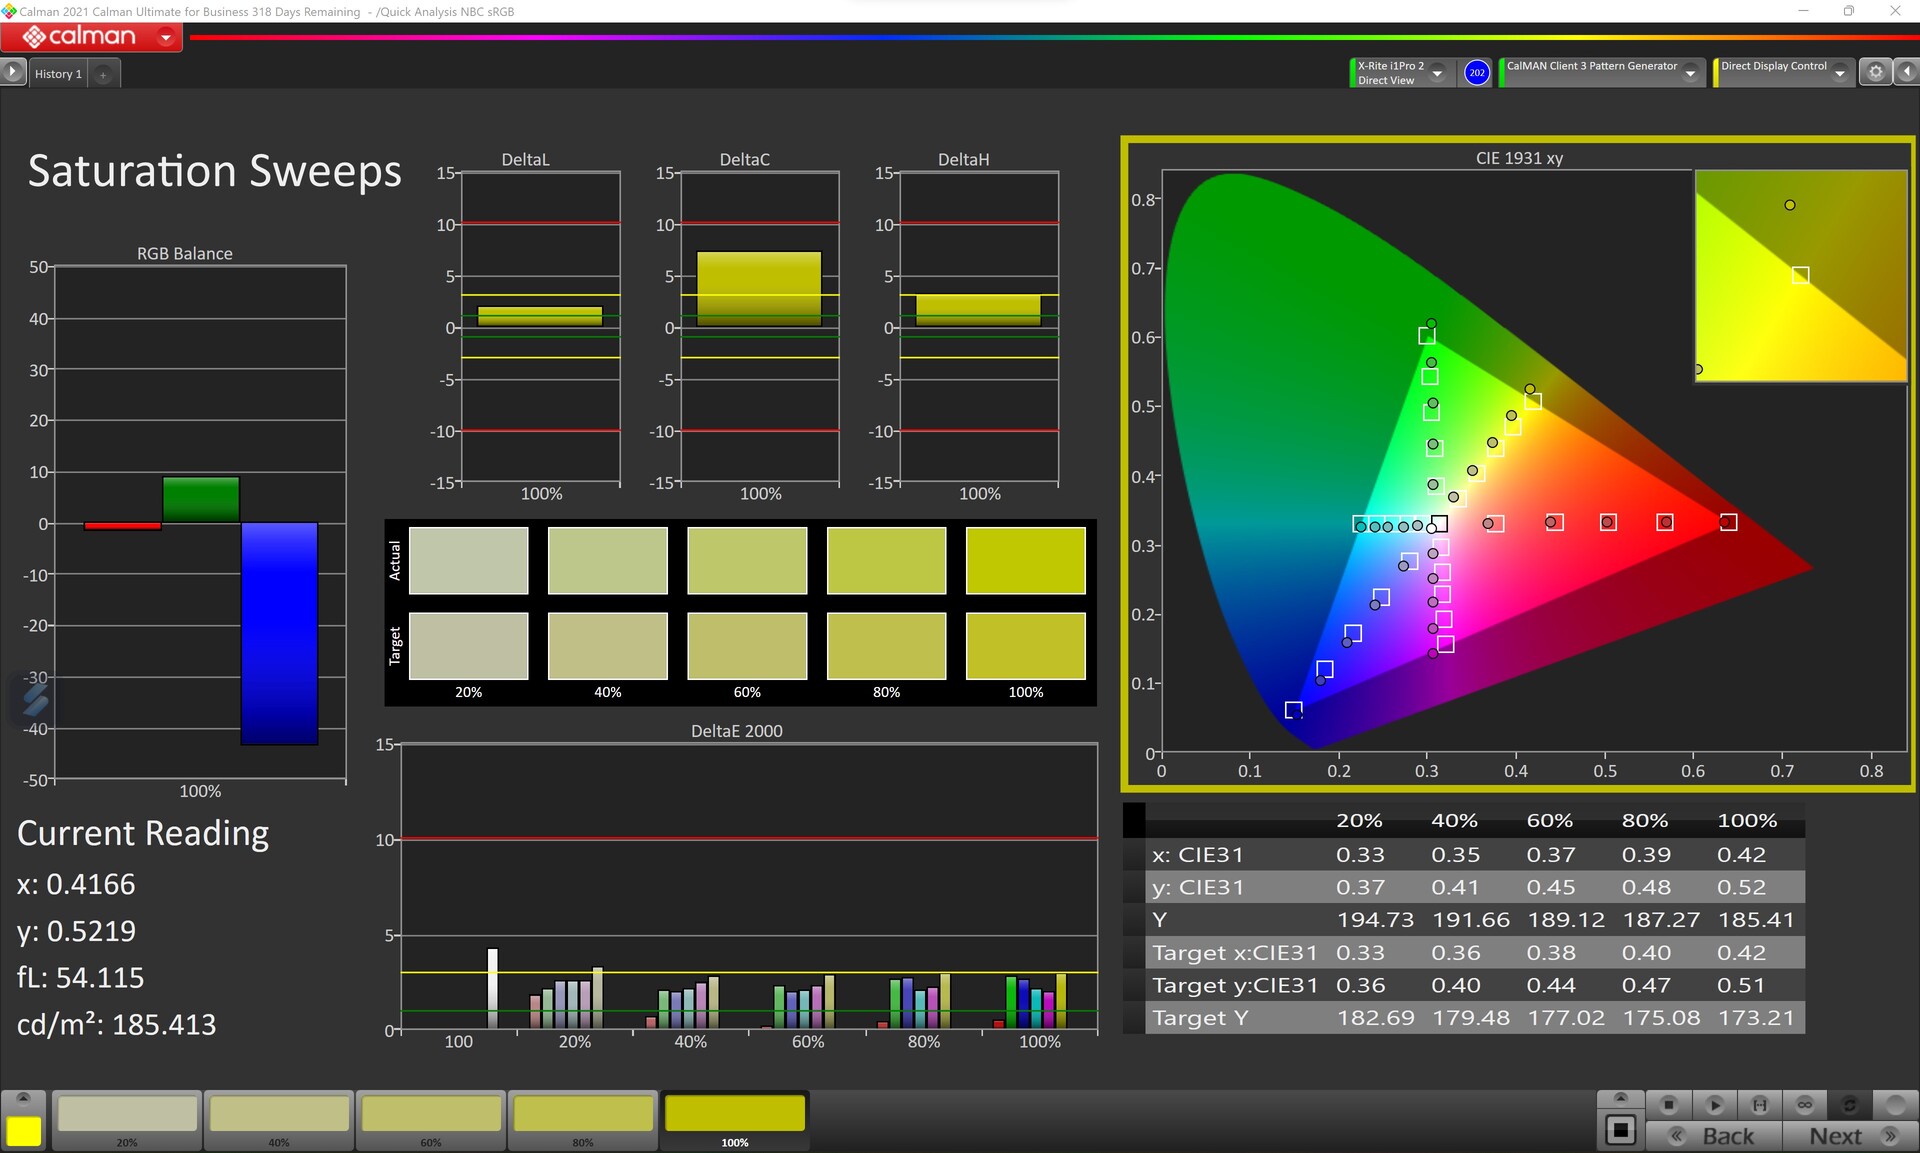
The display quality is good, and the color space coverage is also impressive. However, the competition often offers better rates in this comparison as well. Our review sample can only beat Lenovo's Legion 7 in this discipline. Due to the good Delta E-2000 values of the grayscale and colors compared to the sRGB color space, we assume that Corsair ships the device with a calibrated display. A manual calibration improves the Delta E-2000 values slightly again. Nevertheless, the maximum display brightness suffers. We recommend leaving the display in its delivery state. The color space coverage is sufficient for semi-professional photo and video editing.
Display Response Times
| ↔ Response Time Black to White | ||
|---|---|---|
| 10 ms ... rise ↗ and fall ↘ combined | ↗ 5 ms rise | 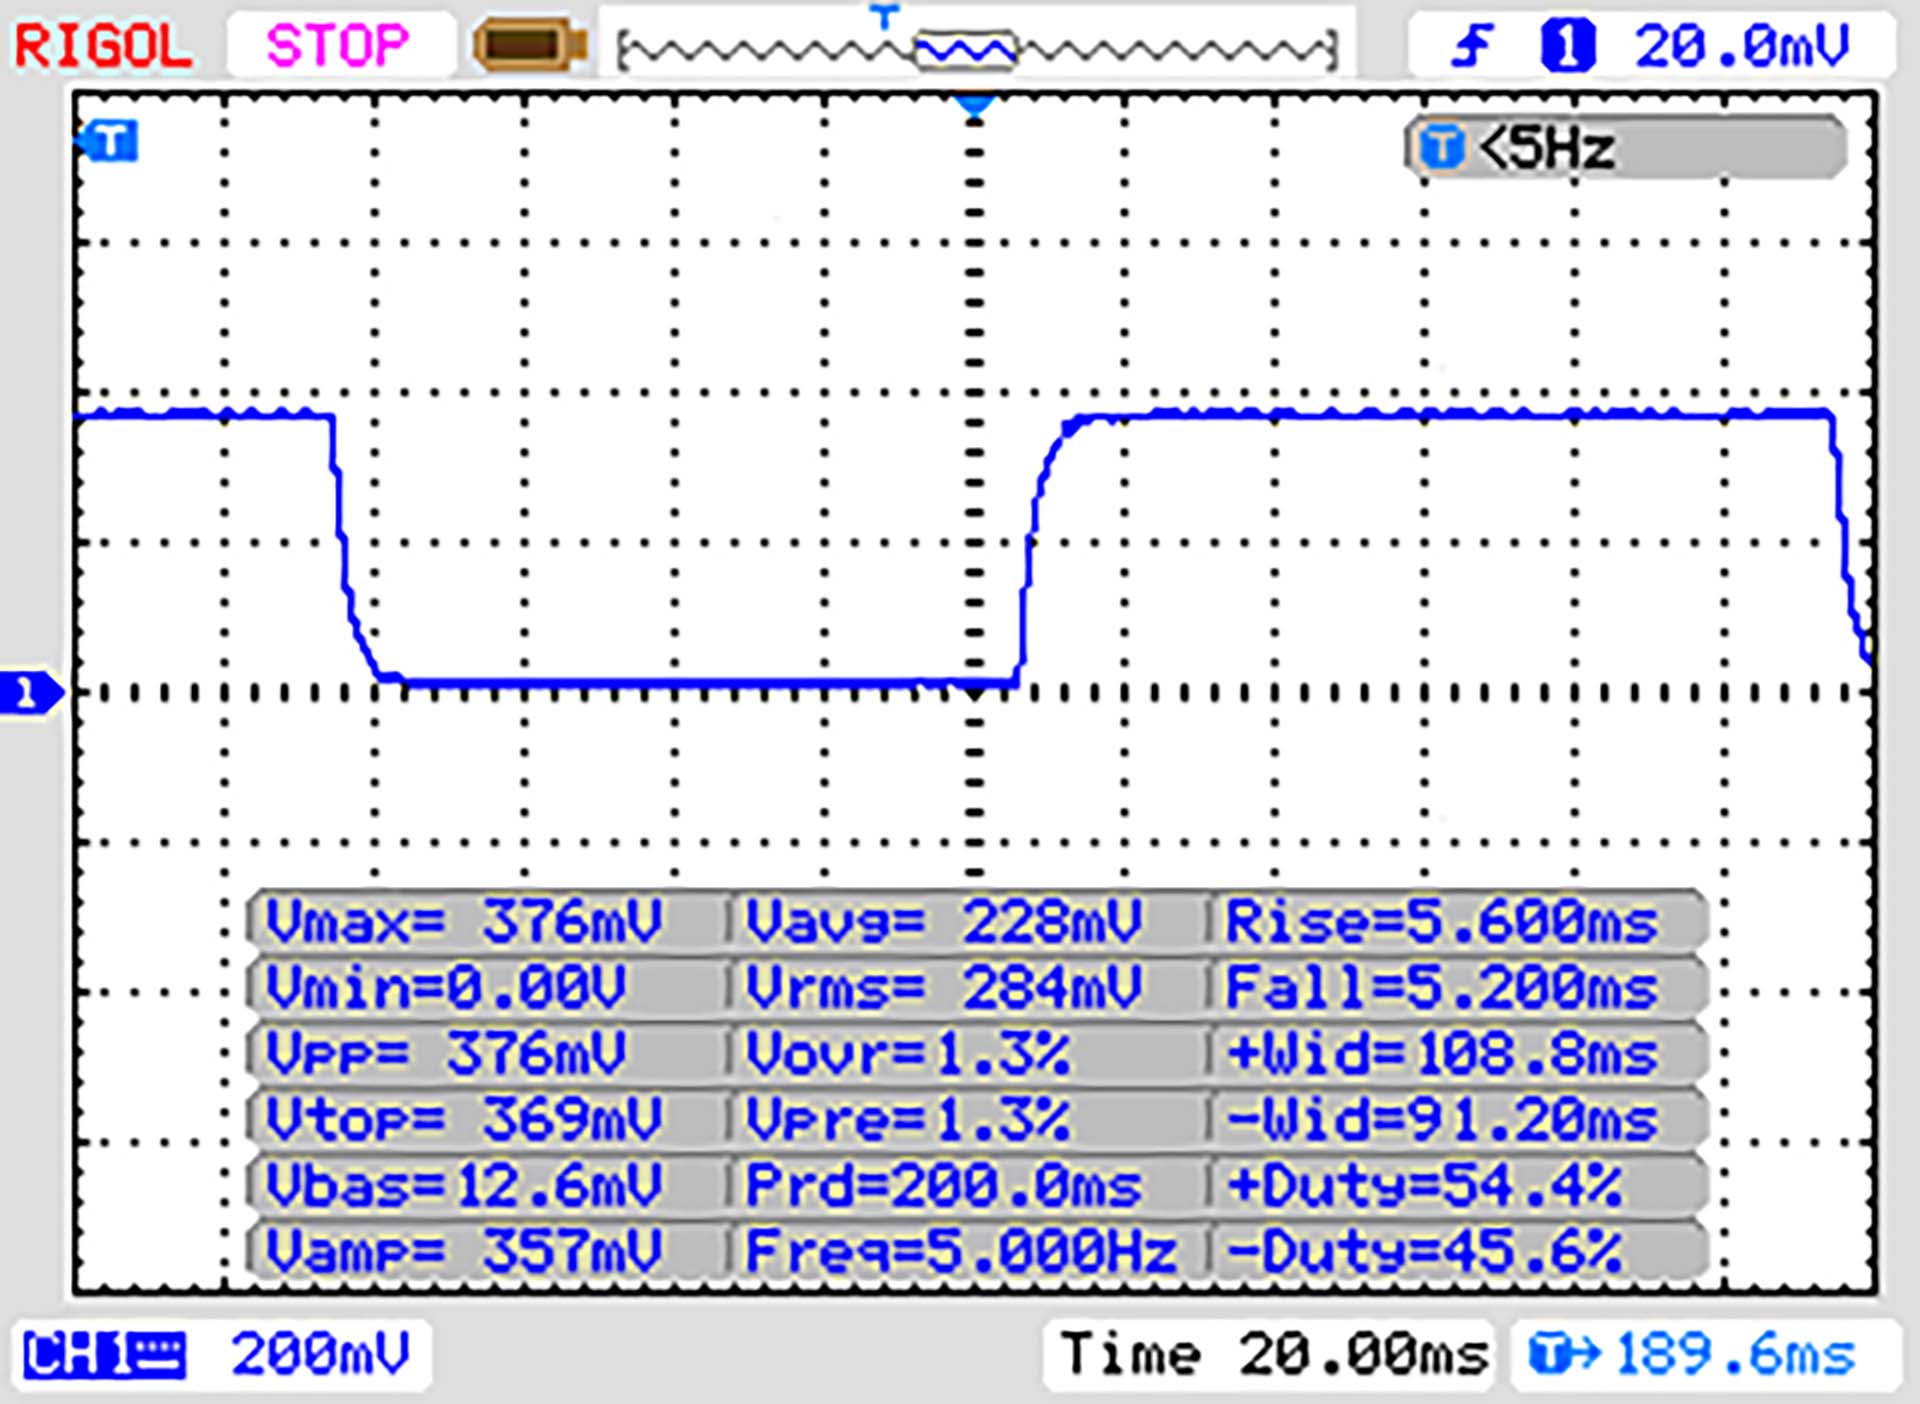 |
| ↘ 5 ms fall | ||
| The screen shows good response rates in our tests, but may be too slow for competitive gamers. In comparison, all tested devices range from 0.1 (minimum) to 240 (maximum) ms. » 27 % of all devices are better. This means that the measured response time is better than the average of all tested devices (19.9 ms). | ||
| ↔ Response Time 50% Grey to 80% Grey | ||
| 13 ms ... rise ↗ and fall ↘ combined | ↗ 7 ms rise |  |
| ↘ 6 ms fall | ||
| The screen shows good response rates in our tests, but may be too slow for competitive gamers. In comparison, all tested devices range from 0.165 (minimum) to 636 (maximum) ms. » 26 % of all devices are better. This means that the measured response time is better than the average of all tested devices (31.1 ms). | ||
Screen Flickering / PWM (Pulse-Width Modulation)
| Screen flickering / PWM not detected | 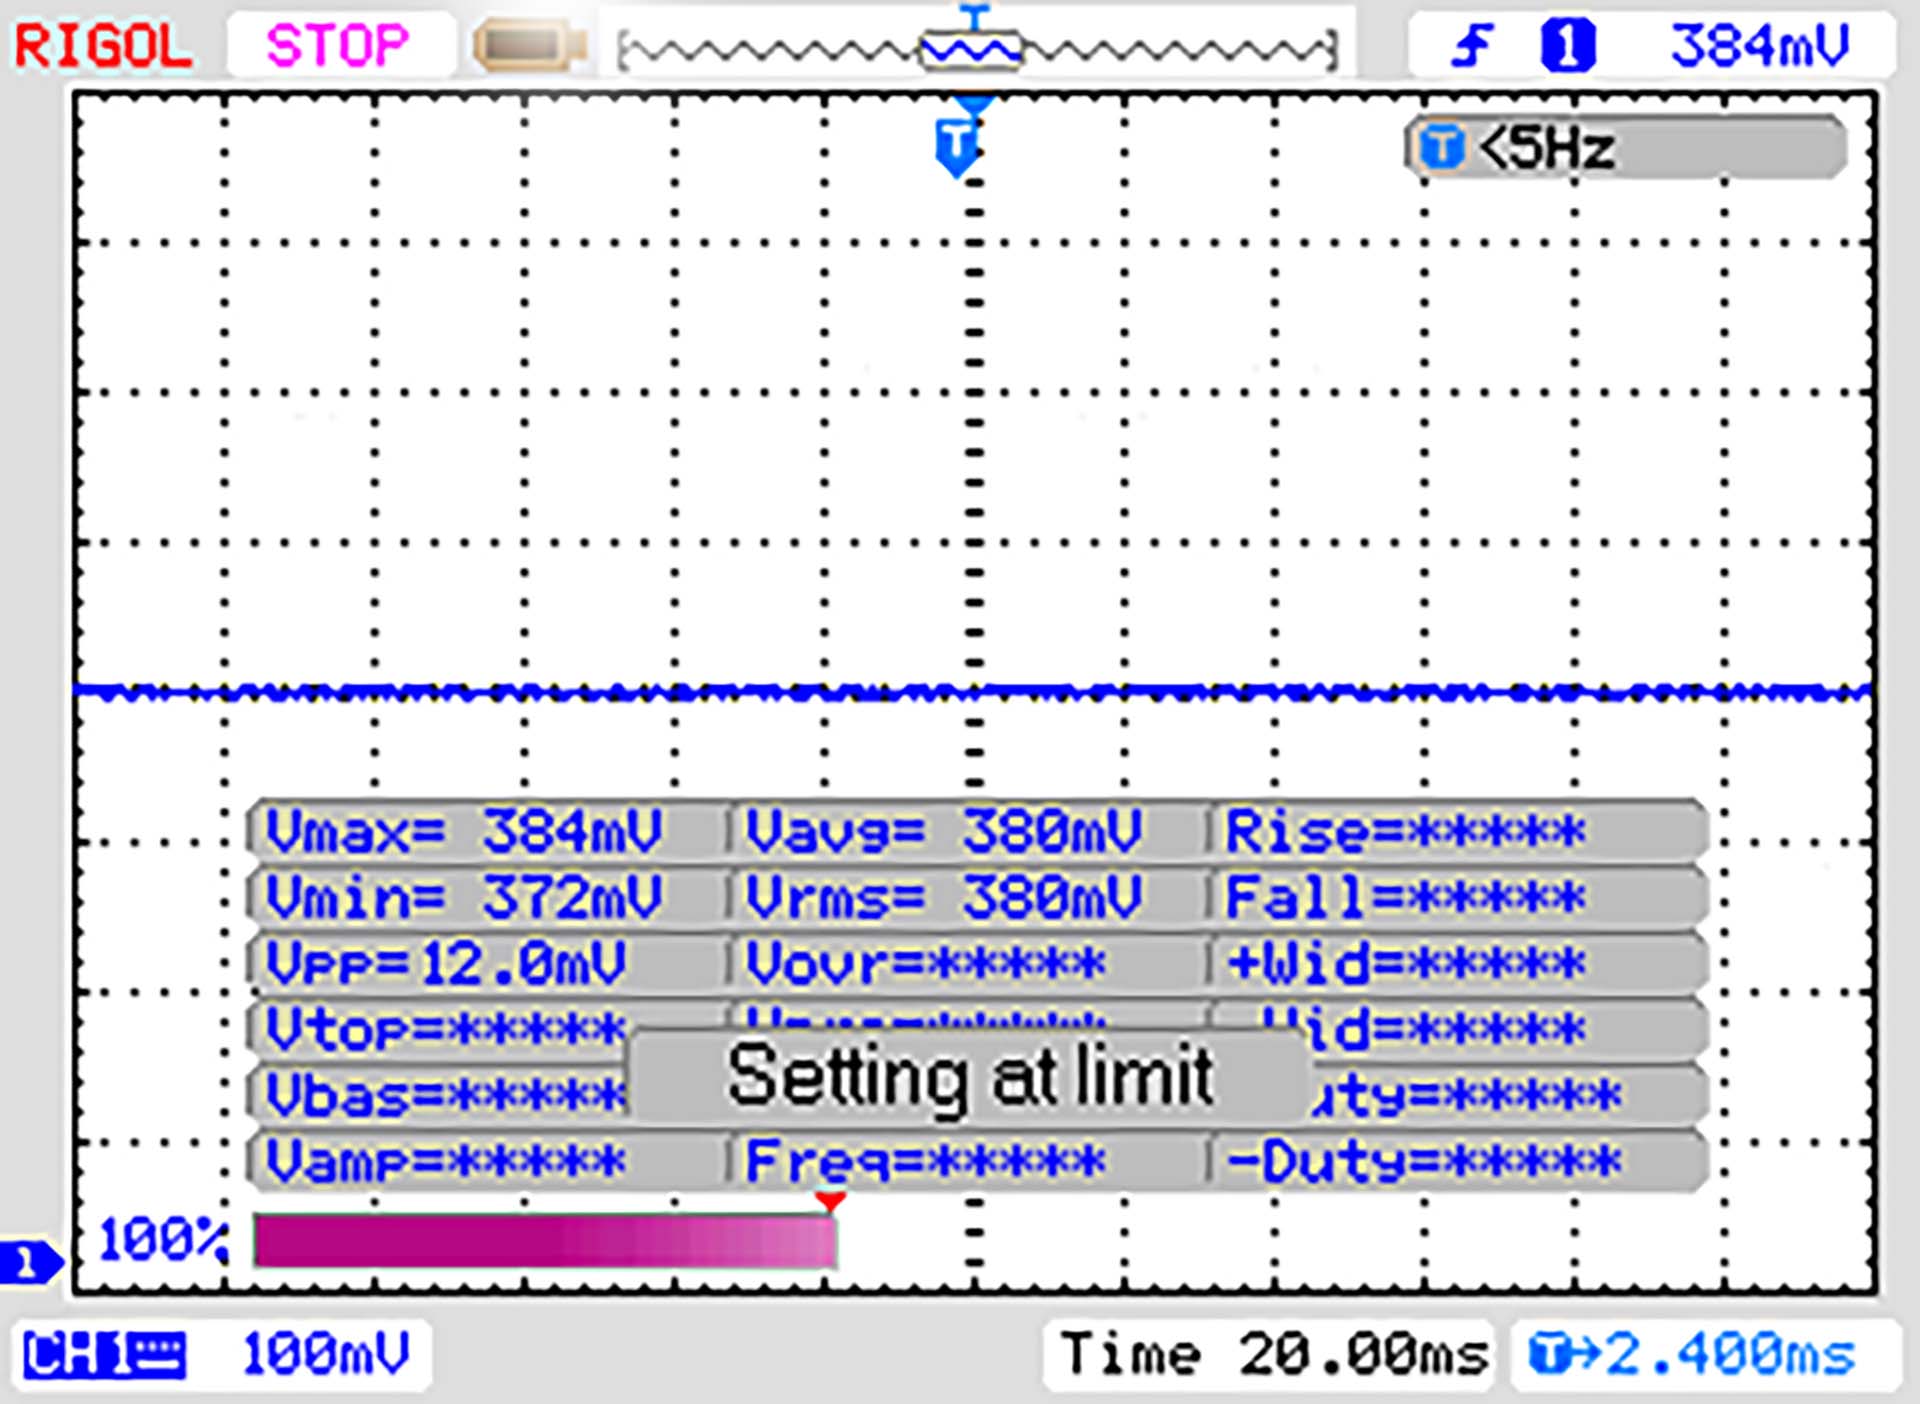 | ||
In comparison: 52 % of all tested devices do not use PWM to dim the display. If PWM was detected, an average of 7798 (minimum: 5 - maximum: 343500) Hz was measured. | |||
In principle, the matte display surface is suitable for outdoor use. However, the comparatively low display brightness speaks against it.
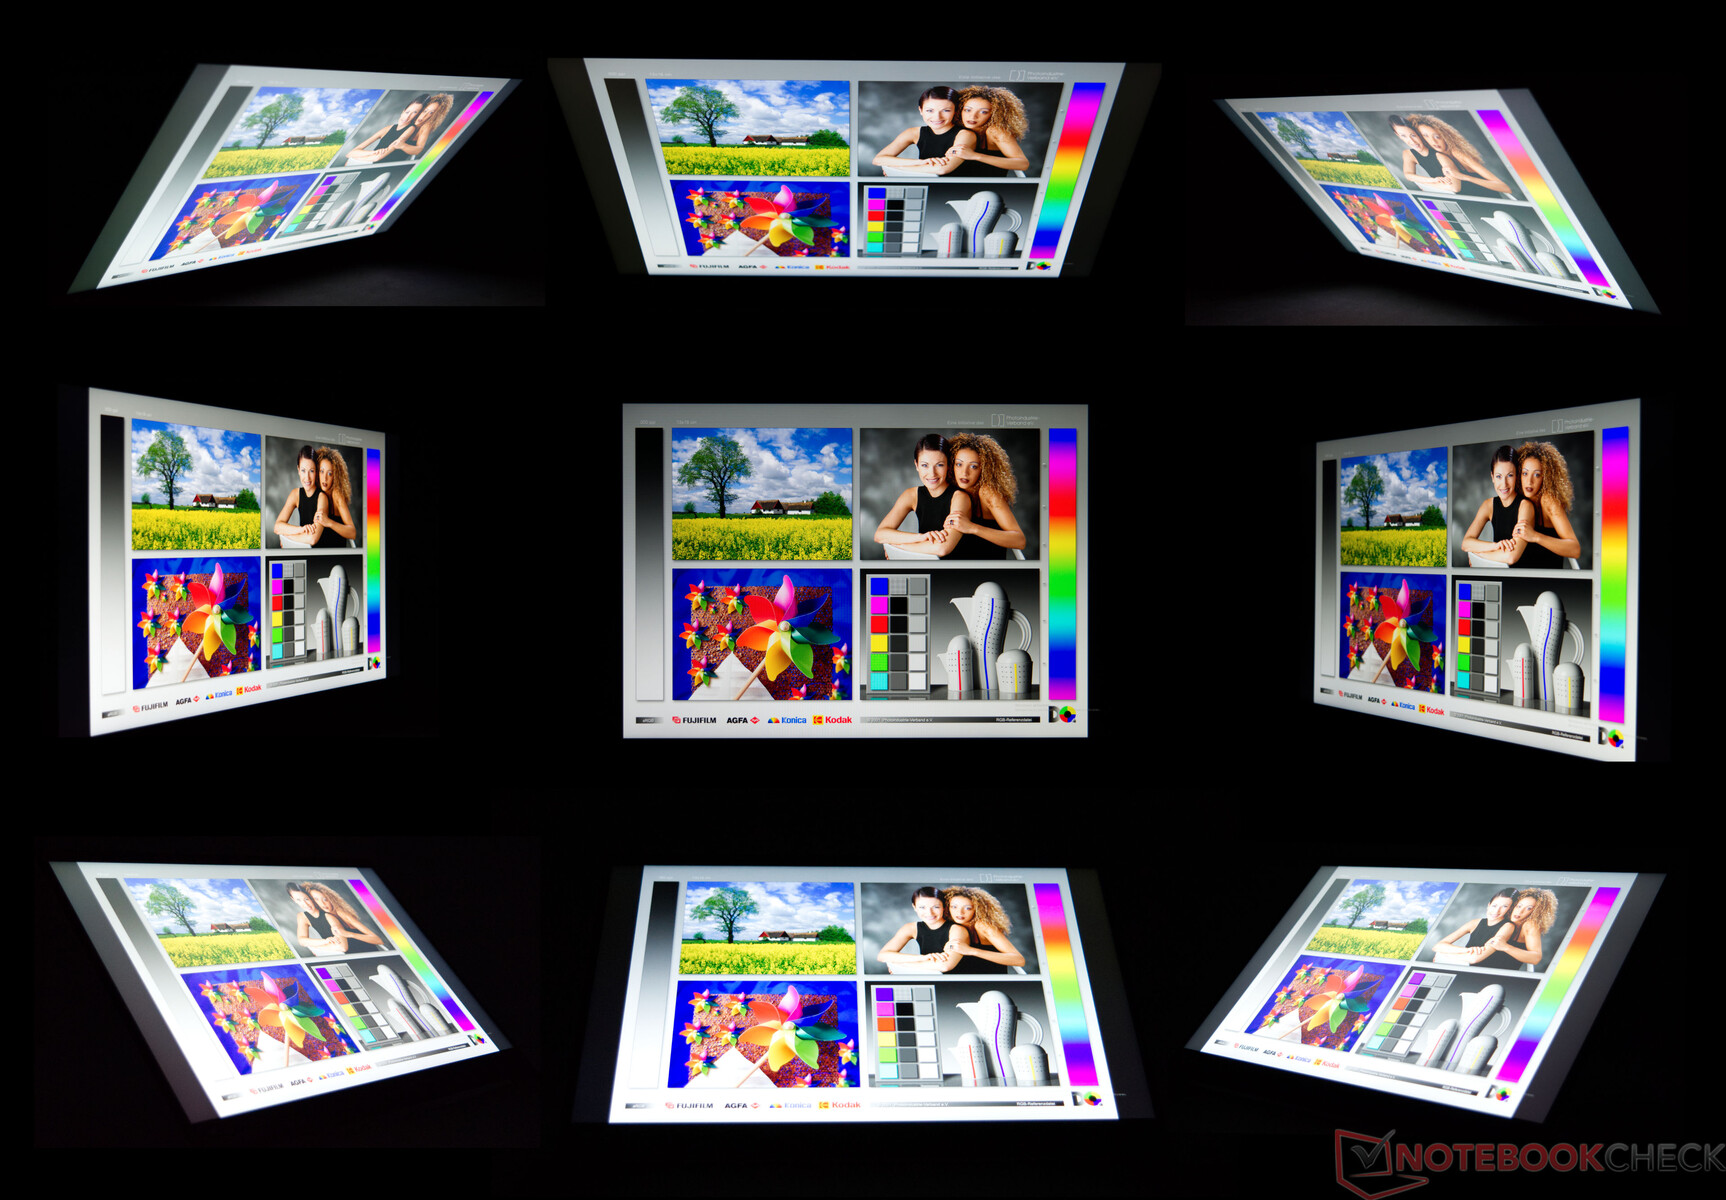
The viewing angle test shows the result of a typical IPS panel. Slight color changes are visible in the four corner images, which do not lead to any restrictions in normal use.
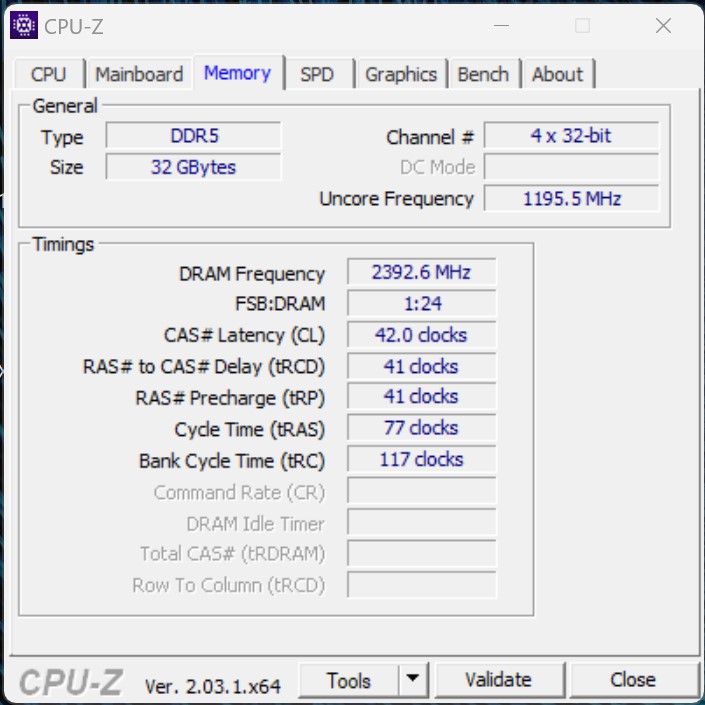
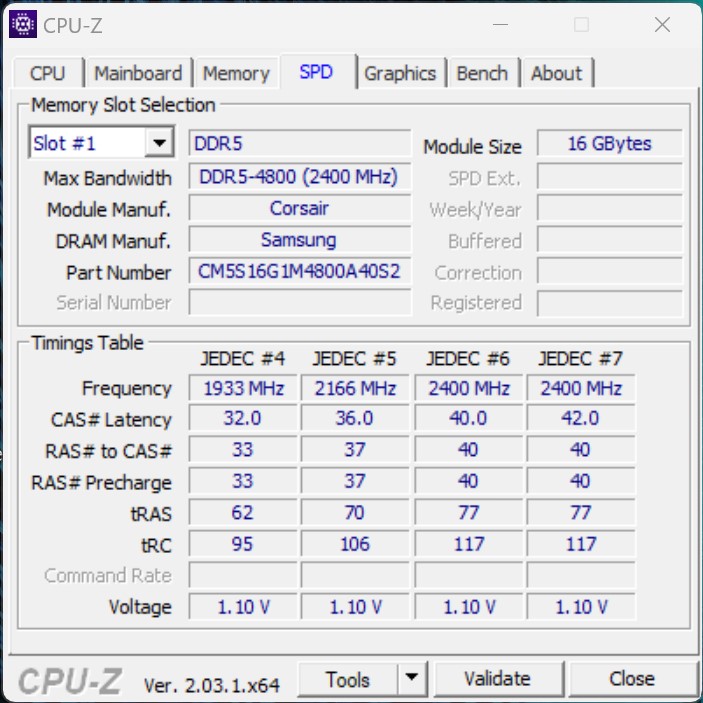
Performance - Rembrandt base with a lot of RAM and storage space
The Corsair Voyager a1600 with the combination of AMD Ryzen 9 6900HS and the AMD Radeon RX 6800M offers a very good basis for gaming current games with maximum details on a laptop. In connection with the 32 GB working memory and a 2 TB SSD, the user also gets a decent performance here.
Test conditions
Corsair offers the possibility to use the device in three different modes, that can be switched via the iCUE software. The options are Quiet
, Balanced
and Extreme.
The differences lie in the maximum performance available to the CPU and GPU even in combination with Smart Shift technology. All performance tests were performed with the Extreme
profile.
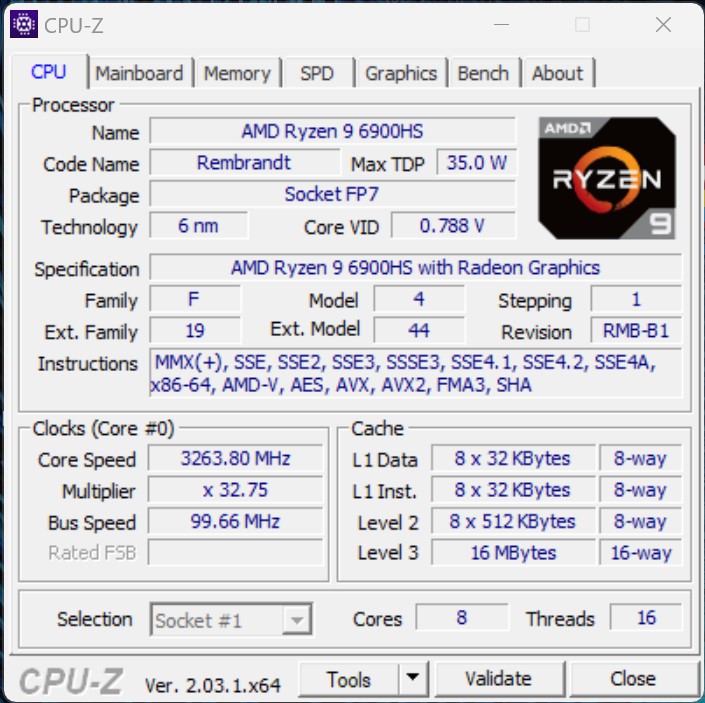
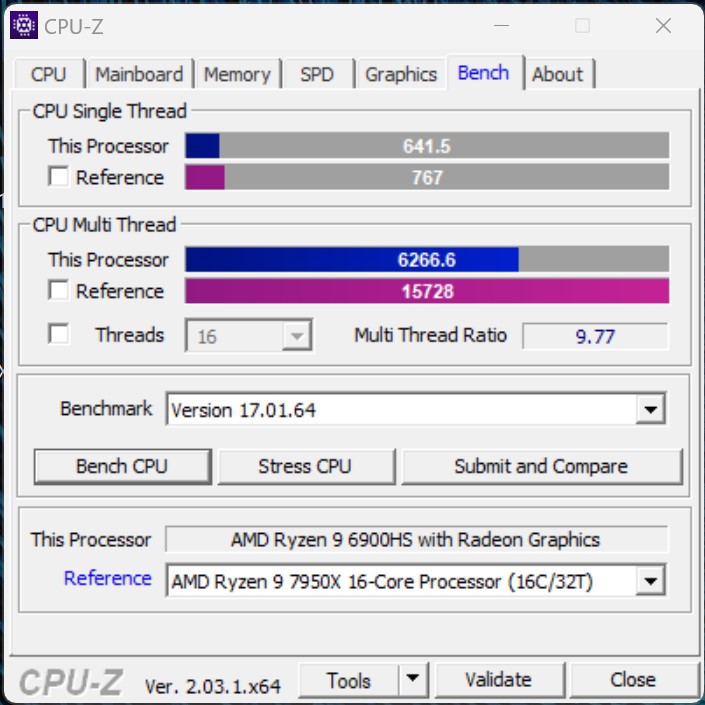
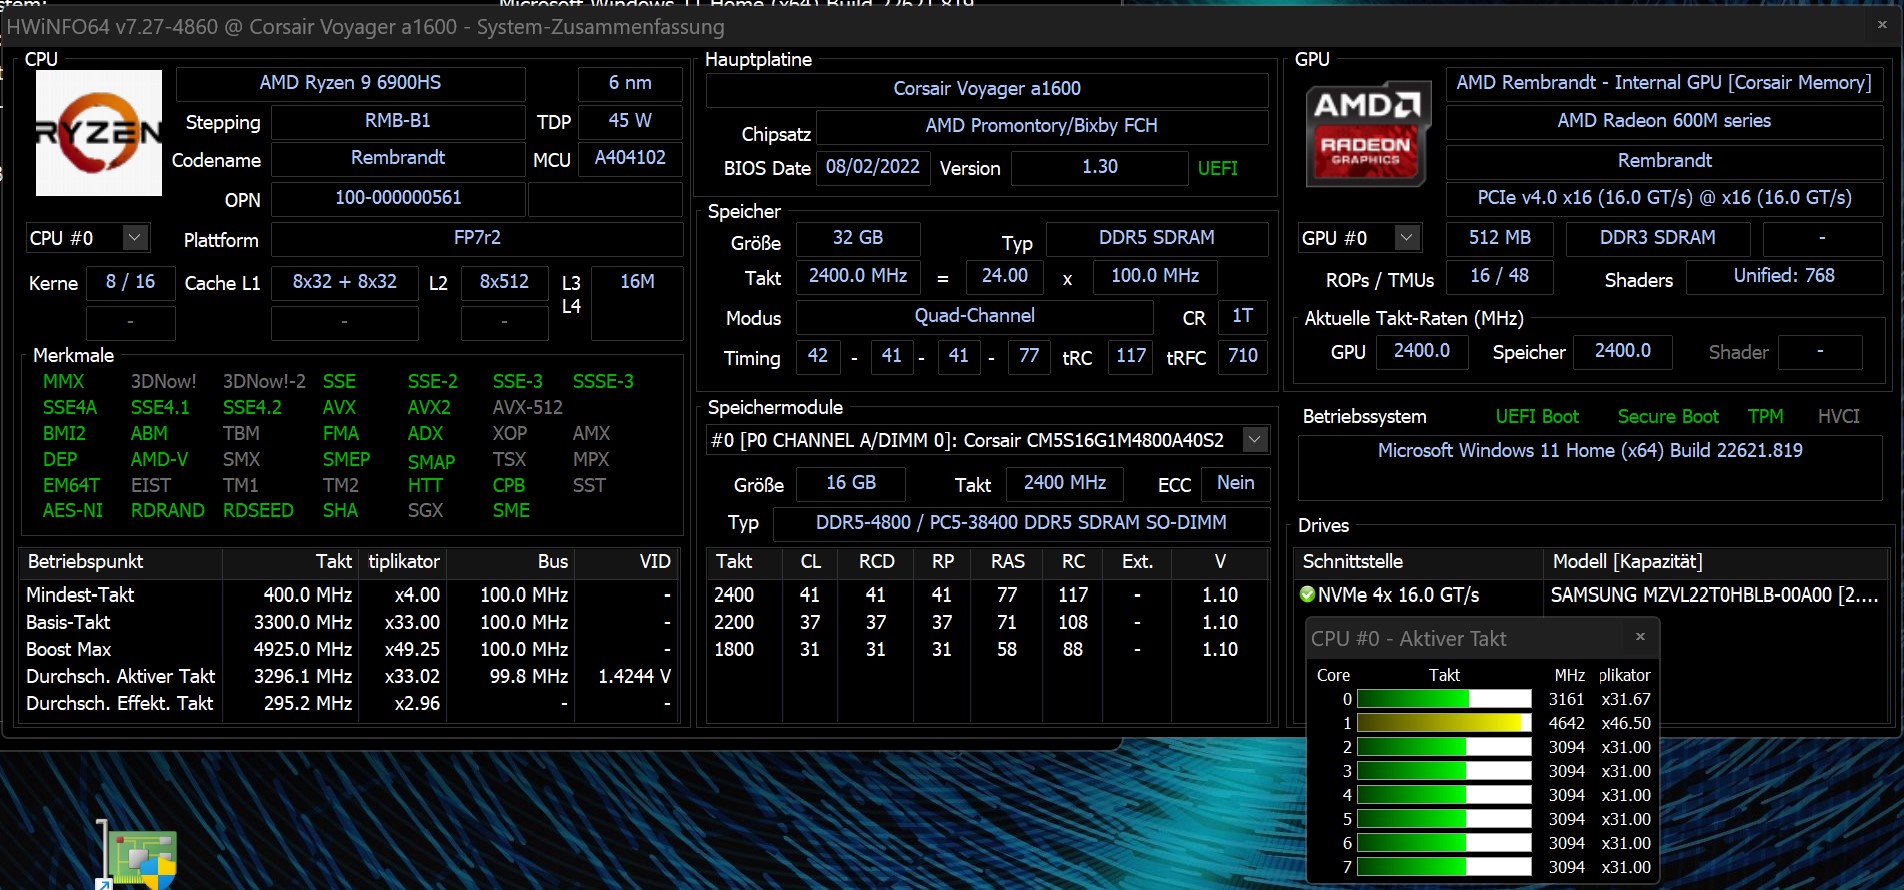
Processor
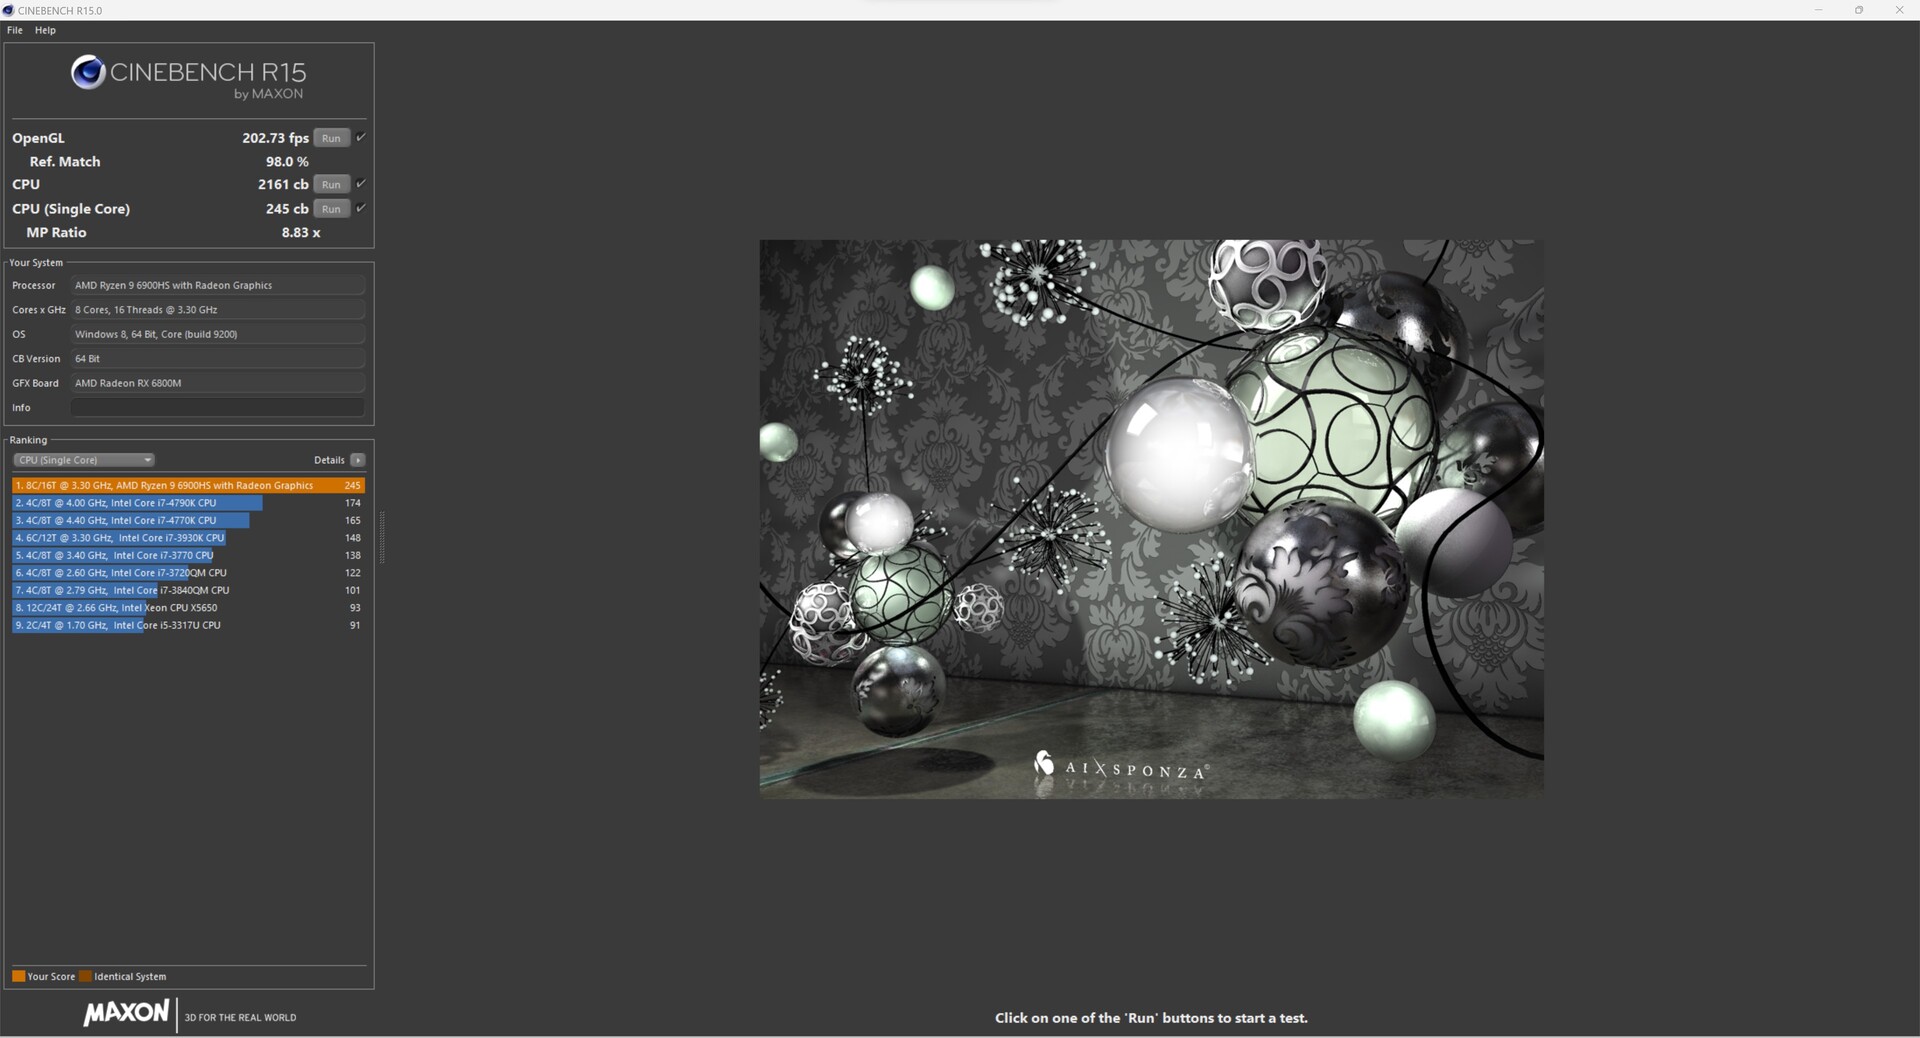
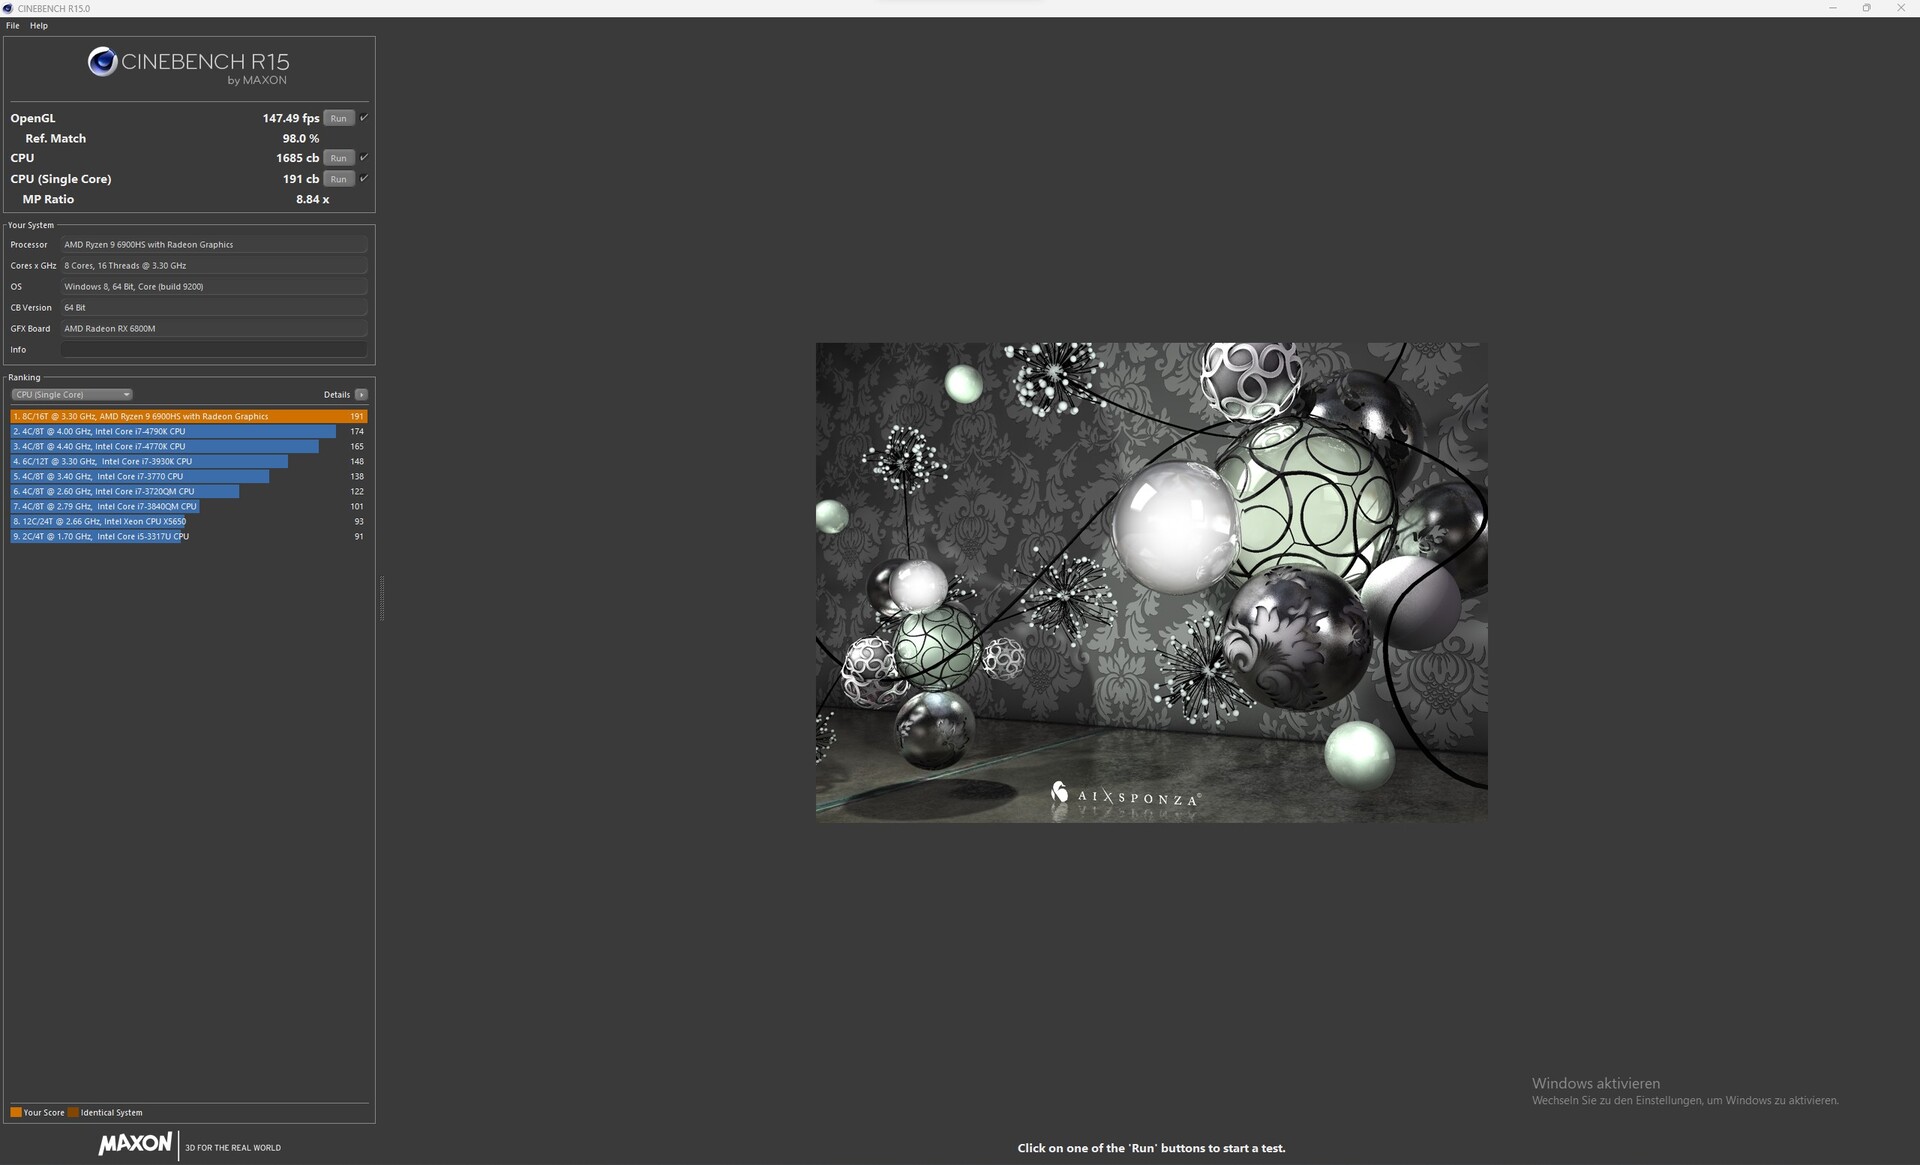
The AMD Ryzen 9 6900HS is an eight-core processor and is based on the current Rembrandt architecture. The SoC clocks with a frequency of 3.3-4.9 GHz in Boost and supports SMT, which provides the user with a total of 16 threads. In direct comparison with the Intel-based competition, the AMD Ryzen 9 6900HS has a hard time holding its own. However, the test sample masters the AIDA64 tests a bit better and takes third place in the ranking.
For further benchmarks, we refer you to our CPU comparison chart.
Cinebench R15 Multi loop
Cinebench R23: Multi Core | Single Core
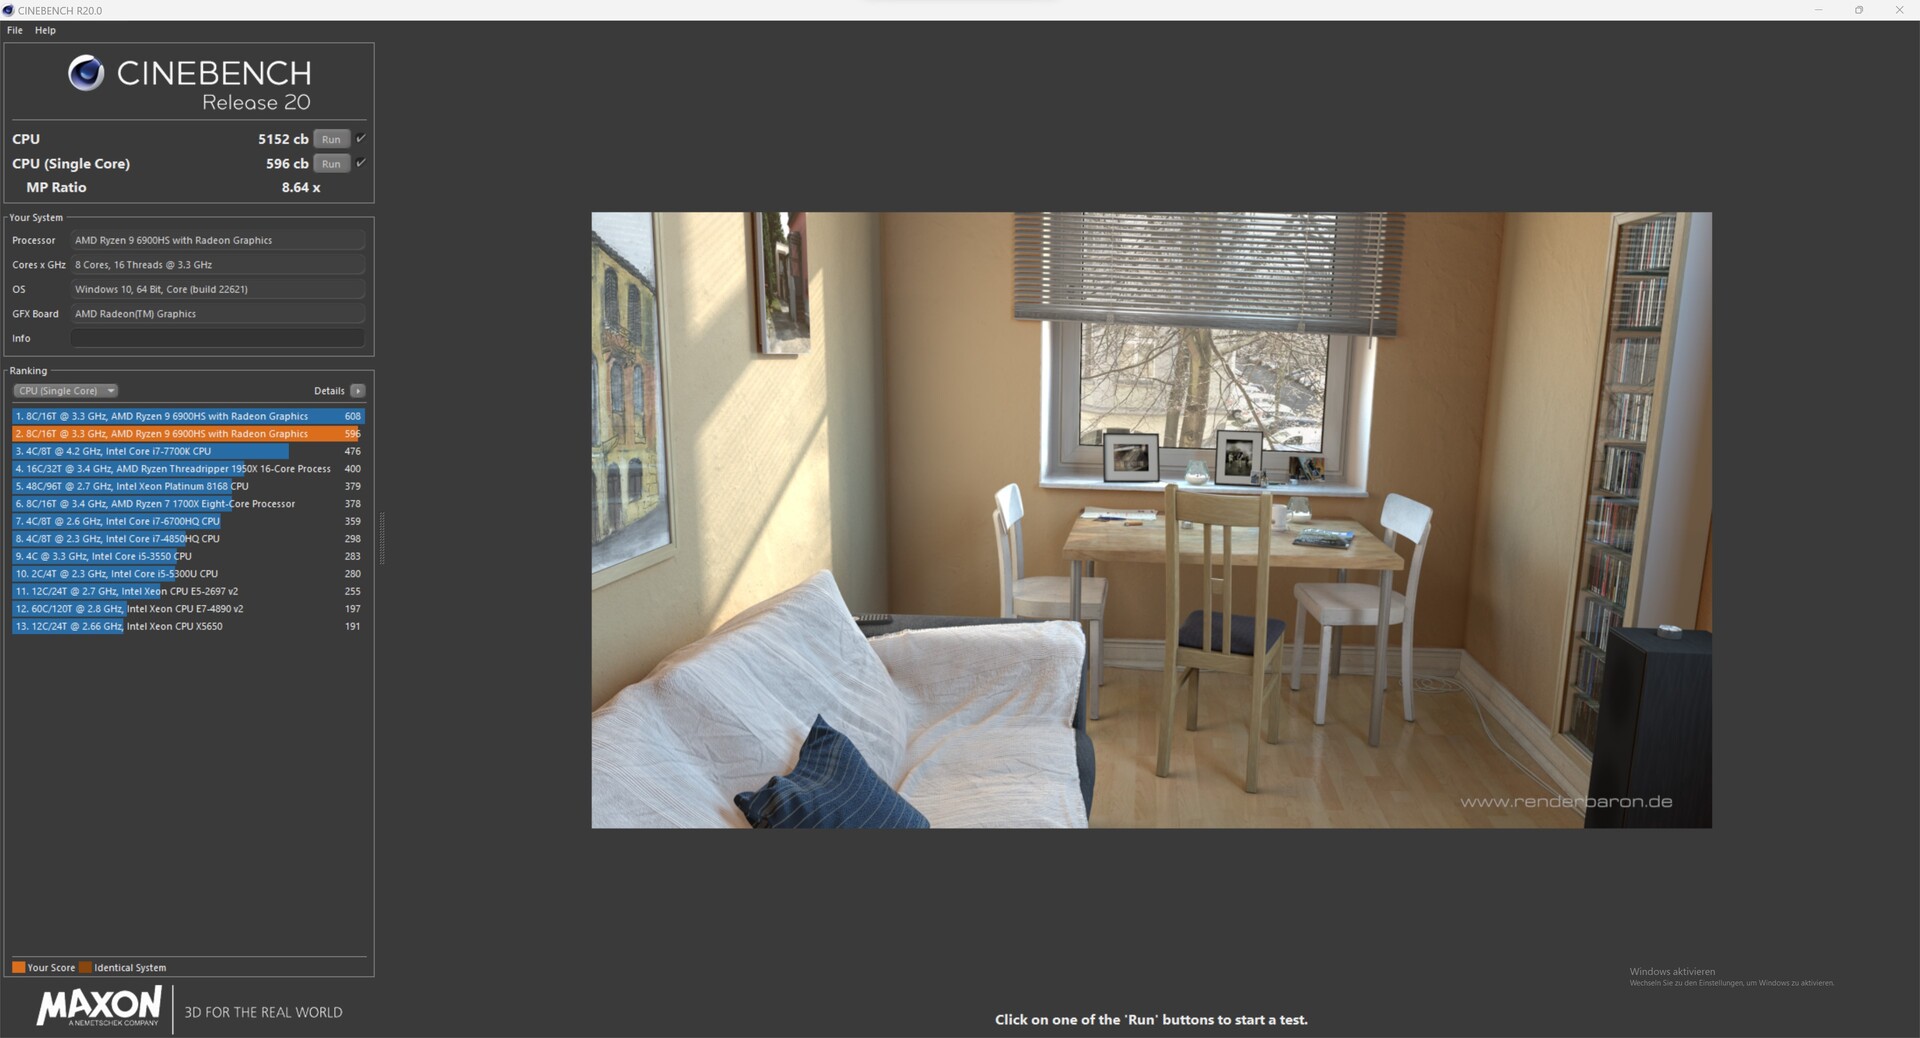
Cinebench R20: CPU (Multi Core) | CPU (Single Core)
Cinebench R15: CPU Multi 64Bit | CPU Single 64Bit
Blender: v2.79 BMW27 CPU
7-Zip 18.03: 7z b 4 | 7z b 4 -mmt1
Geekbench 5.5: Multi-Core | Single-Core
HWBOT x265 Benchmark v2.2: 4k Preset
LibreOffice : 20 Documents To PDF
R Benchmark 2.5: Overall mean
| CPU Performance rating | |
| Average of class Gaming | |
| Lenovo Legion 7 16IAX7-82TD004SGE | |
| HP Omen 16-b1090ng | |
| Acer Predator Triton 500 SE PT516-52s-70KX | |
| Lenovo Legion 7 16ARHA7 | |
| Asus ROG Flow X16 GV601RW-M5082W | |
| Average AMD Ryzen 9 6900HS | |
| Corsair Voyager a1600 | |
| Cinebench R23 / Multi Core | |
| Average of class Gaming (10488 - 40970, n=113, last 2 years) | |
| Lenovo Legion 7 16IAX7-82TD004SGE | |
| Acer Predator Triton 500 SE PT516-52s-70KX | |
| HP Omen 16-b1090ng | |
| Lenovo Legion 7 16ARHA7 | |
| Asus ROG Flow X16 GV601RW-M5082W | |
| Corsair Voyager a1600 | |
| Average AMD Ryzen 9 6900HS (12606 - 14403, n=5) | |
| Cinebench R23 / Single Core | |
| Average of class Gaming (1166 - 2356, n=113, last 2 years) | |
| Lenovo Legion 7 16IAX7-82TD004SGE | |
| HP Omen 16-b1090ng | |
| Acer Predator Triton 500 SE PT516-52s-70KX | |
| Lenovo Legion 7 16ARHA7 | |
| Corsair Voyager a1600 | |
| Average AMD Ryzen 9 6900HS (1526 - 1570, n=5) | |
| Asus ROG Flow X16 GV601RW-M5082W | |
| Cinebench R20 / CPU (Multi Core) | |
| Average of class Gaming (4029 - 16108, n=112, last 2 years) | |
| Lenovo Legion 7 16IAX7-82TD004SGE | |
| Acer Predator Triton 500 SE PT516-52s-70KX | |
| HP Omen 16-b1090ng | |
| Lenovo Legion 7 16ARHA7 | |
| Asus ROG Flow X16 GV601RW-M5082W | |
| Average AMD Ryzen 9 6900HS (4829 - 5552, n=5) | |
| Corsair Voyager a1600 | |
| Cinebench R20 / CPU (Single Core) | |
| Average of class Gaming (442 - 895, n=112, last 2 years) | |
| Lenovo Legion 7 16IAX7-82TD004SGE | |
| HP Omen 16-b1090ng | |
| Acer Predator Triton 500 SE PT516-52s-70KX | |
| Lenovo Legion 7 16ARHA7 | |
| Average AMD Ryzen 9 6900HS (596 - 620, n=5) | |
| Asus ROG Flow X16 GV601RW-M5082W | |
| Corsair Voyager a1600 | |
| Cinebench R15 / CPU Multi 64Bit | |
| Average of class Gaming (1578 - 6271, n=113, last 2 years) | |
| Lenovo Legion 7 16IAX7-82TD004SGE | |
| HP Omen 16-b1090ng | |
| Acer Predator Triton 500 SE PT516-52s-70KX | |
| Lenovo Legion 7 16ARHA7 | |
| Asus ROG Flow X16 GV601RW-M5082W | |
| Average AMD Ryzen 9 6900HS (2054 - 2342, n=5) | |
| Corsair Voyager a1600 | |
| Cinebench R15 / CPU Single 64Bit | |
| Average of class Gaming (188.8 - 343, n=112, last 2 years) | |
| Lenovo Legion 7 16IAX7-82TD004SGE | |
| HP Omen 16-b1090ng | |
| Lenovo Legion 7 16ARHA7 | |
| Corsair Voyager a1600 | |
| Average AMD Ryzen 9 6900HS (218 - 254, n=5) | |
| Asus ROG Flow X16 GV601RW-M5082W | |
| Acer Predator Triton 500 SE PT516-52s-70KX | |
| Blender / v2.79 BMW27 CPU | |
| Average AMD Ryzen 9 6900HS (220 - 277, n=5) | |
| Corsair Voyager a1600 | |
| Asus ROG Flow X16 GV601RW-M5082W | |
| Lenovo Legion 7 16ARHA7 | |
| Acer Predator Triton 500 SE PT516-52s-70KX | |
| HP Omen 16-b1090ng | |
| Average of class Gaming (80 - 330, n=110, last 2 years) | |
| Lenovo Legion 7 16IAX7-82TD004SGE | |
| 7-Zip 18.03 / 7z b 4 | |
| Average of class Gaming (33491 - 148086, n=111, last 2 years) | |
| Lenovo Legion 7 16IAX7-82TD004SGE | |
| HP Omen 16-b1090ng | |
| Acer Predator Triton 500 SE PT516-52s-70KX | |
| Lenovo Legion 7 16ARHA7 | |
| Corsair Voyager a1600 | |
| Asus ROG Flow X16 GV601RW-M5082W | |
| Average AMD Ryzen 9 6900HS (52948 - 63591, n=5) | |
| 7-Zip 18.03 / 7z b 4 -mmt1 | |
| Average of class Gaming (4199 - 7436, n=111, last 2 years) | |
| Lenovo Legion 7 16IAX7-82TD004SGE | |
| HP Omen 16-b1090ng | |
| Corsair Voyager a1600 | |
| Average AMD Ryzen 9 6900HS (5538 - 5958, n=5) | |
| Asus ROG Flow X16 GV601RW-M5082W | |
| Lenovo Legion 7 16ARHA7 | |
| Acer Predator Triton 500 SE PT516-52s-70KX | |
| Geekbench 5.5 / Multi-Core | |
| Average of class Gaming (6460 - 27010, n=111, last 2 years) | |
| Lenovo Legion 7 16IAX7-82TD004SGE | |
| HP Omen 16-b1090ng | |
| Acer Predator Triton 500 SE PT516-52s-70KX | |
| Corsair Voyager a1600 | |
| Lenovo Legion 7 16ARHA7 | |
| Average AMD Ryzen 9 6900HS (8381 - 10040, n=5) | |
| Asus ROG Flow X16 GV601RW-M5082W | |
| Geekbench 5.5 / Single-Core | |
| Average of class Gaming (986 - 2474, n=111, last 2 years) | |
| Lenovo Legion 7 16IAX7-82TD004SGE | |
| HP Omen 16-b1090ng | |
| Acer Predator Triton 500 SE PT516-52s-70KX | |
| Lenovo Legion 7 16ARHA7 | |
| Average AMD Ryzen 9 6900HS (1480 - 1614, n=5) | |
| Asus ROG Flow X16 GV601RW-M5082W | |
| Corsair Voyager a1600 | |
| HWBOT x265 Benchmark v2.2 / 4k Preset | |
| Average of class Gaming (11.5 - 44.3, n=111, last 2 years) | |
| Lenovo Legion 7 16IAX7-82TD004SGE | |
| HP Omen 16-b1090ng | |
| Acer Predator Triton 500 SE PT516-52s-70KX | |
| Lenovo Legion 7 16ARHA7 | |
| Corsair Voyager a1600 | |
| Asus ROG Flow X16 GV601RW-M5082W | |
| Average AMD Ryzen 9 6900HS (14.2 - 17.9, n=5) | |
| LibreOffice / 20 Documents To PDF | |
| Corsair Voyager a1600 | |
| Asus ROG Flow X16 GV601RW-M5082W | |
| Lenovo Legion 7 16ARHA7 | |
| Average AMD Ryzen 9 6900HS (47.6 - 57.2, n=5) | |
| Average of class Gaming (19 - 88.8, n=111, last 2 years) | |
| Acer Predator Triton 500 SE PT516-52s-70KX | |
| HP Omen 16-b1090ng | |
| Lenovo Legion 7 16IAX7-82TD004SGE | |
| R Benchmark 2.5 / Overall mean | |
| Asus ROG Flow X16 GV601RW-M5082W | |
| Lenovo Legion 7 16ARHA7 | |
| Corsair Voyager a1600 | |
| Average AMD Ryzen 9 6900HS (0.4672 - 0.502, n=5) | |
| Acer Predator Triton 500 SE PT516-52s-70KX | |
| HP Omen 16-b1090ng | |
| Average of class Gaming (0.3439 - 0.759, n=112, last 2 years) | |
| Lenovo Legion 7 16IAX7-82TD004SGE | |
* ... smaller is better

AIDA64: FP32 Ray-Trace | FPU Julia | CPU SHA3 | CPU Queen | FPU SinJulia | FPU Mandel | CPU AES | CPU ZLib | FP64 Ray-Trace | CPU PhotoWorxx
| Performance rating | |
| Average of class Gaming | |
| Lenovo Legion 7 16ARHA7 | |
| Asus ROG Flow X16 GV601RW-M5082W | |
| Corsair Voyager a1600 | |
| Lenovo Legion 7 16IAX7-82TD004SGE | |
| Average AMD Ryzen 9 6900HS | |
| Acer Predator Triton 500 SE PT516-52s-70KX | |
| HP Omen 16-b1090ng | |
| AIDA64 / FP32 Ray-Trace | |
| Average of class Gaming (10227 - 85542, n=110, last 2 years) | |
| Lenovo Legion 7 16ARHA7 | |
| Asus ROG Flow X16 GV601RW-M5082W | |
| Corsair Voyager a1600 | |
| Average AMD Ryzen 9 6900HS (14212 - 16072, n=5) | |
| Lenovo Legion 7 16IAX7-82TD004SGE | |
| Acer Predator Triton 500 SE PT516-52s-70KX | |
| HP Omen 16-b1090ng | |
| AIDA64 / FPU Julia | |
| Average of class Gaming (51376 - 238426, n=110, last 2 years) | |
| Lenovo Legion 7 16ARHA7 | |
| Asus ROG Flow X16 GV601RW-M5082W | |
| Corsair Voyager a1600 | |
| Average AMD Ryzen 9 6900HS (90523 - 102881, n=5) | |
| Lenovo Legion 7 16IAX7-82TD004SGE | |
| Acer Predator Triton 500 SE PT516-52s-70KX | |
| HP Omen 16-b1090ng | |
| AIDA64 / CPU SHA3 | |
| Average of class Gaming (2180 - 9817, n=110, last 2 years) | |
| Lenovo Legion 7 16IAX7-82TD004SGE | |
| Lenovo Legion 7 16ARHA7 | |
| Asus ROG Flow X16 GV601RW-M5082W | |
| Corsair Voyager a1600 | |
| Acer Predator Triton 500 SE PT516-52s-70KX | |
| Average AMD Ryzen 9 6900HS (3035 - 3614, n=5) | |
| HP Omen 16-b1090ng | |
| AIDA64 / CPU Queen | |
| Average of class Gaming (49785 - 173351, n=101, last 2 years) | |
| Lenovo Legion 7 16ARHA7 | |
| Corsair Voyager a1600 | |
| Asus ROG Flow X16 GV601RW-M5082W | |
| Average AMD Ryzen 9 6900HS (97461 - 105203, n=5) | |
| Lenovo Legion 7 16IAX7-82TD004SGE | |
| HP Omen 16-b1090ng | |
| Acer Predator Triton 500 SE PT516-52s-70KX | |
| AIDA64 / FPU SinJulia | |
| Average of class Gaming (4424 - 33636, n=110, last 2 years) | |
| Lenovo Legion 7 16IAX7-82TD004SGE | |
| Corsair Voyager a1600 | |
| Lenovo Legion 7 16ARHA7 | |
| Asus ROG Flow X16 GV601RW-M5082W | |
| Average AMD Ryzen 9 6900HS (12548 - 13039, n=5) | |
| Acer Predator Triton 500 SE PT516-52s-70KX | |
| HP Omen 16-b1090ng | |
| AIDA64 / FPU Mandel | |
| Average of class Gaming (25115 - 128721, n=110, last 2 years) | |
| Lenovo Legion 7 16ARHA7 | |
| Asus ROG Flow X16 GV601RW-M5082W | |
| Corsair Voyager a1600 | |
| Average AMD Ryzen 9 6900HS (49657 - 56486, n=5) | |
| Lenovo Legion 7 16IAX7-82TD004SGE | |
| Acer Predator Triton 500 SE PT516-52s-70KX | |
| HP Omen 16-b1090ng | |
| AIDA64 / CPU AES | |
| Asus ROG Flow X16 GV601RW-M5082W | |
| Lenovo Legion 7 16ARHA7 | |
| Corsair Voyager a1600 | |
| Lenovo Legion 7 16IAX7-82TD004SGE | |
| Average AMD Ryzen 9 6900HS (51791 - 142686, n=5) | |
| Average of class Gaming (39258 - 247074, n=110, last 2 years) | |
| Acer Predator Triton 500 SE PT516-52s-70KX | |
| HP Omen 16-b1090ng | |
| AIDA64 / CPU ZLib | |
| Average of class Gaming (574 - 2531, n=110, last 2 years) | |
| Lenovo Legion 7 16IAX7-82TD004SGE | |
| Acer Predator Triton 500 SE PT516-52s-70KX | |
| HP Omen 16-b1090ng | |
| Lenovo Legion 7 16ARHA7 | |
| Asus ROG Flow X16 GV601RW-M5082W | |
| Corsair Voyager a1600 | |
| Average AMD Ryzen 9 6900HS (737 - 888, n=5) | |
| AIDA64 / FP64 Ray-Trace | |
| Average of class Gaming (5509 - 45446, n=110, last 2 years) | |
| Lenovo Legion 7 16ARHA7 | |
| Asus ROG Flow X16 GV601RW-M5082W | |
| Corsair Voyager a1600 | |
| Average AMD Ryzen 9 6900HS (7530 - 8981, n=5) | |
| Lenovo Legion 7 16IAX7-82TD004SGE | |
| Acer Predator Triton 500 SE PT516-52s-70KX | |
| HP Omen 16-b1090ng | |
| AIDA64 / CPU PhotoWorxx | |
| Average of class Gaming (12271 - 89891, n=110, last 2 years) | |
| HP Omen 16-b1090ng | |
| Lenovo Legion 7 16IAX7-82TD004SGE | |
| Acer Predator Triton 500 SE PT516-52s-70KX | |
| Lenovo Legion 7 16ARHA7 | |
| Corsair Voyager a1600 | |
| Asus ROG Flow X16 GV601RW-M5082W | |
| Average AMD Ryzen 9 6900HS (25757 - 30291, n=5) | |
System performance
The benchmark results show good system performance, although a clear difference to the Intel-based notebooks is again noticeable. Subjectively, however, the Corsair Voyager a1600 offers very good system performance with no noticeable latencies in everyday use.
CrossMark: Overall | Productivity | Creativity | Responsiveness
| PCMark 10 / Score | |
| Lenovo Legion 7 16IAX7-82TD004SGE | |
| Average of class Gaming (5828 - 11574, n=96, last 2 years) | |
| Acer Predator Triton 500 SE PT516-52s-70KX | |
| Lenovo Legion 7 16ARHA7 | |
| HP Omen 16-b1090ng | |
| Corsair Voyager a1600 | |
| Average AMD Ryzen 9 6900HS, AMD Radeon RX 6800M (n=1) | |
| Asus ROG Flow X16 GV601RW-M5082W | |
| PCMark 10 / Essentials | |
| Lenovo Legion 7 16IAX7-82TD004SGE | |
| Acer Predator Triton 500 SE PT516-52s-70KX | |
| Average of class Gaming (8810 - 12600, n=100, last 2 years) | |
| Lenovo Legion 7 16ARHA7 | |
| HP Omen 16-b1090ng | |
| Corsair Voyager a1600 | |
| Average AMD Ryzen 9 6900HS, AMD Radeon RX 6800M (n=1) | |
| Asus ROG Flow X16 GV601RW-M5082W | |
| PCMark 10 / Productivity | |
| Lenovo Legion 7 16IAX7-82TD004SGE | |
| Average of class Gaming (6845 - 18766, n=98, last 2 years) | |
| Asus ROG Flow X16 GV601RW-M5082W | |
| Acer Predator Triton 500 SE PT516-52s-70KX | |
| HP Omen 16-b1090ng | |
| Lenovo Legion 7 16ARHA7 | |
| Corsair Voyager a1600 | |
| Average AMD Ryzen 9 6900HS, AMD Radeon RX 6800M (n=1) | |
| PCMark 10 / Digital Content Creation | |
| Lenovo Legion 7 16IAX7-82TD004SGE | |
| Average of class Gaming (7602 - 19657, n=98, last 2 years) | |
| Lenovo Legion 7 16ARHA7 | |
| Corsair Voyager a1600 | |
| Average AMD Ryzen 9 6900HS, AMD Radeon RX 6800M (n=1) | |
| Acer Predator Triton 500 SE PT516-52s-70KX | |
| HP Omen 16-b1090ng | |
| Asus ROG Flow X16 GV601RW-M5082W | |
| CrossMark / Overall | |
| Lenovo Legion 7 16IAX7-82TD004SGE | |
| Average of class Gaming (1366 - 2409, n=98, last 2 years) | |
| Acer Predator Triton 500 SE PT516-52s-70KX | |
| Asus ROG Flow X16 GV601RW-M5082W | |
| Lenovo Legion 7 16ARHA7 | |
| Corsair Voyager a1600 | |
| Average AMD Ryzen 9 6900HS, AMD Radeon RX 6800M (n=1) | |
| CrossMark / Productivity | |
| Lenovo Legion 7 16IAX7-82TD004SGE | |
| Average of class Gaming (1386 - 2254, n=98, last 2 years) | |
| Acer Predator Triton 500 SE PT516-52s-70KX | |
| Asus ROG Flow X16 GV601RW-M5082W | |
| Lenovo Legion 7 16ARHA7 | |
| Corsair Voyager a1600 | |
| Average AMD Ryzen 9 6900HS, AMD Radeon RX 6800M (n=1) | |
| CrossMark / Creativity | |
| Lenovo Legion 7 16IAX7-82TD004SGE | |
| Average of class Gaming (1343 - 2729, n=98, last 2 years) | |
| Acer Predator Triton 500 SE PT516-52s-70KX | |
| Asus ROG Flow X16 GV601RW-M5082W | |
| Lenovo Legion 7 16ARHA7 | |
| Corsair Voyager a1600 | |
| Average AMD Ryzen 9 6900HS, AMD Radeon RX 6800M (n=1) | |
| CrossMark / Responsiveness | |
| Lenovo Legion 7 16IAX7-82TD004SGE | |
| Acer Predator Triton 500 SE PT516-52s-70KX | |
| Average of class Gaming (1226 - 2334, n=98, last 2 years) | |
| Asus ROG Flow X16 GV601RW-M5082W | |
| Lenovo Legion 7 16ARHA7 | |
| Corsair Voyager a1600 | |
| Average AMD Ryzen 9 6900HS, AMD Radeon RX 6800M (n=1) | |
| PCMark 10 Score | 7208 points | |
Help | ||
| AIDA64 / Memory Copy | |
| Average of class Gaming (21750 - 129946, n=110, last 2 years) | |
| Lenovo Legion 7 16IAX7-82TD004SGE | |
| HP Omen 16-b1090ng | |
| Acer Predator Triton 500 SE PT516-52s-70KX | |
| Lenovo Legion 7 16ARHA7 | |
| Average AMD Ryzen 9 6900HS (49150 - 51517, n=5) | |
| Corsair Voyager a1600 | |
| Asus ROG Flow X16 GV601RW-M5082W | |
| AIDA64 / Memory Read | |
| Average of class Gaming (22956 - 118858, n=110, last 2 years) | |
| Lenovo Legion 7 16IAX7-82TD004SGE | |
| Acer Predator Triton 500 SE PT516-52s-70KX | |
| HP Omen 16-b1090ng | |
| Lenovo Legion 7 16ARHA7 | |
| Corsair Voyager a1600 | |
| Asus ROG Flow X16 GV601RW-M5082W | |
| Average AMD Ryzen 9 6900HS (43646 - 51838, n=5) | |
| AIDA64 / Memory Write | |
| Average of class Gaming (22297 - 135096, n=110, last 2 years) | |
| HP Omen 16-b1090ng | |
| Lenovo Legion 7 16IAX7-82TD004SGE | |
| Lenovo Legion 7 16ARHA7 | |
| Corsair Voyager a1600 | |
| Asus ROG Flow X16 GV601RW-M5082W | |
| Acer Predator Triton 500 SE PT516-52s-70KX | |
| Average AMD Ryzen 9 6900HS (15975 - 55235, n=5) | |
| AIDA64 / Memory Latency | |
| Acer Predator Triton 500 SE PT516-52s-70KX | |
| Average of class Gaming (75.3 - 259, n=110, last 2 years) | |
| Corsair Voyager a1600 | |
| Asus ROG Flow X16 GV601RW-M5082W | |
| Average AMD Ryzen 9 6900HS (79.2 - 110.9, n=5) | |
| HP Omen 16-b1090ng | |
| Lenovo Legion 7 16IAX7-82TD004SGE | |
| Lenovo Legion 7 16ARHA7 | |
* ... smaller is better
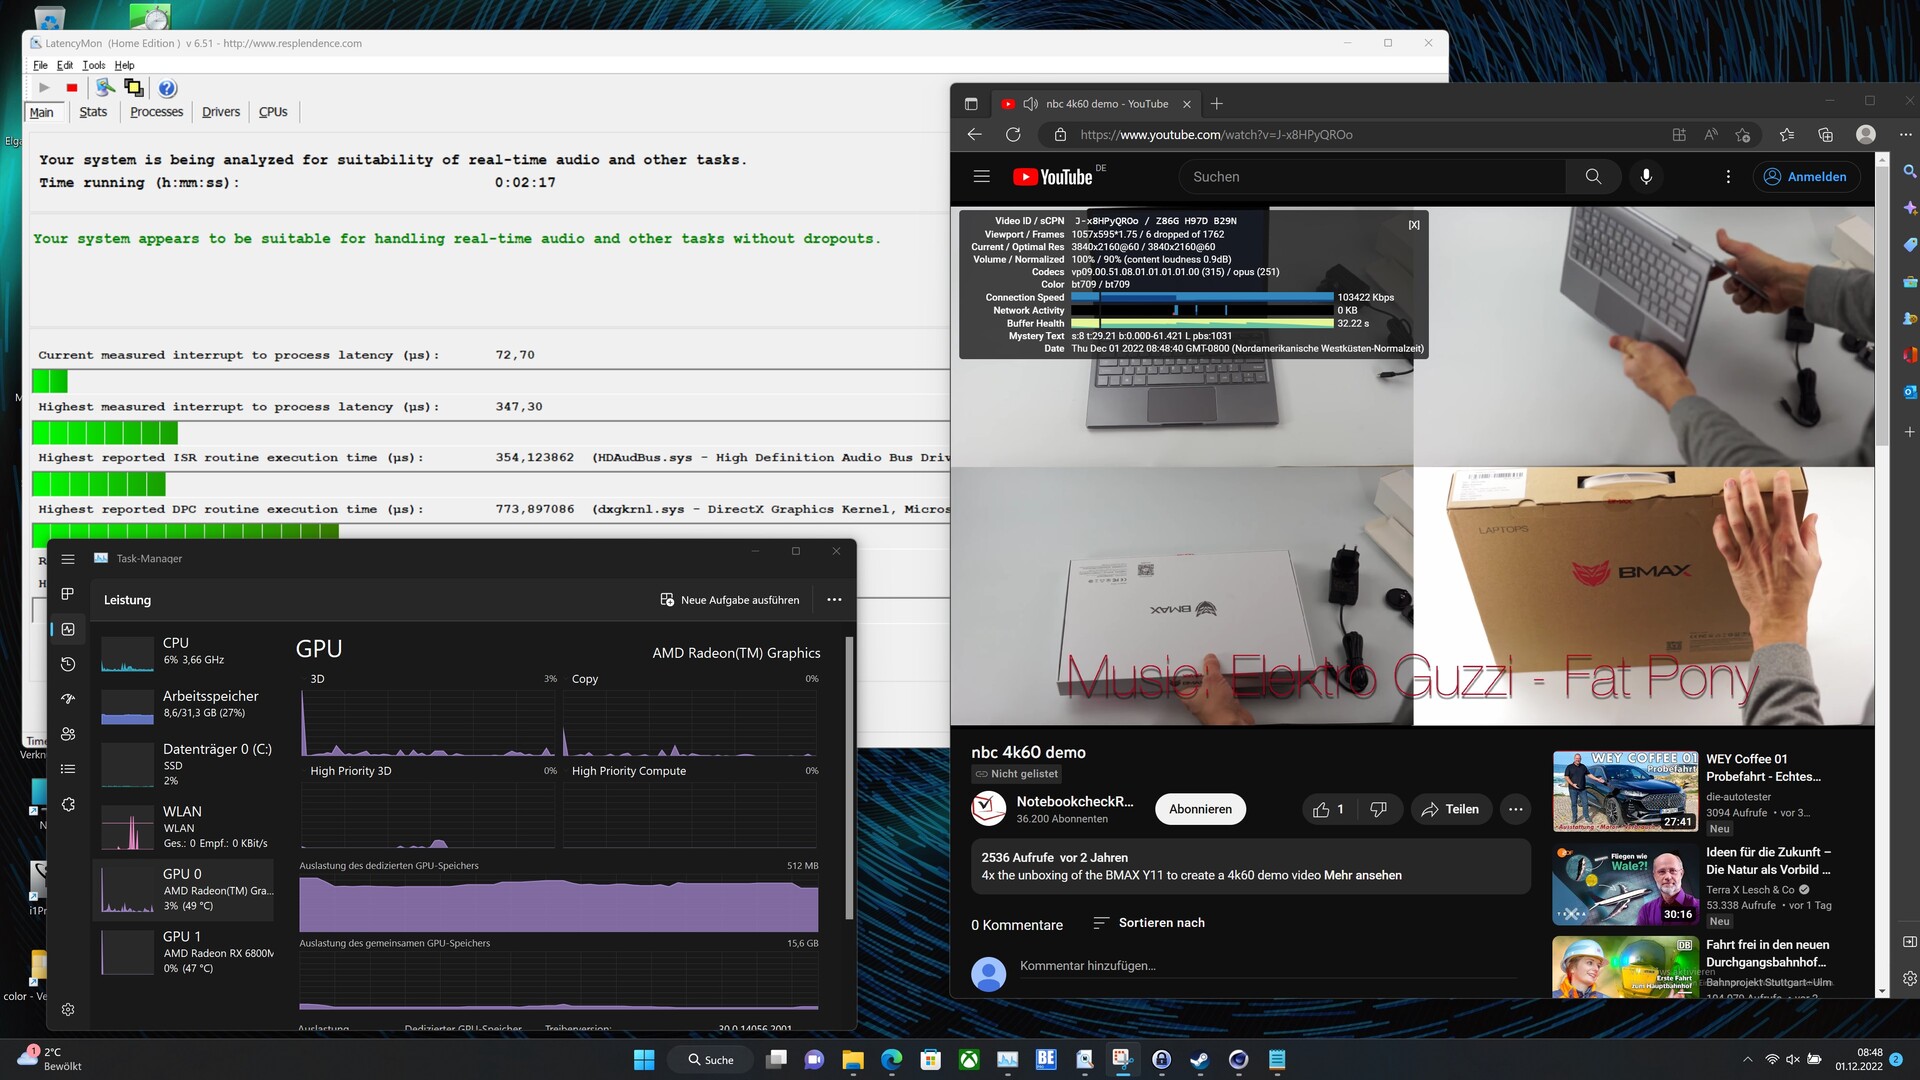
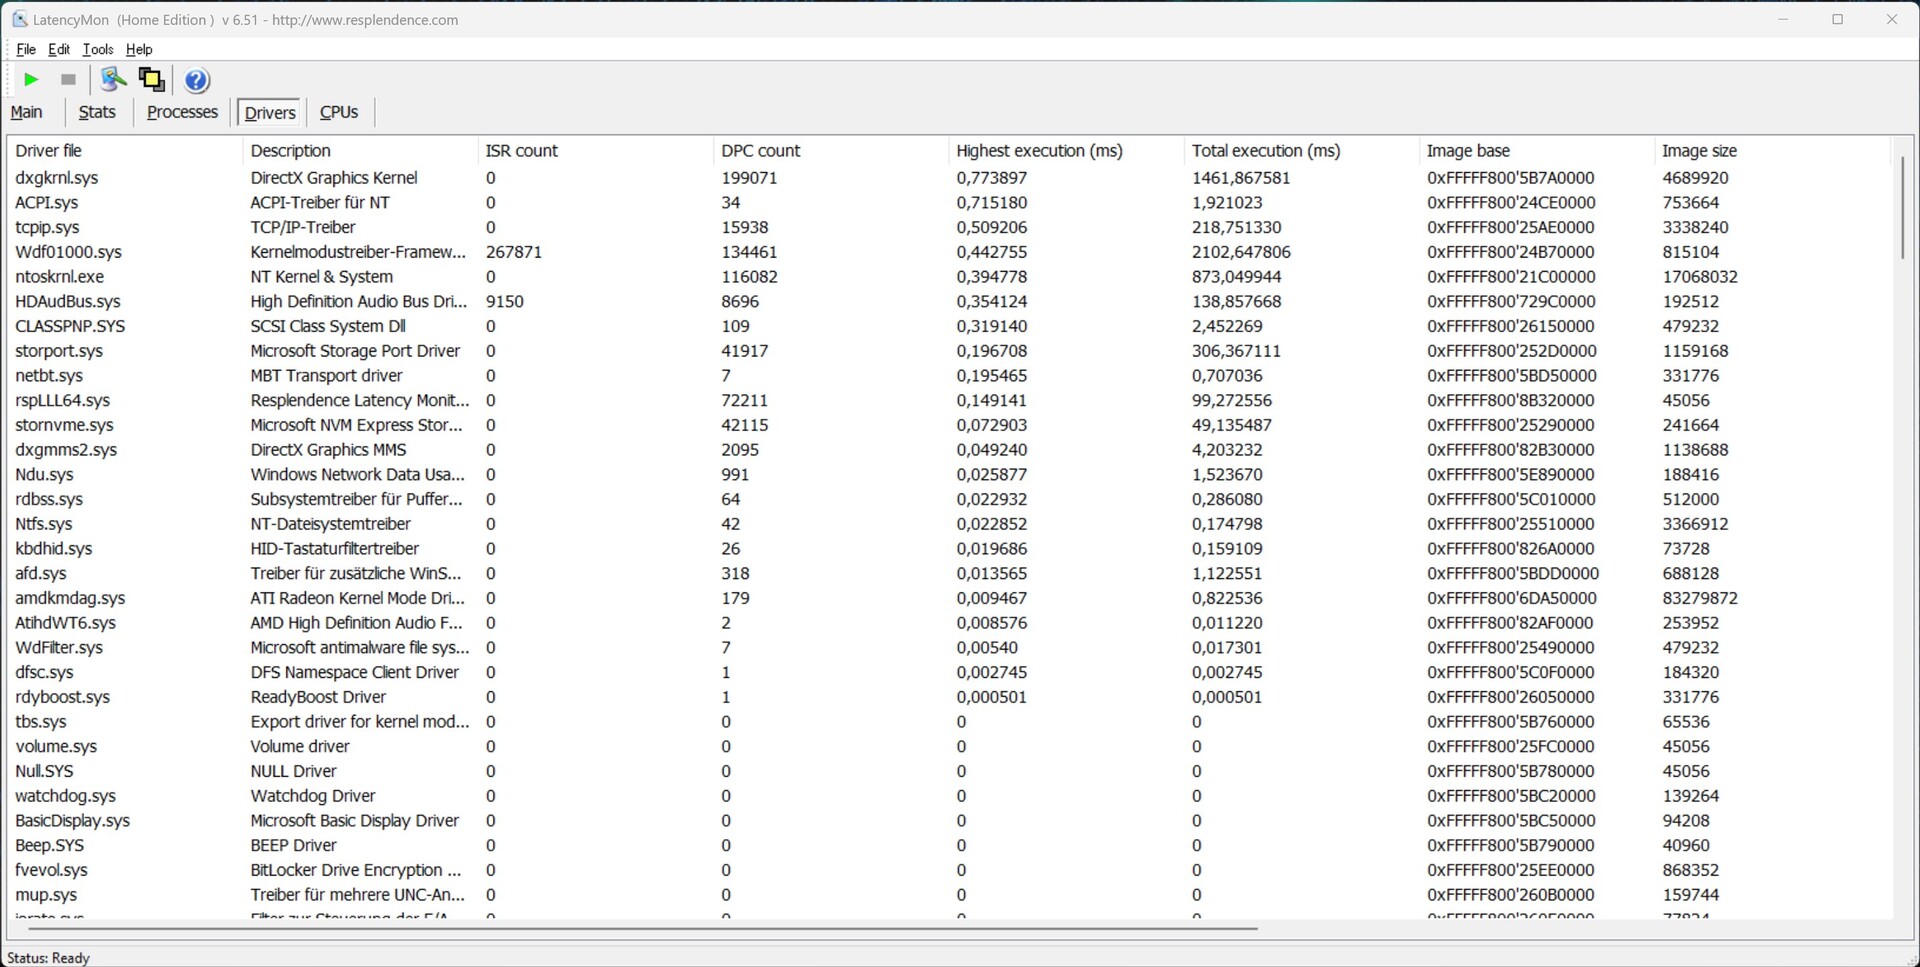
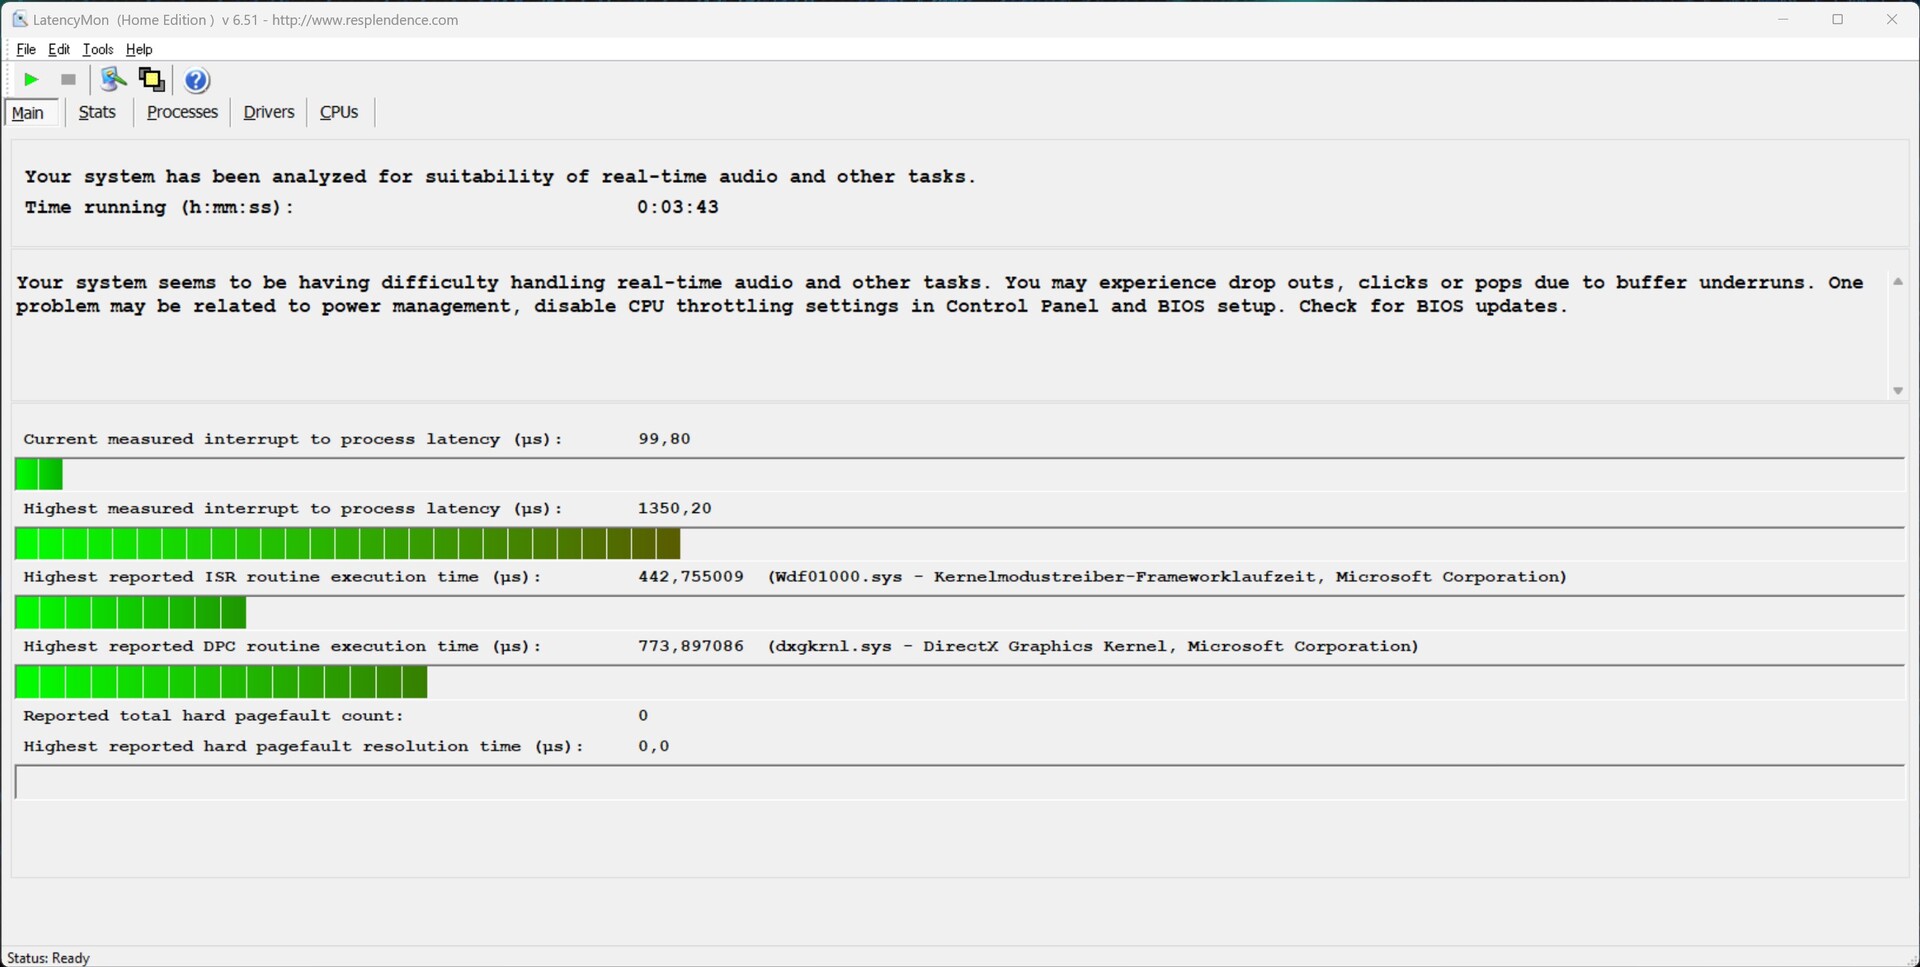
DPC latencies
The documented latencies are not increased when opening multiple browser tabs in Edge. The Voyager a1600 also masters the playback of the 4K YouTube video without problems. We only see slightly increased latencies after starting Prime95.
| DPC Latencies / LatencyMon - interrupt to process latency (max), Web, Youtube, Prime95 | |
| Acer Predator Triton 500 SE PT516-52s-70KX | |
| Lenovo Legion 7 16ARHA7 | |
| Asus ROG Flow X16 GV601RW-M5082W | |
| Lenovo Legion 7 16IAX7-82TD004SGE | |
| Corsair Voyager a1600 | |
| HP Omen 16-b1090ng | |
* ... smaller is better
Mass storage
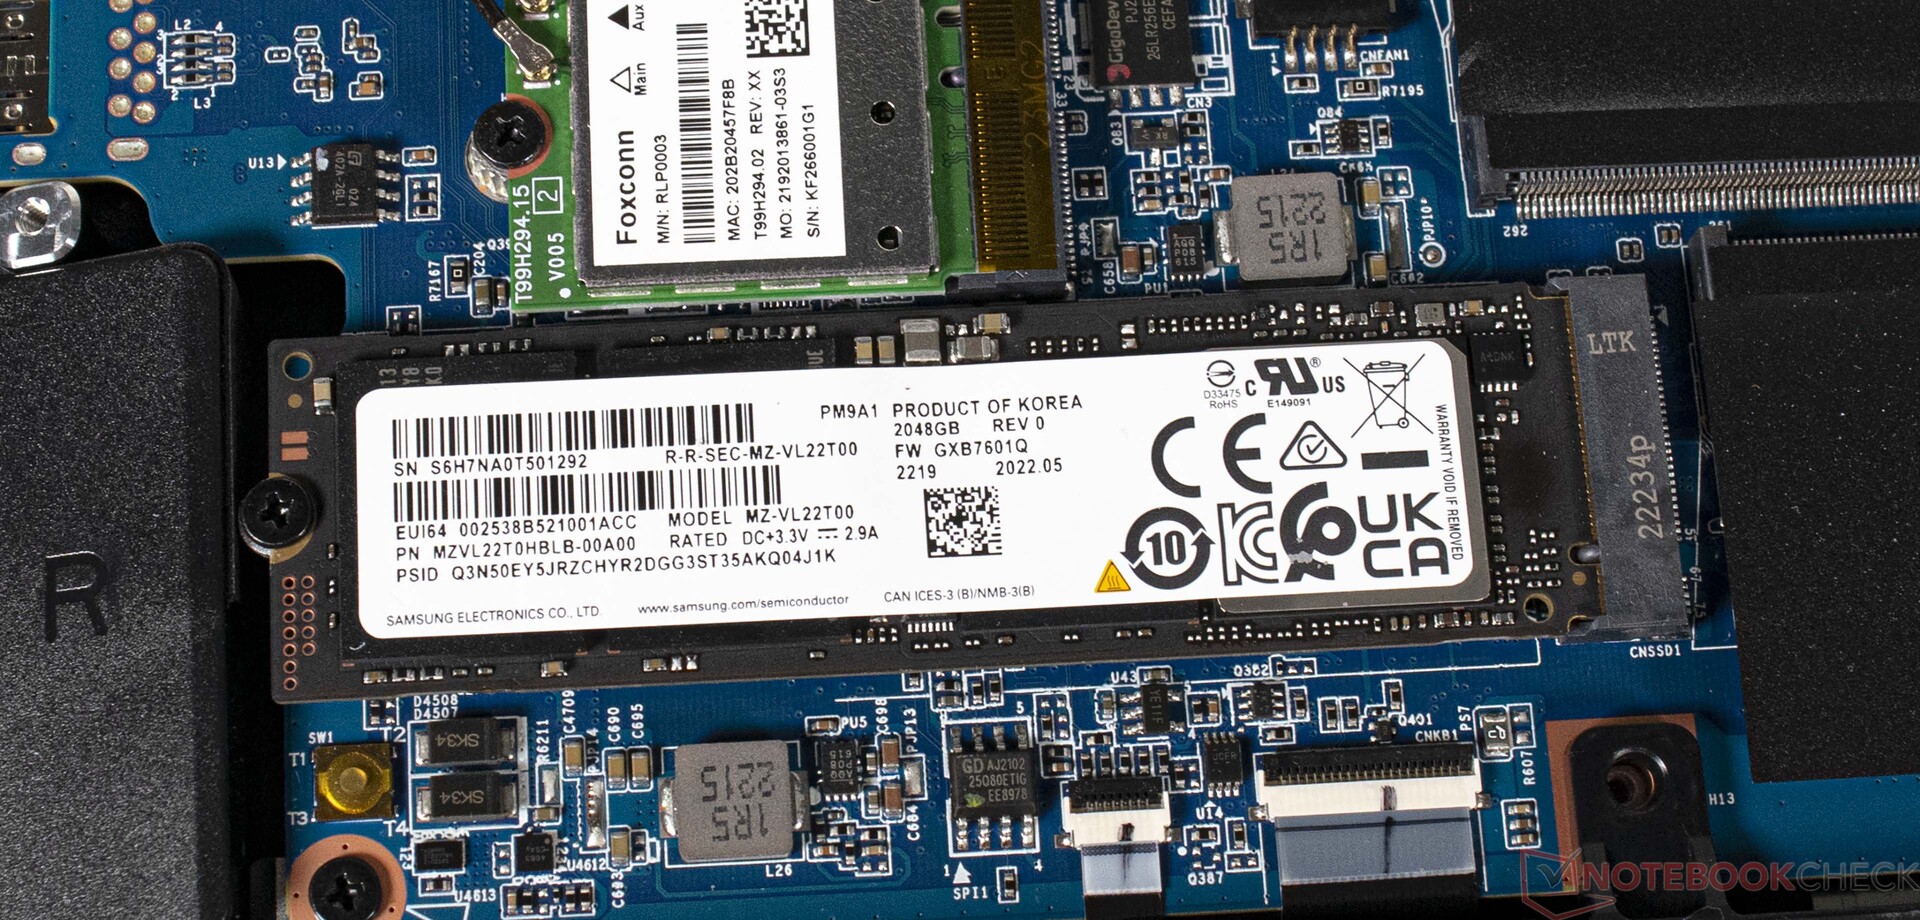
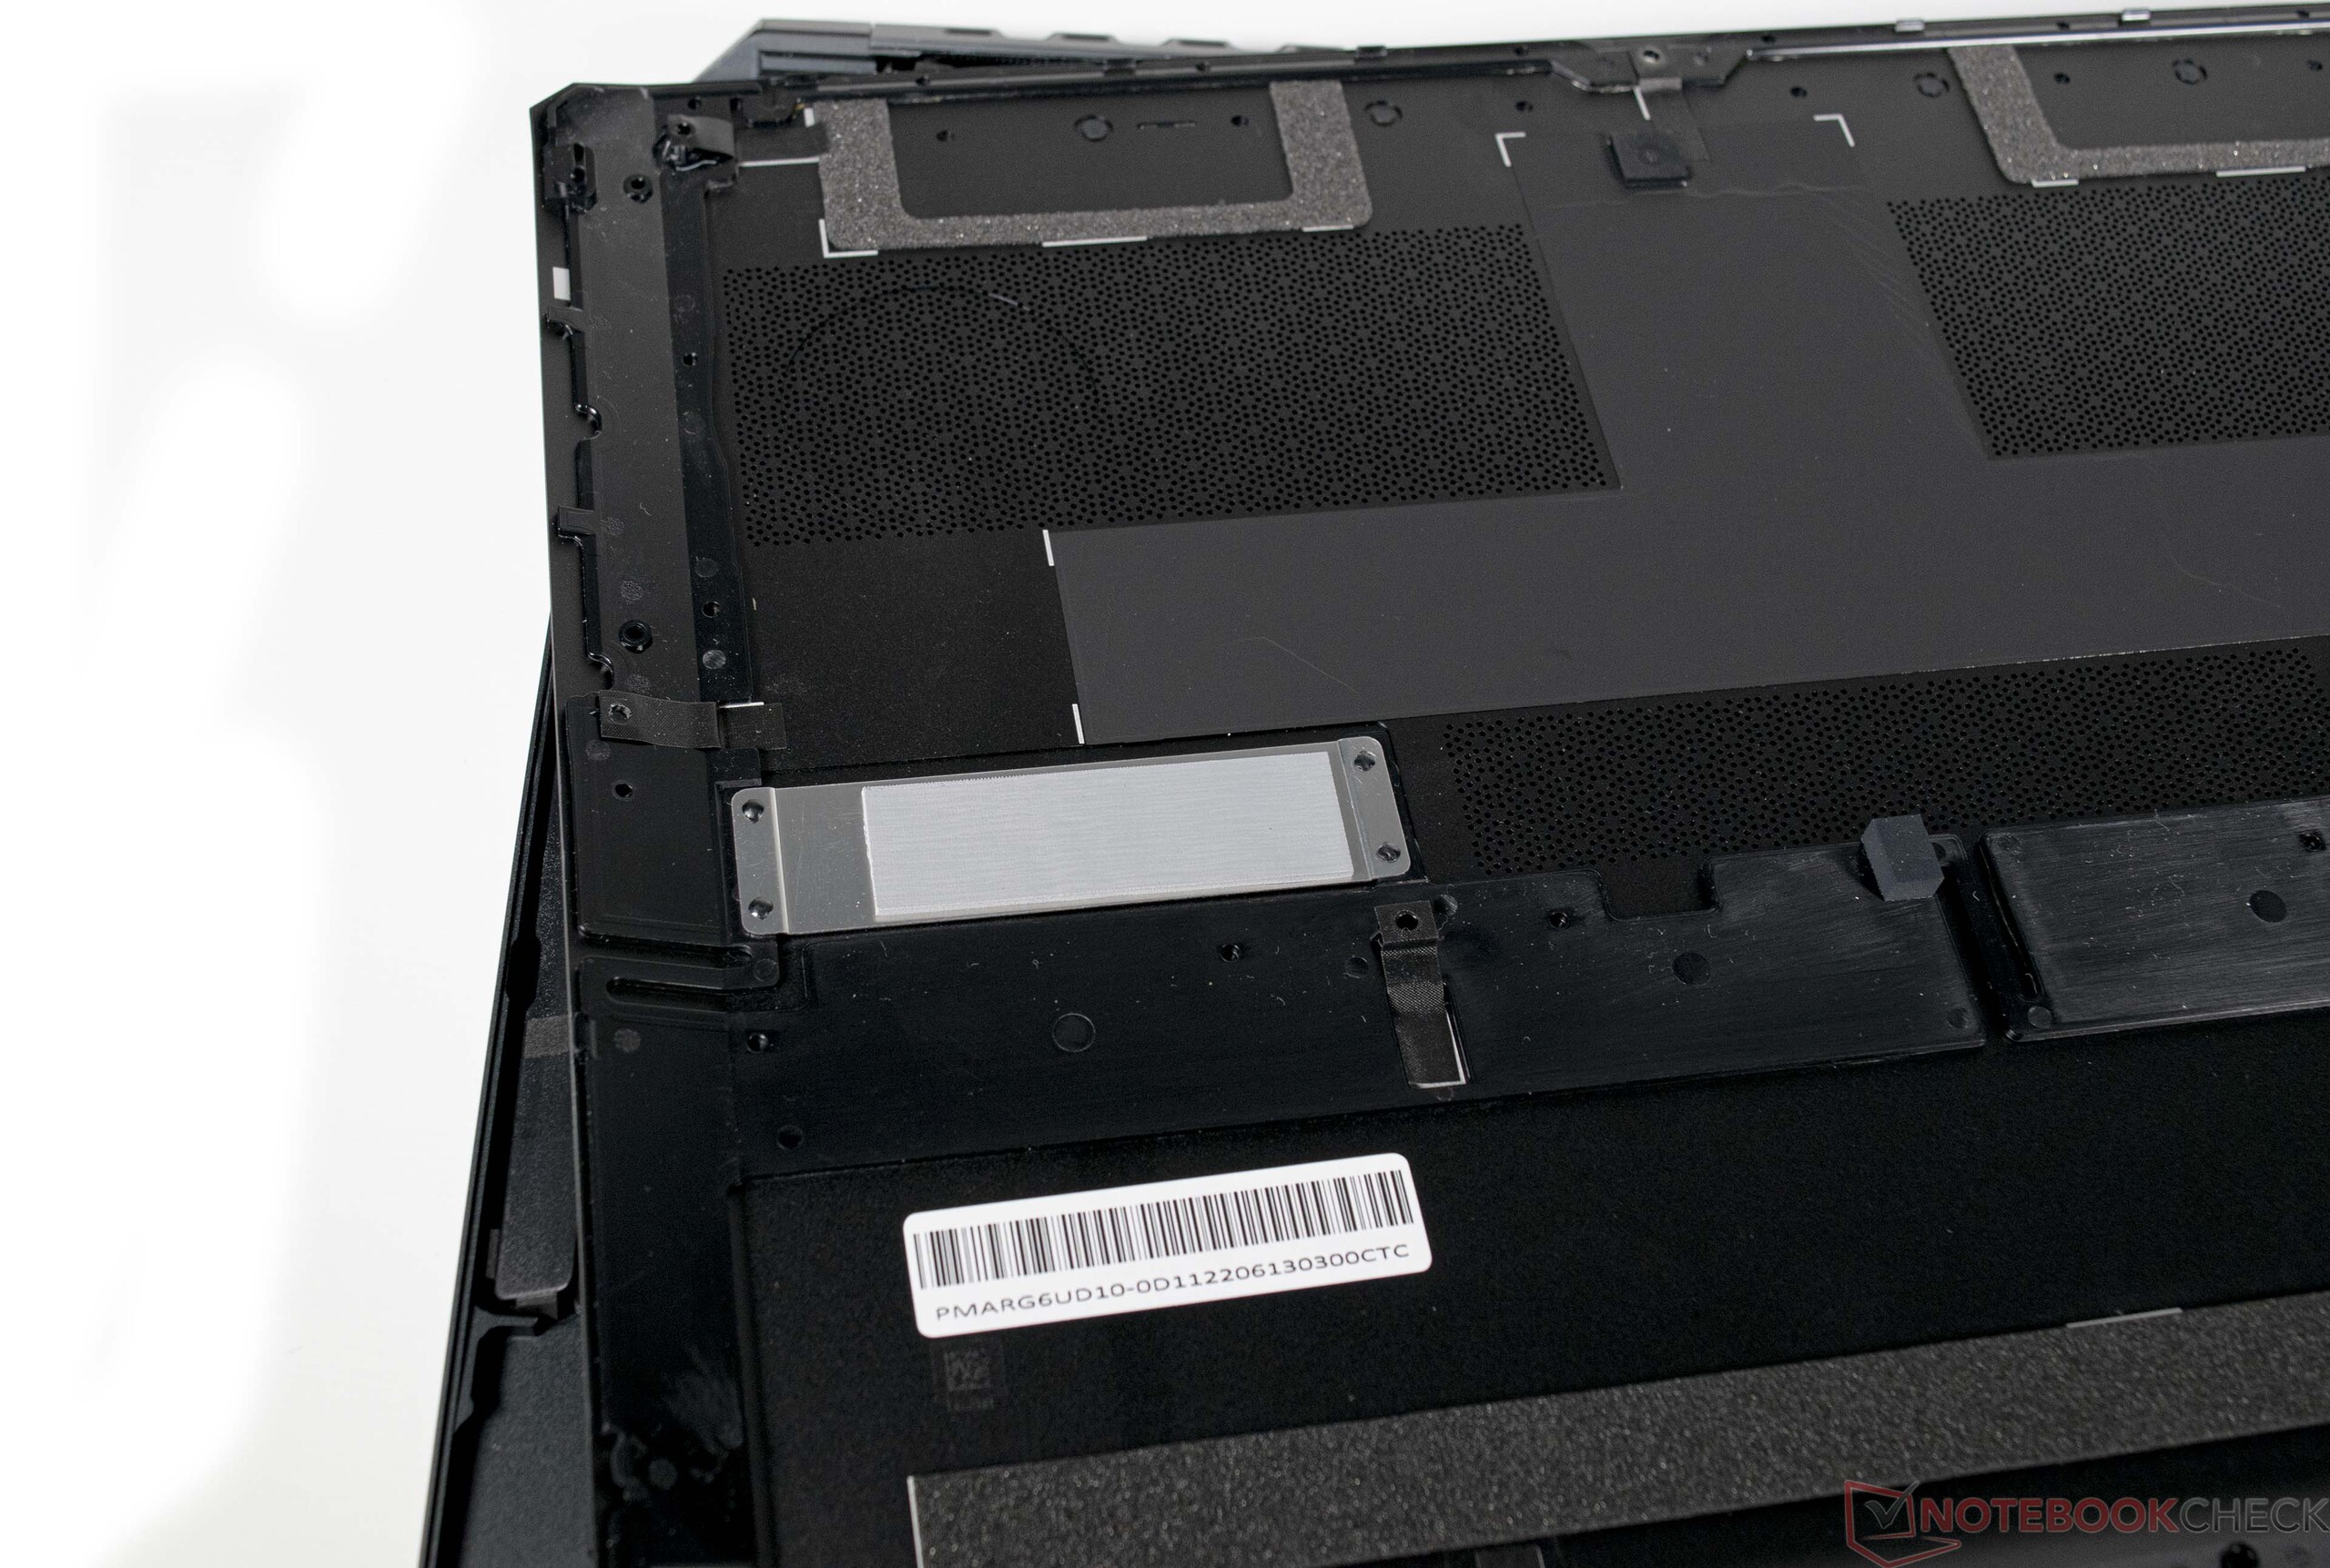
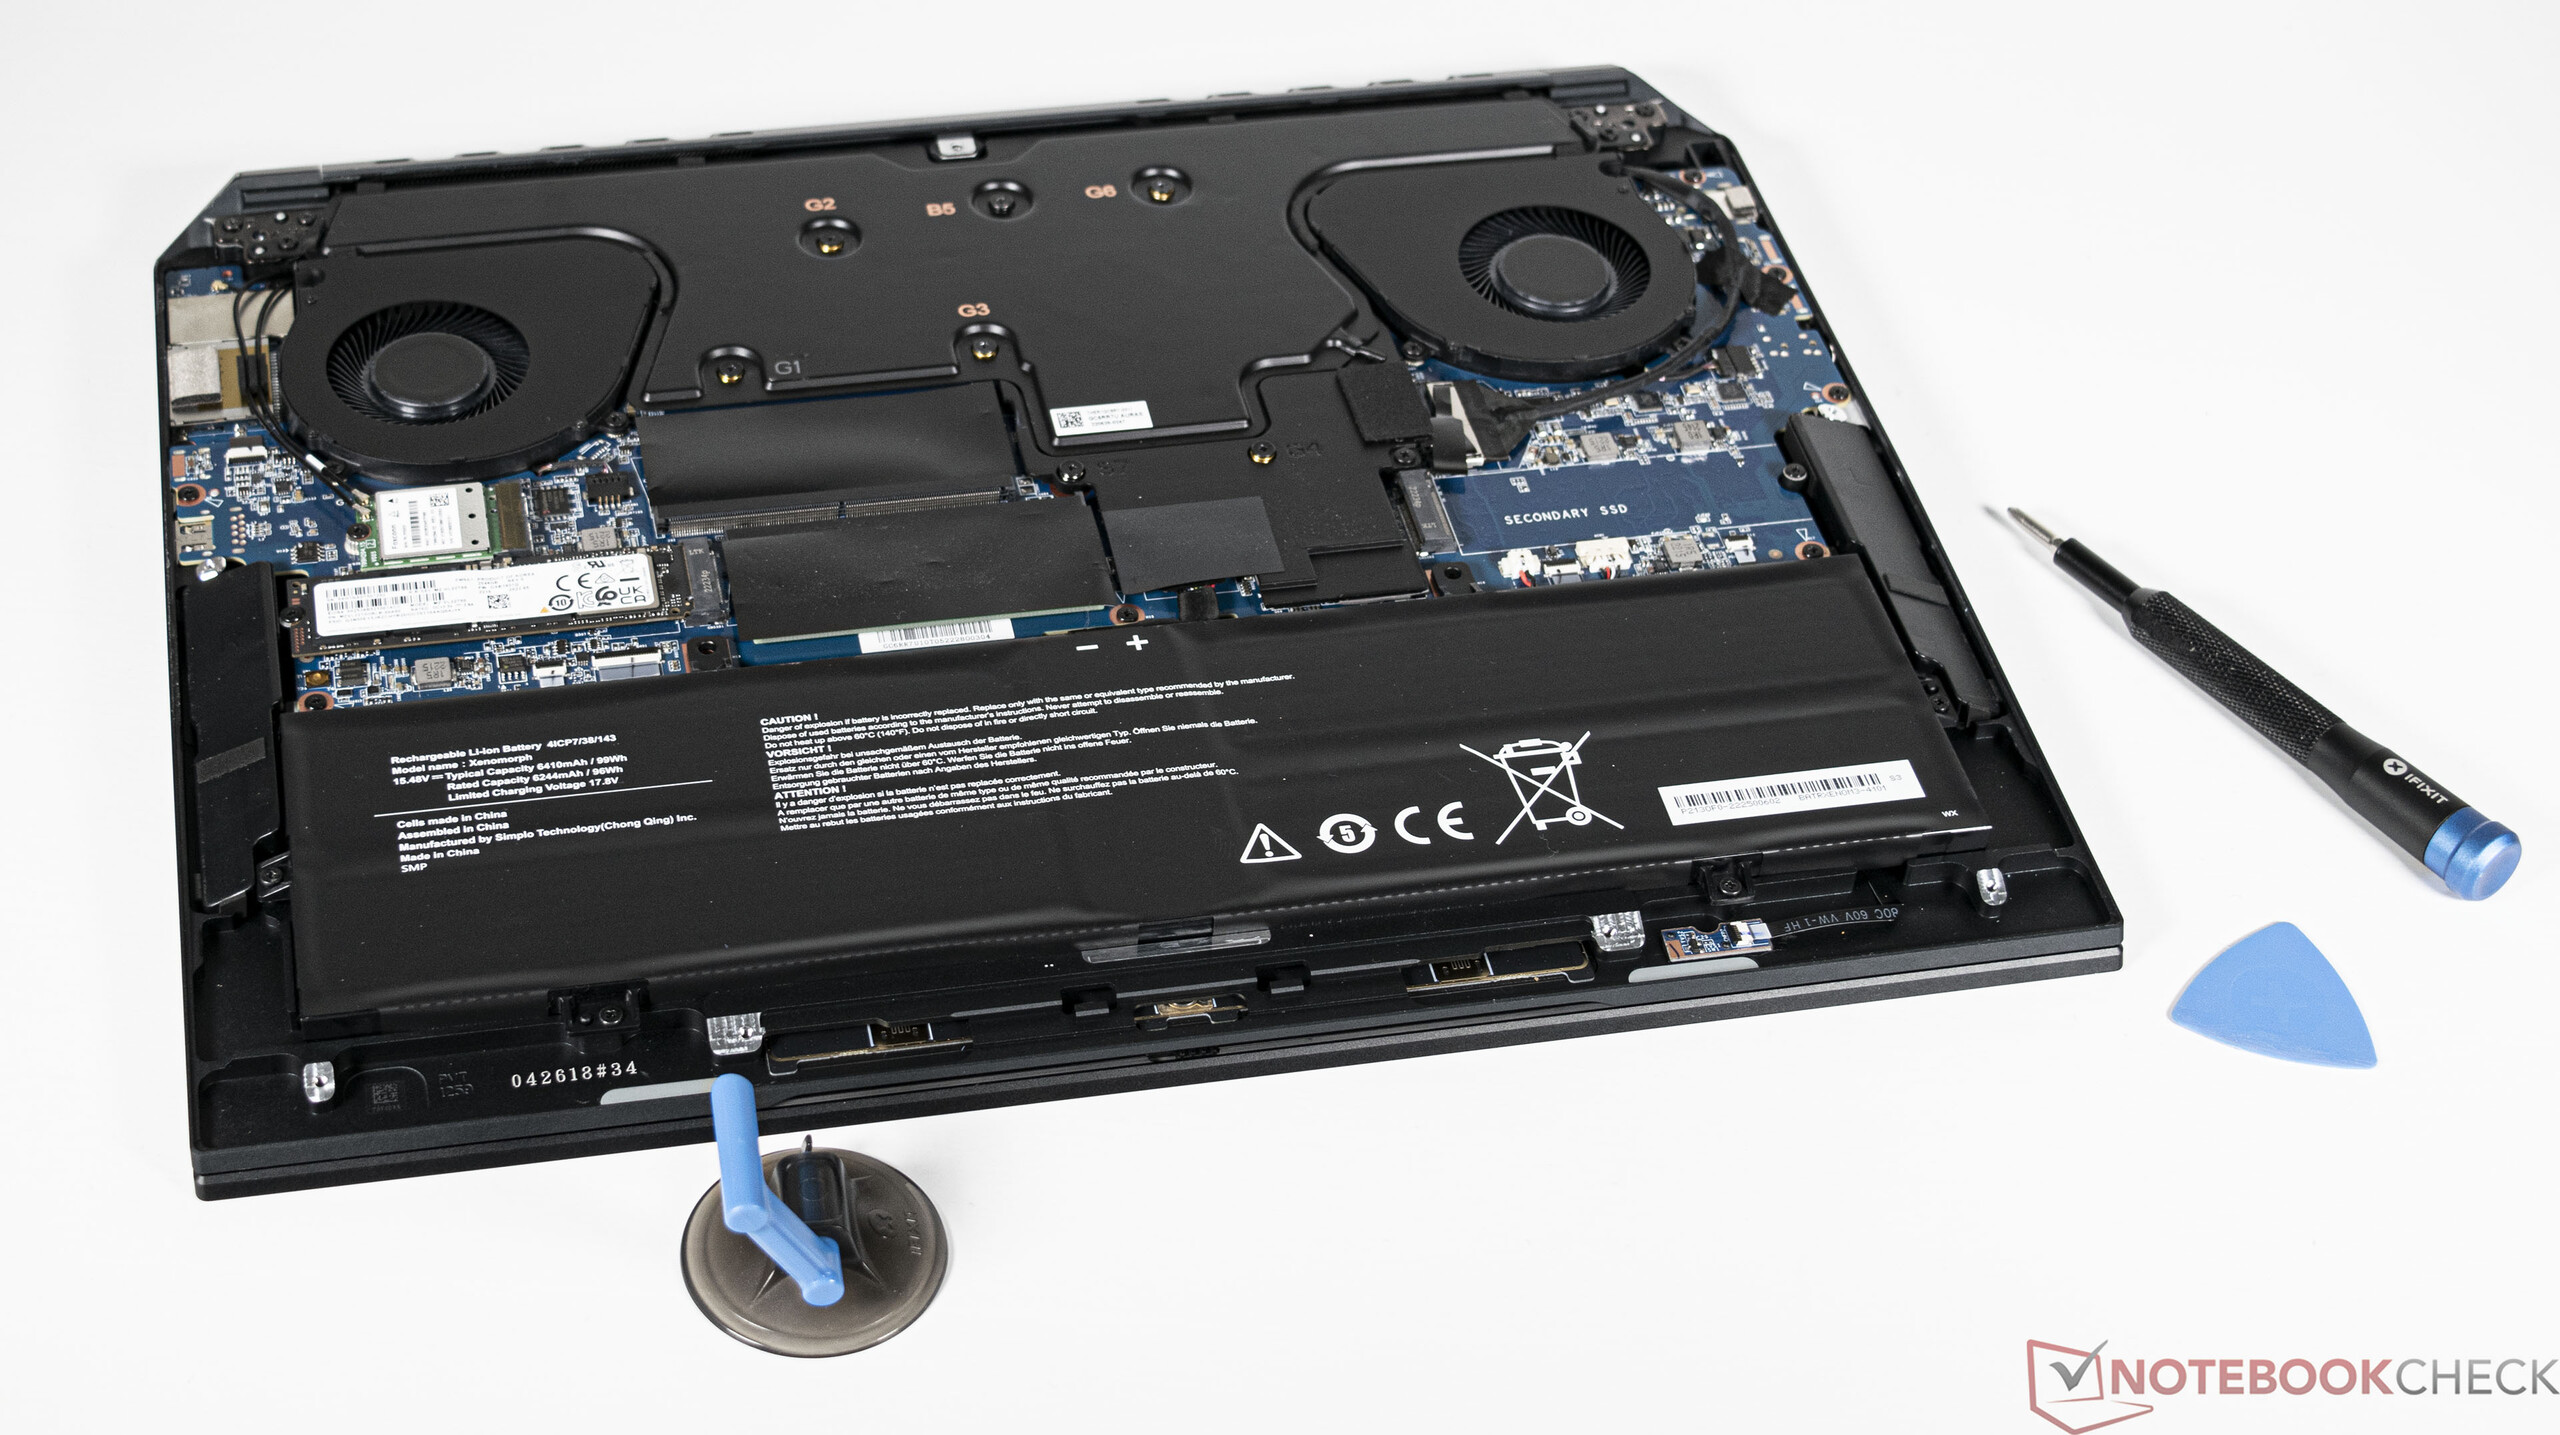
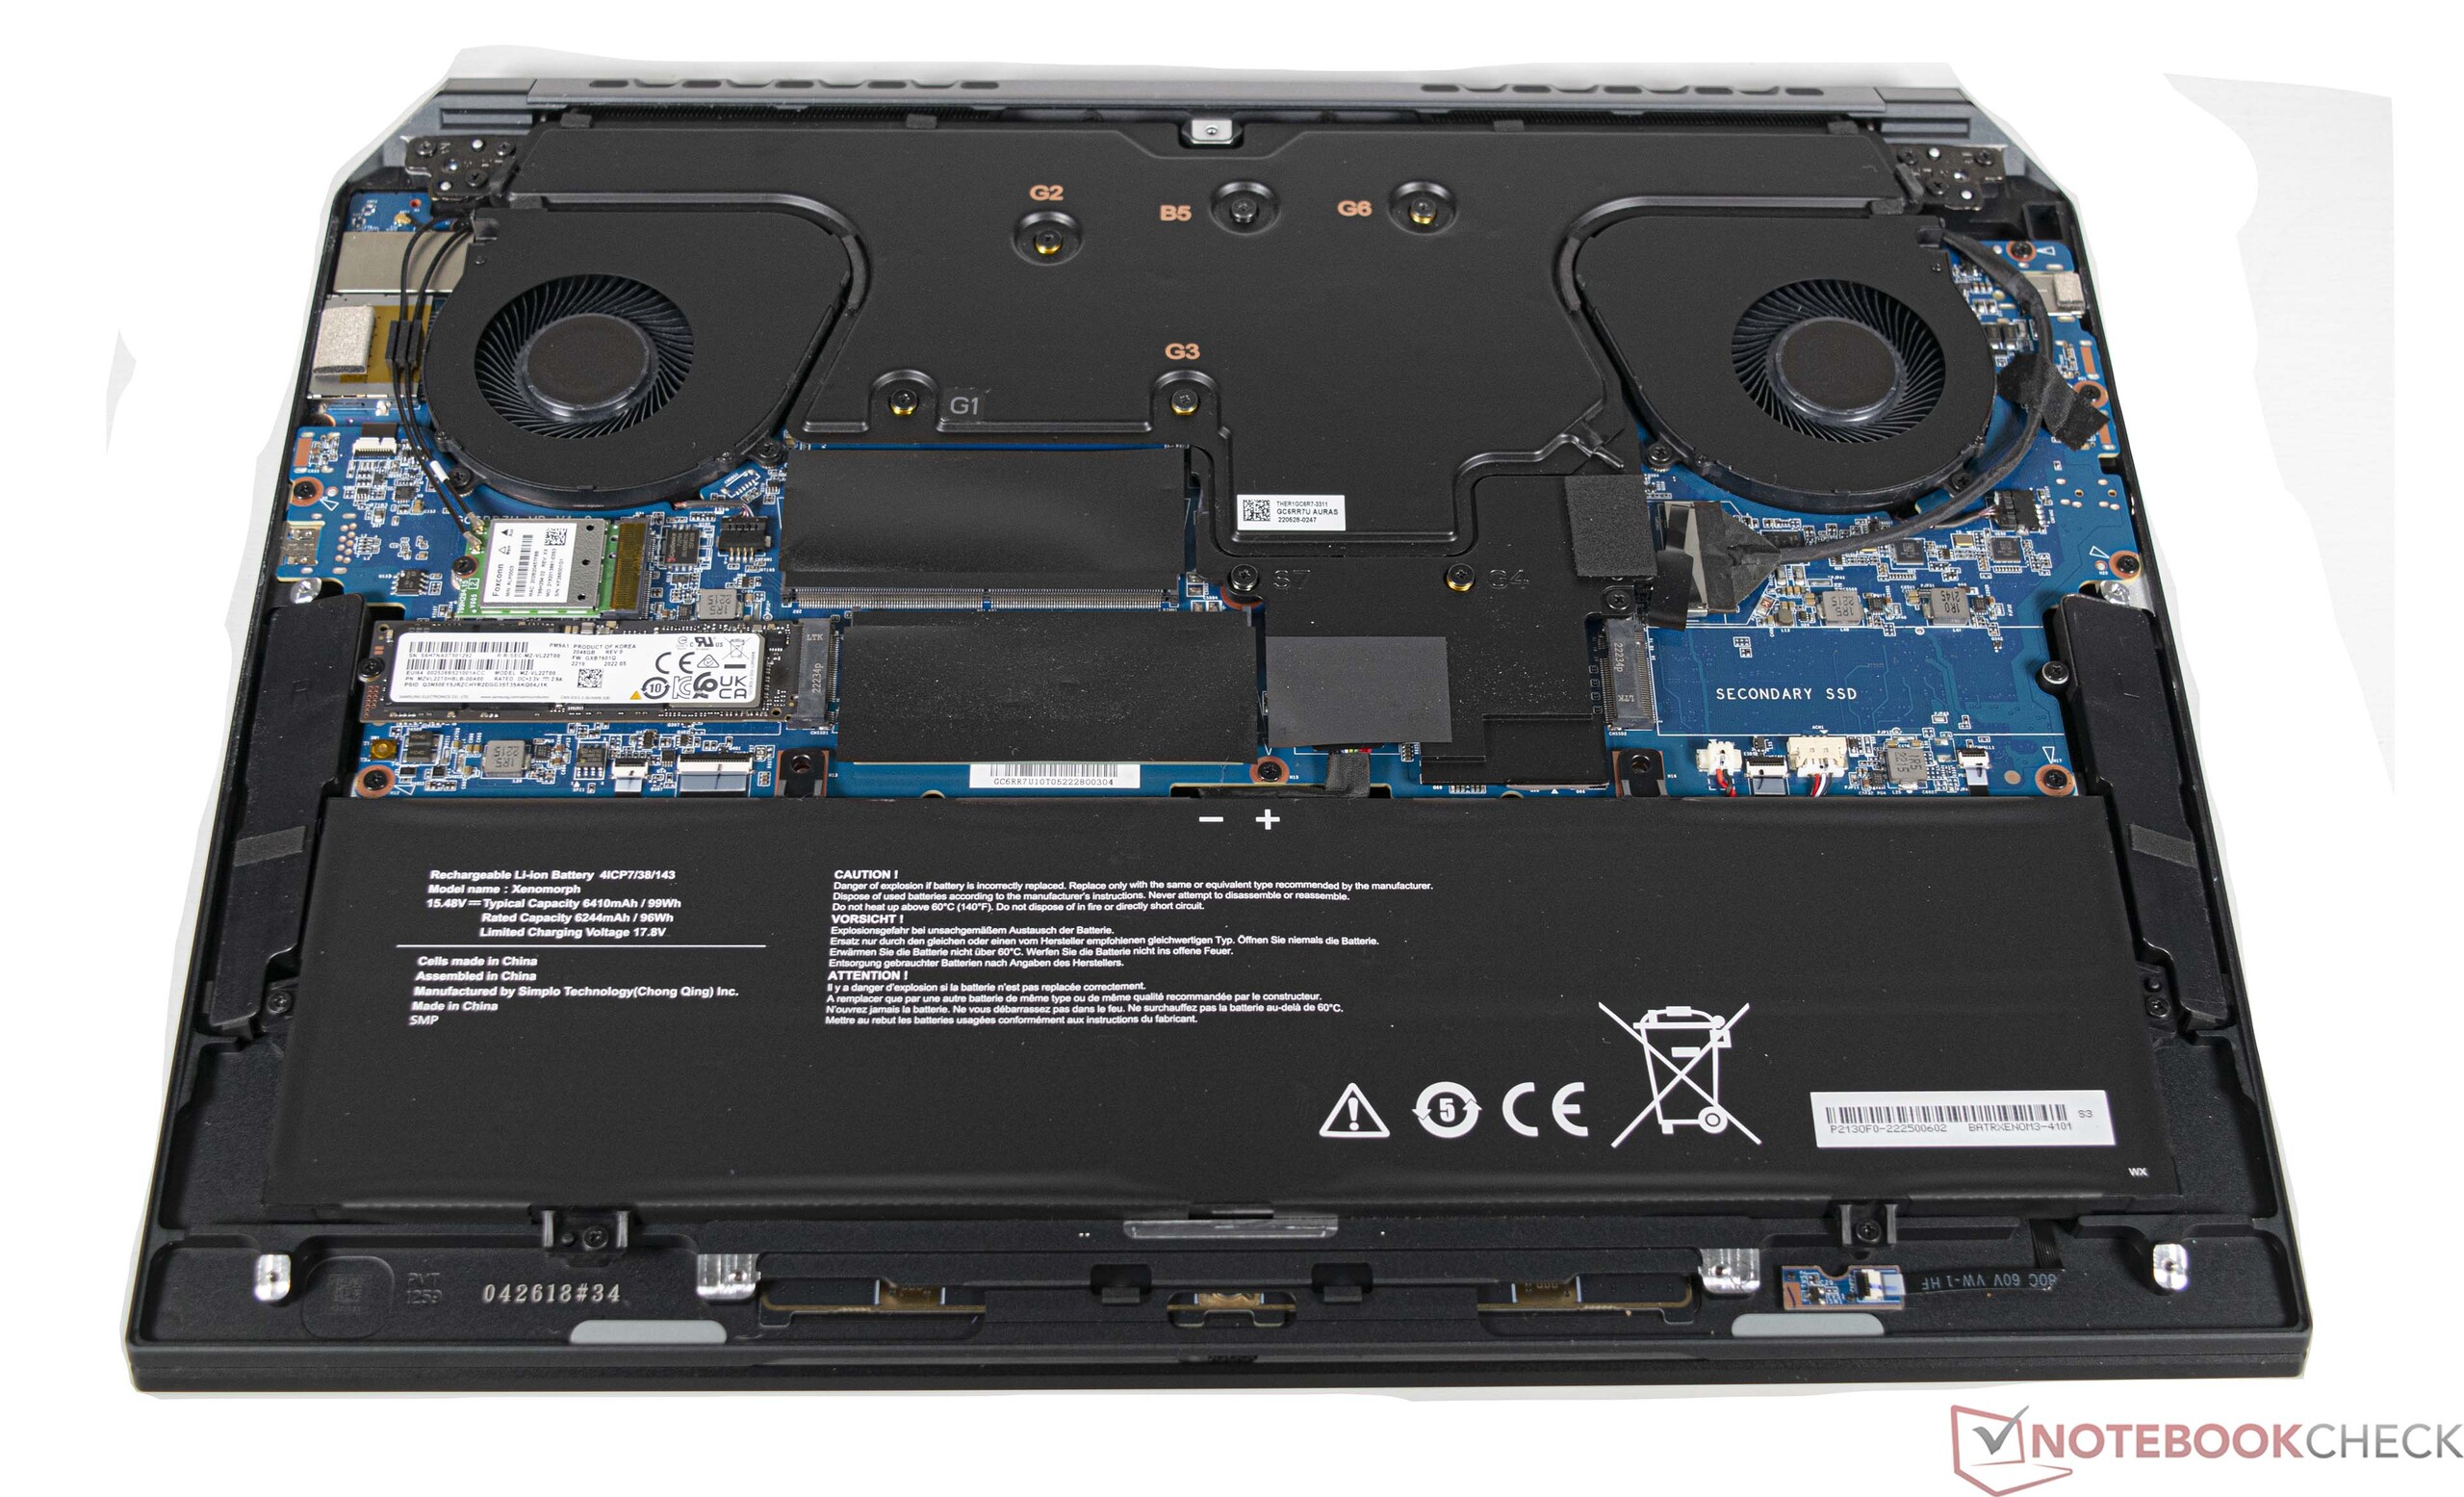
With a 2 TB SSD, the Corsair Voyager a1600 offers a lot of storage space, which is definitely needed due to its intended use. The installed model cannot keep up with the competition in the benchmarks. Nevertheless, the transfer rates are more than sufficient for most users. In the load test, the SSD's performance is consistently available without restrictions. By the way, the base plate of the notebook serves for heat dissipation. A total of two mass storage devices in M.2-2280 format can be installed.
For further comparisons and benchmarks, refer to our SSD/HDD comparison chart.

* ... smaller is better
Continuous Read: DiskSpd Read Loop, Queue Depth 8
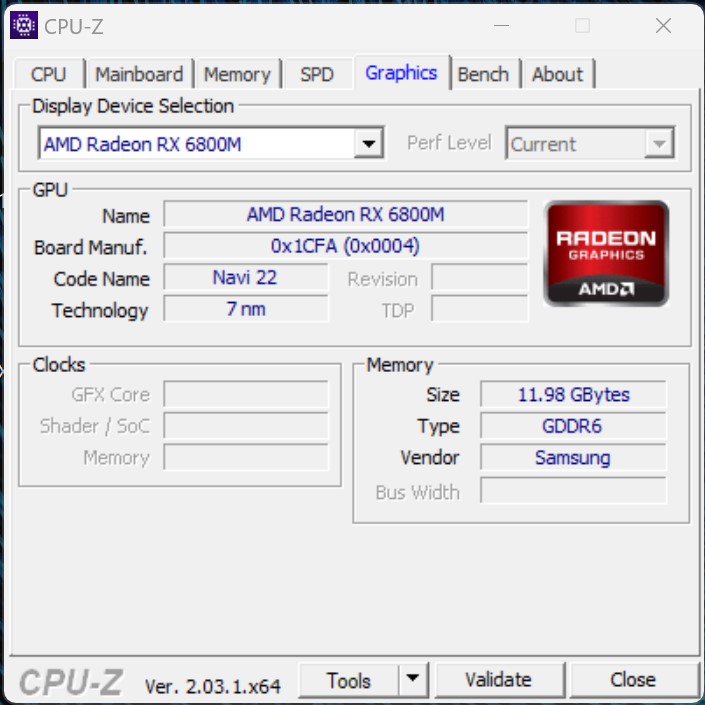
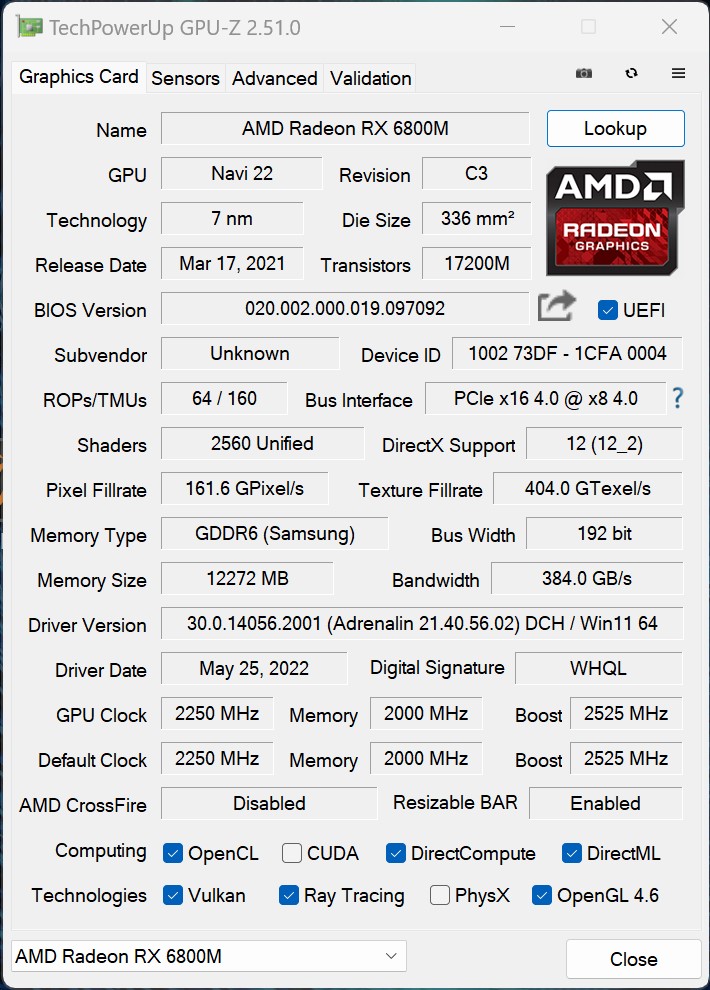
Graphics card
The AMD Radeon RX 6800M is a fast dedicated graphics card equipped with 12 GB VRAM. AMD's current 6000 series for notebooks also offers separate RT cores for ray tracing calculations thanks to RDNA2. In the test, the Corsair Voyager a1600 can come up with a good 3D performance. The gap to the competitors with GeForce RTX 3080 Ti graphics chip is partly small. Basically, the Corsair Voyager a1600 provides enough performance, which is currently sufficient to bring many modern games smoothly to the screen. The CPU always gets the optimal performance from the GPU via AMD's Smart Shift technology.
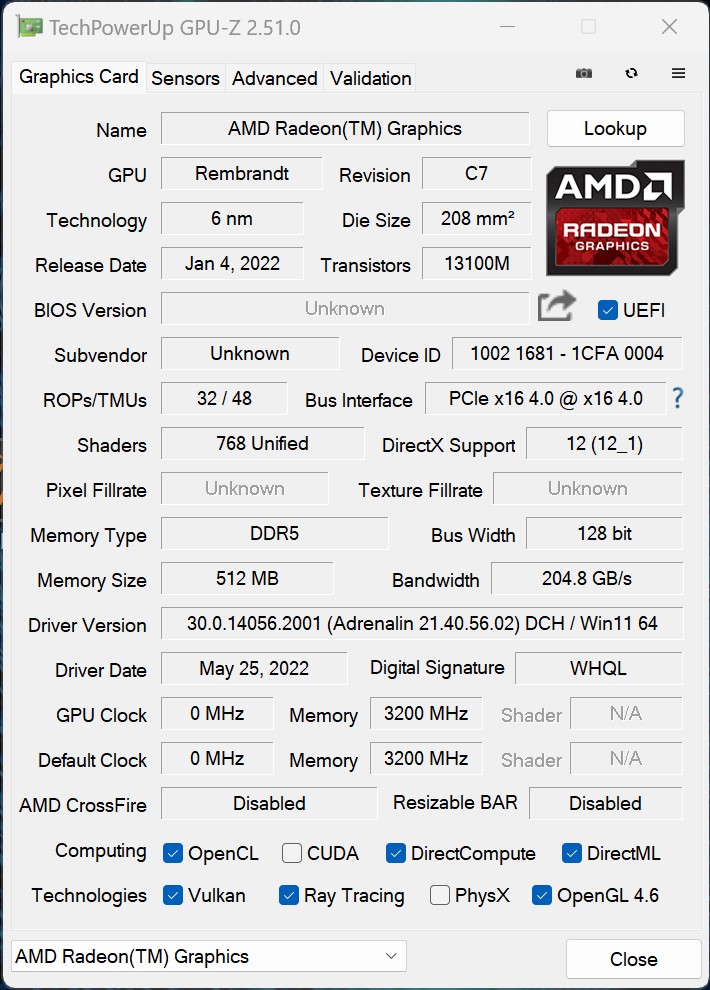
In 2D mode, the iGPU of the AMD Ryzen 9 6900HS do the work and thus saves energy.
For more comparisons and benchmarks, please refer to our GPU comparison chart.
| 3DMark 05 Standard | 57639 points | |
| 3DMark 06 Standard Score | 46732 points | |
| 3DMark Vantage P Result | 77244 points | |
| 3DMark 11 Performance | 30013 points | |
| 3DMark Ice Storm Standard Score | 209564 points | |
| 3DMark Cloud Gate Standard Score | 59585 points | |
| 3DMark Fire Strike Score | 25639 points | |
| 3DMark Fire Strike Extreme Score | 13599 points | |
| 3DMark Time Spy Score | 10391 points | |
Help | ||
* ... smaller is better
| The Witcher 3 | |
| 1920x1080 High Graphics & Postprocessing (Nvidia HairWorks Off) | |
| Average of class Gaming (181 - 341, n=3, last 2 years) | |
| Lenovo Legion 7 16IAX7-82TD004SGE | |
| Lenovo Legion 7 16ARHA7 | |
| Asus ROG Flow X16 GV601RW-M5082W | |
| Average AMD Radeon RX 6800M (177.8 - 199, n=2) | |
| HP Omen 16-b1090ng | |
| Acer Predator Triton 500 SE PT516-52s-70KX | |
| Corsair Voyager a1600 | |
| 1920x1080 Ultra Graphics & Postprocessing (HBAO+) | |
| Average of class Gaming (95 - 240, n=8, last 2 years) | |
| Lenovo Legion 7 16ARHA7 | |
| Lenovo Legion 7 16IAX7-82TD004SGE | |
| Average AMD Radeon RX 6800M (108 - 110, n=2) | |
| Corsair Voyager a1600 | |
| Acer Predator Triton 500 SE PT516-52s-70KX | |
| Asus ROG Flow X16 GV601RW-M5082W | |
| HP Omen 16-b1090ng | |
| F1 2021 | |
| 1920x1080 High Preset AA:T AF:16x | |
| Lenovo Legion 7 16ARHA7 | |
| Acer Predator Triton 500 SE PT516-52s-70KX | |
| Corsair Voyager a1600 | |
| Average AMD Radeon RX 6800M (187 - 231, n=2) | |
| Lenovo Legion 7 16IAX7-82TD004SGE | |
| 1920x1080 Ultra High Preset + Raytracing AA:T AF:16x | |
| Lenovo Legion 7 16ARHA7 | |
| Corsair Voyager a1600 | |
| Acer Predator Triton 500 SE PT516-52s-70KX | |
| Average AMD Radeon RX 6800M (114 - 124.1, n=2) | |
| Lenovo Legion 7 16IAX7-82TD004SGE | |
Witcher 3 FPS diagram
| low | med. | high | ultra | QHD | 4K | |
|---|---|---|---|---|---|---|
| GTA V (2015) | 177.1 | 172 | 156.2 | 92.8 | 84 | 85.4 |
| The Witcher 3 (2015) | 309 | 236 | 177.8 | 108 | 59.5 | |
| Dota 2 Reborn (2015) | 146.1 | 126.2 | 125.5 | 114.8 | 95.2 | |
| Final Fantasy XV Benchmark (2018) | 160.8 | 125.6 | 97.5 | 71 | 41.3 | |
| X-Plane 11.11 (2018) | 60 | 50.7 | 45.3 | 28.8 | ||
| Far Cry 5 (2018) | 129 | 113 | 109 | 101 | 100 | 61 |
| Strange Brigade (2018) | 394 | 258 | 229 | 206 | 145 | 77.2 |
| Shadow of the Tomb Raider (2018) | 143.9 | 119.7 | 112.8 | 106.1 | 80.5 | 43.2 |
| Far Cry New Dawn (2019) | 111 | 97 | 94 | 86 | 82 | 62 |
| Metro Exodus (2019) | 205 | 137.4 | 99.8 | 78.7 | 61.4 | 37.1 |
| Borderlands 3 (2019) | 116.1 | 100.1 | 89.2 | 77.6 | 57 | 30.3 |
| F1 2020 (2020) | 305 | 247 | 228 | 172.4 | 127.4 | 70.2 |
| Dirt 5 (2020) | 242 | 154 | 121 | 95 | 76 | 47 |
| F1 2021 (2021) | 342 | 277 | 231 | 124.1 | 88.2 | 47.6 |
| New World (2021) | 122.5 | 103 | 83.7 | 66.2 | 34.1 | |
| Forza Horizon 5 (2021) | 213 | 165 | 159 | 97 | 79 | 50 |
| God of War (2022) | 88.6 | 88.3 | 85.4 | 68.4 | 53 | 33.8 |
| GRID Legends (2022) | 233 | 205 | 171.2 | 144.1 | 115.8 | 72.8 |
| Cyberpunk 2077 1.6 (2022) | 122.5 | 95.5 | 82 | 76.9 | 48.1 | 22.1 |
| Tiny Tina's Wonderlands (2022) | 196.7 | 161.5 | 104.6 | 80.5 | 54.9 | 28.2 |
| F1 22 (2022) | 226 | 226 | 192.3 | 49.7 | 29.9 | 13.8 |
| A Plague Tale Requiem (2022) | 104.9 | 82.5 | 61.4 | 46 | 32.8 | 17.9 |
| Uncharted Legacy of Thieves Collection (2022) | 93.4 | 87.9 | 80.7 | 76.3 | 59.2 | 33.7 |
| Spider-Man Miles Morales (2022) | 90.8 | 94.2 | 88.6 | 82.5 | 63.2 | 38.1 |
Emissions & Energy - Not to be ignored
Noise emissions
The measured noise emissions almost show a typical result for a gaming laptop. Nevertheless, the measured 51.1 dB(A) is loud and subjectively perceived as significantly louder. The reason is the very high-frequency fan noise. The only remedy is to select the Balanced
or Quiet
profile. The noise level drops to 46 and 36 dB(A) respectively in the stress test.
Noise level
| Idle |
| 30.5 / 30.6 / 30.7 dB(A) |
| Load |
| 44.5 / 51.1 dB(A) |
 | ||
30 dB silent 40 dB(A) audible 50 dB(A) loud |
||
min: | ||
| Corsair Voyager a1600 Radeon RX 6800M, R9 6900HS, Samsung PM9A1 MZVL22T0HBLB | Asus ROG Flow X16 GV601RW-M5082W GeForce RTX 3070 Ti Laptop GPU, R9 6900HS, Micron 3400 1TB MTFDKBA1T0TFH | Lenovo Legion 7 16ARHA7 Radeon RX 6850M XT, R9 6900HX, Samsung PM9A1 MZVL22T0HBLB | Acer Predator Triton 500 SE PT516-52s-70KX GeForce RTX 3080 Ti Laptop GPU, i7-12700H, Micron 3400 1TB MTFDKBA1T0TFH | HP Omen 16-b1090ng GeForce RTX 3070 Ti Laptop GPU, i7-12700H, WDC PC SN810 1TB | Lenovo Legion 7 16IAX7-82TD004SGE GeForce RTX 3080 Ti Laptop GPU, i9-12900HX, Micron 3400 1TB MTFDKBA1T0TFH | |
|---|---|---|---|---|---|---|
| Noise | 7% | 22% | 0% | -3% | 5% | |
| off / environment * (dB) | 29.9 | 25.5 15% | 22.8 24% | 26 13% | 26 13% | 24.5 18% |
| Idle Minimum * (dB) | 30.5 | 25.5 16% | 23 25% | 26 15% | 30 2% | 24.5 20% |
| Idle Average * (dB) | 30.6 | 25.5 17% | 23 25% | 29 5% | 31 -1% | 30 2% |
| Idle Maximum * (dB) | 30.7 | 27.4 11% | 23 25% | 34 -11% | 33 -7% | 32.5 -6% |
| Load Average * (dB) | 44.5 | 49.9 -12% | 26.8 40% | 50 -12% | 49 -10% | 43.9 1% |
| Load Maximum * (dB) | 51.1 | 55 -8% | 54.2 -6% | 56 -10% | 57 -12% | 54.2 -6% |
| Witcher 3 ultra * (dB) | 54.3 | 53 | 53 | 48.8 |
* ... smaller is better
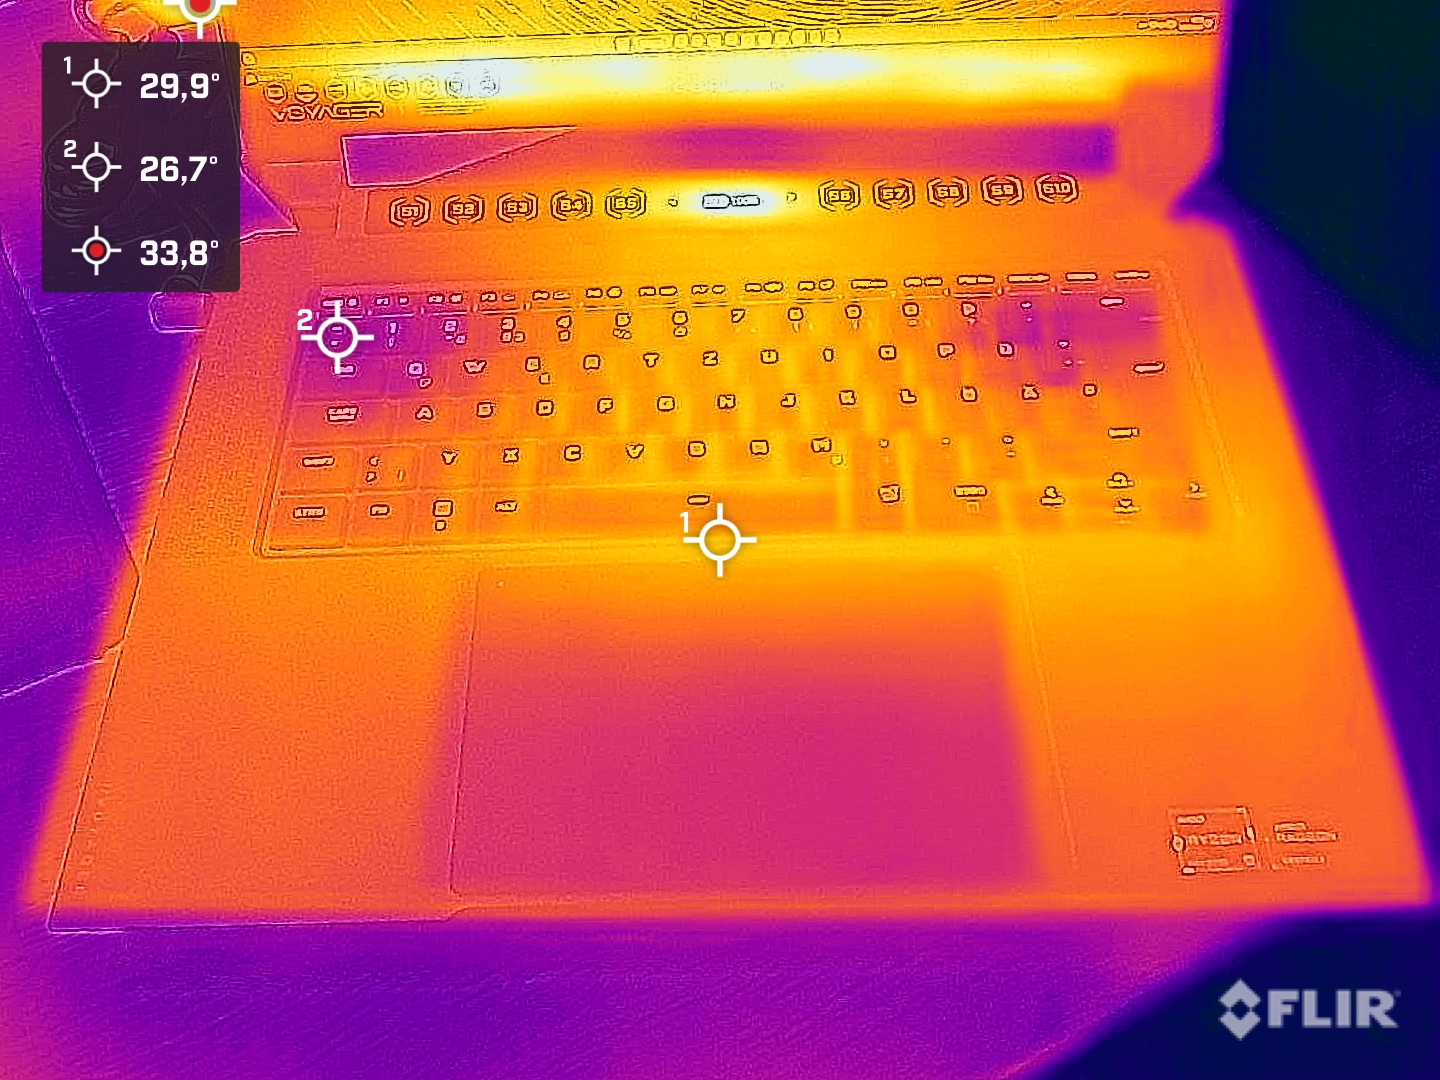
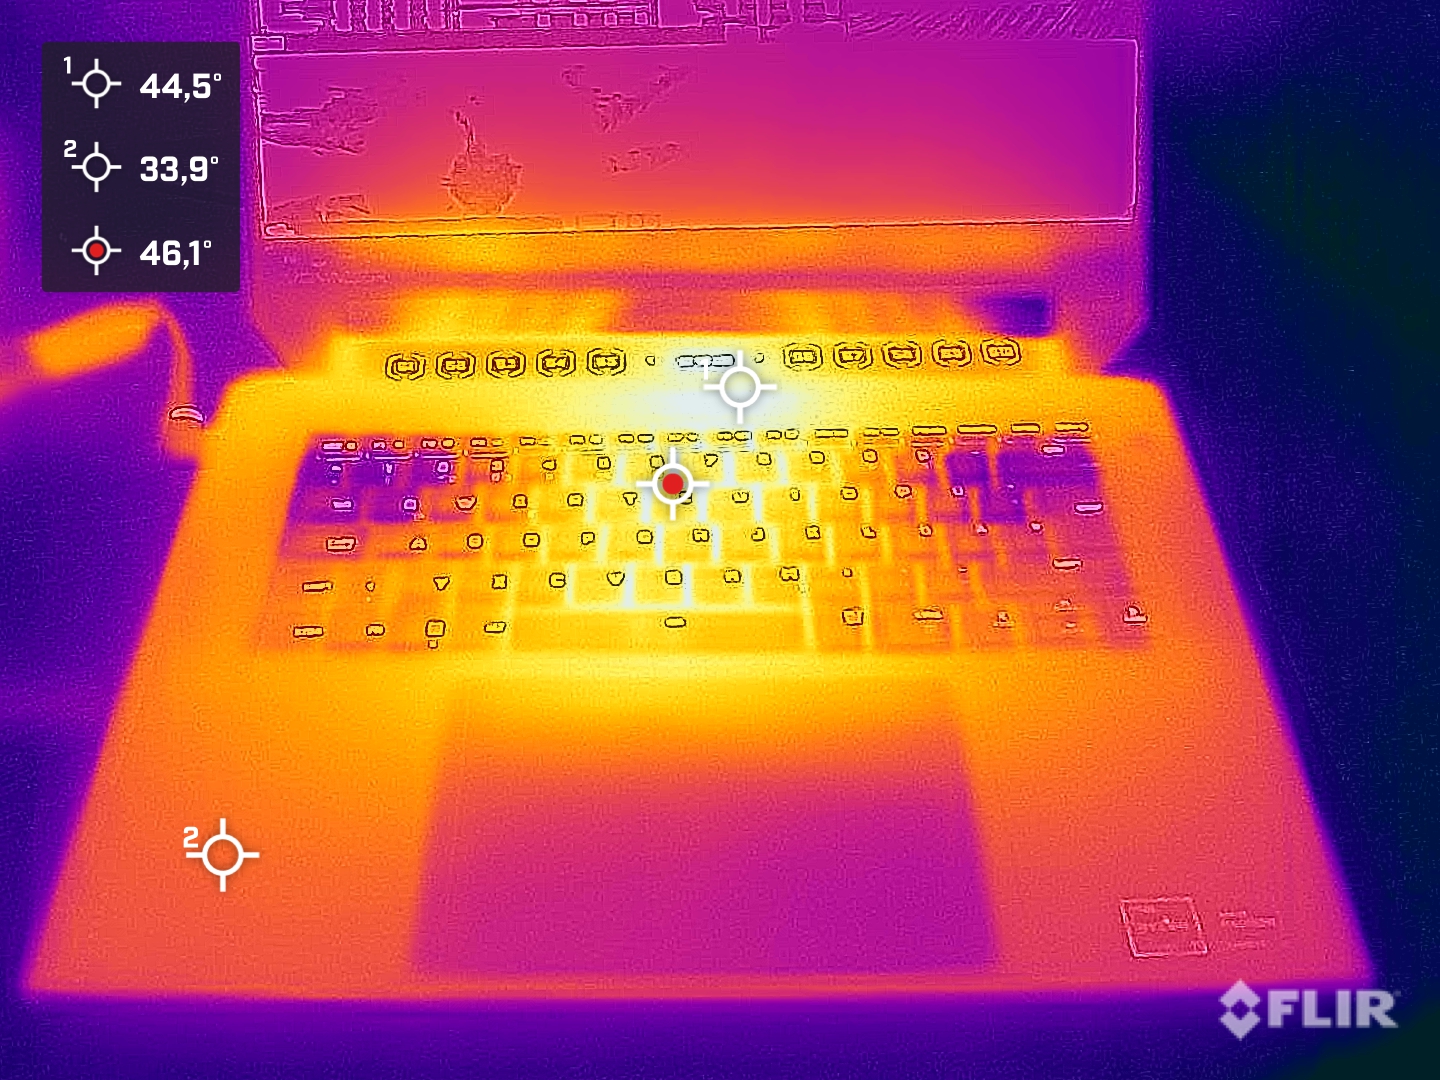
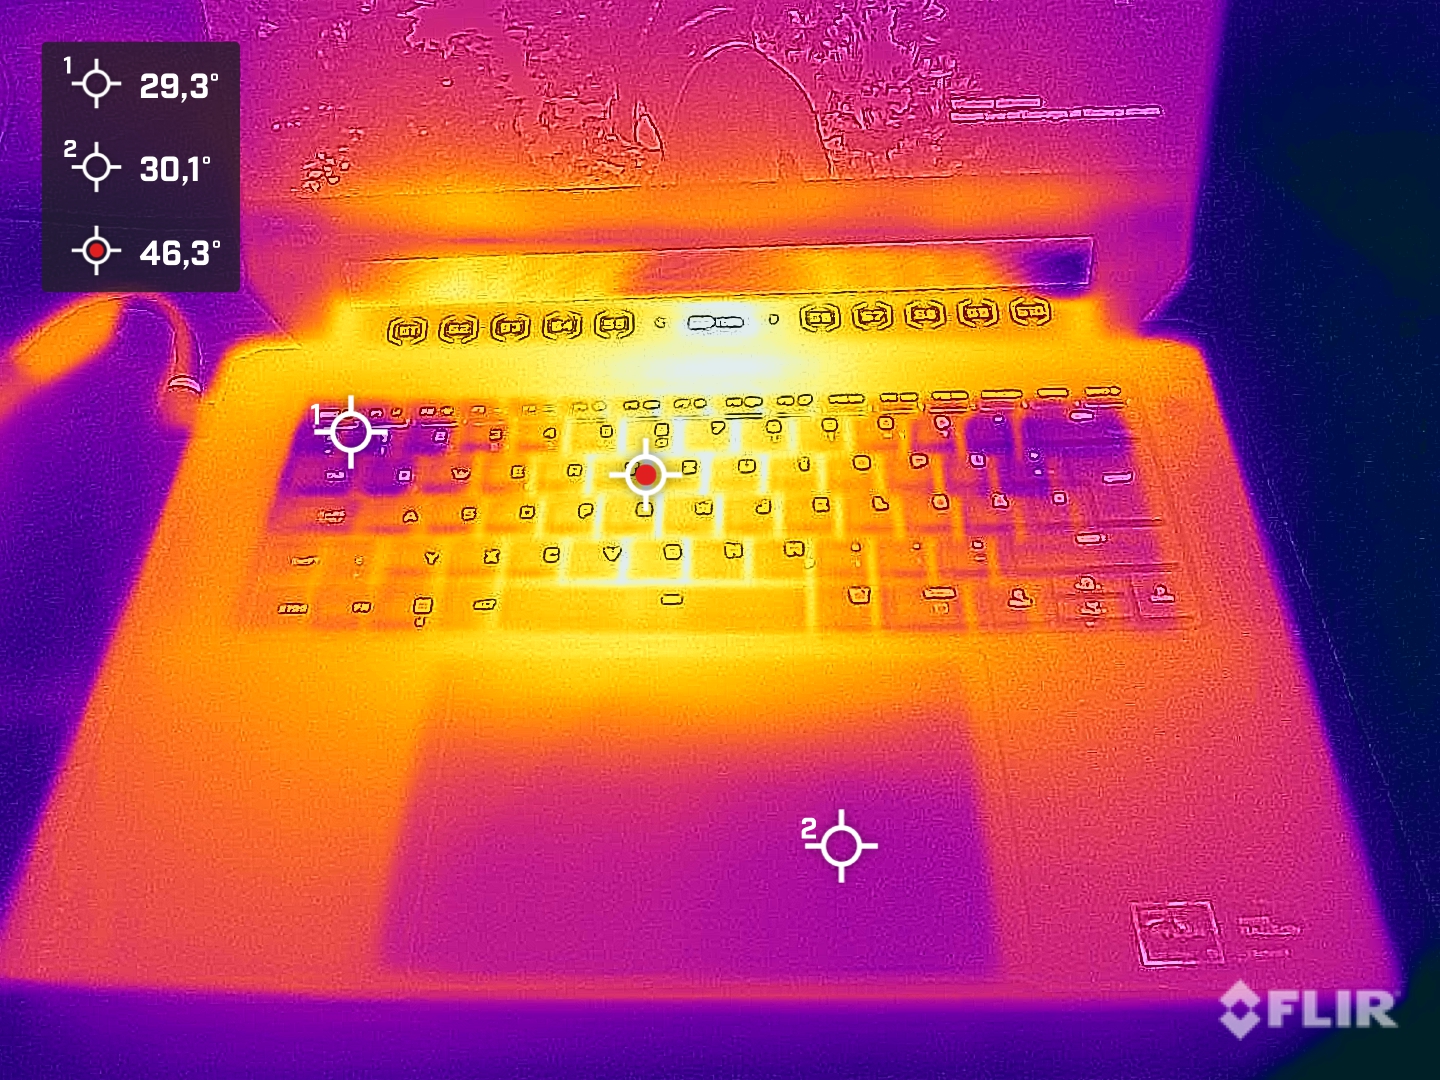
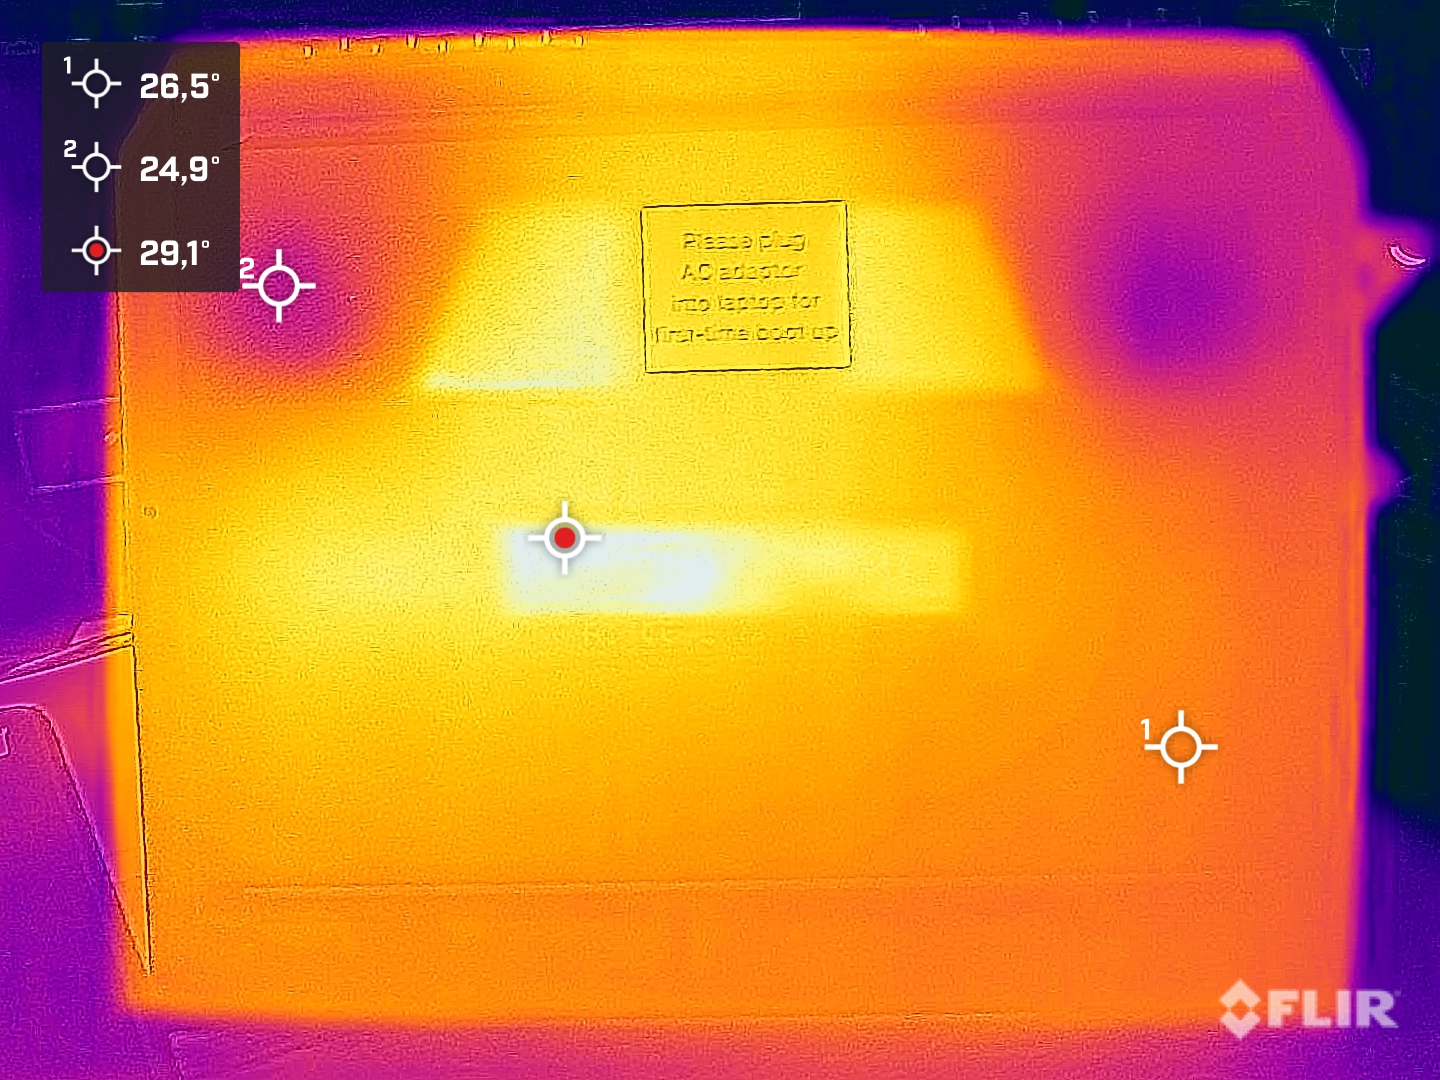
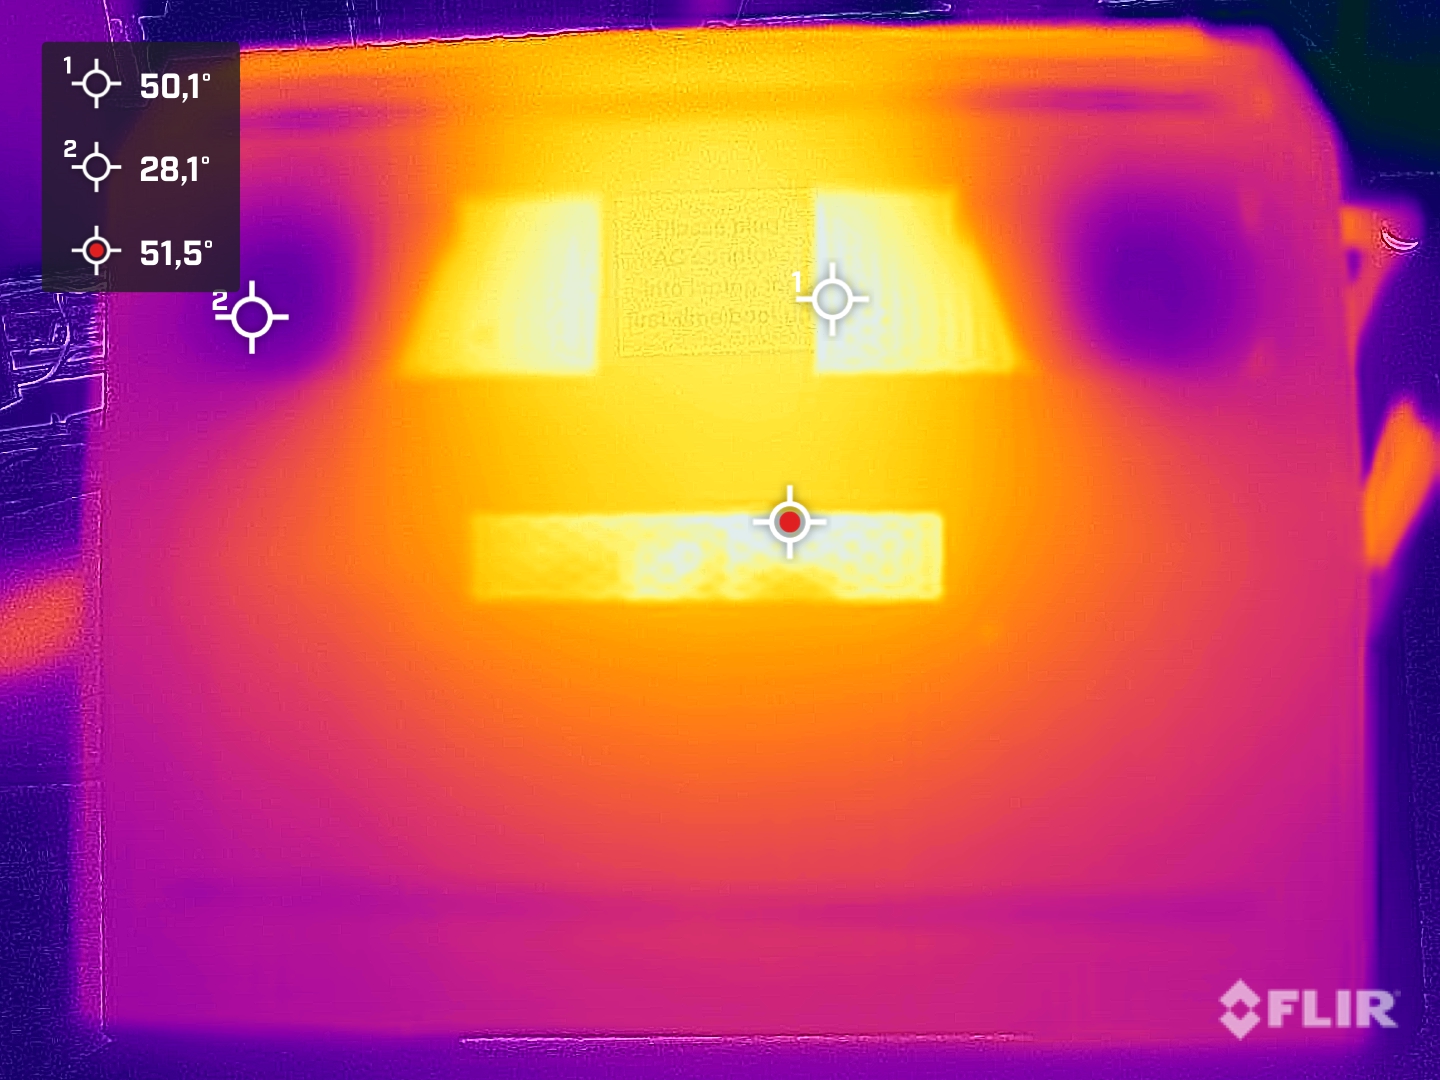
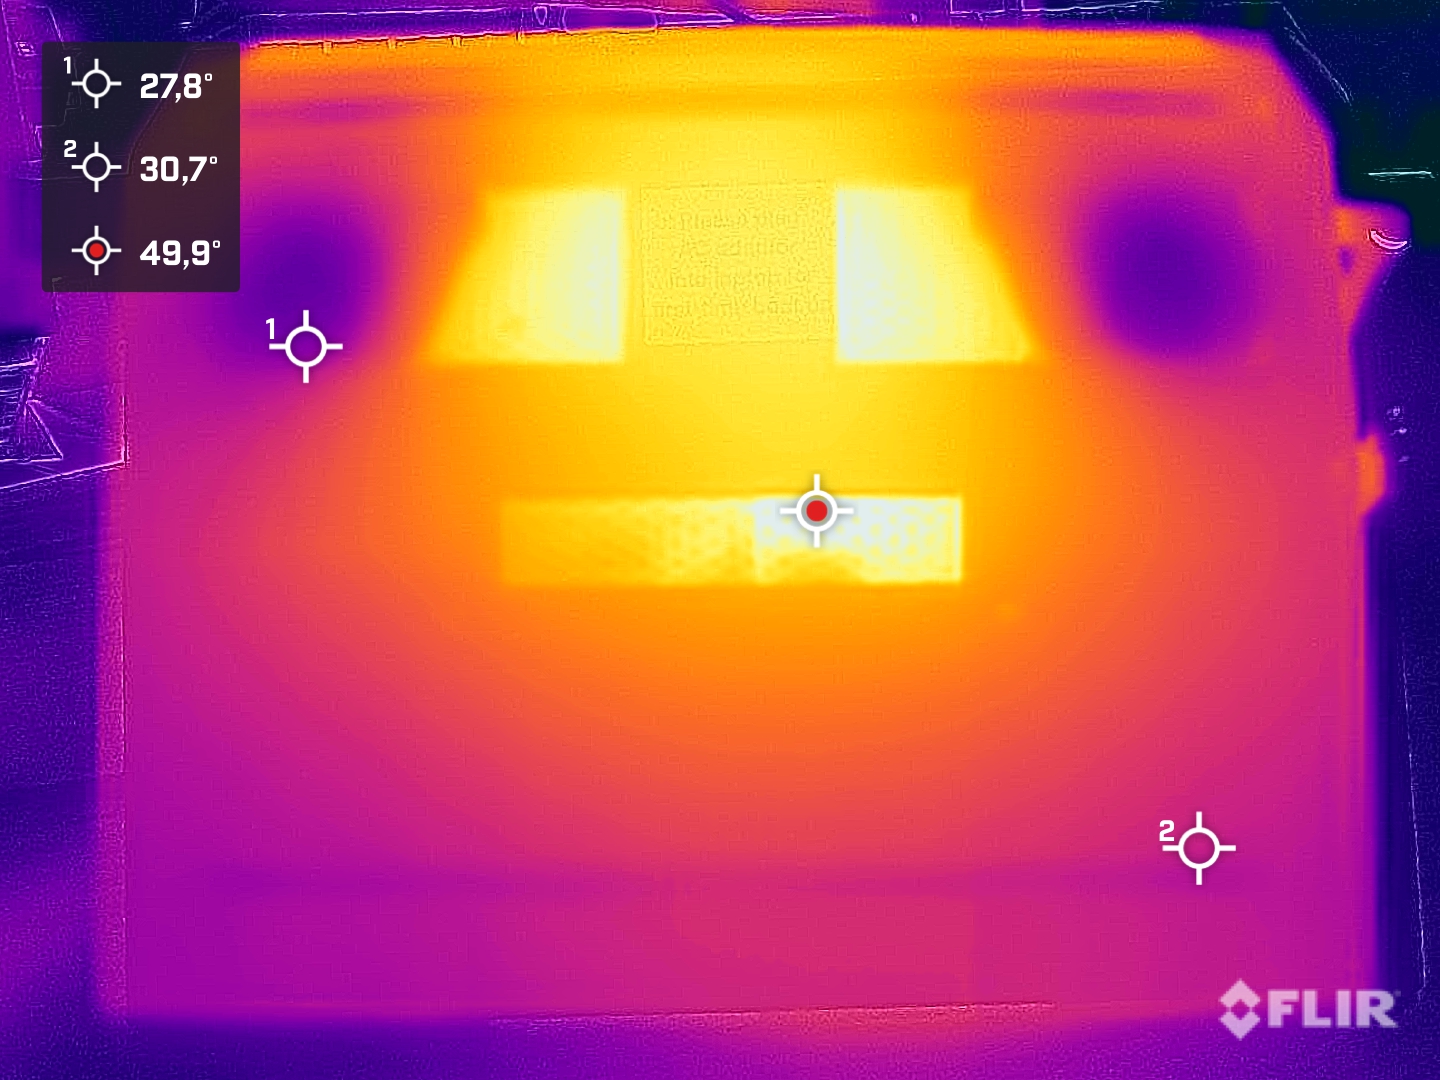
Temperature
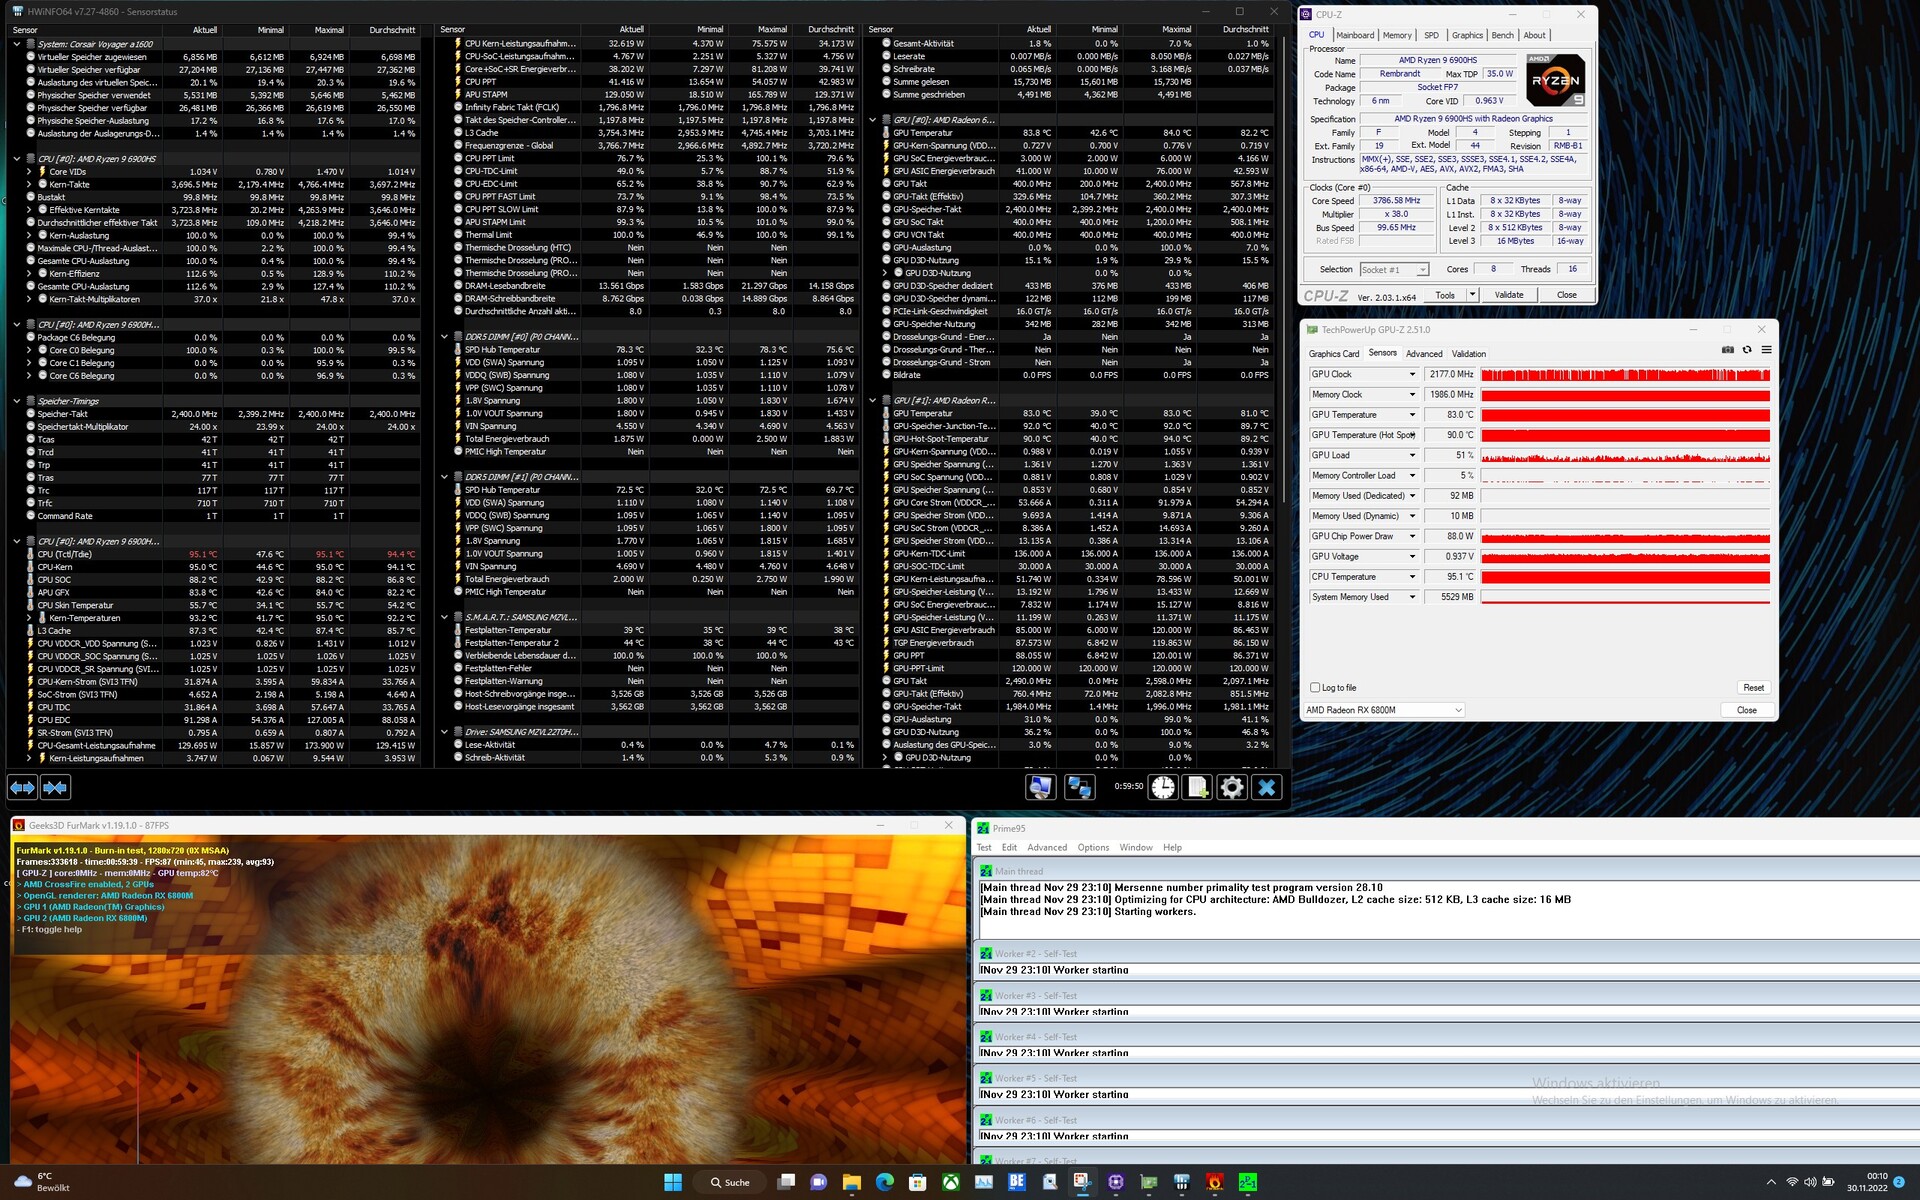
We measured the warmest point on the bottom of the case with up to 54 °C in the stress test. However, the case also gets quite warm on the upper side with just over 50 °C. The case temperature only drops slightly by 1 to 2 °C during gaming.
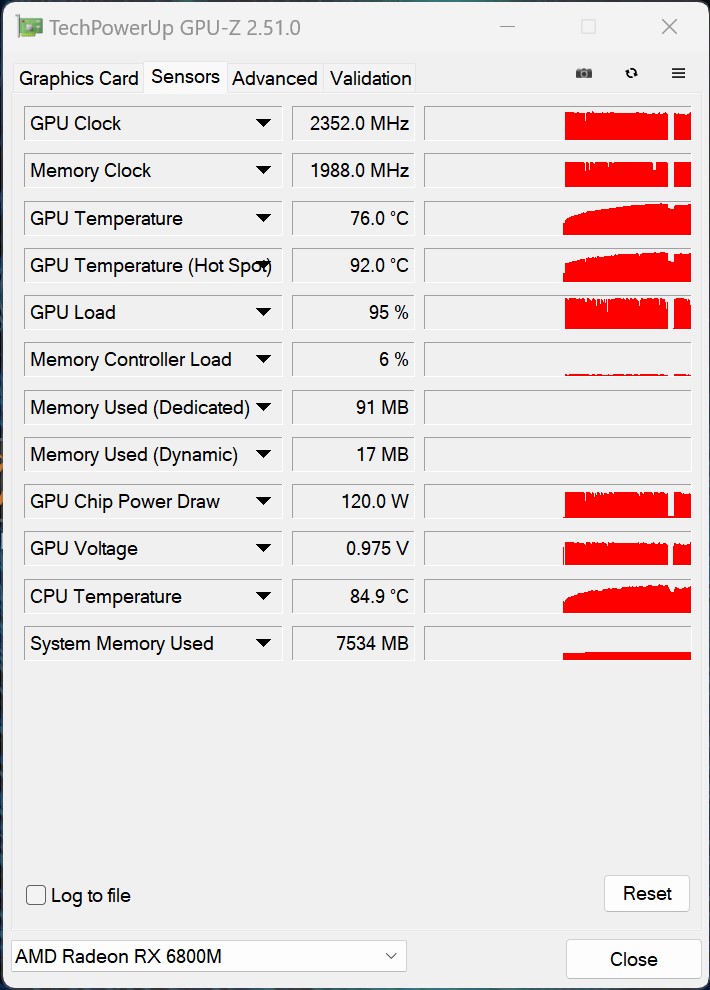
During the stress test, the CPU and GPU temperatures rise to 95 and 83 °C, respectively. However, the SoC still clocks with 3.7 GHz on average. The AMD GPU also achieves high clock rates with just under 2.2 GHz. Corsair uses a large cooling system with a vapor chamber and two fans.
(-) The maximum temperature on the upper side is 50.7 °C / 123 F, compared to the average of 40.4 °C / 105 F, ranging from 21.2 to 68.8 °C for the class Gaming.
(-) The bottom heats up to a maximum of 54.2 °C / 130 F, compared to the average of 43.2 °C / 110 F
(+) In idle usage, the average temperature for the upper side is 31.5 °C / 89 F, compared to the device average of 33.9 °C / 93 F.
(±) Playing The Witcher 3, the average temperature for the upper side is 36.6 °C / 98 F, compared to the device average of 33.9 °C / 93 F.
(+) The palmrests and touchpad are reaching skin temperature as a maximum (34 °C / 93.2 F) and are therefore not hot.
(-) The average temperature of the palmrest area of similar devices was 28.8 °C / 83.8 F (-5.2 °C / -9.4 F).
| Corsair Voyager a1600 AMD Ryzen 9 6900HS, AMD Radeon RX 6800M | Asus ROG Flow X16 GV601RW-M5082W AMD Ryzen 9 6900HS, NVIDIA GeForce RTX 3070 Ti Laptop GPU | Lenovo Legion 7 16ARHA7 AMD Ryzen 9 6900HX, AMD Radeon RX 6850M XT | Acer Predator Triton 500 SE PT516-52s-70KX Intel Core i7-12700H, NVIDIA GeForce RTX 3080 Ti Laptop GPU | HP Omen 16-b1090ng Intel Core i7-12700H, NVIDIA GeForce RTX 3070 Ti Laptop GPU | Lenovo Legion 7 16IAX7-82TD004SGE Intel Core i9-12900HX, NVIDIA GeForce RTX 3080 Ti Laptop GPU | |
|---|---|---|---|---|---|---|
| Heat | -3% | 14% | 8% | 14% | -3% | |
| Maximum Upper Side * (°C) | 50.7 | 55.1 -9% | 37.2 27% | 47 7% | 41 19% | 44.4 12% |
| Maximum Bottom * (°C) | 54.2 | 50.3 7% | 43 21% | 49 10% | 62 -14% | 60.8 -12% |
| Idle Upper Side * (°C) | 35.8 | 35.5 1% | 34 5% | 31 13% | 25 30% | 33.8 6% |
| Idle Bottom * (°C) | 33 | 36.1 -9% | 32.8 1% | 32 3% | 26 21% | 38.8 -18% |
* ... smaller is better
Speaker
The two speakers are located under the palm rests. However, the sound is directed upwards out of the speaker grilles beside the keyboard. As is often the case, the two speakers lack bass, so mids and trebles clearly predominate. However, we recommend using a headset for gaming. This can be connected to the laptop via USB using the 3.5 mm jack or via Slipstream.
Corsair Voyager a1600 audio analysis
(-) | not very loud speakers (69 dB)
Bass 100 - 315 Hz
(±) | reduced bass - on average 10.2% lower than median
(±) | linearity of bass is average (13.7% delta to prev. frequency)
Mids 400 - 2000 Hz
(±) | higher mids - on average 7.8% higher than median
(±) | linearity of mids is average (7% delta to prev. frequency)
Highs 2 - 16 kHz
(+) | balanced highs - only 1.8% away from median
(±) | linearity of highs is average (11.4% delta to prev. frequency)
Overall 100 - 16.000 Hz
(±) | linearity of overall sound is average (25.5% difference to median)
Compared to same class
» 91% of all tested devices in this class were better, 2% similar, 7% worse
» The best had a delta of 6%, average was 18%, worst was 132%
Compared to all devices tested
» 78% of all tested devices were better, 4% similar, 17% worse
» The best had a delta of 4%, average was 24%, worst was 134%
Asus ROG Flow X16 GV601RW-M5082W audio analysis
(±) | speaker loudness is average but good (80.7 dB)
Bass 100 - 315 Hz
(±) | reduced bass - on average 12.7% lower than median
(±) | linearity of bass is average (13.8% delta to prev. frequency)
Mids 400 - 2000 Hz
(+) | balanced mids - only 1.3% away from median
(+) | mids are linear (4.7% delta to prev. frequency)
Highs 2 - 16 kHz
(±) | higher highs - on average 6.4% higher than median
(+) | highs are linear (6.8% delta to prev. frequency)
Overall 100 - 16.000 Hz
(+) | overall sound is linear (12.9% difference to median)
Compared to same class
» 17% of all tested devices in this class were better, 4% similar, 79% worse
» The best had a delta of 6%, average was 18%, worst was 132%
Compared to all devices tested
» 12% of all tested devices were better, 3% similar, 85% worse
» The best had a delta of 4%, average was 24%, worst was 134%
Power consumption
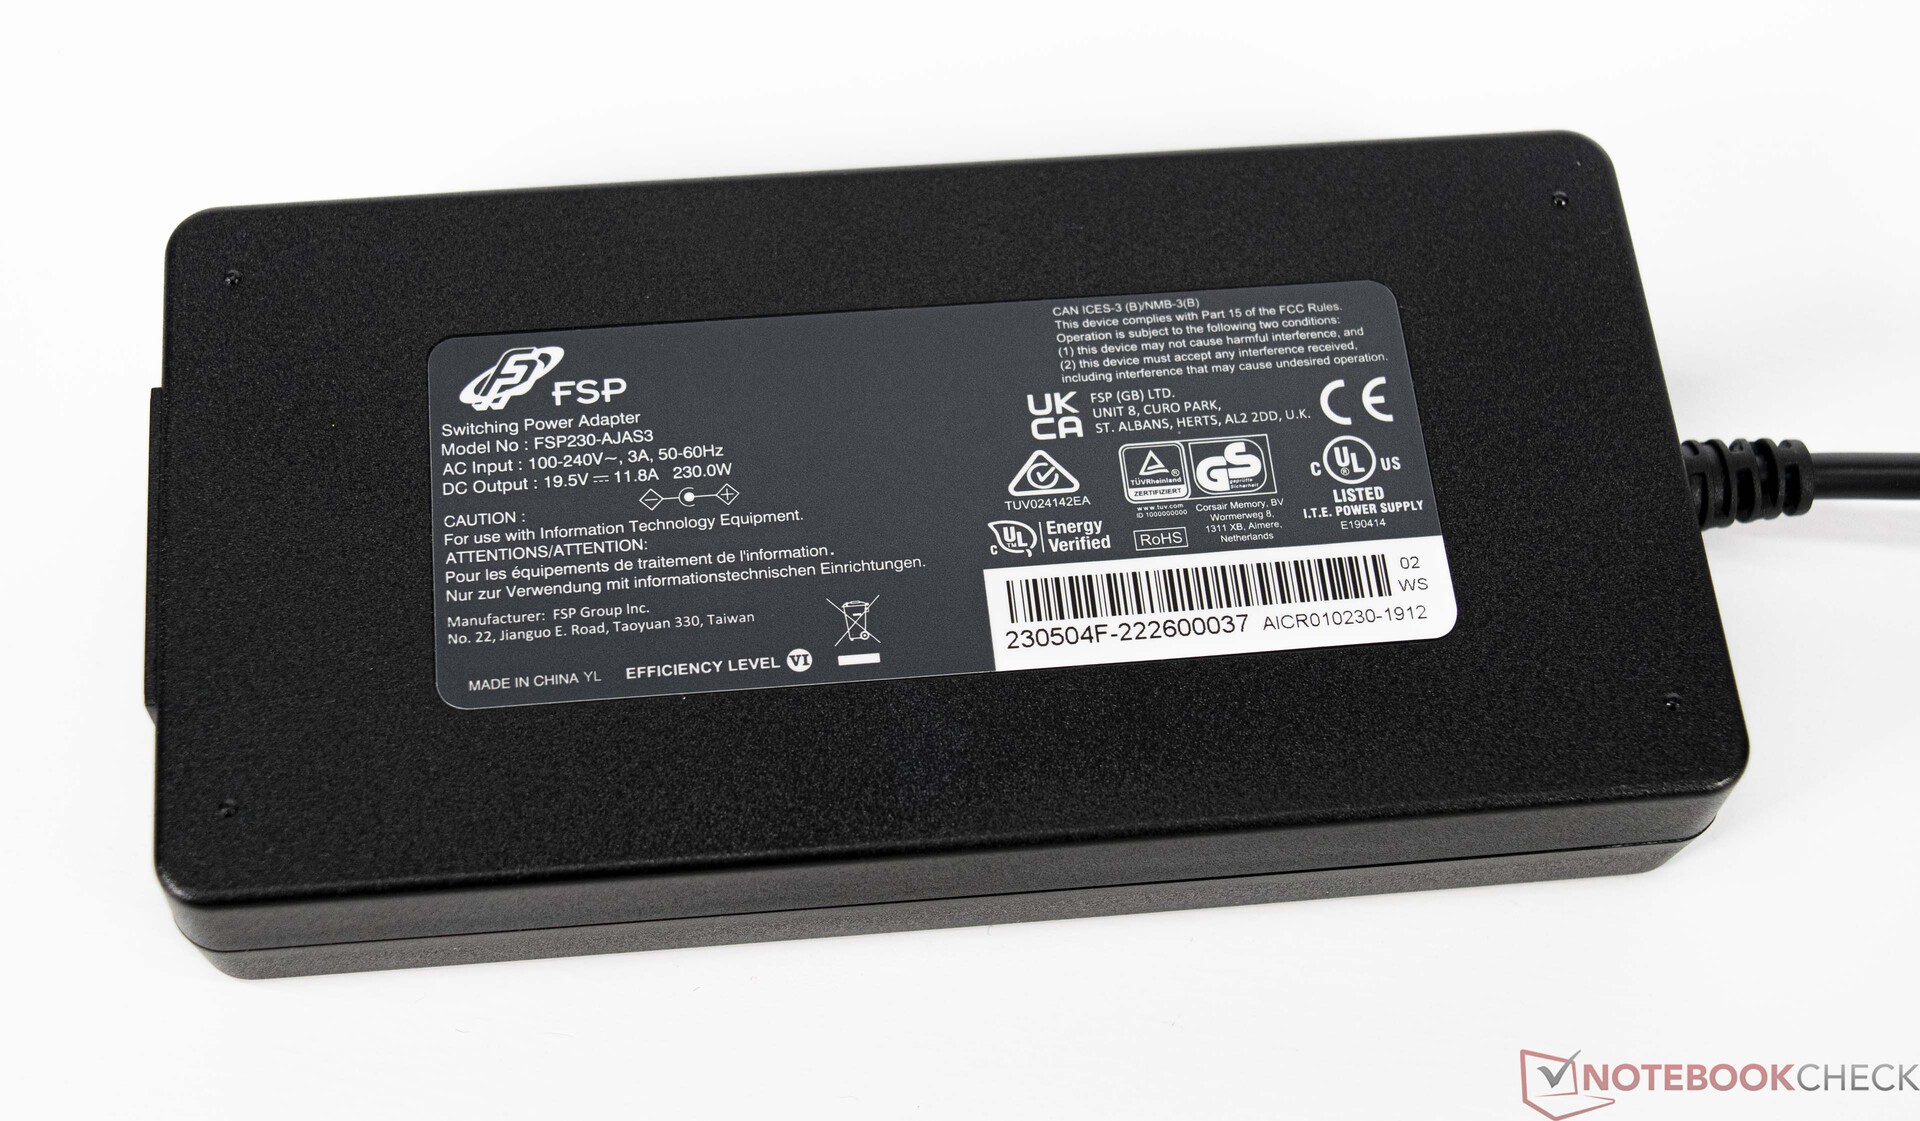
In terms of power consumption, we measured about 16 to 22 watts at idle. Under average load, we registered about 133 watts, although peaks of up to 258 watts are reached. According to the specifications, the power supply can provide 230 watts. However, the higher load peaks did not lead to problems in the test. The battery was not additionally discharged during the stress test.
| Off / Standby | |
| Idle | |
| Load |
|
Key:
min: | |
Energy consumption Witcher 3 / stress test
Energy consumption with an external monitor
Battery life
With 99 Wh, Corsair exhausts the maximum in terms of battery capacity. Due to the relatively high idle energy consumption, the device lags behind the competition at idle. However, Lenovo's Legion 7 scores even worse. With that said, the Voyager a1600 achieves a passable runtime of just under 6 hours in the WLAN test. The display brightness was 52 percent in this test, which corresponds to the general conditions of 150 cd/m². Corsair also throttles the CPU and GPU's performance noticeably in battery mode.


| Corsair Voyager a1600 R9 6900HS, Radeon RX 6800M, 99 Wh | Asus ROG Flow X16 GV601RW-M5082W R9 6900HS, GeForce RTX 3070 Ti Laptop GPU, 90 Wh | Lenovo Legion 7 16ARHA7 R9 6900HX, Radeon RX 6850M XT, 99 Wh | Acer Predator Triton 500 SE PT516-52s-70KX i7-12700H, GeForce RTX 3080 Ti Laptop GPU, 99.98 Wh | HP Omen 16-b1090ng i7-12700H, GeForce RTX 3070 Ti Laptop GPU, 83 Wh | Lenovo Legion 7 16IAX7-82TD004SGE i9-12900HX, GeForce RTX 3080 Ti Laptop GPU, 99 Wh | Average of class Gaming | |
|---|---|---|---|---|---|---|---|
| Battery runtime | -30% | -6% | 13% | 10% | -35% | 13% | |
| Reader / Idle (h) | 7 | 4.9 -30% | 10.1 44% | 8.71 ? 24% | |||
| H.264 (h) | 6 | 8.2 37% | 5.1 -15% | 8.26 ? 38% | |||
| WiFi v1.3 (h) | 5.8 | 5.7 -2% | 7.3 26% | 5.7 -2% | 5.6 -3% | 4.5 -22% | 7.01 ? 21% |
| Load (h) | 2.1 | 0.9 -57% | 1.8 -14% | 2.2 5% | 1.9 -10% | 0.7 -67% | 1.47 ? -30% |
| Witcher 3 ultra (h) | 0.9 | 0.9 |
Pros
Cons
Verdict - Versatile notebook gamer and streamer
Corsair has created a really great device with the Voyager a1600. The combination of AMD SoC and AMD GPU is good and is quite convincing in the test. It often has to admit defeat in the direct duel with Intel's current SoC. However, the differences in performance are not really noticeable. The Voyager a1600 looks particularly high-end due to the material selection, which also gives the device very good stability. The device doesn't look clunky at all
The connectivity turns out to be a bit spartan at first glance. However, those who rely on Slipstream technology to connect peripherals will hardly miss the absent USB Type-A ports.
AMD's Ryzen 9 6900HS performs well and consistently fast without much performance loss under load. We can also attest the same to AMD's Radeon RX 6800M. We liked the 16:10 format display. The only drawbacks are the somewhat low brightness and the not-quite-perfect color space coverage in the AdobeRGB and P3 color spaces, which rule out professional use for video or photo editing. As a gaming laptop, however, the Corsair Voyager a1600 can easily do without them.
The Corsair Voyager a1600 is more than just a pure gaming notebook, as its great features make it the perfect device for streamers and content creators.
However, with the unique streaming features, the Voyager a1600 will be remembered. The quick start buttons, which can be assigned as desired, suit streamers and you can do without an additional stream deck. With that said, due to the intended use, we would have wished for a higher quality camera that isn't only meant to serve as a mobile emergency solution. The biggest drawback of the Corsair Voyager a1600 is the built-in cooling unit. The temperatures remain within limits under load, no question, but still, the measured noise level is too high at maximum performance. Those who forgo the Extreme mode will be rewarded with low emissions, but will also give away some performance at the same time.
Price and availability
The Corsair Voyager a1600 is available directly from Corsair store where you have to pay 3,550 Euros for the tested configuration. Alternatively, Amazon sells the same model for currently 3,540 Euros. The cheaper configuration with a Ryzen 7 6800HS and 16 GB RAM is also available from Amazon for 2,725 Euros.
Corsair Voyager a1600
- 12/05/2022 v7 (old)
Sebastian Bade
Price comparison

