Asus ROG Strix G17 G713QE laptop review: GeForce RTX 3050 Ti drags down a great system

The ROG Strix G17 G713 series succeeds last year's G712 series by bumping off Intel for AMD and upgrading most SKUs to GeForce Ampere graphics. Configurable options are extensive with no less than than 16 (!) individual SKUs all detailed here on Asus' official product page. Options are subsequently massive ranging from the Zen 2 Ryzen 7 4800H to the Zen 3 Ryzen 9 5900HX CPU and 65 W GeForce GTX 1650 graphics up to the 130 W GeForce RTX 3070. Display options also range wildly from the base 144 Hz FHD panel to 165 Hz QHD or 300 Hz FHD with fuller colors. Even battery capacities, thicknesses, and AC adapters are different depending on the graphics.
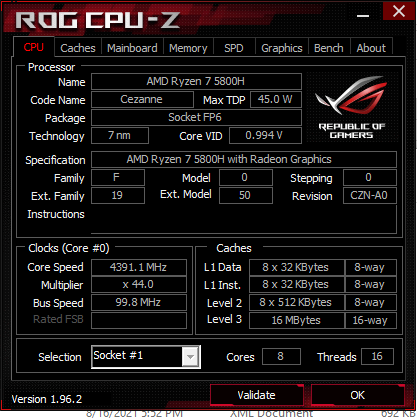
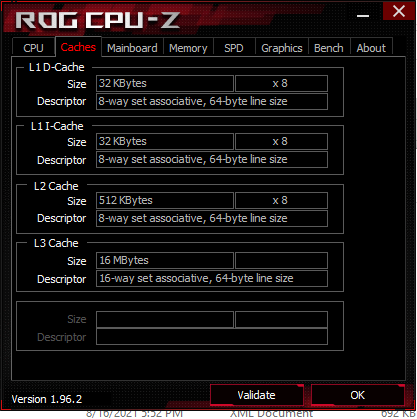
Our test unit today is midrange SKU equipped with the Ryzen 7 5800H CPU, 95 W RTX 3050 Ti GPU, and 144 Hz FHD display. Competitors in this space include other entry-level to midrange 17.3-inch gaming laptops like the MSI Katana GF76, Acer Nitro 5, Dell G series, or Lenovo Legion 5.
More Asus reviews:
potential competitors in comparison
Rating | Date | Model | Weight | Height | Size | Resolution | Price |
|---|---|---|---|---|---|---|---|
| 83.4 % v7 (old) | 08 / 2021 | Asus ROG Strix G17 G713QE-RB74 R7 5800H, GeForce RTX 3050 Ti Laptop GPU | 2.5 kg | 24.6 mm | 17.30" | 1920x1080 | |
| 81.1 % v7 (old) | 08 / 2021 | Acer Nitro 5 AN517-53-54DQ i5-11300H, GeForce RTX 3050 4GB Laptop GPU | 2.6 kg | 25 mm | 17.30" | 1920x1080 | |
| 80.4 % v7 (old) | 06 / 2021 | MSI Katana GF76 11UE i7-11800H, GeForce RTX 3060 Laptop GPU | 2.7 kg | 25.2 mm | 17.30" | 1920x1080 | |
| 86.6 % v7 (old) | 05 / 2021 | Asus Strix Scar 17 G733QSA-XS99 R9 5900HX, GeForce RTX 3080 Laptop GPU | 2.8 kg | 28.3 mm | 17.30" | 1920x1080 | |
| 83.3 % v7 (old) | 02 / 2021 | MSI Alpha 17 A4DEK R7 4800H, Radeon RX 5600M | 2.6 kg | 28 mm | 17.30" | 1920x1080 | |
| 83.1 % v7 (old) | 10 / 2020 | Asus Strix G17 G712LWS i7-10750H, GeForce RTX 2070 Super Mobile | 2.8 kg | 26.5 mm | 17.30" | 1920x1080 |
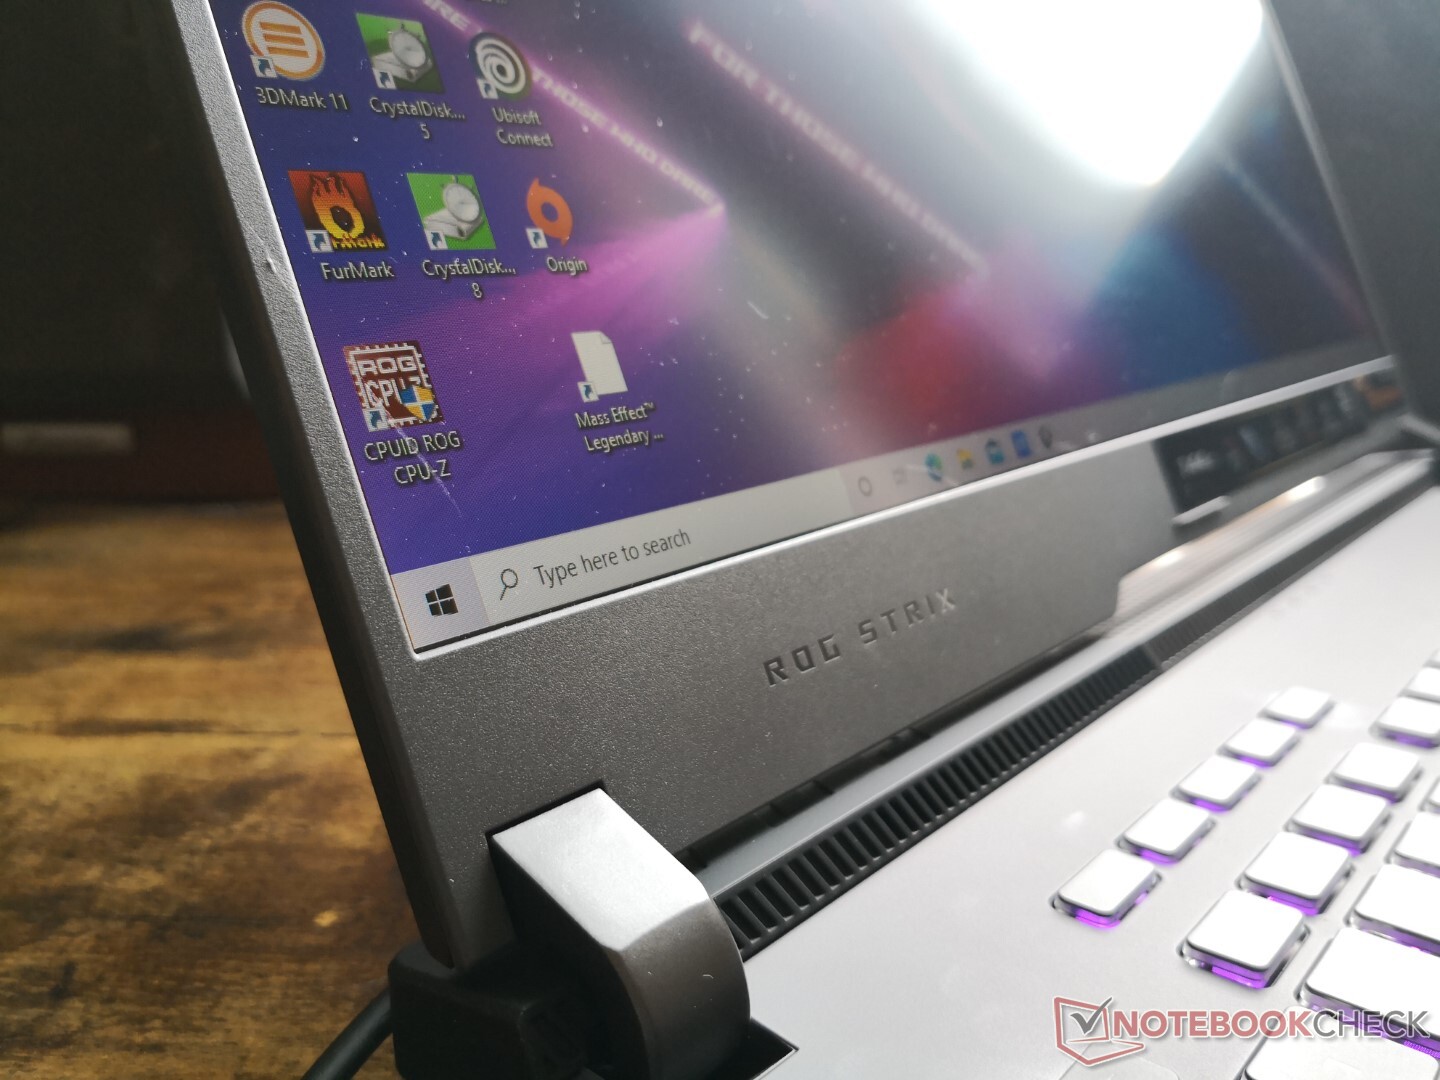
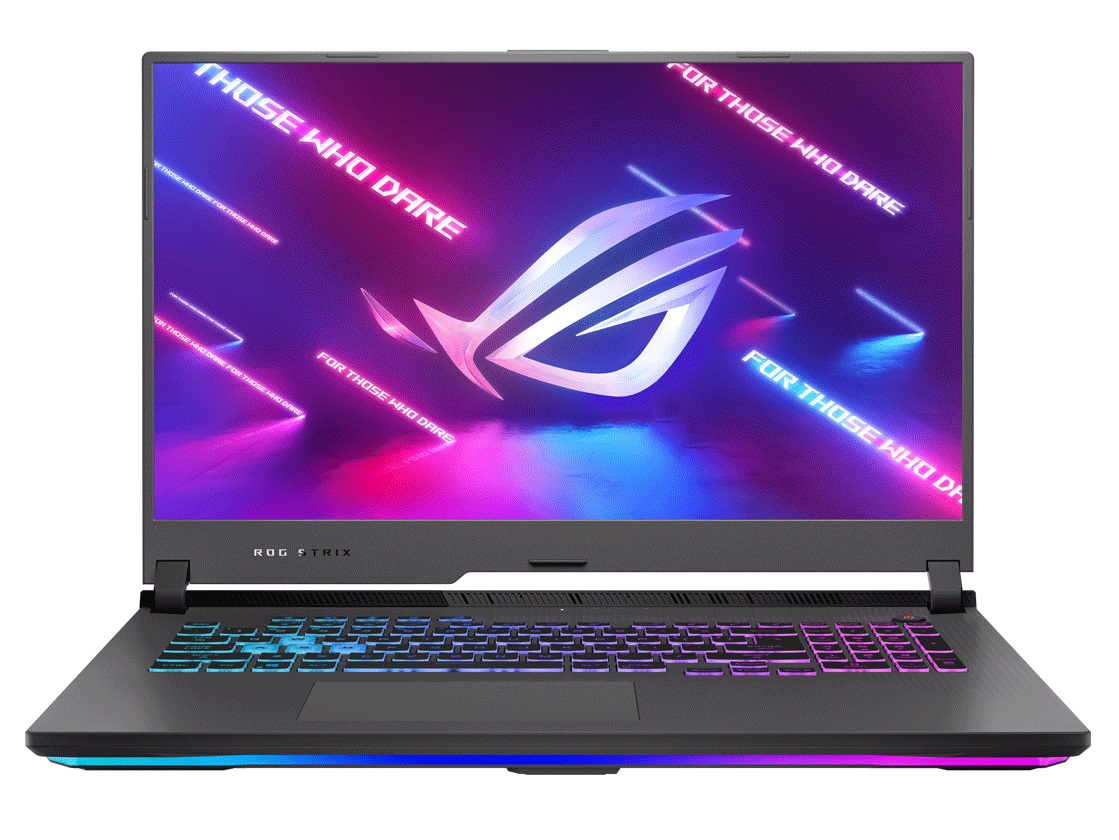
Case — Familiar, but Different
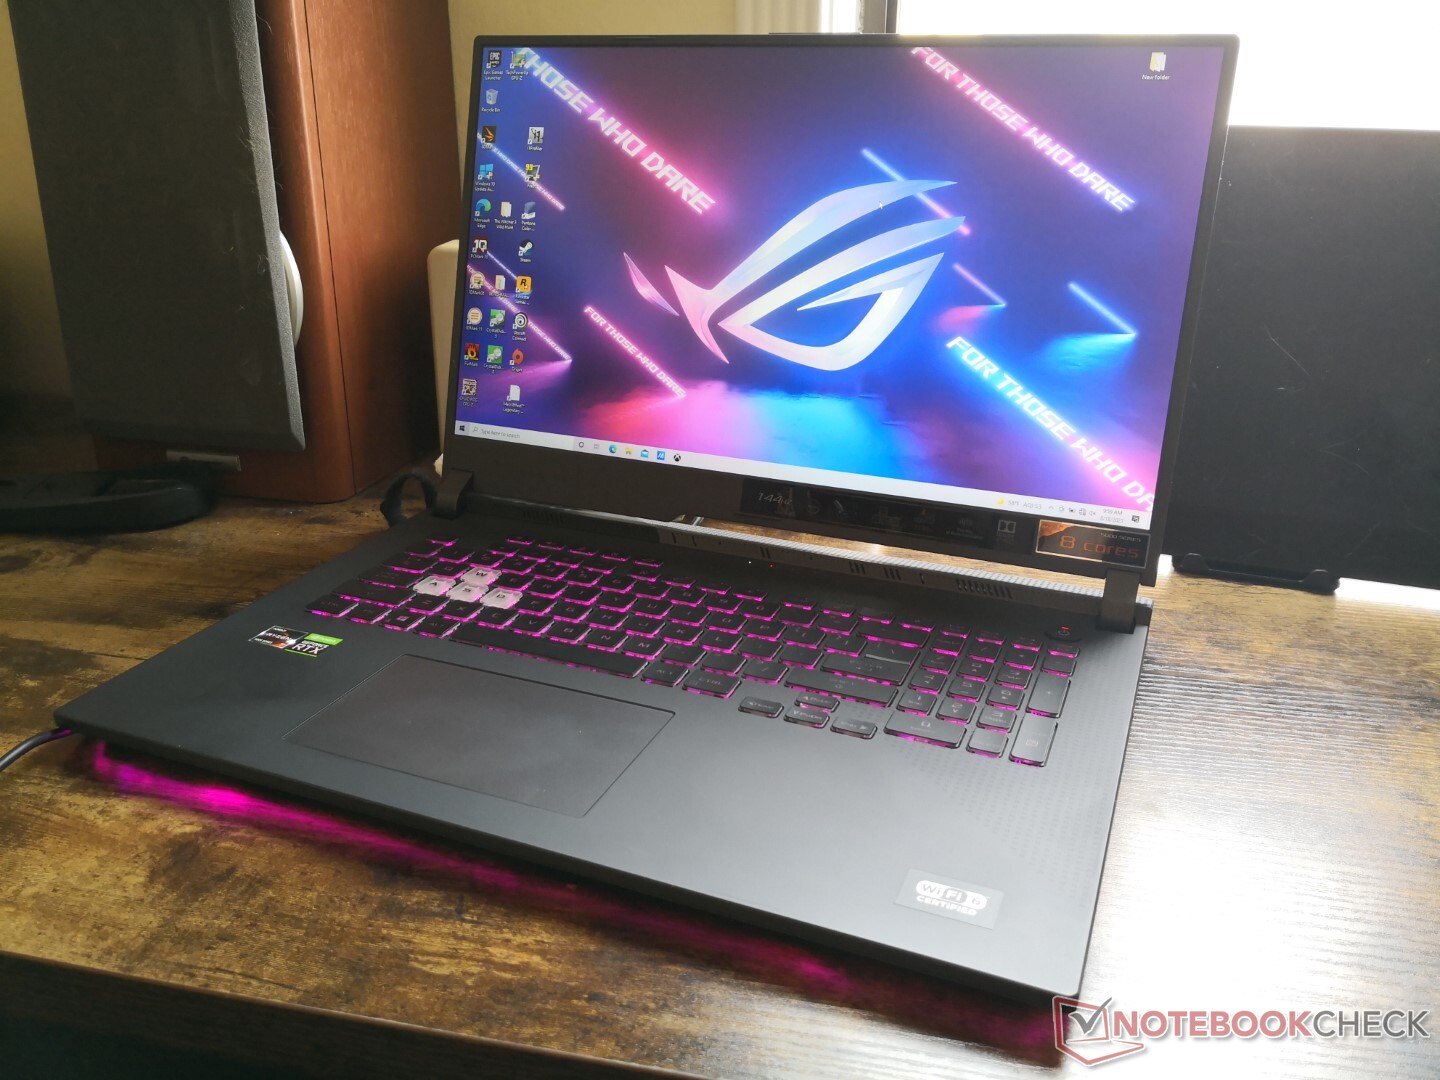
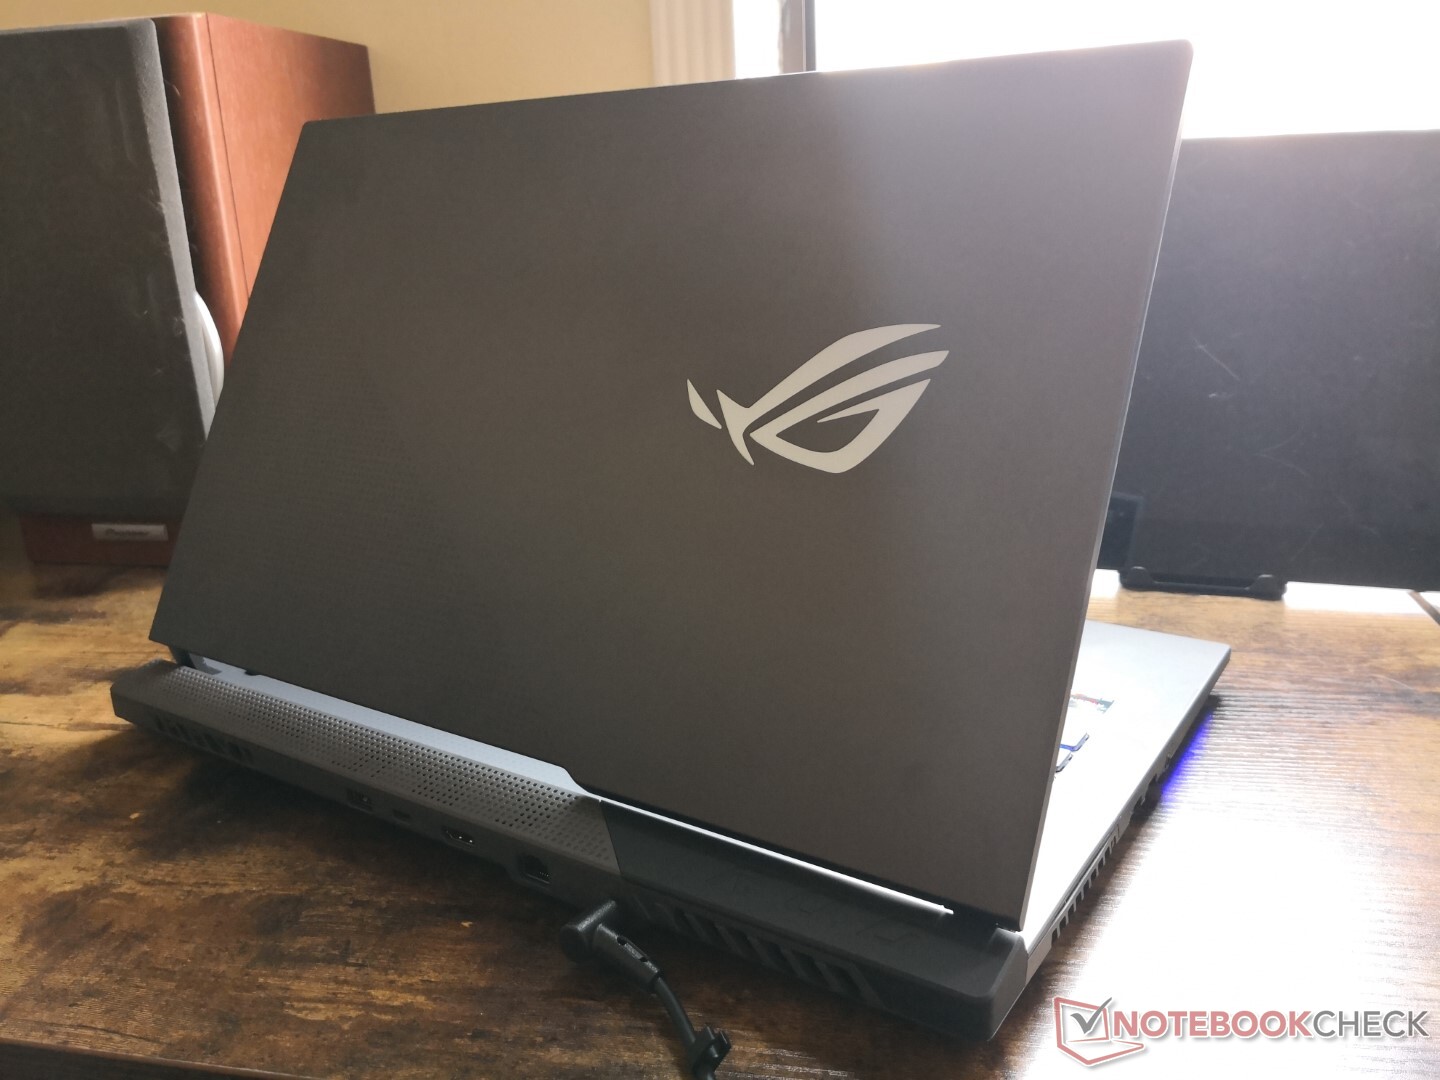
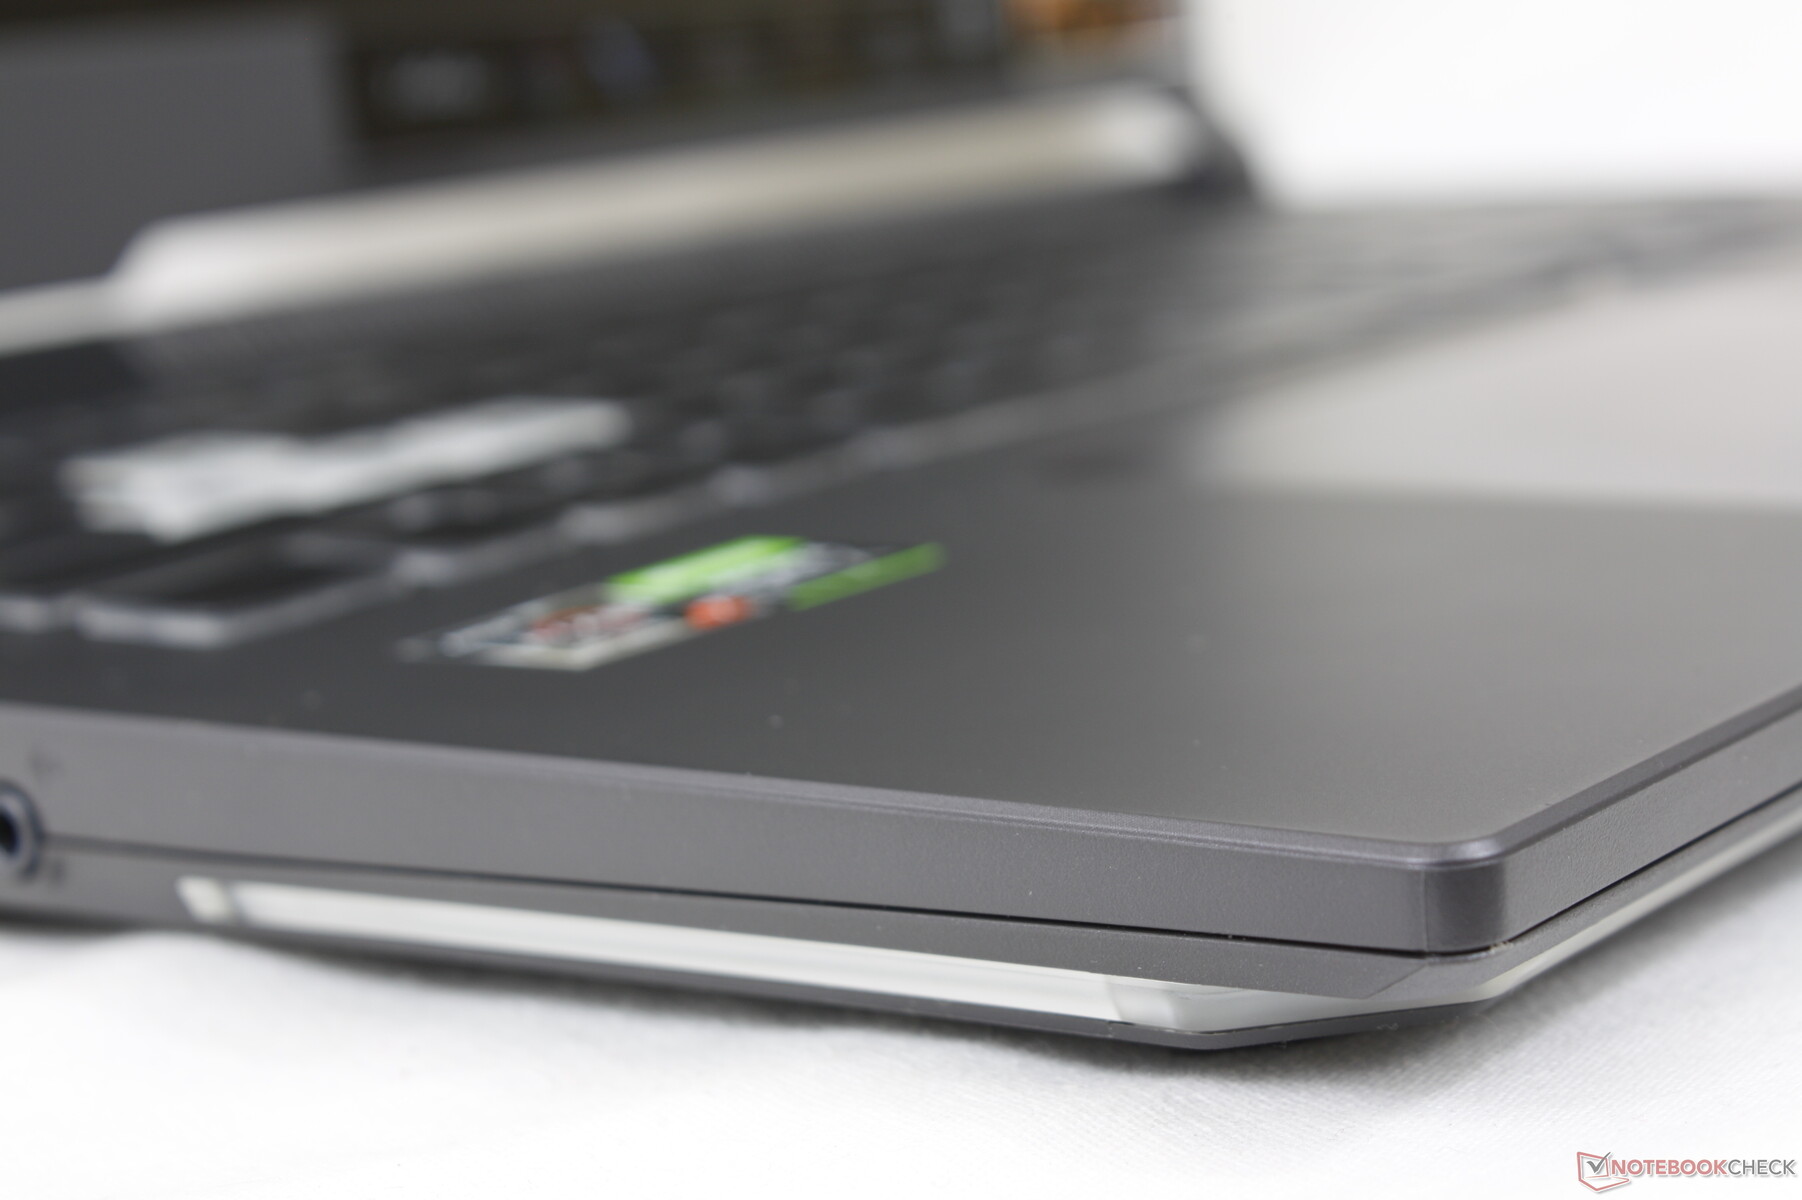
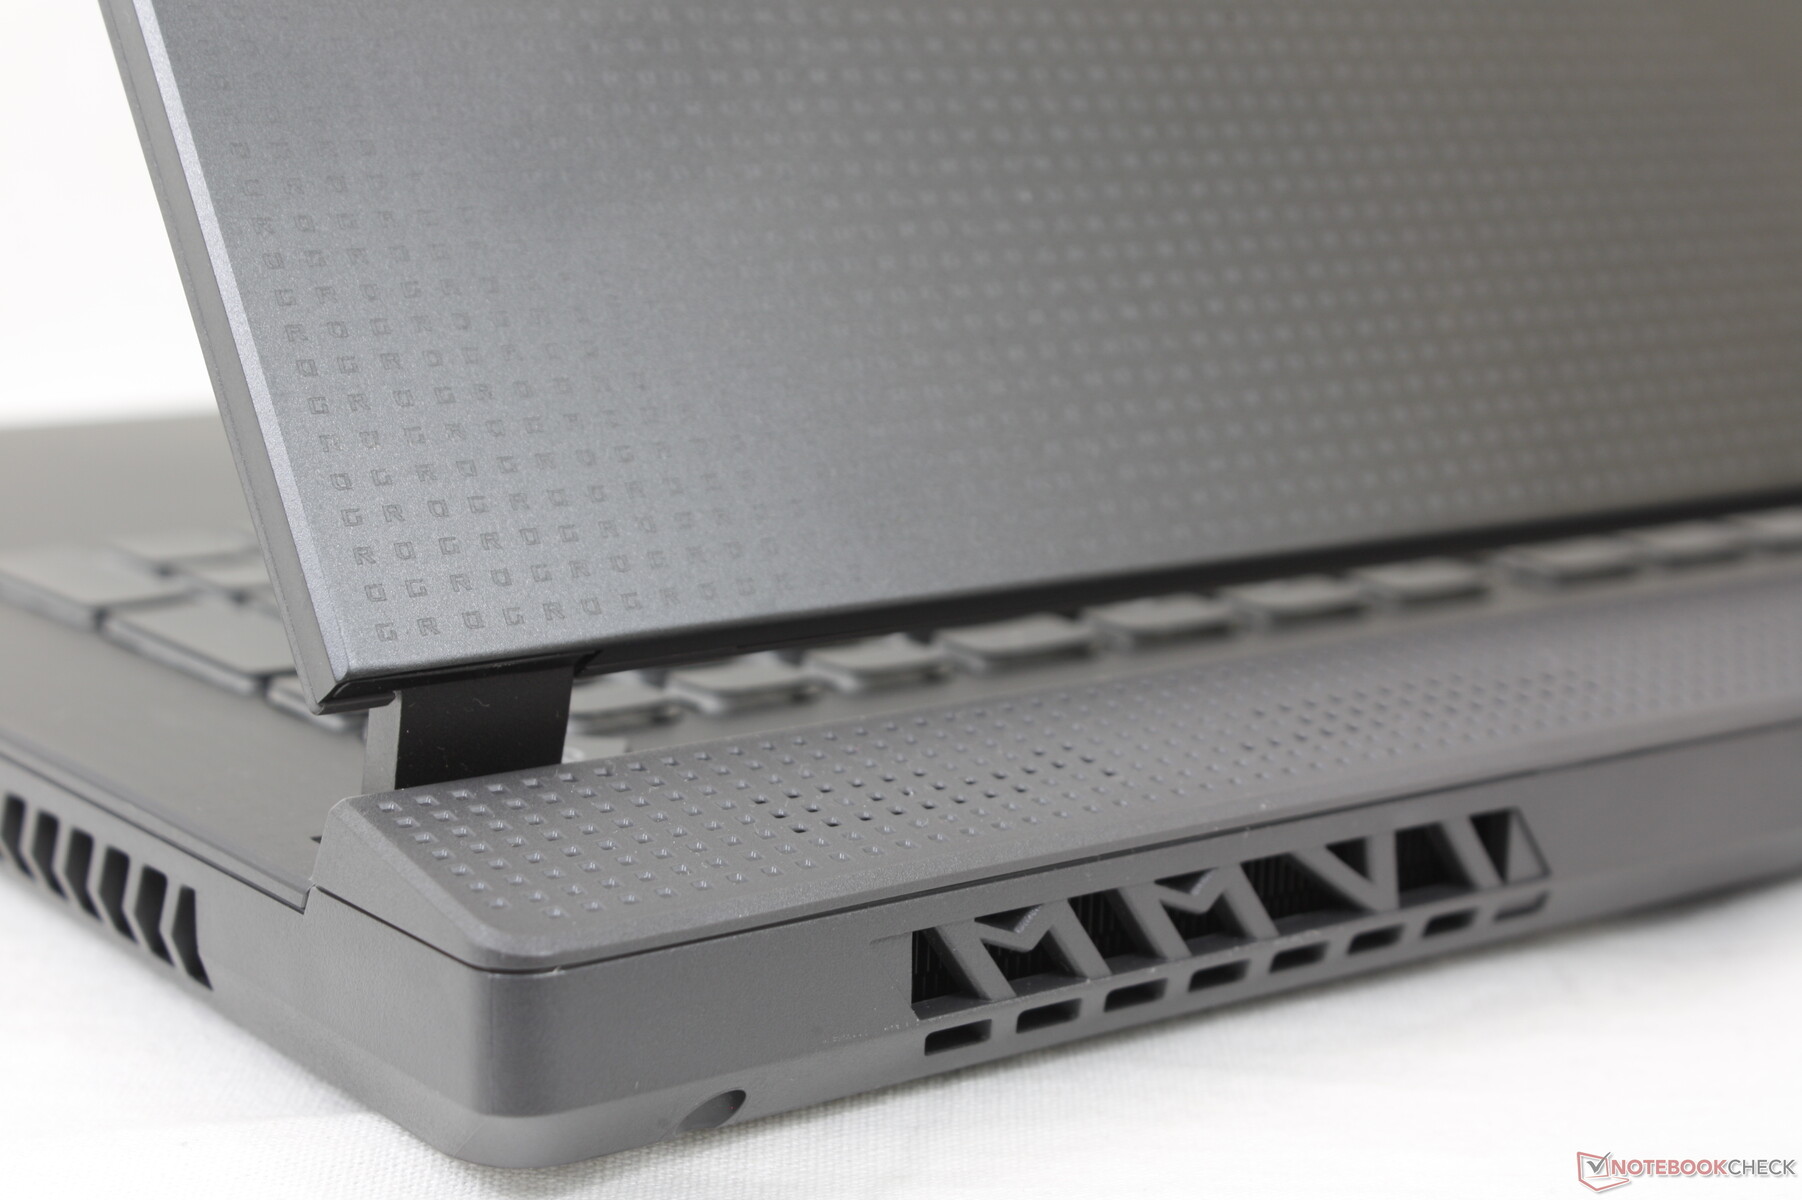
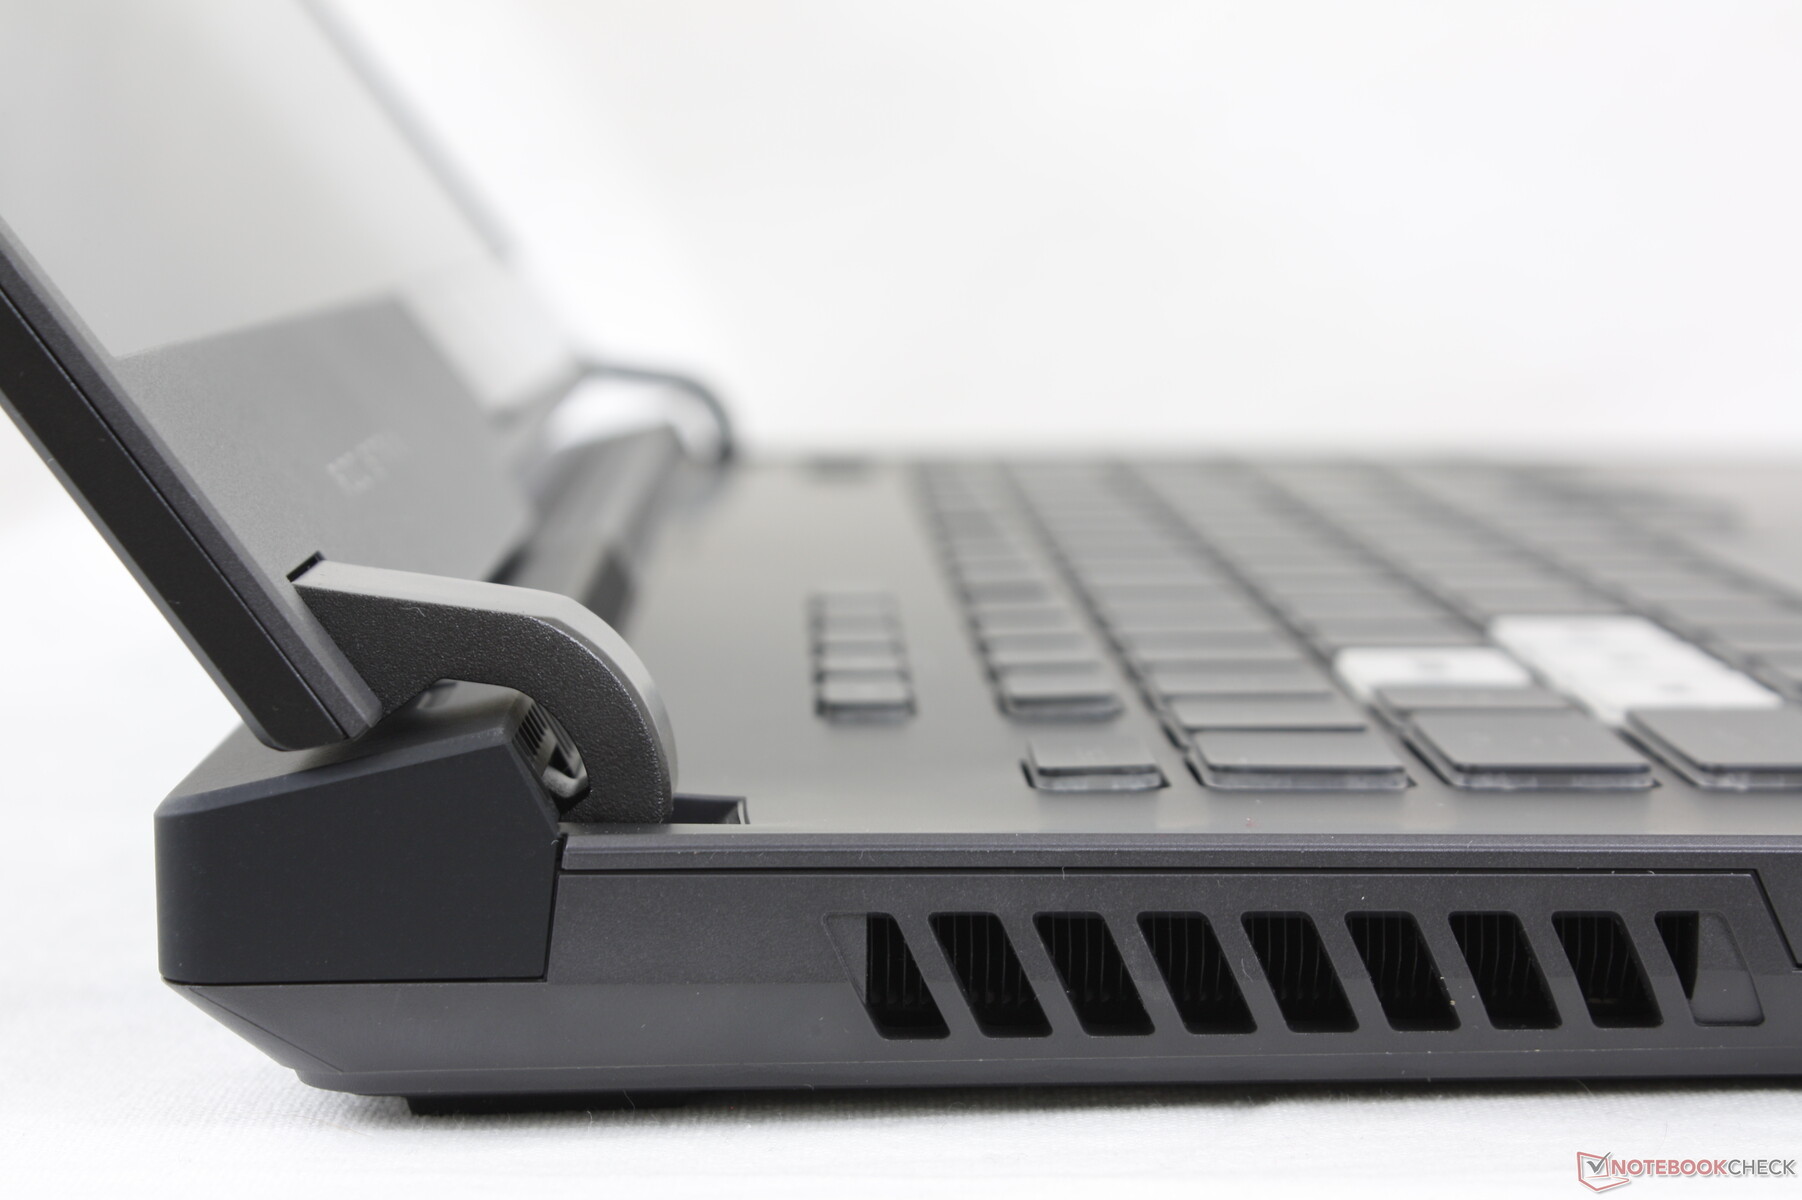
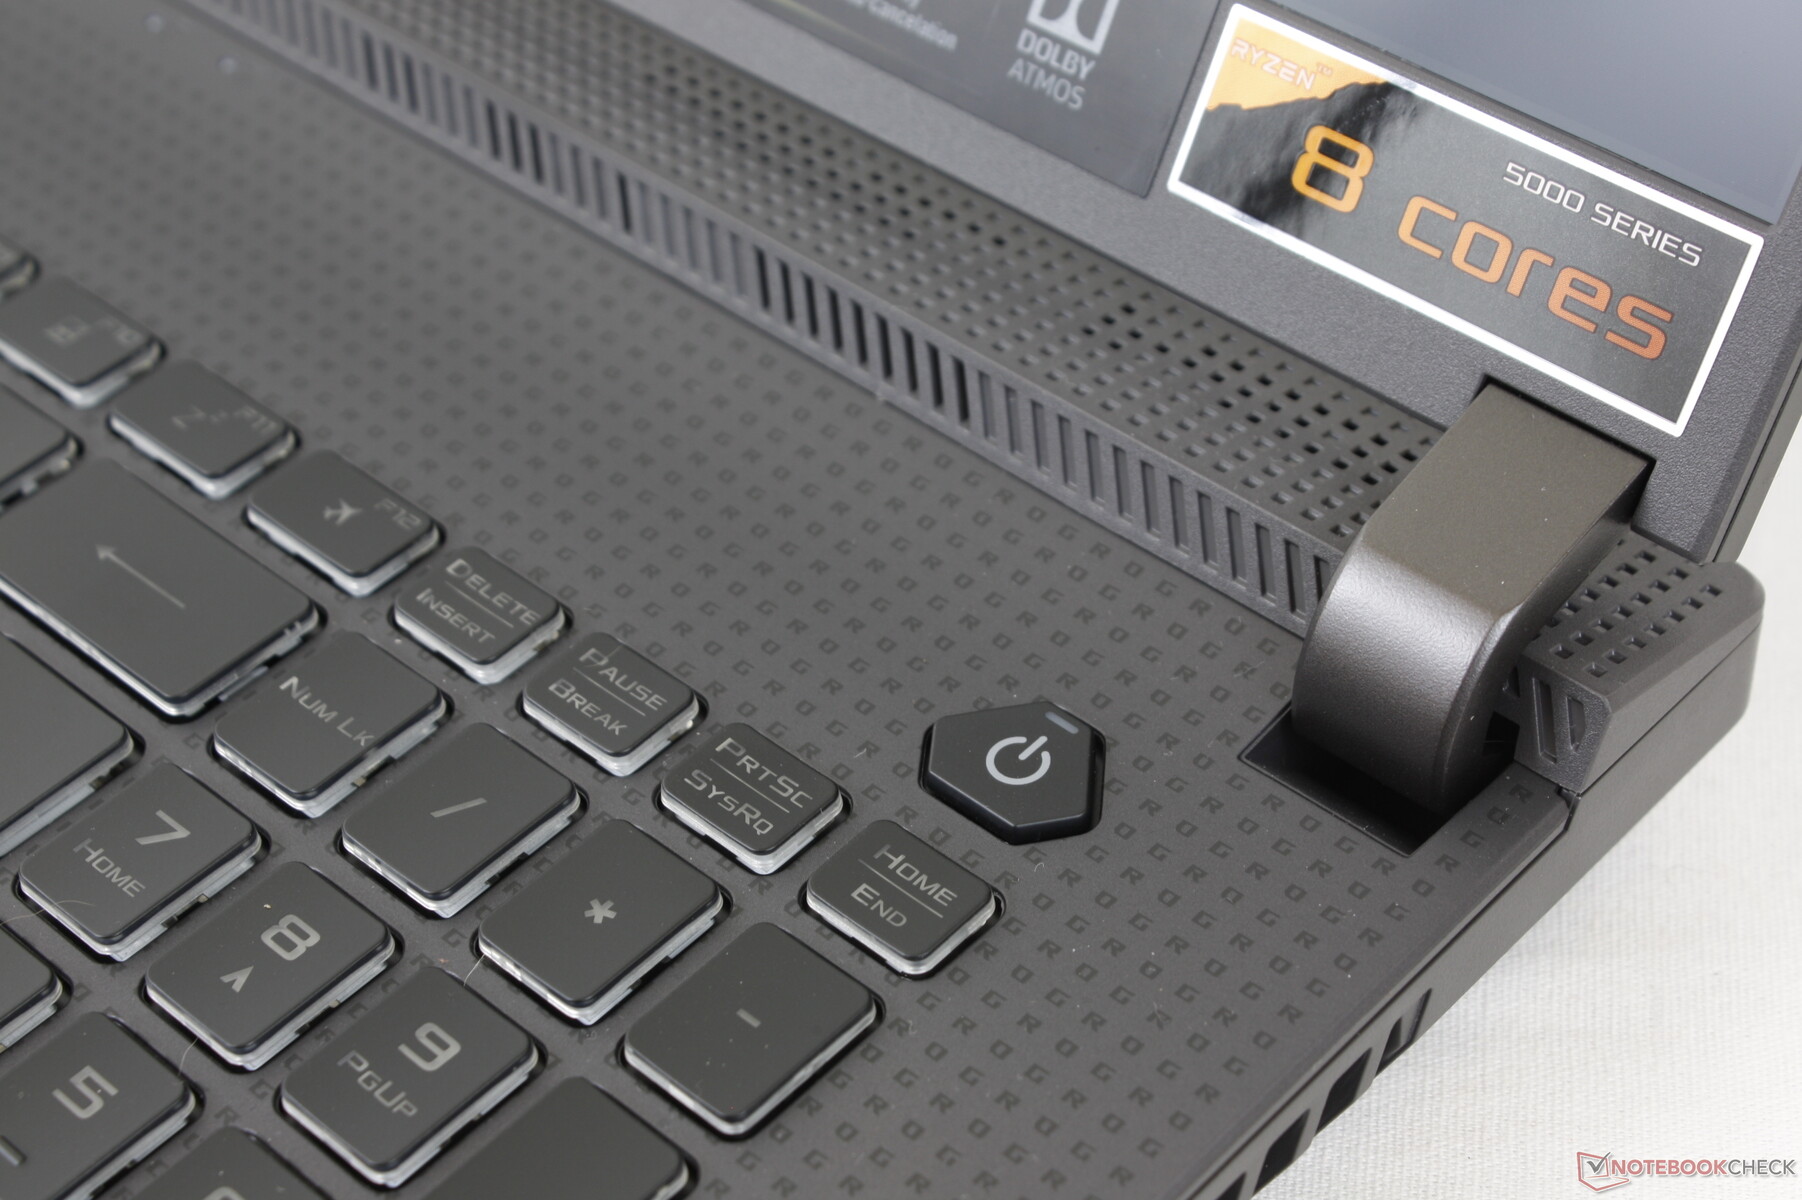
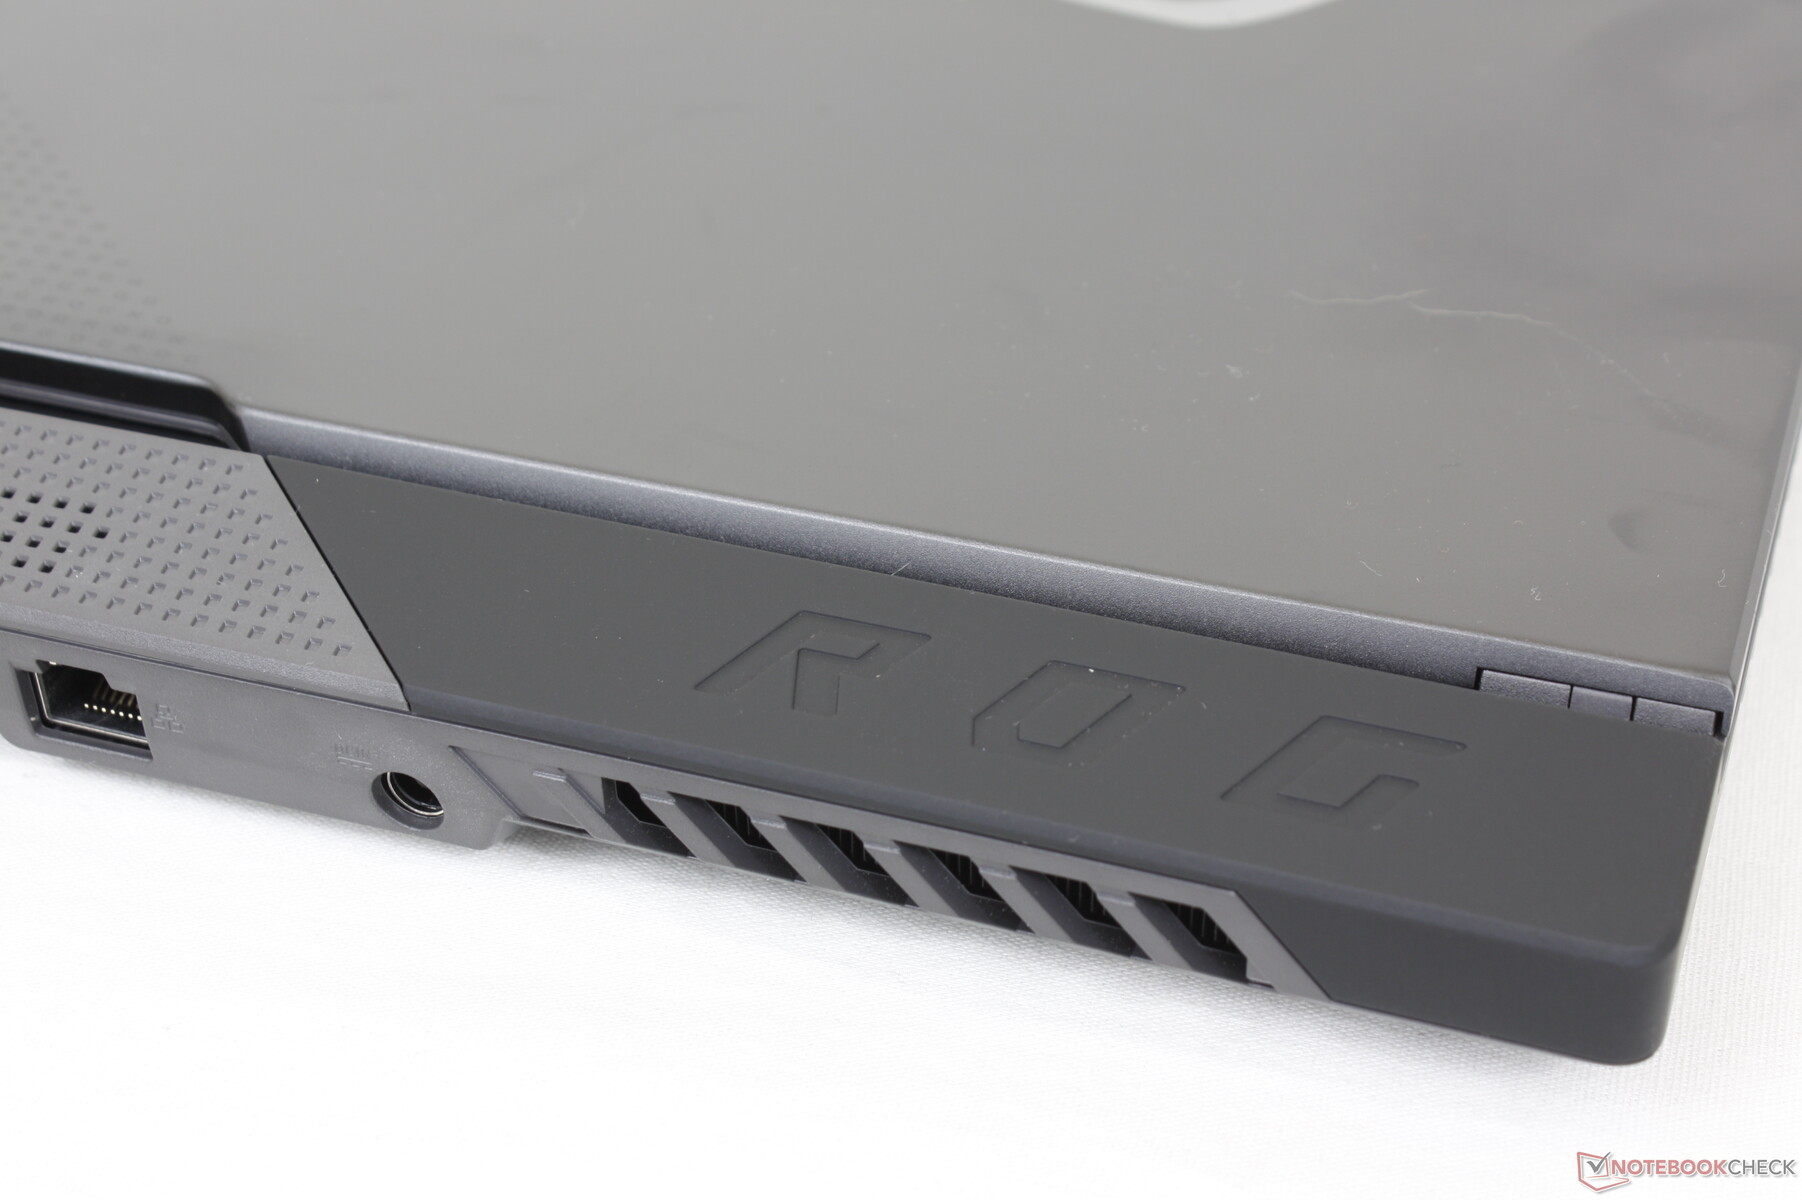
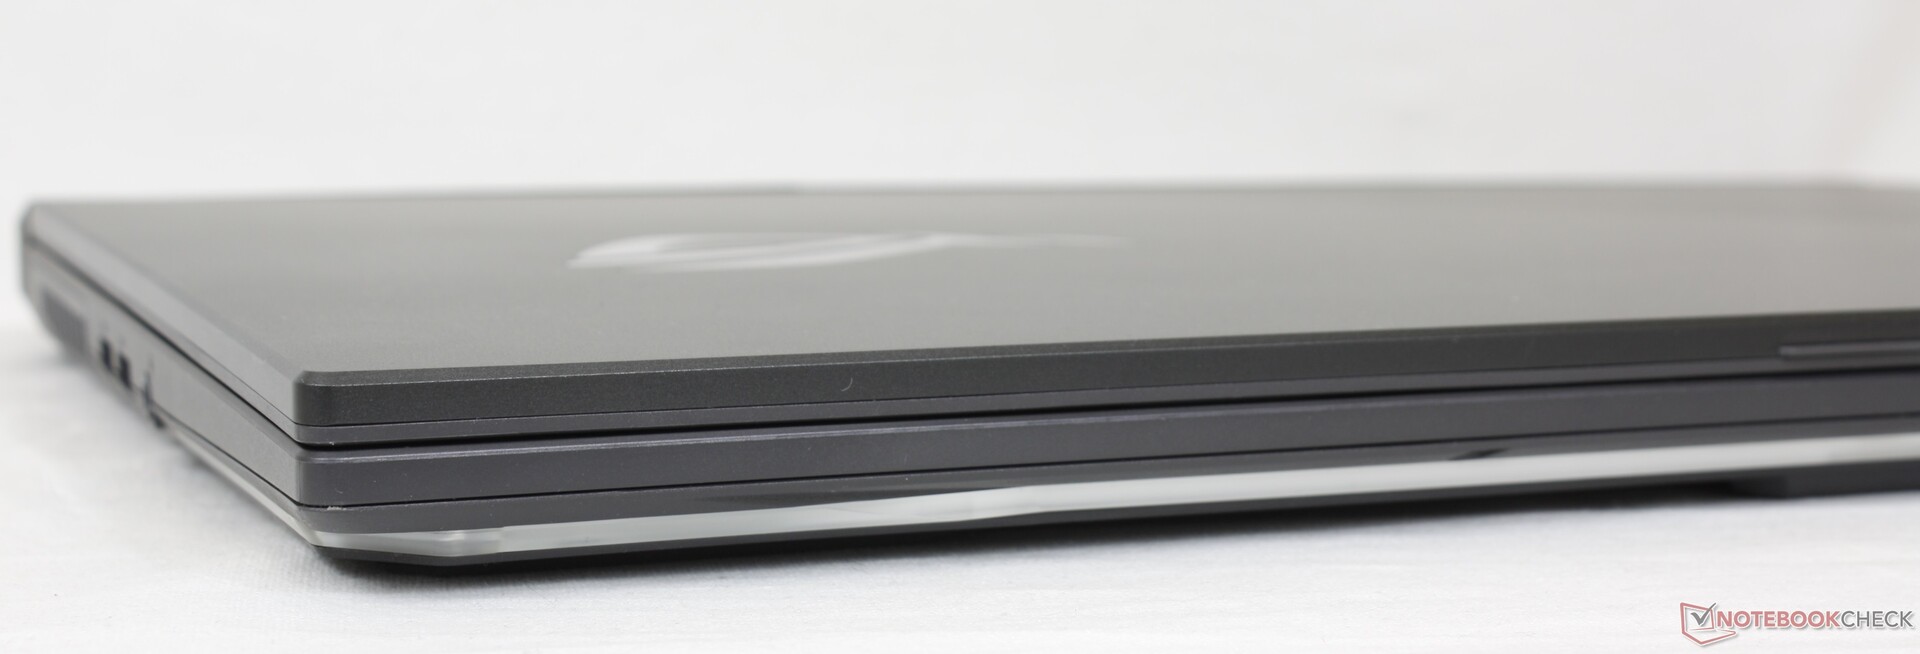
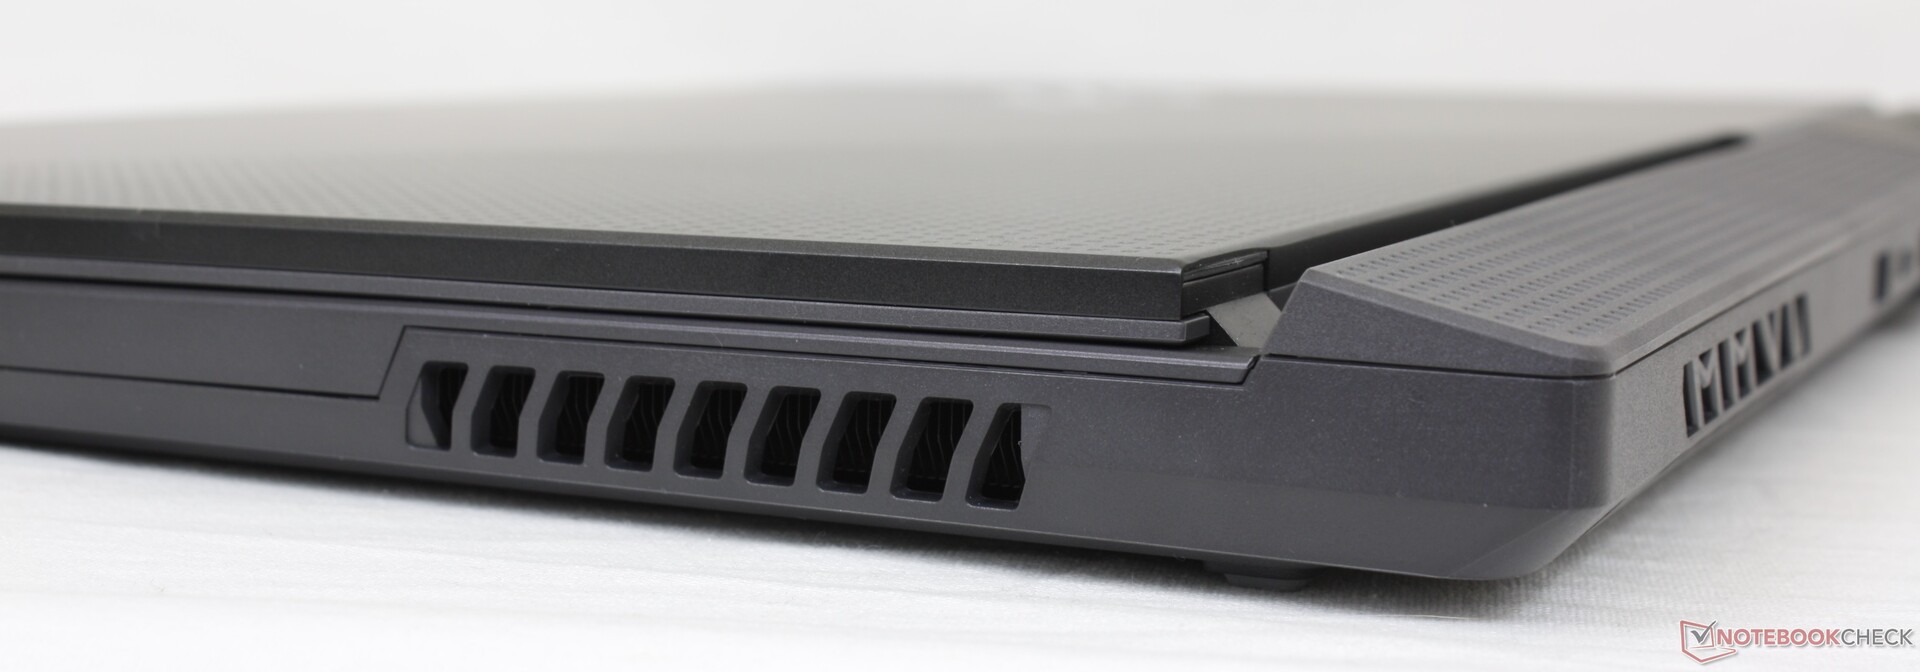
It can be difficult to tell apart all the different ROG Strix models since they share the same visual design. The extended "jet engine" rear, large visible hinges, thick chin bezel, slightly rubberized keyboard deck, and lack of an integrated webcam are all unchanged from previous generations. The main differences are down to styling as certain parts of the chassis are now flatter and smoother for a sleeker look. The right edge and outer lid, for example, are embellished with a new ROG pattern that isn't present on older models.
Chassis rigidity hasn't improved from last year's G712. It is, however, still stronger than the MSI GF or GP series especially when it comes to the hinges.
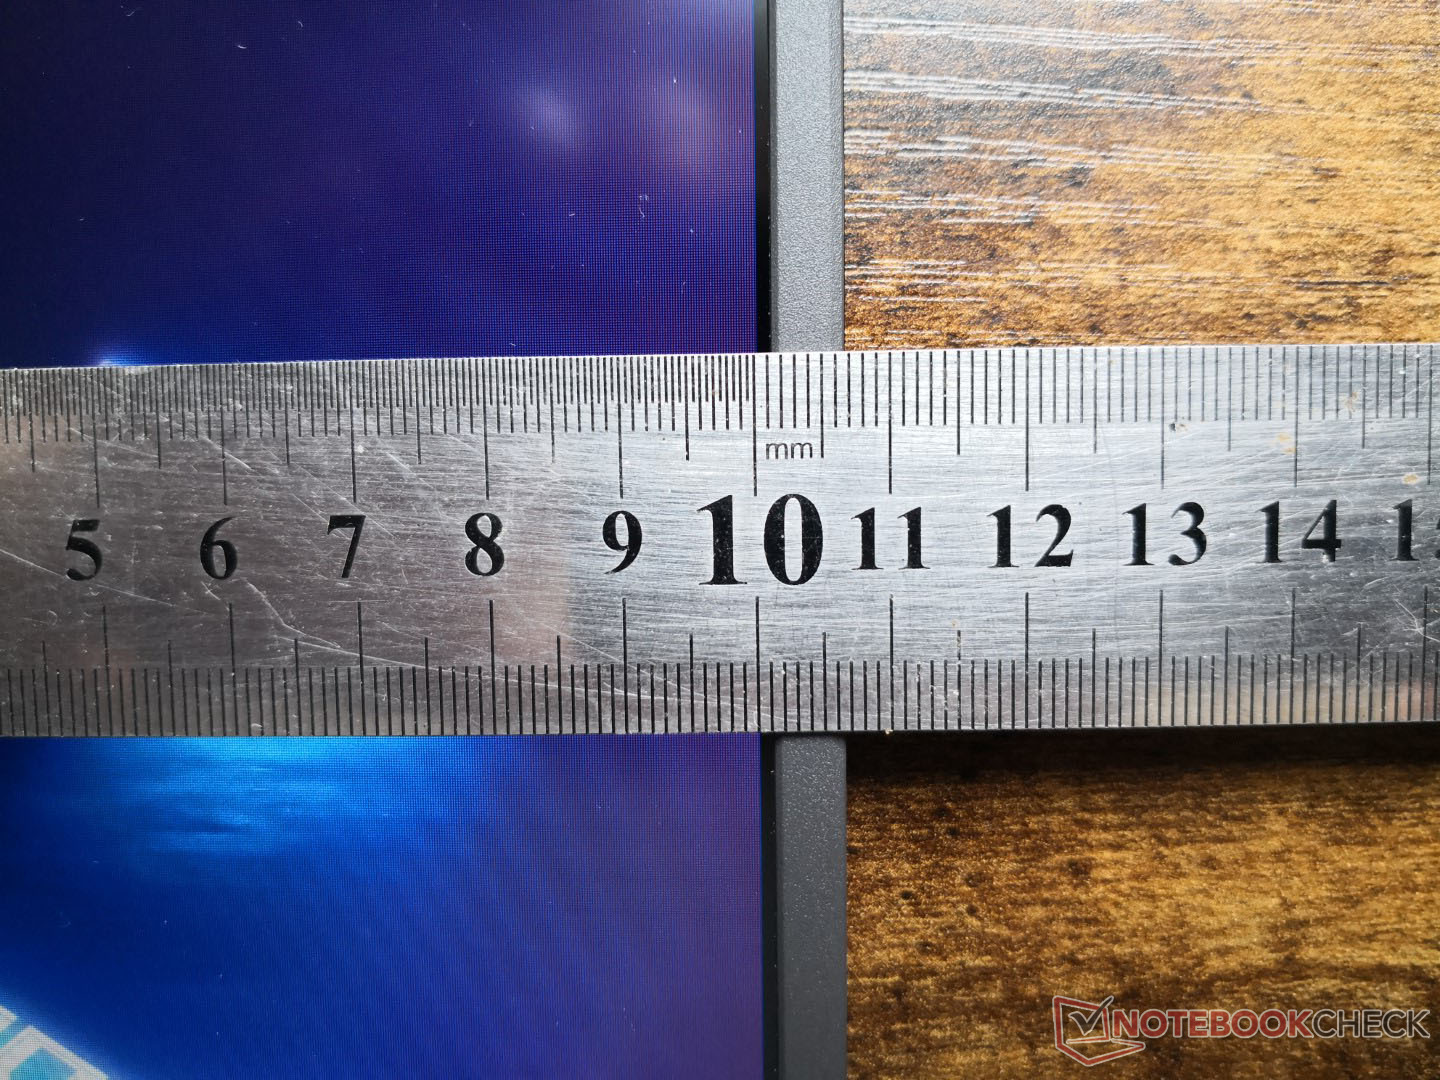
Annoyingly, the G713 comes in two versions differing in both weight and dimensions depending on the configuration. Our specific unit is the smaller version with a thickness and weight of 2.46 cm and 2.5 kg, respectively, while configurations with the RTX 3060 or faster are thicker (2.83 cm) and heavier (2.7+ kg). It's a hefty system regardless sitting in between the thinner Zephyrus S17 and the thicker Lenovo Legion 5.
Connectivity — No Thunderbolt
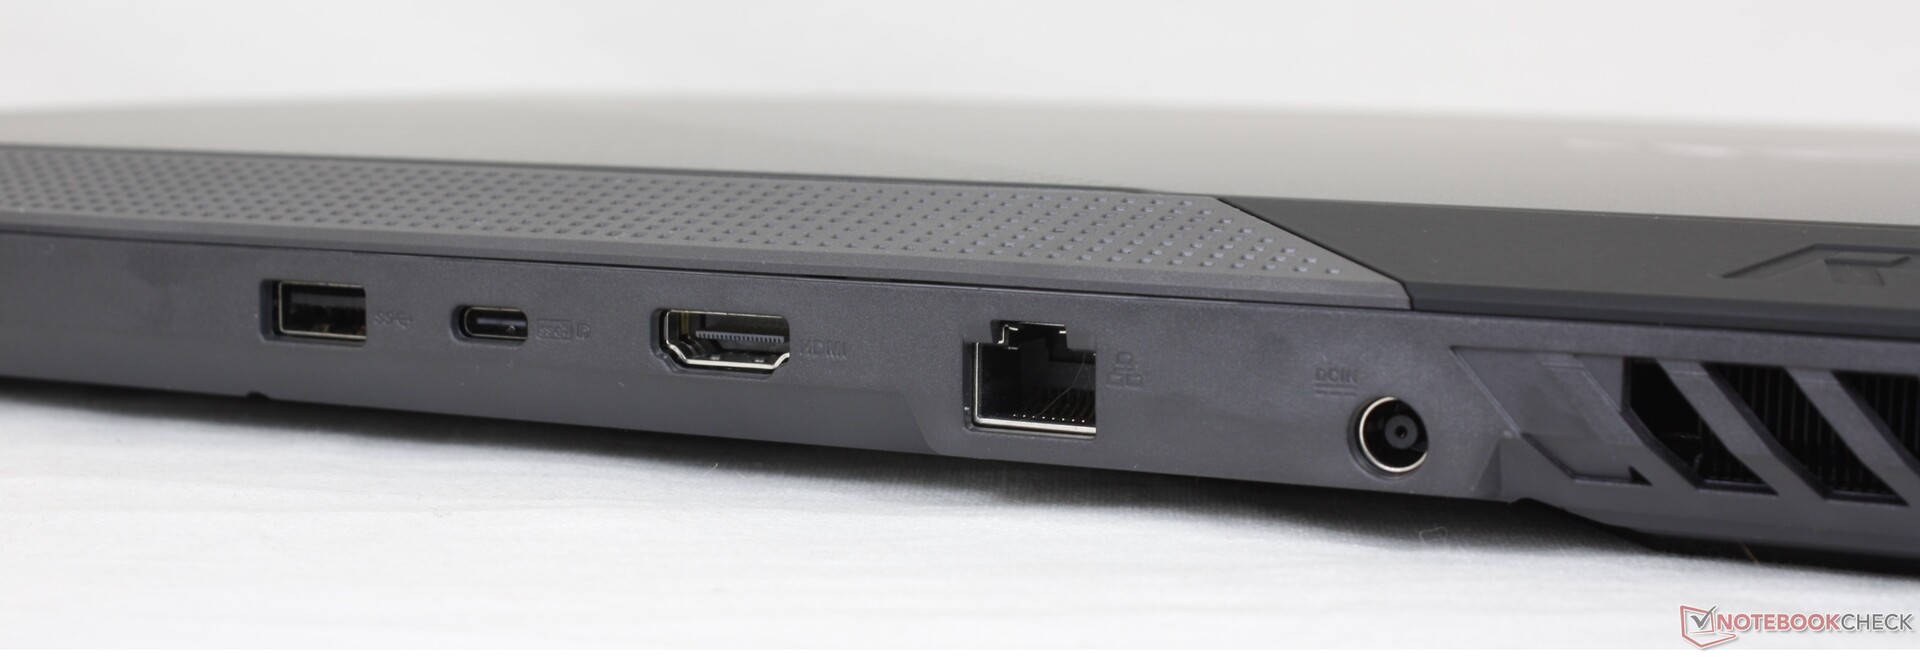
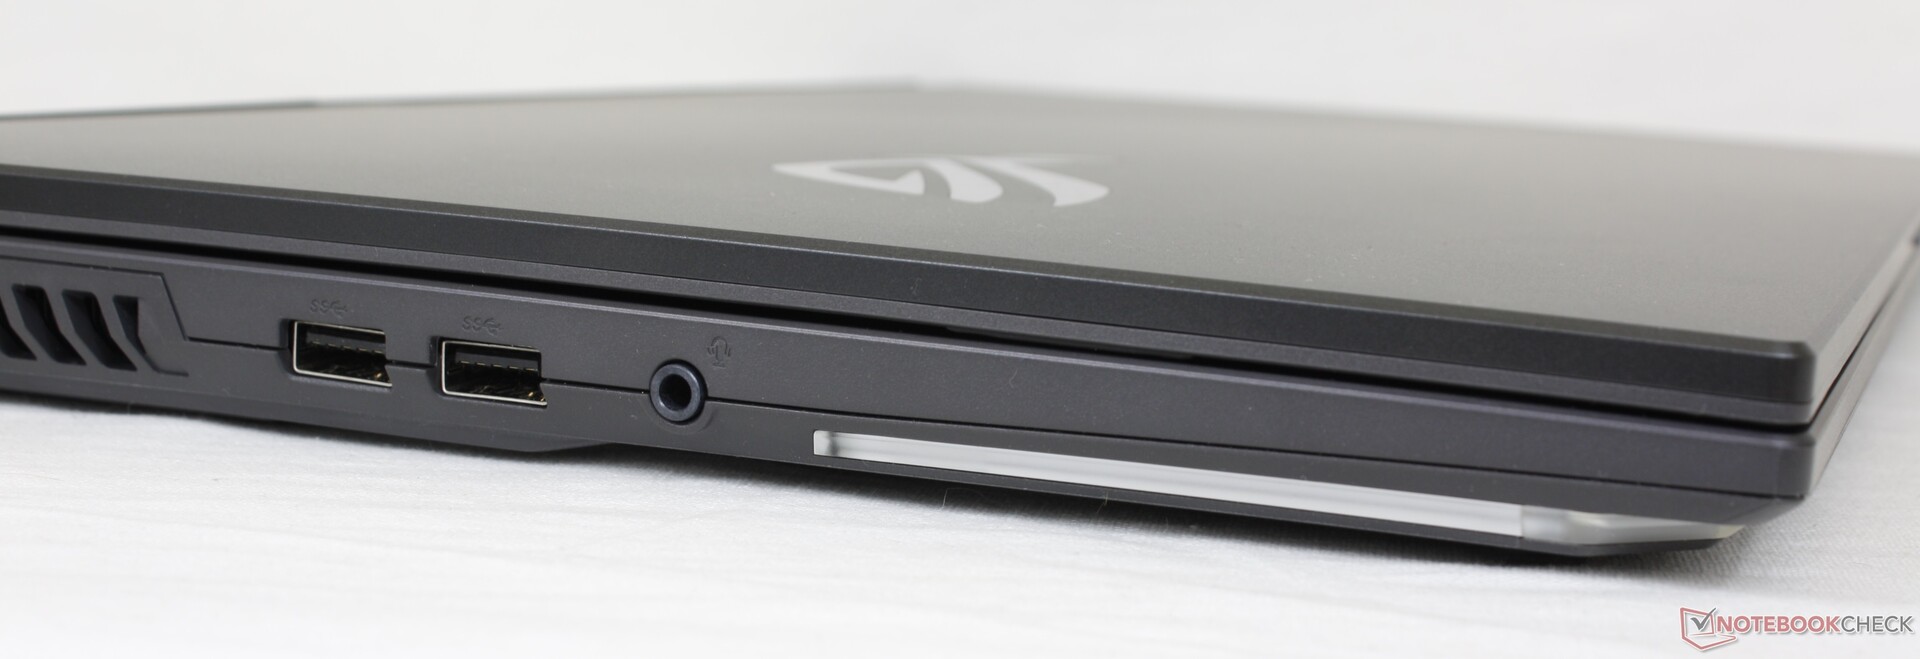
Ports are identical to the pricier G733QS but without Asus Keystone since the manufacturer likes to reserve the feature only for its flagship models. Port positioning may be unfavorable for some users as there are no ports along the right edge while the ports along the rear can be difficult to reach.
Communication
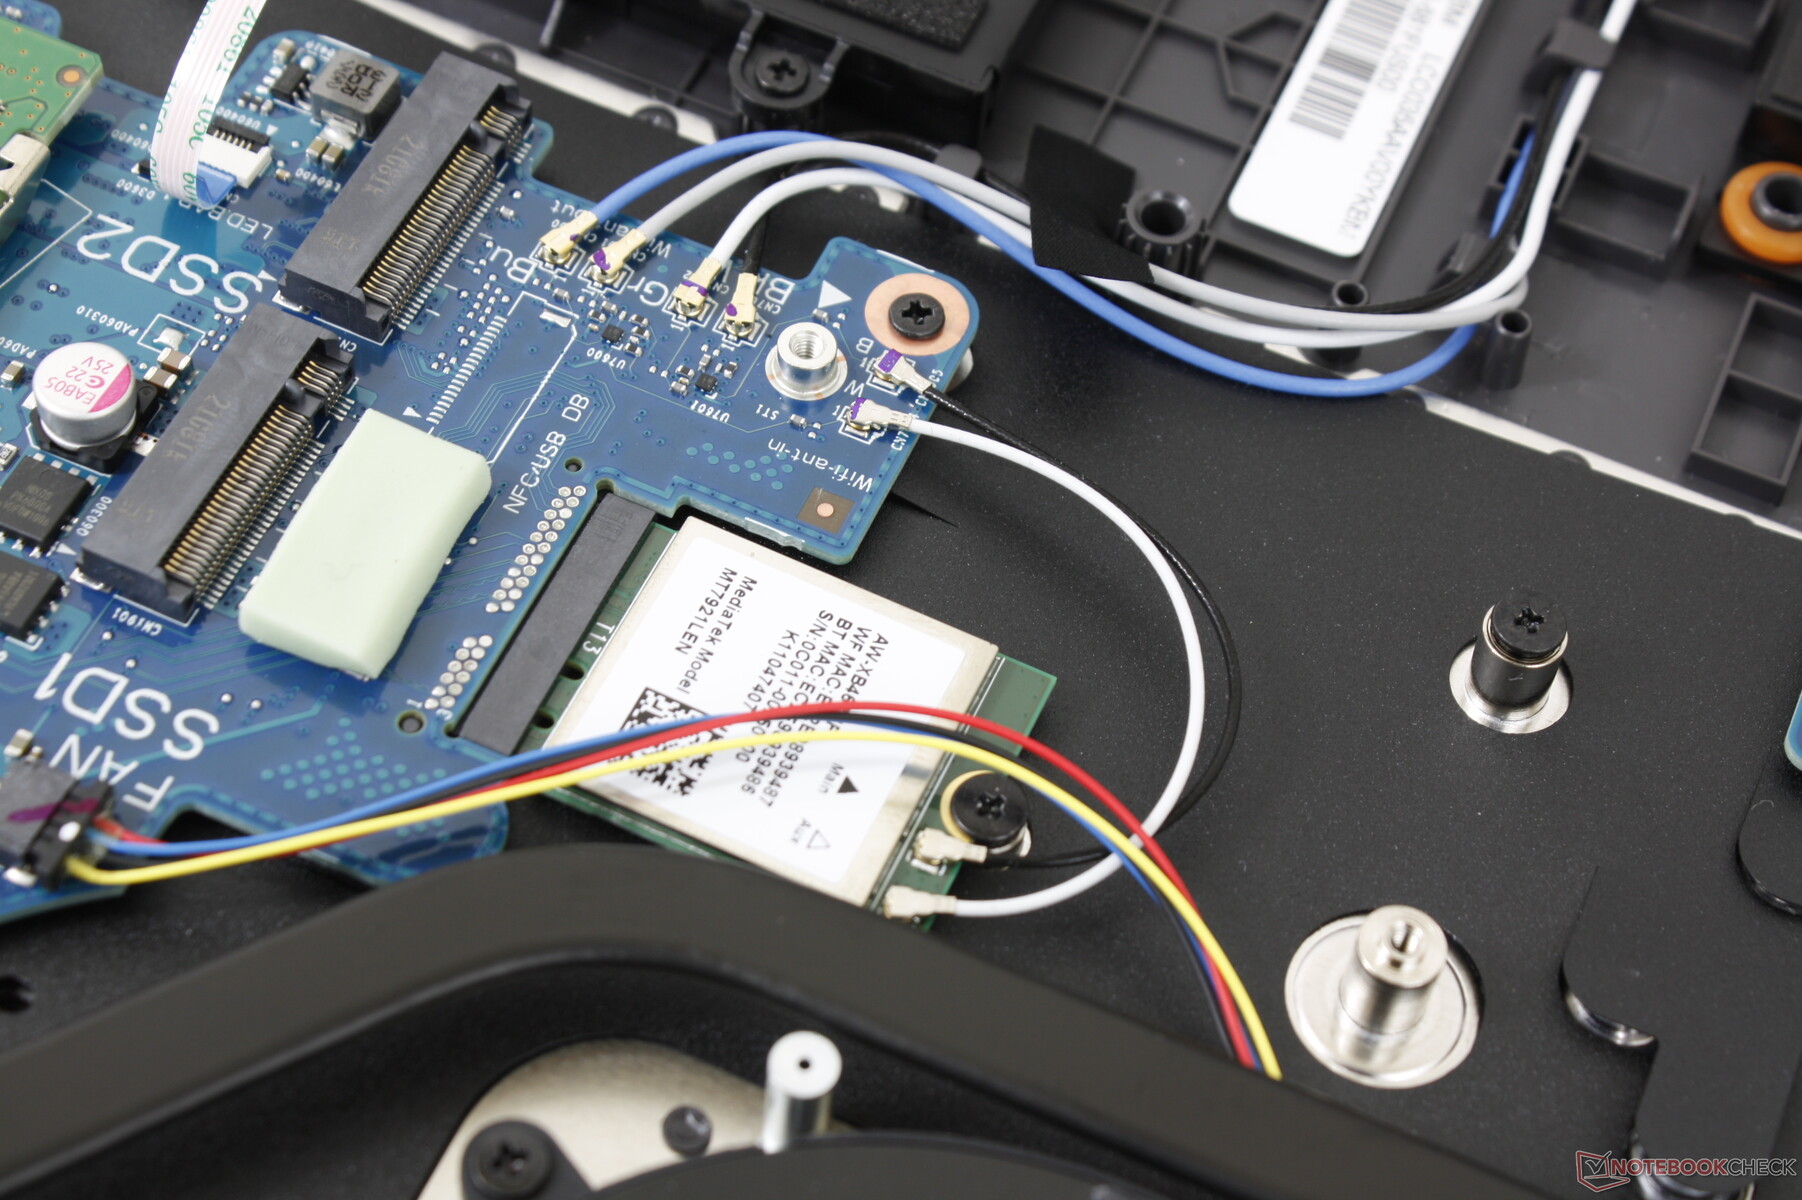
The Wi-Fi 6-enabled MediaTek MT7921 competes against the more common Intel AX200/201 series. Though reliable in terms of browsing and video streaming, its performance is not as fast as the Intel solution which regularly hits above 1 Gbps.
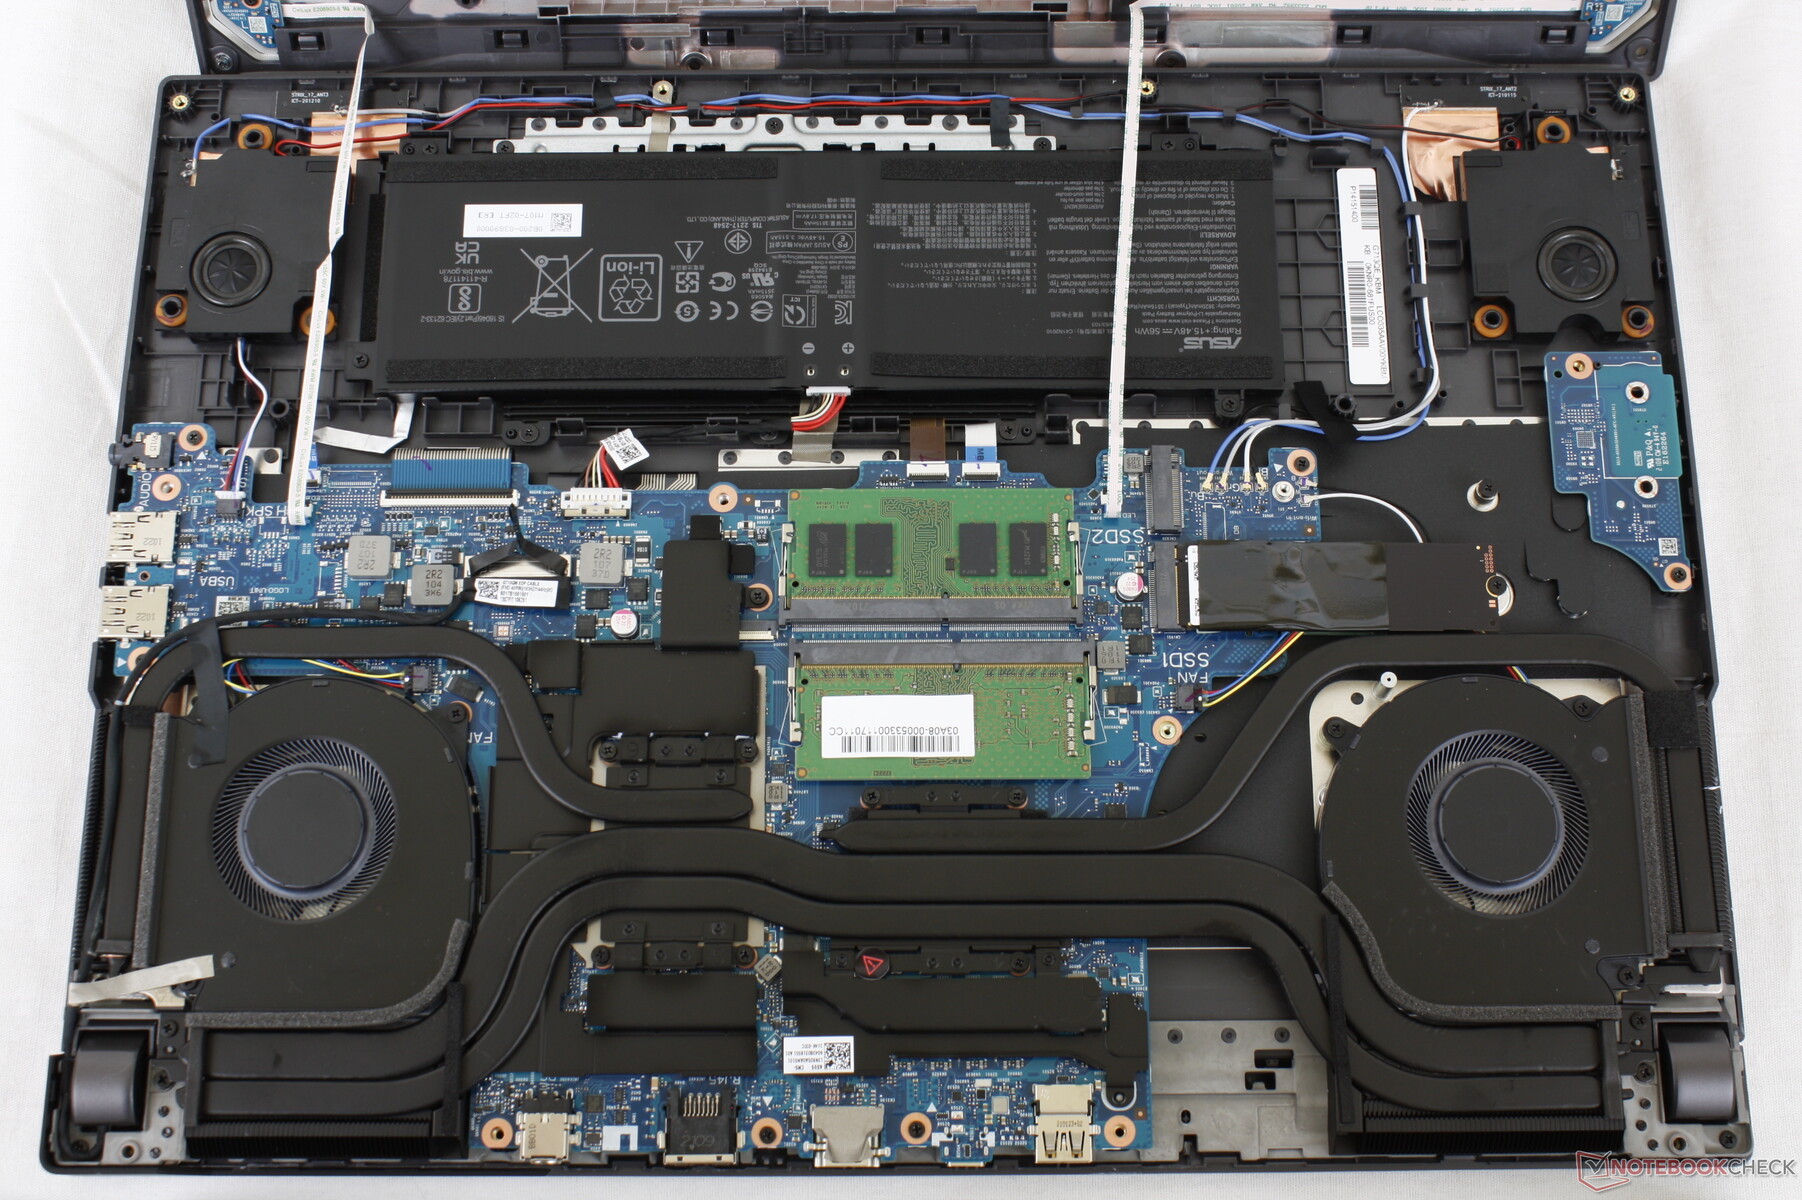
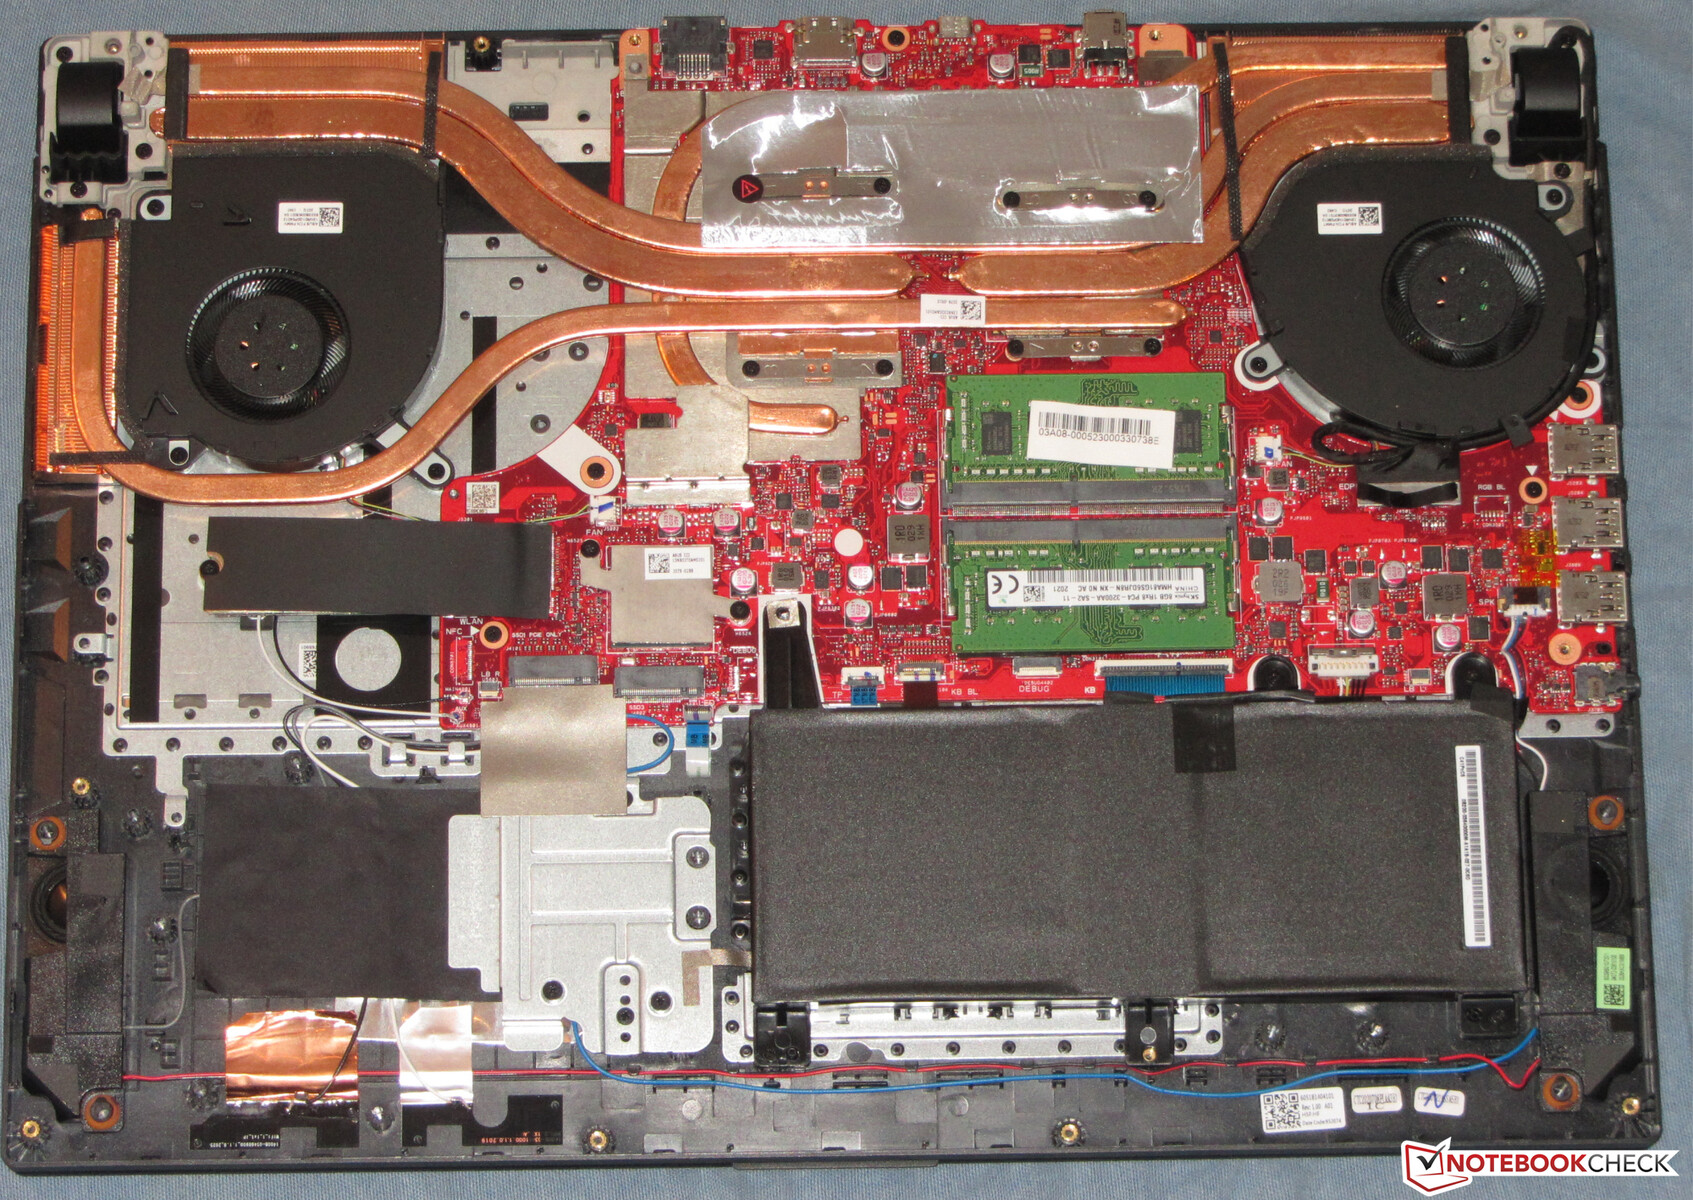
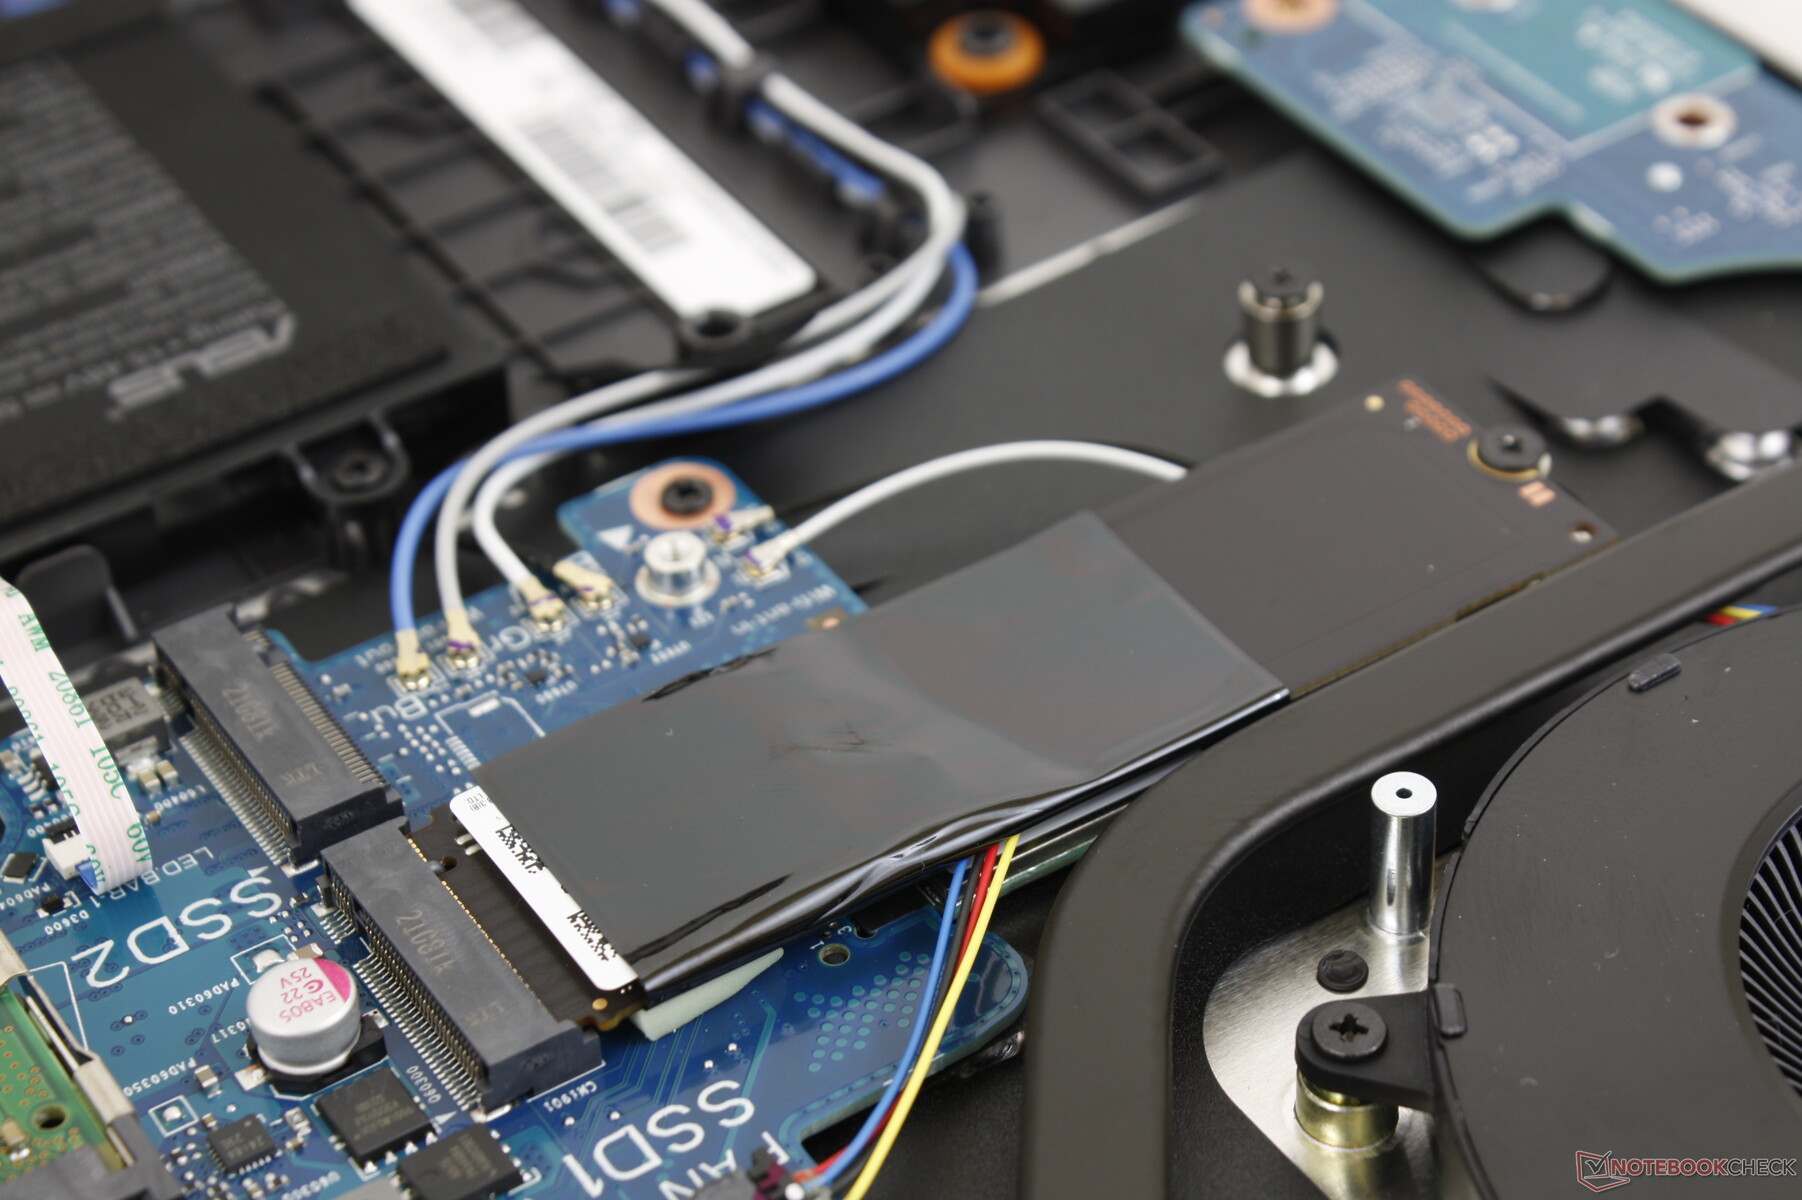
Maintenance — Easy Upgrades
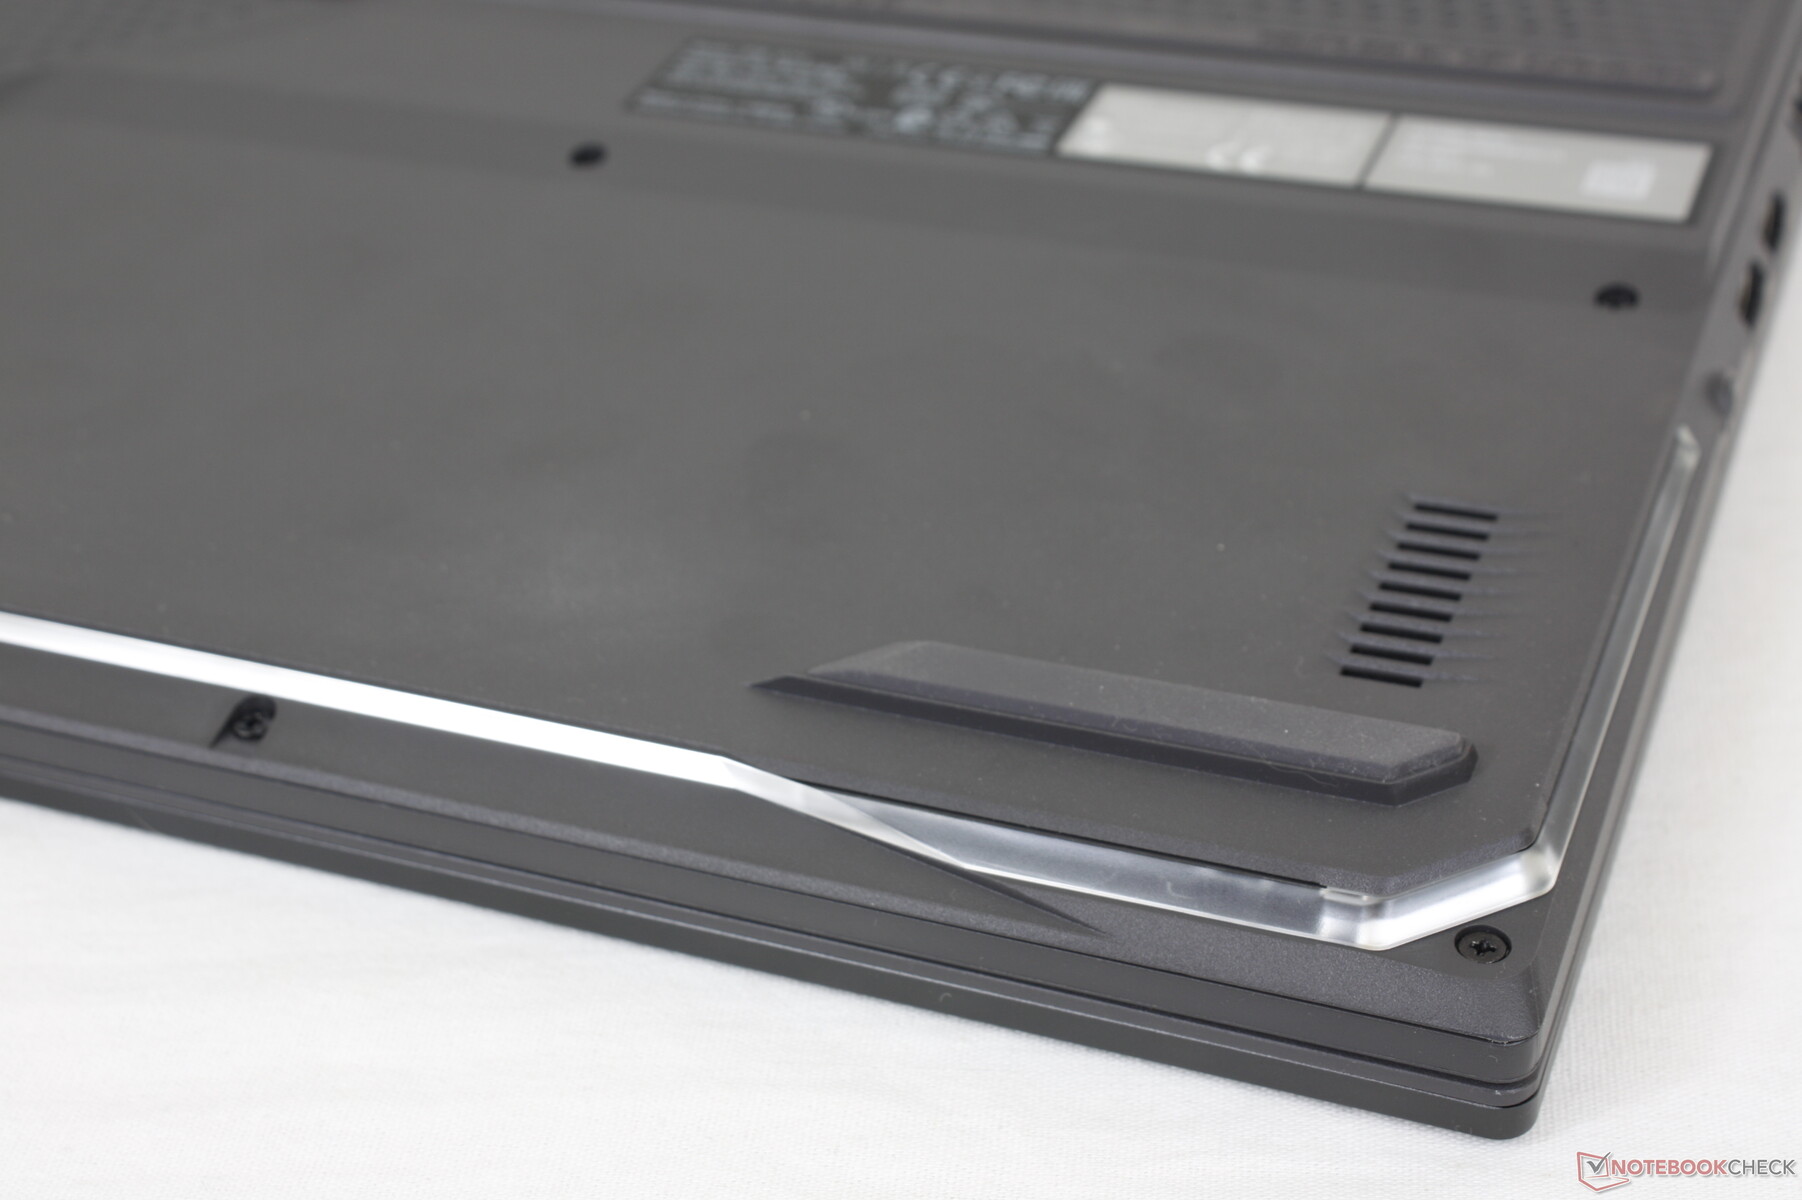
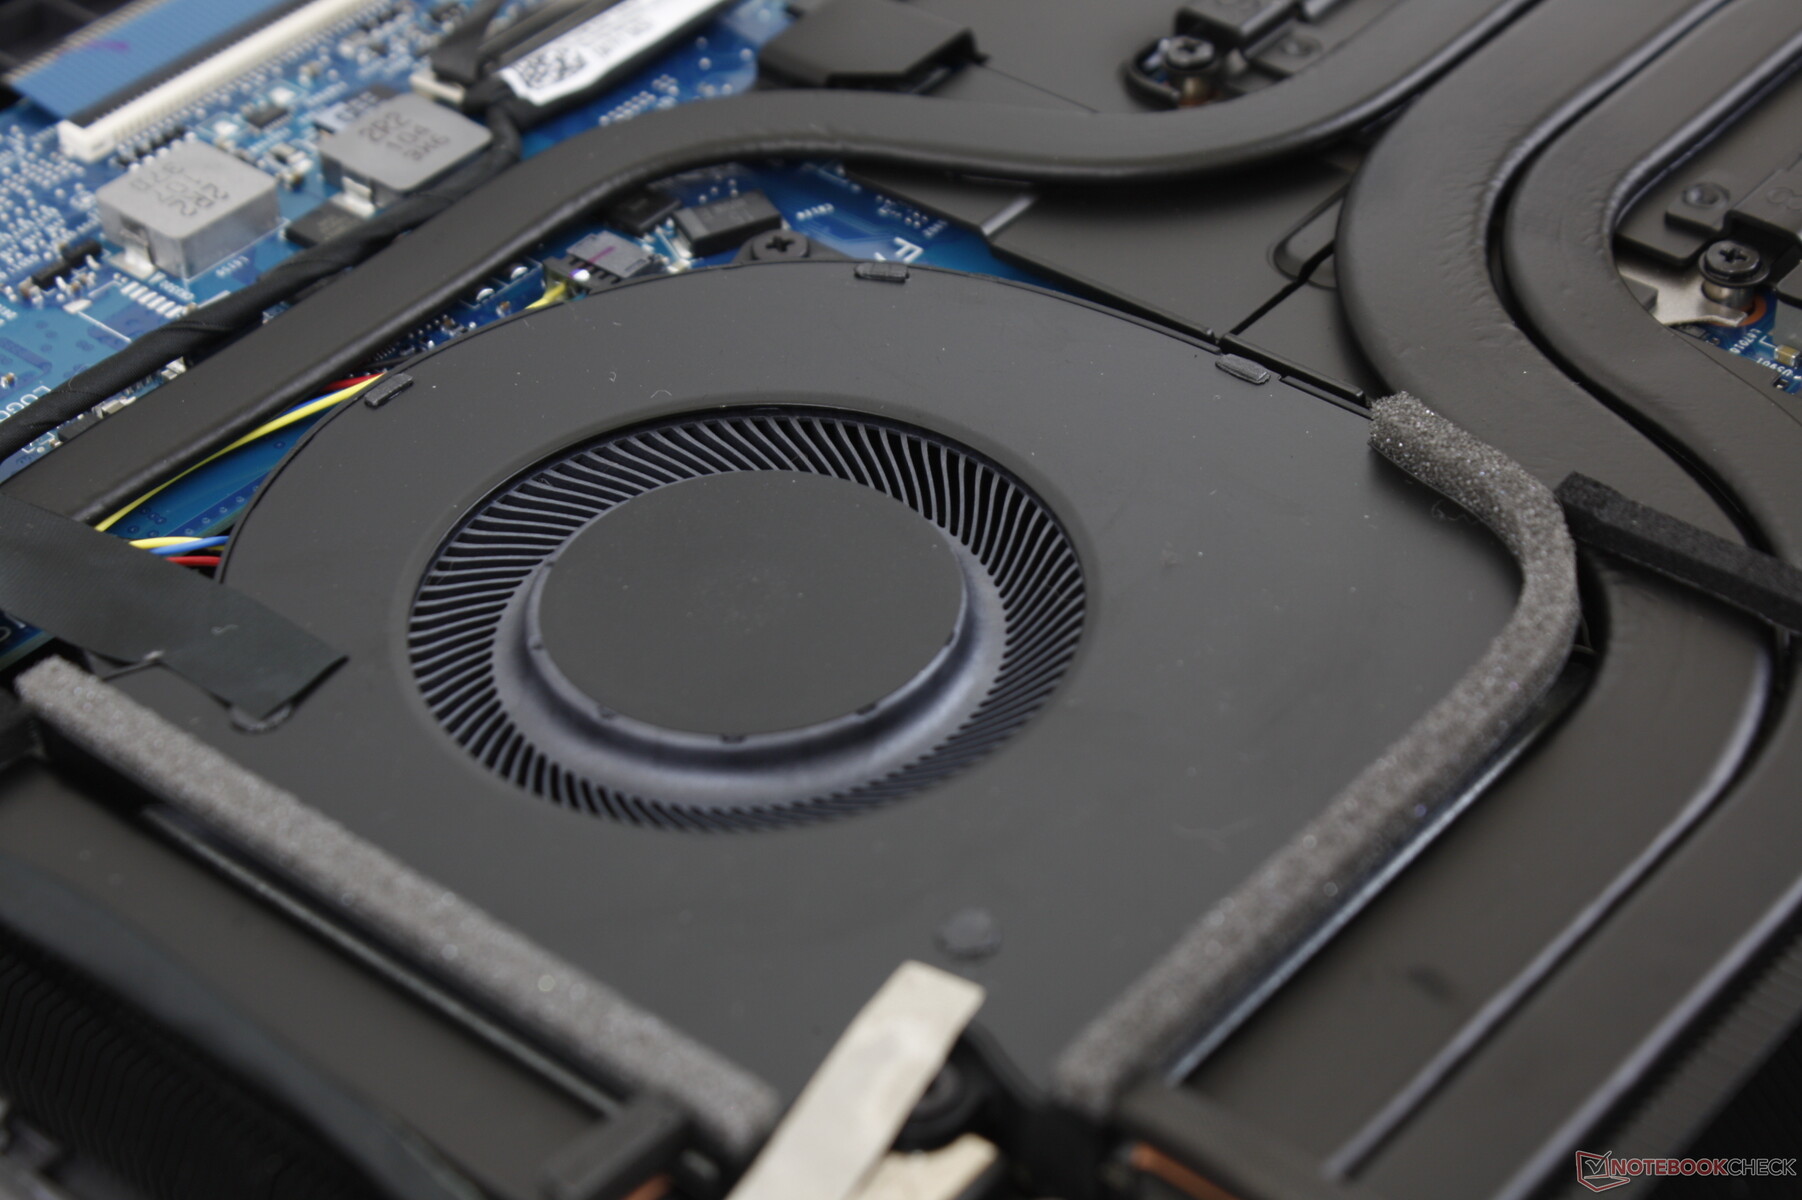
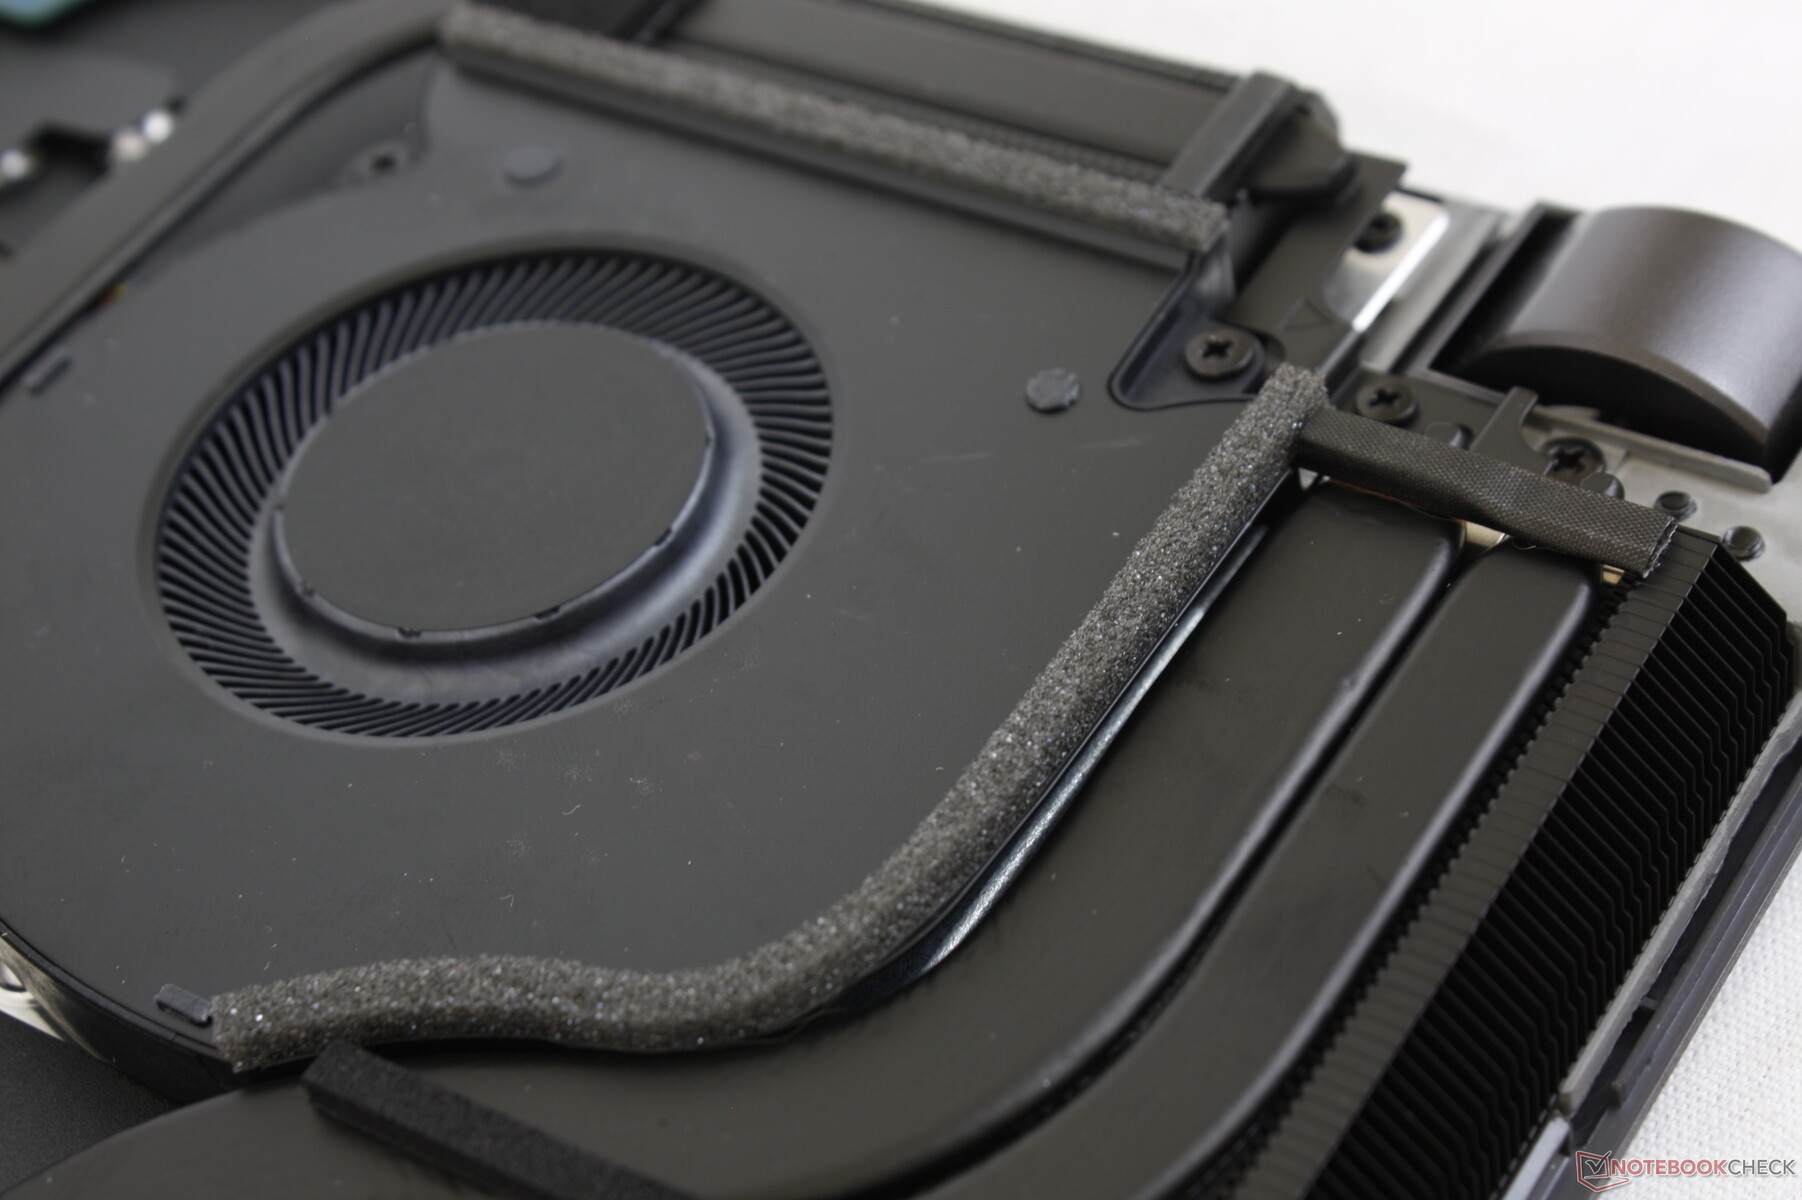
The bottom panel is tightly latched to the base and so a sharp edge is required for disassembly. Internally, the system differs significantly from the G712 in terms of battery, speakers, and the size of the cooling solution.
Be sure to not damage the two fragile ribbons connecting the bottom panel to the motherboard. These ribbons are not present on most other laptops since the G713 has customizable LEDs along the front edge.
Accessories and Warranty
There are no extras in the box outside of the AC adapter and paperwork. The usual one-year limited manufacturer warranty applies.
Input Devices — Loud and Clicky
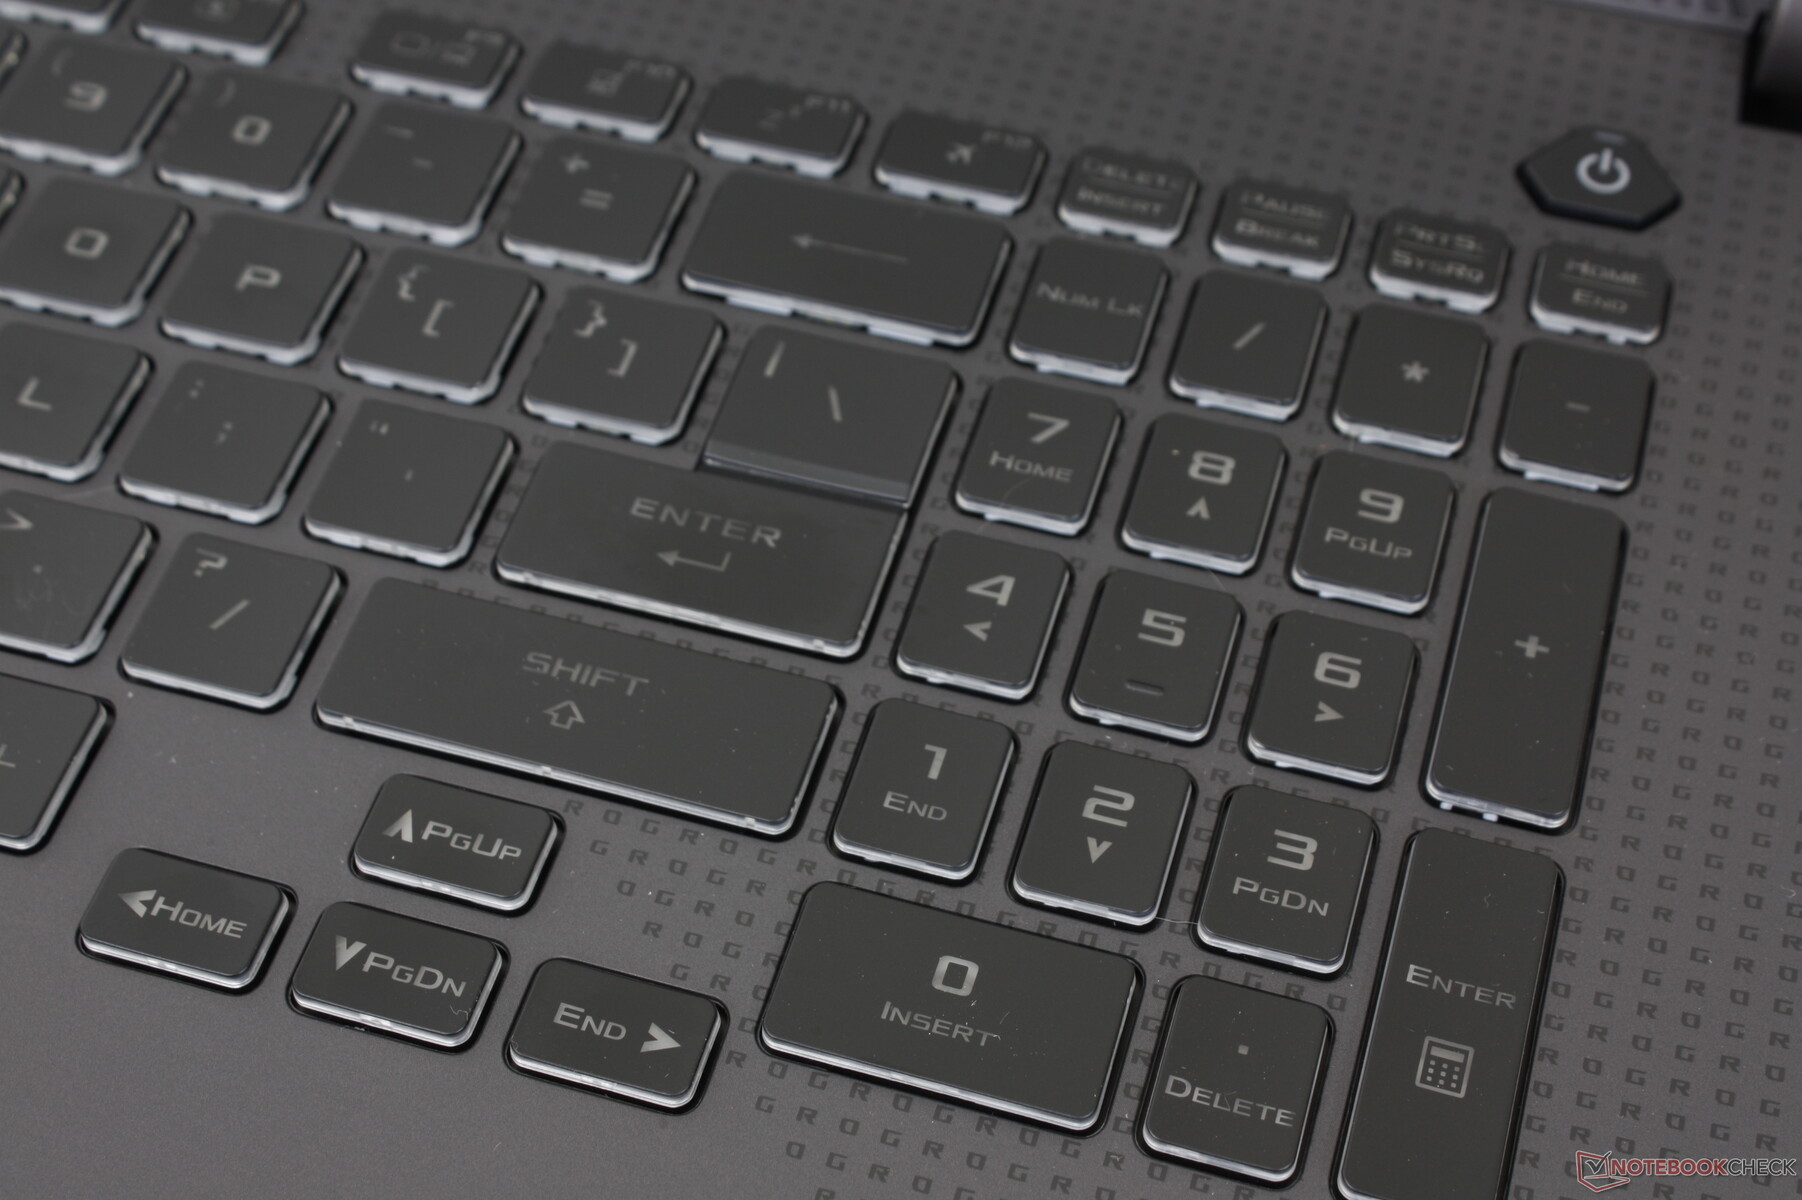
Keyboard
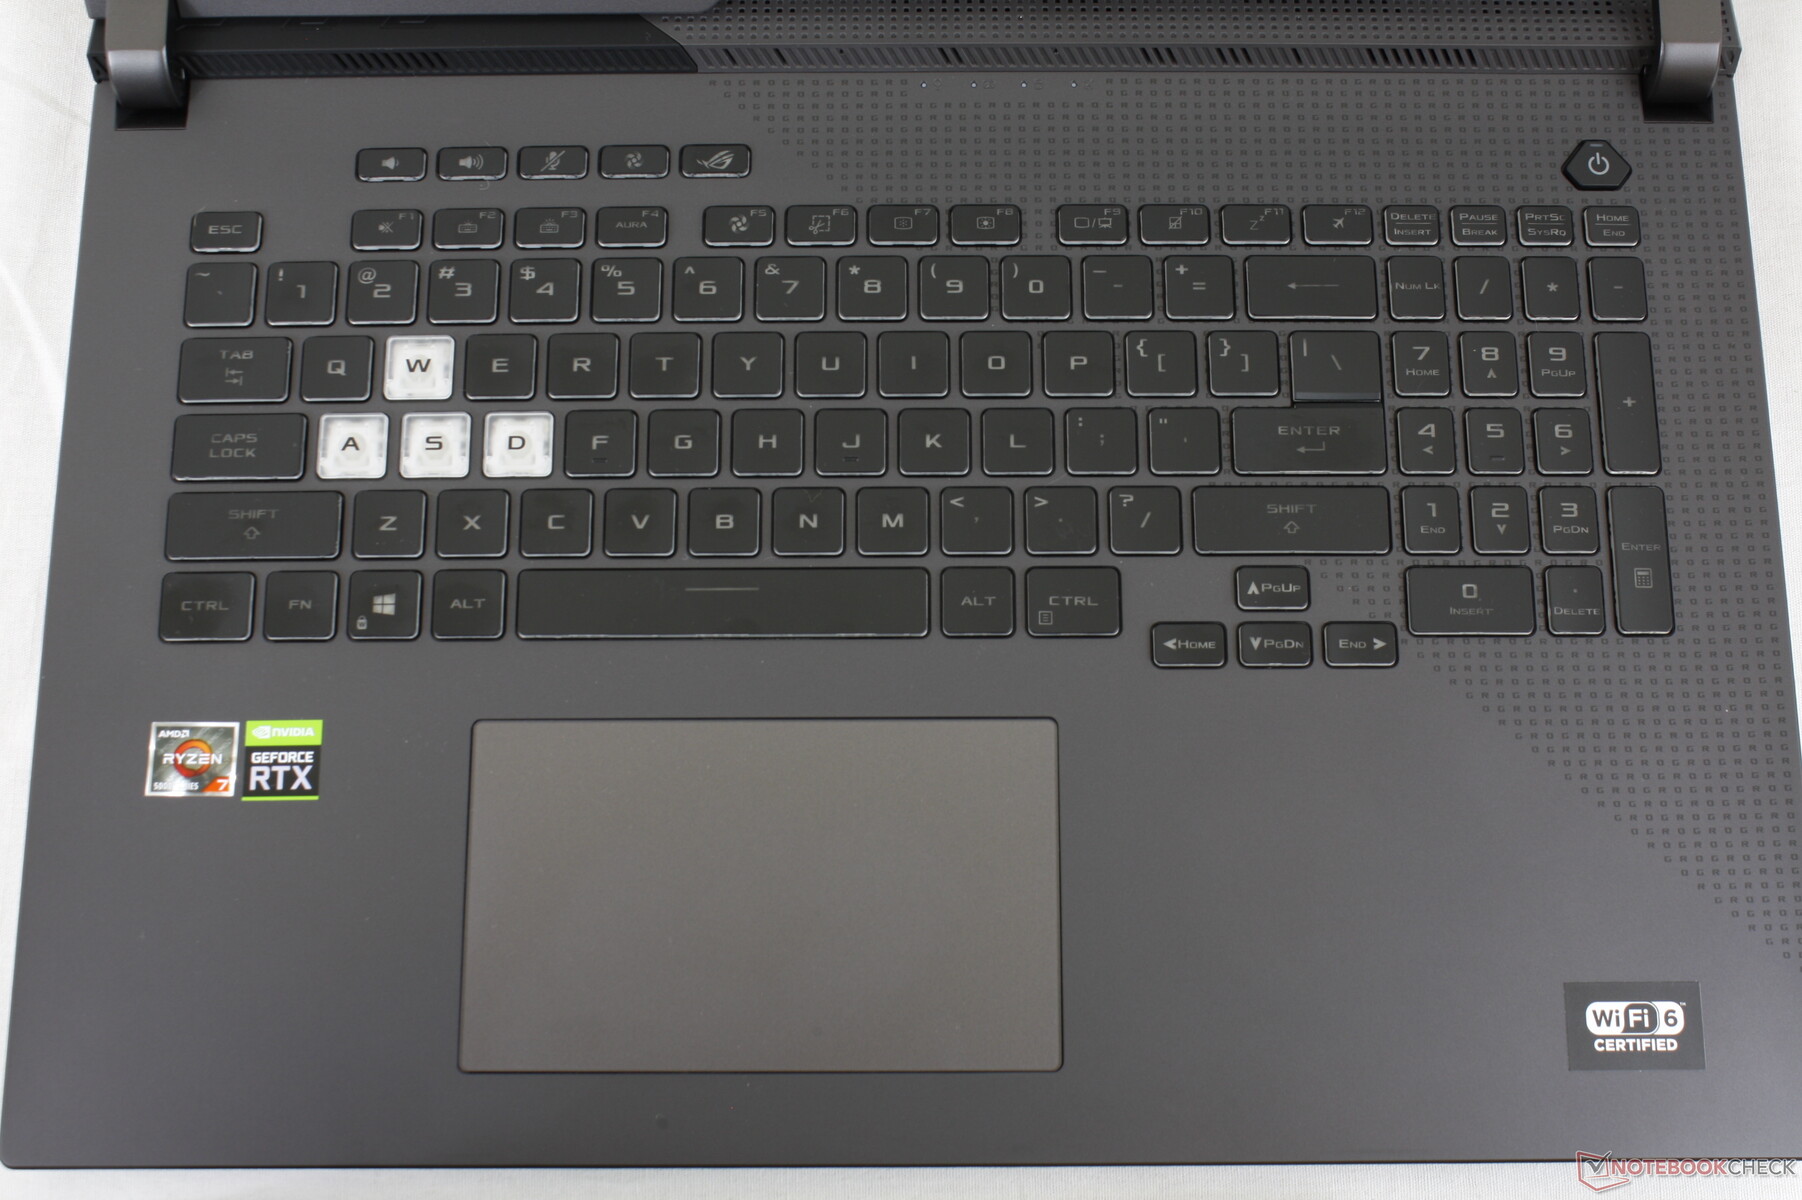
Save for the most recent flagship models with mechanical switches, the typing experience on most ROG Strix laptops are nearly identical since they all utilize similar chassis designs. Keys have deeper and more satisfying feedback than on a Razer laptop but with louder clatter than on the MSI Katana. The numpad and arrow keys remain smaller and more cramped than the main QWERTY keys.
Four-zone RGB lighting is available on most SKUs while the higher-end SKUs have per-key RGB lighting.
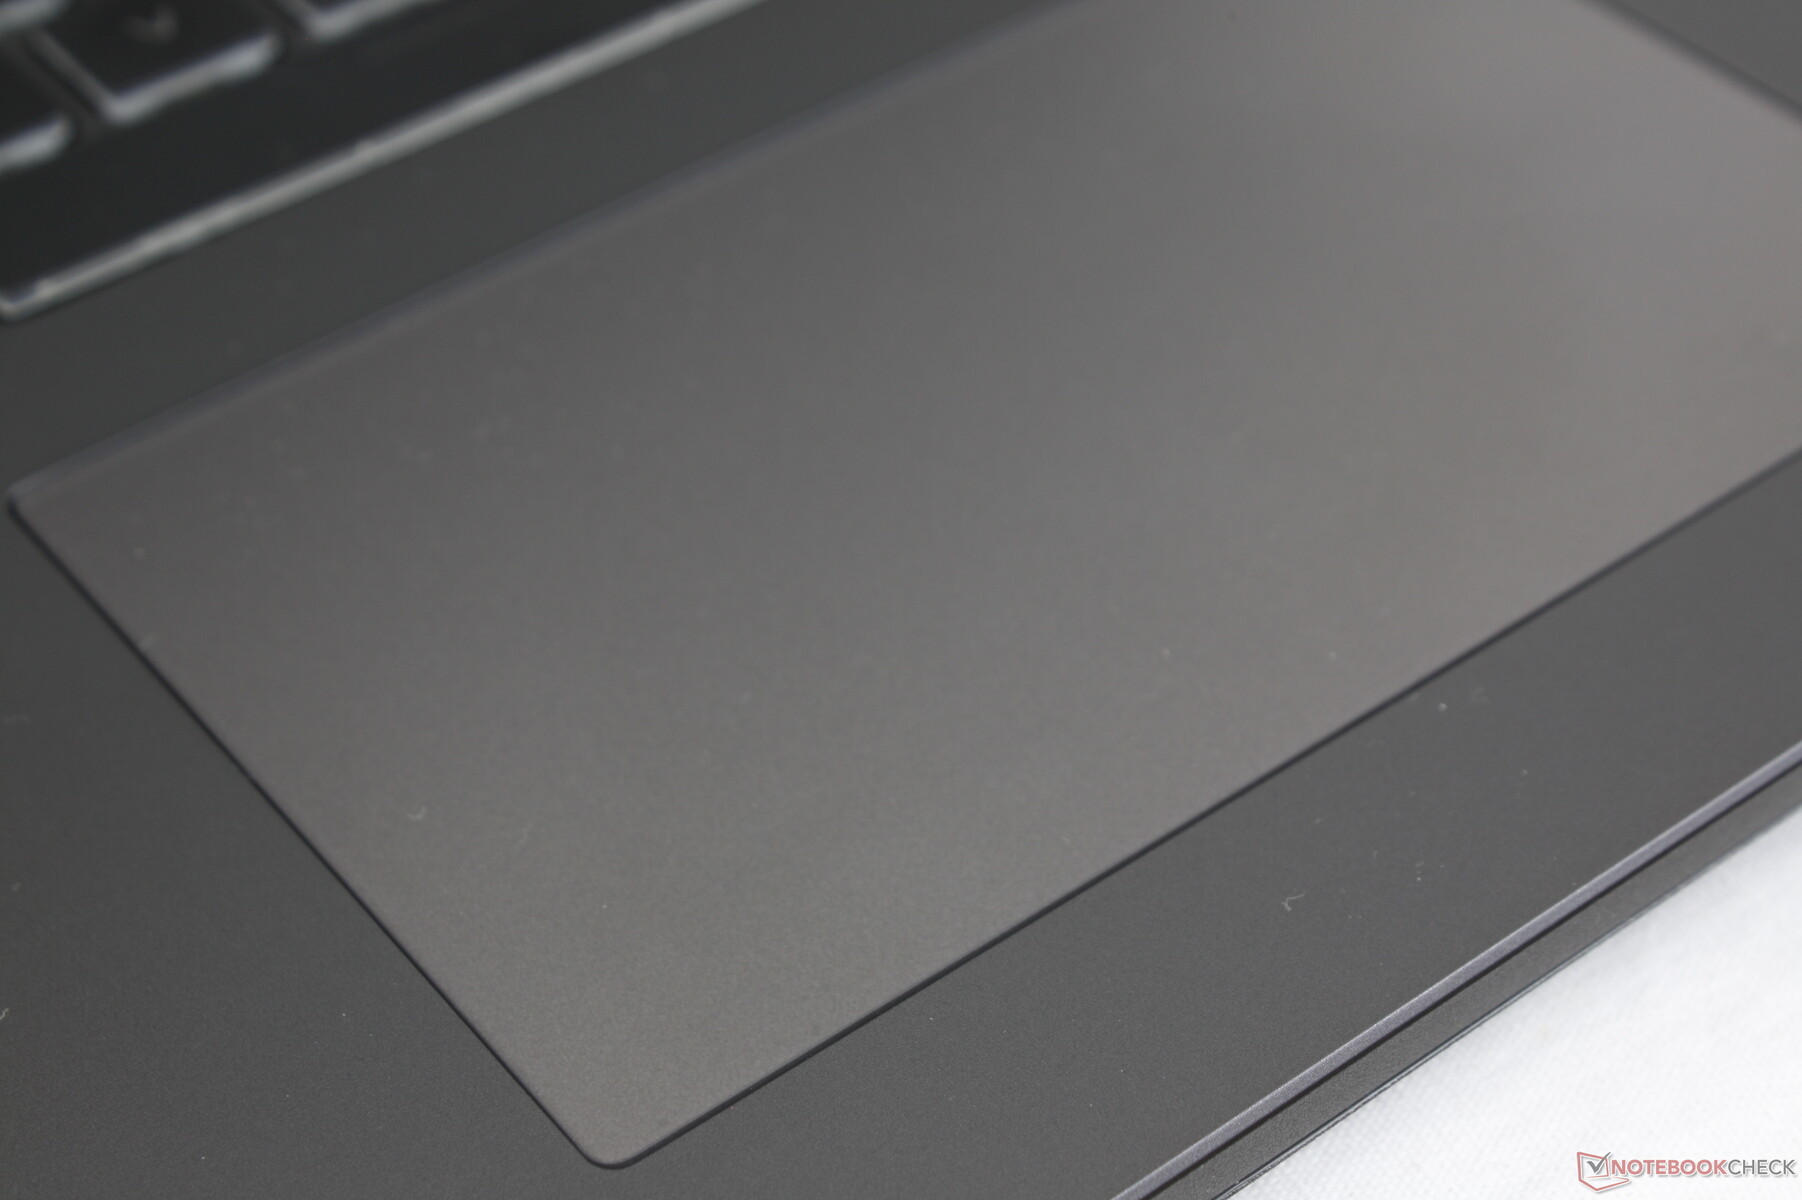
Touchpad
The clickpad is larger than the one on the G733 (13 x 7.7 cm vs. 10.8 x 6 cm) since Asus has dropped the dedicated mouse buttons in favor of a larger surface area. Gliding on the clickpad is smooth and with only very little sticking at slow speeds. Meanwhile, the integrated click keys are loud and relatively firm for a satisfying click when pressed.

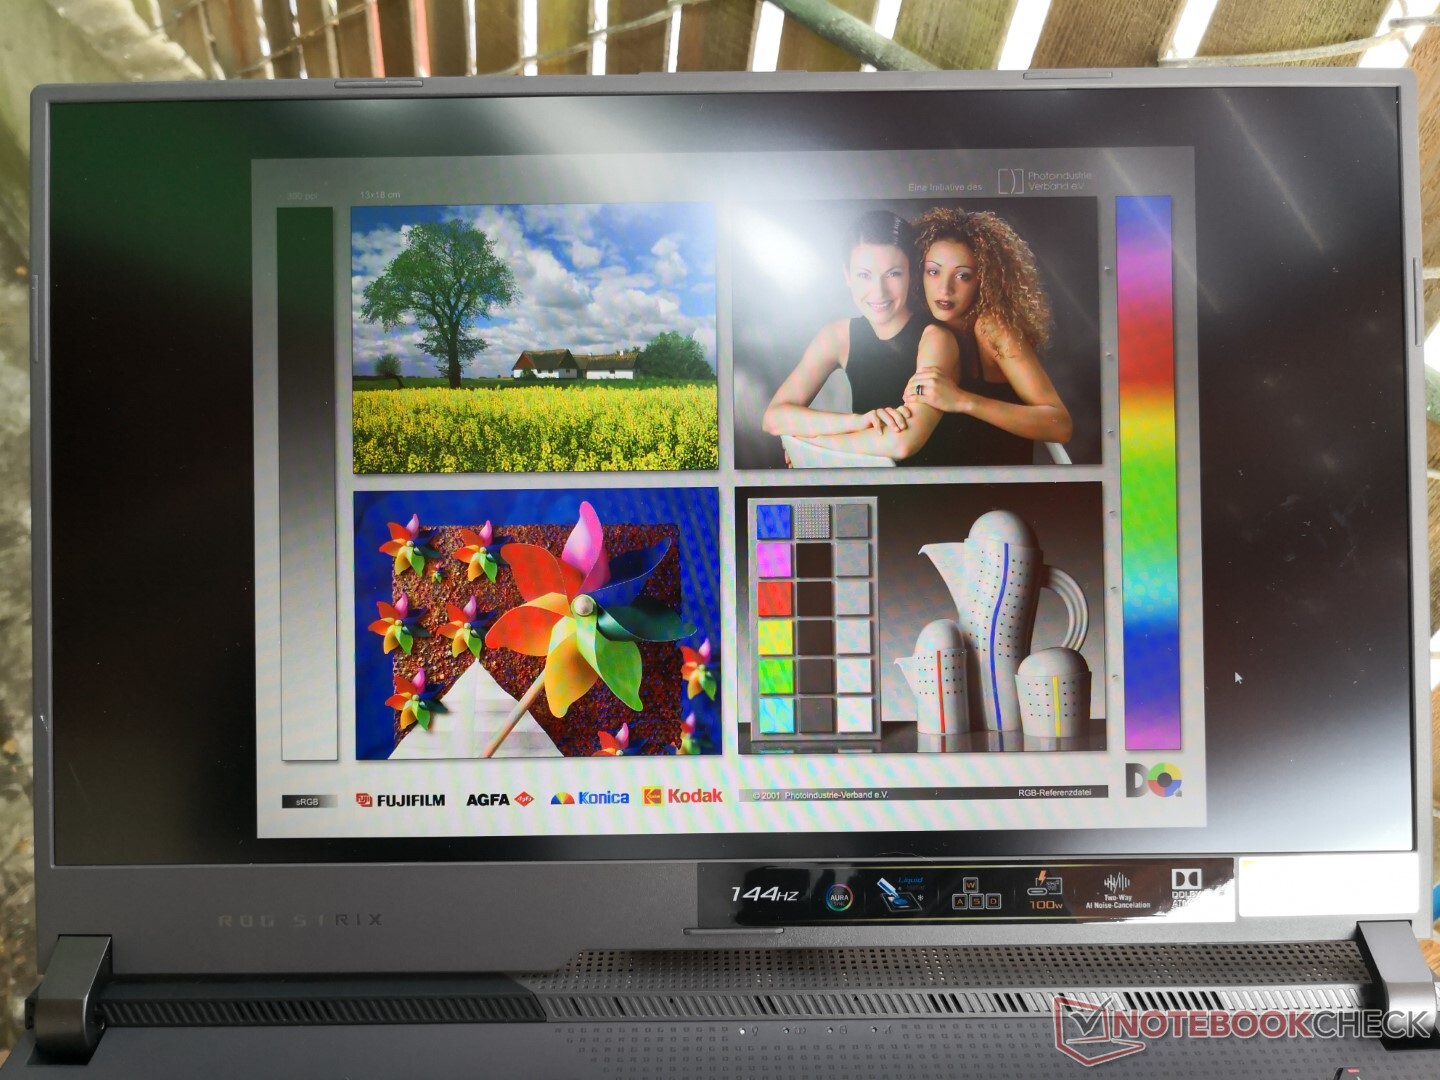
Display — High Refresh Rate, Shallow Colors
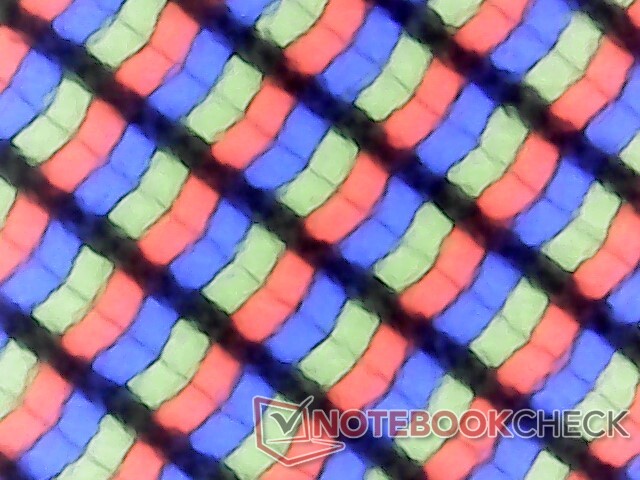
Our Asus configuration uses the same AU Optronics B173HAN04.9 IPS panel as found on the competing MSI Katana for similar characteristics between them. This 1080p panel is notable for its native 144 Hz refresh rate and FreeSync support, but it falls a bit short on response times and color accuracy.
Asus offers at least two other panel options (1080p 300 Hz and 1440p 165 Hz) each with different characteristics than our 1080p 144 Hz unit including faster response times and/or deeper colors. Thus, our measurements below reflect only the 1080p 144 Hz option.

| |||||||||||||||||||||||||
Brightness Distribution: 92 %
Center on Battery: 270.5 cd/m²
Contrast: 1424:1 (Black: 0.19 cd/m²)
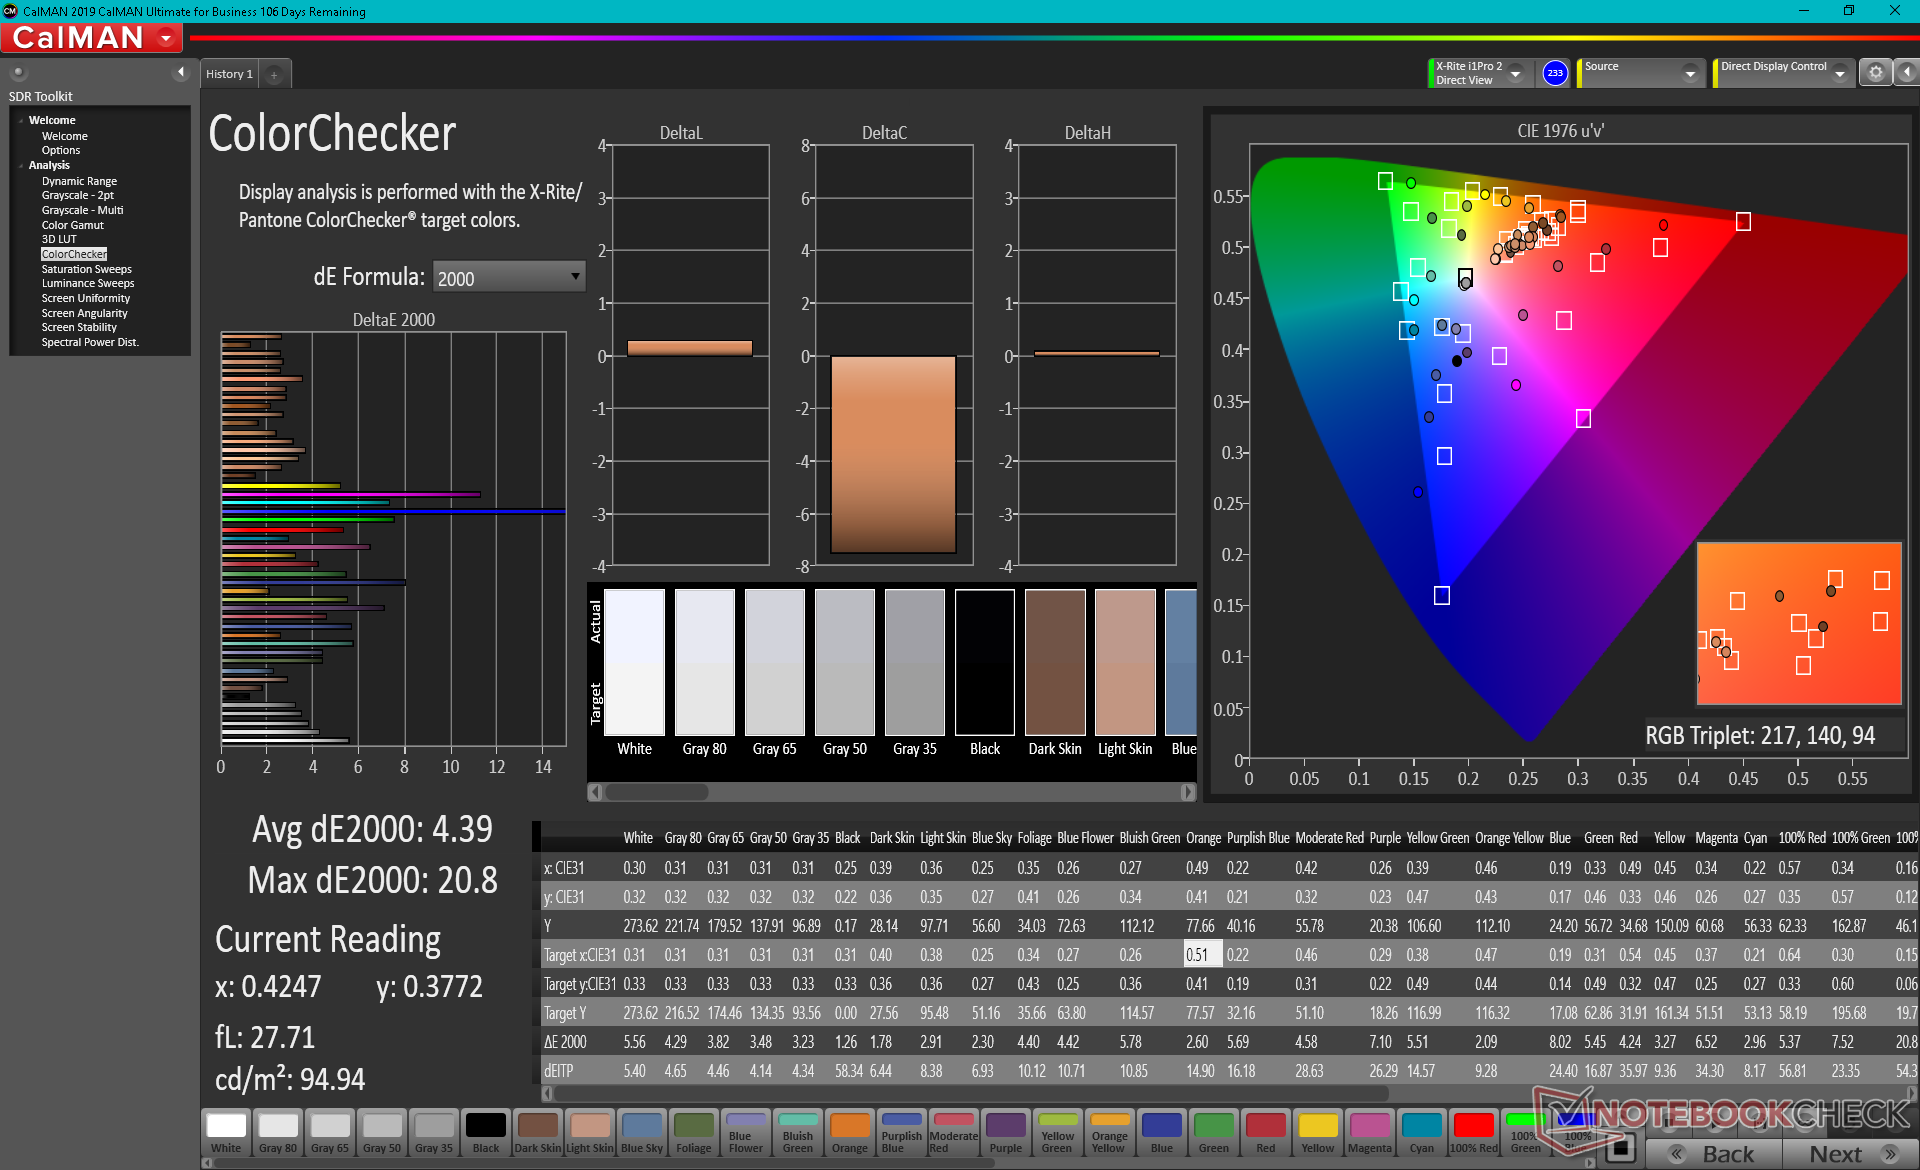
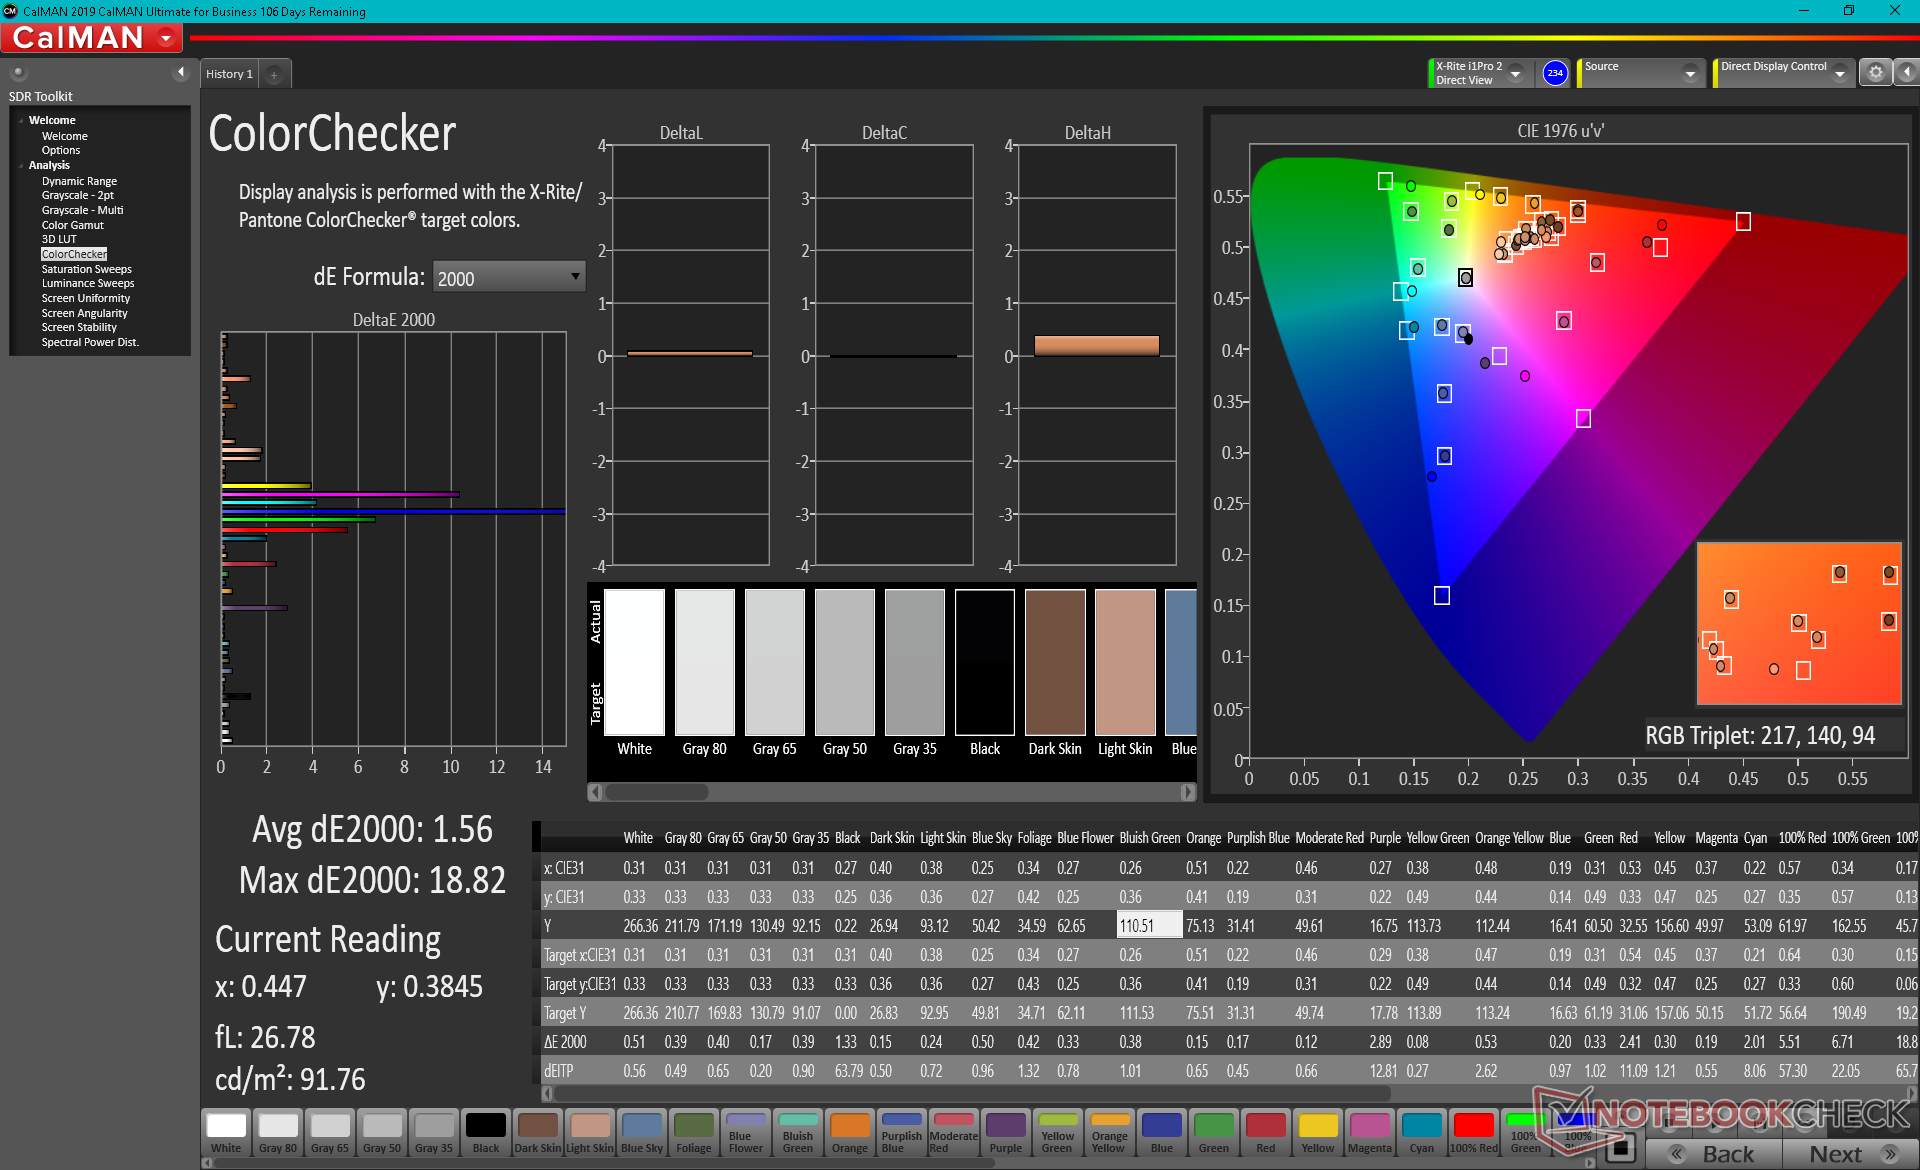
ΔE ColorChecker Calman: 4.39 | ∀{0.5-29.43 Ø4.71}
calibrated: 1.56
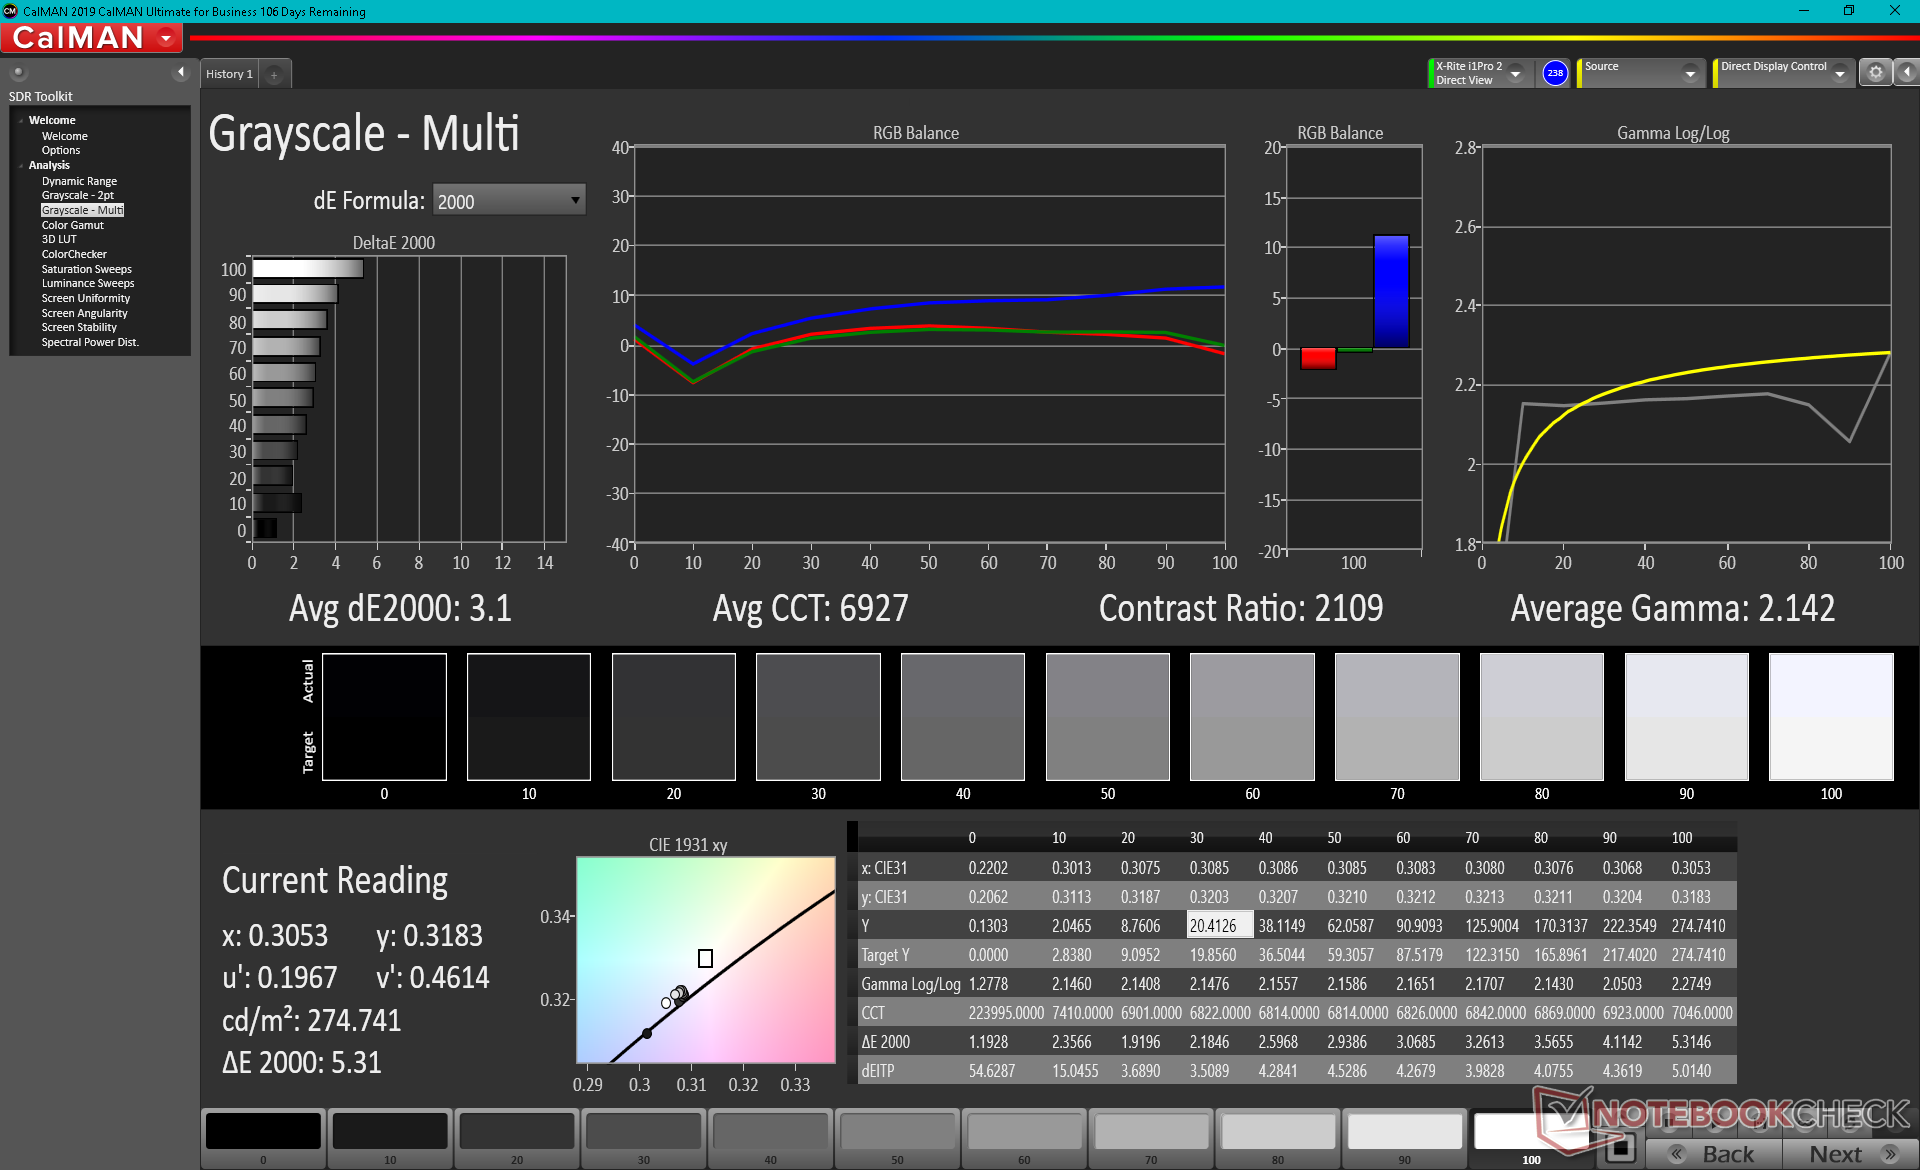
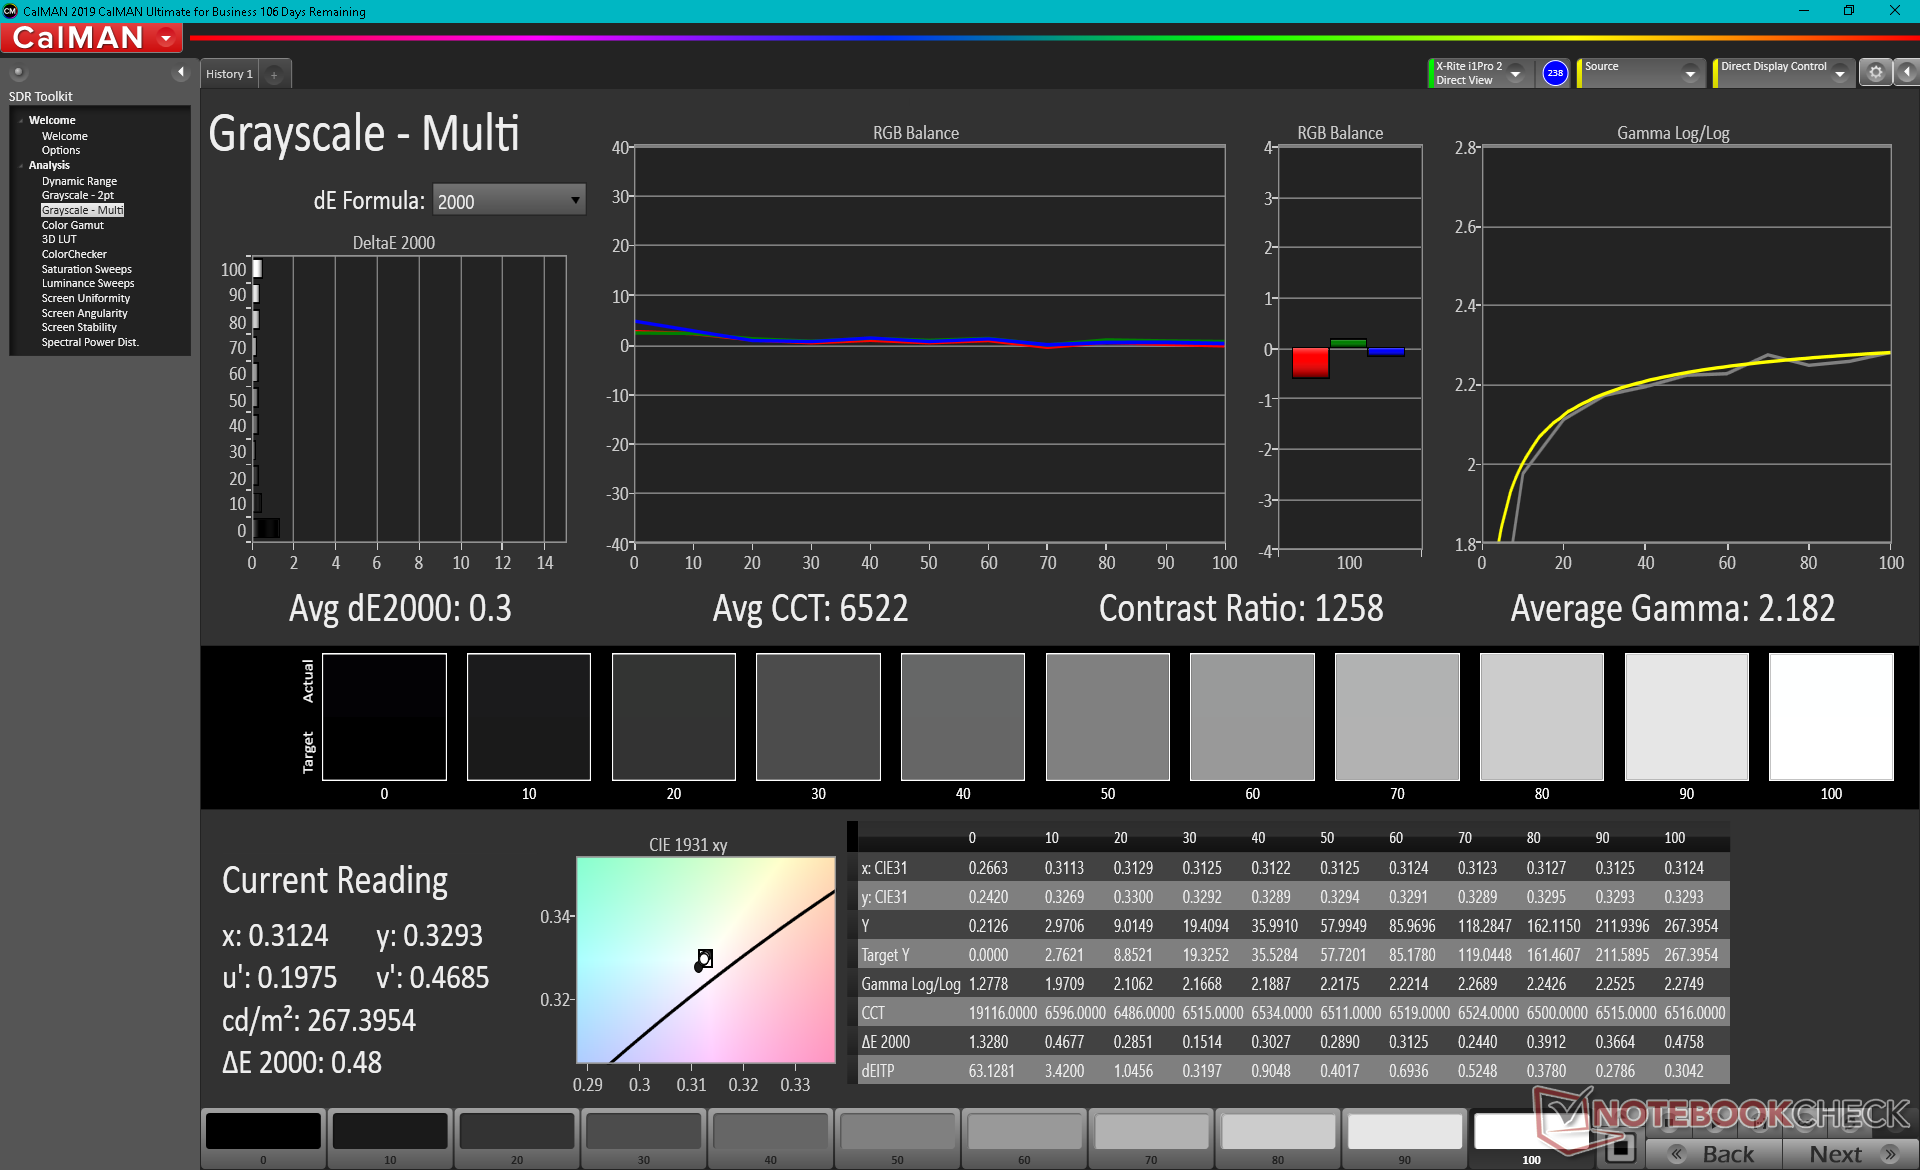
ΔE Greyscale Calman: 3.1 | ∀{0.09-98 Ø4.96}
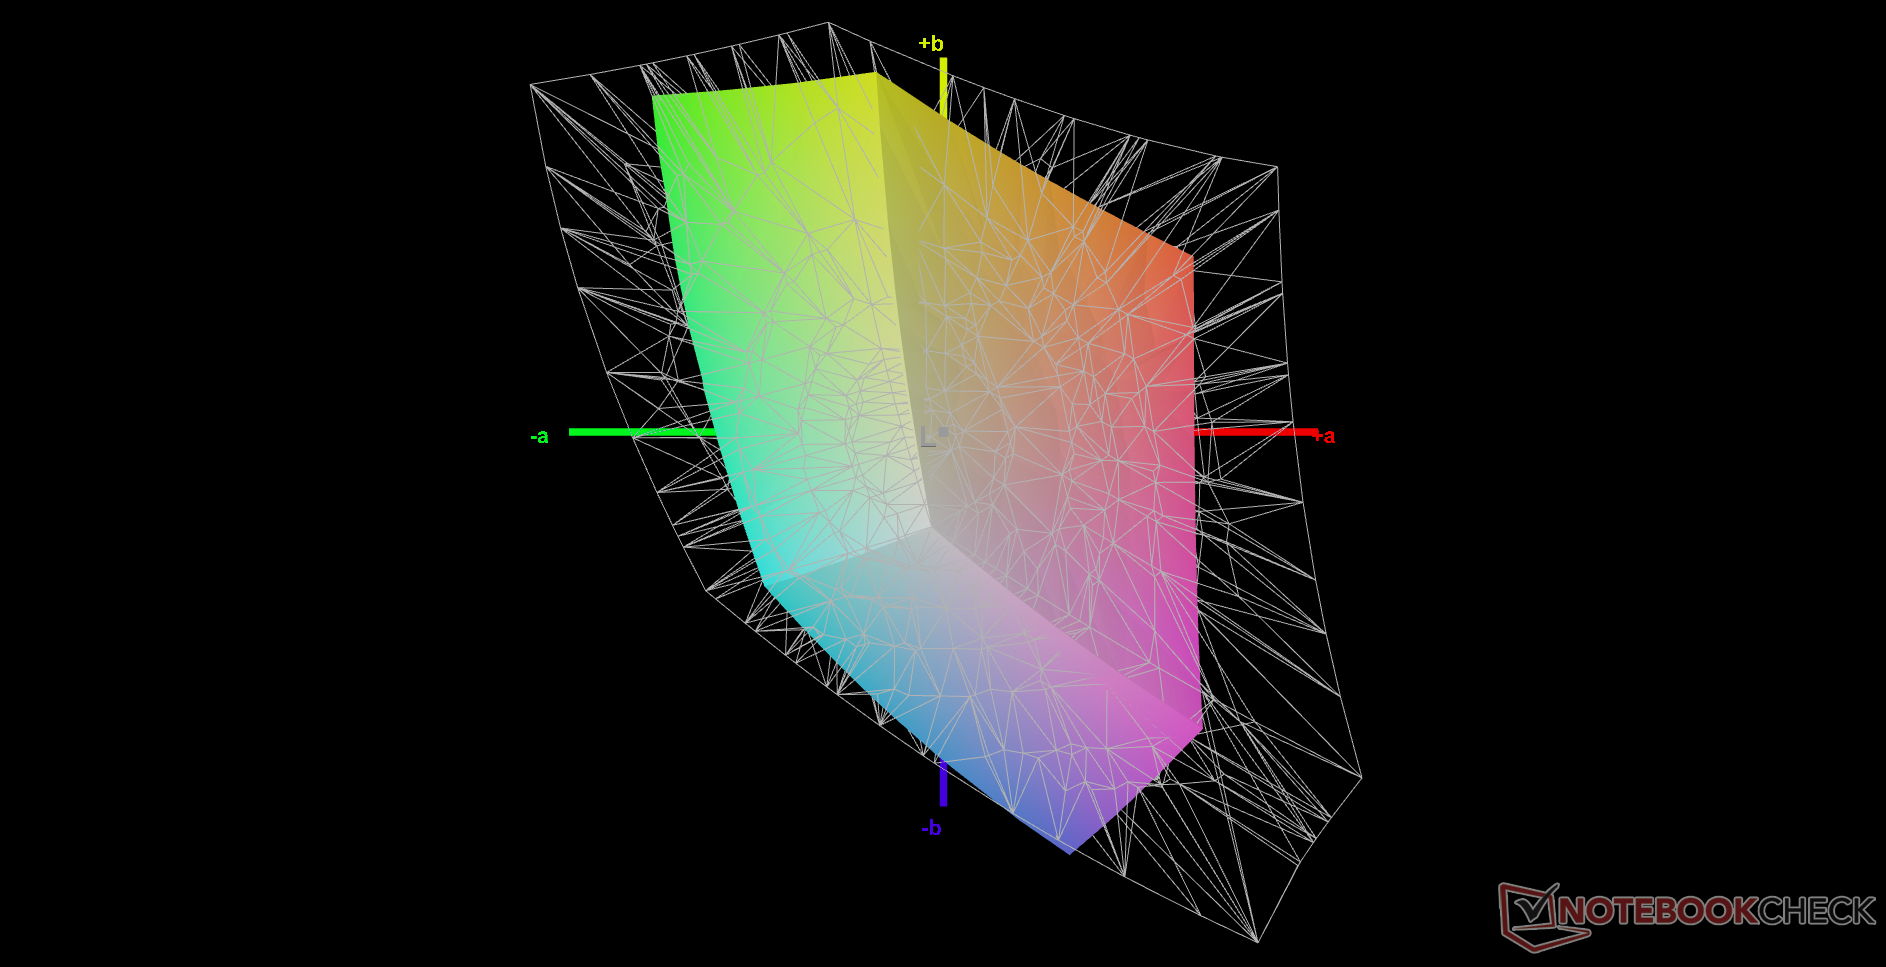
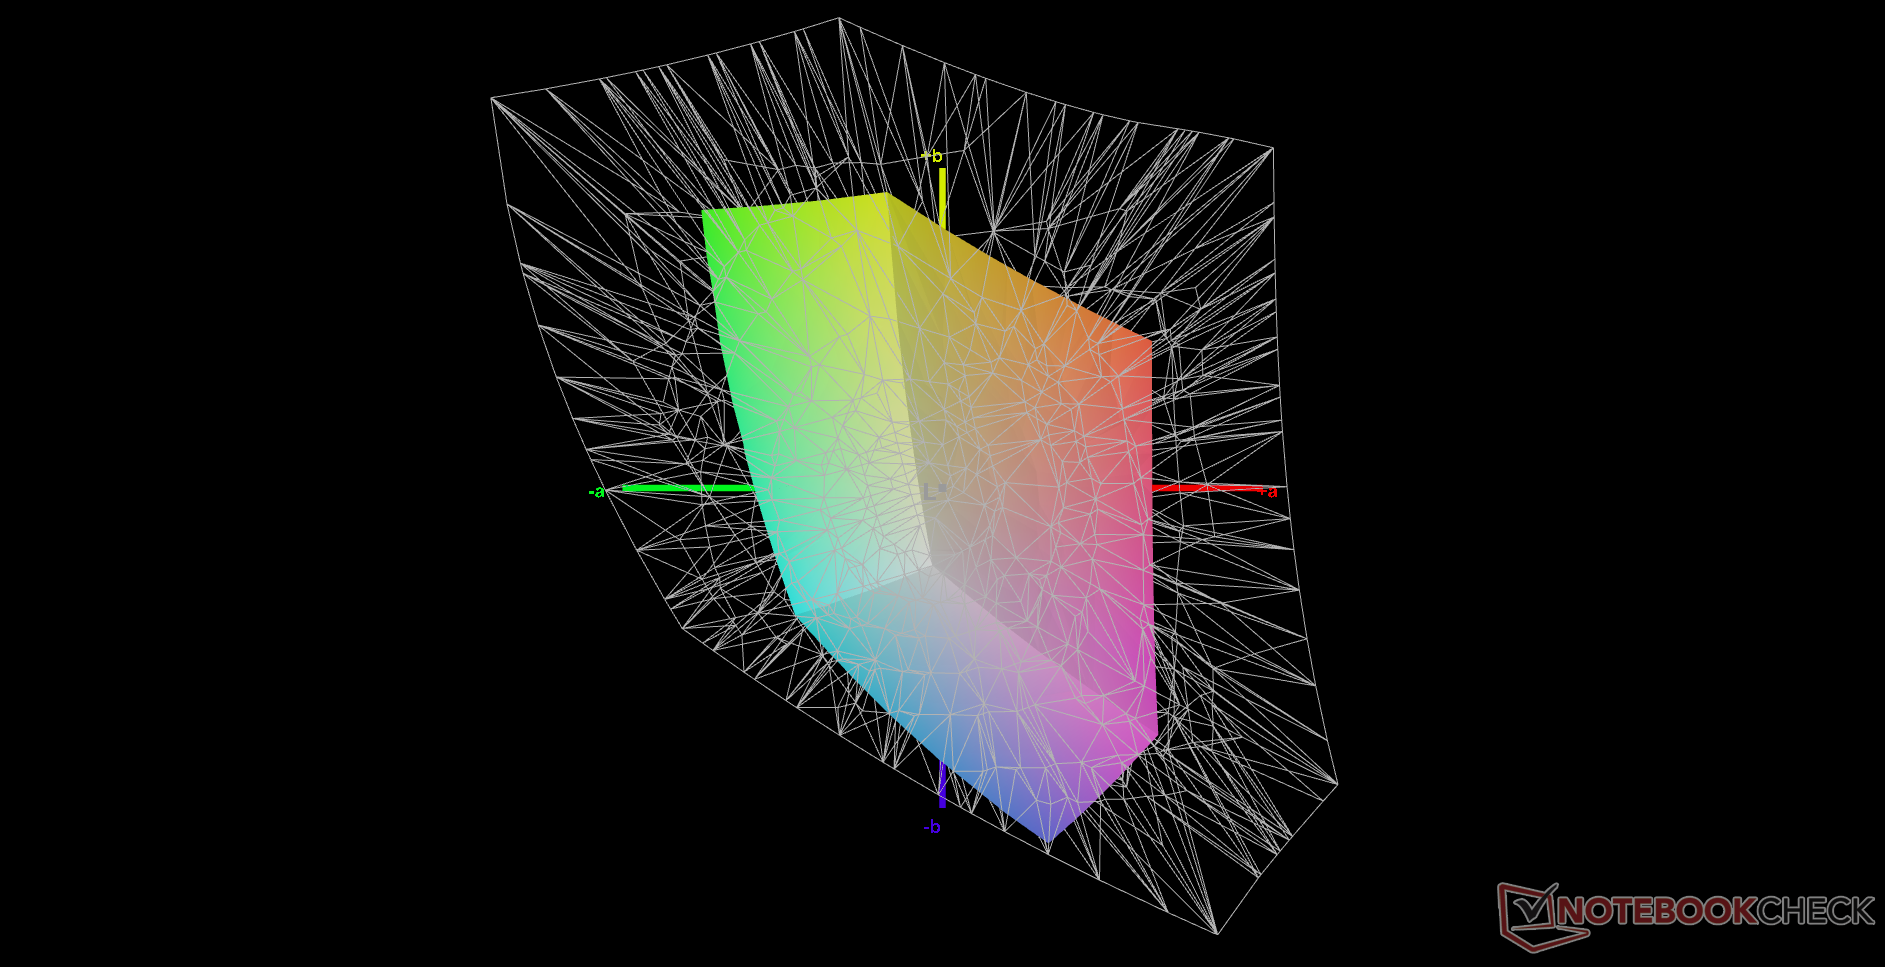
41.6% AdobeRGB 1998 (Argyll 3D)
60.3% sRGB (Argyll 3D)
40.2% Display P3 (Argyll 3D)
Gamma: 2.14
CCT: 6927 K
| Asus ROG Strix G17 G713QE-RB74 AU Optronics B173HAN04.9, IPS, 17.3", 1920x1080 | Acer Nitro 5 AN517-53-54DQ BOE NV173FHM-NX4 (BOE09B4), IPS, 17.3", 1920x1080 | MSI Katana GF76 11UE AU Optronics B173HAN04.9, IPS, 17.3", 1920x1080 | Asus Strix Scar 17 G733QSA-XS99 AU Optronics B173HAN05.4, IPS, 17.3", 1920x1080 | MSI Alpha 17 A4DEK AU Optronics AUO978F, IPS, 17.3", 1920x1080 | Asus Strix G17 G712LWS LG Philips LP173WFG-SPB3, IPS, 17.3", 1920x1080 | |
|---|---|---|---|---|---|---|
| Display | -9% | -1% | 72% | -2% | 61% | |
| Display P3 Coverage (%) | 40.2 | 36.7 -9% | 39.8 -1% | 71 77% | 39.55 -2% | 65.2 62% |
| sRGB Coverage (%) | 60.3 | 55 -9% | 59.5 -1% | 99.4 65% | 59.2 -2% | 96.8 61% |
| AdobeRGB 1998 Coverage (%) | 41.6 | 37.9 -9% | 41.12 -1% | 72.2 74% | 40.86 -2% | 66.4 60% |
| Response Times | 5% | -36% | 60% | -51% | 46% | |
| Response Time Grey 50% / Grey 80% * (ms) | 26.8 ? | 24.8 ? 7% | 36.8 ? -37% | 6.6 ? 75% | 40 ? -49% | 14.4 ? 46% |
| Response Time Black / White * (ms) | 19.2 ? | 18.8 ? 2% | 26 ? -35% | 10.8 ? 44% | 29.2 ? -52% | 10.4 ? 46% |
| PWM Frequency (Hz) | ||||||
| Screen | -23% | -18% | 16% | -21% | 5% | |
| Brightness middle (cd/m²) | 270.5 | 286 6% | 260 -4% | 303.8 12% | 254 -6% | 323 19% |
| Brightness (cd/m²) | 269 | 261 -3% | 251 -7% | 292 9% | 254 -6% | 300 12% |
| Brightness Distribution (%) | 92 | 83 -10% | 85 -8% | 85 -8% | 93 1% | 89 -3% |
| Black Level * (cd/m²) | 0.19 | 0.23 -21% | 0.26 -37% | 0.23 -21% | 0.23 -21% | 0.31 -63% |
| Contrast (:1) | 1424 | 1243 -13% | 1000 -30% | 1321 -7% | 1104 -22% | 1042 -27% |
| Colorchecker dE 2000 * | 4.39 | 4.92 -12% | 3.9 11% | 1.87 57% | 4.12 6% | 3.01 31% |
| Colorchecker dE 2000 max. * | 20.8 | 19.29 7% | 20.64 1% | 3.26 84% | 19.66 5% | 7.65 63% |
| Colorchecker dE 2000 calibrated * | 1.56 | 4.73 -203% | 3.71 -138% | 1.45 7% | 3.78 -142% | 1 36% |
| Greyscale dE 2000 * | 3.1 | 1.9 39% | 1.6 48% | 2.7 13% | 3.2 -3% | 3.8 -23% |
| Gamma | 2.14 103% | 2.175 101% | 2.068 106% | 2.26 97% | 2.179 101% | 2.154 102% |
| CCT | 6927 94% | 6782 96% | 6511 100% | 6436 101% | 6754 96% | 7507 87% |
| Color Space (Percent of AdobeRGB 1998) (%) | 65.6 | 41 | 66 | |||
| Color Space (Percent of sRGB) (%) | 99.4 | 59 | 90 | |||
| Total Average (Program / Settings) | -9% /
-16% | -18% /
-17% | 49% /
34% | -25% /
-21% | 37% /
23% |
* ... smaller is better
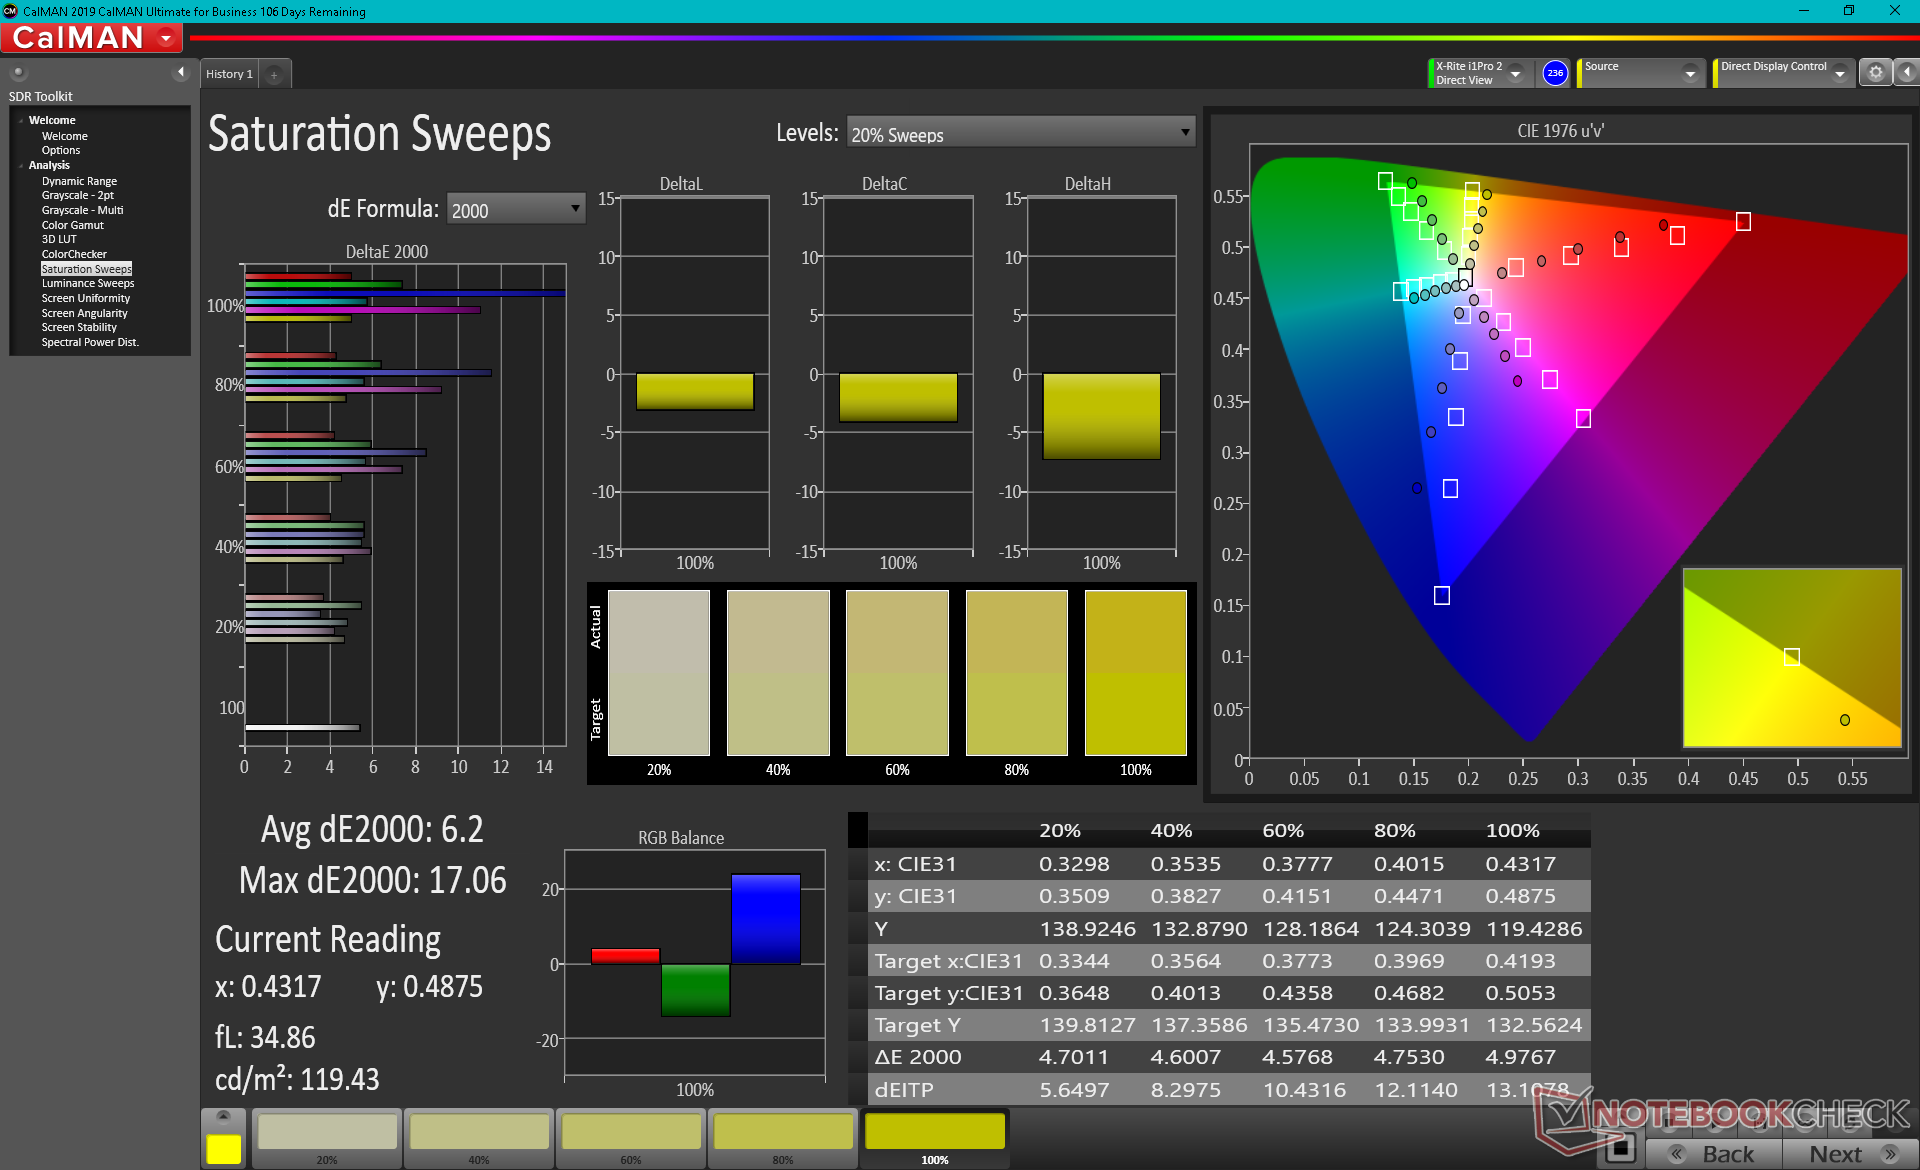
Gamut is narrow at just 60 percent of sRGB to indicate a display unfit for professional graphics editing. Indeed, such panels are common on budget gaming laptops where response times often take priority over color accuracy. Asus offers higher-end panels with full sRGB or P3 coverage on this particular G713 series to cover all bases.
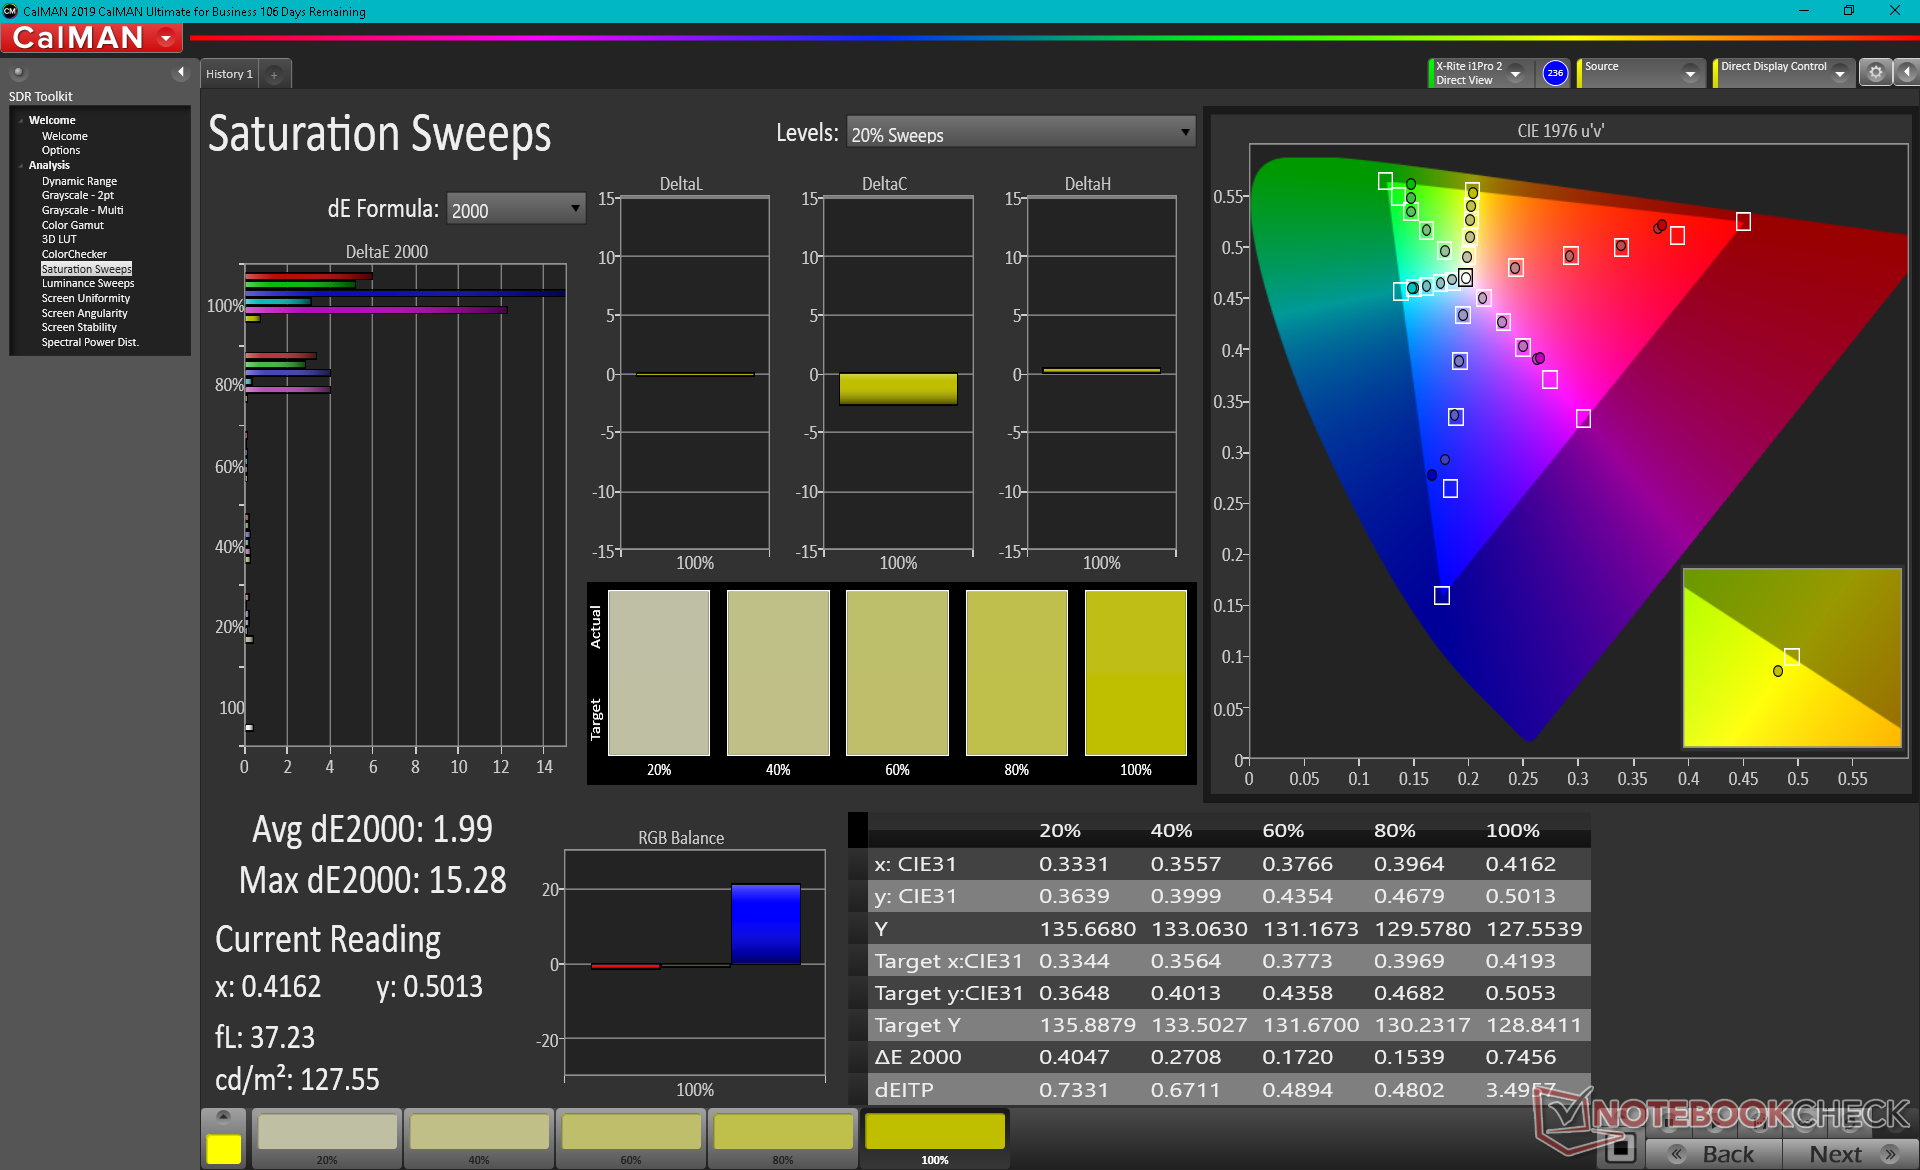
Though not bad out of the box, colors and grayscale have room for improvement. Calibrating the display ourselves would improve average grayscale and color DeltaE values from 3.1 and 4.39 to just 0.3 and 1.56, respectively. Nonetheless, colors inevitably become much more inaccurate at higher saturation levels due to the limited color space mentioned above.
Display Response Times
| ↔ Response Time Black to White | ||
|---|---|---|
| 19.2 ms ... rise ↗ and fall ↘ combined | ↗ 10.8 ms rise | 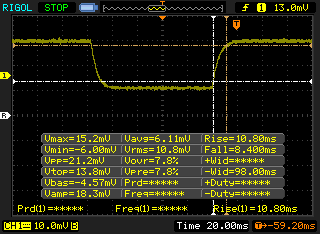 |
| ↘ 8.4 ms fall | ||
| The screen shows good response rates in our tests, but may be too slow for competitive gamers. In comparison, all tested devices range from 0.1 (minimum) to 240 (maximum) ms. » 43 % of all devices are better. This means that the measured response time is similar to the average of all tested devices (19.8 ms). | ||
| ↔ Response Time 50% Grey to 80% Grey | ||
| 26.8 ms ... rise ↗ and fall ↘ combined | ↗ 14 ms rise | 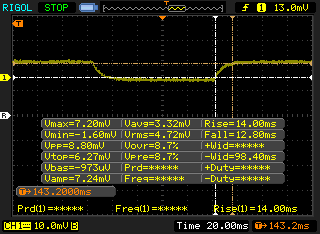 |
| ↘ 12.8 ms fall | ||
| The screen shows relatively slow response rates in our tests and may be too slow for gamers. In comparison, all tested devices range from 0.165 (minimum) to 636 (maximum) ms. » 37 % of all devices are better. This means that the measured response time is better than the average of all tested devices (30.9 ms). | ||
Screen Flickering / PWM (Pulse-Width Modulation)
| Screen flickering / PWM not detected | 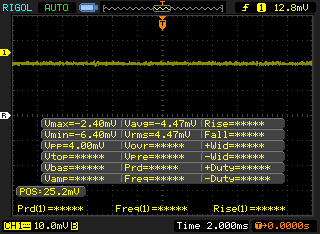 | ||
In comparison: 52 % of all tested devices do not use PWM to dim the display. If PWM was detected, an average of 7744 (minimum: 5 - maximum: 343500) Hz was measured. | |||
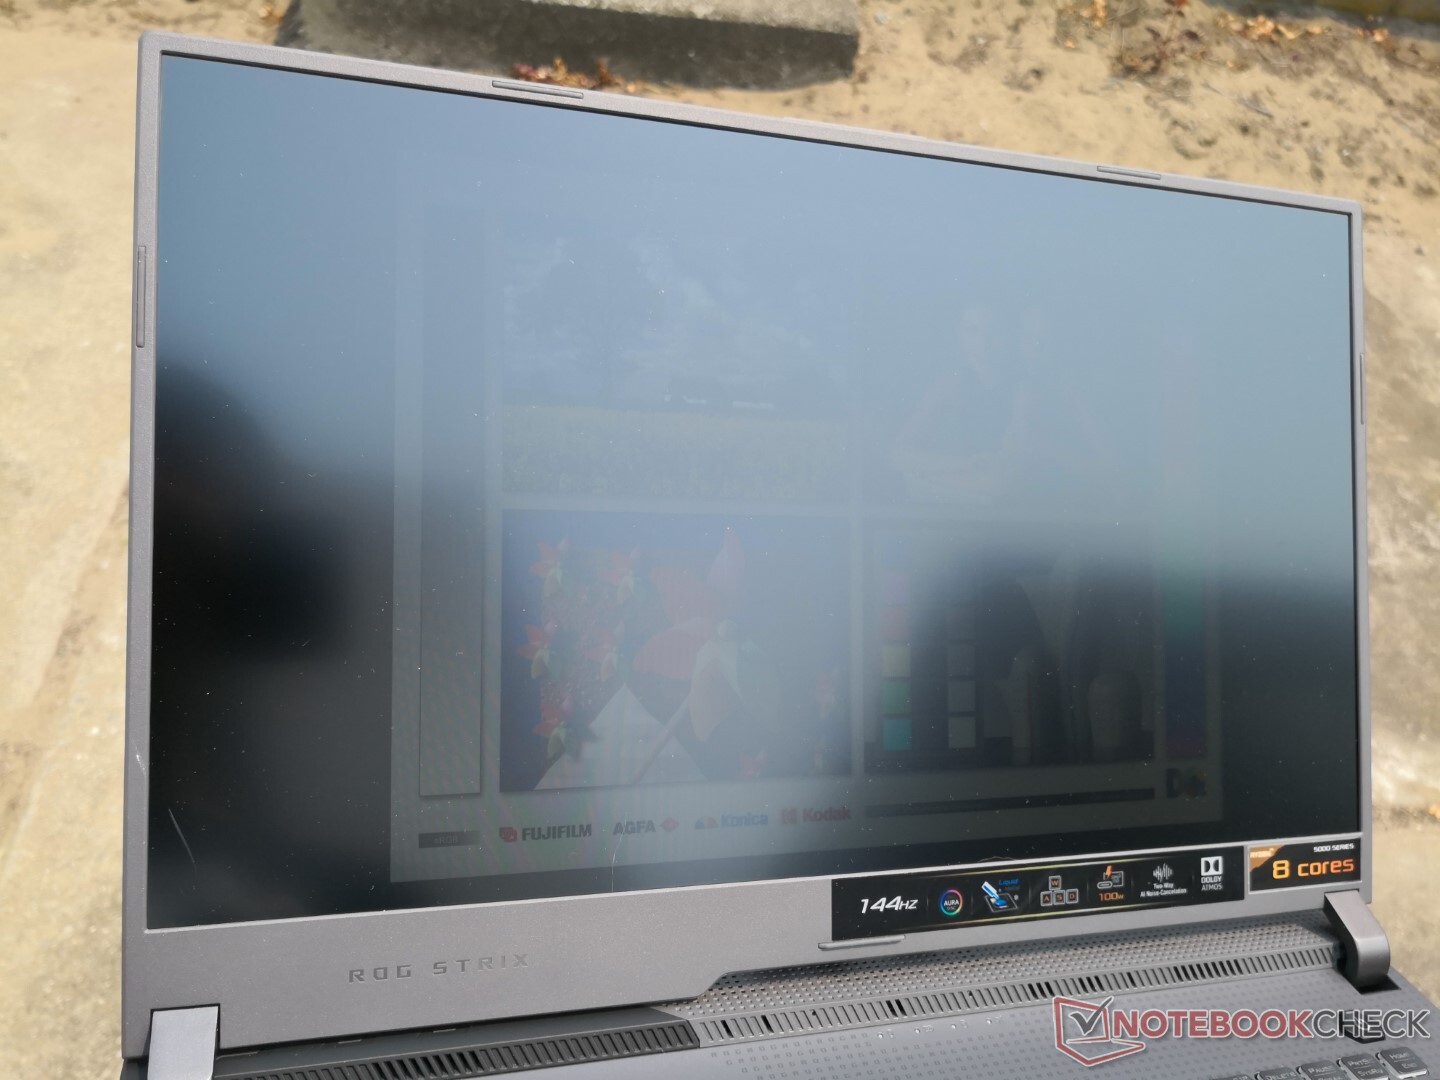
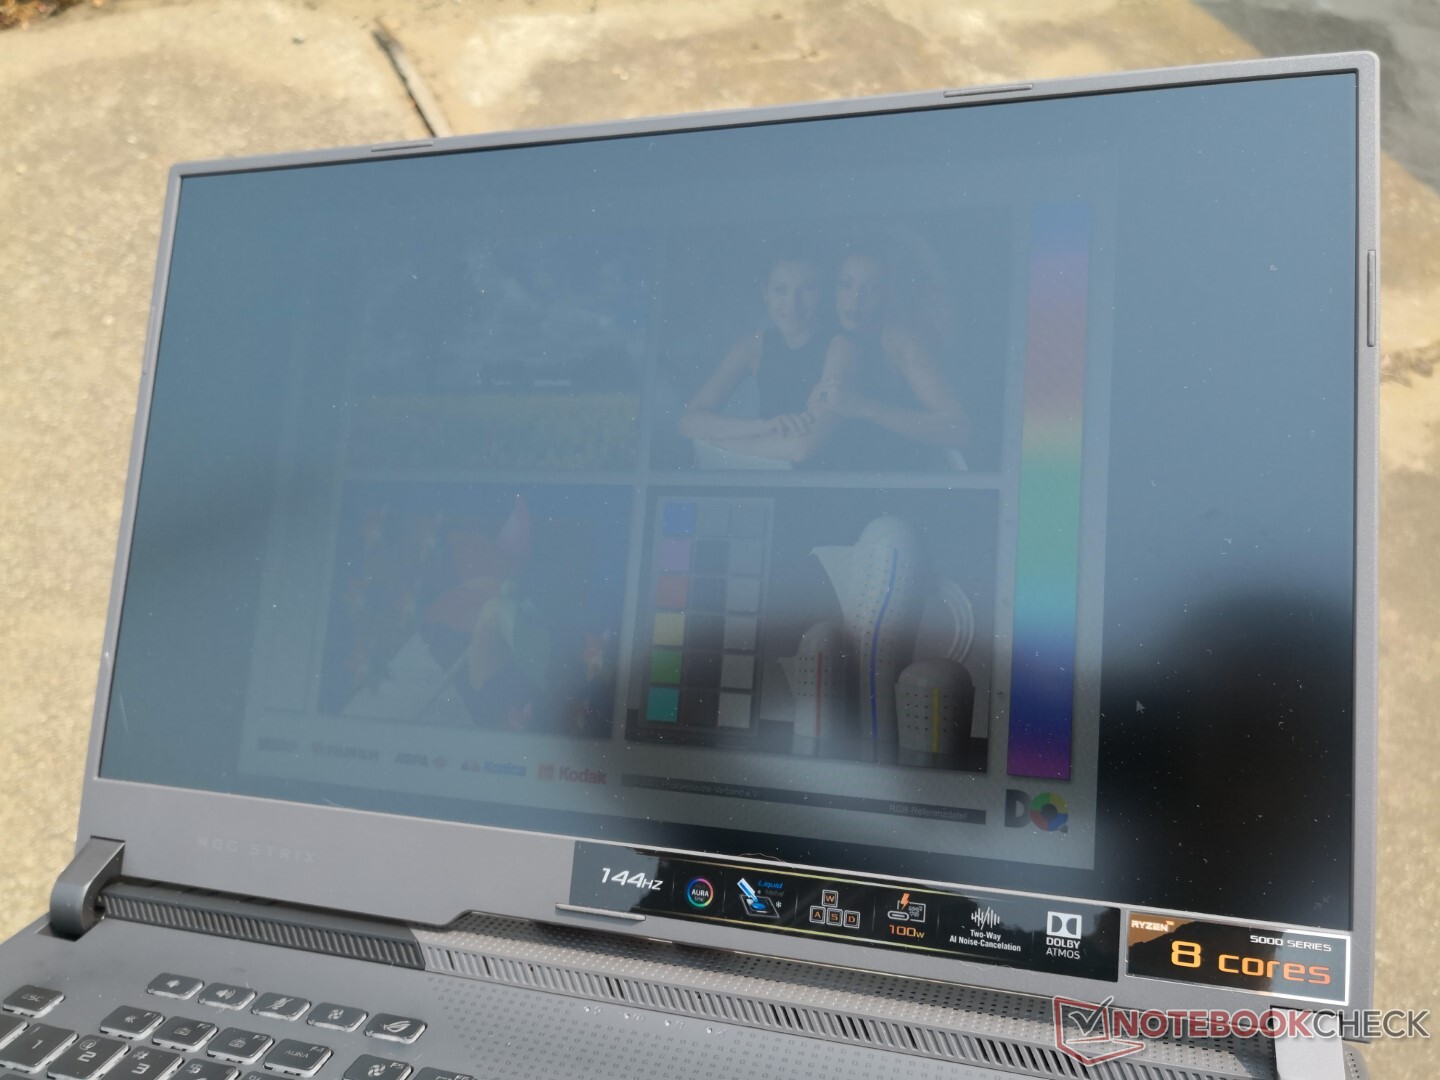
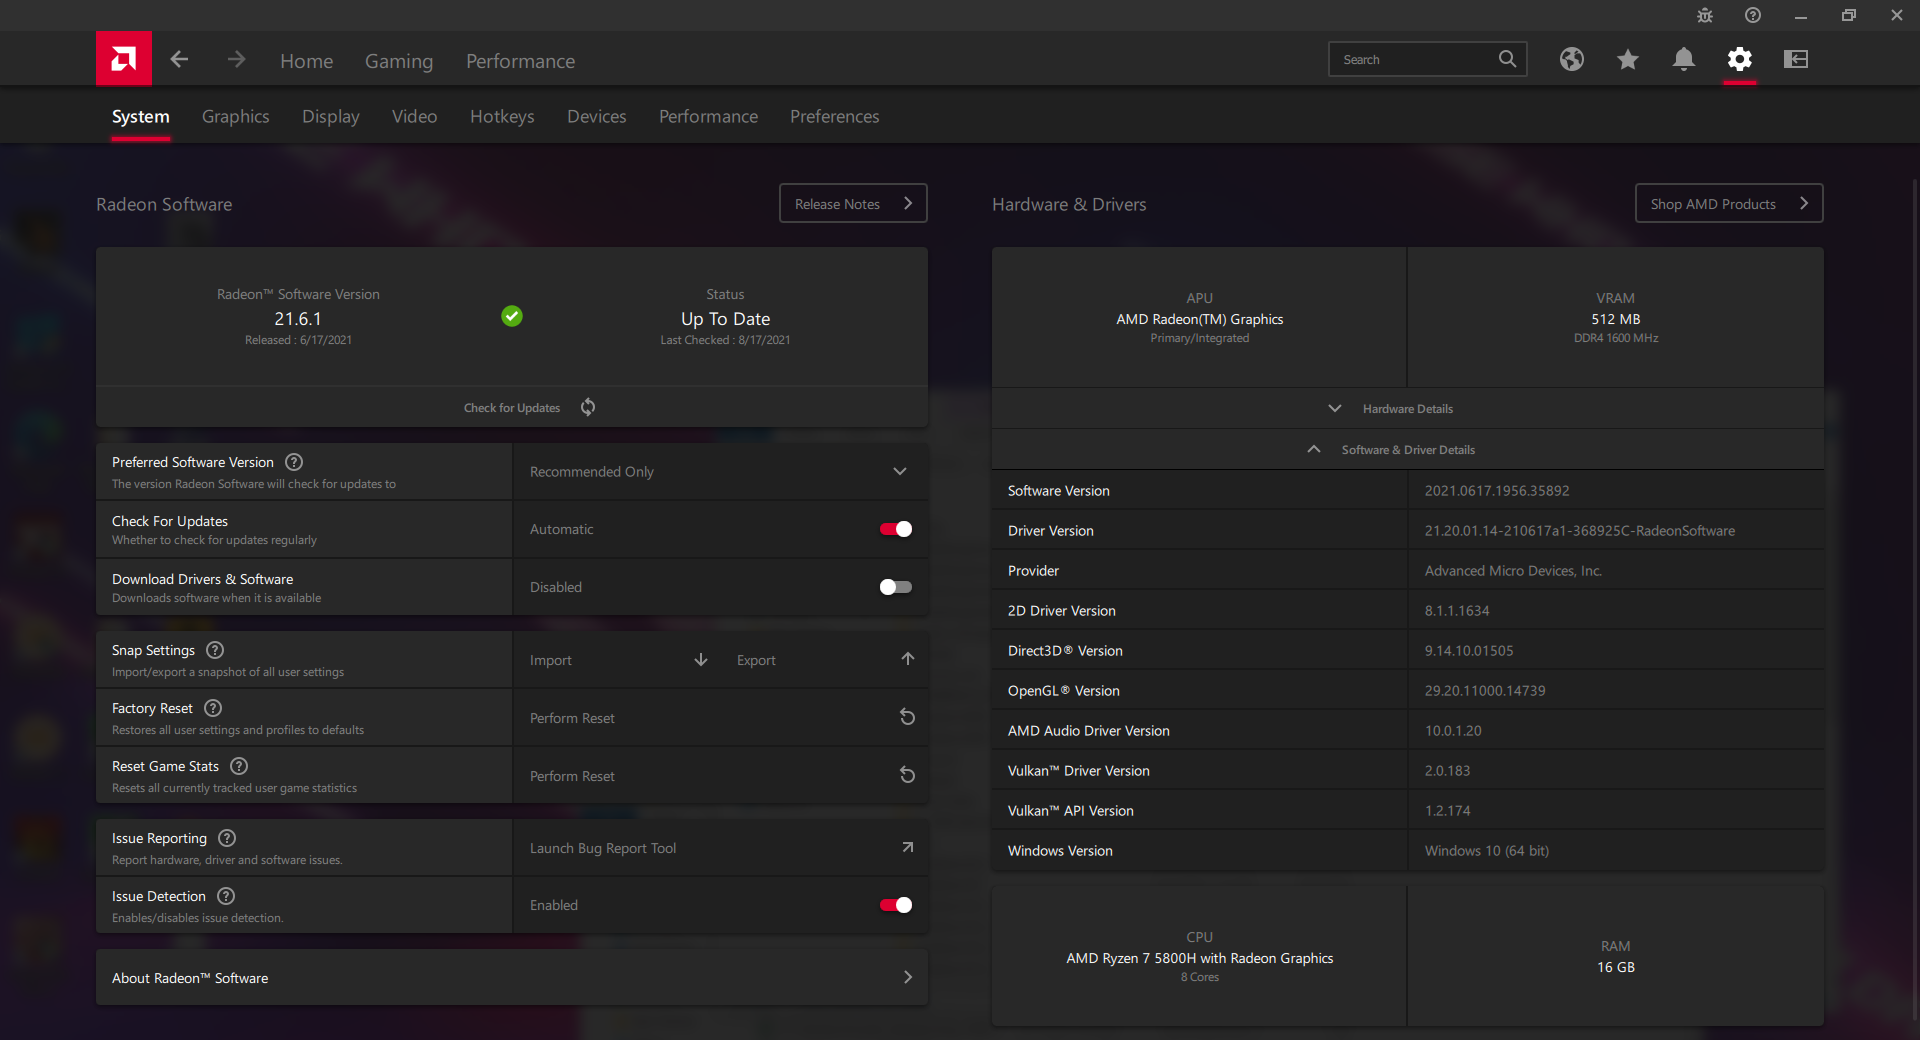
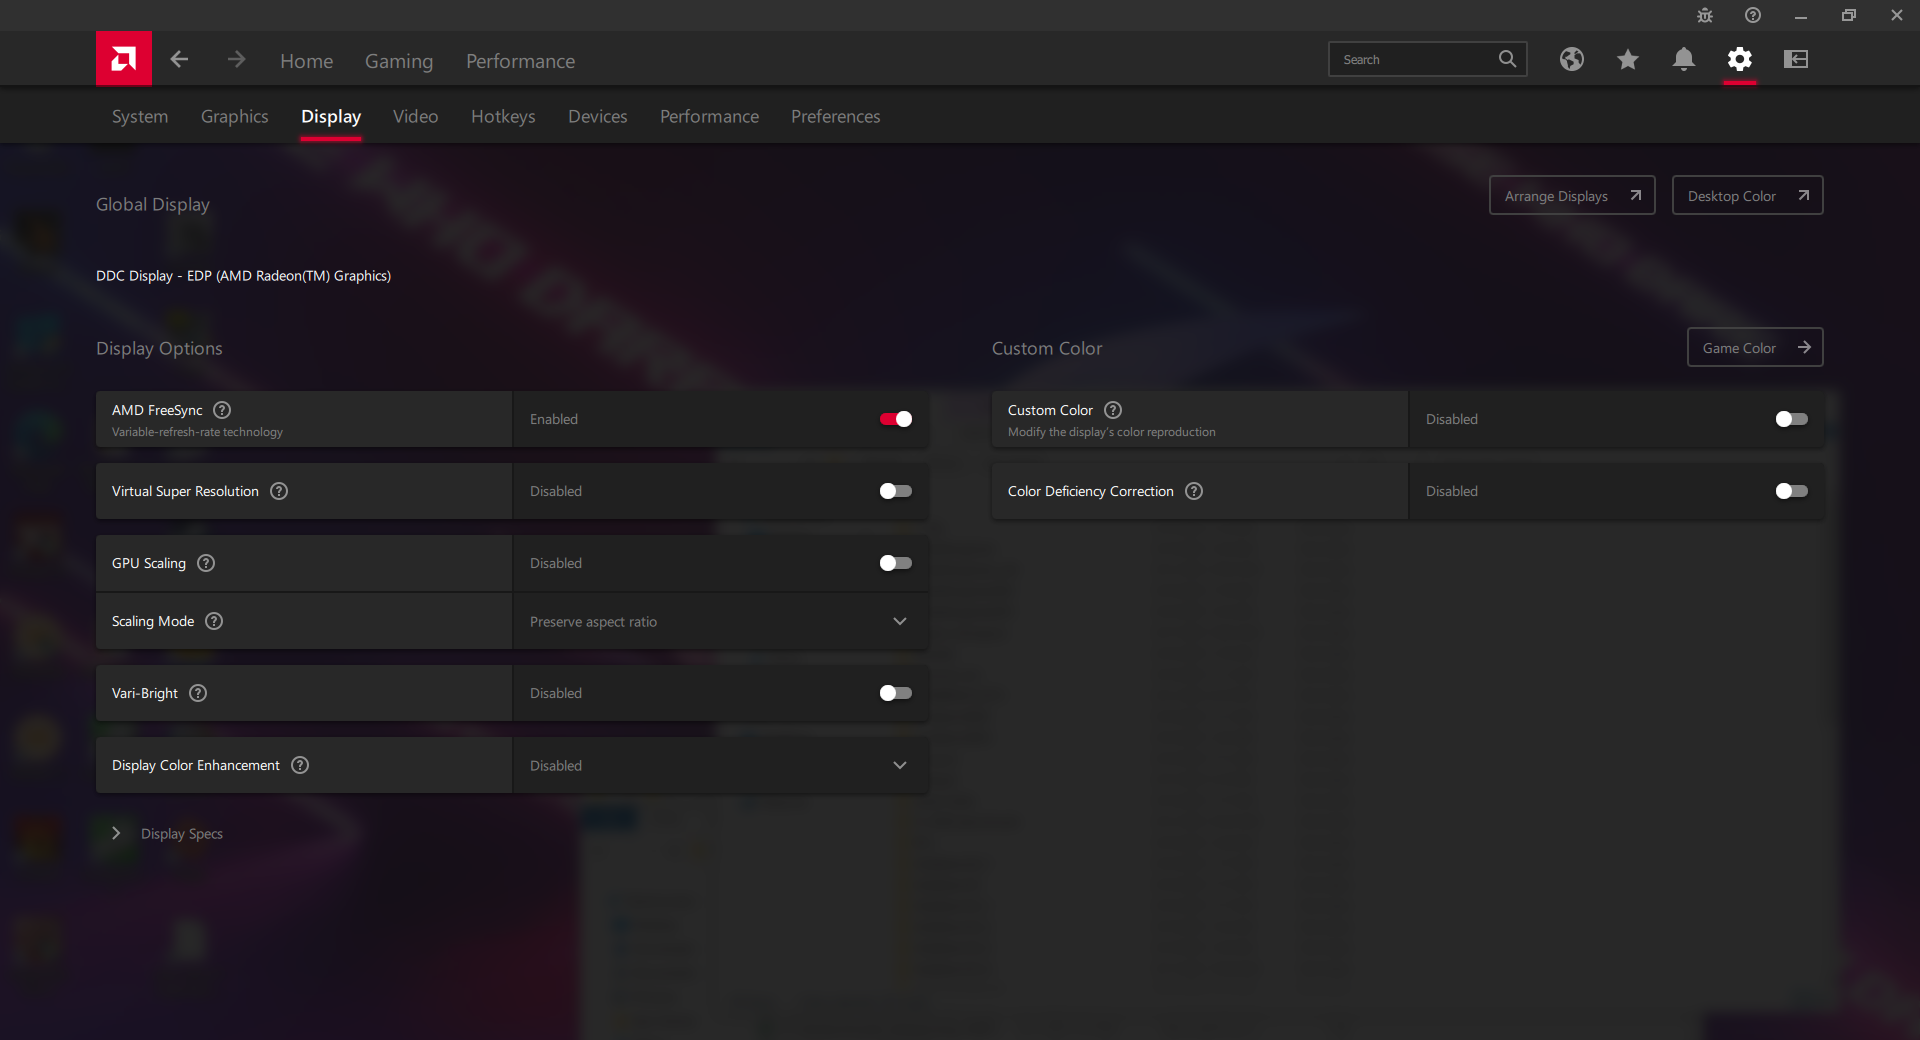
Maximum brightness is about average for a 17.3-inch gaming laptop and so outdoor visibility isn't anything special on the G713. Remember to disable AMD Vari-Bright through the AMD Radeon software or else maximum brightness will drop to just 175 nits when on battery power.

Performance — Core i9-level Processor
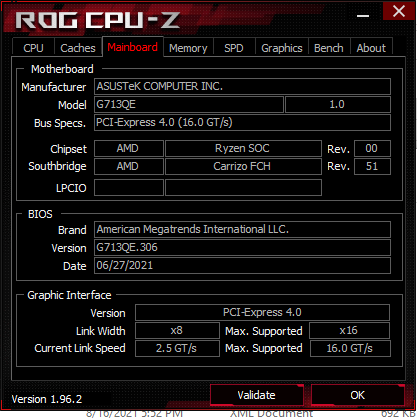
All G713 configurations at the moment come with only AMD CPUs for better or worse. While the Zen 2 and Zen 3 series can oftentimes outperform the best Core-H CPUs from Intel, they lack support for PCIe 4 and Thunderbolt 4 which may irk some gamers.
On the graphics side, GPUs range from the GeForce GTX 1650 up to the RTX 3070 to appeal to a very wide range of budgets. Resizable Bar and FreeSync are supported while Advanced Optimus is not. A manual switch to disable the discrete Nvidia GPU can be found through the Asus Armoury Crate software.
Our unit was set to Turbo Mode prior to running any performance benchmarks below for the best possible scores.
Processor
Raw CPU performance is excellent to rival Core i9 11th gen Tiger Lake-H processors from Intel. The competing Core i9-11900H, for example, offers similar multi-thread performance but slightly faster single-thread performance as per usual when comparing Intel and AMD CPUs. Gen-to-gen, the Ryzen 7 5800H is only marginally faster than the Ryzen 7 4800H since the Zen 2 H-series was already a huge leap over the Ryzen 7 3750H.
Performance sustainability is also excellent with no dips in scores over time when running CineBench R15 xT in a continuous loop. However, it's difficult to recommend the Ryzen 9 5900HX over the Ryzen 7 5800H since they perform almost identically.
Cinebench R15 Multi Loop
Cinebench R23: Multi Core | Single Core
Cinebench R15: CPU Multi 64Bit | CPU Single 64Bit
Blender: v2.79 BMW27 CPU
7-Zip 18.03: 7z b 4 -mmt1 | 7z b 4
Geekbench 5.5: Single-Core | Multi-Core
HWBOT x265 Benchmark v2.2: 4k Preset
LibreOffice : 20 Documents To PDF
R Benchmark 2.5: Overall mean
| Cinebench R23 / Multi Core | |
| Asus Strix Scar 17 G733QSA-XS99 | |
| Asus ROG Strix G17 G713QE-RB74 | |
| Asus ROG Zephyrus S17 GX703HSD | |
| Acer Nitro 5 AN517-41-R9S5 | |
| Average AMD Ryzen 7 5800H (8812 - 13214, n=29) | |
| Medion Erazer Beast X20 | |
| Huawei MateBook D 16-53011VFJ | |
| Cinebench R23 / Single Core | |
| Asus ROG Zephyrus S17 GX703HSD | |
| Asus Strix Scar 17 G733QSA-XS99 | |
| Acer Nitro 5 AN517-41-R9S5 | |
| Asus ROG Strix G17 G713QE-RB74 | |
| Average AMD Ryzen 7 5800H (1294 - 1441, n=29) | |
| Medion Erazer Beast X20 | |
| Huawei MateBook D 16-53011VFJ | |
Cinebench R23: Multi Core | Single Core
Cinebench R15: CPU Multi 64Bit | CPU Single 64Bit
Blender: v2.79 BMW27 CPU
7-Zip 18.03: 7z b 4 -mmt1 | 7z b 4
Geekbench 5.5: Single-Core | Multi-Core
HWBOT x265 Benchmark v2.2: 4k Preset
LibreOffice : 20 Documents To PDF
R Benchmark 2.5: Overall mean
* ... smaller is better
System Performance
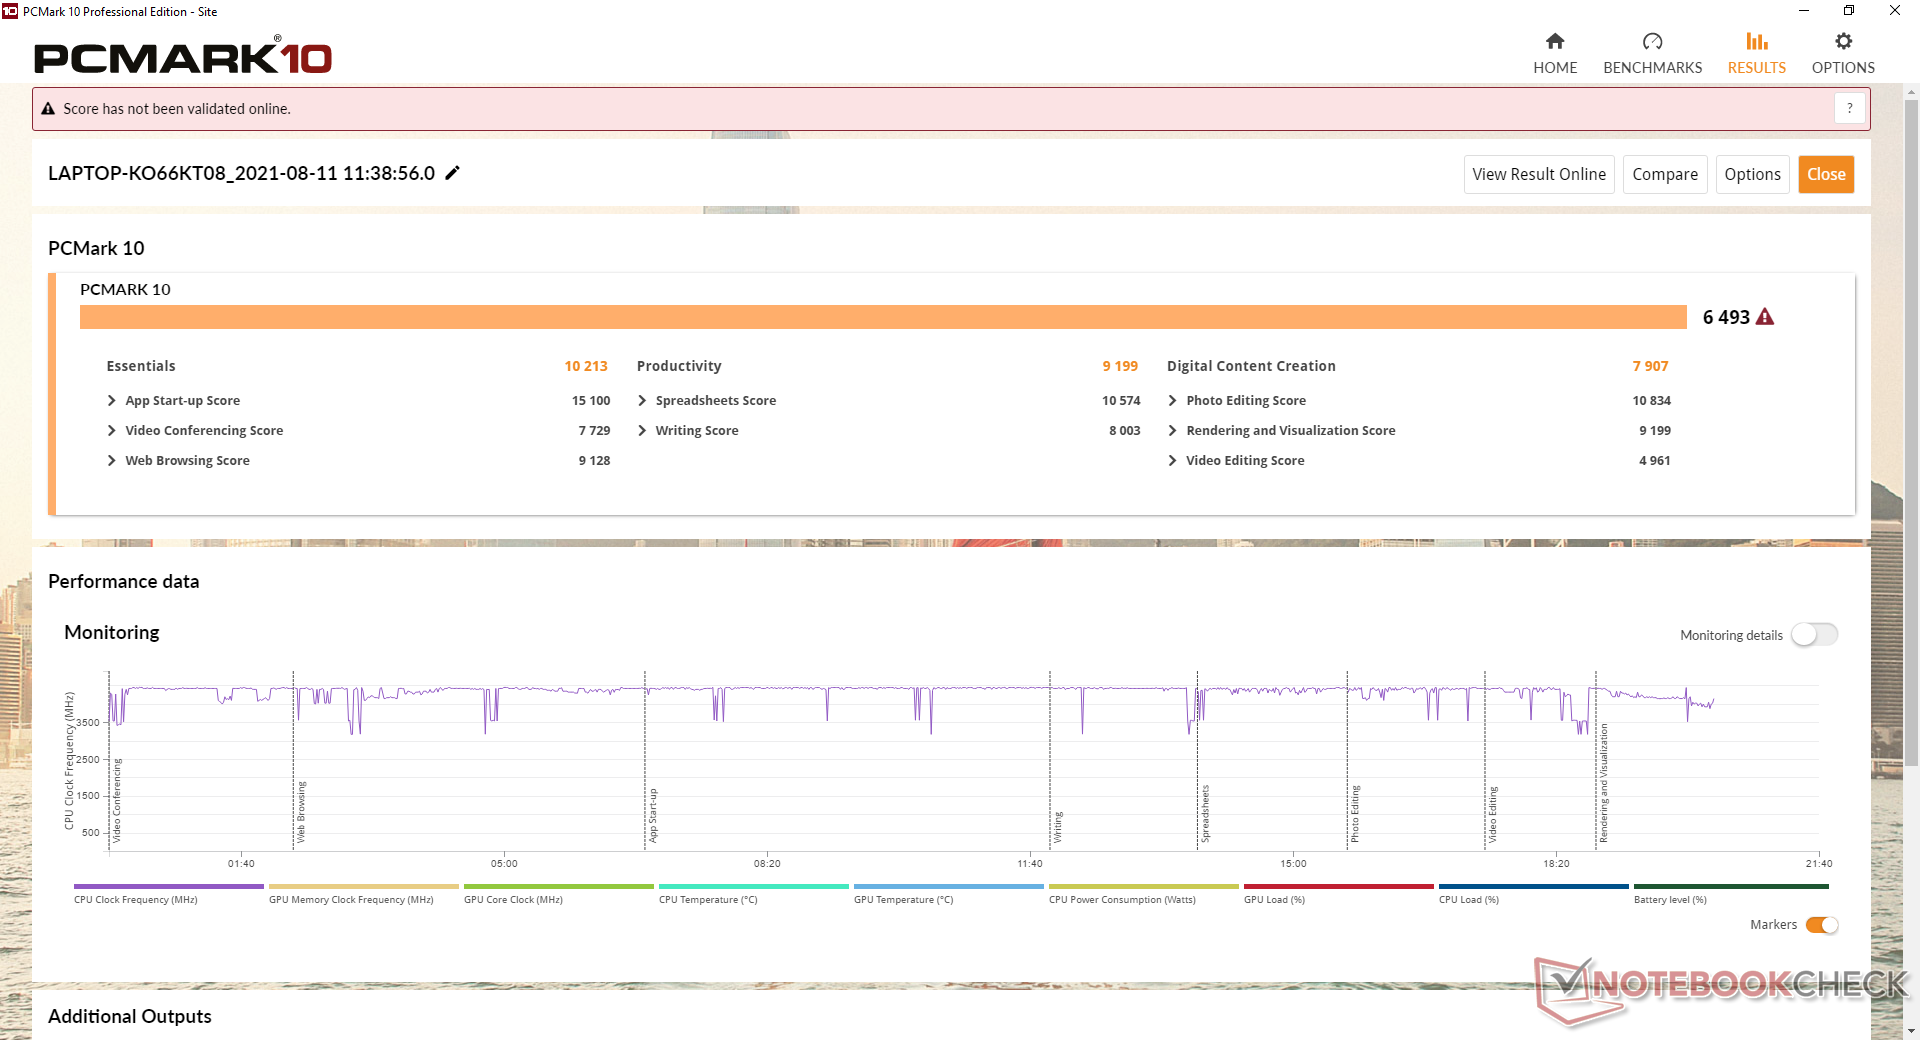
PCMark 10 results are slightly higher than expected likely due to the very fast Ryzen 7 CPU, but the slower RTX 3050 Ti brings everything down. At least results are consistently higher than the MSI Alpha 17 powered only by AMD hardware.
| PCMark 10 / Score | |
| Asus Strix Scar 17 G733QSA-XS99 | |
| MSI Katana GF76 11UE | |
| Asus ROG Strix G17 G713QE-RB74 | |
| Average AMD Ryzen 7 5800H, NVIDIA GeForce RTX 3050 Ti Laptop GPU (6098 - 6493, n=2) | |
| MSI Alpha 17 A4DEK | |
| Acer Nitro 5 AN517-53-54DQ | |
| Asus Strix G17 G712LWS | |
| PCMark 10 / Essentials | |
| Asus Strix Scar 17 G733QSA-XS99 | |
| Asus ROG Strix G17 G713QE-RB74 | |
| Average AMD Ryzen 7 5800H, NVIDIA GeForce RTX 3050 Ti Laptop GPU (9631 - 10213, n=2) | |
| MSI Katana GF76 11UE | |
| Asus Strix G17 G712LWS | |
| Acer Nitro 5 AN517-53-54DQ | |
| MSI Alpha 17 A4DEK | |
| PCMark 10 / Productivity | |
| Asus Strix Scar 17 G733QSA-XS99 | |
| Asus ROG Strix G17 G713QE-RB74 | |
| Average AMD Ryzen 7 5800H, NVIDIA GeForce RTX 3050 Ti Laptop GPU (8625 - 9199, n=2) | |
| MSI Katana GF76 11UE | |
| Acer Nitro 5 AN517-53-54DQ | |
| Asus Strix G17 G712LWS | |
| MSI Alpha 17 A4DEK | |
| PCMark 10 / Digital Content Creation | |
| Asus Strix Scar 17 G733QSA-XS99 | |
| MSI Katana GF76 11UE | |
| MSI Alpha 17 A4DEK | |
| Asus ROG Strix G17 G713QE-RB74 | |
| Average AMD Ryzen 7 5800H, NVIDIA GeForce RTX 3050 Ti Laptop GPU (7408 - 7907, n=2) | |
| Acer Nitro 5 AN517-53-54DQ | |
| Asus Strix G17 G712LWS | |
| PCMark 10 Score | 6493 points | |
Help | ||
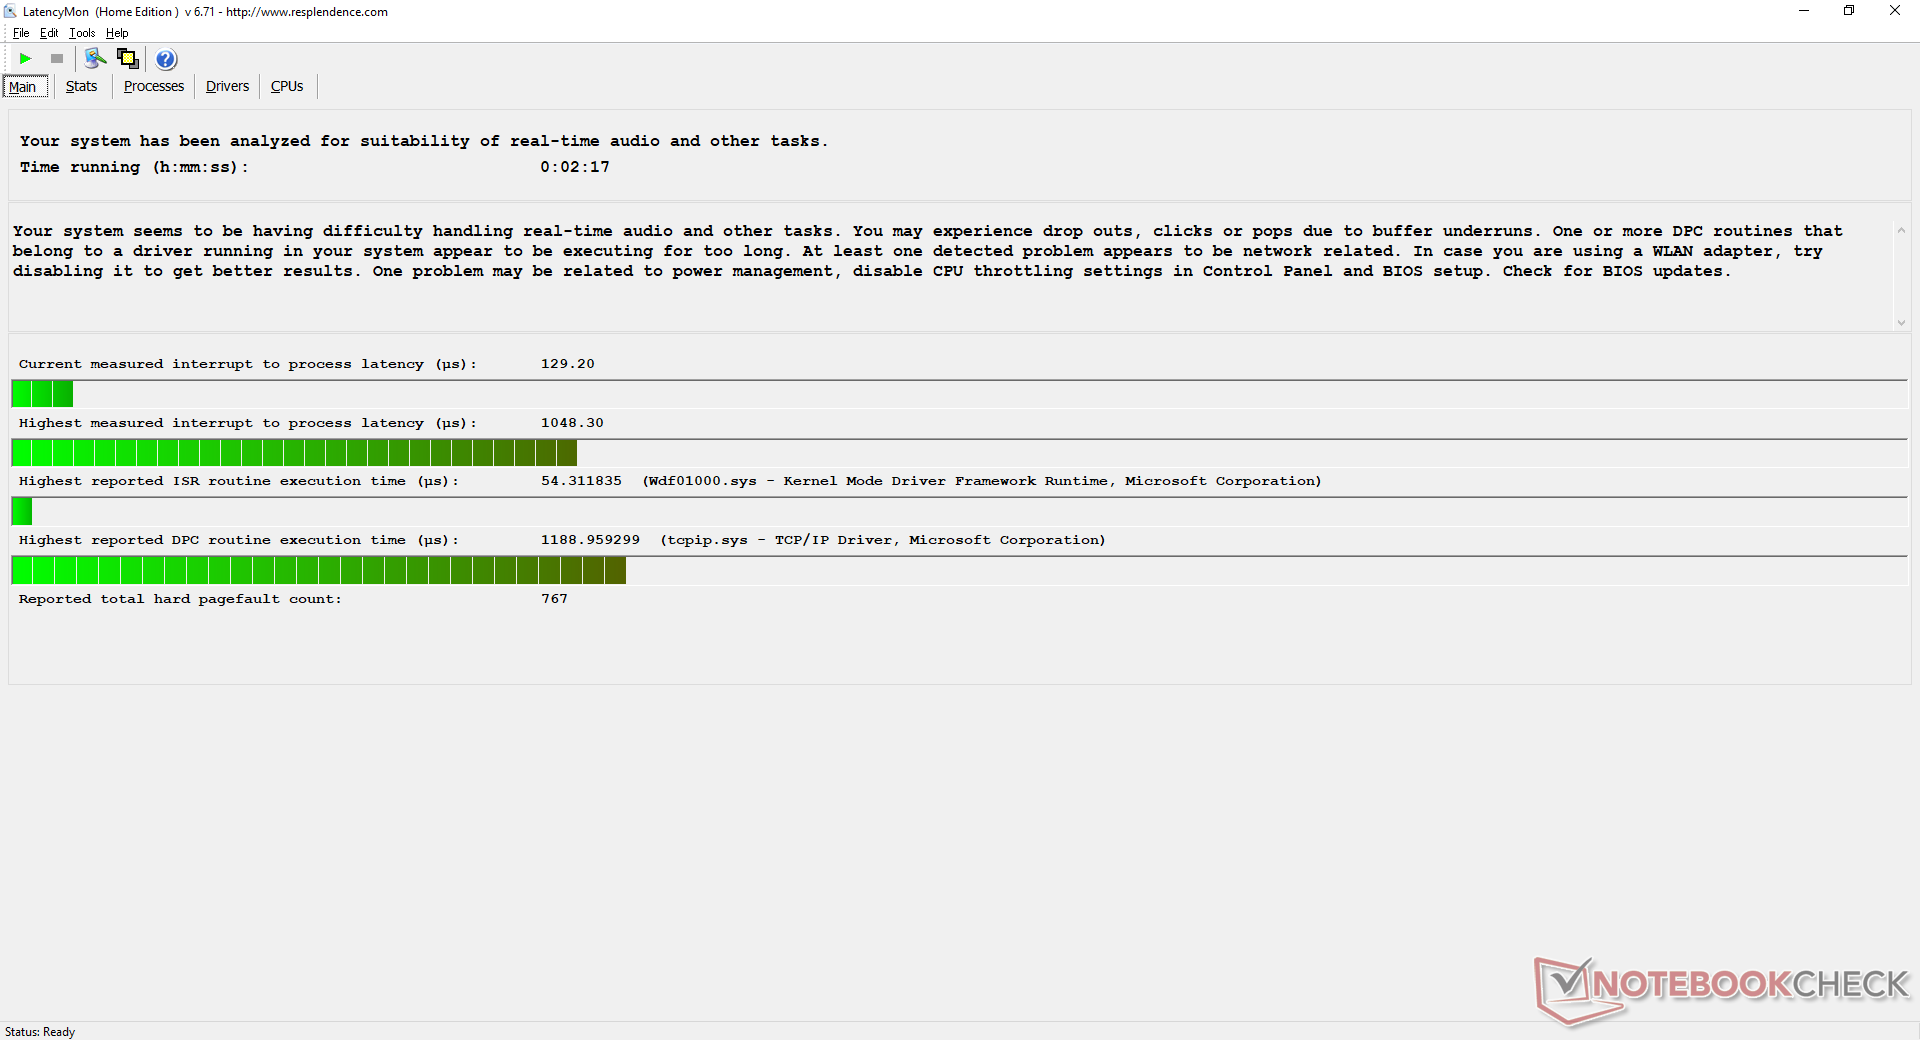
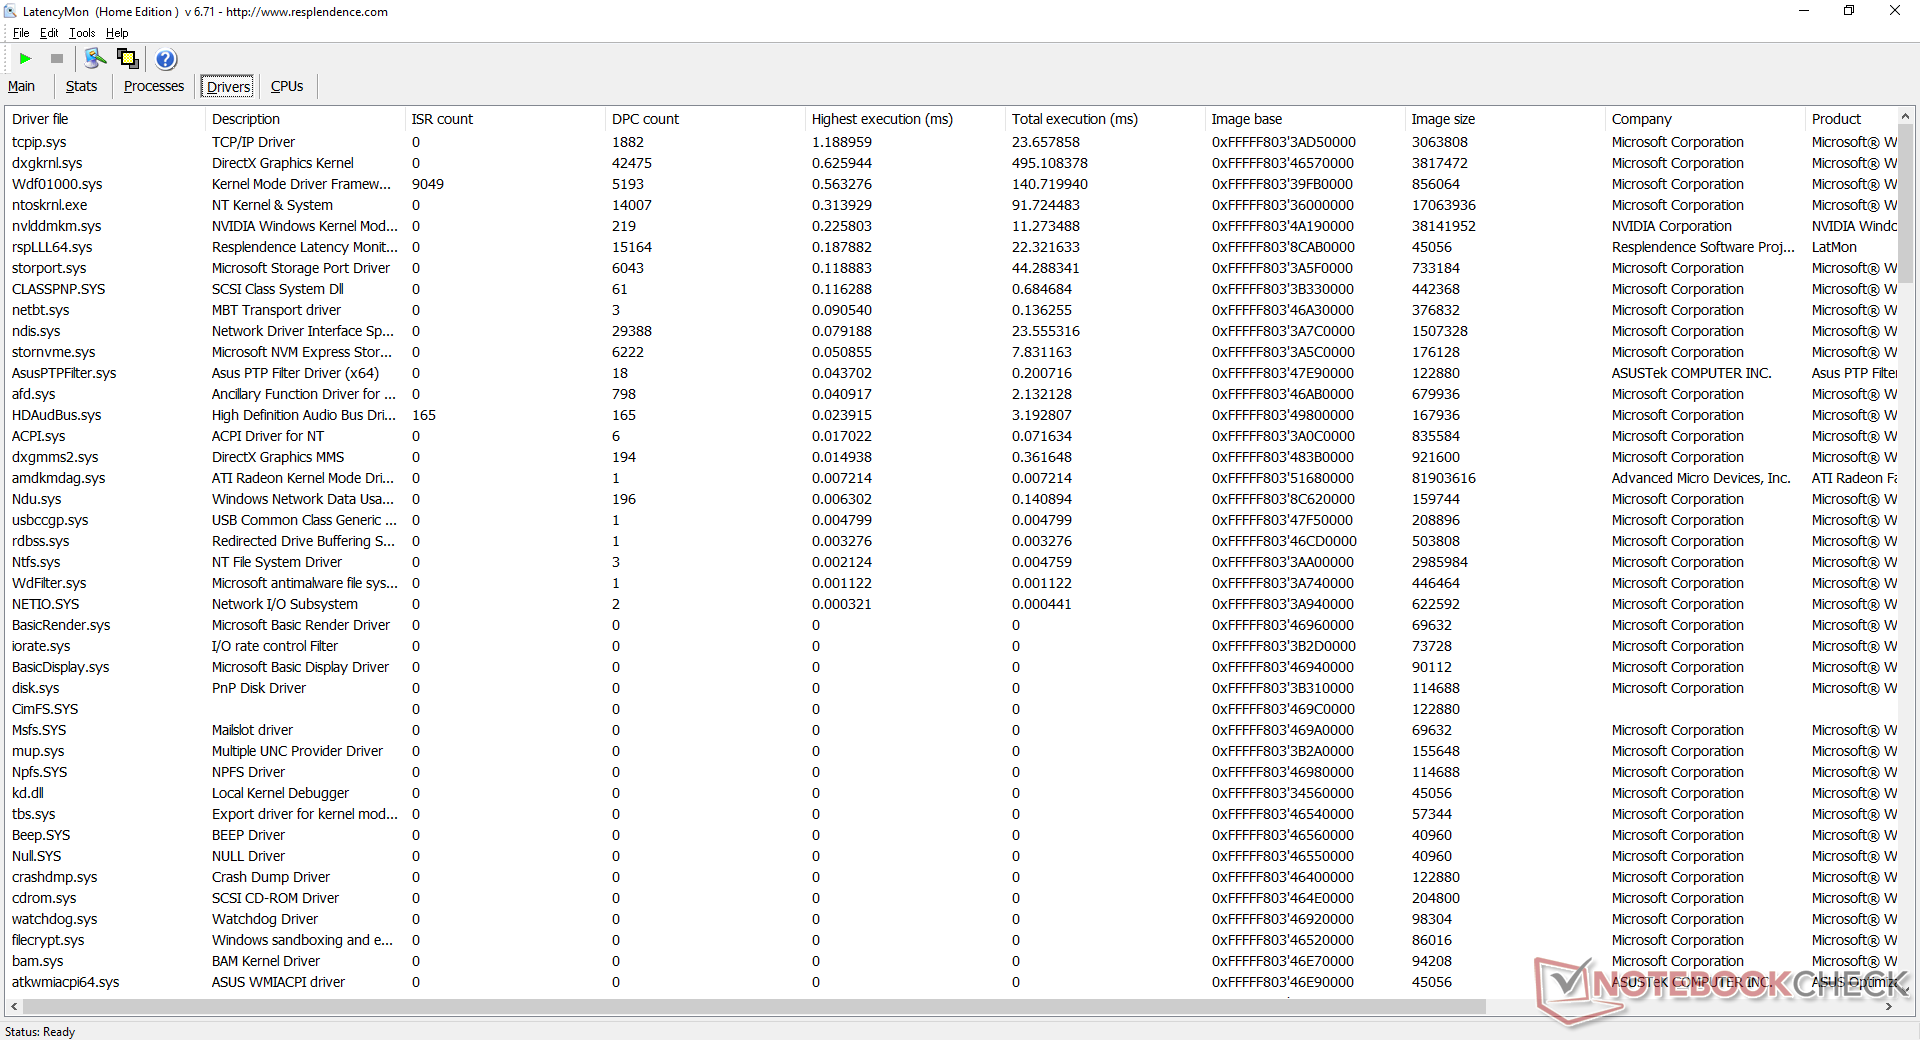
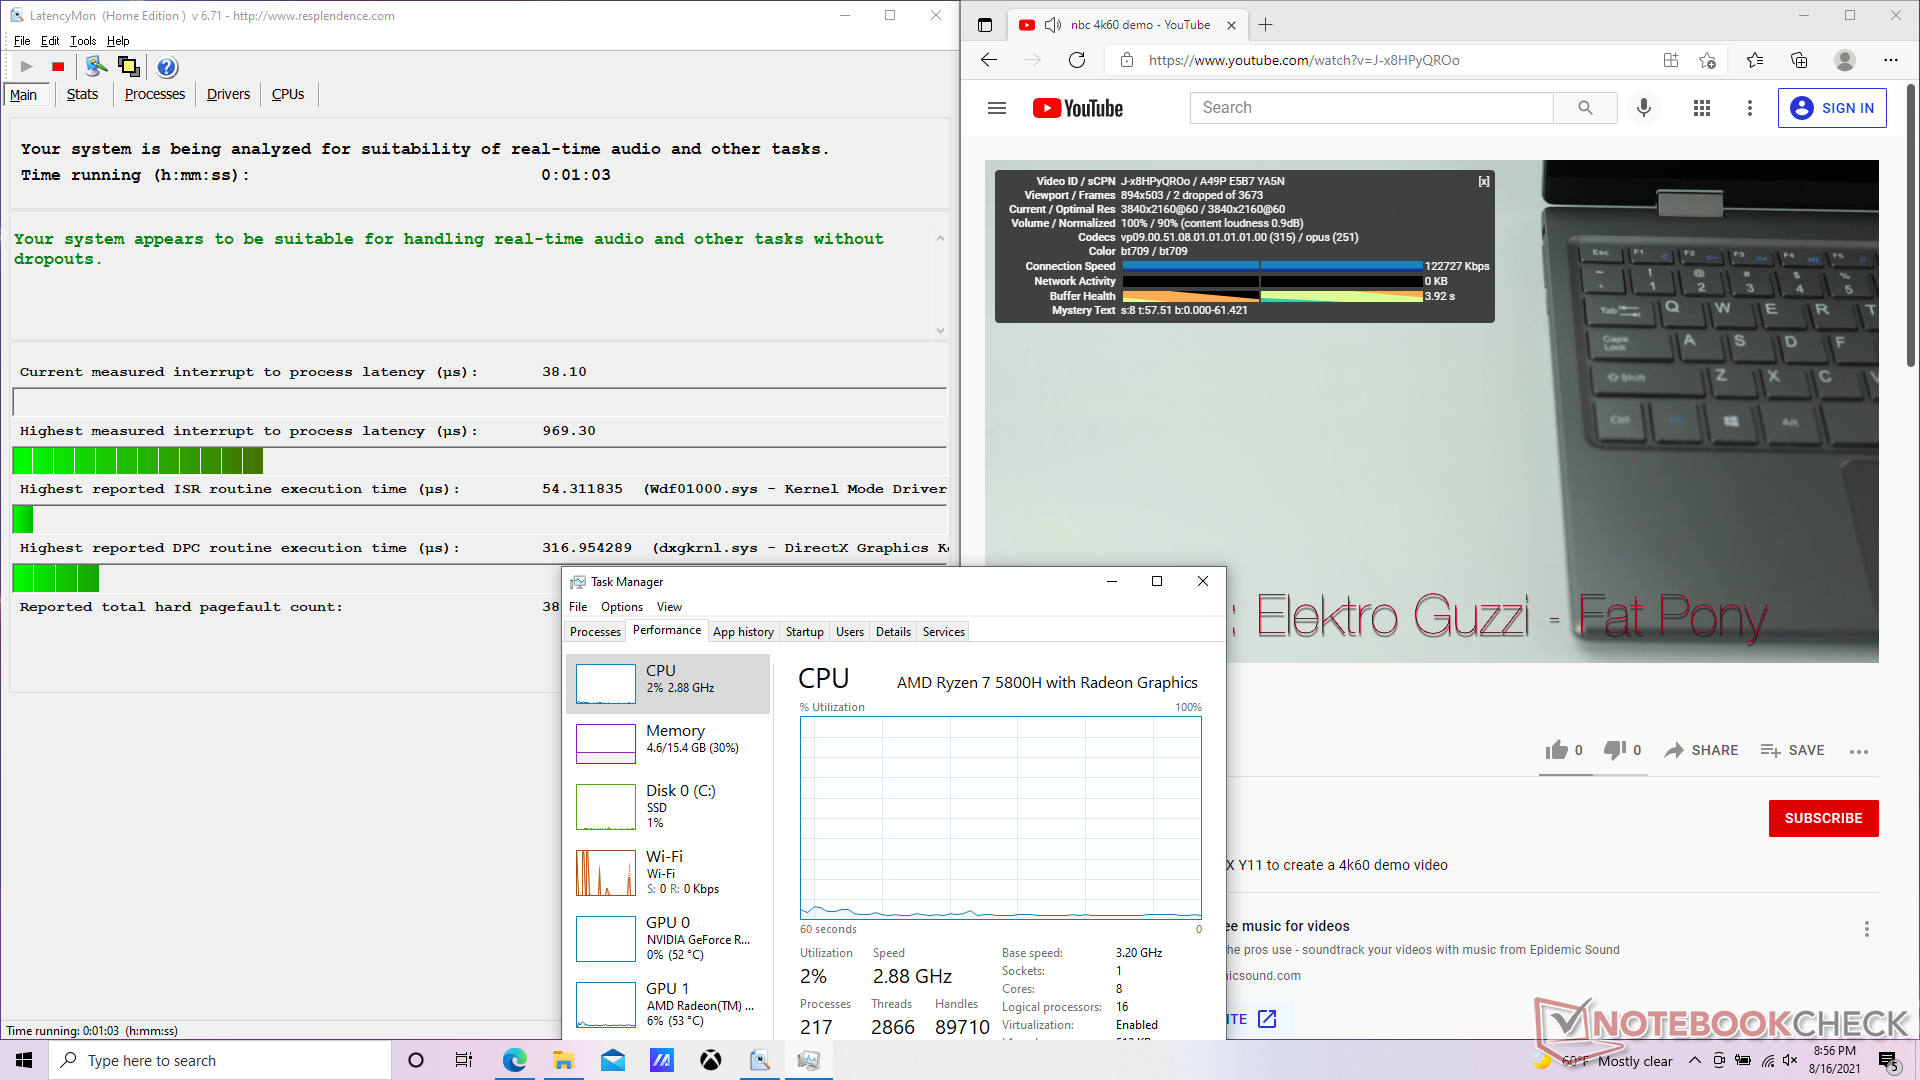
DPC Latency
LatencyMon shows minor latency issues when opening multiple browser tabs on our homepage. 4K video playback at 60 FPS is otherwise smooth with just 2 dropped frames during our minute-long test video.
| DPC Latencies / LatencyMon - interrupt to process latency (max), Web, Youtube, Prime95 | |
| MSI Alpha 17 A4DEK | |
| MSI Katana GF76 11UE | |
| Asus Strix G17 G712LWS | |
| Acer Nitro 5 AN517-53-54DQ | |
| Asus ROG Strix G17 G713QE-RB74 | |
| Asus Strix Scar 17 G733QSA-XS99 | |
* ... smaller is better
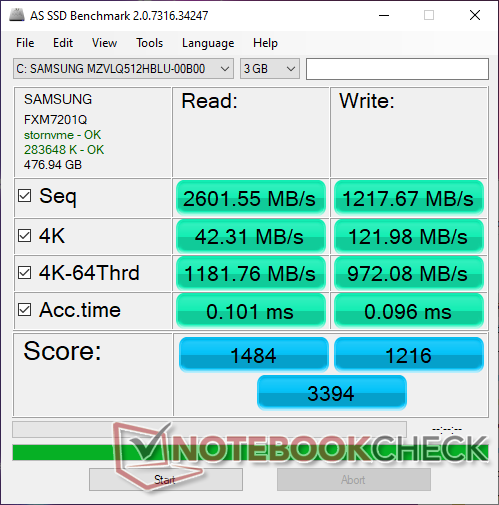
Storage Devices — No 2.5-inch Drives
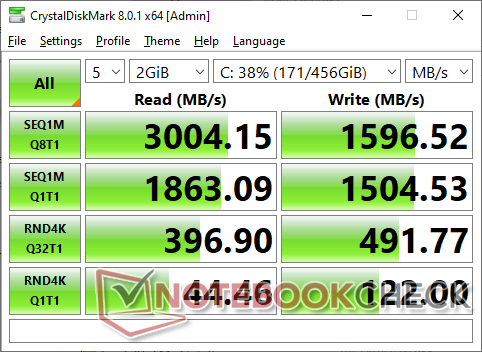
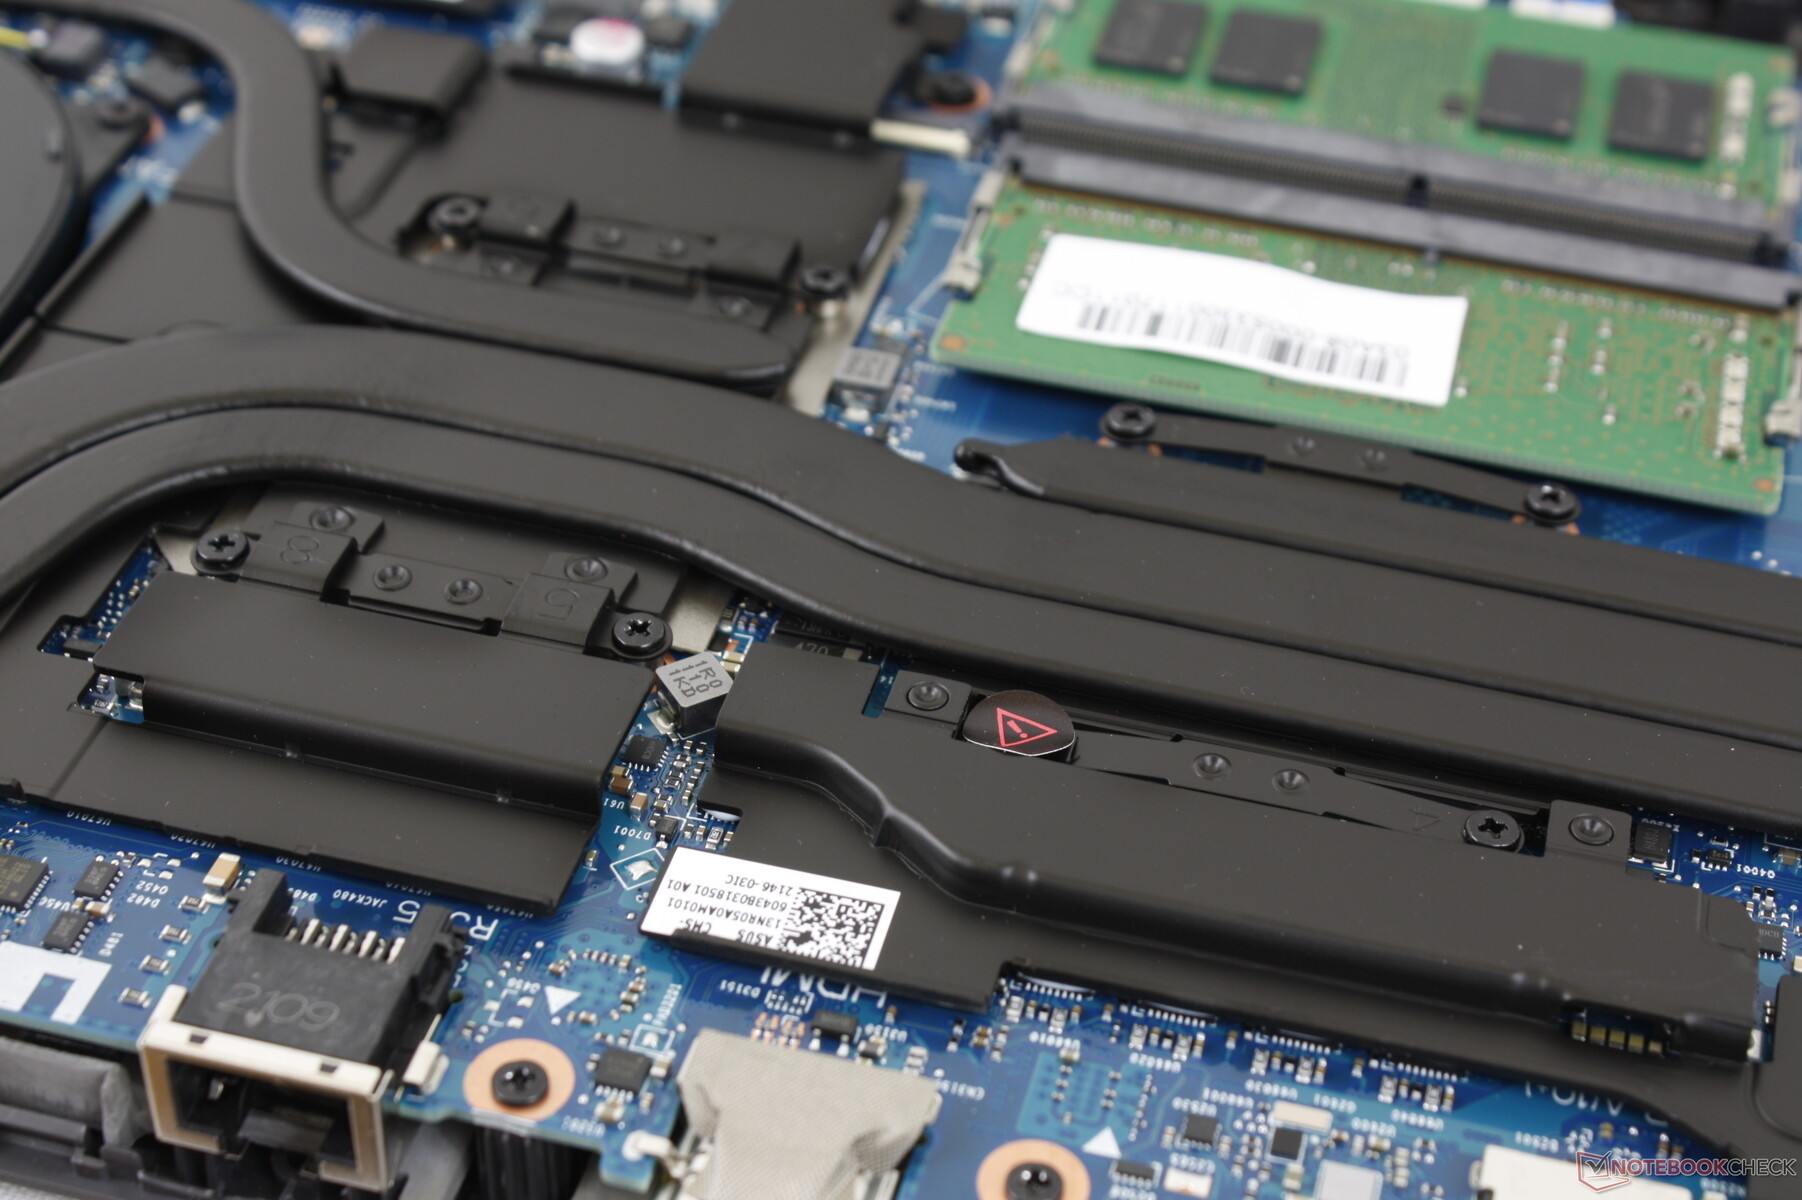
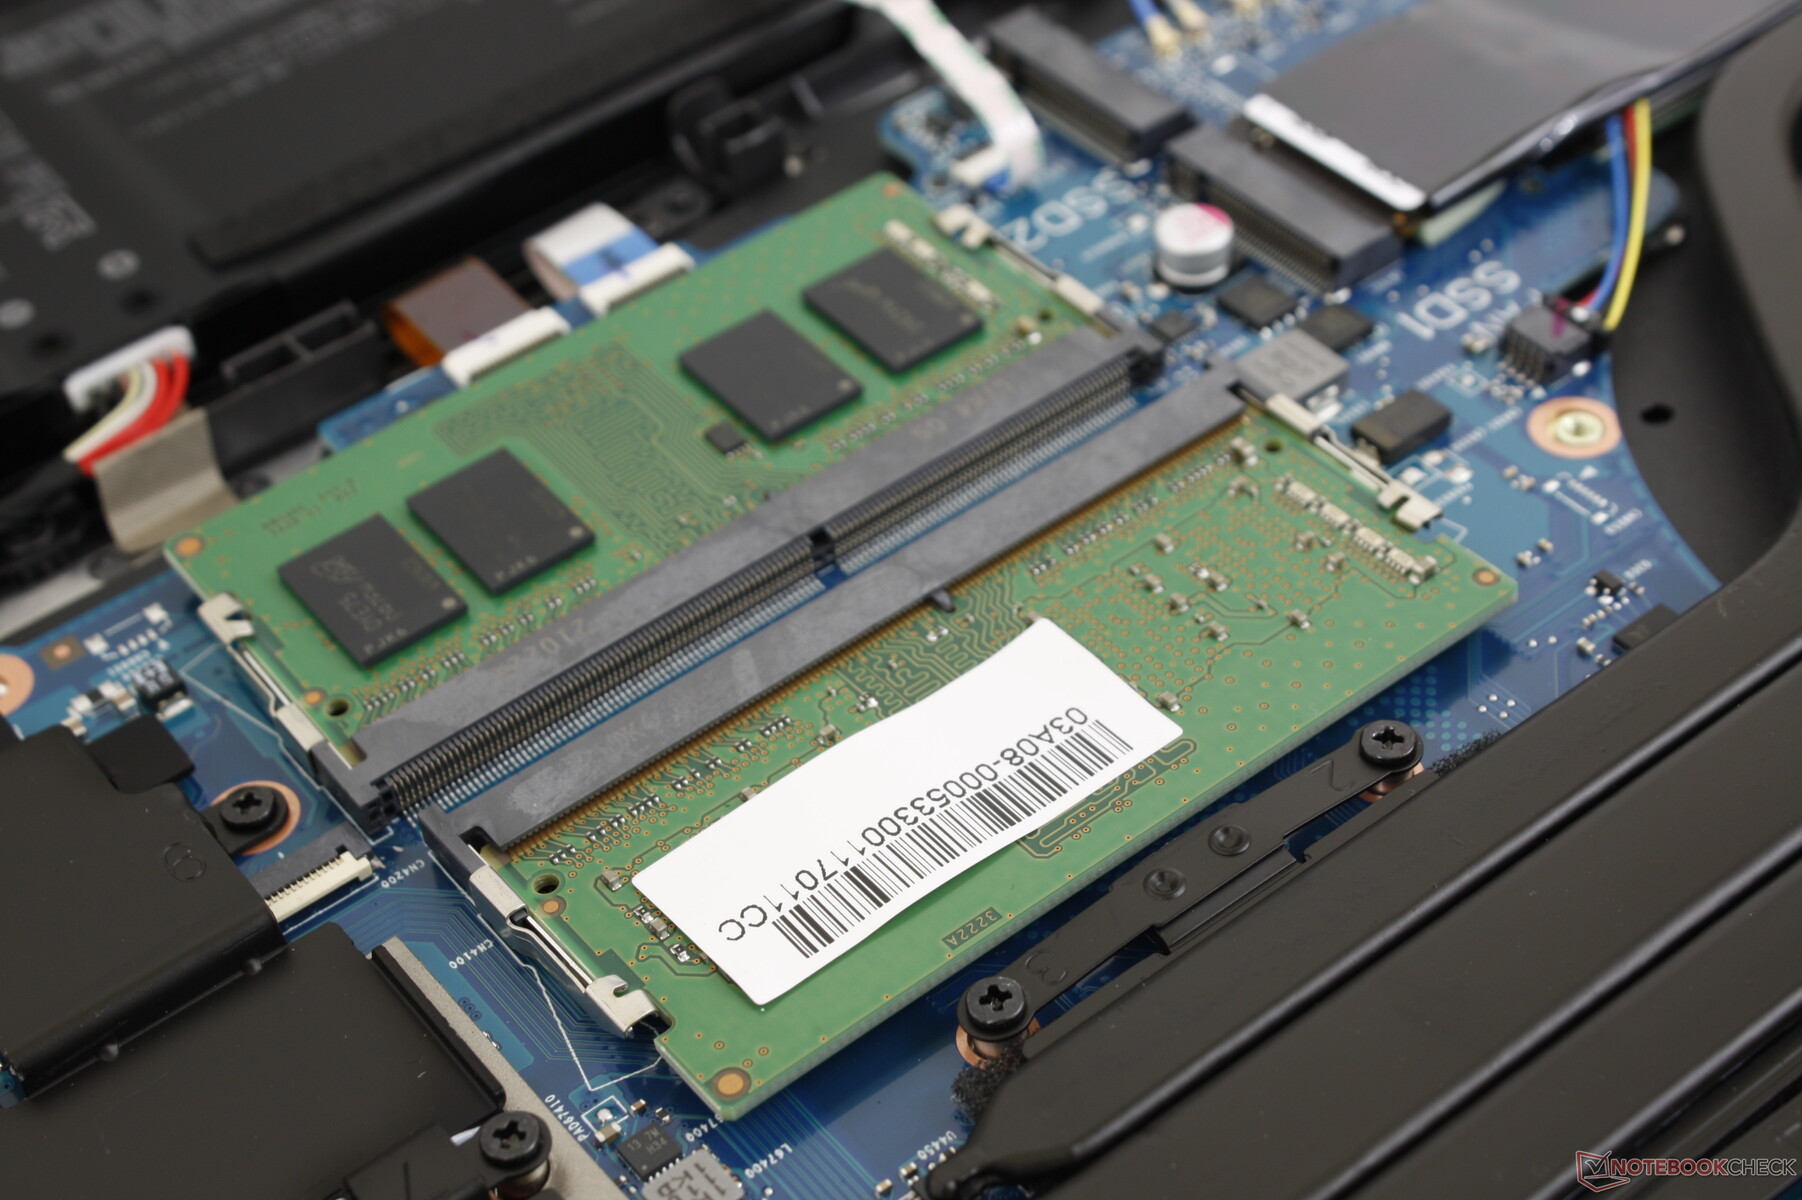
The Samsung PM991a MZVLQ512HBLU is an upper midrange PCIe 3 NVMe SSD with theoretical sequential read and write rates of 3100 MB/s and 1800 MB/s, respectively, to be slower than the PM981a which can reach speeds of up to 3500 MB/s and 2900 MB/s. Owners can install up to two internal M.2 NVMe SSDs.
| Asus ROG Strix G17 G713QE-RB74 Samsung PM991 MZVLQ512HBLU | Acer Nitro 5 AN517-53-54DQ SK Hynix BC711 HFM512GD3HX015N | MSI Katana GF76 11UE Kingston OM8PCP3512F-AB | Asus Strix G17 G712LWS Intel SSD 660p 1TB SSDPEKNW010T8 | Lenovo IdeaPad 5 Pro 16IHU6 Samsung SSD PM981a MZVLB512HBJQ | |
|---|---|---|---|---|---|
| AS SSD | 60% | -42% | -11% | 43% | |
| Seq Read (MB/s) | 2602 | 2859 10% | 1704 -35% | 1778 -32% | 2541 -2% |
| Seq Write (MB/s) | 1218 | 2693 121% | 716 -41% | 1478 21% | 2555 110% |
| 4K Read (MB/s) | 42.31 | 68.8 63% | 37.77 -11% | 49.76 18% | 56 32% |
| 4K Write (MB/s) | 122 | 154.5 27% | 66 -46% | 117.9 -3% | 129.6 6% |
| 4K-64 Read (MB/s) | 1182 | 1860 57% | 441.2 -63% | 591 -50% | 1633 38% |
| 4K-64 Write (MB/s) | 972 | 1680 73% | 735 -24% | 875 -10% | 1863 92% |
| Access Time Read * (ms) | 0.101 | 0.043 57% | 0.191 -89% | 0.082 19% | 0.077 24% |
| Access Time Write * (ms) | 0.096 | 0.028 71% | 0.053 45% | 0.041 57% | 0.029 70% |
| Score Read (Points) | 1484 | 2214 49% | 649 -56% | 818 -45% | 1944 31% |
| Score Write (Points) | 1216 | 2104 73% | 872 -28% | 1140 -6% | 2248 85% |
| Score Total (Points) | 3394 | 5451 61% | 1816 -46% | 2377 -30% | 5192 53% |
| Copy ISO MB/s (MB/s) | 1538 | 912 -41% | 1495 -3% | 2246 46% | |
| Copy Program MB/s (MB/s) | 805 | 278.9 -65% | 446 -45% | 861 7% | |
| Copy Game MB/s (MB/s) | 1418 | 144.6 -90% | 697 -51% | 1552 9% | |
| CrystalDiskMark 5.2 / 6 | 58% | -19% | 4% | 43% | |
| Write 4K (MB/s) | 120.8 | 206.1 71% | 107.3 -11% | 141.1 17% | 203 68% |
| Read 4K (MB/s) | 44.19 | 77.8 76% | 45.46 3% | 60.9 38% | 52.3 18% |
| Write Seq (MB/s) | 1518 | 2842 87% | 978 -36% | 1681 11% | 2138 41% |
| Read Seq (MB/s) | 1828 | 2552 40% | 1255 -31% | 1602 -12% | 1974 8% |
| Write 4K Q32T1 (MB/s) | 492.5 | 583 18% | 579 18% | 406.6 -17% | 640 30% |
| Read 4K Q32T1 (MB/s) | 390.7 | 663 70% | 299.6 -23% | 470.2 20% | 707 81% |
| Write Seq Q32T1 (MB/s) | 1602 | 3014 88% | 978 -39% | 1759 10% | 2973 86% |
| Read Seq Q32T1 (MB/s) | 3086 | 3556 15% | 1977 -36% | 1932 -37% | 3559 15% |
| Total Average (Program / Settings) | 59% /
59% | -31% /
-34% | -4% /
-6% | 43% /
43% |
* ... smaller is better

Disk Throttling: DiskSpd Read Loop, Queue Depth 8
GPU Performance — Slower Than The GeForce GTX 1660 Ti
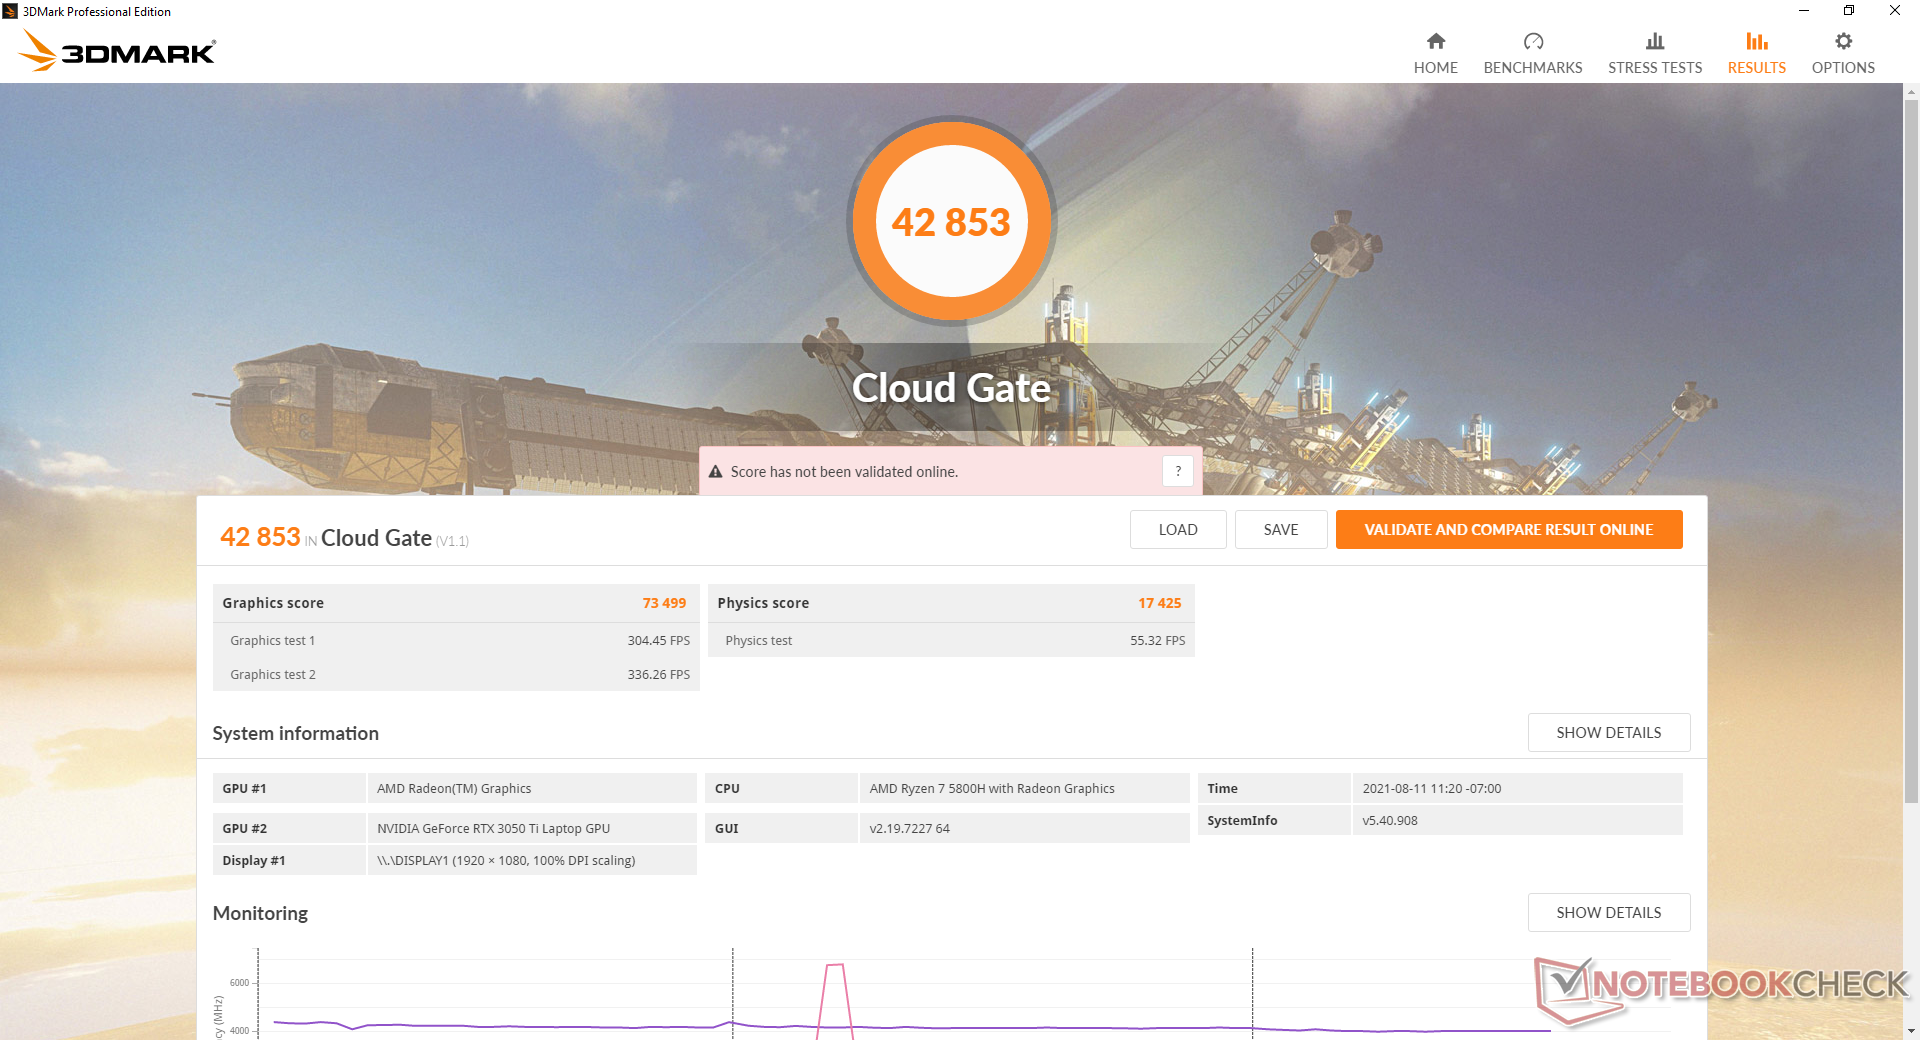
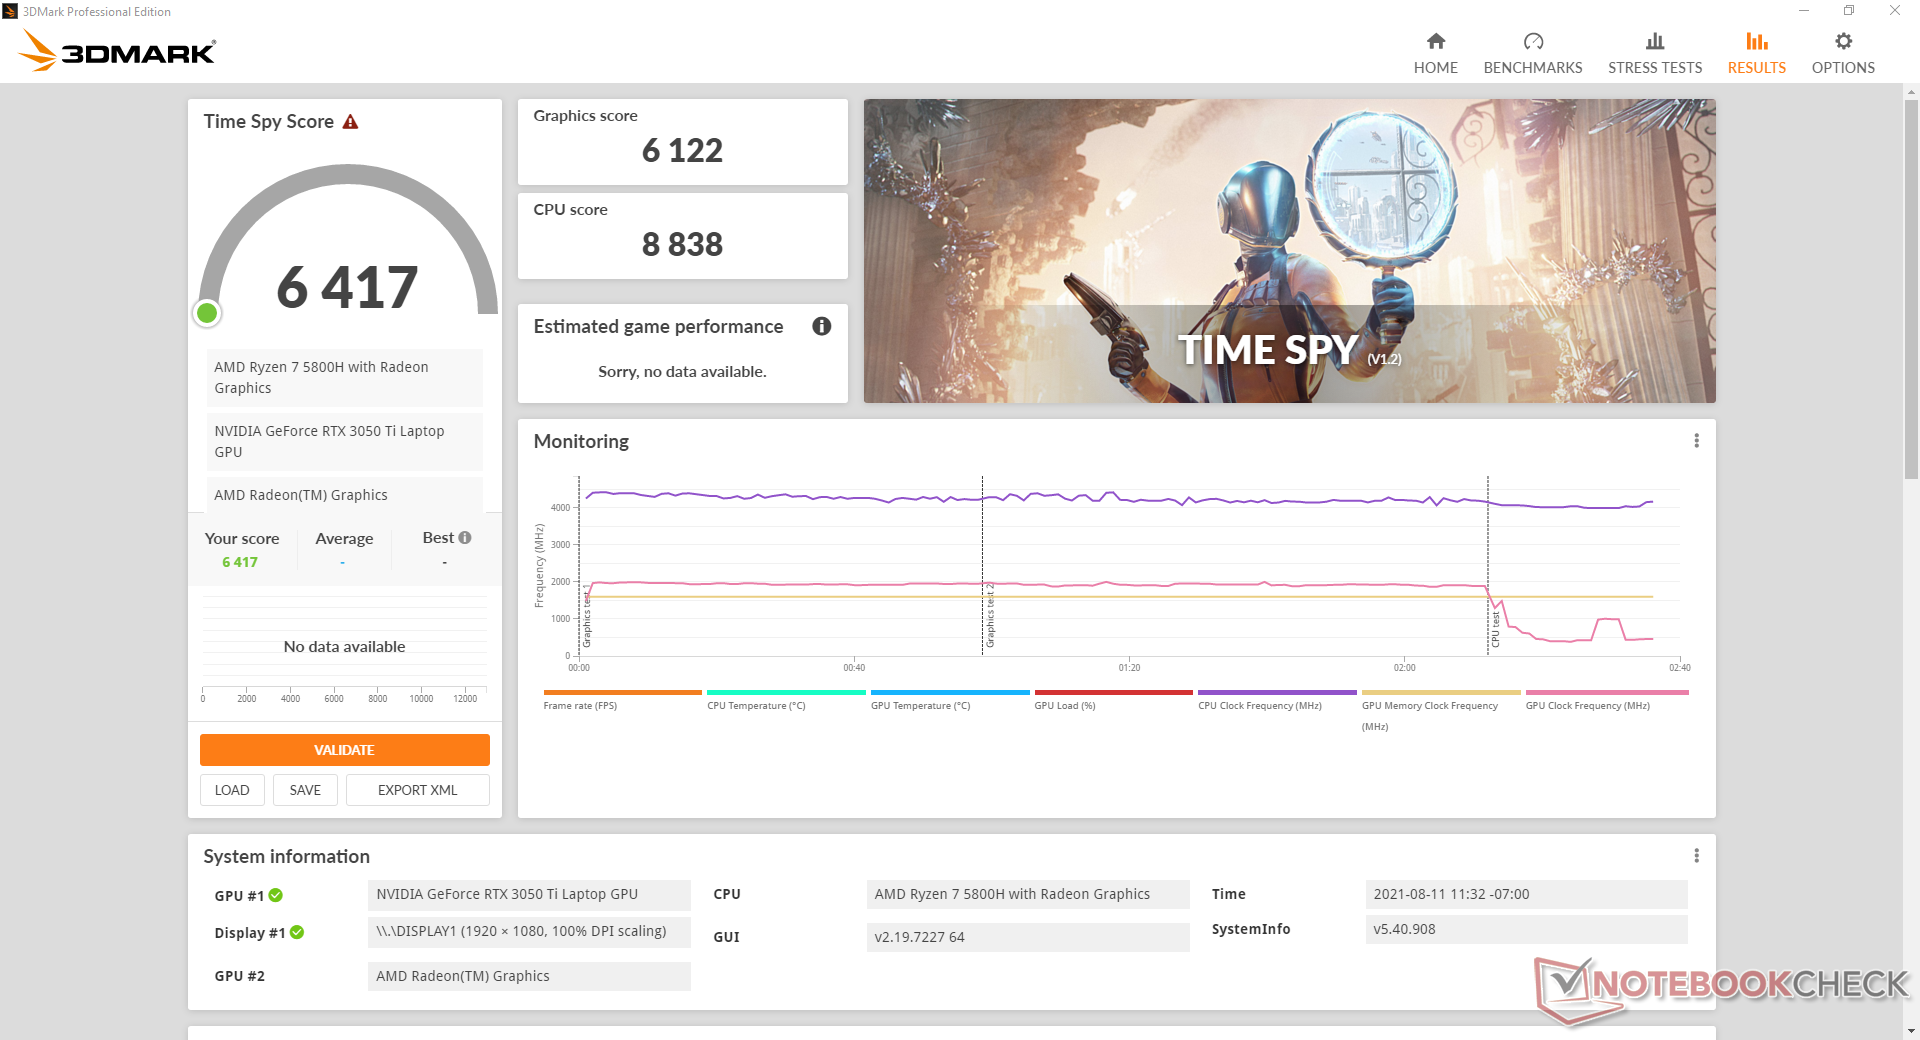
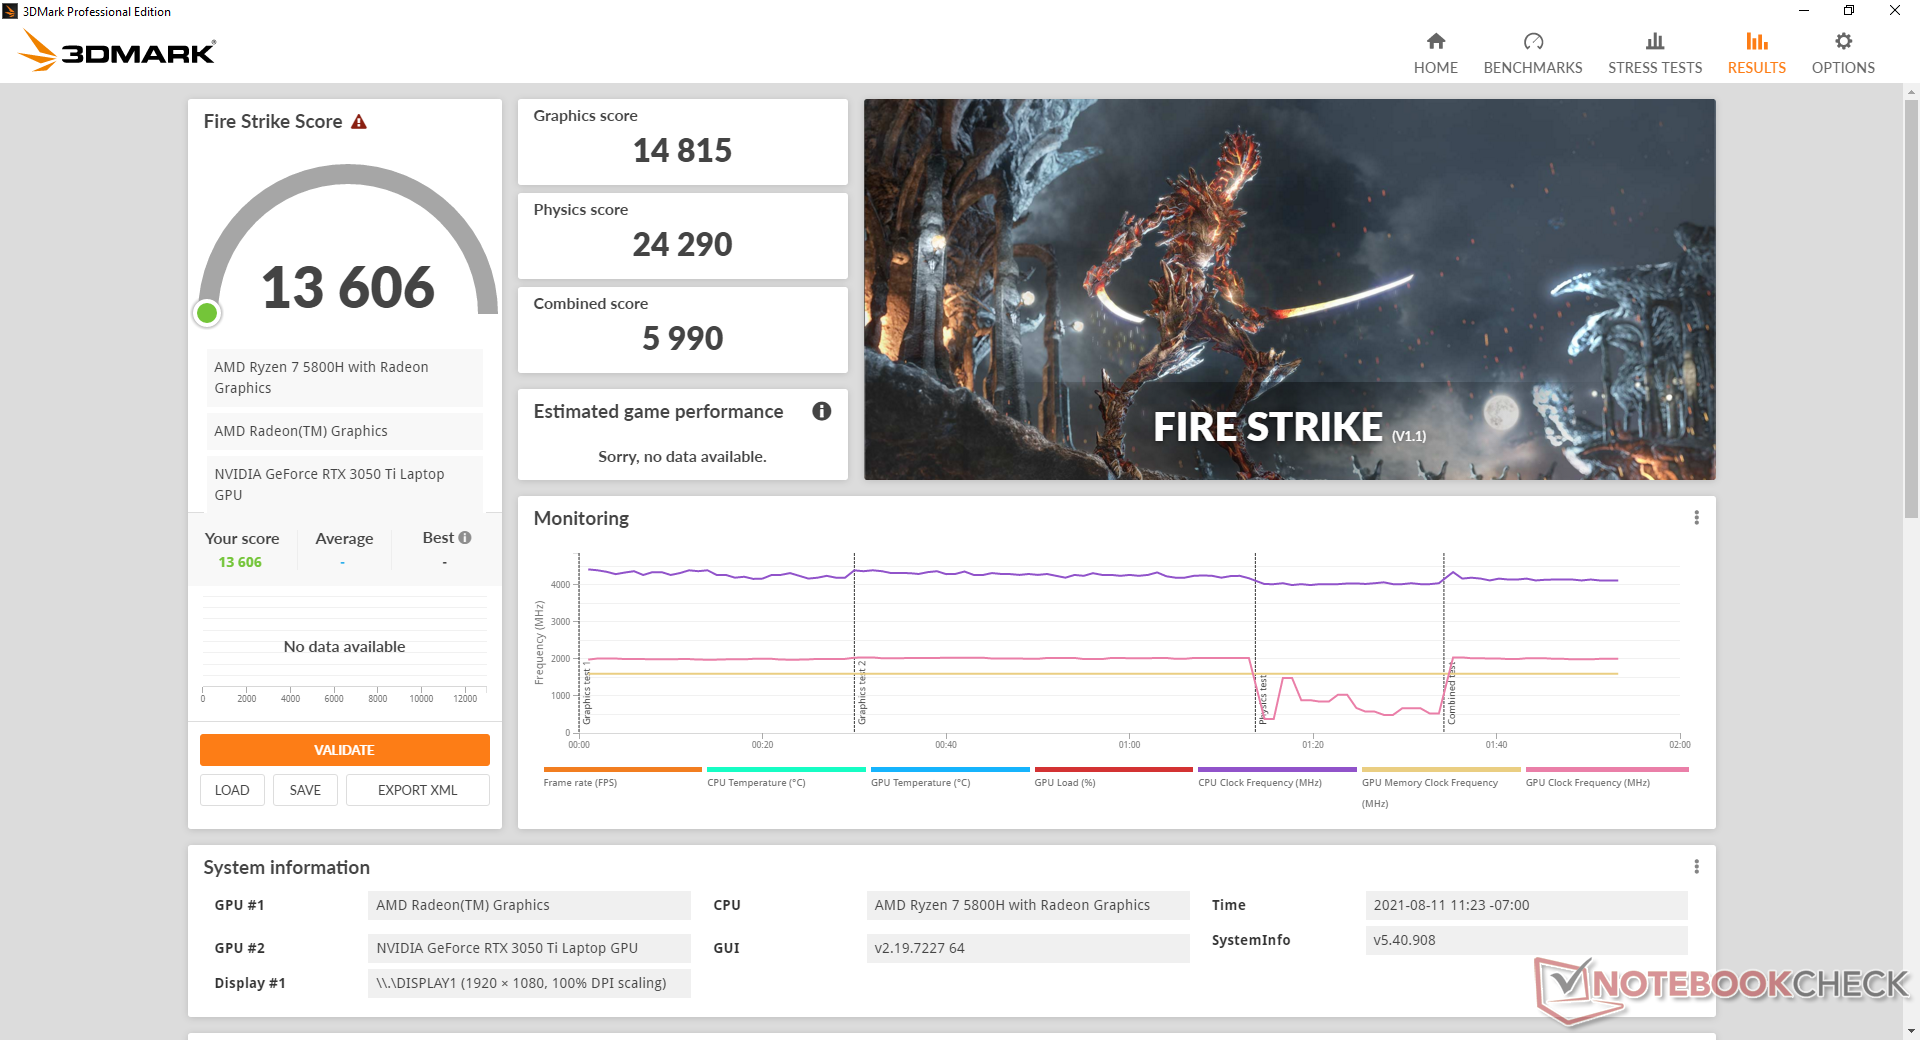
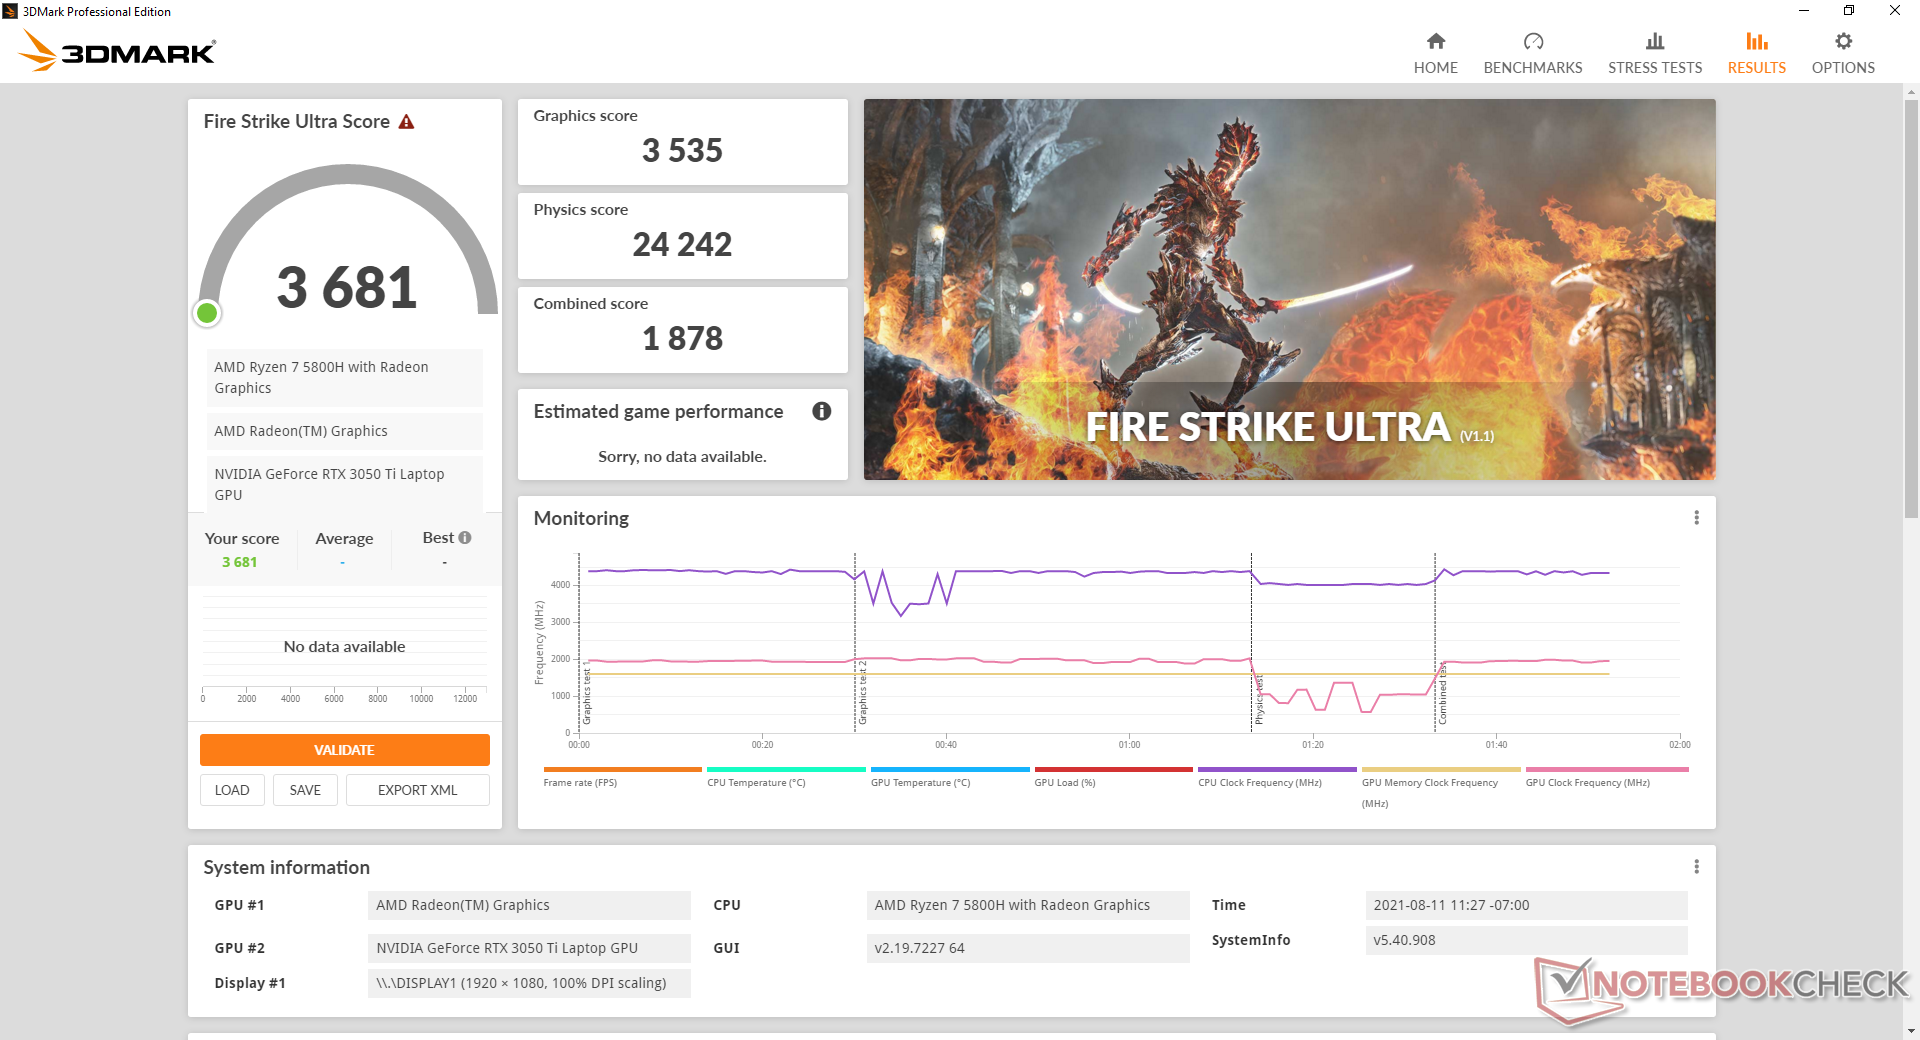
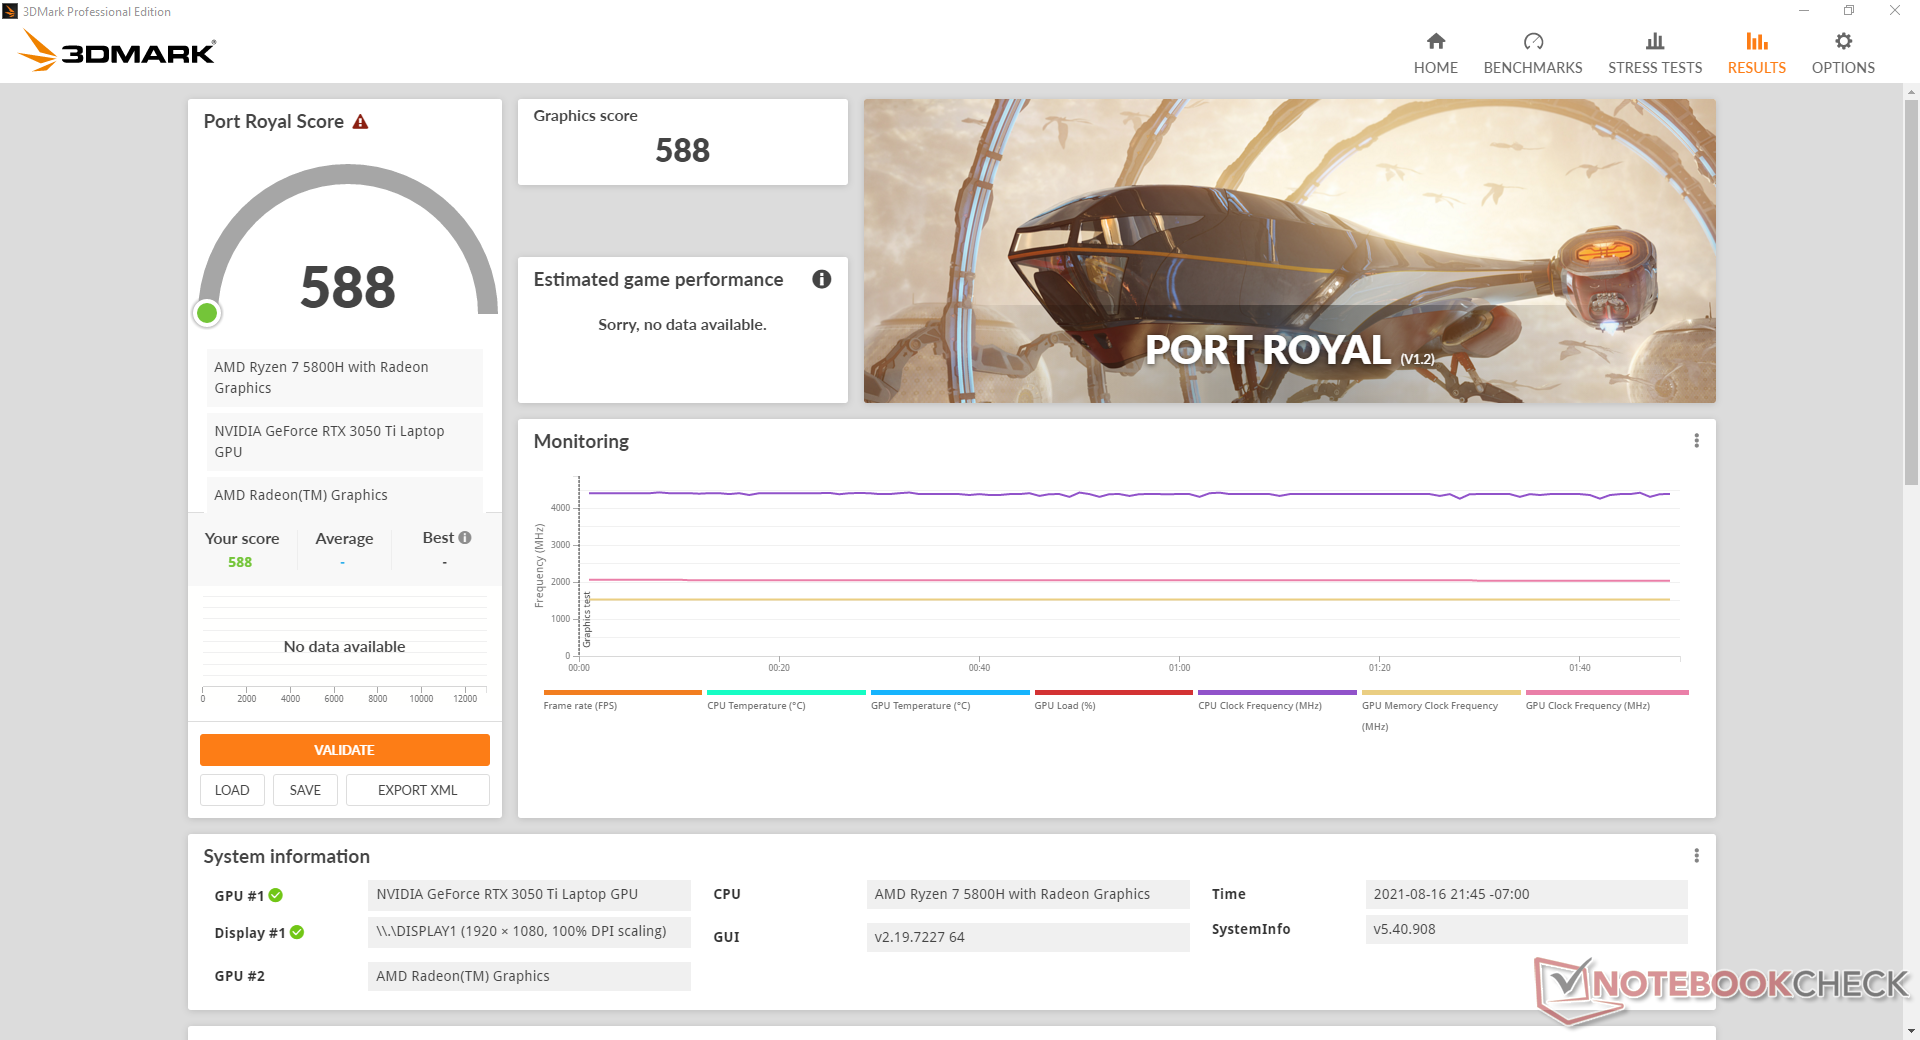
Graphics performance is disappointing for an RTX-based graphics card. 3DMark results are about 16 to 25 percent faster than the RTX 3050 in the Acer Nitro 5 to be on par with the less expensive GeForce GTX 1660 Ti at best. In fact, the GTX 1660 Ti will still edge out our RTX 3050 Ti under most gaming scenarios especially when at higher 1080p settings. Upgrading to the RTX 3060 will net users a 40 to 50 percent raw graphics boost.
Graphics performance will drop slightly if not running on Asus Turbo mode as exemplified by our Stress Test section below.
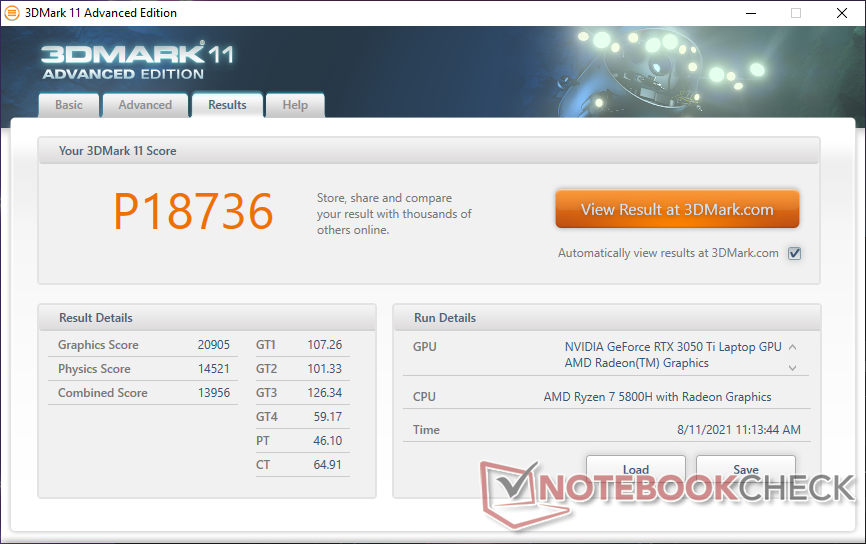
| 3DMark 11 Performance | 18736 points | |
| 3DMark Cloud Gate Standard Score | 42853 points | |
| 3DMark Fire Strike Score | 13606 points | |
| 3DMark Time Spy Score | 6417 points | |
Help | ||
Running Witcher 3 for a full hour shows stable performance save for one unexpected dip to the low 20 FPS range. The drop indicates an interrupting background activity during gameplay that's potentially related to preinstalled Asus software or other pop ups. Thankfully, this doesn't occur on a periodic basis.
Witcher 3 FPS Chart
| low | med. | high | ultra | |
|---|---|---|---|---|
| GTA V (2015) | 172 | 122 | 72.2 | |
| The Witcher 3 (2015) | 262.3 | 104.2 | 58.4 | |
| Dota 2 Reborn (2015) | 134 | 131 | 111 | 107 |
| Final Fantasy XV Benchmark (2018) | 132 | 81.8 | 56.6 | |
| X-Plane 11.11 (2018) | 94.1 | 81.6 | 68.4 | |
| Far Cry 5 (2018) | 125 | 101 | 94 | 89 |
| Strange Brigade (2018) | 227 | 134 | 114 | 100 |
| Shadow of the Tomb Raider (2018) | 115 | 92 | 83 | 72 |
| Far Cry New Dawn (2019) | 94 | 80 | 78 | 70 |
| Metro Exodus (2019) | 126.3 | 71.2 | 55.3 | 43.5 |
| Borderlands 3 (2019) | 123.5 | 88 | 56.8 | 36.8 |
| Gears Tactics (2020) | 125.9 | 136.4 | 90.6 | 64.7 |
| Horizon Zero Dawn (2020) | 52 | 47 | 44 | 41 |
| Watch Dogs Legion (2020) | 44 | 46 | 42 | 28 |
| Dirt 5 (2020) | 111.8 | 77.4 | 67.3 | 53.3 |
| Assassin´s Creed Valhalla (2020) | 84 | 53 | 34 | 24 |
| Immortals Fenyx Rising (2020) | 89 | 73 | 58 | 54 |
| Hitman 3 (2021) | 121.3 | 95.3 | 82.7 | 79.8 |
| F1 2021 (2021) | 200 | 141 | 125 | 69 |
Emissions — Loud Only When Gaming
System Noise
Fan noise is tied closely to the Armoury Crate power profiles. This time, however, Asus appears to have improved the behavior of the fans. Whereas the fans on older Strix models would boost to maximum RPM automatically when set to Turbo mode, they appear to be quieter no matter the mode until the extra horsepower is actually needed. Users can stream videos and perform other light tasks on Turbo mode without the fans constantly pulsing.
There is a noticeable fan noise difference between Performance mode and Turbo mode. Gaming on Performance mode results in a steady fan noise of 46.4 dB(A) while Turbo mode boosts this to 49.9 dB(A). The louder fans come with faster graphics performance as shown in our Stress Test section below.
| Asus ROG Strix G17 G713QE-RB74 GeForce RTX 3050 Ti Laptop GPU, R7 5800H, Samsung PM991 MZVLQ512HBLU | Acer Nitro 5 AN517-53-54DQ GeForce RTX 3050 4GB Laptop GPU, i5-11300H, SK Hynix BC711 HFM512GD3HX015N | MSI Katana GF76 11UE GeForce RTX 3060 Laptop GPU, i7-11800H, Kingston OM8PCP3512F-AB | Asus Strix Scar 17 G733QSA-XS99 GeForce RTX 3080 Laptop GPU, R9 5900HX, 2x Samsung PM981a MZVLB1T0HBLR (RAID 0) | MSI Alpha 17 A4DEK Radeon RX 5600M, R7 4800H, Kingston OM8PCP3512F-AB | Asus Strix G17 G712LWS GeForce RTX 2070 Super Mobile, i7-10750H, Intel SSD 660p 1TB SSDPEKNW010T8 | |
|---|---|---|---|---|---|---|
| Noise | -8% | -23% | 1% | -12% | -22% | |
| off / environment * (dB) | 24.9 | 25 -0% | 25 -0% | 25 -0% | 25 -0% | 25 -0% |
| Idle Minimum * (dB) | 25.1 | 25 -0% | 33 -31% | 25.2 -0% | 31 -24% | 32 -27% |
| Idle Average * (dB) | 25.1 | 31 -24% | 34 -35% | 25.2 -0% | 32 -27% | 34 -35% |
| Idle Maximum * (dB) | 25.1 | 33 -31% | 35 -39% | 25.2 -0% | 33 -31% | 37 -47% |
| Load Average * (dB) | 36.3 | 43 -18% | 53 -46% | 30.7 15% | 38 -5% | 51 -40% |
| Witcher 3 ultra * (dB) | 49.9 | 44 12% | 49 2% | 51.3 -3% | 46 8% | 50 -0% |
| Load Maximum * (dB) | 49.9 | 47 6% | 57 -14% | 51.3 -3% | 54 -8% | 53 -6% |
* ... smaller is better
Noise level
| Idle |
| 25.1 / 25.1 / 25.1 dB(A) |
| Load |
| 36.3 / 49.9 dB(A) |
 | ||
30 dB silent 40 dB(A) audible 50 dB(A) loud |
||
min: | ||
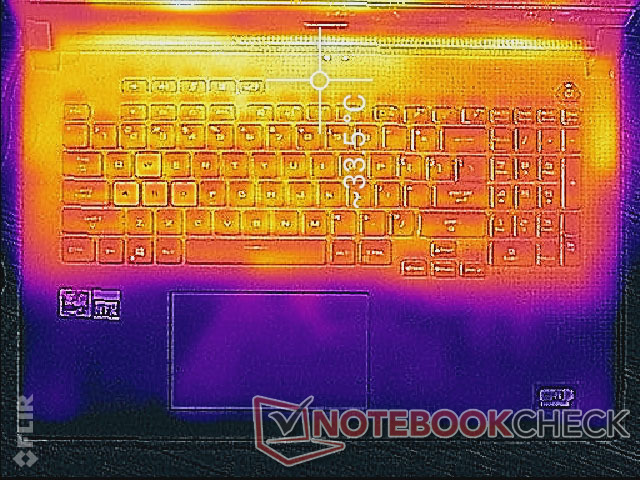
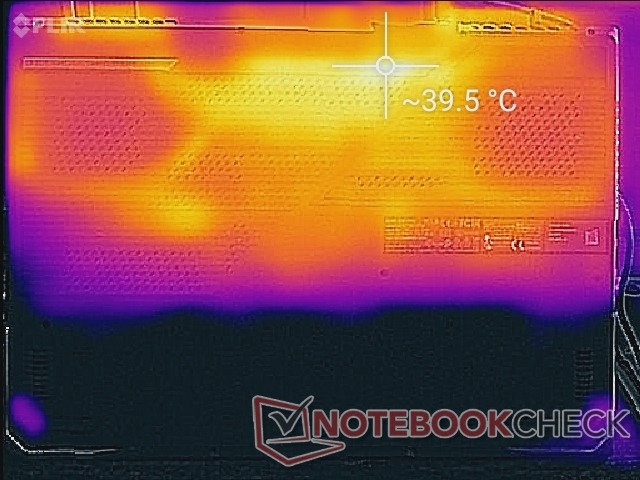
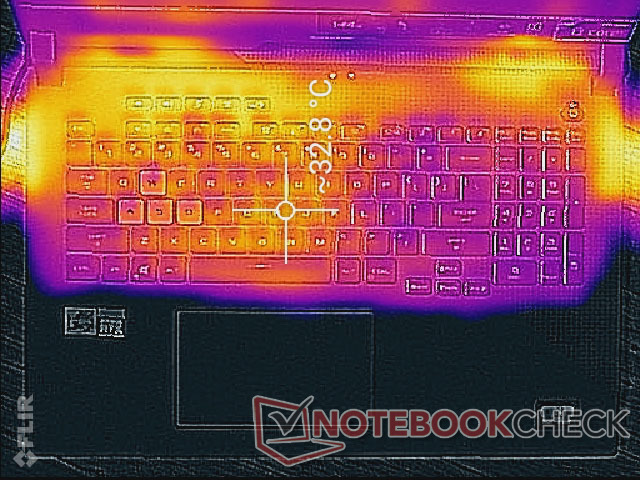
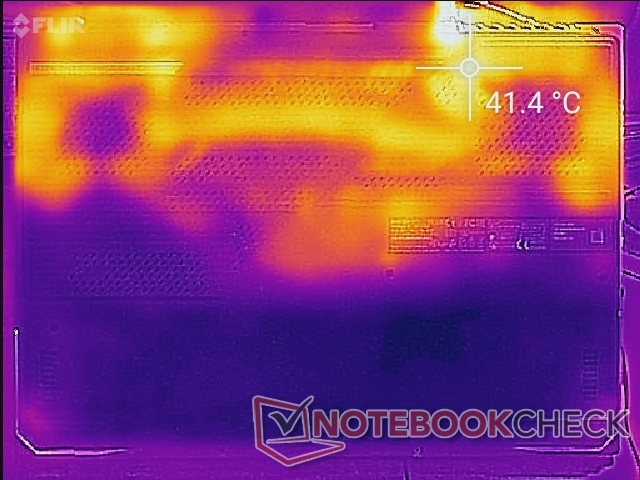
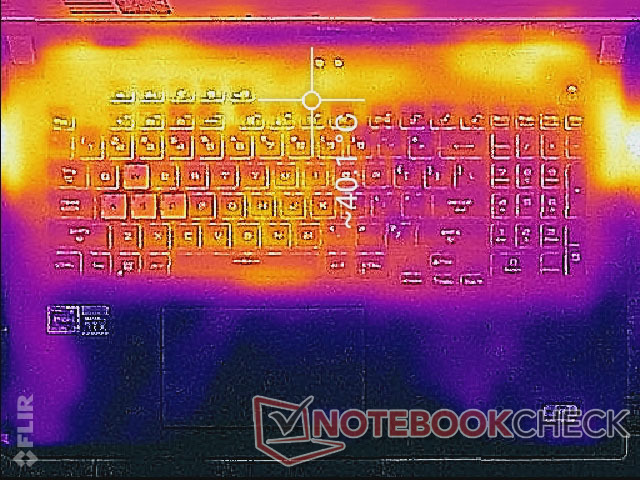
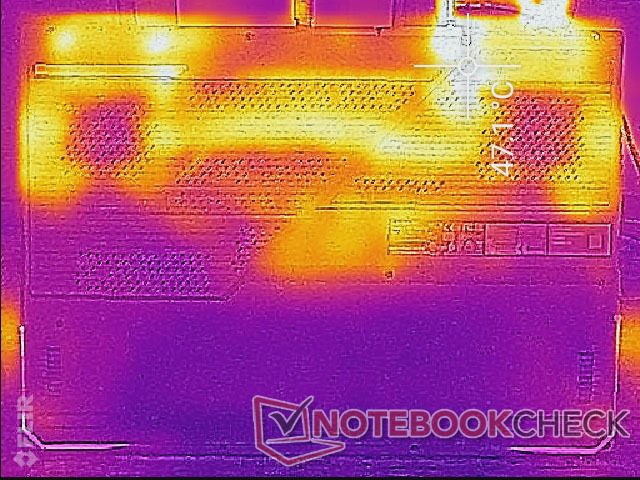
Temperature — Almost Always Warm
Surface temperatures are cool along the front quadrants while growing steadily warmer toward the rear. Since the internal fans like to idle when processing loads are low, hot spots are on the warmer side at up to 33 C and 40 C on the top and bottom hot spots, respectively.
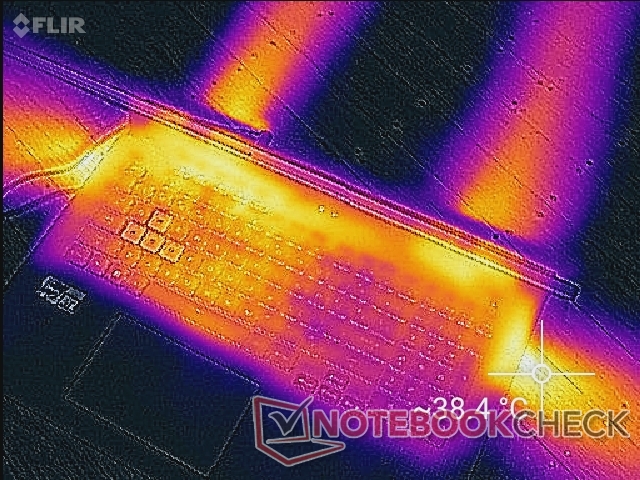
(±) The maximum temperature on the upper side is 43.8 °C / 111 F, compared to the average of 40.4 °C / 105 F, ranging from 21.2 to 68.8 °C for the class Gaming.
(-) The bottom heats up to a maximum of 47.2 °C / 117 F, compared to the average of 43.2 °C / 110 F
(+) In idle usage, the average temperature for the upper side is 29.5 °C / 85 F, compared to the device average of 33.9 °C / 93 F.
(+) Playing The Witcher 3, the average temperature for the upper side is 28.8 °C / 84 F, compared to the device average of 33.9 °C / 93 F.
(+) The palmrests and touchpad are cooler than skin temperature with a maximum of 29.6 °C / 85.3 F and are therefore cool to the touch.
(±) The average temperature of the palmrest area of similar devices was 28.8 °C / 83.8 F (-0.8 °C / -1.5 F).
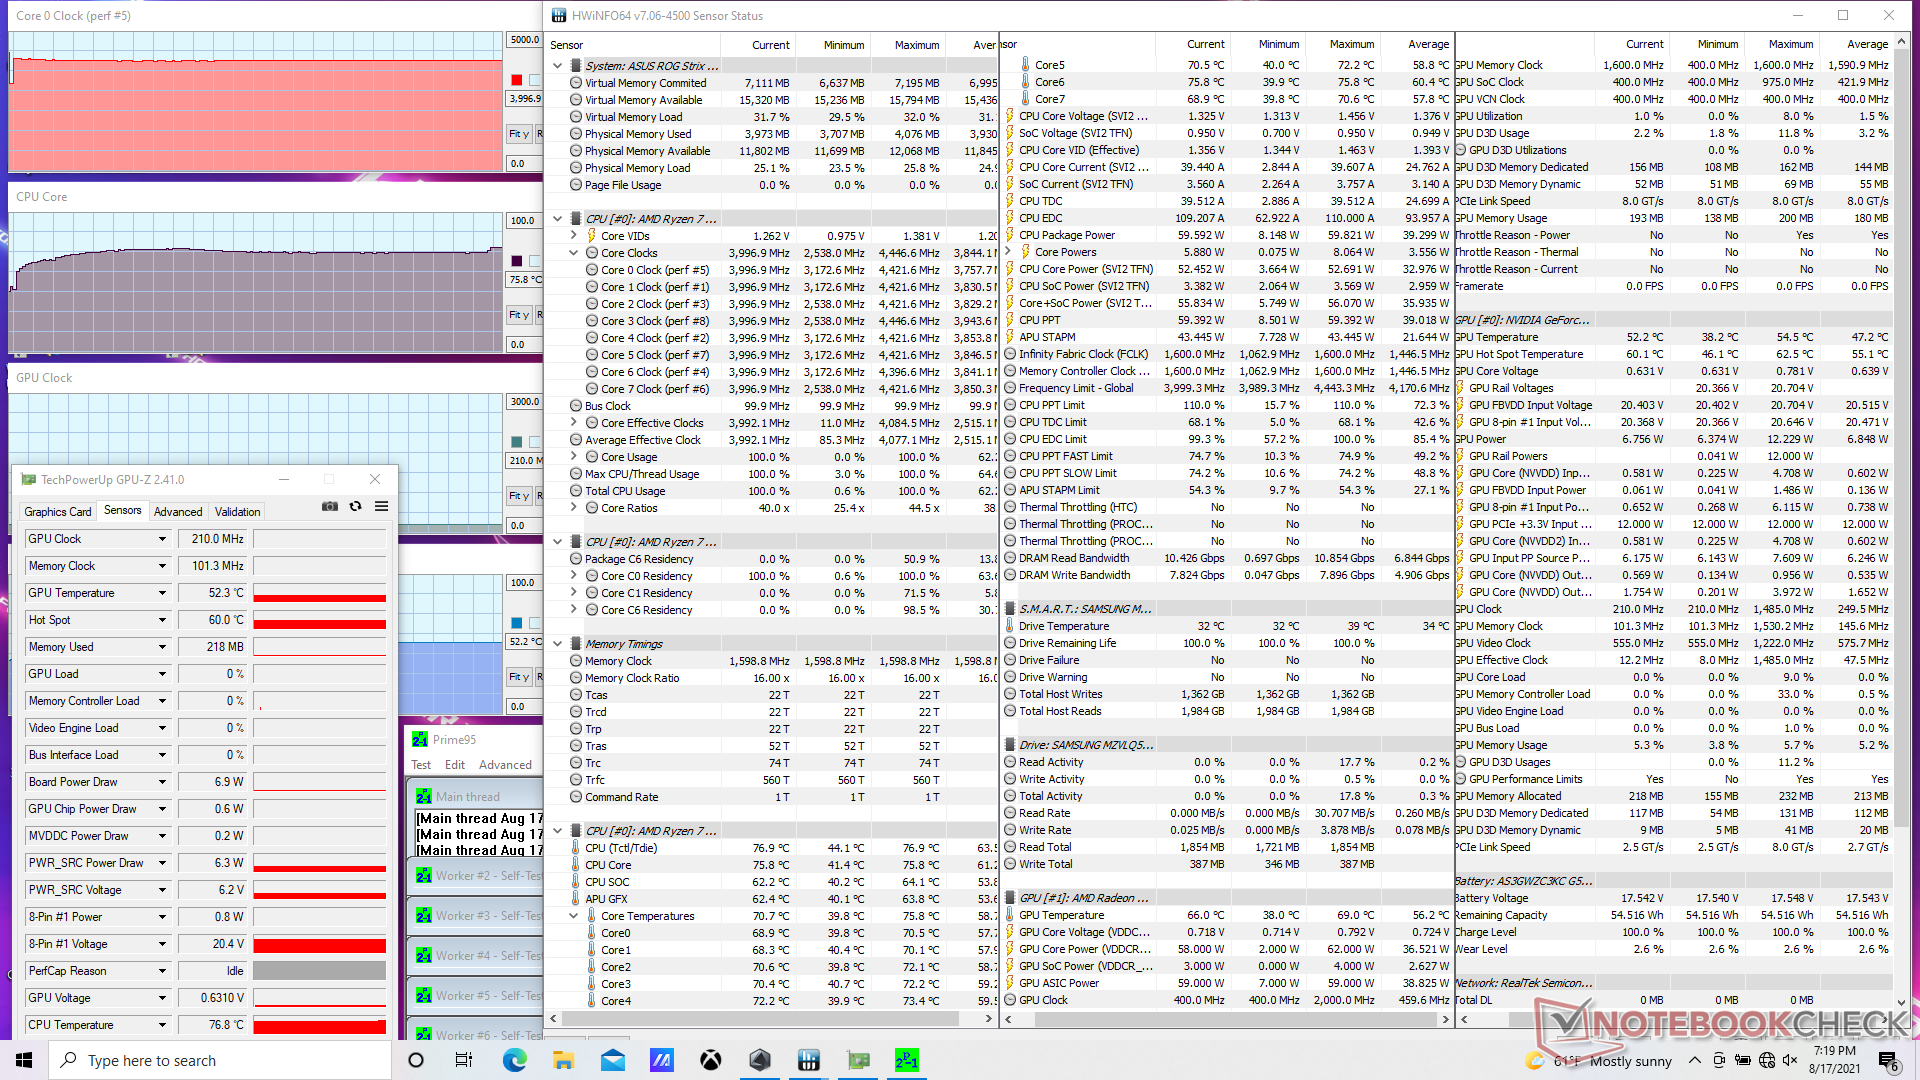
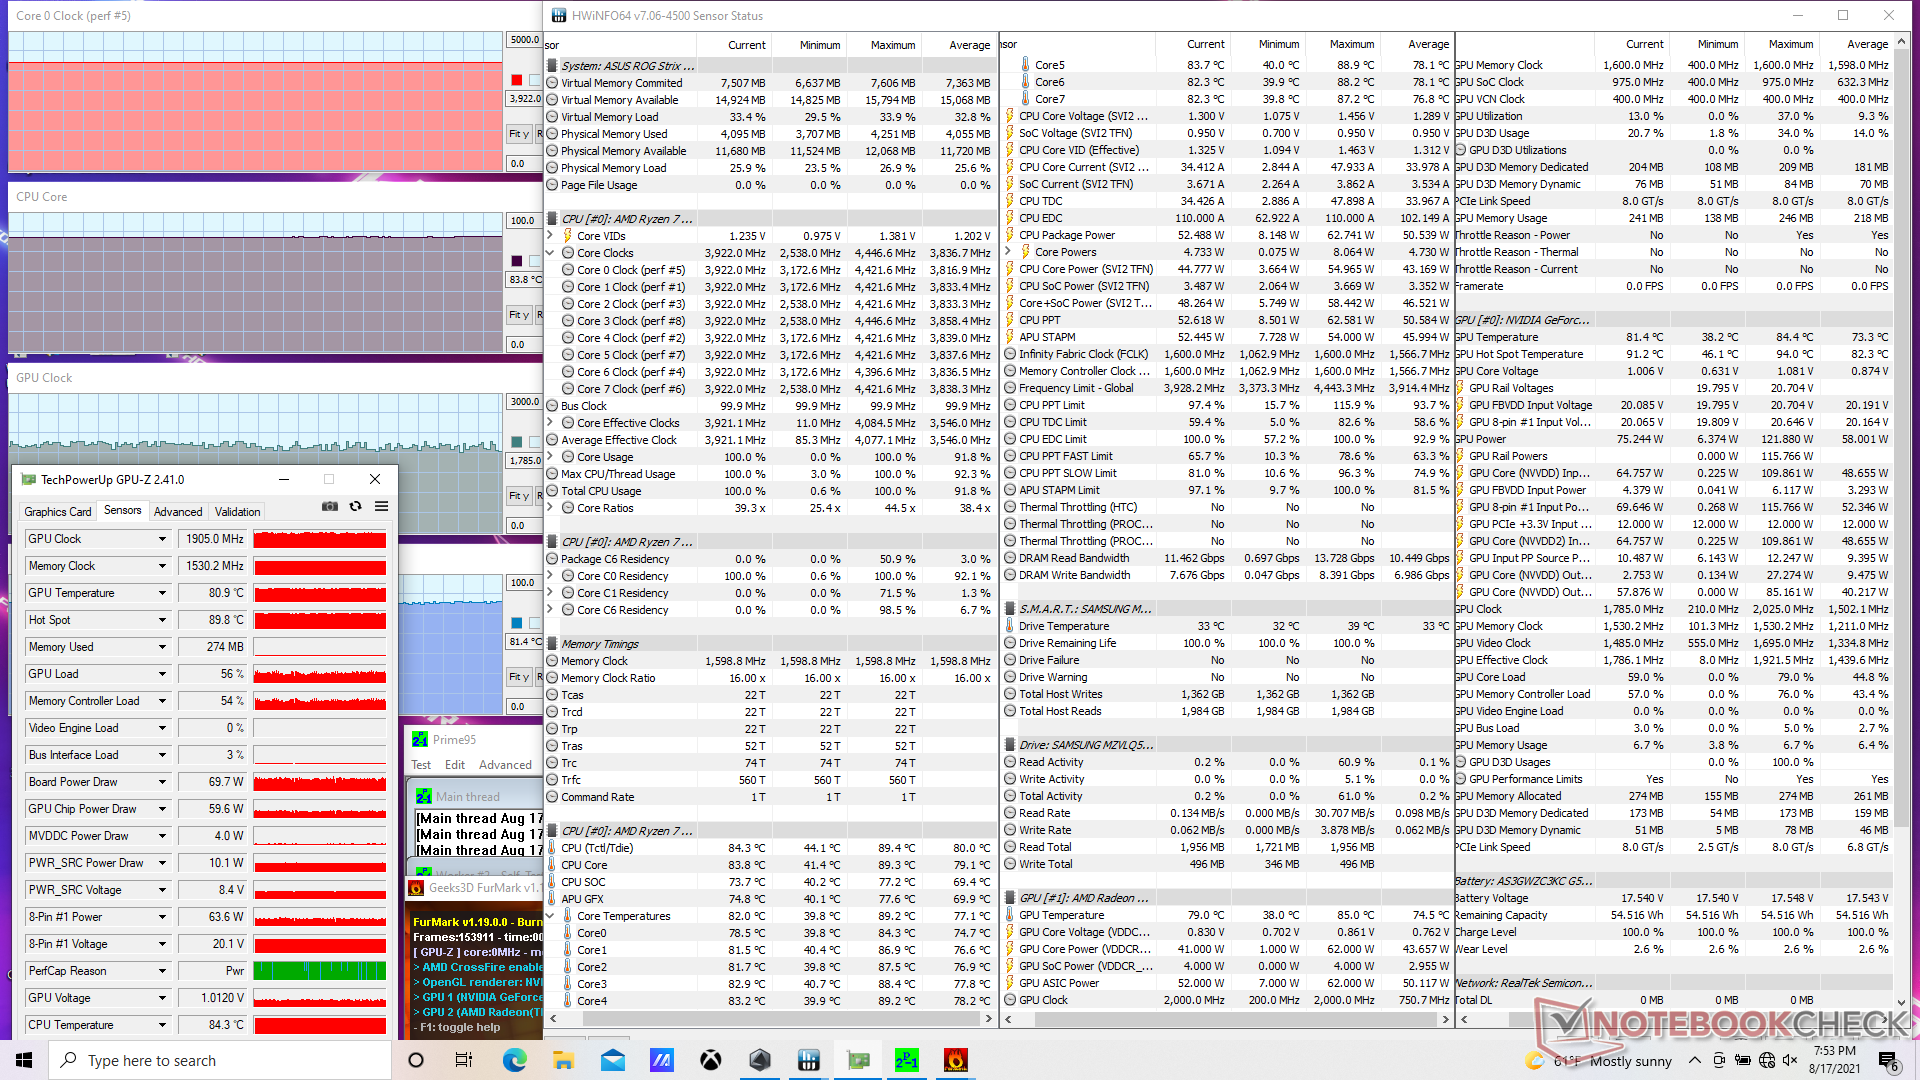
Stress Test — Excellent CPU Boost Sustainability
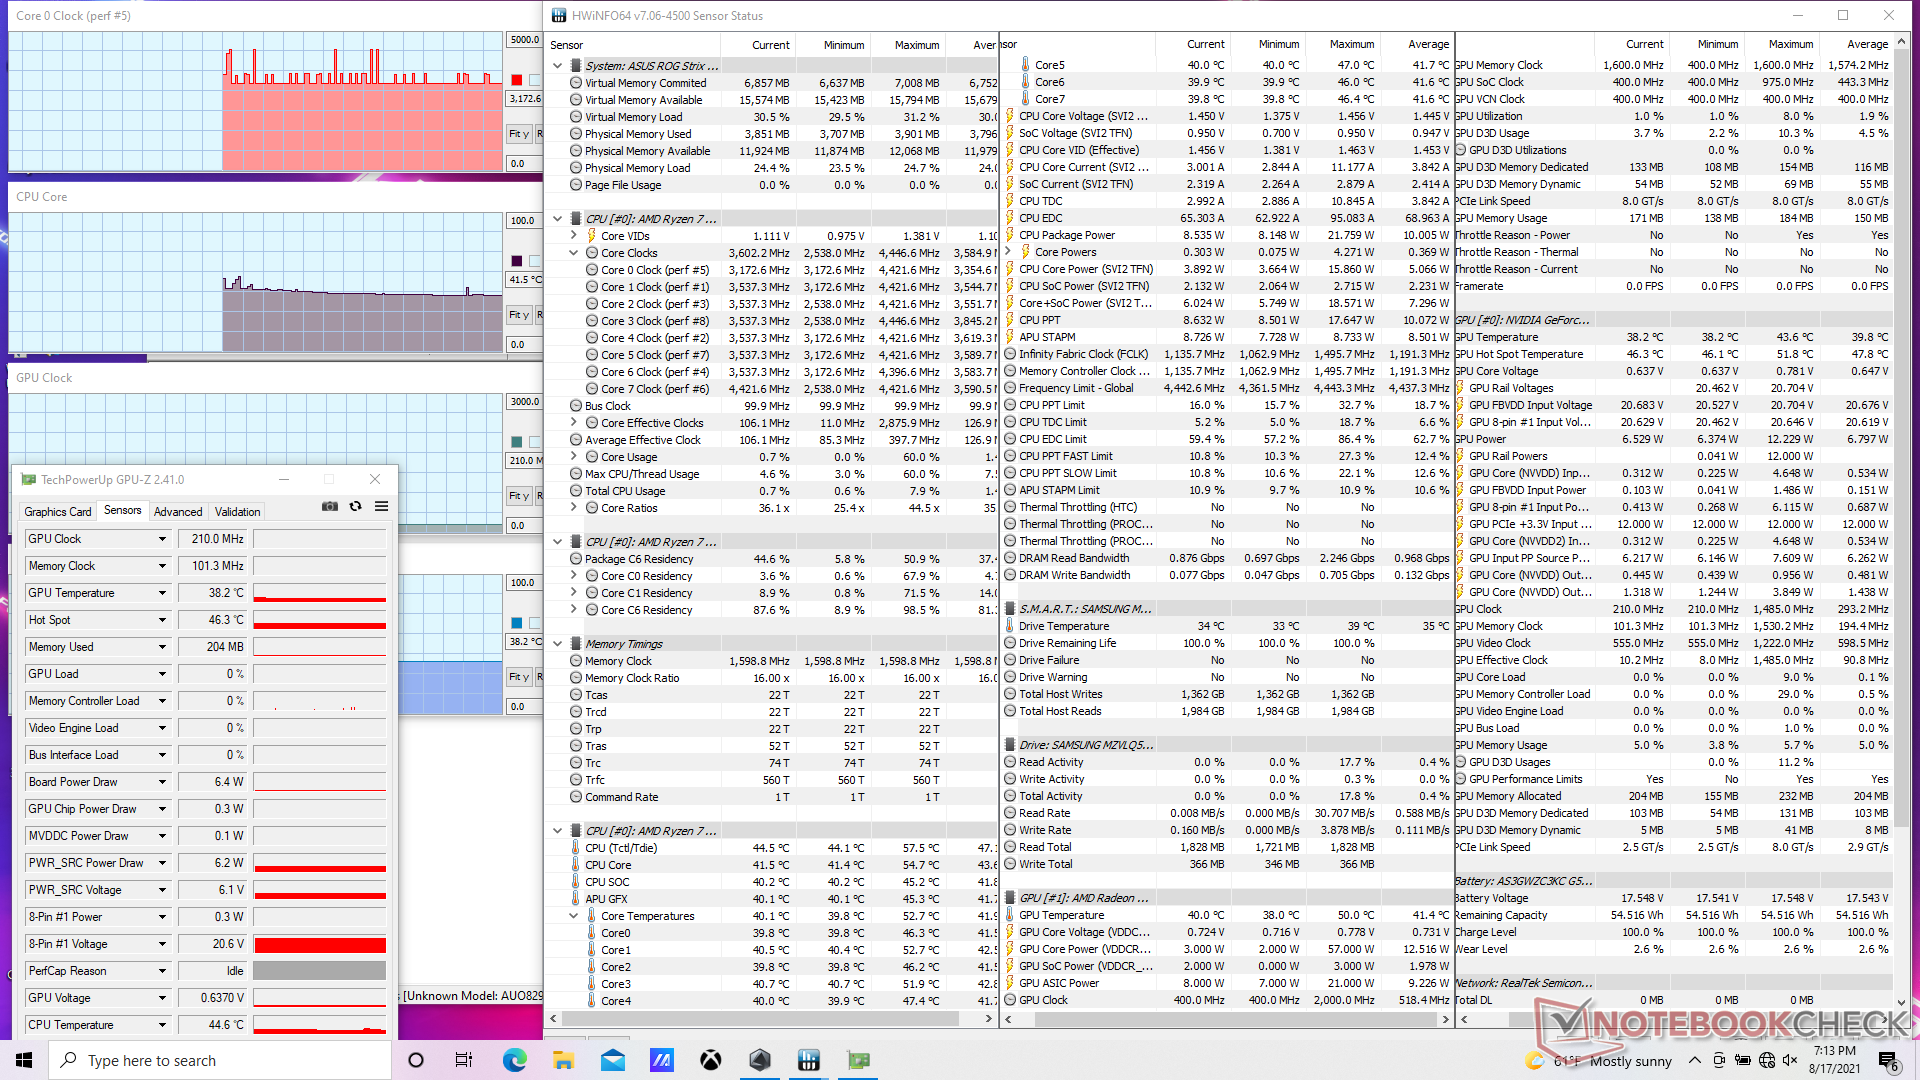
When under Prime95 stress, the CPU would boost to 4.1 GHz momentarily before stabilizing at 4 GHz and 76 C. The rated maximum Boost clock rate of the Ryzen 7 5800H is 4.4 GHz and so the stable 4 GHz is respectable. The CPU maxes out at 84 C when under extreme loads for long periods.
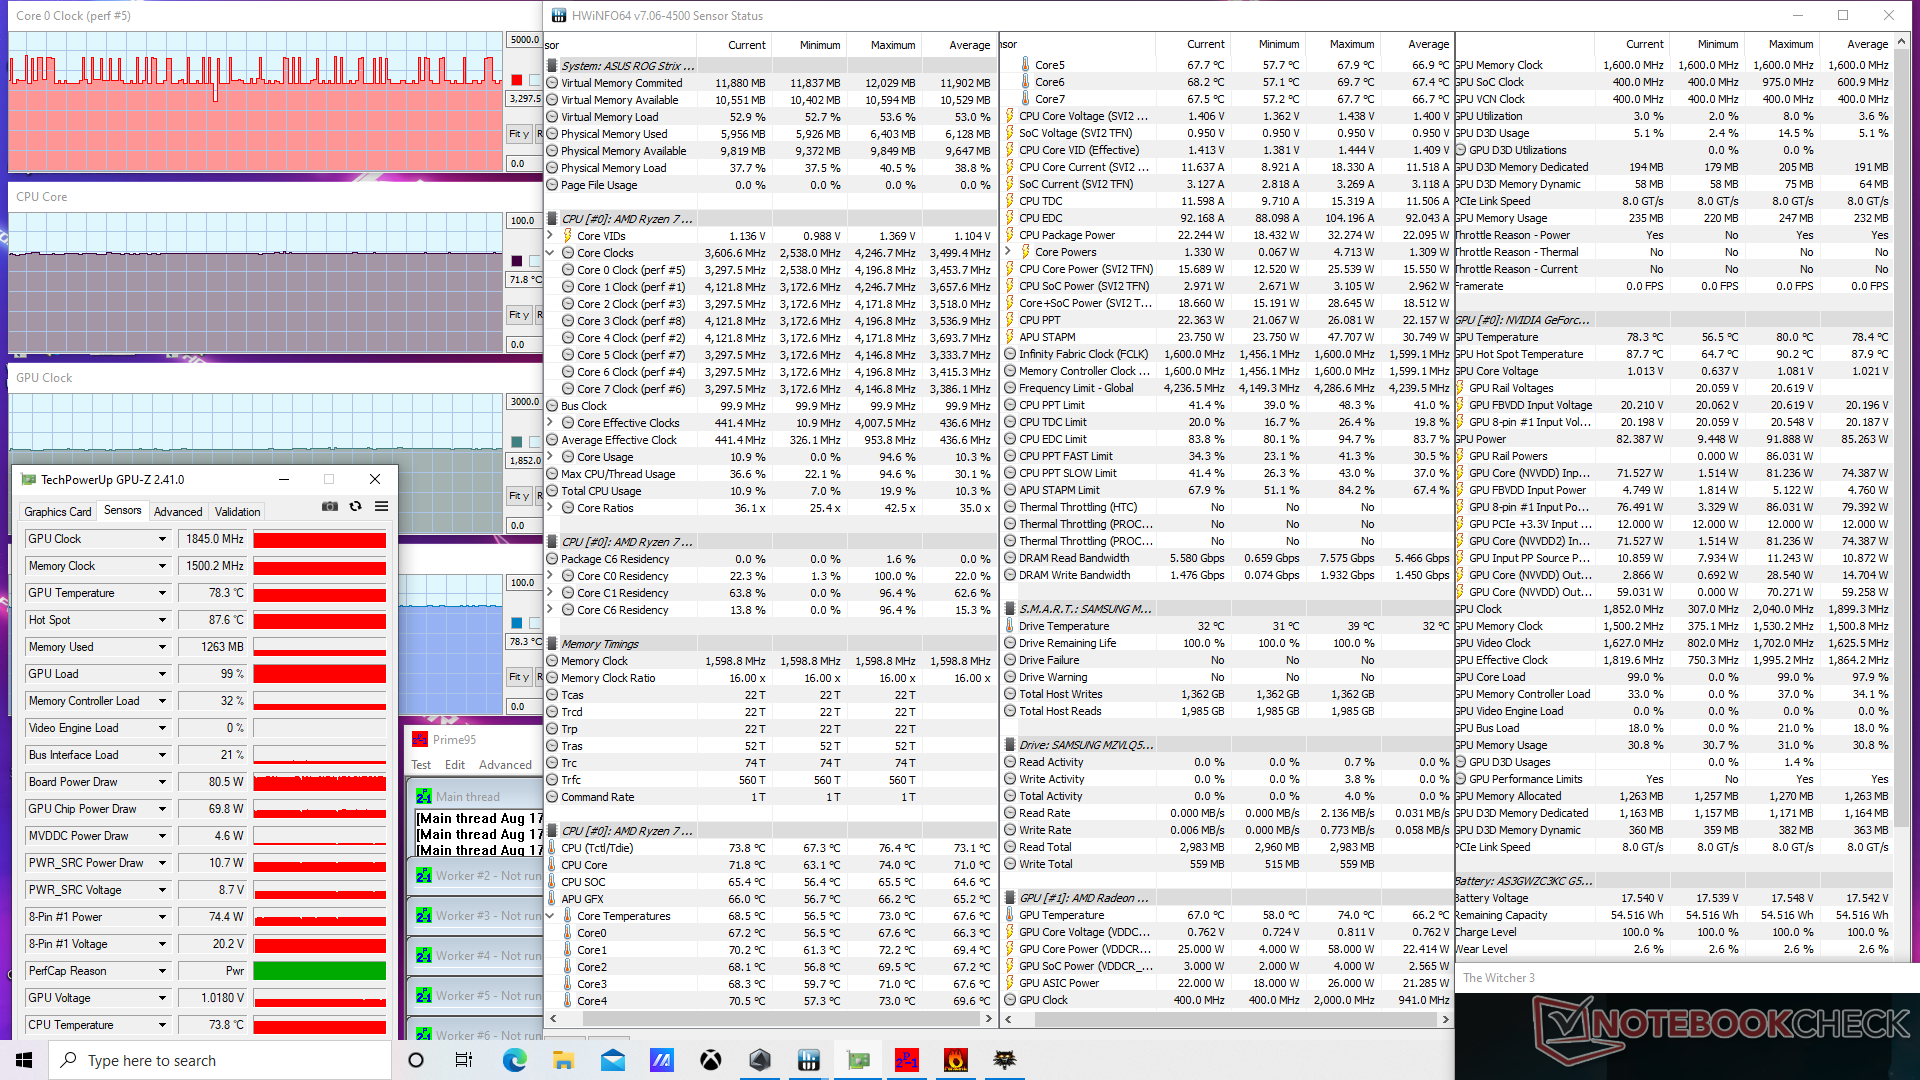
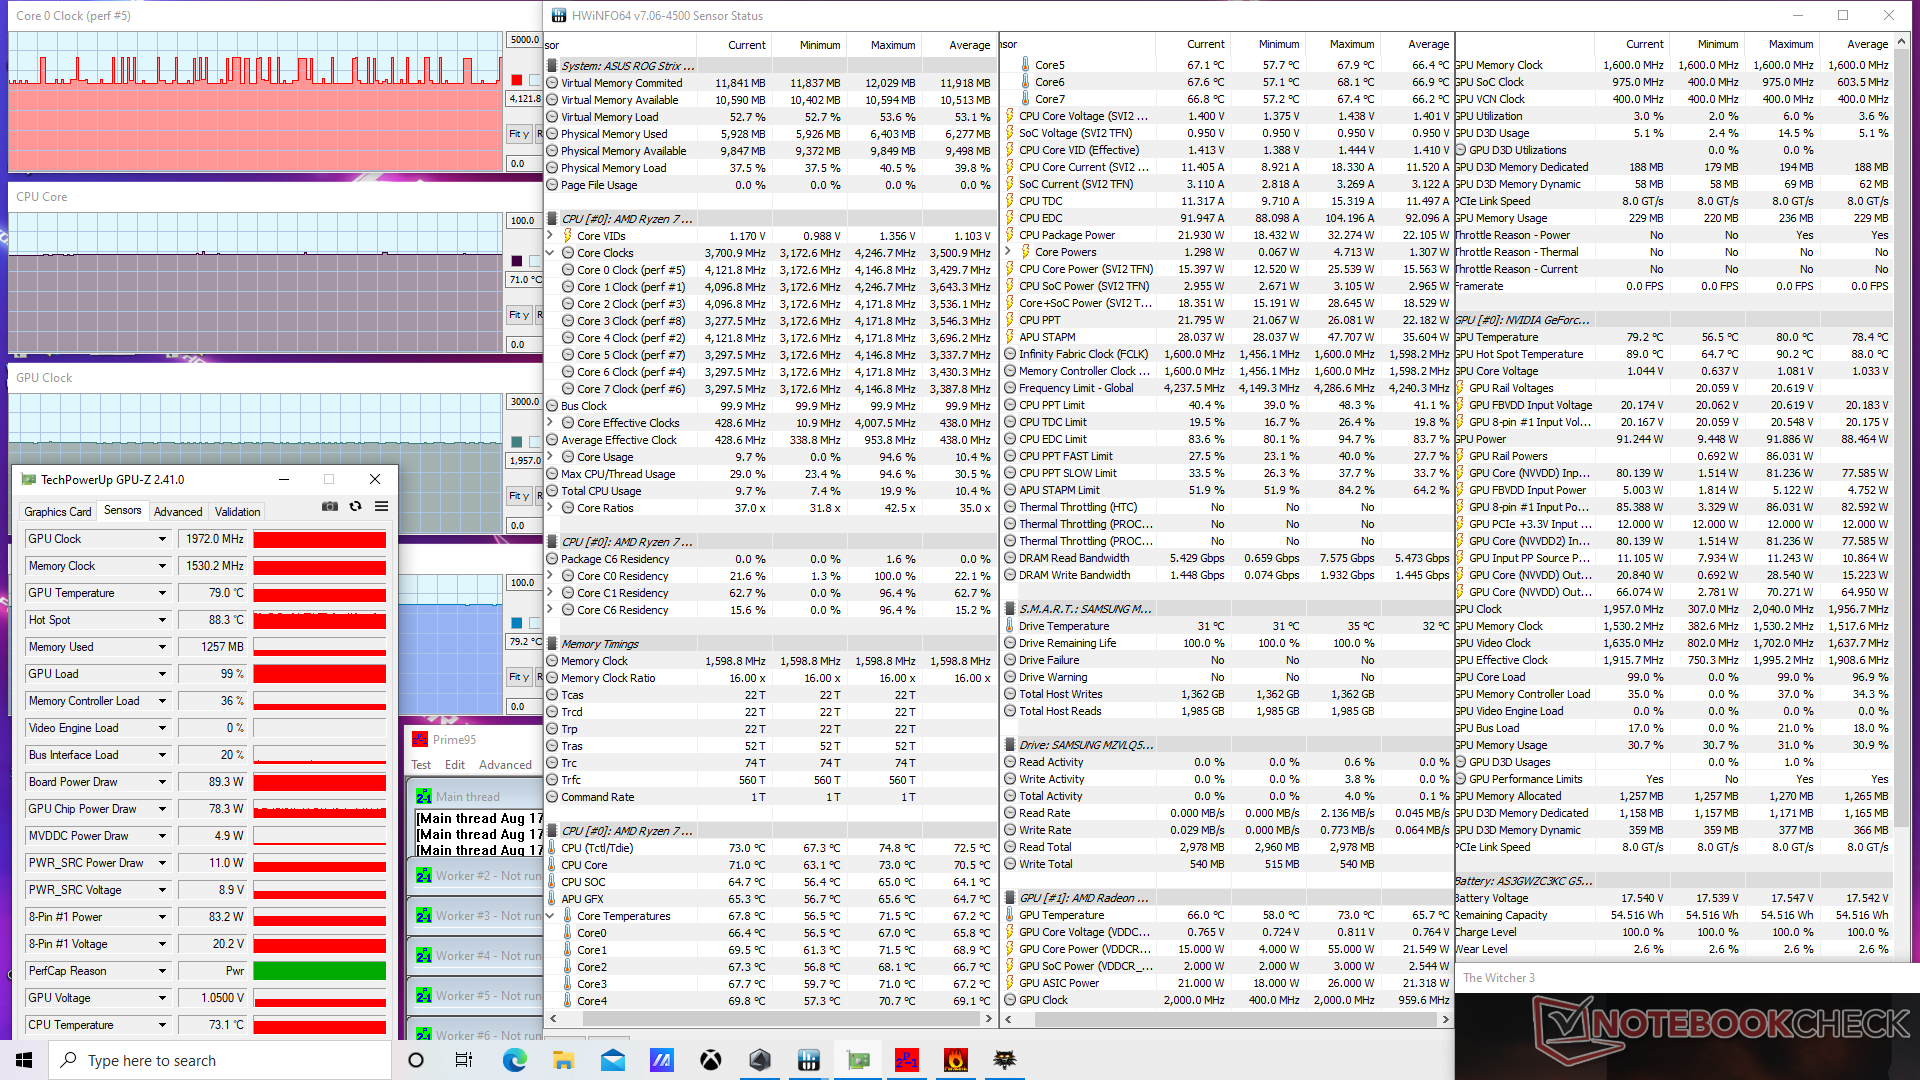
The CPU and GPU stabilize at 72 C and 78 C, respectively, when running Witcher 3. Interestingly, these temperatures remain about the same no matter the Turbo mode setting, but most gamers will want to enable Turbo mode anyway as GPU and memory clock rates each become slightly faster (1845 MHz to 1972 MHz GPU and 1500 MHz to 1530 MHz memory) at the cost of louder fans. Maximum GPU power draw would also jump from 80 W to 90 W when on Turbo mode which is close to Asus' advertisement of a 95 W TGP GPU.
Running on battery power will limit graphics performance especially since Turbo mode is only available when on mains. A 3DMark 11 test on batteries would return Physics and Graphics scores of 13986 and 12434 points, respectively, compared to 14521 and 20905 points when on mains.
| CPU Clock (GHz) | GPU Clock (MHz) | Average CPU Temperature (°C) | Average GPU Temperature (°C) | |
| System Idle | -- | -- | 42 | 38 |
| Prime95 Stress (Turbo on) | 4.0 | -- | 76 | 52 |
| Prime95 + FurMark Stress (Turbo on) | 3.9 | 1905 | 84 | 81 |
| Witcher 3 Stress (Turbo off) | 3.3 - 4.1 | 1845 | 72 | 78 |
| Witcher 3 Stress (Turbo on) | 3.3 - 4.1 | 1972 | 71 | 79 |
Speakers
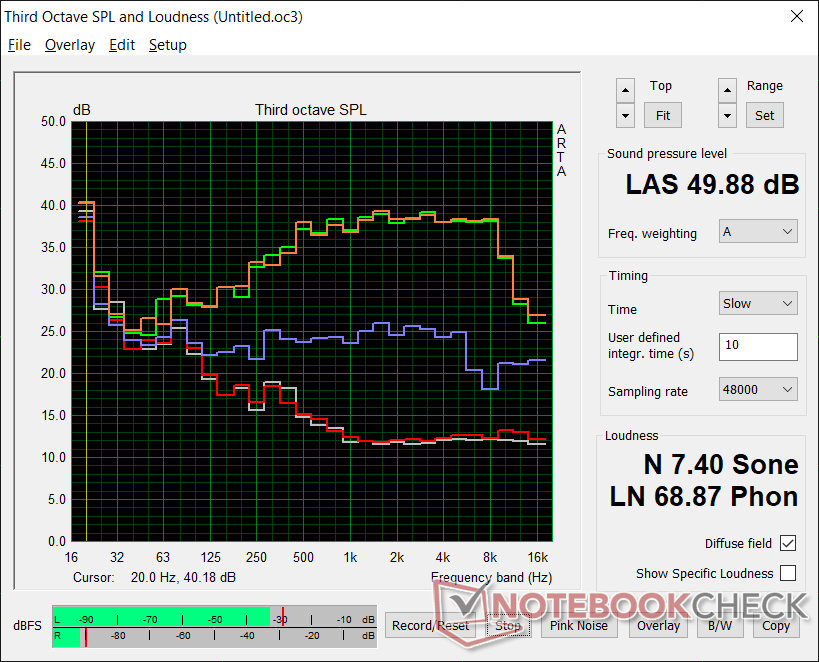
The 2 W stereo speakers are relatively weak. Even the speakers on the smaller 13-inch HP Pavilion Aero 13 are louder and have broader range than the ones on our Strix G17.


Asus ROG Strix G17 G713QE-RB74 audio analysis
(±) | speaker loudness is average but good (73.5 dB)
Bass 100 - 315 Hz
(±) | reduced bass - on average 13% lower than median
(±) | linearity of bass is average (9.8% delta to prev. frequency)
Mids 400 - 2000 Hz
(±) | higher mids - on average 5.6% higher than median
(+) | mids are linear (6.5% delta to prev. frequency)
Highs 2 - 16 kHz
(+) | balanced highs - only 3.4% away from median
(±) | linearity of highs is average (12% delta to prev. frequency)
Overall 100 - 16.000 Hz
(±) | linearity of overall sound is average (16.9% difference to median)
Compared to same class
» 44% of all tested devices in this class were better, 11% similar, 44% worse
» The best had a delta of 6%, average was 18%, worst was 132%
Compared to all devices tested
» 30% of all tested devices were better, 8% similar, 62% worse
» The best had a delta of 4%, average was 23%, worst was 134%
Apple MacBook 12 (Early 2016) 1.1 GHz audio analysis
(+) | speakers can play relatively loud (83.6 dB)
Bass 100 - 315 Hz
(±) | reduced bass - on average 11.3% lower than median
(±) | linearity of bass is average (14.2% delta to prev. frequency)
Mids 400 - 2000 Hz
(+) | balanced mids - only 2.4% away from median
(+) | mids are linear (5.5% delta to prev. frequency)
Highs 2 - 16 kHz
(+) | balanced highs - only 2% away from median
(+) | highs are linear (4.5% delta to prev. frequency)
Overall 100 - 16.000 Hz
(+) | overall sound is linear (10.2% difference to median)
Compared to same class
» 7% of all tested devices in this class were better, 2% similar, 90% worse
» The best had a delta of 5%, average was 18%, worst was 53%
Compared to all devices tested
» 5% of all tested devices were better, 1% similar, 94% worse
» The best had a delta of 4%, average was 23%, worst was 134%
Energy Management — Poor GPU Performance-per-Watt
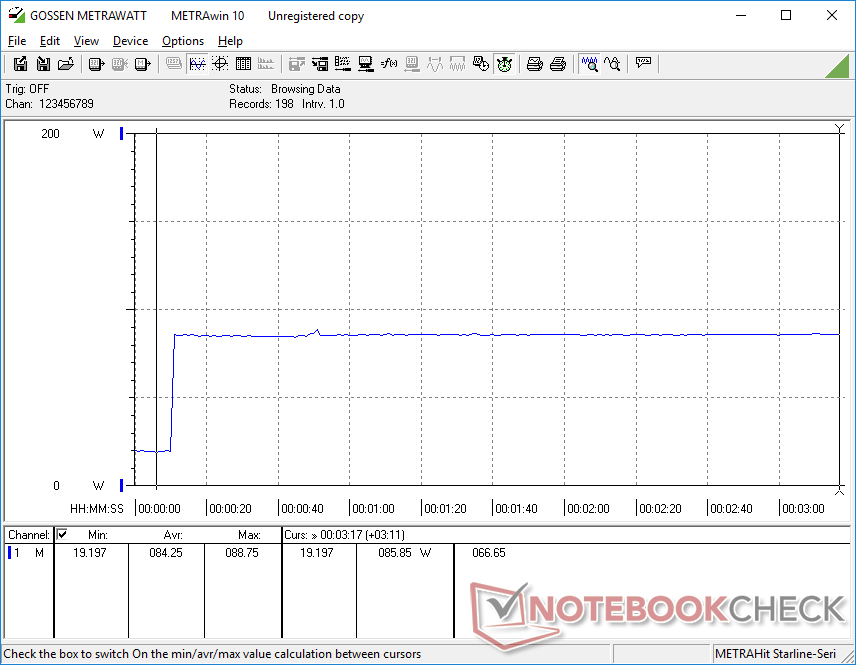
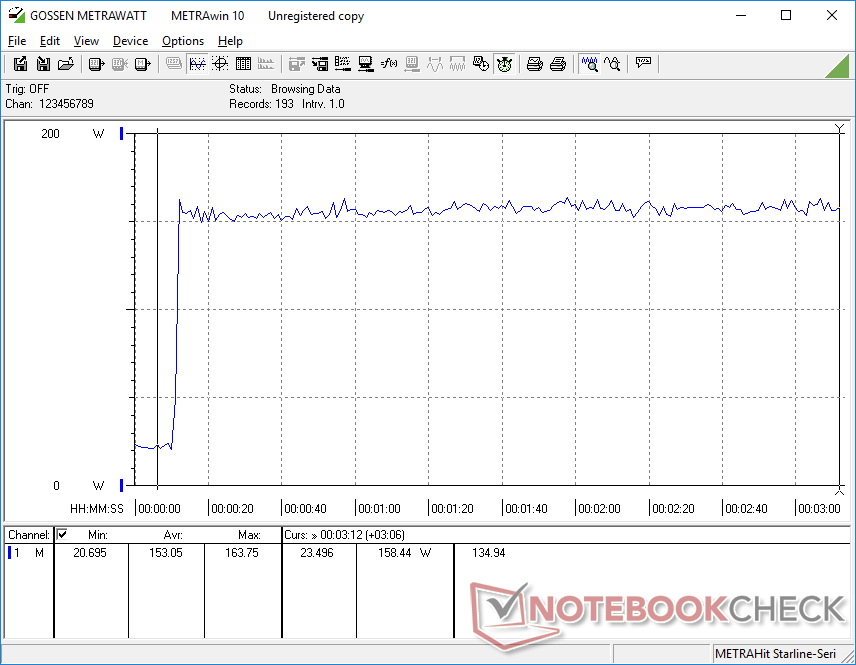
Power Consumption
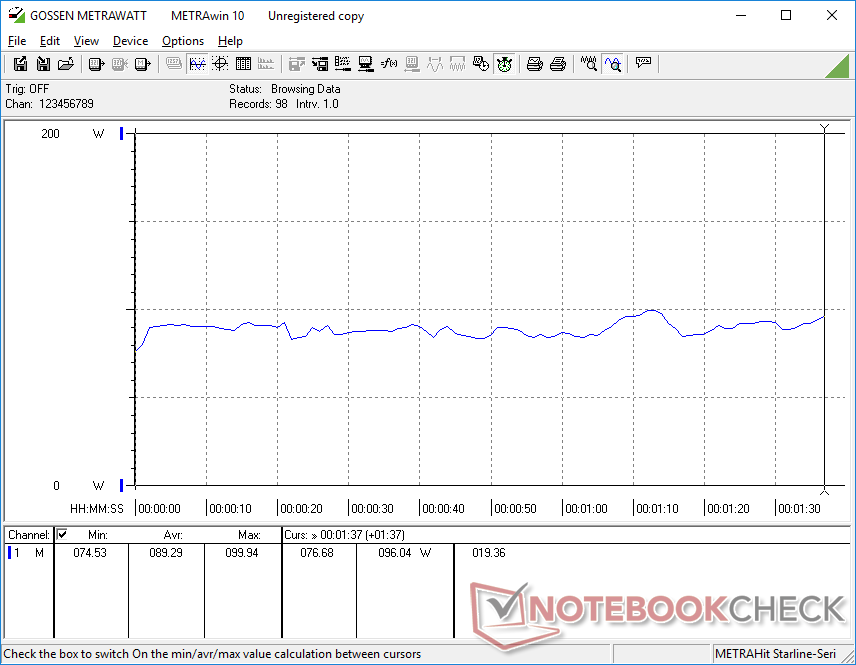
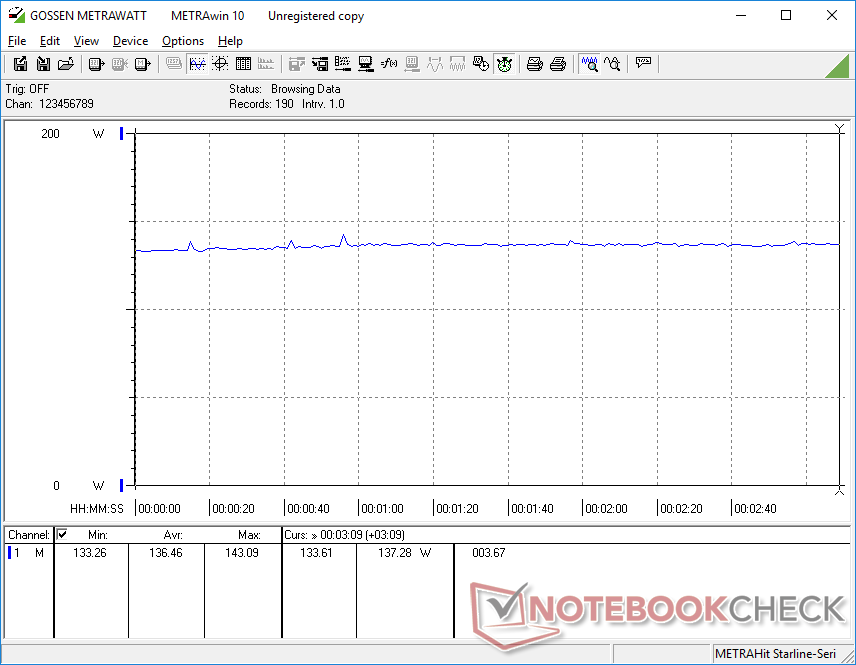
Overall power consumption is close to what we observed on the MSI Katana with the faster RTX 3060 GPU. Running Witcher 3 would consume about 9 percent less power on our Asus despite its 30 percent graphics performance deficit to show poorer performance-per-watt from the RTX 3050 Ti.
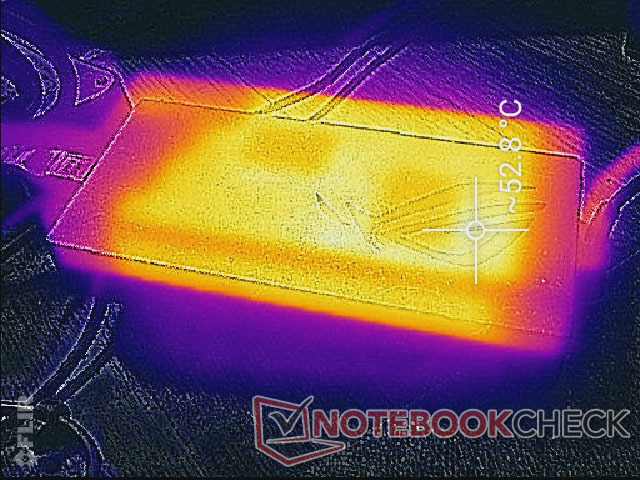
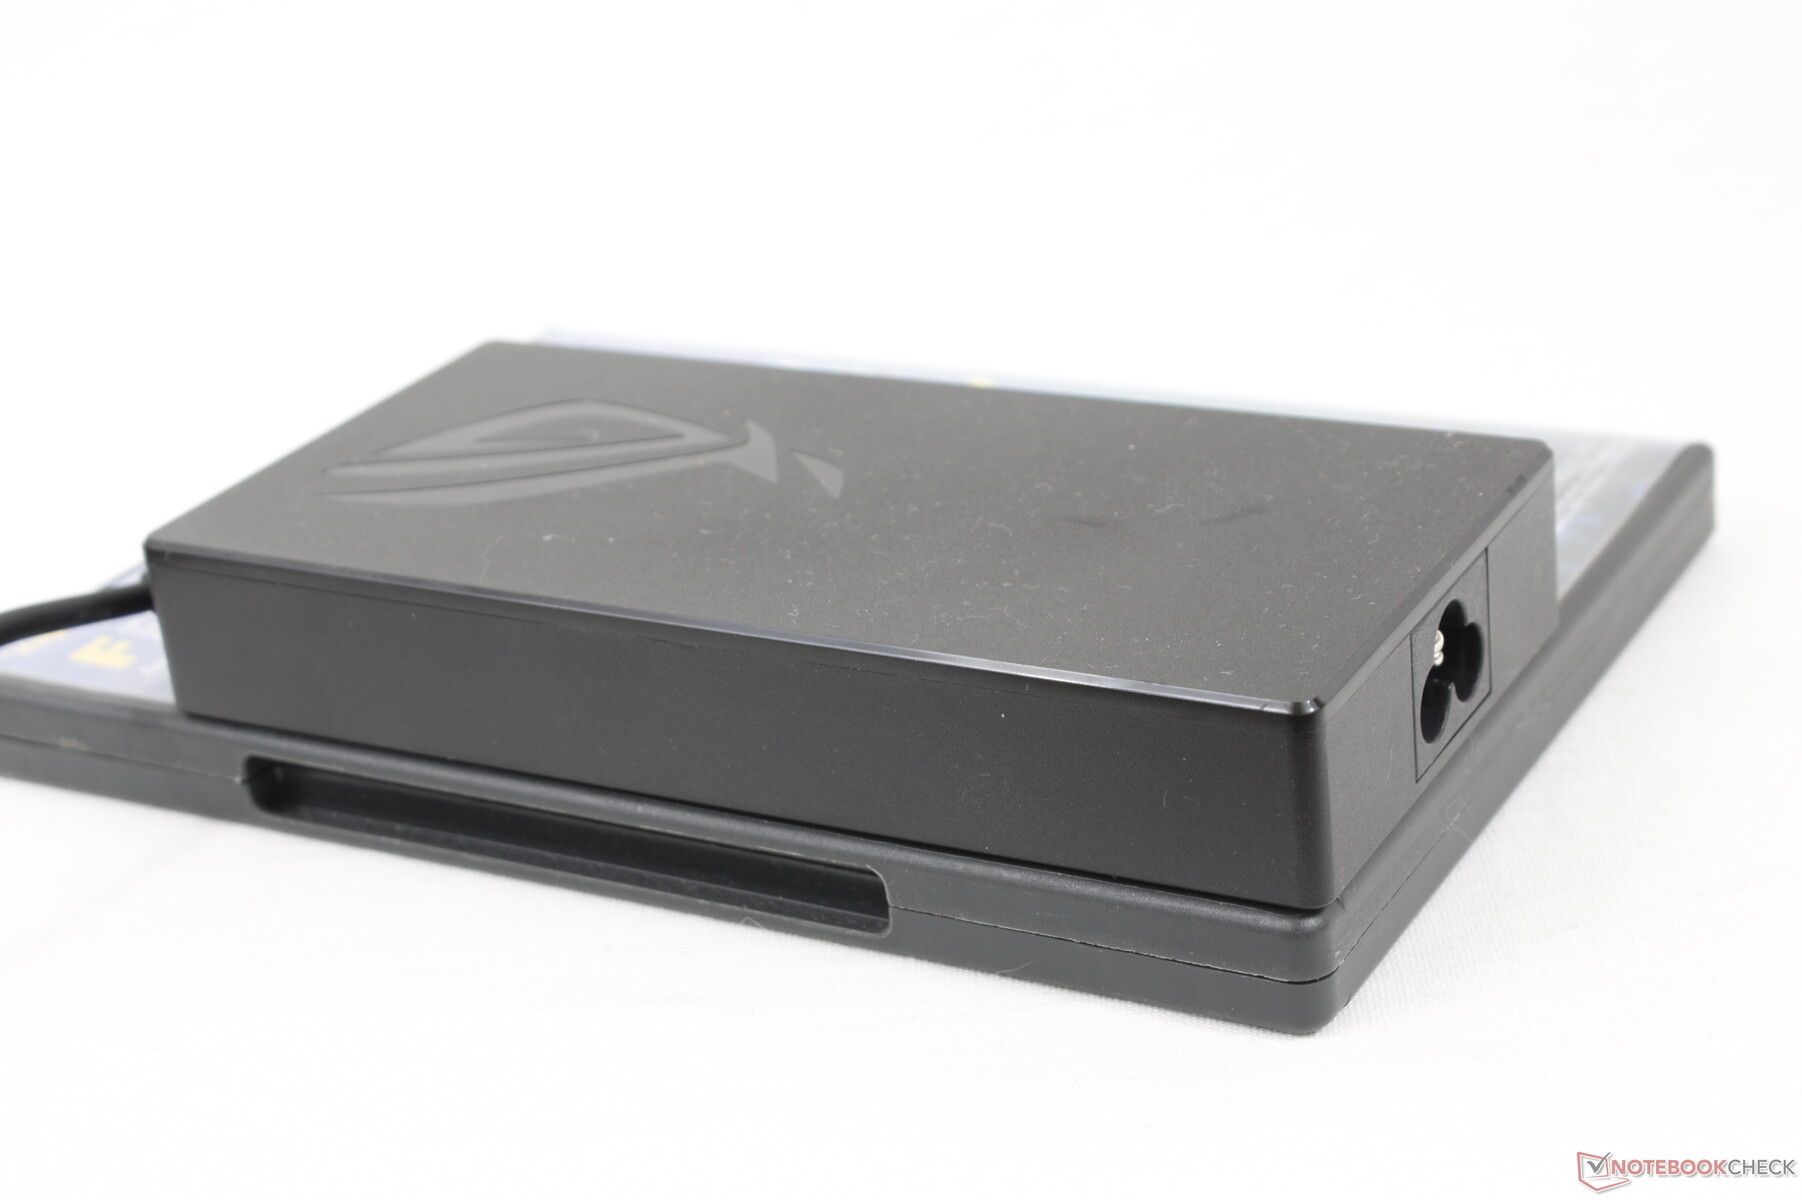
We're able to record a maximum draw of 163 W from the medium-sized (~15.2 x 7.3 x 2.3 cm) 200 W AC adapter. Our configuration has no issues charging and running games simultaneously. Other SKUs may come with smaller 160 W or larger 240 W adapters depending on the graphics option.
| Off / Standby | |
| Idle | |
| Load |
|
Key:
min: | |
| Asus ROG Strix G17 G713QE-RB74 R7 5800H, GeForce RTX 3050 Ti Laptop GPU, Samsung PM991 MZVLQ512HBLU, IPS, 1920x1080, 17.3" | Acer Nitro 5 AN517-53-54DQ i5-11300H, GeForce RTX 3050 4GB Laptop GPU, SK Hynix BC711 HFM512GD3HX015N, IPS, 1920x1080, 17.3" | MSI Katana GF76 11UE i7-11800H, GeForce RTX 3060 Laptop GPU, Kingston OM8PCP3512F-AB, IPS, 1920x1080, 17.3" | Asus Strix Scar 17 G733QSA-XS99 R9 5900HX, GeForce RTX 3080 Laptop GPU, 2x Samsung PM981a MZVLB1T0HBLR (RAID 0), IPS, 1920x1080, 17.3" | MSI Alpha 17 A4DEK R7 4800H, Radeon RX 5600M, Kingston OM8PCP3512F-AB, IPS, 1920x1080, 17.3" | Asus Strix G17 G712LWS i7-10750H, GeForce RTX 2070 Super Mobile, Intel SSD 660p 1TB SSDPEKNW010T8, IPS, 1920x1080, 17.3" | |
|---|---|---|---|---|---|---|
| Power Consumption | 28% | -4% | -25% | 2% | -26% | |
| Idle Minimum * (Watt) | 9.2 | 4 57% | 9 2% | 10.9 -18% | 9 2% | 10 -9% |
| Idle Average * (Watt) | 12.6 | 9 29% | 13 -3% | 14.7 -17% | 12 5% | 14 -11% |
| Idle Maximum * (Watt) | 23.3 | 15 36% | 20 14% | 26.8 -15% | 18 23% | 25 -7% |
| Load Average * (Watt) | 89.3 | 85 5% | 102 -14% | 106.7 -19% | 76 15% | 134 -50% |
| Witcher 3 ultra * (Watt) | 136 | 104 24% | 149 -10% | 192.4 -41% | 136 -0% | 186 -37% |
| Load Maximum * (Watt) | 162.7 | 135 17% | 187 -15% | 228.4 -40% | 222 -36% | 230 -41% |
* ... smaller is better
Power Consumption Witcher 3 / Stresstest
Battery Life
Battery capacity is smaller than it was on the last generation G712 (56 Wh vs. 66 Wh), but runtimes remain about the same at 5.5 to 6 hours of real-world WLAN use when on the Balanced power profile with the integrated GPU active. The more expensive Strix Scar 17 G733 can last for several hours longer due to its much larger 90 Wh battery. Higher-end G713 configurations come with the larger 90 Wh battery instead of the base 56 Wh for extended battery life.
Charging from empty to full takes about 1.5 hours. USB-C PD recharging is supported albeit at a slower rate.
| Asus ROG Strix G17 G713QE-RB74 R7 5800H, GeForce RTX 3050 Ti Laptop GPU, 56 Wh | Acer Nitro 5 AN517-53-54DQ i5-11300H, GeForce RTX 3050 4GB Laptop GPU, 57 Wh | MSI Katana GF76 11UE i7-11800H, GeForce RTX 3060 Laptop GPU, 53 Wh | Asus Strix Scar 17 G733QSA-XS99 R9 5900HX, GeForce RTX 3080 Laptop GPU, 90 Wh | MSI Alpha 17 A4DEK R7 4800H, Radeon RX 5600M, 65 Wh | Asus Strix G17 G712LWS i7-10750H, GeForce RTX 2070 Super Mobile, 66 Wh | |
|---|---|---|---|---|---|---|
| Battery runtime | 35% | -26% | 34% | 18% | 6% | |
| Reader / Idle (h) | 11.1 | 17.4 57% | 4.8 -57% | 13.3 20% | 10.5 -5% | 9.1 -18% |
| WiFi v1.3 (h) | 6 | 7.2 20% | 3.7 -38% | 9.3 55% | 7.3 22% | 5.5 -8% |
| Load (h) | 1.1 | 1.4 27% | 1.3 18% | 1.4 27% | 1.5 36% | 1.6 45% |
| Witcher 3 ultra (h) | 0.8 |
Pros
Cons
Verdict — Choose Your Configuration Carefully
As stated earlier, there are no less than 16 configurations of the Asus ROG Strix G17 G713 with varying thicknesses, weight, AC adapters, displays, battery capacities, RGB lighting, and more. Potential buyers should select their respective SKUs carefully by looking at the specifications on Asus' official website that detail all the differences between them.
For our review configuration in particular, both the AMD Zen 3 CPU and fast 144 Hz display refresh rate deserve praise. The RTX 3050 and RTX 3050 Ti are more difficult to recommend, however, as their performance levels trail the older GTX 1660 Ti at best. Upgrading to the RTX 3060 or higher will give longer legs and significantly higher performance-per-watt.
Unfortunately, opting for the RTX 3060 or faster entails some drawbacks because such SKUs are thicker, heavier, and with larger AC adapters than our RTX 3050 Ti SKU. Asus' naming convention is especially confusing in this regard as the G713 series actually consists of two distinct models and yet they share almost the same retail names. The strong base, stiff hinges, and easy upgradeability are nonetheless better than most other budget gaming laptops including the HP Pavilion Gaming, Lenovo Legion 5, MSI Katana, or Dell G5 series at the cost of a larger footprint.
Price and availability
Asus ROG Strix G17 G713QE-RB74
- 08/20/2021 v7 (old)
Allen Ngo
Price comparison
