Dell G5 15 5500 Laptop Review: Aspirational mid-ranger let down by a sub-par display
The Dell G series has always been seen as an alternative to the more expensive and more customizable Alienware laptops. The Dell G5 sits in the middle of the G series product stack and comes in several configuration choices.
Previously, we have reviewed several G5 15 models including various SKUs of the G5 15 5590 (1), (2), and (3), and the G5 15 SE 5505 with an all-AMD spec.
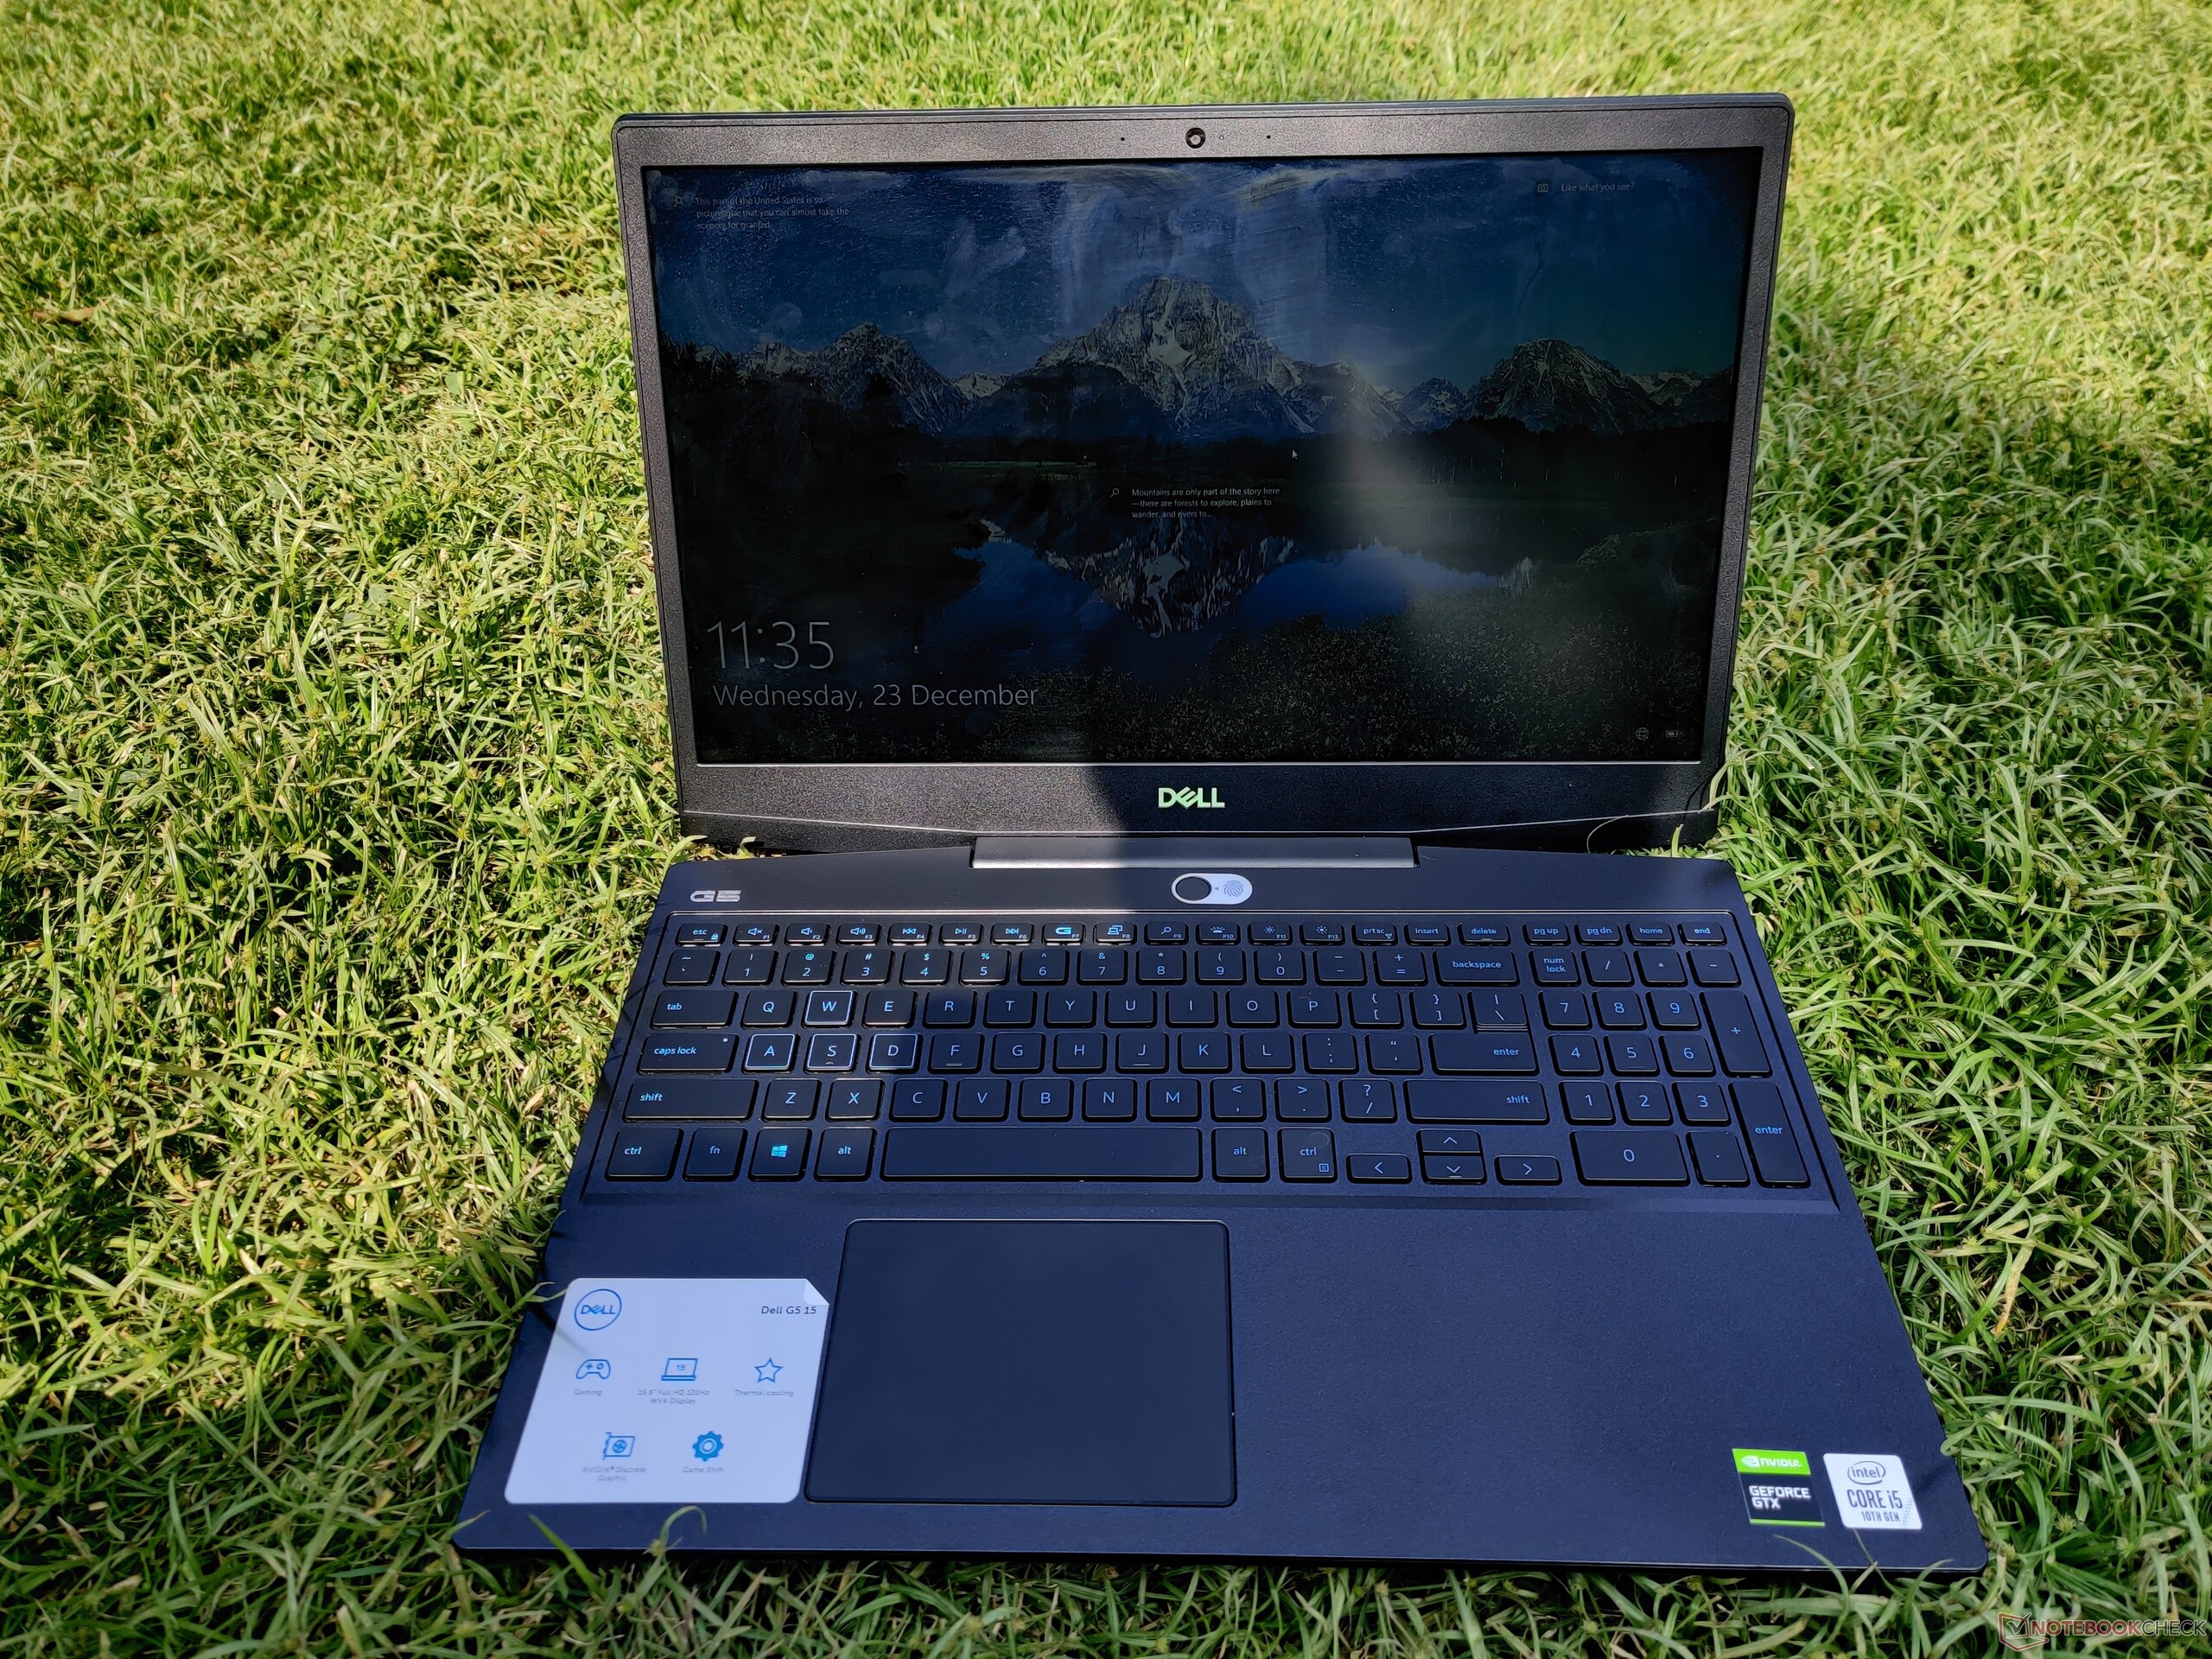
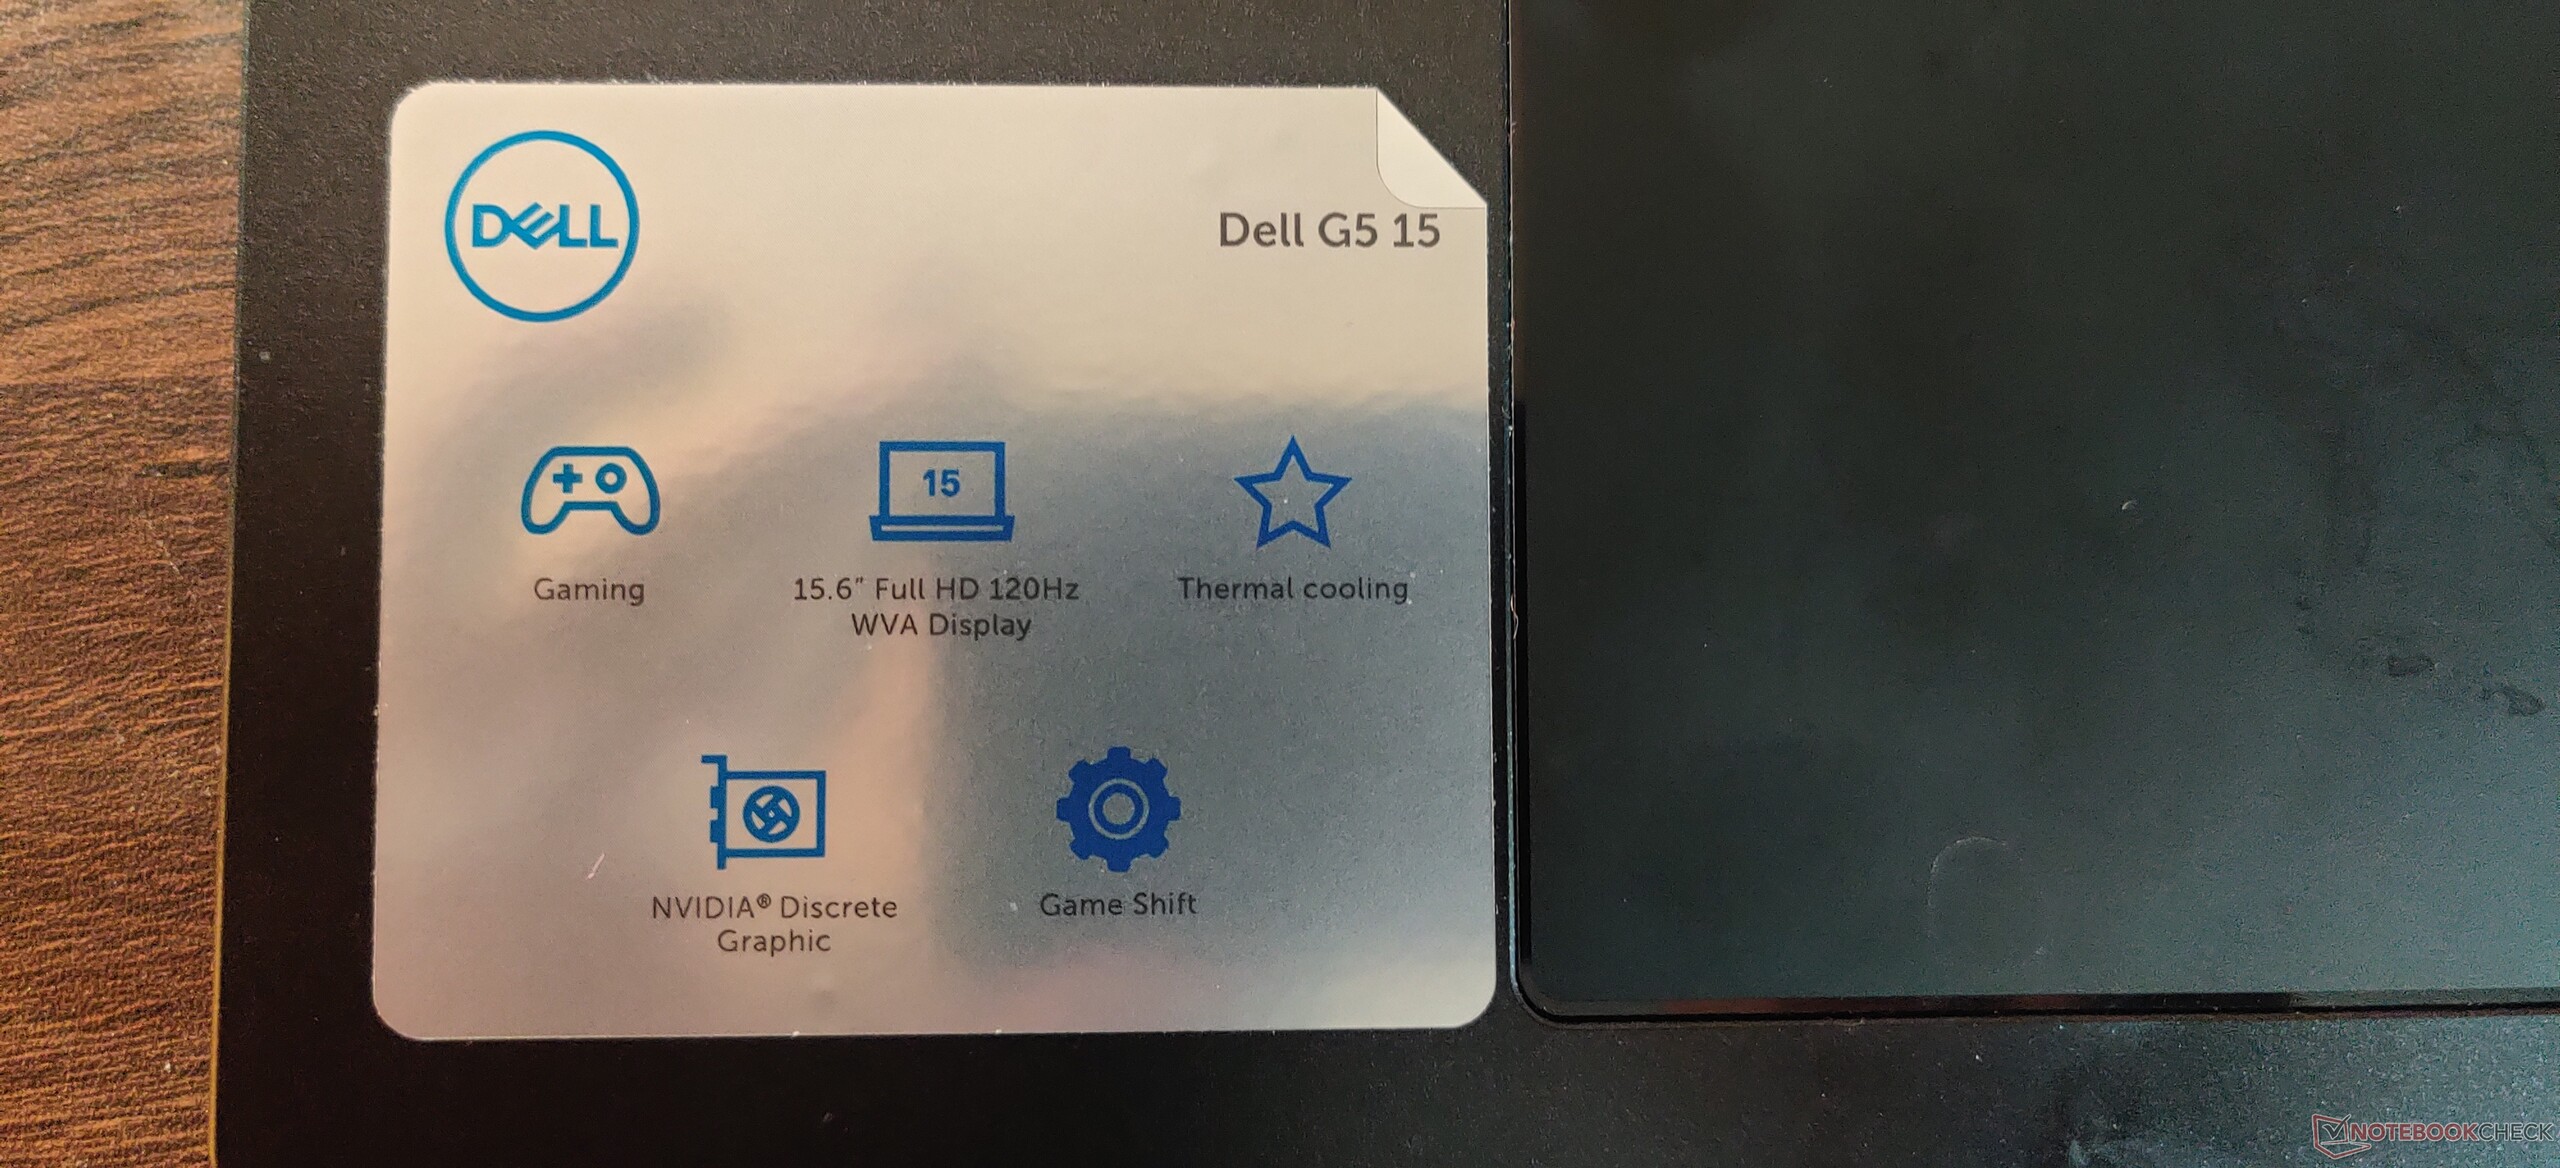
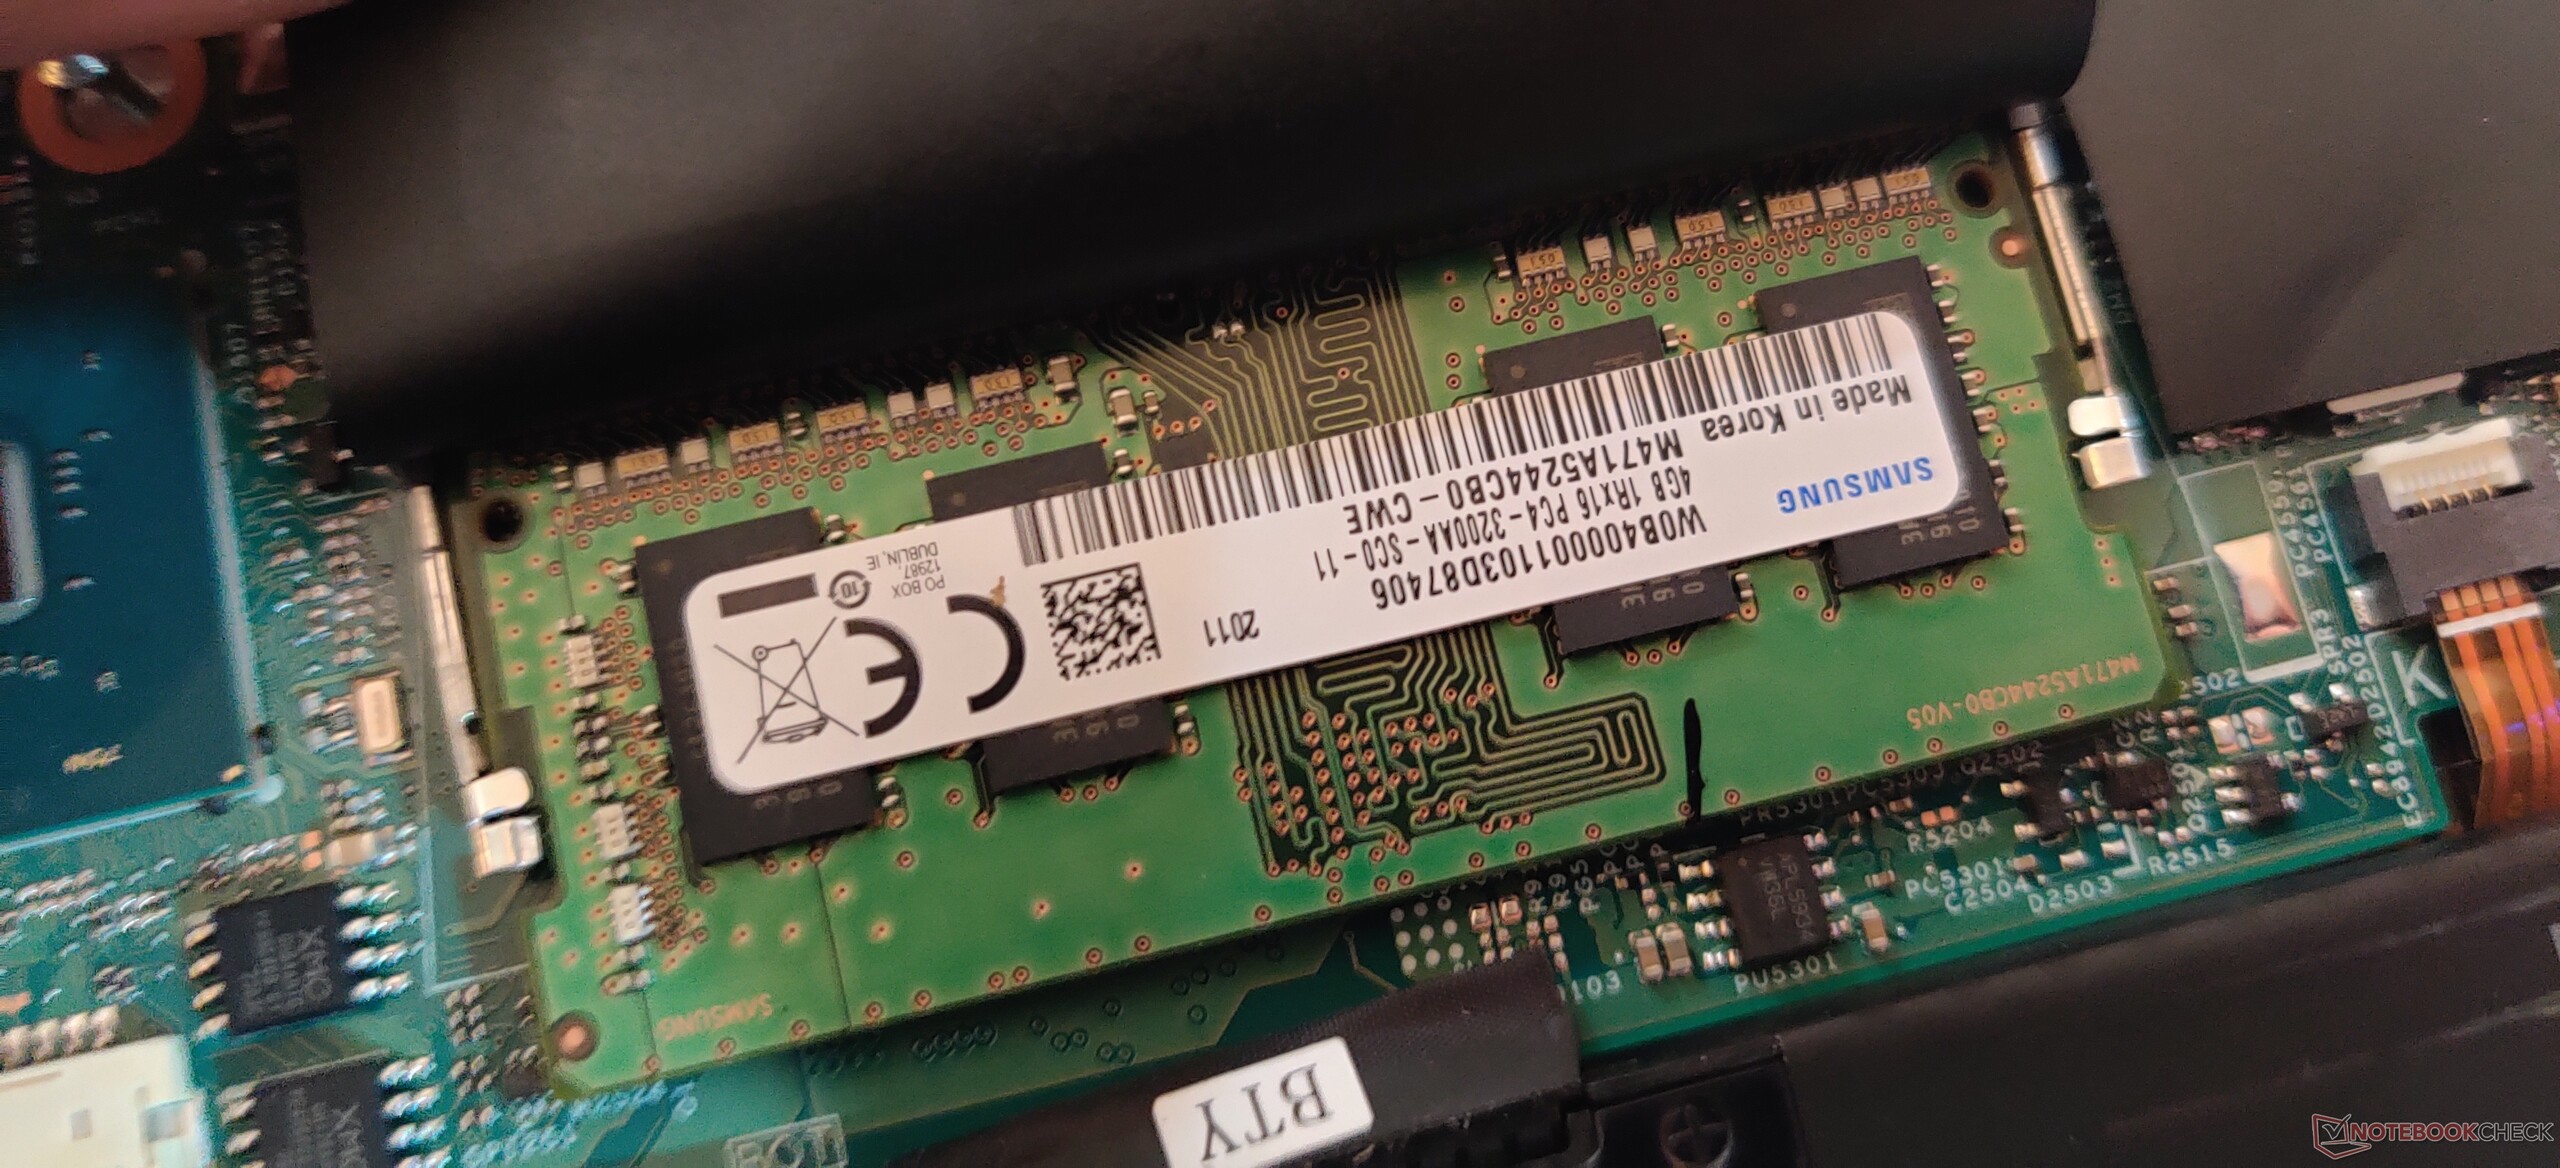
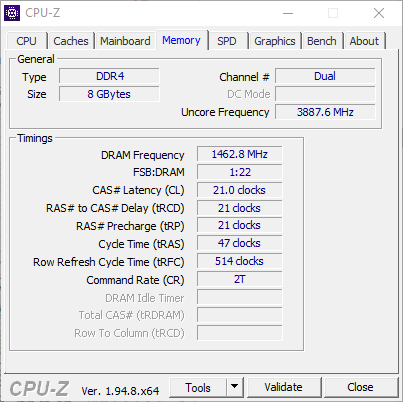
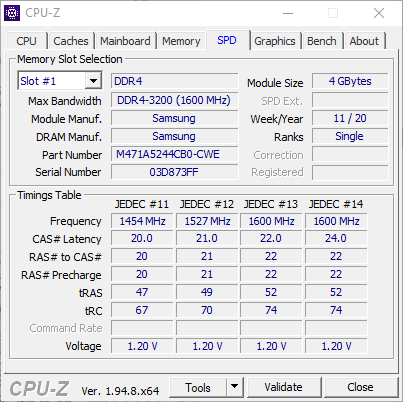
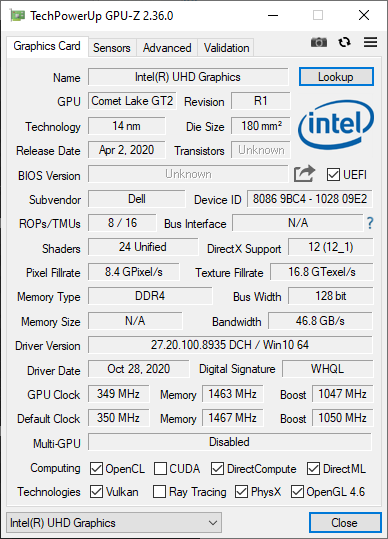
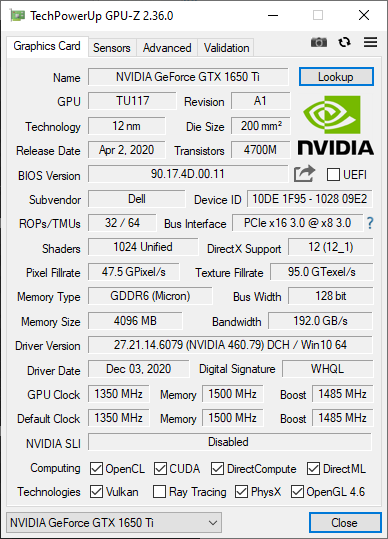
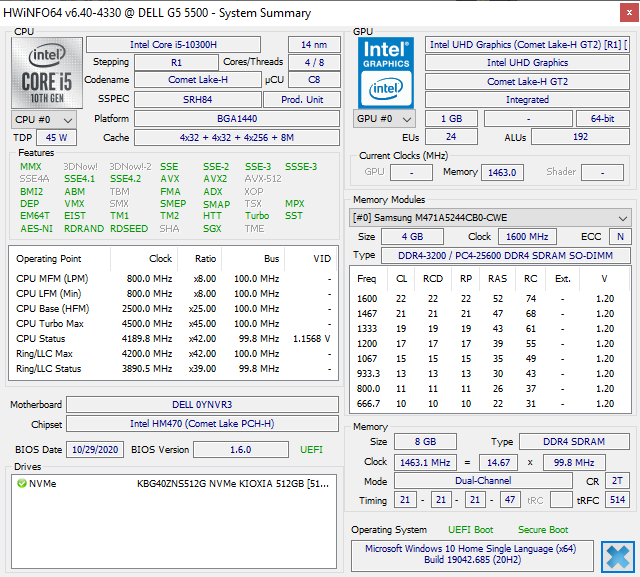
At ₹87,990 (US$1,195), the current SKU from Dell India is tailored more towards the mid-range gamer who prefers decent 1080p high/ultra gaming without much compromise. Our Dell G5 15 5500 SKU is equipped with an Intel Core i5-10300H CPU, NVIDIA GeForce GTX 1650 Ti non-Max-Q GPU, 8 GB DDR4-3200 RAM, and a 512 GB NVMe SSD along with a 15.6-inch 120 Hz display.
We pit the Dell G5 15 5500 against other competing laptops with near-similar configurations and price ranges (see comparison table below). Let's check out if this laptop can really hold its own against the competition.
Note: For this review, we are not awarding a rating as not all measurements could be carried out on our unit. However, we hope that this review can offer a fair assessment of what can be expected from this particular laptop.
Comparison
Rating | Date | Model | Weight | Height | Size | Resolution | Price |
|---|---|---|---|---|---|---|---|
v (old) | 12 / 2020 | Dell G5 15 5500 09E2 i5-10300H, GeForce GTX 1650 Ti Mobile | 2.3 kg | 21.6 mm | 15.60" | 1920x1080 | |
| 79.9 % v7 (old) | 08 / 2020 | HP Pavilion Gaming 16-a0242ng i5-10300H, GeForce GTX 1650 Ti Mobile | 2.2 kg | 23.5 mm | 16.10" | 1920x1080 | |
| 81.9 % v7 (old) | 10 / 2020 | Lenovo Legion 5 17IMH05 i5-10300H, GeForce GTX 1650 Mobile | 2.9 kg | 26.2 mm | 17.30" | 1920x1080 | |
| 78.4 % v7 (old) | 07 / 2020 | Lenovo IdeaPad Gaming 3i 15IMH05 i5-10300H, GeForce GTX 1650 Mobile | 2.2 kg | 24.9 mm | 15.60" | 1920x1080 | |
| 78.5 % v7 (old) | 04 / 2020 | MSI GF75 Thin 10SCXR i5-10300H, GeForce GTX 1650 Mobile | 2.2 kg | 23.1 mm | 17.30" | 1920x1080 | |
| 87 % v7 (old) | 12 / 2020 | Asus ZenBook UX535-M01440 i7-10750H, GeForce GTX 1650 Ti Max-Q | 2 kg | 20 mm | 15.60" | 3840x2160 | |
| 78.6 % v7 (old) | 09 / 2020 | Asus VivoBook 15 K571LI-PB71 i7-10750H, GeForce GTX 1650 Ti Mobile | 2.1 kg | 21.9 mm | 15.60" | 1920x1080 | |
| 80.8 % v7 (old) | 07 / 2020 | Asus ROG Strix G15 G512LI i7-10750H, GeForce GTX 1650 Ti Mobile | 2.3 kg | 25.8 mm | 15.60" | 1920x1080 | |
| 79.8 % v7 (old) | 06 / 2020 | Acer Nitro 5 AN515-44-R5FT R5 4600H, GeForce GTX 1650 Ti Mobile | 2.2 kg | 24 mm | 15.60" | 1920x1080 |
Case
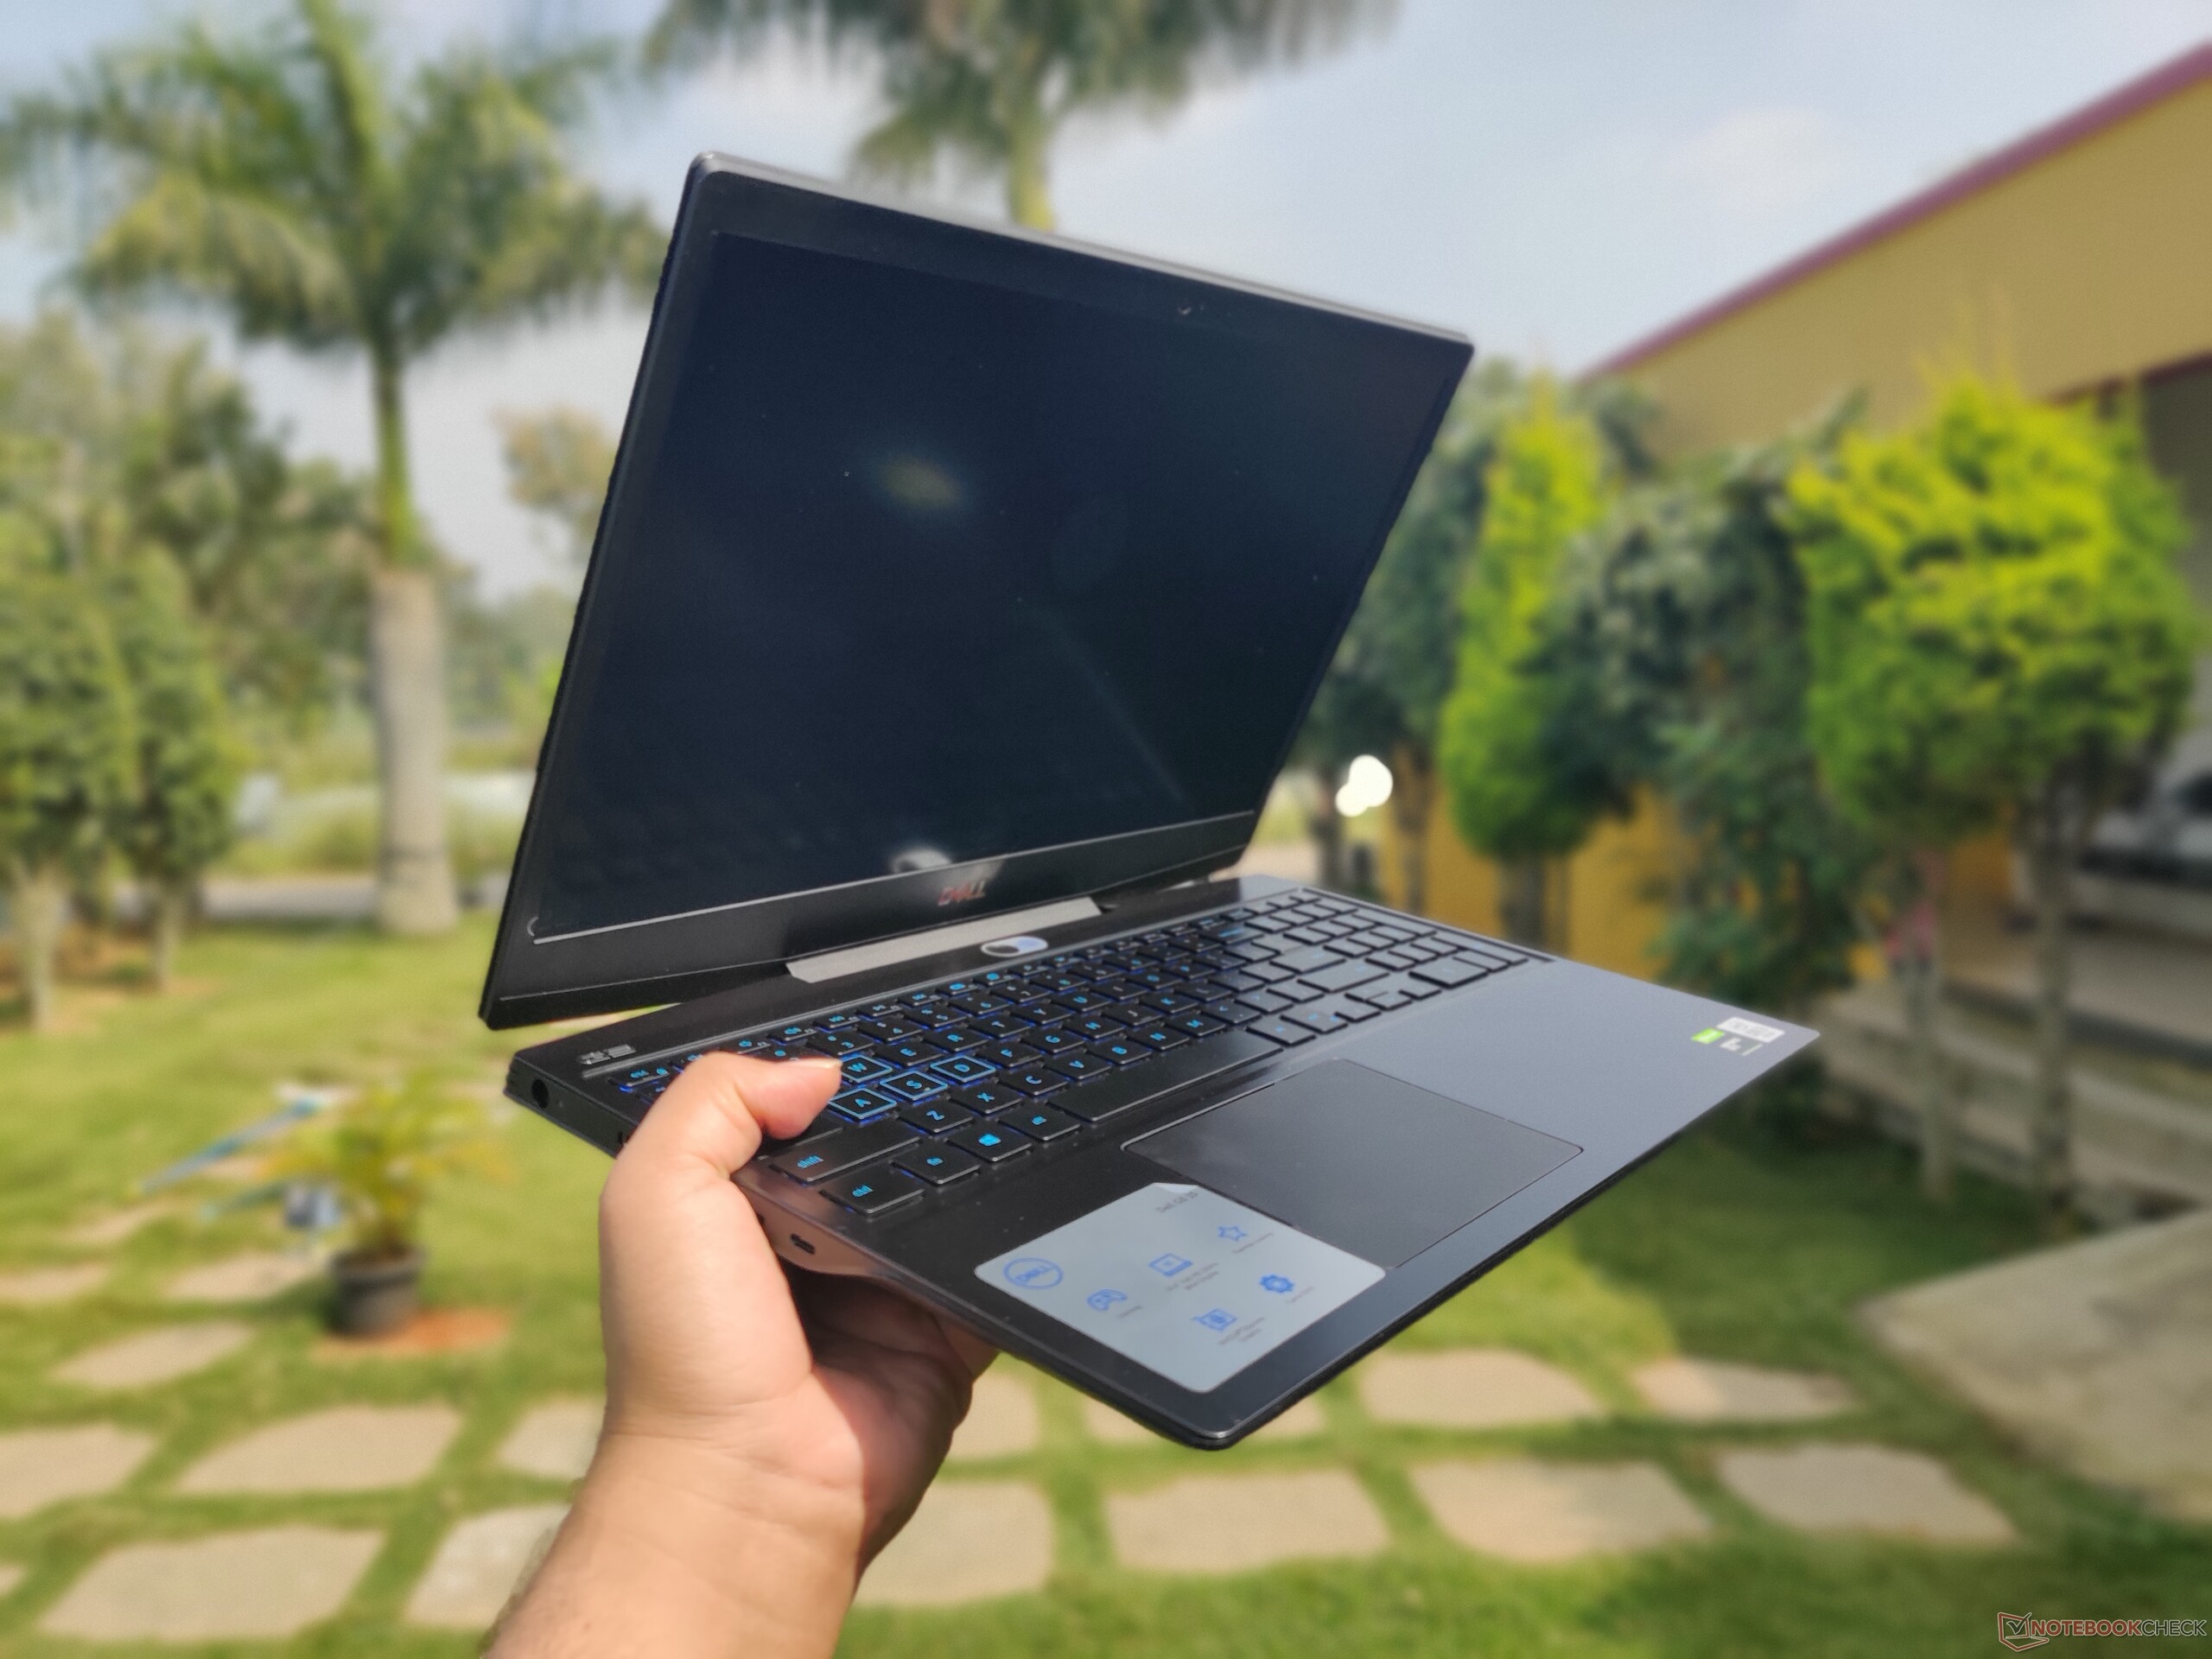
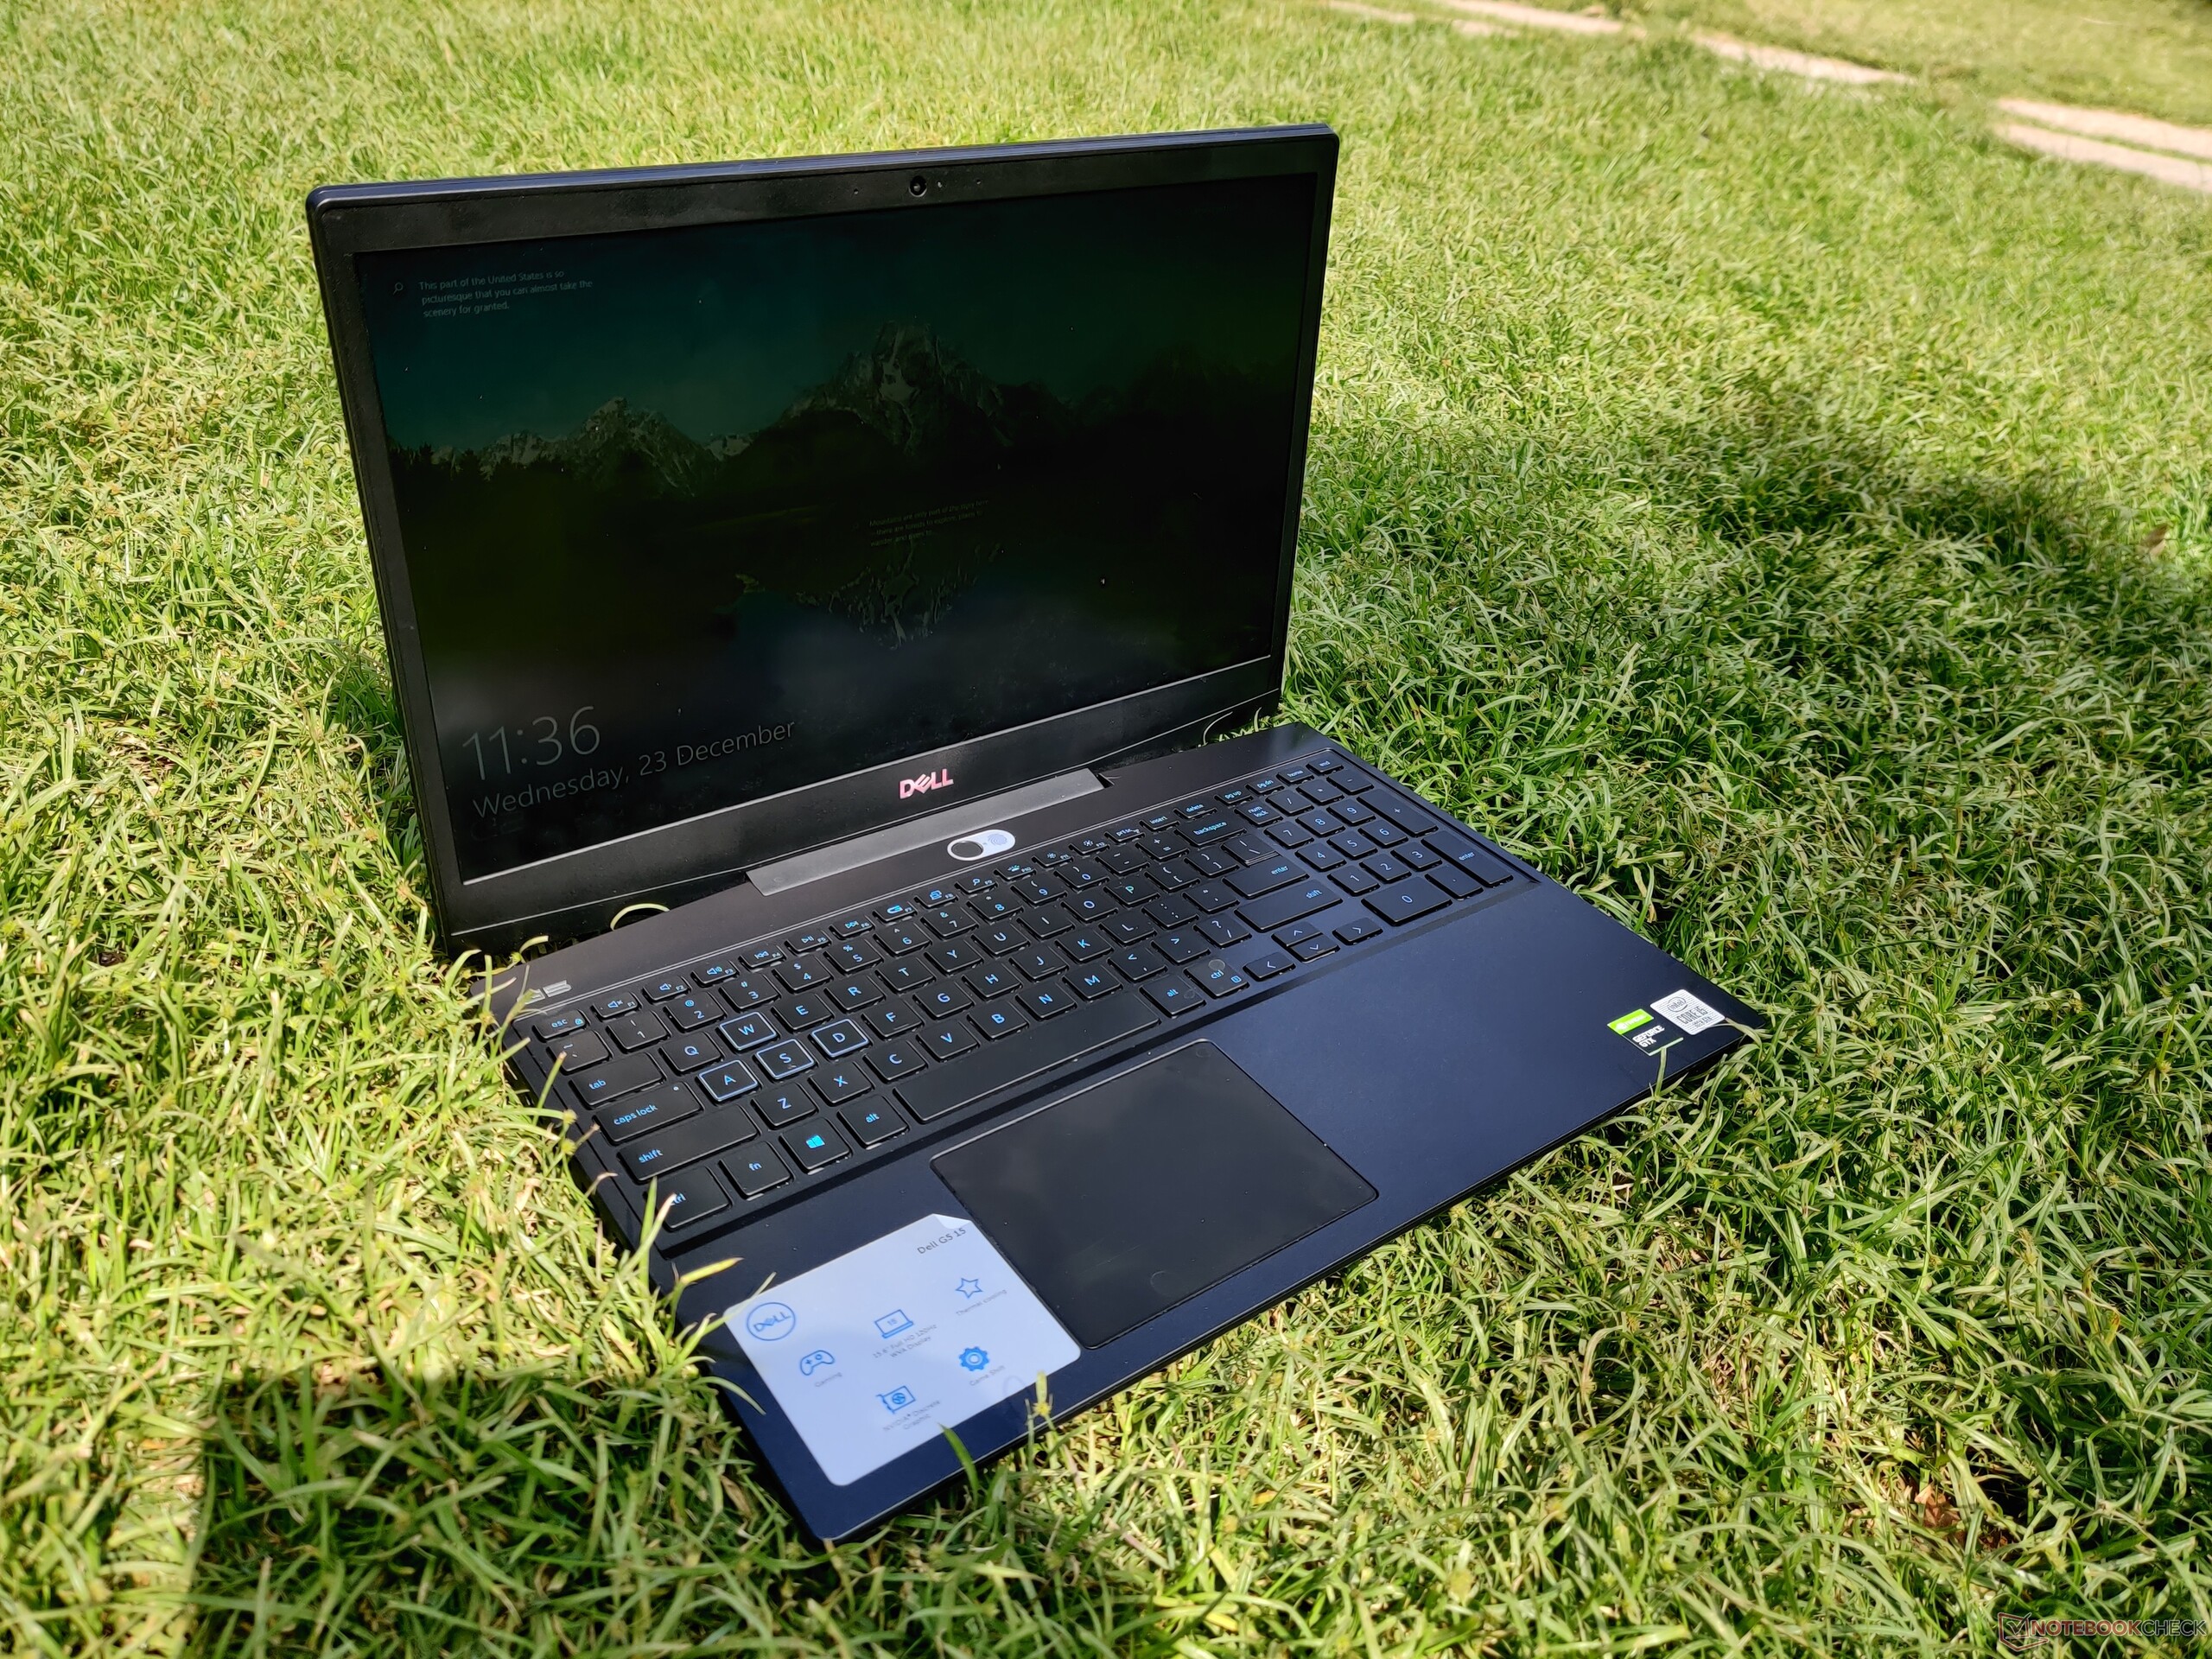
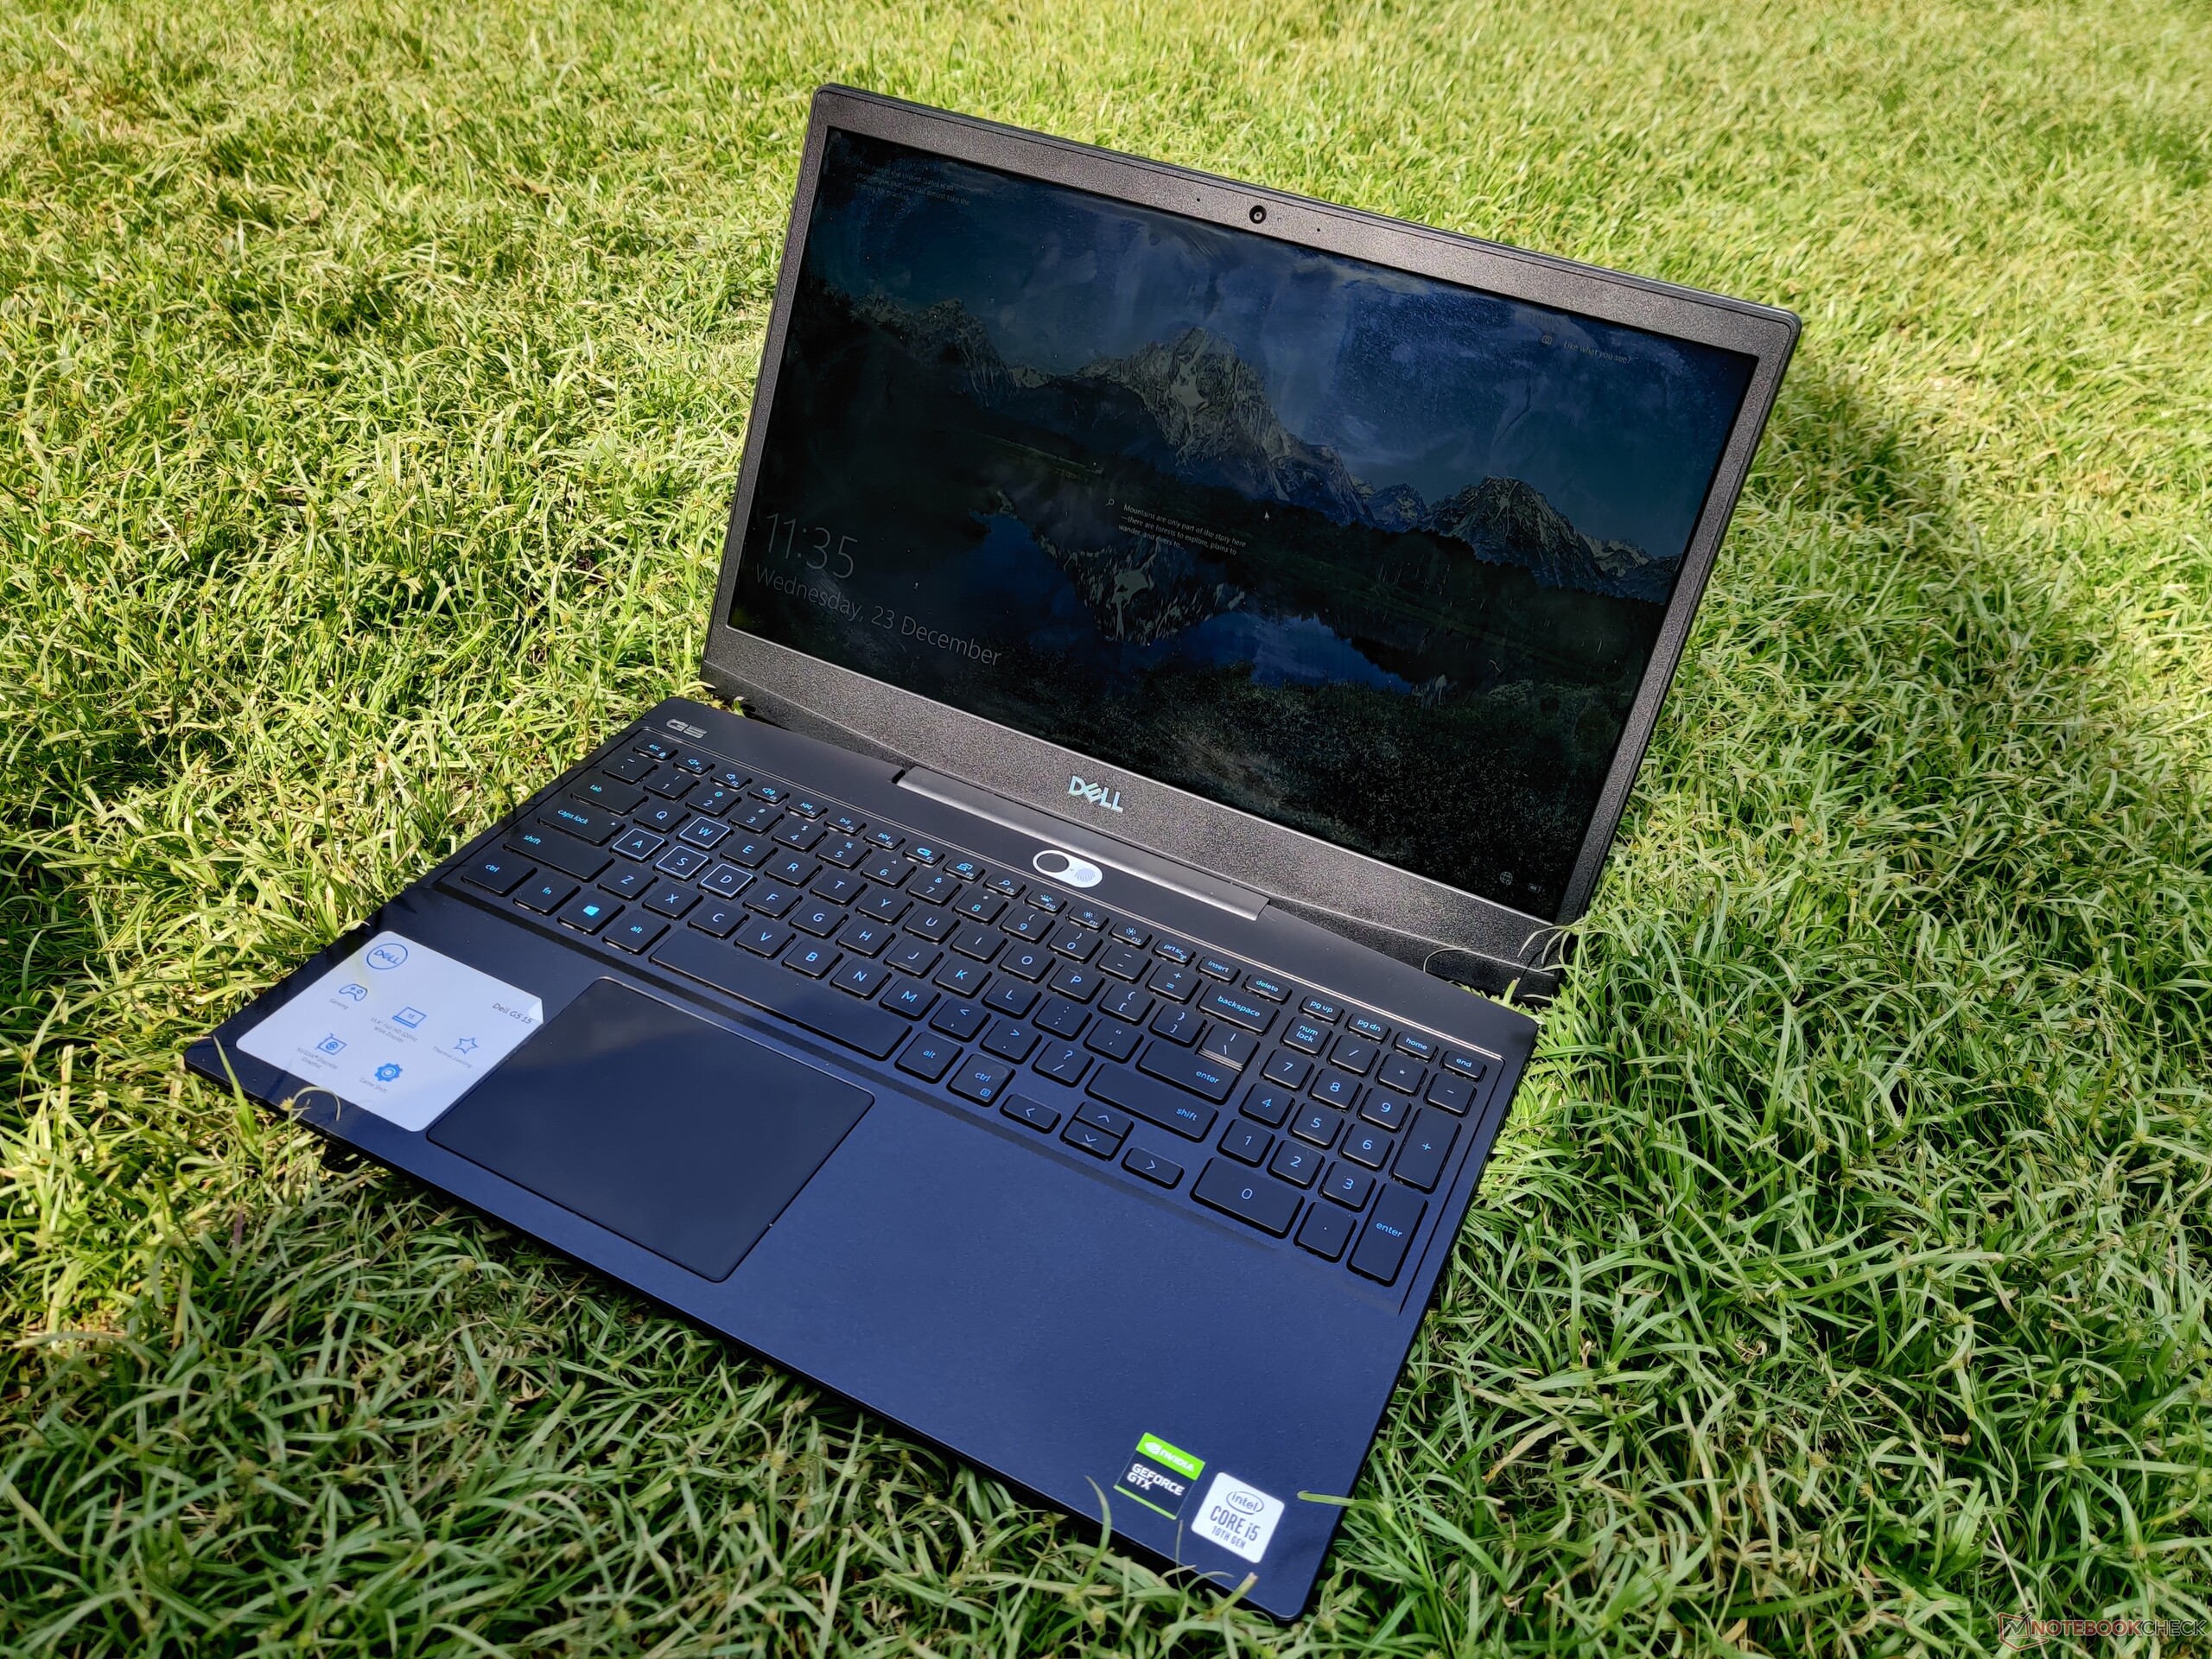
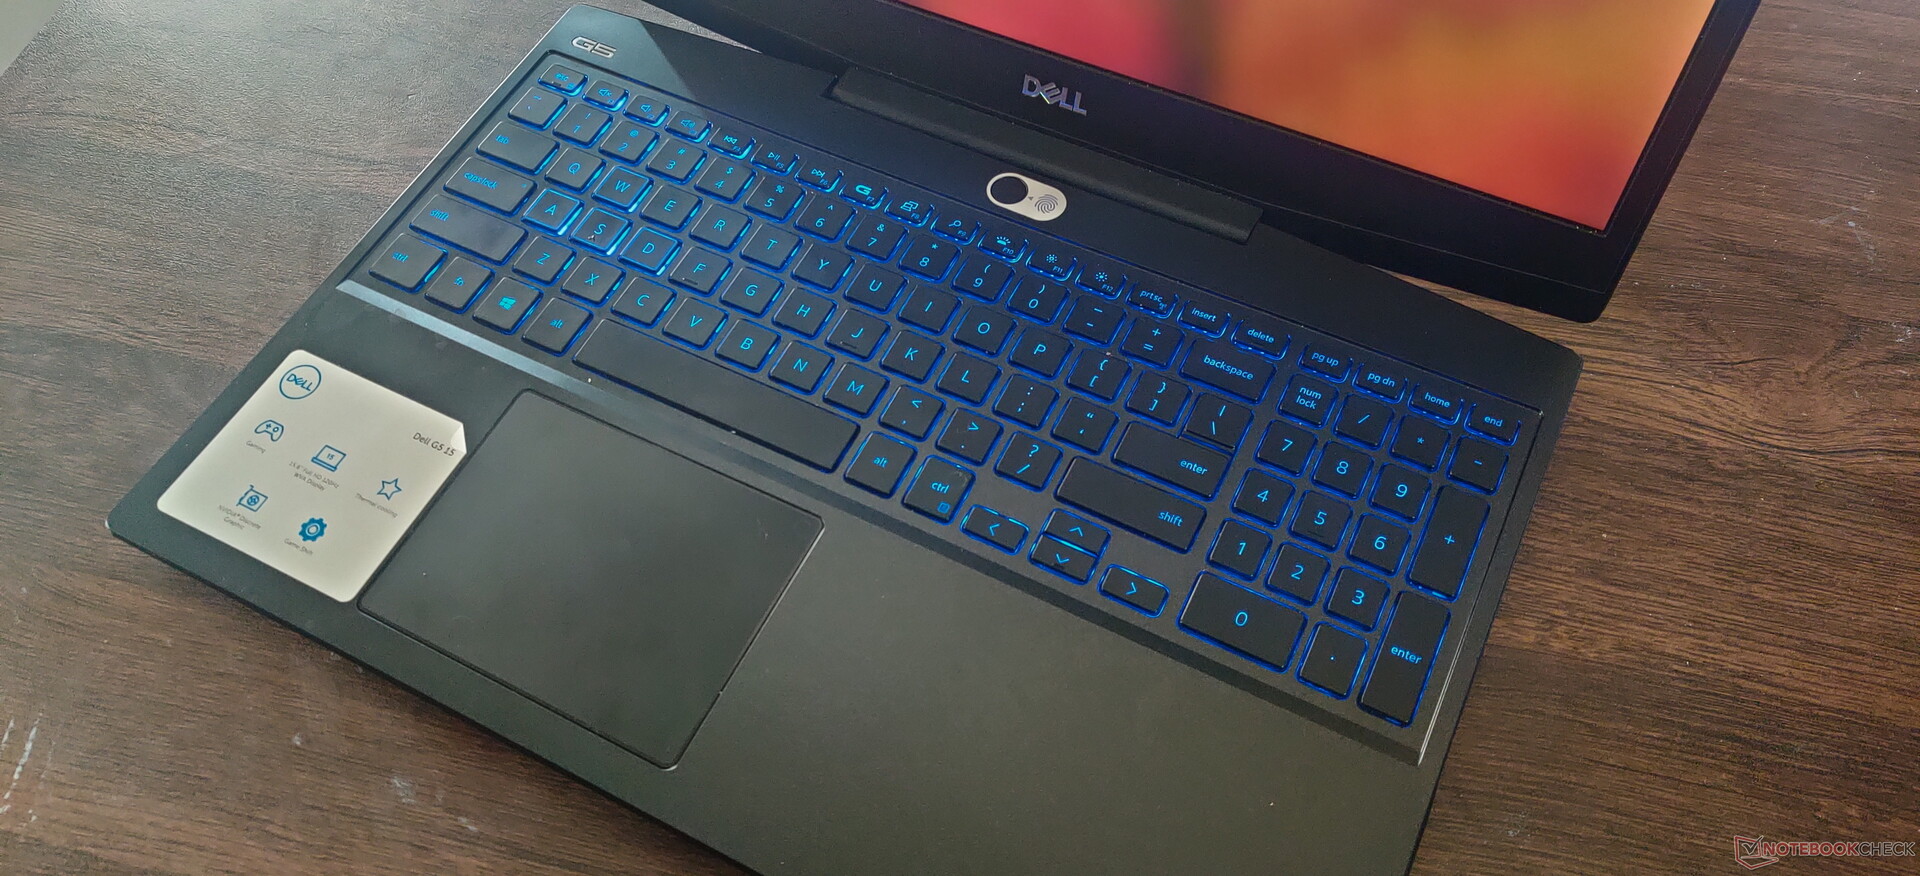
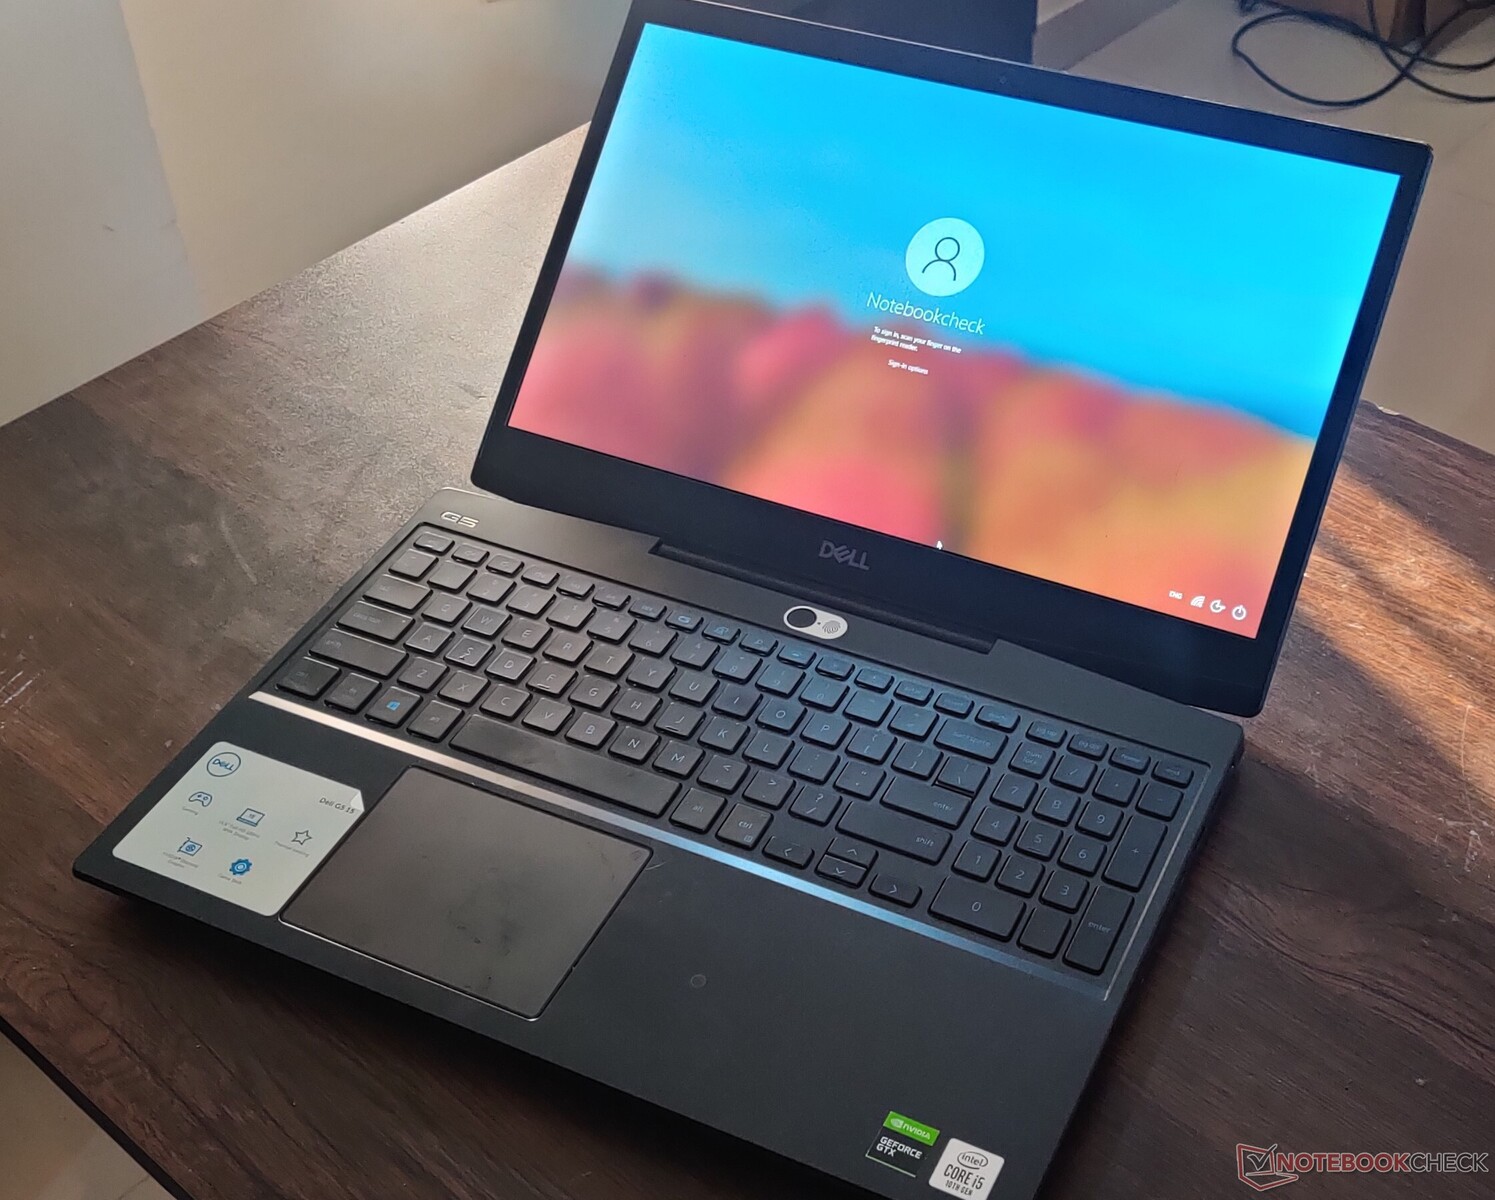
At first look, the Dell G5 15 5500 is instantly recognizable as a gaming laptop with its iridescent lid and a grooved design near the heat exhausts. The build is primarily made of plastic — it does not feel cheap but is not exactly premium either. Unlike some of the G5 15s where the top part of the keyboard deck is made of metal, our unit was plastic through and through. Still, at 2.34 kg, this year's iteration is about 415 g lighter than the previous generation.
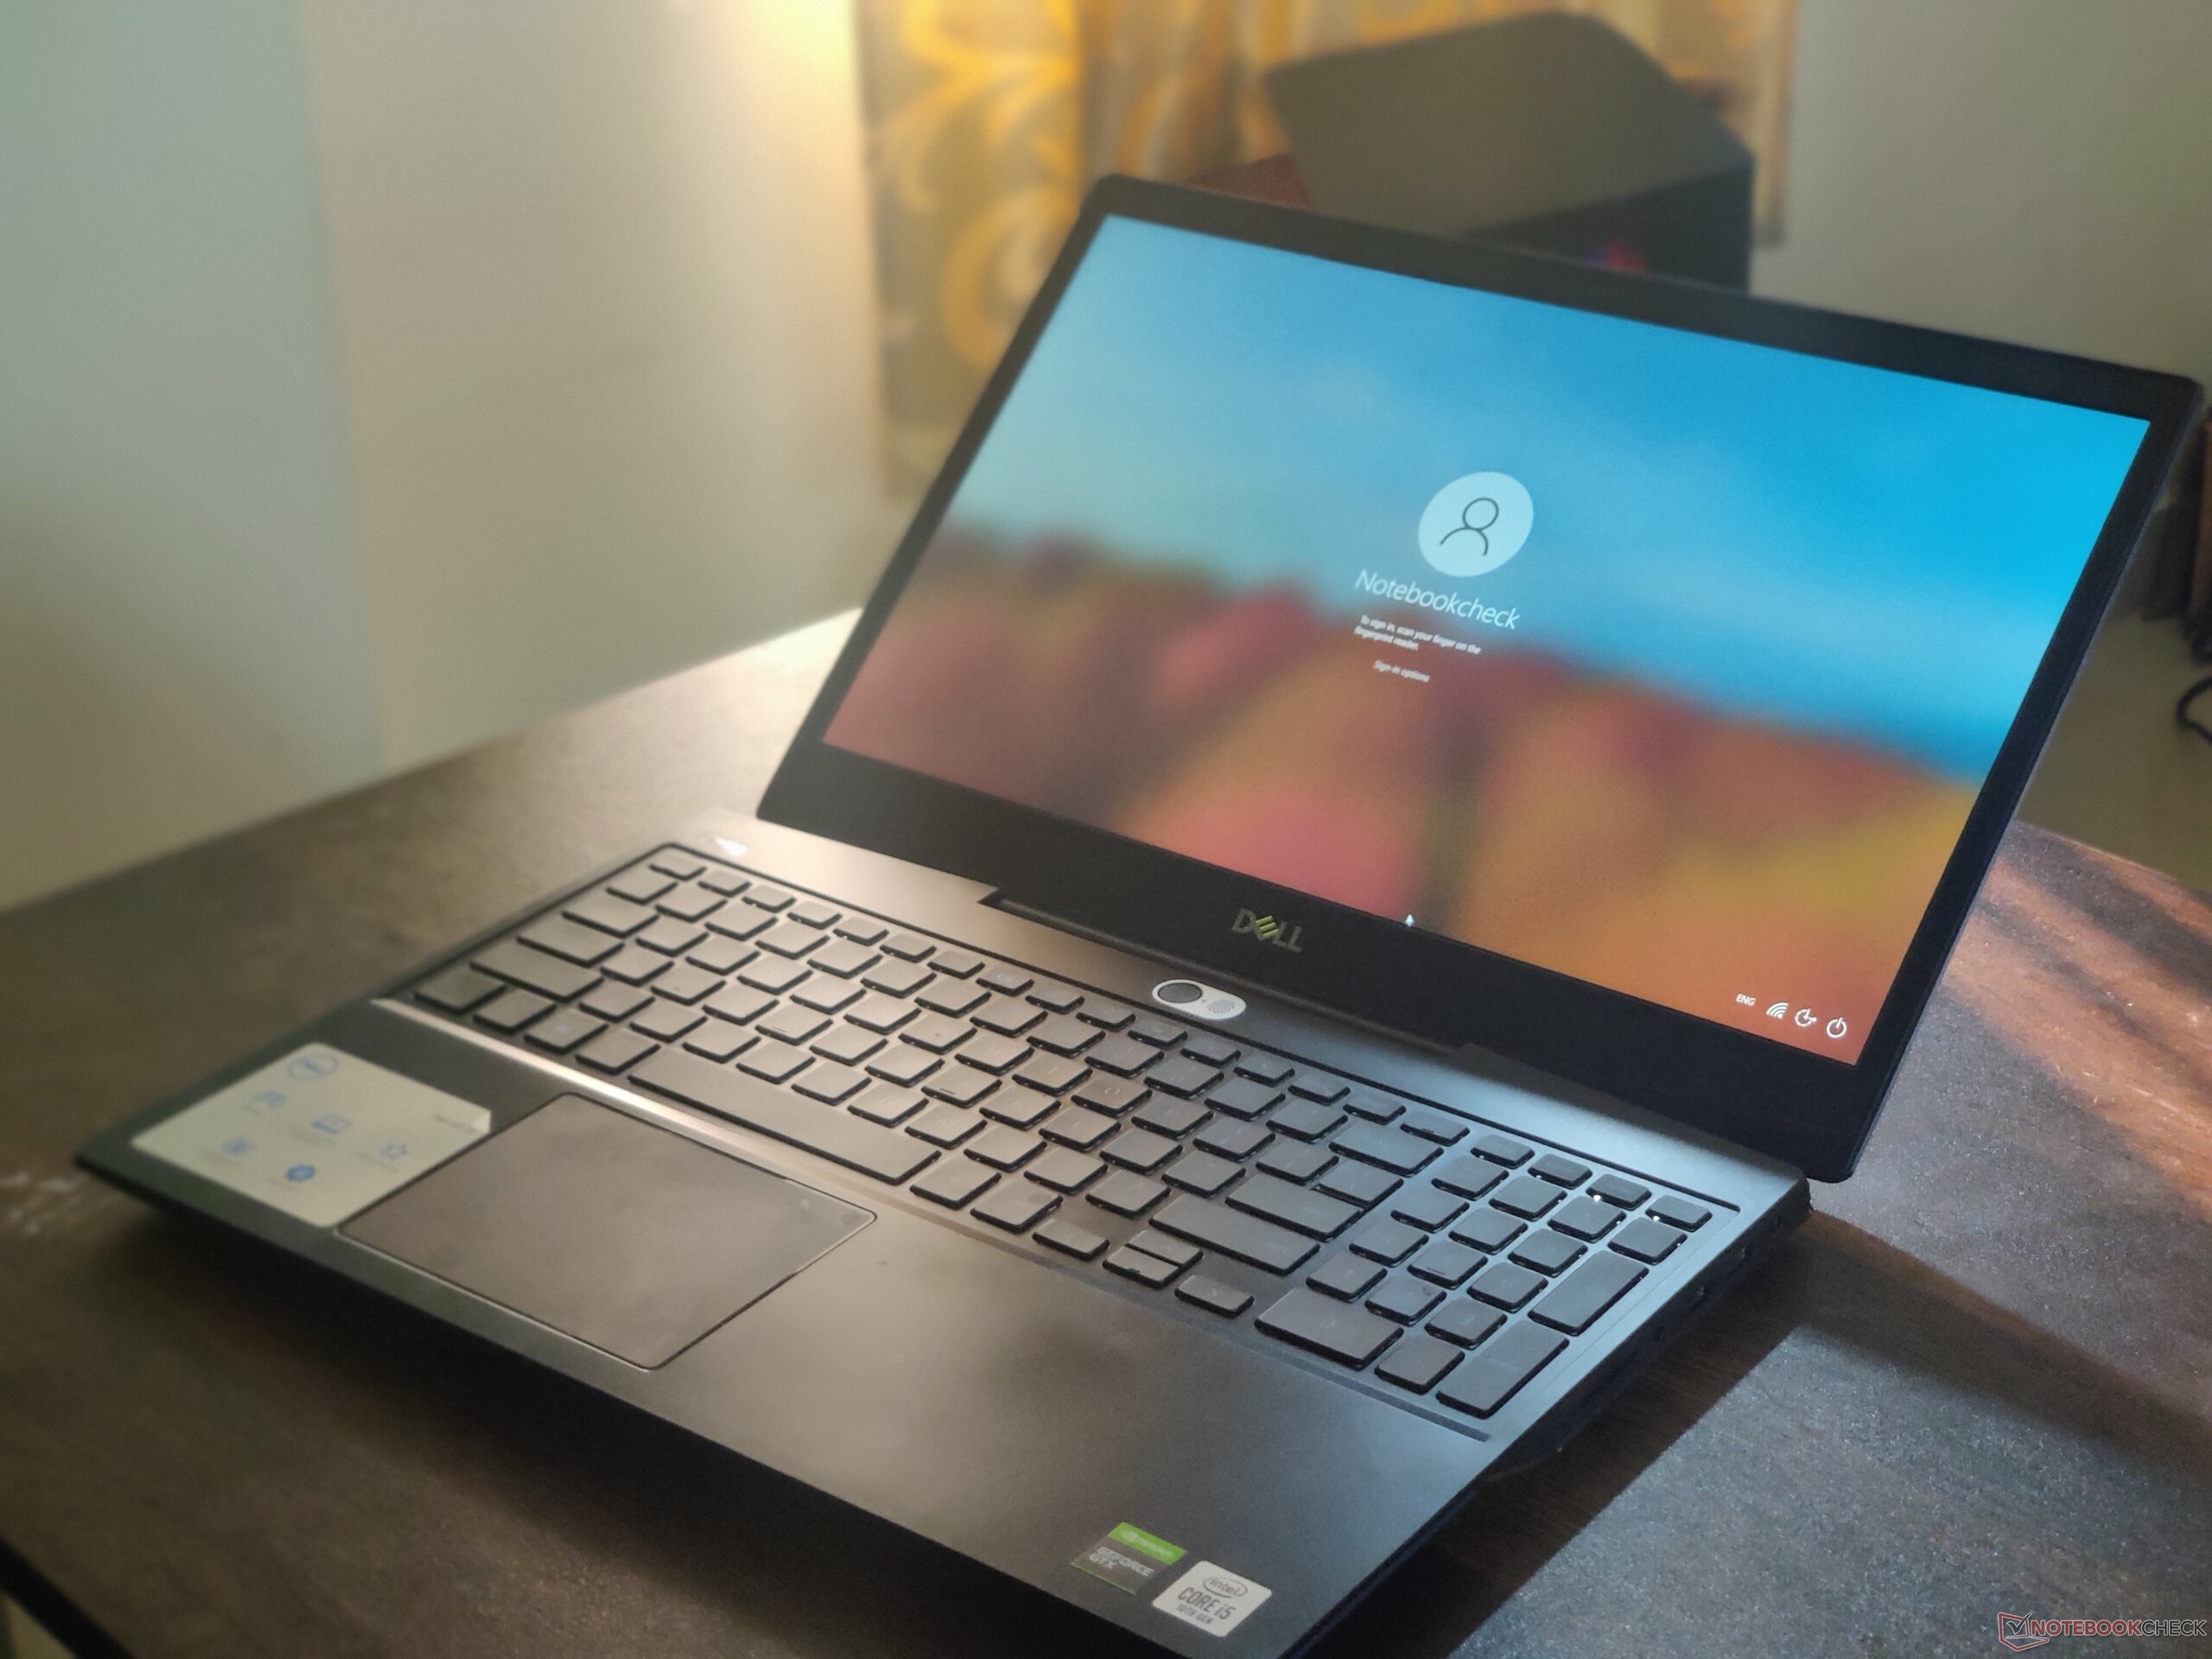
The top part of the keyboard deck houses the power button-cum-fingerprint reader. In our use, we found the fingerprint reader's performance to be somewhat inconsistent even with fairly clean fingers.
The overall build quality seems sturdy with no flexing or bending on the chassis or the keyboard. The display does lend itself to some twisting although it requires force to do so. The lid can be opened with one hand but not without displacing the laptop from its position by a few centimeters.
As is characteristic of the G series, the G5 15 features a central hinge that feels sturdy enough and keeps the display from wobbling during use.

Connectivity
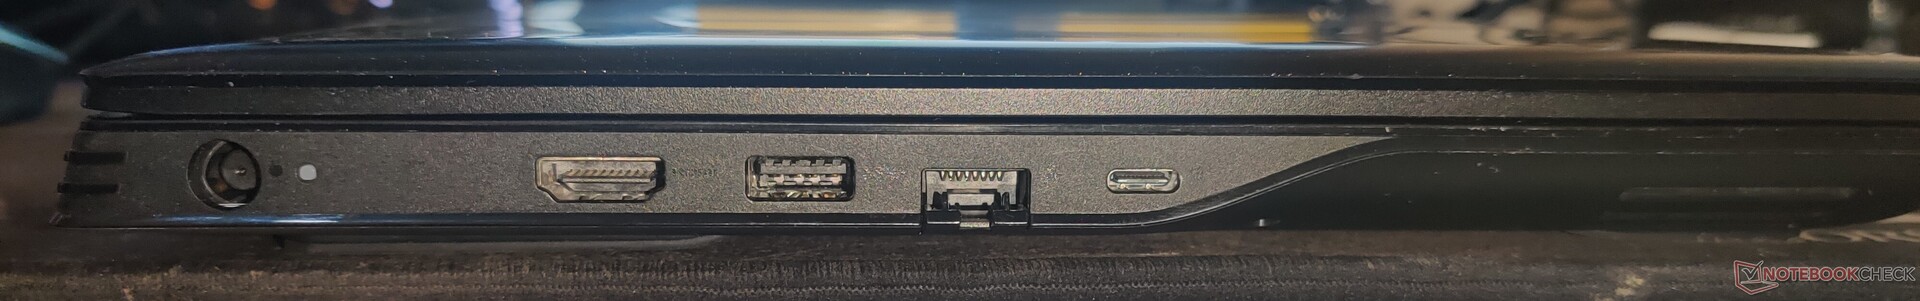
Our Dell G5 15 5505 unit is equipped with three USB Type-A ports (1x USB 3.1 Gen1 and 2x USB 2.0). There's also a USB 3.1 Gen2 Type-C port that does not support Thunderbolt but offers DisplayPort-out. Apart from these, there's an RJ-45 LAN port, a 3.5 mm combo audio jack, HDMI 2.0-out, an SD card slot, and a wedge lock slot. These ports are distributed on either side of the laptop leaving the rear clean.


Communication
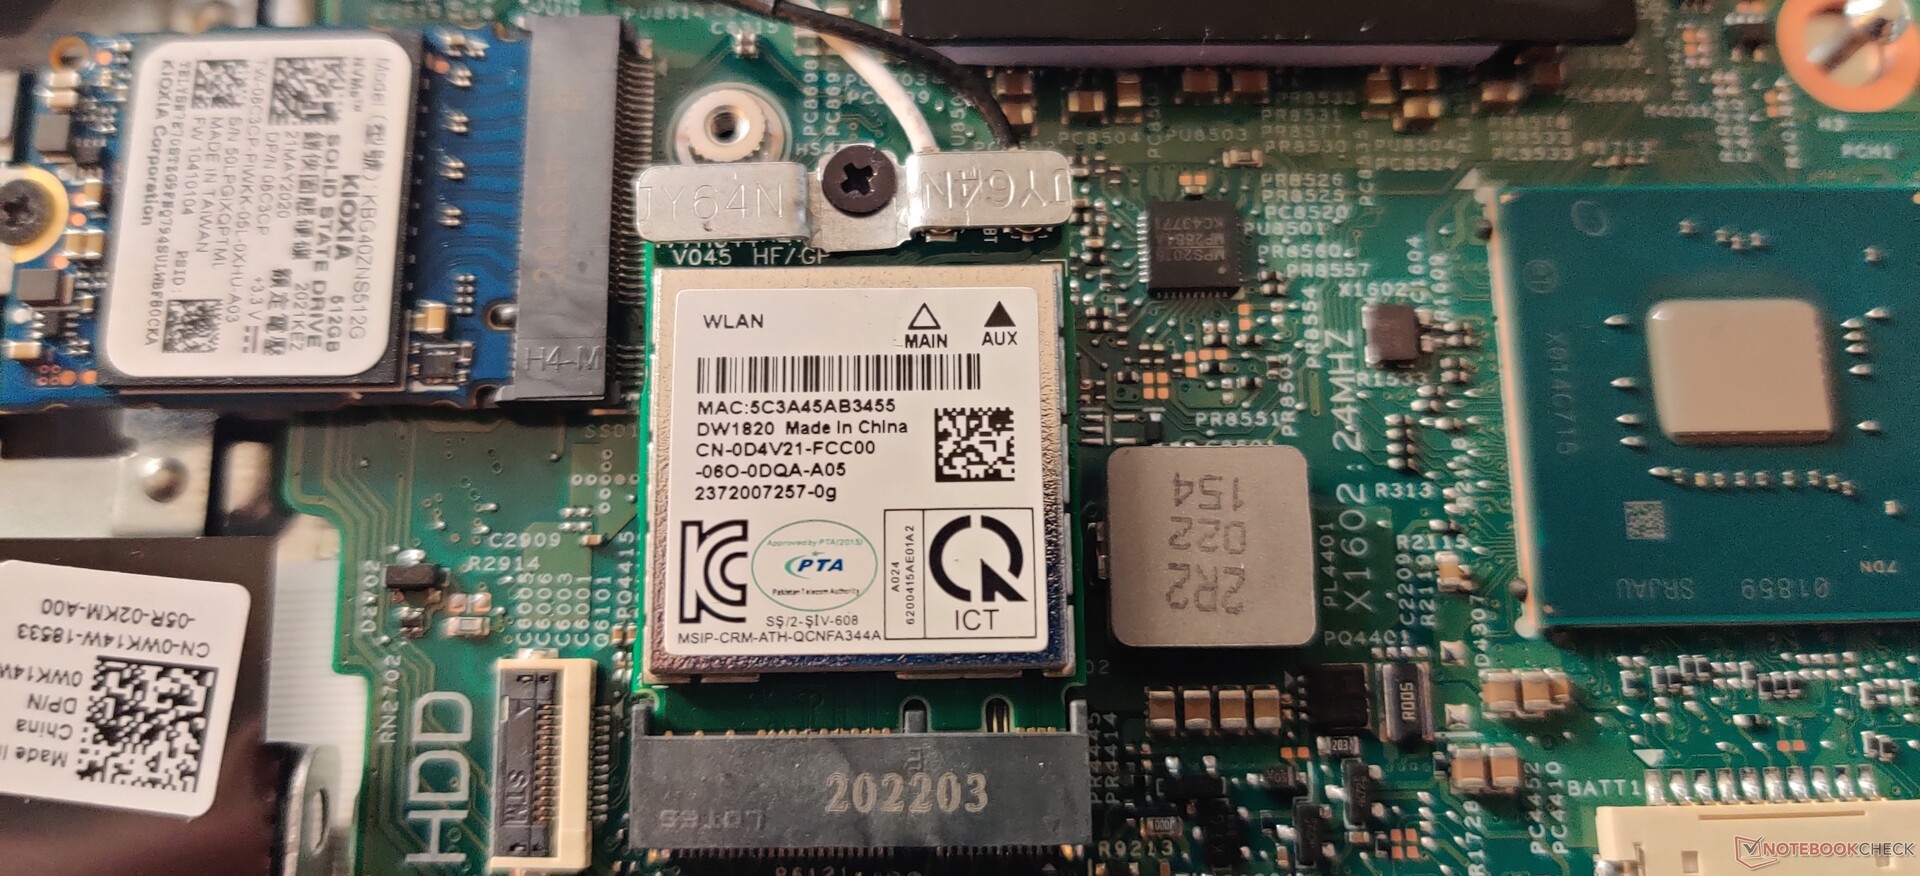
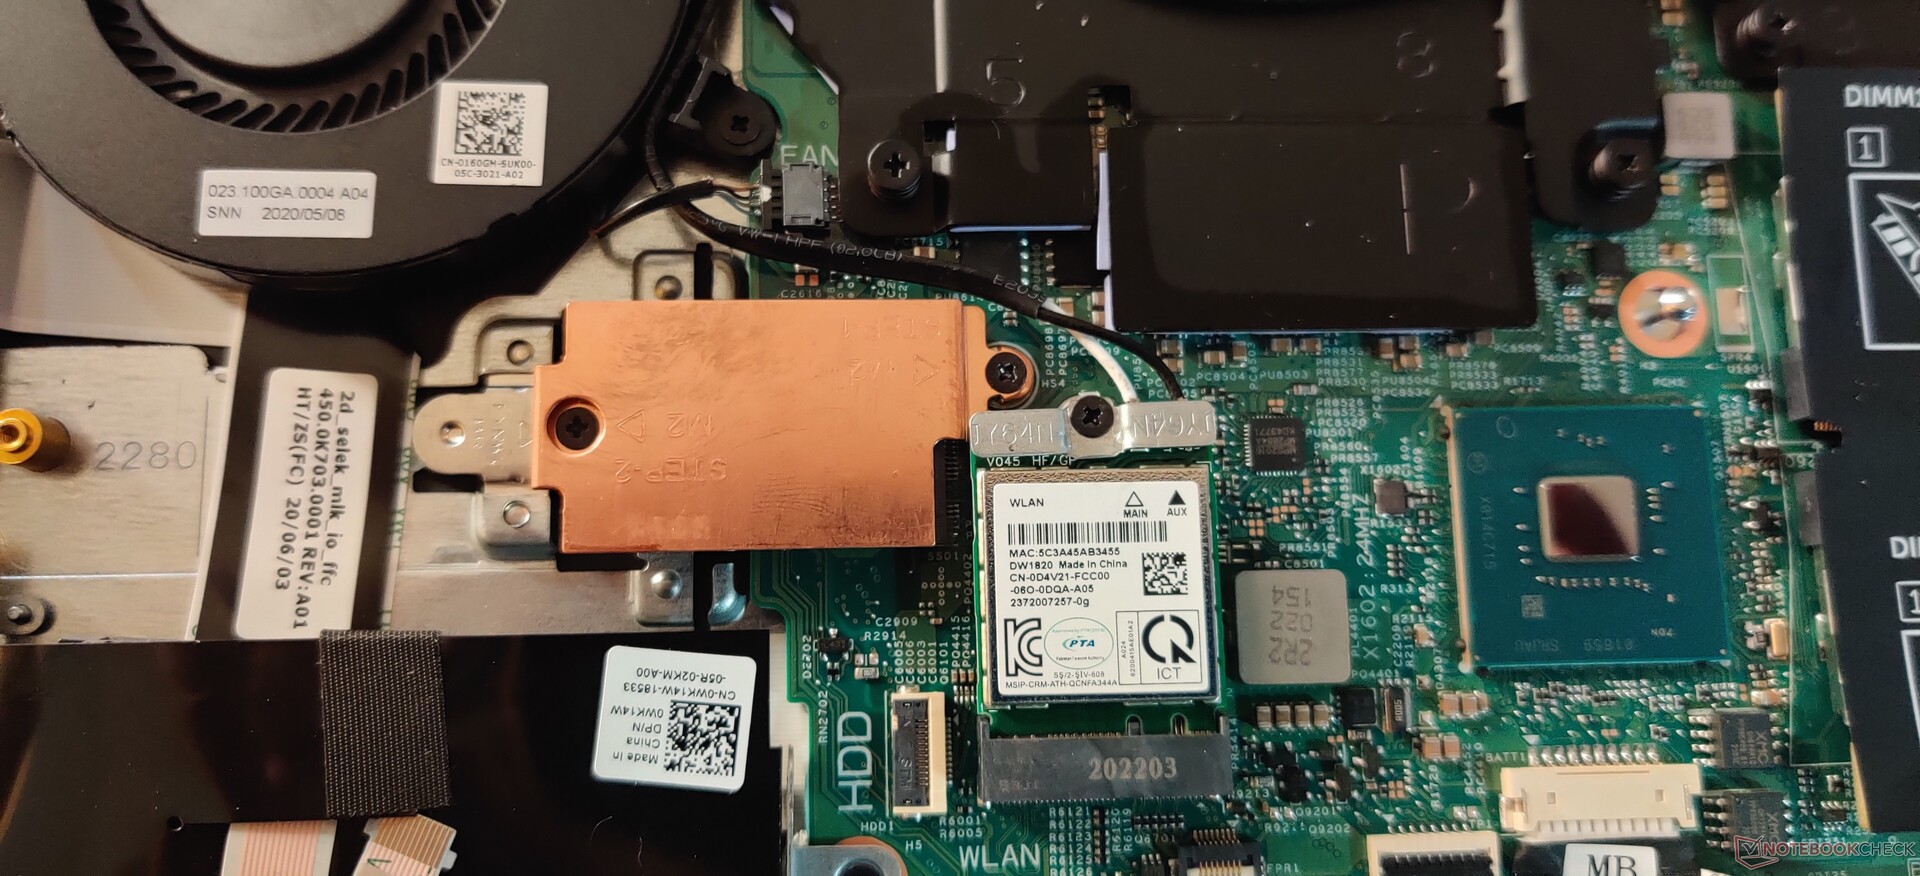
Dell has equipped our model with a Qualcomm QCA61x4A wireless AC WLAN card that offers 802.11ac and Bluetooth 5.0 connectivity. The Qualcomm card performs well and we were able to utilize the maximum possible throughput of our connection without any issues or signal-drops at about six meters away from the router. A Realtek controller provides 1x1 Gigabit Ethernet connectivity.
Webcam
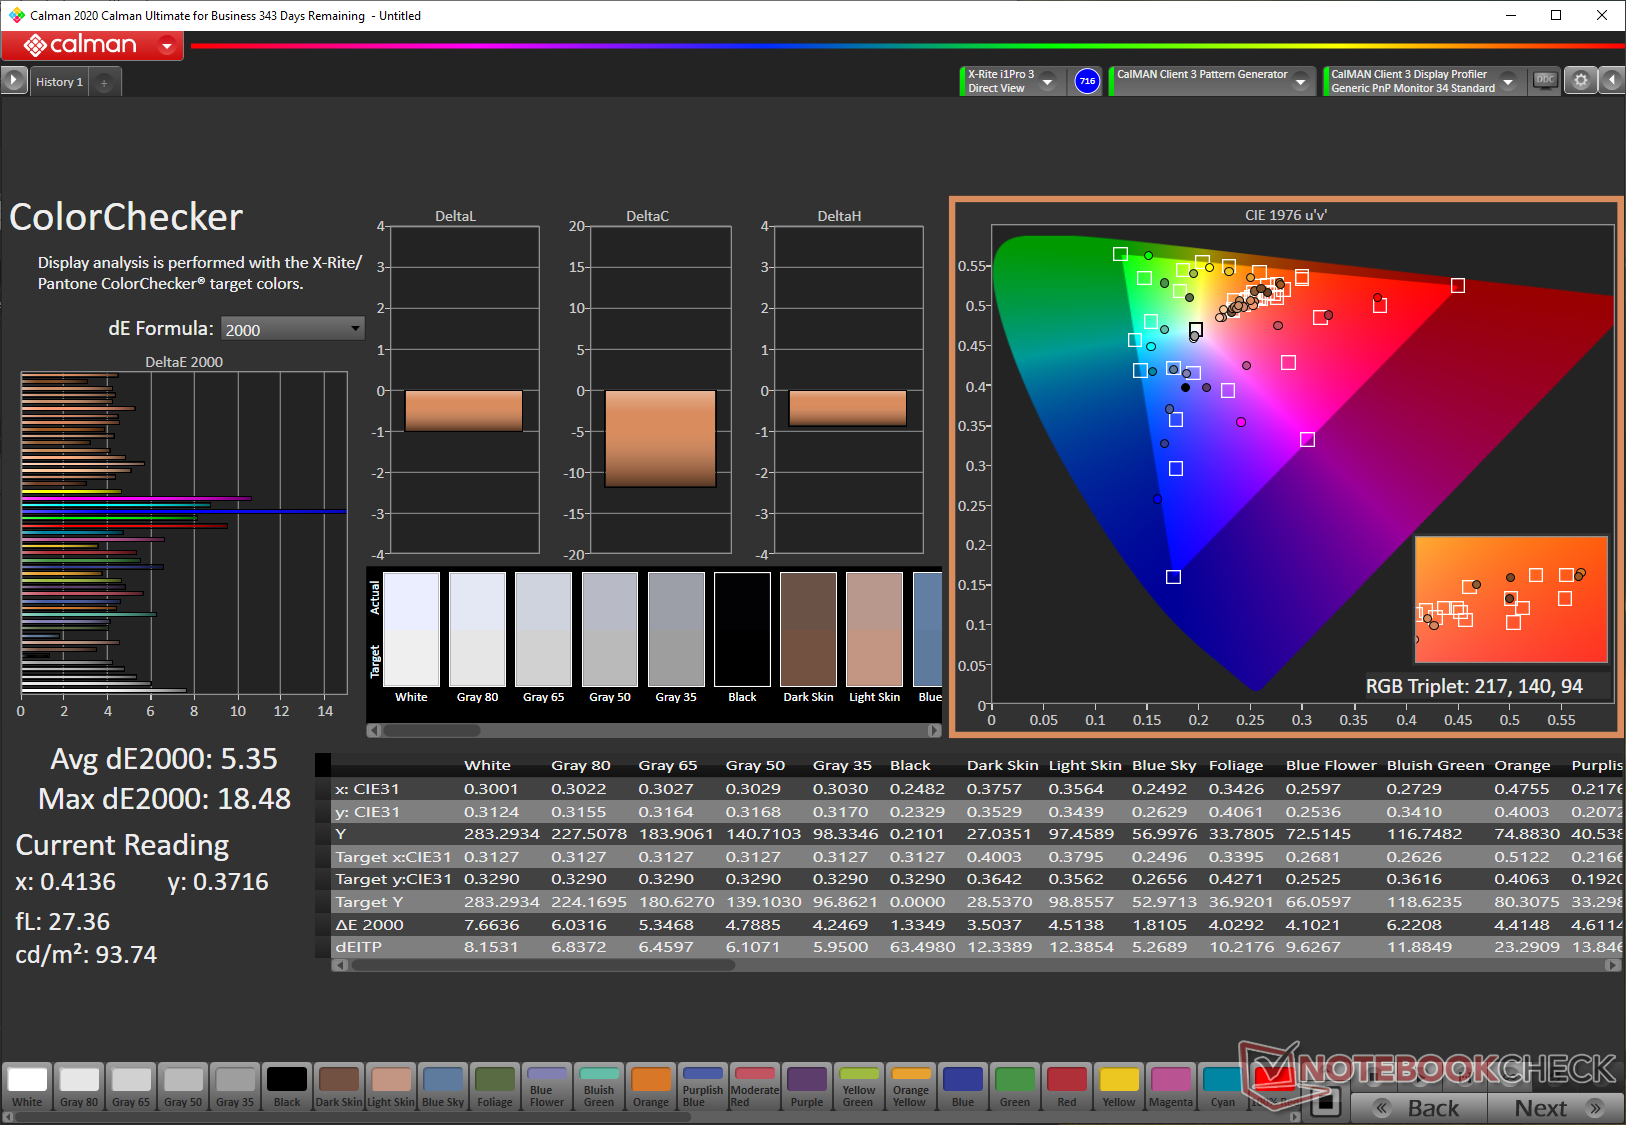
The integrated webcam offers a standard 720p resolution and is only barely suitable for video calls. Only certain colors are reproduced closer to the best possible Delta E of 2.33 as shown in our ColorChecker test below while the others show large deviations. Images often turn out to be blurry and lack detail. Darker areas of the scene are highly noisy.

Maintenance
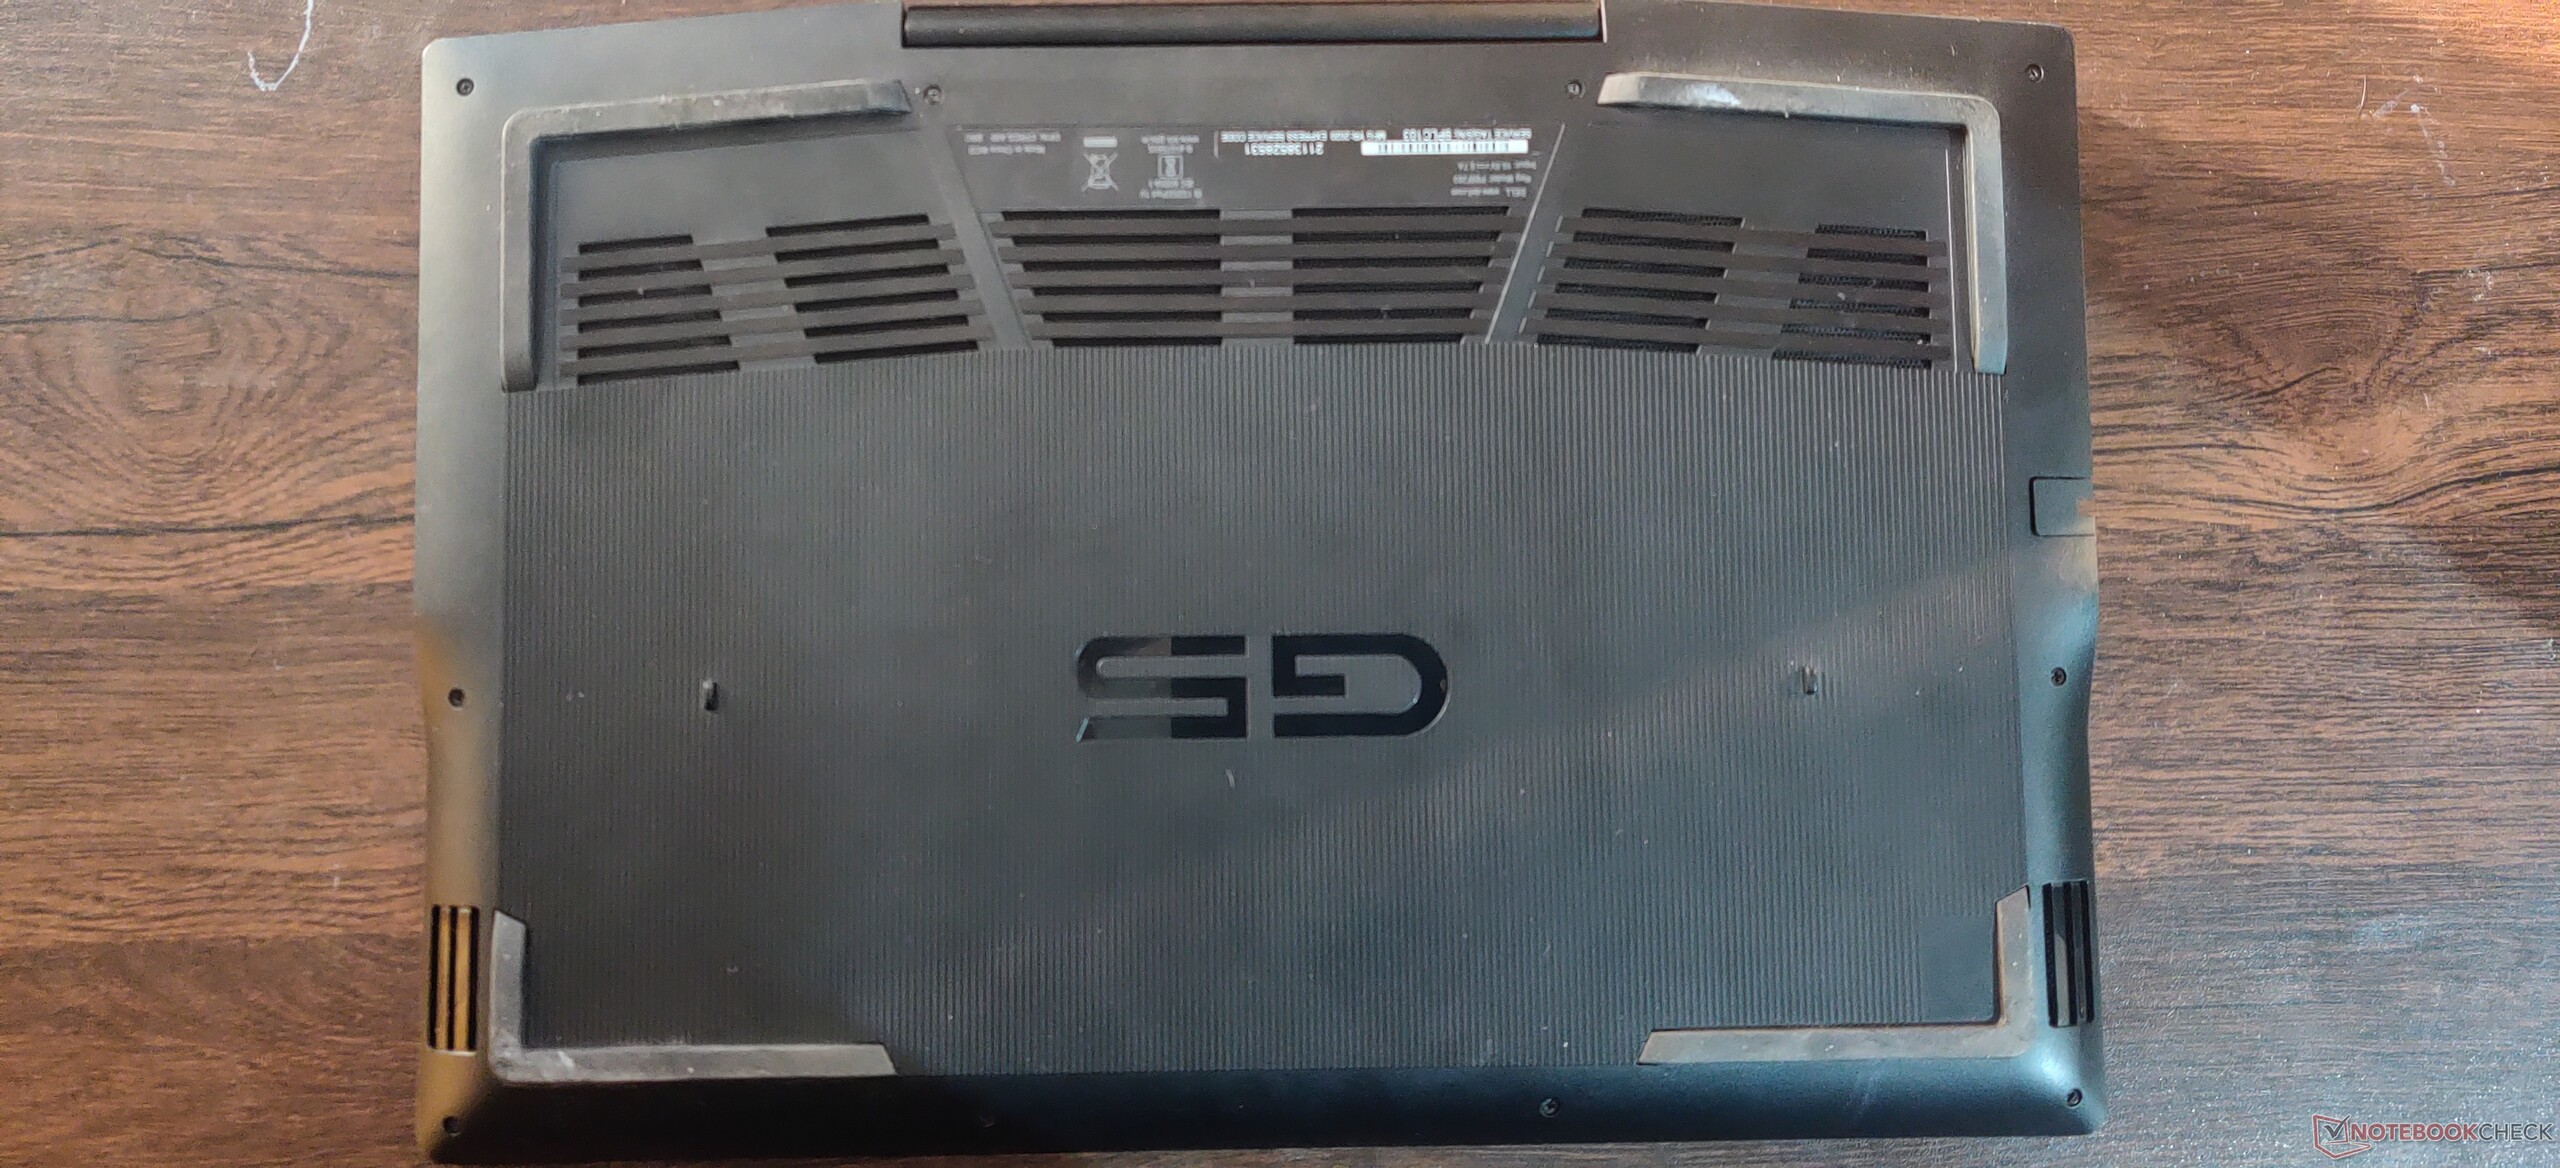
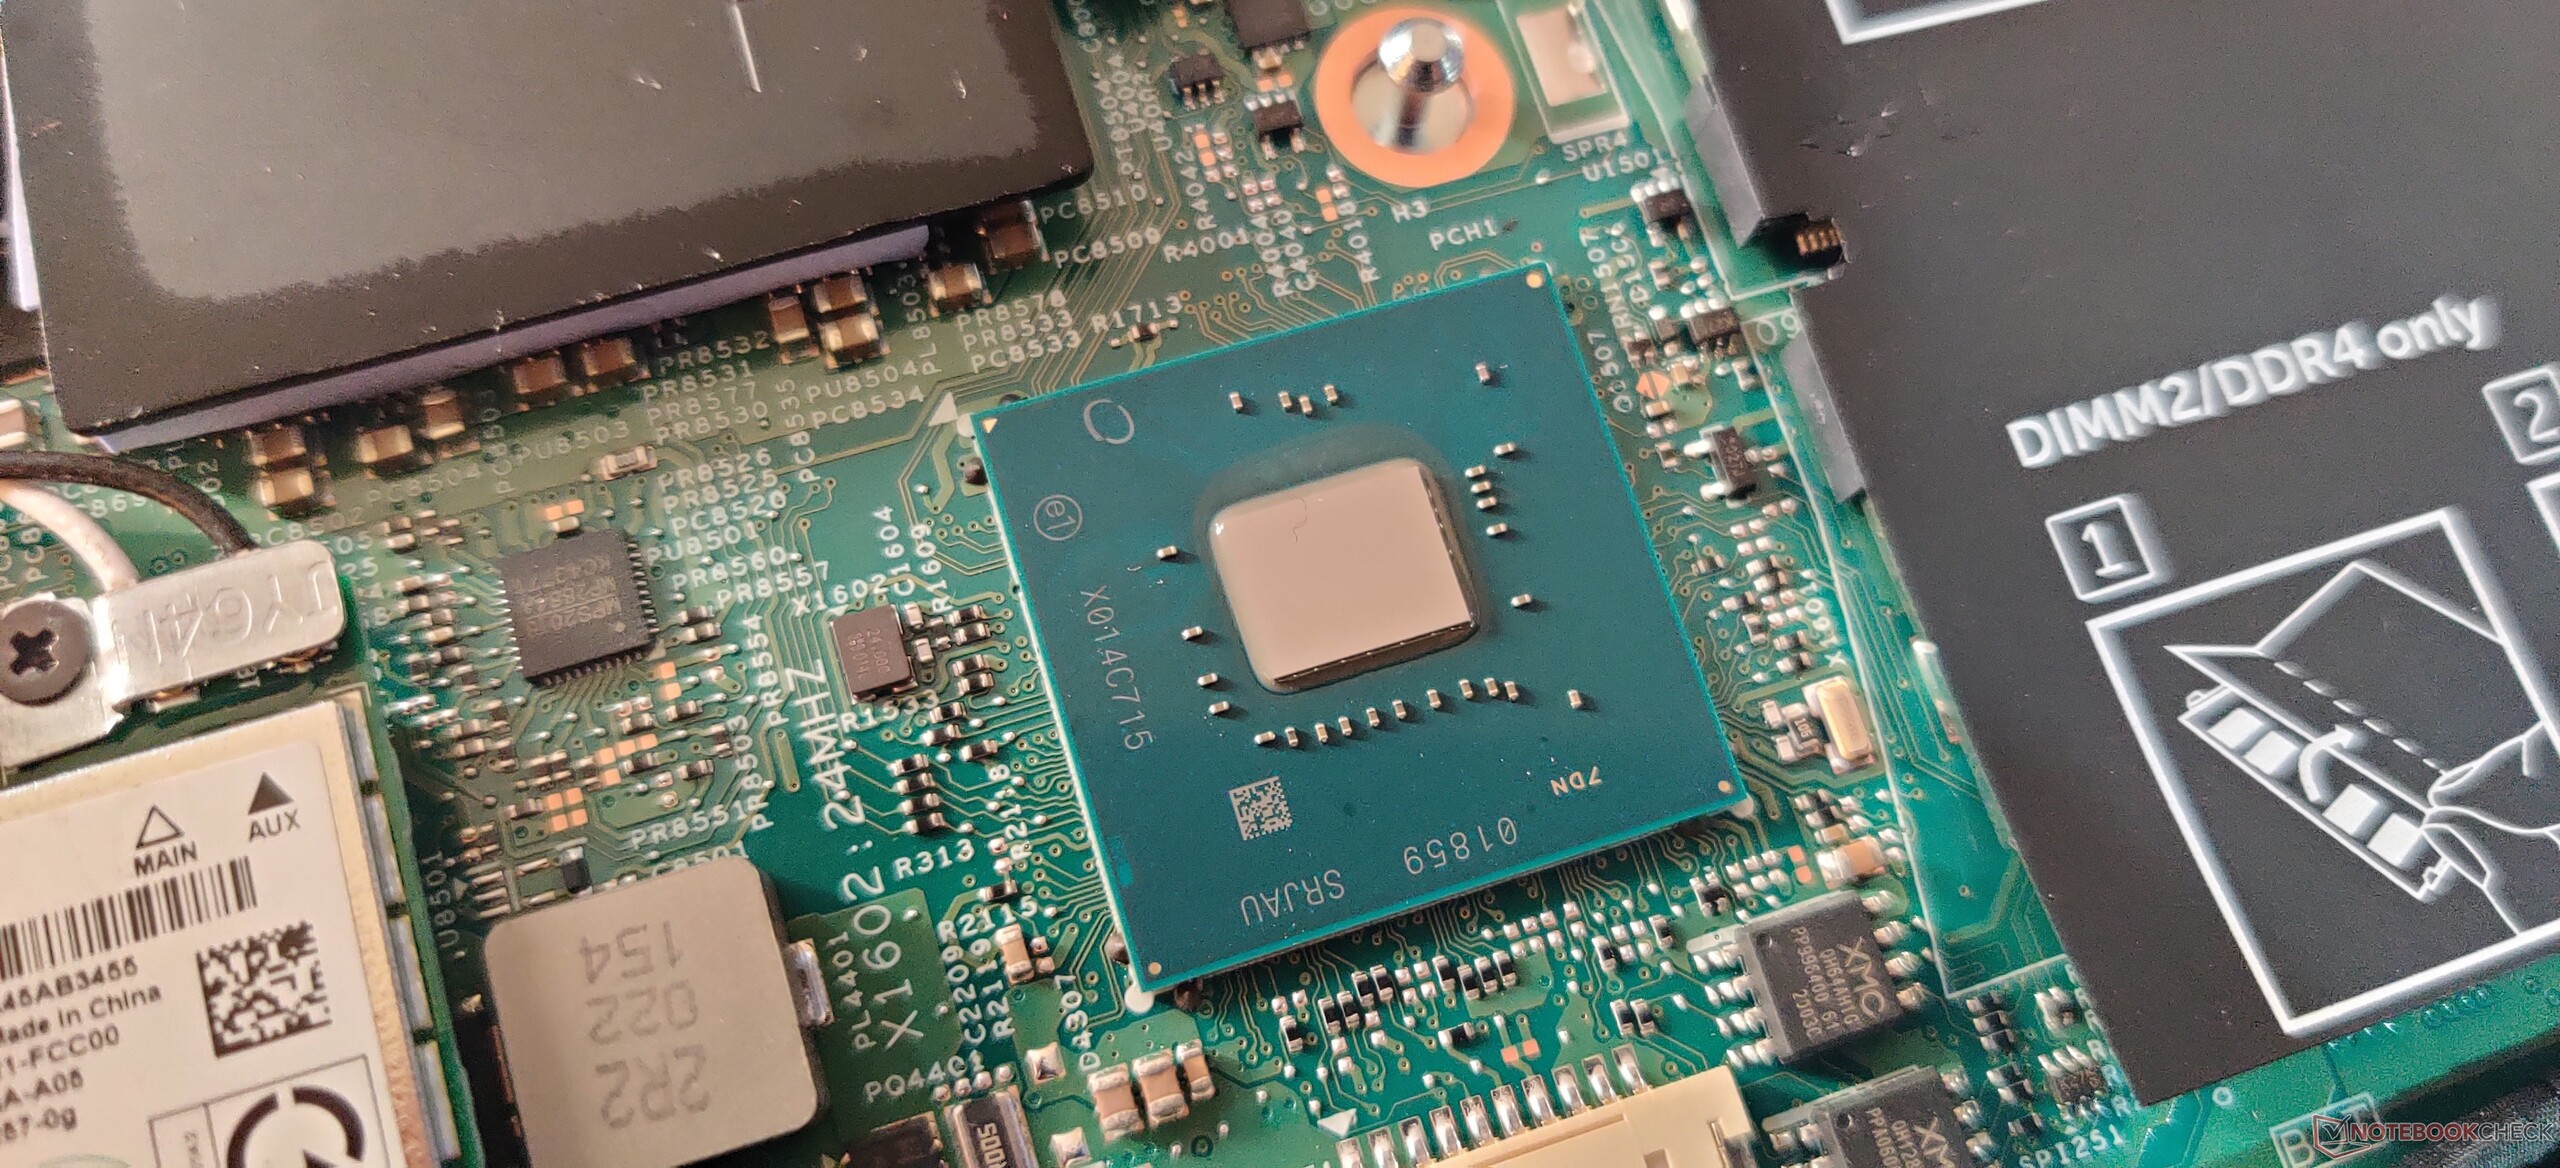
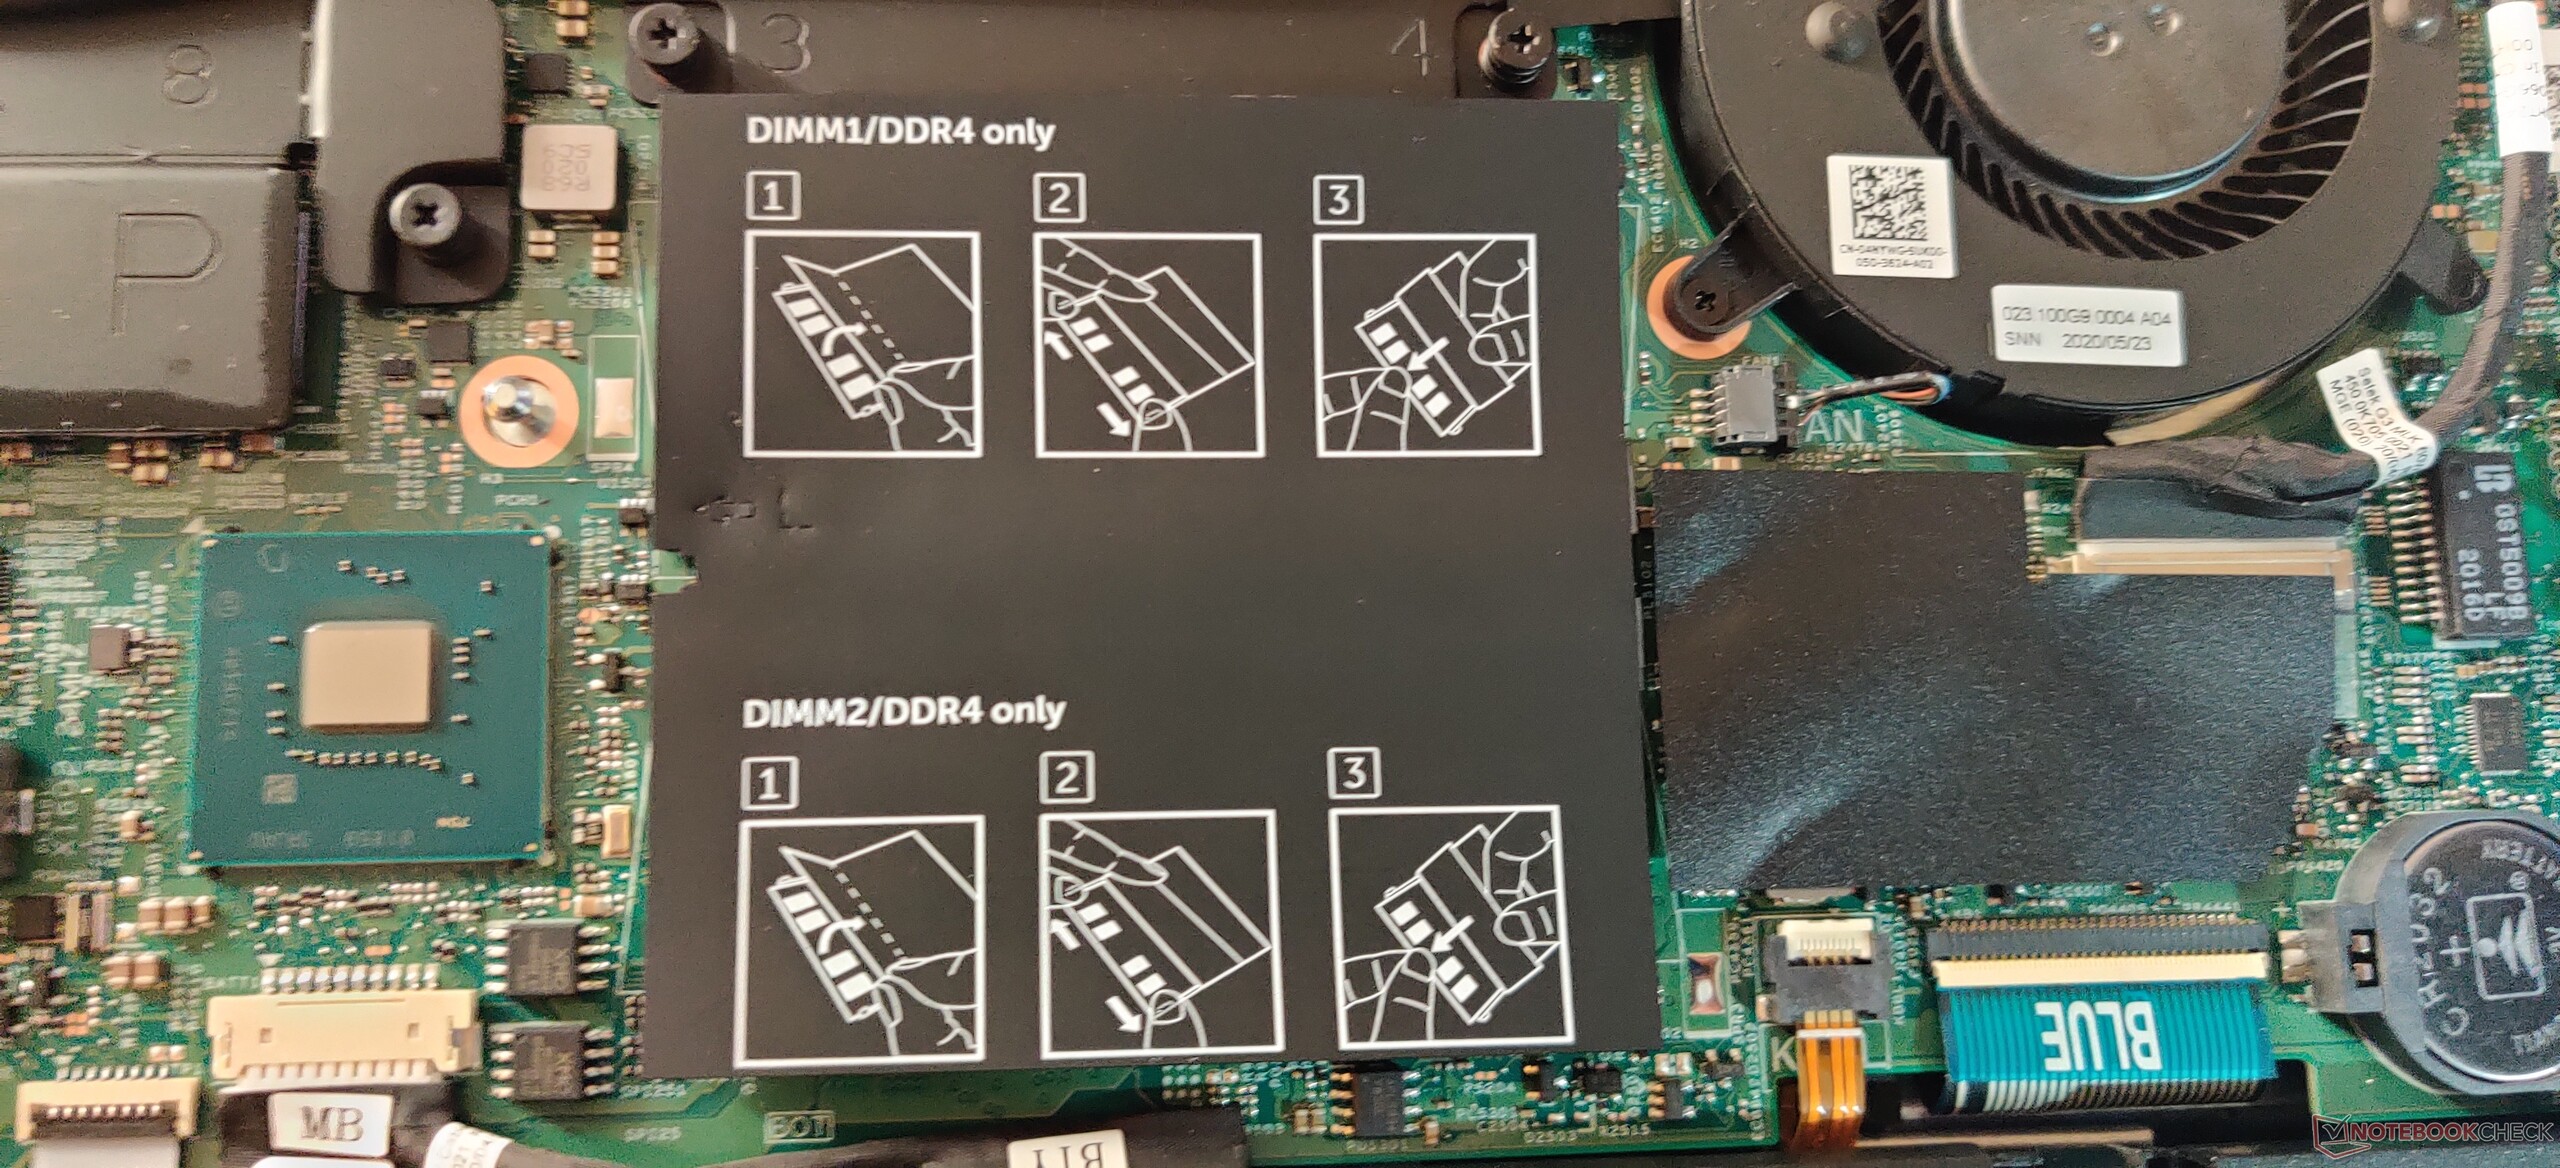
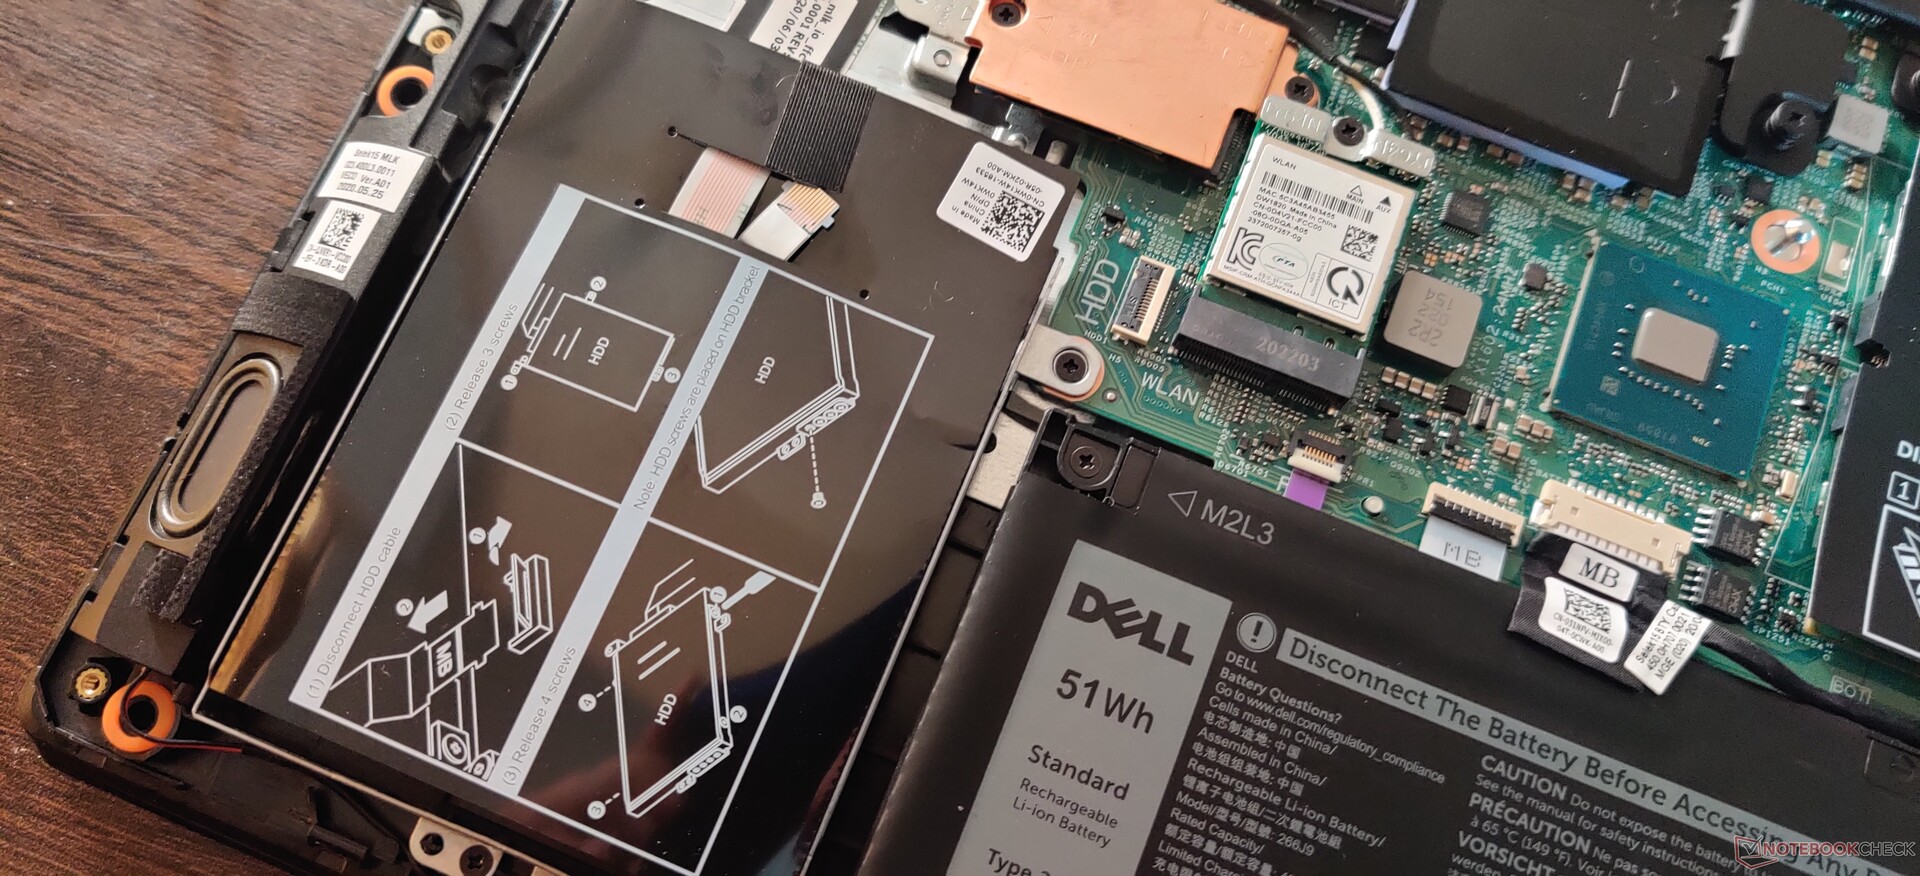
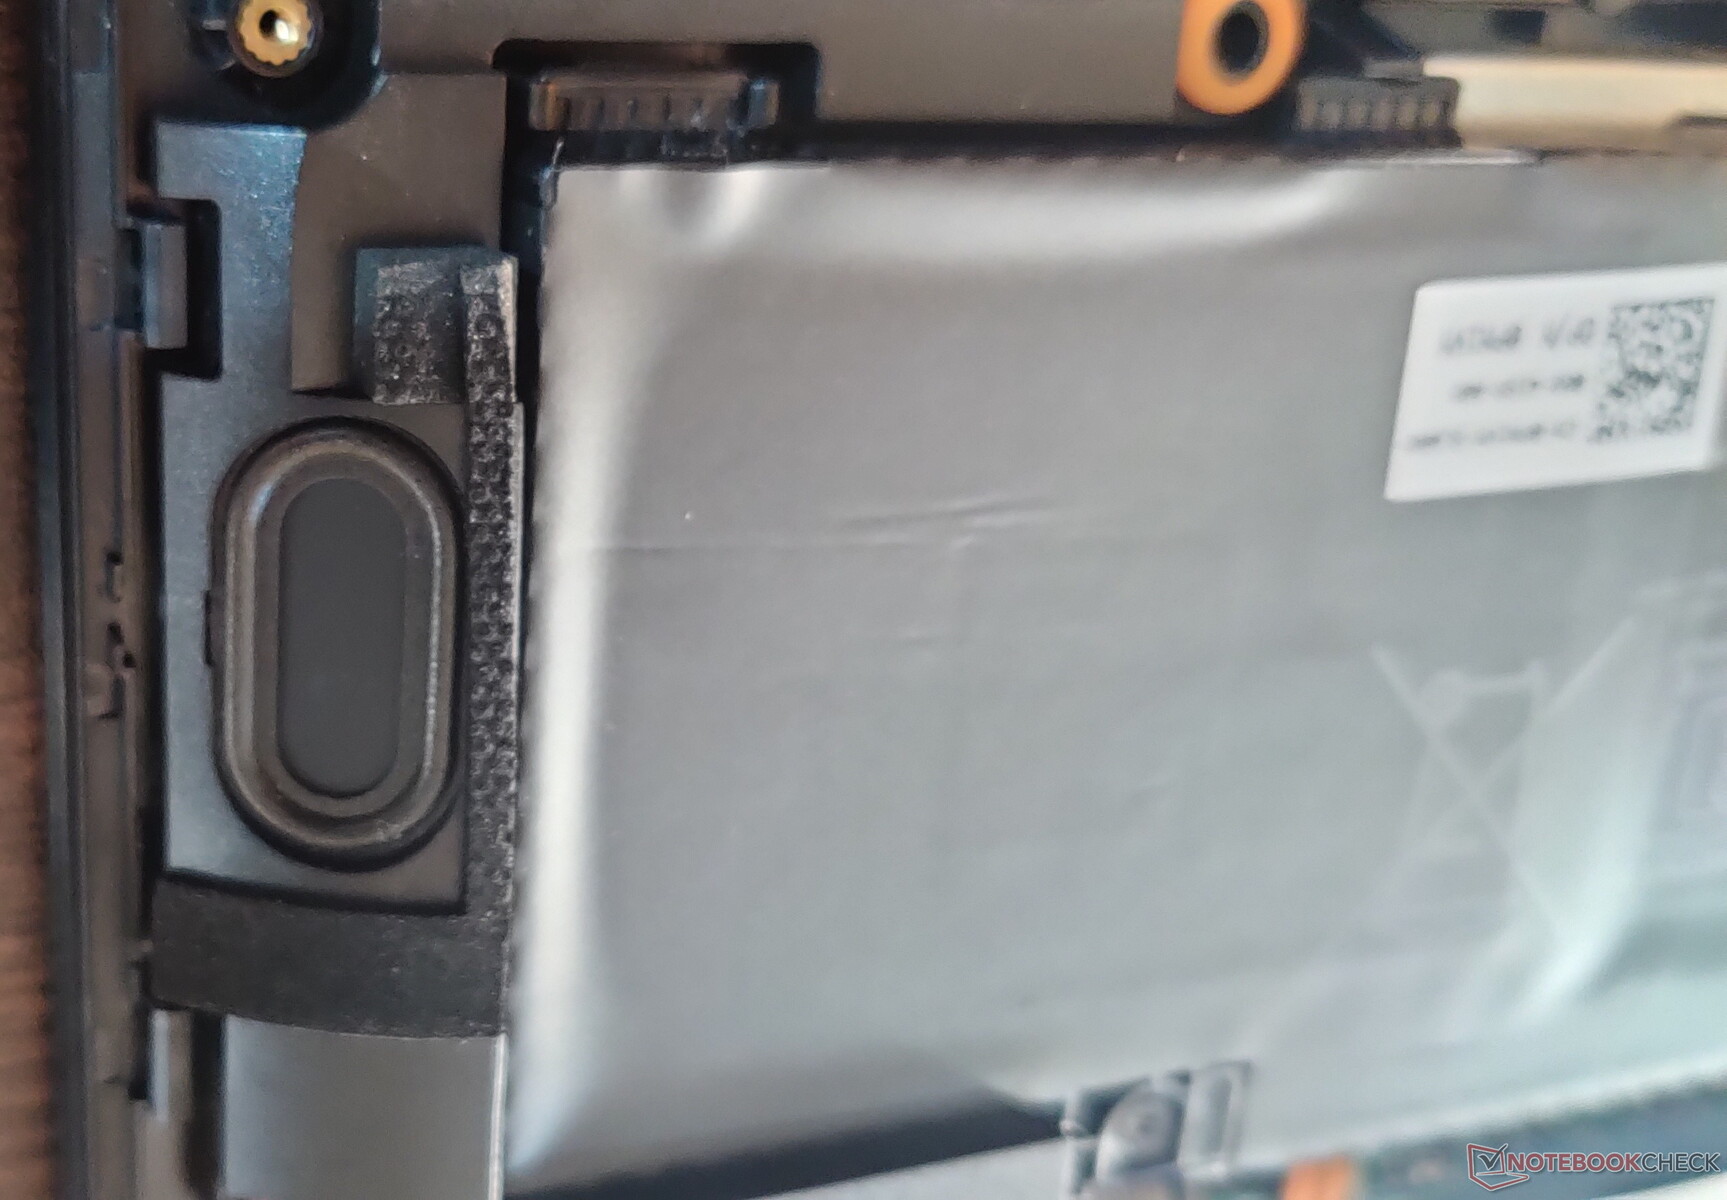
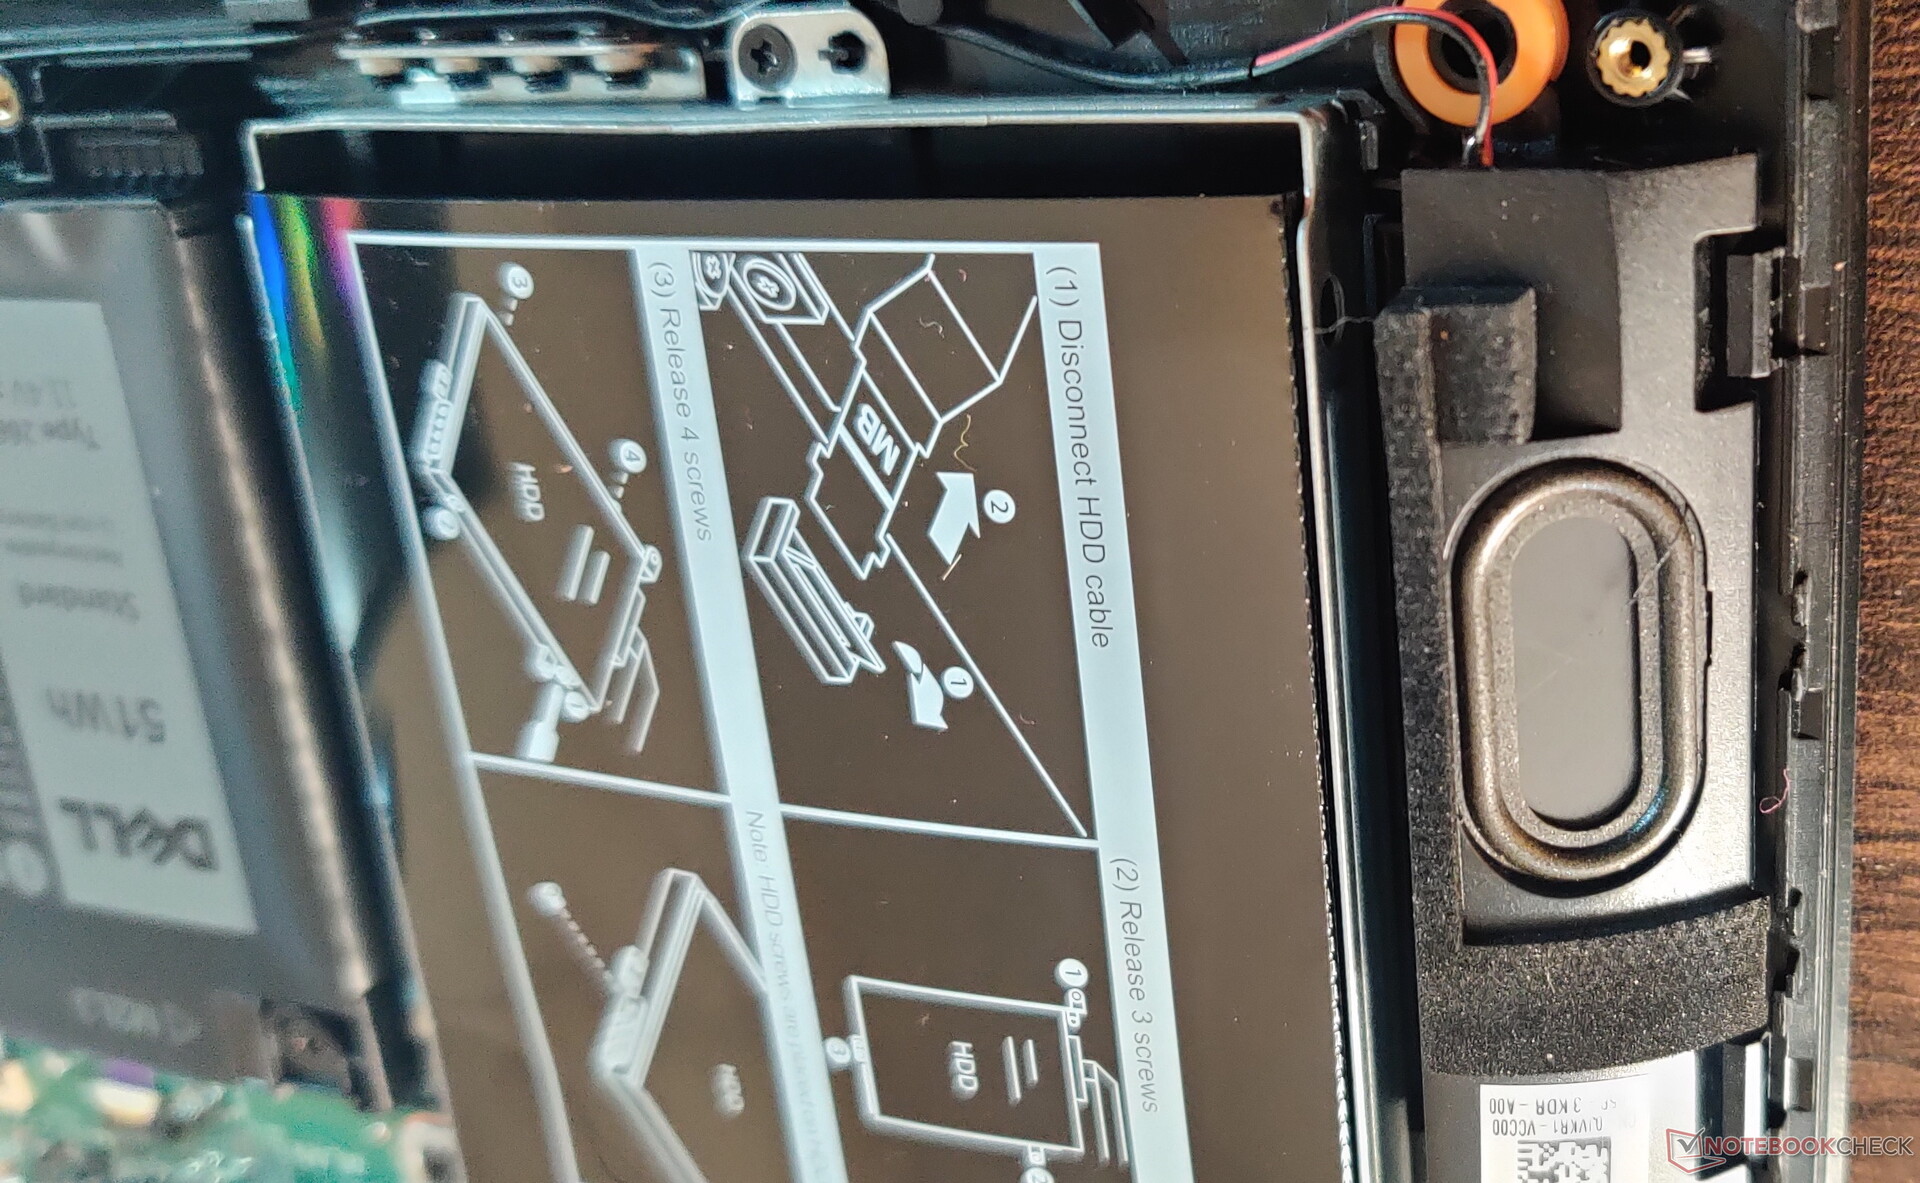
There is no maintenance hatch provided for the Dell G5 15 5500. However, the bottom cover is easy to remove by unscrewing 10 screws with a Philips screwdriver and prying the clips with a pry tool. Once inside, users have access to the RAM, SSD, WLAN card, HDD, and the battery.
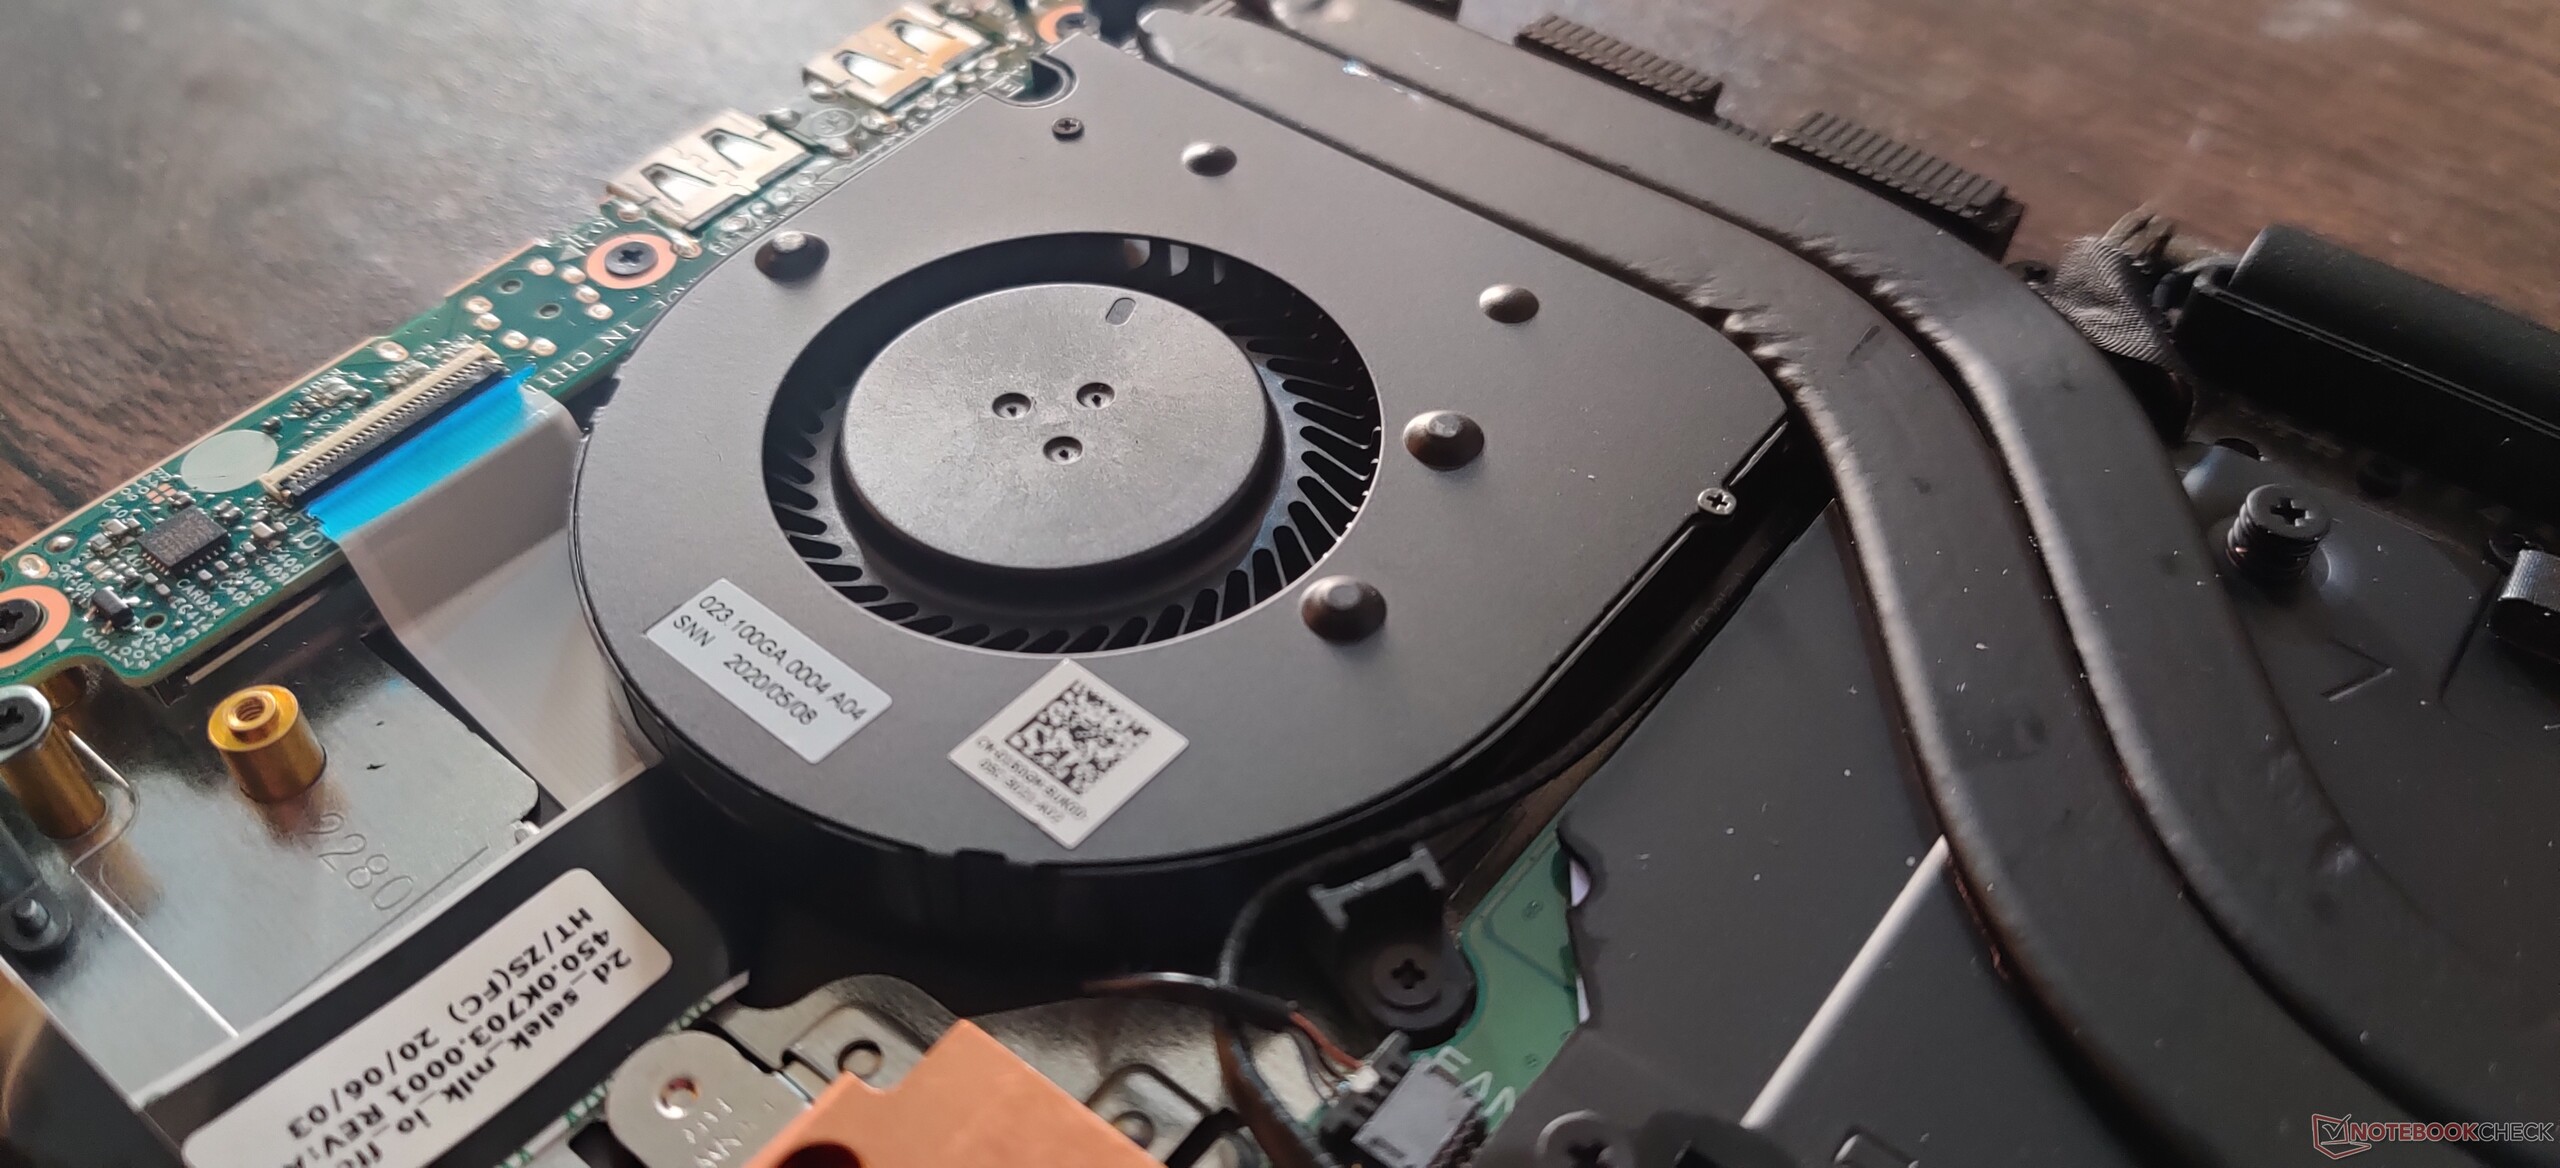
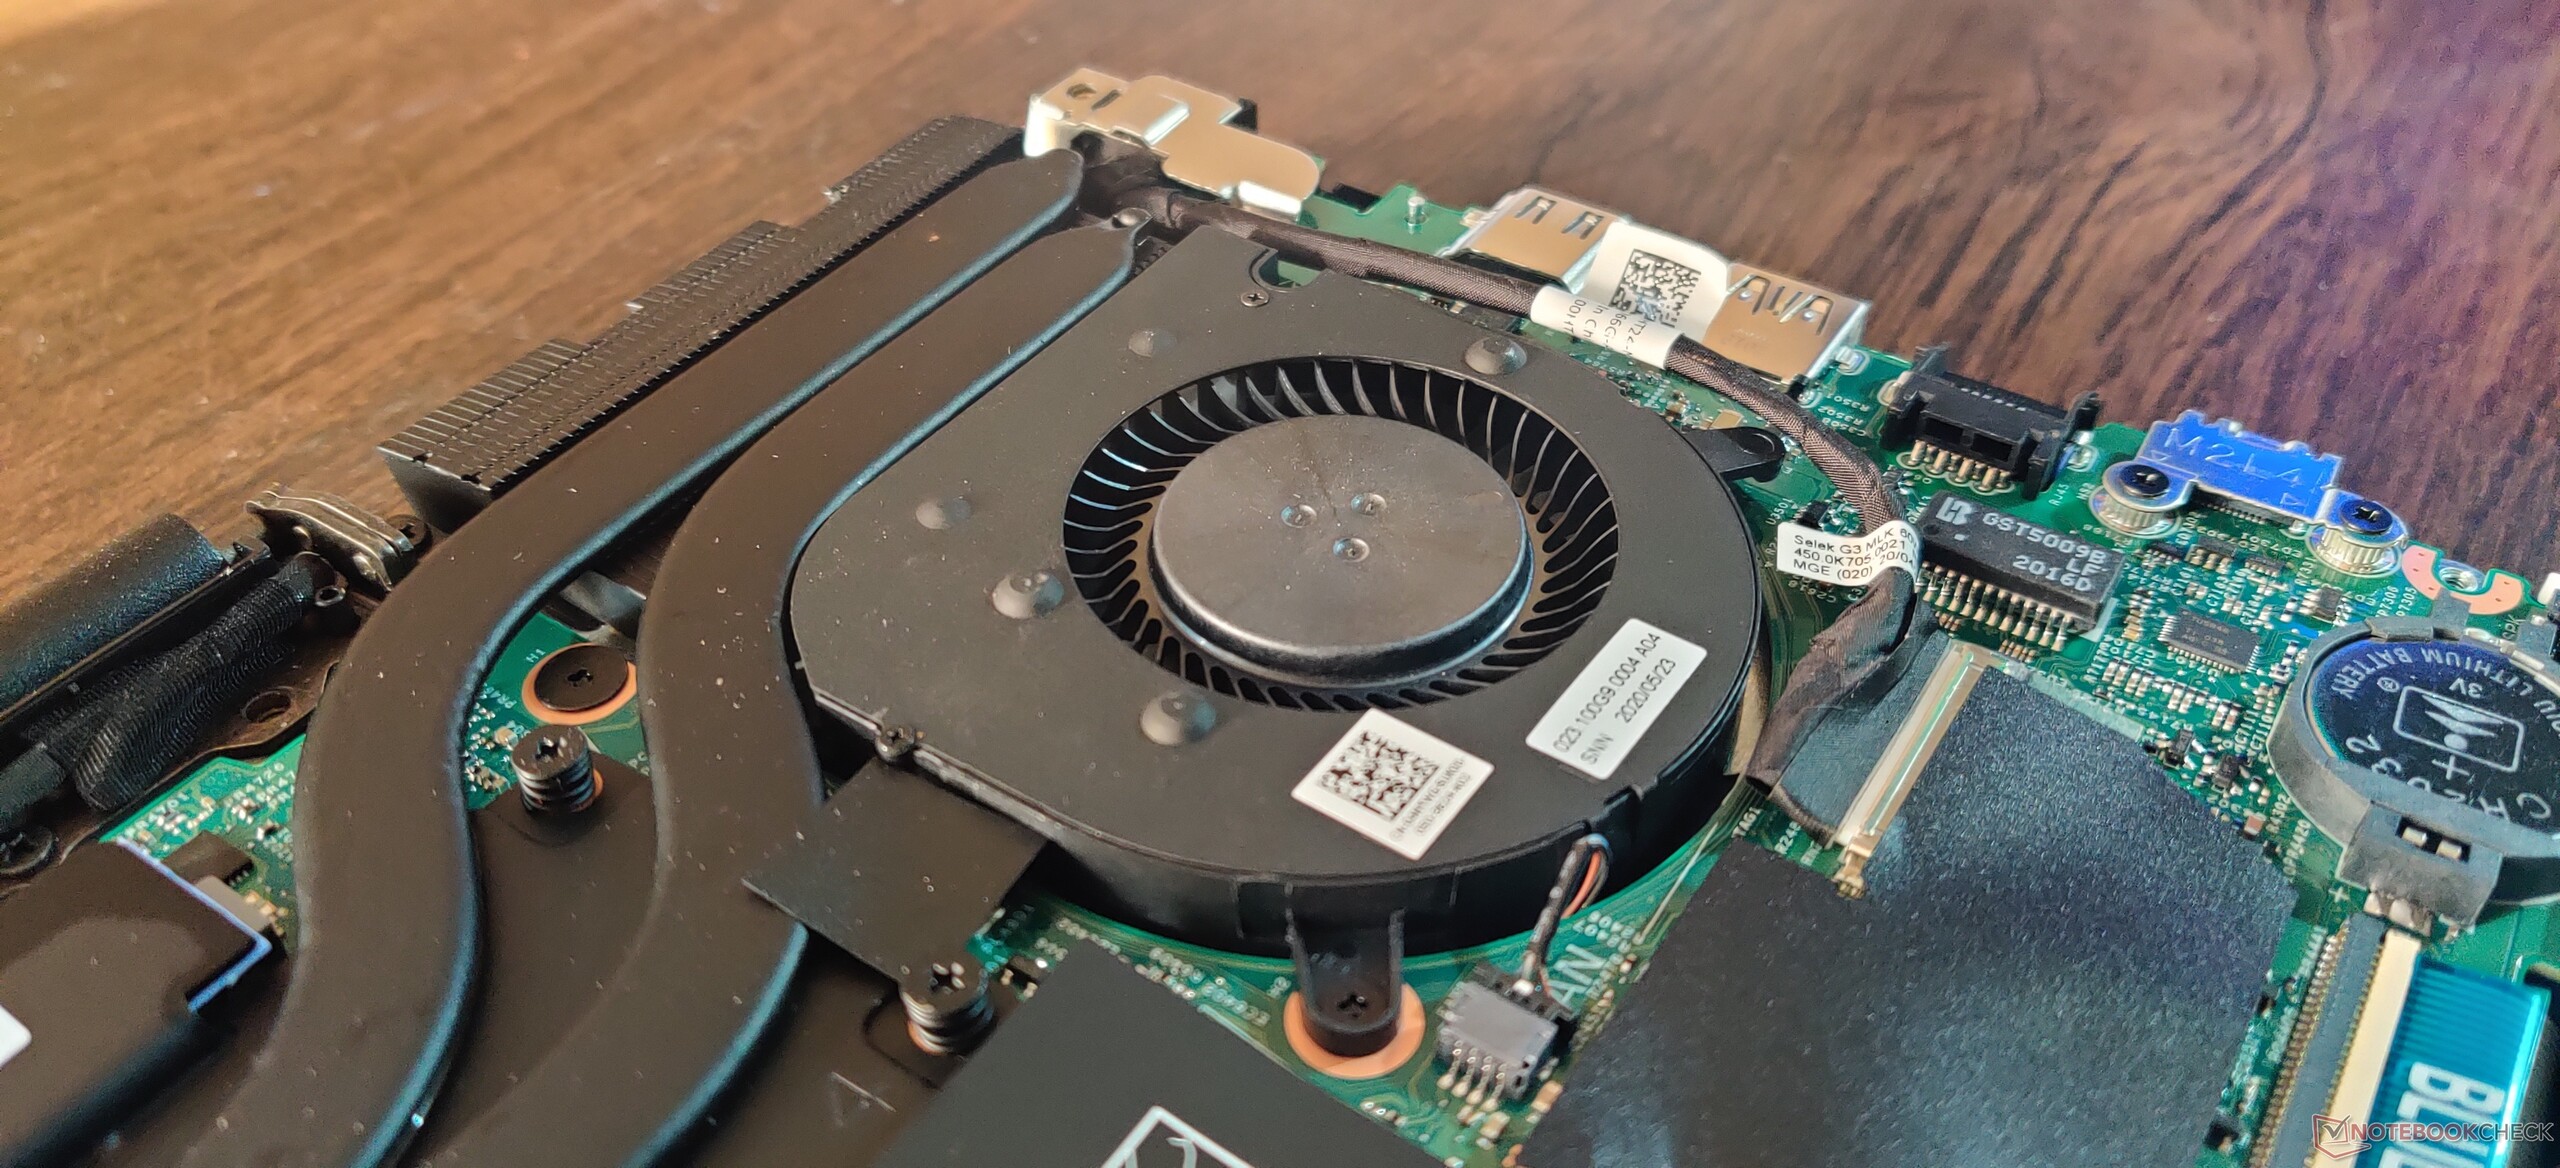
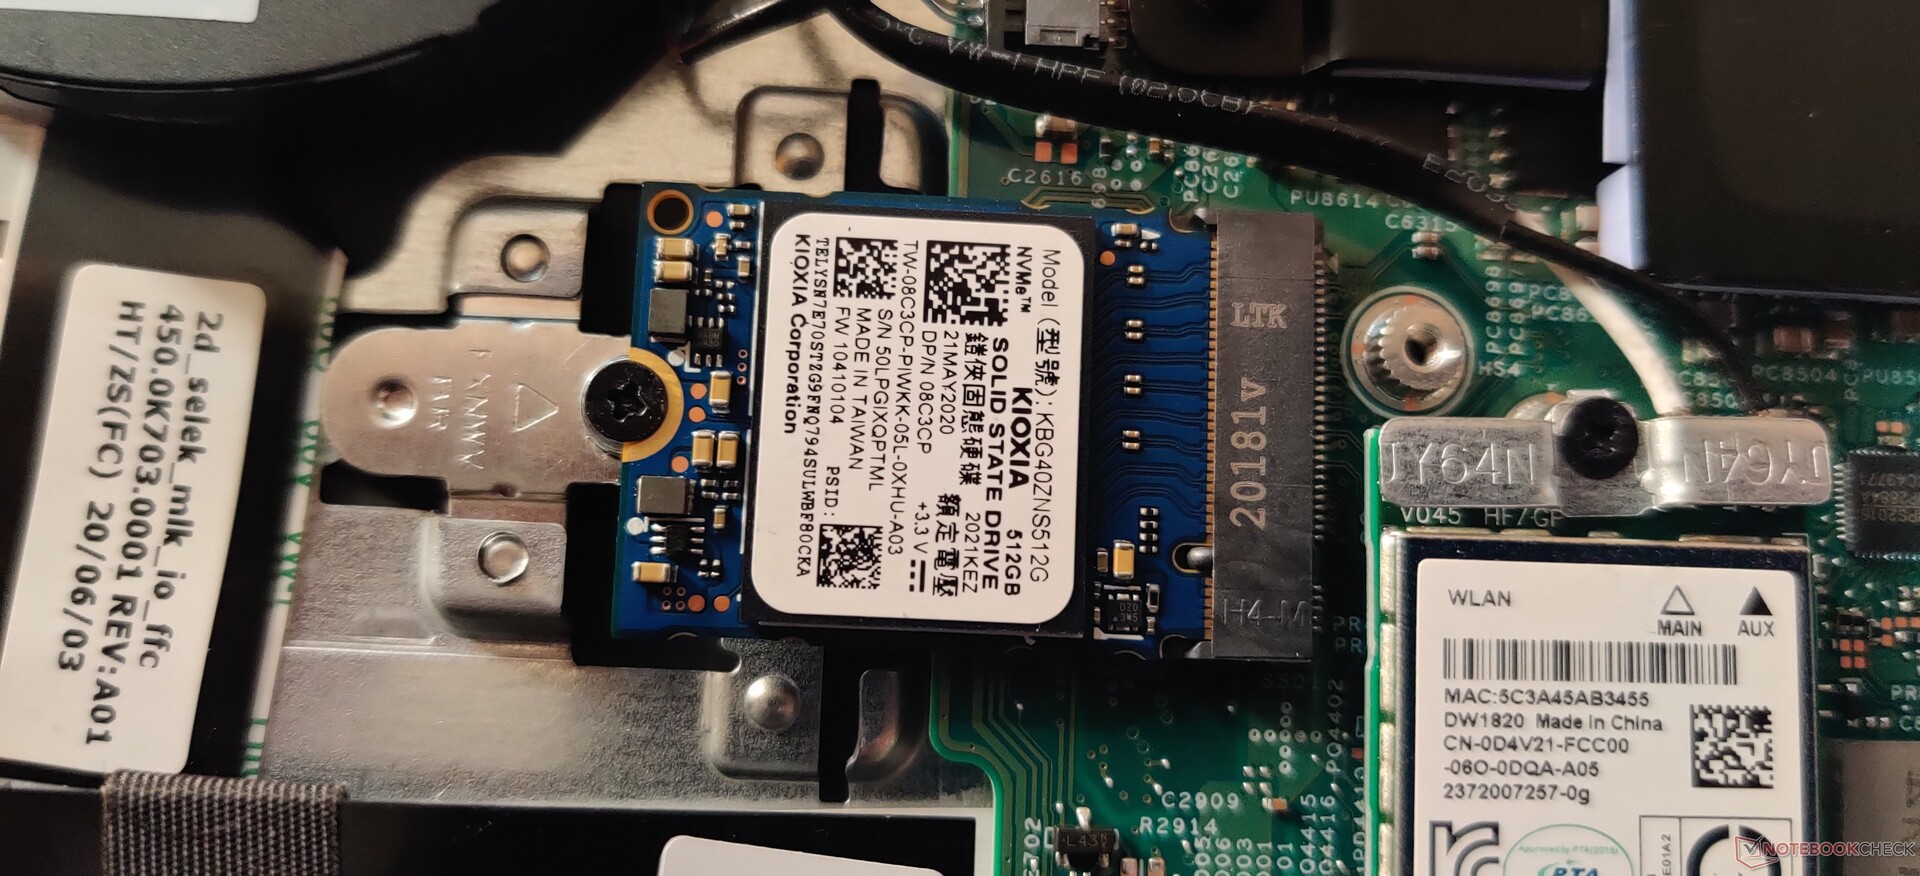
Dell has endowed the G5 15 5500 with a dual-heatpipe solution to cool the CPU and GPU. The NVMe SSD used is an M.2 2230 variant and comes with its own heat spreader with a thermal pad underneath.

Accessories and Warranty
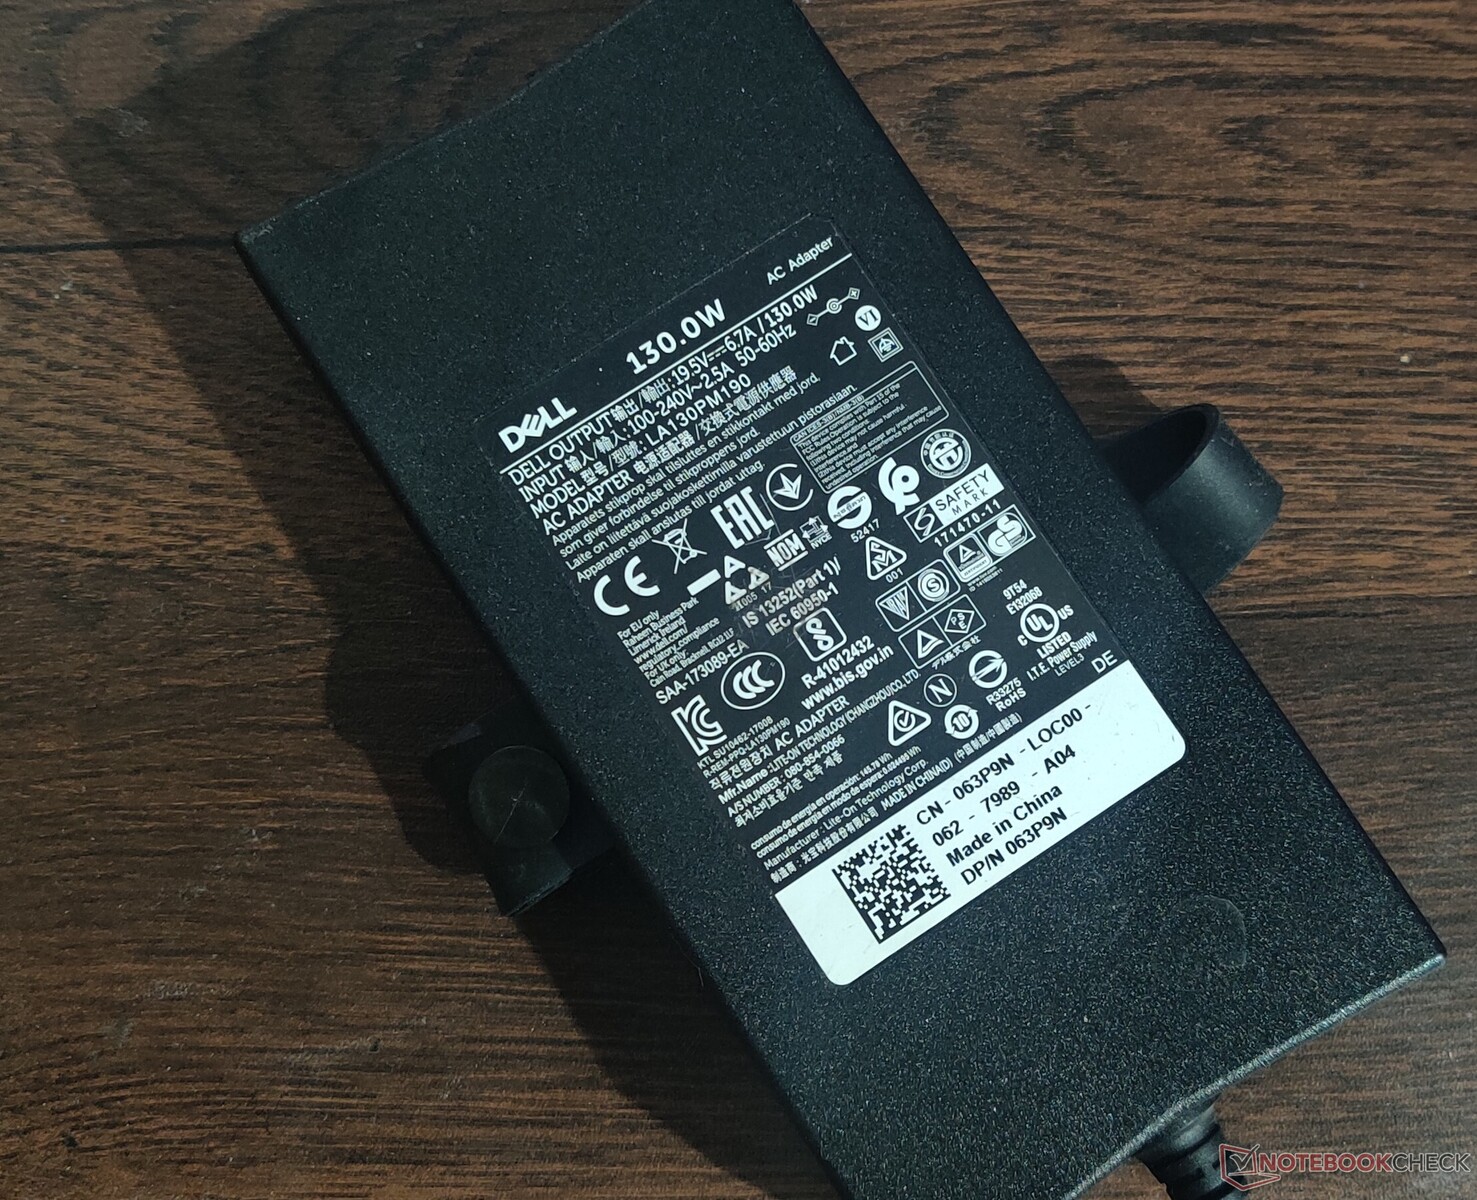
There are no additional accessories in the box aside from the AC adapter and usual paperwork. A one-year limited hardware warranty comes standard with scope for extending the same directly from Dell.
Input Devices
Keyboard
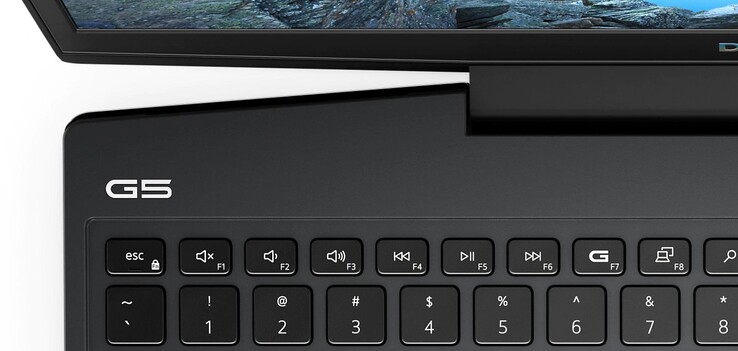
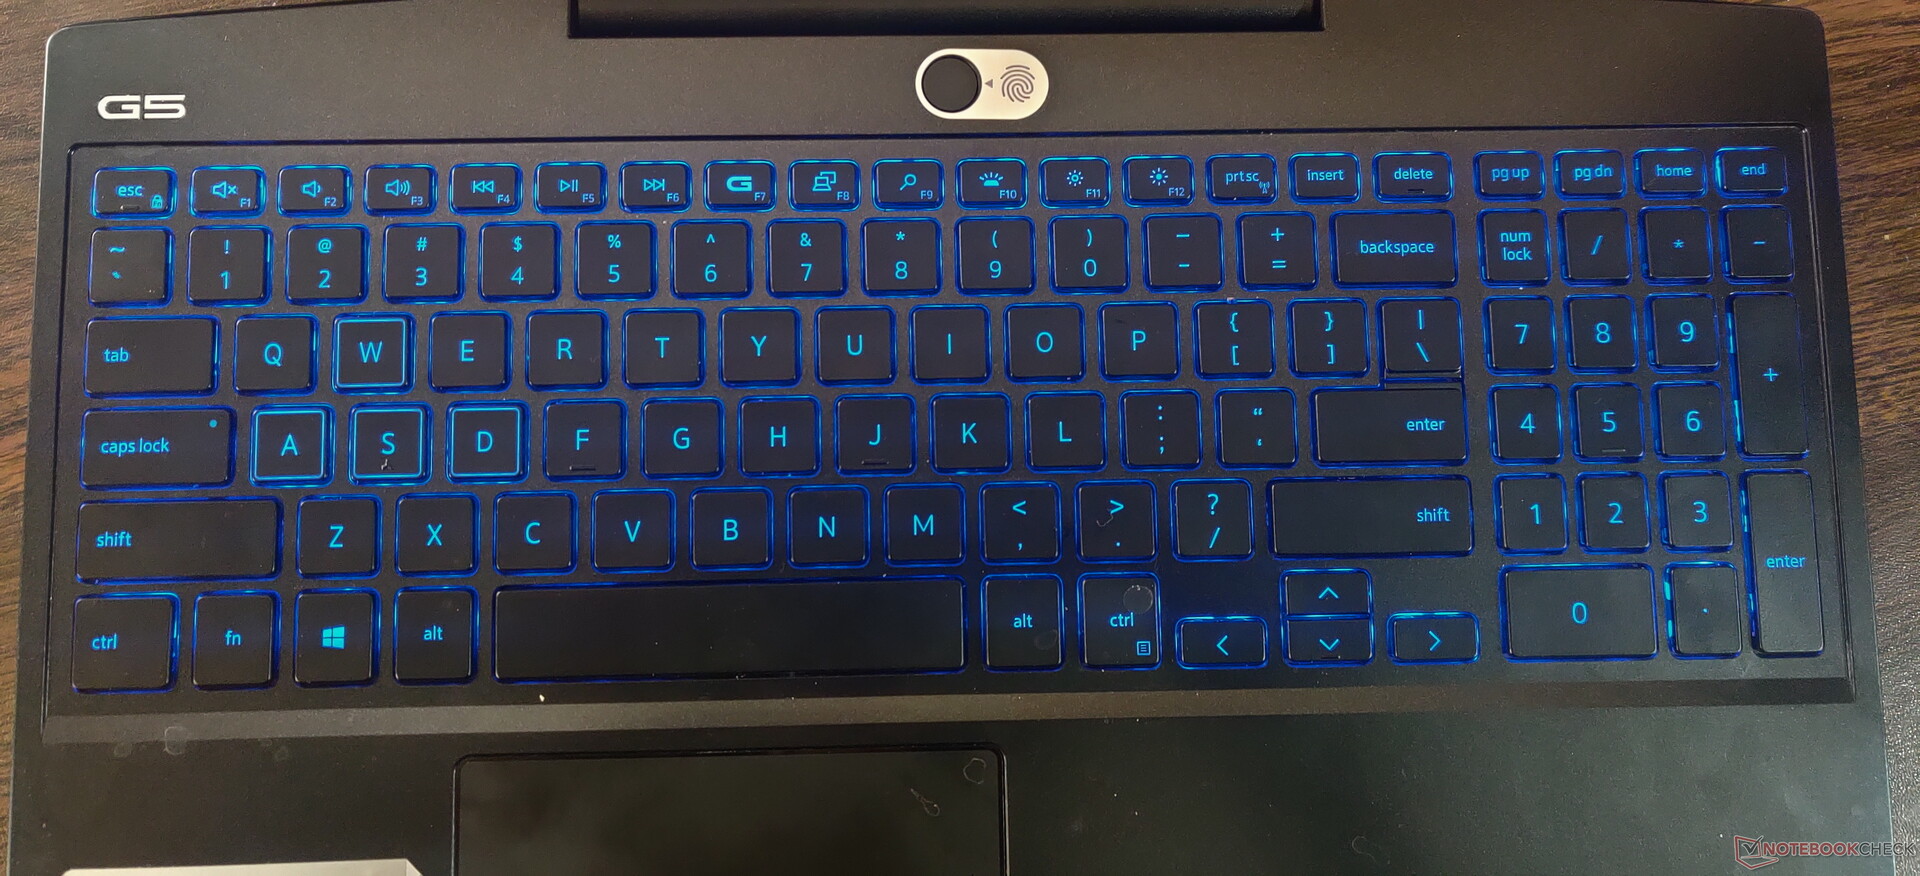
The G5 15 5500 offers a full-size chiclet keyboard with decent key travel and noticeable feedback enabling fairly prolonged typing without much discomfort. Unlike some of the higher configurations that come with RGB backlighting, our unit offers only a two-level blue backlight. All shortcuts are placed on the function keys.
A dedicated "G" Game Shift hotkey on the F7 function key enables instant toggling of the Alienware Command Center High Performance mode. The arrow keys are tiny, especially the up and down ones, making them a tad cumbersome for playing racing games and such.
Touchpad
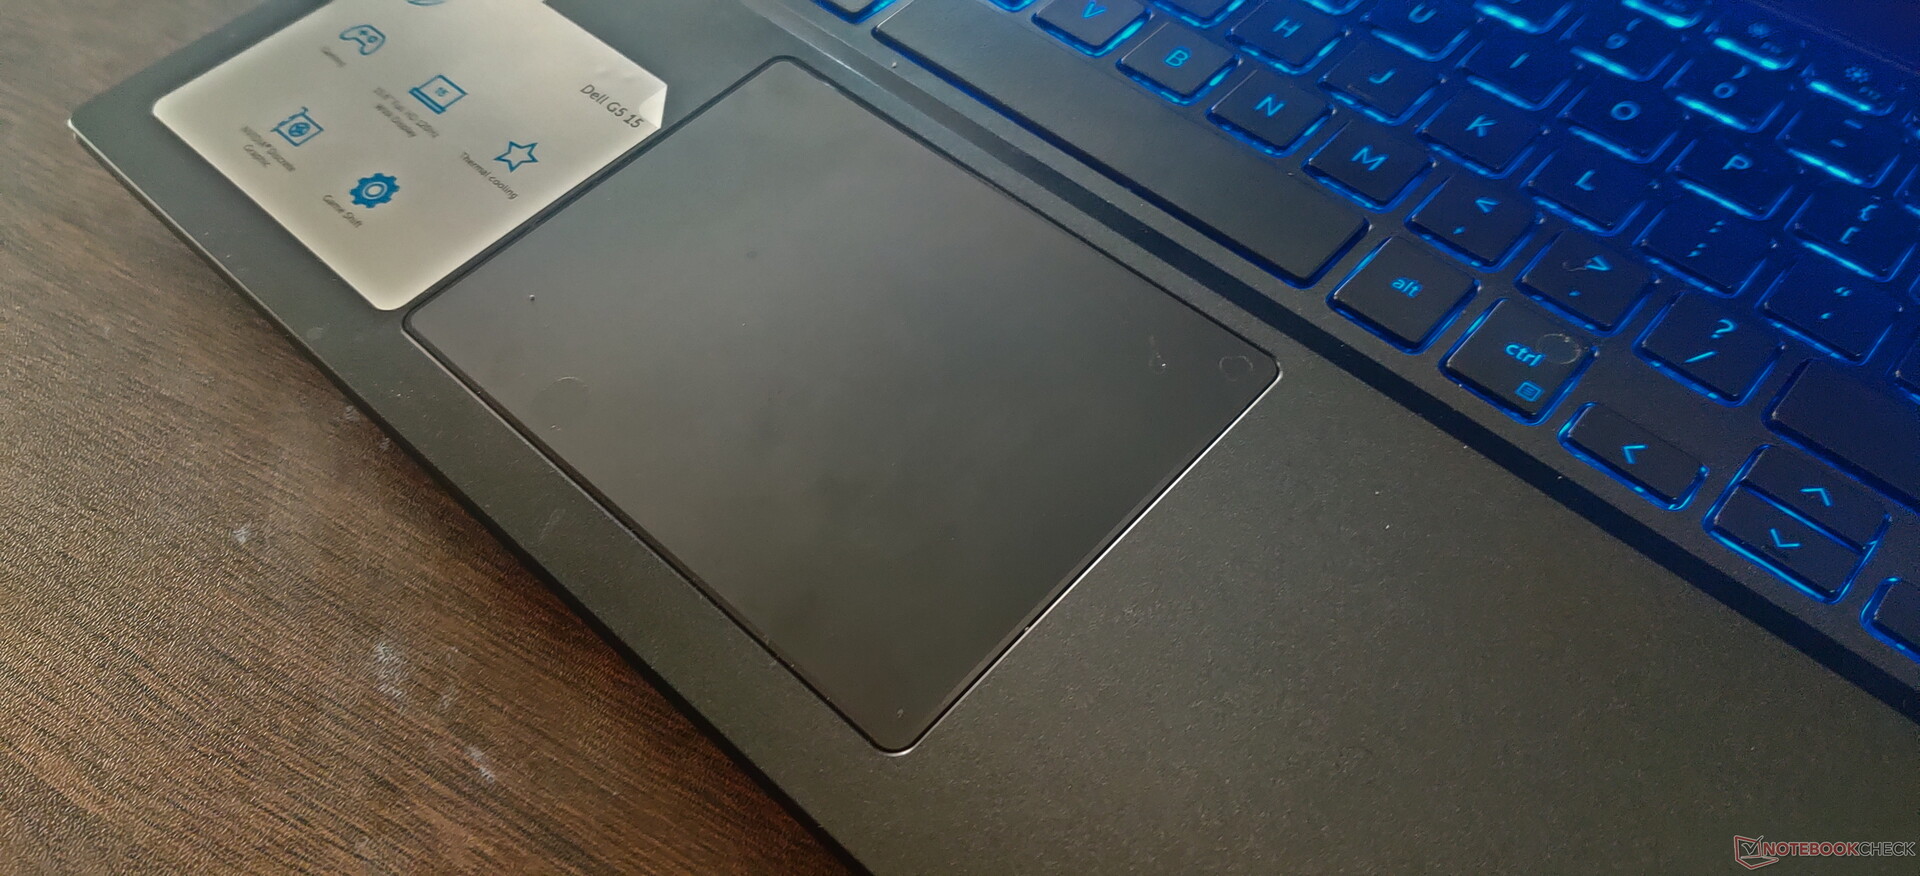
At 10.5 x 8 cm, the touchpad is standard fare and offers enough space for gliding. The left and right clicks didn't seem noisy but can give a somewhat shallow feel. Thanks to Windows Precision drivers and in part aided by the 120 Hz display, multi-touch gestures and scrolling are smooth and responsive. The touchpad works well for most productivity workflows but gamers would want to invest in a quality gaming mouse.
Display
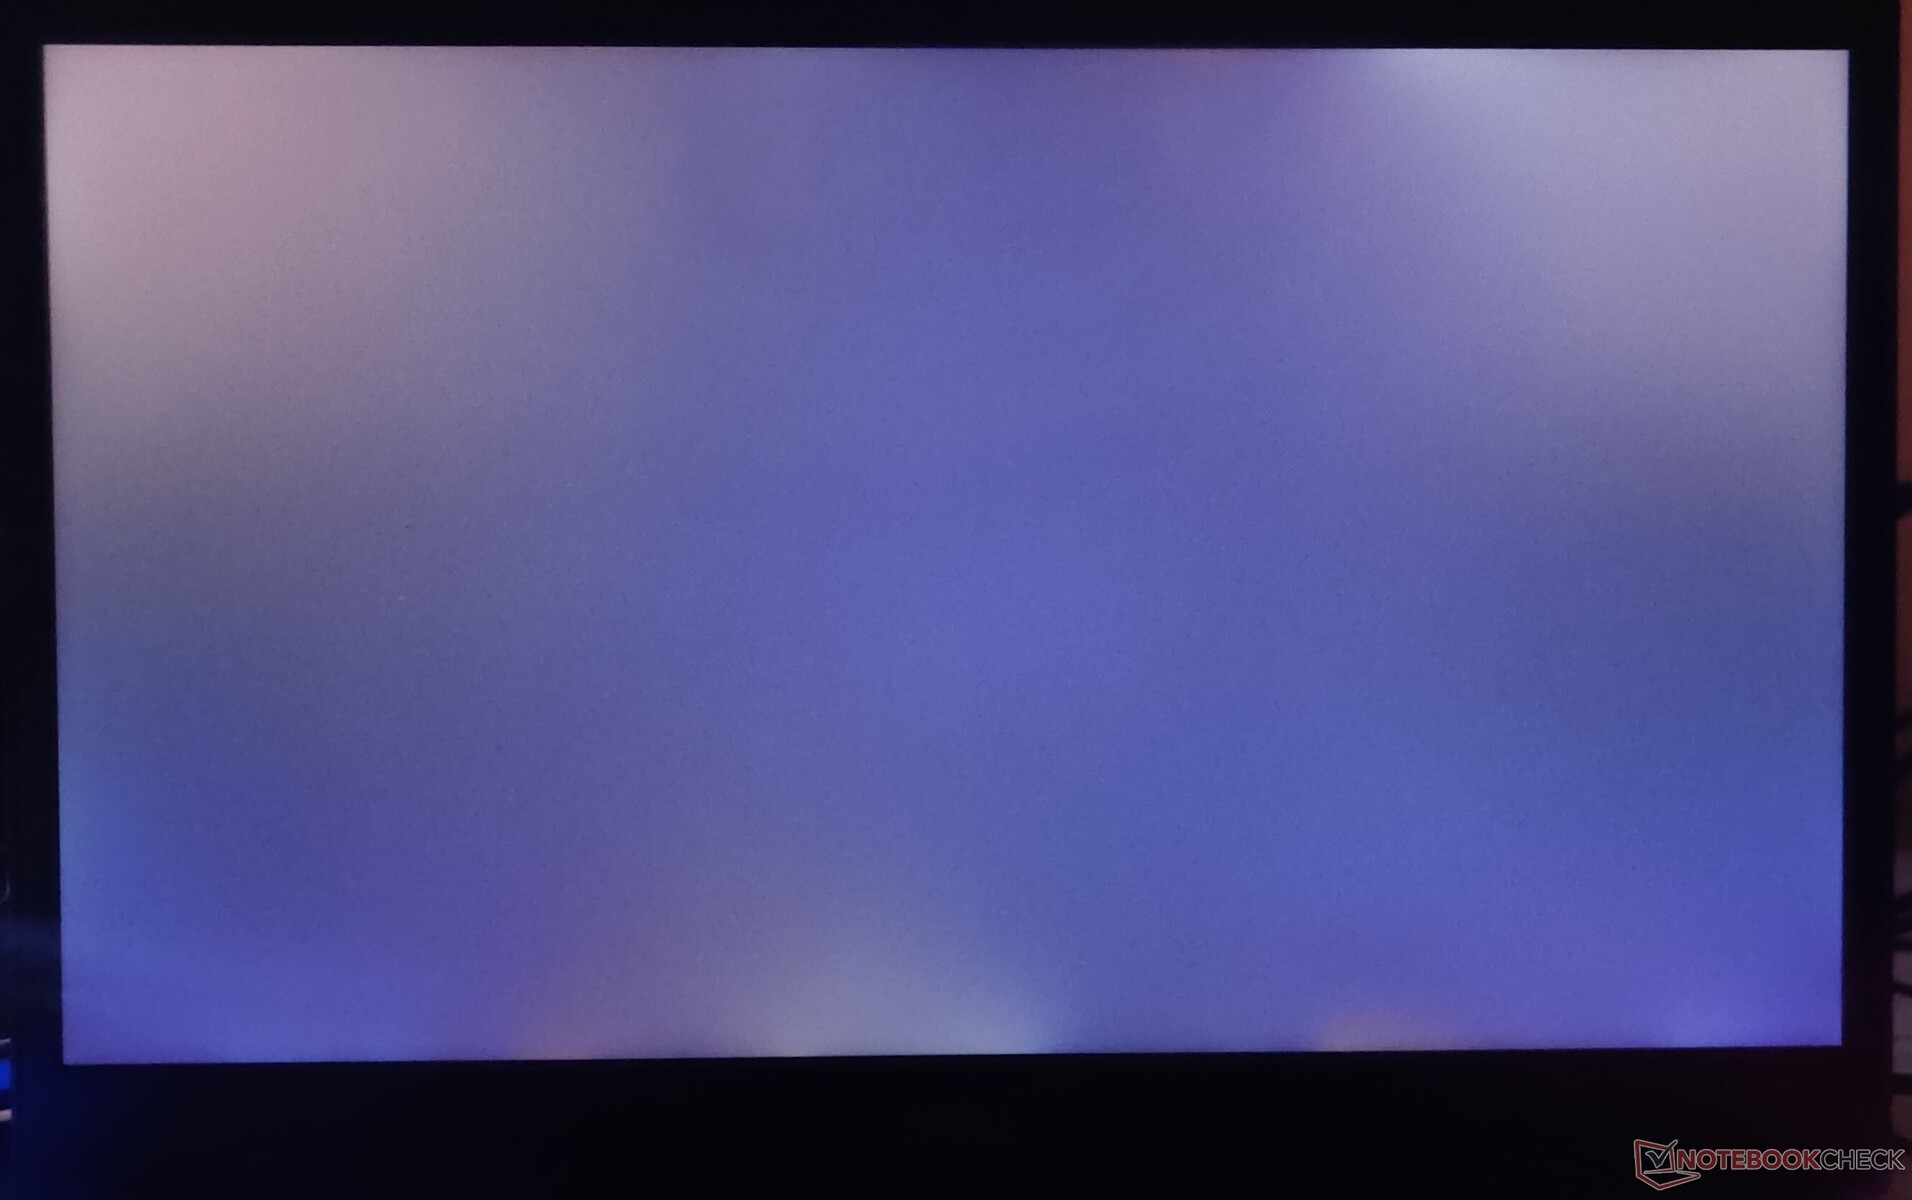
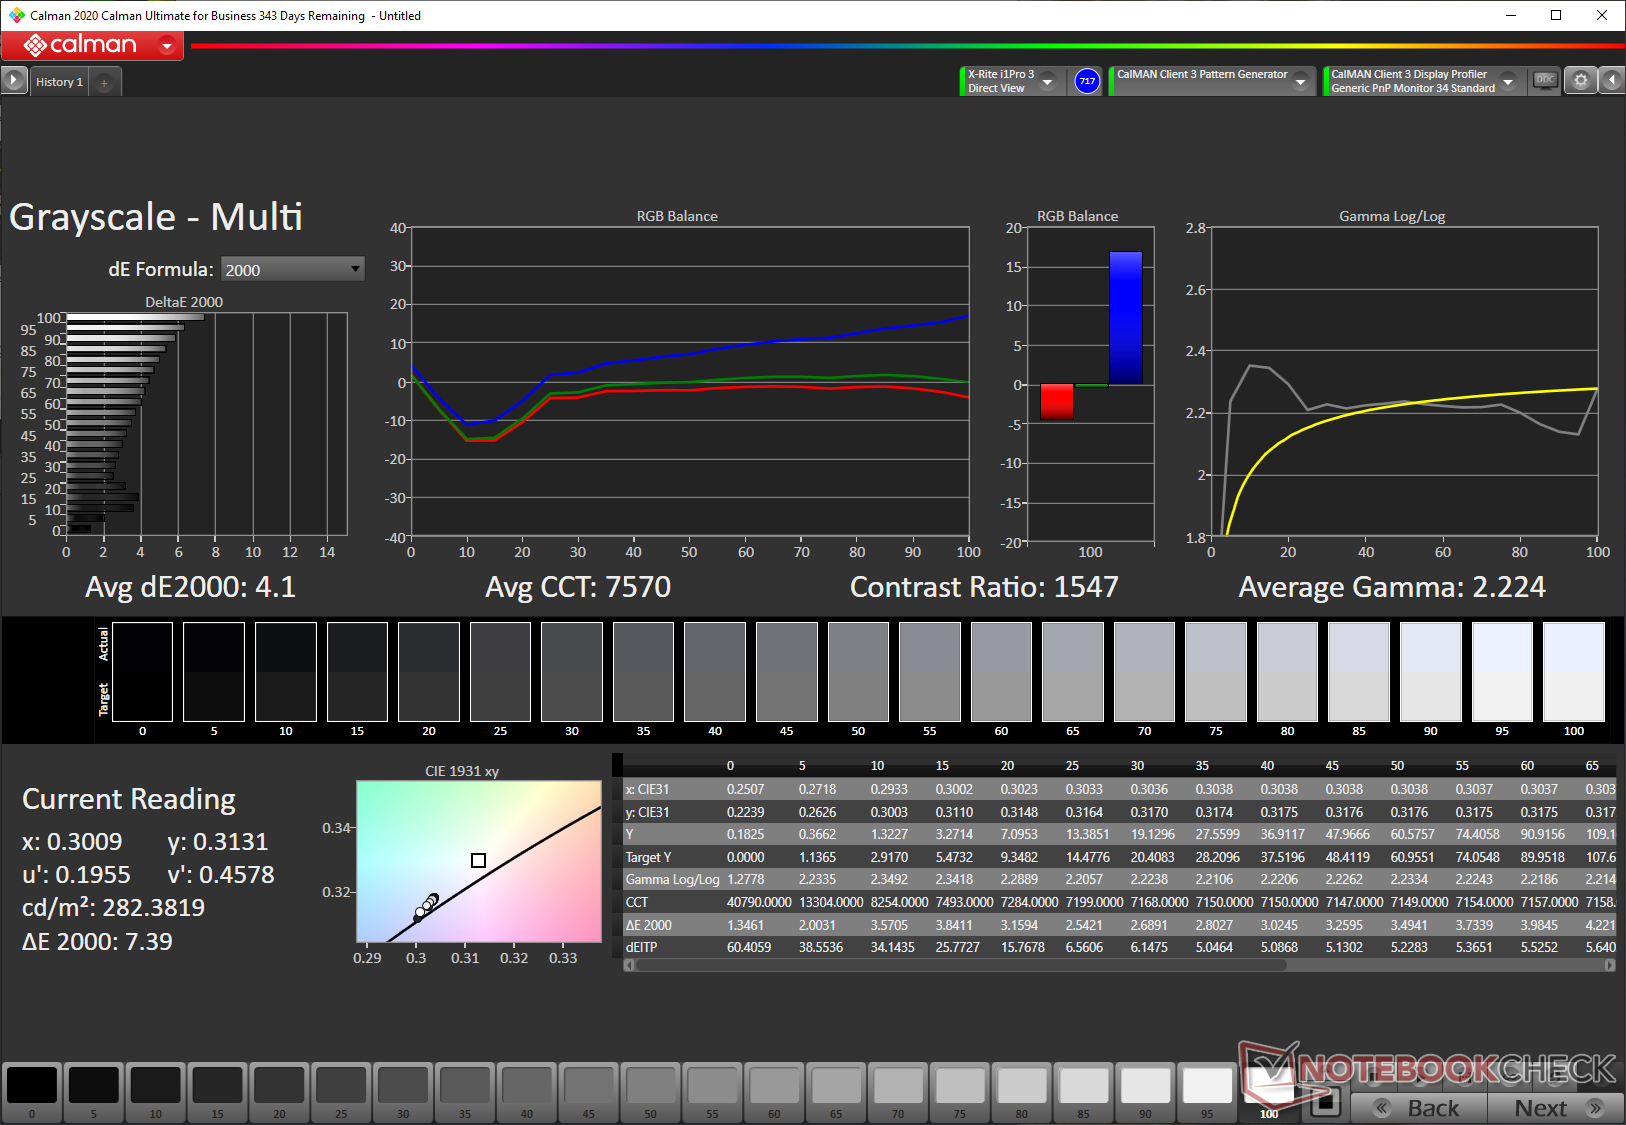
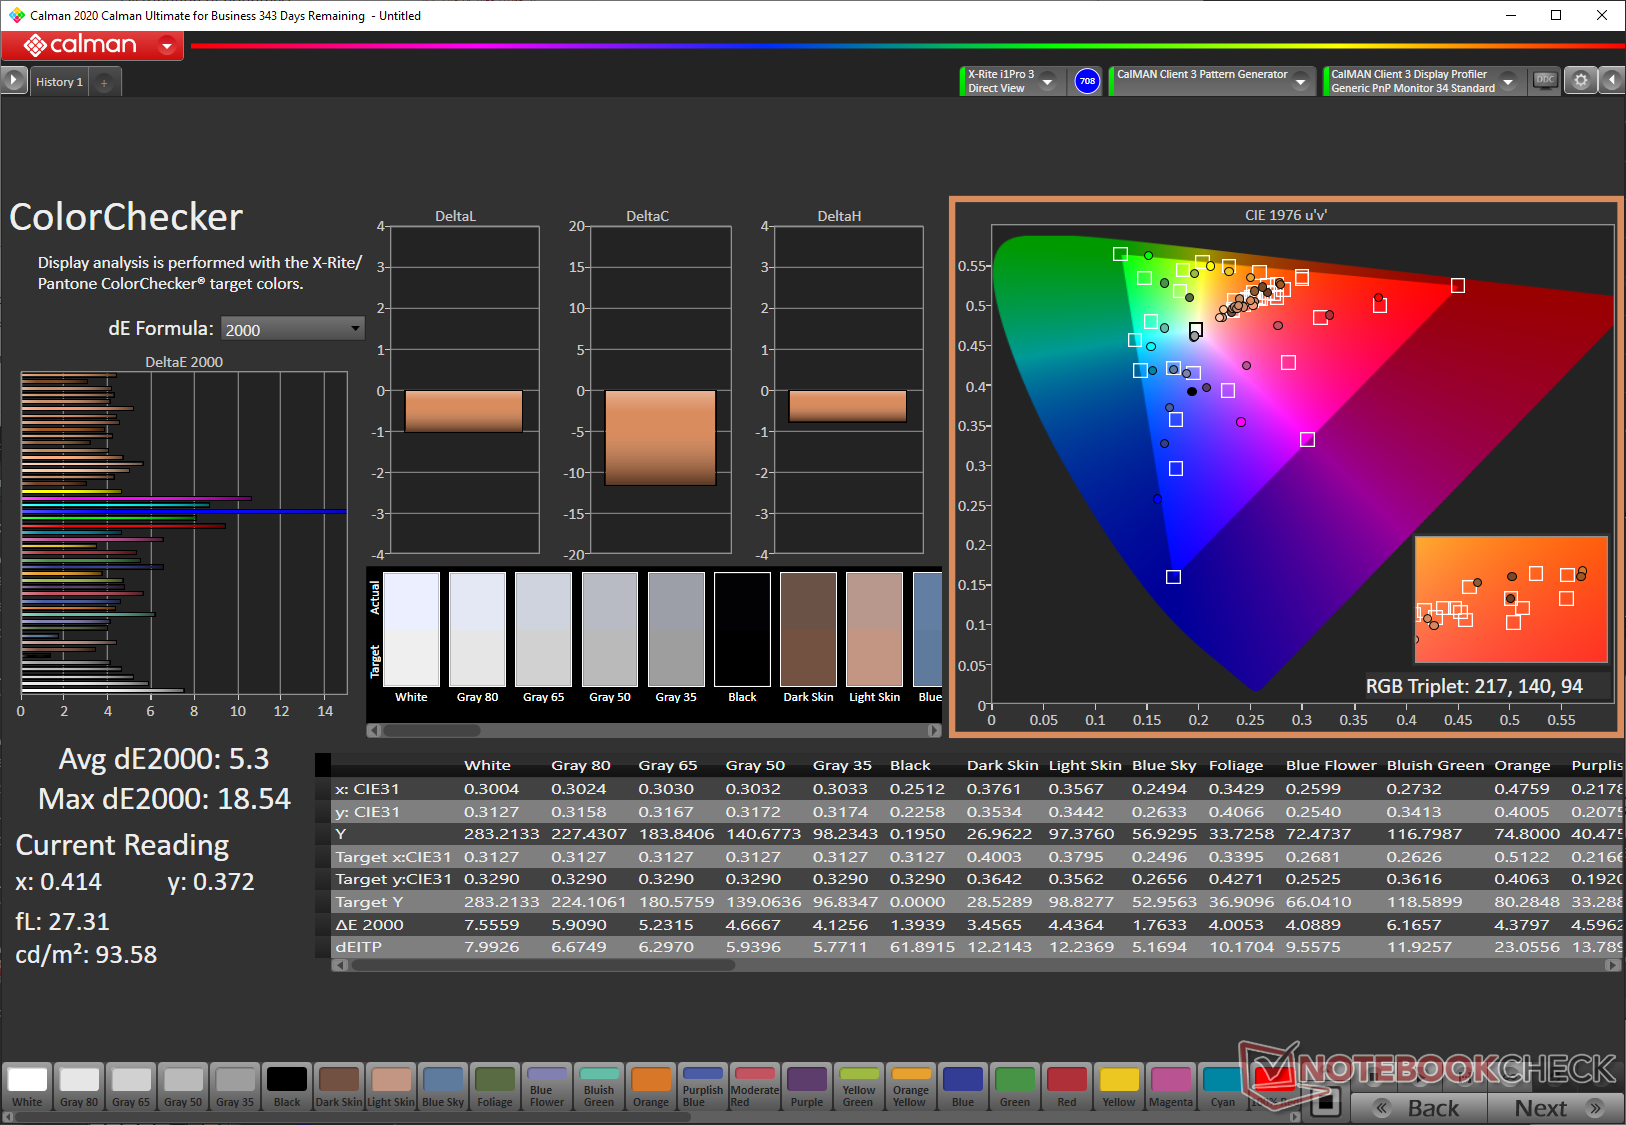
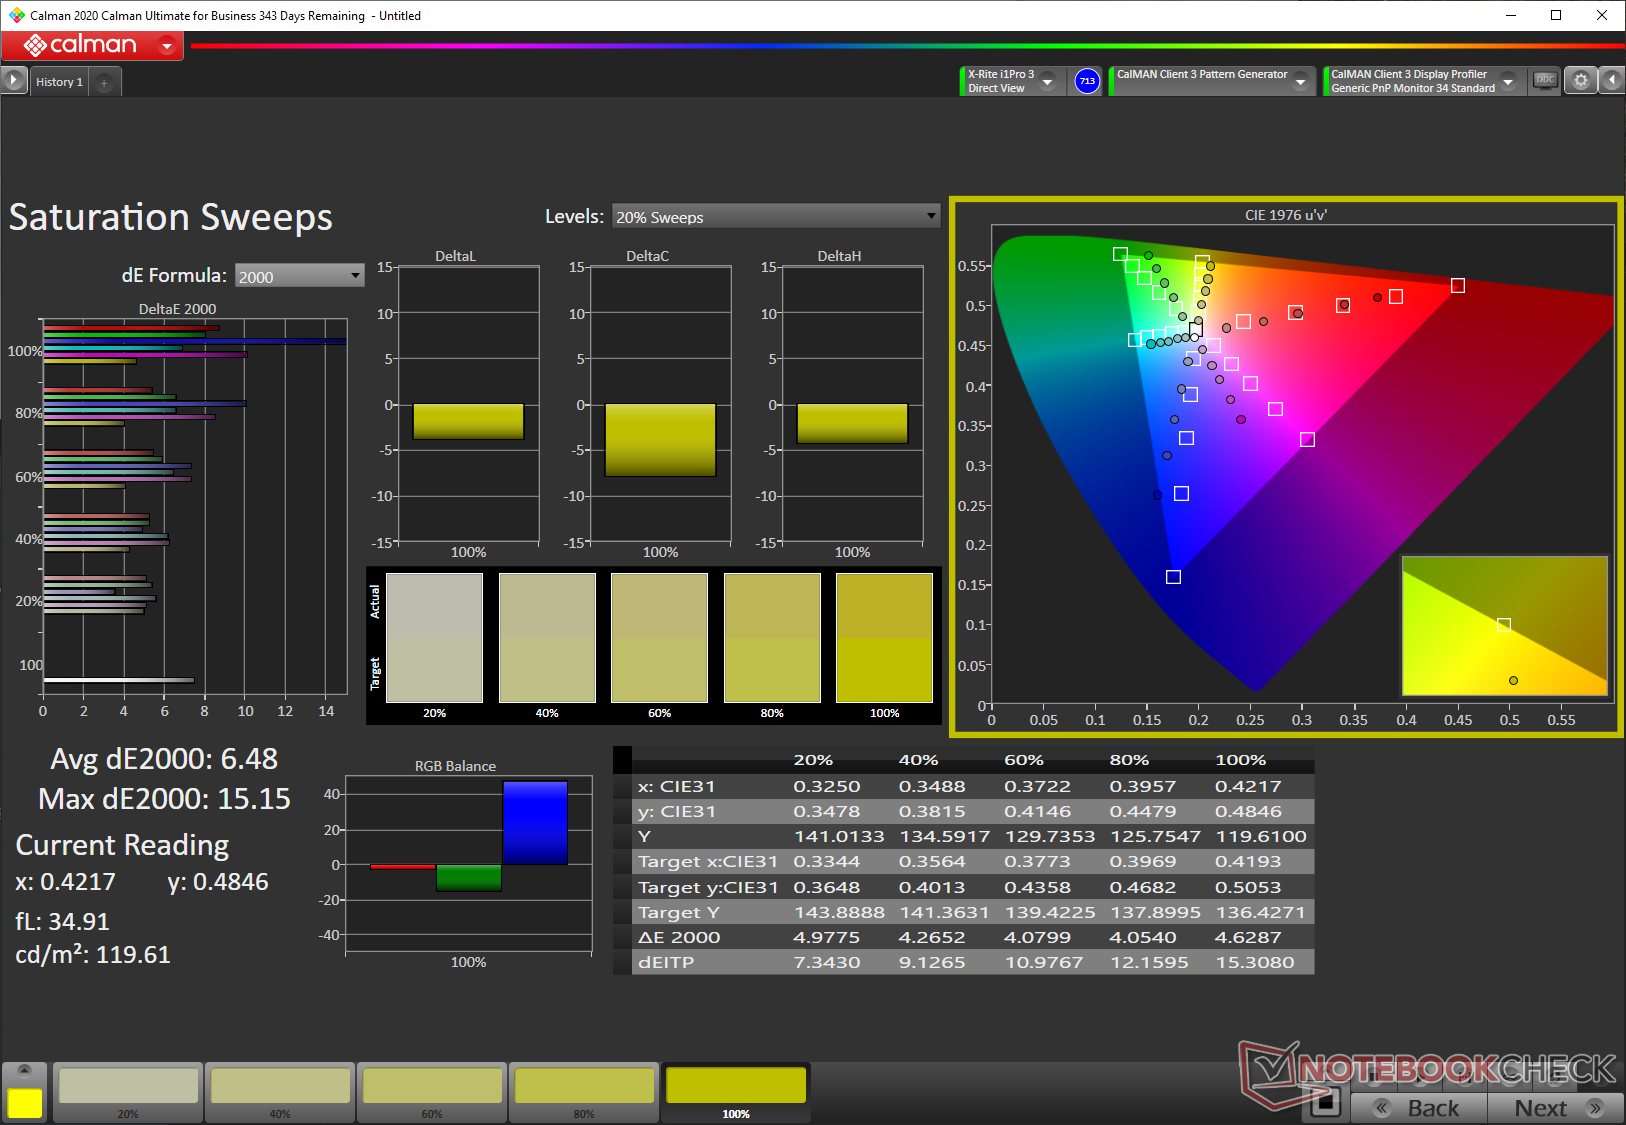
The display is probably the weakest aspect of our unit. Considering the asking price, we feel Dell could have endowed this particular G5 15 5500 SKU with a better panel. It does have a 120 Hz refresh rate but performs poorly when it comes to color gamut coverage and color accuracy. Even our calibration could not do much to improve the results as you can see below.
There is uneven backlight bleeding seen near the top corners and along the bottom bezel.
| |||||||||||||||||||||||||
Brightness Distribution: 86 %
Center on Battery: 285.4 cd/m²
Contrast: 1502:1 (Black: 0.19 cd/m²)
ΔE ColorChecker Calman: 5.35 | ∀{0.5-29.43 Ø4.71}
calibrated: 5.3
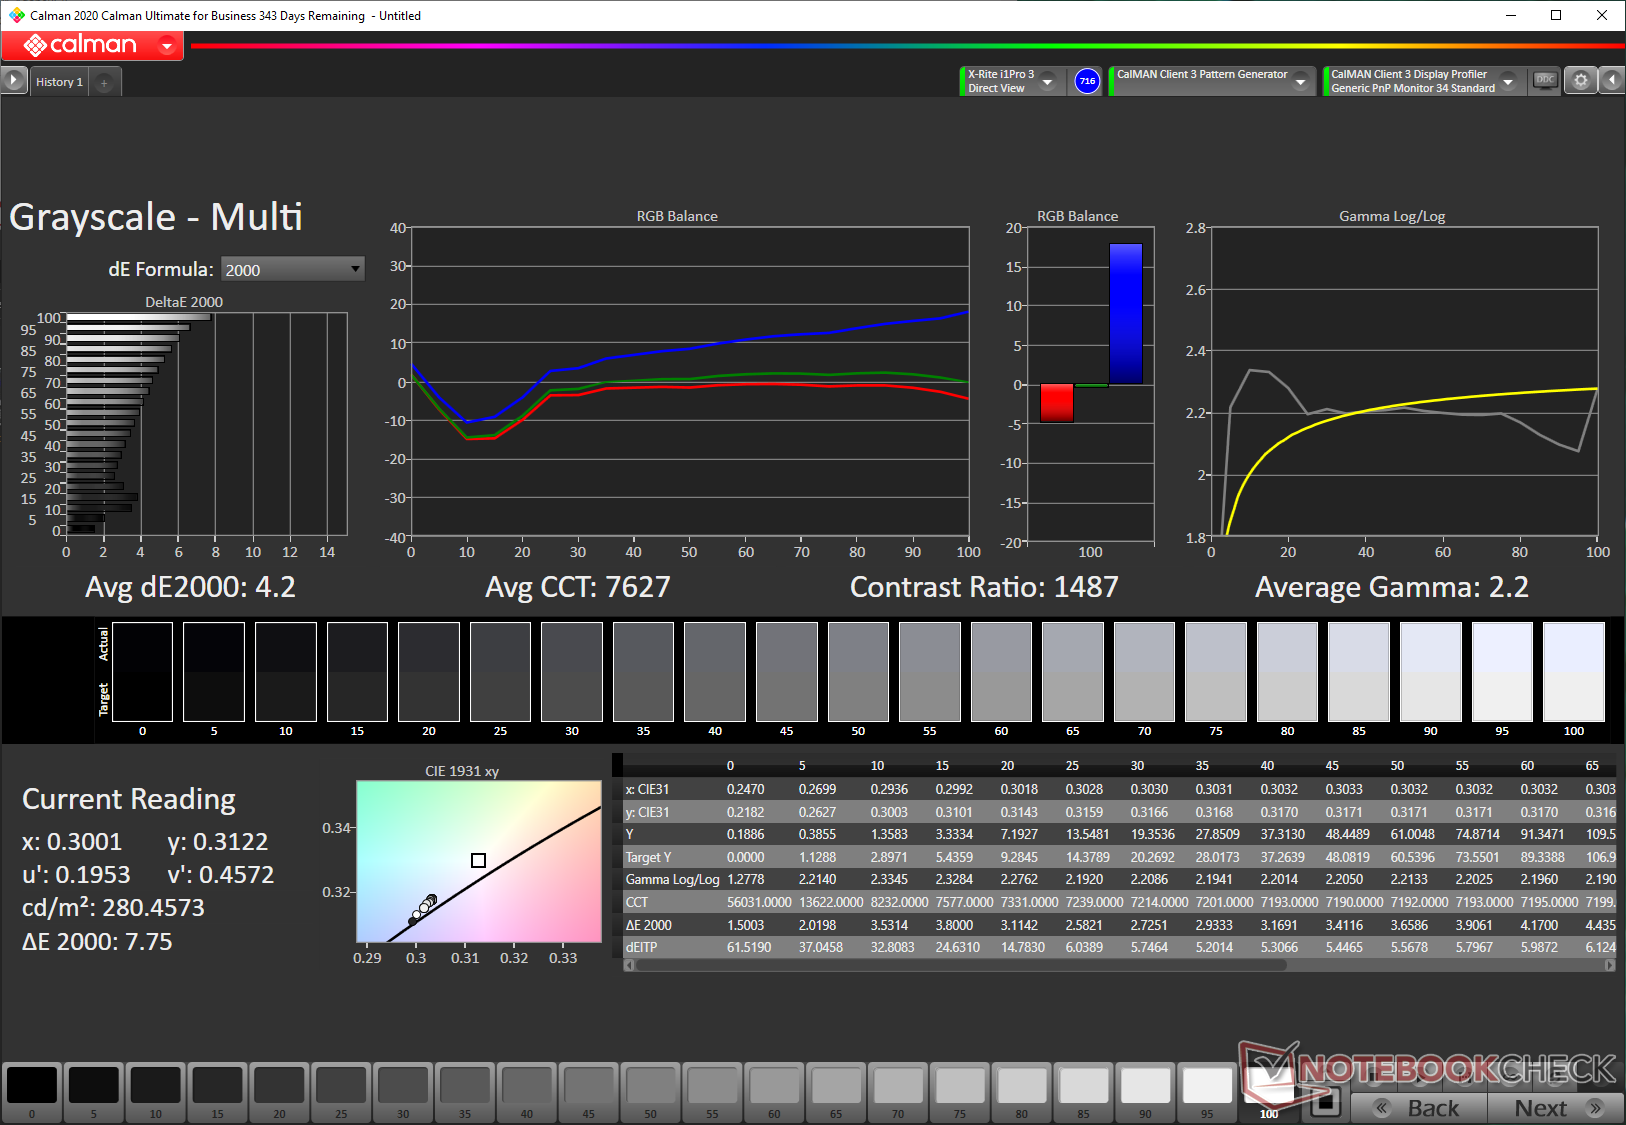
ΔE Greyscale Calman: 4.2 | ∀{0.09-98 Ø4.96}
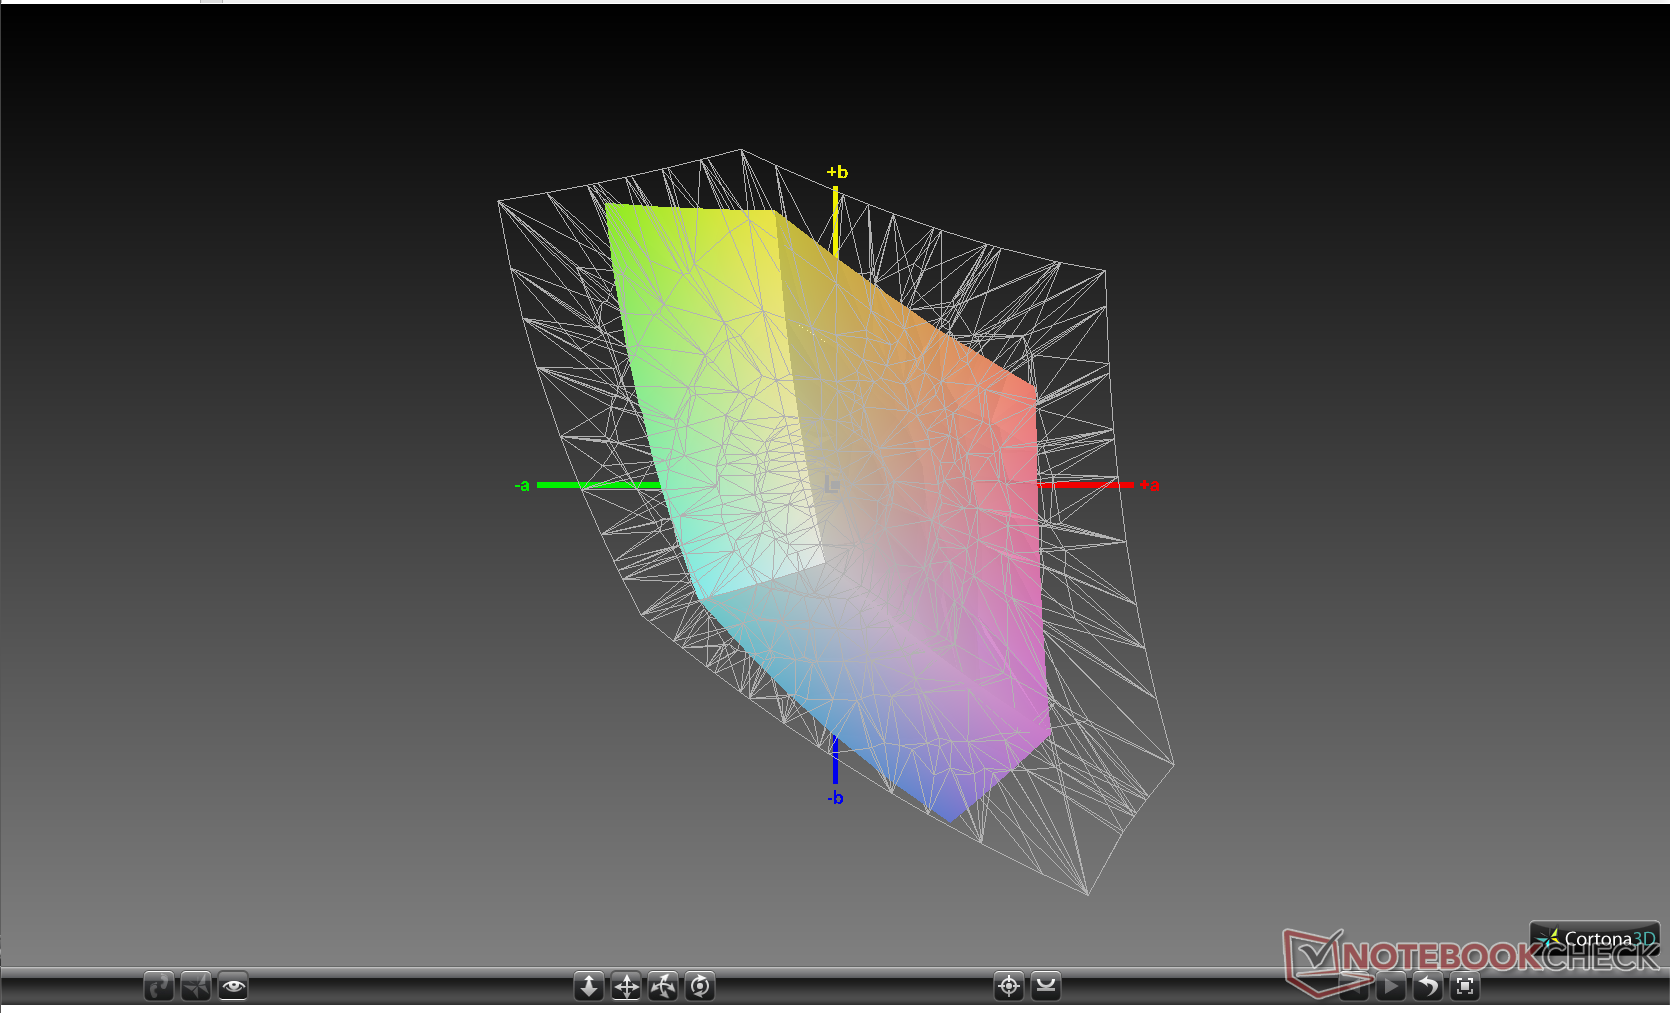
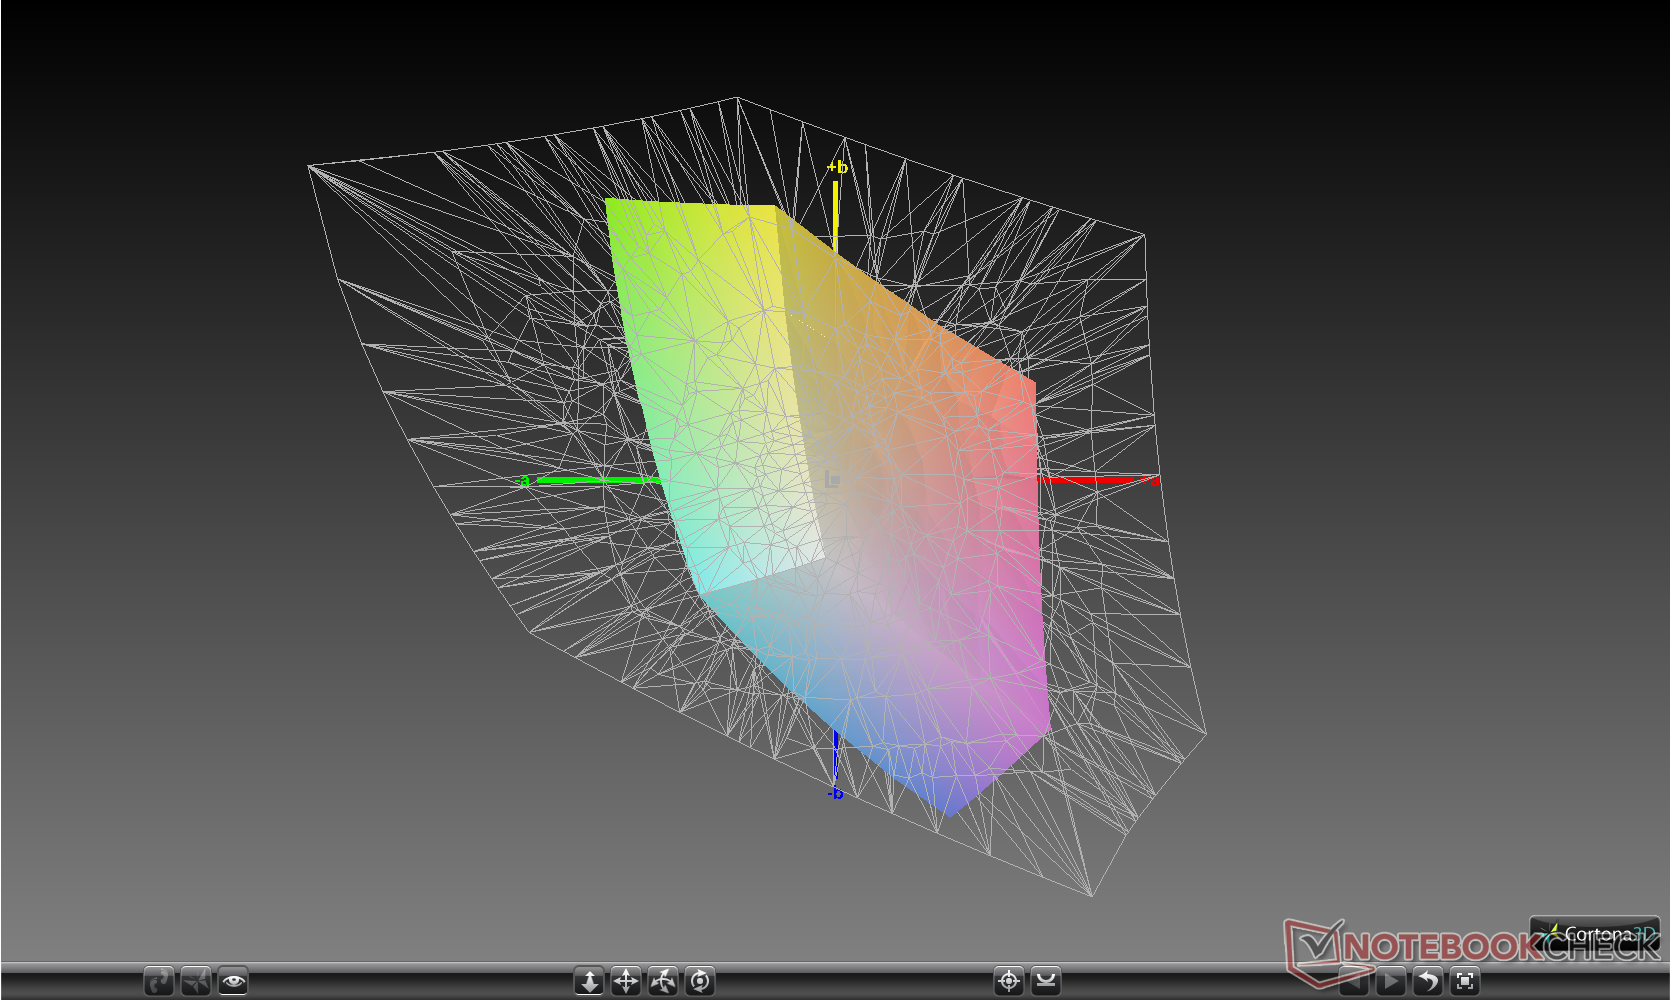
55.26% sRGB (Argyll 1.6.3 3D)
37.95% AdobeRGB 1998 (Argyll 1.6.3 3D)
37.95% AdobeRGB 1998 (Argyll 3D)
55.3% sRGB (Argyll 3D)
36.73% Display P3 (Argyll 3D)
Gamma: 2.2
CCT: 7627 K
| Dell G5 15 5500 09E2 AU Optronics B156HAN, , 1920x1080, 15.6" | HP Pavilion Gaming 16-a0242ng BOE08F6, , 1920x1080, 16.1" | Lenovo Legion 5 17IMH05 AU Optronics B173HAN04.3, , 1920x1080, 17.3" | Lenovo IdeaPad Gaming 3i 15IMH05 BOE CQ NV156FHM-NX1, , 1920x1080, 15.6" | MSI GF75 Thin 10SCXR AU Optronics B173HAN04.7, , 1920x1080, 17.3" | Asus VivoBook 15 K571LI-PB71 Panda LM156LF-GL03, , 1920x1080, 15.6" | |
|---|---|---|---|---|---|---|
| Display | 10% | 84% | 3% | 7% | 9% | |
| Display P3 Coverage (%) | 36.73 | 40.42 10% | 69.4 89% | 38.04 4% | 39.46 7% | 40.2 9% |
| sRGB Coverage (%) | 55.3 | 60.7 10% | 97.1 76% | 56.6 2% | 58.4 6% | 60.4 9% |
| AdobeRGB 1998 Coverage (%) | 37.95 | 41.77 10% | 71.2 88% | 39.3 4% | 40.77 7% | 41.56 10% |
| Response Times | ||||||
| Response Time Grey 50% / Grey 80% * (ms) | 43.2 ? | 38.4 ? | 25 ? | 34 ? | 28.4 ? | |
| Response Time Black / White * (ms) | 30.4 ? | 28 ? | 17 ? | 26.4 ? | 24 ? | |
| PWM Frequency (Hz) | ||||||
| Screen | 21% | 22% | -16% | -9% | -7% | |
| Brightness middle (cd/m²) | 285.4 | 319 12% | 326 14% | 305 7% | 251.2 -12% | 263.9 -8% |
| Brightness (cd/m²) | 260 | 306 18% | 304 17% | 294 13% | 242 -7% | 246 -5% |
| Brightness Distribution (%) | 86 | 91 6% | 89 3% | 70 -19% | 92 7% | 87 1% |
| Black Level * (cd/m²) | 0.19 | 0.18 5% | 0.25 -32% | 0.405 -113% | 0.34 -79% | 0.26 -37% |
| Contrast (:1) | 1502 | 1772 18% | 1304 -13% | 753 -50% | 739 -51% | 1015 -32% |
| Colorchecker dE 2000 * | 5.35 | 4 25% | 4.42 17% | 6.01 -12% | 4.5 16% | 5.56 -4% |
| Colorchecker dE 2000 max. * | 18.48 | 11.18 40% | 9.44 49% | 21.9 -19% | 20 -8% | 16.11 13% |
| Colorchecker dE 2000 calibrated * | 5.3 | 3.52 34% | 1.53 71% | 5.12 3% | 3.91 26% | 4.3 19% |
| Greyscale dE 2000 * | 4.2 | 1.53 64% | 5.8 -38% | 3.23 23% | 4 5% | 5.8 -38% |
| Gamma | 2.2 100% | 2.39 92% | 2.261 97% | 2.43 91% | 2.25 98% | 2.16 102% |
| CCT | 7627 85% | 6533 99% | 6822 95% | 6818 95% | 5882 111% | 7828 83% |
| Color Space (Percent of AdobeRGB 1998) (%) | 37.95 | 38 0% | 71 87% | 36 -5% | 37.3 -2% | 38.2 1% |
| Color Space (Percent of sRGB) (%) | 55.26 | 60 9% | 93 68% | 56 1% | 58.1 5% | 60.1 9% |
| Total Average (Program / Settings) | 16% /
19% | 53% /
35% | -7% /
-12% | -1% /
-6% | 1% /
-4% |
* ... smaller is better
We have reviewed a similar AUO B156HAN panel before in the Dell G5 15 5590. Our test model's panel also offers a similarly poor sRGB (55.26%) and AdobeRGB (37.95%) gamut coverage. However, such low coverage is a common trend in this price segment with only the Lenovo Legion 5 17IMH offering a markedly better display albeit at the cost of not having higher refresh rates.
Low color gamut coverage apart, our test model seems to offer good black levels, a decent brightness distribution of about 86%, and a good contrast ratio of 1,500:1. However, it suffers from high Delta E in the 100% blue color, which tends to skew the overall color accuracy. Calibration offers little to no improvement. We hope this is an isolated problem with our review unit and not a widespread issue.
In any case, this is not a display we would recommend for any professional work.

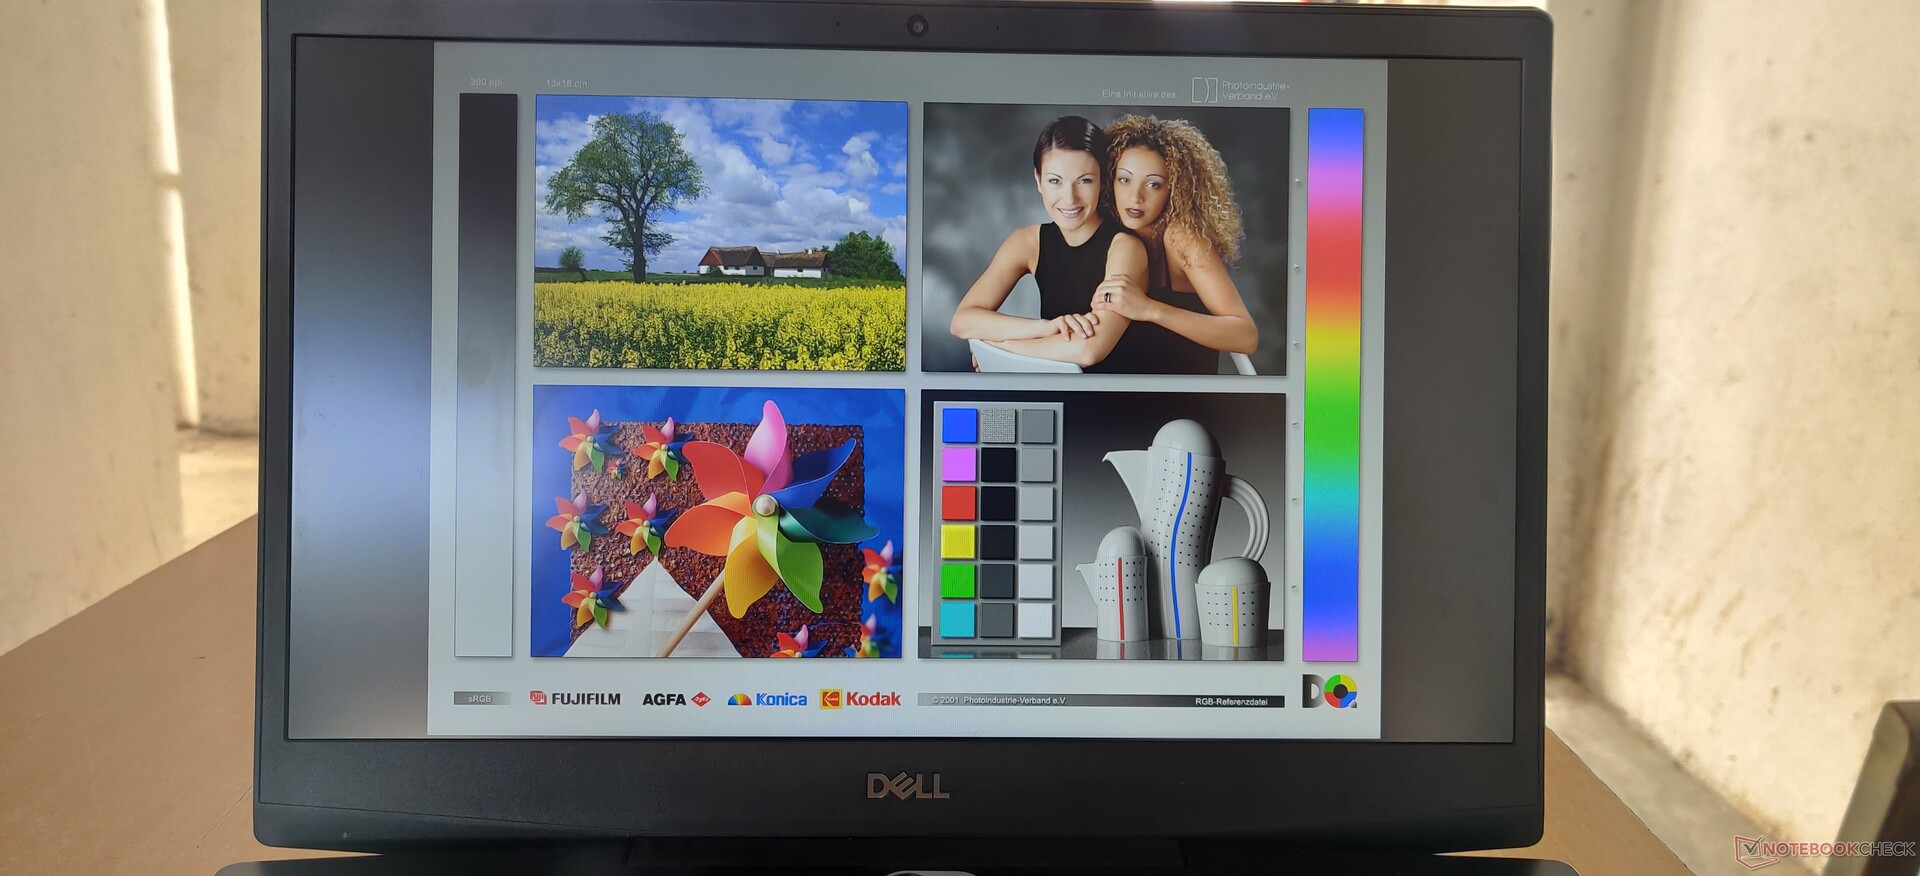
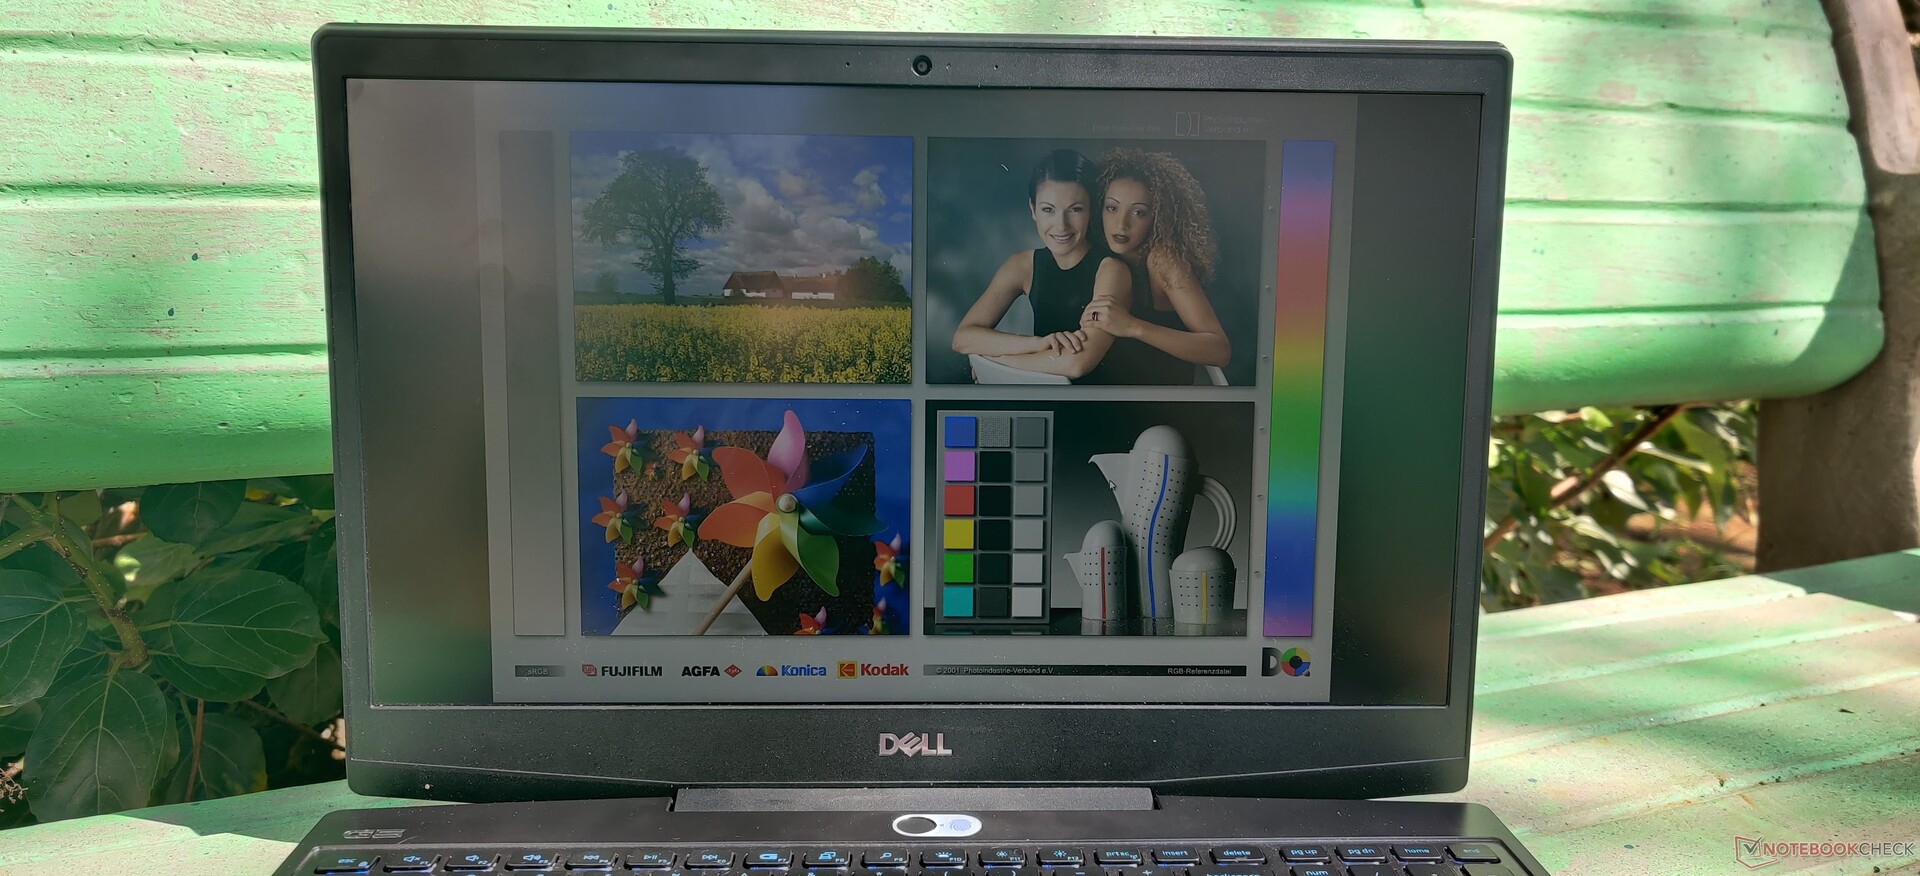
Viewing angles are stable with minimal color shifts. Since the display falls short of reaching the 300 nits brightness mark, outdoor viewing under the sun is not a pleasant experience.


Performance
A combination of the Core i5-10300H and the GeForce GTX 1650 Ti is decent for mid-range and casual gaming. Buyers may want to upgrade the RAM and storage given that many modern games have become increasingly demanding on system resources.
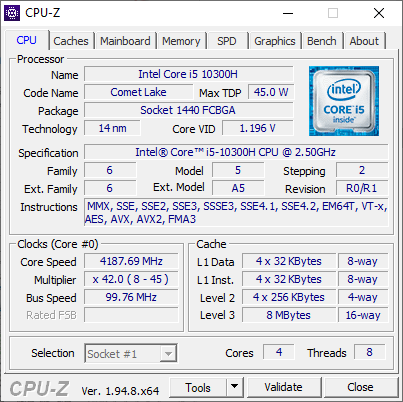
Processor
The Intel Core i5-10300H is a four-core, eight-thread, 45-W part built on the 14 nm process. This CPU in the Dell G5 15 5500 scores about 795 points in the Cinebench R15 multi-core test, which is 12% lower than what is scored by the HP Pavilion Gaming 16 and the Lenovo IdeaPad Gaming 3i.
The Core i5-10300H is no match for the Ryzen 5 4600H's multi-core prowess. That being said, it is just within 6% of the single-core scores posted by the Core i7-10750H and 5% faster than the Ryzen 5 4600H in the Acer Nitro 5. A similar trend is seen in the Cinebench R20 test as well.
In the Cinebench R15 multi-core loop test, we find that there's an initial dip from 795 to 770 points after round 1. We noticed that the fans would ramp up and down during the start of each run in the loop, which probably explains the intermittent highs and lows we see.
Cinebench R15: CPU Single 64Bit | CPU Multi 64Bit
Blender: v2.79 BMW27 CPU
7-Zip 18.03: 7z b 4 -mmt1 | 7z b 4
Geekbench 5.5: Single-Core | Multi-Core
HWBOT x265 Benchmark v2.2: 4k Preset
LibreOffice : 20 Documents To PDF
R Benchmark 2.5: Overall mean
| Cinebench R20 / CPU (Single Core) | |
| Average of class Gaming (442 - 913, n=106, last 2 years) | |
| Asus ZenBook UX535-M01440 | |
| Asus VivoBook 15 K571LI-PB71 | |
| HP Pavilion Gaming 16-a0242ng | |
| Lenovo IdeaPad Gaming 3i 15IMH05 | |
| Asus ROG Strix G15 G512LI | |
| Dell G5 15 5500 09E2 | |
| Average Intel Core i5-10300H (312 - 470, n=15) | |
| MSI GF75 Thin 10SCXR | |
| Acer Nitro 5 AN515-44-R5FT | |
| Lenovo Legion 5 17IMH05 | |
| Cinebench R20 / CPU (Multi Core) | |
| Average of class Gaming (4029 - 16433, n=106, last 2 years) | |
| Acer Nitro 5 AN515-44-R5FT | |
| Asus ROG Strix G15 G512LI | |
| Asus ZenBook UX535-M01440 | |
| Asus VivoBook 15 K571LI-PB71 | |
| Lenovo IdeaPad Gaming 3i 15IMH05 | |
| HP Pavilion Gaming 16-a0242ng | |
| Average Intel Core i5-10300H (1397 - 2240, n=15) | |
| Dell G5 15 5500 09E2 | |
| MSI GF75 Thin 10SCXR | |
| Lenovo Legion 5 17IMH05 | |
| Cinebench R15 / CPU Single 64Bit | |
| Average of class Gaming (188.8 - 350, n=106, last 2 years) | |
| Asus ZenBook UX535-M01440 | |
| Asus VivoBook 15 K571LI-PB71 | |
| Asus ROG Strix G15 G512LI | |
| HP Pavilion Gaming 16-a0242ng | |
| Lenovo IdeaPad Gaming 3i 15IMH05 | |
| Dell G5 15 5500 09E2 | |
| MSI GF75 Thin 10SCXR | |
| Acer Nitro 5 AN515-44-R5FT | |
| Average Intel Core i5-10300H (108 - 194, n=17) | |
| Lenovo Legion 5 17IMH05 | |
| Cinebench R15 / CPU Multi 64Bit | |
| Average of class Gaming (1578 - 6330, n=105, last 2 years) | |
| Acer Nitro 5 AN515-44-R5FT | |
| Asus ZenBook UX535-M01440 | |
| Asus ROG Strix G15 G512LI | |
| Asus VivoBook 15 K571LI-PB71 | |
| HP Pavilion Gaming 16-a0242ng | |
| Lenovo IdeaPad Gaming 3i 15IMH05 | |
| MSI GF75 Thin 10SCXR | |
| Average Intel Core i5-10300H (536 - 921, n=17) | |
| Dell G5 15 5500 09E2 | |
| Lenovo Legion 5 17IMH05 | |
| Blender / v2.79 BMW27 CPU | |
| MSI GF75 Thin 10SCXR | |
| Dell G5 15 5500 09E2 | |
| Lenovo Legion 5 17IMH05 | |
| Average Intel Core i5-10300H (479 - 555, n=14) | |
| HP Pavilion Gaming 16-a0242ng | |
| Lenovo IdeaPad Gaming 3i 15IMH05 | |
| Asus VivoBook 15 K571LI-PB71 | |
| Asus ZenBook UX535-M01440 | |
| Asus ROG Strix G15 G512LI | |
| Acer Nitro 5 AN515-44-R5FT | |
| Average of class Gaming (79 - 330, n=104, last 2 years) | |
| 7-Zip 18.03 / 7z b 4 -mmt1 | |
| Average of class Gaming (4199 - 7436, n=105, last 2 years) | |
| Asus ZenBook UX535-M01440 | |
| Asus VivoBook 15 K571LI-PB71 | |
| Asus ROG Strix G15 G512LI | |
| HP Pavilion Gaming 16-a0242ng | |
| Lenovo IdeaPad Gaming 3i 15IMH05 | |
| Dell G5 15 5500 09E2 | |
| Average Intel Core i5-10300H (2945 - 4956, n=14) | |
| MSI GF75 Thin 10SCXR | |
| Acer Nitro 5 AN515-44-R5FT | |
| Lenovo Legion 5 17IMH05 | |
| 7-Zip 18.03 / 7z b 4 | |
| Average of class Gaming (33491 - 148086, n=105, last 2 years) | |
| Acer Nitro 5 AN515-44-R5FT | |
| Asus ROG Strix G15 G512LI | |
| Asus ZenBook UX535-M01440 | |
| Asus VivoBook 15 K571LI-PB71 | |
| HP Pavilion Gaming 16-a0242ng | |
| Lenovo IdeaPad Gaming 3i 15IMH05 | |
| Dell G5 15 5500 09E2 | |
| Average Intel Core i5-10300H (15146 - 24841, n=14) | |
| MSI GF75 Thin 10SCXR | |
| Lenovo Legion 5 17IMH05 | |
| Geekbench 5.5 / Single-Core | |
| Average of class Gaming (986 - 2474, n=105, last 2 years) | |
| Asus ZenBook UX535-M01440 | |
| Asus VivoBook 15 K571LI-PB71 | |
| HP Pavilion Gaming 16-a0242ng | |
| HP Pavilion Gaming 16-a0242ng | |
| Lenovo IdeaPad Gaming 3i 15IMH05 | |
| Dell G5 15 5500 09E2 | |
| Average Intel Core i5-10300H (703 - 1241, n=16) | |
| MSI GF75 Thin 10SCXR | |
| Asus ROG Strix G15 G512LI | |
| Acer Nitro 5 AN515-44-R5FT | |
| Lenovo Legion 5 17IMH05 | |
| Geekbench 5.5 / Multi-Core | |
| Average of class Gaming (6460 - 28263, n=105, last 2 years) | |
| Asus ROG Strix G15 G512LI | |
| Asus VivoBook 15 K571LI-PB71 | |
| Asus ZenBook UX535-M01440 | |
| Acer Nitro 5 AN515-44-R5FT | |
| HP Pavilion Gaming 16-a0242ng | |
| HP Pavilion Gaming 16-a0242ng | |
| Lenovo IdeaPad Gaming 3i 15IMH05 | |
| Average Intel Core i5-10300H (2783 - 4728, n=16) | |
| Dell G5 15 5500 09E2 | |
| MSI GF75 Thin 10SCXR | |
| Lenovo Legion 5 17IMH05 | |
| HWBOT x265 Benchmark v2.2 / 4k Preset | |
| Average of class Gaming (11.5 - 44.4, n=105, last 2 years) | |
| Asus ROG Strix G15 G512LI | |
| Asus ZenBook UX535-M01440 | |
| Acer Nitro 5 AN515-44-R5FT | |
| Asus VivoBook 15 K571LI-PB71 | |
| HP Pavilion Gaming 16-a0242ng | |
| Lenovo IdeaPad Gaming 3i 15IMH05 | |
| Average Intel Core i5-10300H (6.13 - 7.78, n=14) | |
| Dell G5 15 5500 09E2 | |
| MSI GF75 Thin 10SCXR | |
| Lenovo Legion 5 17IMH05 | |
| LibreOffice / 20 Documents To PDF | |
| Asus ZenBook UX535-M01440 | |
| Lenovo Legion 5 17IMH05 | |
| Dell G5 15 5500 09E2 | |
| Acer Nitro 5 AN515-44-R5FT | |
| MSI GF75 Thin 10SCXR | |
| Average Intel Core i5-10300H (23.9 - 94, n=14) | |
| HP Pavilion Gaming 16-a0242ng | |
| Lenovo IdeaPad Gaming 3i 15IMH05 | |
| Asus ROG Strix G15 G512LI | |
| Average of class Gaming (33.2 - 88.8, n=105, last 2 years) | |
| Asus VivoBook 15 K571LI-PB71 | |
| R Benchmark 2.5 / Overall mean | |
| Lenovo Legion 5 17IMH05 | |
| Average Intel Core i5-10300H (0.625 - 1.088, n=14) | |
| MSI GF75 Thin 10SCXR | |
| Dell G5 15 5500 09E2 | |
| Lenovo IdeaPad Gaming 3i 15IMH05 | |
| HP Pavilion Gaming 16-a0242ng | |
| Acer Nitro 5 AN515-44-R5FT | |
| Asus ROG Strix G15 G512LI | |
| Asus ZenBook UX535-M01440 | |
| Asus VivoBook 15 K571LI-PB71 | |
| Average of class Gaming (0.3439 - 0.759, n=106, last 2 years) | |
* ... smaller is better
System Performance
Performance in productivity benchmarks such as PCMark 8 and PCMark 10 is on par with what is expected from this configuration and is about 10% slower overall than a typical Core i7-10750H-powered laptop.
| PCMark 8 Home Score Accelerated v2 | 4319 points | |
| PCMark 8 Work Score Accelerated v2 | 5138 points | |
| PCMark 10 Score | 4800 points | |
Help | ||
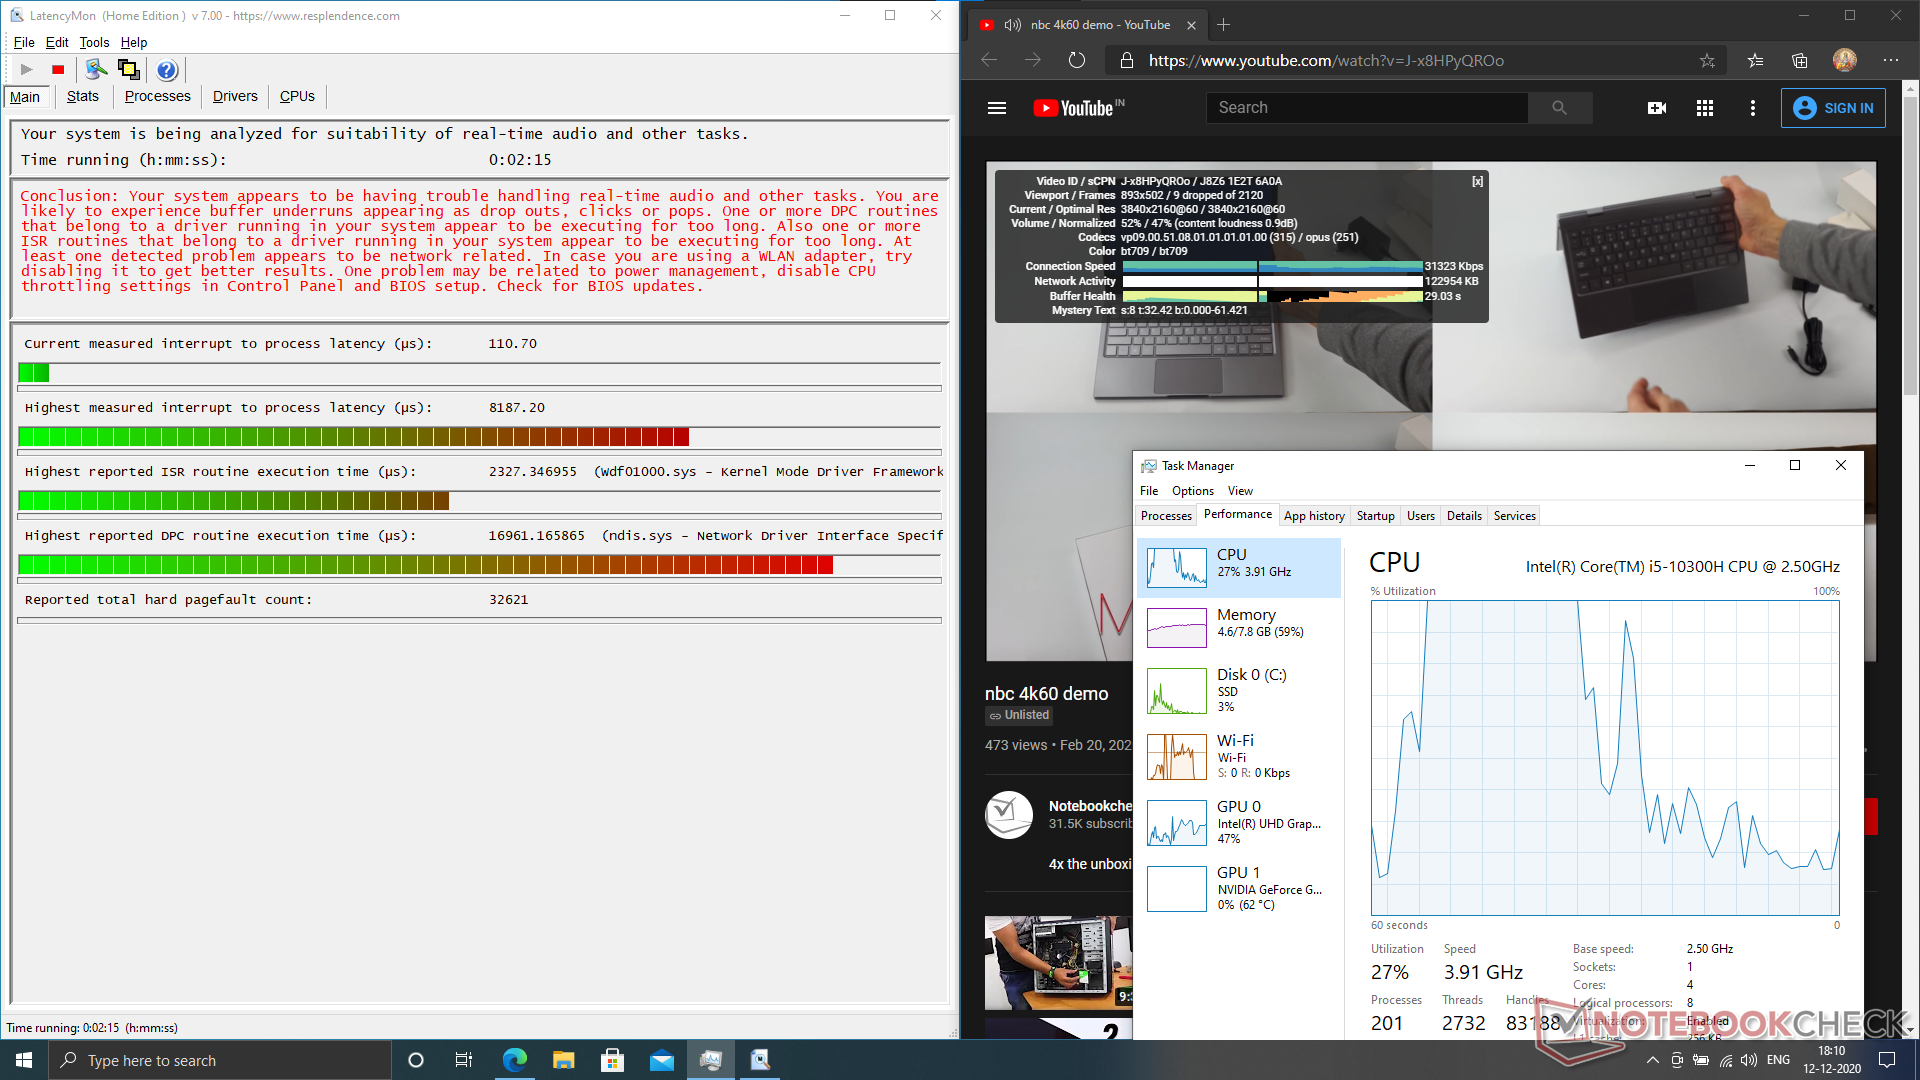
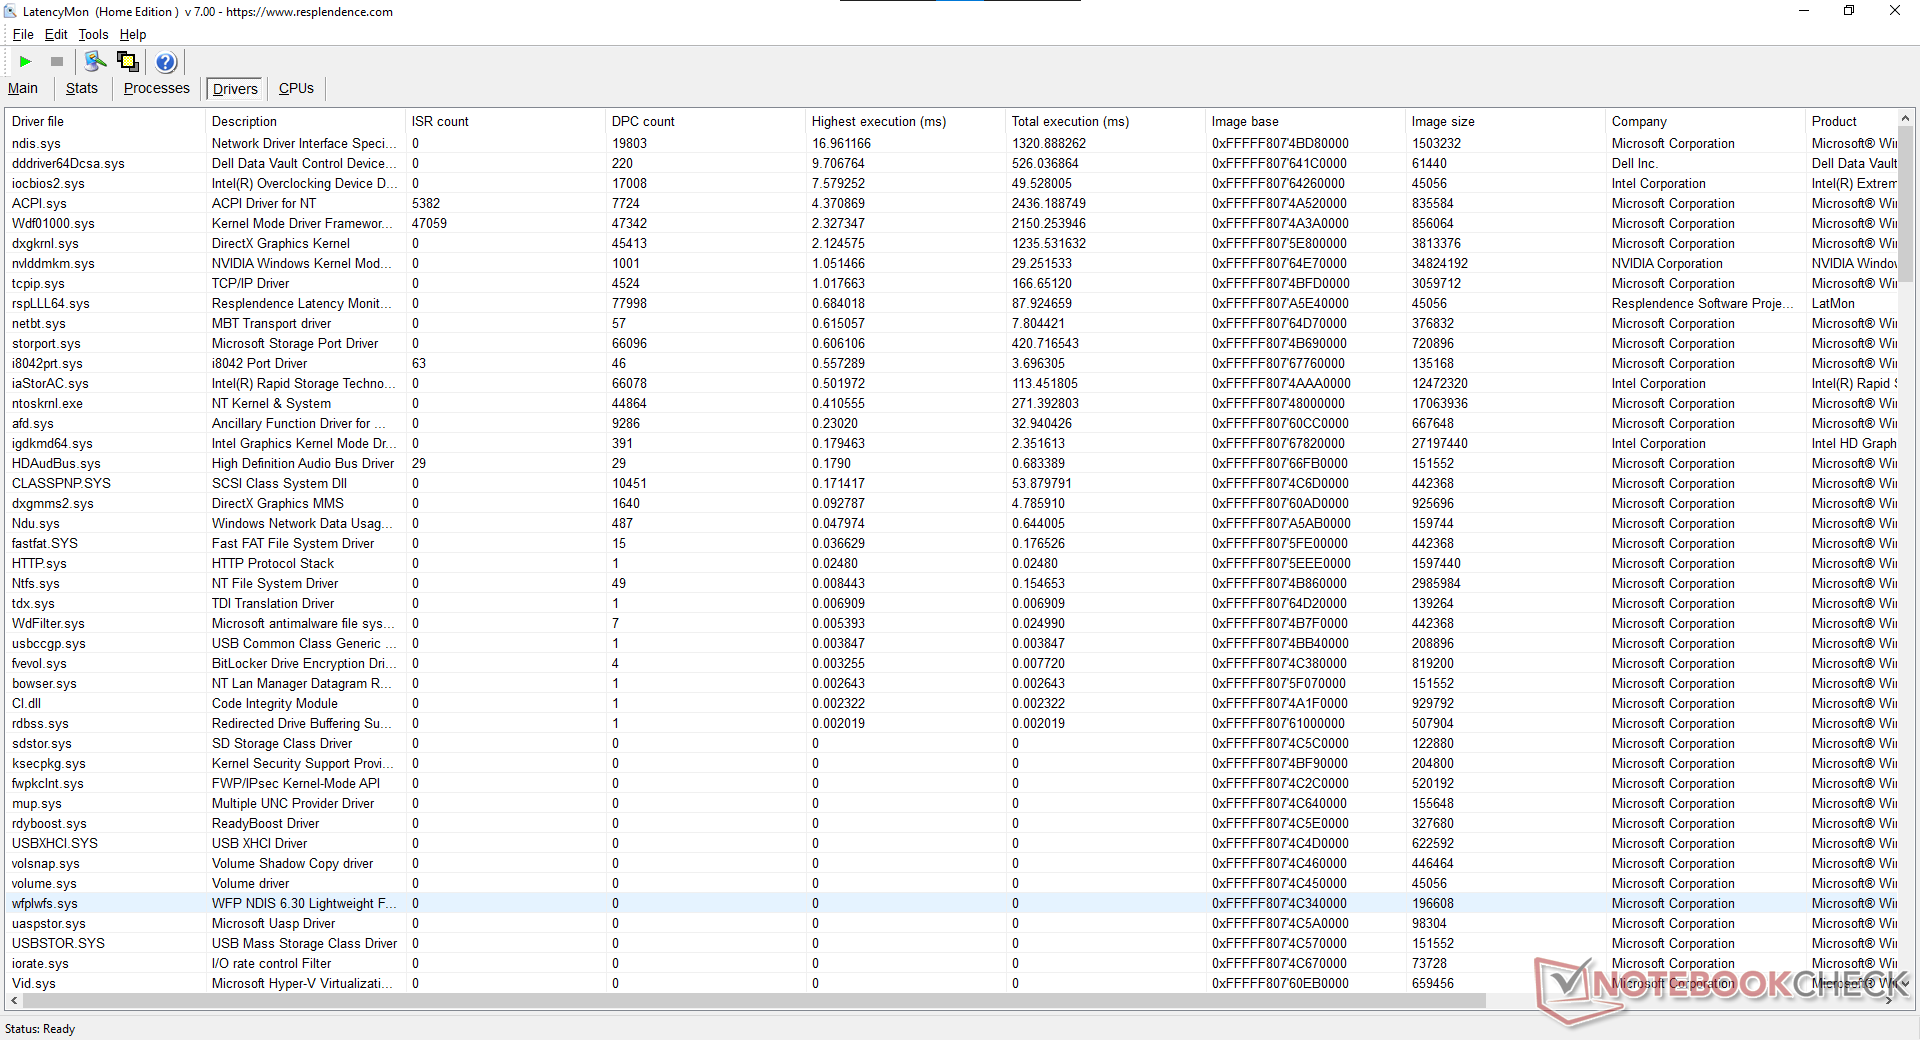
DPC Latency
We measured system latency using LatencyMon by opening multiple tabs of our site, playing back our sample 4K video on YouTube, and running an instance of Prime95 in-place large FFTs for 10 seconds. The analysis reveals that the Dell G5 15 5500 is not really suitable for real-time audio owing to its high latency of 8187.2 μs. That being said, we noticed only about nine frames dropped out of 2,120 in our 4K YouTube playback test, so streaming 4K content should not pose much of an issue.
Check out our dedicated DPC Latency Ranking page for more latency comparisons.
| DPC Latencies / LatencyMon - interrupt to process latency (max), Web, Youtube, Prime95 | |
| Dell G5 15 5500 09E2 | |
| HP Pavilion Gaming 16-a0242ng | |
| MSI GF75 Thin 10SCXR | |
| Lenovo Legion 5 17IMH05 | |
| Lenovo IdeaPad Gaming 3i 15IMH05 | |
* ... smaller is better
Storage Devices
Our unit comes with a Kioxia 512 GB NVMe SSD in an uncommon M.2 2230 form factor. Unfortunately, there is only one such slot provided so additional PCIe NVMe expansion is not possible. However, storage can be expanded to a SATA SSD or HDD via a 2.5-inch bay that comes with necessary connectors.
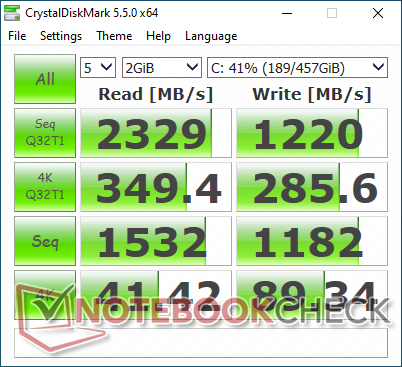
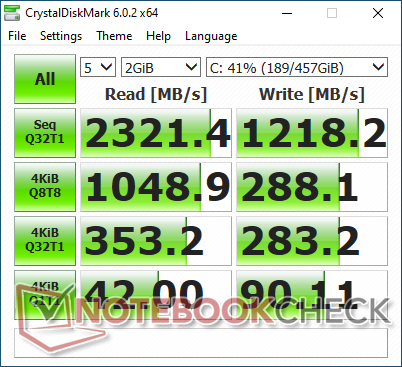
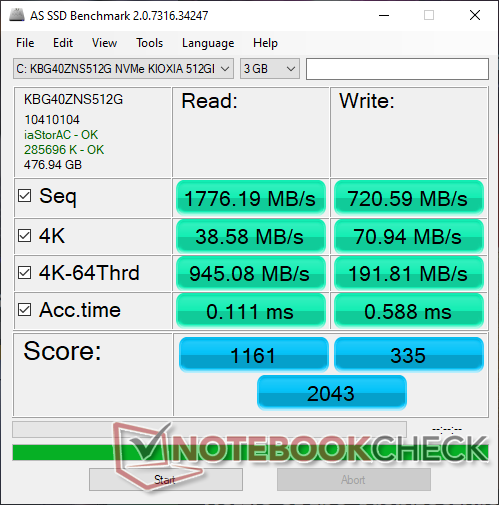
We observed that the G5 15 5500's SSD performed comparably to the Samsung PM991 in a Lenovo Legion 5 15IMH05H laptop in sequential reads and writes but fell behind the competition in 4K random read-writes and access times tests.
Check out our dedicated SSD and HDD benchmarks page for more storage performance comparisons.
| Dell G5 15 5500 09E2 Toshiba KBG40ZNS512G NVMe | Lenovo Legion 5 17IMH05 SK hynix BC511 HFM512GDHTNI-87A0B | MSI GF75 Thin 10SCXR WDC PC SN530 SDBPNPZ-512G | Acer Nitro 5 AN515-44-R5FT SK Hynix BC511 HFM512GDJTNI | Lenovo Legion 5 15IMH05H Samsung PM991 MZALQ512HALU | |
|---|---|---|---|---|---|
| CrystalDiskMark 5.2 / 6 | |||||
| Write 4K (MB/s) | 89.3 | 134.7 51% | 140.7 58% | 94.7 6% | 145.4 63% |
| Read 4K (MB/s) | 41.42 | 44.84 8% | 43.18 4% | 38.91 -6% | 51.6 25% |
| Write Seq (MB/s) | 1182 | 1053 -11% | 1829 55% | 1056 -11% | 1007 -15% |
| Read Seq (MB/s) | 1532 | 1241 -19% | 1095 -29% | 1183 -23% | 1145 -25% |
| Write 4K Q32T1 (MB/s) | 283.2 | 499.8 76% | 431.7 52% | 445.3 57% | 468.4 65% |
| Read 4K Q32T1 (MB/s) | 353.2 | 518 47% | 527 49% | 477.7 35% | 528 49% |
| Write Seq Q32T1 (MB/s) | 1220 | 1022 -16% | 1831 50% | 1063 -13% | 1381 13% |
| Read Seq Q32T1 (MB/s) | 2329 | 2263 -3% | 1708 -27% | 2154 -8% | 2291 -2% |
| Write 4K Q8T8 (MB/s) | 288.1 | ||||
| Read 4K Q8T8 (MB/s) | 1049 | ||||
| AS SSD | |||||
| Seq Read (MB/s) | 1776 | 1635 -8% | 1007 -43% | 1504 -15% | 2012 13% |
| Seq Write (MB/s) | 721 | 913 27% | 1755 143% | 1064 48% | 1261 75% |
| 4K Read (MB/s) | 38.58 | 46.18 20% | 39.88 3% | 51.5 33% | 43.66 13% |
| 4K Write (MB/s) | 70.9 | 101.7 43% | 111.6 57% | 123.2 74% | 109.3 54% |
| 4K-64 Read (MB/s) | 945 | 773 -18% | 751 -21% | 703 -26% | 851 -10% |
| 4K-64 Write (MB/s) | 191.8 | 745 288% | 402.6 110% | 730 281% | 780 307% |
| Access Time Read * (ms) | 0.111 | 0.05 55% | 0.084 24% | 0.064 42% | 0.117 -5% |
| Access Time Write * (ms) | 0.588 | 0.037 94% | 0.151 74% | 0.031 95% | 0.036 94% |
| Score Read (Points) | 1161 | 983 -15% | 892 -23% | 905 -22% | 1096 -6% |
| Score Write (Points) | 335 | 938 180% | 690 106% | 960 187% | 1016 203% |
| Score Total (Points) | 2043 | 2399 17% | 2085 2% | 2321 14% | 2643 29% |
| Copy ISO MB/s (MB/s) | 1037 | 573 -45% | 1828 76% | 1481 43% | |
| Copy Program MB/s (MB/s) | 429.7 | 344.4 -20% | 307.2 -29% | 467.5 9% | |
| Copy Game MB/s (MB/s) | 892 | 535 -40% | 532 -40% | 734 -18% |
* ... smaller is better
Disk Throttling: DiskSpd Read Loop, Queue Depth 8
GPU Performance
Performance in 3DMark is on par with what is expected from a GeForce 1650 Ti GPU. In 3DMark Time Spy, the GTX 1650 Ti performs about 20% faster than the corresponding Max-Q version found in the Asus ZenBook Pro 15 UX535. Though slower on the CPU side of things, the Dell G5 15 5500 gains a lead over its HP, Lenovo, and MSI equivalents in synthetic GPU tests.
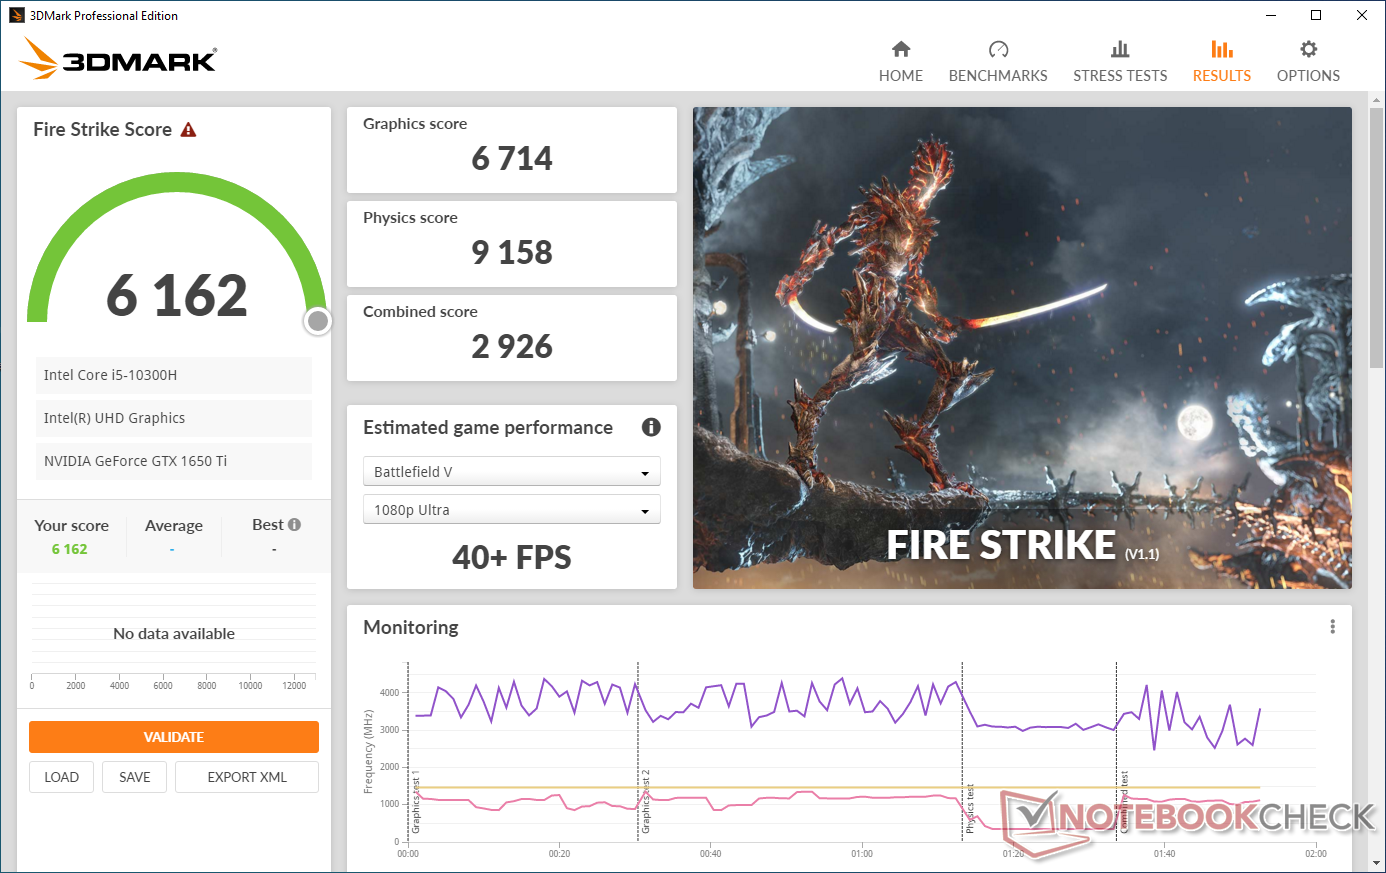
As expected, running on battery power results in a drastic drop in GPU performance. In 3DMark Fire Strike, we observe that the G5 15 5500 achieves scores of 9,833 Graphics and 13,034 Physics whereas on battery, it is able to post just 6,714 Graphics and 9,158 Physics points with a total Fire Strike score of 6,162. While the laptop does not seem to fall back on UHD Graphics while on battery, the GTX 1650 Ti drops in clocks from 1,460 MHz to 950-1,200 MHz. This combined with only mediocre battery life on load means that gaming is difficult without mains power.
| 3DMark 11 Performance | 12192 points | |
| 3DMark Ice Storm Standard Score | 86822 points | |
| 3DMark Cloud Gate Standard Score | 26602 points | |
| 3DMark Fire Strike Score | 8805 points | |
| 3DMark Fire Strike Extreme Score | 4337 points | |
| 3DMark Time Spy Score | 3738 points | |
Help | ||
Gaming Performance
The Dell G5 15 5500 performs as expected for a laptop of its class when it comes to gaming. As a non-RTX card, ray tracing and DLSS are out of scope for the GTX 1650 Ti. Games from a few years ago can play very well at 1080p medium to high settings with the 120 Hz display aiding in smooth visuals.
Modern AAA titles such as Assassin's Creed: Valhalla or Cyberpunk 2077 will need further tuning of settings to hit the 60 fps sweet spot at the medium preset. Depending on the game, the display resolution may need to be lowered in order to achieve fps rates that match the refresh rate of the display.
Idling on The Witcher 3 for 30 minutes at 1080p High shows fairly consistent frame rates for the first 15 minutes of the test. After that, we observe the frame rate dipping from the 80s to about 60-70 fps where it stays so for about seven minutes before again recovering back to 80 fps for the remainder of the test.
| low | med. | high | ultra | |
|---|---|---|---|---|
| BioShock Infinite (2013) | 299.1 | 239.3 | 222.6 | 125.6 |
| The Witcher 3 (2015) | 126 | 72.2 | 34.7 | |
| Shadow of the Tomb Raider (2018) | 65 | 55 | 48 | |
| Assassin´s Creed Odyssey (2018) | 62 | 49 | 29 | |
| Far Cry New Dawn (2019) | 66 | 63 | 57 | |
| Doom Eternal (2020) | 101 | 75.3 | ||
| Horizon Zero Dawn (2020) | 56 | 49 | 43 | |
| Assassin´s Creed Valhalla (2020) | 47 | 27 | 9 | |
| Call of Duty Black Ops Cold War (2020) | 48.4 | 40.1 | 29.3 | |
| Cyberpunk 2077 1.0 (2020) | 58.7 | 32.7 | 26.3 | 22.4 |
Emissions
Temperature
Despite the high CPU and GPU temperatures under load, surface temperatures remain relatively cool. During idling, we record an average of 28 °C on the front side of the laptop and an average temperature of 41 °C under maximum load. Playing The Witcher 3 at Ultra results in an average temperature on the front of nearly 39 °C.
As shown in the heat distribution map below, gaming can cause the WASD key area and the keyboard deck overall to touch the initial 40s making our test unit slightly warmer than its competition. That being said, this does not pose too much discomfort in actual usage. While gaming, only the right palmrest tends to get somewhat warmer than usual while the left palmrest and trackpad area remain cooler than skin temperature.
(-) The maximum temperature on the upper side is 51 °C / 124 F, compared to the average of 40.4 °C / 105 F, ranging from 21.2 to 68.8 °C for the class Gaming.
(-) The bottom heats up to a maximum of 46 °C / 115 F, compared to the average of 43.2 °C / 110 F
(+) In idle usage, the average temperature for the upper side is 28.2 °C / 83 F, compared to the device average of 33.9 °C / 93 F.
(-) Playing The Witcher 3, the average temperature for the upper side is 38.9 °C / 102 F, compared to the device average of 33.9 °C / 93 F.
(±) The palmrests and touchpad can get very hot to the touch with a maximum of 38.5 °C / 101.3 F.
(-) The average temperature of the palmrest area of similar devices was 28.8 °C / 83.8 F (-9.7 °C / -17.5 F).
Stress test
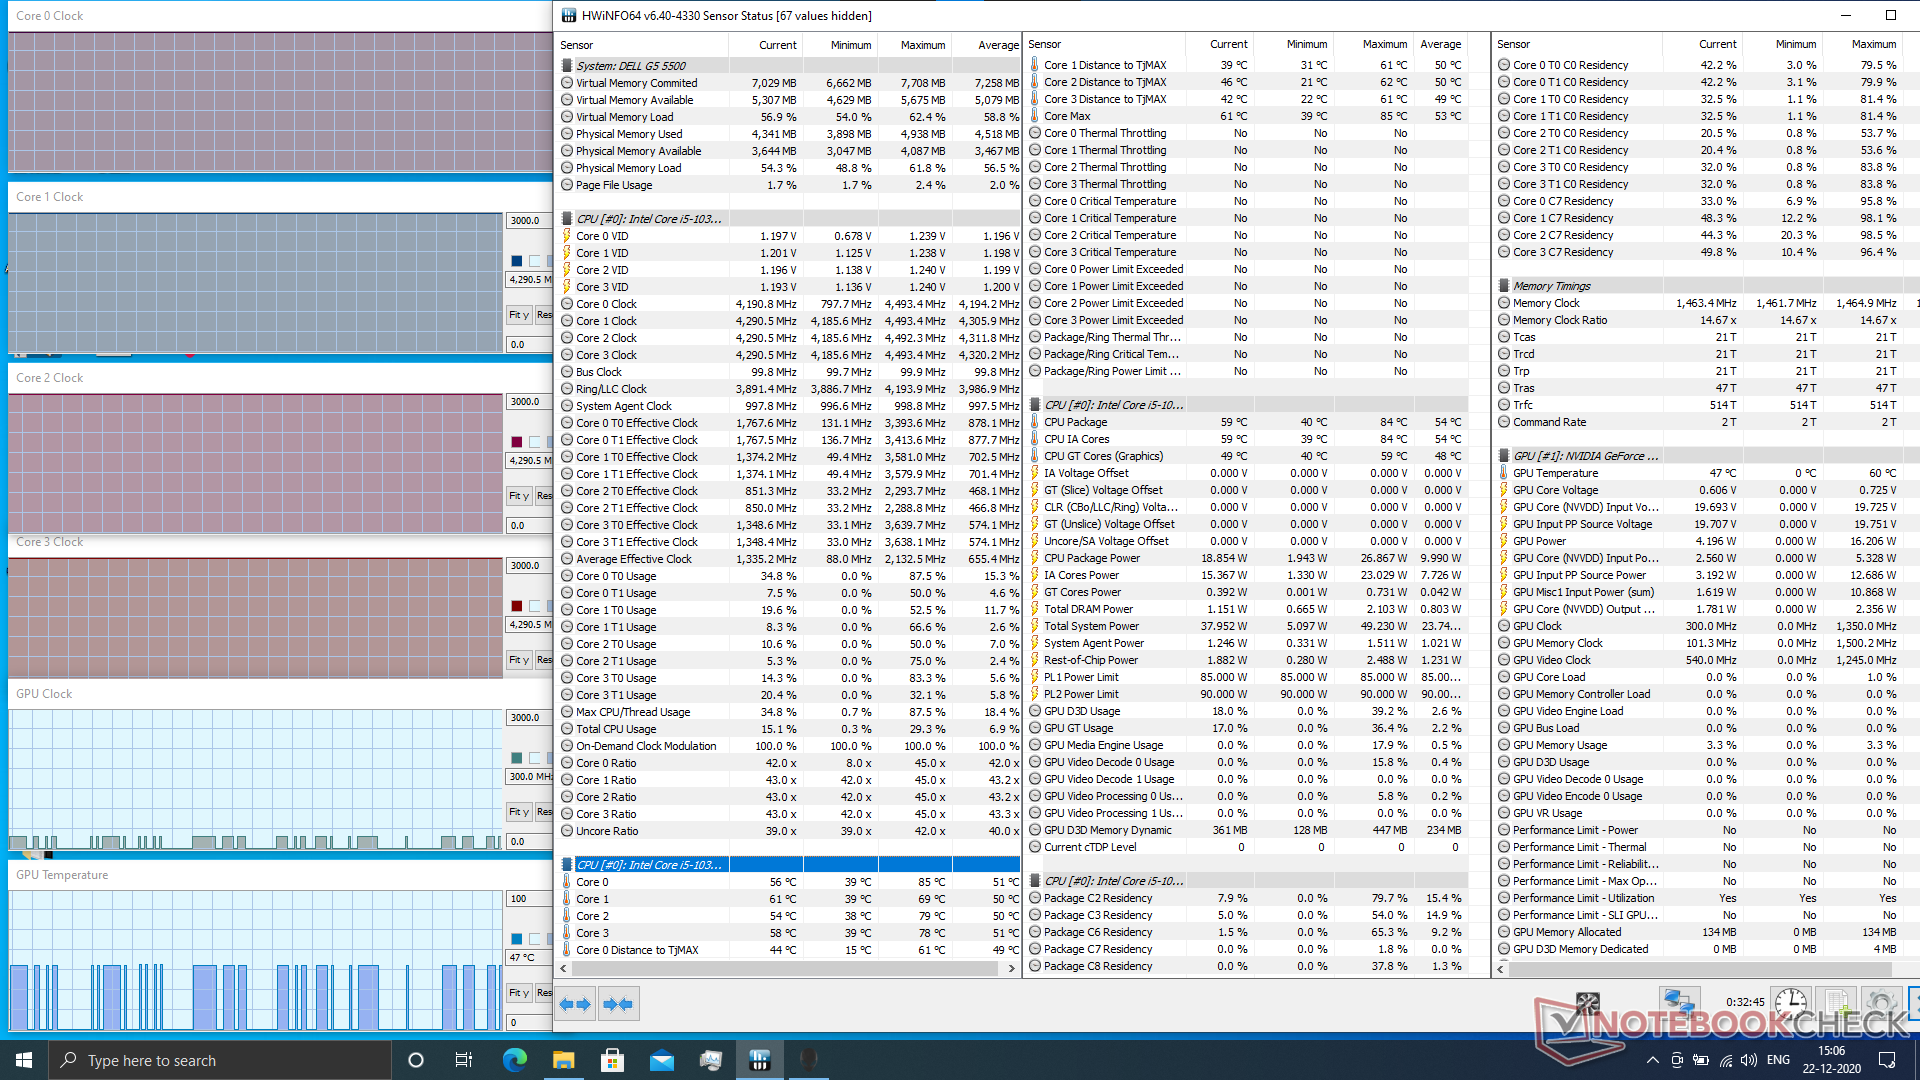
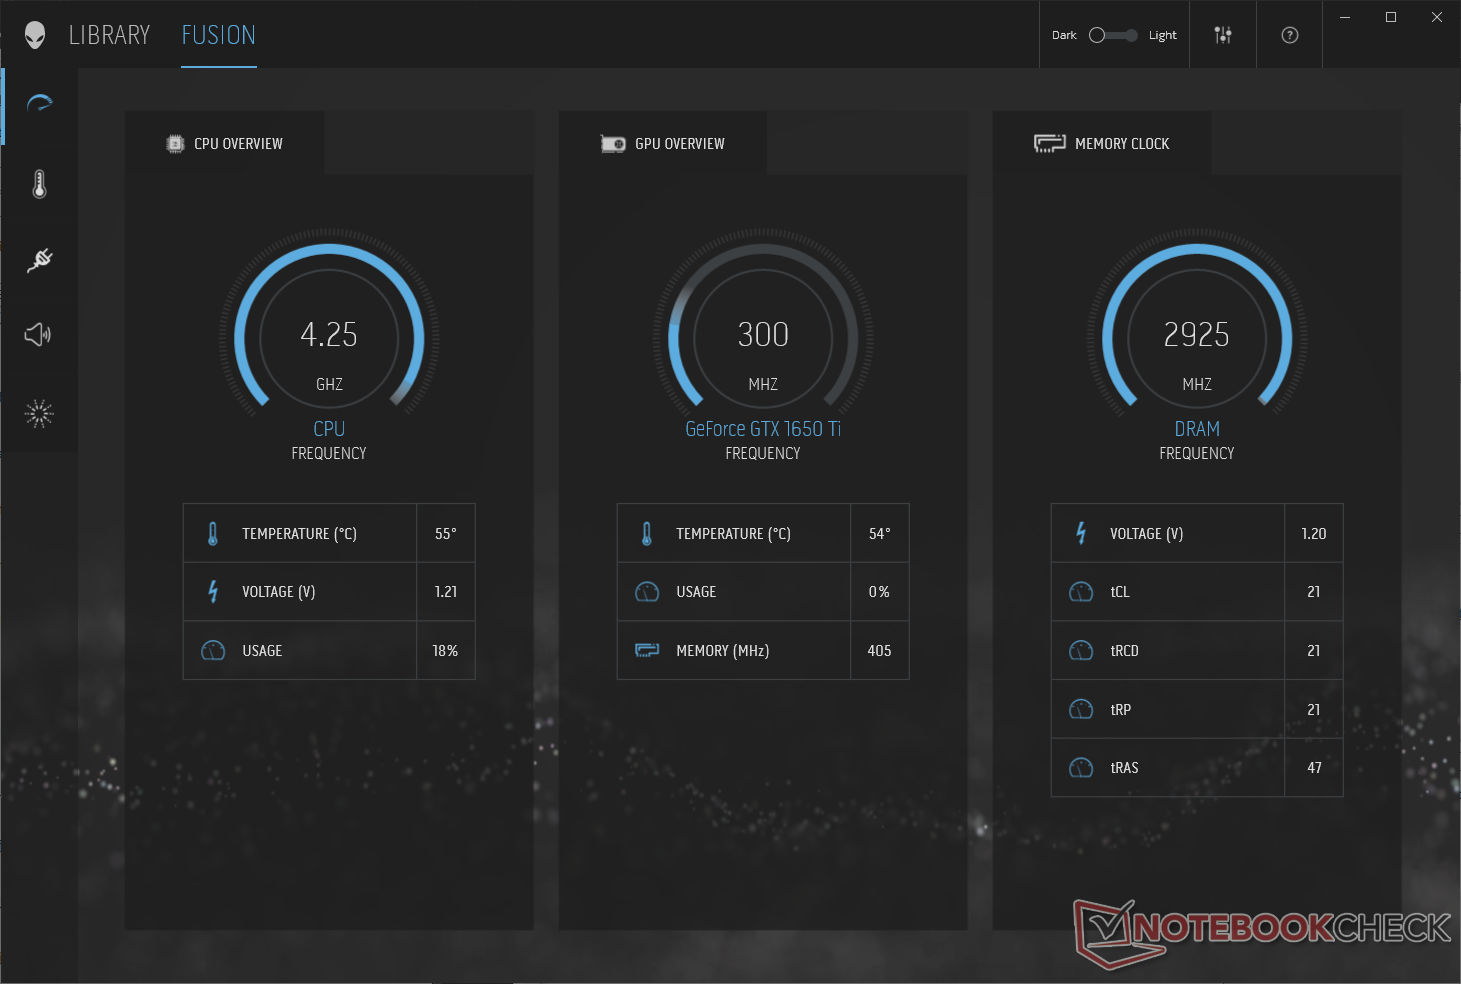
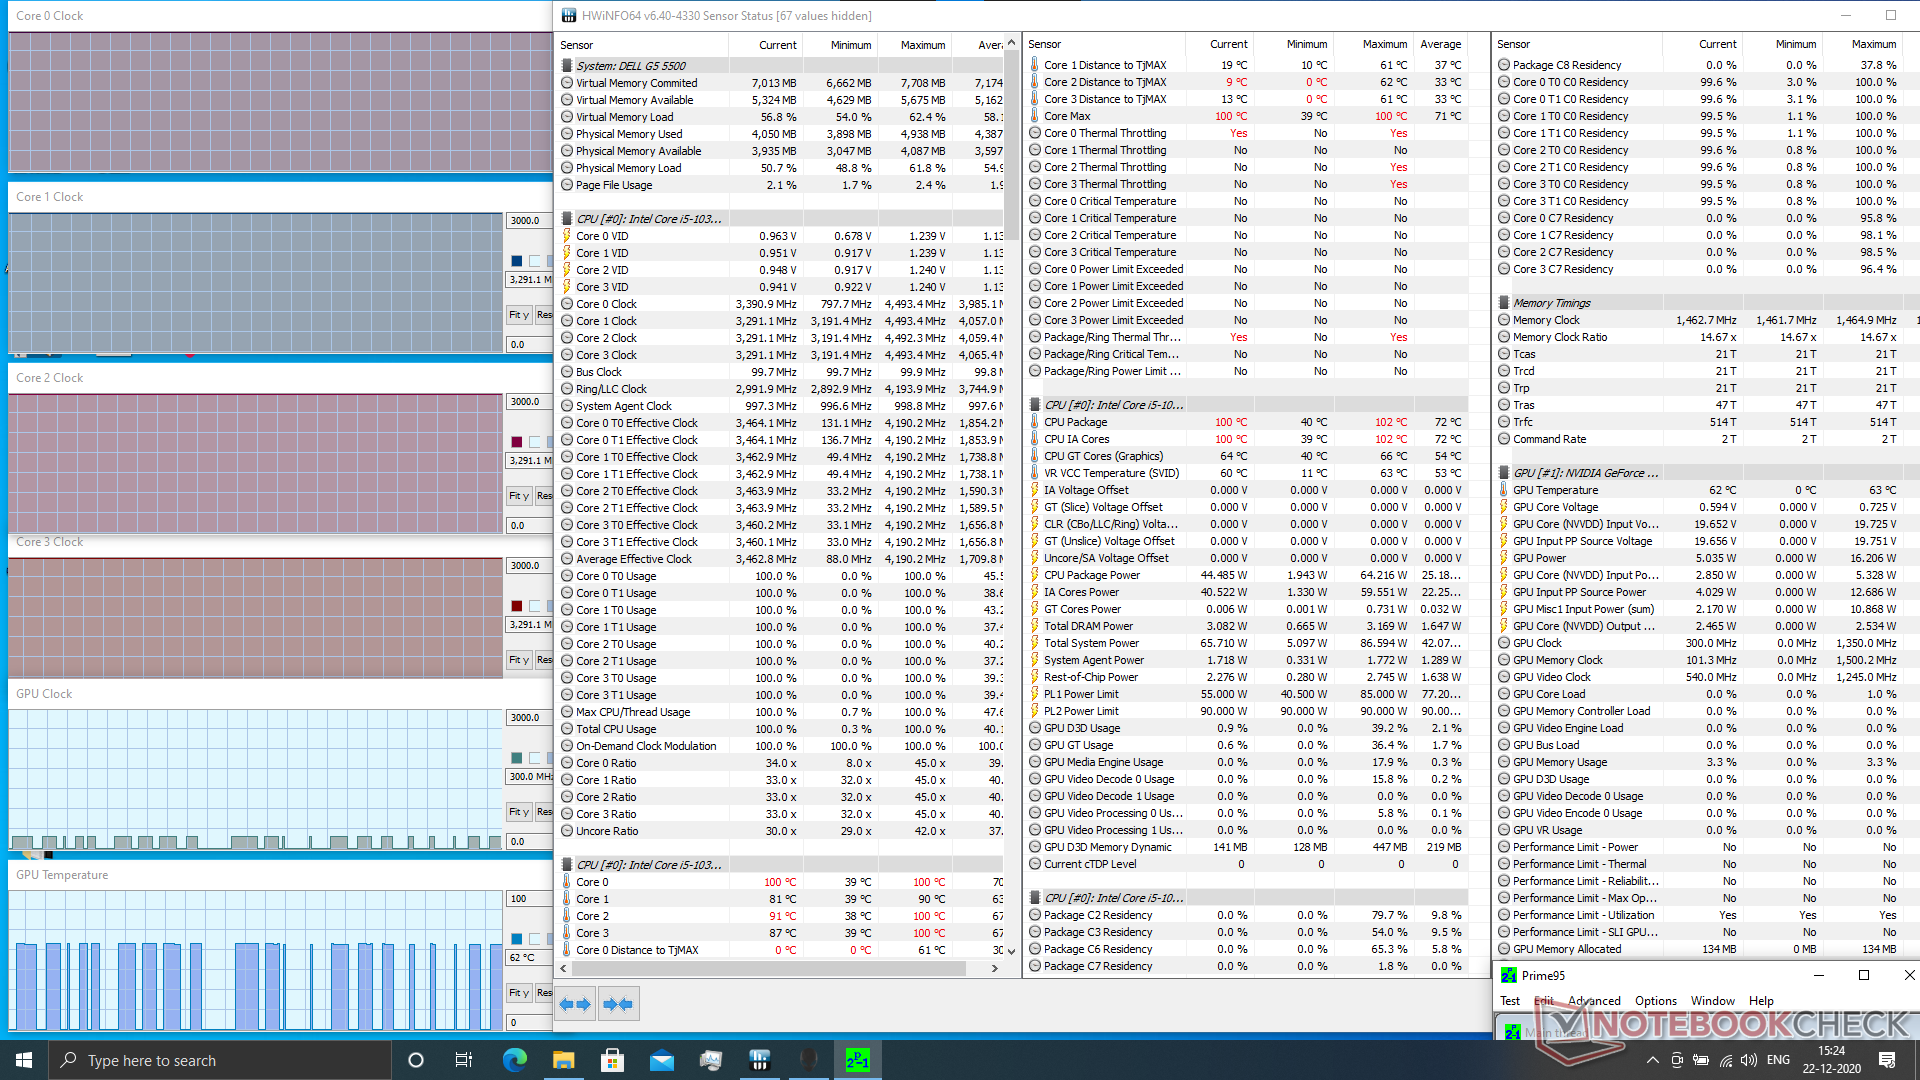
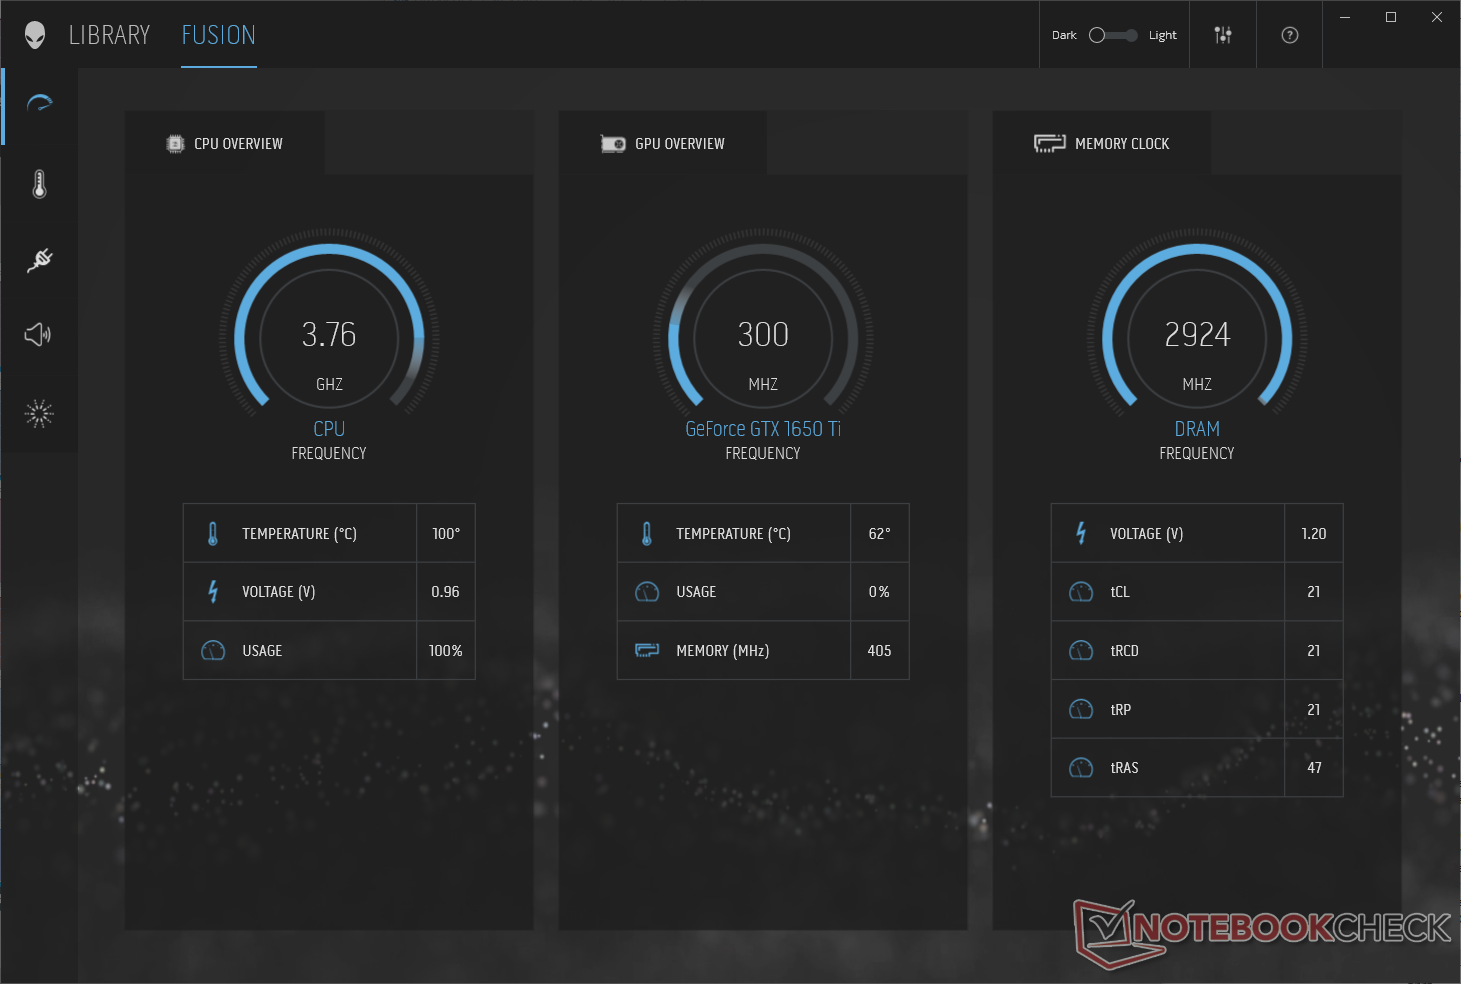
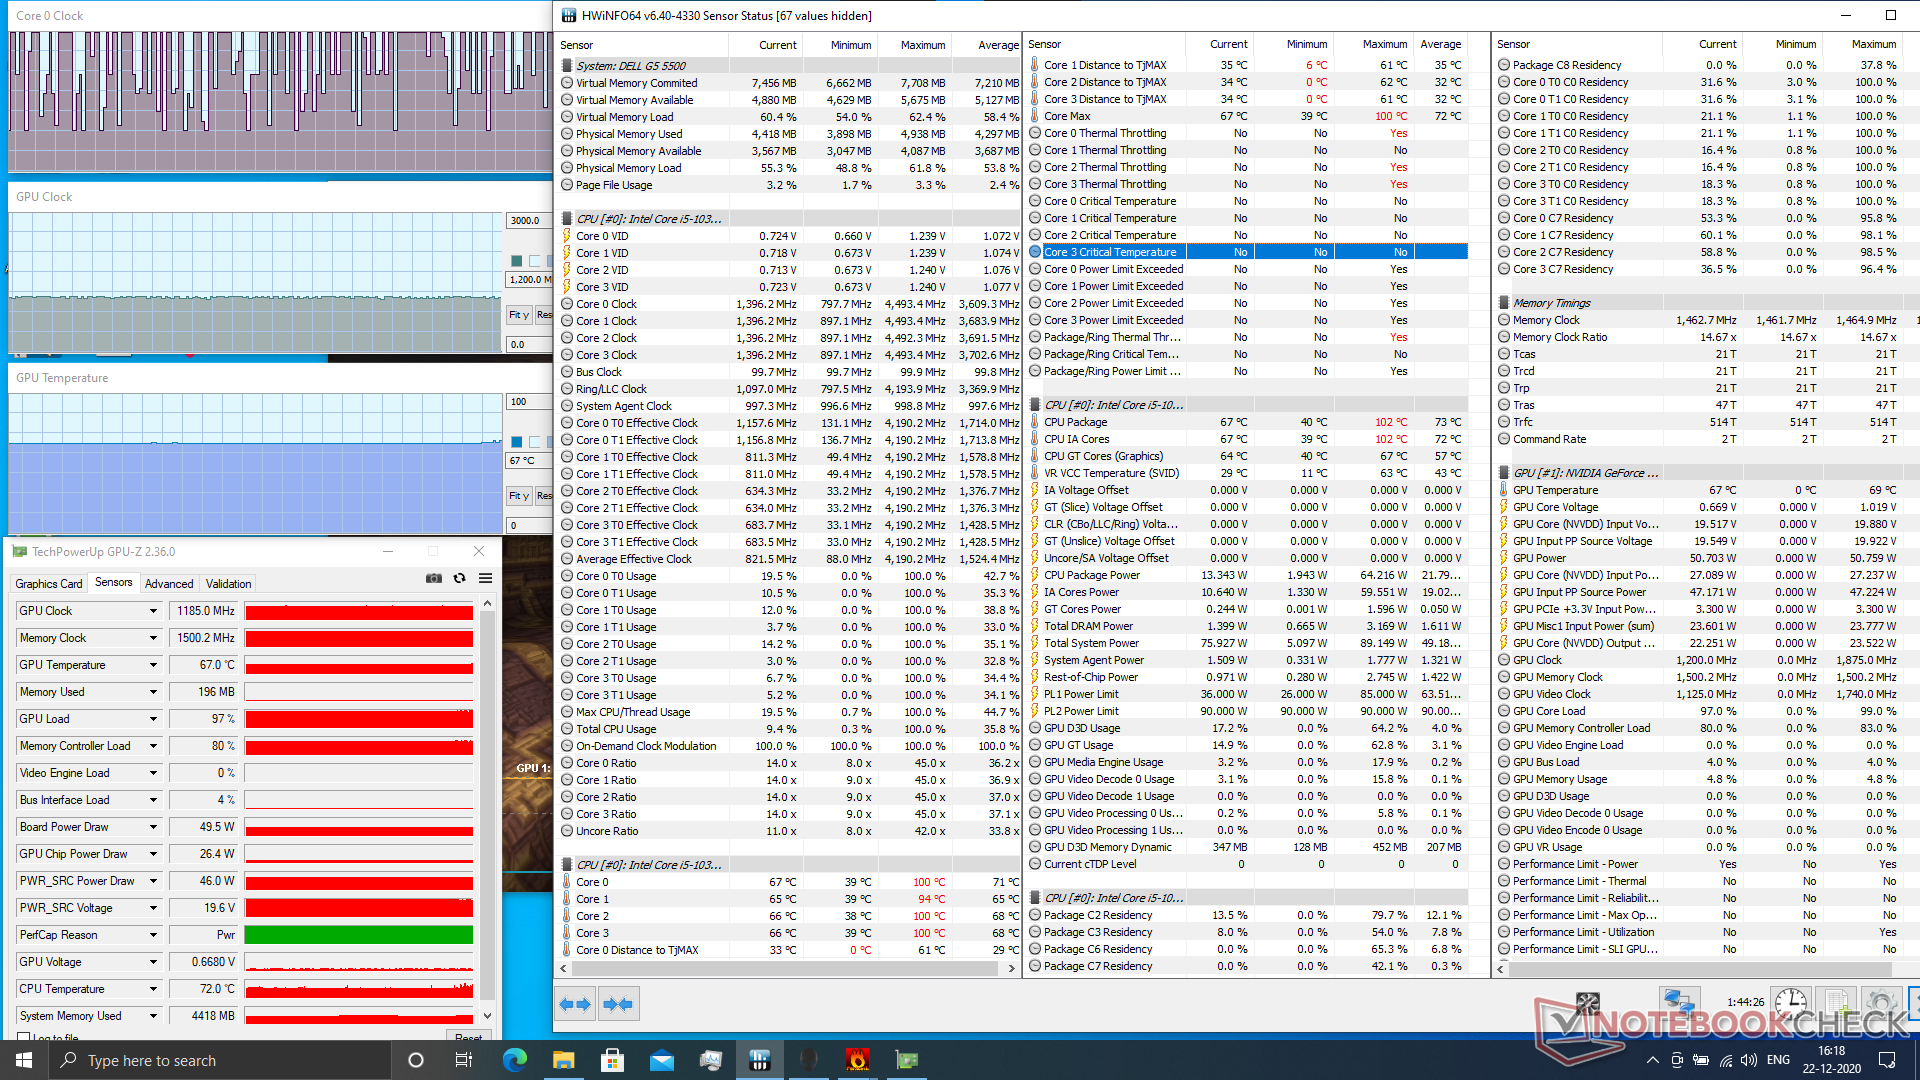
During idle, we see average temperatures of 54 °C on both the CPU and dGPU. The CPU can offer a boost up to 4.25 GHz at a voltage of 1.21 V while the dGPU idles at 300 MHz. Running a Prime95 in-place large FFTs stress test for 30 minutes sees the CPU temperature reaching as high as 102 °C and throttling down to 3.76 GHz. The dGPU continues to remain at idle clocks.
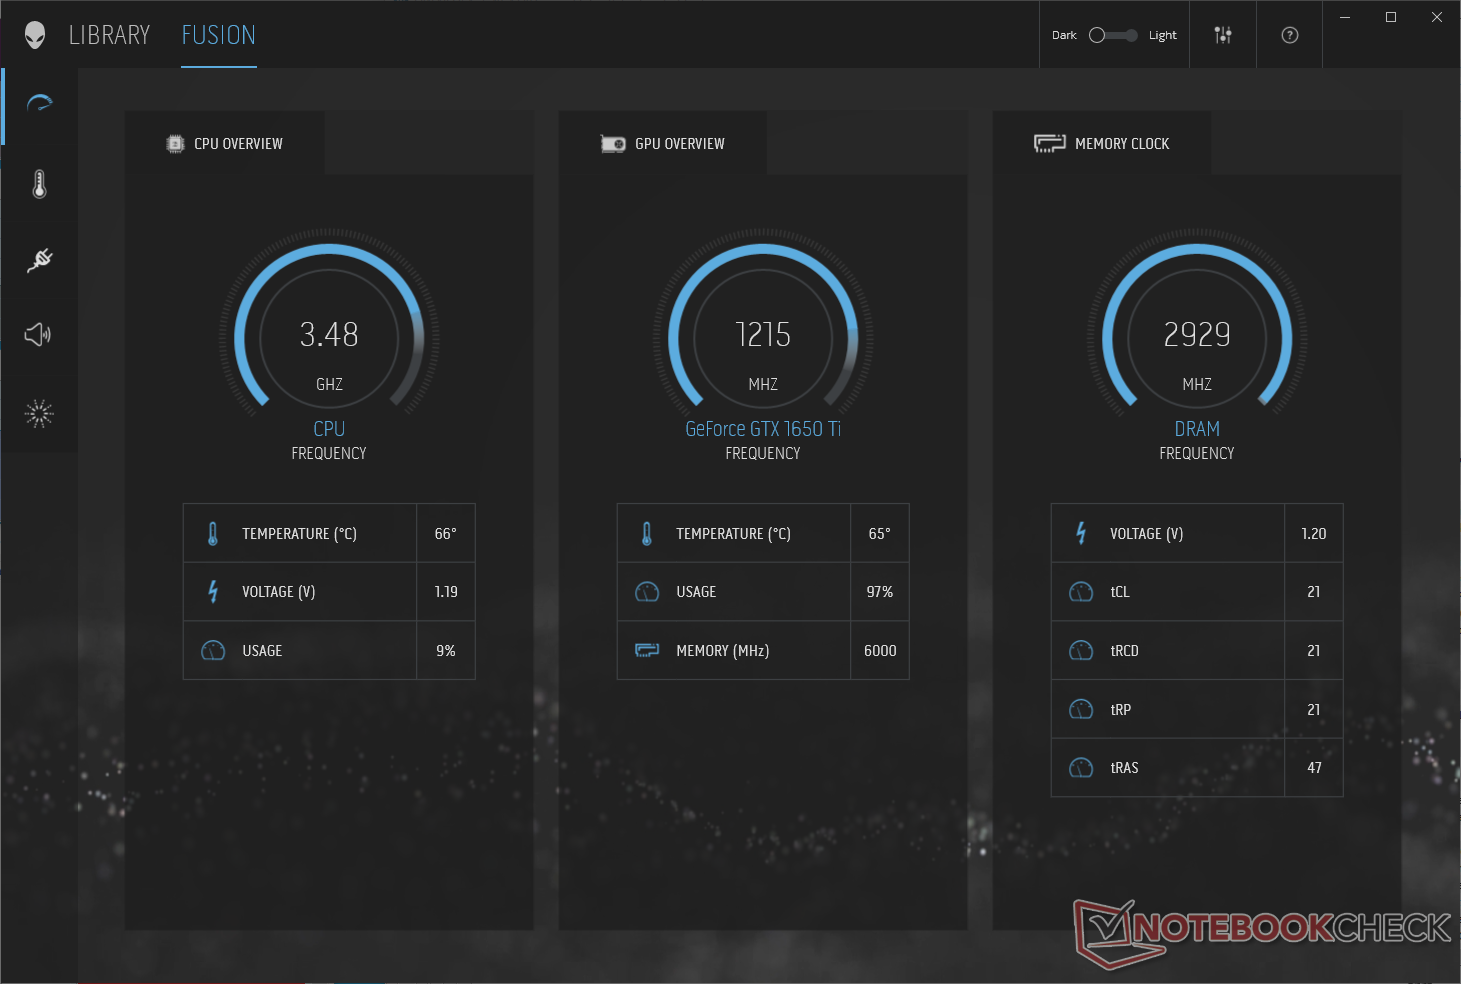
A FurMark stress causes the dGPU clocks to boost up to 1,215 MHz with the temperature touching a maximum of 69 °C. There is some voltage reduction observed on the CPU side (1.19 V), which causes a reduction of core clocks to 3.48 GHz.
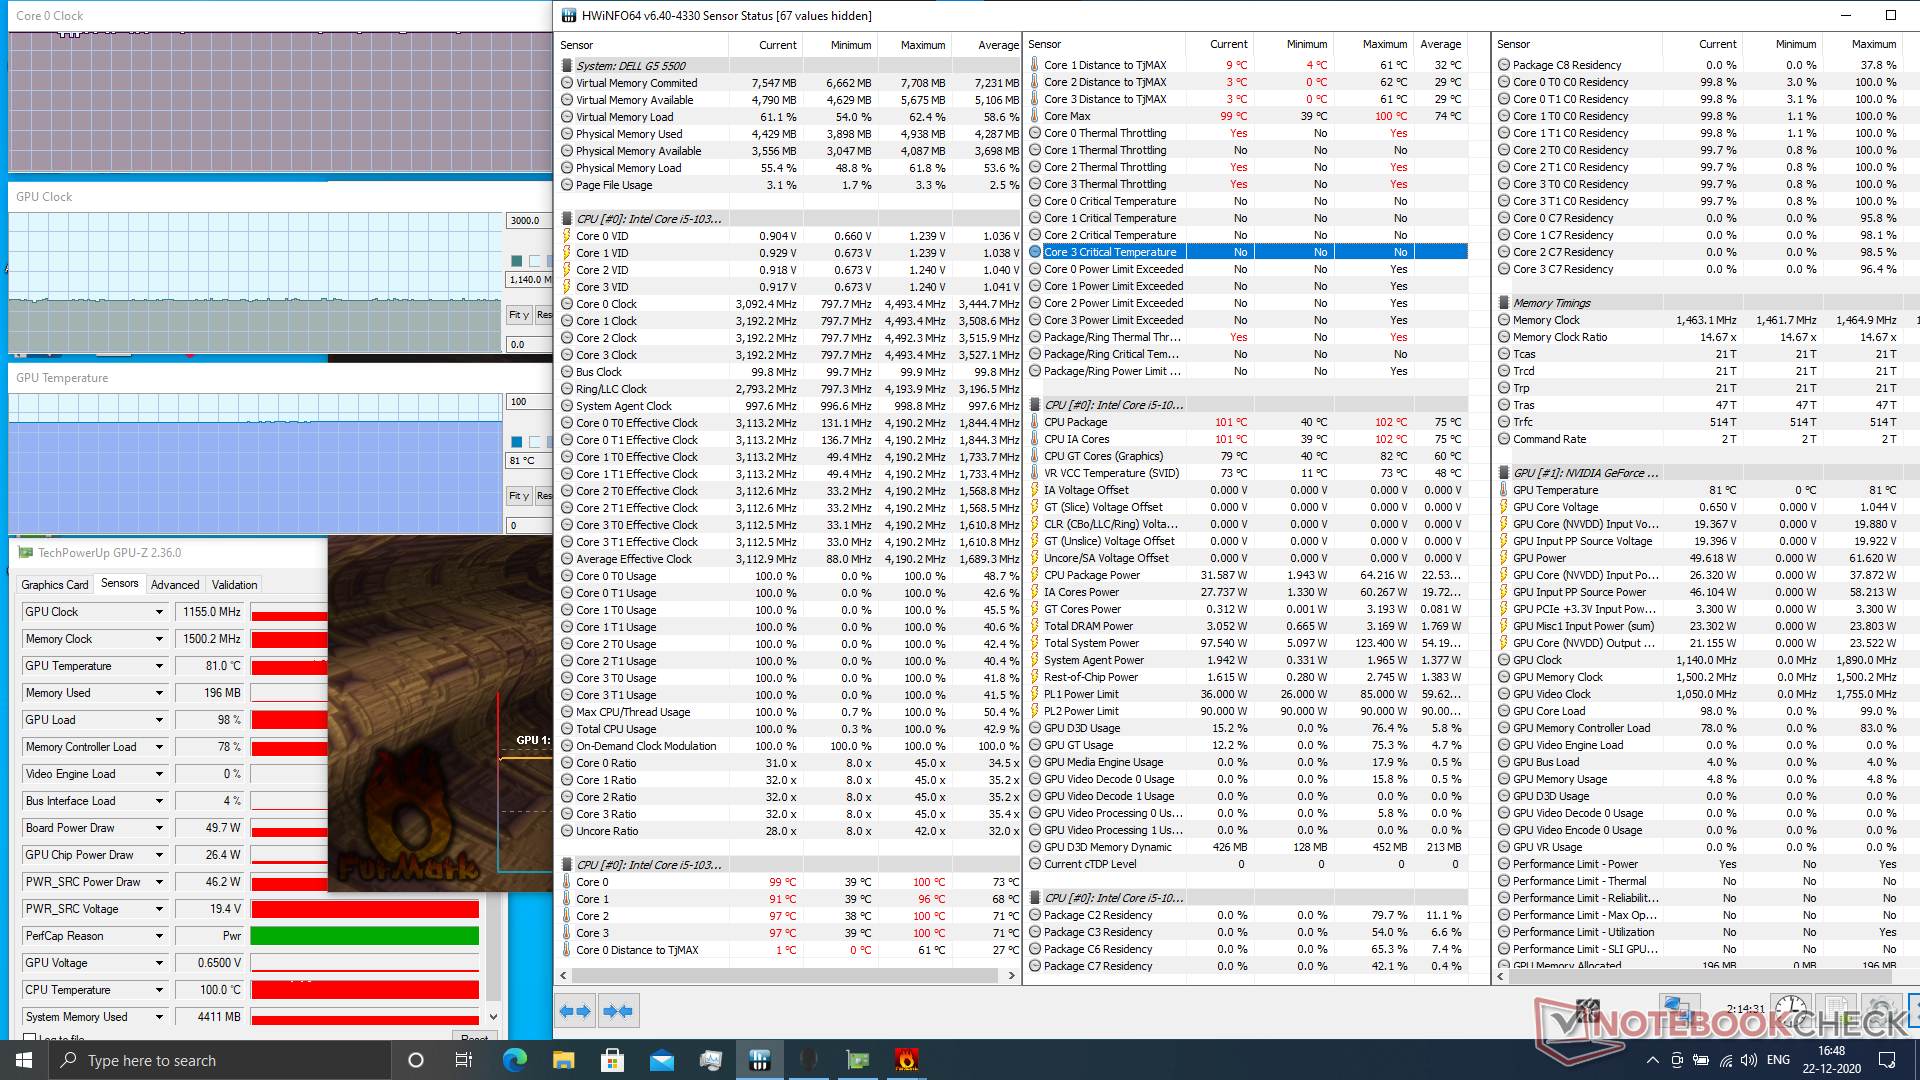
We further stressed the laptop by running both Prime95 and FurMark together. This caused maximum CPU and GPU temperatures to hit 100 °C and 81 °C, respectively. The system seems to try hard to allocate power to both components. This results in the CPU voltage dropping down to just 0.88 V. That being said, in both CPU stress tests, the laptop did not show signs of clock speed dips once the initial throttling phase has passed.
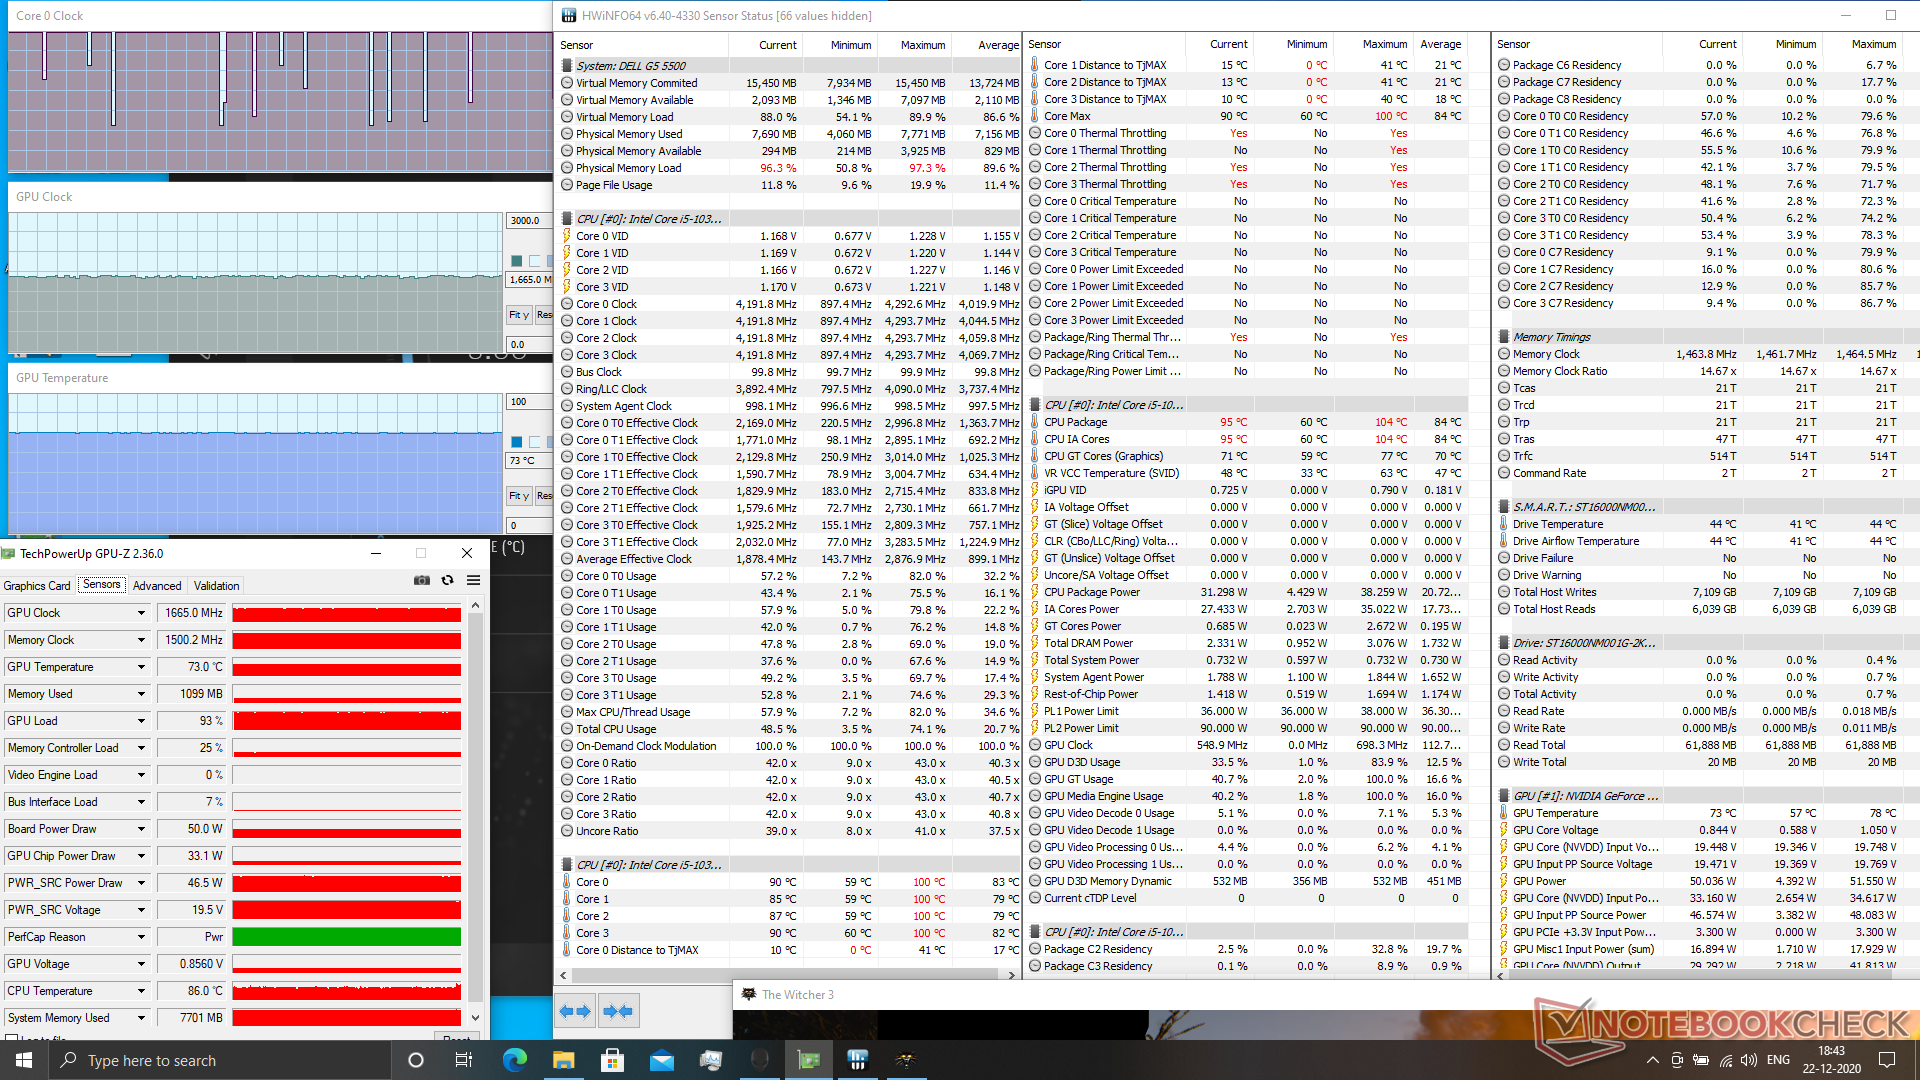
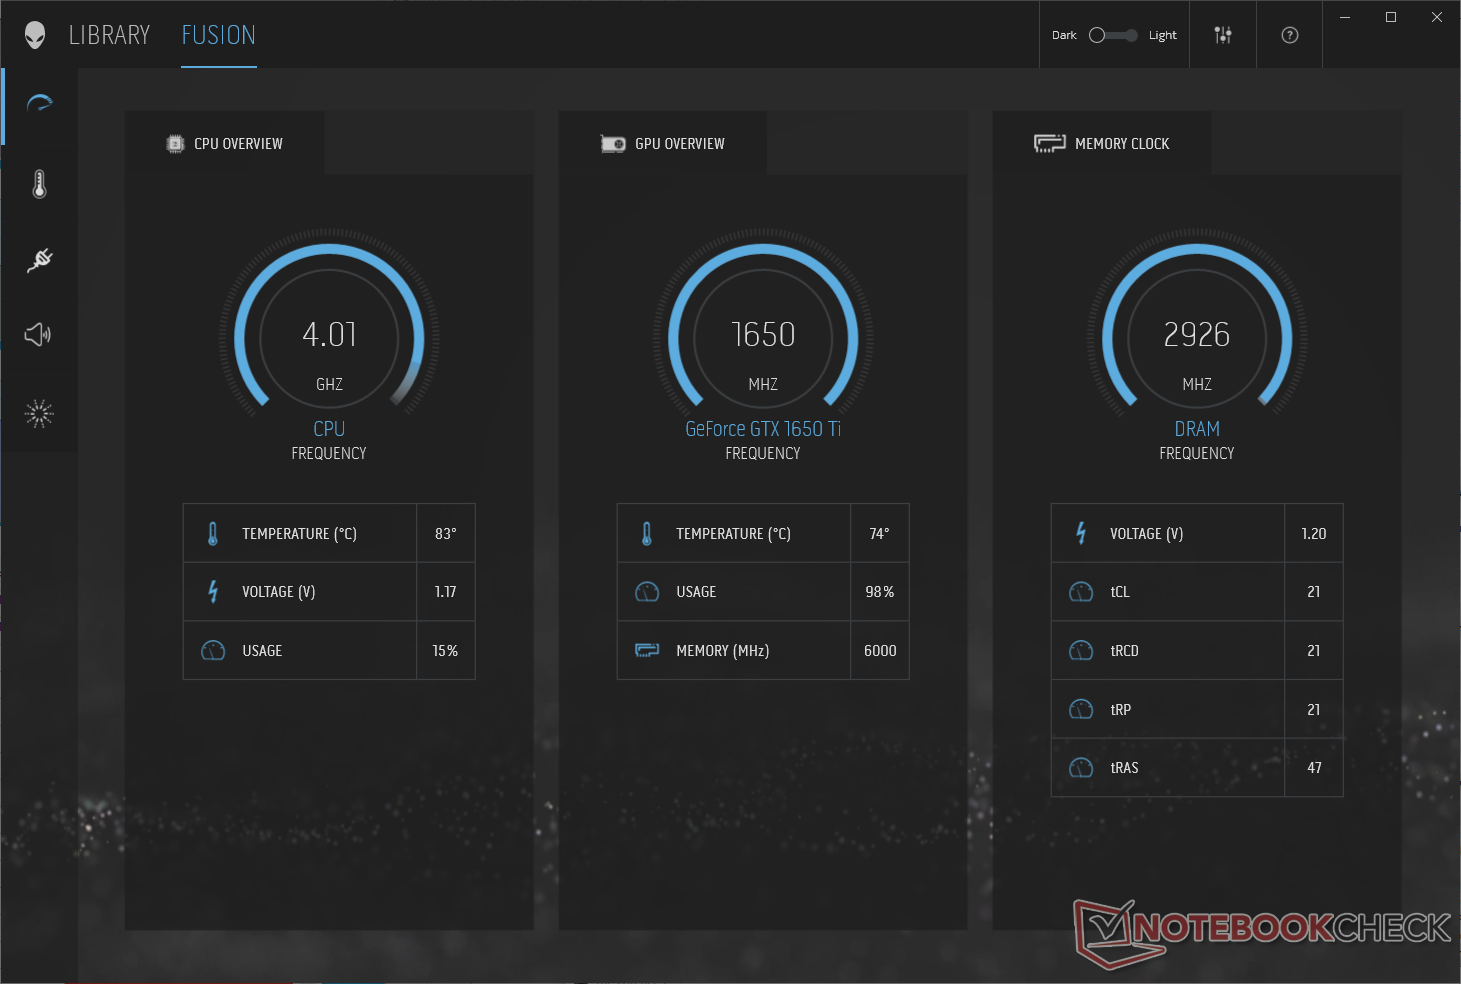
We ran The Witcher 3 on ultra graphics and monitored CPU and GPU clocks, voltages, and temperatures over a 30-minute period. The Core i3-10300H here manages to hit a high of 104 °C and an average of 84 °C while being able to achieve 4.01 GHz at 1.17 V. The GTX 1650 Ti could hit 1,650 MHz while running at a much cooler 74 °C and drawing 33.1 W for the chip alone.
Of course, real-life usage wouldn't be as stressful as our tests, so you can expect fairly consistent CPU and GPU performance for most applications including games. However, the higher temperatures mean that placing the device on the lap while under load should be avoided to prevent burn injuries.
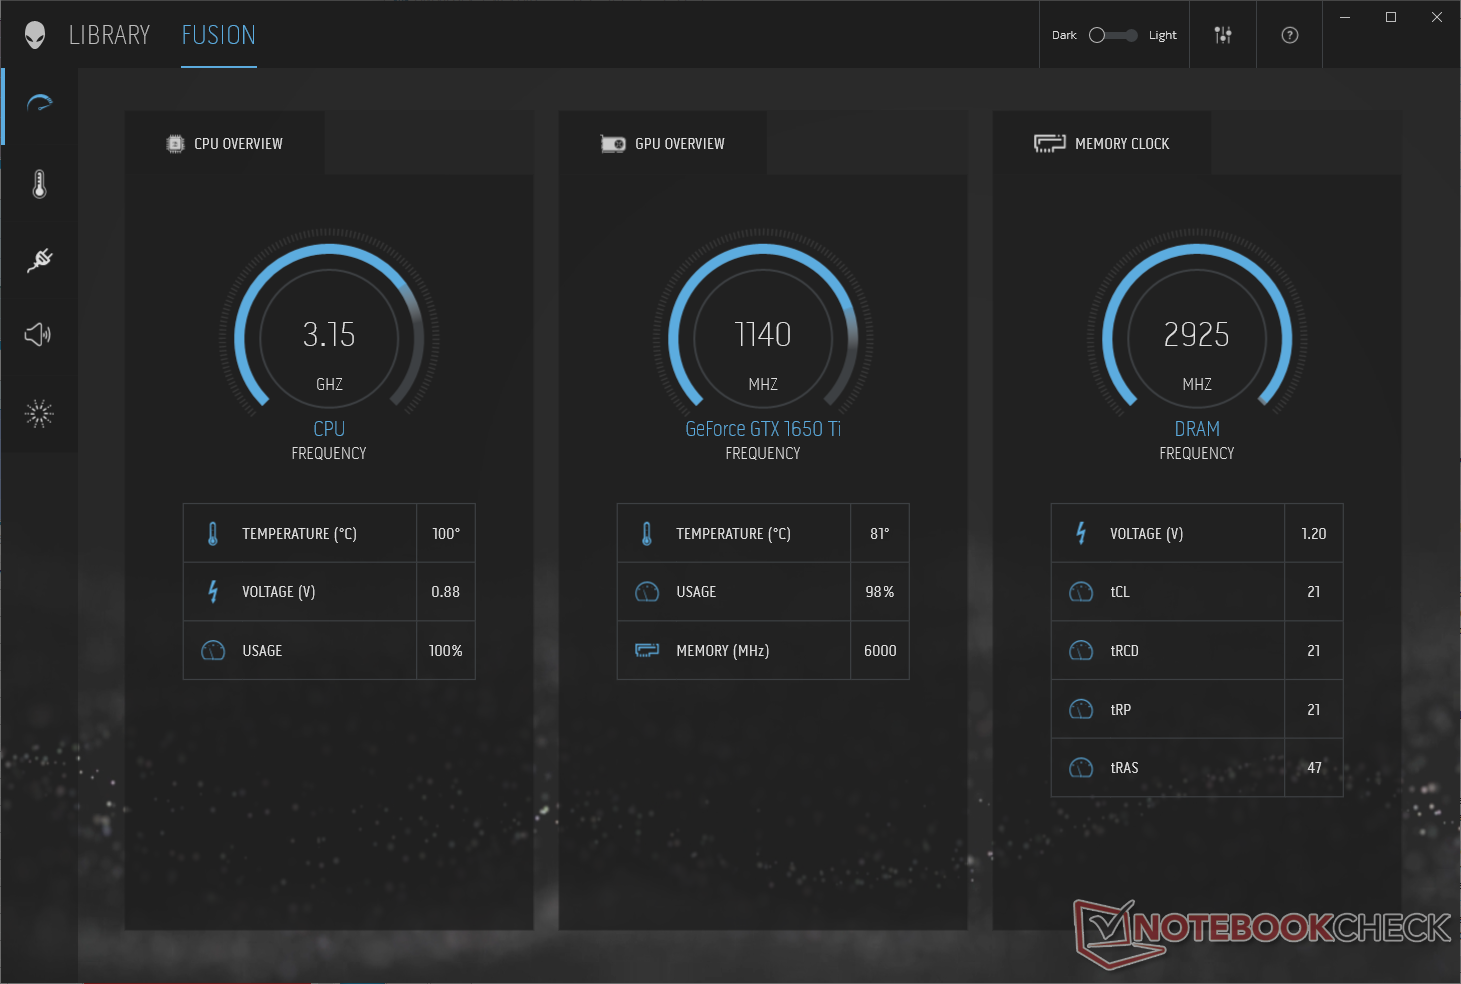
| Stress Test | CPU Clock (GHz) | GPU Clock (MHz) | Average CPU Temperature (°C) | Average GPU Temperature (°C) |
|---|---|---|---|---|
| Idle | 4.25 | 300 | 54 | 54 |
| Prime95 | 3.76 | 300 | 72 | 62 |
| FurMark | 3.48 | 1,215 | 73 | 65 |
| Prime95 + FurMark | 3.15 | 1,140 | 75 | 81 |
| The Witcher 3 Ultra | 4.01 | 1,650 | 84 | 73 |
Speakers
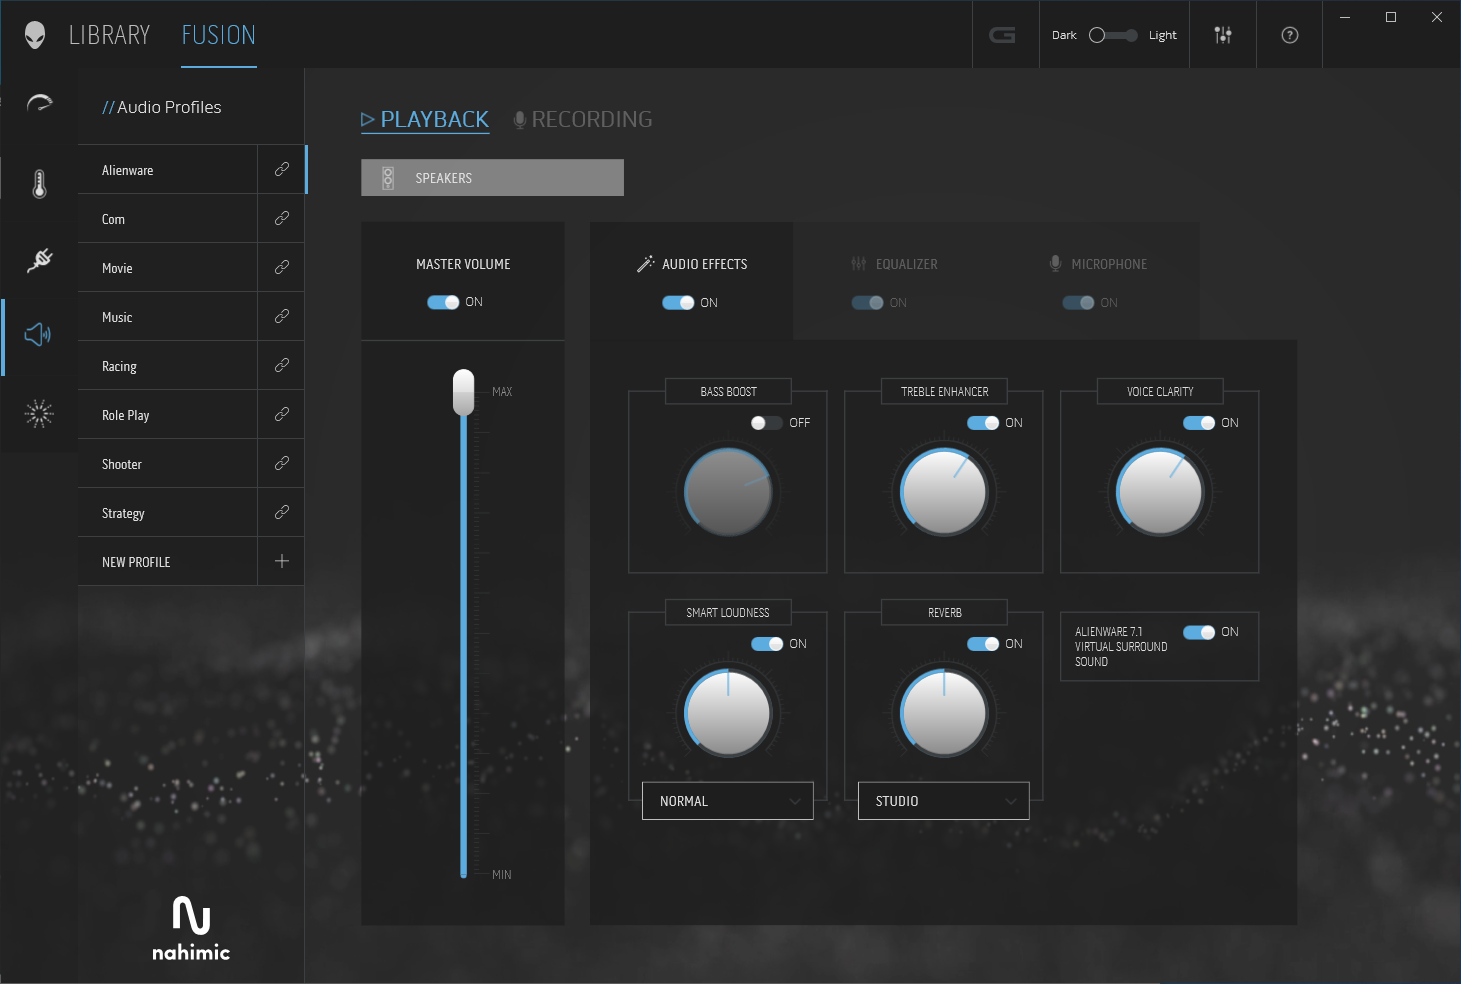
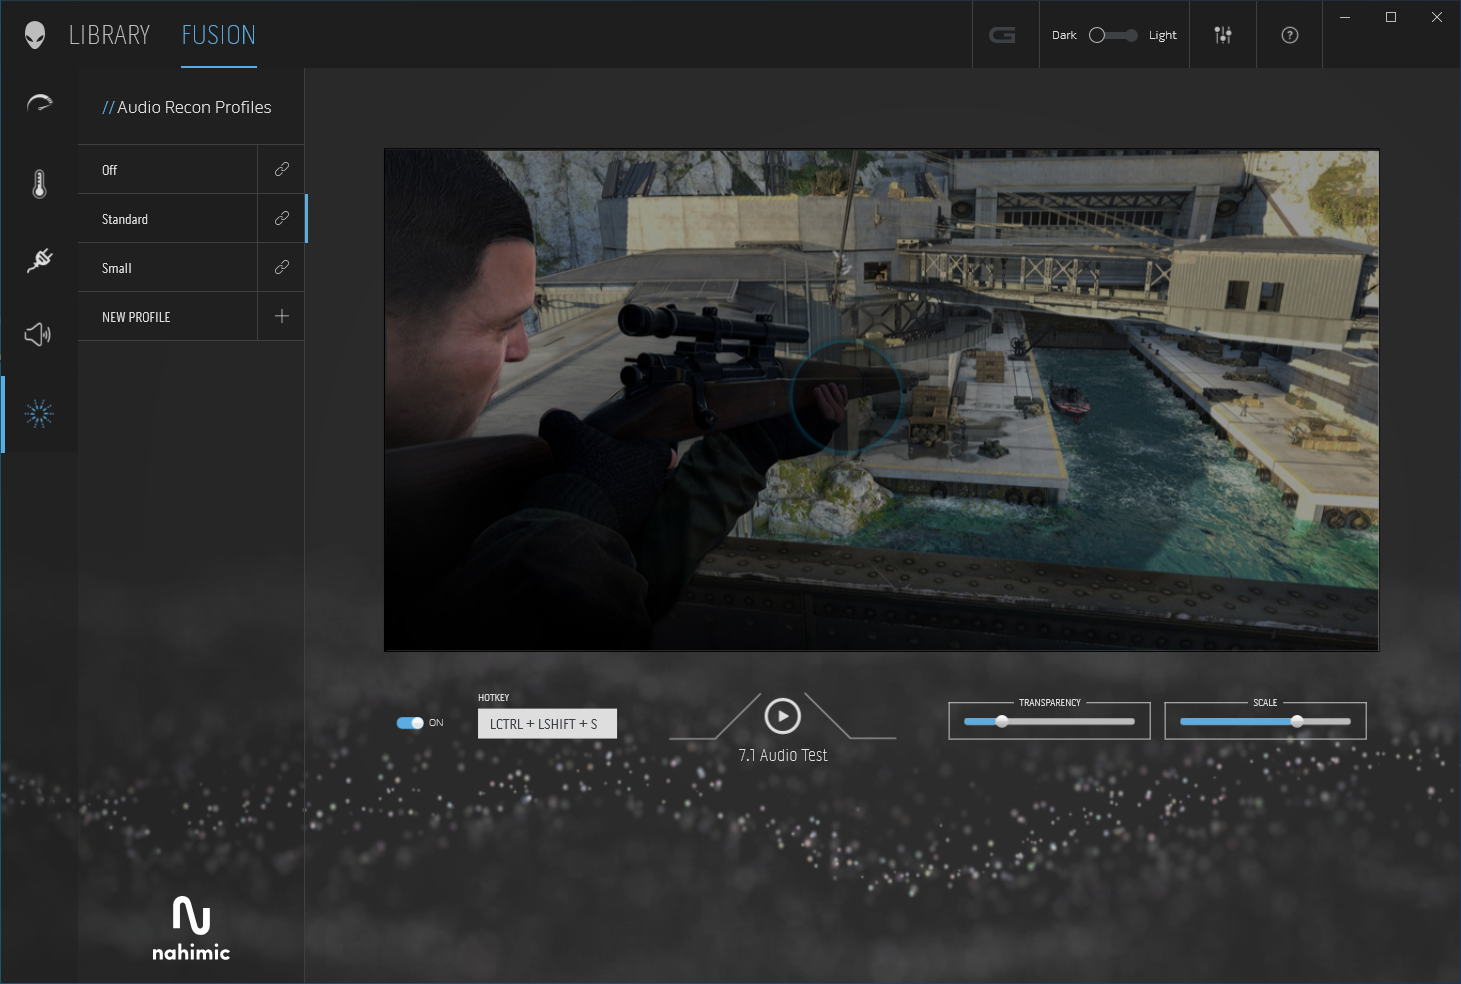
Bottom-firing speakers are present on either side of the chassis. Like most laptops in this price range, the speaker quality is mediocre at best with almost non-existent bass. That being said, they don't sound tinny and there is perceivable depth to the sound, especially in the mids and highs.
In an indoor environment, the output is amply loud at full volume without any distortions. Nahimic sound controls are integrated into the Alienware Command Center app.
Battery Life
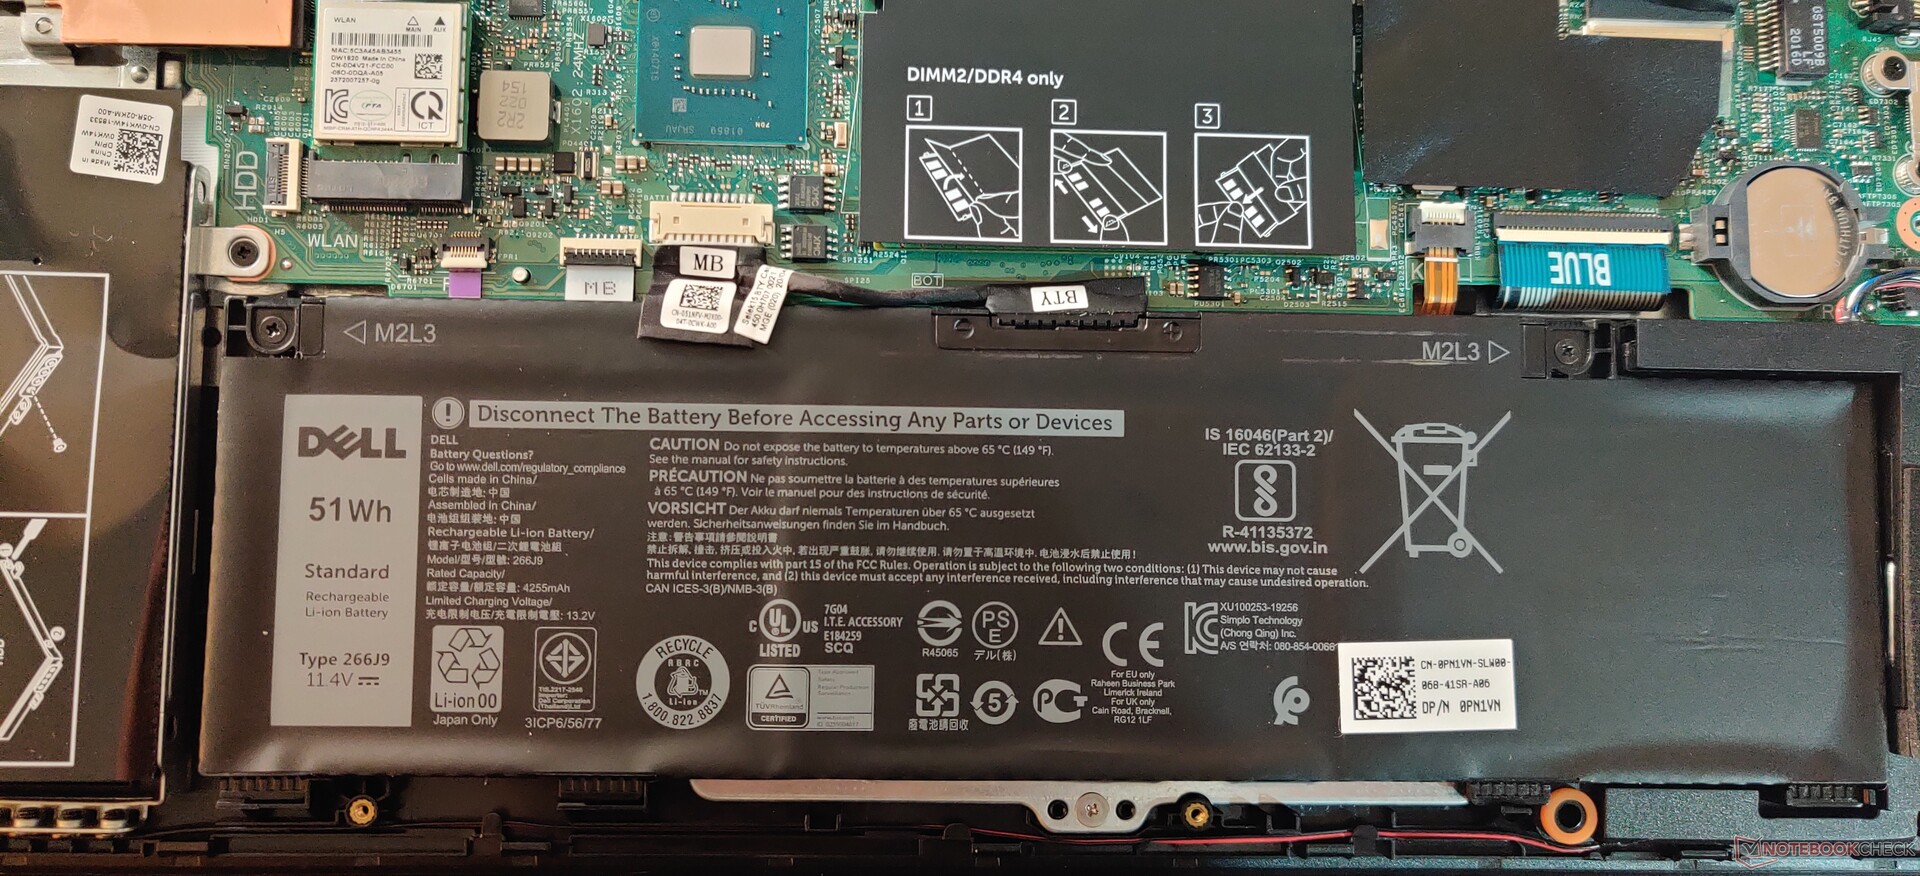
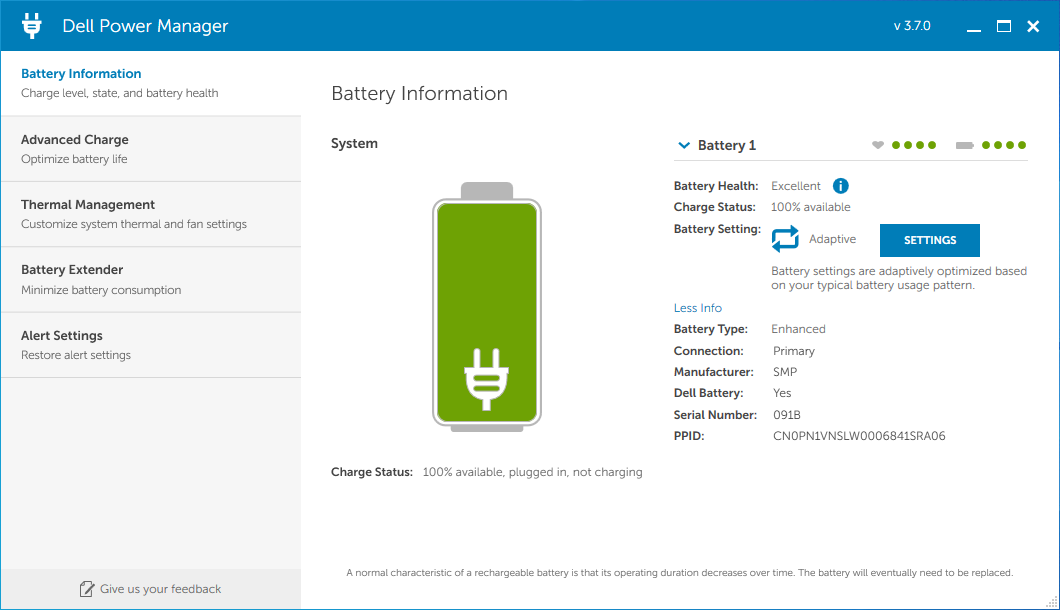
The Core i5-10300H and GTX 1650 Ti combination makes sparing use of available battery resources. However, with a rating of just 51 Wh, the Dell G5 15 5500 can only offer mediocre battery life. Battery life on idle at the lowest brightness without WLAN is very good at 12 hours 10 minutes. Surfing on Wi-Fi at a brightness of approximately 150 cd/m2 yields close to 6 hours 22 minutes of runtime.
The battery lasts for just about 1 hour 14 minutes on load, which we determined by running The Witcher 3 on Ultra settings and setting the screen brightness to 150 cd/m2. However, we observe that the frame rates drop to a meager 7 fps average as the battery reaches around the 15% level, indicating that it is not able to supply enough power to keep up with the GPU's demand.
These results indicate that staying away from AC power for extended periods of time may not be feasible. It takes approximately 2.5 hours to charge the laptop from 0 to 100% using the supplied 130 W power brick. There is no possibility of charging the laptop via USB-C.
| Dell G5 15 5500 09E2 i5-10300H, GeForce GTX 1650 Ti Mobile, 51 Wh | HP Pavilion Gaming 16-a0242ng i5-10300H, GeForce GTX 1650 Ti Mobile, 52 Wh | Lenovo Legion 5 17IMH05 i5-10300H, GeForce GTX 1650 Mobile, 80 Wh | Lenovo IdeaPad Gaming 3i 15IMH05 i5-10300H, GeForce GTX 1650 Mobile, 45 Wh | MSI GF75 Thin 10SCXR i5-10300H, GeForce GTX 1650 Mobile, 51 Wh | Average of class Gaming | |
|---|---|---|---|---|---|---|
| Battery Runtime | ||||||
| WiFi Websurfing (h) | 6.4 | 8.3 30% | 11.4 78% | 6.3 -2% | 4.7 -27% | 7.11 ? 11% |
Pros
Cons
Verdict
The Dell G5 15 5500 sports enough oomph without offering any RGB bling or being too "gamery", thereby making it a decent work companion as well. The overall build quality is great with almost little to no flexing except slightly in the usual areas such as the keyboard deck and the display. Connectivity options are decent, though we would have liked to see a Thunderbolt 3 port and USB power delivery options as well.
The RAM, SSD/HDD, and WLAN card are user-upgradeable, though it baffles us why Dell prefers using the uncommon M.2 2230 slot for NVMe SSDs, especially when there is no M.2 2280 expansion available.
The display is the Achilles' heel for our model. We hope this is limited to only our unit and not actually a "feature". Though most gaming laptops in this price sacrifice color gamut and accuracy for high refresh rates, for a 2020 laptop, the measured sRGB coverage still leaves a lot to be desired.
The Dell G5 15 5500 tries its best to appeal to the mid-range gamer with decent system performance. However, its sub-par display limits its application for many other workflows despite sporting fairly capable hardware.
Display issues apart, the Dell G5 15 5500 performs as expected on the CPU and GPU side of things. Those gaming at medium to high settings at 1080p will find the performance adequate for most AAA titles. While idle times on battery are good, runtimes aren't that impressive on load.
As mentioned before, since the full gauntlet of measurements could not be performed, we are not awarding a rating for the moment. The Dell G5 15 5500 performs admirably for the given configuration, but a better display, more RAM, and a larger battery are some of the things Dell needs to focus on in order to earn an enthusiastic recommendation for its asking price.
Price comparison
