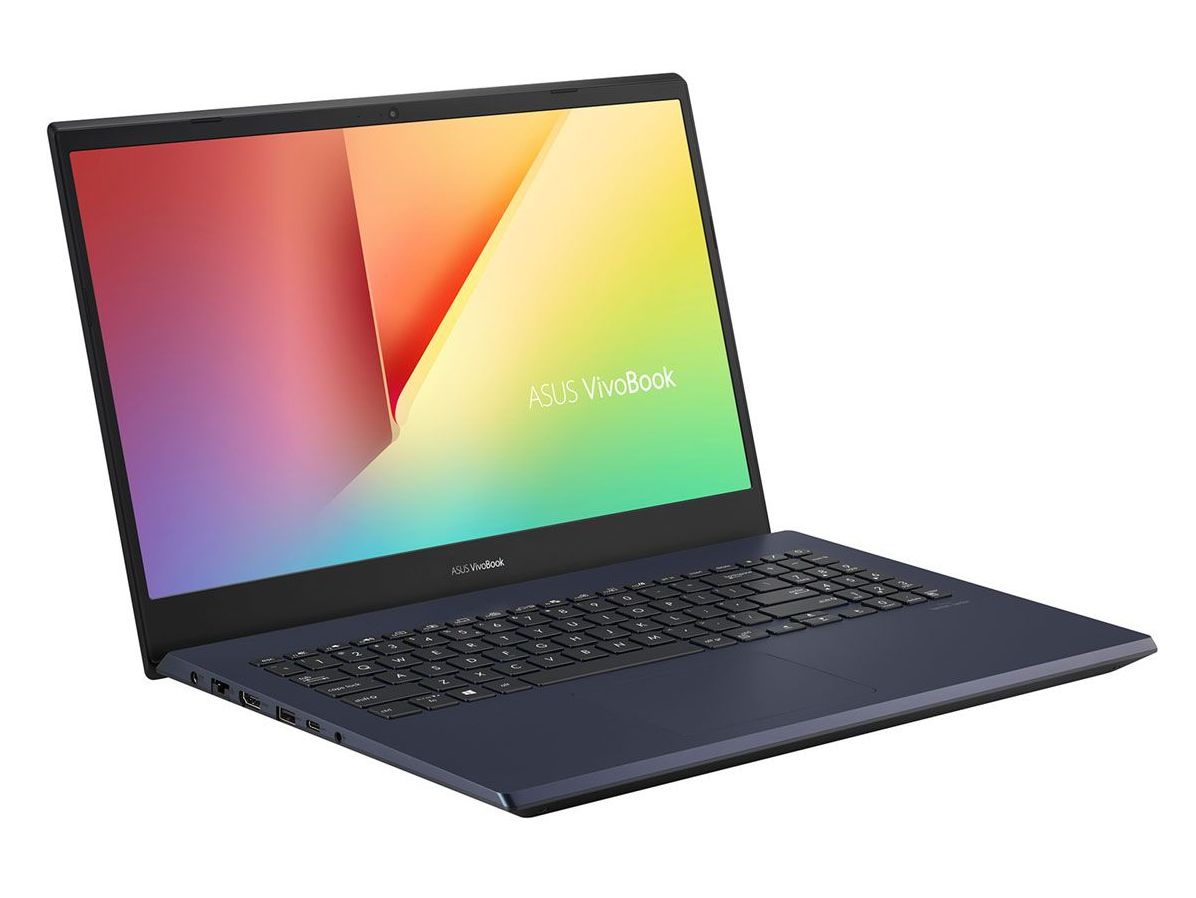
Asus VivoBook 15 K571LI Laptop Review: Gaming Multimedia Hybrid
The VivoBook series is home to Asus' mid-range multimedia laptops or Ultrabooks designed to be a step down from the pricier flagship ZenBook series. In this case, our VivoBook 15 K571LI is a higher-end model in the family targeting performance users who aren't ready to spend hundreds of dollars more on the HP Envy 15, MacBook Pro 15, or Dell XPS 15. This particular system offers many of the same performance features including Core H-series CPUs and GeForce GTX-level GPUs without breaking the bank.
Our test unit today comes fully equipped courtesy of Computer Upgrade King for approximately $1100 to $1200 USD retail. Lesser SKUs without our Core i7 CPU, 120 Hz 1080p display, 1 TB SSD, and 40 GB of RAM are also available.
More Asus reviews:
Rating | Date | Model | Weight | Height | Size | Resolution | Price |
|---|---|---|---|---|---|---|---|
| 78.6 % v7 (old) | 09 / 2020 | Asus VivoBook 15 K571LI-PB71 i7-10750H, GeForce GTX 1650 Ti Mobile | 2.1 kg | 21.9 mm | 15.60" | 1920x1080 | |
| 83 % v7 (old) | 08 / 2020 | HP Envy 15-ep0098nr i7-10750H, GeForce RTX 2060 Max-Q | 2 kg | 19 mm | 15.60" | 3840x2160 | |
| 81.5 % v7 (old) | 04 / 2020 | Acer Aspire 5 A515-54G i5-10210U, GeForce MX250 | 1.7 kg | 17.9 mm | 15.60" | 1920x1080 | |
| 85.2 % v7 (old) | 03 / 2020 | Asus ZenBook 15 UX534FTC-A8190T i7-10510U, GeForce GTX 1650 Max-Q | 1.6 kg | 18.9 mm | 15.60" | 1920x1080 | |
| 81.4 % v7 (old) | 01 / 2020 | Lenovo Ideapad S540-15IML i5-10210U, GeForce MX250 | 1.9 kg | 17 mm | 15.60" | 1920x1080 | |
| 79.7 % v6 (old) | 08 / 2019 | Dell Inspiron 15 5000 5585 R7 3700U, Vega 10 | 1.8 kg | 19.5 mm | 15.60" | 1920x1080 |
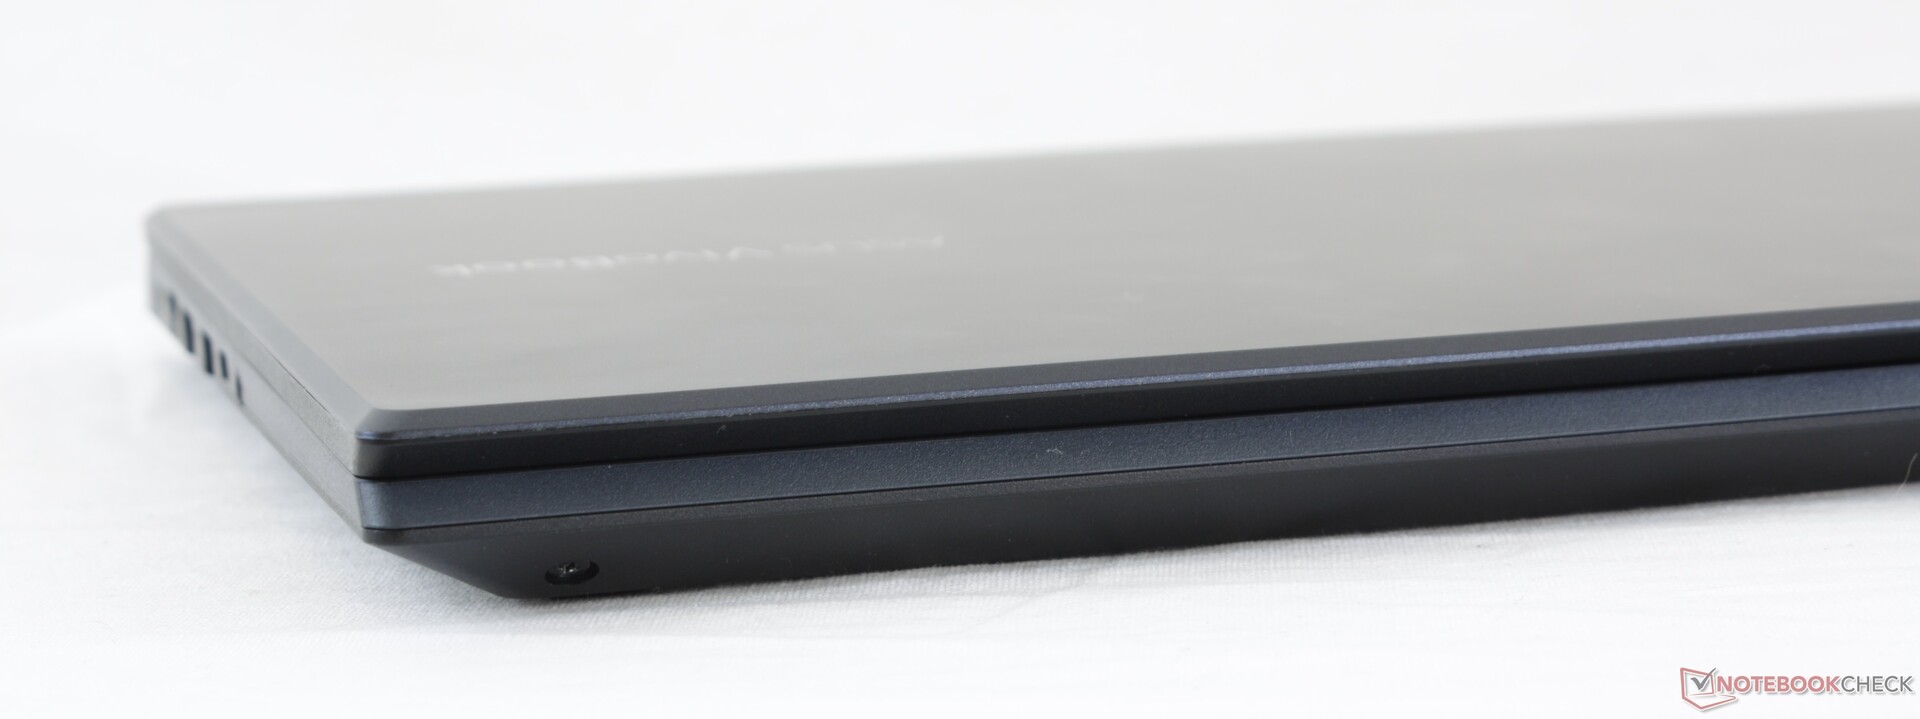
Case
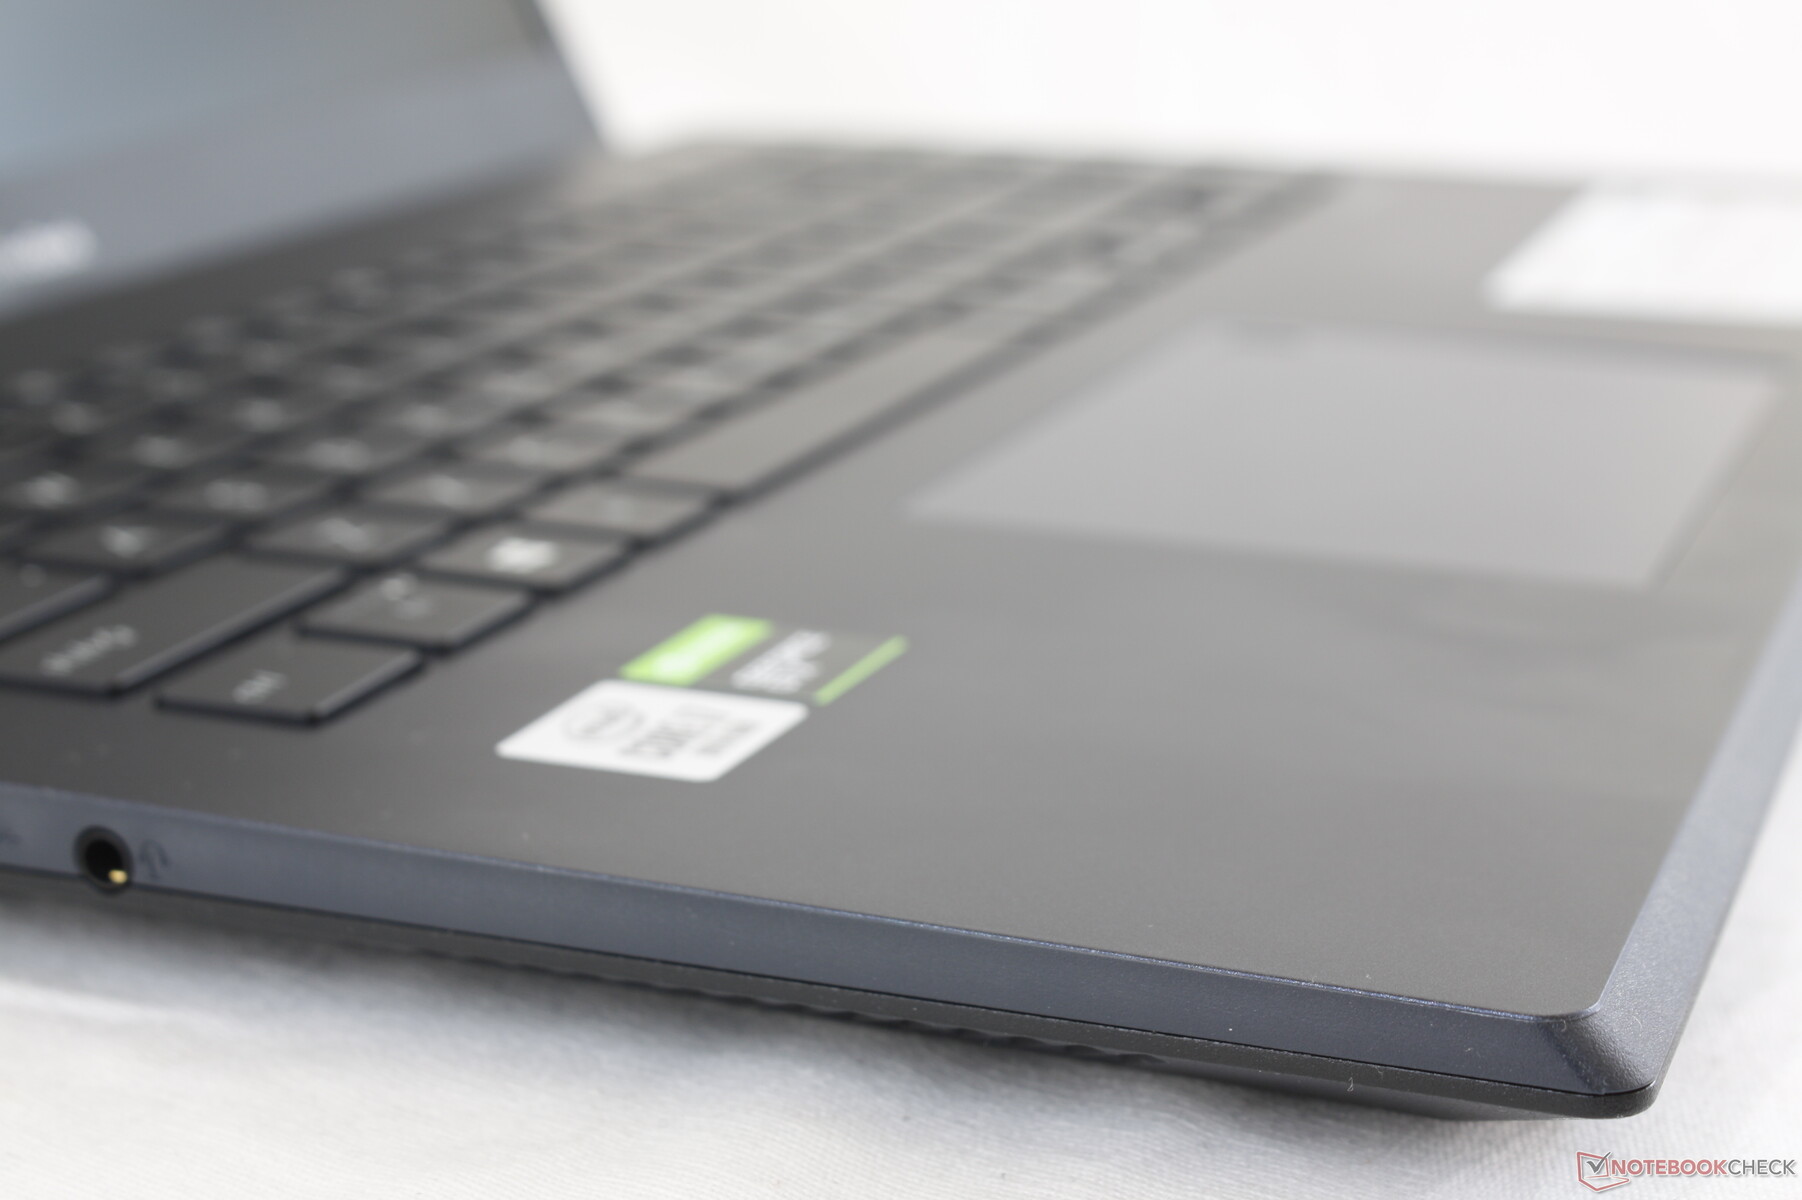
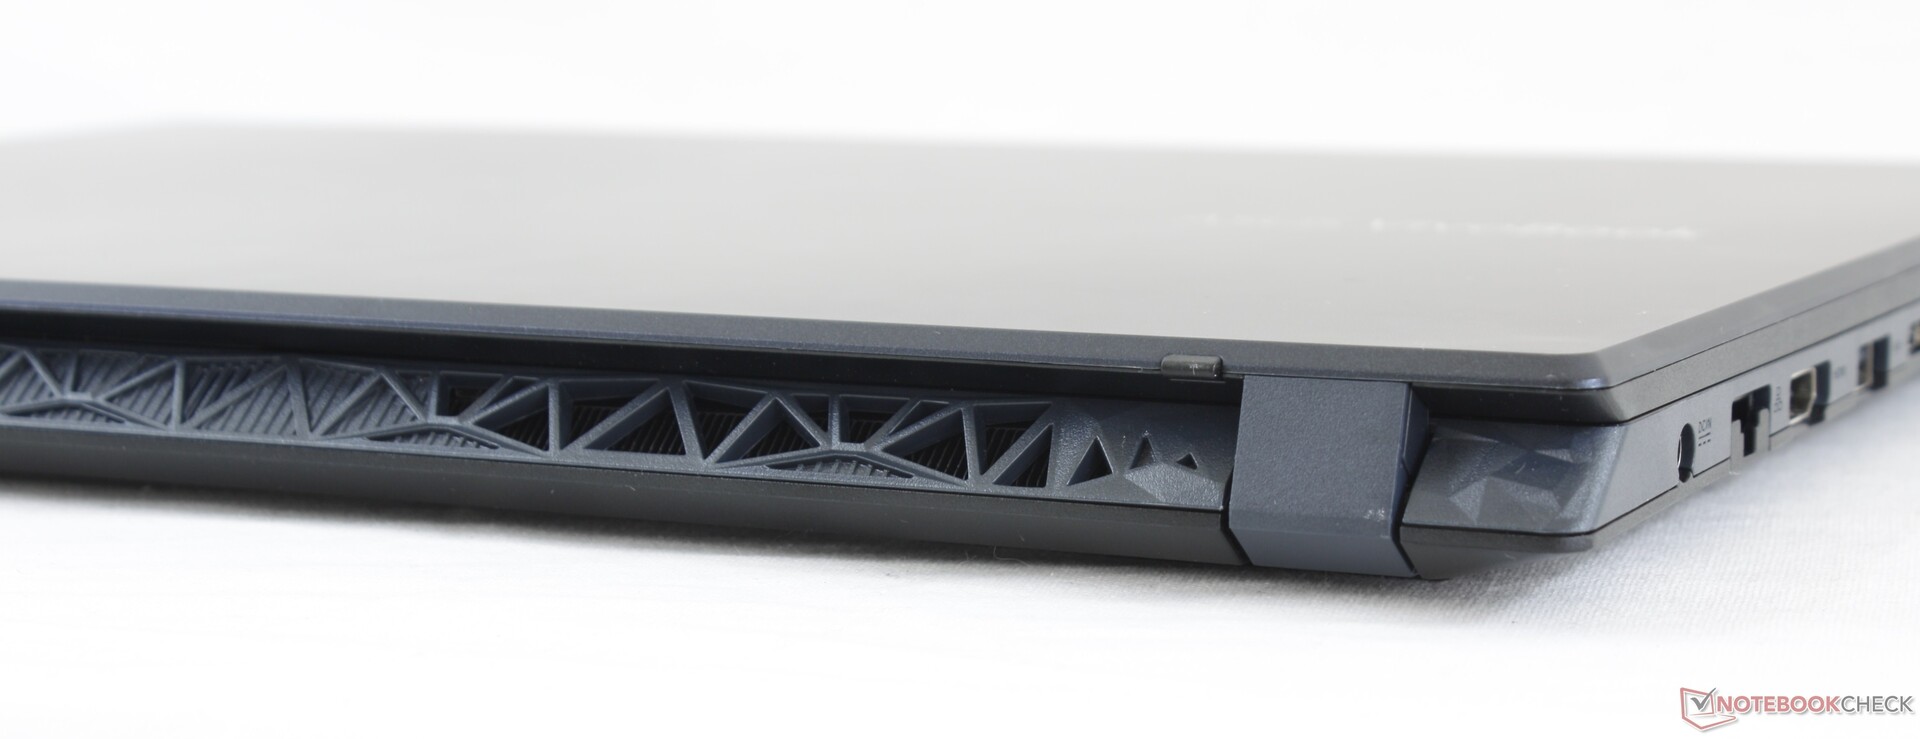
The VivoBook 15 K571 series uses a different chassis design than the VivoBook 15 F512 series in order to accommodate the faster processor options. Chassis rigidity remains about the same as it's still mostly plastic. Both the base and lid will bend more easily to pressure when compared to the HP Pavilion Gaming series while being slightly more rigid than the Lenovo Legion Y540 series. It's decent for a $1000 system so long as users aren't expecting Razer, MacBook, or ZenBook metal materials.
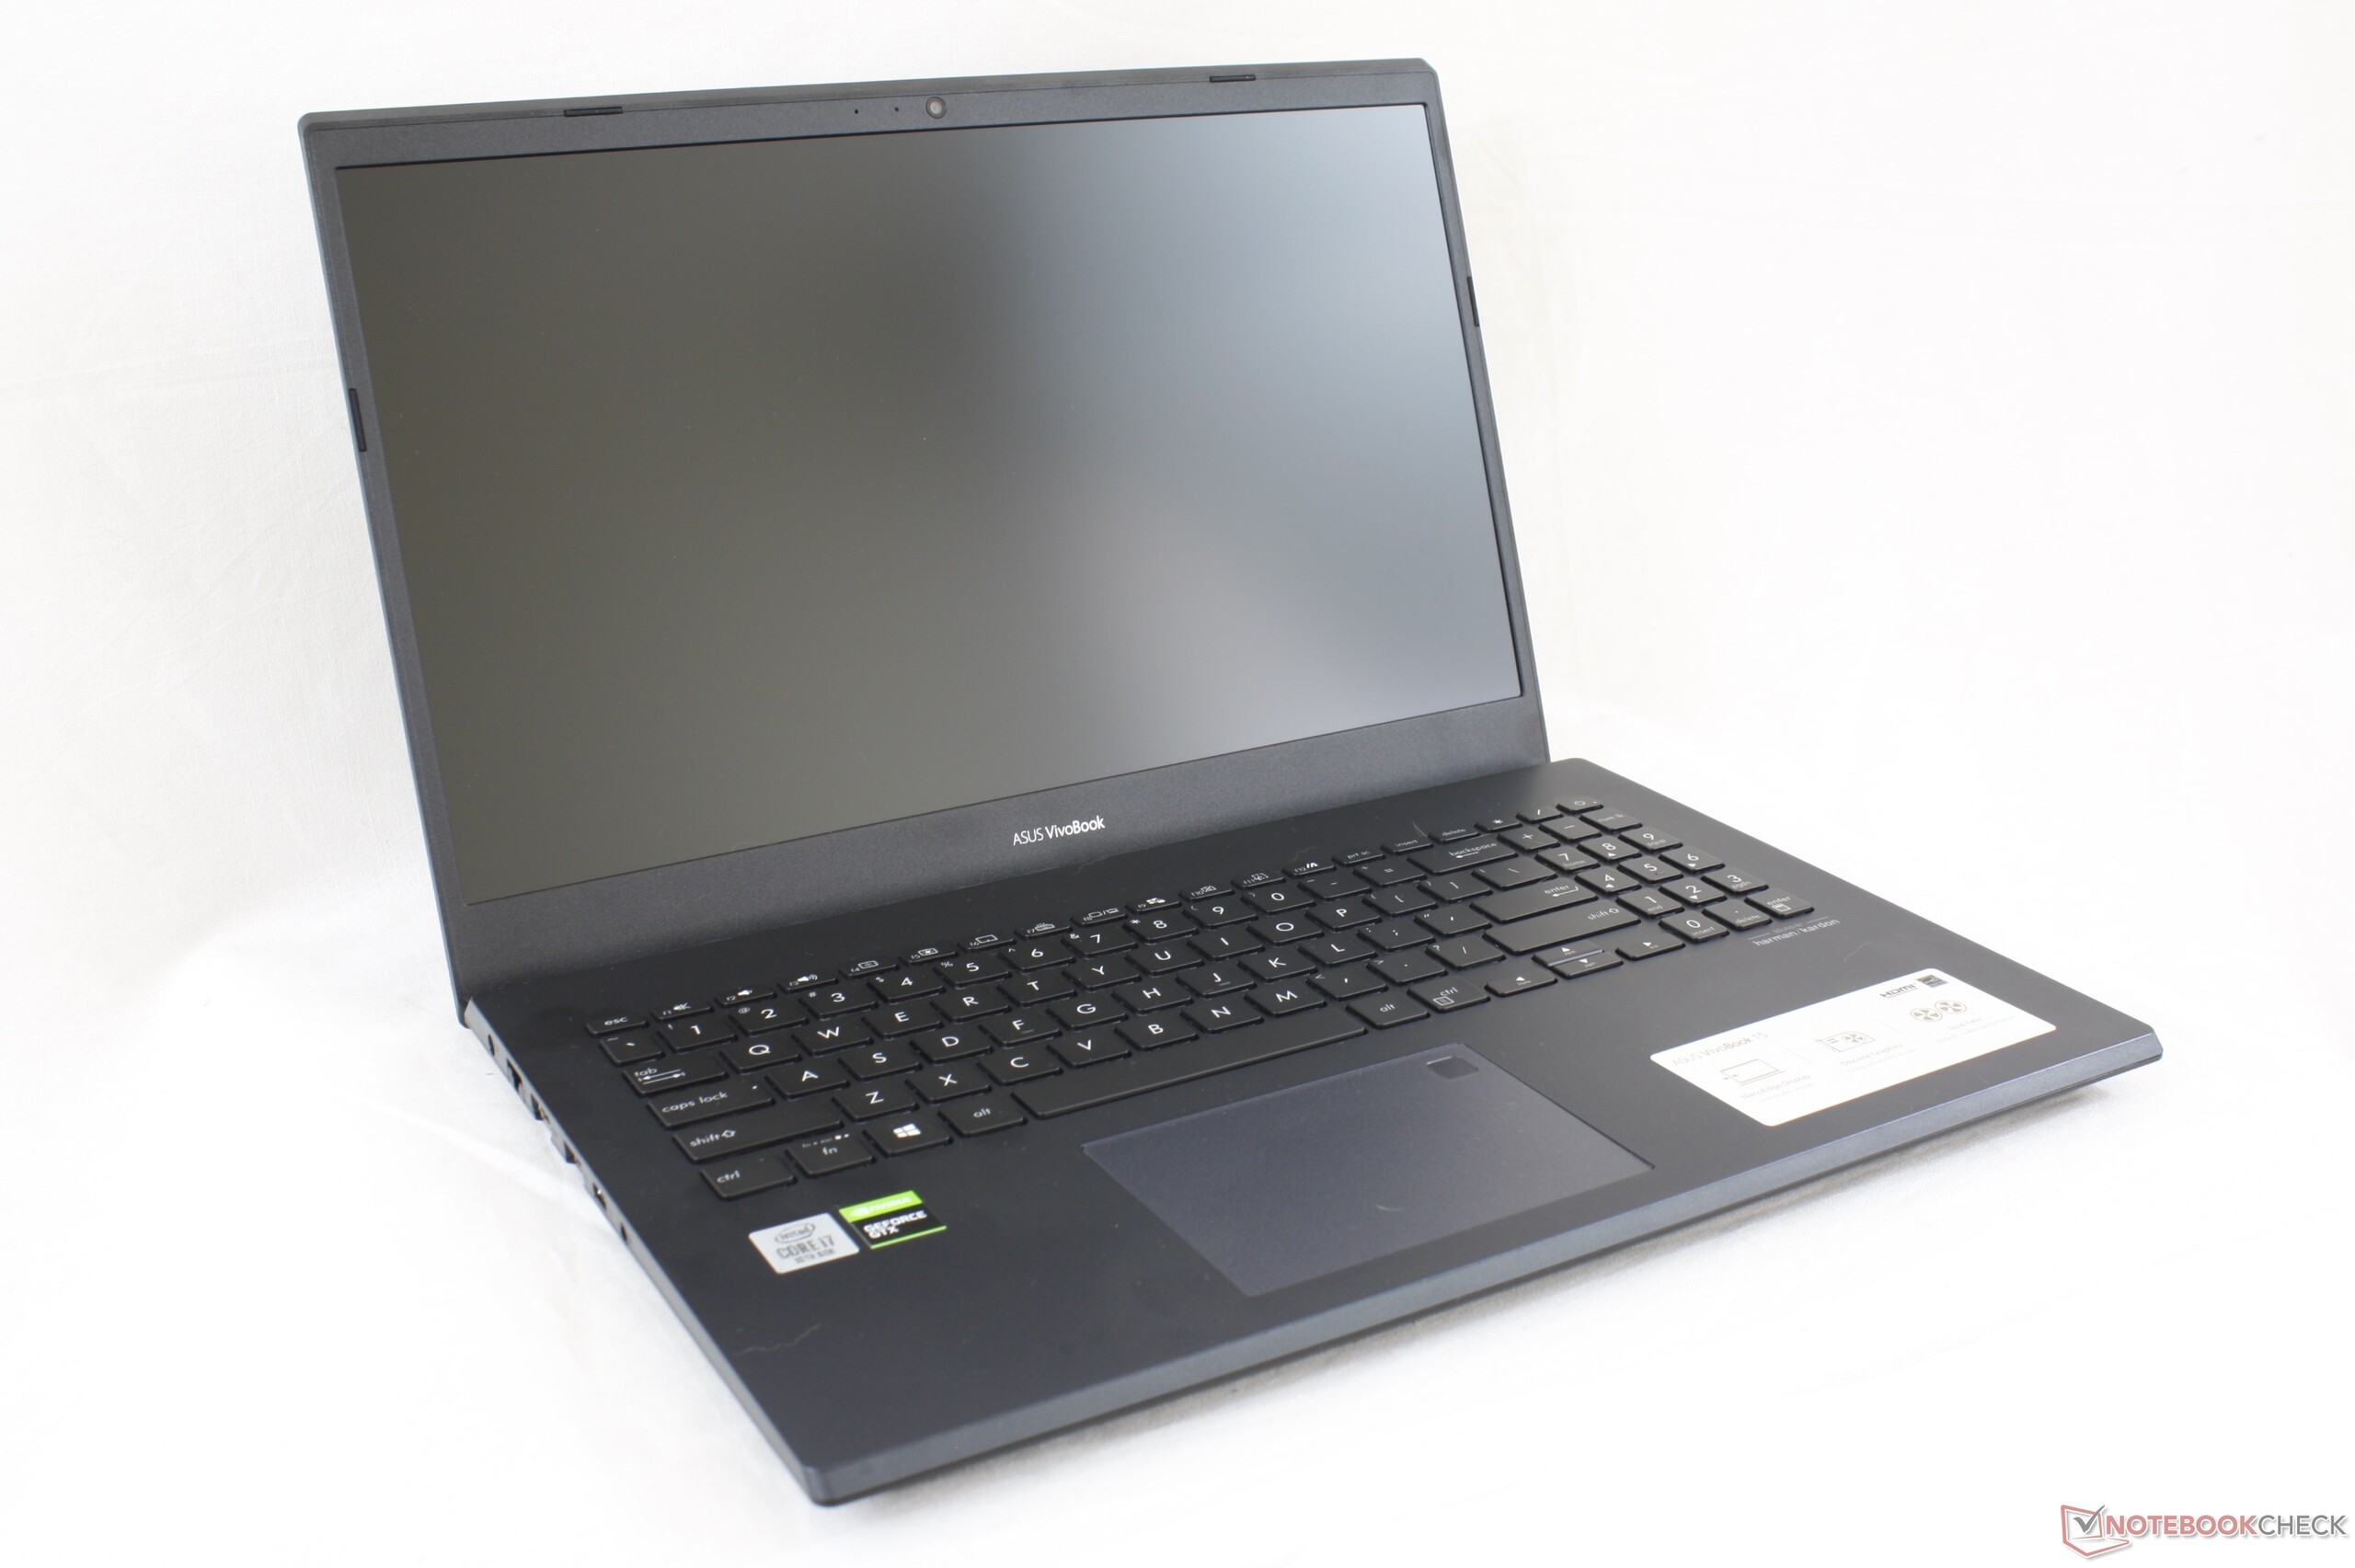
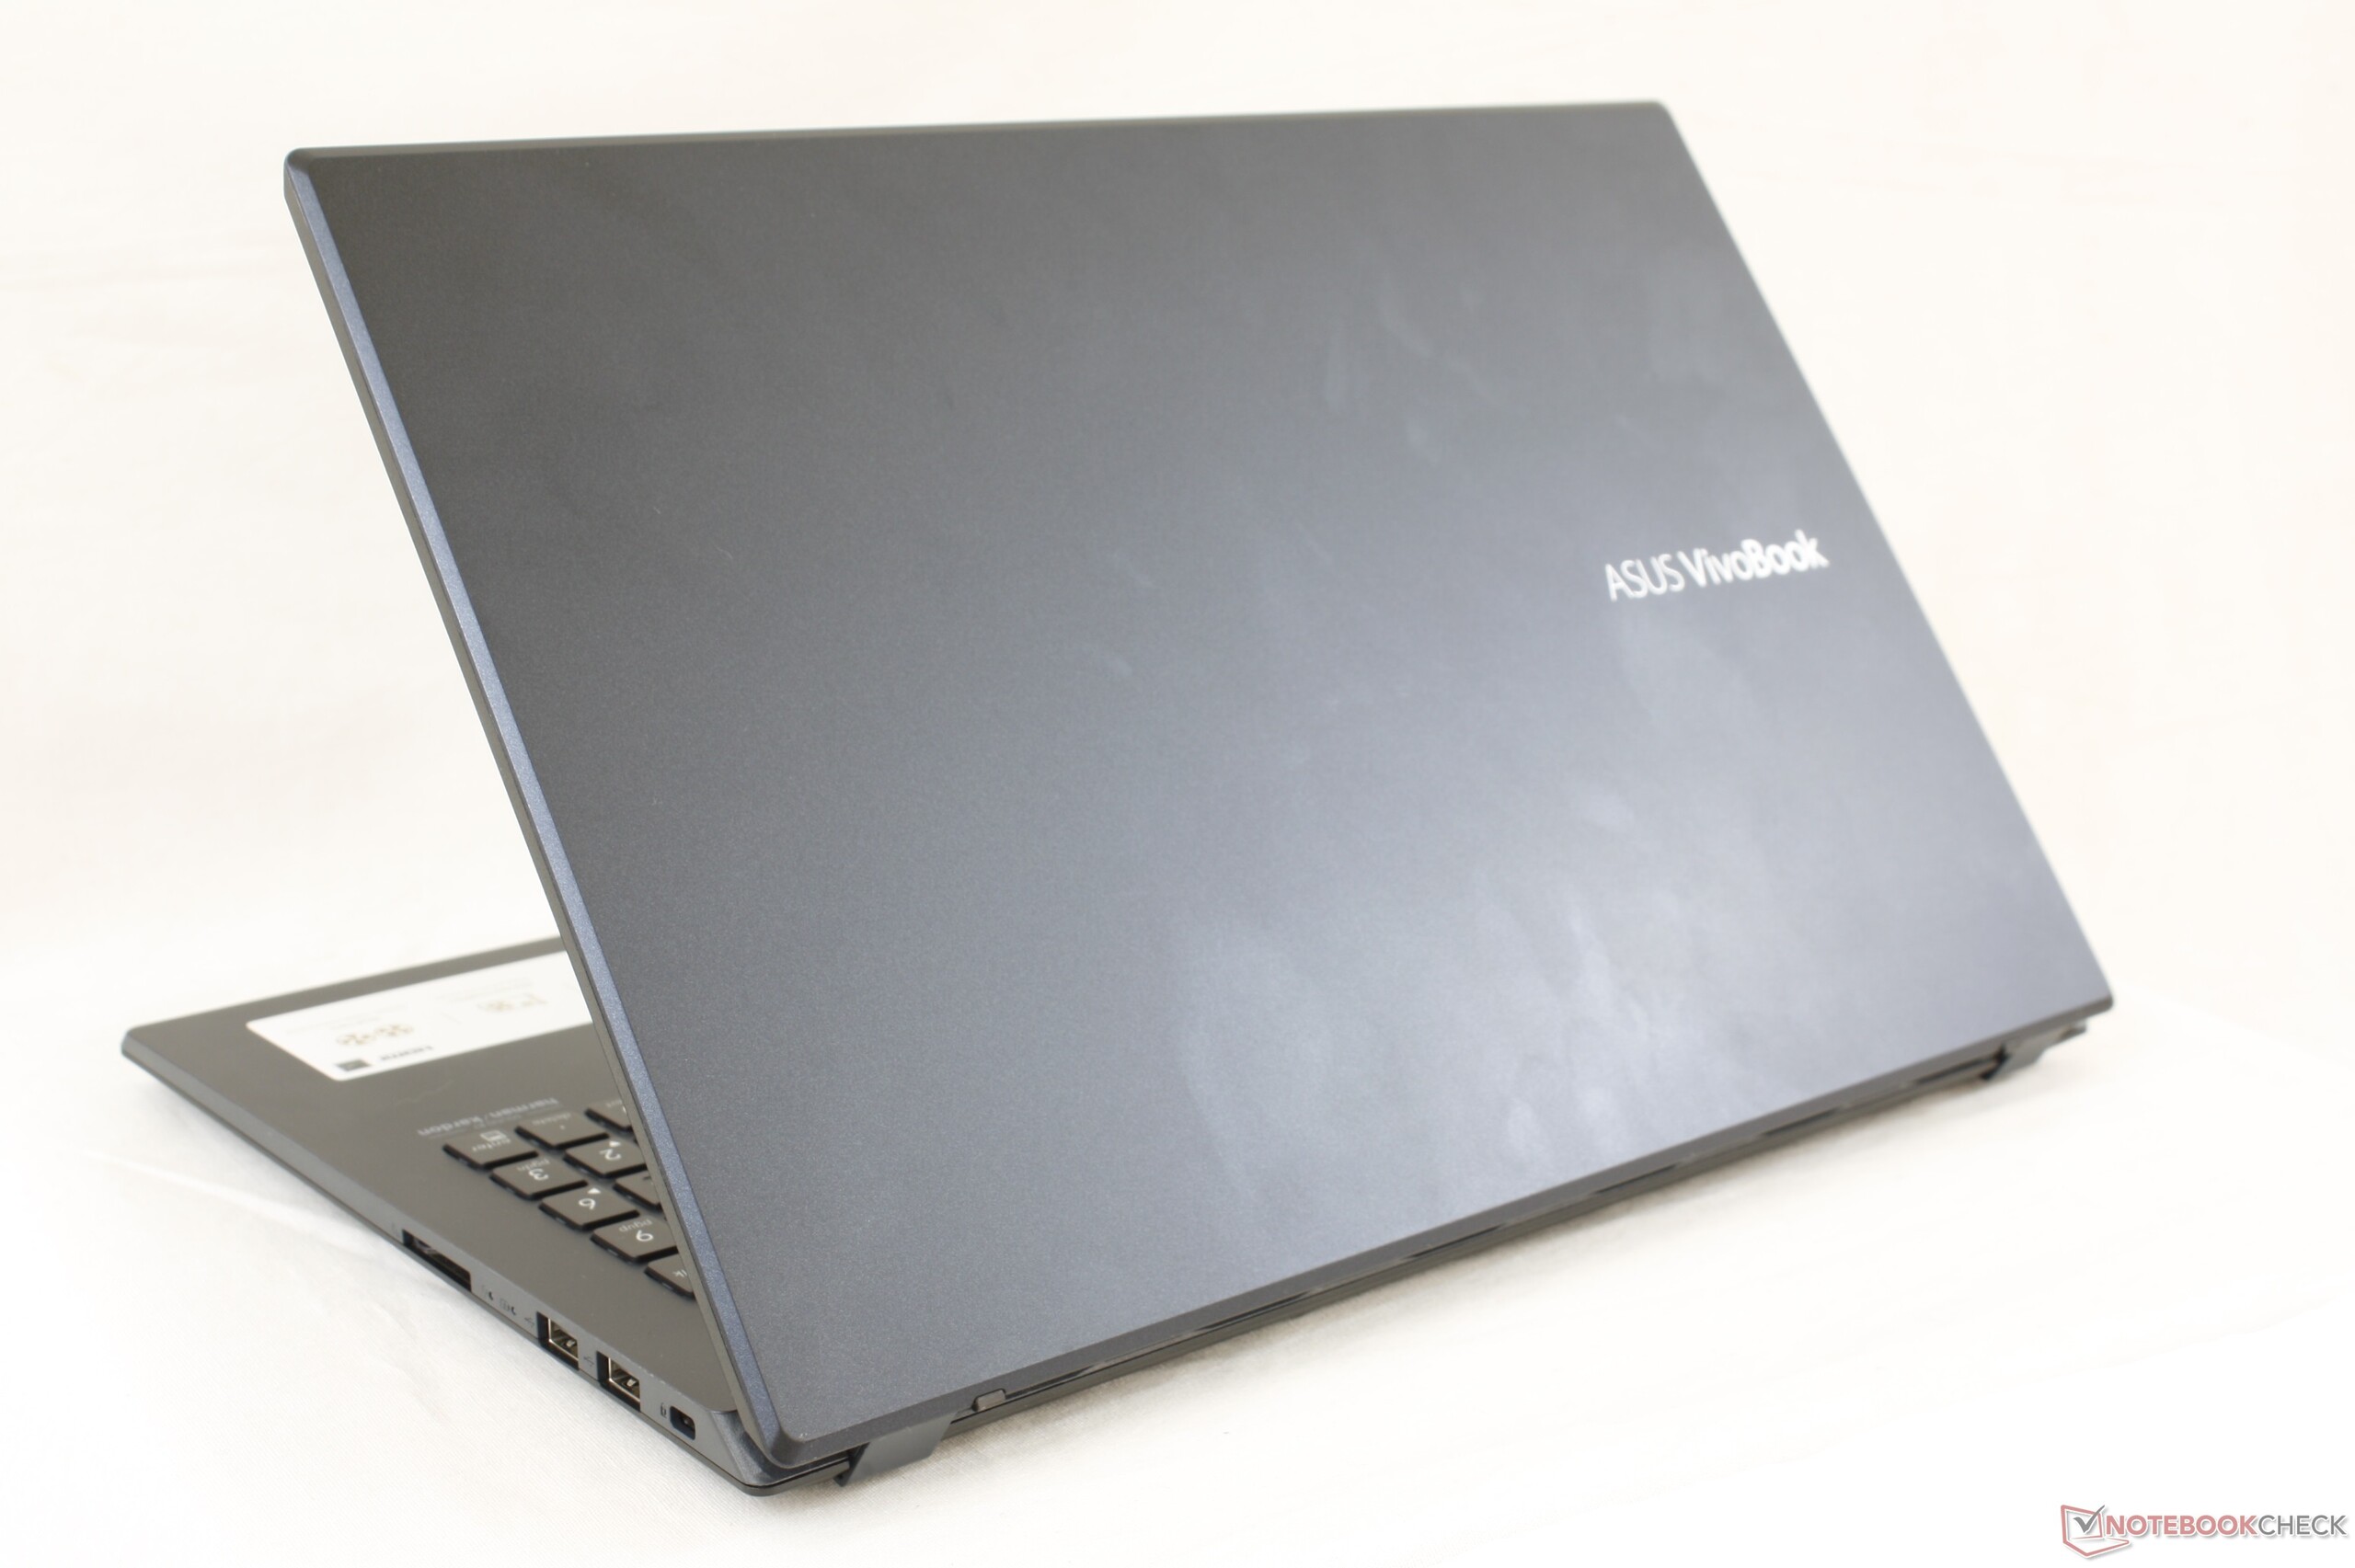
Chassis size and weight are larger than many other multimedia laptops including the HP Envy, ZenBook 15, or Lenovo IdeaPad S540 due in part to its more powerful CPU and GPU options. It sits in between more traditional Ultrabooks and entry-level gaming laptops like the MSI GP65 or TUF A15 series to be relatively compact considering the performance.
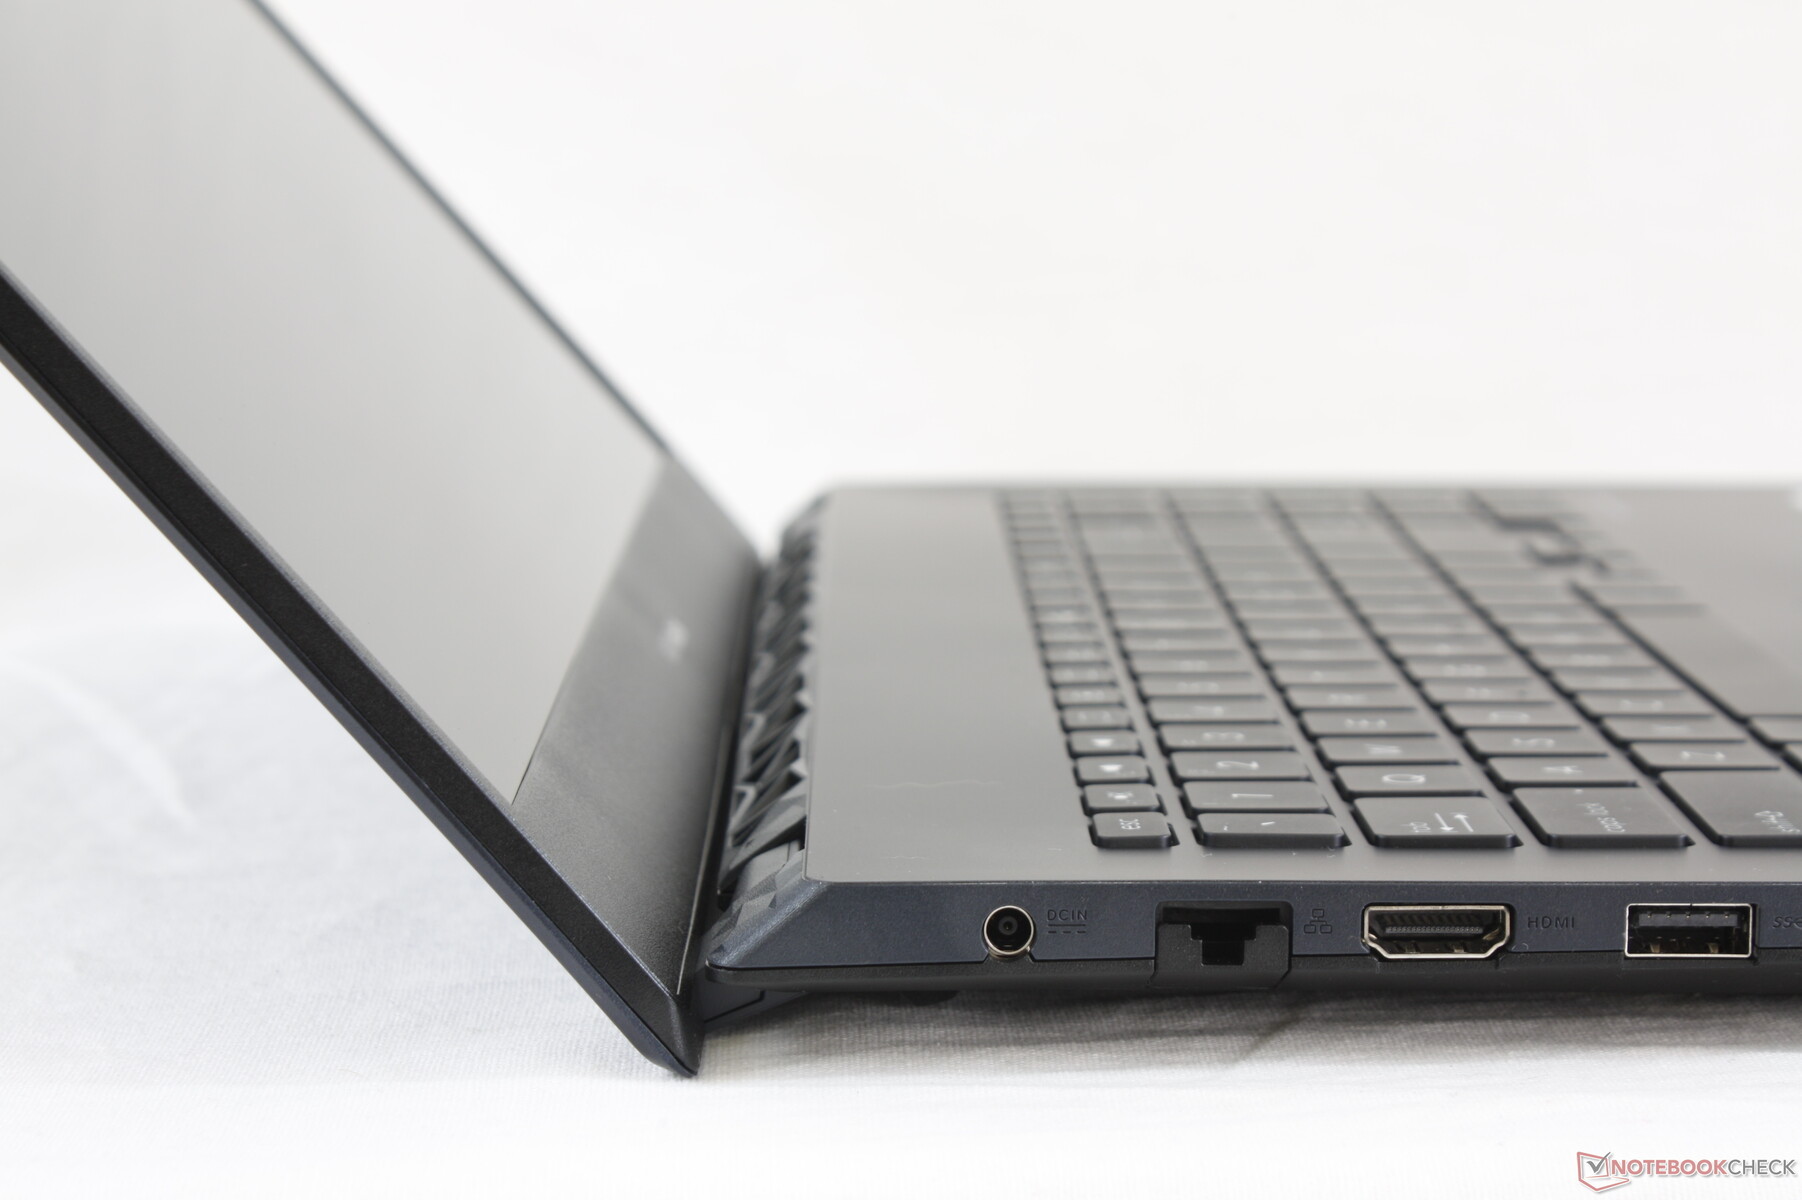
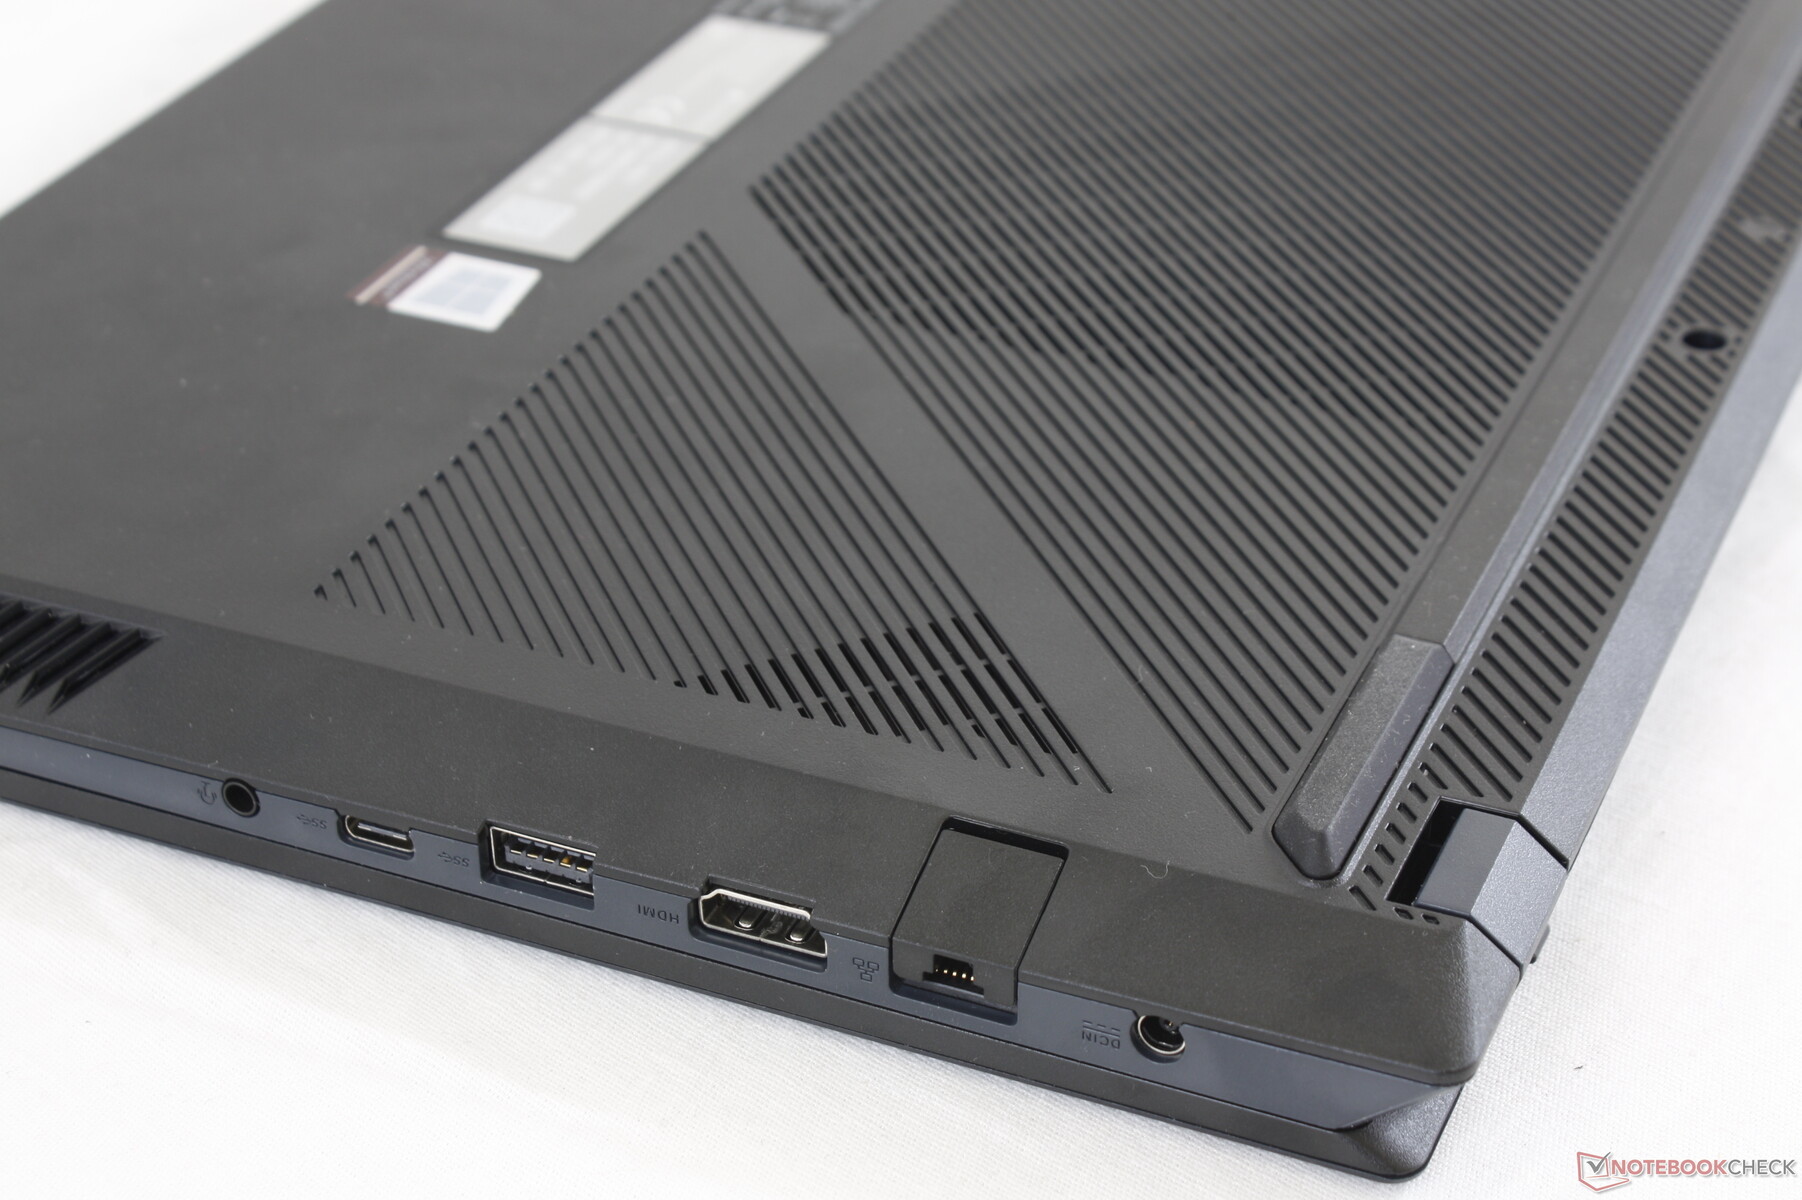
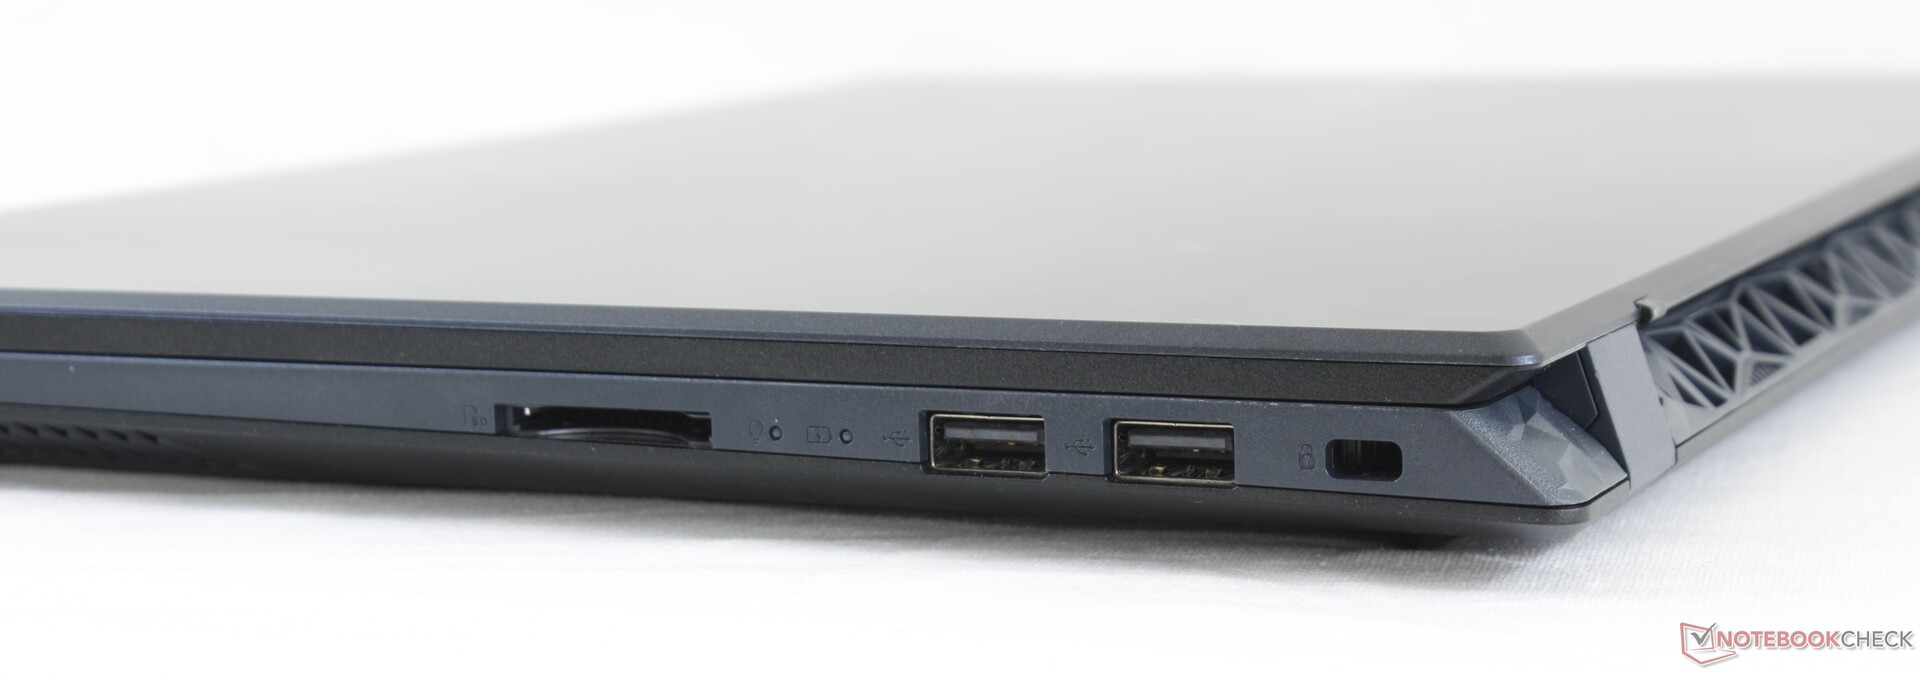
Connectivity
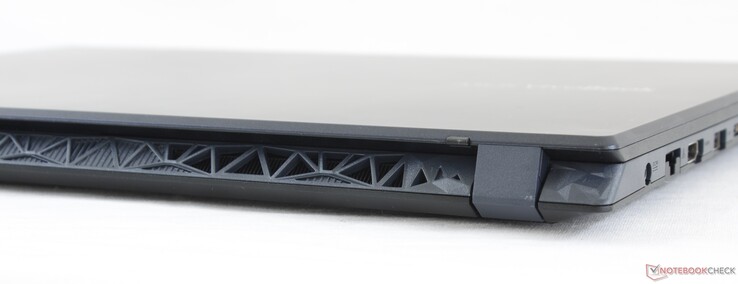
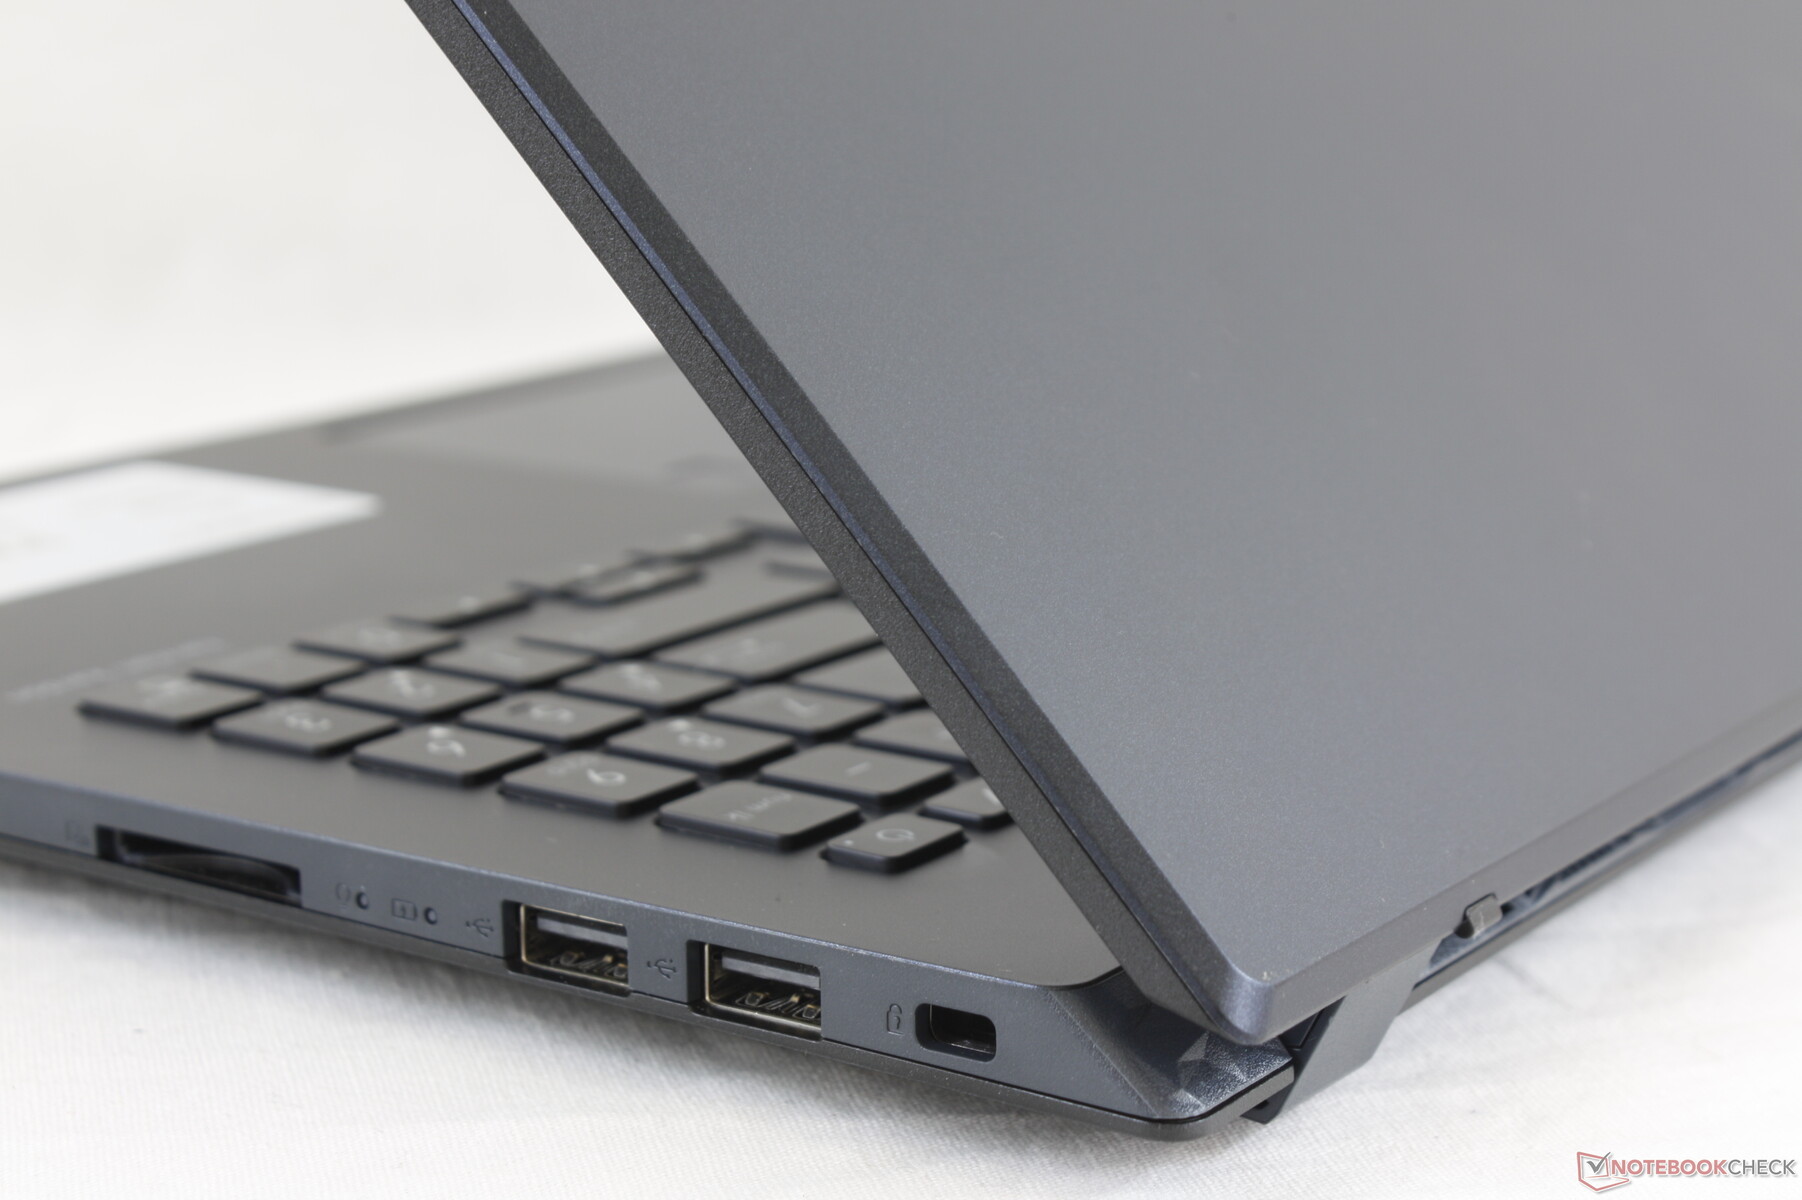
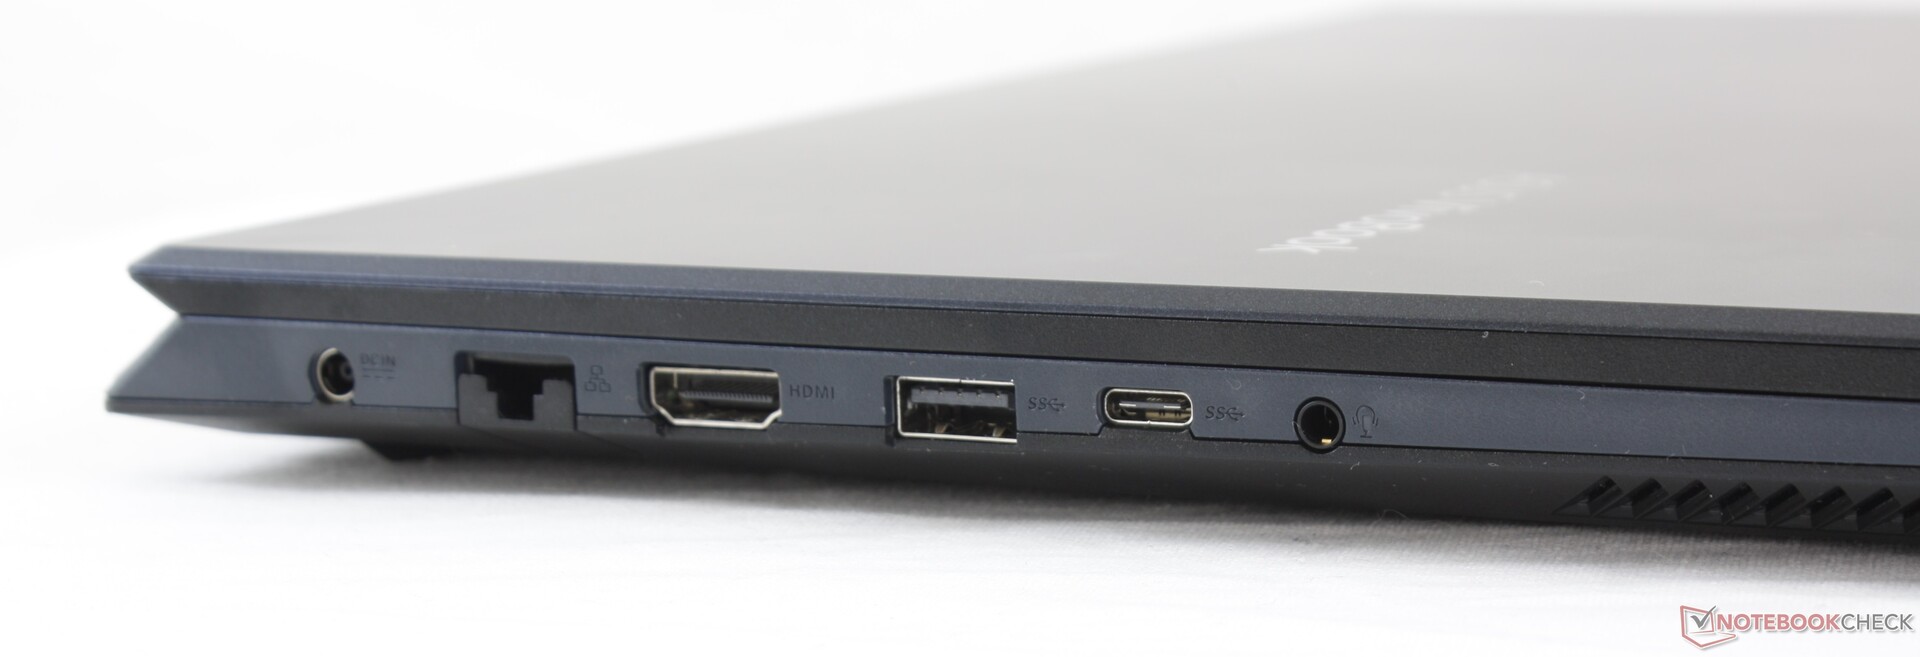
Though the system integrates a good selection of ports, keep in mind that they are tightly packed and therefore not very friendly toward thicker cables. We attempted to connect an external monitor via USB-C but it was unsuccessful.
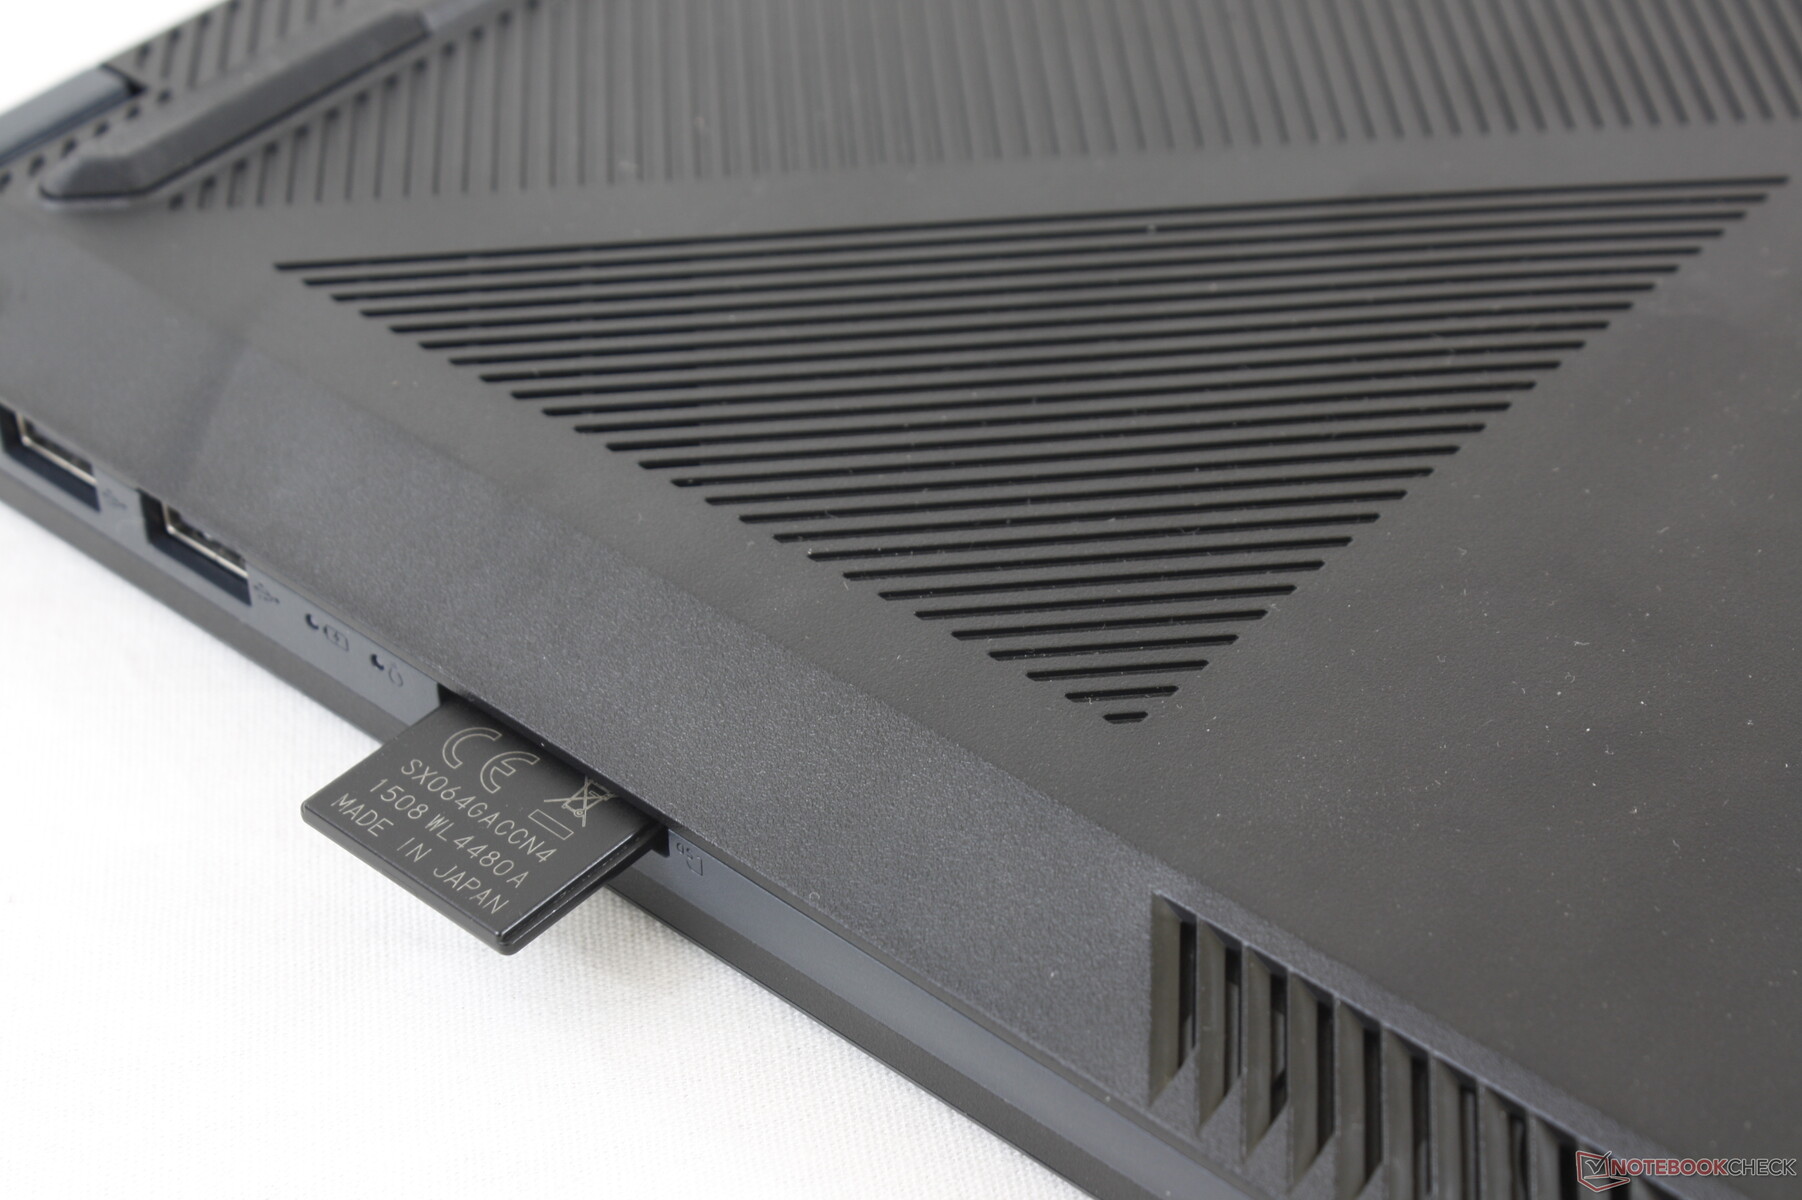
SD Card Reader
Transfer rates are slow at just under 20 MB/s. Moving 1 GB of pictures from our UHS-II test card to desktop takes almost a full minute.
| SD Card Reader | |
| average JPG Copy Test (av. of 3 runs) | |
| Lenovo Ideapad S540-15IML (Toshiba Exceria Pro SDXC 64 GB UHS-II) | |
| HP Envy 15-ep0098nr (Toshiba Exceria Pro M501 UHS-II) | |
| Dell Inspiron 15 5000 5585 (Toshiba Exceria Pro SDXC 64 GB UHS-II) | |
| Asus VivoBook 15 K571LI-PB71 (Toshiba Exceria Pro SDXC 64 GB UHS-II) | |
| maximum AS SSD Seq Read Test (1GB) | |
| HP Envy 15-ep0098nr (Toshiba Exceria Pro M501 UHS-II) | |
| Lenovo Ideapad S540-15IML (Toshiba Exceria Pro SDXC 64 GB UHS-II) | |
| Dell Inspiron 15 5000 5585 (Toshiba Exceria Pro SDXC 64 GB UHS-II) | |
| Asus VivoBook 15 K571LI-PB71 (Toshiba Exceria Pro SDXC 64 GB UHS-II) | |
Communication
The Intel AX201 comes standard for Wi-Fi 6 and Bluetooth 5.1 connectivity. We experienced no issues when connected to our Netgear RAX200 test router.
Webcam


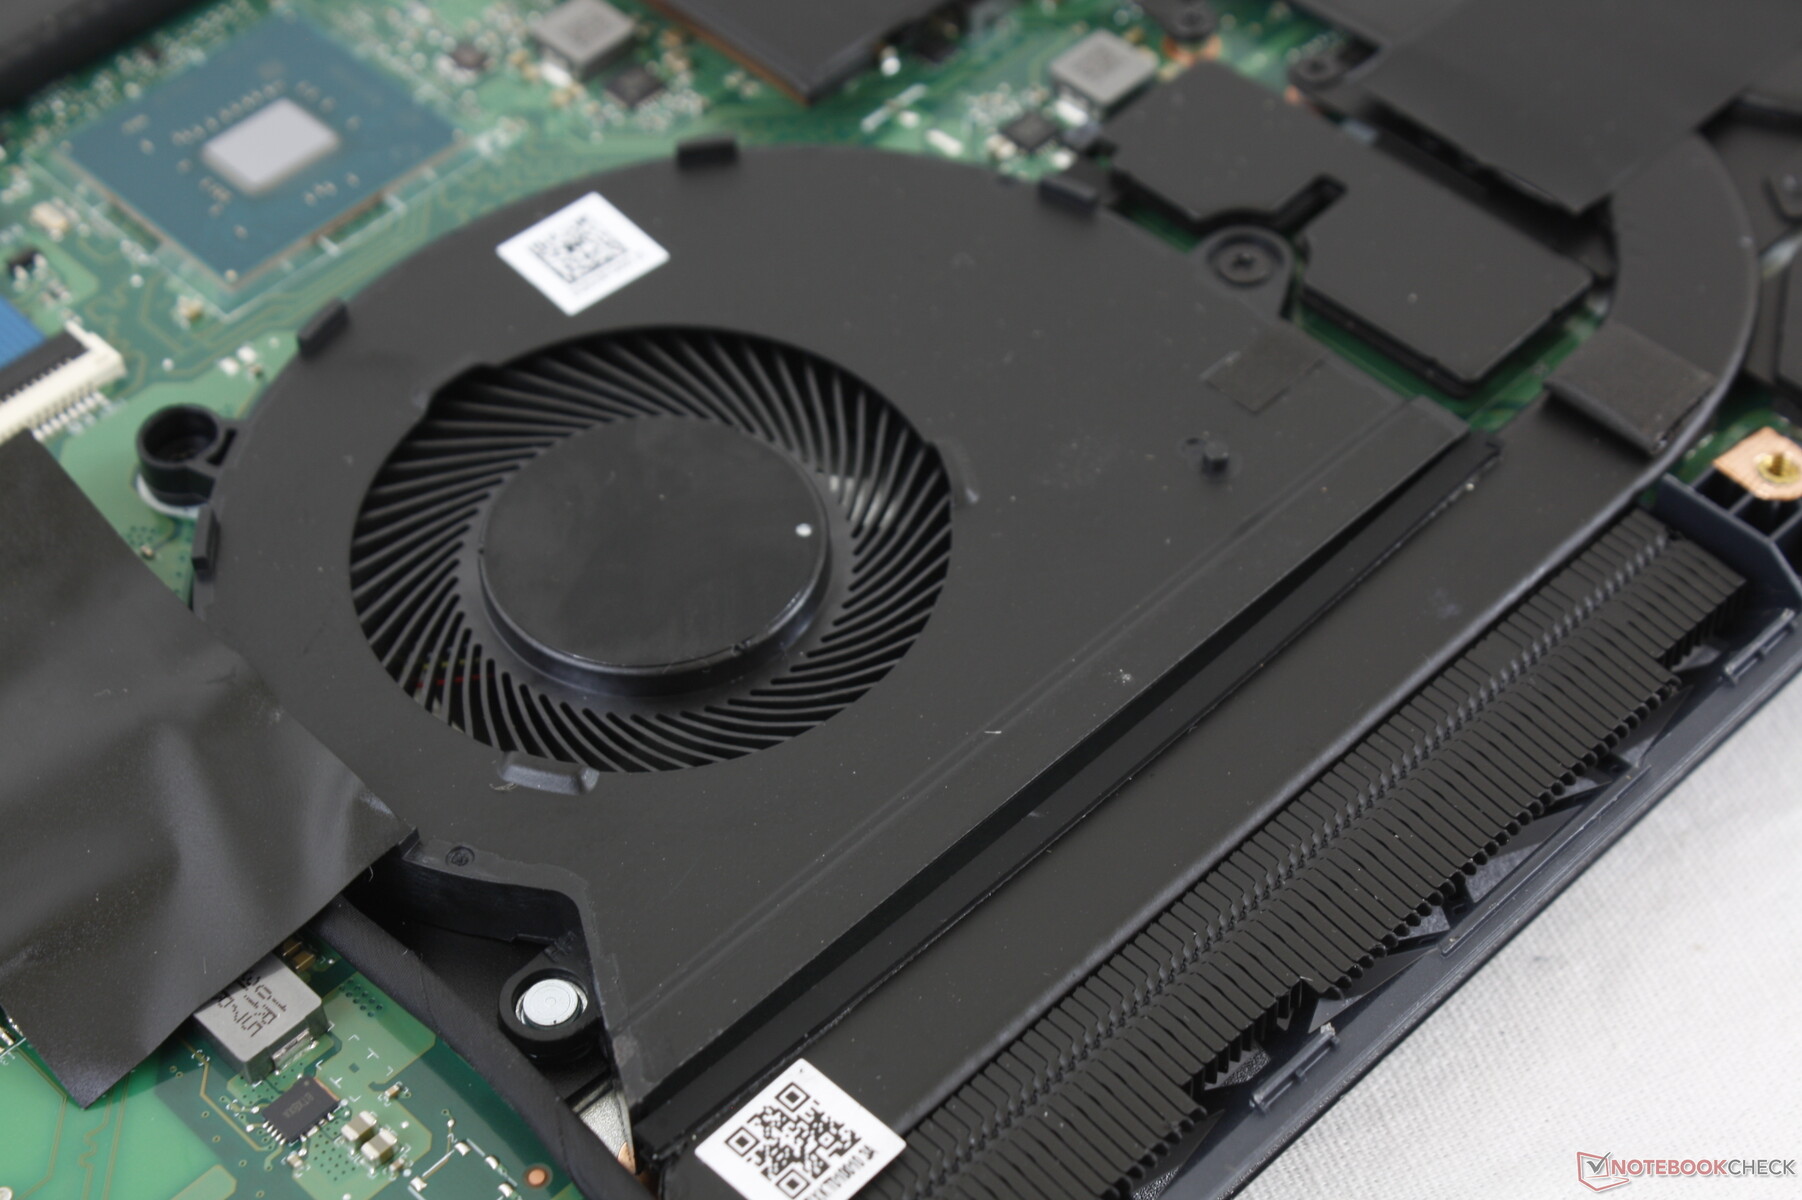
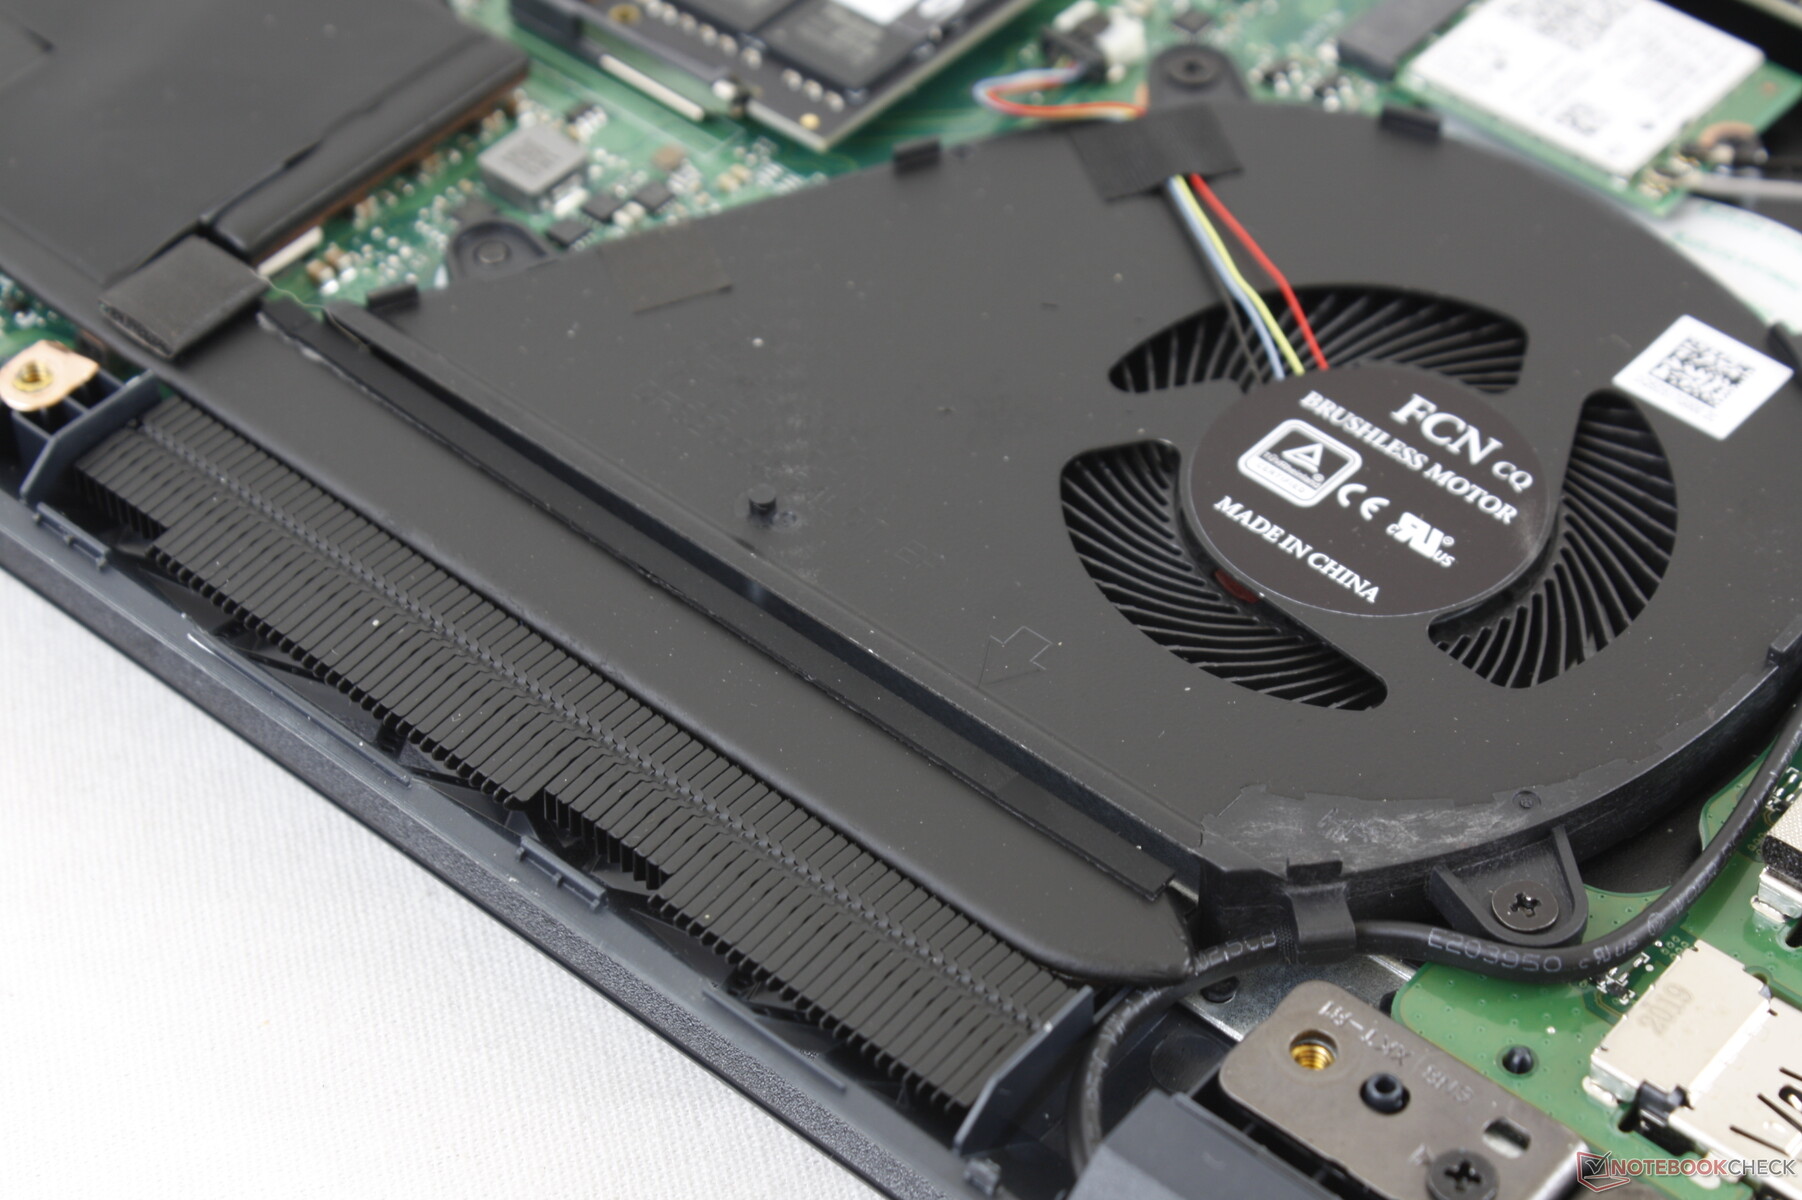
Maintenance
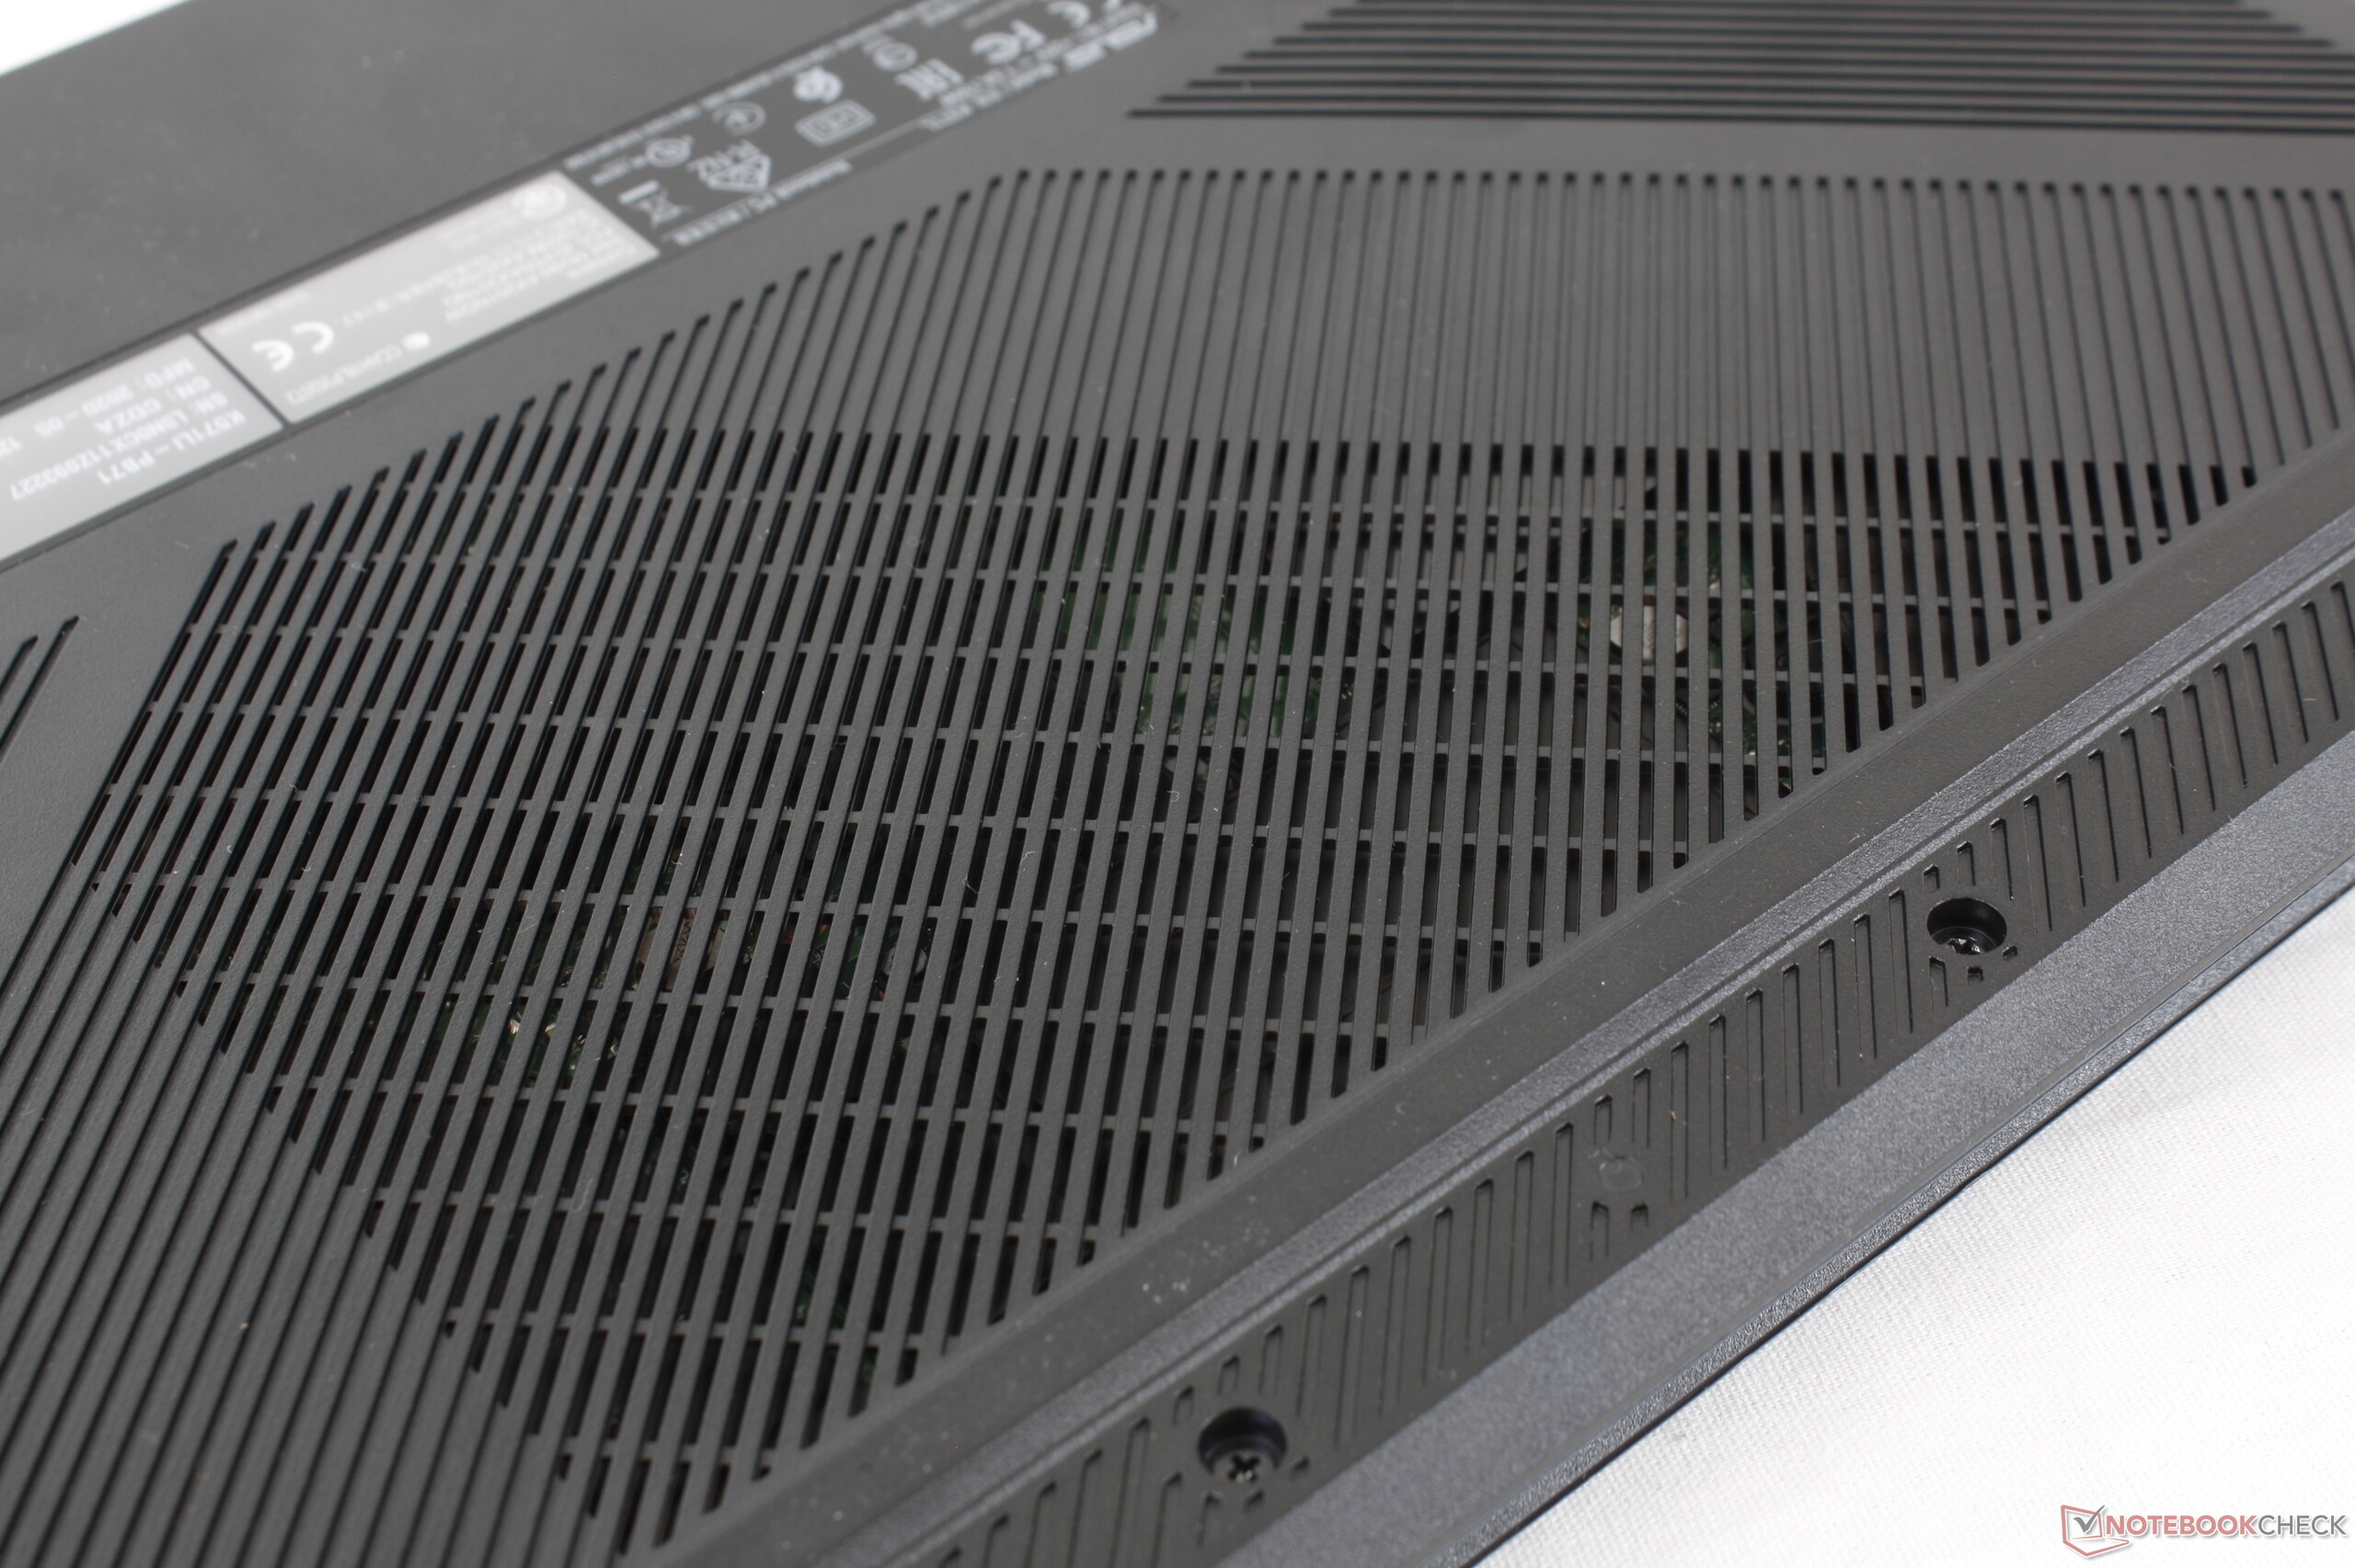
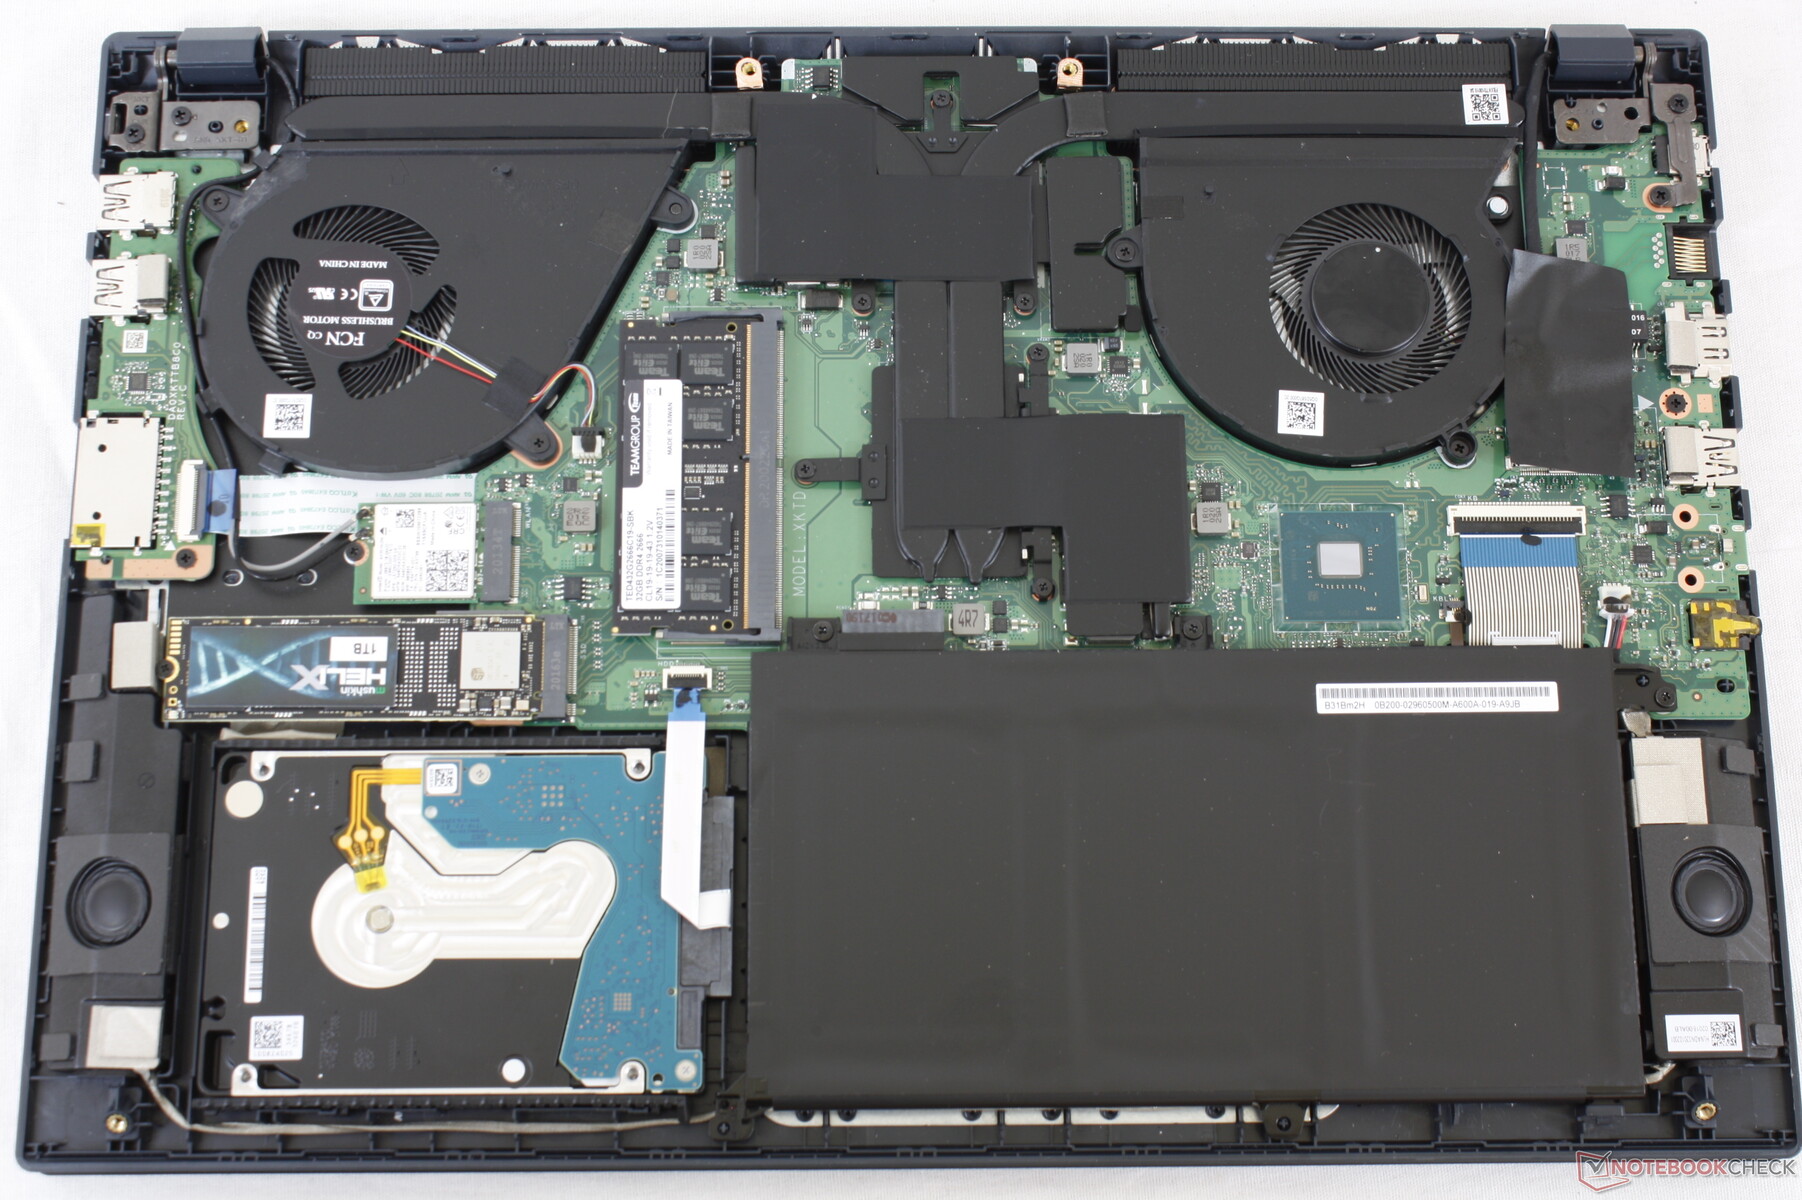
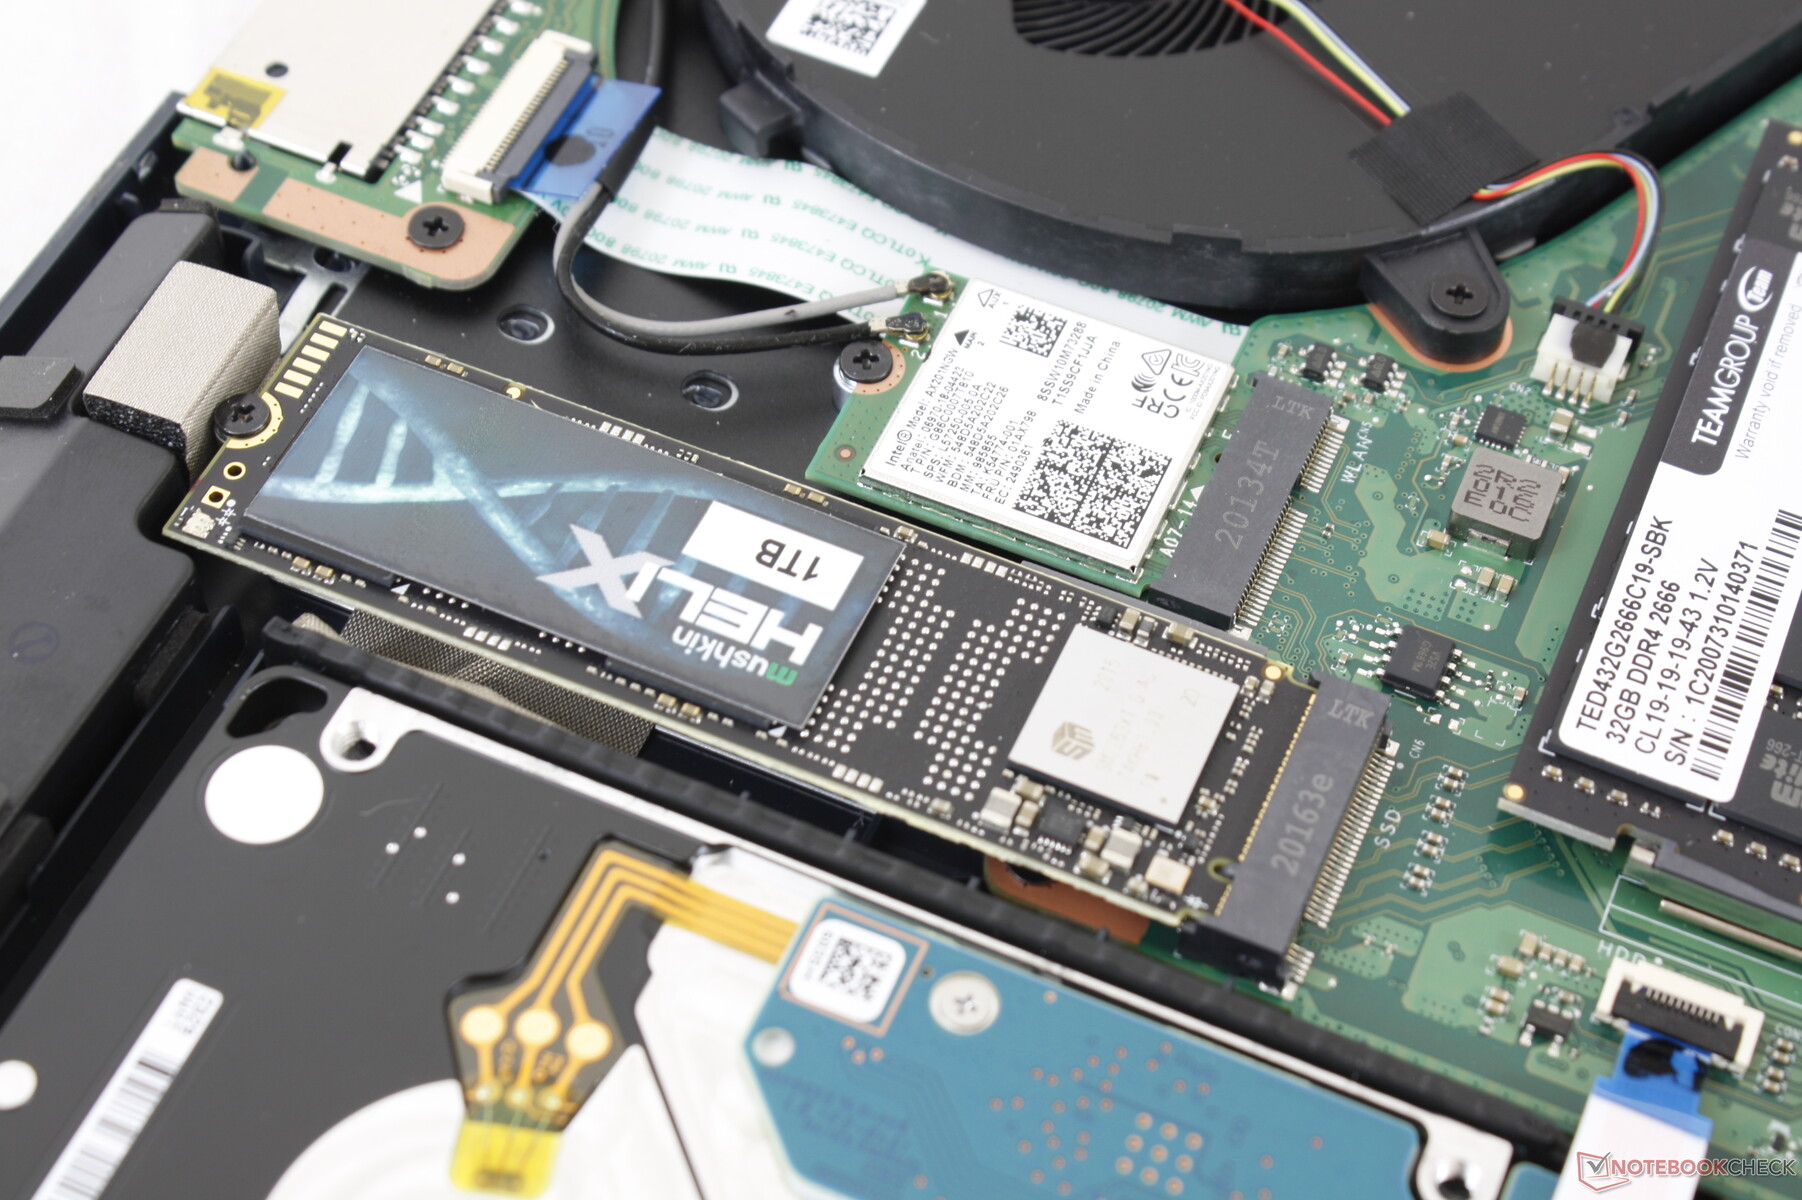
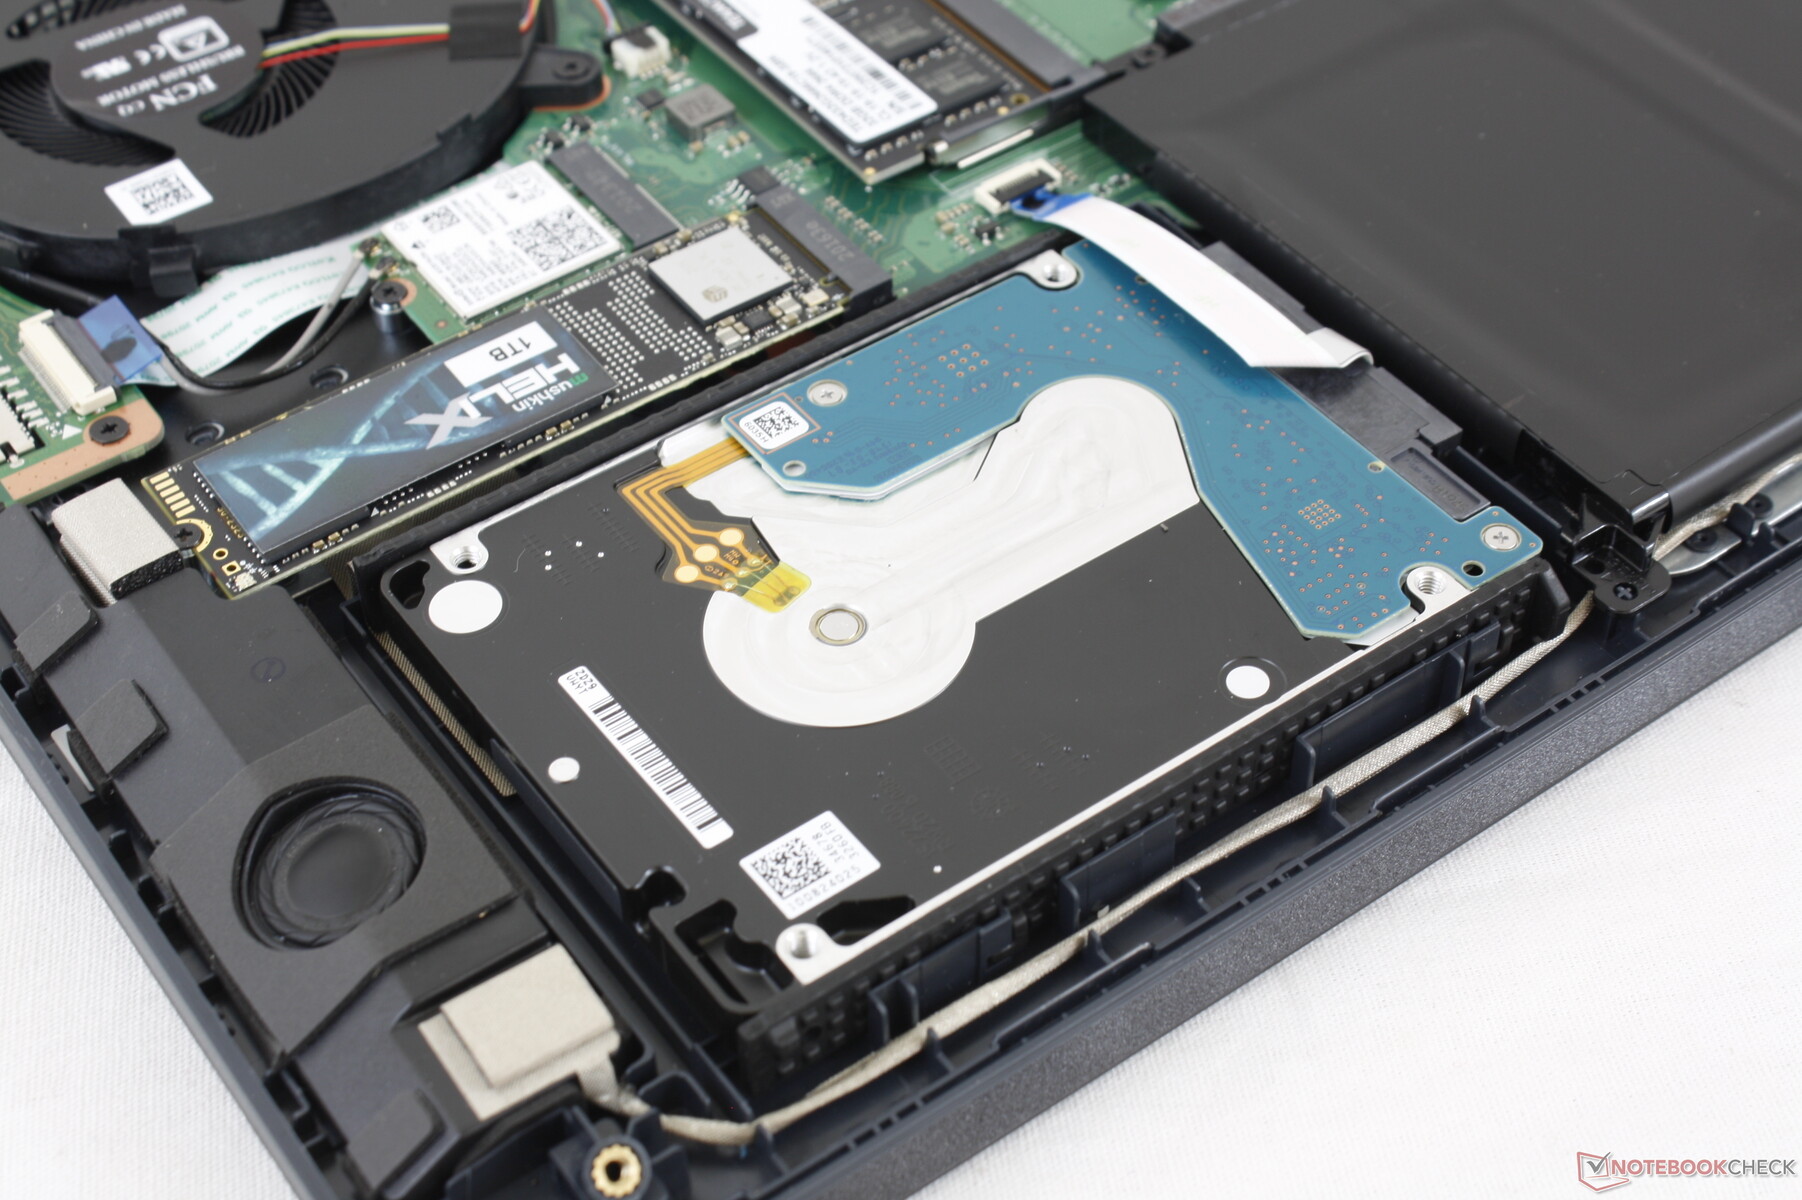
The bottom panel is secured by six screws with two of those hidden underneath the rear rubber feet. Users have direct access to the main battery, SODIMM slot, WLAN module, and both storage bays.
Accessories and Warranty
There are no extras in the box other than the AC adapter and paperwork. The standard one-year limited warranty applies while individual components installed by CUKUSA are covered for three years.
Input Devices
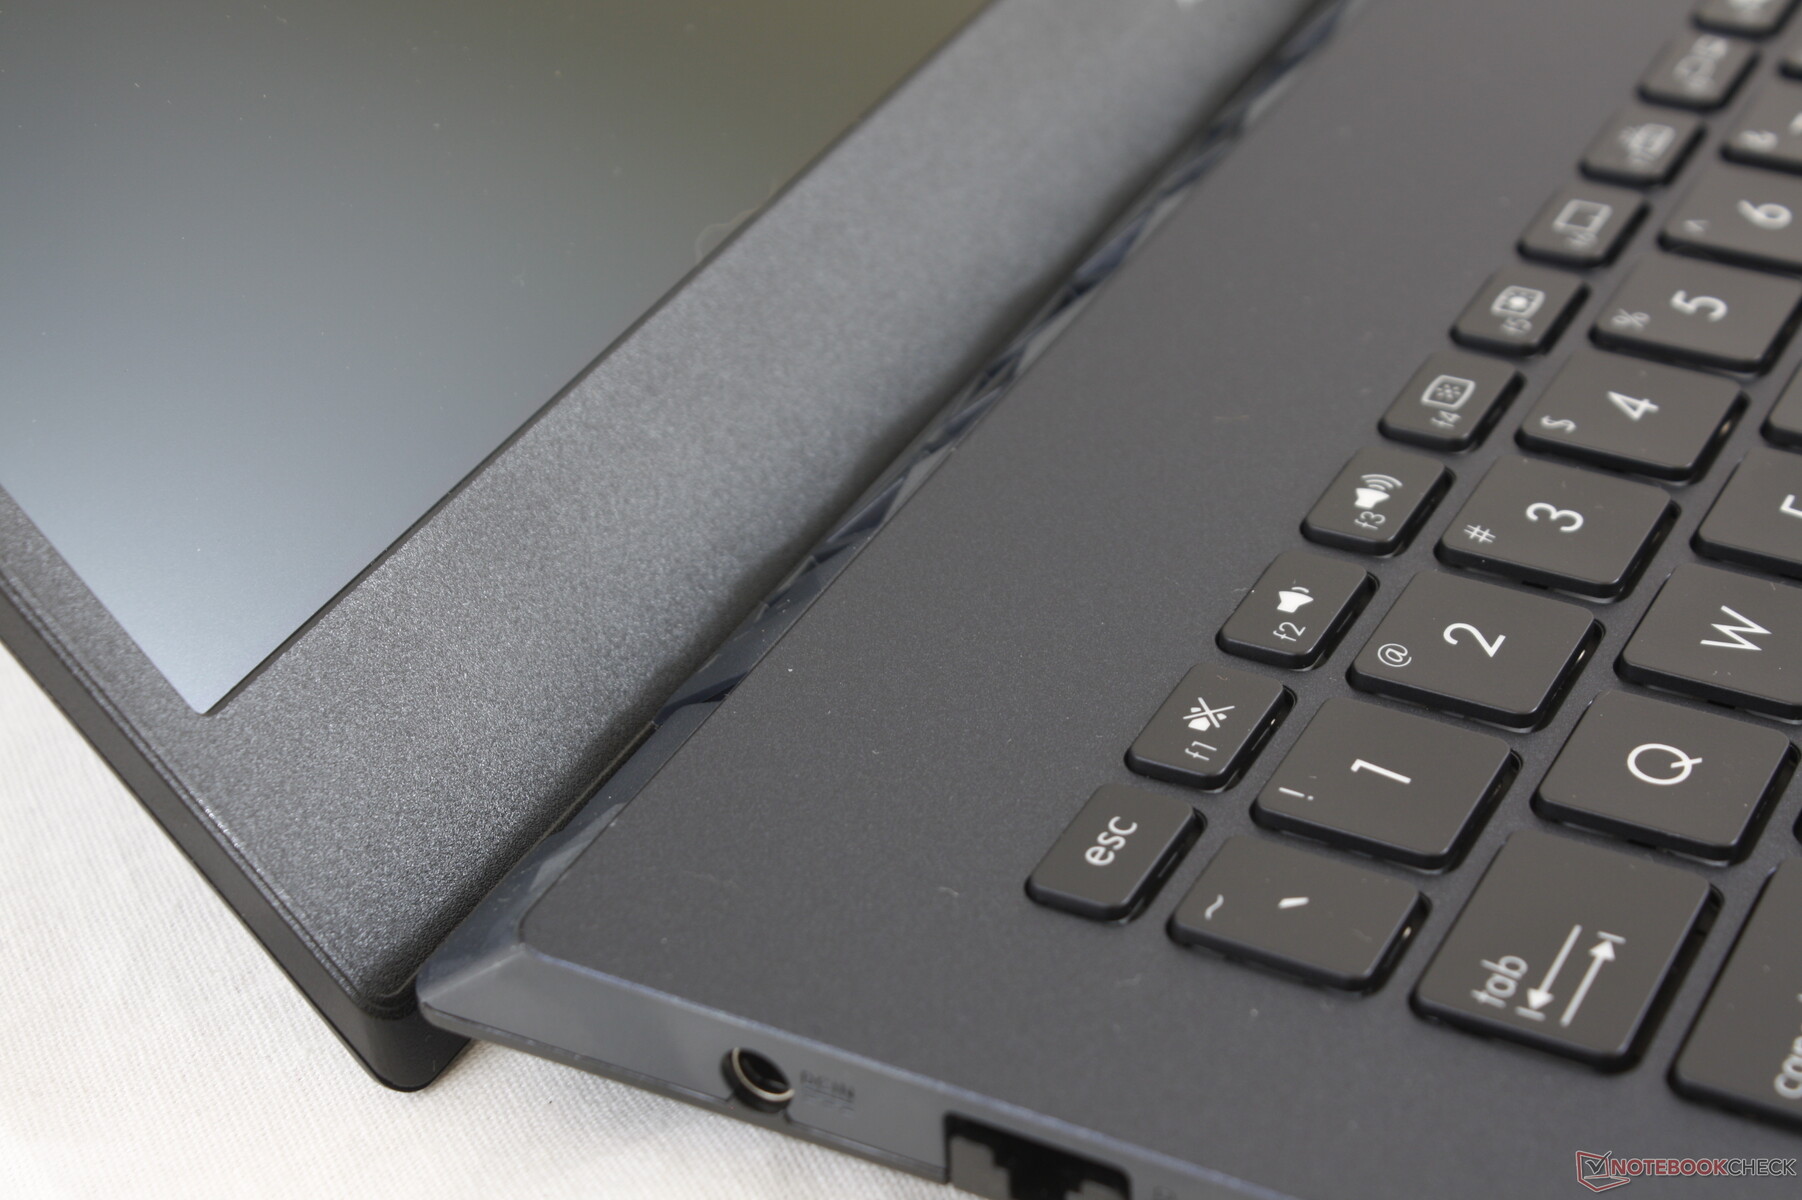
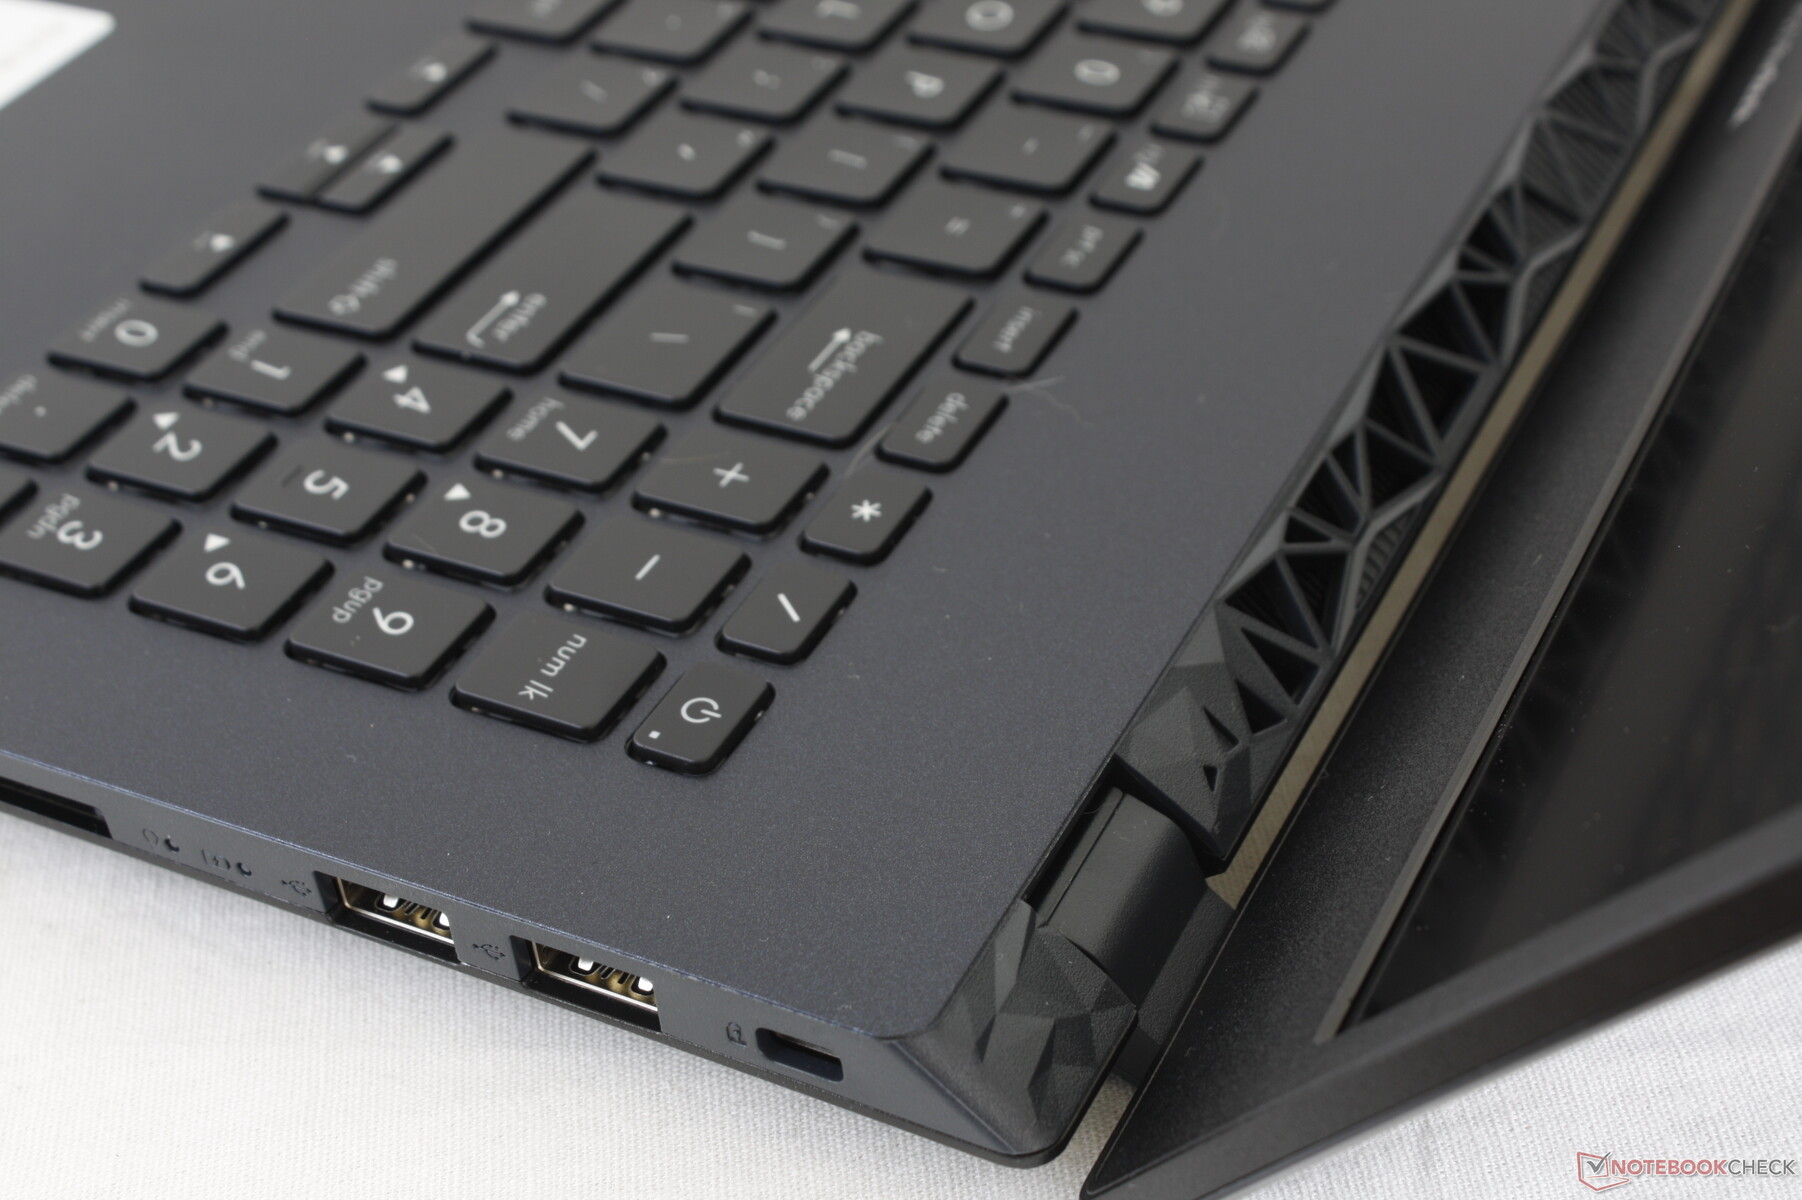
Keyboard
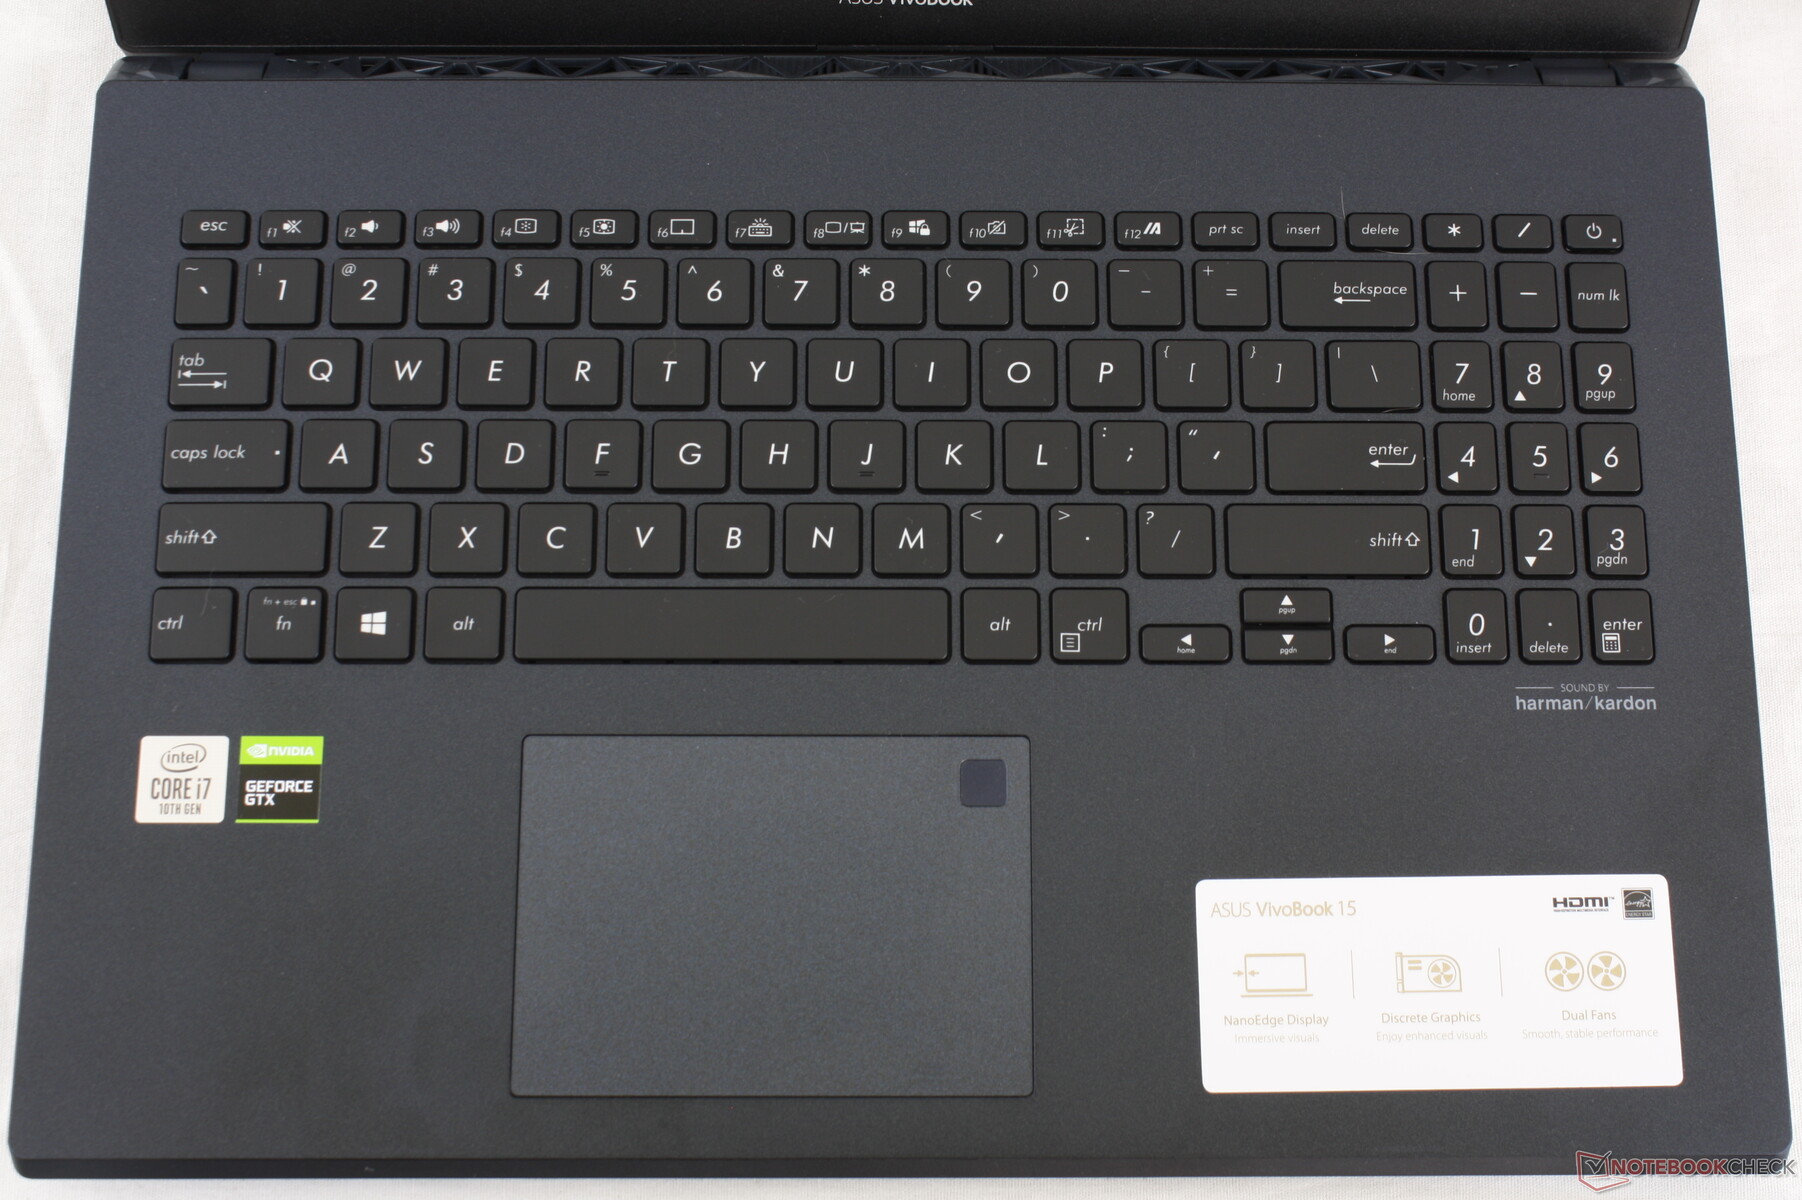
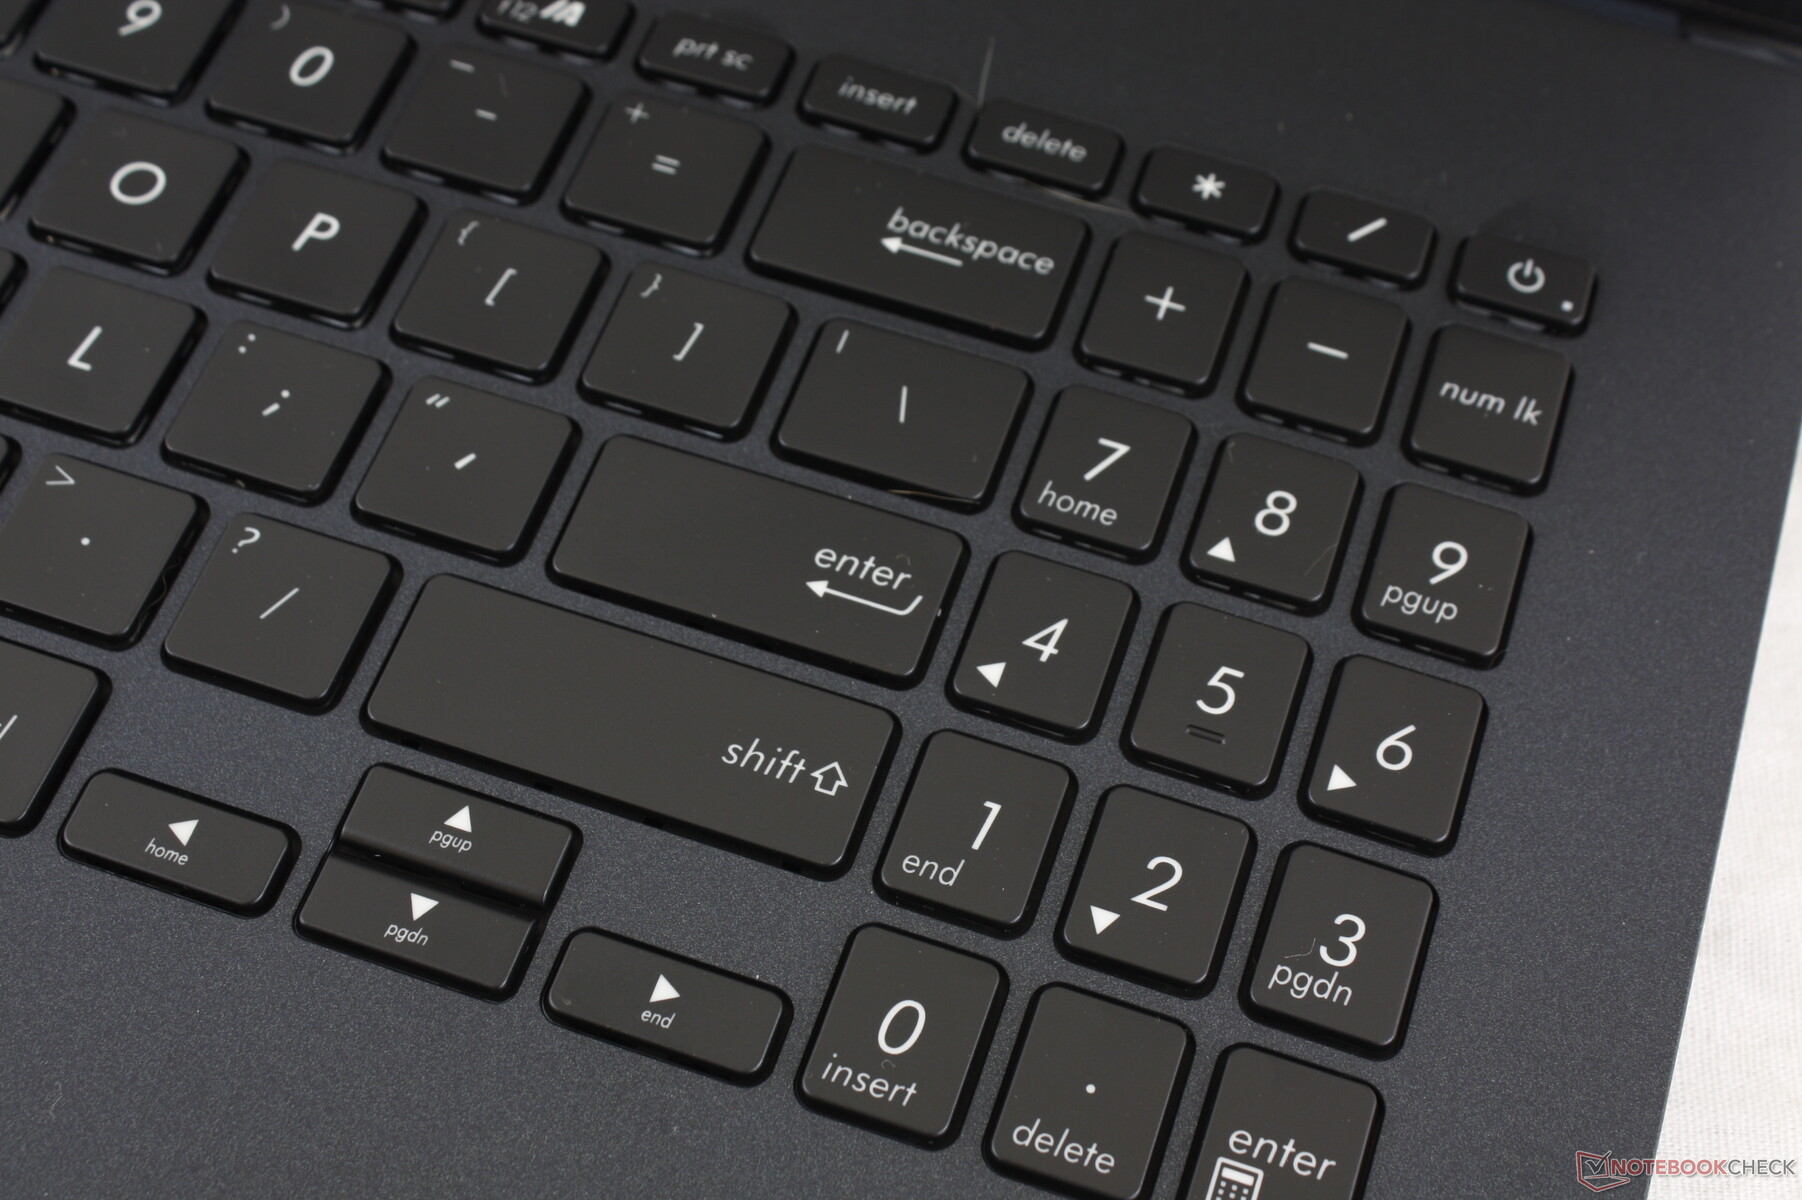
Typing on the backlit keyboard is comfortable with its satisfactory key feedback and shallow travel. We still prefer the firmer and deeper keys of the HP Envy, Spectre, MSI SteelSeries or Lenovo ThinkPad T series, but such laptops also cost a lot more. If you rely on the arrow keys and NumPad keys, however, then you'd be better off with a USB keyboard since these integrated keys are spongier and smaller than the main QWERTY keys.
Touchpad
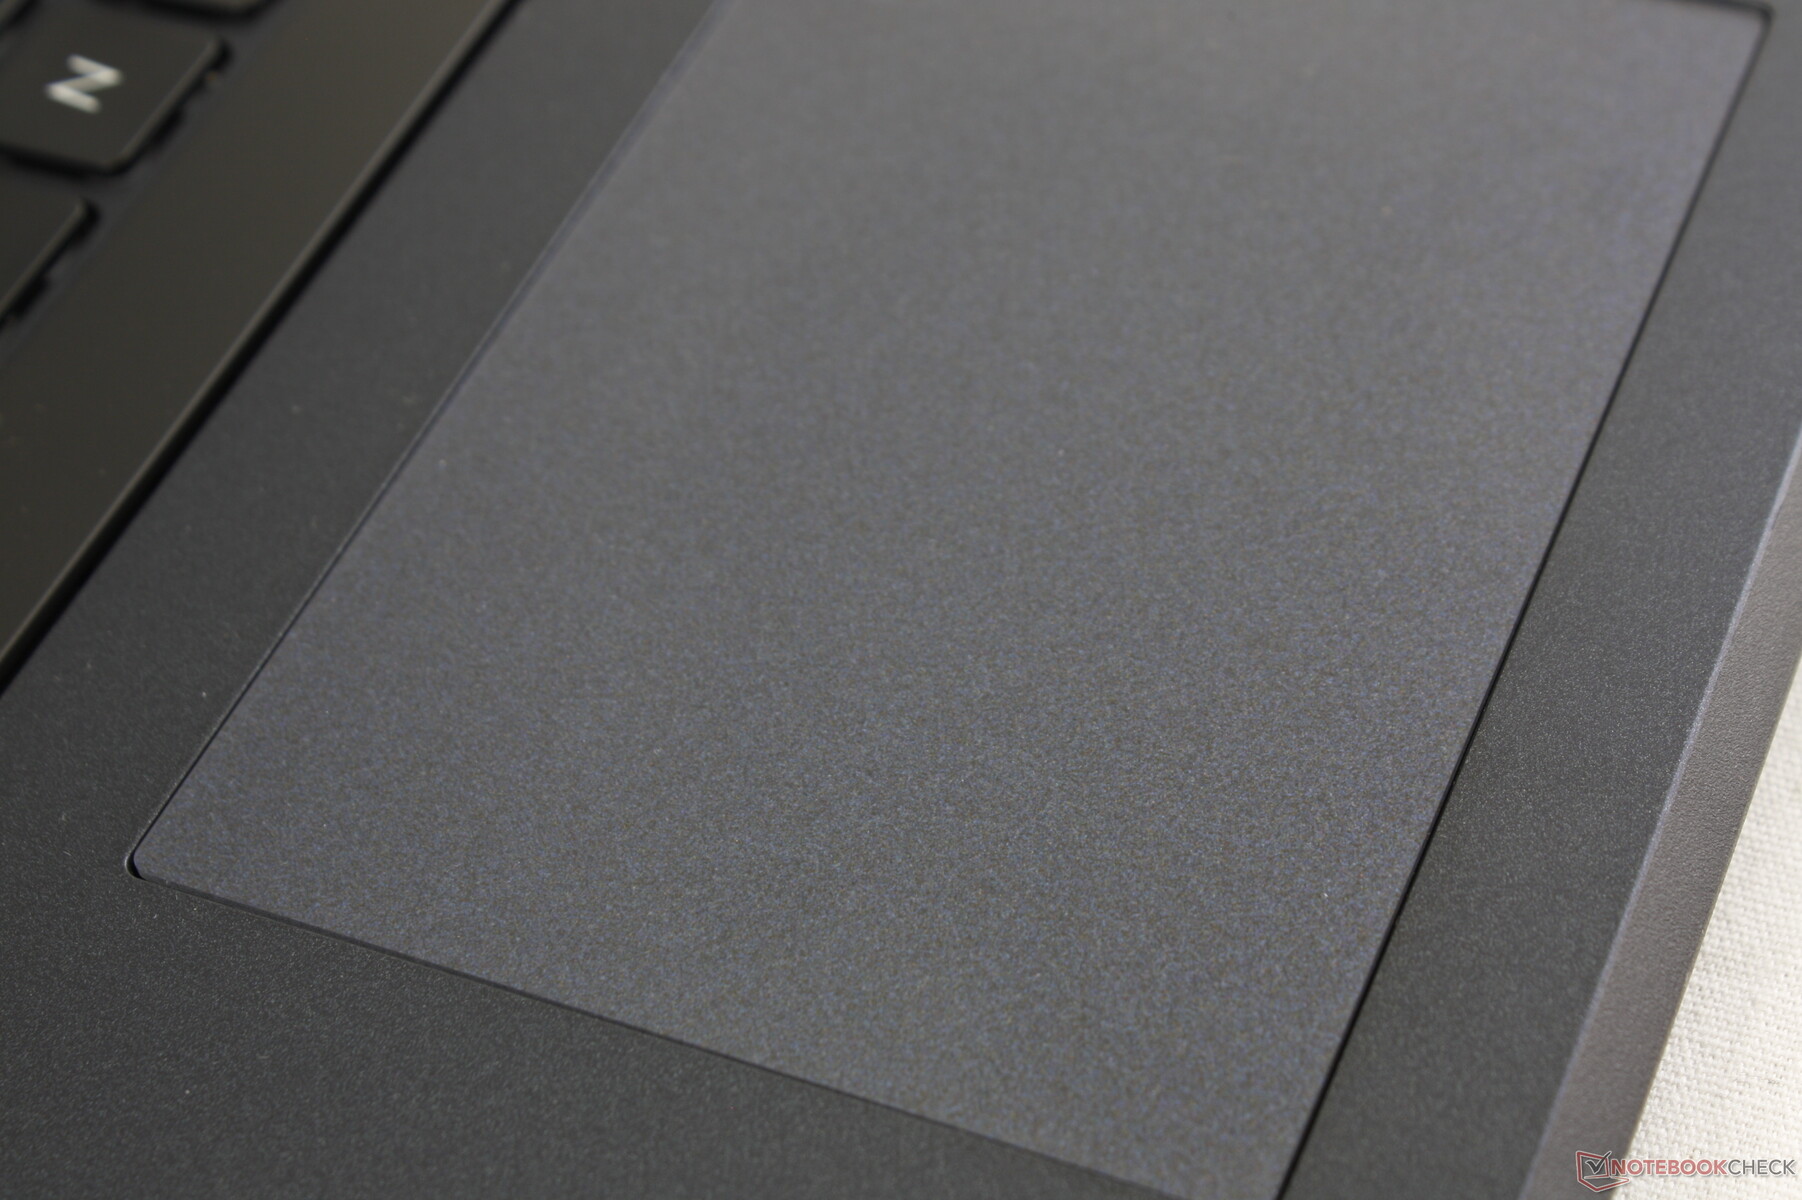
The smooth clickpad (10.5 x 7.5 cm) is smaller than the one on the HP Envy 15 (12.5 x 7.5 cm). It works well enough for basic cursor control with just the right amount of sticking when gliding at slow speeds, but the integrated mouse buttons could have been firmer. Drag and drop actions are made difficult because the cursor will sometimes jump or freeze in place when two or more fingers are on the surface. Its multi-touch recognition could definitely be better in this regard.

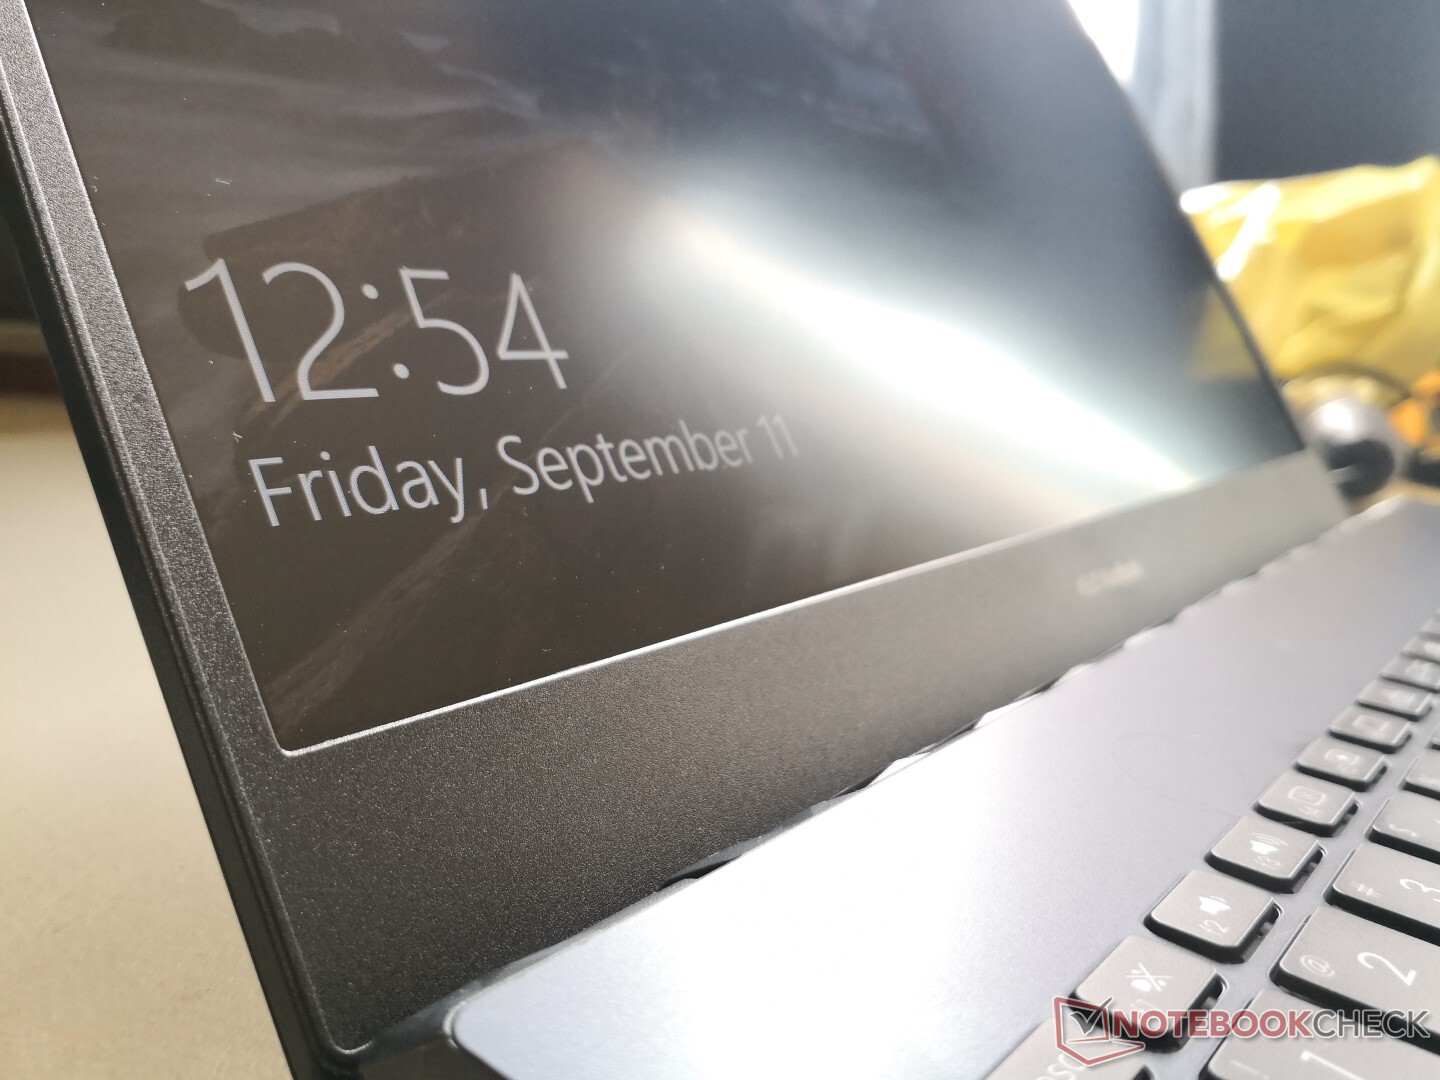
Display
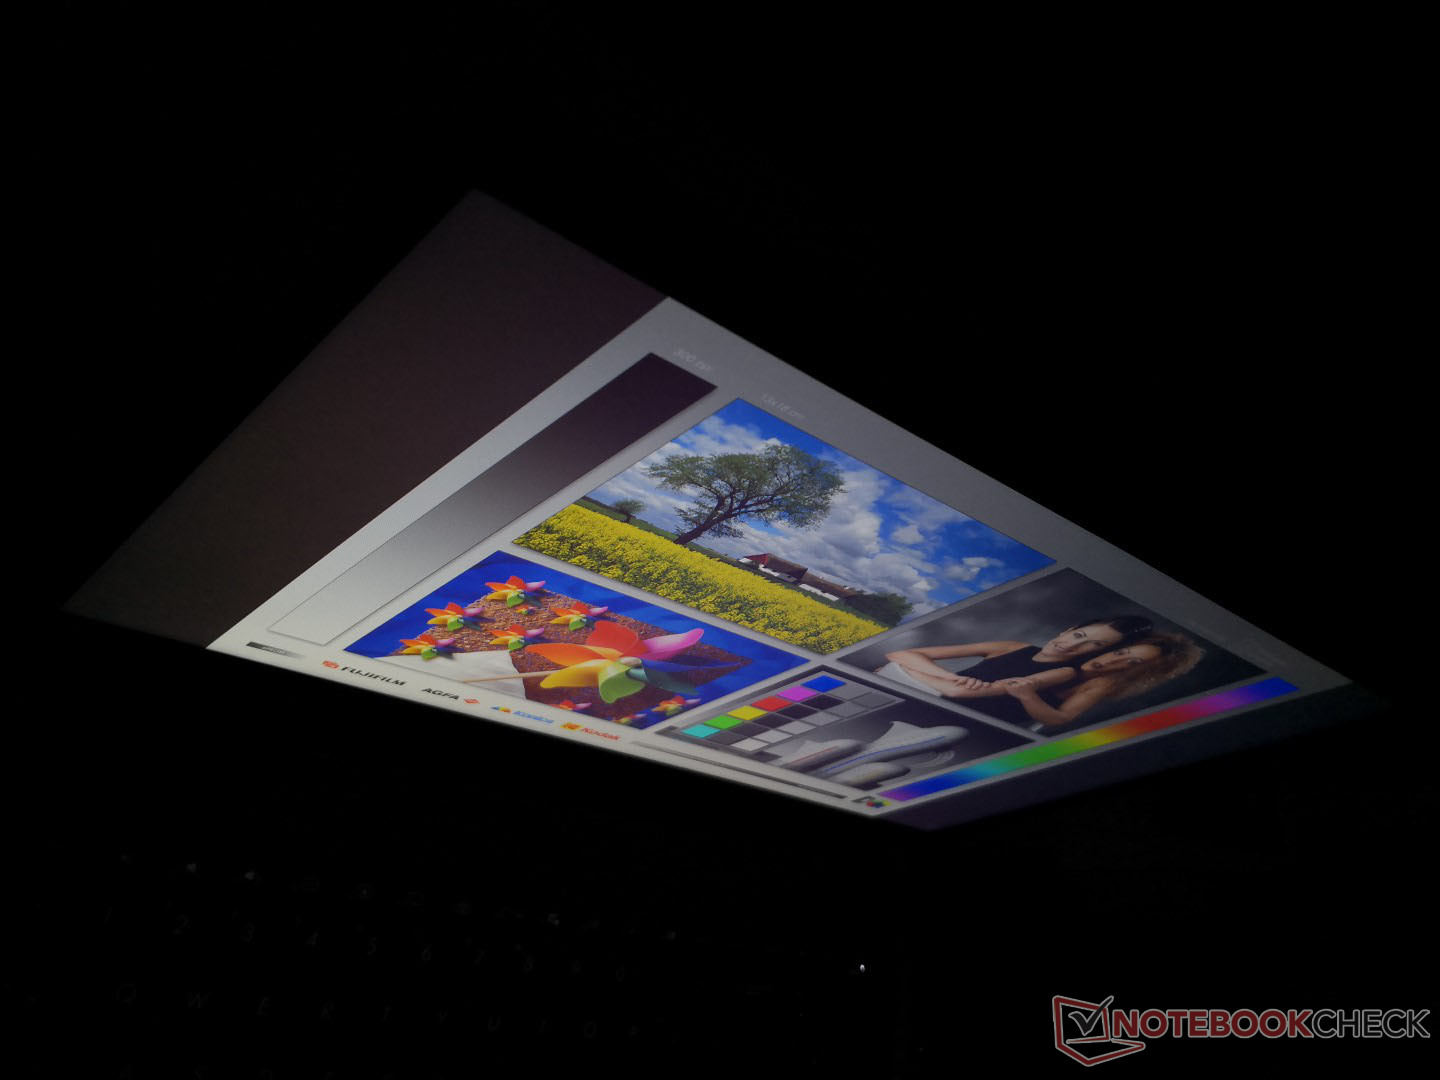
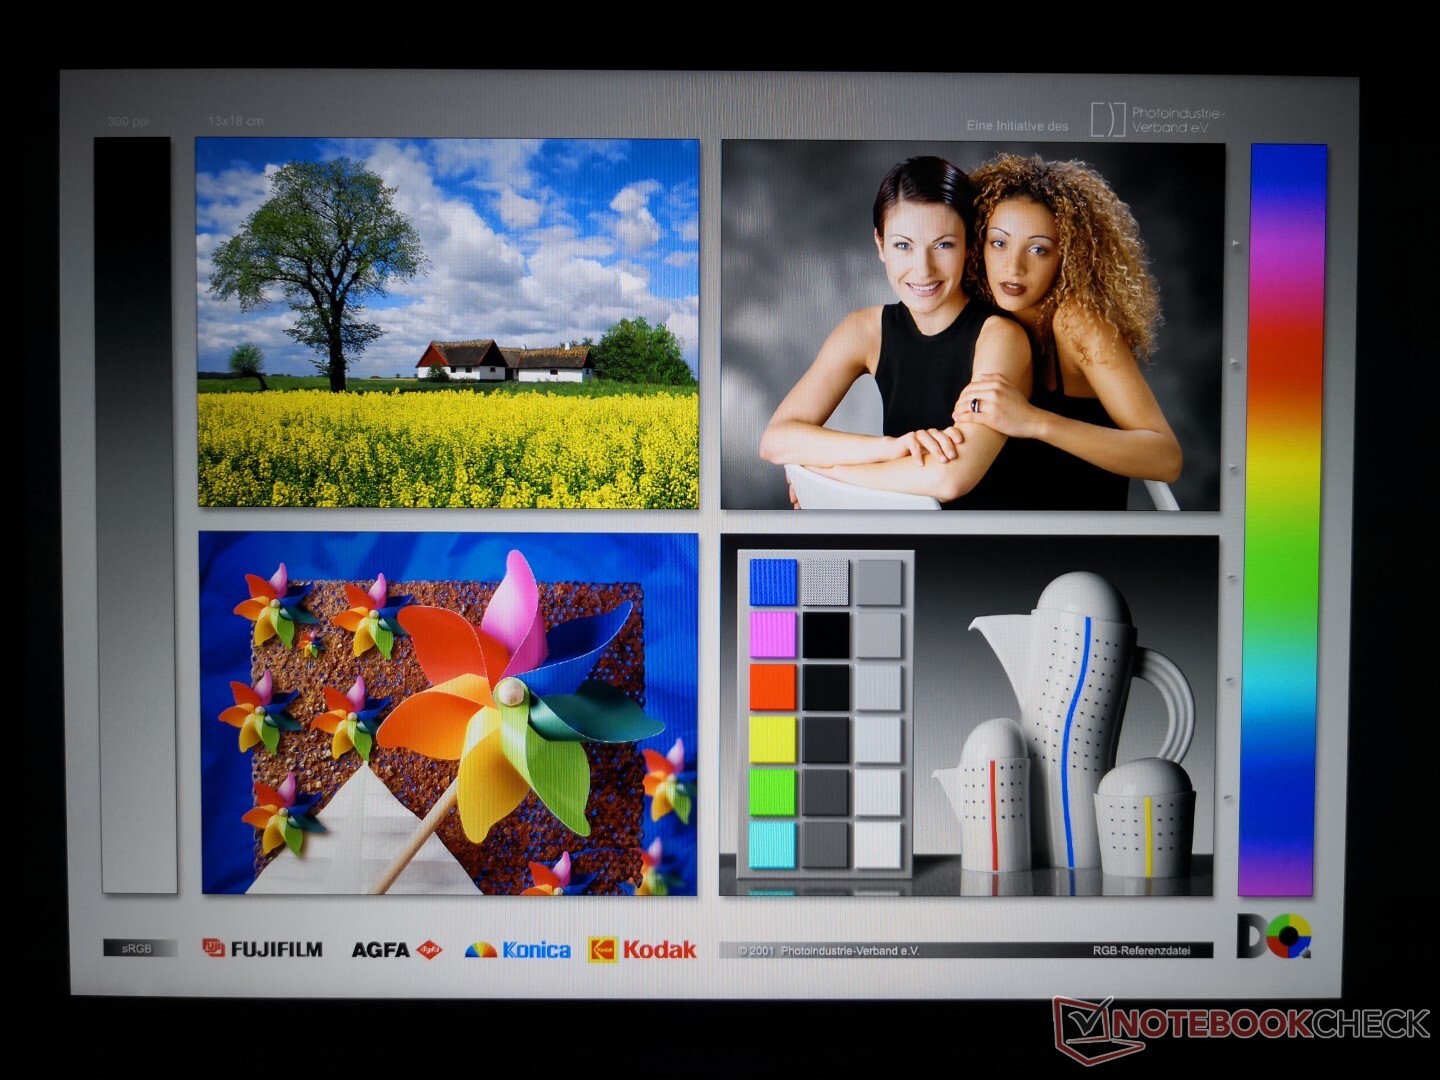
The Panda LM156LF IPS panel here is similar to the ones found on the ROG Strix G GL531GV, TUF FX505DY, ROG Strix G15 G512LI, or Acer Nitro 5 AN515. It's notable for its 120 Hz native refresh rate for ultra-smooth cursor control and movement, but its colors and response times are inferior to other high refresh rate displays from LG or BOE. Expect ghosting to be more noticeable and colors to not be as vibrant when compared to other laptops in this price range.
Asus does offer a display option with wider color coverage, but it will be limited to a refresh rate of 60 Hz unlike our 120 Hz panel here. Users will have to choose one or the other with no options for both.


| |||||||||||||||||||||||||
Brightness Distribution: 87 %
Center on Battery: 263.9 cd/m²
Contrast: 1015:1 (Black: 0.26 cd/m²)
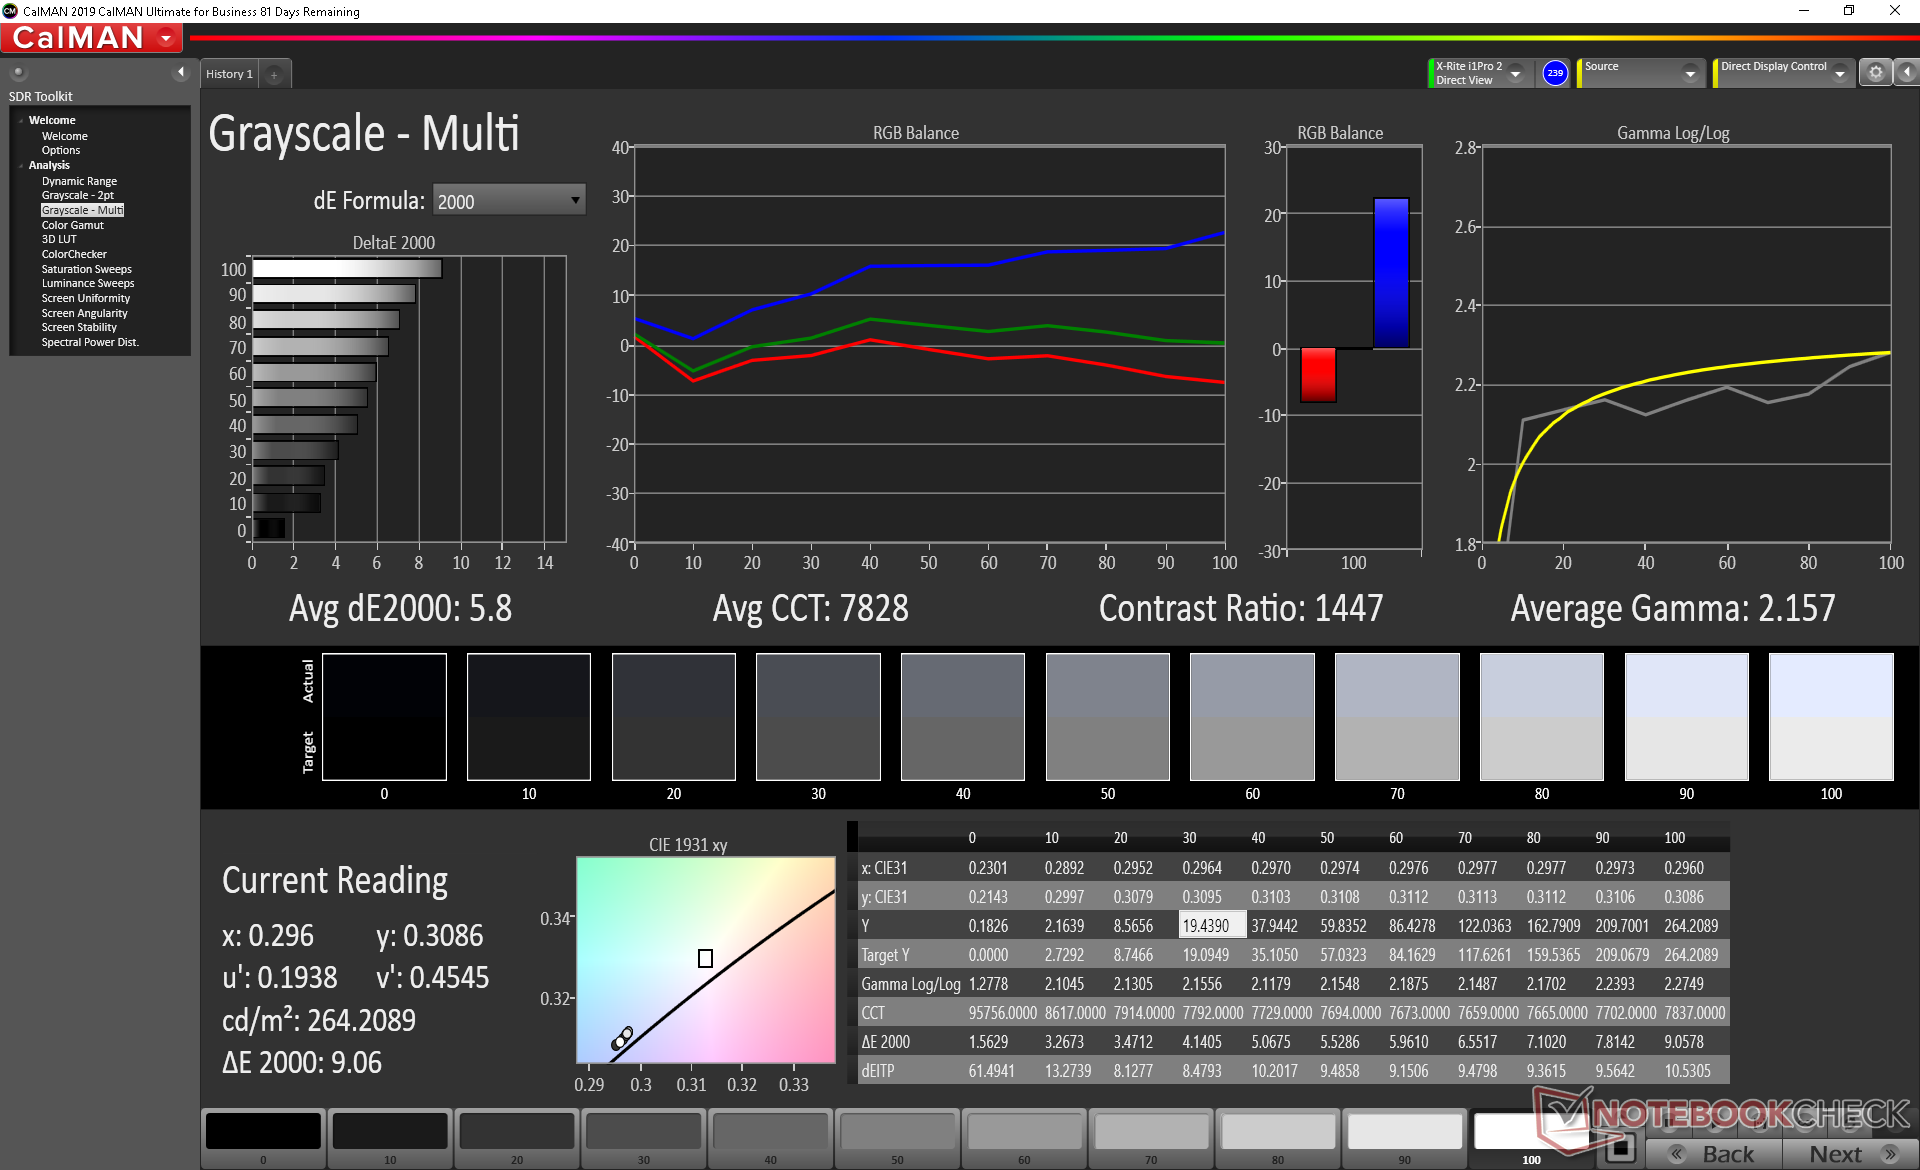
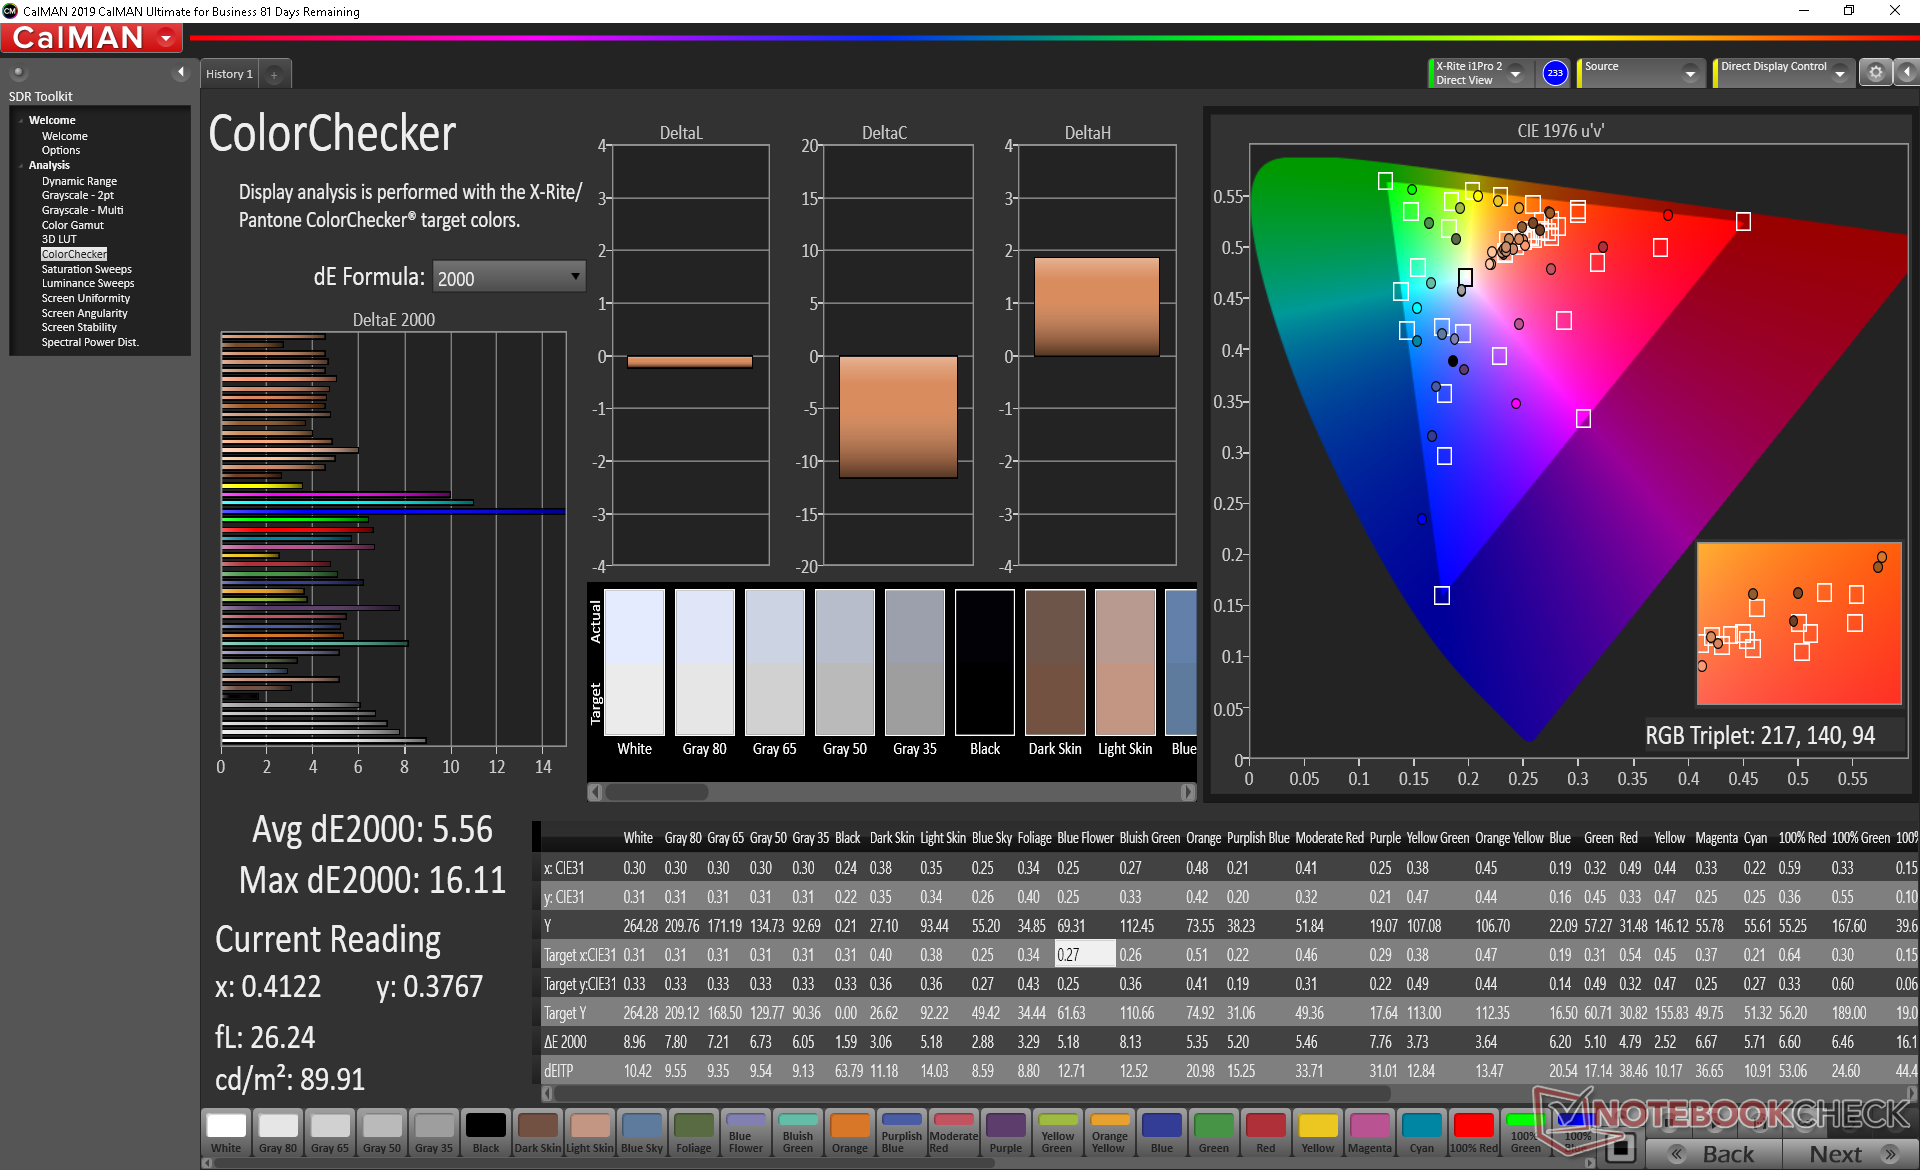
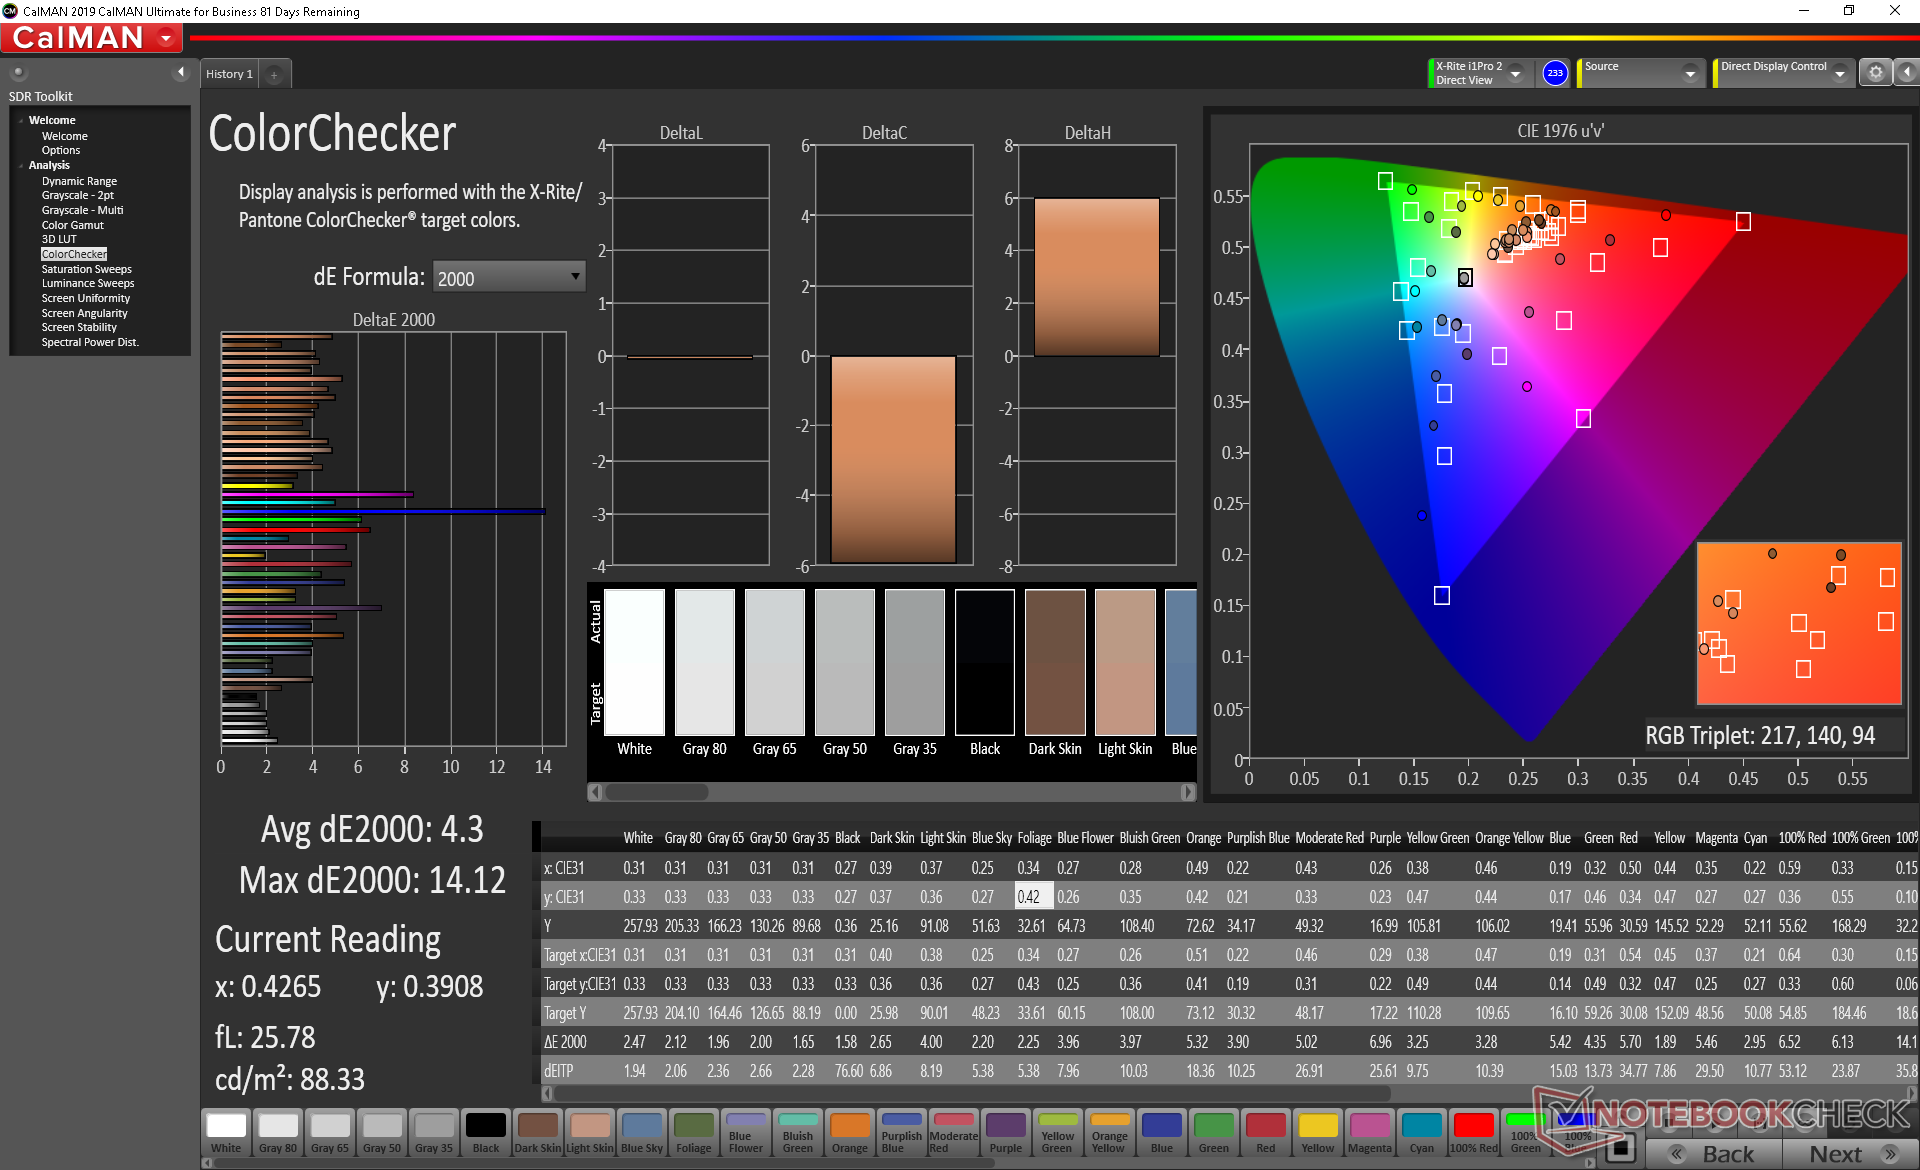
ΔE ColorChecker Calman: 5.56 | ∀{0.5-29.43 Ø4.73}
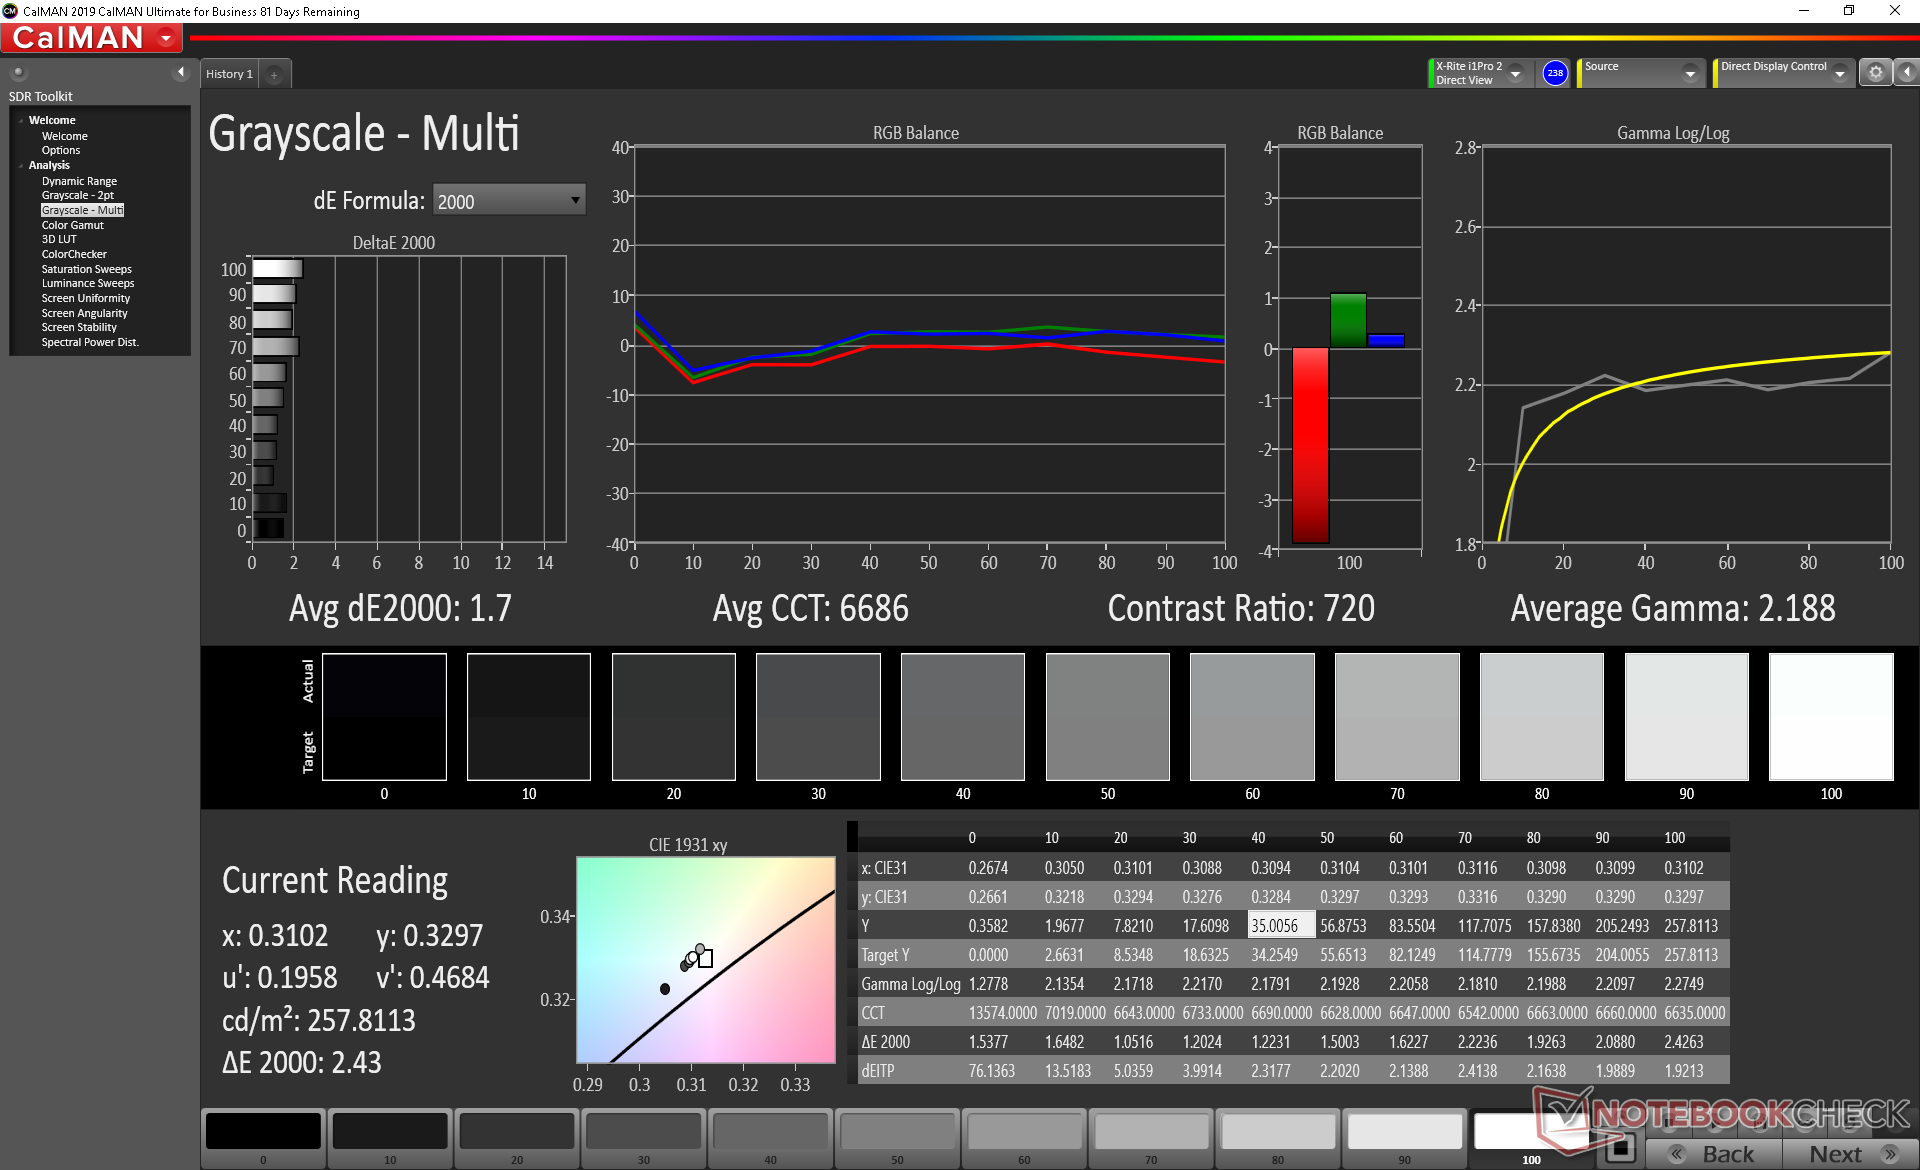
calibrated: 4.3
ΔE Greyscale Calman: 5.8 | ∀{0.09-98 Ø4.97}
60.1% sRGB (Argyll 1.6.3 3D)
38.2% AdobeRGB 1998 (Argyll 1.6.3 3D)
41.56% AdobeRGB 1998 (Argyll 3D)
60.4% sRGB (Argyll 3D)
40.2% Display P3 (Argyll 3D)
Gamma: 2.16
CCT: 7828 K
| Asus VivoBook 15 K571LI-PB71 Panda LM156LF-GL03, IPS, 15.6", 1920x1080 | HP Envy 15-ep0098nr Samsung SDC4145, AMOLED, 15.6", 3840x2160 | Acer Aspire 5 A515-54G LG Display LP156WFC SPD1, IPS, 15.6", 1920x1080 | Asus ZenBook 15 UX534FTC-A8190T BOE CQ NV156FHM-N63, IPS, 15.6", 1920x1080 | Lenovo Ideapad S540-15IML BOEhydis NV156FHM-N61 (BOE06FB), IPS, 15.6", 1920x1080 | Dell Inspiron 15 5000 5585 LG Philips 156WFC, IPS, 15.6", 1920x1080 | |
|---|---|---|---|---|---|---|
| Display | 109% | -16% | 52% | 54% | -7% | |
| Display P3 Coverage (%) | 40.2 | 88.5 120% | 33.78 -16% | 65 62% | 66.8 66% | 37.31 -7% |
| sRGB Coverage (%) | 60.4 | 100 66% | 50.8 -16% | 86.2 43% | 86.5 43% | 56.2 -7% |
| AdobeRGB 1998 Coverage (%) | 41.56 | 99.9 140% | 34.9 -16% | 62.9 51% | 63.2 52% | 38.55 -7% |
| Response Times | 93% | -16% | -46% | -60% | -7% | |
| Response Time Grey 50% / Grey 80% * (ms) | 28.4 ? | 0.8 ? 97% | 36 ? -27% | 45 ? -58% | 49.6 ? -75% | 28.4 ? -0% |
| Response Time Black / White * (ms) | 24 ? | 2.7 ? 89% | 25 ? -4% | 32 ? -33% | 34.8 ? -45% | 27.2 ? -13% |
| PWM Frequency (Hz) | 242.7 ? | 202 ? | ||||
| Screen | 45% | 6% | 28% | 25% | -1% | |
| Brightness middle (cd/m²) | 263.9 | 374.3 42% | 248 -6% | 299 13% | 299 13% | 253.6 -4% |
| Brightness (cd/m²) | 246 | 379 54% | 238 -3% | 280 14% | 278 13% | 227 -8% |
| Brightness Distribution (%) | 87 | 91 5% | 86 -1% | 89 2% | 87 0% | 84 -3% |
| Black Level * (cd/m²) | 0.26 | 0.23 12% | 0.21 19% | 0.25 4% | 0.27 -4% | |
| Contrast (:1) | 1015 | 1078 6% | 1424 40% | 1196 18% | 939 -7% | |
| Colorchecker dE 2000 * | 5.56 | 5.47 2% | 5.05 9% | 4.76 14% | 4.32 22% | 6.05 -9% |
| Colorchecker dE 2000 max. * | 16.11 | 8.22 49% | 14.34 11% | 9 44% | 9.3 42% | 14.03 13% |
| Colorchecker dE 2000 calibrated * | 4.3 | 4.61 -7% | 4.76 -11% | 2.58 40% | 4.97 -16% | |
| Greyscale dE 2000 * | 5.8 | 2.3 60% | 1.37 76% | 3.53 39% | 4.21 27% | 3.2 45% |
| Gamma | 2.16 102% | 2.09 105% | 2.4 92% | 2.3 96% | 2.39 92% | 2 110% |
| CCT | 7828 83% | 6340 103% | 6592 99% | 7228 90% | 6799 96% | 6820 95% |
| Color Space (Percent of AdobeRGB 1998) (%) | 38.2 | 87.8 130% | 32 -16% | 56 47% | 57 49% | 35.5 -7% |
| Color Space (Percent of sRGB) (%) | 60.1 | 100 66% | 51 -15% | 86 43% | 86 43% | 55.6 -7% |
| Total Average (Program / Settings) | 82% /
65% | -9% /
-1% | 11% /
23% | 6% /
20% | -5% /
-3% |
* ... smaller is better
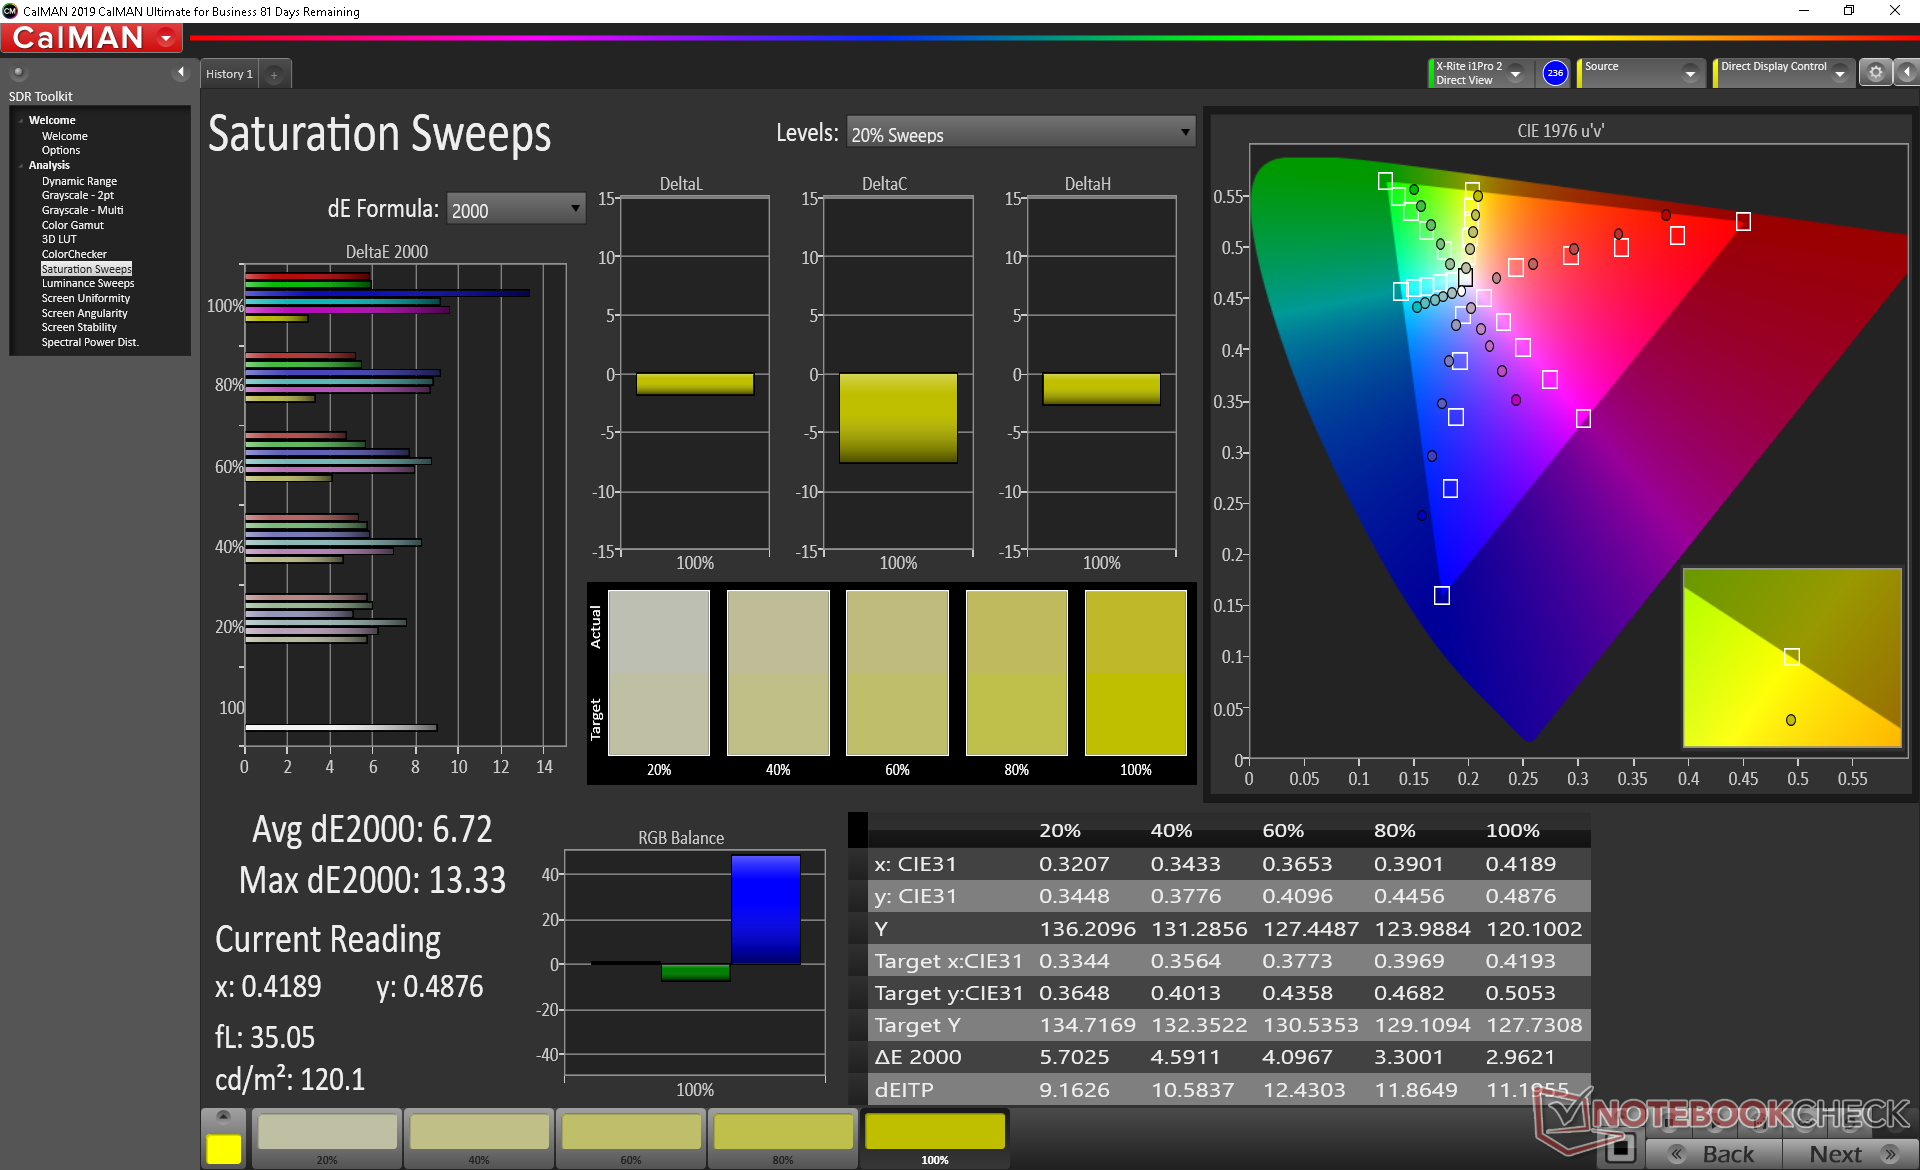
Color space is limited to just 60 percent and 38 percent of sRGB and AdobeRGB, respectively, to be indicative of an inexpensive panel. Most Ultrabooks in this price range offer >95 percent sRGB coverage for deeper and more accurate colors.
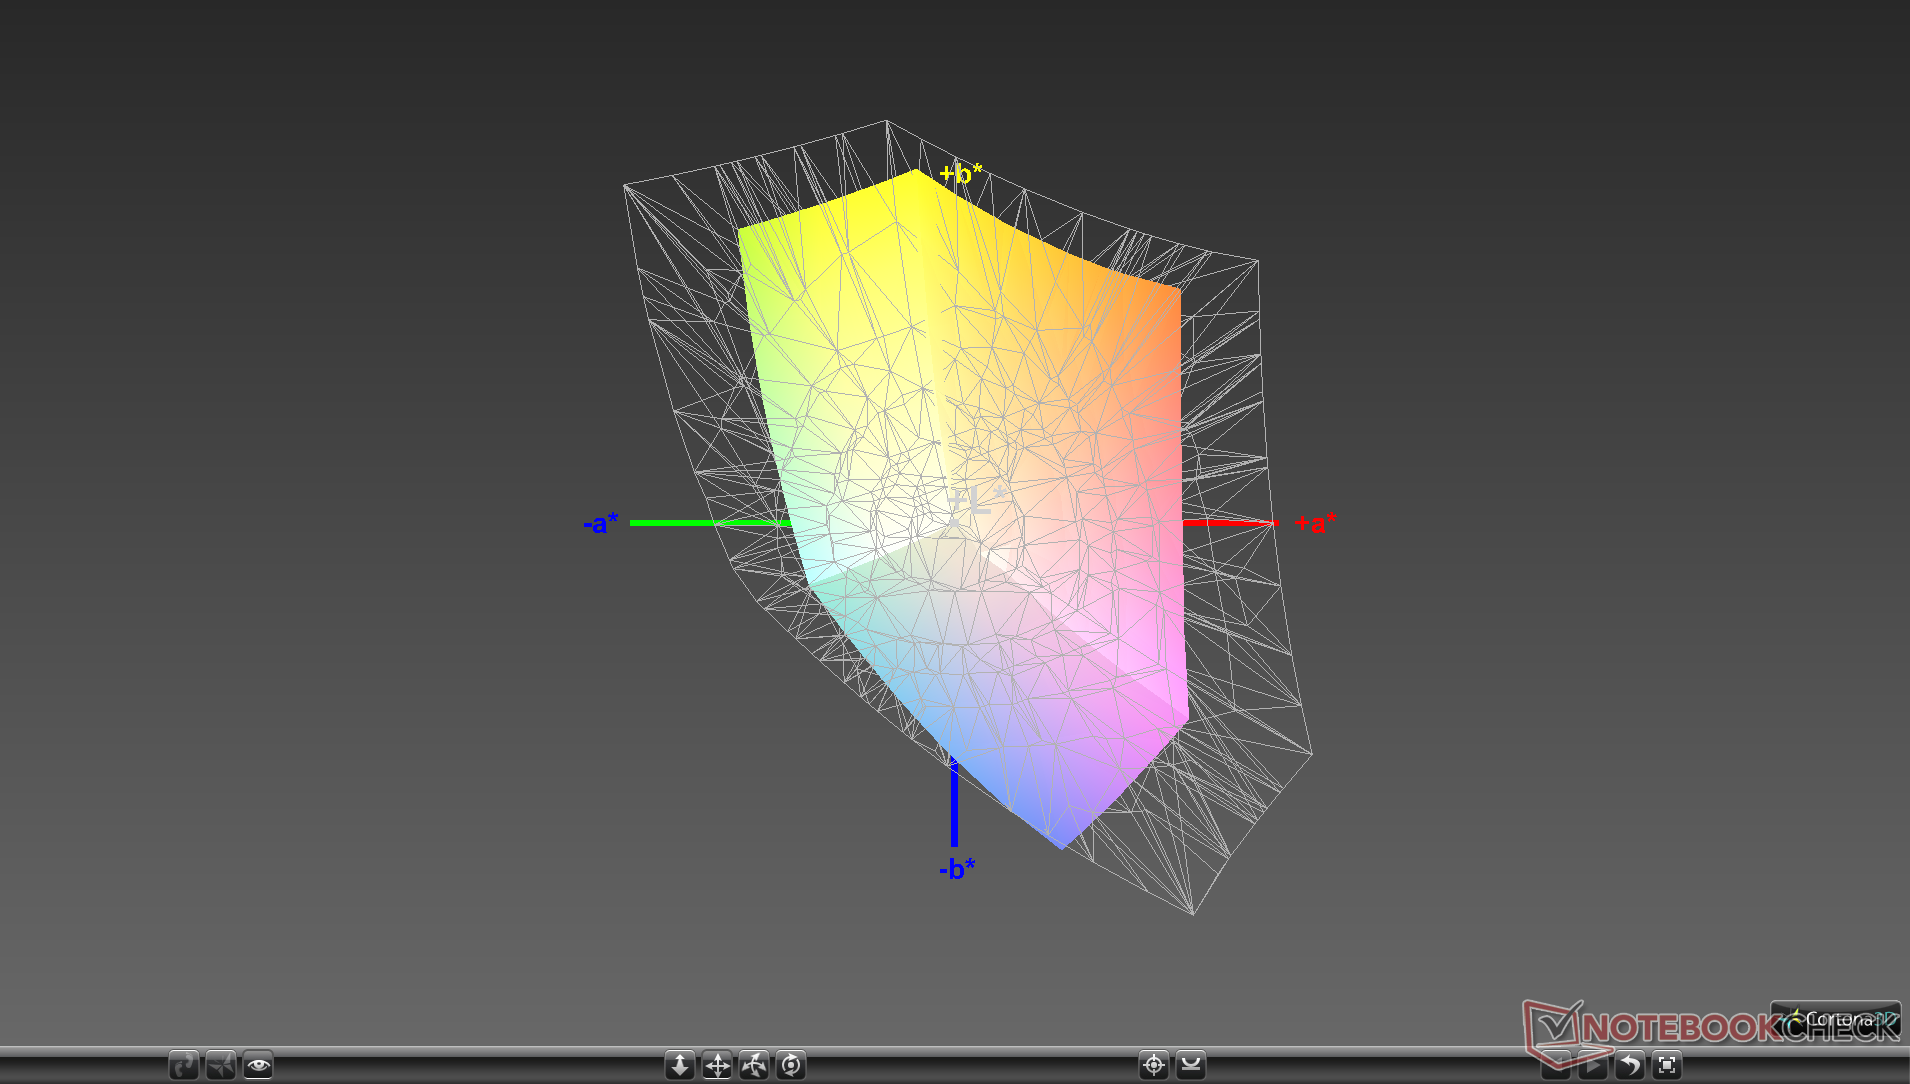
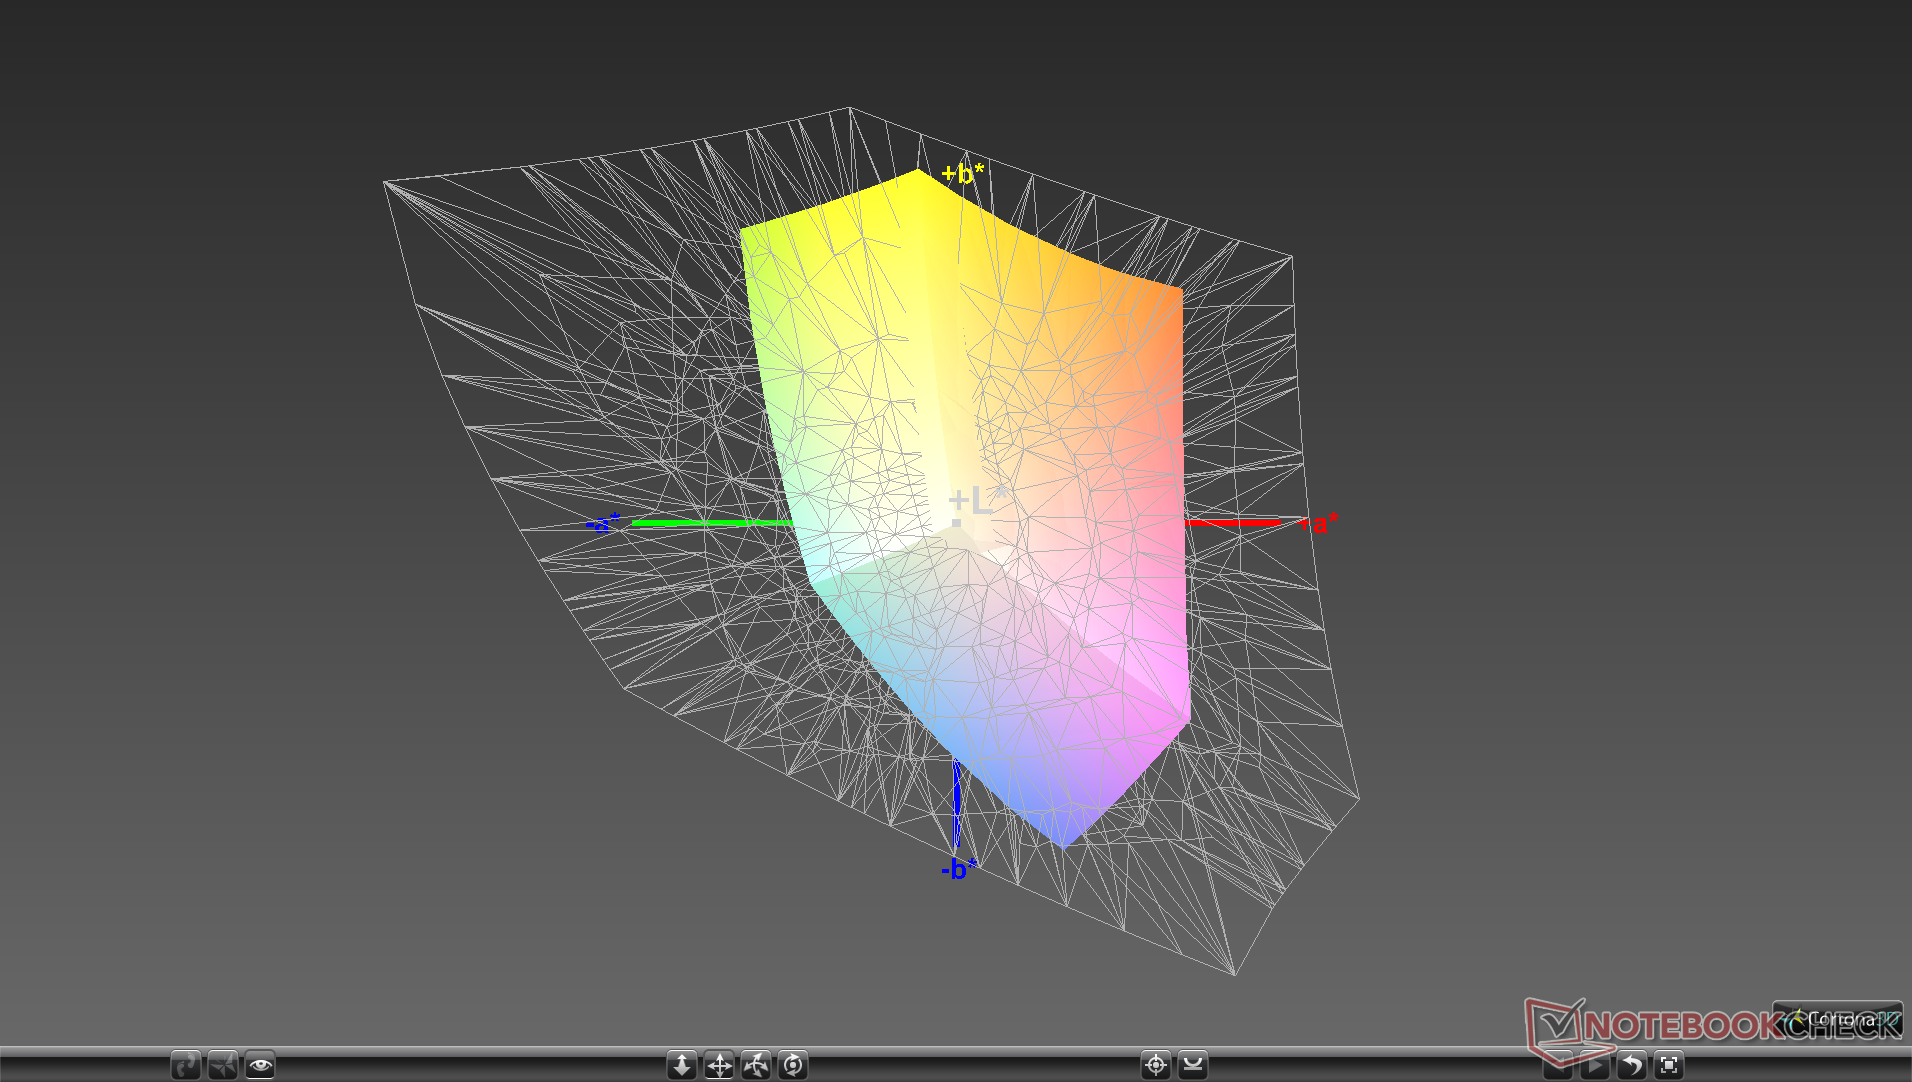
The display is not well calibrated out of the box with an overly cool color temperature and a relatively high grayscale deltaE value of 5.8. These shortcomings improve noticeably after calibrating the panel ourselves, but colors still become increasingly inaccurate at higher saturation levels due to the limited color space mentioned above.

Display Response Times
| ↔ Response Time Black to White | ||
|---|---|---|
| 24 ms ... rise ↗ and fall ↘ combined | ↗ 13.2 ms rise | 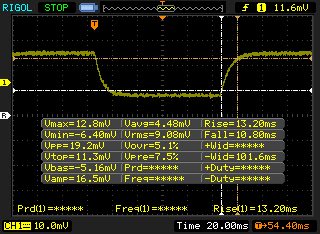 |
| ↘ 10.8 ms fall | ||
| The screen shows good response rates in our tests, but may be too slow for competitive gamers. In comparison, all tested devices range from 0.1 (minimum) to 240 (maximum) ms. » 54 % of all devices are better. This means that the measured response time is worse than the average of all tested devices (19.9 ms). | ||
| ↔ Response Time 50% Grey to 80% Grey | ||
| 28.4 ms ... rise ↗ and fall ↘ combined | ↗ 16.8 ms rise | 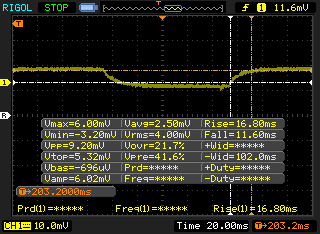 |
| ↘ 11.6 ms fall | ||
| The screen shows relatively slow response rates in our tests and may be too slow for gamers. In comparison, all tested devices range from 0.165 (minimum) to 636 (maximum) ms. » 38 % of all devices are better. This means that the measured response time is similar to the average of all tested devices (31.1 ms). | ||
Screen Flickering / PWM (Pulse-Width Modulation)
| Screen flickering / PWM not detected | 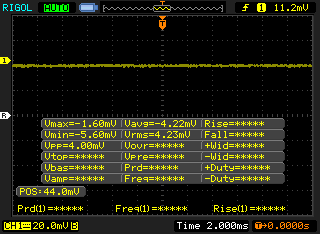 | ||
In comparison: 52 % of all tested devices do not use PWM to dim the display. If PWM was detected, an average of 7798 (minimum: 5 - maximum: 343500) Hz was measured. | |||
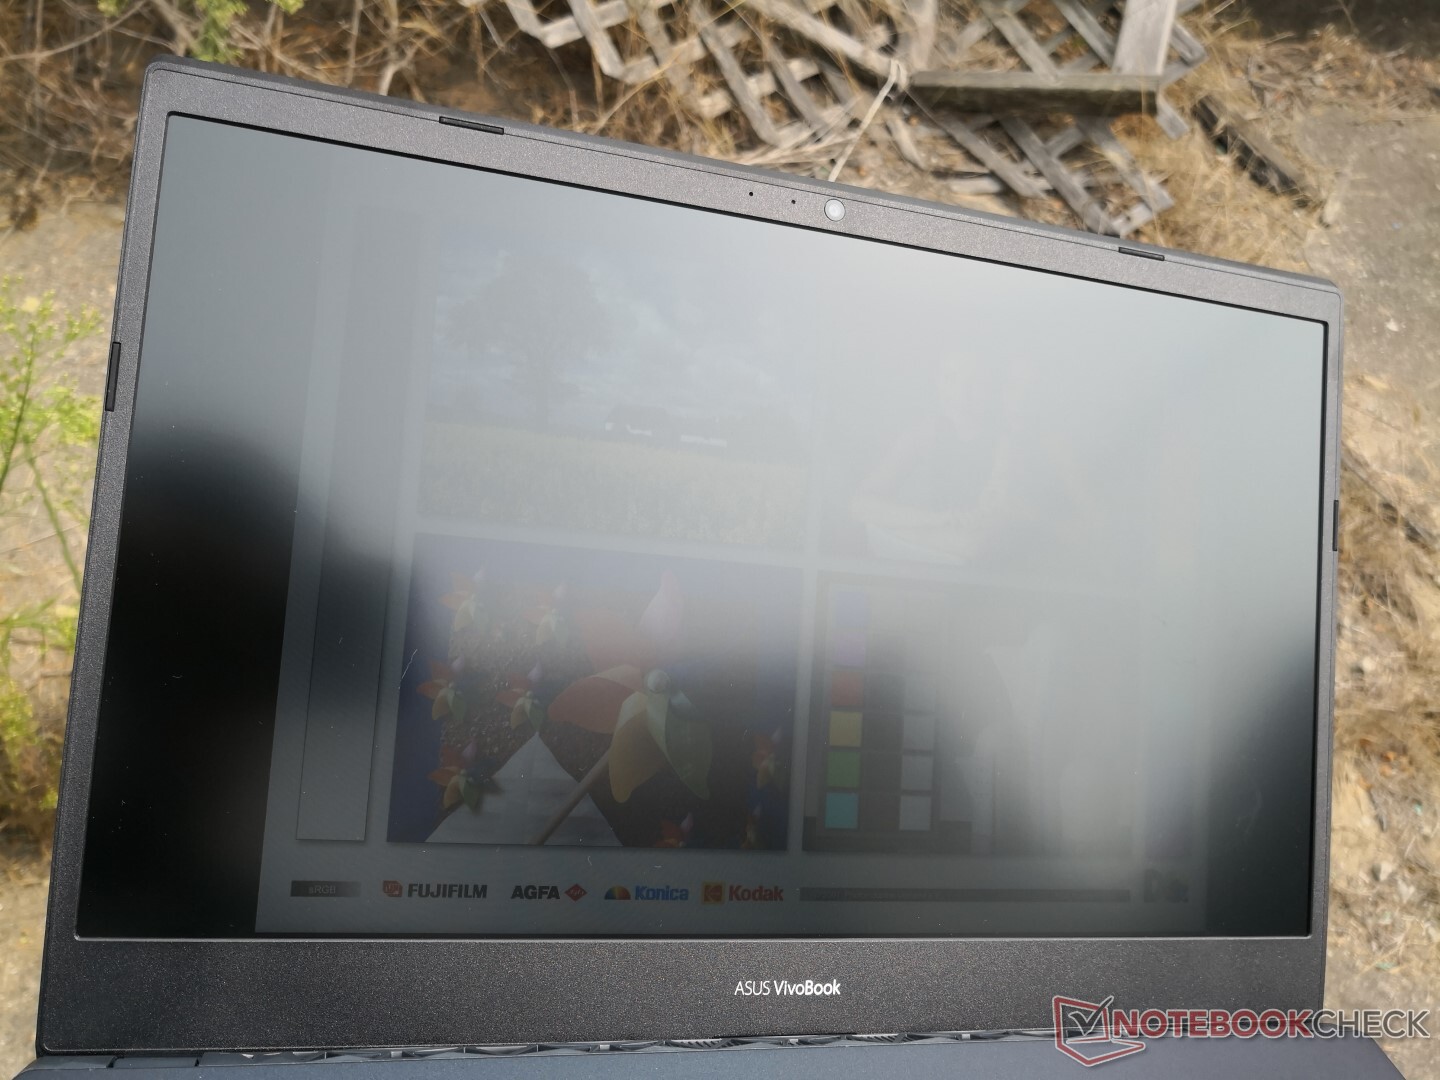
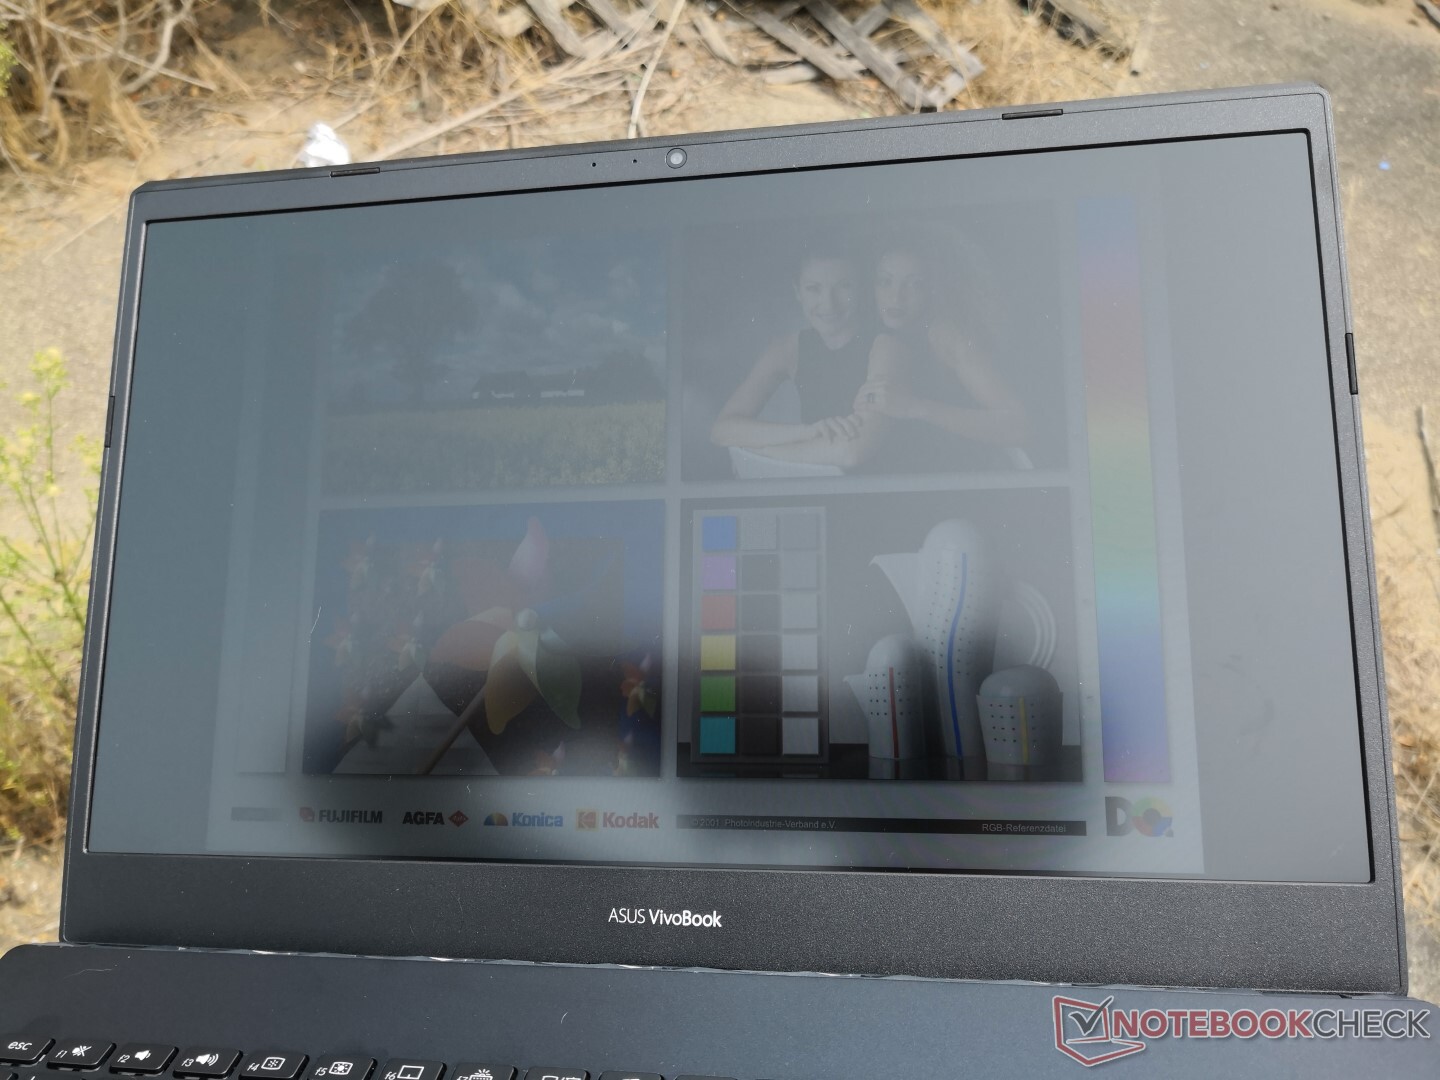
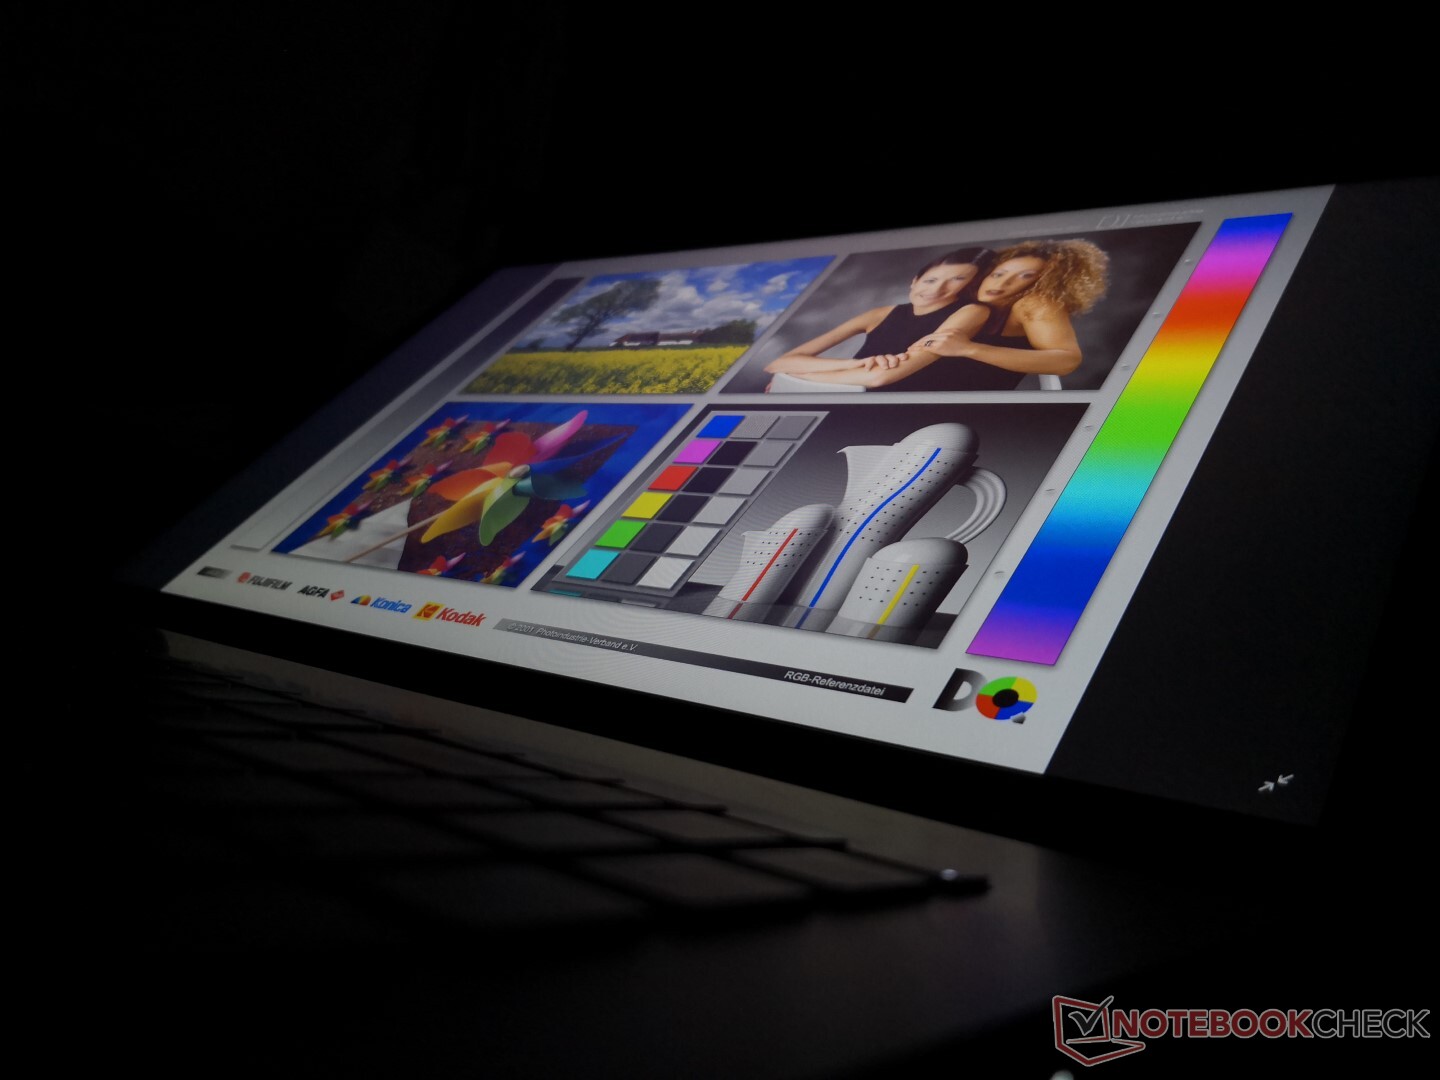
Outdoor visibility is average at best because of the insufficient 250-nit backlight and inevitable ambient glare. ZenBooks and especially the Dell XPS 15 or MacBook Pro 15 will have brighter displays.
Performance
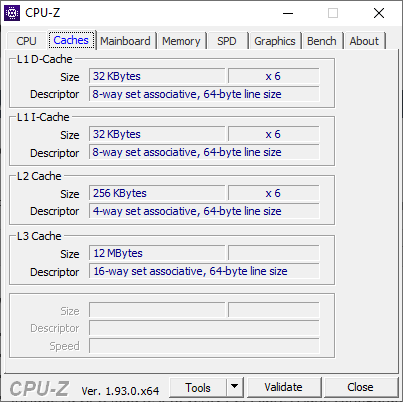
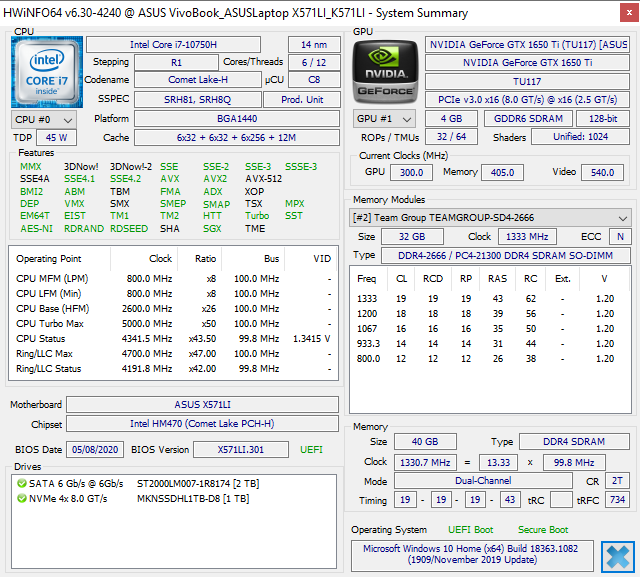
The Core i7-10750H, GeForce GTX 1650 Ti, and 120 Hz display are the defining features of the VivoBook 15 K571 series. While such components are common on entry-level gaming laptops, general-purpose performance users can also appreciate the hardware especially for those who desire something faster than the usual Core U-series or integrated graphics solutions.
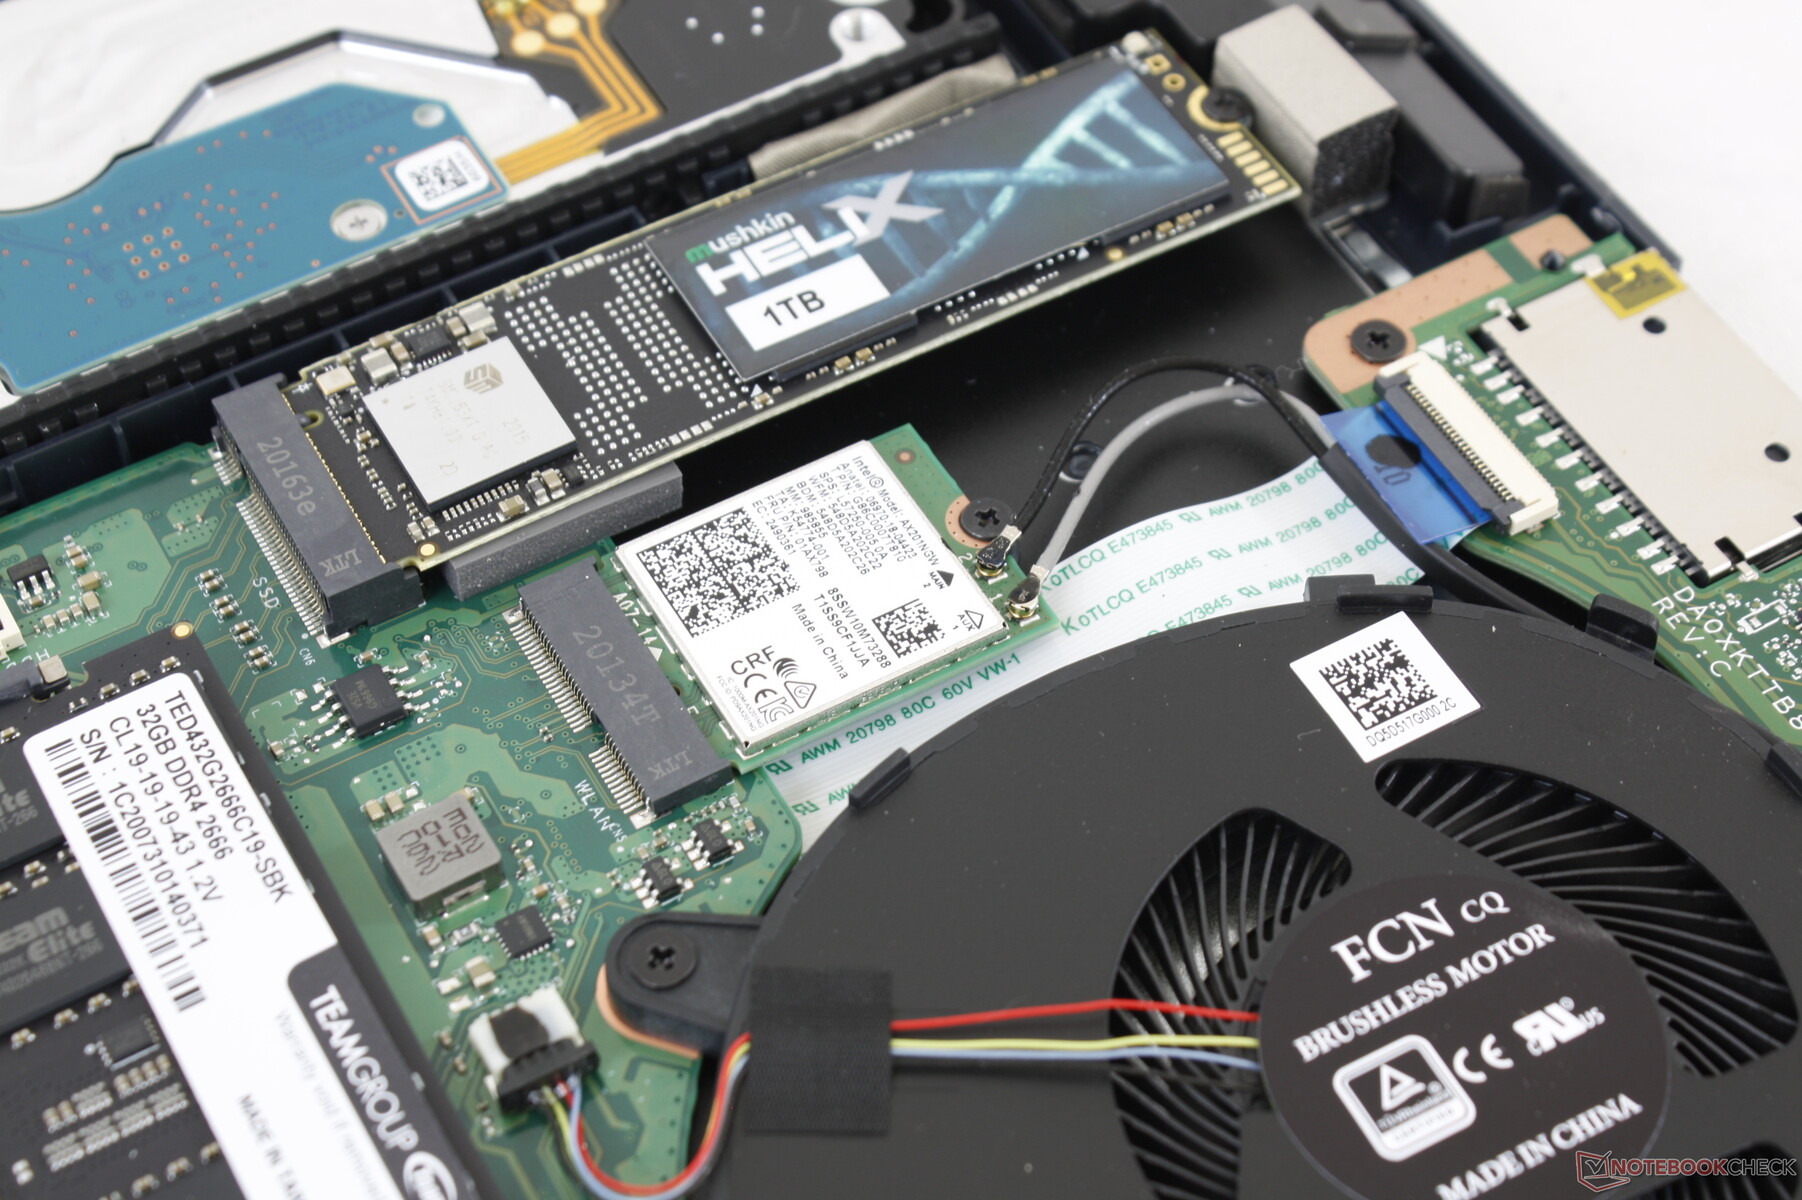
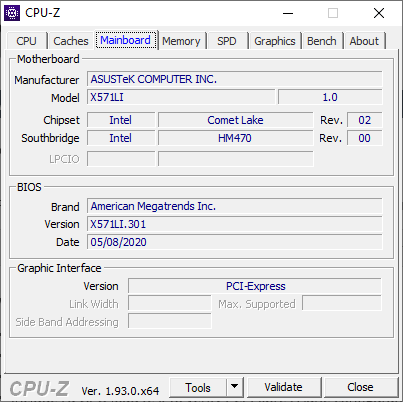
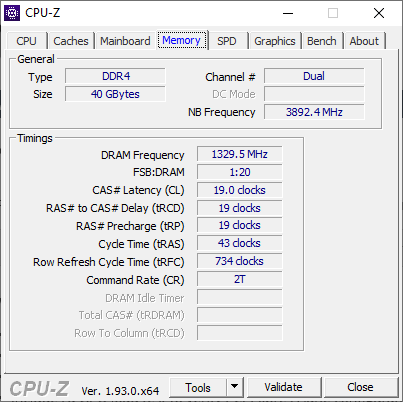
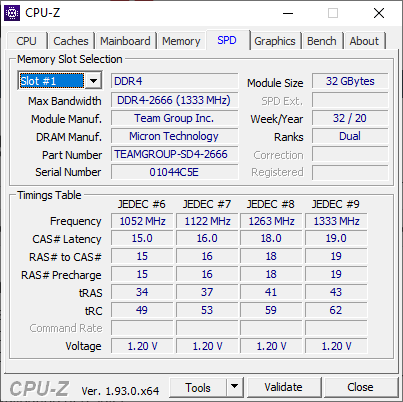
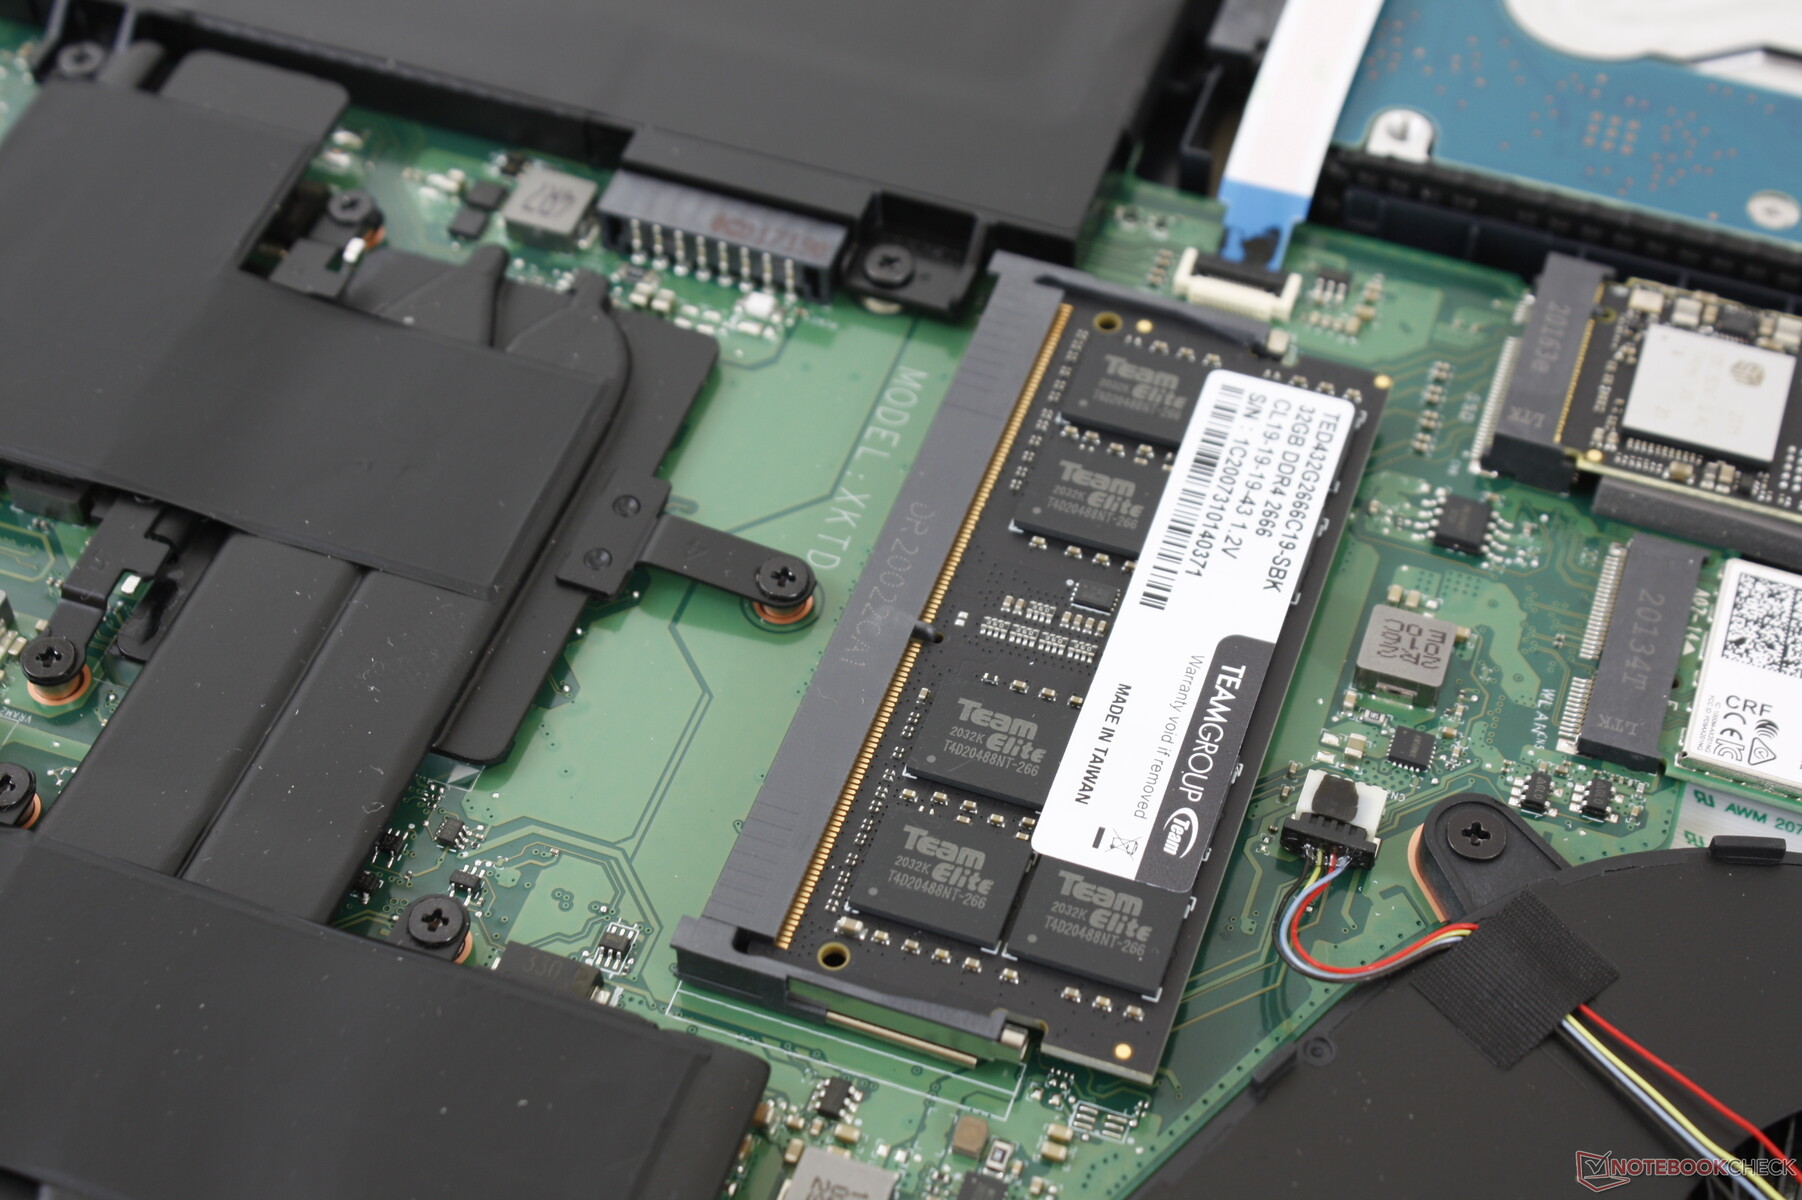
Both soldered and removable RAM are present much like on some Asus ROG laptops. 4 GB or 8 GB comes soldered depending on the configuration alongside a single SODIMM slot supporting up to 32 GB for a combined maximum of 40 GB.
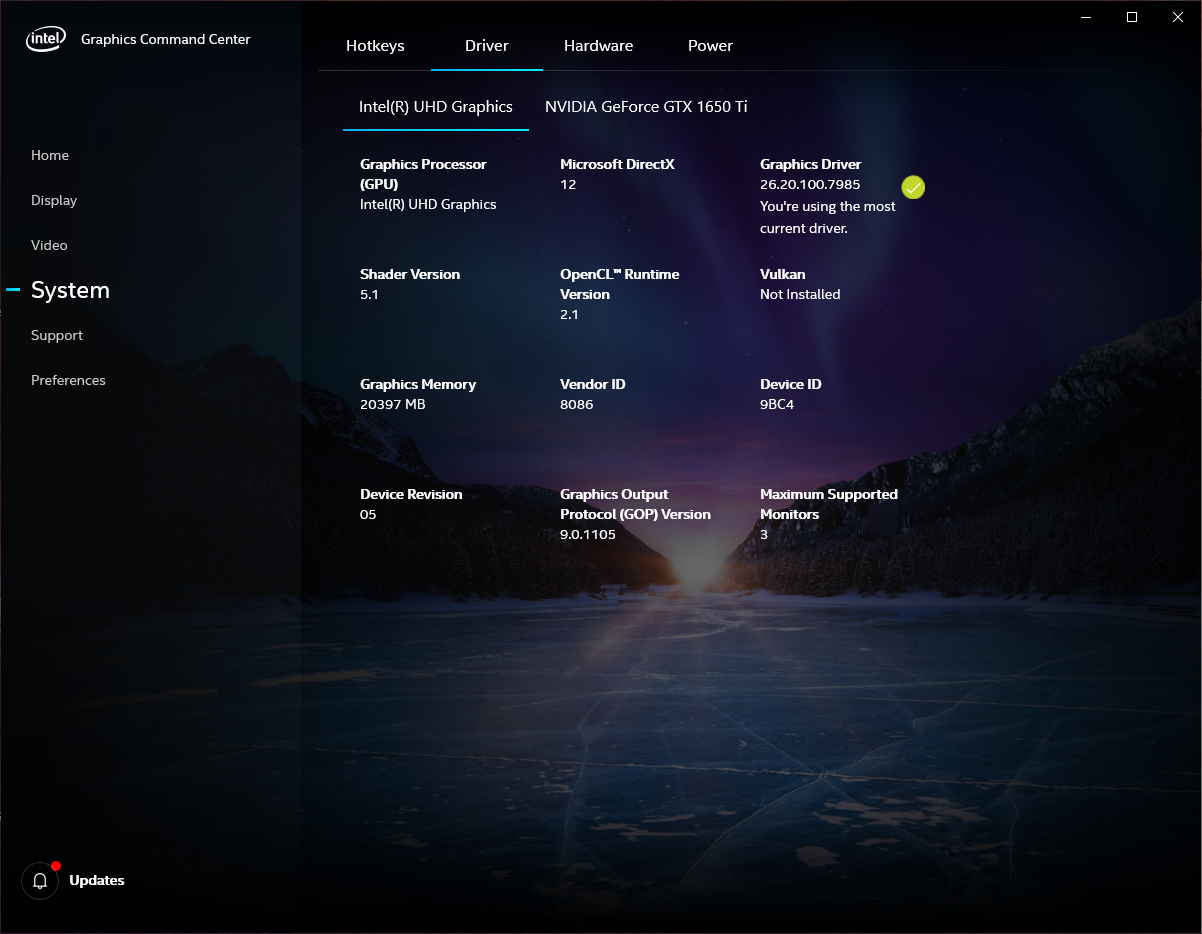
Optimus comes standard for automatic graphics switching. Our unit was set to High Performance mode prior to running any performance benchmarks below.
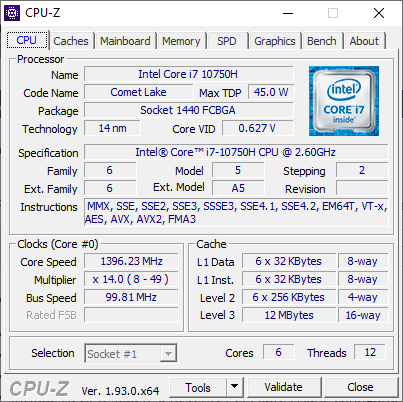
Processor
CPU performance is disappointing at about 15 to 20 percent slower than the average laptop in our database equipped with the same Core i7-10750H CPU. This deficit is enough to put our Asus below the last generation Core i7-9750H that the Core i7-10750H is supposed to supplant. Turbo Boost potential is also poor as shown by our CineBench R15 xT loop results below. Nonetheless, multi-thread performance will still be about 20 percent faster than the lesser Core i5-10300H option.
See our dedicated page on the Core i7-10750H for more technical information and benchmarks.
Cinebench R15: CPU Multi 64Bit | CPU Single 64Bit
Blender: v2.79 BMW27 CPU
7-Zip 18.03: 7z b 4 -mmt1 | 7z b 4
Geekbench 5.5: Single-Core | Multi-Core
HWBOT x265 Benchmark v2.2: 4k Preset
LibreOffice : 20 Documents To PDF
R Benchmark 2.5: Overall mean
| Cinebench R20 / CPU (Single Core) | |
| Dell XPS 15 9500 Core i7 4K UHD | |
| Asus ROG Strix Scar 15 G532LWS | |
| Dell G5 15 SE 5505 P89F | |
| Average Intel Core i7-10750H (431 - 504, n=43) | |
| Asus VivoBook 15 K571LI-PB71 | |
| Asus ZenBook 15 UX534FTC-A8190T | |
| Lenovo IdeaPad S740-15IRH | |
| Dell XPS 15 9500 Core i5 | |
| HP Pavilion Gaming 15-ec1206ng | |
| Dell G5 15 5590-PCNJJ | |
| Blender / v2.79 BMW27 CPU | |
| Dell XPS 15 9500 Core i5 | |
| Asus VivoBook 15 K571LI-PB71 | |
| Average Intel Core i7-10750H (322 - 587, n=43) | |
| Dell XPS 15 9500 Core i7 4K UHD | |
| HP Pavilion Gaming 15-ec1206ng | |
| Asus ROG Strix Scar 15 G532LWS | |
| Dell G5 15 SE 5505 P89F | |
| 7-Zip 18.03 / 7z b 4 -mmt1 | |
| Asus ROG Strix Scar 15 G532LWS | |
| Dell XPS 15 9500 Core i7 4K UHD | |
| Asus VivoBook 15 K571LI-PB71 | |
| Average Intel Core i7-10750H (4504 - 5470, n=43) | |
| Dell XPS 15 9500 Core i5 | |
| Dell G5 15 SE 5505 P89F | |
| HP Pavilion Gaming 15-ec1206ng | |
| 7-Zip 18.03 / 7z b 4 | |
| Dell G5 15 SE 5505 P89F | |
| Asus ROG Strix Scar 15 G532LWS | |
| HP Pavilion Gaming 15-ec1206ng | |
| Dell XPS 15 9500 Core i7 4K UHD | |
| Average Intel Core i7-10750H (26040 - 37345, n=43) | |
| Asus VivoBook 15 K571LI-PB71 | |
| Dell XPS 15 9500 Core i5 | |
| Geekbench 5.5 / Single-Core | |
| Asus ROG Strix Scar 15 G532LWS | |
| Dell XPS 15 9500 Core i7 4K UHD | |
| Asus VivoBook 15 K571LI-PB71 | |
| Average Intel Core i7-10750H (1114 - 1333, n=43) | |
| Asus ZenBook 15 UX534FTC-A8190T | |
| Dell XPS 15 9500 Core i5 | |
| Dell G5 15 SE 5505 P89F | |
| HP Pavilion Gaming 15-ec1206ng | |
| Geekbench 5.5 / Multi-Core | |
| Asus ROG Strix Scar 15 G532LWS | |
| Dell XPS 15 9500 Core i7 4K UHD | |
| Dell G5 15 SE 5505 P89F | |
| Asus VivoBook 15 K571LI-PB71 | |
| Average Intel Core i7-10750H (4443 - 6674, n=43) | |
| HP Pavilion Gaming 15-ec1206ng | |
| Asus ZenBook 15 UX534FTC-A8190T | |
| Dell XPS 15 9500 Core i5 | |
| HWBOT x265 Benchmark v2.2 / 4k Preset | |
| Asus ROG Strix Scar 15 G532LWS | |
| Dell G5 15 SE 5505 P89F | |
| HP Pavilion Gaming 15-ec1206ng | |
| Dell XPS 15 9500 Core i7 4K UHD | |
| Average Intel Core i7-10750H (5.54 - 11.6, n=43) | |
| Asus VivoBook 15 K571LI-PB71 | |
| Dell XPS 15 9500 Core i5 | |
| LibreOffice / 20 Documents To PDF | |
| HP Pavilion Gaming 15-ec1206ng | |
| Dell G5 15 SE 5505 P89F | |
| Dell XPS 15 9500 Core i5 | |
| Average Intel Core i7-10750H (43.1 - 99.2, n=43) | |
| Dell XPS 15 9500 Core i7 4K UHD | |
| Asus ROG Strix Scar 15 G532LWS | |
| Asus VivoBook 15 K571LI-PB71 | |
| R Benchmark 2.5 / Overall mean | |
| Dell XPS 15 9500 Core i5 | |
| Average Intel Core i7-10750H (0.578 - 0.708, n=42) | |
| HP Pavilion Gaming 15-ec1206ng | |
| Asus VivoBook 15 K571LI-PB71 | |
| Dell XPS 15 9500 Core i7 4K UHD | |
| Dell G5 15 SE 5505 P89F | |
| Asus ROG Strix Scar 15 G532LWS | |
* ... smaller is better
System Performance
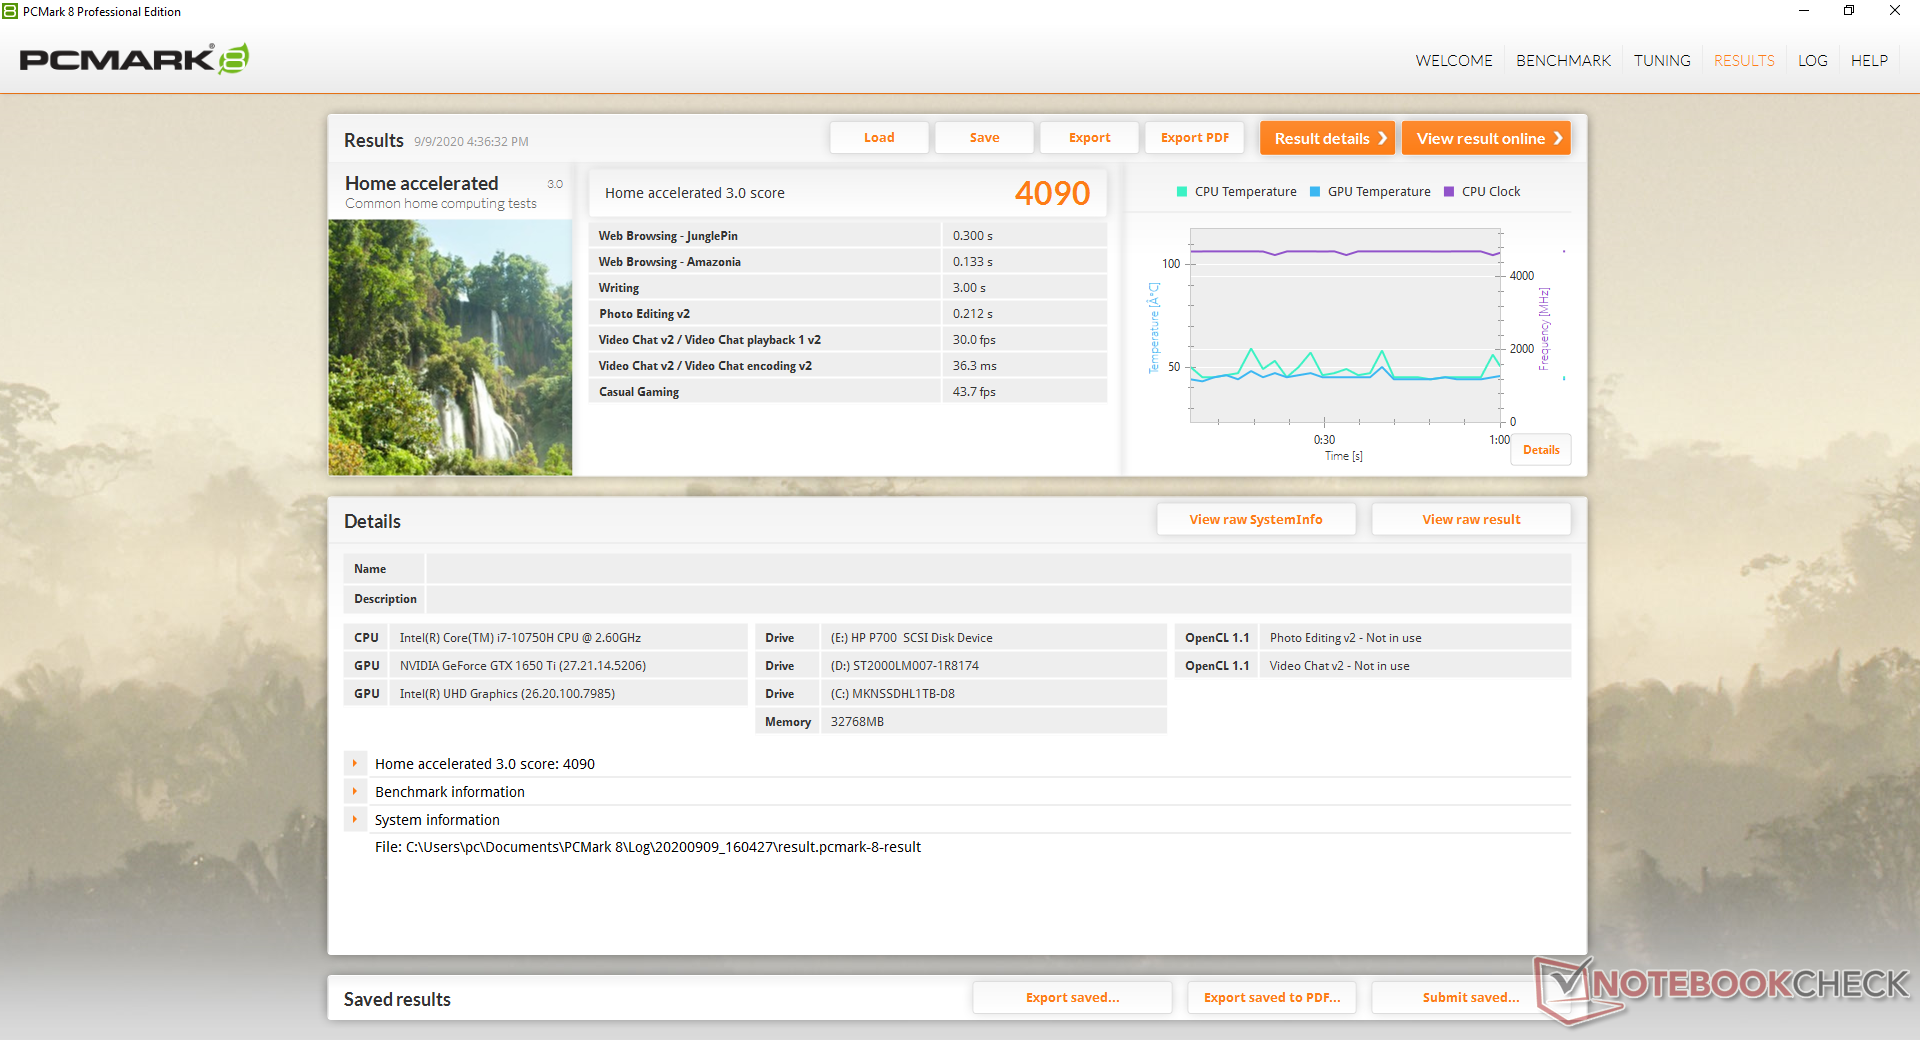
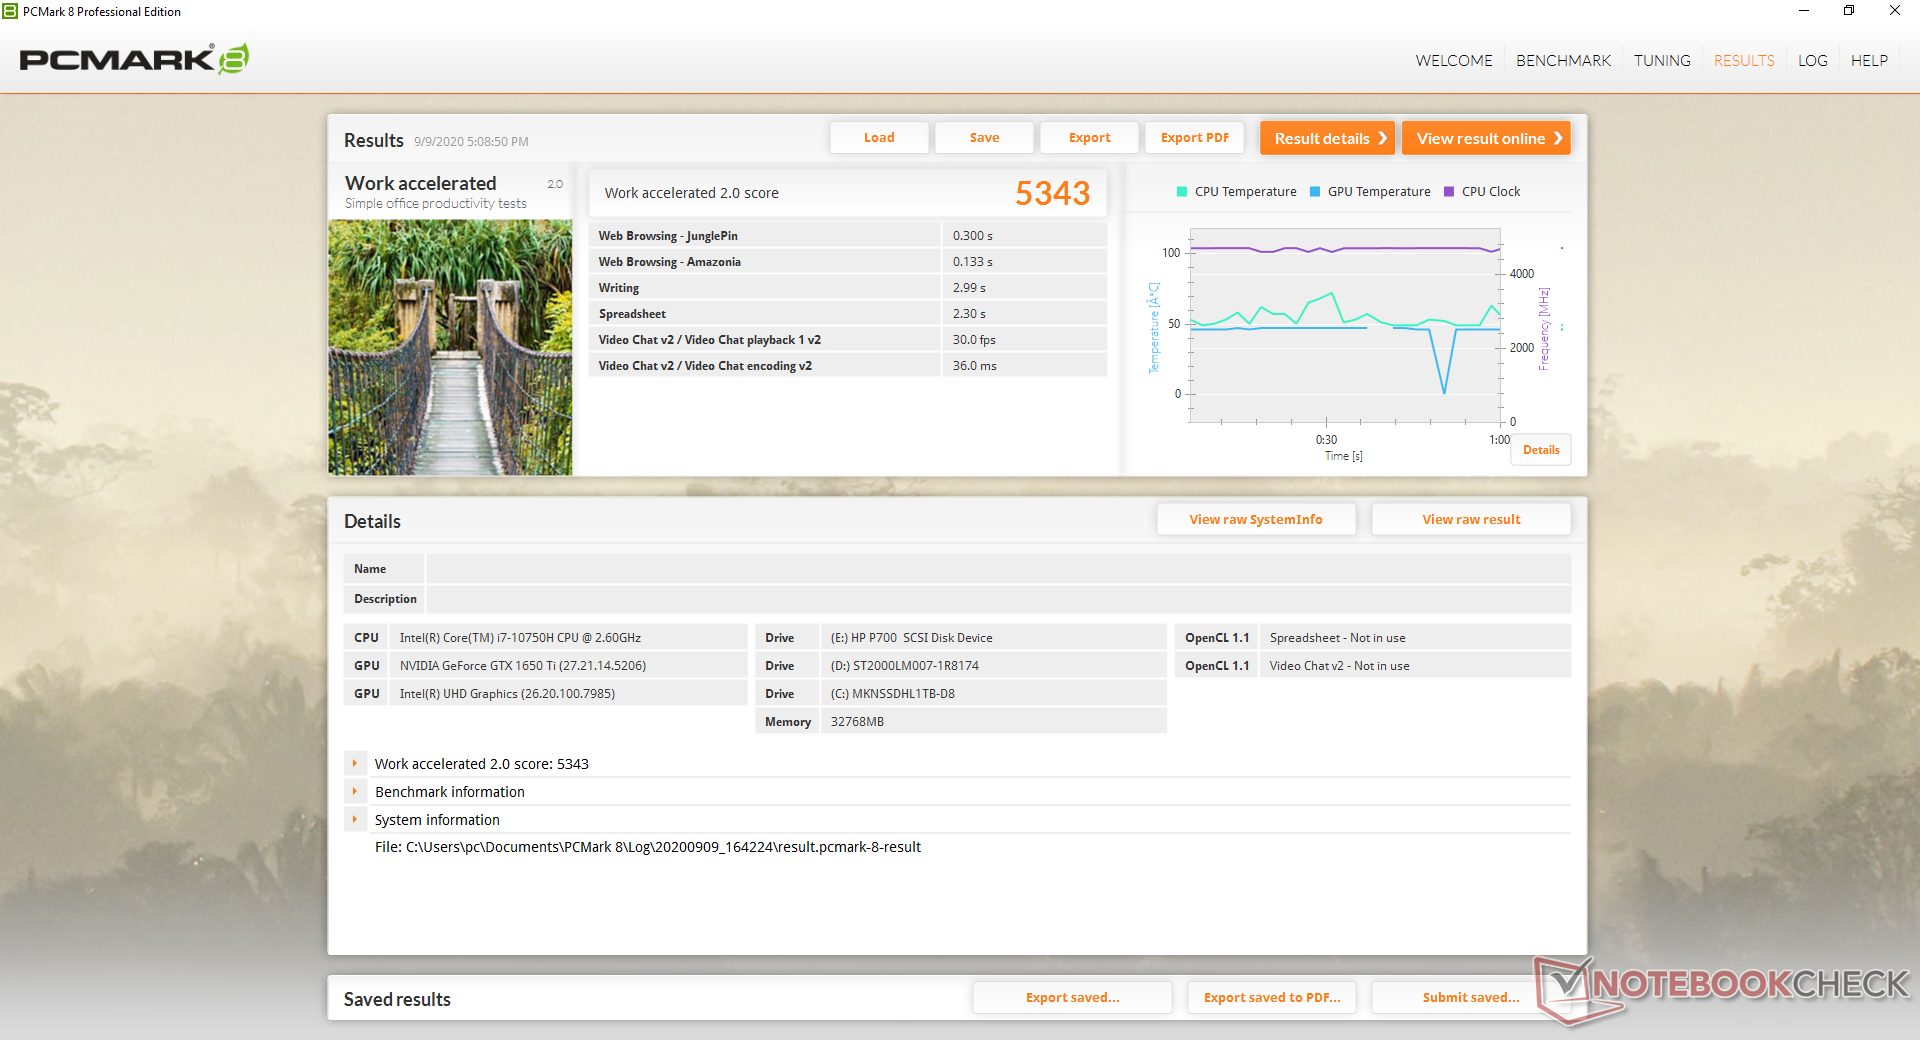
| PCMark 8 Home Score Accelerated v2 | 4090 points | |
| PCMark 8 Work Score Accelerated v2 | 5343 points | |
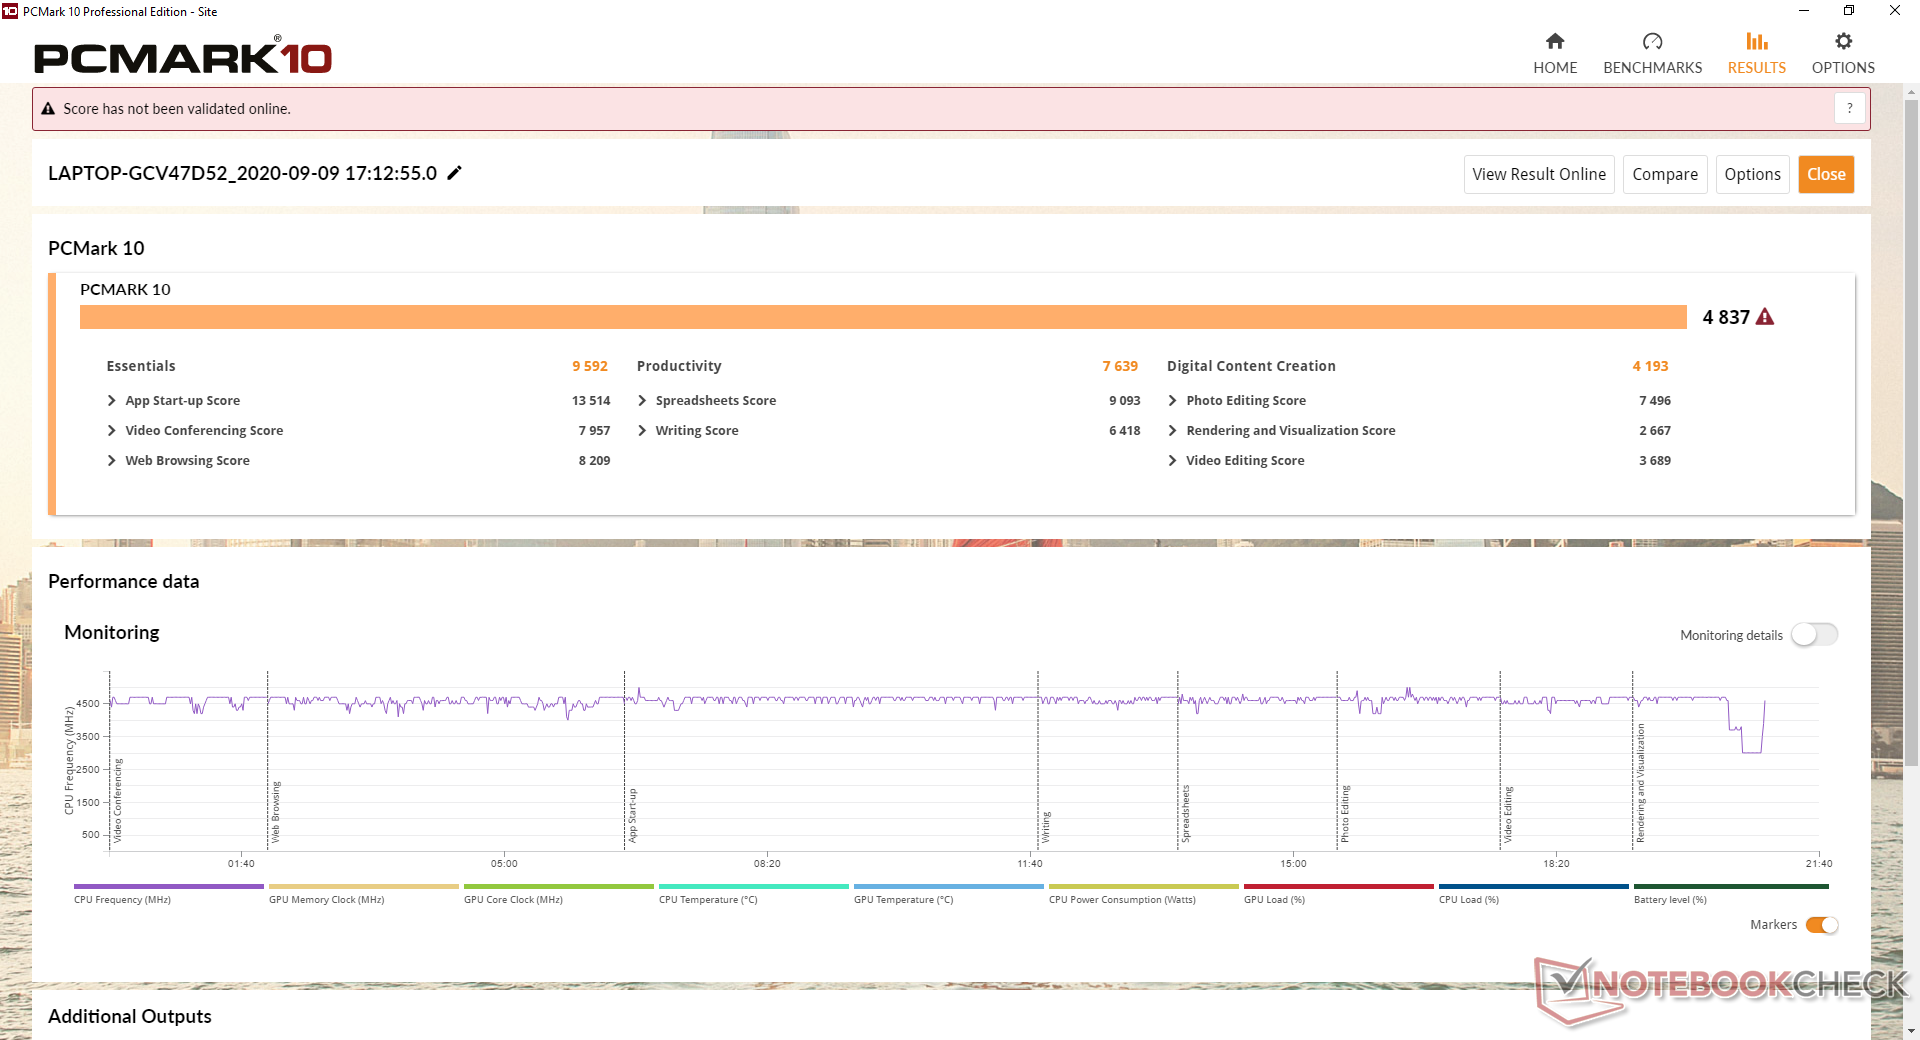
| PCMark 10 Score | 4837 points | |
Help | ||
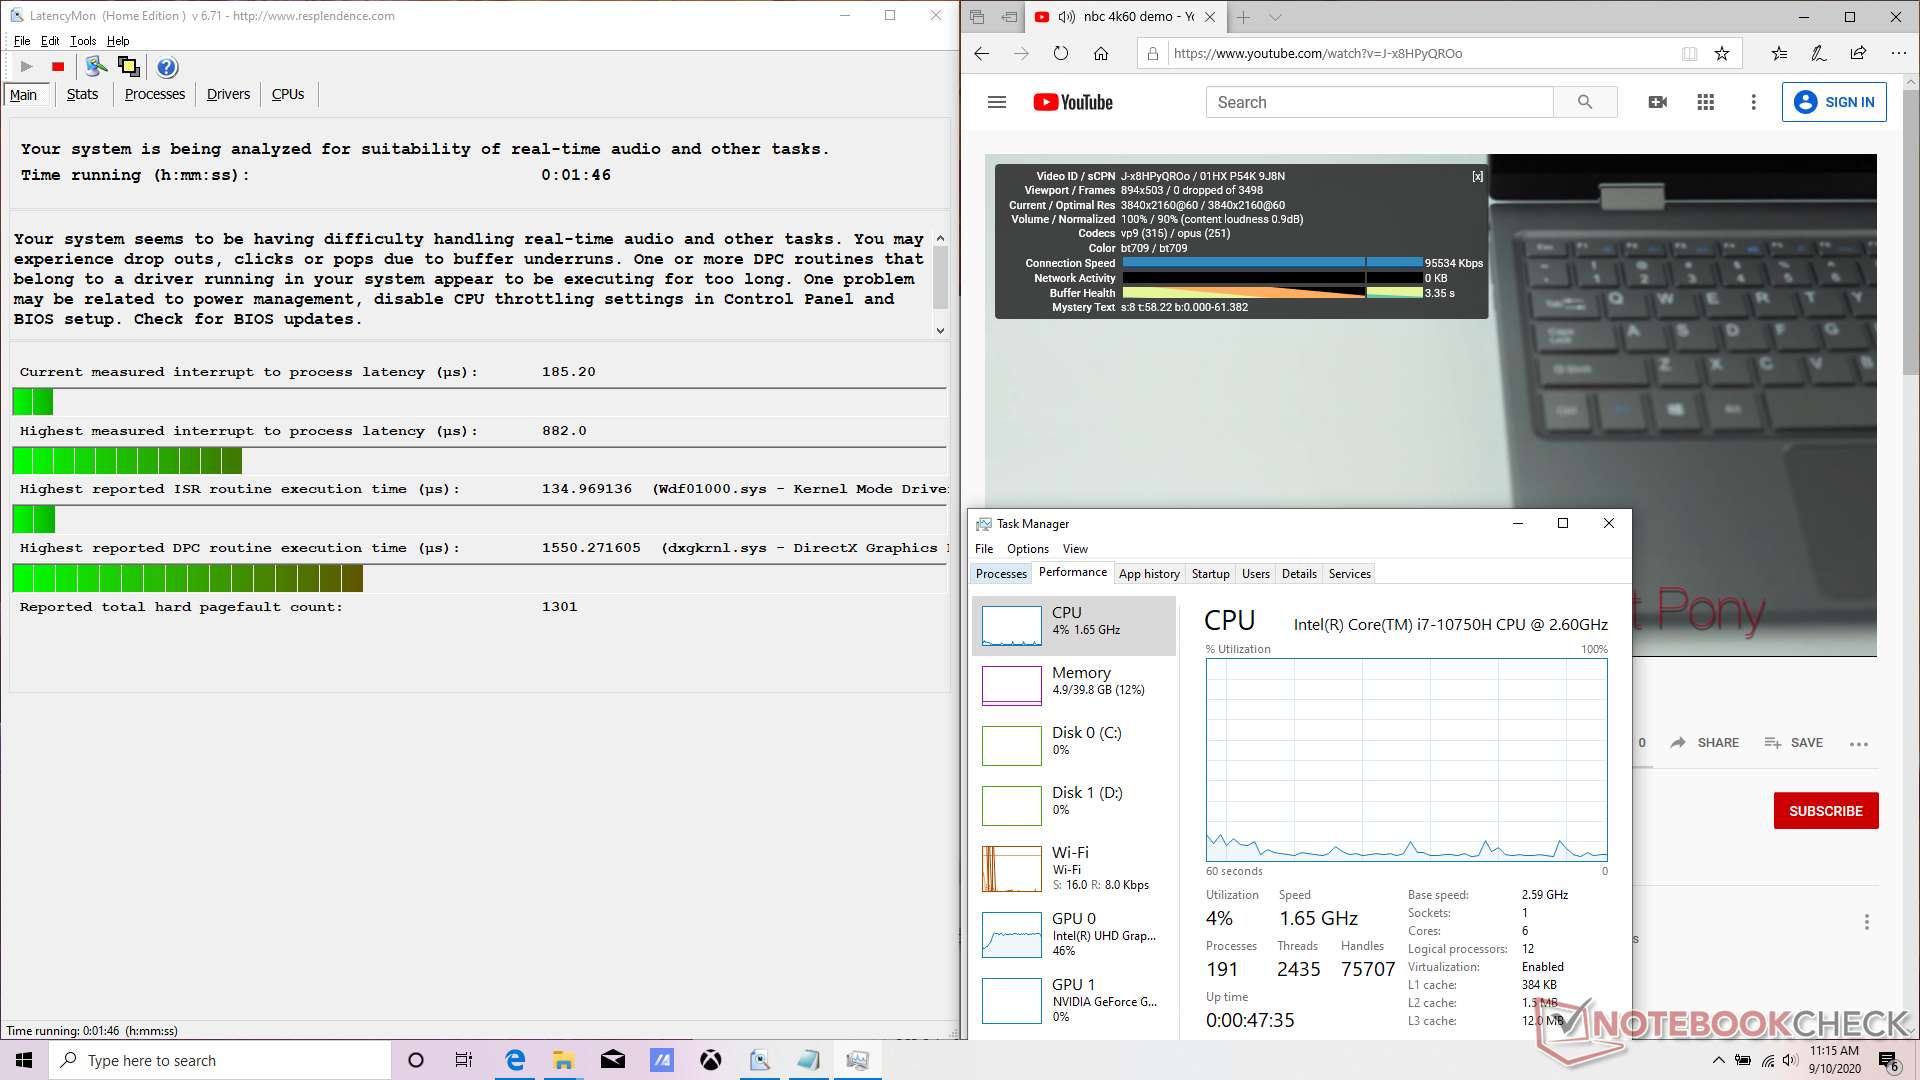
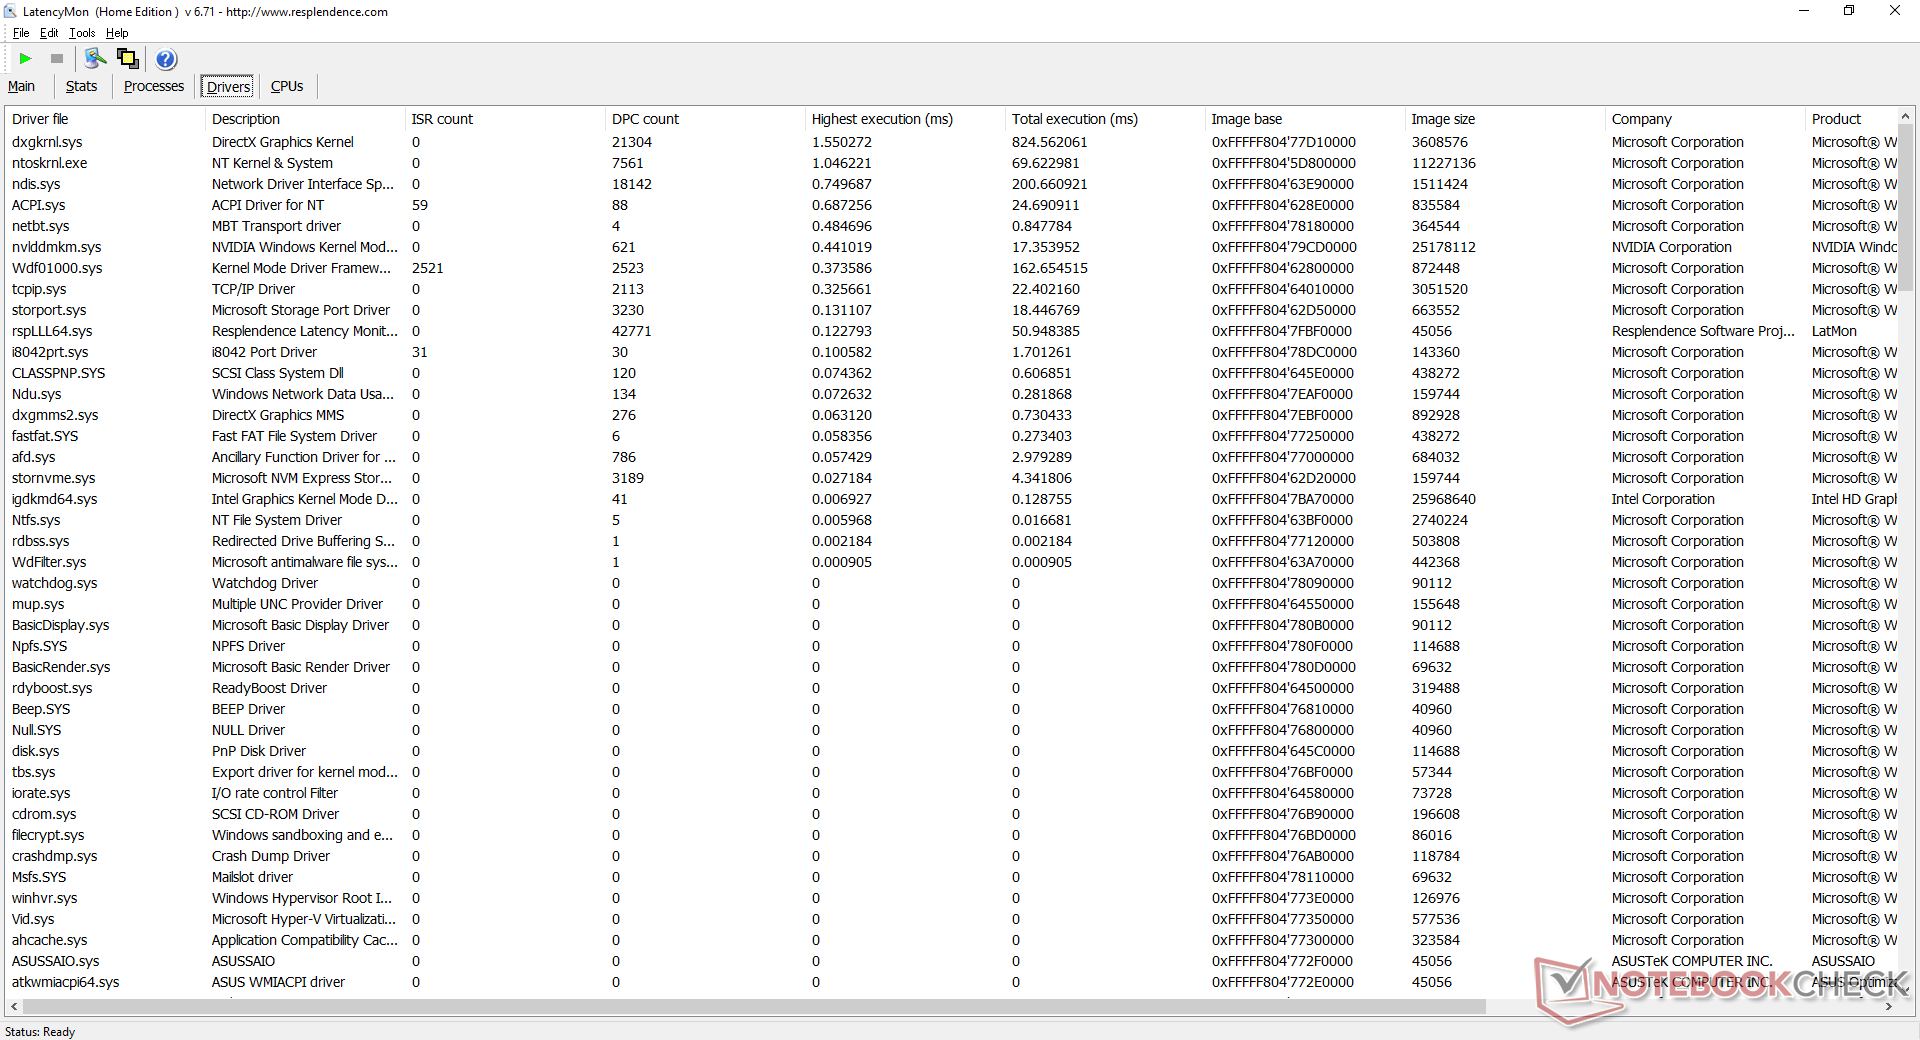
DPC Latency
LatencyMon shows DPC latency issues when opening multiple tabs on our homepage. 4K60 video playback is otherwise smooth and with no dropped frames.
| DPC Latencies / LatencyMon - interrupt to process latency (max), Web, Youtube, Prime95 | |
| Dell XPS 15 9500 Core i7 4K UHD | |
| HP Envy 15-ep0098nr | |
| Dell G5 15 SE 5505 P89F | |
| Dell XPS 15 9500 Core i5 | |
| Asus ROG Strix Scar 15 G532LWS | |
| Asus ROG Strix G15 G512LI | |
| Asus VivoBook 15 K571LI-PB71 | |
| HP Pavilion Gaming 15-ec1206ng | |
| Acer Nitro 5 AN517-52-77DS | |
* ... smaller is better
Storage Devices
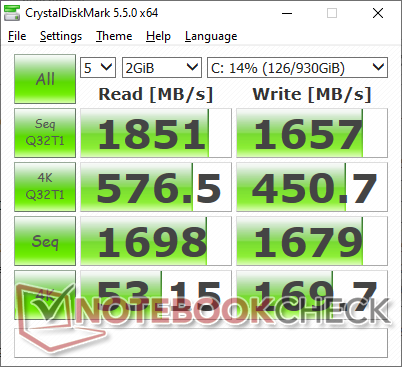
The system supports one M.2 2280 SSD and a second 2.5-inch SATA III drive which sits underneath the right palm rest. CUKUSA has configured our unit with a 1 TB Mushkin Helix MKNSSDHL1TB-08 NVMe SSD, but different drives are likely if purchased from other retailers. The Mushkin SSD is a mid-range NVMe drive with sequential read and write rates of 2110 MB/s and 1700 MB/s, respectively, to be in line with other budget to mid-range multimedia laptops like the Acer Aspire 5. Costlier laptops like Asus' own ZenBook series tend to ship with the faster Samsung PM981 drive instead.
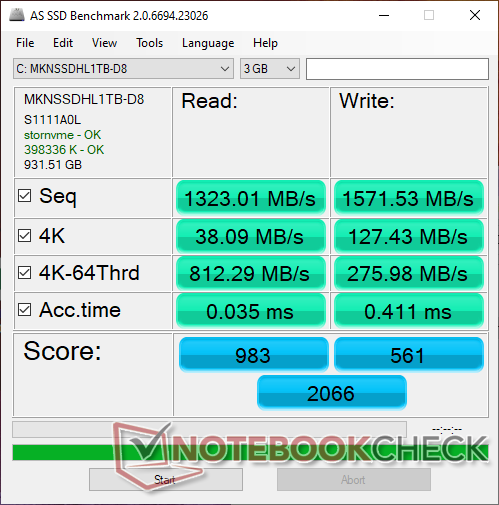
| Asus VivoBook 15 K571LI-PB71 Mushkin Helix-L 1TB MKNSSDHL1TB-08 | HP Envy 15-ep0098nr Intel Optane Memory H10 with Solid State Storage 32GB + 512GB HBRPEKNX0202A(L/H) | Acer Aspire 5 A515-54G Kingston RBUSNS8154P3512GJ1 | Asus ZenBook 15 UX534FTC-A8190T Samsung SSD PM981 MZVLB1T0HALR | Lenovo Ideapad S540-15IML Samsung SSD PM981a MZVLB512HBJQ | Dell Inspiron 15 5000 5585 WDC PC SN520 SDAPNUW-512G | |
|---|---|---|---|---|---|---|
| AS SSD | -5% | 31% | 63% | 119% | -0% | |
| Seq Read (MB/s) | 1323 | 1005 -24% | 1405 6% | 2643 100% | 2642 100% | 398.9 -70% |
| Seq Write (MB/s) | 1572 | 436.8 -72% | 953 -39% | 1533 -2% | 2433 55% | 884 -44% |
| 4K Read (MB/s) | 38.09 | 51.5 35% | 54 42% | 49.12 29% | 58 52% | 34.54 -9% |
| 4K Write (MB/s) | 127.4 | 88 -31% | 93 -27% | 134.7 6% | 145.3 14% | 82.1 -36% |
| 4K-64 Read (MB/s) | 812 | 517 -36% | 959 18% | 1028 27% | 1431 76% | 647 -20% |
| 4K-64 Write (MB/s) | 276 | 839 204% | 772 180% | 1353 390% | 1753 535% | 985 257% |
| Access Time Read * (ms) | 0.035 | 0.088 -151% | 0.051 -46% | 0.033 6% | 0.072 -106% | 0.072 -106% |
| Access Time Write * (ms) | 0.411 | 0.151 63% | 0.044 89% | 0.028 93% | 0.027 93% | 0.047 89% |
| Score Read (Points) | 983 | 669 -32% | 1153 17% | 1342 37% | 1753 78% | 721 -27% |
| Score Write (Points) | 561 | 970 73% | 961 71% | 1641 193% | 2142 282% | 1155 106% |
| Score Total (Points) | 2066 | 1972 -5% | 2695 30% | 3622 75% | 4790 132% | 2279 10% |
| Copy ISO MB/s (MB/s) | 2846 | 1173 -59% | 2226 -22% | 862 -70% | ||
| Copy Program MB/s (MB/s) | 728 | 769 6% | 506 -30% | 457 -37% | ||
| Copy Game MB/s (MB/s) | 1610 | 1045 -35% | 1230 -24% | 902 -44% | ||
| CrystalDiskMark 5.2 / 6 | -5% | -27% | 15% | 11% | -43% | |
| Write 4K (MB/s) | 169.7 | 100.2 -41% | 100.4 -41% | 138.1 -19% | 170.7 1% | 105.9 -38% |
| Read 4K (MB/s) | 53.2 | 112.8 112% | 47.16 -11% | 45.89 -14% | 49.51 -7% | 36.56 -31% |
| Write Seq (MB/s) | 1679 | 537 -68% | 993 -41% | 2147 28% | 1156 -31% | 1165 -31% |
| Read Seq (MB/s) | 1698 | 1270 -25% | 1176 -31% | 2188 29% | 1136 -33% | 423.2 -75% |
| Write 4K Q32T1 (MB/s) | 450.7 | 480.6 7% | 354.7 -21% | 427.8 -5% | 420.5 -7% | 332.1 -26% |
| Read 4K Q32T1 (MB/s) | 577 | 364.9 -37% | 473 -18% | 404 -30% | 527 -9% | 229.3 -60% |
| Write Seq Q32T1 (MB/s) | 1657 | 1224 -26% | 1034 -38% | 2396 45% | 2984 80% | 1460 -12% |
| Read Seq Q32T1 (MB/s) | 1851 | 2635 42% | 1635 -12% | 3454 87% | 3550 92% | 472.5 -74% |
| Total Average (Program / Settings) | -5% /
-5% | 2% /
7% | 39% /
45% | 65% /
74% | -22% /
-16% |
* ... smaller is better

Disk Throttling: DiskSpd Read Loop, Queue Depth 8
GPU Performance
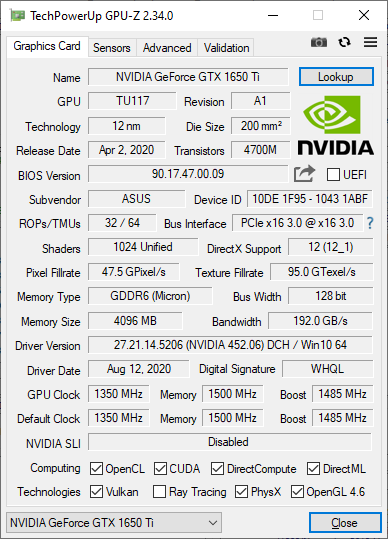
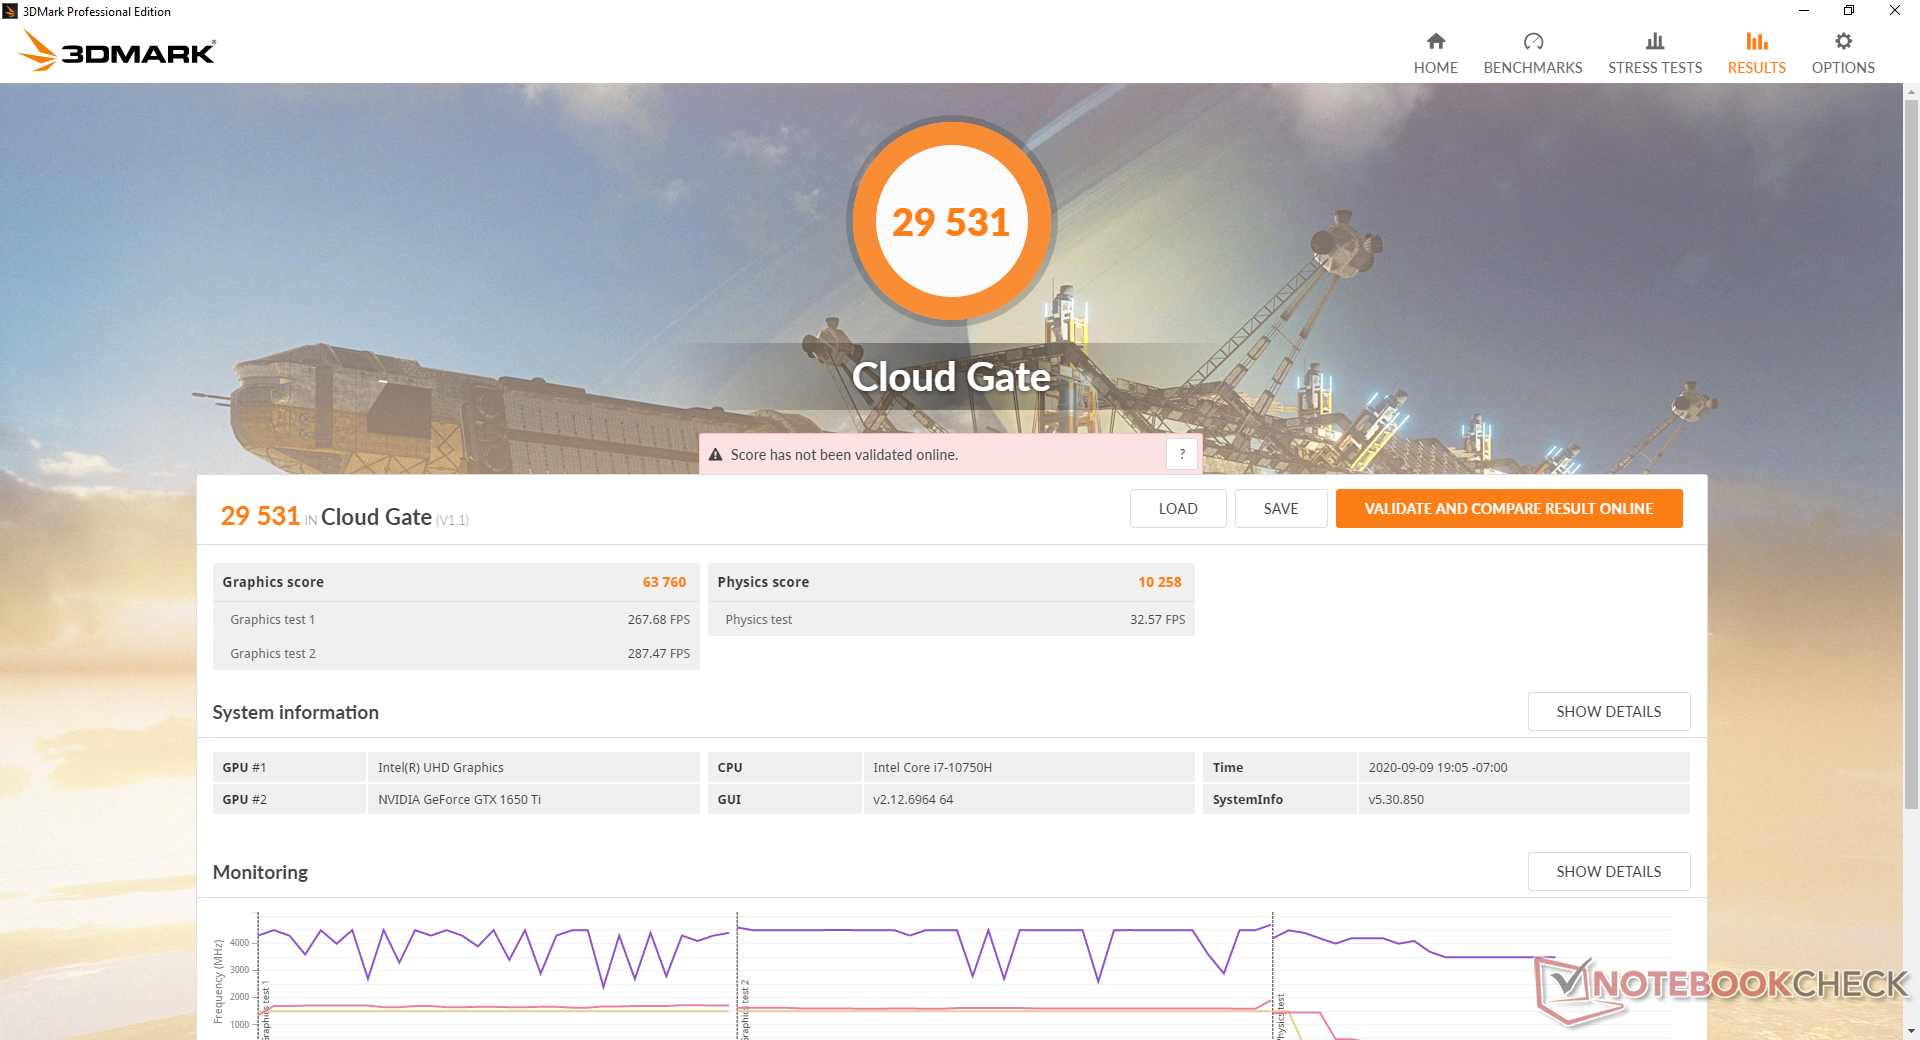
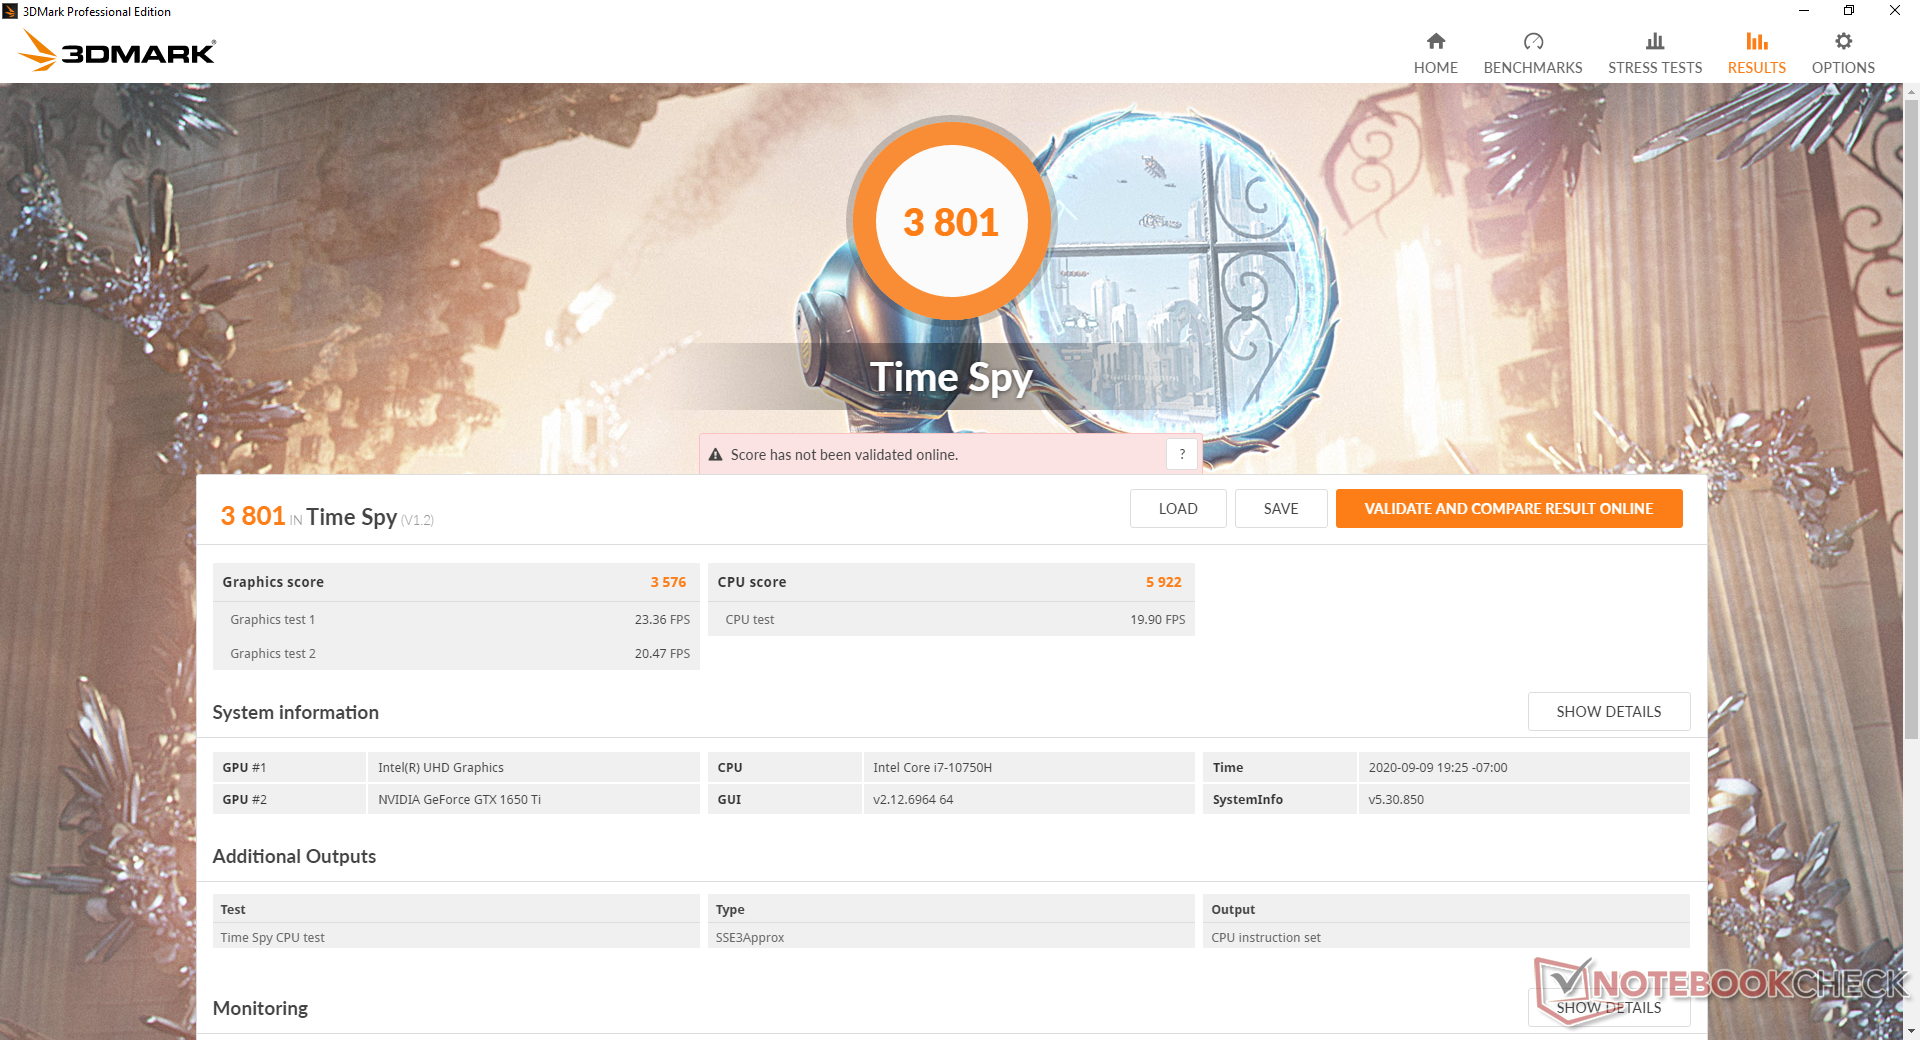
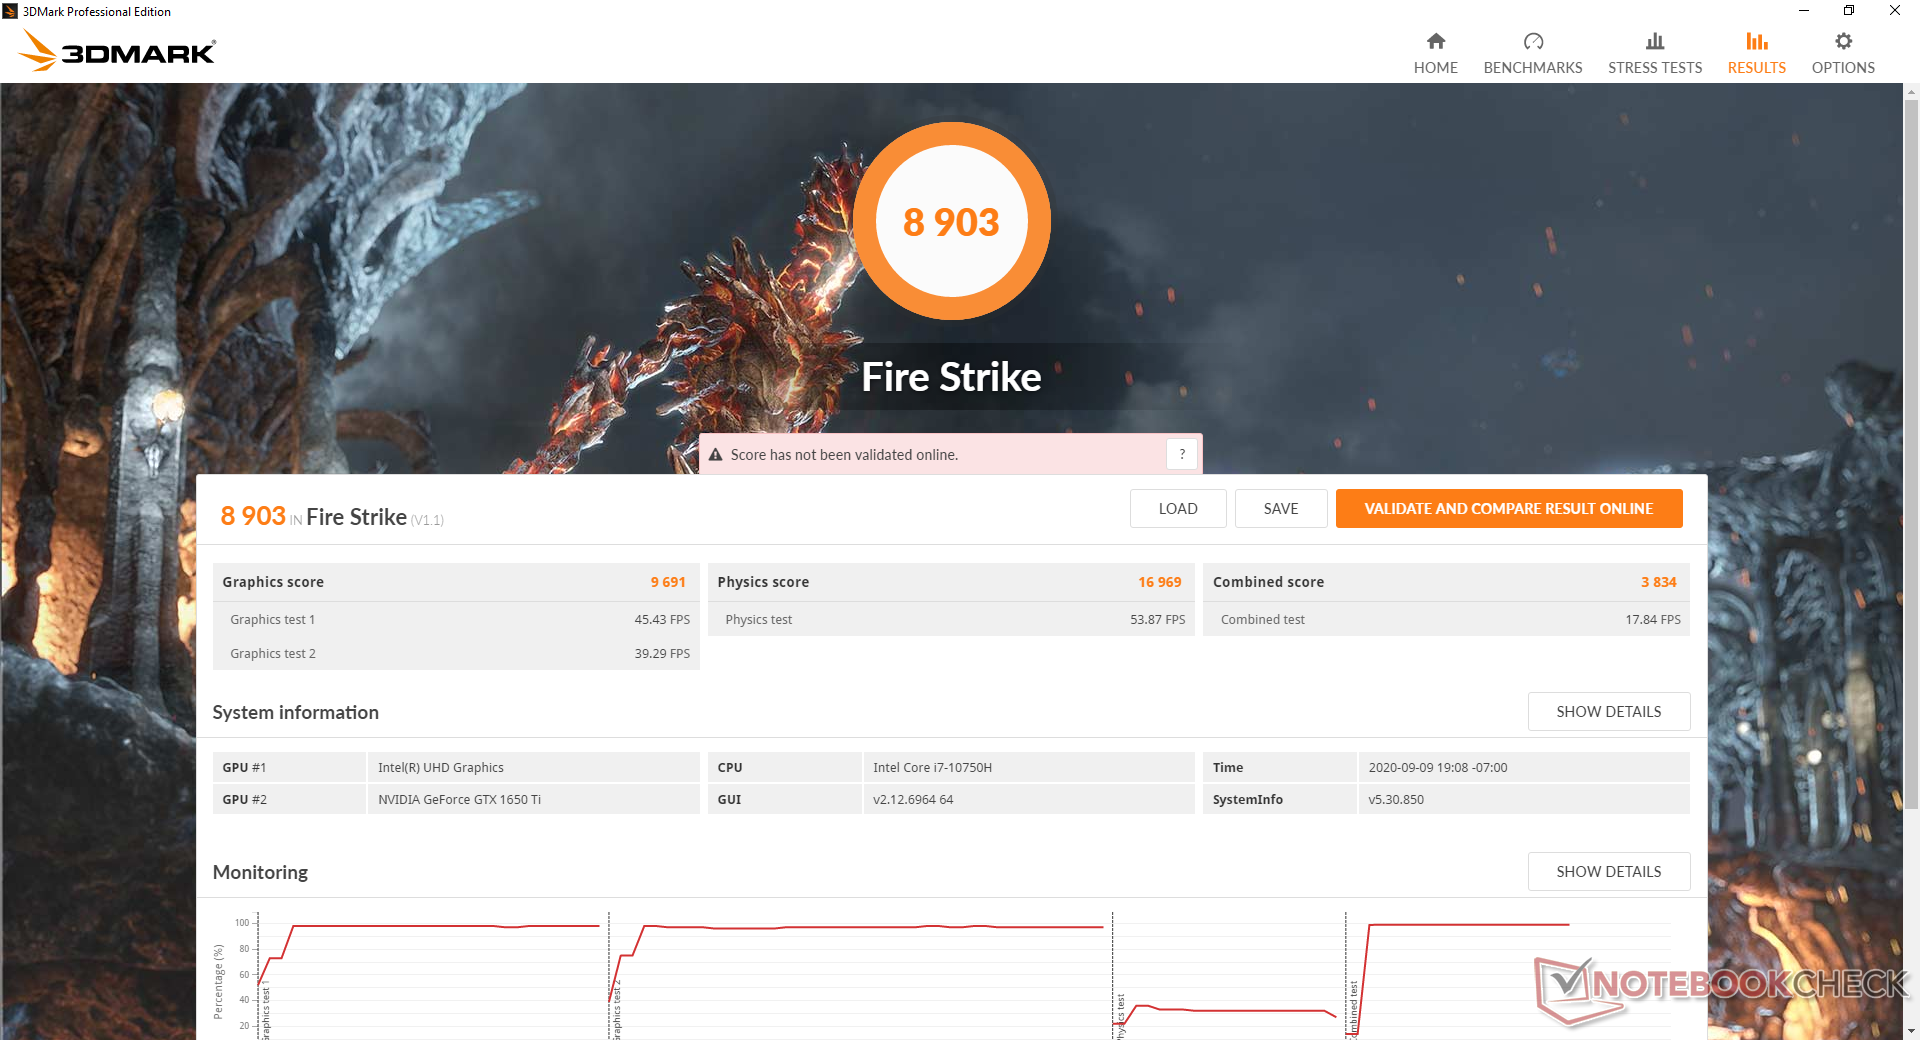
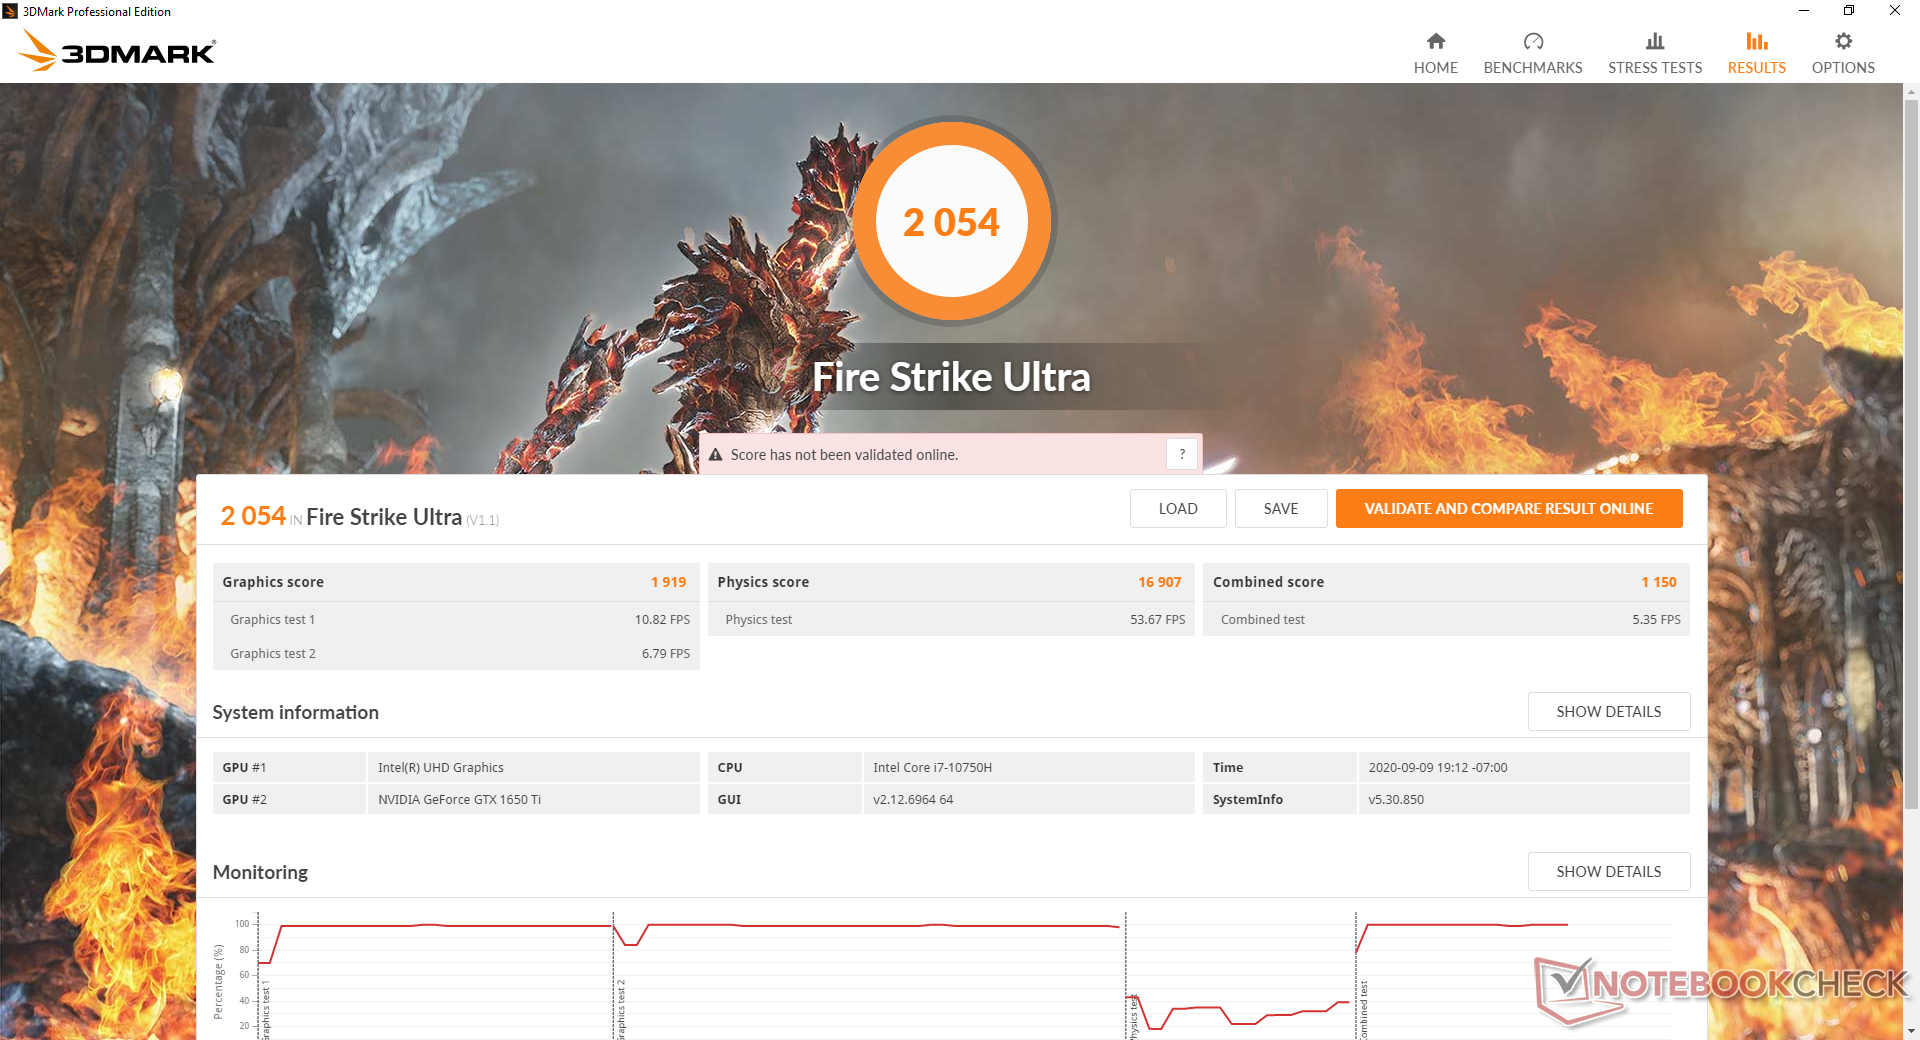
The mobile GeForce GTX 1650 Ti straddles the line between a multimedia GPU and a full-fledged gaming GPU. Overall performance is most similar to the mobile GTX 1060 especially when running DX12 titles. Graphics performance is where we expect it to be relative to other laptops with the same GPU option.
See our dedicated page on the mobile GTX 1650 Ti for more technical information and benchmarks.
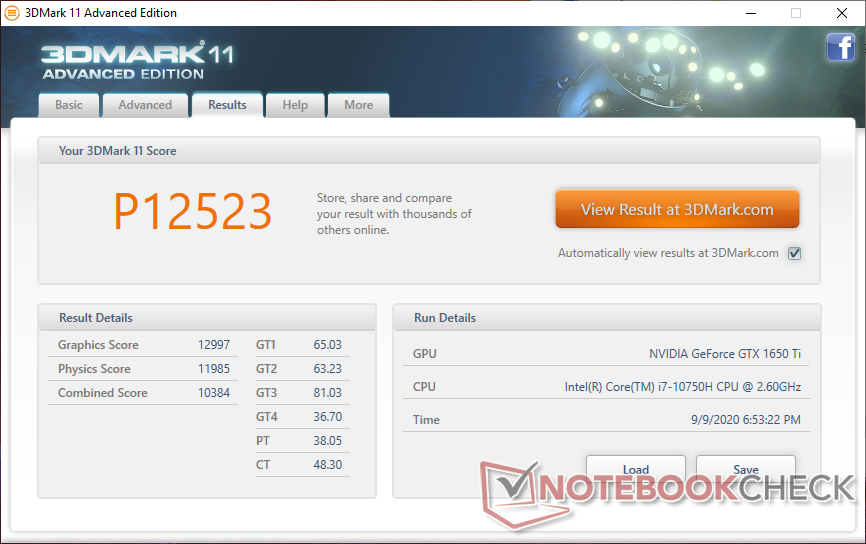
| 3DMark 11 Performance | 12523 points | |
| 3DMark Cloud Gate Standard Score | 29531 points | |
| 3DMark Fire Strike Score | 8903 points | |
| 3DMark Time Spy Score | 3801 points | |
Help | ||
| Final Fantasy XV Benchmark | |
| 1280x720 Lite Quality | |
| MSI RTX 2060 Gaming Z 6G | |
| HP Envy 15-ep0098nr | |
| Asus VivoBook 15 K571LI-PB71 | |
| MSI Alpha 15 A3DDK-034 | |
| 1920x1080 Standard Quality | |
| MSI RTX 2060 Gaming Z 6G | |
| HP Envy 15-ep0098nr | |
| MSI Alpha 15 A3DDK-034 | |
| Asus VivoBook 15 K571LI-PB71 | |
| 1920x1080 High Quality | |
| MSI RTX 2060 Gaming Z 6G | |
| HP Envy 15-ep0098nr | |
| Asus VivoBook 15 K571LI-PB71 | |
| MSI Alpha 15 A3DDK-034 | |
| low | med. | high | ultra | |
|---|---|---|---|---|
| The Witcher 3 (2015) | 199.3 | 126.6 | 74.5 | 38.8 |
| Dota 2 Reborn (2015) | 138 | 124 | 115 | 109 |
| Final Fantasy XV Benchmark (2018) | 104 | 54.9 | 39.3 | |
| X-Plane 11.11 (2018) | 95.6 | 80.5 | 71 |
Emissions
System Noise
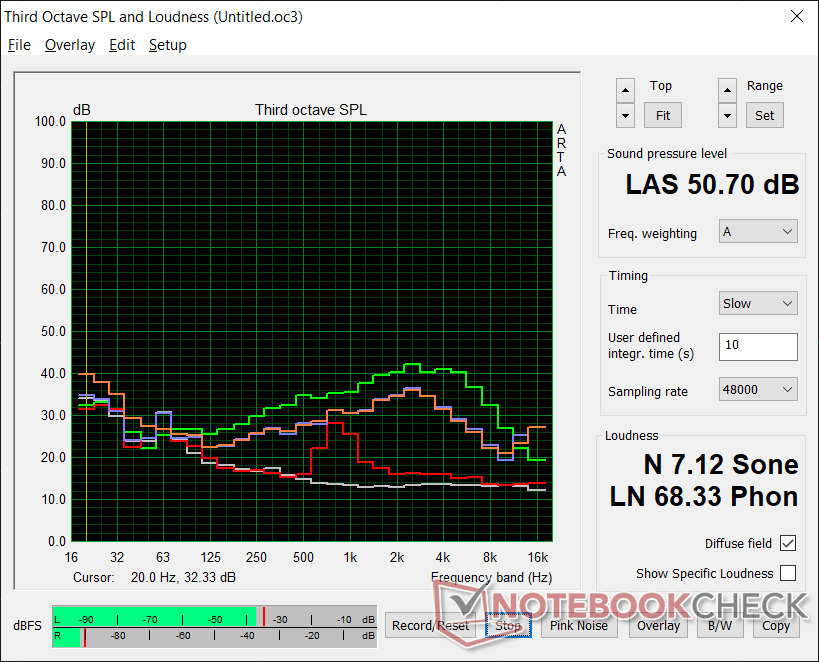
Fan noise is always active at a minimum of 31.9 dB(A) against a background of 25.7 dB(A) even when on the Power Saver profile. Though not loud enough to be bothersome, it's still audible when working in quieter environments like classrooms or libraries compared to newer Ultrabooks which are usually silent on Power Saver mode.
Running higher loads like games will induce a fan noise of 43.9 dB(A) up to even 50 dB(A) to be more like a gaming laptop than a multimedia laptop. The HP Pavilion Gaming 15 behaves similarly when under gaming loads but it is generally quieter across the board.

| Asus VivoBook 15 K571LI-PB71 GeForce GTX 1650 Ti Mobile, i7-10750H, Mushkin Helix-L 1TB MKNSSDHL1TB-08 | HP Envy 15-ep0098nr GeForce RTX 2060 Max-Q, i7-10750H, Intel Optane Memory H10 with Solid State Storage 32GB + 512GB HBRPEKNX0202A(L/H) | Acer Aspire 5 A515-54G GeForce MX250, i5-10210U, Kingston RBUSNS8154P3512GJ1 | Asus ZenBook 15 UX534FTC-A8190T GeForce GTX 1650 Max-Q, i7-10510U, Samsung SSD PM981 MZVLB1T0HALR | Lenovo Ideapad S540-15IML GeForce MX250, i5-10210U, Samsung SSD PM981a MZVLB512HBJQ | Dell Inspiron 15 5000 5585 Vega 10, R7 3700U, WDC PC SN520 SDAPNUW-512G | |
|---|---|---|---|---|---|---|
| Noise | -8% | 7% | 9% | 1% | 11% | |
| off / environment * (dB) | 25.7 | 26.4 -3% | 29.8 -16% | 30.3 -18% | 30 -17% | 28.3 -10% |
| Idle Minimum * (dB) | 31.9 | 32.2 -1% | 29.8 7% | 30.3 5% | 30 6% | 28.3 11% |
| Idle Average * (dB) | 31.9 | 32.2 -1% | 29.8 7% | 30.3 5% | 32 -0% | 28.3 11% |
| Idle Maximum * (dB) | 31.9 | 32.2 -1% | 29.8 7% | 30.9 3% | 37 -16% | 28.3 11% |
| Load Average * (dB) | 44.2 | 48.3 -9% | 37.3 16% | 31.3 29% | 41 7% | 31.4 29% |
| Witcher 3 ultra * (dB) | 43.9 | 53.7 -22% | 38.1 13% | 39 11% | 41.4 6% | |
| Load Maximum * (dB) | 50.7 | 58.8 -16% | 40.1 21% | 38.2 25% | 42 17% | 41.4 18% |
* ... smaller is better
Noise level
| Idle |
| 31.9 / 31.9 / 31.9 dB(A) |
| Load |
| 44.2 / 50.7 dB(A) |
 | ||
30 dB silent 40 dB(A) audible 50 dB(A) loud |
||
min: | ||
Temperature
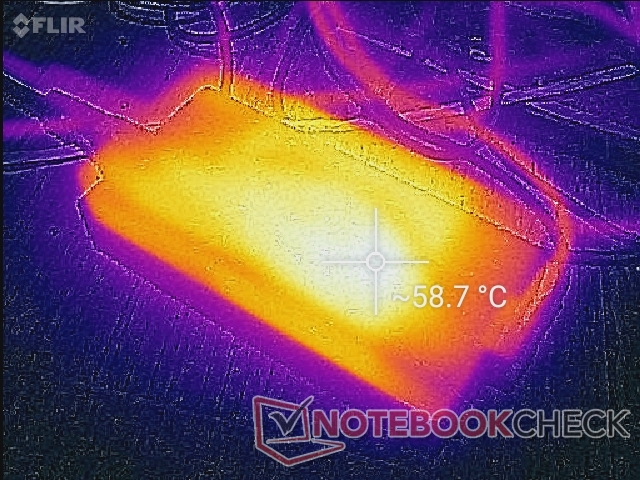
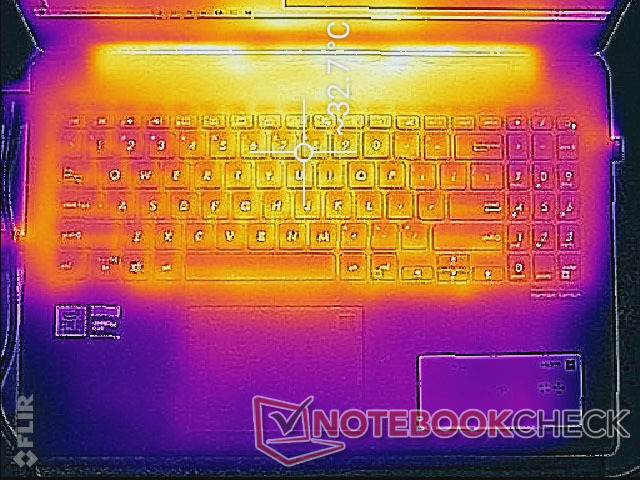
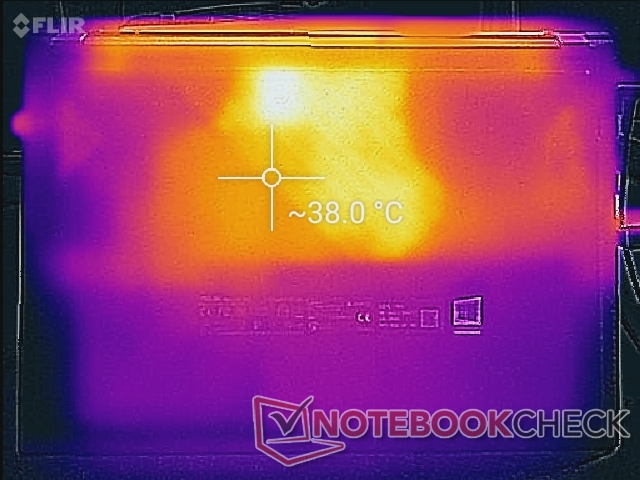
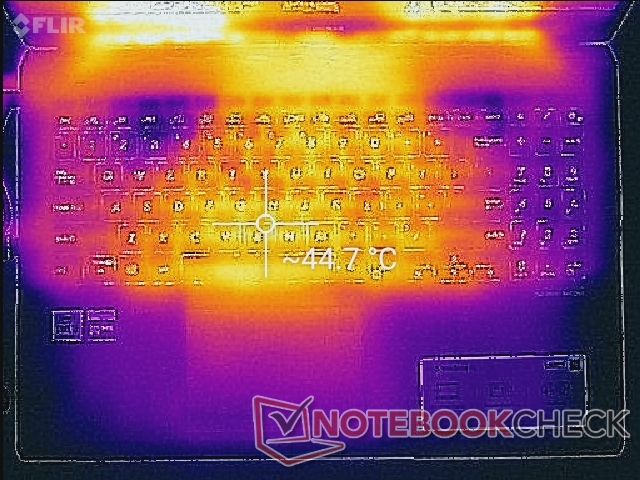
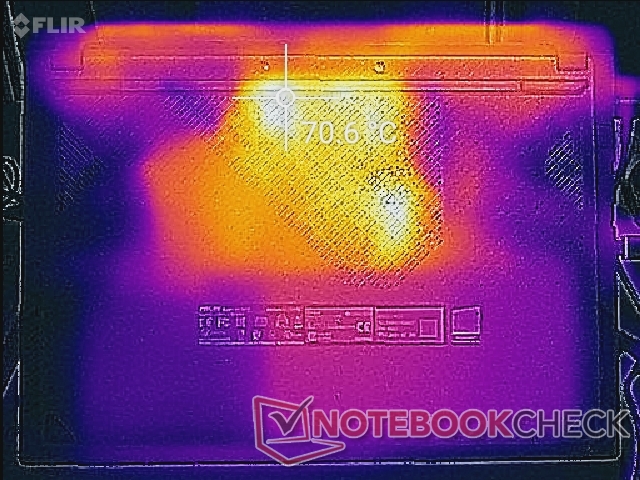
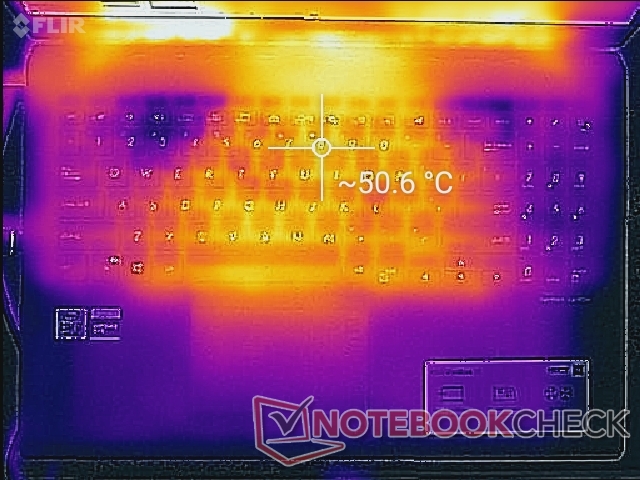
Surface temperatures are quite warm even when simply idling on desktop with hot spots reaching over 32 C and 38 C on the top and bottom, respectively. These same spots can become as warm as 44 C to even 70 C on the bottom since the heat pipes are touching the bottom plate. These areas are thankfully toward the rear of the chassis and away from the palm rests, though we still recommend using a flat desk when running such extreme loads.

(-) The maximum temperature on the upper side is 53 °C / 127 F, compared to the average of 36.8 °C / 98 F, ranging from 21 to 71 °C for the class Multimedia.
(-) The bottom heats up to a maximum of 72 °C / 162 F, compared to the average of 39.1 °C / 102 F
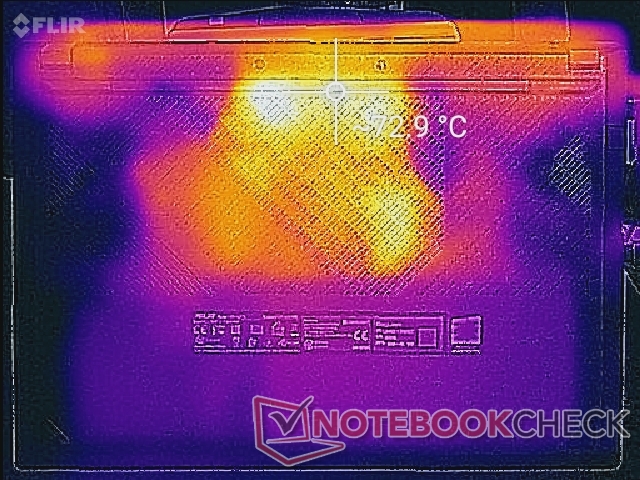
(+) In idle usage, the average temperature for the upper side is 28.9 °C / 84 F, compared to the device average of 31.3 °C / 88 F.
(±) Playing The Witcher 3, the average temperature for the upper side is 34.7 °C / 94 F, compared to the device average of 31.3 °C / 88 F.
(+) The palmrests and touchpad are cooler than skin temperature with a maximum of 30 °C / 86 F and are therefore cool to the touch.
(±) The average temperature of the palmrest area of similar devices was 28.7 °C / 83.7 F (-1.3 °C / -2.3 F).
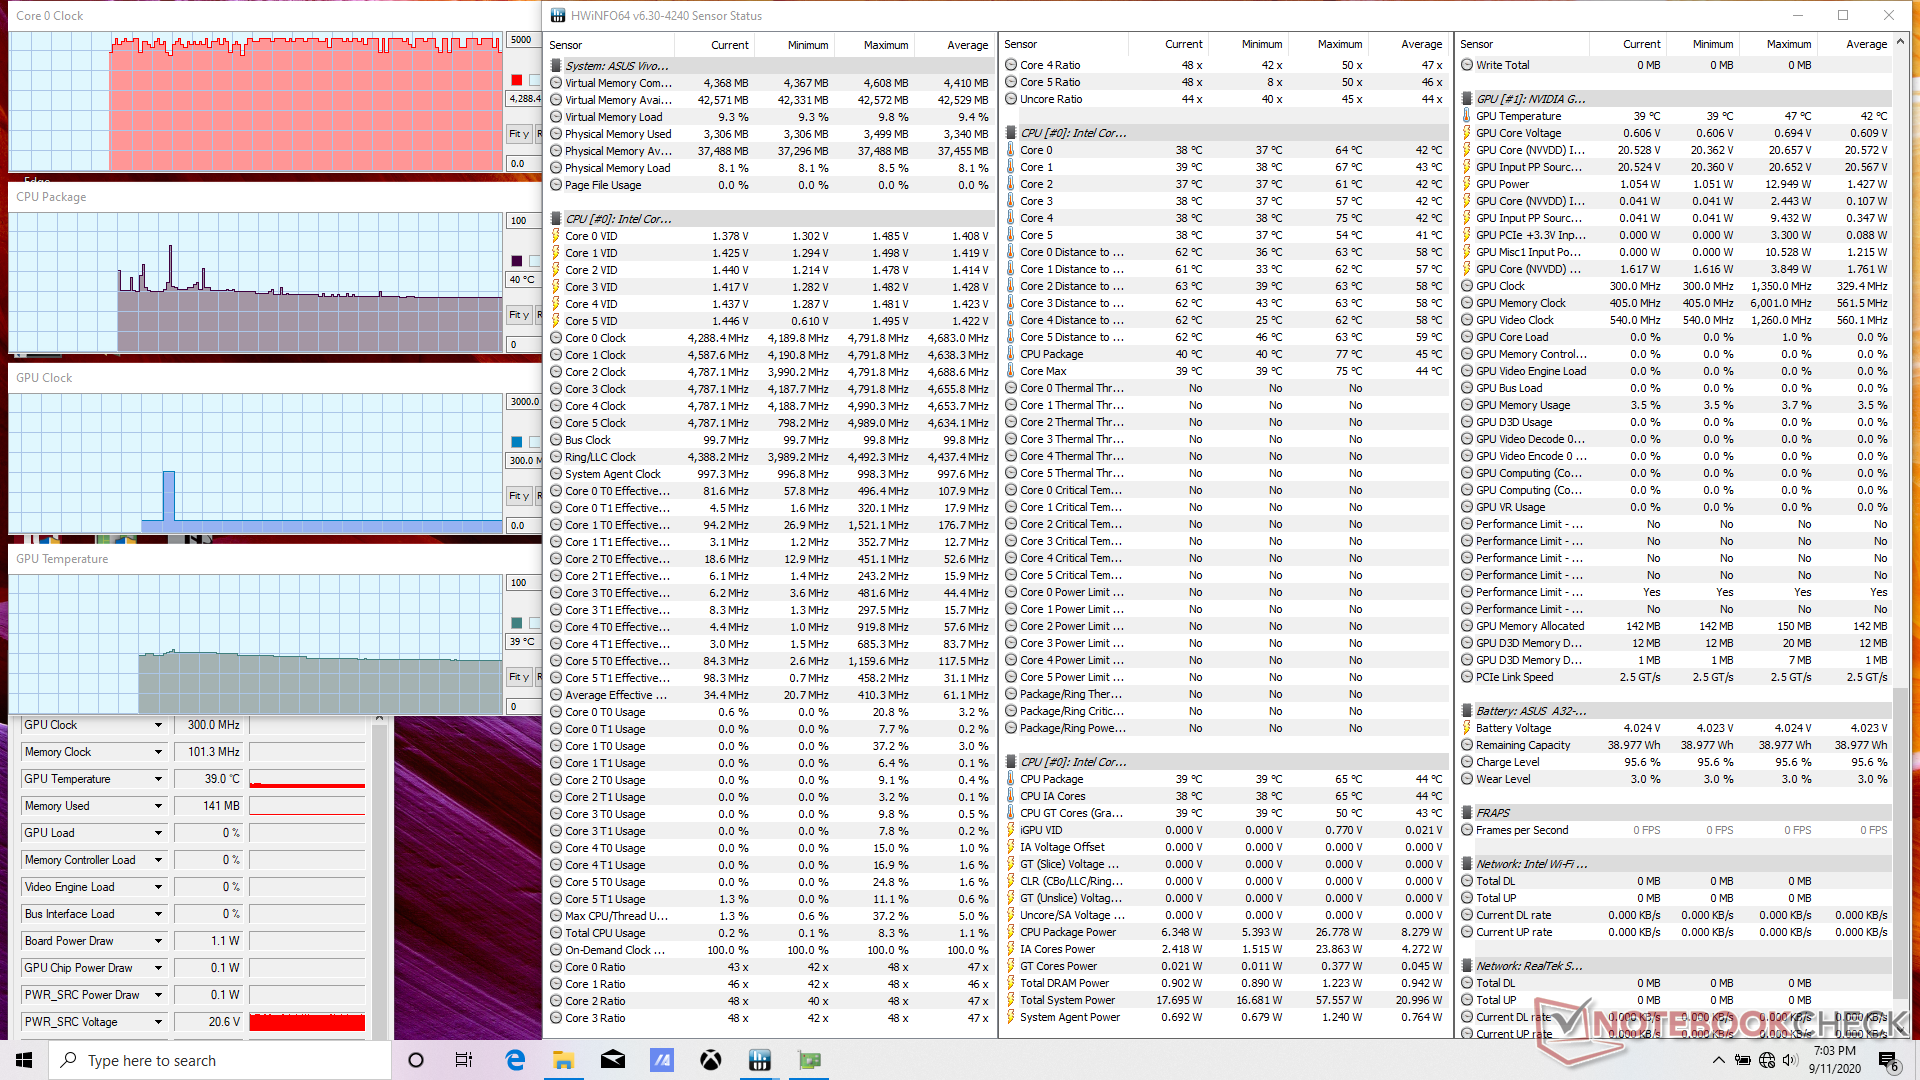
Stress Test
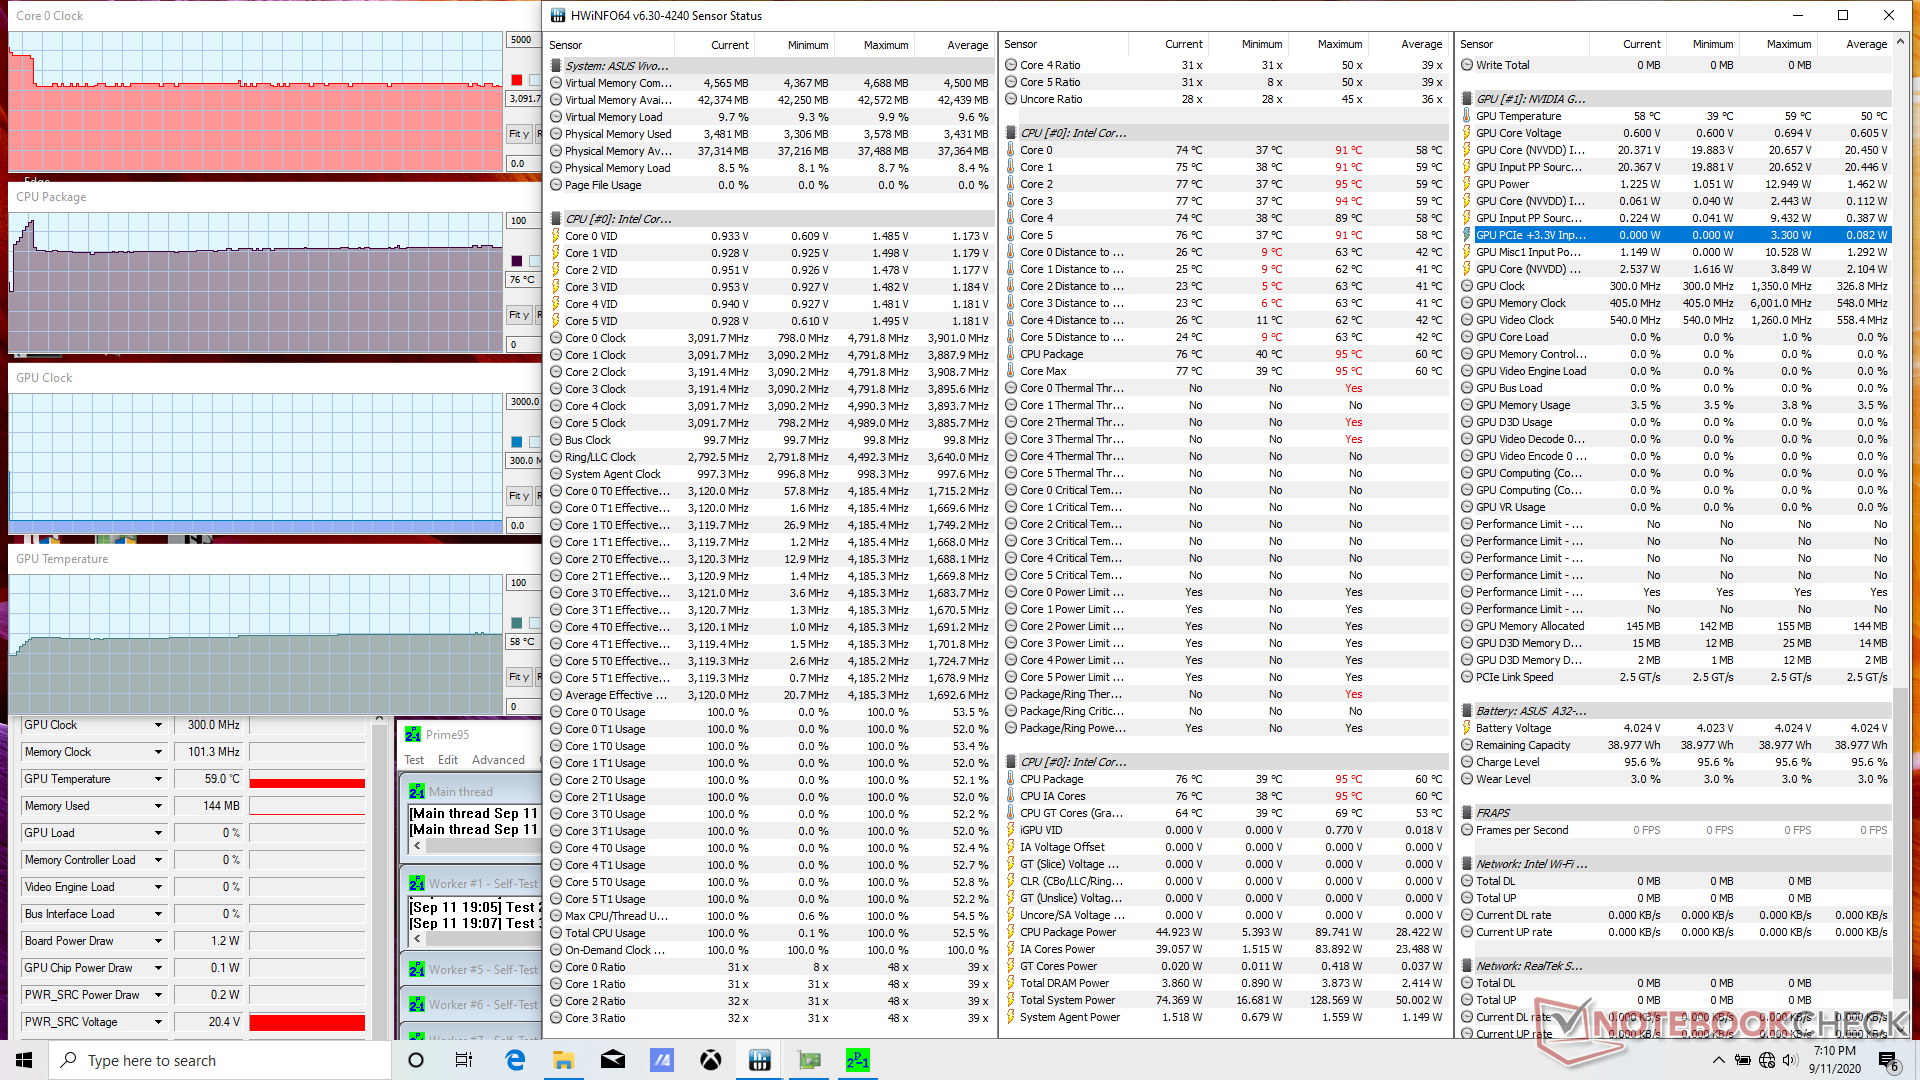
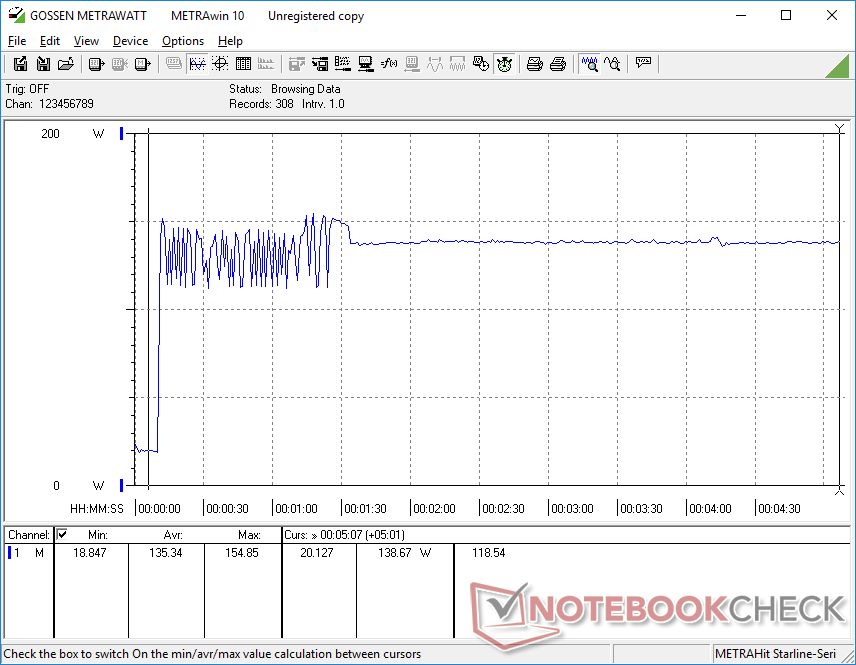
When running Prime95, CPU clock rates would boost to 4.2 GHz until hitting a core temperature of 95 C about 10 seconds later. Thereafter, clock rates drop to the 3.1 to 3.2 GHz range in order to maintain a cooler temperature of 76 C. The Alienware m15 R3 with the same Core i7-10750H stabilizes at a much higher 4.2 GHz when under similar conditions which explains our slower-than-average CineBench results above for the Asus.
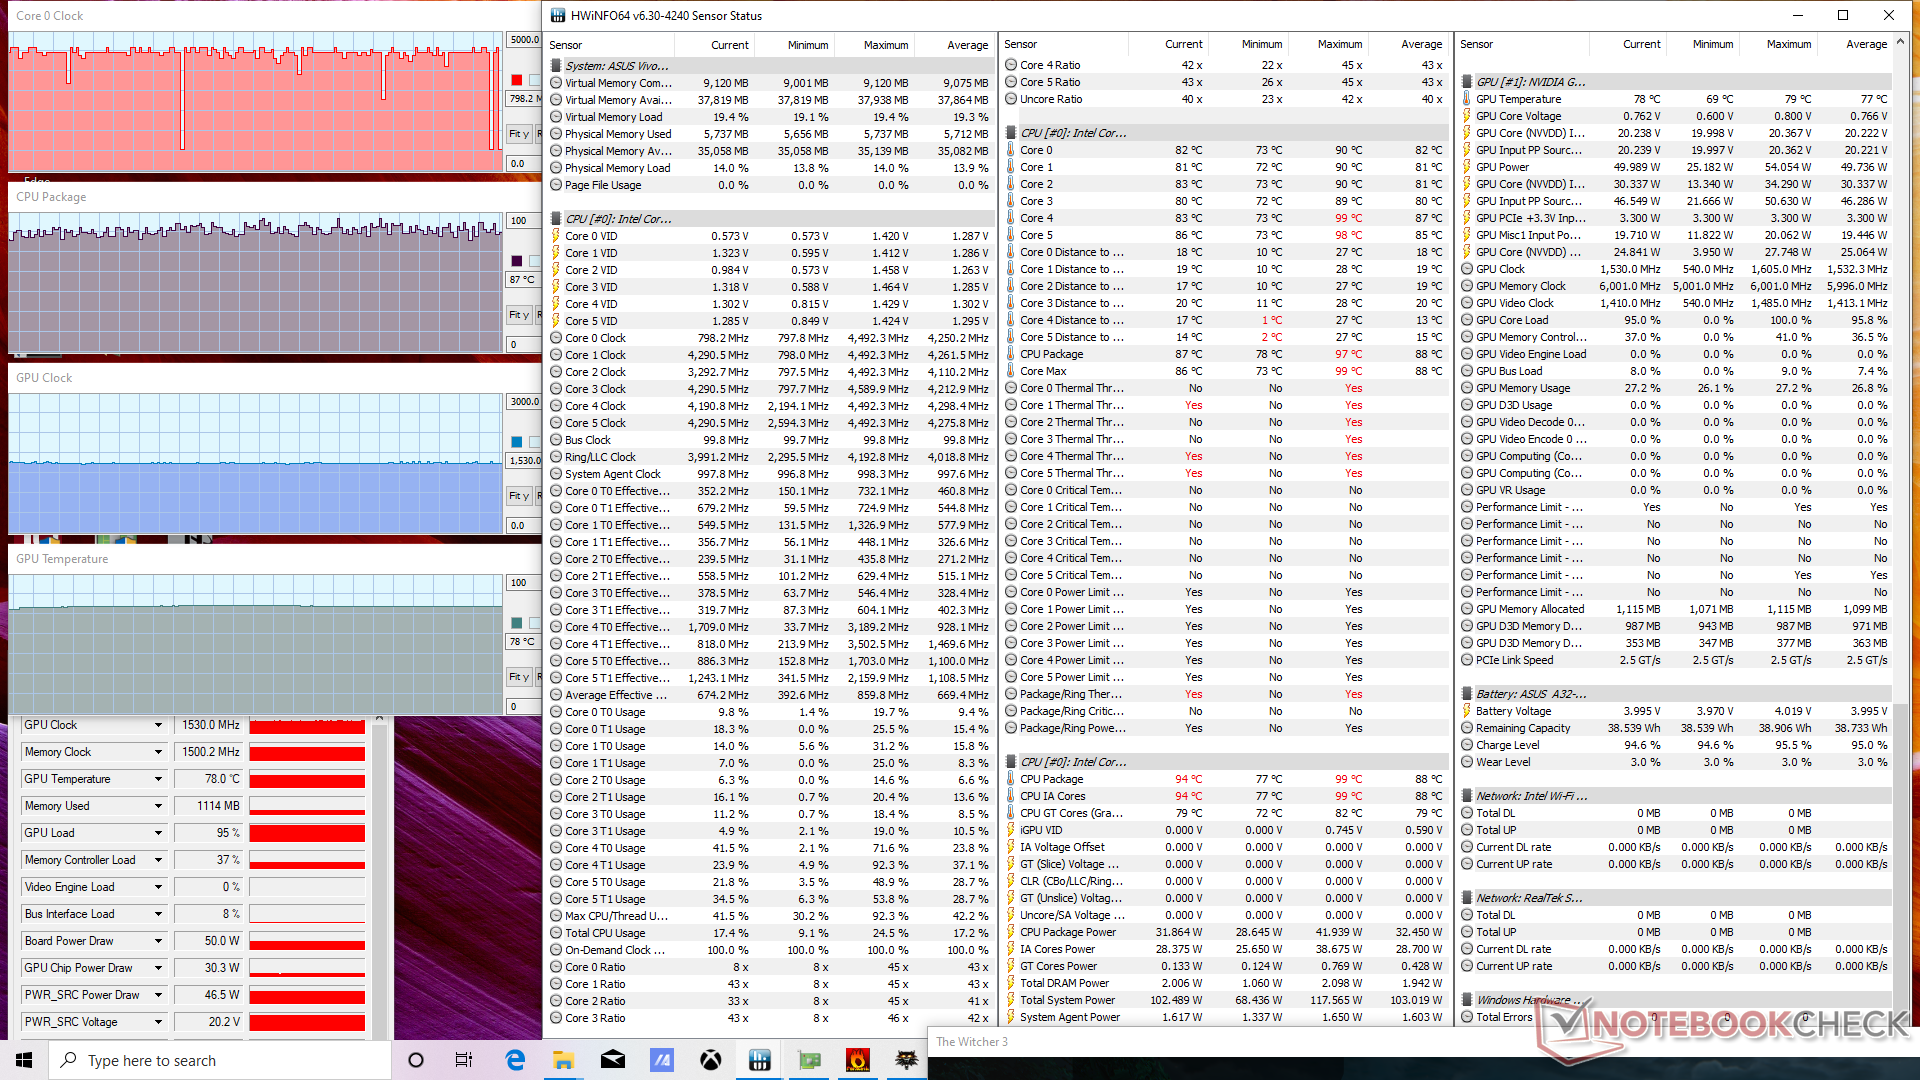
When gaming, CPU and GPU temperatures would stabilize at 87 C and 78 C, respectively, compared to 71 C and 68 C on the HP Pavilion Gaming 15. Such temperatures are very warm to suggest that the cooling solution was tailored specifically for the TDP levels of the Core H-series CPU and GTX 1650 Ti GPU and not any higher.
Running on batteries will limit performance. A Fire Strike test on battery power would return Physics and Graphics scores of 10274 and 7804 points, respectively, compared to 16969 and 9691 points when on mains.
| CPU Clock (GHz) | GPU Clock (MHz) | Average CPU Temperature (°C) | Average GPU Temperature (°C) | |
| System Idle | -- | -- | 40 | 39 |
| Prime95 Stress | 3.1 - 3.2 | -- | 76 | 58 |
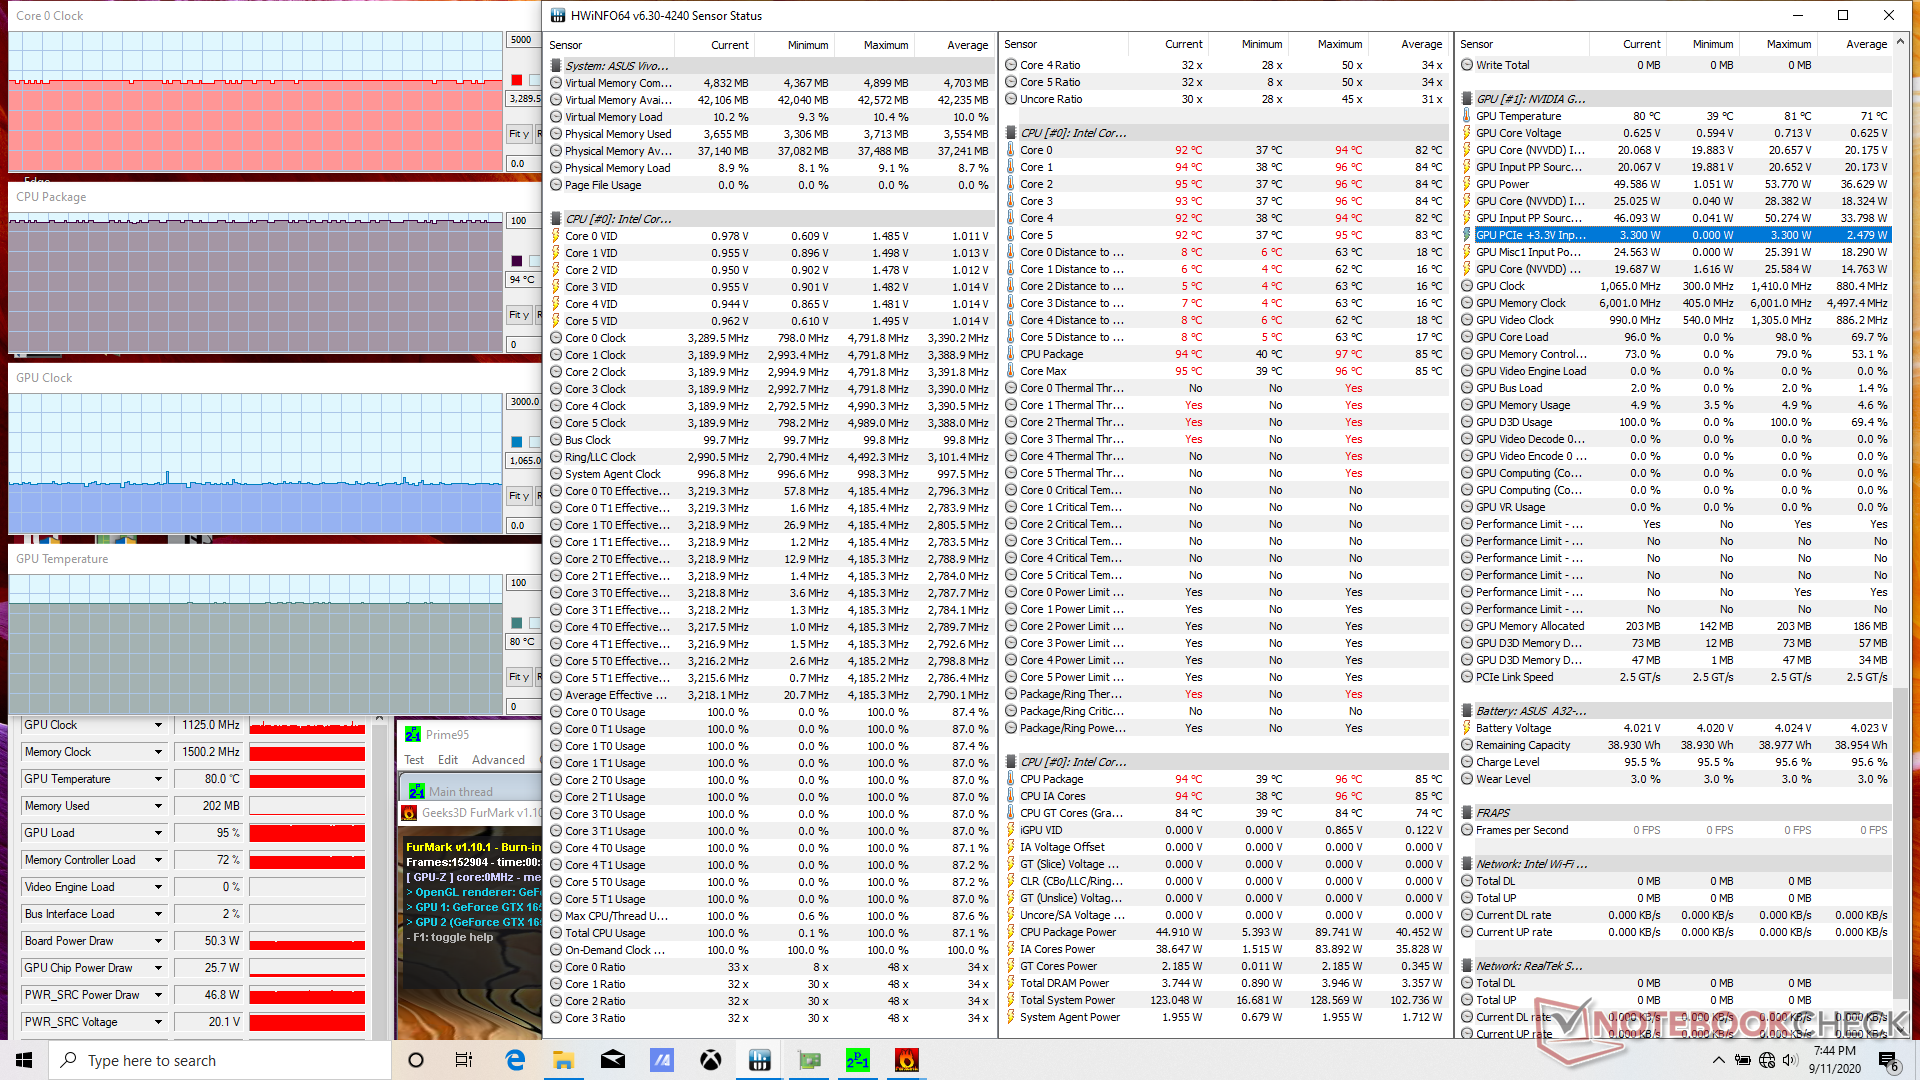
| Prime95 + FurMark Stress | 3.2 - 3.3 | 1125 | 94 | 80 |
| Witcher 3 Stress | ~4.2 | 1530 | ~87 | 78 |
Speakers


Asus VivoBook 15 K571LI-PB71 audio analysis
(±) | speaker loudness is average but good (78.7 dB)
Bass 100 - 315 Hz
(-) | nearly no bass - on average 20.1% lower than median
(±) | linearity of bass is average (14.6% delta to prev. frequency)
Mids 400 - 2000 Hz
(±) | higher mids - on average 5% higher than median
(+) | mids are linear (3.9% delta to prev. frequency)
Highs 2 - 16 kHz
(+) | balanced highs - only 1.1% away from median
(+) | highs are linear (3.4% delta to prev. frequency)
Overall 100 - 16.000 Hz
(±) | linearity of overall sound is average (17.8% difference to median)
Compared to same class
» 52% of all tested devices in this class were better, 7% similar, 41% worse
» The best had a delta of 5%, average was 17%, worst was 45%
Compared to all devices tested
» 36% of all tested devices were better, 8% similar, 56% worse
» The best had a delta of 4%, average was 24%, worst was 134%
Apple MacBook 12 (Early 2016) 1.1 GHz audio analysis
(+) | speakers can play relatively loud (83.6 dB)
Bass 100 - 315 Hz
(±) | reduced bass - on average 11.3% lower than median
(±) | linearity of bass is average (14.2% delta to prev. frequency)
Mids 400 - 2000 Hz
(+) | balanced mids - only 2.4% away from median
(+) | mids are linear (5.5% delta to prev. frequency)
Highs 2 - 16 kHz
(+) | balanced highs - only 2% away from median
(+) | highs are linear (4.5% delta to prev. frequency)
Overall 100 - 16.000 Hz
(+) | overall sound is linear (10.2% difference to median)
Compared to same class
» 7% of all tested devices in this class were better, 2% similar, 91% worse
» The best had a delta of 5%, average was 18%, worst was 53%
Compared to all devices tested
» 5% of all tested devices were better, 1% similar, 94% worse
» The best had a delta of 4%, average was 24%, worst was 134%
Energy Management
Power Consumption
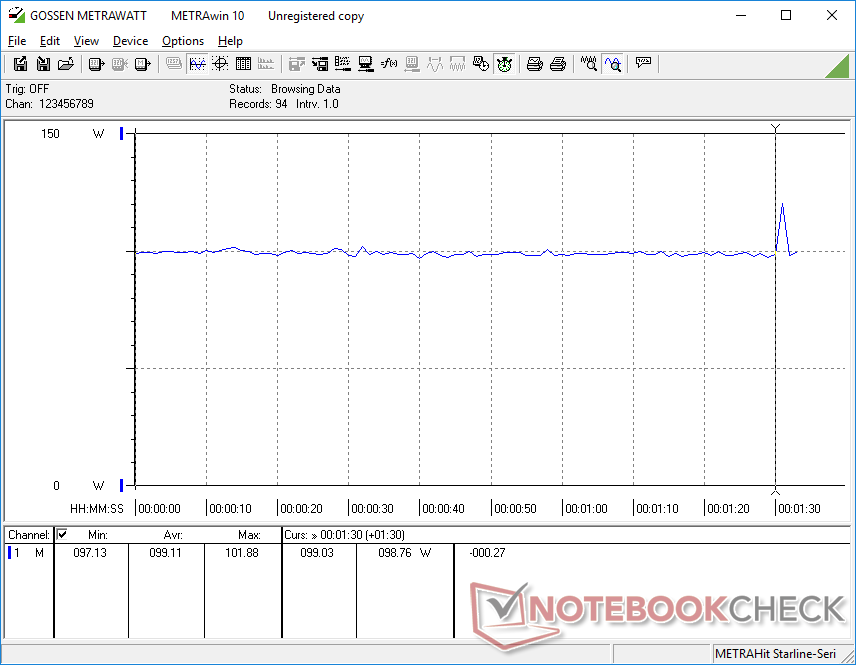
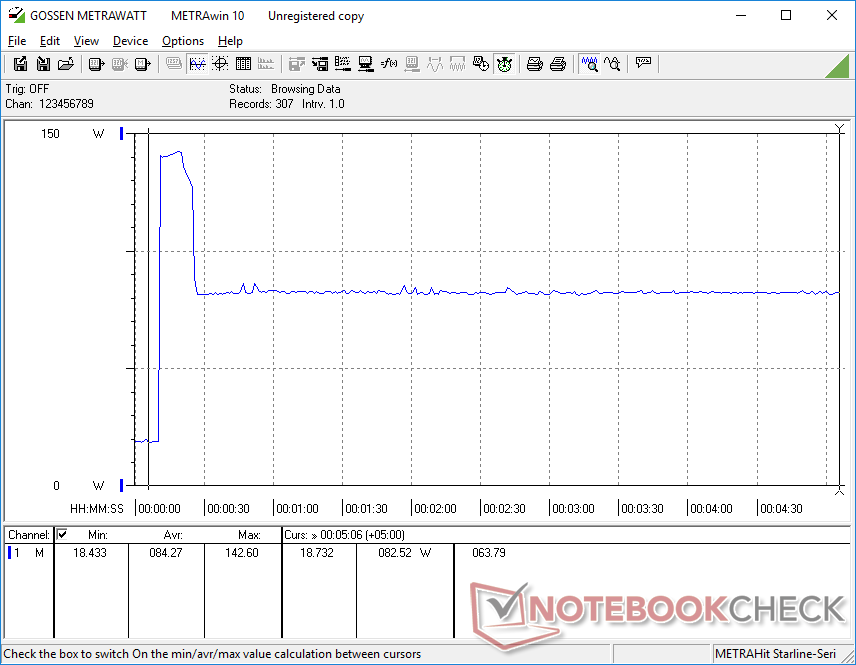
Idling on desktop would consume between 6 W and 19 W to be less power efficient than most Ultrabooks. The high consumption also explains the short battery life numbers in our next section below.
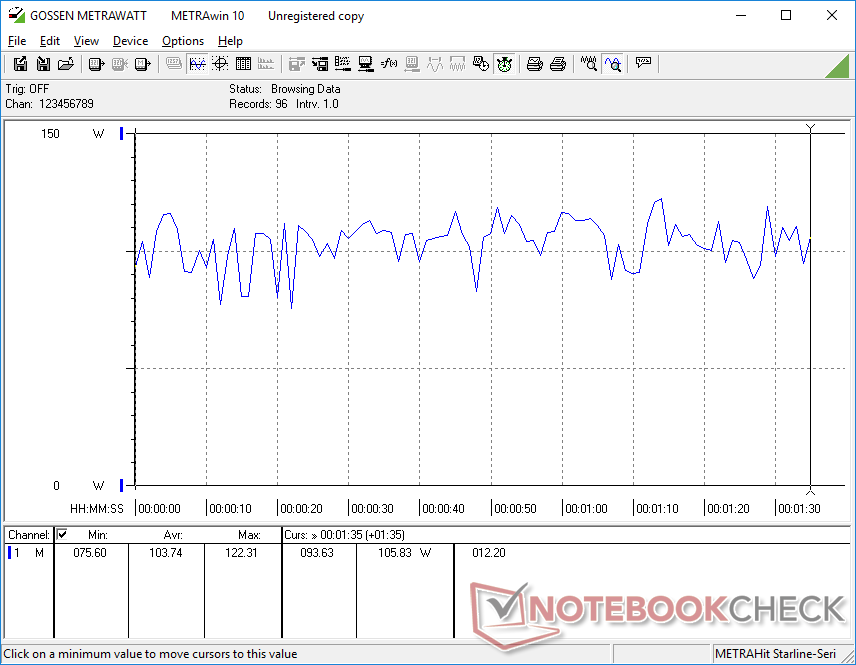
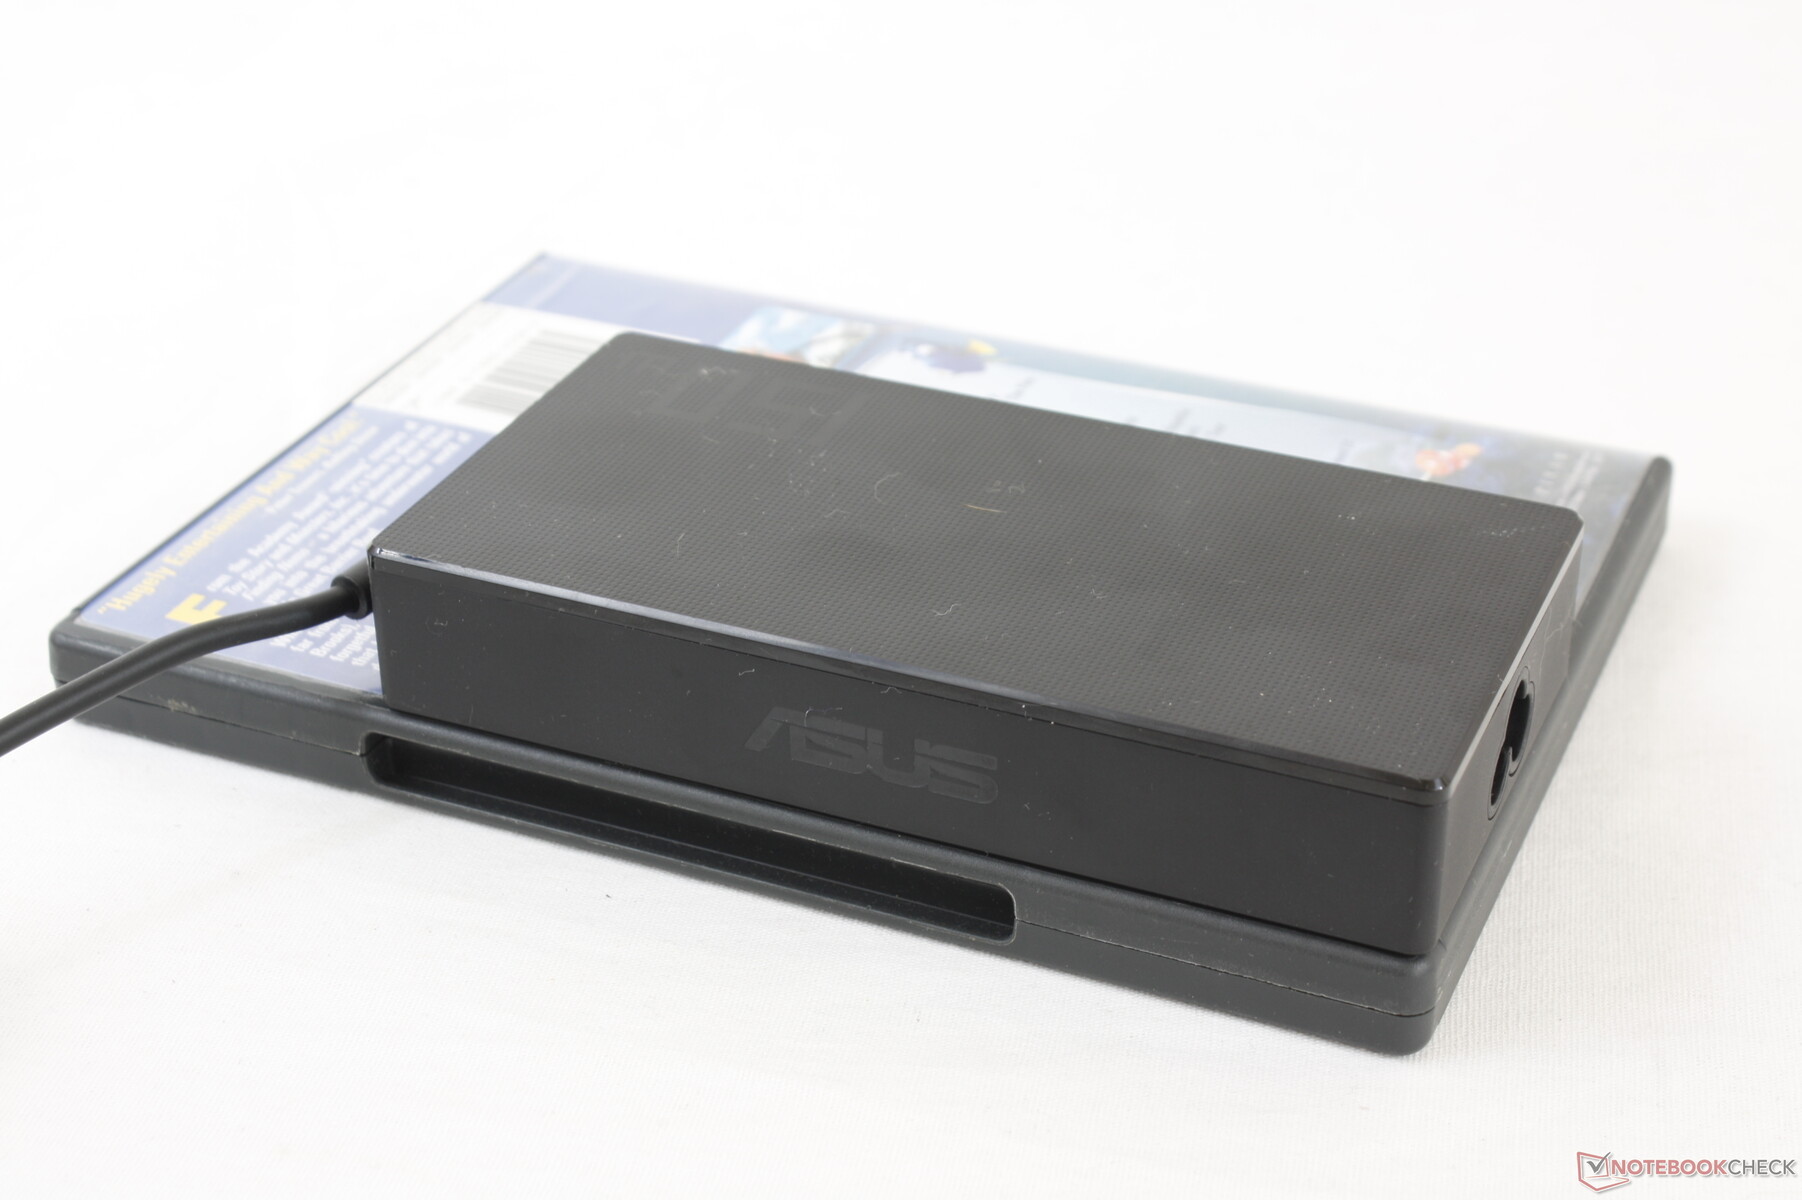
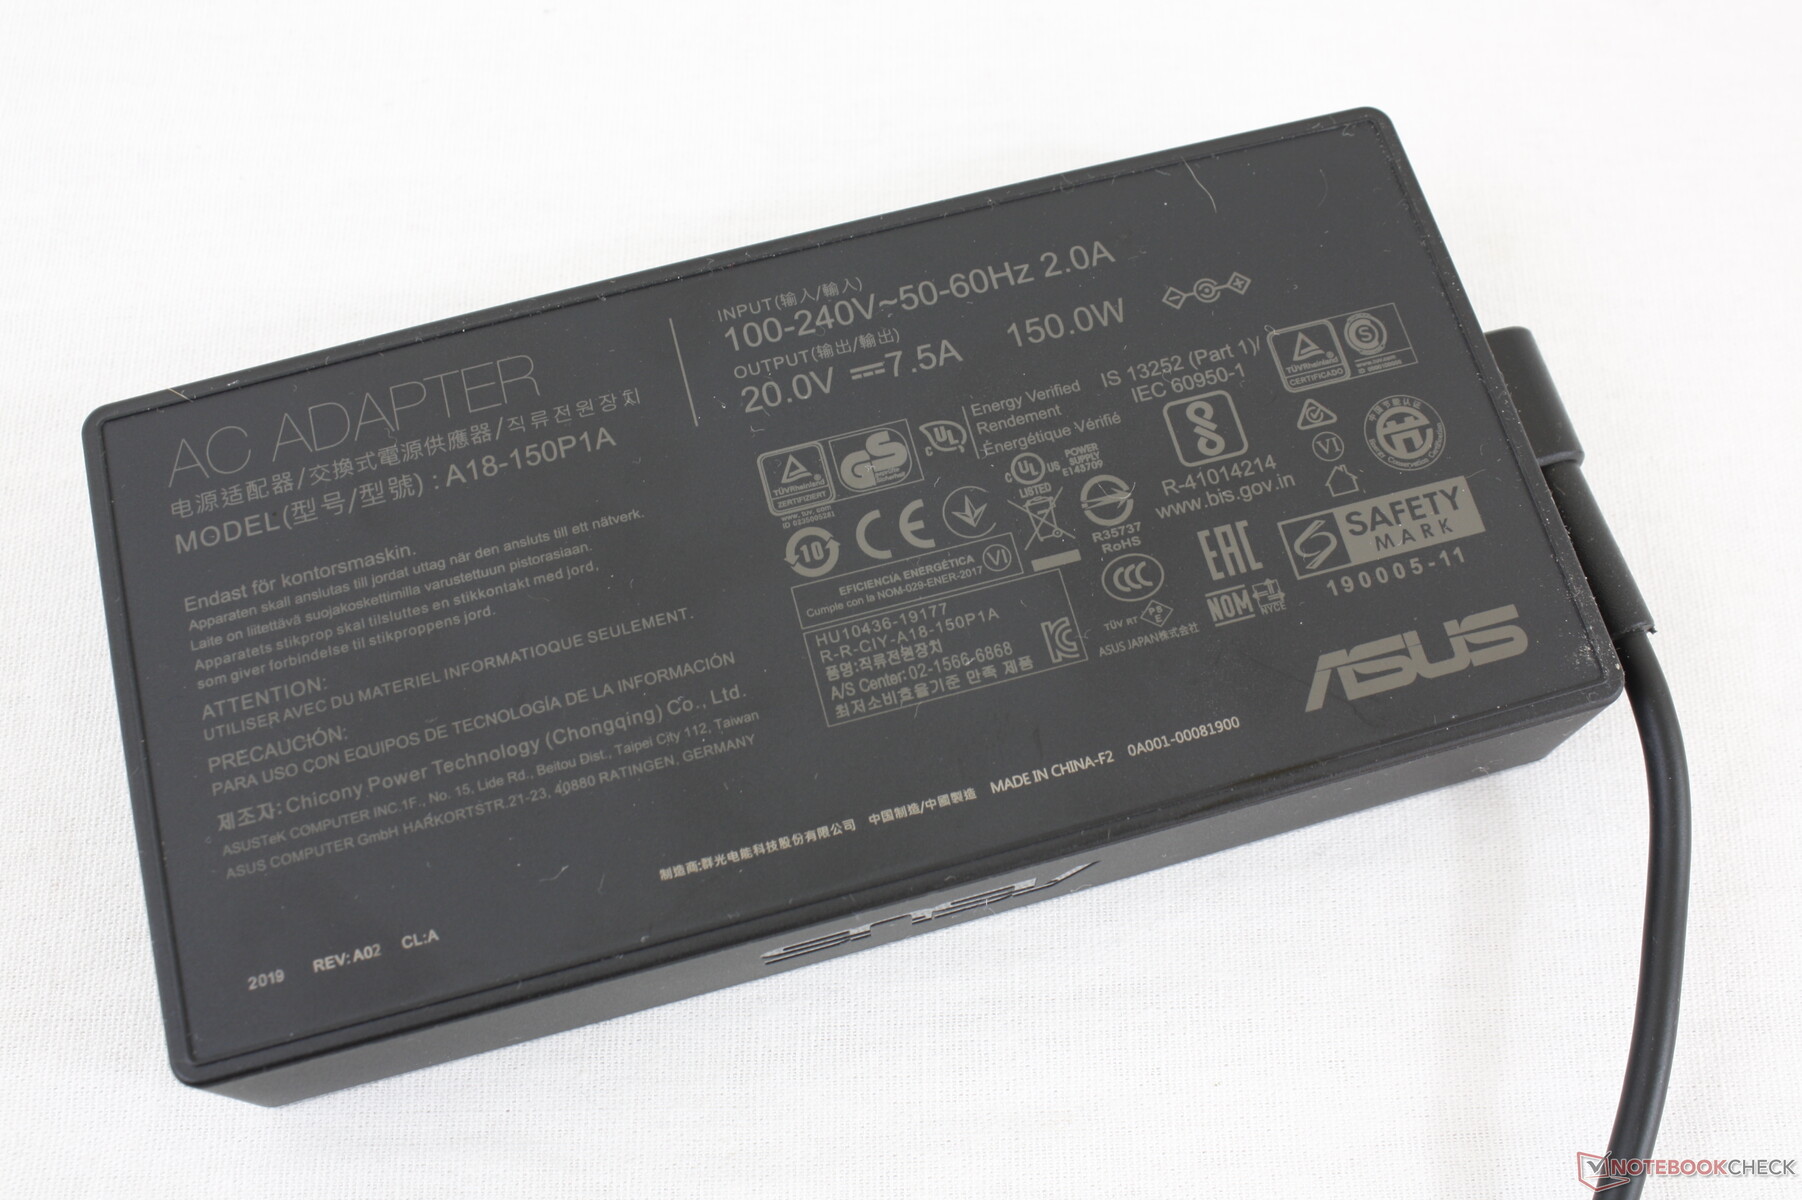
Overall power consumption is more similar to gaming machines like the ROG Strix G15 G512LI rather than other multimedia machines. Gaming will draw at least 99 W from the small-medium (~13.8 x 6.8 x 2.4 cm) 150 W AC adapter and the charging rate will slow if running more demanding loads.
| Off / Standby | |
| Idle | |
| Load |
|
Key:
min: | |
| Asus VivoBook 15 K571LI-PB71 i7-10750H, GeForce GTX 1650 Ti Mobile, Mushkin Helix-L 1TB MKNSSDHL1TB-08, IPS, 1920x1080, 15.6" | HP Envy 15-ep0098nr i7-10750H, GeForce RTX 2060 Max-Q, Intel Optane Memory H10 with Solid State Storage 32GB + 512GB HBRPEKNX0202A(L/H), AMOLED, 3840x2160, 15.6" | Acer Aspire 5 A515-54G i5-10210U, GeForce MX250, Kingston RBUSNS8154P3512GJ1, IPS, 1920x1080, 15.6" | Asus ZenBook 15 UX534FTC-A8190T i7-10510U, GeForce GTX 1650 Max-Q, Samsung SSD PM981 MZVLB1T0HALR, IPS, 1920x1080, 15.6" | Lenovo Ideapad S540-15IML i5-10210U, GeForce MX250, Samsung SSD PM981a MZVLB512HBJQ, IPS, 1920x1080, 15.6" | Dell Inspiron 15 5000 5585 R7 3700U, Vega 10, WDC PC SN520 SDAPNUW-512G, IPS, 1920x1080, 15.6" | |
|---|---|---|---|---|---|---|
| Power Consumption | -23% | 52% | 40% | 42% | 55% | |
| Idle Minimum * (Watt) | 6.4 | 9.2 -44% | 3.4 47% | 2.8 56% | 5 22% | 4.2 34% |
| Idle Average * (Watt) | 10.6 | 14.5 -37% | 6.4 40% | 7.7 27% | 7 34% | 6.8 36% |
| Idle Maximum * (Watt) | 18.4 | 18 2% | 9.2 50% | 9.4 49% | 10 46% | 7 62% |
| Load Average * (Watt) | 103.7 | 110.9 -7% | 38 63% | 57 45% | 64 38% | 36.5 65% |
| Witcher 3 ultra * (Watt) | 99.1 | 125.5 -27% | 62 37% | 44 56% | 37.9 62% | |
| Load Maximum * (Watt) | 154.9 | 194.6 -26% | 59 62% | 116 25% | 67 57% | 44 72% |
* ... smaller is better
Battery Life
Battery capacity is small at just 42 Wh which, when combined with the high power consumption rates above, result in short runtimes. Expect just over 3.5 hours of real-world WLAN use when set to the Balanced power profile with the integrated GPU active. Users may be able to squeeze out more from the battery if set to Power Saver mode.
Charging from empty to full capacity takes about 1.5 hours. The system cannot be recharged via USB-C.
| Asus VivoBook 15 K571LI-PB71 i7-10750H, GeForce GTX 1650 Ti Mobile, 42 Wh | HP Envy 15-ep0098nr i7-10750H, GeForce RTX 2060 Max-Q, 83 Wh | Acer Aspire 5 A515-54G i5-10210U, GeForce MX250, 48 Wh | Asus ZenBook 15 UX534FTC-A8190T i7-10510U, GeForce GTX 1650 Max-Q, 71 Wh | Lenovo Ideapad S540-15IML i5-10210U, GeForce MX250, 70 Wh | Dell Inspiron 15 5000 5585 R7 3700U, Vega 10, 42 Wh | |
|---|---|---|---|---|---|---|
| Battery runtime | 62% | 141% | 190% | 160% | 62% | |
| Reader / Idle (h) | 10.2 | 15 47% | 27.2 167% | 30.2 196% | 14.3 40% | |
| WiFi v1.3 (h) | 3.7 | 6 62% | 8.9 141% | 12.4 235% | 12.1 227% | 7 89% |
| Load (h) | 0.9 | 1.6 78% | 2.4 167% | 1.4 56% | 1.4 56% |
Pros
Cons
Verdict

The VivoBook 15 K571 is at its best for students who want an affordable laptop for both gaming and classwork that's also relatively portable. It's powerful for the size and weight and as a middle-ground solution between a traditional Ultrabook and an entry-level gaming laptop. Very few laptops in this price range come with a 120 Hz panel option as well.
If you don't have any use for a Core H-series CPU or GTX 1650 Ti GPU, then a ZenBook would be the better option. Battery life, fan noise, and temperatures are just average at best on the VivoBook 15 due to the demanding processors within.
We recommend choosing the display carefully. Asus offers three options: 1080p120 45% NTSC, 1080p60 45% NTSC, or 1080p60 72% NTSC. The 1080p120 45% NTSC option will be best for gaming even after accounting for the average black-white response times. For editing and graphics work, the 1080p60 72% NTSC option will be better for its deeper colors.
The Asus VivoBook 15 K571 doesn't particularly excel at one singular aspect, but it balances being a multimedia machine and gaming machine fairly well for its inexpensive price.
Asus VivoBook 15 K571LI-PB71
- 09/13/2020 v7 (old)
Allen Ngo
Price comparison
