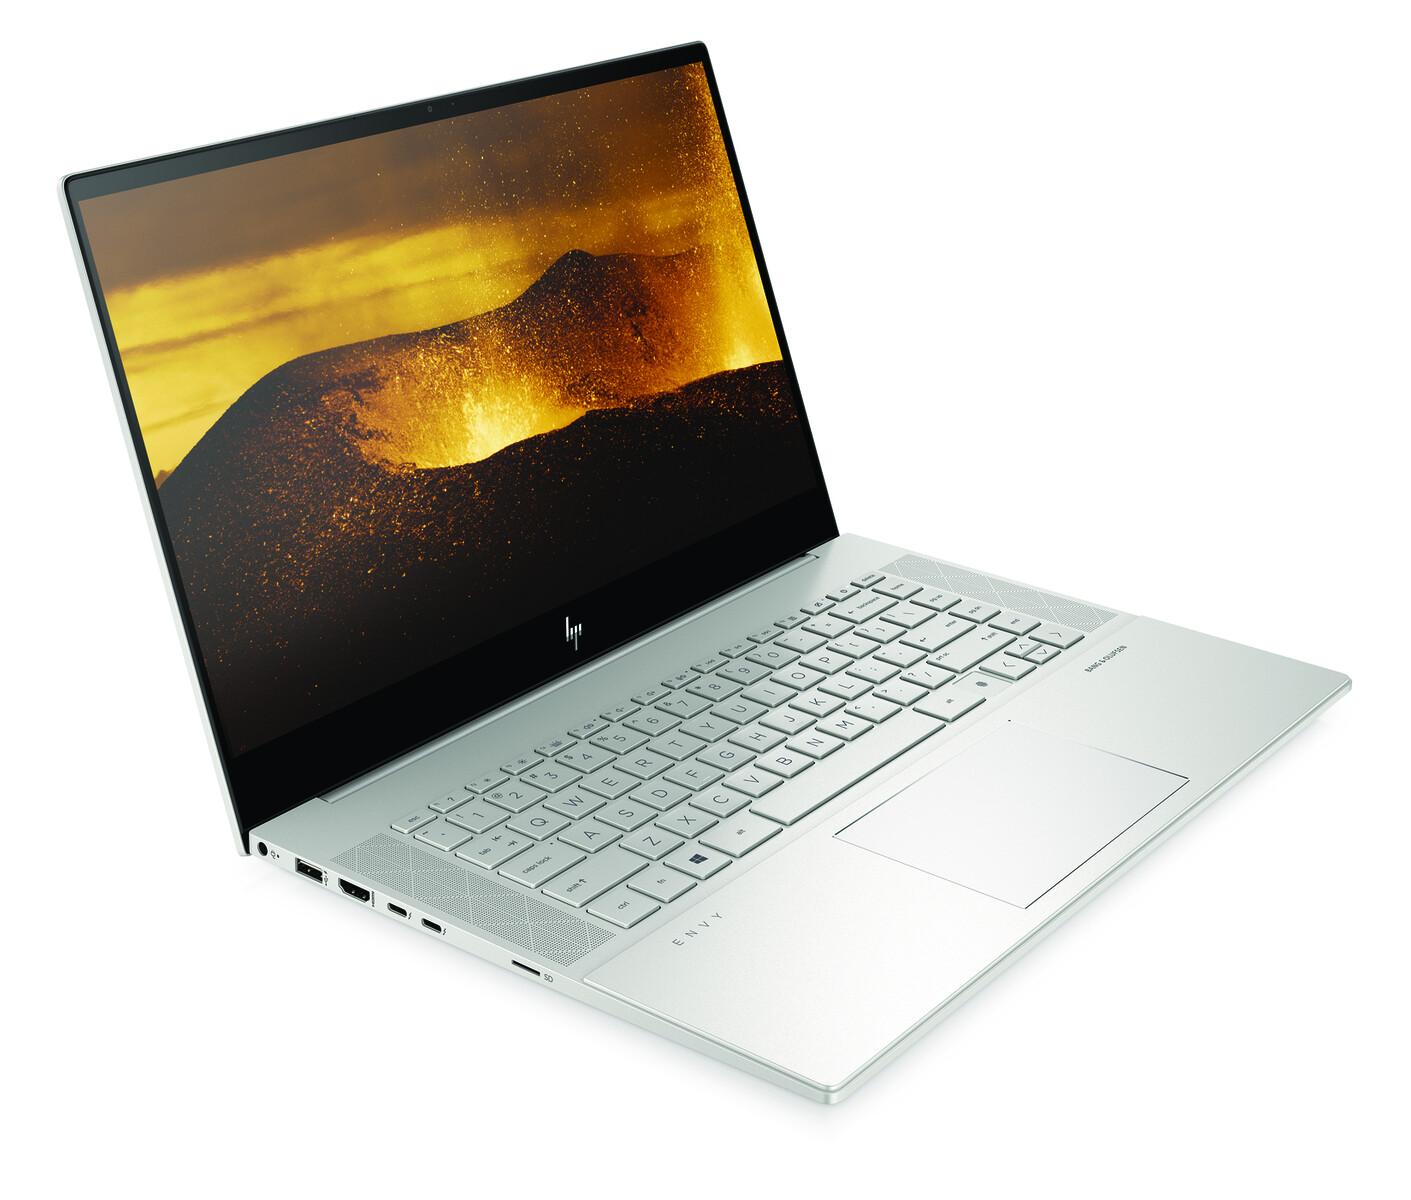
This is HP's Answer To The Apple MacBook Pro: 2020 Envy 15 Creator Core i7 Review
Traditionally, the HP Envy series has always been the middle-ground solution between the budget Pavilion series and higher-end Spectre series. More recently, however, the manufacturer has been pushing it more towards the high-performance direction to cater to demanding multimedia users and content creators. The latest Envy 15 model is being marketed as a direct competitor to the Apple MacBook Pro series and therefore other GeForce-powered multimedia laptops like the Dell XPS 15, Gigabyte Aero 15, or Microsoft Surface Book 3 15.
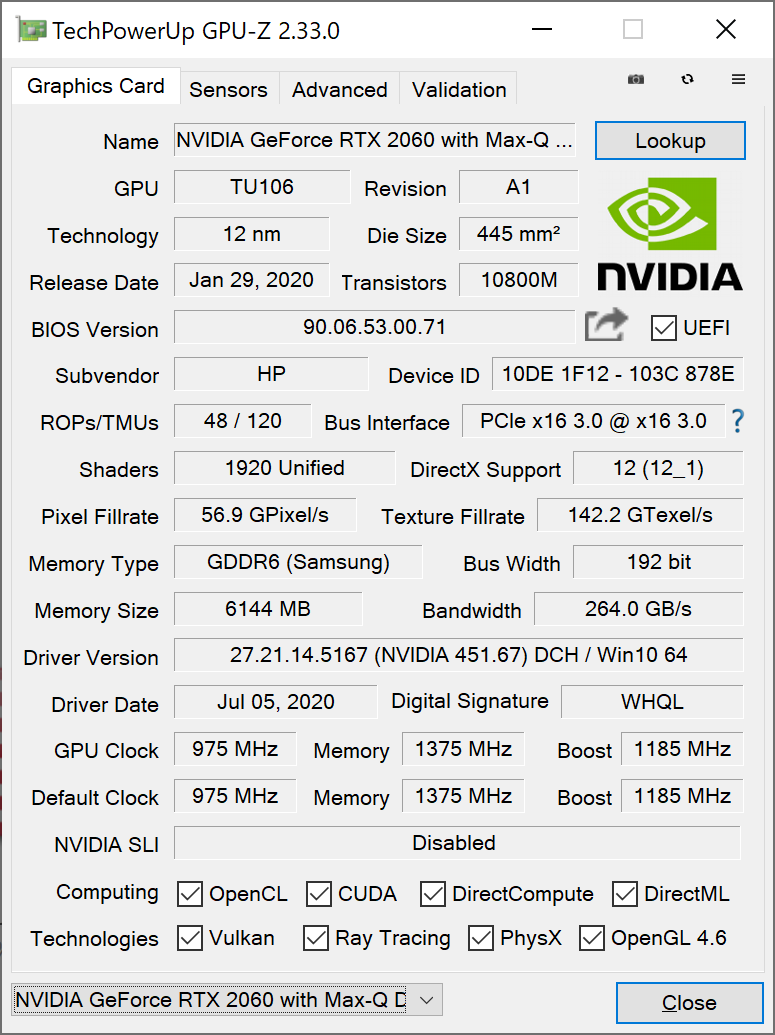
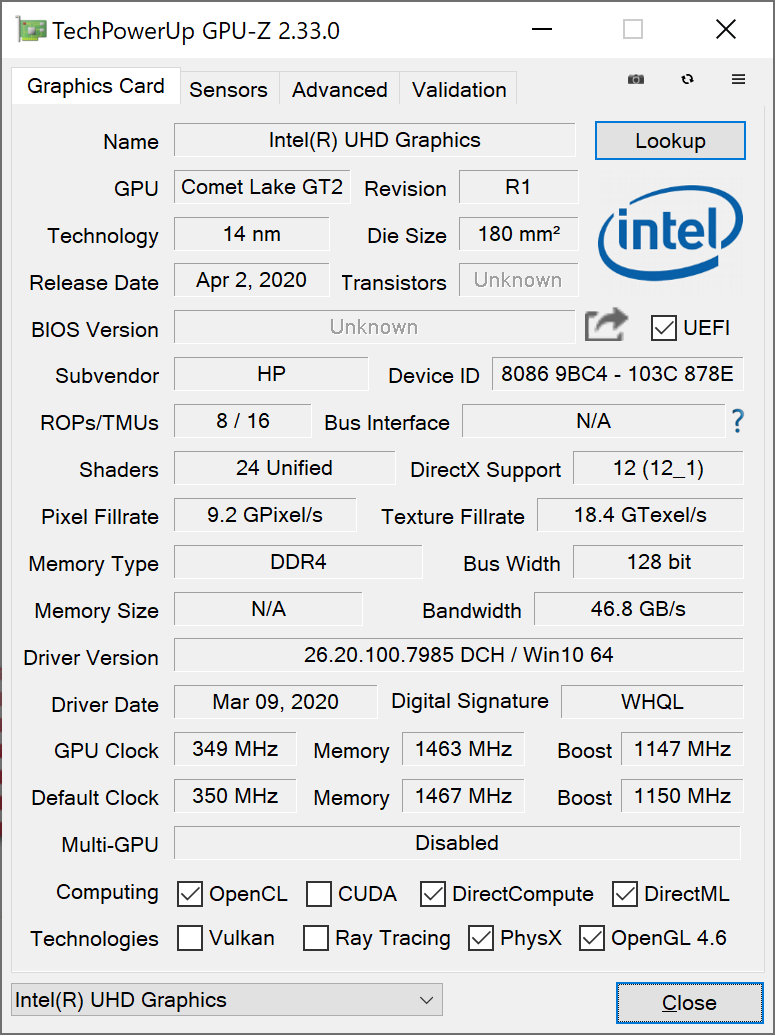
Perhaps the defining feature of the 2020 Envy 15 is its uncommon GeForce RTX 2060 Max-Q option which is not found on many other laptops. This GPU alone should give the HP significant performance boosts against most other multimedia laptops that tend to top out at "only" the GTX 1650 or 1660 Ti. Outside of the GPU, 10th gen Intel Comet Lake-H CPUs come standard alongside the optional 4K UHD AMOLED touchscreen or lesser UHD Graphics 630. Our specific configuration retails for about $1500 USD on HP.com.
More HP reviews:
Rating | Date | Model | Weight | Height | Size | Resolution | Price |
|---|---|---|---|---|---|---|---|
| 83 % v7 (old) | 08 / 2020 | HP Envy 15-ep0098nr i7-10750H, GeForce RTX 2060 Max-Q | 2 kg | 19 mm | 15.60" | 3840x2160 | |
| 80.4 % v7 (old) | 06 / 2020 | HP Envy x360 15-dr1679cl i7-10510U, UHD Graphics 620 | 2.1 kg | 17.2 mm | 15.60" | 1920x1080 | |
| 85 % v7 (old) | 01 / 2020 | HP Spectre X360 15-5ZV31AV i7-10510U, GeForce MX250 | 2.1 kg | 19.3 mm | 15.60" | 3840x2160 | |
| 90.1 % v7 (old) | 06 / 2020 | Dell XPS 15 9500 Core i7 4K UHD i7-10875H, GeForce GTX 1650 Ti Mobile | 2 kg | 18 mm | 15.60" | 3840x2400 | |
| 86 % v7 (old) | 12 / 2019 | Lenovo Yoga C940-15IRH i7-9750H, GeForce GTX 1650 Max-Q | 2 kg | 19.7 mm | 15.60" | 1920x1080 | |
| 89.7 % v7 (old) | 12 / 2019 | Apple MacBook Pro 16 2019 i9 5500M i9-9880H, Radeon Pro 5500M | 2 kg | 16.2 mm | 16.00" | 3072x1920 |
Case
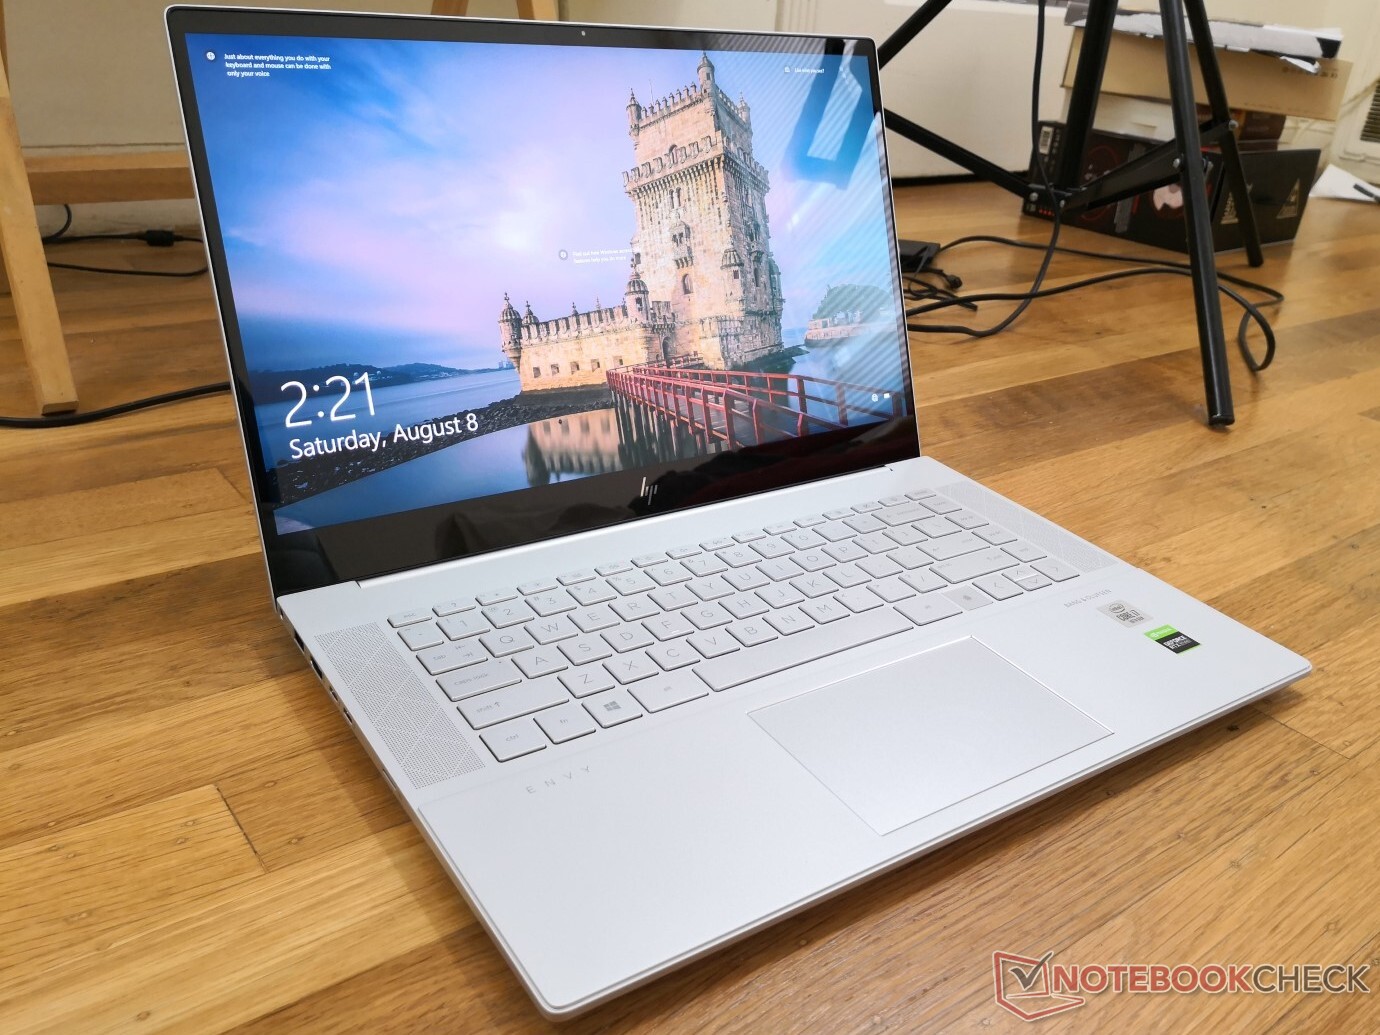
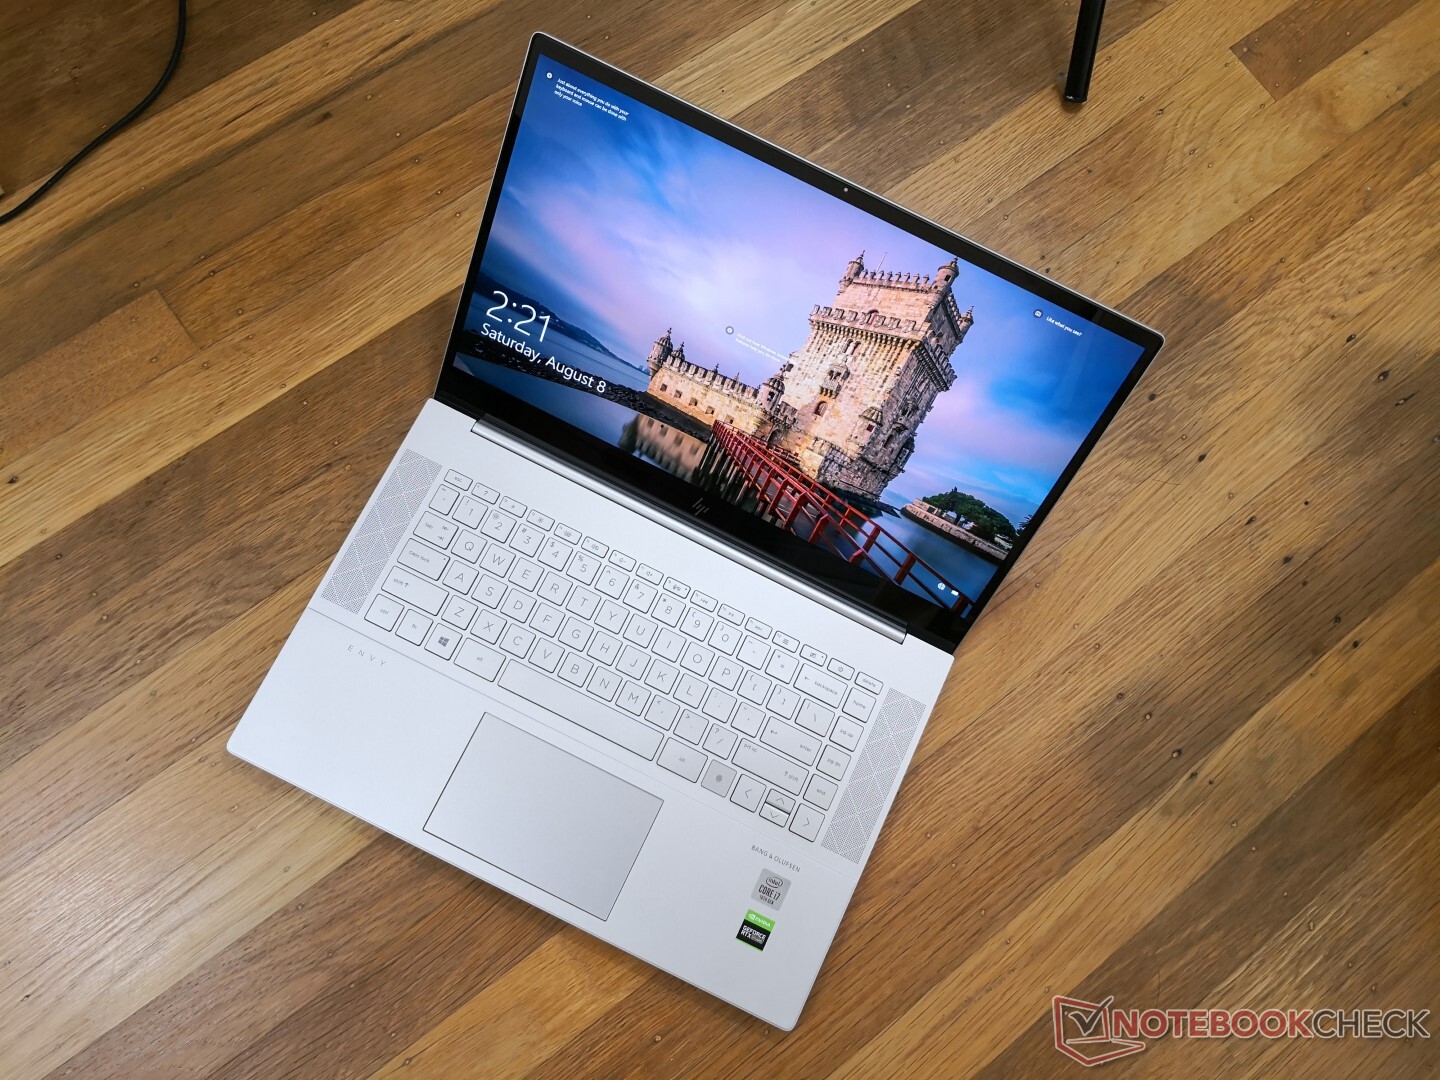
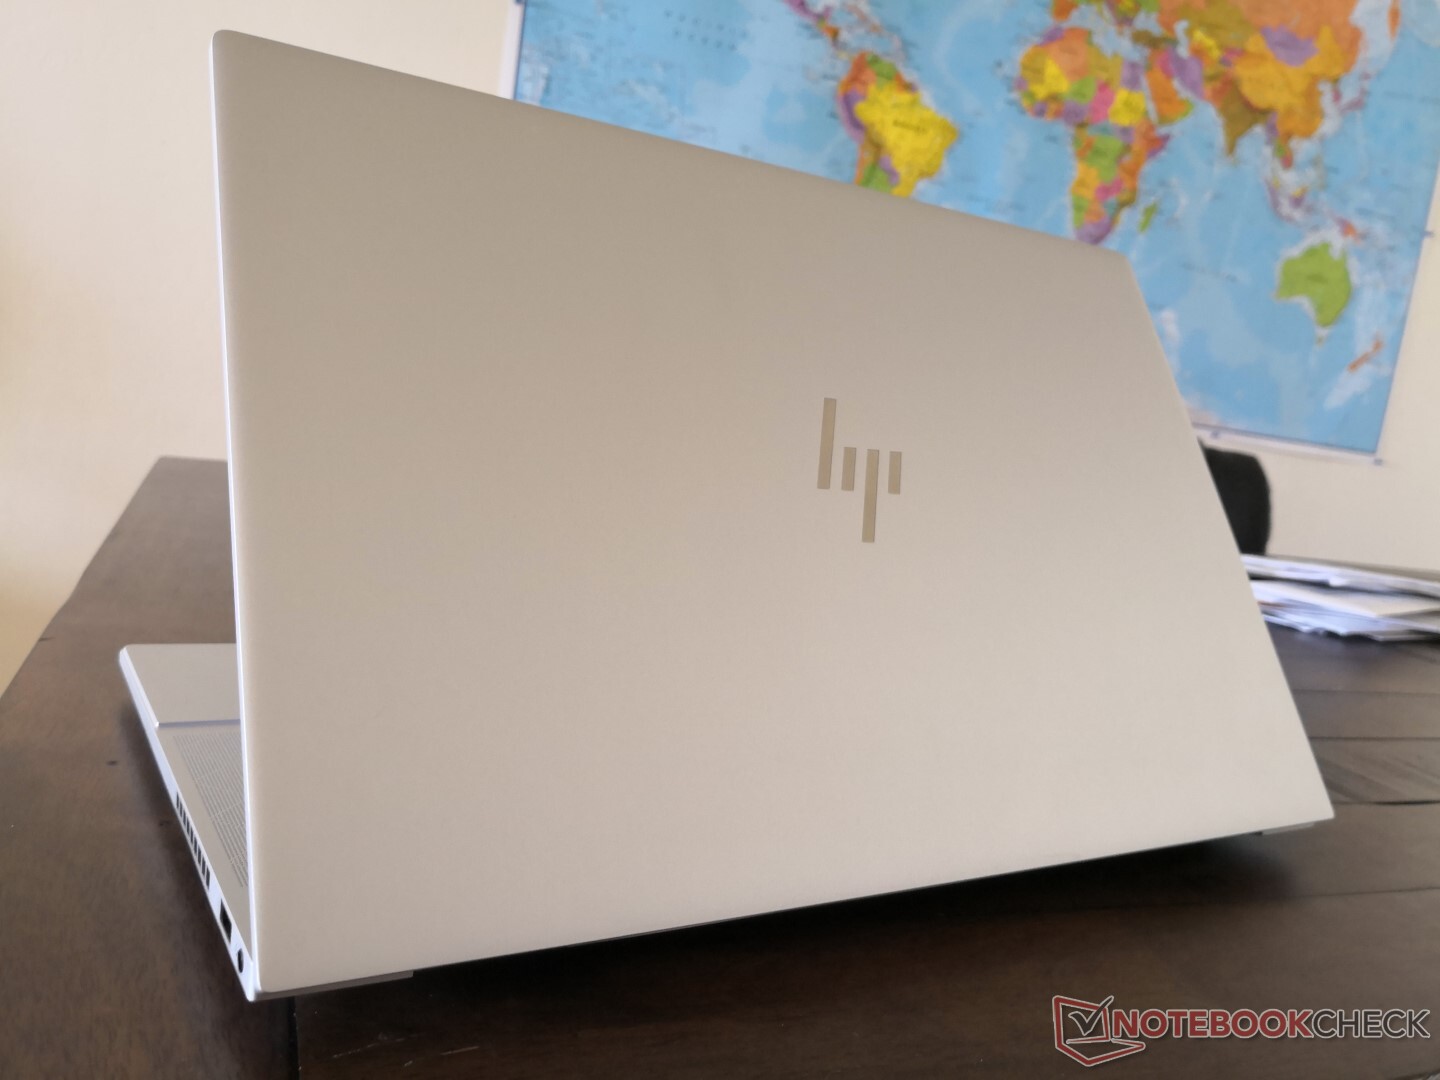
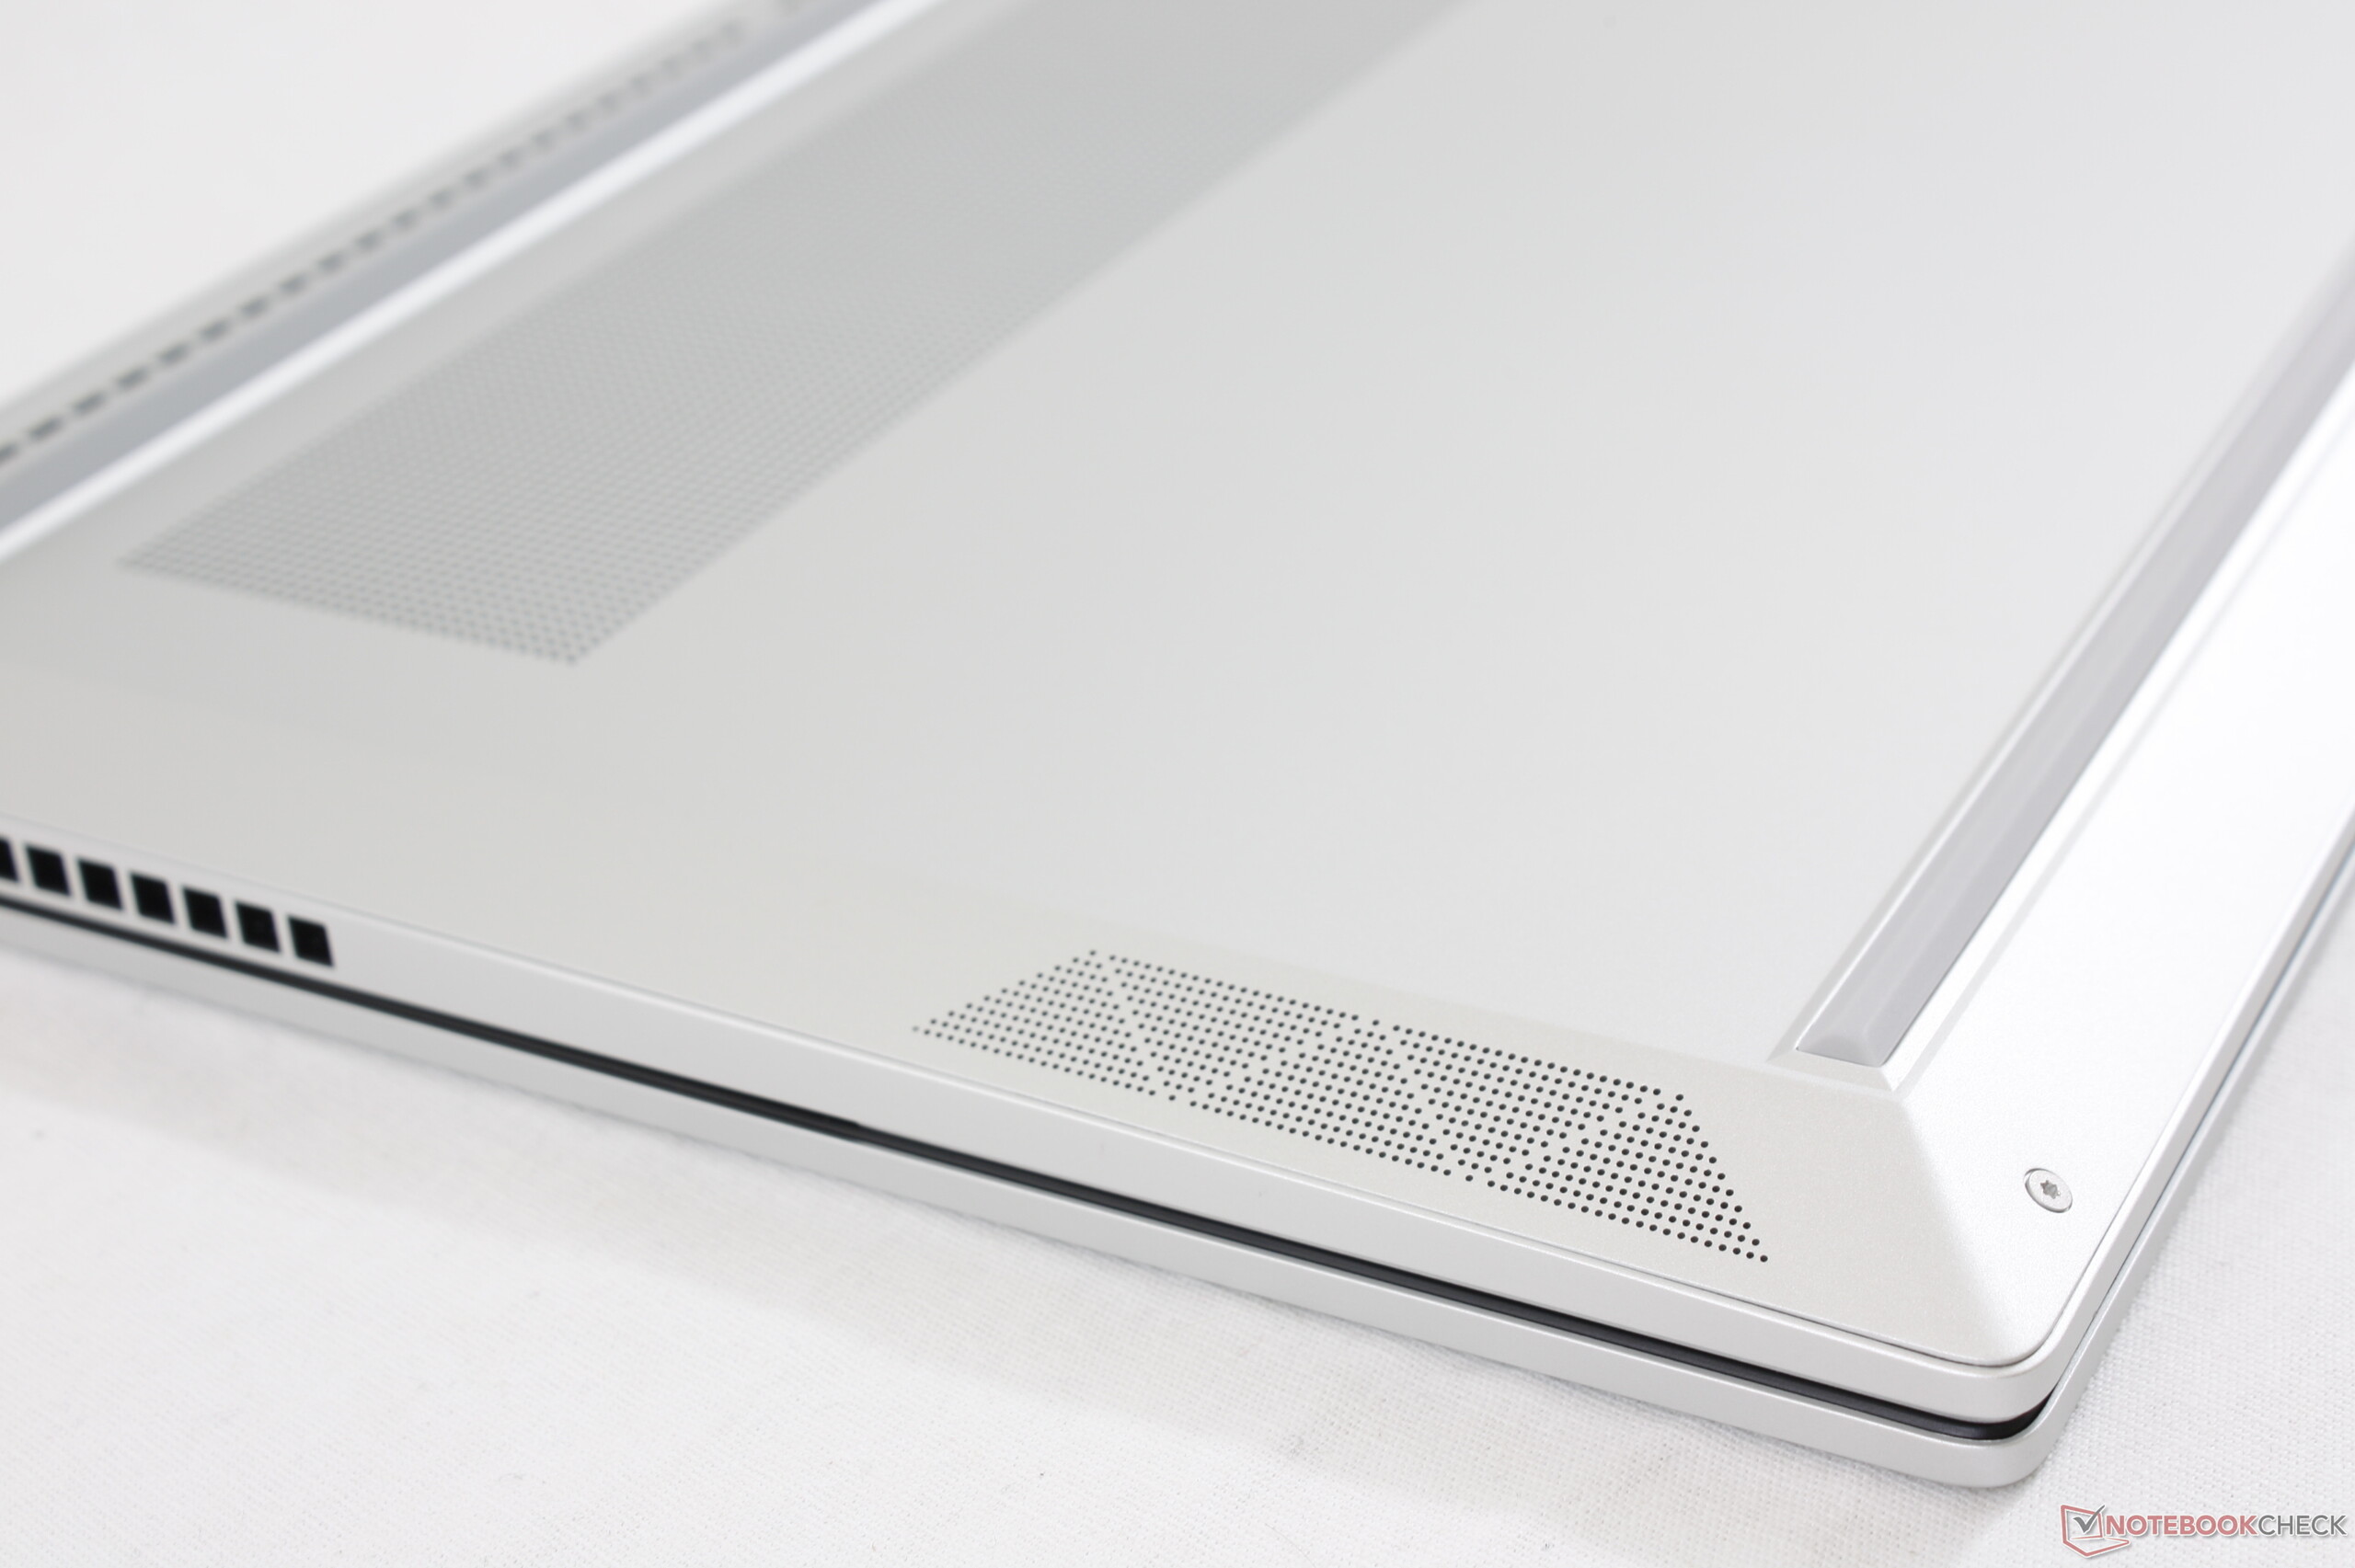
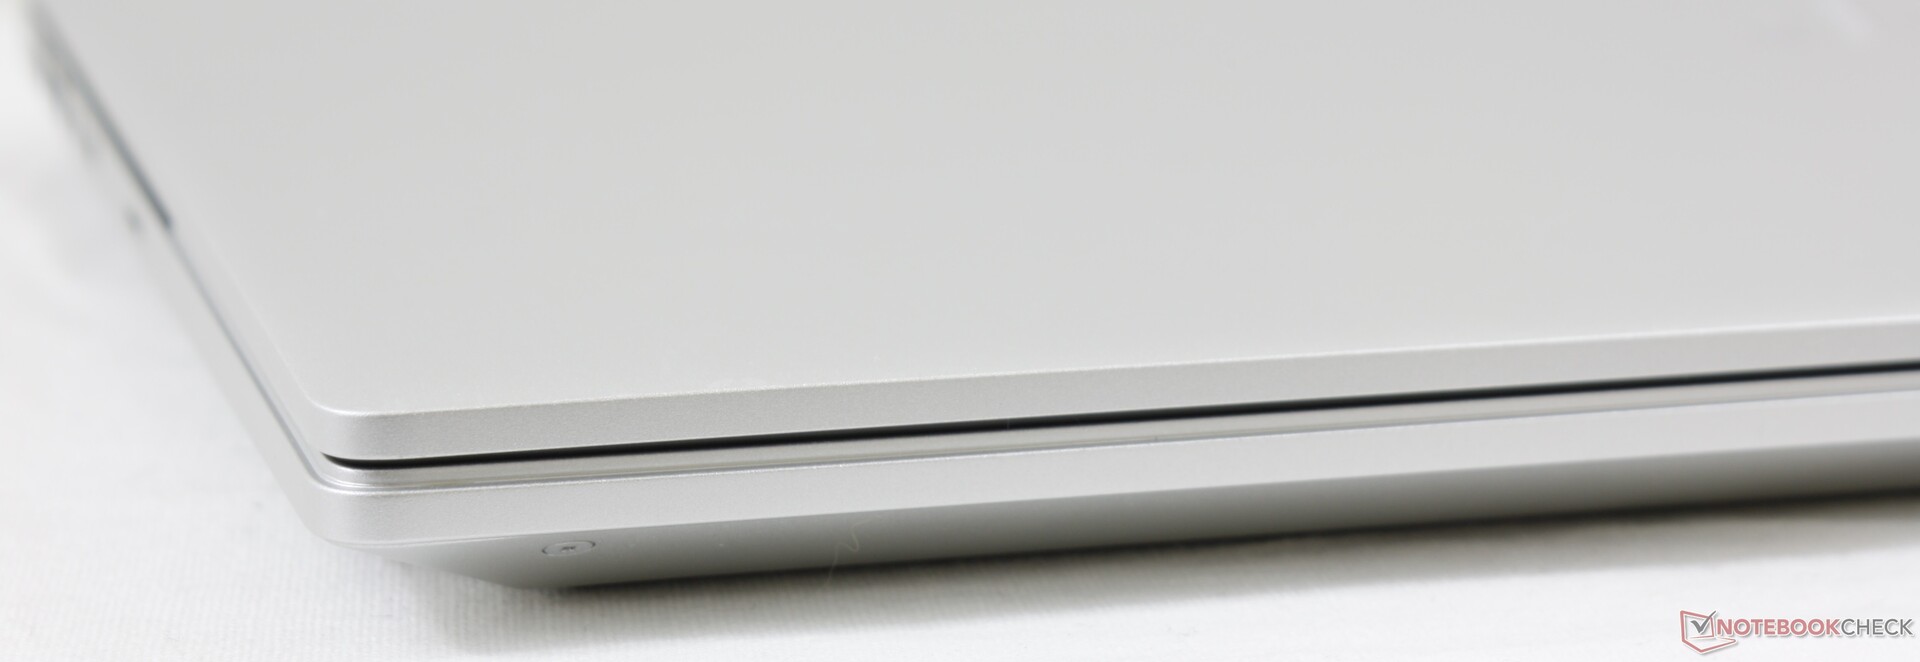
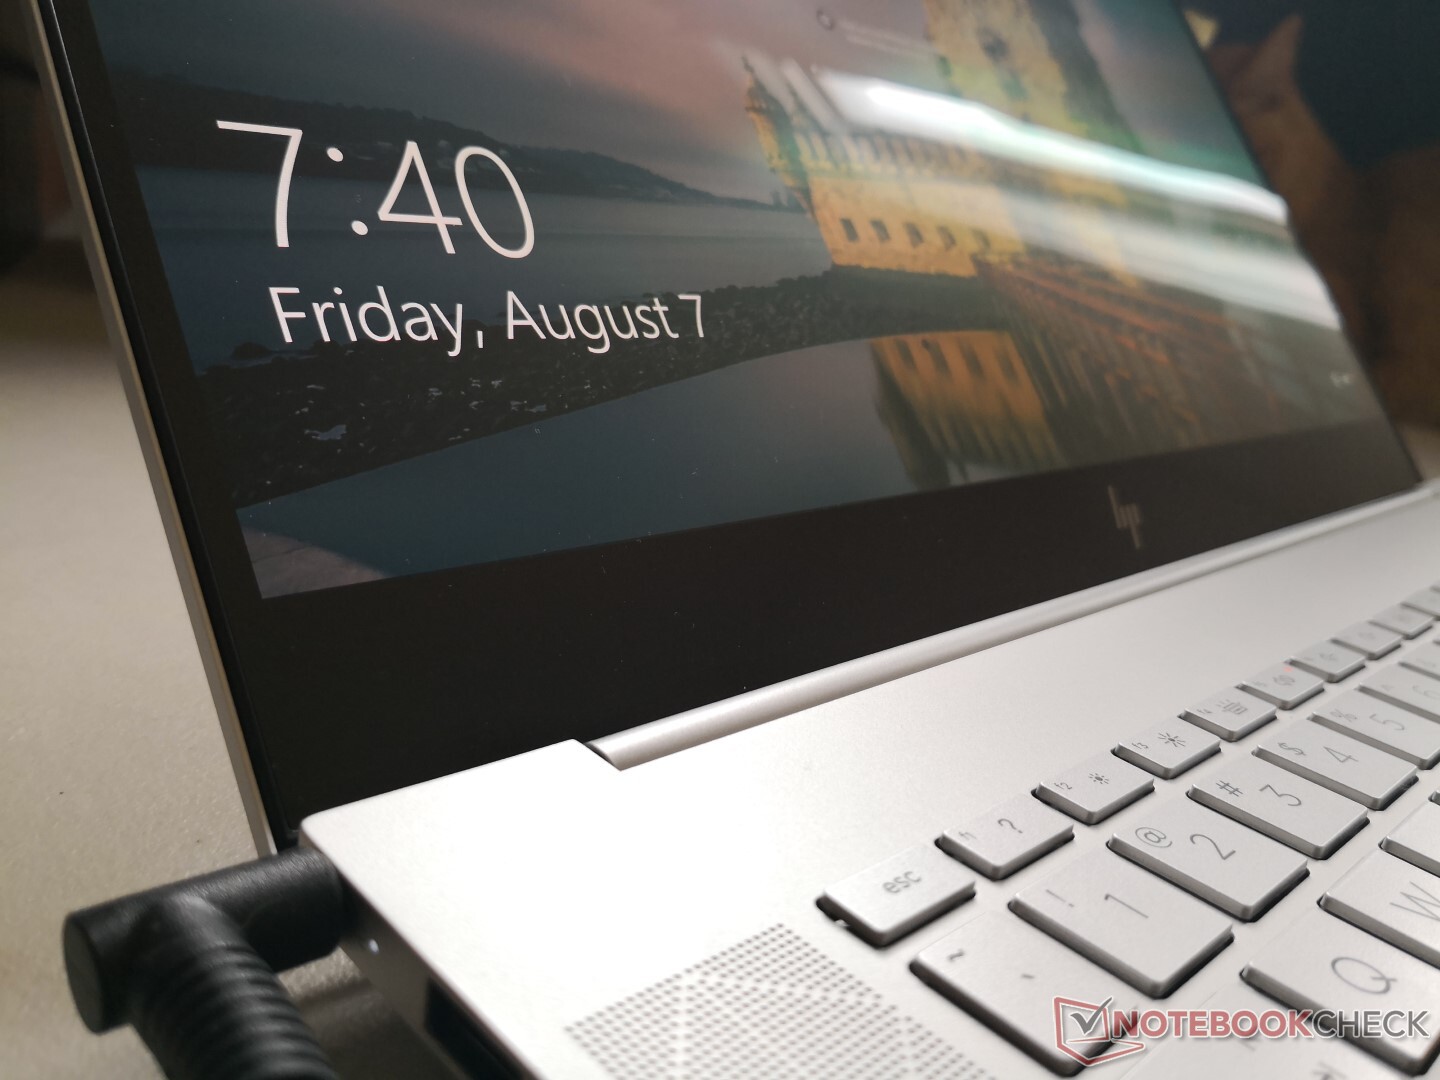
It's been three years since we last checked out an Envy 15 clamshell and the latest model brings significant changes both inside and out. The newer design is smaller in footprint because of the thinner bezels but thicker in size because of the much faster processors inside. HP has also dropped the old "hooked" hinge design in favor of regular hinges akin to the MacBook Pro for a more professional no-frills look.
Hinge rigidity could be stiffer nonetheless. The lid tends to teeter a bit when adjusting angles which doesn't give a sense of longevity.
The system is slightly thicker and heavier than the MacBook Pro 15 while being slightly smaller than the MacBook Pro 16. Performance-per-volume favors the HP Envy because of its more powerful GeForce RTX 2060 Max-Q GPU.
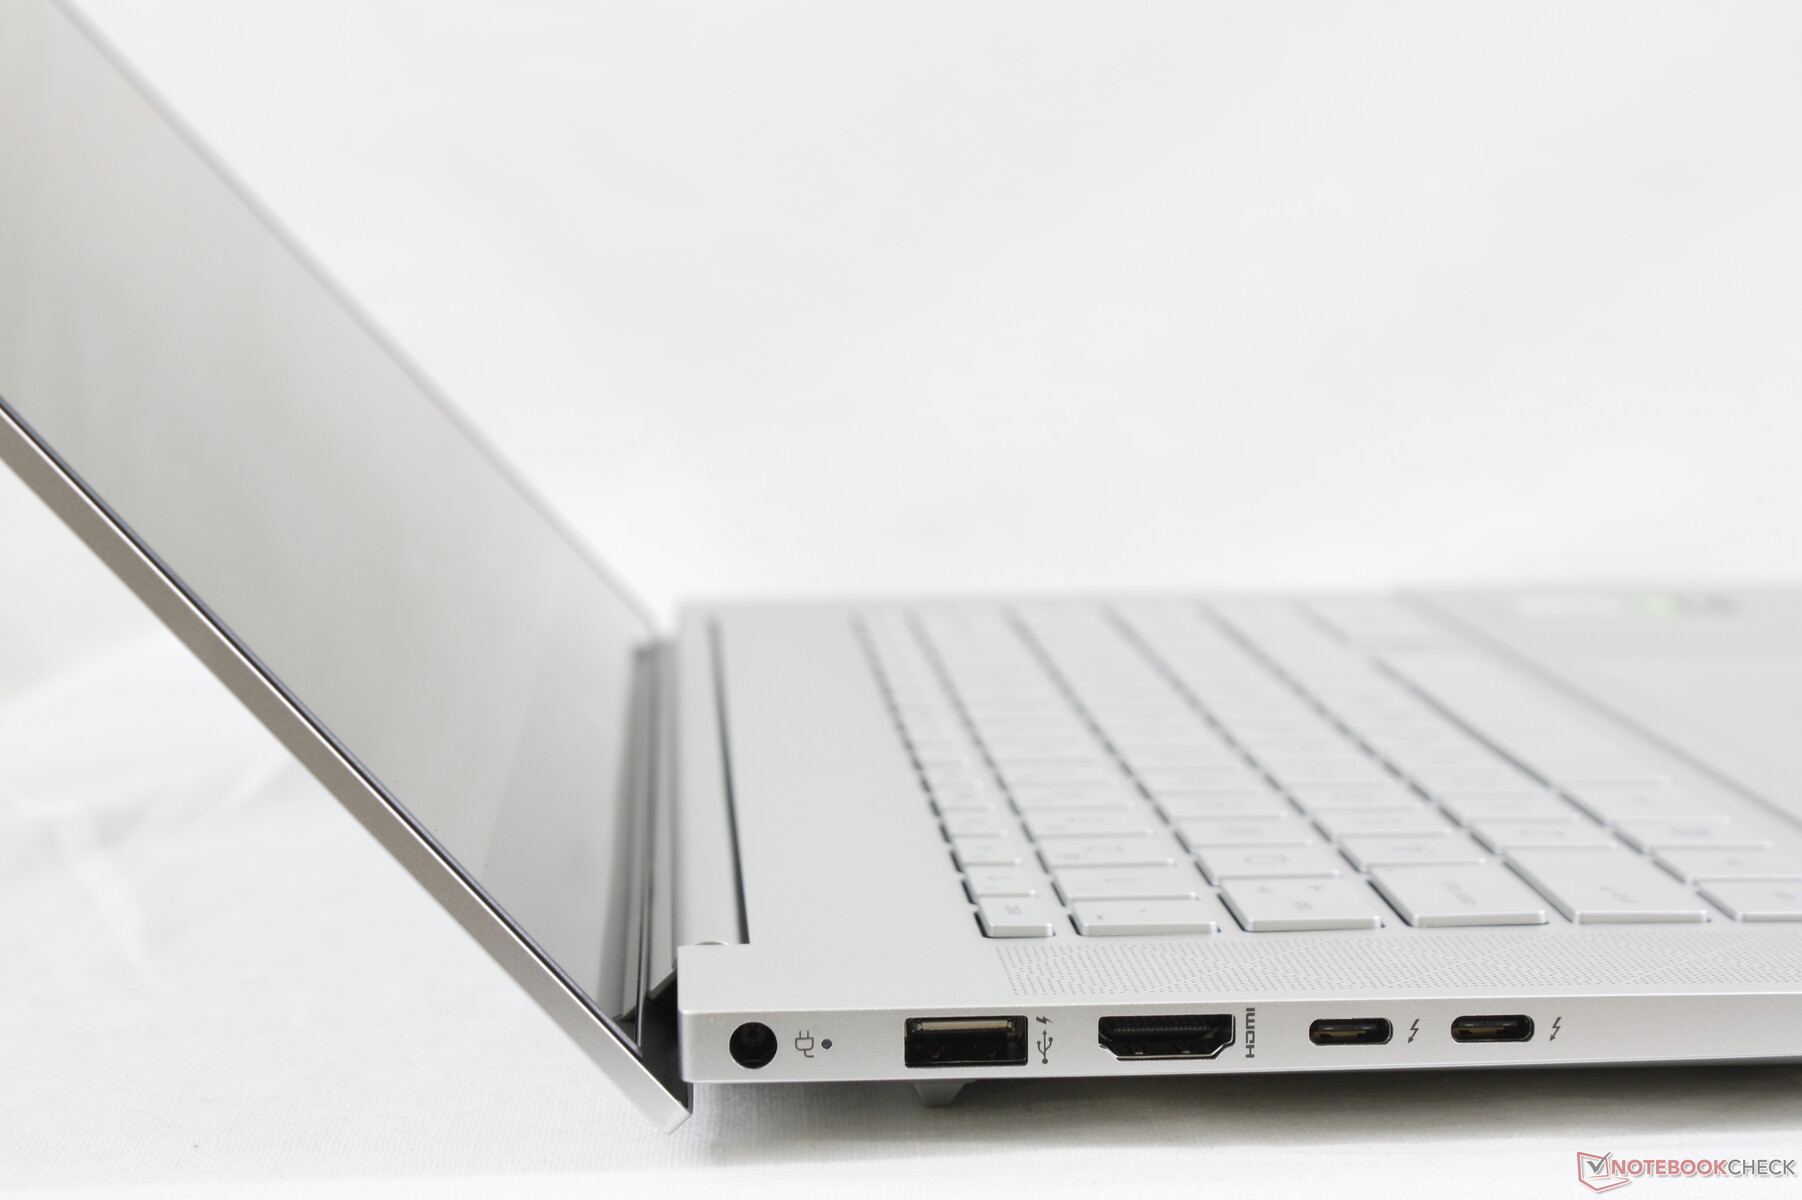
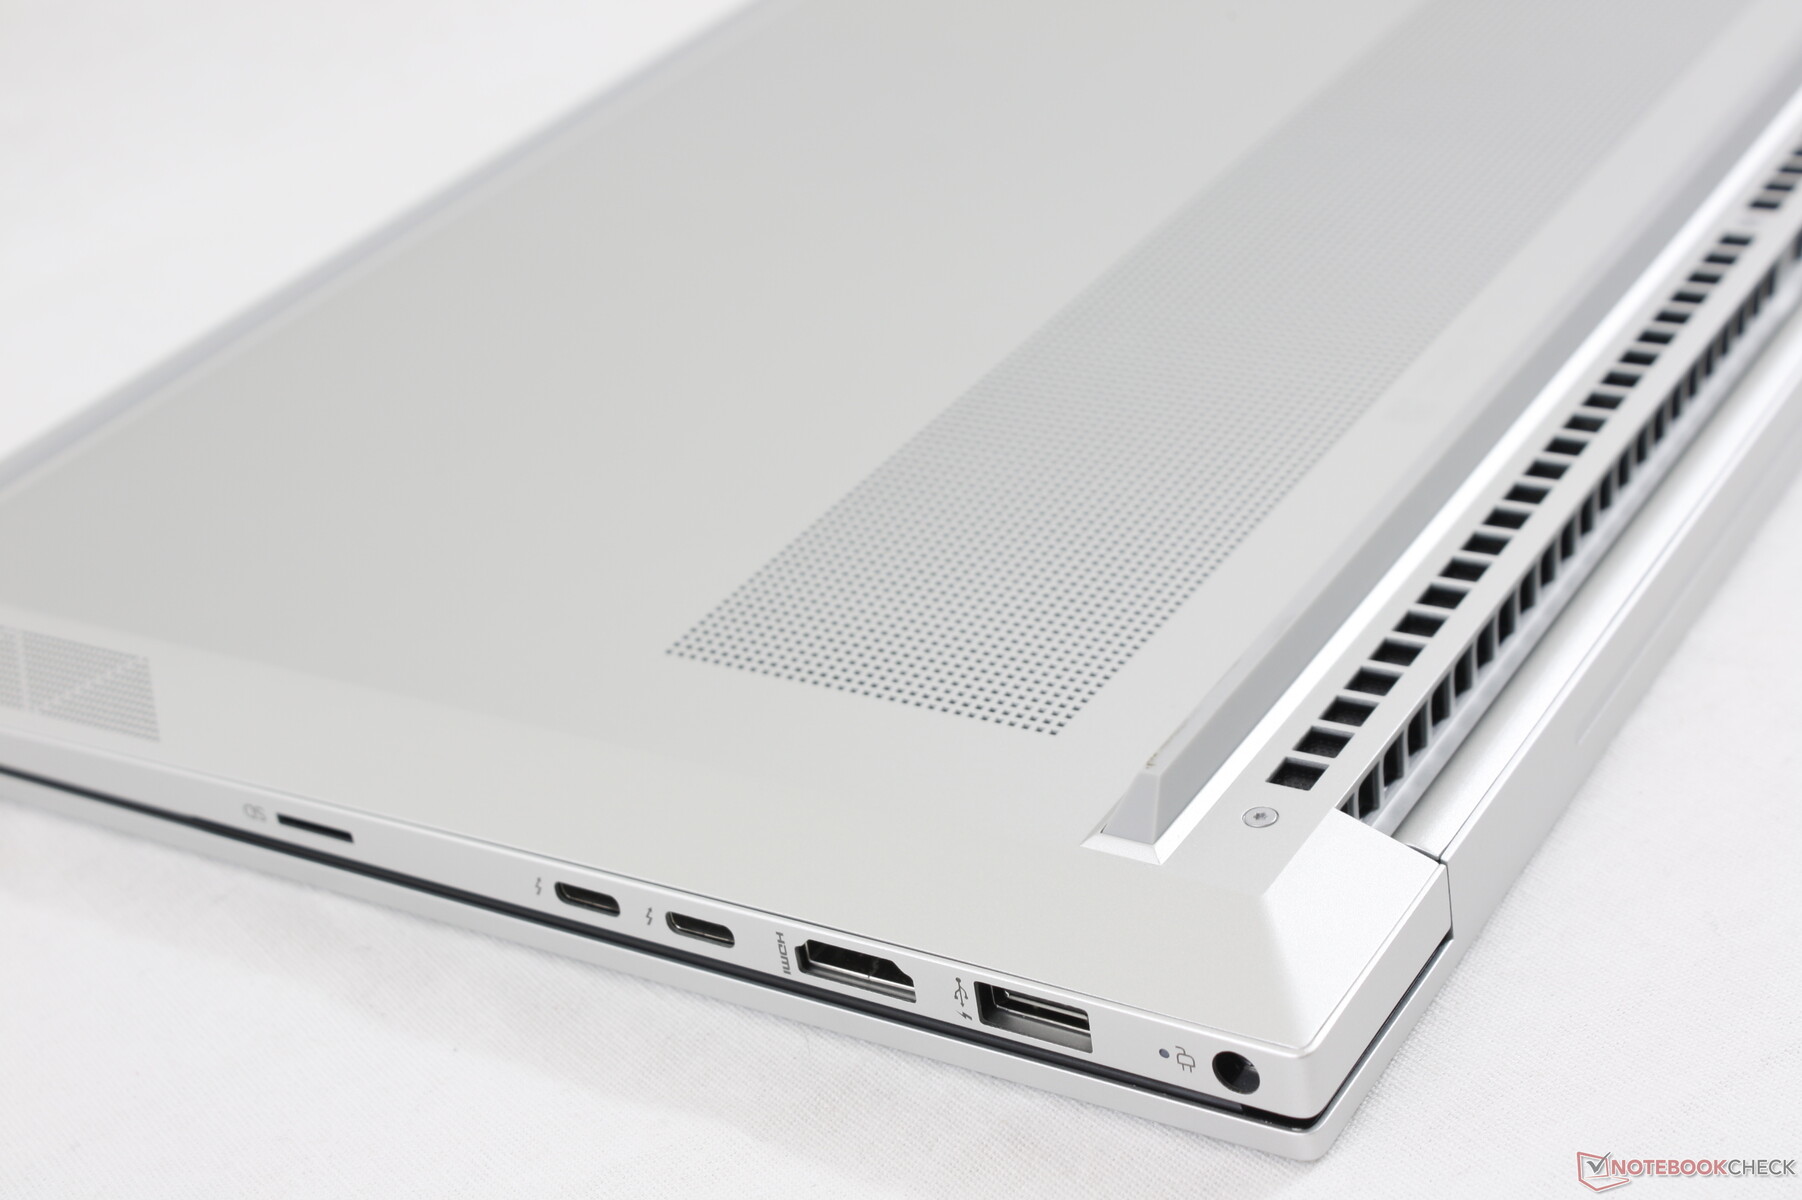
Connectivity
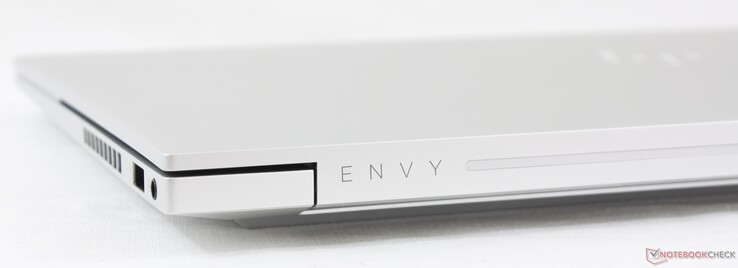
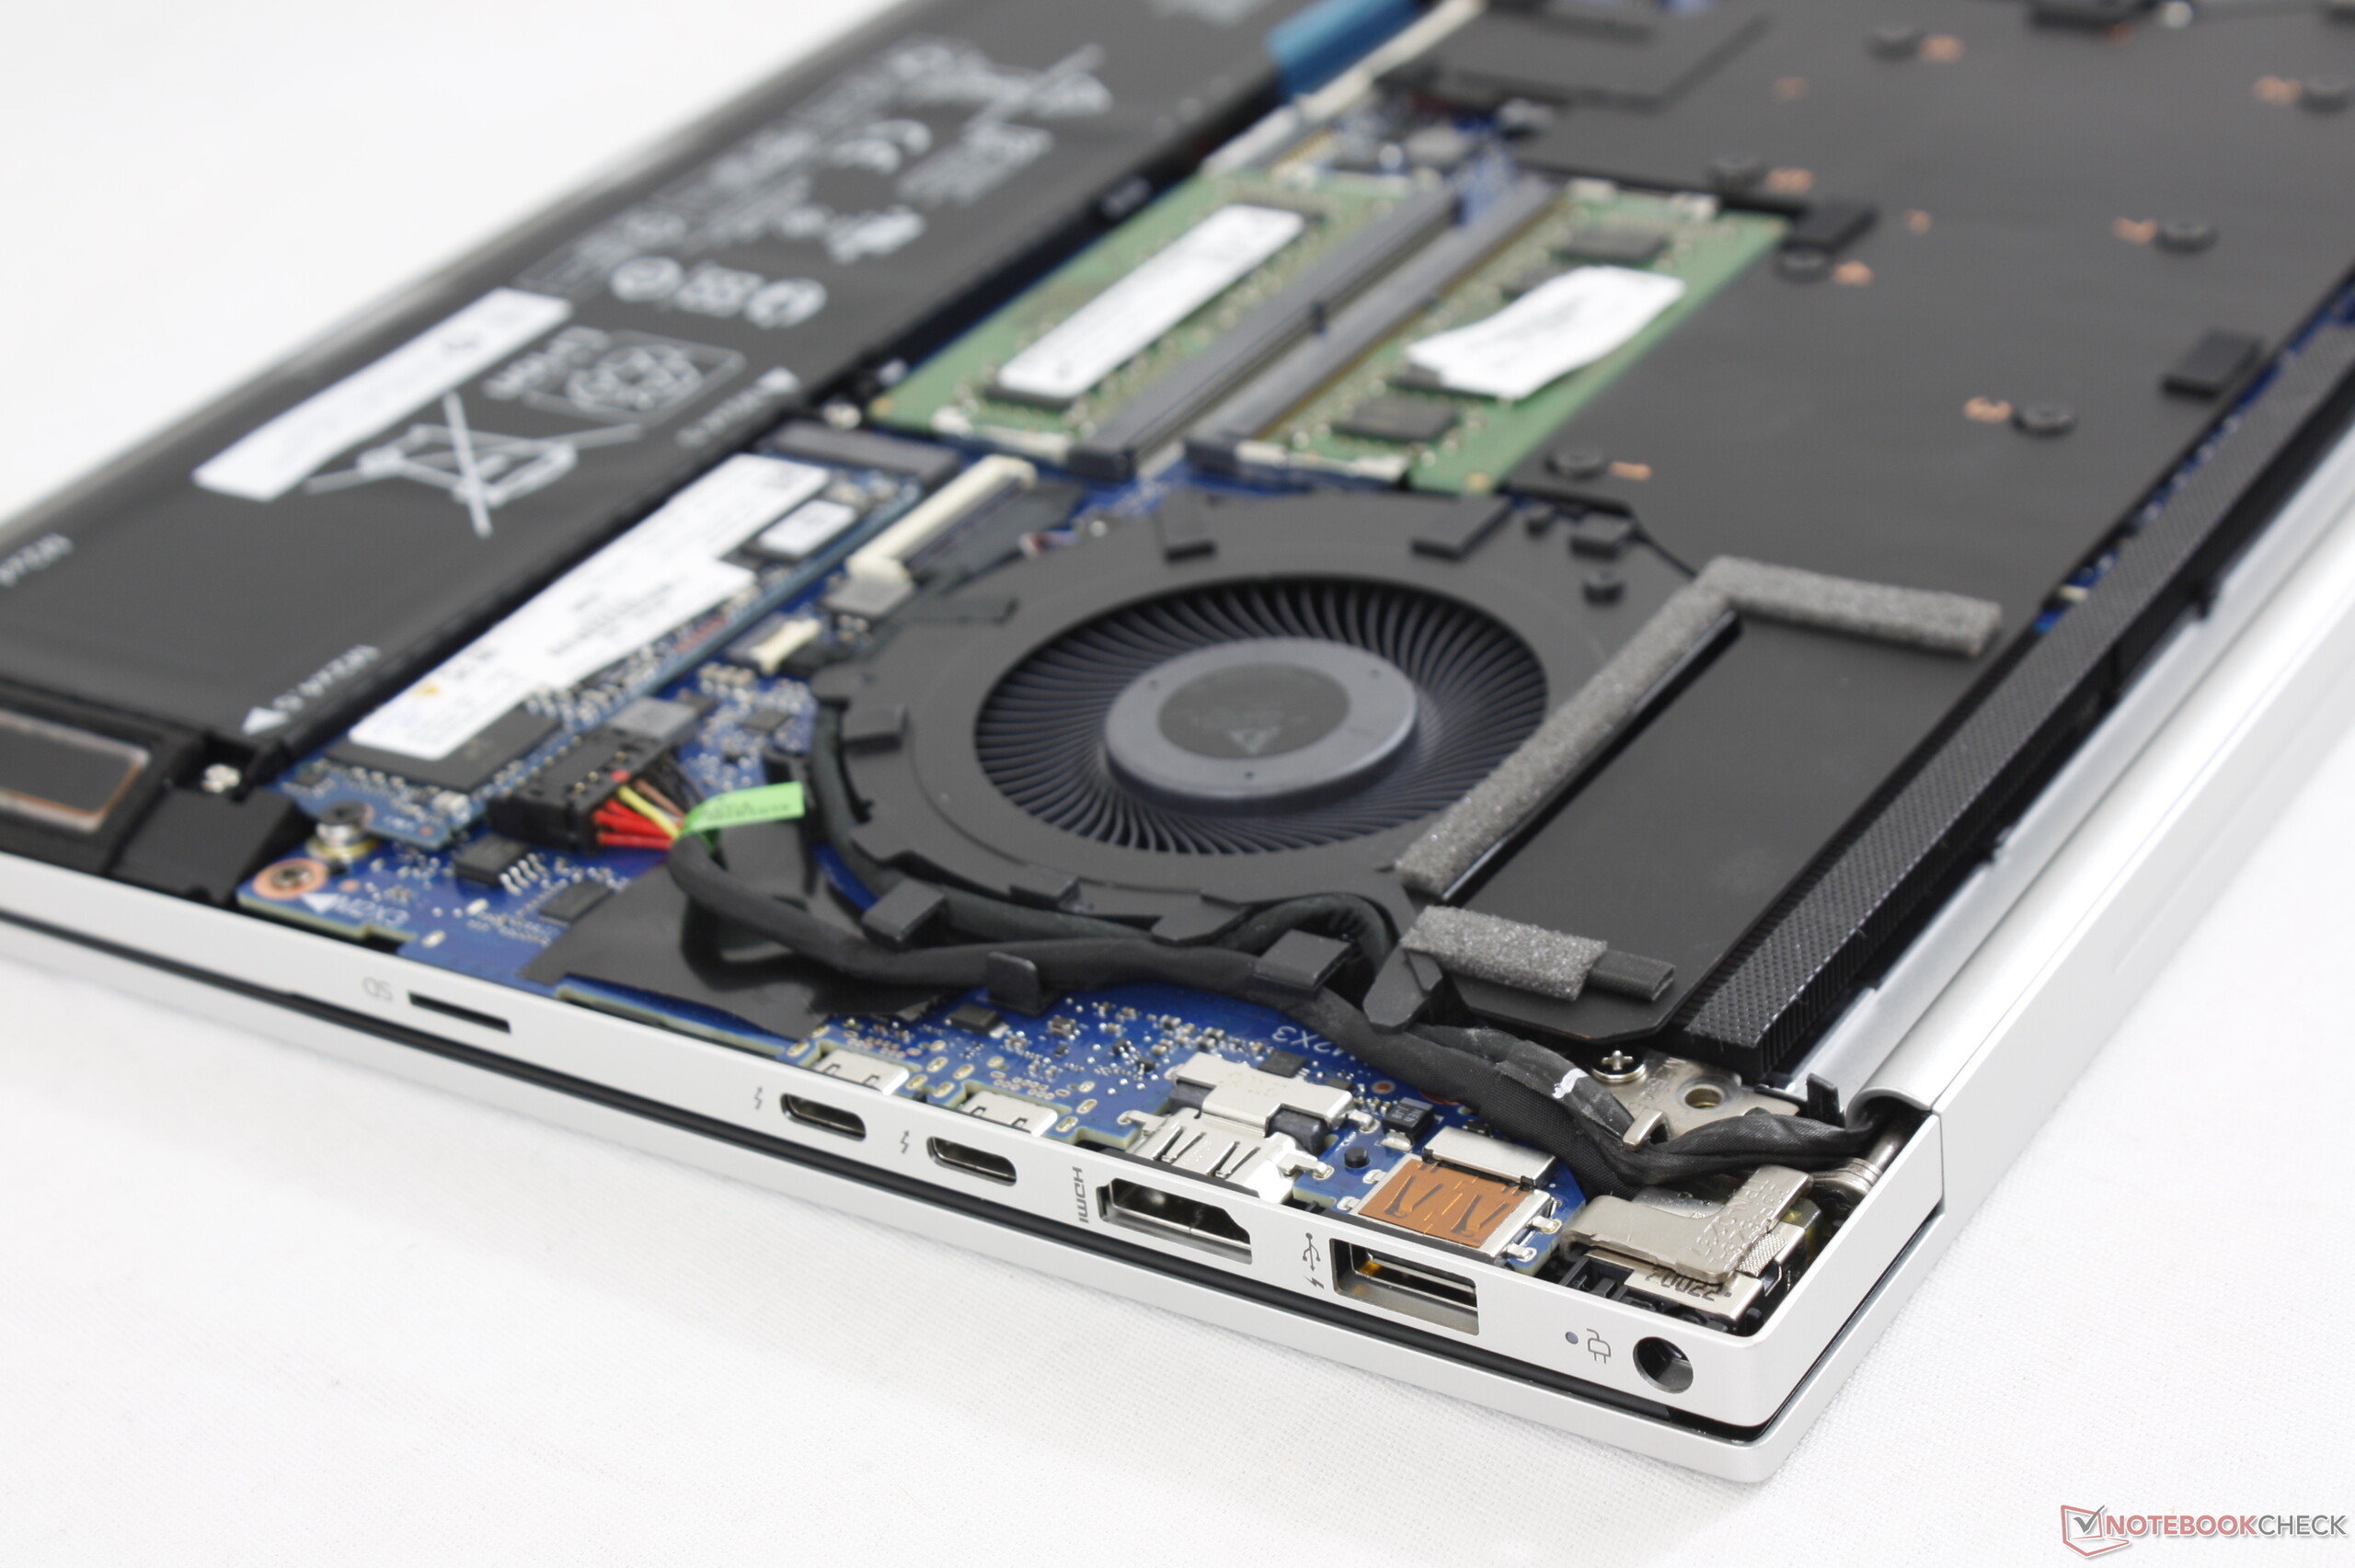
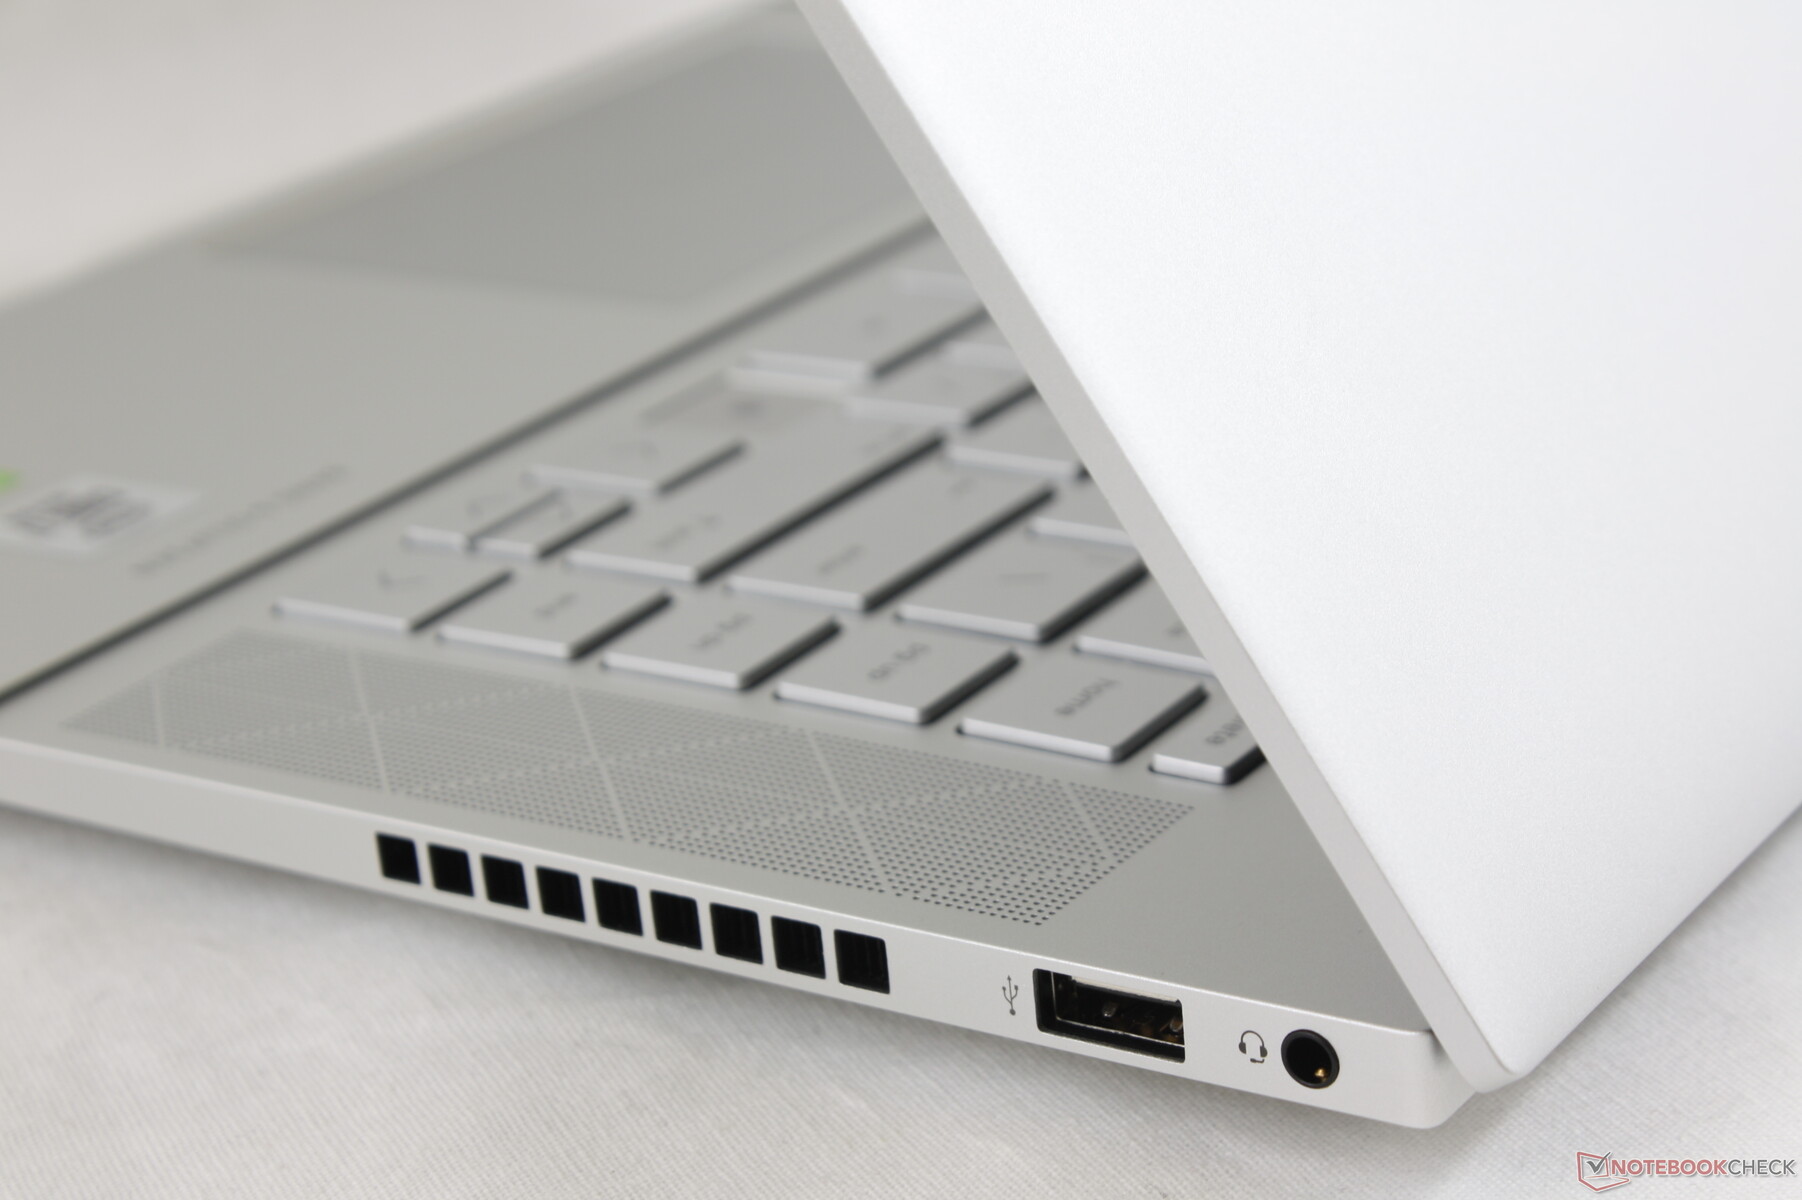
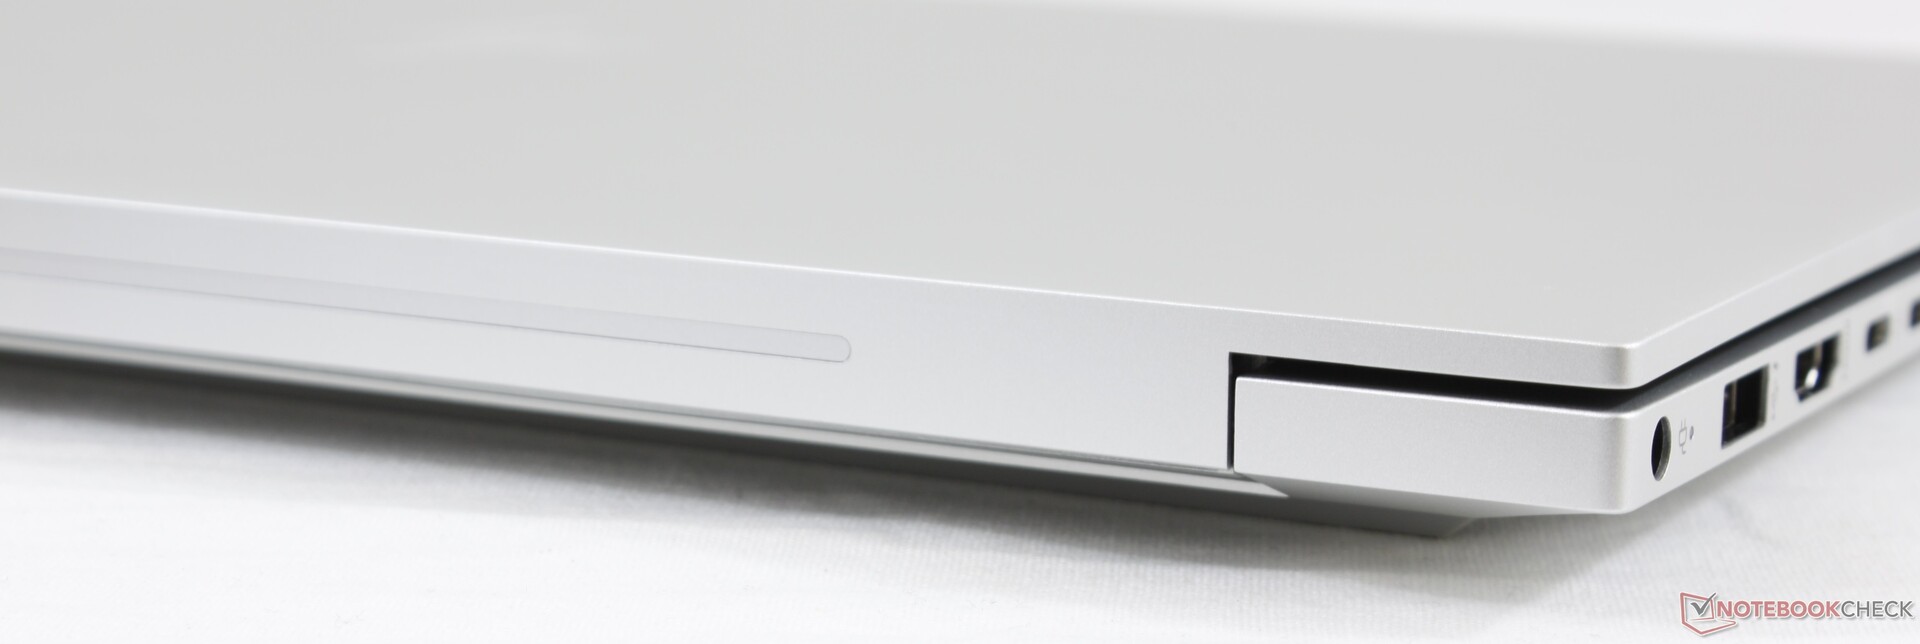
Unlike the Dell XPS 17 or MacBook Pro 16 and their ludicrous number of Thunderbolt 3 ports, the Envy 15 offers a better variety of options. Its full-size USB-A and HDMI ports will indubitably come in handy whereas the aforementioned Dell or Apple systems rely heavily on adapters. There is no Kensington Lock, however.
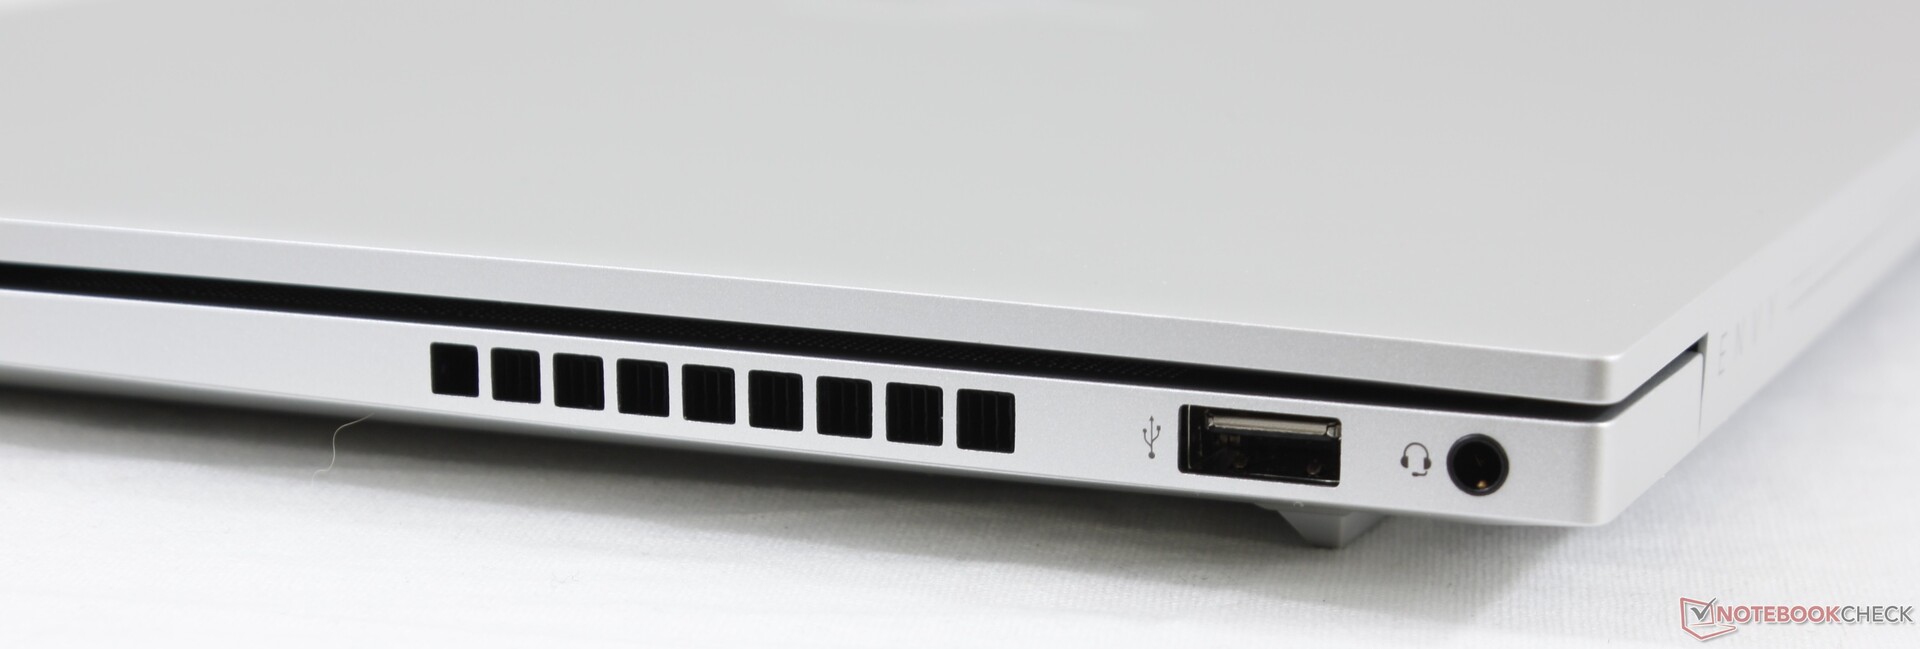
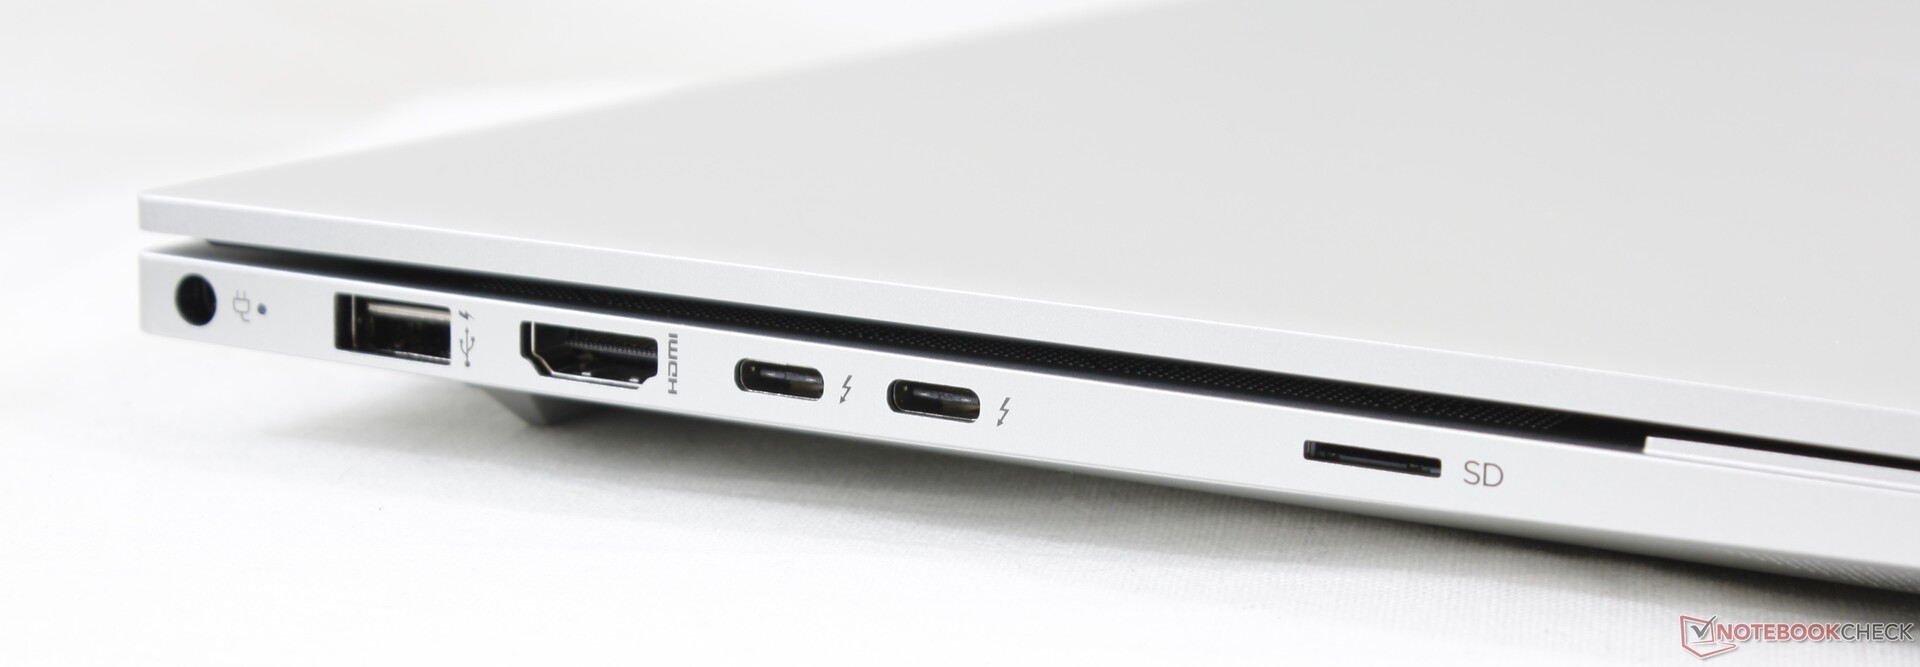
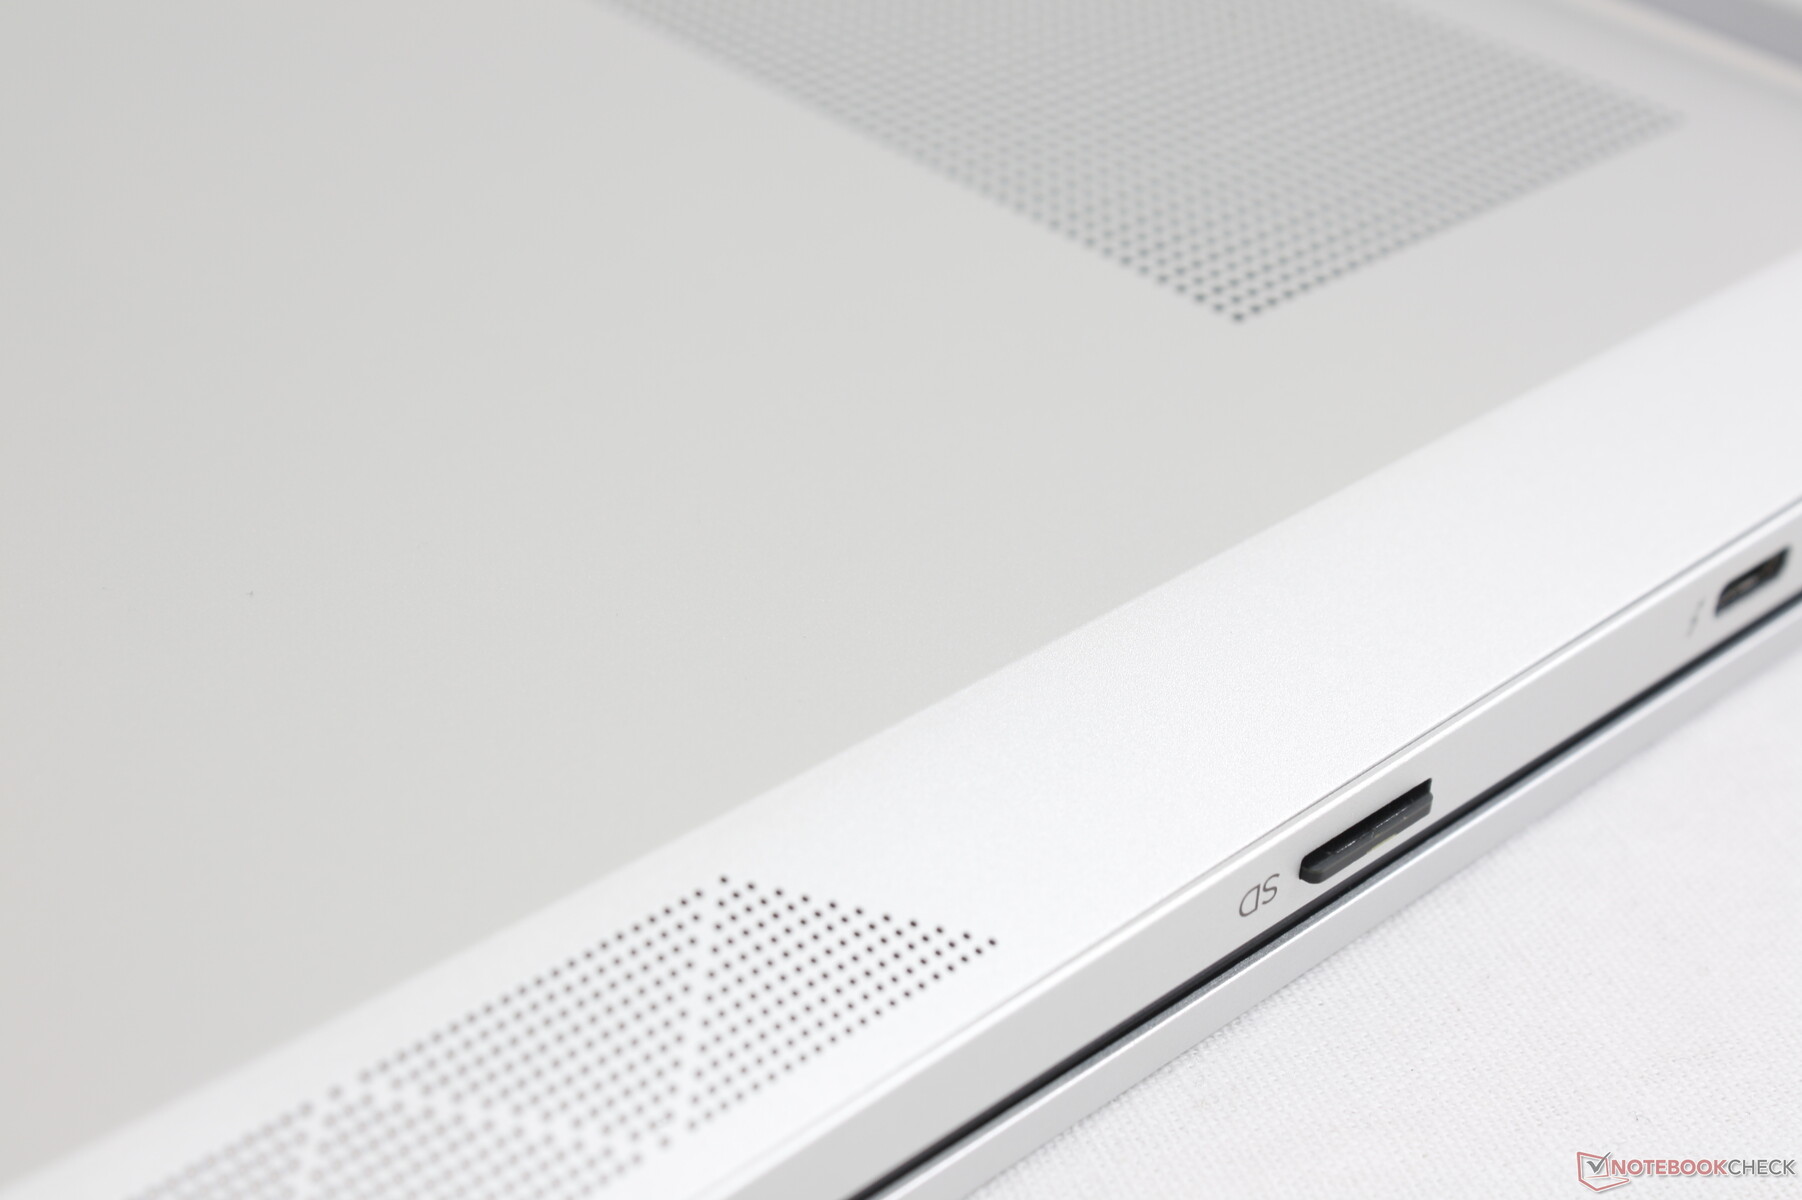
SD Card Reader
The system integrates a MicroSD reader instead of a full-size one. Transfer rates are decent, but they're nowhere near as fast as what you'd get from the Dell XPS 15 series or Spectre x360 15 series.
| SD Card Reader | |
| average JPG Copy Test (av. of 3 runs) | |
| Dell XPS 15 9500 Core i7 4K UHD (Toshiba Exceria Pro SDXC 64 GB UHS-II) | |
| HP Spectre X360 15-5ZV31AV (Toshiba Exceria Pro M501 UHS-II) | |
| HP Envy x360 15-dr1679cl (Toshiba Exceria Pro SDXC 64 GB UHS-II) | |
| HP Envy 15-ep0098nr (Toshiba Exceria Pro M501 UHS-II) | |
| maximum AS SSD Seq Read Test (1GB) | |
| Dell XPS 15 9500 Core i7 4K UHD (Toshiba Exceria Pro SDXC 64 GB UHS-II) | |
| HP Spectre X360 15-5ZV31AV (Toshiba Exceria Pro M501 UHS-II) | |
| HP Envy 15-ep0098nr (Toshiba Exceria Pro M501 UHS-II) | |
| HP Envy x360 15-dr1679cl (Toshiba Exceria Pro SDXC 64 GB UHS-II) | |
Communication
The Intel AX201 comes standard for Wi-Fi 6 and Bluetooth 5.1 connectivity. We experienced no issues when connected to our Netgear RAX200 router.
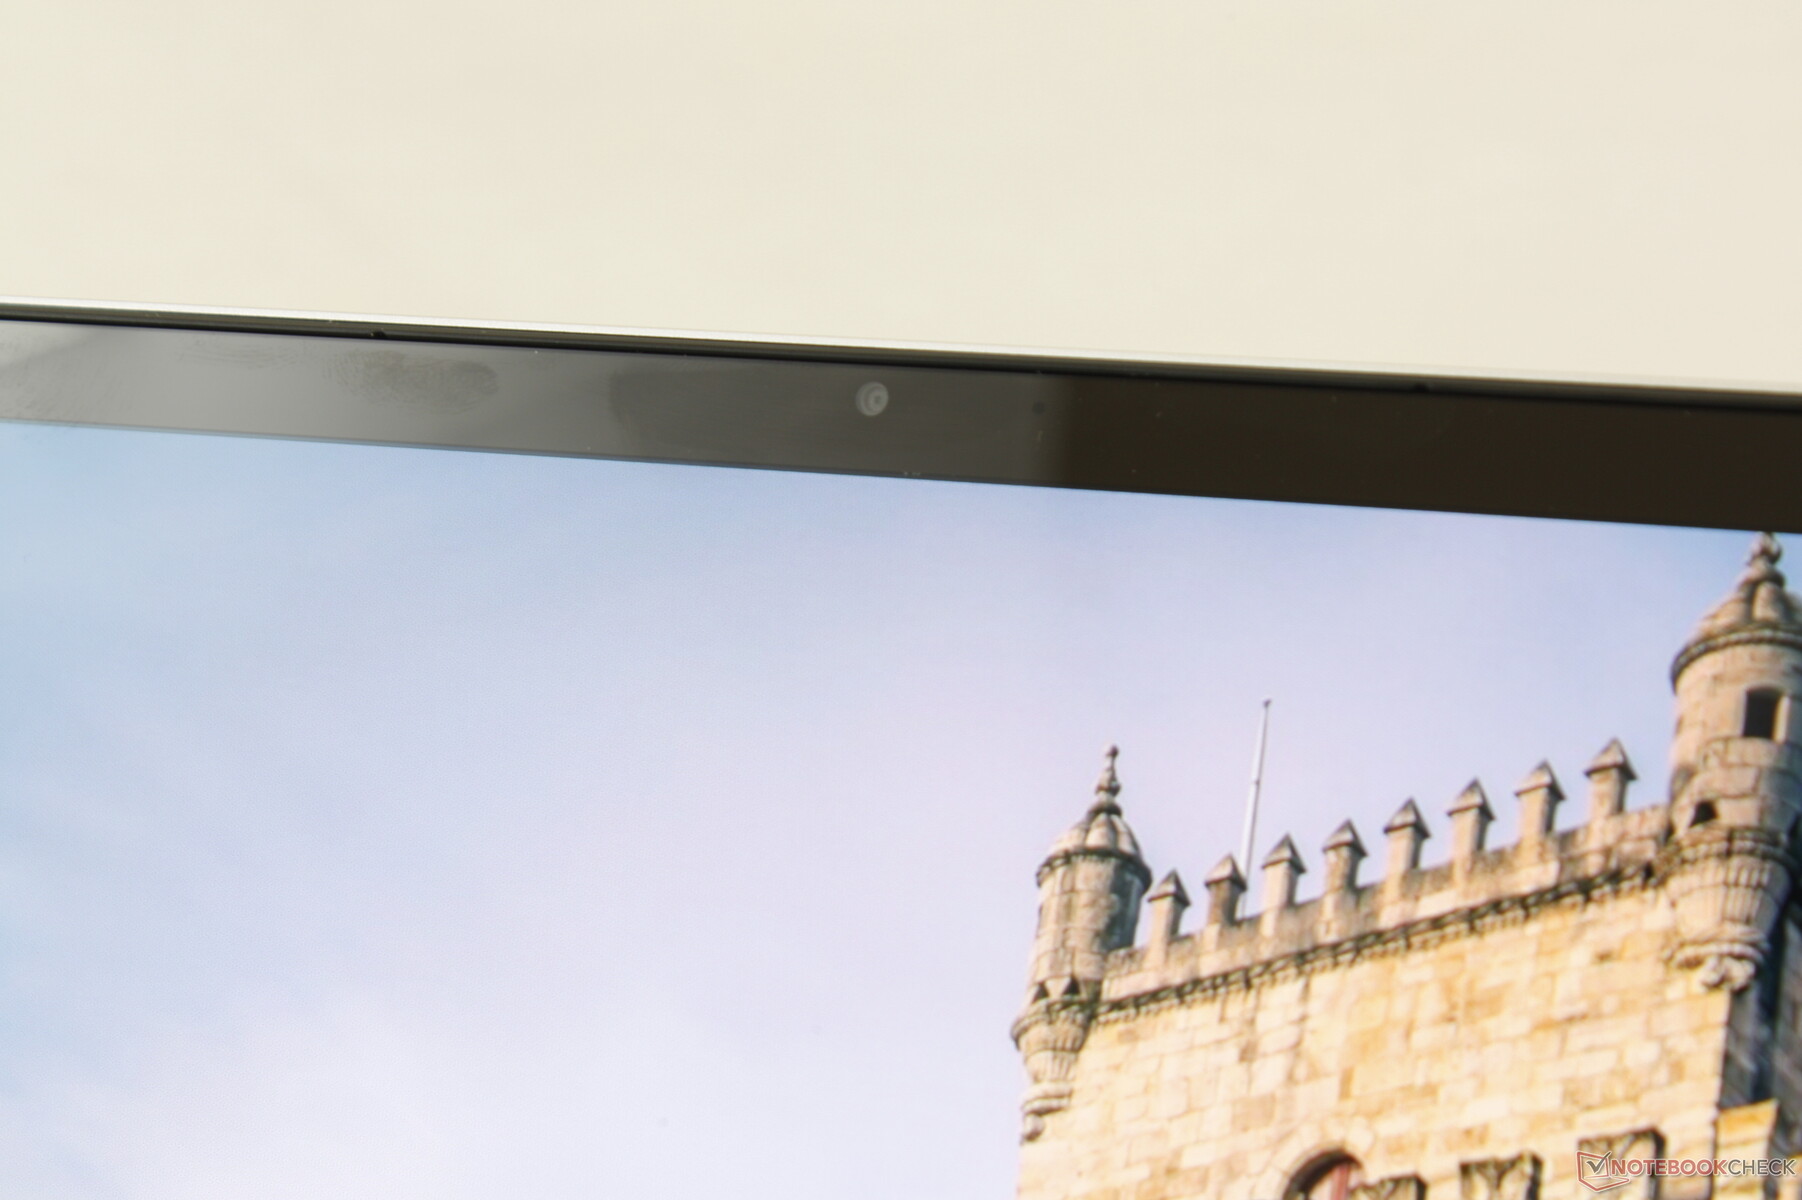
Webcam


")
")
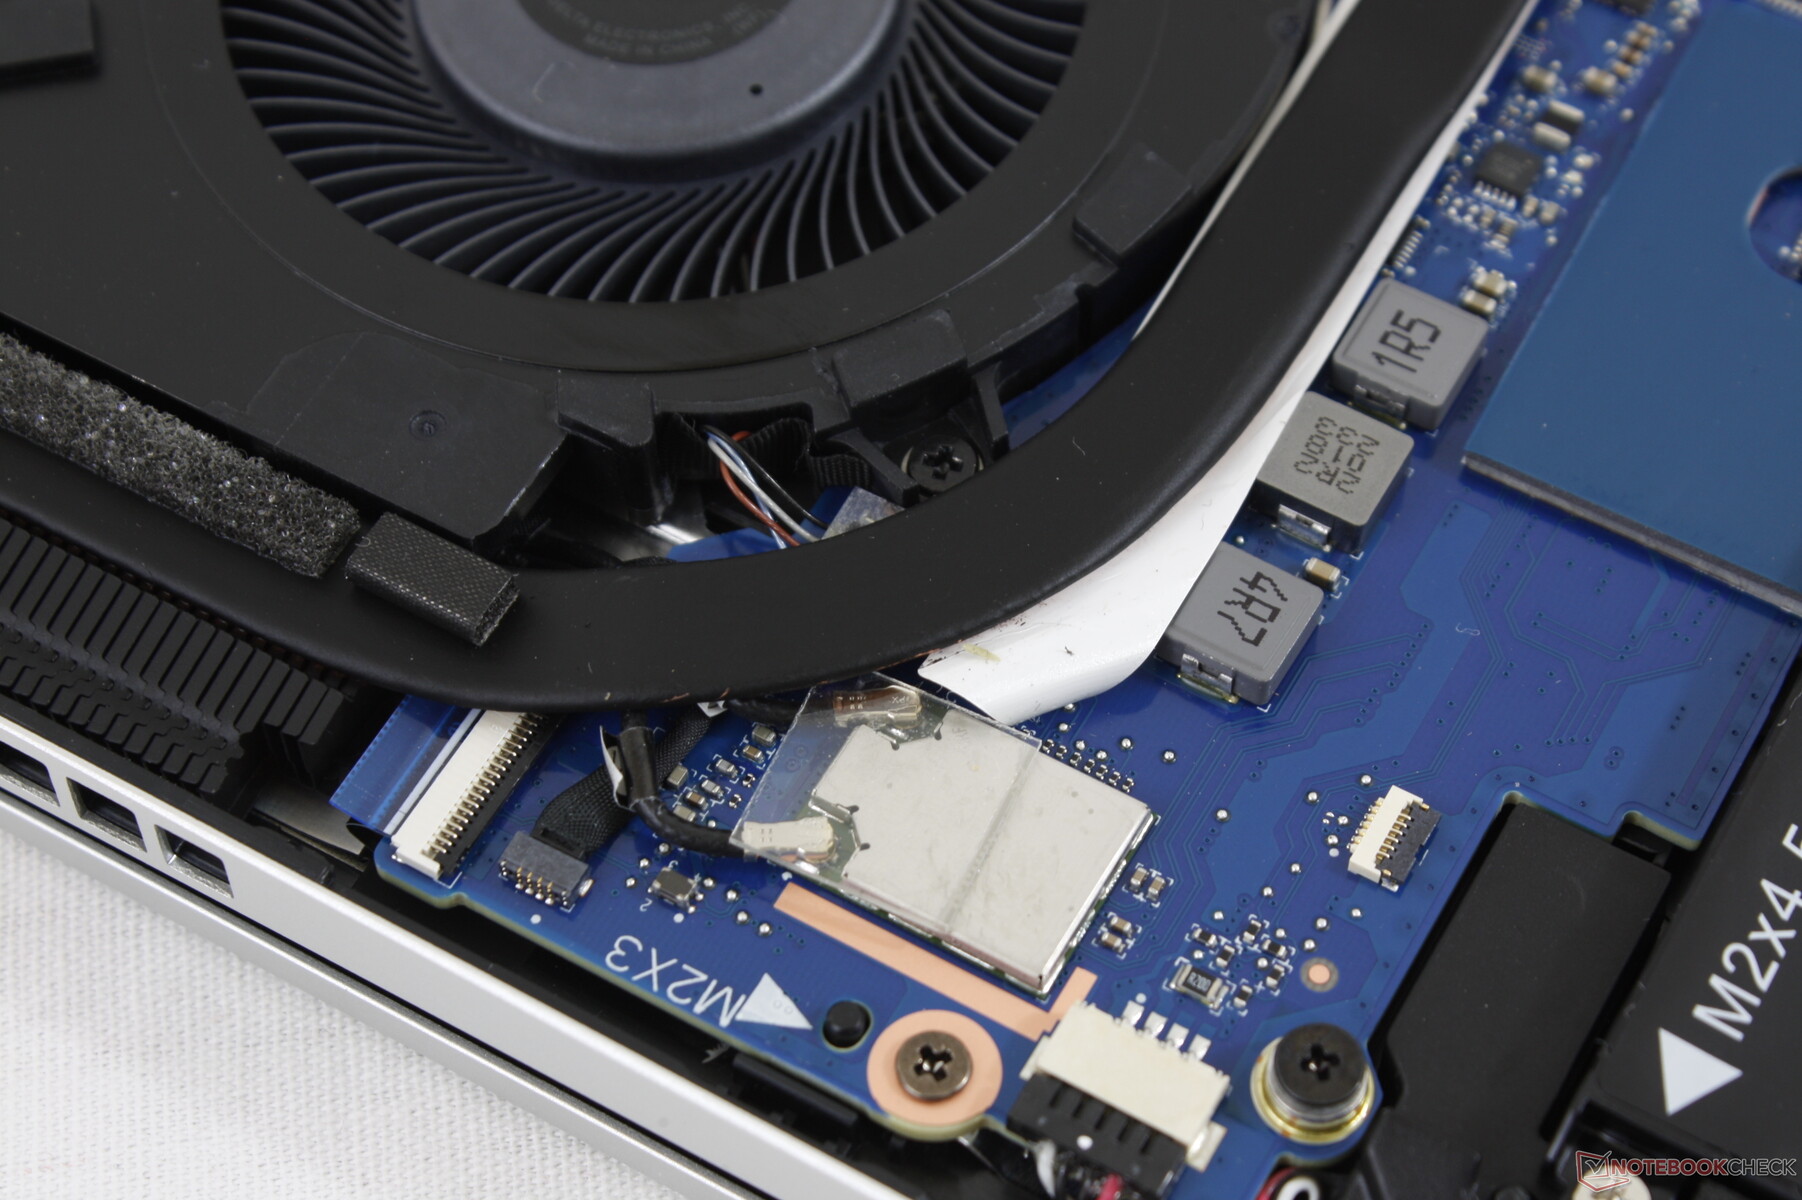
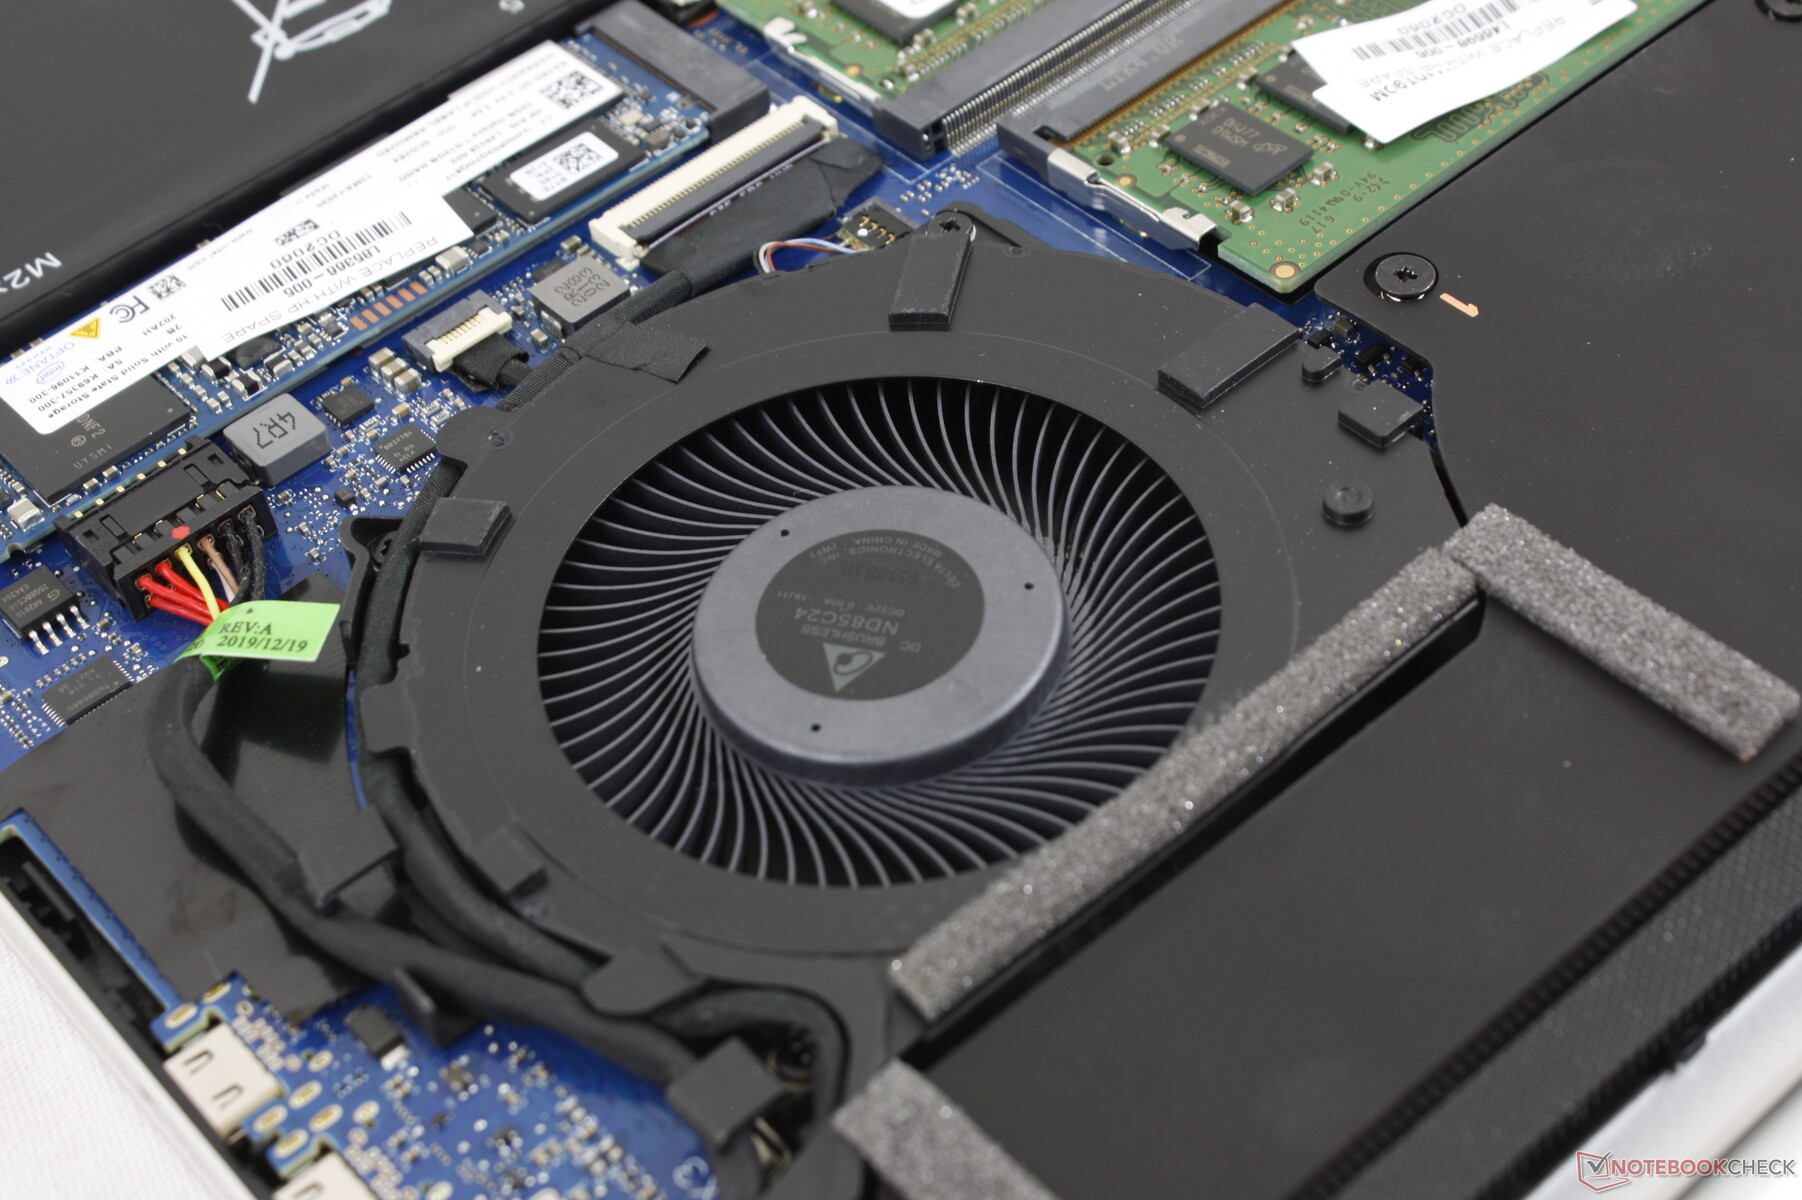
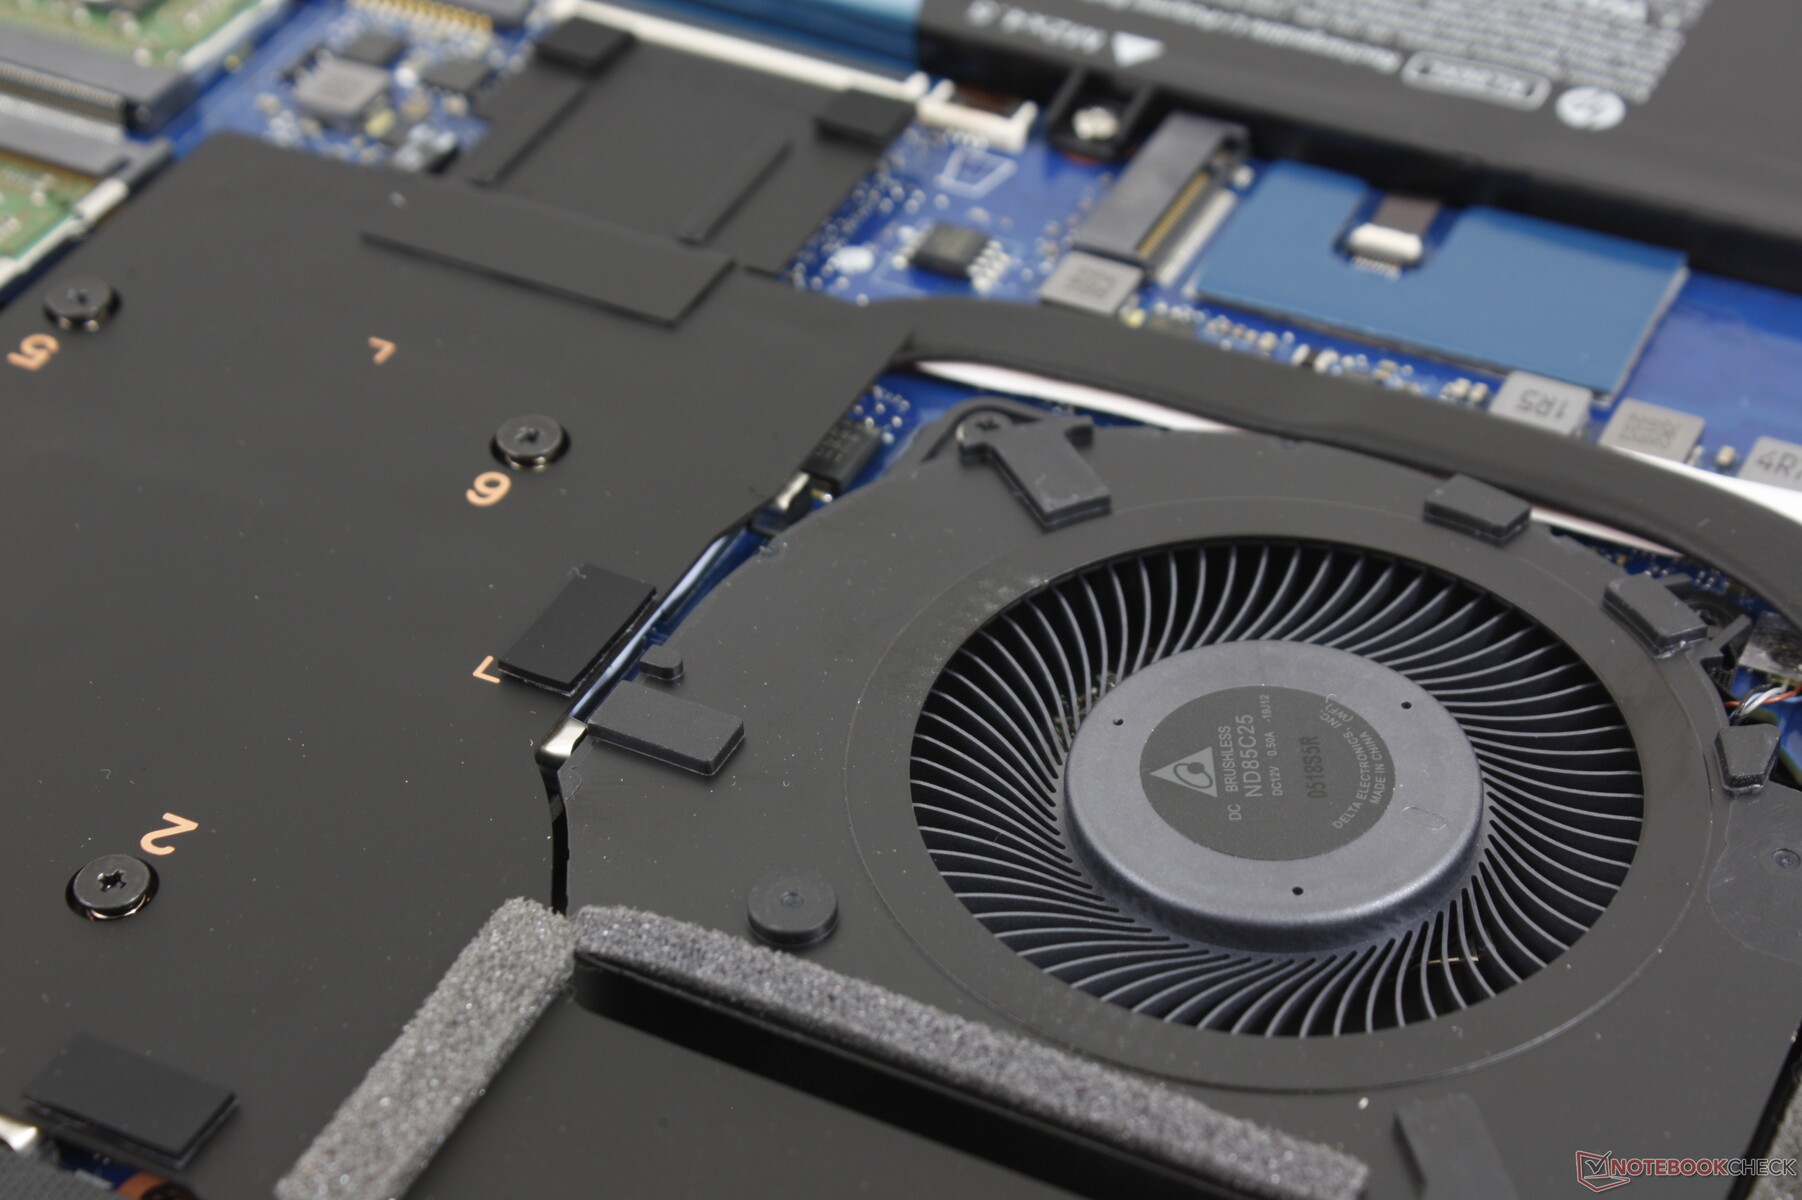
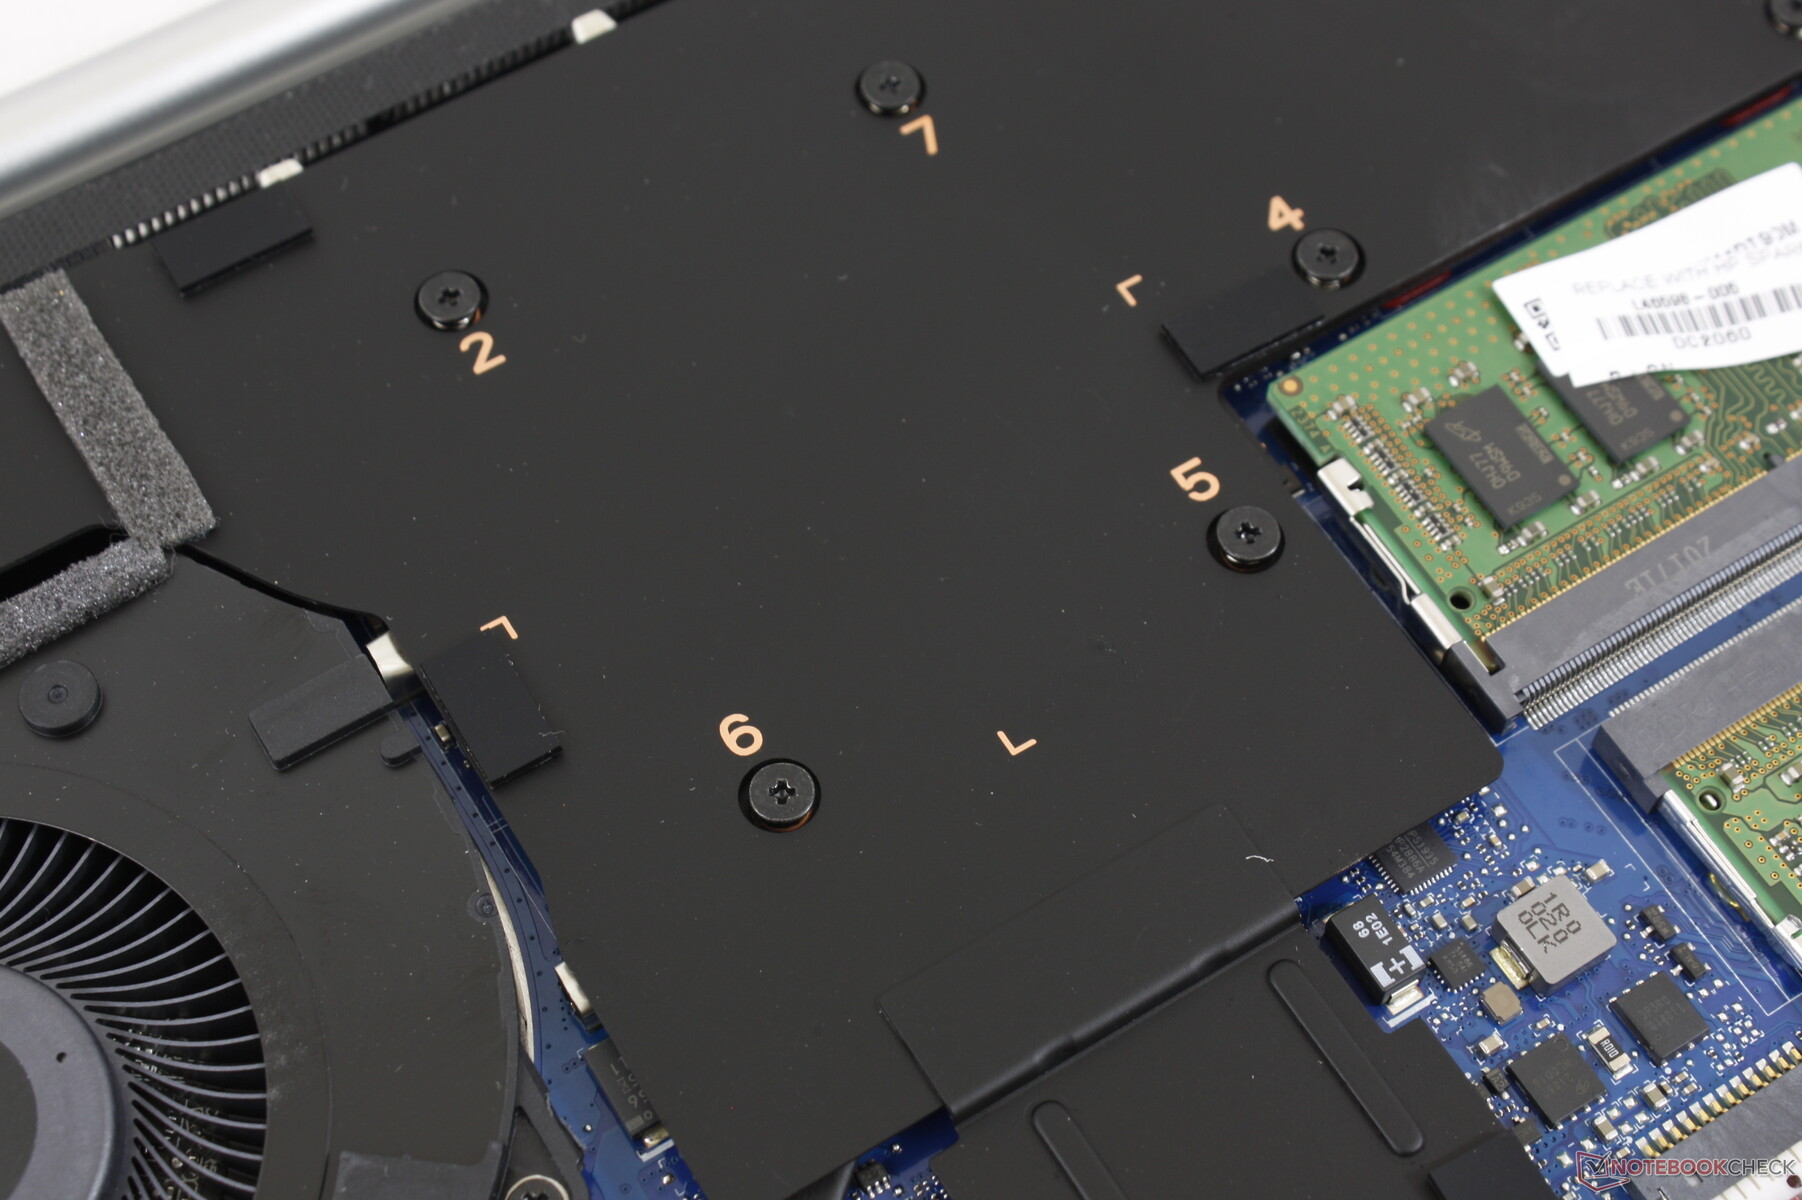
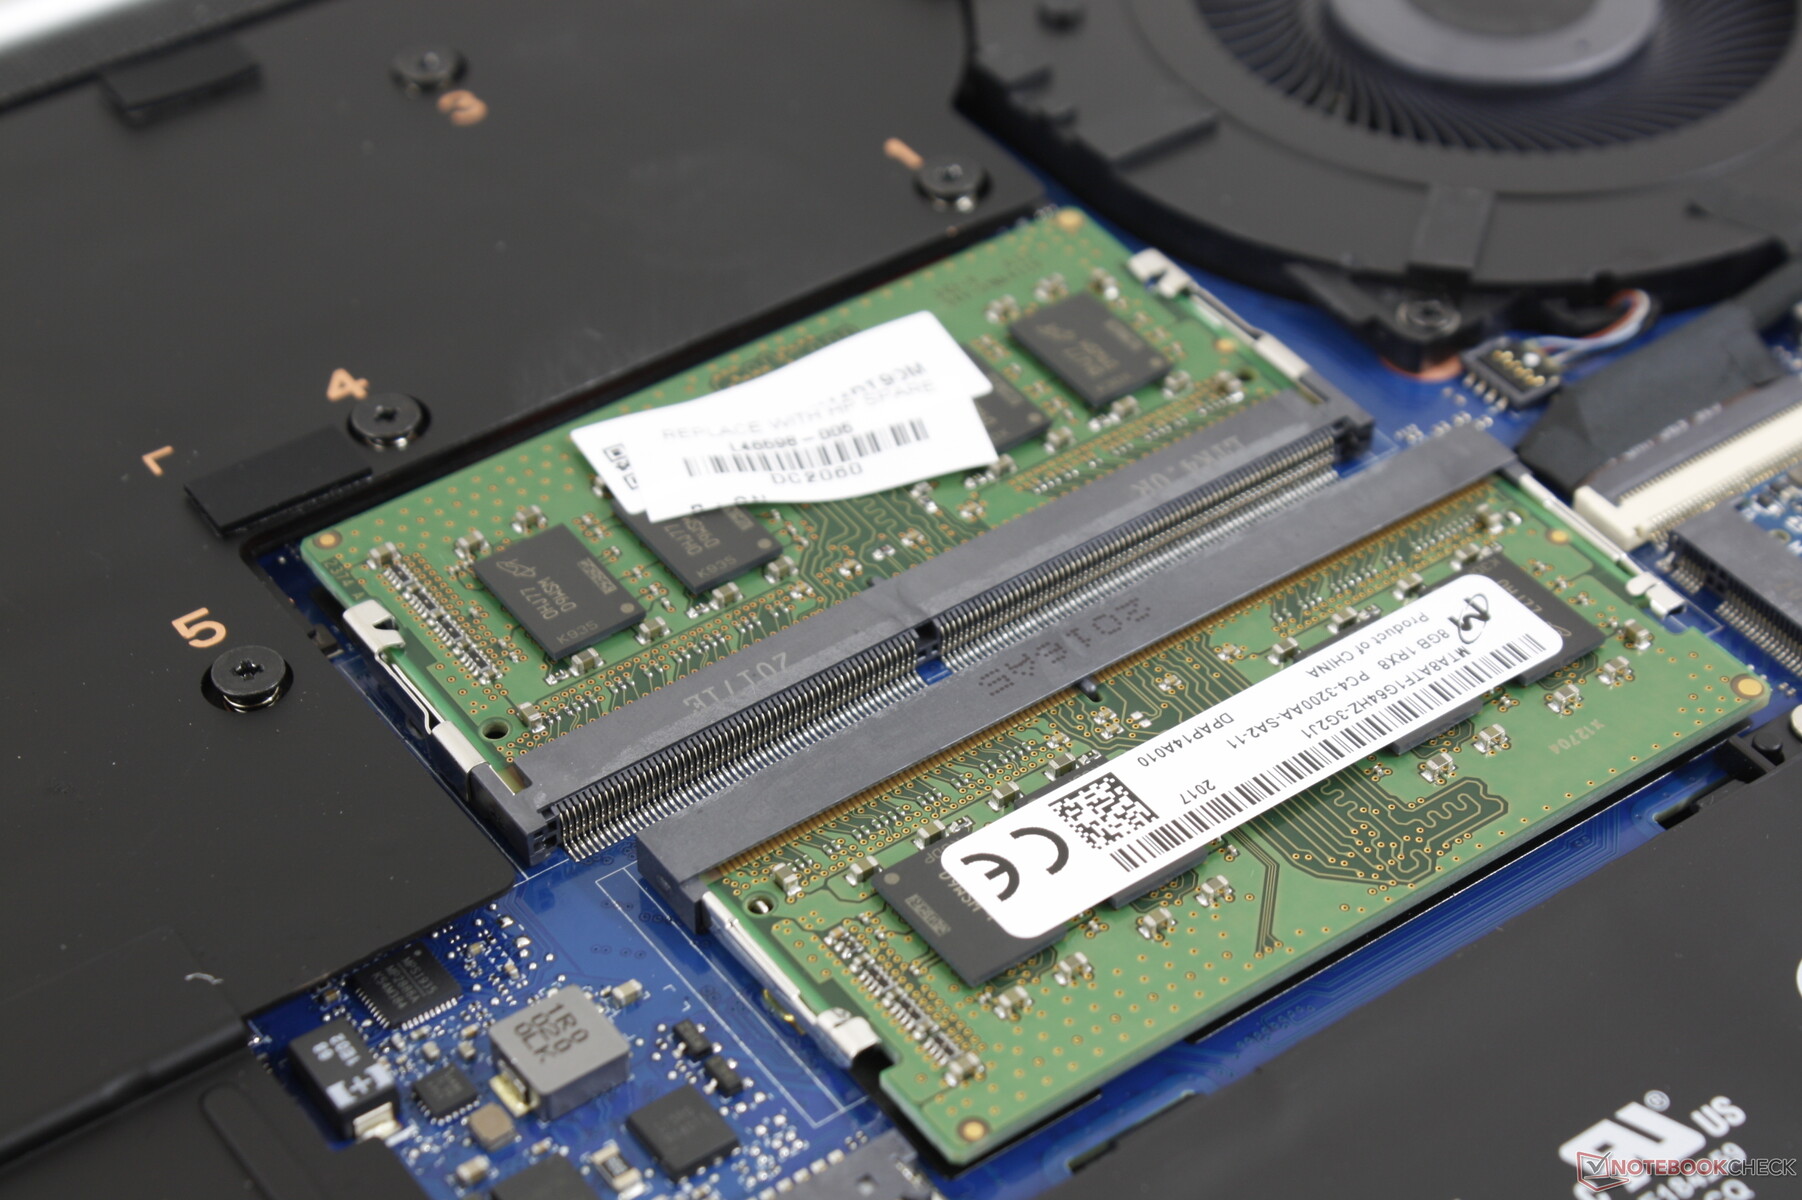
Maintenance
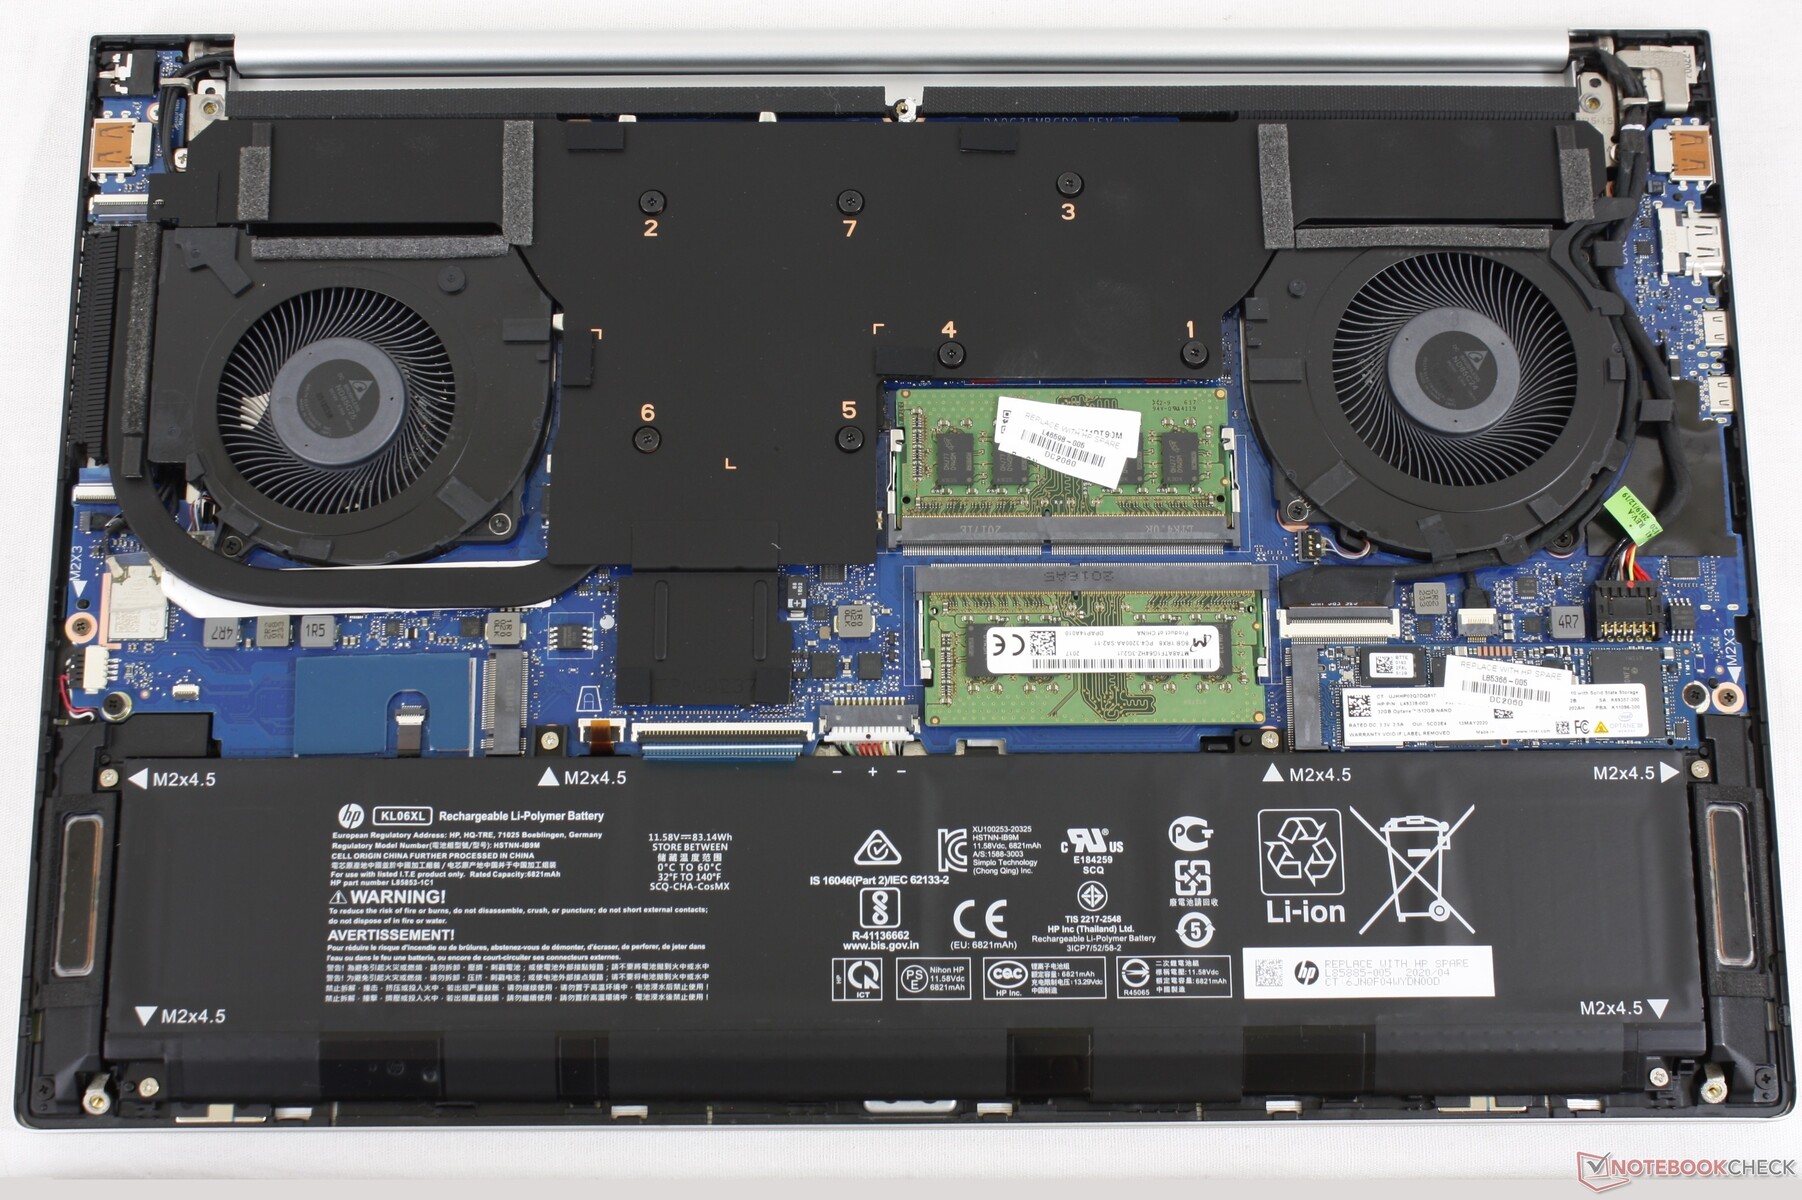
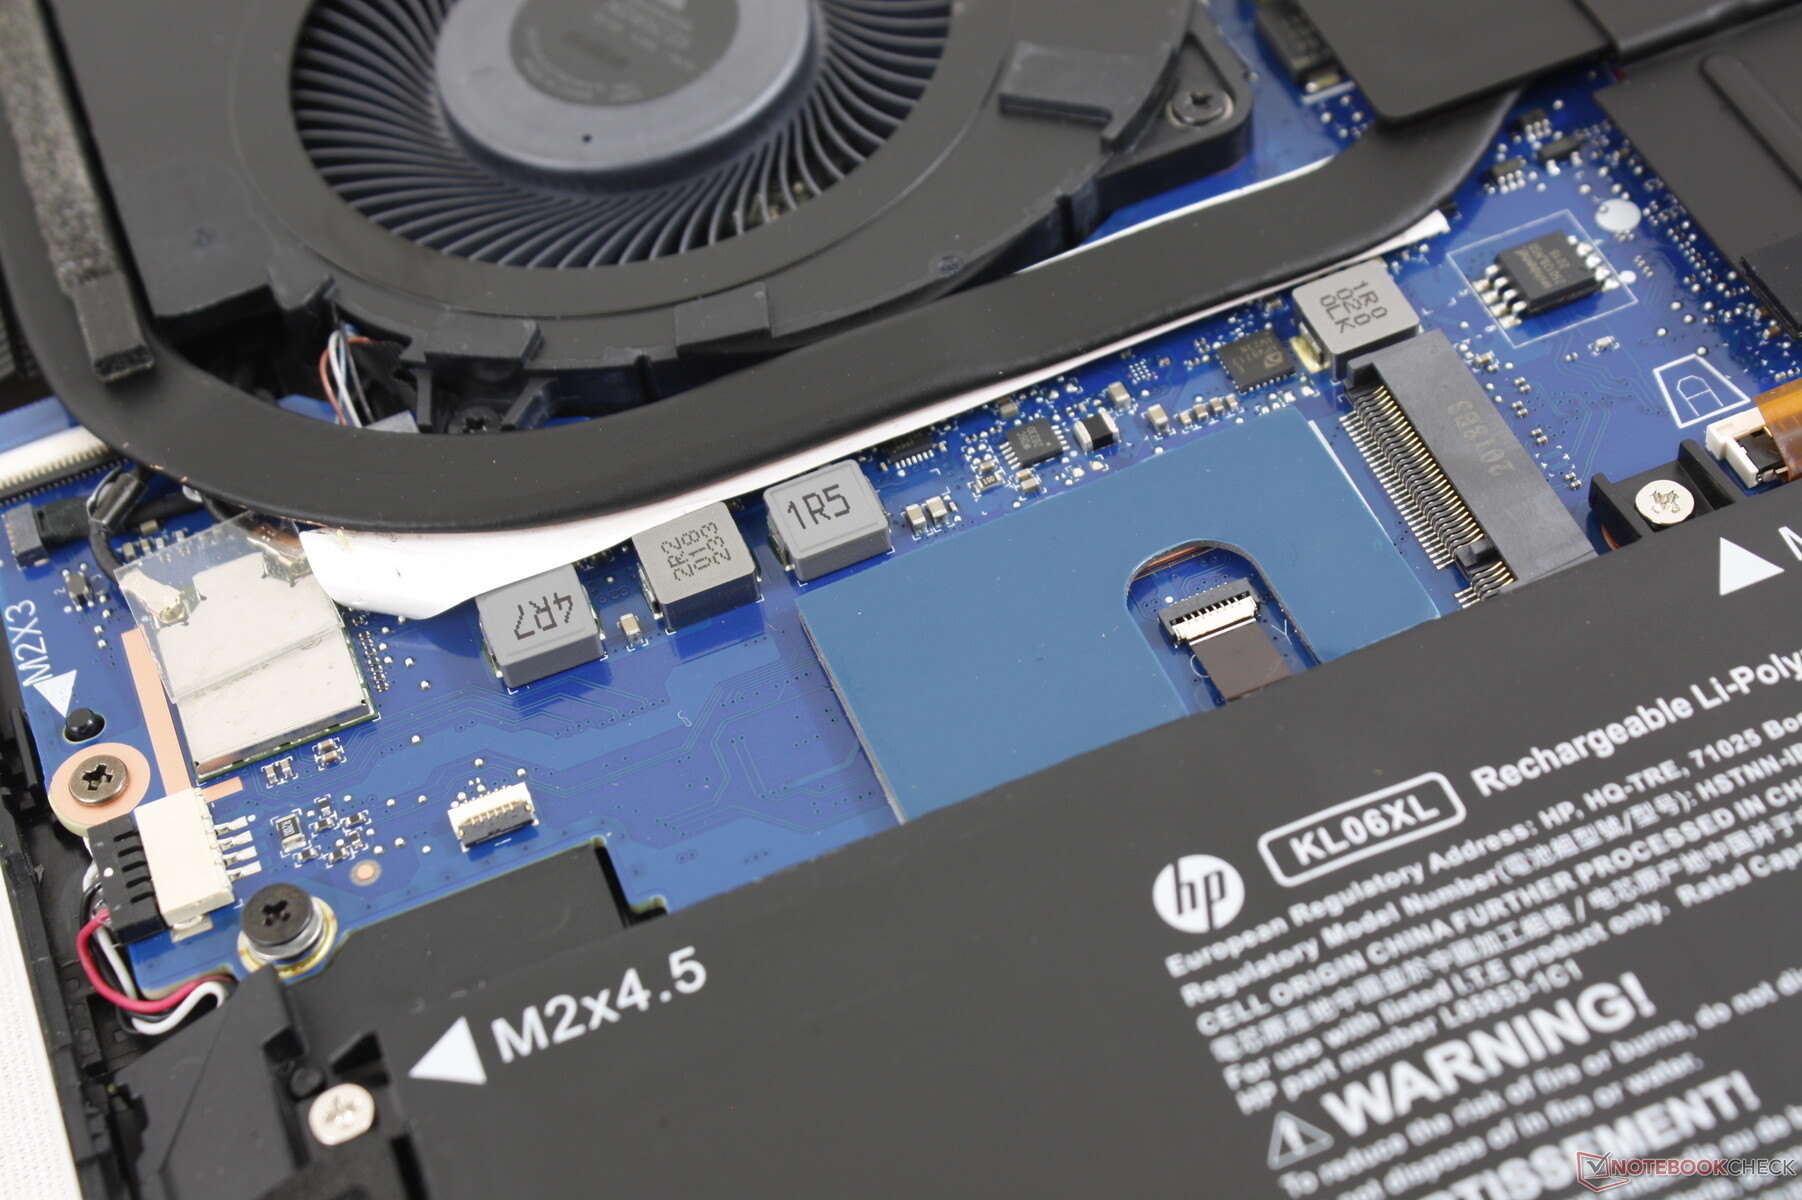
The bottom panel is secured by just five T5 Torx screws and none are hidden underneath the rubber footing for easier serviceability.
Accessories and Warranty
There are no extras in the box other than the AC adapter and paperwork. Nonetheless, a wide range of optional accessories and docking stations are available from HP.
The standard one-year limited warranty applies with free 90-day phone support.
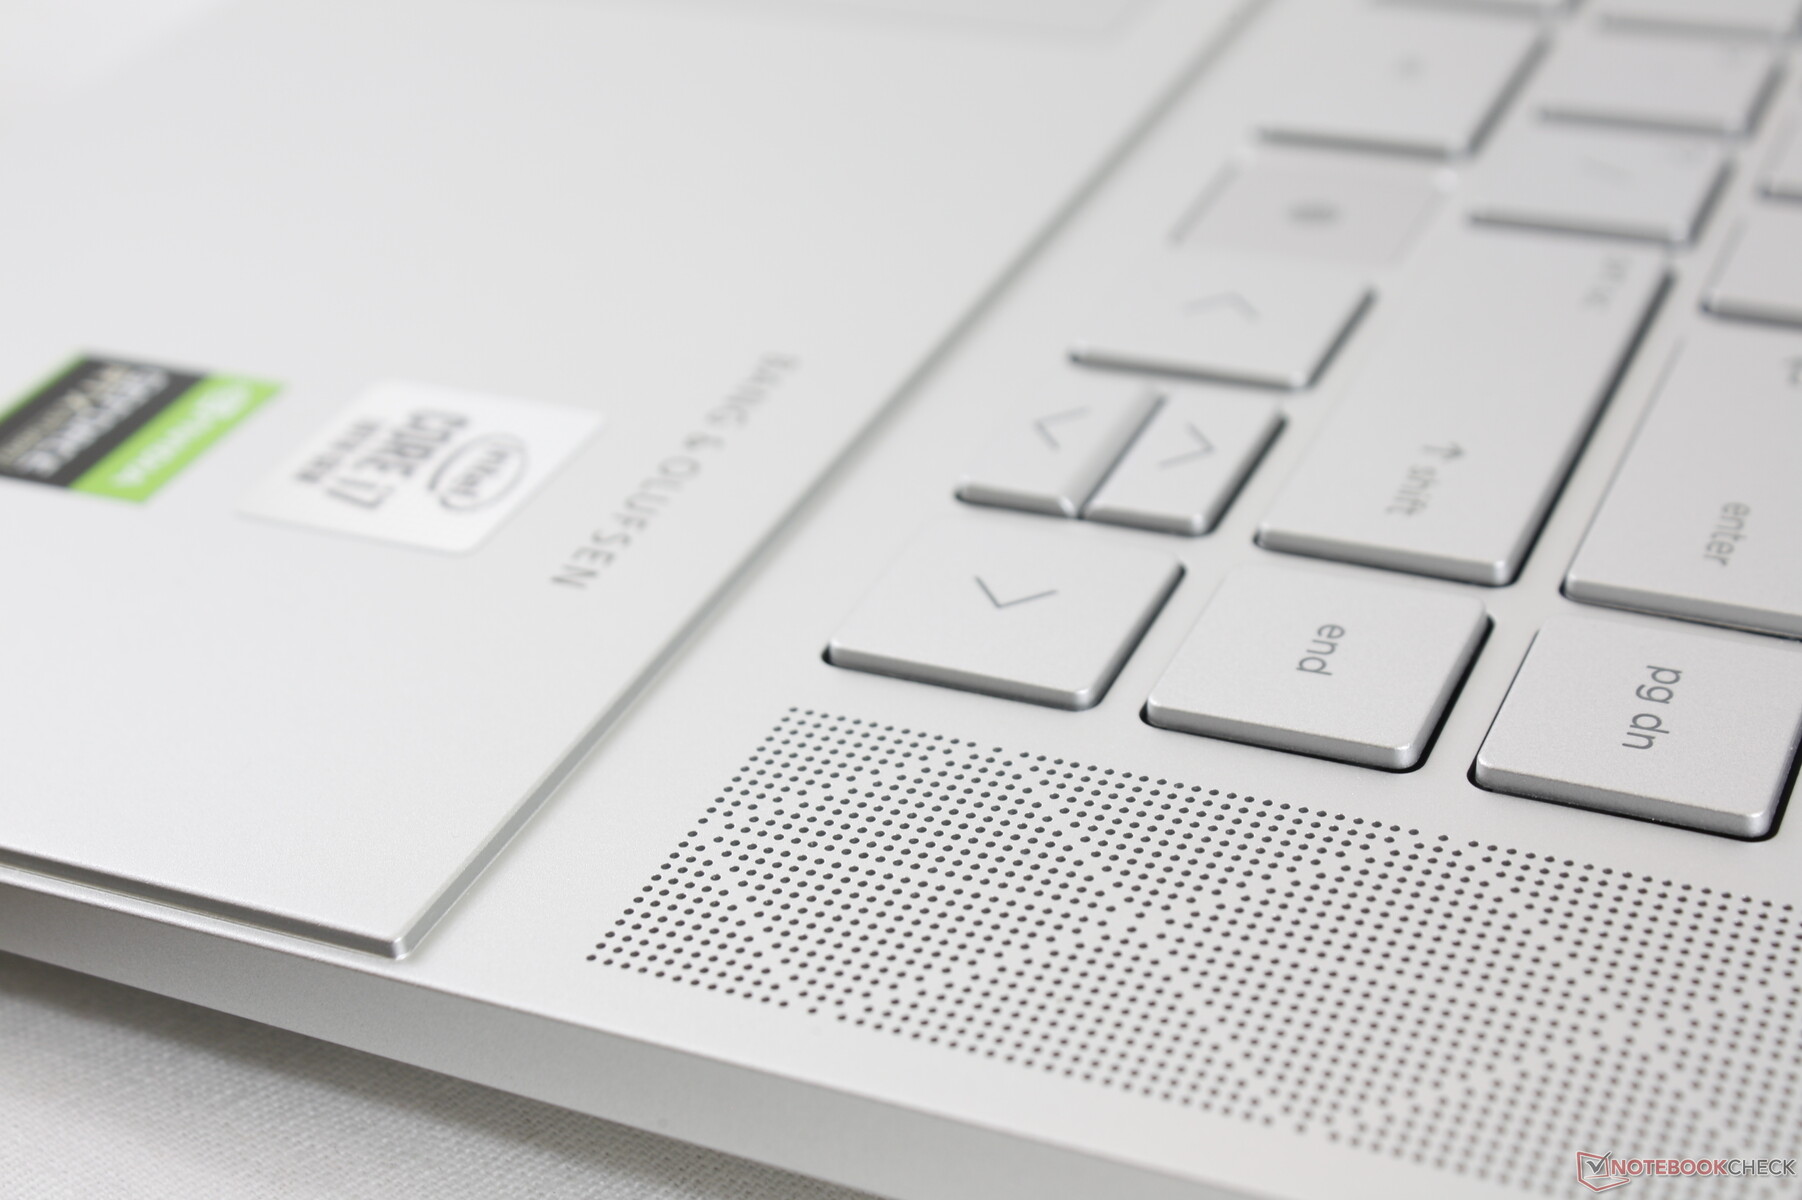
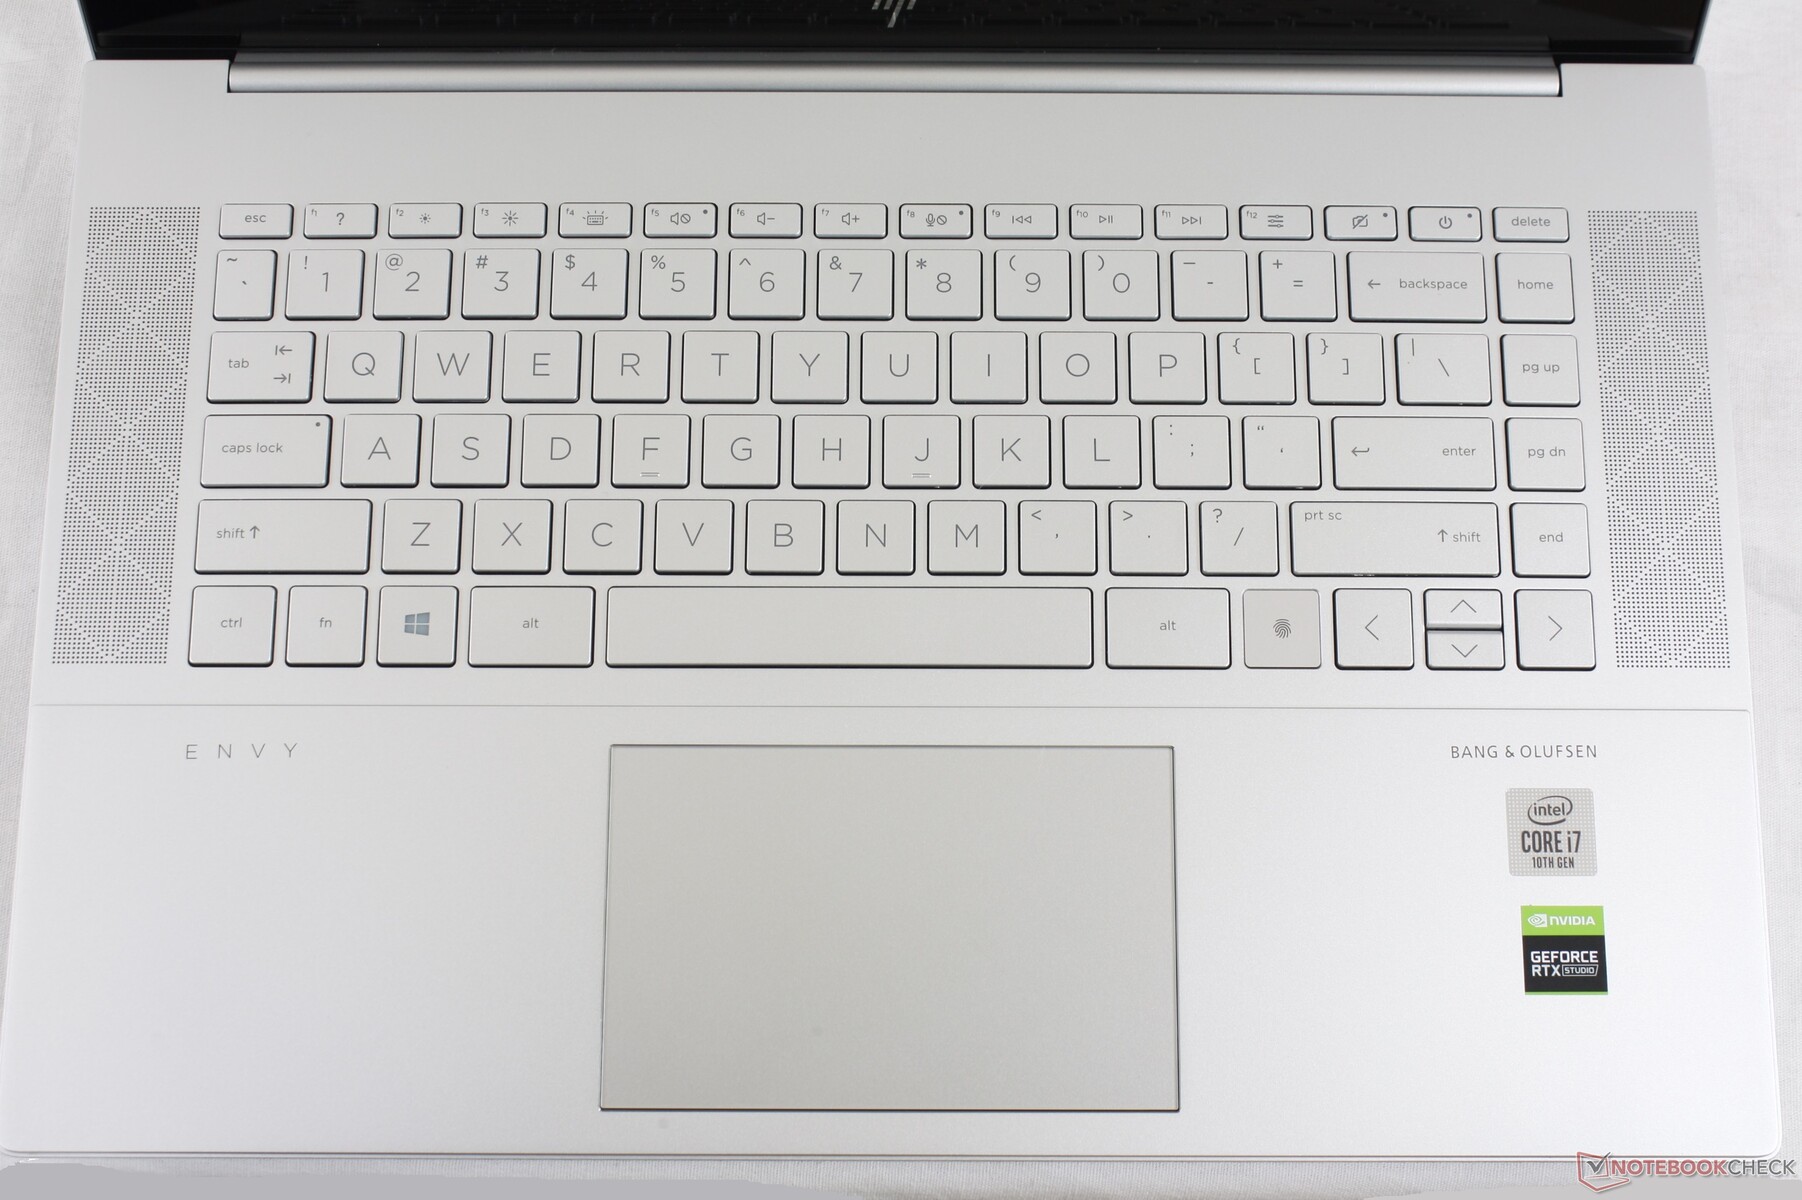
Input Devices
Keyboard
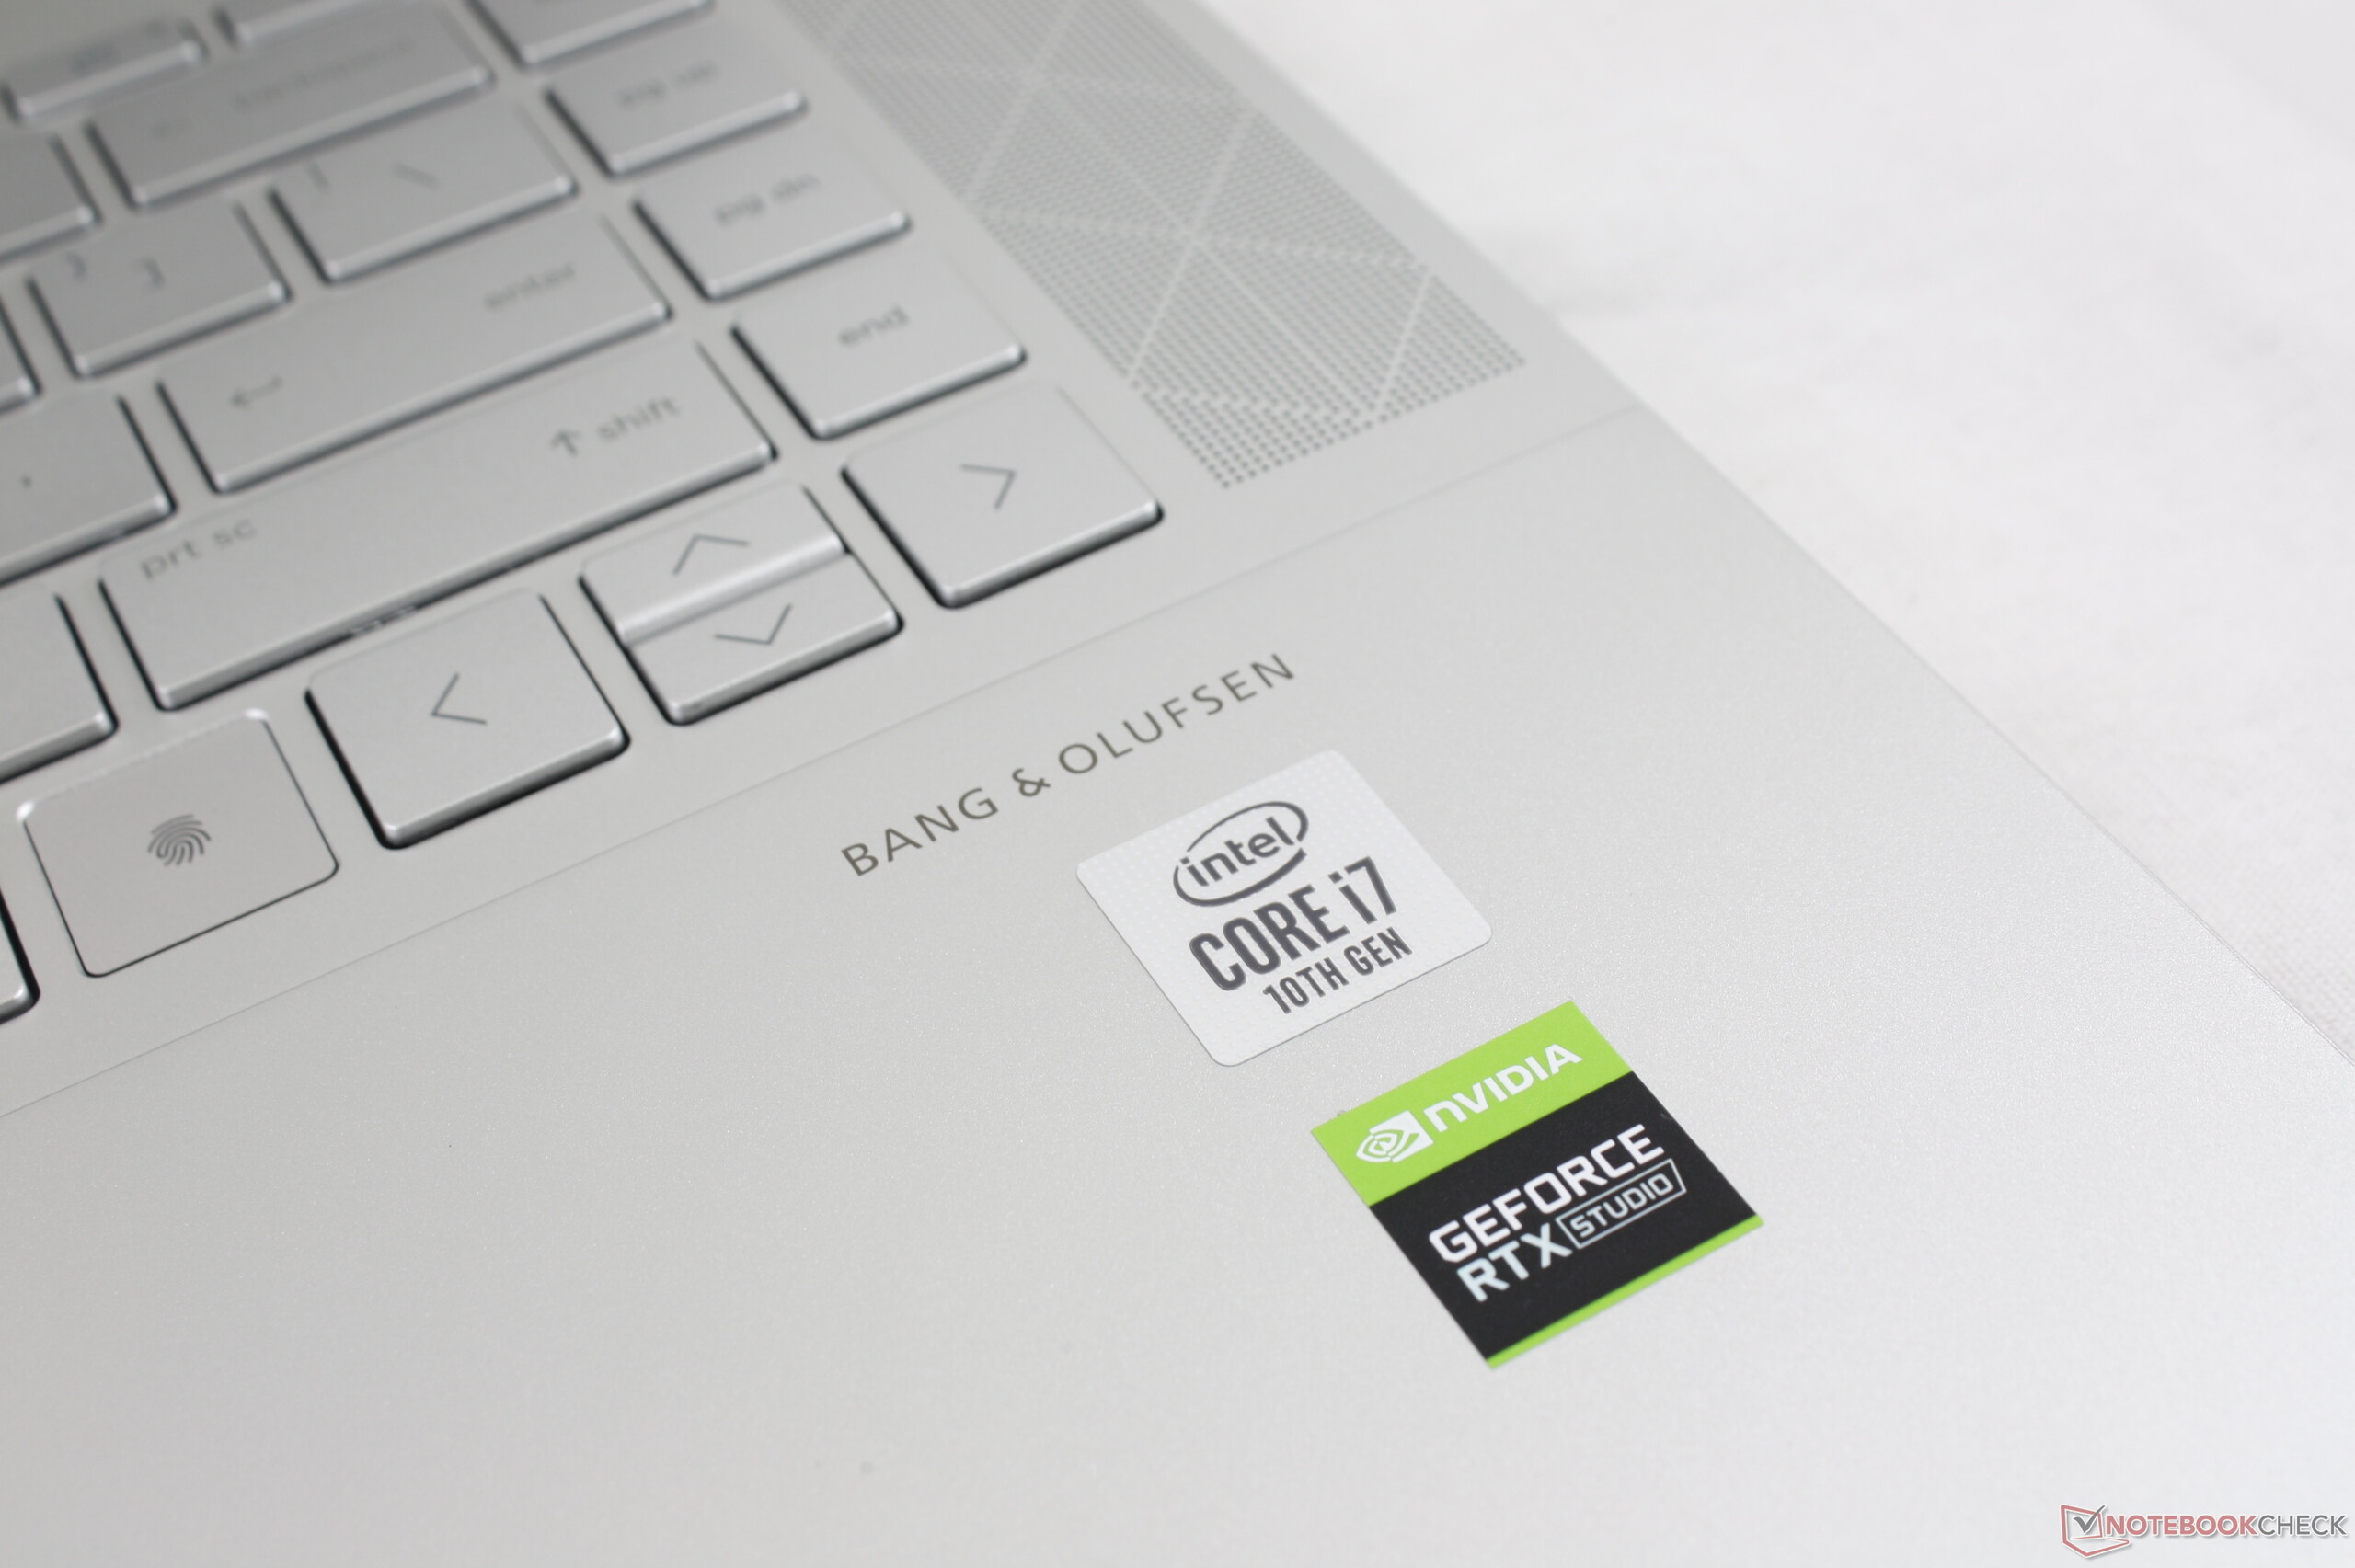
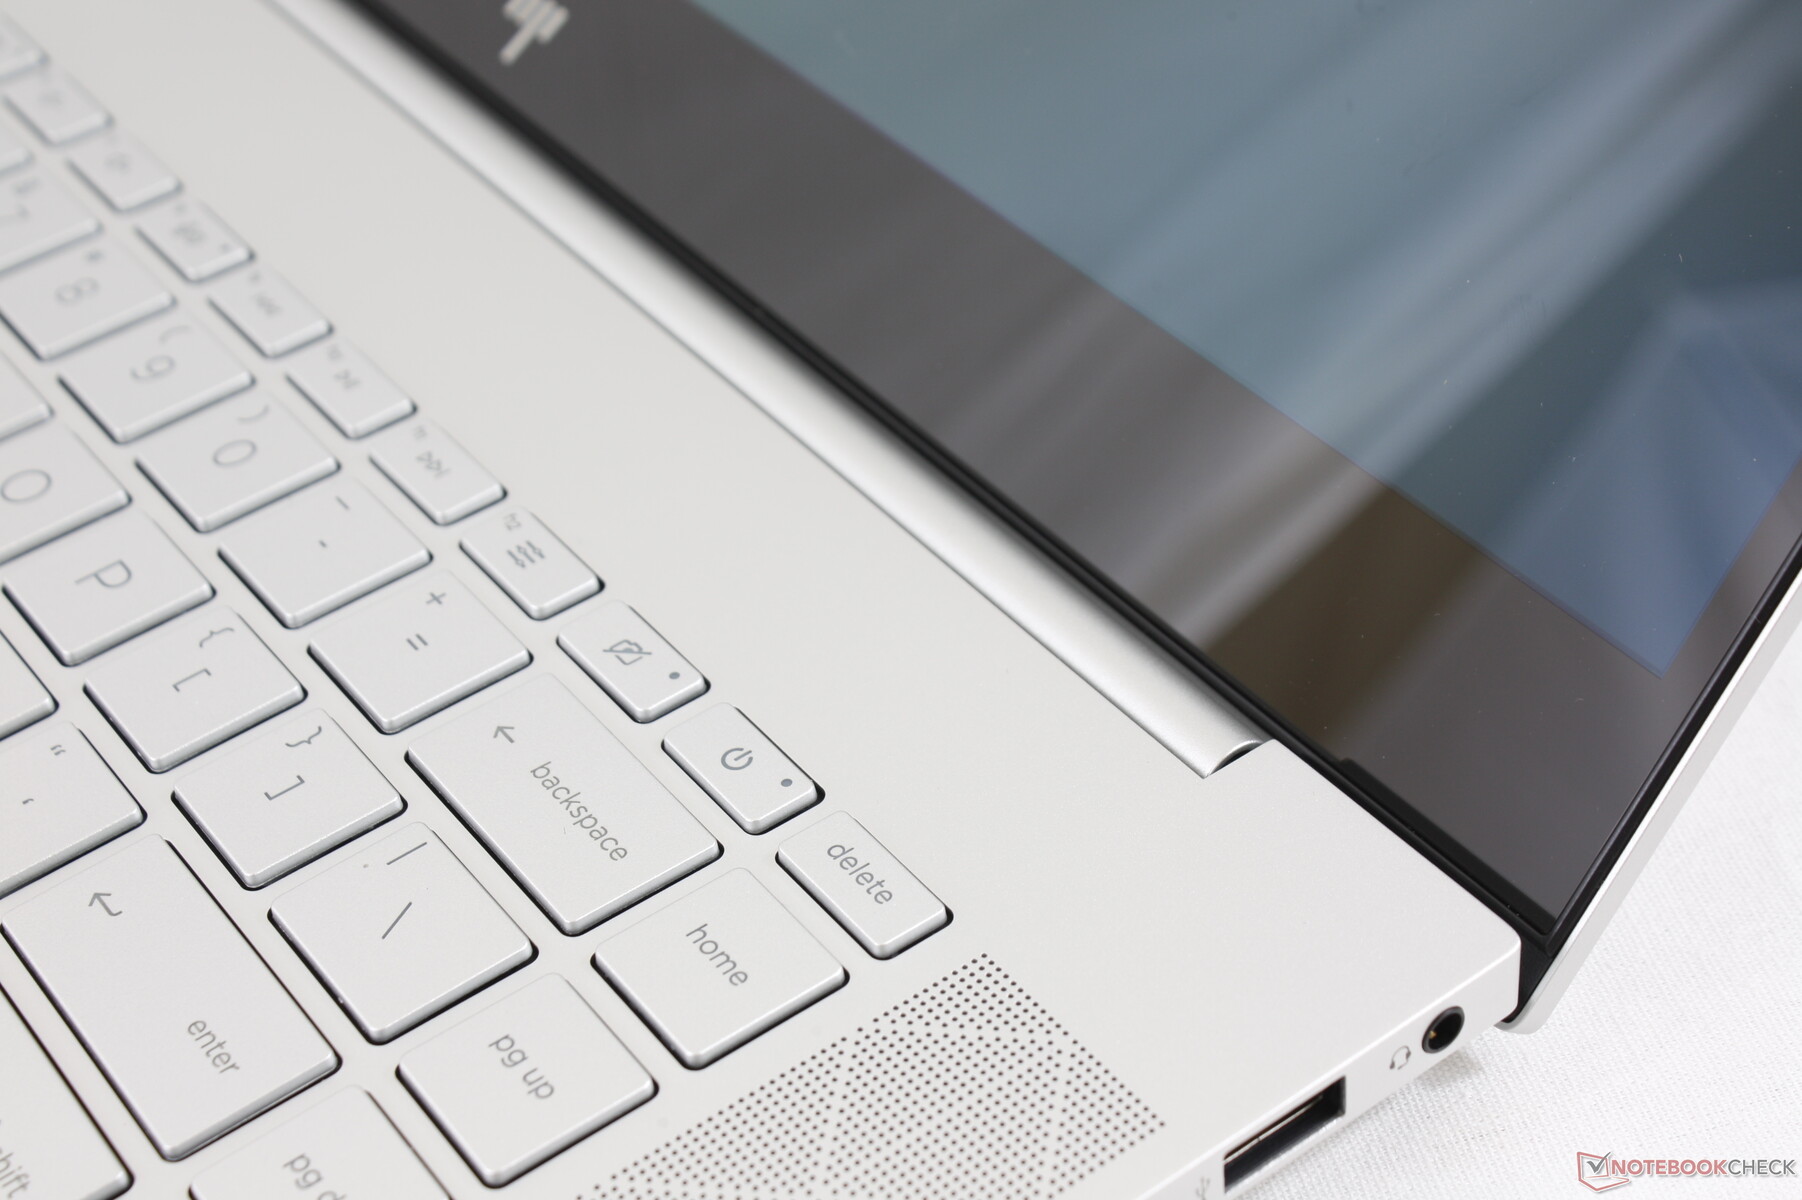
Unlike most other keyboards, the large fingerprint reader on the Envy 15 replaces the Fn key for better or worse. This "feature" is shared between the latest Envy x360 13 and Envy 17t as well. It's a comfortable typing experience so long as you can get used to this change.
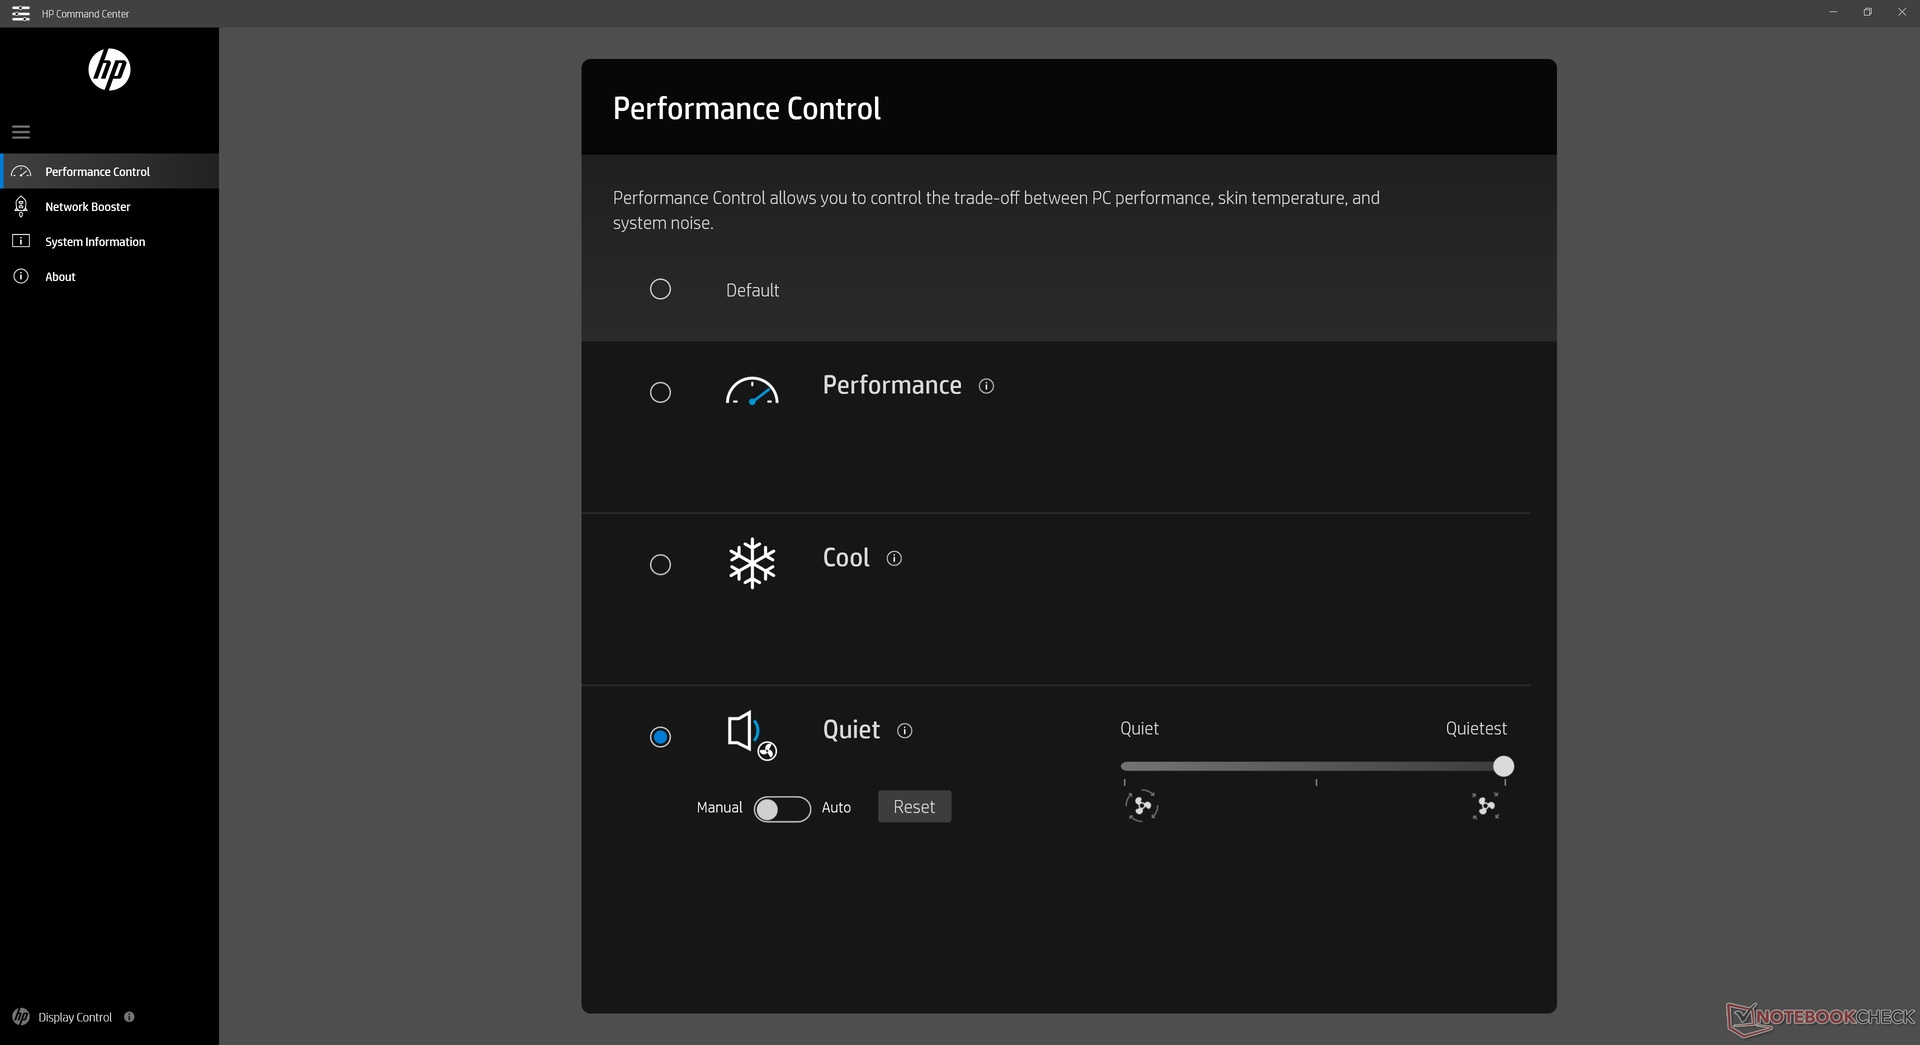
The F12 key doubles as a hotkey for HP Command Center which you will want to access frequently for fan control and performance control.
Touchpad
(February 1, 2020 update: Corrected the size of the clickpad dimensions.)
The Precision glass clickpad is similar in size to the on the Microsoft Surface Laptop 3 15 (11.5 x 7.5 cm vs. 11.5 x 7.6 cm). Glide is smooth with almost no sticking even when moving at slow speeds. The main issue is that its integrated mouse keys are spongy with shallow travel and weak feedback when pressed. A firmer click would have made the clickpad easier and more reliable to use.


Display
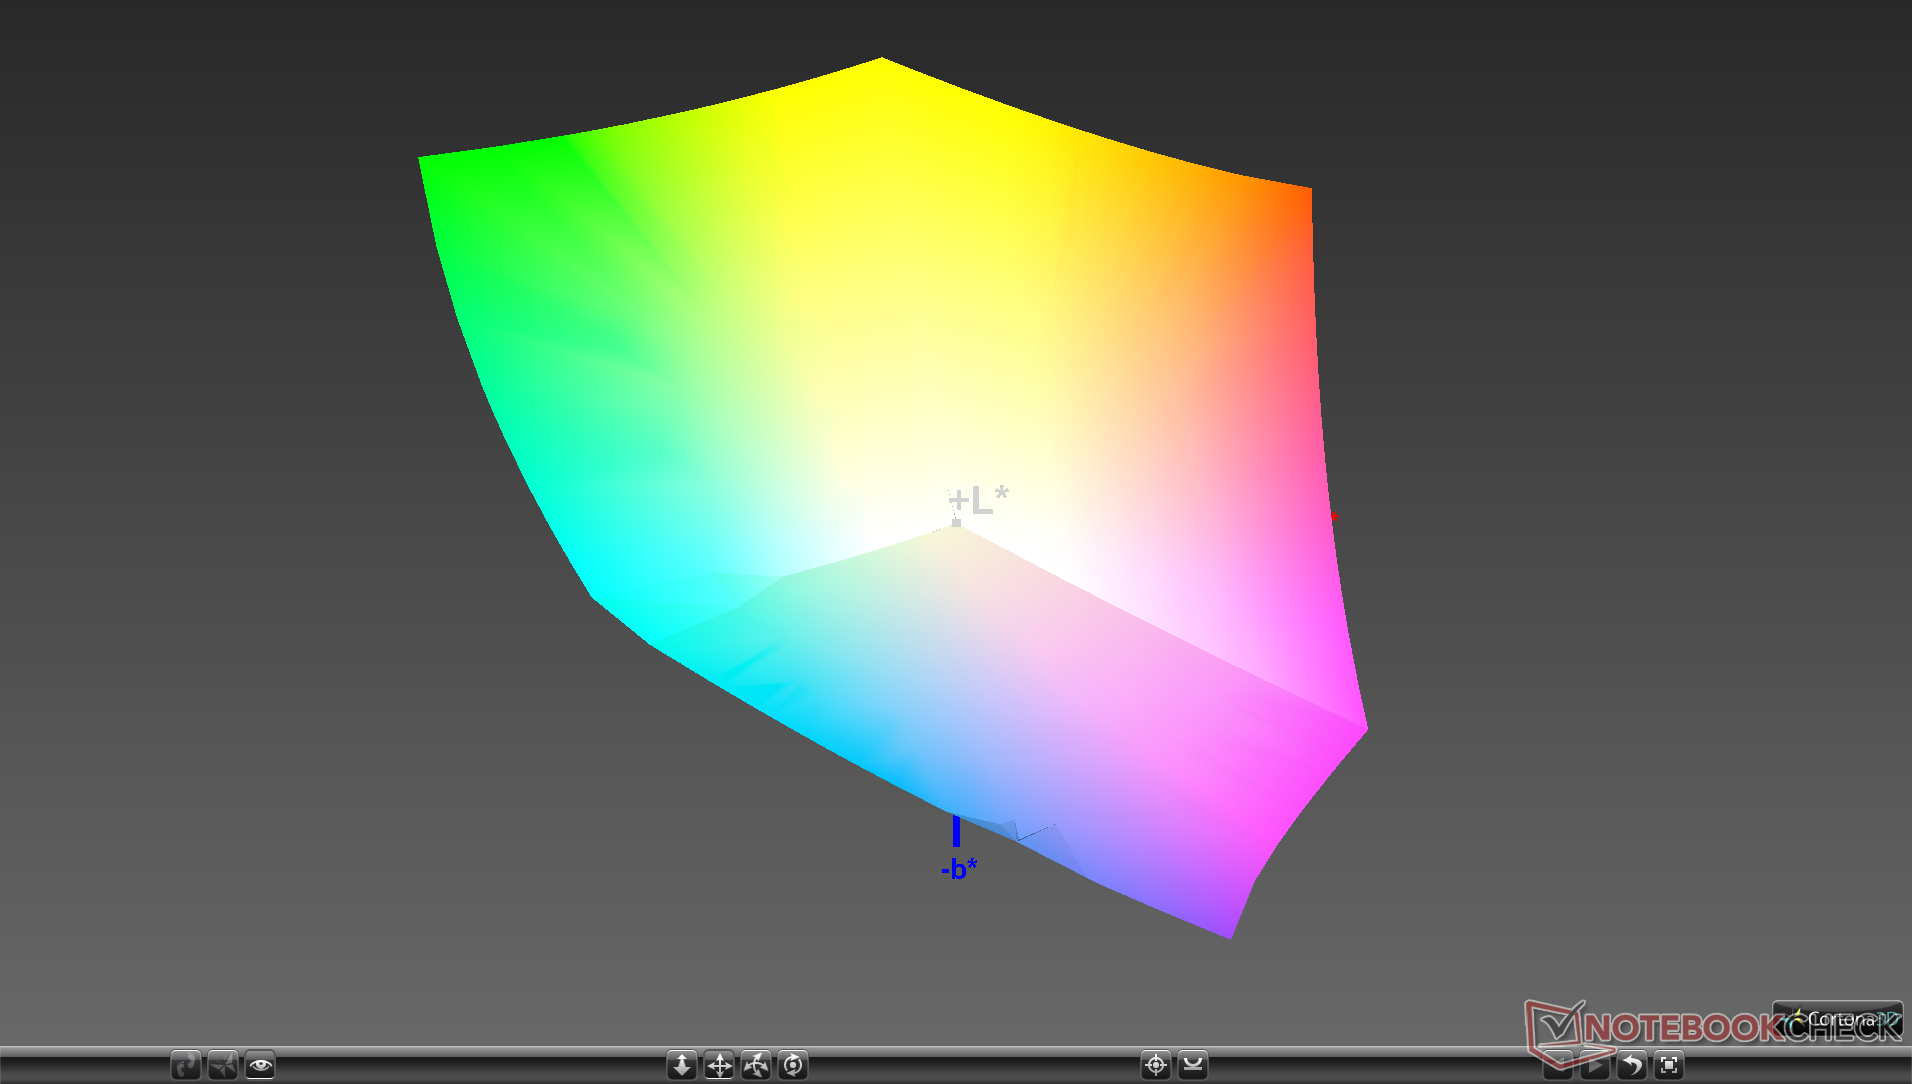
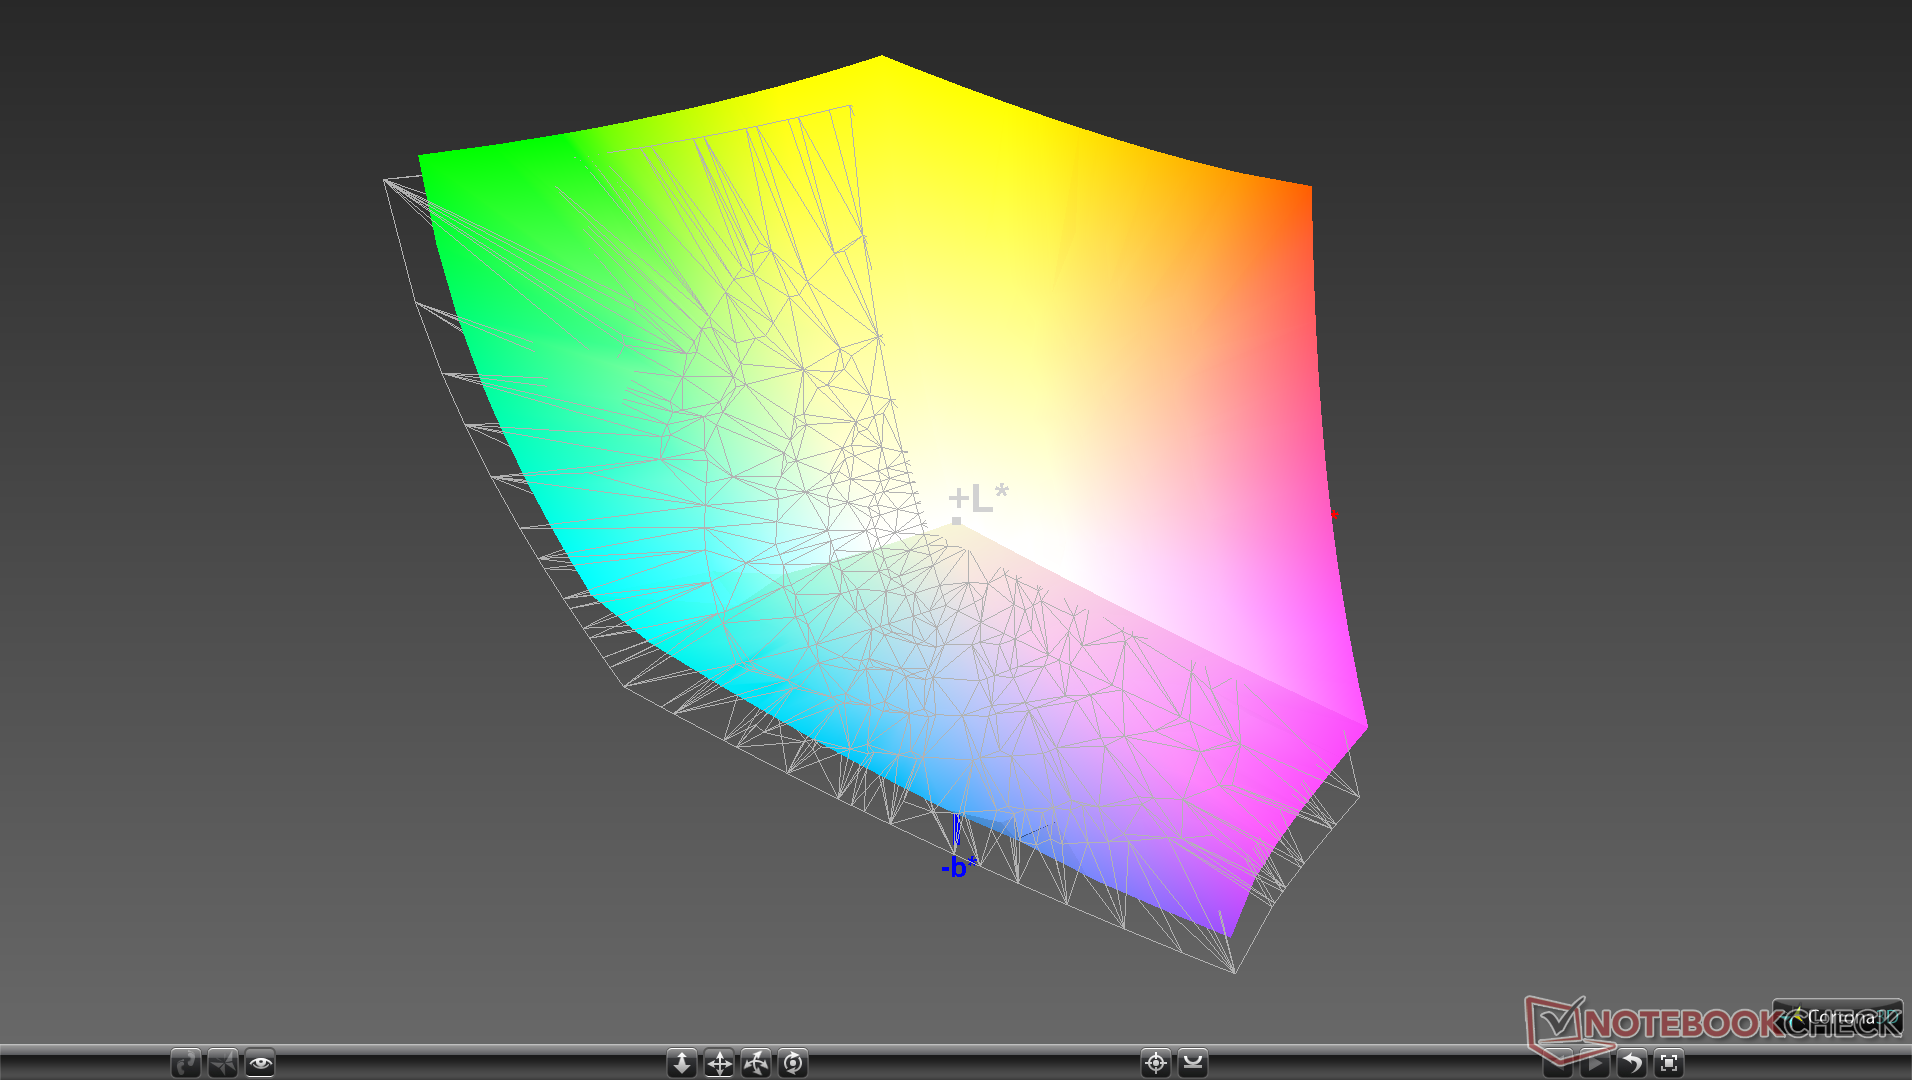
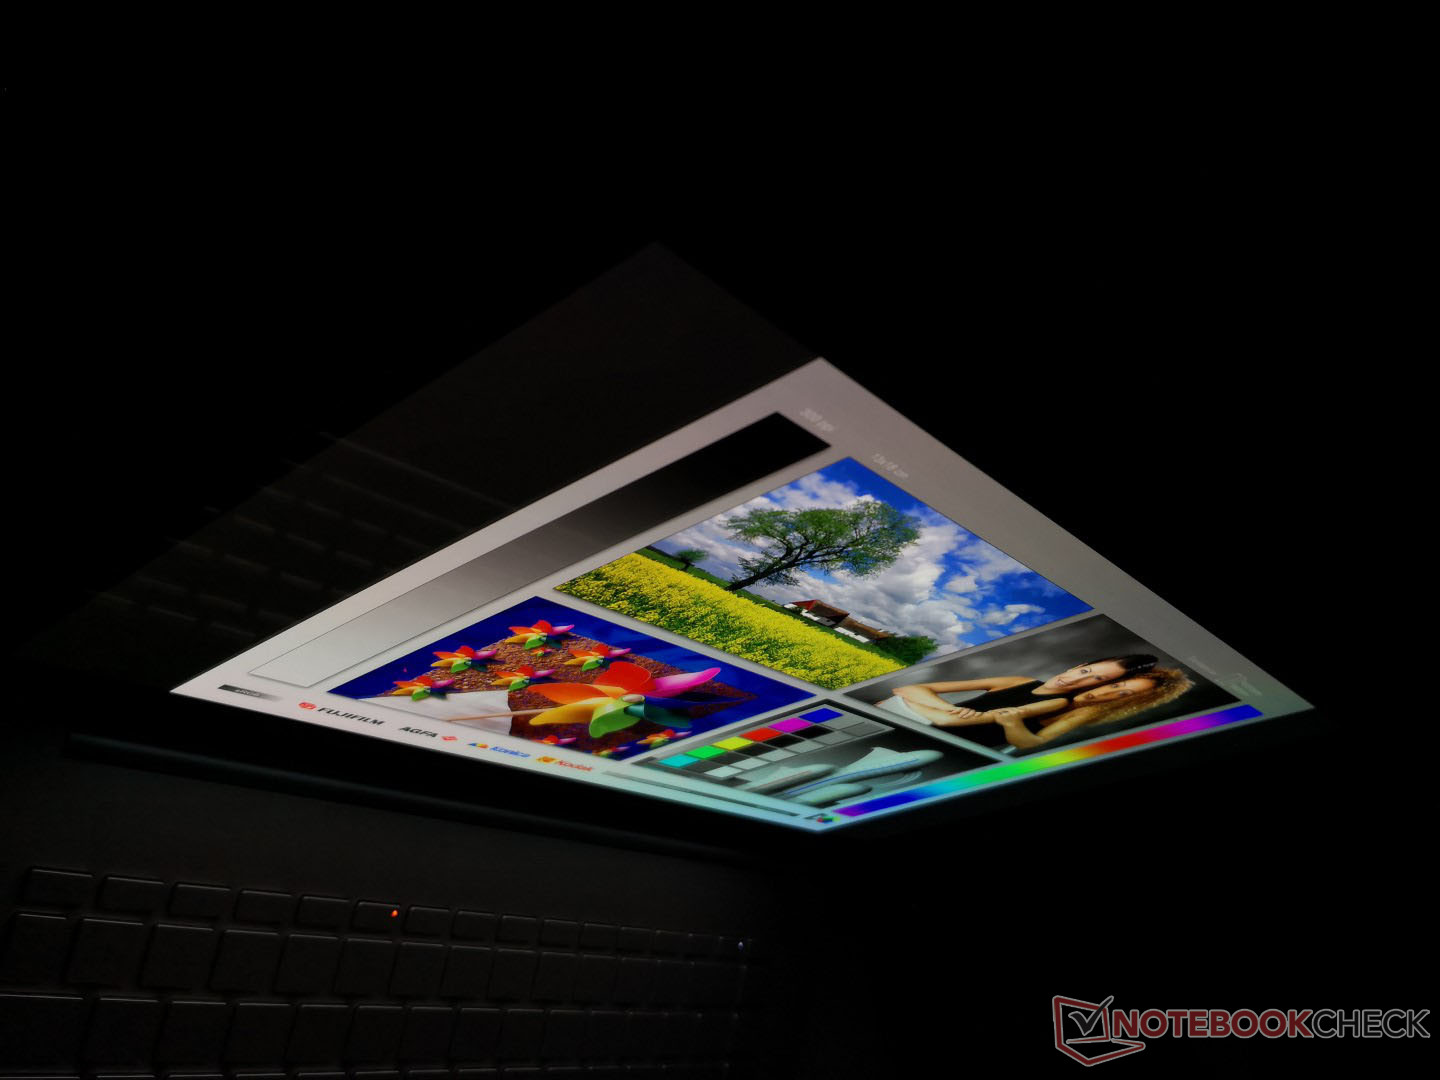
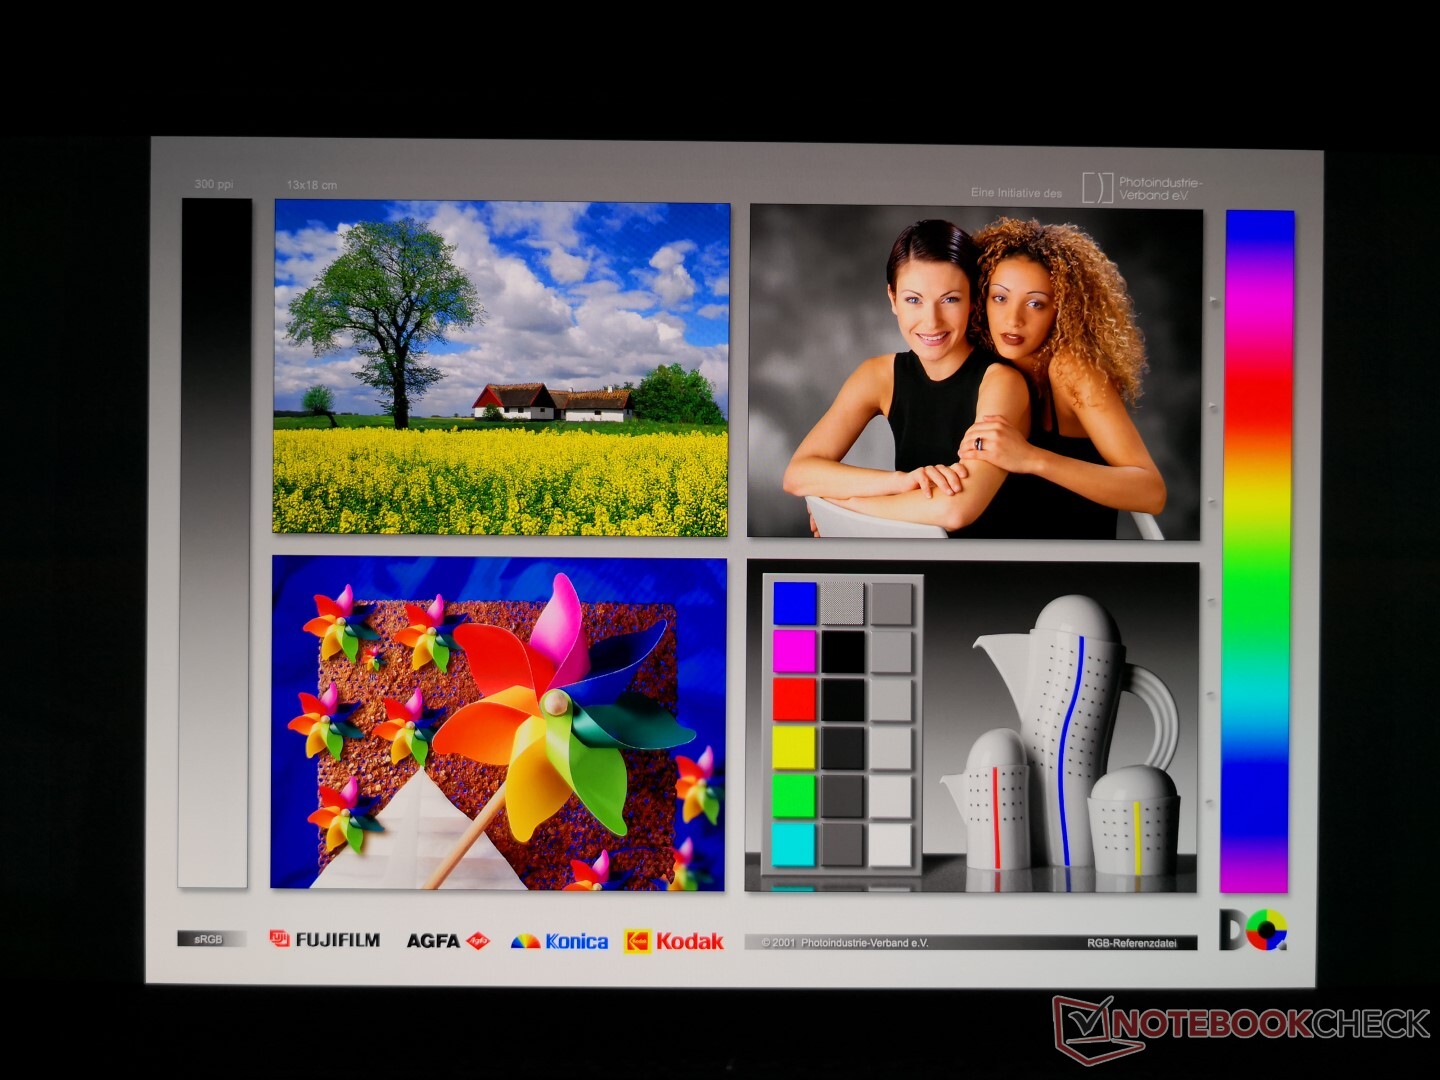
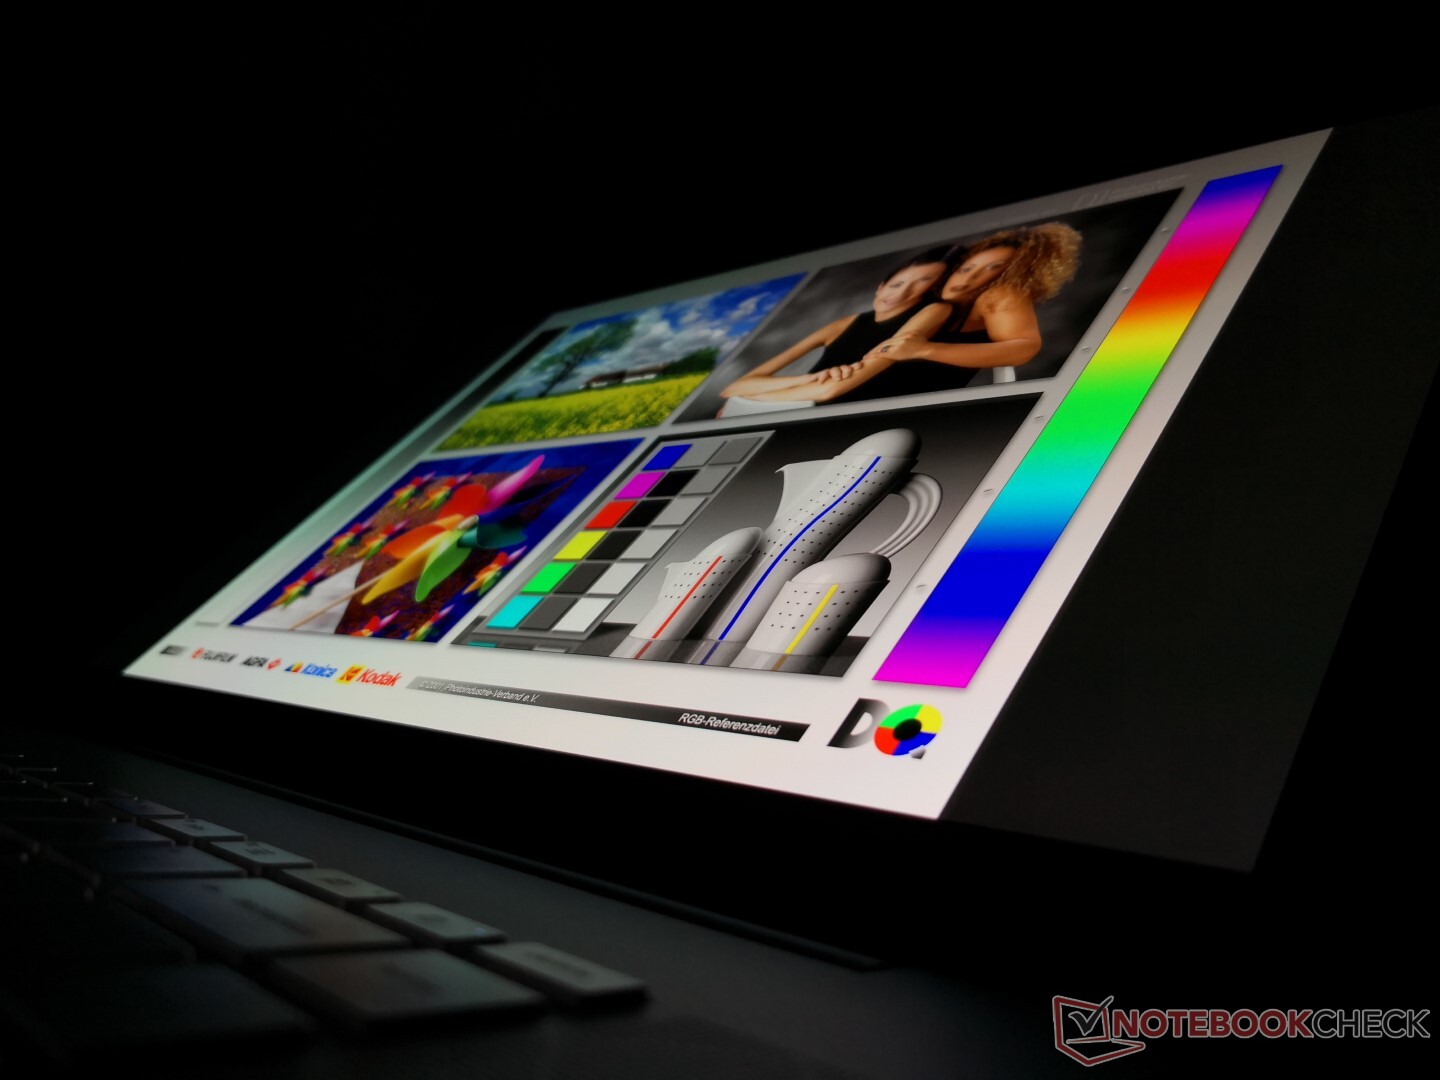
HP advertises a 400-nit AMOLED touchscreen while our independent measurements show an average of 374 nits to be about 25 to 35 percent dimmer than the XPS 15 or MacBook Pro 16. HP is well aware of this brightness deficit and it says the Envy 15 makes up for it with the higher native resolution, faster response times, deeper blacks, and wider color space than the Apple alternative which we can confirm.
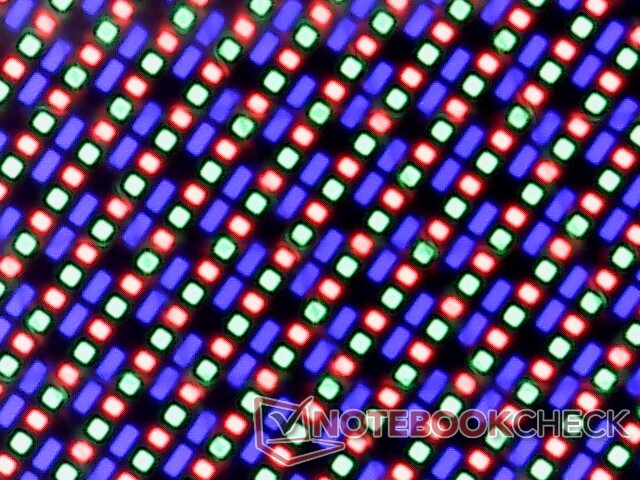
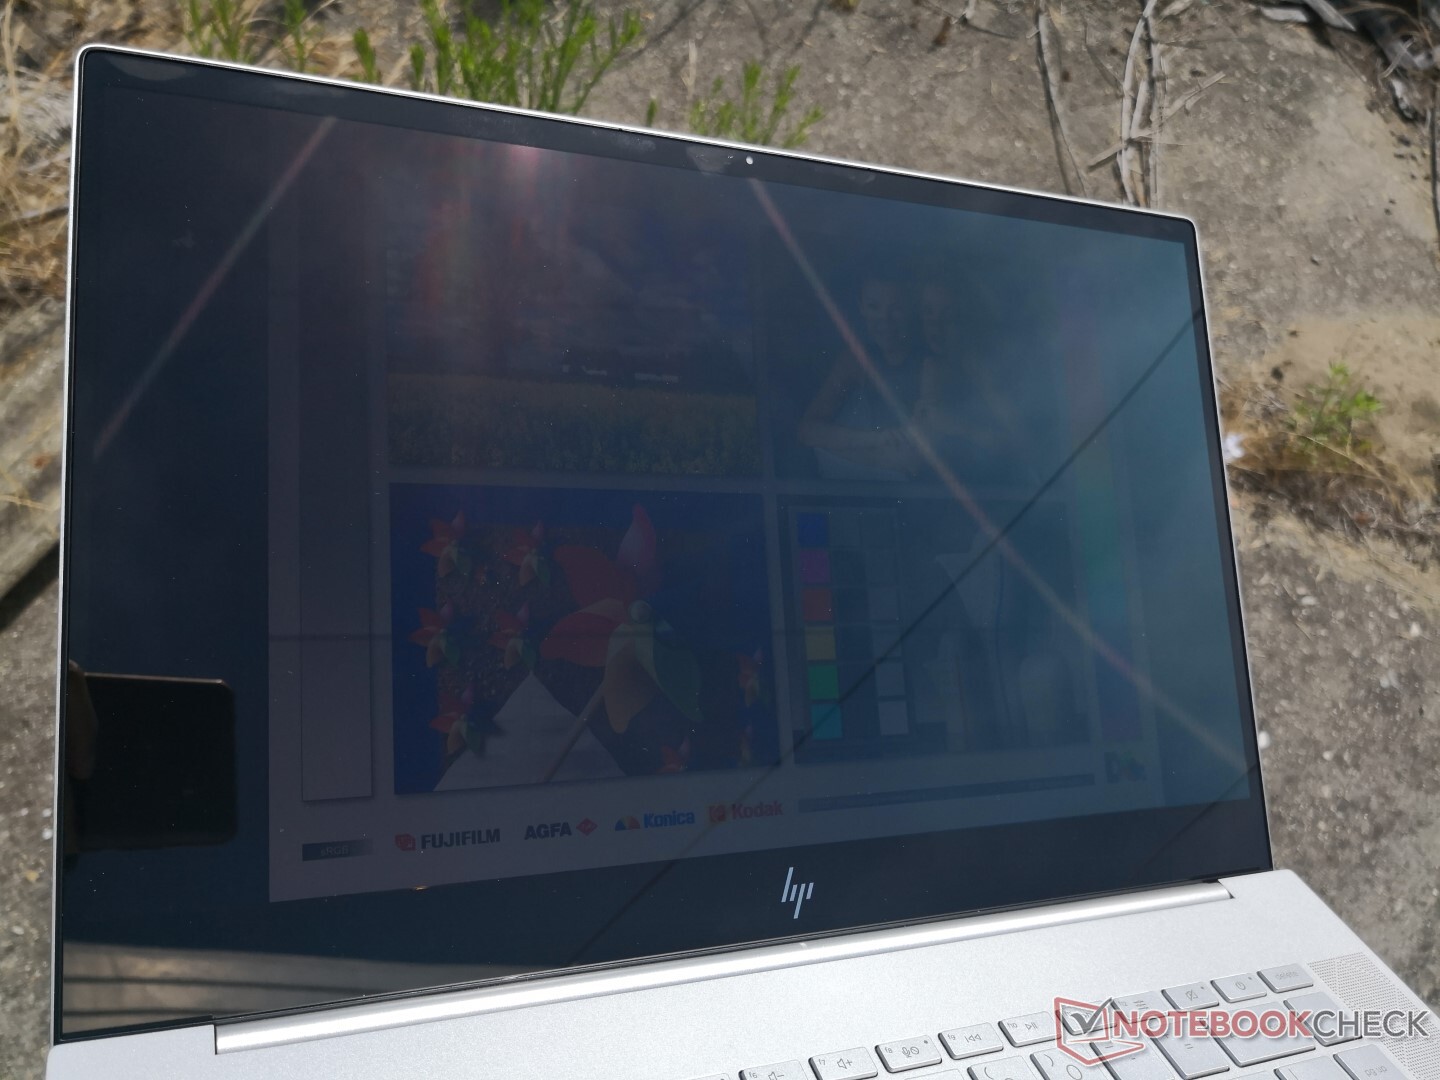
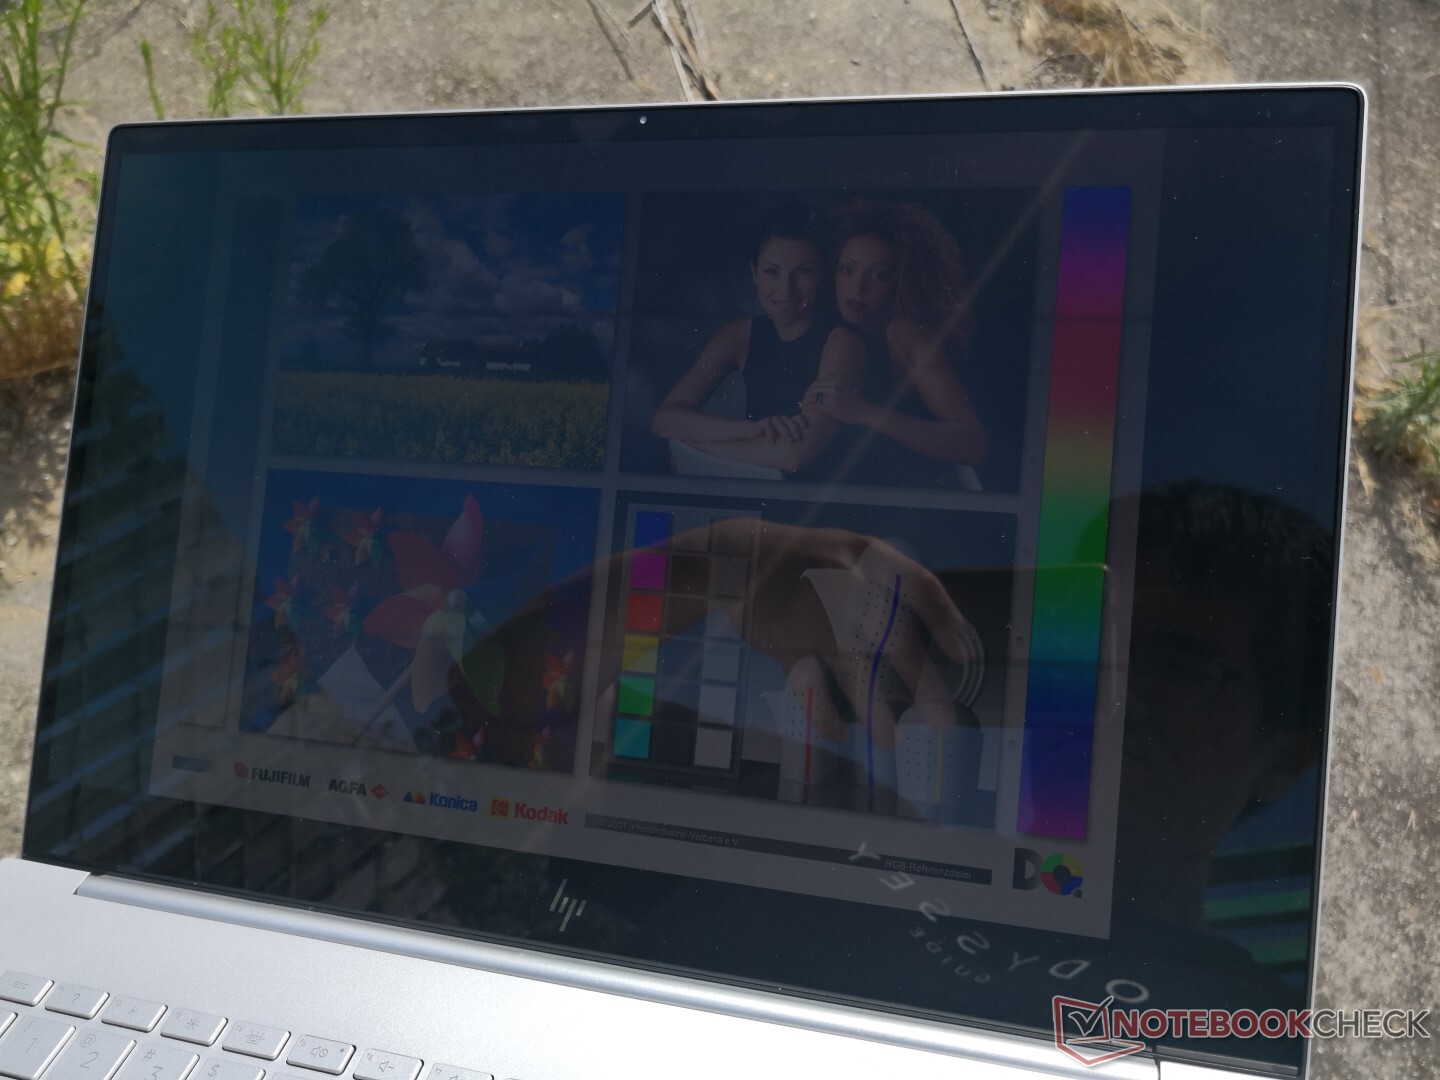
Interestingly, the screen is slightly grainier than what we are used to from a glossy display. Put up a completely white image at maximum brightness and the picture won't appear as sharp as a glossy Dell XPS 15. It's nothing drastic, but it's worth noting nonetheless.
HWiNFO is unable to identify the exact panel name as it only states the Samsung SDC4145 controller. Pulse-width modulation from 0 percent to 44 percent brightness is 240 Hz while pulse-width modulation from 45 percent to 100 percent brightness is 59.5 Hz which is similar in behavior to what we observed on the OLED XPS 15 and OLED Razer Blade 15. Perhaps not coincidentally, all of these laptops are using similar OLED panels from Samsung.

| |||||||||||||||||||||||||
Brightness Distribution: 91 %
Center on Battery: 374.3 cd/m²
Contrast: ∞:1 (Black: 0 cd/m²)
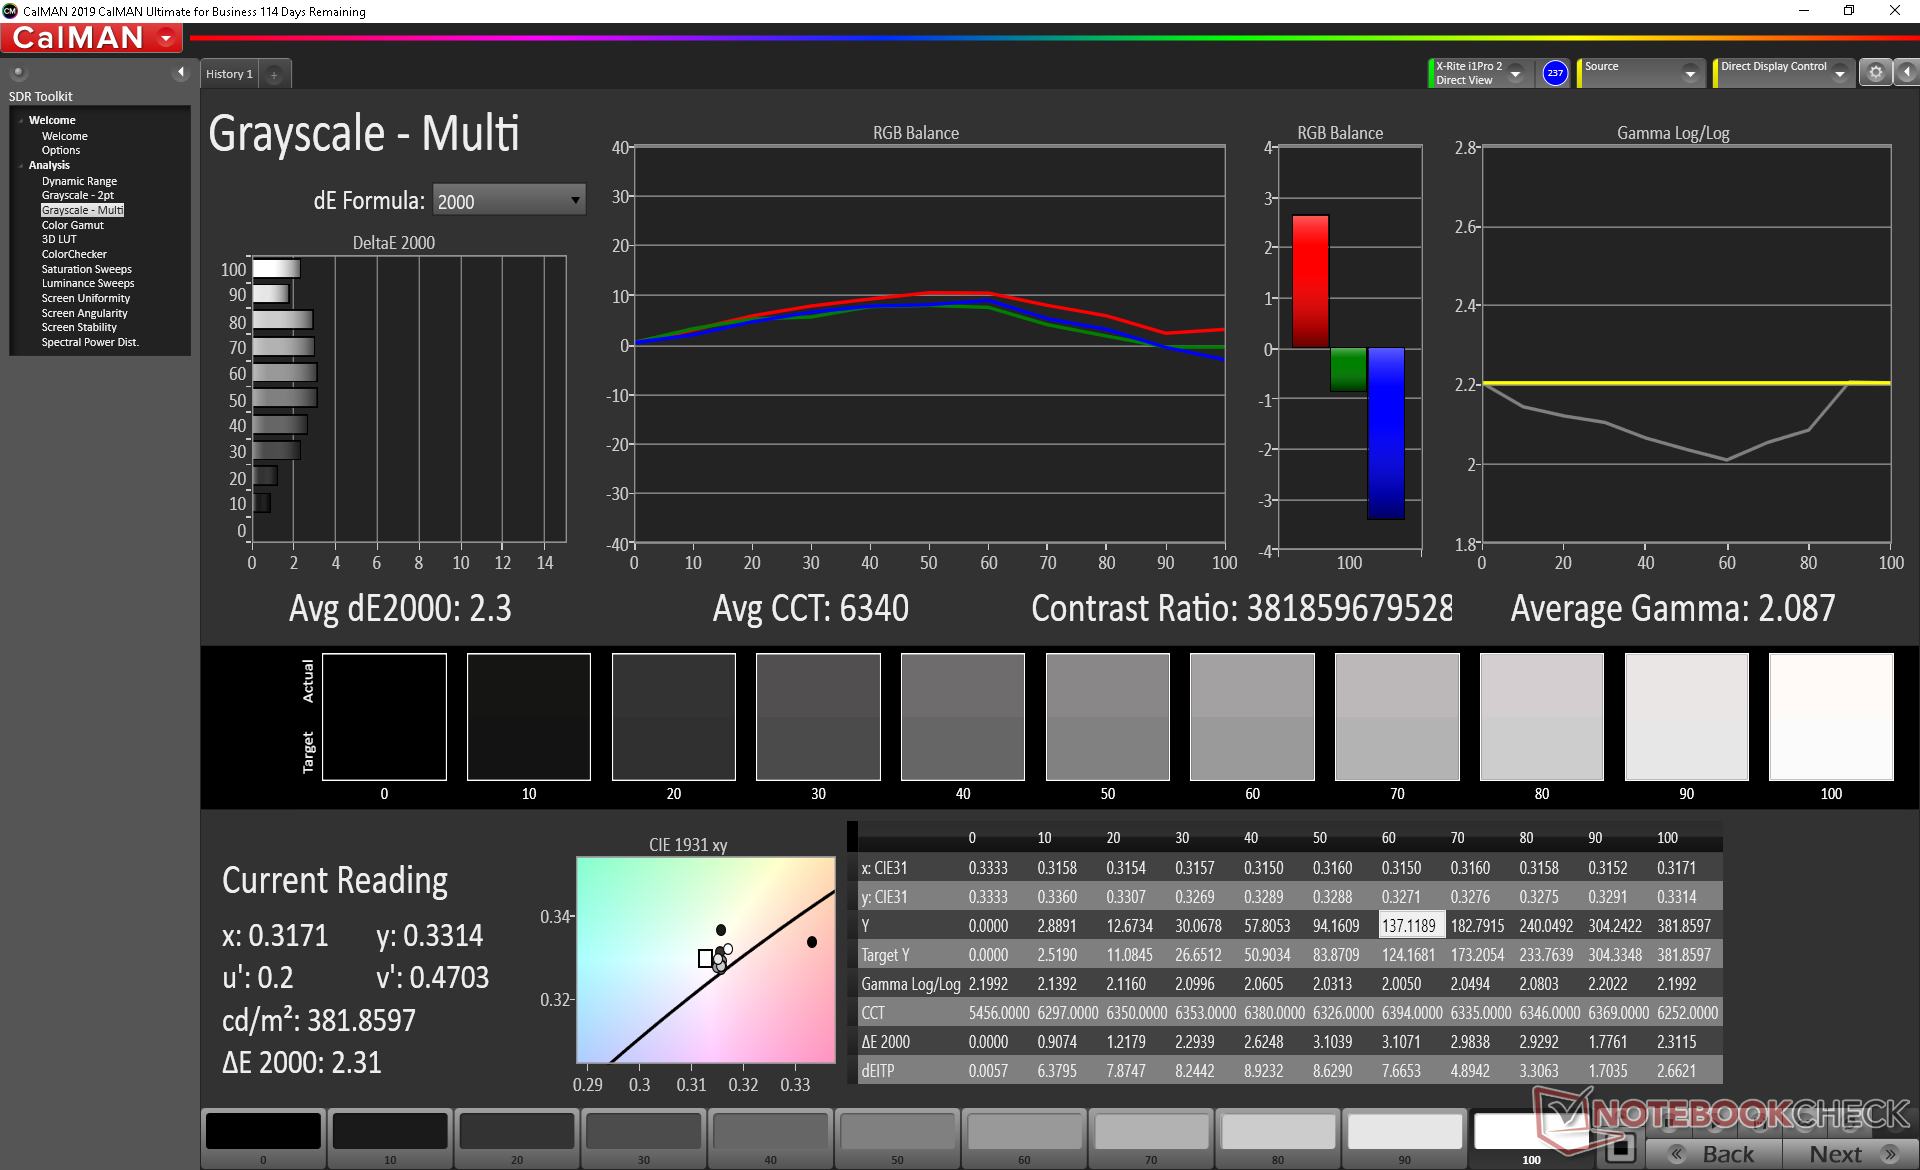
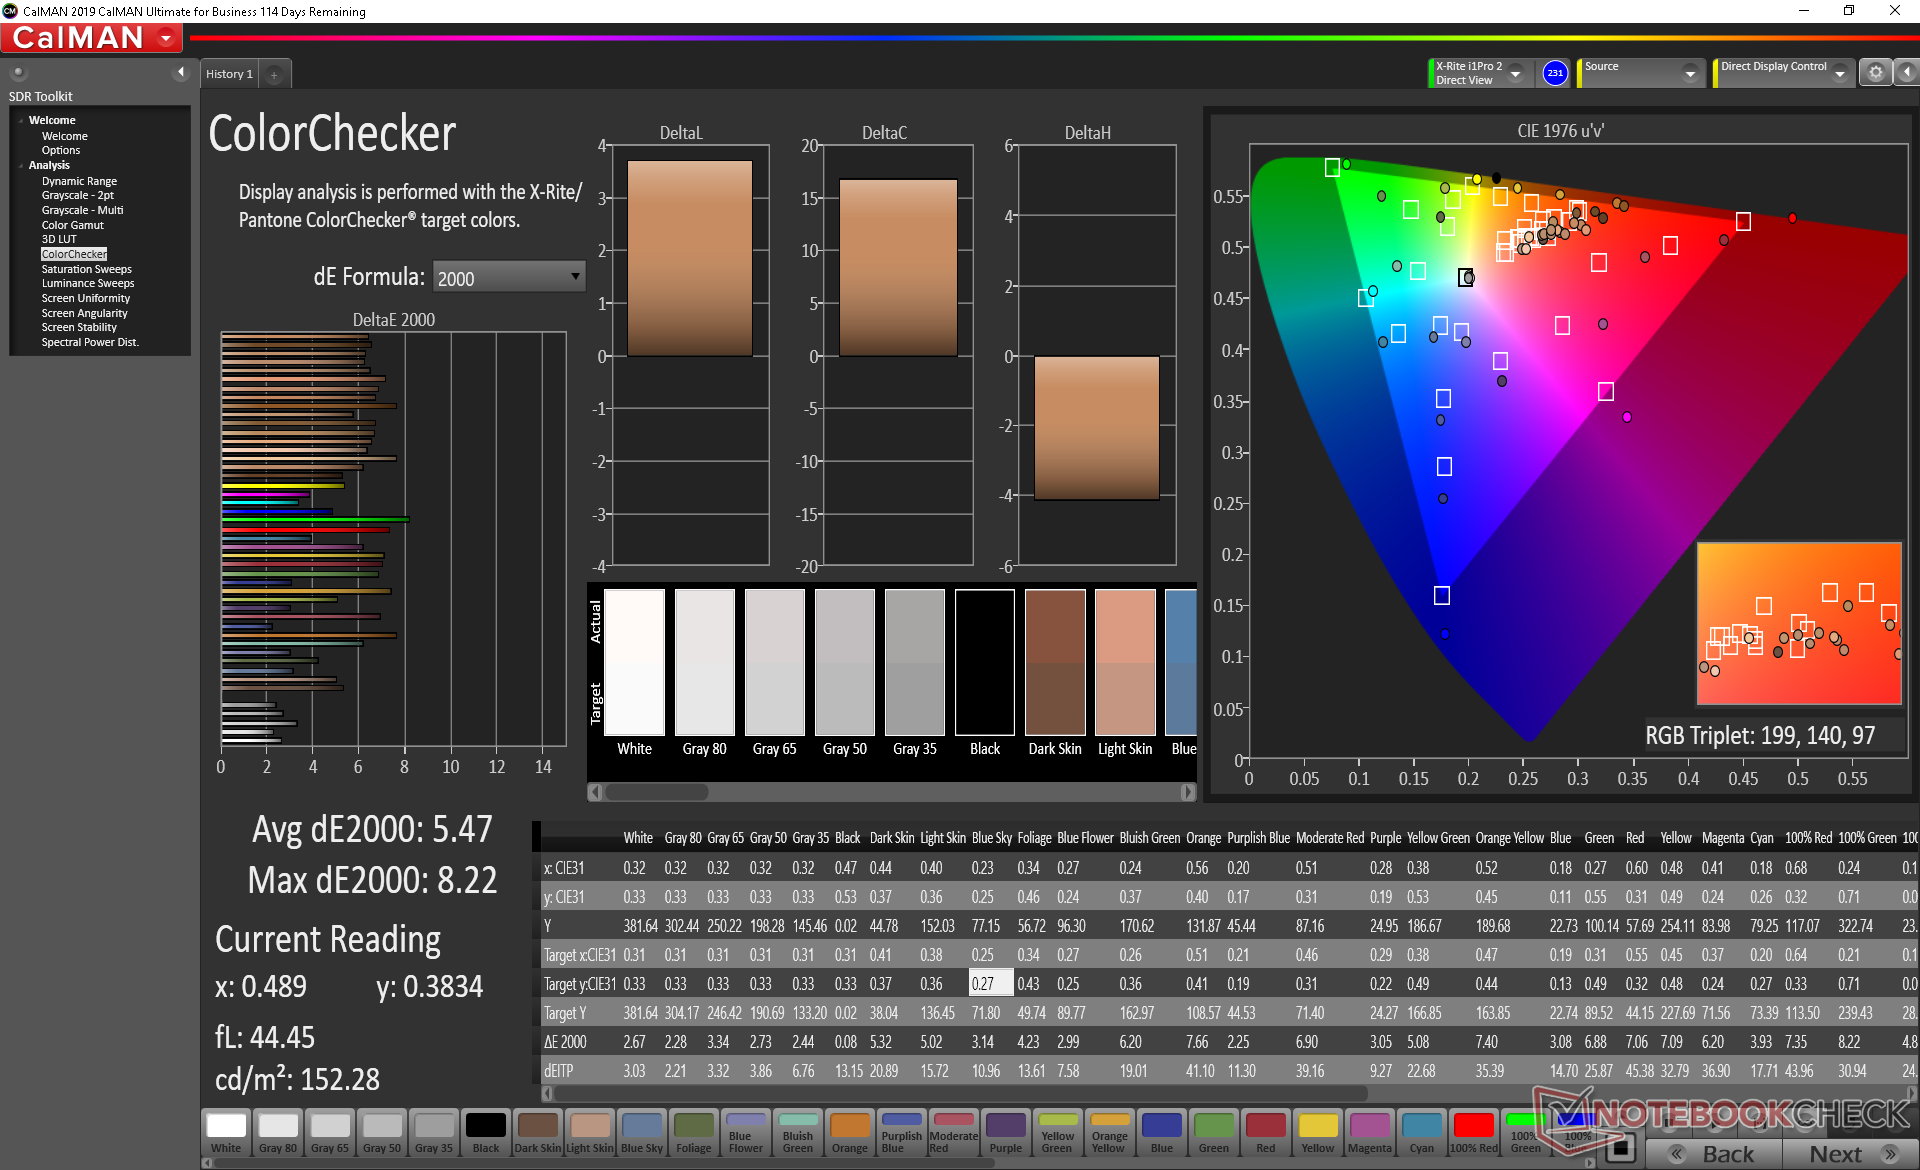
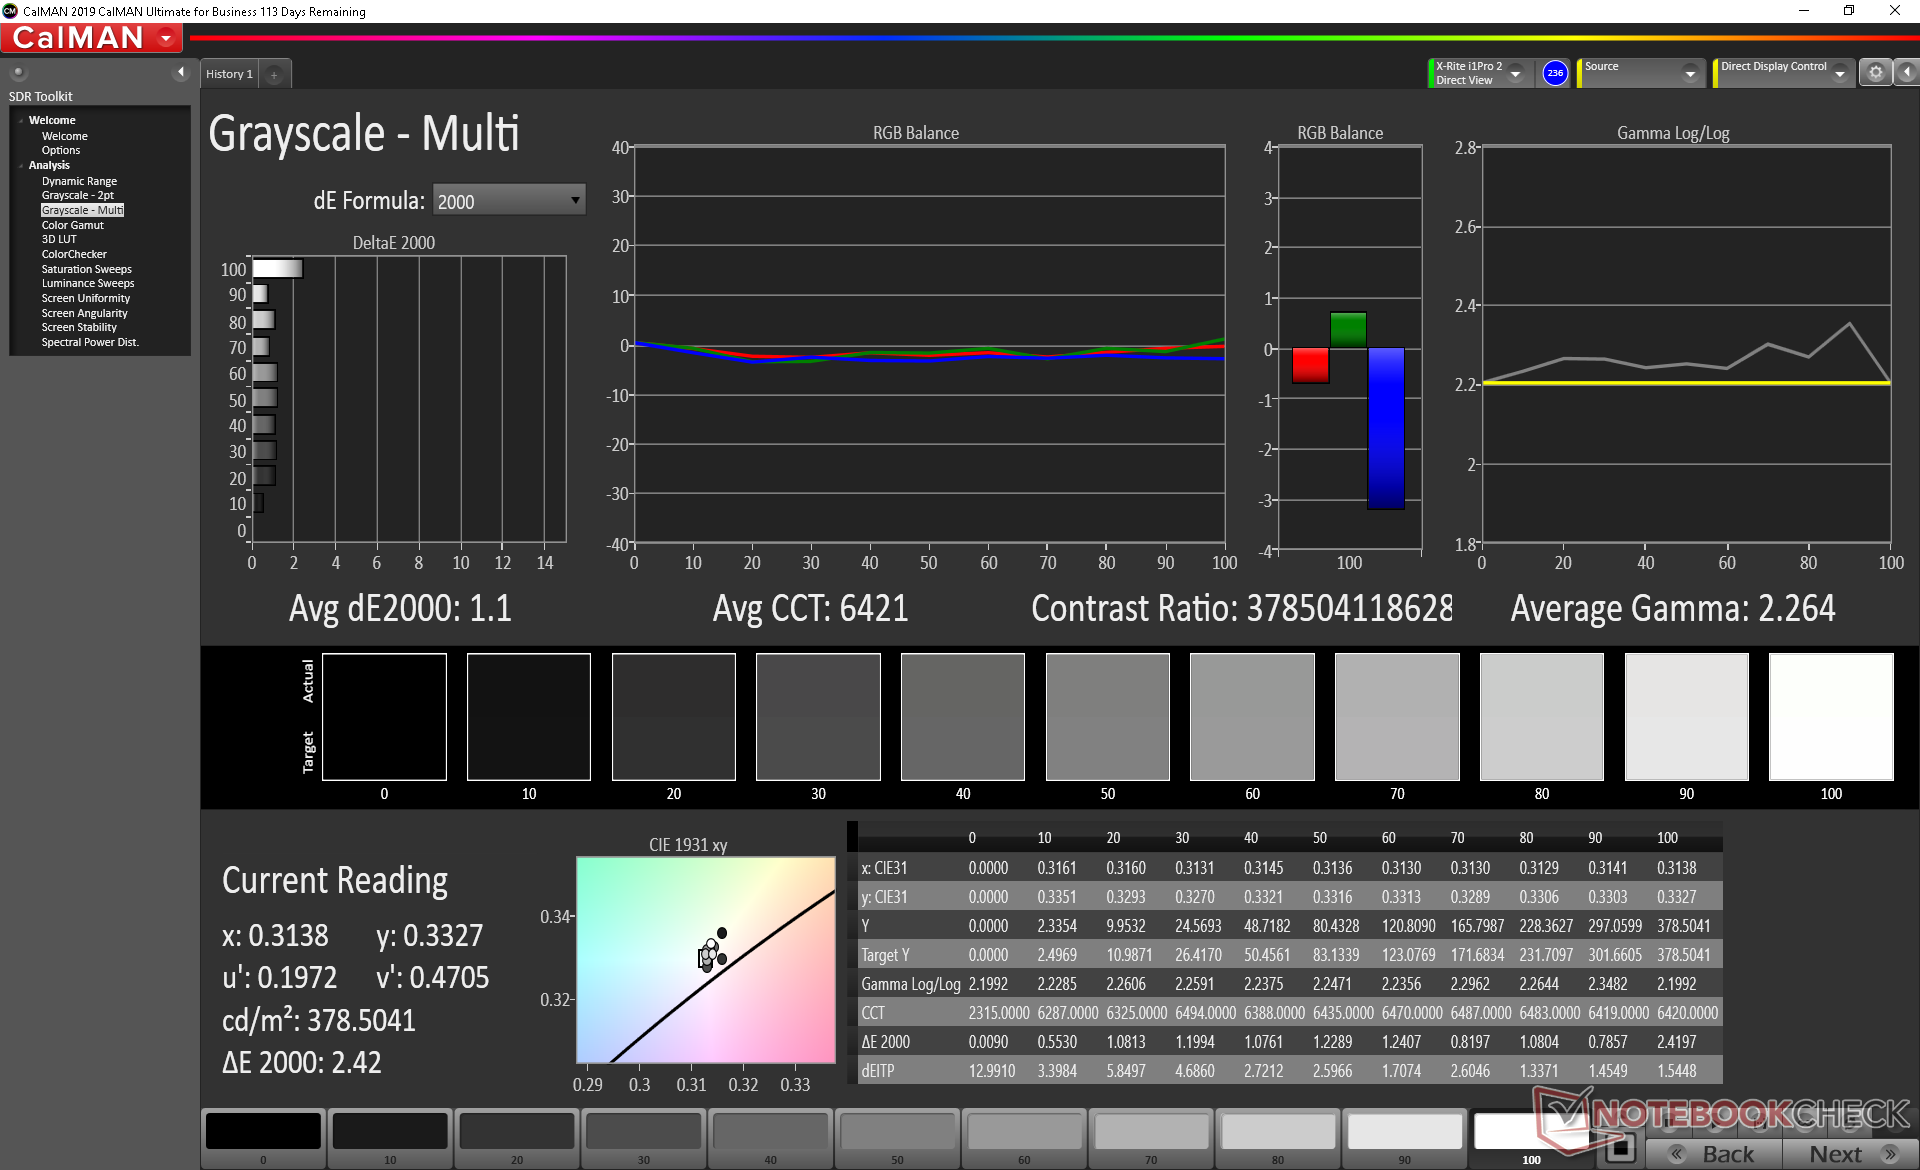
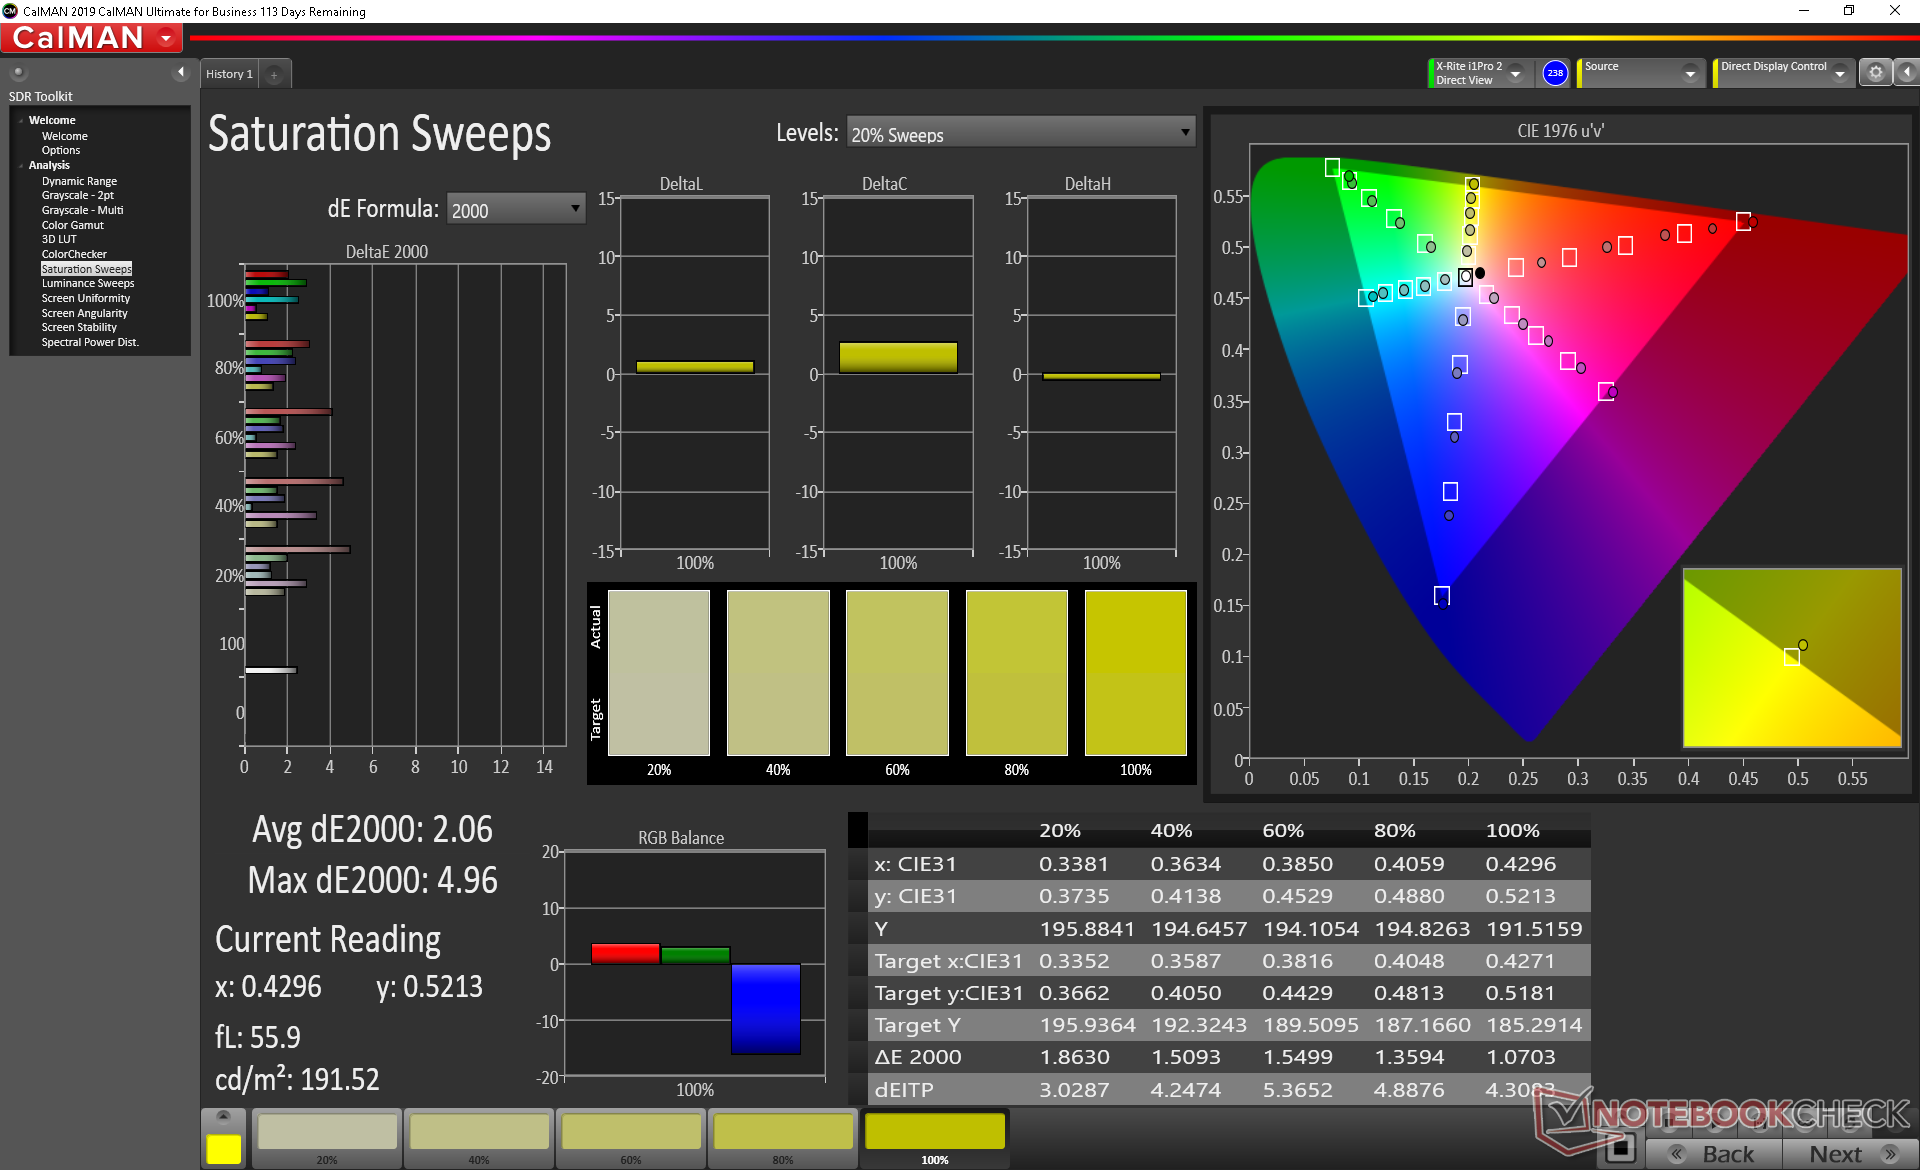
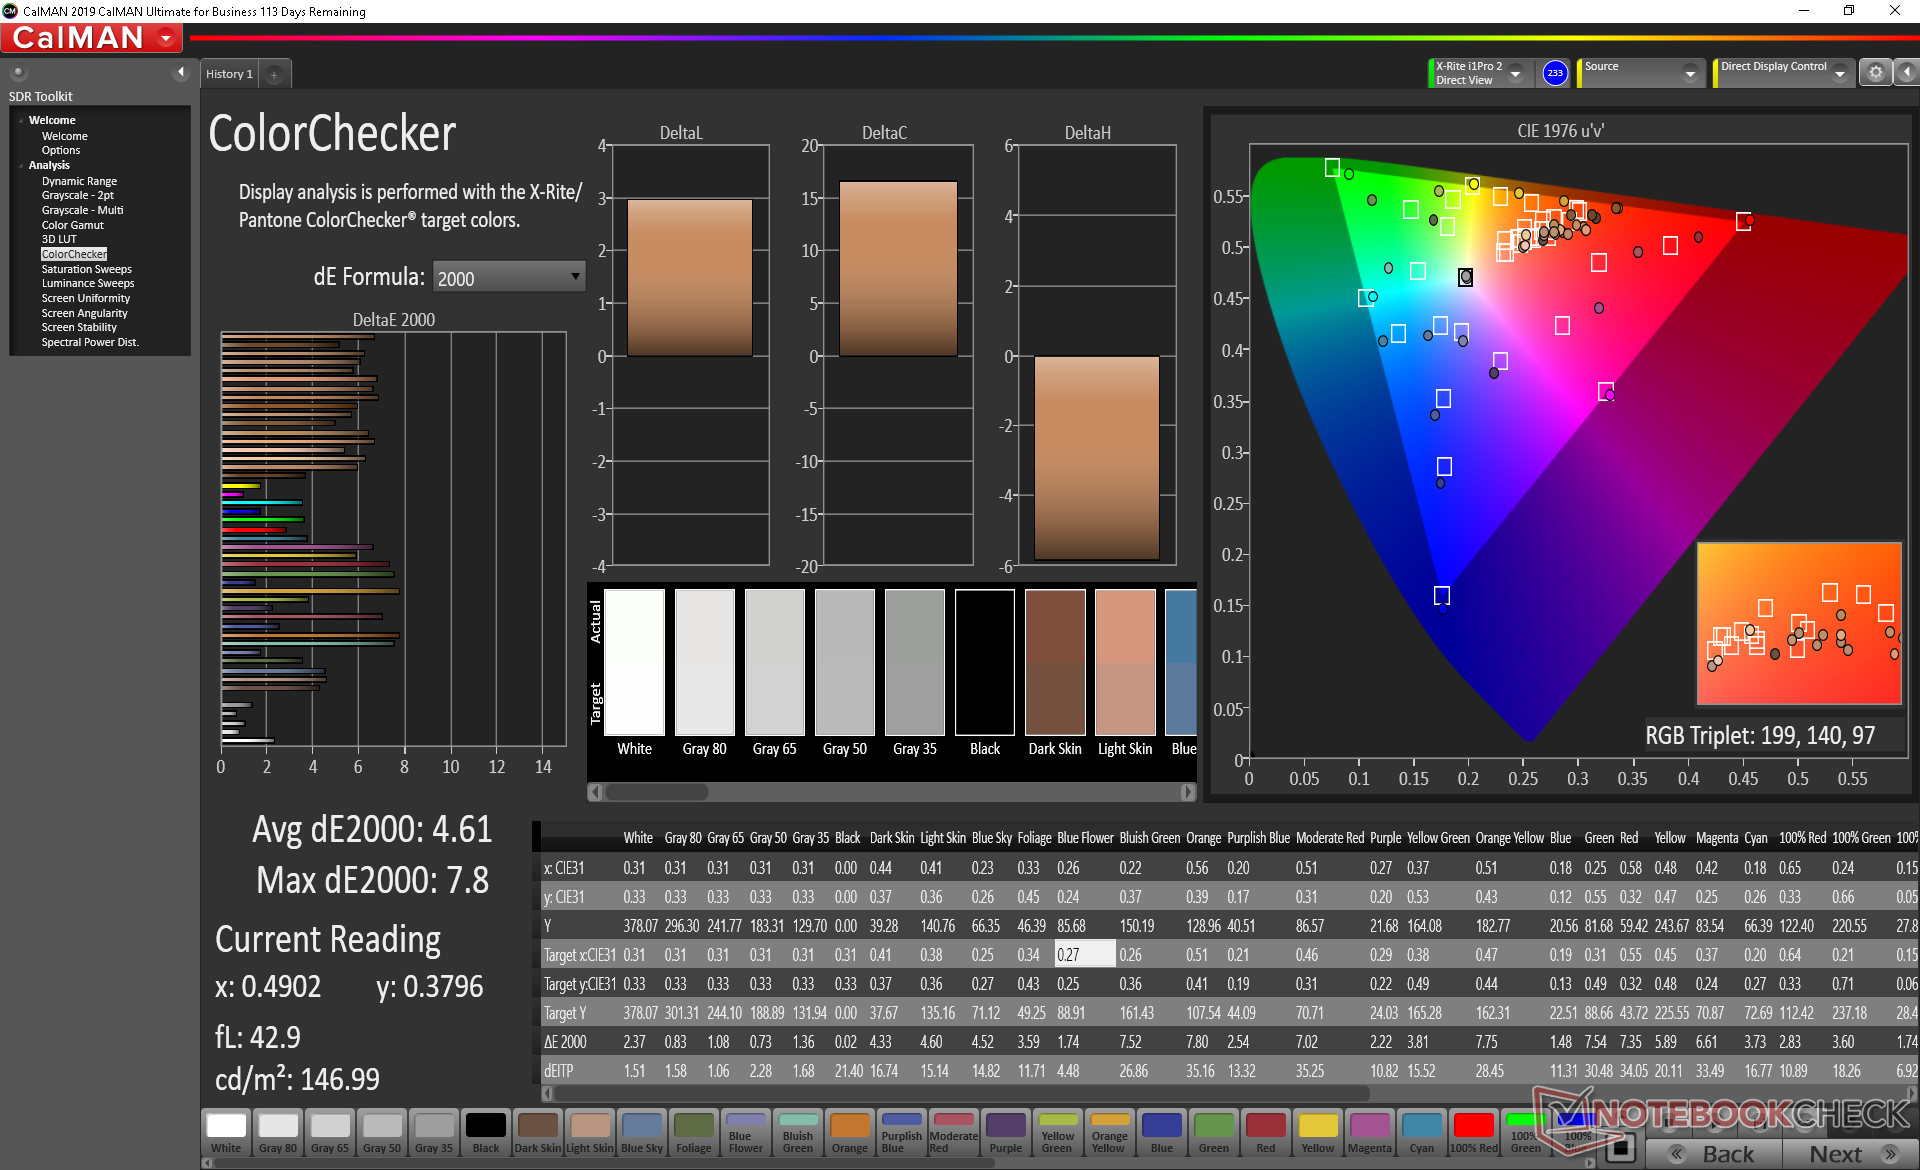
ΔE ColorChecker Calman: 5.47 | ∀{0.5-29.43 Ø4.71}
calibrated: 4.61
ΔE Greyscale Calman: 2.3 | ∀{0.09-98 Ø4.96}
100% sRGB (Argyll 1.6.3 3D)
87.8% AdobeRGB 1998 (Argyll 1.6.3 3D)
99.9% AdobeRGB 1998 (Argyll 3D)
100% sRGB (Argyll 3D)
88.5% Display P3 (Argyll 3D)
Gamma: 2.09
CCT: 6340 K
| HP Envy 15-ep0098nr Samsung SDC4145, AMOLED, 15.6", 3840x2160 | HP Envy x360 15-dr1679cl AU Optronics B156HW02, IPS, 15.6", 1920x1080 | HP Spectre X360 15-5ZV31AV AU Optronics AUO30EB, IPS, 15.6", 3840x2160 | Dell XPS 15 9500 Core i7 4K UHD Sharp LQ156R1, IPS, 15.6", 3840x2400 | Lenovo Yoga C940-15IRH LG Philips LP156WFC-SPU1, IPS, 15.6", 1920x1080 | Apple MacBook Pro 16 2019 i9 5500M APPA044, IPS, 16", 3072x1920 | |
|---|---|---|---|---|---|---|
| Display | -52% | -20% | 0% | -25% | ||
| Display P3 Coverage (%) | 88.5 | 39.28 -56% | 68.3 -23% | 89.7 1% | 61.5 -31% | |
| sRGB Coverage (%) | 100 | 58.8 -41% | 94.3 -6% | 100 0% | 92.7 -7% | |
| AdobeRGB 1998 Coverage (%) | 99.9 | 40.58 -59% | 68.4 -32% | 99.8 0% | 63.6 -36% | |
| Response Times | -2812% | -4206% | -3890% | -3599% | -3822% | |
| Response Time Grey 50% / Grey 80% * (ms) | 0.8 ? | 39.6 ? -4850% | 56.8 ? -7000% | 54 ? -6650% | 48.4 ? -5950% | 52.4 ? -6450% |
| Response Time Black / White * (ms) | 2.7 ? | 23.6 ? -774% | 40.8 ? -1411% | 33.2 ? -1130% | 36.4 ? -1248% | 34.9 ? -1193% |
| PWM Frequency (Hz) | 242.7 ? | 131700 | ||||
| Screen | -36% | -3% | 10% | -5% | 34% | |
| Brightness middle (cd/m²) | 374.3 | 261.2 -30% | 284.6 -24% | 557.9 49% | 484.8 30% | 519 39% |
| Brightness (cd/m²) | 379 | 248 -35% | 285 -25% | 541 43% | 463 22% | 477 26% |
| Brightness Distribution (%) | 91 | 92 1% | 85 -7% | 91 0% | 82 -10% | 86 -5% |
| Black Level * (cd/m²) | 0.38 | 0.25 | 0.39 | 0.26 | 0.39 | |
| Colorchecker dE 2000 * | 5.47 | 5.4 1% | 3.52 36% | 4.54 17% | 4.5 18% | 2.28 58% |
| Colorchecker dE 2000 max. * | 8.22 | 16.31 -98% | 5.56 32% | 7.92 4% | 7.55 8% | 6.54 20% |
| Colorchecker dE 2000 calibrated * | 4.61 | 3.81 17% | 3 35% | 3.82 17% | 1.19 74% | 0.86 81% |
| Greyscale dE 2000 * | 2.3 | 4.1 -78% | 3.2 -39% | 3.2 -39% | 5.7 -148% | 0.9 61% |
| Gamma | 2.09 105% | 2.53 87% | 2.28 96% | 1.99 111% | 2.45 90% | 2145 0% |
| CCT | 6340 103% | 6611 98% | 7070 92% | 6451 101% | 6101 107% | 6572 99% |
| Color Space (Percent of AdobeRGB 1998) (%) | 87.8 | 37.4 -57% | 61.1 -30% | 89.5 2% | 58.7 -33% | 78 -11% |
| Color Space (Percent of sRGB) (%) | 100 | 58.7 -41% | 93.8 -6% | 100 0% | 92.8 -7% | |
| Contrast (:1) | 687 | 1138 | 1431 | 1865 | 1331 | |
| Total Average (Program / Settings) | -967% /
-436% | -1410% /
-607% | -1293% /
-549% | -1210% /
-523% | -1894% /
-737% |
* ... smaller is better
HP promises 100 percent DCI-P3 color coverage when configured with 4K OLED much like all other 4K OLED options on other laptops at the moment. Our own measurements show color space to be slightly wider on the HP when compared to the MacBook Pro 16 (88 percent vs. 78 percent AdobeRGB). Users can quickly toggle between sRGB, AdobeRGB, DCI-P3, or default by right-clicking on desktop.
X-Rite measurements show a well-calibrated display out of the box. Attempting to calibrate the panel ourselves even further would improve grayscale slightly from an average DeltaE of 2.3 to 1.1, but colors may take some more massaging to get right.
Display Response Times
| ↔ Response Time Black to White | ||
|---|---|---|
| 2.7 ms ... rise ↗ and fall ↘ combined | ↗ 1.3 ms rise | 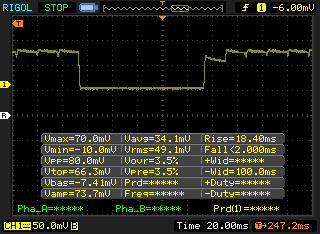 |
| ↘ 1.4 ms fall | ||
| The screen shows very fast response rates in our tests and should be very well suited for fast-paced gaming. In comparison, all tested devices range from 0.1 (minimum) to 240 (maximum) ms. » 14 % of all devices are better. This means that the measured response time is better than the average of all tested devices (19.8 ms). | ||
| ↔ Response Time 50% Grey to 80% Grey | ||
| 0.8 ms ... rise ↗ and fall ↘ combined | ↗ 0.4 ms rise | 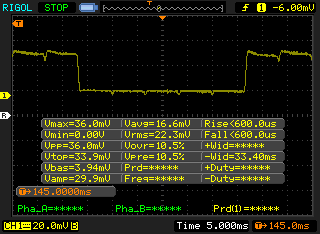 |
| ↘ 0.4 ms fall | ||
| The screen shows very fast response rates in our tests and should be very well suited for fast-paced gaming. In comparison, all tested devices range from 0.165 (minimum) to 636 (maximum) ms. » 3 % of all devices are better. This means that the measured response time is better than the average of all tested devices (30.9 ms). | ||
Screen Flickering / PWM (Pulse-Width Modulation)
| Screen flickering / PWM detected | 242.7 Hz | ≤ 44 % brightness setting | 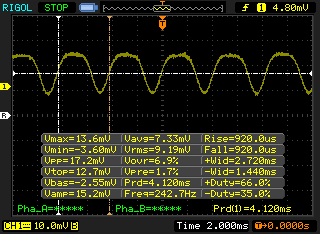 |
The display backlight flickers at 242.7 Hz (worst case, e.g., utilizing PWM) Flickering detected at a brightness setting of 44 % and below. There should be no flickering or PWM above this brightness setting. The frequency of 242.7 Hz is relatively low, so sensitive users will likely notice flickering and experience eyestrain at the stated brightness setting and below. In comparison: 52 % of all tested devices do not use PWM to dim the display. If PWM was detected, an average of 7741 (minimum: 5 - maximum: 343500) Hz was measured. | |||
The display backlight is not bright enough for comfortable use outdoors on a bright day. The glossy screen makes glare mostly unavoidable as well even when working under shade. If outdoor visibility is important, then the HP EliteBook series would be the better option for its super-bright 1000-nit panels.

Performance
There are no Core i3, Core i5, or ULV Comet Lake-U options as HP wants to position its latest Envy 15 as a high-performance multimedia laptop. However, users can still configure with only the integrated UHD Graphics 630 or the GTX 1650 Ti or GTX 1660 Ti Max-Q if desired.
Nvidia Optimus comes standard if configured with a GeForce GPU for automatic graphics switching. All benchmarks below were performed on HP Performance mode for the best possible scores.
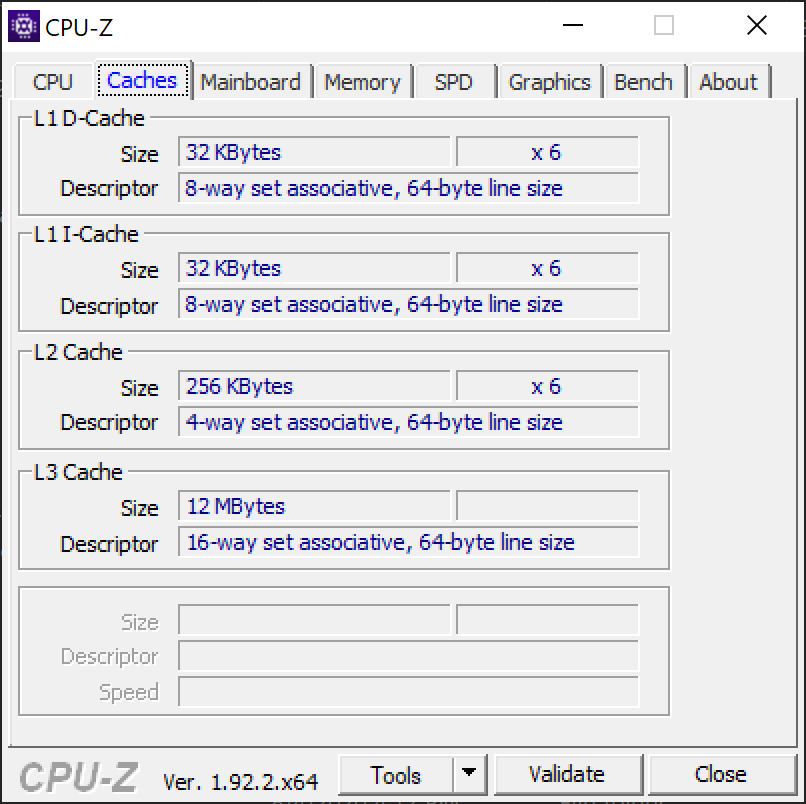
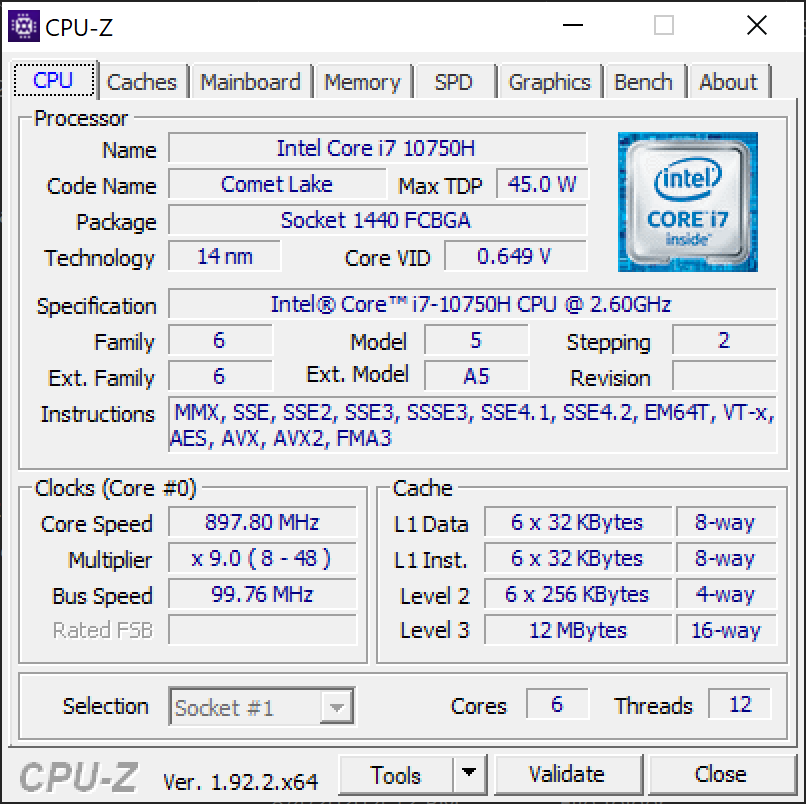
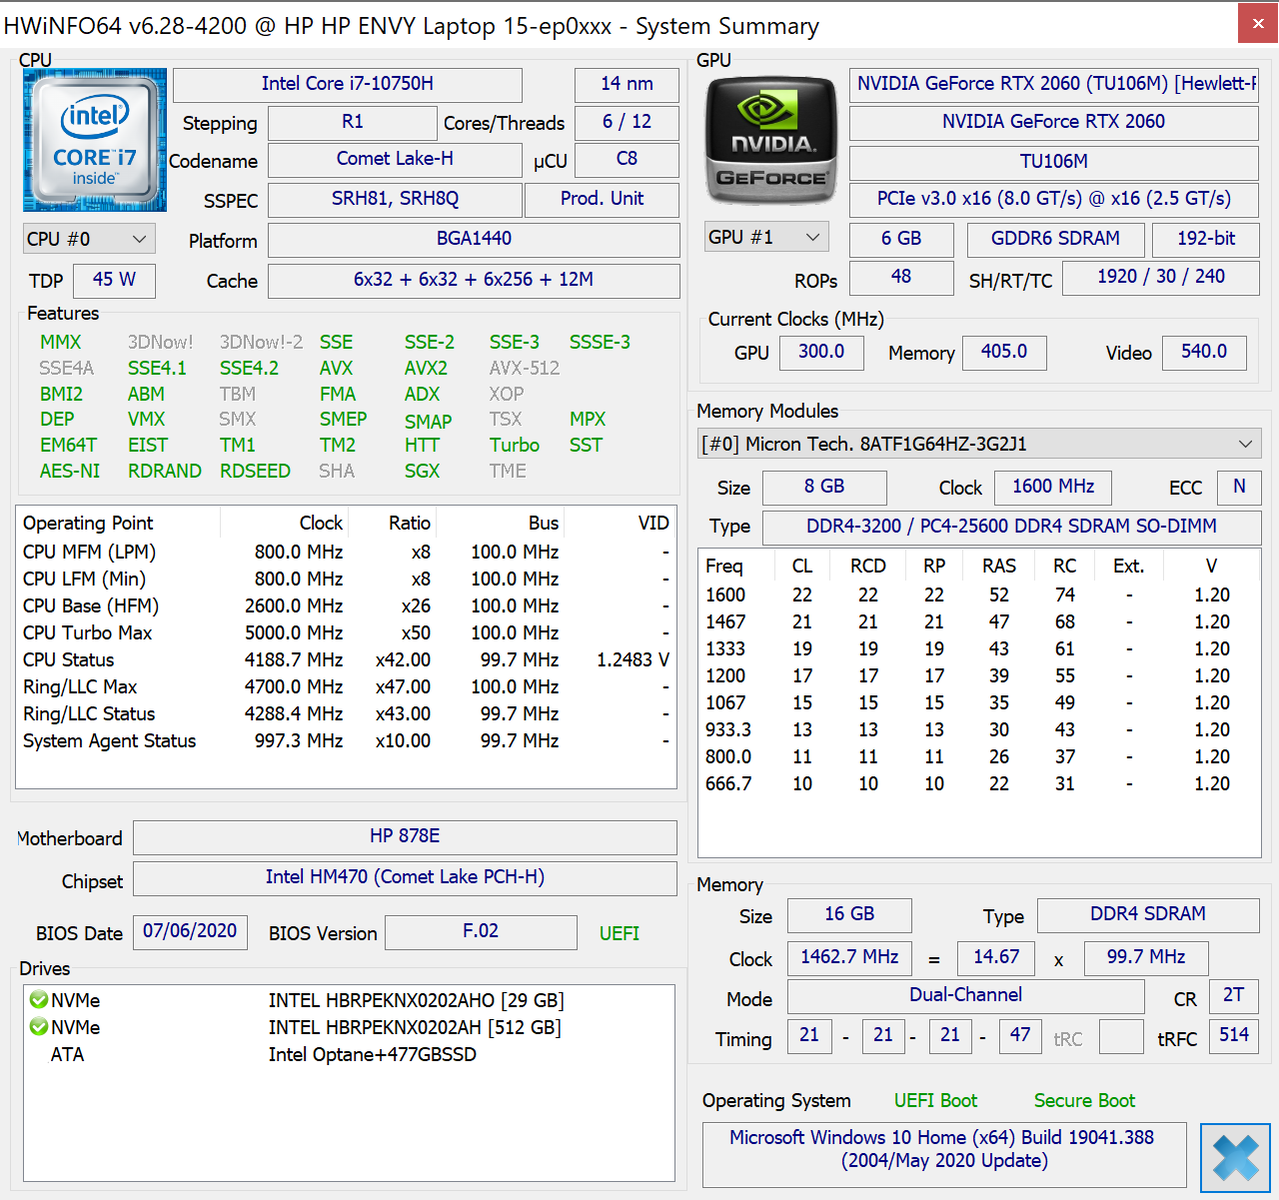
Processor
While the Core i7-10750H in general isn't that huge of a leap over the Core i7-9750H, it runs surprisingly well on the Envy 15. Performance sustainability is excellent when running CineBench R15 xT in a loop as shown by our graph below. The Core i9-10885H is available for users who can benefit from having extra cores.
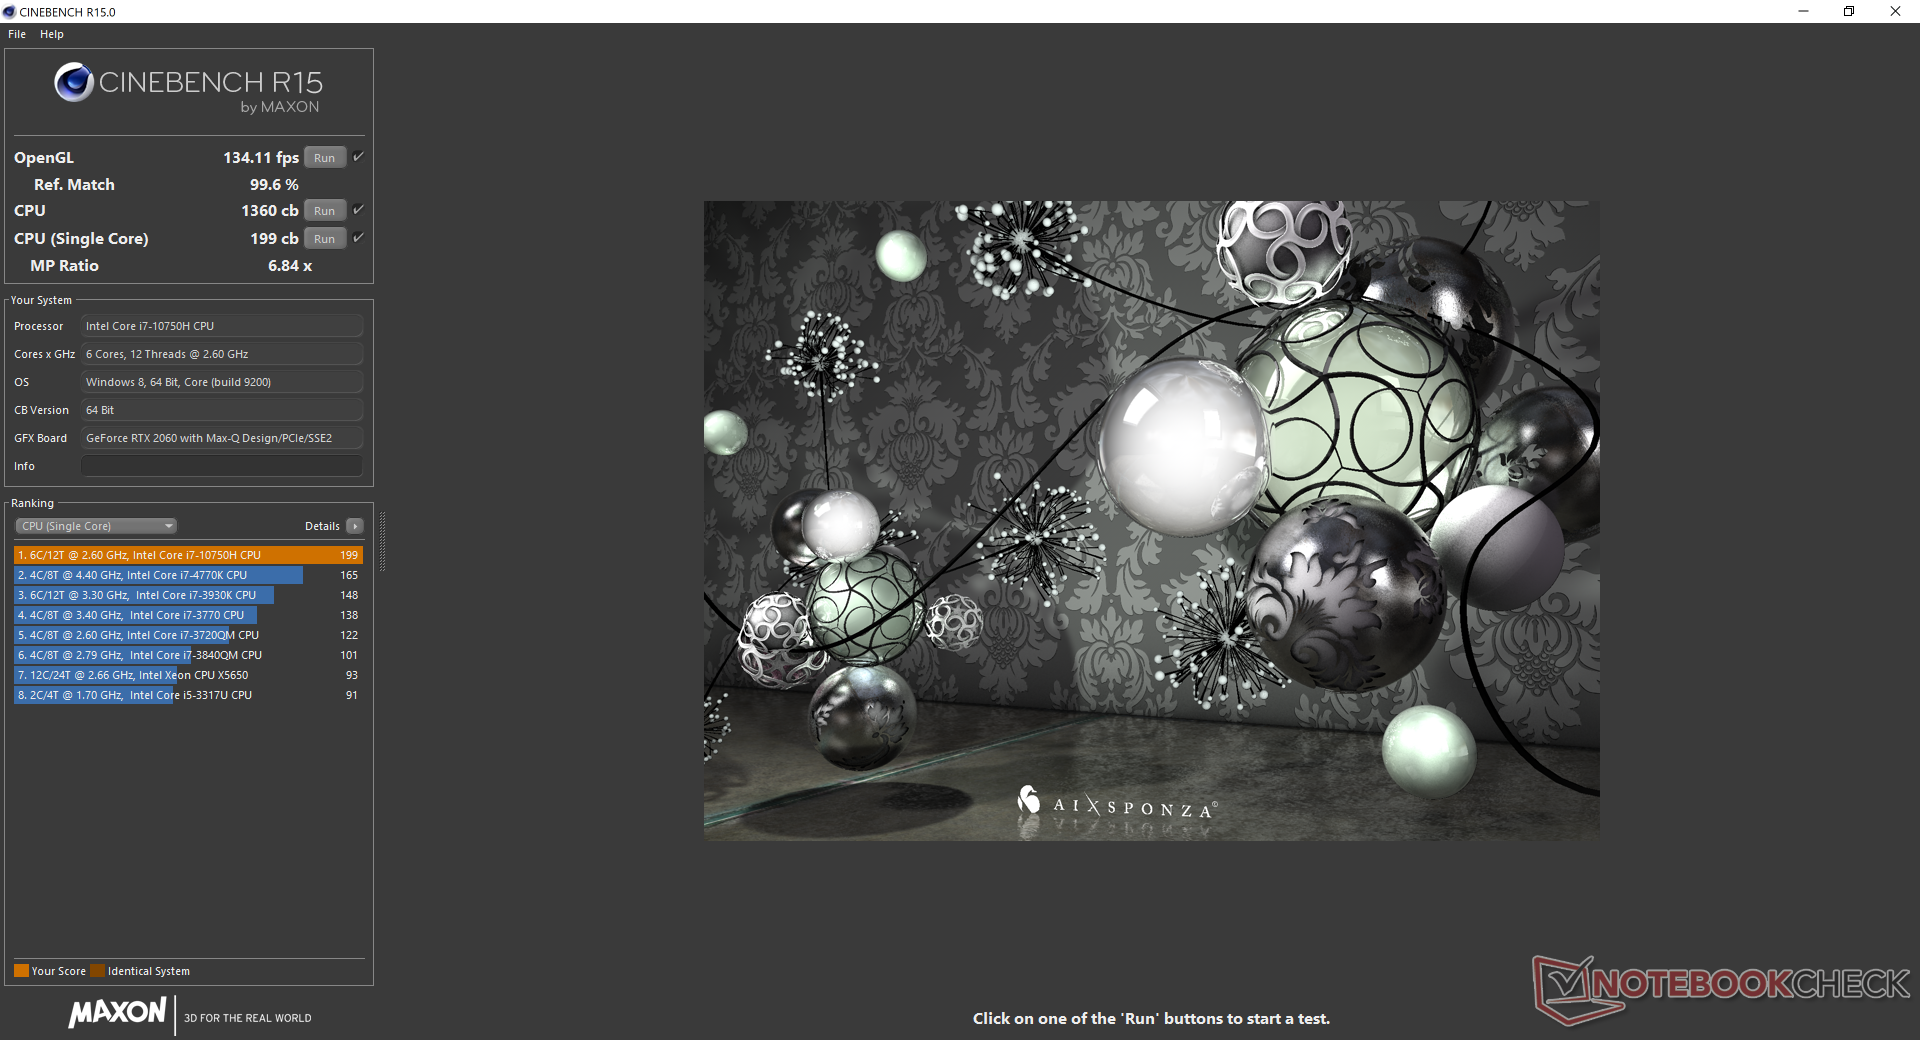
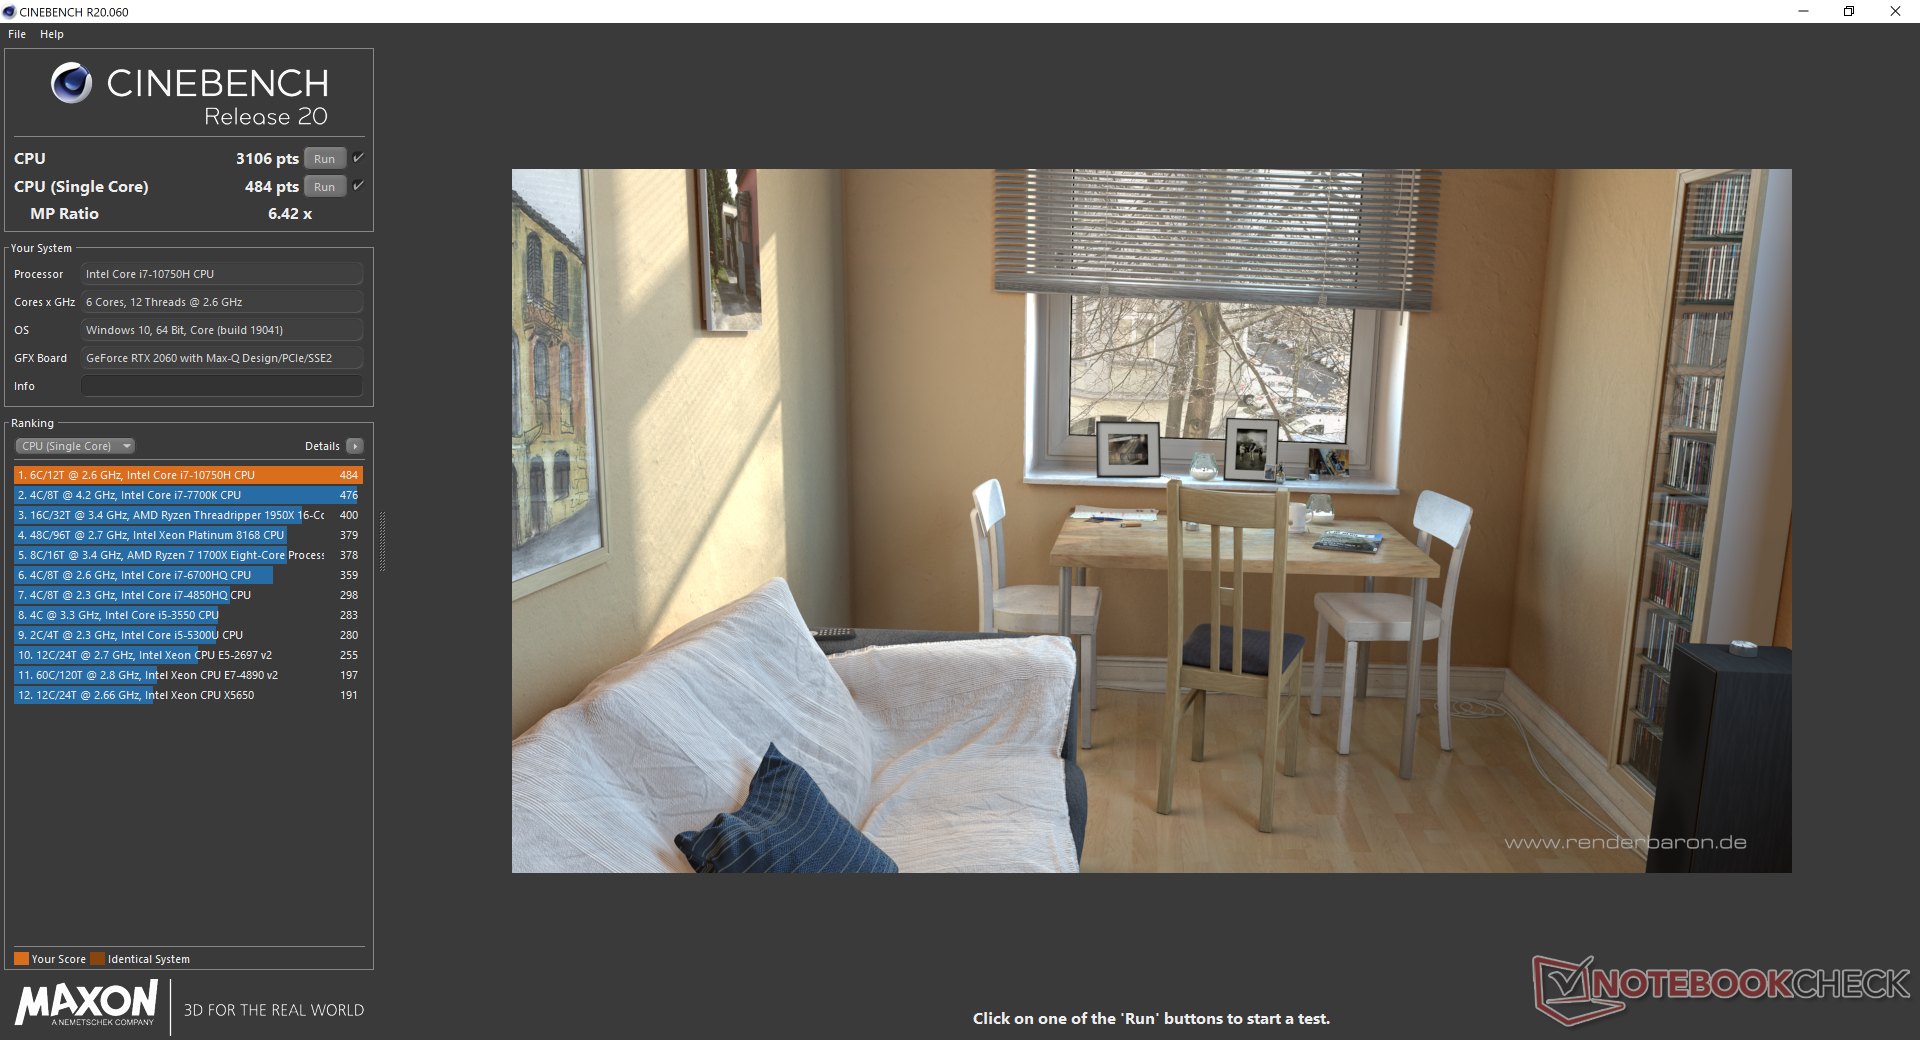
Cinebench R15: CPU Multi 64Bit | CPU Single 64Bit
Blender: v2.79 BMW27 CPU
7-Zip 18.03: 7z b 4 -mmt1 | 7z b 4
Geekbench 5.5: Single-Core | Multi-Core
HWBOT x265 Benchmark v2.2: 4k Preset
LibreOffice : 20 Documents To PDF
R Benchmark 2.5: Overall mean
| Cinebench R20 / CPU (Multi Core) | |
| Eurocom Sky X4C i9-9900KS | |
| Asus TUF Gaming A15 FA506IV-HN172 | |
| MSI GS66 Stealth 10SFS | |
| MSI GE65 Raider 9SF-049US | |
| Dell XPS 15 9500 Core i7 4K UHD | |
| Acer Nitro 5 AN515-44-R5FT | |
| HP Envy 15-ep0098nr | |
| Average Intel Core i7-10750H (1749 - 3325, n=43) | |
| Lenovo Yoga C940-15IRH | |
| Schenker Work 15 | |
| Cinebench R20 / CPU (Single Core) | |
| Eurocom Sky X4C i9-9900KS | |
| Dell XPS 15 9500 Core i7 4K UHD | |
| Asus TUF Gaming A15 FA506IV-HN172 | |
| MSI GS66 Stealth 10SFS | |
| MSI GE65 Raider 9SF-049US | |
| Average Intel Core i7-10750H (431 - 504, n=43) | |
| Lenovo Yoga C940-15IRH | |
| HP Envy 15-ep0098nr | |
| Acer Nitro 5 AN515-44-R5FT | |
| Schenker Work 15 | |
| Cinebench R15 / CPU Multi 64Bit | |
| Eurocom Sky X4C i9-9900KS | |
| Asus TUF Gaming A15 FA506IV-HN172 | |
| MSI GS66 Stealth 10SFS | |
| MSI GE65 Raider 9SF-049US | |
| Acer Nitro 5 AN515-44-R5FT | |
| Dell XPS 15 9500 Core i7 4K UHD | |
| HP Envy 15-ep0098nr | |
| Average Intel Core i7-10750H (804 - 1418, n=50) | |
| Lenovo Yoga C940-15IRH | |
| Schenker Work 15 | |
| Cinebench R15 / CPU Single 64Bit | |
| Eurocom Sky X4C i9-9900KS | |
| Dell XPS 15 9500 Core i7 4K UHD | |
| MSI GS66 Stealth 10SFS | |
| MSI GE65 Raider 9SF-049US | |
| HP Envy 15-ep0098nr | |
| Average Intel Core i7-10750H (184 - 213, n=45) | |
| Asus TUF Gaming A15 FA506IV-HN172 | |
| Lenovo Yoga C940-15IRH | |
| Acer Nitro 5 AN515-44-R5FT | |
| Schenker Work 15 | |
| Blender / v2.79 BMW27 CPU | |
| Schenker Work 15 | |
| Schenker Work 15 | |
| Average Intel Core i7-10750H (322 - 587, n=43) | |
| Dell XPS 15 9500 Core i7 4K UHD | |
| HP Envy 15-ep0098nr | |
| Acer Nitro 5 AN515-44-R5FT | |
| MSI GS66 Stealth 10SFS | |
| Asus TUF Gaming A15 FA506IV-HN172 | |
| Eurocom Sky X4C i9-9900KS | |
| 7-Zip 18.03 / 7z b 4 -mmt1 | |
| Eurocom Sky X4C i9-9900KS | |
| Dell XPS 15 9500 Core i7 4K UHD | |
| MSI GS66 Stealth 10SFS | |
| Average Intel Core i7-10750H (4504 - 5470, n=43) | |
| Asus TUF Gaming A15 FA506IV-HN172 | |
| Schenker Work 15 | |
| Schenker Work 15 | |
| HP Envy 15-ep0098nr | |
| Acer Nitro 5 AN515-44-R5FT | |
| 7-Zip 18.03 / 7z b 4 | |
| Eurocom Sky X4C i9-9900KS | |
| Asus TUF Gaming A15 FA506IV-HN172 | |
| MSI GS66 Stealth 10SFS | |
| Acer Nitro 5 AN515-44-R5FT | |
| Dell XPS 15 9500 Core i7 4K UHD | |
| Average Intel Core i7-10750H (26040 - 37345, n=43) | |
| HP Envy 15-ep0098nr | |
| Schenker Work 15 | |
| Schenker Work 15 | |
| Geekbench 5.5 / Single-Core | |
| Eurocom Sky X4C i9-9900KS | |
| Dell XPS 15 9500 Core i7 4K UHD | |
| MSI GS66 Stealth 10SFS | |
| HP Envy 15-ep0098nr | |
| Average Intel Core i7-10750H (1114 - 1333, n=43) | |
| Asus TUF Gaming A15 FA506IV-HN172 | |
| Acer Nitro 5 AN515-44-R5FT | |
| Geekbench 5.5 / Multi-Core | |
| Eurocom Sky X4C i9-9900KS | |
| Dell XPS 15 9500 Core i7 4K UHD | |
| MSI GS66 Stealth 10SFS | |
| HP Envy 15-ep0098nr | |
| Average Intel Core i7-10750H (4443 - 6674, n=43) | |
| Asus TUF Gaming A15 FA506IV-HN172 | |
| Acer Nitro 5 AN515-44-R5FT | |
| HWBOT x265 Benchmark v2.2 / 4k Preset | |
| Eurocom Sky X4C i9-9900KS | |
| MSI GS66 Stealth 10SFS | |
| Asus TUF Gaming A15 FA506IV-HN172 | |
| HP Envy 15-ep0098nr | |
| Dell XPS 15 9500 Core i7 4K UHD | |
| Average Intel Core i7-10750H (5.54 - 11.6, n=43) | |
| Acer Nitro 5 AN515-44-R5FT | |
| Schenker Work 15 | |
| Schenker Work 15 | |
| LibreOffice / 20 Documents To PDF | |
| Acer Nitro 5 AN515-44-R5FT | |
| Average Intel Core i7-10750H (43.1 - 99.2, n=43) | |
| Dell XPS 15 9500 Core i7 4K UHD | |
| MSI GS66 Stealth 10SFS | |
| HP Envy 15-ep0098nr | |
| Asus TUF Gaming A15 FA506IV-HN172 | |
| R Benchmark 2.5 / Overall mean | |
| Acer Nitro 5 AN515-44-R5FT | |
| Average Intel Core i7-10750H (0.578 - 0.708, n=42) | |
| HP Envy 15-ep0098nr | |
| Asus TUF Gaming A15 FA506IV-HN172 | |
| MSI GS66 Stealth 10SFS | |
| Dell XPS 15 9500 Core i7 4K UHD | |
* ... smaller is better
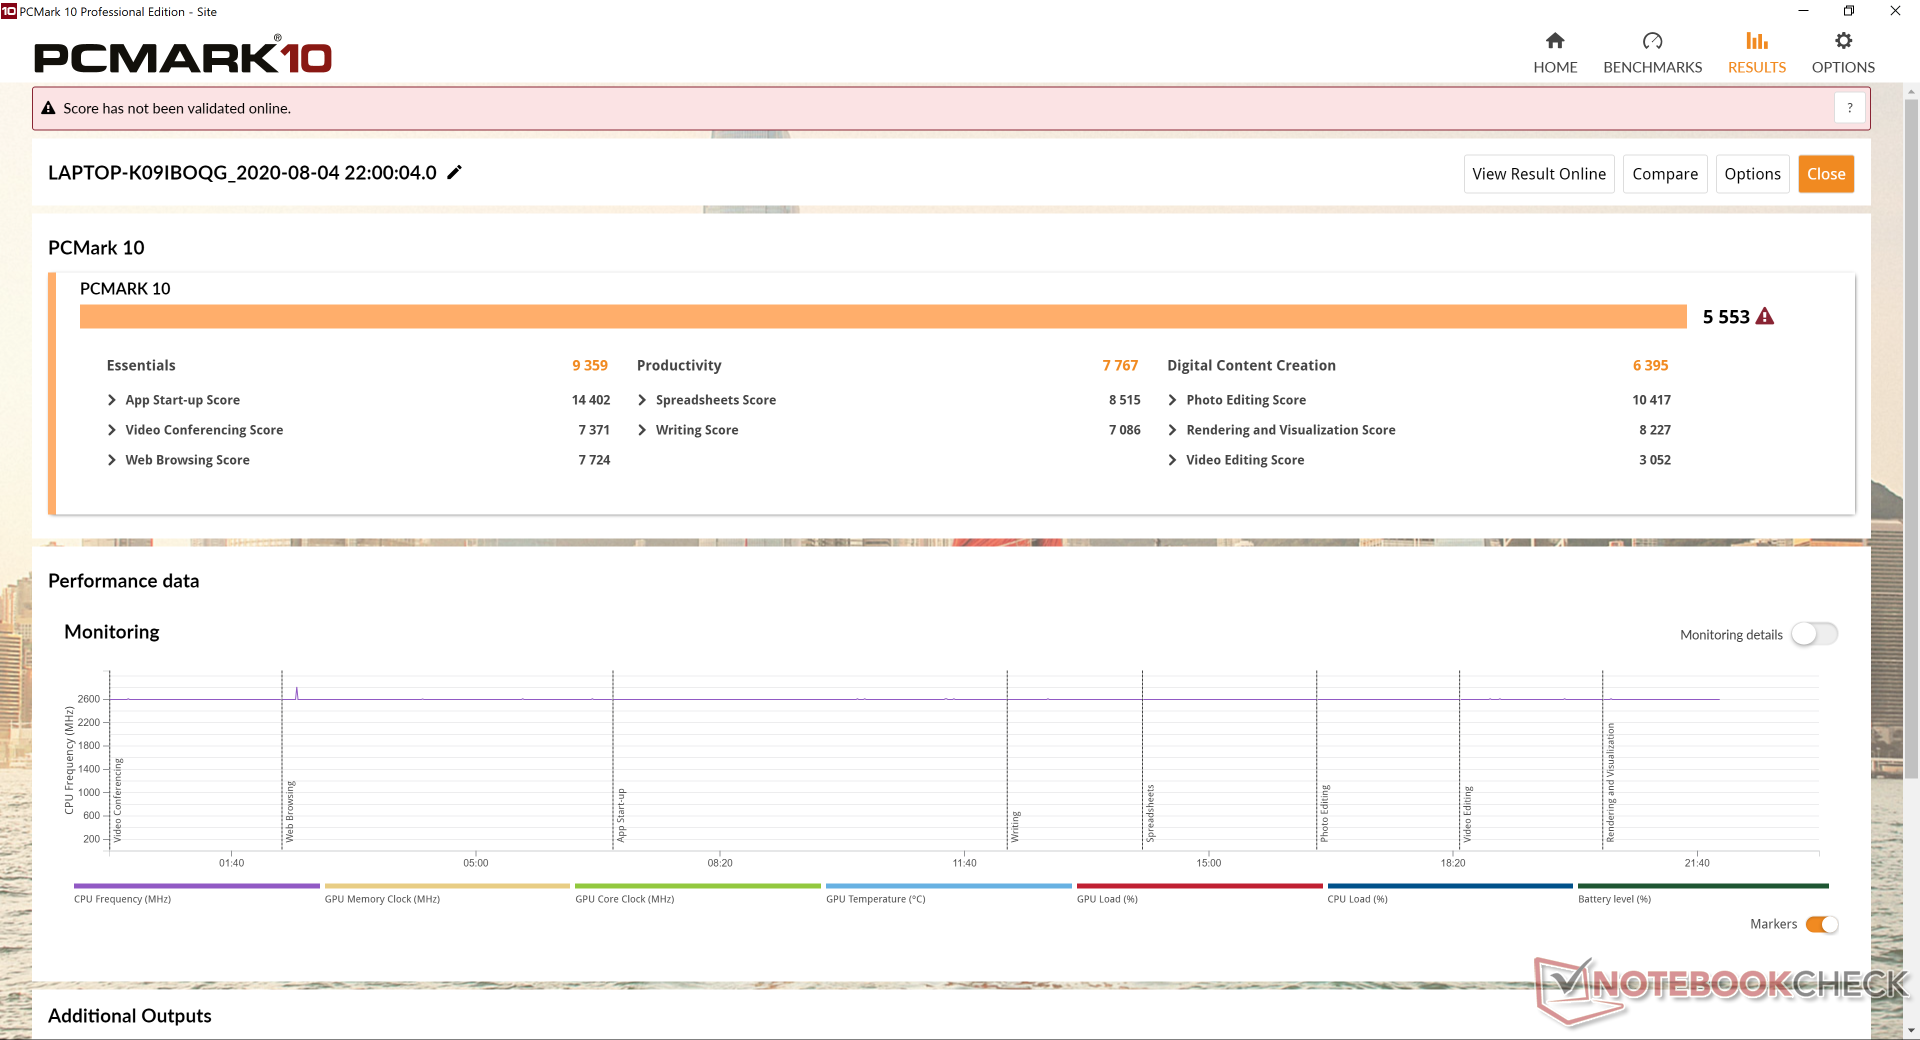
System Performance
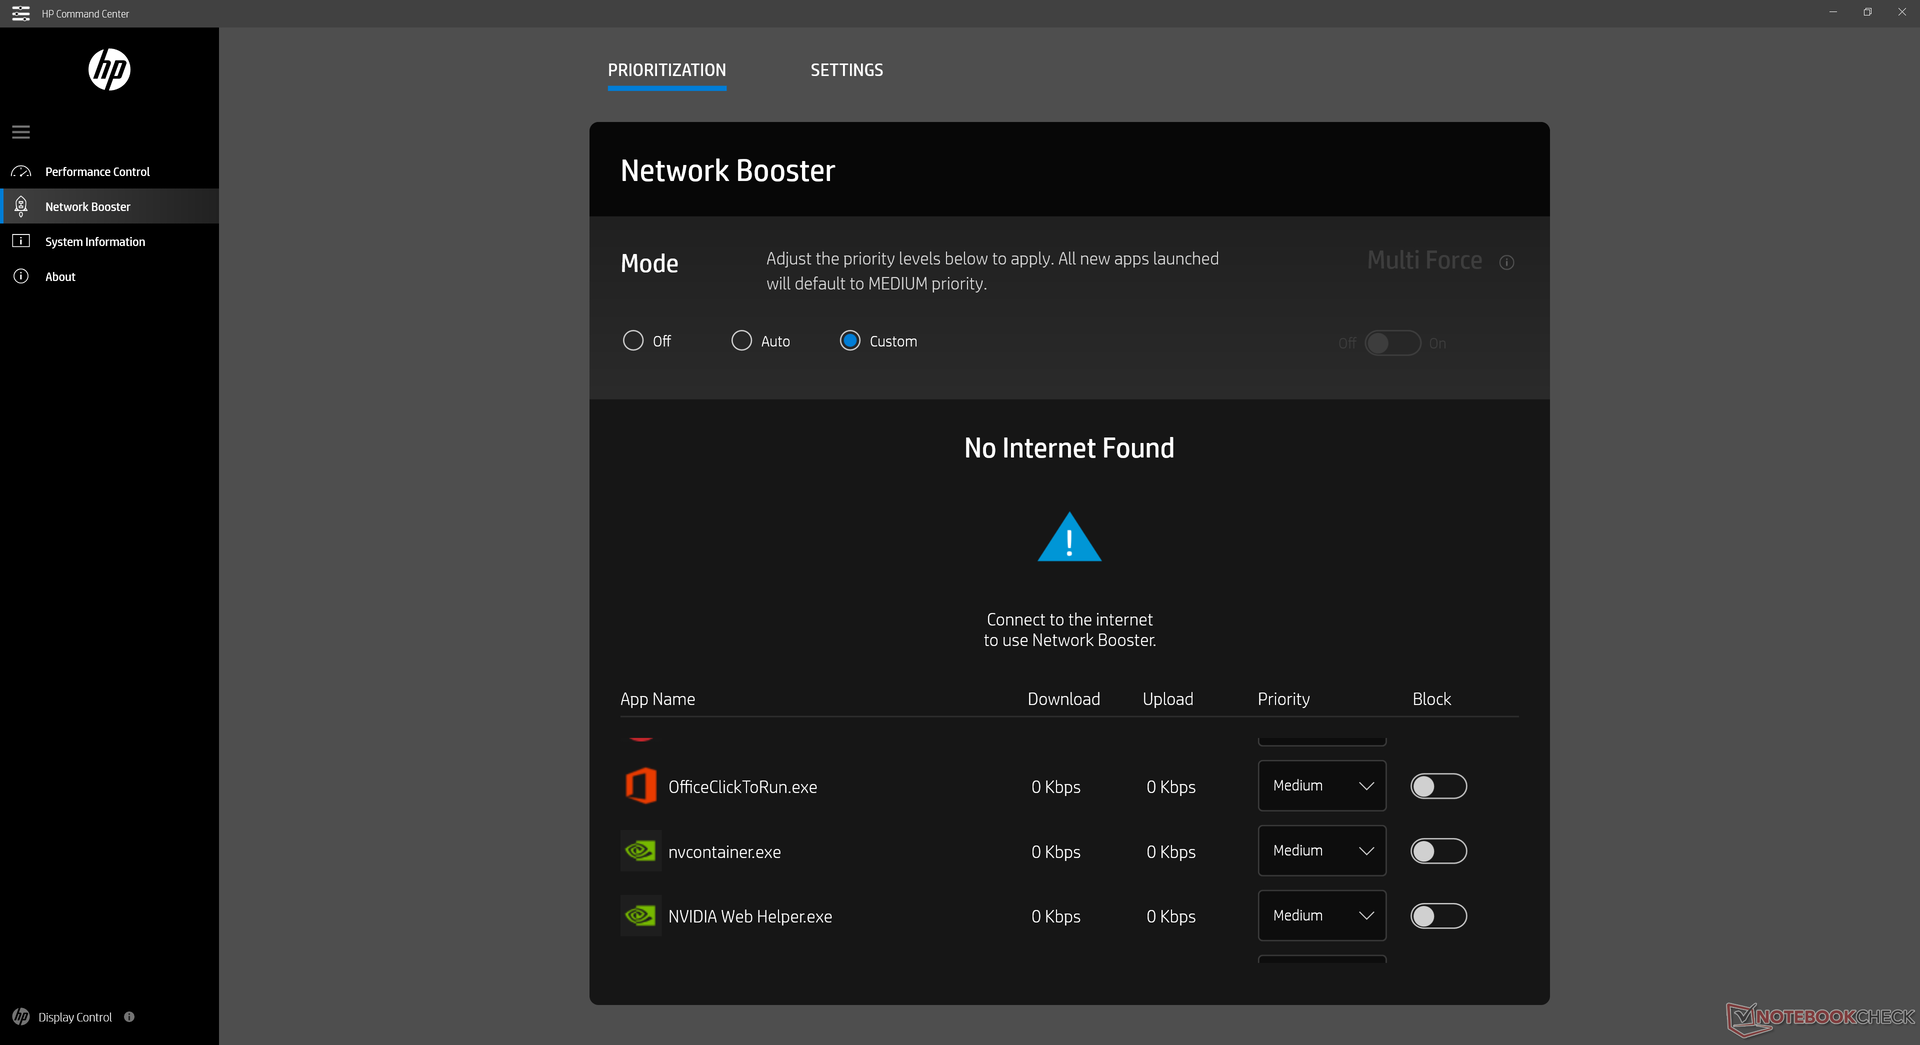
PCMark scores are higher than most other multimedia laptops due largely to the powerful GeForce RTX 2060 Max-Q GPU. We recommend becoming familiar with HP Command Center as system performance and fan noise are intimately tied to this software.
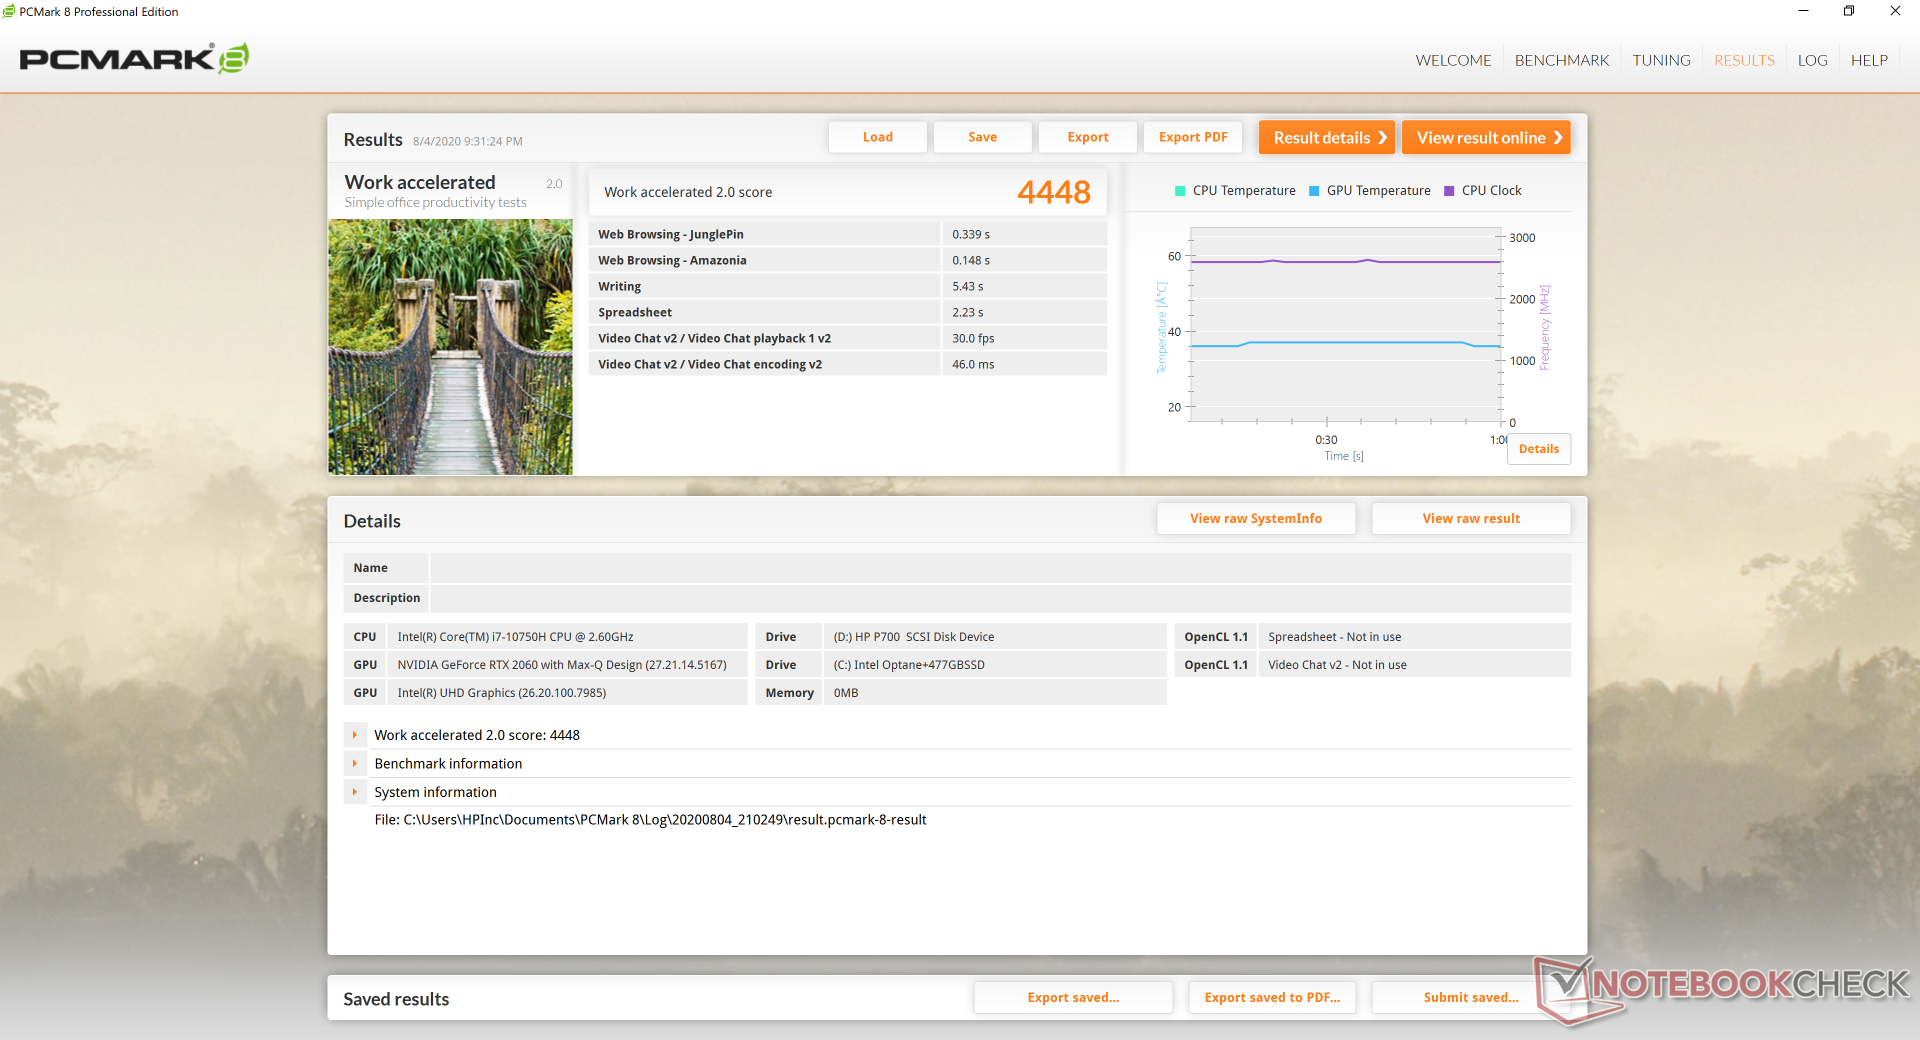
| PCMark 8 Home Score Accelerated v2 | 3463 points | |
| PCMark 8 Work Score Accelerated v2 | 4448 points | |
| PCMark 10 Score | 5553 points | |
Help | ||
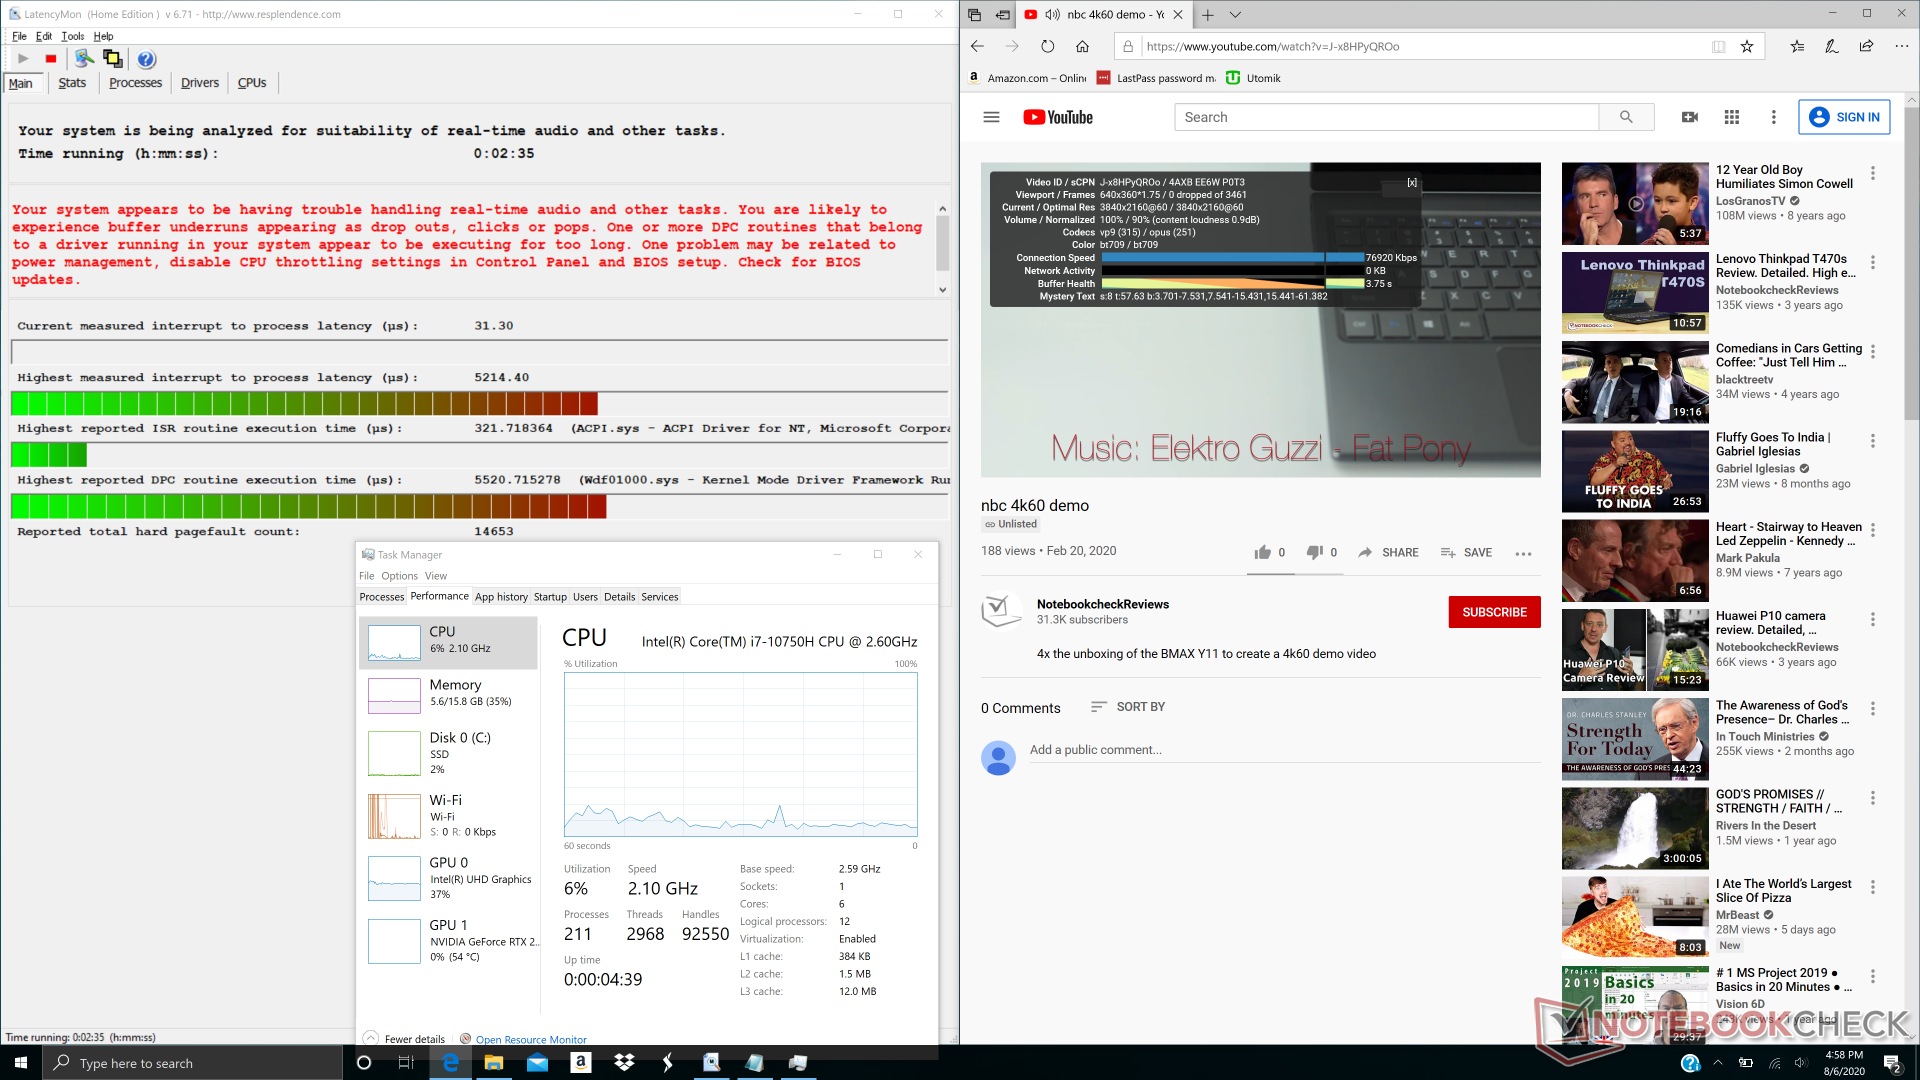
DPC Latency
LatencyMon reveals DPC latency issues when opening multiple tabs on our home page. 4K UHD video playback is otherwise smooth and with no dropped frames.
| DPC Latencies / LatencyMon - interrupt to process latency (max), Web, Youtube, Prime95 | |
| Dell XPS 15 9500 Core i7 4K UHD | |
| HP Envy 15-ep0098nr | |
| HP Envy x360 15-dr1679cl | |
| MSI GS66 Stealth 10SFS | |
| MSI GS66 Stealth 10SE-045 | |
| Razer Blade 15 RZ09-0328 | |
| Asus TUF Gaming A15 FA506IV-HN172 | |
* ... smaller is better
Storage Devices
HP uses the same Intel Optane H10 HBRPEKNX0202A SSD for both its Envy clamshell and Envy x360 convertible series. Standard NVMe options are available at configuration which we recommend over Optane for most general consumers due to price. You're likely not going to notice the advantages of Optane unless if you're a serious content creator working with tons of small 4K block file sizes.
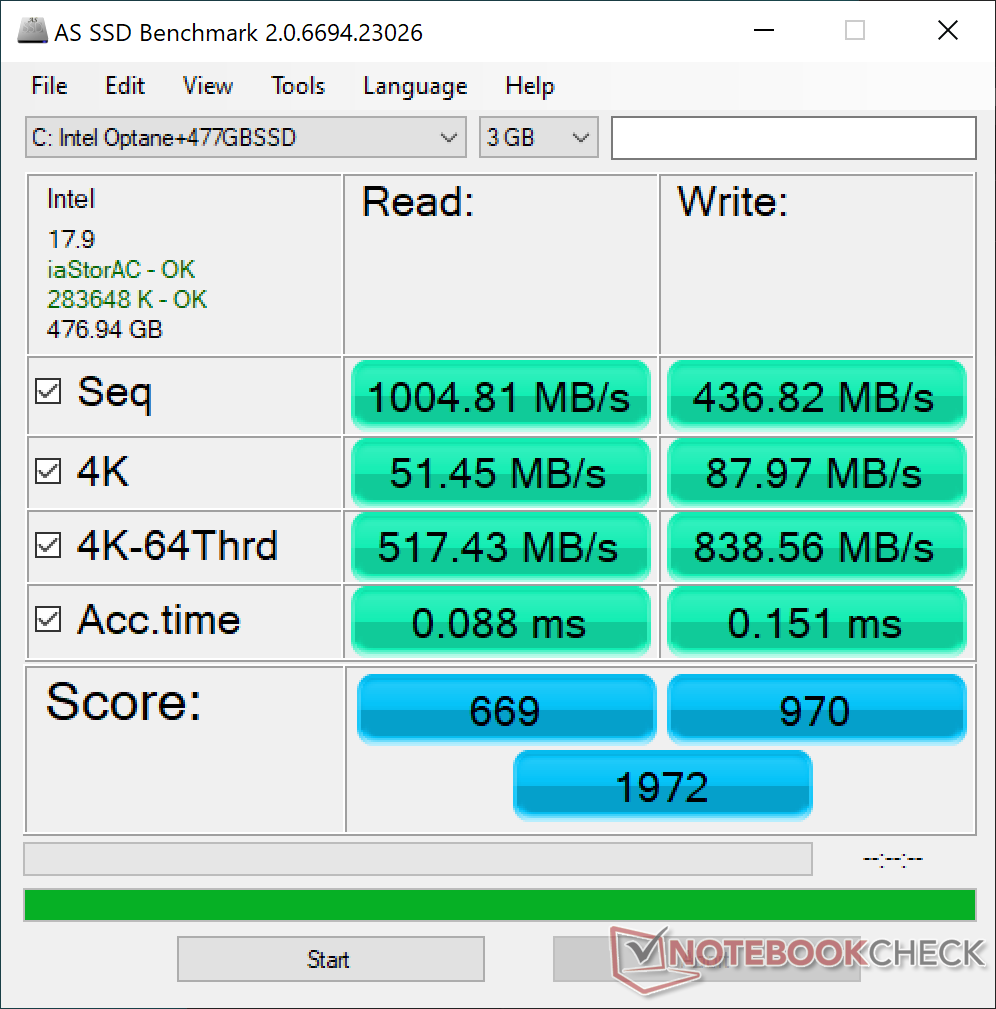
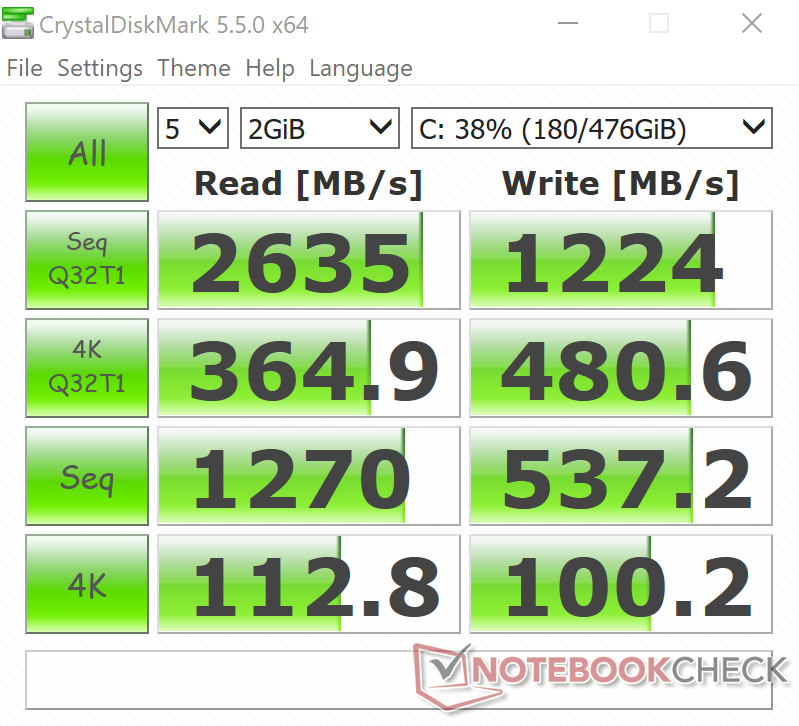
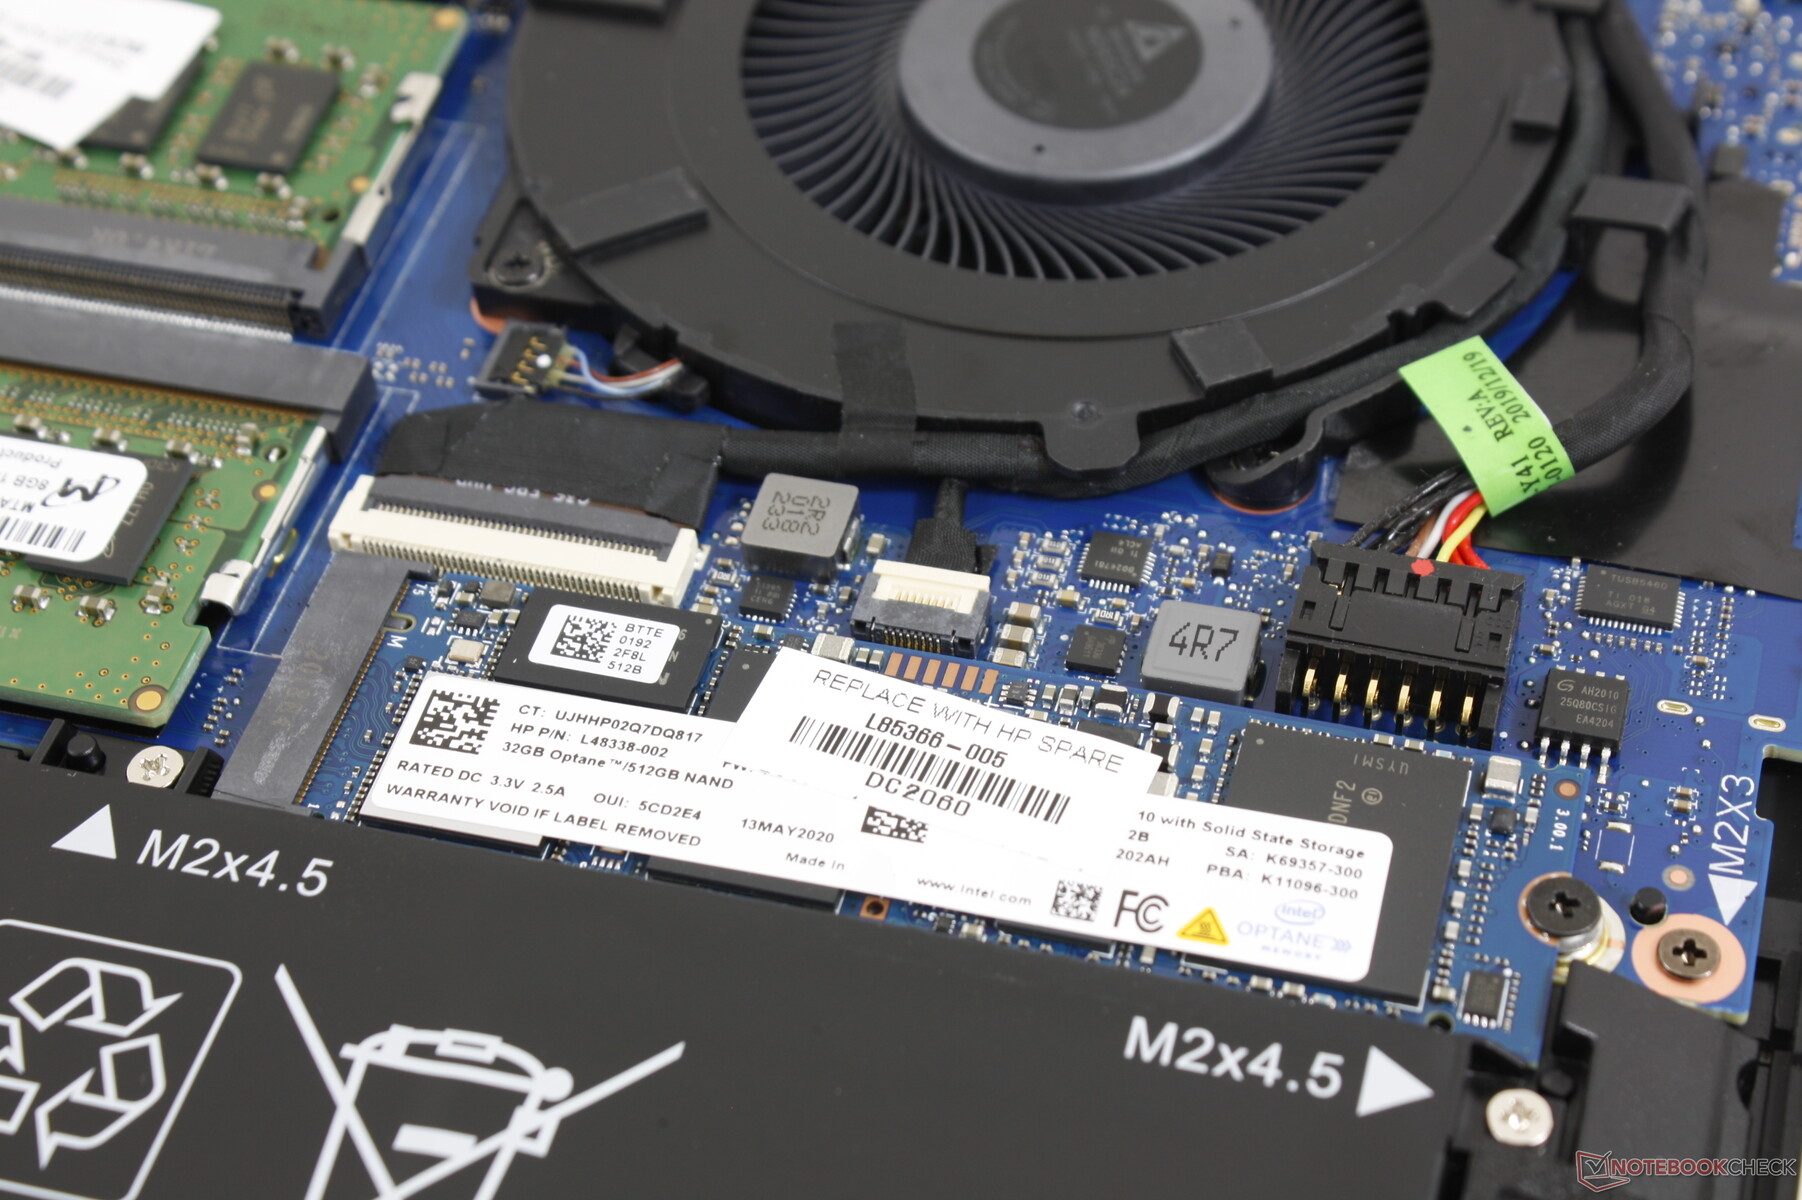
| HP Envy 15-ep0098nr Intel Optane Memory H10 with Solid State Storage 32GB + 512GB HBRPEKNX0202A(L/H) | HP Spectre X360 15-5ZV31AV Intel SSD 660p 2TB SSDPEKNW020T8 | Dell XPS 15 9500 Core i7 4K UHD SK Hynix PC611 512GB | Apple MacBook Pro 16 2019 i9 5500M Apple SSD AP1024 7171 | |
|---|---|---|---|---|
| AS SSD | 32% | 49% | 80% | |
| Seq Read (MB/s) | 1005 | 1220 21% | 2072 106% | 2531 152% |
| Seq Write (MB/s) | 436.8 | 1152 164% | 1486 240% | 2289 424% |
| 4K Read (MB/s) | 51.5 | 52.3 2% | 47.41 -8% | 15.85 -69% |
| 4K Write (MB/s) | 88 | 146.6 67% | 117.6 34% | 39.88 -55% |
| 4K-64 Read (MB/s) | 517 | 652 26% | 967 87% | 1267 145% |
| 4K-64 Write (MB/s) | 839 | 847 1% | 715 -15% | 1749 108% |
| Access Time Read * (ms) | 0.088 | 0.077 12% | 0.057 35% | 0.122 -39% |
| Access Time Write * (ms) | 0.151 | 0.106 30% | 0.096 36% | 0.095 37% |
| Score Read (Points) | 669 | 826 23% | 1222 83% | 1536 130% |
| Score Write (Points) | 970 | 1109 14% | 981 1% | 2018 108% |
| Score Total (Points) | 1972 | 2371 20% | 2809 42% | 4317 119% |
| Copy ISO MB/s (MB/s) | 1173 | 2070 76% | 1999 70% | 1995 70% |
| Copy Program MB/s (MB/s) | 769 | 571 -26% | 627 -18% | 584 -24% |
| Copy Game MB/s (MB/s) | 1045 | 1219 17% | 1001 -4% | 1135 9% |
| CrystalDiskMark 5.2 / 6 | 26% | 51% | 48% | |
| Write 4K (MB/s) | 100.2 | 151.5 51% | 123.3 23% | 55.5 -45% |
| Read 4K (MB/s) | 112.8 | 59.3 -47% | 41.85 -63% | 16.21 -86% |
| Write Seq (MB/s) | 537 | 1424 165% | 2054 282% | 1959 265% |
| Read Seq (MB/s) | 1270 | 1609 27% | 1617 27% | 1763 39% |
| Write 4K Q32T1 (MB/s) | 480.6 | 393.6 -18% | 413 -14% | 398.5 -17% |
| Read 4K Q32T1 (MB/s) | 364.9 | 369.4 1% | 377.5 3% | 648 78% |
| Write Seq Q32T1 (MB/s) | 1224 | 1946 59% | 2705 121% | 2727 123% |
| Read Seq Q32T1 (MB/s) | 2635 | 1934 -27% | 3442 31% | 3242 23% |
| Total Average (Program / Settings) | 29% /
30% | 50% /
50% | 64% /
68% |
* ... smaller is better

Disk Throttling: DiskSpd Read Loop, Queue Depth 8
GPU Performance
Though HP isn't marketing the Envy 15 as a gaming laptop, its GeForce RTX 2060 Max-Q GPU is wholly capable of playing the latest titles at 1080p. Raw performance is only about 5 to 10 percent slower than the regular mobile GeForce RTX 2060 as found on most dedicated gaming laptops. Upgrading from the GTX 1650 Ti or GTX 1660 Ti Max-Q option to our RTX 2060 Max-Q will net about 65 percent and 15 percent faster graphics performance, respectively, on top of any RTX-specific features.
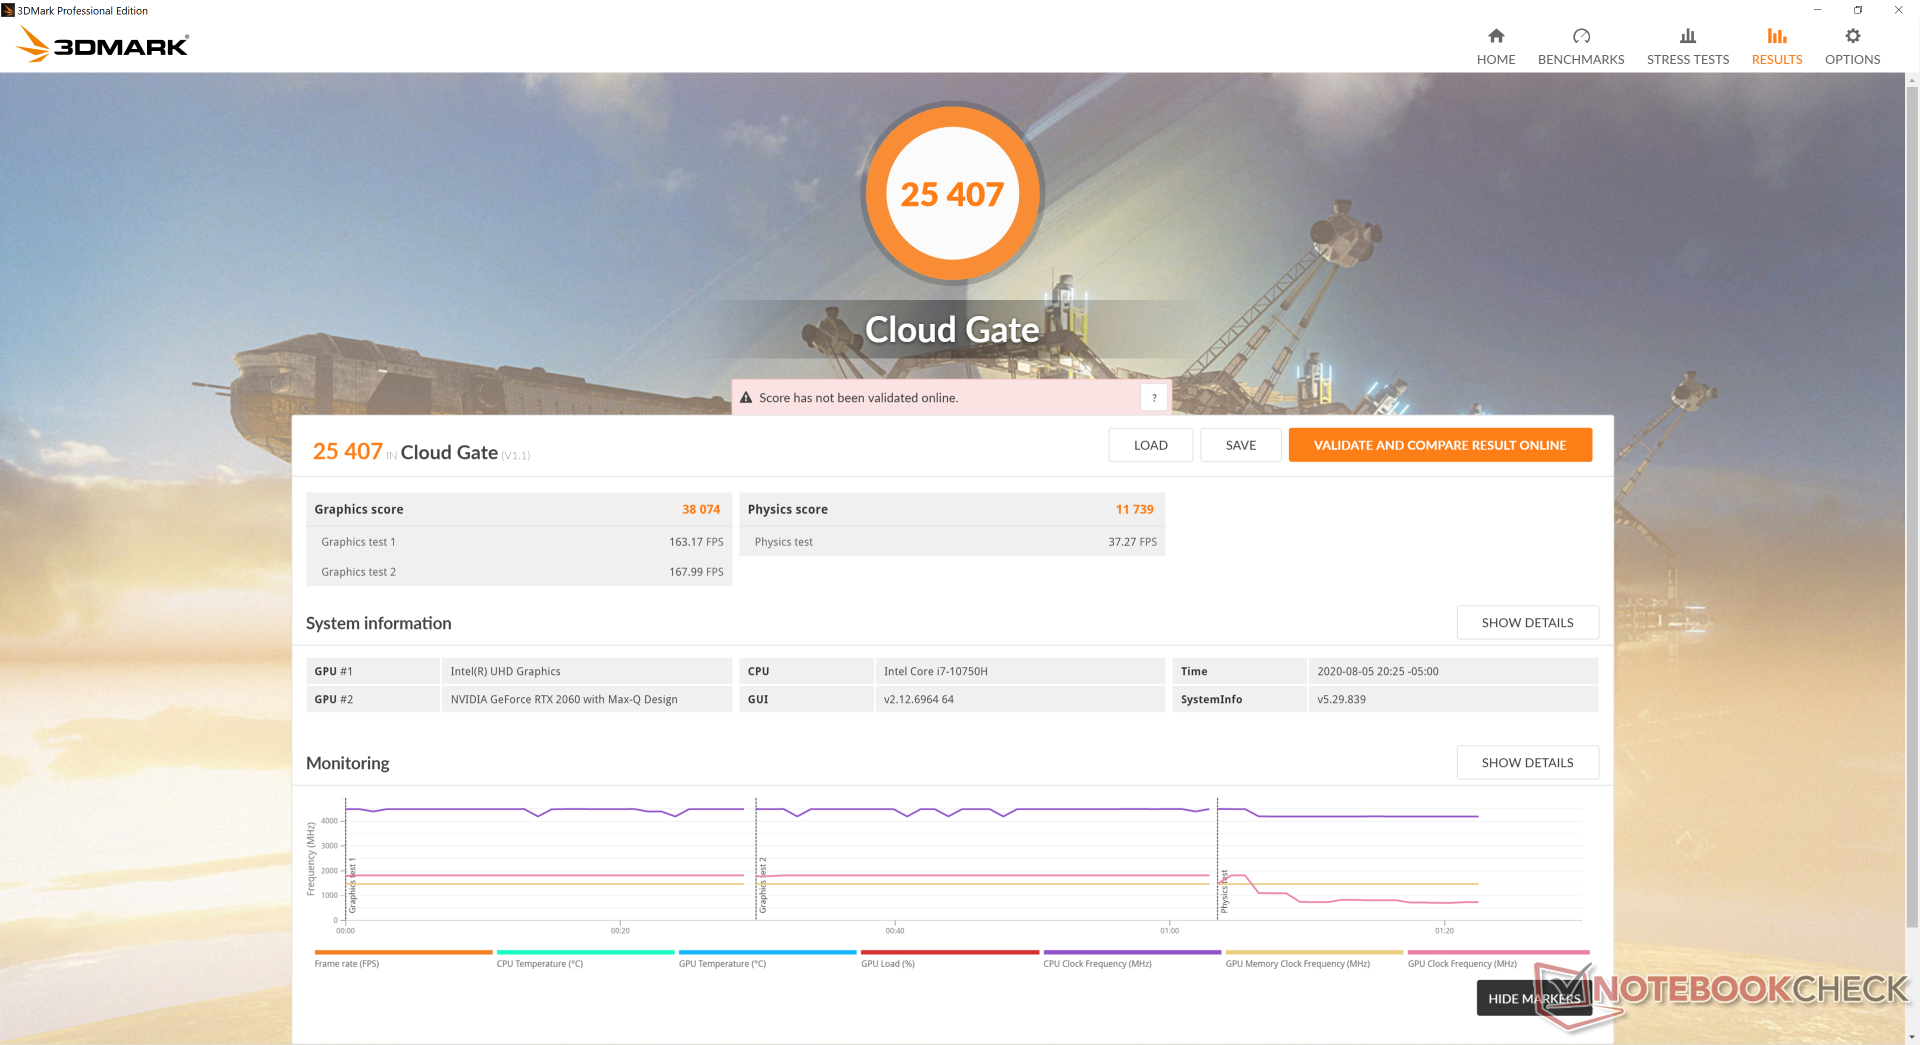
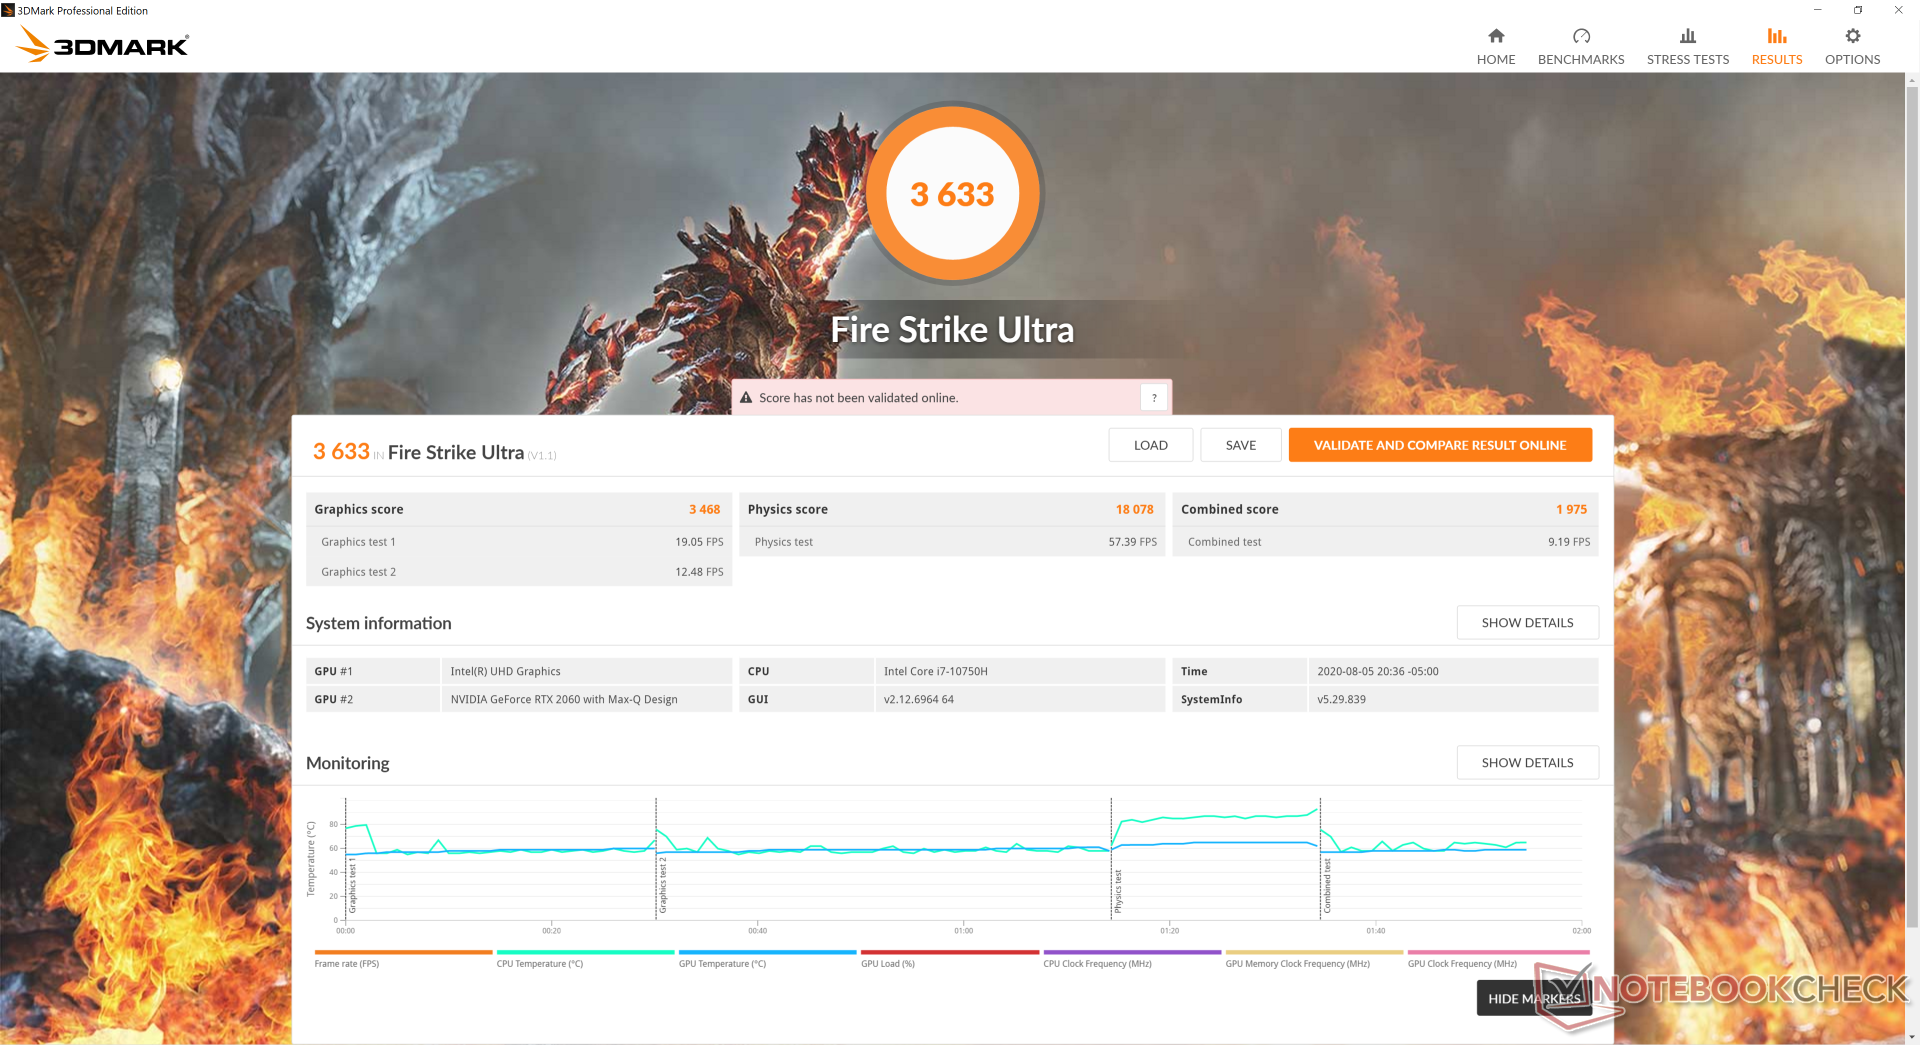
3DMark results are 50 to 75 percent higher than the Radeon Pro 5500M as found on the MacBook Pro 16 to the noticeably faster graphics solution.
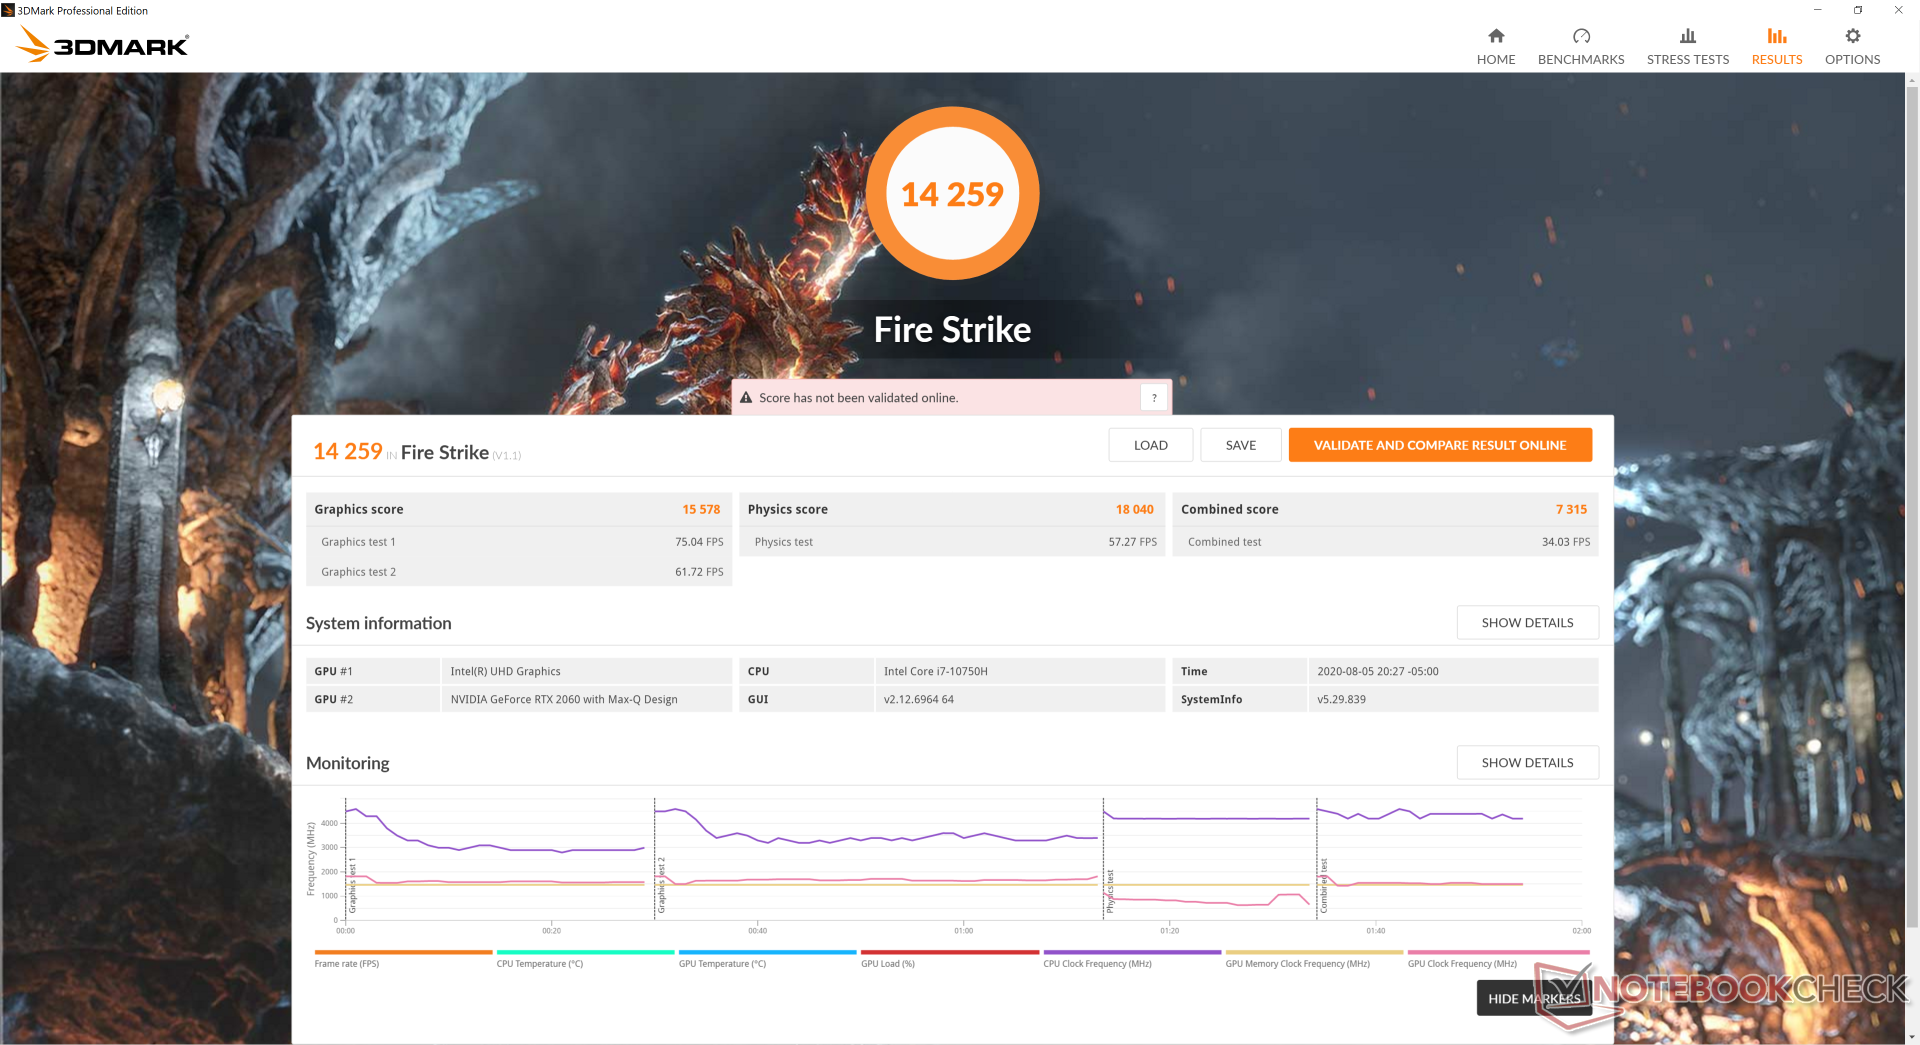
Running the laptop on HP Performance mode results in faster CPU performance when compared to the regular HP Default mode. Our Fire Strike Physics score, for example, would jump from 15002 points to 18040 points.
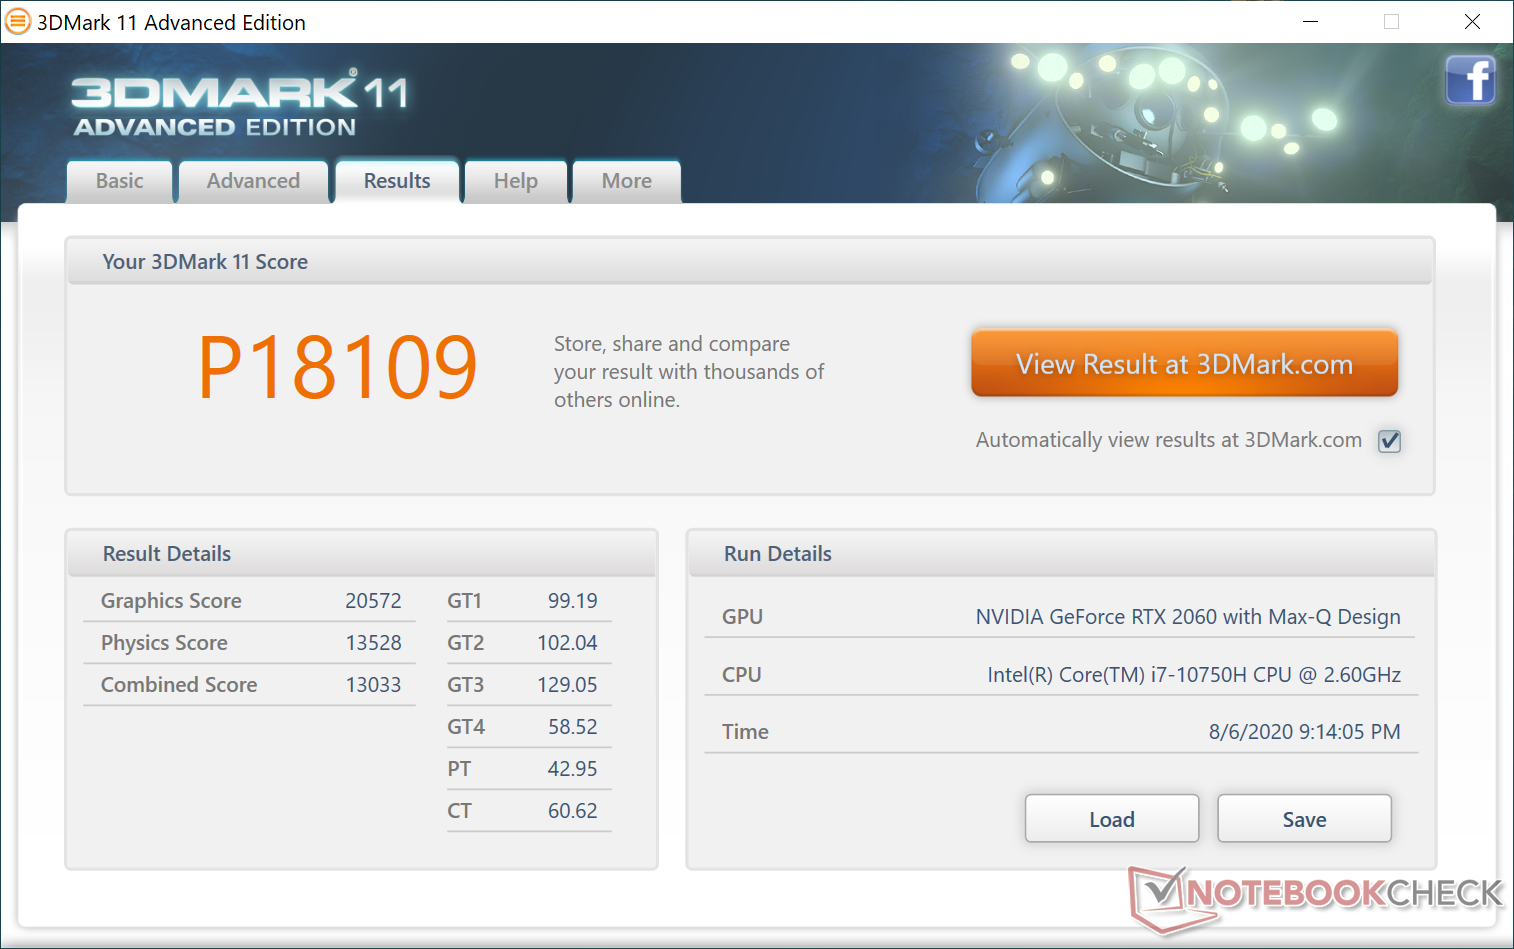

| 3DMark 11 Performance | 18109 points | |
| 3DMark Cloud Gate Standard Score | 25407 points | |
| 3DMark Fire Strike Score | 14259 points | |
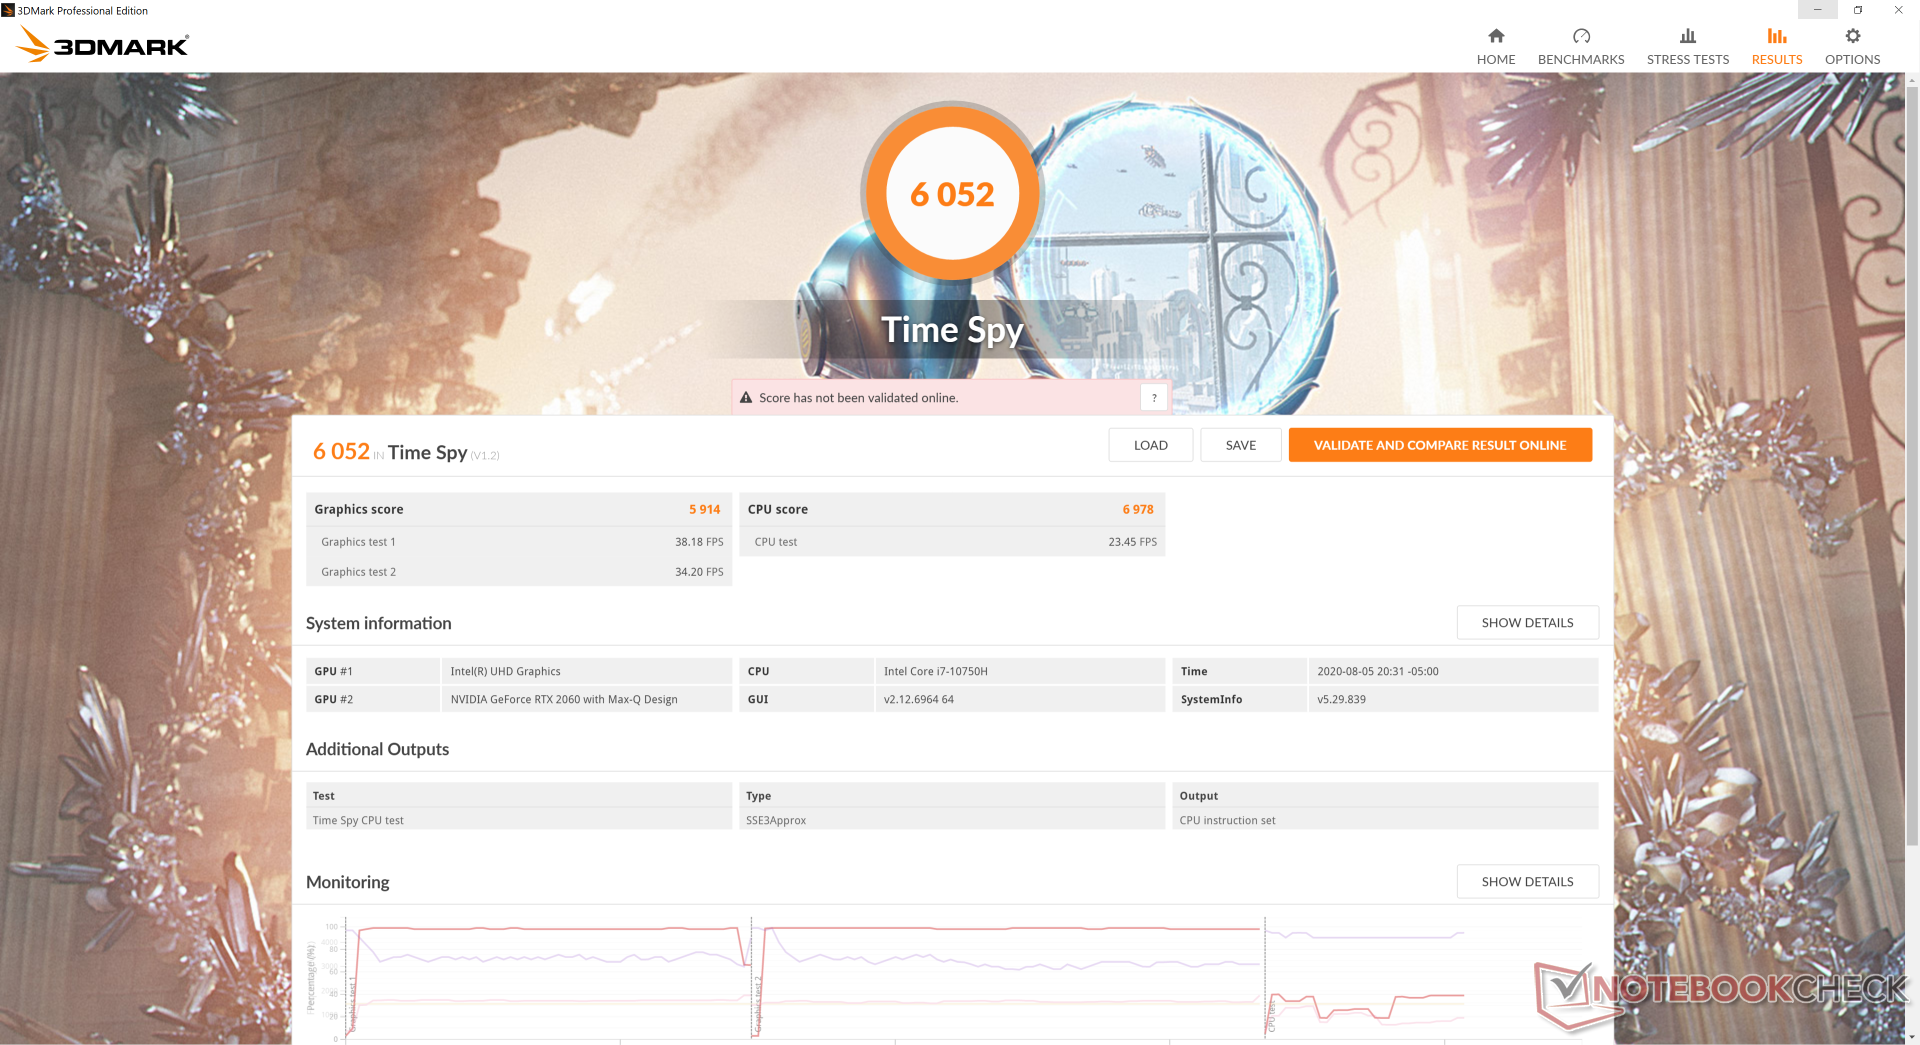
| 3DMark Time Spy Score | 6052 points | |
Help | ||
| low | med. | high | ultra | QHD | 4K | |
|---|---|---|---|---|---|---|
| The Witcher 3 (2015) | 310.8 | 209.6 | 119 | 62.9 | 45.5 | |
| Dota 2 Reborn (2015) | 141 | 129 | 120 | 114 | 83.2 | |
| Final Fantasy XV Benchmark (2018) | 139 | 79 | 61.3 | 43.6 | 24.9 | |
| X-Plane 11.11 (2018) | 103 | 90.7 | 77.4 | 59.3 |
Emissions
System Noise
The fans never idle even when set to the quietest settings through HP Command Center. Fan noise bottoms at 32.2 dB(A) against a background of 26.4 dB(A) to always be slightly audible no matter the onscreen load. It's not loud enough to be distracting, but don't expect this laptop to be as quiet as a typical Ultrabook.
Fan noise jumps noticeably when subjected to higher loads. Running Witcher 3 on the HP Default and HP performance power profiles would result in a fan noise of 50 .8 dB(A) and 53.7 dB(A), respectively, to be similar in range to many high-performance gaming laptops.
| HP Envy 15-ep0098nr GeForce RTX 2060 Max-Q, i7-10750H, Intel Optane Memory H10 with Solid State Storage 32GB + 512GB HBRPEKNX0202A(L/H) | HP Envy x360 15-dr1679cl UHD Graphics 620, i7-10510U, Intel Optane Memory H10 with Solid State Storage 32GB + 512GB HBRPEKNX0202A(L/H) | HP Spectre X360 15-5ZV31AV GeForce MX250, i7-10510U, Intel SSD 660p 2TB SSDPEKNW020T8 | Dell XPS 15 9500 Core i7 4K UHD GeForce GTX 1650 Ti Mobile, i7-10875H, SK Hynix PC611 512GB | Apple MacBook Pro 16 2019 i9 5500M Radeon Pro 5500M, i9-9880H, Apple SSD AP1024 7171 | |
|---|---|---|---|---|---|
| Noise | 11% | 14% | 11% | 8% | |
| off / environment * (dB) | 26.4 | 28 -6% | 30.1 -14% | 28.4 -8% | 29.8 -13% |
| Idle Minimum * (dB) | 32.2 | 28 13% | 30.1 7% | 28.4 12% | 29.9 7% |
| Idle Average * (dB) | 32.2 | 30.2 6% | 30.1 7% | 28.4 12% | 29.9 7% |
| Idle Maximum * (dB) | 32.2 | 31.5 2% | 30.1 7% | 28.4 12% | 29.9 7% |
| Load Average * (dB) | 48.3 | 35.7 26% | 30.1 38% | 46 5% | 43 11% |
| Witcher 3 ultra * (dB) | 53.7 | 39.7 26% | 42 22% | 45.4 15% | |
| Load Maximum * (dB) | 58.8 | 43.1 27% | 42 29% | 47.1 20% | 46.1 22% |
* ... smaller is better
Noise level
| Idle |
| 32.2 / 32.2 / 32.2 dB(A) |
| Load |
| 48.3 / 58.8 dB(A) |
 | ||
30 dB silent 40 dB(A) audible 50 dB(A) loud |
||
min: | ||
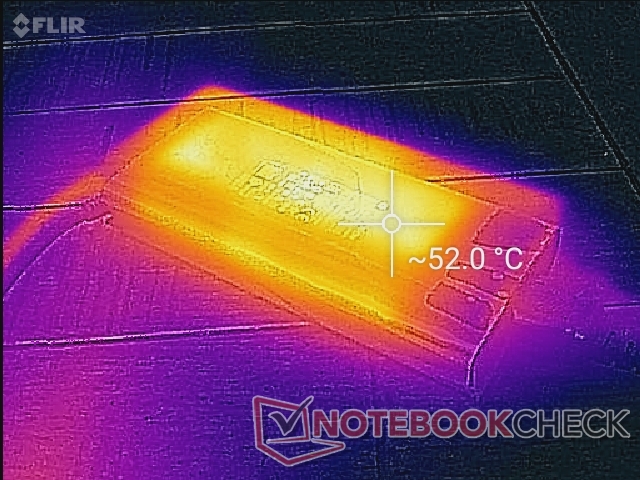
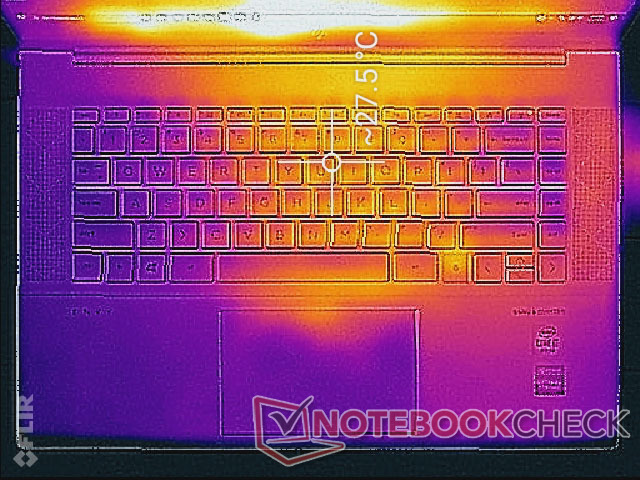
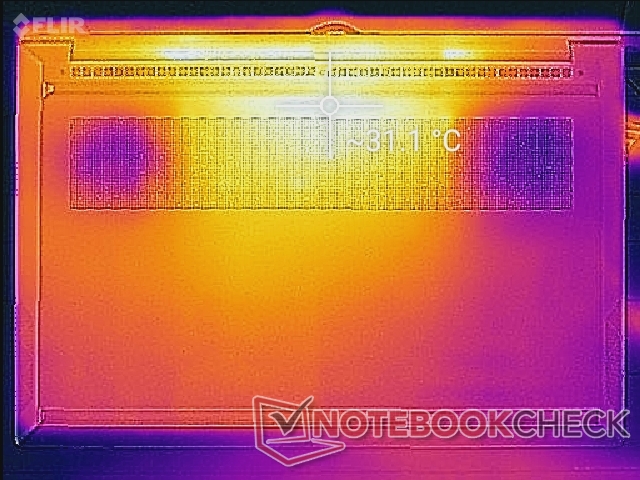
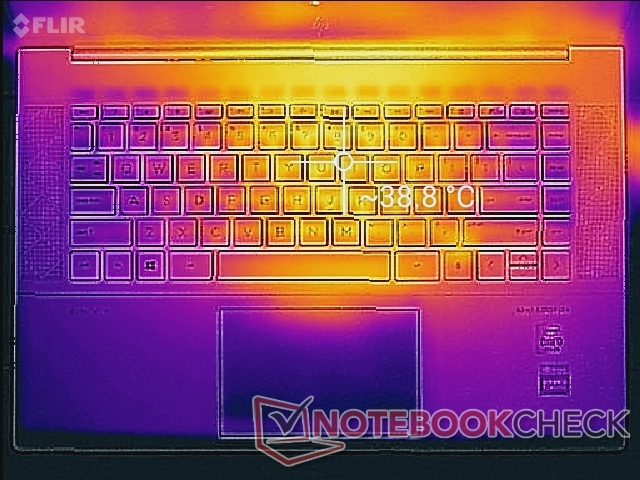
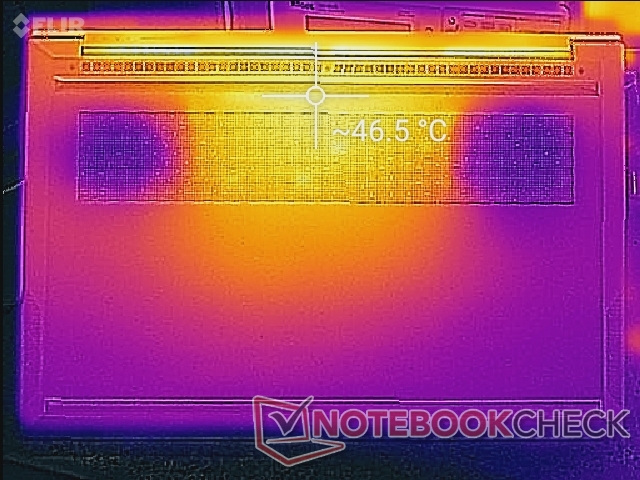
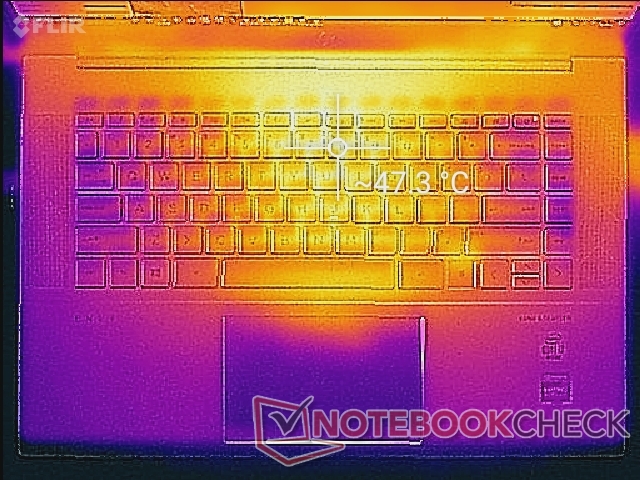
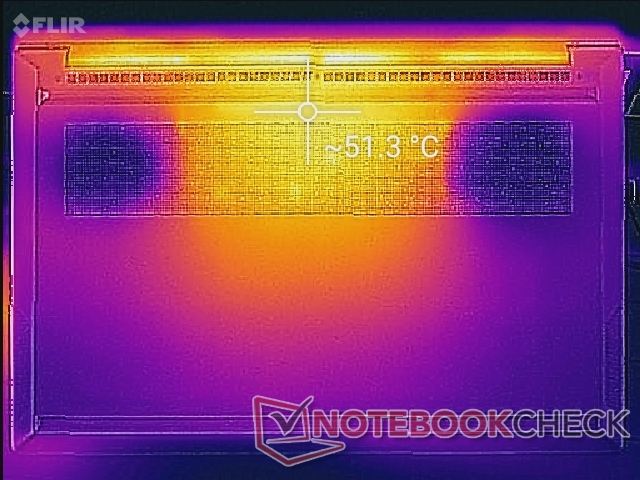
Temperature
Surface temperature development is largely symmetrical. Hot spots near the center can be as warm as 47 C to 51 C on the top and bottom sides of the laptop, respectively, compared to 41 C to 47 C on the MacBook Pro 16. The Envy 15 will feel more like a thin gaming laptop than an Ultrabook when under high loads in this regard.
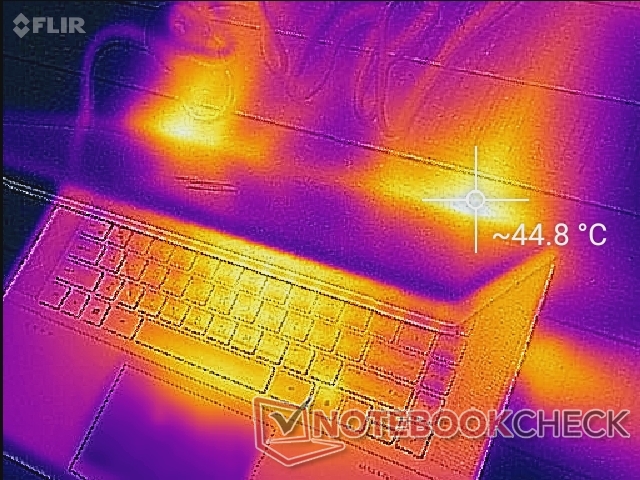
(-) The maximum temperature on the upper side is 47.6 °C / 118 F, compared to the average of 36.8 °C / 98 F, ranging from 21 to 71 °C for the class Multimedia.
(-) The bottom heats up to a maximum of 52 °C / 126 F, compared to the average of 39.1 °C / 102 F
(+) In idle usage, the average temperature for the upper side is 26.1 °C / 79 F, compared to the device average of 31.3 °C / 88 F.
(±) Playing The Witcher 3, the average temperature for the upper side is 32.4 °C / 90 F, compared to the device average of 31.3 °C / 88 F.
(+) The palmrests and touchpad are cooler than skin temperature with a maximum of 31.8 °C / 89.2 F and are therefore cool to the touch.
(-) The average temperature of the palmrest area of similar devices was 28.7 °C / 83.7 F (-3.1 °C / -5.5 F).
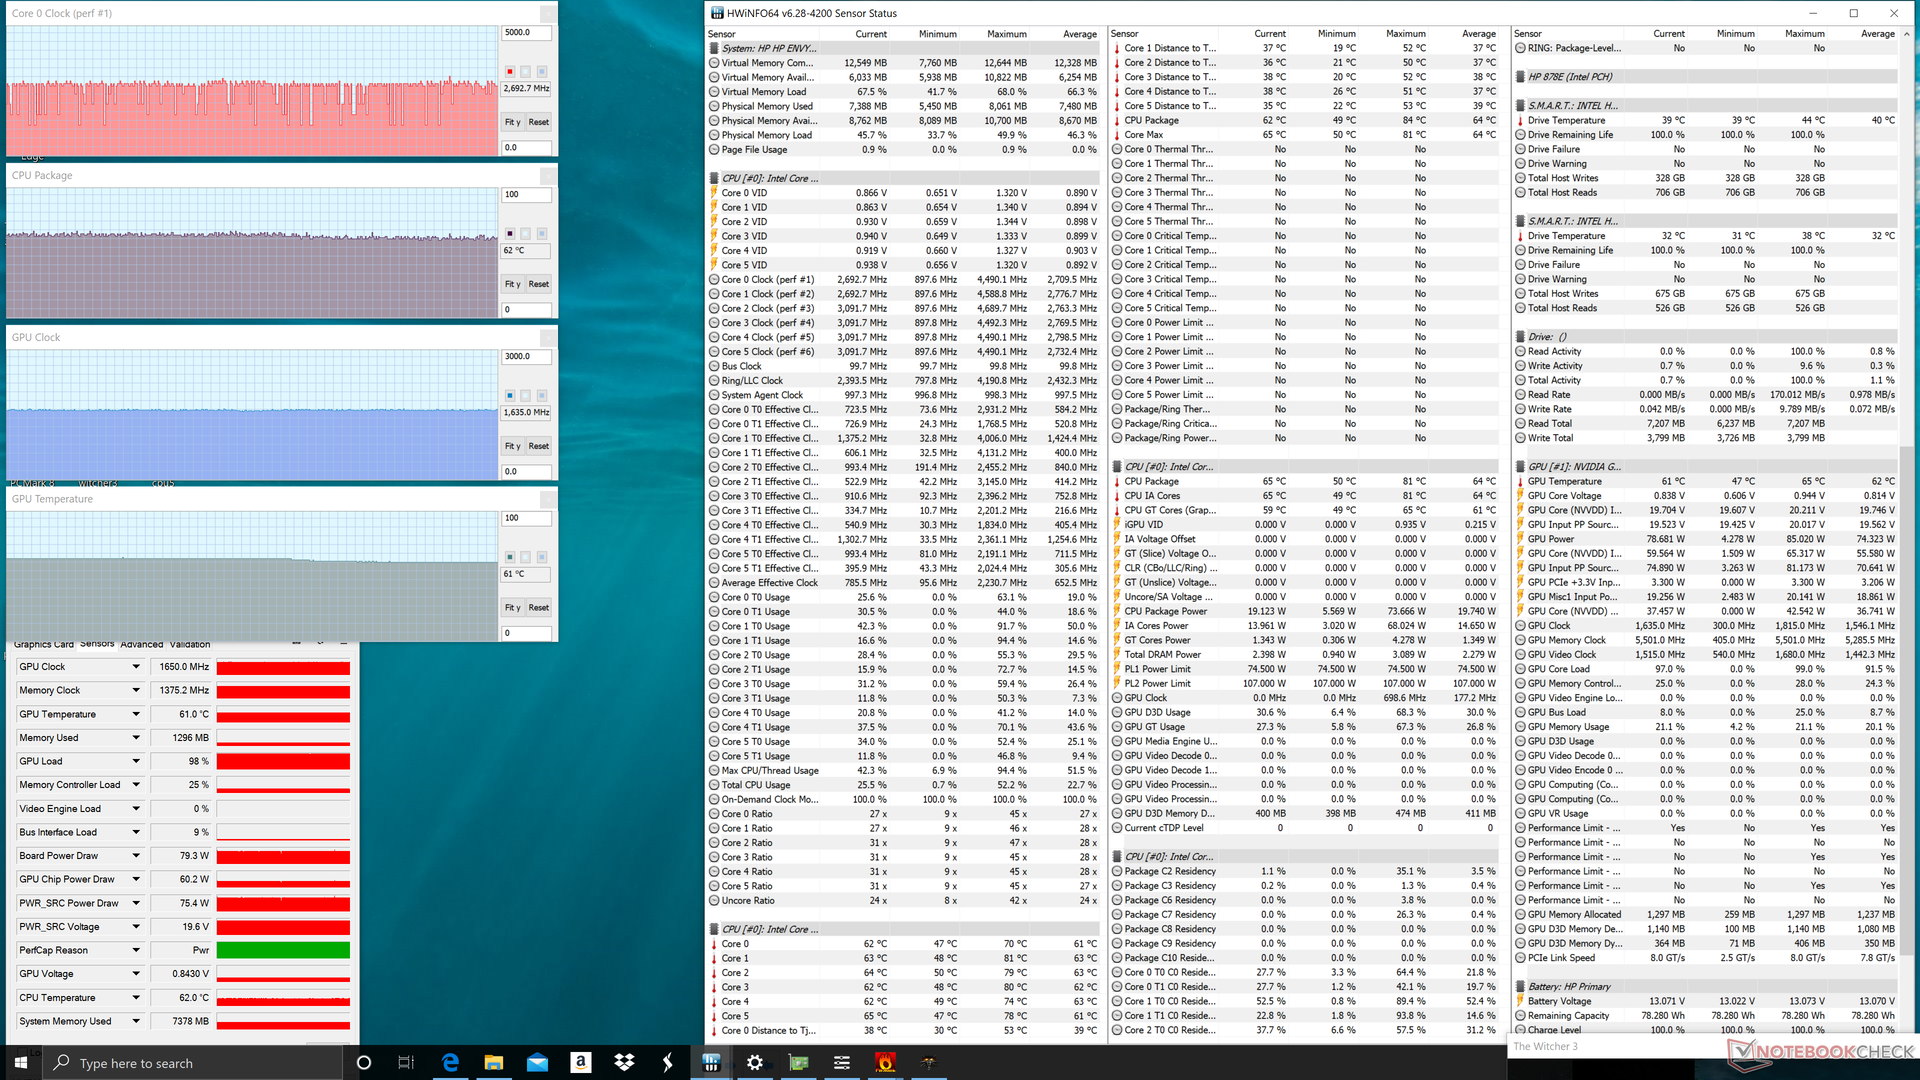
Stress Test
When running Prime95 on HP Performance mode, the CPU would boost to 4.2 GHz with the fan kicking to gear once core temperature reaches 85 C. It eventually stabilizes at 4.0 to 4.1 GHz and at a core temperature of 86 C. If running the same test on HP Default mode, the CPU would stabilize at a much lower 2.1 GHz clock rate and 61 C core temperature instead. The performance differences between the HP profiles are therefore significant if running high processing loads.
Interestingly, average core temperatures when under extreme loads are not all that different from the MacBook Pro 16 even though the latter uses a slower Radeon GPU. When running Prime95 and FurMark, the CPU and GPU in the HP would stabilize at 88 C and 71 C, respectively, compared to 78 C and 79 C on the Apple.
Running on battery power will limit performance. A Fire Strike test on batteries would return Physics and Graphics scores of 11779 and 4440 points, respectively, compared to 18040 and 15578 points when on mains.
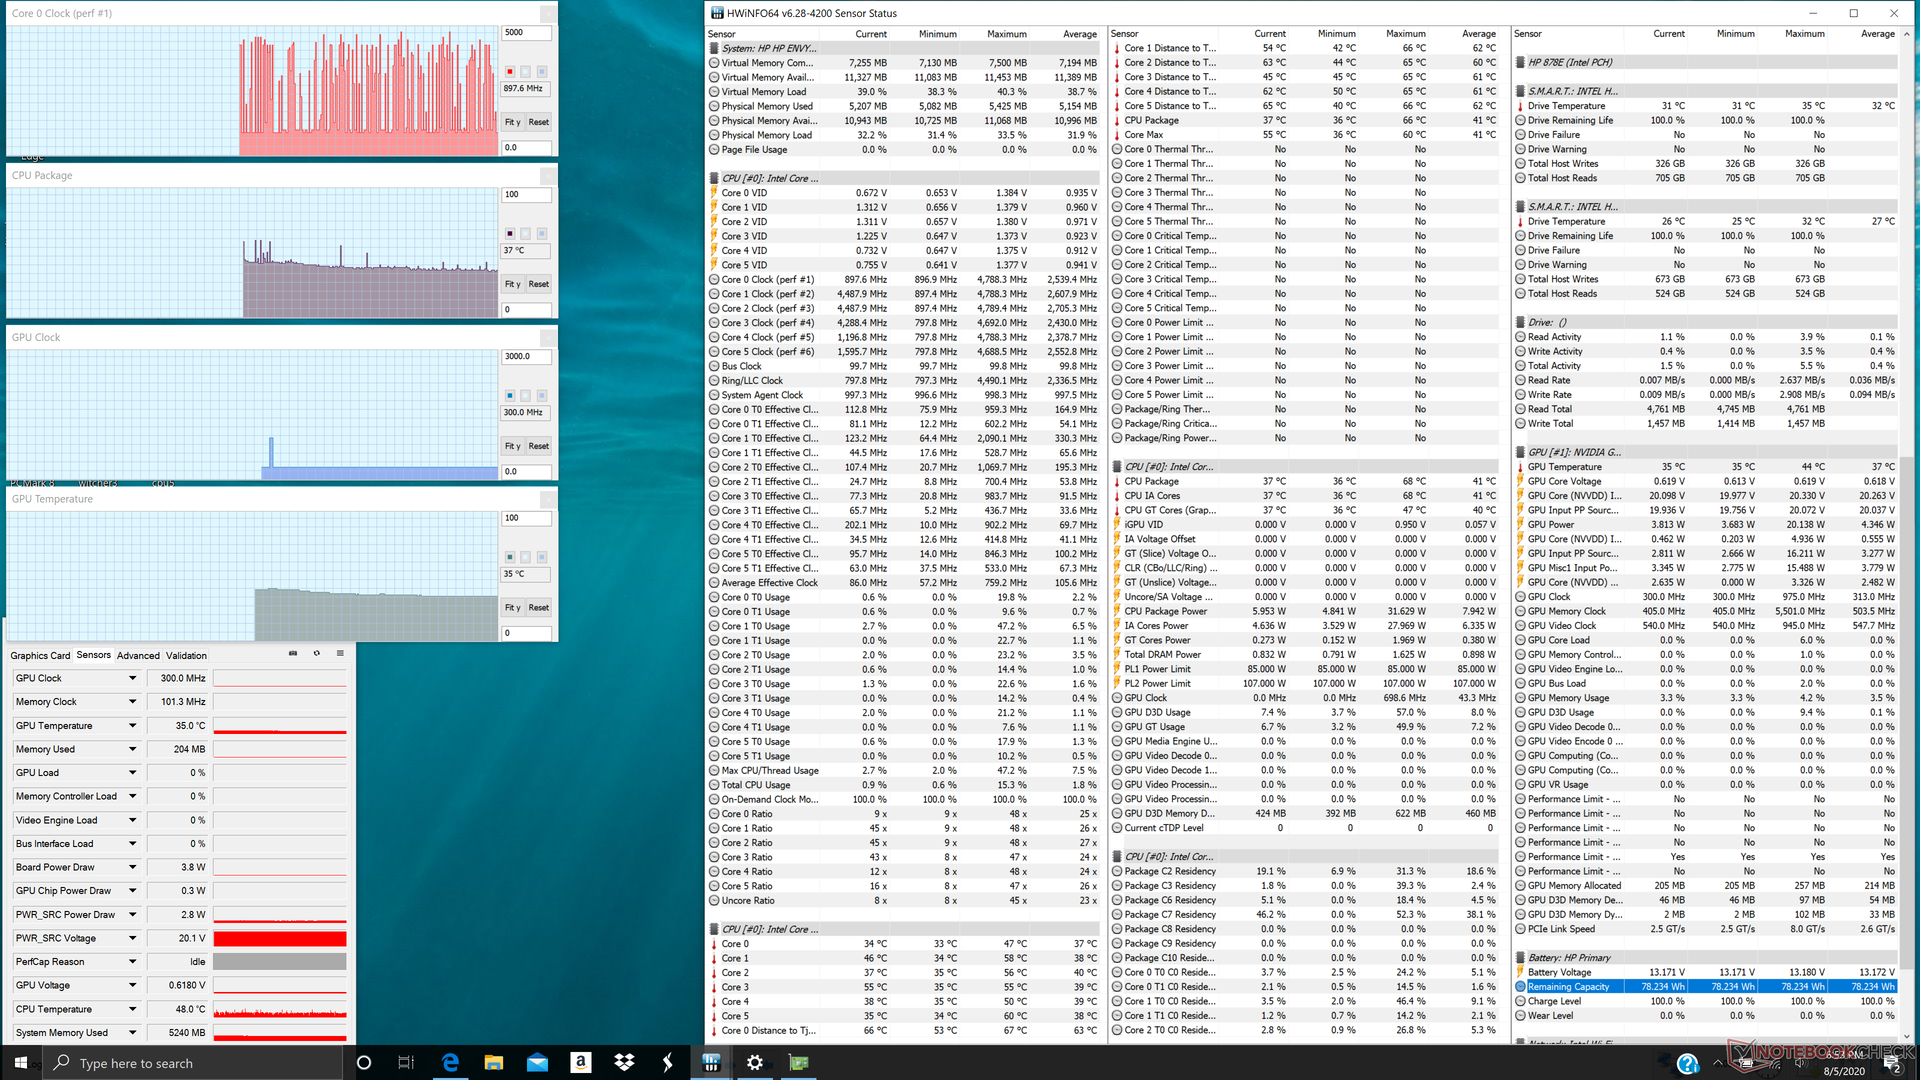
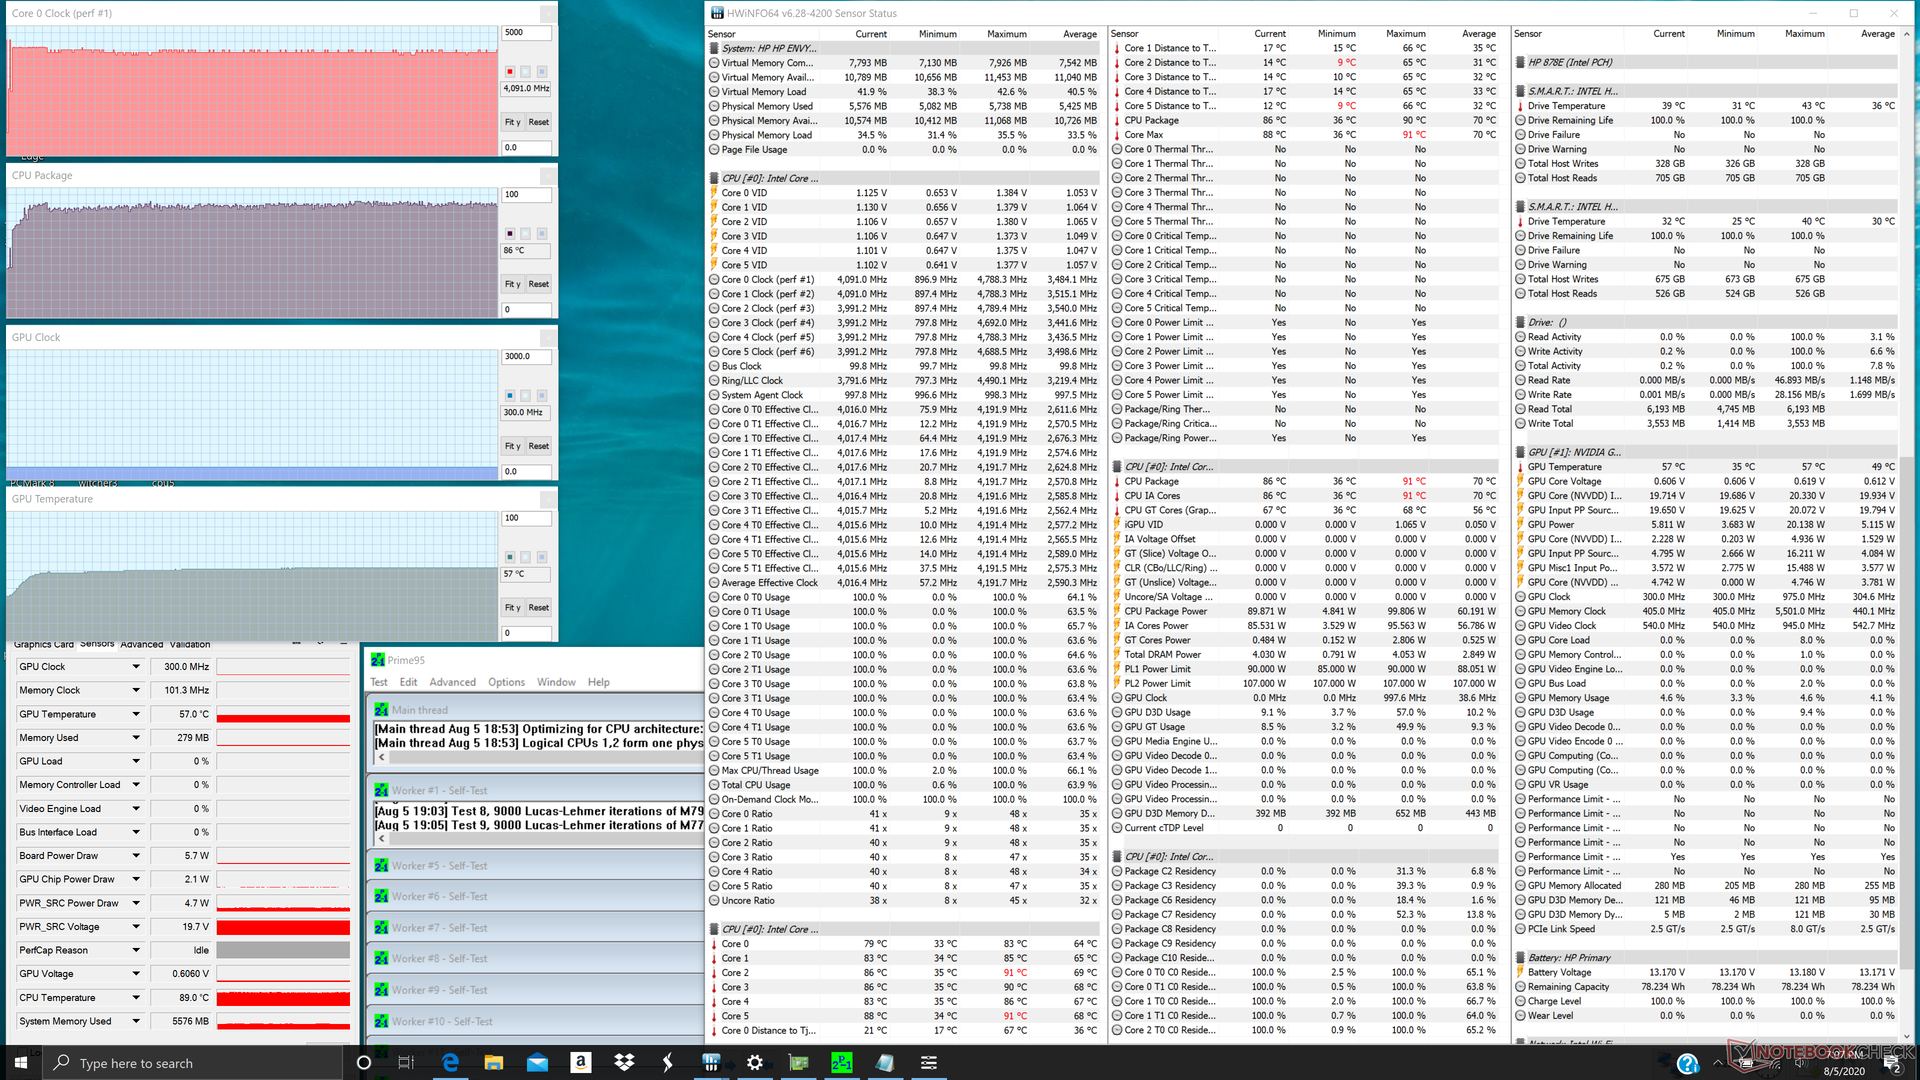
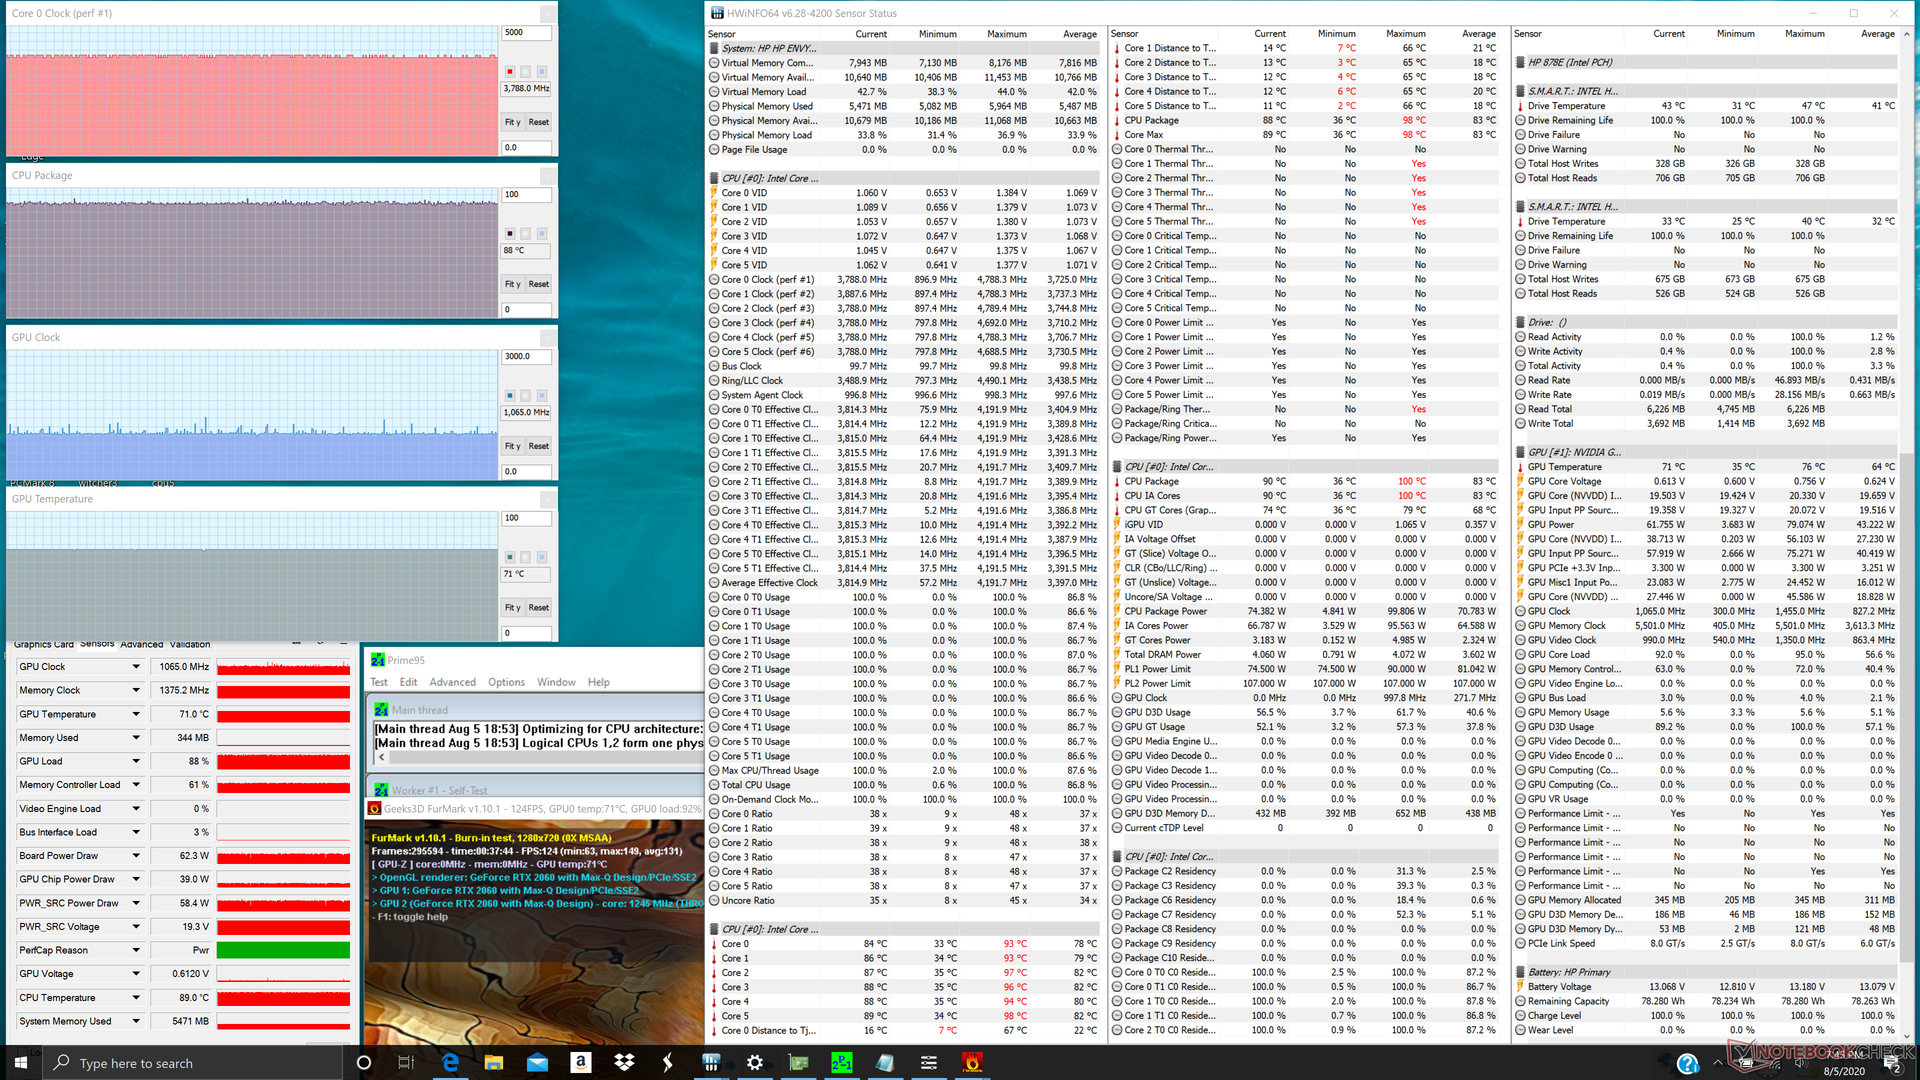
| CPU Clock (GHz) | GPU Clock (MHz) | Average CPU Temperature (°C) | Average GPU Temperature (°C) | |
| System Idle | -- | -- | 37 | 35 |
| Prime95 Stress | 4.0 - 4.1 | -- | 86 | 57 |
| Prime95 + FurMark Stress | 3.7 - 3.8 | 1065 | 88 | 71 |
| Witcher 3 Stress | ~2.7 | 1650 | 62 | 61 |
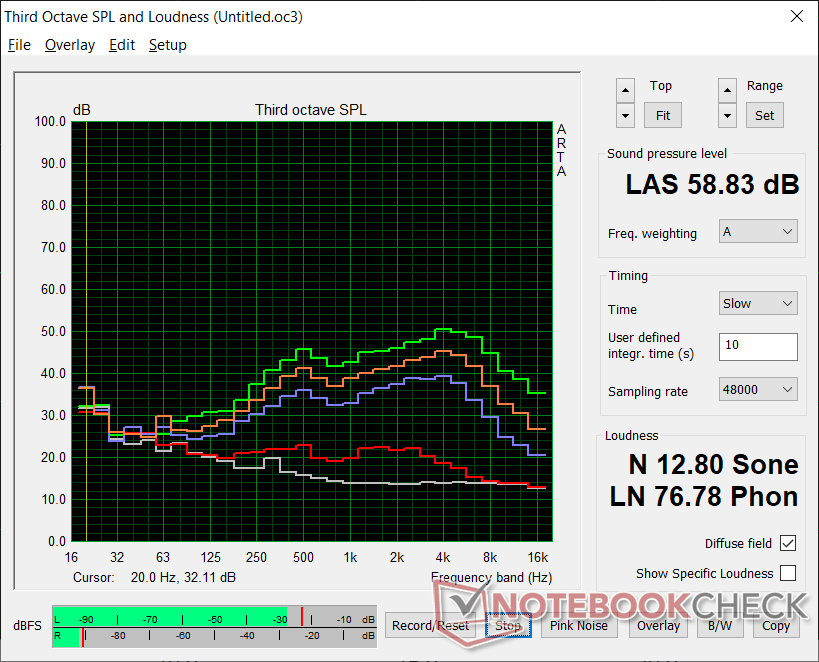
Speakers


HP Envy 15-ep0098nr audio analysis
(±) | speaker loudness is average but good (79.9 dB)
Bass 100 - 315 Hz
(-) | nearly no bass - on average 15.8% lower than median
(±) | linearity of bass is average (14.9% delta to prev. frequency)
Mids 400 - 2000 Hz
(+) | balanced mids - only 3.7% away from median
(+) | mids are linear (5.9% delta to prev. frequency)
Highs 2 - 16 kHz
(+) | balanced highs - only 1.8% away from median
(+) | highs are linear (4% delta to prev. frequency)
Overall 100 - 16.000 Hz
(±) | linearity of overall sound is average (16.2% difference to median)
Compared to same class
» 41% of all tested devices in this class were better, 7% similar, 51% worse
» The best had a delta of 5%, average was 17%, worst was 45%
Compared to all devices tested
» 26% of all tested devices were better, 6% similar, 68% worse
» The best had a delta of 4%, average was 23%, worst was 134%
Apple MacBook 12 (Early 2016) 1.1 GHz audio analysis
(+) | speakers can play relatively loud (83.6 dB)
Bass 100 - 315 Hz
(±) | reduced bass - on average 11.3% lower than median
(±) | linearity of bass is average (14.2% delta to prev. frequency)
Mids 400 - 2000 Hz
(+) | balanced mids - only 2.4% away from median
(+) | mids are linear (5.5% delta to prev. frequency)
Highs 2 - 16 kHz
(+) | balanced highs - only 2% away from median
(+) | highs are linear (4.5% delta to prev. frequency)
Overall 100 - 16.000 Hz
(+) | overall sound is linear (10.2% difference to median)
Compared to same class
» 7% of all tested devices in this class were better, 2% similar, 90% worse
» The best had a delta of 5%, average was 18%, worst was 53%
Compared to all devices tested
» 5% of all tested devices were better, 1% similar, 94% worse
» The best had a delta of 4%, average was 23%, worst was 134%
Energy Management
Power Consumption
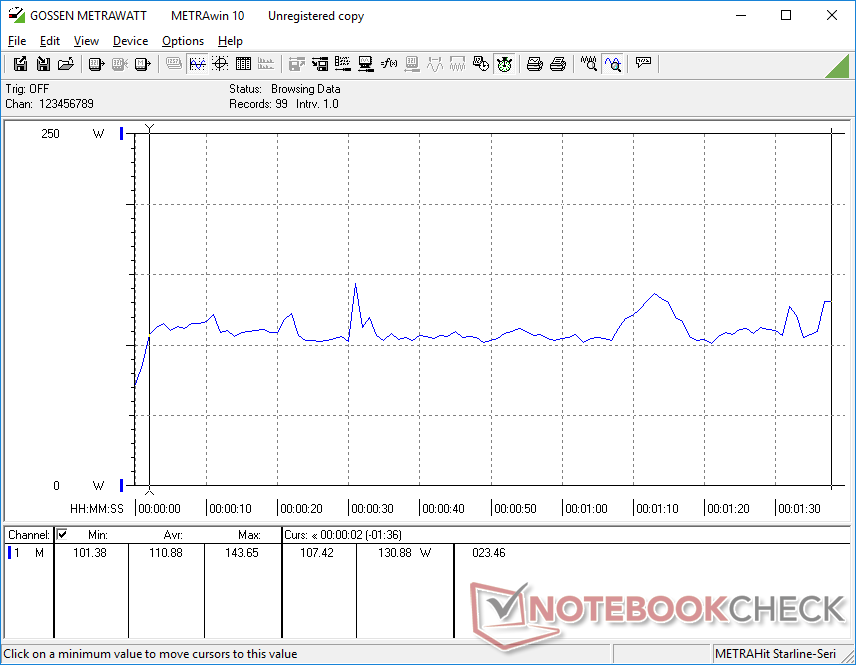
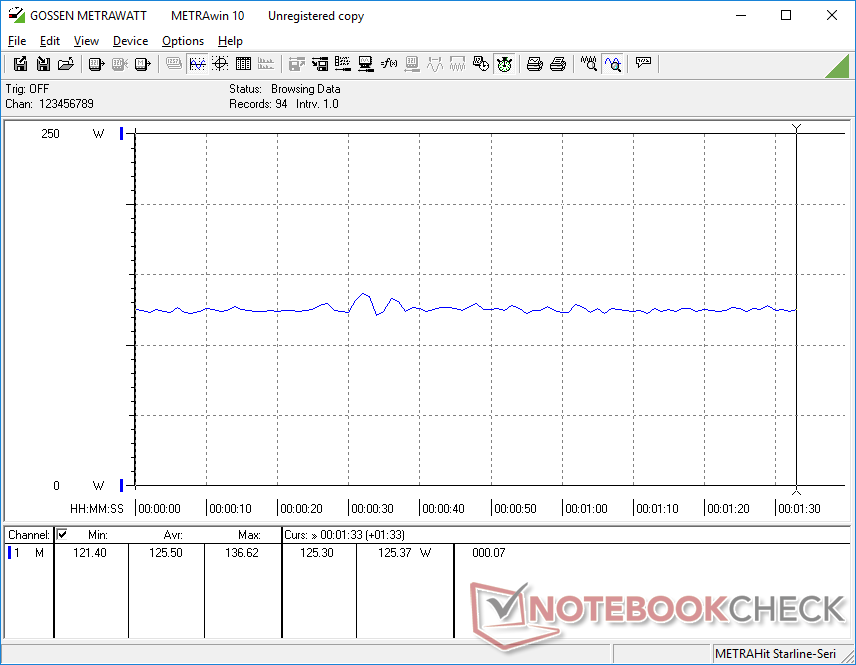
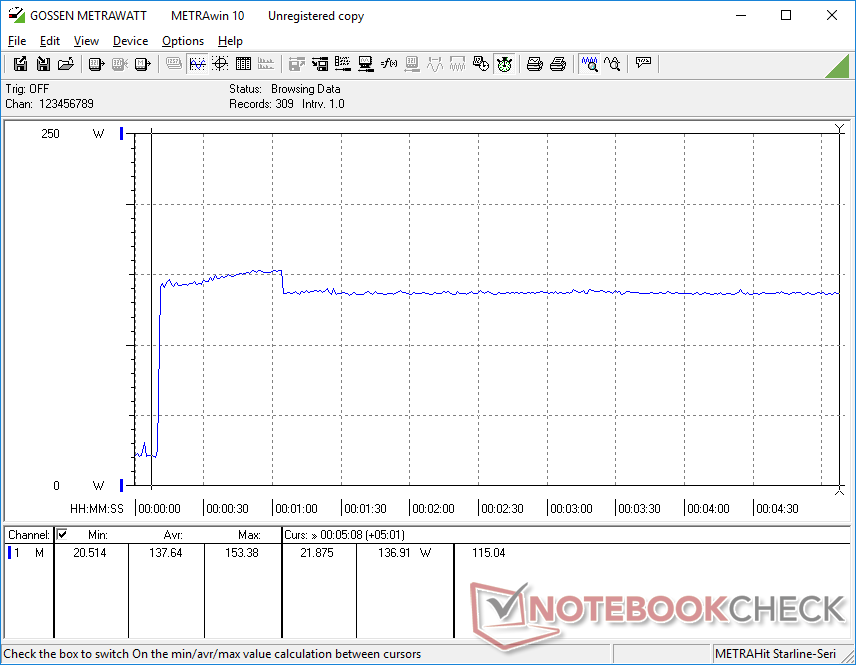
All that graphics power comes at a cost as power consumption is more akin to a gaming laptop than a multimedia laptop. When running Witcher 3, for example, the HP would consume 125 W compared to 103 W or 93 W on the MacBook Pro 16 and Dell XPS 15, respectively.
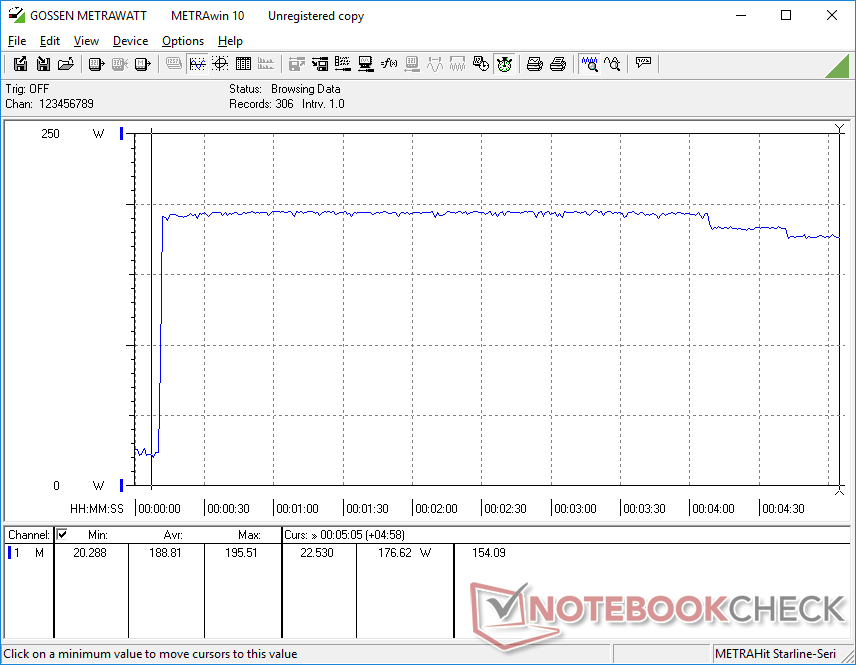
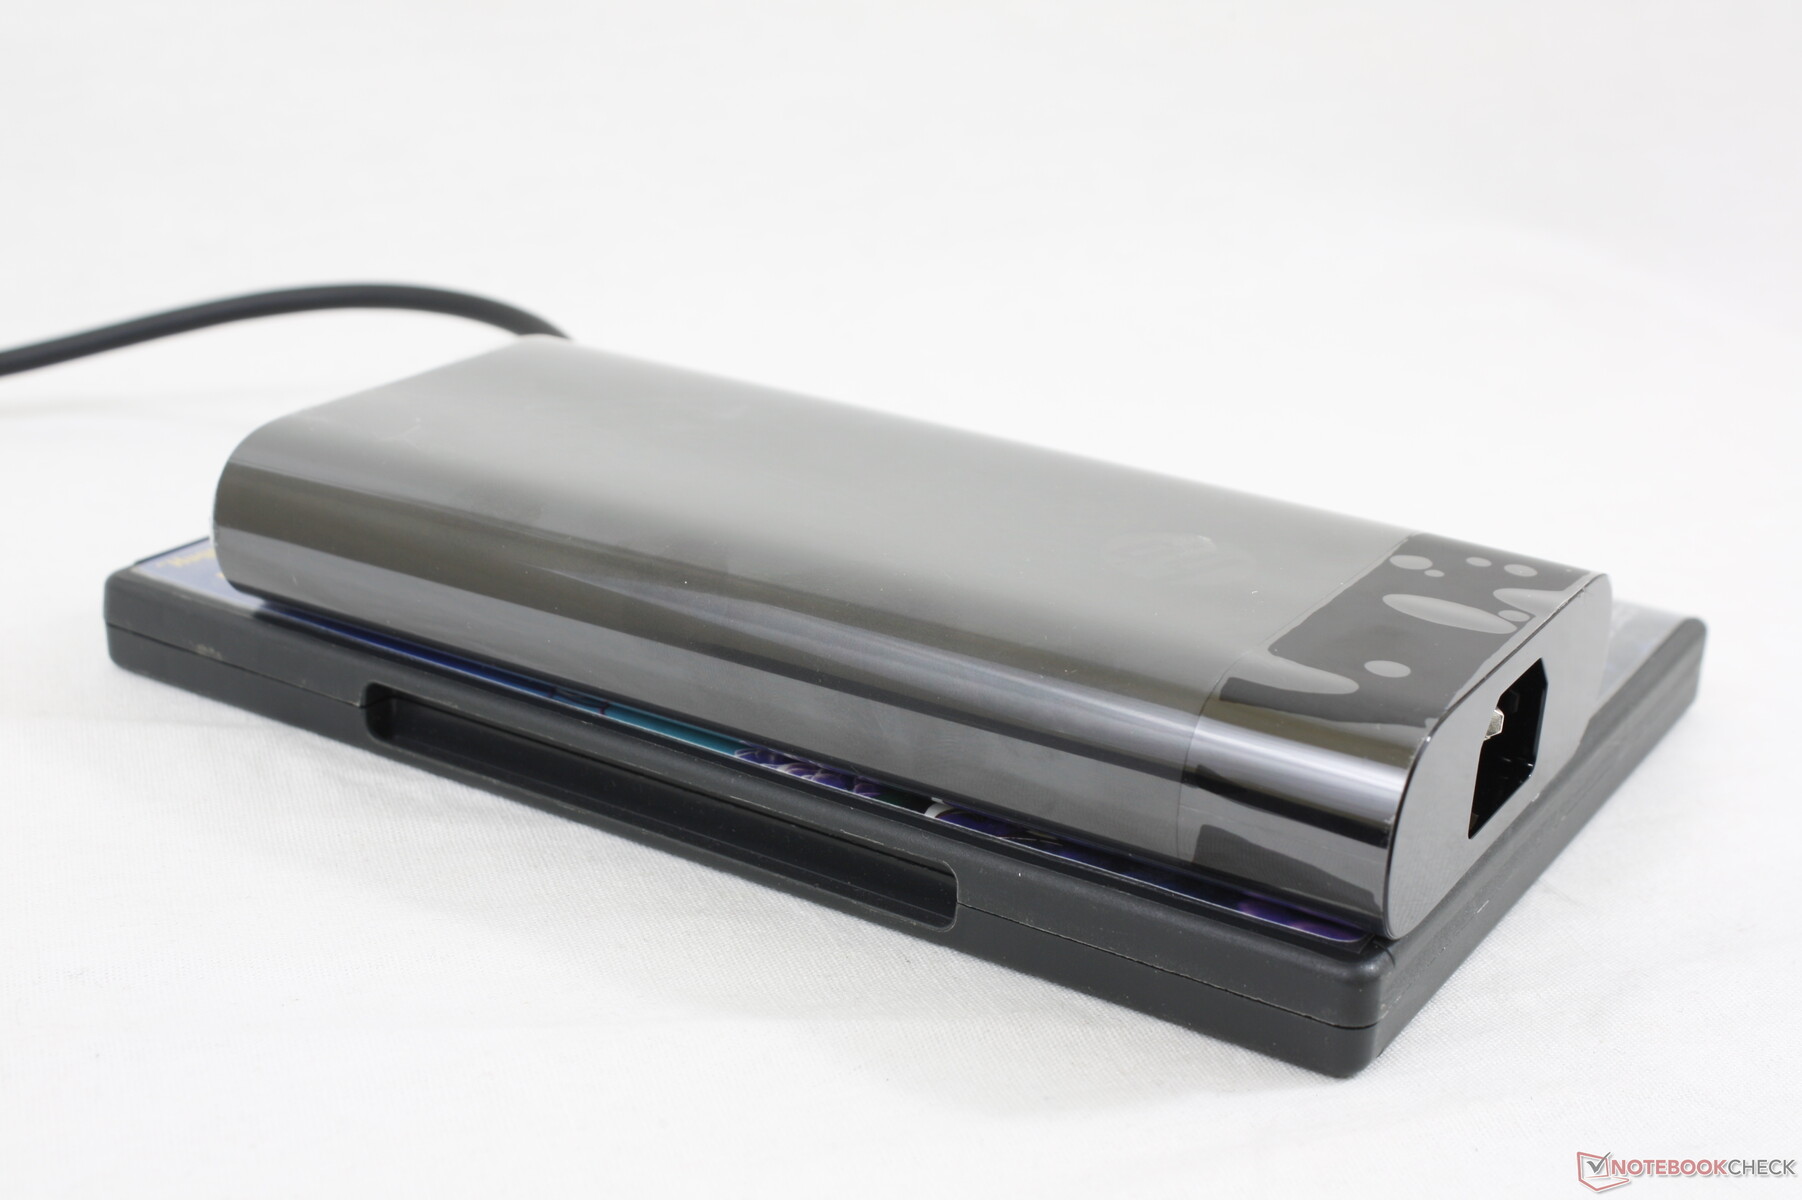
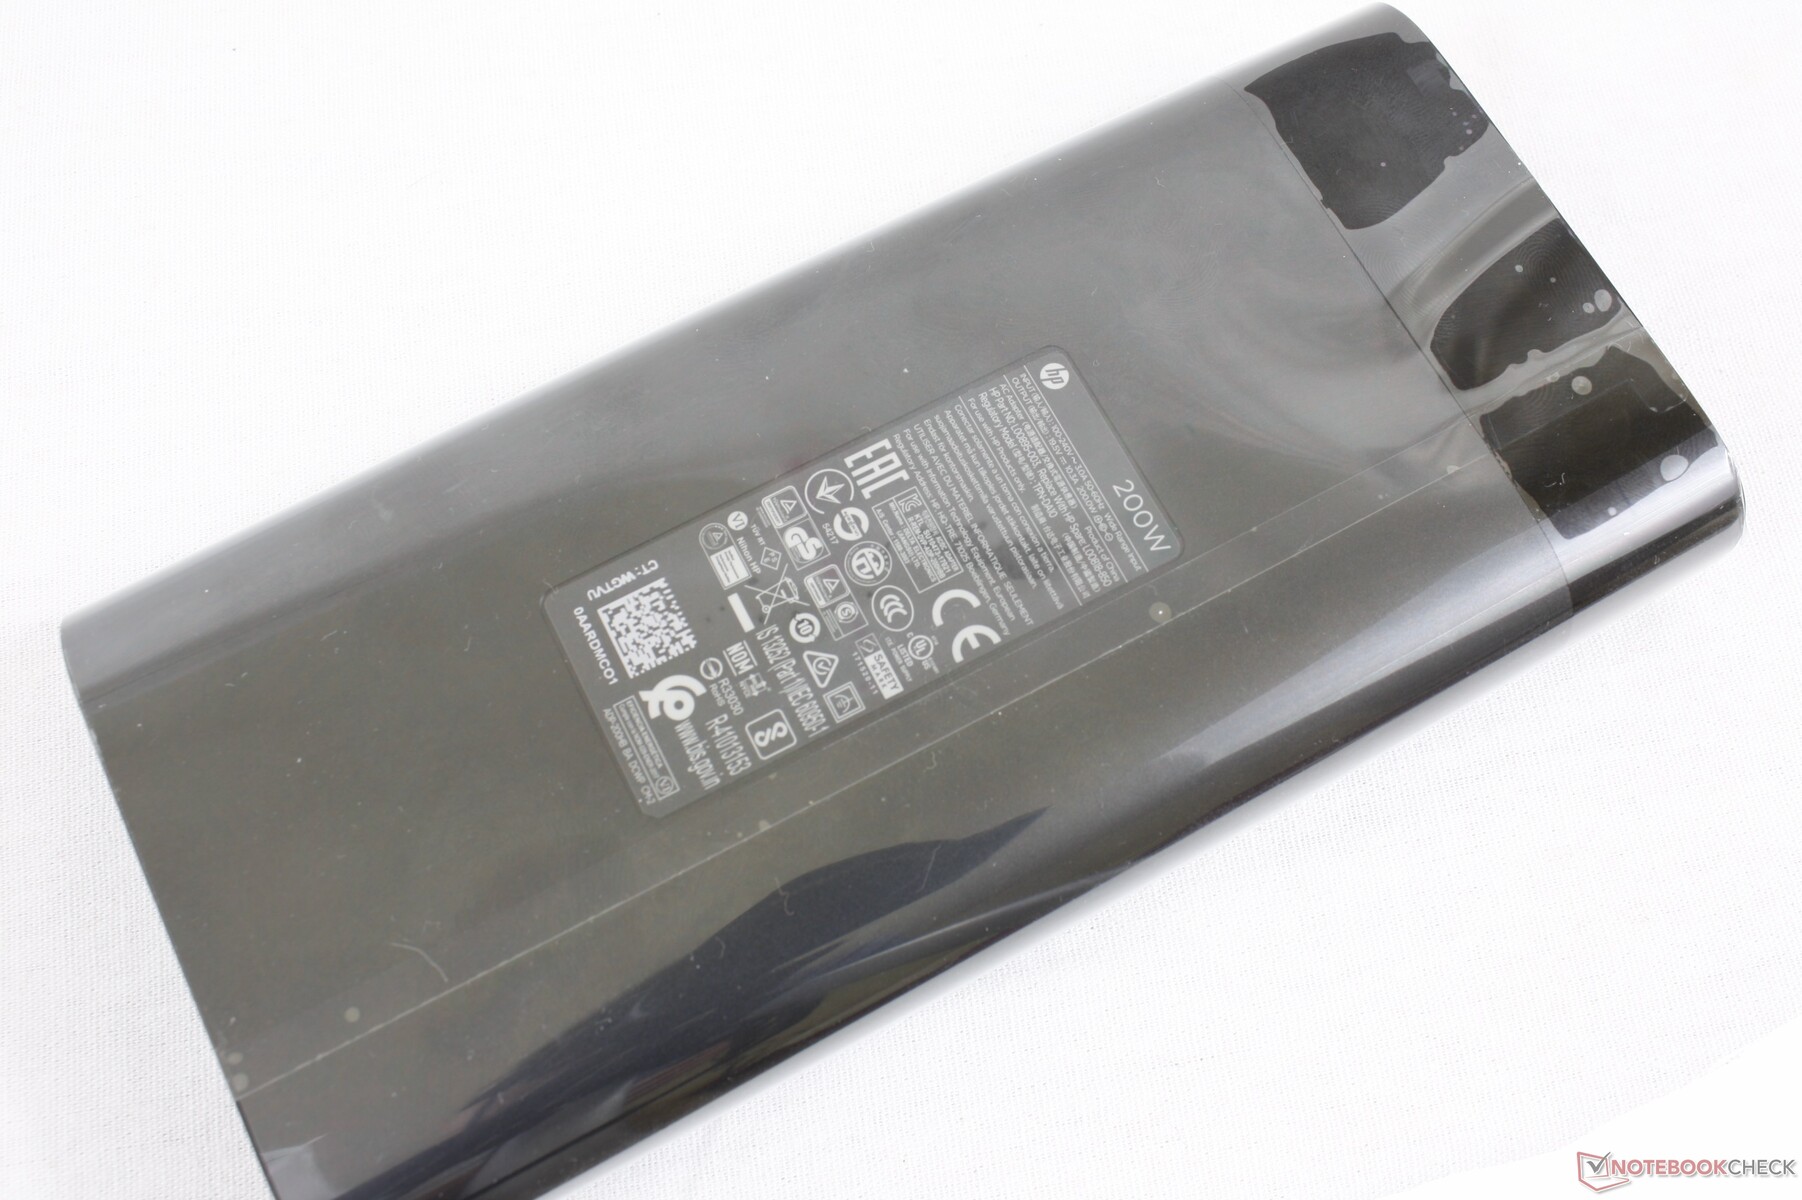
We're able to record a maximum consumption of 194.6 W from the medium-large (~16.5 x 8 x 2.5 cm) 200 W AC adapter when running extreme loads. Fortunately, we can observe no battery draining issue when plugged in due to the hefty AC adapter which is more than what we can say for the Dell XPS 17.
| Off / Standby | |
| Idle | |
| Load |
|
Key:
min: | |
| HP Envy 15-ep0098nr i7-10750H, GeForce RTX 2060 Max-Q, Intel Optane Memory H10 with Solid State Storage 32GB + 512GB HBRPEKNX0202A(L/H), AMOLED, 3840x2160, 15.6" | HP Envy x360 15-dr1679cl i7-10510U, UHD Graphics 620, Intel Optane Memory H10 with Solid State Storage 32GB + 512GB HBRPEKNX0202A(L/H), IPS, 1920x1080, 15.6" | HP Spectre X360 15-5ZV31AV i7-10510U, GeForce MX250, Intel SSD 660p 2TB SSDPEKNW020T8, IPS, 3840x2160, 15.6" | Dell XPS 15 9500 Core i7 4K UHD i7-10875H, GeForce GTX 1650 Ti Mobile, SK Hynix PC611 512GB, IPS, 3840x2400, 15.6" | Apple MacBook Pro 16 2019 i9 5500M i9-9880H, Radeon Pro 5500M, Apple SSD AP1024 7171, IPS, 3072x1920, 16" | Lenovo Yoga C940-15IRH i7-9750H, GeForce GTX 1650 Max-Q, Intel Optane Memory H10 with Solid State Storage 32GB + 512GB HBRPEKNX0202A(L/H), IPS, 1920x1080, 15.6" | |
|---|---|---|---|---|---|---|
| Power Consumption | 58% | 48% | 15% | 28% | 20% | |
| Idle Minimum * (Watt) | 9.2 | 4.3 53% | 5.2 43% | 5.7 38% | 3.7 60% | 5.2 43% |
| Idle Average * (Watt) | 14.5 | 7.2 50% | 8.5 41% | 13.5 7% | 12.1 17% | 10.7 26% |
| Idle Maximum * (Watt) | 18 | 7.5 58% | 8.7 52% | 19.6 -9% | 17 6% | 24.3 -35% |
| Load Average * (Watt) | 110.9 | 40.4 64% | 65.6 41% | 114.1 -3% | 91.5 17% | 84.4 24% |
| Witcher 3 ultra * (Watt) | 125.5 | 56.5 55% | 93 26% | 103 18% | 83.9 33% | |
| Load Maximum * (Watt) | 194.6 | 65.7 66% | 92.4 53% | 135.2 31% | 102.3 47% | 142.8 27% |
* ... smaller is better
Battery Life
Runtimes are decent but not nearly as long as many other 15.6-inch laptops despite the large 83 Wh internal battery. The 4K UHD Dell XPS 15, for example, can last about 3 hours longer when under the same WLAN testing conditions.
Recharging from empty to full capacity takes about 1.5 hours. Unfortunately, the system cannot be recharged via USB-C.
| HP Envy 15-ep0098nr i7-10750H, GeForce RTX 2060 Max-Q, 83 Wh | HP Envy x360 15-dr1679cl i7-10510U, UHD Graphics 620, 55.67 Wh | HP Spectre X360 15-5ZV31AV i7-10510U, GeForce MX250, 84 Wh | Dell XPS 15 9500 Core i7 4K UHD i7-10875H, GeForce GTX 1650 Ti Mobile, 86 Wh | Apple MacBook Pro 15 2019 i9 Vega 20 i9-9980HK, Radeon Pro Vega 20, 83 Wh | Lenovo Yoga C940-15IRH i7-9750H, GeForce GTX 1650 Max-Q, 69 Wh | |
|---|---|---|---|---|---|---|
| Battery runtime | 55% | 71% | 43% | 92% | 15% | |
| Reader / Idle (h) | 15 | 25.4 69% | 22.6 51% | 23 53% | 18.2 21% | |
| WiFi v1.3 (h) | 6 | 9.2 53% | 10.8 80% | 9.1 52% | 11.5 92% | 9.7 62% |
| Load (h) | 1.6 | 2.3 44% | 2.9 81% | 2 25% | 1 -37% |
Pros
Cons
Verdict
HP has essentially reinvented its Envy 15 series. This latest model is completely different from the last generation version with almost all changes being for the better. Aside from the more professional look, easier serviceability, and new Core H-series options, the optional GeForce RTX 2060 Max-Q GPU is much faster than what the MacBook Pro 15 or MacBook Pro 16 can offer at the moment while costing less in the process which is exactly what HP wanted.
However, the gaming-level hardware means the Envy 15 also inherits many of the same drawbacks as a thin gaming laptop. Don't be fooled by its sleek Ultrabook-like look because this laptop will not run as long as your typical Intel UHD or GeForce MX-powered Ultrabook nor will it be as quiet or as lightweight. It's almost a gaming laptop in disguise even though it's marketed to content creators in much the same way as the Gigabyte Aero series. The 200 W AC adapter, for example, is significantly larger and thus more cumbersome to carry than for any Ultrabook. If users understand these inherent disadvantages, then they'll be happy with the new Envy 15 and its high level of performance considering the price and form factor. Otherwise, you'd be better off with a Spectre instead if your workloads consist mostly of web surfing and word processing.
There are a handful of adjustments we would like to see to make the Envy 15 better. USB-C charging support would be extremely useful for travelers as the large 200 W AC adapter can then stay home when it's not needed. Both the clickpad and hinges could be firmer to better reflect the high price of the new model. A less obtrusive positioning for the fingerprint reader would satisfy users who rely on the Fn key.
Want a MacBook Pro but wish it had faster graphics, OLED, and more port options? Then the 2020 Envy 15 is worth looking into. No longer powered by ULV processors, the new Envy houses powerful gaming-like hardware options wrapped in an Ultrabook-like chassis to be a great middle-ground solution.
HP Envy 15-ep0098nr
- 08/31/2022 v7 (old)
Allen Ngo
Price comparison
