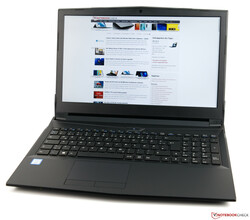
Schenker Work 15 (Core i7-8750H, 16 GB RAM, FHD) Laptop Review

With the Work 15 from Schenker, we have a very fast work laptop if you rely purely on its technical data. The 15-inch device is powered by an Intel Core i7-8750H processor, which belongs to Intel’s Coffee Lake generation and has 6 cores that deliver impressive multi-threaded performance. Additionally, our test sample has 16 GB of DDR4 RAM and a 500 GB SSD. Schenker currently charges just under €1,200 (~$1,345) for this configuration. Lest we forget the display too, which is a matte, FHD panel.
On Schenker’s website, the company allows you to customise the Work 15, which can help you minimise costs. You can save €95 (~$107) alone by switching to an Intel Core i5-8300H, while if you go for an 8 GB RAM, a 240 GB SSD and forgo a pre-installed OS, then you can purchase the Work 15 for around €815 (~$914). This combination would still be a competent office device.
We have chosen to compare the Work 15 against other 15-inch office devices. The HP ProBook 450 G6 also offers a good overall package and comes with an NVIDIA GeForce MX130 for more GPU intensive tasks. Lenovo is still the go-to brand for office laptops, and its ThinkPad T580 will put the Work 15 to the test with its excellent input devices. Moreover, the Fujitsu LifeBook E558 and Dell Latitude 5590 are worthy opponents too.
Case
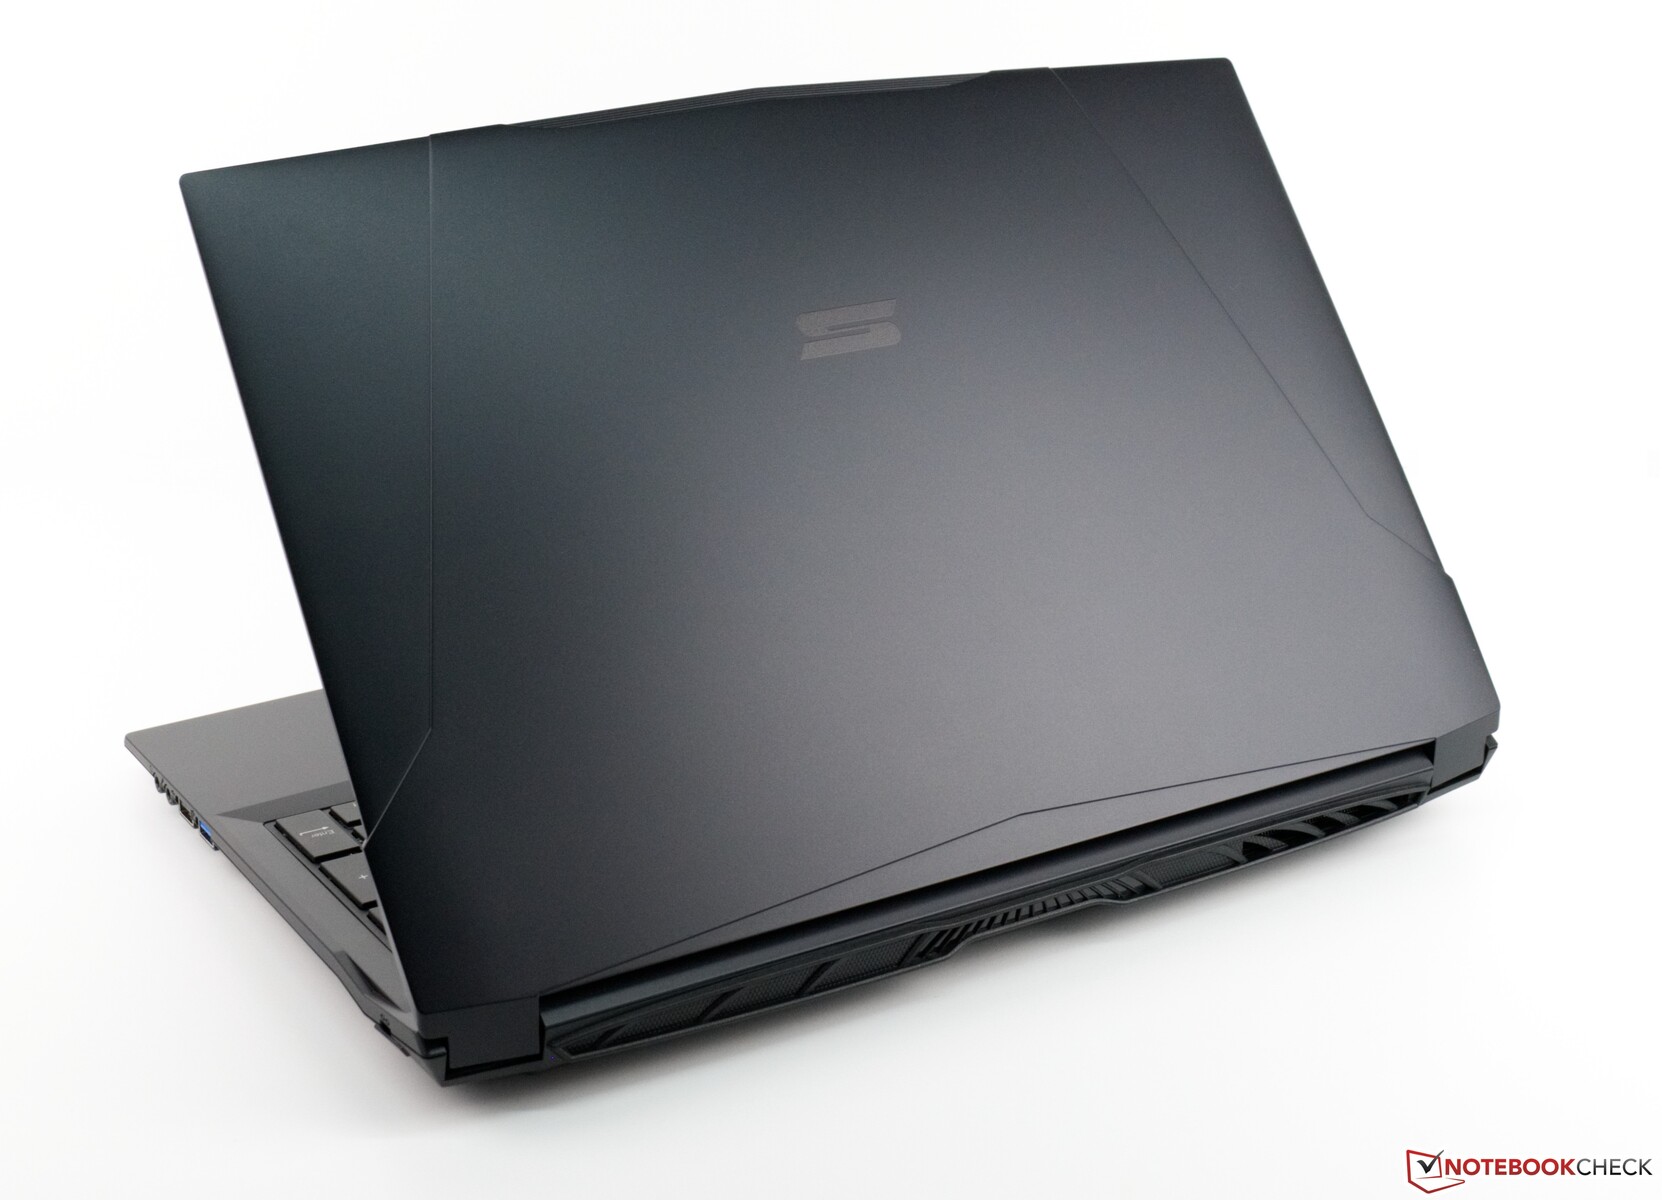
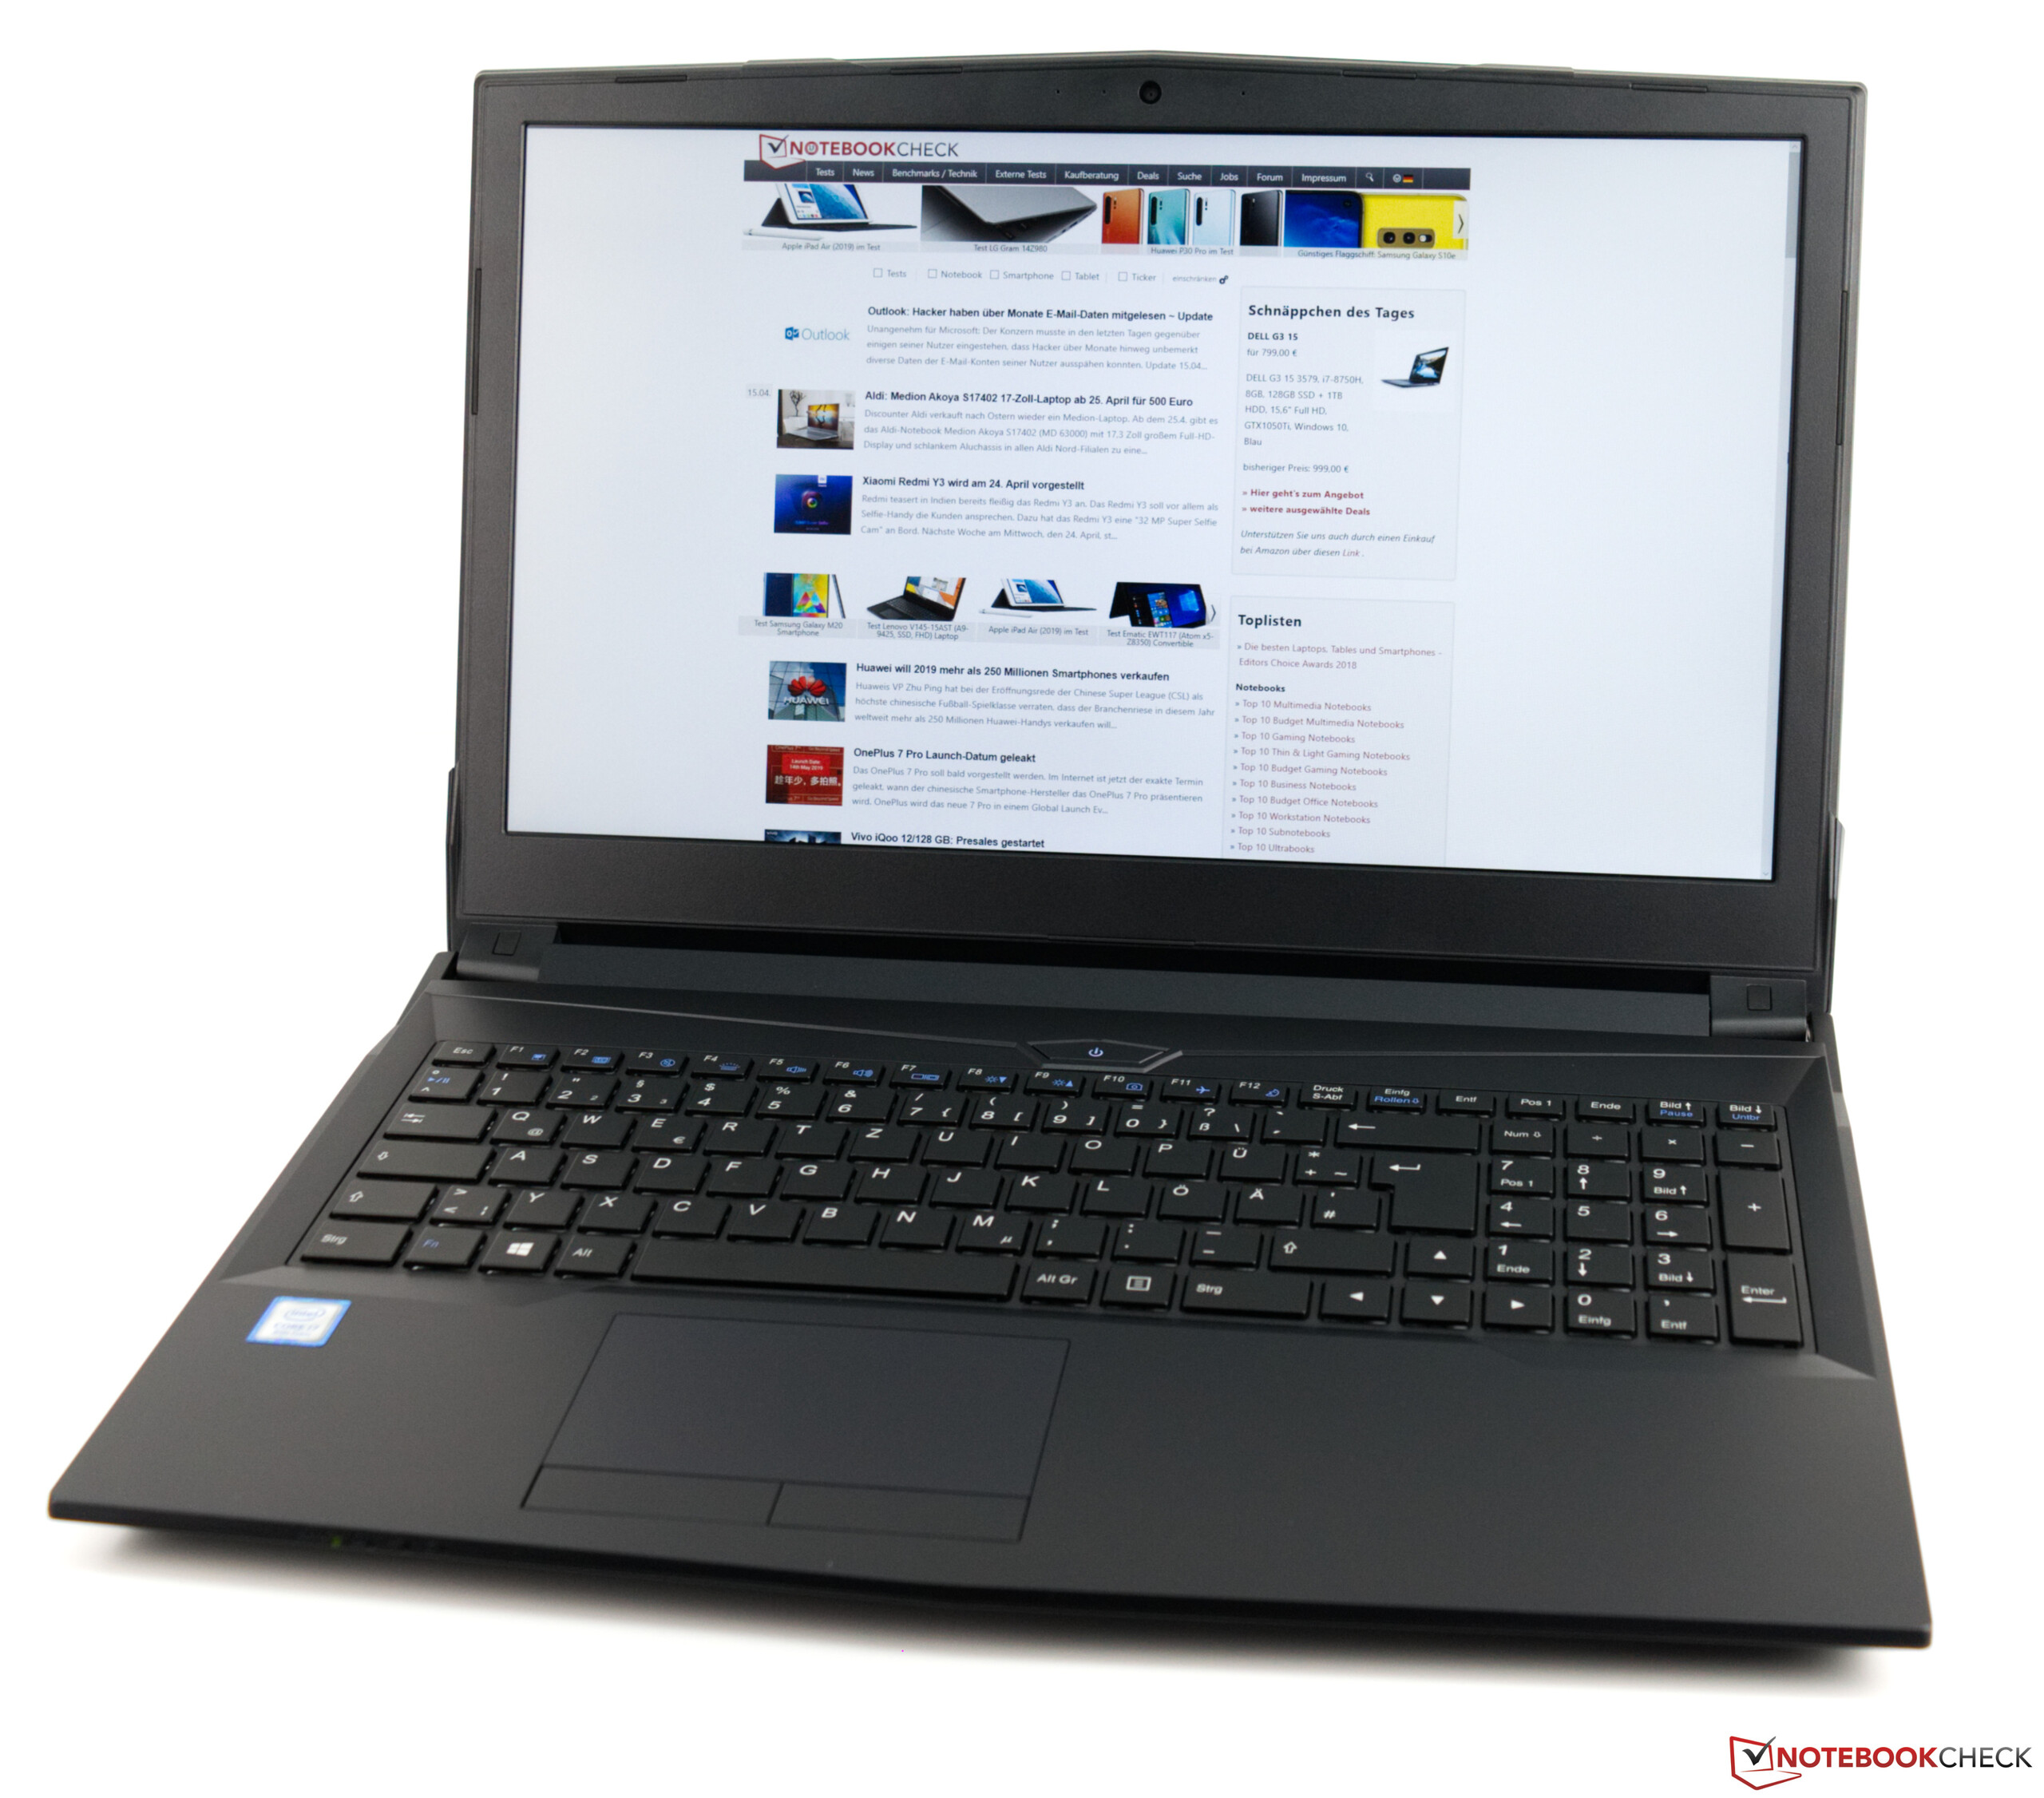
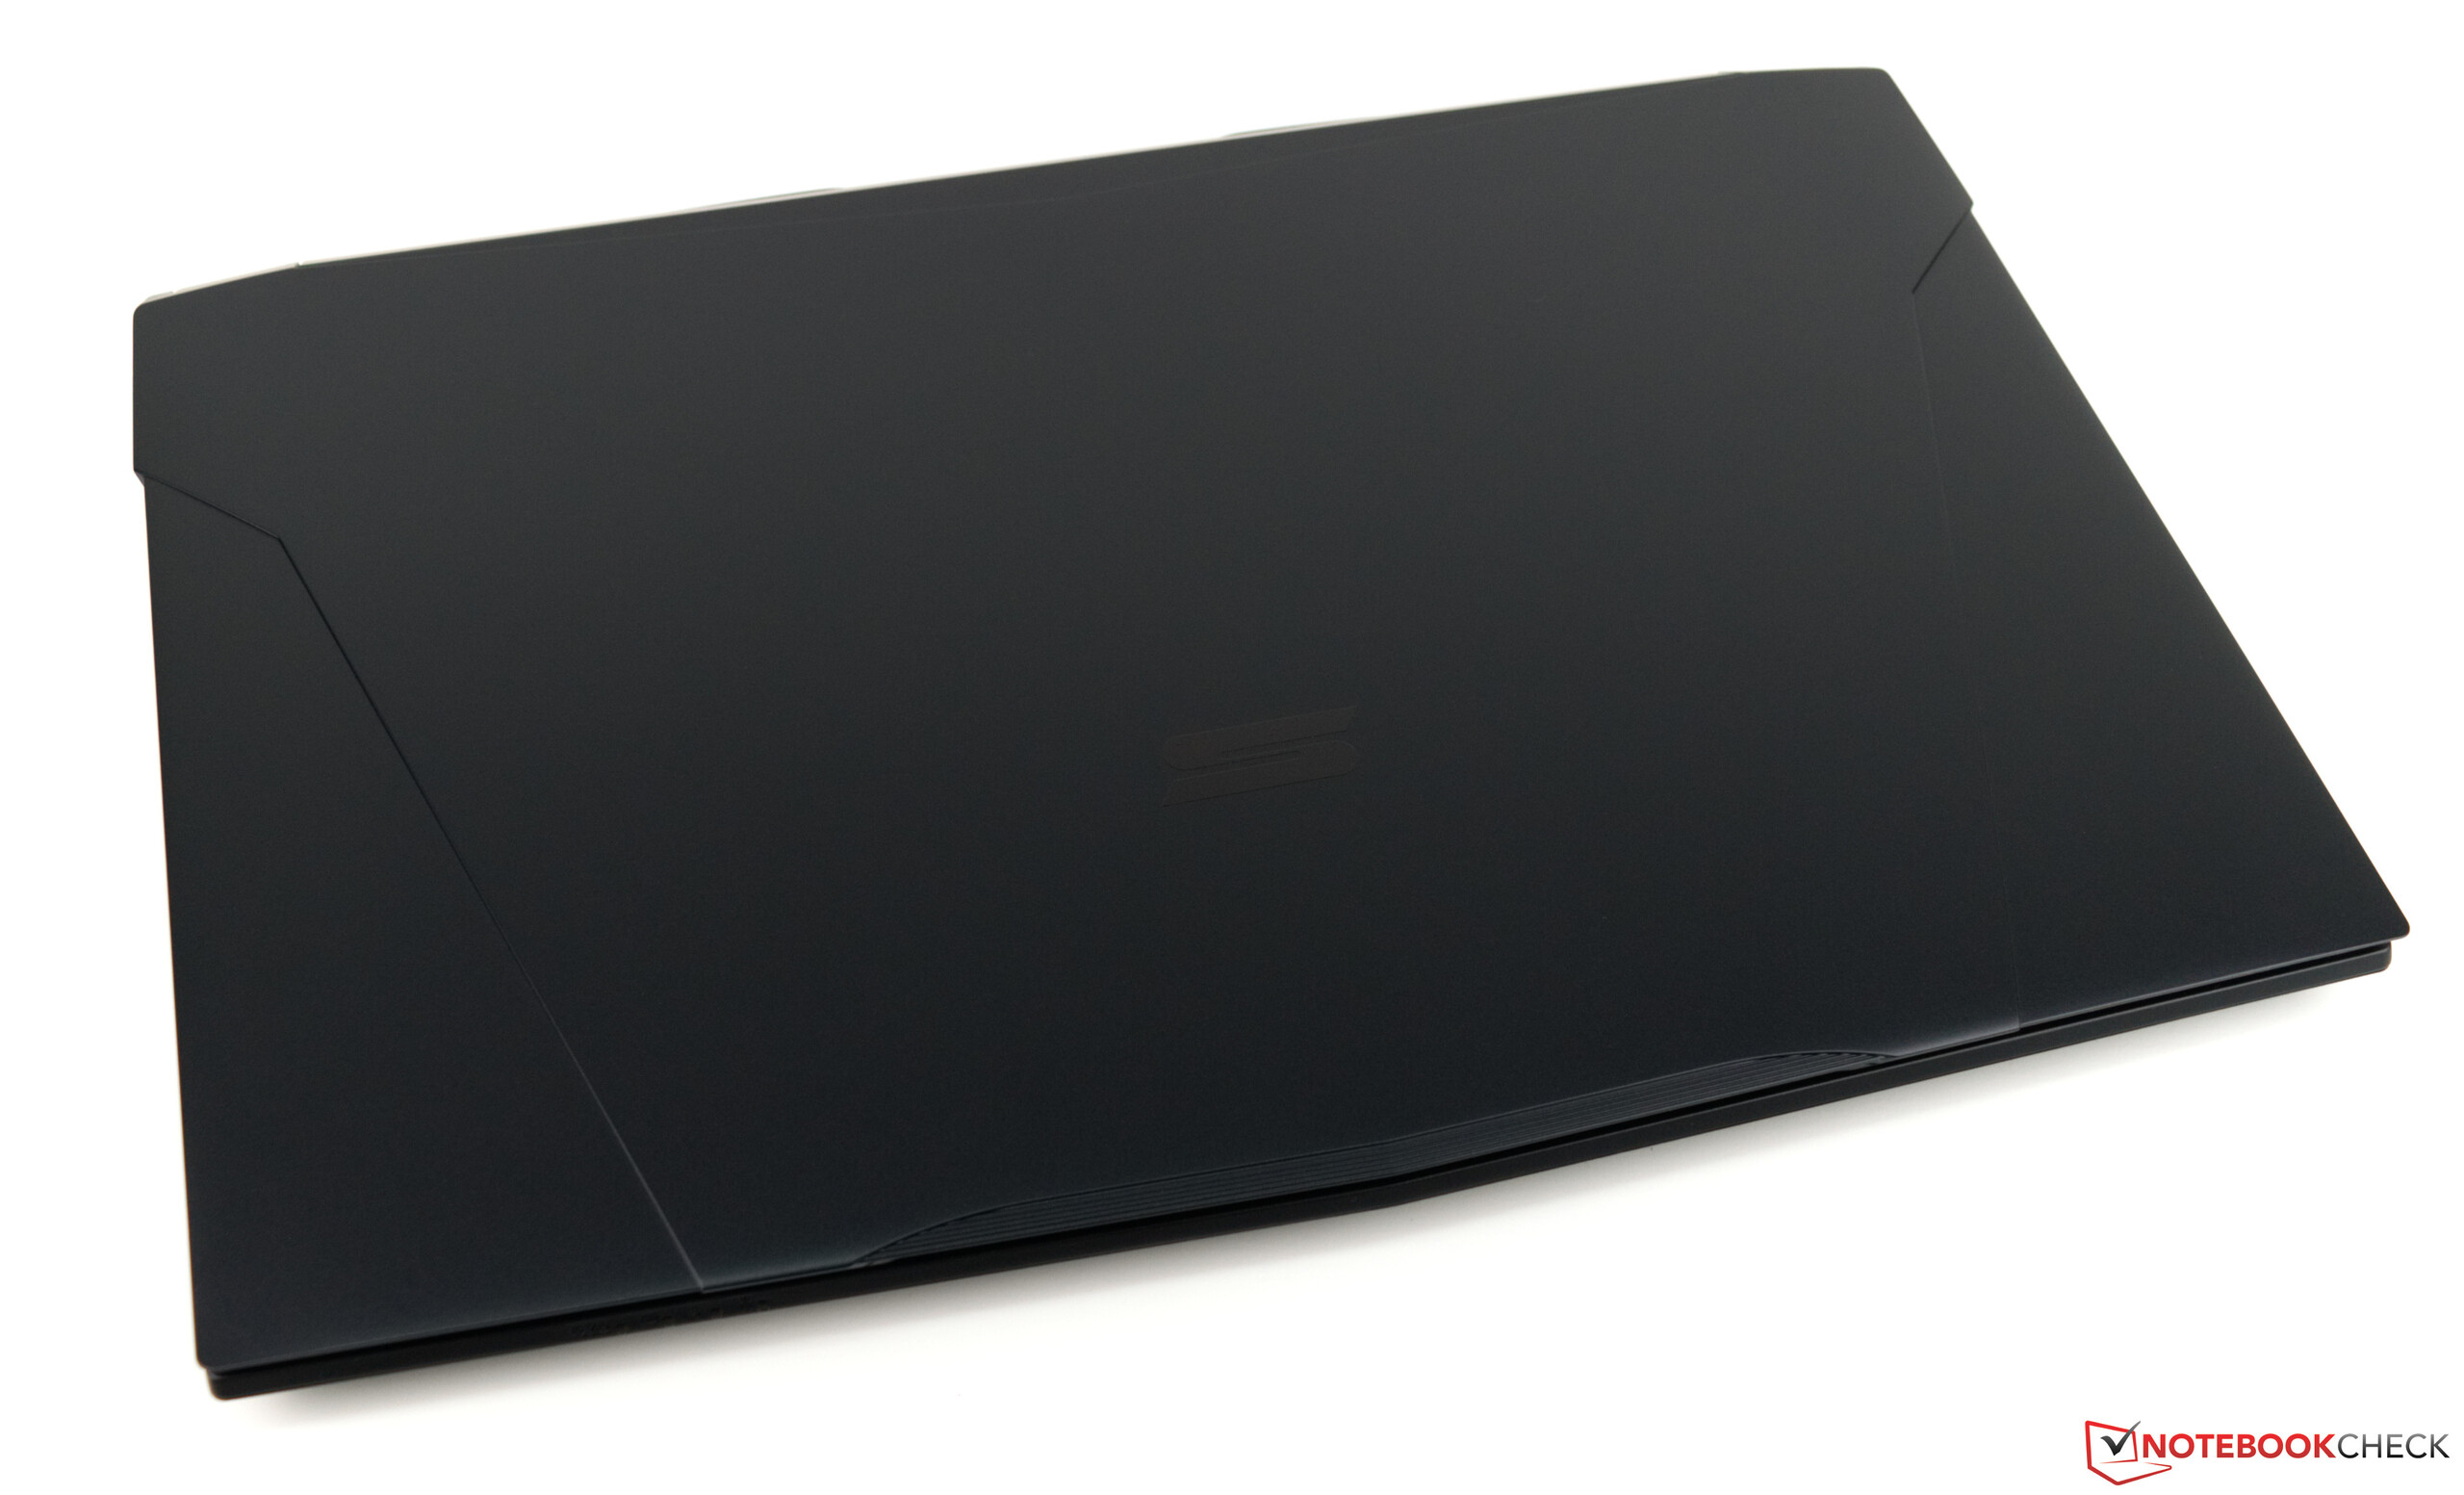
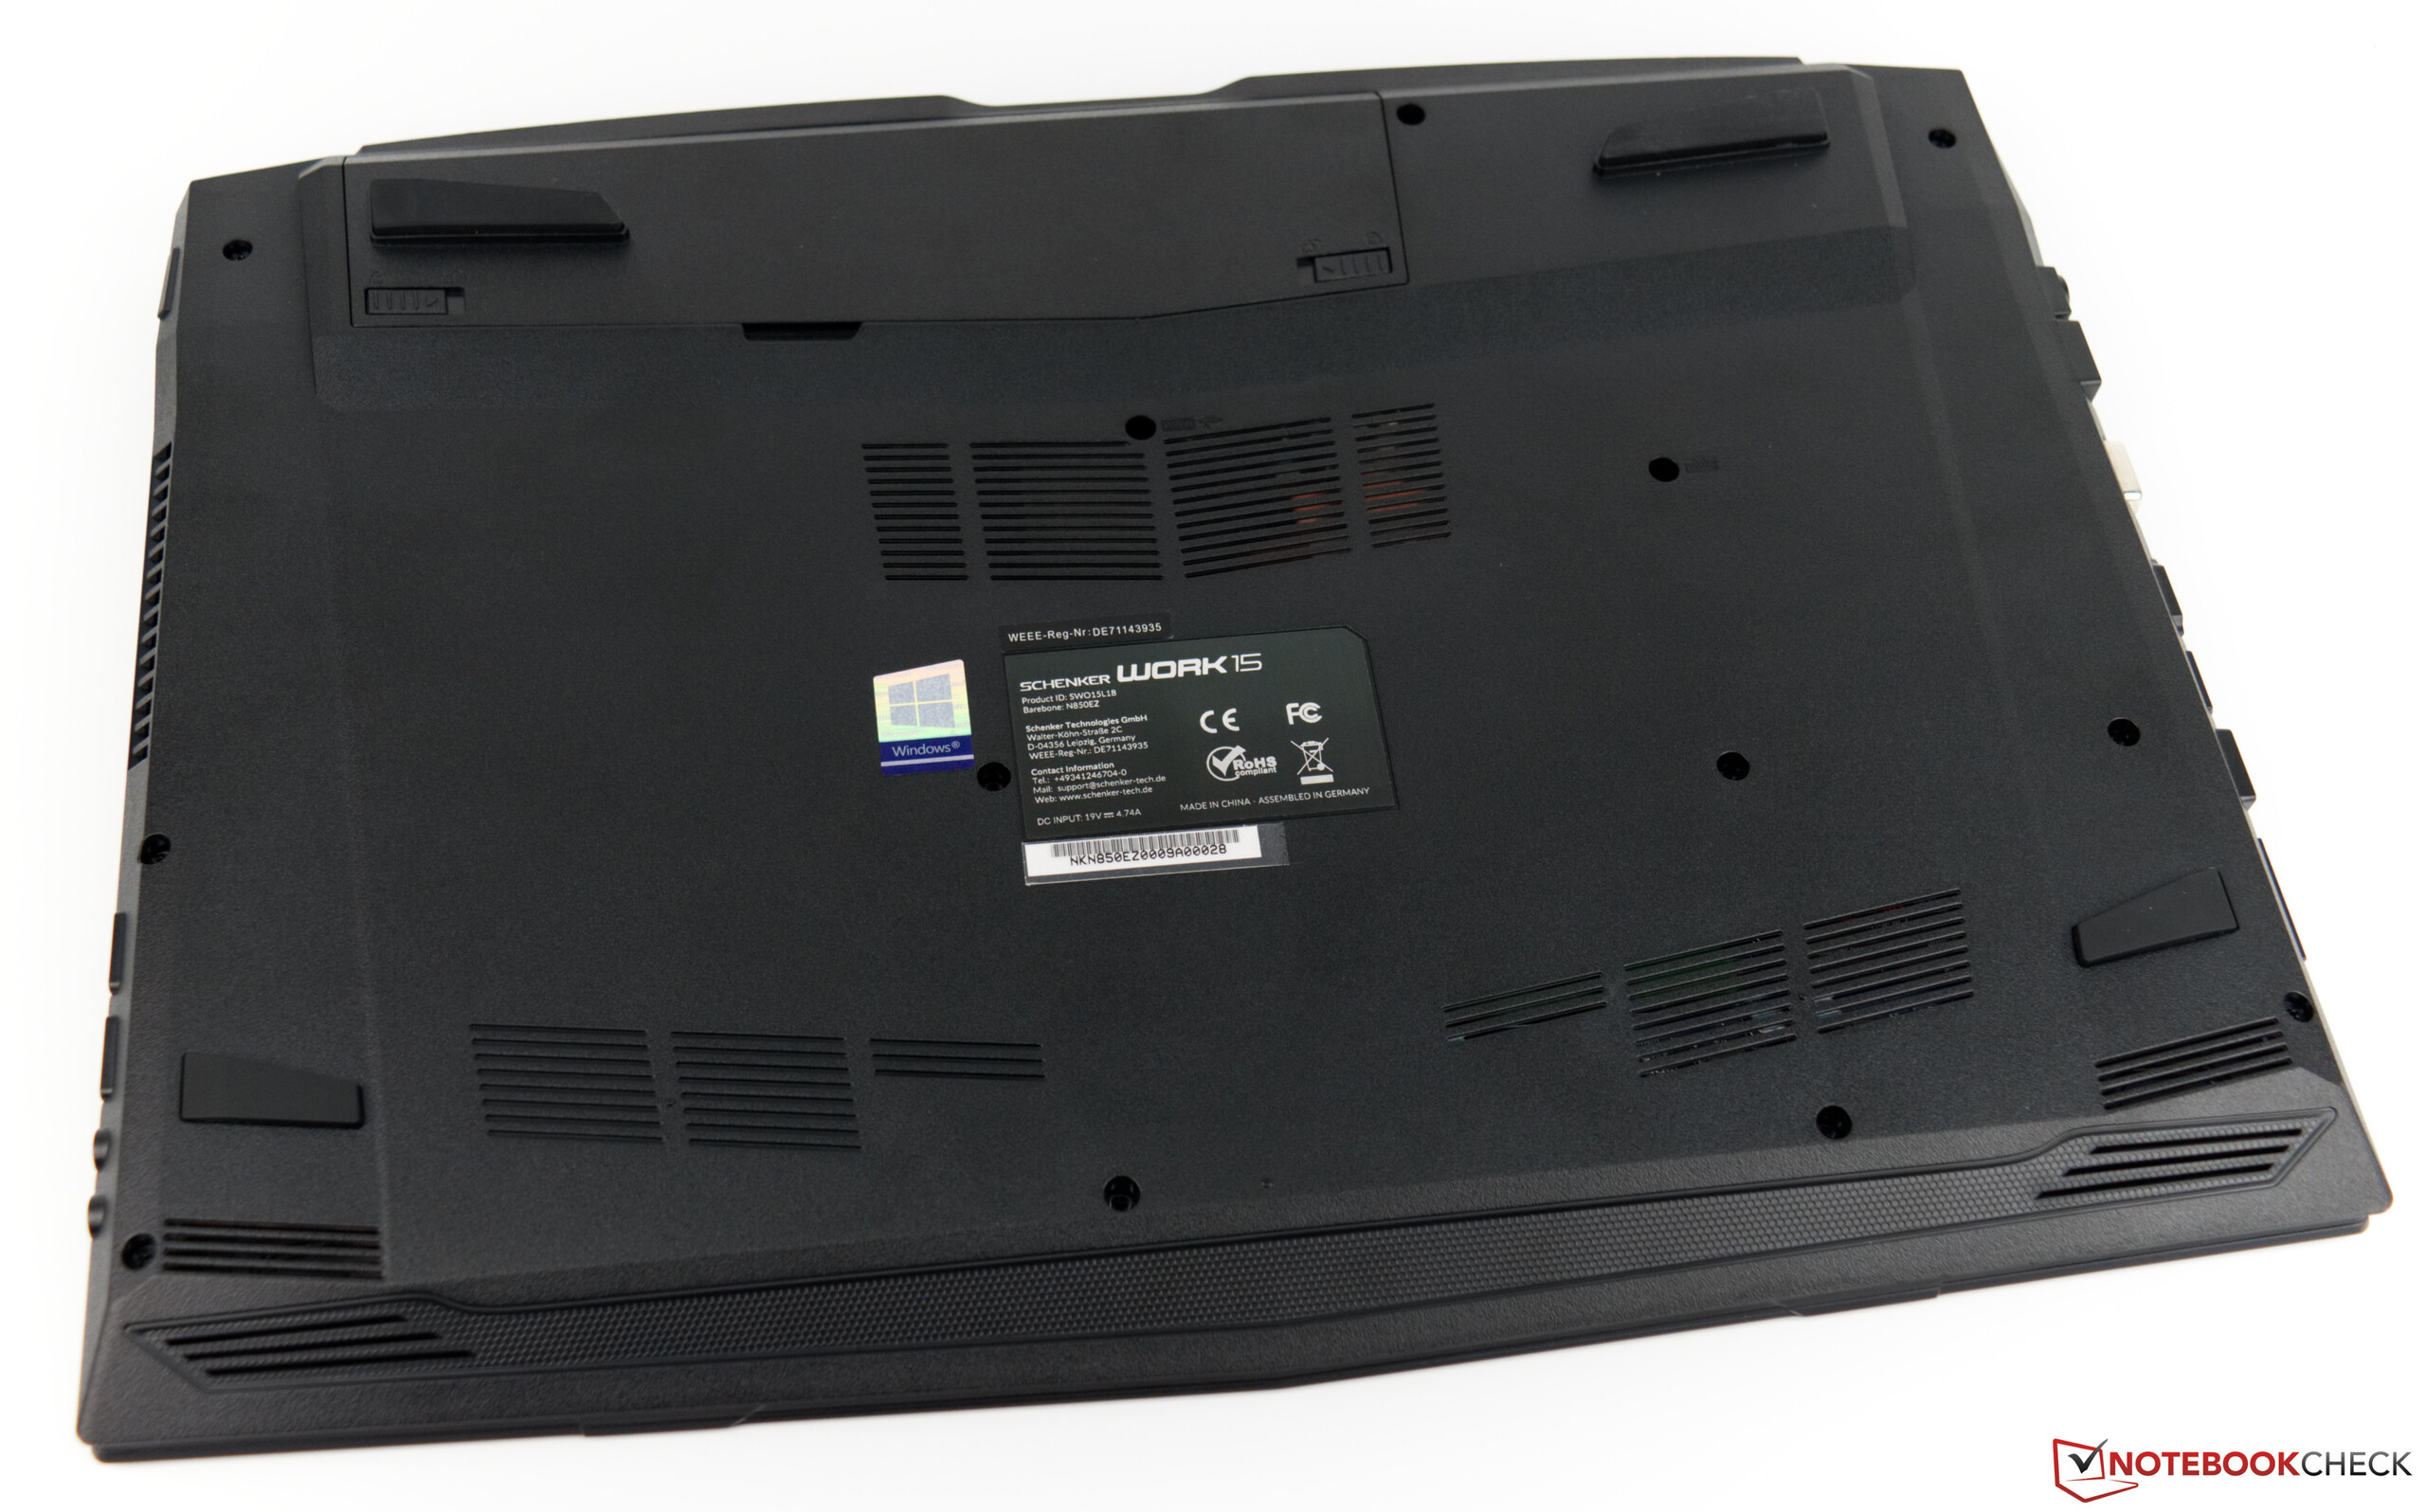
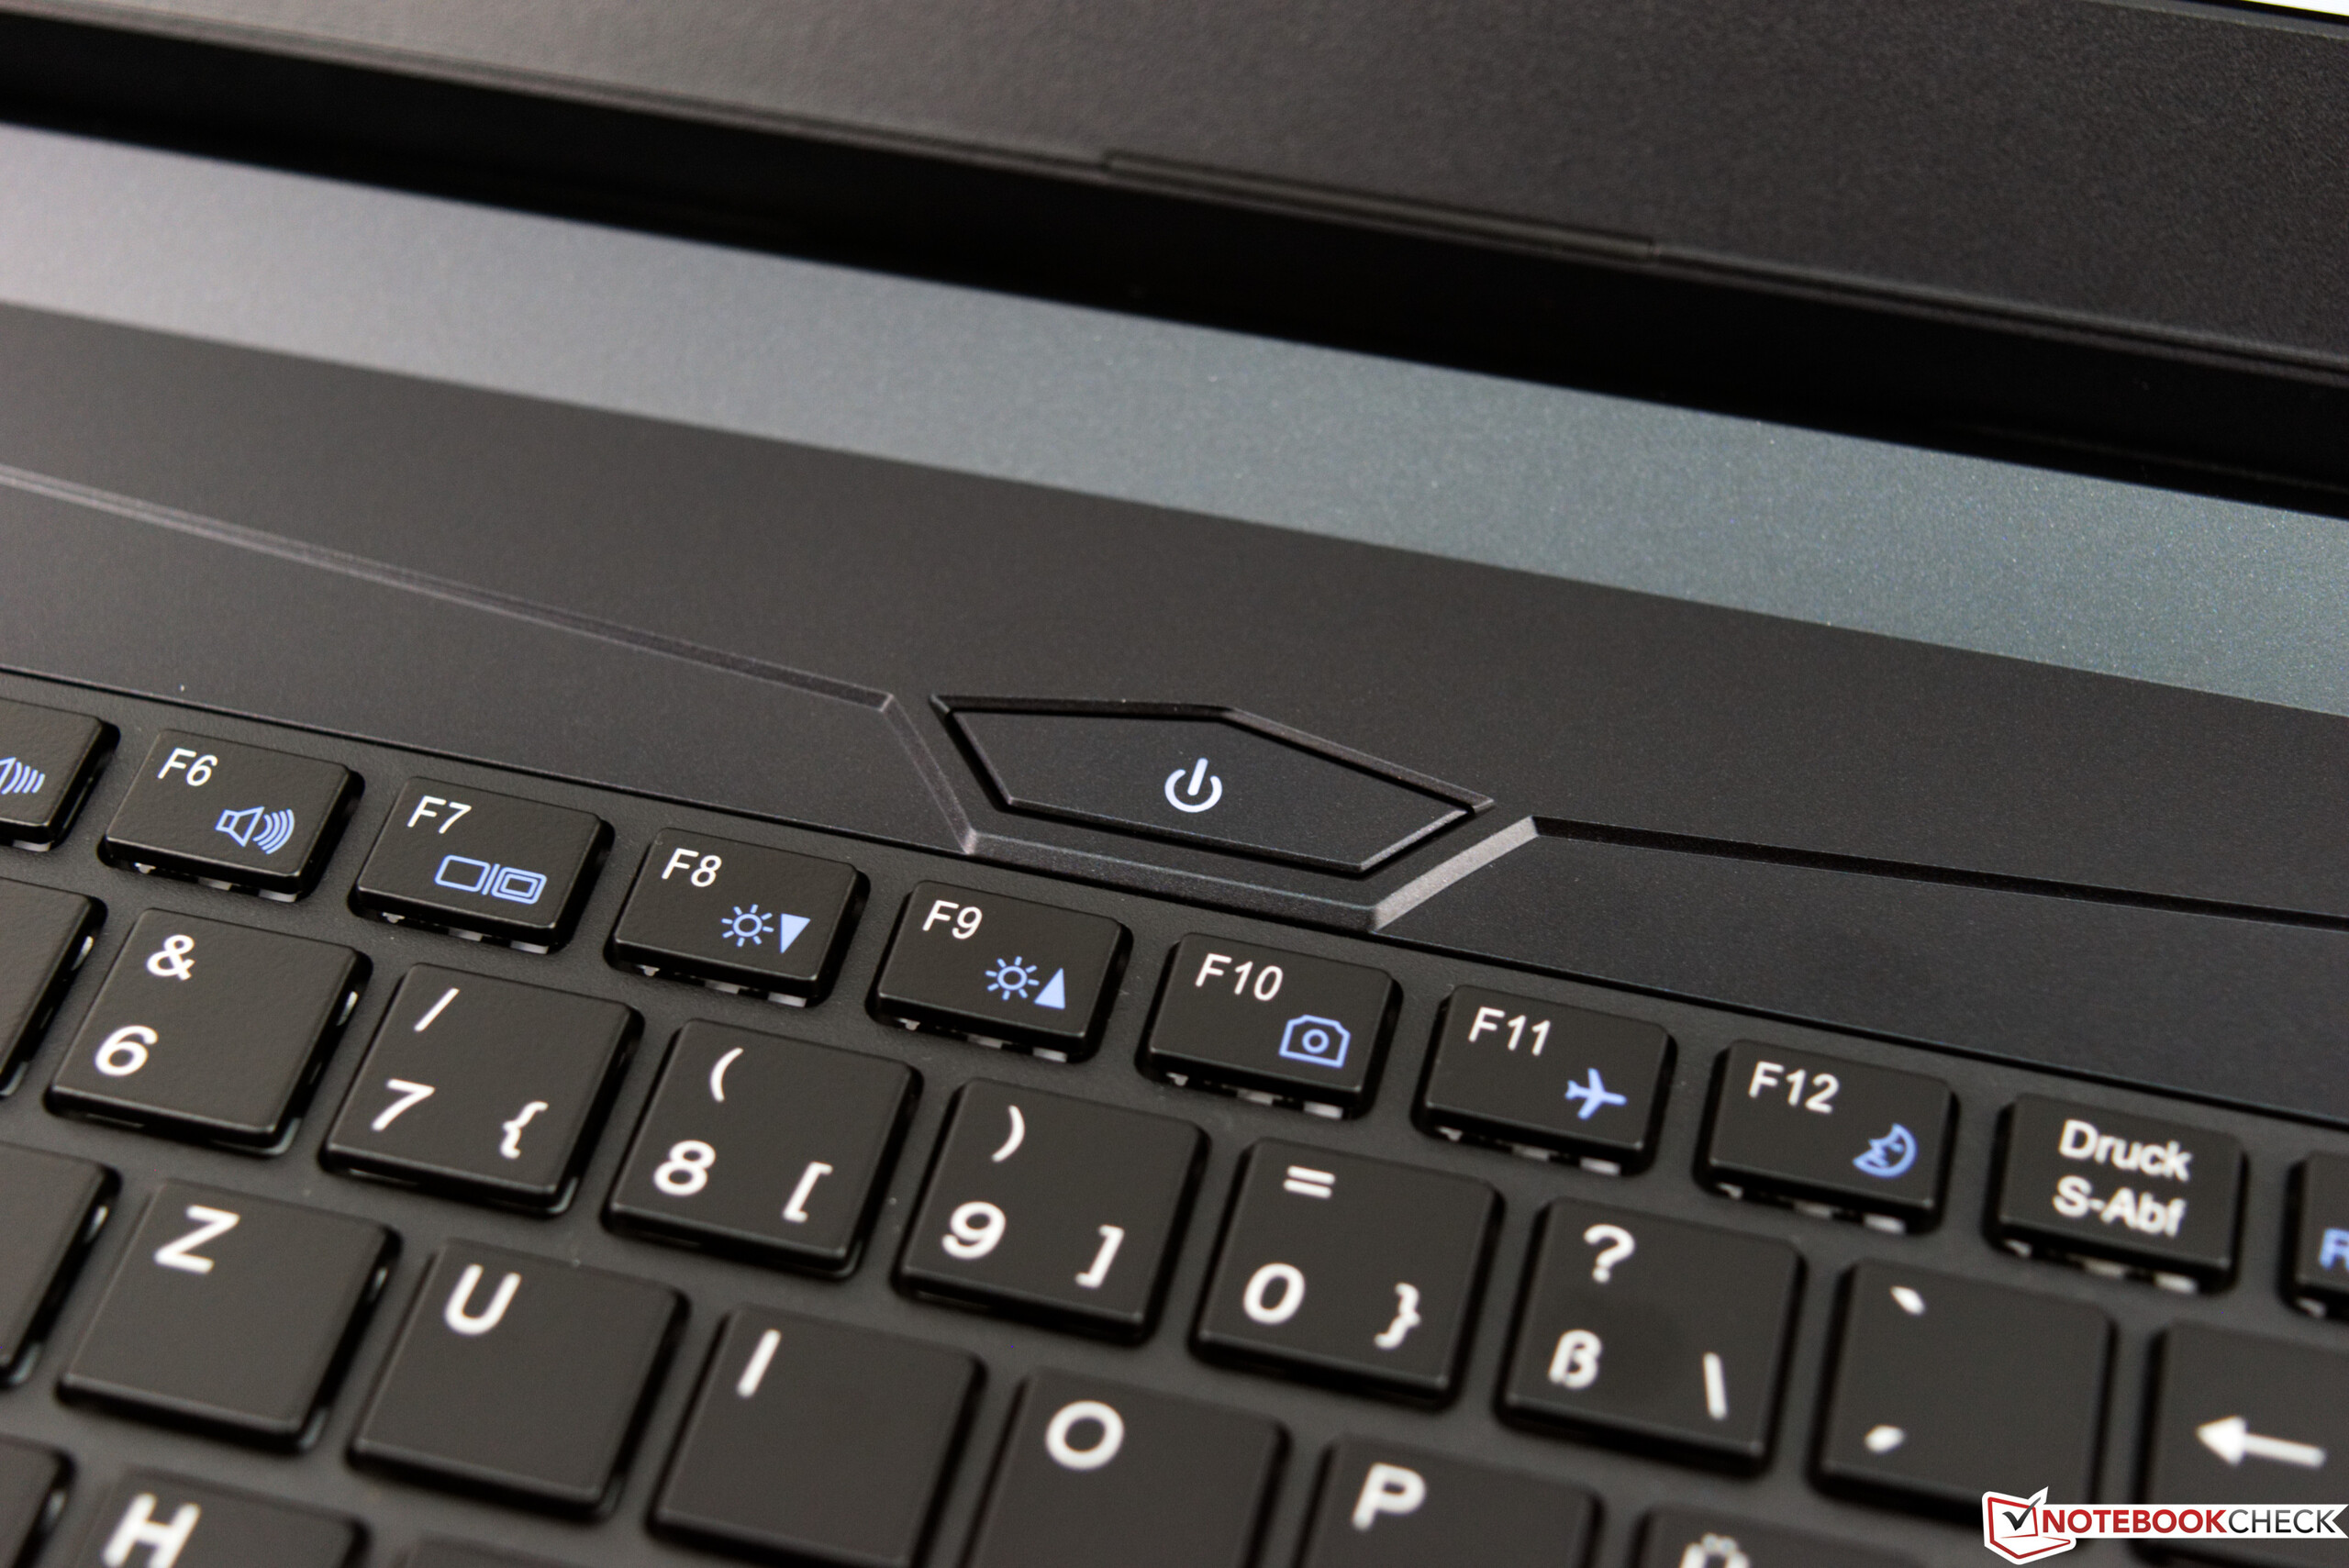
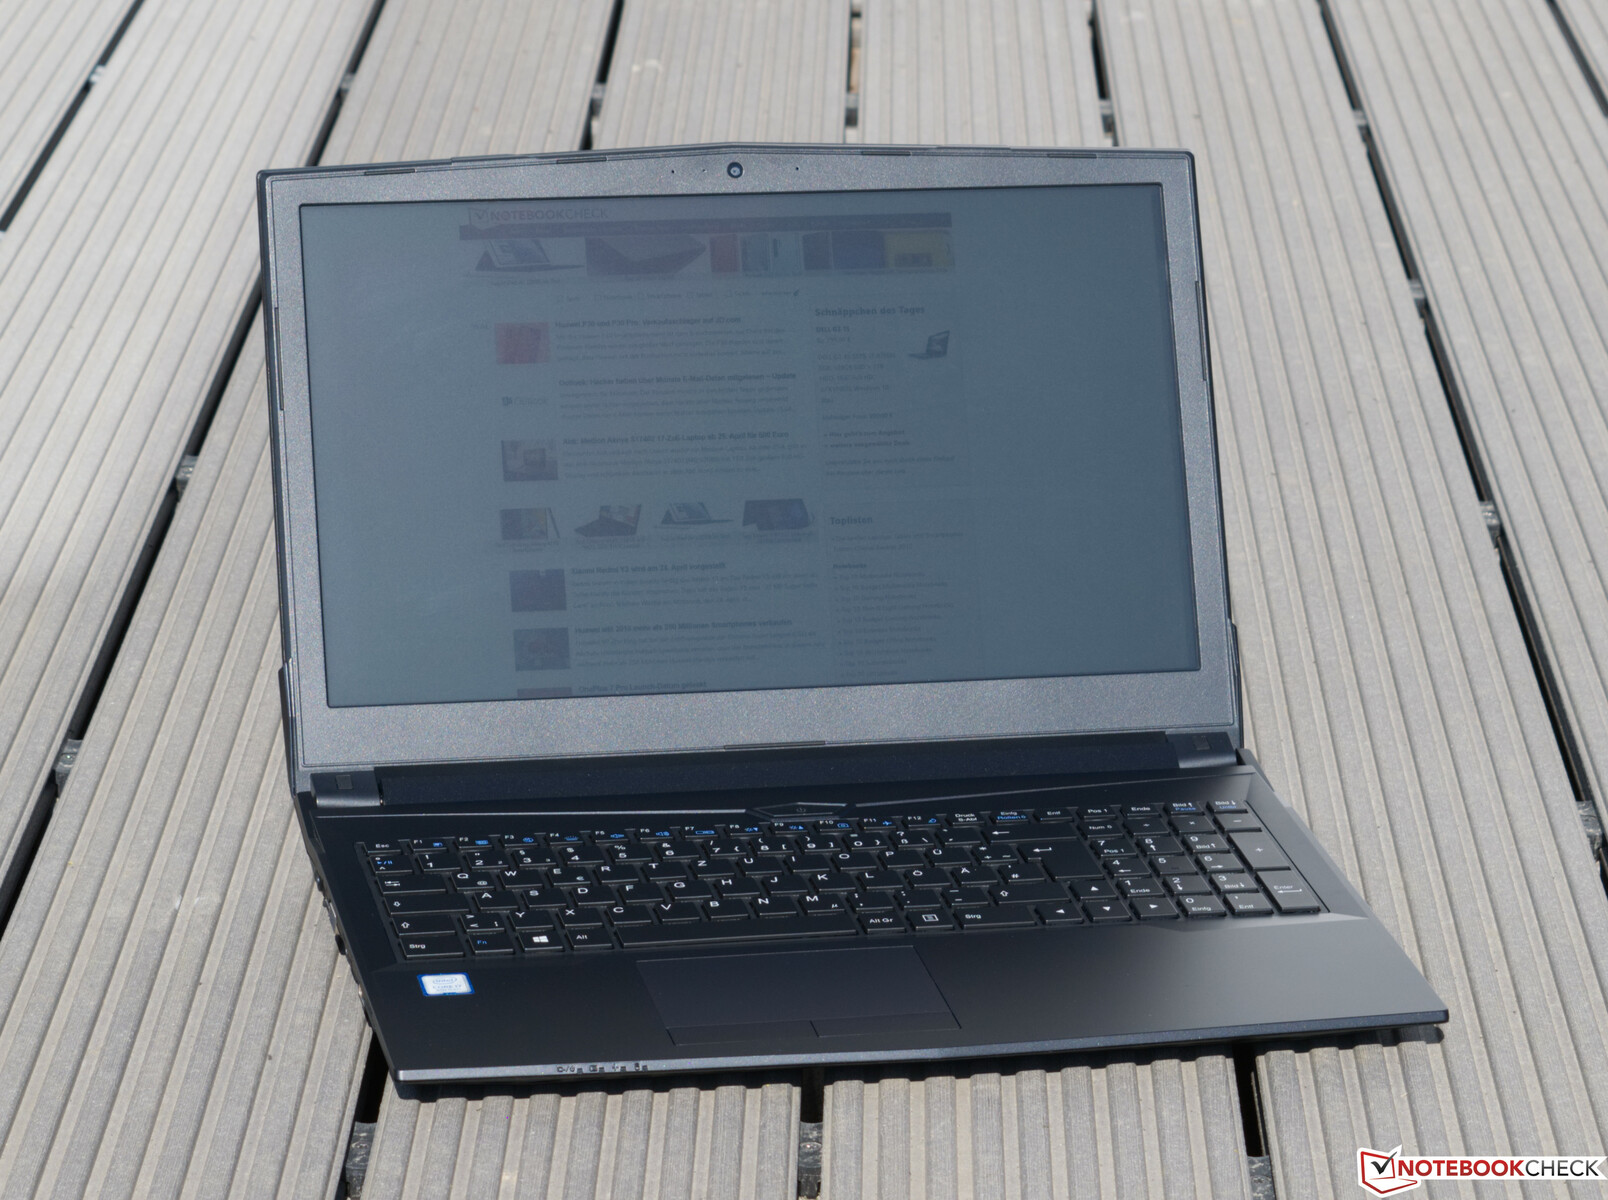
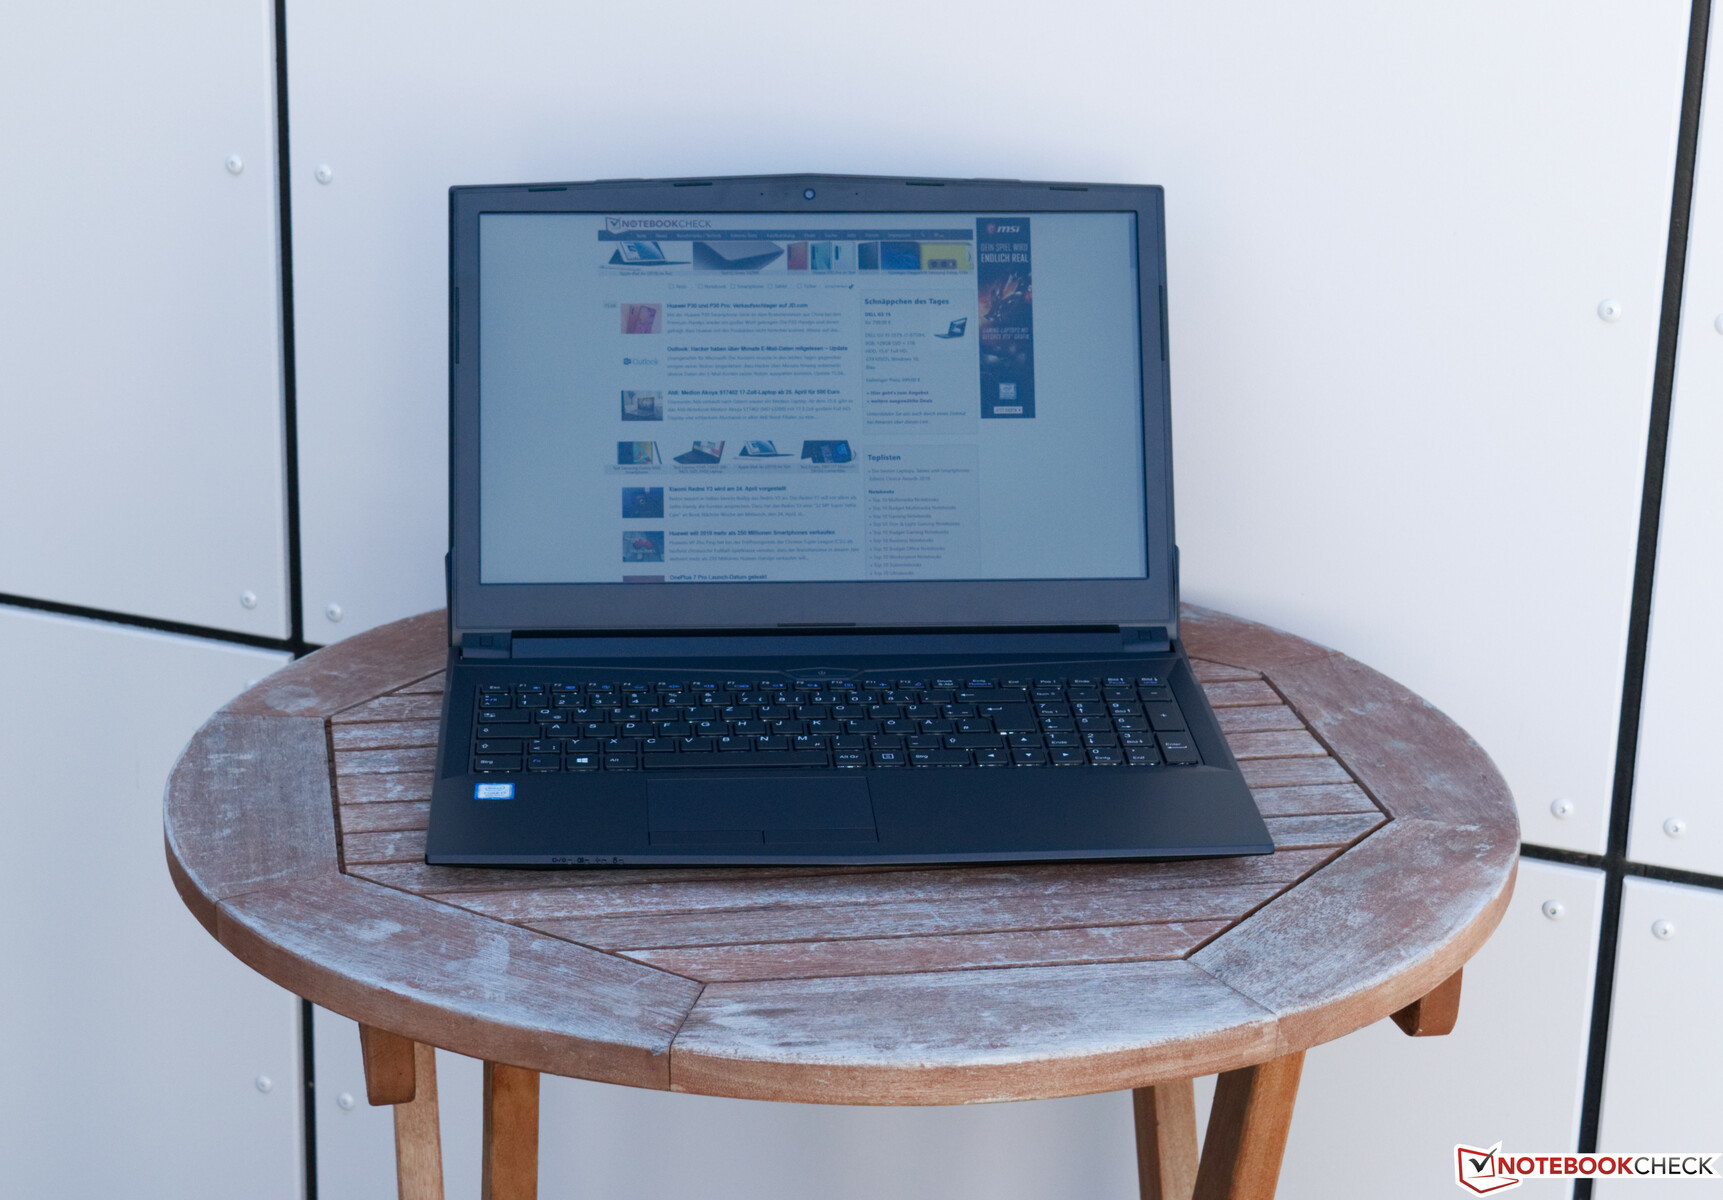
The Work 15 comes in a simple black case without any colour accents, which would have improved the look of the device in our opinion. The choice of materials looks a bit cheap, primarily because of its mostly plastic design. However, our test device is surprisingly stiff, even though it does twist slightly when we apply pressure to it. Unfortunately, the base bows in the middle to the slightest of pressure, while the area around the power button emits an audible creaking sound when we press the said button.
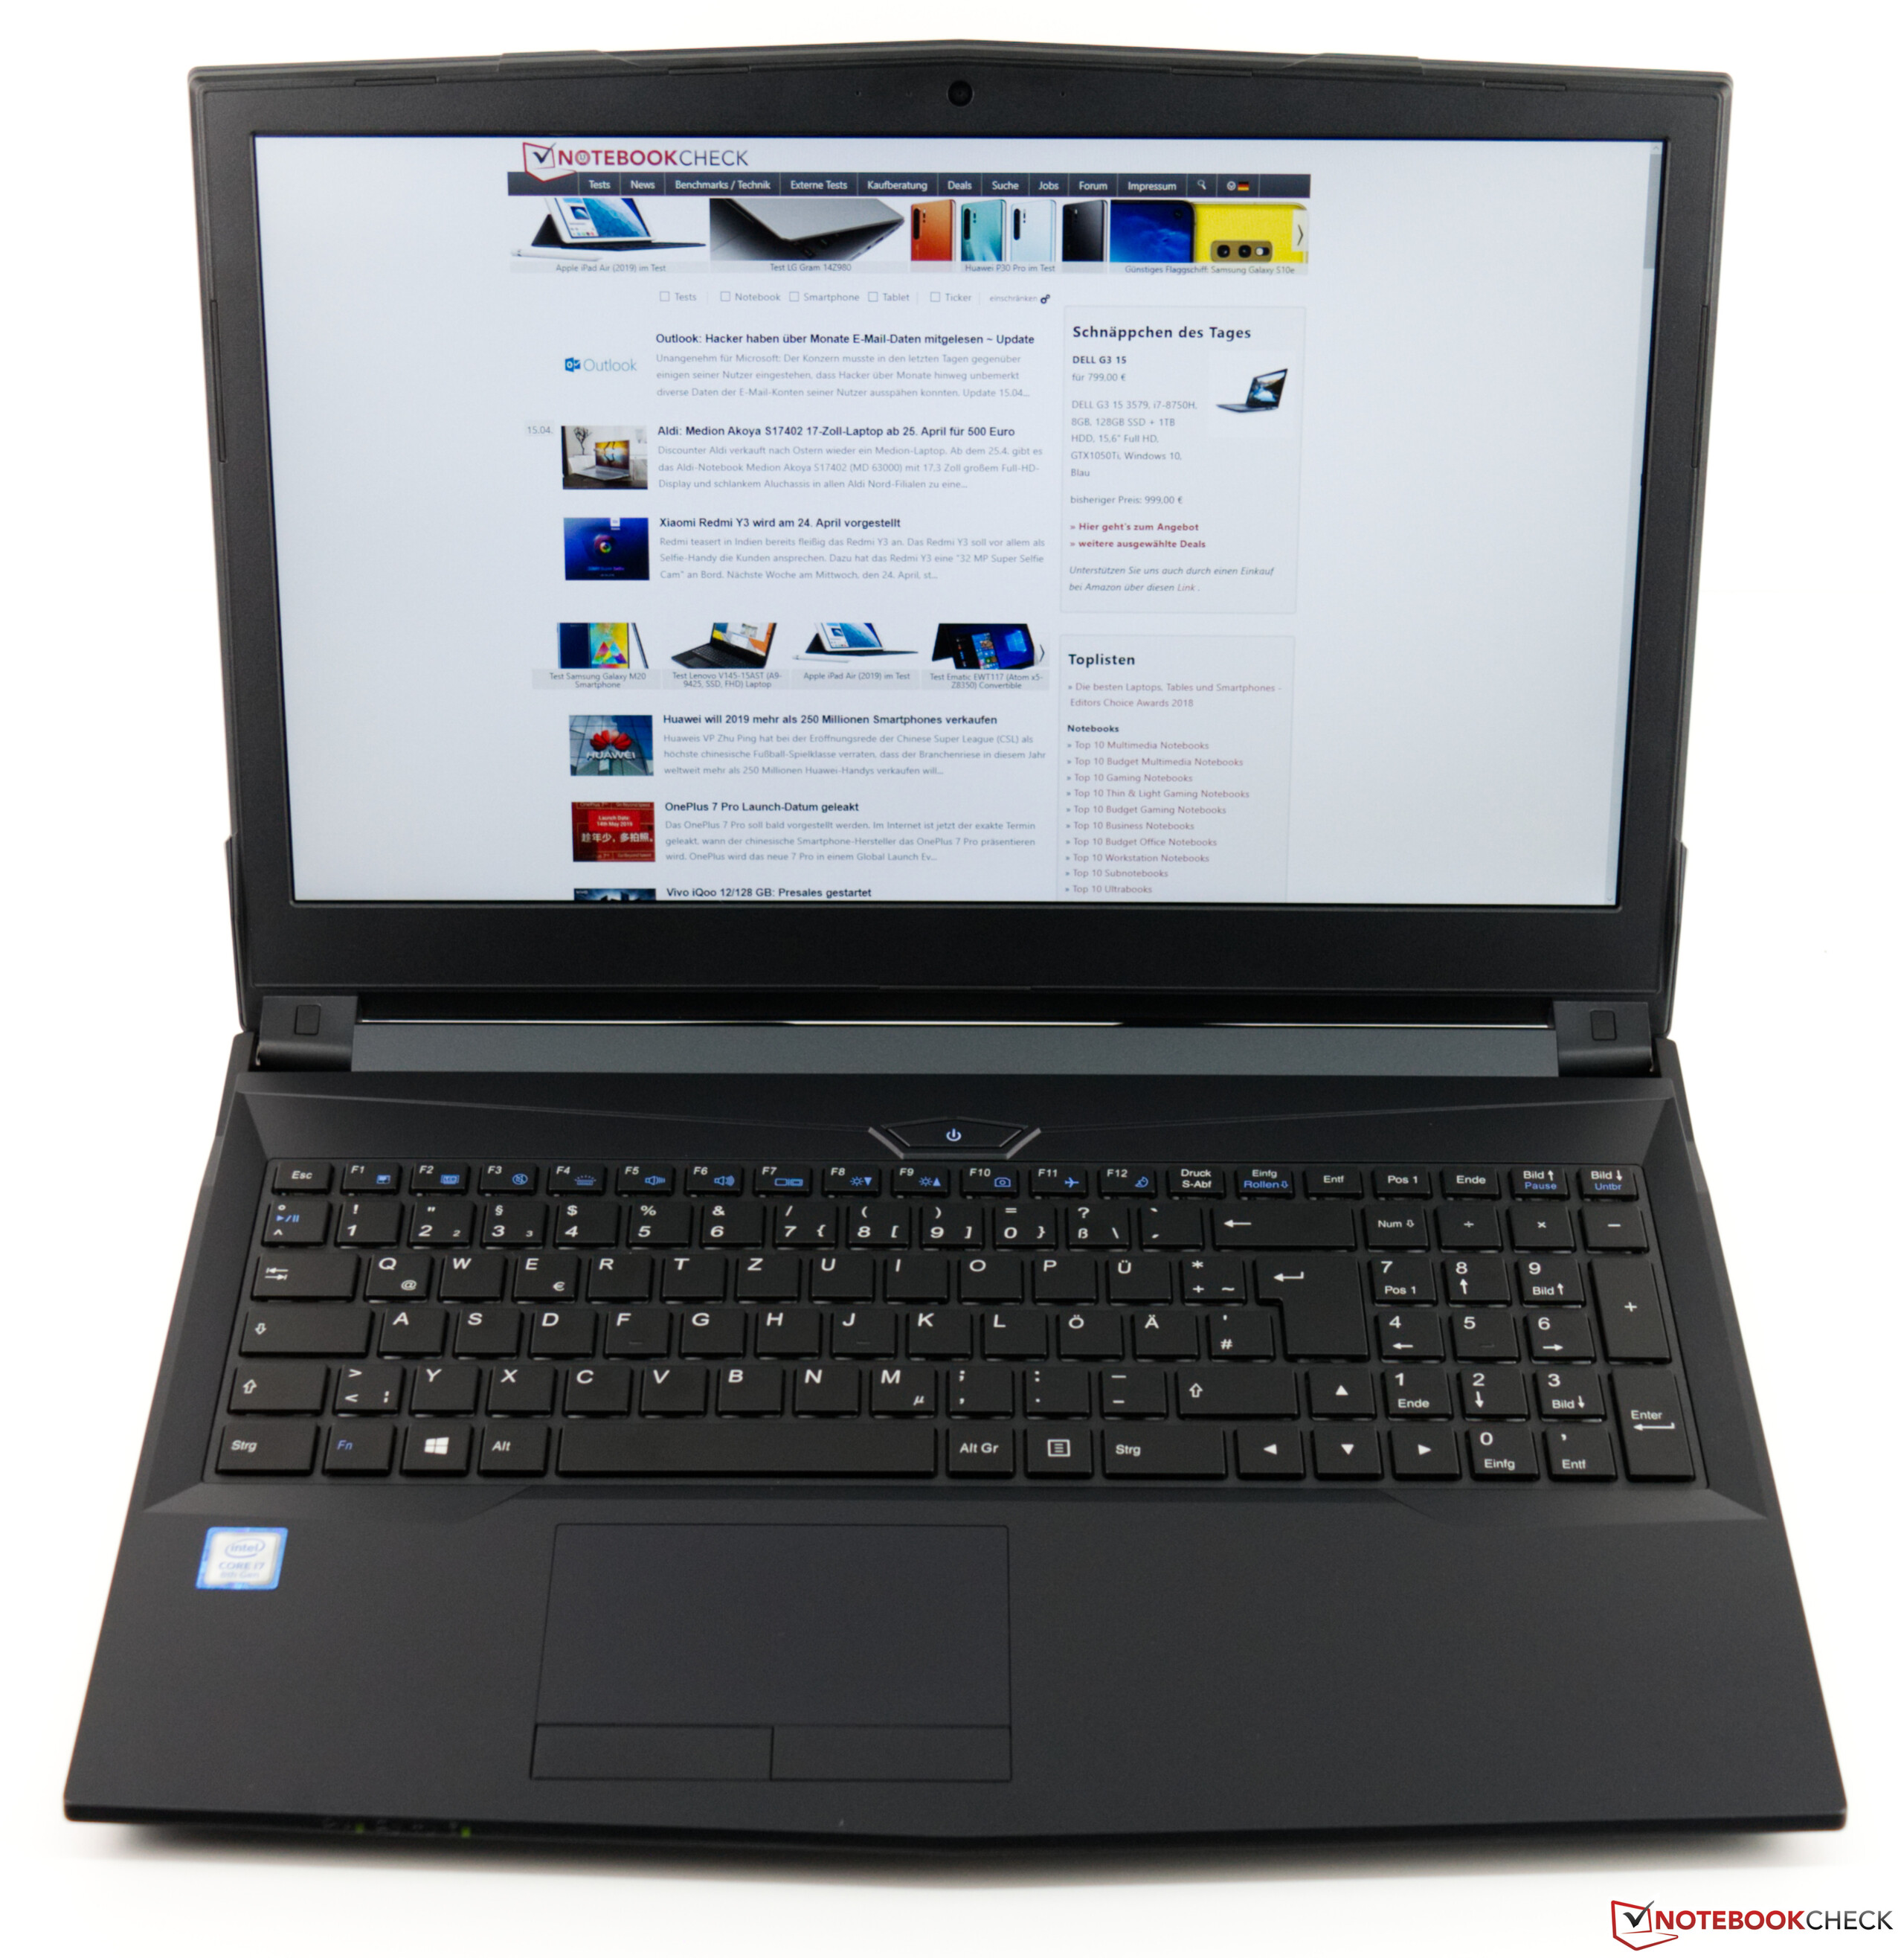
The display lid is just as sturdy as the base, which is not ideal. We can easily twist it without much effort and it does not dissipate pressure well so we can get the display to temporarily deform by flexing the lid. The hinges, on the other hand, hold the display reliably in position and stop it from teetering in daily use. The display opens to about 130°, which is comparatively short. Many of our comparison devices have up to 180° hinges, which provide a greater range of movement than the Work 15 offers.
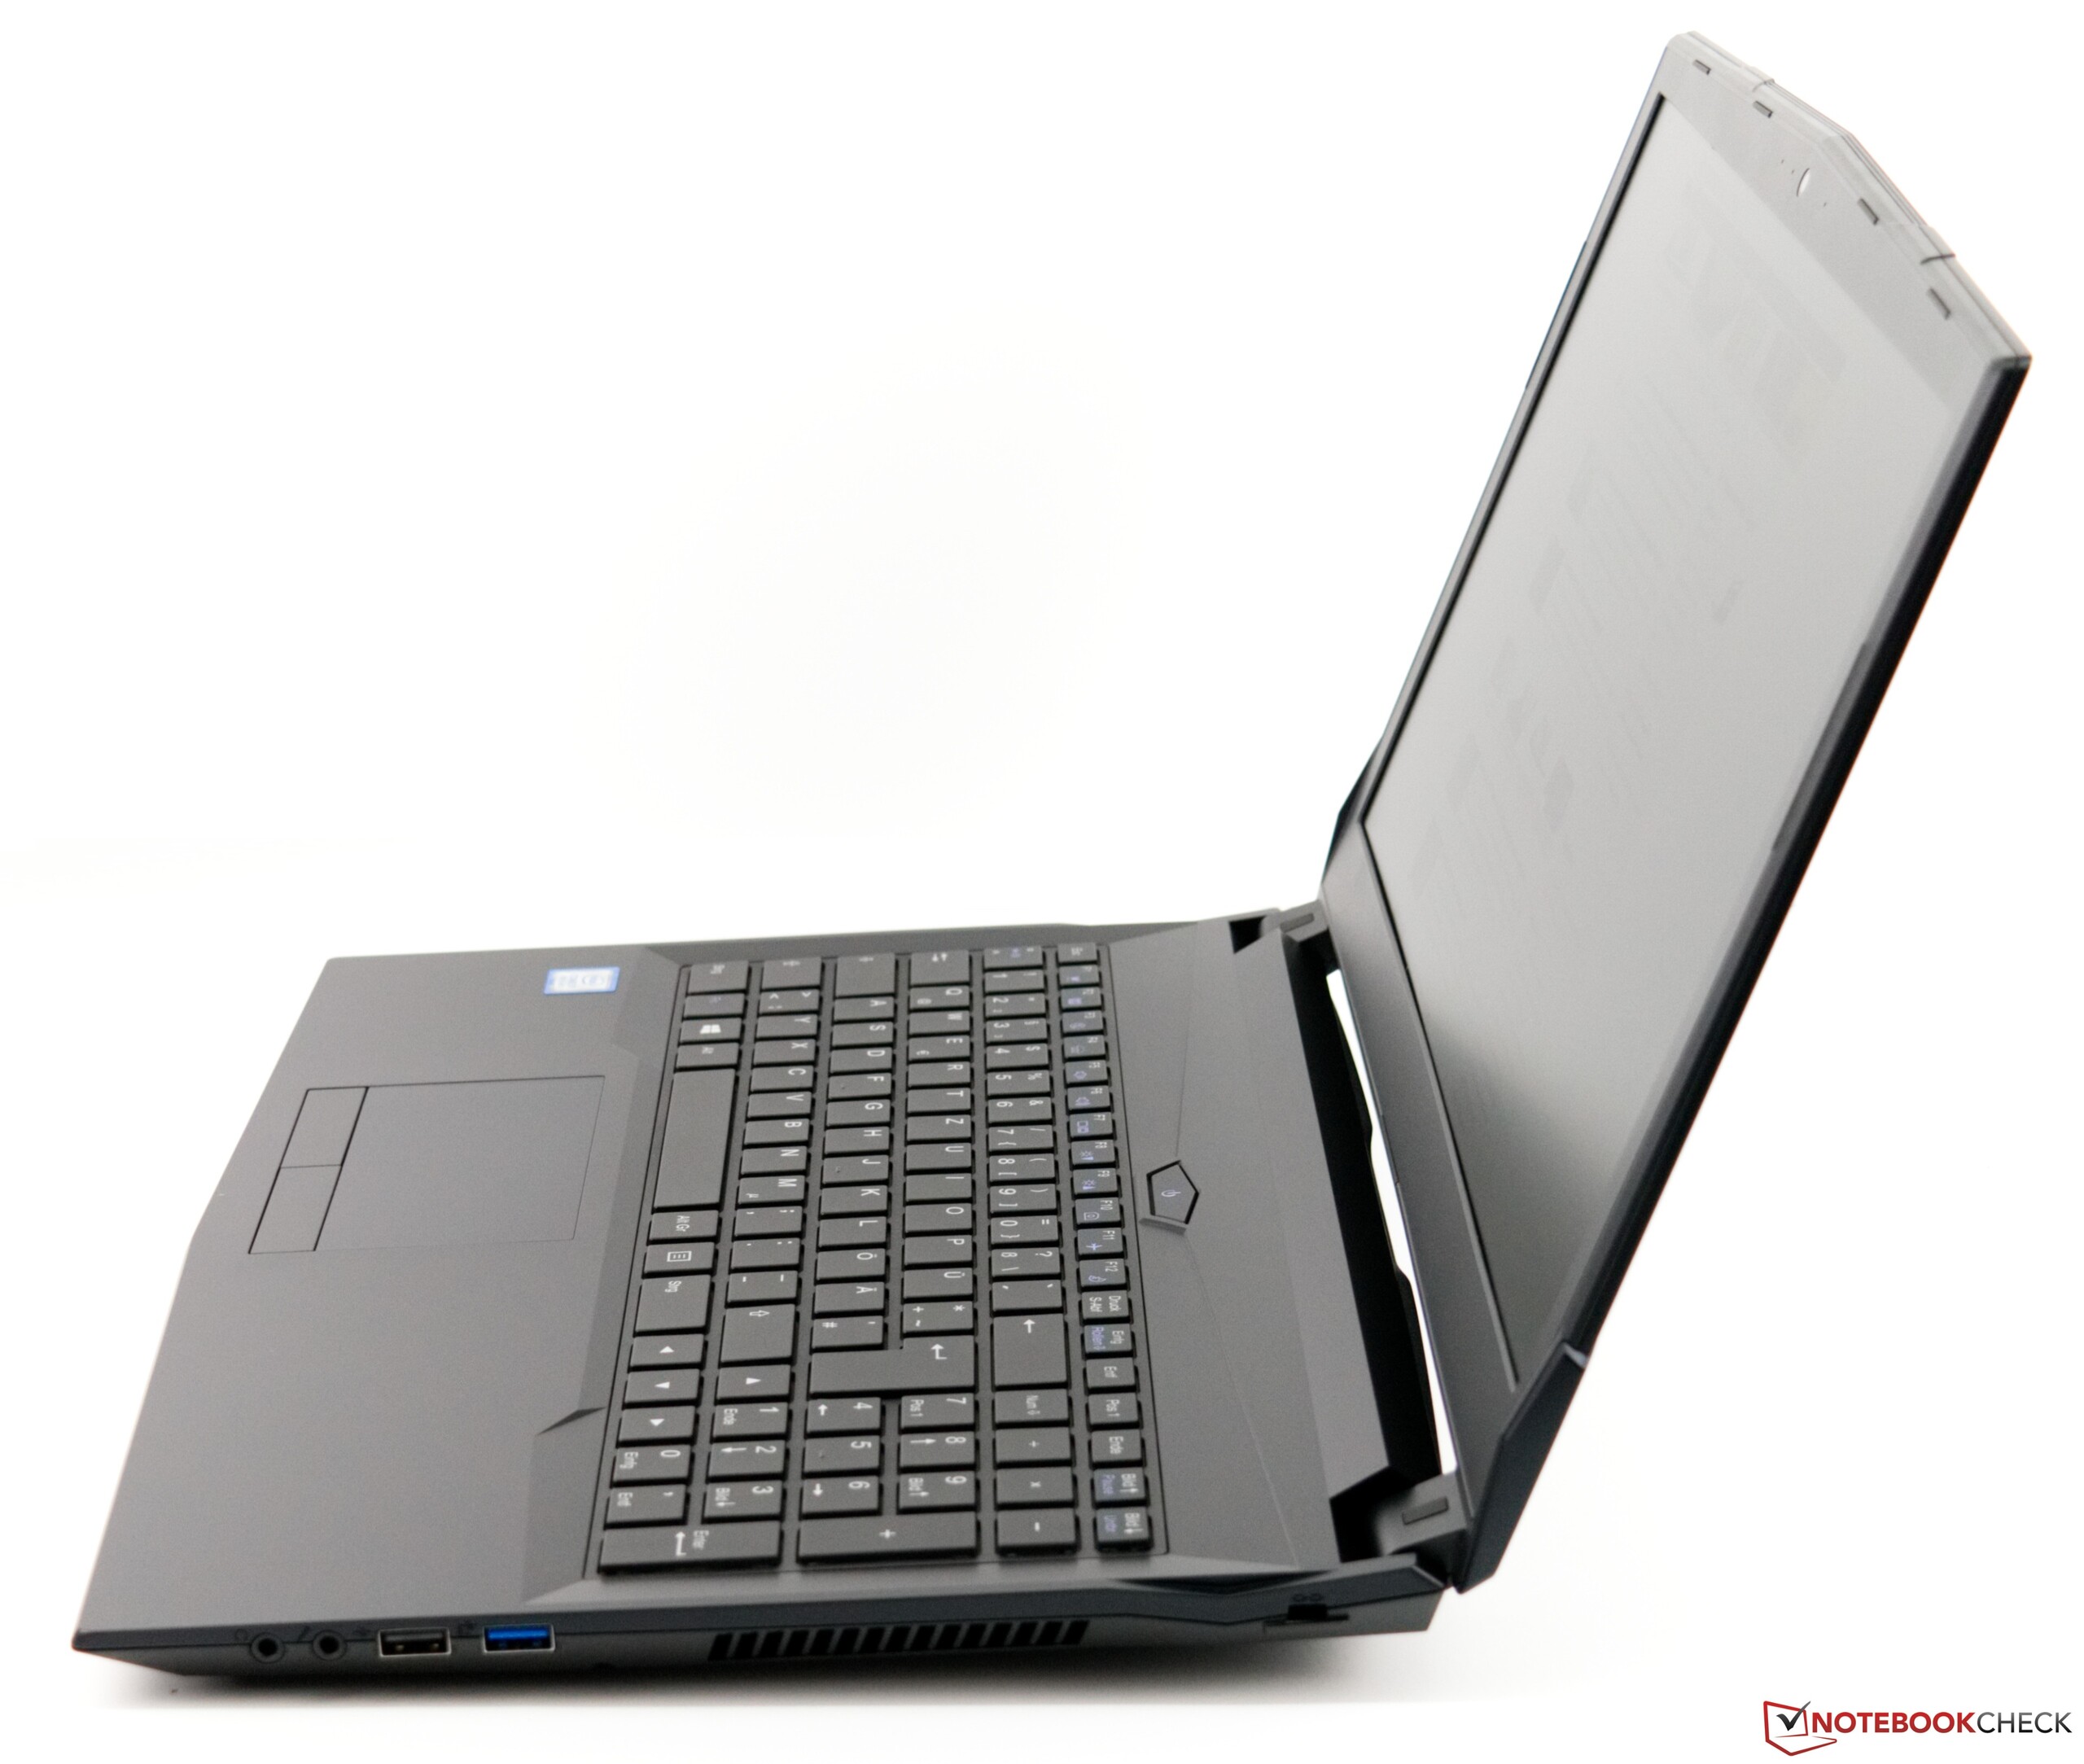
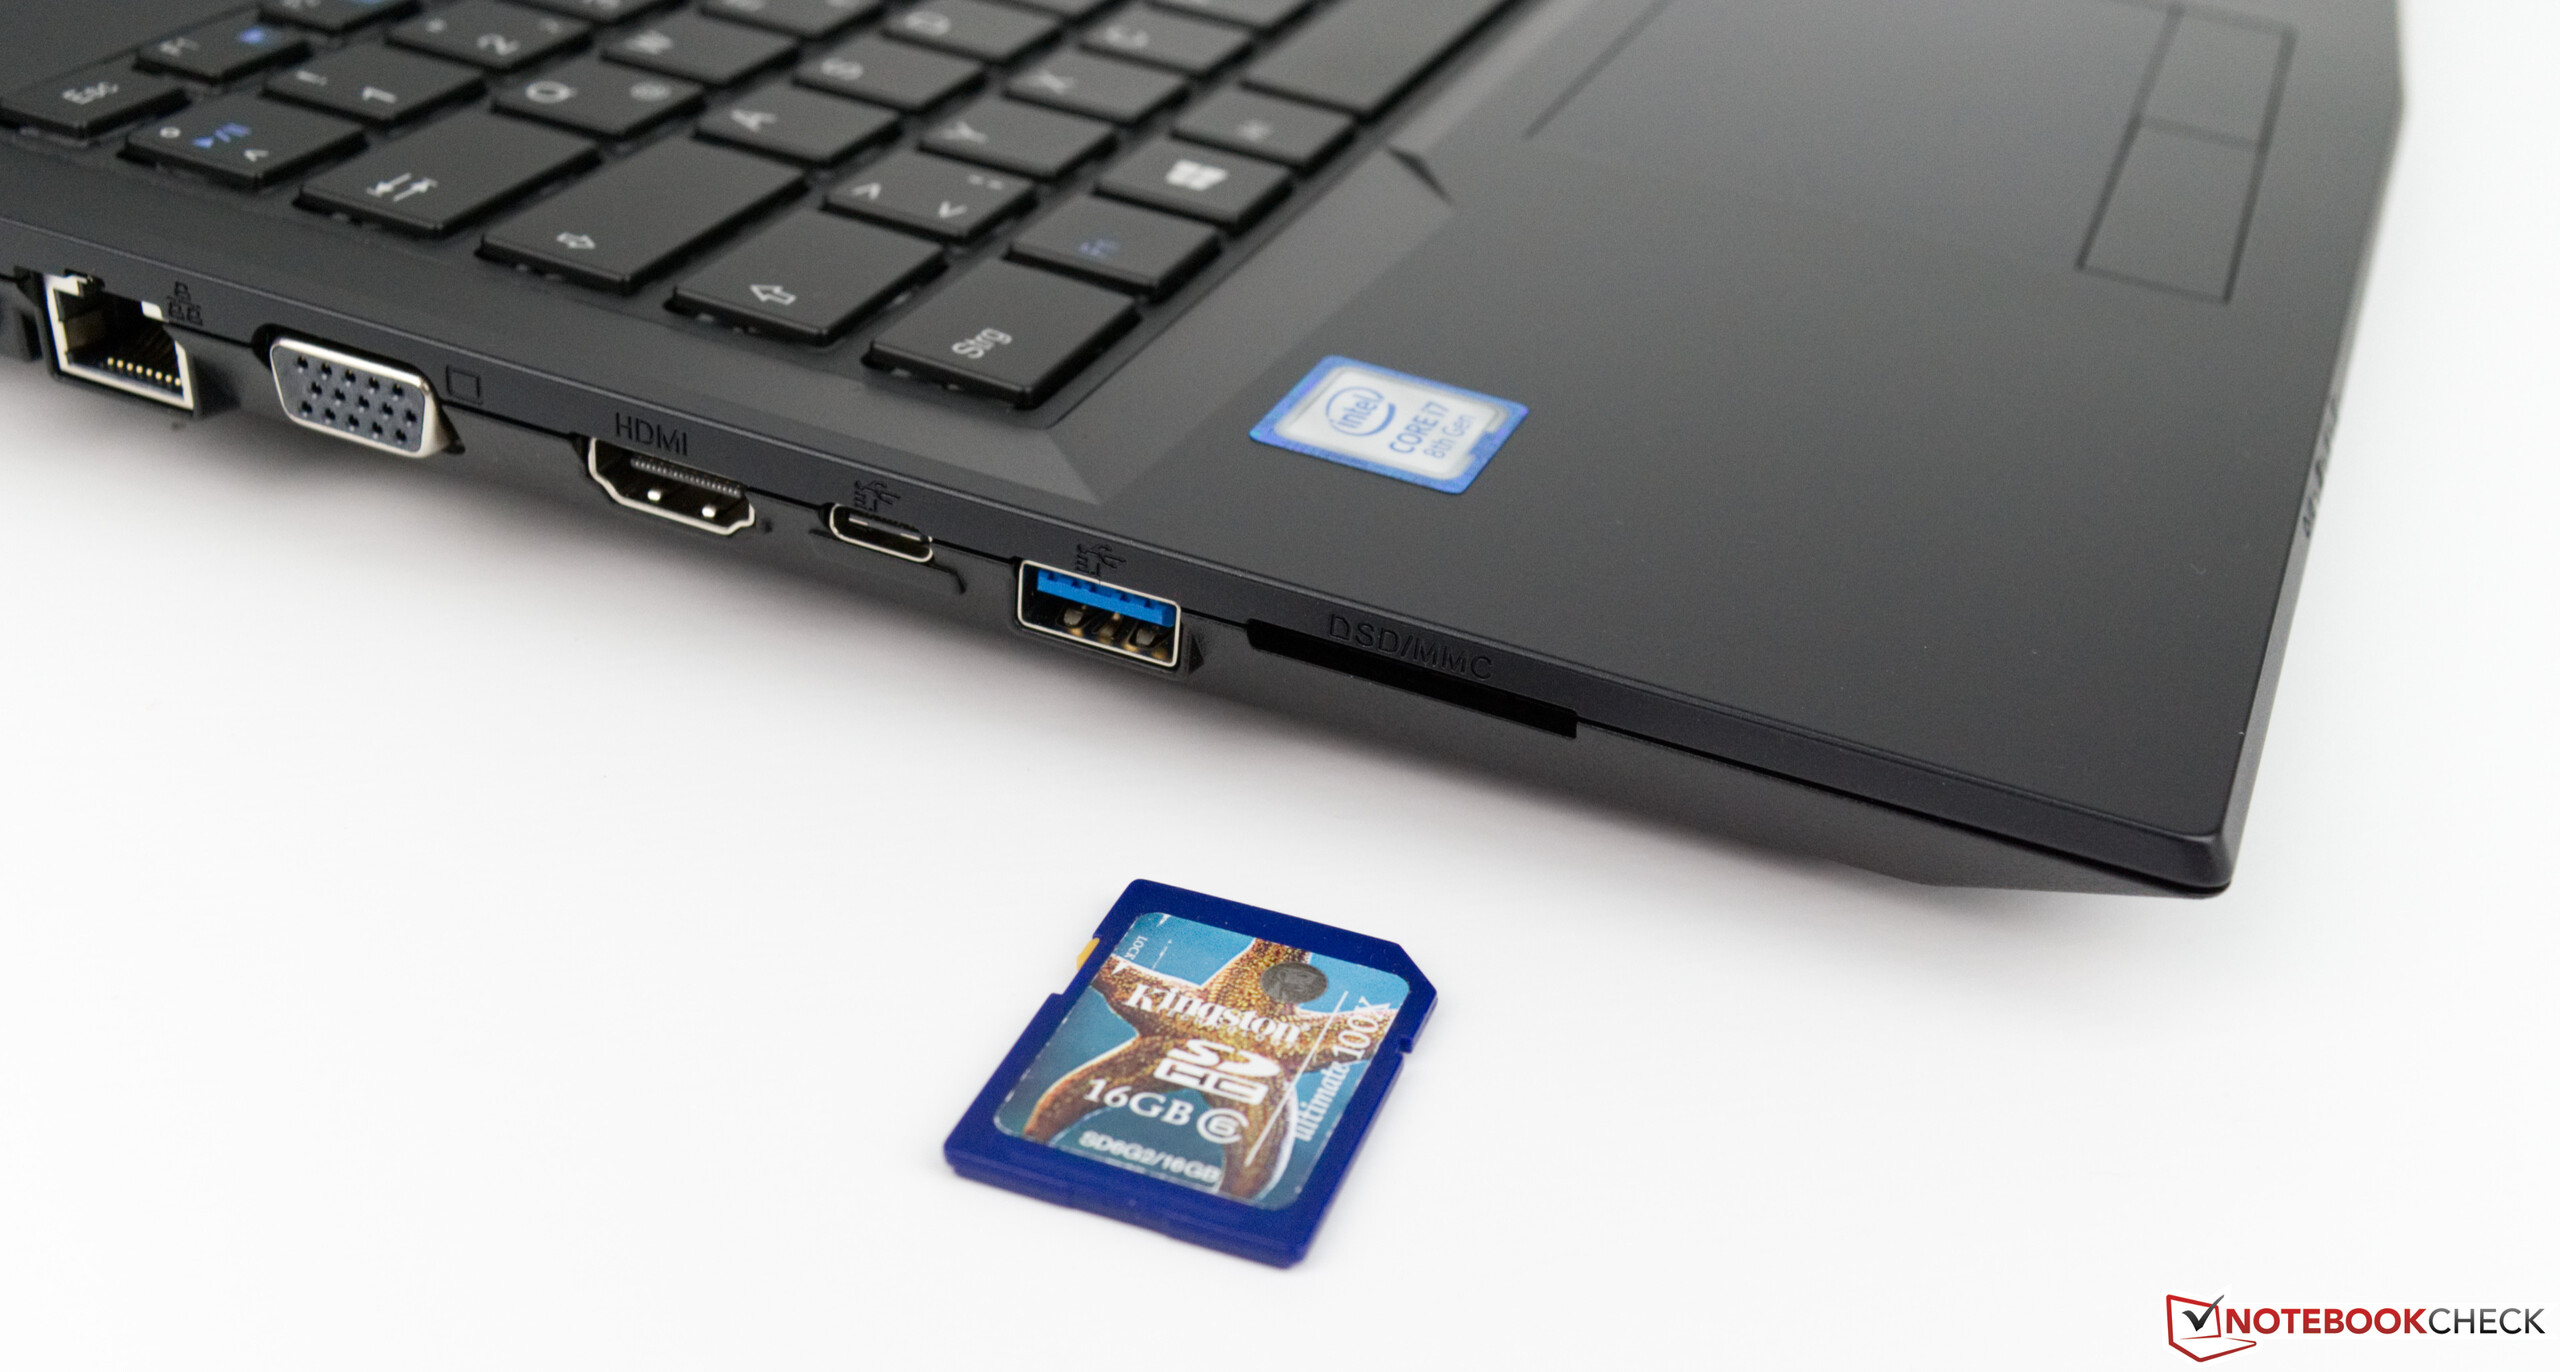
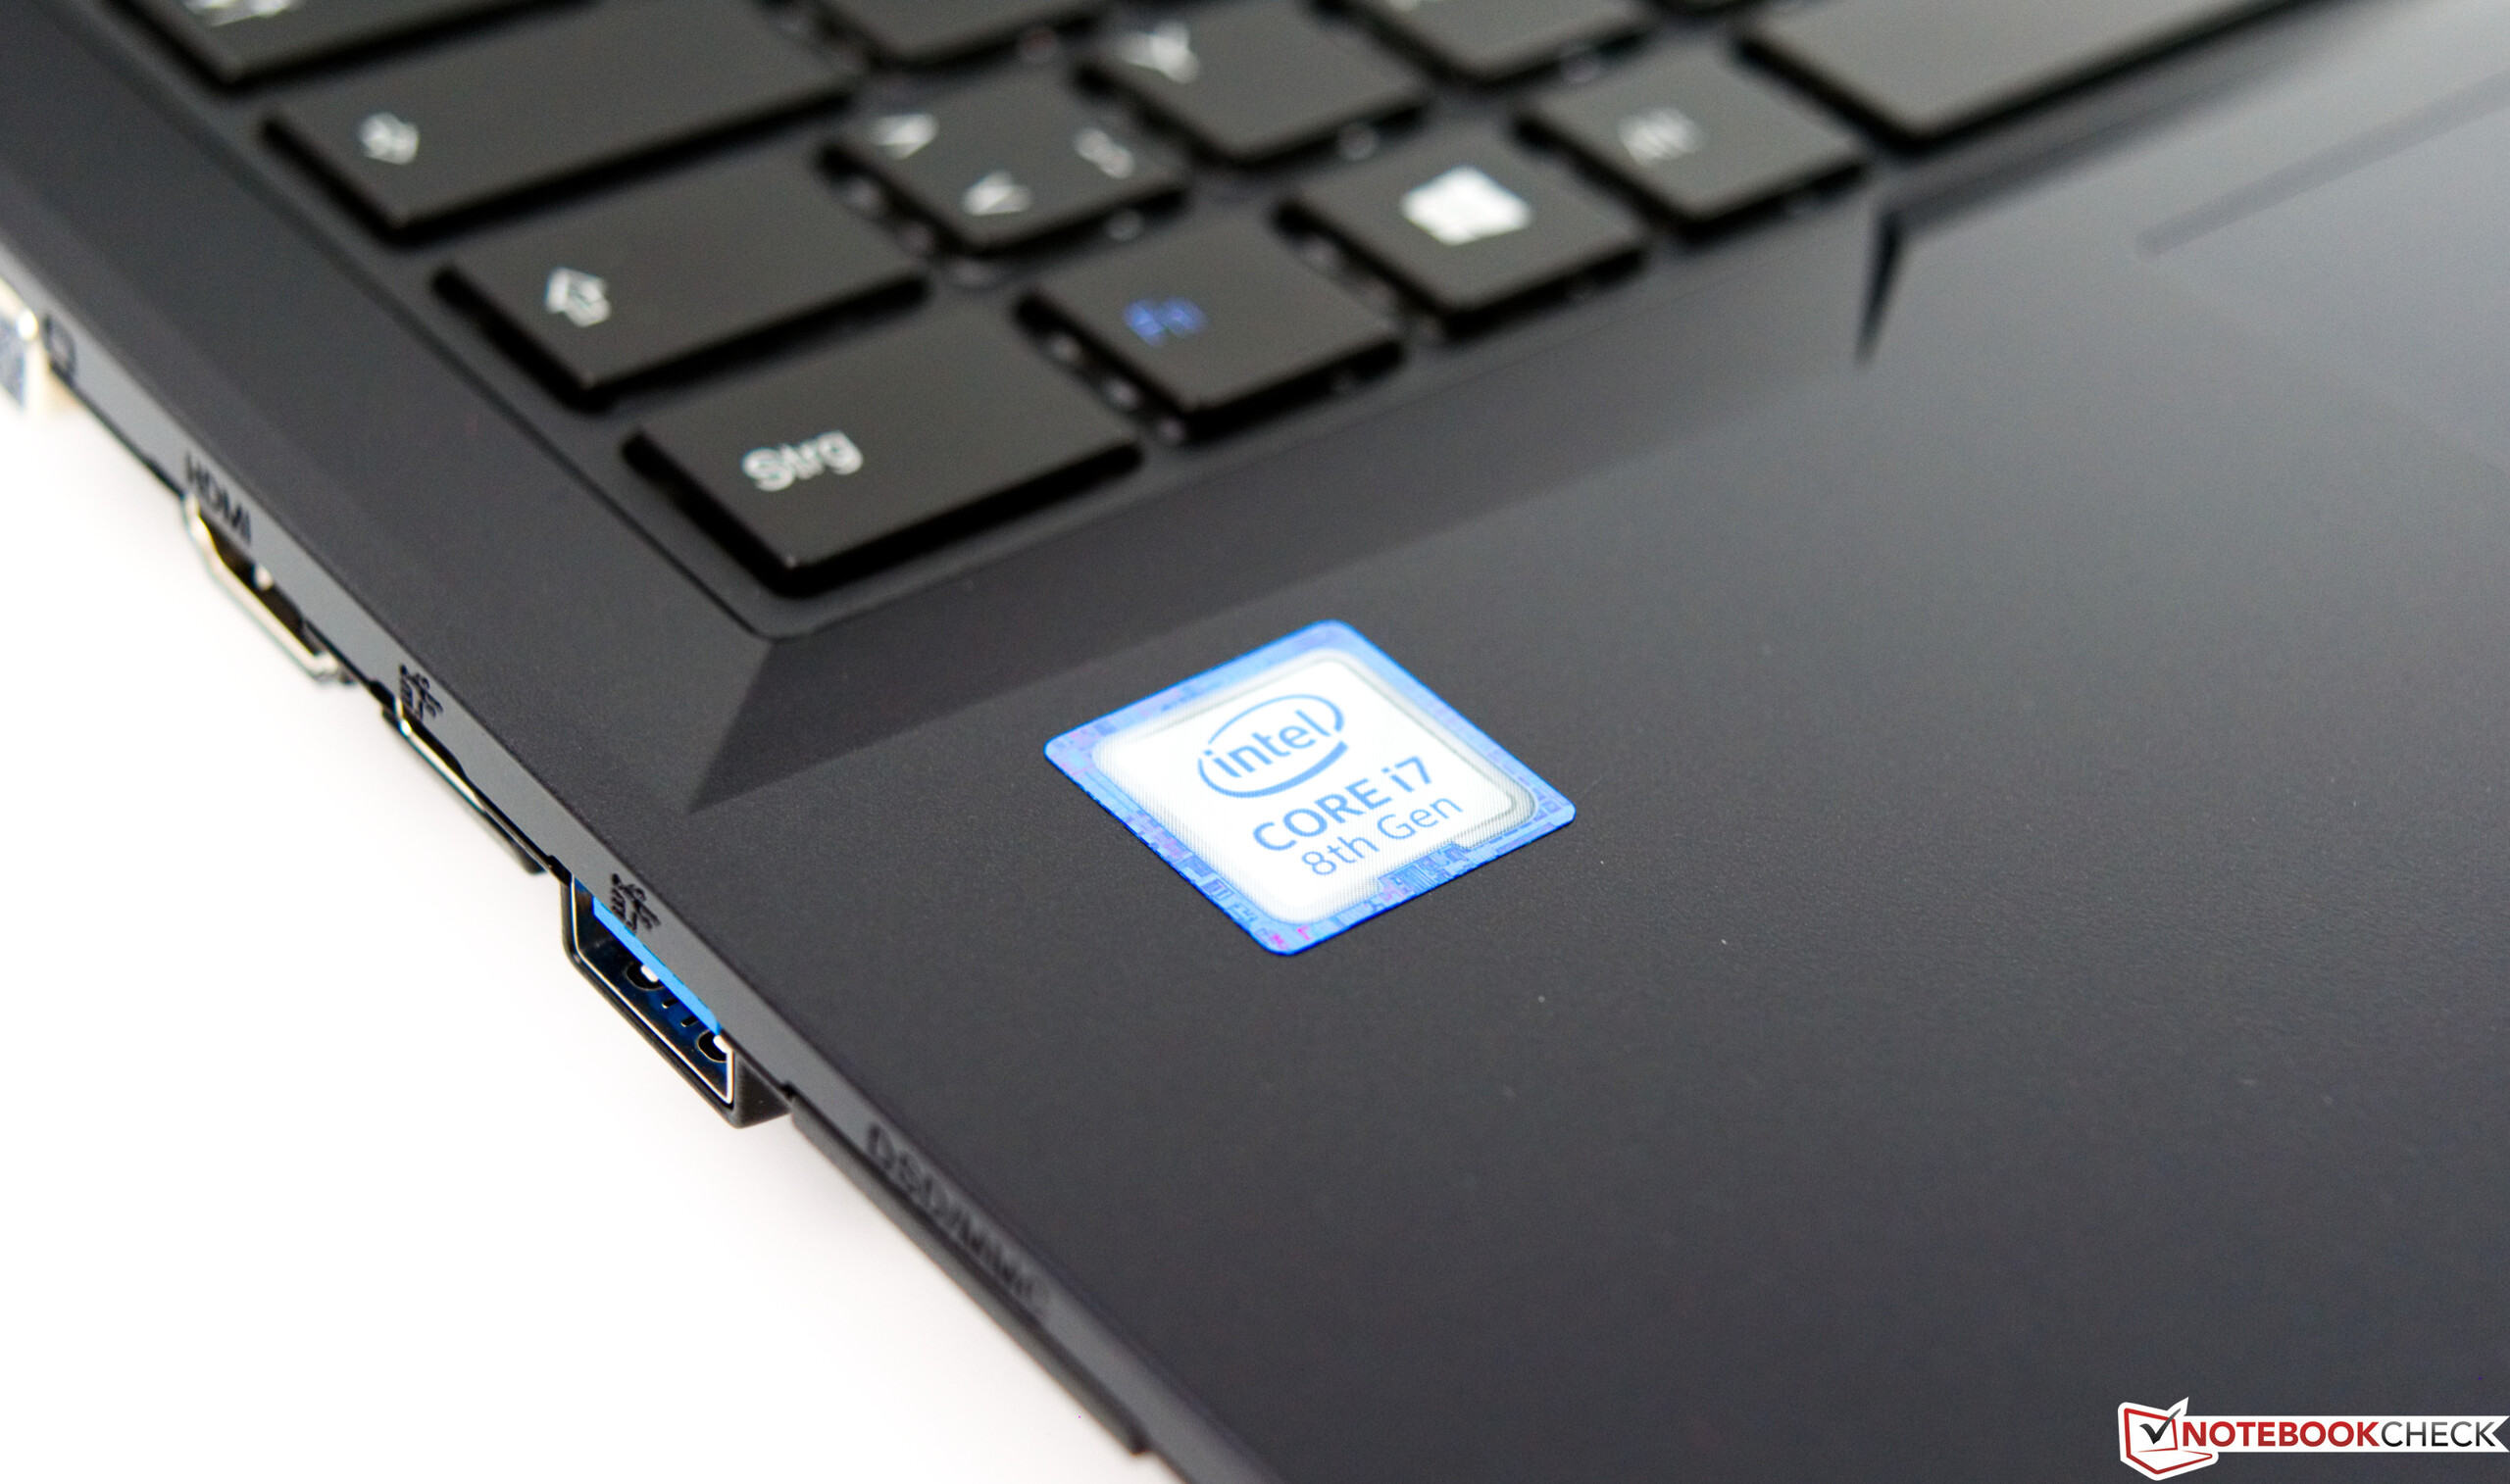
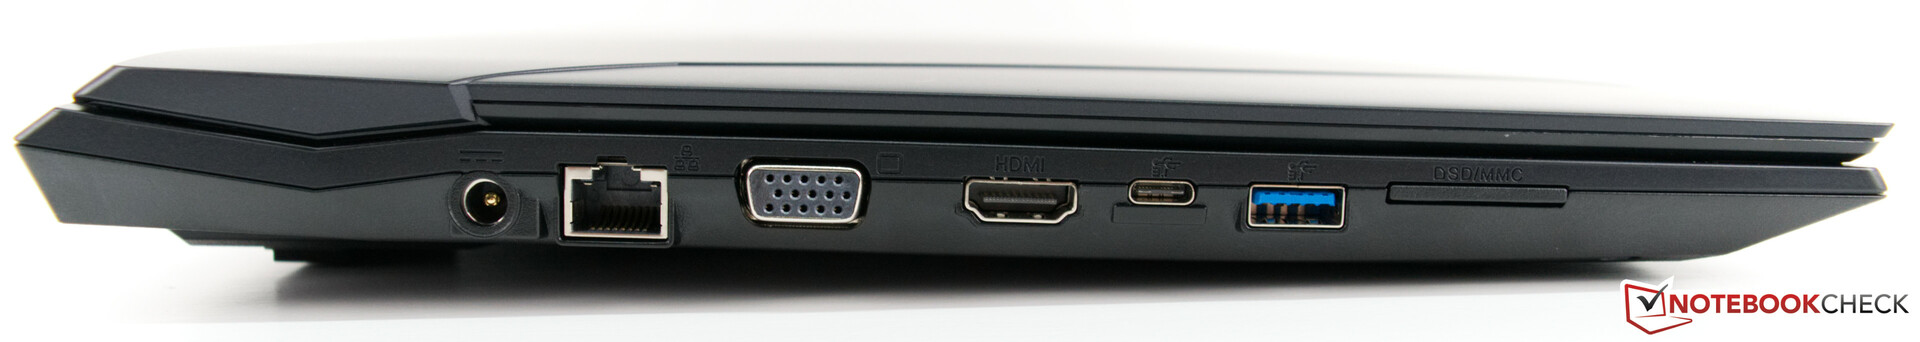
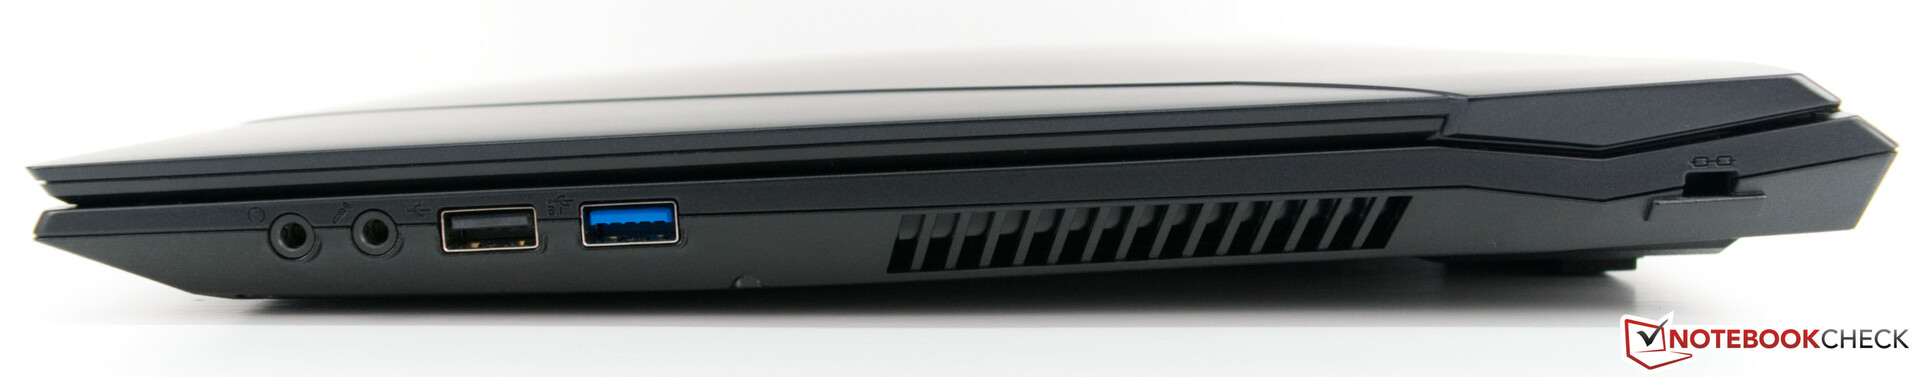
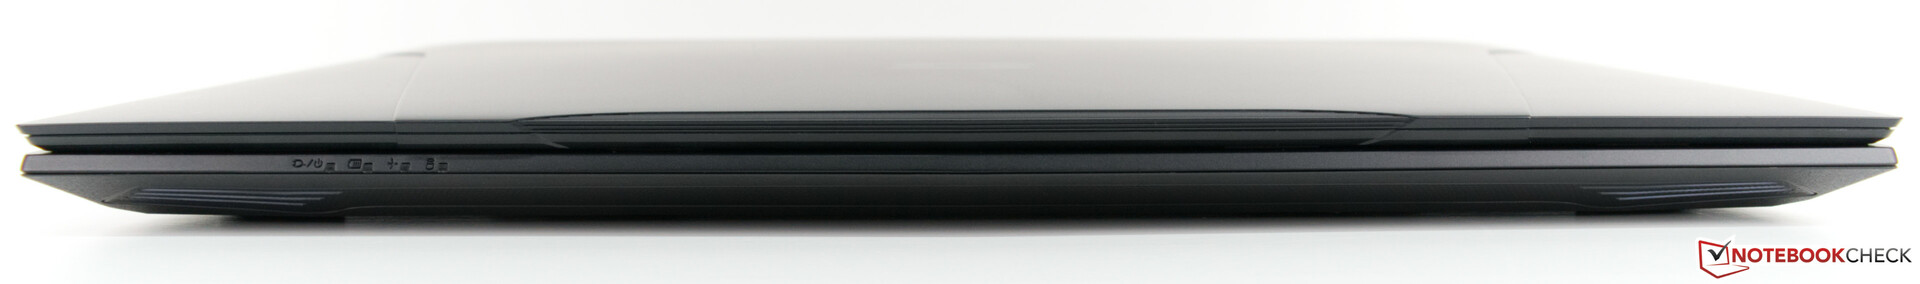
At 2.2 kilograms (~4.85 lb), the Work 15 is heavier than all our comparison devices. The same is the case with its footprint. Schenker has distributed all ports across the left and right-hand sides of the frame, although most are on the left-hand side. The Work 15 has a total of four USB ports, which should be plenty for most everyday users. However, you should pay attention to what standard you need, because Schenker has equipped the device with a slower USB 2.0 port on the right-hand side of the frame. The Work 15 also comes with a full-sized SD card reader and a dust cap to protect it. SD cards hardly protrude from the reader either. Our test device achieved acceptable transfer speeds in our tests, which are comparable to those achieved by the HP ProBook 450 G6 and Lenovo ThinkPad T580. The Work 15 cannot compete with the fast UHS-II card reader in the Dell Latitude 5590 though.
Wi-Fi performance is also on par with the best of our comparison devices. Schenker has equipped the Work 15 with an Intel Wireless AC 9560 chip that delivers very good transfer speeds, and which puts the device level with the ProBook 450 G6 in our iperf3 Client Wi-Fi tests. You can also use the RJ45 Ethernet port for a wired connection should you need one. The Ethernet port sits next to the VGA port, for reference. Yes, you read it right. The Work 15 also has a VGA connection, which means that the device can still be paired with older hardware. However, you still have an HDMI 1.4b output for connecting to more modern external monitors.
Connectivity
| SD Card Reader | |
| average JPG Copy Test (av. of 3 runs) | |
| Dell Latitude 5590 (Toshiba Exceria Pro SDXC 64 GB UHS-II) | |
| Schenker Work 15 (Toshiba Exceria Pro SDXC 64 GB UHS-II) | |
| HP ProBook 450 G6-5TJ93EA (Toshiba Exceria Pro SDXC 64 GB UHS-II) | |
| Lenovo ThinkPad T580-20L9001AUS (Toshiba Exceria Pro SDXC 64 GB UHS-II) | |
| Fujitsu Lifebook E558 E5580MP581DE (Toshiba Exceria Pro SDXC 64 GB UHS-II) | |
| Average of class Office (19.8 - 198.5, n=22, last 2 years) | |
| maximum AS SSD Seq Read Test (1GB) | |
| Dell Latitude 5590 (Toshiba Exceria Pro SDXC 64 GB UHS-II) | |
| Lenovo ThinkPad T580-20L9001AUS (Toshiba Exceria Pro SDXC 64 GB UHS-II) | |
| Schenker Work 15 (Toshiba Exceria Pro SDXC 64 GB UHS-II) | |
| HP ProBook 450 G6-5TJ93EA (Toshiba Exceria Pro SDXC 64 GB UHS-II) | |
| Average of class Office (27.4 - 249, n=21, last 2 years) | |
| Fujitsu Lifebook E558 E5580MP581DE (Toshiba Exceria Pro SDXC 64 GB UHS-II) | |
Input Devices
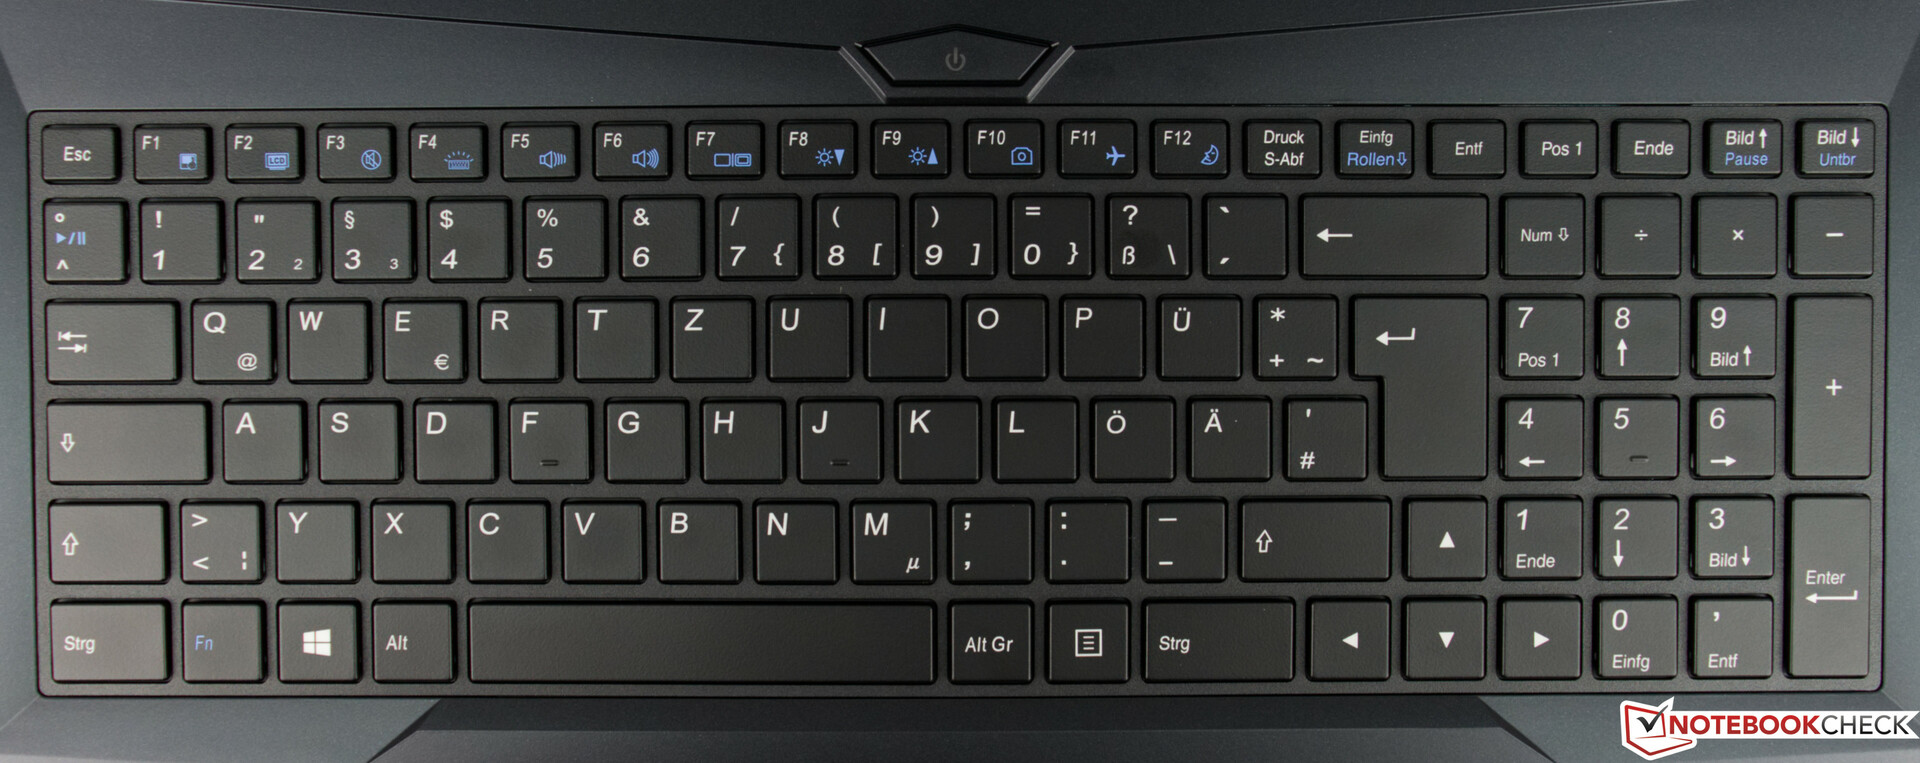
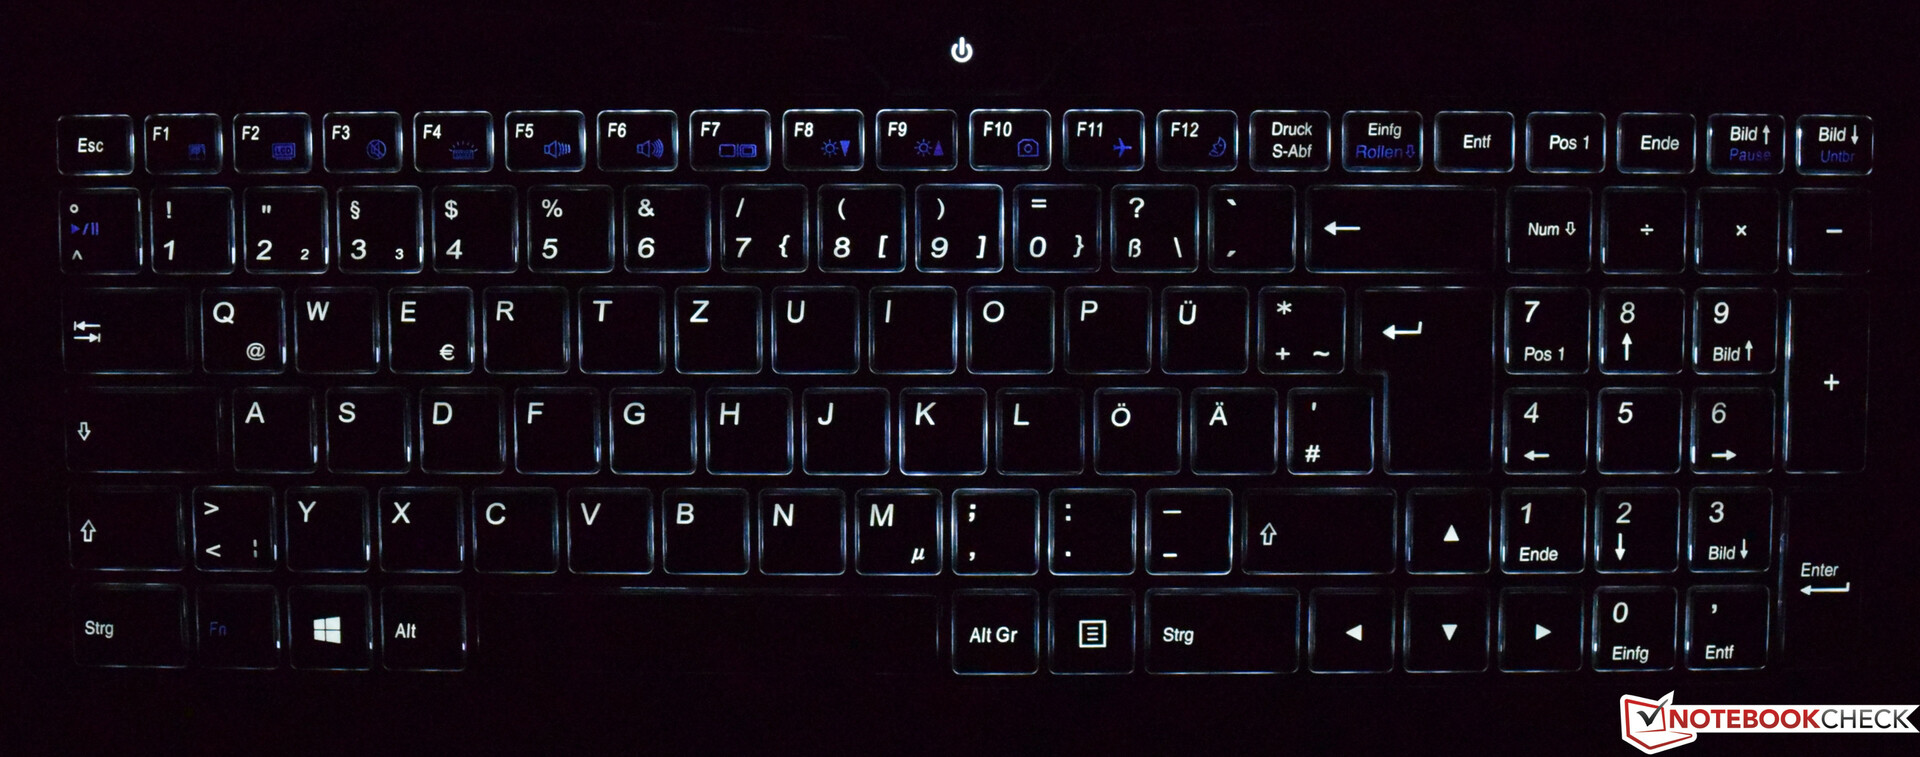
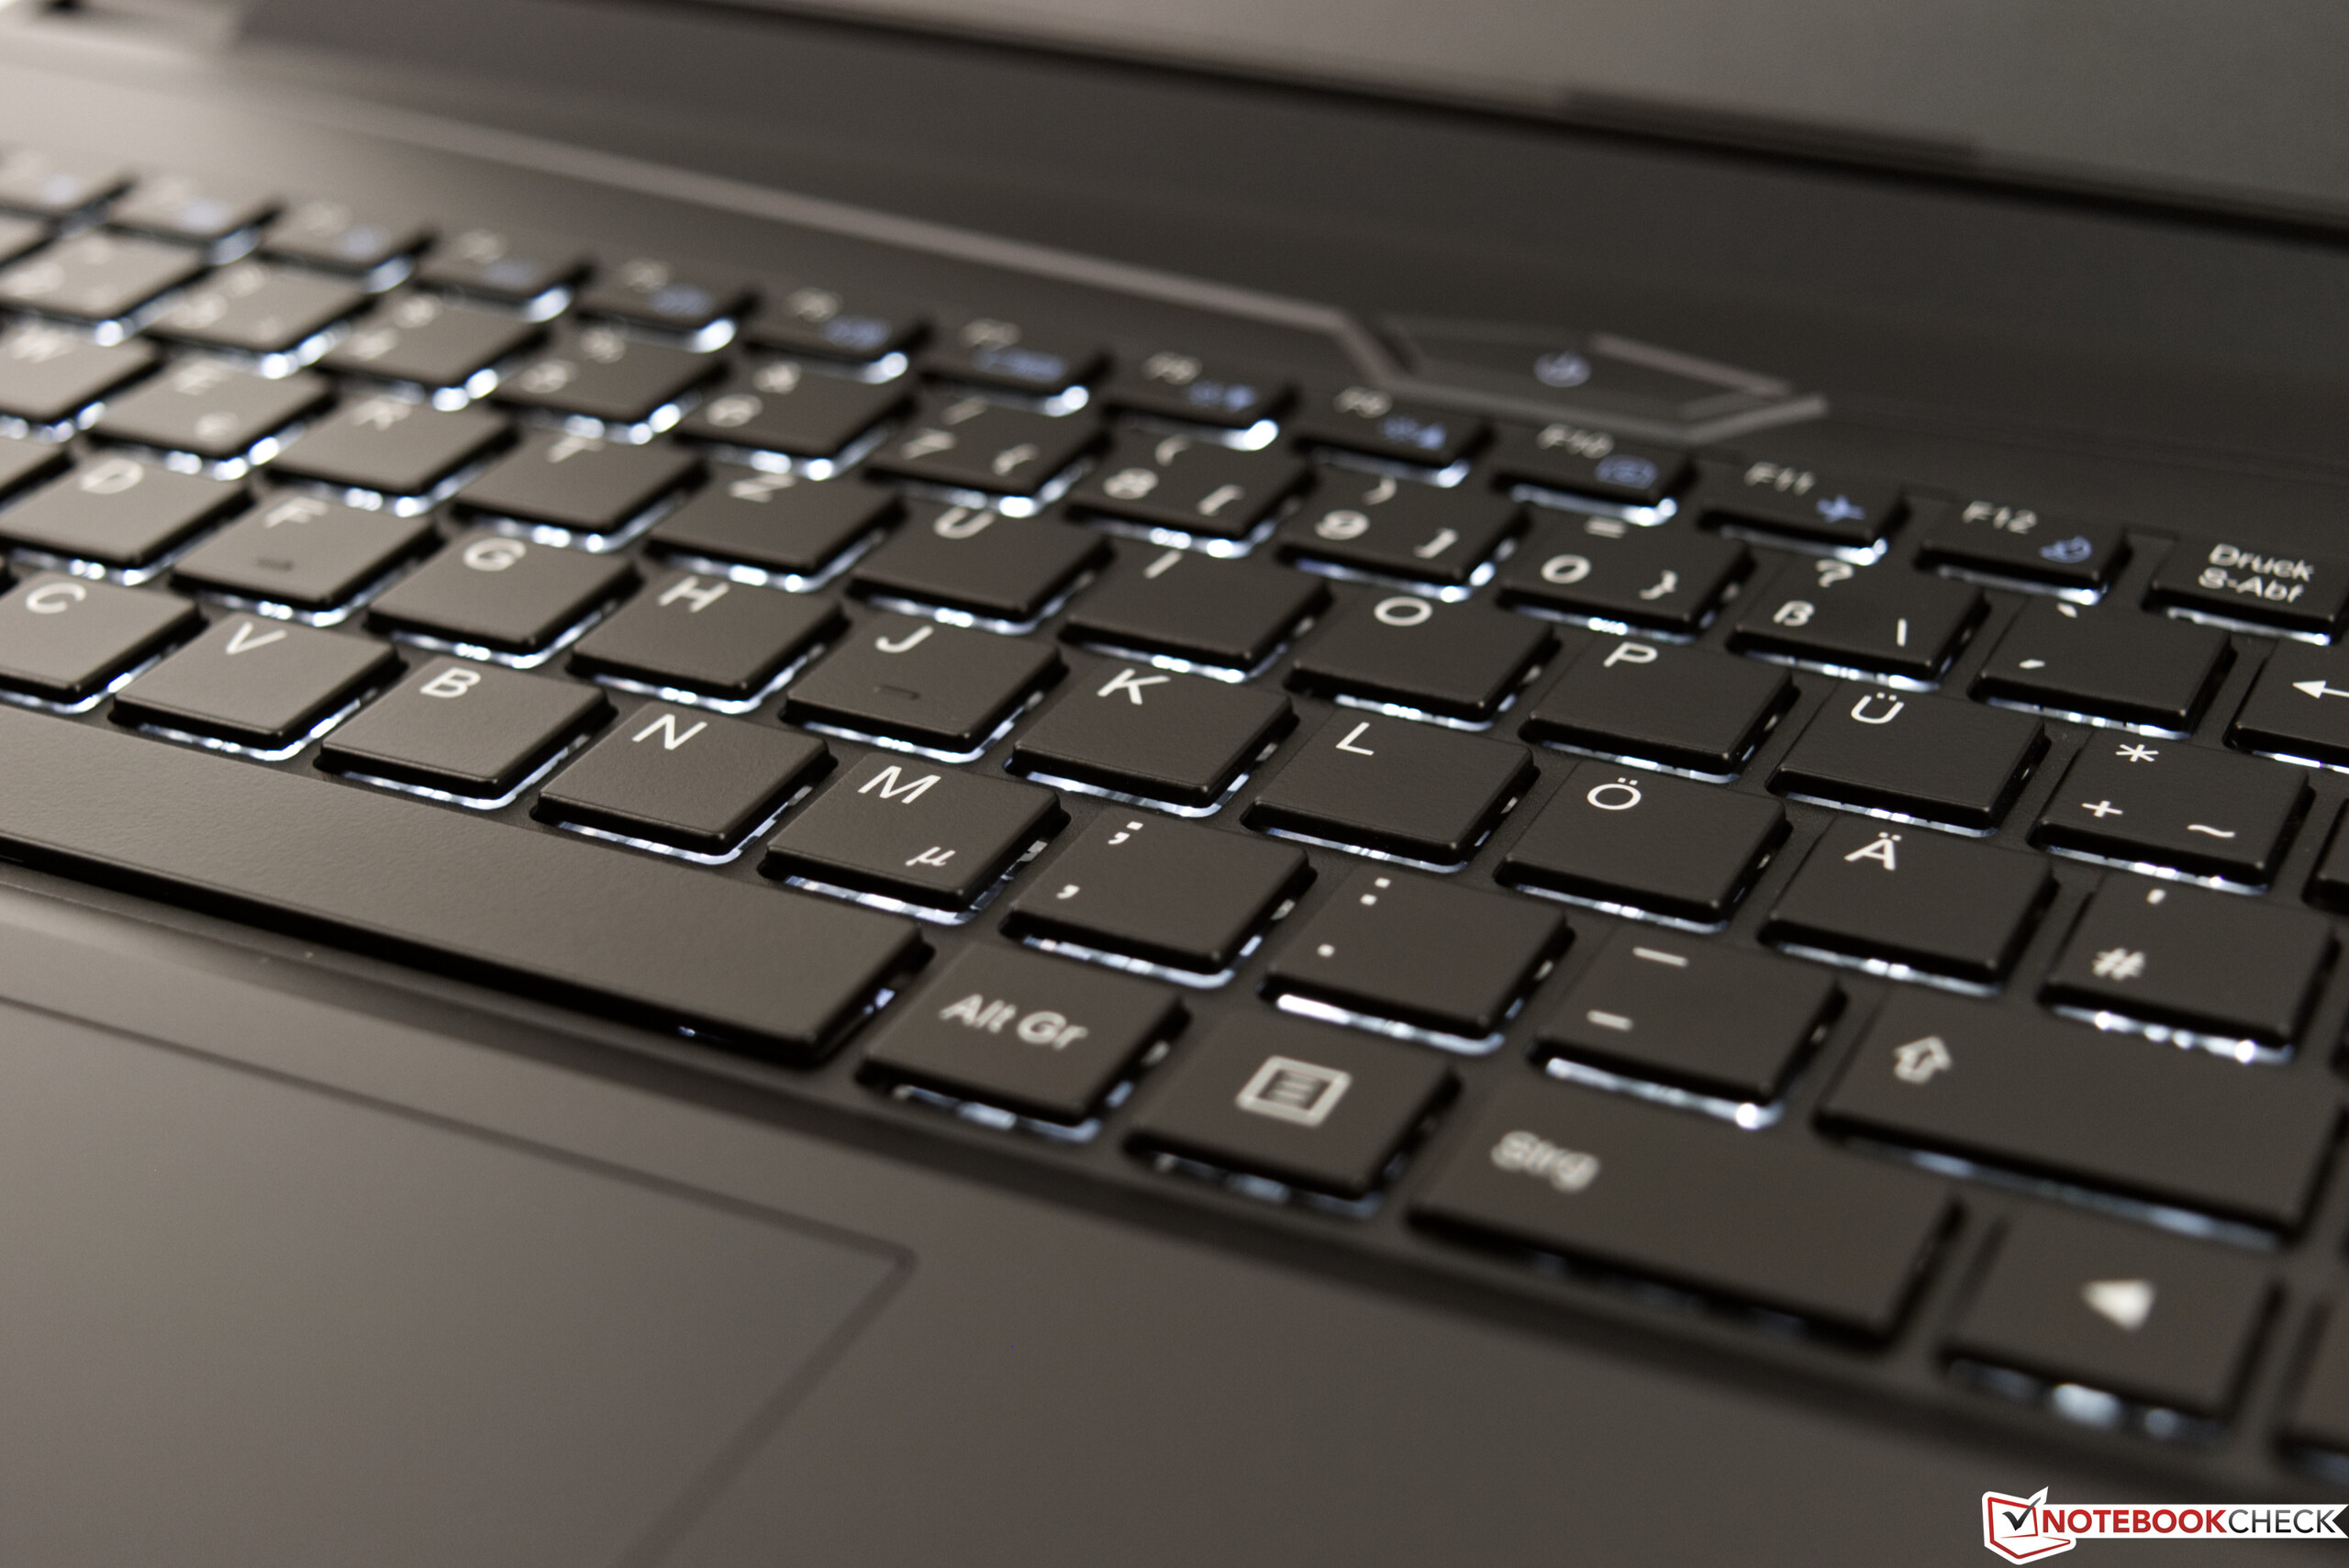
We can already say that the ThinkPad T580 has the best input devices of our comparison devices. By comparison, the Work 15 and its 6-line chiclet keyboard is difficult to type on. The keys deliver decent feedback when pressed, but it is a bit too crisp for our liking. They also have a dampened stop, which makes the keyboard feel slightly spongy. We really like the layout and the large keys though. Impressively, Schenker has included a number pad and full-sized arrow keys, which not all 15-inch laptops have. The keys have bright lettering too, that should always remain legible in daily use. The keyboard also has a 5-stage white backlight for when you are using the Work 15 in a dark room.
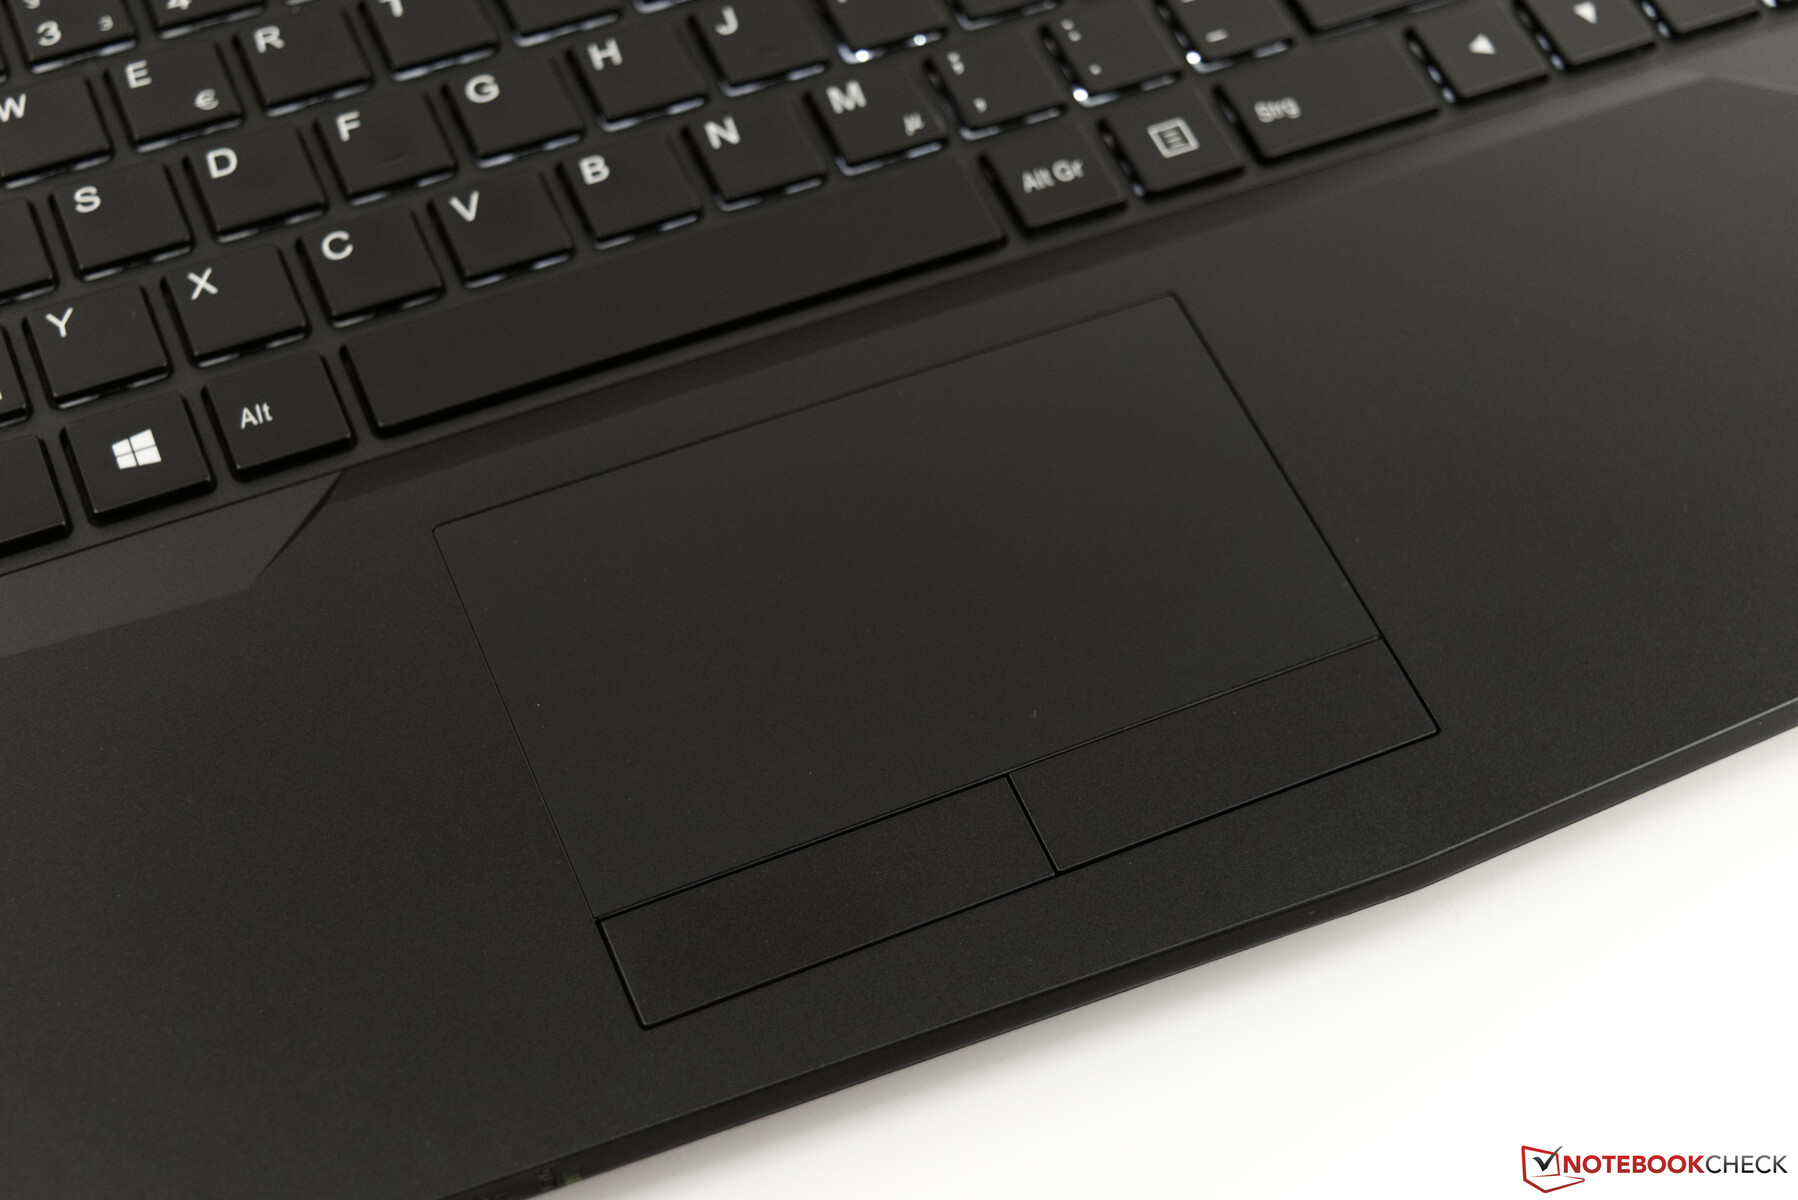
The trackpad measures 10.2 x 5.7 cm (~4 x 2.24 in), which is rather small for a 15-inch laptop. However, Schenker has included dedicated mouse buttons that take some of the space that would otherwise have been filled by a larger trackpad. The one in our review unit mostly worked well during our tests, although there are some slight inaccuracies in its lower two corners. The mouse buttons worked perfectly though, and emit a soft click when pressed.
Display
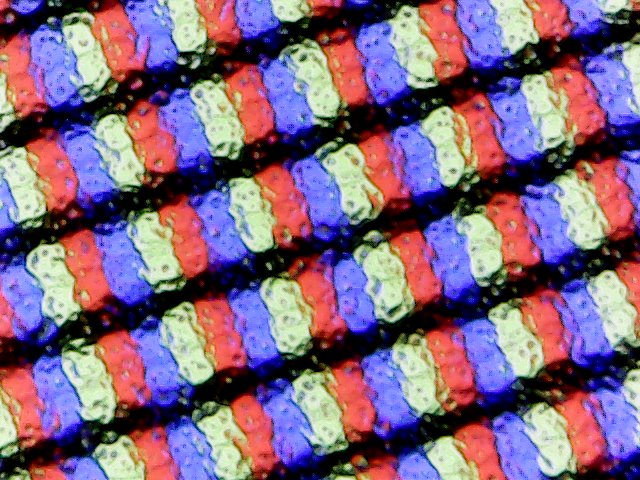

Schenker has equipped the Work 15 with a 15.6-inch IPS display that operates natively at 1,920x1,080. The panel has a matte finish too, but it is disappointing to see the German manufacturer only offers one display for the device. Other manufacturers offer several options.
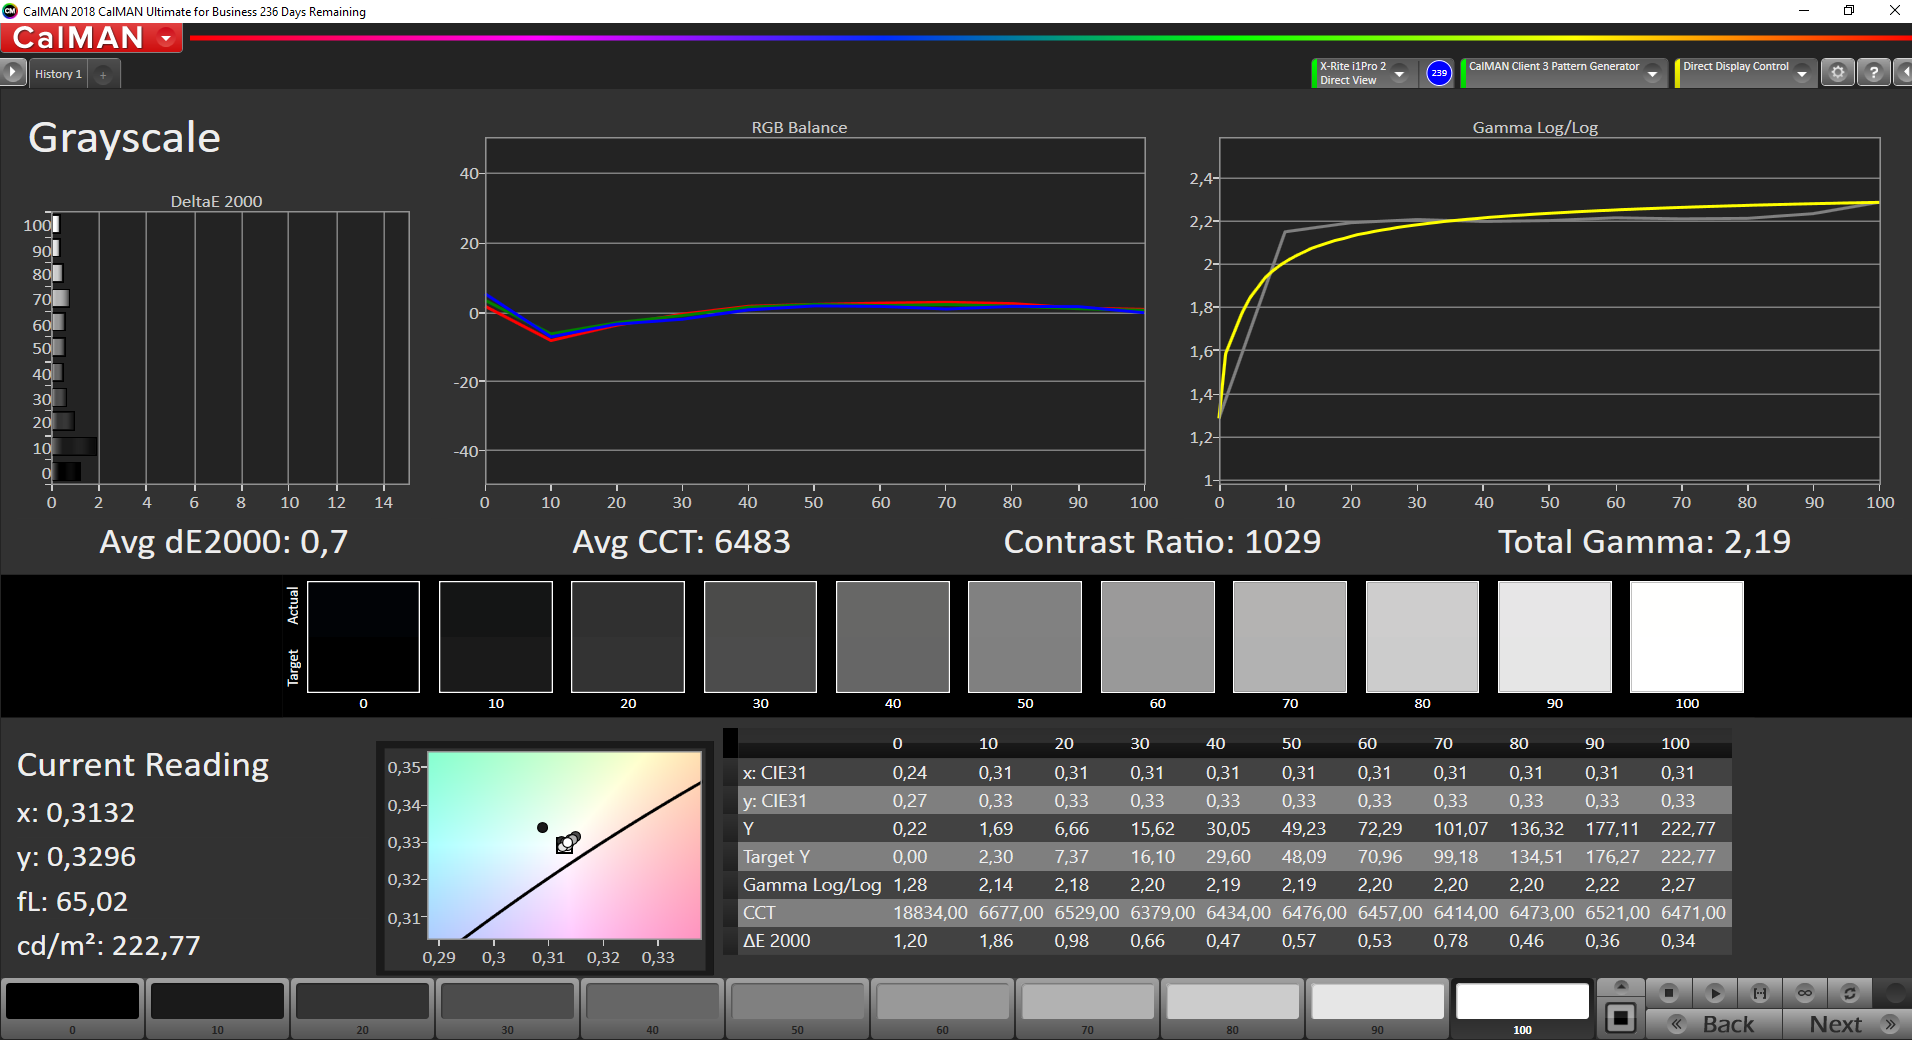
According to our tests, the display in our test sample achieved an average display brightness of 235 cd/m², which is on par with our comparison devices. The display also has an impressively low black value at 0.14 cd/m² that results in a 1,700:1 contrast ratio. The latter is much higher than all our comparison devices and helps make on-screen images look vivid. On another positive note, the work 15 does not use pulse-width modulation (PWM) to control display brightness. Additionally, our device suffers from hardly any backlight bleed, which is noticeably better than many other displays we have seen. In short, this means that the display does not look cloudy when using the Work 15 in a dark room.
| |||||||||||||||||||||||||
Brightness Distribution: 87 %
Center on Battery: 241 cd/m²
Contrast: 1700:1 (Black: 0.14 cd/m²)
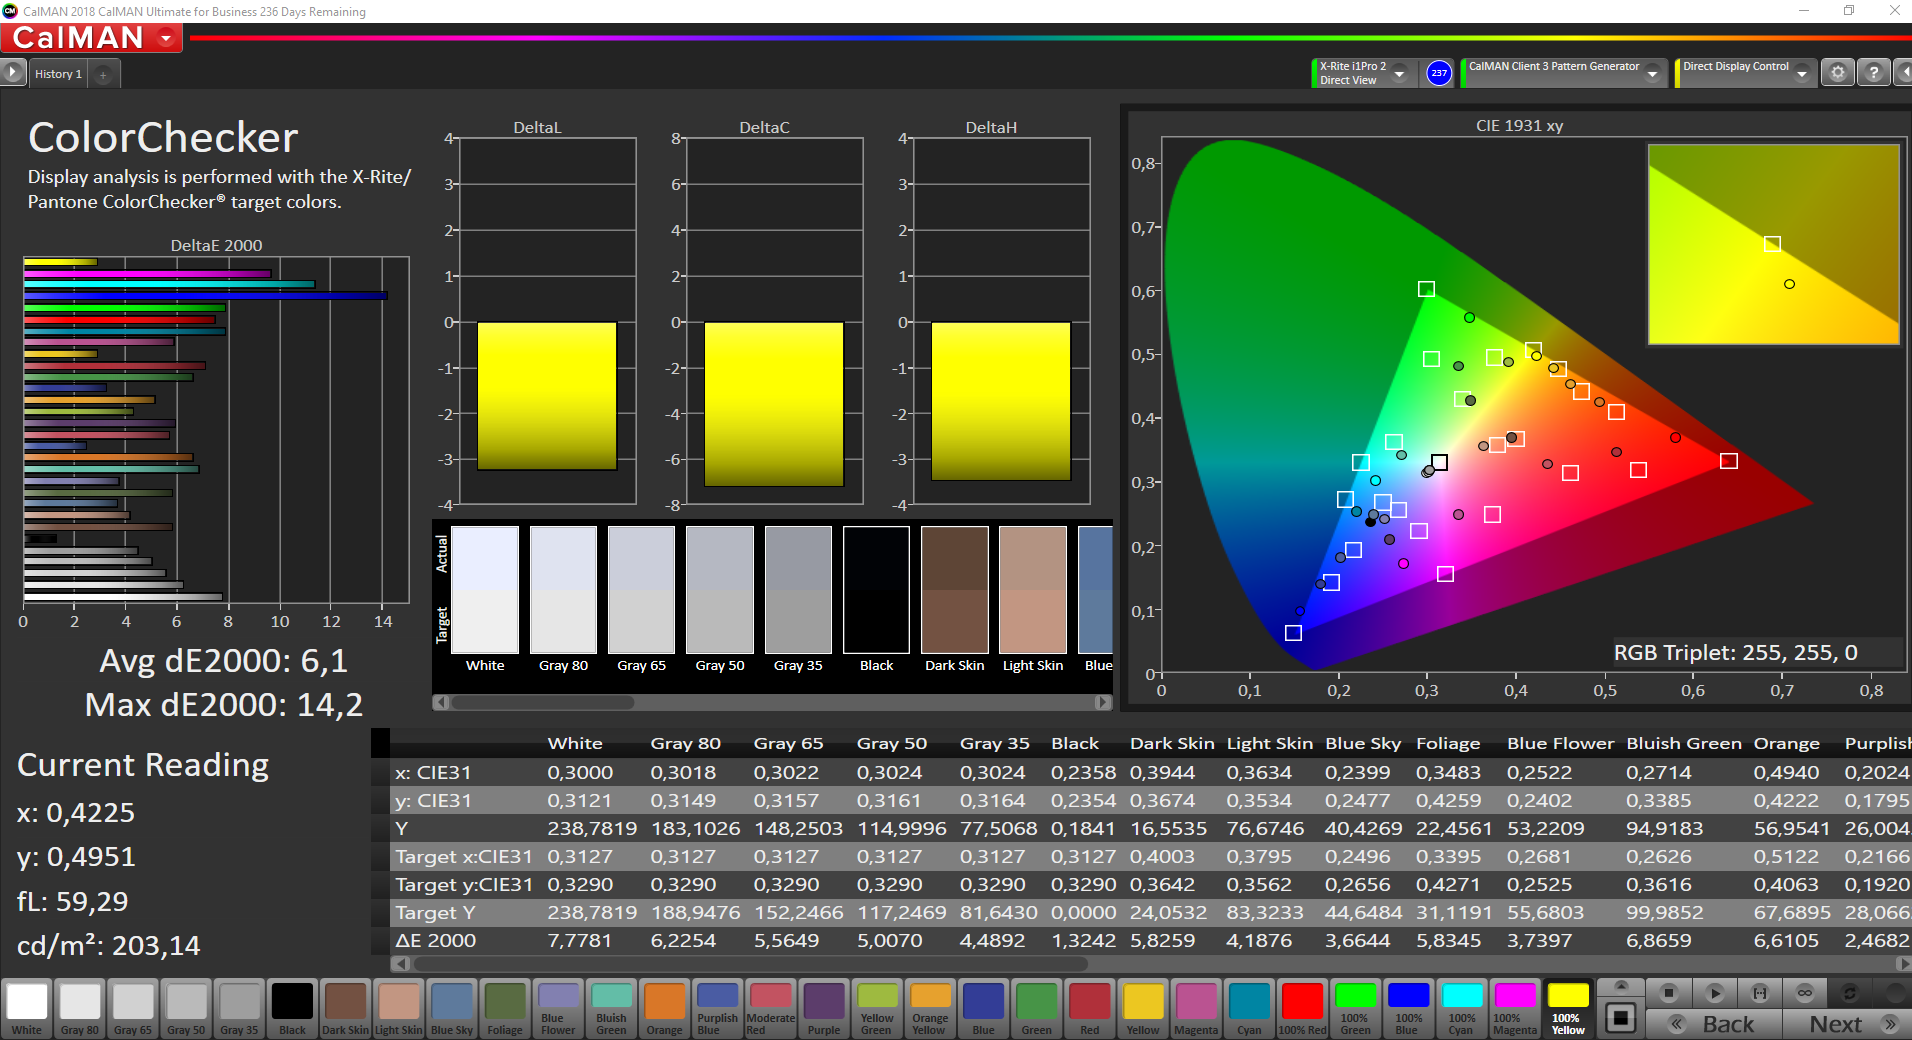
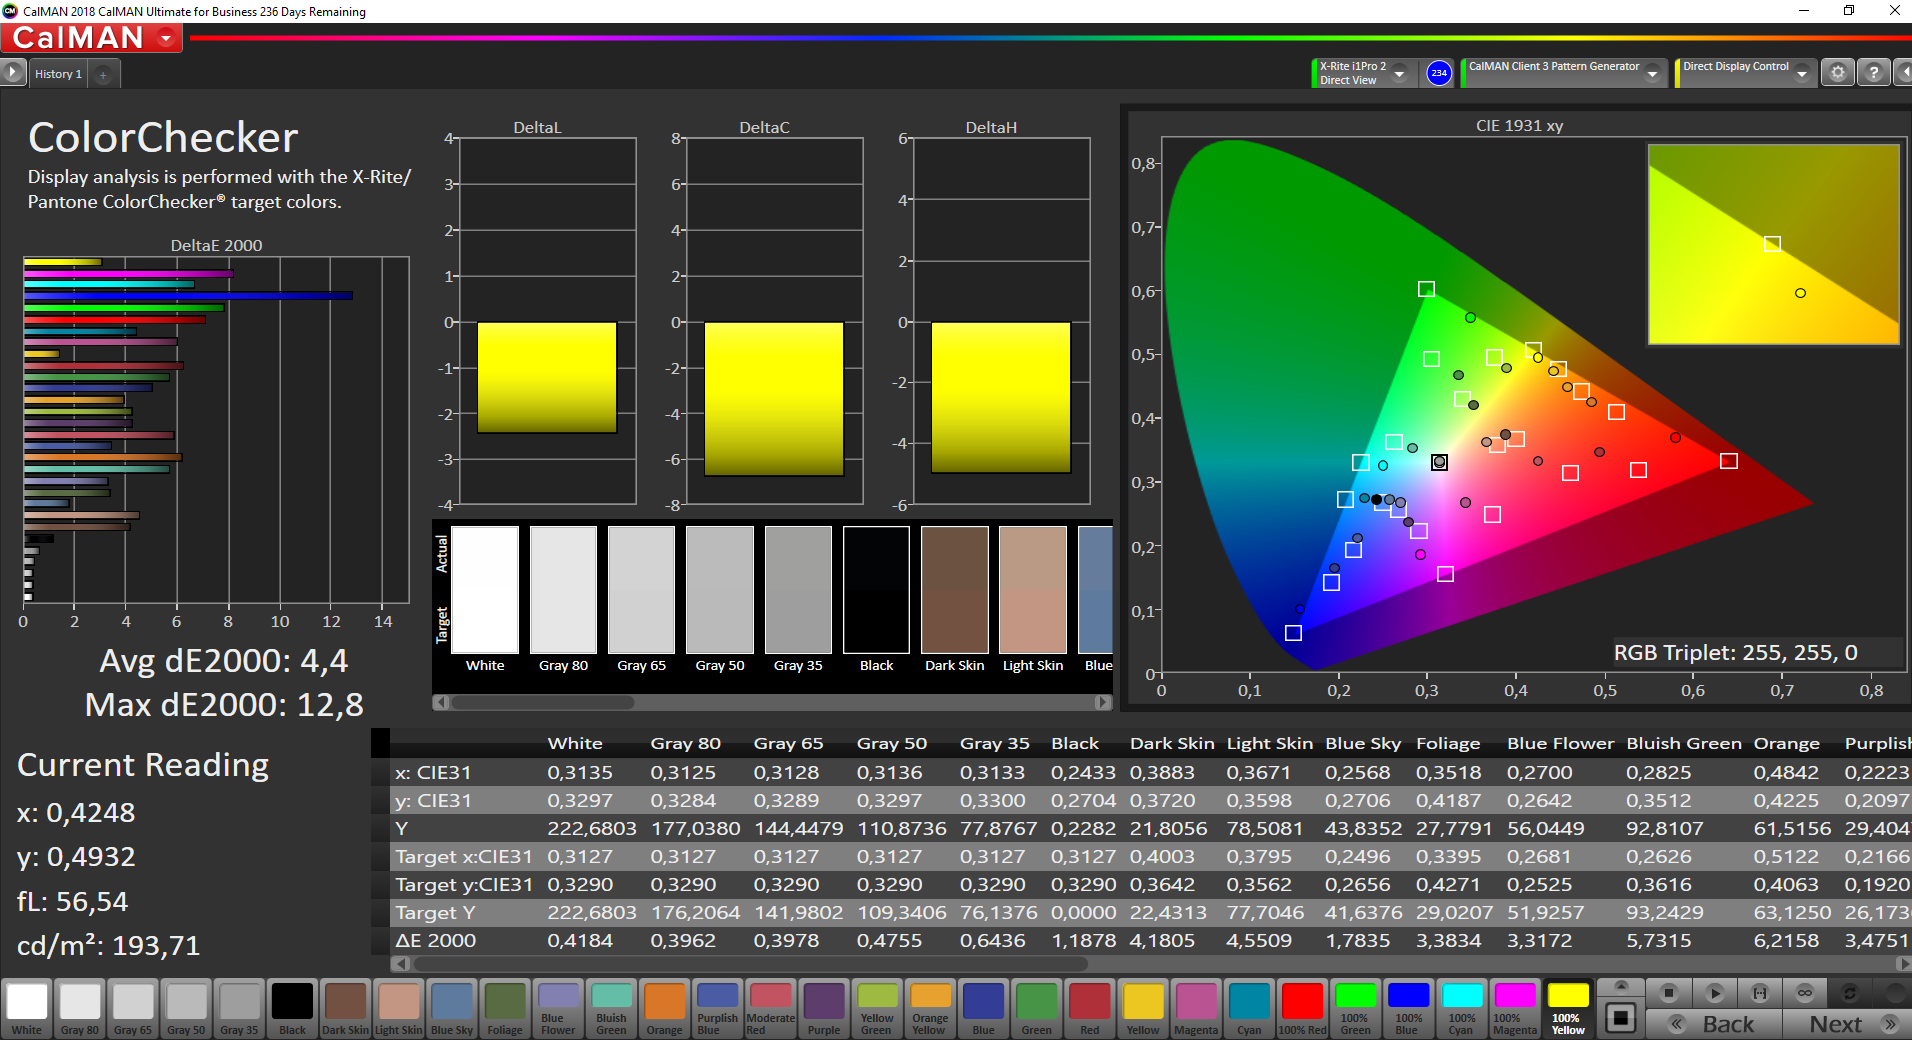
ΔE ColorChecker Calman: 6.1 | ∀{0.5-29.43 Ø4.72}
calibrated: 4.4
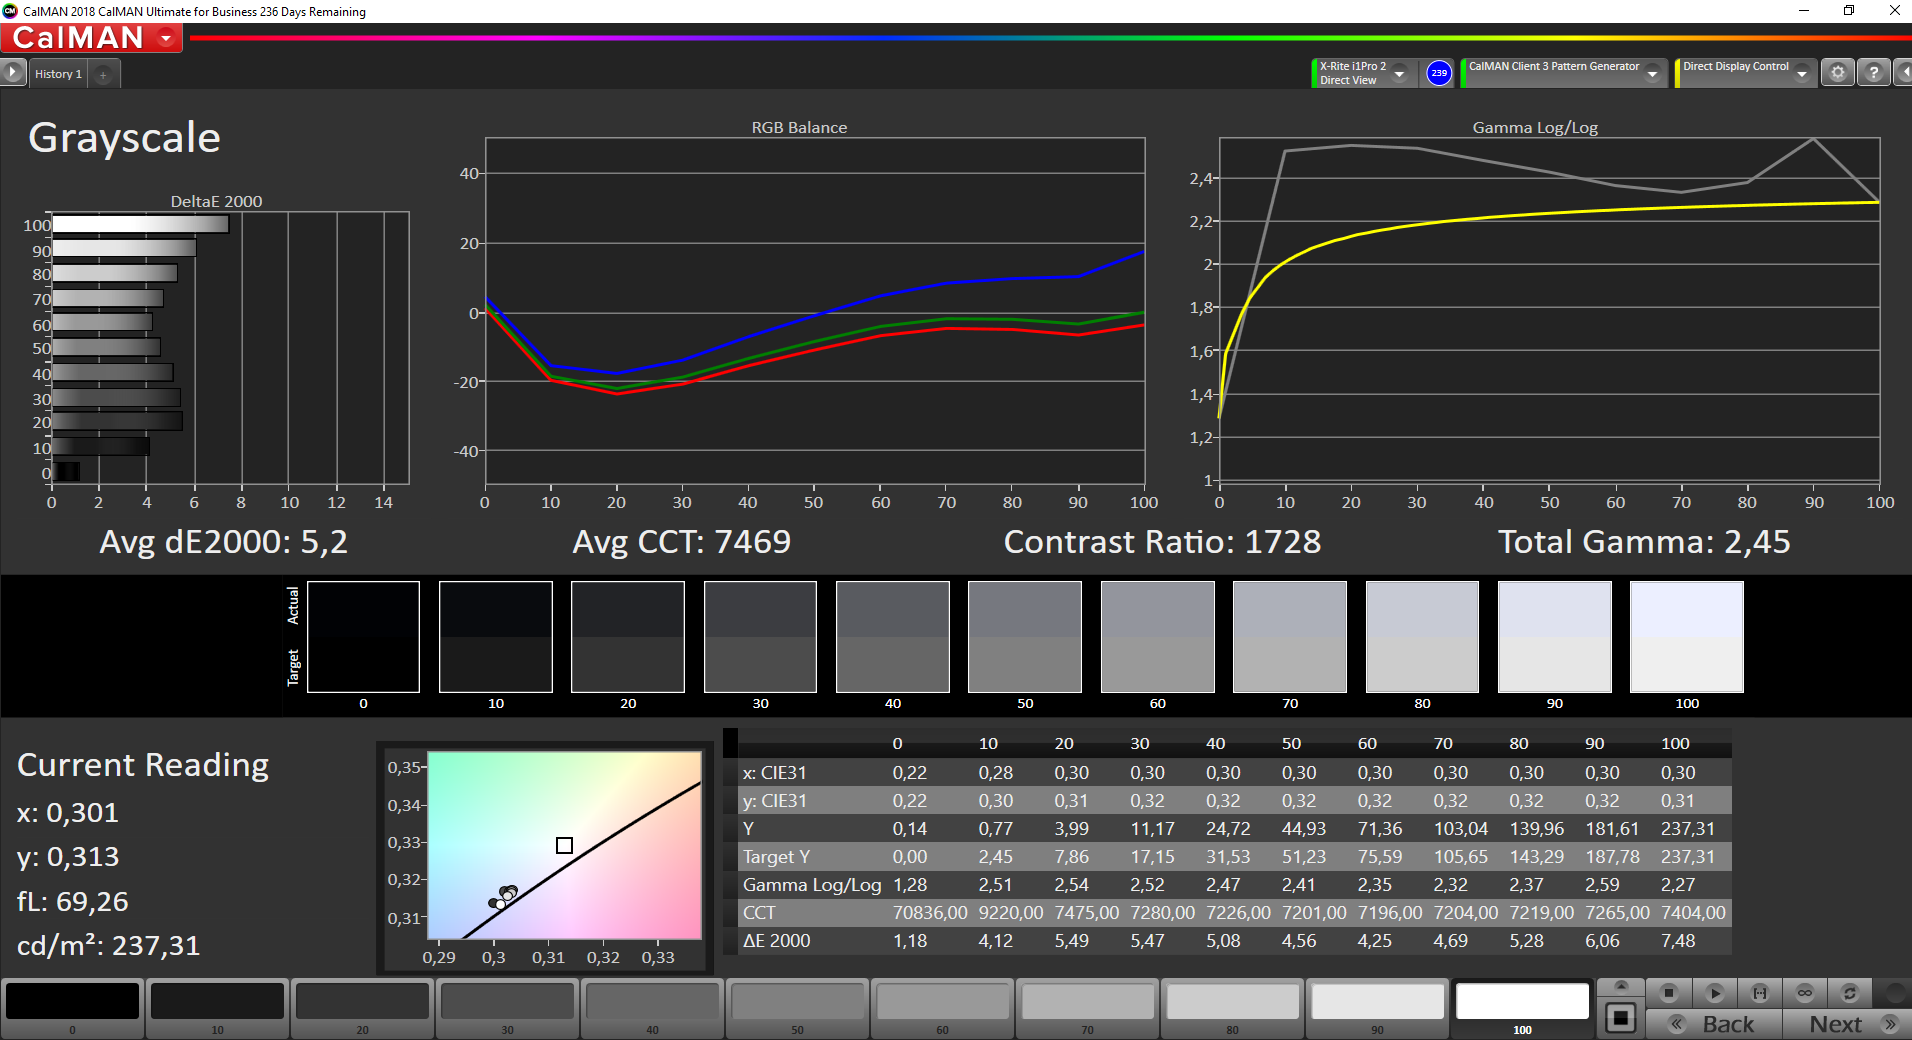
ΔE Greyscale Calman: 5.2 | ∀{0.09-98 Ø4.97}
57.2% sRGB (Argyll 1.6.3 3D)
36.3% AdobeRGB 1998 (Argyll 1.6.3 3D)
39.39% AdobeRGB 1998 (Argyll 3D)
57.4% sRGB (Argyll 3D)
38.12% Display P3 (Argyll 3D)
Gamma: 2.45
CCT: 7469 K
| Schenker Work 15 LP156WFC-SPP1, IPS, 1920x1080, 15.6" | HP ProBook 450 G6-5TJ93EA Chi Mei CMN15FE, IPS, 1920x1080, 15.6" | Lenovo ThinkPad T580-20L9001AUS B156HAK02.0, IPS, 1920x1080, 15.6" | Fujitsu Lifebook E558 E5580MP581DE LG Philips LP156WFB-SPB1, IPS, 1920x1080, 15.6" | Dell Latitude 5590 NV15N42, IPS, 1920x1080, 15.6" | |
|---|---|---|---|---|---|
| Display | 12% | -3% | -8% | 8% | |
| Display P3 Coverage (%) | 38.12 | 42.83 12% | 36.94 -3% | 35.25 -8% | 41.56 9% |
| sRGB Coverage (%) | 57.4 | 64.2 12% | 55.3 -4% | 53 -8% | 61.3 7% |
| AdobeRGB 1998 Coverage (%) | 39.39 | 44.29 12% | 38.16 -3% | 36.43 -8% | 42.93 9% |
| Response Times | 9% | 5% | 6% | -45% | |
| Response Time Grey 50% / Grey 80% * (ms) | 37.2 ? | 34.4 ? 8% | 33.2 ? 11% | 36 ? 3% | 53.2 ? -43% |
| Response Time Black / White * (ms) | 27.2 ? | 24.4 ? 10% | 27.6 ? -1% | 25 ? 8% | 39.6 ? -46% |
| PWM Frequency (Hz) | 26040 ? | 1000 ? | |||
| Screen | -1% | -9% | 5% | -12% | |
| Brightness middle (cd/m²) | 238 | 242 2% | 254.5 7% | 231 -3% | 243 2% |
| Brightness (cd/m²) | 235 | 226 -4% | 238 1% | 227 -3% | 234 0% |
| Brightness Distribution (%) | 87 | 88 1% | 87 0% | 88 1% | 83 -5% |
| Black Level * (cd/m²) | 0.14 | 0.21 -50% | 0.27 -93% | 0.16 -14% | 0.19 -36% |
| Contrast (:1) | 1700 | 1152 -32% | 943 -45% | 1444 -15% | 1279 -25% |
| Colorchecker dE 2000 * | 6.1 | 4.7 23% | 4.58 25% | 4.83 21% | 6.6 -8% |
| Colorchecker dE 2000 max. * | 14.2 | 18.5 -30% | 17.99 -27% | 8.42 41% | 22.3 -57% |
| Colorchecker dE 2000 calibrated * | 4.4 | 4 9% | 4.34 1% | 5 -14% | |
| Greyscale dE 2000 * | 5.2 | 2.7 48% | 3.3 37% | 3.49 33% | 5.2 -0% |
| Gamma | 2.45 90% | 2.26 97% | 2.403 92% | 2.54 87% | 2.24 98% |
| CCT | 7469 87% | 6442 101% | 6355 102% | 6233 104% | 6990 93% |
| Color Space (Percent of AdobeRGB 1998) (%) | 36.3 | 40.8 12% | 35 -4% | 34 -6% | 39.2 8% |
| Color Space (Percent of sRGB) (%) | 57.2 | 64 12% | 55 -4% | 53 -7% | 60.8 6% |
| Total Average (Program / Settings) | 7% /
3% | -2% /
-6% | 1% /
2% | -16% /
-12% |
* ... smaller is better
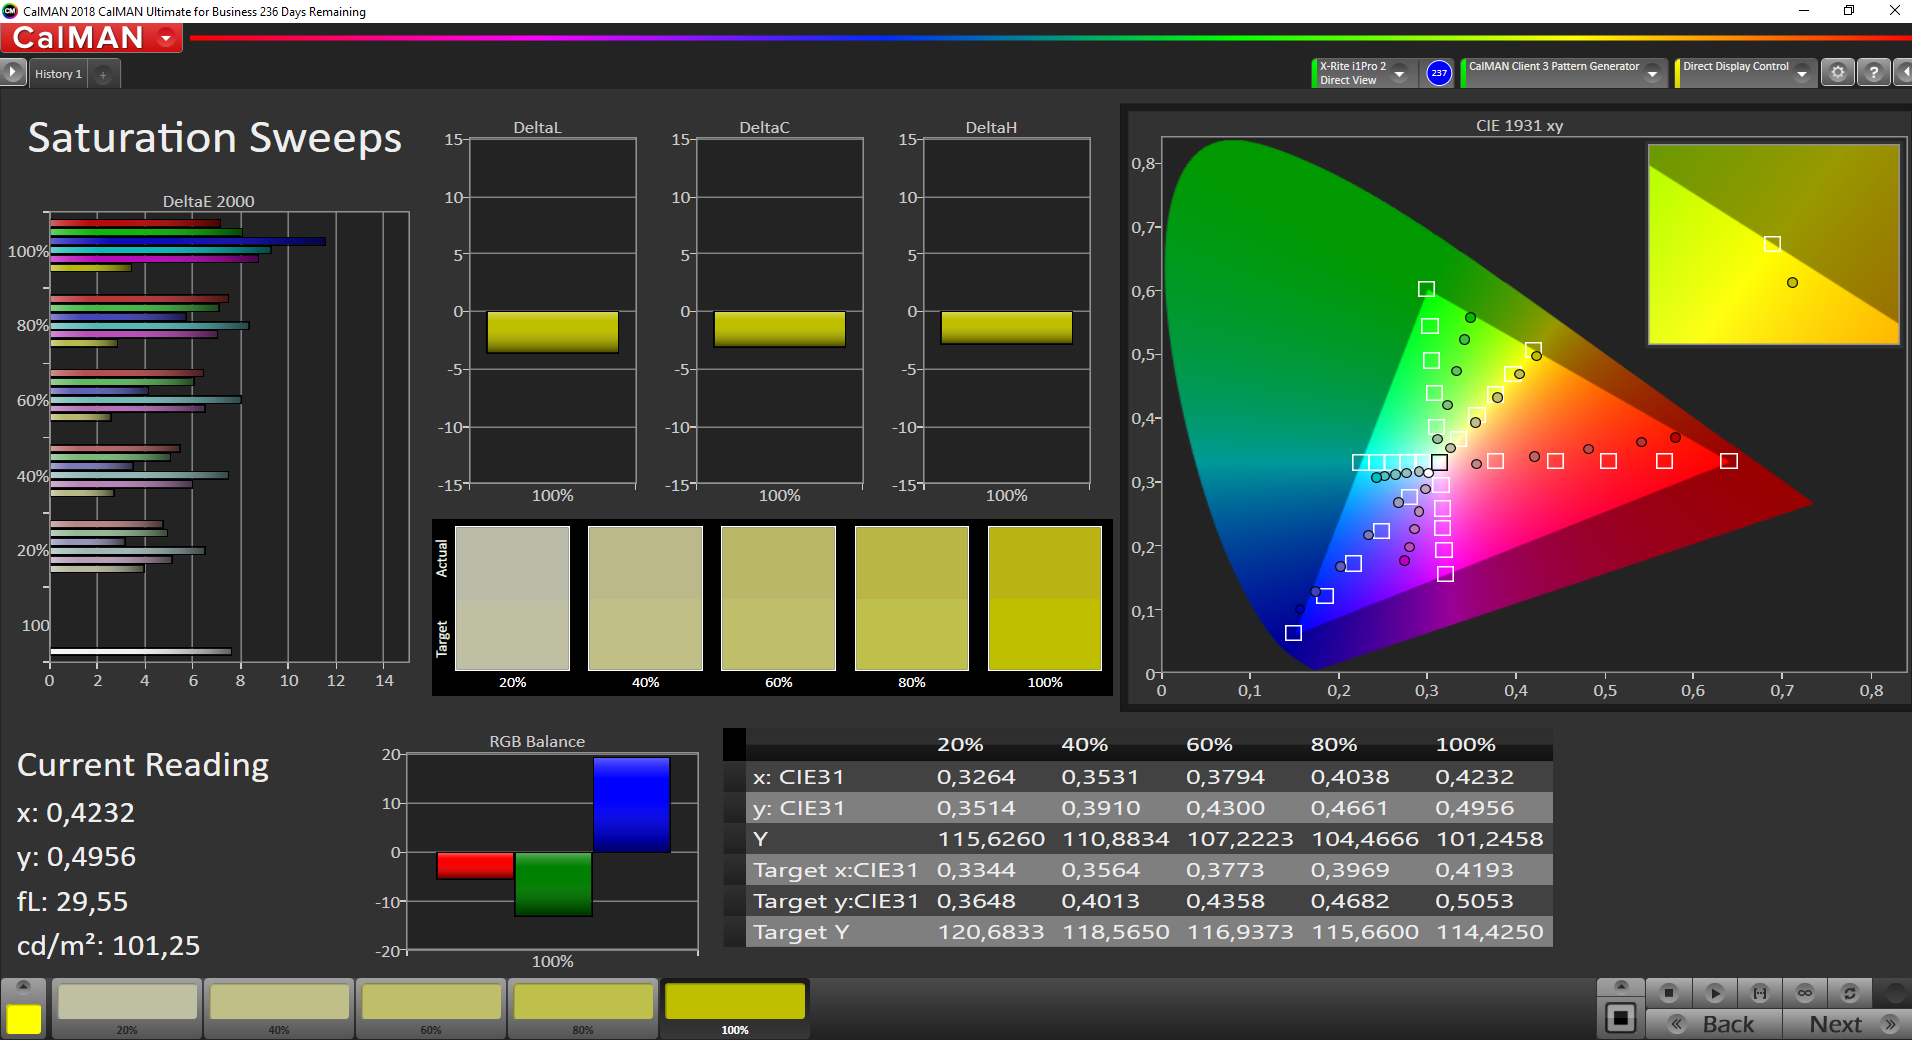
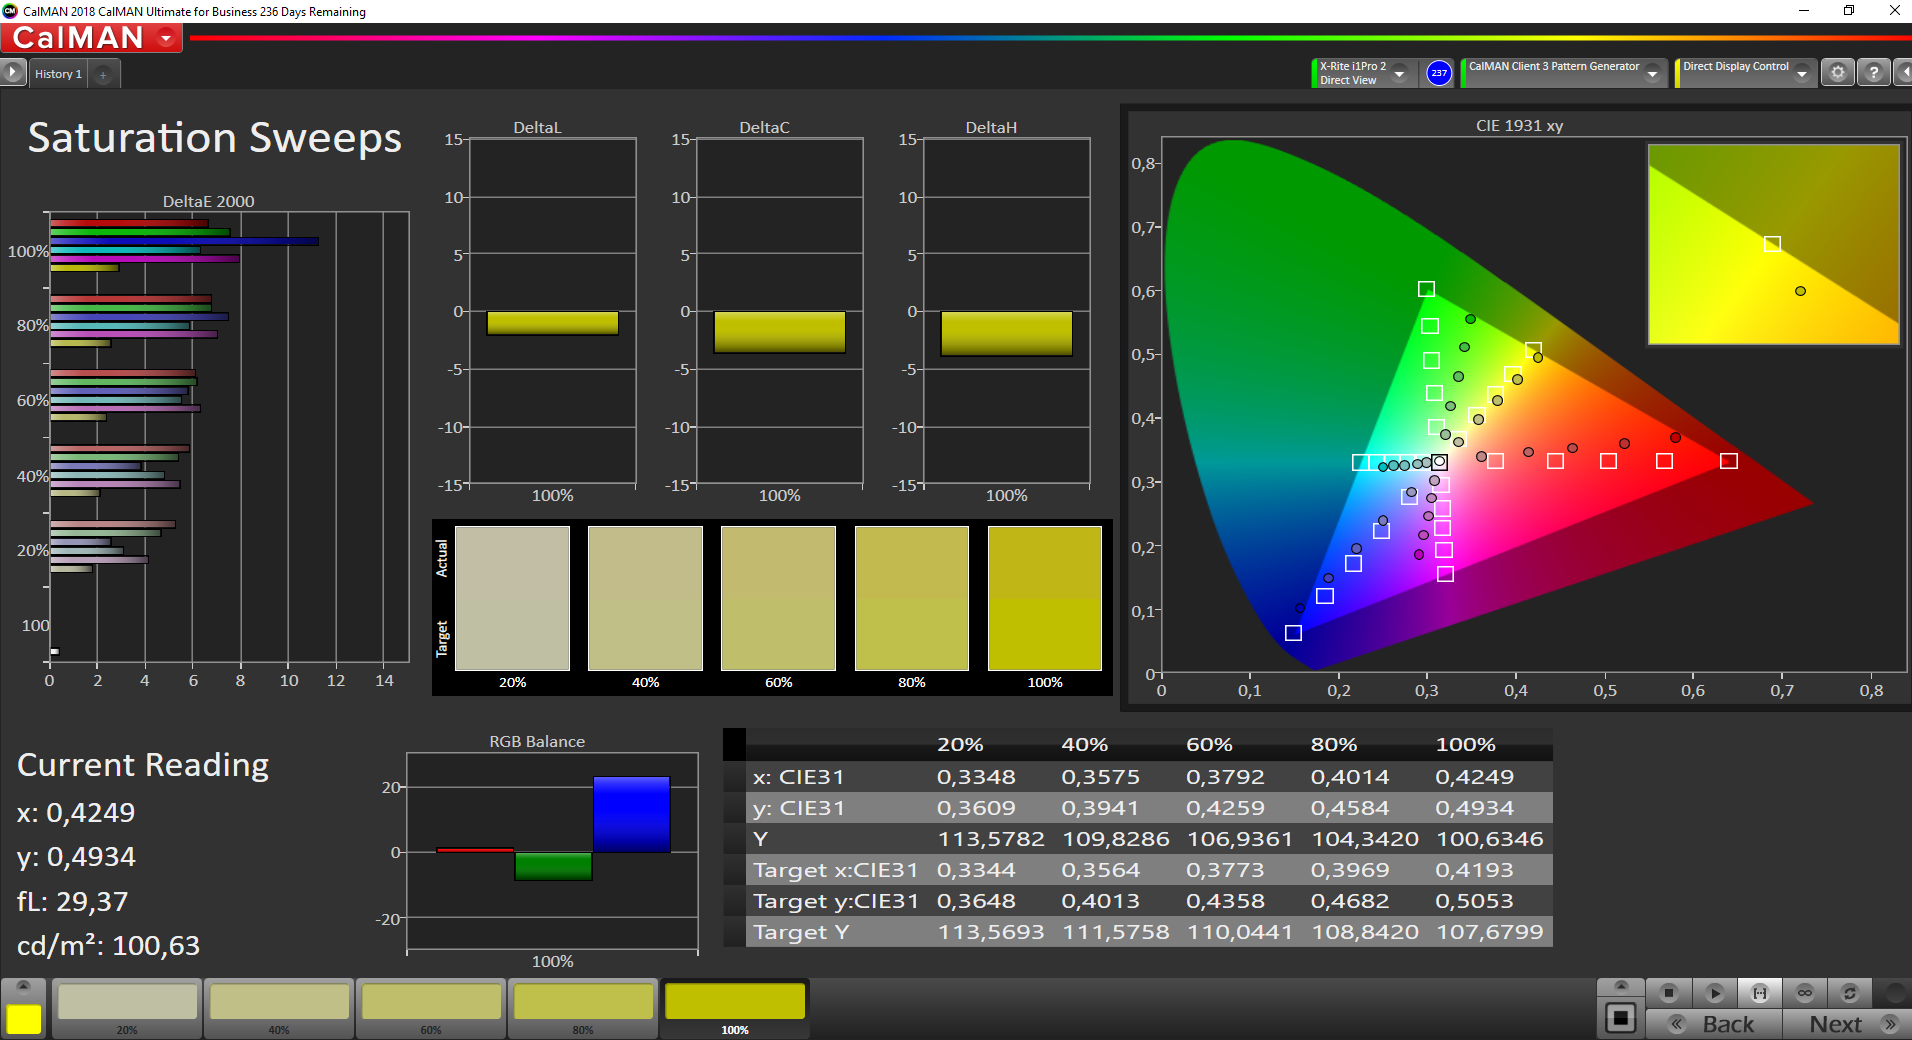
The high contrast ratio and low black value make colours look vivid despite the matte finish, which would normally wash out a display. Overall, the display in our review unit looks colour accurate to our eyes. However, CalMAN and our spectrophotometer tell a different story. Schenker does not factory calibrate the displays with which it equips the Work 15, as shown by the high Delta E 2000 deviations compared to the sRGB colour space. Only the Latitude 5590 of our comparison devices has a worse colour accuracy upon delivery. Calibrating the display in our review unit reduces greyscale deviations dramatically though. You can download our calibrated ICC profile by clicking the link in the box above our comparison table. Please only use this if you have a Work 15 that has an LP156WFC-SPP1 display. Applying the profile to a different display will probably worsen its colour reproduction.
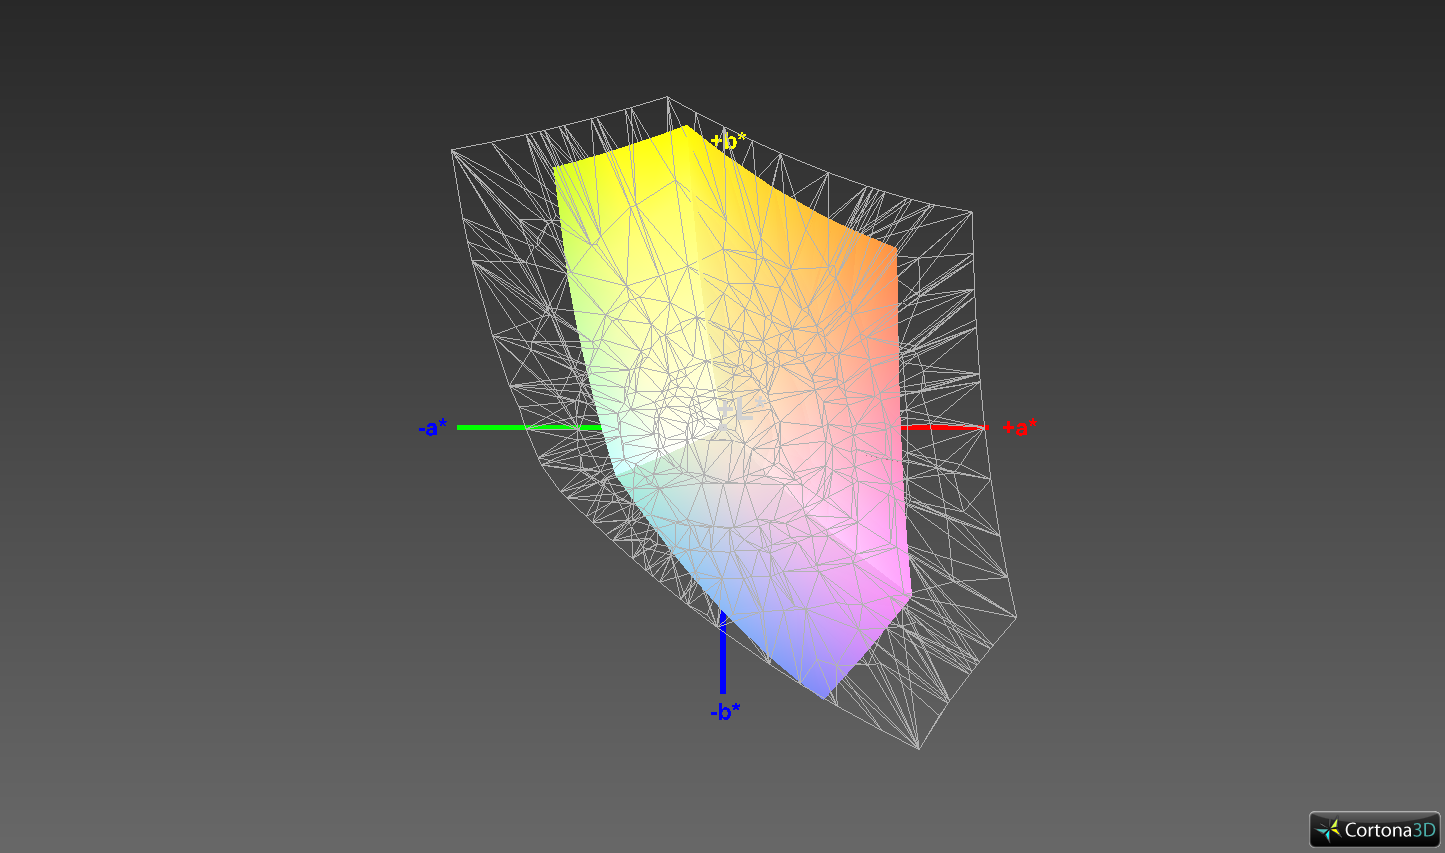
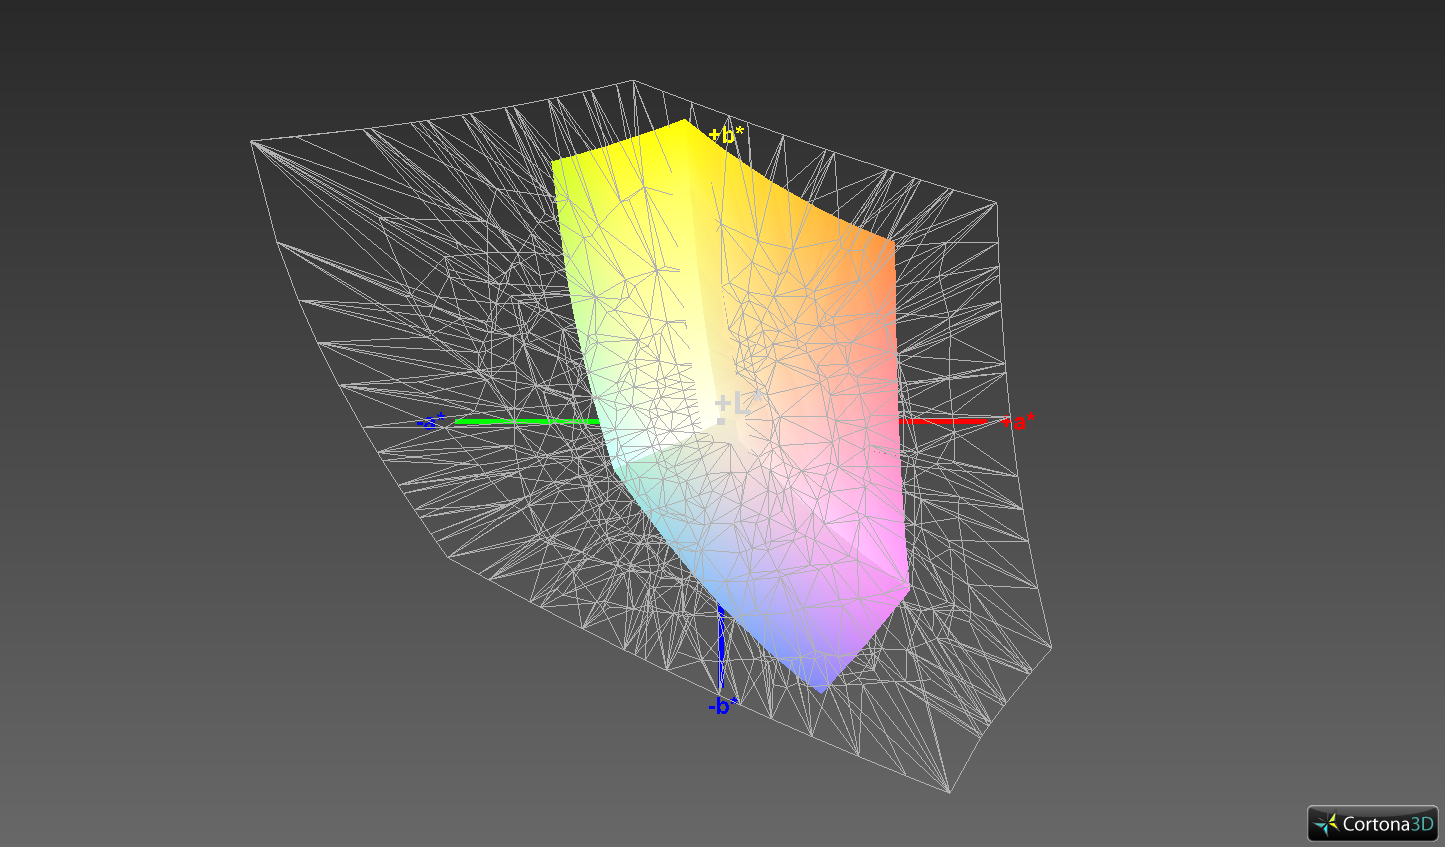
Additional calibration does not improve colour space coverage though, which remains sub-standard. Our review unit covers only 57.2% of the sRGB colour space and 36.3% of AdobeRGB. These mean that the Work 15 is unsuitable to use for image or video editing because it cannot accurately reproduce colours.
The matte display is perfect for outdoor use. Unfortunately, the display does not get bright enough to work comfortably outside on a sunny day. You should have no readability issues with using the Work 15 outside in the shade though.
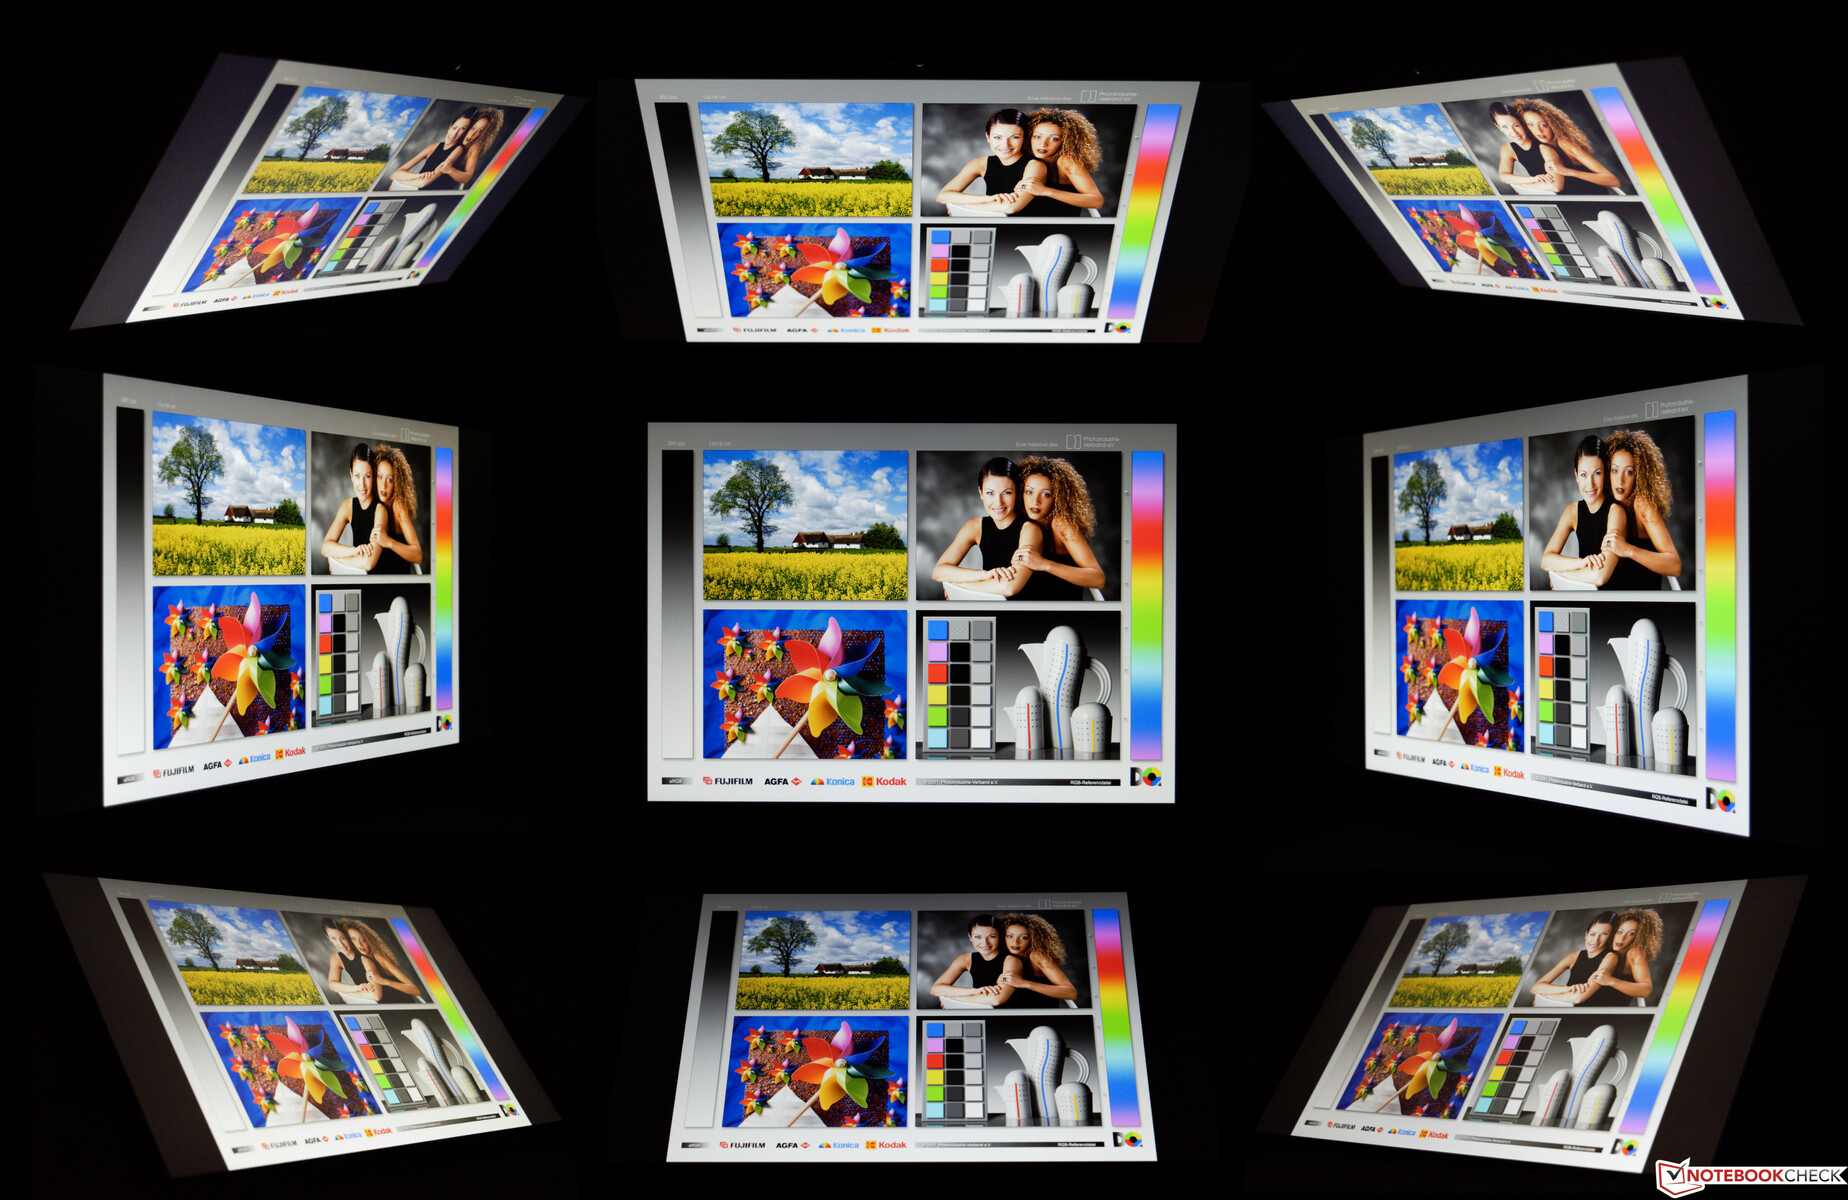
The Work 15 also has excellent viewing angles thanks to its IPS panel. We noticed no brightness or colour distortions even at acute viewing angles. Hence, you should have no issue with reading the display from practically any angle.
Display Response Times
| ↔ Response Time Black to White | ||
|---|---|---|
| 27.2 ms ... rise ↗ and fall ↘ combined | ↗ 17.2 ms rise | 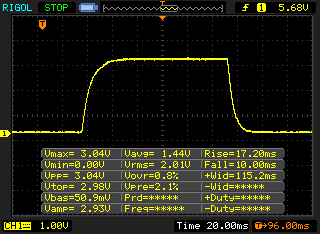 |
| ↘ 10 ms fall | ||
| The screen shows relatively slow response rates in our tests and may be too slow for gamers. In comparison, all tested devices range from 0.1 (minimum) to 240 (maximum) ms. » 69 % of all devices are better. This means that the measured response time is worse than the average of all tested devices (19.8 ms). | ||
| ↔ Response Time 50% Grey to 80% Grey | ||
| 37.2 ms ... rise ↗ and fall ↘ combined | ↗ 19.2 ms rise | 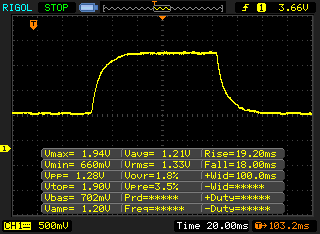 |
| ↘ 18 ms fall | ||
| The screen shows slow response rates in our tests and will be unsatisfactory for gamers. In comparison, all tested devices range from 0.165 (minimum) to 636 (maximum) ms. » 54 % of all devices are better. This means that the measured response time is worse than the average of all tested devices (31 ms). | ||
Screen Flickering / PWM (Pulse-Width Modulation)
| Screen flickering / PWM not detected |  | ||
In comparison: 52 % of all tested devices do not use PWM to dim the display. If PWM was detected, an average of 7747 (minimum: 5 - maximum: 343500) Hz was measured. | |||
Performance
The Work 15 is powerful enough for actual use as an office device. Its hexacore CPU, 16 GB of RAM, and 500 GB SSD combine to make the device even suitable to run virtual machines. Incidentally, you can expand the RAM to 32 GB should you need to do so. The Work 15 is also powerful enough for photo and video editing, but its lack of a dedicated GPU and colour inaccurate display reduces the kind of editing you could do. Connecting the Work 15 to a more colour accurate external monitor would solve the latter issue though.
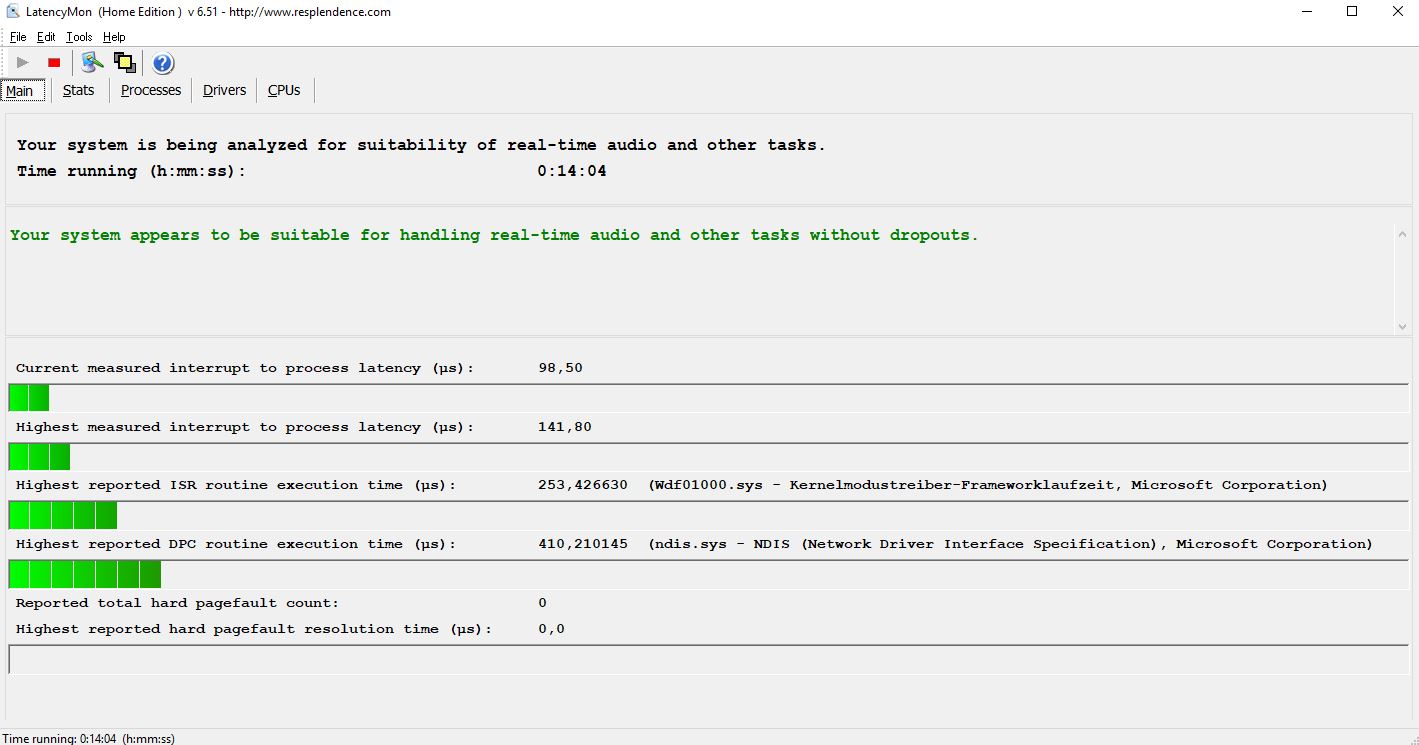
We should also point out that we experienced no latency issues during our tests. Hence, you should have no issues with playing music while you work.
Processor
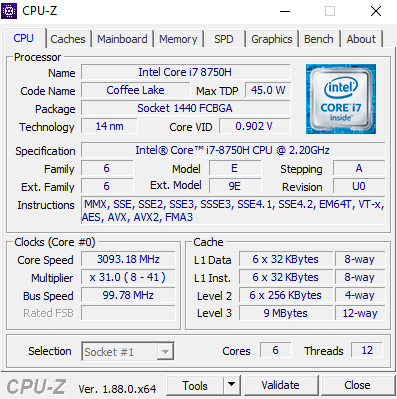
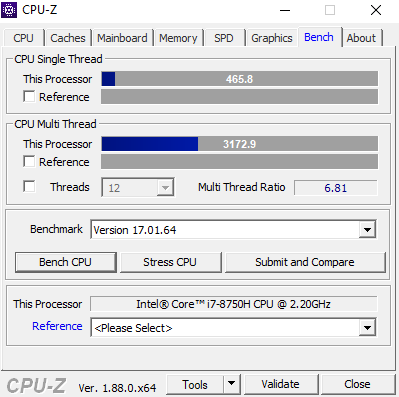
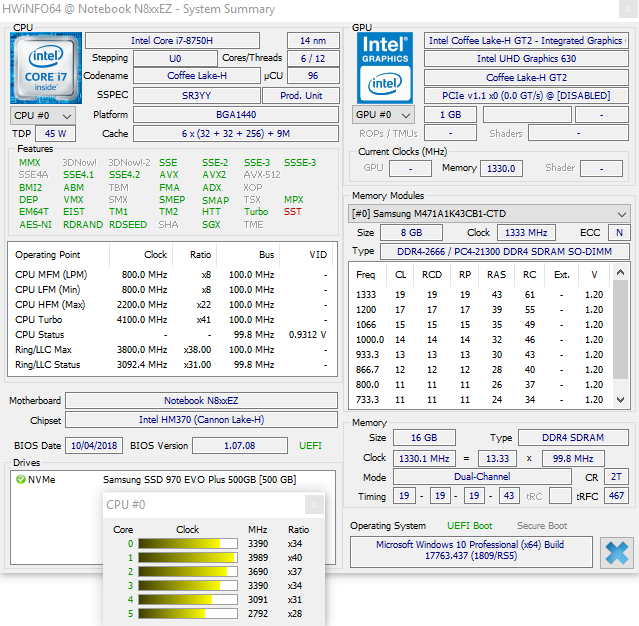
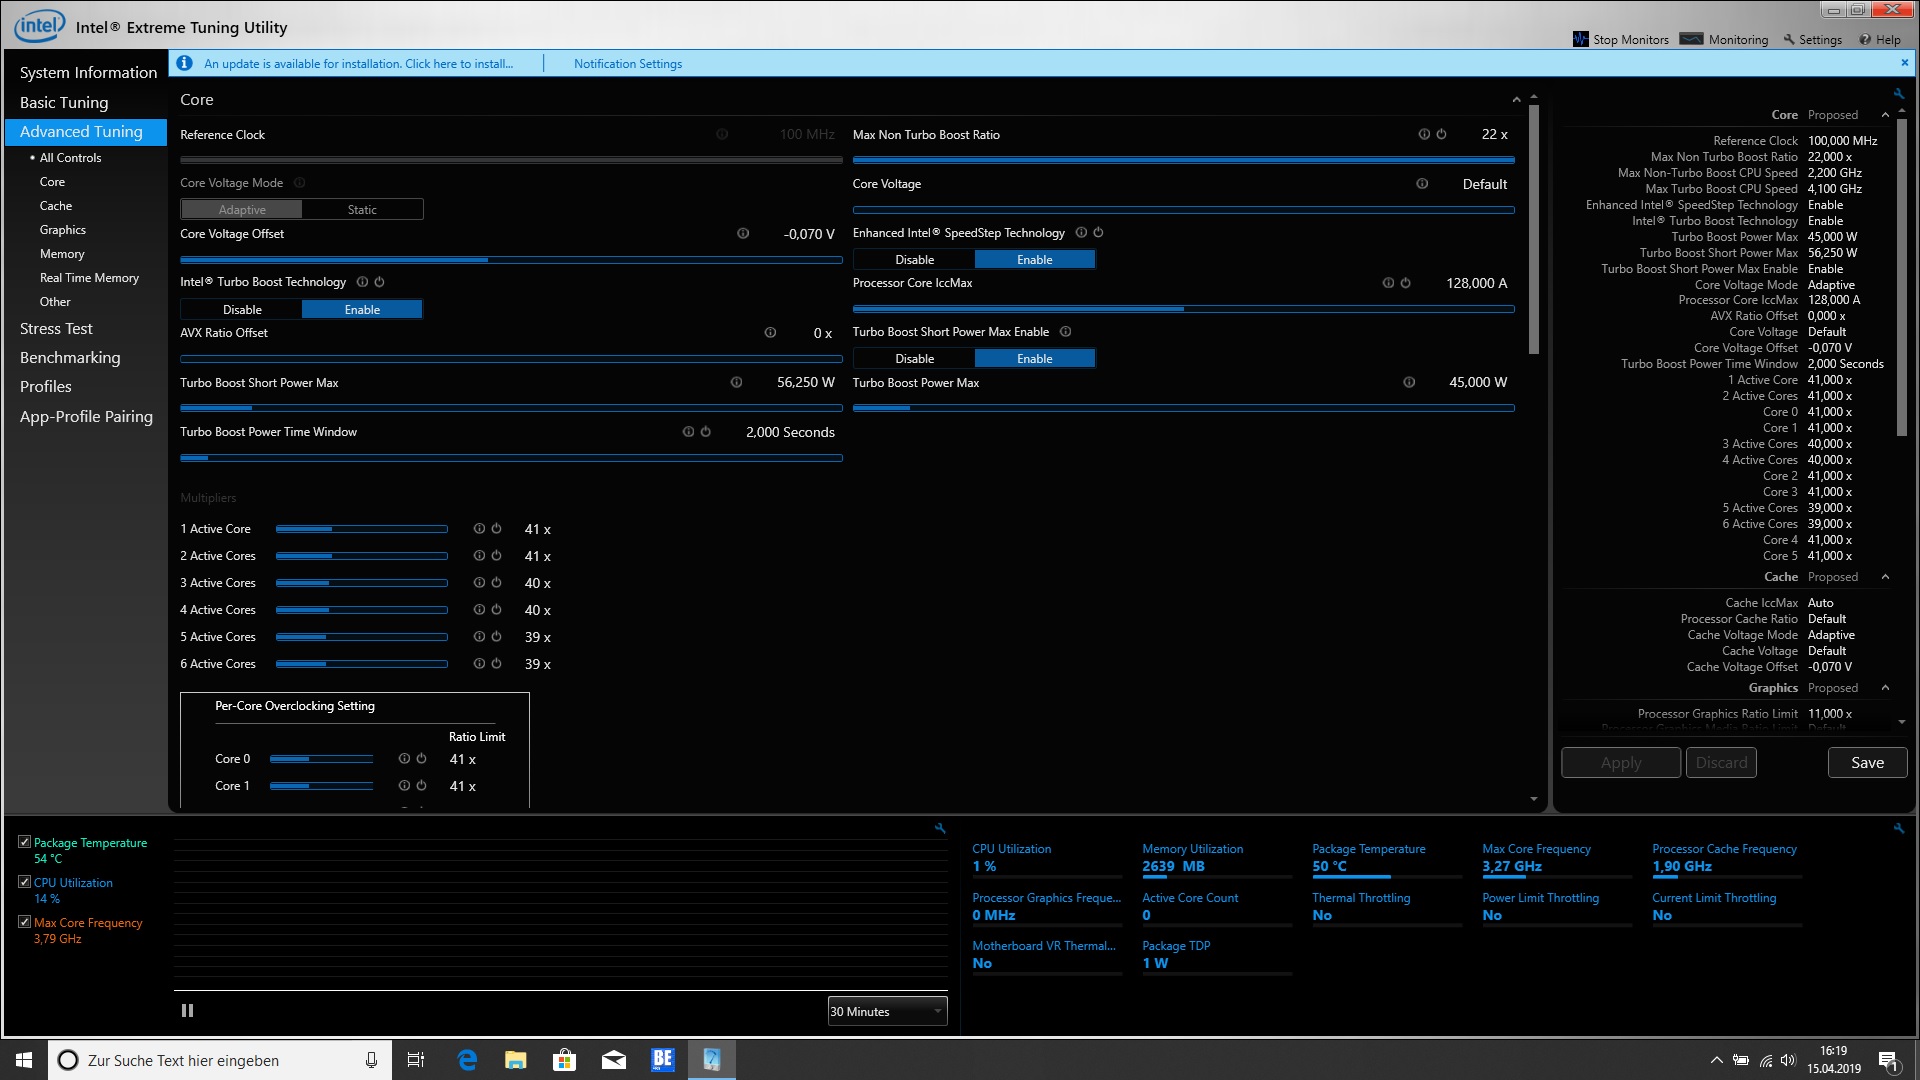
The Core i7-8750H is a 6-core processor with a thermal design power (TDP) of up to 45 W and a 2.2 GHz base clock speed. The processor supports Intel Turbo Boost that allows it to boost to 4.1 GHz on single and dual cores and 3.9 GHz across all cores. By comparison, all our comparison devices have quad-core processors such as the Core i5-8250U, the Core i7-8650U and the Core i7-8565U.
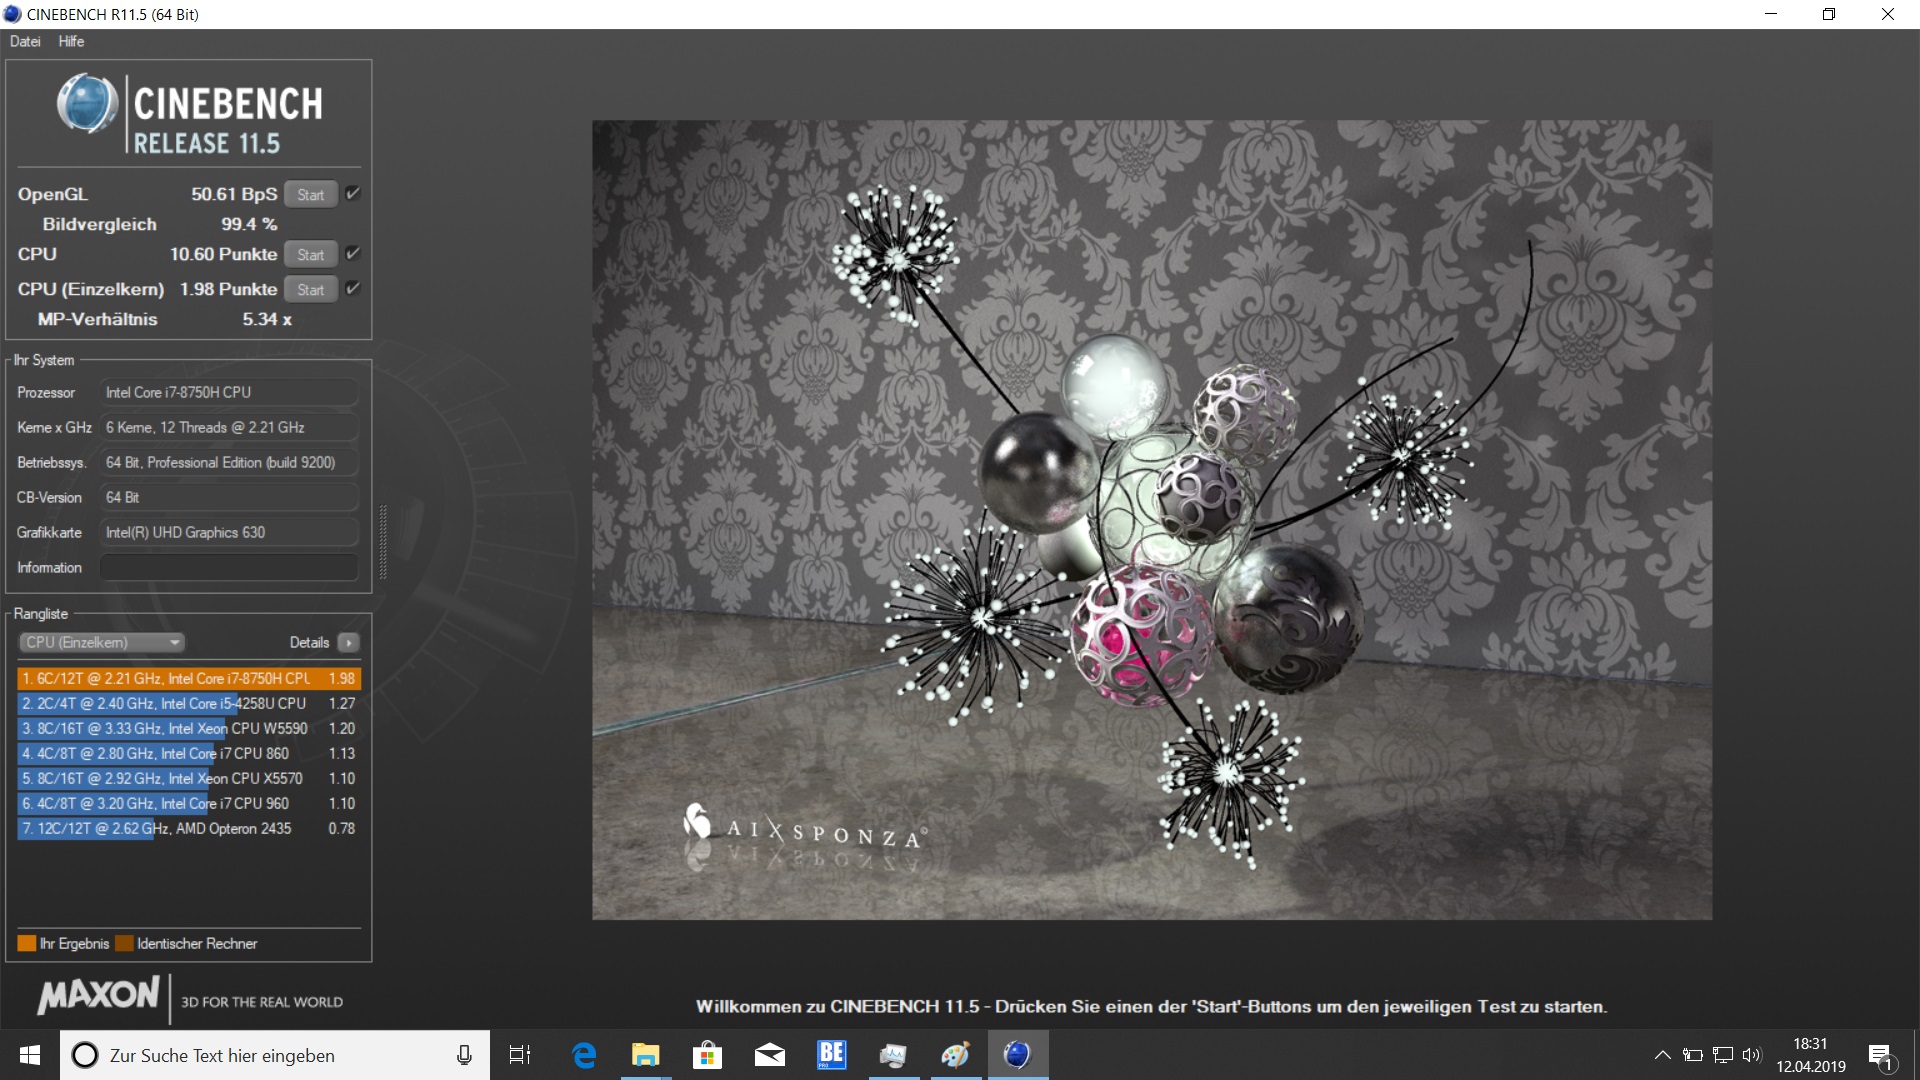
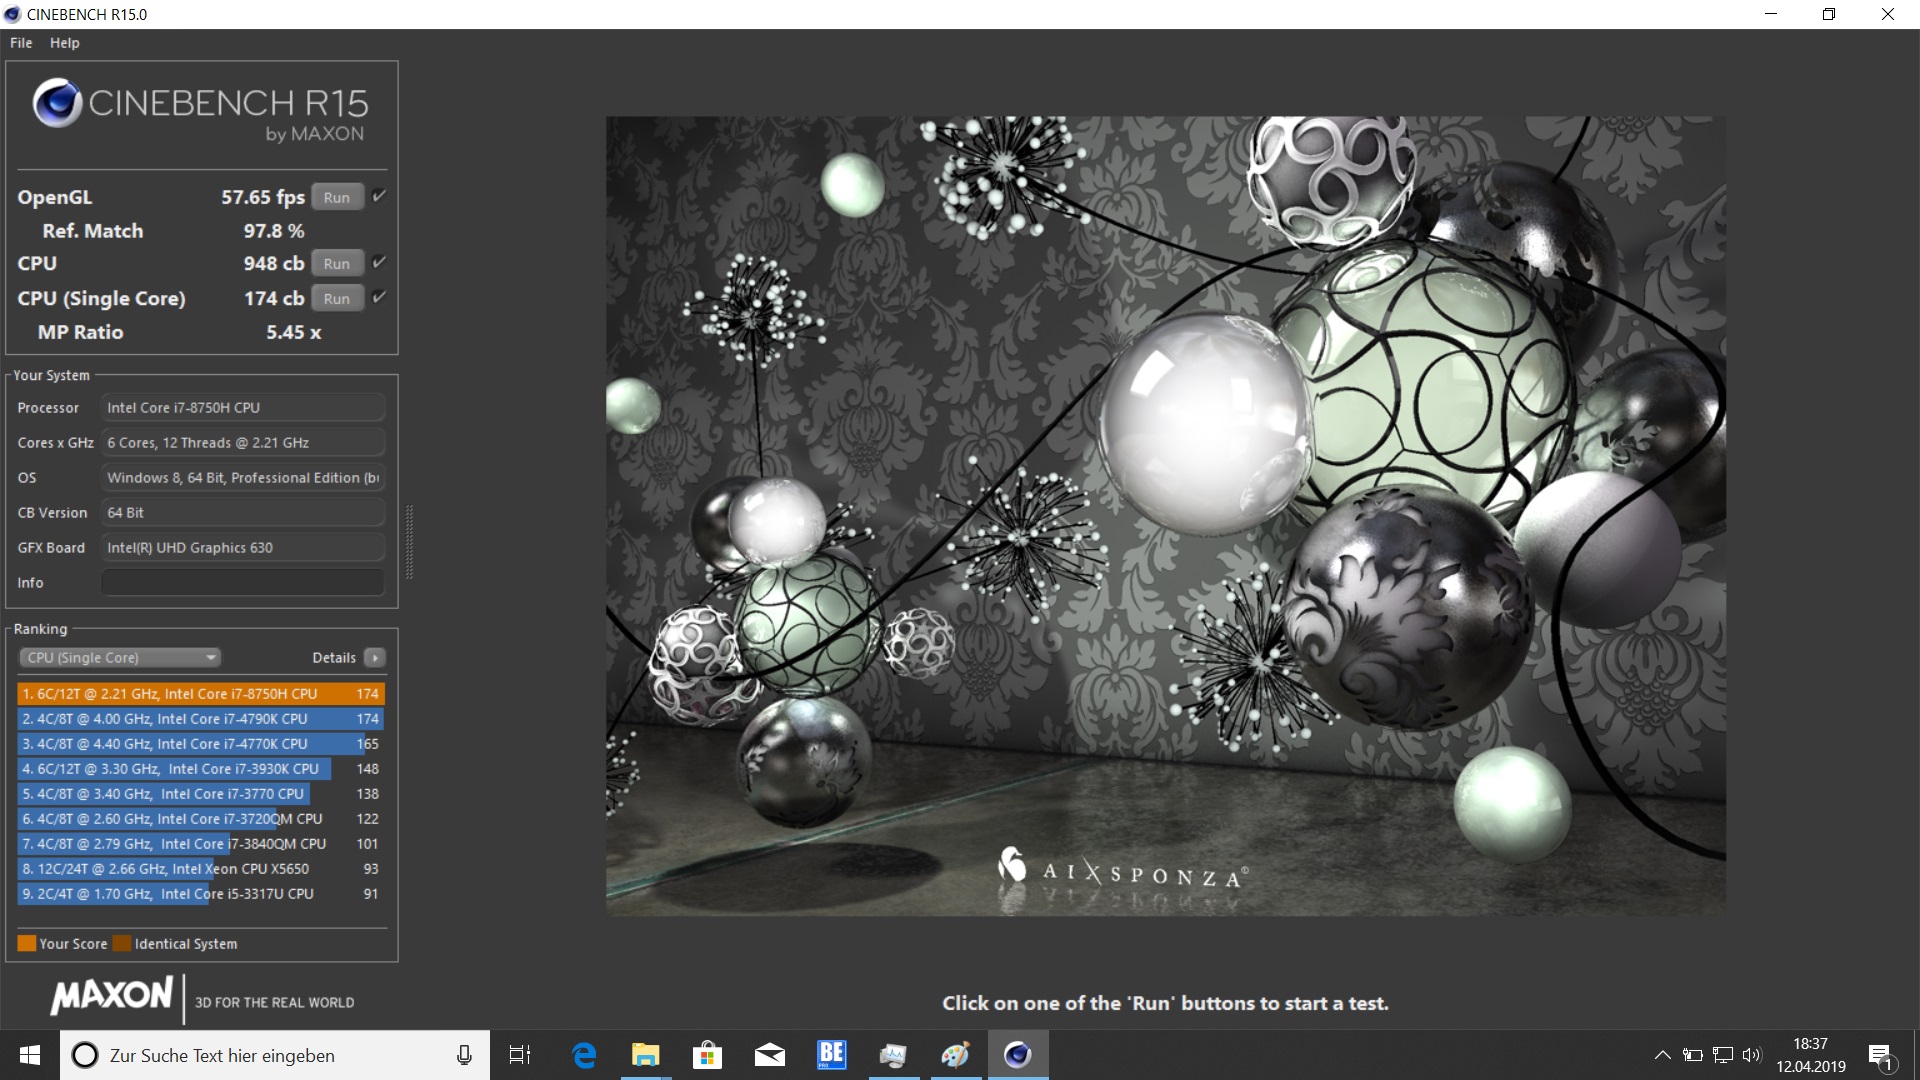
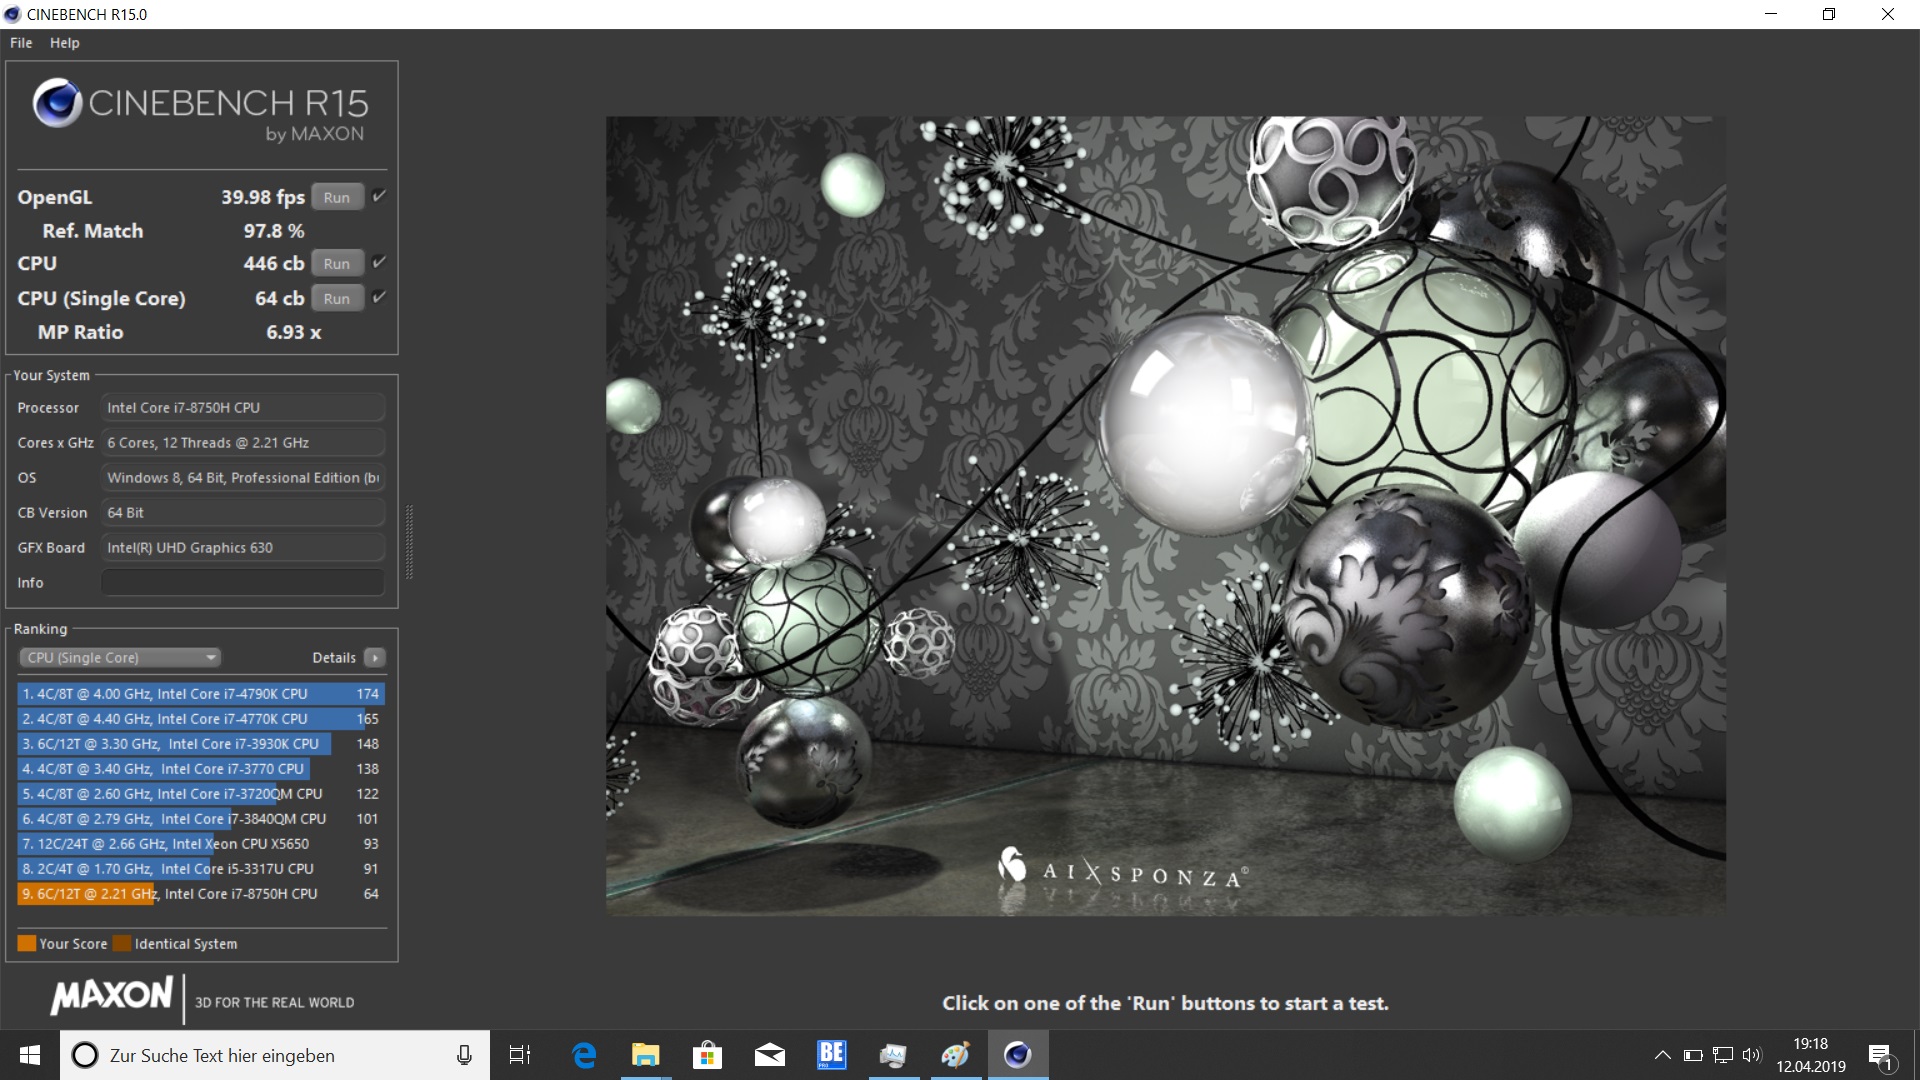
Correspondingly, the Work 15 finished some way ahead of our of comparison devices in Cinebench R15. The U series processors are no match for the Core i7-8750H in multi-core applications as demonstrated by our CB R15 Multi 64Bit comparison table, with the Work 15 scoring 36% more than our highest scoring comparison devices However, our review unit scored 16% less than the average of Core i7-8750H devices that we have tested, which is disappointing. Our review unit also finished top of our single core benchmark comparison table, despite our Core i7 U series powered comparison devices having higher clock speeds.
Our looped CB R15 Multi 64Bit test shows that these initial scores are somewhat misleading. The Work 15 initially scored 971 points, but steadily throttled before it settled at around 930 points by the tenth pass through. Scores then fluctuated between 922 and 940 points for the remaining run-throughs. In short, this indicates that the cooling system reaches its limits quickly.
Please see our CPU comparison page for more information about the Core i7-8750H and how it compares against other CPUs.
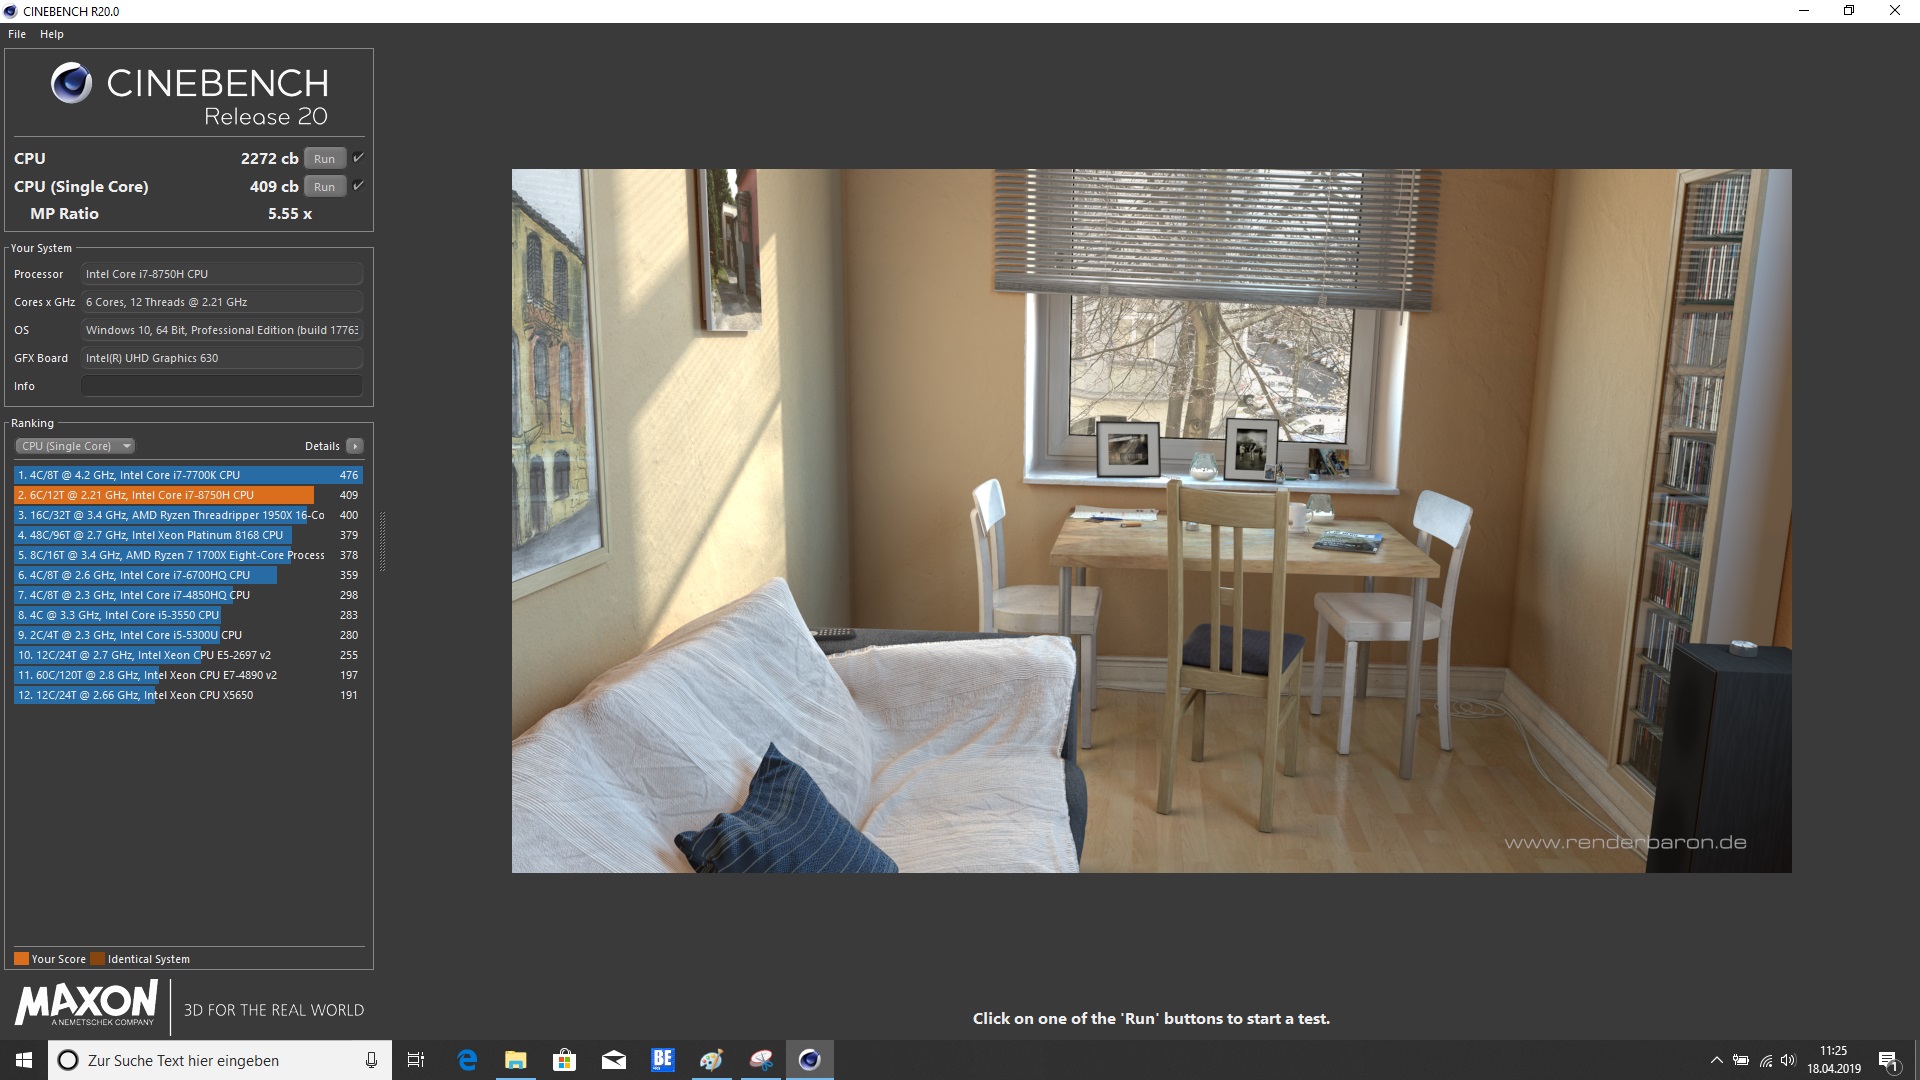
| Cinebench R20 | |
| CPU (Single Core) | |
| Average of class Office (345 - 816, n=73, last 2 years) | |
| Average Intel Core i7-8750H (403 - 418, n=6) | |
| Schenker Work 15 | |
| CPU (Multi Core) | |
| Average of class Office (648 - 8840, n=73, last 2 years) | |
| Average Intel Core i7-8750H (2142 - 2707, n=6) | |
| Schenker Work 15 | |
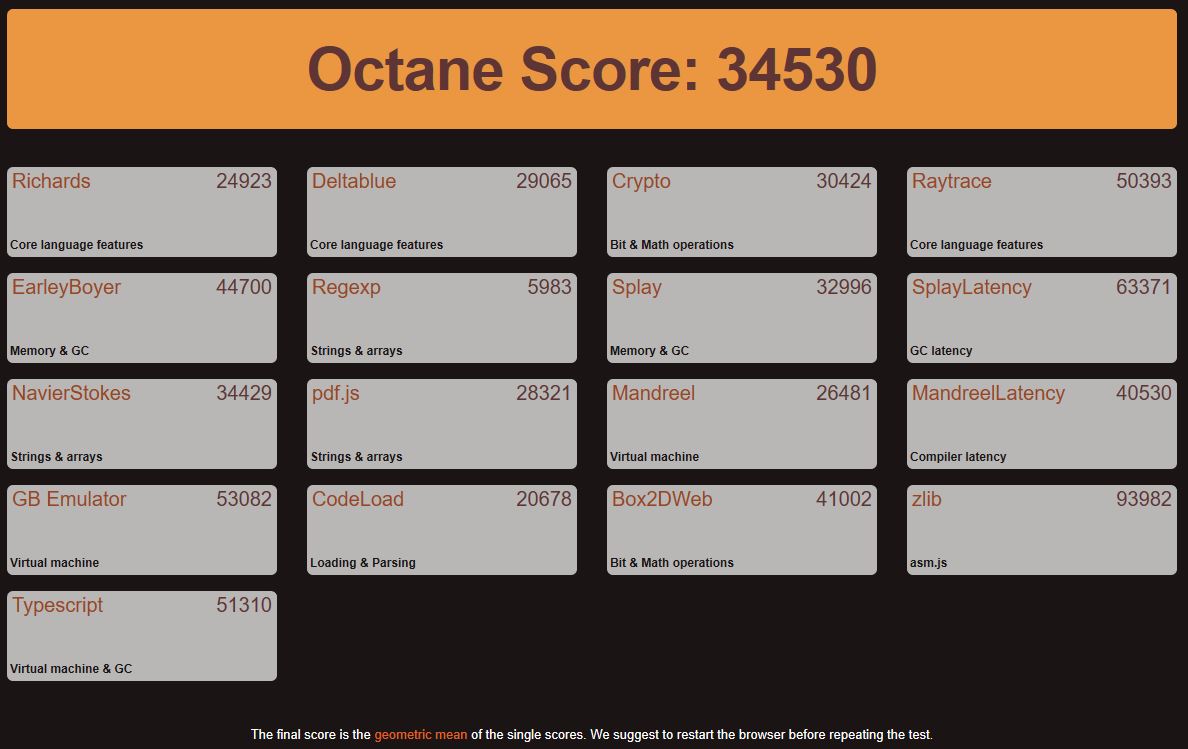
| Octane V2 - Total Score | |
| Average of class Office (49011 - 126830, n=19, last 2 years) | |
| Lenovo ThinkPad T580-20L9001AUS | |
| Schenker Work 15 | |
| Average Intel Core i7-8750H (27460 - 44549, n=47) | |
| Dell Latitude 5590 | |
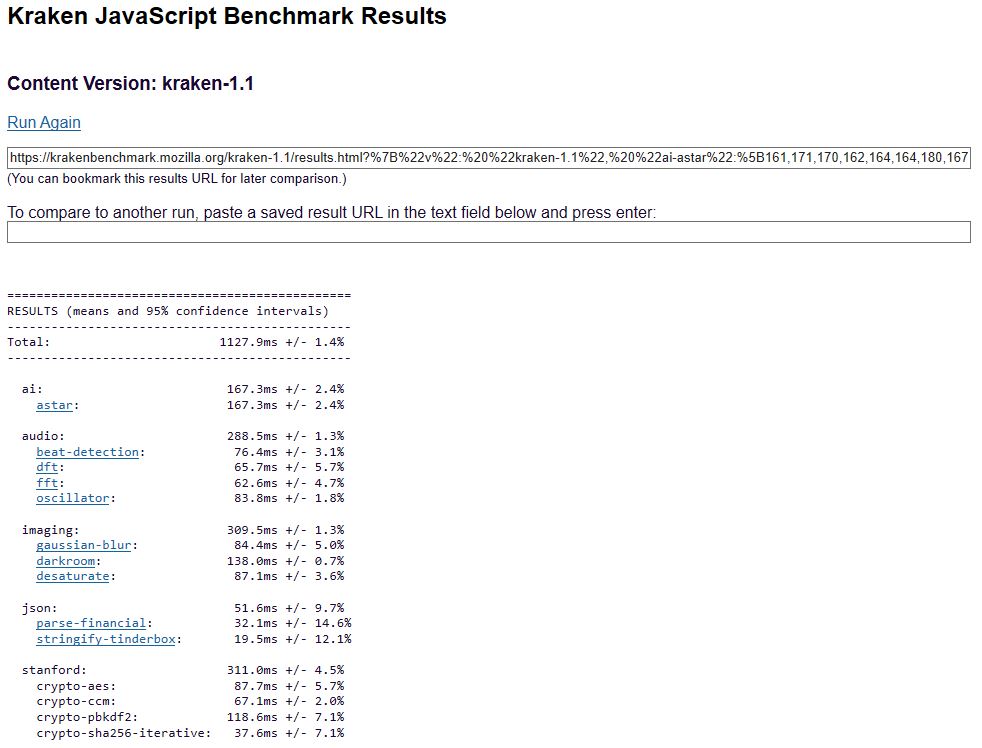
| Mozilla Kraken 1.1 - Total | |
| Dell Latitude 5590 | |
| Schenker Work 15 | |
| Average Intel Core i7-8750H (695 - 1272, n=50) | |
| Lenovo ThinkPad T580-20L9001AUS | |
| Average of class Office (391 - 1297, n=76, last 2 years) | |
| HWBOT x265 Benchmark v2.2 - 4k Preset | |
| Average of class Office (2.21 - 26, n=74, last 2 years) | |
| Average Intel Core i7-8750H (7.56 - 9.55, n=5) | |
| Schenker Work 15 | |
| Schenker Work 15 | |
| HP ProBook 450 G6-5TJ93EA | |
| Blender - v2.79 BMW27 CPU | |
| HP ProBook 450 G6-5TJ93EA | |
| Schenker Work 15 | |
| Schenker Work 15 | |
| Average Intel Core i7-8750H (396 - 486, n=6) | |
| Average of class Office (158 - 1940, n=74, last 2 years) | |
* ... smaller is better
System Performance
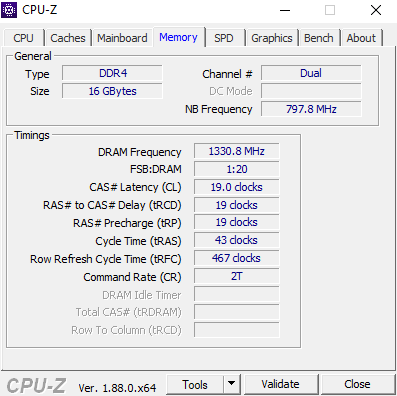
PCMark benchmark results also reflect the advantage that the Work 15 has over our comparison devices. Its hexacore processor, 16 GB of RAM and fast SSD allow it finish top of all but one of our comparison tables, which is impressive. We should also point out that the system operates in dual-channel mode, which helps maximise performance.
| PCMark 8 Home Score Accelerated v2 | 4326 points | |
| PCMark 8 Creative Score Accelerated v2 | 5102 points | |
| PCMark 8 Work Score Accelerated v2 | 5164 points | |
| PCMark 10 Score | 4154 points | |
Help | ||
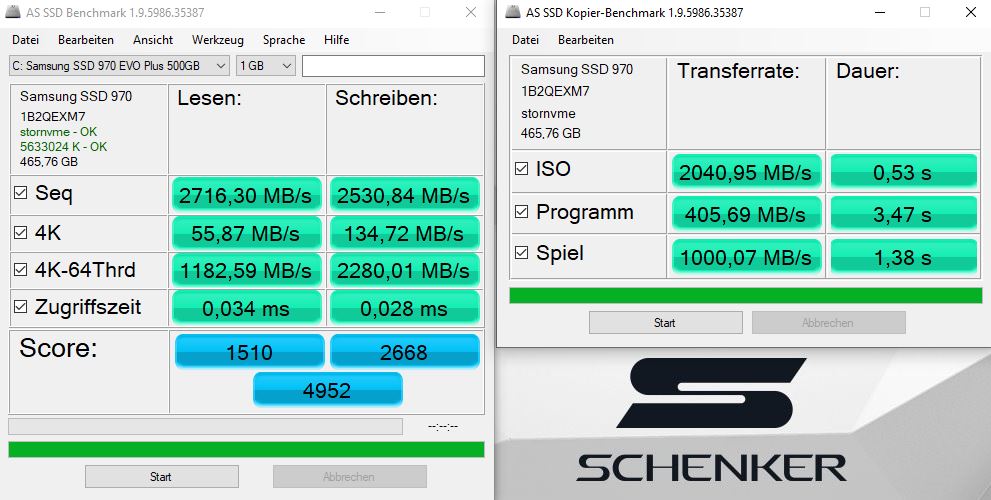
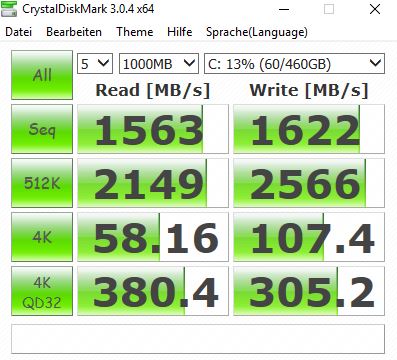
Storage Devices
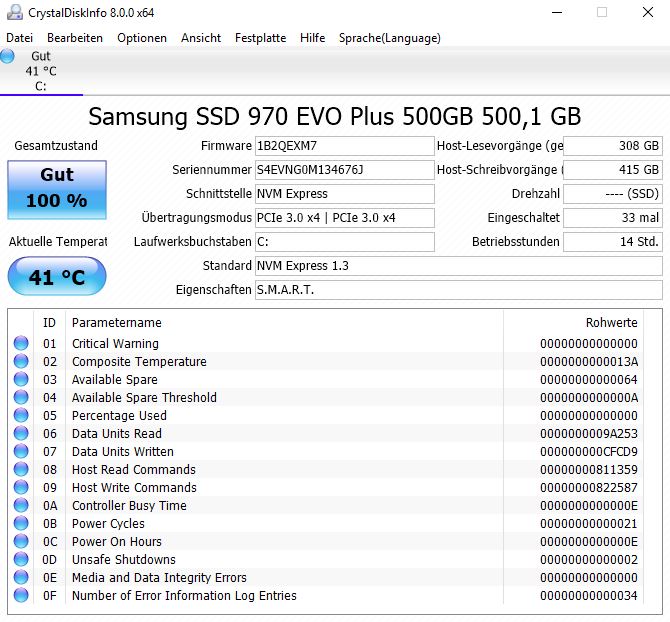
The Samsung 970 EVO Plus offers excellent transfer speeds, as we have covered extensively in our corresponding review. Schenker offers numerous drives on its configurator, but the 970 EVO Plus is one of the best value for money of those offered. Only the Samsung PM981 in the ProBook 450 G6 comes close to matching the 970 EVO Plus in benchmarks.
You can also equip the Work 15 with an additional M.2 SSD should you need more storage. If that is not enough, then Schenker has left a 2.5-inch drive bay free to add a third drive. Only drives that are 7.5 mm (~0.29 in) or thinner will fit though.
Please see our HDD/SSD comparison page for more information on the 970 EVO Plus and how it compares against other drives.
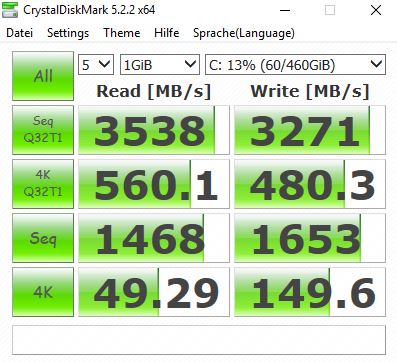
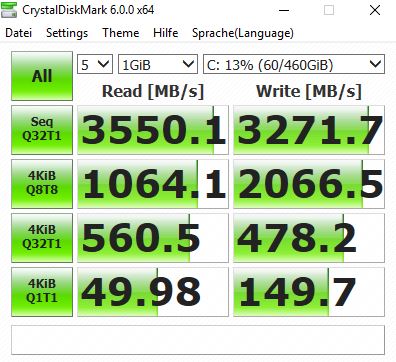
| Schenker Work 15 Samsung SSD 970 EVO Plus 500GB | HP ProBook 450 G6-5TJ93EA Samsung SSD PM981 MZVLB512HAJQ | Lenovo ThinkPad T580-20L9001AUS Samsung SSD PM981 MZVLB512HAJQ | Fujitsu Lifebook E558 E5580MP581DE Micron 1100 MTFDDAV256TBN | Dell Latitude 5590 SK hynix SC311 M.2 | Average Samsung SSD 970 EVO Plus 500GB | Average of class Office | |
|---|---|---|---|---|---|---|---|
| CrystalDiskMark 5.2 / 6 | -9% | -37% | -64% | -62% | 5% | 27% | |
| Write 4K (MB/s) | 149.6 | 126.1 -16% | 122.1 -18% | 80.5 -46% | 76.7 -49% | 159.2 ? 6% | 153.5 ? 3% |
| Read 4K (MB/s) | 49.29 | 43.92 -11% | 44.61 -9% | 26.14 -47% | 28.41 -42% | 48.5 ? -2% | 73.3 ? 49% |
| Write Seq (MB/s) | 1653 | 1669 1% | 826 -50% | 356.6 -78% | 436.7 -74% | 2114 ? 28% | 2454 ? 48% |
| Read Seq (MB/s) | 1468 | 2224 51% | 811 -45% | 467.1 -68% | 508 -65% | 2044 ? 39% | 3229 ? 120% |
| Write 4K Q32T1 (MB/s) | 478.2 | 410.4 -14% | 293.9 -39% | 257.2 -46% | 288.1 -40% | 435 ? -9% | 428 ? -10% |
| Read 4K Q32T1 (MB/s) | 561 | 338.1 -40% | 374.8 -33% | 243.3 -57% | 271.9 -52% | 508 ? -9% | 513 ? -9% |
| Write Seq Q32T1 (MB/s) | 3272 | 1979 -40% | 1714 -48% | 437.4 -87% | 503 -85% | 3238 ? -1% | 4083 ? 25% |
| Read Seq Q32T1 (MB/s) | 3550 | 3368 -5% | 1772 -50% | 526 -85% | 549 -85% | 3499 ? -1% | 6007 ? 69% |
| Write 4K Q8T8 (MB/s) | 2067 | 2067 ? 0% | 971 ? -53% | ||||
| Read 4K Q8T8 (MB/s) | 1064 | 1064 ? 0% | 1371 ? 29% | ||||
| AS SSD | -61% | -29% | -86% | -84% | -1% | -5% | |
| Seq Read (MB/s) | 2716 | 2063 -24% | 1454 -46% | 445 -84% | 503 -81% | 2640 ? -3% | 4305 ? 59% |
| Seq Write (MB/s) | 2531 | 1163 -54% | 1324 -48% | 333.8 -87% | 393 -84% | 2500 ? -1% | 2766 ? 9% |
| 4K Read (MB/s) | 55.9 | 50.6 -9% | 50.8 -9% | 24.6 -56% | 29.03 -48% | 54.8 ? -2% | 57.8 ? 3% |
| 4K Write (MB/s) | 134.7 | 125.4 -7% | 106.2 -21% | 71.8 -47% | 73.5 -45% | 141.2 ? 5% | 162.9 ? 21% |
| 4K-64 Read (MB/s) | 1183 | 1352 14% | 1140 -4% | 236 -80% | 306 -74% | 1345 ? 14% | 965 ? -18% |
| 4K-64 Write (MB/s) | 2280 | 1023 -55% | 1325 -42% | 270.9 -88% | 212.7 -91% | 2116 ? -7% | 1632 ? -28% |
| Access Time Read * (ms) | 0.034 | 0.044 -29% | 0.047 -38% | 0.093 -174% | 0.111 -226% | 0.0475 ? -40% | 0.08504 ? -150% |
| Access Time Write * (ms) | 0.028 | 0.182 -550% | 0.035 -25% | 0.059 -111% | 0.047 -68% | 0.02775 ? 1% | 0.05931 ? -112% |
| Score Read (Points) | 1510 | 1608 6% | 1336 -12% | 305 -80% | 385 -75% | 1664 ? 10% | 1453 ? -4% |
| Score Write (Points) | 2668 | 1265 -53% | 1564 -41% | 376 -86% | 326 -88% | 2507 ? -6% | 2071 ? -22% |
| Score Total (Points) | 4952 | 3658 -26% | 3587 -28% | 841 -83% | 912 -82% | 5023 ? 1% | 4202 ? -15% |
| Copy ISO MB/s (MB/s) | 2041 | 1382 -32% | 302.2 -85% | 311.5 -85% | 1989 ? -3% | 2533 ? 24% | |
| Copy Program MB/s (MB/s) | 405.7 | 414.3 2% | 154.6 -62% | 208.6 -49% | 442 ? 9% | 788 ? 94% | |
| Copy Game MB/s (MB/s) | 1000 | 660 -34% | 234.8 -77% | 210 -79% | 1121 ? 12% | 1643 ? 64% | |
| Total Average (Program / Settings) | -35% /
-42% | -33% /
-32% | -75% /
-78% | -73% /
-76% | 2% /
2% | 11% /
8% |
* ... smaller is better

Graphics Card
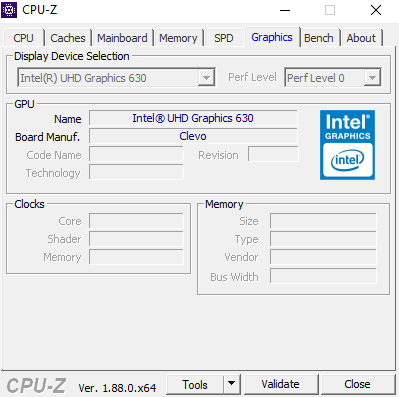
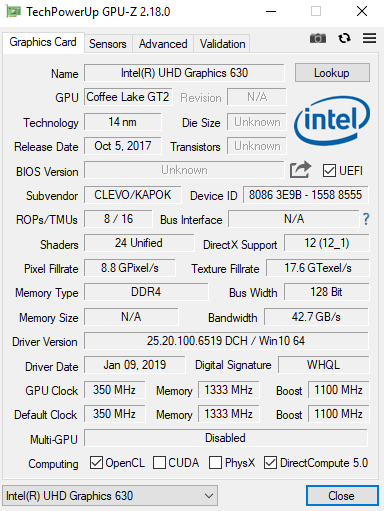
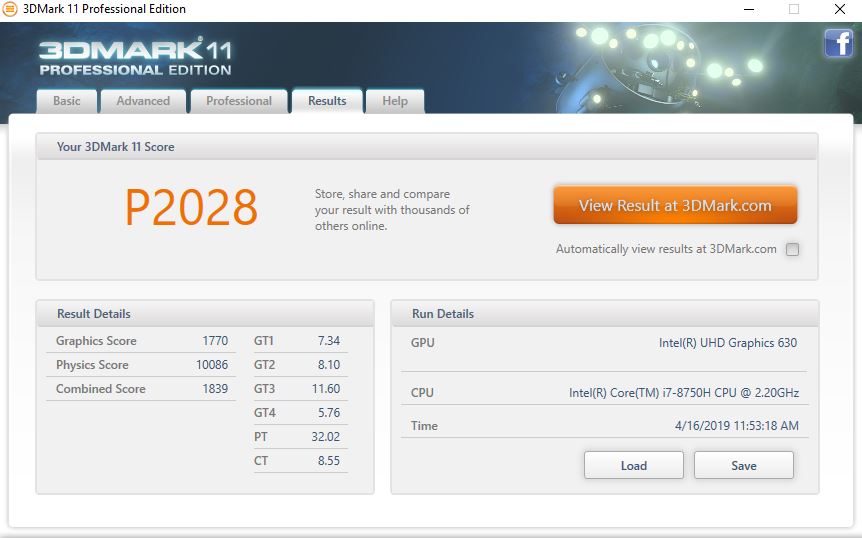
The Work 15 does not have a dedicated GPU and relies on the UHD Graphics 630 that Intel integrates within the Core i7-8750H. The GPU can clock up to 1,100 MHz and delivers largely the same performance as a UHD Graphics 620 running in dual-channel mode.
The UHD Graphics 630 is basically a rebranded HD Graphics 630. Hence, the GPU supports 4K H.265 and has 10-bit colour thanks to support for HDCP 2.2. You should be able to play videos or stream Netflix in 4K on an appropriate TV or external monitor.
The Work 15 ranked just ahead of the ThinkPad T580 in the benchmarks. Both devices cannot compete with the ProBook 450 G6 and its GeForce MX130 GPU though.
Please see our GPU comparison page for more information on the Intel UHD Graphics 630 and it how compares against other GPUs.
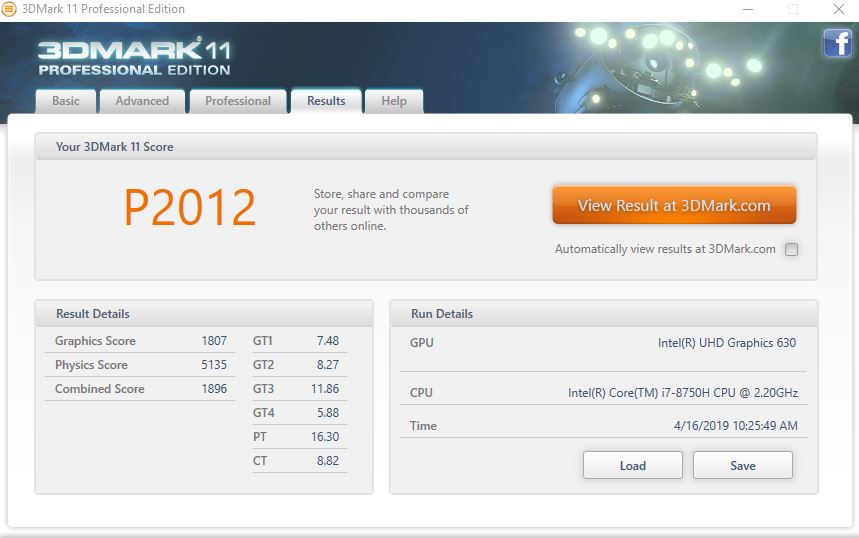
| 3DMark 11 Performance | 2070 points | |
| 3DMark Ice Storm Standard Score | 69790 points | |
| 3DMark Cloud Gate Standard Score | 10919 points | |
| 3DMark Fire Strike Score | 1215 points | |
| 3DMark Fire Strike Extreme Score | 580 points | |
| 3DMark Time Spy Score | 470 points | |
Help | ||
Gaming Performance
The Work 15 and its UHD Graphics 630 can play some older and simple games, but complex modern titles such as "X-Plane 11" are out of the question. Our review unit can play games such as "BioShock Infinite" and "Dota 2 Reborn" smoothly at minimum graphics in 720p. This will not be a treat for your eyes though.
| low | med. | high | ultra | |
|---|---|---|---|---|
| BioShock Infinite (2013) | 82.4 | 40.1 | 33.9 | 10.8 |
| Dota 2 Reborn (2015) | 76.7 | 48 | 21 | 19.1 |
| X-Plane 11.11 (2018) | 31.3 | 20.1 | 18.3 |
Emissions
Fan Noise
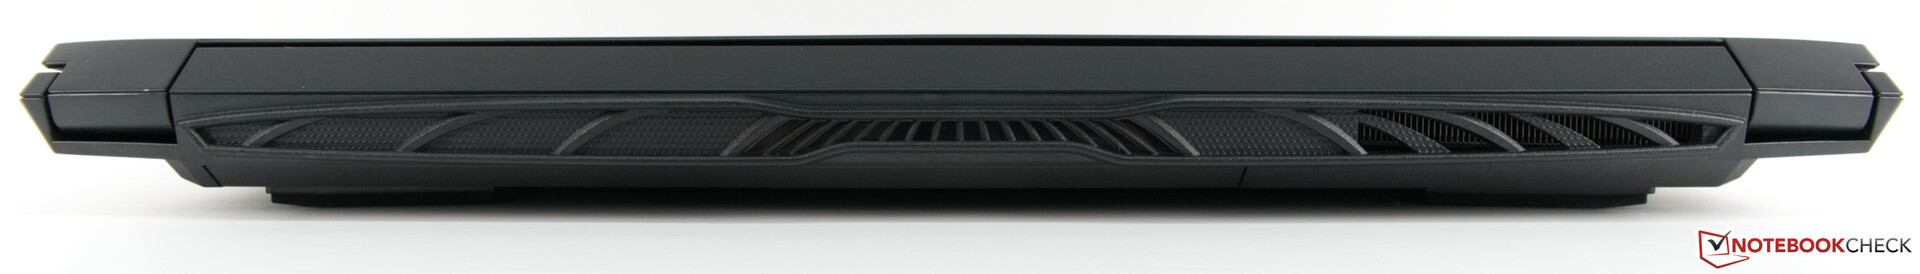
The cooling unit has a lot of work to do, especially under load. The fans typically operate at 35.4 dB(A) in these conditions, but they can reach a maximum of 47.4 dB(A). This makes the Work 15 noticeably louder than our comparison devices, although it generally operates silently or at idle. If the fans do turn on when you are not pushing the system hard, they should only reach a maximum of 29.7 dB(A), which is pleasantly quiet.
Moreover, the system adjusts fan speed quickly. In practice, this means that the fans will only run at maximum speeds when you are pushing the system to its limits. They will then quieten down a few moments after you stop whatever task you are doing.
Noise level
| Idle |
| 29.2 / 29.2 / 29.7 dB(A) |
| Load |
| 35.4 / 47.4 dB(A) |
 | ||
30 dB silent 40 dB(A) audible 50 dB(A) loud |
||
min: | ||
| Schenker Work 15 UHD Graphics 630, i7-8750H, Samsung SSD 970 EVO Plus 500GB | HP ProBook 450 G6-5TJ93EA GeForce MX130, i7-8565U, Samsung SSD PM981 MZVLB512HAJQ | Lenovo ThinkPad T580-20L9001AUS UHD Graphics 620, i7-8650U, Samsung SSD PM981 MZVLB512HAJQ | Fujitsu Lifebook E558 E5580MP581DE UHD Graphics 620, i5-8250U, Micron 1100 MTFDDAV256TBN | Dell Latitude 5590 UHD Graphics 620, i5-8250U, SK hynix SC311 M.2 | |
|---|---|---|---|---|---|
| Noise | 5% | 3% | 4% | 2% | |
| off / environment * (dB) | 29.2 | 29 1% | 28.6 2% | 30 -3% | 29 1% |
| Idle Minimum * (dB) | 29.2 | 29 1% | 28.6 2% | 30 -3% | 29 1% |
| Idle Average * (dB) | 29.2 | 29 1% | 28.6 2% | 30 -3% | 29 1% |
| Idle Maximum * (dB) | 29.7 | 29 2% | 28.6 4% | 30 -1% | 31.3 -5% |
| Load Average * (dB) | 35.4 | 34.2 3% | 37.4 -6% | 34.8 2% | 36.6 -3% |
| Load Maximum * (dB) | 47.4 | 38.4 19% | 40 16% | 33.5 29% | 40.9 14% |
| Witcher 3 ultra * (dB) | 34.2 |
* ... smaller is better
Temperature
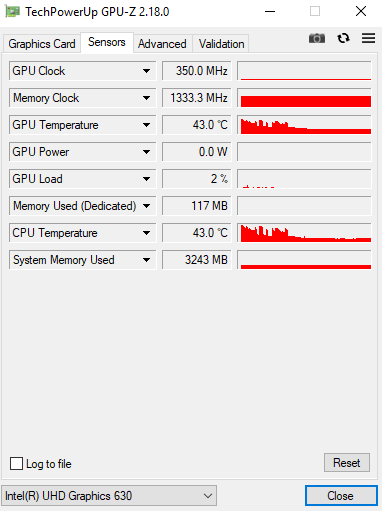
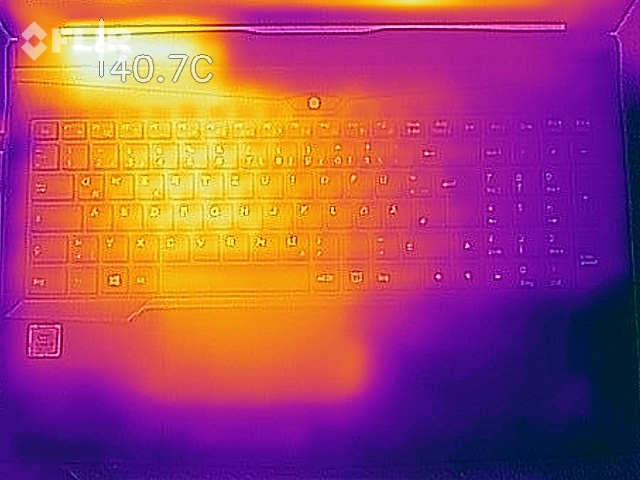
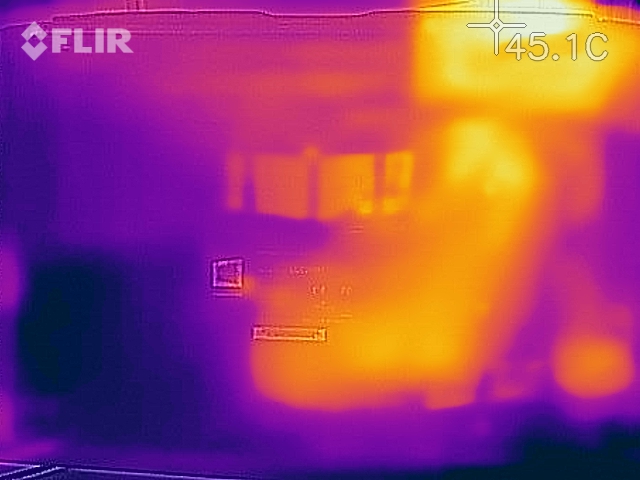
The high fan noise does allow the Work 15 to keep its surface temperatures in check though. The warmest area of the case unit did not exceed 43 °C (~109 °F) even during a stress test. Likewise, most of the case stayed below 30 °C (~86 °F) even with the system operating under full load.
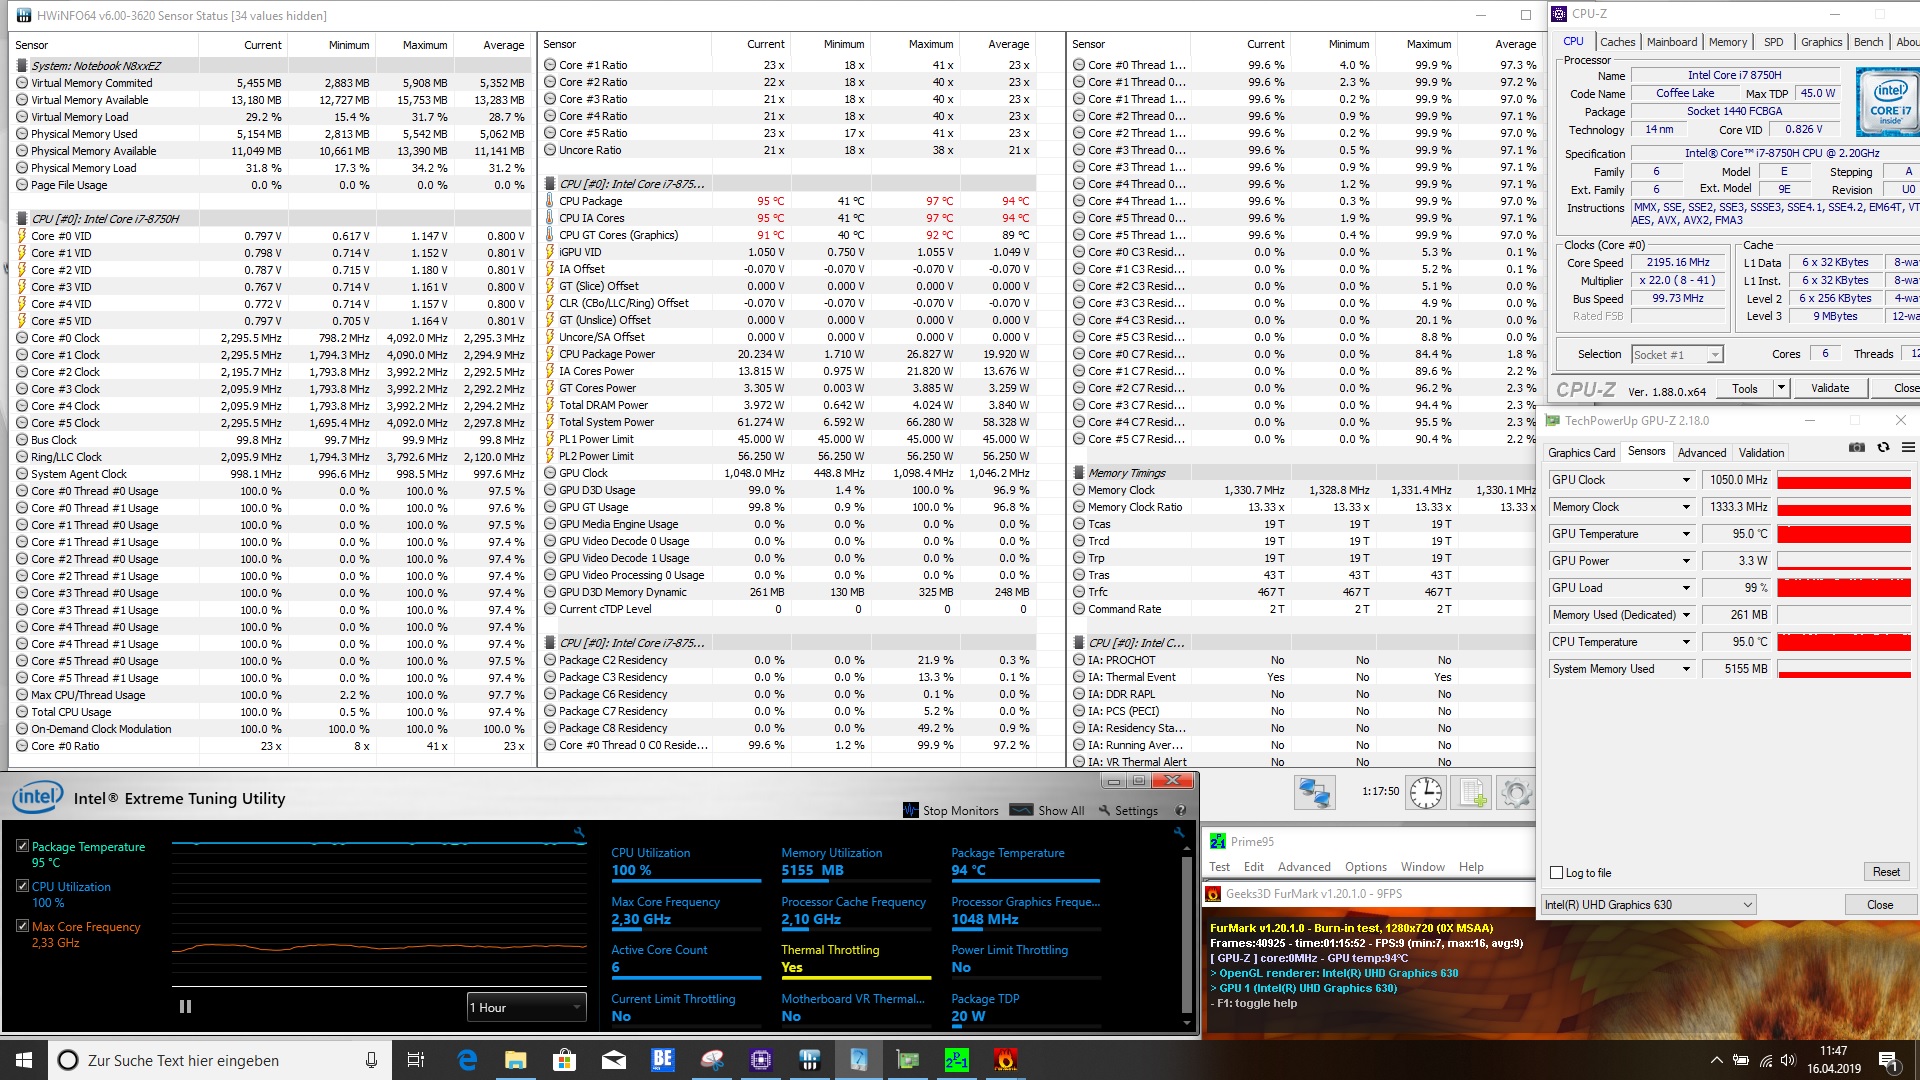
It looks quite different internally though. CPU core temperatures peaked at 97 °C (~207 °F) during our one-hour stress test, which causes the processor to throttle to cool itself. Our review unit can still maintain its 2.2 GHz base clock, although this is well below its peak clock speeds.
The UHD Graphics 630 also gets worryingly hot and reached a maximum of 95 °C (~203 °F). The GPU can maintain 1,050 MHz though. We should point out that the CPU and GPU share the same TDP, so the former cannot work as hard as it potentially could if the latter is also in use. Our stress test pushes both to their limits, which is part of the reason why the CPU operates at a comparatively lower clock speed.
We should also point out that our stress test did not have any adverse effects on benchmark scores. Our review unit scored roughly the same in 3DMark 11 after a stress test as those when we ran it from cold.
(±) The maximum temperature on the upper side is 40.2 °C / 104 F, compared to the average of 34.3 °C / 94 F, ranging from 21.2 to 62.5 °C for the class Office.
(±) The bottom heats up to a maximum of 43 °C / 109 F, compared to the average of 36.8 °C / 98 F
(+) In idle usage, the average temperature for the upper side is 23.9 °C / 75 F, compared to the device average of 29.5 °C / 85 F.
(+) The palmrests and touchpad are cooler than skin temperature with a maximum of 28.9 °C / 84 F and are therefore cool to the touch.
(±) The average temperature of the palmrest area of similar devices was 27.5 °C / 81.5 F (-1.4 °C / -2.5 F).
| Schenker Work 15 UHD Graphics 630, i7-8750H, Samsung SSD 970 EVO Plus 500GB | HP ProBook 450 G6-5TJ93EA GeForce MX130, i7-8565U, Samsung SSD PM981 MZVLB512HAJQ | Lenovo ThinkPad T580-20L9001AUS UHD Graphics 620, i7-8650U, Samsung SSD PM981 MZVLB512HAJQ | Fujitsu Lifebook E558 E5580MP581DE UHD Graphics 620, i5-8250U, Micron 1100 MTFDDAV256TBN | Dell Latitude 5590 UHD Graphics 620, i5-8250U, SK hynix SC311 M.2 | |
|---|---|---|---|---|---|
| Heat | -2% | -20% | -5% | 2% | |
| Maximum Upper Side * (°C) | 40.2 | 39.4 2% | 39 3% | 42 -4% | 36.6 9% |
| Maximum Bottom * (°C) | 43 | 50.2 -17% | 56 -30% | 41 5% | 47.5 -10% |
| Idle Upper Side * (°C) | 24.7 | 22.9 7% | 28.2 -14% | 26.8 -9% | 23.2 6% |
| Idle Bottom * (°C) | 24.4 | 24.1 1% | 34.2 -40% | 27.2 -11% | 24.2 1% |
* ... smaller is better
Speakers
The Work 15 has stereo speakers that Schenker has placed below the palm rest. Their placement makes the speakers sound muffled if it is placed on a soft surface, which is impractical. The speakers reached a maximum of 75.7 dB(A) during our tests, although they sound too high pitched for our liking at this volume. Reducing the volume helps the speakers deliver a more balanced sound, but they lack bass at any volume.
Overall, the speakers are good enough for occasionally listening to music or watching videos. We would recommend using external speakers or headphones for a better listening experience though, which you can connect via the 3.5 mm headphone jack or Bluetooth.
Schenker Work 15 audio analysis
(±) | speaker loudness is average but good (75.7 dB)
Bass 100 - 315 Hz
(-) | nearly no bass - on average 25.3% lower than median
(±) | linearity of bass is average (10.2% delta to prev. frequency)
Mids 400 - 2000 Hz
(±) | higher mids - on average 8.6% higher than median
(±) | linearity of mids is average (11.1% delta to prev. frequency)
Highs 2 - 16 kHz
(±) | higher highs - on average 6% higher than median
(±) | linearity of highs is average (10.3% delta to prev. frequency)
Overall 100 - 16.000 Hz
(-) | overall sound is not linear (34.2% difference to median)
Compared to same class
» 96% of all tested devices in this class were better, 2% similar, 2% worse
» The best had a delta of 7%, average was 21%, worst was 53%
Compared to all devices tested
» 93% of all tested devices were better, 1% similar, 6% worse
» The best had a delta of 4%, average was 23%, worst was 134%
Lenovo ThinkPad T580-20L9001AUS audio analysis
(±) | speaker loudness is average but good (80.4 dB)
Bass 100 - 315 Hz
(±) | reduced bass - on average 7.5% lower than median
(±) | linearity of bass is average (7.8% delta to prev. frequency)
Mids 400 - 2000 Hz
(+) | balanced mids - only 3.6% away from median
(±) | linearity of mids is average (7% delta to prev. frequency)
Highs 2 - 16 kHz
(+) | balanced highs - only 2.3% away from median
(±) | linearity of highs is average (8.3% delta to prev. frequency)
Overall 100 - 16.000 Hz
(+) | overall sound is linear (12.7% difference to median)
Compared to same class
» 5% of all tested devices in this class were better, 2% similar, 93% worse
» The best had a delta of 7%, average was 21%, worst was 53%
Compared to all devices tested
» 12% of all tested devices were better, 3% similar, 86% worse
» The best had a delta of 4%, average was 23%, worst was 134%
Power Management
Power Consumption
In terms of power consumption, the Work 15 can be found in the midfield of our comparison devices. The Core i7-8750H is the culprit here, as it can consume up to 56 W at full throttle. The system consumes a maximum of 86 W as a result, although it typically averages 42.5 W under load. Our test device also consumed about 69 W during our stress test, for reference.
The Work 15 is more frugal at idle though. The system consumes between 3.7 W and 7.1 W in these conditions, which is on par, or better than our comparison devices.
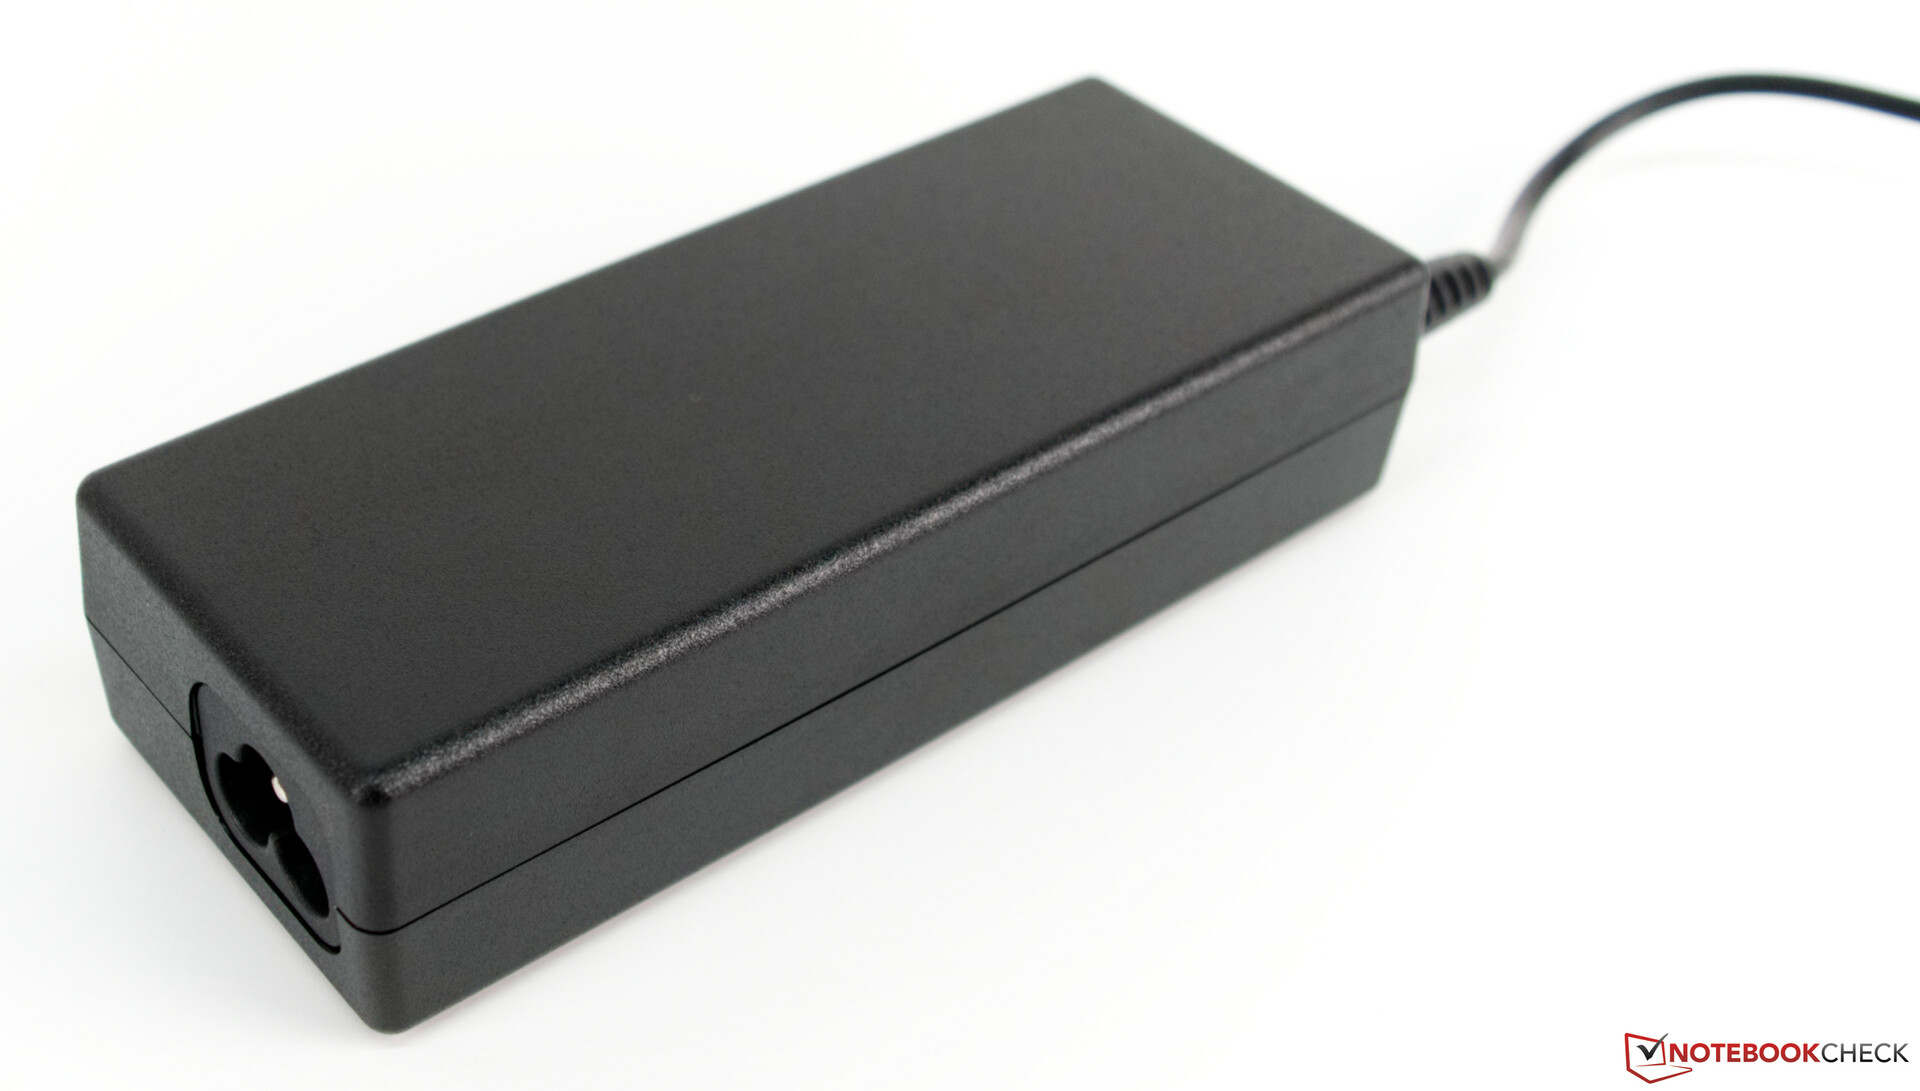
Schenker includes a 90-W power supply in the box, which is powerful enough to keep the Work 15 charging even when it is being pushed hard; we noticed no battery discharging during our stress test.
| Off / Standby | |
| Idle | |
| Load |
|
Key:
min: | |
| Schenker Work 15 i7-8750H, UHD Graphics 630, Samsung SSD 970 EVO Plus 500GB, IPS, 1920x1080, 15.6" | HP ProBook 450 G6-5TJ93EA i7-8565U, GeForce MX130, Samsung SSD PM981 MZVLB512HAJQ, IPS, 1920x1080, 15.6" | Lenovo ThinkPad T580-20L9001AUS i7-8650U, UHD Graphics 620, Samsung SSD PM981 MZVLB512HAJQ, IPS, 1920x1080, 15.6" | Fujitsu Lifebook E558 E5580MP581DE i5-8250U, UHD Graphics 620, Micron 1100 MTFDDAV256TBN, IPS, 1920x1080, 15.6" | Dell Latitude 5590 i5-8250U, UHD Graphics 620, SK hynix SC311 M.2, IPS, 1920x1080, 15.6" | Average Intel UHD Graphics 630 | Average of class Office | |
|---|---|---|---|---|---|---|---|
| Power Consumption | -7% | -16% | 13% | 2% | -12% | -6% | |
| Idle Minimum * (Watt) | 3.7 | 3.12 16% | 4.7 -27% | 3.8 -3% | 3.6 3% | 3.95 ? -7% | 4.28 ? -16% |
| Idle Average * (Watt) | 6.4 | 6.3 2% | 7.9 -23% | 6.7 -5% | 6.5 -2% | 7.23 ? -13% | 7.31 ? -14% |
| Idle Maximum * (Watt) | 7.1 | 9.78 -38% | 11.4 -61% | 8.3 -17% | 7.2 -1% | 8.87 ? -25% | 8.58 ? -21% |
| Load Average * (Watt) | 42.5 | 57.6 -36% | 47.2 -11% | 29 32% | 46.2 -9% | 45.9 ? -8% | 43.7 ? -3% |
| Load Maximum * (Watt) | 86 | 67.3 22% | 48.1 44% | 36.7 57% | 68.8 20% | 93.8 ? -9% | 64.4 ? 25% |
| Witcher 3 ultra * (Watt) | 42 |
* ... smaller is better
Battery Life
The Work 15 has a 62 Wh, which is larger than all the batteries in our comparison devices. However, its power-hungry CPU means that the device does not have considerably better battery life.
Our test still lasted for a respectable 8:24 hours in our practical Wi-Fi test, which is longer than all but the ProBook 450 G6 of our comparison devices. We lowered the display brightness to 150 cd/m², or 79%, for this test as we do with all the devices that we test. The battery only lasted around 6 hours in our looped H.264 video test, but this should still be enough for a long movie night.
The included power supply recharges our review unit fully in just under 2.5 hours.
Disappointingly, the Work 15 heavily throttles its CPU when running on battery. Our review unit scored around 50% less in CB R15 Multi 64Bit on battery than we tested it connected to the mains. We had no such issues with the GPU though.


Pros
Cons
Verdict
The Schenker Work 15 is undoubtedly a powerful 15-inch work laptop. €1,200 (~$1,345) gets you a laptop with a hexacore processor, 16 GB of RAM and a fast SSD. Moreover, its display is a pleasure to use, although we wished that it was more colour accurate. Overall, the Work 15 often outperformed our comparison devices because of its strong Core i7-8750H processor, even if it does not meet expectations for what that CPU should achieve.
The cooling system is underpowered though, which hampers CPU performance. Our review unit can still maintain its CPU base clock when pushed to its limits, but the cooling system cannot keep the chip from overheating, so it thermal throttles instead to cool itself.
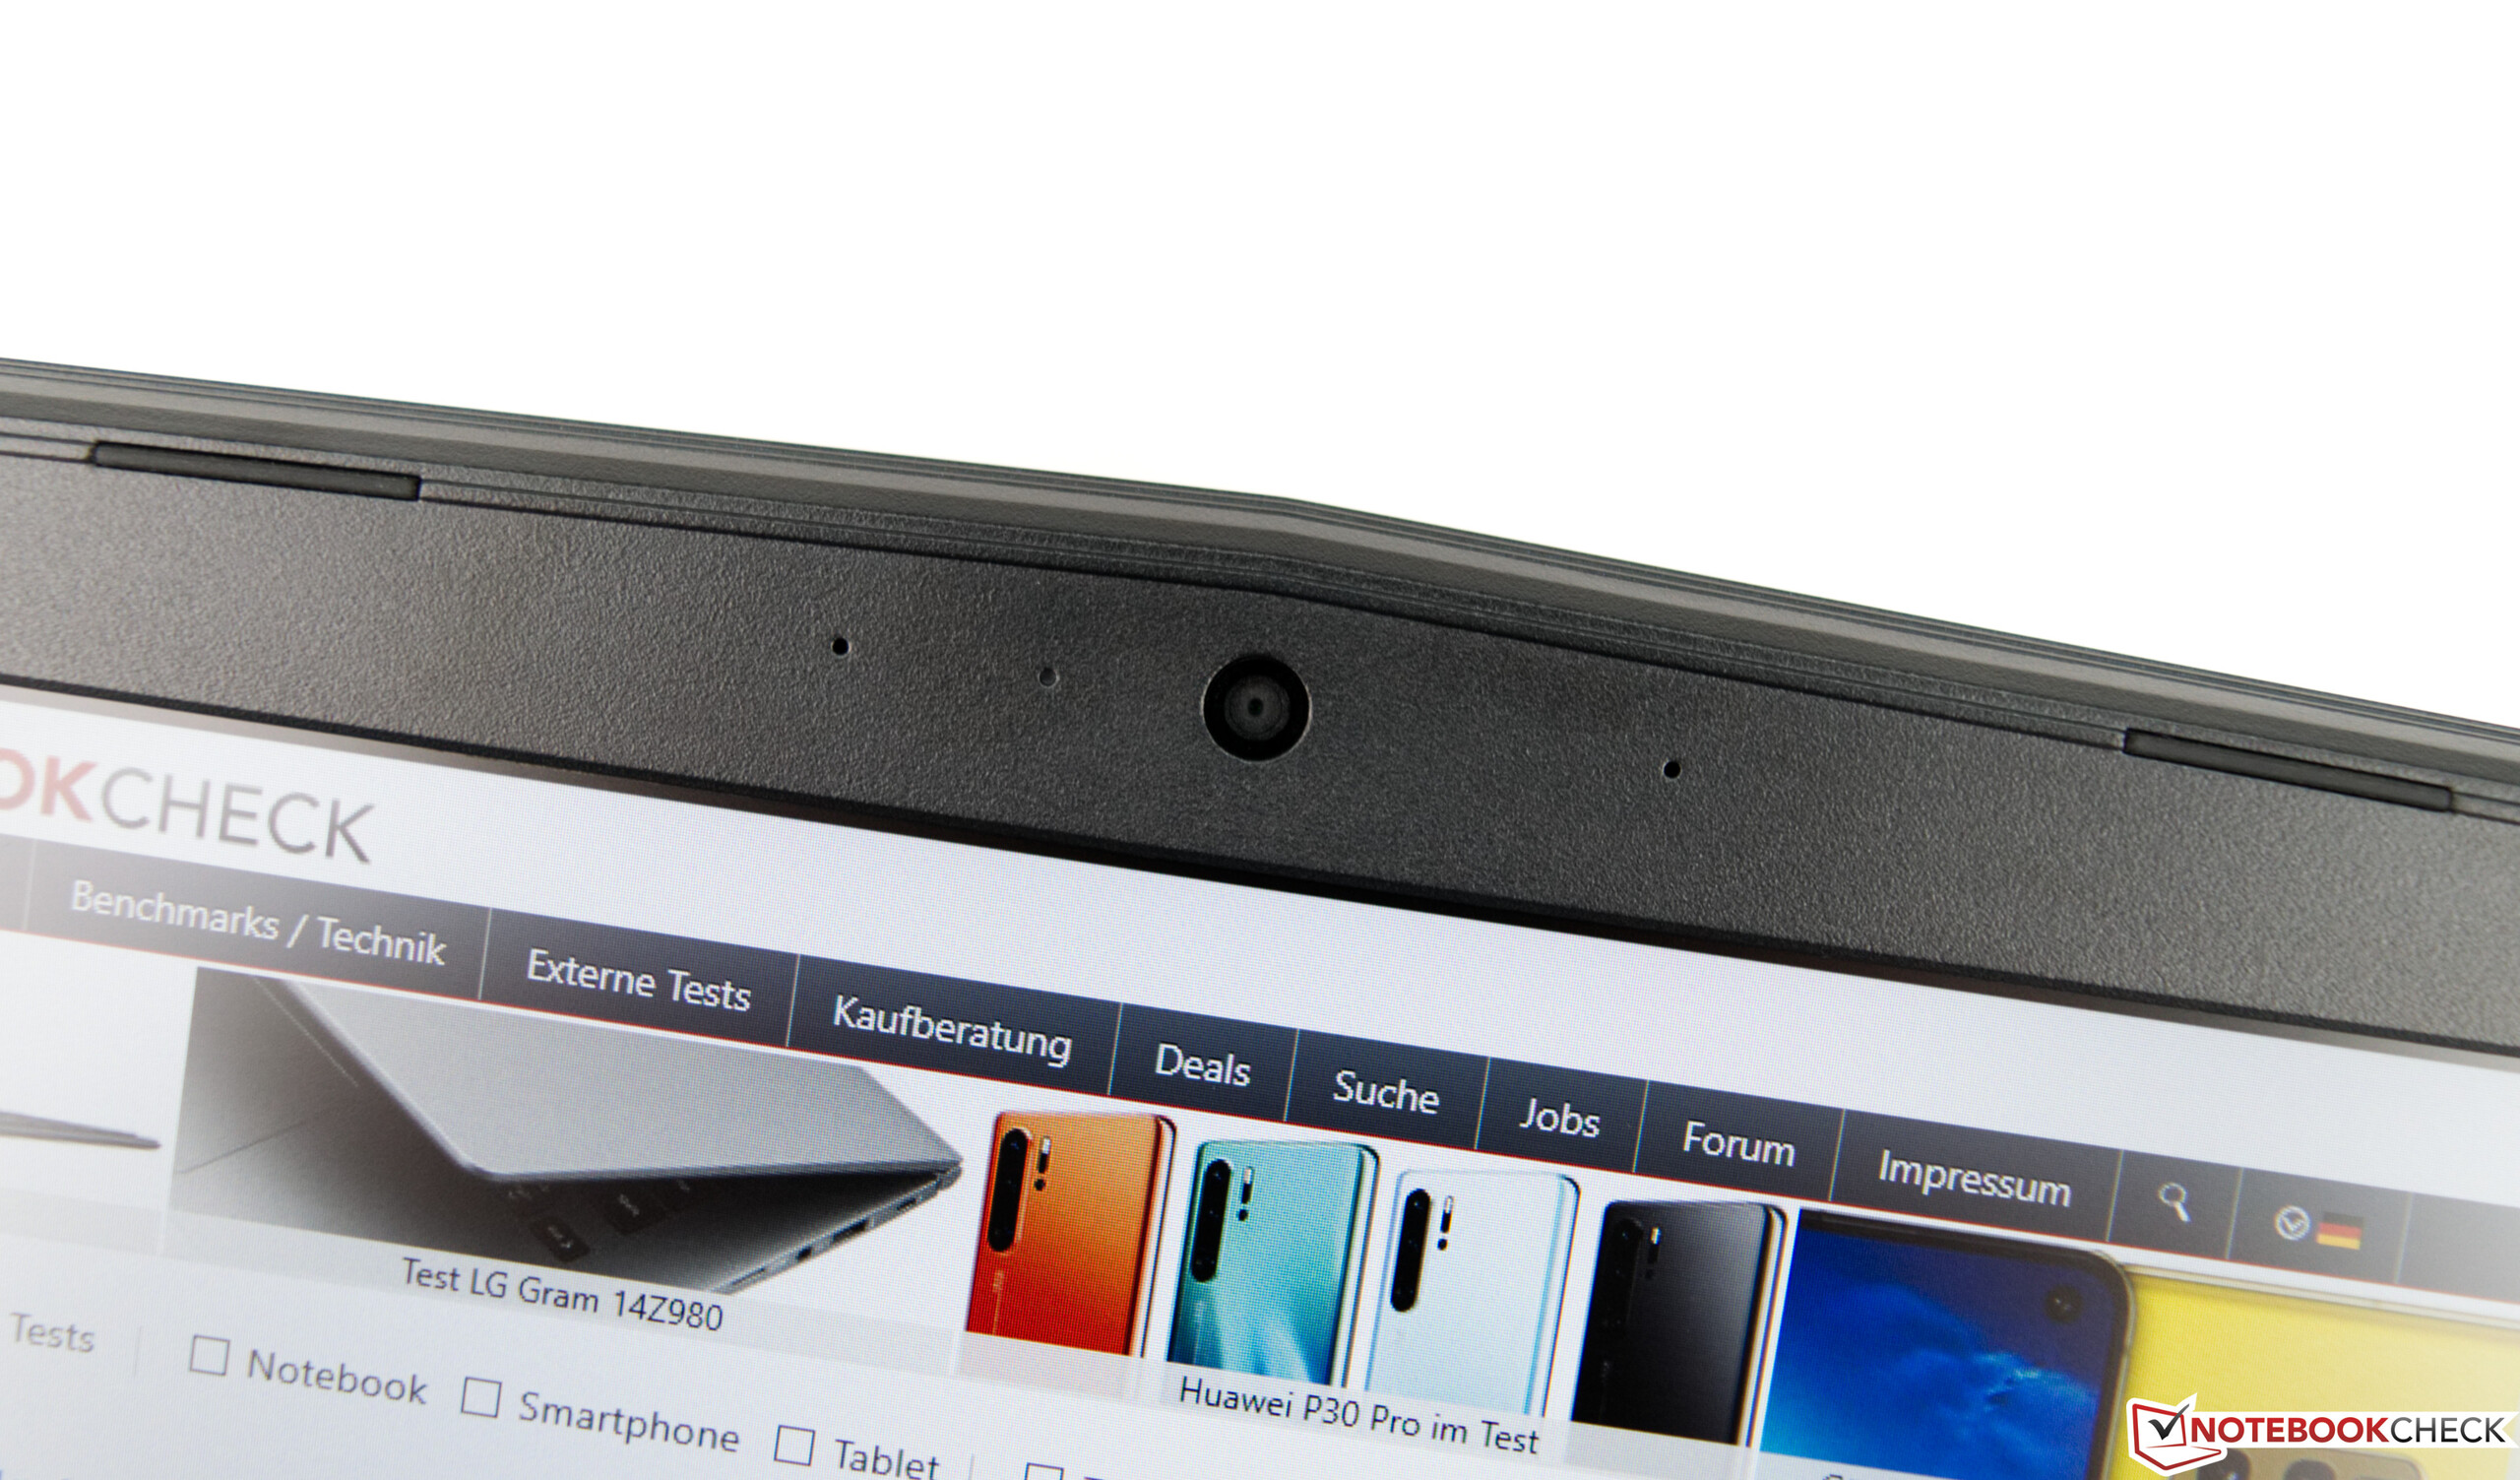
In short, the Work 15 is a solid work device, but it lacks the finishing touches of its competitors. It has no smart card reader, fingerprint scanner or IR camera, which OEMs usually adorn their business devices. The only consolation here is the optional LTE module, but this does not compensate for the lack of security features in our opinion.
The Schenker Work 15 is a fast workhorse with a strong CPU of which it, unfortunately, cannot take full advantage.
The Work 15 has a decent keyboard too, but it is not at the same level as the ThinkPad T580. The trackpad and dedicated mouse buttons also worked well, but we would have preferred a larger trackpad. Likewise, a Type-C port that supports DisplayPort would have been welcome. Overall, the Work 15 is a decent office laptop, but it has a few trade-offs.
Schenker Work 15
- 04/18/2019 v6 (old)
Sebastian Bade
Price comparison

