Schenker Work 15 Tiger Lake-H Laptop Review: RGB lighting in the office
Schenker's work laptops combine strong hardware with many configuration options. Thus, the company's office notebooks can be adapted well to the required purpose. Intel Core i5 and i7 from the H-series are available as processors accompanied by up to 64 GB of working memory. A robust case, mainly made of aluminum, rounds off the overall picture.
Our test device with 32 GB working memory, Intel Core i7-11370H, and 1 TB NVMe SSD costs 1440 Euros without a Windows license. The cheapest configuration via the manufacturer's website costs around 1000 Euros.
Several 15-inch office devices are available as competitors for the Work 15. Similarly configurable are, for example, the Lenovo ThinkPad E15 and the Dell Inspiron 15 3501. However, no other office laptop boasts an RGB-lit keyboard.
Possible competitors in comparison
Rating | Date | Model | Weight | Height | Size | Resolution | Price |
|---|---|---|---|---|---|---|---|
| 84.3 % v7 (old) | 02 / 2022 | Schenker Work 15 Tiger Lake-H i7-11370H, Iris Xe G7 96EUs | 1.7 kg | 19.9 mm | 15.60" | 1920x1080 | |
| 84.9 % v7 (old) | 01 / 2022 | LG Gram 15Z90P-G.AA89G i7-1165G7, Iris Xe G7 96EUs | 1.1 kg | 17.4 mm | 15.60" | 1920x1080 | |
| 80.5 % v7 (old) | 10 / 2021 | Dell Inspiron 15 3501 i7-1165G7, Iris Xe G7 96EUs | 2 kg | 19.9 mm | 15.60" | 1920x1080 | |
| 85.5 % v7 (old) | 08 / 2021 | Lenovo ThinkPad E15 G3-20YG003UGE R7 5700U, Vega 8 | 1.8 kg | 18.9 mm | 15.60" | 1920x1080 | |
| 82.1 % v7 (old) | 07 / 2021 | Asus VivoBook S15 D533UA R7 5700U, Vega 8 | 1.8 kg | 16.1 mm | 15.60" | 1920x1080 | |
| 80.8 % v7 (old) | 07 / 2021 | HP Pavilion x360 15-er0155ng i5-1135G7, Iris Xe G7 80EUs | 1.8 kg | 19.9 mm | 15.60" | 1920x1080 |
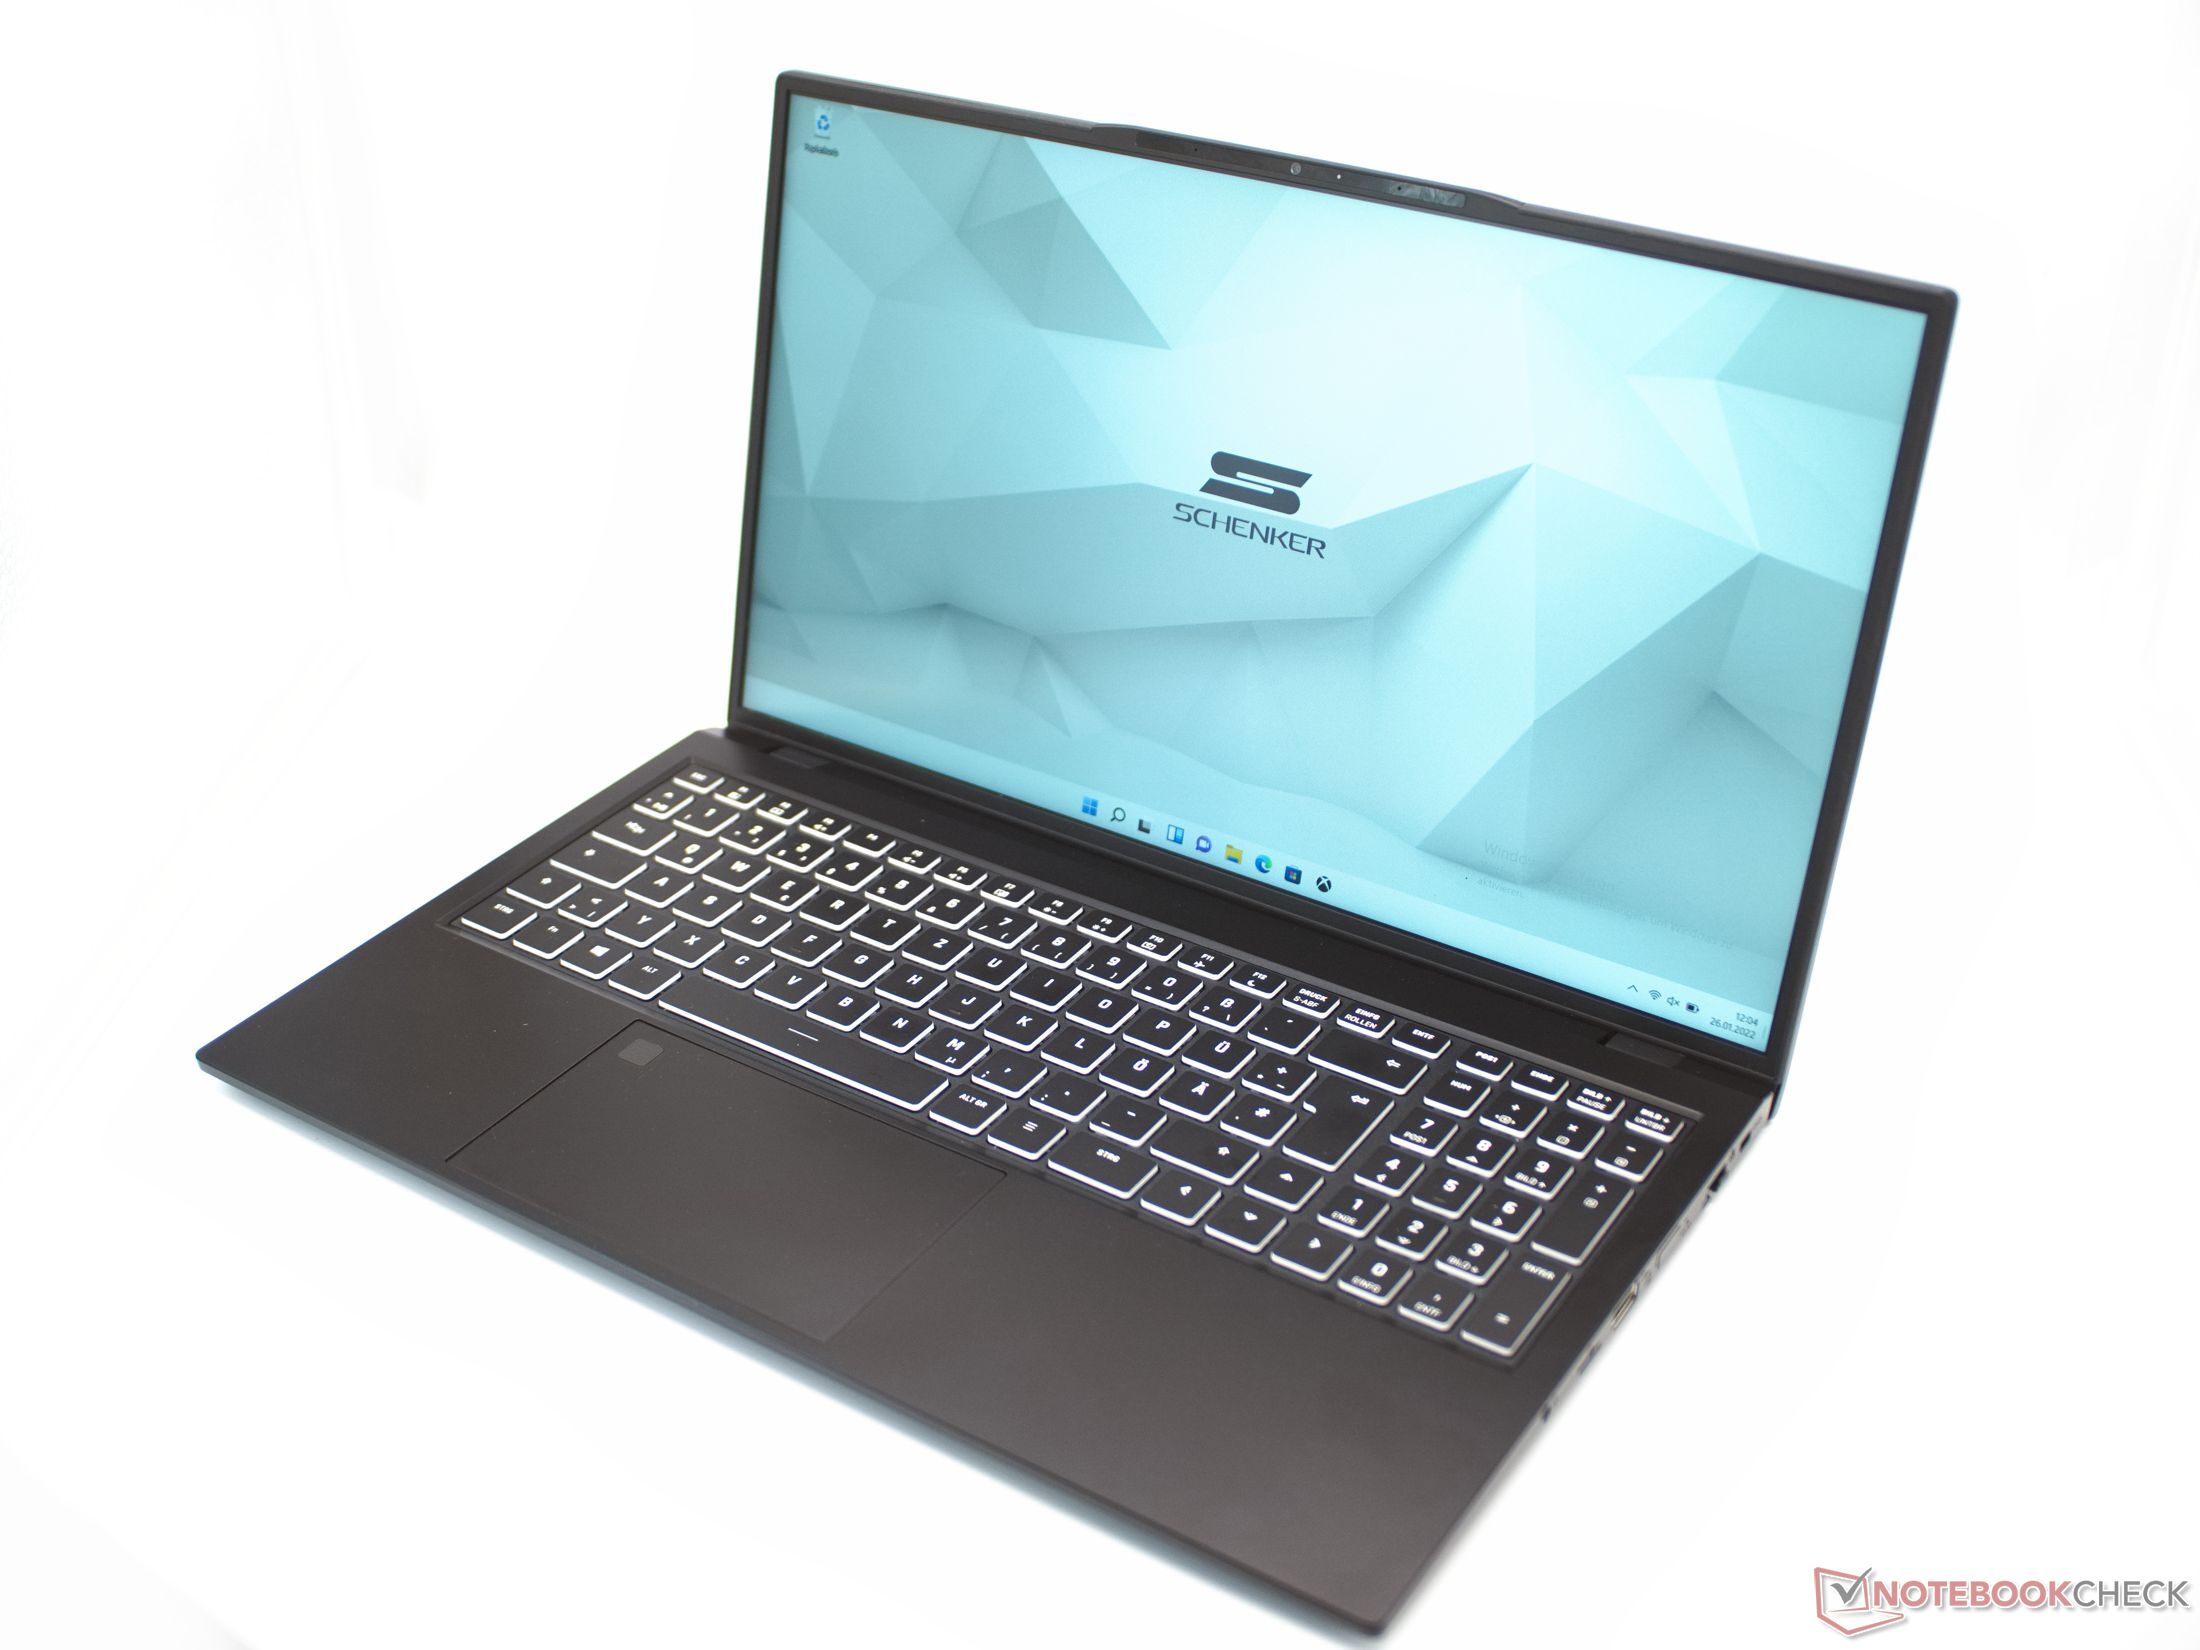
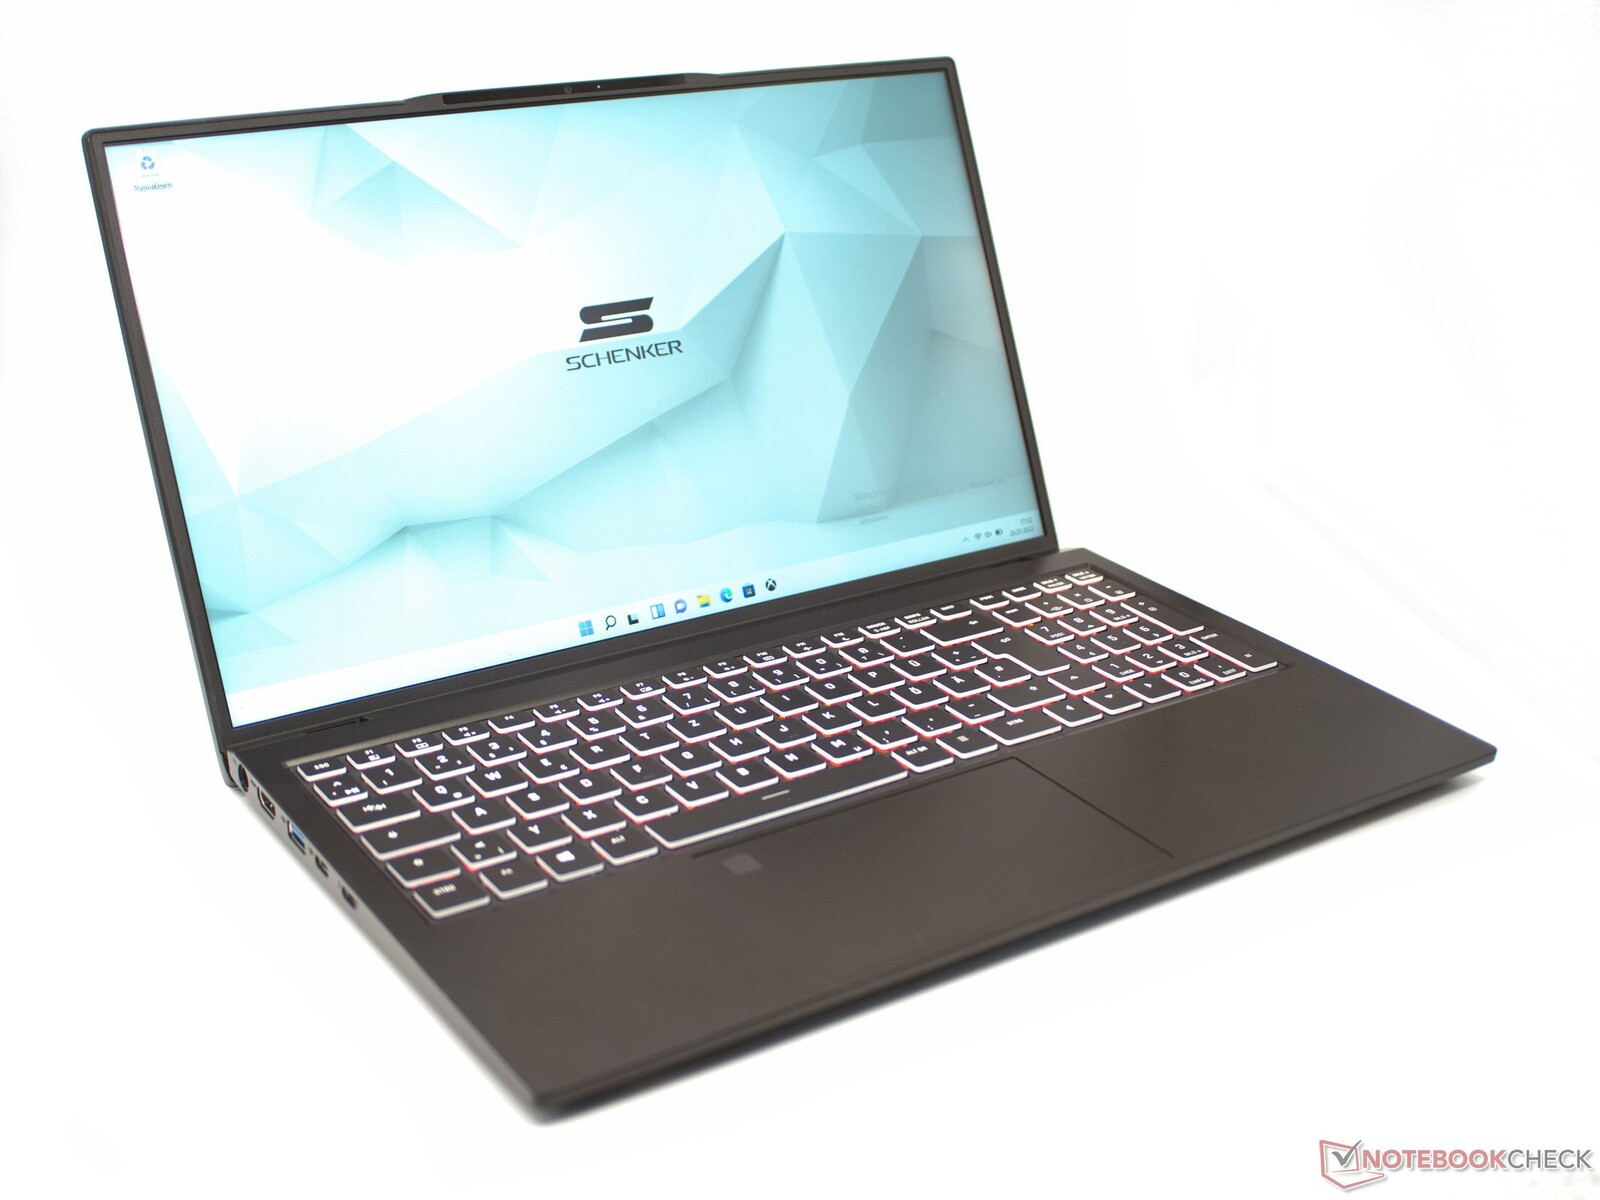
Case & equipment: Aluminum case and Thunderbolt 4
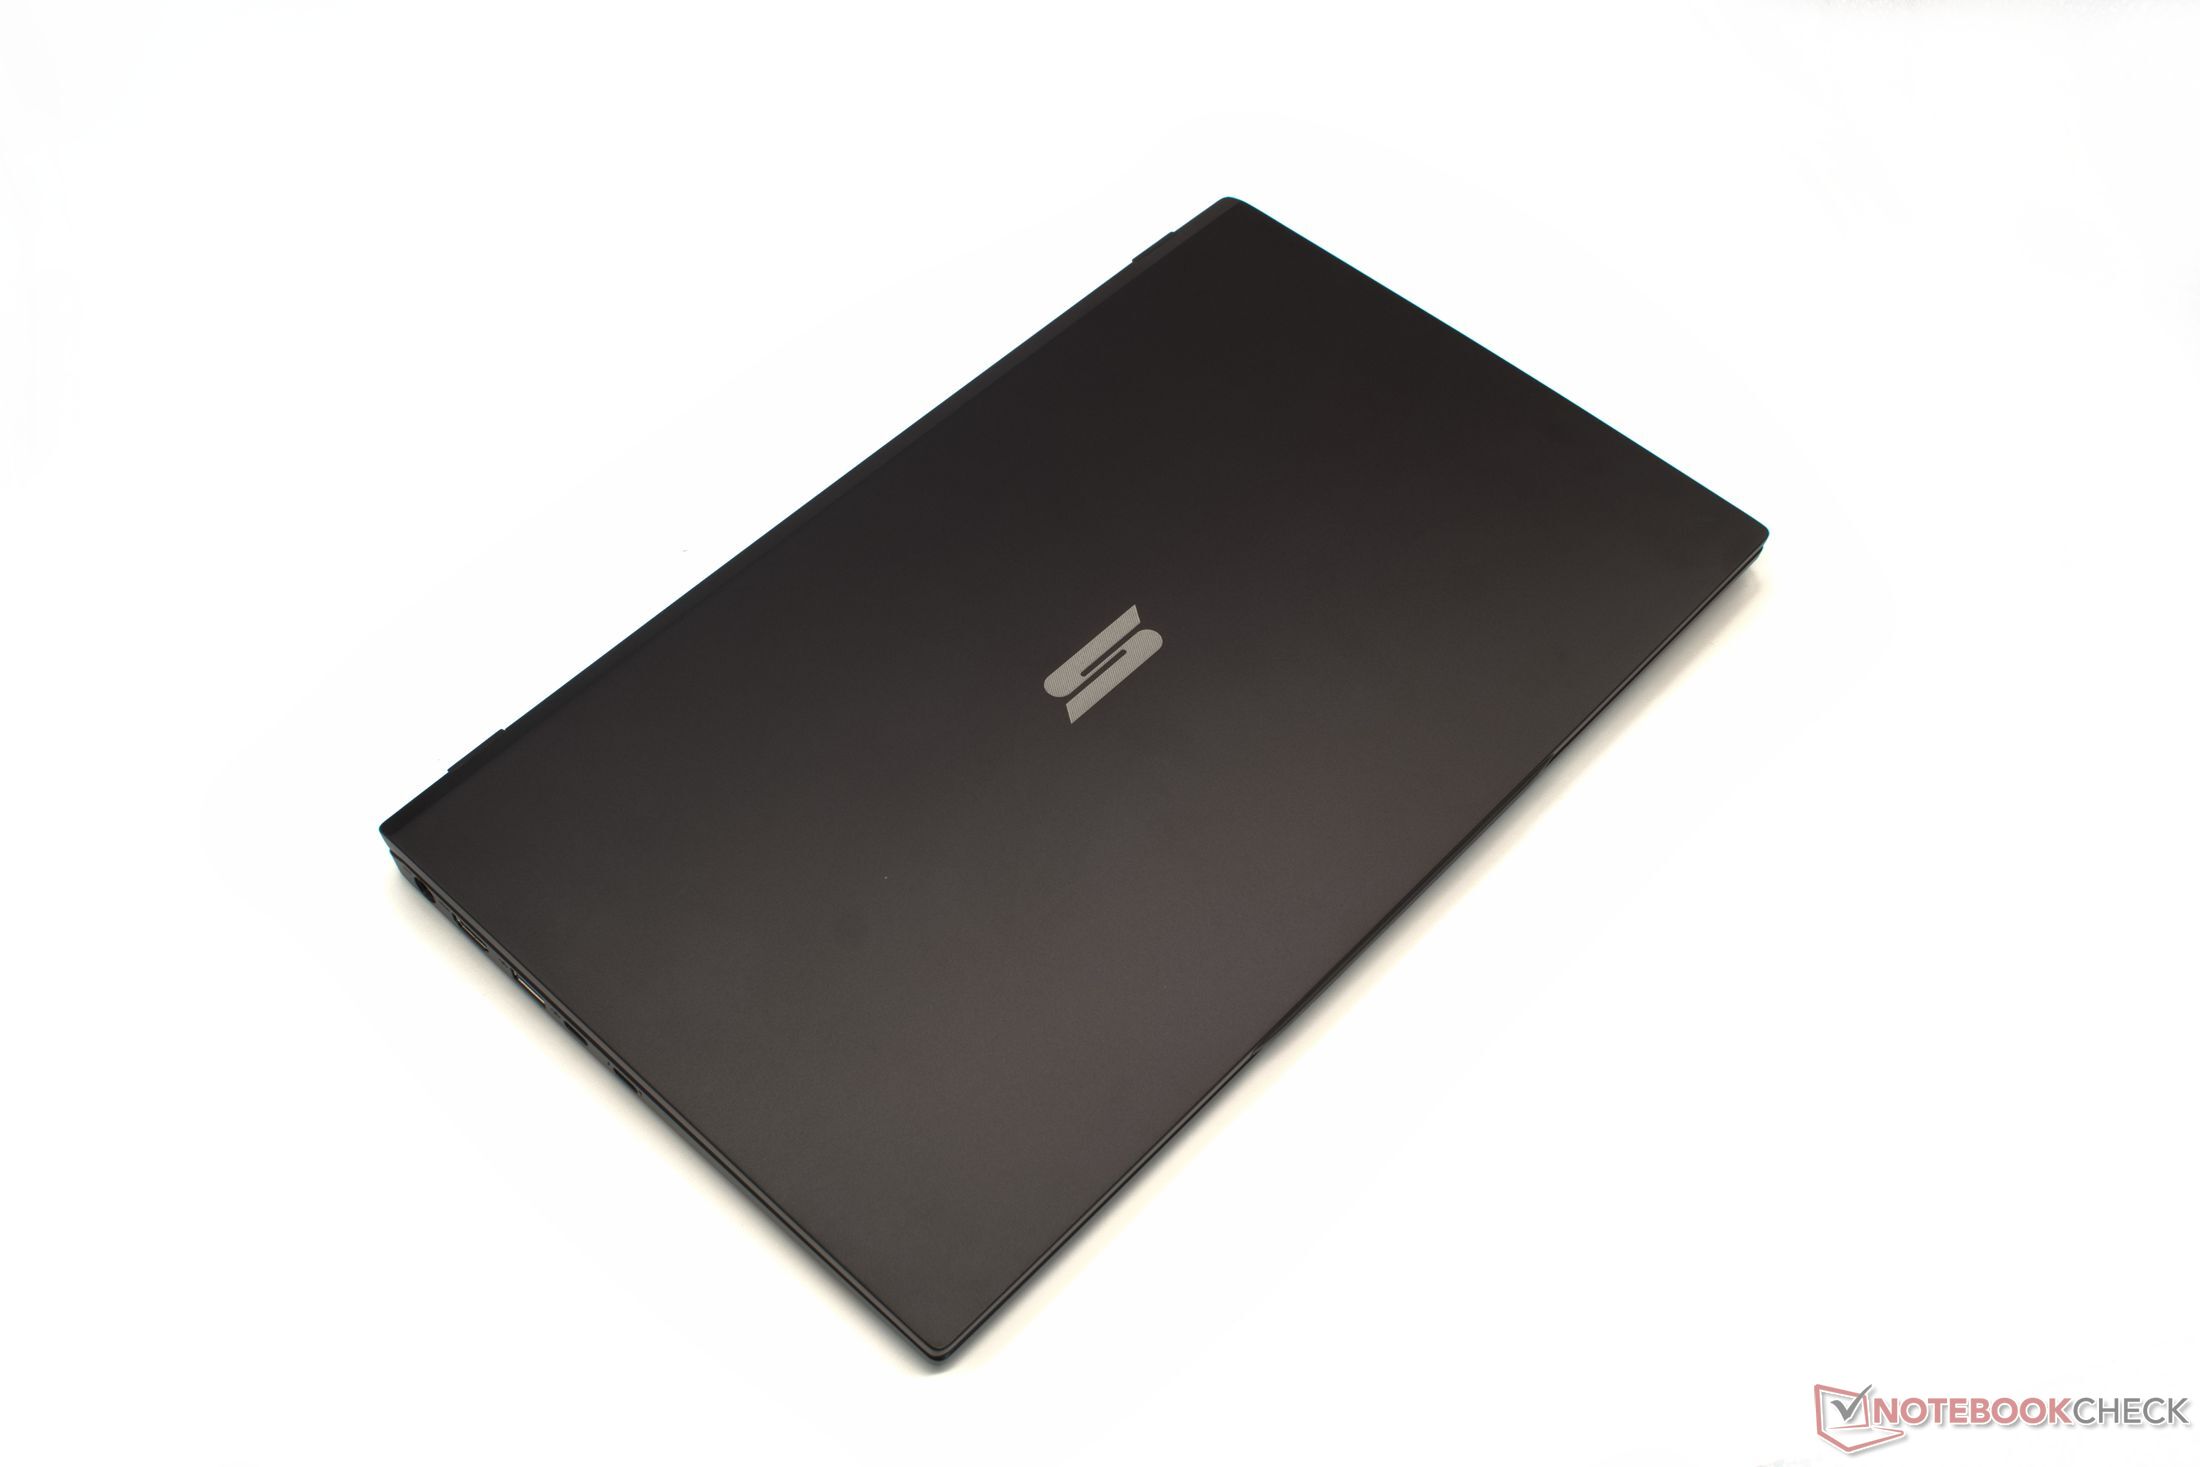
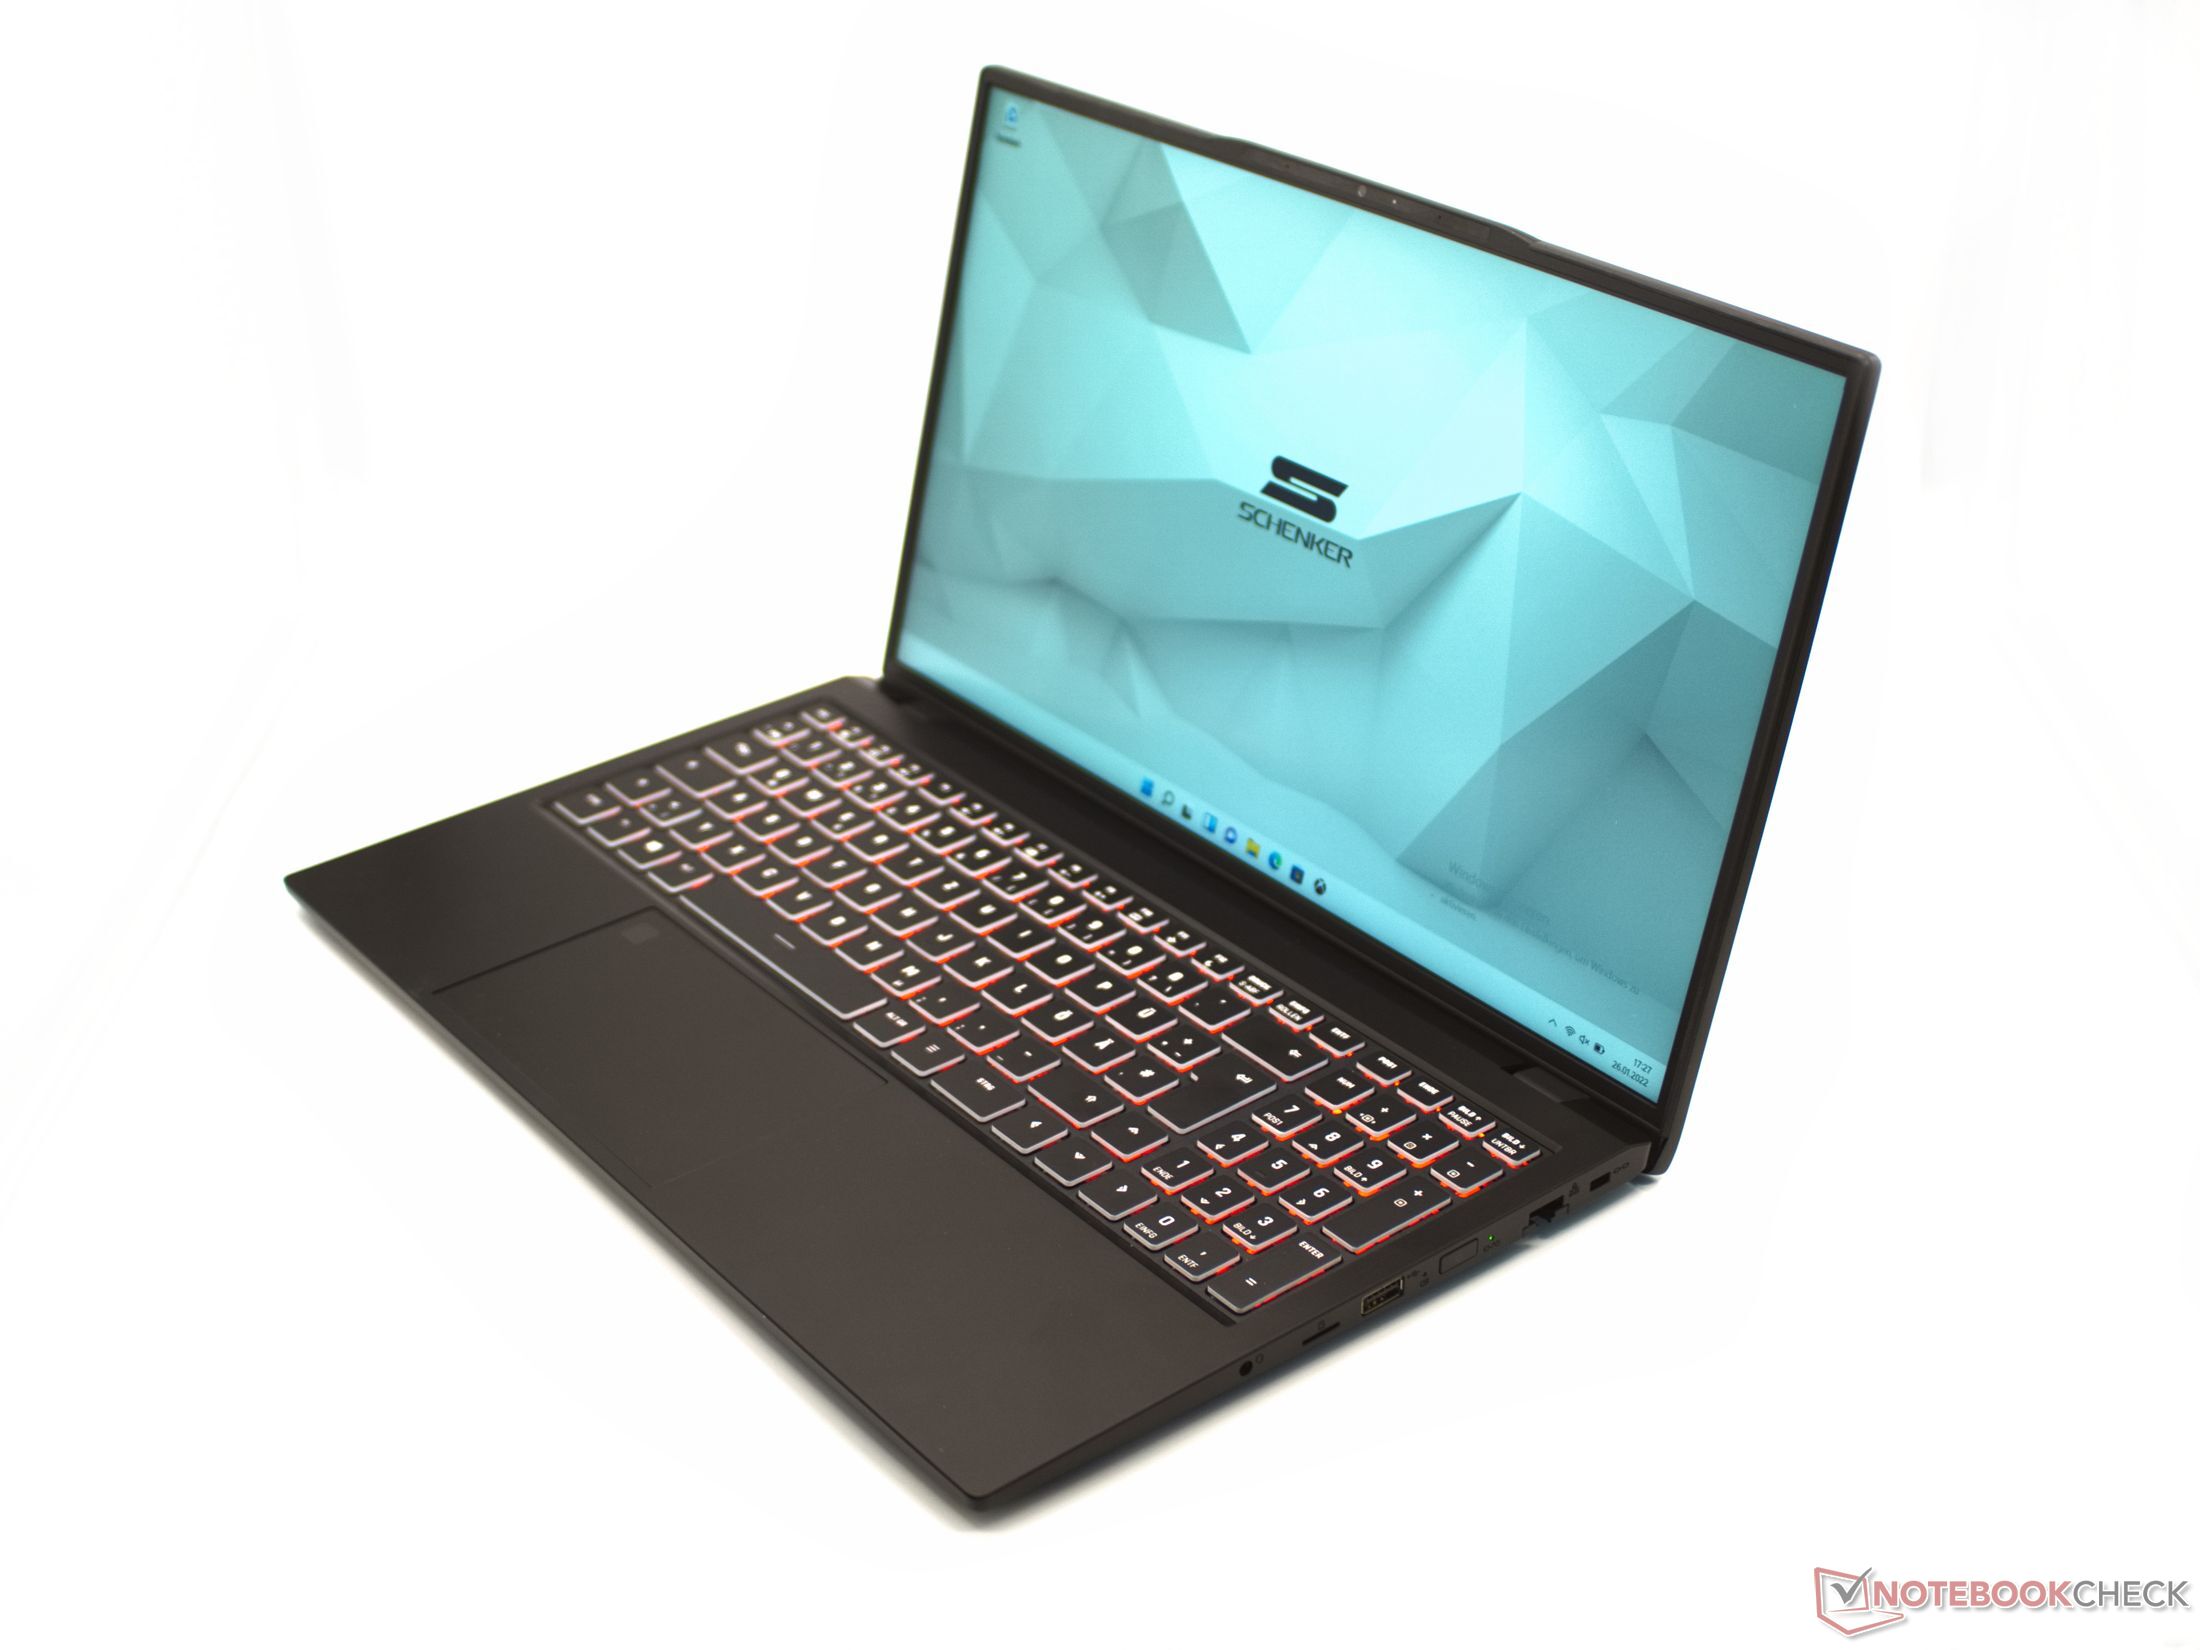
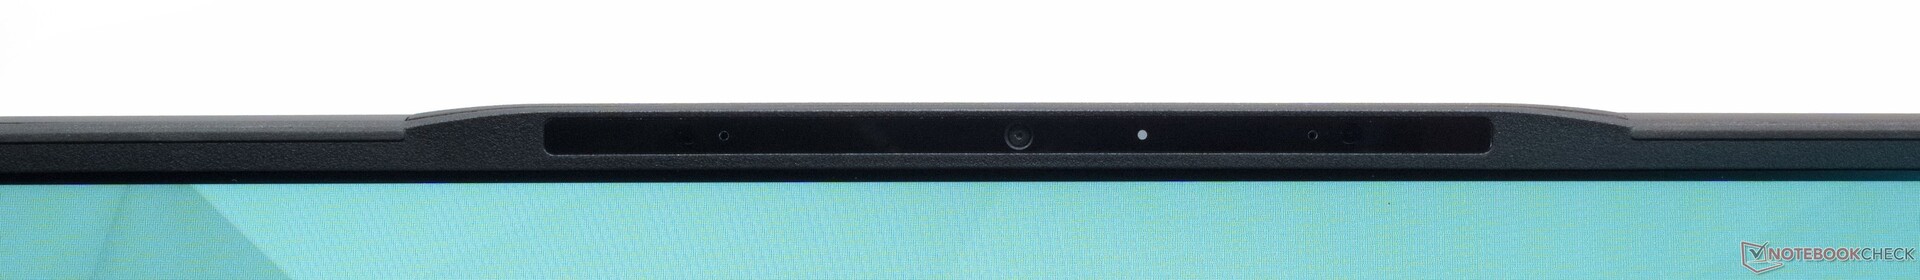
The black case made of metal and plastic is very slim and still offers high connectivity. The display is surrounded by a 6 mm wide bezel. The frame is widened a bit just for the webcam and the microphones. The matte surface is not susceptible to dirt and offers a pleasant feel. Clear edges and small radii determine the exterior of the laptop. Schenker's design is very simple and looks high-quality at the same time. The bottom of the base and display lid are made of metal, while the top of the base is made of plastic.
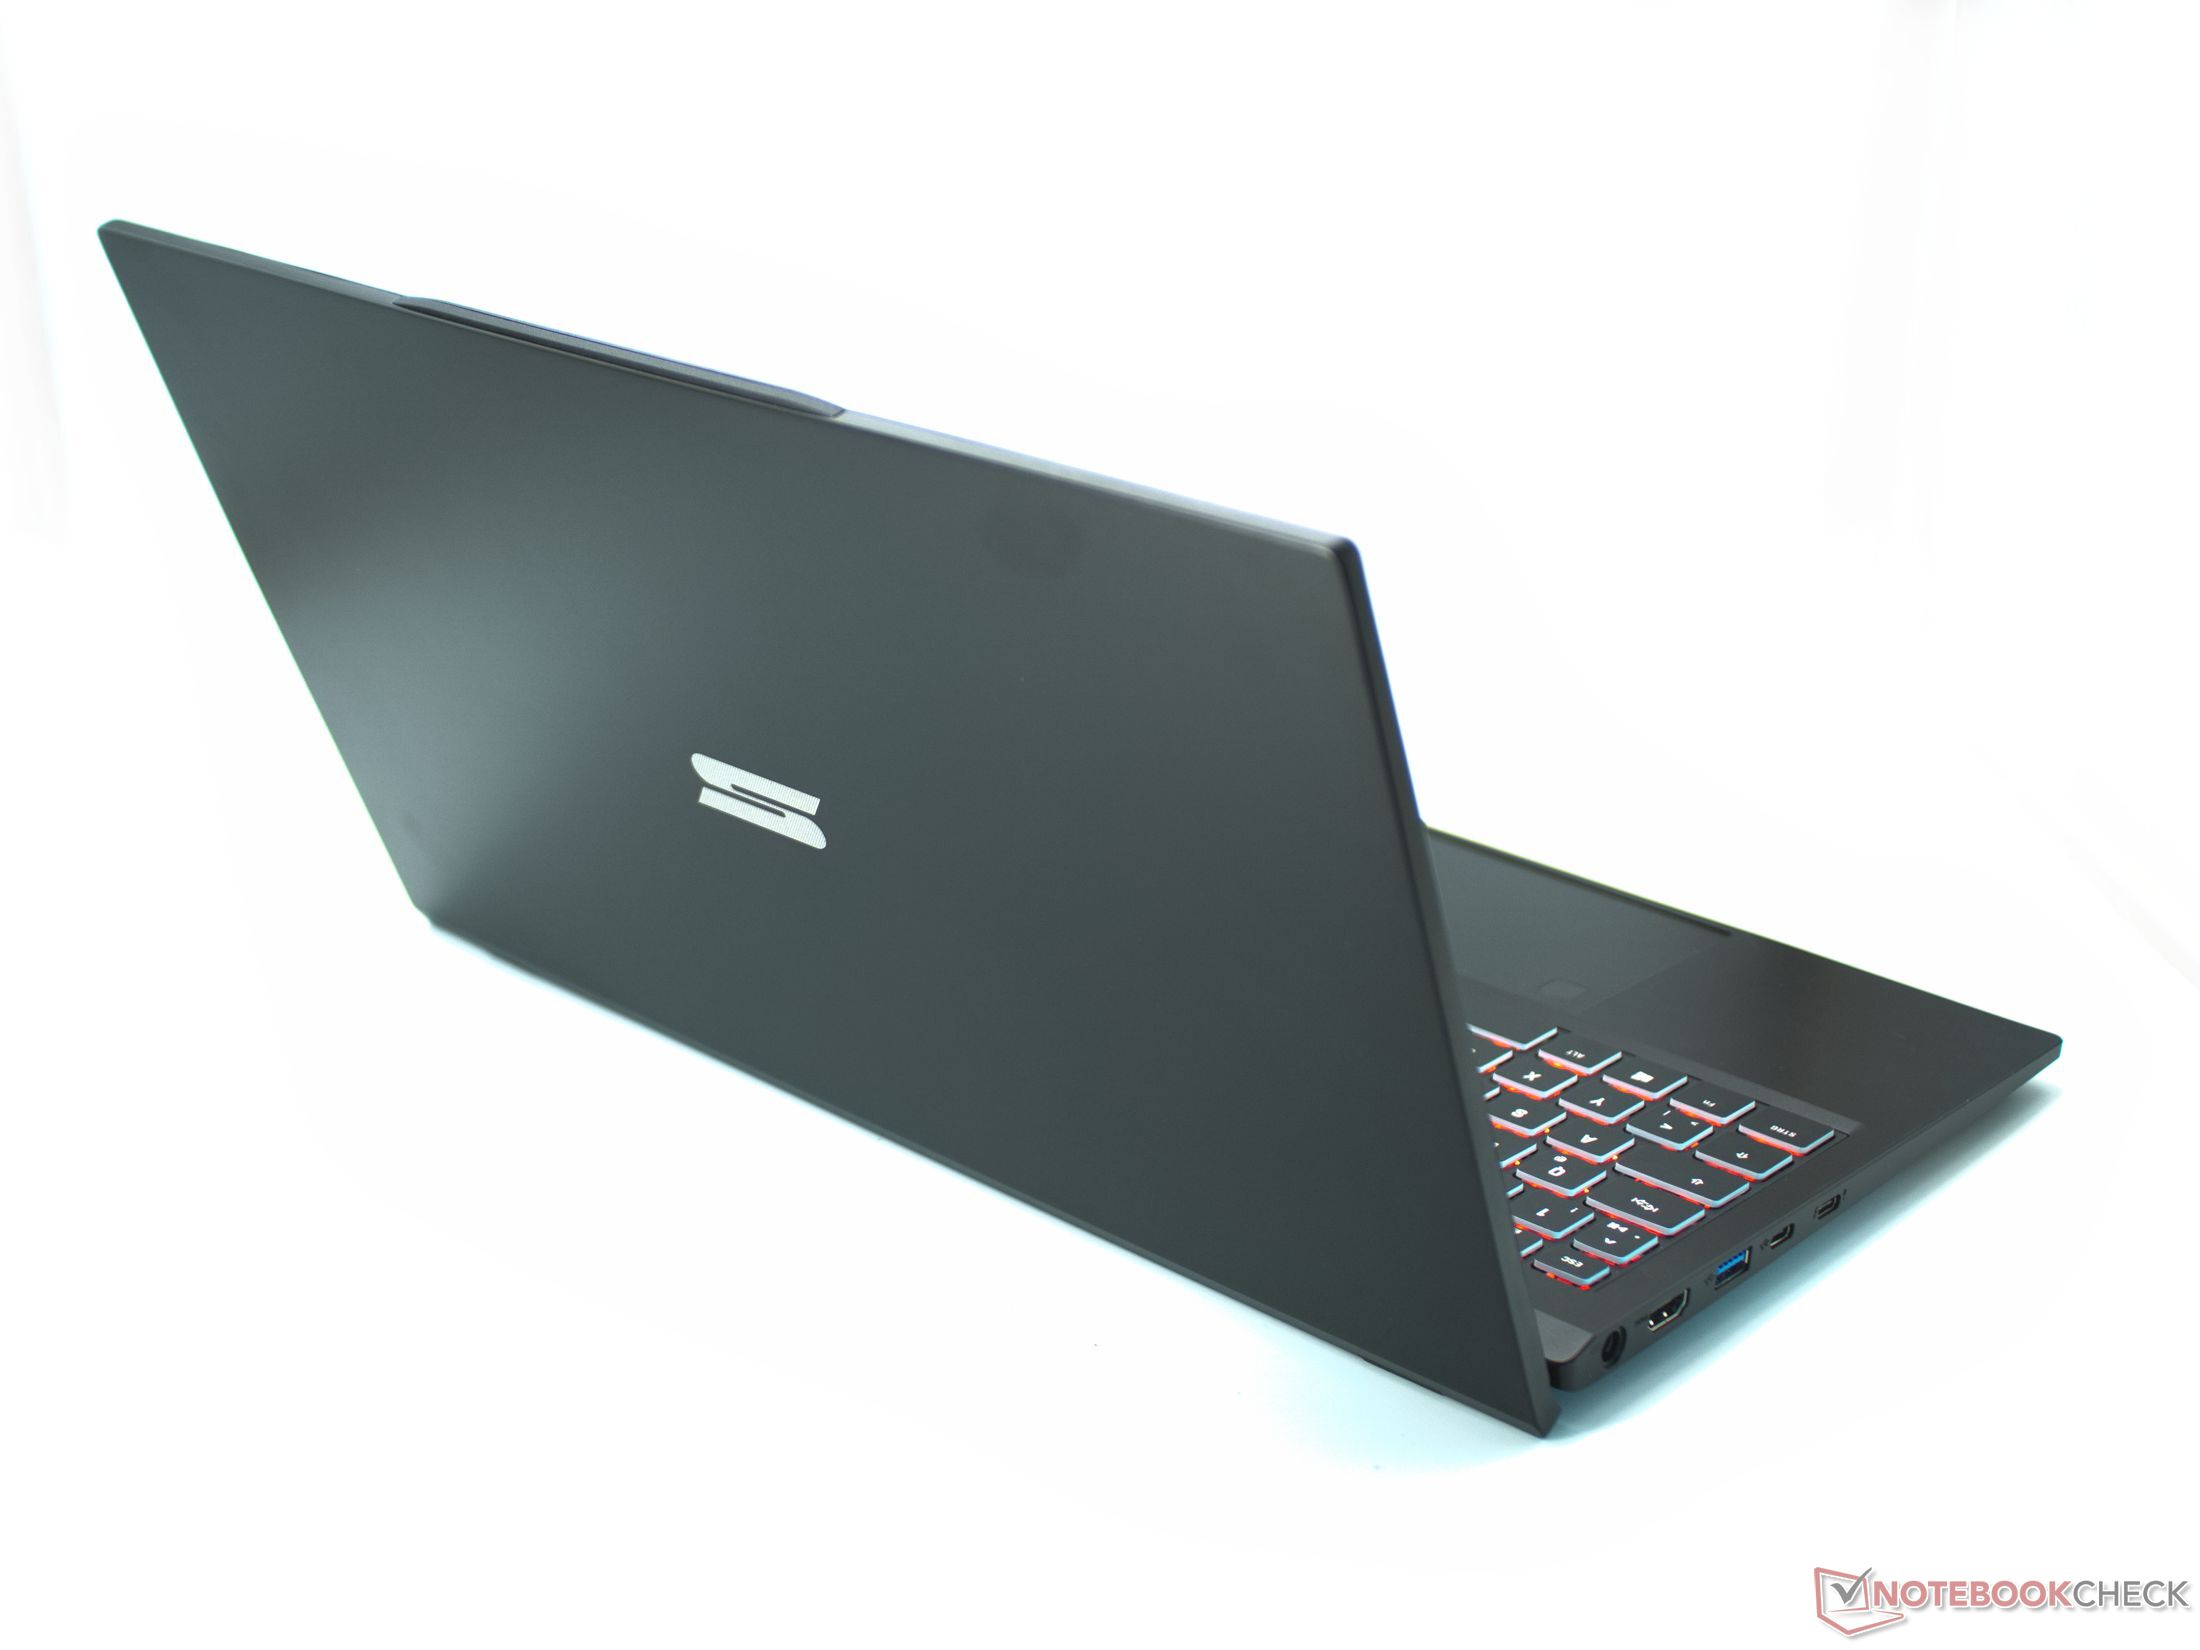

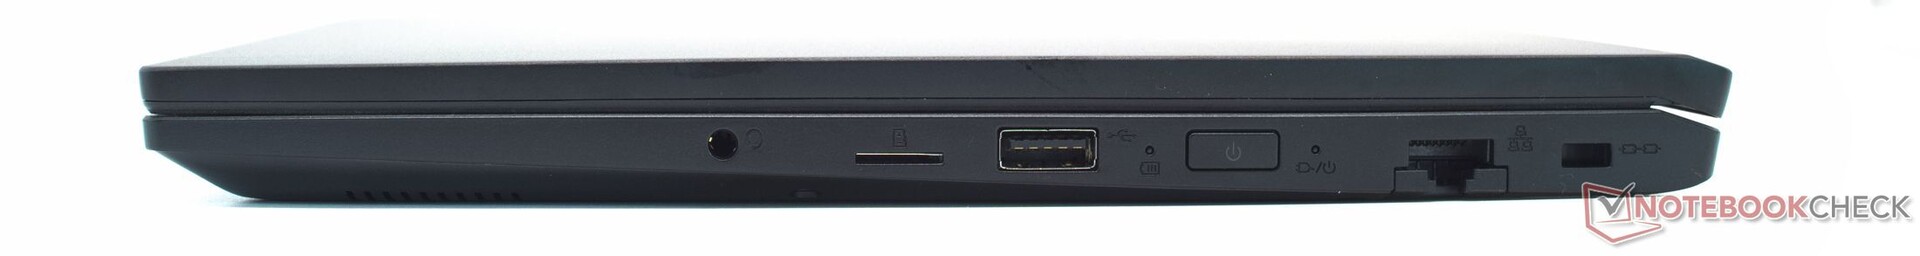
The Schenker Work 15 offers a wide range of connectivity options. The microSD card reader and Wi-Fi 6 work with expectedly high speed. Thanks to Thunderbolt 4 and PowerDelivery, both USB-C ports provide the full range of functions. HDMI and Gigabit LAN are also available. For security, the Intel Core i7-11370H's security features are available alongside the fingerprint sensor and Kensington lock slot. The webcam shows the typical low quality of laptop webcams.

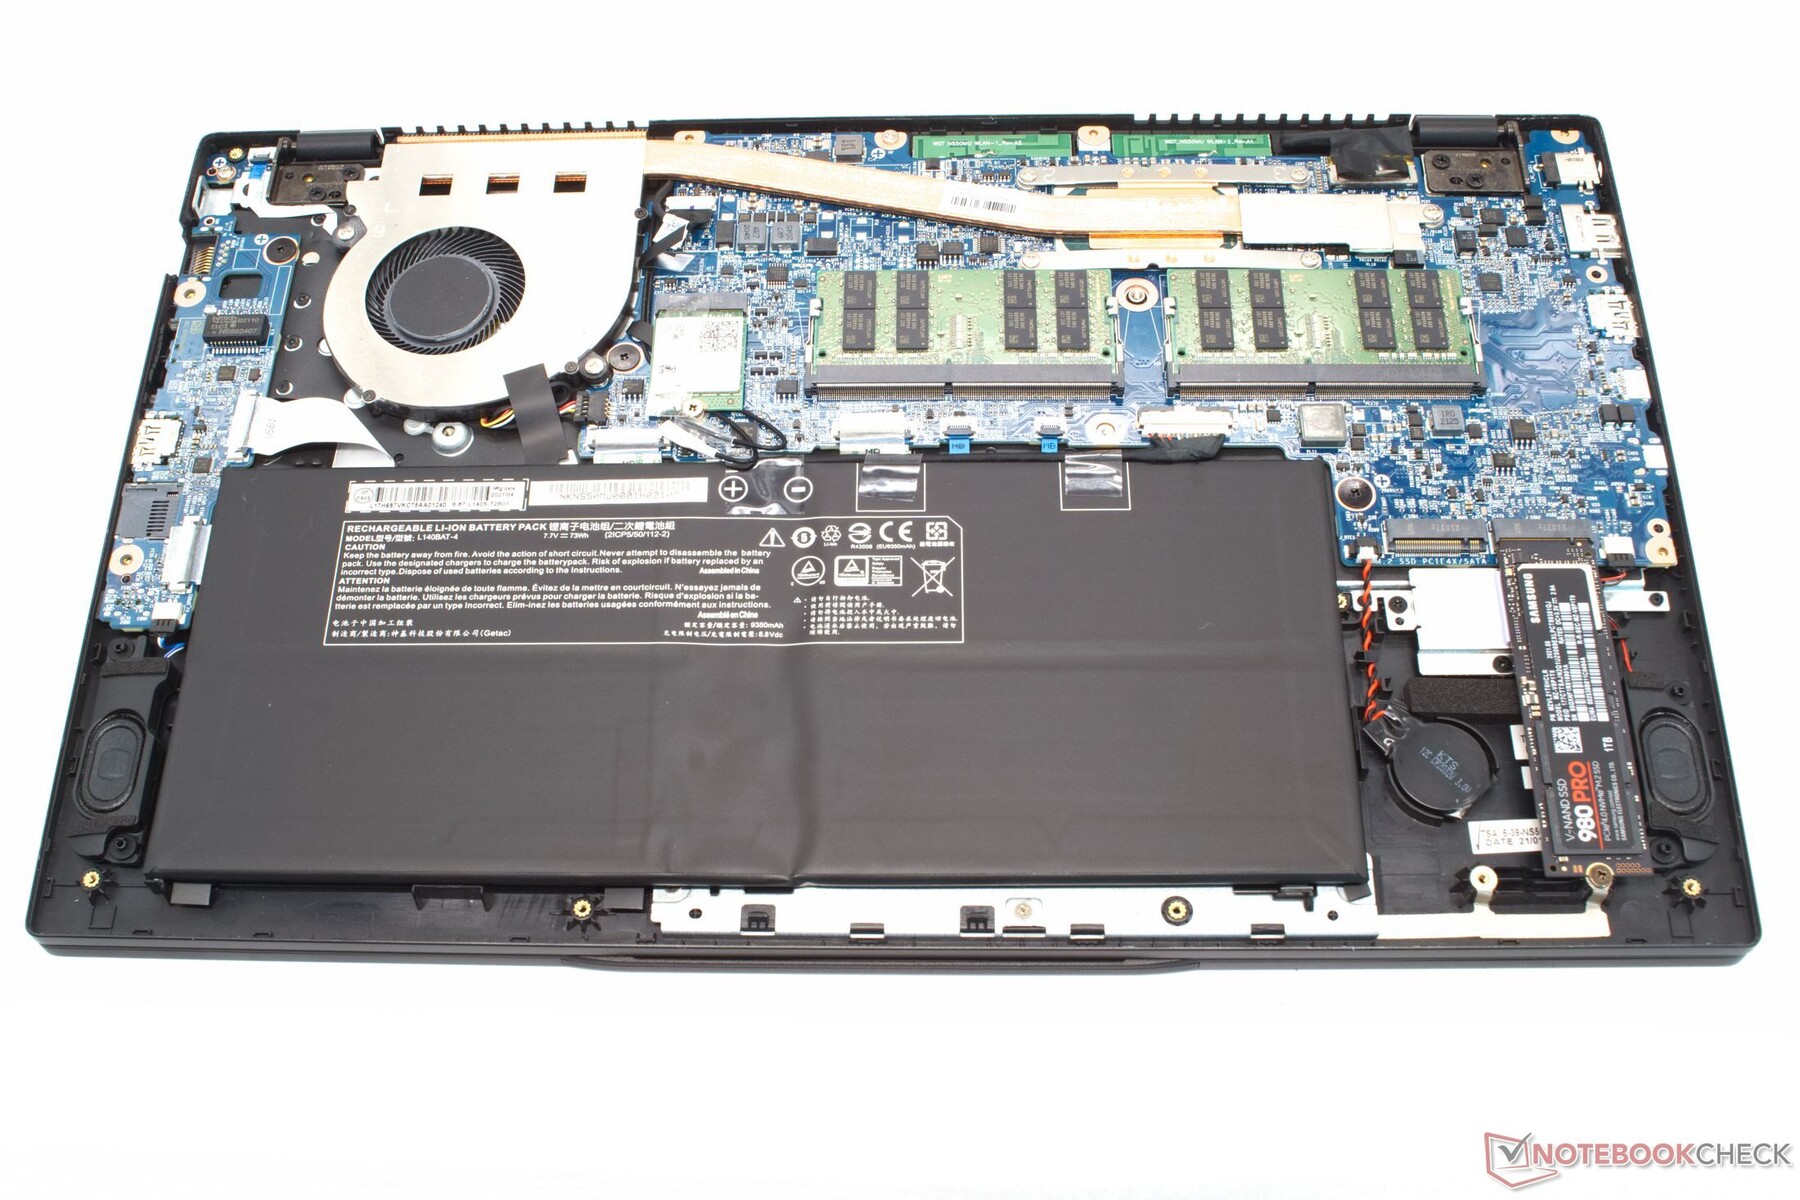
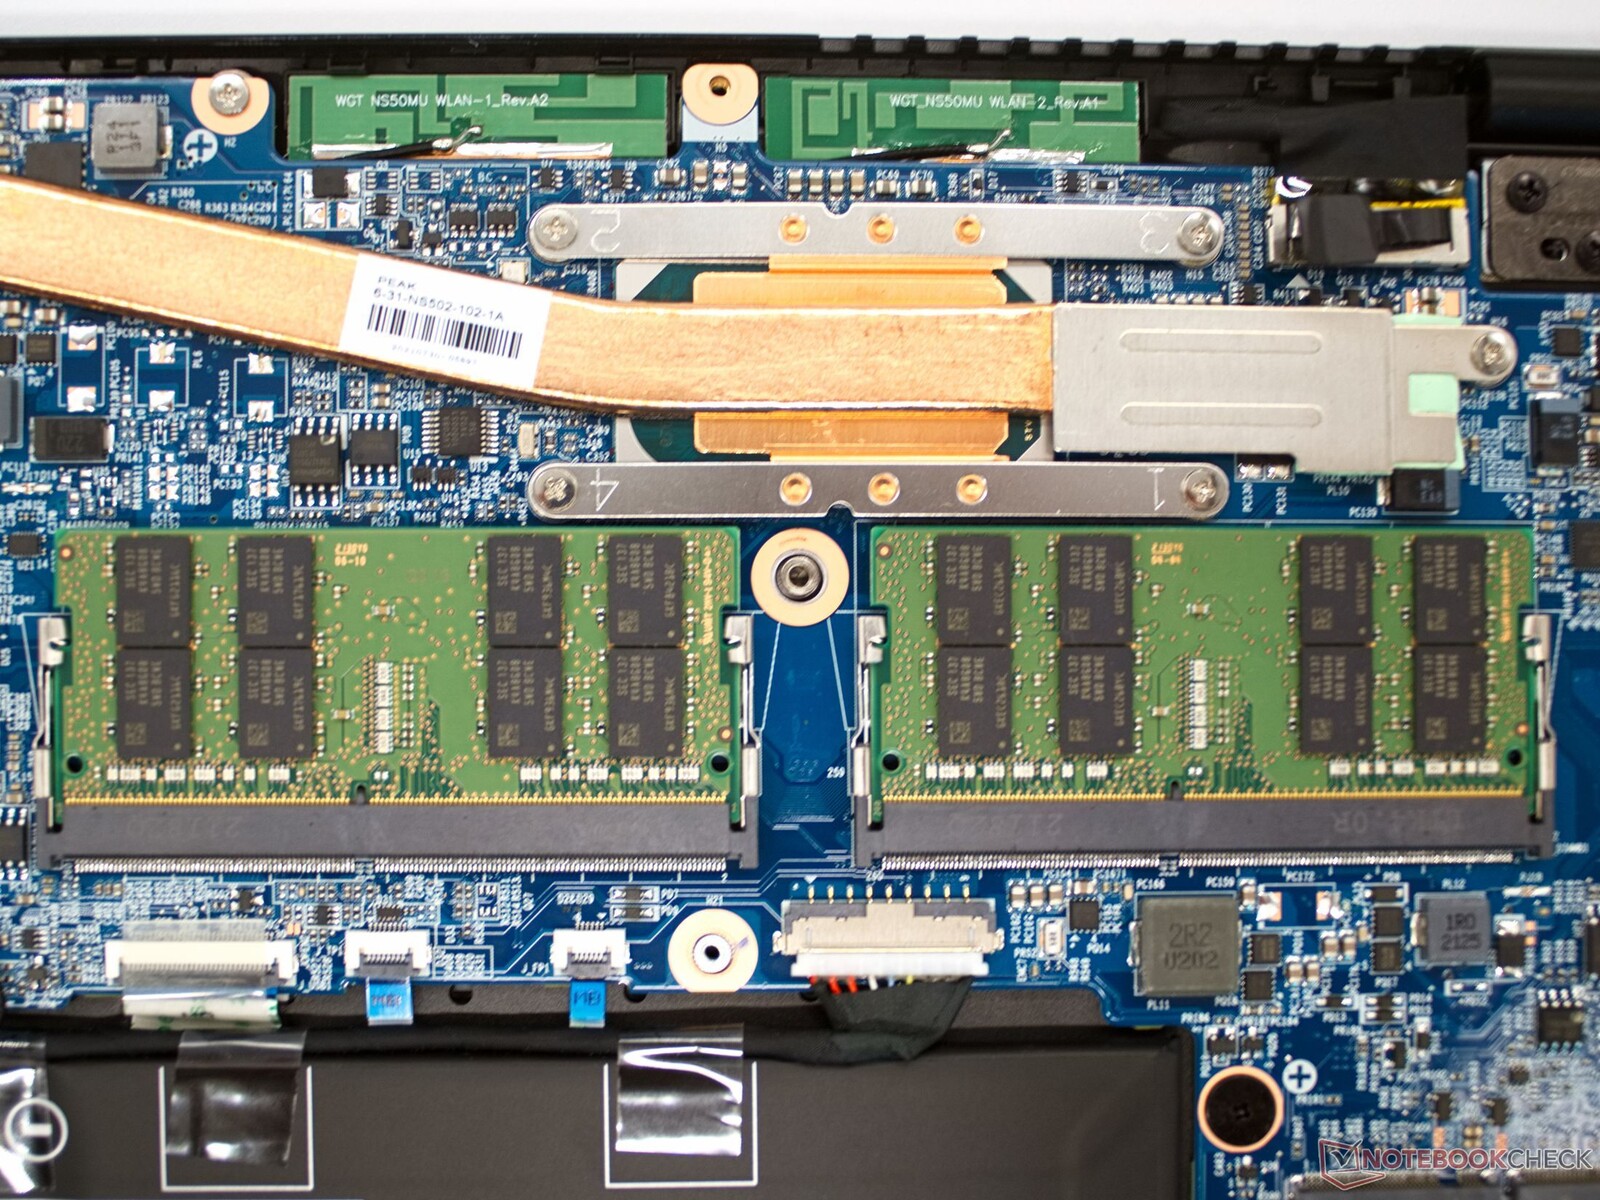
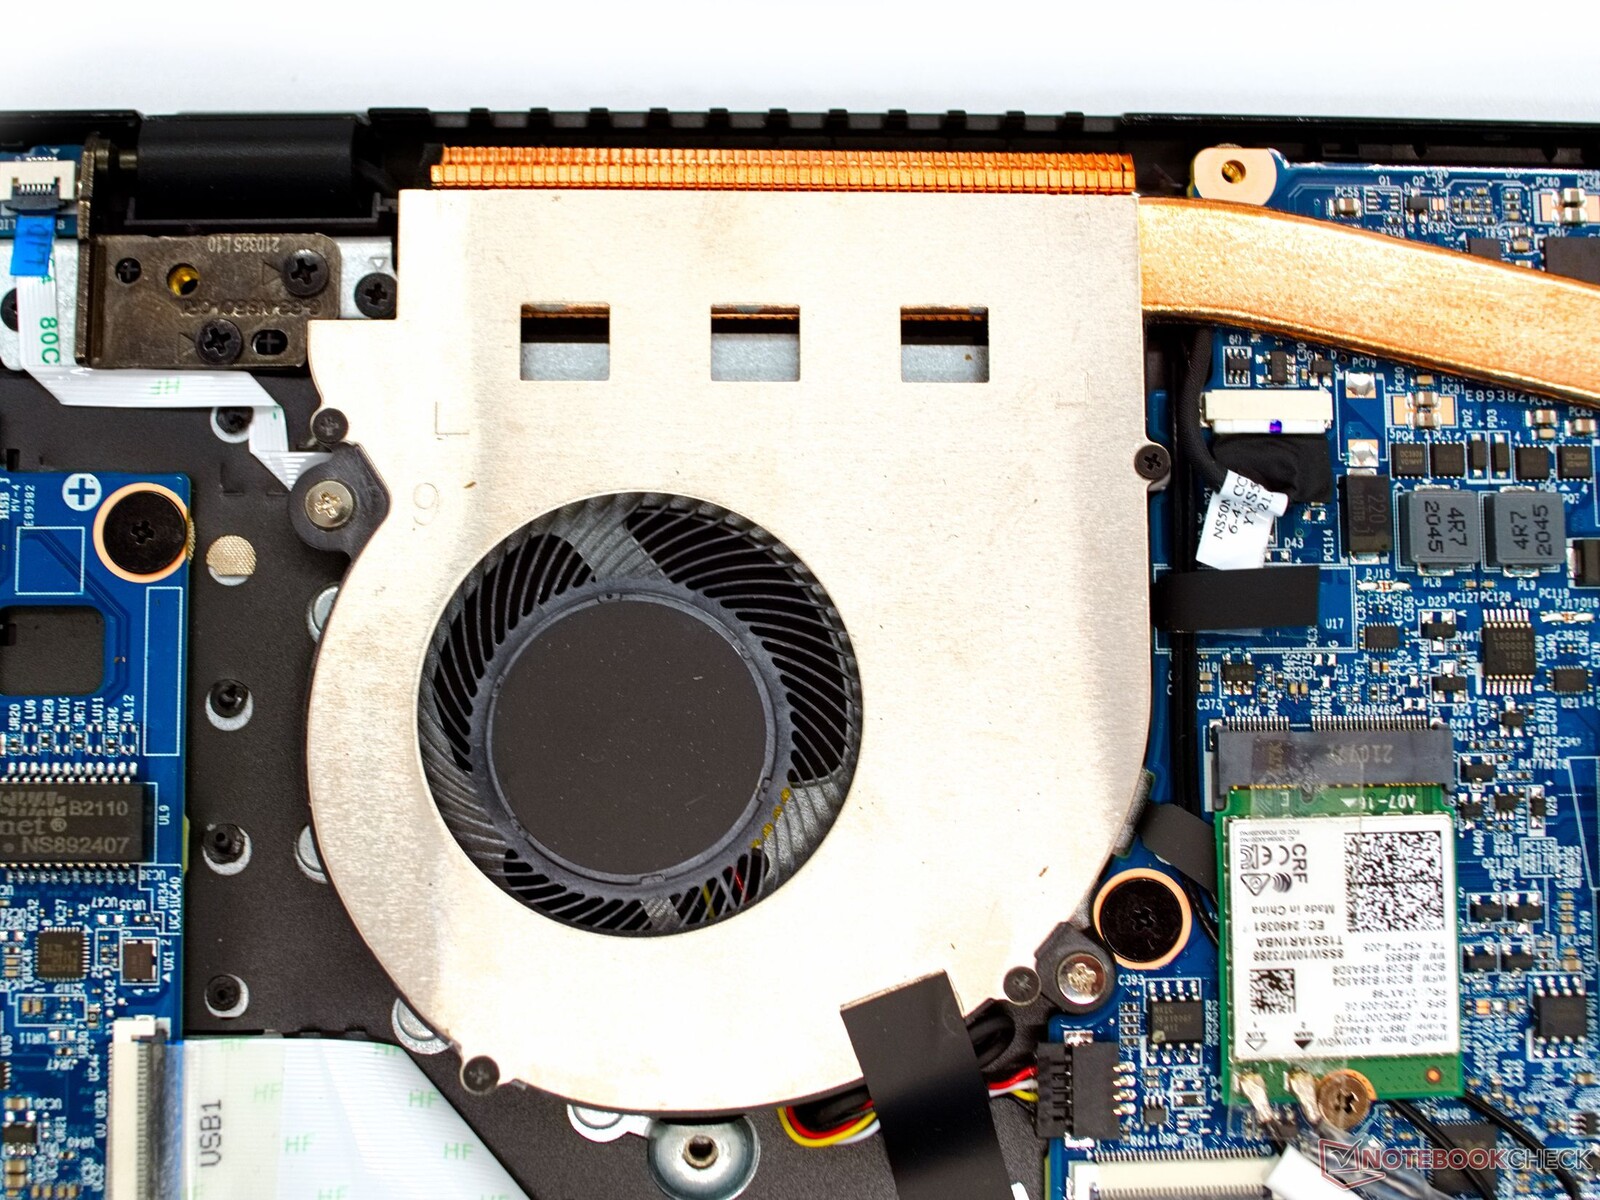
The case cover on the bottom is held in place by many screws but once removed, the review sample is easy to open. Underneath are upgradeable working memory and a free M.2 slot for another SSD.
| SD Card Reader | |
| average JPG Copy Test (av. of 3 runs) | |
| LG Gram 15Z90P-G.AA89G (AV Pro SD microSD 128 GB V60) | |
| HP Pavilion x360 15-er0155ng (AV PRO microSD 128 GB V60) | |
| Schenker Work 15 Tiger Lake-H (Angelbird AV Pro V60) | |
| Average of class Office (19.8 - 198.5, n=22, last 2 years) | |
| Asus VivoBook S15 D533UA (AV PRO microSD 128 GB V60) | |
| Dell Inspiron 15 3501 (AV Pro SD 128 GB V60) | |
| maximum AS SSD Seq Read Test (1GB) | |
| LG Gram 15Z90P-G.AA89G (AV Pro SD microSD 128 GB V60) | |
| HP Pavilion x360 15-er0155ng (AV PRO microSD 128 GB V60) | |
| Average of class Office (27.4 - 249, n=21, last 2 years) | |
| Schenker Work 15 Tiger Lake-H (Angelbird AV Pro V60) | |
| Asus VivoBook S15 D533UA (AV PRO microSD 128 GB V60) | |
| Dell Inspiron 15 3501 (AV Pro SD microSD 128 GB V60) | |


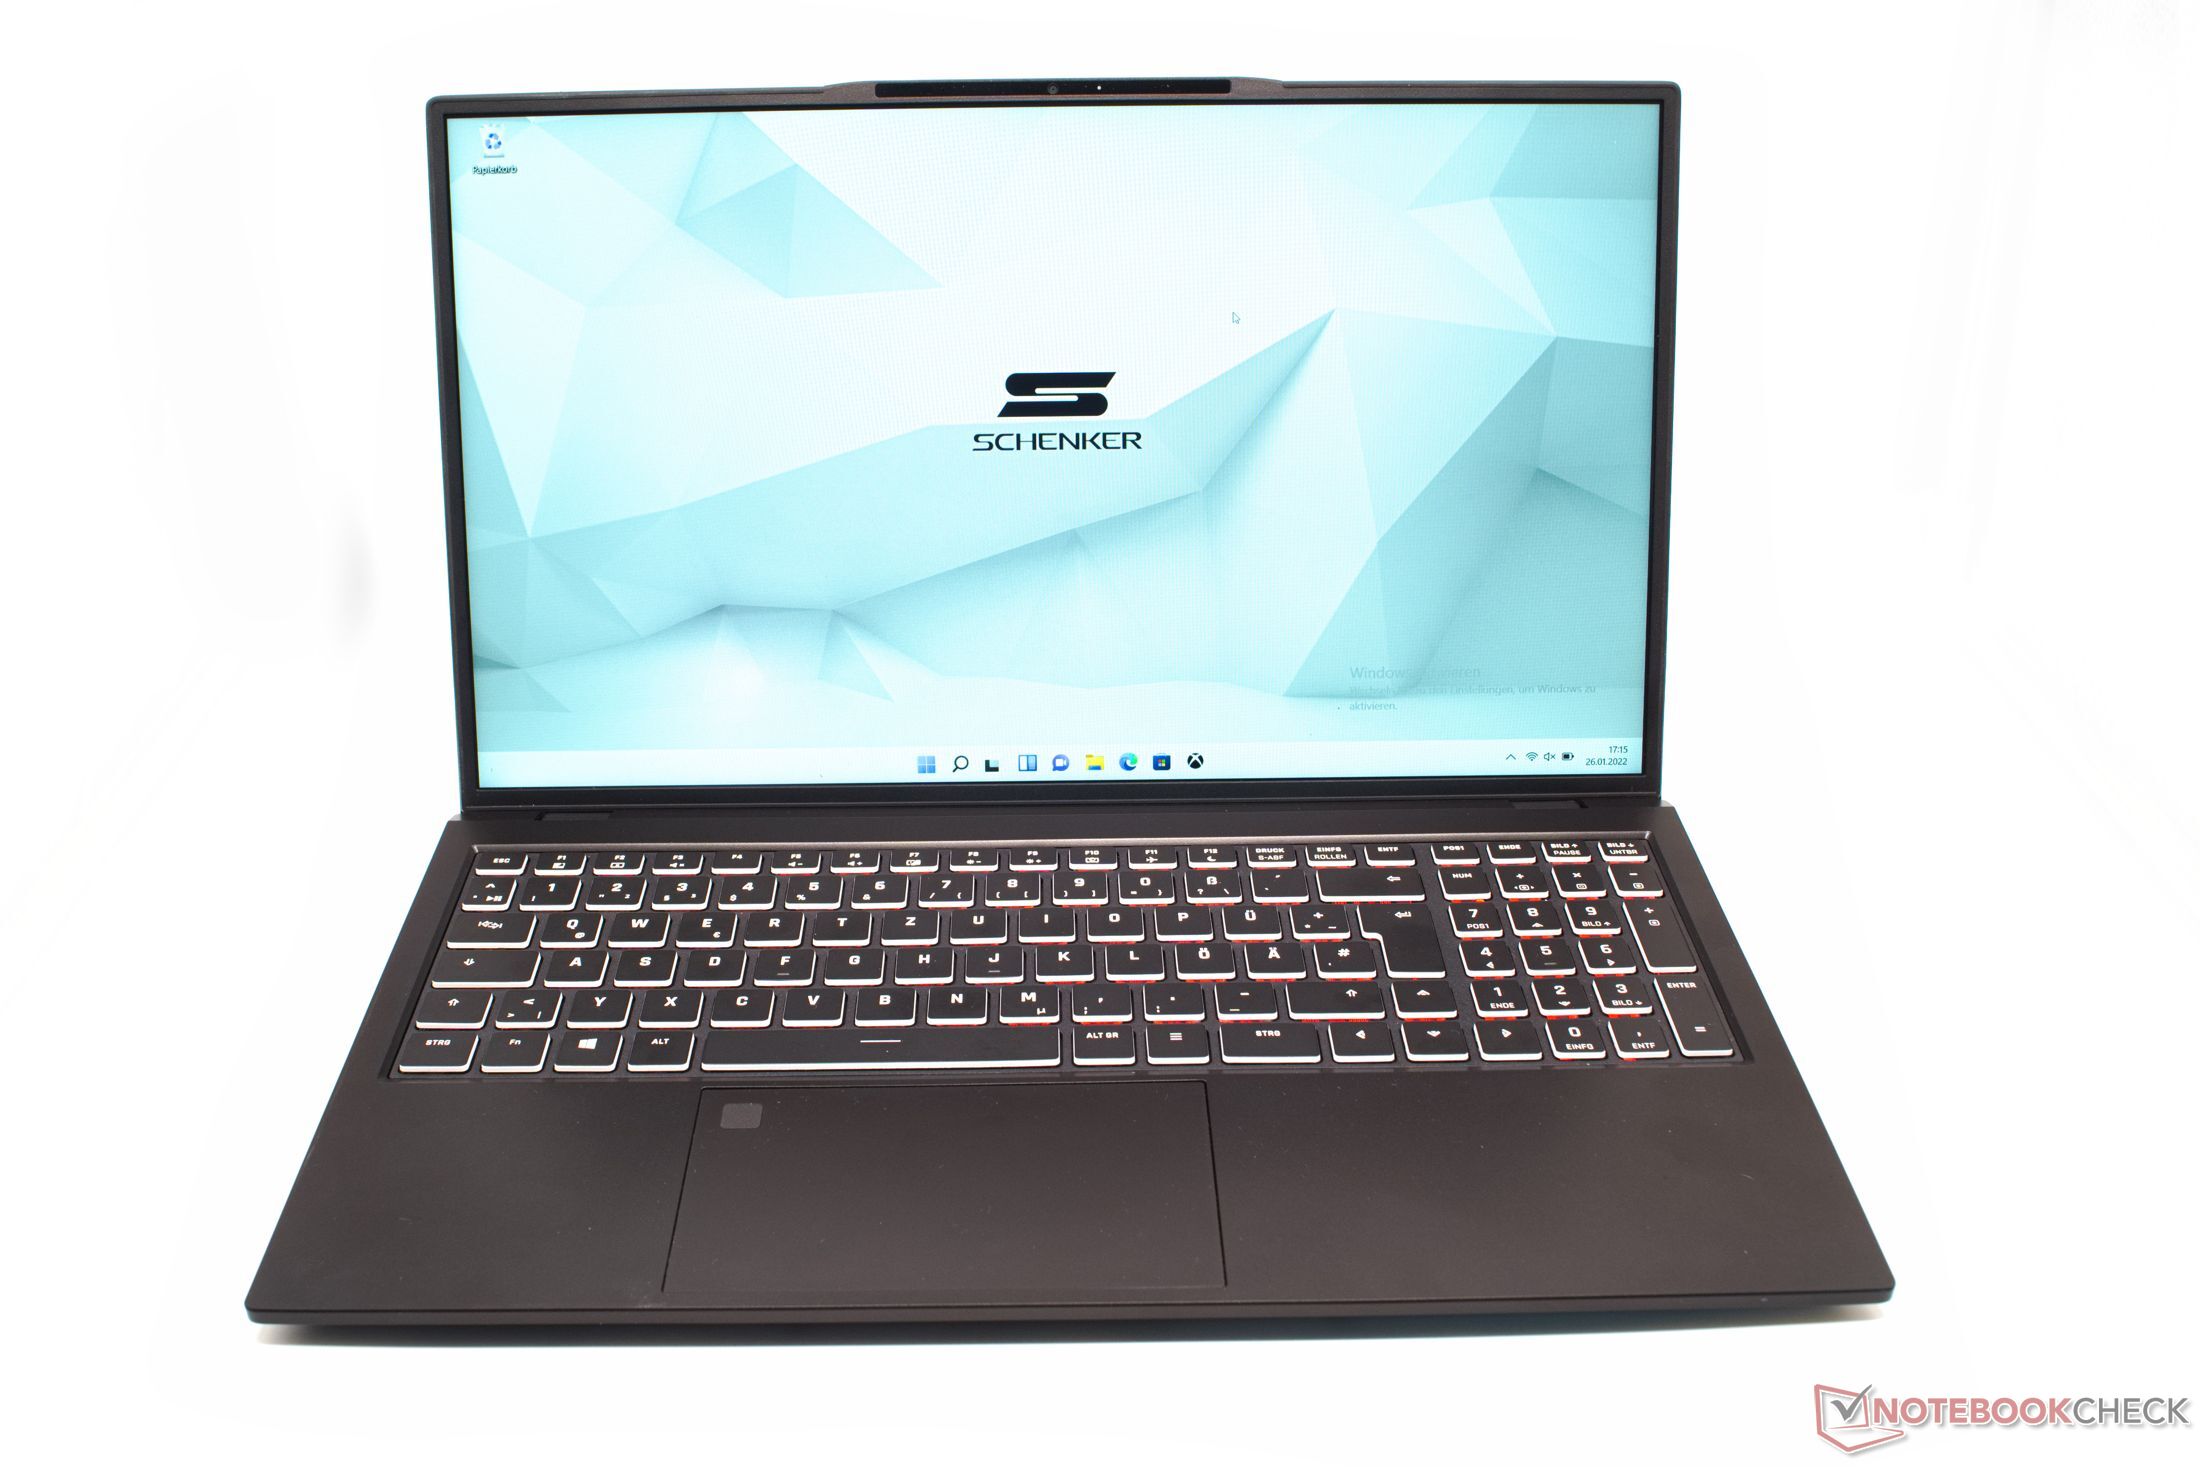
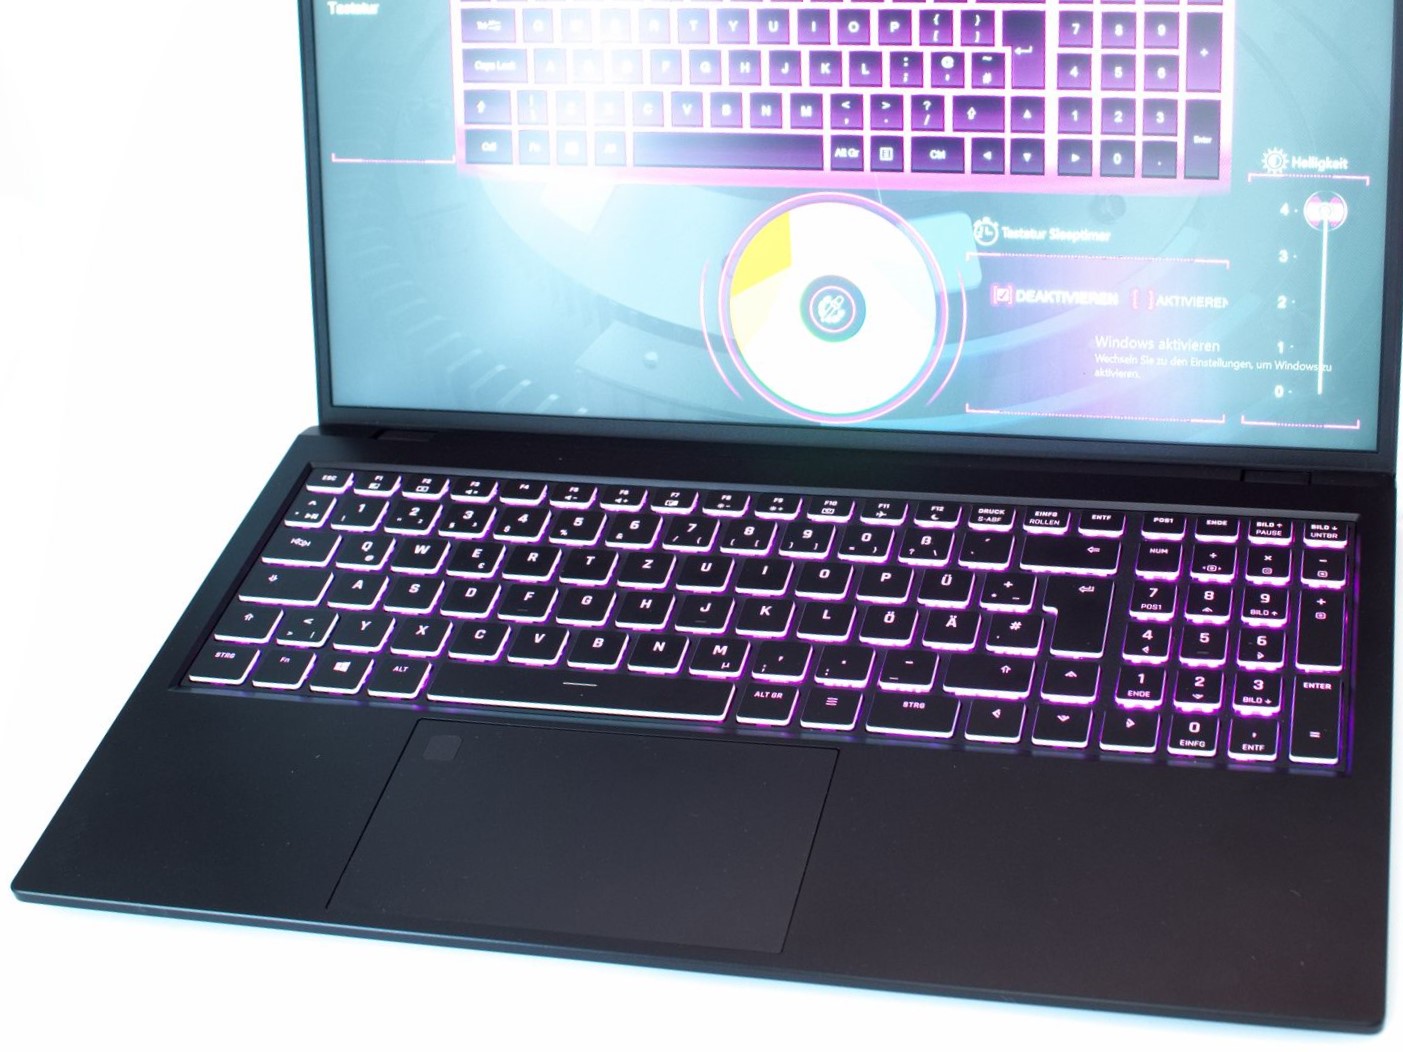
Input devices: With RGB light
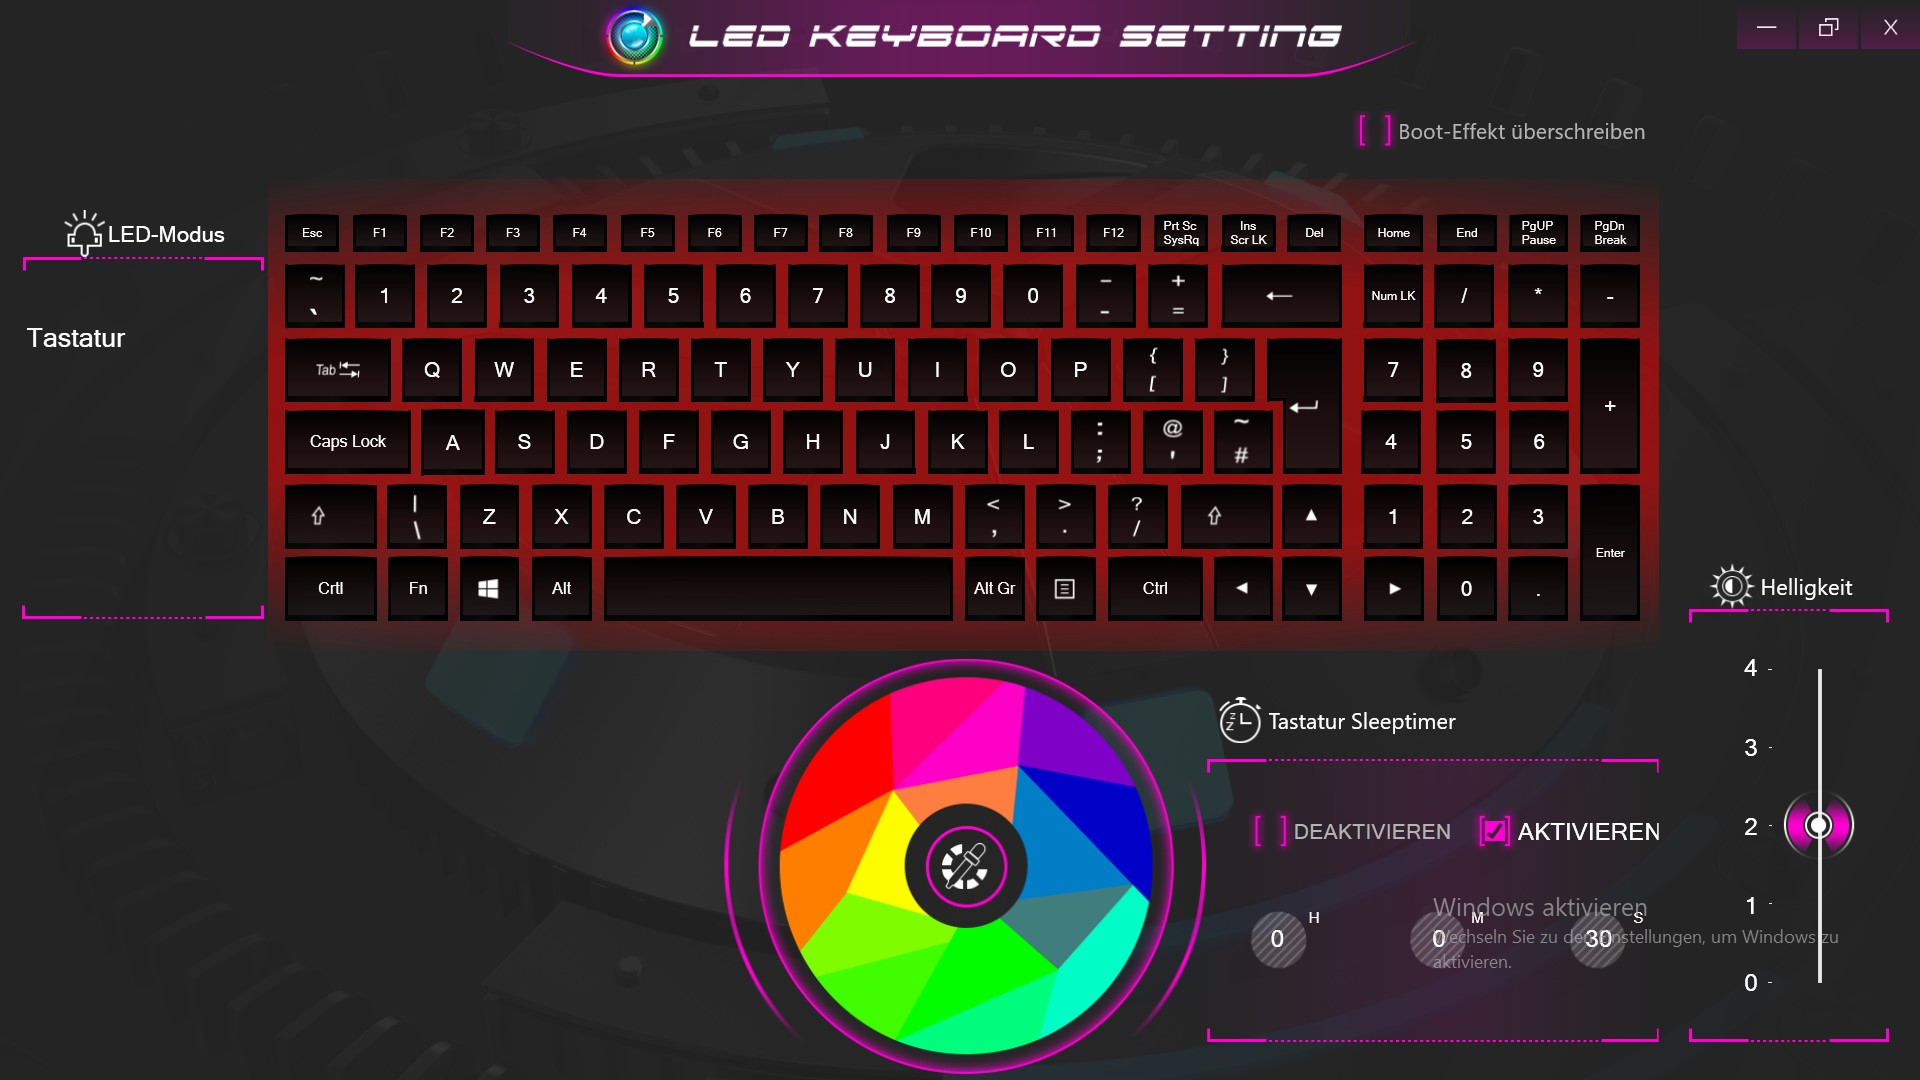
Large keys with adequate key travel and good haptic feedback give the keyboard of the Schenker Work 15 a pleasant feel while typing. The RGB backlight seems a bit unusual at first, but at least you can adjust the illumination as per need.
The 12 cm × 7 cm touchpad has a smooth gliding surface and delivers precise inputs. A fingerprint sensor is integrated into the upper left corner of the clickpad.
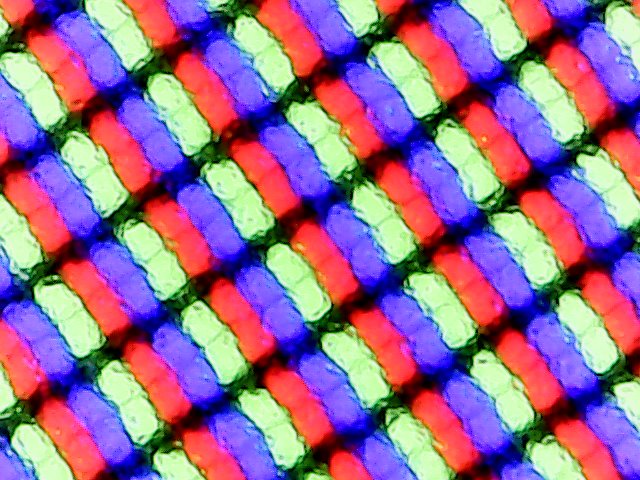
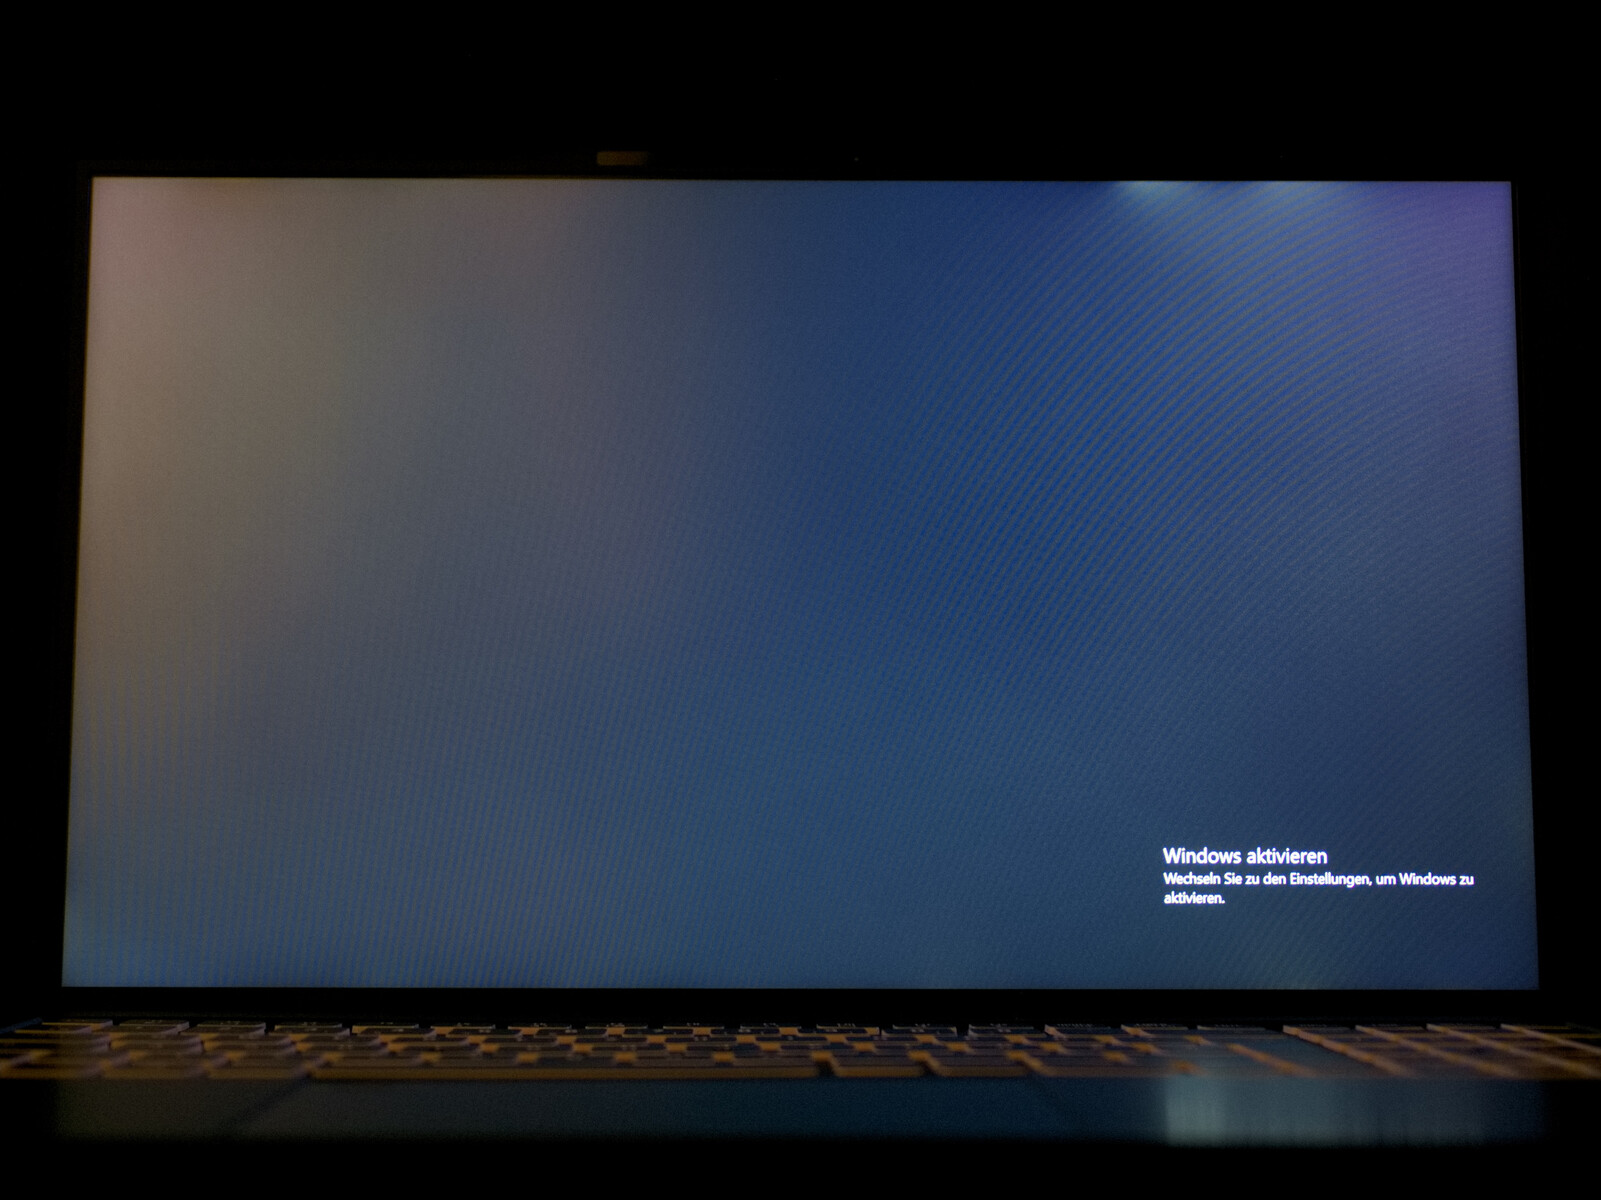
Display: Work 15 with matte IPS panel
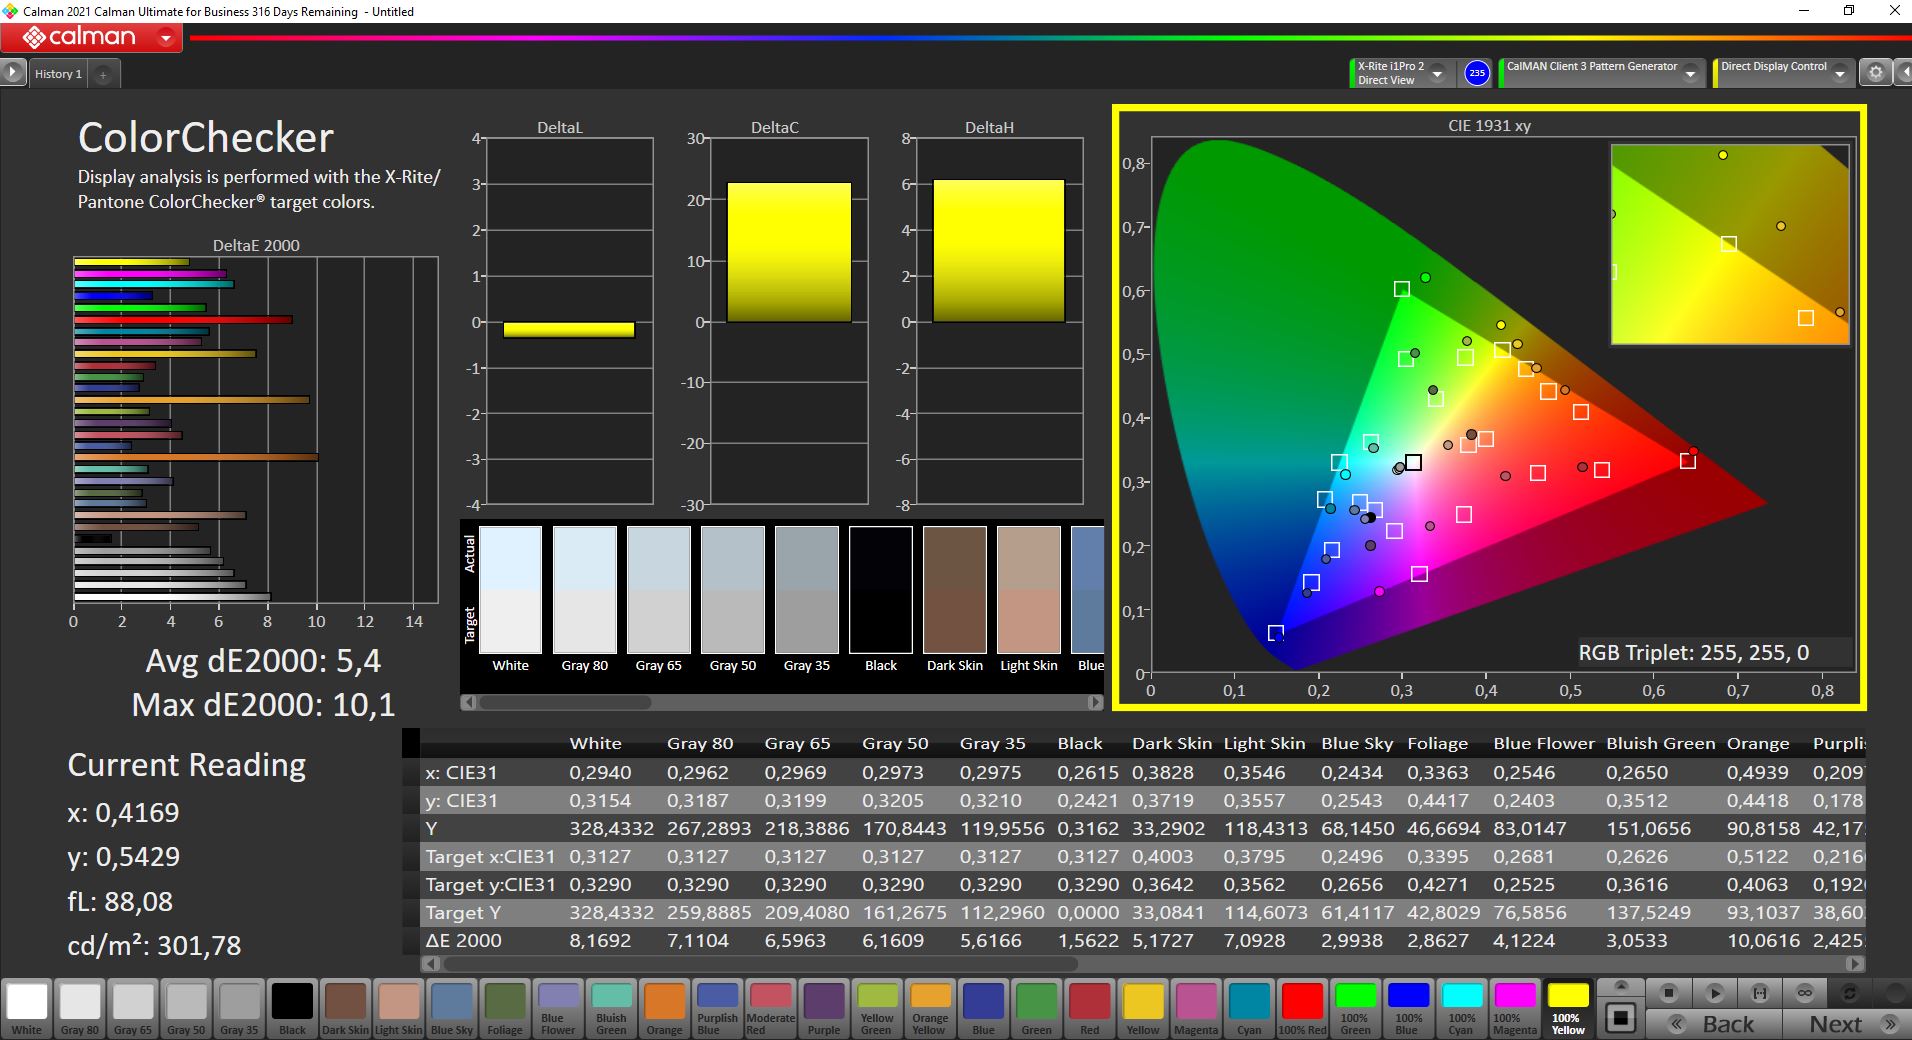
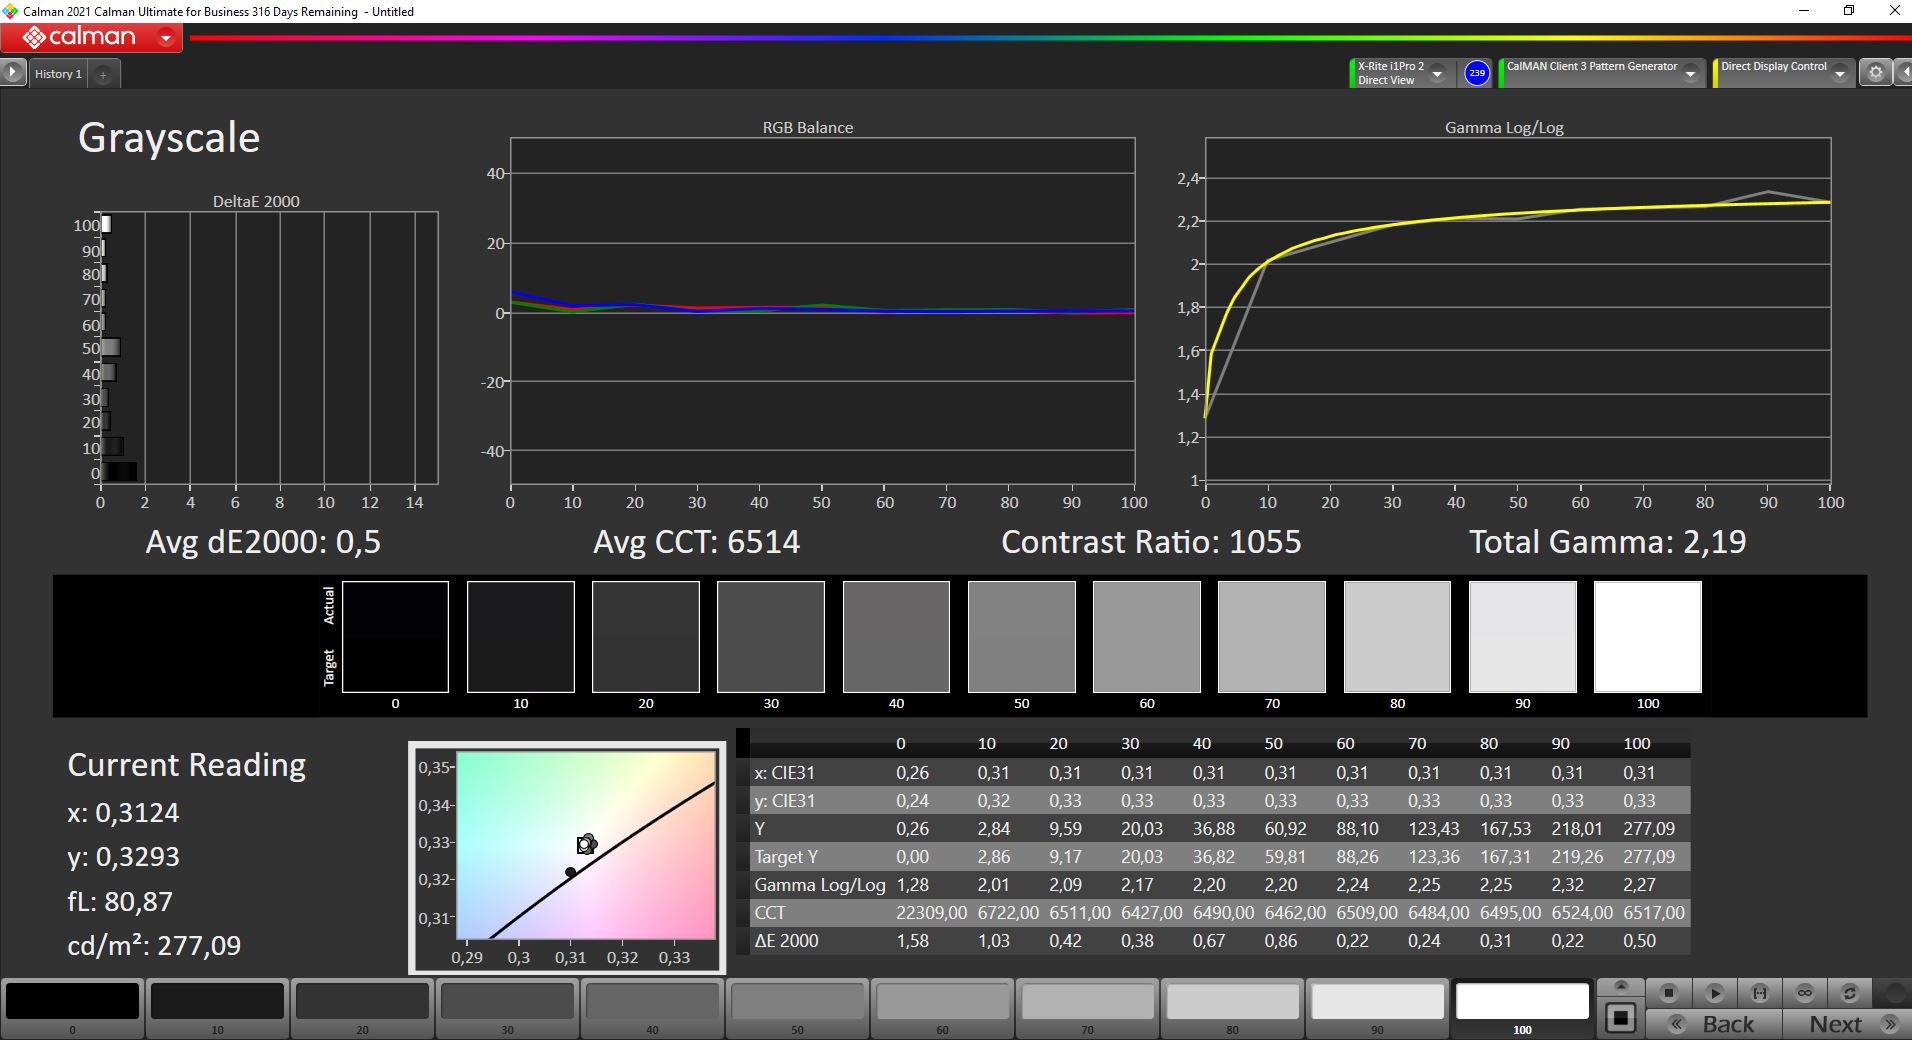
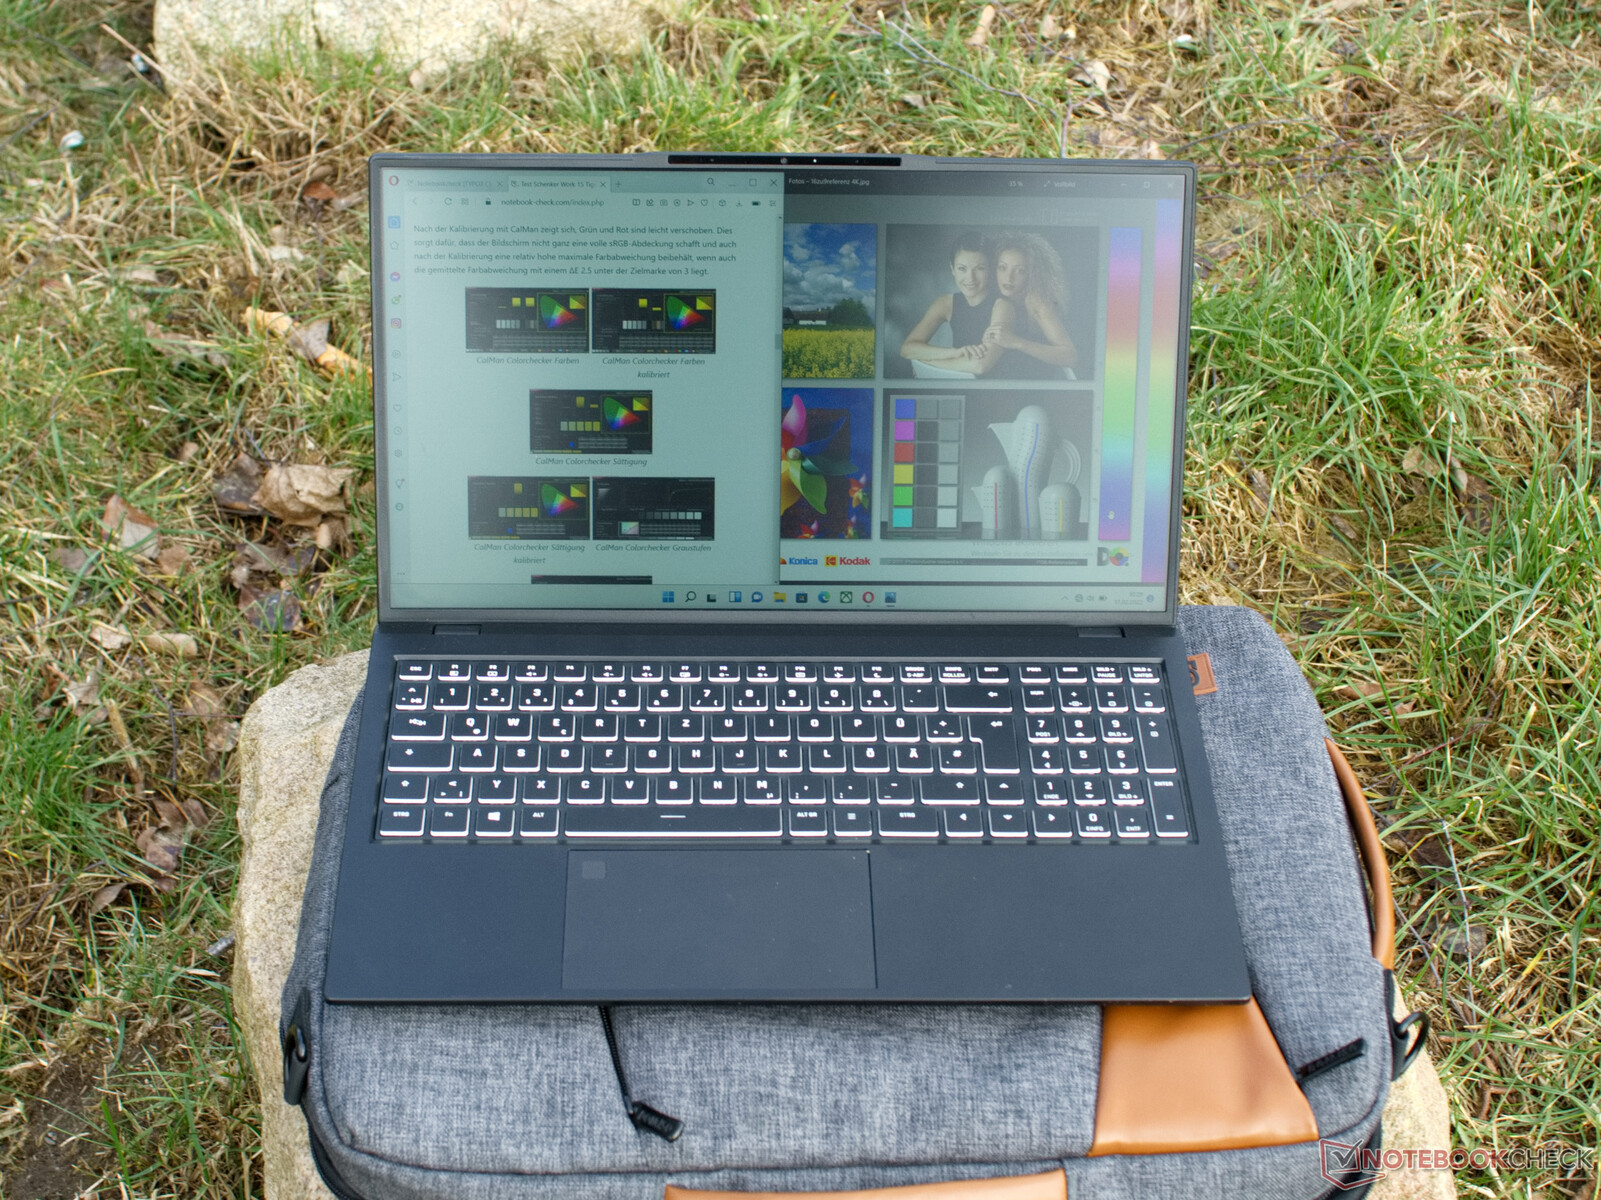
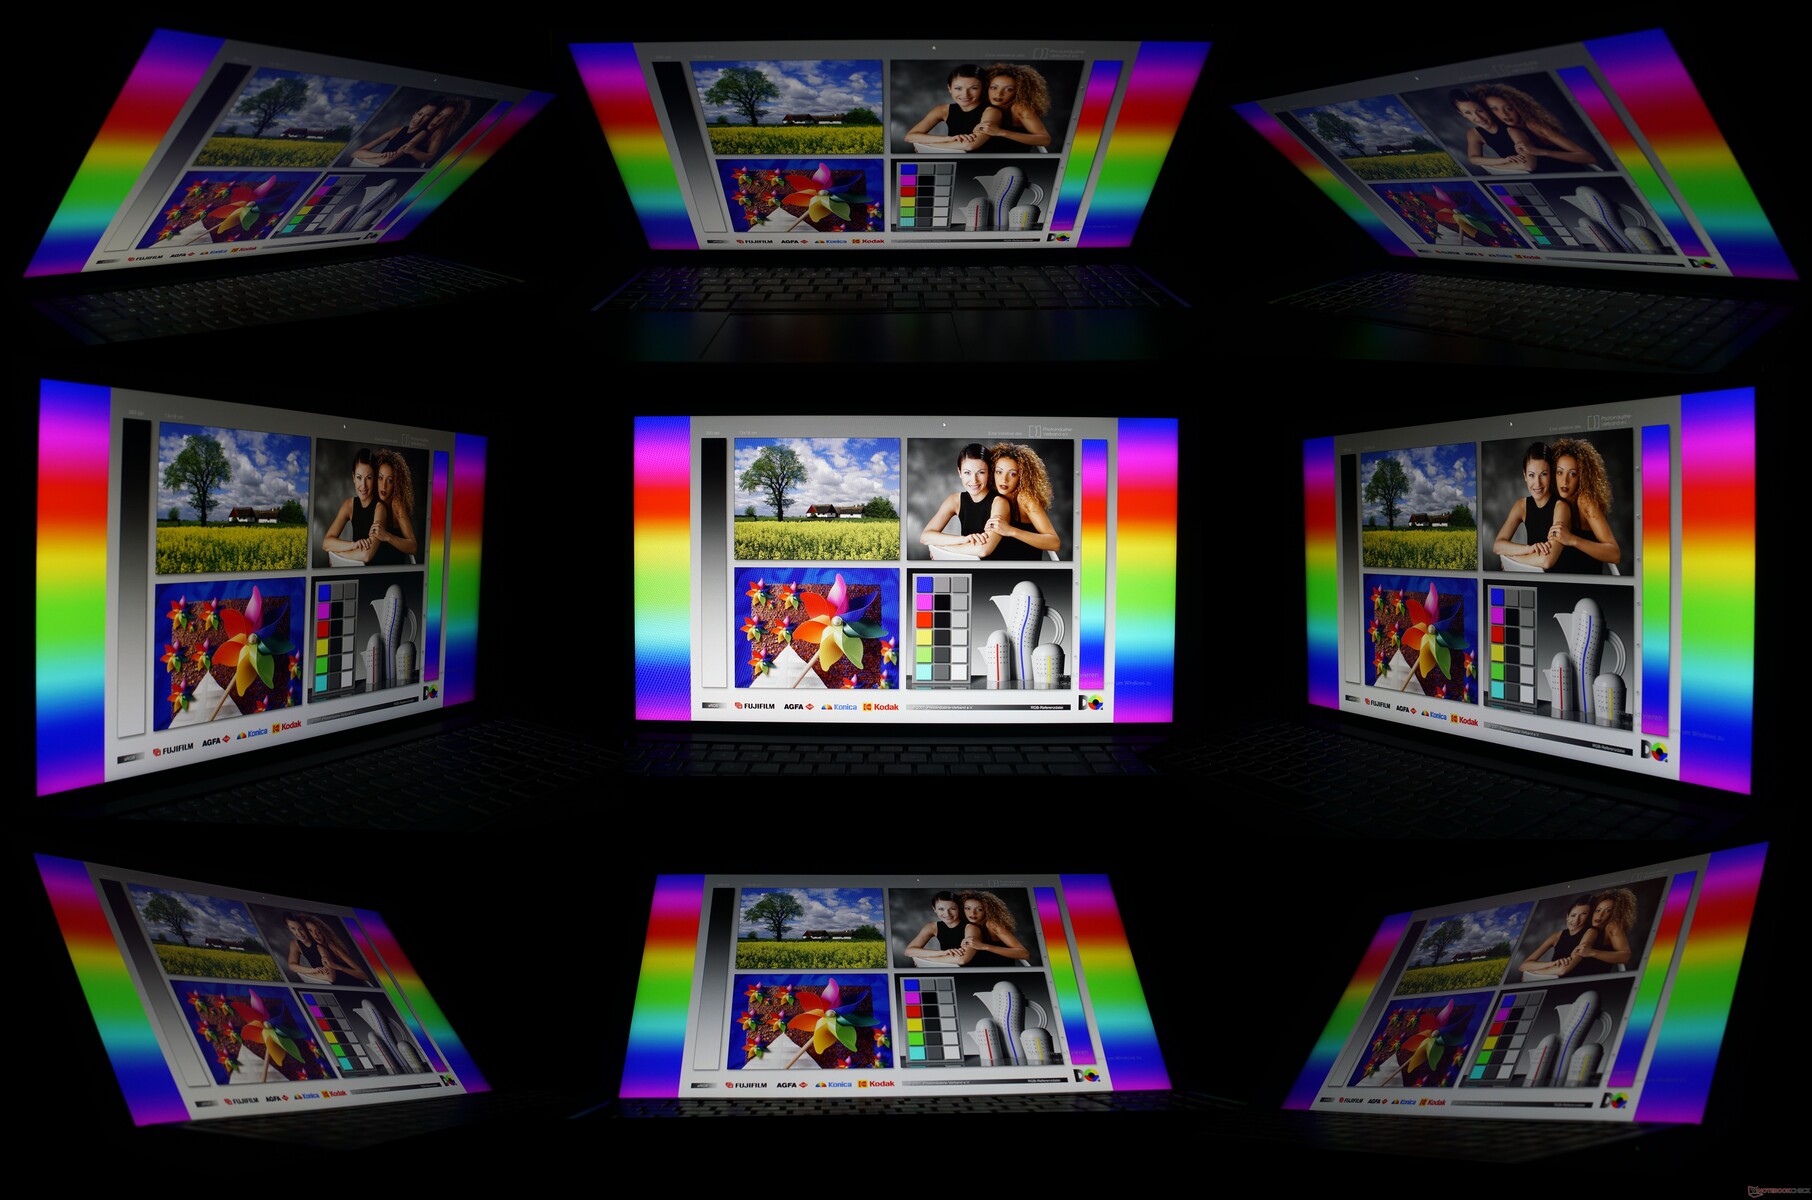
The matte display in the Schenker Work 15 provides a good overall picture with Full HD resolution. The brightness of more than 300 cd/m² ensures good legibility, even outdoors. The illumination is so even that screen bleeding is not noticeable unless observed with a camera with long exposure times. The color space coverage of 86.2% sRGB and the color deviations are sufficient for office work but are not suitable for image editing. Flickering could not be detected on the screen and the contrast ratio of 1097:1 is also decent.
| |||||||||||||||||||||||||
Brightness Distribution: 92 %
Center on Battery: 329 cd/m²
Contrast: 1097:1 (Black: 0.3 cd/m²)
ΔE ColorChecker Calman: 5.4 | ∀{0.5-29.43 Ø4.73}
calibrated: 2.5
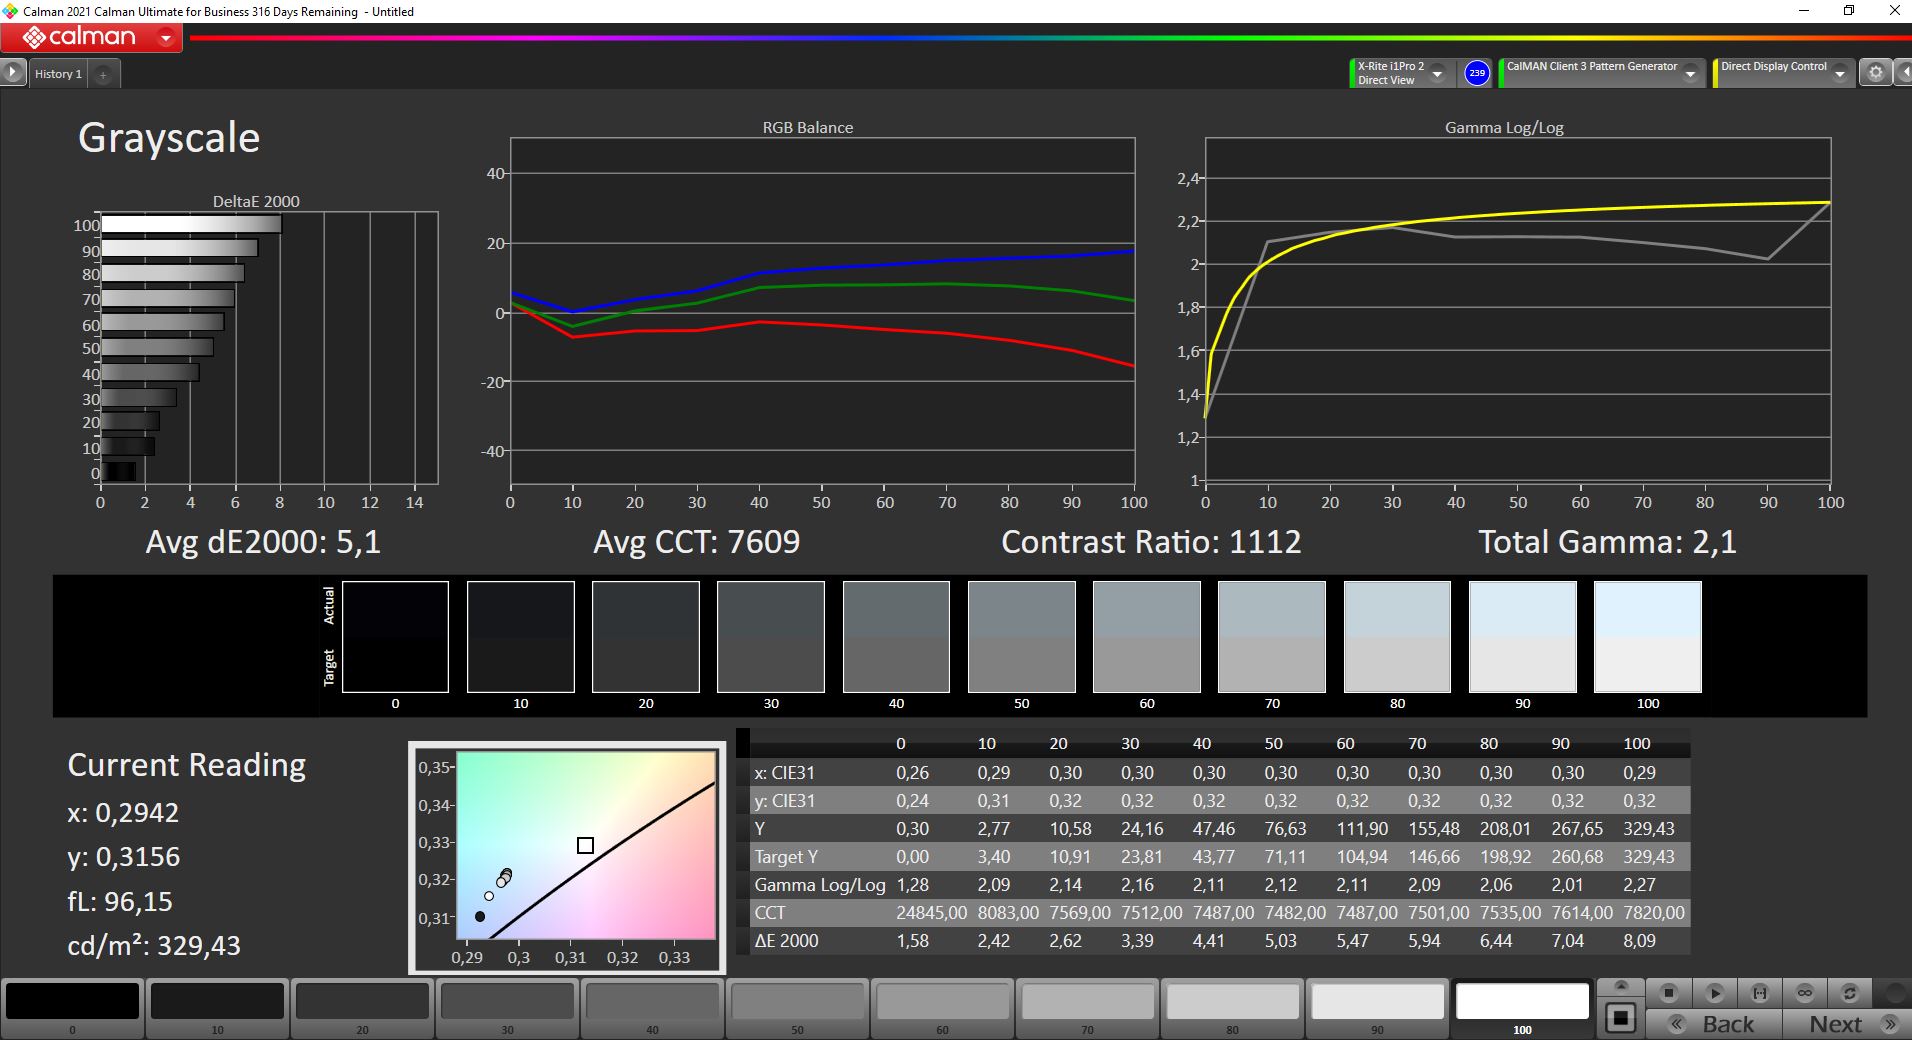
ΔE Greyscale Calman: 5.1 | ∀{0.09-98 Ø4.97}
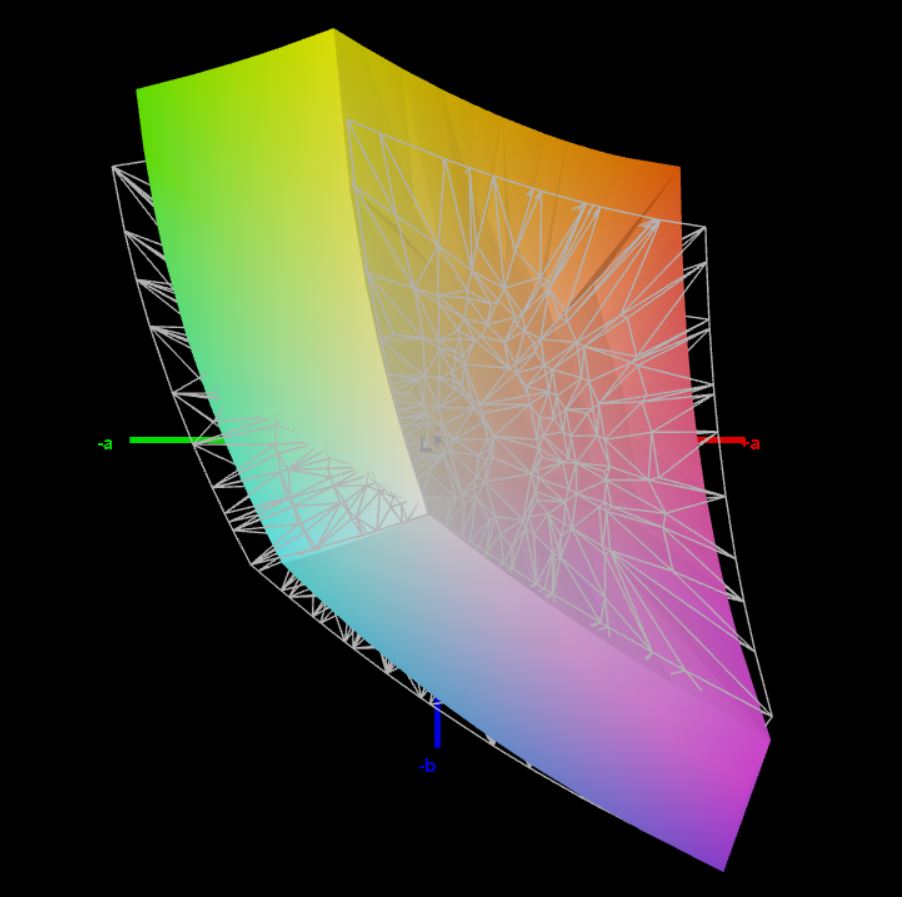
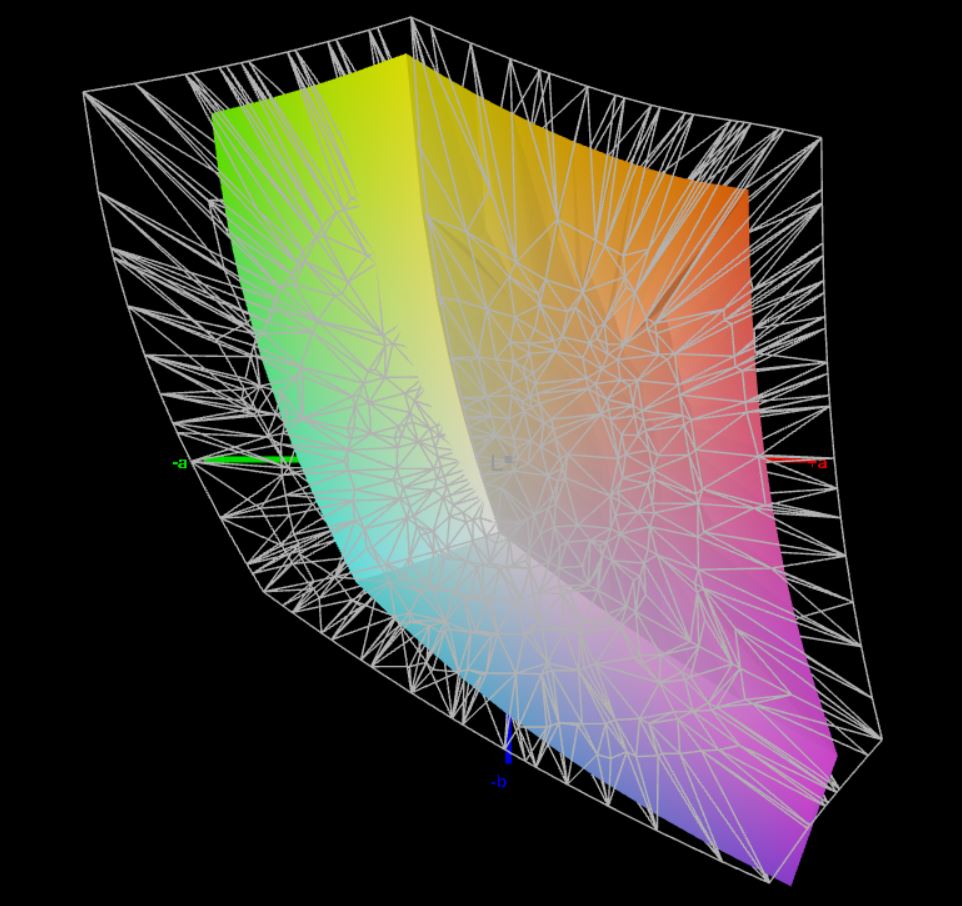
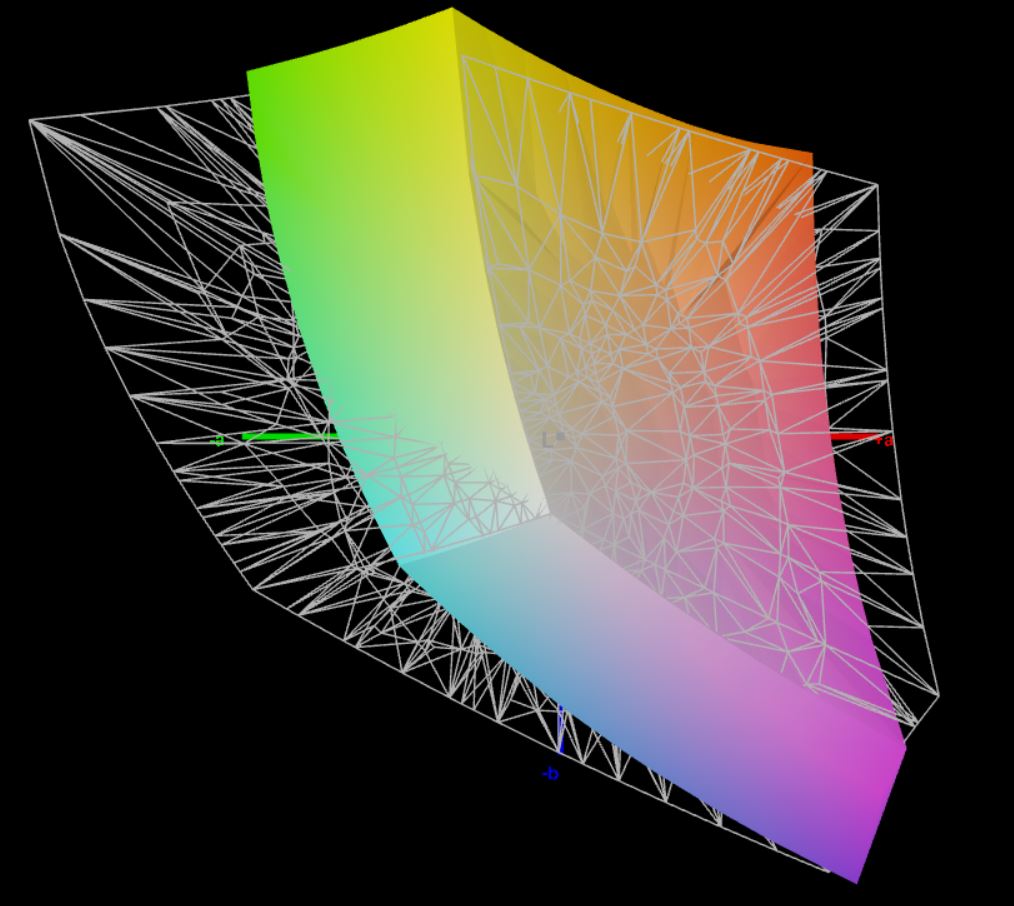
62.9% AdobeRGB 1998 (Argyll 3D)
86.2% sRGB (Argyll 3D)
64.5% Display P3 (Argyll 3D)
Gamma: 2.1
CCT: 7609 K
| Schenker Work 15 Tiger Lake-H BOE07D8, IPS, 1920x1080, 15.6" | LG Gram 15Z90P-G.AA89G LG Display LP156WFC-SPY1, IPS 99% sRGB, 1920x1080, 15.6" | Dell Inspiron 15 3501 BOE NV15N3D (Dell P/N: N39X1), IPS, 1920x1080, 15.6" | Lenovo ThinkPad E15 G3-20YG003UGE B156HAN02.1, IPS, 1920x1080, 15.6" | Asus VivoBook S15 D533UA Chi Mei N156HCA-EAB, IPS, 1920x1080, 15.6" | HP Pavilion x360 15-er0155ng AU Optronics AUOC48A, IPS, 1920x1080, 15.6" | |
|---|---|---|---|---|---|---|
| Display | 2% | -35% | -34% | -28% | -35% | |
| Display P3 Coverage (%) | 64.5 | 62 -4% | 39.4 -39% | 40.3 -38% | 43.6 -32% | 39.8 -38% |
| sRGB Coverage (%) | 86.2 | 92 7% | 58.7 -32% | 60.2 -30% | 65.2 -24% | 59.7 -31% |
| AdobeRGB 1998 Coverage (%) | 62.9 | 64 2% | 40.7 -35% | 41.6 -34% | 45 -28% | 41.1 -35% |
| Response Times | 44% | 18% | 20% | 58% | 24% | |
| Response Time Grey 50% / Grey 80% * (ms) | 58.4 ? | 36 ? 38% | 43 ? 26% | 44 ? 25% | 18 ? 69% | 42 ? 28% |
| Response Time Black / White * (ms) | 35.2 ? | 18 ? 49% | 32 ? 9% | 30.4 ? 14% | 19 ? 46% | 28 ? 20% |
| PWM Frequency (Hz) | 1000 ? | |||||
| Screen | 6% | 20% | -4% | -10% | -10% | |
| Brightness middle (cd/m²) | 329 | 343 4% | 271 -18% | 347 5% | 289 -12% | 249 -24% |
| Brightness (cd/m²) | 316 | 311 -2% | 263 -17% | 329 4% | 267 -16% | 246 -22% |
| Brightness Distribution (%) | 92 | 86 -7% | 92 0% | 93 1% | 85 -8% | 93 1% |
| Black Level * (cd/m²) | 0.3 | 0.46 -53% | 0.15 50% | 0.25 17% | 0.56 -87% | 0.29 3% |
| Contrast (:1) | 1097 | 746 -32% | 1807 65% | 1388 27% | 516 -53% | 859 -22% |
| Colorchecker dE 2000 * | 5.4 | 3.5 35% | 4.83 11% | 4.7 13% | 3.96 27% | 6.01 -11% |
| Colorchecker dE 2000 max. * | 10.1 | 6.25 38% | 7 31% | 19.4 -92% | 6.76 33% | 11.01 -9% |
| Colorchecker dE 2000 calibrated * | 2.5 | 1.17 53% | 4.4 -76% | |||
| Greyscale dE 2000 * | 5.1 | 4.35 15% | 3.36 34% | 1.7 67% | 3.43 33% | 4.67 8% |
| Gamma | 2.1 105% | 2.55 86% | 2.56 86% | 2.2 100% | 2.28 96% | 2.79 79% |
| CCT | 7609 85% | 6016 108% | 6764 96% | 6475 100% | 7191 90% | 6390 102% |
| Color Space (Percent of AdobeRGB 1998) (%) | 42 | 38 | ||||
| Color Space (Percent of sRGB) (%) | 65 | 59 | ||||
| Total Average (Program / Settings) | 17% /
10% | 1% /
7% | -6% /
-7% | 7% /
-4% | -7% /
-10% |
* ... smaller is better
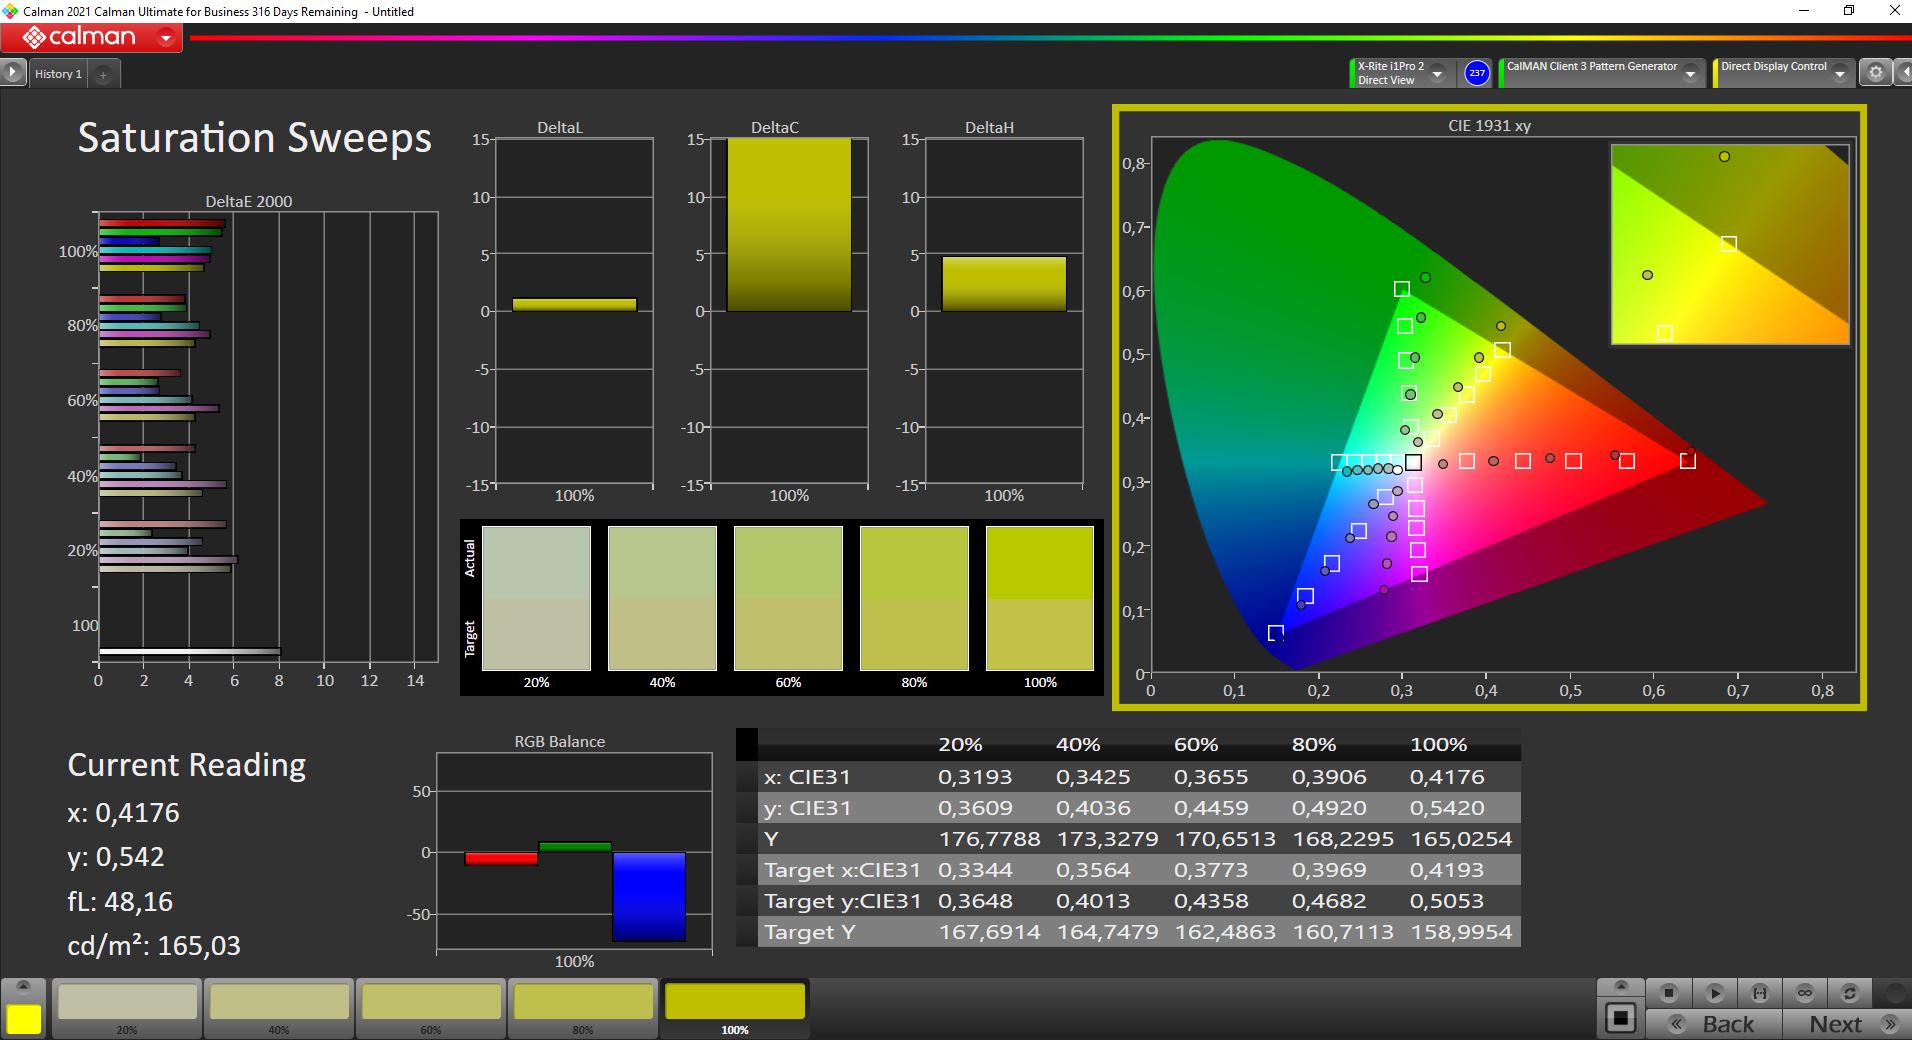
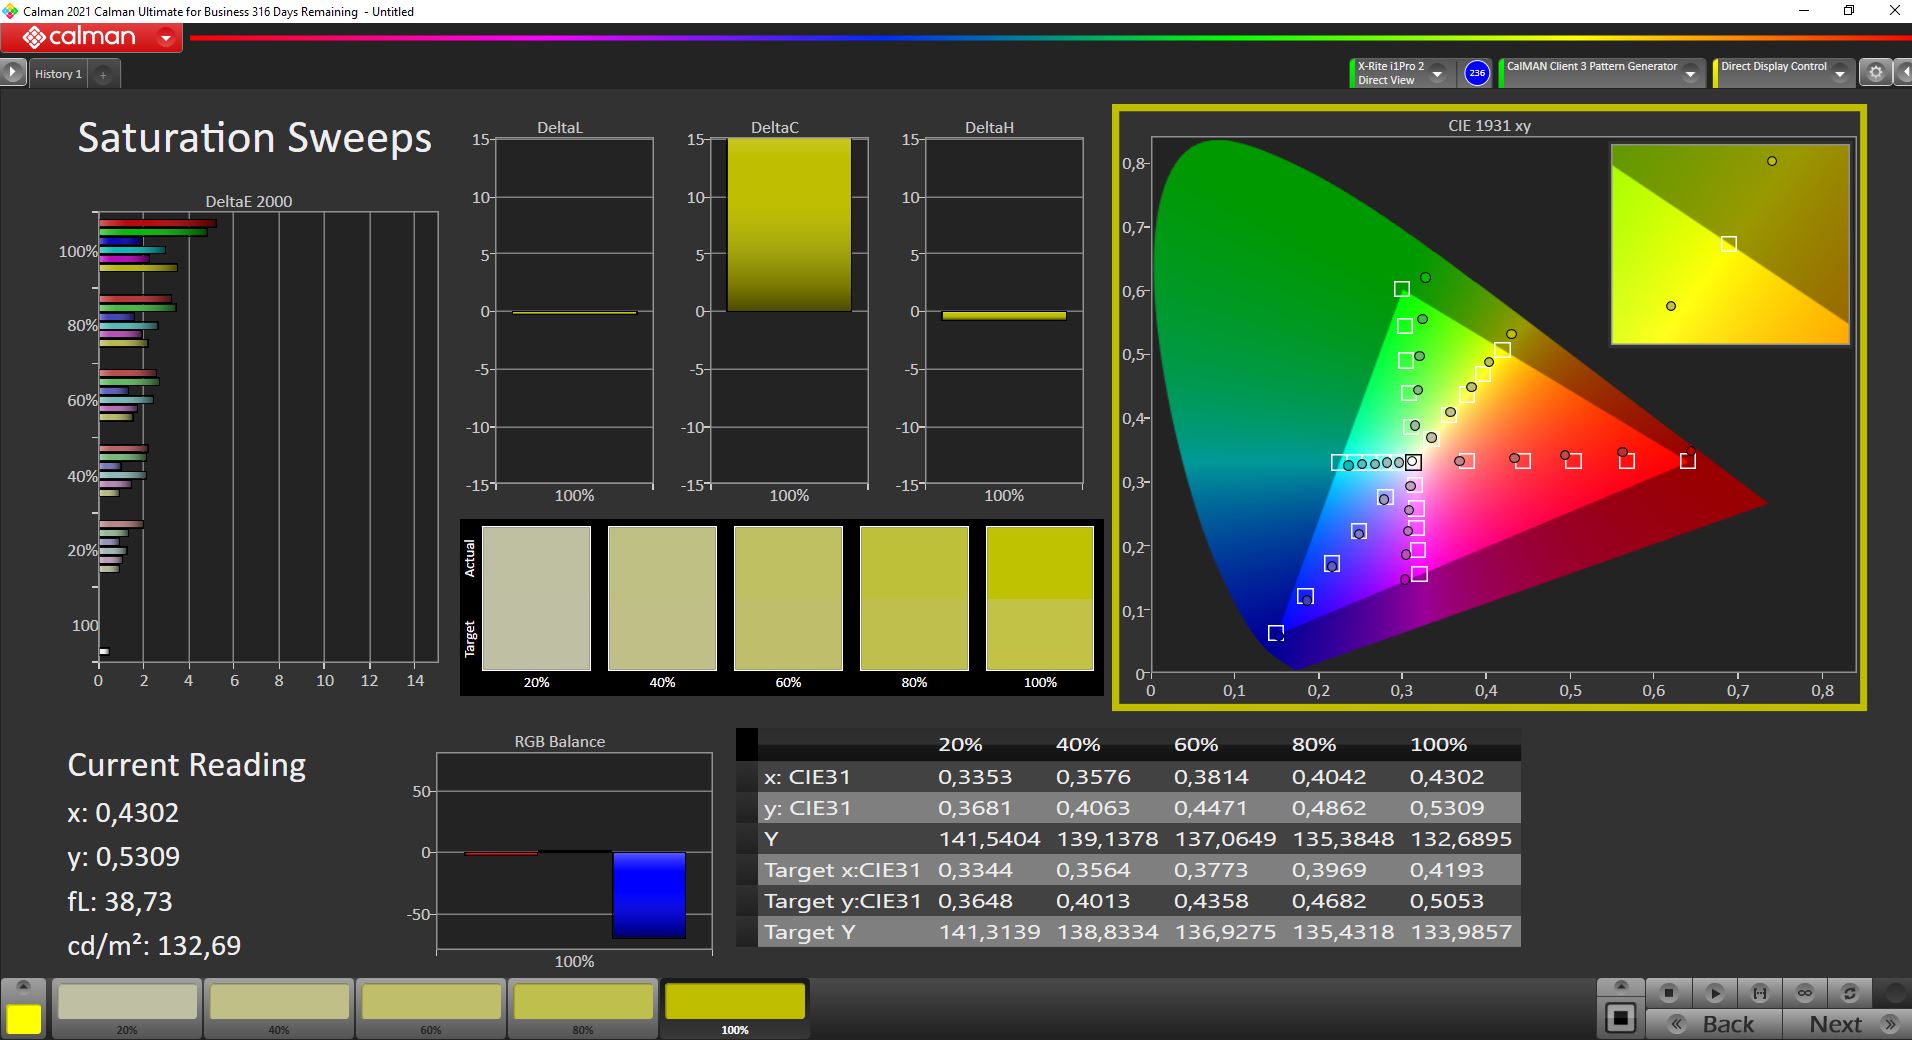
Out-of-the-box color checks with CalMan show green and red to be slightly displaced. This shows that the screen does not quite achieve full sRGB coverage, and it maintains a relatively high maximum color deviation even after calibration. However, the averaged color deviation with a ΔΕ 2.5 is still below the target mark of 3.

Display Response Times
| ↔ Response Time Black to White | ||
|---|---|---|
| 35.2 ms ... rise ↗ and fall ↘ combined | ↗ 18 ms rise | 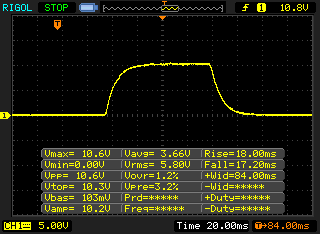 |
| ↘ 17.2 ms fall | ||
| The screen shows slow response rates in our tests and will be unsatisfactory for gamers. In comparison, all tested devices range from 0.1 (minimum) to 240 (maximum) ms. » 93 % of all devices are better. This means that the measured response time is worse than the average of all tested devices (19.9 ms). | ||
| ↔ Response Time 50% Grey to 80% Grey | ||
| 58.4 ms ... rise ↗ and fall ↘ combined | ↗ 26.8 ms rise | 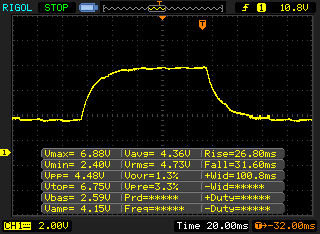 |
| ↘ 31.6 ms fall | ||
| The screen shows slow response rates in our tests and will be unsatisfactory for gamers. In comparison, all tested devices range from 0.165 (minimum) to 636 (maximum) ms. » 95 % of all devices are better. This means that the measured response time is worse than the average of all tested devices (31.1 ms). | ||
Screen Flickering / PWM (Pulse-Width Modulation)
| Screen flickering / PWM not detected | 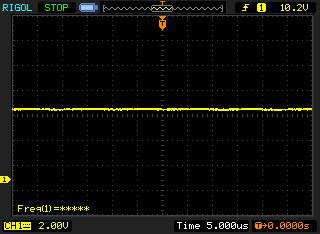 | ||
In comparison: 52 % of all tested devices do not use PWM to dim the display. If PWM was detected, an average of 7784 (minimum: 5 - maximum: 343500) Hz was measured. | |||
Reading outdoors becomes difficult only when the sun reflects directly on the display's matte surface. The office laptop shows a good picture both outdoors and from various angles.
Performance: A question of attitude
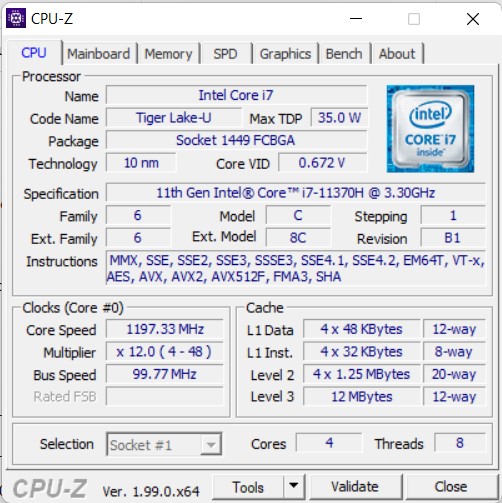
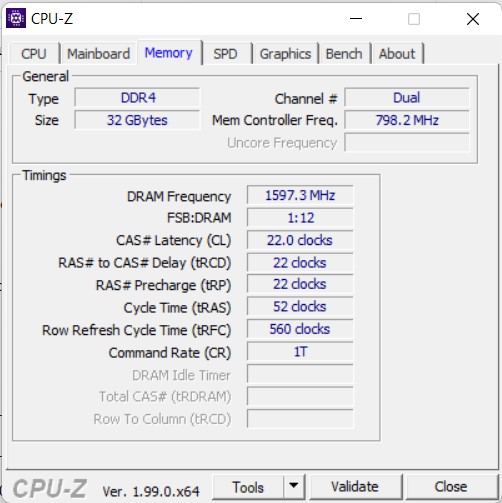
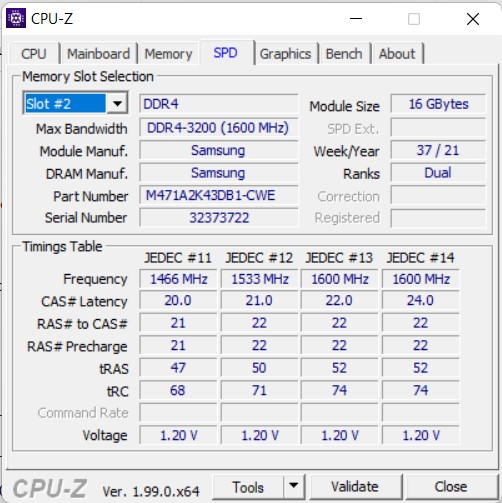
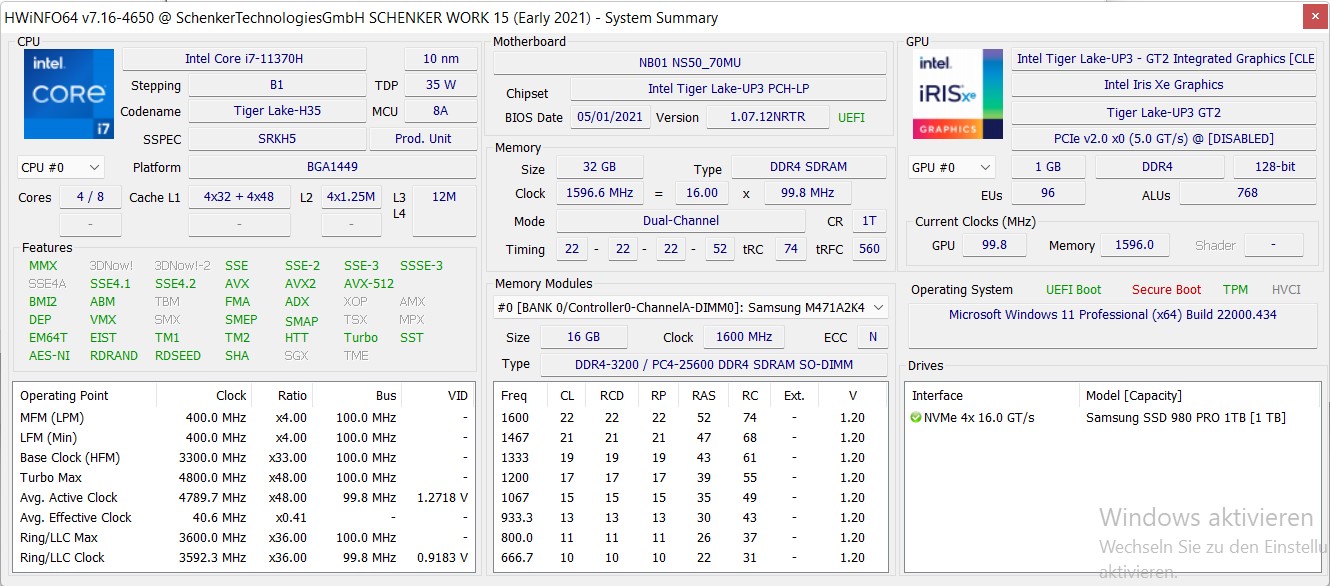
Thanks to many freely selectable configurations, the Schenker Work 15 can be adapted to many fields of use. Our test device is equipped with the Intel Core i7-11370H, 32 GB working memory, and 1 TB fast NVMe SSD. Further configuration options are available with the Intel Core i5-11300H, 8 to 32 GB working memory, different SSD storage with up to 8 TB, and many other options for warranty, WLAN, keyboard, and the operating system.
Test conditions
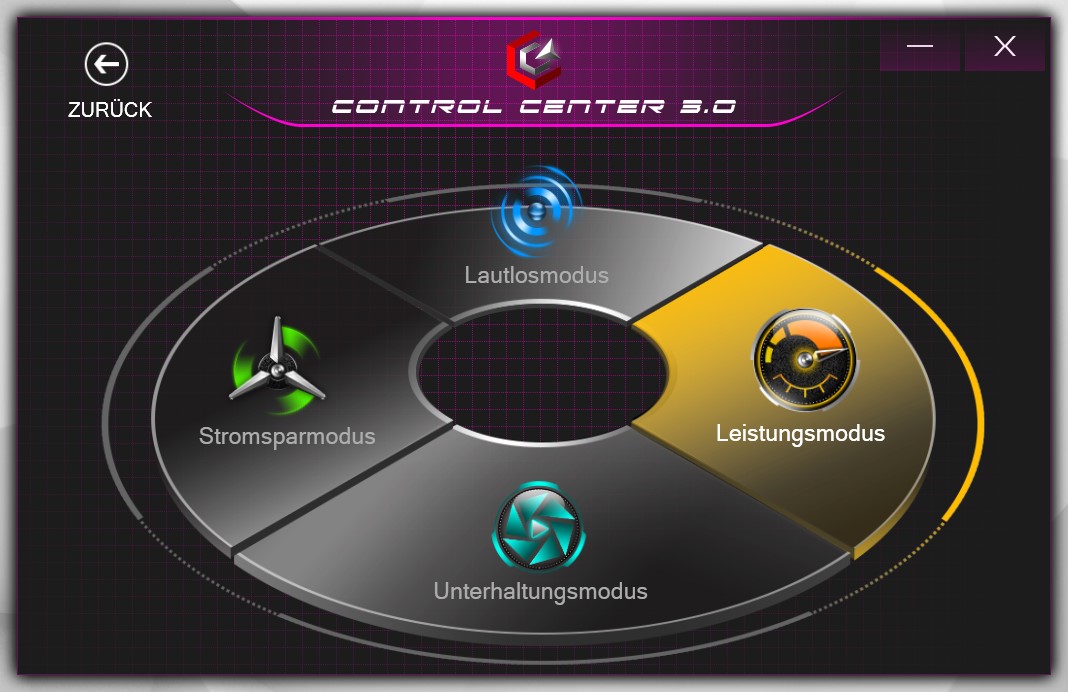
All benchmarks were run in the Windows "Best Performance" enery plan. The "Entertainment mode" preset was selected in Schenker's Control Center. This results in a PL2 of 42 W and a PL1 of around 22 W for the Intel Core i7.
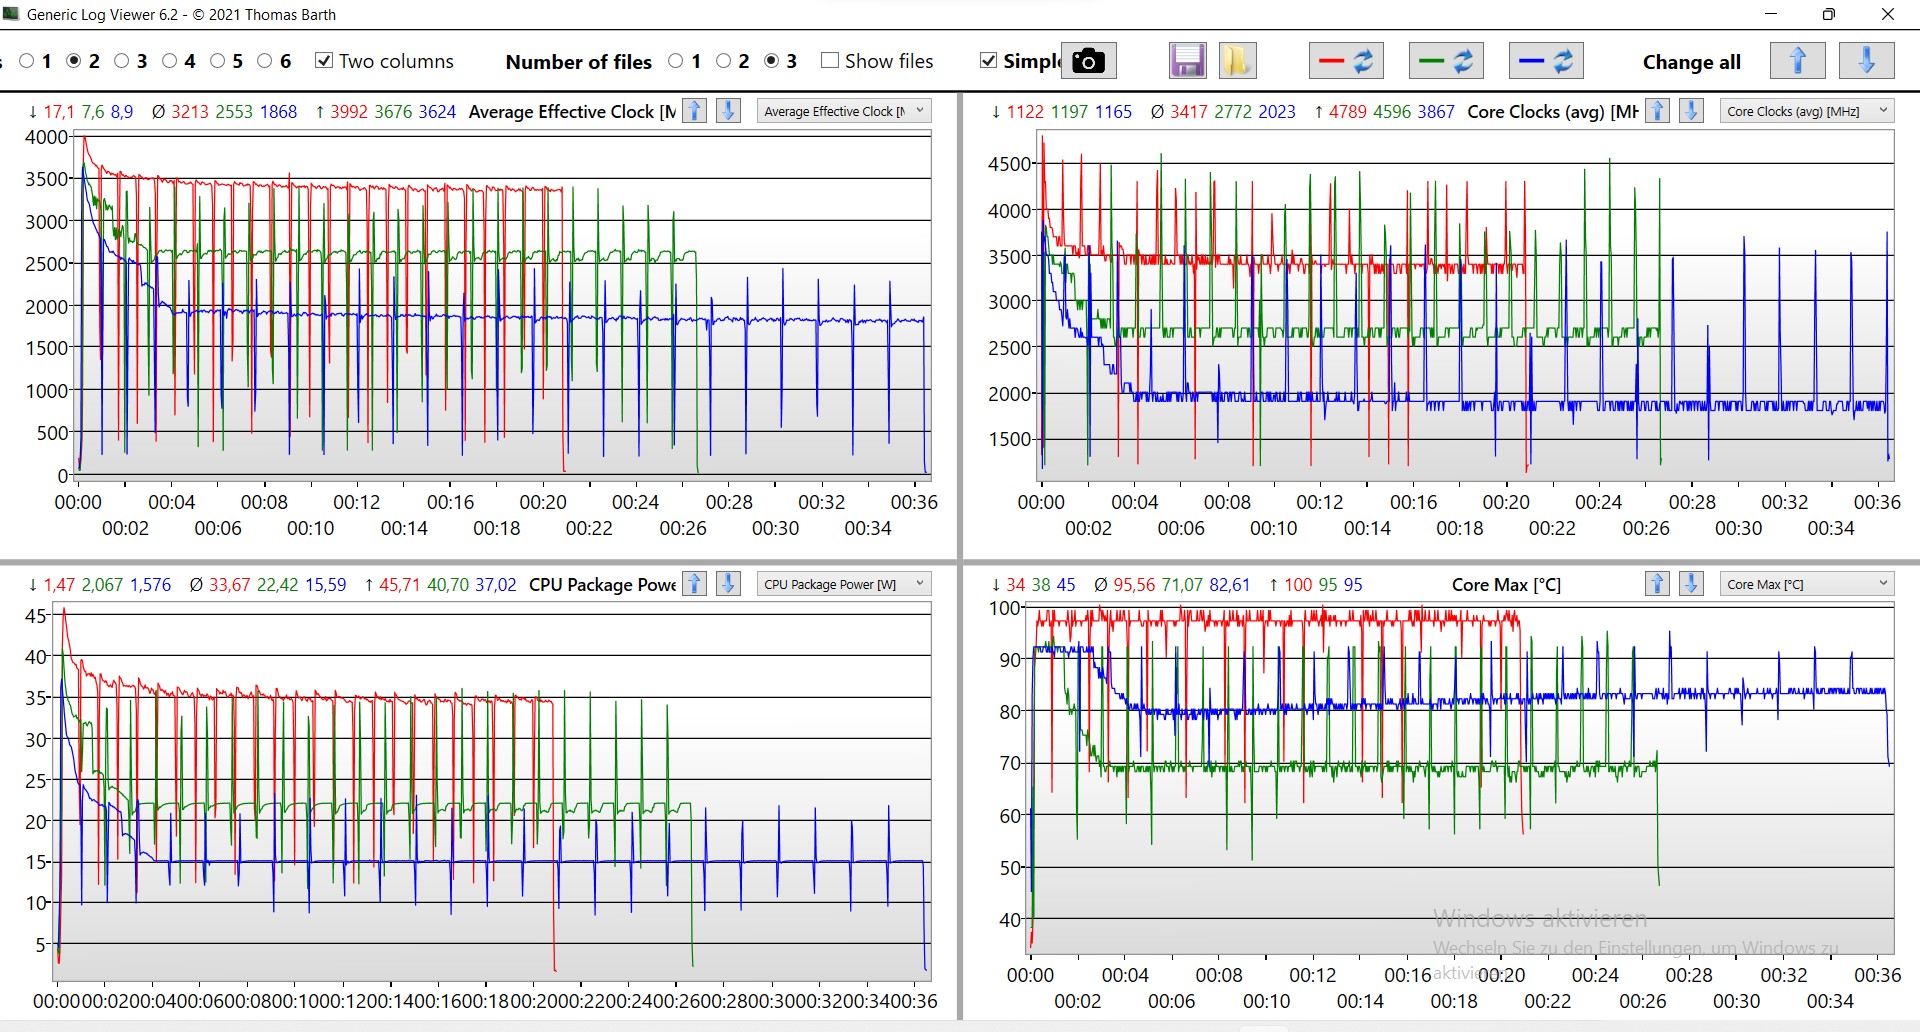
The Control Center also offers other performance modes. Thus, a considerably higher PL1 of 35 W can be achieved in the performance mode. However, the core temperature also increases up to 100 °C here. Apart from some generic processor benchmarks, such as Cinebench, no clear performance gain is seen with this mode.
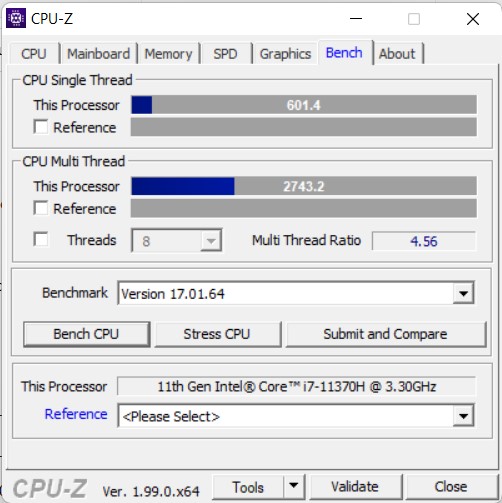
Processor
The Intel Core i7-11370H is particularly common in slim workstations and gaming notebooks. Depending on the set performance mode, the processor shows slightly below-average performance in the benchmarks with long-term load. The processor can only fully convince in performance mode. However, thanks to relatively high Boost performance and the typically strong single-core performance, the Schenker Work 15 always delivers good scores in tests apart from Cinebench.
In battery mode, the processor is allowed to work with around 16 W. Compared with the performance mode, just over half the computing power is available in the Cinebench R15 benchmark.
Cinebench R15 Multi Dauertest
Cinebench R23: Multi Core | Single Core
Cinebench R20: CPU (Multi Core) | CPU (Single Core)
Cinebench R15: CPU Multi 64Bit | CPU Single 64Bit
Blender: v2.79 BMW27 CPU
7-Zip 18.03: 7z b 4 | 7z b 4 -mmt1
Geekbench 5.5: Multi-Core | Single-Core
HWBOT x265 Benchmark v2.2: 4k Preset
LibreOffice : 20 Documents To PDF
R Benchmark 2.5: Overall mean
| CPU Performance rating | |
| Average of class Office | |
| Asus VivoBook S15 D533UA | |
| Lenovo ThinkPad E15 G3-20YG003UGE | |
| Average Intel Core i7-11370H | |
| Schenker Work 15 Tiger Lake-H | |
| Dell Inspiron 15 3501 | |
| HP Pavilion x360 15-er0155ng | |
| LG Gram 15Z90P-G.AA89G | |
| Cinebench R23 / Multi Core | |
| Average of class Office (1673 - 22808, n=74, last 2 years) | |
| Asus VivoBook S15 D533UA | |
| Lenovo ThinkPad E15 G3-20YG003UGE | |
| Average Intel Core i7-11370H (3696 - 6646, n=12) | |
| Dell Inspiron 15 3501 | |
| Schenker Work 15 Tiger Lake-H | |
| HP Pavilion x360 15-er0155ng | |
| LG Gram 15Z90P-G.AA89G | |
| Cinebench R23 / Single Core | |
| Average of class Office (708 - 2130, n=74, last 2 years) | |
| Average Intel Core i7-11370H (1081 - 1556, n=11) | |
| Schenker Work 15 Tiger Lake-H | |
| Dell Inspiron 15 3501 | |
| HP Pavilion x360 15-er0155ng | |
| Asus VivoBook S15 D533UA | |
| Lenovo ThinkPad E15 G3-20YG003UGE | |
| LG Gram 15Z90P-G.AA89G | |
| Cinebench R20 / CPU (Multi Core) | |
| Average of class Office (648 - 8840, n=73, last 2 years) | |
| Asus VivoBook S15 D533UA | |
| Lenovo ThinkPad E15 G3-20YG003UGE | |
| Average Intel Core i7-11370H (1438 - 2578, n=11) | |
| Dell Inspiron 15 3501 | |
| HP Pavilion x360 15-er0155ng | |
| Schenker Work 15 Tiger Lake-H | |
| LG Gram 15Z90P-G.AA89G | |
| Cinebench R20 / CPU (Single Core) | |
| Average of class Office (345 - 816, n=73, last 2 years) | |
| Average Intel Core i7-11370H (475 - 601, n=11) | |
| Dell Inspiron 15 3501 | |
| Schenker Work 15 Tiger Lake-H | |
| HP Pavilion x360 15-er0155ng | |
| Asus VivoBook S15 D533UA | |
| Lenovo ThinkPad E15 G3-20YG003UGE | |
| LG Gram 15Z90P-G.AA89G | |
| Cinebench R15 / CPU Multi 64Bit | |
| Average of class Office (250 - 3380, n=75, last 2 years) | |
| Asus VivoBook S15 D533UA | |
| Lenovo ThinkPad E15 G3-20YG003UGE | |
| Average Intel Core i7-11370H (606 - 1086, n=17) | |
| Schenker Work 15 Tiger Lake-H | |
| Schenker Work 15 Tiger Lake-H | |
| Schenker Work 15 Tiger Lake-H | |
| Dell Inspiron 15 3501 | |
| LG Gram 15Z90P-G.AA89G | |
| HP Pavilion x360 15-er0155ng | |
| Cinebench R15 / CPU Single 64Bit | |
| Average of class Office (99.5 - 312, n=75, last 2 years) | |
| Average Intel Core i7-11370H (162.9 - 233, n=15) | |
| Schenker Work 15 Tiger Lake-H | |
| Schenker Work 15 Tiger Lake-H | |
| HP Pavilion x360 15-er0155ng | |
| Asus VivoBook S15 D533UA | |
| Lenovo ThinkPad E15 G3-20YG003UGE | |
| LG Gram 15Z90P-G.AA89G | |
| Dell Inspiron 15 3501 | |
| Blender / v2.79 BMW27 CPU | |
| LG Gram 15Z90P-G.AA89G | |
| Schenker Work 15 Tiger Lake-H | |
| HP Pavilion x360 15-er0155ng | |
| Dell Inspiron 15 3501 | |
| Average Intel Core i7-11370H (432 - 762, n=11) | |
| Average of class Office (158 - 1940, n=74, last 2 years) | |
| Asus VivoBook S15 D533UA | |
| Lenovo ThinkPad E15 G3-20YG003UGE | |
| 7-Zip 18.03 / 7z b 4 | |
| Average of class Office (7098 - 76886, n=75, last 2 years) | |
| Asus VivoBook S15 D533UA | |
| Lenovo ThinkPad E15 G3-20YG003UGE | |
| Average Intel Core i7-11370H (18961 - 28520, n=11) | |
| Dell Inspiron 15 3501 | |
| HP Pavilion x360 15-er0155ng | |
| Schenker Work 15 Tiger Lake-H | |
| LG Gram 15Z90P-G.AA89G | |
| 7-Zip 18.03 / 7z b 4 -mmt1 | |
| Average of class Office (3387 - 6469, n=75, last 2 years) | |
| Average Intel Core i7-11370H (5074 - 5550, n=11) | |
| Schenker Work 15 Tiger Lake-H | |
| Dell Inspiron 15 3501 | |
| HP Pavilion x360 15-er0155ng | |
| LG Gram 15Z90P-G.AA89G | |
| Asus VivoBook S15 D533UA | |
| Lenovo ThinkPad E15 G3-20YG003UGE | |
| Geekbench 5.5 / Multi-Core | |
| Average of class Office (1483 - 16999, n=71, last 2 years) | |
| Asus VivoBook S15 D533UA | |
| Lenovo ThinkPad E15 G3-20YG003UGE | |
| Schenker Work 15 Tiger Lake-H | |
| Average Intel Core i7-11370H (3828 - 6115, n=10) | |
| HP Pavilion x360 15-er0155ng | |
| LG Gram 15Z90P-G.AA89G | |
| Dell Inspiron 15 3501 | |
| Geekbench 5.5 / Single-Core | |
| Average of class Office (811 - 2128, n=71, last 2 years) | |
| Schenker Work 15 Tiger Lake-H | |
| Average Intel Core i7-11370H (1376 - 1607, n=10) | |
| LG Gram 15Z90P-G.AA89G | |
| Dell Inspiron 15 3501 | |
| HP Pavilion x360 15-er0155ng | |
| Asus VivoBook S15 D533UA | |
| Lenovo ThinkPad E15 G3-20YG003UGE | |
| HWBOT x265 Benchmark v2.2 / 4k Preset | |
| Average of class Office (2.21 - 26, n=74, last 2 years) | |
| Asus VivoBook S15 D533UA | |
| Lenovo ThinkPad E15 G3-20YG003UGE | |
| Average Intel Core i7-11370H (4.98 - 8.82, n=11) | |
| Dell Inspiron 15 3501 | |
| HP Pavilion x360 15-er0155ng | |
| Schenker Work 15 Tiger Lake-H | |
| LG Gram 15Z90P-G.AA89G | |
| LibreOffice / 20 Documents To PDF | |
| Lenovo ThinkPad E15 G3-20YG003UGE | |
| Average of class Office (39.9 - 102.3, n=74, last 2 years) | |
| Asus VivoBook S15 D533UA | |
| LG Gram 15Z90P-G.AA89G | |
| Dell Inspiron 15 3501 | |
| HP Pavilion x360 15-er0155ng | |
| Average Intel Core i7-11370H (23.6 - 56.5, n=11) | |
| Schenker Work 15 Tiger Lake-H | |
| R Benchmark 2.5 / Overall mean | |
| LG Gram 15Z90P-G.AA89G | |
| HP Pavilion x360 15-er0155ng | |
| Dell Inspiron 15 3501 | |
| Lenovo ThinkPad E15 G3-20YG003UGE | |
| Asus VivoBook S15 D533UA | |
| Schenker Work 15 Tiger Lake-H | |
| Average Intel Core i7-11370H (0.544 - 0.596, n=11) | |
| Average of class Office (0.4098 - 0.888, n=74, last 2 years) | |
* ... smaller is better
AIDA64: FP32 Ray-Trace | FPU Julia | CPU SHA3 | CPU Queen | FPU SinJulia | FPU Mandel | CPU AES | CPU ZLib | FP64 Ray-Trace | CPU PhotoWorxx
| Performance rating | |
| Average of class Office | |
| Asus VivoBook S15 D533UA | |
| Lenovo ThinkPad E15 G3-20YG003UGE | |
| Schenker Work 15 Tiger Lake-H | |
| Average Intel Core i7-11370H | |
| Dell Inspiron 15 3501 | |
| HP Pavilion x360 15-er0155ng | |
| LG Gram 15Z90P-G.AA89G | |
| AIDA64 / FP32 Ray-Trace | |
| Average of class Office (2083 - 31245, n=80, last 2 years) | |
| Asus VivoBook S15 D533UA | |
| Lenovo ThinkPad E15 G3-20YG003UGE | |
| Average Intel Core i7-11370H (5204 - 8413, n=10) | |
| Schenker Work 15 Tiger Lake-H | |
| Dell Inspiron 15 3501 | |
| HP Pavilion x360 15-er0155ng | |
| LG Gram 15Z90P-G.AA89G | |
| AIDA64 / FPU Julia | |
| Asus VivoBook S15 D533UA | |
| Lenovo ThinkPad E15 G3-20YG003UGE | |
| Average of class Office (8191 - 125394, n=80, last 2 years) | |
| Average Intel Core i7-11370H (23958 - 34020, n=10) | |
| Schenker Work 15 Tiger Lake-H | |
| Dell Inspiron 15 3501 | |
| HP Pavilion x360 15-er0155ng | |
| LG Gram 15Z90P-G.AA89G | |
| AIDA64 / CPU SHA3 | |
| Average of class Office (433 - 5755, n=80, last 2 years) | |
| Average Intel Core i7-11370H (1656 - 2297, n=10) | |
| Schenker Work 15 Tiger Lake-H | |
| Asus VivoBook S15 D533UA | |
| Lenovo ThinkPad E15 G3-20YG003UGE | |
| Dell Inspiron 15 3501 | |
| HP Pavilion x360 15-er0155ng | |
| LG Gram 15Z90P-G.AA89G | |
| AIDA64 / CPU Queen | |
| Asus VivoBook S15 D533UA | |
| Lenovo ThinkPad E15 G3-20YG003UGE | |
| Average of class Office (22784 - 115197, n=69, last 2 years) | |
| Schenker Work 15 Tiger Lake-H | |
| Average Intel Core i7-11370H (42086 - 52930, n=10) | |
| Dell Inspiron 15 3501 | |
| HP Pavilion x360 15-er0155ng | |
| LG Gram 15Z90P-G.AA89G | |
| AIDA64 / FPU SinJulia | |
| Asus VivoBook S15 D533UA | |
| Lenovo ThinkPad E15 G3-20YG003UGE | |
| Average of class Office (1378 - 18321, n=80, last 2 years) | |
| Schenker Work 15 Tiger Lake-H | |
| Average Intel Core i7-11370H (3755 - 5027, n=10) | |
| Dell Inspiron 15 3501 | |
| HP Pavilion x360 15-er0155ng | |
| LG Gram 15Z90P-G.AA89G | |
| AIDA64 / FPU Mandel | |
| Asus VivoBook S15 D533UA | |
| Lenovo ThinkPad E15 G3-20YG003UGE | |
| Average of class Office (4601 - 66922, n=80, last 2 years) | |
| Average Intel Core i7-11370H (14433 - 20417, n=10) | |
| Schenker Work 15 Tiger Lake-H | |
| Dell Inspiron 15 3501 | |
| HP Pavilion x360 15-er0155ng | |
| LG Gram 15Z90P-G.AA89G | |
| AIDA64 / CPU AES | |
| Schenker Work 15 Tiger Lake-H | |
| Average Intel Core i7-11370H (44267 - 76866, n=10) | |
| Dell Inspiron 15 3501 | |
| Asus VivoBook S15 D533UA | |
| Lenovo ThinkPad E15 G3-20YG003UGE | |
| HP Pavilion x360 15-er0155ng | |
| Average of class Office (4854 - 155900, n=80, last 2 years) | |
| LG Gram 15Z90P-G.AA89G | |
| AIDA64 / CPU ZLib | |
| Average of class Office (114.6 - 1366, n=80, last 2 years) | |
| Asus VivoBook S15 D533UA | |
| Lenovo ThinkPad E15 G3-20YG003UGE | |
| Schenker Work 15 Tiger Lake-H | |
| Average Intel Core i7-11370H (289 - 422, n=10) | |
| Dell Inspiron 15 3501 | |
| HP Pavilion x360 15-er0155ng | |
| LG Gram 15Z90P-G.AA89G | |
| AIDA64 / FP64 Ray-Trace | |
| Average of class Office (1109 - 17834, n=80, last 2 years) | |
| Asus VivoBook S15 D533UA | |
| Lenovo ThinkPad E15 G3-20YG003UGE | |
| Average Intel Core i7-11370H (2756 - 4551, n=10) | |
| Schenker Work 15 Tiger Lake-H | |
| Dell Inspiron 15 3501 | |
| HP Pavilion x360 15-er0155ng | |
| LG Gram 15Z90P-G.AA89G | |
| AIDA64 / CPU PhotoWorxx | |
| Average of class Office (11090 - 65229, n=80, last 2 years) | |
| LG Gram 15Z90P-G.AA89G | |
| Schenker Work 15 Tiger Lake-H | |
| Average Intel Core i7-11370H (15892 - 40069, n=10) | |
| HP Pavilion x360 15-er0155ng | |
| Dell Inspiron 15 3501 | |
| Asus VivoBook S15 D533UA | |
| Lenovo ThinkPad E15 G3-20YG003UGE | |
System Performance
The Schenker Work 15 does not compromise in terms of system performance. A high Boost and the generous 32 GB working memory enable the test device to achieve a slightly above-average result in the PCMark10 benchmark. Thus, you get a responsive and powerful device for normal use.
| PCMark 10 / Score | |
| Average of class Office (2601 - 9298, n=64, last 2 years) | |
| Schenker Work 15 Tiger Lake-H | |
| Lenovo ThinkPad E15 G3-20YG003UGE | |
| Asus VivoBook S15 D533UA | |
| Average Intel Core i7-11370H, Intel Iris Xe Graphics G7 96EUs (5199 - 5459, n=6) | |
| Dell Inspiron 15 3501 | |
| LG Gram 15Z90P-G.AA89G | |
| HP Pavilion x360 15-er0155ng | |
| PCMark 10 / Essentials | |
| Schenker Work 15 Tiger Lake-H | |
| Average Intel Core i7-11370H, Intel Iris Xe Graphics G7 96EUs (9996 - 10650, n=6) | |
| Average of class Office (3245 - 11594, n=64, last 2 years) | |
| LG Gram 15Z90P-G.AA89G | |
| Dell Inspiron 15 3501 | |
| HP Pavilion x360 15-er0155ng | |
| Lenovo ThinkPad E15 G3-20YG003UGE | |
| Asus VivoBook S15 D533UA | |
| PCMark 10 / Productivity | |
| Average of class Office (5336 - 17243, n=64, last 2 years) | |
| Lenovo ThinkPad E15 G3-20YG003UGE | |
| Asus VivoBook S15 D533UA | |
| Average Intel Core i7-11370H, Intel Iris Xe Graphics G7 96EUs (6911 - 7388, n=6) | |
| Schenker Work 15 Tiger Lake-H | |
| Dell Inspiron 15 3501 | |
| LG Gram 15Z90P-G.AA89G | |
| HP Pavilion x360 15-er0155ng | |
| PCMark 10 / Digital Content Creation | |
| Average of class Office (2049 - 13541, n=64, last 2 years) | |
| Schenker Work 15 Tiger Lake-H | |
| Average Intel Core i7-11370H, Intel Iris Xe Graphics G7 96EUs (5483 - 5838, n=6) | |
| Asus VivoBook S15 D533UA | |
| Lenovo ThinkPad E15 G3-20YG003UGE | |
| Dell Inspiron 15 3501 | |
| LG Gram 15Z90P-G.AA89G | |
| HP Pavilion x360 15-er0155ng | |
| PCMark 10 Score | 5415 points | |
Help | ||
| AIDA64 / Memory Copy | |
| Average of class Office (20075 - 110930, n=77, last 2 years) | |
| LG Gram 15Z90P-G.AA89G | |
| Schenker Work 15 Tiger Lake-H | |
| Average Intel Core i7-11370H (32035 - 64524, n=10) | |
| HP Pavilion x360 15-er0155ng | |
| Asus VivoBook S15 D533UA | |
| Lenovo ThinkPad E15 G3-20YG003UGE | |
| Dell Inspiron 15 3501 | |
| AIDA64 / Memory Read | |
| Average of class Office (10084 - 128030, n=78, last 2 years) | |
| LG Gram 15Z90P-G.AA89G | |
| Schenker Work 15 Tiger Lake-H | |
| Average Intel Core i7-11370H (37216 - 62417, n=10) | |
| HP Pavilion x360 15-er0155ng | |
| Asus VivoBook S15 D533UA | |
| Lenovo ThinkPad E15 G3-20YG003UGE | |
| Dell Inspiron 15 3501 | |
| AIDA64 / Memory Write | |
| Average of class Office (20073 - 119858, n=78, last 2 years) | |
| LG Gram 15Z90P-G.AA89G | |
| Average Intel Core i7-11370H (36920 - 65610, n=10) | |
| Schenker Work 15 Tiger Lake-H | |
| HP Pavilion x360 15-er0155ng | |
| Asus VivoBook S15 D533UA | |
| Lenovo ThinkPad E15 G3-20YG003UGE | |
| Dell Inspiron 15 3501 | |
| AIDA64 / Memory Latency | |
| LG Gram 15Z90P-G.AA89G | |
| Lenovo ThinkPad E15 G3-20YG003UGE | |
| Average of class Office (7.6 - 162.9, n=73, last 2 years) | |
| Asus VivoBook S15 D533UA | |
| Dell Inspiron 15 3501 | |
| Average Intel Core i7-11370H (73.4 - 103, n=10) | |
| Schenker Work 15 Tiger Lake-H | |
| HP Pavilion x360 15-er0155ng | |
* ... smaller is better
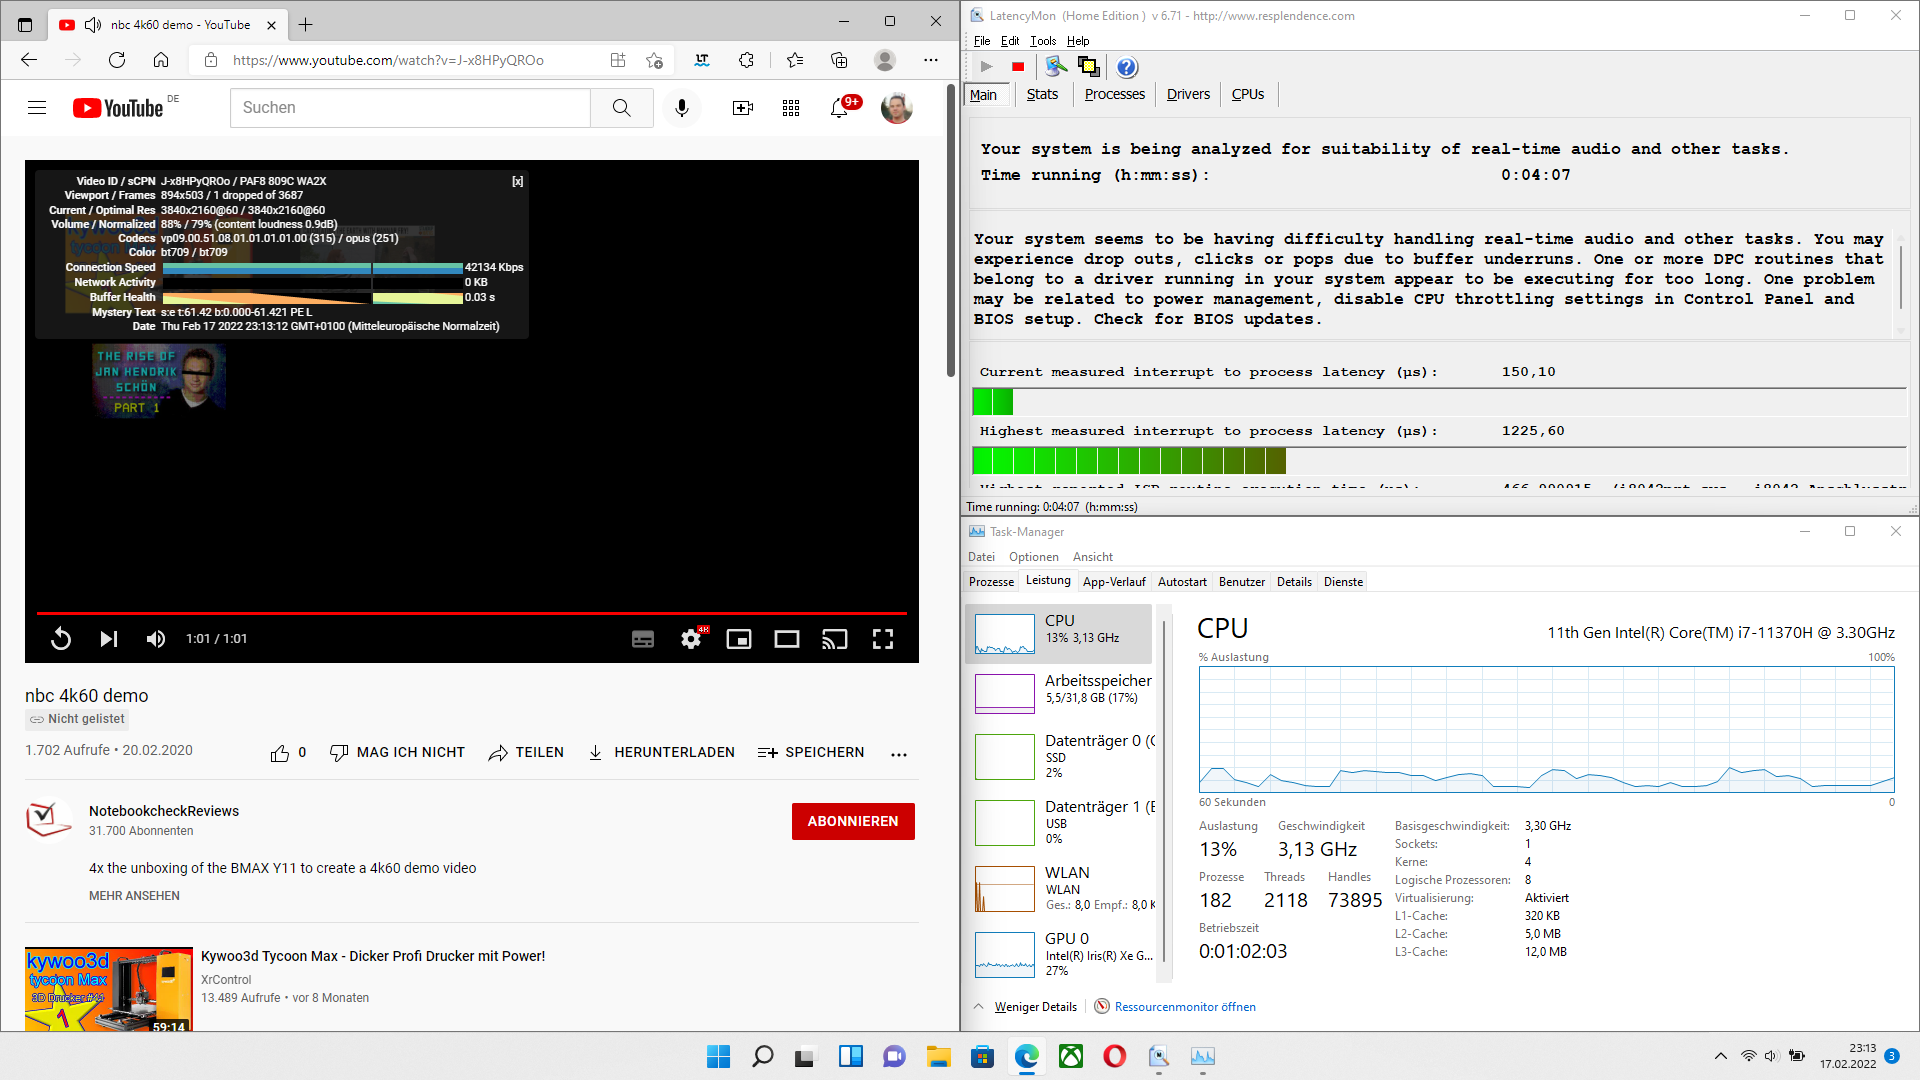
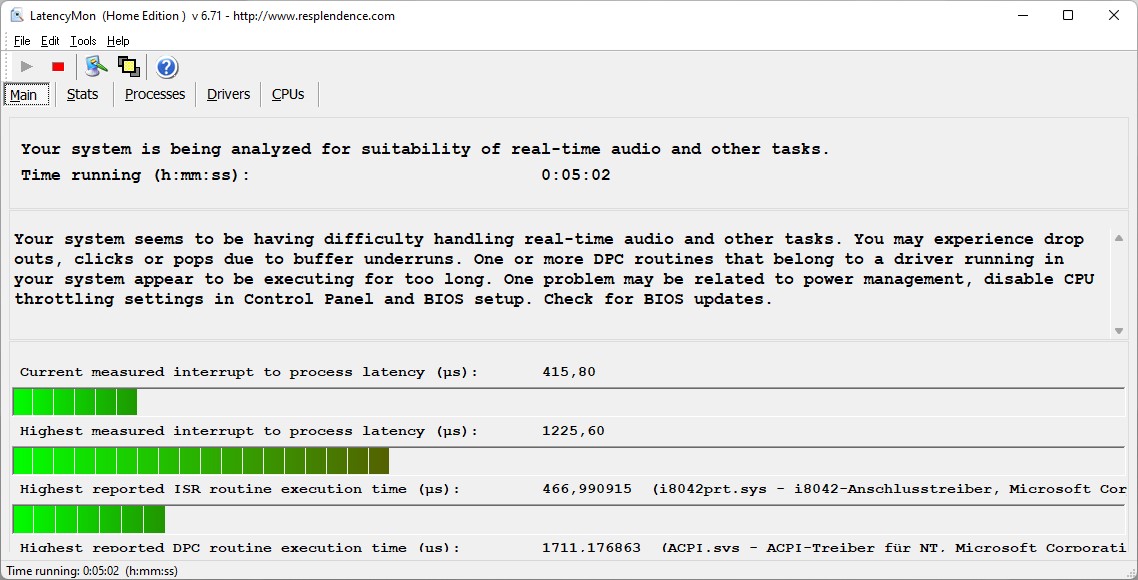
DPC Latency
With a DPC latency of over one millisecond, the Schenker Work 15 is not alone in the comparison field. This far from good value reflects the problems of many current laptops, but this can fluctuate greatly with driver updates.

| DPC Latencies / LatencyMon - interrupt to process latency (max), Web, Youtube, Prime95 | |
| LG Gram 15Z90P-G.AA89G | |
| Schenker Work 15 Tiger Lake-H | |
| Dell Inspiron 15 3501 | |
| Lenovo ThinkPad E15 G3-20YG003UGE | |
| Asus VivoBook S15 D533UA | |
* ... smaller is better
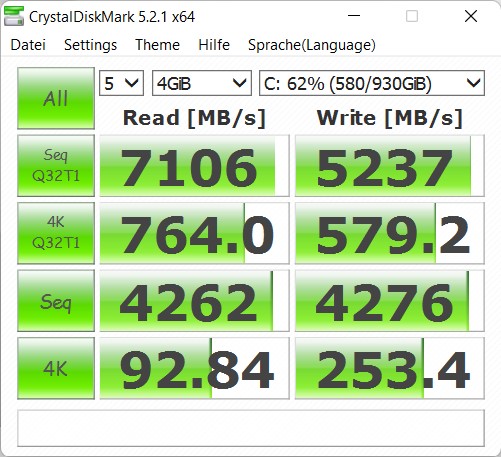
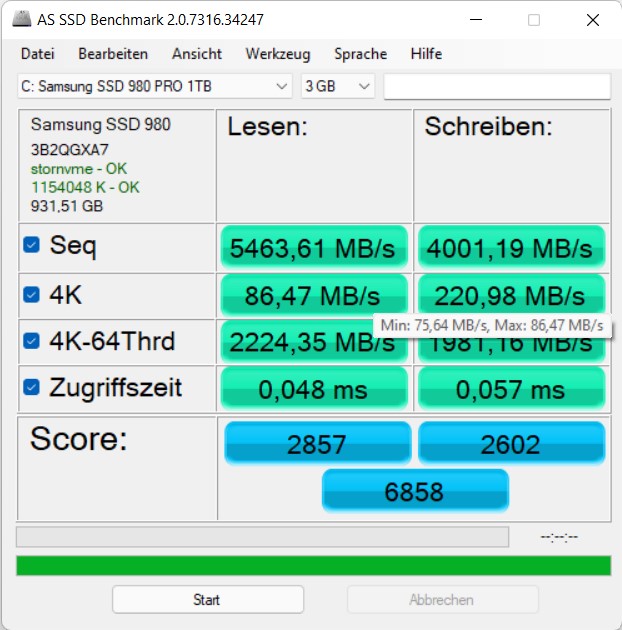
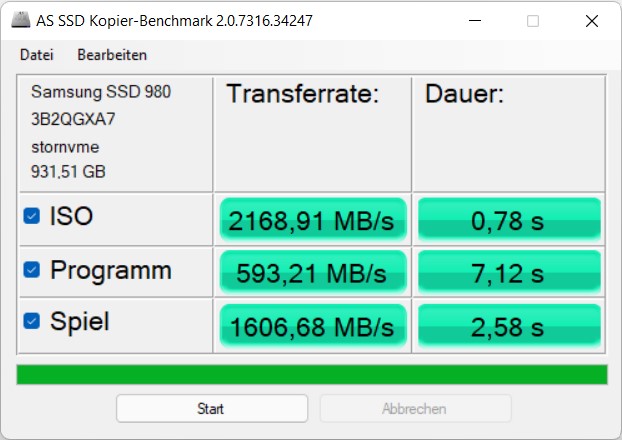
Mass storage
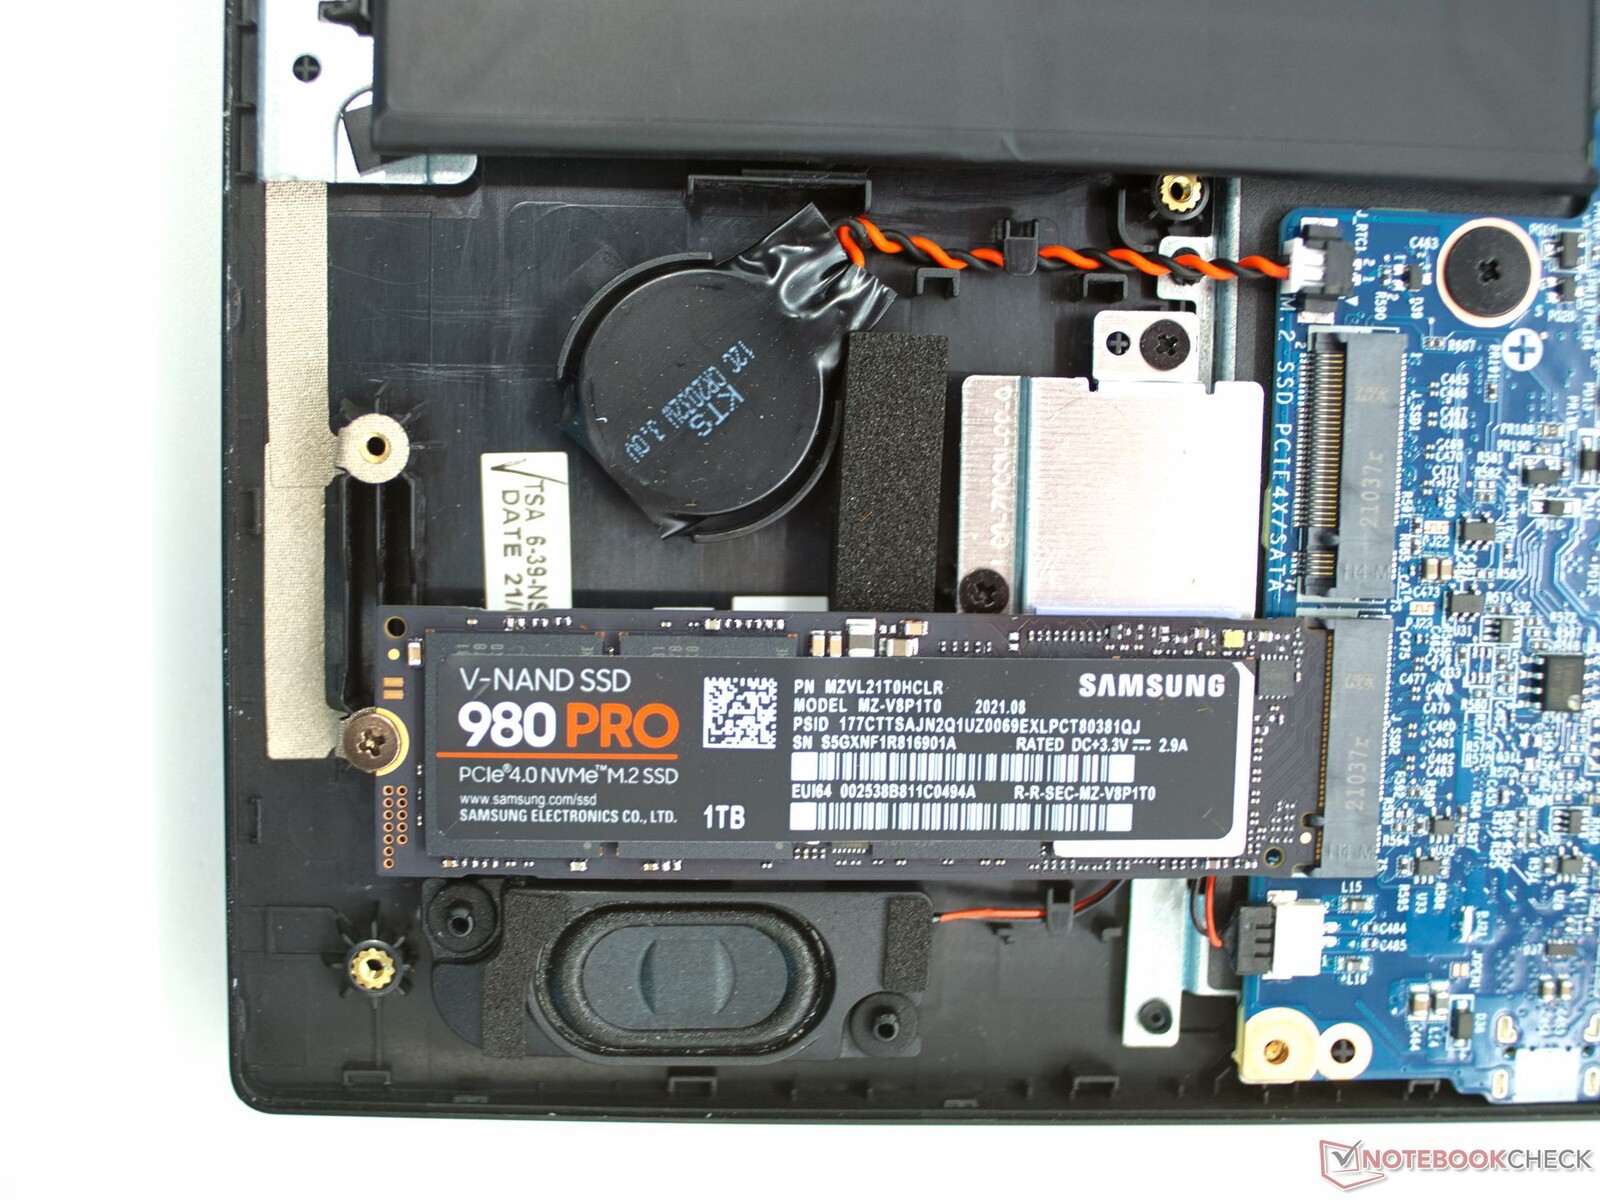
The Samsung 980 Pro with 1 TB of storage space is one of the fastest storage options, according to our benchmark table of SSDs and HDDs. The SSD works at expected high speeds in the Schenker laptop thanks to PCIe 4.0 (the second M.2 slot uses a PCIe 3.0 x4 interface).

* ... smaller is better
Dauerleistung Lesen: DiskSpd Read Loop, Queue Depth 8
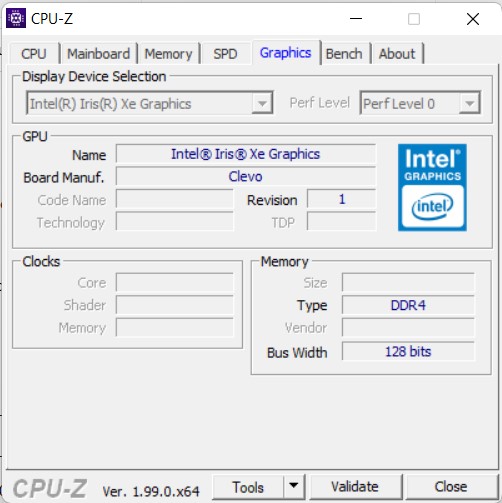
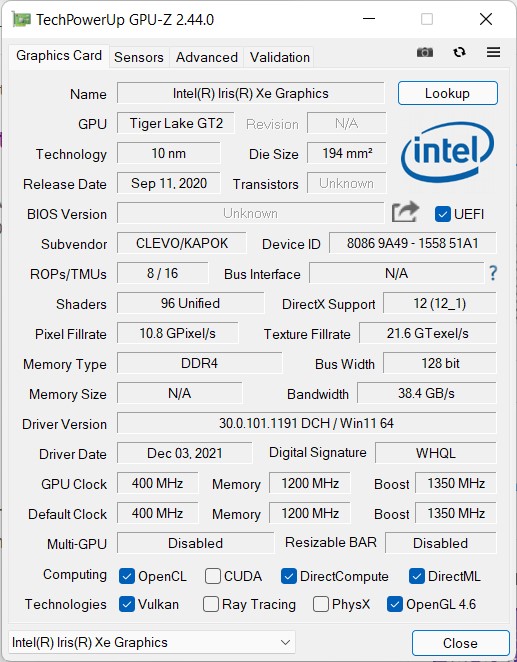
Graphics card
With the Intel Iris Xe Graphics G7 with 96EUs the Schenker Work 15 does not become a gaming laptop, but the office notebook can still render many games smoothly. The laptop also delivers quite good scores in the 3DMark benchmarks, especially since the iGPU has a lot of working memory at its disposal. If you need more graphics power, you can connect an external graphics card via the Thunderbolt 4 port.
| 3DMark 06 Standard Score | 27110 points | |
| 3DMark Ice Storm Standard Score | 72531 points | |
| 3DMark Fire Strike Score | 4450 points | |
| 3DMark Time Spy Score | 1774 points | |
Help | ||
| The Witcher 3 | |
| 1366x768 Medium Graphics & Postprocessing | |
| Schenker Work 15 Tiger Lake-H | |
| Average Intel Iris Xe Graphics G7 96EUs (21.4 - 77.8, n=185) | |
| Average of class Office (44.7 - 63.9, n=4, last 2 years) | |
| Dell Inspiron 15 3501 | |
| Asus VivoBook S15 D533UA | |
| LG Gram 15Z90P-G.AA89G | |
| 1920x1080 High Graphics & Postprocessing (Nvidia HairWorks Off) | |
| Average of class Office (23.7 - 39.9, n=4, last 2 years) | |
| Average Intel Iris Xe Graphics G7 96EUs (10.6 - 45.9, n=191) | |
| Schenker Work 15 Tiger Lake-H | |
| Lenovo ThinkPad E15 G3-20YG003UGE | |
| Asus VivoBook S15 D533UA | |
| LG Gram 15Z90P-G.AA89G | |
| Dell Inspiron 15 3501 | |
| F1 2021 | |
| 1920x1080 Medium Preset AA:T AF:16x | |
| Schenker Work 15 Tiger Lake-H | |
| Average Intel Iris Xe Graphics G7 96EUs (29.4 - 64.9, n=45) | |
| Lenovo ThinkPad E15 G3-20YG003UGE | |
| 1920x1080 High Preset AA:T AF:16x | |
| Schenker Work 15 Tiger Lake-H | |
| Average Intel Iris Xe Graphics G7 96EUs (24 - 50.8, n=45) | |
| Lenovo ThinkPad E15 G3-20YG003UGE | |
Witcher 3 FPS-Diagramm
| low | med. | high | ultra | |
|---|---|---|---|---|
| GTA V (2015) | 92 | 73.2 | 24.7 | 10.1 |
| The Witcher 3 (2015) | 91.2 | 59.2 | 22 | 12.6 |
| Dota 2 Reborn (2015) | 120 | 70 | 47 | 47.2 |
| X-Plane 11.11 (2018) | 40 | 34 | 30.4 | |
| Far Cry 5 (2018) | 47 | 25 | 22 | |
| Strange Brigade (2018) | 87 | 36.9 | 29.9 | 24.4 |
| F1 2021 (2021) | 99.1 | 48.2 | 38.1 | 26.9 |
Emissions & energy: Loud but cool
Noise emissions
With noise emissions around 45 dB(A), the Schenker Work 15 is not really quiet under load and is almost annoyingly loud. However, the fan stays below the perception threshold or can go completely off depending on the set power mode. The fans do not produce unpleasantly high frequencies in any case.
Noise level
| Idle |
| 24.4 / 24.4 / 26.7 dB(A) |
| Load |
| 43.8 / 44.8 dB(A) |
 | ||
30 dB silent 40 dB(A) audible 50 dB(A) loud |
||
min: | ||
| Schenker Work 15 Tiger Lake-H Iris Xe G7 96EUs, i7-11370H, Samsung SSD 980 Pro 1TB MZ-V8P1T0BW | LG Gram 15Z90P-G.AA89G Iris Xe G7 96EUs, i7-1165G7, SK Hynix HFM001TD3JX013N | Dell Inspiron 15 3501 Iris Xe G7 96EUs, i7-1165G7, Samsung PM991a MZ9LQ512HBLU-00BD1 | Lenovo ThinkPad E15 G3-20YG003UGE Vega 8, R7 5700U, SK Hynix PC711 1TB HFS001TDE9X084N | Asus VivoBook S15 D533UA Vega 8, R7 5700U, WDC PC SN530 SDBPNPZ-1T00 | HP Pavilion x360 15-er0155ng Iris Xe G7 80EUs, i5-1135G7, WDC PC SN530 SDBPNPZ-512G | |
|---|---|---|---|---|---|---|
| Noise | 8% | 3% | 8% | -5% | 2% | |
| off / environment * (dB) | 24.4 | 25 -2% | 26 -7% | 23.8 2% | 26 -7% | 26 -7% |
| Idle Minimum * (dB) | 24.4 | 25 -2% | 26 -7% | 23.8 2% | 26 -7% | 26 -7% |
| Idle Average * (dB) | 24.4 | 25 -2% | 26 -7% | 23.8 2% | 26 -7% | 26 -7% |
| Idle Maximum * (dB) | 26.7 | 26.7 -0% | 26 3% | 28 -5% | 28.8 -8% | 26 3% |
| Load Average * (dB) | 43.8 | 32.2 26% | 35.9 18% | 32.9 25% | 45 -3% | 35.1 20% |
| Witcher 3 ultra * (dB) | 43.8 | |||||
| Load Maximum * (dB) | 44.8 | 32.4 28% | 35.8 20% | 35 22% | 45 -0% | 39.6 12% |
* ... smaller is better
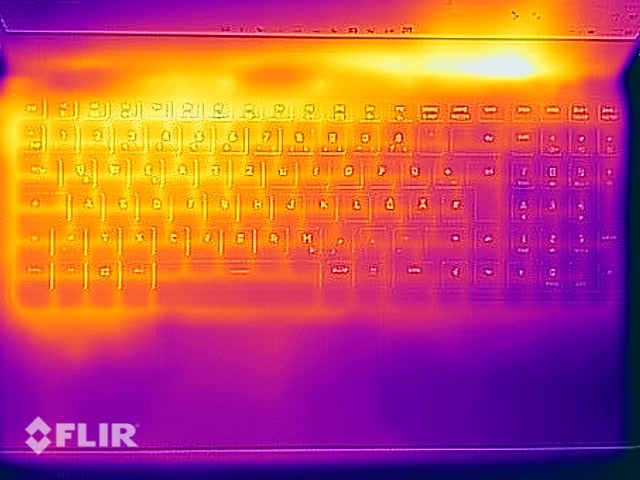
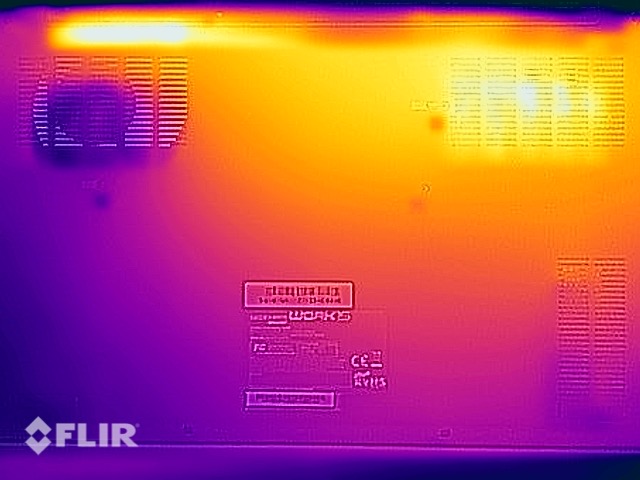
Temperature
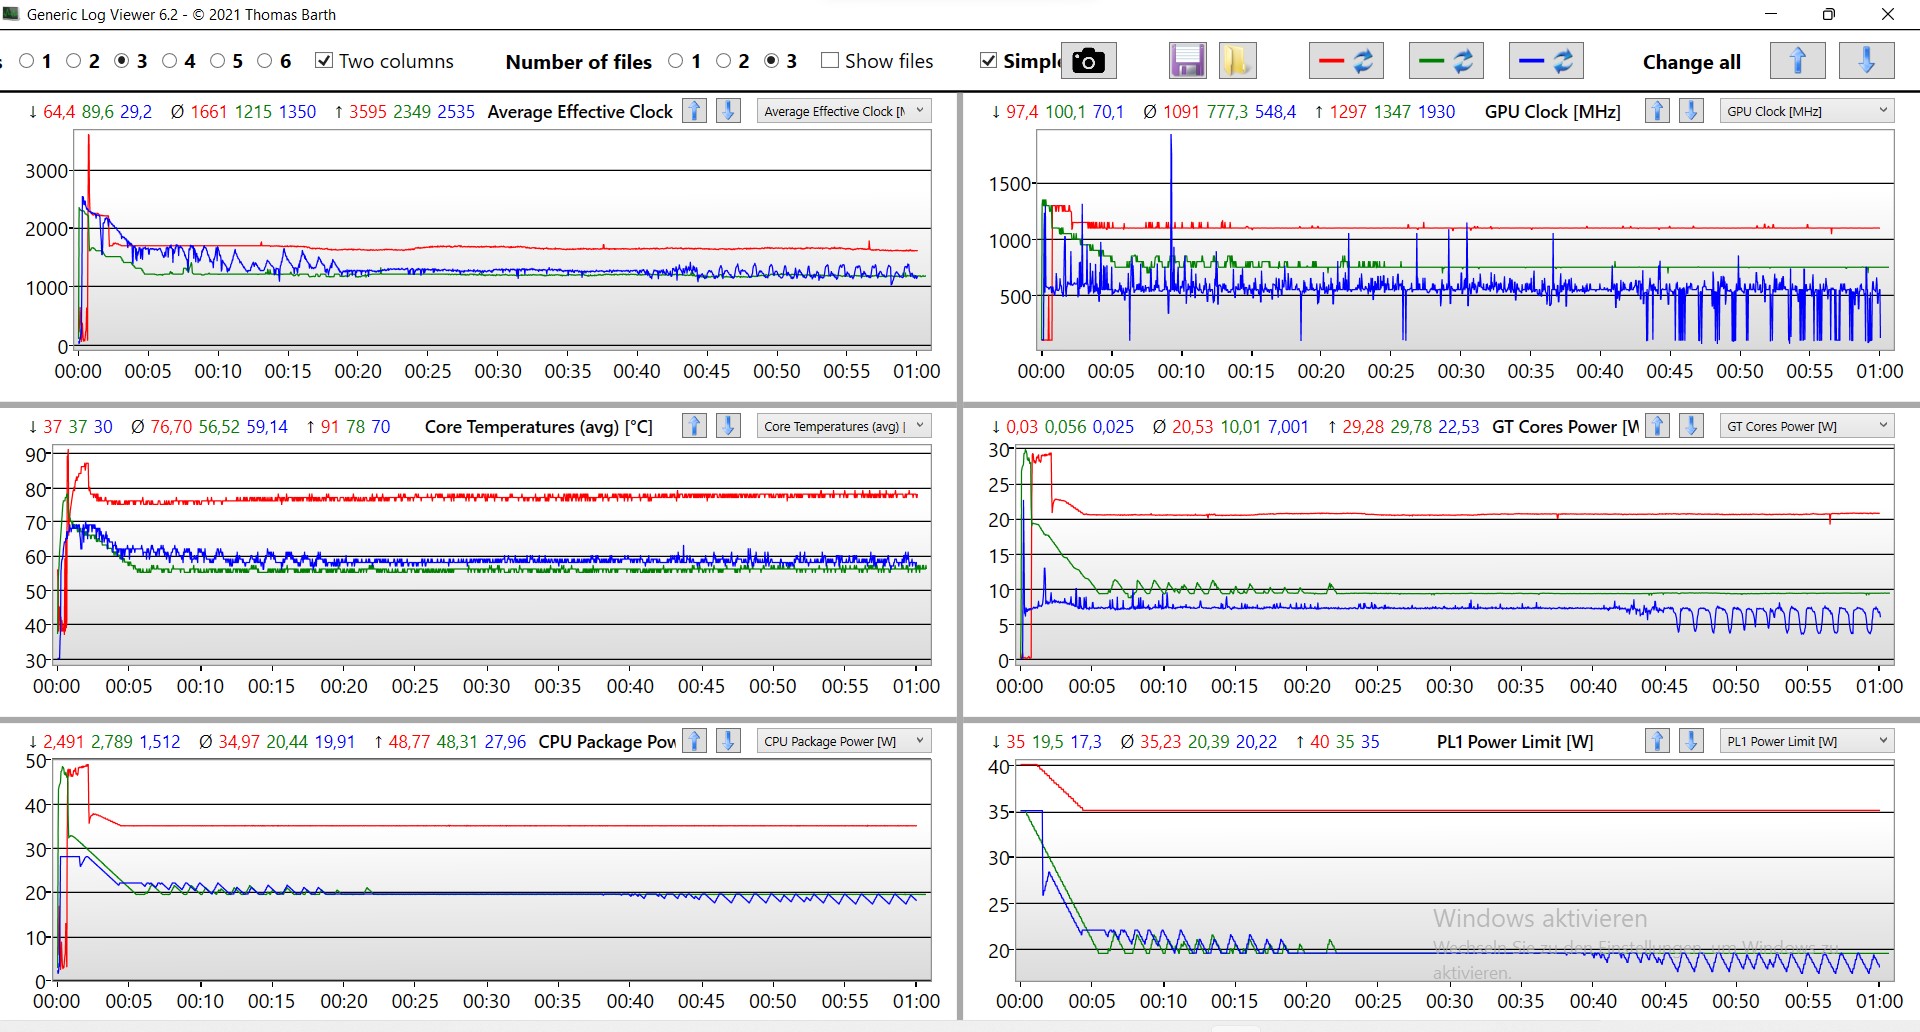
The laptop's surface temperatures are barely above human body temperature in the stress test. The underside gets noticeably warmer than the upper side, but the palm rests always remain relatively cool
In the stress test, the laptop can maintain the performance set via the Control Center over the long term. Thus, the office laptop shows great endurance. Nevertheless, it is noticeable that slight fluctuations of the PL1 occur in Entertainment mode.
(+) The maximum temperature on the upper side is 39.1 °C / 102 F, compared to the average of 34.3 °C / 94 F, ranging from 21.2 to 62.5 °C for the class Office.
(±) The bottom heats up to a maximum of 43.4 °C / 110 F, compared to the average of 36.8 °C / 98 F
(+) In idle usage, the average temperature for the upper side is 23.6 °C / 74 F, compared to the device average of 29.5 °C / 85 F.
(+) Playing The Witcher 3, the average temperature for the upper side is 31.6 °C / 89 F, compared to the device average of 29.5 °C / 85 F.
(+) The palmrests and touchpad are cooler than skin temperature with a maximum of 29 °C / 84.2 F and are therefore cool to the touch.
(±) The average temperature of the palmrest area of similar devices was 27.5 °C / 81.5 F (-1.5 °C / -2.7 F).
| Schenker Work 15 Tiger Lake-H Intel Core i7-11370H, Intel Iris Xe Graphics G7 96EUs | LG Gram 15Z90P-G.AA89G Intel Core i7-1165G7, Intel Iris Xe Graphics G7 96EUs | Dell Inspiron 15 3501 Intel Core i7-1165G7, Intel Iris Xe Graphics G7 96EUs | Lenovo ThinkPad E15 G3-20YG003UGE AMD Ryzen 7 5700U, AMD Radeon RX Vega 8 (Ryzen 4000/5000) | Asus VivoBook S15 D533UA AMD Ryzen 7 5700U, AMD Radeon RX Vega 8 (Ryzen 4000/5000) | HP Pavilion x360 15-er0155ng Intel Core i5-1135G7, Intel Iris Xe Graphics G7 80EUs | |
|---|---|---|---|---|---|---|
| Heat | -1% | -11% | -20% | -13% | -5% | |
| Maximum Upper Side * (°C) | 39.1 | 42.9 -10% | 45.6 -17% | 46.4 -19% | 46.1 -18% | 39.9 -2% |
| Maximum Bottom * (°C) | 43.4 | 39.4 9% | 41 6% | 60.9 -40% | 46.6 -7% | 43.1 1% |
| Idle Upper Side * (°C) | 24.3 | 25.4 -5% | 28.2 -16% | 26.5 -9% | 27.4 -13% | 26.3 -8% |
| Idle Bottom * (°C) | 25.1 | 24.9 1% | 29.1 -16% | 27.5 -10% | 28.2 -12% | 27.4 -9% |
* ... smaller is better
Loudspeaker
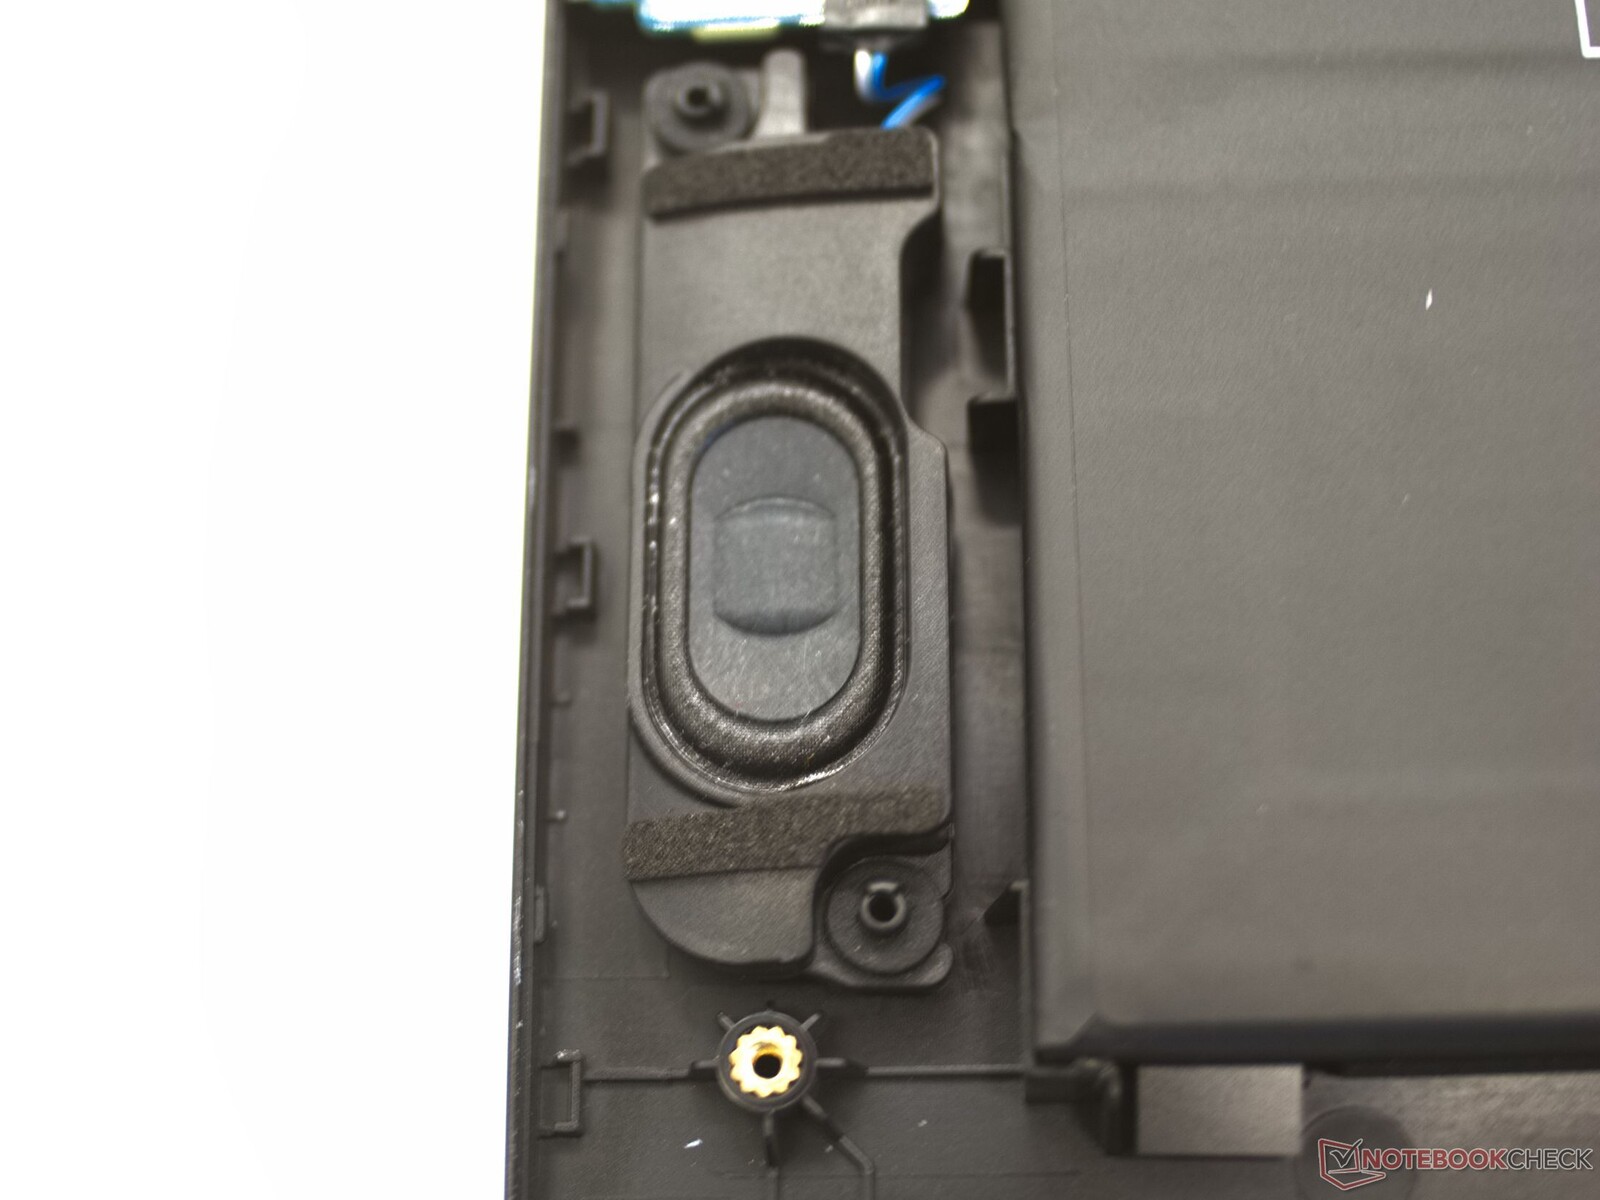
The small speakers of the Schenker Work 15 are sufficient for an office laptop. However, due to a less linear reproduction of different frequencies and the lack of bass and sub-bass, the sound comes across as very tinny.
Schenker Work 15 Tiger Lake-H audio analysis
(+) | speakers can play relatively loud (82.3 dB)
Bass 100 - 315 Hz
(-) | nearly no bass - on average 27.2% lower than median
(+) | bass is linear (6.5% delta to prev. frequency)
Mids 400 - 2000 Hz
(±) | higher mids - on average 10.1% higher than median
(-) | mids are not linear (15.1% delta to prev. frequency)
Highs 2 - 16 kHz
(+) | balanced highs - only 4.1% away from median
(+) | highs are linear (6.9% delta to prev. frequency)
Overall 100 - 16.000 Hz
(±) | linearity of overall sound is average (28.8% difference to median)
Compared to same class
» 89% of all tested devices in this class were better, 2% similar, 8% worse
» The best had a delta of 7%, average was 21%, worst was 53%
Compared to all devices tested
» 86% of all tested devices were better, 3% similar, 11% worse
» The best had a delta of 4%, average was 24%, worst was 134%
LG Gram 15Z90P-G.AA89G audio analysis
(+) | speakers can play relatively loud (85.3 dB)
Bass 100 - 315 Hz
(-) | nearly no bass - on average 19.7% lower than median
(±) | linearity of bass is average (13.4% delta to prev. frequency)
Mids 400 - 2000 Hz
(+) | balanced mids - only 2.1% away from median
(+) | mids are linear (3.7% delta to prev. frequency)
Highs 2 - 16 kHz
(±) | higher highs - on average 7.4% higher than median
(±) | linearity of highs is average (7.7% delta to prev. frequency)
Overall 100 - 16.000 Hz
(±) | linearity of overall sound is average (16.6% difference to median)
Compared to same class
» 42% of all tested devices in this class were better, 6% similar, 52% worse
» The best had a delta of 5%, average was 18%, worst was 53%
Compared to all devices tested
» 29% of all tested devices were better, 6% similar, 65% worse
» The best had a delta of 4%, average was 24%, worst was 134%
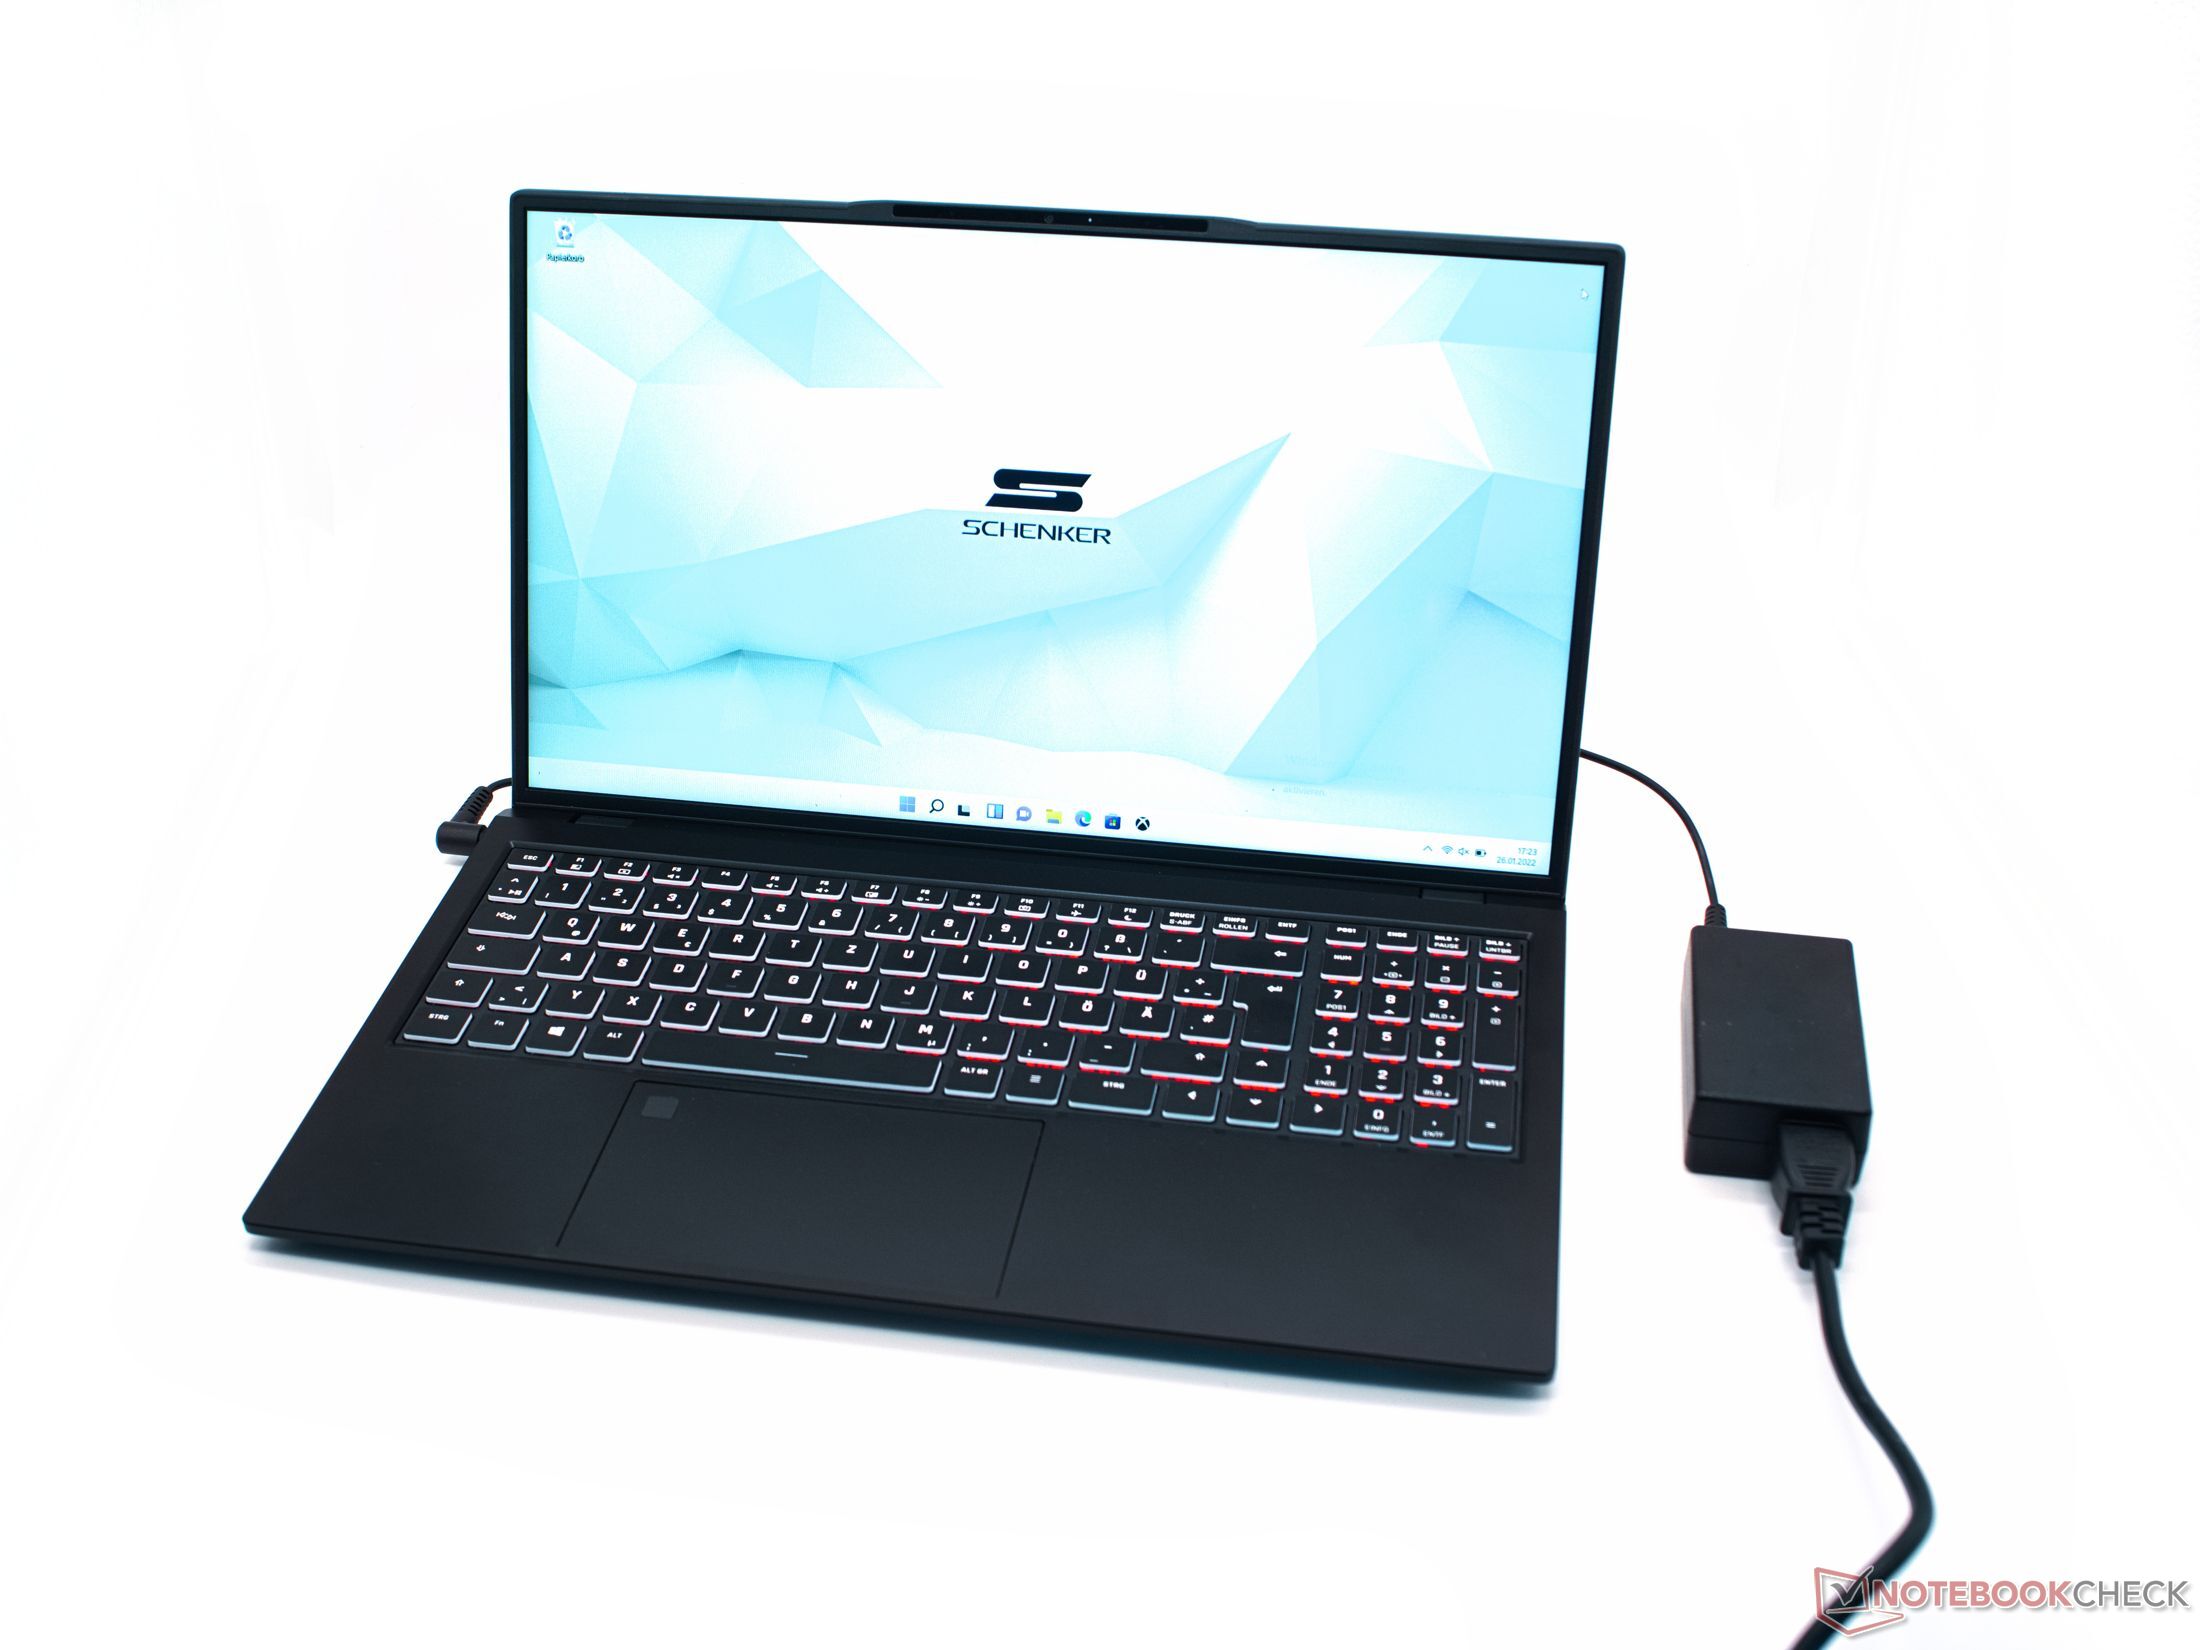
Power management: Long battery runtimes
Energy absorption
With an average of 8 W of idle power consumption, Schenker's laptop is quite energy-saving. Under load, however, it can also fully utilize the 65 W power limit of the included power supply for several minutes. With a measured maximum power consumption of 69.4 W, the power supply is just about sufficient.
| Off / Standby | |
| Idle | |
| Load |
|
Key:
min: | |
Energieaufnahme Witcher 3 / Stresstest
Power consumption with external monitor
Battery life
The dual-cell 74 Whr lithium-ion battery enables relatively long battery runtimes for the Schenker Work 15. Eight to 10 hours in our practical Wi-Fi web surfing test should also result in correspondingly long real-world work times. Even under load, the runtimes are relatively long but with the restriction that the available computing power is significantly lower than in mains operation.
| Schenker Work 15 Tiger Lake-H i7-11370H, Iris Xe G7 96EUs, 73 Wh | LG Gram 15Z90P-G.AA89G i7-1165G7, Iris Xe G7 96EUs, 80 Wh | Dell Inspiron 15 3501 i7-1165G7, Iris Xe G7 96EUs, 42 Wh | Lenovo ThinkPad E15 G3-20YG003UGE R7 5700U, Vega 8, 57 Wh | Asus VivoBook S15 D533UA R7 5700U, Vega 8, 50 Wh | Average of class Office | |
|---|---|---|---|---|---|---|
| Battery runtime | 41% | -33% | -2% | -12% | 15% | |
| Reader / Idle (h) | 24.5 | 26 6% | 23.7 ? -3% | |||
| H.264 (h) | 9.6 | 15 ? 56% | ||||
| WiFi v1.3 (h) | 10.2 | 13.7 34% | 6.8 -33% | 10 -2% | 9 -12% | 12.9 ? 26% |
| Load (h) | 2.2 | 4 82% | 1.794 ? -18% |
Pros
Cons
Verdict: Exciting configuration options with savings potential
An excellent keyboard, long battery run times, and many ports make the Schenker Work 15 an excellent office laptop. However, the good performance of the Intel Core i7-11370H is accompanied by a relatively high noise level. Many configuration options in software and hardware allow buyers to adapt the notebook to their own needs.
Internet applications and office as well as many games don't pose a big challenge for the APU. The laptop doesn't show any major weaknesses. Only the screen could be a bit better, but it is adequate for an office device.
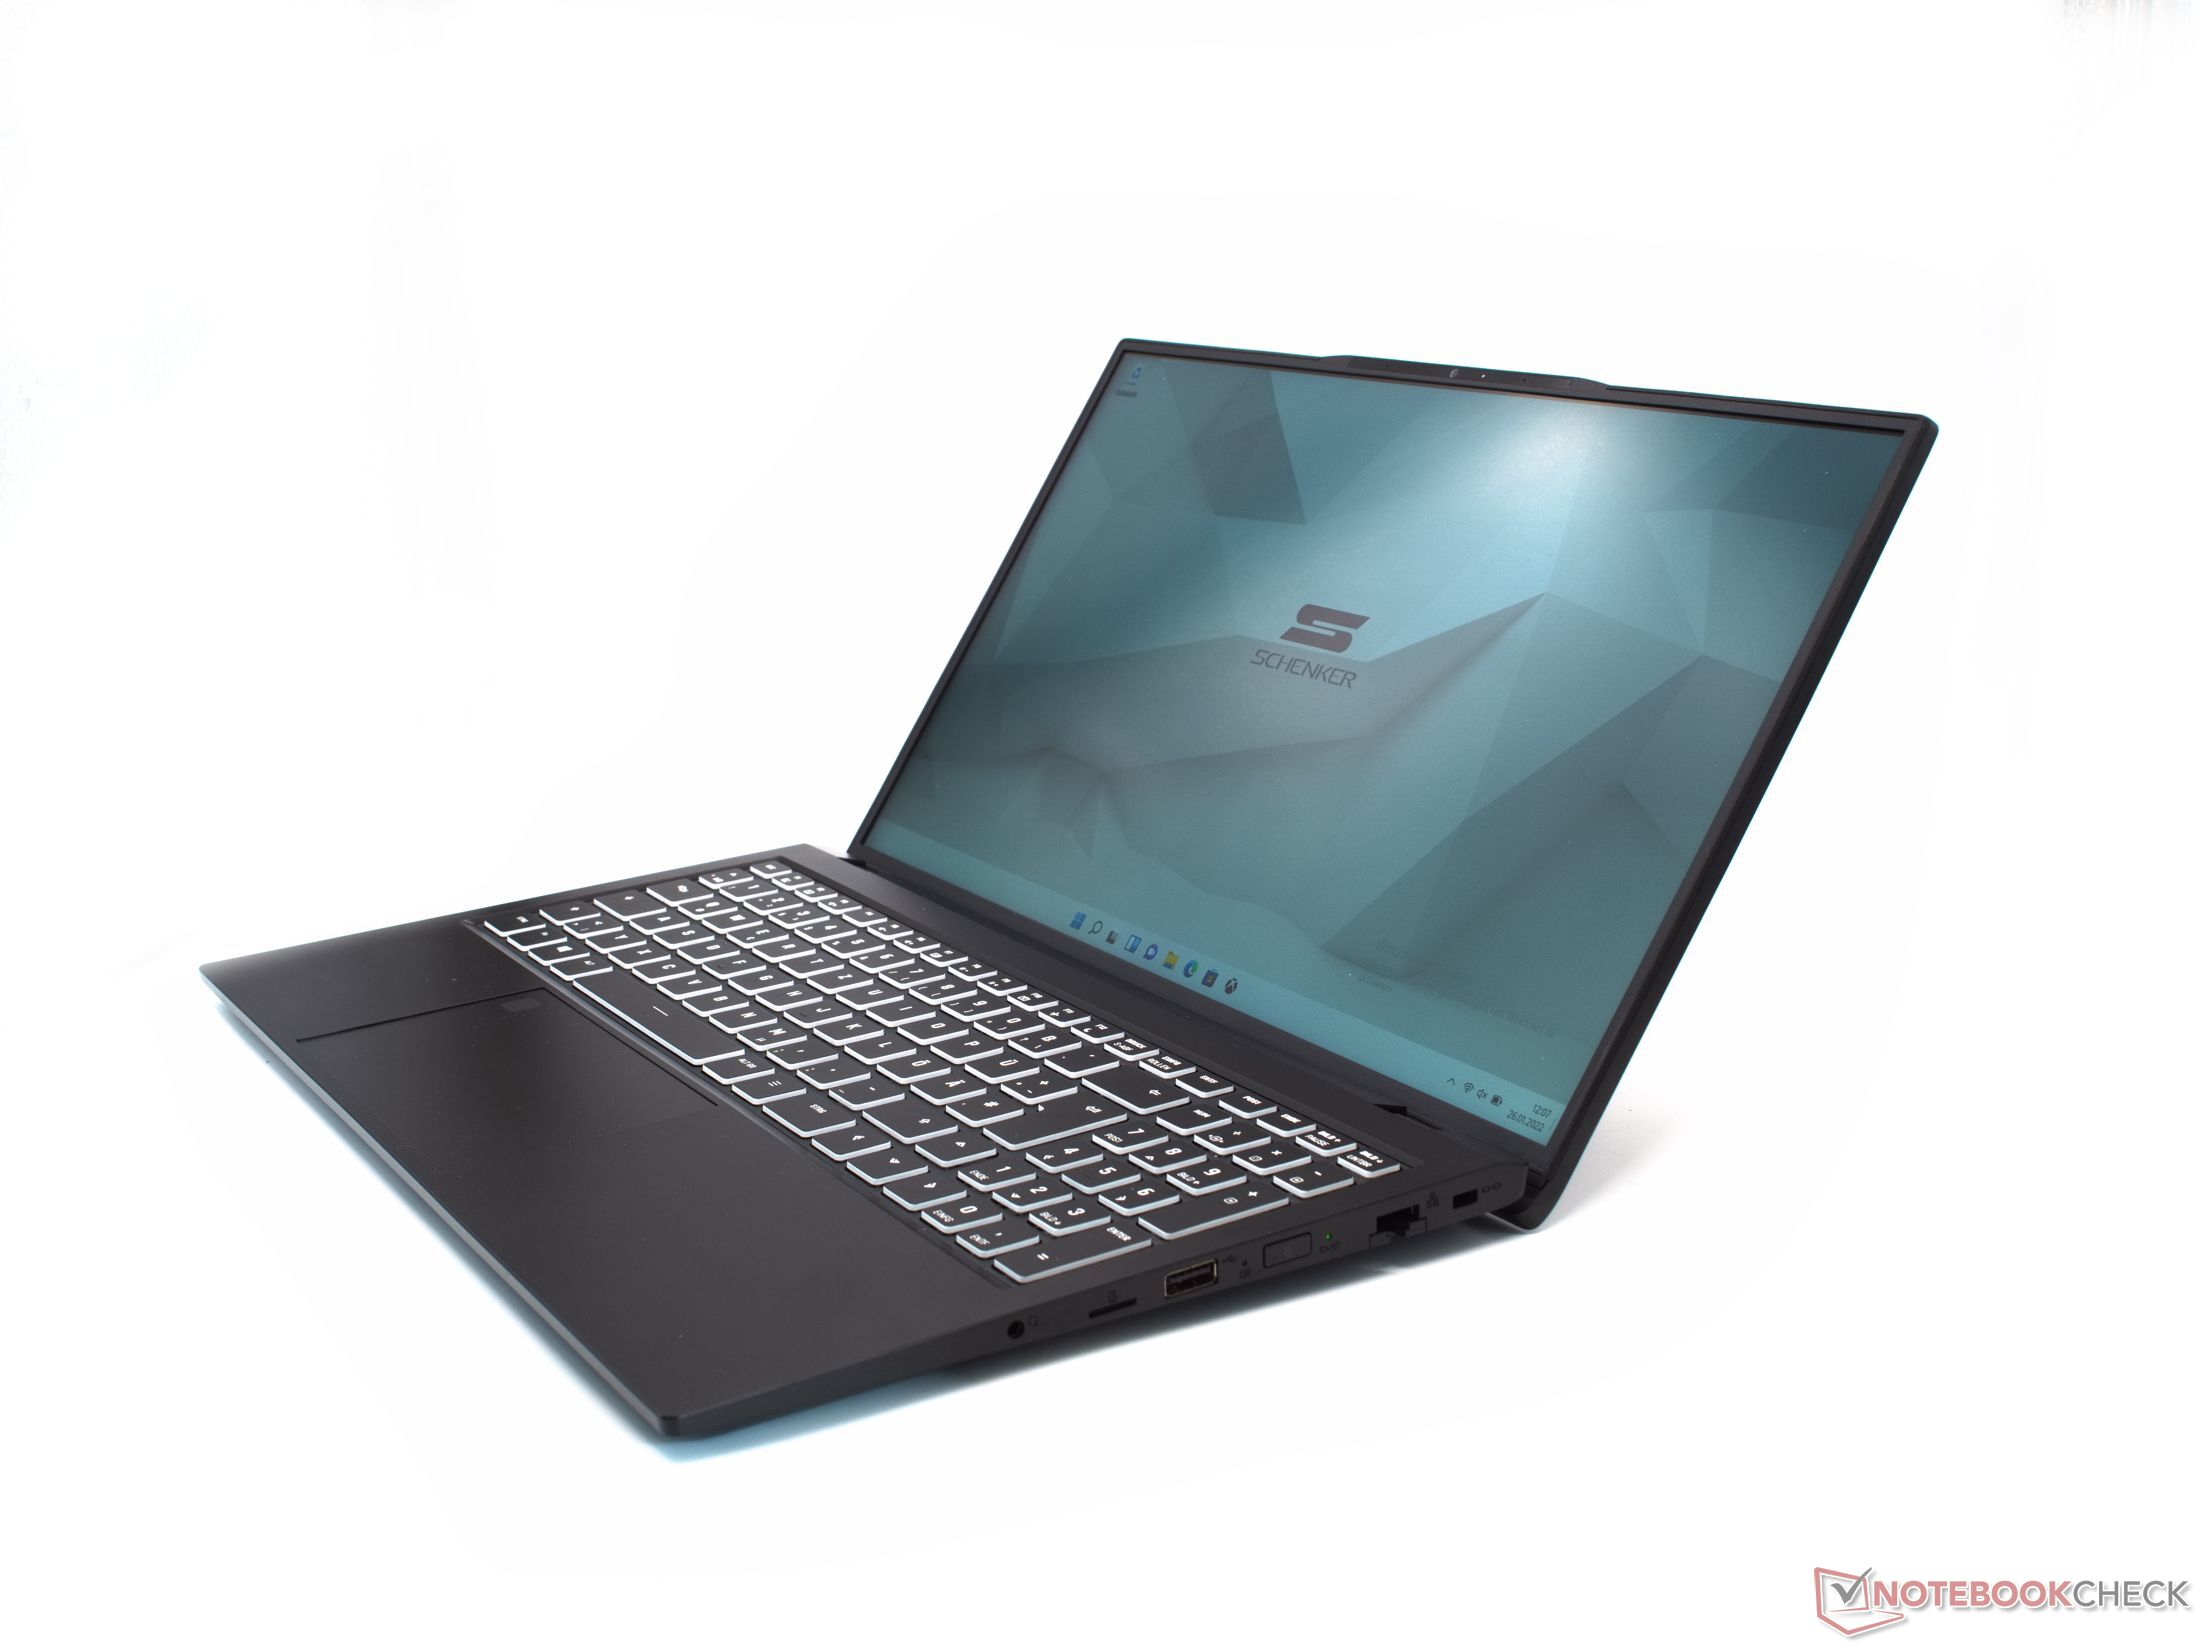
The Schenker Work 15 is an unusual office laptop with many configuration options.
Users who do not want to pay the high purchase price can save a lot of money in the configurator with an i5 and less working memory. Presumably, the slightly weaker Core i5-11300H should not have a significantly negative impact on the computing performance. However, the purchase price can also be reduced by quite a few Euros by choosing a shorter warranty period or a different SSD.
Price and availability
The Schenker Work 15 is available from the manufacturer in various configurations starting at €927.
Schenker Work 15 Tiger Lake-H
- 02/18/2022 v7 (old)
Marc Herter
Price comparison

