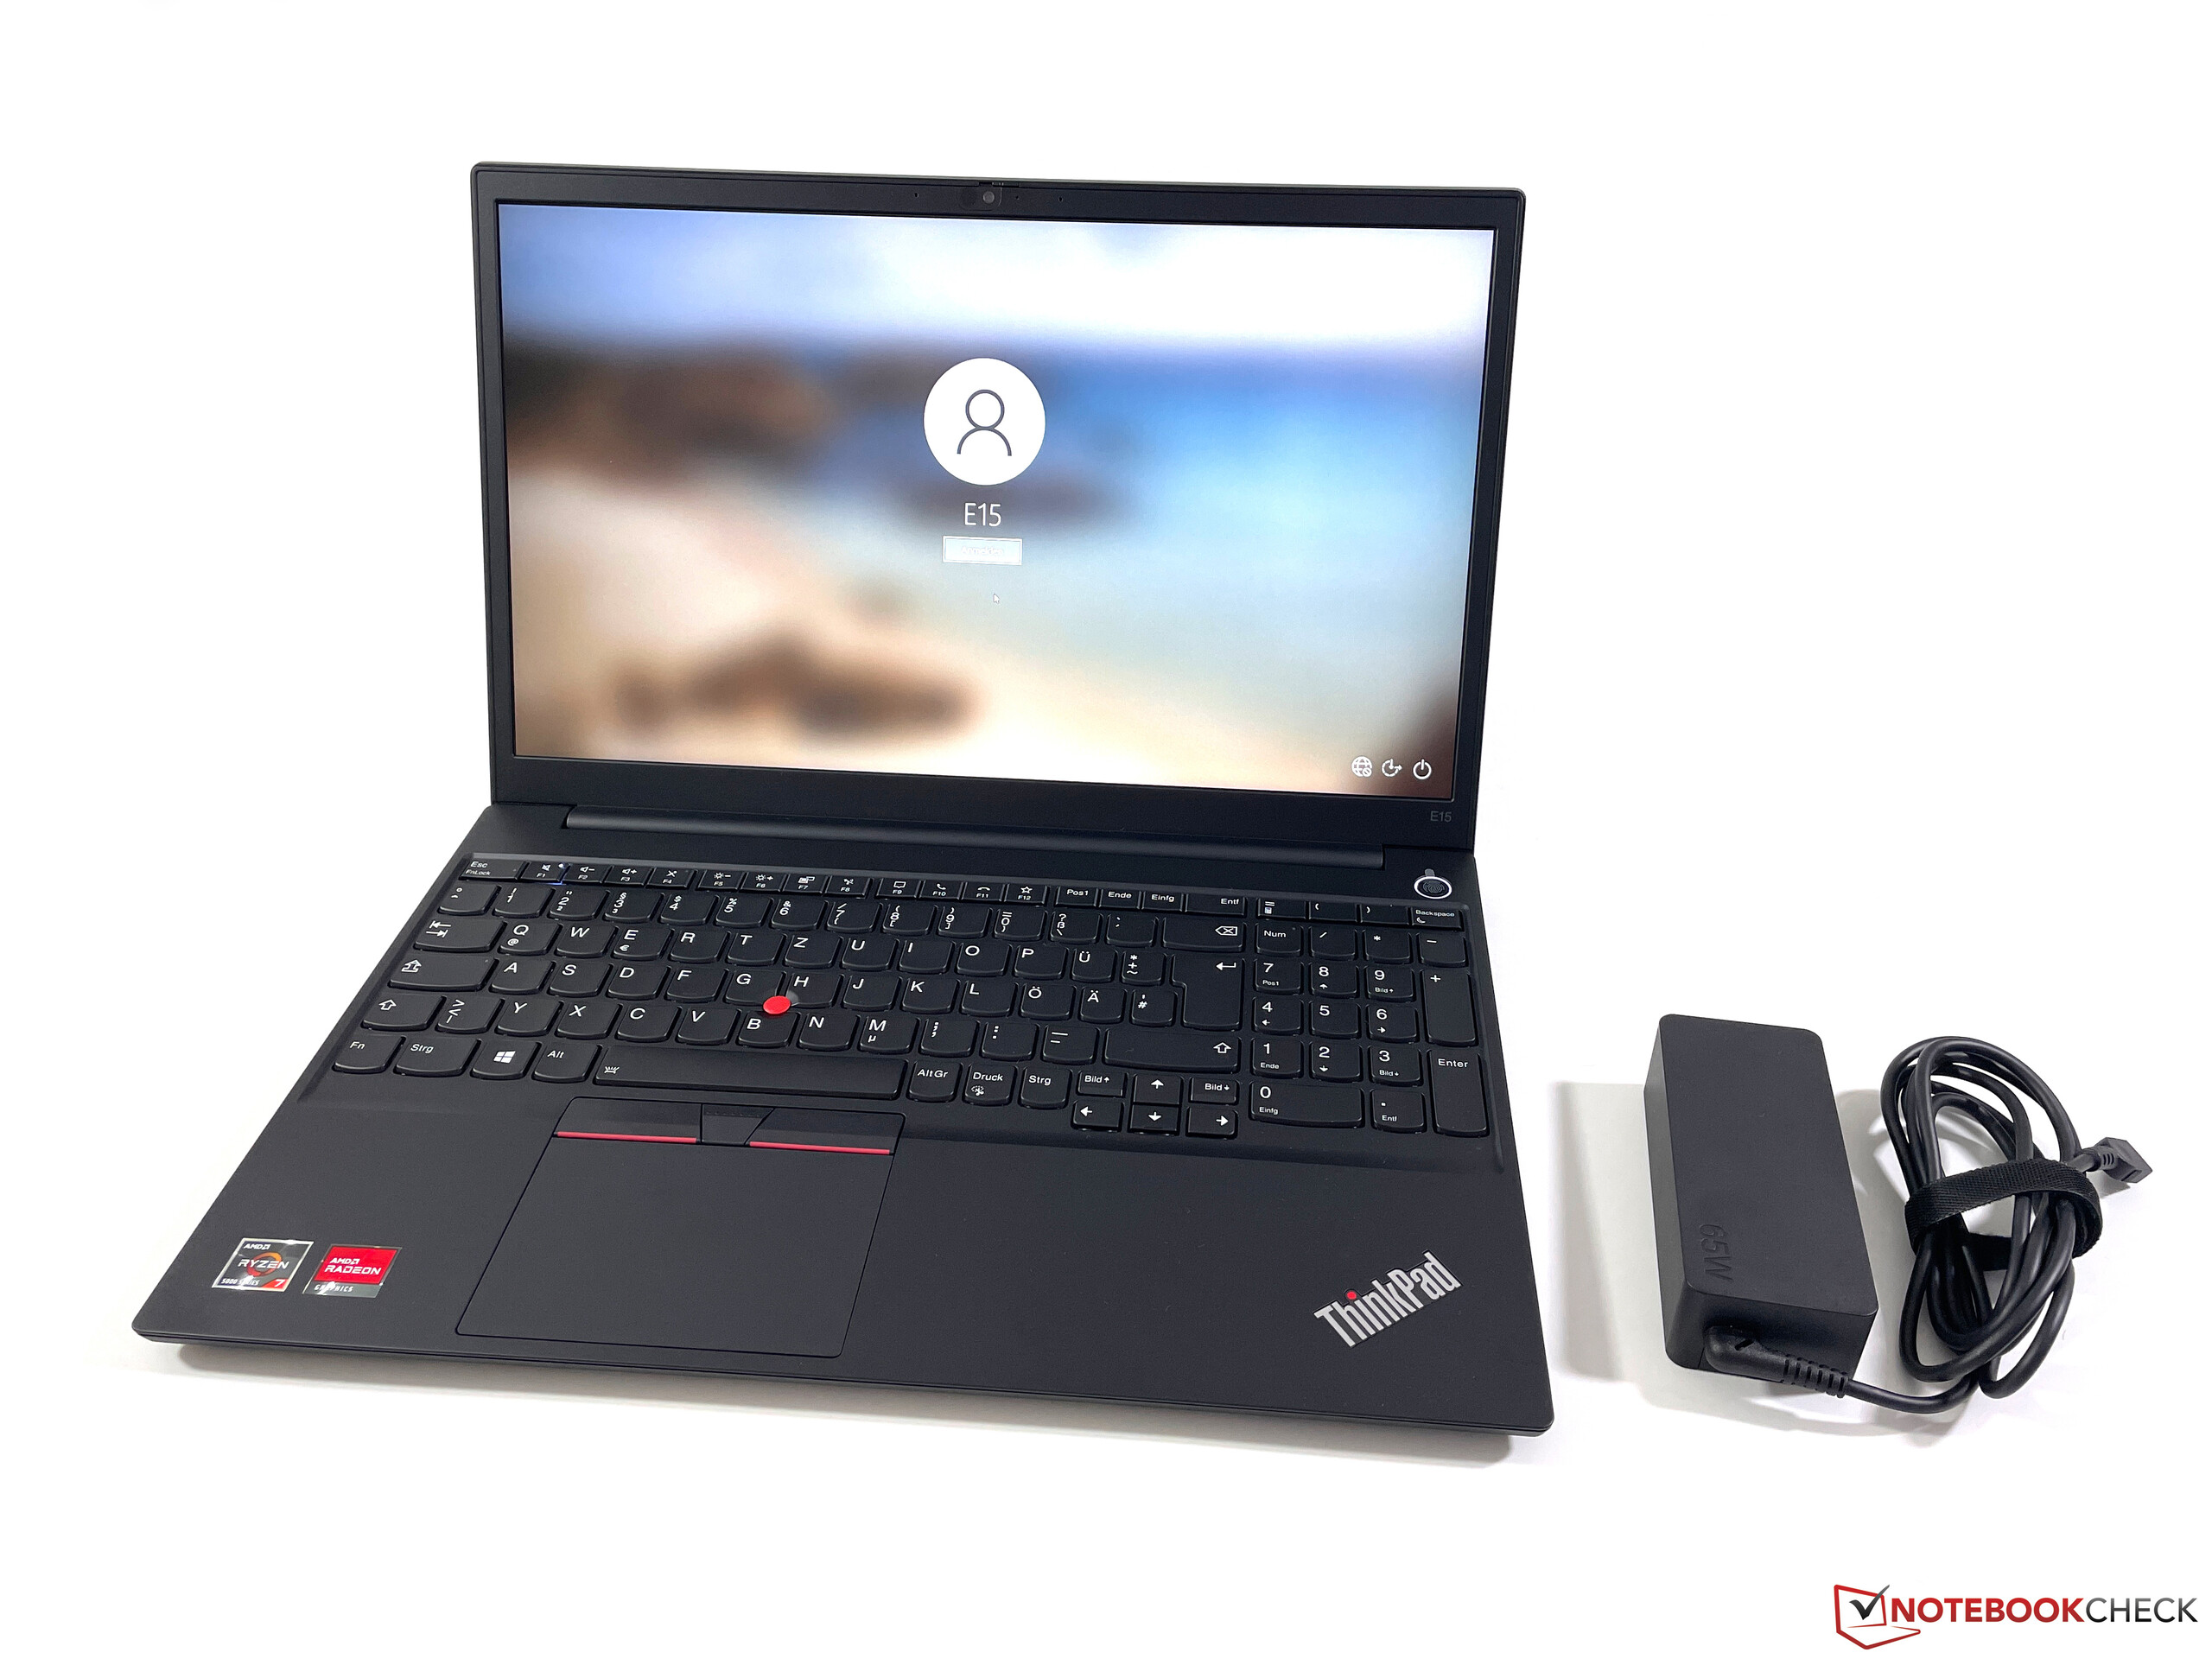
Lenovo ThinkPad E15 G3 AMD Review: Inexpensive Business Laptop with Ryzen 7
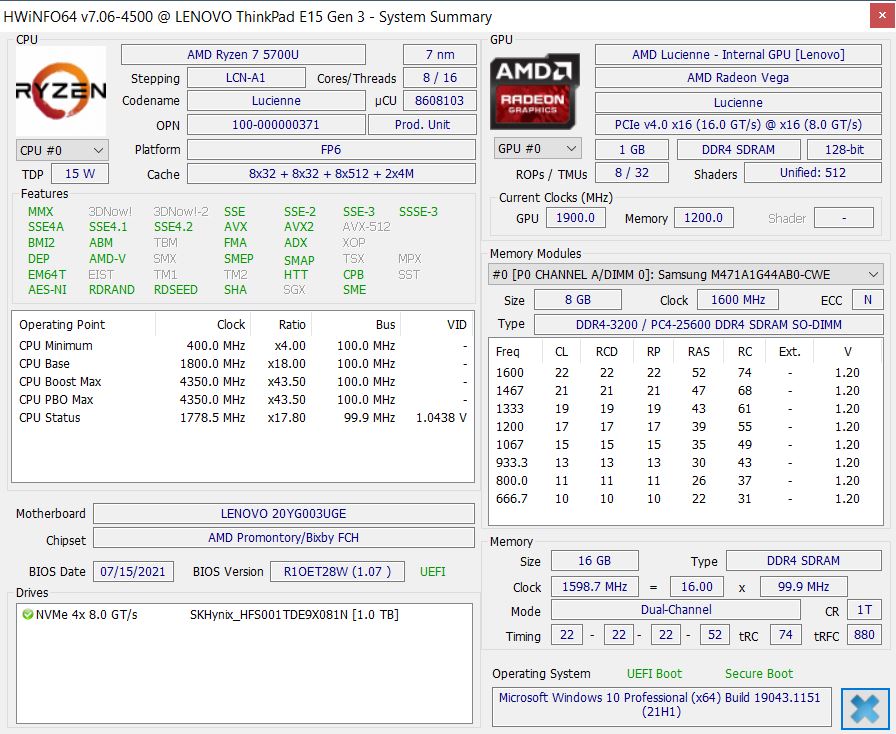
After we have reviewed the ThinkPad E14 G3, we now have a look at the larger E15 G3 with new Ryzen 5000 CPUs from AMD. Customers now also get brighter displays (100% sRGB as an option) as well as a larger battery. Prices start at 770 Euros from Lenovo, while our test unit with the Ryzen 7 5700U, 16 GB RAM, a 1 TB PCIe-SSD and the 300 nits FHD screen costs 1000 Euros. Customers with access to Lenovo’s campus program can get it for 950 Euros.
Possible competitors
Rating | Date | Model | Weight | Height | Size | Resolution | Price |
|---|---|---|---|---|---|---|---|
| 85.5 % v7 (old) | 08 / 2021 | Lenovo ThinkPad E15 G3-20YG003UGE R7 5700U, Vega 8 | 1.8 kg | 18.9 mm | 15.60" | 1920x1080 | |
| 85.1 % v7 (old) | 07 / 2021 | Lenovo ThinkPad L15 G2 AMD R5 5600U, Vega 7 | 1.9 kg | 21 mm | 15.60" | 1920x1080 | |
| 85.8 % v7 (old) | 02 / 2021 | Lenovo ThinkPad E15 Gen2-20TD002MGE i7-1165G7, GeForce MX450 | 1.8 kg | 18.9 mm | 15.60" | 1920x1080 | |
| 82.1 % v7 (old) | 07 / 2021 | Asus VivoBook S15 D533UA R7 5700U, Vega 8 | 1.8 kg | 16.1 mm | 15.60" | 1920x1080 | |
| 83.6 % v7 (old) | 01 / 2021 | Dell Latitude 15 5511-VNJNW i5-10400H, UHD Graphics 630 | 1.9 kg | 25 mm | 15.60" | 1920x1080 |
Case & Connectivity
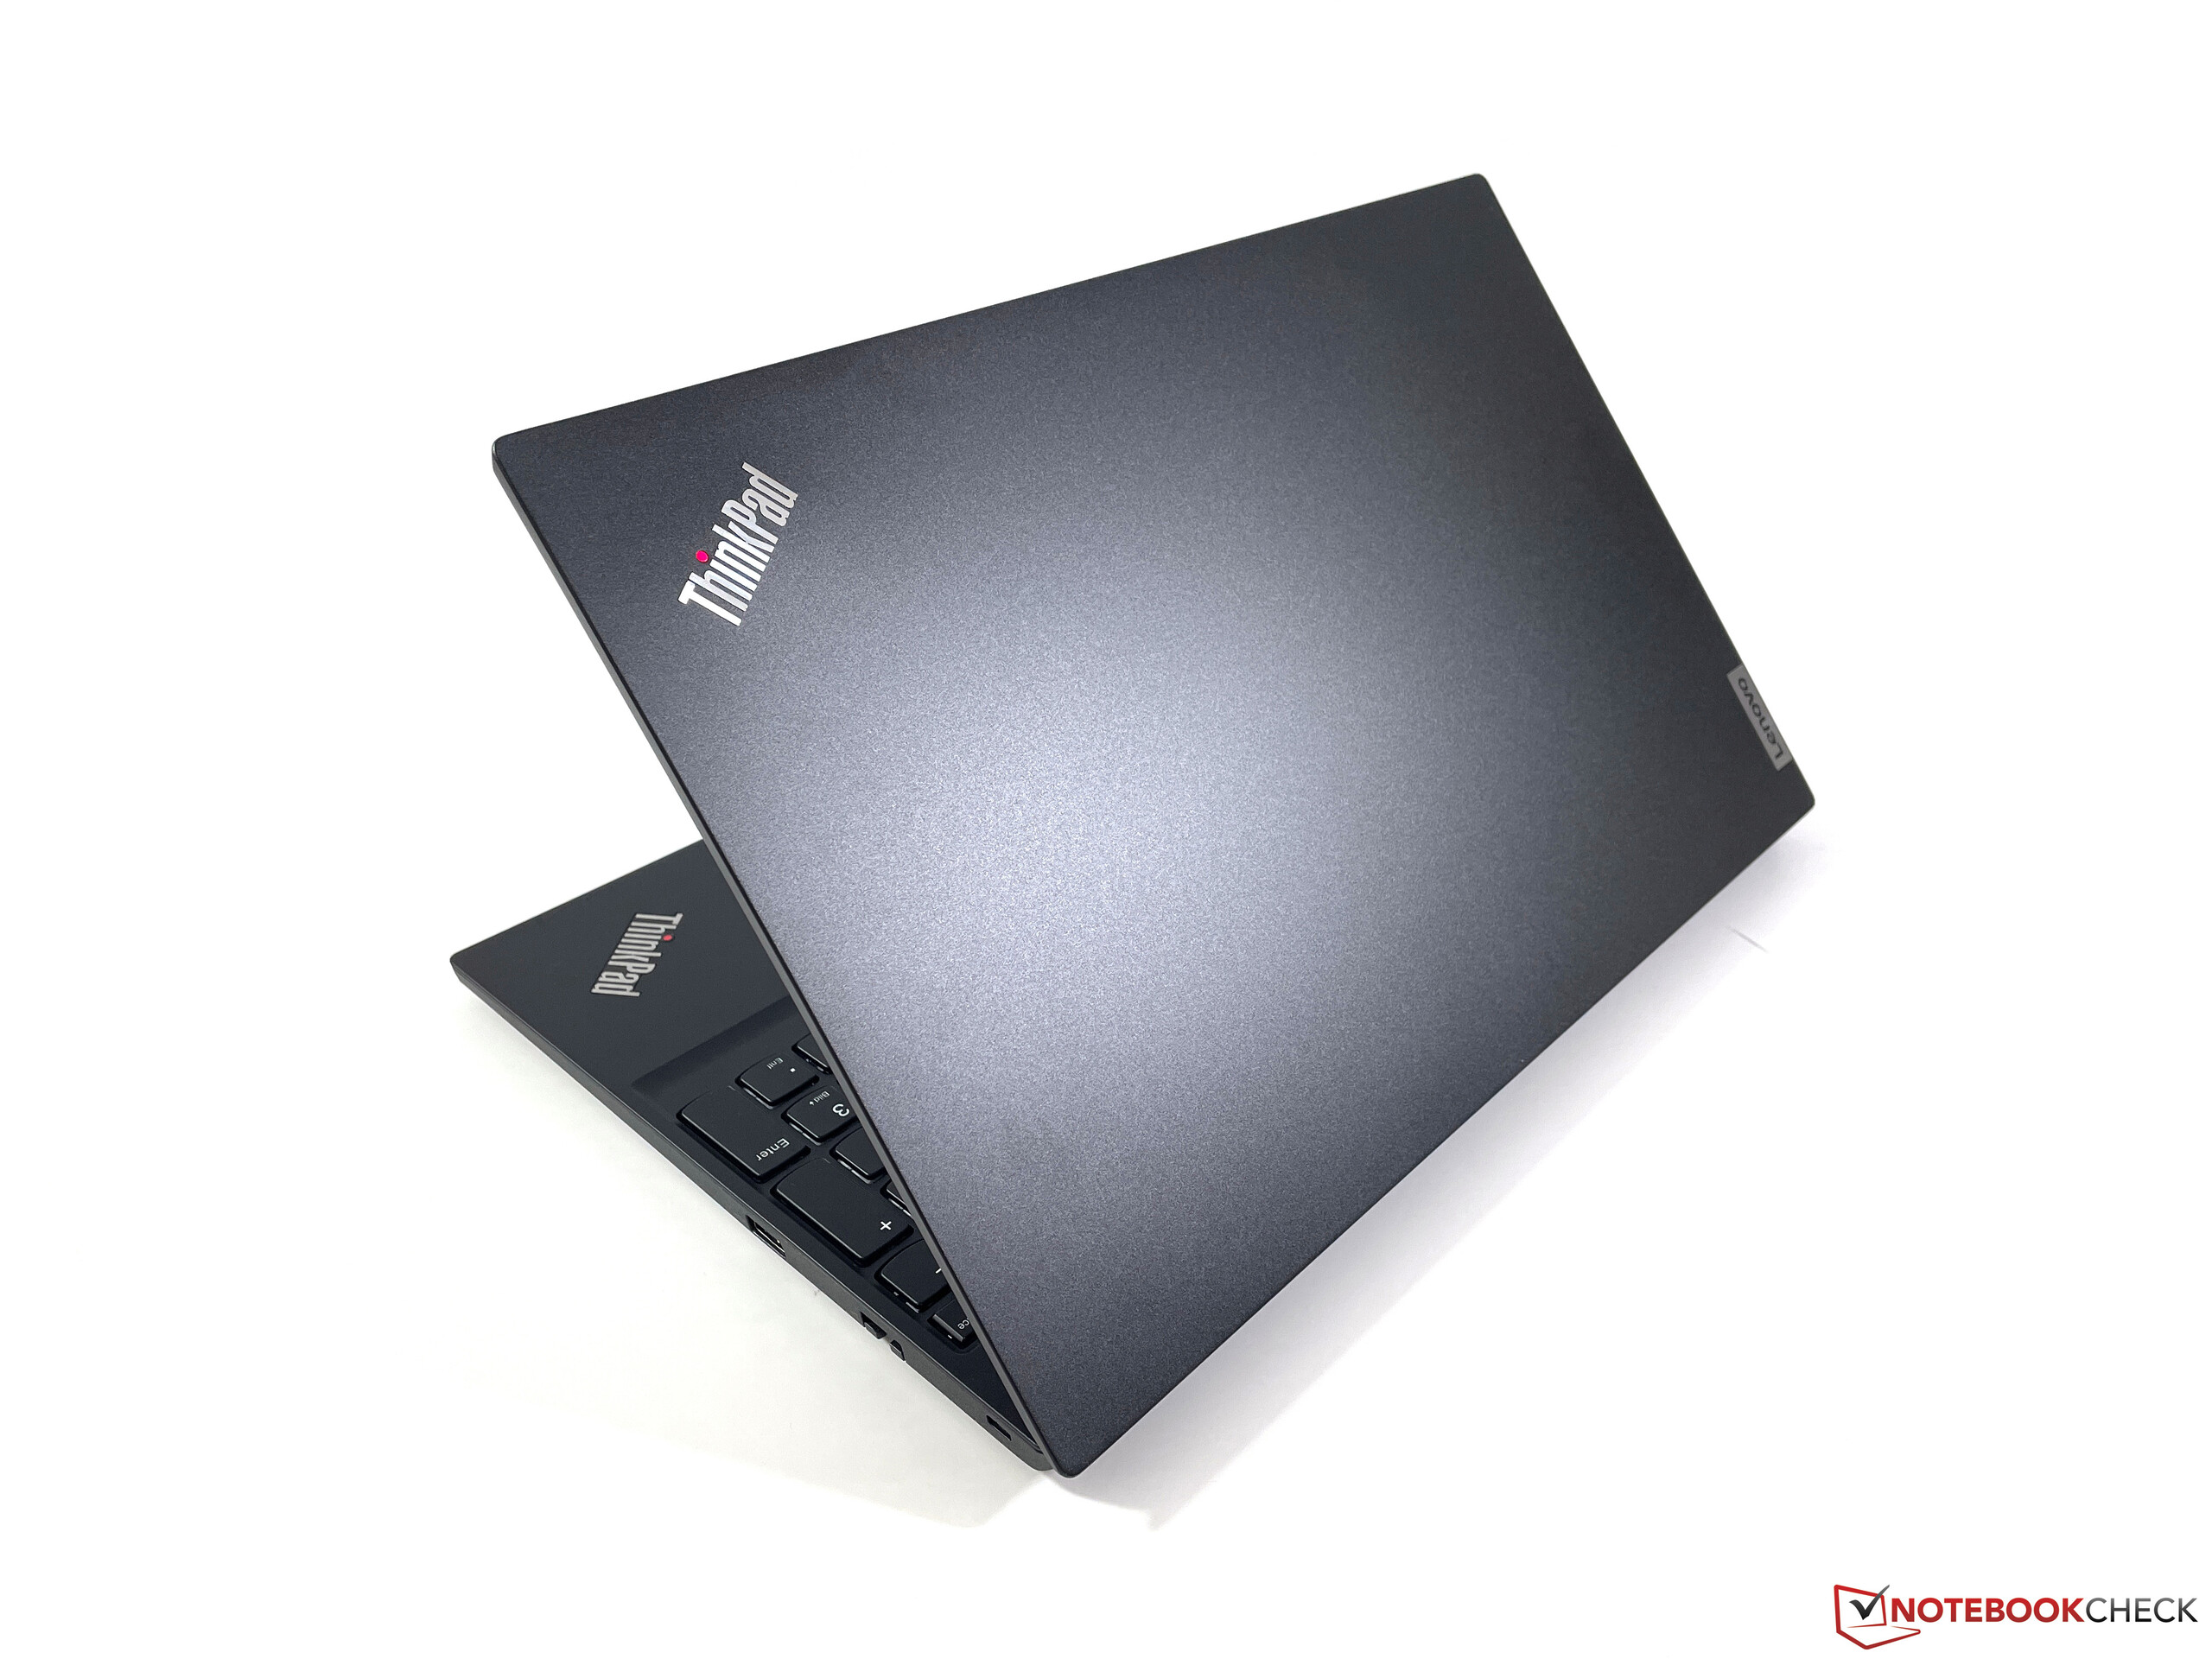
Lenovo did not change the case compared to the previous model. The lid is made of aluminum, while all the other parts are made of plastic. Both the lid as well as the smooth top of the base unit are very susceptible to fingerprints, so you will have to clean it regularly. The overall stability is very good and there is only minor creaking noises when we try to twist the base unit.
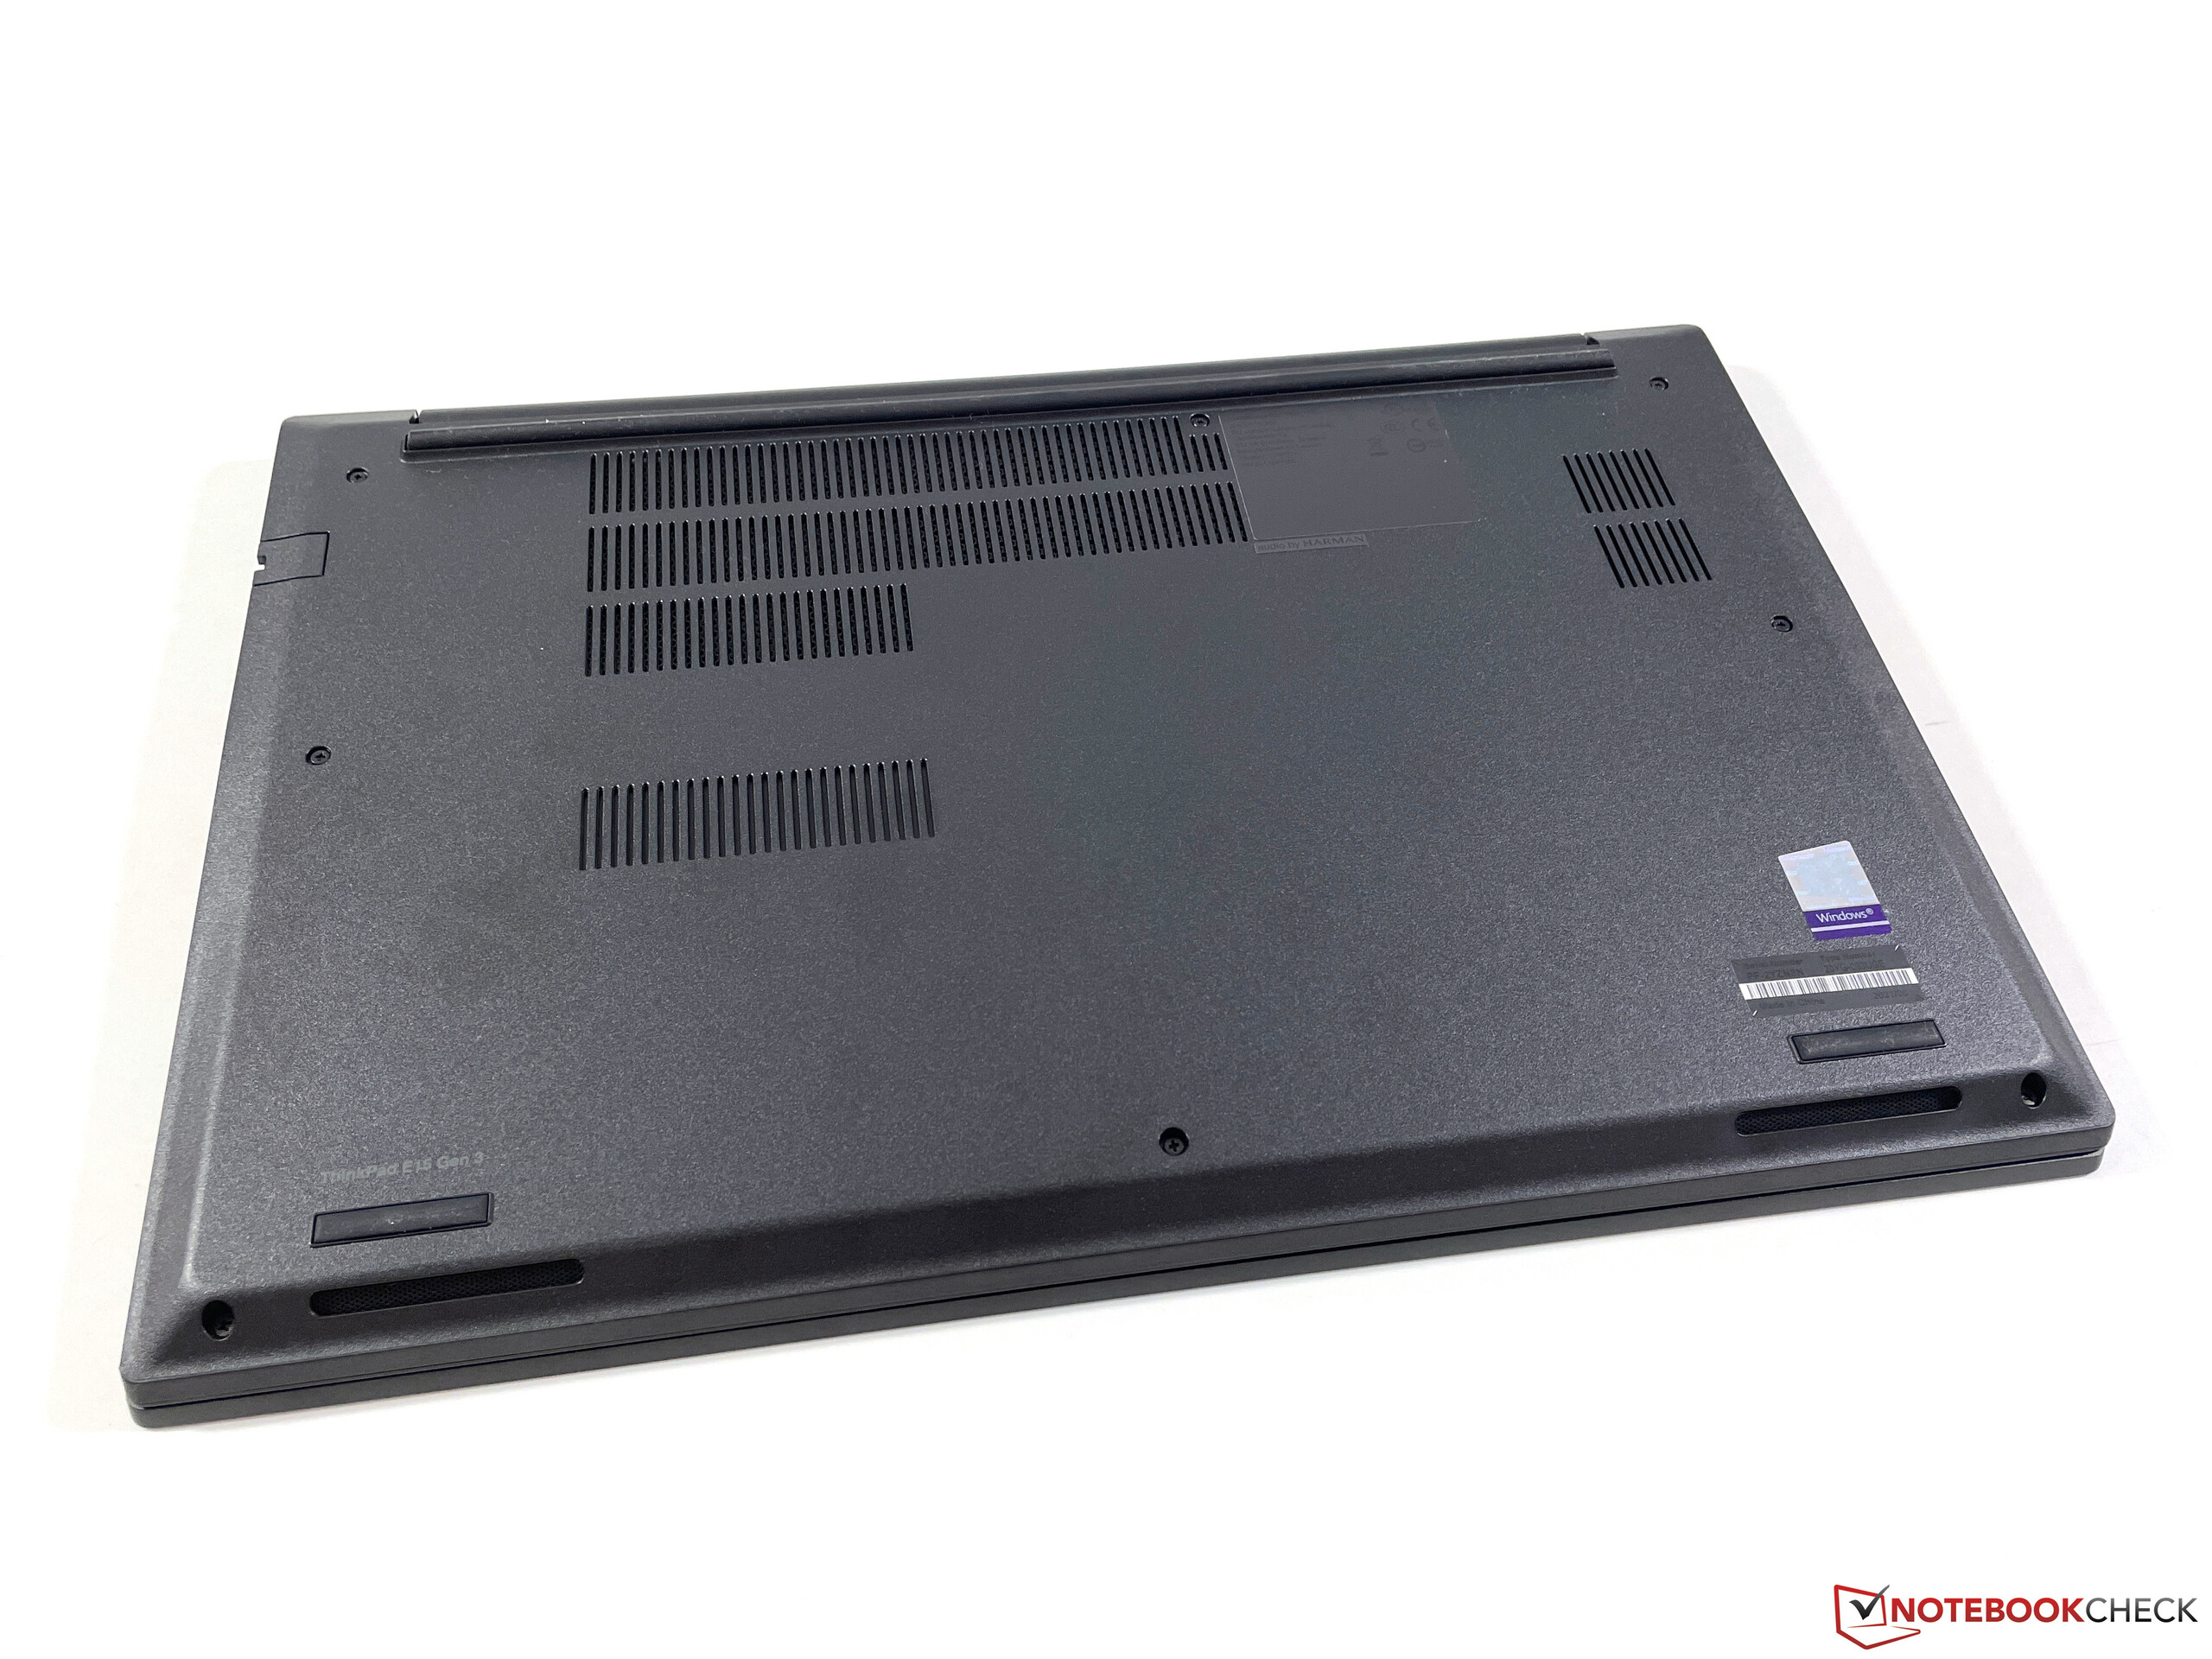
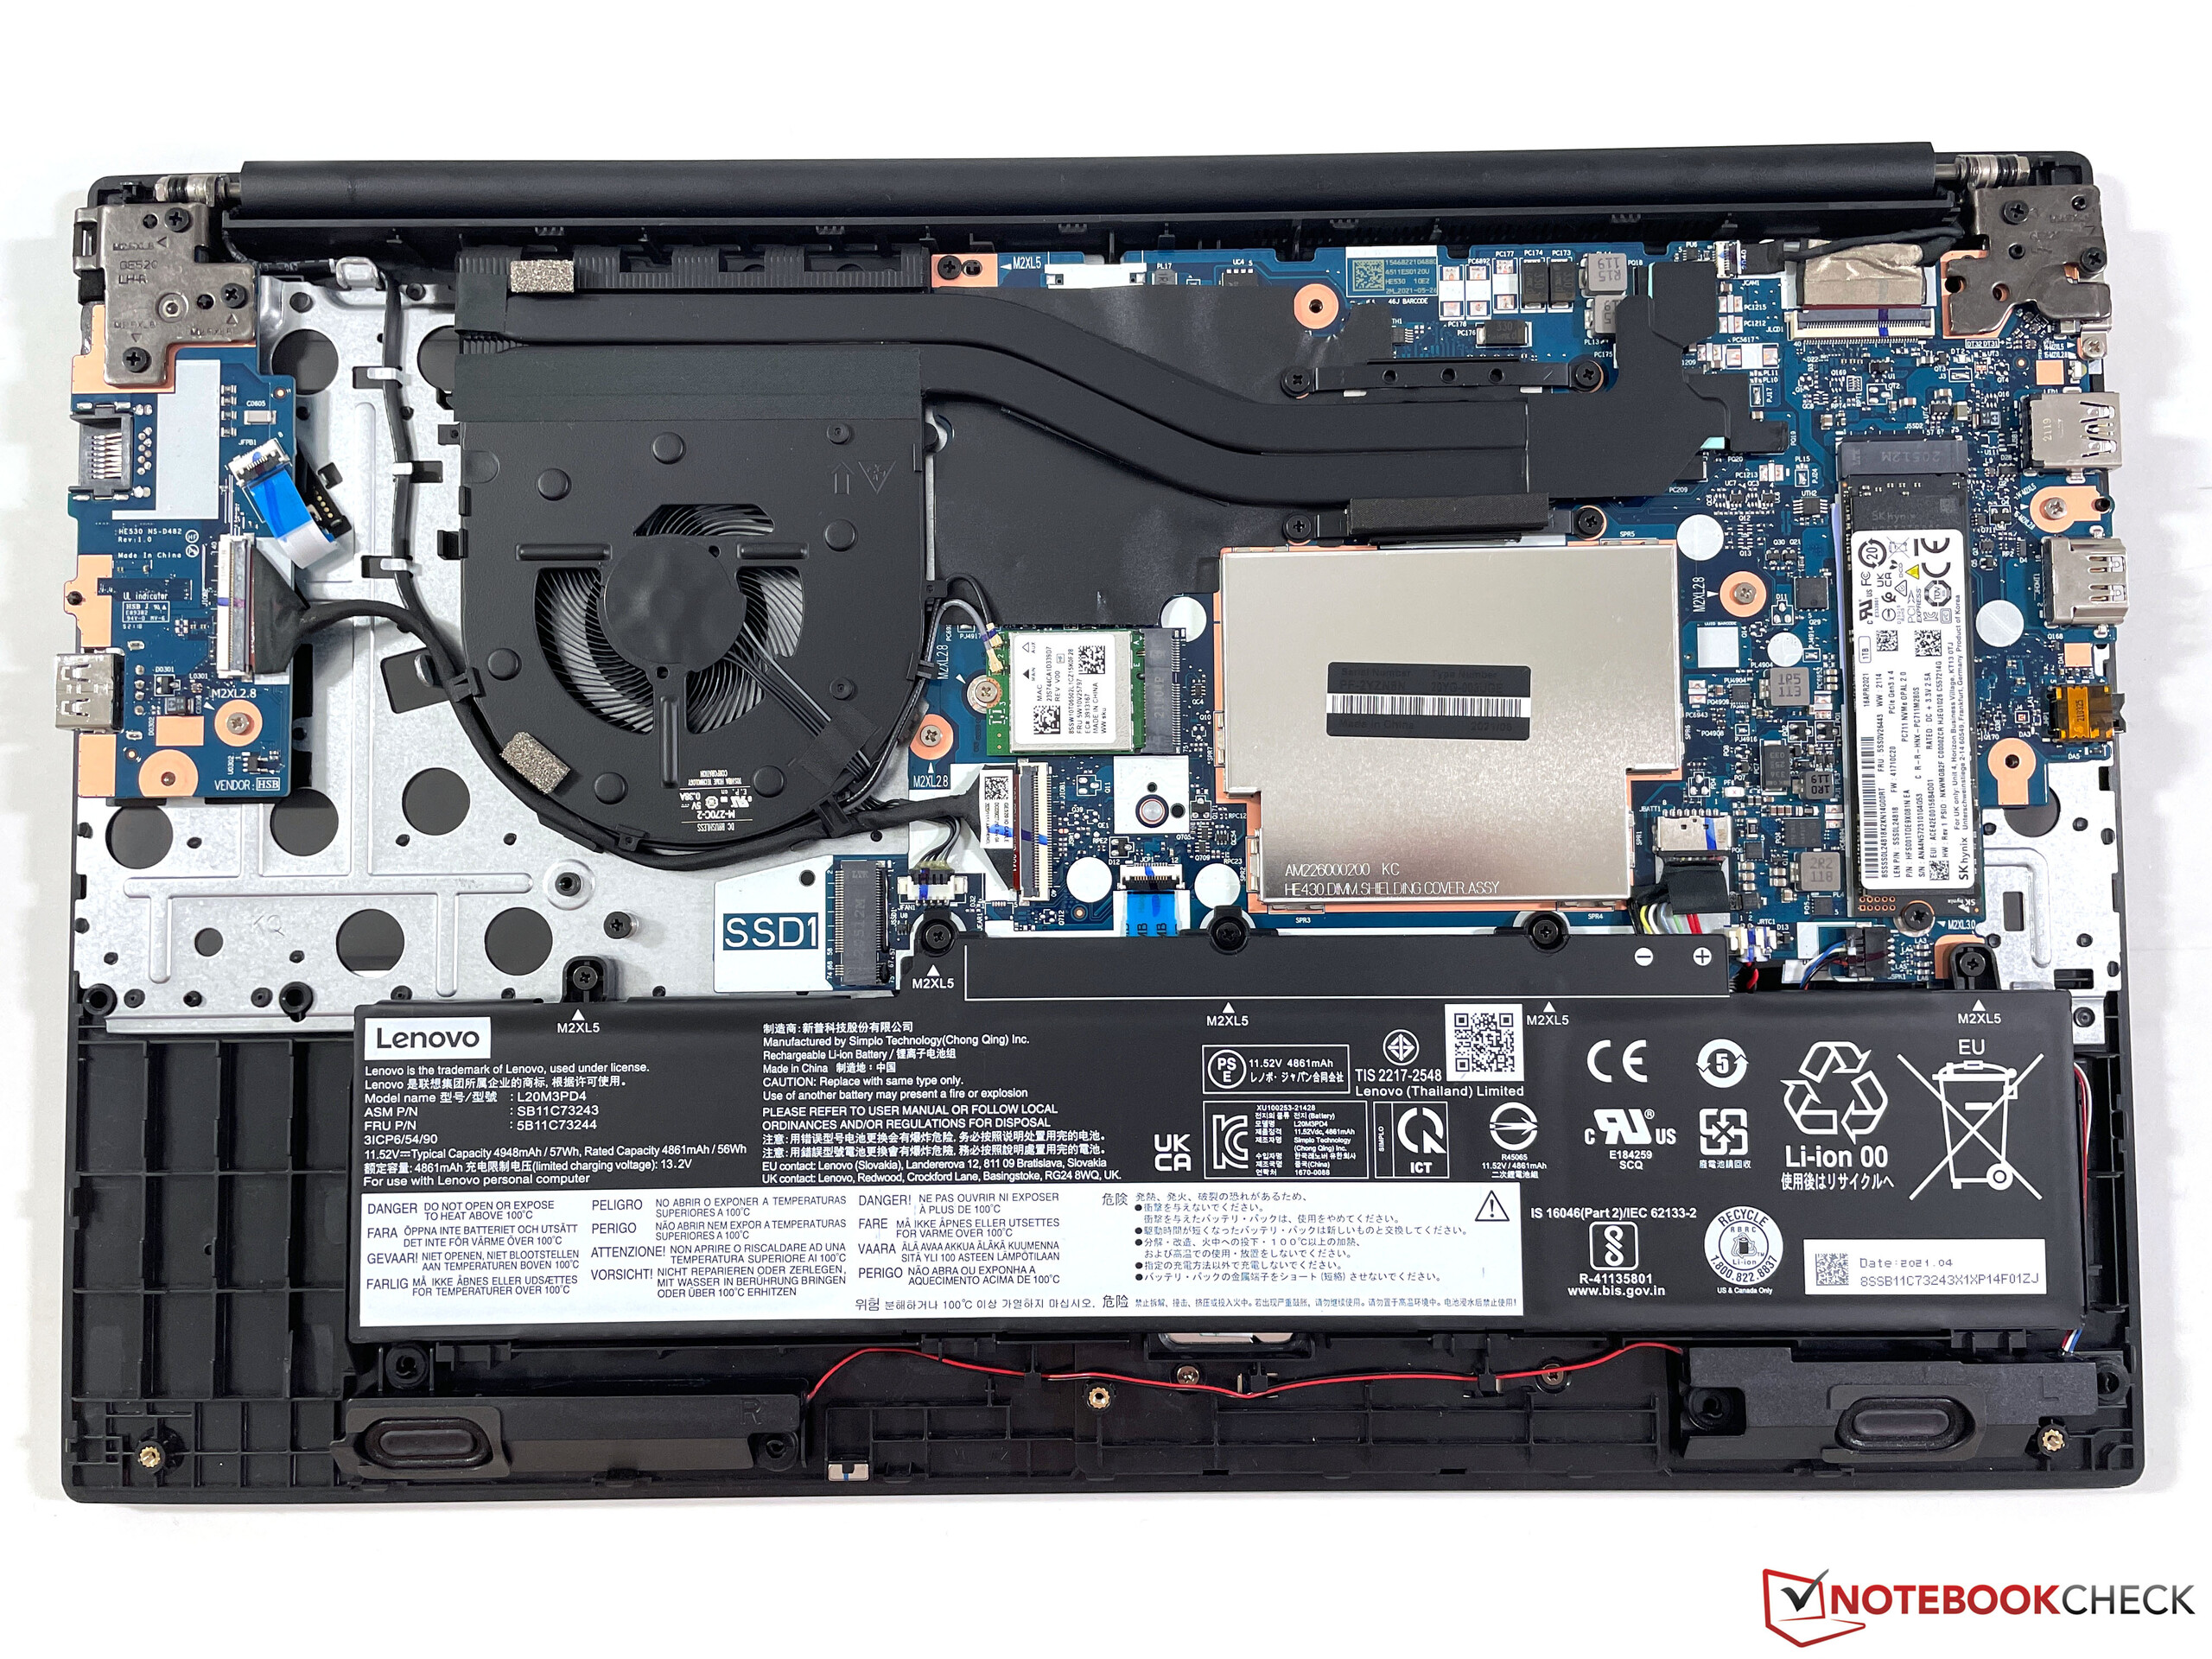
Our test unit shows good build quality, but the lid is not perfectly aligned with the base unit, which is noticeable at slightly protruding edges when the device is closed. The whole bottom part can be removed, but you have to be careful not to damage the plastic hooks. 8 GB RAM are soldered onto the mainboard, but you can use one SODIMM slot to expand the memory and there is one empty M.2-2242. You can replace the Wi-Fi module, but unlike the ThinkPad L15 G2, there is no WWAN module.
Connectivity
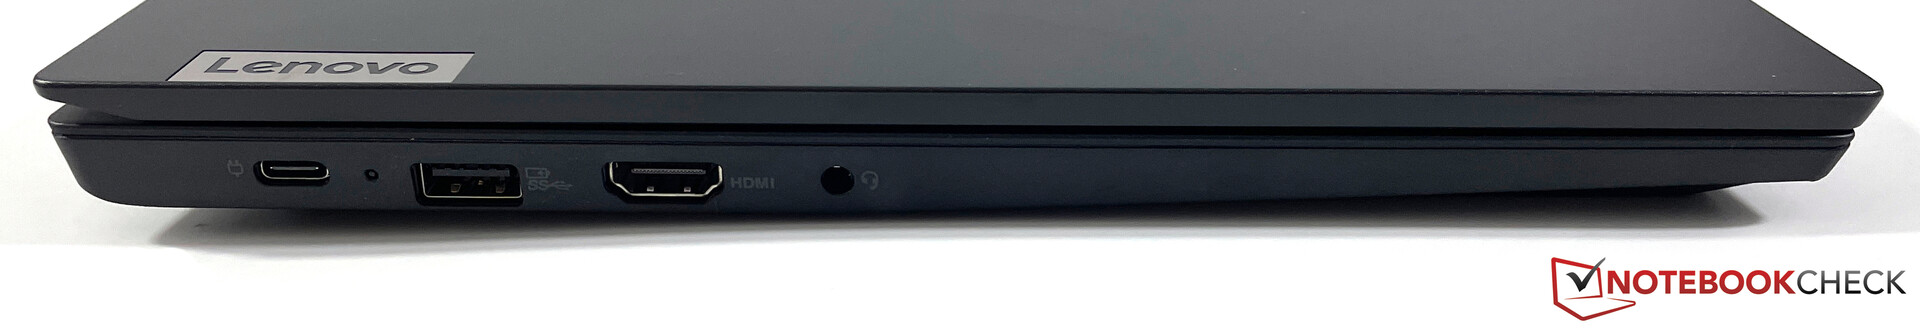
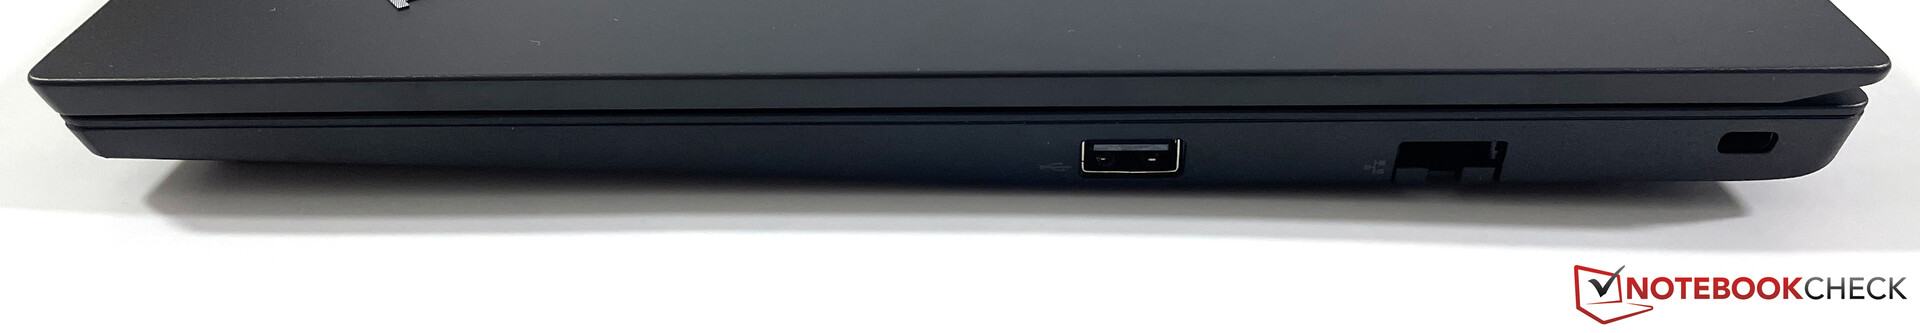
Lenovo should definitely improve the port situation for the next model, because a USB 2.0 port is just too slow for a modern laptop. The USB-C port also only supports the 3.2 Gen. 1 standard, so you should only expect the minimum when you get the new E15.
The Wi-Fi module supports the Wi-Fi 6 standard, but the maximum transfer rate of the RealTek module is limited to 1201 Mbps, which is also shown by our Wi-Fi test results. The hinkPad E15 G2 with Intel CPU is equipped with a faster AX201 Wi-Fi module.
The 720p webcam is equipped with a mechanical shutter, but the picture quality is poor even in good lighting conditions.


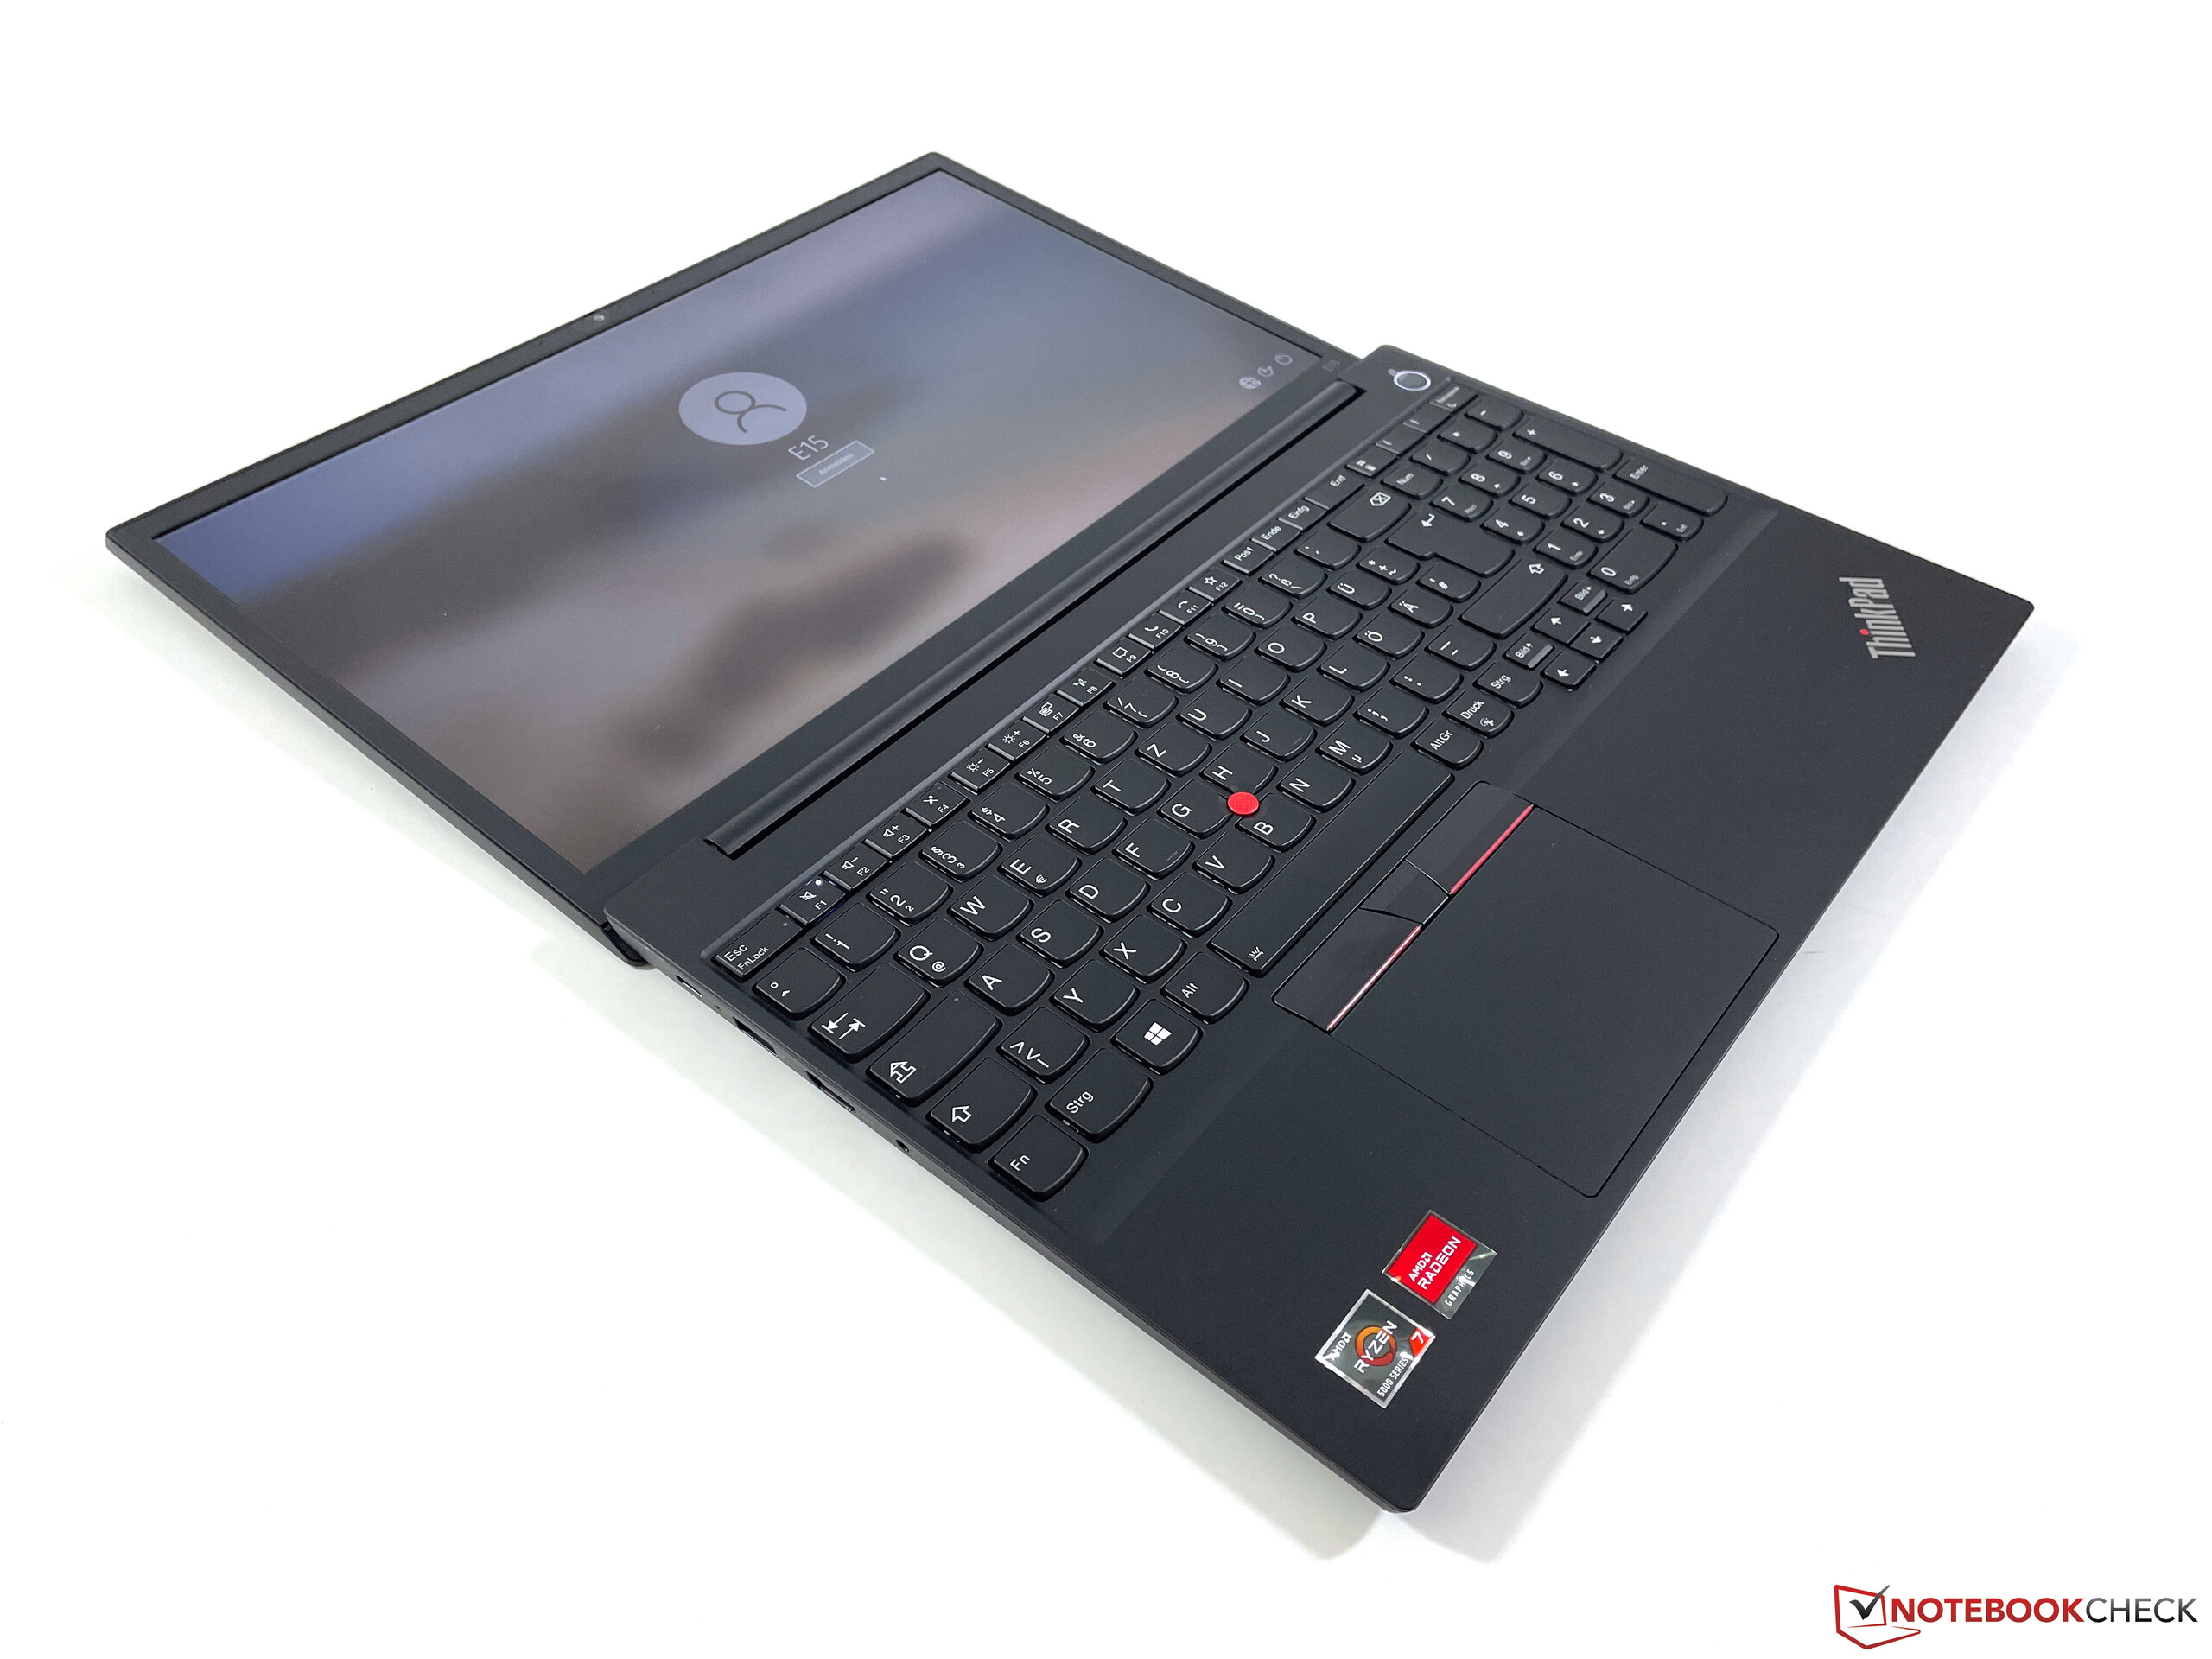
Input Devices - Still a good ThinkPad keyboard
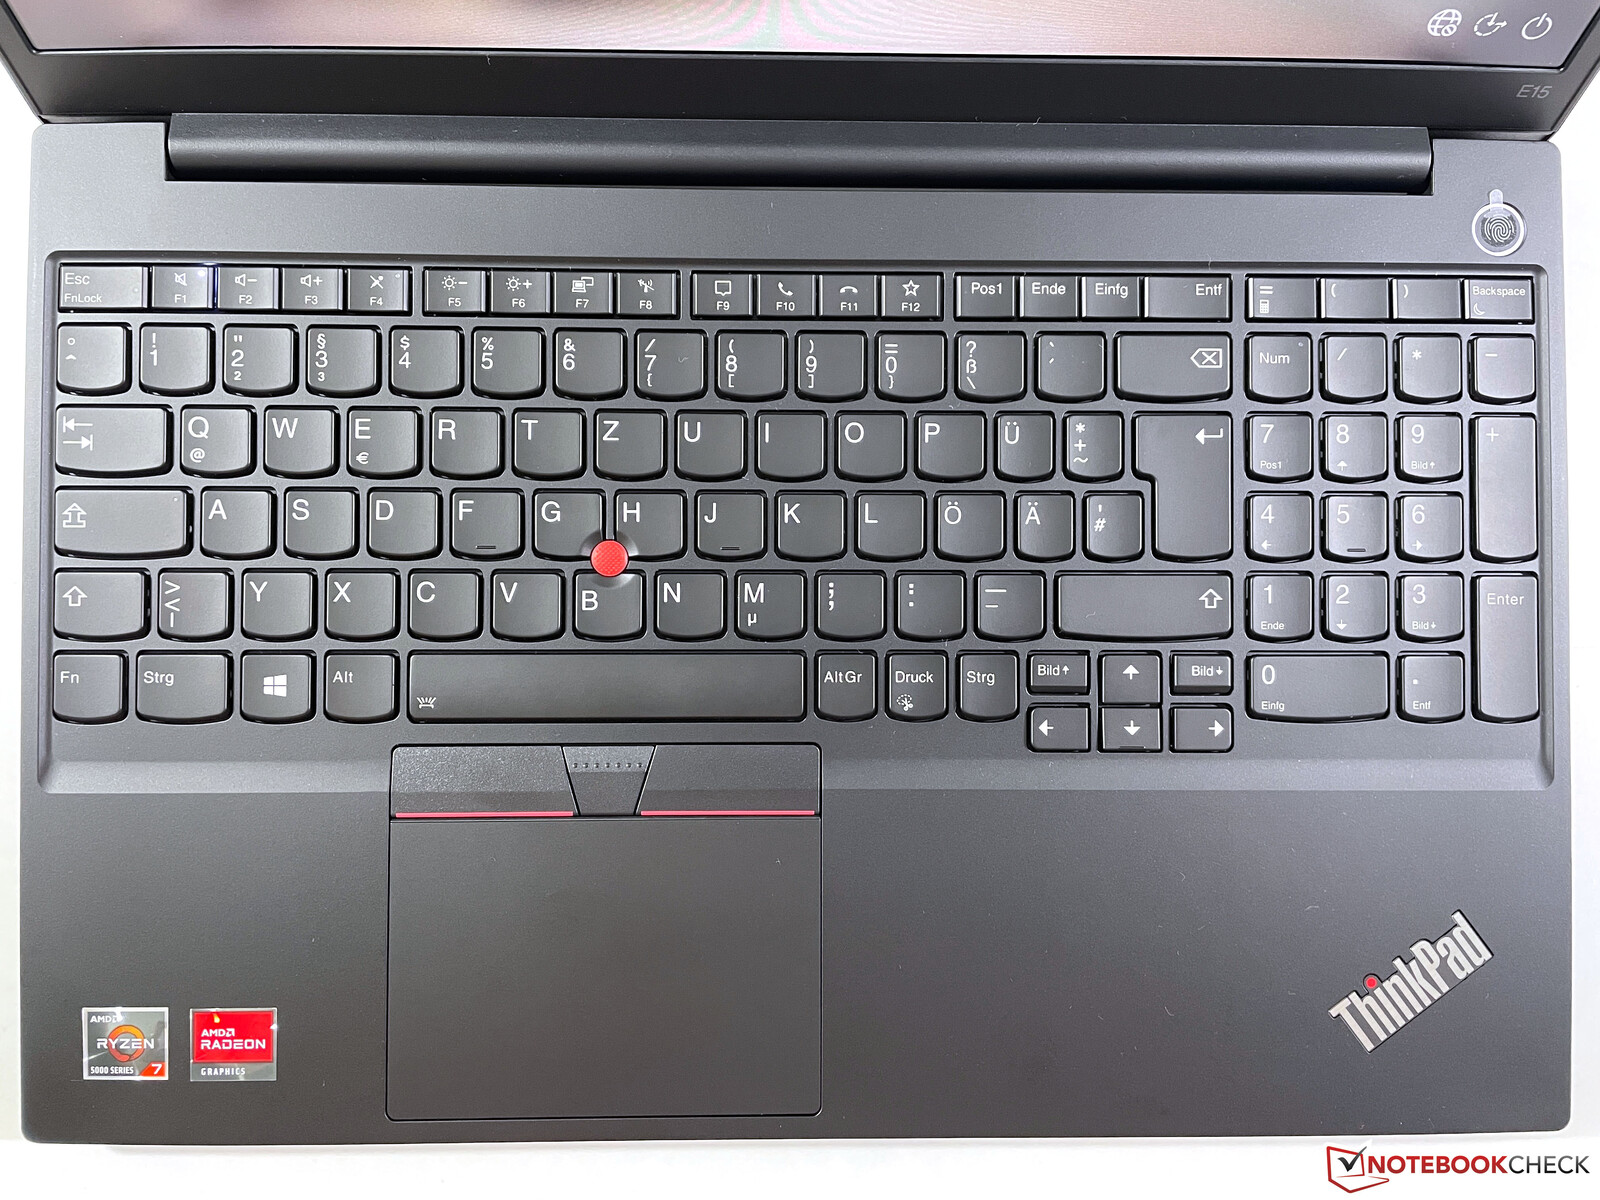
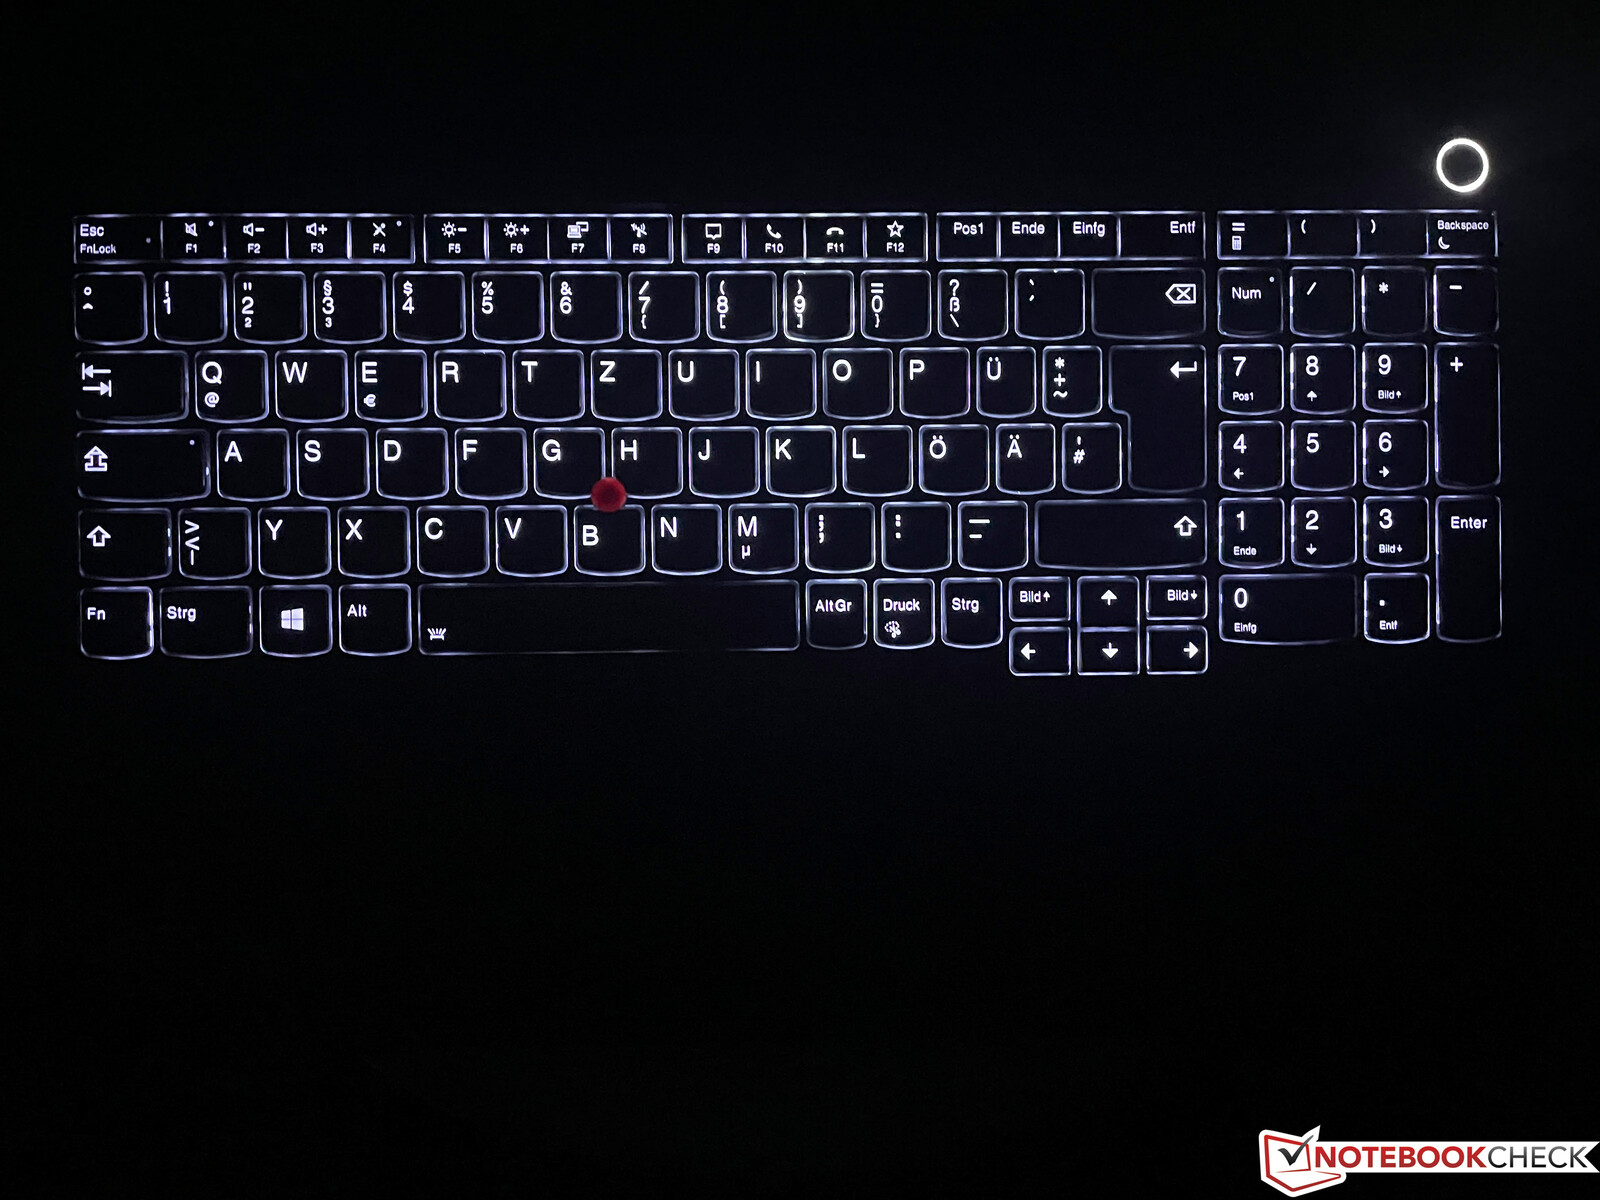
Lenovo still uses the familiar keyboard with 1.8 mm travel for the E15, which offers a rich typing experience, and it is one of the best keyboards in the mobile segment, despite the low price. You also get a dedicated numpad, but this means the touchpad is slightly shifted towards the left, which might require some time getting used to. Thanks to the two-stage background illumination, typing in darker environments is no problem, either.
The touchpad works well, but the size is not very generous for modern standards due to the additional TrackPoint buttons. The buttons create a very quiet and subdued clicking noise, which leaves a high quality impression. Using the TrackPoint also works well after a little training period.
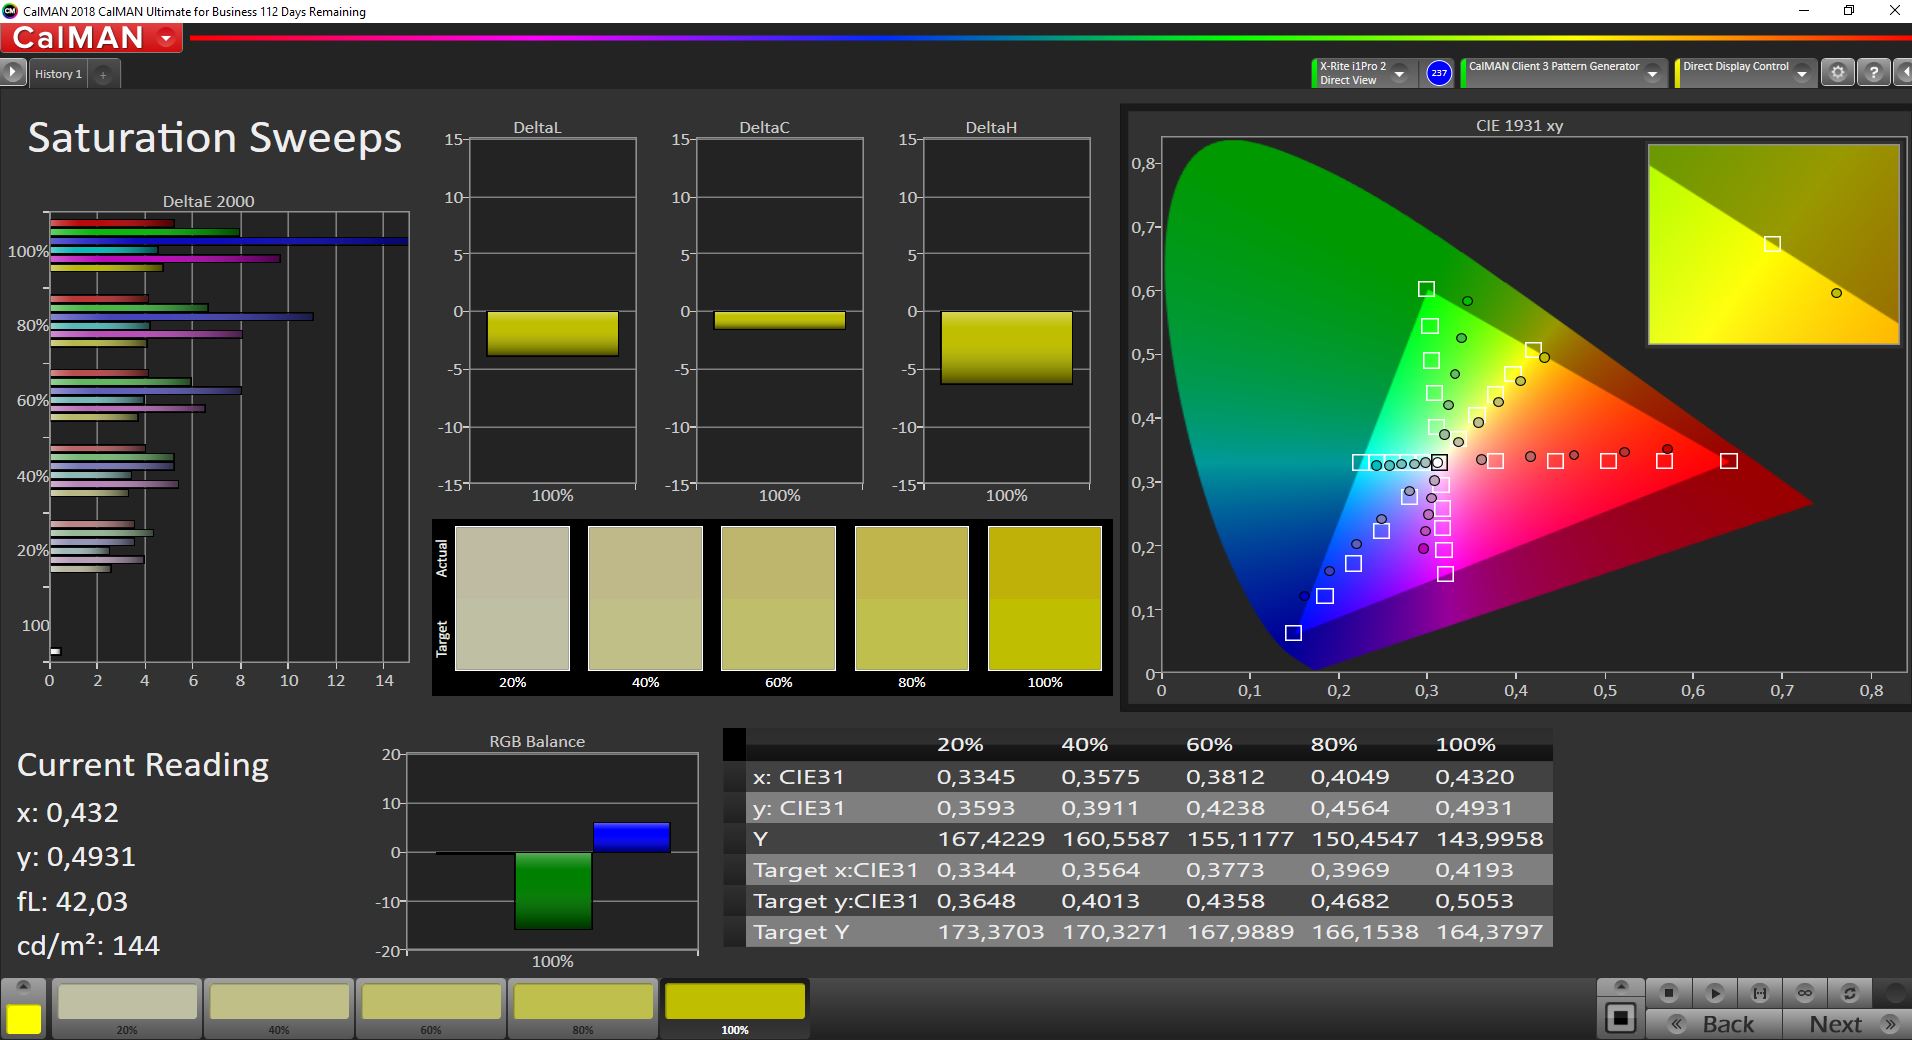
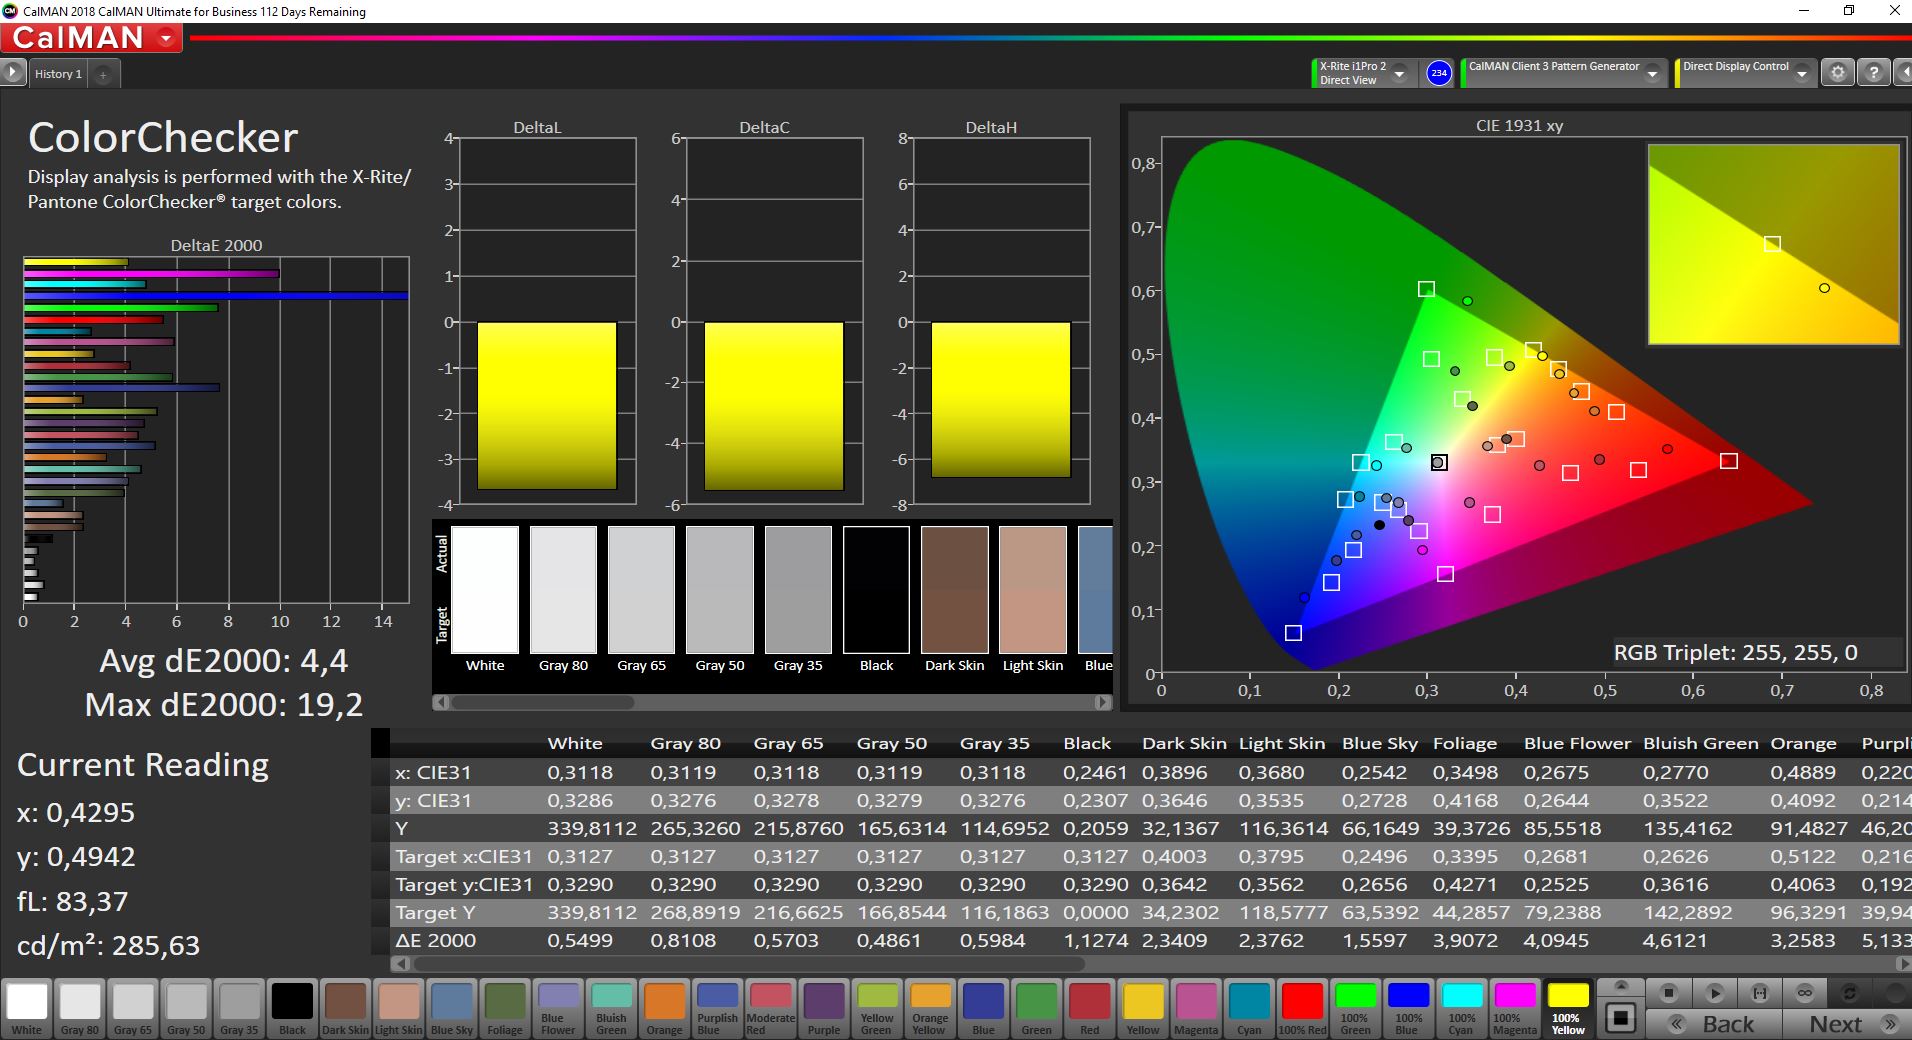
Display - E15 G3 with optional 100% sRGB screen
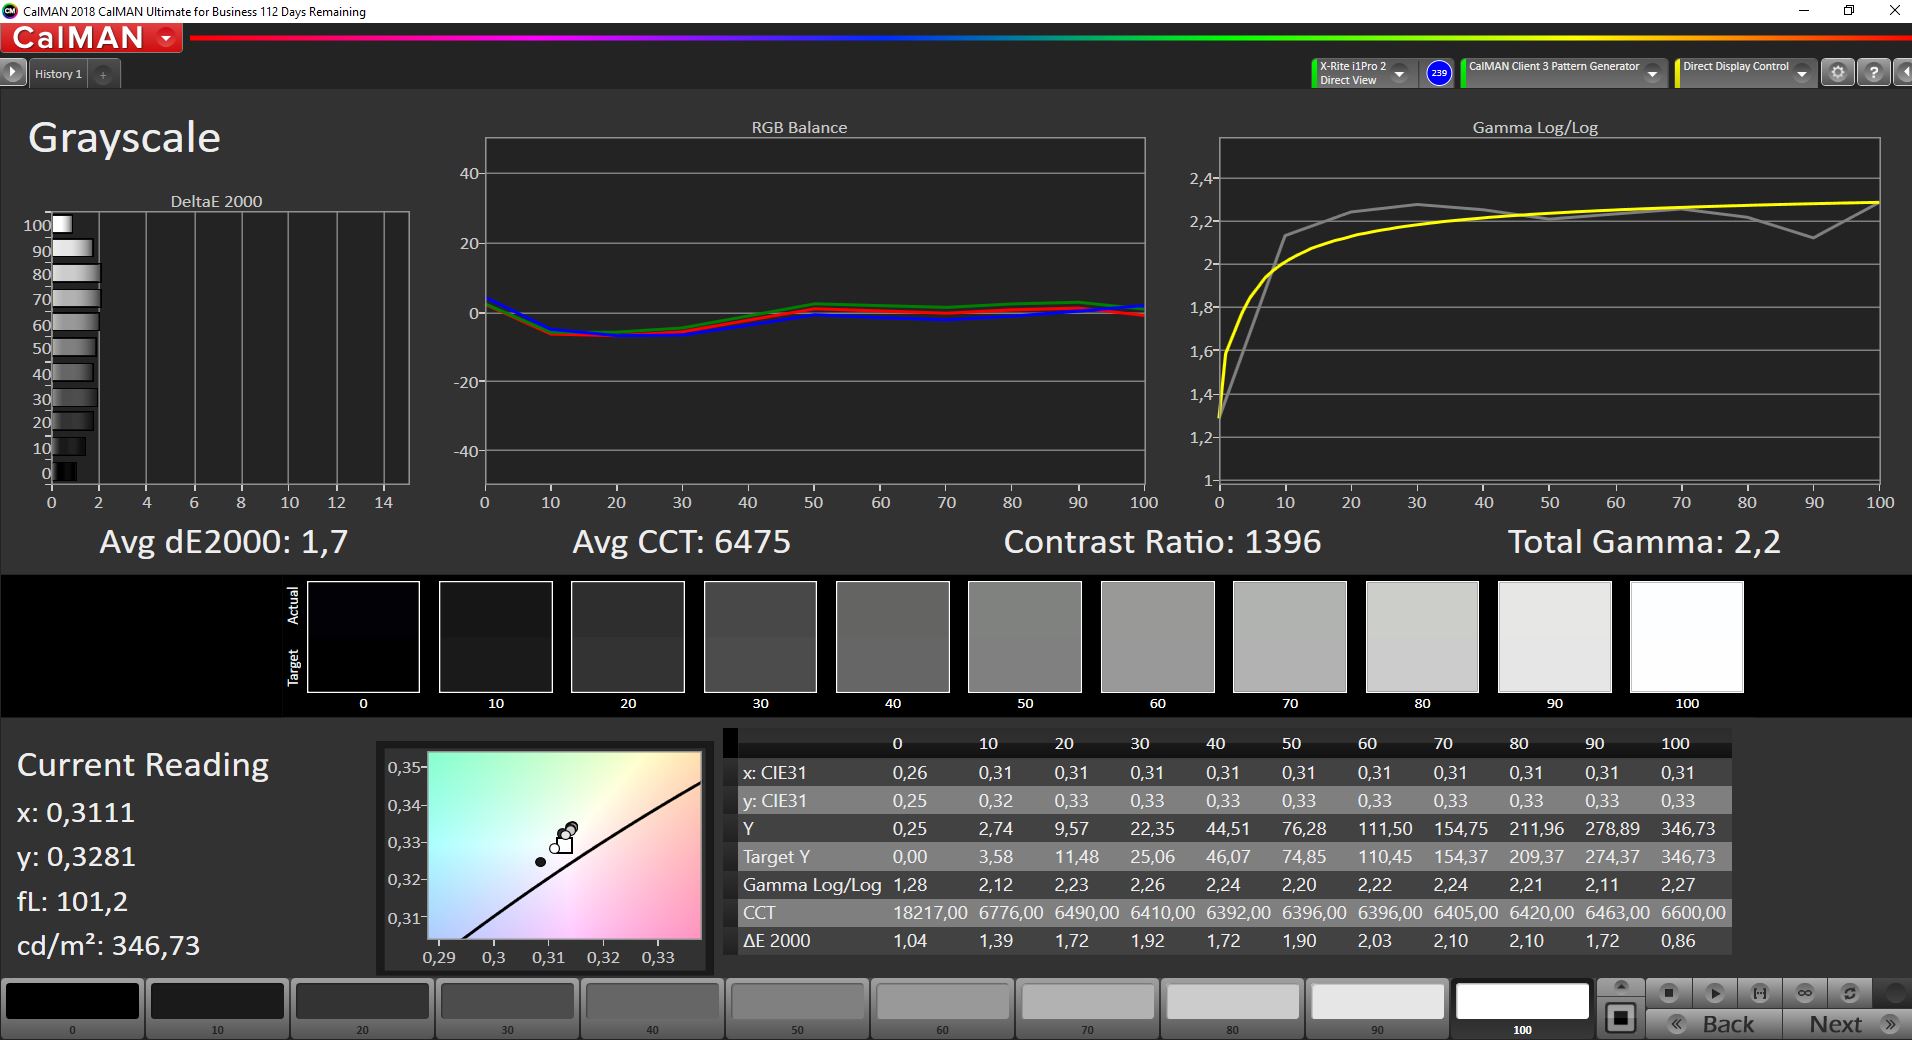
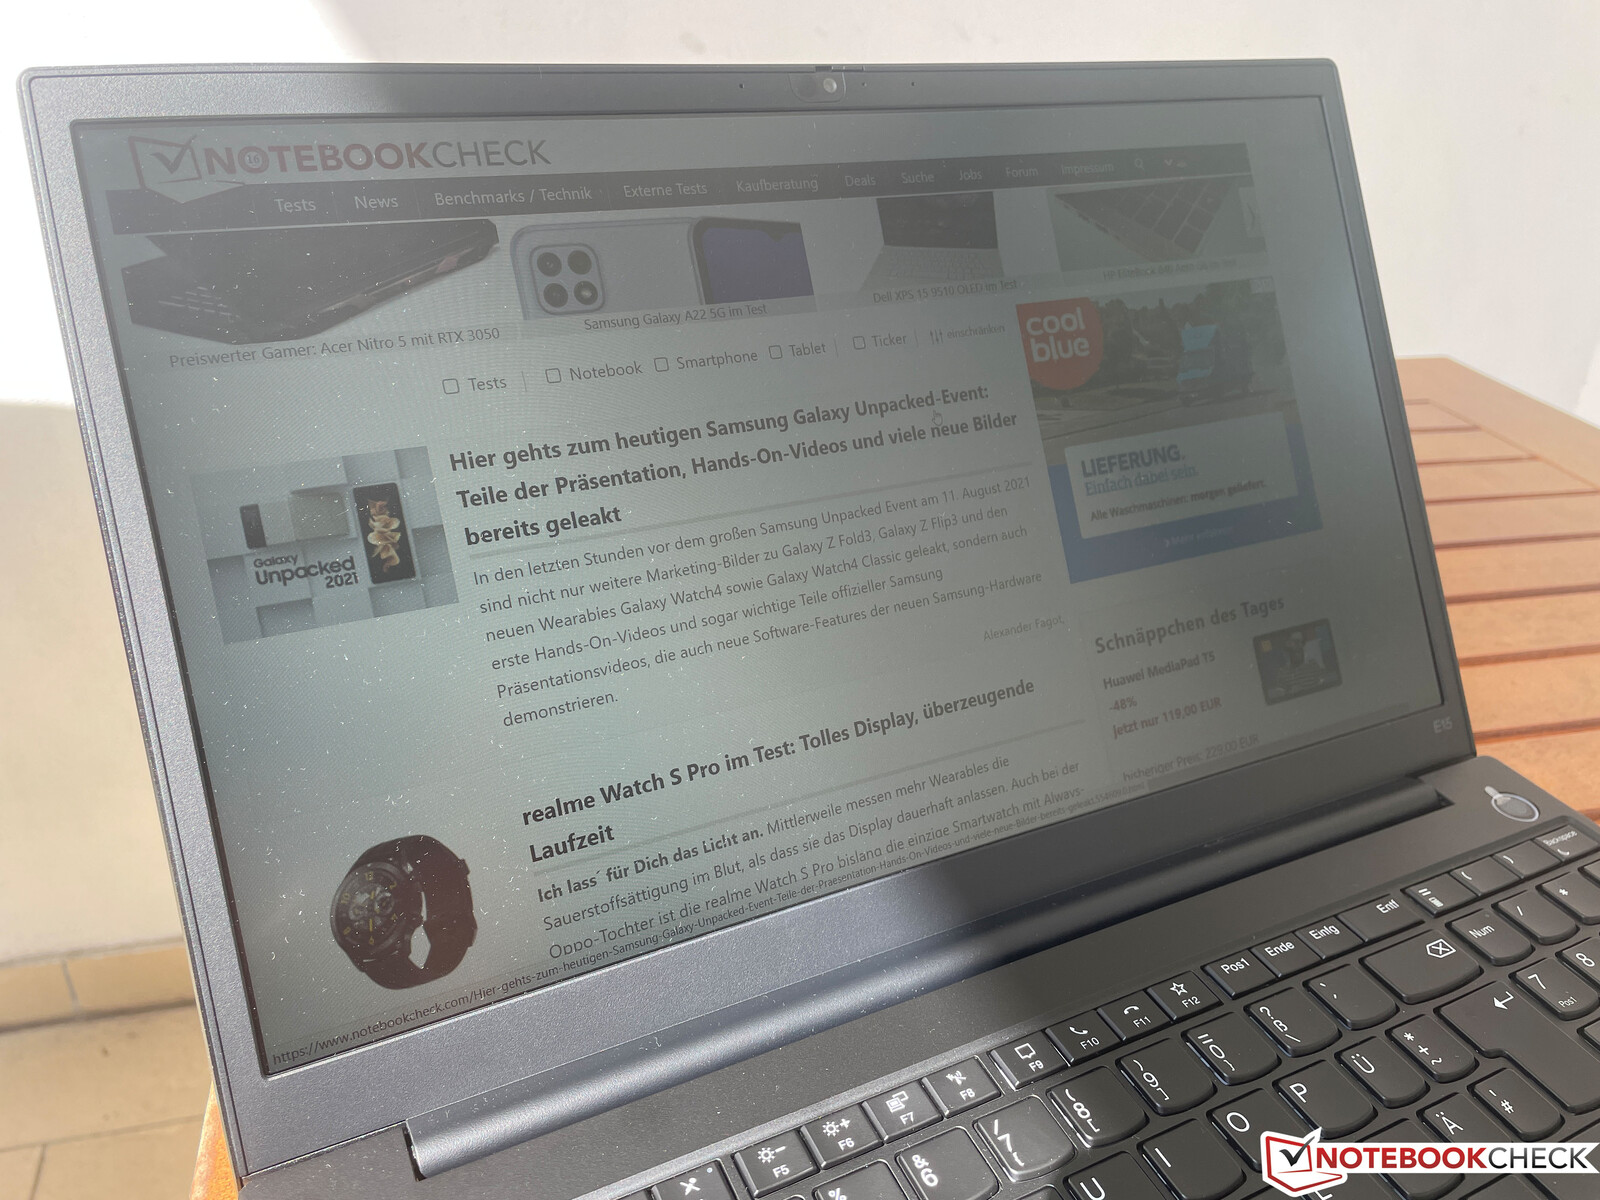
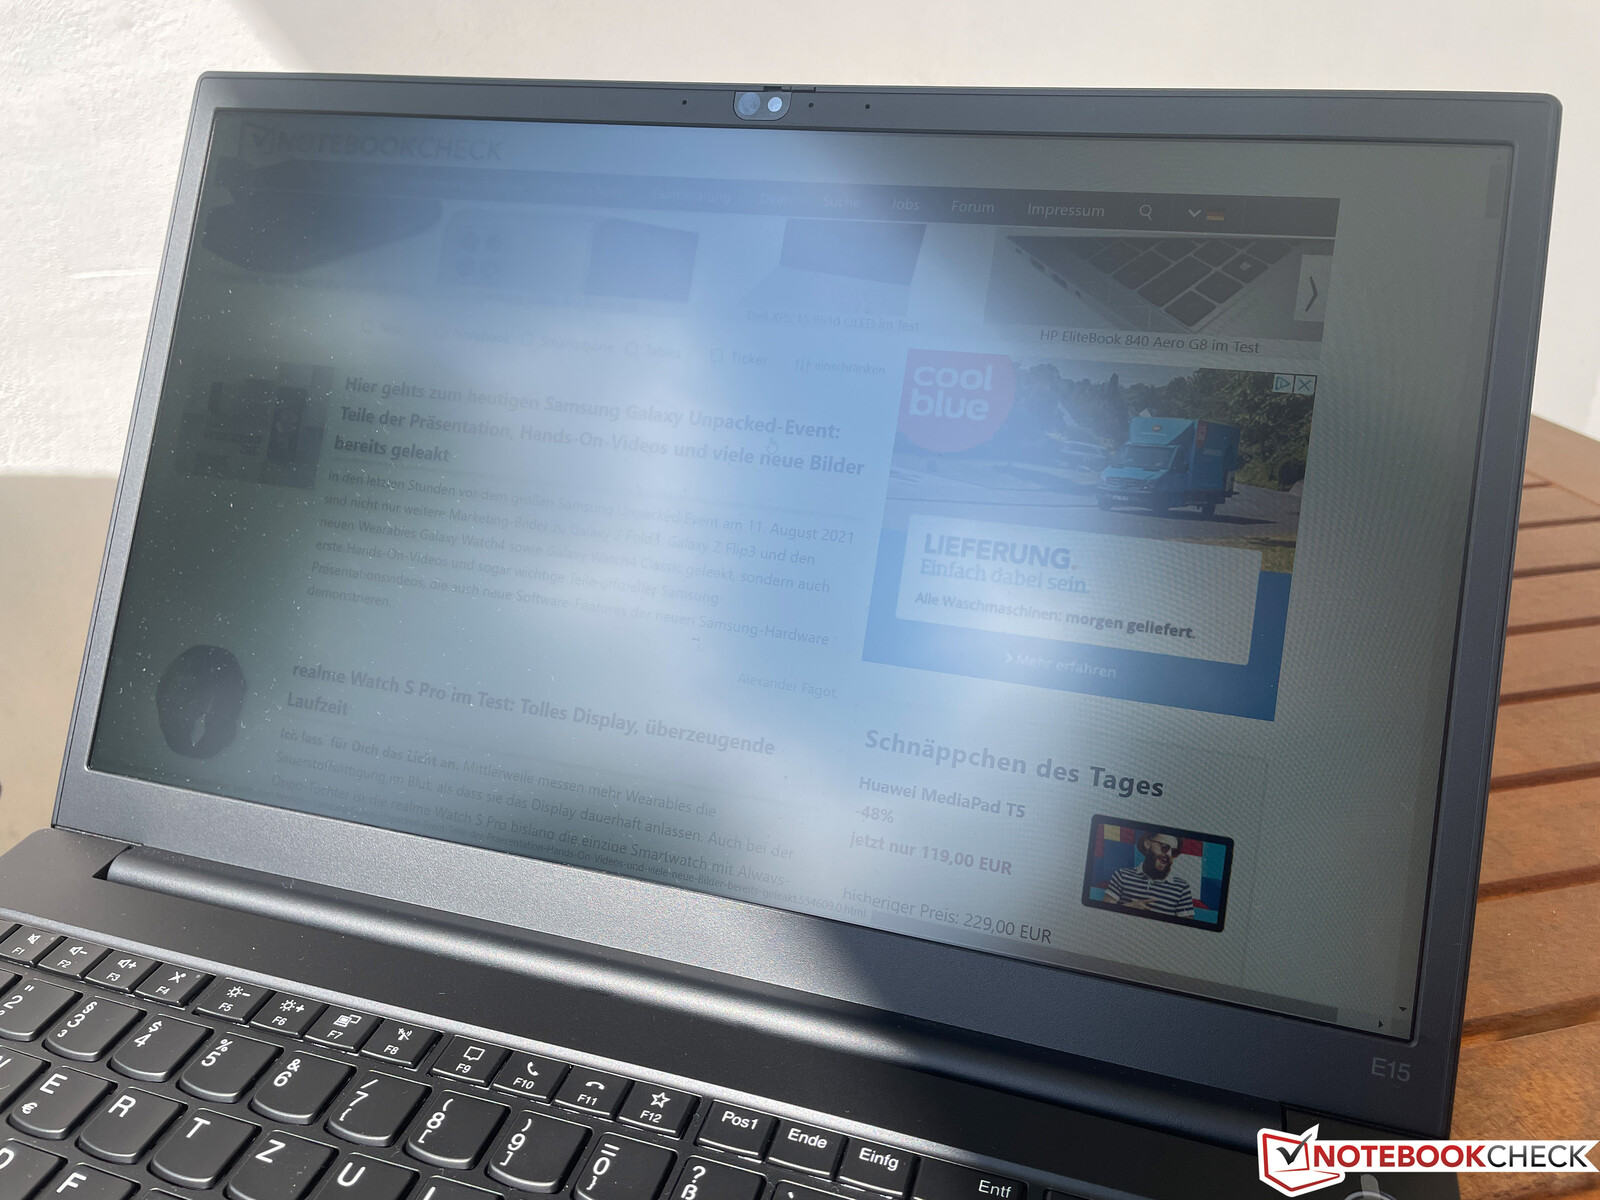
The display was always weakness of the ThinkPad E15 with a luminance around 250 nits. Lenovo improved the specs for the E15 G3 and the panel is new brighter rated at 300 nits, but our model is even brighter at ~330 nits on average. Thanks to the low black value, the contrast ratio is very good and the subjective picture quality is good as well, but bright surfaces look a bit grainy.
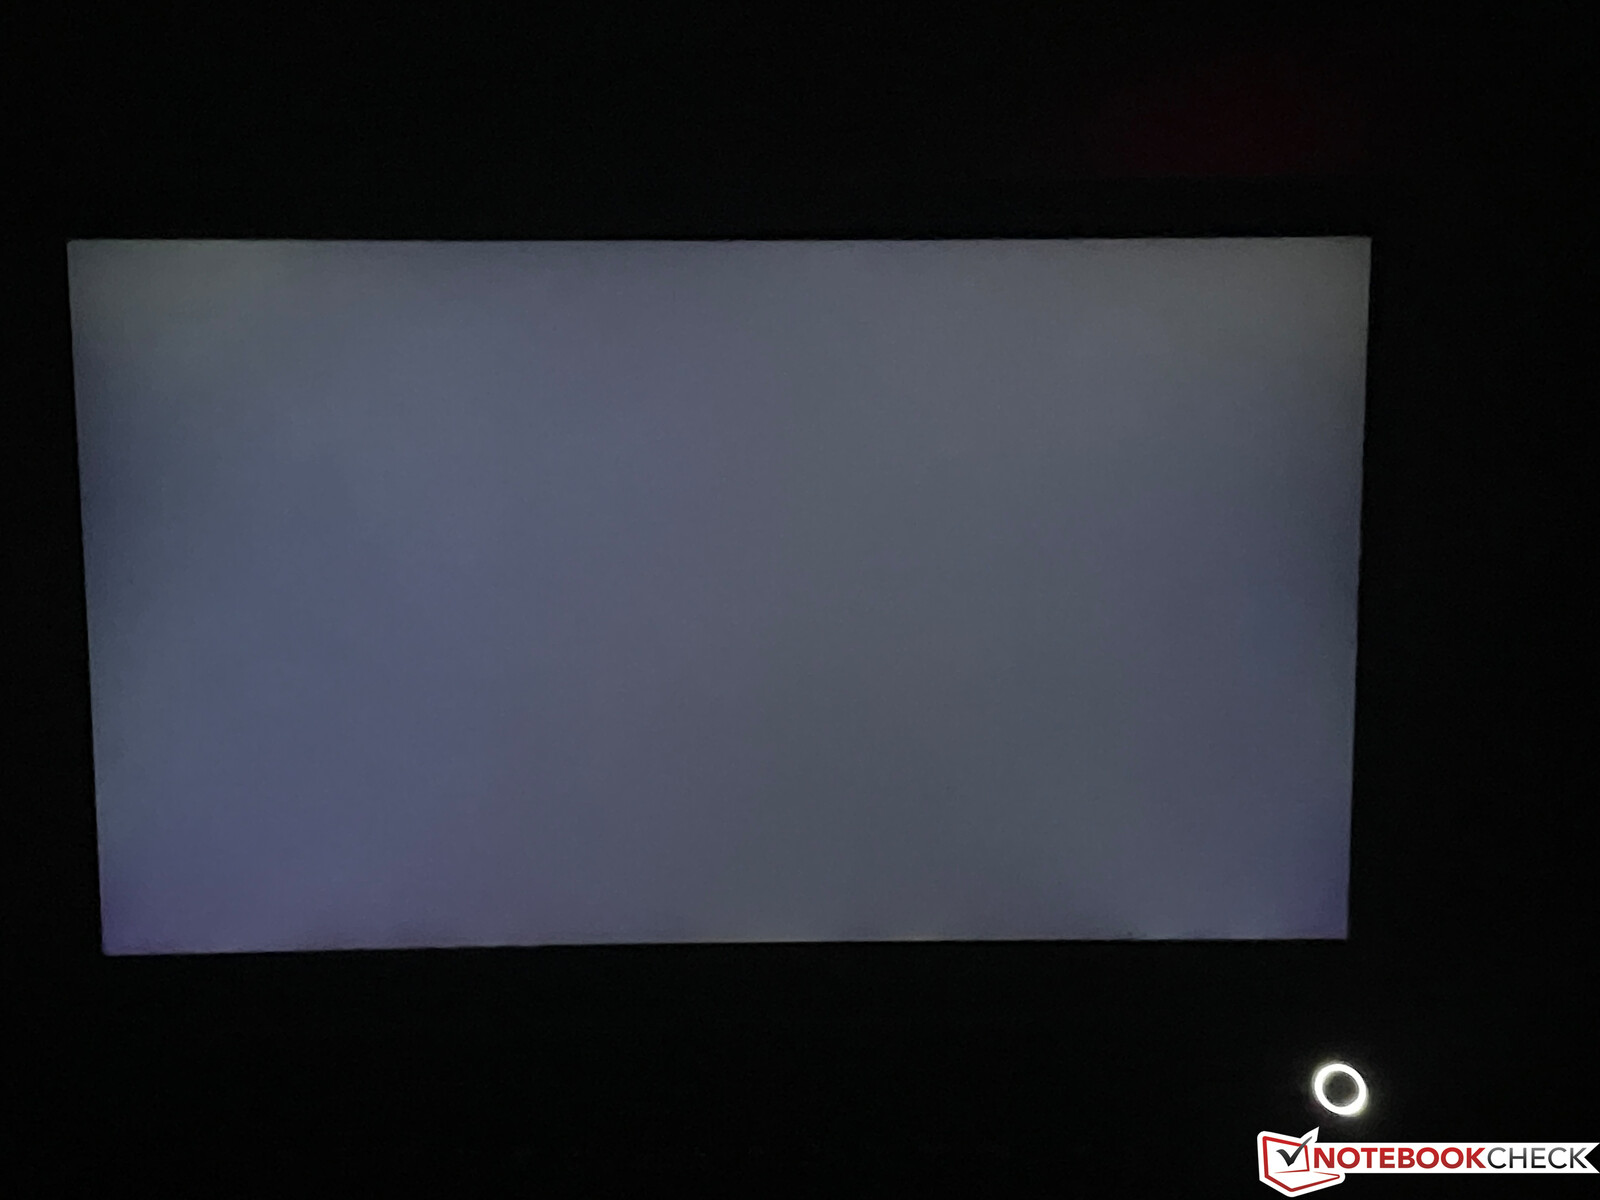
We did not detect PWM flickering, but the response times are not the fastest and there is some ghosting. However, this should not be a big issue for an office laptop. Backlight bleeding is very minor at the bottom edge.
| |||||||||||||||||||||||||
Brightness Distribution: 93 %
Center on Battery: 345 cd/m²
Contrast: 1388:1 (Black: 0.25 cd/m²)
ΔE ColorChecker Calman: 4.7 | ∀{0.5-29.43 Ø4.71}
calibrated: 4.4
ΔE Greyscale Calman: 1.7 | ∀{0.09-98 Ø4.96}
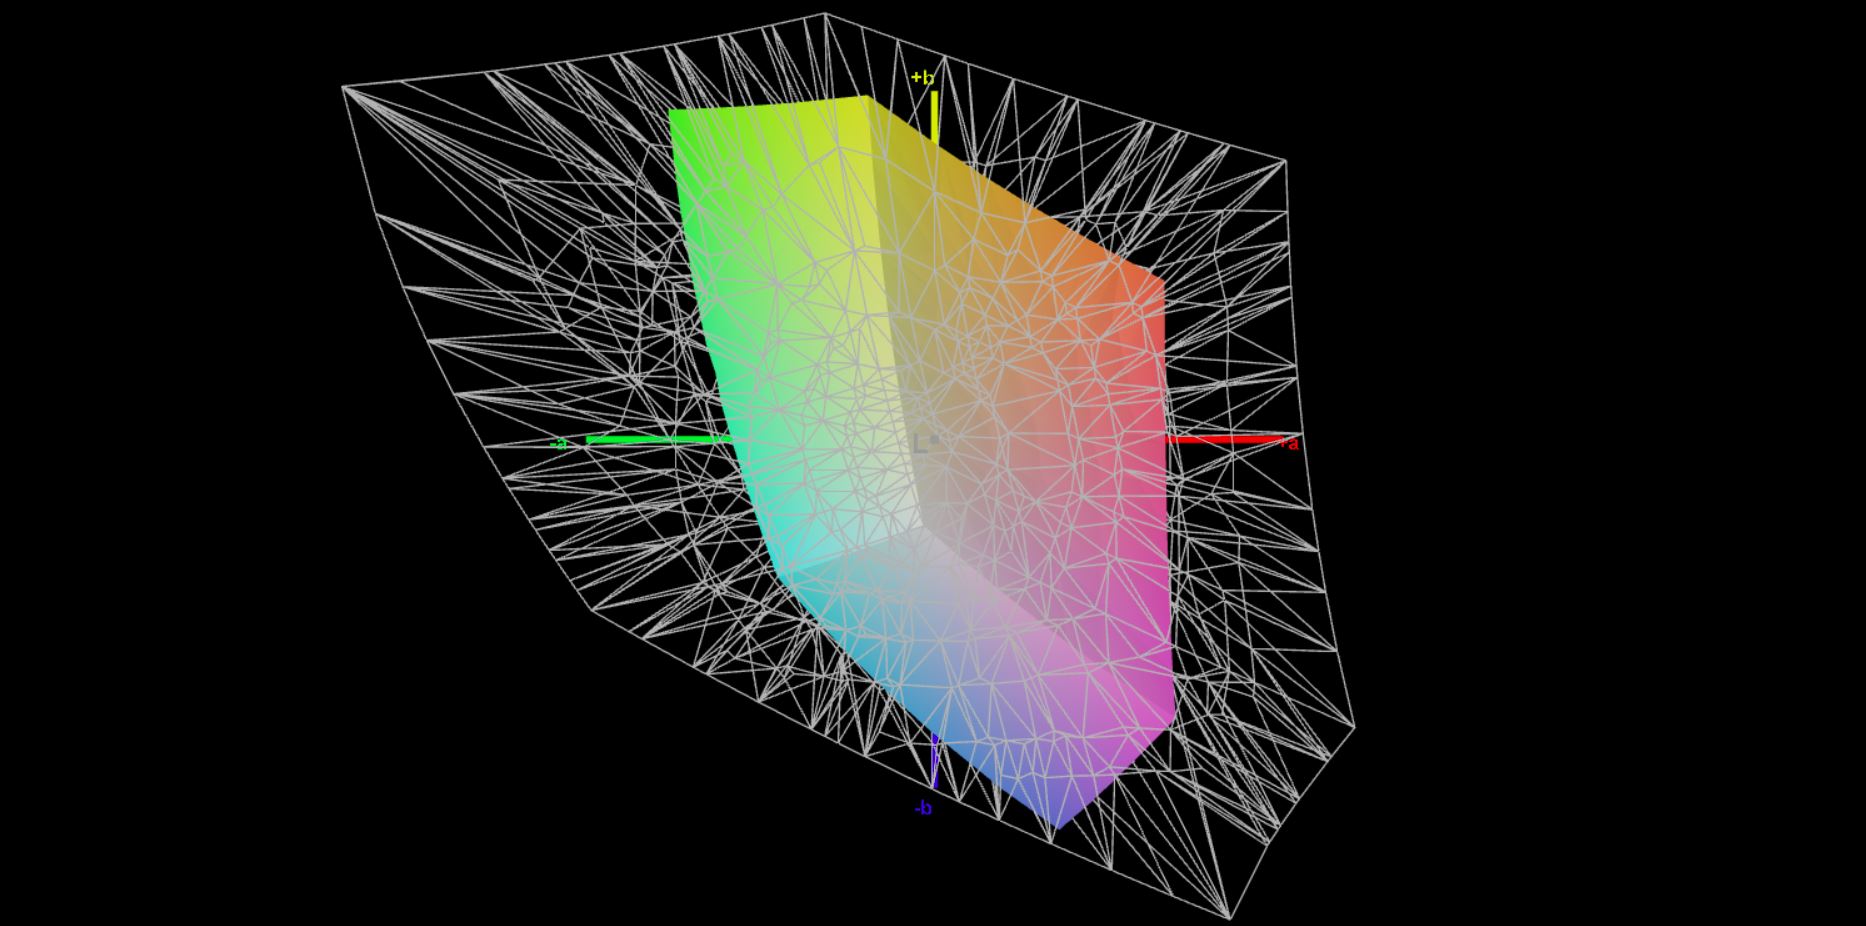
41.6% AdobeRGB 1998 (Argyll 3D)
60.2% sRGB (Argyll 3D)
40.3% Display P3 (Argyll 3D)
Gamma: 2.2
CCT: 6475 K
| Lenovo ThinkPad E15 G3-20YG003UGE B156HAN02.1, IPS, 1920x1080, 15.6" | Lenovo ThinkPad L15 G2 AMD N156HCA-EAB, IPS LED, 1920x1080, 15.6" | Lenovo ThinkPad E15 Gen2-20TD002MGE Lenovo LEN40BA, IPS, 1920x1080, 15.6" | Asus VivoBook S15 D533UA Chi Mei N156HCA-EAB, IPS, 1920x1080, 15.6" | Dell Latitude 15 5511-VNJNW BOE0869, IPS, 1920x1080, 15.6" | Lenovo ThinkPad E15 Gen2-20T9S00K00 B156HAN02.1, IPS, 1920x1080, 15.6" | |
|---|---|---|---|---|---|---|
| Display | 9% | -4% | 8% | -2% | -5% | |
| Display P3 Coverage (%) | 40.3 | 43.8 9% | 38.71 -4% | 43.6 8% | 39.56 -2% | 38.42 -5% |
| sRGB Coverage (%) | 60.2 | 65.7 9% | 58.2 -3% | 65.2 8% | 58.3 -3% | 57.8 -4% |
| AdobeRGB 1998 Coverage (%) | 41.6 | 45.3 9% | 39.99 -4% | 45 8% | 40.87 -2% | 39.69 -5% |
| Response Times | 5% | 55% | 48% | -4% | -5% | |
| Response Time Grey 50% / Grey 80% * (ms) | 44 ? | 40 9% | 28 ? 36% | 18 ? 59% | 48 ? -9% | 46.8 ? -6% |
| Response Time Black / White * (ms) | 30.4 ? | 30 1% | 8 ? 74% | 19 ? 37% | 30 ? 1% | 31.2 ? -3% |
| PWM Frequency (Hz) | 1000 ? | |||||
| Screen | 1% | -14% | -32% | -15% | -35% | |
| Brightness middle (cd/m²) | 347 | 298 -14% | 248 -29% | 289 -17% | 268 -23% | 249 -28% |
| Brightness (cd/m²) | 329 | 276 -16% | 244 -26% | 267 -19% | 241 -27% | 239 -27% |
| Brightness Distribution (%) | 93 | 86 -8% | 87 -6% | 85 -9% | 79 -15% | 87 -6% |
| Black Level * (cd/m²) | 0.25 | 0.26 -4% | 0.27 -8% | 0.56 -124% | 0.34 -36% | 0.22 12% |
| Contrast (:1) | 1388 | 1146 -17% | 919 -34% | 516 -63% | 788 -43% | 1132 -18% |
| Colorchecker dE 2000 * | 4.7 | 3.7 21% | 5.07 -8% | 3.96 16% | 4.64 1% | 6.7 -43% |
| Colorchecker dE 2000 max. * | 19.4 | 15 23% | 17.47 10% | 6.76 65% | 7.11 63% | 19.7 -2% |
| Colorchecker dE 2000 calibrated * | 4.4 | 3.5 20% | 3.67 17% | 4.4 -0% | ||
| Greyscale dE 2000 * | 1.7 | 1.7 -0% | 1.91 -12% | 3.43 -102% | 2.96 -74% | 5.1 -200% |
| Gamma | 2.2 100% | 2.21 100% | 2.39 92% | 2.28 96% | 2.37 93% | 2.48 89% |
| CCT | 6475 100% | 6588 99% | 6697 97% | 7191 90% | 6343 102% | 7277 89% |
| Color Space (Percent of AdobeRGB 1998) (%) | 37 | 42 | 37 | 36.6 | ||
| Color Space (Percent of sRGB) (%) | 58 | 65 | 52 | 57.7 | ||
| Total Average (Program / Settings) | 5% /
3% | 12% /
-1% | 8% /
-10% | -7% /
-11% | -15% /
-24% |
* ... smaller is better
Display Response Times
| ↔ Response Time Black to White | ||
|---|---|---|
| 30.4 ms ... rise ↗ and fall ↘ combined | ↗ 16.4 ms rise | 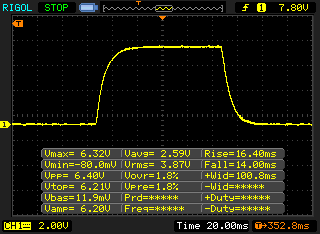 |
| ↘ 14 ms fall | ||
| The screen shows slow response rates in our tests and will be unsatisfactory for gamers. In comparison, all tested devices range from 0.1 (minimum) to 240 (maximum) ms. » 82 % of all devices are better. This means that the measured response time is worse than the average of all tested devices (19.8 ms). | ||
| ↔ Response Time 50% Grey to 80% Grey | ||
| 44 ms ... rise ↗ and fall ↘ combined | ↗ 21.2 ms rise | 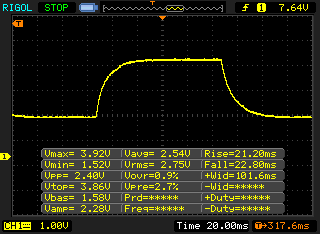 |
| ↘ 22.8 ms fall | ||
| The screen shows slow response rates in our tests and will be unsatisfactory for gamers. In comparison, all tested devices range from 0.165 (minimum) to 636 (maximum) ms. » 73 % of all devices are better. This means that the measured response time is worse than the average of all tested devices (31 ms). | ||
Screen Flickering / PWM (Pulse-Width Modulation)
| Screen flickering / PWM not detected |  | ||
In comparison: 52 % of all tested devices do not use PWM to dim the display. If PWM was detected, an average of 7754 (minimum: 5 - maximum: 343500) Hz was measured. | |||
We analyzed and calibrated the panel with the professional CalMAN software and the X-Rite i1 Pro 2. First of all, this is an inexpensive IPS screen with high color deviations and even the small sRGB color gamut is only covered by 60%. The grayscale performance, however, is already very good out of the box and there is no color cast. We can slightly improve the results with our own calibration, but you will not see the difference with the naked eye.
This display is a good choice for an office environment, but we recommend you get the optional FHD screen with full sRGB coverage if you plan on editing some pictures/videos.
Depending on the ambient light, you can work pretty comfortably on the matte panel outdoors and there are no limitations in terms of viewing angle stability.

Performance - AMD Ryzen 5000
Processor - Ryzen 7 5700U (Zen 2)
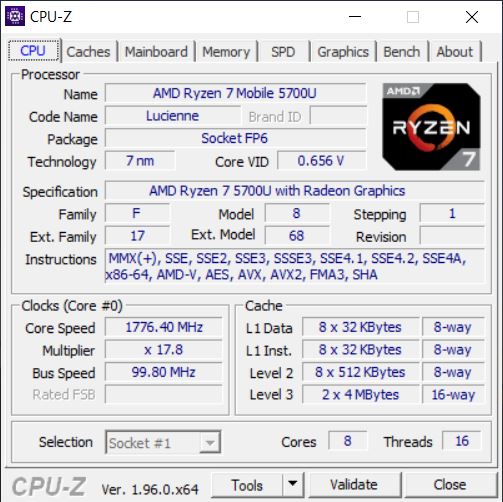
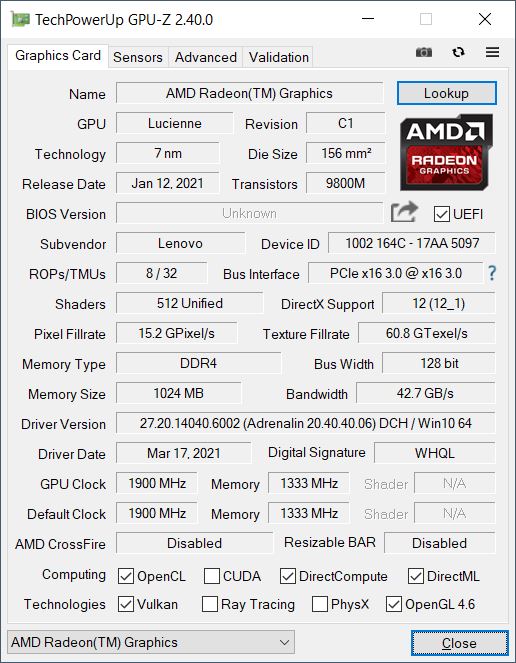
Our test unit is equipped with the AMD Ryzen 7 5700U with 8 cores (16 threads), which is manufactured in a 7 nm process, but it is still based on the Zen 2 architecture. The recently reviewed ThinkPad L15 G2 is already equipped with Zen 3 chips and is even available with Ryzen Pro CPUs that offer enhanced security features.
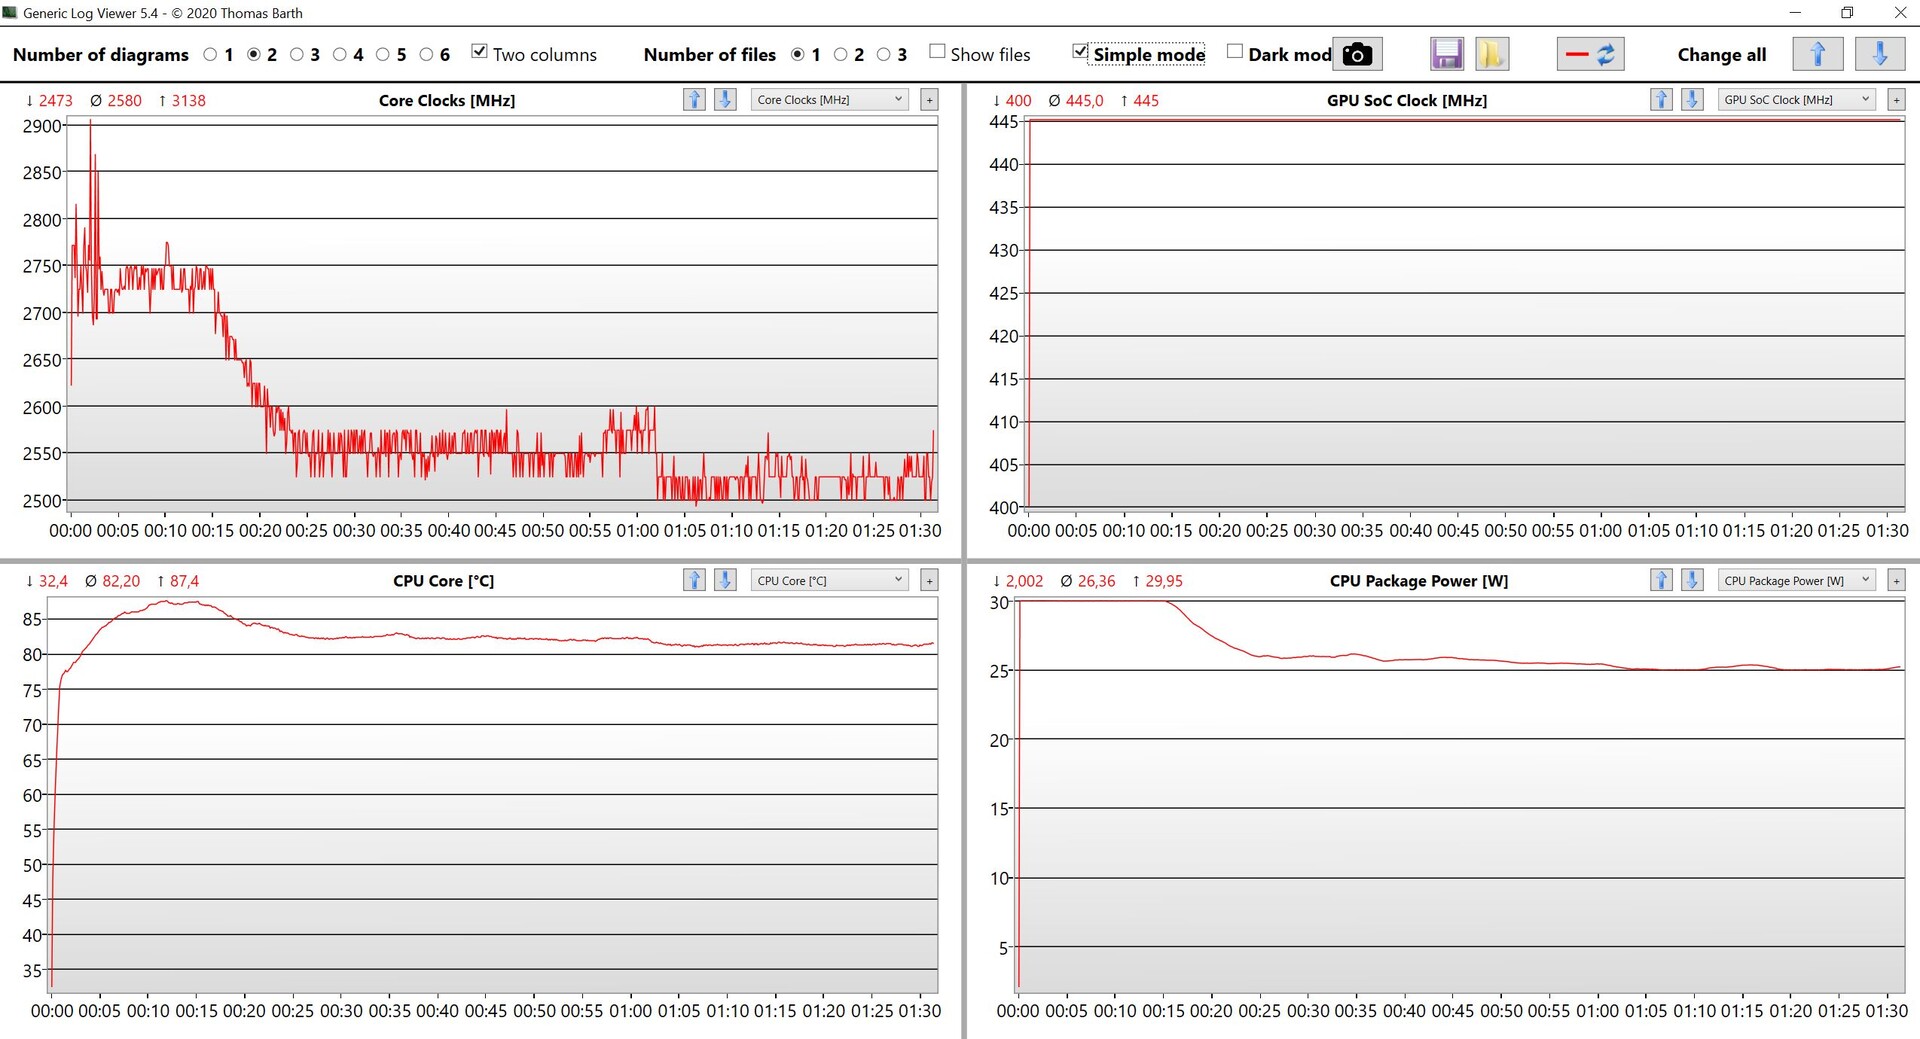
The CPU maintains a power consumption of 30W (8x 3.3 GHz) for a while and only starts dropping to 25W after around 15-20 minutes. The performance is very good and the new processor is about 30-40% faster than the old Ryzen 7 4700U in multi-core tests. Intel's Tiger Lake-U chips are clearly beaten and only have a small advantage in single-core tests. The new Zen 3 CPUs (see ThinkPad L15 G2), however, have already closed the gap. The CPU performance is not reduced on battery power.
Cinebench R15 Multi Loop
Cinebench R20: CPU (Single Core) | CPU (Multi Core)
Cinebench R15: CPU Single 64Bit | CPU Multi 64Bit
Blender: v2.79 BMW27 CPU
7-Zip 18.03: 7z b 4 -mmt1 | 7z b 4
Geekbench 5.5: Single-Core | Multi-Core
HWBOT x265 Benchmark v2.2: 4k Preset
LibreOffice : 20 Documents To PDF
R Benchmark 2.5: Overall mean
| Cinebench R23 / Single Core | |
| Average of class Office (708 - 2130, n=76, last 2 years) | |
| Lenovo ThinkPad L15 G2 AMD | |
| Asus VivoBook S15 D533UA | |
| Lenovo ThinkPad E15 G3-20YG003UGE | |
| Average AMD Ryzen 7 5700U (1177 - 1268, n=20) | |
| Cinebench R23 / Multi Core | |
| Average of class Office (1673 - 22808, n=76, last 2 years) | |
| Asus VivoBook S15 D533UA | |
| Lenovo ThinkPad E15 G3-20YG003UGE | |
| Average AMD Ryzen 7 5700U (4861 - 10139, n=20) | |
| Lenovo ThinkPad L15 G2 AMD | |
| Cinebench R20 / CPU (Single Core) | |
| Average of class Office (345 - 816, n=75, last 2 years) | |
| Lenovo ThinkPad L15 G2 AMD | |
| Lenovo ThinkPad E15 Gen2-20TD002MGE | |
| Asus VivoBook S15 D533UA | |
| Lenovo ThinkPad E15 G3-20YG003UGE | |
| Average AMD Ryzen 7 5700U (471 - 495, n=21) | |
| Lenovo ThinkPad E15 Gen2-20T9S00K00 | |
| Dell Latitude 15 5511-VNJNW | |
| Cinebench R20 / CPU (Multi Core) | |
| Average of class Office (648 - 8840, n=75, last 2 years) | |
| Asus VivoBook S15 D533UA | |
| Lenovo ThinkPad E15 G3-20YG003UGE | |
| Average AMD Ryzen 7 5700U (1887 - 3877, n=21) | |
| Lenovo ThinkPad L15 G2 AMD | |
| Lenovo ThinkPad E15 Gen2-20T9S00K00 | |
| Lenovo ThinkPad E15 Gen2-20TD002MGE | |
| Dell Latitude 15 5511-VNJNW | |
| Cinebench R15 / CPU Single 64Bit | |
| Average of class Office (99.5 - 316, n=77, last 2 years) | |
| Lenovo ThinkPad L15 G2 AMD | |
| Lenovo ThinkPad E15 Gen2-20TD002MGE | |
| Dell Latitude 15 5511-VNJNW | |
| Asus VivoBook S15 D533UA | |
| Lenovo ThinkPad E15 G3-20YG003UGE | |
| Average AMD Ryzen 7 5700U (181 - 190, n=19) | |
| Lenovo ThinkPad E15 Gen2-20T9S00K00 | |
| Cinebench R15 / CPU Multi 64Bit | |
| Average of class Office (250 - 3380, n=77, last 2 years) | |
| Asus VivoBook S15 D533UA | |
| Lenovo ThinkPad E15 G3-20YG003UGE | |
| Average AMD Ryzen 7 5700U (856 - 1691, n=20) | |
| Lenovo ThinkPad L15 G2 AMD | |
| Lenovo ThinkPad E15 Gen2-20T9S00K00 | |
| Lenovo ThinkPad E15 Gen2-20TD002MGE | |
| Dell Latitude 15 5511-VNJNW | |
| Blender / v2.79 BMW27 CPU | |
| Dell Latitude 15 5511-VNJNW | |
| Lenovo ThinkPad E15 Gen2-20TD002MGE | |
| Lenovo ThinkPad E15 Gen2-20T9S00K00 | |
| Lenovo ThinkPad L15 G2 AMD | |
| Average AMD Ryzen 7 5700U (292 - 557, n=20) | |
| Average of class Office (158 - 1940, n=76, last 2 years) | |
| Asus VivoBook S15 D533UA | |
| Lenovo ThinkPad E15 G3-20YG003UGE | |
| 7-Zip 18.03 / 7z b 4 -mmt1 | |
| Average of class Office (3387 - 6469, n=77, last 2 years) | |
| Lenovo ThinkPad L15 G2 AMD | |
| Lenovo ThinkPad E15 Gen2-20TD002MGE | |
| Dell Latitude 15 5511-VNJNW | |
| Asus VivoBook S15 D533UA | |
| Average AMD Ryzen 7 5700U (4402 - 4620, n=20) | |
| Lenovo ThinkPad E15 G3-20YG003UGE | |
| Lenovo ThinkPad E15 Gen2-20T9S00K00 | |
| 7-Zip 18.03 / 7z b 4 | |
| Average of class Office (7098 - 76886, n=77, last 2 years) | |
| Asus VivoBook S15 D533UA | |
| Lenovo ThinkPad E15 G3-20YG003UGE | |
| Average AMD Ryzen 7 5700U (29095 - 47501, n=20) | |
| Lenovo ThinkPad L15 G2 AMD | |
| Lenovo ThinkPad E15 Gen2-20T9S00K00 | |
| Lenovo ThinkPad E15 Gen2-20TD002MGE | |
| Dell Latitude 15 5511-VNJNW | |
| Geekbench 5.5 / Single-Core | |
| Average of class Office (811 - 2175, n=73, last 2 years) | |
| Lenovo ThinkPad E15 Gen2-20TD002MGE | |
| Lenovo ThinkPad L15 G2 AMD | |
| Dell Latitude 15 5511-VNJNW | |
| Asus VivoBook S15 D533UA | |
| Average AMD Ryzen 7 5700U (1105 - 1205, n=19) | |
| Lenovo ThinkPad E15 G3-20YG003UGE | |
| Lenovo ThinkPad E15 Gen2-20T9S00K00 | |
| Geekbench 5.5 / Multi-Core | |
| Average of class Office (1483 - 16999, n=73, last 2 years) | |
| Asus VivoBook S15 D533UA | |
| Average AMD Ryzen 7 5700U (4254 - 7635, n=19) | |
| Lenovo ThinkPad E15 G3-20YG003UGE | |
| Lenovo ThinkPad E15 Gen2-20T9S00K00 | |
| Lenovo ThinkPad L15 G2 AMD | |
| Lenovo ThinkPad E15 Gen2-20TD002MGE | |
| Dell Latitude 15 5511-VNJNW | |
| HWBOT x265 Benchmark v2.2 / 4k Preset | |
| Average of class Office (2.21 - 26, n=76, last 2 years) | |
| Asus VivoBook S15 D533UA | |
| Lenovo ThinkPad E15 G3-20YG003UGE | |
| Lenovo ThinkPad L15 G2 AMD | |
| Average AMD Ryzen 7 5700U (6.08 - 12.1, n=20) | |
| Lenovo ThinkPad E15 Gen2-20T9S00K00 | |
| Lenovo ThinkPad E15 Gen2-20TD002MGE | |
| Dell Latitude 15 5511-VNJNW | |
| LibreOffice / 20 Documents To PDF | |
| Average AMD Ryzen 7 5700U (52.4 - 75.5, n=20) | |
| Lenovo ThinkPad E15 G3-20YG003UGE | |
| Asus VivoBook S15 D533UA | |
| Lenovo ThinkPad E15 Gen2-20T9S00K00 | |
| Average of class Office (39.9 - 102.3, n=76, last 2 years) | |
| Lenovo ThinkPad E15 Gen2-20TD002MGE | |
| Dell Latitude 15 5511-VNJNW | |
| Lenovo ThinkPad L15 G2 AMD | |
| R Benchmark 2.5 / Overall mean | |
| Dell Latitude 15 5511-VNJNW | |
| Lenovo ThinkPad E15 Gen2-20T9S00K00 | |
| Lenovo ThinkPad E15 G3-20YG003UGE | |
| Average AMD Ryzen 7 5700U (0.567 - 0.641, n=20) | |
| Lenovo ThinkPad E15 Gen2-20TD002MGE | |
| Asus VivoBook S15 D533UA | |
| Lenovo ThinkPad L15 G2 AMD | |
| Average of class Office (0.393 - 0.888, n=76, last 2 years) | |
* ... smaller is better
System Performance
Thanks to the powerful processor and the PCIe-SSD, the E15 G3 is a very fast and responsive companion, which is also supported by the synthetic benchmarks. There won't be any bottlenecks in the next couple of years.
| PCMark 10 / Score | |
| Average of class Office (2601 - 9298, n=68, last 2 years) | |
| Lenovo ThinkPad E15 Gen2-20TD002MGE | |
| Lenovo ThinkPad L15 G2 AMD | |
| Lenovo ThinkPad E15 G3-20YG003UGE | |
| Asus VivoBook S15 D533UA | |
| Average AMD Ryzen 7 5700U, AMD Radeon RX Vega 8 (Ryzen 4000/5000) (4325 - 5518, n=15) | |
| Lenovo ThinkPad E15 Gen2-20T9S00K00 | |
| Dell Latitude 15 5511-VNJNW | |
| PCMark 10 / Essentials | |
| Lenovo ThinkPad L15 G2 AMD | |
| Average of class Office (3245 - 11594, n=68, last 2 years) | |
| Lenovo ThinkPad E15 Gen2-20T9S00K00 | |
| Lenovo ThinkPad E15 Gen2-20TD002MGE | |
| Lenovo ThinkPad E15 G3-20YG003UGE | |
| Asus VivoBook S15 D533UA | |
| Average AMD Ryzen 7 5700U, AMD Radeon RX Vega 8 (Ryzen 4000/5000) (8025 - 10091, n=15) | |
| Dell Latitude 15 5511-VNJNW | |
| PCMark 10 / Productivity | |
| Average of class Office (5336 - 17243, n=68, last 2 years) | |
| Lenovo ThinkPad L15 G2 AMD | |
| Lenovo ThinkPad E15 Gen2-20TD002MGE | |
| Lenovo ThinkPad E15 G3-20YG003UGE | |
| Asus VivoBook S15 D533UA | |
| Average AMD Ryzen 7 5700U, AMD Radeon RX Vega 8 (Ryzen 4000/5000) (7001 - 8457, n=15) | |
| Dell Latitude 15 5511-VNJNW | |
| Lenovo ThinkPad E15 Gen2-20T9S00K00 | |
| PCMark 10 / Digital Content Creation | |
| Average of class Office (2049 - 13541, n=68, last 2 years) | |
| Lenovo ThinkPad E15 Gen2-20TD002MGE | |
| Asus VivoBook S15 D533UA | |
| Lenovo ThinkPad E15 G3-20YG003UGE | |
| Average AMD Ryzen 7 5700U, AMD Radeon RX Vega 8 (Ryzen 4000/5000) (3738 - 5964, n=15) | |
| Lenovo ThinkPad E15 Gen2-20T9S00K00 | |
| Lenovo ThinkPad L15 G2 AMD | |
| Dell Latitude 15 5511-VNJNW | |
| PCMark 10 Score | 5404 points | |
Help | ||
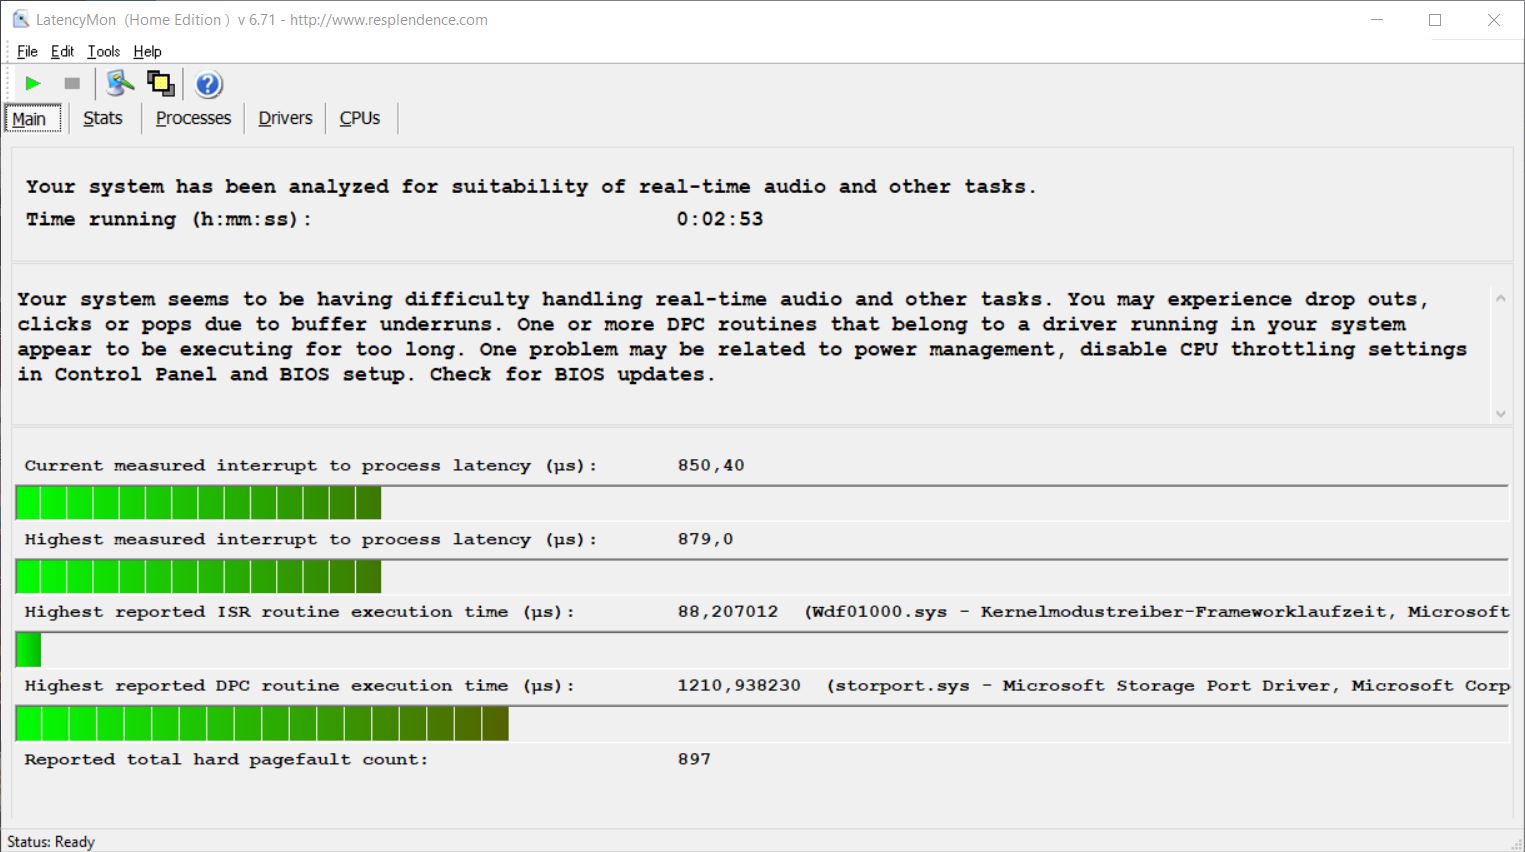
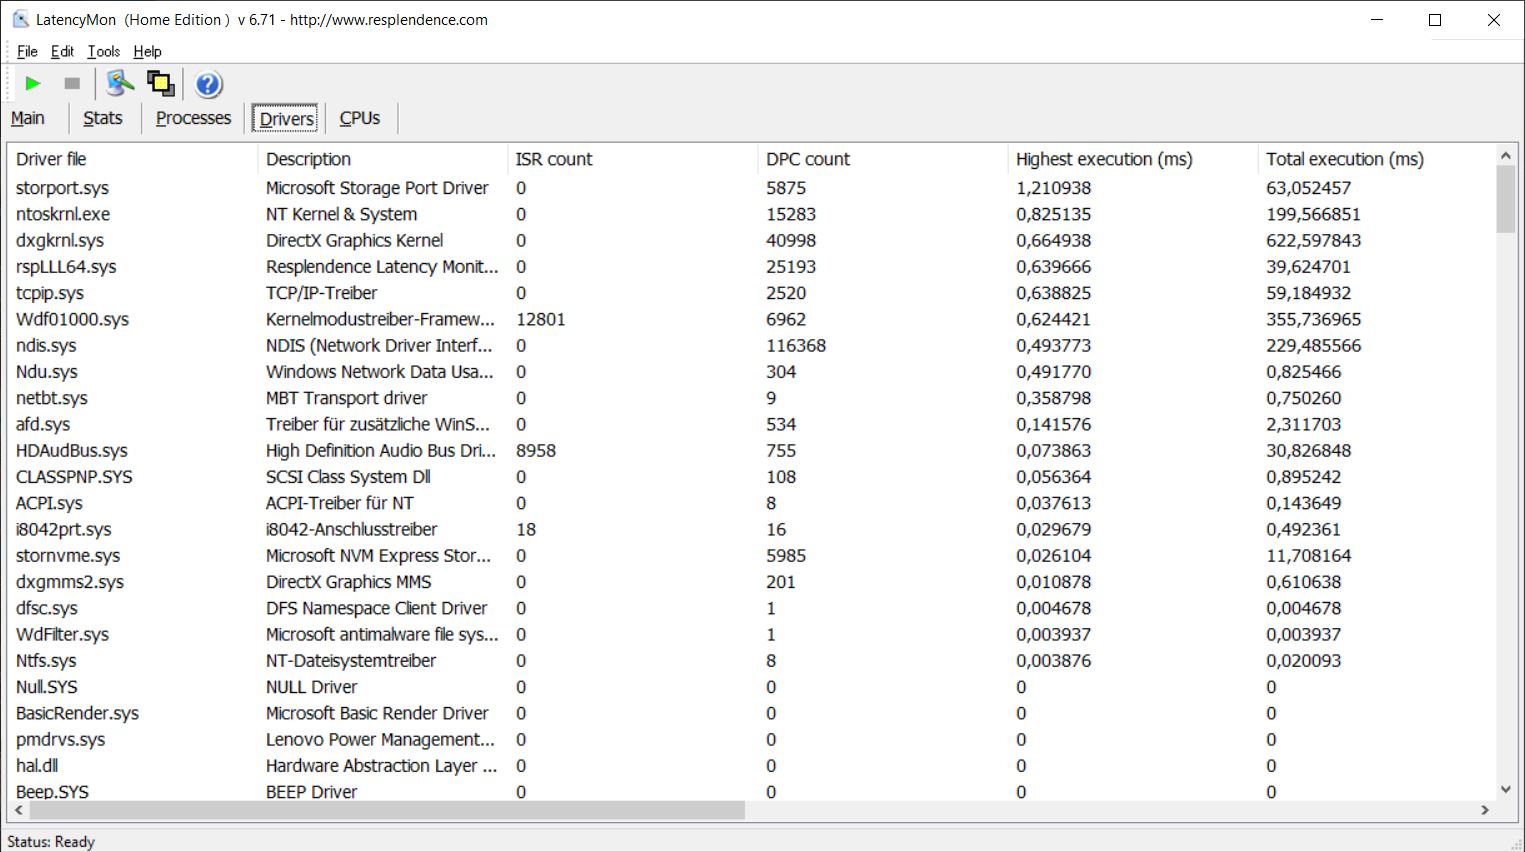
DPC-Latency
Our DPC latency test shows an improvement over the previous model, but there are still limitations. The E15 G3 is therefore not ideal for real-time audio applications.
| DPC Latencies / LatencyMon - interrupt to process latency (max), Web, Youtube, Prime95 | |
| Dell Latitude 15 5511-VNJNW | |
| Lenovo ThinkPad E15 Gen2-20TD002MGE | |
| Lenovo ThinkPad L15 G2 AMD | |
| Lenovo ThinkPad E15 G3-20YG003UGE | |
| Asus VivoBook S15 D533UA | |
* ... smaller is better
Storage Devices
The ThinkPad E15 G2 has two M.2-SSD slots (PCIe 3.0 x4) and our test unit is equipped with a M.2-2280 drive, which means you can use the free M.2-2242 slot for storage expansion. The SSD from SK Hynix (PC711) offers a generous storage capacity of 1 TB and you can use around 912 GB after the initial set-up. Transfer rates are very good and the SSD is one of the fastest PCIe 3.0 drives. More SSD benchmarks are available here.
| Lenovo ThinkPad E15 G3-20YG003UGE SK Hynix PC711 1TB HFS001TDE9X084N | Lenovo ThinkPad L15 G2 AMD SK Hynix HFS512 GDE9X081N | Lenovo ThinkPad E15 Gen2-20TD002MGE Samsung PM991 MZALQ512HALU | Asus VivoBook S15 D533UA WDC PC SN530 SDBPNPZ-1T00 | Dell Latitude 15 5511-VNJNW Micron 2200S 256GB | Lenovo ThinkPad E15 Gen2-20T9S00K00 Samsung PM991 MZALQ512HALU | Average SK Hynix PC711 1TB HFS001TDE9X084N | Average of class Office | |
|---|---|---|---|---|---|---|---|---|
| CrystalDiskMark 5.2 / 6 | 12% | -18% | -1% | -19% | -12% | 22% | 49% | |
| Write 4K (MB/s) | 87.7 | 126.9 45% | 118.8 35% | 116.8 33% | 72.6 -17% | 104.9 20% | 140.4 ? 60% | 153.2 ? 75% |
| Read 4K (MB/s) | 48.69 | 59.2 22% | 37.55 -23% | 43.92 -10% | 43.41 -11% | 46.54 -4% | 64.5 ? 32% | 73.4 ? 51% |
| Write Seq (MB/s) | 1829 | 2180 19% | 1224 -33% | 1990 9% | 1098 -40% | 1333 -27% | 2059 ? 13% | 2531 ? 38% |
| Read Seq (MB/s) | 1579 | 1792 13% | 1589 1% | 1959 24% | 1770 12% | 1565 -1% | 1867 ? 18% | 3292 ? 108% |
| Write 4K Q32T1 (MB/s) | 482.4 | 540 12% | 409.5 -15% | 373.3 -23% | 465.8 -3% | 437.2 -9% | 432 ? -10% | 431 ? -11% |
| Read 4K Q32T1 (MB/s) | 422.8 | 399 -6% | 335.5 -21% | 524 24% | 374.9 -11% | 498.9 18% | 495 ? 17% | 516 ? 22% |
| Write Seq Q32T1 (MB/s) | 3250 | 2778 -15% | 1427 -56% | 1985 -39% | 1104 -66% | 1315 -60% | 3777 ? 16% | 4178 ? 29% |
| Read Seq Q32T1 (MB/s) | 3341 | 3601 8% | 2353 -30% | 2456 -26% | 2921 -13% | 2340 -30% | 4204 ? 26% | 6043 ? 81% |
| AS SSD | -9% | -48% | -15% | -68% | -34% | 28% | 10% | |
| Seq Read (MB/s) | 2432 | 2721 12% | 1886 -22% | 2082 -14% | 2058 -15% | 1934 -20% | 3325 ? 37% | 4326 ? 78% |
| Seq Write (MB/s) | 1266 | 1329 5% | 1226 -3% | 1844 46% | 788 -38% | 1198 -5% | 2415 ? 91% | 2771 ? 119% |
| 4K Read (MB/s) | 48.88 | 51.5 5% | 32.37 -34% | 44.33 -9% | 39.7 -19% | 47.08 -4% | 59.2 ? 21% | 58.1 ? 19% |
| 4K Write (MB/s) | 128.4 | 132.5 3% | 100.8 -21% | 157.5 23% | 68.6 -47% | 132.8 3% | 169.1 ? 32% | 162.6 ? 27% |
| 4K-64 Read (MB/s) | 1805 | 932 -48% | 842 -53% | 1039 -42% | 731 -60% | 866 -52% | 1446 ? -20% | 958 ? -47% |
| 4K-64 Write (MB/s) | 2470 | 1856 -25% | 485 -80% | 1556 -37% | 753 -70% | 872 -65% | 2526 ? 2% | 1643 ? -33% |
| Access Time Read * (ms) | 0.044 | 0.038 14% | 0.102 -132% | 0.05 -14% | 0.079 -80% | 0.116 -164% | 0.035 ? 20% | 0.08448 ? -92% |
| Access Time Write * (ms) | 0.038 | 0.028 26% | 0.037 3% | 0.065 -71% | 0.128 -237% | 0.03 21% | 0.0252 ? 34% | 0.05931 ? -56% |
| Score Read (Points) | 2097 | 1256 -40% | 1063 -49% | 1292 -38% | 977 -53% | 1106 -47% | 1838 ? -12% | 1449 ? -31% |
| Score Write (Points) | 2725 | 2122 -22% | 708 -74% | 1898 -30% | 900 -67% | 1125 -59% | 2937 ? 8% | 2083 ? -24% |
| Score Total (Points) | 5837 | 3961 -32% | 2286 -61% | 3845 -34% | 2322 -60% | 2771 -53% | 5678 ? -3% | 4207 ? -28% |
| Copy ISO MB/s (MB/s) | 1301 | 1441 11% | 1258 -3% | 2288 ? 76% | 2541 ? 95% | |||
| Copy Program MB/s (MB/s) | 554 | 484.9 -12% | 411.2 -26% | 745 ? 34% | 790 ? 43% | |||
| Copy Game MB/s (MB/s) | 993 | 1098 11% | 945 -5% | 1687 ? 70% | 1627 ? 64% | |||
| Total Average (Program / Settings) | 2% /
-0% | -33% /
-35% | -8% /
-10% | -44% /
-47% | -23% /
-26% | 25% /
26% | 30% /
24% |
* ... smaller is better

Dauerleistung Lesen: DiskSpd Read Loop, Queue Depth 8
GPU Performance
We are already familiar with integrated graphics card Radeon RX Vega 8 from the old Ryzen 4000 processors. The performance is pretty much identical, only the integrated video decoder is much more efficient. Our test unit has a dual-channel memory configuration, which improves the iGPU performance, but Intel's current Xe Graphics G7 (96 EUs) is still 20-40% faster in the synthetic benchmarks. The actual gaming performance is much more comparable though. The gaming performance of an office laptop is obviously not great, but many popular and not very demanding still run smoothly at low/medium settings.
The performance is stable under sustained workloads and there are no limitations on battery power, either. More gaming benchmarks with the RX Vega are available in our tech section.
| 3DMark 11 Performance | 5746 points | |
| 3DMark Ice Storm Standard Score | 100849 points | |
| 3DMark Cloud Gate Standard Score | 21645 points | |
| 3DMark Fire Strike Score | 3220 points | |
| 3DMark Time Spy Score | 1274 points | |
Help | ||
Witcher 3 FPS Chart
| low | med. | high | ultra | |
|---|---|---|---|---|
| GTA V (2015) | 86.7 | 80.9 | 24.8 | 10.8 |
| The Witcher 3 (2015) | 64 | 20.4 | 13.4 | |
| Dota 2 Reborn (2015) | 93.4 | 74.9 | 49.5 | 46.3 |
| Final Fantasy XV Benchmark (2018) | 33.2 | 16.9 | 11.4 | |
| X-Plane 11.11 (2018) | 43.4 | 33.3 | 29.6 | |
| Strange Brigade (2018) | 74 | 30 | 25 | 22 |
| F1 2021 (2021) | 79.9 | 36.1 | 27.7 | 19.1 |
Emissions & Energy - E15 G3 is always quiet
System Noise
The new ThinkPad E15 G3 is still a very quiet laptop, and you can only hear a quiet murmur from the fan under load. It is often completely silent in everyday situations and even short peak load is handled without the fan. We noticed a quiet electronic noise during some benchmarks, which seemed to originate from the SSD, but we did not hear it on any other occasion. Our test unit did not suffer from coil whine.
Noise level
| Idle |
| 23.8 / 23.8 / 28 dB(A) |
| Load |
| 32.9 / 35 dB(A) |
 | ||
30 dB silent 40 dB(A) audible 50 dB(A) loud |
||
min: | ||
| Lenovo ThinkPad E15 G3-20YG003UGE Vega 8, R7 5700U, SK Hynix PC711 1TB HFS001TDE9X084N | Lenovo ThinkPad L15 G2 AMD Vega 7, R5 5600U, SK Hynix HFS512 GDE9X081N | Lenovo ThinkPad E15 Gen2-20TD002MGE GeForce MX450, i7-1165G7, Samsung PM991 MZALQ512HALU | Asus VivoBook S15 D533UA Vega 8, R7 5700U, WDC PC SN530 SDBPNPZ-1T00 | Dell Latitude 15 5511-VNJNW UHD Graphics 630, i5-10400H, Micron 2200S 256GB | Lenovo ThinkPad E15 Gen2-20T9S00K00 Vega 7, R7 4700U, Samsung PM991 MZALQ512HALU | |
|---|---|---|---|---|---|---|
| Noise | 4% | 3% | -16% | -2% | -11% | |
| off / environment * (dB) | 23.8 | 24.22 -2% | 25 -5% | 26 -9% | 24.9 -5% | 29.4 -24% |
| Idle Minimum * (dB) | 23.8 | 24.22 -2% | 25 -5% | 26 -9% | 24.9 -5% | 29.4 -24% |
| Idle Average * (dB) | 23.8 | 24.22 -2% | 25 -5% | 26 -9% | 24.9 -5% | 29.4 -24% |
| Idle Maximum * (dB) | 28 | 24.22 13% | 25.2 10% | 28.8 -3% | 24.9 11% | 30.2 -8% |
| Load Average * (dB) | 32.9 | 25.84 21% | 30.4 8% | 45 -37% | 27.1 18% | 31.1 5% |
| Load Maximum * (dB) | 35 | 36.02 -3% | 30.6 13% | 45 -29% | 44.2 -26% | 32.2 8% |
| Witcher 3 ultra * (dB) | 40.15 | 32.2 |
* ... smaller is better
Temperature
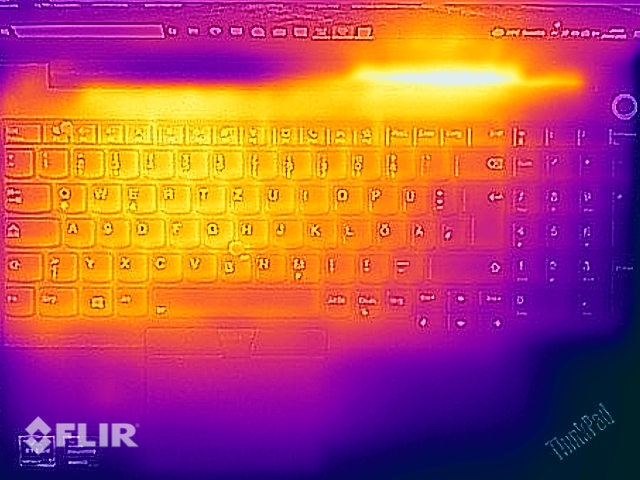
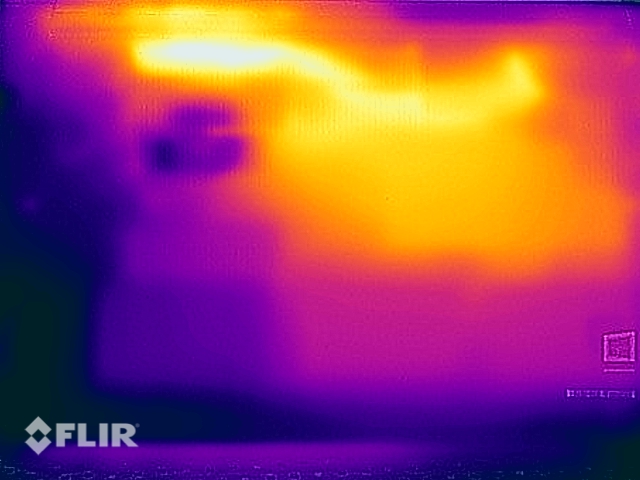
The high performance in combination with the quiet fan results in very high surface temperatures under heavy load. We measure around 60 °C around the heat pipe, which is just too much for an office laptop. You should not put the notebook on your lap in these scenarios. You will also notice the warm keyboard, but there are no limitations. However, the device is much cooler in regular office scenarios (MS Office suite, mails, web tools etc.).
The power consumption is steady at 30W for the first 15 minutes and then slowly levels off at 25W. All in all a good result, but we would have liked to see a better cooling solution.
(-) The maximum temperature on the upper side is 46.4 °C / 116 F, compared to the average of 34.3 °C / 94 F, ranging from 21.2 to 62.5 °C for the class Office.
(-) The bottom heats up to a maximum of 60.9 °C / 142 F, compared to the average of 36.8 °C / 98 F
(+) In idle usage, the average temperature for the upper side is 25.7 °C / 78 F, compared to the device average of 29.5 °C / 85 F.
(±) Playing The Witcher 3, the average temperature for the upper side is 37.4 °C / 99 F, compared to the device average of 29.5 °C / 85 F.
(+) The palmrests and touchpad are reaching skin temperature as a maximum (32.3 °C / 90.1 F) and are therefore not hot.
(-) The average temperature of the palmrest area of similar devices was 27.5 °C / 81.5 F (-4.8 °C / -8.6 F).
Speakers
The two speakers (2x 2W) are located at the bottom (front edge) and can be really loud. They do a good job for an office laptop and they are completely sufficient in an office environment (conferences, videos).
Lenovo ThinkPad E15 G3-20YG003UGE audio analysis
(±) | speaker loudness is average but good (81.5 dB)
Bass 100 - 315 Hz
(-) | nearly no bass - on average 21.4% lower than median
(±) | linearity of bass is average (9.5% delta to prev. frequency)
Mids 400 - 2000 Hz
(+) | balanced mids - only 2.6% away from median
(+) | mids are linear (5.6% delta to prev. frequency)
Highs 2 - 16 kHz
(+) | balanced highs - only 4.4% away from median
(±) | linearity of highs is average (7.3% delta to prev. frequency)
Overall 100 - 16.000 Hz
(±) | linearity of overall sound is average (16.1% difference to median)
Compared to same class
» 19% of all tested devices in this class were better, 6% similar, 75% worse
» The best had a delta of 7%, average was 21%, worst was 53%
Compared to all devices tested
» 26% of all tested devices were better, 5% similar, 69% worse
» The best had a delta of 4%, average was 23%, worst was 134%
Lenovo ThinkPad L15 G2 AMD audio analysis
(-) | not very loud speakers (71.2 dB)
Bass 100 - 315 Hz
(-) | nearly no bass - on average 21.3% lower than median
(±) | linearity of bass is average (12.7% delta to prev. frequency)
Mids 400 - 2000 Hz
(+) | balanced mids - only 3% away from median
(+) | mids are linear (3.9% delta to prev. frequency)
Highs 2 - 16 kHz
(+) | balanced highs - only 2.7% away from median
(+) | highs are linear (6.9% delta to prev. frequency)
Overall 100 - 16.000 Hz
(±) | linearity of overall sound is average (20.1% difference to median)
Compared to same class
» 43% of all tested devices in this class were better, 10% similar, 47% worse
» The best had a delta of 7%, average was 21%, worst was 53%
Compared to all devices tested
» 52% of all tested devices were better, 8% similar, 40% worse
» The best had a delta of 4%, average was 23%, worst was 134%
Asus VivoBook S15 D533UA audio analysis
(±) | speaker loudness is average but good (81.5 dB)
Bass 100 - 315 Hz
(-) | nearly no bass - on average 22.9% lower than median
(±) | linearity of bass is average (14.7% delta to prev. frequency)
Mids 400 - 2000 Hz
(+) | balanced mids - only 1.9% away from median
(+) | mids are linear (6.4% delta to prev. frequency)
Highs 2 - 16 kHz
(±) | higher highs - on average 5.3% higher than median
(±) | linearity of highs is average (8.2% delta to prev. frequency)
Overall 100 - 16.000 Hz
(±) | linearity of overall sound is average (16.7% difference to median)
Compared to same class
» 22% of all tested devices in this class were better, 7% similar, 71% worse
» The best had a delta of 7%, average was 21%, worst was 53%
Compared to all devices tested
» 29% of all tested devices were better, 7% similar, 64% worse
» The best had a delta of 4%, average was 23%, worst was 134%
Power Consumption
Our consumption measurements do not reveal any surprises. Contrary to Intel based laptops, the consumption is stable for a while during the stress test at around 53-54W and then drops towards 47-48W. The included 65W power adapter (USB-C) is completely sufficient.
| Off / Standby | |
| Idle | |
| Load |
|
Key:
min: | |
Power Consumption Witcher 3 / Stress test
Battery Runtime
Thanks to the increased battery capacity (from 45 to 57 Wh), the battery runtime is longer now. Our Wi-Fi test at 150 nits runs for almost 10 hours and still more than 7 hours with the maximum brightness. These are very good results and there is no disadvantage for AMD systems anymore. A full charge takes two hours when the device is turned on (59% after 38 minutes).
Pros
Cons
Verdict - The ThinkPad E15 G3 offers a good price-performance ratio

The third generation of the ThinkPad E15 offers a much faster processor and a brighter display. The standard display is already brighter than 300 nits, which fixes on of the issues from the previous models. There is even a new option for a panel with full sRGB gamut if you want to edit pictures or videos, but the standard panel is completely sufficient for most office scenarios.
The performance utilization of the Ryzen 5000 processor (Zen 2) is very good and the fan is also quiet, but this results in very high surface temperatures under load. We already know the temperature problems from earlier ThinkPad E-series laptops with dedicated GPUs. Lenovo should improve the cooling for future models. The port selection with HDMI 1.4b and USB 2.0 is also pretty outdated and should be improved.
A lot of performance, brighter display, very good keyboard and long battery runtime: The ThinkPad E15 G3 with the AMD Ryzen processor is a good office laptop for an affordable price, only the high surface temperatures under load and the outdated port selection affect the overall impression.
The recently reviewed ThinkPad L15 G2 is a bit more expensive, but also offers more modern ports and faster Zen 3 processor with the option for Ryzen Pro chips with enhanced security features. We did not review the current entry-level office laptops from competitors like Dell (Vostro) and HP (ProBook) yet, so we cannot compare the devices yet.
Price and Availability
The ThinkPad E15 G3 with the Ryzen 7 5700U is available on Amazon for $1099.
Lenovo ThinkPad E15 G3-20YG003UGE
- 08/11/2021 v7 (old)
Andreas Osthoff
Price comparison
