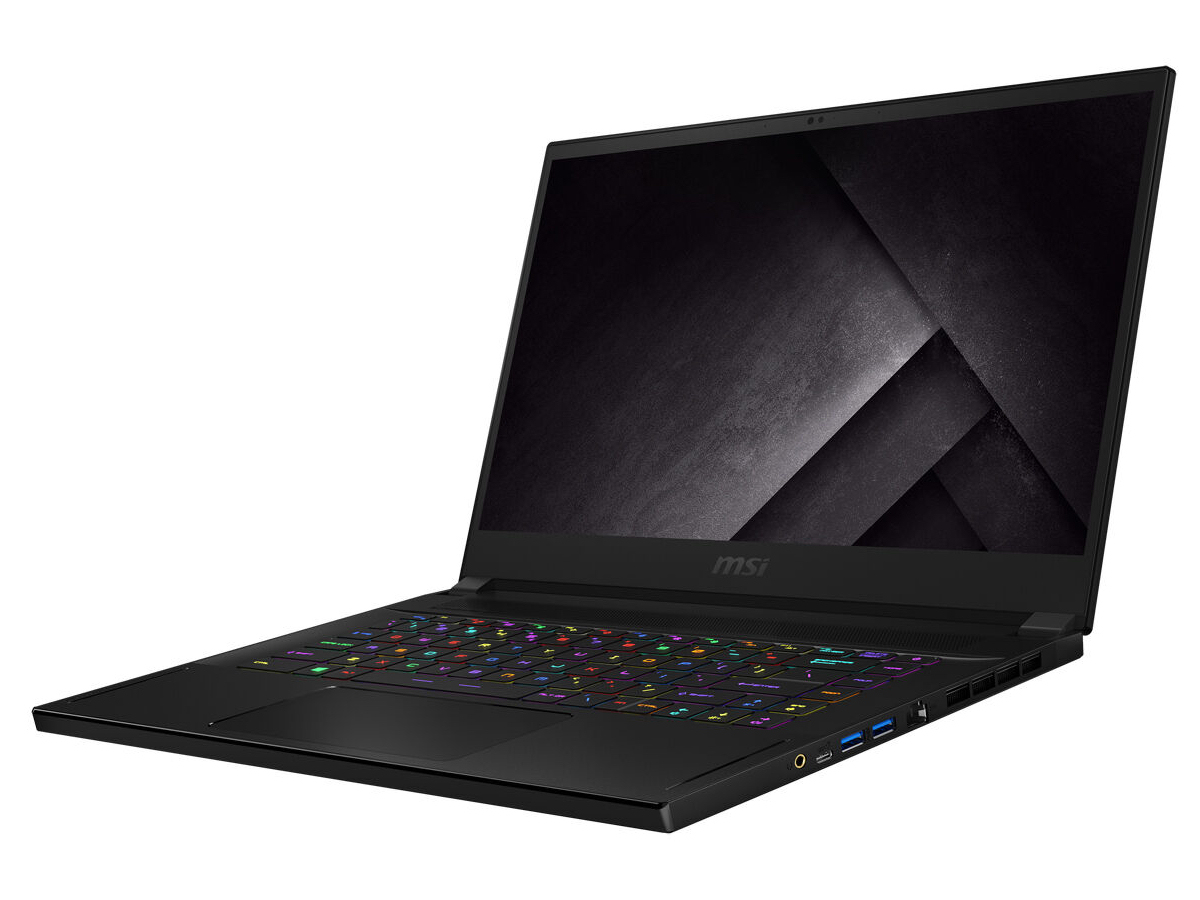
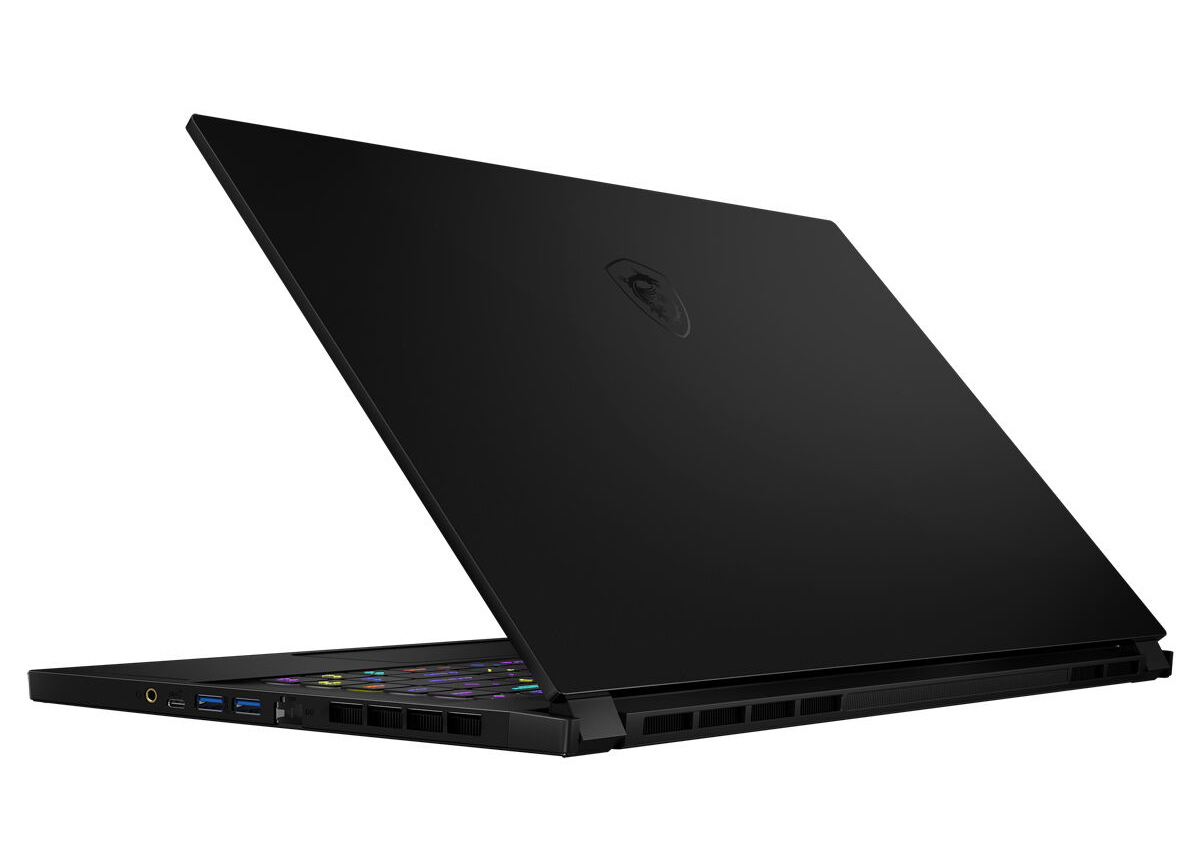
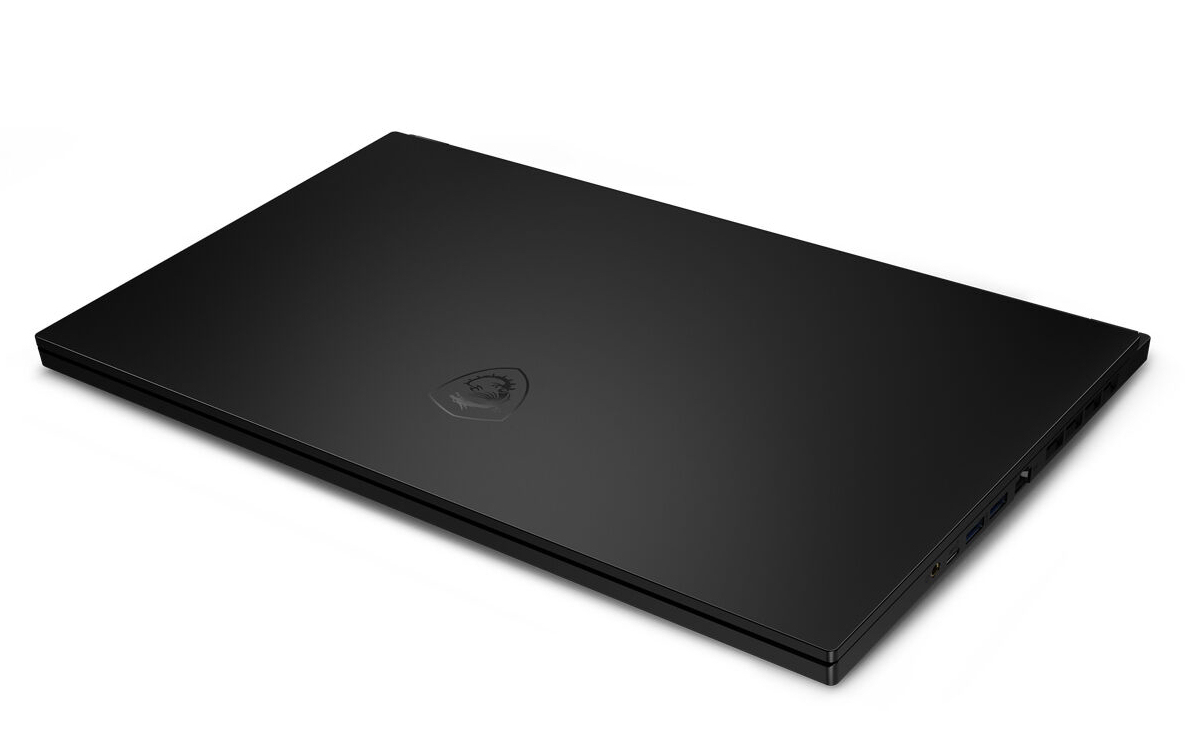
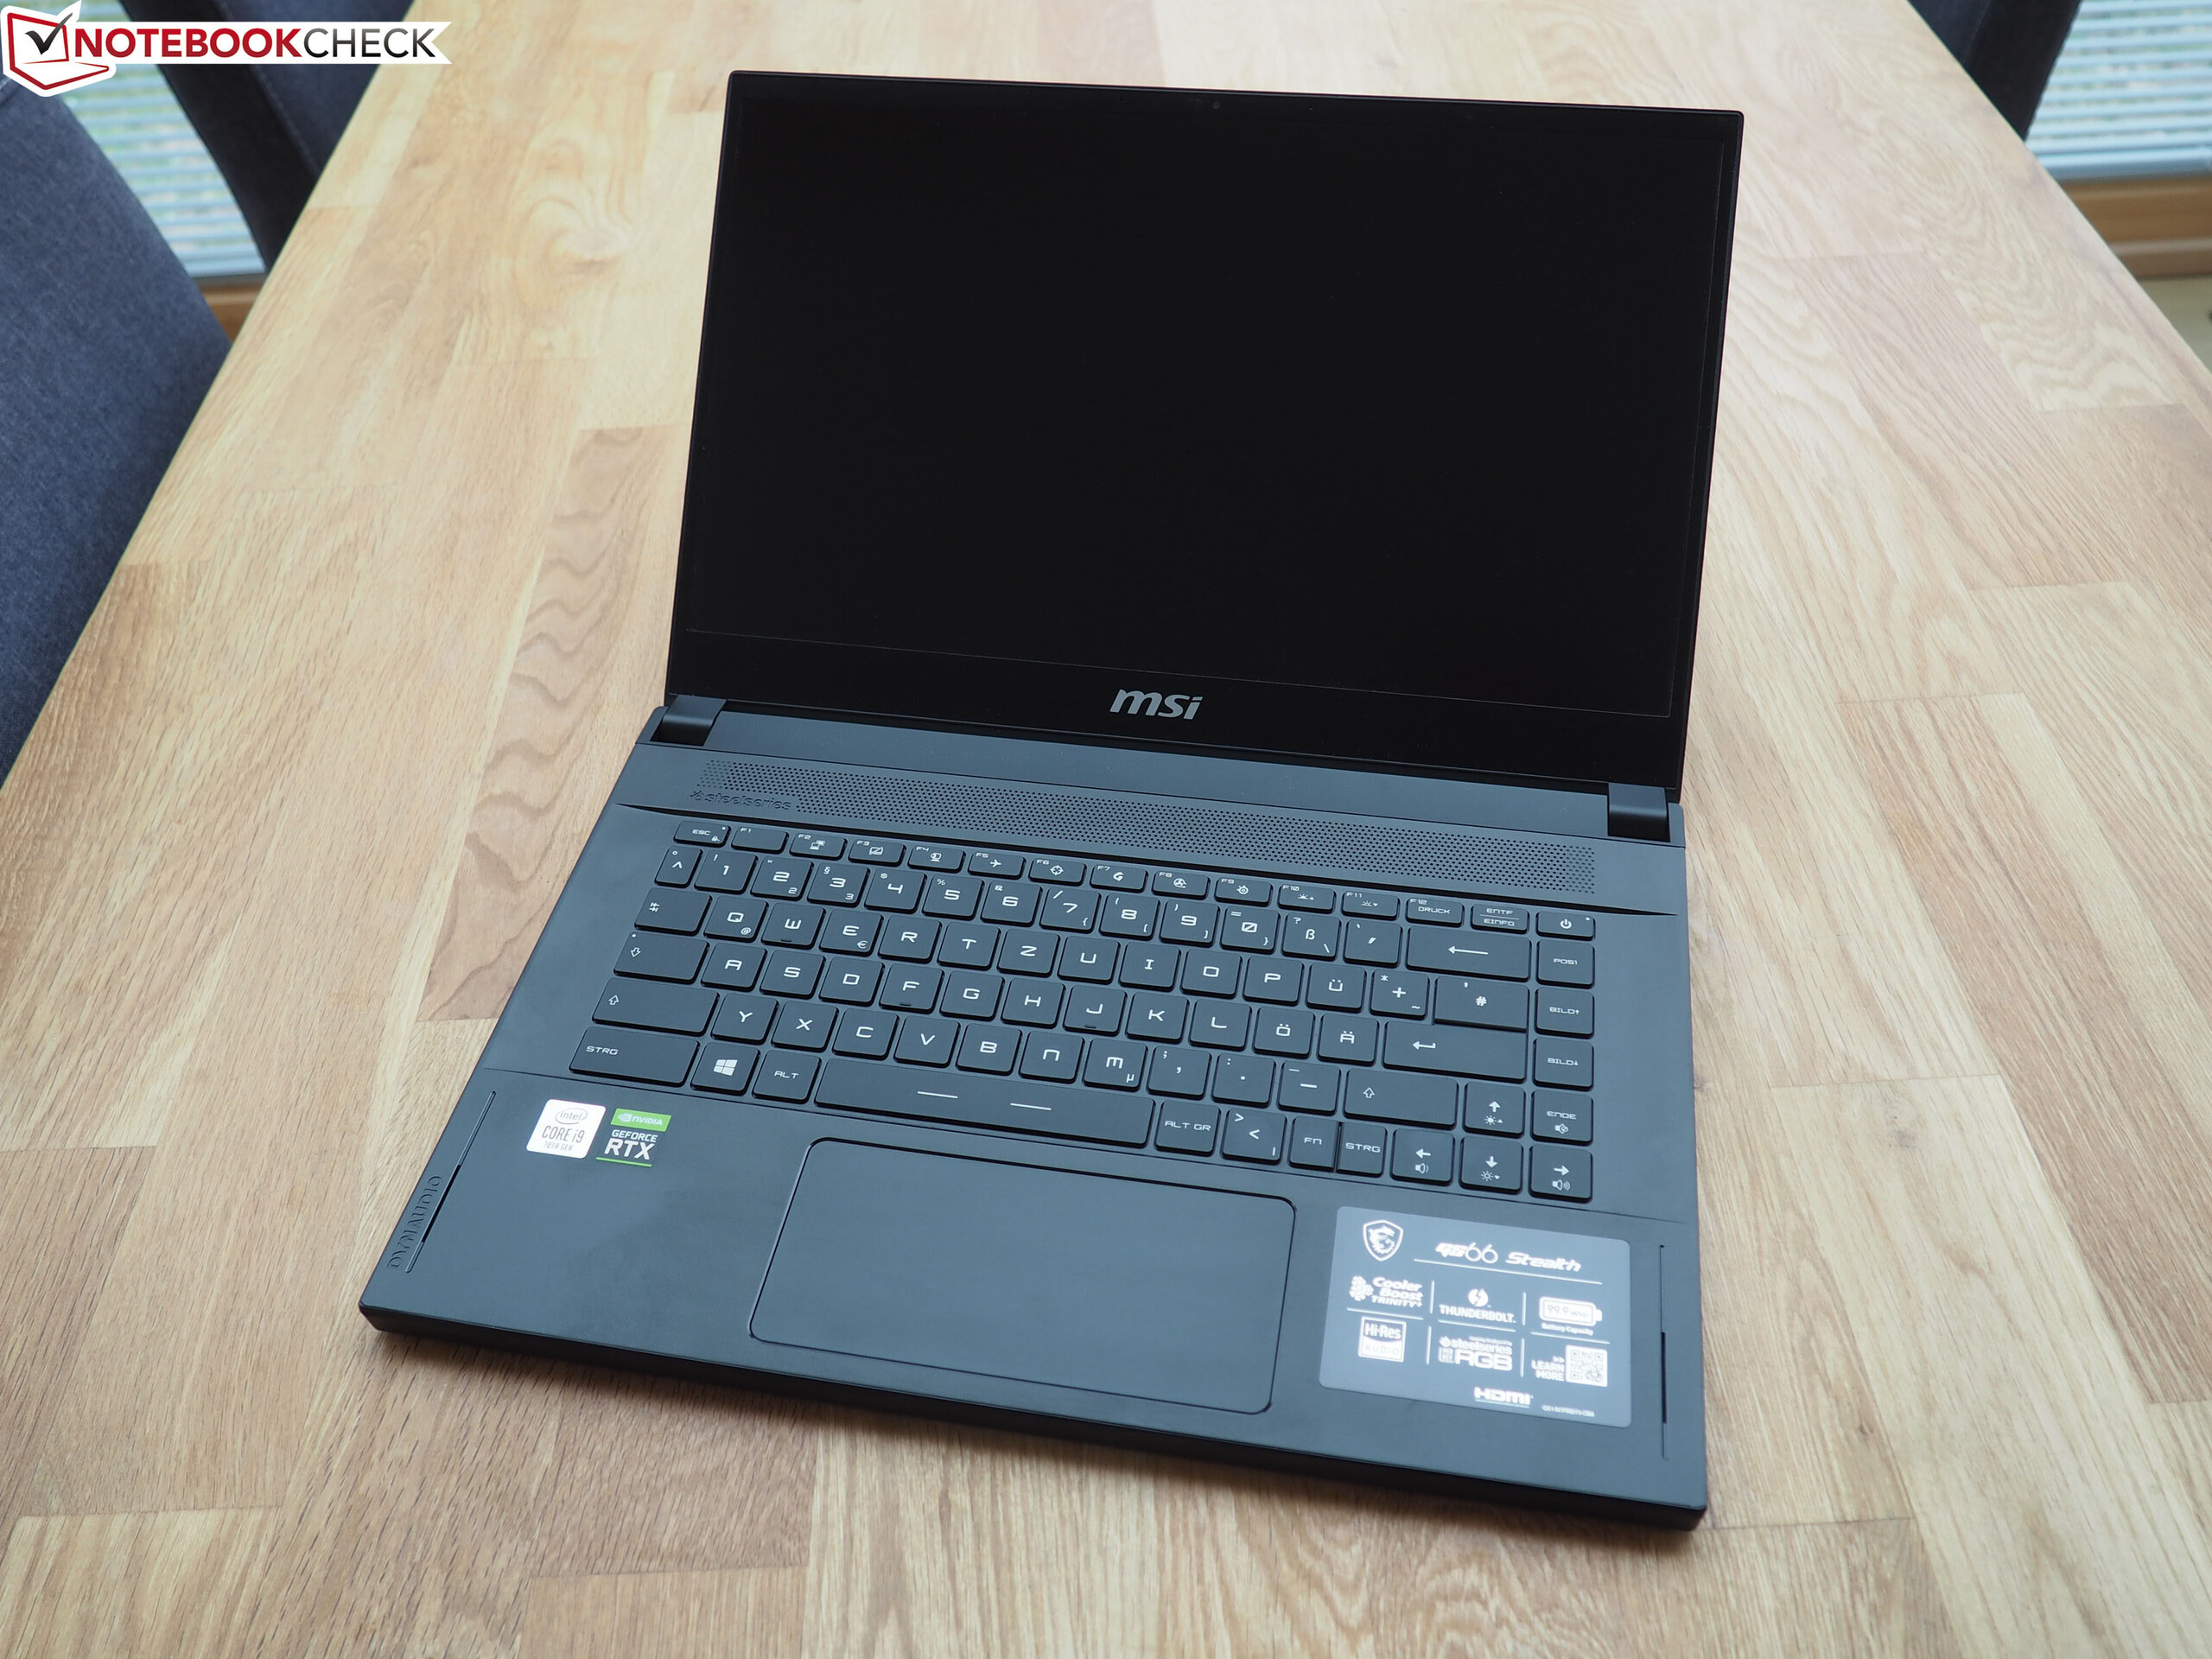
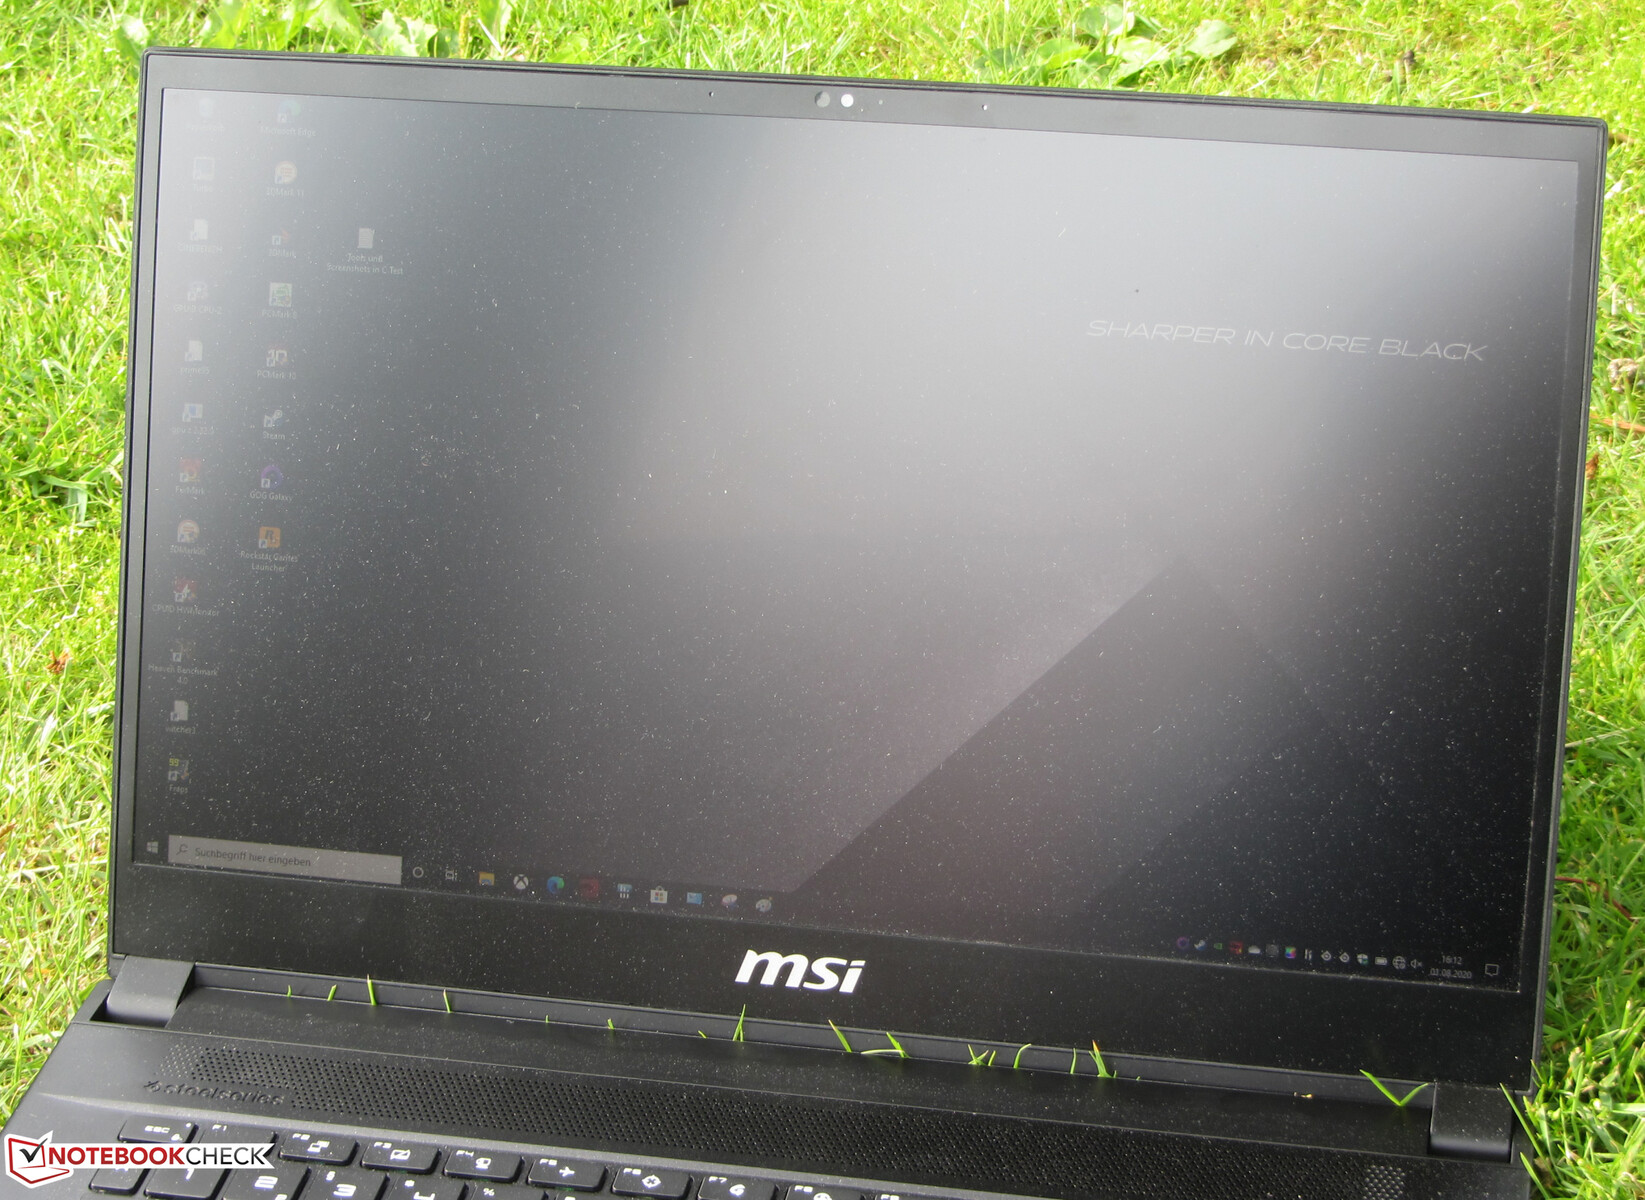
MSI GS66 Stealth 10SE in review: Classy gaming laptop with a 240 Hz display

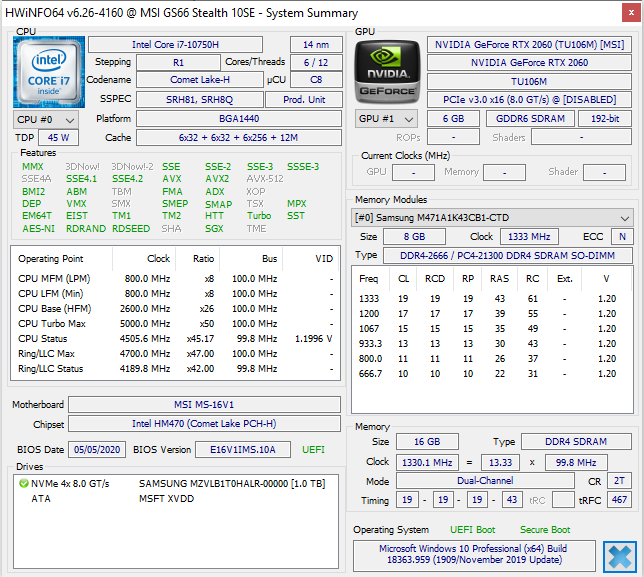
In technical terms, the MSI GS66 Stealth 10SE 15.6-inch gaming laptop is a slightly watered-down version of the GS66 Stealth 10SFS, which we already reviewed, and it's also sold at a lower price than the latter. The test device provided to us is powered by a Core i7-10750H hexa-core processor and a GeForce RTX 2060 graphics core. Competitors include devices like the Dell G5 15 SE, the Lenovo Legion 5 15IMH05H, the Asus TUF A15 FA506IV, the Schenker XMG Core 15 GK5CP6V, and the Razer Blade 15.
Since the two GS66 models are identical in construction, we won't go any further into the case, connectivity, input devices, and speakers. The corresponding information can be found in the GS66 10SFS review.
Rating | Date | Model | Weight | Height | Size | Resolution | Price |
|---|---|---|---|---|---|---|---|
| 82.5 % v7 (old) | 08 / 2020 | MSI GS66 Stealth 10SE-045 i7-10750H, GeForce RTX 2060 Mobile | 2.2 kg | 19.8 mm | 15.60" | 1920x1080 | |
| 84.2 % v7 (old) | 09 / 2019 | Razer Blade 15 GTX 1660 Ti i7-9750H, GeForce GTX 1660 Ti Mobile | 2.1 kg | 19.9 mm | 15.60" | 1920x1080 | |
| 83.7 % v7 (old) | 06 / 2020 | Dell G5 15 SE 5505 P89F R7 4800H, Radeon RX 5600M | 2.4 kg | 21.6 mm | 15.60" | 1920x1080 | |
| 83.3 % v7 (old) | 07 / 2020 | Lenovo Legion 5 15IMH05H i5-10300H, GeForce RTX 2060 Mobile | 2.5 kg | 26.1 mm | 15.60" | 1920x1080 | |
| 82.7 % v7 (old) | 06 / 2020 | Asus TUF Gaming A15 FA506IV-HN172 R7 4800H, GeForce RTX 2060 Mobile | 2.2 kg | 24.9 mm | 15.60" | 1920x1080 | |
| 81.3 % v7 (old) | 02 / 2020 | Schenker XMG Core 15 GK5CP6V i7-9750H, GeForce GTX 1660 Ti Mobile | 2 kg | 26 mm | 15.60" | 1920x1080 |


Display - GS66 with responsive 240 Hz panel
MSI equips the laptop with a 240 Hz panel in the 15.6-inch format that offers good response times. The display has a native resolution of 1920x1080 pixels. While it delivers a good contrast (1,007:1), the maximum brightness (259 cd/m²) is relatively low. We consider values beyond 300 cd/m² to be good.
Unfortunately, the display flickers at a frequency of 23,580 Hz at brightness levels of 19% and below. However, even sensitive users shouldn't be troubled by headaches and/or eye problems due to the high frequency.
| |||||||||||||||||||||||||
Brightness Distribution: 91 %
Center on Battery: 272 cd/m²
Contrast: 1007:1 (Black: 0.27 cd/m²)
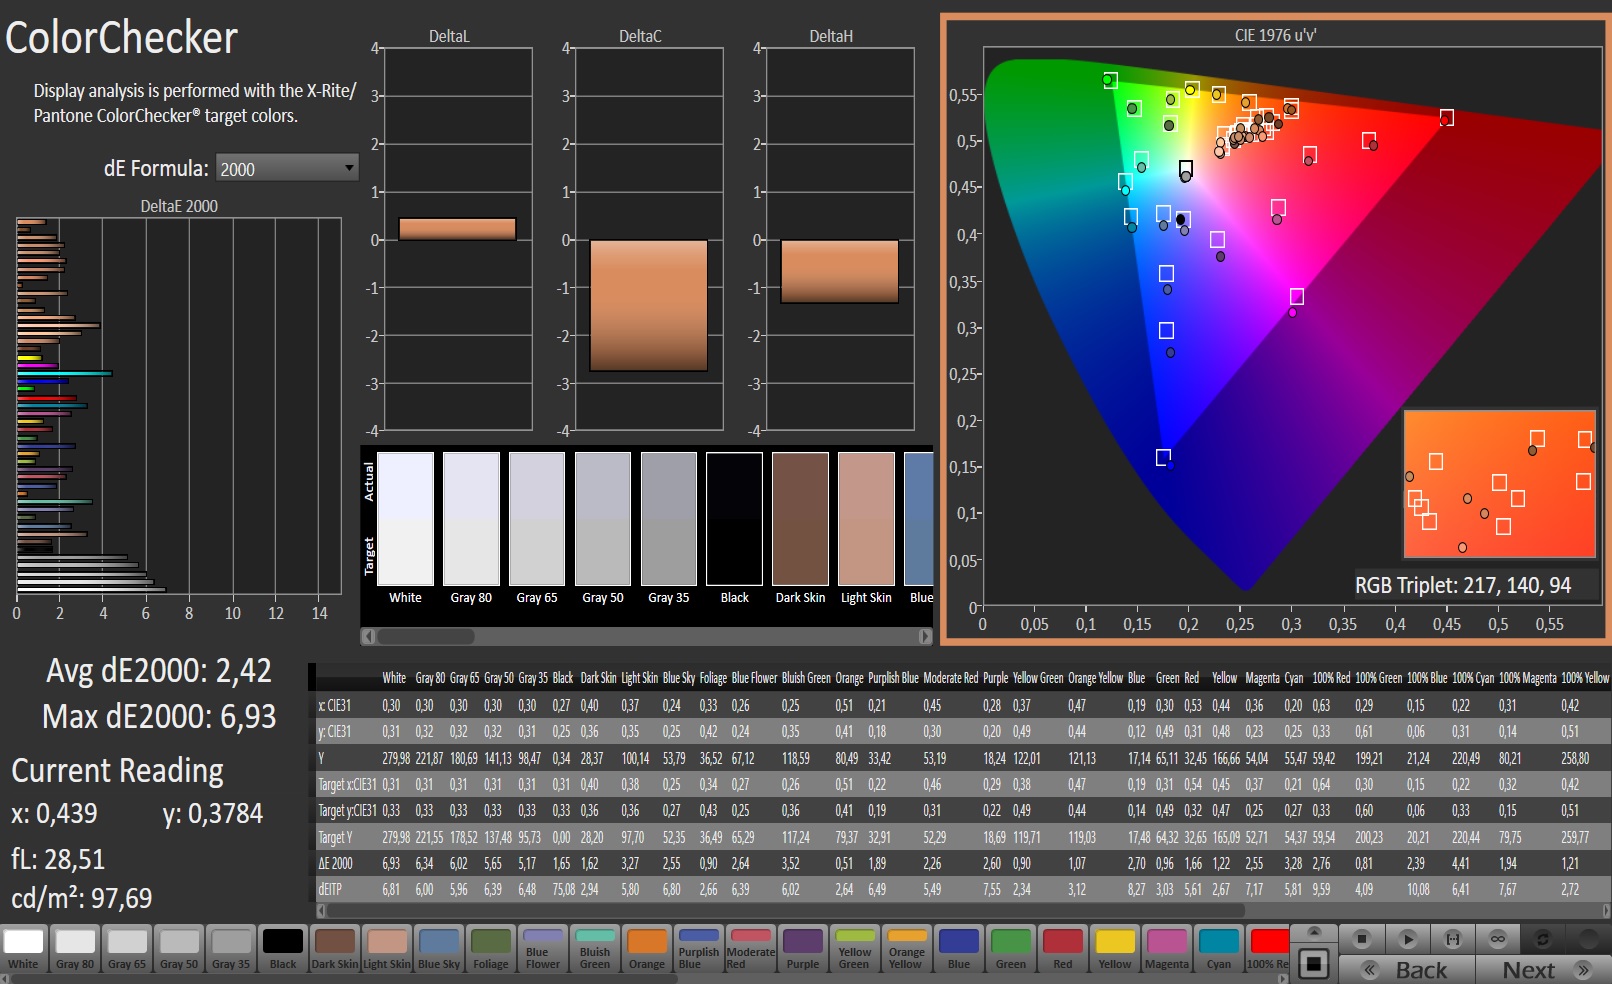
ΔE ColorChecker Calman: 2.42 | ∀{0.5-29.43 Ø4.71}
calibrated: 0.88
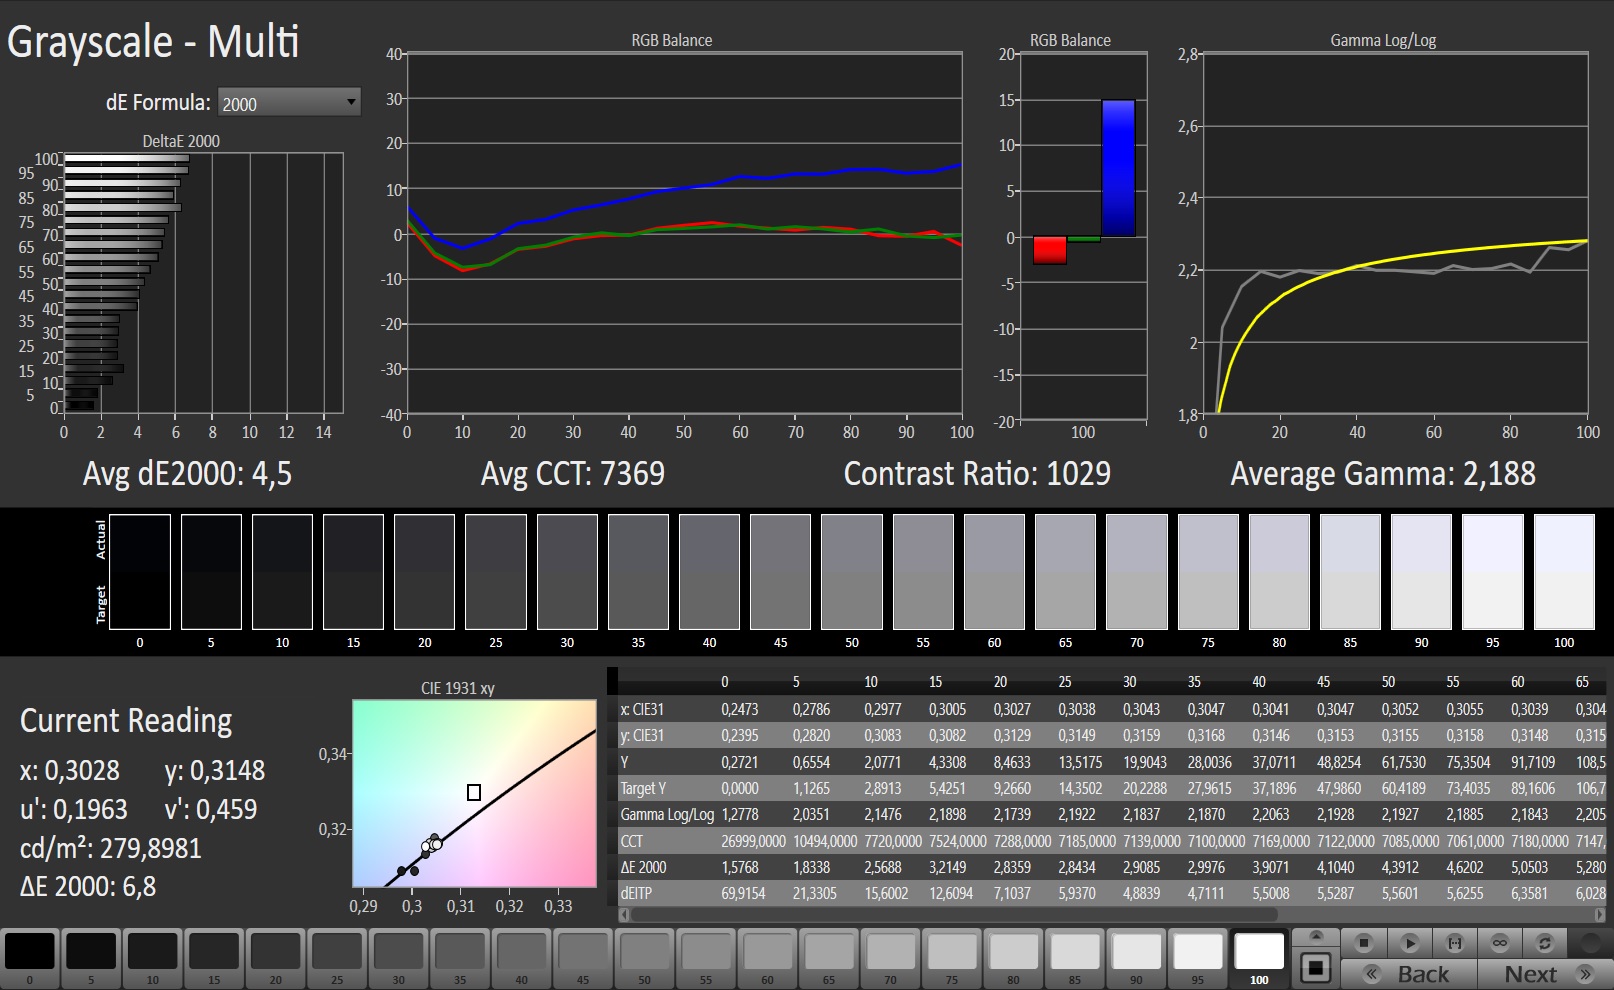
ΔE Greyscale Calman: 4.5 | ∀{0.09-98 Ø4.96}
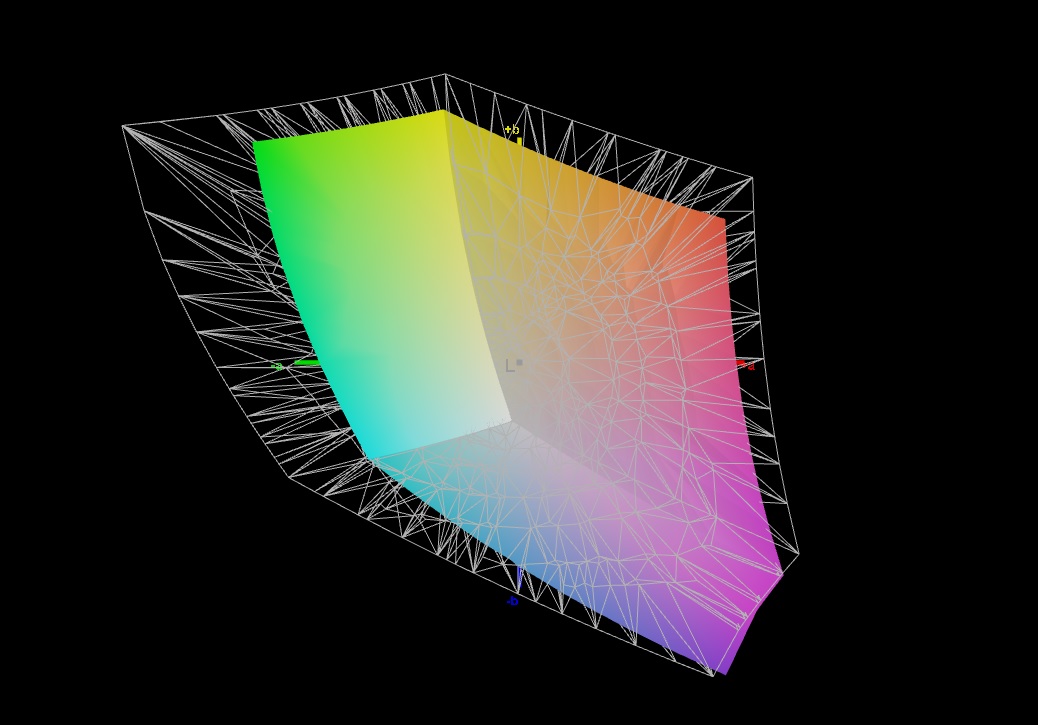
91% sRGB (Argyll 1.6.3 3D)
69% AdobeRGB 1998 (Argyll 1.6.3 3D)
68.9% AdobeRGB 1998 (Argyll 3D)
98.3% sRGB (Argyll 3D)
67.5% Display P3 (Argyll 3D)
Gamma: 2.188
CCT: 7369 K
| MSI GS66 Stealth 10SE-045 Sharp LQ156M1JW03, IPS, 1920x1080, 15.6" | MSI GS66 Stealth 10SFS AUO B156HAN12.0 (AUO328E), IPS, 1920x1080, 15.6" | Razer Blade 15 GTX 1660 Ti BOE NV156FHM-N4K, IPS, 1920x1080, 15.6" | Dell G5 15 SE 5505 P89F BOE NV156FH, WVA, 1920x1080, 15.6" | Lenovo Legion 5 15IMH05H BOE CQ NV156FHM-NX1, IPS, 1920x1080, 15.6" | Asus TUF Gaming A15 FA506IV-HN172 LM156LF-2F01, IPS, 1920x1080, 15.6" | Schenker XMG Core 15 GK5CP6V BOEhydis NV156FHM-N4G (BOE084D), IPS, 1920x1080, 15.6" | |
|---|---|---|---|---|---|---|---|
| Display | 2% | -4% | -7% | -42% | -41% | -6% | |
| Display P3 Coverage (%) | 67.5 | 69.5 3% | 65.3 -3% | 63 -7% | 38.8 -43% | 38.92 -42% | 63.3 -6% |
| sRGB Coverage (%) | 98.3 | 99.6 1% | 91.8 -7% | 90.1 -8% | 57.8 -41% | 58.5 -40% | 91.2 -7% |
| AdobeRGB 1998 Coverage (%) | 68.9 | 70.8 3% | 66.5 -3% | 64.1 -7% | 40.09 -42% | 40.22 -42% | 65 -6% |
| Response Times | -5% | -5% | -37% | -90% | -157% | 14% | |
| Response Time Grey 50% / Grey 80% * (ms) | 12 ? | 14 ? -17% | 13.6 ? -13% | 20.4 ? -70% | 26 ? -117% | 34 ? -183% | 8.8 ? 27% |
| Response Time Black / White * (ms) | 10.4 ? | 9.6 ? 8% | 10 ? 4% | 10.8 ? -4% | 17 ? -63% | 24 ? -131% | 10.4 ? -0% |
| PWM Frequency (Hz) | 23580 ? | 200 ? | 198.4 ? | ||||
| Screen | 6% | -26% | -25% | -58% | -64% | -8% | |
| Brightness middle (cd/m²) | 272 | 316 16% | 312.7 15% | 292 7% | 301 11% | 280 3% | 324 19% |
| Brightness (cd/m²) | 259 | 311 20% | 305 18% | 290 12% | 277 7% | 254 -2% | 296 14% |
| Brightness Distribution (%) | 91 | 92 1% | 90 -1% | 77 -15% | 77 -15% | 88 -3% | 88 -3% |
| Black Level * (cd/m²) | 0.27 | 0.21 22% | 0.27 -0% | 0.27 -0% | 0.26 4% | 0.15 44% | 0.27 -0% |
| Contrast (:1) | 1007 | 1505 49% | 1158 15% | 1081 7% | 1158 15% | 1867 85% | 1200 19% |
| Colorchecker dE 2000 * | 2.42 | 3.03 -25% | 4.57 -89% | 3.99 -65% | 5.12 -112% | 5.89 -143% | 4.07 -68% |
| Colorchecker dE 2000 max. * | 6.93 | 7.32 -6% | 6.81 2% | 6.11 12% | 8.86 -28% | 19 -174% | 6.39 8% |
| Colorchecker dE 2000 calibrated * | 0.88 | 1.1 -25% | 2.91 -231% | 3.02 -243% | 4.88 -455% | 4.79 -444% | 1.49 -69% |
| Greyscale dE 2000 * | 4.5 | 3.9 13% | 4.3 4% | 3.3 27% | 3.47 23% | 4.08 9% | 4.01 11% |
| Gamma | 2.188 101% | 2.42 91% | 2.29 96% | 2.25 98% | 2.37 93% | 2.33 94% | 2.6 85% |
| CCT | 7369 88% | 7439 87% | 7098 92% | 7047 92% | 7062 92% | 7303 89% | 7350 88% |
| Color Space (Percent of AdobeRGB 1998) (%) | 69 | 65 -6% | 59.4 -14% | 58.1 -16% | 37 -46% | 37 -46% | 59 -14% |
| Color Space (Percent of sRGB) (%) | 91 | 100 10% | 91.3 0% | 89.7 -1% | 57 -37% | 58 -36% | 91 0% |
| Total Average (Program / Settings) | 1% /
4% | -12% /
-19% | -23% /
-23% | -63% /
-59% | -87% /
-72% | 0% /
-5% |
* ... smaller is better
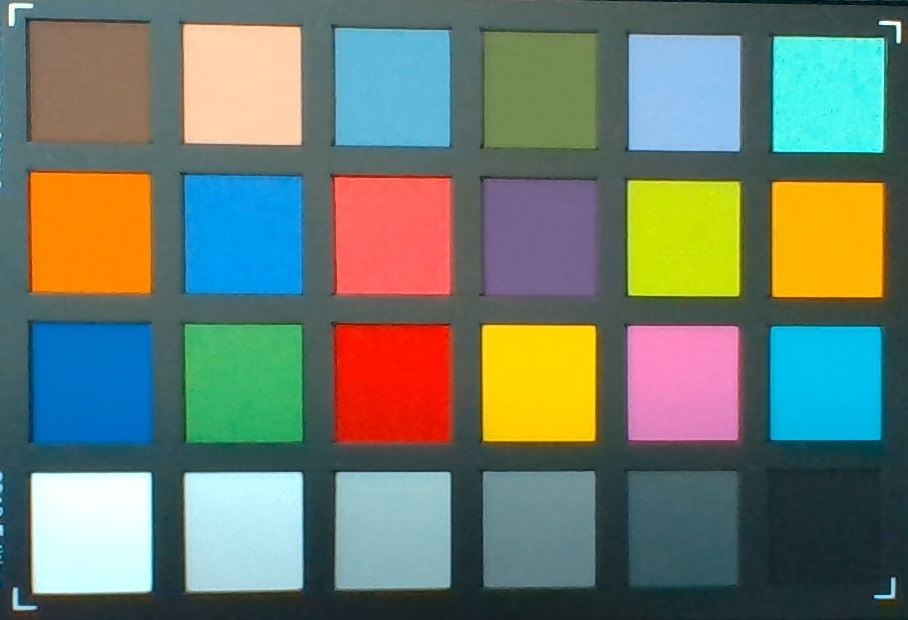
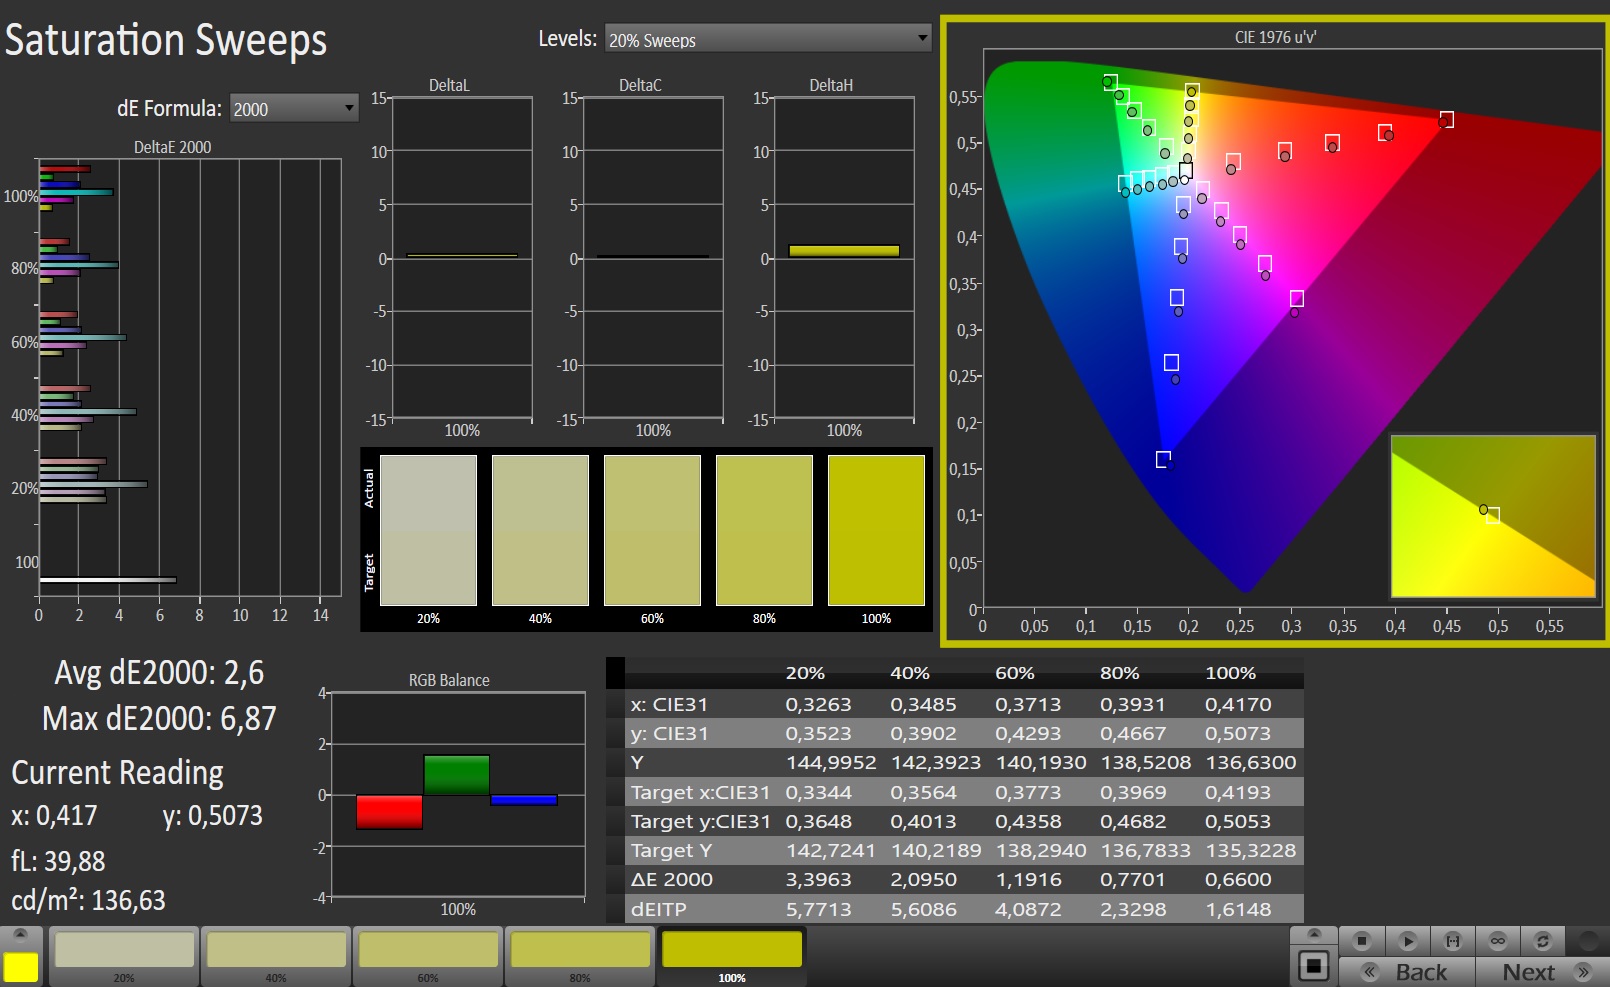
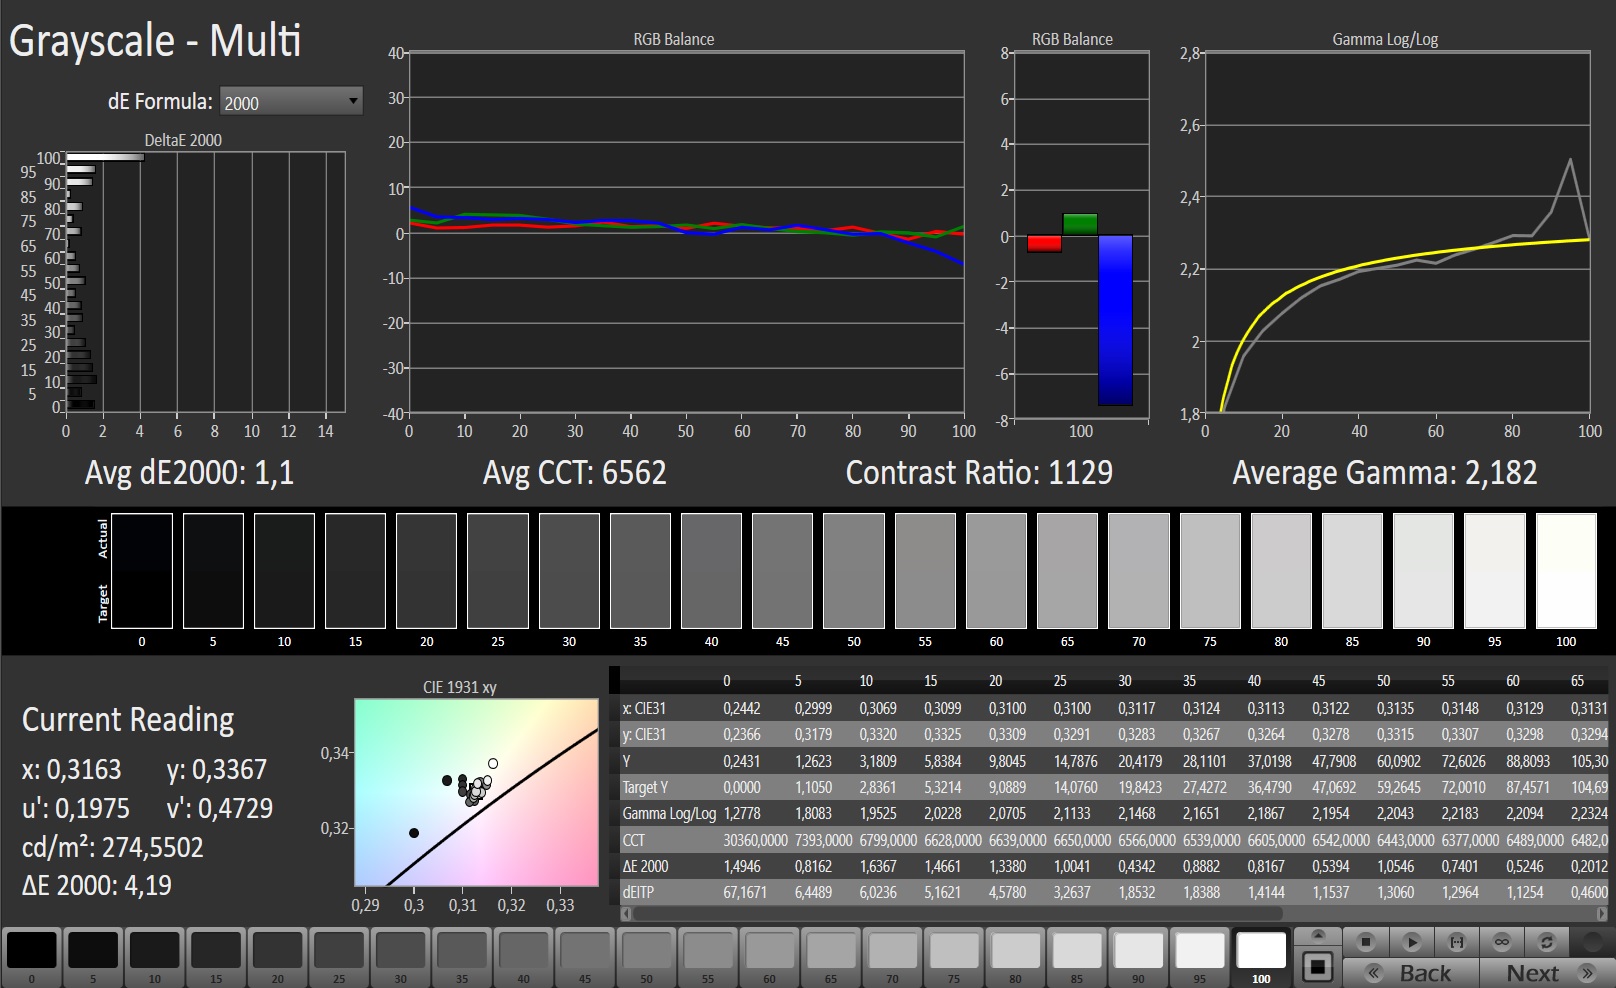
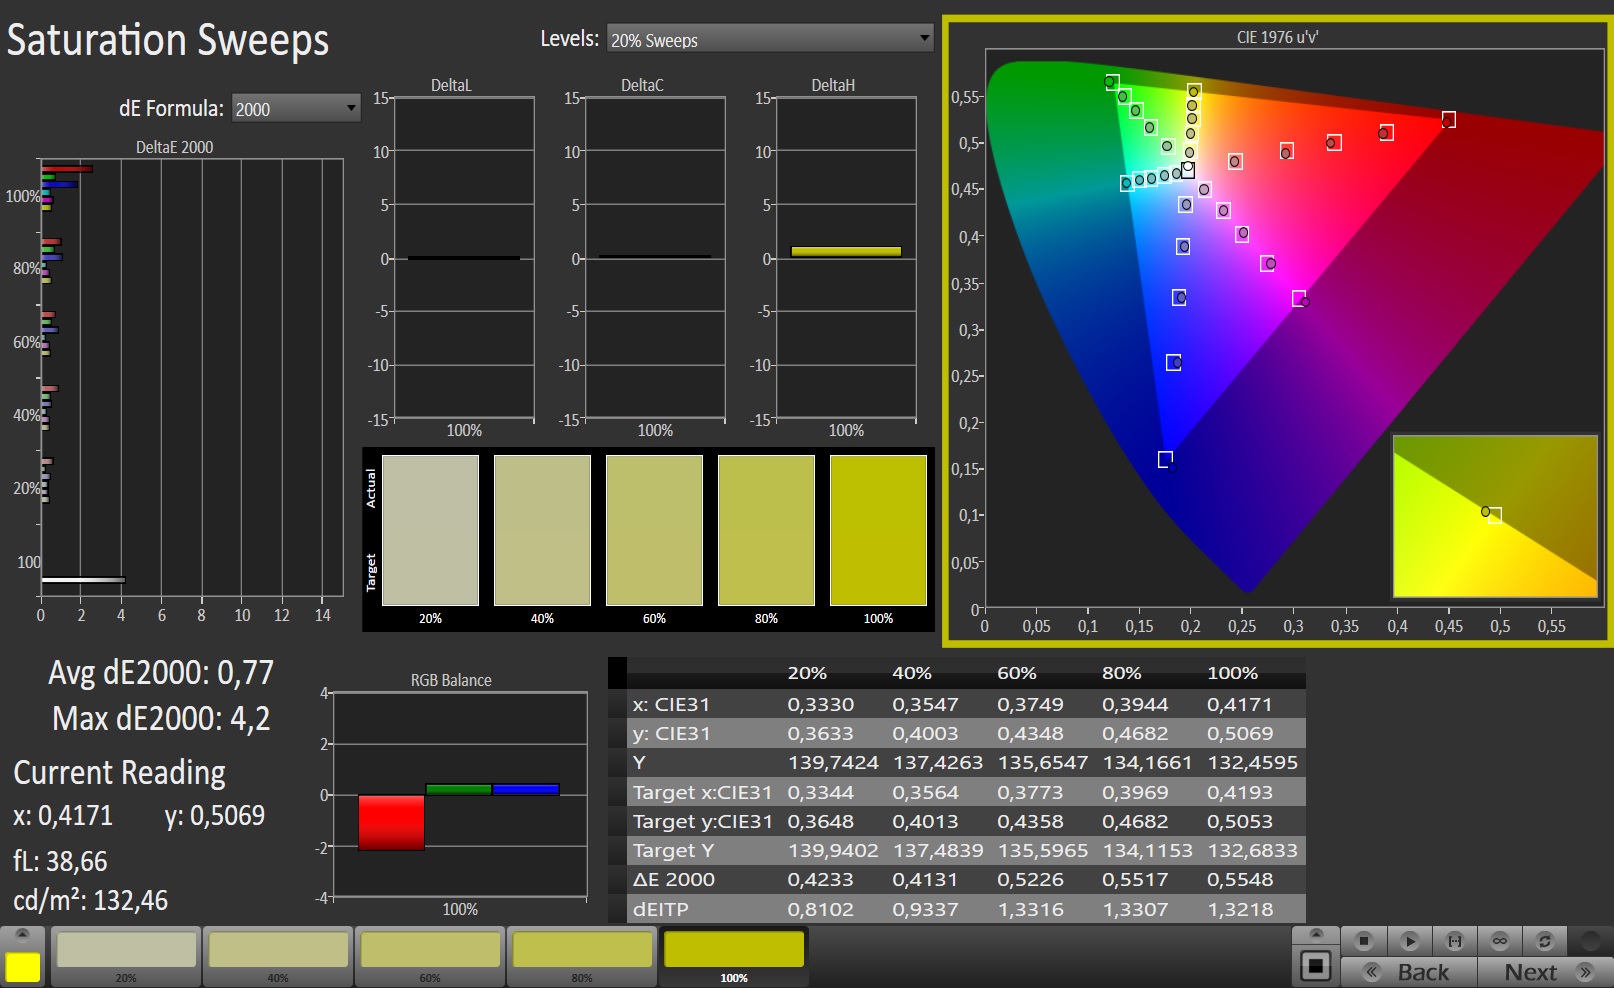
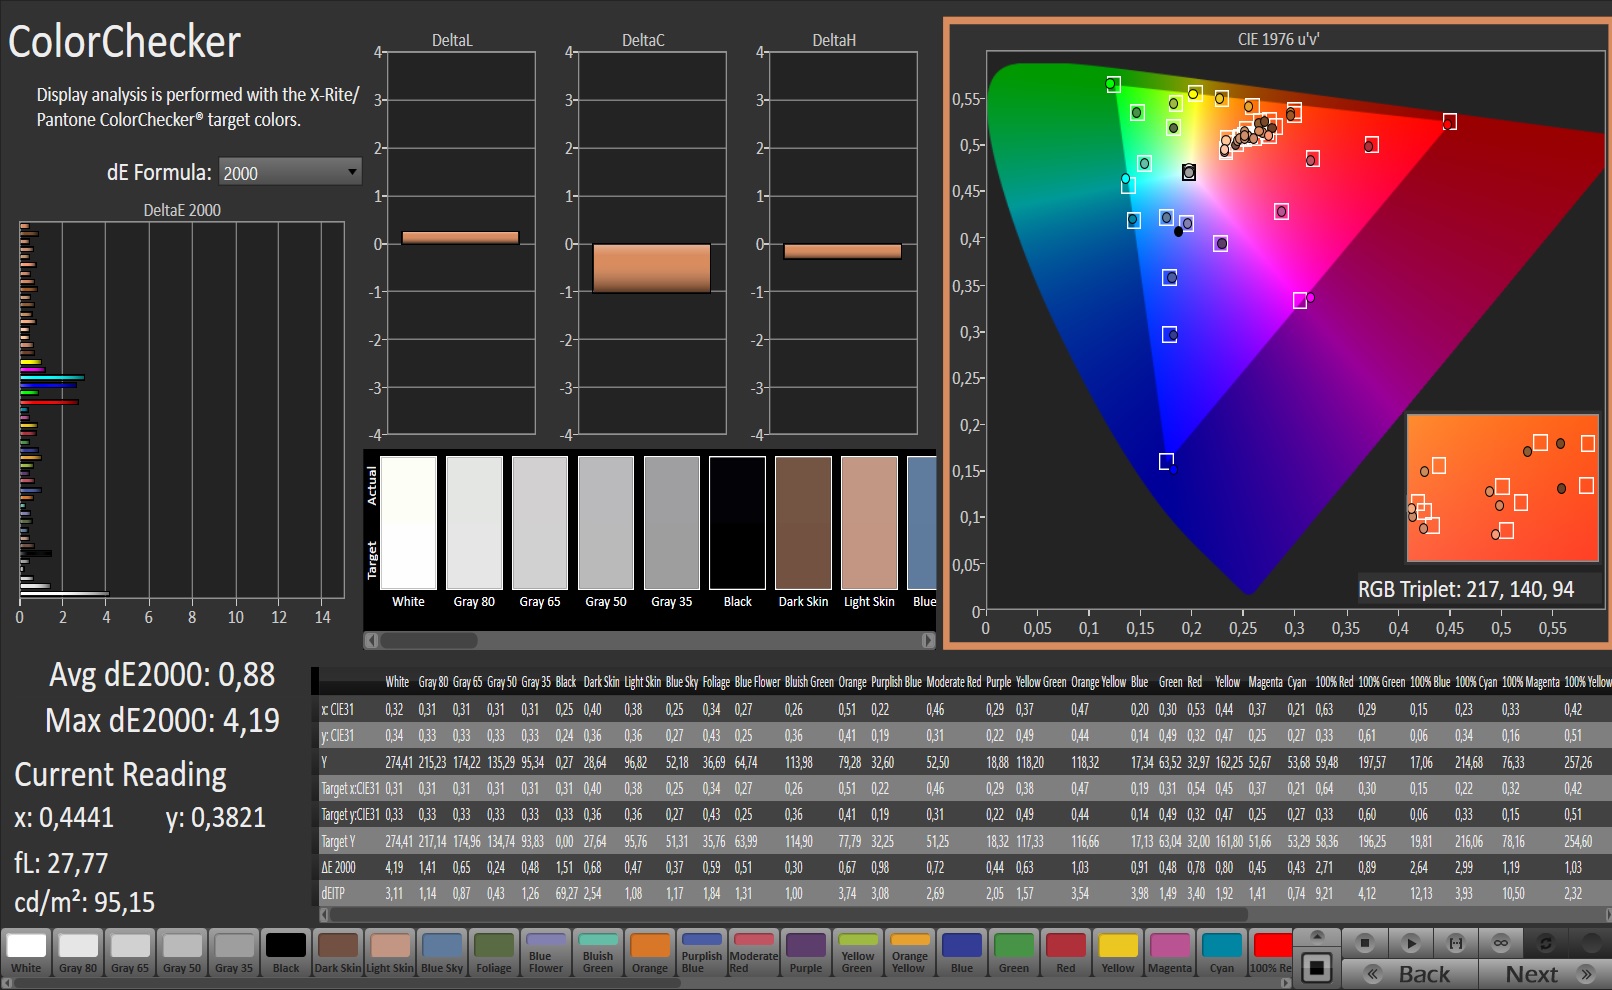
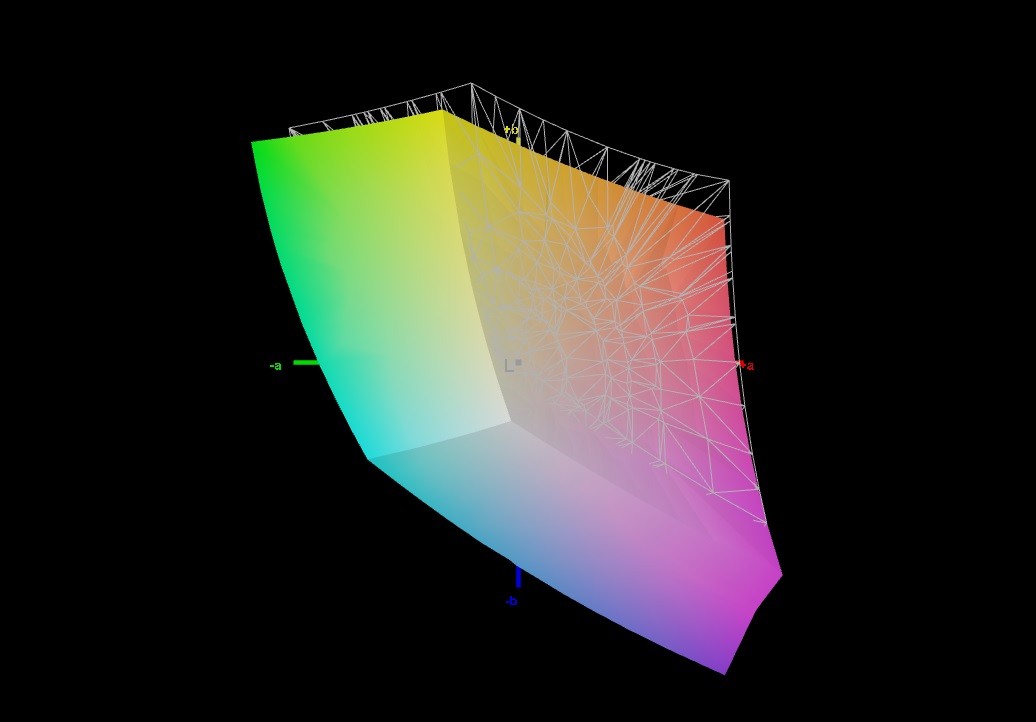
Out of the box, the display already shows a great color reproduction. With a Delta E 2000 color deviation of 2.42, the target (Delta E less than 3) is met. The display doesn't suffer from a blue tint. Moreover, calibration provides for improvements in terms of color reproduction. In this way, the color deviation is reduced to 0.88, and the grayscales are displayed in a more balanced way. The AdobeRGB (69%) and sRGB (91%) color spaces aren't fully mapped.
Display Response Times
| ↔ Response Time Black to White | ||
|---|---|---|
| 10.4 ms ... rise ↗ and fall ↘ combined | ↗ 6 ms rise | 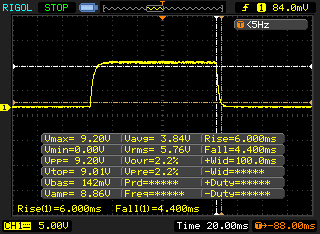 |
| ↘ 4.4 ms fall | ||
| The screen shows good response rates in our tests, but may be too slow for competitive gamers. In comparison, all tested devices range from 0.1 (minimum) to 240 (maximum) ms. » 28 % of all devices are better. This means that the measured response time is better than the average of all tested devices (19.8 ms). | ||
| ↔ Response Time 50% Grey to 80% Grey | ||
| 12 ms ... rise ↗ and fall ↘ combined | ↗ 7.6 ms rise | 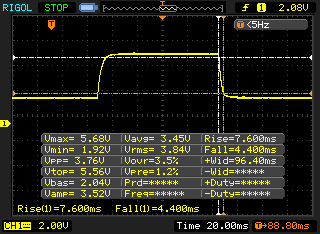 |
| ↘ 4.4 ms fall | ||
| The screen shows good response rates in our tests, but may be too slow for competitive gamers. In comparison, all tested devices range from 0.165 (minimum) to 636 (maximum) ms. » 25 % of all devices are better. This means that the measured response time is better than the average of all tested devices (30.9 ms). | ||
Screen Flickering / PWM (Pulse-Width Modulation)
| Screen flickering / PWM detected | 23580 Hz | ≤ 19 % brightness setting | 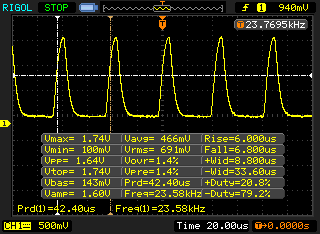 |
The display backlight flickers at 23580 Hz (worst case, e.g., utilizing PWM) Flickering detected at a brightness setting of 19 % and below. There should be no flickering or PWM above this brightness setting. The frequency of 23580 Hz is quite high, so most users sensitive to PWM should not notice any flickering. In comparison: 52 % of all tested devices do not use PWM to dim the display. If PWM was detected, an average of 7744 (minimum: 5 - maximum: 343500) Hz was measured. | |||
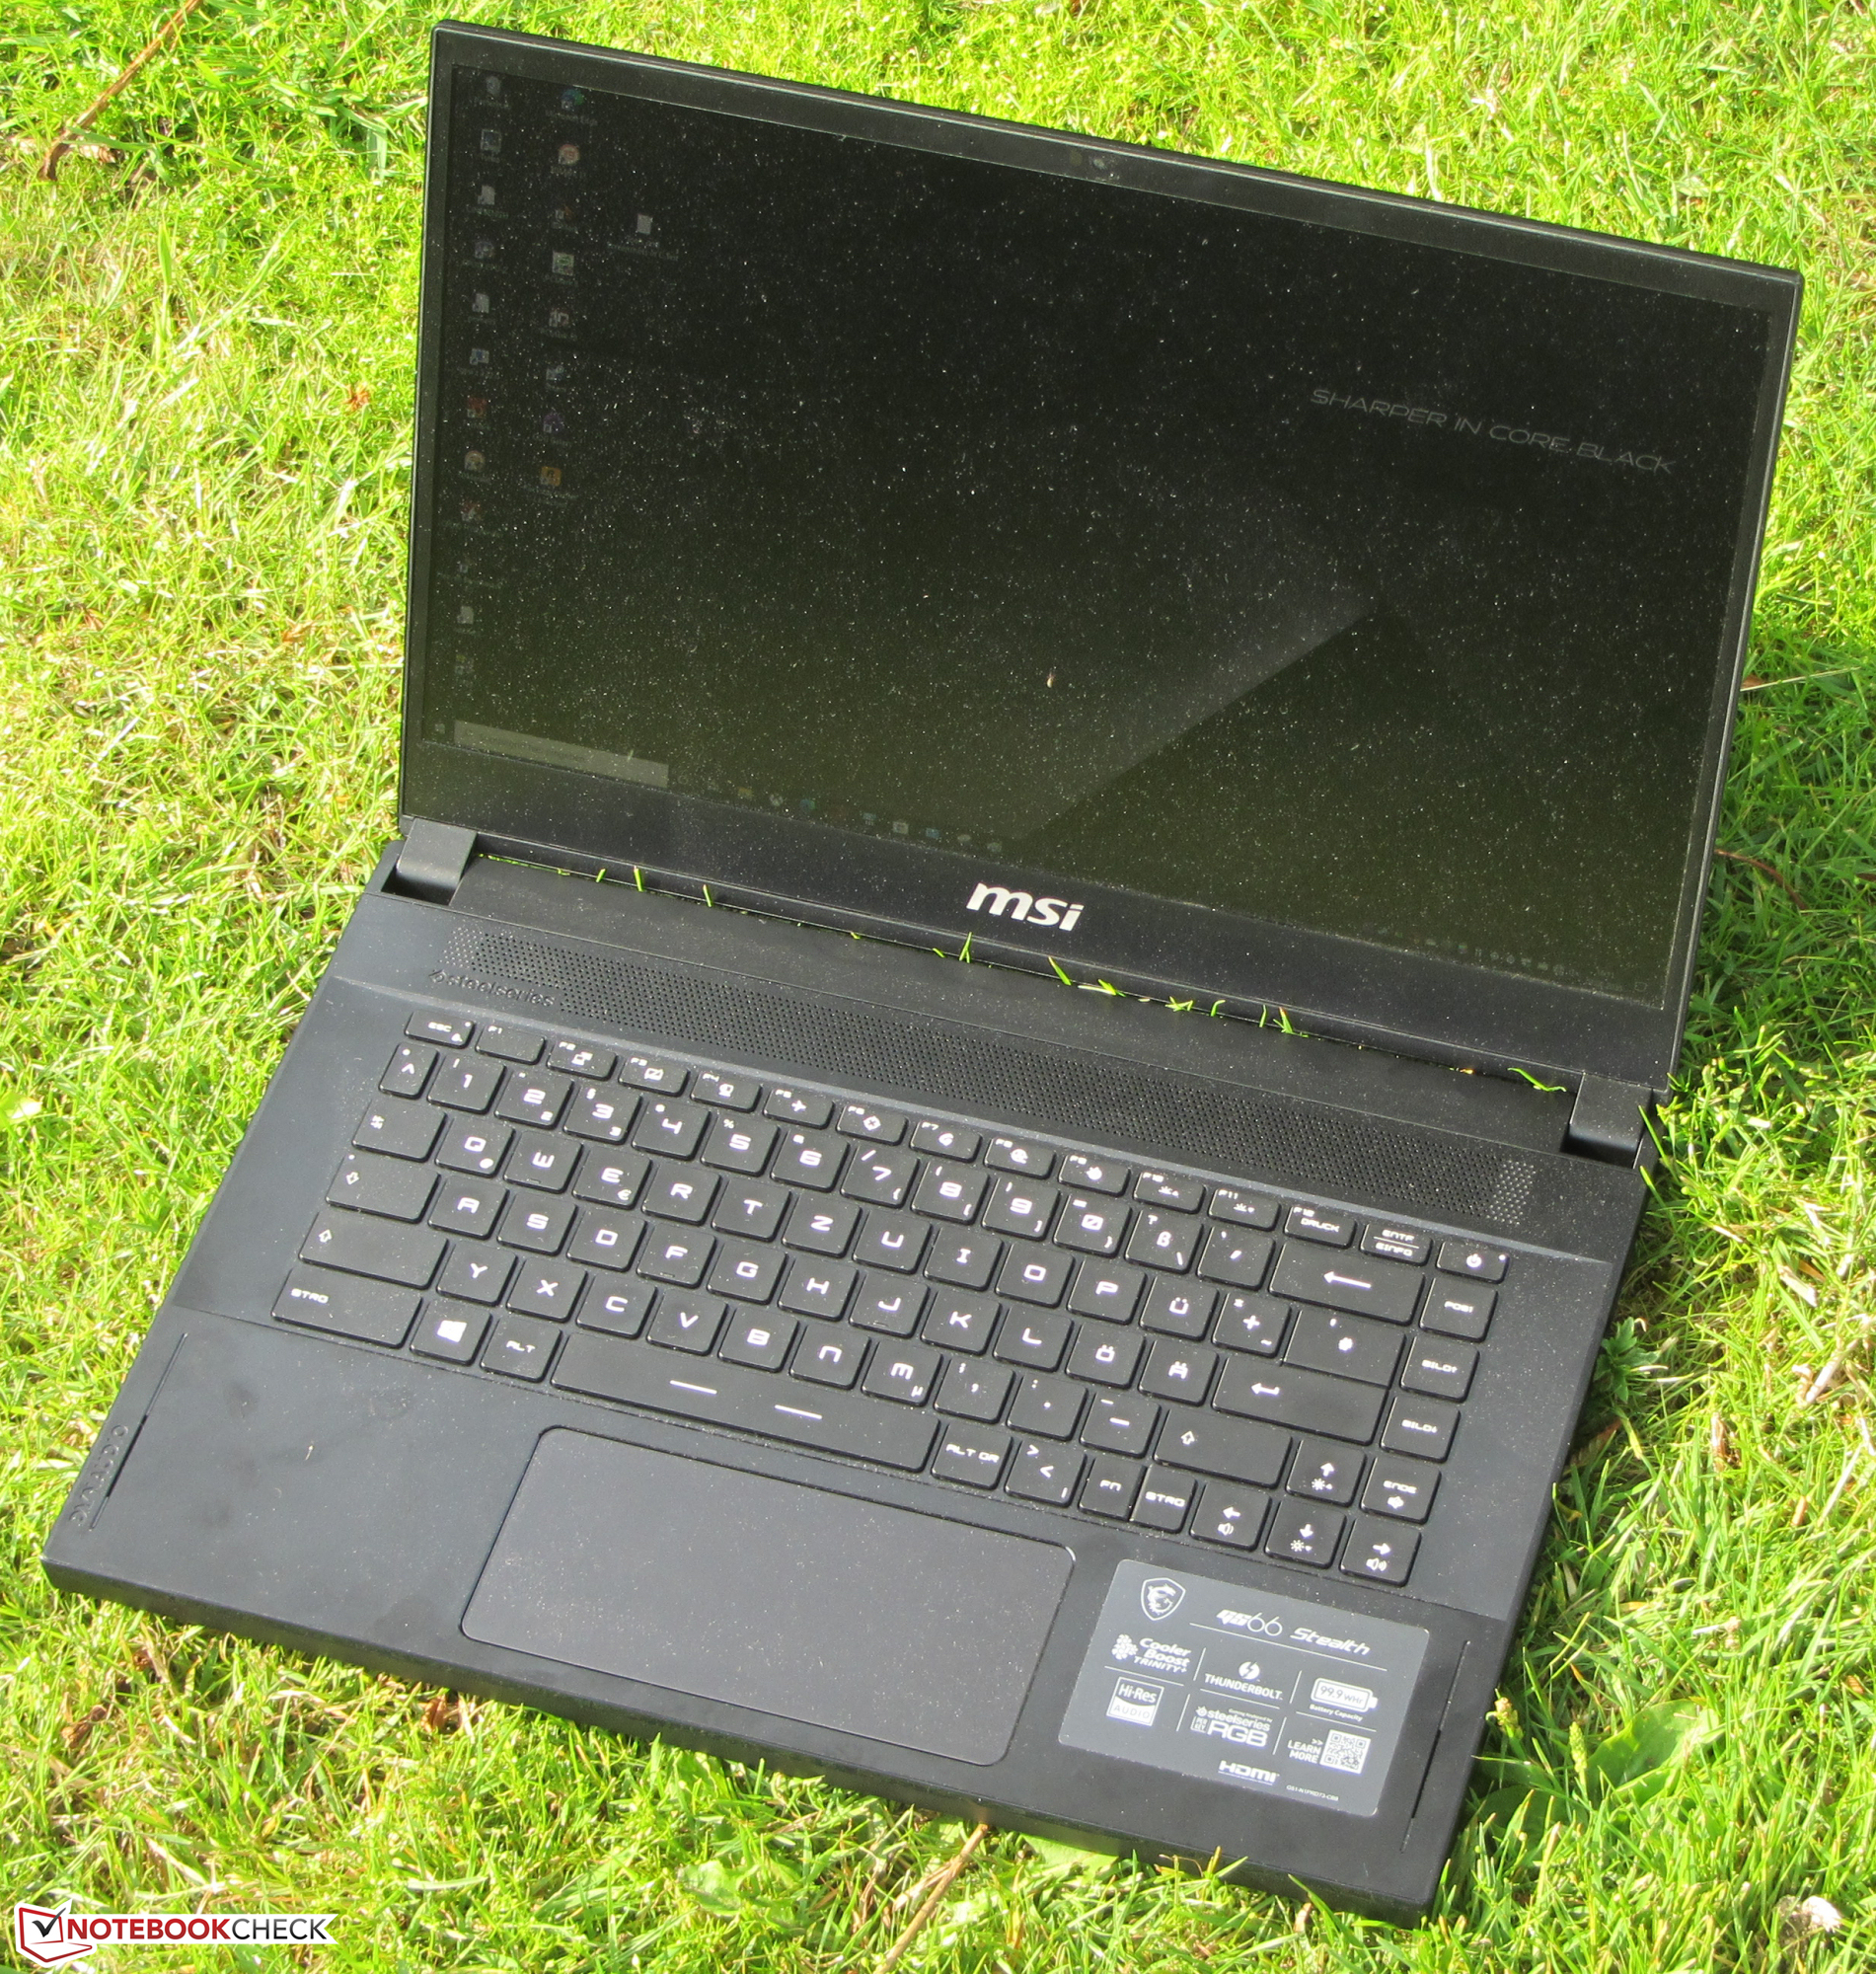
MSI equips the laptop with a viewing-angle stable IPS panel. Consequently, the screen can be read from any position. Outdoors, the display can be read when the sun is not too bright.

Performance - Enough for the coming years
MSI has a 15.6-inch gaming laptop in its range with the GS66 Stealth 10SE. It brings every modern game smoothly onto the screen and also cuts a fine figure in all other application areas. About 1,900 Euros (~$2,257) has to be paid for our test device. As a result, it's currently the cheapest representative of the series. Other configuration variants are available.
Test conditions
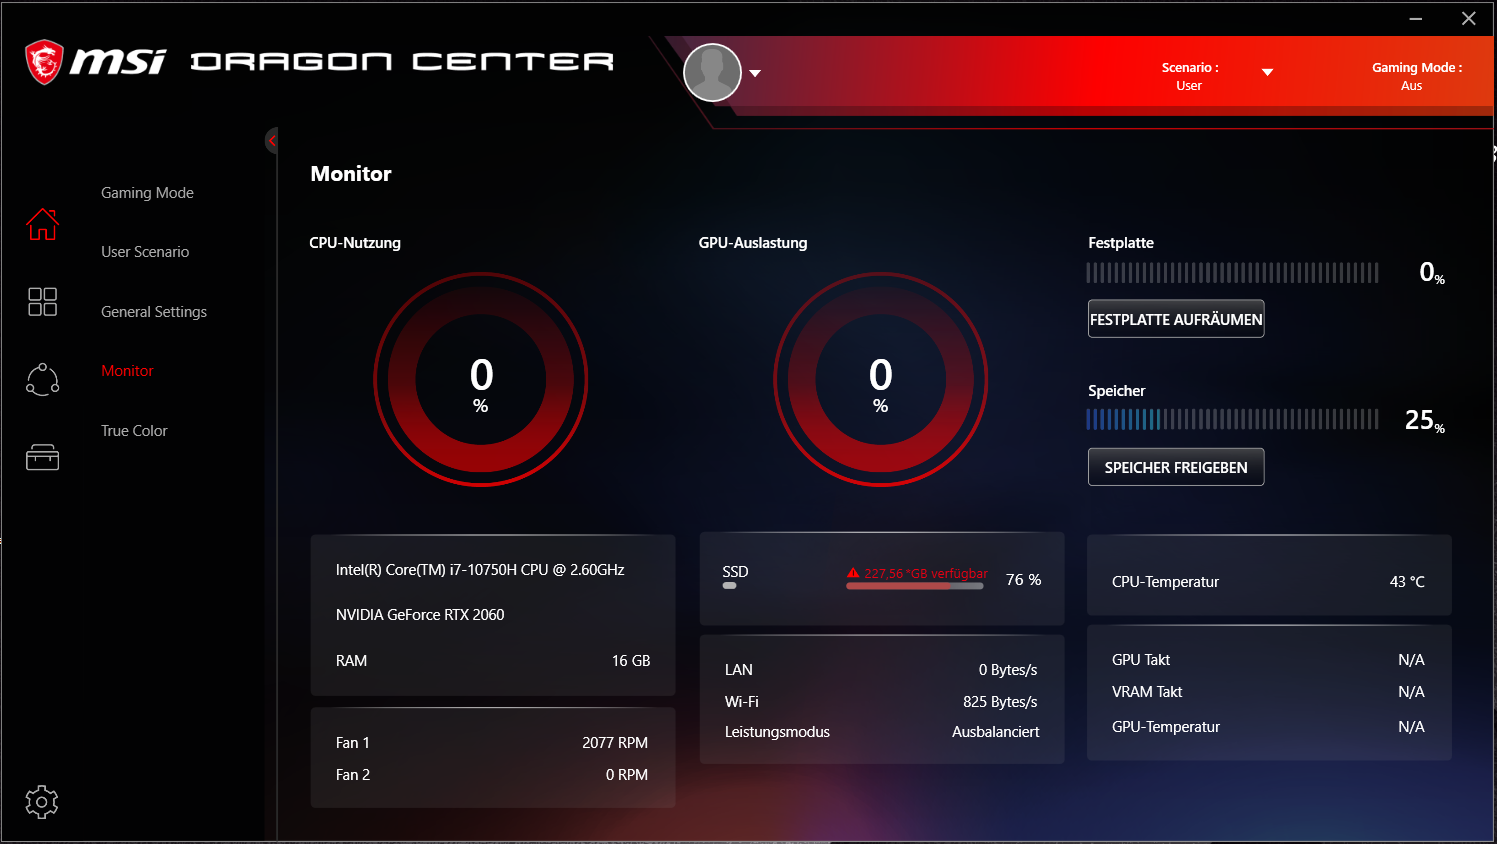
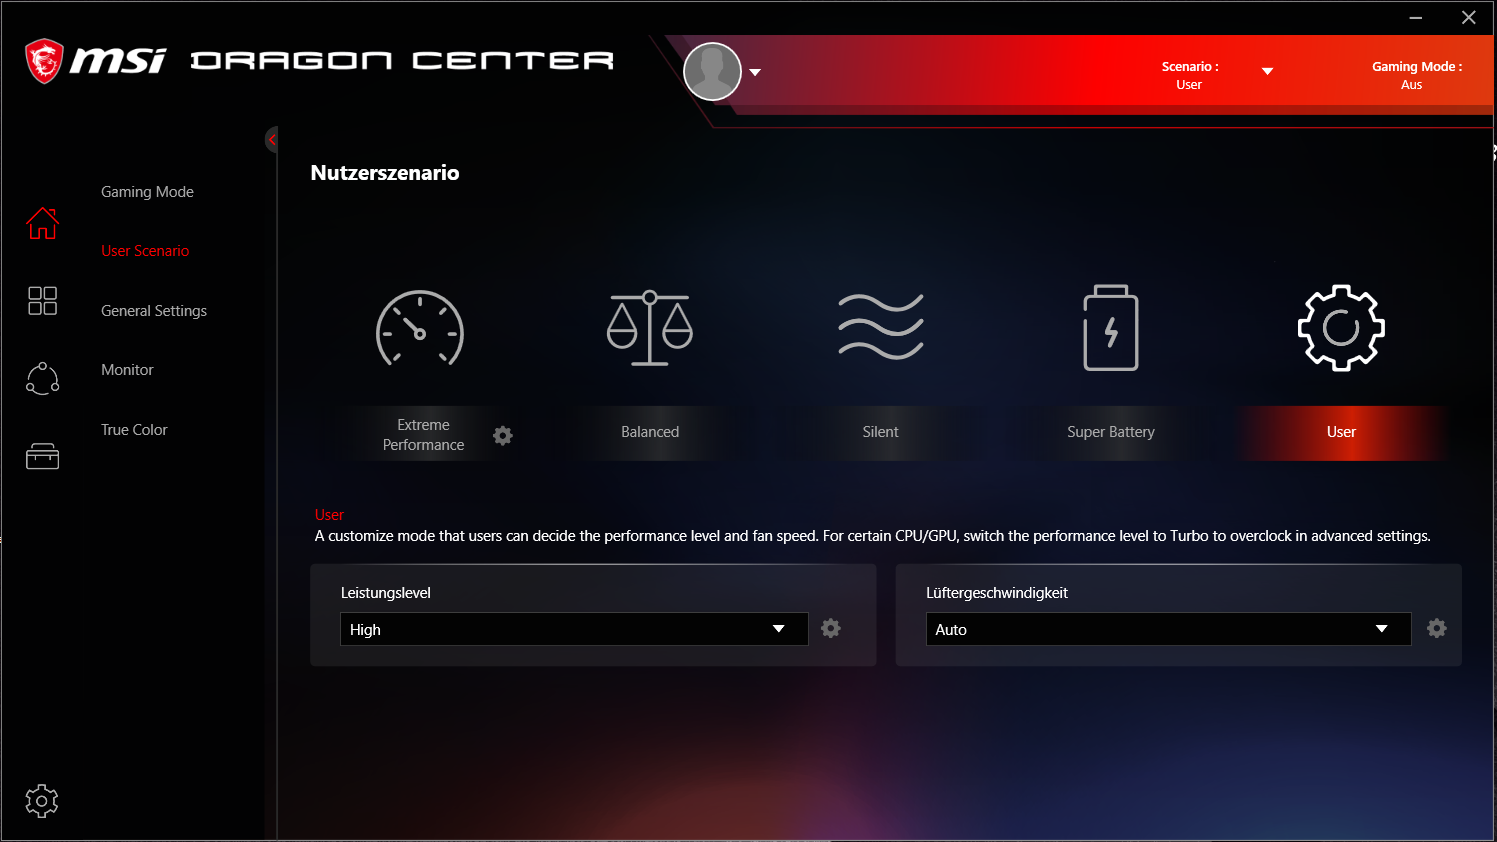
The preinstalled Dragon Center software offers a variety of performance profiles to choose from that have an impact on noise and computing power. We have carried out all tests with the "User" performance profile. The "High" performance level was selected, and the automatic fan control was activated. In addition, the integrated GPU is switched on.
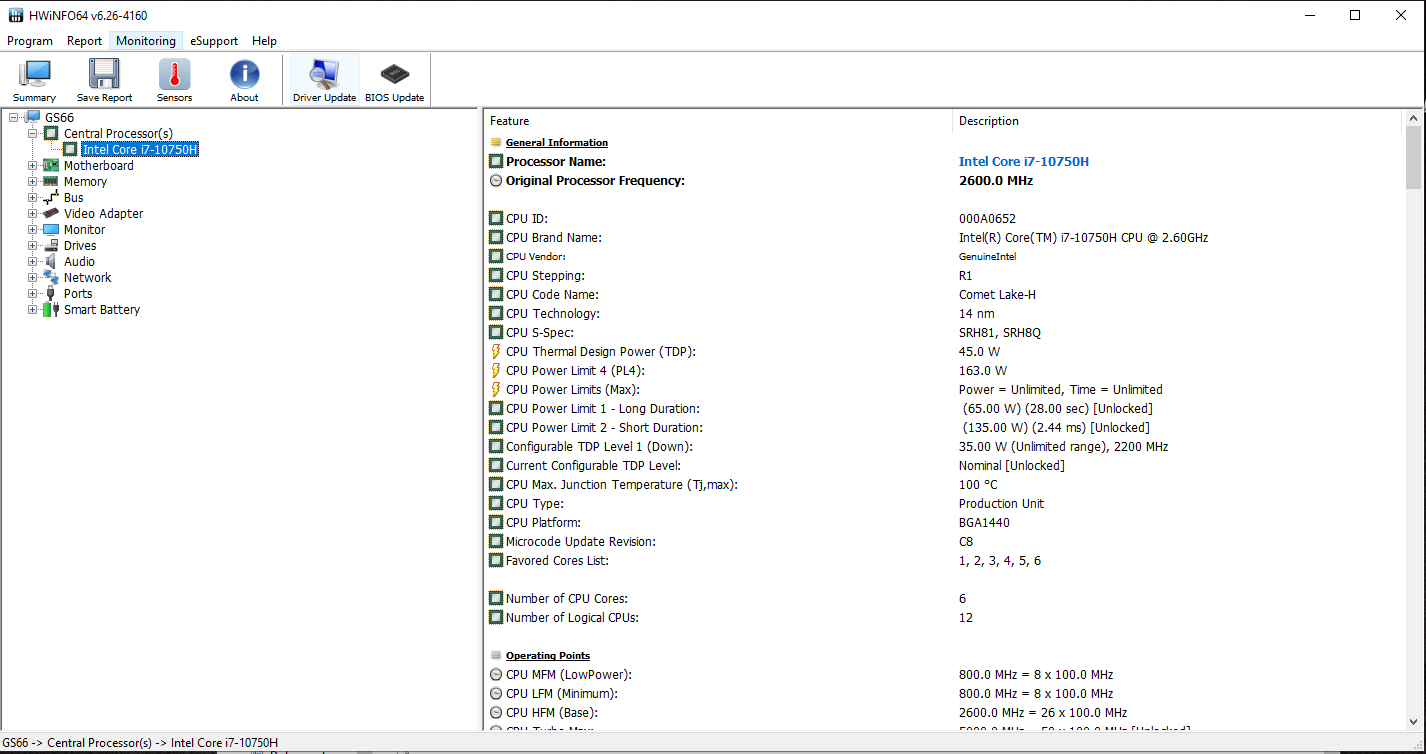
Processor
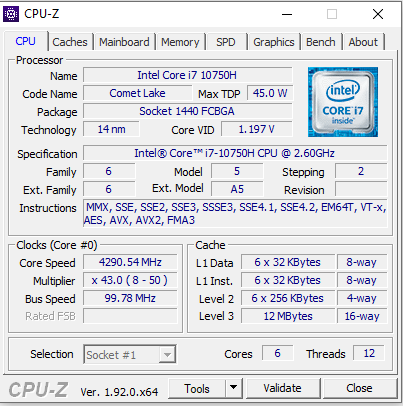
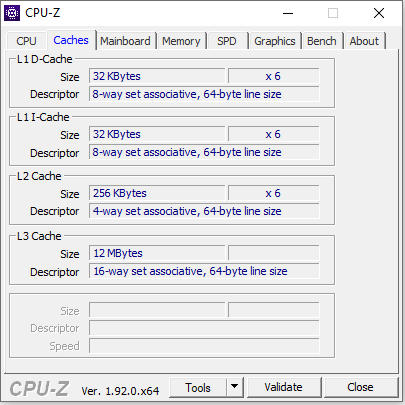
The built-in Core i7-10750H hexa-core processor (Comet Lake) represents a good compromise between performance, power consumption, and price. The CPU runs at a base speed of 2.3 GHz. The clock rate can be increased to range between 4.3 GHz (six cores) and 5 GHz (one core) via Turbo. Moreover, Hyper-Threading (two threads per core) is supported.
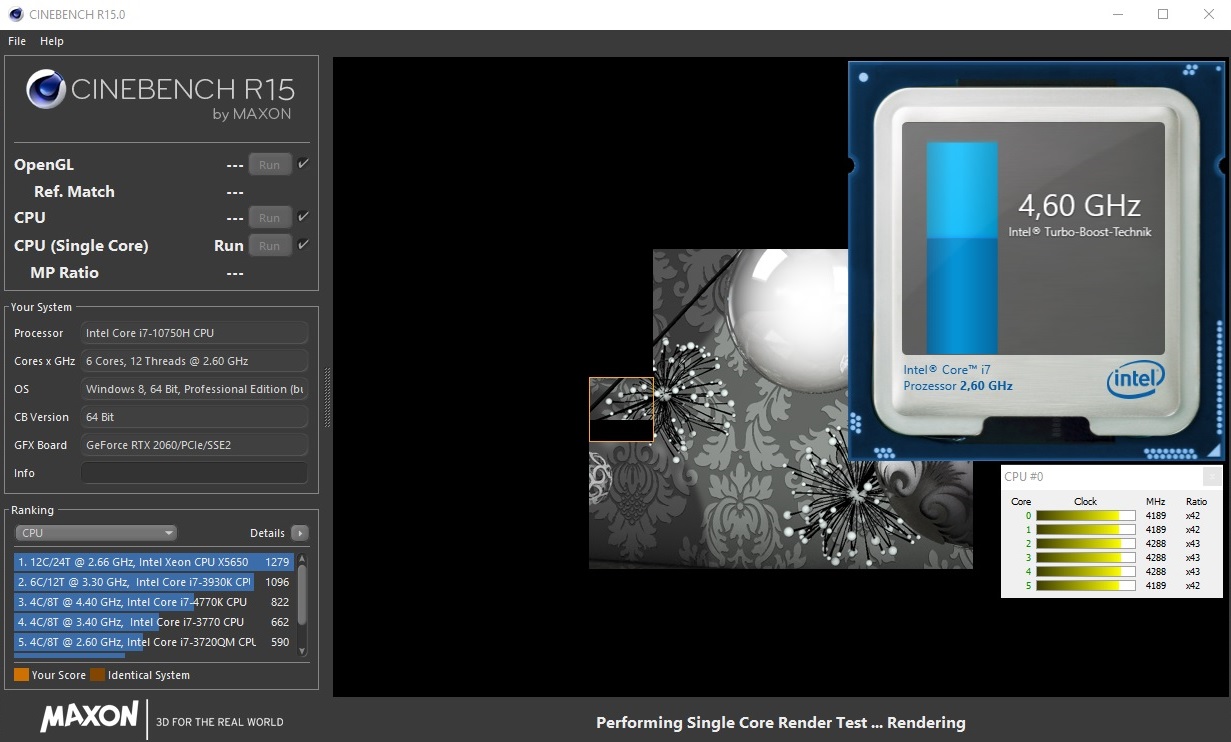
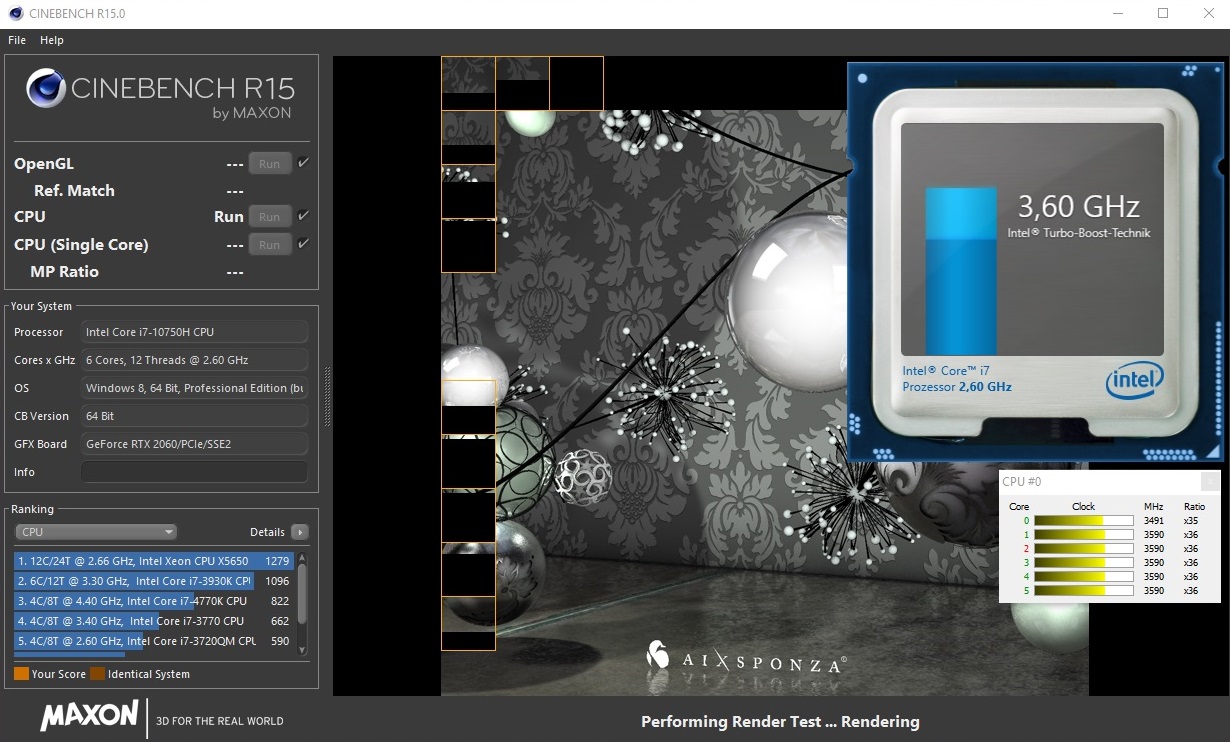
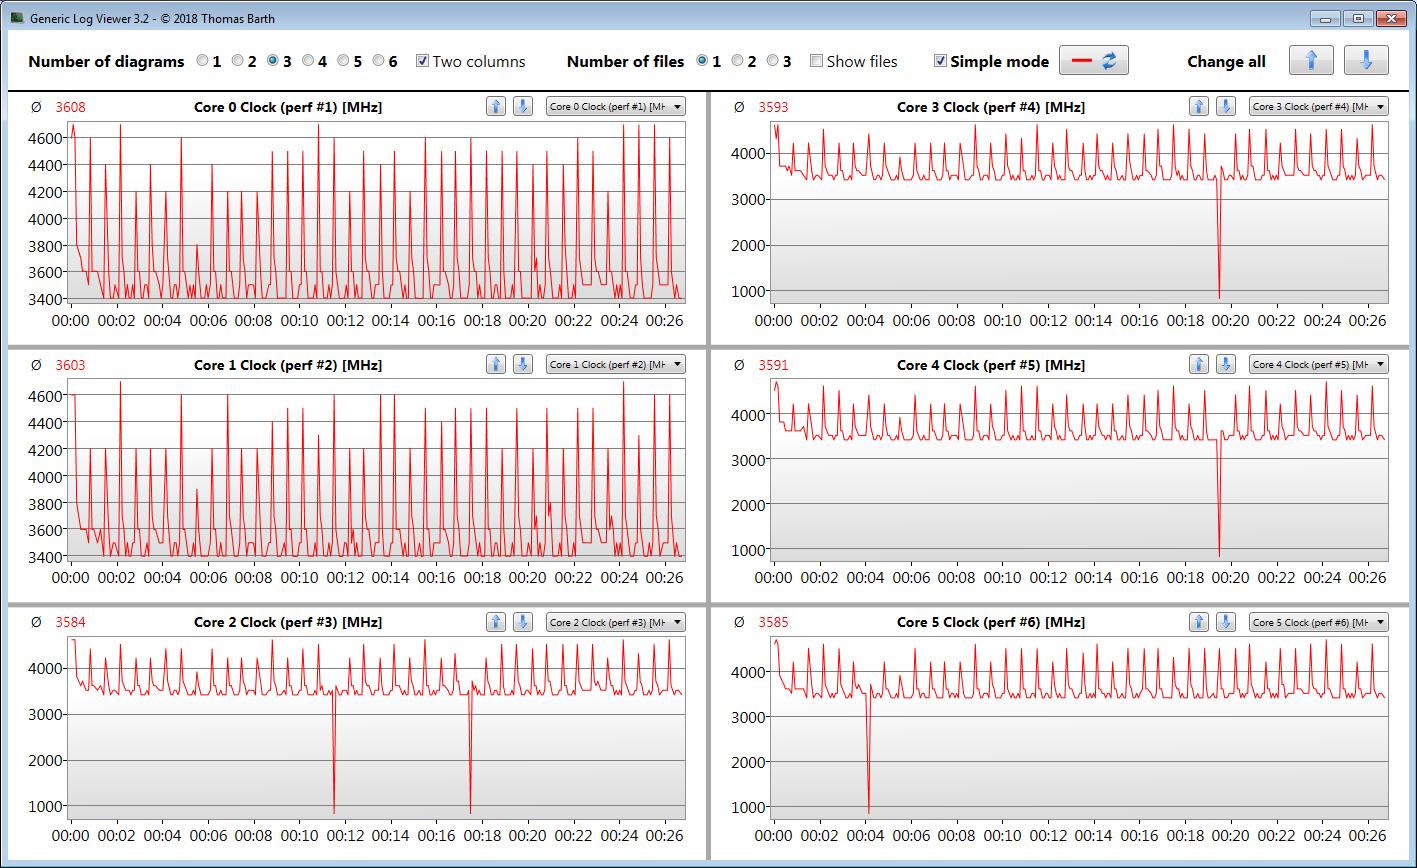
The processor briefly processes the Cinebench R15 benchmark's multithread test at 4 to 4.1 GHz. The clock rate then drops to 3.6 to 3.8 GHz. The single-thread test is run at 4.2 to 4.6 GHz. On battery power, the speeds are 2.6 to 2.9 GHz (multithread) and 2.6 to 4.2 GHz (single-thread), respectively.
We verify if the CPU Turbo is also consistently used when plugged in by running the Cinebench R15 benchmark's multithread test in a continuous loop for at least 30 minutes. Turbo is used at a moderate level.
* ... smaller is better
System performance
The MSI laptop will provide enough computing power for all common application areas over the next years. A powerful hexa-core processor, dual-channel memory, and a fast NVMe SSD make for a fast and smooth system. Furthermore, the high-end GPU brings all modern computer games smoothly onto the screen. This is accompanied by good results in the PCMark benchmarks.
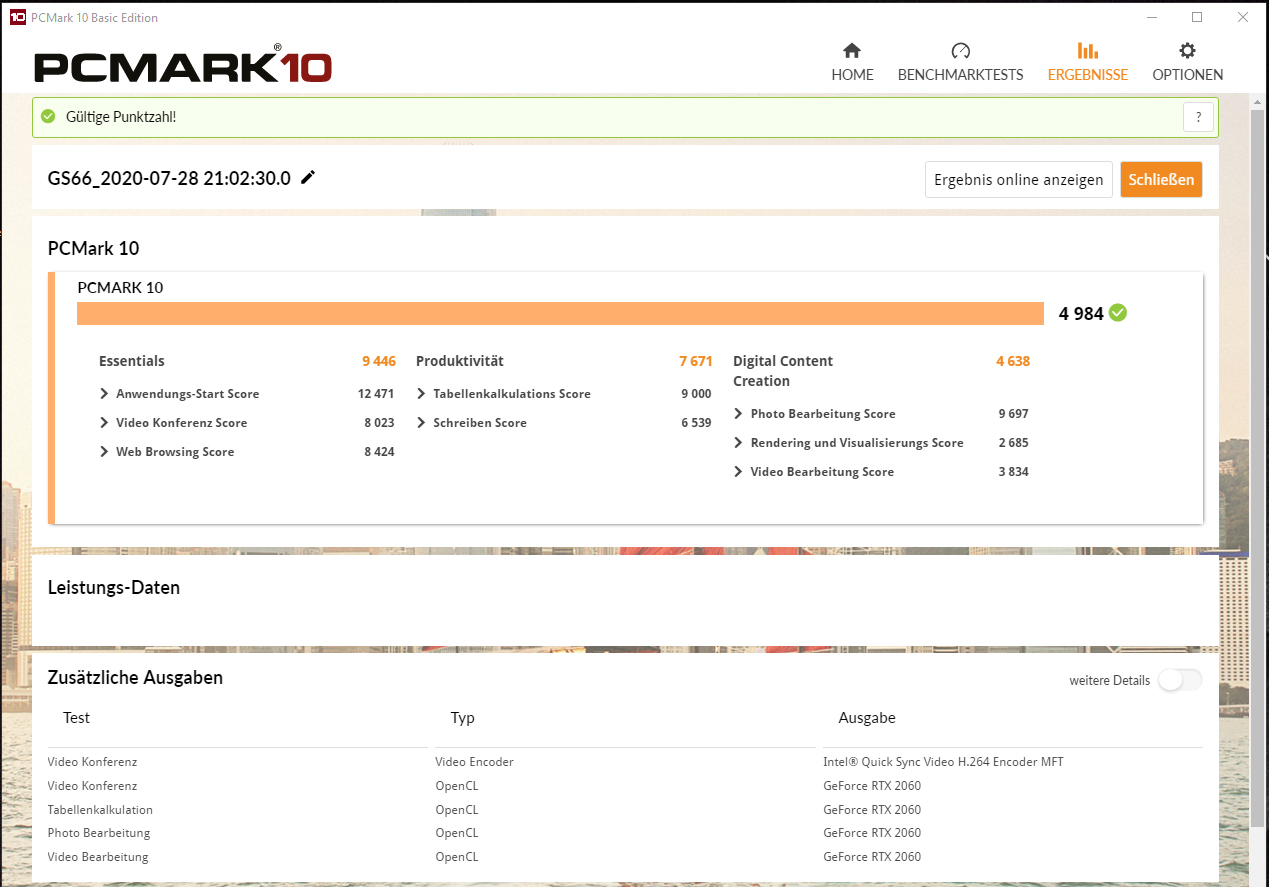
| PCMark 8 Home Score Accelerated v2 | 4539 points | |
| PCMark 8 Creative Score Accelerated v2 | 4314 points | |
| PCMark 8 Work Score Accelerated v2 | 5908 points | |
| PCMark 10 Score | 4984 points | |
Help | ||
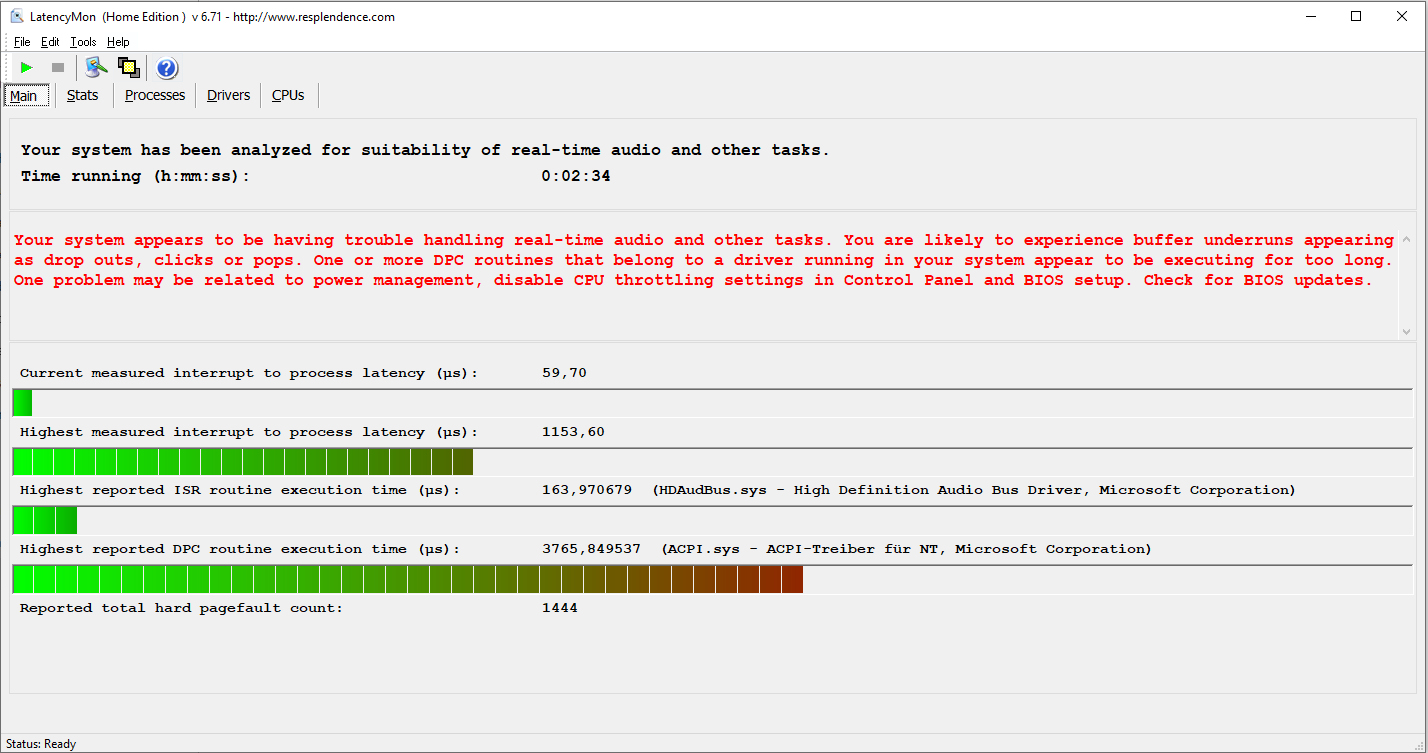
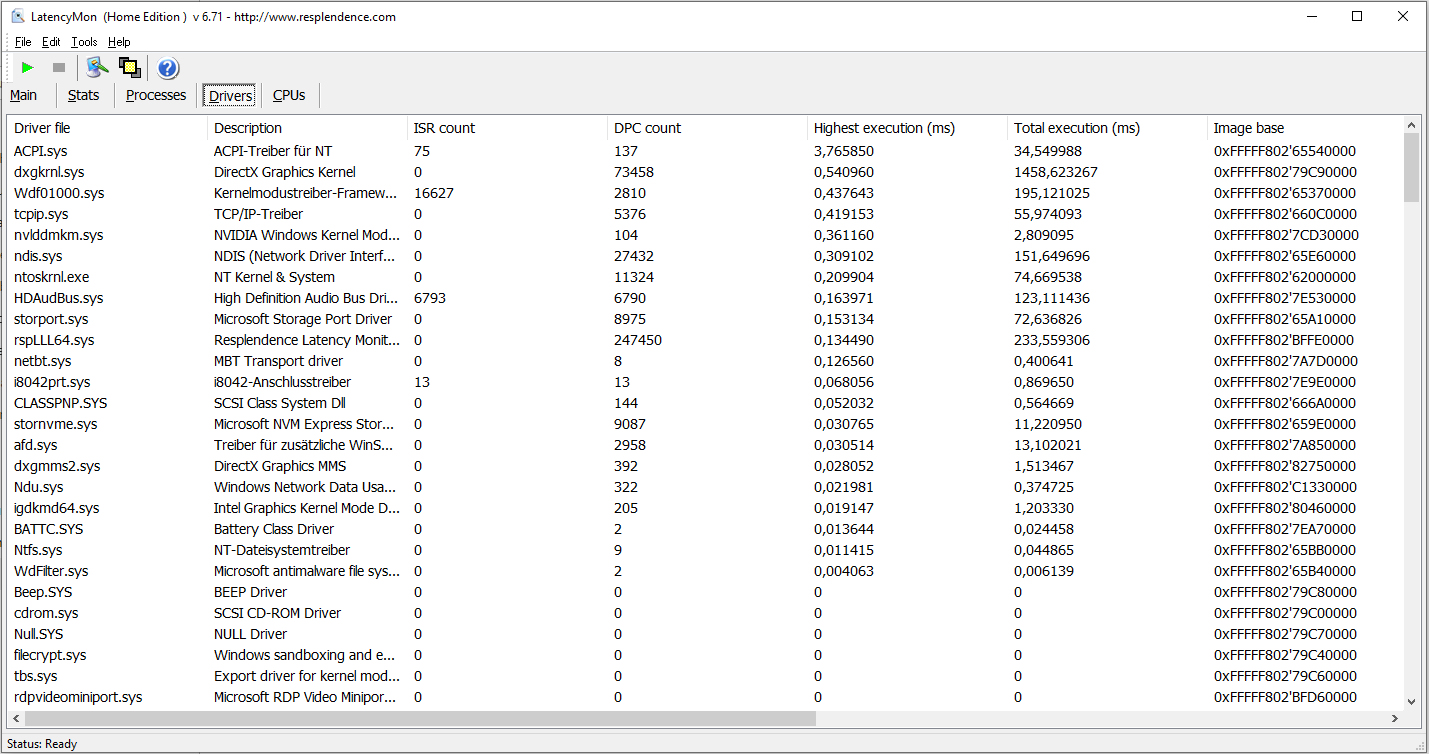
DPC latencies
In our standardized latency monitor test (web surfing, 4K video playback, high-load Prime95), we could observe issues with the DPC latencies. The system doesn't seem to be suitable for real-time video and audio-editing.
| DPC Latencies / LatencyMon - interrupt to process latency (max), Web, Youtube, Prime95 | |
| Dell G5 15 SE 5505 P89F | |
| MSI GS66 Stealth 10SFS | |
| Gigabyte Aero 15 OLED XB-8DE51B0SP | |
| MSI GS66 10SGS | |
| MSI GS66 Stealth 10SE-045 | |
| Razer Blade 15 RZ09-0328 | |
| Asus TUF Gaming A15 FA506IV-HN172 | |
| Lenovo Legion 5 15IMH05H | |
* ... smaller is better
Storage
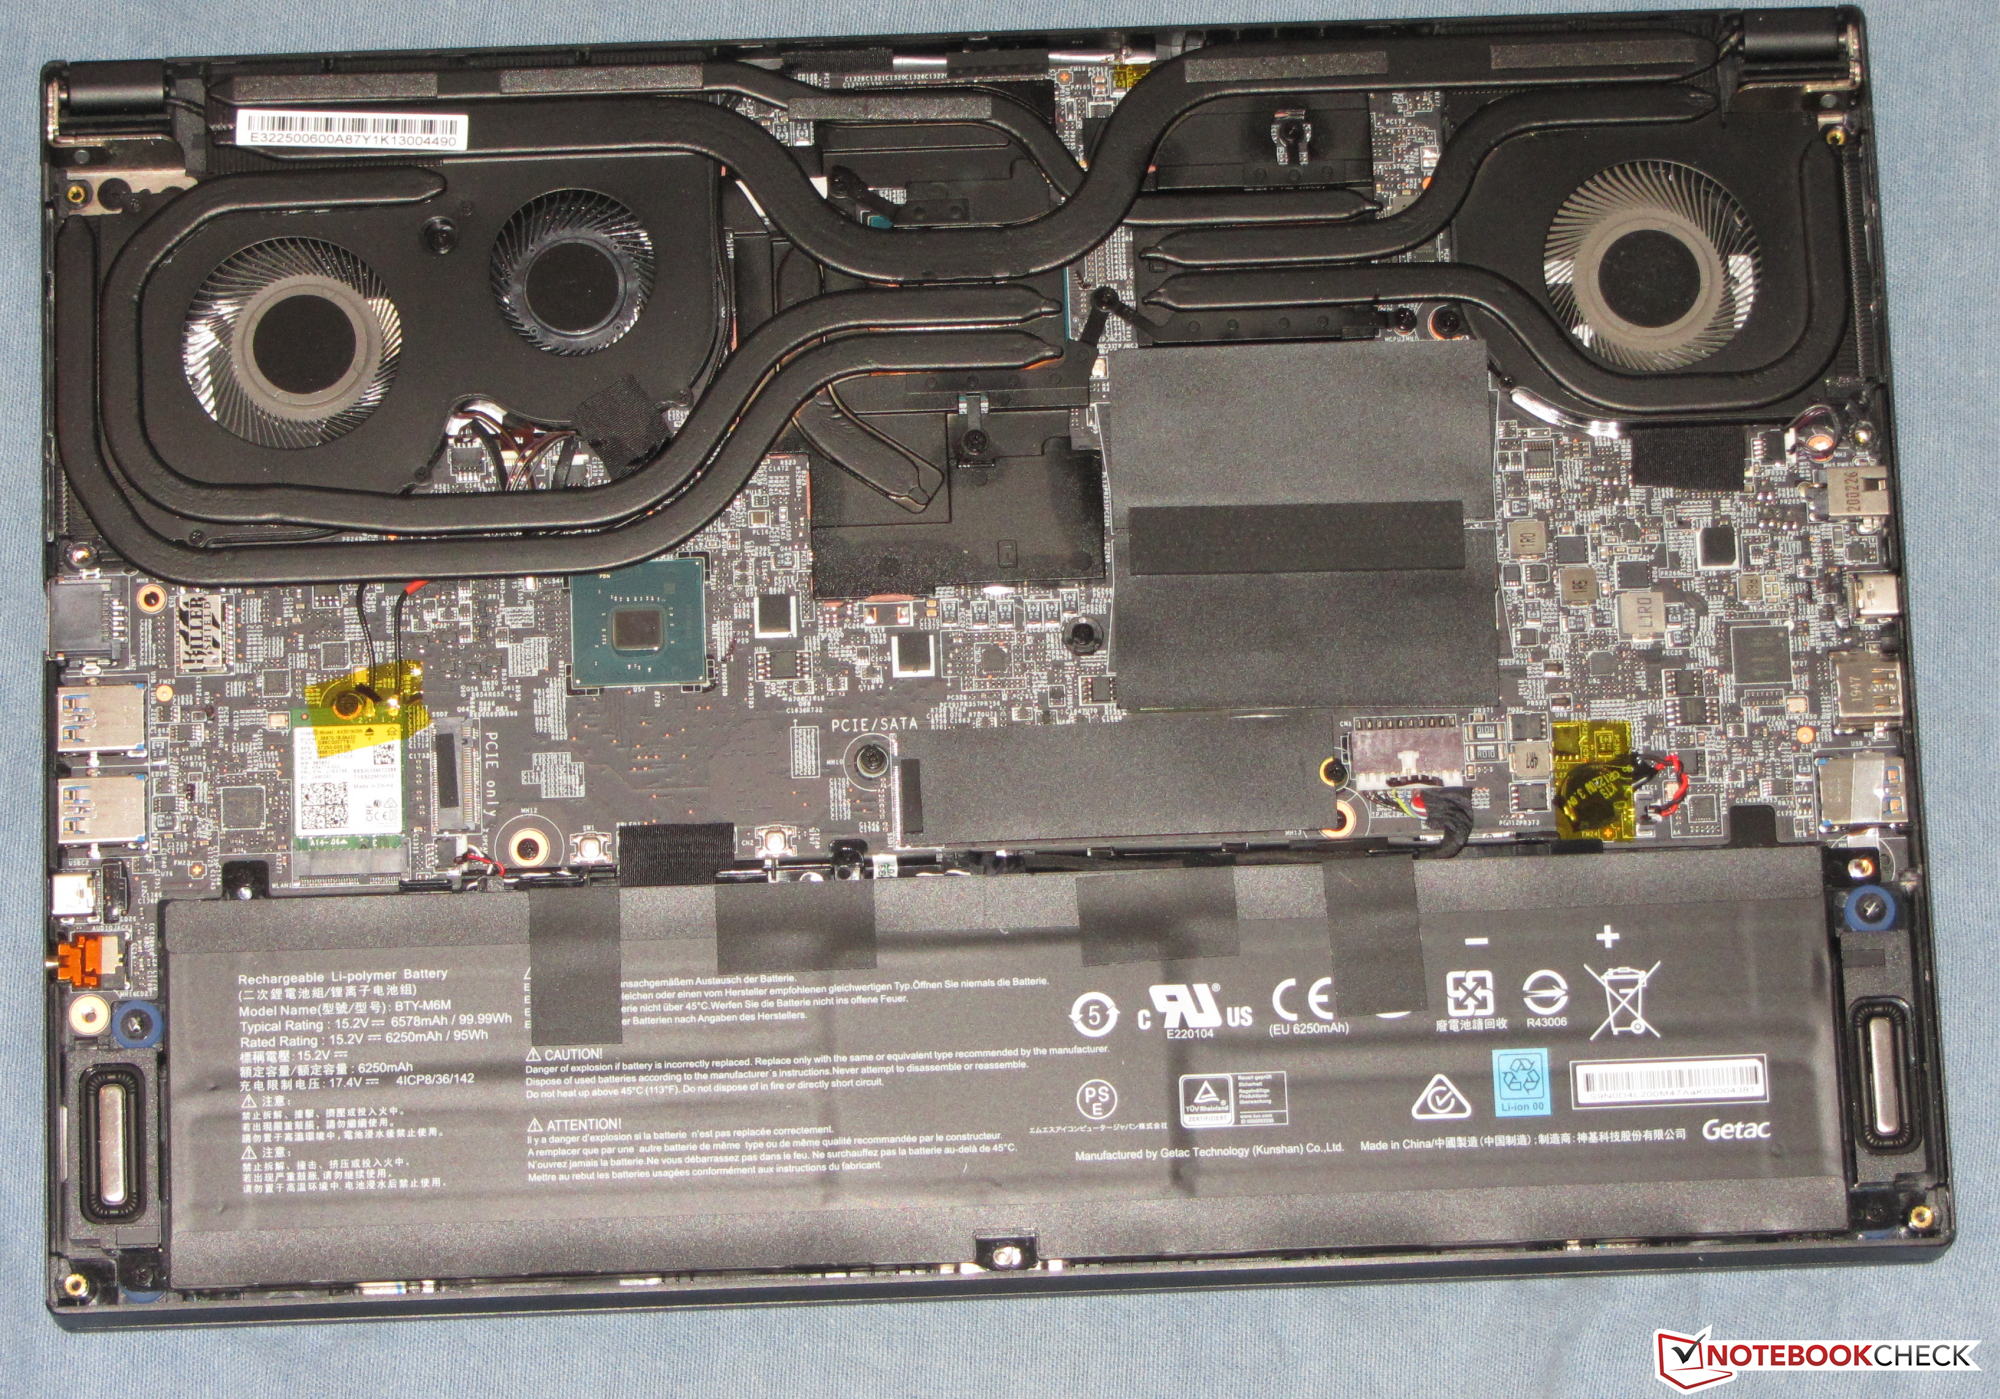
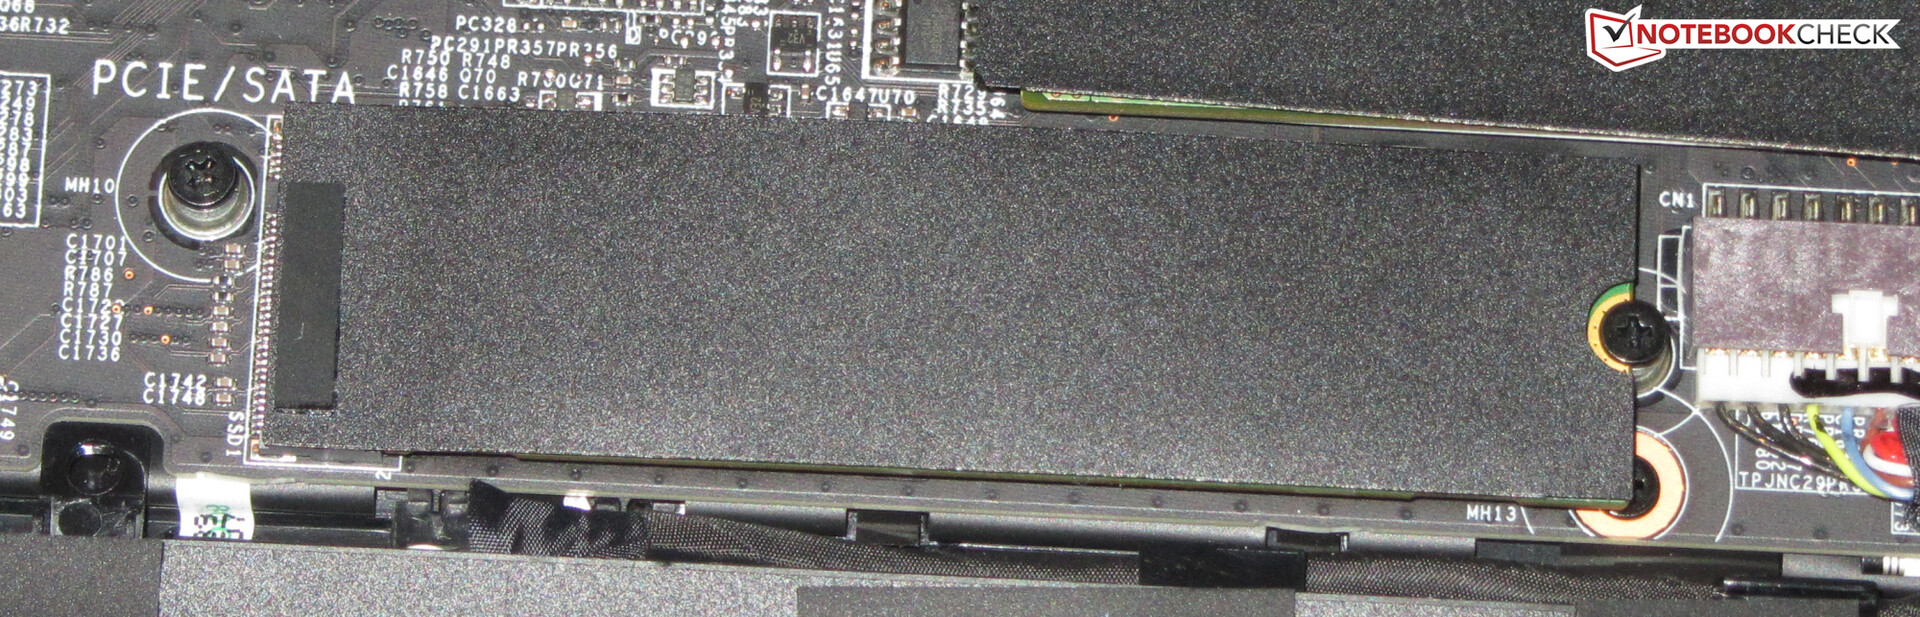
The system drive is an NVMe SSD (M.2 2280 format) from Samsung that offers 1 TB of storage space. The SSD delivers very good transfer rates. The laptop still offers space for a second NVMe SSD.
| MSI GS66 Stealth 10SE-045 Samsung SSD PM981 MZVLB1T0HALR | Dell G5 15 SE 5505 P89F Samsung PM991 MZ9LQ512HALU | Lenovo Legion 5 15IMH05H Samsung PM991 MZALQ512HALU | Asus TUF Gaming A15 FA506IV-HN172 Kingston OM8PCP3512F-AB | Schenker XMG Core 15 GK5CP6V Samsung SSD 970 EVO Plus 500GB | MSI GS66 Stealth 10SFS Samsung SSD PM981 MZVLB1T0HALR | Razer Blade 15 GTX 1660 Ti Samsung SSD PM981 MZVLB256HAHQ | |
|---|---|---|---|---|---|---|---|
| CrystalDiskMark 5.2 / 6 | -20% | -21% | -18% | -14% | -4% | -14% | |
| Write 4K (MB/s) | 156.3 | 142.1 -9% | 145.4 -7% | 219.8 41% | 102 -35% | 131.3 -16% | 135 -14% |
| Read 4K (MB/s) | 47.65 | 46.43 -3% | 51.6 8% | 50.2 5% | 41.39 -13% | 45.84 -4% | 41.1 -14% |
| Write Seq (MB/s) | 2374 | 1108 -53% | 1007 -58% | 979 -59% | 1649 -31% | 2370 0% | 1427 -40% |
| Read Seq (MB/s) | 2045 | 1622 -21% | 1145 -44% | 1990 -3% | 1367 -33% | 1509 -26% | 1494 -27% |
| Write 4K Q32T1 (MB/s) | 431.3 | 467 8% | 468.4 9% | 516 20% | 379 -12% | 481.5 12% | 494.9 15% |
| Read 4K Q32T1 (MB/s) | 509 | 525 3% | 528 4% | 298.3 -41% | 401.2 -21% | 560 10% | 578 14% |
| Write Seq Q32T1 (MB/s) | 2385 | 1203 -50% | 1381 -42% | 982 -59% | 3276 37% | 2392 0% | 1417 -41% |
| Read Seq Q32T1 (MB/s) | 3505 | 2288 -35% | 2291 -35% | 1907 -46% | 3417 -3% | 3232 -8% | 3251 -7% |
| Write 4K Q8T8 (MB/s) | 981 | ||||||
| Read 4K Q8T8 (MB/s) | 300.9 | ||||||
| AS SSD | -61% | -48% | -45% | -7% | -17% | -48% | |
| Seq Read (MB/s) | 2612 | 1386 -47% | 2012 -23% | 1682 -36% | 2261 -13% | 1065 -59% | 1829 -30% |
| Seq Write (MB/s) | 2368 | 1234 -48% | 1261 -47% | 904 -62% | 2393 1% | 2360 0% | 1315 -44% |
| 4K Read (MB/s) | 51.1 | 41.32 -19% | 43.66 -15% | 60.2 18% | 54.6 7% | 48.09 -6% | 51.3 0% |
| 4K Write (MB/s) | 135.9 | 128 -6% | 109.3 -20% | 164.8 21% | 118.4 -13% | 110.7 -19% | 106 -22% |
| 4K-64 Read (MB/s) | 1635 | 854 -48% | 851 -48% | 472.5 -71% | 1376 -16% | 1635 0% | 917 -44% |
| 4K-64 Write (MB/s) | 1831 | 721 -61% | 780 -57% | 845 -54% | 2299 26% | 1829 0% | 1212 -34% |
| Access Time Read * (ms) | 0.042 | 0.098 -133% | 0.117 -179% | 0.087 -107% | 0.07 -67% | 0.071 -69% | 0.063 -50% |
| Access Time Write * (ms) | 0.028 | 0.095 -239% | 0.036 -29% | 0.02 29% | 0.031 -11% | 0.034 -21% | 0.104 -271% |
| Score Read (Points) | 1947 | 1034 -47% | 1096 -44% | 701 -64% | 1657 -15% | 1790 -8% | 1152 -41% |
| Score Write (Points) | 2204 | 973 -56% | 1016 -54% | 1101 -50% | 2657 21% | 2176 -1% | 1450 -34% |
| Score Total (Points) | 5138 | 2536 -51% | 2643 -49% | 2143 -58% | 5175 1% | 4950 -4% | 3177 -38% |
| Copy ISO MB/s (MB/s) | 2334 | 1284 -45% | 1481 -37% | 675 -71% | 1539 -34% | ||
| Copy Program MB/s (MB/s) | 569 | 401.9 -29% | 467.5 -18% | 248.4 -56% | 513 -10% | ||
| Copy Game MB/s (MB/s) | 1401 | 1013 -28% | 734 -48% | 535 -62% | 1150 -18% | ||
| Total Average (Program / Settings) | -41% /
-46% | -35% /
-38% | -32% /
-35% | -11% /
-10% | -11% /
-12% | -31% /
-36% |
* ... smaller is better

Continuous load read: DiskSpd Read Loop, Queue Depth 8
Graphics card
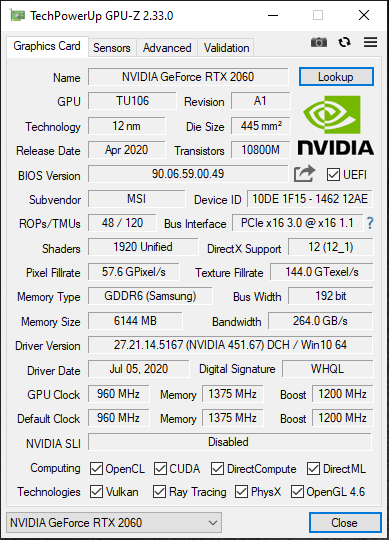
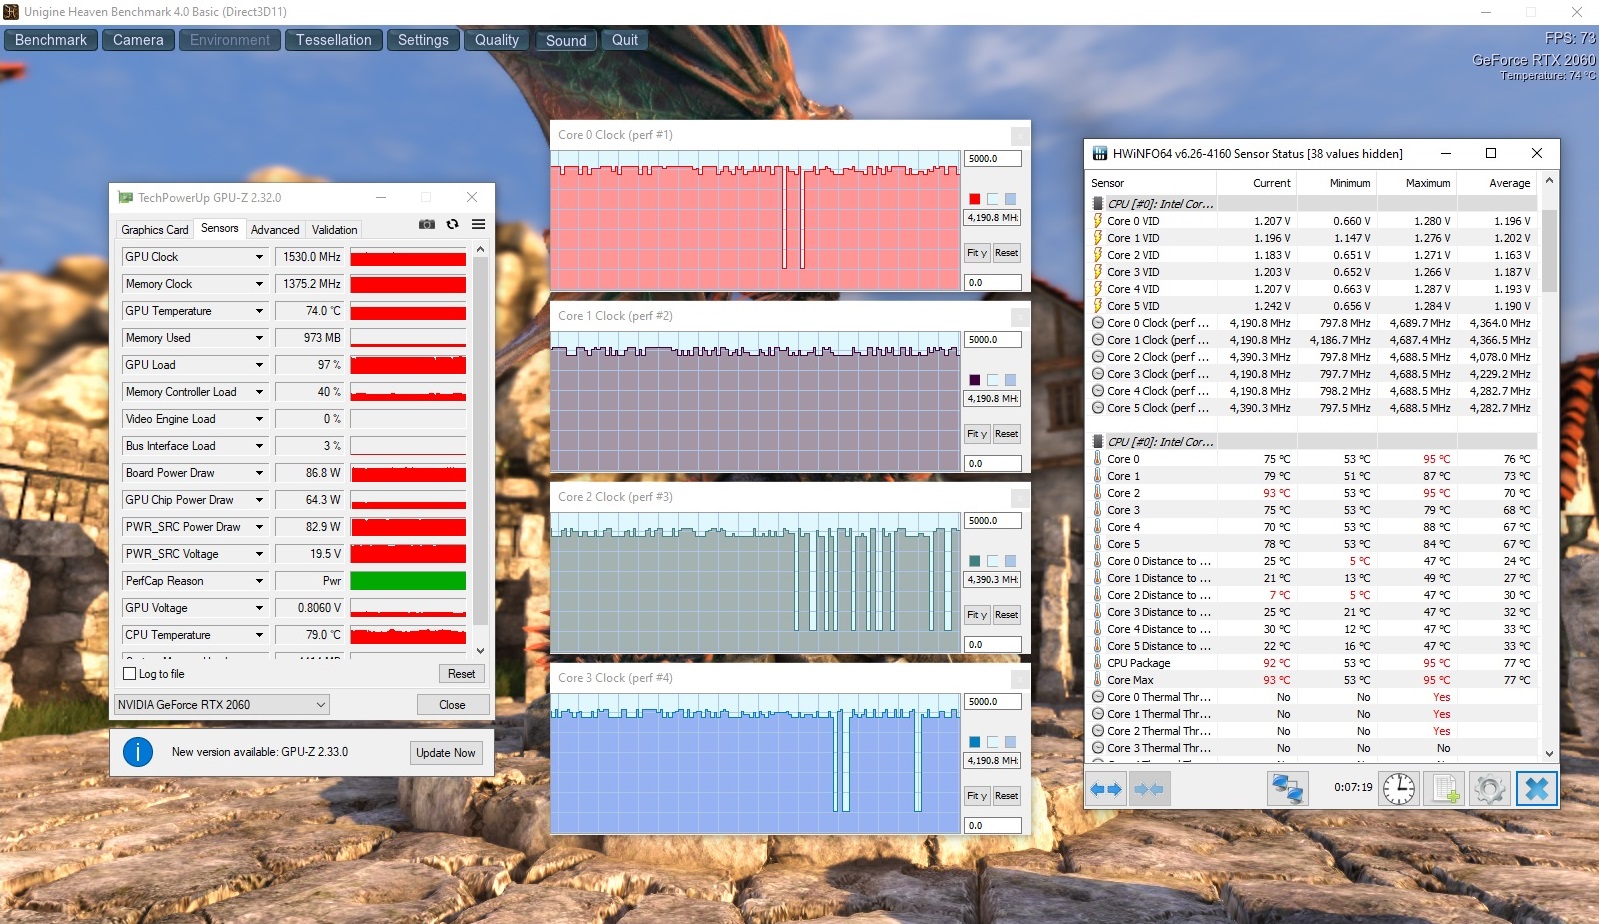
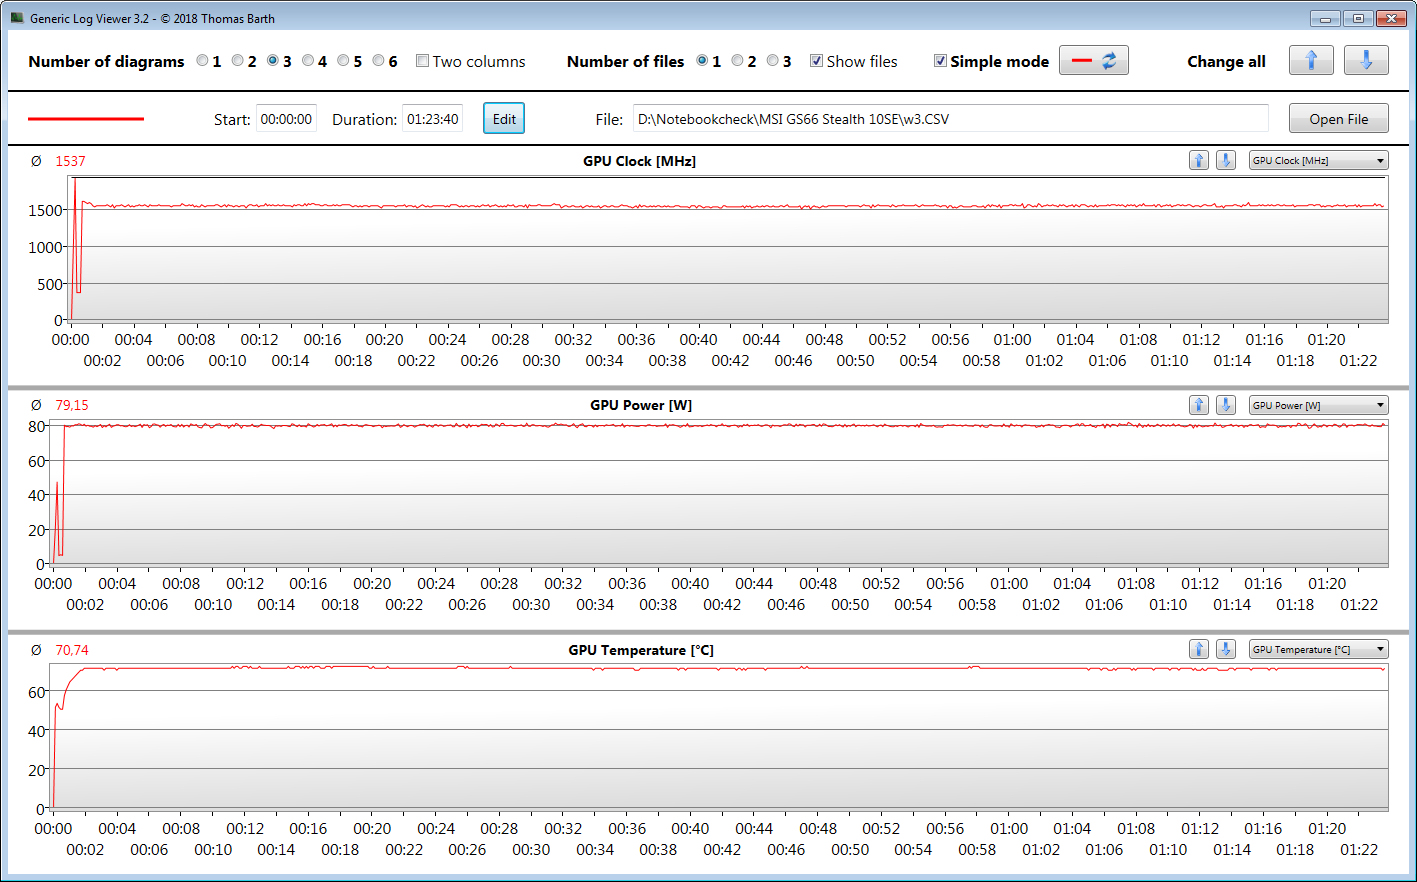
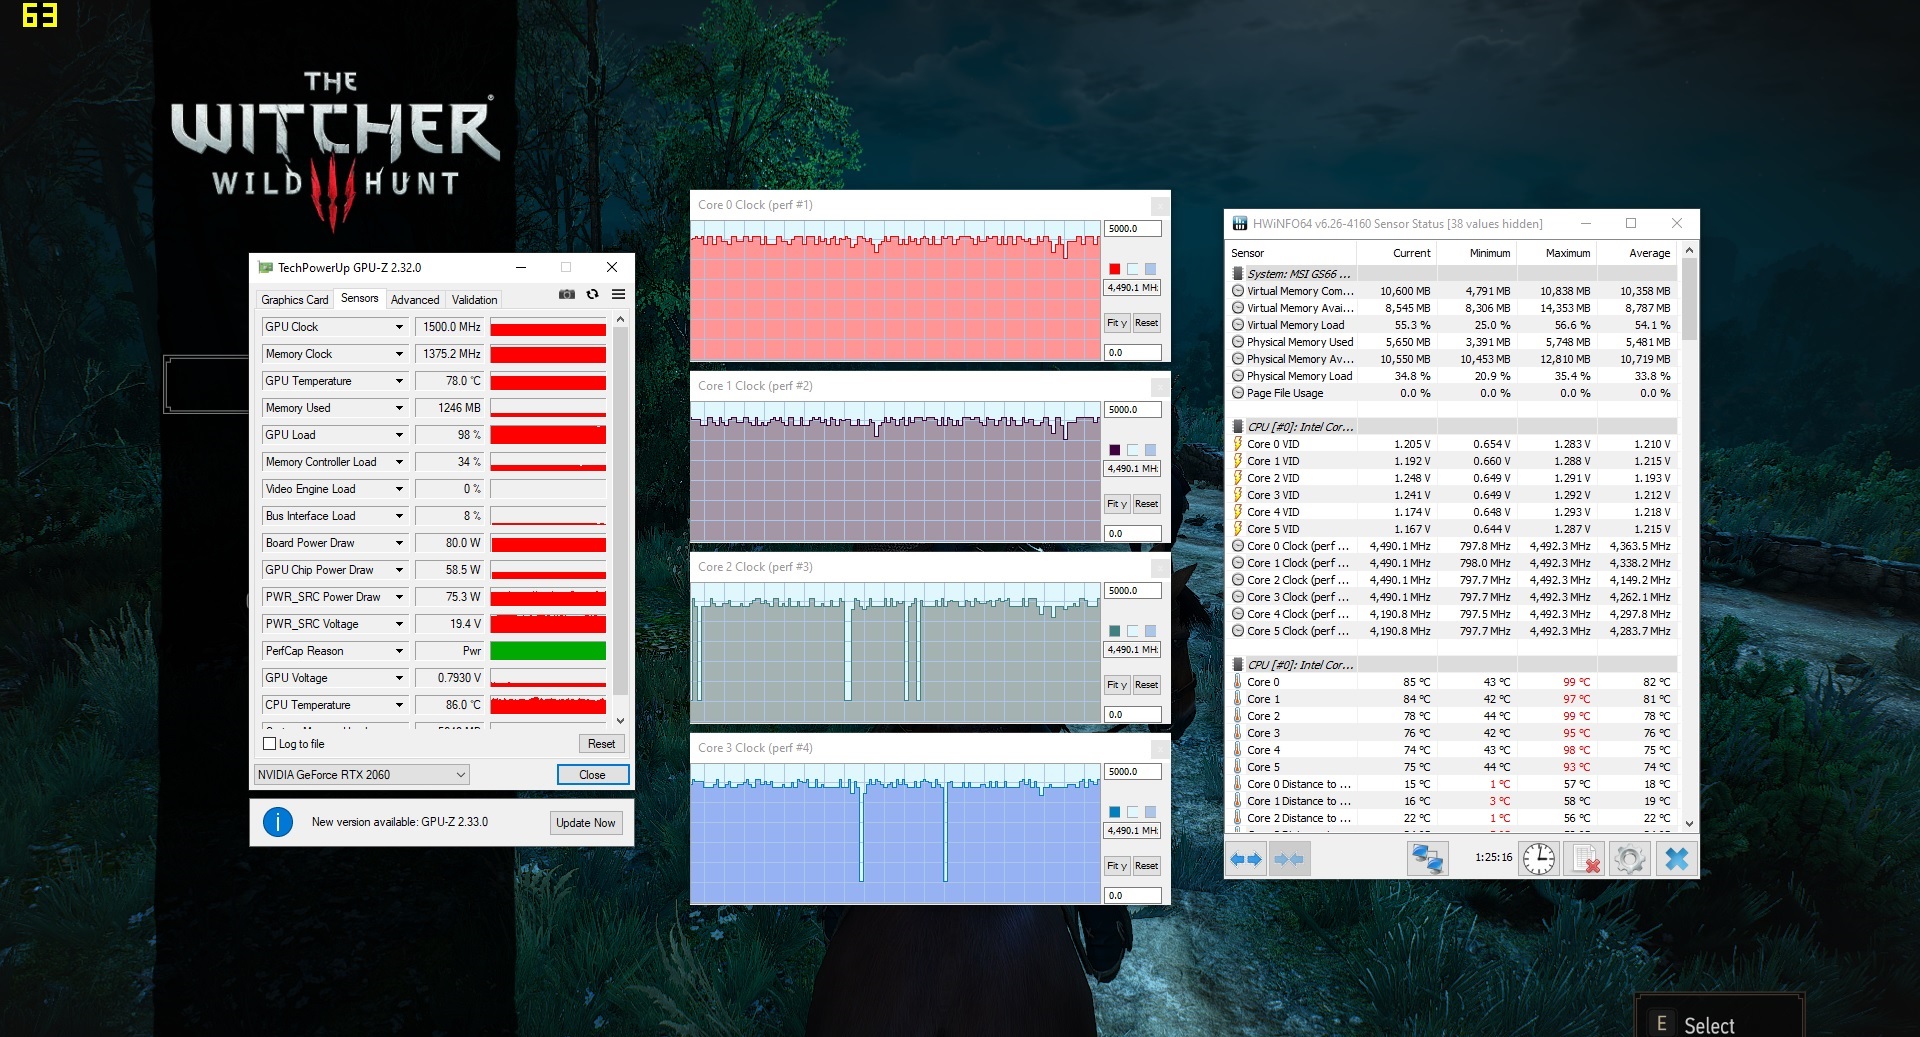
The GeForce RTX 2060 graphics core (Turing) supports DirectX 12 and runs at a base speed of 960 MHz. An increase up to 1,200 MHz is possible when boosted. Higher speeds are feasible if the GPU doesn't reach a specified temperature and/or energy threshold. In this way, we register a maximum of 1,919 MHz. Our The Witcher 3 test is run at an average speed of 1,537 MHz. In addition, the GPU can make use of fast GDDR6 graphics memory (6,144 MB).
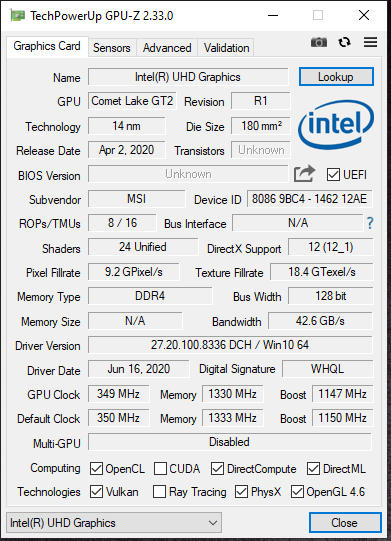
The results in the 3DMark benchmarks are at a normal level for the GPU installed here. The UHD Graphics 630 GPU that's integrated into the processor is active, and the laptop works with Nvidia's Optimus graphics-switching solution. Optimus can be disabled within the Dragon Center software if necessary.
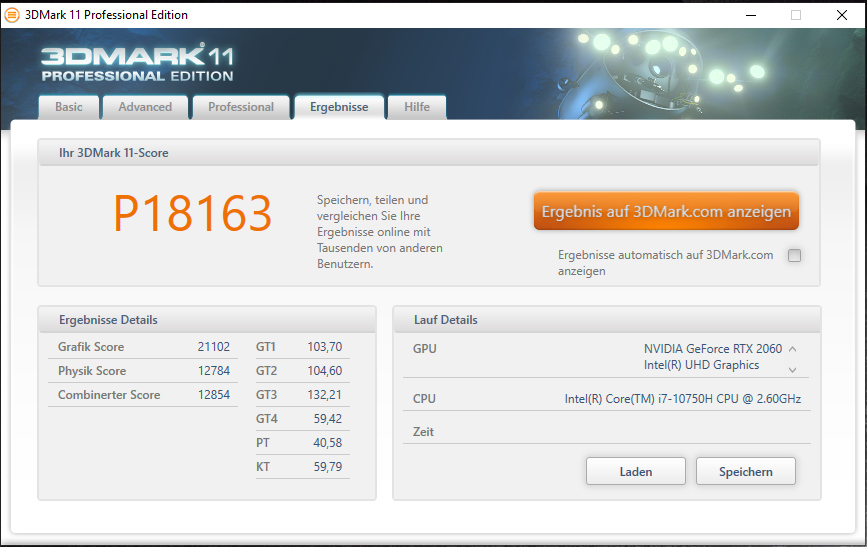

| 3DMark 11 Performance | 18163 points | |
| 3DMark Cloud Gate Standard Score | 36138 points | |
| 3DMark Fire Strike Score | 14290 points | |
| 3DMark Time Spy Score | 6038 points | |
Help | ||
Gaming performance
The fact that the GS66 can bring all modern computer games smoothly onto the screen shouldn't come as a surprise given its powerful hardware. Full HD resolution and high to maximum quality settings can always be selected. The GPU can also handle resolutions beyond Full HD (an appropriate monitor would have to be plugged in for this). However, the quality level needs to be reduced in that case.
| BioShock Infinite - 1920x1080 Ultra Preset, DX11 (DDOF) | |
| Lenovo Legion 5 15IMH05H | |
| MSI GS66 Stealth 10SE-045 | |
| Razer Blade 15 GTX 1660 Ti | |
| Asus TUF Gaming A15 FA506IV-HN172 | |
| Shadow of the Tomb Raider - 1920x1080 Highest Preset AA:T | |
| Average of class Gaming (96 - 116, n=2, last 2 years) | |
| Gigabyte Aero 15 OLED XB-8DE51B0SP | |
| MSI GS66 10SGS | |
| MSI GS66 Stealth 10SFS | |
| Razer Blade 15 RZ09-0328 | |
| Lenovo Legion 5 15IMH05H | |
| MSI GS66 Stealth 10SE-045 | |
| Dell G5 15 SE 5505 P89F | |
| Razer Blade 15 GTX 1660 Ti | |
| Metro Exodus - 1920x1080 Ultra Quality AF:16x | |
| Gigabyte Aero 15 OLED XB-8DE51B0SP | |
| MSI GS66 10SGS | |
| Dell G5 15 SE 5505 P89F | |
| MSI GS66 Stealth 10SE-045 | |
| Far Cry 5 - 1920x1080 Ultra Preset AA:T | |
| Average of class Gaming (70 - 151, n=6, last 2 years) | |
| MSI GS66 Stealth 10SE-045 | |
| Lenovo Legion 5 15IMH05H | |
| Call of Duty Modern Warfare 2019 - 1920x1080 Maximum Settings AA:T2X Filmic SM | |
| Schenker XMG Core 15 GK5CP6V | |
| MSI GS66 Stealth 10SE-045 | |
| Red Dead Redemption 2 - 1920x1080 High Settings | |
| Gigabyte Aero 15 OLED XB-8DE51B0SP | |
| Lenovo Legion 5 15IMH05H | |
| MSI GS66 Stealth 10SE-045 | |
| Schenker XMG Core 15 GK5CP6V | |
In order to verify whether the frame rates remain largely constant even over a prolonged period of time, we let the game The Witcher 3 run for about 60 minutes at Full HD resolution and maximum quality settings. The character embodied by the player is not moved during this whole period. A drop in frame rates wasn't found.
| low | med. | high | ultra | |
|---|---|---|---|---|
| BioShock Infinite (2013) | 336 | 290 | 268.3 | 135.8 |
| The Witcher 3 (2015) | 280.6 | 196.7 | 117.7 | 63.4 |
| Far Cry 5 (2018) | 128 | 96 | 90 | 86 |
| Shadow of the Tomb Raider (2018) | 114 | 93 | 86 | 77 |
| Metro Exodus (2019) | 140.9 | 69.9 | 53.4 | 42.2 |
| Call of Duty Modern Warfare 2019 (2019) | 143.9 | 97.3 | 80.8 | 70.7 |
| Red Dead Redemption 2 (2019) | 118.5 | 81.9 | 54.9 | 35.1 |
| Doom Eternal (2020) | 209.2 | 136.9 | 124.6 | 121.9 |
| Gears Tactics (2020) | 243.5 | 144.4 | 95.9 | 62.8 |
| F1 2020 (2020) | 230 | 150 | 131 | 93 |
| Death Stranding (2020) | 146.6 | 102 | 93.1 | 91 |
Emissions - The three fans in the MSI Stealth turn up strongly
Noise emissions
The GS66's fans can already turn up considerably in idle usage. In this way, we measure sound pressure levels of up to 40 dB(A). Nevertheless, the fans are indeed also quiet from time to time, and then silence prevails. In other words: There is no clear fan behavior. Moreover, the sound pressure levels increase even more under load. We register values of 54 dB(A) (stress test) and 48 dB(A) (The Witcher 3 test), respectively. Gaming isn't any fun without a headset here.
Noise level
| Idle |
| 29 / 30 / 40 dB(A) |
| Load |
| 51 / 54 dB(A) |
 | ||
30 dB silent 40 dB(A) audible 50 dB(A) loud |
||
min: | ||
| MSI GS66 Stealth 10SE-045 i7-10750H, GeForce RTX 2060 Mobile | MSI GS66 Stealth 10SFS i9-10980HK, GeForce RTX 2070 Super Max-Q | Razer Blade 15 GTX 1660 Ti i7-9750H, GeForce GTX 1660 Ti Mobile | Dell G5 15 SE 5505 P89F R7 4800H, Radeon RX 5600M | Lenovo Legion 5 15IMH05H i5-10300H, GeForce RTX 2060 Mobile | Asus TUF Gaming A15 FA506IV-HN172 R7 4800H, GeForce RTX 2060 Mobile | Schenker XMG Core 15 GK5CP6V i7-9750H, GeForce GTX 1660 Ti Mobile | Average of class Gaming | |
|---|---|---|---|---|---|---|---|---|
| Noise | -6% | 4% | 11% | 4% | 4% | -0% | 10% | |
| off / environment * (dB) | 25 | 30 -20% | 28.5 -14% | 28 -12% | 30.7 -23% | 30.2 -21% | 30 -20% | 24.1 ? 4% |
| Idle Minimum * (dB) | 29 | 32 -10% | 30.3 -4% | 28 3% | 30.7 -6% | 30.2 -4% | 30 -3% | 25.9 ? 11% |
| Idle Average * (dB) | 30 | 34 -13% | 30.5 -2% | 28 7% | 30.7 -2% | 30.2 -1% | 31 -3% | 27.4 ? 9% |
| Idle Maximum * (dB) | 40 | 39 2% | 30.5 24% | 28 30% | 30.7 23% | 30.2 24% | 33 17% | 30.1 ? 25% |
| Load Average * (dB) | 51 | 53 -4% | 41 20% | 28 45% | 36.6 28% | 40 22% | 48 6% | 43.7 ? 14% |
| Witcher 3 ultra * (dB) | 48 | 48 -0% | 48 -0% | 50.6 -5% | 47 2% | 49 -2% | 51 -6% | |
| Load Maximum * (dB) | 54 | 53 2% | 51.9 4% | 50.6 6% | 50.9 6% | 49 9% | 51 6% | 54.3 ? -1% |
* ... smaller is better
Temperature
Our stress test (Prime95 and FurMark run for at least an hour) is run by the processor and graphics core at 2.5 to 2.7 GHz and 1,390 to 1,400 MHz, respectively. On battery power, the clock rates are 1.9 to 2 GHz (CPU) and 1,300 to 1,350 MHz (GPU), respectively. The stress test represents an extreme scenario that doesn't occur in everyday life. We use this test to check if the system remains stable even under full load.
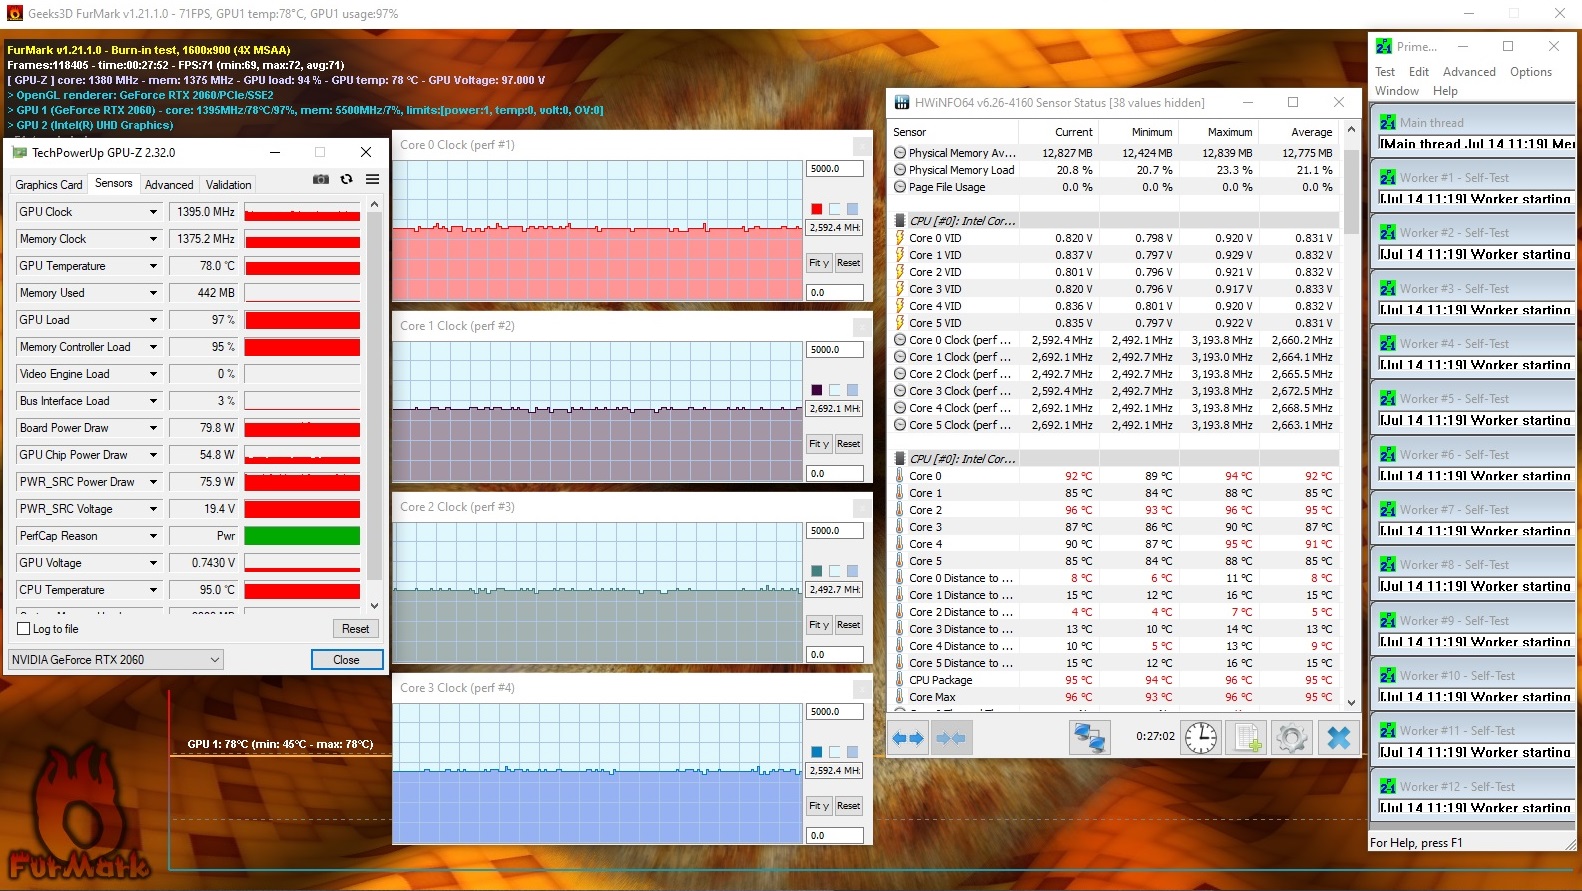
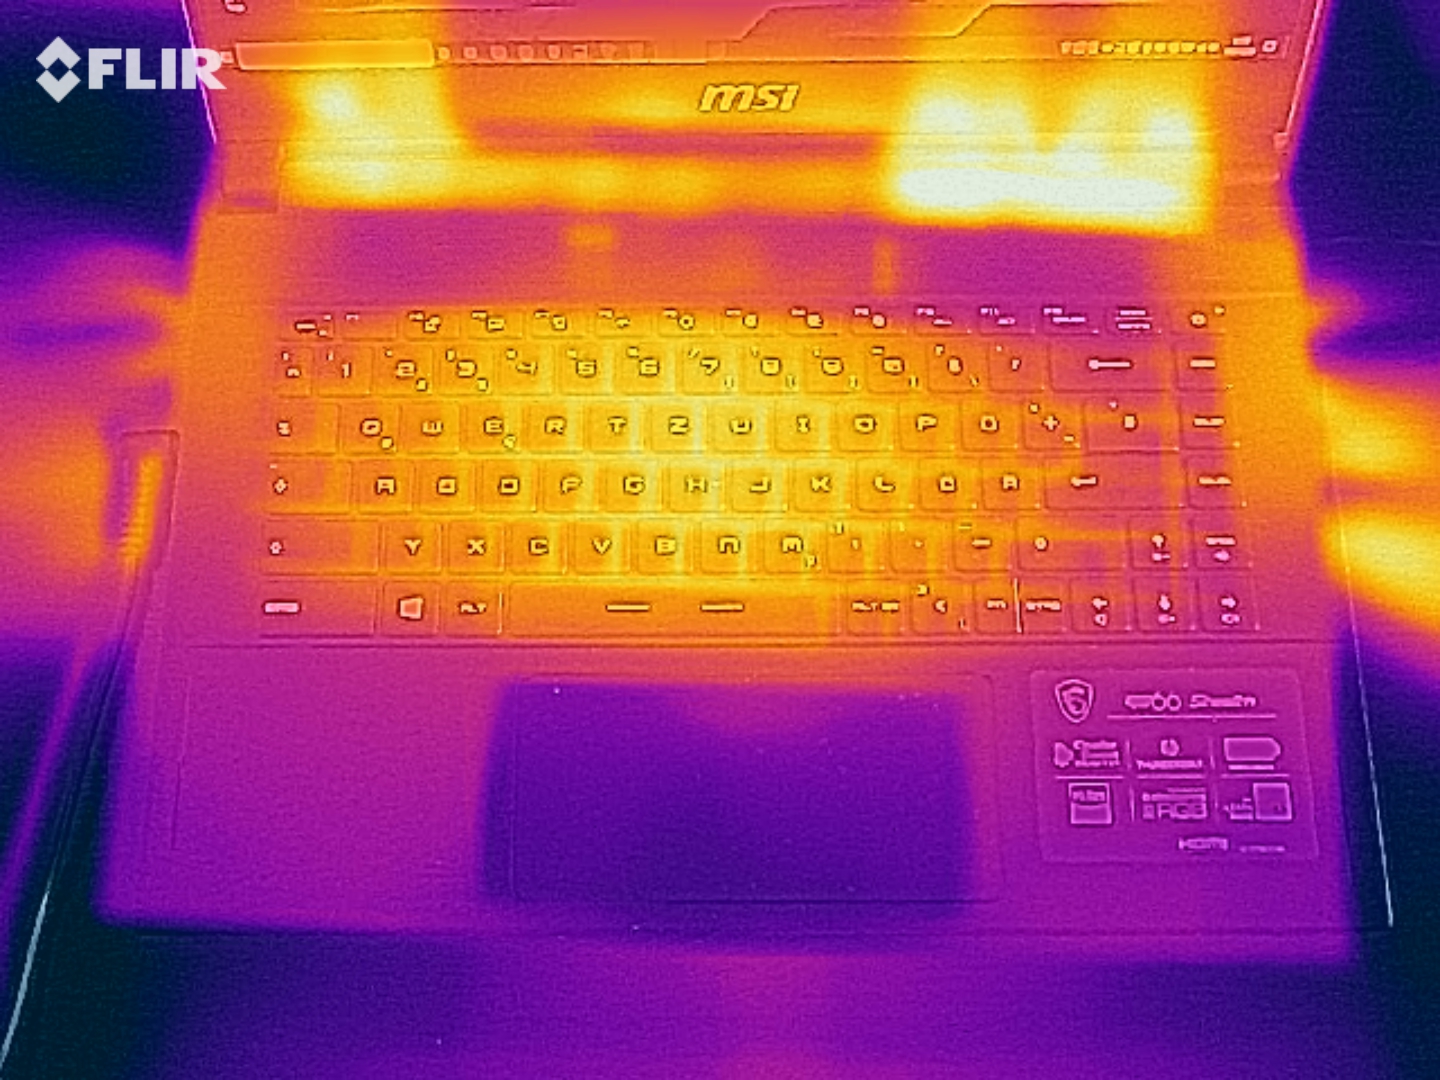
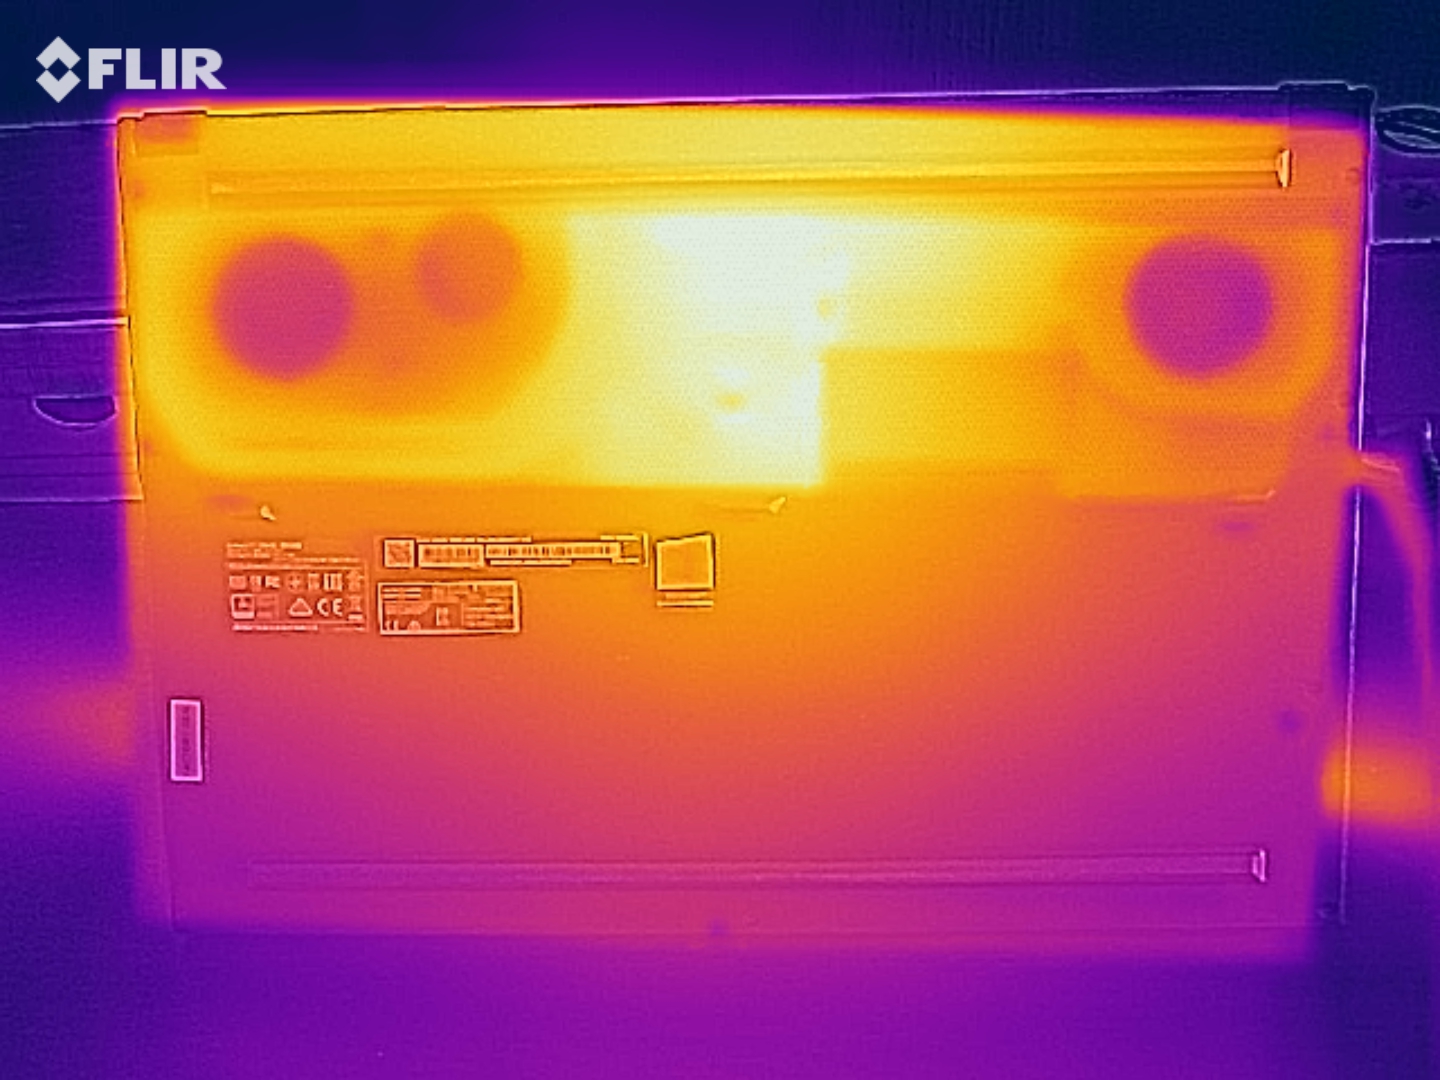
The MSI laptop warms up noticeably under load but not excessively. During the stress test, we register temperatures above 50 °C (~122 °F) at some measuring points. The heat development is a bit stronger when performing our The Witcher 3 test. As a result, the computer shouldn't be placed on the lap. In everyday use, the temperatures are in the green range.
(-) The maximum temperature on the upper side is 53 °C / 127 F, compared to the average of 40.4 °C / 105 F, ranging from 21.2 to 68.8 °C for the class Gaming.
(-) The bottom heats up to a maximum of 53 °C / 127 F, compared to the average of 43.2 °C / 110 F
(+) In idle usage, the average temperature for the upper side is 27.4 °C / 81 F, compared to the device average of 33.9 °C / 93 F.
(-) Playing The Witcher 3, the average temperature for the upper side is 42.6 °C / 109 F, compared to the device average of 33.9 °C / 93 F.
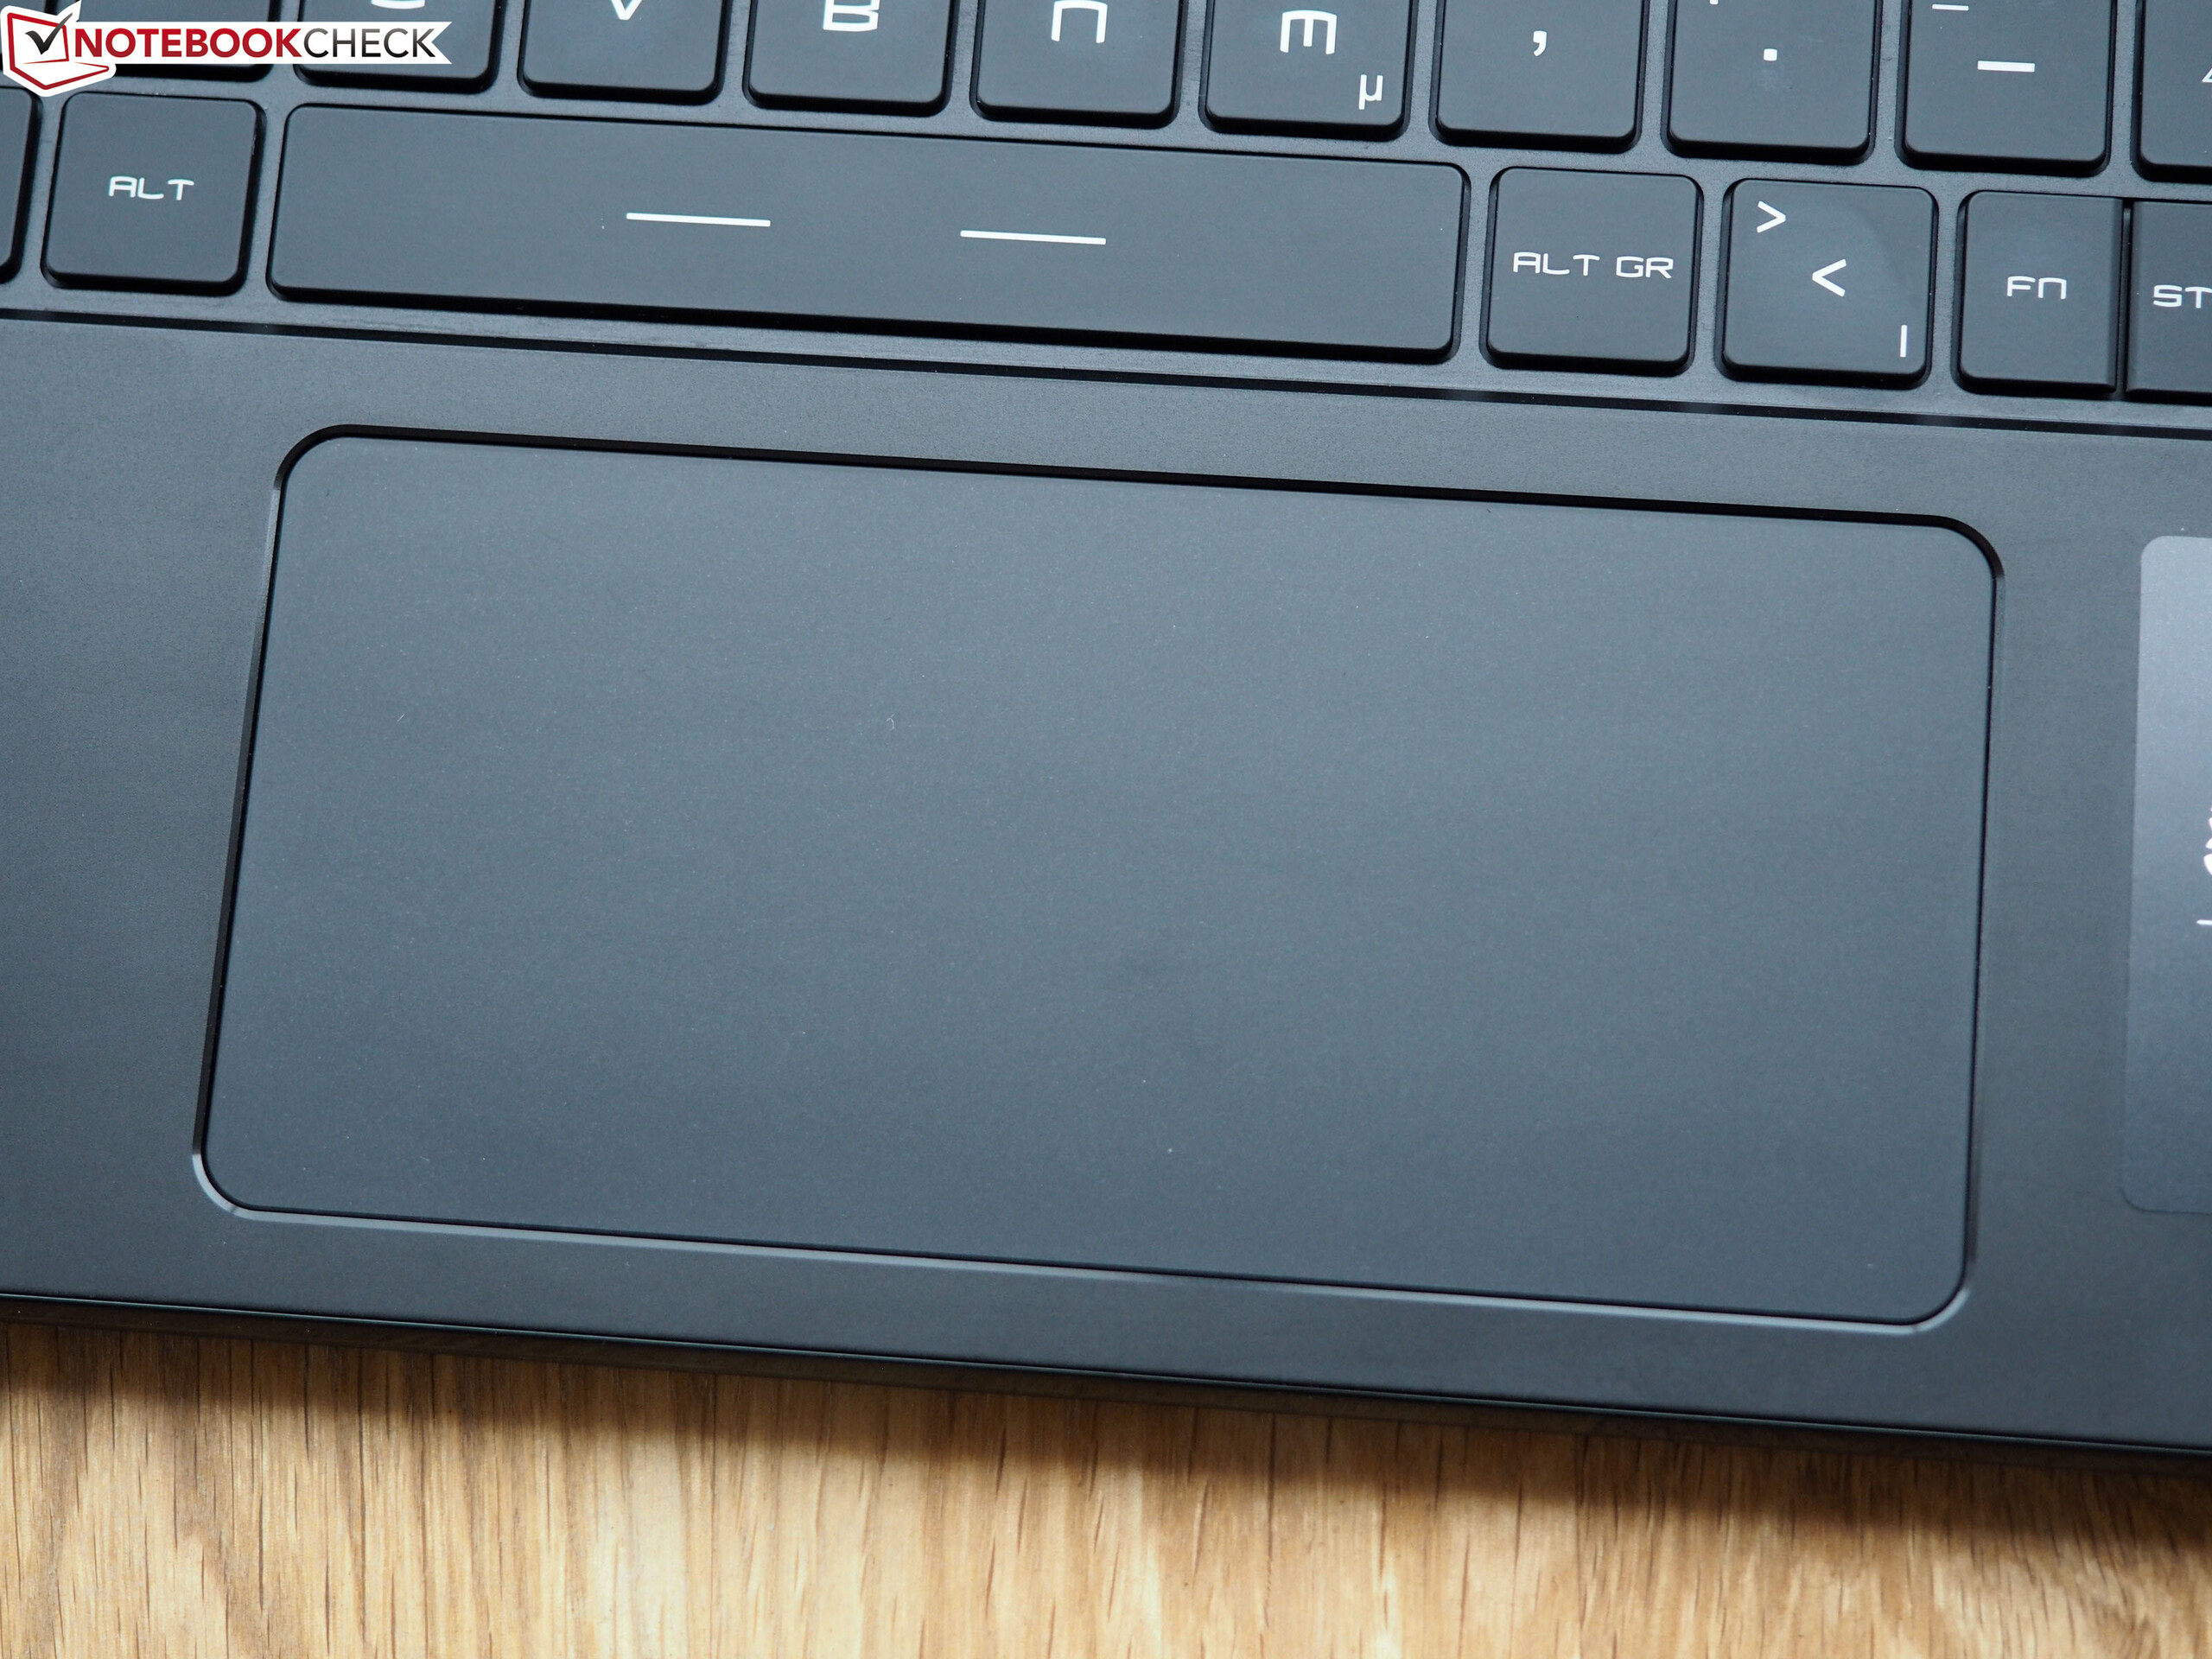
(+) The palmrests and touchpad are reaching skin temperature as a maximum (35 °C / 95 F) and are therefore not hot.
(-) The average temperature of the palmrest area of similar devices was 28.8 °C / 83.8 F (-6.2 °C / -11.2 F).
| MSI GS66 Stealth 10SE-045 i7-10750H, GeForce RTX 2060 Mobile | MSI GS66 Stealth 10SFS i9-10980HK, GeForce RTX 2070 Super Max-Q | Razer Blade 15 GTX 1660 Ti i7-9750H, GeForce GTX 1660 Ti Mobile | Dell G5 15 SE 5505 P89F R7 4800H, Radeon RX 5600M | Lenovo Legion 5 15IMH05H i5-10300H, GeForce RTX 2060 Mobile | Asus TUF Gaming A15 FA506IV-HN172 R7 4800H, GeForce RTX 2060 Mobile | Schenker XMG Core 15 GK5CP6V i7-9750H, GeForce GTX 1660 Ti Mobile | Average of class Gaming | |
|---|---|---|---|---|---|---|---|---|
| Heat | -0% | -17% | -3% | 8% | 9% | 2% | -0% | |
| Maximum Upper Side * (°C) | 53 | 53 -0% | 52 2% | 53 -0% | 46.3 13% | 42.9 19% | 48 9% | 45.1 ? 15% |
| Maximum Bottom * (°C) | 53 | 55 -4% | 52.2 2% | 57.6 -9% | 44.4 16% | 49.9 6% | 59 -11% | 48.1 ? 9% |
| Idle Upper Side * (°C) | 29 | 28 3% | 38 -31% | 27.4 6% | 28.1 3% | 27.8 4% | 27 7% | 31 ? -7% |
| Idle Bottom * (°C) | 29 | 29 -0% | 40.4 -39% | 31 -7% | 29.4 -1% | 27 7% | 28 3% | 34.2 ? -18% |
* ... smaller is better
Speakers
MSI GS66 Stealth 10SE-045 audio analysis
(+) | speakers can play relatively loud (86 dB)
Bass 100 - 315 Hz
(-) | nearly no bass - on average 30.3% lower than median
(±) | linearity of bass is average (8.1% delta to prev. frequency)
Mids 400 - 2000 Hz
(±) | higher mids - on average 7.7% higher than median
(±) | linearity of mids is average (7.3% delta to prev. frequency)
Highs 2 - 16 kHz
(+) | balanced highs - only 3.3% away from median
(+) | highs are linear (6% delta to prev. frequency)
Overall 100 - 16.000 Hz
(±) | linearity of overall sound is average (24% difference to median)
Compared to same class
» 86% of all tested devices in this class were better, 4% similar, 9% worse
» The best had a delta of 6%, average was 18%, worst was 132%
Compared to all devices tested
» 72% of all tested devices were better, 6% similar, 22% worse
» The best had a delta of 4%, average was 23%, worst was 134%
Energy management - The MSI laptop delivers solid battery life
Energy consumption
We register a maximum power consumption of 31 watts in idle usage - quite a lot for a laptop with Optimus enabled. The competition partly consumes considerably less energy. Furthermore, the stress test lets the demand increase up to 186 watts. We measure an average power consumption of 146 watts during our The Witcher 3 test. The power adapter's rated output is 180 watts.
| Off / Standby | |
| Idle | |
| Load |
|
Key:
min: | |
| MSI GS66 Stealth 10SE-045 i7-10750H, GeForce RTX 2060 Mobile | MSI GS66 Stealth 10SFS i9-10980HK, GeForce RTX 2070 Super Max-Q | Razer Blade 15 GTX 1660 Ti i7-9750H, GeForce GTX 1660 Ti Mobile | Dell G5 15 SE 5505 P89F R7 4800H, Radeon RX 5600M | Lenovo Legion 5 15IMH05H i5-10300H, GeForce RTX 2060 Mobile | Asus TUF Gaming A15 FA506IV-HN172 R7 4800H, GeForce RTX 2060 Mobile | Schenker XMG Core 15 GK5CP6V i7-9750H, GeForce GTX 1660 Ti Mobile | Average of class Gaming | |
|---|---|---|---|---|---|---|---|---|
| Power Consumption | -16% | -41% | 22% | 33% | 22% | 15% | -23% | |
| Idle Minimum * (Watt) | 7 | 13 -86% | 18.7 -167% | 6.5 7% | 3.2 54% | 5.4 23% | 9 -29% | 13.1 ? -87% |
| Idle Average * (Watt) | 18 | 16 11% | 30.7 -71% | 10.6 41% | 8.3 54% | 10 44% | 12 33% | 19 ? -6% |
| Idle Maximum * (Watt) | 31 | 27 13% | 33.9 -9% | 11 65% | 8.7 72% | 10.5 66% | 18 42% | 24.6 ? 21% |
| Load Average * (Watt) | 107 | 109 -2% | 93.4 13% | 84.1 21% | 82 23% | 135 -26% | 86 20% | 111.3 ? -4% |
| Witcher 3 ultra * (Watt) | 146 | 155 -6% | 158.9 -9% | 152.9 -5% | 151 -3% | 144 1% | 126 14% | |
| Load Maximum * (Watt) | 186 | 236 -27% | 195.3 -5% | 180.4 3% | 195 -5% | 147 21% | 173 7% | 260 ? -40% |
* ... smaller is better
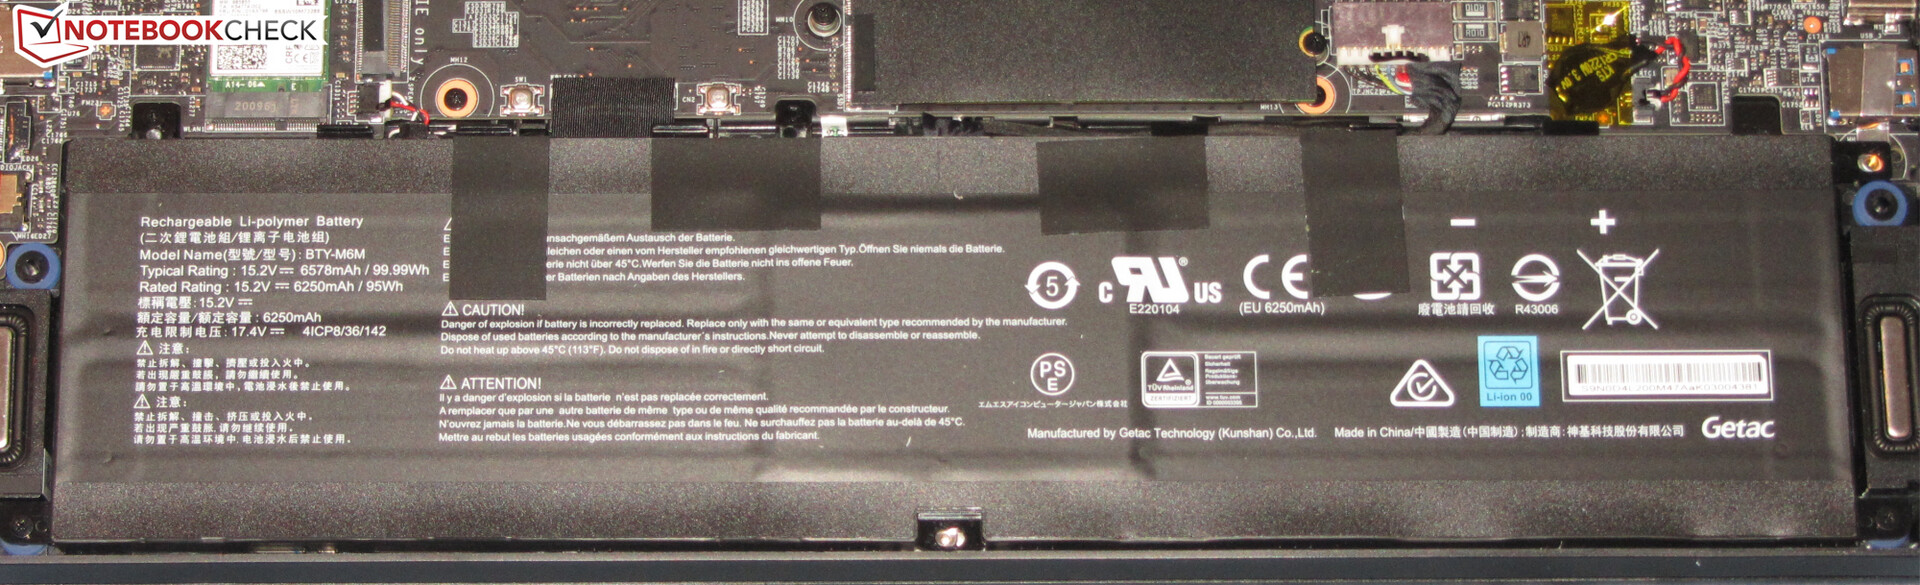
Battery life
The gaming laptop achieves a runtime of 6:21 h in our practical WLAN test (accessing websites using a script). In addition, the 15.6-incher completes our video test after 6:35 h. We let the short film Big Buck Bunny (H.264 encoding, 1920x1080 pixels) run in a continuous loop here. Test conditions: The energy-saving functions and the wireless modules (only during the video test) are deactivated, and the display brightness is regulated to about 150 cd/m².
| MSI GS66 Stealth 10SE-045 i7-10750H, GeForce RTX 2060 Mobile, 99.9 Wh | Dell G5 15 SE 5505 P89F R7 4800H, Radeon RX 5600M, 51 Wh | Lenovo Legion 5 15IMH05H i5-10300H, GeForce RTX 2060 Mobile, 60 Wh | Asus TUF Gaming A15 FA506IV-HN172 R7 4800H, GeForce RTX 2060 Mobile, 48 Wh | Schenker XMG Core 15 GK5CP6V i7-9750H, GeForce GTX 1660 Ti Mobile, 46 Wh | MSI GS66 10SGS i7-10750H, GeForce RTX 2080 Super Max-Q, 99.99 Wh | MSI GS66 Stealth 10SFS i9-10980HK, GeForce RTX 2070 Super Max-Q, 99.99 Wh | Razer Blade 15 GTX 1660 Ti i7-9750H, GeForce GTX 1660 Ti Mobile, 65 Wh | Average of class Gaming | |
|---|---|---|---|---|---|---|---|---|---|
| Battery runtime | 15% | 32% | 12% | -39% | 18% | 10% | -14% | 12% | |
| Reader / Idle (h) | 9 | 11.2 24% | 14.1 57% | 9.8 9% | 6.1 -32% | 10.2 13% | 8.4 -7% | 7.84 ? -13% | |
| H.264 (h) | 6.6 | 9.2 39% | 5.4 -18% | 8.27 ? 25% | |||||
| WiFi v1.3 (h) | 6.4 | 6.2 -3% | 7.2 13% | 6.2 -3% | 3.6 -44% | 6.9 8% | 6.1 -5% | 5.5 -14% | 7.08 ? 11% |
| Load (h) | 1.2 | 1.5 25% | 1.4 17% | 1.9 58% | 0.7 -42% | 1.6 33% | 1.7 42% | 1.496 ? 25% |
Pros
Cons
Verdict
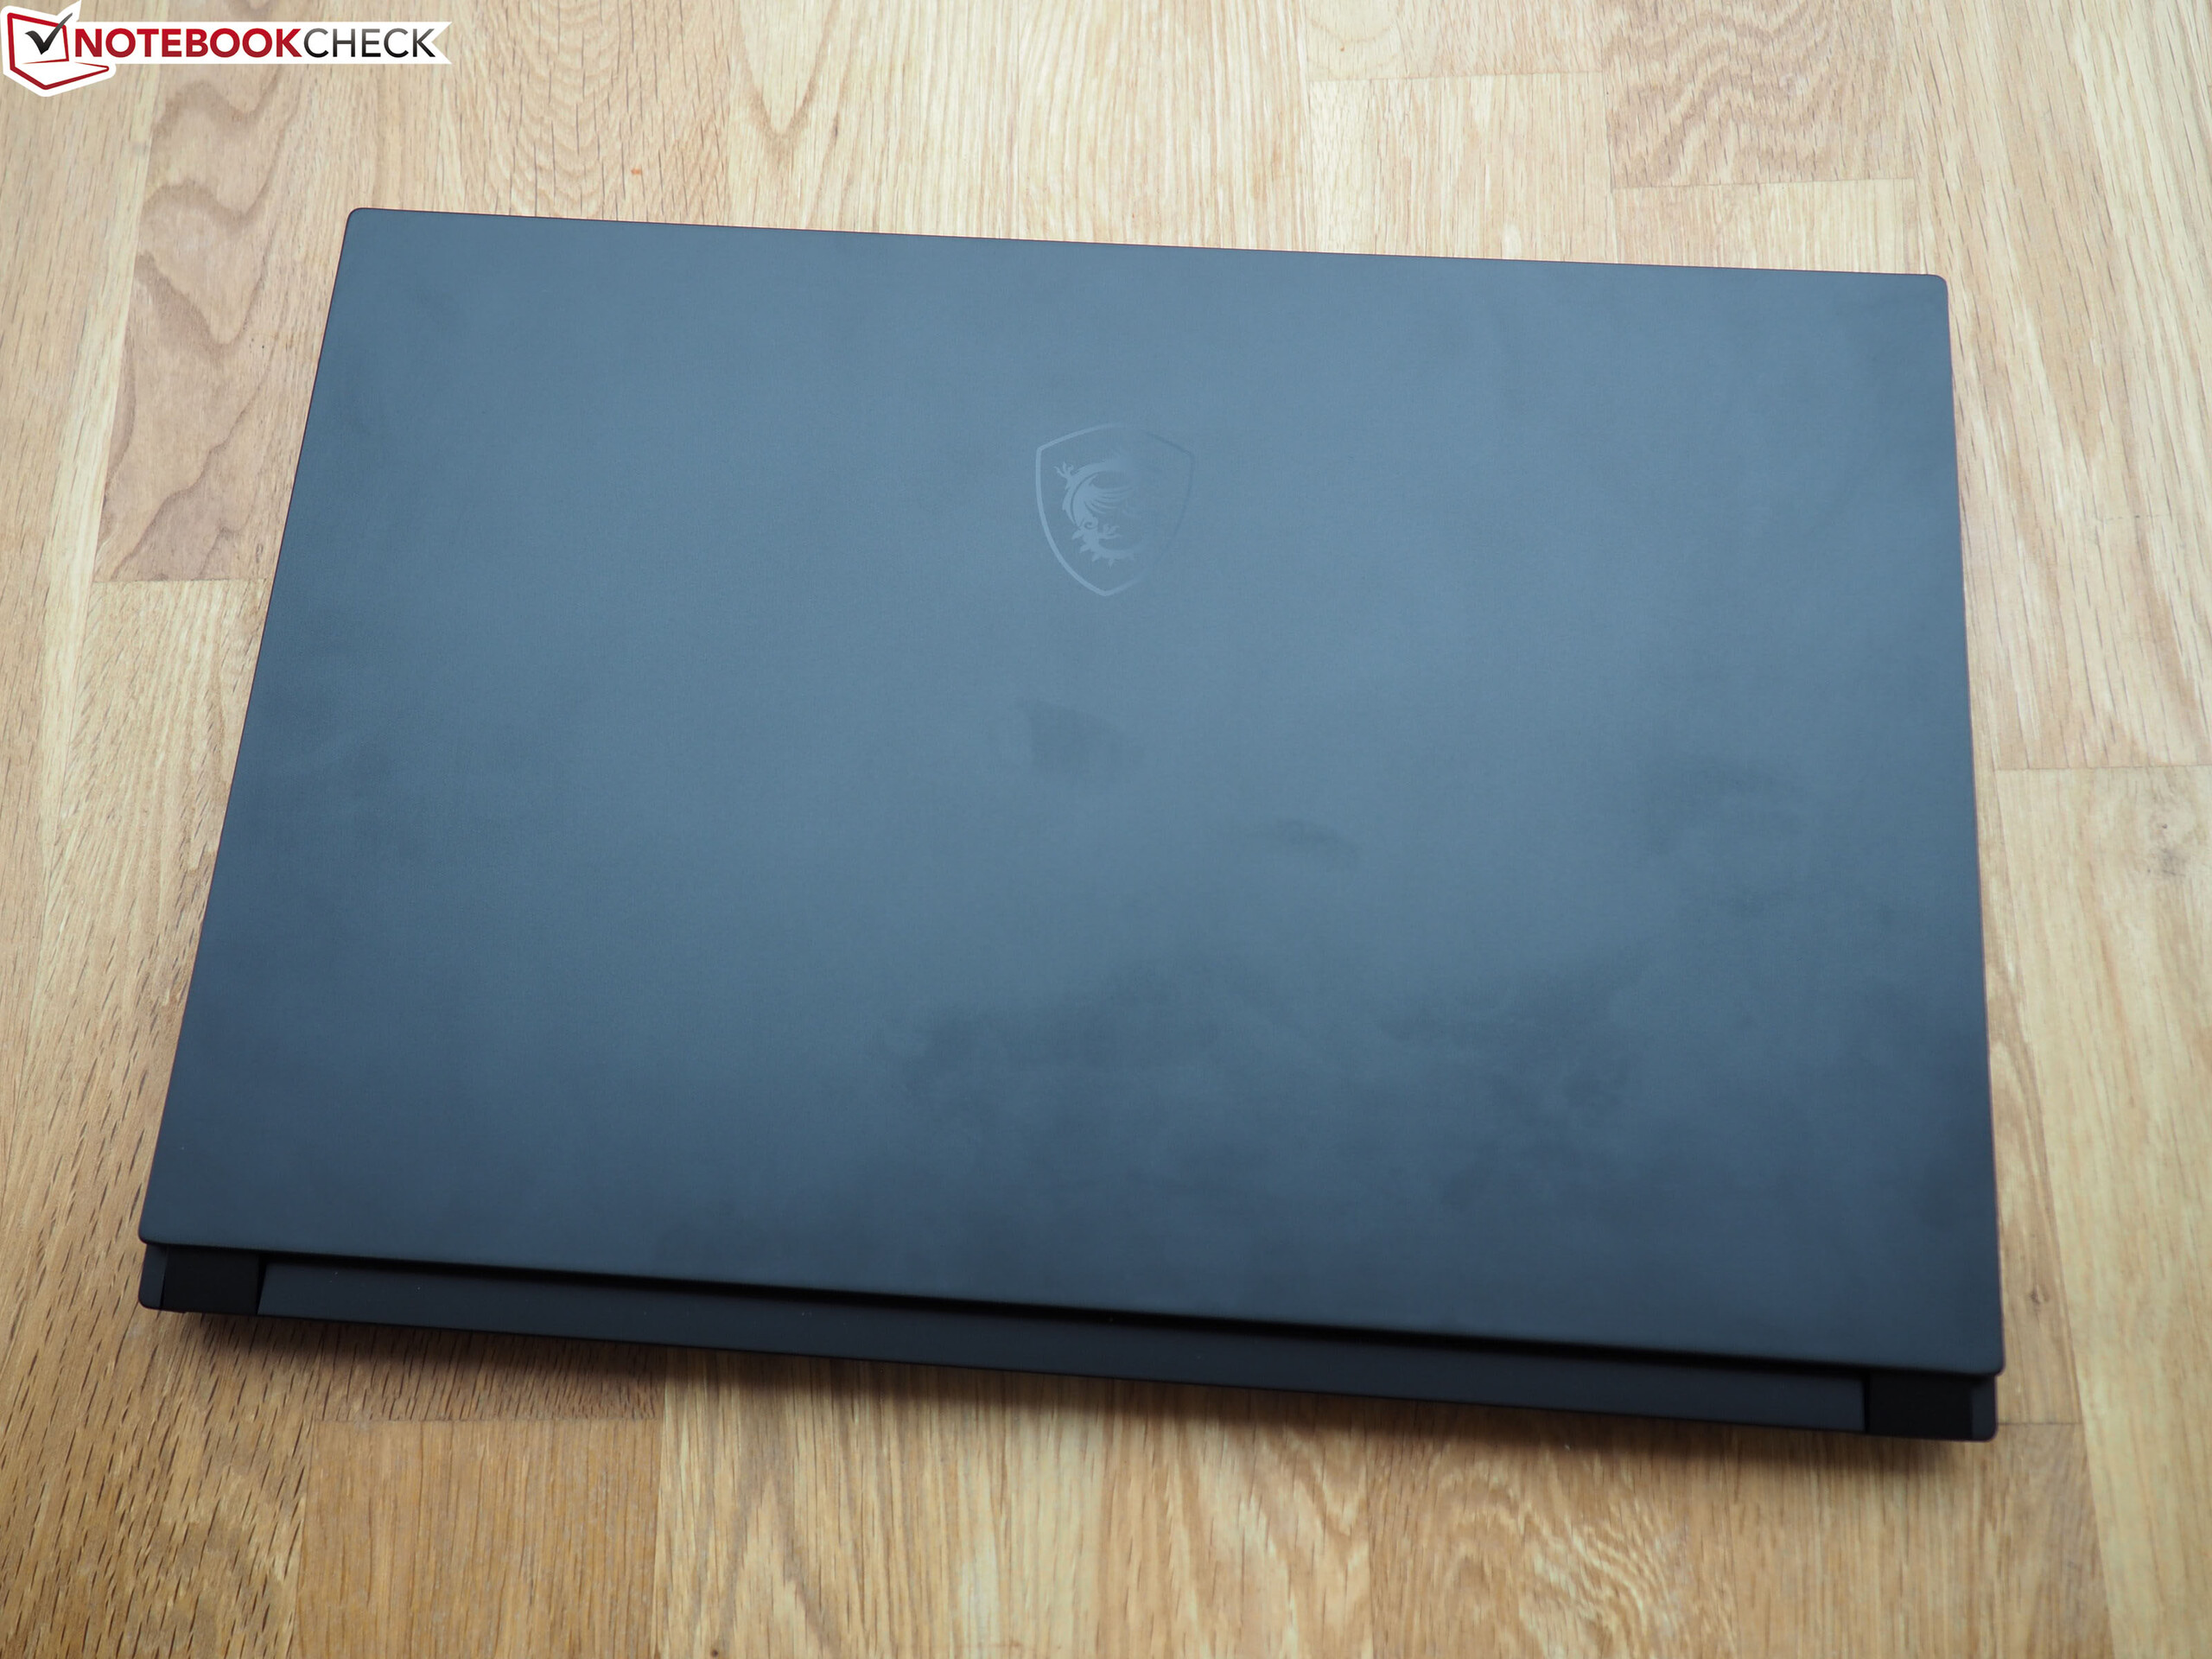
The MSI GS66 features a classy, compact metal case that has proven to be very susceptible to fingerprints. Inside the chassis is a Core i7-10750H processor and a GeForce RTX 2060 graphics core, which together bring all modern computer games smoothly onto the matte Full HD display. High to maximum quality settings can always be selected.
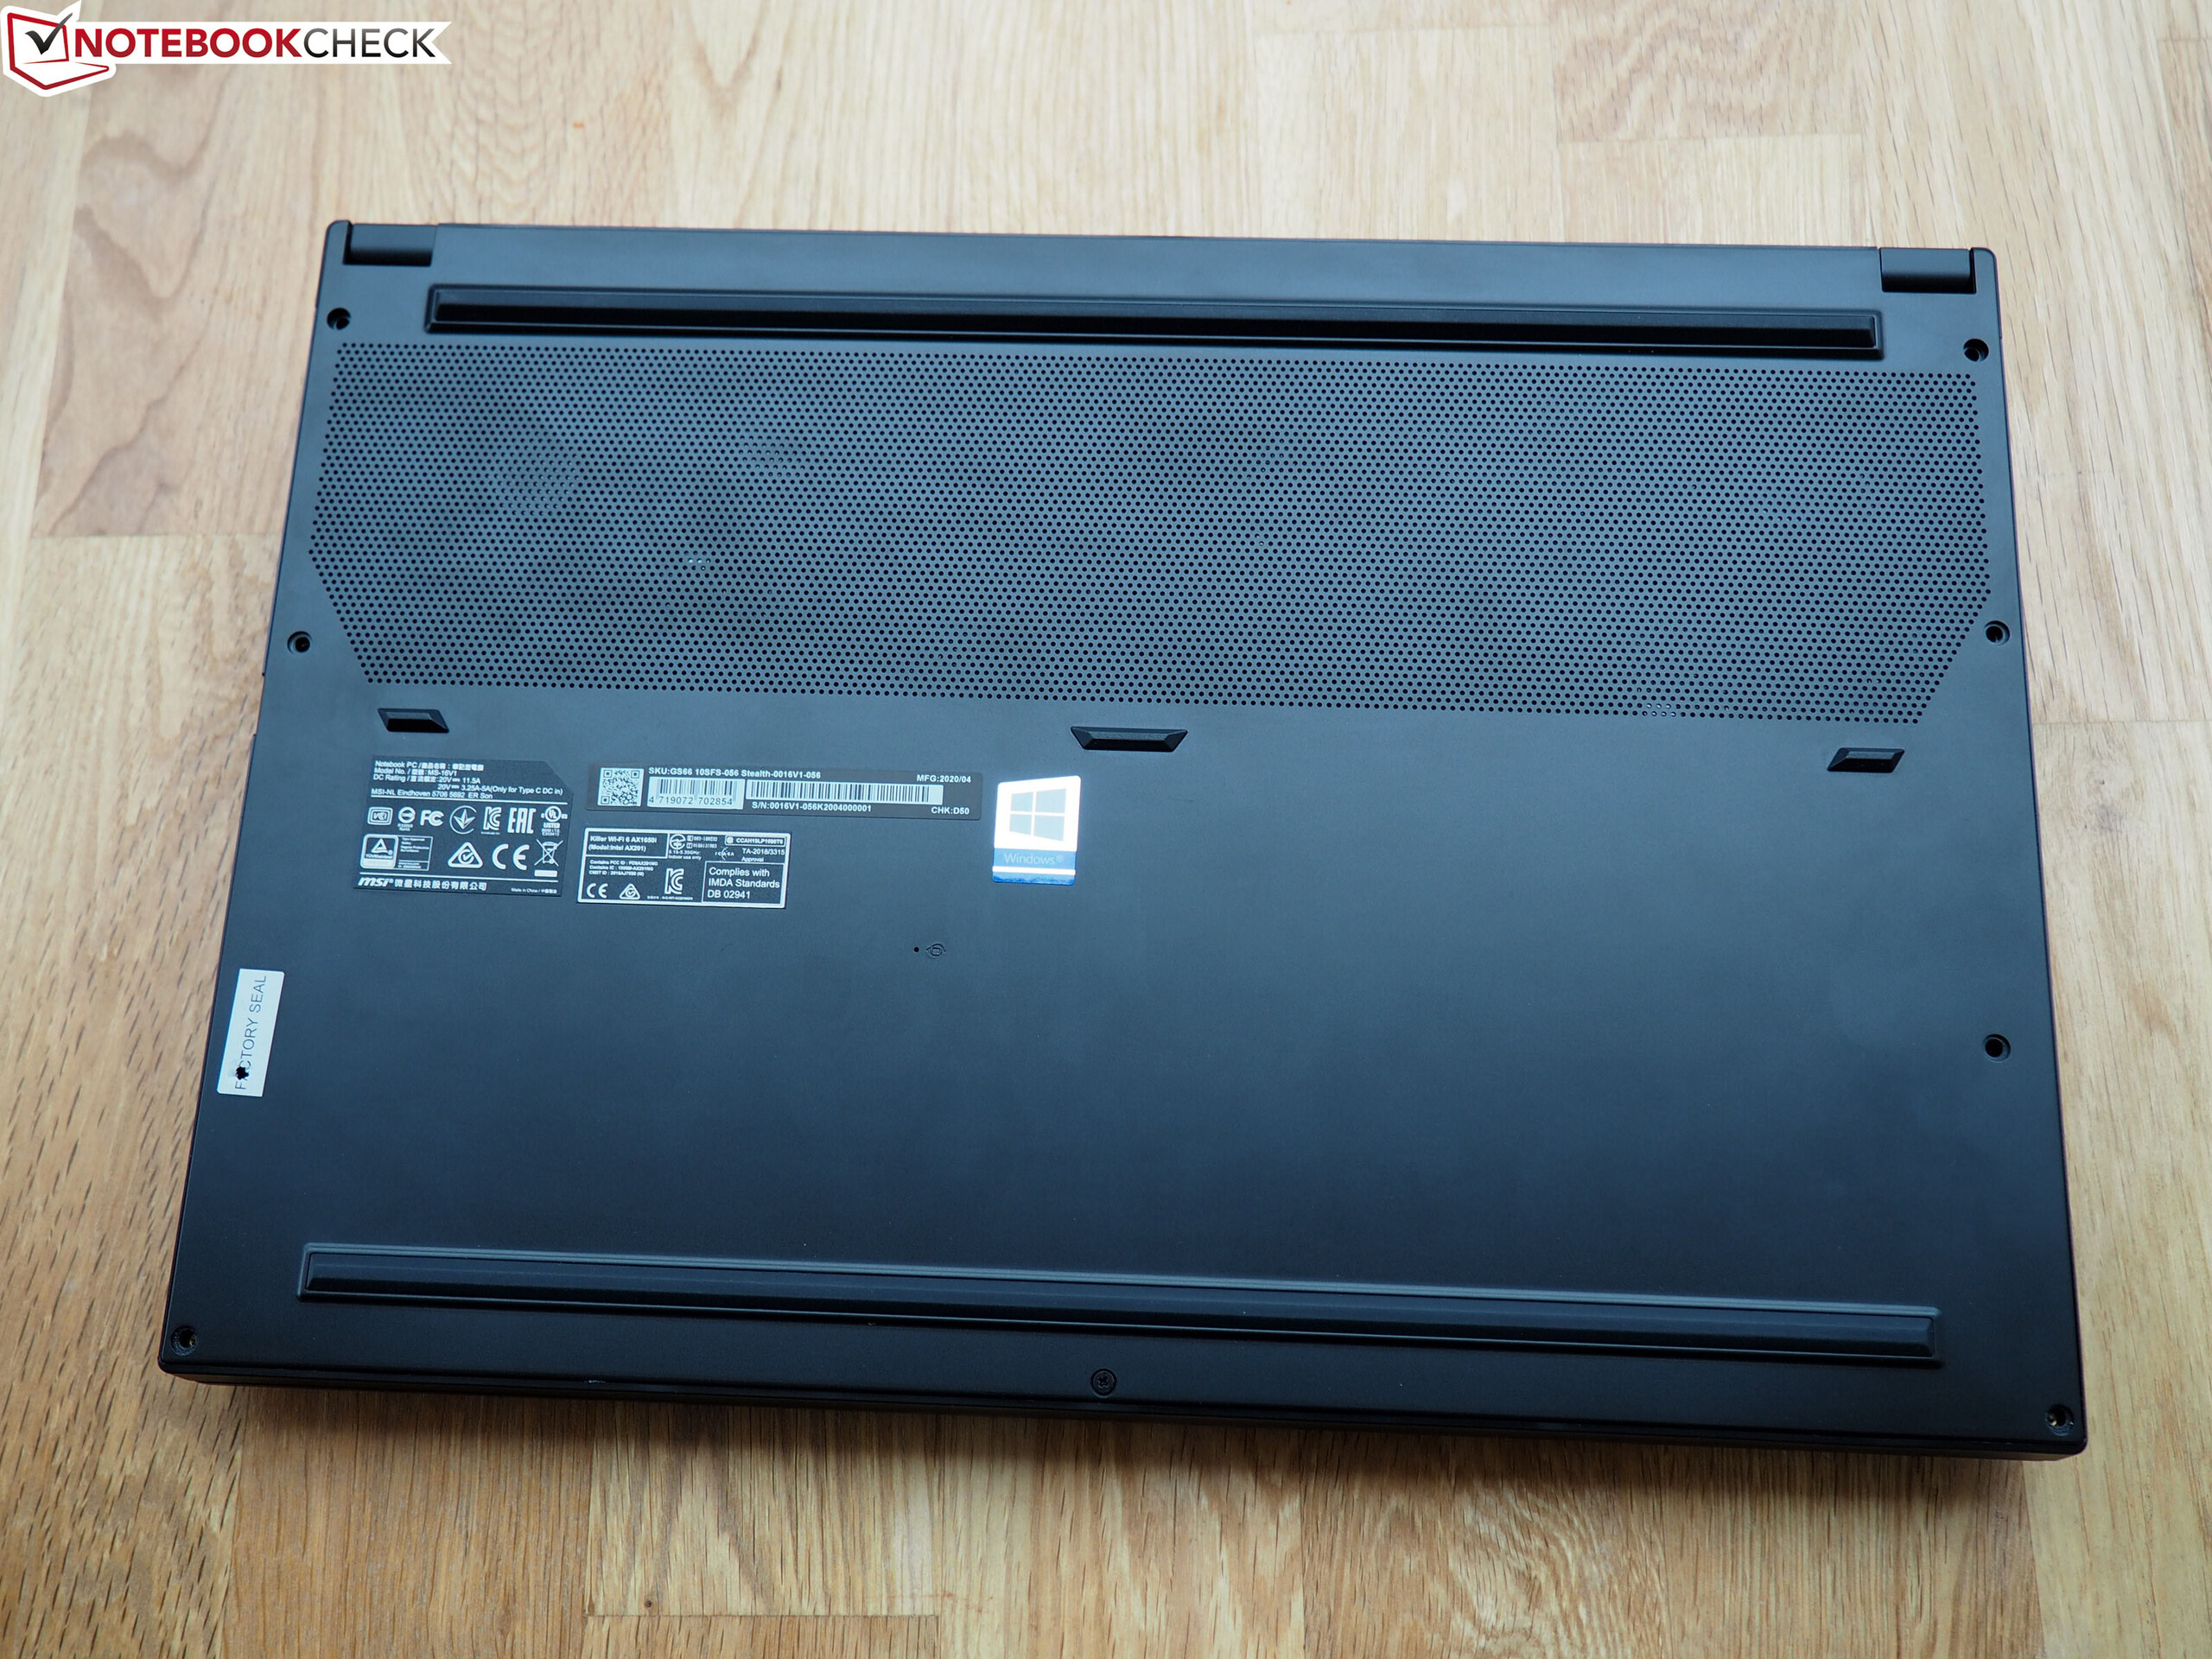
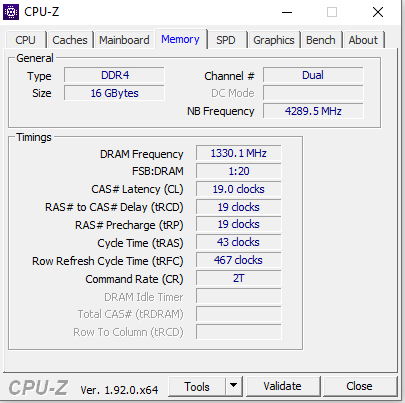
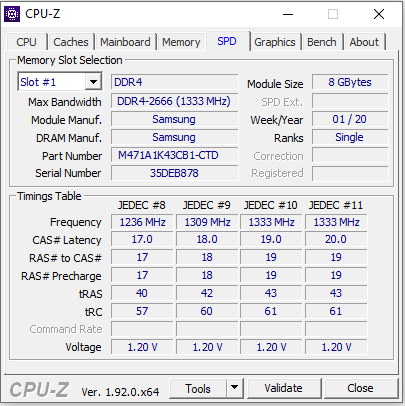
The hardware has access to 16 GB of RAM (dual-channel mode). An upgrade to up to 64 GB would be possible. A fast 1 TB NVMe SSD provides the necessary storage space. Should the storage space run out, the laptop could be expanded with a second NVMe SSD. Maintenance/upgrade measures require the removal of the case's bottom cover.
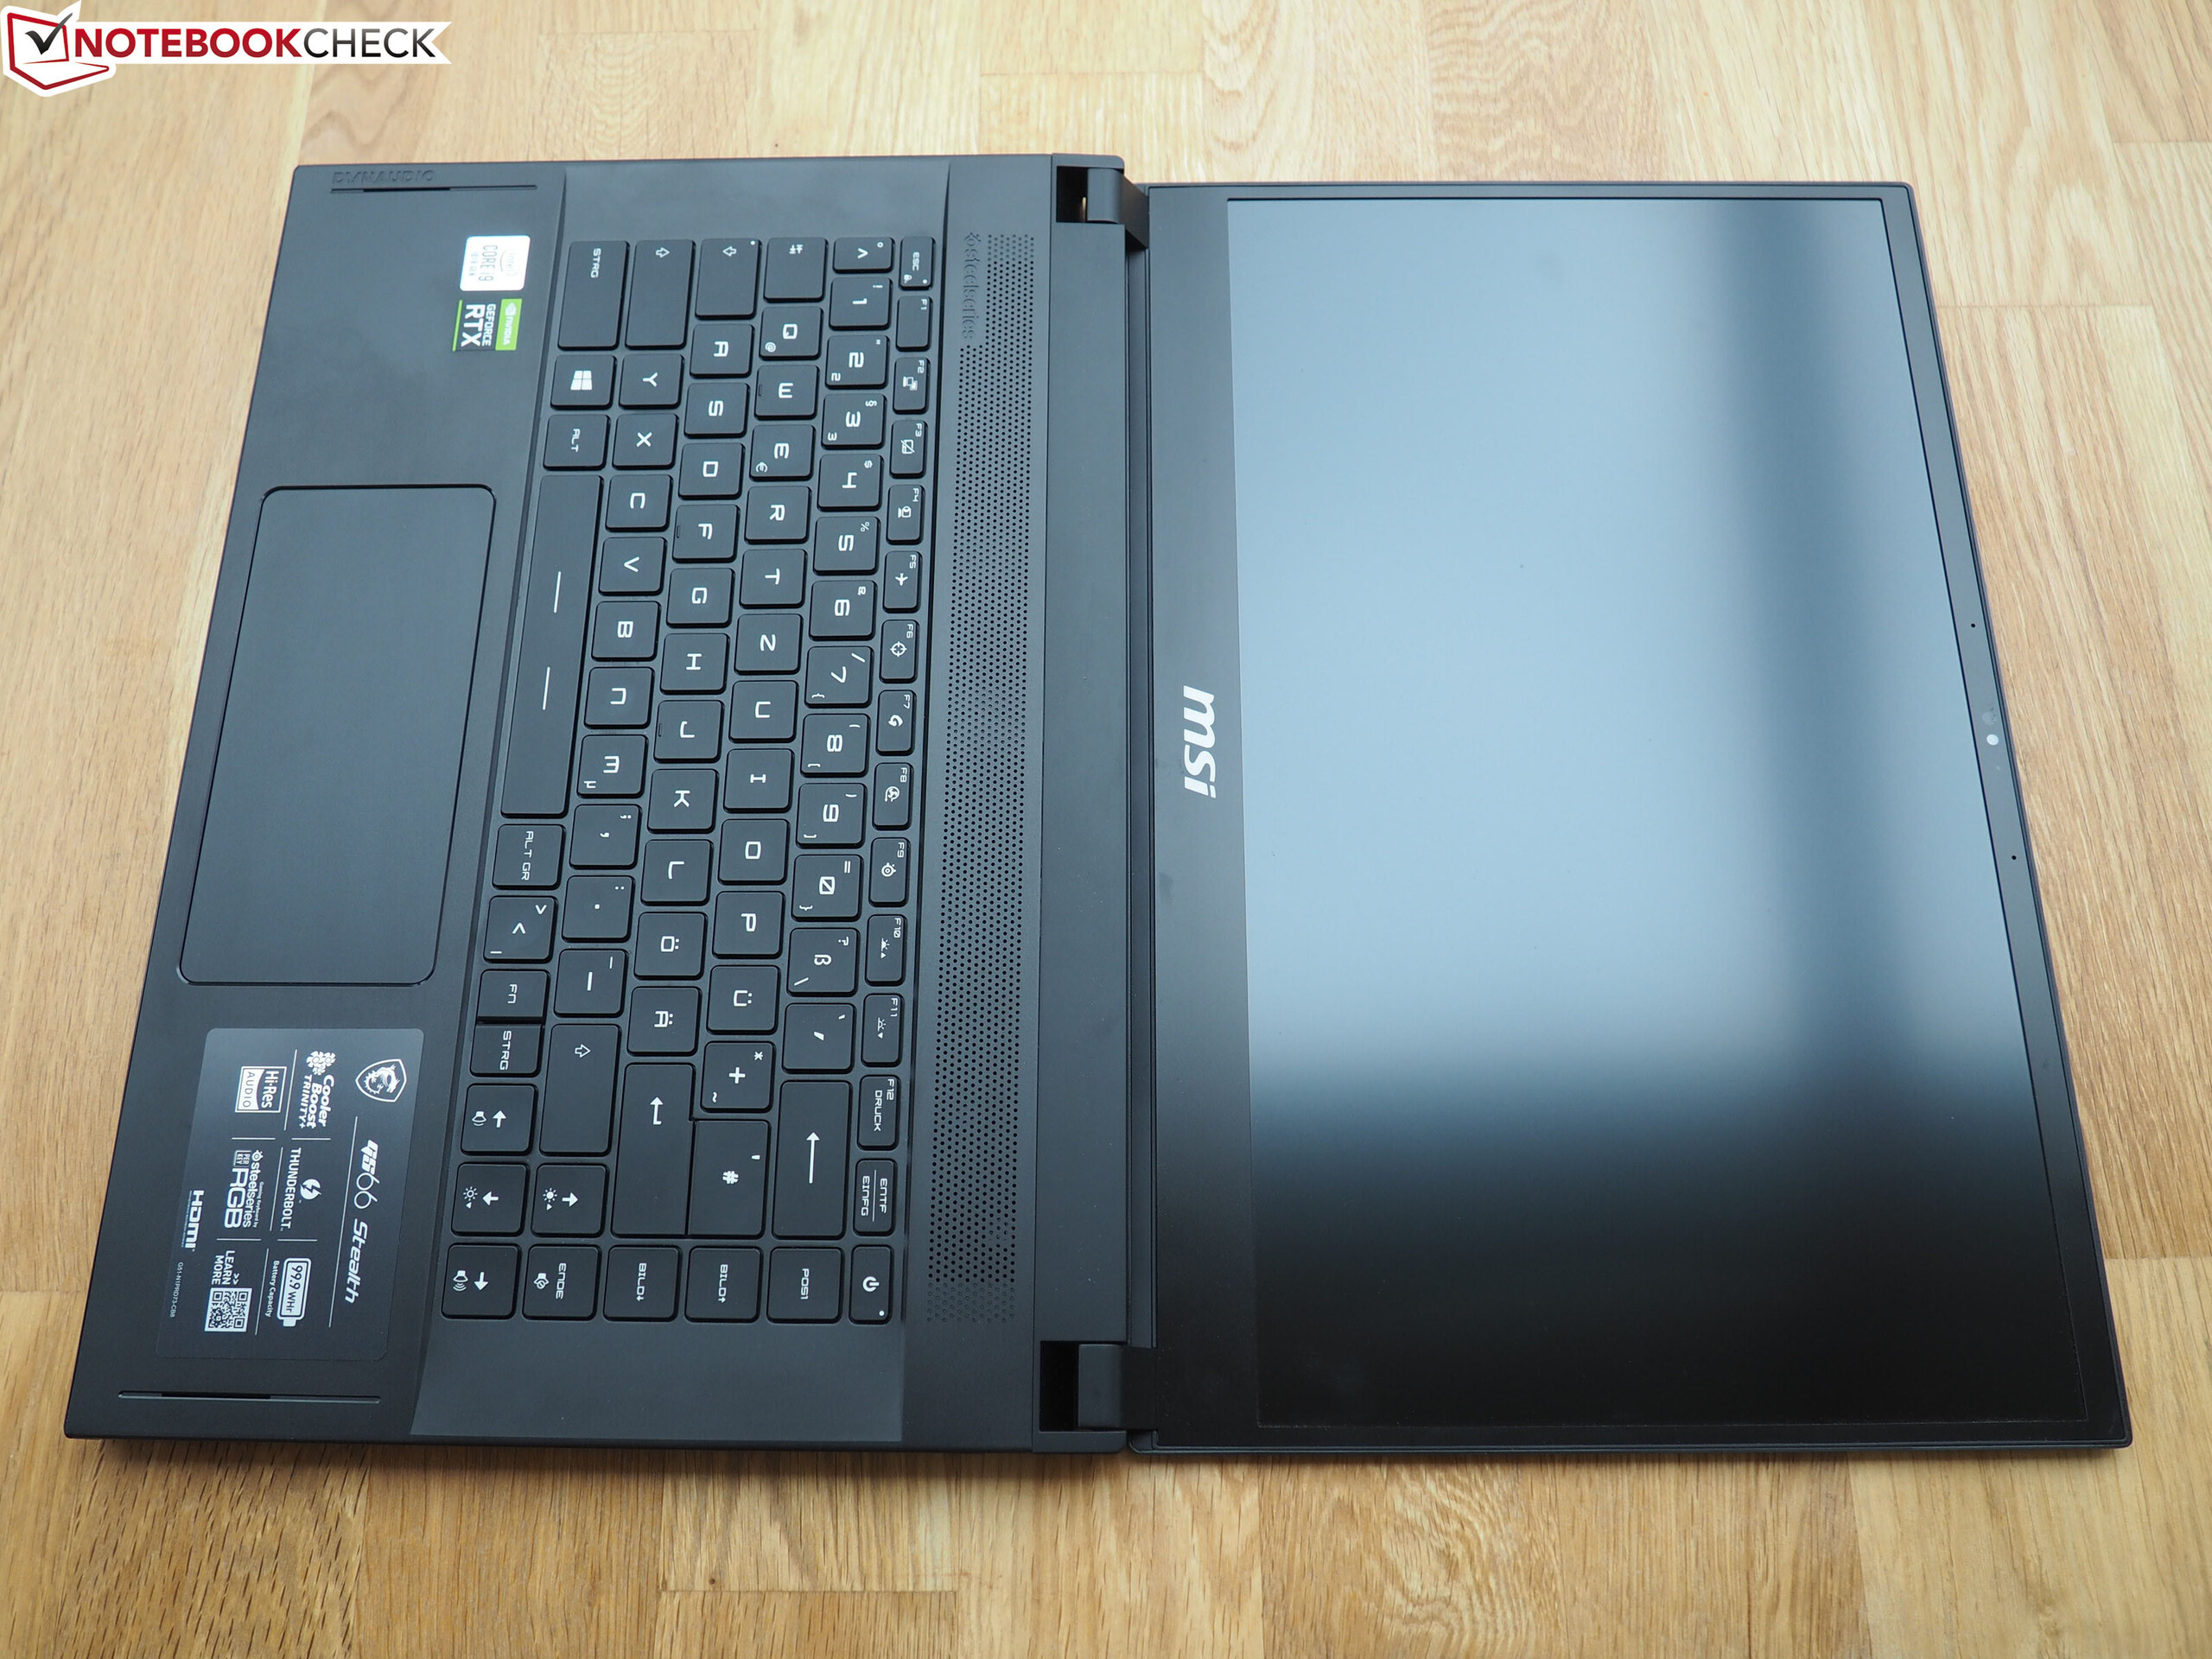
The laptop's highlight is the 240 Hz IPS display.
The display scores points with quick response times, stable viewing angles, good contrast, and great color reproduction. On the other hand, the maximum brightness is low. A laptop in this price range should offer more in this regard.
In principle, the battery runtimes are more than adequate for a gaming laptop. But if you view them in relation to the battery capacity (99.9 Wh), things look different. Competitors get similar or partly better runtimes from batteries that only have half the capacity of the GS66's battery. The high energy consumption in idle usage and under low load is noticeable here.
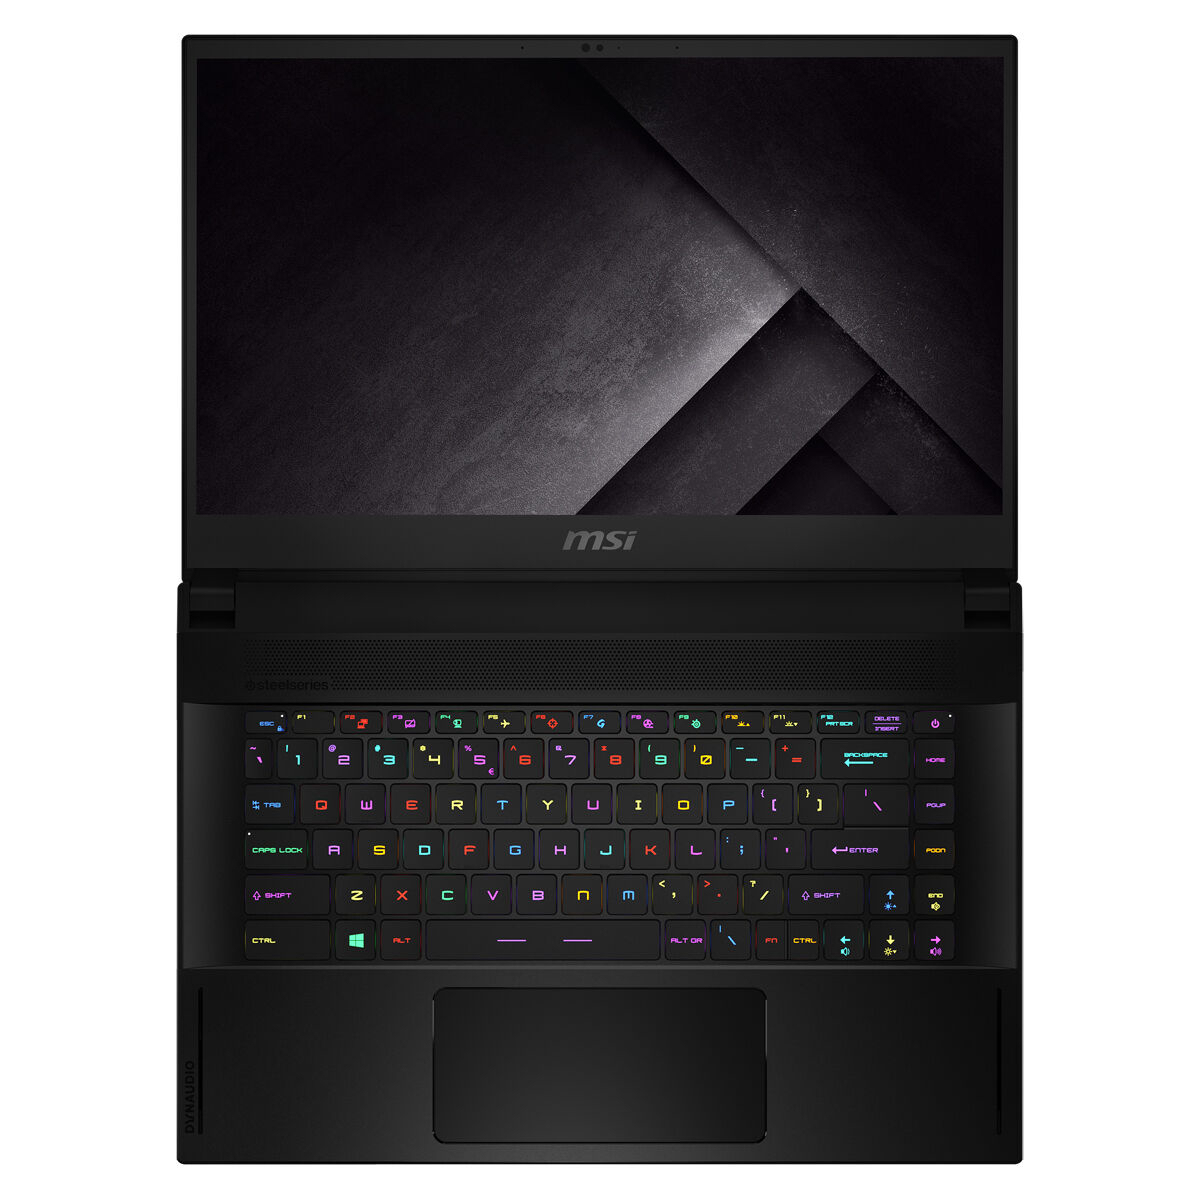
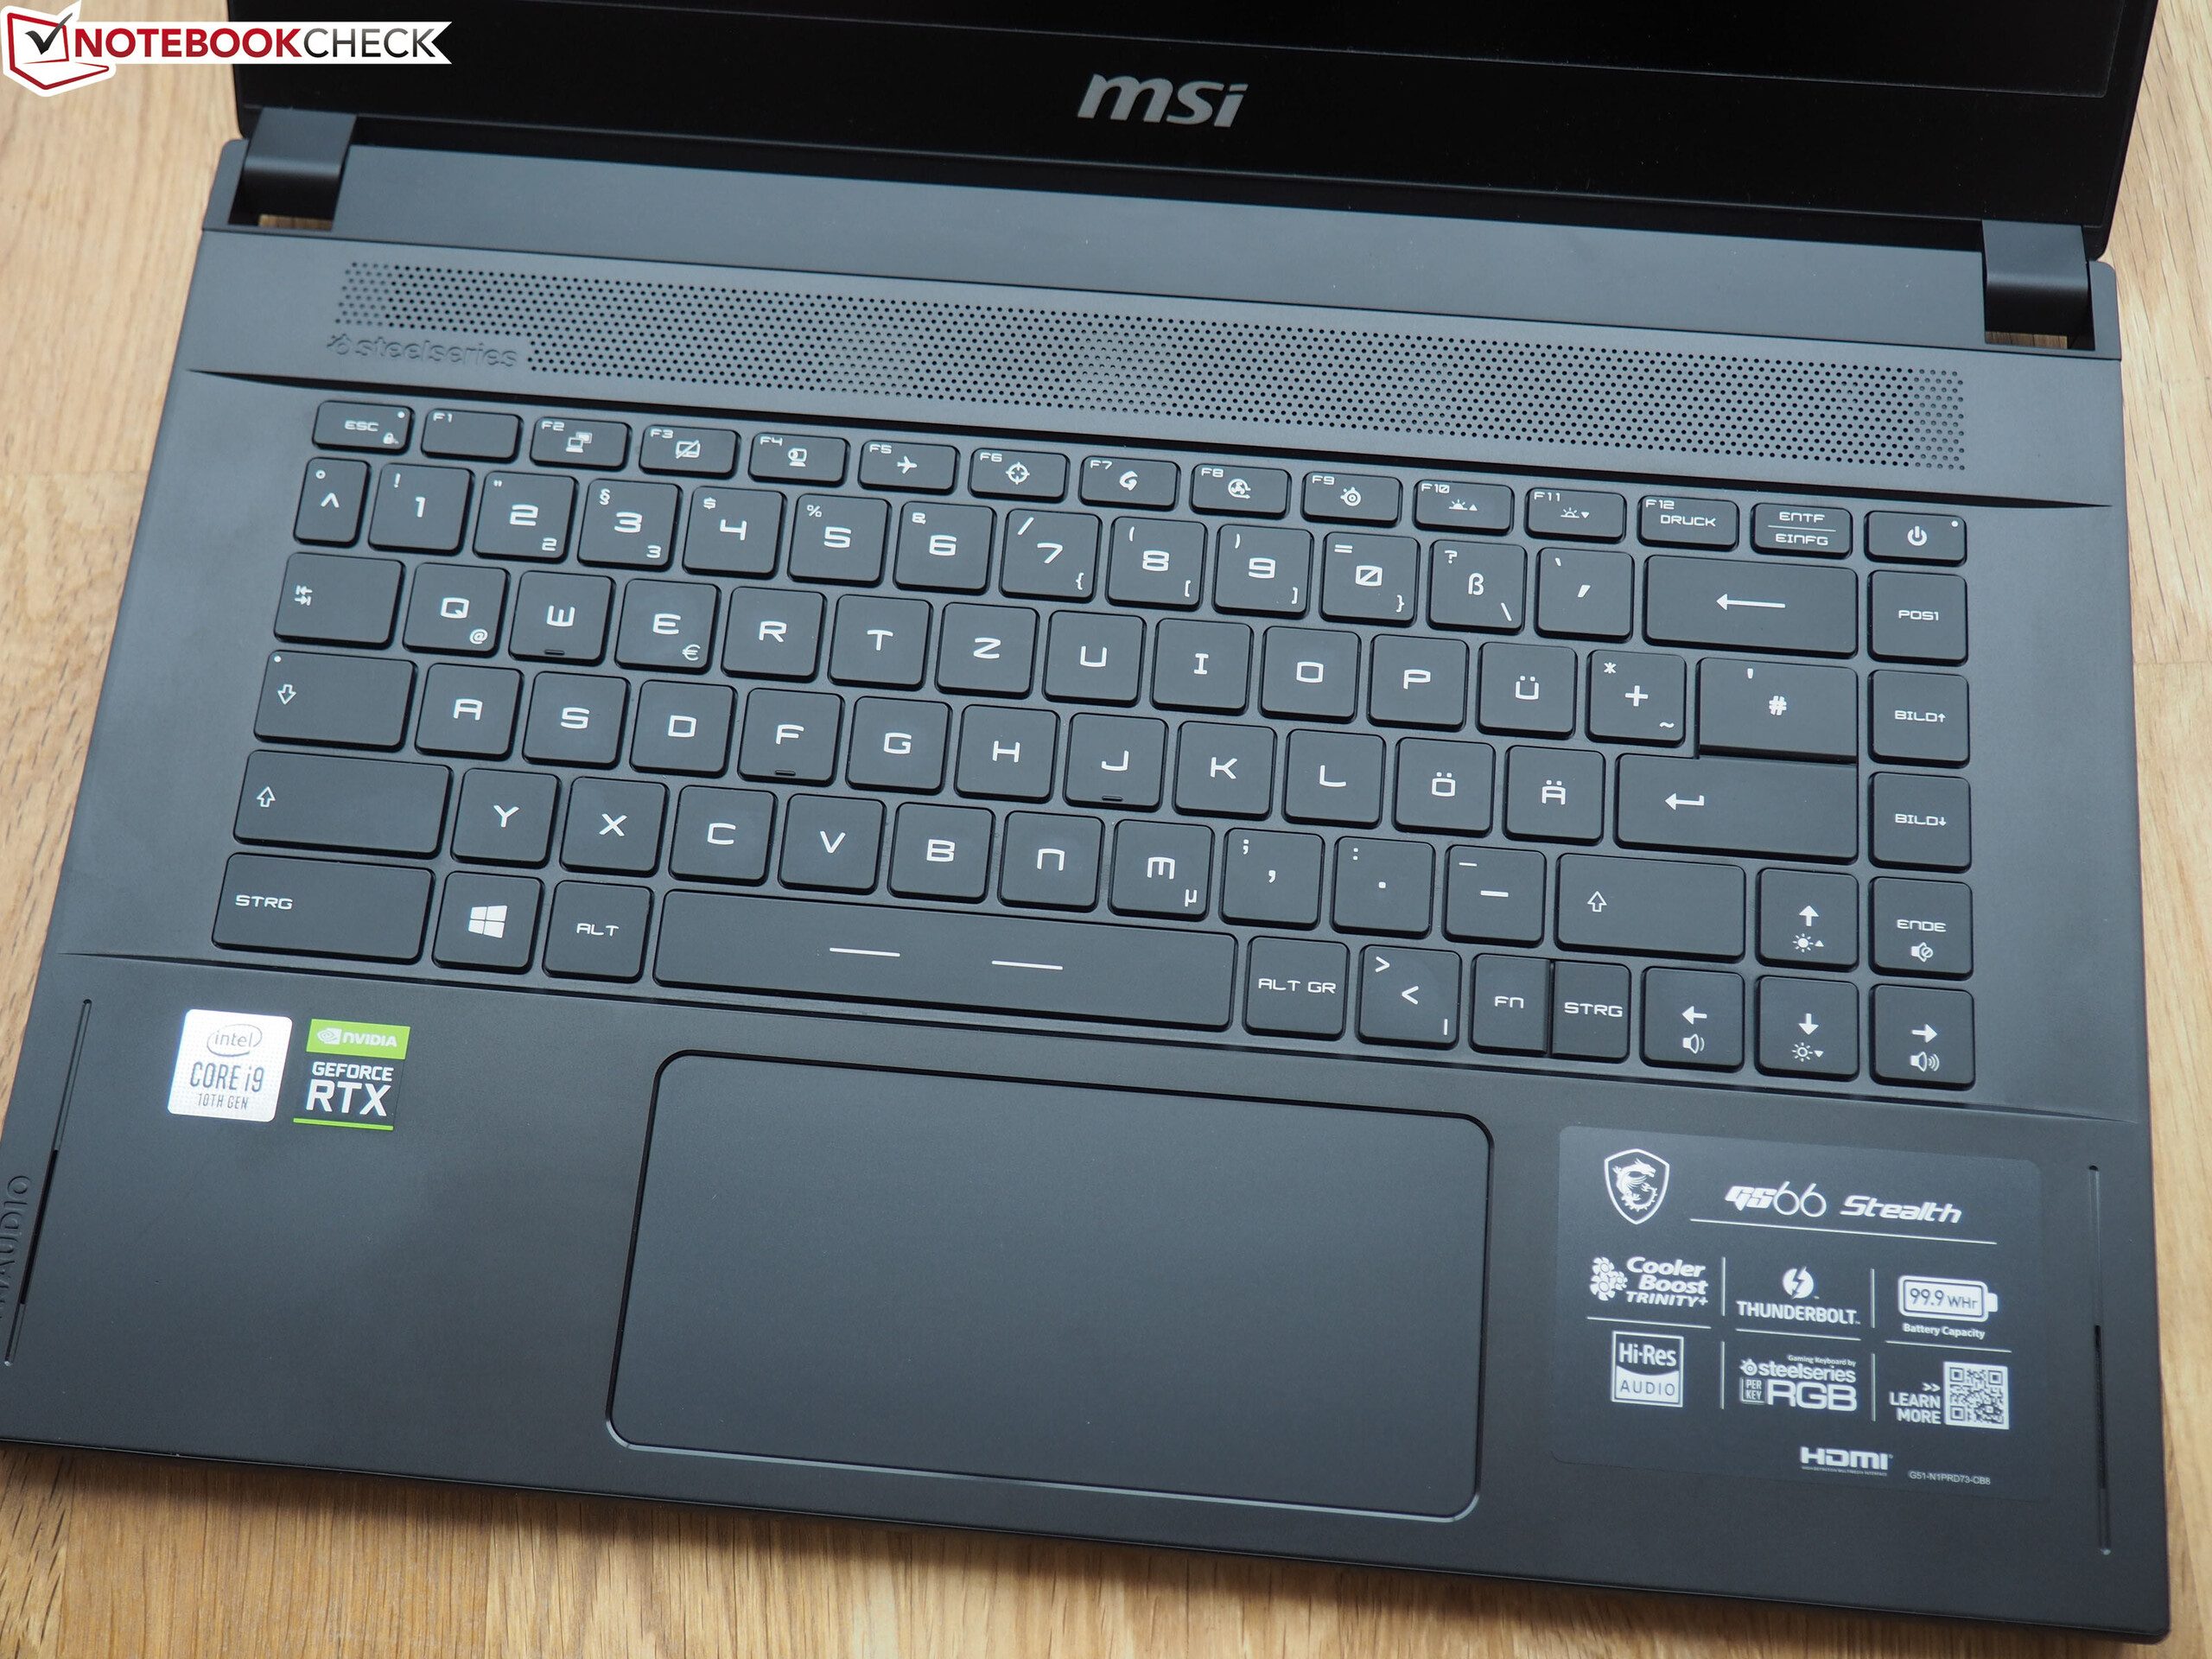
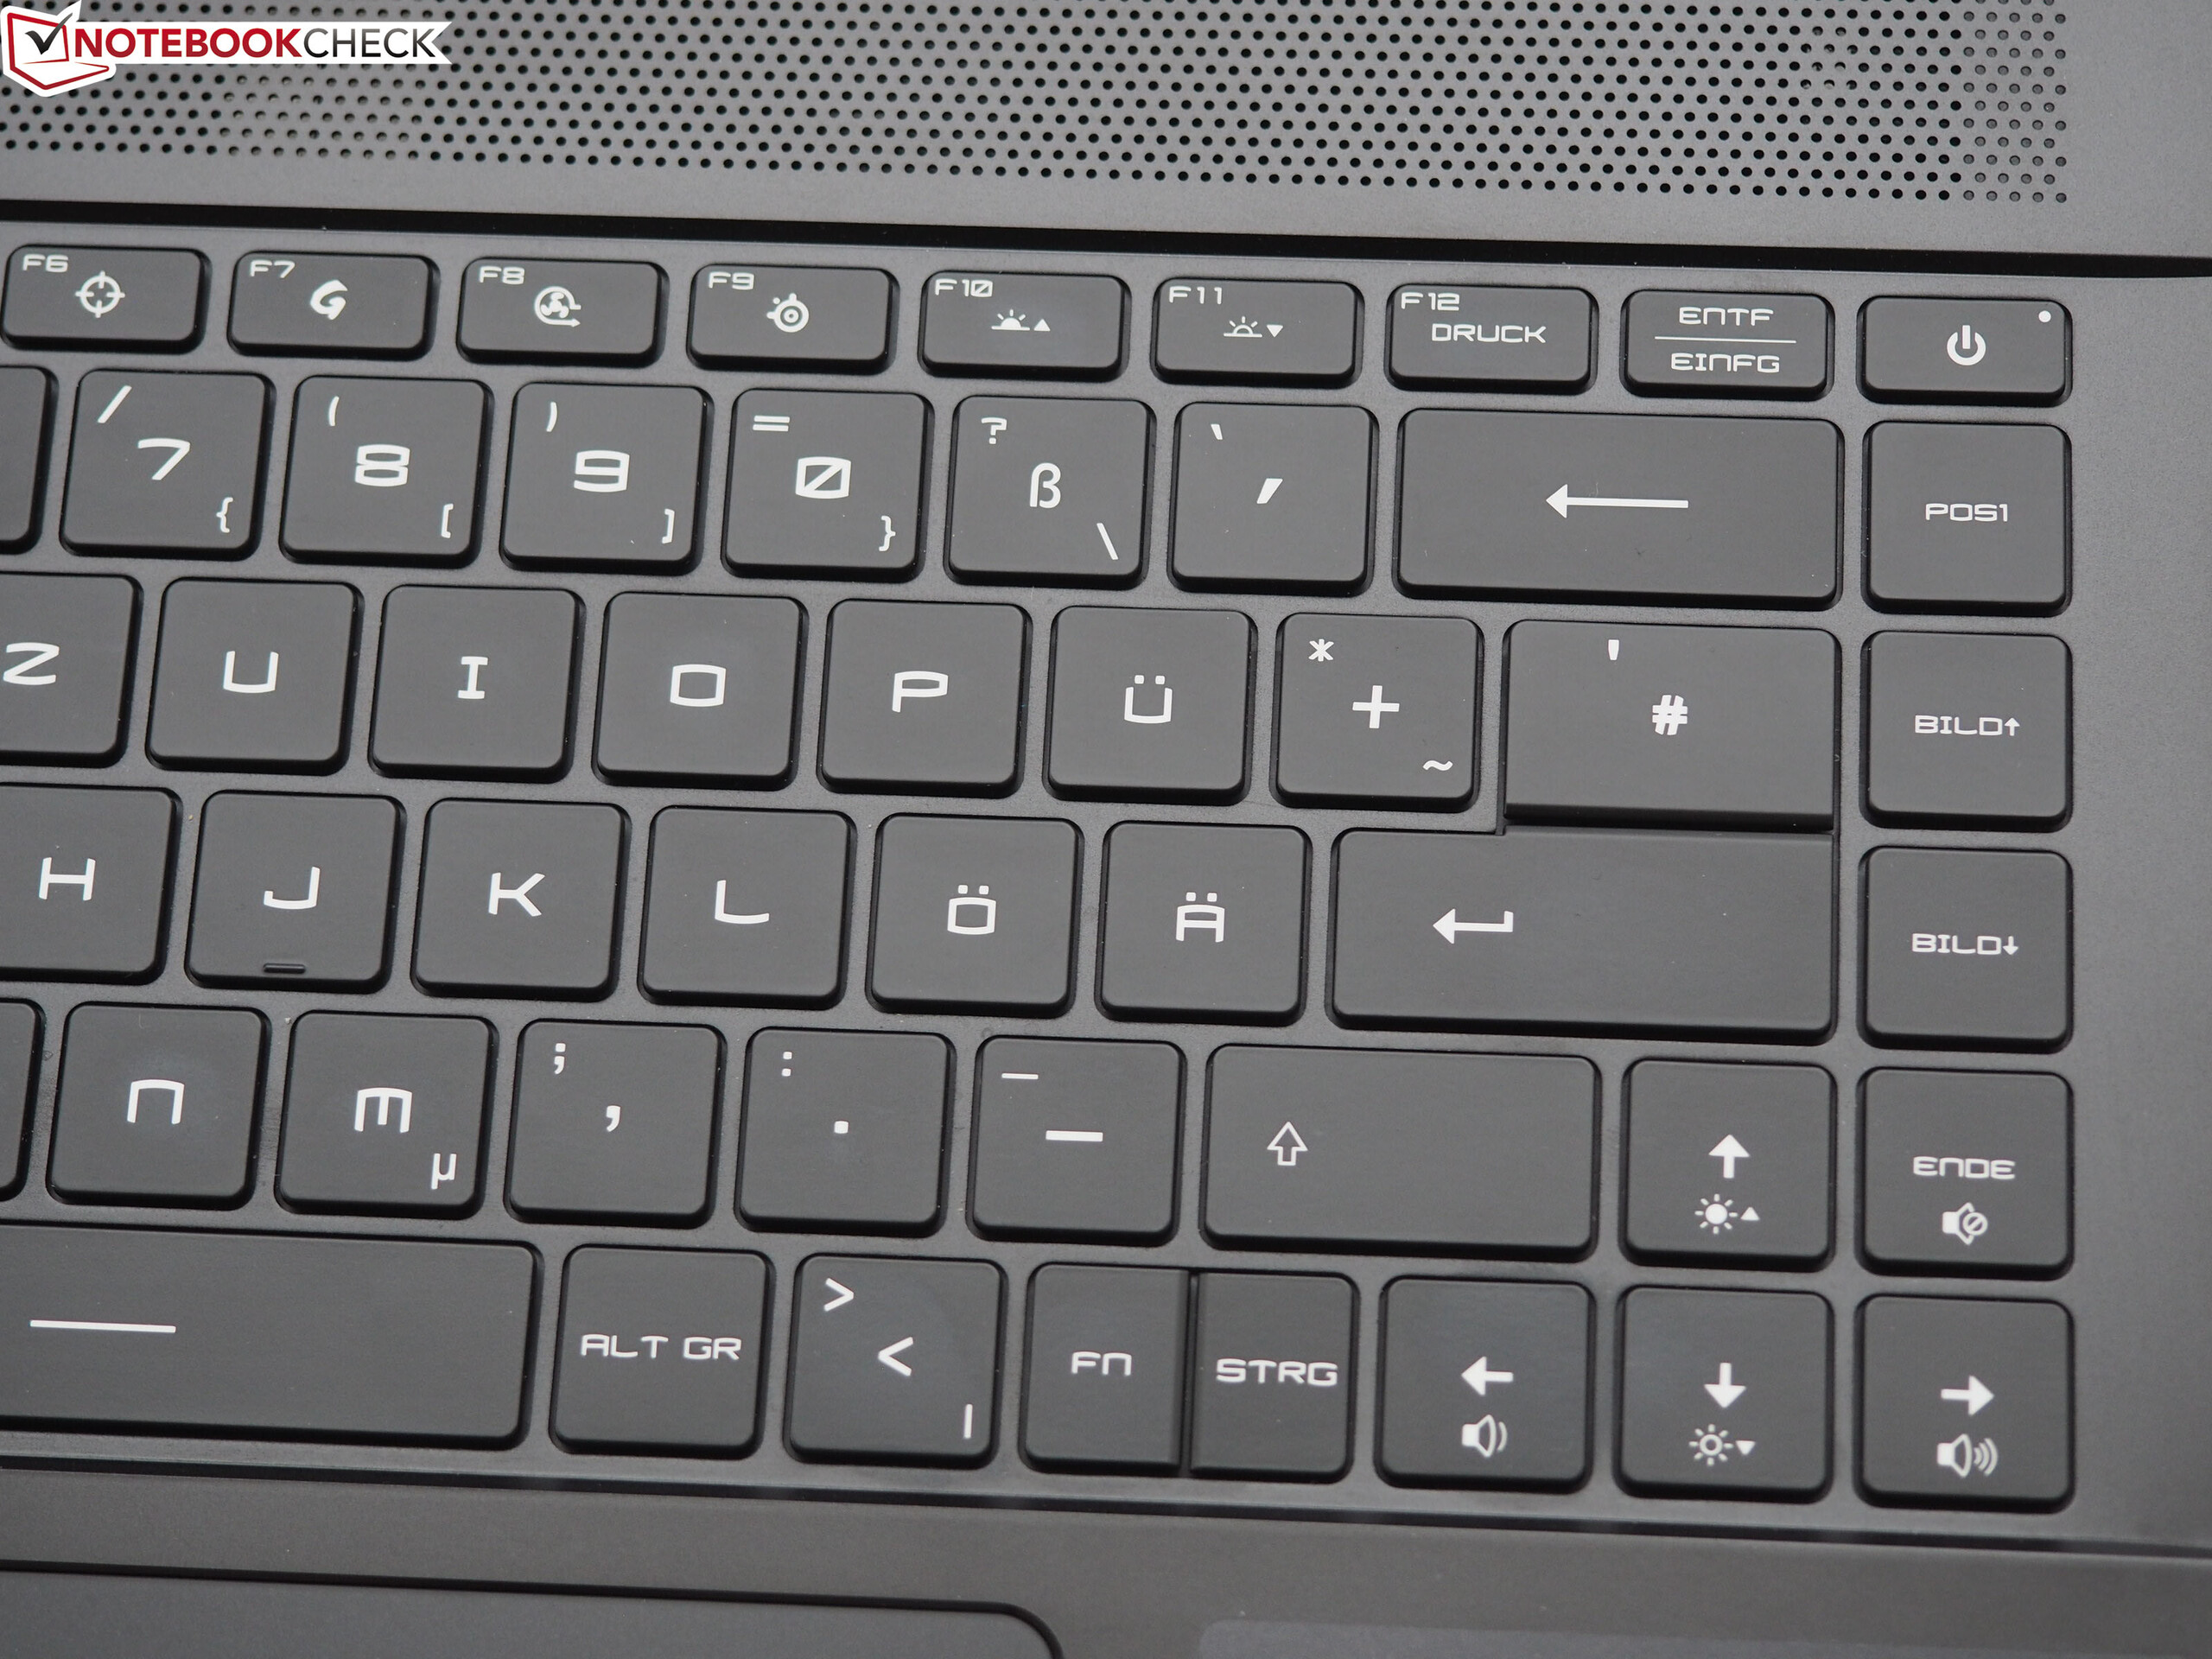
The chiclet keyboard (RGB lighting) has proven to be suitable for everyday use. Moreover, the well-rounded port configuration includes, among other things, a Thunderbolt 3 port that allows the connection of extensive docking solutions or an external GPU. The battery can't be charged via the Thunderbolt 3 or the USB Type-C 3.2 Gen 2 ports. We plugged in a 45-watt power adapter but couldn't trigger a charging process with it.
MSI GS66 Stealth 10SE-045
- 08/05/2020 v7 (old)
Sascha Mölck
Price comparison

