Lenovo IdeaPad S740-15IRH Laptop Review: Best and Priciest IdeaPad Yet
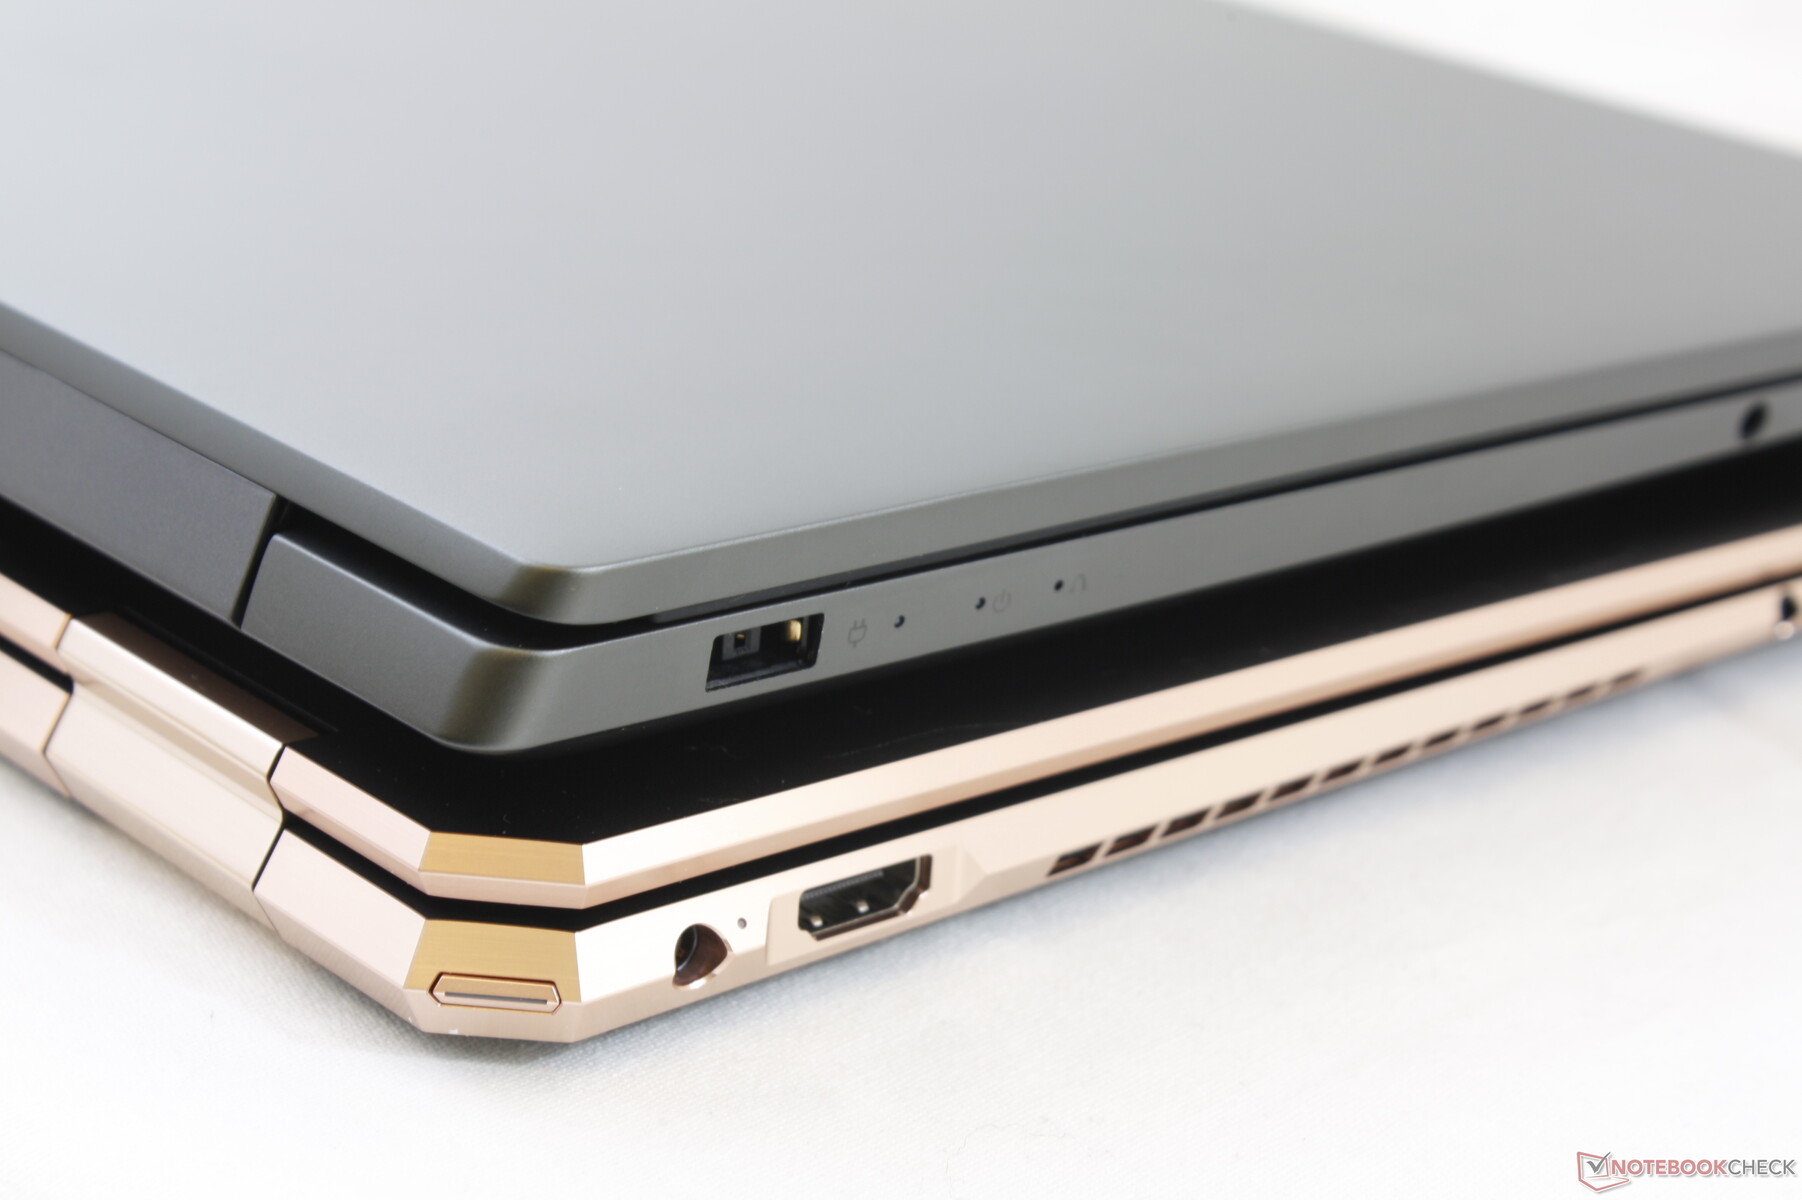
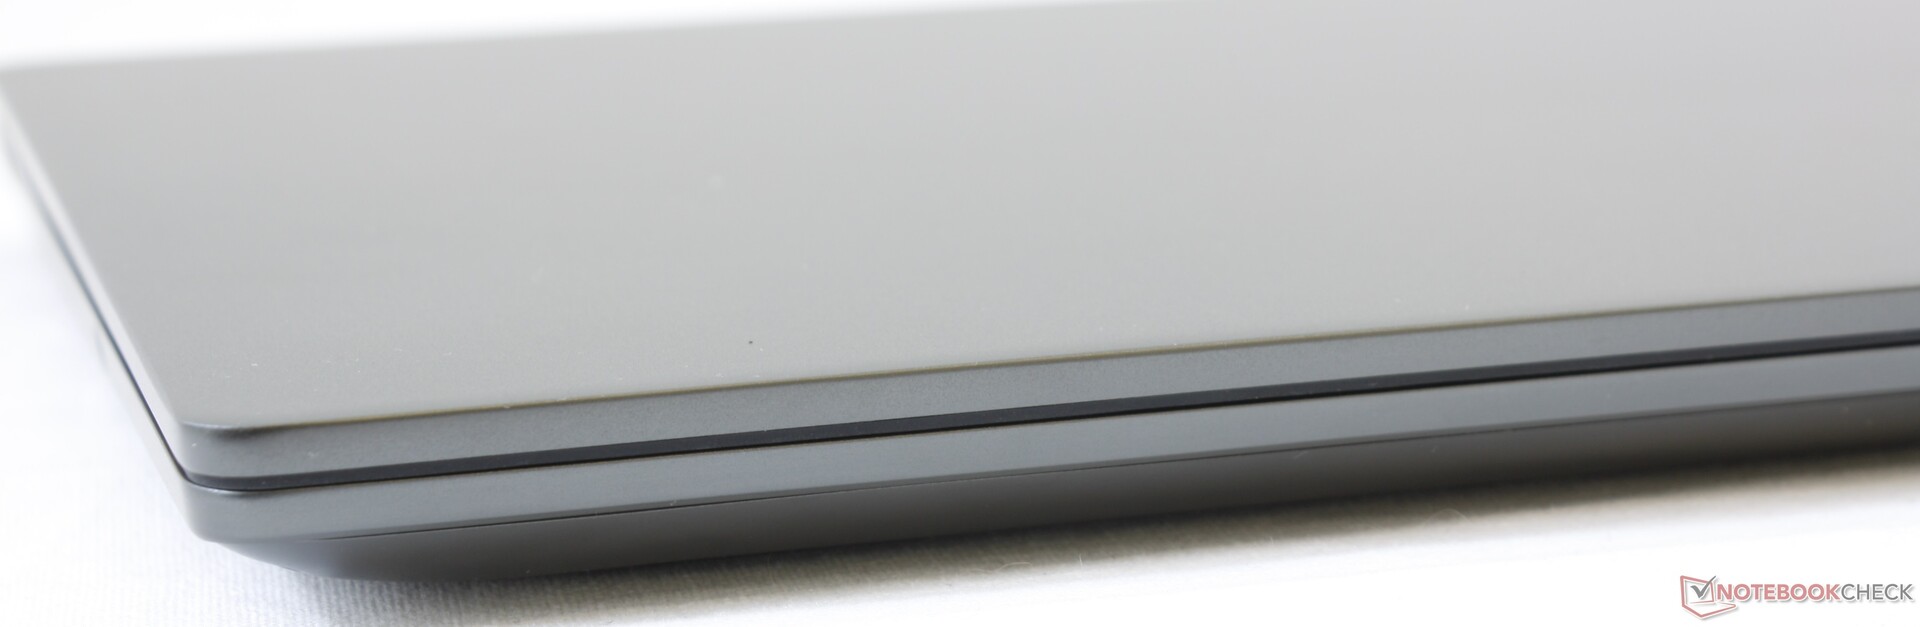
 vs. 2019 HP Spectre x360 15 (bottom). Note the significant difference in length")
Traditionally, the IdeaPad series has been home to Lenovo's more affordable PCs designed for users on tighter budgets in contrast to the higher-end Yoga series. The IdeaPad 330S-15 and IdeaPad S540-15, for example, each retail for well under $1000 USD. The IdeaPad S740-15 we have here today throws this all out the window by offering both a powerful Core i7 H-series CPU and GeForce GTX graphics for a comparable level of performance to most high-end multimedia laptops. Even the Yoga C940 15, which is Lenovo's higher-end alternative to the IdeaPad S740-15, comes with the same CPU and GPU.
The Lenovo IdeaPad Y740-15IRH SKU in this review can be found online for a hefty $1300 to $1500 USD with just 256 GB to 512 GB of SSD storage. It succeeds the smaller 2018 IdeaPad 730S 13. The system competes with other high-performance 15.6-inch multimedia or office laptops like the Asus ZenBook Pro 15, HP Spectre x360 15, Dell XPS 15, MSI Prestige 15, and Lenovo's own Yoga C740 15.
More Lenovo reviews:
Rating | Date | Model | Weight | Height | Size | Resolution | Price |
|---|---|---|---|---|---|---|---|
| 85.5 % v7 (old) | 01 / 2020 | Lenovo IdeaPad S740-15IRH i7-9750H, GeForce GTX 1650 Max-Q | 1.9 kg | 19.95 mm | 15.60" | 3840x2160 | |
| 87.8 % v7 (old) | 08 / 2019 | Dell XPS 15 7590 9980HK GTX 1650 i9-9980HK, GeForce GTX 1650 Mobile | 2 kg | 17 mm | 15.60" | 3840x2160 | |
| 85 % v7 (old) | 01 / 2020 | HP Spectre X360 15-5ZV31AV i7-10510U, GeForce MX250 | 2.1 kg | 19.3 mm | 15.60" | 3840x2160 | |
| 82.7 % v6 (old) | 07 / 2018 | Lenovo Yoga 730-15IKB i5-8550U, GeForce GTX 1050 Mobile | 1.9 kg | 17.2 mm | 15.60" | 3840x2160 | |
| 83.1 % v7 (old) | 09 / 2019 | Asus ZenBook 15 UX534FT-DB77 i7-8565U, GeForce GTX 1650 Max-Q | 1.7 kg | 18.9 mm | 15.60" | 1920x1080 |
Case
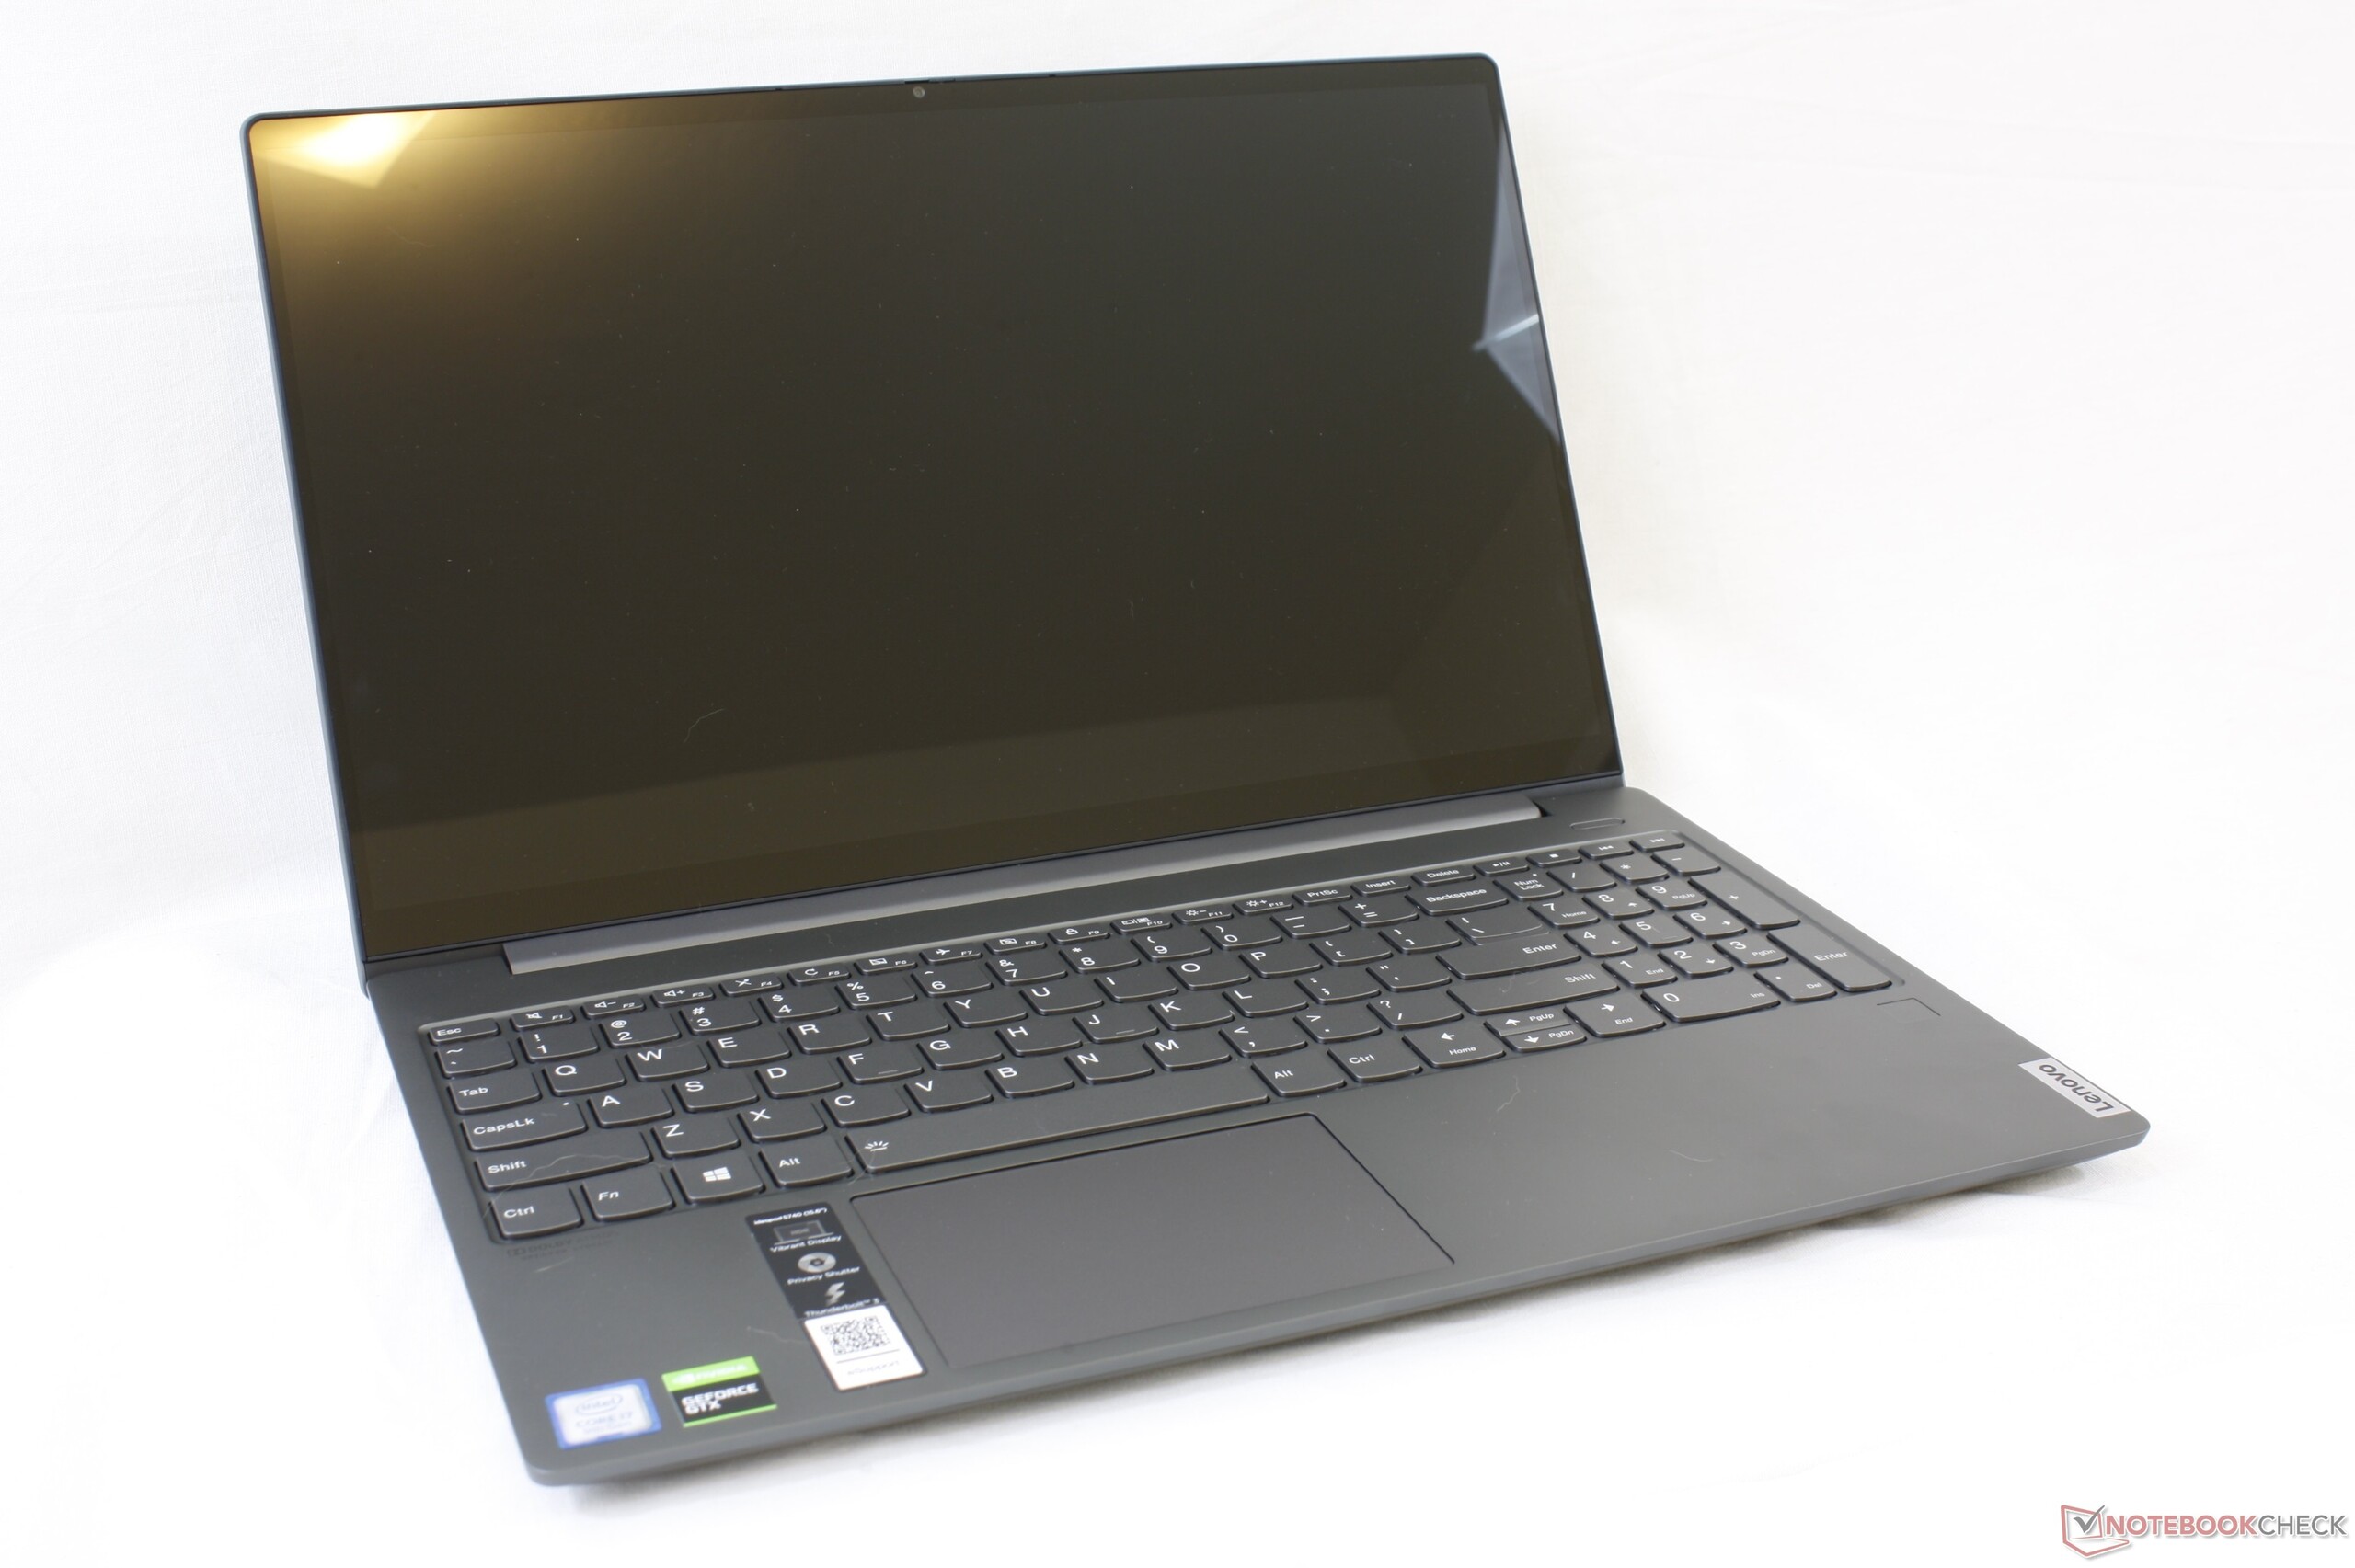
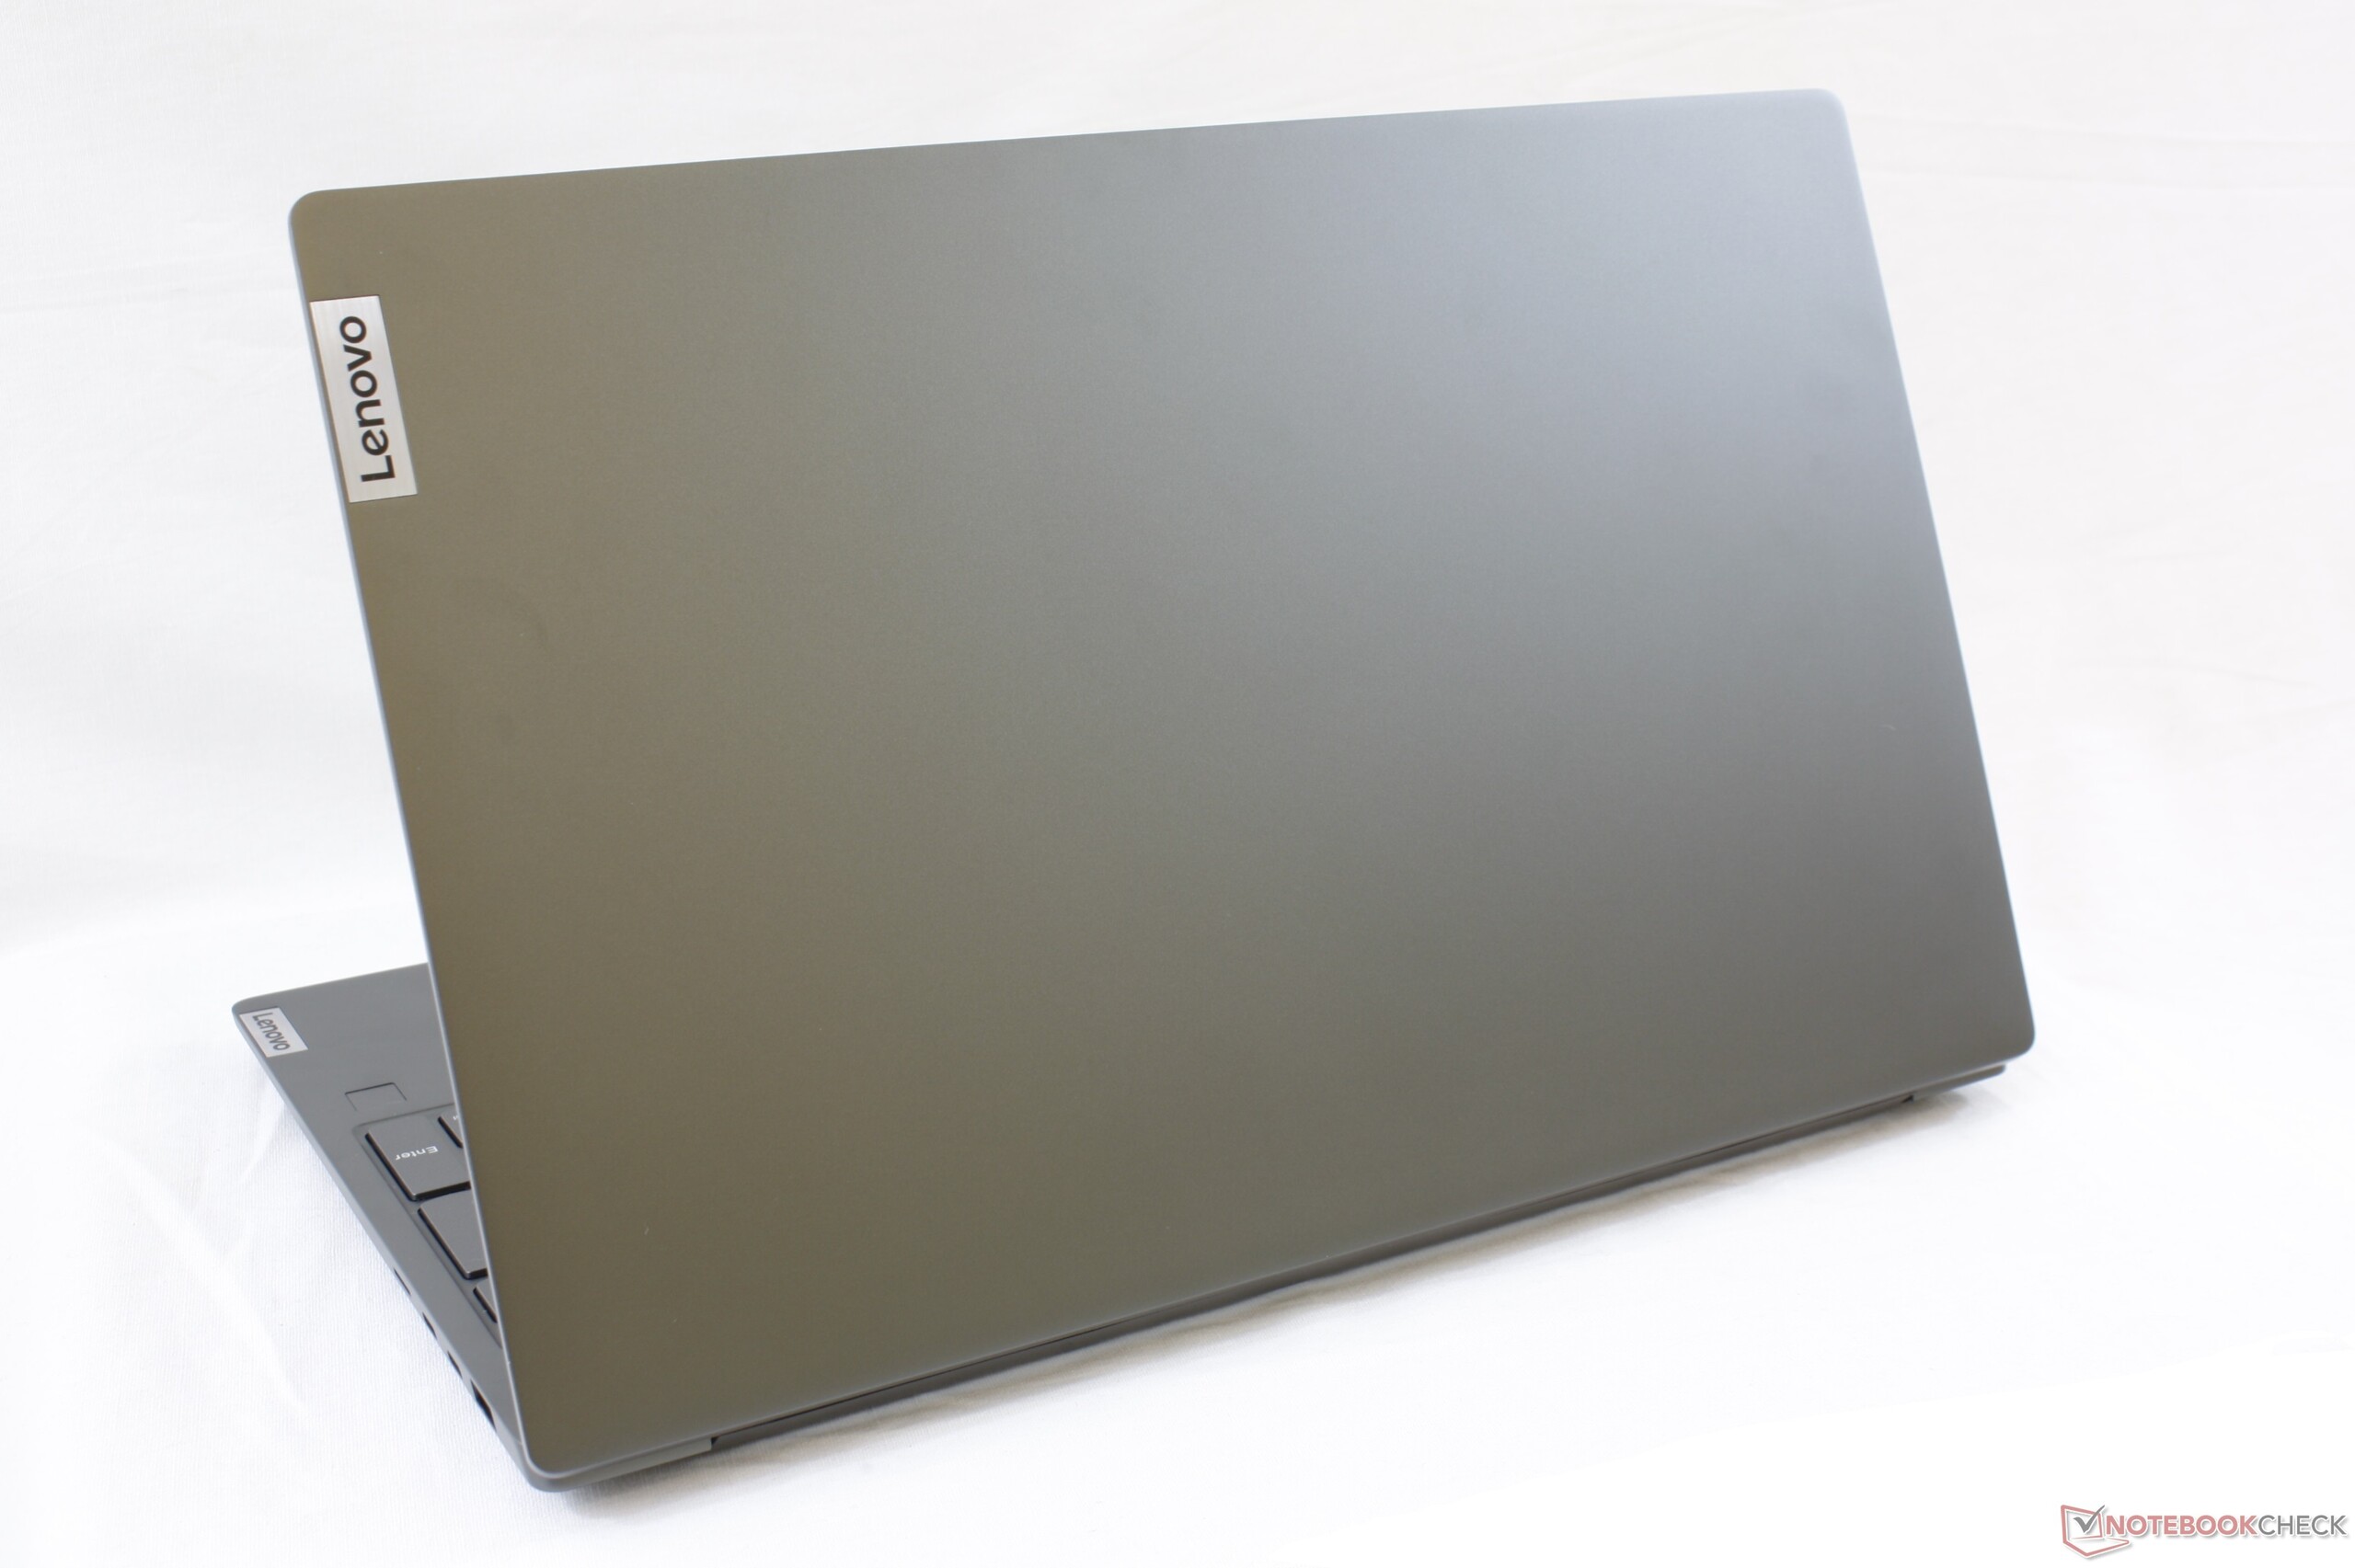
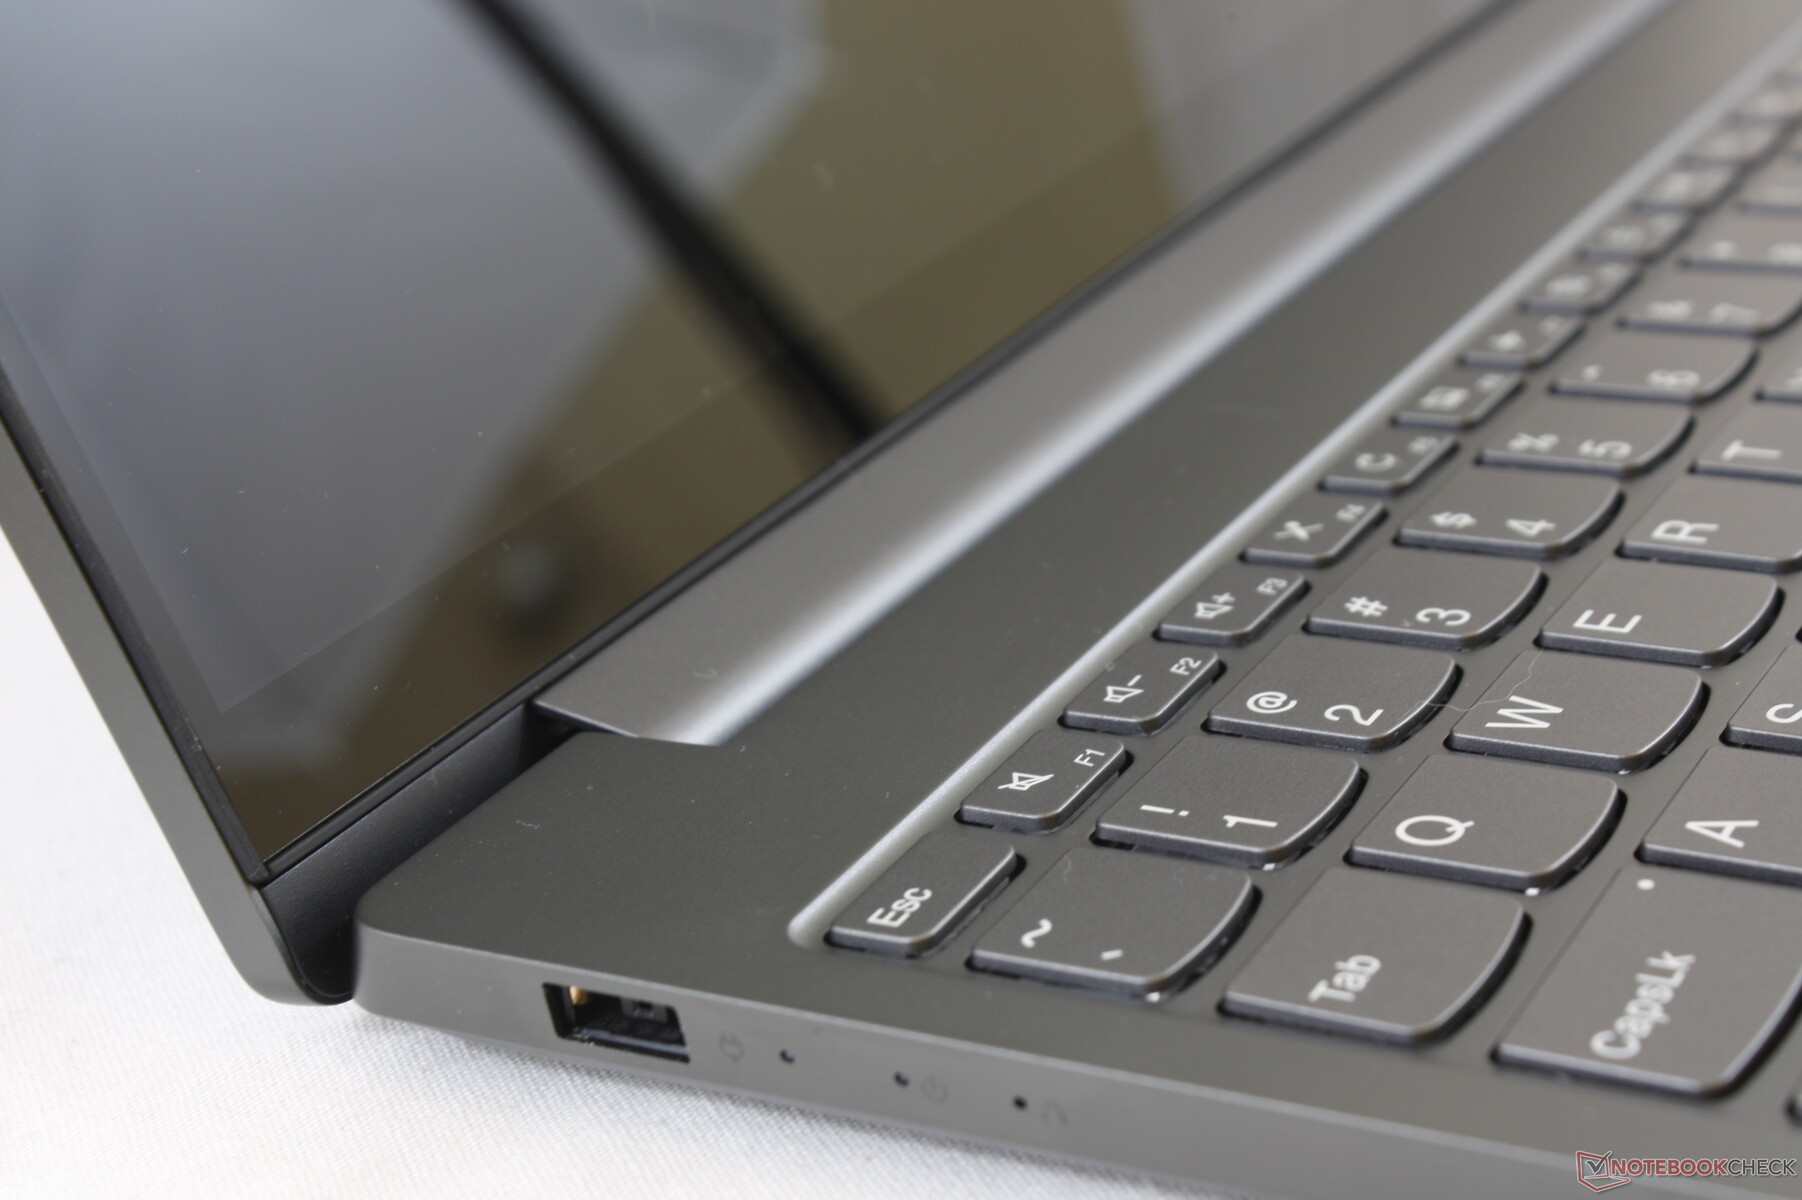
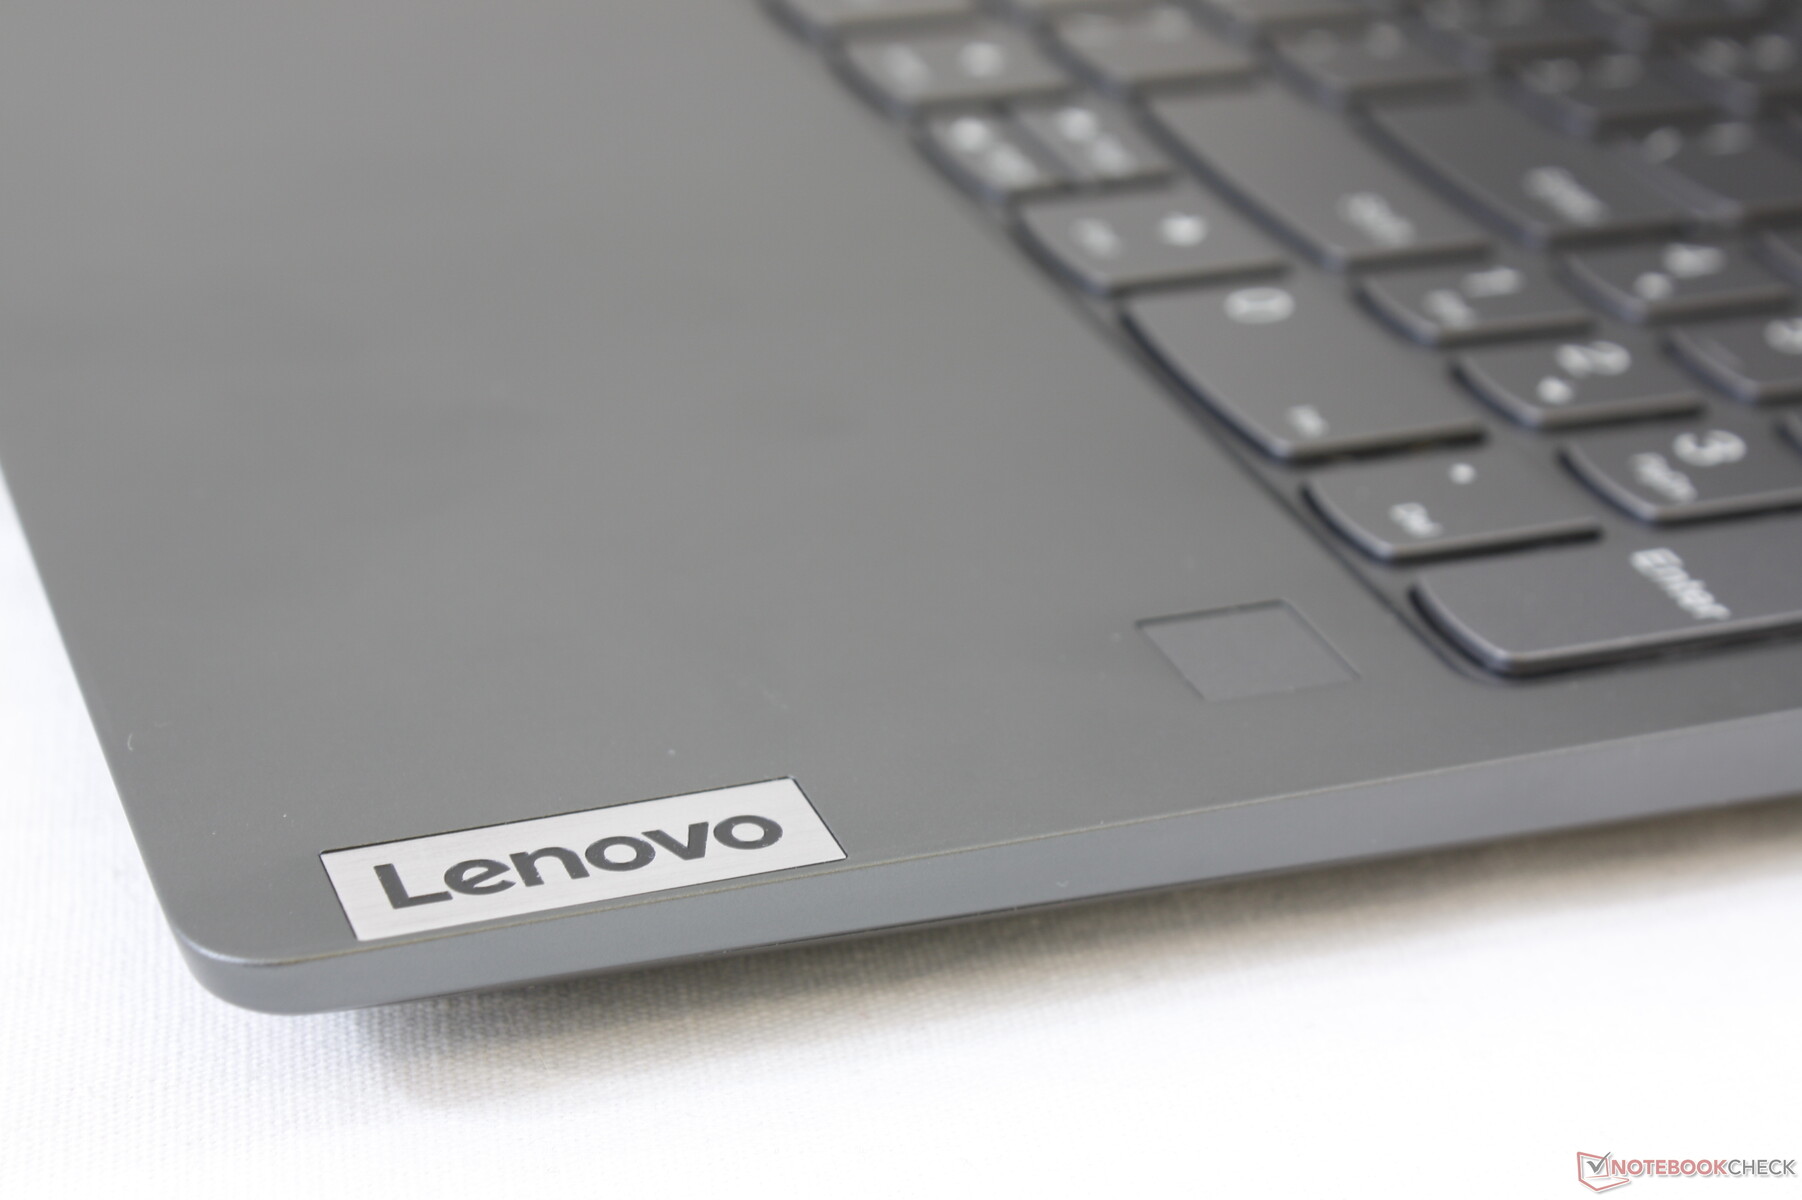
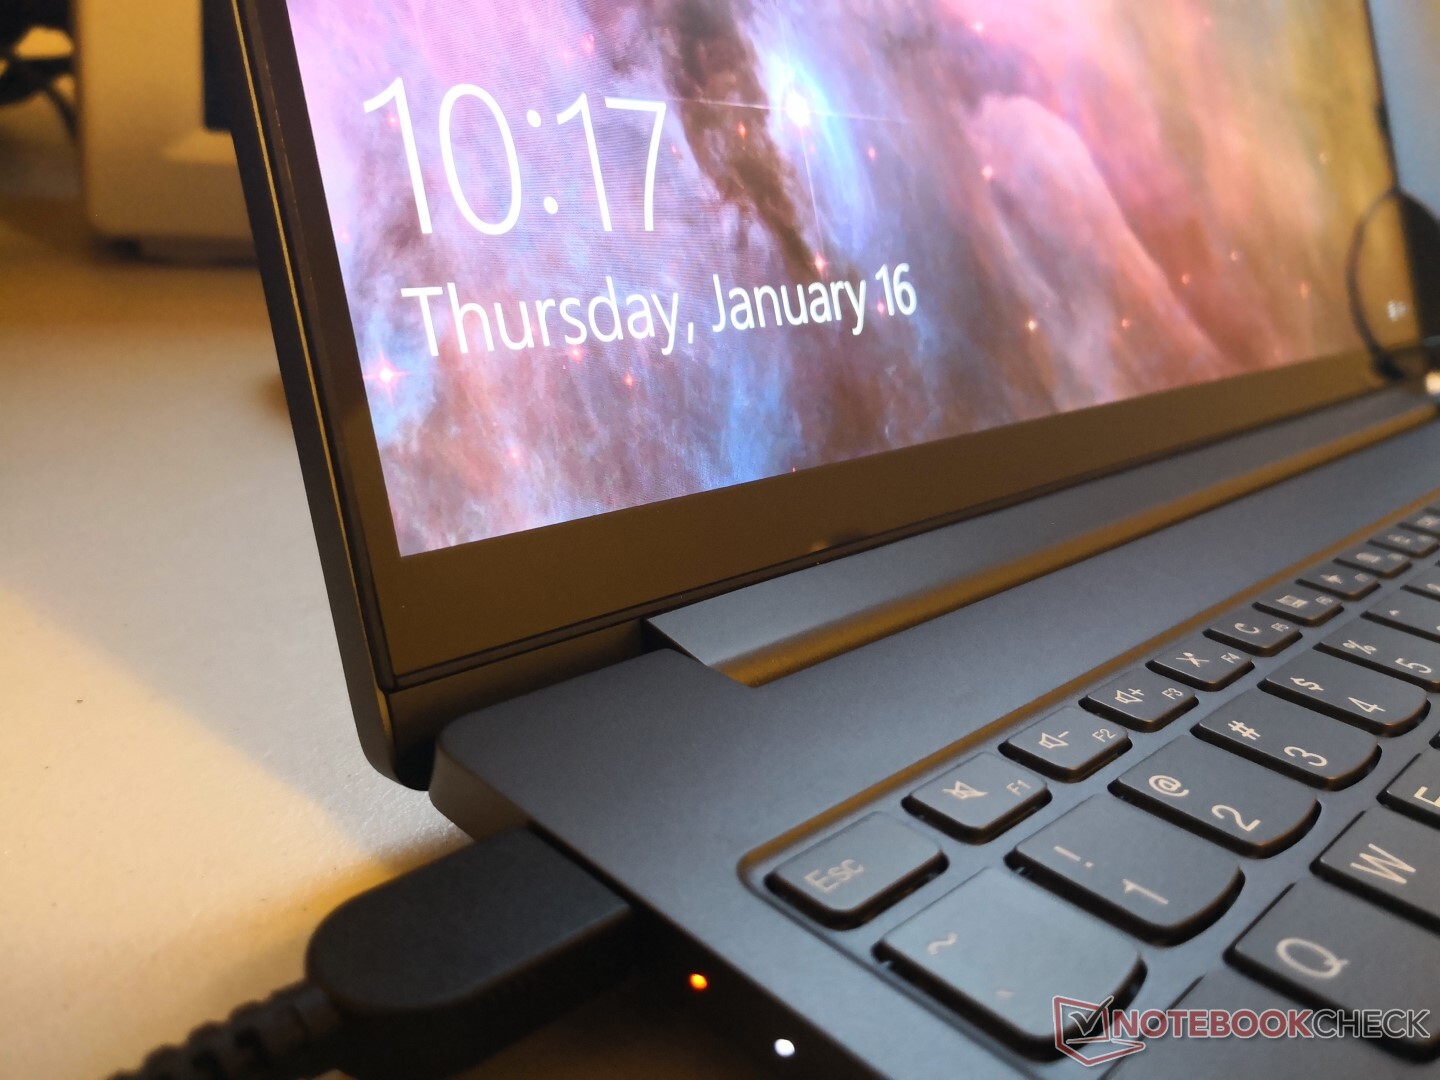
The "S" prefix in the IdeaPad S740 stands for "Slim" which Lenovo has reserved for its clamshell designs. True to its name, the system has a sleek, smooth, and professional look that has more in common with the recent ThinkBook series rather than another IdeaPad model. Visually, the chassis compares favorably against heavy hitters like the Dell XPS 15 or HP Spectre x360 15.
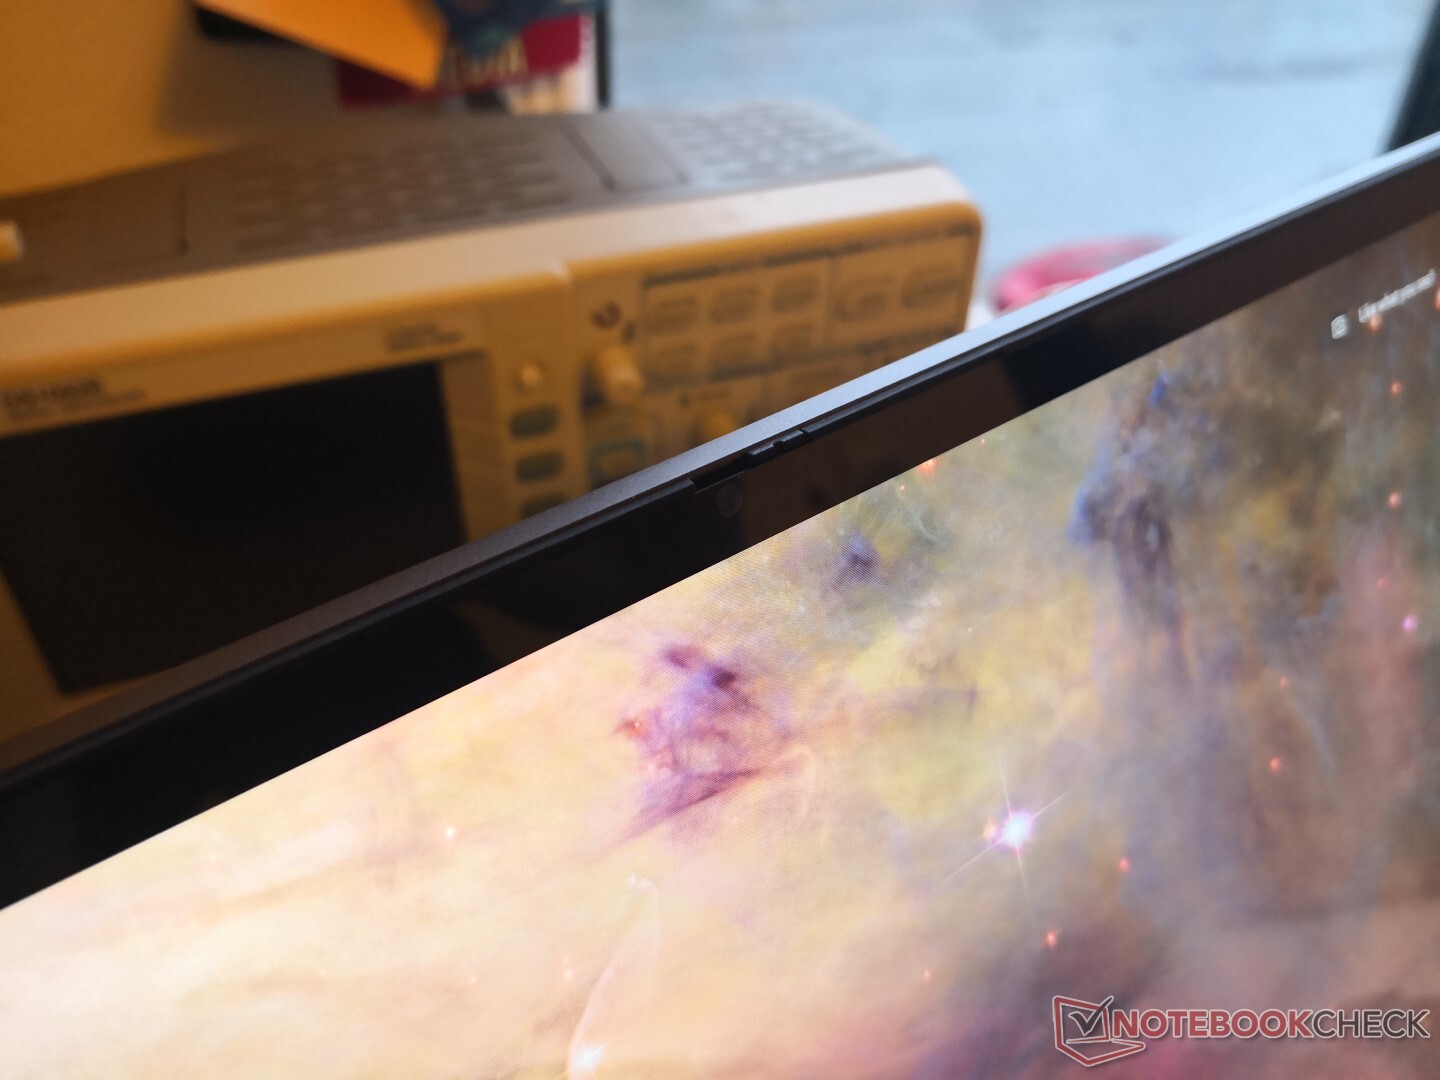
Rigidity is a step or two below the aforementioned alternatives. The surfaces of our IdeaPad feel comparatively thinner and not as strong as the XPS or Spectre. Creaking is more noticeable when attempting to twist the base and lid. For an IdeaPad, however, it's definitely classier and of higher quality than expected. Keen-eyed users will notice that Lenovo uses very similar chassis materials for both the IdeaPad S740 and the recent Legion Y740 series. Users looking for a more luxurious experience should consider the Yoga C940 15 instead.
Chassis size and weight are slightly bigger and lighter, respectively, than the XPS 15. Differences in volume are otherwise minor. For a more substantial difference, the Asus ZenBook 15 is noticeably smaller and more portable at the cost of CPU horsepower.
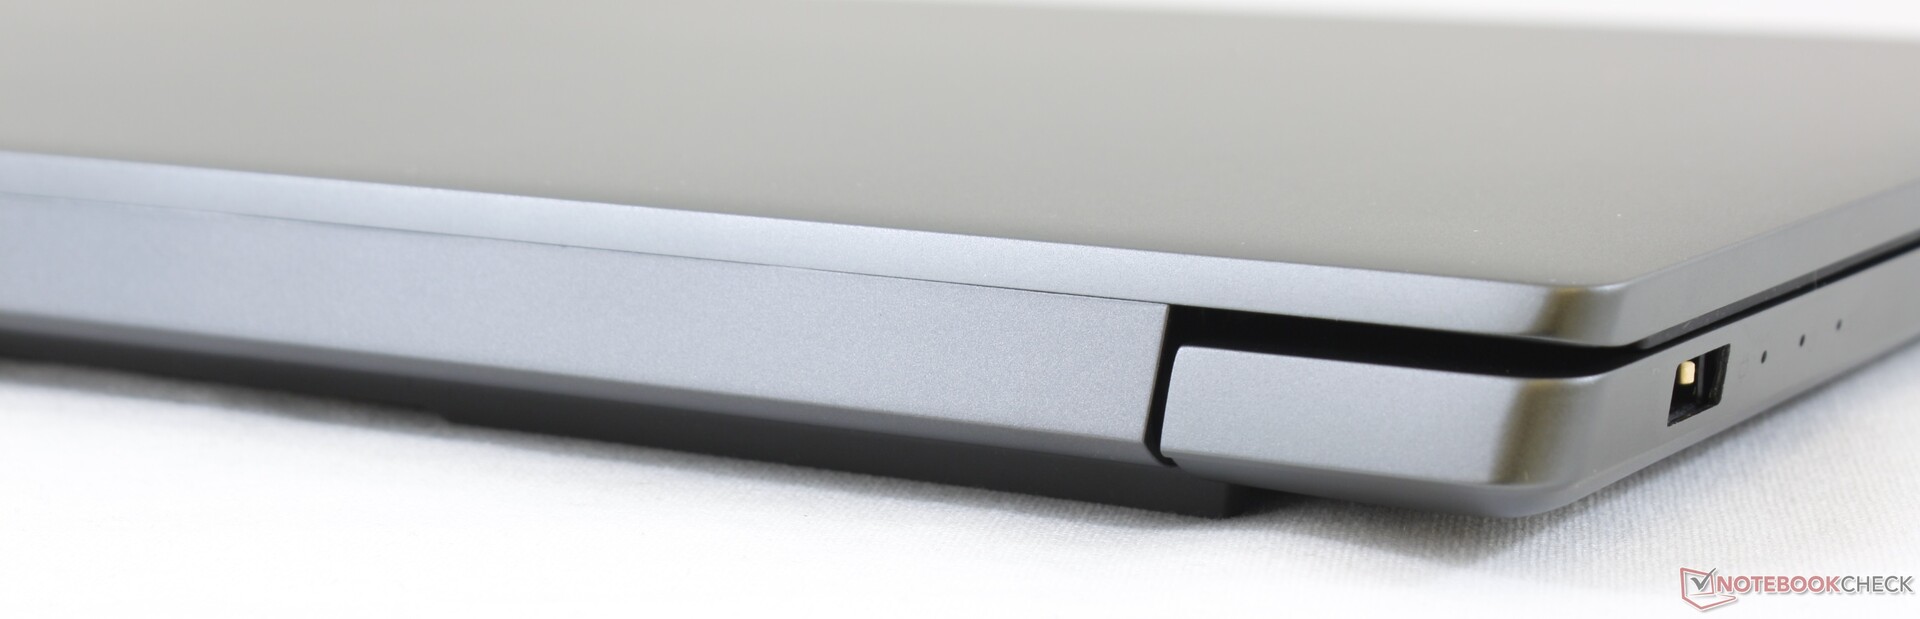
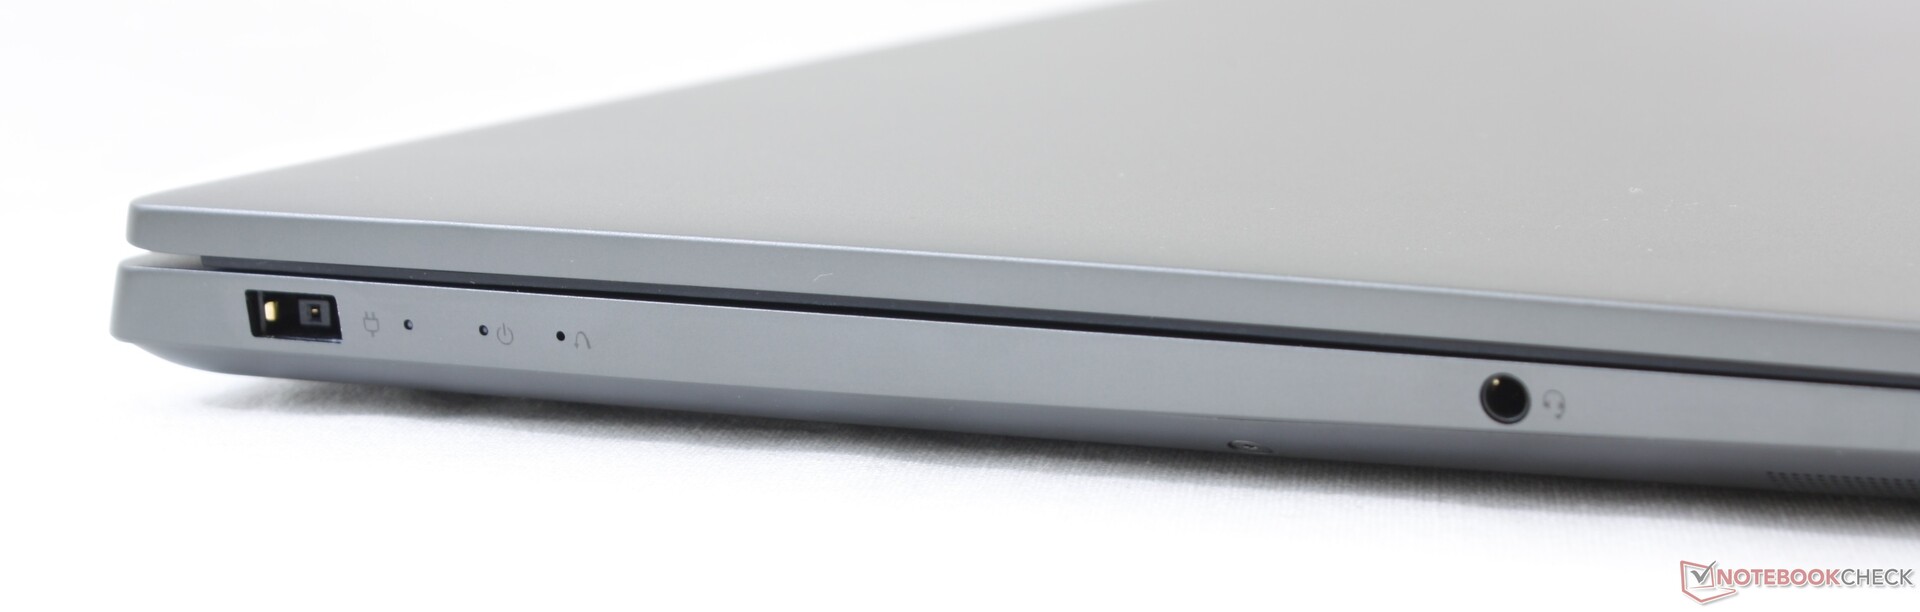
Connectivity
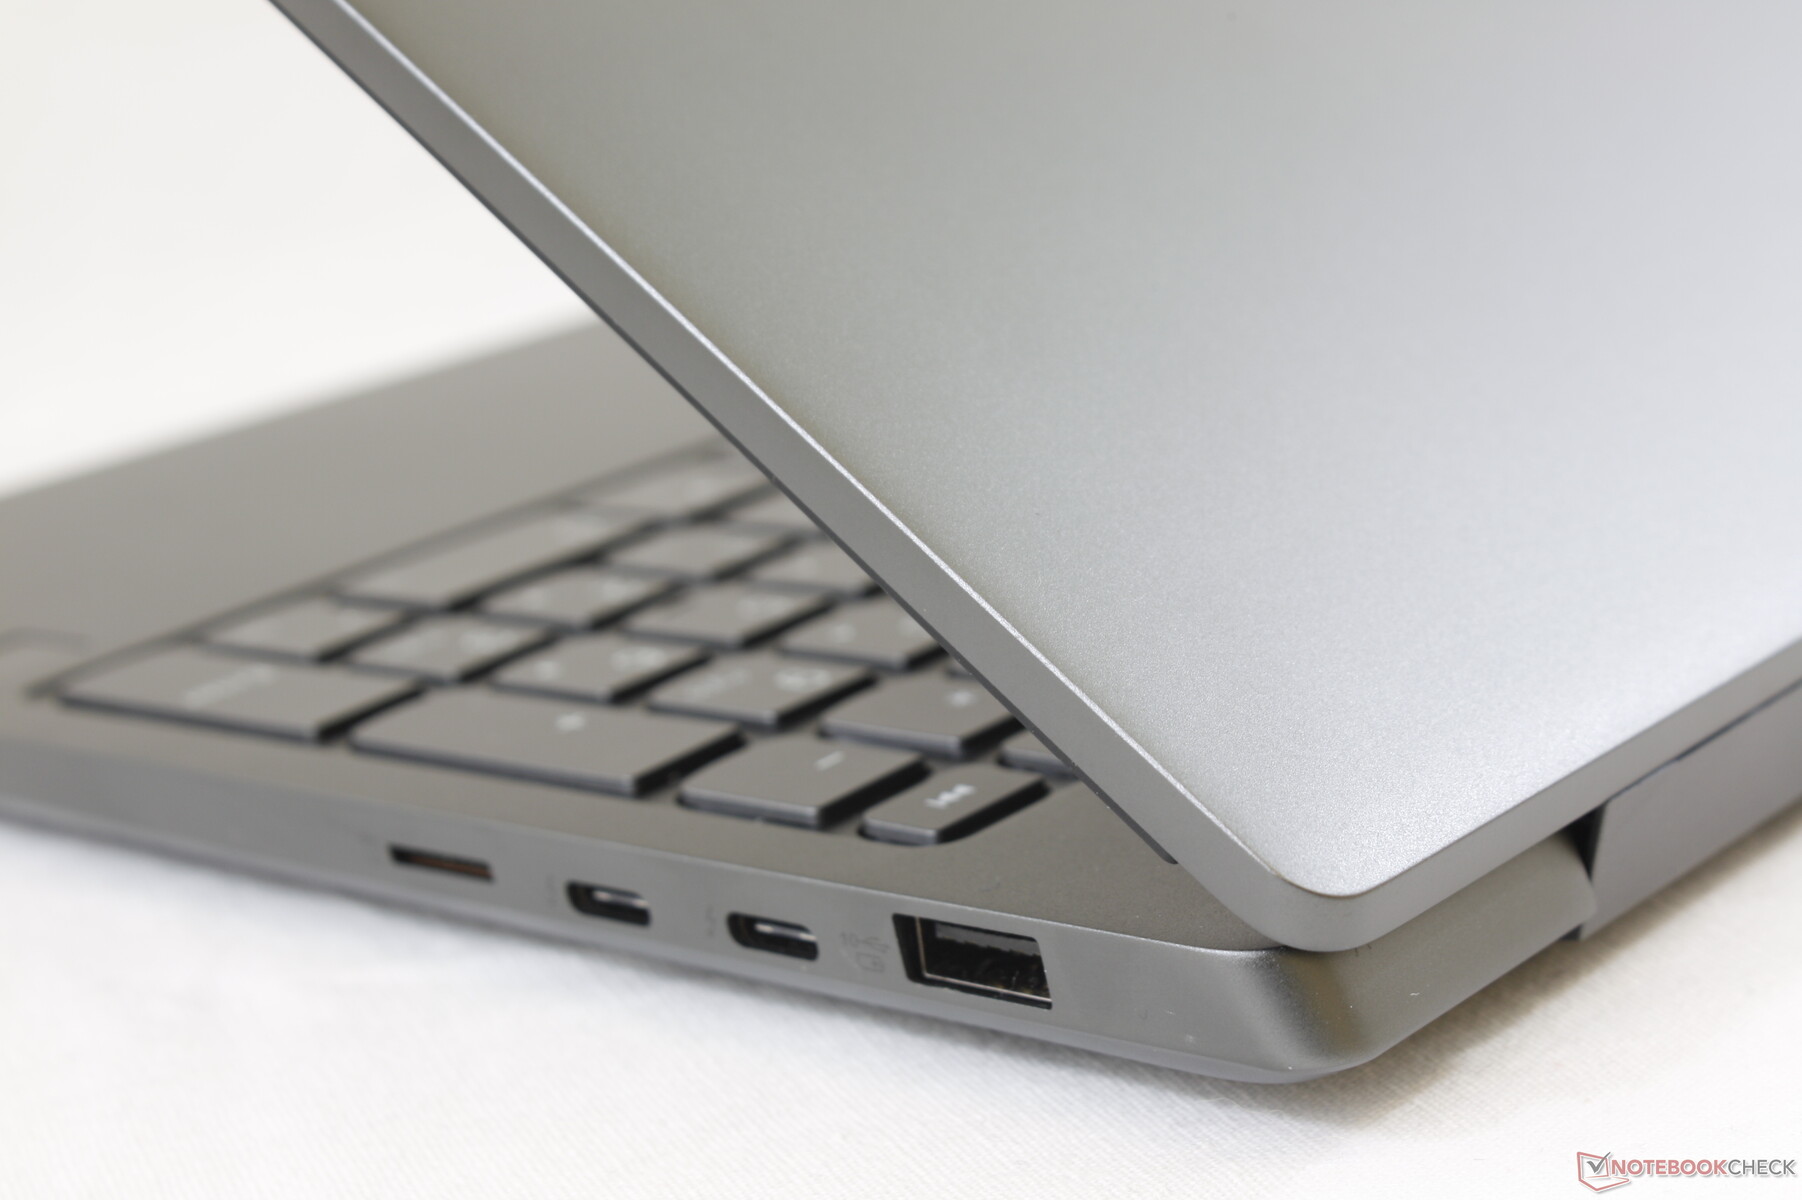
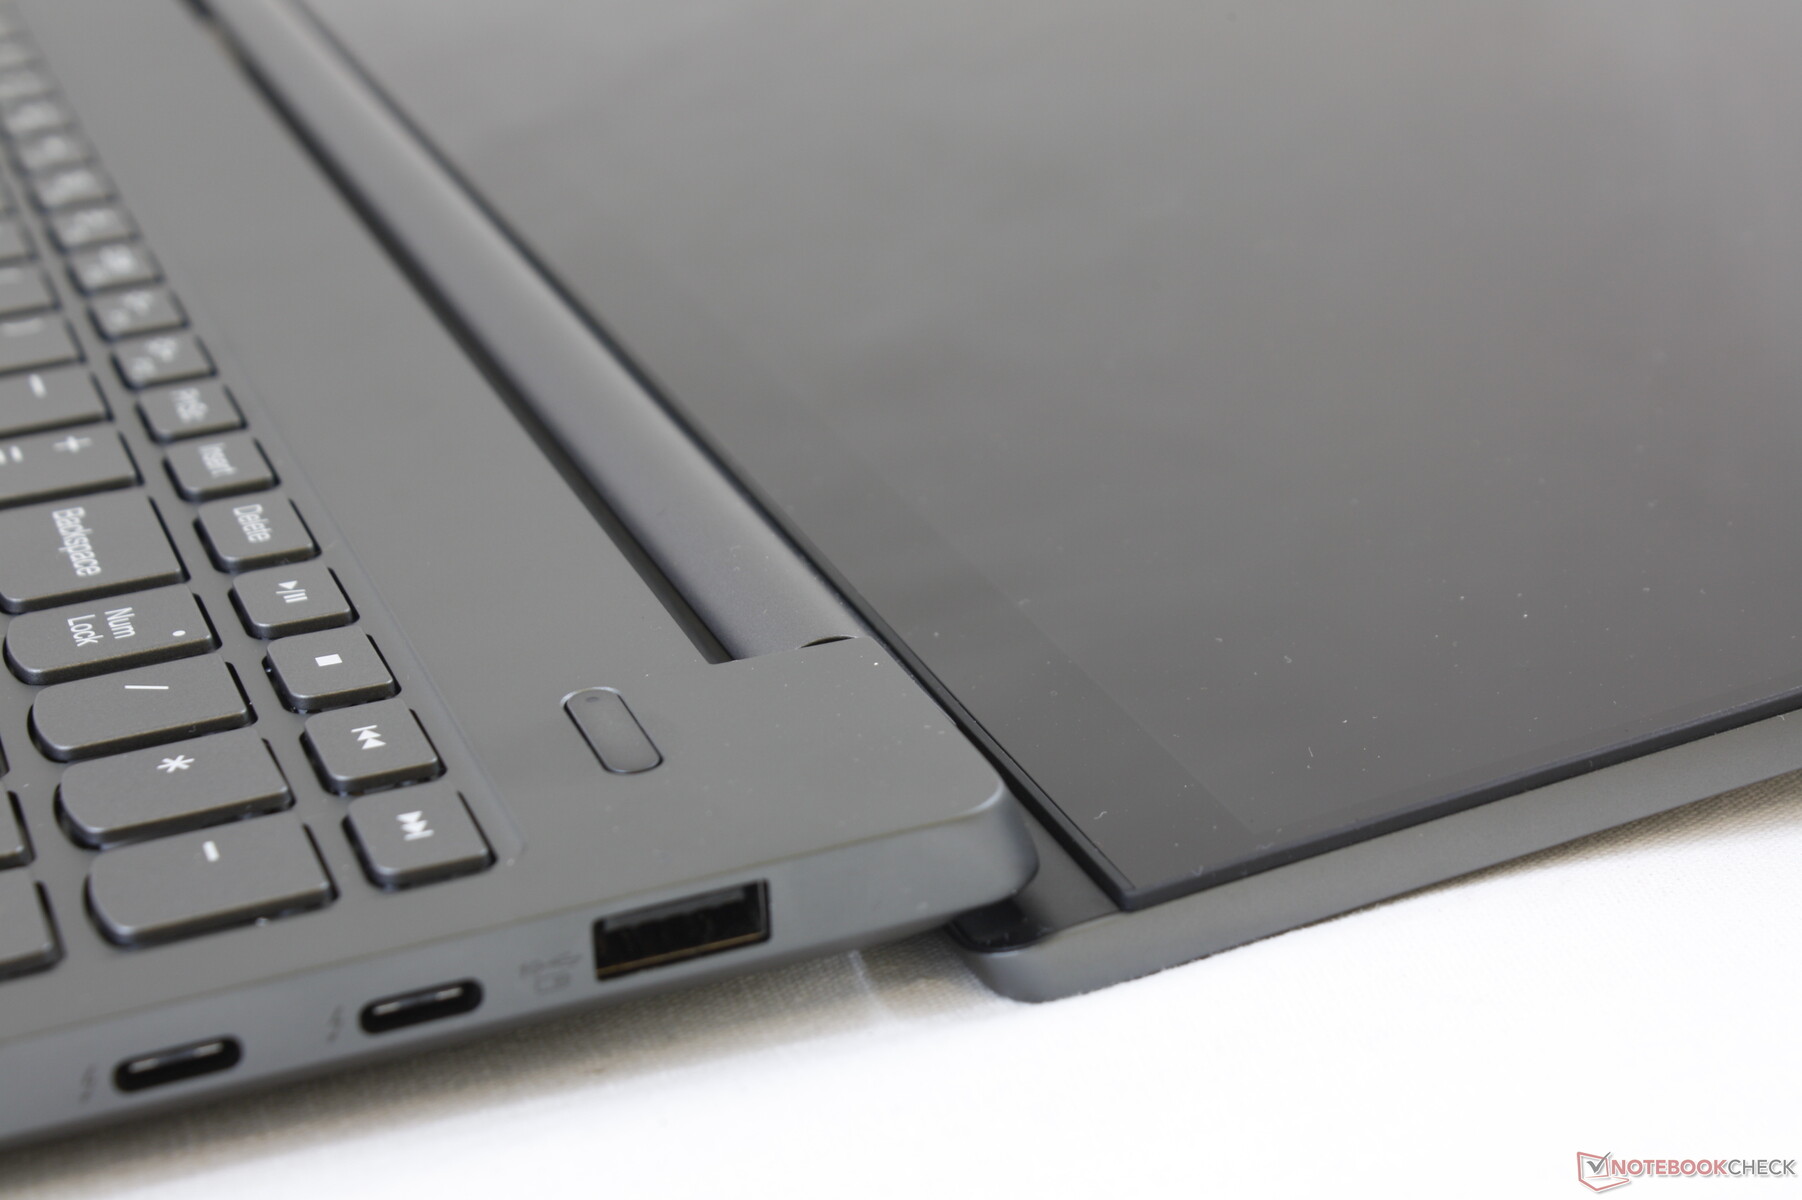
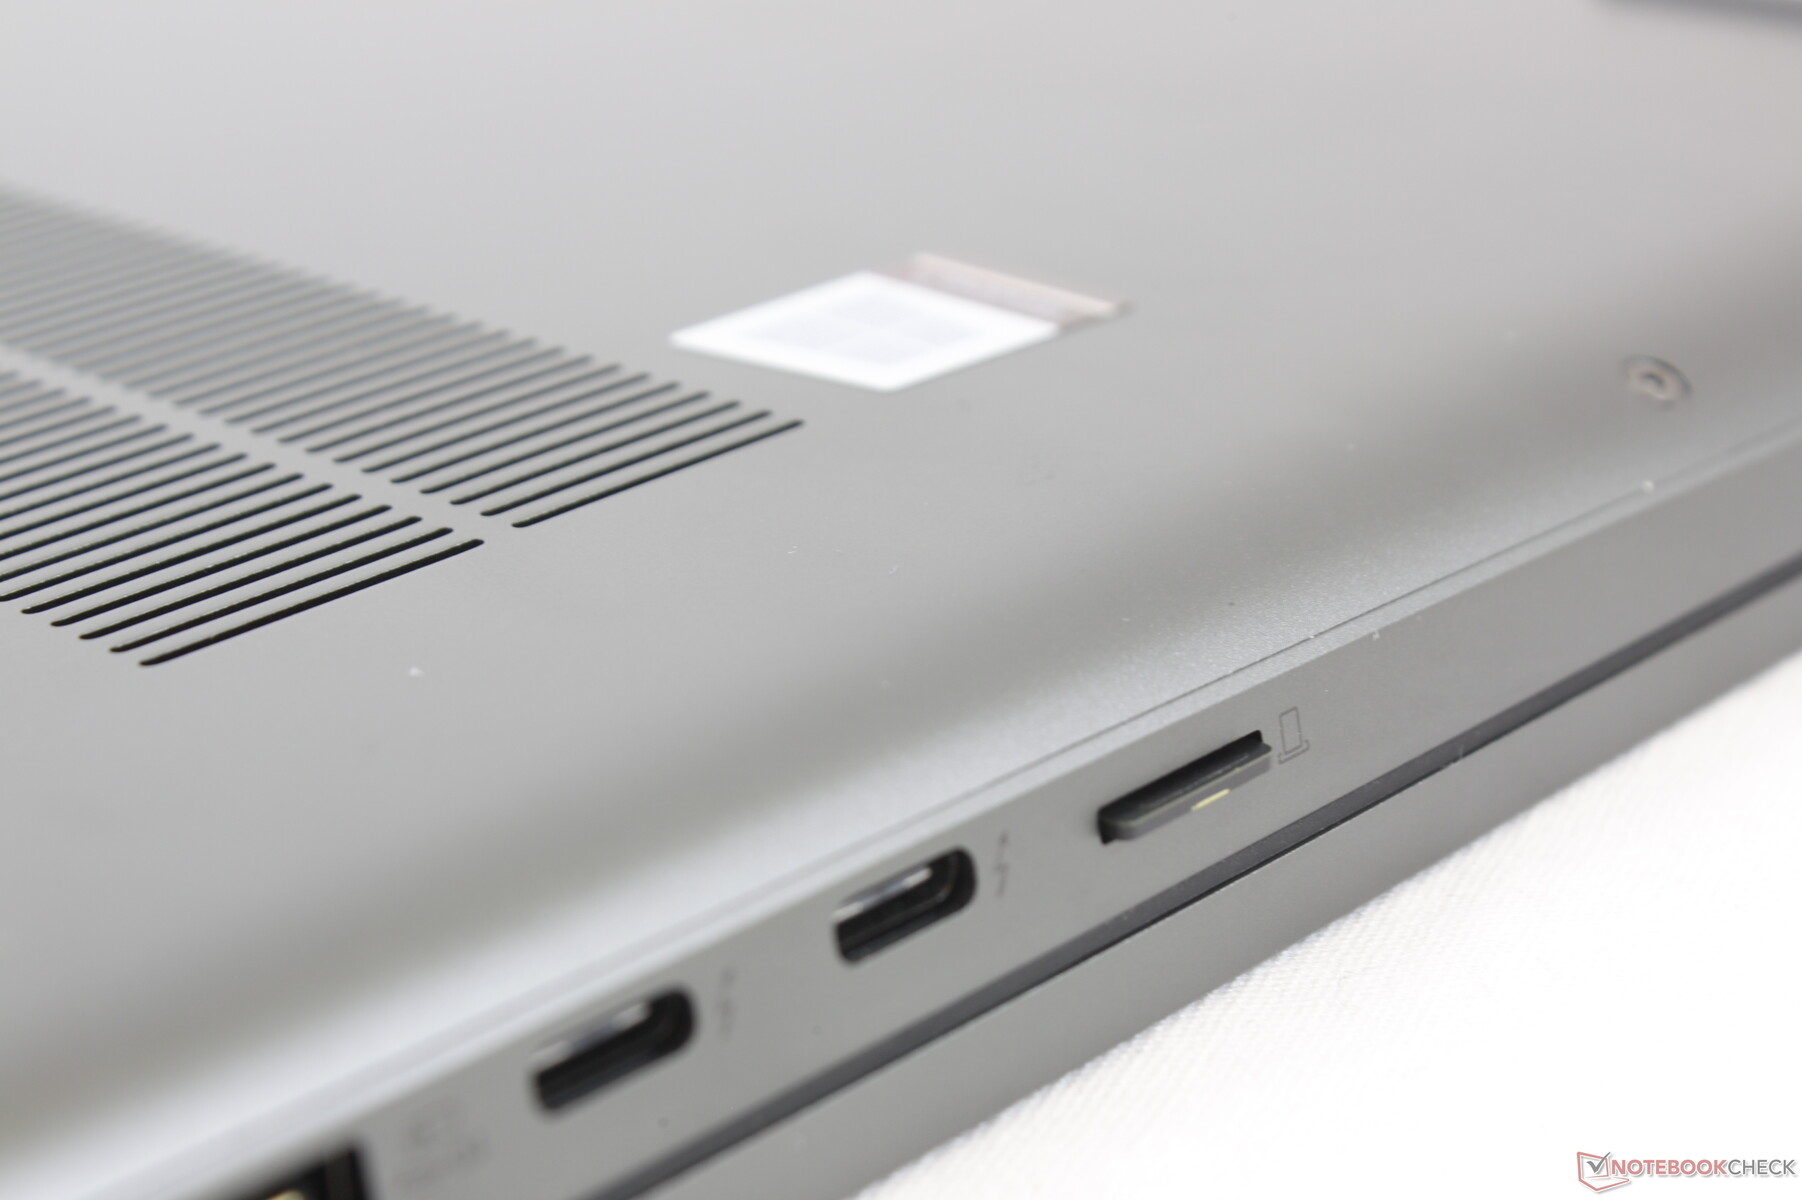
Ports options are a mixed bag. For one, be prepared to rely on USB Type-C adapters and docks as the system integrates no HDMI or RJ-45 ports and just one USB Type-A port. When considering the large 15.6-inch screen size, the limited ports are disappointing.
Furthermore, the positioning of the ports is not optimal as all the USB ports are along the right edge with none along the left. A more symmetrical port positioning like on the Razer Blade Stealth would have been more desirable.
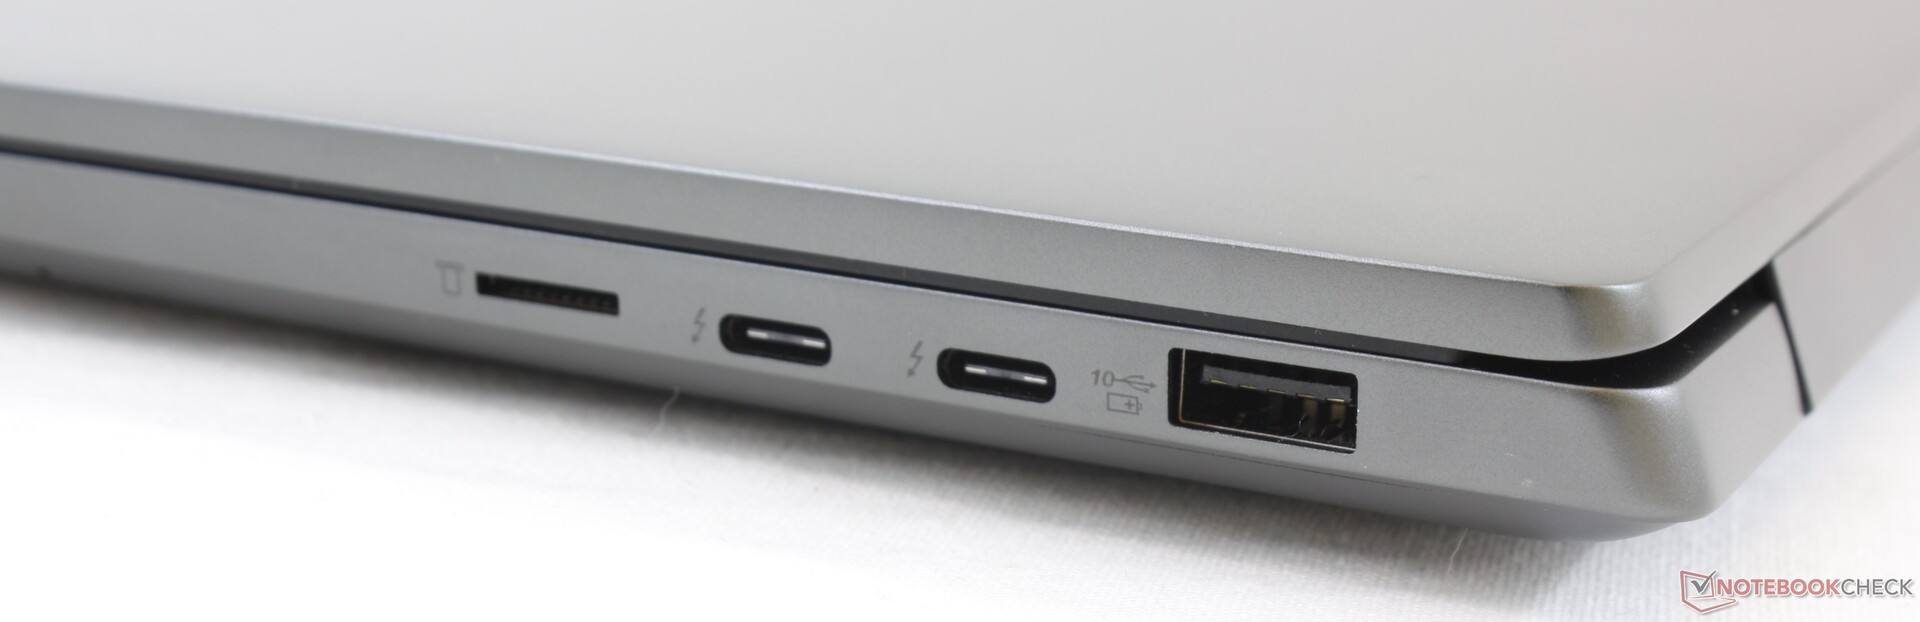
SD Card Reader
The spring-loaded MicroSD reader is average in speed. Transferring 1 GB worth of pictures from our card to desktop takes about 13 seconds compared to nearly half that on the Dell XPS 15.
| SD Card Reader | |
| average JPG Copy Test (av. of 3 runs) | |
| Dell XPS 15 7590 9980HK GTX 1650 (Toshiba Exceria Pro SDXC 64 GB UHS-II) | |
| HP Spectre X360 15-5ZV31AV (Toshiba Exceria Pro M501 UHS-II) | |
| MSI Prestige 15 A10SC (Toshiba Exceria Pro M501 UHS-II) | |
| Lenovo IdeaPad S740-15IRH (Toshiba Exceria Pro M501 UHS-II) | |
| Asus ZenBook 15 UX534FT-DB77 (Toshiba Exceria Pro SDXC 64 GB UHS-II) | |
| maximum AS SSD Seq Read Test (1GB) | |
| MSI Prestige 15 A10SC (Toshiba Exceria Pro M501 UHS-II) | |
| Dell XPS 15 7590 9980HK GTX 1650 (Toshiba Exceria Pro SDXC 64 GB UHS-II) | |
| HP Spectre X360 15-5ZV31AV (Toshiba Exceria Pro M501 UHS-II) | |
| Lenovo IdeaPad S740-15IRH (Toshiba Exceria Pro M501 UHS-II) | |
| Asus ZenBook 15 UX534FT-DB77 (Toshiba Exceria Pro SDXC 64 GB UHS-II) | |
Communication
The IdeaPad Y740 15 ships with Wi-Fi 5 (802.11ac) or Wi-Fi 6 (802.11ax) depending on the SKU. We experienced no connectivity issues during our time with our Wi-Fi 5 test unit.
| Networking | |
| iperf3 transmit AX12 | |
| MSI Prestige 15 A10SC | |
| Lenovo Yoga 730-15IKB | |
| iperf3 receive AX12 | |
| MSI Prestige 15 A10SC | |
| Lenovo Yoga 730-15IKB | |
Maintenance
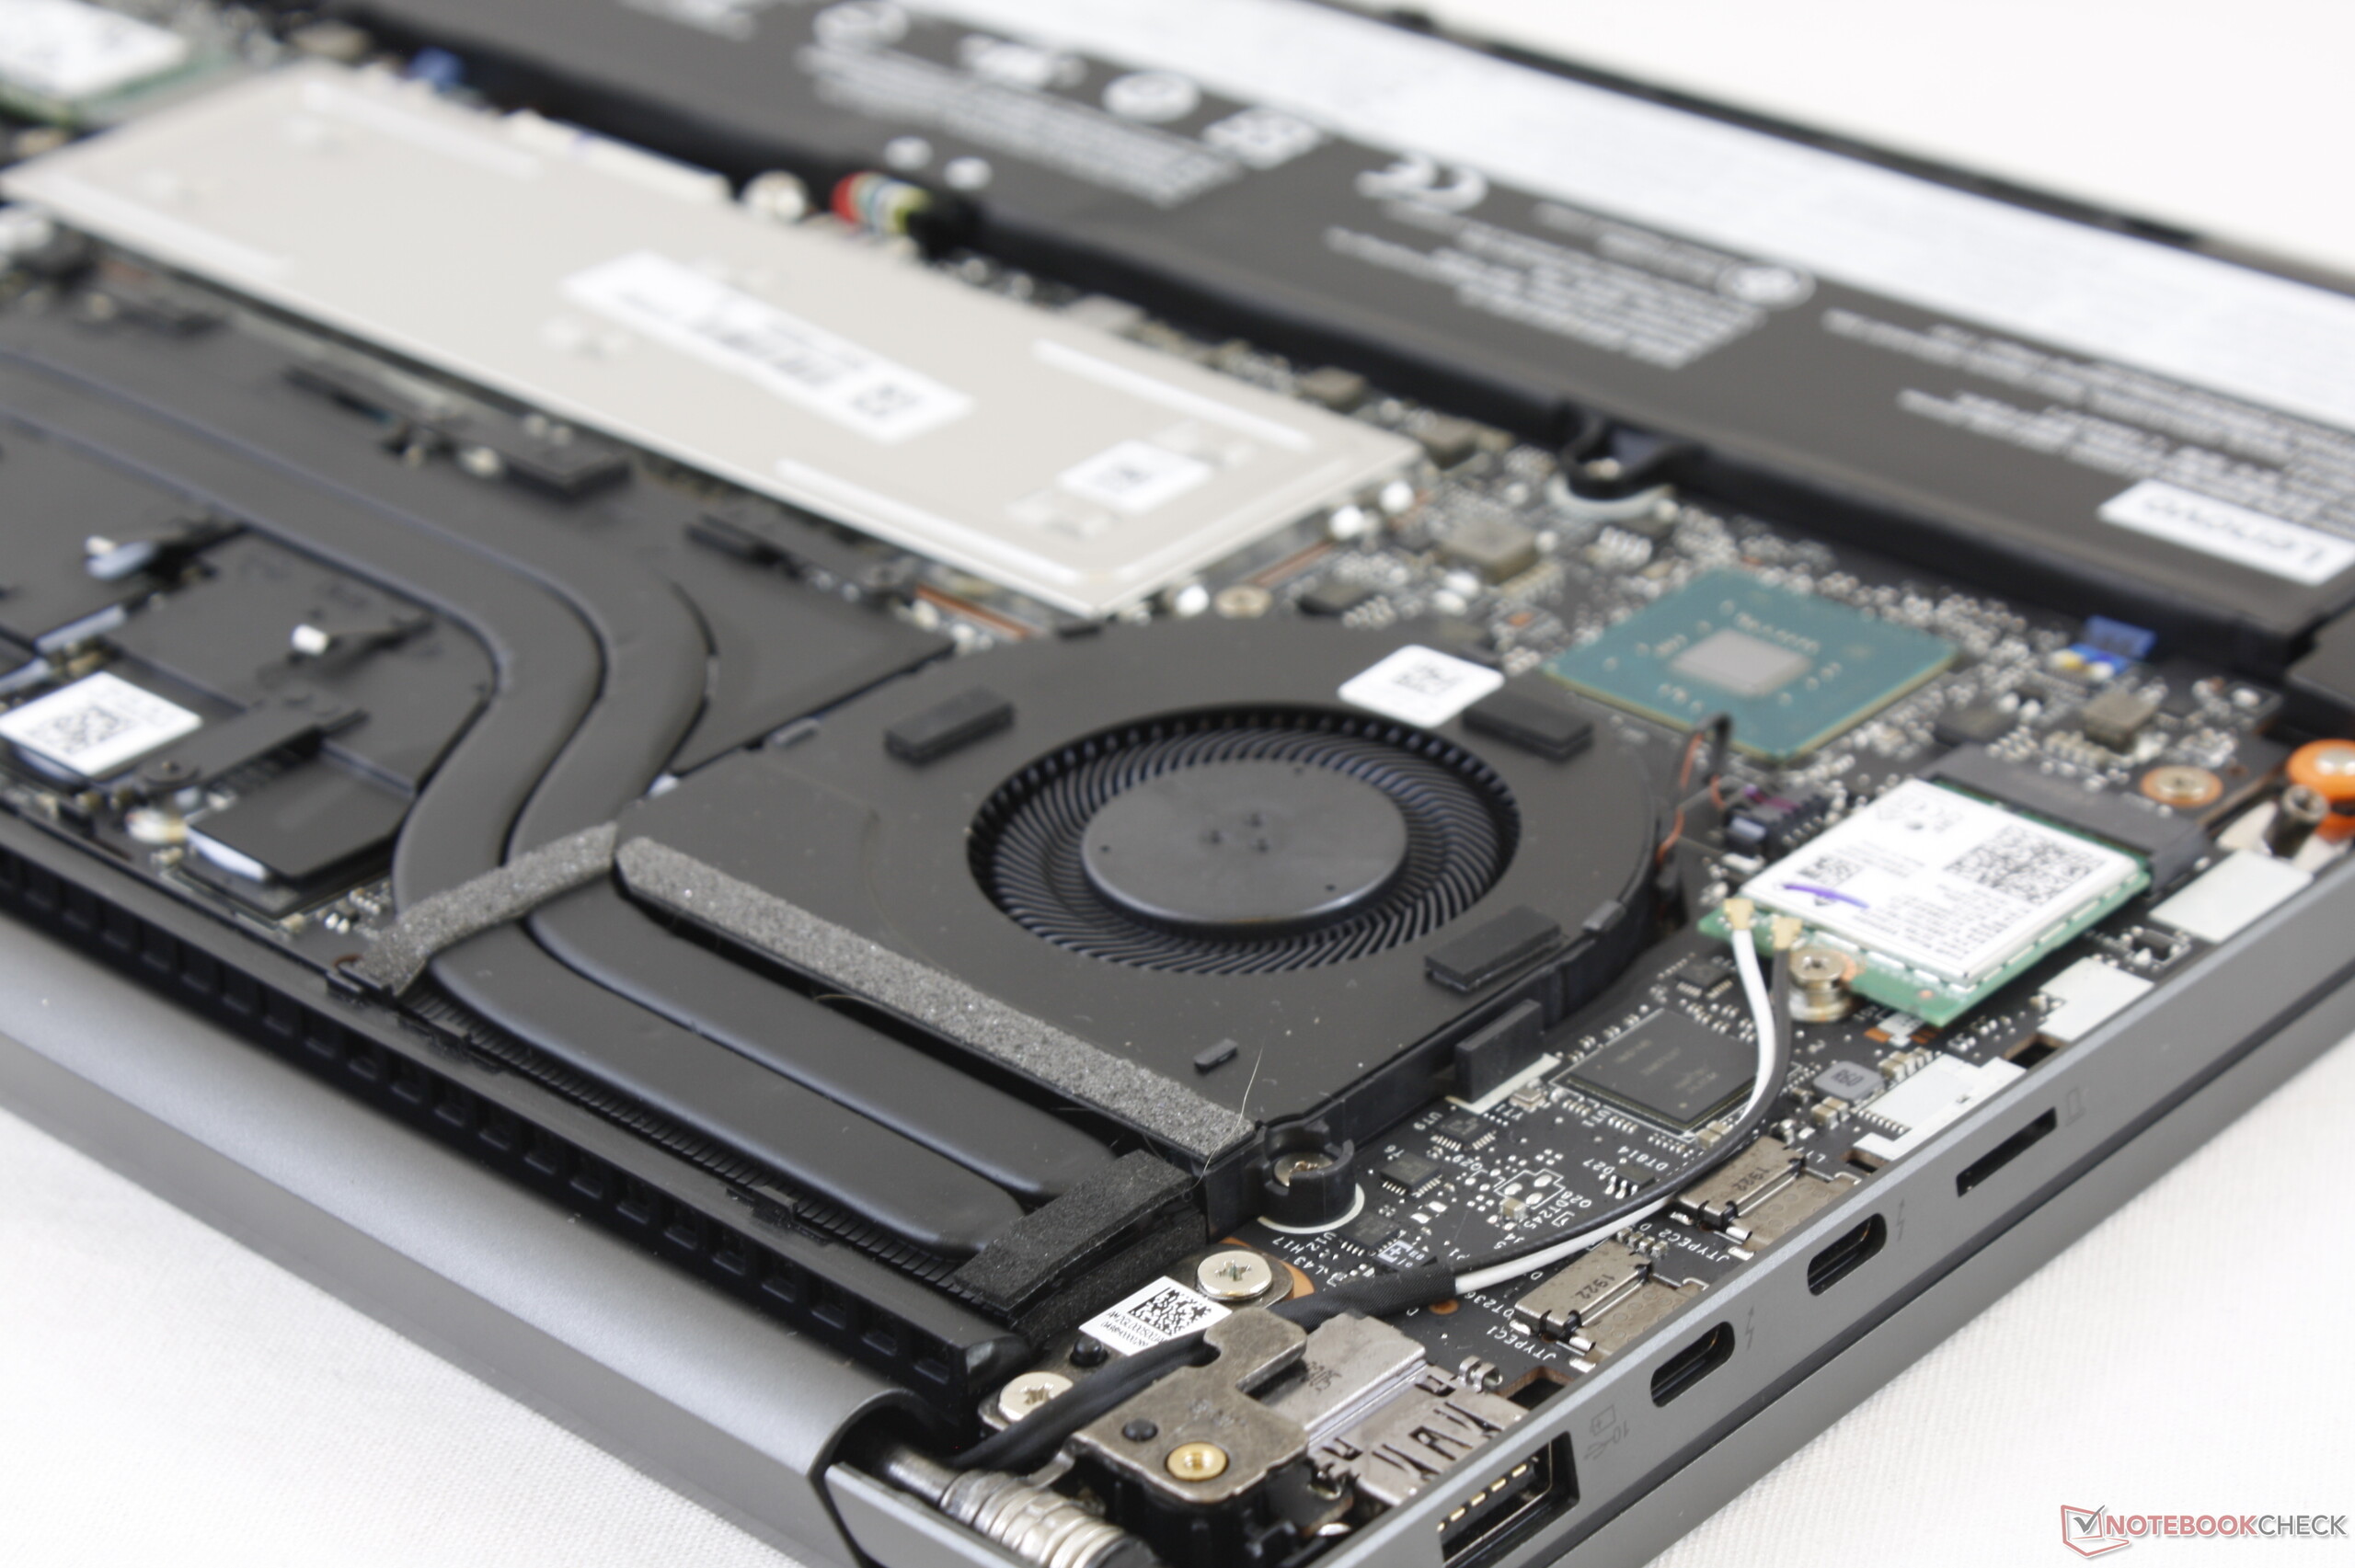
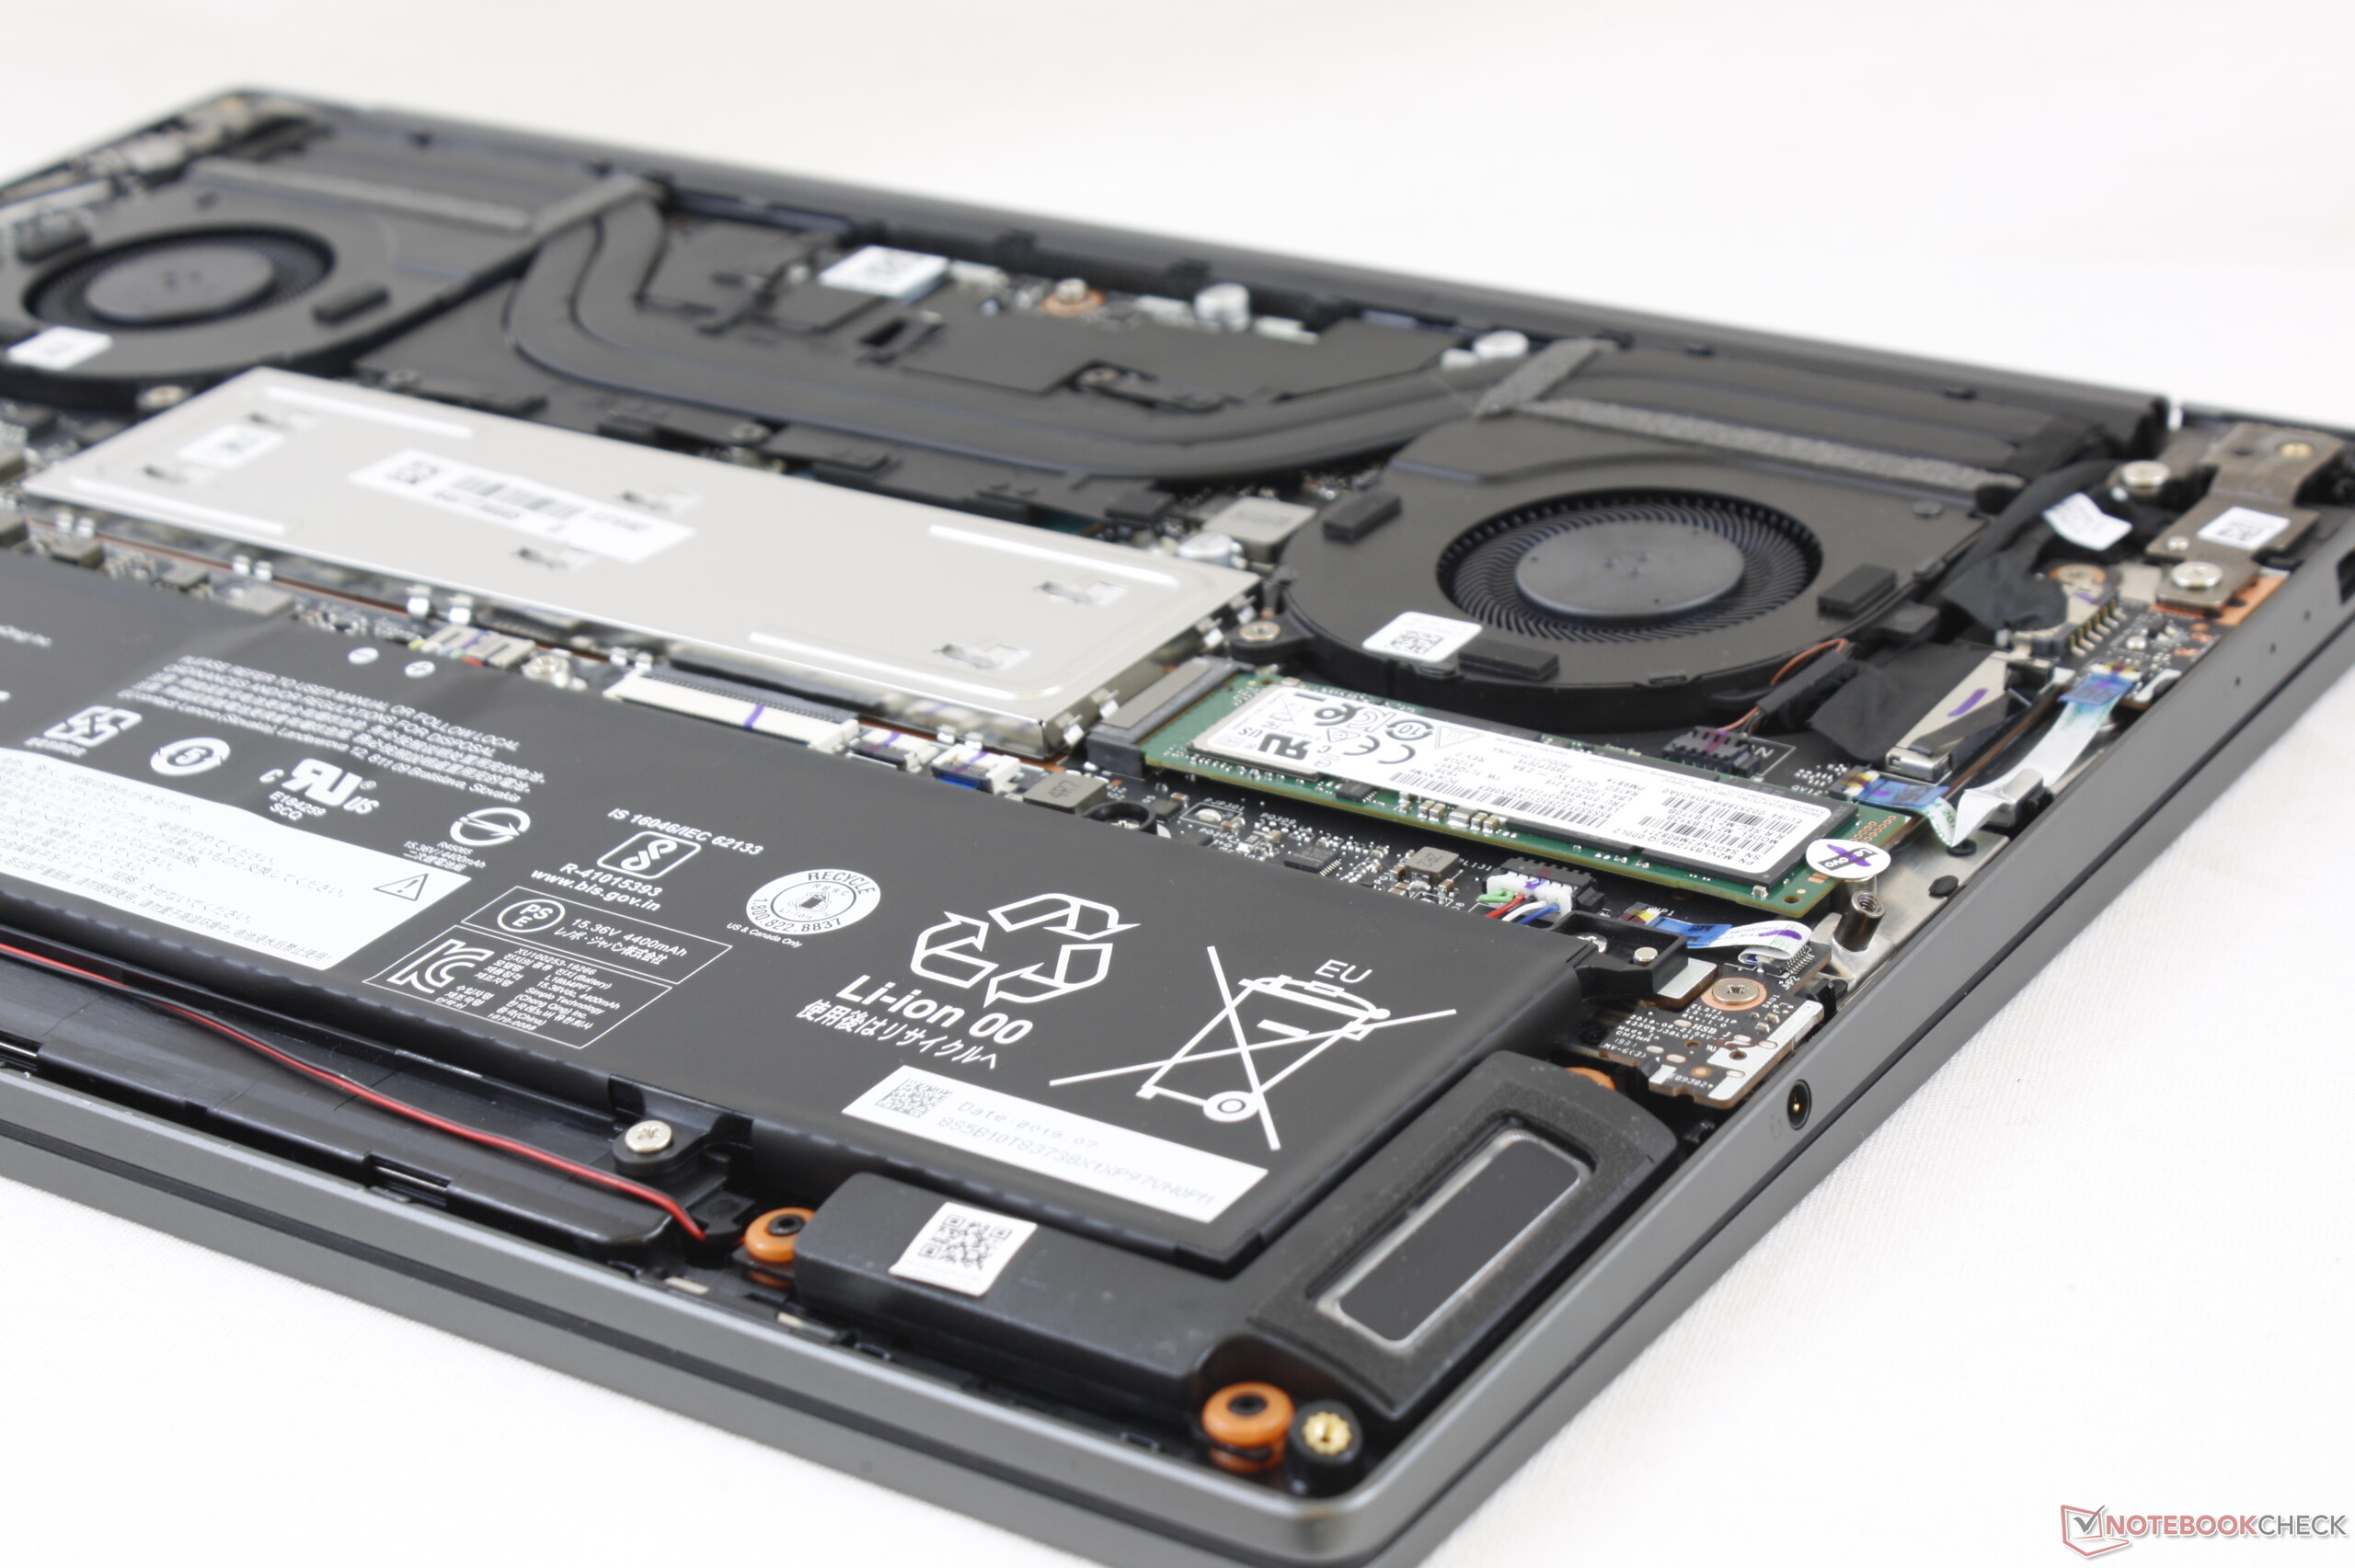
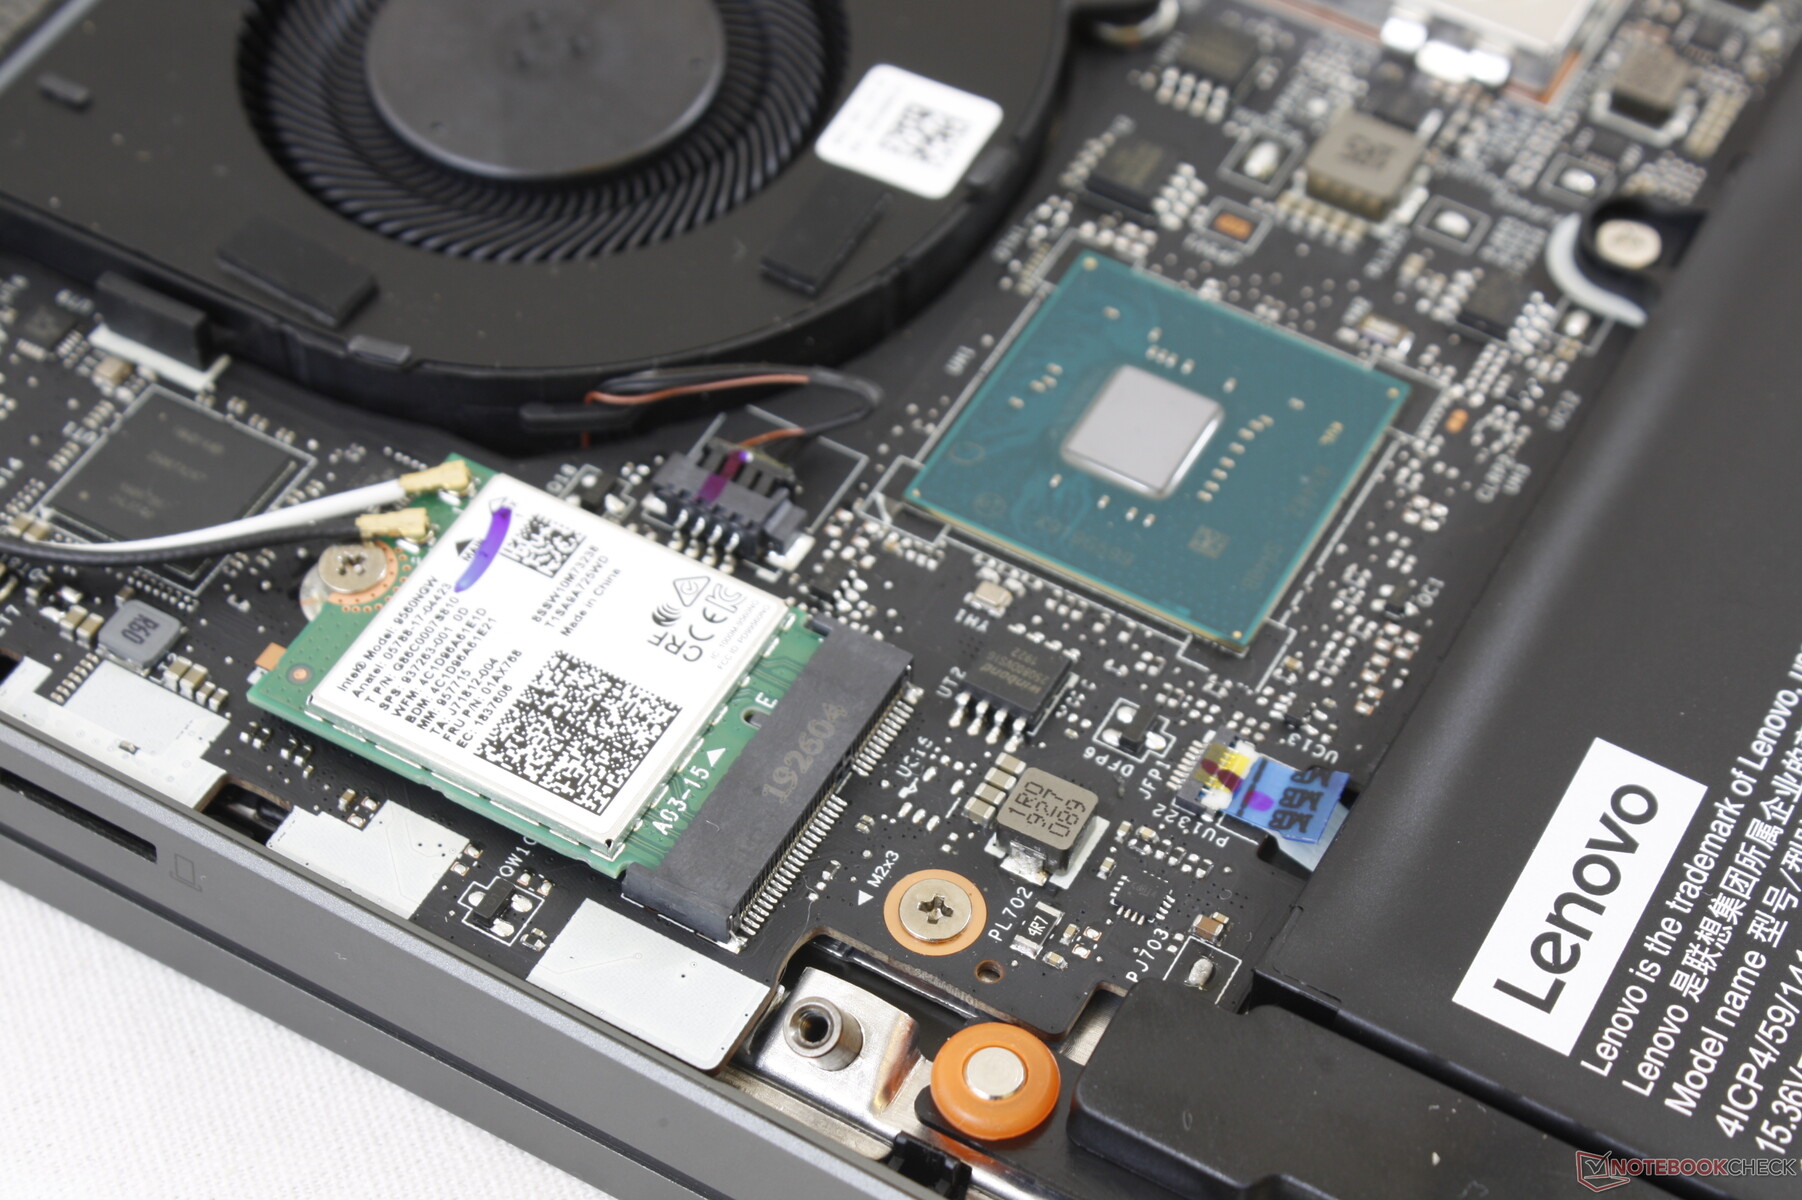
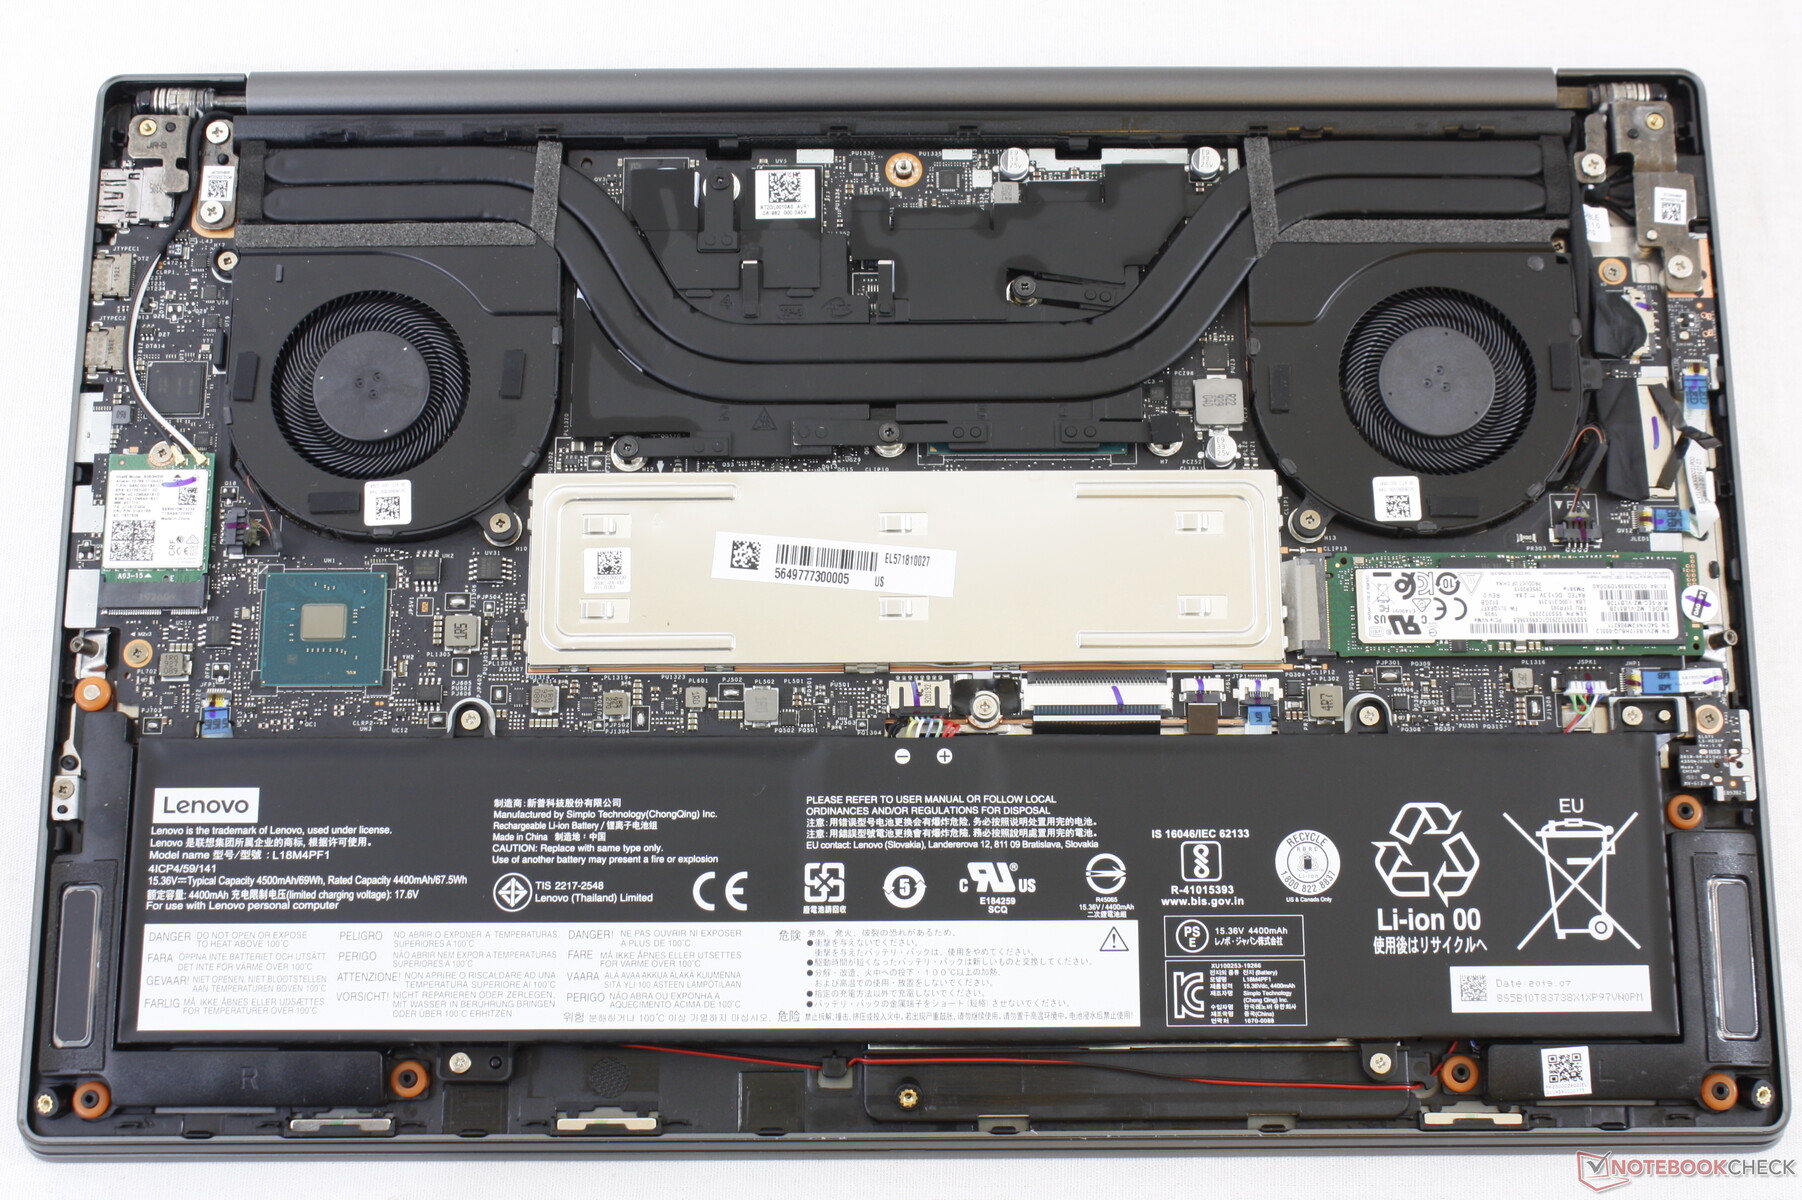
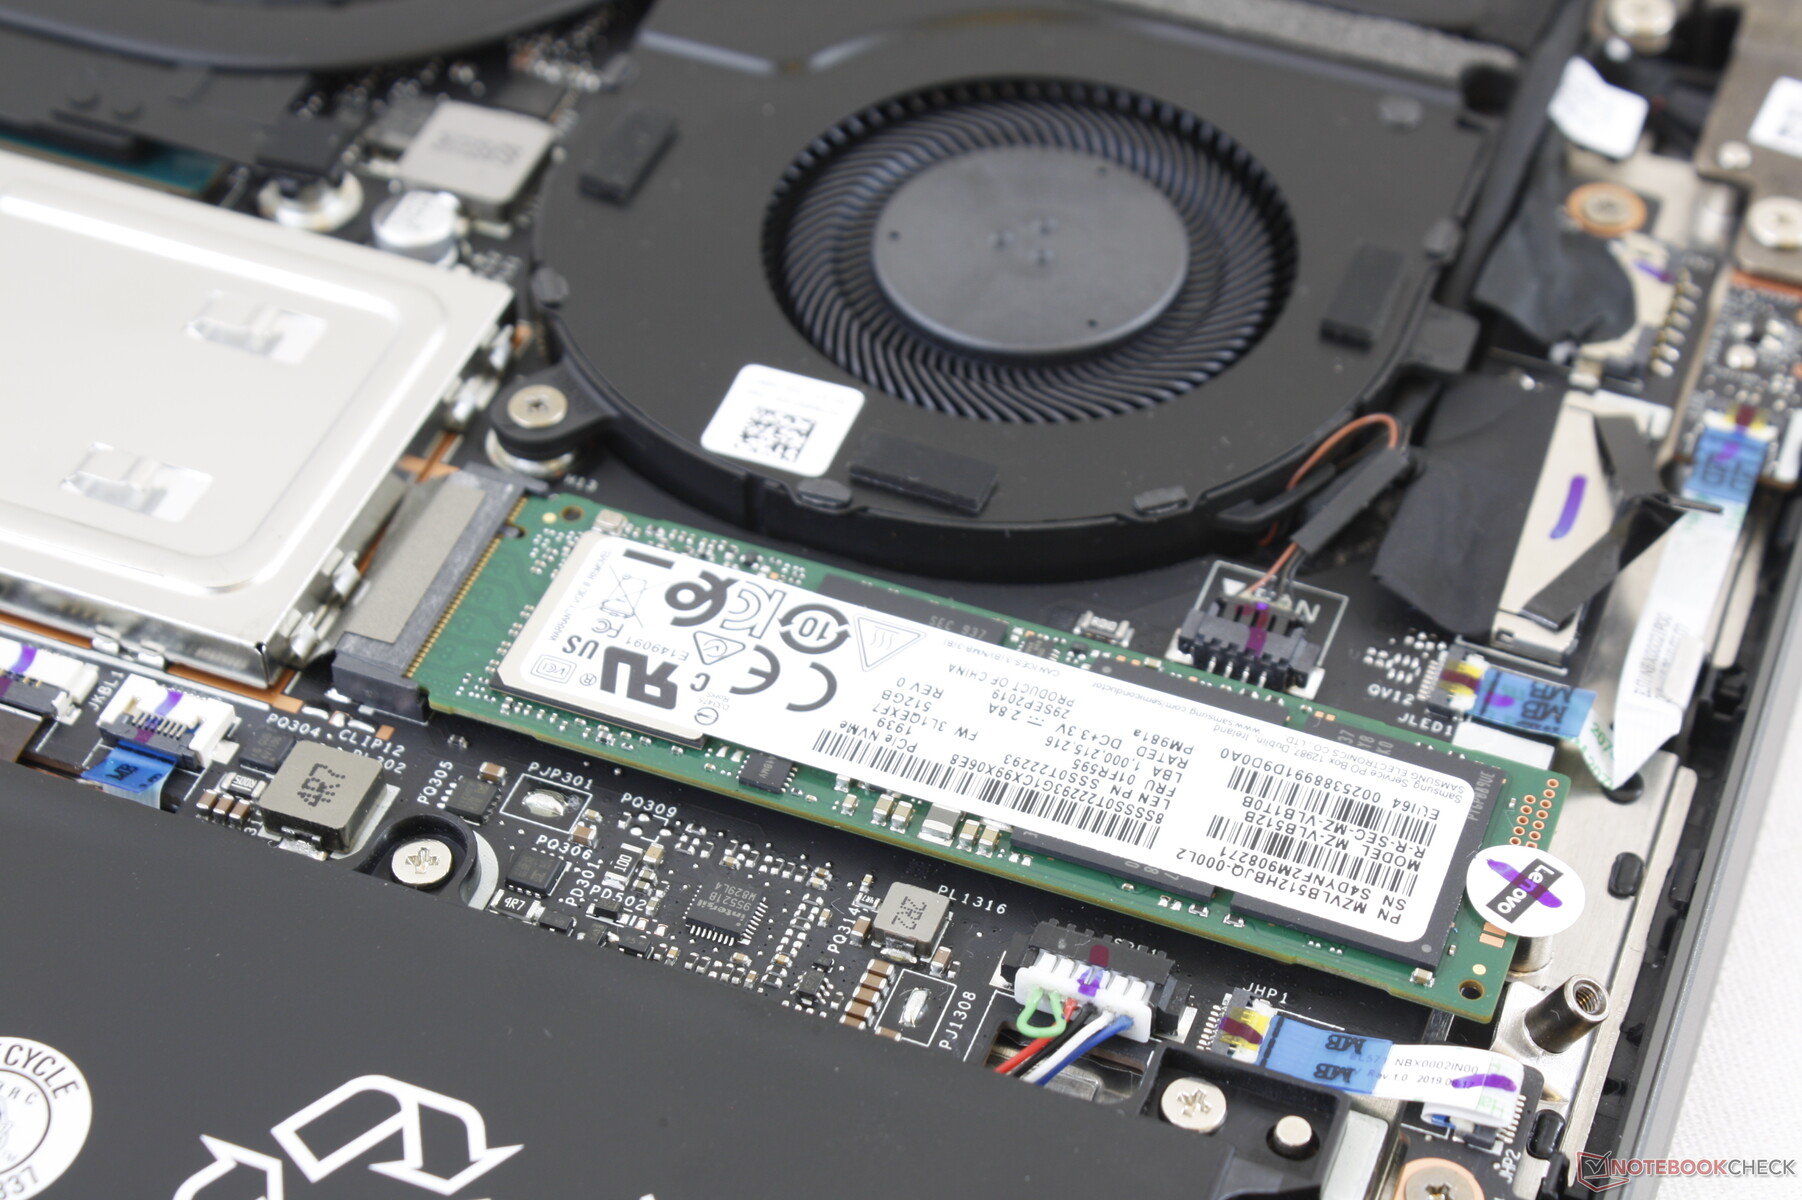
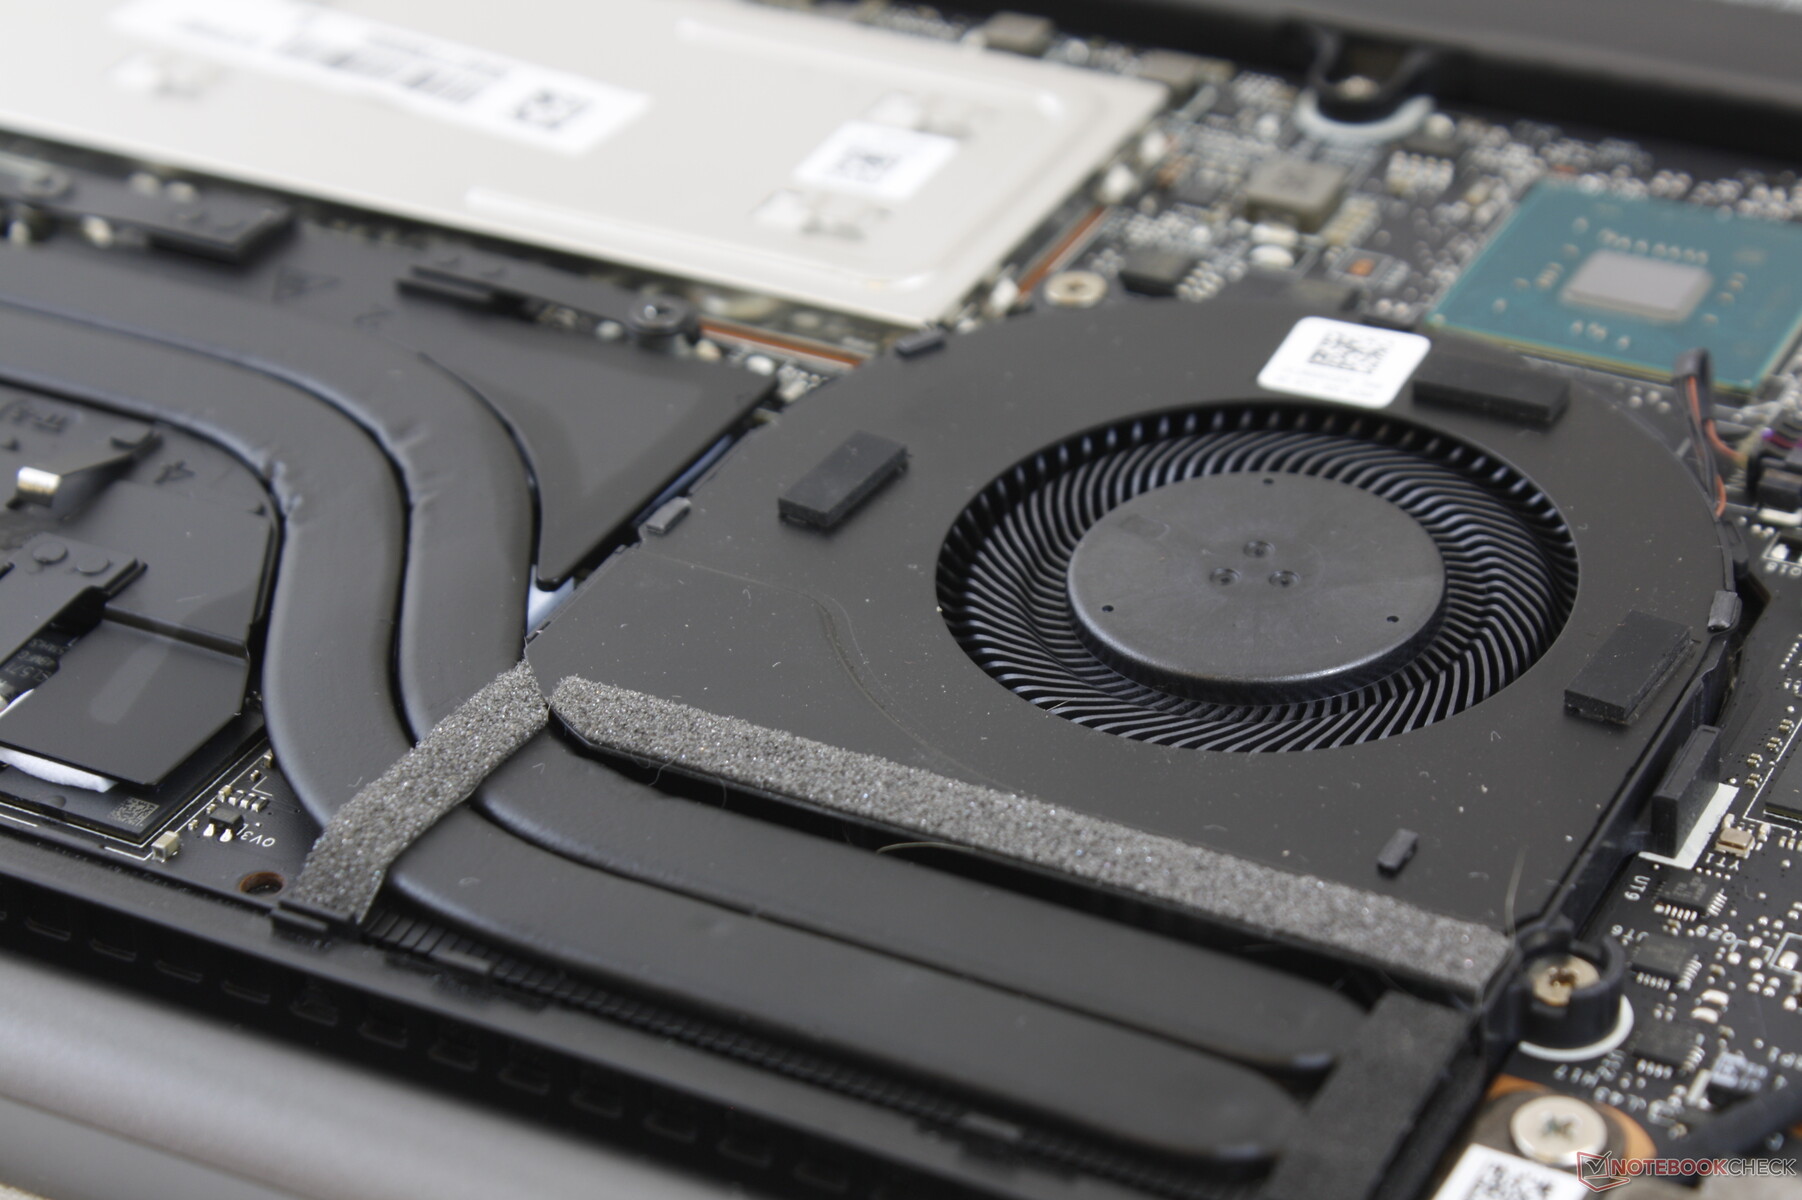
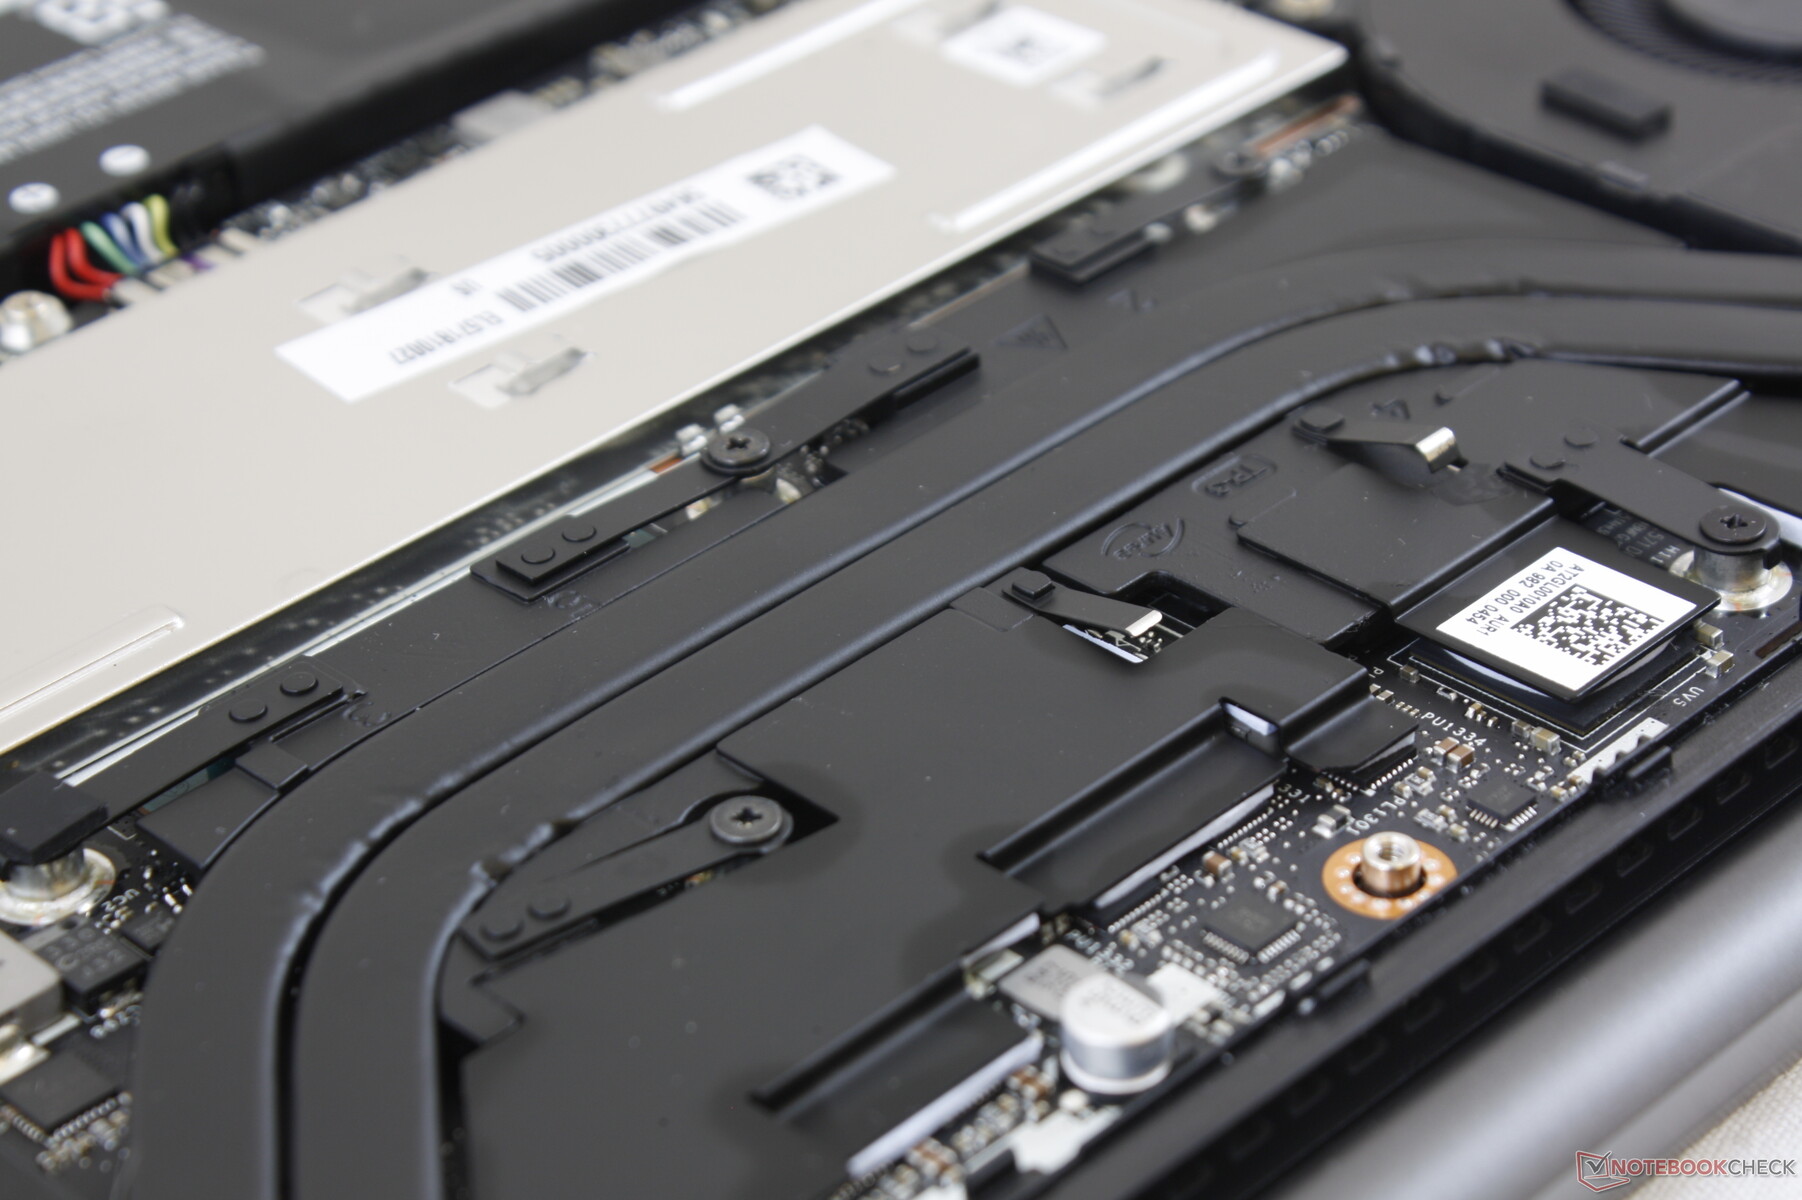
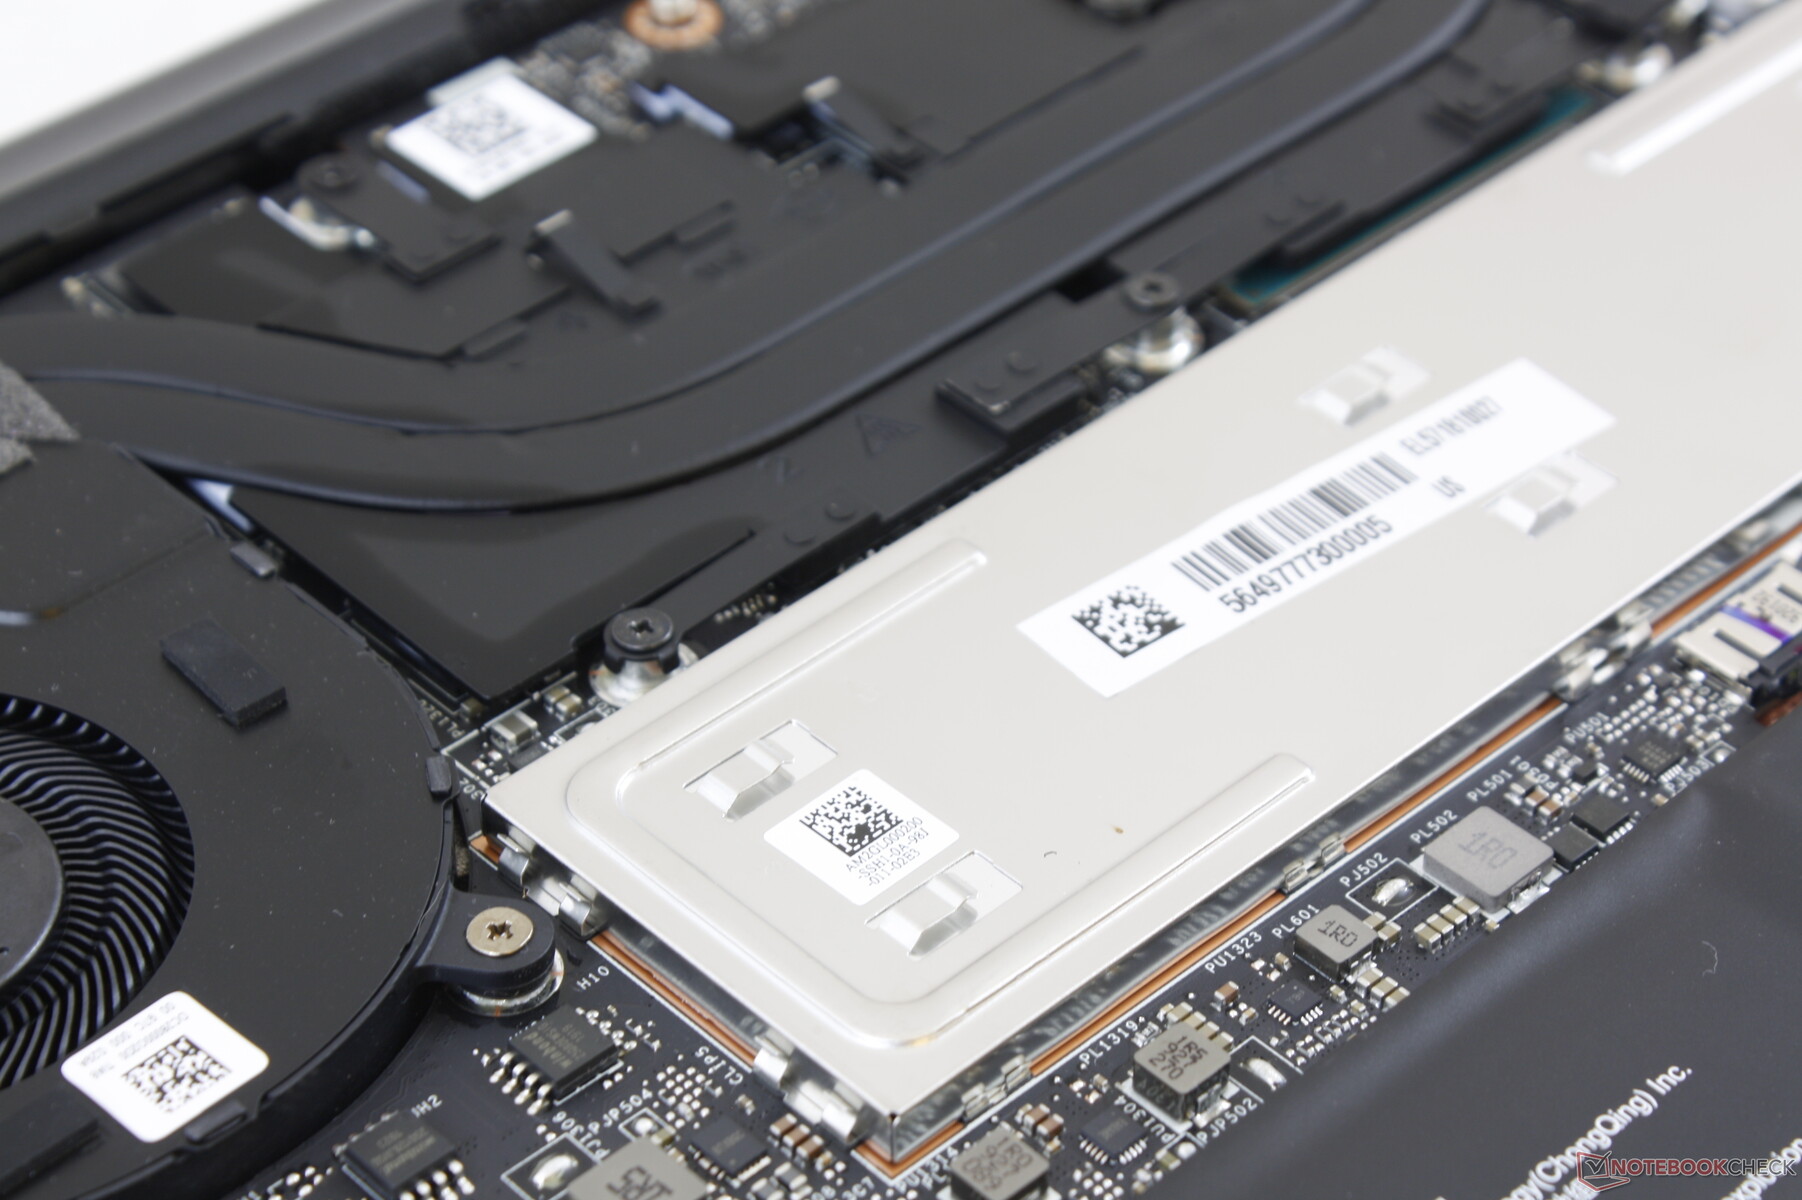
The bottom panel is secured by eight T5 Torx screws with none hidden underneath the rubber footing. Be aware that the edges of the panel are both sharp and tightly latched. Once inside, users can upgrade the WLAN, M.2 SSD, and both SODIMM slots protected under the aluminum plate.
Accessories and Warranty
There are no extras in the box other than the AC adapter and instruction booklet. The standard one-year limited warranty applies with extension and accidental damage protection options up to four years.
Input Devices
Keyboard
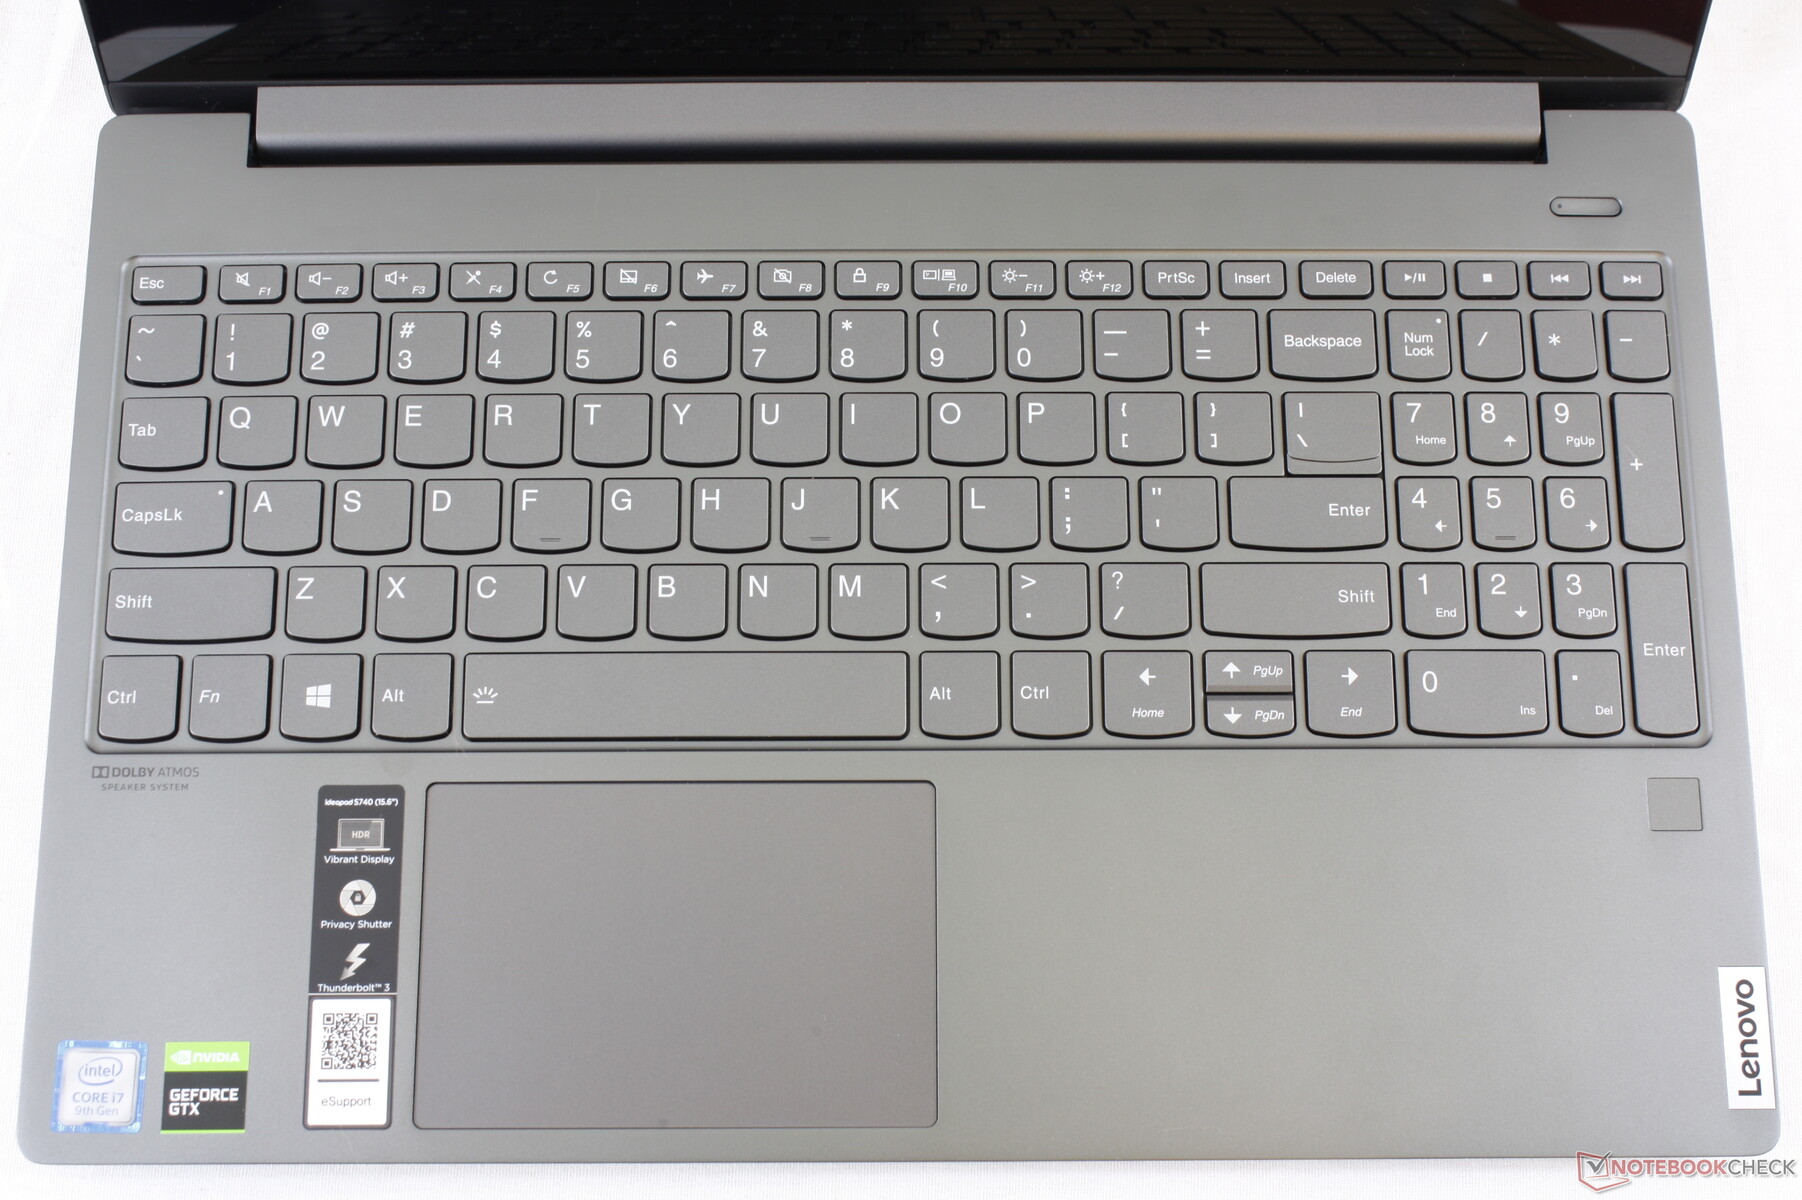
When compared to ThinkPad keyboards, IdeaPad keyboards are noticeably shallower with weaker feedback. It'll take some getting used to if you're coming from a Spectre, XPS, or desktop PC where keys are firmer and more satisfying to type on. If you're already accustomed to typing on Ultrabooks, however, then the IdeaPad S740 won't feel all that different especially since Lenovo uses almost identical key caps across most IdeaPad models.
Touchpad
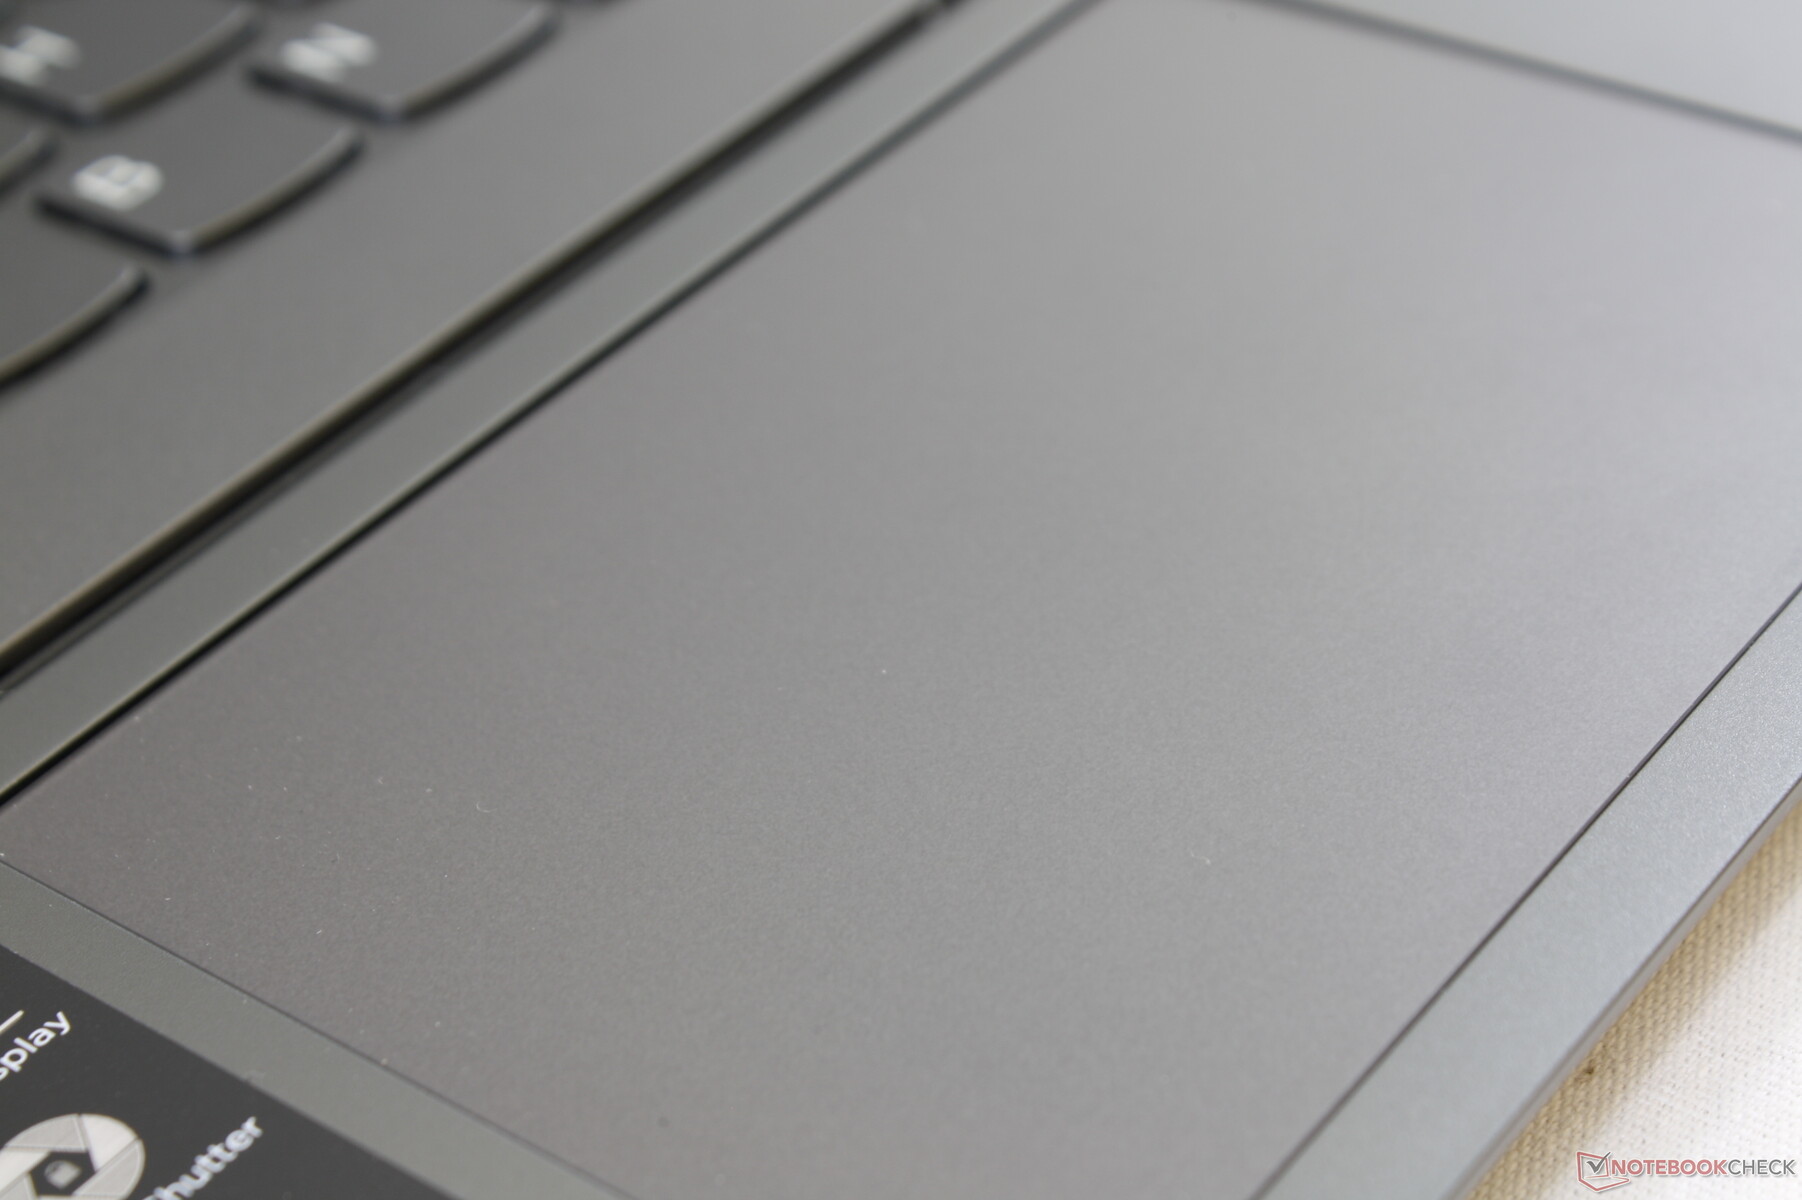
The clickpad (10.5 x 7 cm) is smaller than on the XPS 15 (10.5 x 8.5 cm) and only slightly larger than on the 2019 Spectre x360 15 (12 x 6 cm). Its surface is smoother than on most other clickpads even when gliding at very slow speeds. We can observe no cursor jumping or responsiveness issues.
The integrated mouse keys are shallow in travel with weak feedback despite the high-pitched auditory click. While we wouldn't call it spongy, it's nothing special or noteworthy, either.


Display
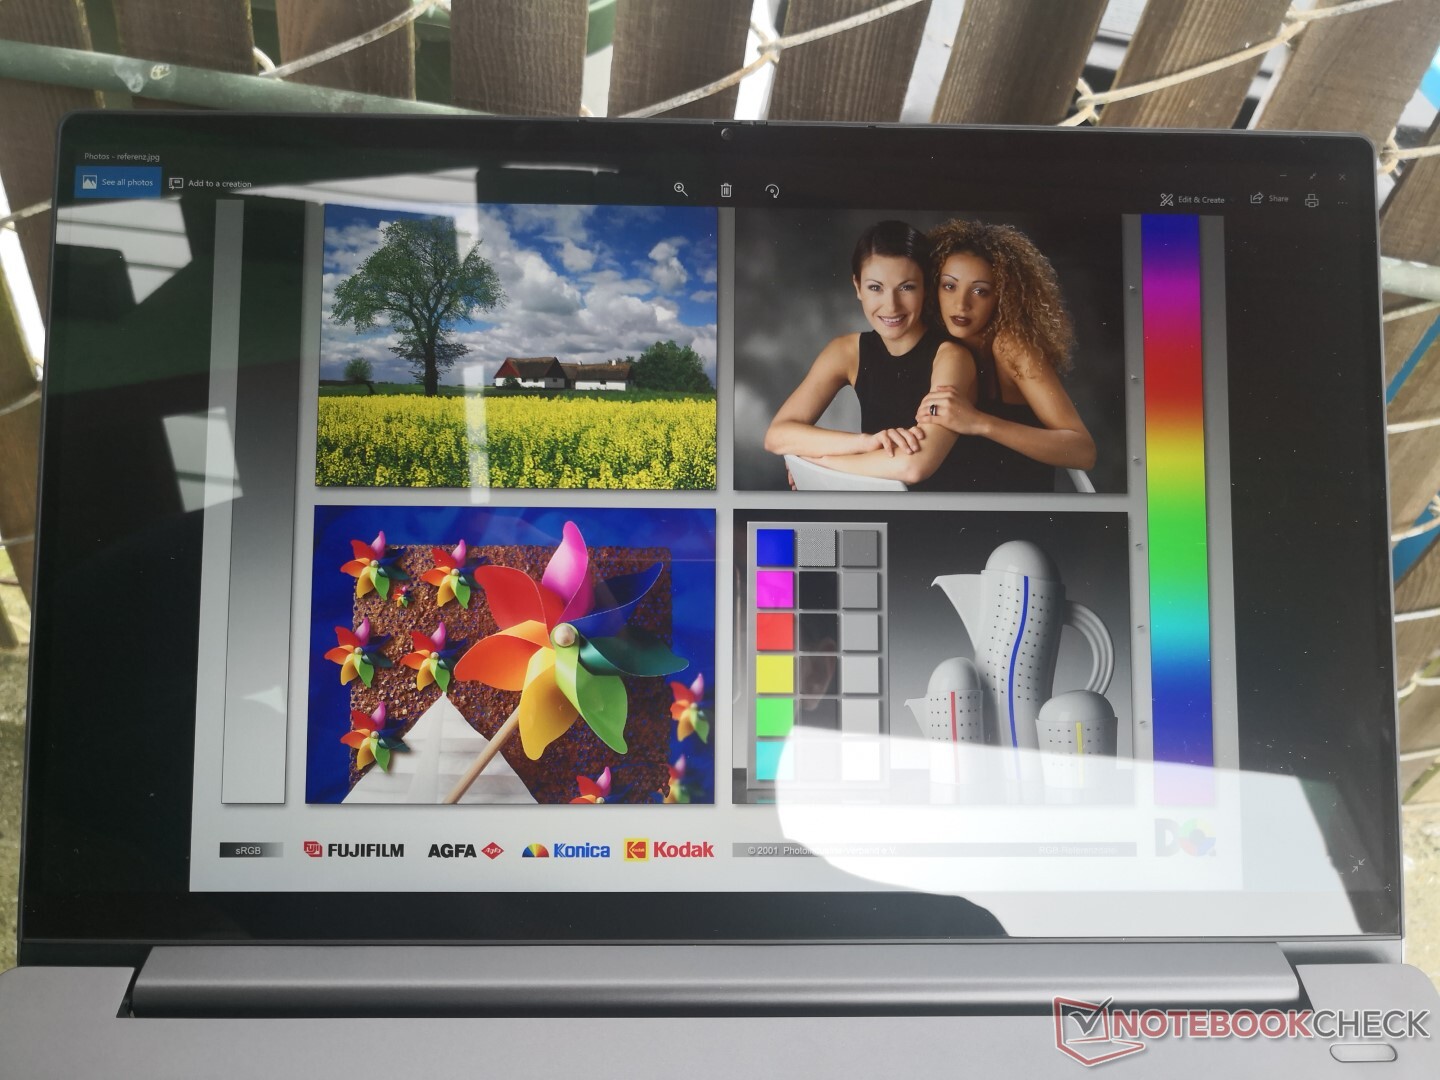
Two display options are available: 1080p or 4K UHD Dolby Vision HDR. Both are glossy with the promise of 500 nits to be nearly as bright as the new MacBook Pro 16. The BOE HF NE156QUM-N55 IPS panel here also offers faster response times than the AU Optronics panel on the HP Spectre x360 15 for less noticeable ghosting. It's a high quality panel with minimal uneven backlight bleeding and a comparable contrast ratio to flagship alternatives.


| |||||||||||||||||||||||||
Brightness Distribution: 83 %
Center on Battery: 475.8 cd/m²
Contrast: 1220:1 (Black: 0.39 cd/m²)
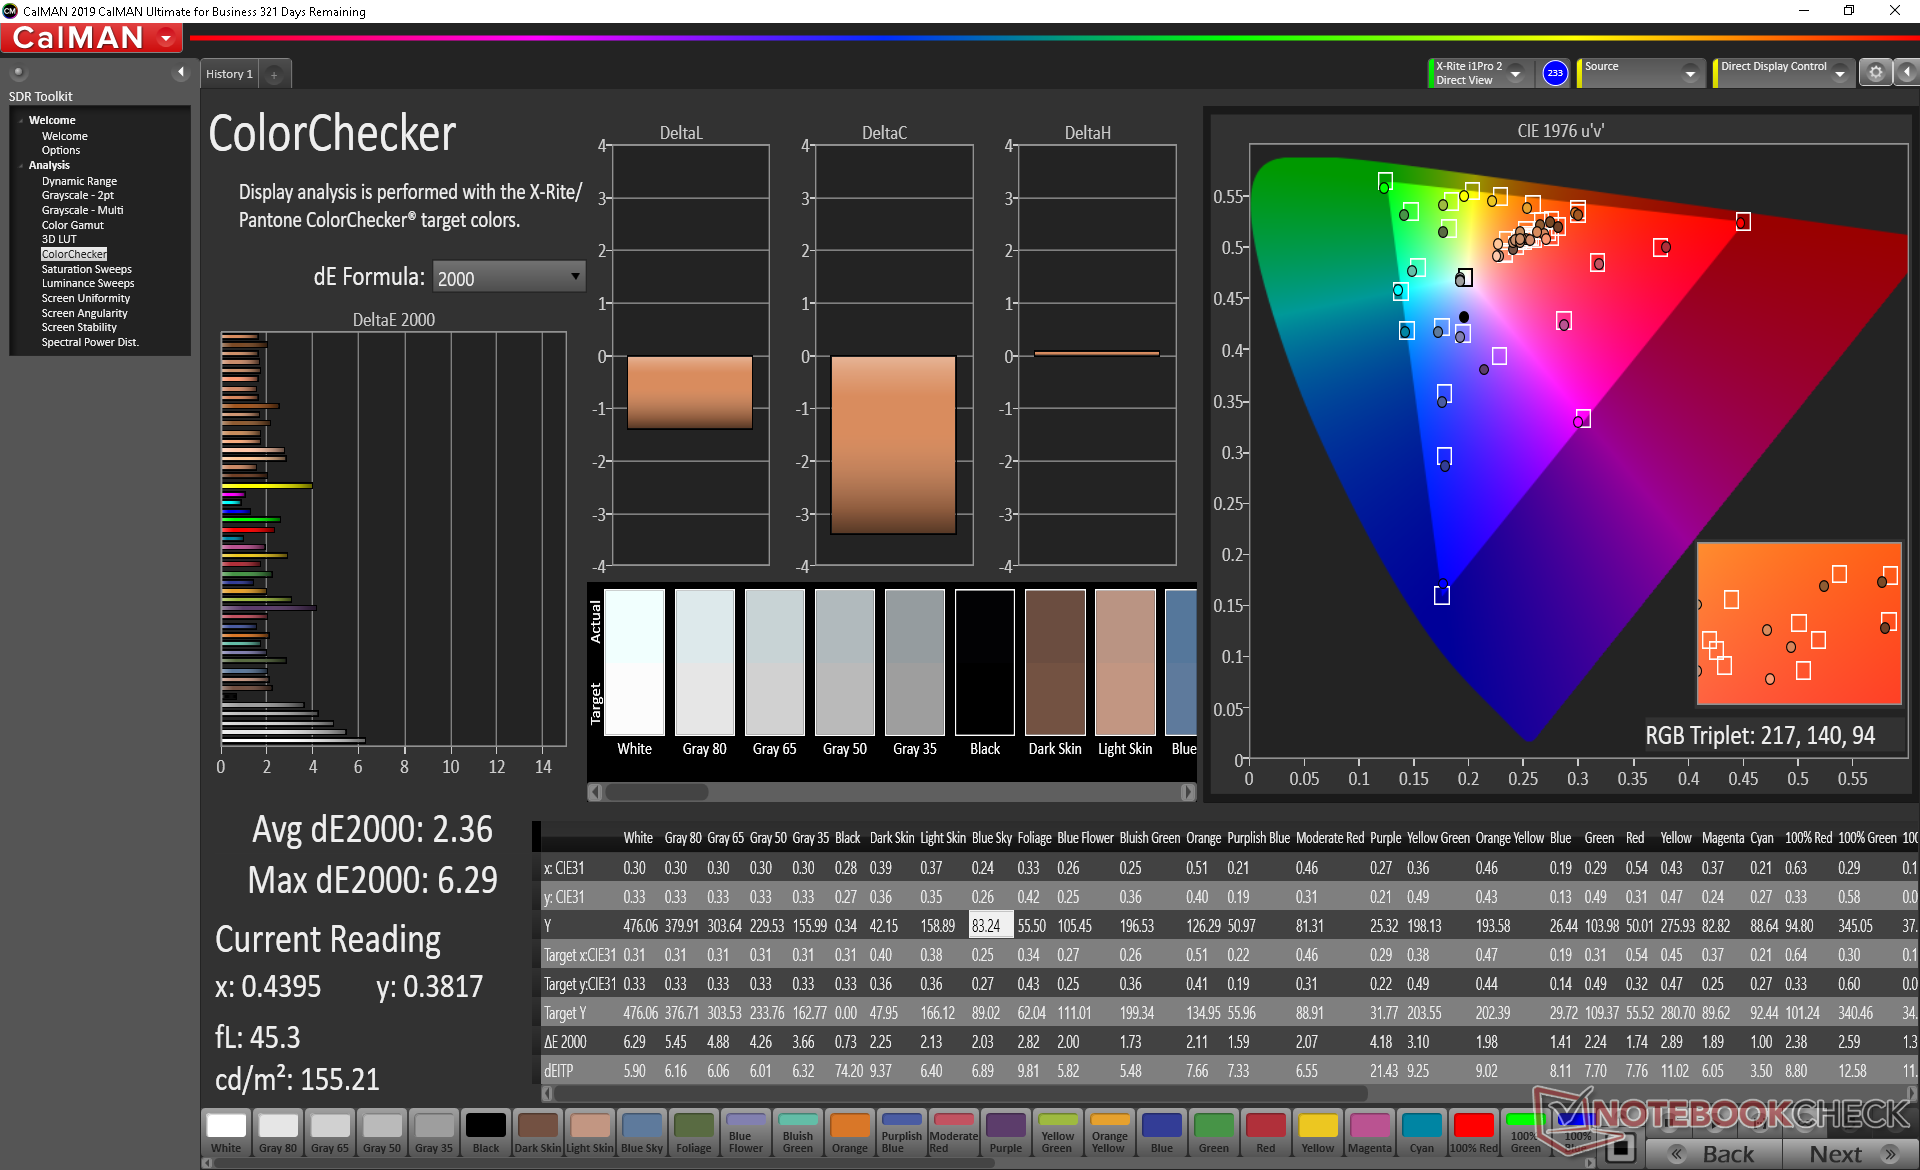
ΔE ColorChecker Calman: 2.36 | ∀{0.5-29.43 Ø4.73}
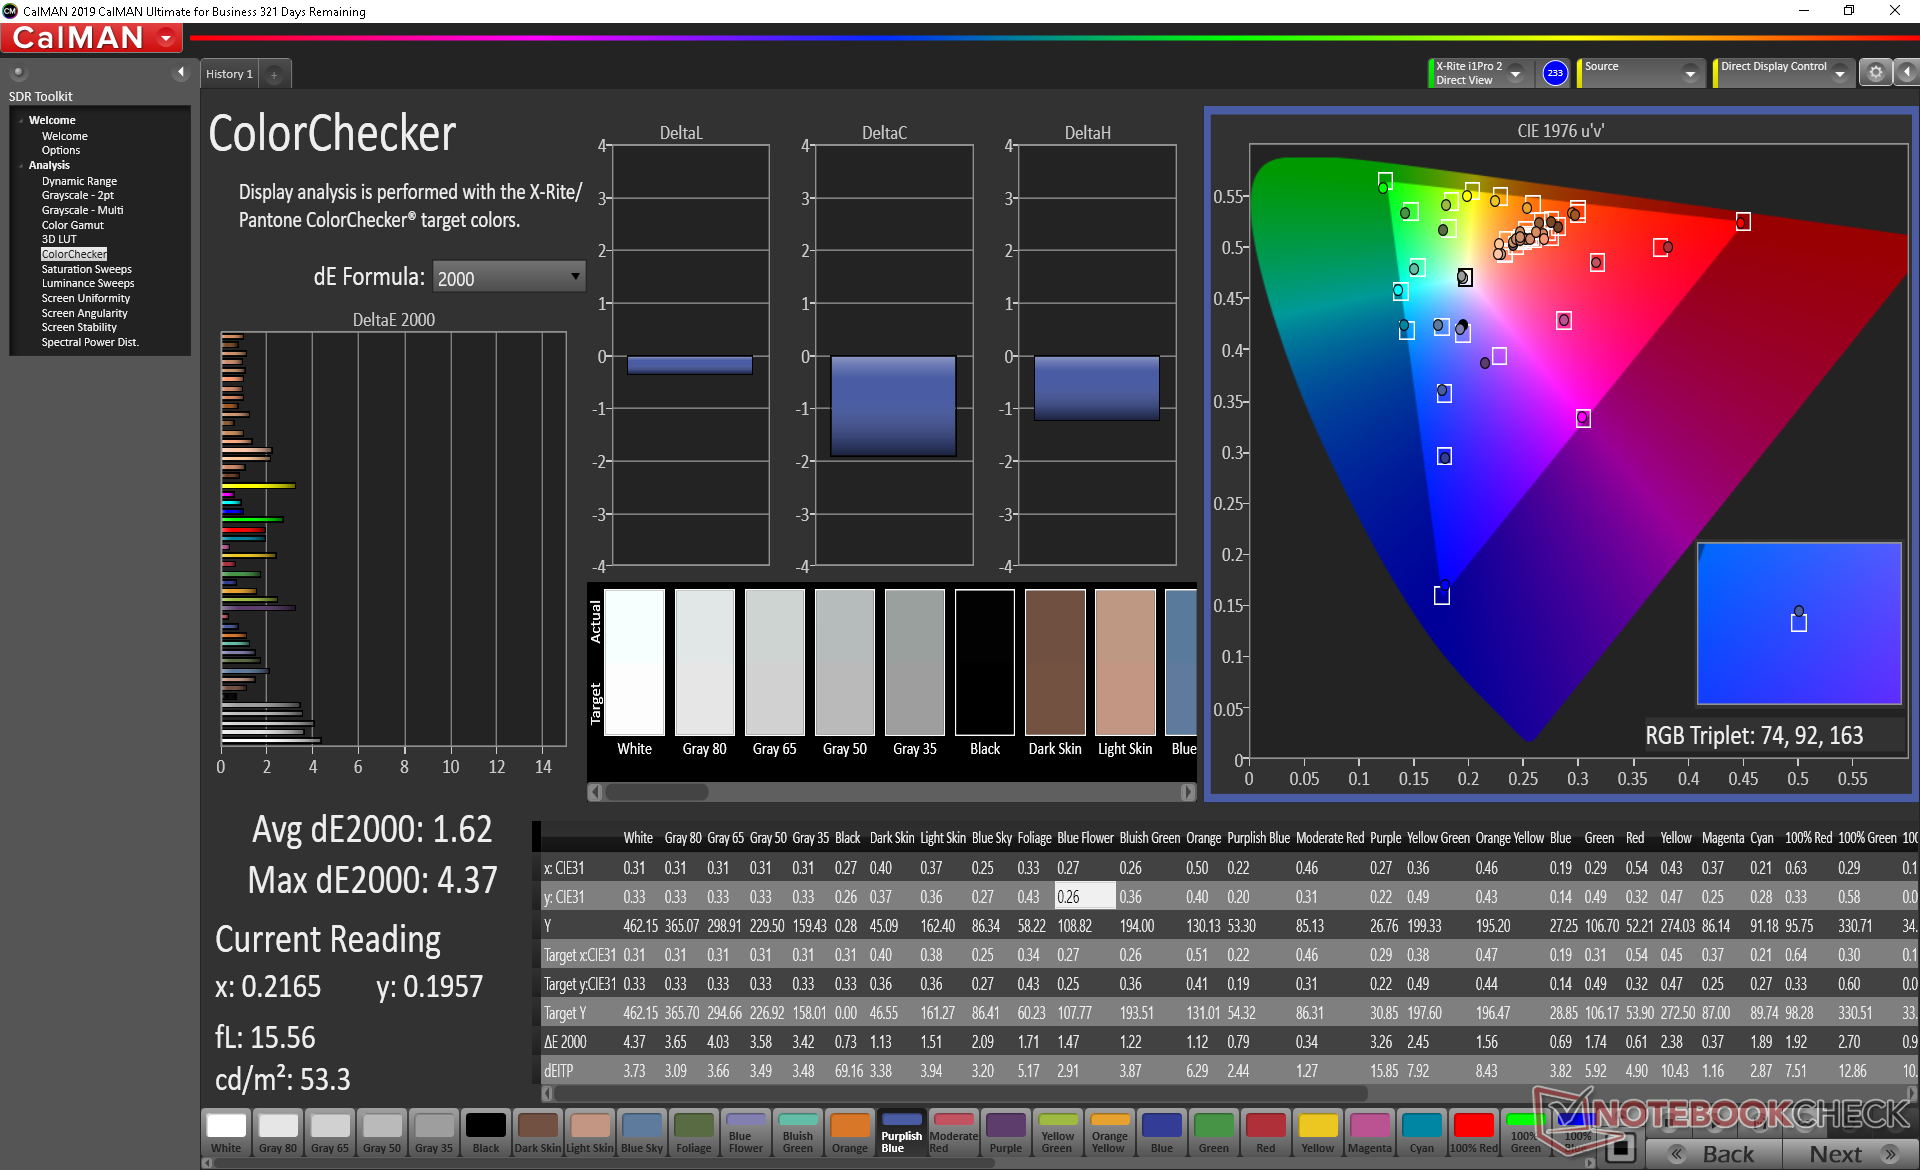
calibrated: 1.62
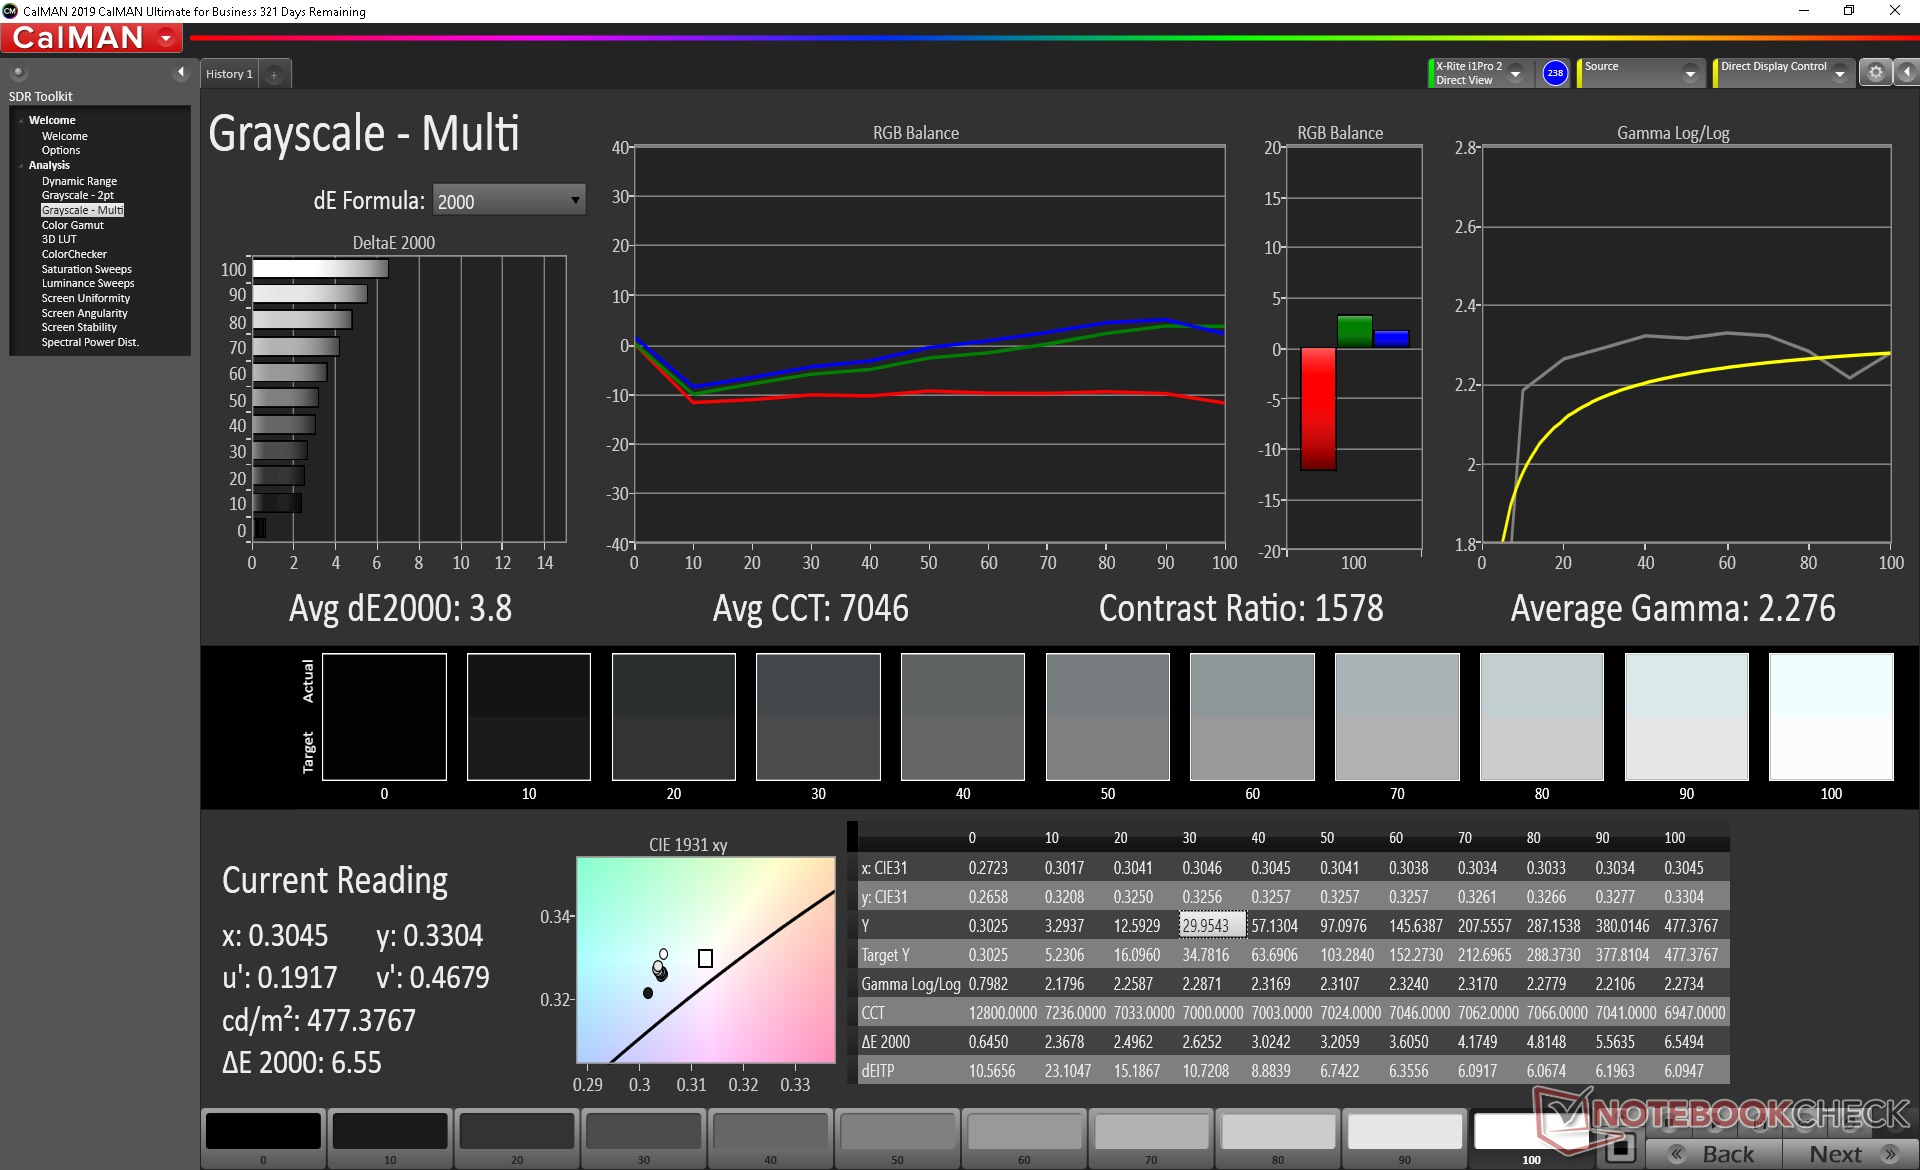
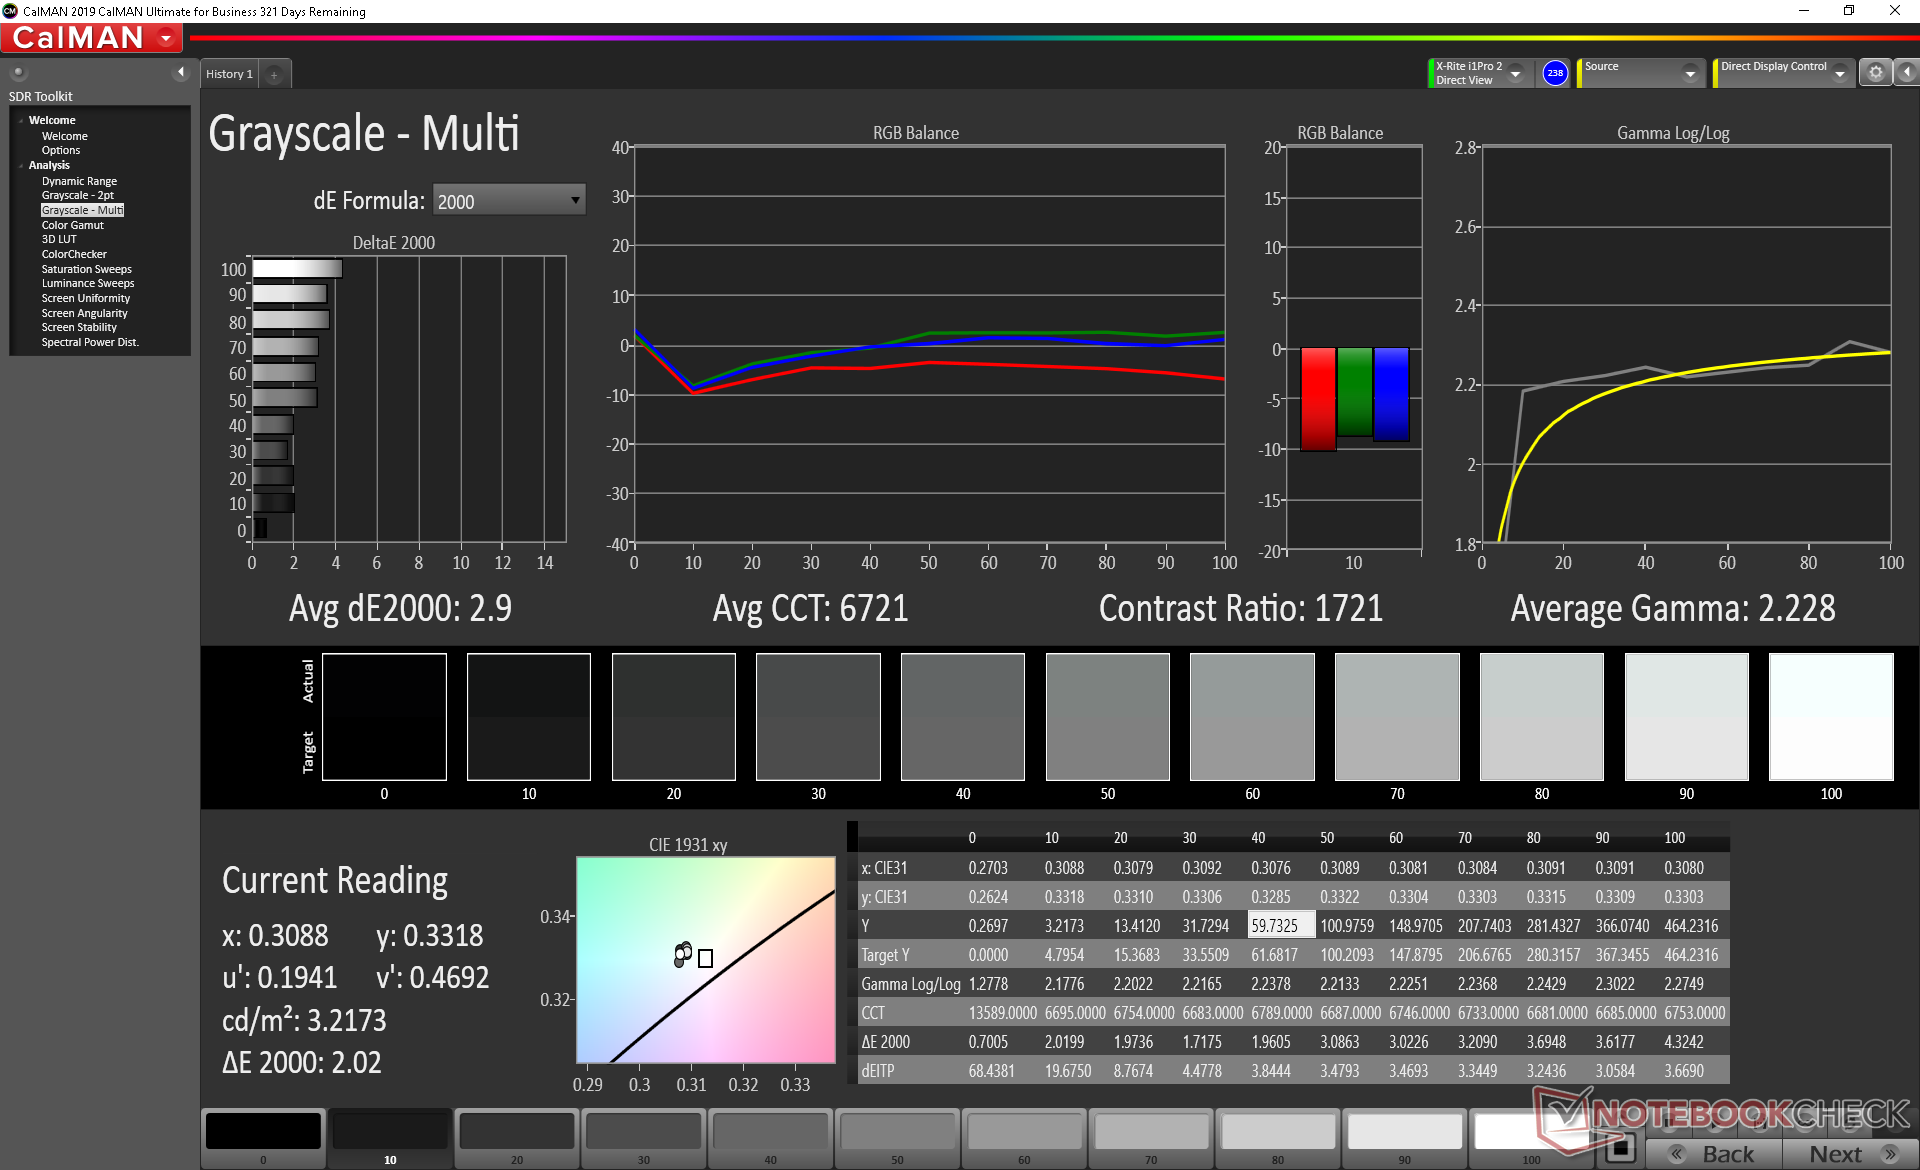
ΔE Greyscale Calman: 3.8 | ∀{0.09-98 Ø4.97}
91.7% sRGB (Argyll 1.6.3 3D)
58% AdobeRGB 1998 (Argyll 1.6.3 3D)
63.1% AdobeRGB 1998 (Argyll 3D)
90.5% sRGB (Argyll 3D)
61.2% Display P3 (Argyll 3D)
Gamma: 2.28
CCT: 7046 K
| Lenovo IdeaPad S740-15IRH BOE HF NE156QUM-N55, IPS, 15.6", 3840x2160 | Dell XPS 15 7590 9980HK GTX 1650 Samsung 156WR04, SDCA029, OLED, 15.6", 3840x2160 | HP Spectre X360 15-5ZV31AV AU Optronics AUO30EB, IPS, 15.6", 3840x2160 | Lenovo Yoga 730-15IKB BOE HF NV156QUM-N51, IPS, 15.6", 3840x2160 | Asus ZenBook 15 UX534FT-DB77 BOE NV156FHM-N63, IPS, 15.6", 1920x1080 | MSI Prestige 15 A10SC Sharp LQ156D1JW42, IPS, 15.6", 3840x2160 | |
|---|---|---|---|---|---|---|
| Display | 33% | 8% | 5% | 3% | 32% | |
| Display P3 Coverage (%) | 61.2 | 88.1 44% | 68.3 12% | 68.7 12% | 66.6 9% | 82 34% |
| sRGB Coverage (%) | 90.5 | 99.6 10% | 94.3 4% | 90 -1% | 87.7 -3% | 98.3 9% |
| AdobeRGB 1998 Coverage (%) | 63.1 | 91.8 45% | 68.4 8% | 65.8 4% | 64.1 2% | 96.2 52% |
| Response Times | 93% | -46% | 12% | -12% | -50% | |
| Response Time Grey 50% / Grey 80% * (ms) | 40.4 ? | 2.3 ? 94% | 56.8 ? -41% | 34 ? 16% | 41.2 ? -2% | 60 ? -49% |
| Response Time Black / White * (ms) | 27.2 ? | 2.4 ? 91% | 40.8 ? -50% | 25 ? 8% | 33.2 ? -22% | 41.2 ? -51% |
| PWM Frequency (Hz) | 59.5 ? | 961 ? | 26040 ? | |||
| Screen | -22% | -13% | -19% | -39% | -8% | |
| Brightness middle (cd/m²) | 475.8 | 421.2 -11% | 284.6 -40% | 309 -35% | 312.6 -34% | 464.5 -2% |
| Brightness (cd/m²) | 439 | 417 -5% | 285 -35% | 299 -32% | 290 -34% | 451 3% |
| Brightness Distribution (%) | 83 | 94 13% | 85 2% | 84 1% | 85 2% | 92 11% |
| Black Level * (cd/m²) | 0.39 | 0.25 36% | 0.29 26% | 0.31 21% | 0.5 -28% | |
| Contrast (:1) | 1220 | 1138 -7% | 1066 -13% | 1008 -17% | 929 -24% | |
| Colorchecker dE 2000 * | 2.36 | 6.06 -157% | 3.52 -49% | 3.9 -65% | 5.78 -145% | 3.36 -42% |
| Colorchecker dE 2000 max. * | 6.29 | 11.89 -89% | 5.56 12% | 7.5 -19% | 8.86 -41% | 7.06 -12% |
| Colorchecker dE 2000 calibrated * | 1.62 | 3 -85% | 3.78 -133% | 3.42 -111% | ||
| Greyscale dE 2000 * | 3.8 | 2.8 26% | 3.2 16% | 4.58 -21% | 5.4 -42% | 1.3 66% |
| Gamma | 2.28 96% | 2.15 102% | 2.28 96% | 2.43 91% | 2.21 100% | 2.14 103% |
| CCT | 7046 92% | 6235 104% | 7070 92% | 7344 89% | 7864 83% | 6596 99% |
| Color Space (Percent of AdobeRGB 1998) (%) | 58 | 81 40% | 61.1 5% | 39 -33% | 57.1 -2% | 84.8 46% |
| Color Space (Percent of sRGB) (%) | 91.7 | 99.6 9% | 93.8 2% | 90 -2% | 87.4 -5% | 98.3 7% |
| Total Average (Program / Settings) | 35% /
8% | -17% /
-13% | -1% /
-10% | -16% /
-28% | -9% /
-6% |
* ... smaller is better
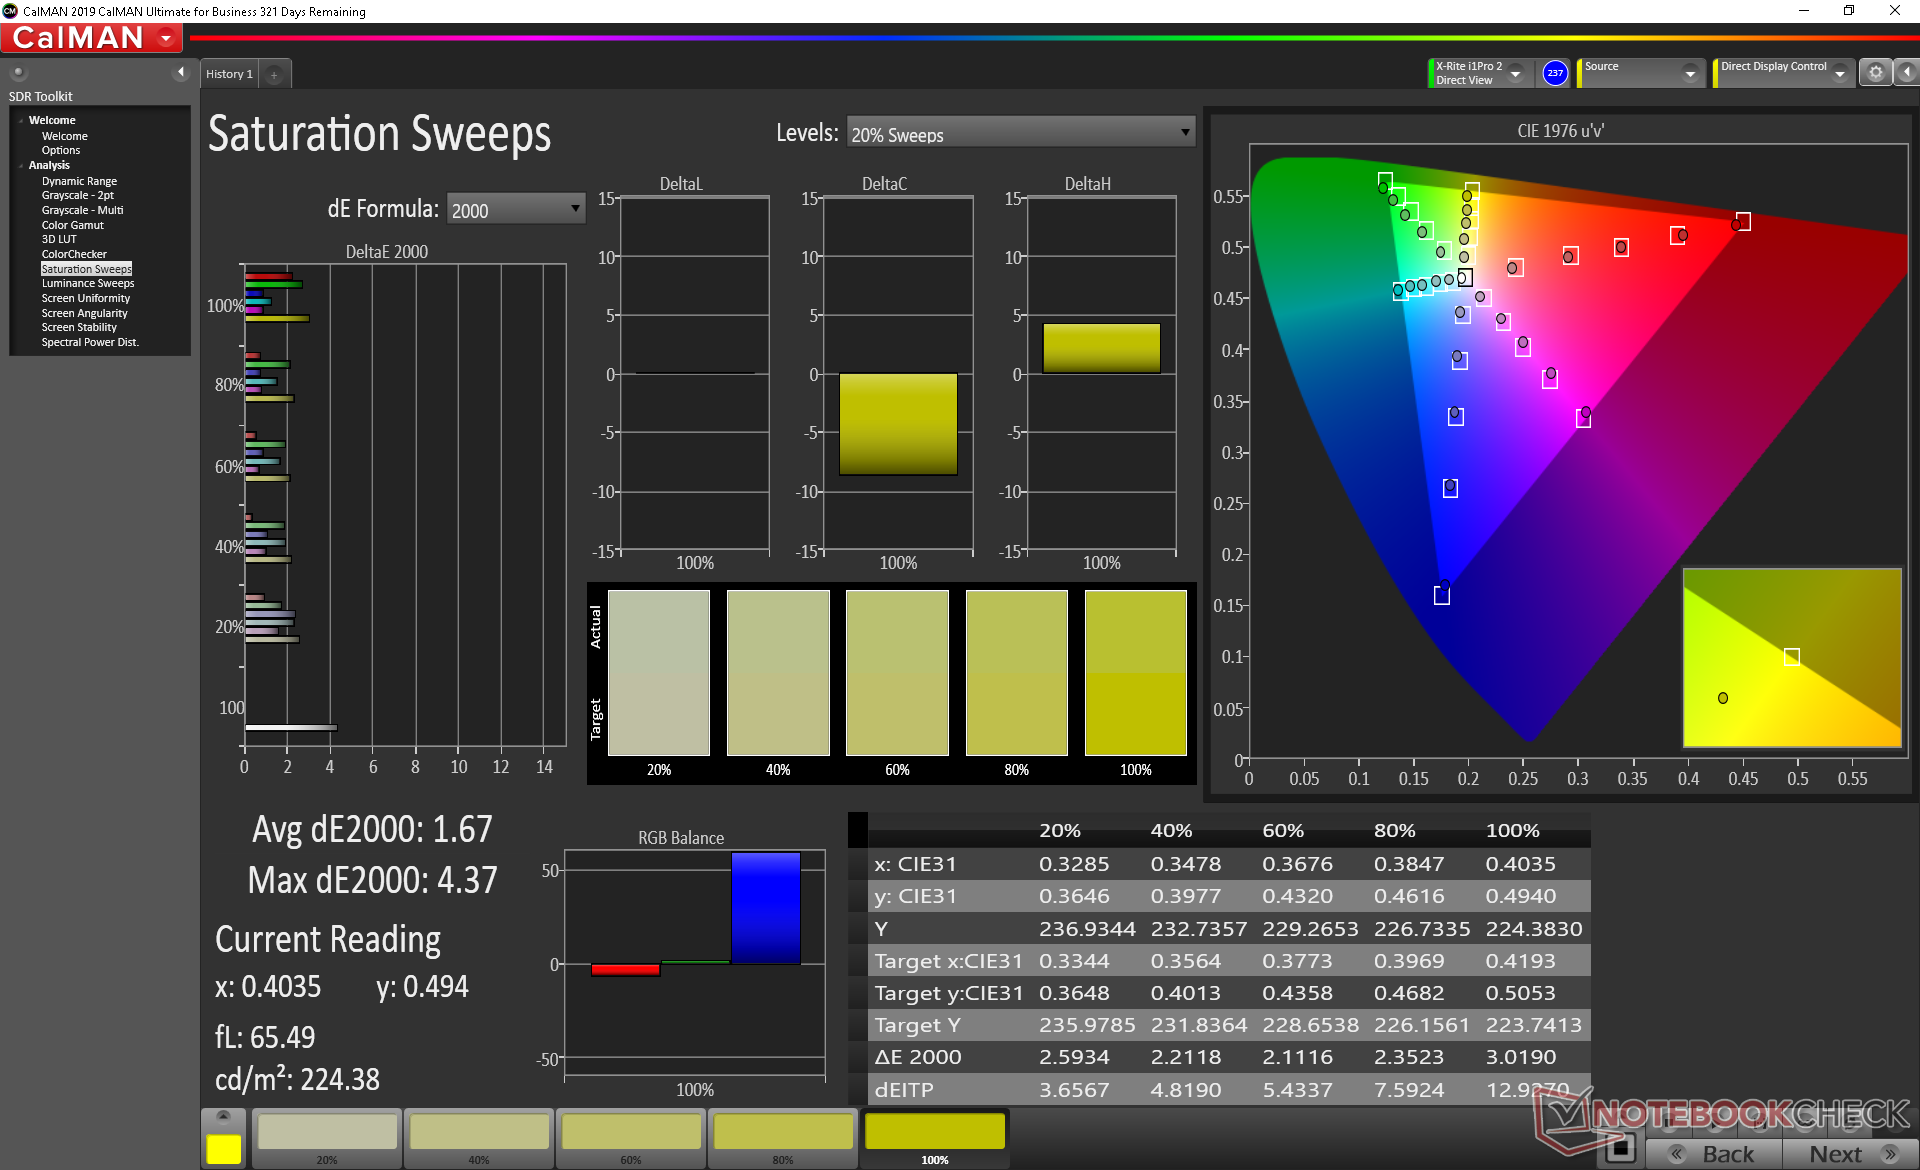
Color space covers approximately 92 percent and 58 percent of the sRGB and AdobeRGB standards, respectively, to be comparable to the 4K UHD panel on the late 2019 HP Spectre x360 15. Users who want even deeper and more accurate colors should consider other laptops with Sharp IGZO or OLED options like the Razer Blade 15 or Dell XPS 15.
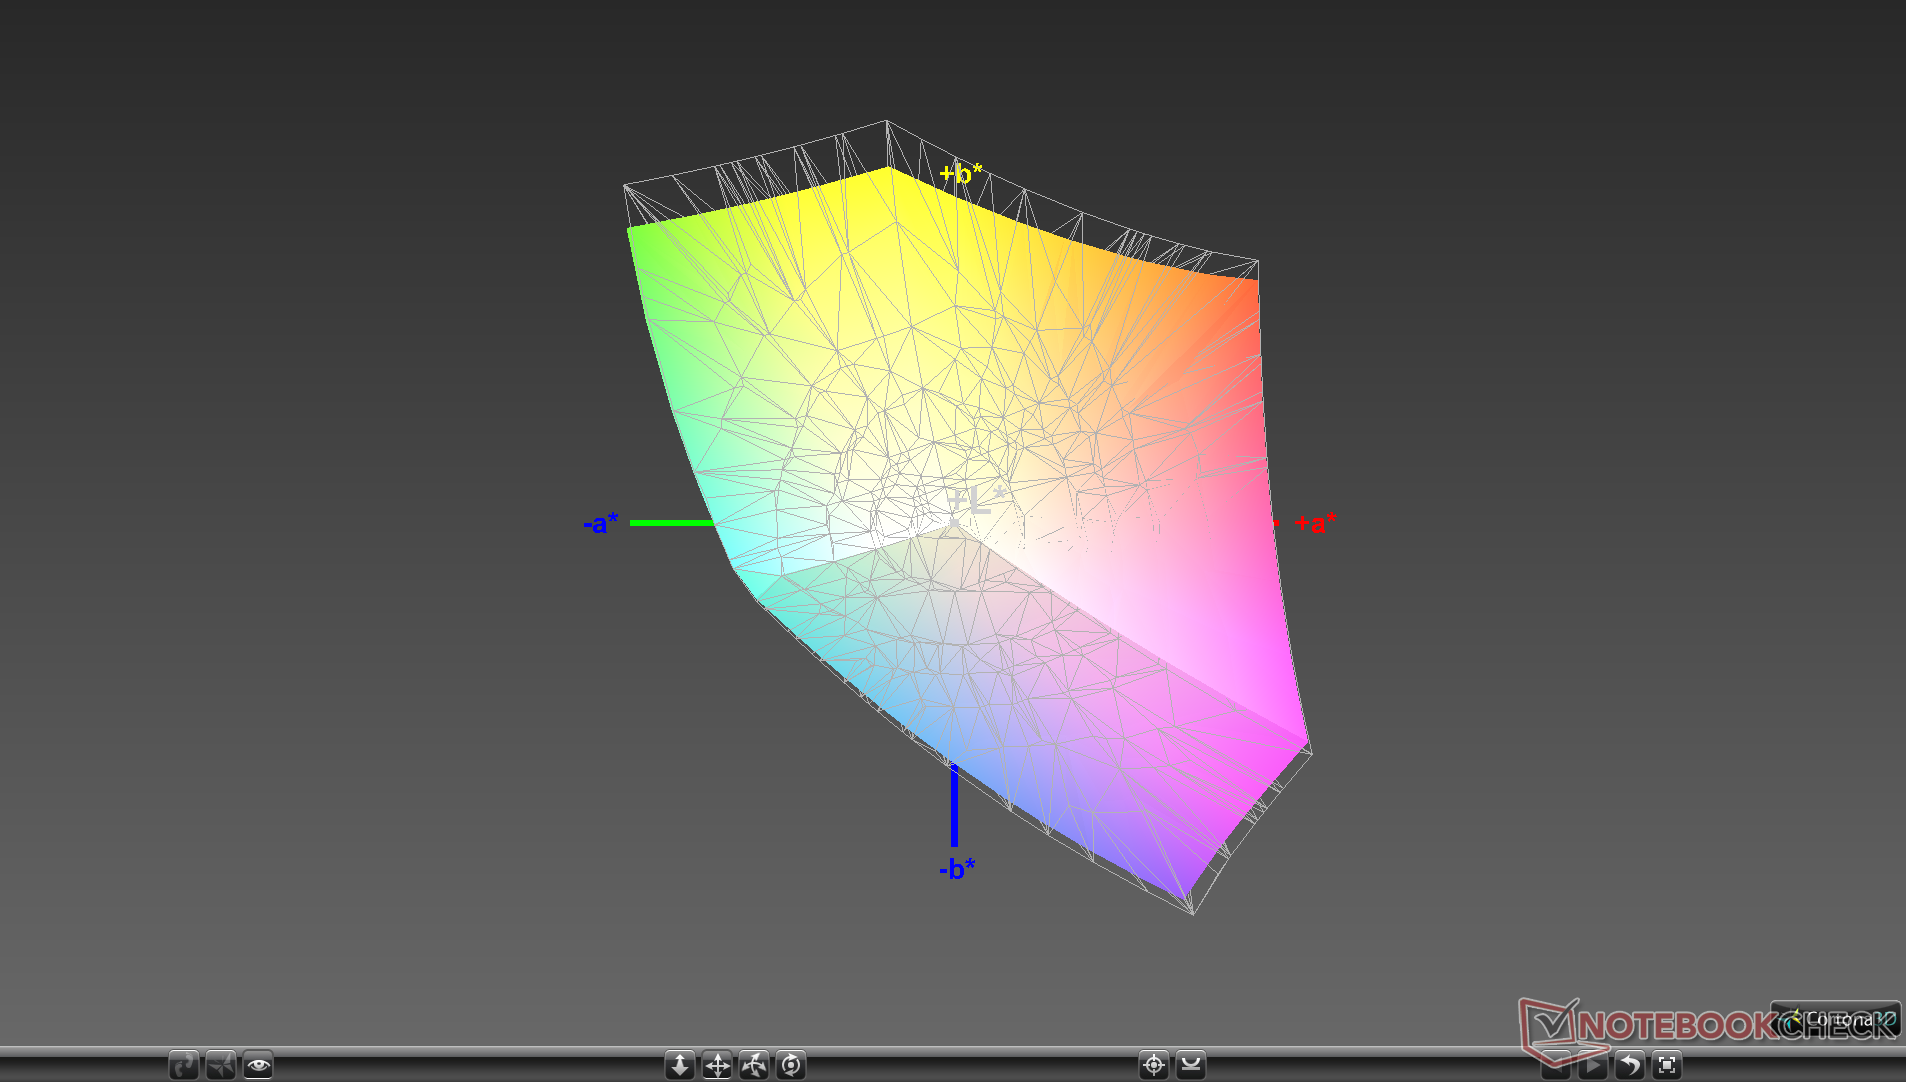
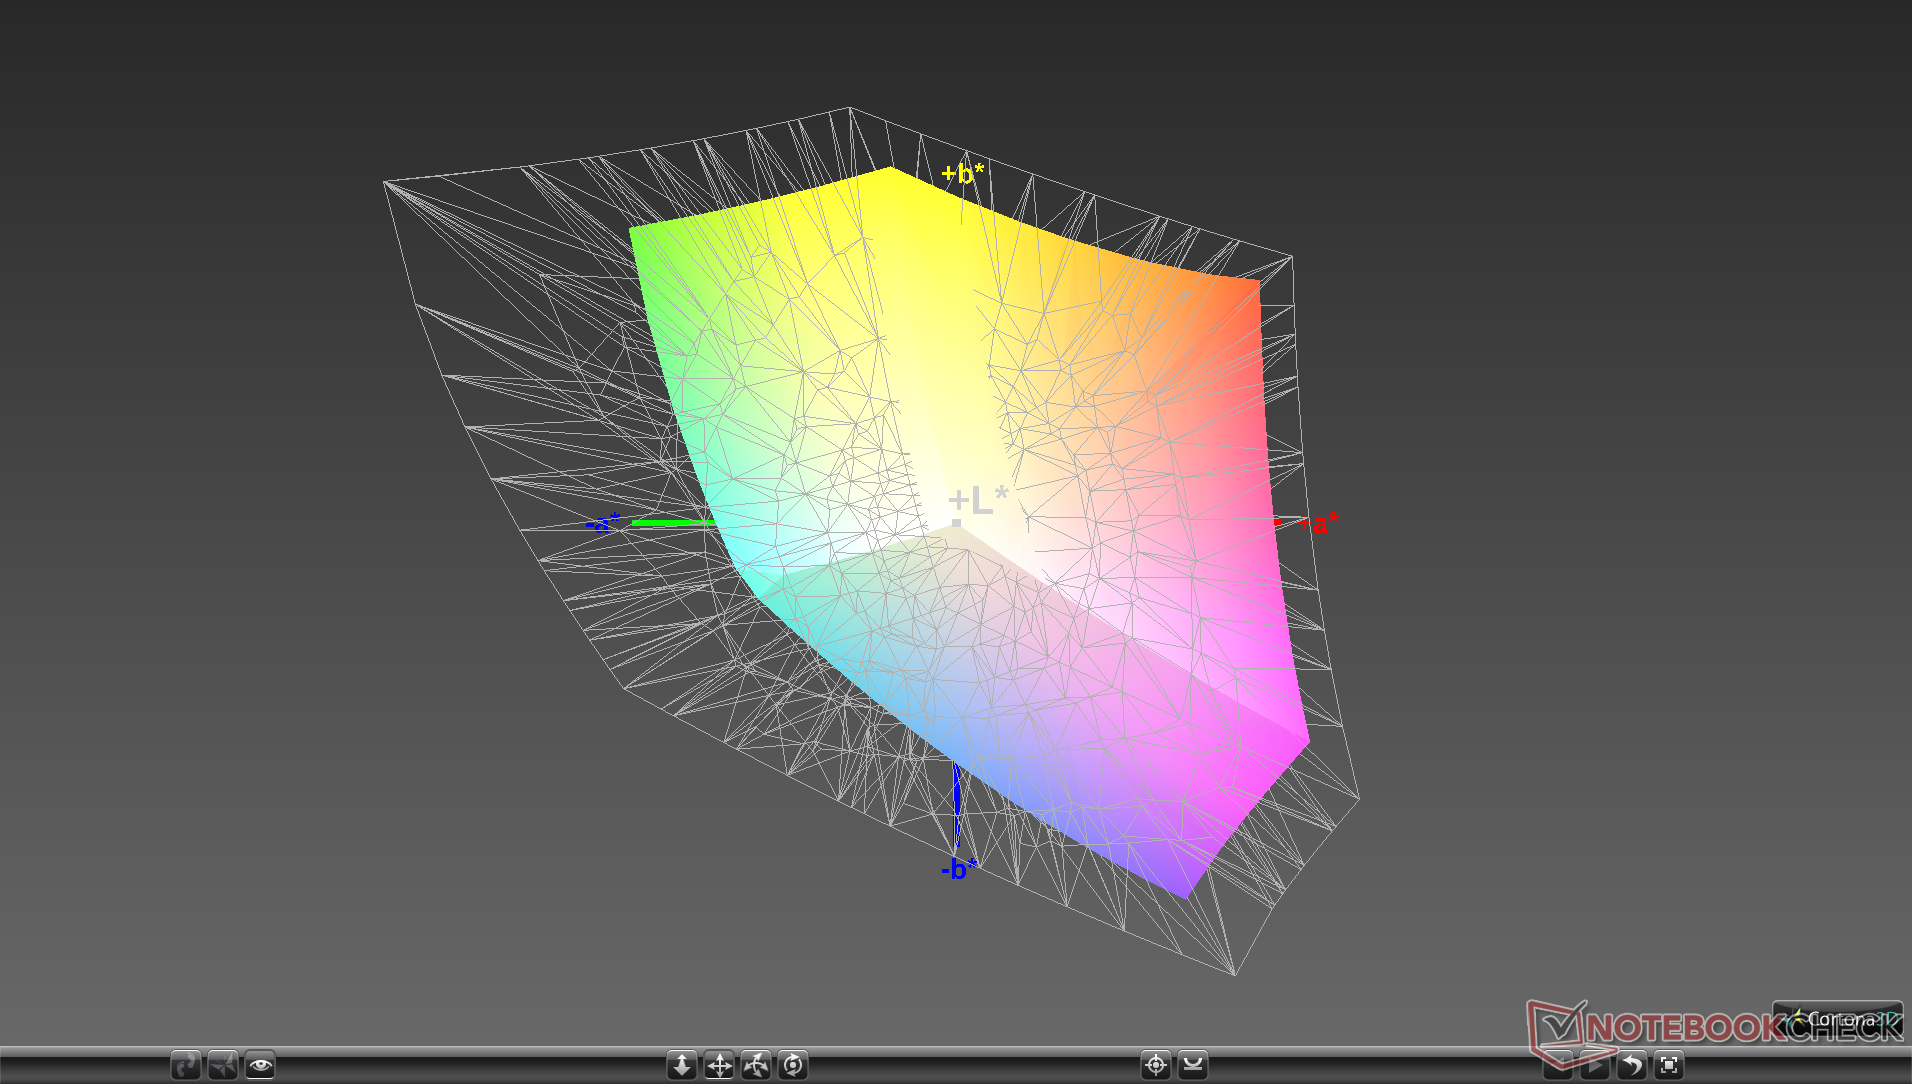
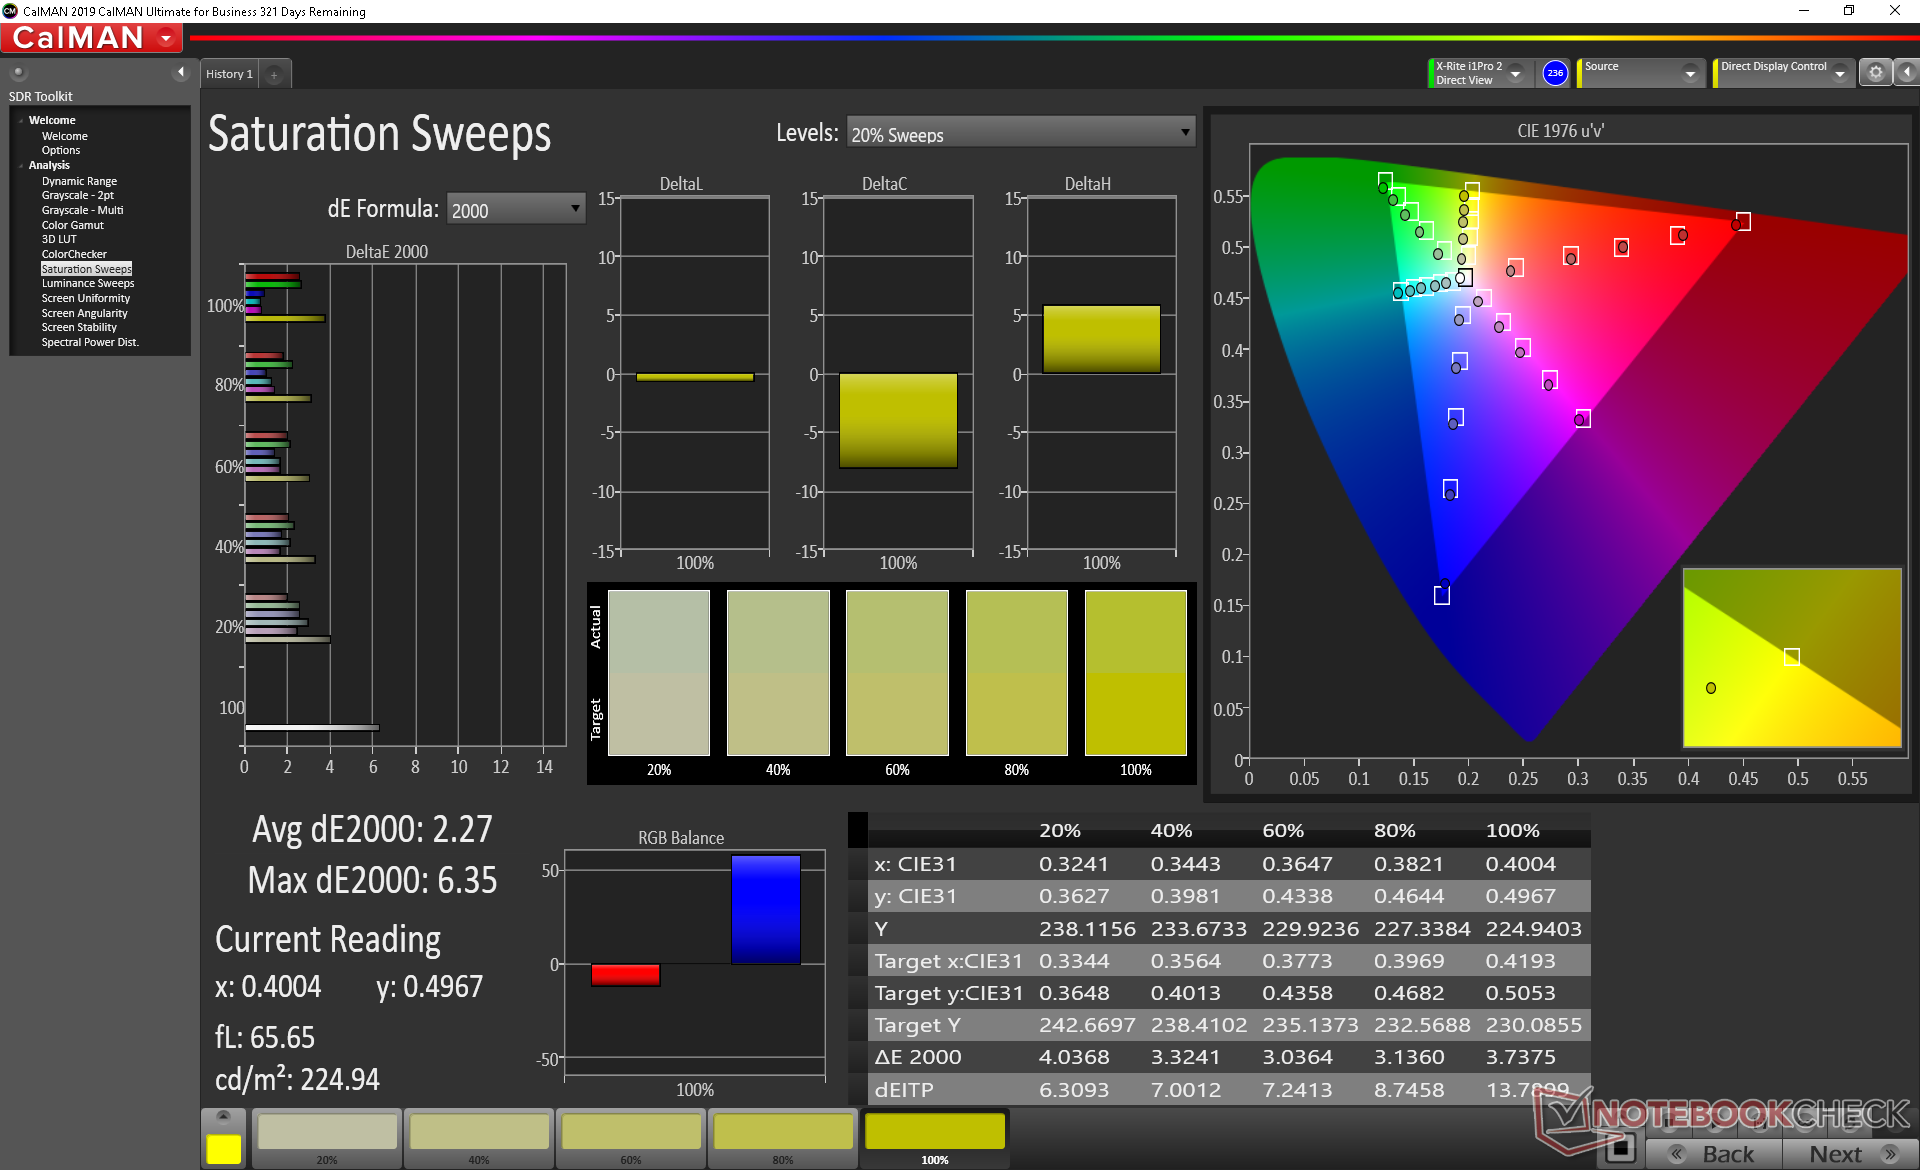
Further measurements with an X-Rite colorimeter show good grayscale and colors out of the box. Color temperature, however, is slightly too cool at just over 7000. Our own calibration addresses this for a slightly more accurate display.
Display Response Times
| ↔ Response Time Black to White | ||
|---|---|---|
| 27.2 ms ... rise ↗ and fall ↘ combined | ↗ 14.8 ms rise | 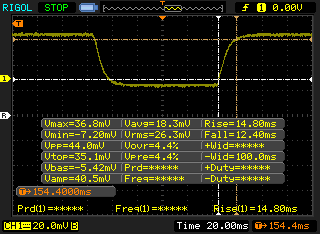 |
| ↘ 12.4 ms fall | ||
| The screen shows relatively slow response rates in our tests and may be too slow for gamers. In comparison, all tested devices range from 0.1 (minimum) to 240 (maximum) ms. » 69 % of all devices are better. This means that the measured response time is worse than the average of all tested devices (19.9 ms). | ||
| ↔ Response Time 50% Grey to 80% Grey | ||
| 40.4 ms ... rise ↗ and fall ↘ combined | ↗ 18 ms rise | 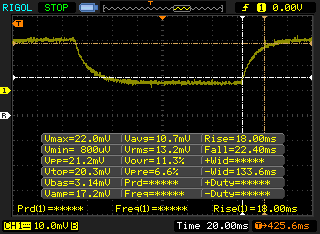 |
| ↘ 22 ms fall | ||
| The screen shows slow response rates in our tests and will be unsatisfactory for gamers. In comparison, all tested devices range from 0.165 (minimum) to 636 (maximum) ms. » 63 % of all devices are better. This means that the measured response time is worse than the average of all tested devices (31.1 ms). | ||
Screen Flickering / PWM (Pulse-Width Modulation)
| Screen flickering / PWM not detected | 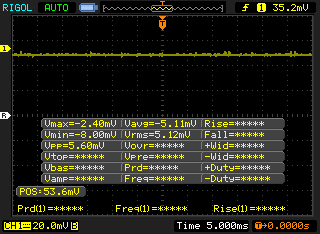 | ||
In comparison: 52 % of all tested devices do not use PWM to dim the display. If PWM was detected, an average of 7798 (minimum: 5 - maximum: 343500) Hz was measured. | |||
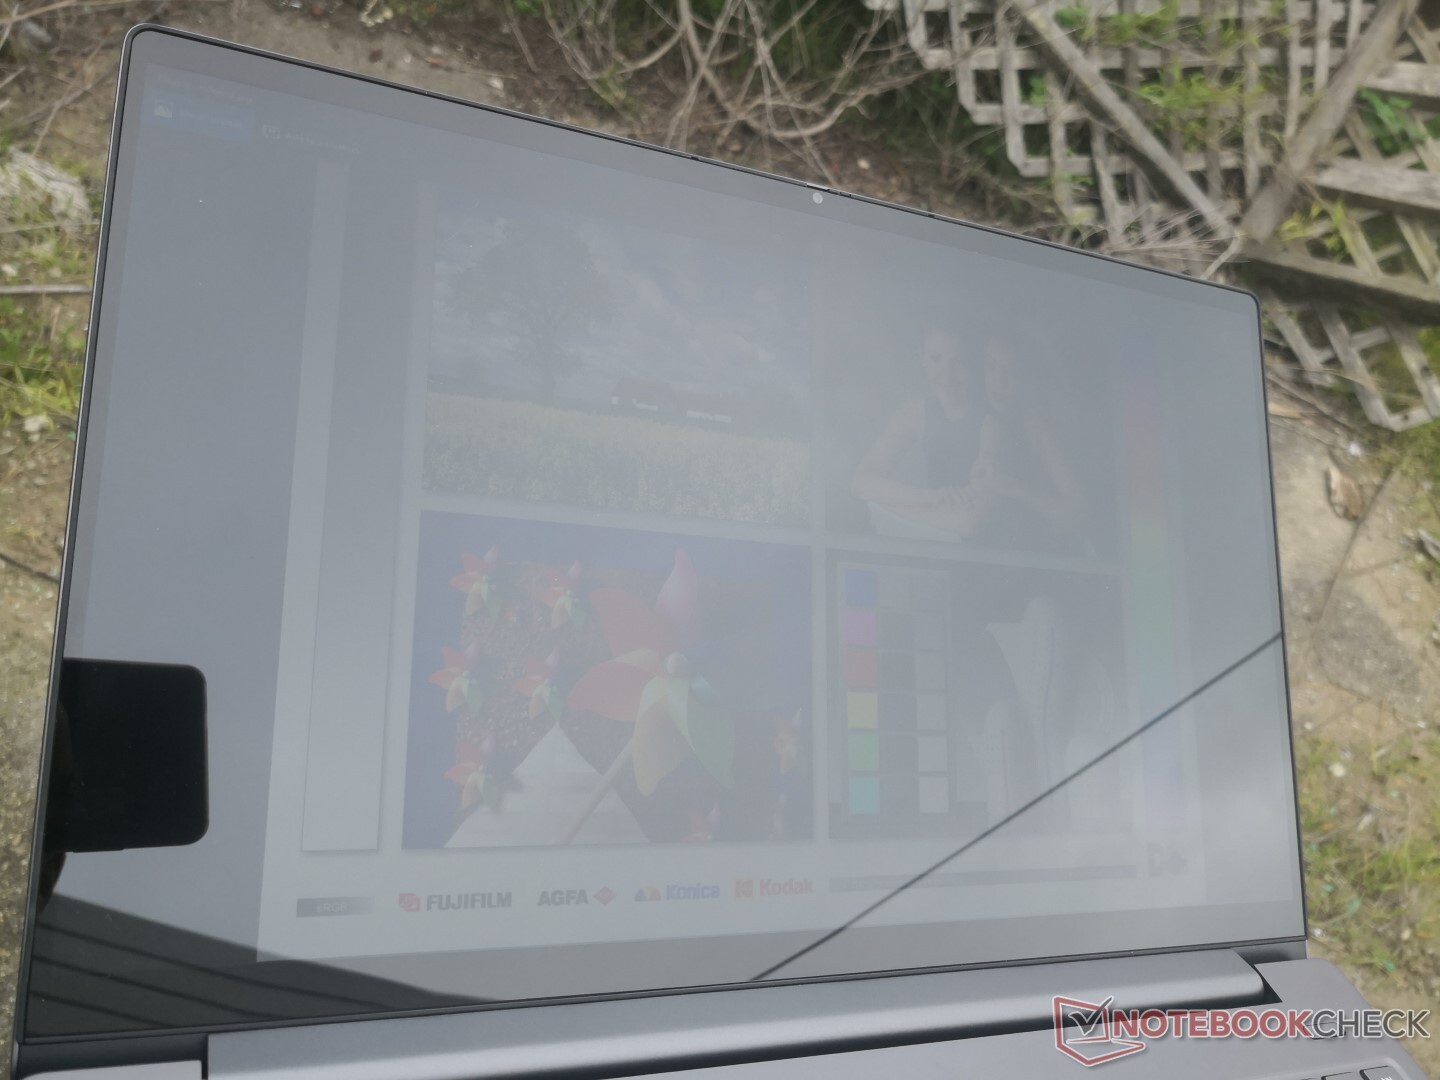
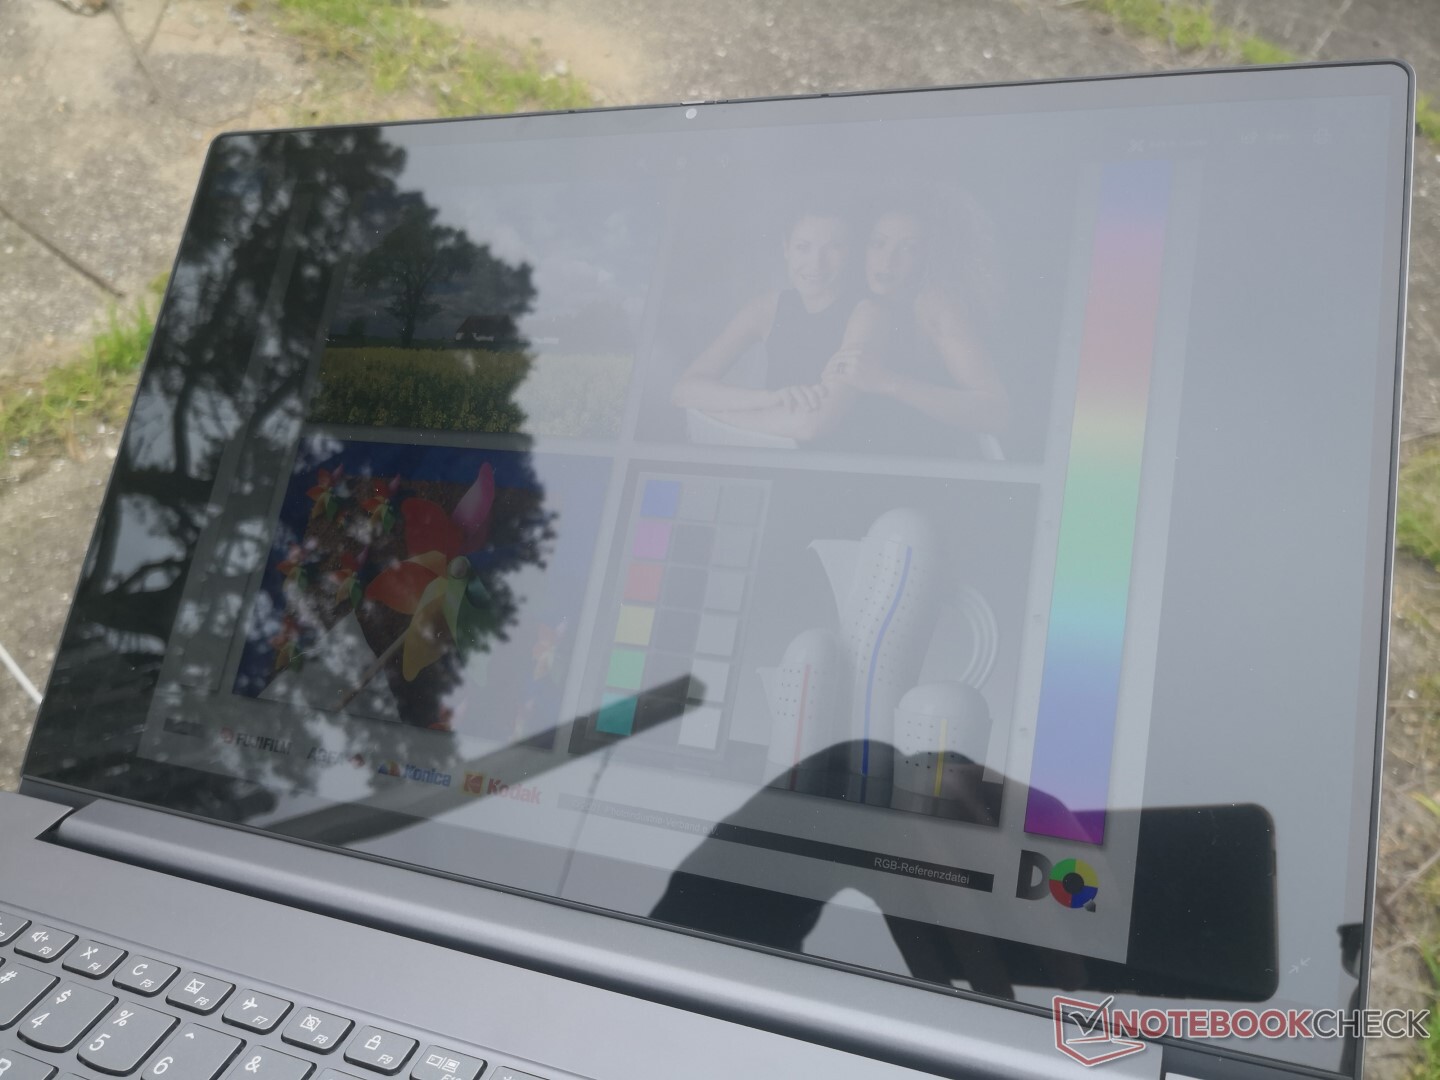
Outdoor visibility is better than on most other Ultrabooks due to the brighter backlight of the Lenovo. Still, be prepared for glare because of the glossy screen. Working under shade remains the best option if outdoors.
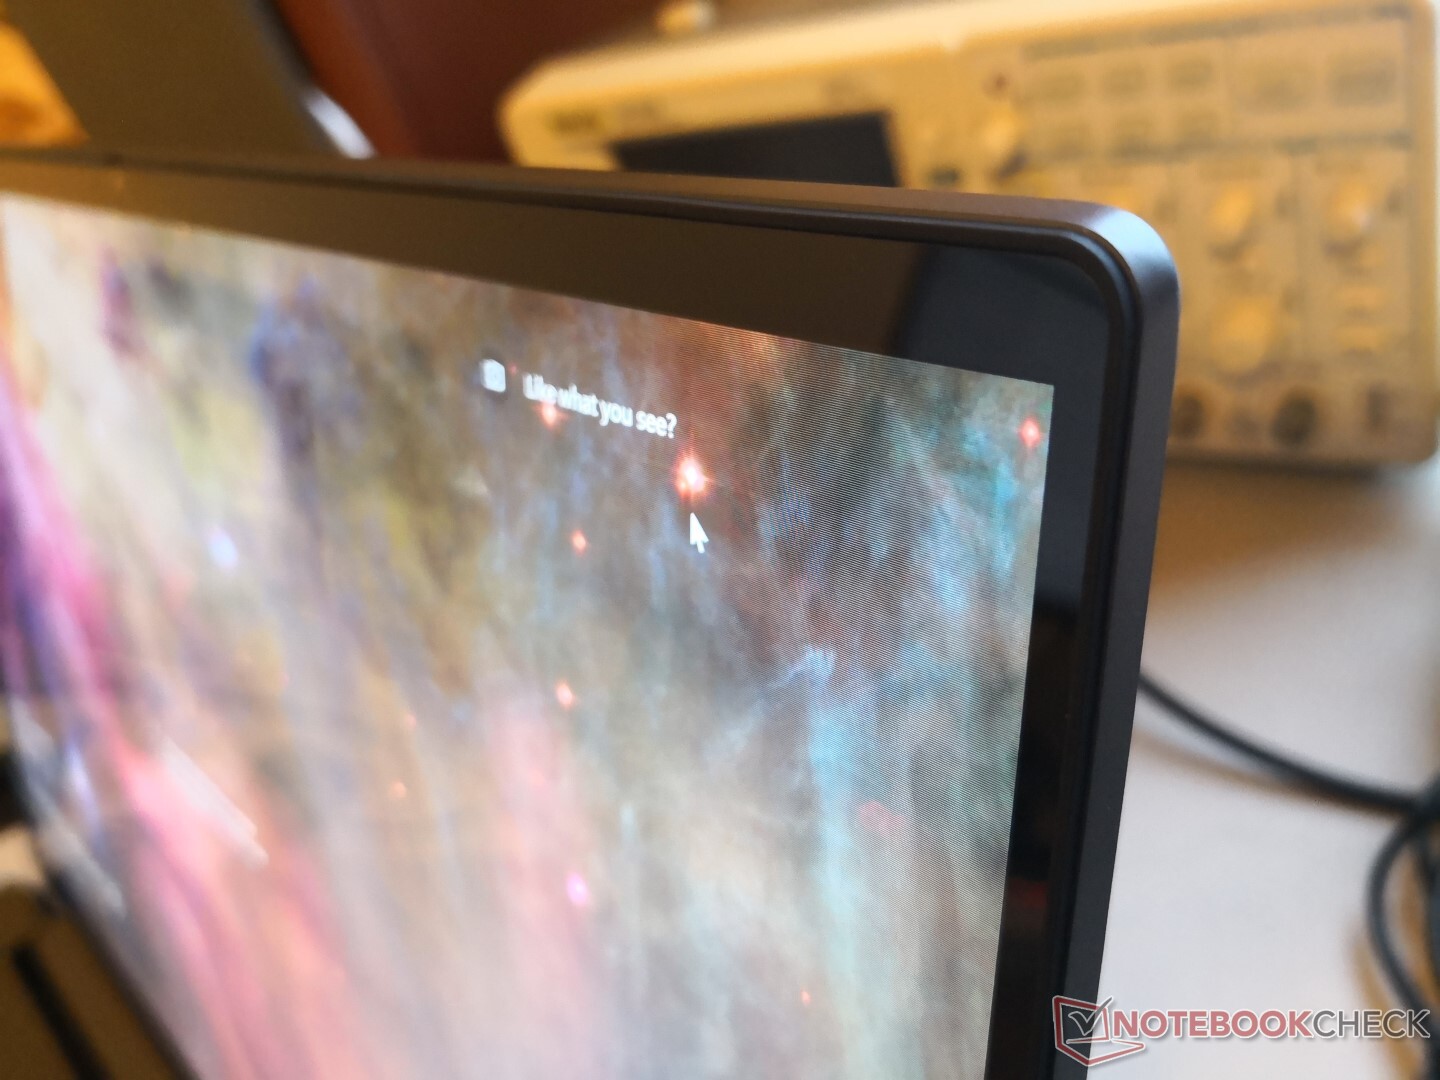
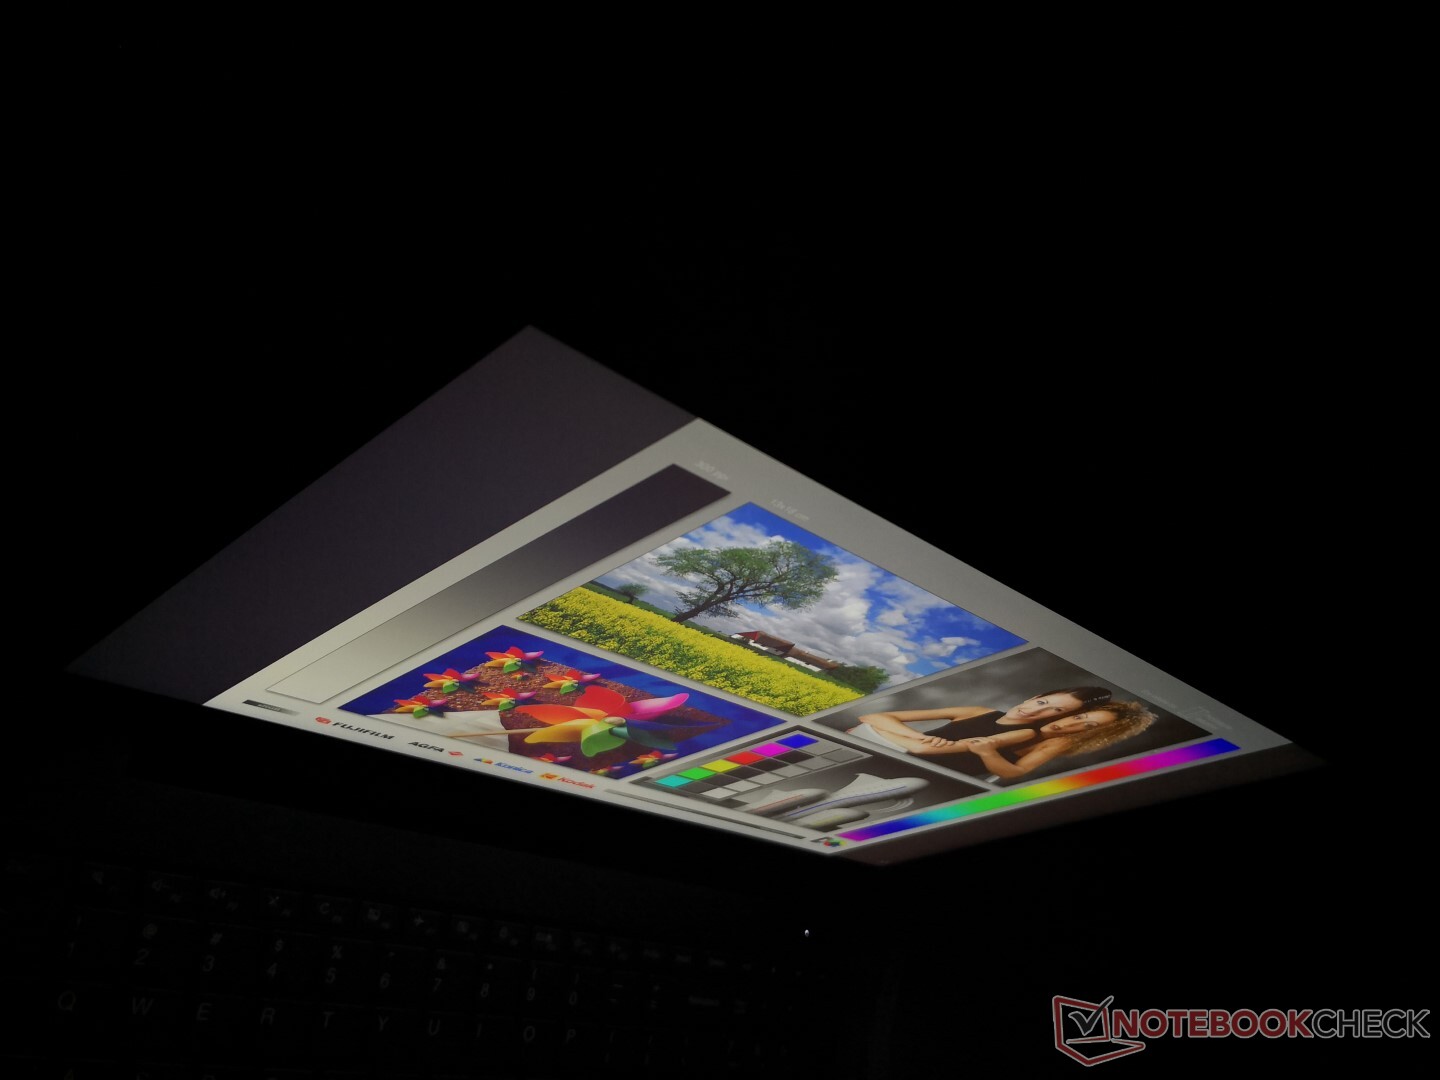
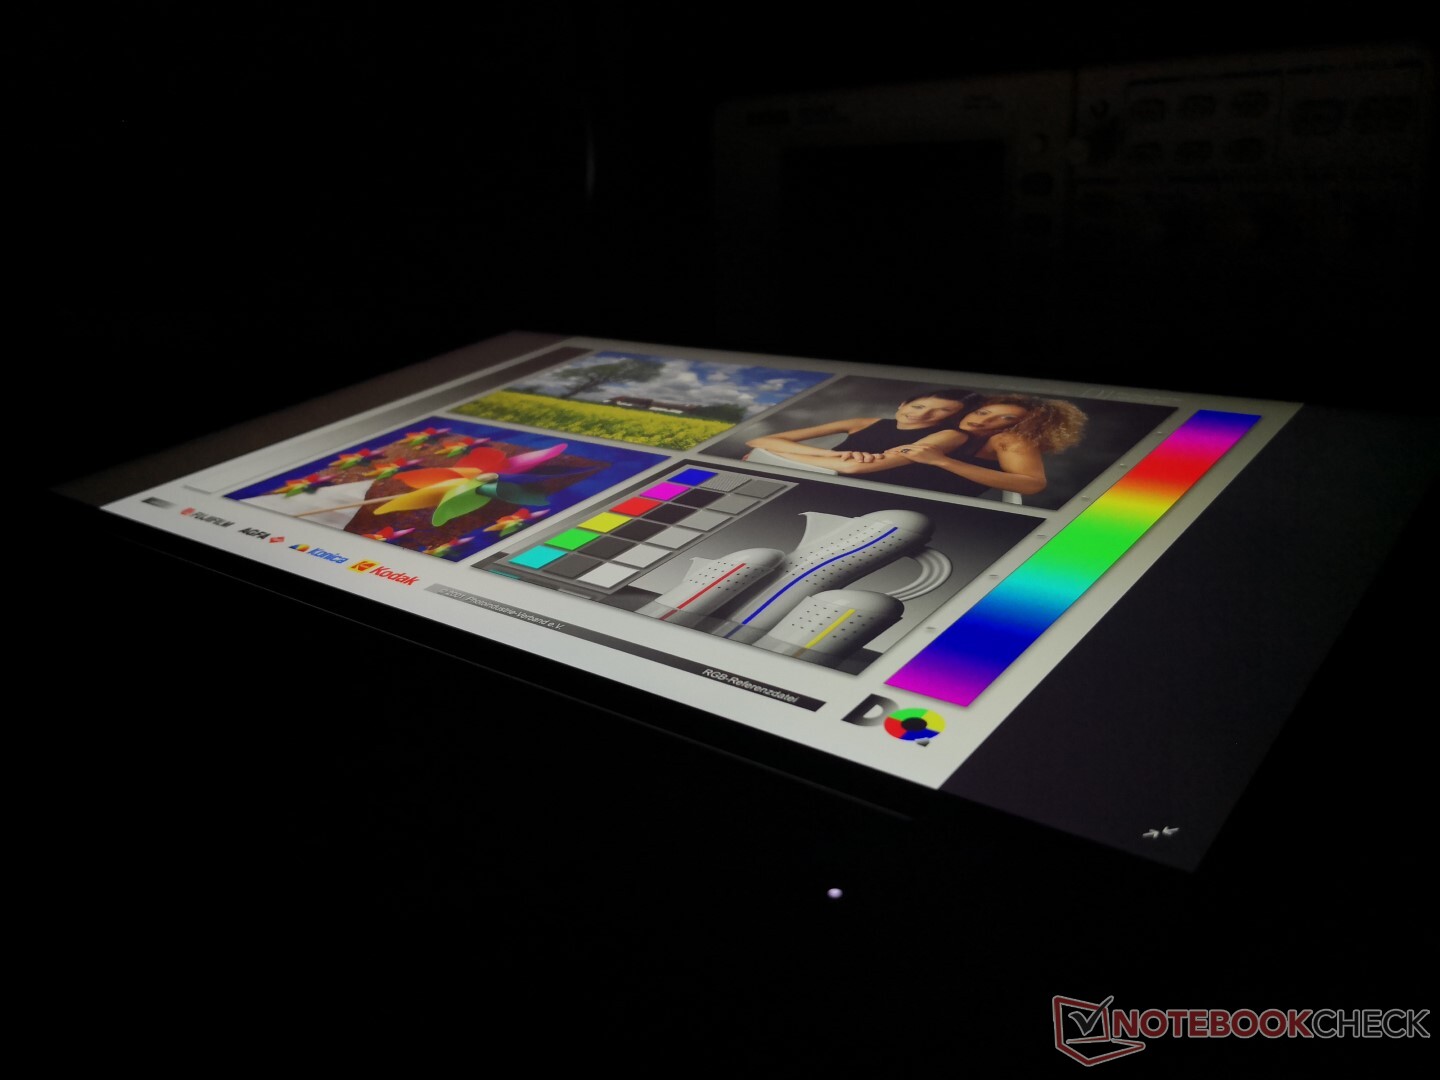
Viewing angles are wide with no major degradation in contrast or colors unless if viewing from extreme angles.

Performance
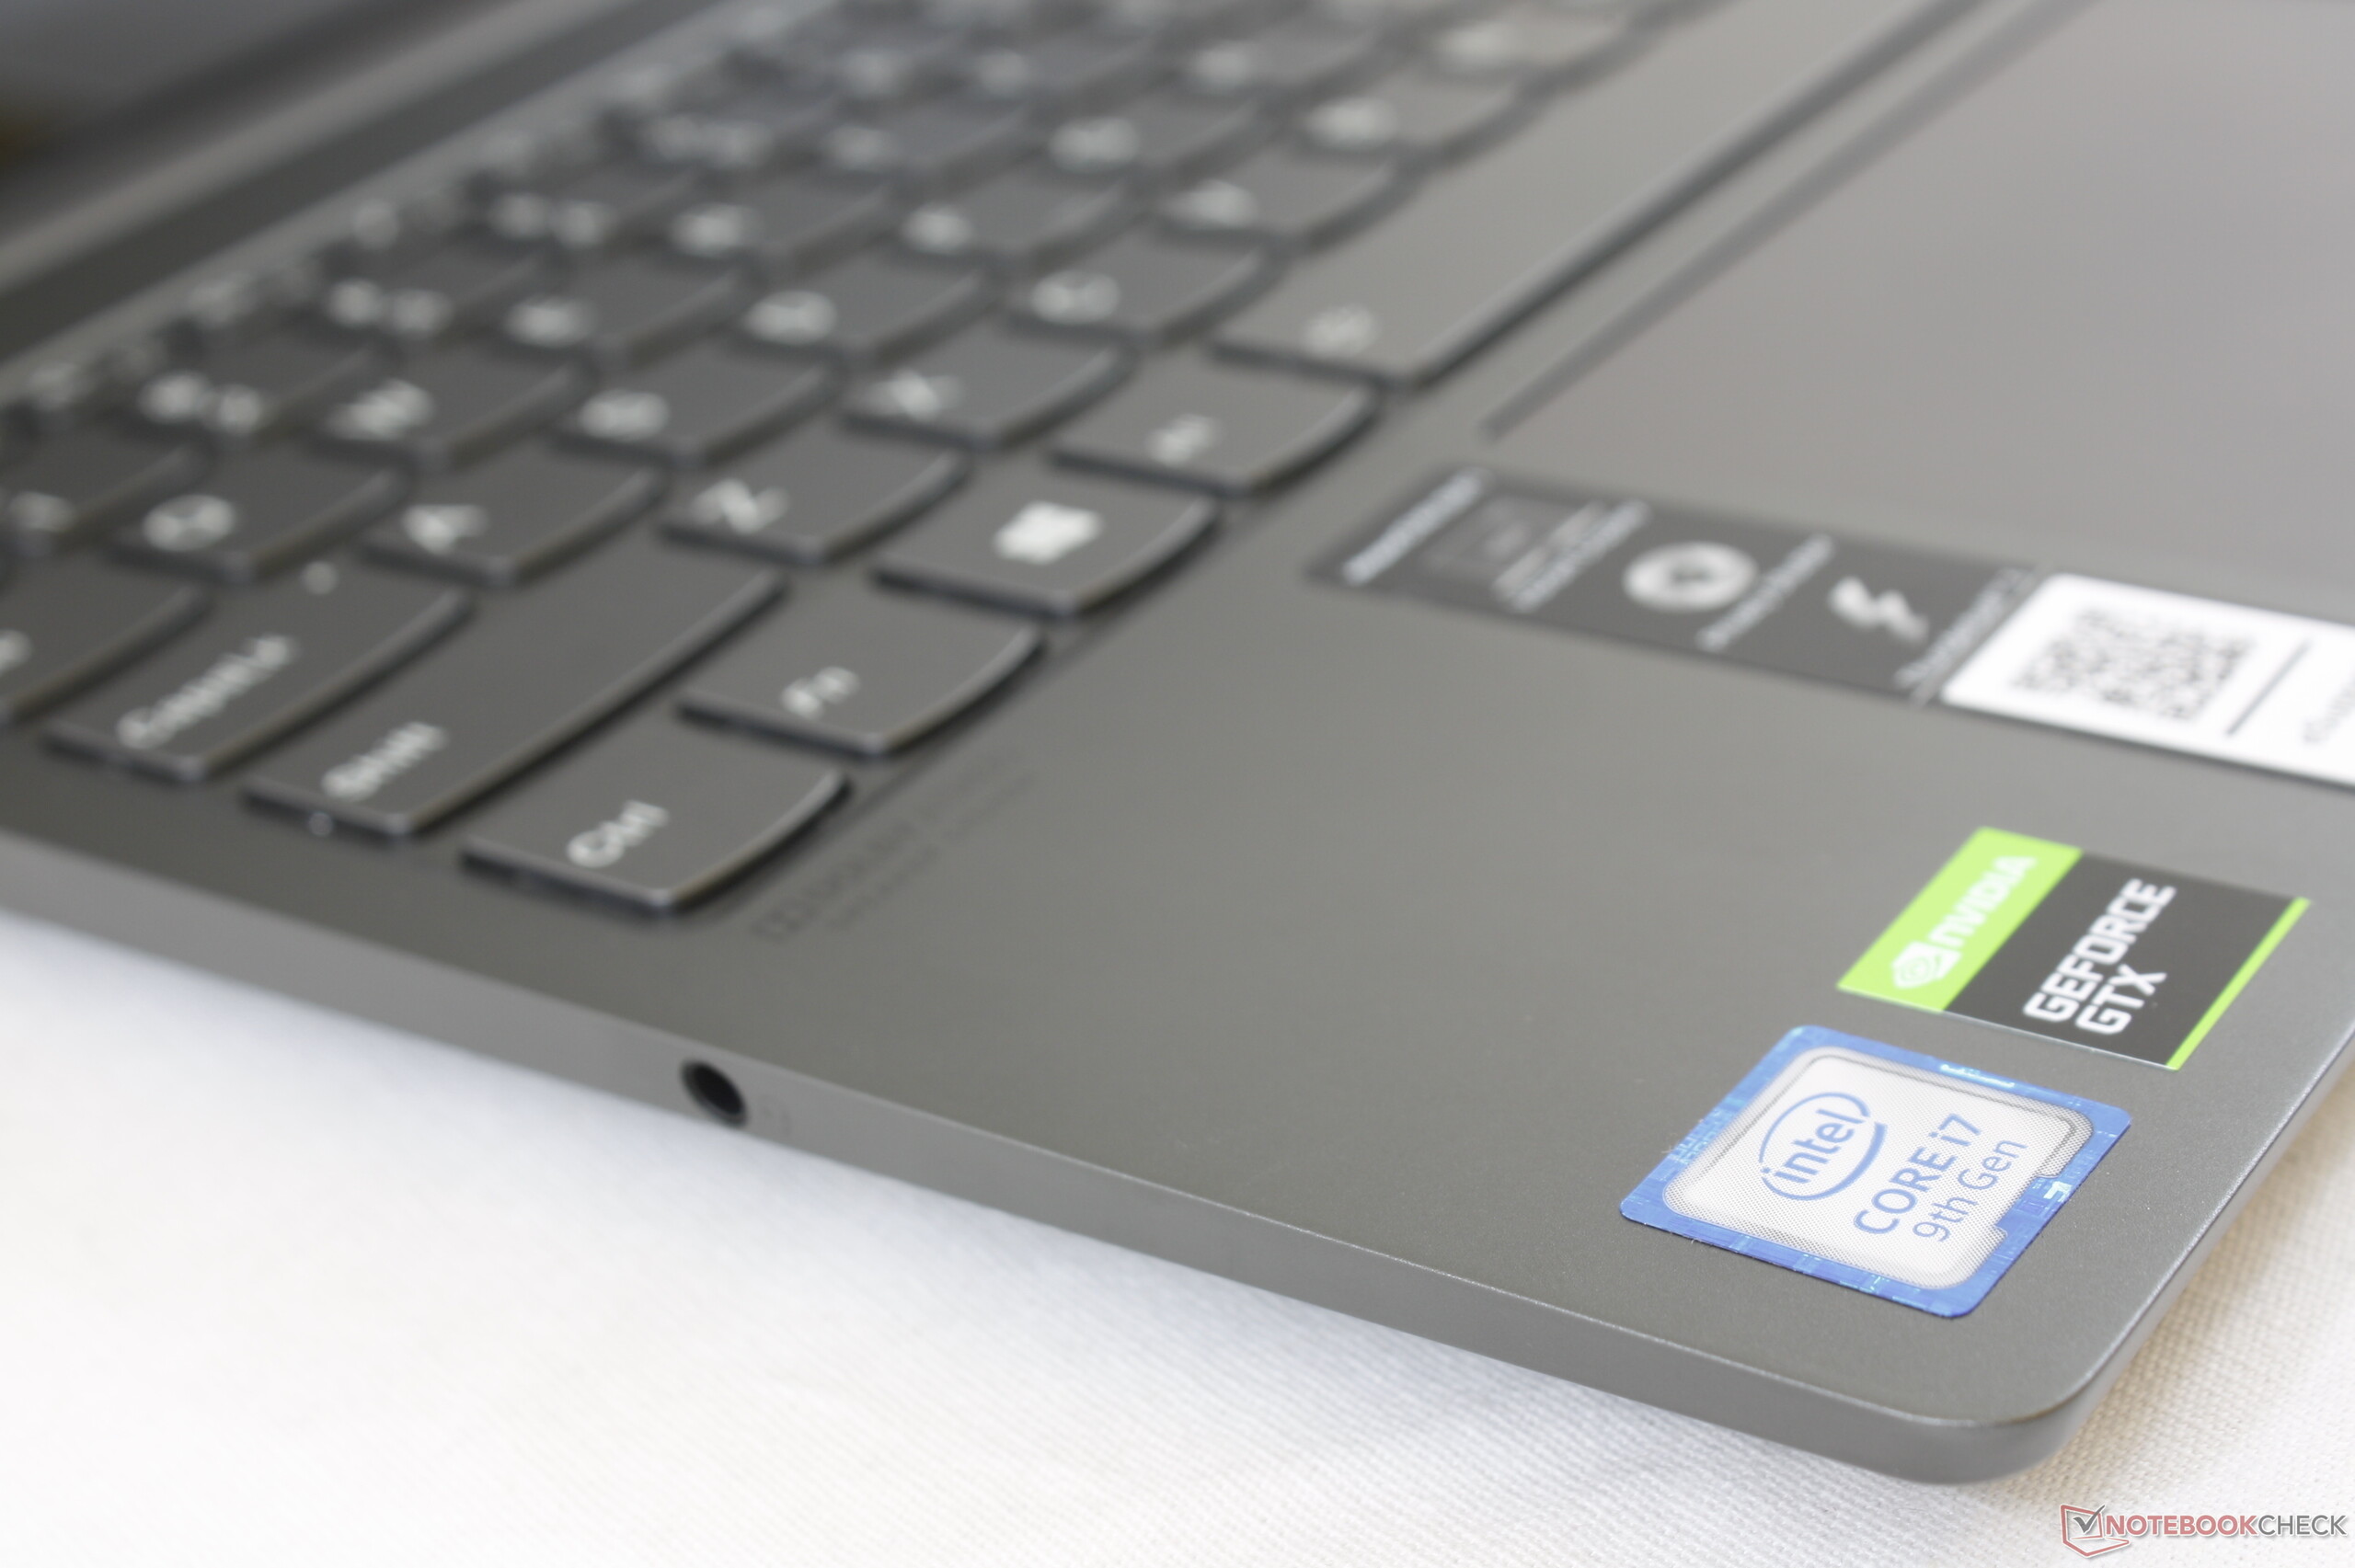
The Core H-series CPU and GeForce Max-Q GPU target performance users who may need more power than the typical Ultrabook with the Core U-series CPU and integrated GPU only. Unlike the highly configurable HP Spectre x360 15 or Dell XPS 15, the Lenovo Yoga Y740 15 carries fewer SKUs with only Core i7 and GTX 1650 Max-Q options for now.
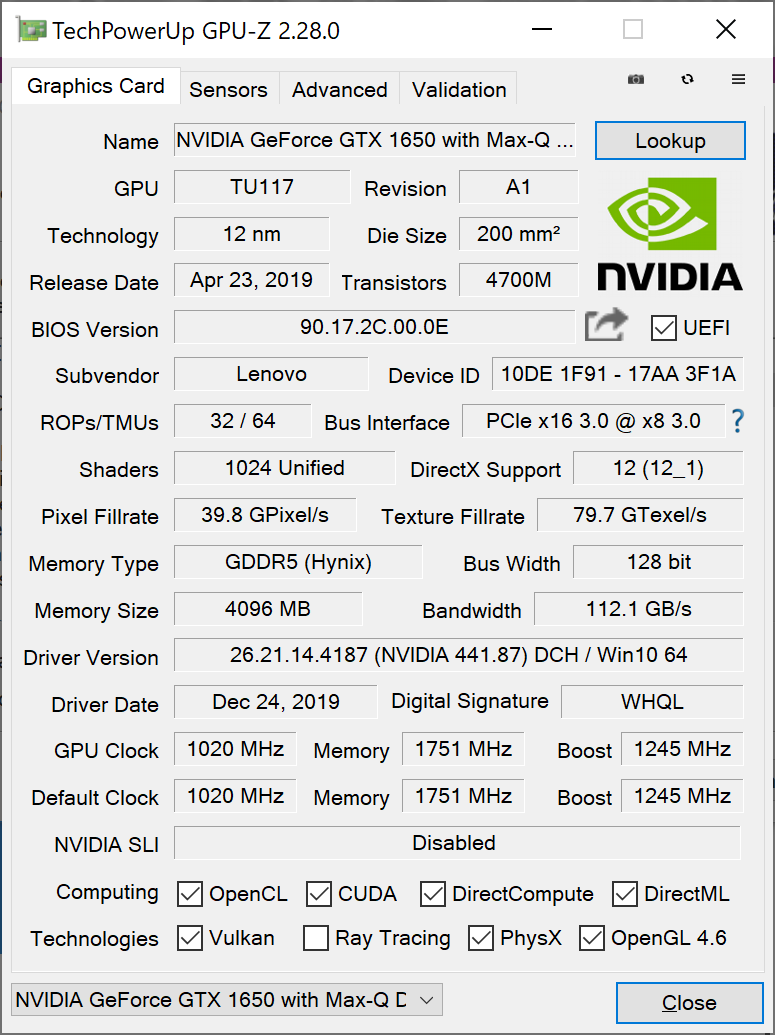
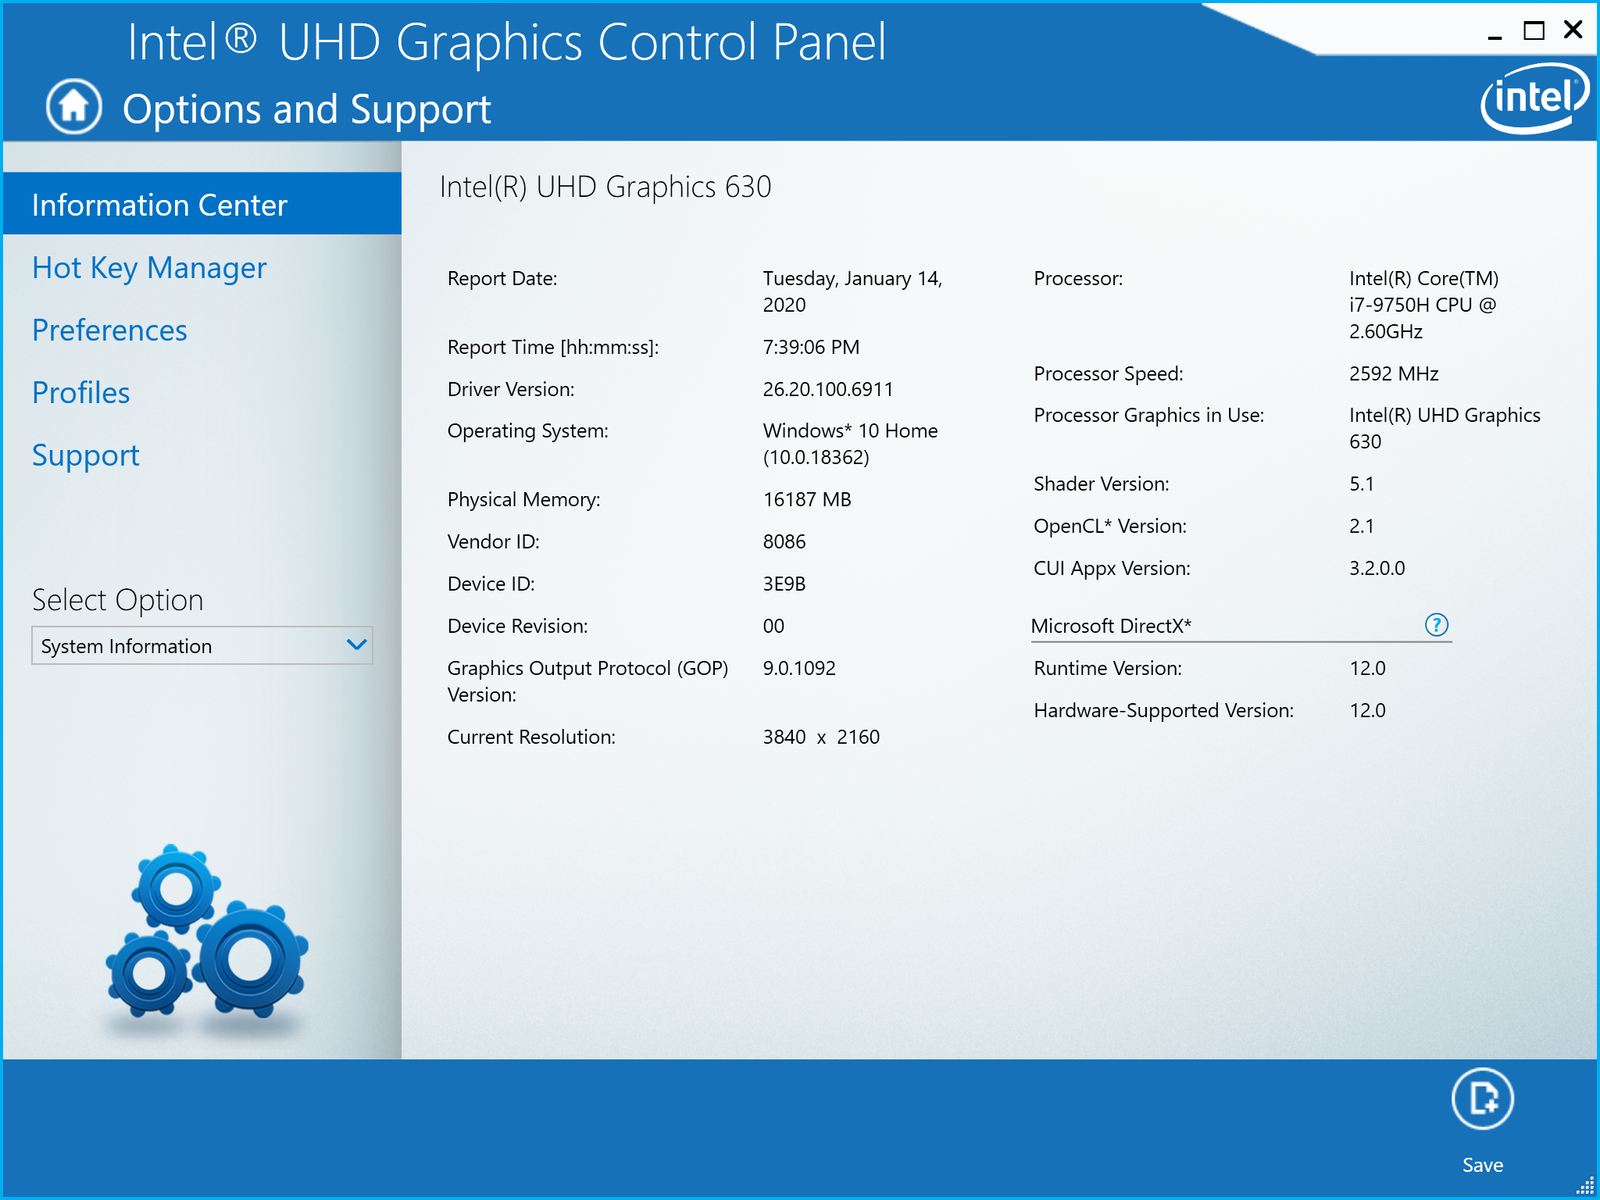
Nvidia Optimus comes standard for automatic switching to the integrated UHD Graphics 630. Note that the GPU is the slower GeForce GTX 1650 Max-Q version and not the standard GTX 1650 even though the official Lenovo product page makes no mention of this.
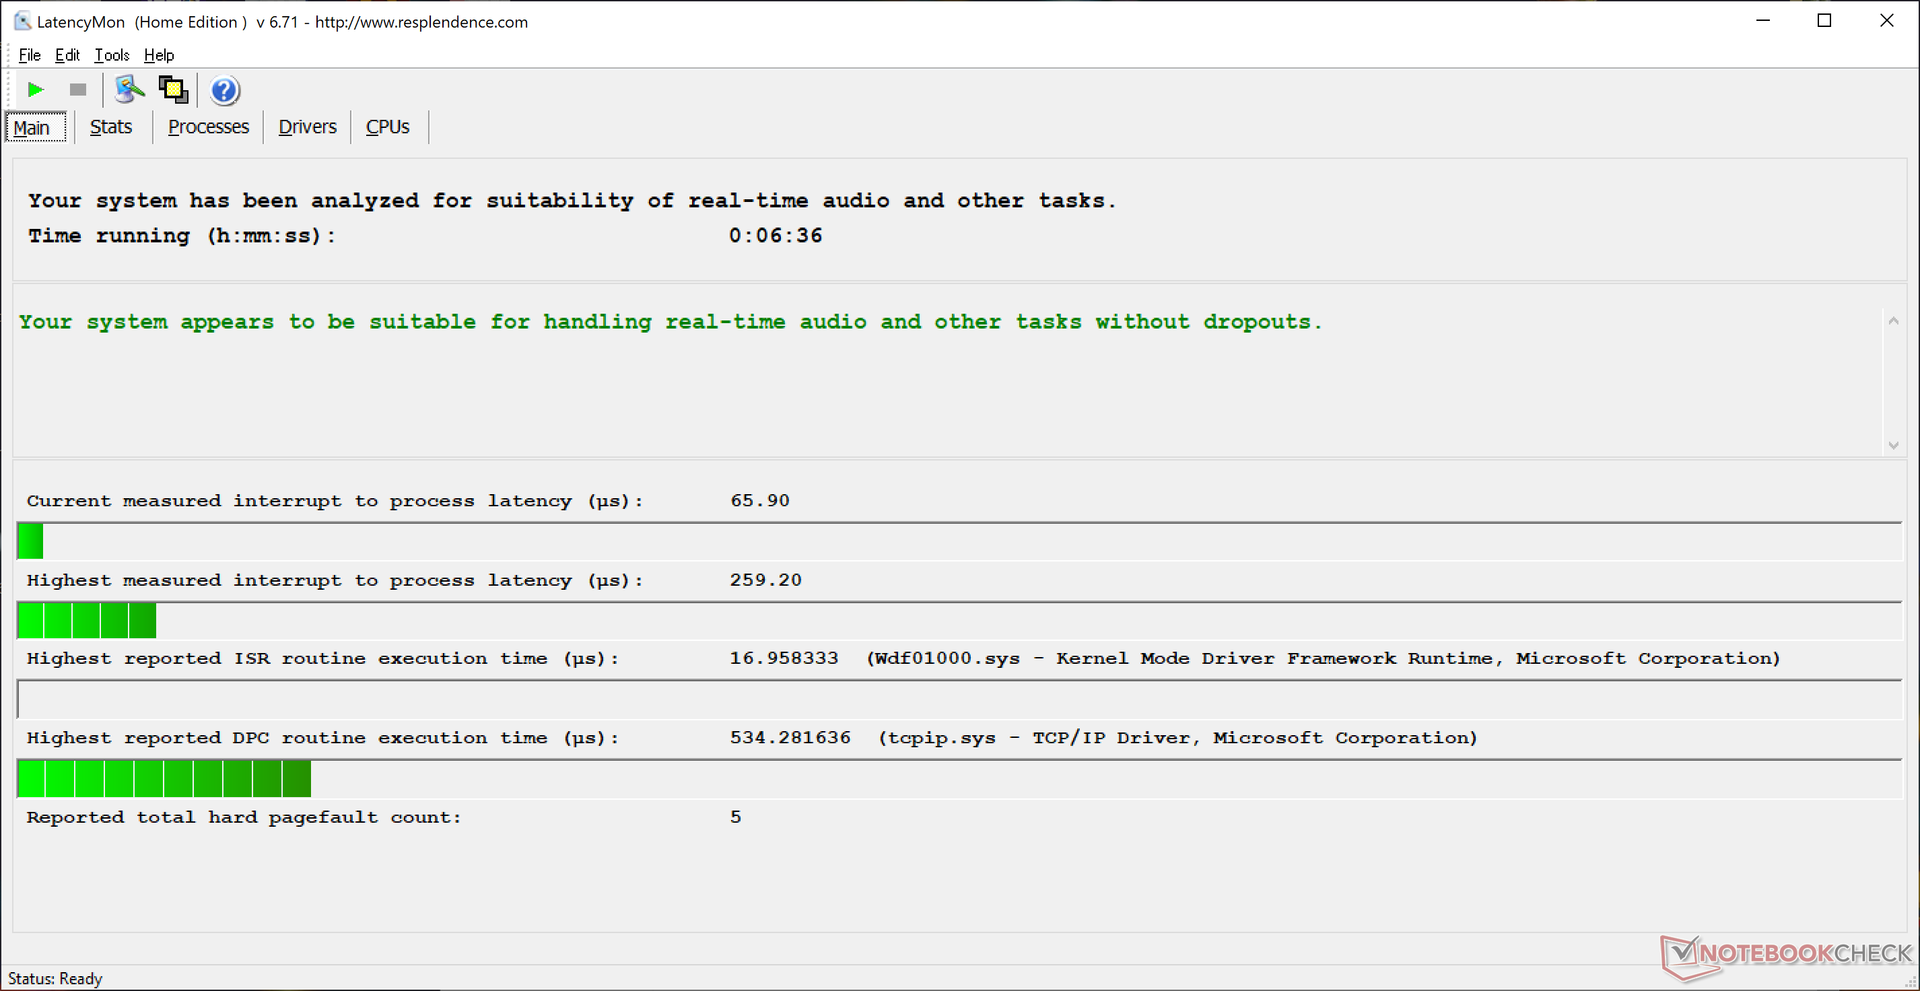
LatencyMon shows no DPC latency issues even when wireless is enabled.
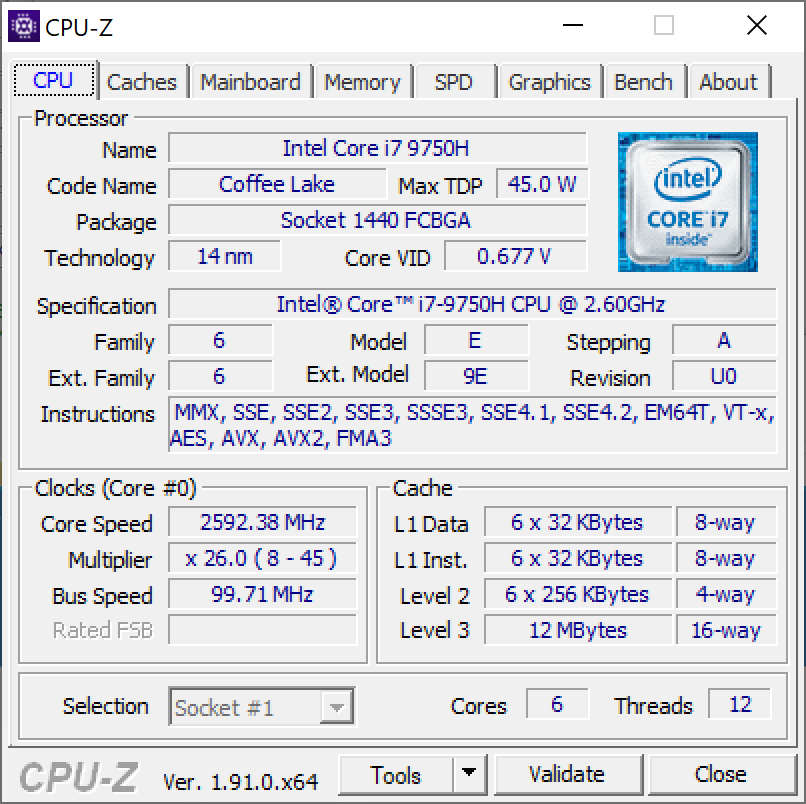
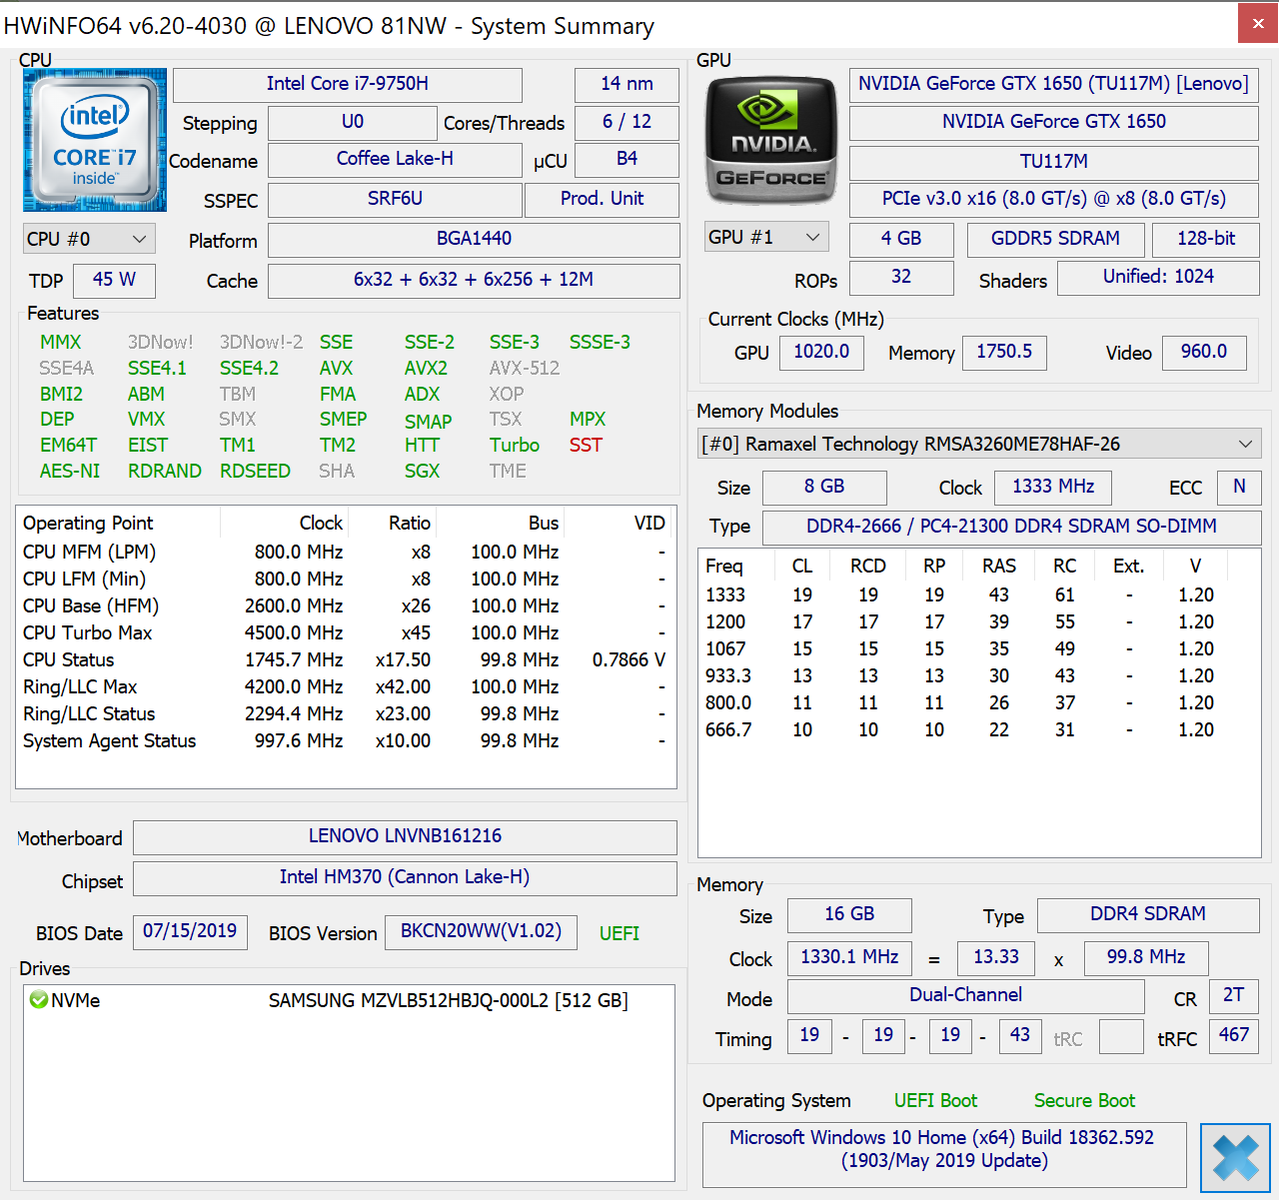
Processor
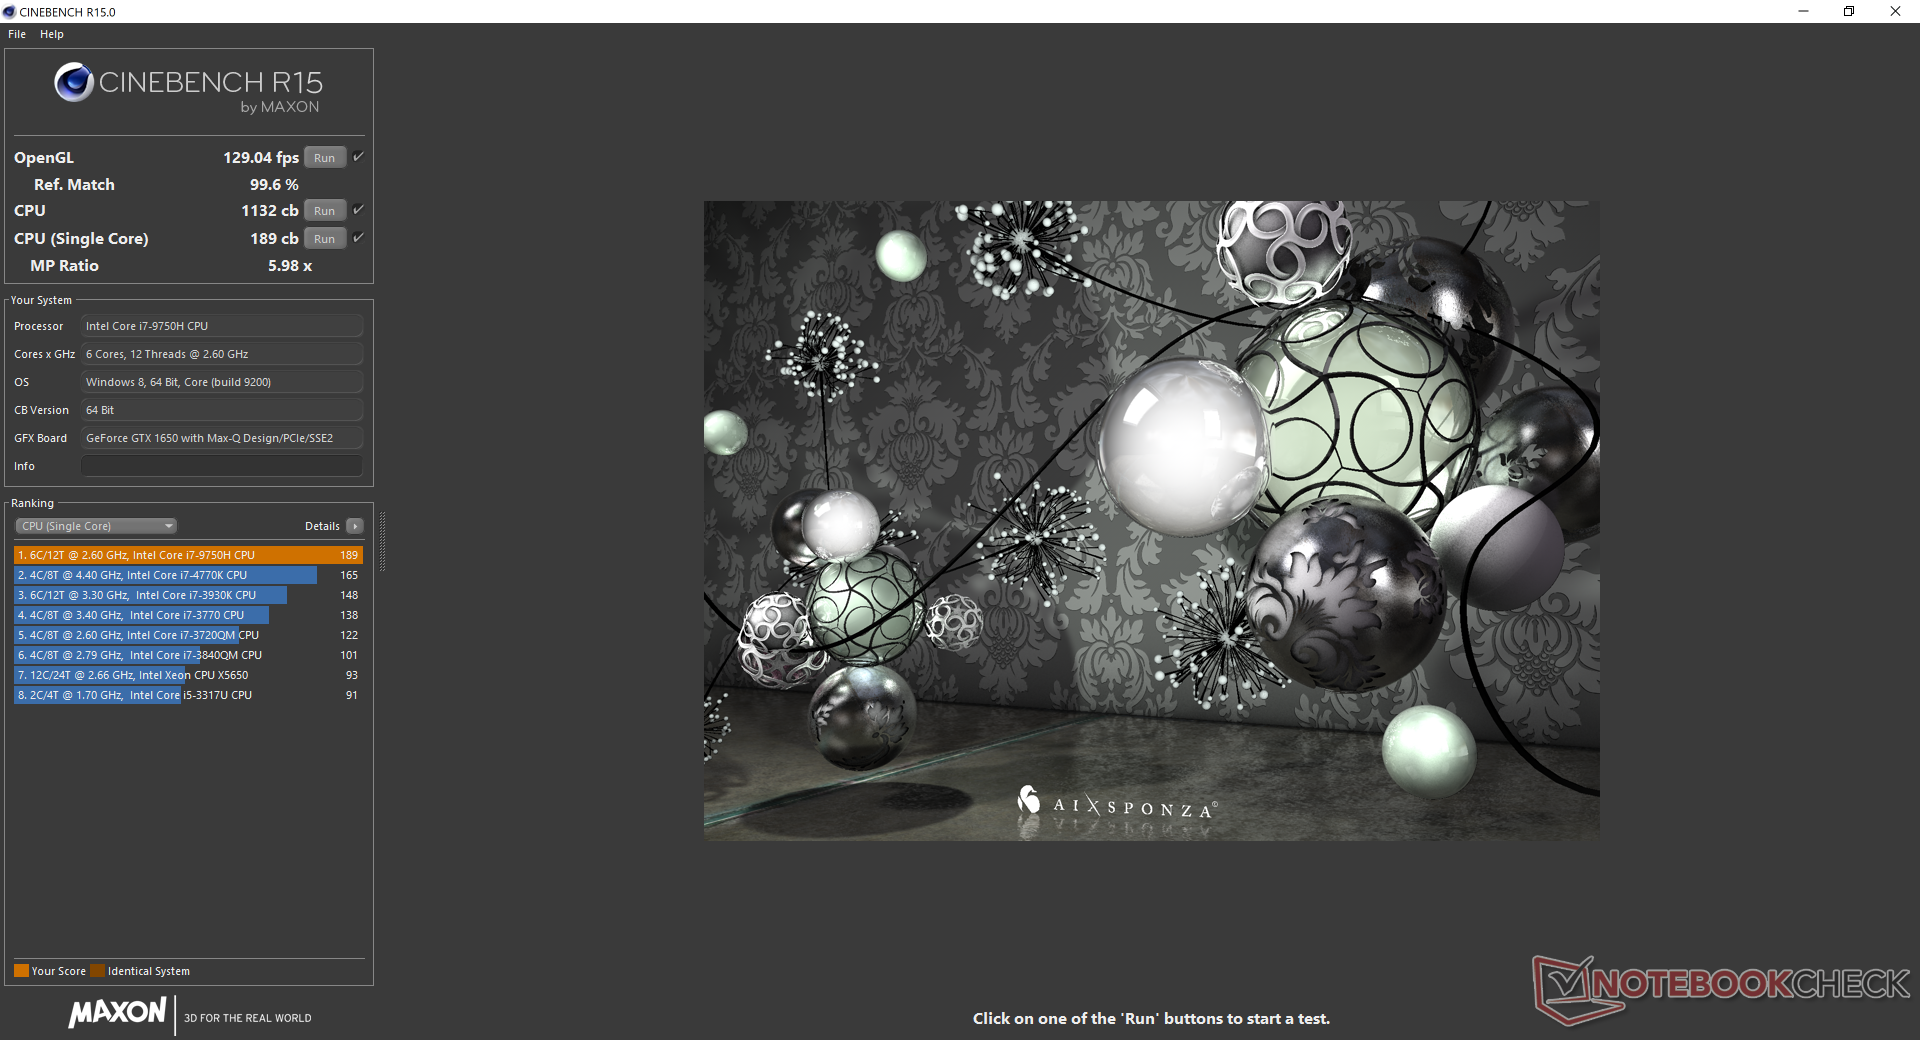
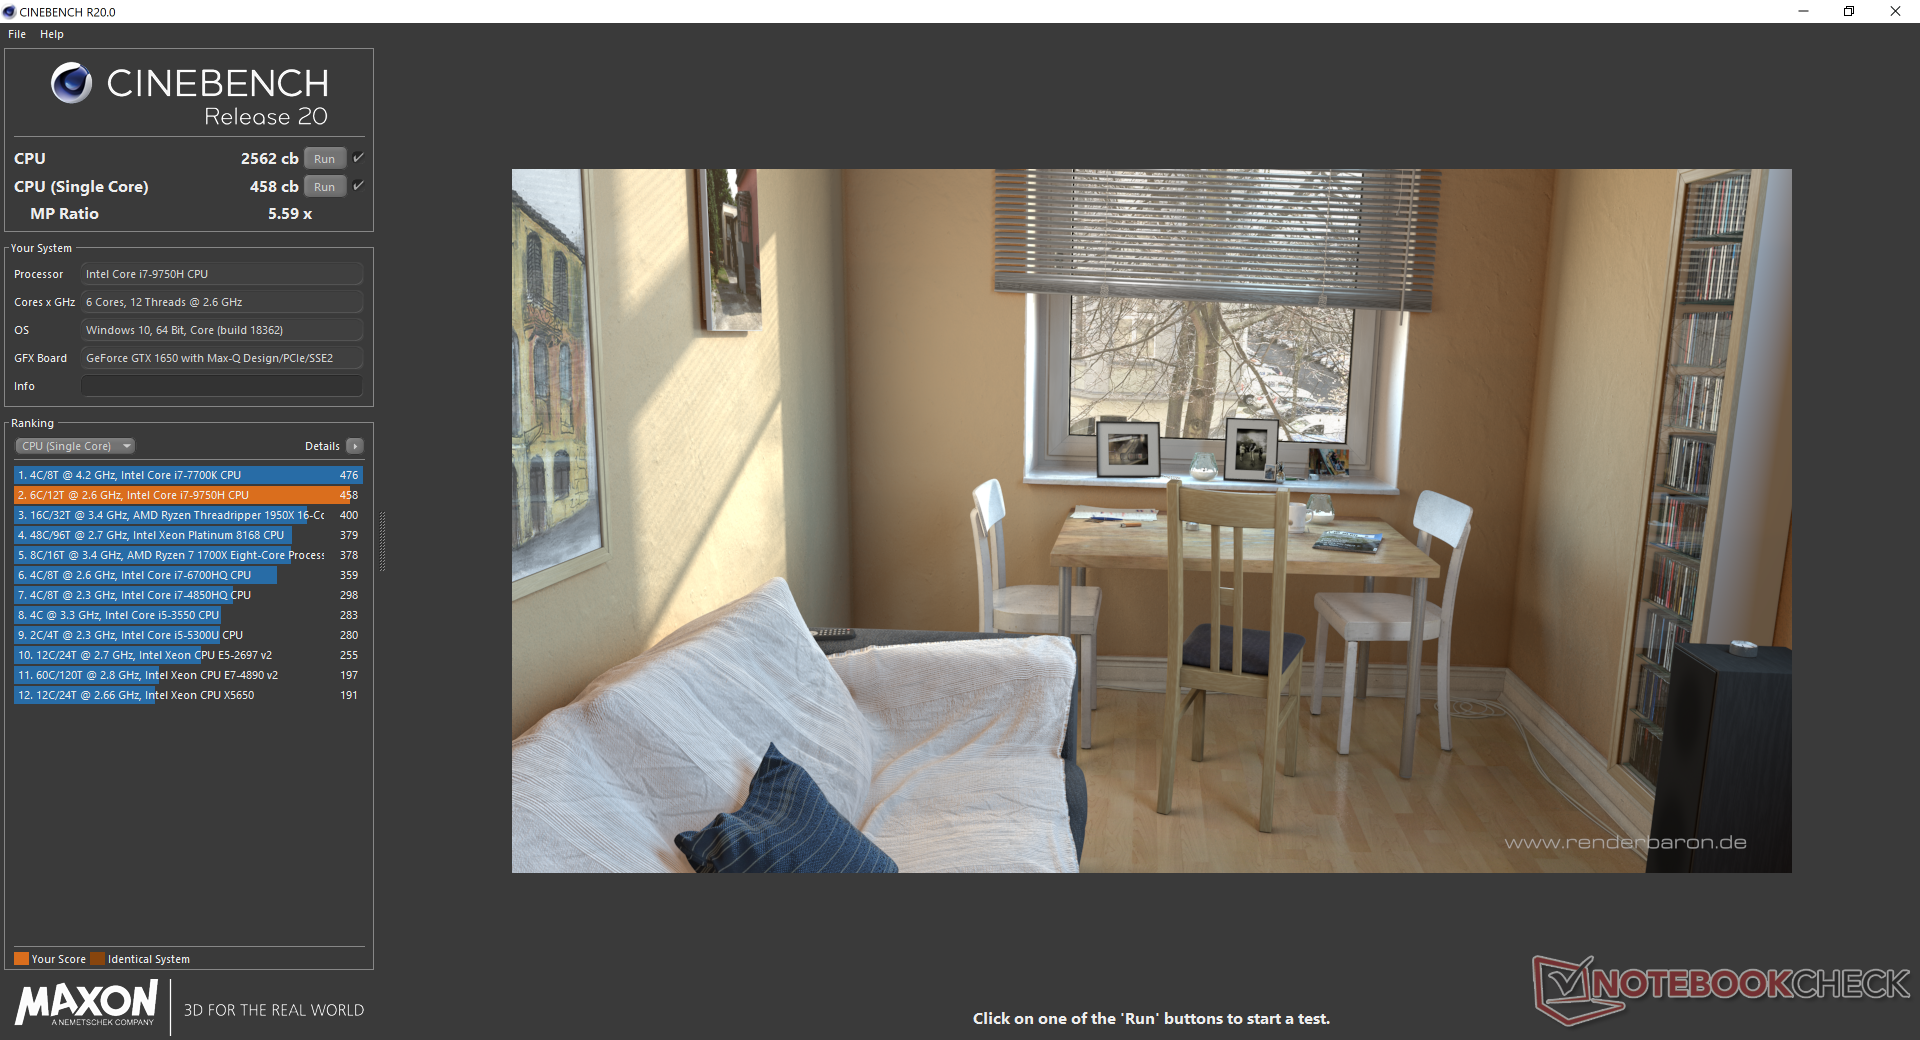
CineBench results are within 1 to 4 percent of the average Core i7-9750H in our database taken from 70 other gaming laptops. Users upgrading from the Core i7-8750H shouldn't expect too big of a jump, but owners of any Core i5 or older Core i7-7700HQ laptops will see more significant gains in CPU performance.
Performance sustainability is imperfect but still respectable. When running CineBench R15 Multi-Thread in a loop, the initial score of 1138 points drops to about 1060 points over time to represent a performance dip of about 7 percent when under extreme processing stress.
See our dedicated page on the Core i7-9750H for more technical information and benchmark comparisons.
| wPrime 2.10 - 1024m | |
| Asus ROG Zephyrus G15 GA502DU | |
| Dell XPS 13 7390 Core i7-10710U | |
| Average Intel Core i7-9750H (n=1) | |
| MSI GE75 9SG | |
| Corsair One i160 | |
* ... smaller is better
System Performance
PCMark results are within single-digit percentages of other laptops with the same Core i7-9750H CPU and GTX 1650 Max-Q GPU. The pricier Dell XPS 15 edges out our Lenovo in each sub category due to its faster non-Max-Q GTX 1650 GPU and Core i9 CPU.
We experienced no software or hardware issues during our time with the test unit. Because of Connected Standby, however, power consumption and surface temperatures can be much higher than usual when the lid is closed.
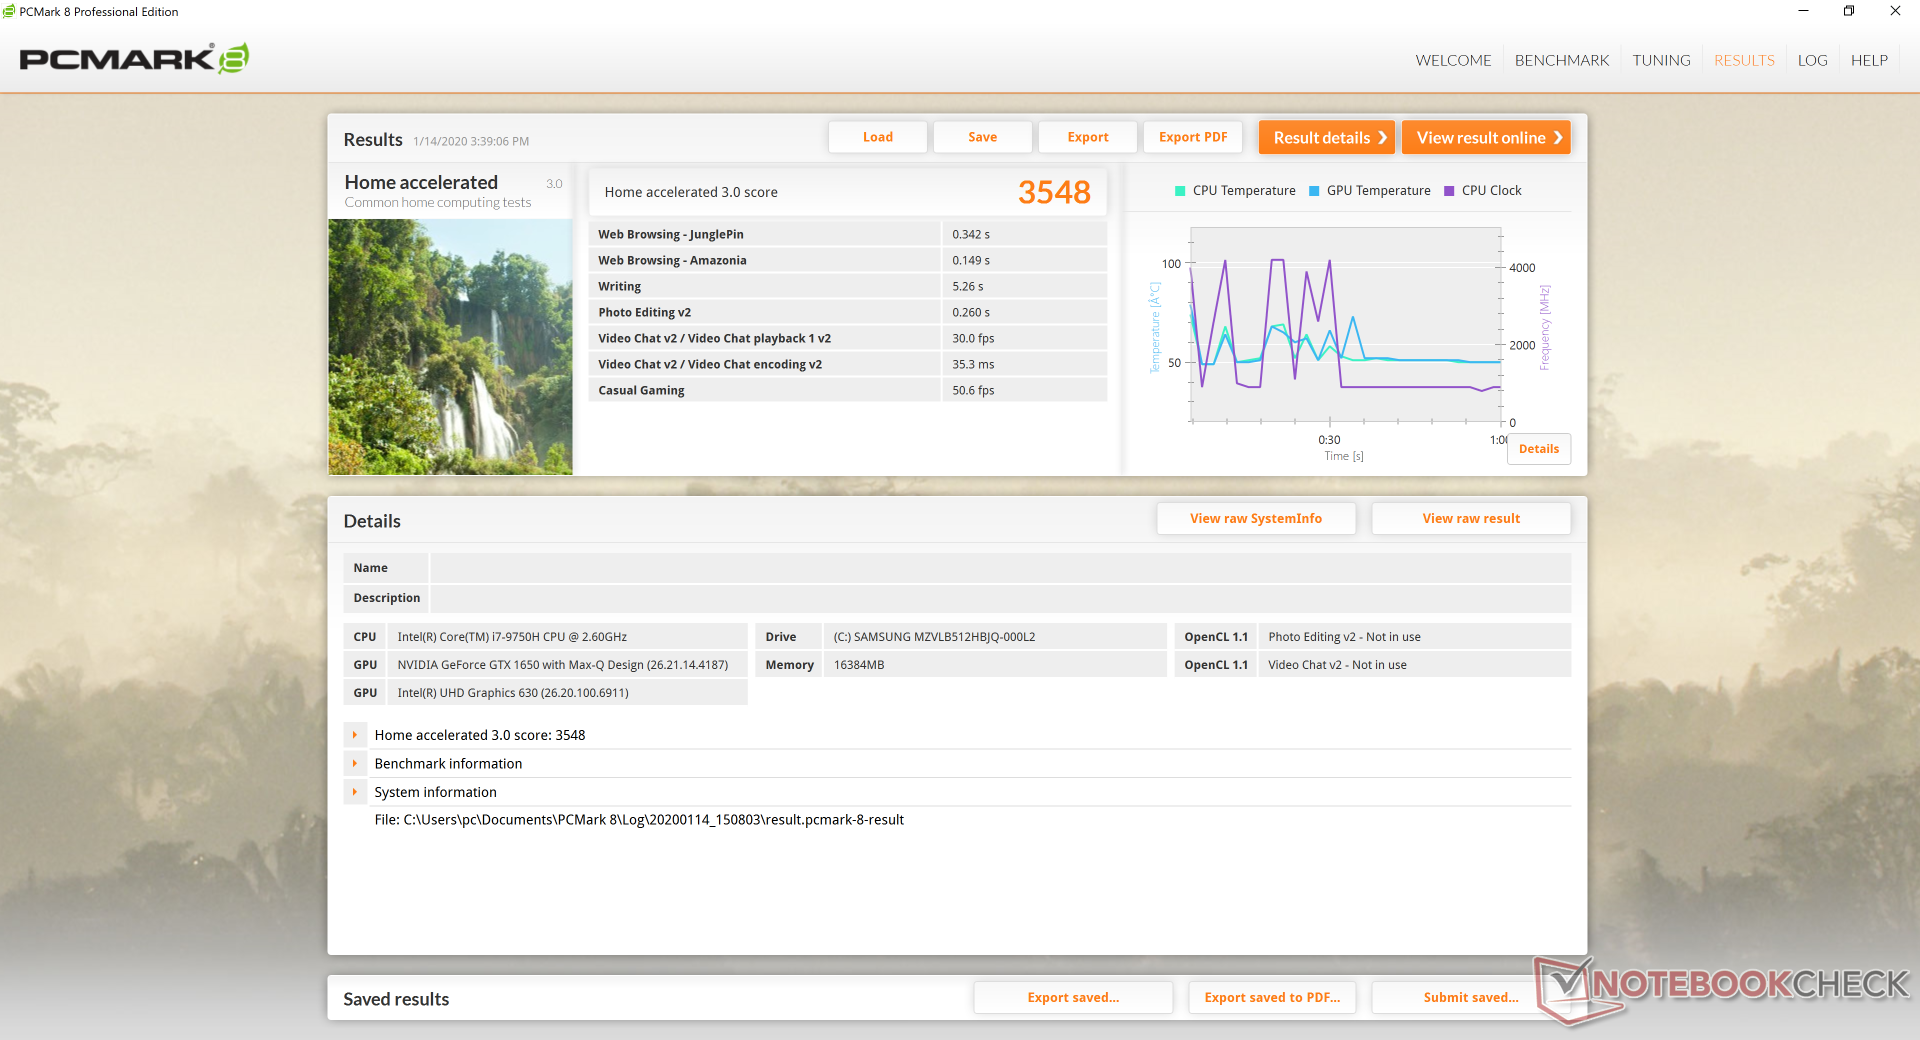
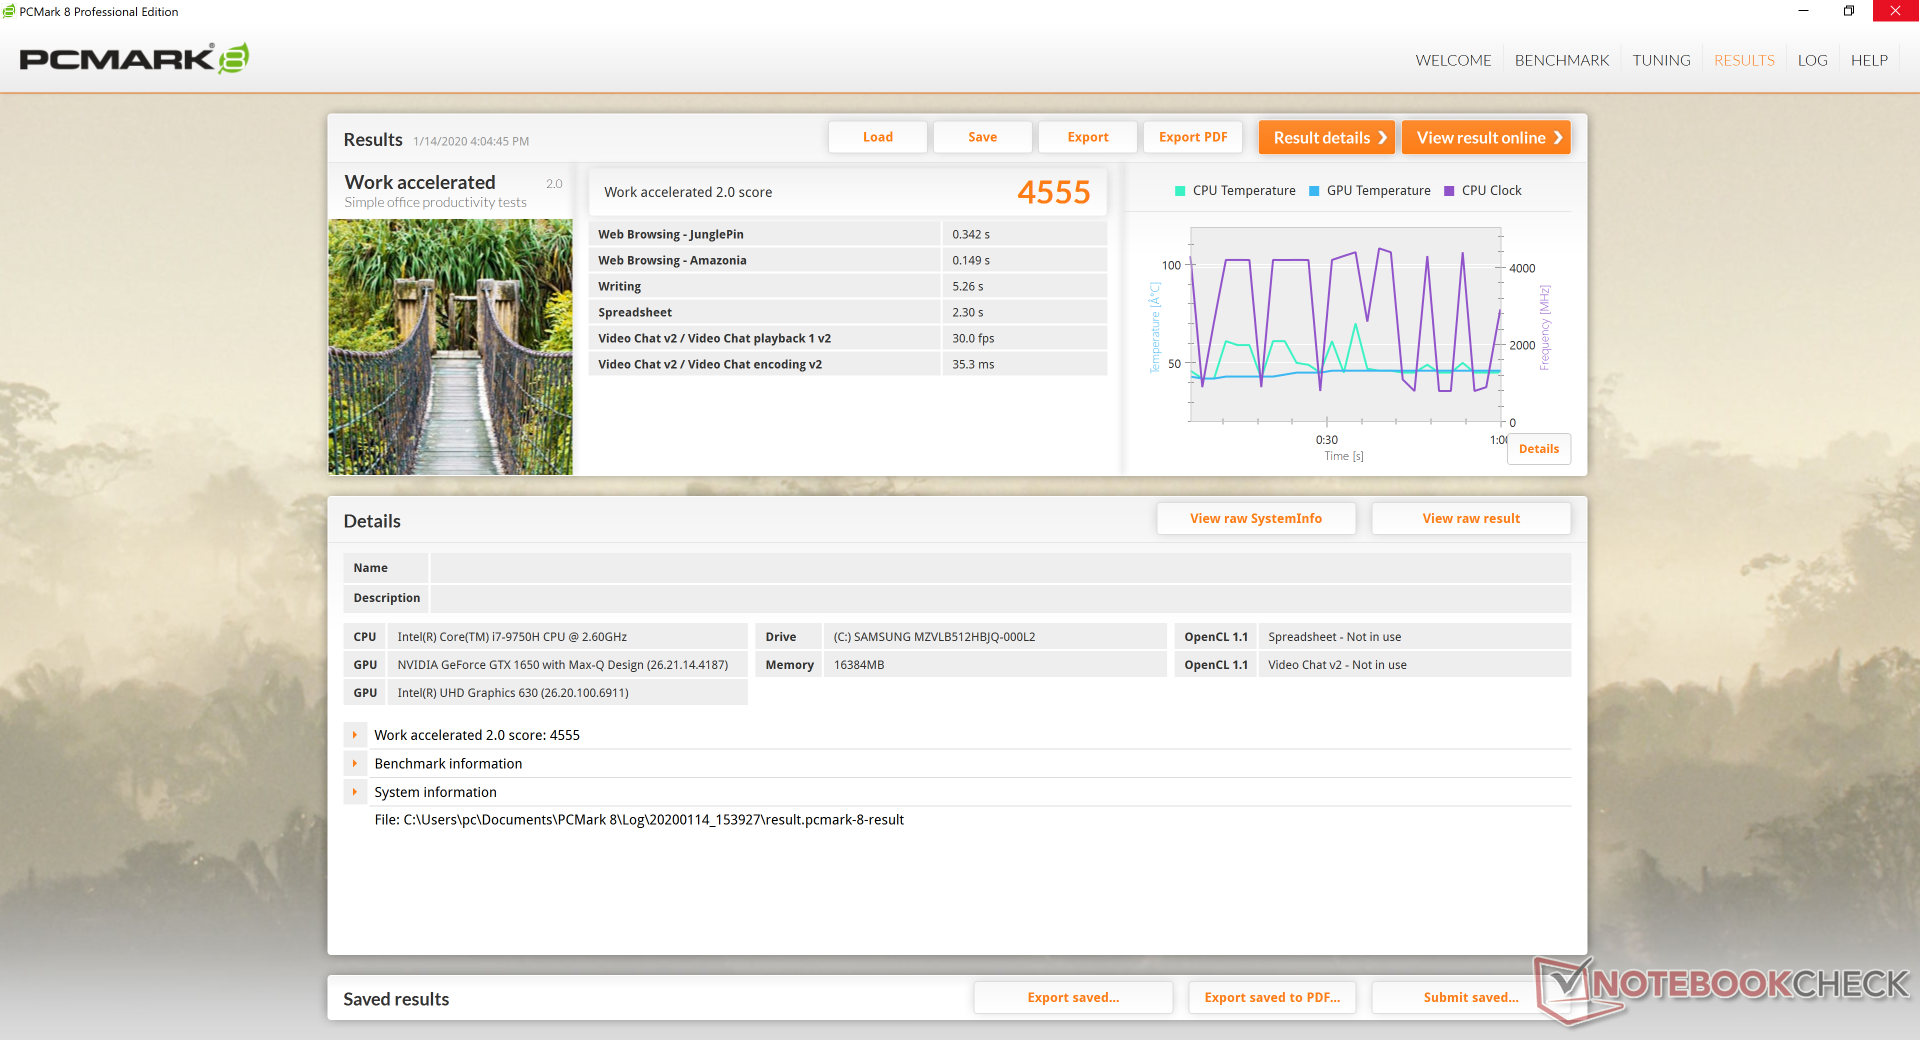
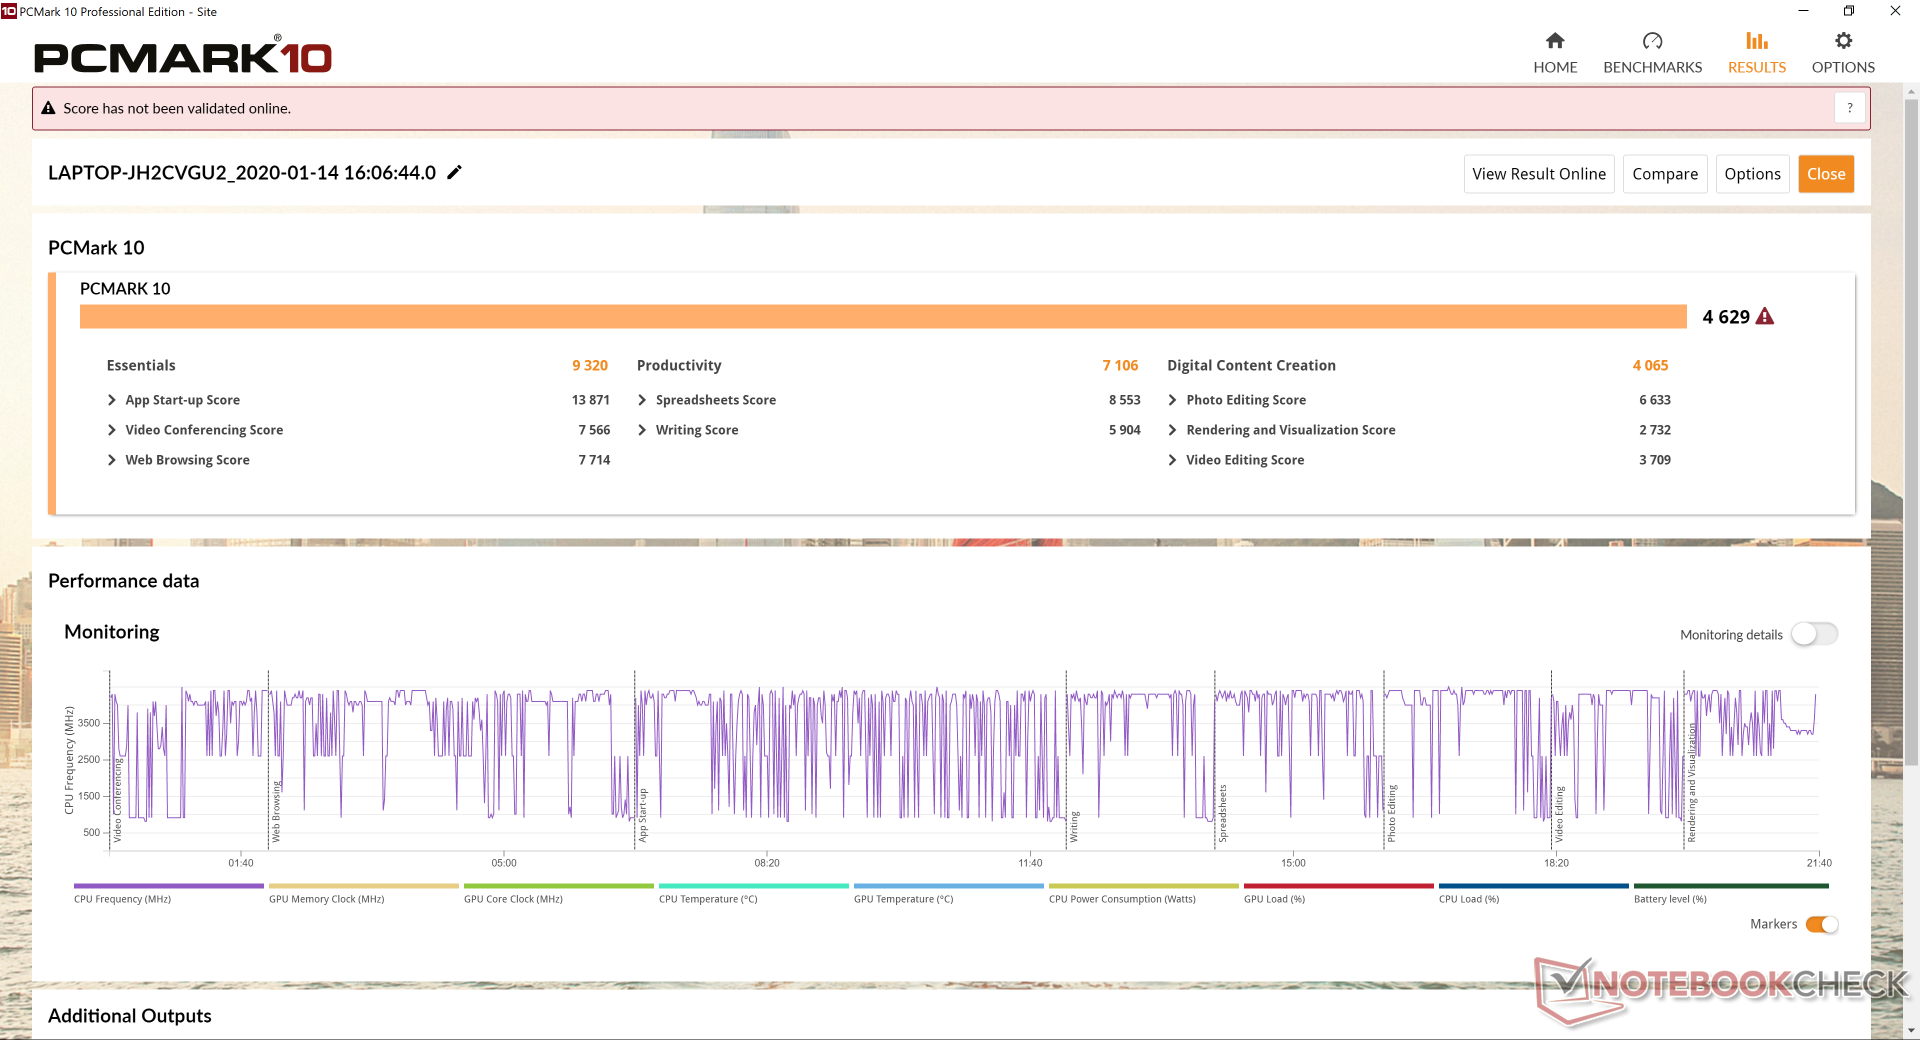
| PCMark 8 Home Score Accelerated v2 | 3548 points | |
| PCMark 8 Work Score Accelerated v2 | 4555 points | |
| PCMark 10 Score | 4629 points | |
Help | ||
Storage Devices
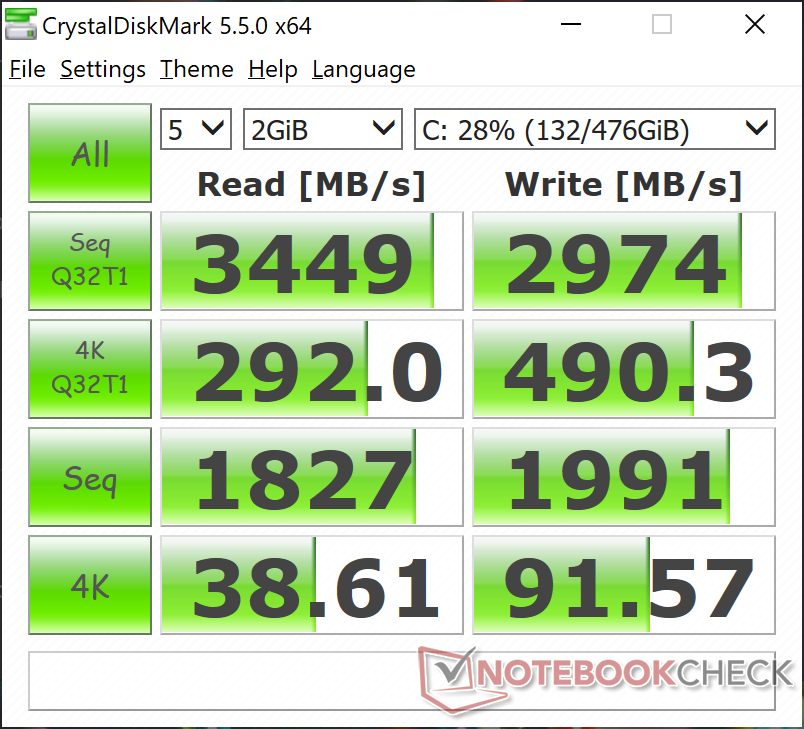
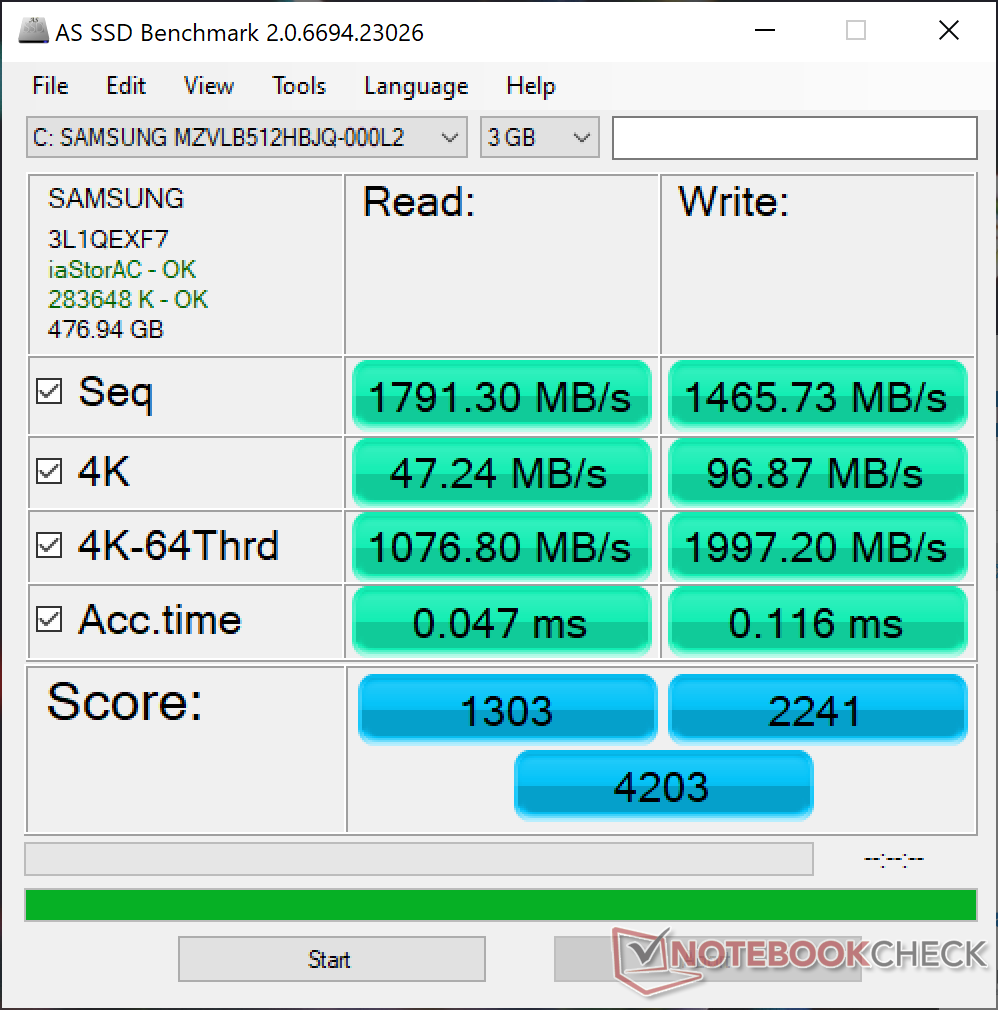
Only one internal storage bay is available. Our test unit comes equipped with the high-end Samsung PM981 instead of a lesser SK Hynix or Intel part which is surprising for an IdeaPad laptop. Sequential read and write rates average about 1800 MB/s and 1500 MB/s, respectively, according to AS SSD.
See our table of SSDs and HDDs for more performance comparisons.
| Lenovo IdeaPad S740-15IRH Samsung SSD PM981 MZVLB512HAJQ | Dell XPS 15 7590 9980HK GTX 1650 Toshiba XG6 KXG60ZNV1T02 | HP Spectre X360 15-5ZV31AV Intel SSD 660p 2TB SSDPEKNW020T8 | Lenovo Yoga 730-15IKB SK Hynix PC401 512GB M.2 (HFS512GD9TNG) | Asus ZenBook 15 UX534FT-DB77 Samsung SSD PM981 MZVLB1T0HALR | MSI Prestige 15 A10SC Samsung SSD PM981 MZVLB1T0HALR | |
|---|---|---|---|---|---|---|
| AS SSD | 4% | -24% | -26% | -4% | 4% | |
| Seq Read (MB/s) | 1791 | 1723 -4% | 1220 -32% | 2158 20% | 1887 5% | 1274 -29% |
| Seq Write (MB/s) | 1466 | 1386 -5% | 1152 -21% | 680 -54% | 1432 -2% | 1395 -5% |
| 4K Read (MB/s) | 47.24 | 43.25 -8% | 52.3 11% | 44.74 -5% | 52.3 11% | 50.3 6% |
| 4K Write (MB/s) | 96.9 | 98.3 1% | 146.6 51% | 123 27% | 146 51% | 119.8 24% |
| 4K-64 Read (MB/s) | 1077 | 1078 0% | 652 -39% | 623 -42% | 969 -10% | 1599 48% |
| 4K-64 Write (MB/s) | 1997 | 1456 -27% | 847 -58% | 486 -76% | 1375 -31% | 1455 -27% |
| Access Time Read * (ms) | 0.047 | 0.05 -6% | 0.077 -64% | 0.044 6% | 0.034 28% | 0.044 6% |
| Access Time Write * (ms) | 0.116 | 0.039 66% | 0.106 9% | 0.051 56% | 0.075 35% | 0.092 21% |
| Score Read (Points) | 1303 | 1294 -1% | 826 -37% | 884 -32% | 1210 -7% | 1777 36% |
| Score Write (Points) | 2241 | 1693 -24% | 1109 -51% | 677 -70% | 1664 -26% | 1714 -24% |
| Score Total (Points) | 4203 | 3638 -13% | 2371 -44% | 1951 -54% | 3483 -17% | 4411 5% |
| Copy ISO MB/s (MB/s) | 2127 | 3182 50% | 2070 -3% | 1641 -23% | 1375 -35% | 2830 33% |
| Copy Program MB/s (MB/s) | 828 | 984 19% | 571 -31% | 390 -53% | 468 -43% | 609 -26% |
| Copy Game MB/s (MB/s) | 1639 | 1824 11% | 1219 -26% | 574 -65% | 1287 -21% | 1424 -13% |
| CrystalDiskMark 5.2 / 6 | 5% | 1% | 12% | 13% | -5% | |
| Write 4K (MB/s) | 91.6 | 104.3 14% | 151.5 65% | 164.9 80% | 141.6 55% | 150.8 65% |
| Read 4K (MB/s) | 38.61 | 45.23 17% | 59.3 54% | 50.5 31% | 45.28 17% | 47.3 23% |
| Write Seq (MB/s) | 1991 | 1729 -13% | 1424 -28% | 1262 -37% | 1975 -1% | 981 -51% |
| Read Seq (MB/s) | 1827 | 1861 2% | 1609 -12% | 2054 12% | 2272 24% | 976 -47% |
| Write 4K Q32T1 (MB/s) | 490.3 | 509 4% | 393.6 -20% | 477.6 -3% | 458.6 -6% | 442.7 -10% |
| Read 4K Q32T1 (MB/s) | 292 | 388.5 33% | 369.4 27% | 550 88% | 391.4 34% | 499.7 71% |
| Write Seq Q32T1 (MB/s) | 2974 | 2813 -5% | 1946 -35% | 1400 -53% | 2393 -20% | 1706 -43% |
| Read Seq Q32T1 (MB/s) | 3449 | 2906 -16% | 1934 -44% | 2672 -23% | 3464 0% | 1758 -49% |
| Total Average (Program / Settings) | 5% /
4% | -12% /
-15% | -7% /
-12% | 5% /
2% | -1% /
1% |
* ... smaller is better

GPU Performance
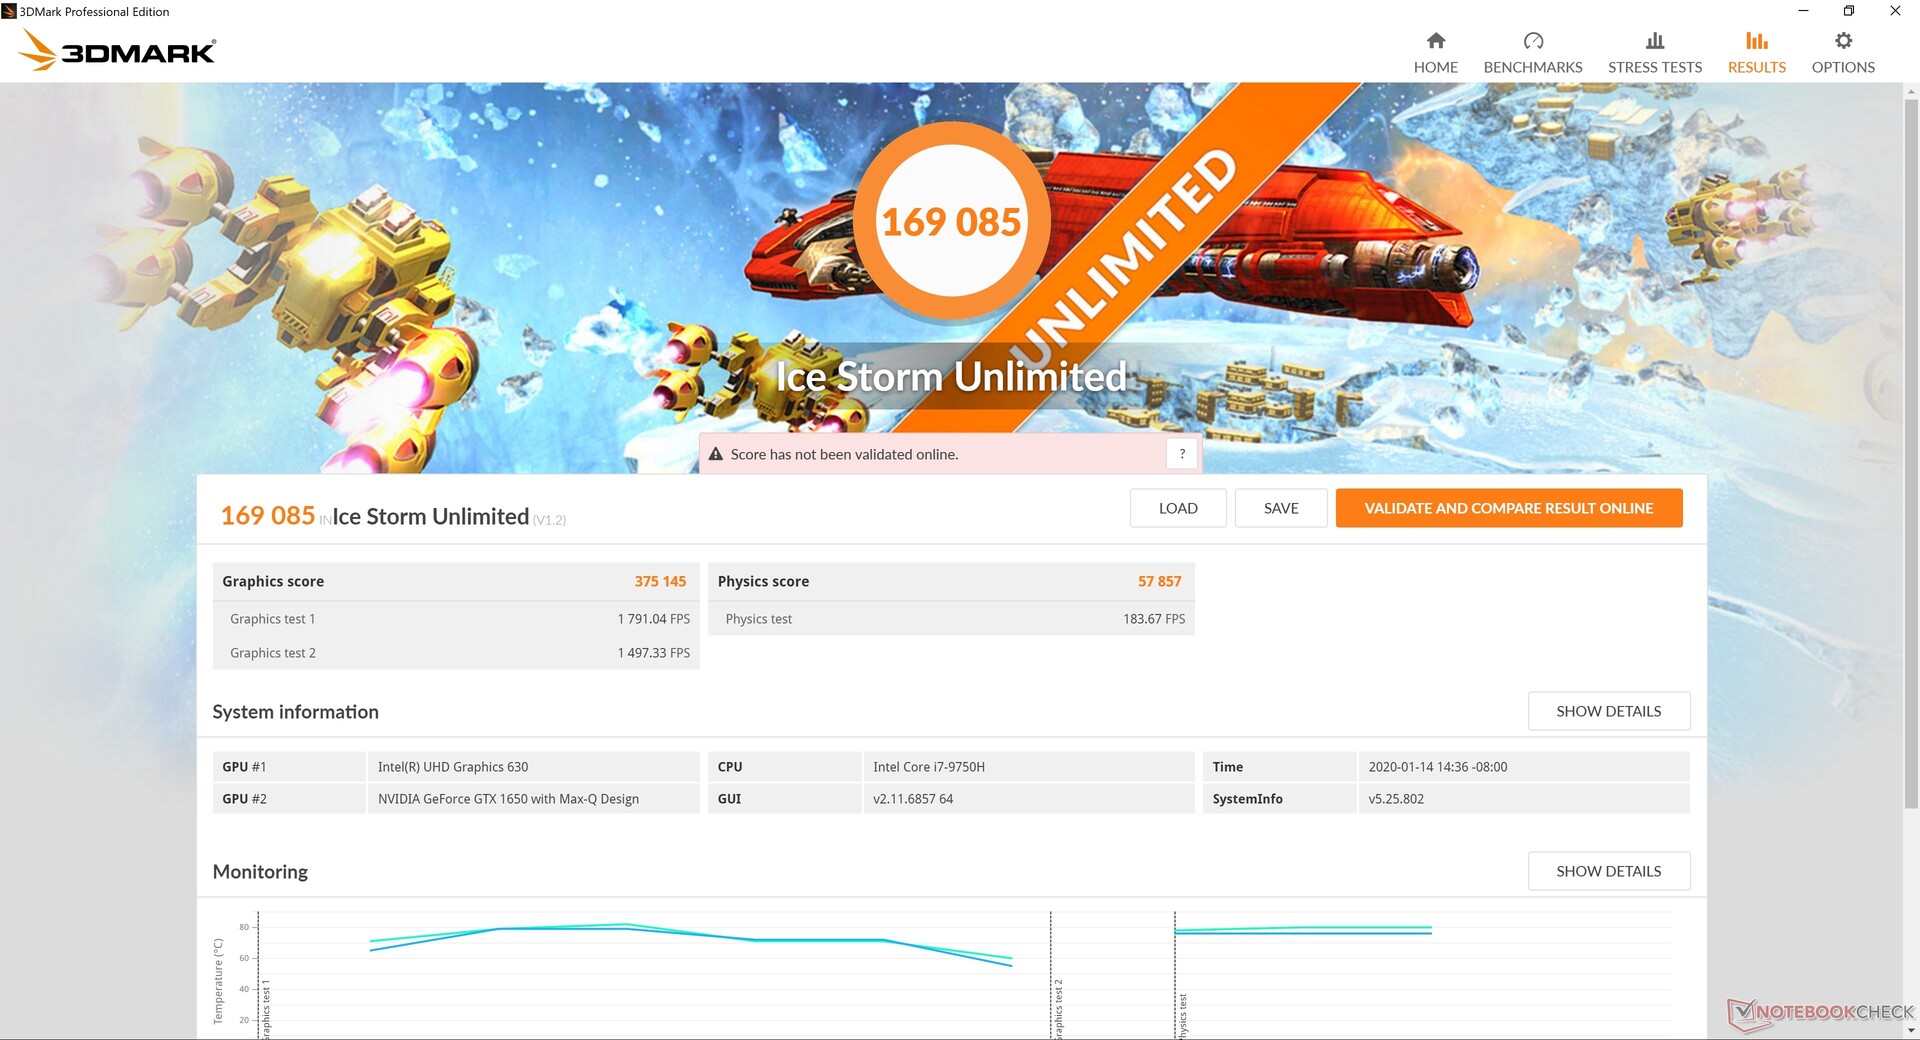
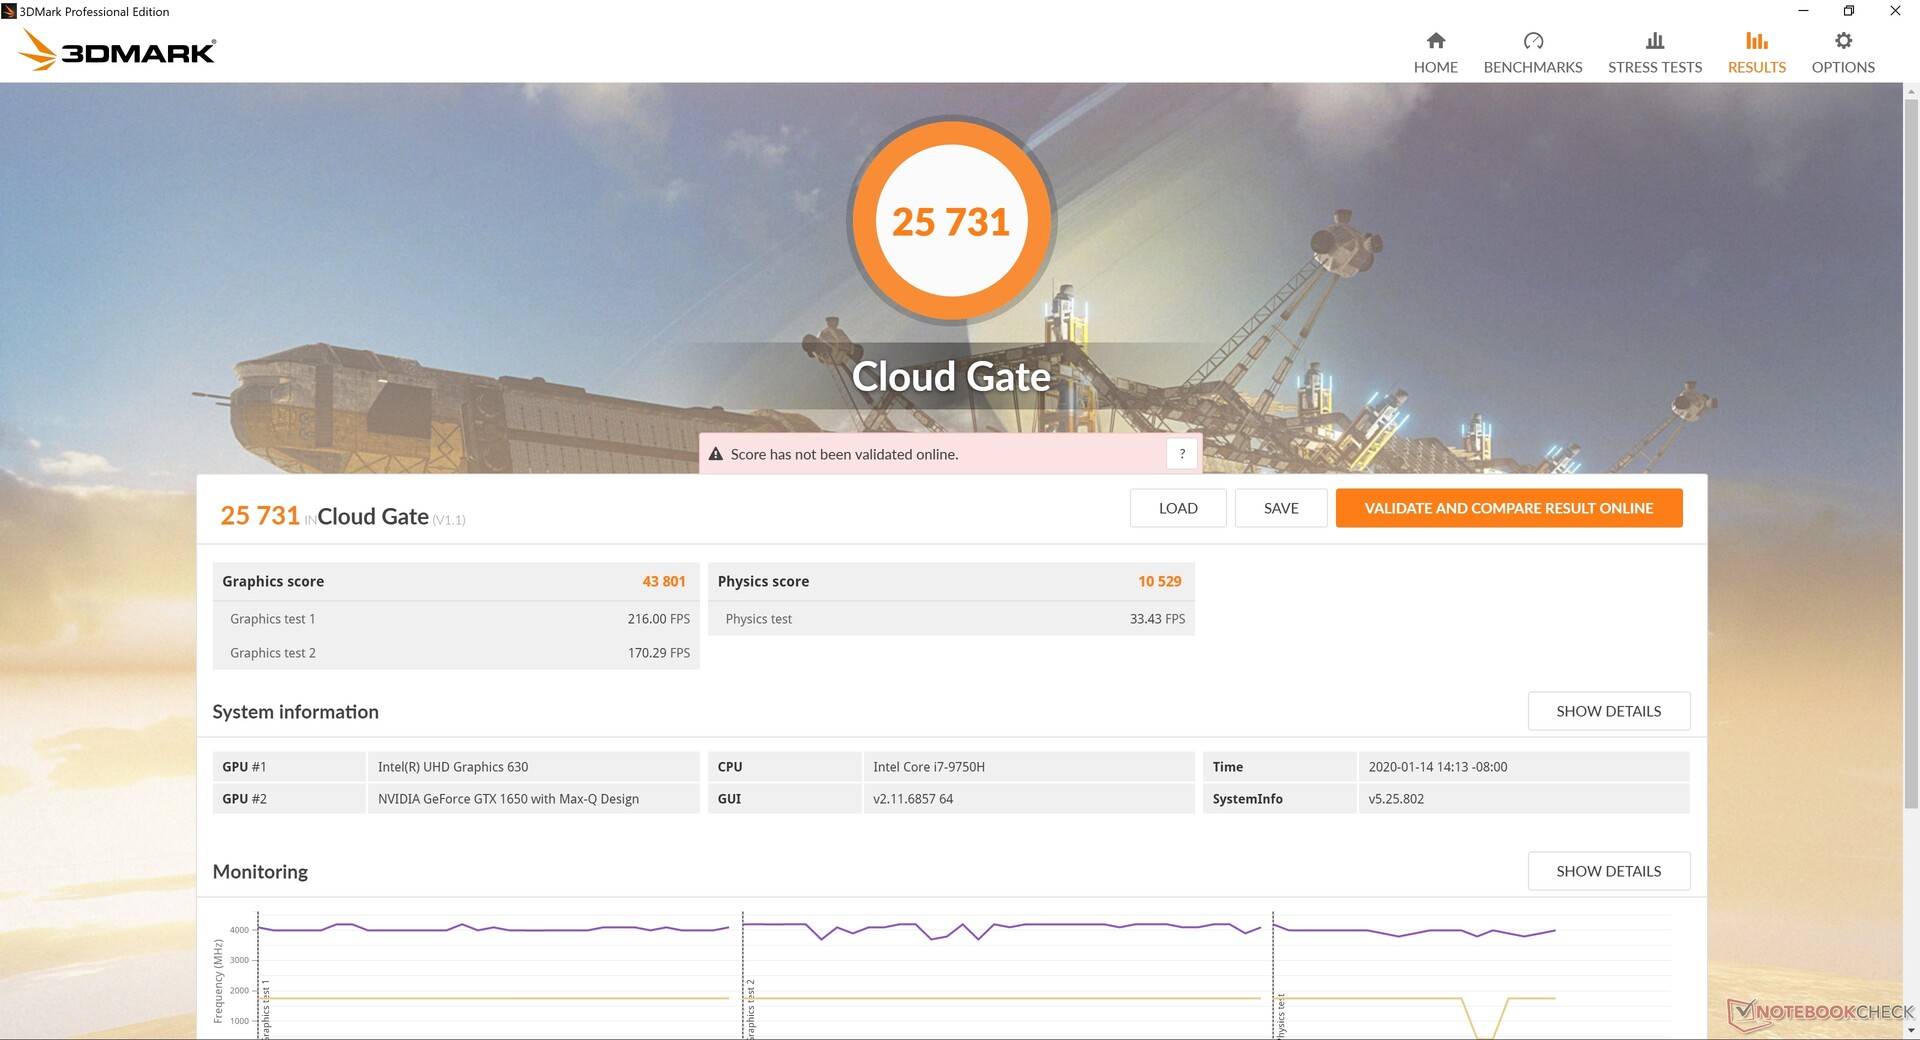
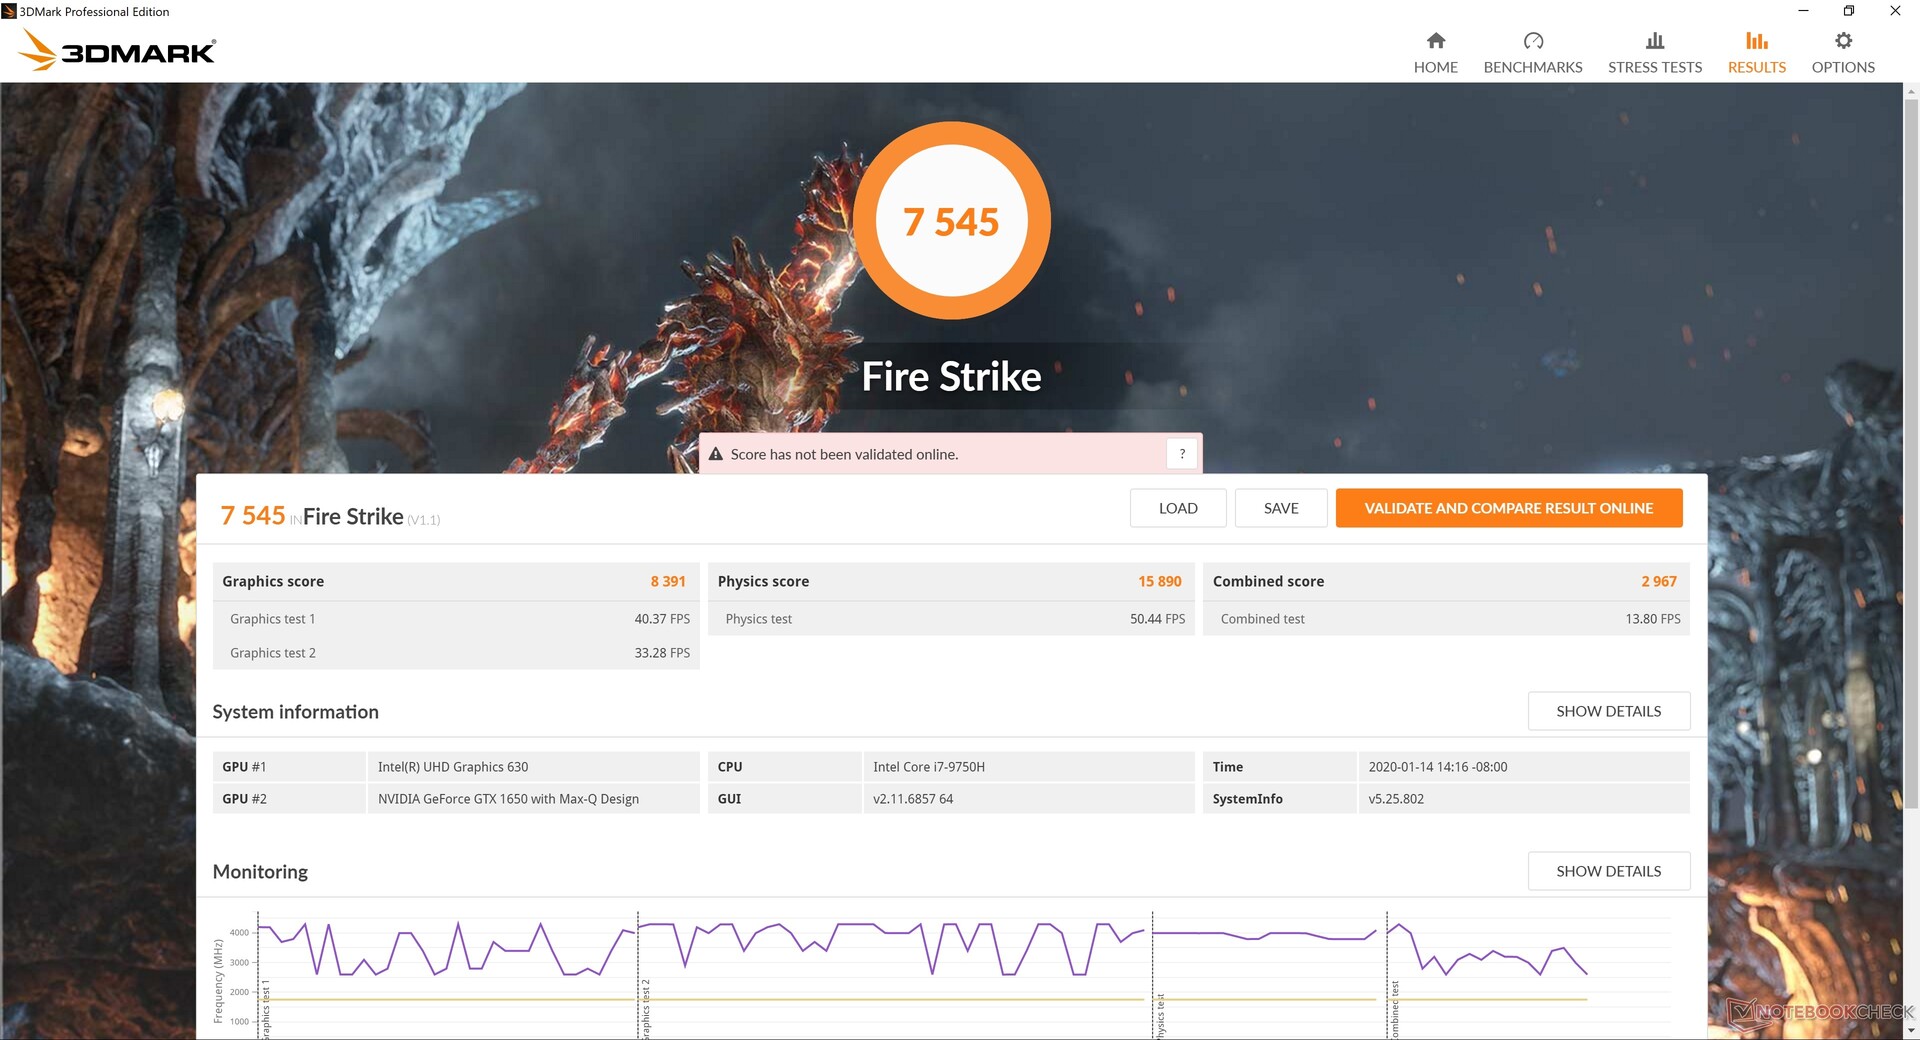
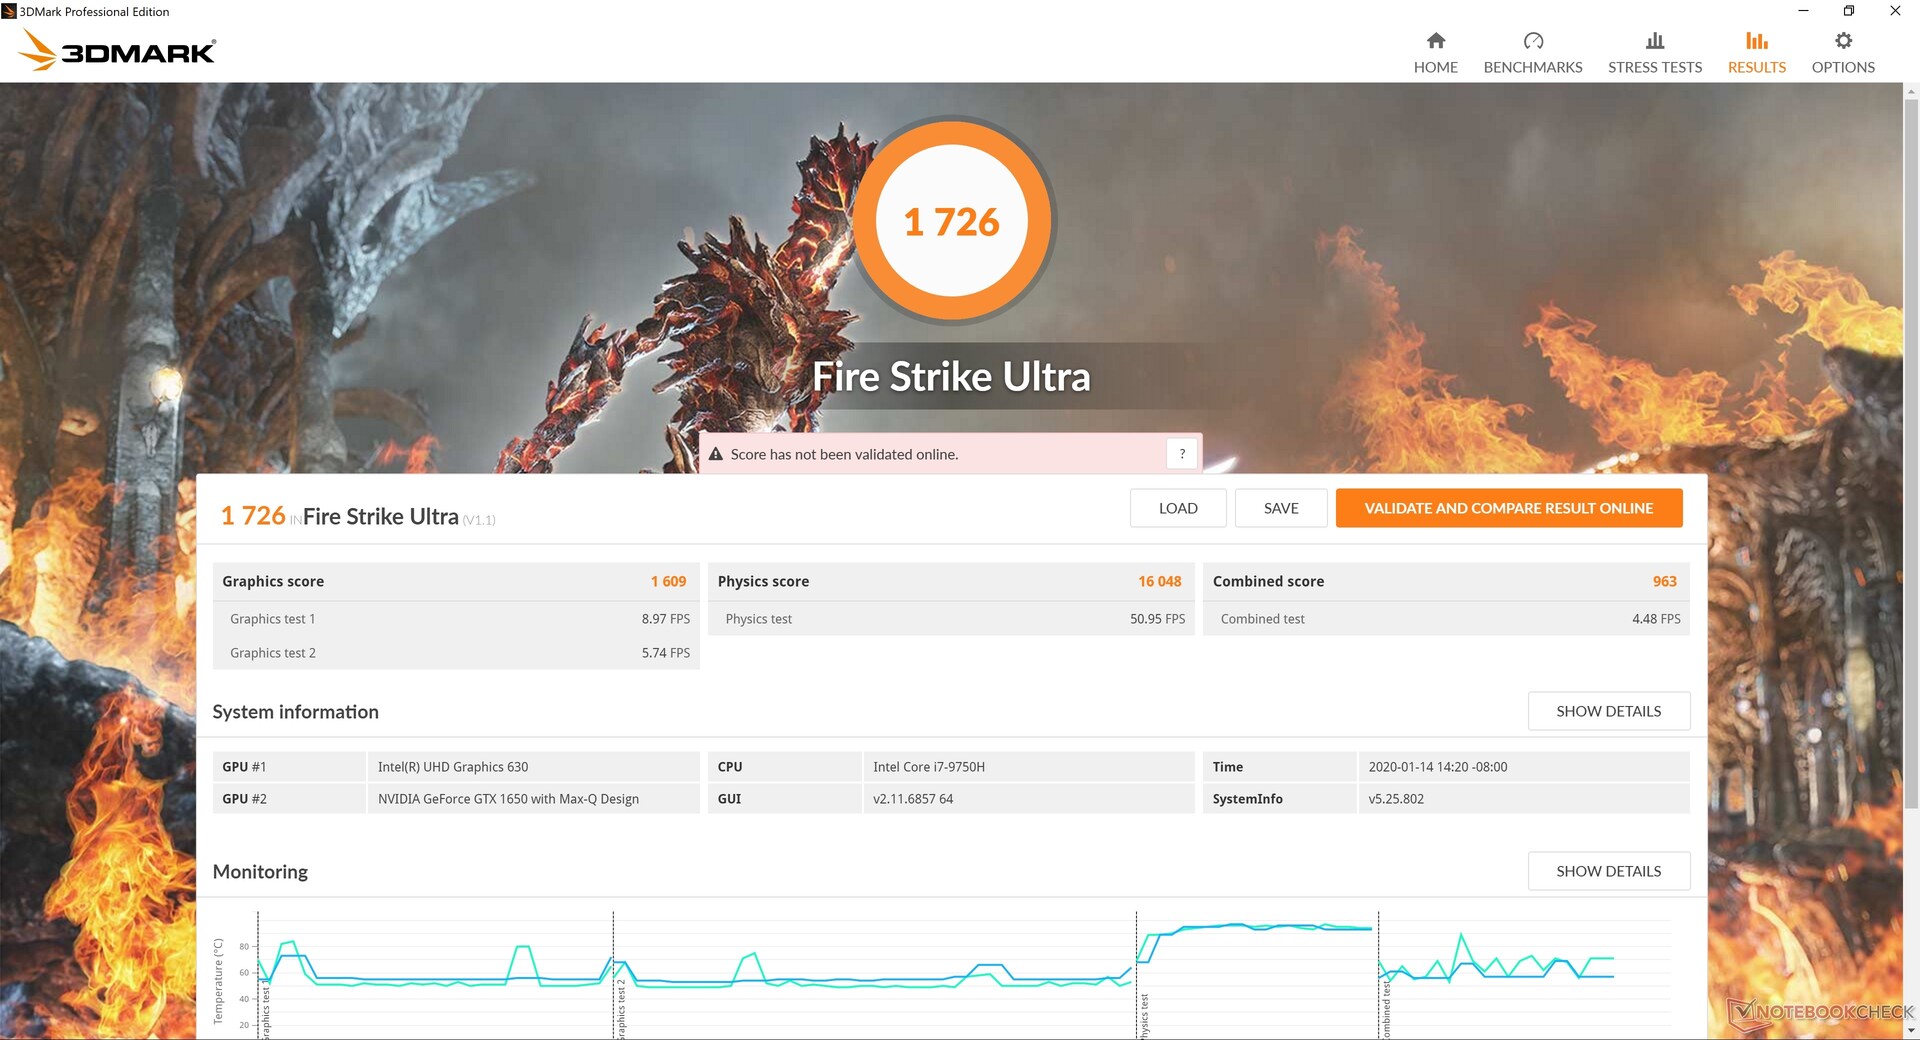
The GeForce GTX 1650 Max-Q is Nvidia's slowest GTX GPU based on the Turing architecture. Raw performance is still excellent relatively speaking; 3DMark results are only 14 to 26 percent slower than the older mobile GTX 1060 or about 10 percent slower than our desktop GTX 1650 reference.
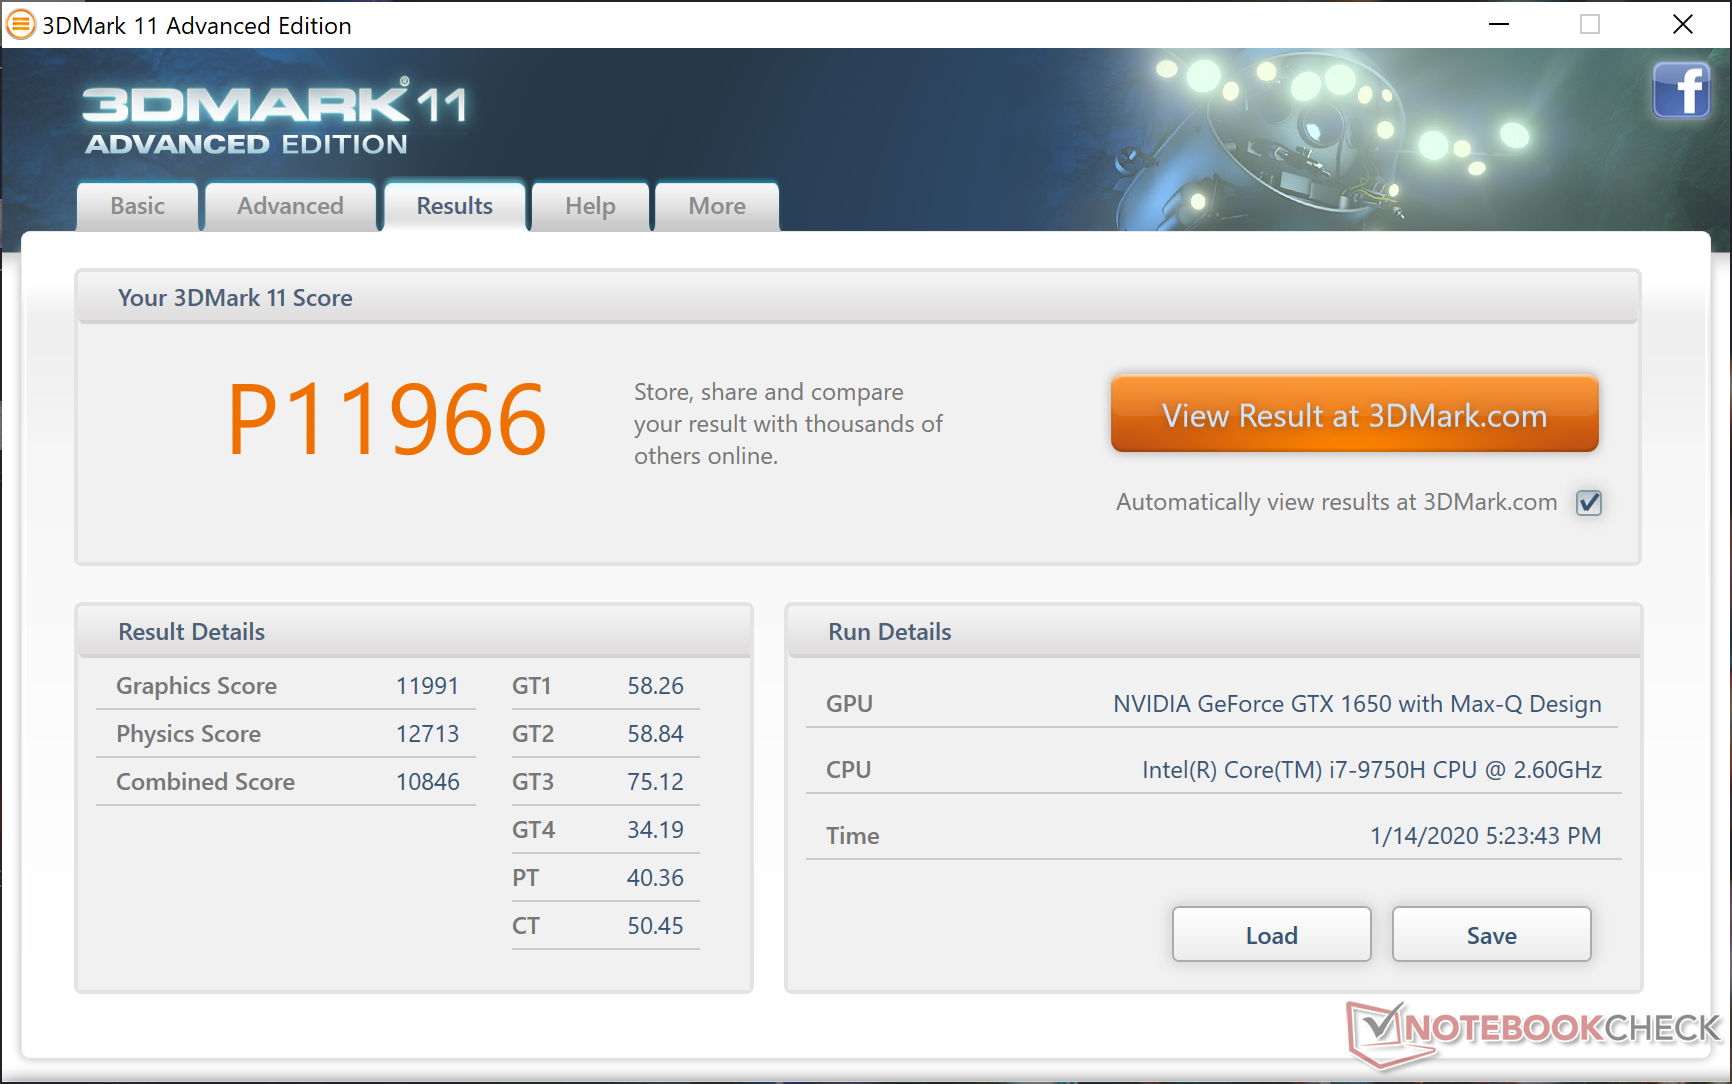
| 3DMark 11 Performance | 11966 points | |
| 3DMark Ice Storm Standard Score | 42968 points | |
| 3DMark Cloud Gate Standard Score | 25731 points | |
| 3DMark Fire Strike Score | 7545 points | |
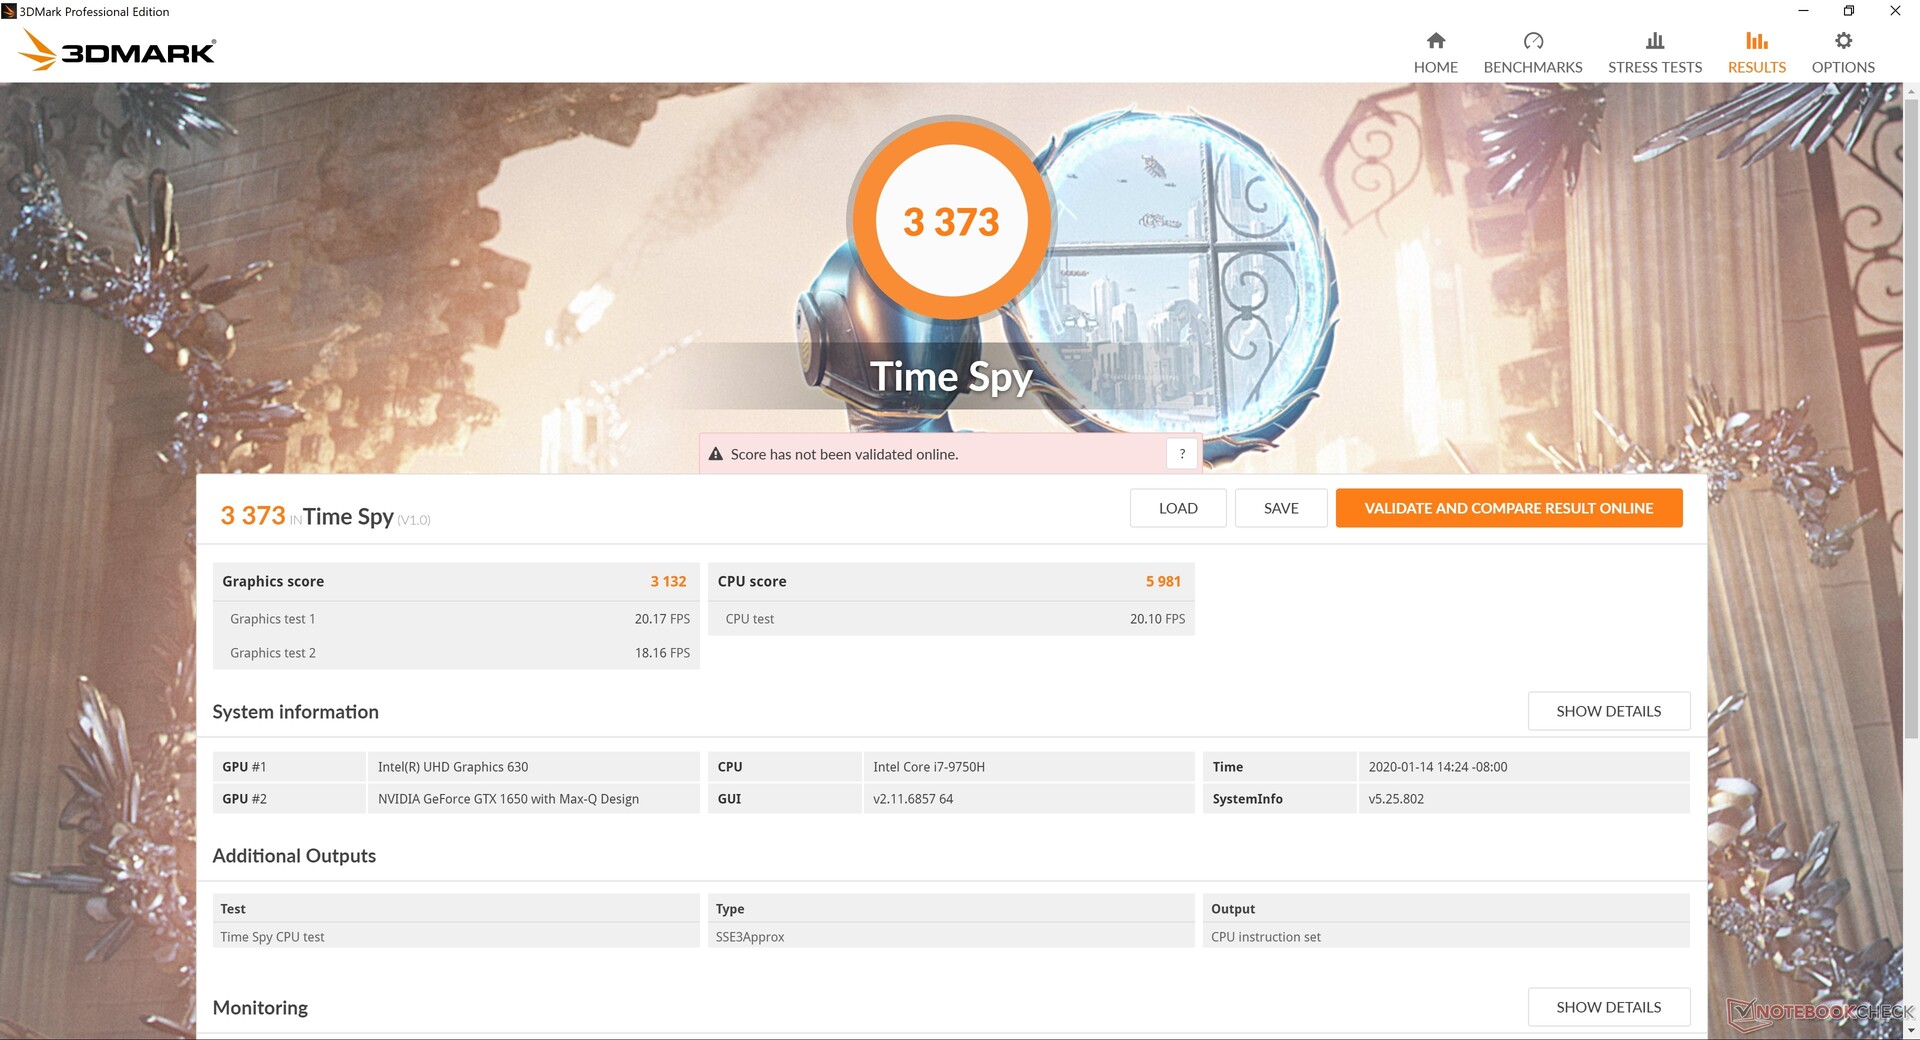
| 3DMark Time Spy Score | 3373 points | |
Help | ||
Gaming Performance
Most games run very well at 1080p not unlike on the mobile GTX 1060. Reaching 60+ FPS is possible so long as most graphical settings are reduced. Don't expect to have a good experience if running demanding titles at the native 4K UHD resolution.
Idling on Witcher 3 for over an hour shows consistent frame rates over time to suggest no recurring frame dips or interrupting background activity in contrast to what we observed on the late 2019 HP Spectre x360 15.
See our dedicated page on the GeForce GTX 1650 Max-Q for more technical information and benchmarks.
| Shadow of the Tomb Raider - 1920x1080 Highest Preset AA:T | |
| MSI RTX 2060 Gaming Z 6G | |
| HP Pavilion Gaming 17-cd0085cl | |
| MSI GF65 9SD | |
| Asus TUF FX705GM | |
| Gainward GeForce GTX 1650 4 GB | |
| Lenovo IdeaPad S740-15IRH | |
| Asus G752VY | |
| Average NVIDIA GeForce GTX 1650 Max-Q (33 - 45, n=6) | |
| Asus TUF FX705GE-EW096T | |
| Xiaomi Mi Notebook Pro i7 | |
| The Witcher 3 - 1920x1080 Ultra Graphics & Postprocessing (HBAO+) | |
| MSI RTX 2060 Gaming Z 6G | |
| MSI GF65 9SD | |
| HP Pavilion Gaming 17-cd0085cl | |
| Gainward GeForce GTX 1650 4 GB | |
| Asus TUF FX705GM | |
| Dell G3 3590 | |
| Lenovo IdeaPad S740-15IRH | |
| Average NVIDIA GeForce GTX 1650 Max-Q (27.5 - 36.5, n=11) | |
| Asus TUF FX705GE-EW096T | |
| Xiaomi Mi Notebook Pro i7 | |
| low | med. | high | ultra | |
|---|---|---|---|---|
| BioShock Infinite (2013) | 323.6 | 238.3 | 206.8 | 81.7 |
| The Witcher 3 (2015) | 188 | 114.8 | 60.4 | 34.4 |
| Shadow of the Tomb Raider (2018) | 117 | 56 | 47 | 41 |
Emissions
System Noise
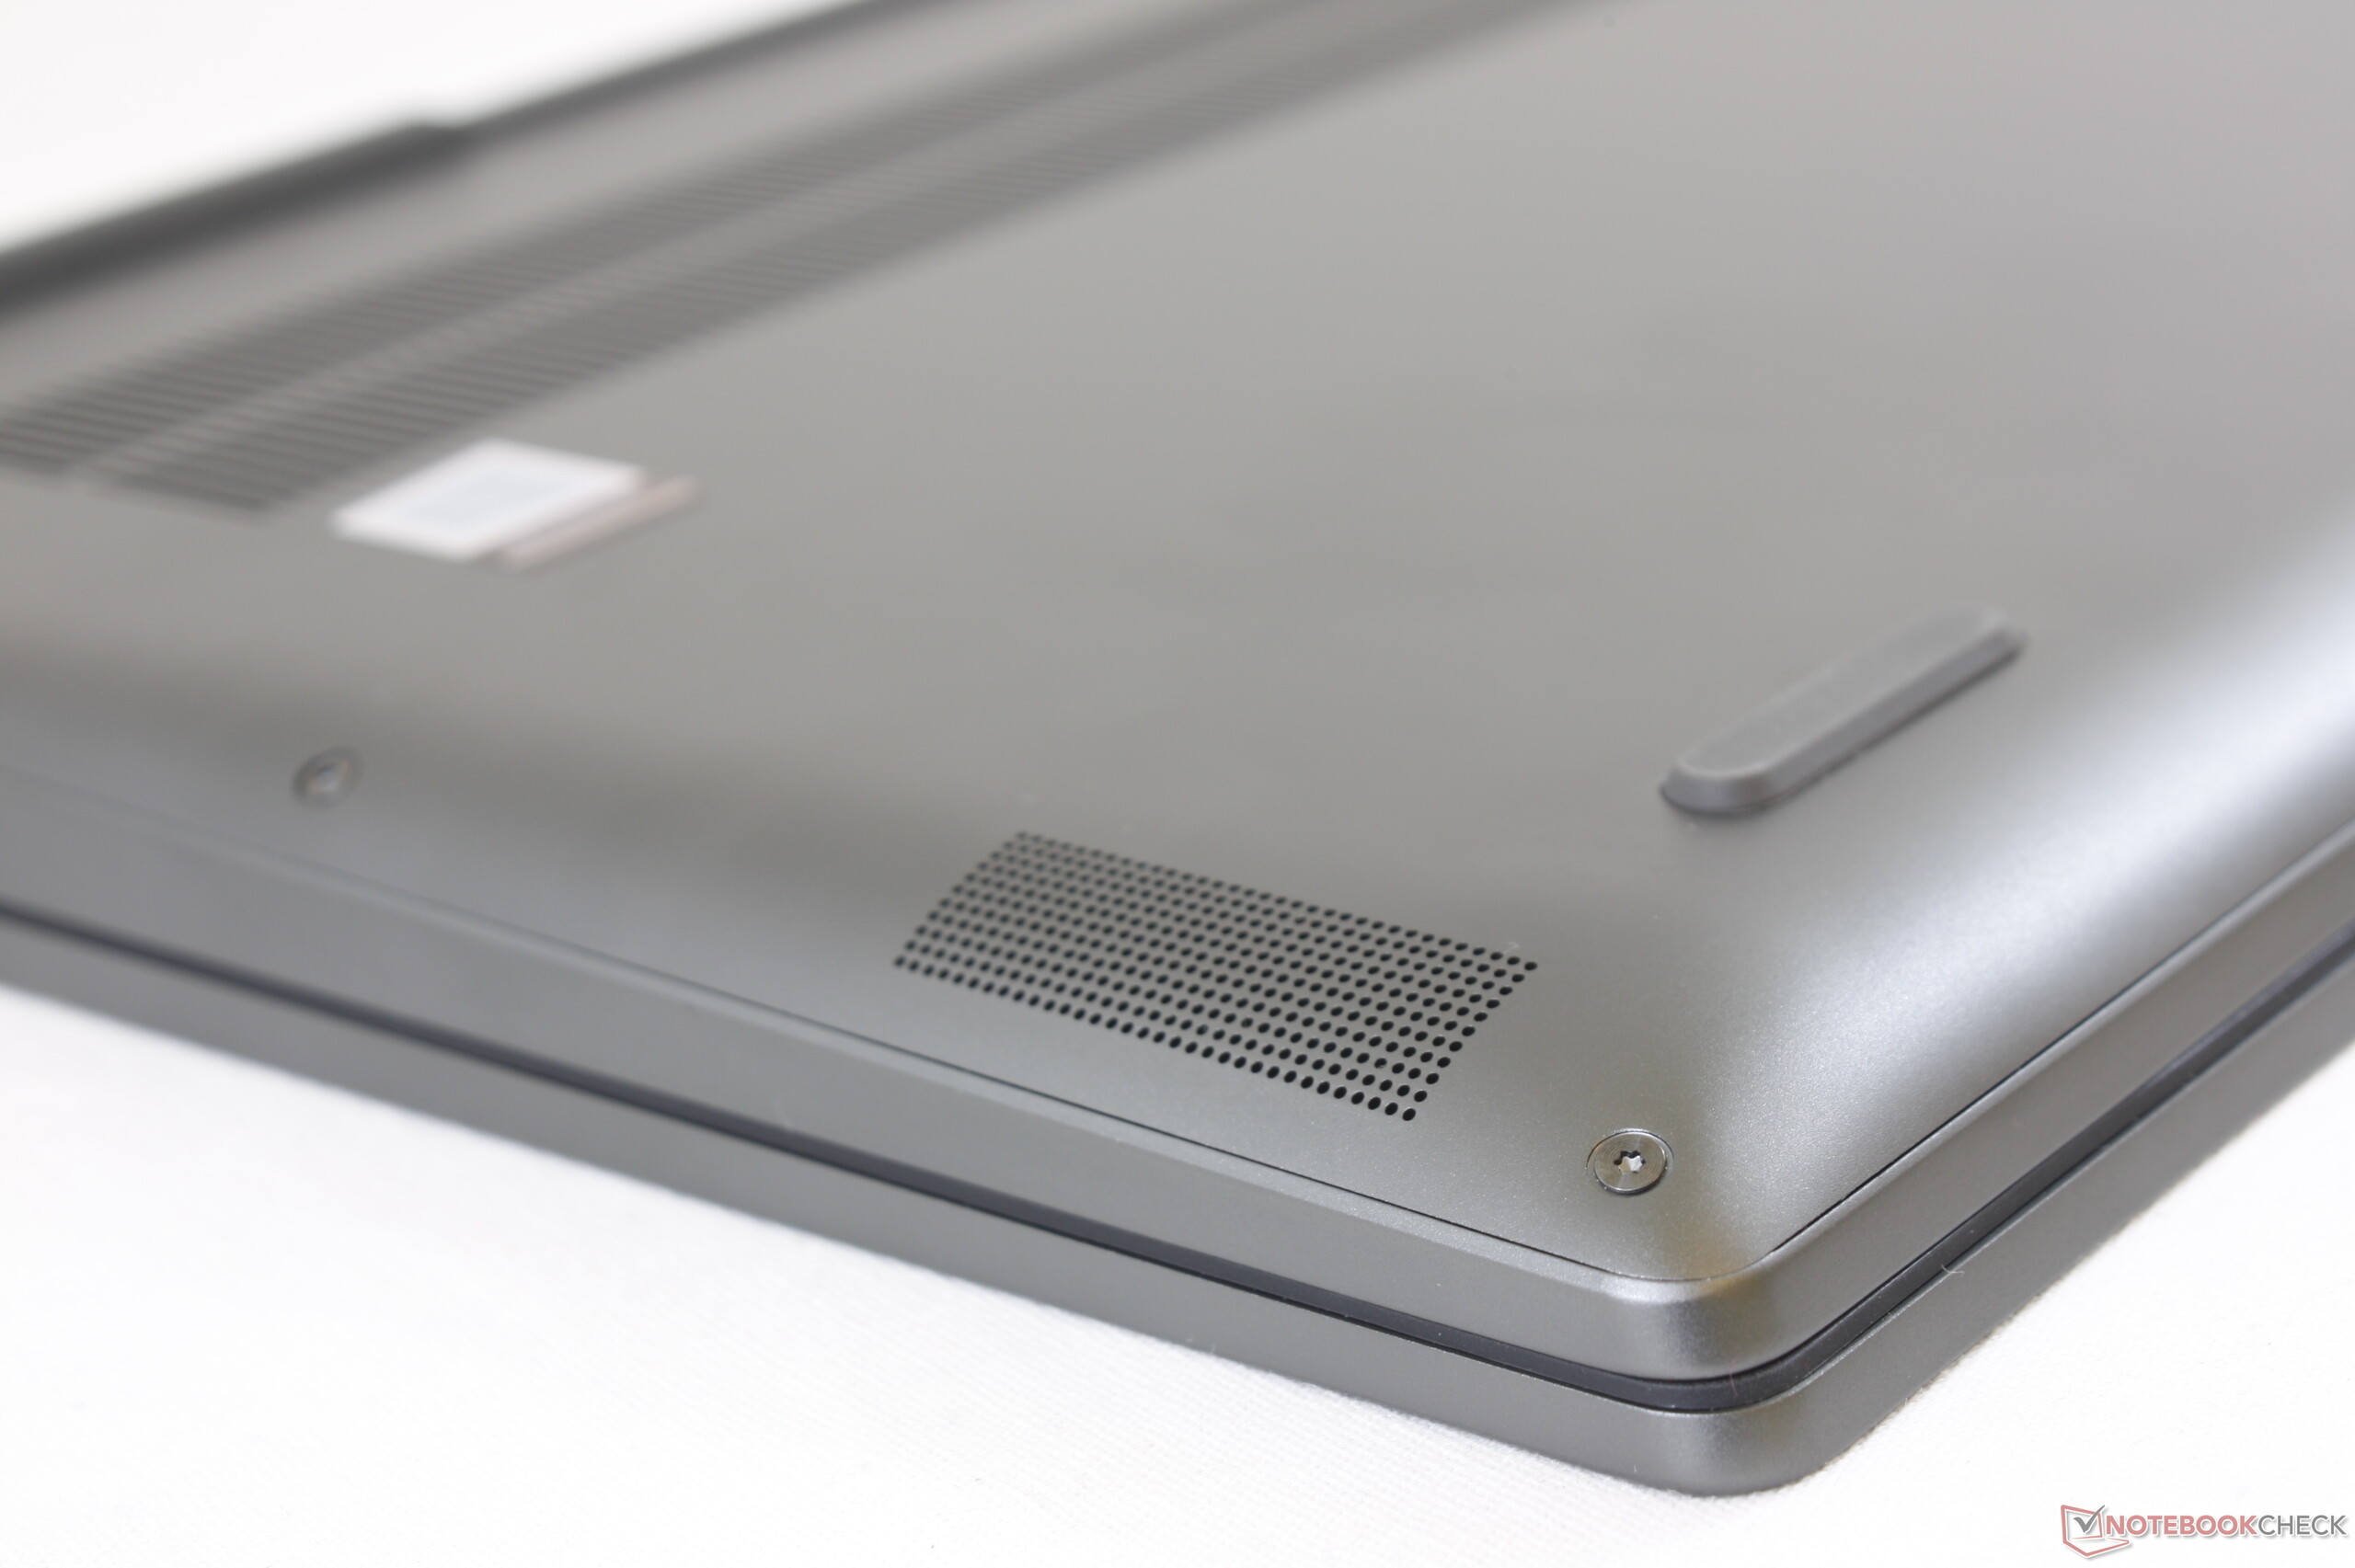
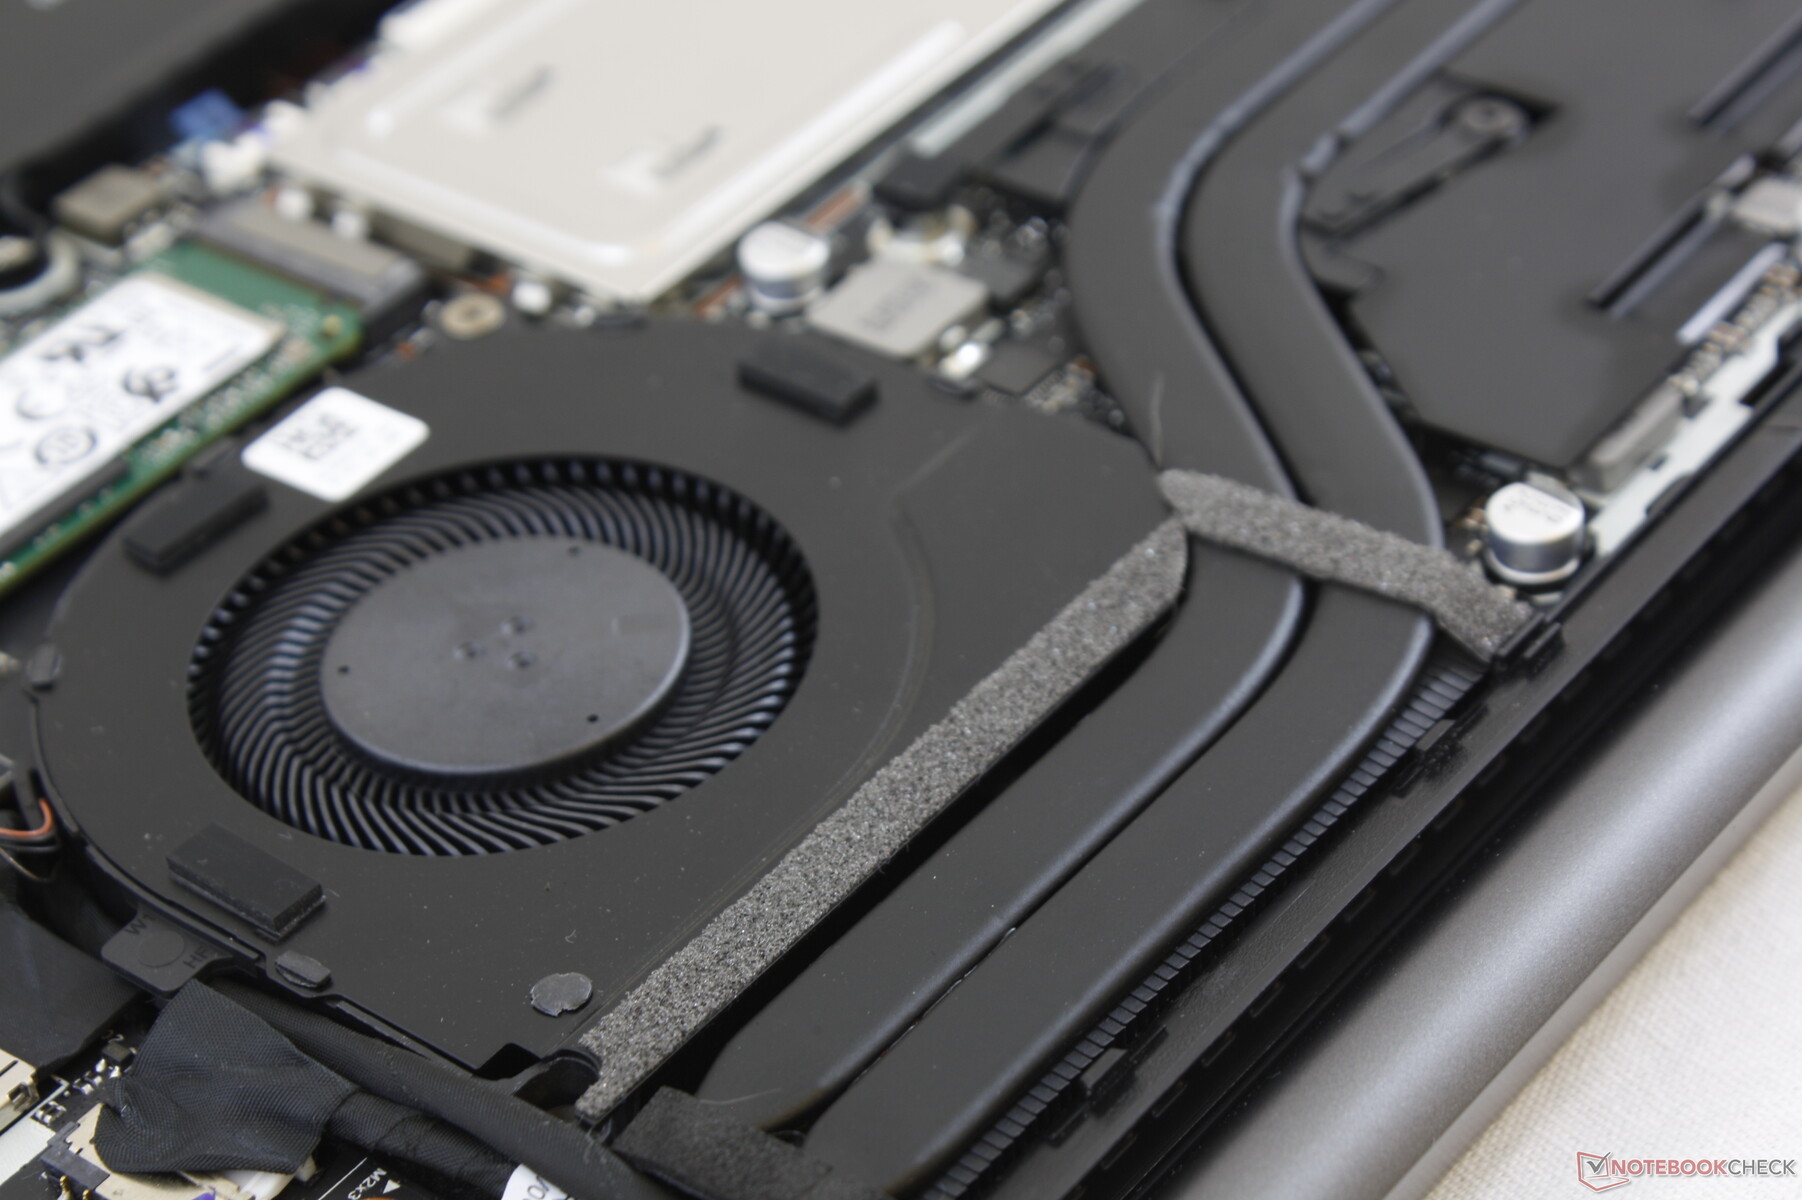
The cooling solution consists of dual fans and two heat pipes between them shared across both processors. Though silent when the system is idling or video streaming on the Power Saver profile, the fans tend to pulse frequently when launching applications. Running the first benchmark scene of 3DMark 06, which only lasts for 90 seconds, is already enough to cause the fans to run at their maximum noise level of 45 dB(A).
Fan noise remains steady at about 43.9 dB(A) when running Witcher 3 to be quieter and louder than the XPS 15 and Spectre x360 15, respectively, when under similar gaming conditions. We can notice very slight coil whine or electronic noise from our test unit.
| Lenovo IdeaPad S740-15IRH GeForce GTX 1650 Max-Q, i7-9750H, Samsung SSD PM981 MZVLB512HAJQ | Dell XPS 15 7590 9980HK GTX 1650 GeForce GTX 1650 Mobile, i9-9980HK, Toshiba XG6 KXG60ZNV1T02 | HP Spectre X360 15-5ZV31AV GeForce MX250, i7-10510U, Intel SSD 660p 2TB SSDPEKNW020T8 | Lenovo Yoga 730-15IKB GeForce GTX 1050 Mobile, i5-8550U, SK Hynix PC401 512GB M.2 (HFS512GD9TNG) | Asus ZenBook 15 UX534FT-DB77 GeForce GTX 1650 Max-Q, i7-8565U, Samsung SSD PM981 MZVLB1T0HALR | MSI Prestige 15 A10SC GeForce GTX 1650 Max-Q, i7-10710U, Samsung SSD PM981 MZVLB1T0HALR | |
|---|---|---|---|---|---|---|
| Noise | -2% | 4% | 1% | 6% | 3% | |
| off / environment * (dB) | 28.5 | 28.2 1% | 30.1 -6% | 30.5 -7% | 28.4 -0% | 29.3 -3% |
| Idle Minimum * (dB) | 28.5 | 28.2 1% | 30.1 -6% | 30.5 -7% | 28.4 -0% | 30.1 -6% |
| Idle Average * (dB) | 28.5 | 28.2 1% | 30.1 -6% | 30.5 -7% | 28.4 -0% | 30.2 -6% |
| Idle Maximum * (dB) | 28.5 | 30.4 -7% | 30.1 -6% | 30.5 -7% | 28.4 -0% | 30.2 -6% |
| Load Average * (dB) | 45 | 43.8 3% | 30.1 33% | 37.5 17% | 33.9 25% | 31.5 30% |
| Witcher 3 ultra * (dB) | 43.9 | 47.2 -8% | 39.7 10% | 39.8 9% | 37 16% | |
| Load Maximum * (dB) | 44.7 | 47.2 -6% | 42 6% | 37.5 16% | 40.2 10% | 47 -5% |
* ... smaller is better
Noise level
| Idle |
| 28.5 / 28.5 / 28.5 dB(A) |
| Load |
| 45 / 44.7 dB(A) |
 | ||
30 dB silent 40 dB(A) audible 50 dB(A) loud |
||
min: | ||
Temperature
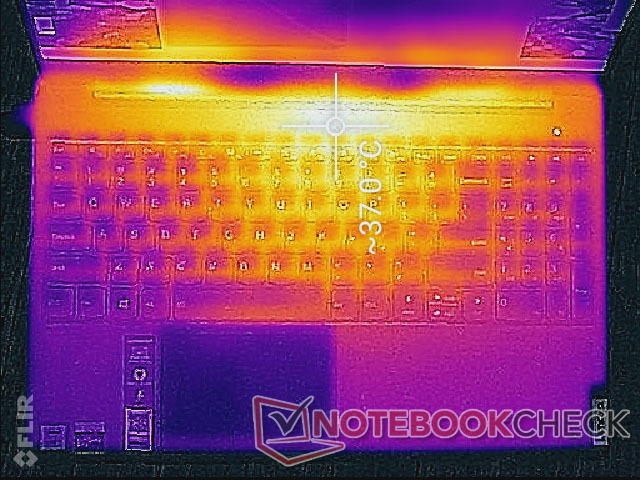
Surface temperatures when idling on desktop are far too warm with hot spots approaching 41 C as shown by the temperature maps below. In comparison, the Spectre x360 15 with GTX 1050 Ti Max-Q graphics tops out at just 29 C when idling on desktop. The high surface temperature of the Lenovo correlates with the unusually high idling power consumption as detailed in the Power Consumption section below.
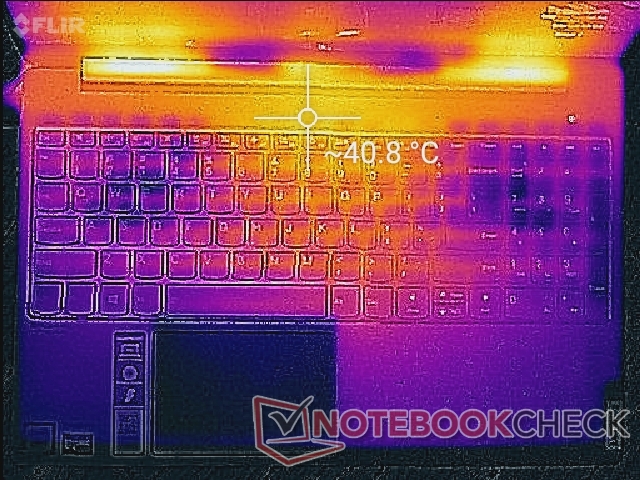
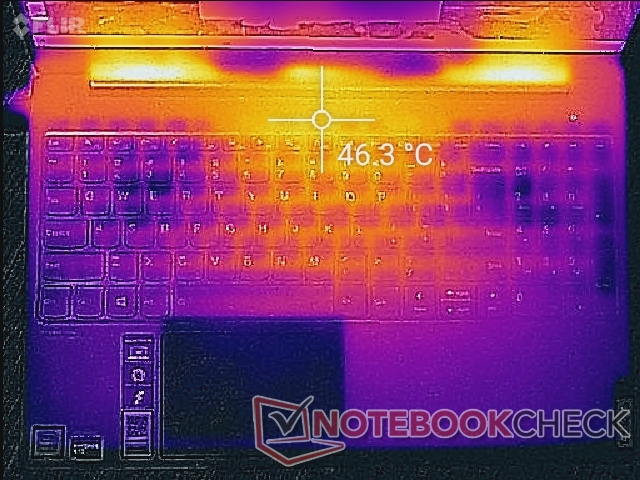
If gaming, surface temperatures can reach over 40 C or even 50 C if under extreme processing conditions. The fans are more active when under these demanding conditions whereas they are silent when the system is idling.
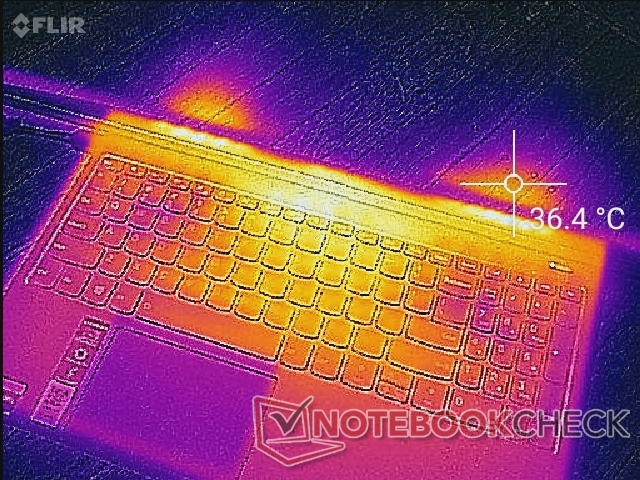

(-) The maximum temperature on the upper side is 46.2 °C / 115 F, compared to the average of 36.8 °C / 98 F, ranging from 21 to 71 °C for the class Multimedia.
(-) The bottom heats up to a maximum of 50 °C / 122 F, compared to the average of 39.1 °C / 102 F
(+) In idle usage, the average temperature for the upper side is 31.2 °C / 88 F, compared to the device average of 31.3 °C / 88 F.
(±) Playing The Witcher 3, the average temperature for the upper side is 32.8 °C / 91 F, compared to the device average of 31.3 °C / 88 F.
(+) The palmrests and touchpad are cooler than skin temperature with a maximum of 30.2 °C / 86.4 F and are therefore cool to the touch.
(±) The average temperature of the palmrest area of similar devices was 28.7 °C / 83.7 F (-1.5 °C / -2.7 F).


Stress Test
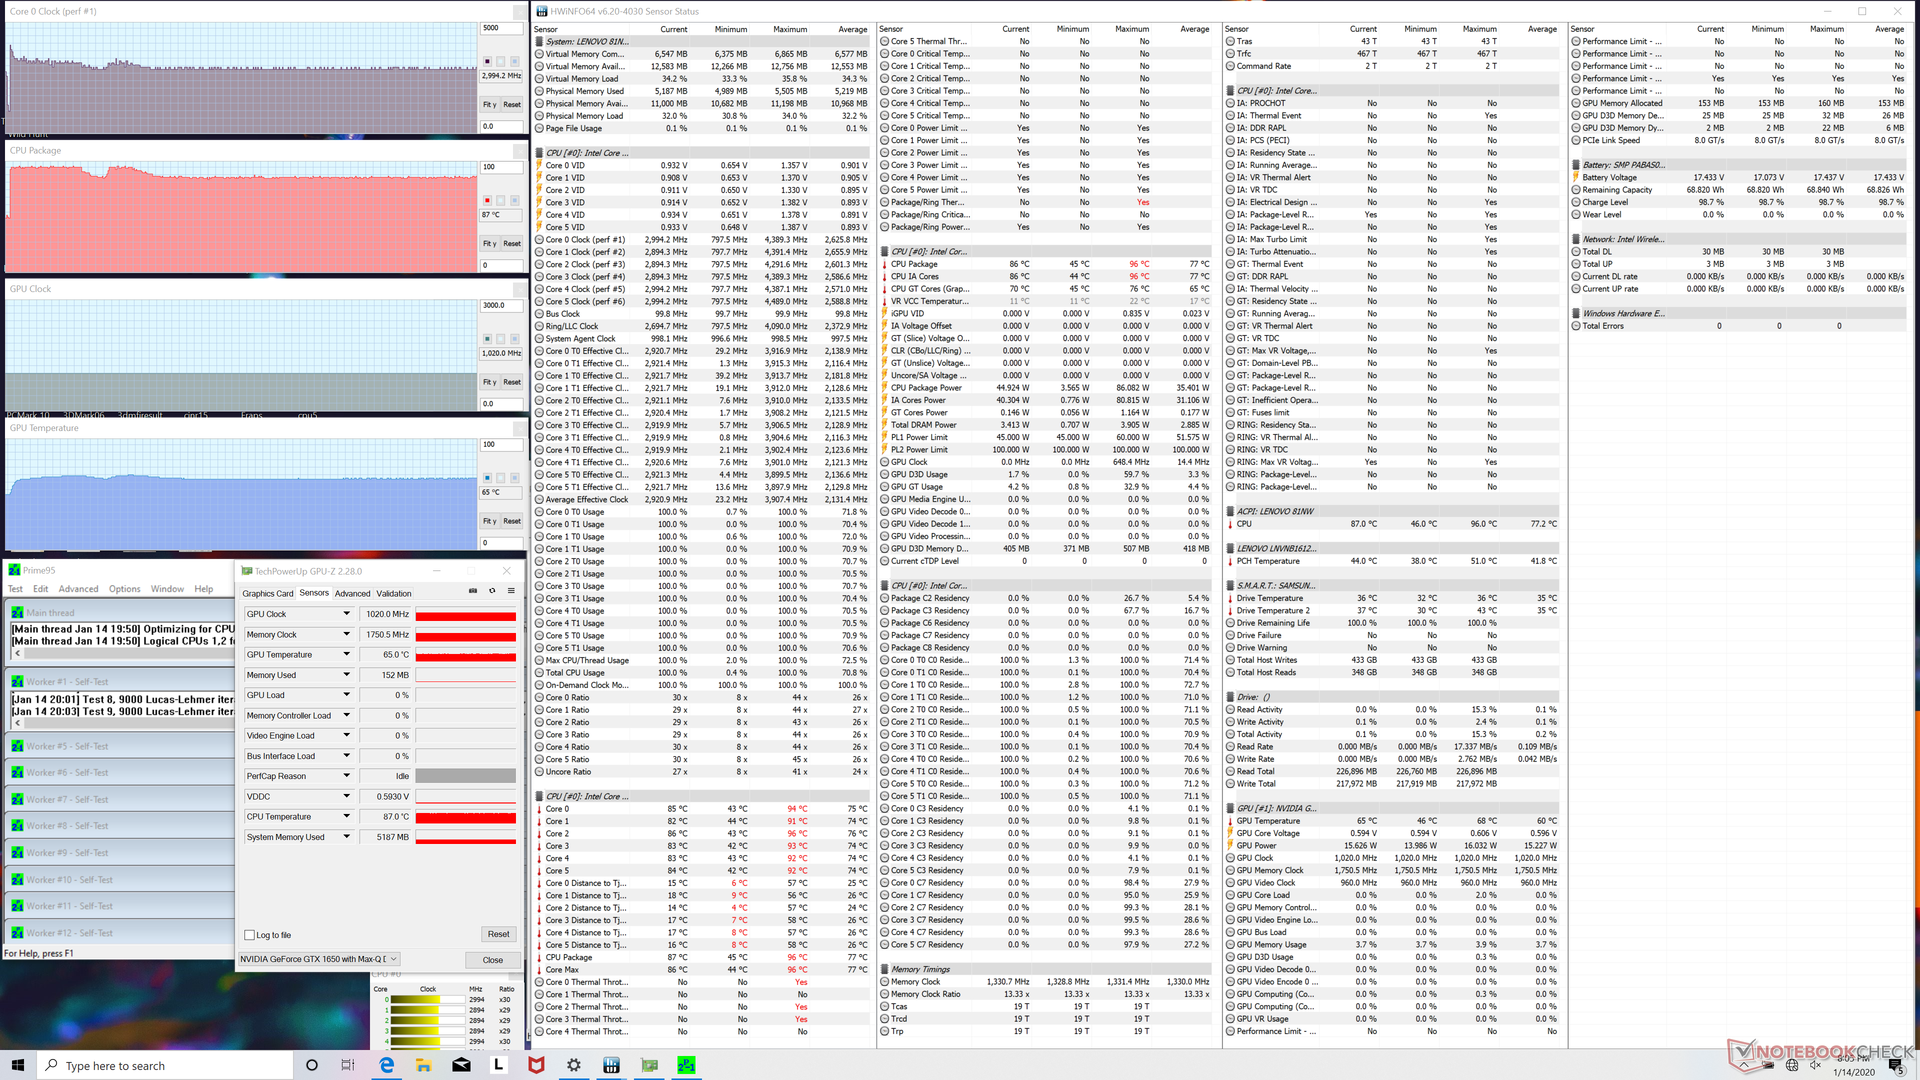
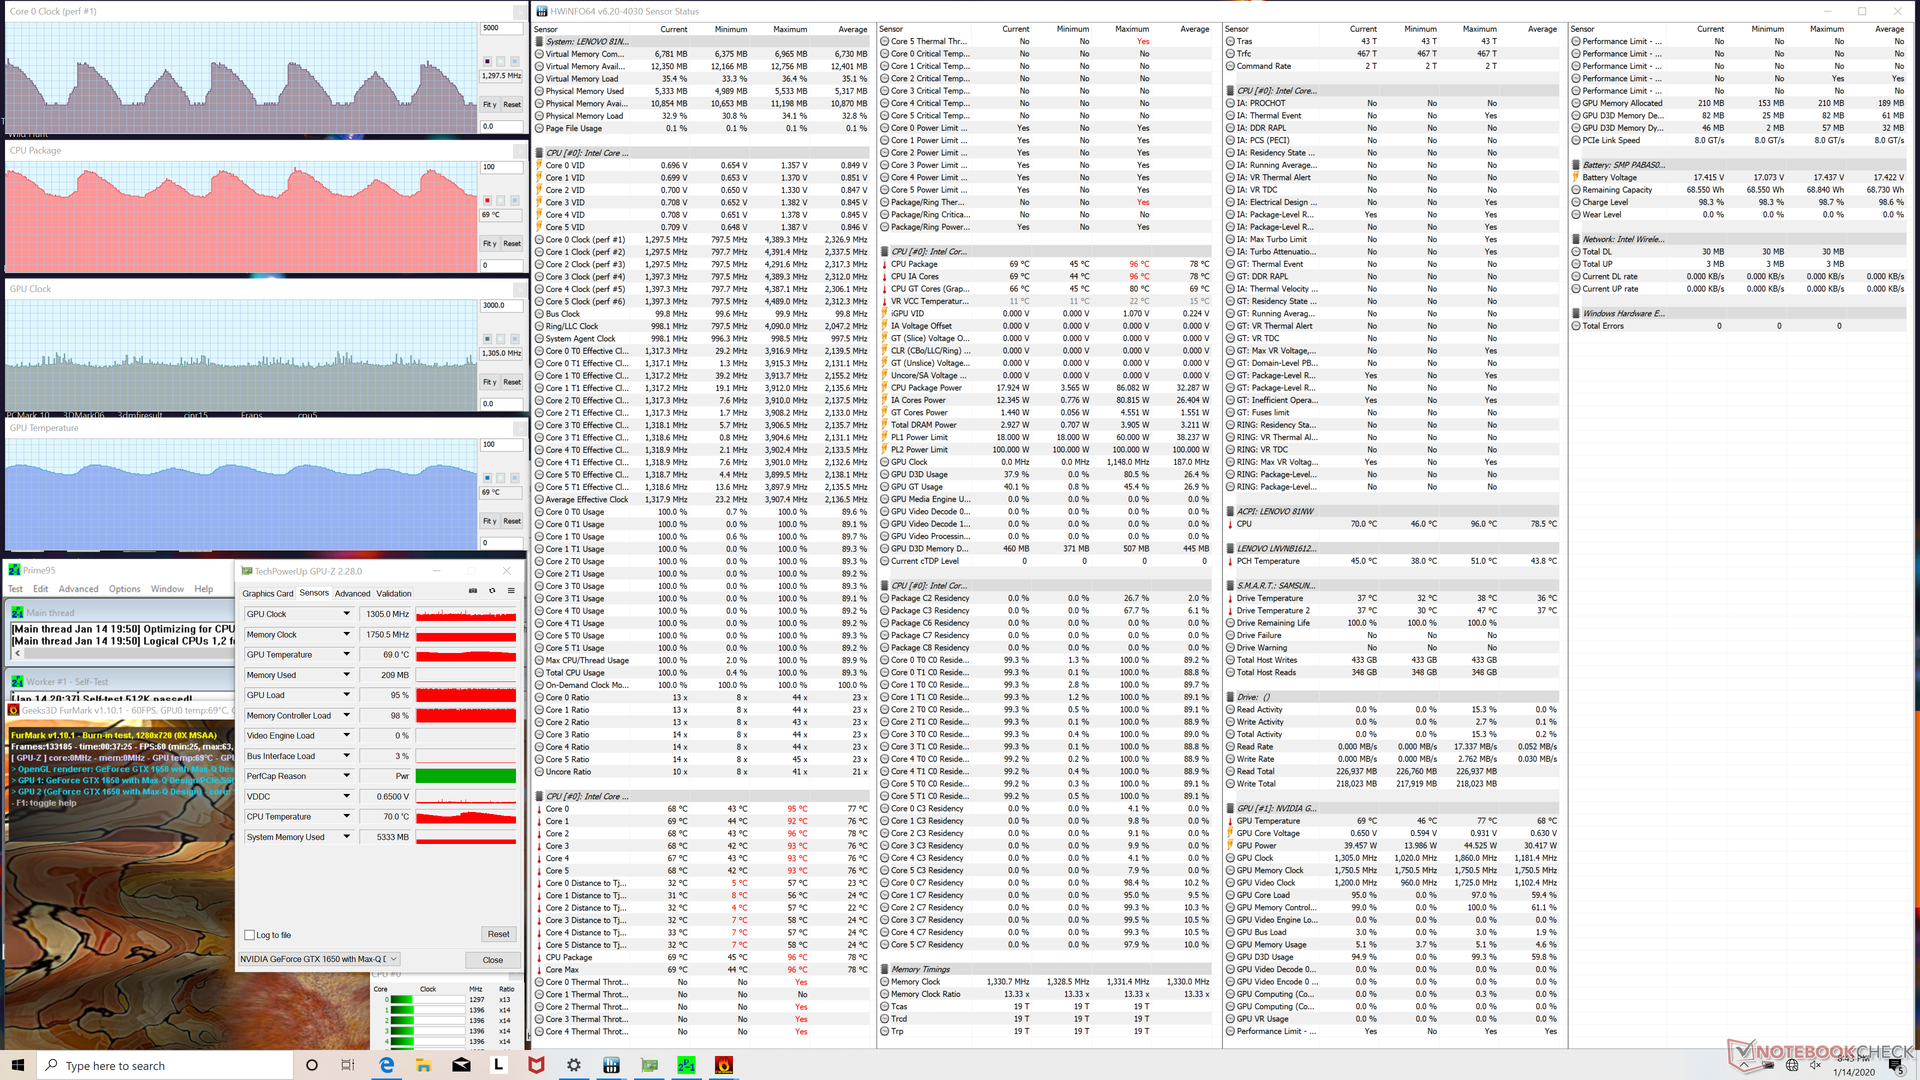
We stress the laptop with synthetic loads to identify for any potential throttling or stability issues. When running Prime95, clock rates would spoke to 4 GHz for the first few seconds before stabilizing at 3.2 to 3.3 GHz for the next few minutes. Thereafter, clock rates would fall even further to the 2.9 to 3 GHz range in order to maintain a stable core temperature of 87 C. Running both Prime95 and FurMark simultaneously will cause clock rates and temperatures for both the CPU and GPU to cycle indefinitely as shown by the screenshots and table below.
When running Witcher 3, CPU clock rates would cycle between 3 GHz and 4.1 GHz while CPU and GPU temperatures would cycle as well. GPU clock rate, however, remains stable at 1570 MHz to ensure stable frame rates even if core temperatures are fluctuating.
Running on battery will limit performance. A 3DMark 11 run on batteries returns Physics and Graphics scores of 9712 and 10002 points, respectively, compared to 12713 and 11991 points when on mains.
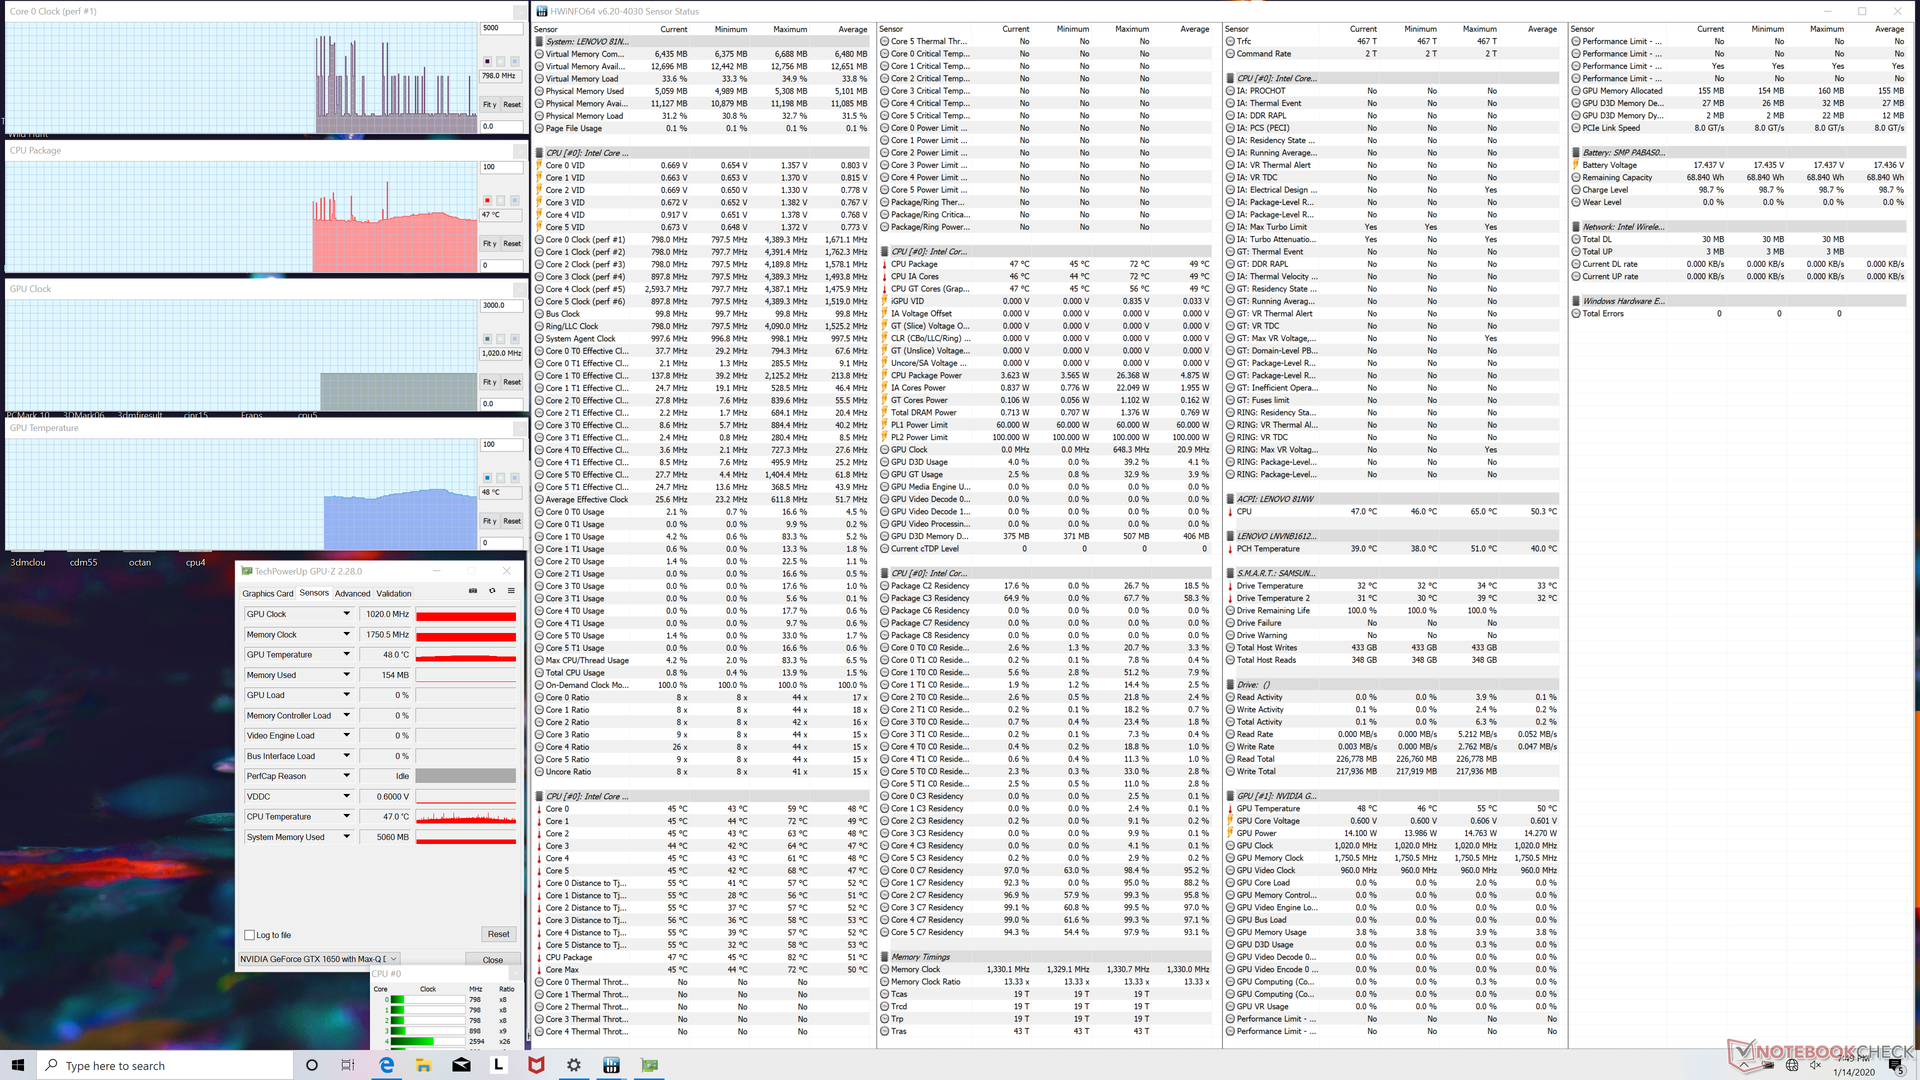
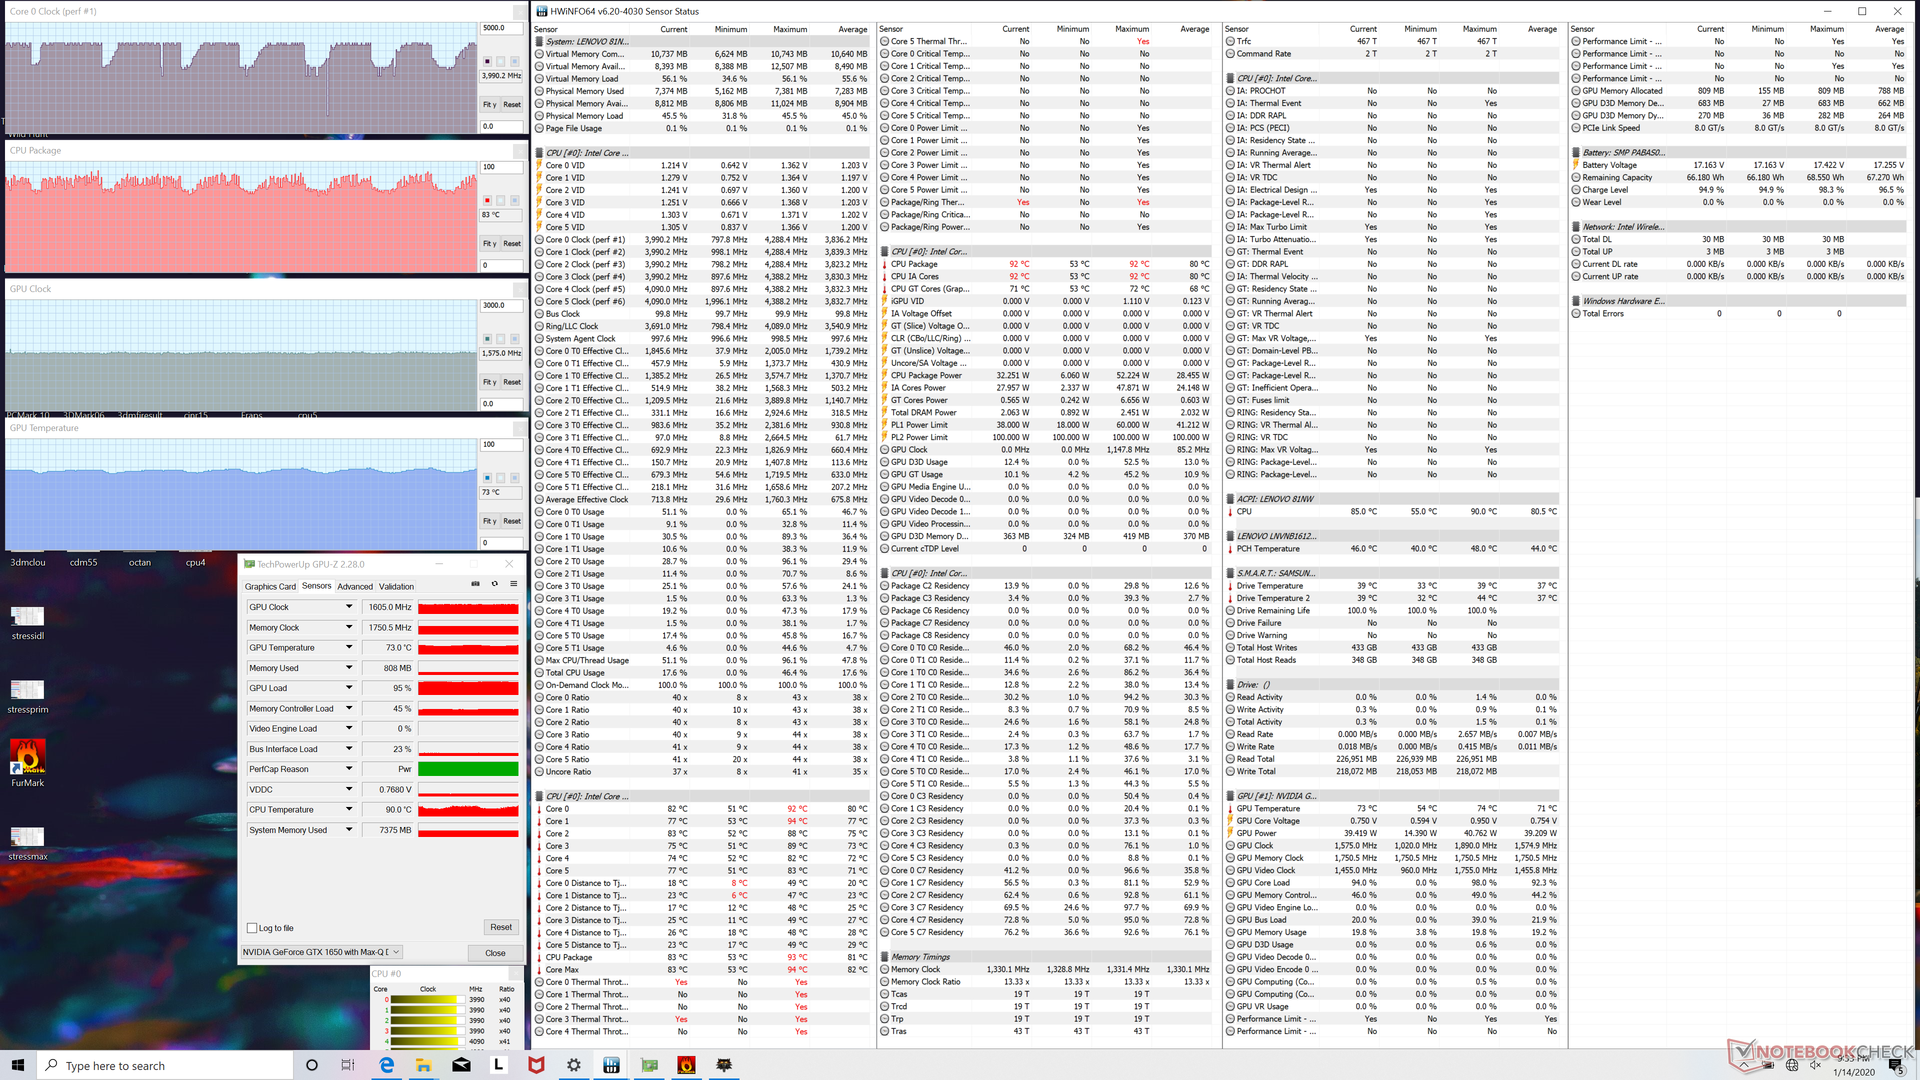
| CPU Clock (GHz) | GPU Clock (MHz) | Average CPU Temperature (°C) | Average GPU Temperature (°C) | |
| System Idle | -- | -- | 47 | 48 |
| Prime95 Stress | 2.9 - 3.0 | -- | 87 | 65 |
| Prime95 + FurMark Stress | 1.3 - 3.2 | 1155 - 1650 | 67 - 92 | 68 - 73 |
| Witcher 3 Stress | 3.0 - 4.1 | 1570 | 60 - 88 | 69 - 74 |
Speakers
Audio from the stereo speakers is relatively balanced for a laptop with decent bass reproduction. The HP Spectre offers both a louder and fuller audio experience as exemplified by its broader pink noise graph. Maximum volume introduces no static or vibrations on the palm rests.


Lenovo IdeaPad S740-15IRH audio analysis
(±) | speaker loudness is average but good (78.8 dB)
Bass 100 - 315 Hz
(±) | reduced bass - on average 10.8% lower than median
(-) | bass is not linear (15.2% delta to prev. frequency)
Mids 400 - 2000 Hz
(±) | higher mids - on average 5.1% higher than median
(±) | linearity of mids is average (7.2% delta to prev. frequency)
Highs 2 - 16 kHz
(+) | balanced highs - only 2.1% away from median
(±) | linearity of highs is average (11.3% delta to prev. frequency)
Overall 100 - 16.000 Hz
(±) | linearity of overall sound is average (18.5% difference to median)
Compared to same class
» 57% of all tested devices in this class were better, 7% similar, 36% worse
» The best had a delta of 5%, average was 17%, worst was 45%
Compared to all devices tested
» 41% of all tested devices were better, 8% similar, 51% worse
» The best had a delta of 4%, average was 24%, worst was 134%
Apple MacBook 12 (Early 2016) 1.1 GHz audio analysis
(+) | speakers can play relatively loud (83.6 dB)
Bass 100 - 315 Hz
(±) | reduced bass - on average 11.3% lower than median
(±) | linearity of bass is average (14.2% delta to prev. frequency)
Mids 400 - 2000 Hz
(+) | balanced mids - only 2.4% away from median
(+) | mids are linear (5.5% delta to prev. frequency)
Highs 2 - 16 kHz
(+) | balanced highs - only 2% away from median
(+) | highs are linear (4.5% delta to prev. frequency)
Overall 100 - 16.000 Hz
(+) | overall sound is linear (10.2% difference to median)
Compared to same class
» 7% of all tested devices in this class were better, 2% similar, 91% worse
» The best had a delta of 5%, average was 18%, worst was 53%
Compared to all devices tested
» 5% of all tested devices were better, 1% similar, 94% worse
» The best had a delta of 4%, average was 24%, worst was 134%
Energy Management
Power Consumption
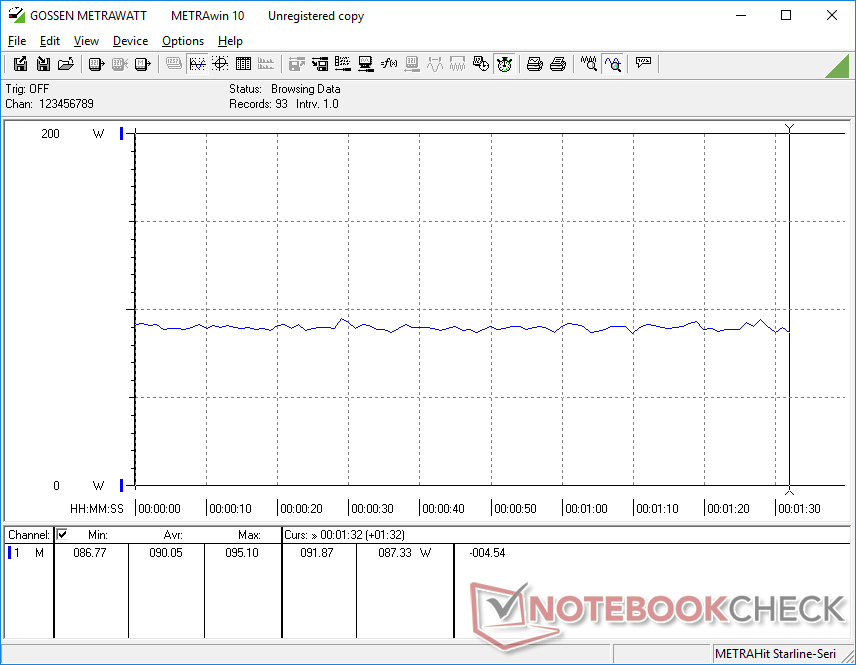
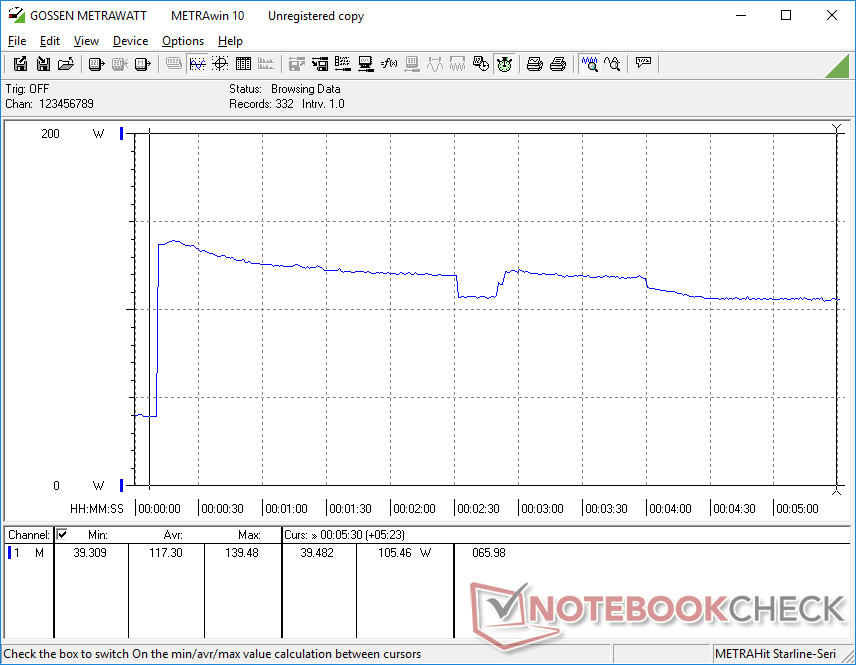
Power consumption behavior during low loads is unusual and undesirable. Idling on desktop consumes anywhere between 28 W and 32 W compared to only 5 W to 24 W on most other multimedia laptops. Furthermore, power consumption remains very high at 27 W when the lid is closed and put to "Sleep" mode likely due to Windows Connected Standby.
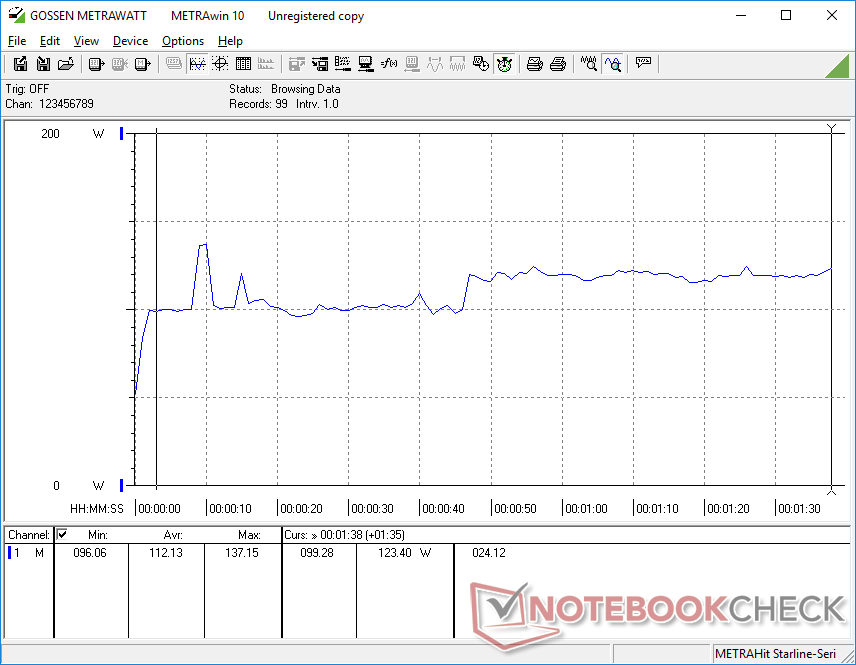
Fortunately, power consumption becomes more normal when under higher loads. Running Witcher 3, for example, consumes about 90 W to be very close to the Yoga C940 15 equipped with the same CPU and GPU. Perhaps not coincidentally, the Maingear Vector 15 gaming laptop with the GTX 1660 Ti GPU consumes about 77 percent more power for 77 percent higher 3DMark benchmark results.
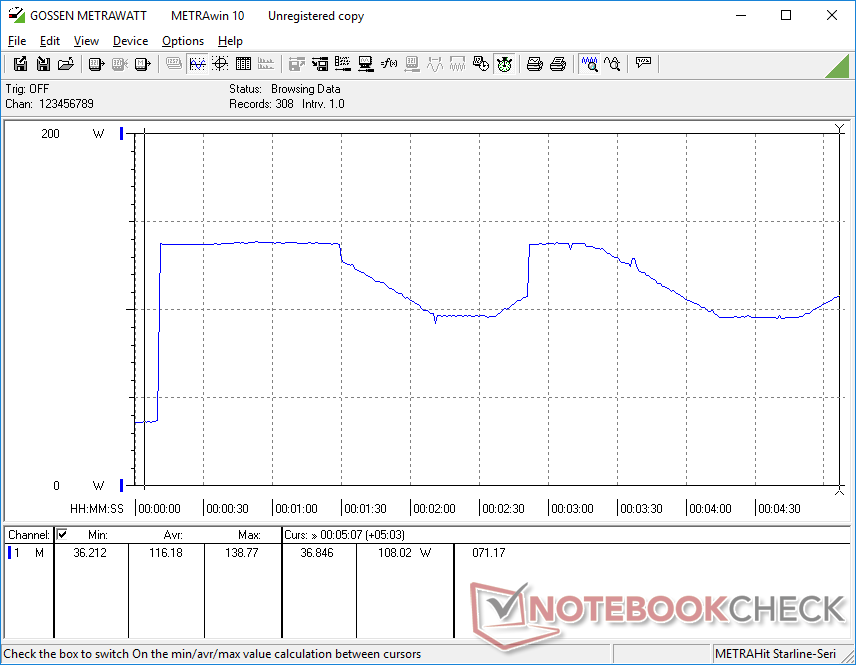
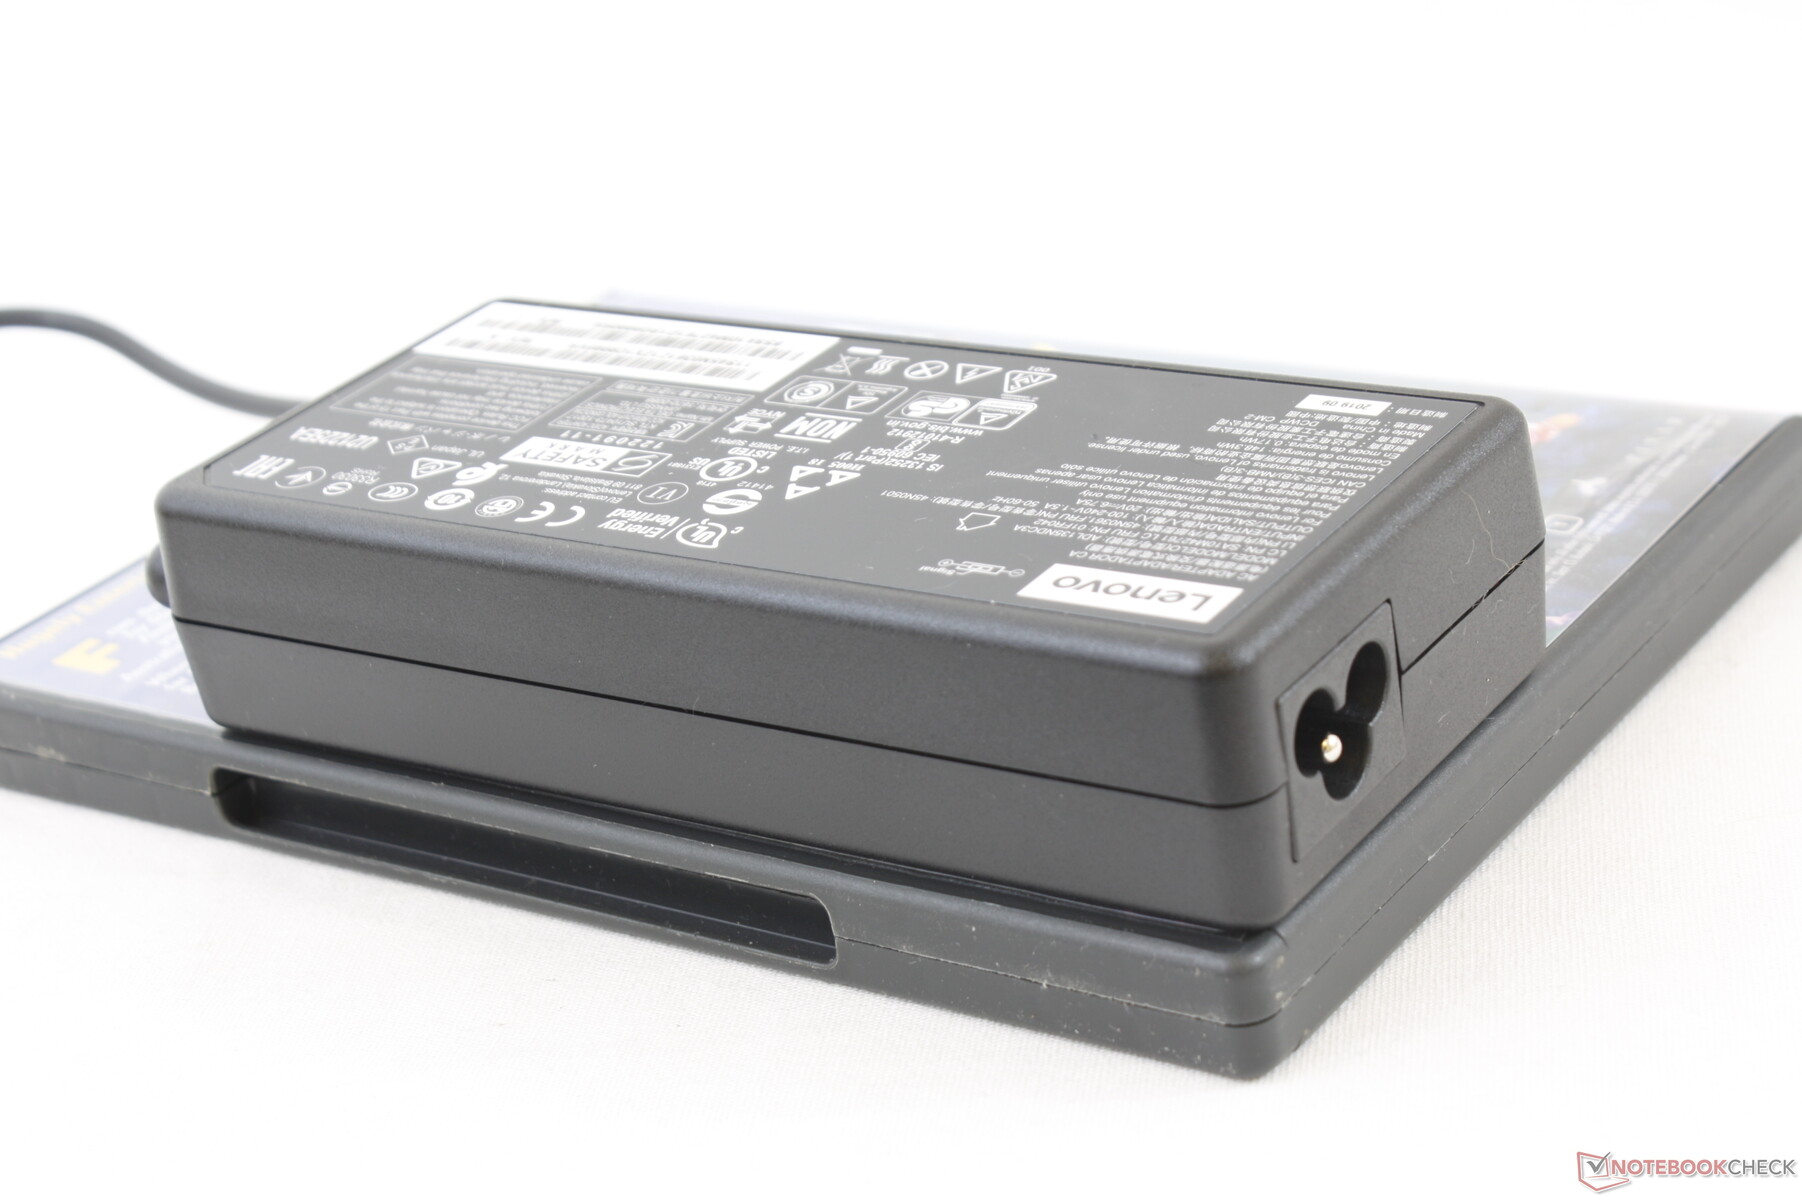
We're able to record a maximum consumption of 139 W from the medium-sized (~14.4 x 6.3 x 3 cm) 135 W AC adapter. Consumption cycles when under such high processing loads as shown by our graphs below to reflect our Stress Test observations above.
| Off / Standby | |
| Idle | |
| Load |
|
Key:
min: | |
| Lenovo IdeaPad S740-15IRH i7-9750H, GeForce GTX 1650 Max-Q, Samsung SSD PM981 MZVLB512HAJQ, IPS, 3840x2160, 15.6" | Dell XPS 15 7590 9980HK GTX 1650 i9-9980HK, GeForce GTX 1650 Mobile, Toshiba XG6 KXG60ZNV1T02, OLED, 3840x2160, 15.6" | HP Spectre X360 15-5ZV31AV i7-10510U, GeForce MX250, Intel SSD 660p 2TB SSDPEKNW020T8, IPS, 3840x2160, 15.6" | Lenovo Yoga 730-15IKB i5-8550U, GeForce GTX 1050 Mobile, SK Hynix PC401 512GB M.2 (HFS512GD9TNG), IPS, 3840x2160, 15.6" | Asus ZenBook 15 UX534FT-DB77 i7-8565U, GeForce GTX 1650 Max-Q, Samsung SSD PM981 MZVLB1T0HALR, IPS, 1920x1080, 15.6" | MSI Prestige 15 A10SC i7-10710U, GeForce GTX 1650 Max-Q, Samsung SSD PM981 MZVLB1T0HALR, IPS, 3840x2160, 15.6" | |
|---|---|---|---|---|---|---|
| Power Consumption | 31% | 56% | 61% | 41% | 43% | |
| Idle Minimum * (Watt) | 28.6 | 6.2 78% | 5.2 82% | 4.8 83% | 5 83% | 6.1 79% |
| Idle Average * (Watt) | 26.5 | 9.6 64% | 8.5 68% | 10.1 62% | 13.2 50% | 13.2 50% |
| Idle Maximum * (Watt) | 32.1 | 21.2 34% | 8.7 73% | 10.7 67% | 24 25% | 19.2 40% |
| Load Average * (Watt) | 112.2 | 104.3 7% | 65.6 42% | 44 61% | 70 38% | 75 33% |
| Witcher 3 ultra * (Watt) | 90.1 | 91.7 -2% | 56.5 37% | 63.3 30% | 74 18% | |
| Load Maximum * (Watt) | 138.8 | 135.3 3% | 92.4 33% | 94.7 32% | 114 18% | 89.7 35% |
* ... smaller is better
Battery Life
The 69 Wh battery is larger than the one in the older Yoga 730-15IKB while being smaller than the batteries in both the Dell XPS 15 and Spectre x360 15. Battery life is otherwise excellent at just over 9 hours of real-world WLAN use.
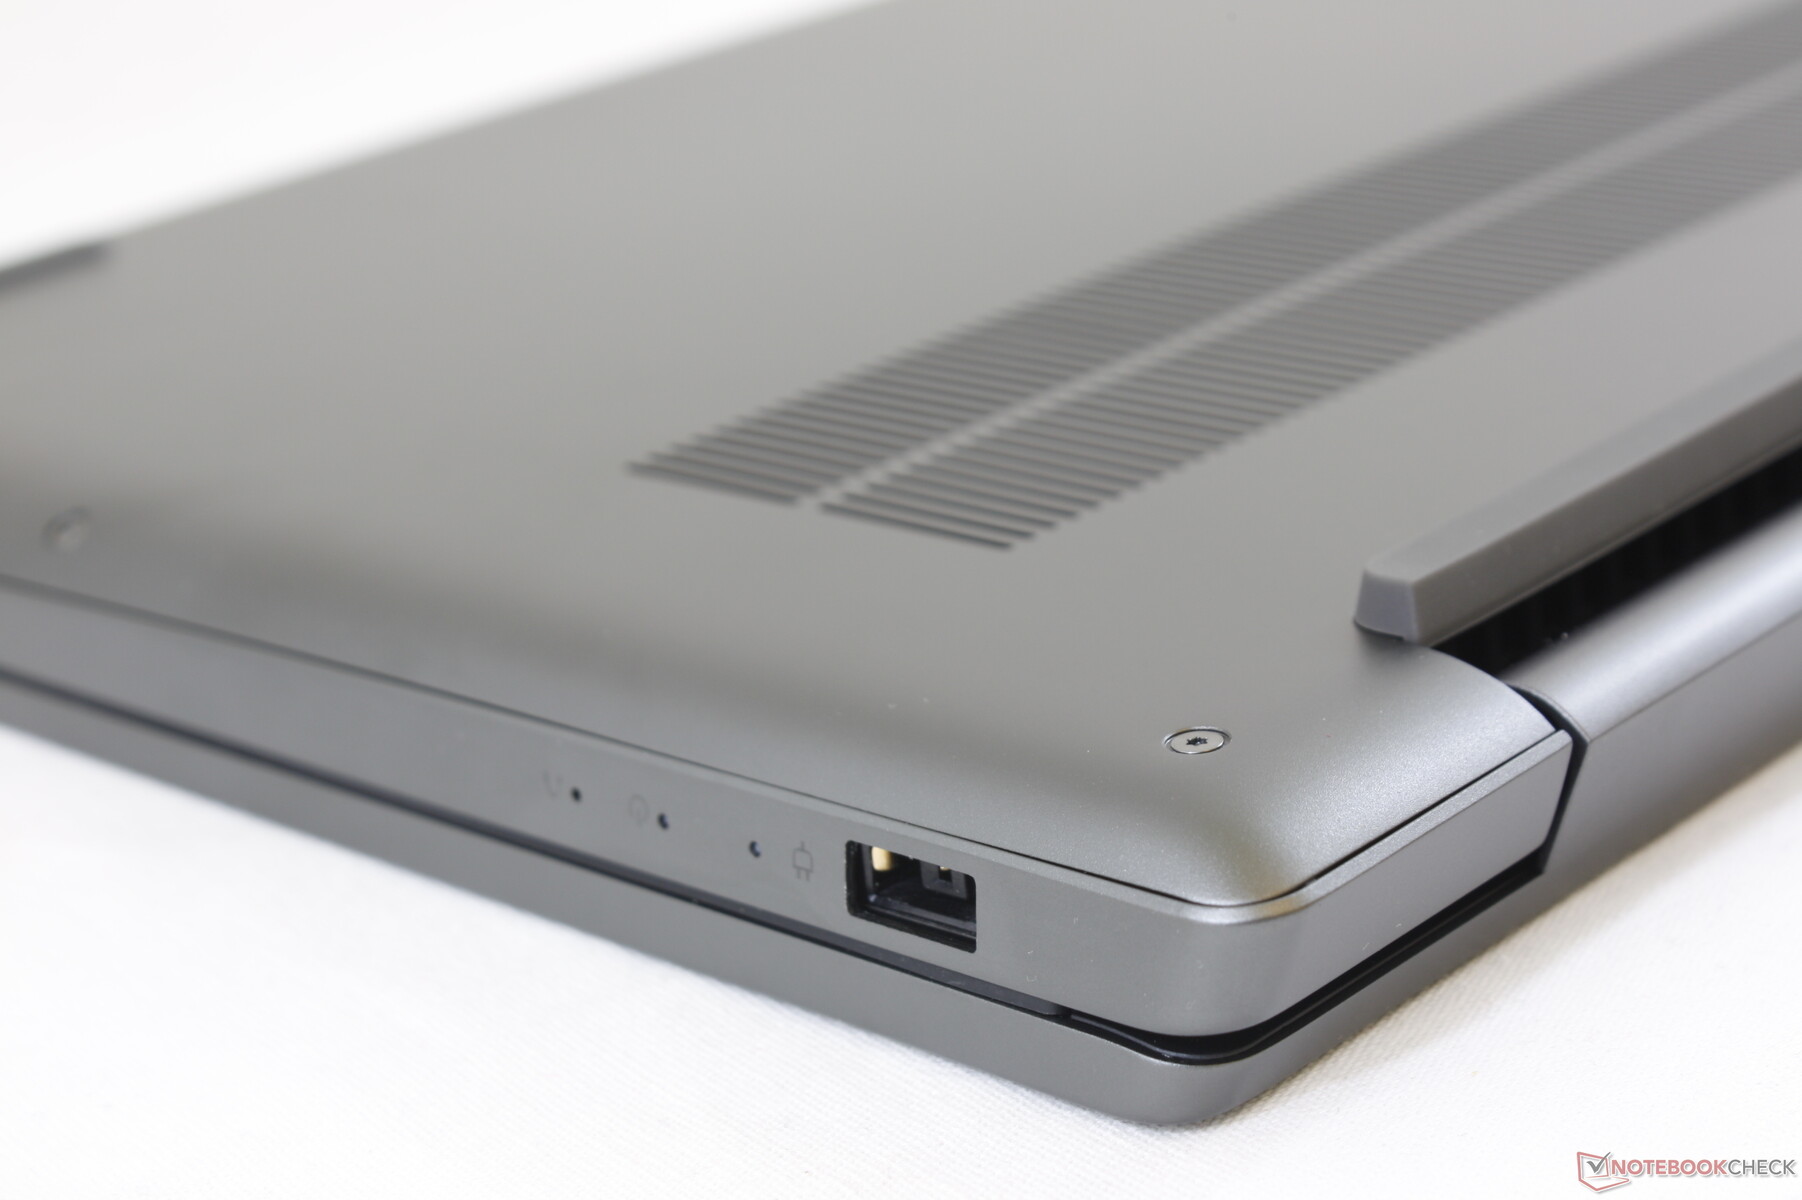
Charging with the included AC adapter is extremely slow. Expect to wait between 4 to 5 hours if recharging from empty to full capacity compared to just 1.5 to 2 hours of most other laptops. Furthermore, the system cannot be recharged via USB Type-C.
| Lenovo IdeaPad S740-15IRH i7-9750H, GeForce GTX 1650 Max-Q, 69 Wh | Dell XPS 15 7590 9980HK GTX 1650 i9-9980HK, GeForce GTX 1650 Mobile, 97 Wh | HP Spectre X360 15-5ZV31AV i7-10510U, GeForce MX250, 84 Wh | Lenovo Yoga 730-15IKB i5-8550U, GeForce GTX 1050 Mobile, 51.5 Wh | Asus ZenBook 15 UX534FT-DB77 i7-8565U, GeForce GTX 1650 Max-Q, 71 Wh | MSI Prestige 15 A10SC i7-10710U, GeForce GTX 1650 Max-Q, 82 Wh | |
|---|---|---|---|---|---|---|
| Battery runtime | 127% | 139% | -8% | 127% | 79% | |
| Reader / Idle (h) | 12.4 | 15.2 23% | 22.6 82% | 11.6 -6% | 21.5 73% | 19.1 54% |
| WiFi v1.3 (h) | 9 | 7.8 -13% | 10.8 20% | 6.2 -31% | 8.4 -7% | 7.6 -16% |
| Load (h) | 0.7 | 3.3 371% | 2.9 314% | 0.8 14% | 2.9 314% | 2.1 200% |
Pros
Cons
Verdict
The Lenovo IdeaPad S740 is a blend of mid-range and high-end parts. The Core i7 CPU, GeForce GTX GPU, bright 4K UHD display, Samsung SSD, dual Thunderbolt 3 ports, and narrow bezels rival the Dell XPS 15 and HP Spectre x360 15 that Lenovo is trying to emulate. Meanwhile, the shallow keyboard, limited port options, and relatively flexible chassis are more reflective of an inexpensive IdeaPad. The Lenovo costs a bit less than the Dell and HP if configured with the same Core i7-9750H CPU and GTX 1650/1650 Max-Q GPU, but you'll get an inferior typing experience and weaker design out of it.
When compared to other IdeaPad models, however, the S740 is easily the top of its class in terms of both visuals and performance. It's got the power of an entry-level gaming machine without the bulkiness or gaudy appearance that are commonly associated with them. Thus, the system strikes a better balance between gaming, office, travel, and price than many other alternatives in its price range.
More expensive than your typical IdeaPad while being less expensive than the Dell XPS or HP Spectre. The IdeaPad S740 is for those who want the performance of a high-end multimedia machine without sacrificing too much in the visuals and portability departments.
Lenovo IdeaPad S740-15IRH
- 01/25/2020 v7 (old)
Allen Ngo
Price comparison
