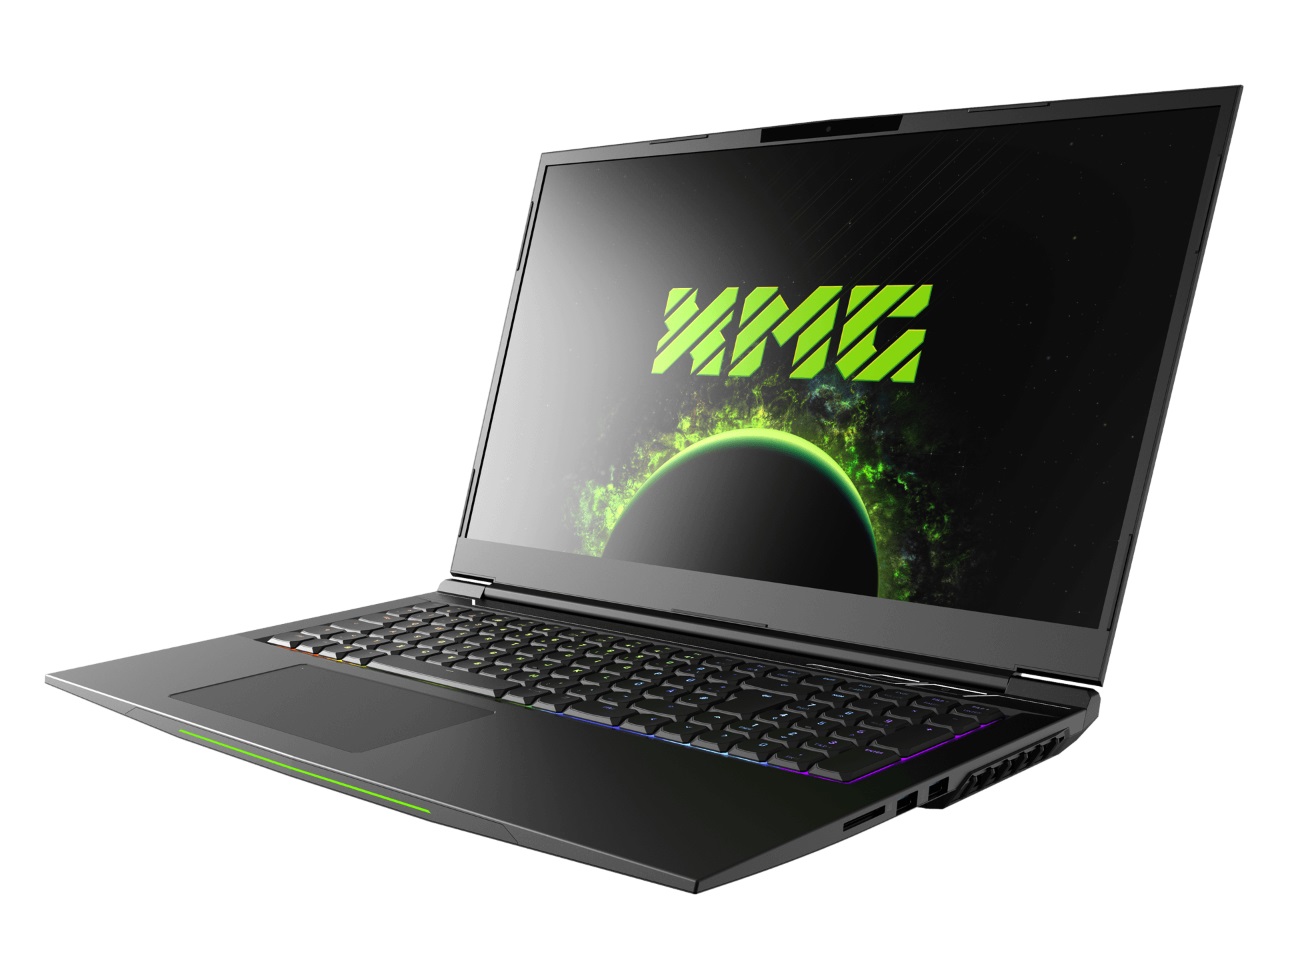
Schenker XMG Neo 17 (Tongfang GK7CP0S) Laptop Review: A good package

We have been provided with the 17-inch XMG Neo 17 as well as the 15-inch XMG Neo 15 (see review) from Schenker Technologies. The high-end gamer has a starting price of 1450 Euros (~$1600) with a configuration including 8 GB of DDR4-RAM, a 250-GB SSD and a GeForce GTX 1660 Ti.
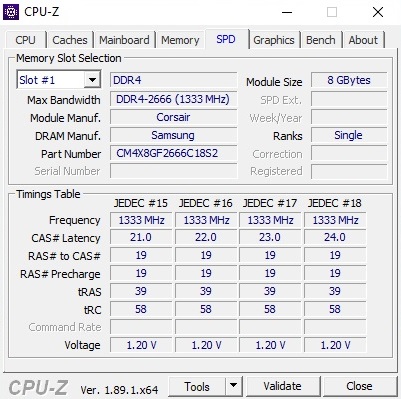
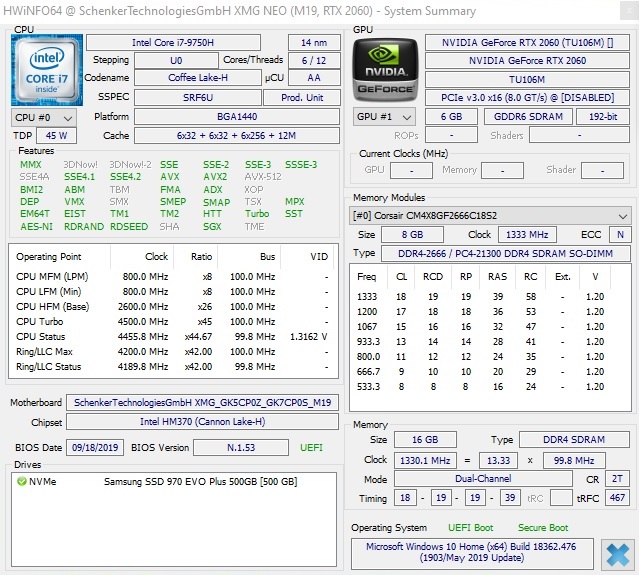
If you are looking for more performance, you will have to dig a little deeper into your pocket. Users can create their own configurations with up to 64 GB of RAM and up to three storage devices (2x M.2 Type 2280 & 1x 2.5-inch). Demanding gamers can also choose from the raytracing GPUs RTX 2060, RTX 2070 and RTX 2080 Max-Q. The created images are displayed on a matte 144-Hz display with a resolution of 1920x1080 pixels. There is only one available processor. But Intel's six-core chip Core i7-9750H should be largely sufficient for the next few years. Our test unit, which costs around 1850 Euros (~$2000), is equipped with 16 GB of RAM, a 500-GB SSD and a GeForce RTX 2060.
XMG Neo 17 competes with other 17-inch devices running on Coffee Lake and Turing such as the Asus Strix G731GV, the Lenovo Legion Y740-17, the MSI GL75 9SEK and the Razer Blade Pro 17. We have included these devices in our comparison tables for this review.
Rating | Date | Model | Weight | Height | Size | Resolution | Price |
|---|---|---|---|---|---|---|---|
| 83.2 % v7 (old) | 11 / 2019 | Schenker XMG Neo 17 XNE17M19 i7-9750H, GeForce RTX 2060 Mobile | 2.5 kg | 27 mm | 17.30" | 1920x1080 | |
| 86 % v7 (old) | 08 / 2019 | Asus Strix Hero III G731GV i7-9750H, GeForce RTX 2060 Mobile | 2.9 kg | 26.2 mm | 17.30" | 1920x1080 | |
| 83.2 % v7 (old) | 10 / 2019 | Lenovo Legion Y740-17IRH i7-9750H, GeForce RTX 2060 Mobile | 3 kg | 23 mm | 17.30" | 1920x1080 | |
| 82.9 % v7 (old) | 10 / 2019 | MSI GL75 9SEK-056US i7-9750H, GeForce RTX 2060 Mobile | 2.5 kg | 28 mm | 17.30" | 1920x1080 | |
| 89.4 % v6 (old) | 08 / 2019 | Razer Blade Pro 17 RTX 2060 i7-9750H, GeForce RTX 2060 Mobile | 2.8 kg | 19.9 mm | 17.30" | 1920x1080 |
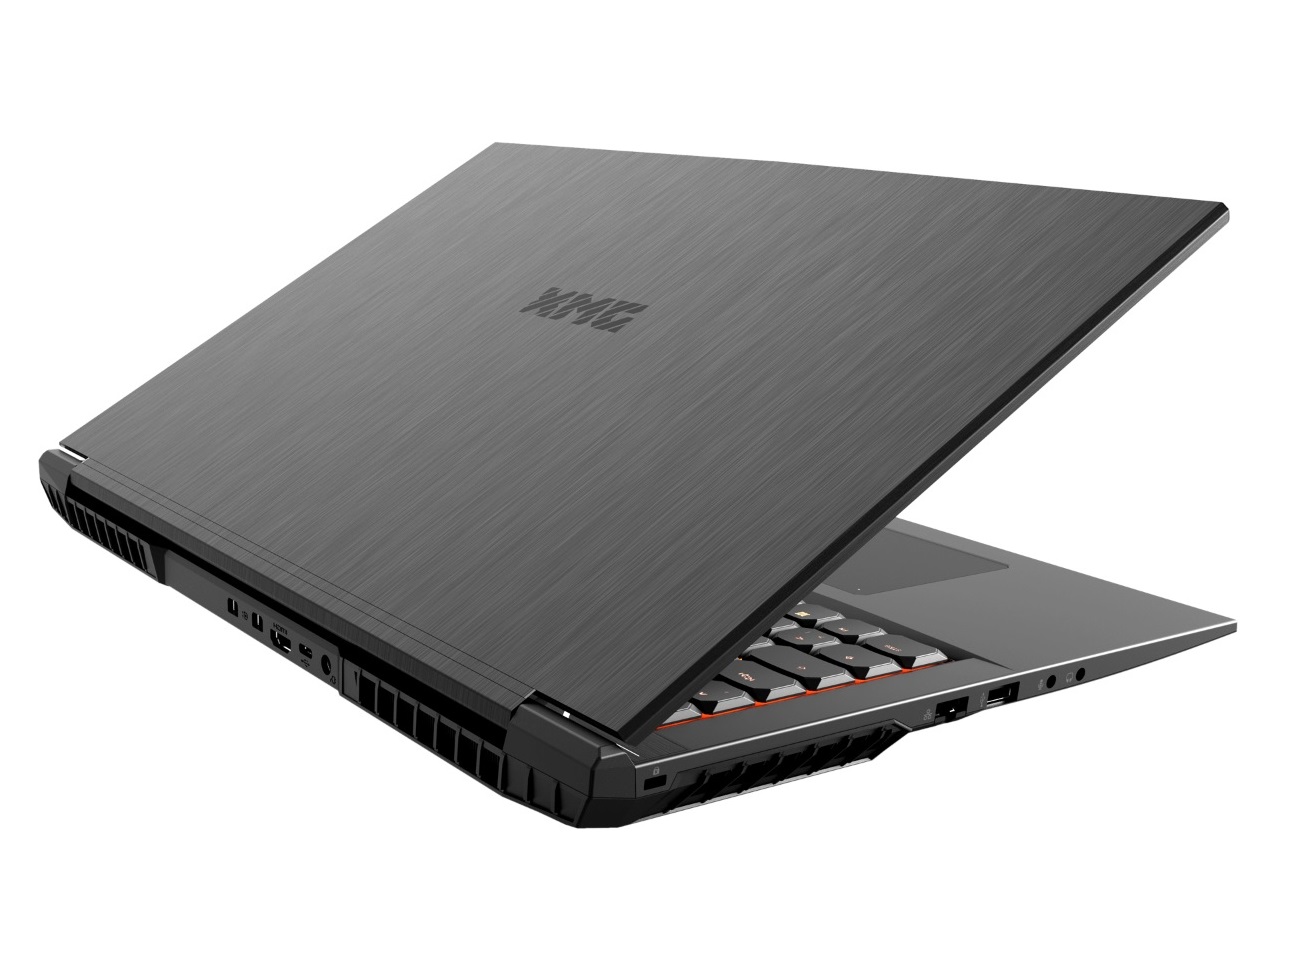
As the case is identical with that of its predecessor, we shall not be going into detail on the chassis, the connectivity and the input devices. You can find more information on these aspects here.
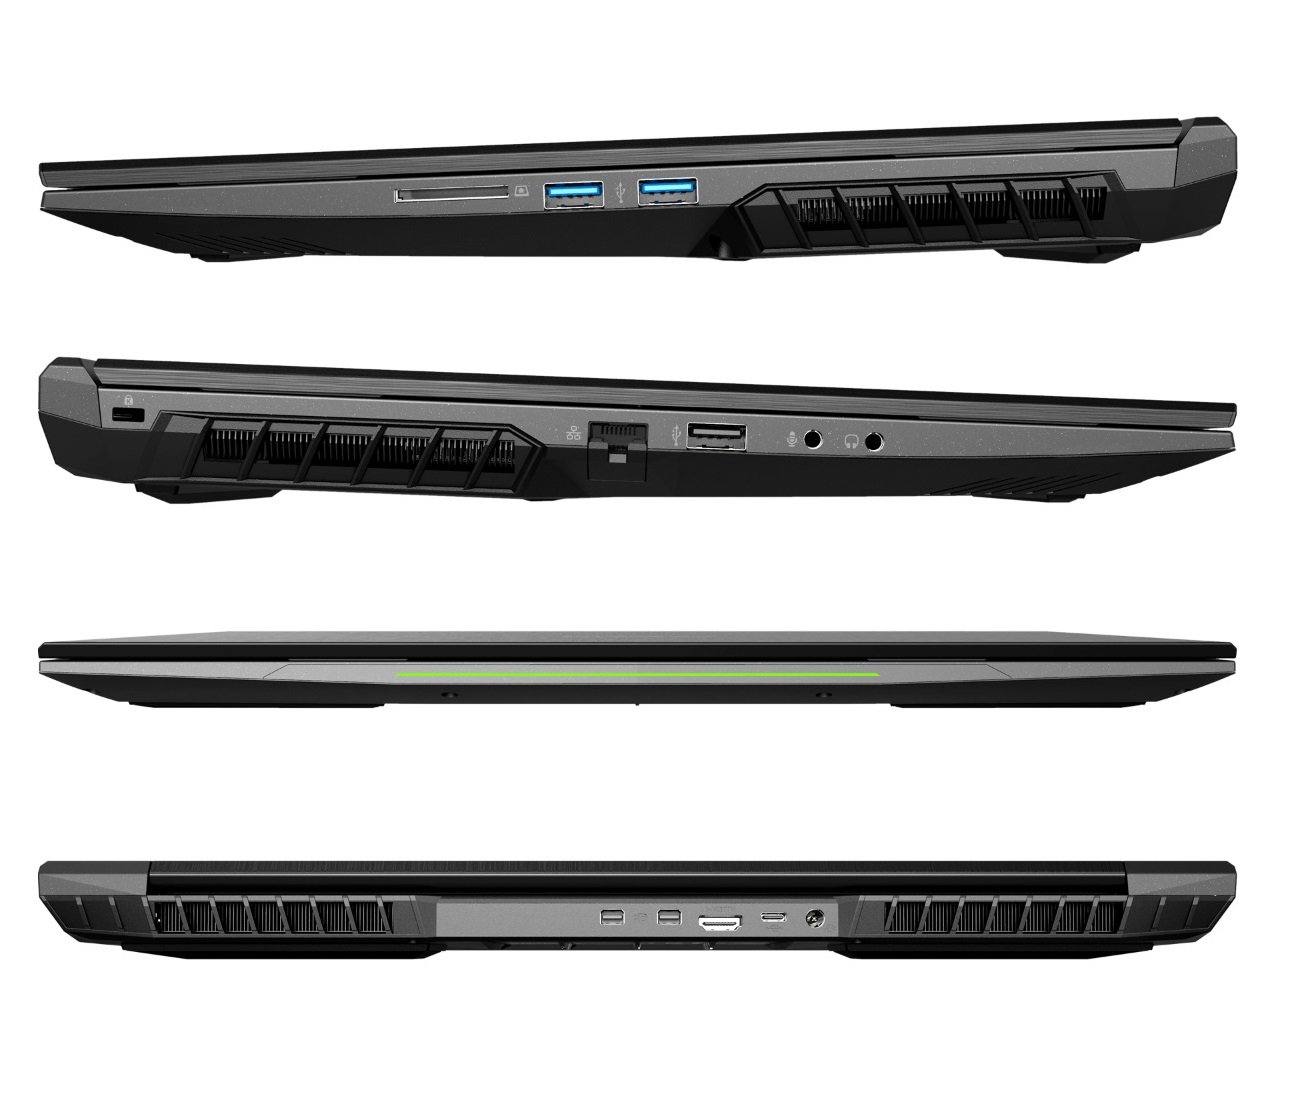
| SD Card Reader | |
| average JPG Copy Test (av. of 3 runs) | |
| Razer Blade Pro 17 RTX 2060 (Toshiba Exceria Pro SDXC 64 GB UHS-II) | |
| Average of class Gaming (20.9 - 210, n=54, last 2 years) | |
| Schenker XMG Neo 17 XNE17M19 (Toshiba Exceria Pro SDXC 64 GB UHS-II) | |
| MSI GL75 9SEK-056US | |
| maximum AS SSD Seq Read Test (1GB) | |
| Razer Blade Pro 17 RTX 2060 (Toshiba Exceria Pro SDXC 64 GB UHS-II) | |
| Average of class Gaming (25.5 - 261, n=51, last 2 years) | |
| Schenker XMG Neo 17 XNE17M19 (Toshiba Exceria Pro SDXC 64 GB UHS-II) | |
| MSI GL75 9SEK-056US | |
| Networking | |
| iperf3 transmit AX12 | |
| Schenker XMG Neo 17 XNE17M19 | |
| iperf3 receive AX12 | |
| Schenker XMG Neo 17 XNE17M19 | |
Display
The Full-HD display has been updated slightly since the last generation. Our new test unit is equipped with a display from LG instead of the BOE panel.
| |||||||||||||||||||||||||
Brightness Distribution: 86 %
Center on Battery: 318 cd/m²
Contrast: 1383:1 (Black: 0.23 cd/m²)
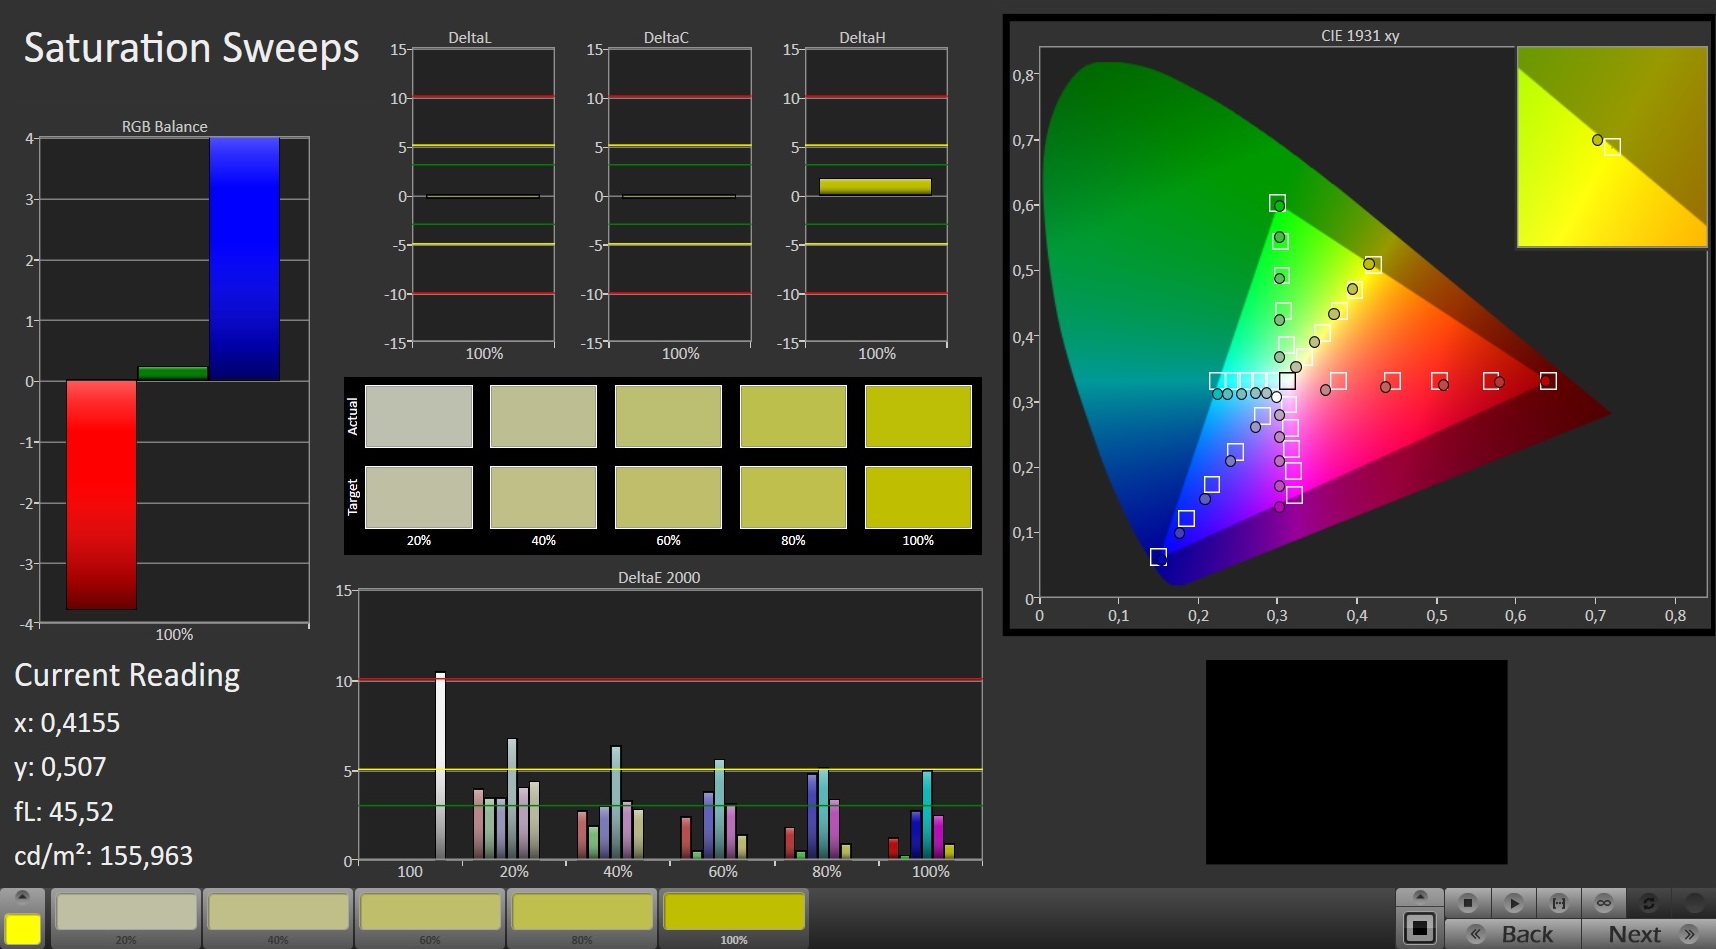
ΔE ColorChecker Calman: 3.89 | ∀{0.5-29.43 Ø4.73}
calibrated: 1.03
ΔE Greyscale Calman: 5.3 | ∀{0.09-98 Ø4.97}
96% sRGB (Argyll 1.6.3 3D)
60% AdobeRGB 1998 (Argyll 1.6.3 3D)
65.6% AdobeRGB 1998 (Argyll 3D)
95.6% sRGB (Argyll 3D)
64.6% Display P3 (Argyll 3D)
Gamma: 2.46
CCT: 7462 K
| Schenker XMG Neo 17 XNE17M19 LG LP173WFG-SPB1 (LGD0615), IPS, 1920x1080 | Asus Strix Hero III G731GV AU Optronics AUO B173HAN04.0, IPS, 1920x1080 | Lenovo Legion Y740-17IRH LG Philips LP173WFG-SPD2 (LGD05E0), IPS, 1920x1080 | MSI GL75 9SEK-056US AU Optronics AUO479D (B173HAN04.7), IPS, 1920x1080 | Razer Blade Pro 17 RTX 2060 AU Optronics B173HAN04.0, IPS, 1920x1080 | |
|---|---|---|---|---|---|
| Display | -5% | 0% | -36% | -5% | |
| Display P3 Coverage (%) | 64.6 | 62.9 -3% | 64.8 0% | 41.12 -36% | 61.1 -5% |
| sRGB Coverage (%) | 95.6 | 87.2 -9% | 96 0% | 61.1 -36% | 89.4 -6% |
| AdobeRGB 1998 Coverage (%) | 65.6 | 63.8 -3% | 65.8 0% | 42.49 -35% | 62.5 -5% |
| Response Times | 27% | 4% | -89% | 40% | |
| Response Time Grey 50% / Grey 80% * (ms) | 15.6 ? | 6.8 ? 56% | 14.8 ? 5% | 26 ? -67% | 6.8 ? 56% |
| Response Time Black / White * (ms) | 11.6 ? | 12 ? -3% | 11.2 ? 3% | 24.4 ? -110% | 8.8 ? 24% |
| PWM Frequency (Hz) | |||||
| Screen | -17% | 1% | -42% | -8% | |
| Brightness middle (cd/m²) | 318 | 312.3 -2% | 282 -11% | 259.1 -19% | 300.4 -6% |
| Brightness (cd/m²) | 286 | 297 4% | 261 -9% | 261 -9% | 289 1% |
| Brightness Distribution (%) | 86 | 91 6% | 87 1% | 93 8% | 93 8% |
| Black Level * (cd/m²) | 0.23 | 0.21 9% | 0.27 -17% | 0.25 -9% | 0.32 -39% |
| Contrast (:1) | 1383 | 1487 8% | 1044 -25% | 1036 -25% | 939 -32% |
| Colorchecker dE 2000 * | 3.89 | 3.6 7% | 3.18 18% | 4.23 -9% | 2.32 40% |
| Colorchecker dE 2000 max. * | 10.56 | 6.74 36% | 8.39 21% | 23.39 -121% | 3.81 64% |
| Colorchecker dE 2000 calibrated * | 1.03 | 3.95 -283% | 0.95 8% | 3.9 -279% | 2.95 -186% |
| Greyscale dE 2000 * | 5.3 | 3.1 42% | 4.1 23% | 1.3 75% | 1.5 72% |
| Gamma | 2.46 89% | 2.26 97% | 2.55 86% | 2.076 106% | 2.3 96% |
| CCT | 7462 87% | 7002 93% | 7260 90% | 6542 99% | 6764 96% |
| Color Space (Percent of AdobeRGB 1998) (%) | 60 | 56.6 -6% | 61 2% | 39 -35% | 57.4 -4% |
| Color Space (Percent of sRGB) (%) | 96 | 86.6 -10% | 96 0% | 61 -36% | 89 -7% |
| Total Average (Program / Settings) | 2% /
-9% | 2% /
1% | -56% /
-46% | 9% /
-2% |
* ... smaller is better
The LP173WFG-SPB1 gets a high score for its low black value (0.23 cd/m²) as well as for its great contrast (1383:1).
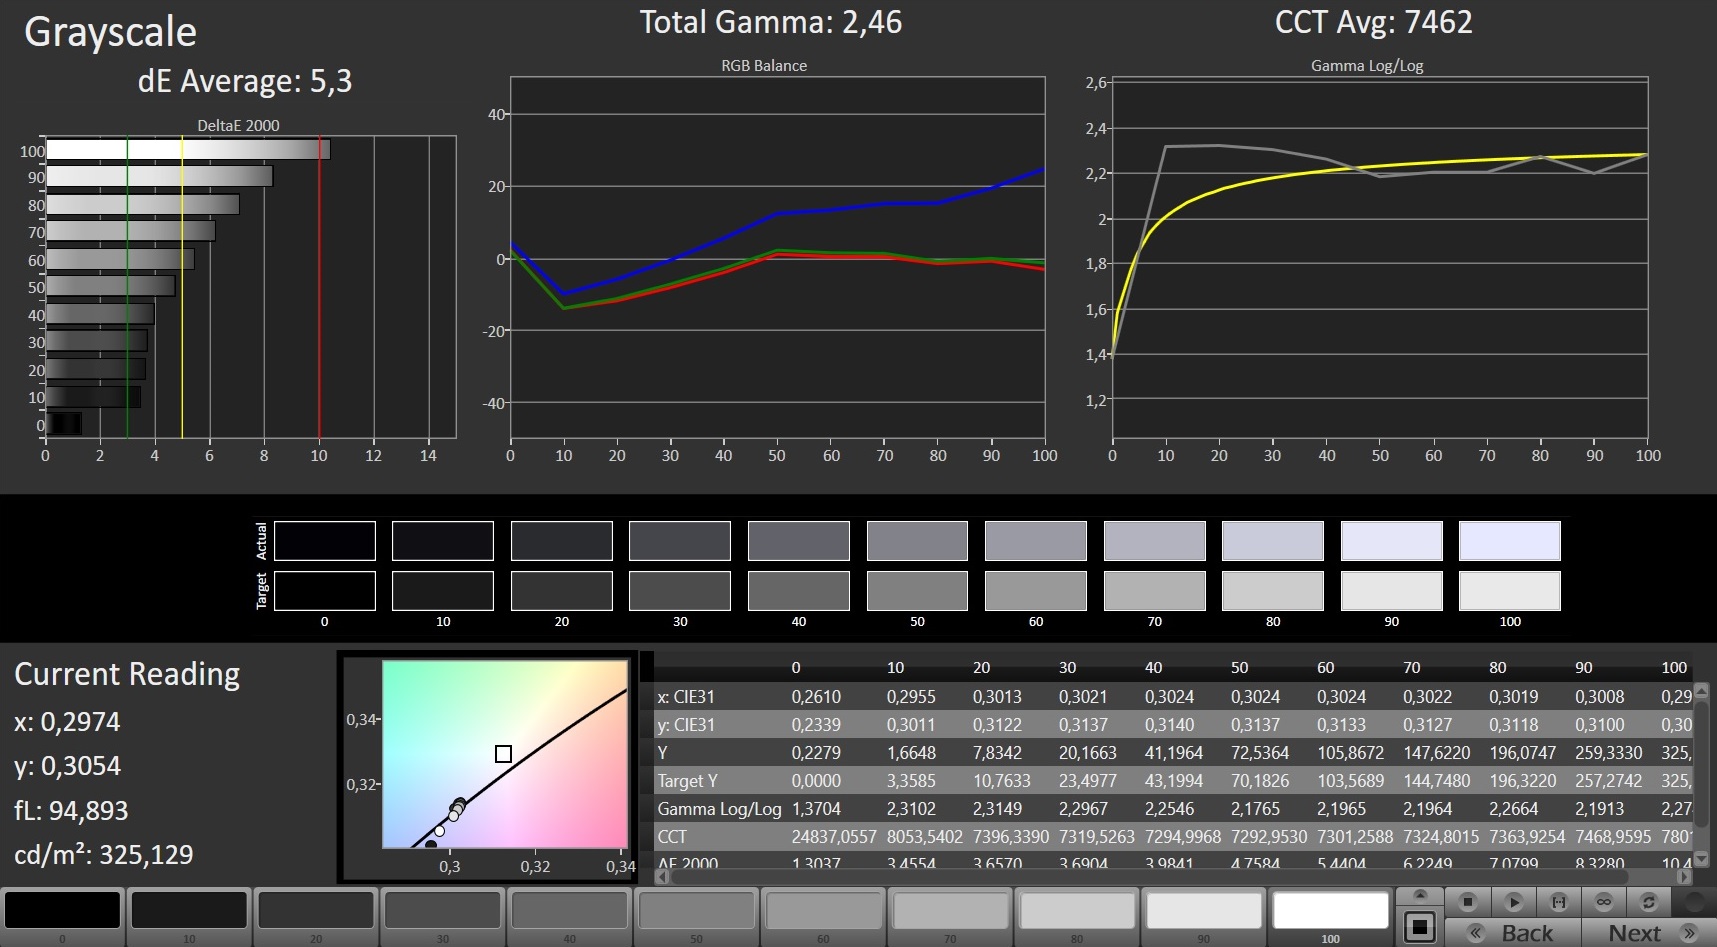
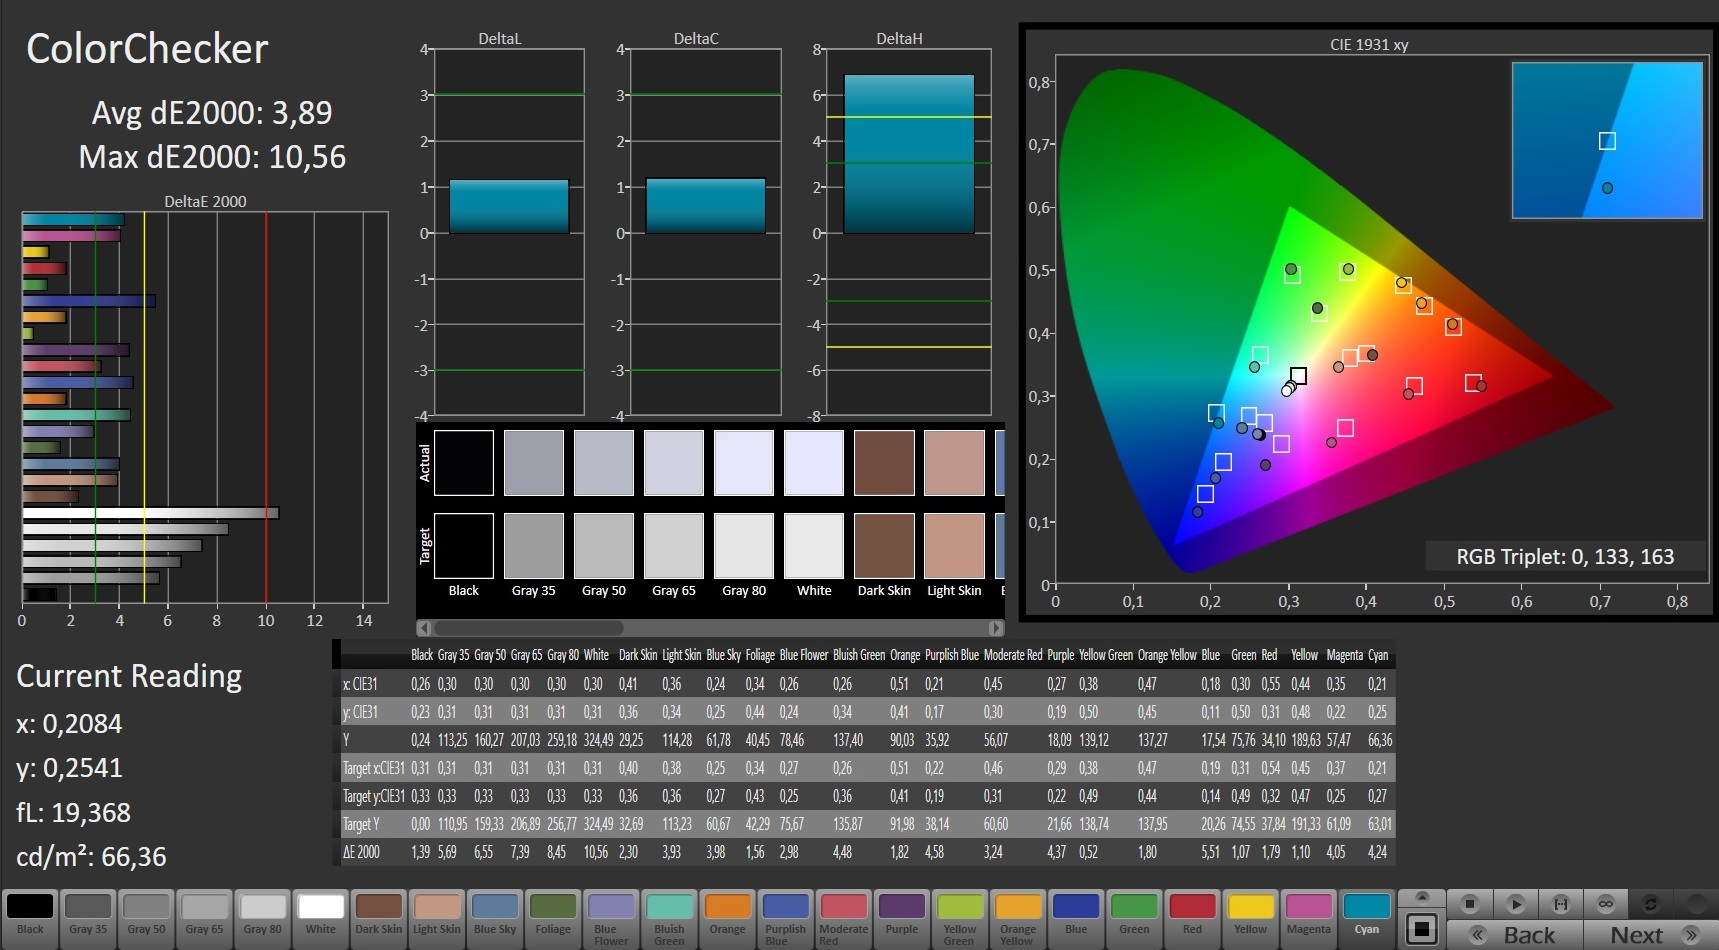
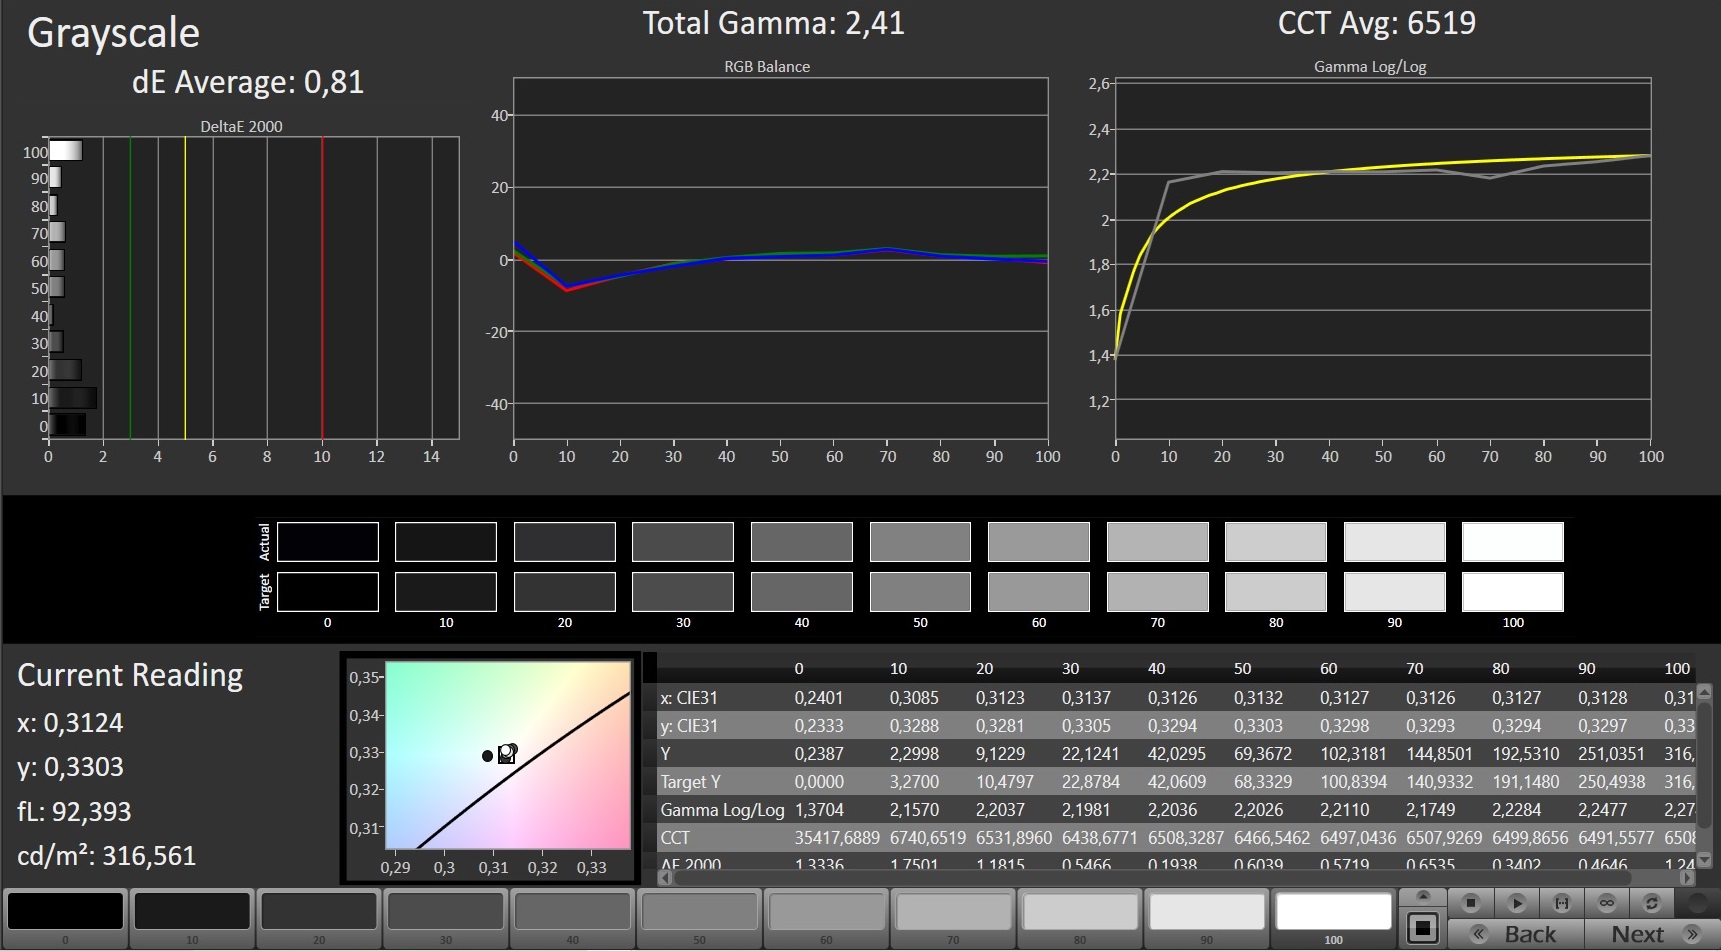
The panel covers 96% of the sRGB color space and has a great response time of 11.6 - 15.6 ms. The average luminosity of 286 cd/m² and the color accuracy, on the other hand, are only mediocre.
Instead, the panel can offer great viewing angle stability, which is not surprising considering it is based on IPS technology.
Display Response Times
| ↔ Response Time Black to White | ||
|---|---|---|
| 11.6 ms ... rise ↗ and fall ↘ combined | ↗ 6 ms rise | 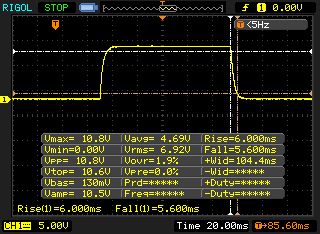 |
| ↘ 5.6 ms fall | ||
| The screen shows good response rates in our tests, but may be too slow for competitive gamers. In comparison, all tested devices range from 0.1 (minimum) to 240 (maximum) ms. » 31 % of all devices are better. This means that the measured response time is better than the average of all tested devices (19.9 ms). | ||
| ↔ Response Time 50% Grey to 80% Grey | ||
| 15.6 ms ... rise ↗ and fall ↘ combined | ↗ 8 ms rise | 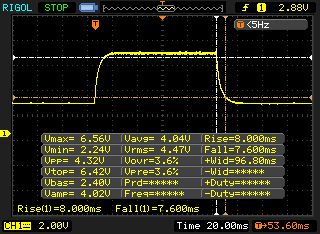 |
| ↘ 7.6 ms fall | ||
| The screen shows good response rates in our tests, but may be too slow for competitive gamers. In comparison, all tested devices range from 0.165 (minimum) to 636 (maximum) ms. » 30 % of all devices are better. This means that the measured response time is better than the average of all tested devices (31.1 ms). | ||
Screen Flickering / PWM (Pulse-Width Modulation)
| Screen flickering / PWM not detected | 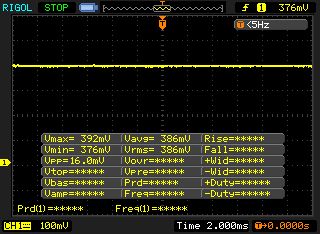 | ||
In comparison: 52 % of all tested devices do not use PWM to dim the display. If PWM was detected, an average of 7794 (minimum: 5 - maximum: 343500) Hz was measured. | |||
Testing conditions
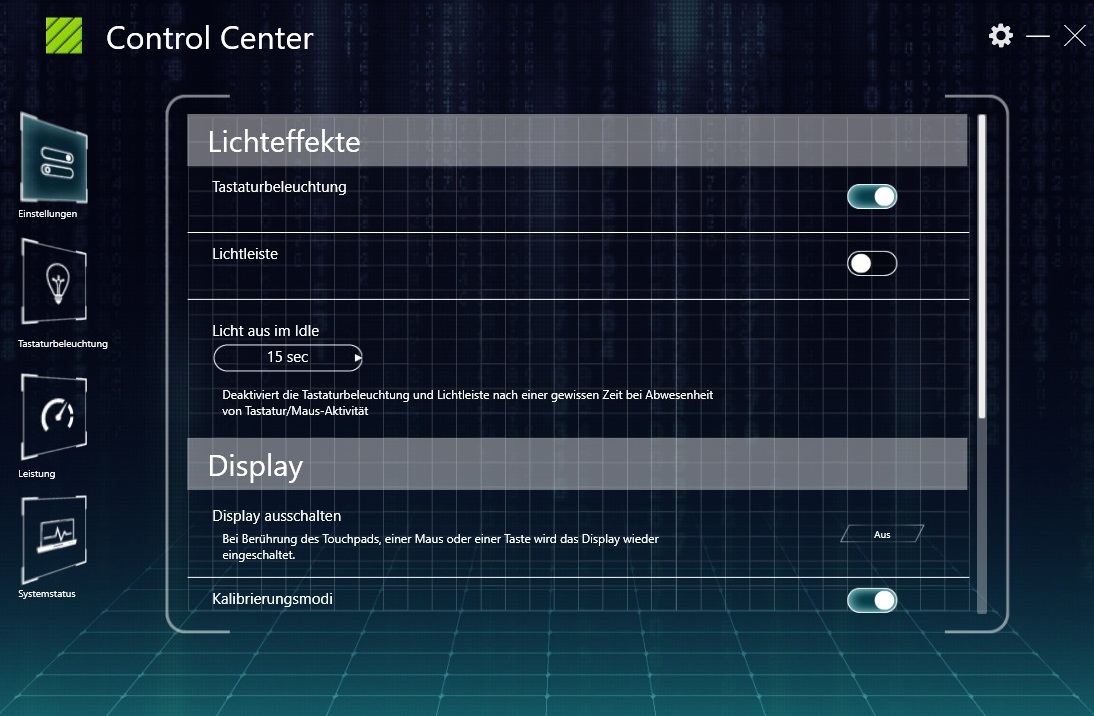
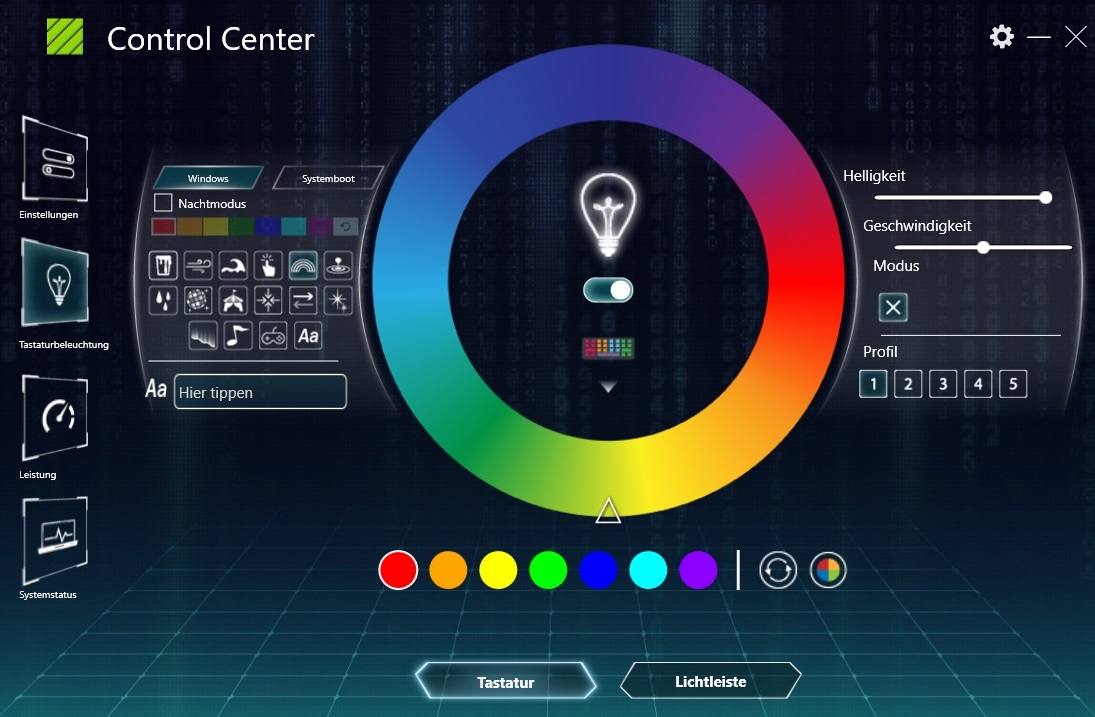
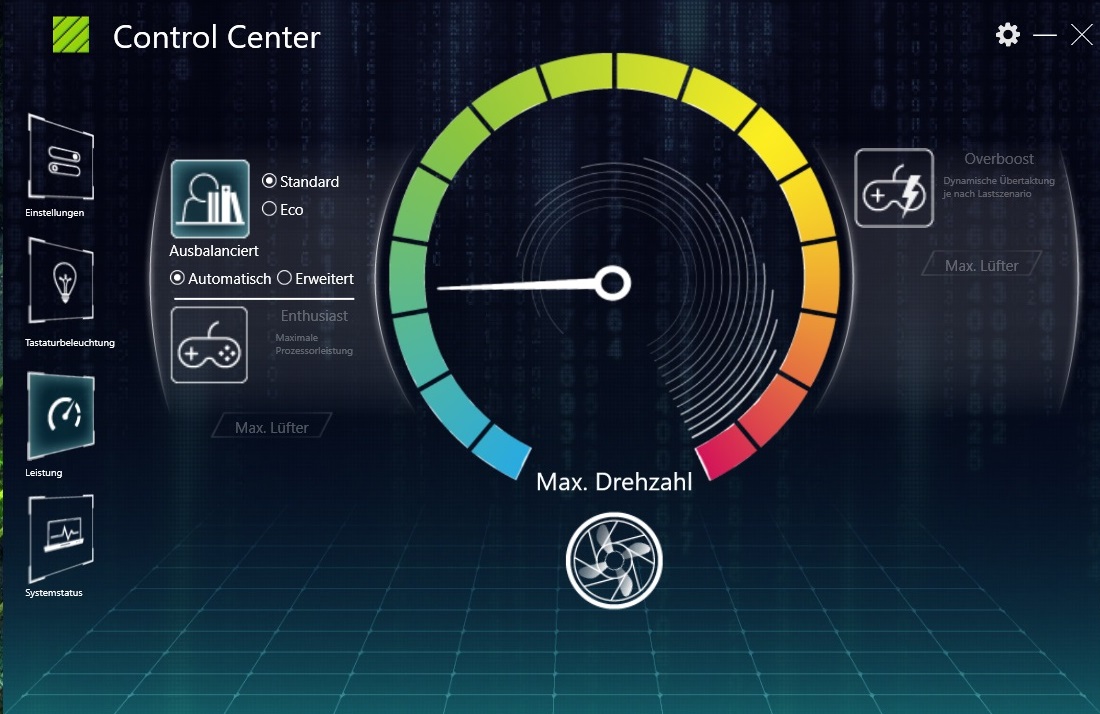
The preinstalled Control Center allows the user to make various changes to the system settings (e.g. the color of the keyboard backlighting). We were particularly interested in the "performance" tab. Our tests were completed in standard mode with automatic fan control. These are the settings that are activated at delivery.
Performance
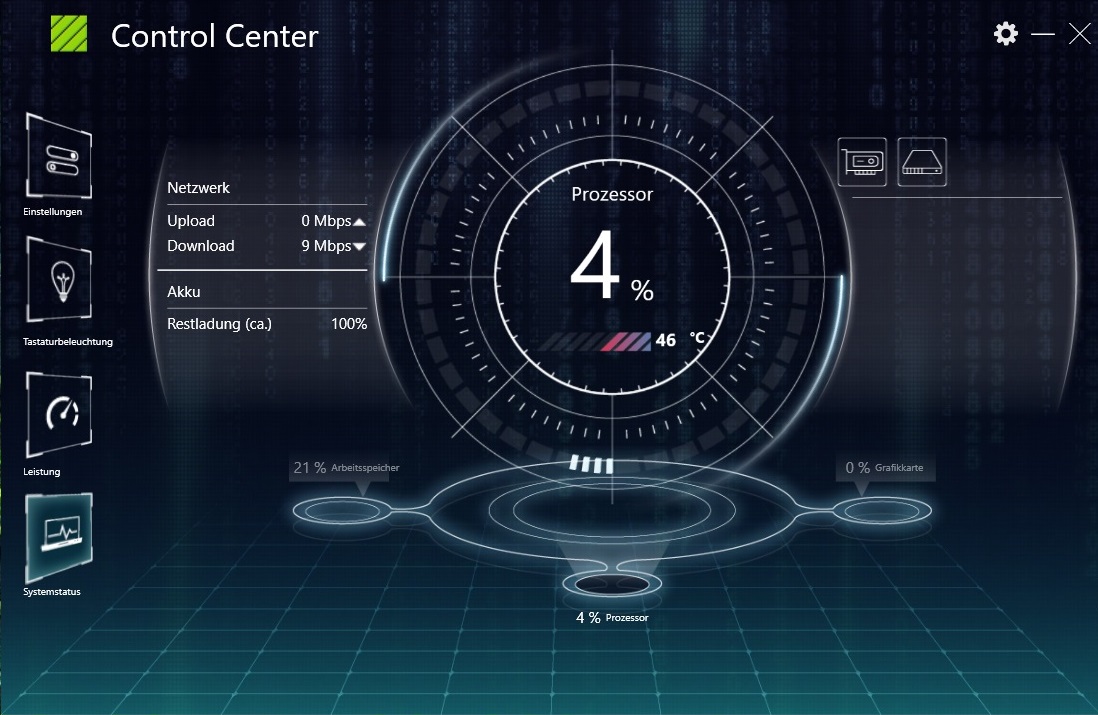
First, we will be taking a look at several screenshots of the most important system components.
Processor
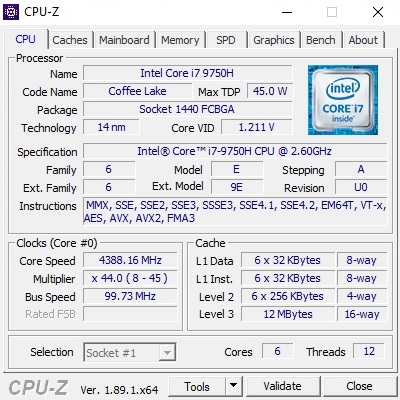
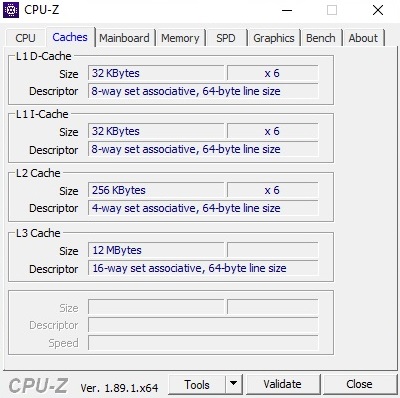
As mentioned before, the Core i7-9750H is a six-core chip. The 14-nm chip is based on Intel's improved Coffee Lake architecture and can work up to 12 threads simultaneously via hyper threading.
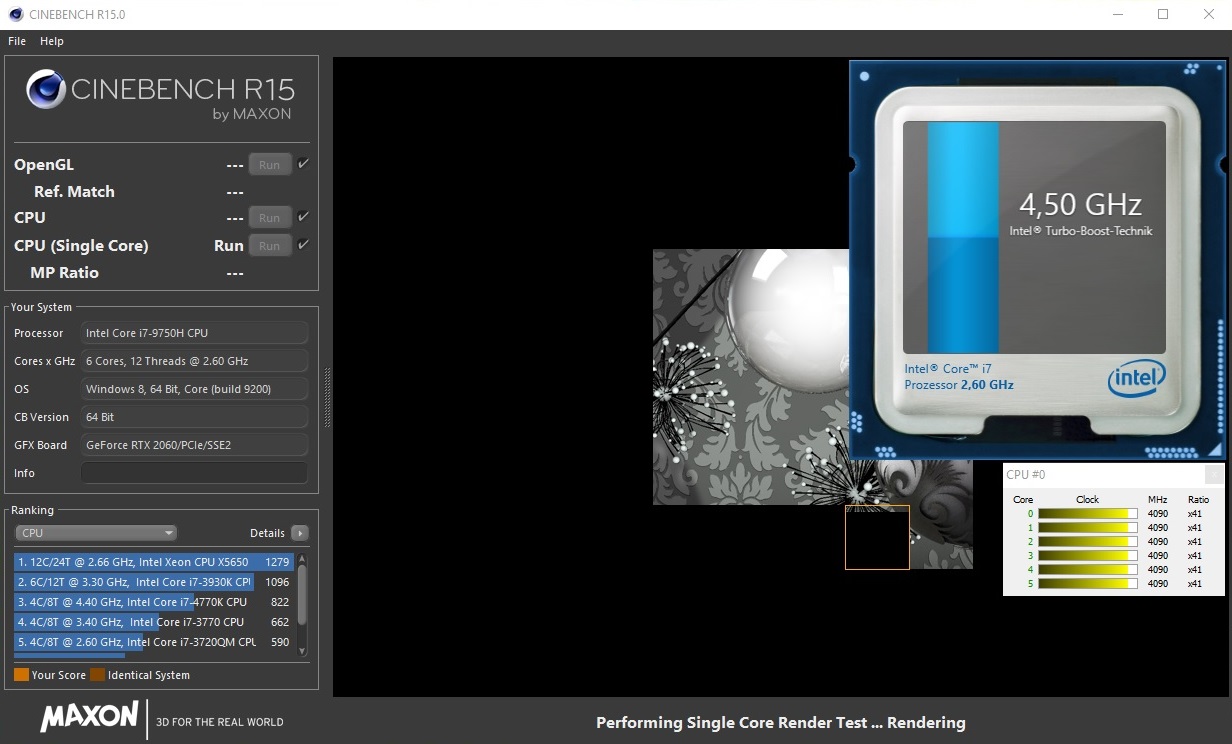
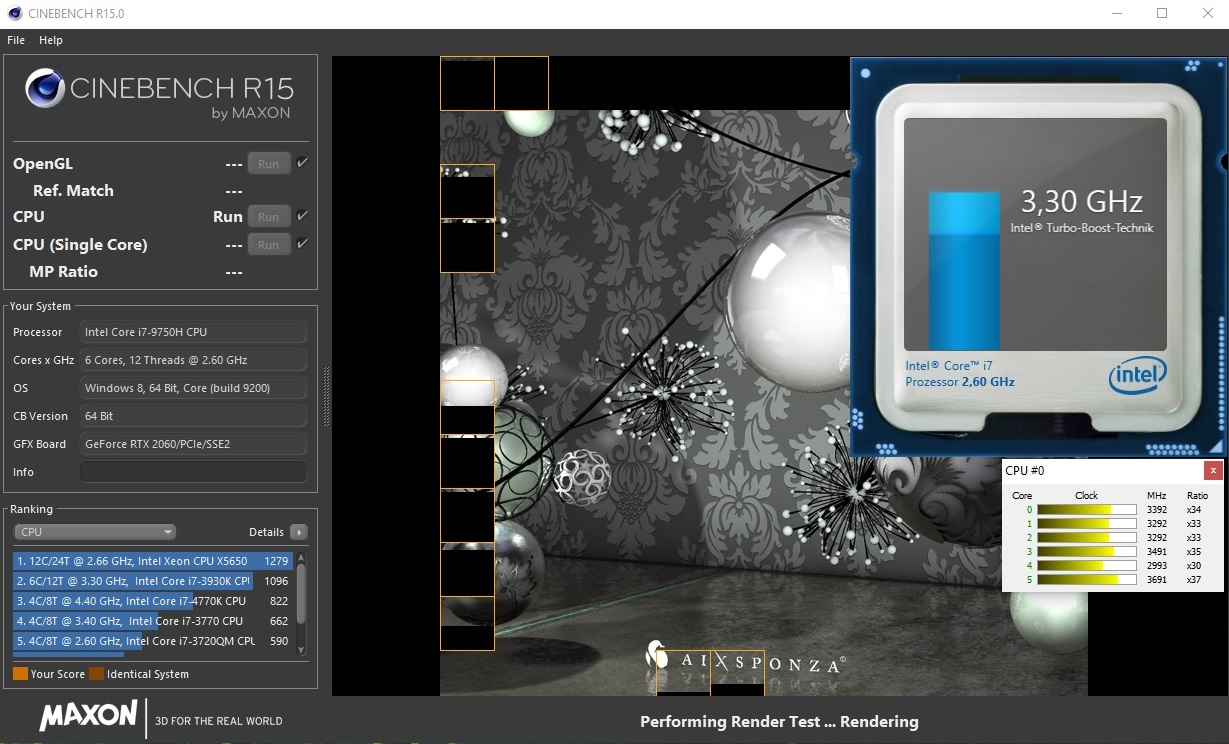
The clock rate of 2.6 GHz seems unspectacular at first. However, the processor can speed up to a maximum of 4.5 GHz under load thanks to its Turbo Boost.
We ran the Cinebench R15 benchmark in order to find out whether the XMG Neo 17 can reach and keep up its overclocking potential. Unfortunately, we were not particularly impressed by the 2.9 to 3.8 GHz clock rate during the multi-core test (average 3.3 GHz), which positioned our 17-inch laptop towards the back of our comparison field. It only made last place in terms of prolonged performance as well (see the Cinebench loop).
System Performance
The system performance gives a similar picture. The Neo 17 reached 5454 points in the PCMark 10, which positioned it on last place. Nonetheless, the performance differences are only marginal - particularly in real life.
Storage Devices
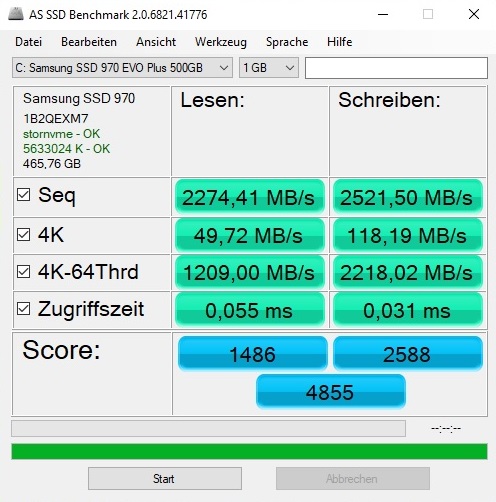
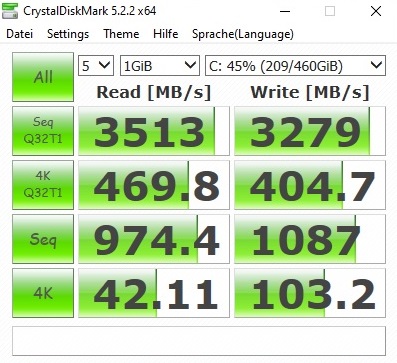
The 17-inch-Schenker did a considerably better job in terms of storage devices. Schenker has equipped our test unit with the 500-GB version of the lighting-fast Samsung 970 EVO Plus SSD. The M.2 NVMe drive reached sequential read and write rates of over 3000 MB/s in the CrystalDiskMark benchmark, which positions it at the top of our comparison field.
| Schenker XMG Neo 17 XNE17M19 Samsung SSD 970 EVO Plus 500GB | Asus Strix Hero III G731GV Intel SSD 660p SSDPEKNW512G8 | Lenovo Legion Y740-17IRH WDC PC SN520 SDAPMUW-128G | MSI GL75 9SEK-056US WDC PC SN520 SDAPNUW-512G | Razer Blade Pro 17 RTX 2060 Samsung SSD PM981 MZVLB512HAJQ | |
|---|---|---|---|---|---|
| CrystalDiskMark 5.2 / 6 | -5% | -35% | -1% | 10% | |
| Write 4K (MB/s) | 103.2 | 129.3 25% | 102.7 0% | 149.1 44% | 124.1 20% |
| Read 4K (MB/s) | 42.11 | 54.4 29% | 29.12 -31% | 48.58 15% | 44.75 6% |
| Write Seq (MB/s) | 1087 | 978 -10% | 362.2 -67% | 1292 19% | |
| Read Seq (MB/s) | 974 | 1447 49% | 1010 4% | 1272 31% | |
| Write 4K Q32T1 (MB/s) | 404.7 | 476.8 18% | 298.1 -26% | 462 14% | 514 27% |
| Read 4K Q32T1 (MB/s) | 469.8 | 338.1 -28% | 349.6 -26% | 606 29% | 596 27% |
| Write Seq Q32T1 (MB/s) | 3279 | 982 -70% | 788 -76% | 1454 -56% | 1892 -42% |
| Read Seq Q32T1 (MB/s) | 3513 | 1622 -54% | 1490 -58% | 1724 -51% | 3209 -9% |

Graphics Card
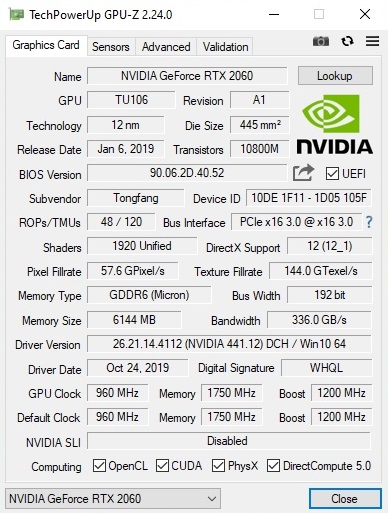
The GeForce RTX 2060 is currently the most affordable entry into the raytracing world. The DirectX 12 model is a Turing chip and has 1920 shader units. The chip has a GDDR6 VRAM of 6 GB (192-Bit interface).
| 3DMark 11 Performance | 16713 points | |
| 3DMark Cloud Gate Standard Score | 33879 points | |
| 3DMark Fire Strike Score | 13789 points | |
| 3DMark Time Spy Score | 5725 points | |
Help | ||
The base clock rate of 960 MHz can increase significantly during 3D applications thanks to the GPU boost. This means that the GPU reaches just under 1400 MHz in the Unigine Heaven 4.0 benchmark. There were no worrisome issues such as drops in performance during the 60-minute "The Witcher 3" test (Full-HD/Ultra), which the Neo 17 completed at 1350 MHz.
The fact that other RTX 2060 laptops do an even better job of making full use of their GPU turbo becomes apparent when you take a look at our benchmark table. Whether it's the 3DMark 11 or the 3DMark 13: As long as users limit the device to standard mode in the Control Center, the competition can easily overtake the Neo 17.
| 3DMark | |
| 2560x1440 Port Royal Graphics | |
| Razer Blade Pro 17 RTX 2060 | |
| Asus Strix Hero III G731GV | |
| Schenker XMG Neo 17 XNE17M19 | |
| 1920x1080 Fire Strike Graphics | |
| Razer Blade Pro 17 RTX 2060 | |
| MSI GL75 9SEK-056US | |
| Lenovo Legion Y740-17IRH | |
| Asus Strix Hero III G731GV | |
| Schenker XMG Neo 17 XNE17M19 | |
| 2560x1440 Time Spy Graphics | |
| Razer Blade Pro 17 RTX 2060 | |
| MSI GL75 9SEK-056US | |
| Lenovo Legion Y740-17IRH | |
| Asus Strix Hero III G731GV | |
| Schenker XMG Neo 17 XNE17M19 | |
| 3DMark 11 - 1280x720 Performance GPU | |
| Razer Blade Pro 17 RTX 2060 | |
| MSI GL75 9SEK-056US | |
| Asus Strix Hero III G731GV | |
| Lenovo Legion Y740-17IRH | |
| Schenker XMG Neo 17 XNE17M19 | |
Gaming Performance
We tested the Neo 17's performance in a higher performance mode during the obligatory gaming round. The result: In the overboost mode, the frame rate increases by about 15% (together with the fan noise), which cancels the gap in performance compared to the competition.
| The Witcher 3 - 1920x1080 Ultra Graphics & Postprocessing (HBAO+) | |
| Average of class Gaming (95 - 240, n=8, last 2 years) | |
| Schenker XMG Neo 17 (Overboost) | |
| Schenker XMG Neo 17 XNE17M19 | |
| Call of Duty Modern Warfare 2019 - 1920x1080 Maximum Settings AA:T2X Filmic SM | |
| Schenker XMG Neo 17 (Overboost) | |
| Schenker XMG Neo 17 XNE17M19 | |
| GRID 2019 - 1920x1080 Ultra High Preset | |
| Schenker XMG Neo 17 (Overboost) | |
| Schenker XMG Neo 17 XNE17M19 | |
| Ghost Recon Breakpoint - 1920x1080 Ultra Preset AA:T | |
| Schenker XMG Neo 17 (Overboost) | |
| Schenker XMG Neo 17 XNE17M19 | |
| FIFA 20 - 1920x1080 Ultra Preset AA:4xMS | |
| Schenker XMG Neo 17 (Overboost) | |
| Schenker XMG Neo 17 XNE17M19 | |
| Borderlands 3 - 1920x1080 Badass Overall Quality (DX11) | |
| Schenker XMG Neo 17 (Overboost) | |
| Schenker XMG Neo 17 XNE17M19 | |
| Control - 1920x1080 High Quality Preset | |
| Schenker XMG Neo 17 (Overboost) | |
| Schenker XMG Neo 17 XNE17M19 | |
| Rage 2 - 1920x1080 Ultra Preset (Resolution Scale Off) | |
| Schenker XMG Neo 17 (Overboost) | |
| Schenker XMG Neo 17 XNE17M19 | |
| Apex Legends - 1920x1080 Maximum Settings AA:TS AF:16x | |
| Schenker XMG Neo 17 (Overboost) | |
| Schenker XMG Neo 17 XNE17M19 | |
In general, the RTX 2060 can display all modern games smoothly at native resolution (1920x1080) and at high to maximum details. Only very demanding or badly optimized games such as "Anno 1800" might encounter difficulties. In these cases, the frame rate can drop below the 60 FPS mark. Less demanding titles (e.g. "Fifa 20" and "Apex") can be played at over 100 fps, which makes good use of the display frequency.
| low | med. | high | ultra | |
|---|---|---|---|---|
| The Witcher 3 (2015) | 107 | 56.9 | ||
| Apex Legends (2019) | 116 | 114 | ||
| Dirt Rally 2.0 (2019) | 124 | 69.9 | ||
| The Division 2 (2019) | 82 | 59 | ||
| Anno 1800 (2019) | 60.8 | 35.7 | ||
| Rage 2 (2019) | 79.9 | 77.8 | ||
| Control (2019) | 54.3 | |||
| Borderlands 3 (2019) | 64.4 | 49.4 | ||
| FIFA 20 (2019) | 184 | 181 | ||
| Ghost Recon Breakpoint (2019) | 74 | 54 | ||
| GRID 2019 (2019) | 94.6 | 62.2 | ||
| Call of Duty Modern Warfare 2019 (2019) | 93.9 | 81.5 | ||
| Star Wars Jedi Fallen Order (2019) | 87.8 | 78.9 |
Emissions
System Noise
One positive aspect of the standard mode is that the system noise is relatively low. The Neo 17 is usually quieter than its competition at 43 to max. 47 dB(A) during 3D applications.
We can't say anything negative about noise production of the 17-inch Schenker while idling either. An average of 33 dB(A) is a good level for a gaming notebook. Ideally, the fans would turn off completely, making the device silent.
Noise level
| Idle |
| 31 / 33 / 35 dB(A) |
| Load |
| 43 / 47 dB(A) |
 | ||
30 dB silent 40 dB(A) audible 50 dB(A) loud |
||
min: | ||
| Schenker XMG Neo 17 XNE17M19 i7-9750H, GeForce RTX 2060 Mobile | Asus Strix Hero III G731GV i7-9750H, GeForce RTX 2060 Mobile | Lenovo Legion Y740-17IRH i7-9750H, GeForce RTX 2060 Mobile | MSI GL75 9SEK-056US i7-9750H, GeForce RTX 2060 Mobile | Razer Blade Pro 17 RTX 2060 i7-9750H, GeForce RTX 2060 Mobile | Average of class Gaming | |
|---|---|---|---|---|---|---|
| Noise | -1% | -3% | 0% | 4% | 9% | |
| off / environment * (dB) | 31 | 28.2 9% | 30 3% | 28.1 9% | 28.2 9% | 24.1 ? 22% |
| Idle Minimum * (dB) | 31 | 29.5 5% | 33 -6% | 30.9 -0% | 28.2 9% | 25.8 ? 17% |
| Idle Average * (dB) | 33 | 30.3 8% | 34 -3% | 30.9 6% | 28.2 15% | 27.4 ? 17% |
| Idle Maximum * (dB) | 35 | 31.9 9% | 35 -0% | 31 11% | 28.2 19% | 30 ? 14% |
| Load Average * (dB) | 43 | 50.4 -17% | 48 -12% | 39 9% | 43 -0% | 43 ? -0% |
| Witcher 3 ultra * (dB) | 45 | 50.1 -11% | 46 -2% | 53.5 -19% | 48.4 -8% | |
| Load Maximum * (dB) | 47 | 50.1 -7% | 49 -4% | 53.5 -14% | 53.4 -14% | 54 ? -15% |
* ... smaller is better
Temperature
The temperature development is a mixed bag. While the XMG Neo 17 reaches a maximum of 27 °C (~81 °F) while idling, which is cooler than its competition, its case can heat up to 54 °C (~129 °F) under load, which is the highest value in our comparison field.
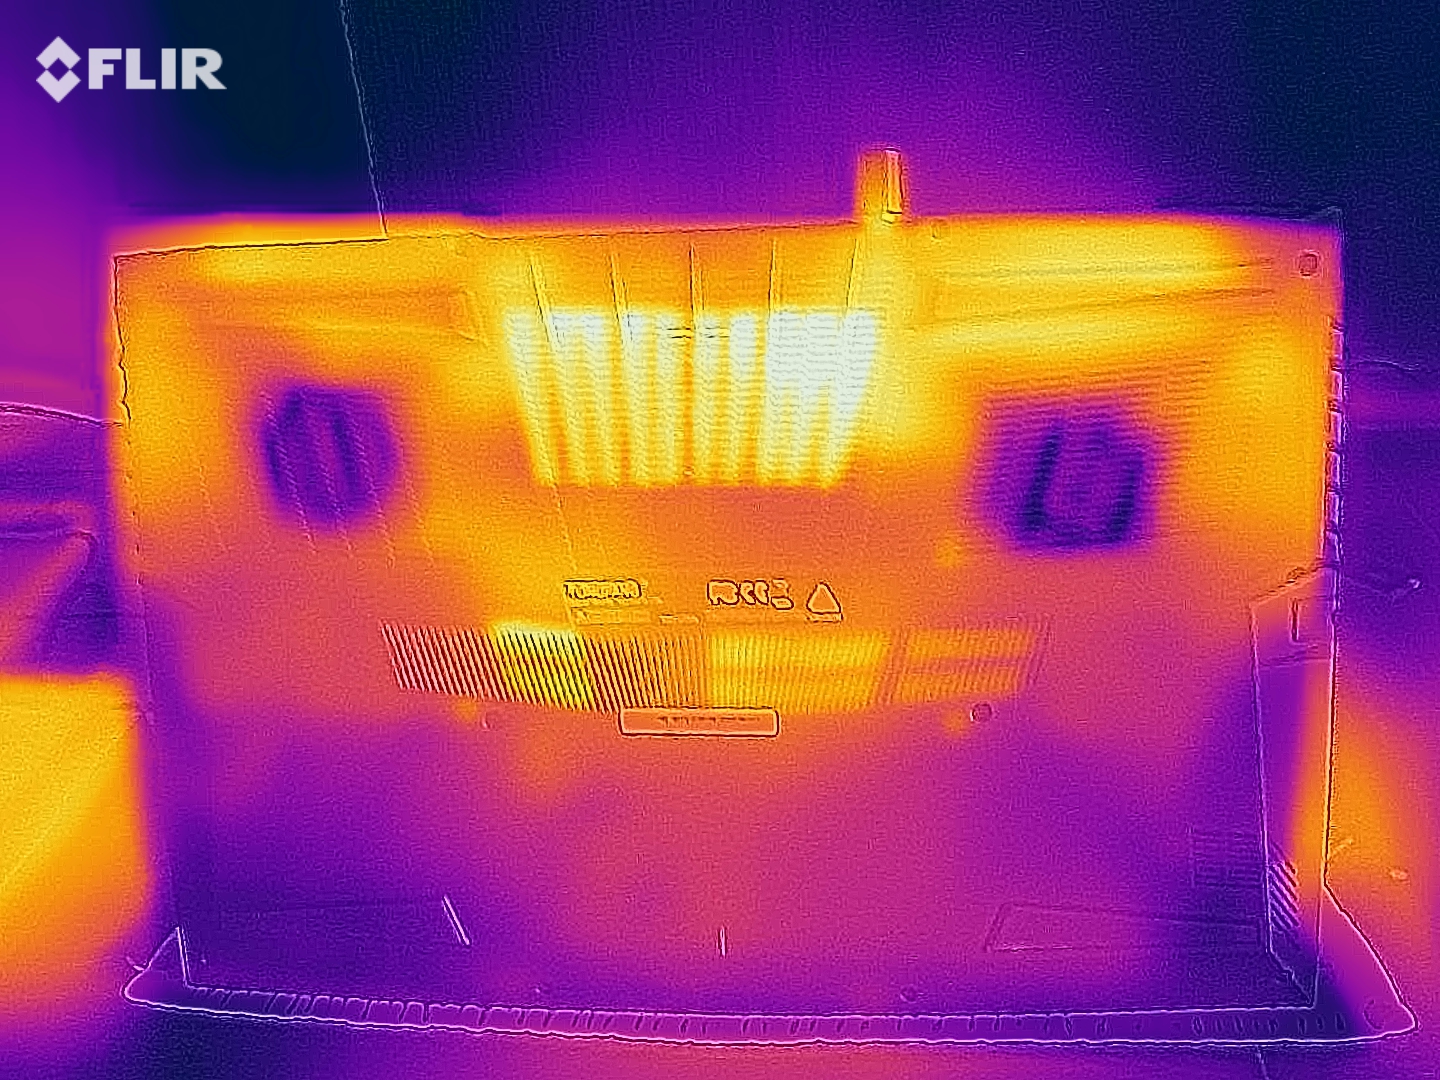
The CPU and GPU heat up evenly during 3D applications. They reached around 70 °C (~158 °F) during "The Witcher 3", which implies a decent cooling system. The processors only reached around 80 °C (~176 °F) during the stress test with FurMark & Prime95, although the Turbo was largely unavailable for both the Core i7-9750H and the GeForce RTX 2060 in this scenario.
(-) The maximum temperature on the upper side is 48 °C / 118 F, compared to the average of 40.4 °C / 105 F, ranging from 21.2 to 68.8 °C for the class Gaming.
(-) The bottom heats up to a maximum of 54 °C / 129 F, compared to the average of 43.2 °C / 110 F
(+) In idle usage, the average temperature for the upper side is 25.1 °C / 77 F, compared to the device average of 33.9 °C / 93 F.
(±) Playing The Witcher 3, the average temperature for the upper side is 37.1 °C / 99 F, compared to the device average of 33.9 °C / 93 F.
(+) The palmrests and touchpad are reaching skin temperature as a maximum (34 °C / 93.2 F) and are therefore not hot.
(-) The average temperature of the palmrest area of similar devices was 28.8 °C / 83.8 F (-5.2 °C / -9.4 F).
| Schenker XMG Neo 17 XNE17M19 i7-9750H, GeForce RTX 2060 Mobile | Asus Strix Hero III G731GV i7-9750H, GeForce RTX 2060 Mobile | Lenovo Legion Y740-17IRH i7-9750H, GeForce RTX 2060 Mobile | MSI GL75 9SEK-056US i7-9750H, GeForce RTX 2060 Mobile | Razer Blade Pro 17 RTX 2060 i7-9750H, GeForce RTX 2060 Mobile | Average of class Gaming | |
|---|---|---|---|---|---|---|
| Heat | -10% | -5% | -26% | 0% | -8% | |
| Maximum Upper Side * (°C) | 48 | 47.2 2% | 43 10% | 49.4 -3% | 40.6 15% | 45.2 ? 6% |
| Maximum Bottom * (°C) | 54 | 51 6% | 46 15% | 50.6 6% | 45.4 16% | 48 ? 11% |
| Idle Upper Side * (°C) | 26 | 30.2 -16% | 31 -19% | 39 -50% | 30 -15% | 31.1 ? -20% |
| Idle Bottom * (°C) | 27 | 35.4 -31% | 34 -26% | 42 -56% | 31 -15% | 34.2 ? -27% |
* ... smaller is better
Speakers
Schenker XMG Neo 17 XNE17M19 audio analysis
(±) | speaker loudness is average but good (77 dB)
Bass 100 - 315 Hz
(-) | nearly no bass - on average 17.6% lower than median
(±) | linearity of bass is average (10% delta to prev. frequency)
Mids 400 - 2000 Hz
(+) | balanced mids - only 4.7% away from median
(±) | linearity of mids is average (8.5% delta to prev. frequency)
Highs 2 - 16 kHz
(+) | balanced highs - only 2% away from median
(+) | highs are linear (4.7% delta to prev. frequency)
Overall 100 - 16.000 Hz
(±) | linearity of overall sound is average (18.1% difference to median)
Compared to same class
» 57% of all tested devices in this class were better, 8% similar, 35% worse
» The best had a delta of 6%, average was 18%, worst was 132%
Compared to all devices tested
» 38% of all tested devices were better, 8% similar, 54% worse
» The best had a delta of 4%, average was 24%, worst was 134%
Asus Strix Hero III G731GV audio analysis
(±) | speaker loudness is average but good (81 dB)
Bass 100 - 315 Hz
(±) | reduced bass - on average 6.6% lower than median
(±) | linearity of bass is average (11.8% delta to prev. frequency)
Mids 400 - 2000 Hz
(+) | balanced mids - only 2.8% away from median
(+) | mids are linear (6.7% delta to prev. frequency)
Highs 2 - 16 kHz
(+) | balanced highs - only 1.8% away from median
(+) | highs are linear (5.4% delta to prev. frequency)
Overall 100 - 16.000 Hz
(+) | overall sound is linear (13.4% difference to median)
Compared to same class
» 19% of all tested devices in this class were better, 7% similar, 74% worse
» The best had a delta of 6%, average was 18%, worst was 132%
Compared to all devices tested
» 14% of all tested devices were better, 4% similar, 83% worse
» The best had a delta of 4%, average was 24%, worst was 134%
Energy Management
Power Consumption
In favor of the battery life, the Barebone manufacturer Tongfang has included Optimus technology instead of the image improvement technology G-Sync. Thanks to this graphics switching technology, the 17-inch device only consumes between 11 and 20 watts while idling. When the Nvidia GPU is activated under load, the consumption increases dramatically. We measured a consumption of 100 - 174 watts during 3D applications, which is still well under the rated output of the AC adaptor (230 watts).
| Off / Standby | |
| Idle | |
| Load |
|
Key:
min: | |
| Schenker XMG Neo 17 XNE17M19 i7-9750H, GeForce RTX 2060 Mobile | Asus Strix Hero III G731GV i7-9750H, GeForce RTX 2060 Mobile | Lenovo Legion Y740-17IRH i7-9750H, GeForce RTX 2060 Mobile | MSI GL75 9SEK-056US i7-9750H, GeForce RTX 2060 Mobile | Razer Blade Pro 17 RTX 2060 i7-9750H, GeForce RTX 2060 Mobile | Average of class Gaming | |
|---|---|---|---|---|---|---|
| Power Consumption | -36% | -25% | 0% | -29% | -26% | |
| Idle Minimum * (Watt) | 11 | 16.2 -47% | 20 -82% | 10.7 3% | 16 -45% | 13.2 ? -20% |
| Idle Average * (Watt) | 14 | 24.8 -77% | 21 -50% | 15.2 -9% | 21.7 -55% | 18.9 ? -35% |
| Idle Maximum * (Watt) | 20 | 28.6 -43% | 26 -30% | 17.8 11% | 26.1 -31% | 24.3 ? -22% |
| Load Average * (Watt) | 100 | 127.6 -28% | 97 3% | 88.2 12% | 105.6 -6% | 108 ? -8% |
| Witcher 3 ultra * (Watt) | 151 | 147.1 3% | 139 8% | 147.8 2% | 161.8 -7% | |
| Load Maximum * (Watt) | 174 | 212.7 -22% | 168 3% | 206.5 -19% | 225.3 -29% | 254 ? -46% |
* ... smaller is better
Battery Life
The runtime of the 46-Wh battery in our test unit is neither particularly bad nor particularly good. It manages 4:40 hours while browsing the web (brightness set to 150 cd/m²), which is similar to its competition. In ideal conditions (low load, minimum brightness), the 17-inch laptop even manages over 6 hours of battery life. However, users should only expect about 1 hour of gaming when running on battery.
| Schenker XMG Neo 17 XNE17M19 i7-9750H, GeForce RTX 2060 Mobile, 46 Wh | Asus Strix Hero III G731GV i7-9750H, GeForce RTX 2060 Mobile, 66 Wh | Lenovo Legion Y740-17IRH i7-9750H, GeForce RTX 2060 Mobile, 76 Wh | MSI GL75 9SEK-056US i7-9750H, GeForce RTX 2060 Mobile, 51 Wh | Razer Blade Pro 17 RTX 2060 i7-9750H, GeForce RTX 2060 Mobile, 70 Wh | Average of class Gaming | |
|---|---|---|---|---|---|---|
| Battery runtime | -4% | 1% | 2% | -4% | 42% | |
| Reader / Idle (h) | 6.7 | 6.9 3% | 7.9 18% | 8.71 ? 30% | ||
| WiFi v1.3 (h) | 4.7 | 4.5 -4% | 4.3 -9% | 4.2 -11% | 4.5 -4% | 7.02 ? 49% |
| Load (h) | 1 | 1.1 10% | 1 0% | 1.47 ? 47% | ||
| H.264 (h) | 4.3 | 8.26 ? |
Pros
Cons
Verdict
The meagre sound quality and missing Thunderbolt 3 port aside, the XMS Neo 17 from Schenker Technologies does not have any real issues.
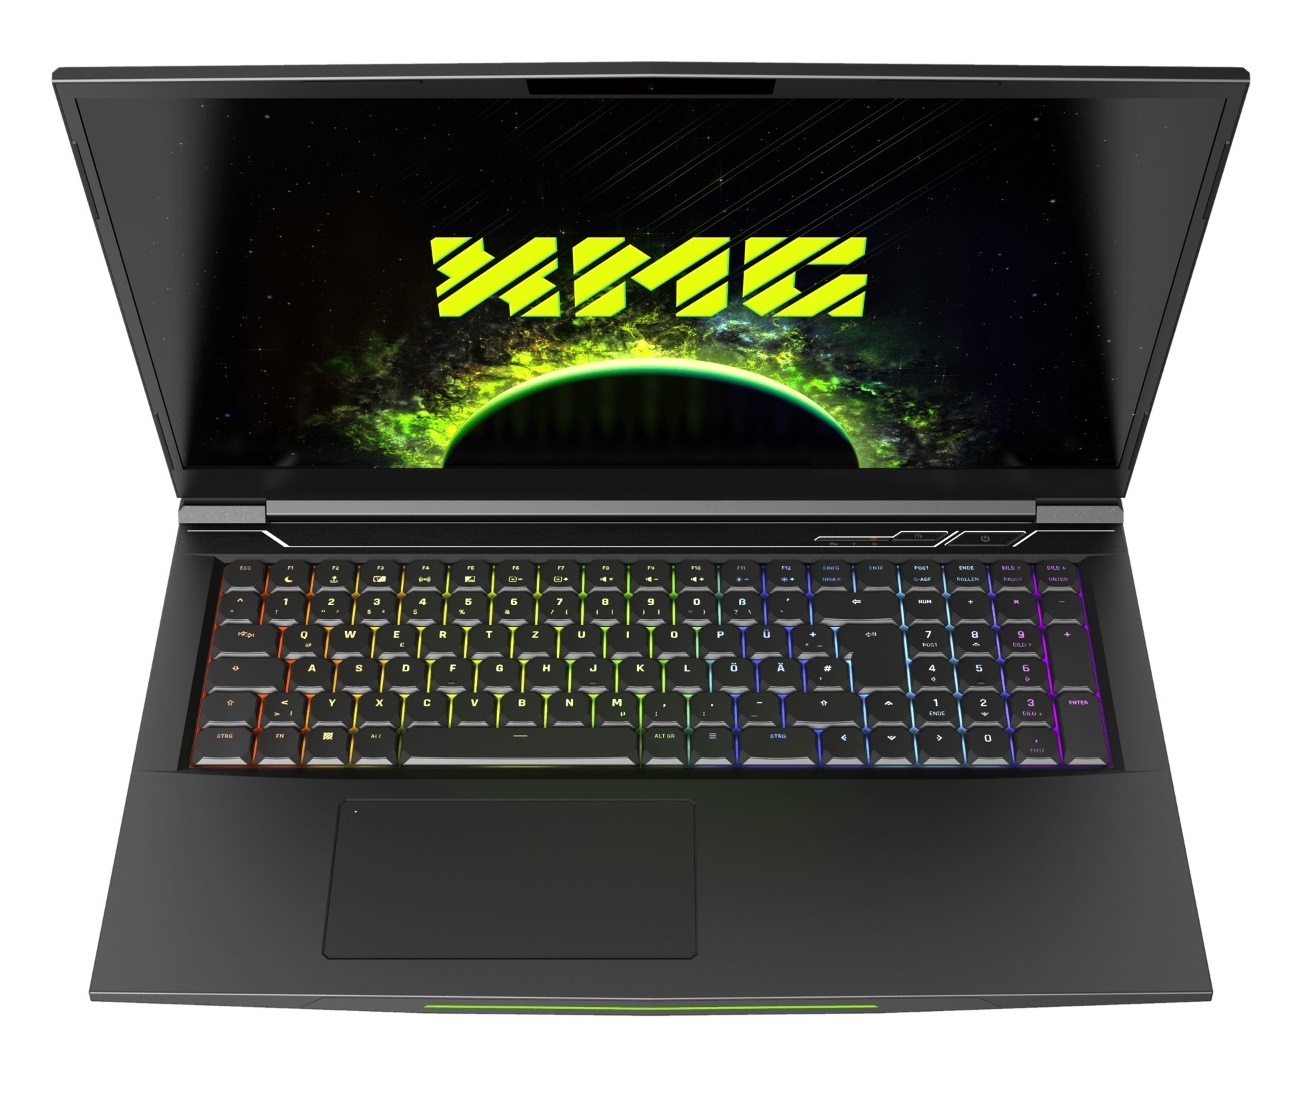
Its Tongfang Barebone GK7CP0S offers an impressively rigid and high-quality case as well as a high-contrast, responsive 144-Hz display. Other highlights include the mechanical keyboard with RGB backlighting.
The manufacturer did a good job in terms of performance as well. Depending on the mode (as chosen in the Control Center), the 17-inch device can either be focused on performance or on moderate system noise. The configuration we tested with a Core i7-9750H, a GeForce RTX 2060 and 16 GB of RAM can handle almost every application with ease.
Schenker XMG Neo 17 XNE17M19
- 05/14/2020 v7 (old)
Florian Glaser
Price comparison

