Medion Erazer Beast X20 (Tongfang GM7MG7P) in review: Thin gaming notebook with good battery runtimes

The Medion Erazer Beast X20 belongs to the class of 17.3-inch gaming notebooks. Like the almost identical predecessor, the current model is also based on a barebone from the company Tongfang (GM7MG7P). The competitors include devices like the Schenker XMG Neo 17 the Aorus 17G YD and the MSI GP76 Leopard 10UG.
Possible competitors in comparison
Rating | Rating Version | Date | Model | Weight | Drive | Size | Resolution |
|---|---|---|---|---|---|---|---|
| 85.5 % v7 (old) | 07 / 2021 | Medion Erazer Beast X20 i7-10870H, GeForce RTX 3070 Laptop GPU | 2.2 kg | 23 mm | 17.30" | 2560x1440 | |
| 85.1 % v7 (old) | 01 / 2021 | Schenker XMG Neo 17 (Early 2021, RTX 3070, 5800H) R7 5800H, GeForce RTX 3070 Laptop GPU | 2.5 kg | 27 mm | 17.30" | 2560x1440 | |
| 85.1 % v7 (old) | 03 / 2021 | MSI GP76 Leopard 10UG i7-10750H, GeForce RTX 3070 Laptop GPU | 2.9 kg | 26 mm | 17.30" | 1920x1080 | |
| 86 % v7 (old) | 06 / 2021 | Aorus 17G YD i7-11800H, GeForce RTX 3080 Laptop GPU | 2.8 kg | 26 mm | 17.30" | 1920x1080 |
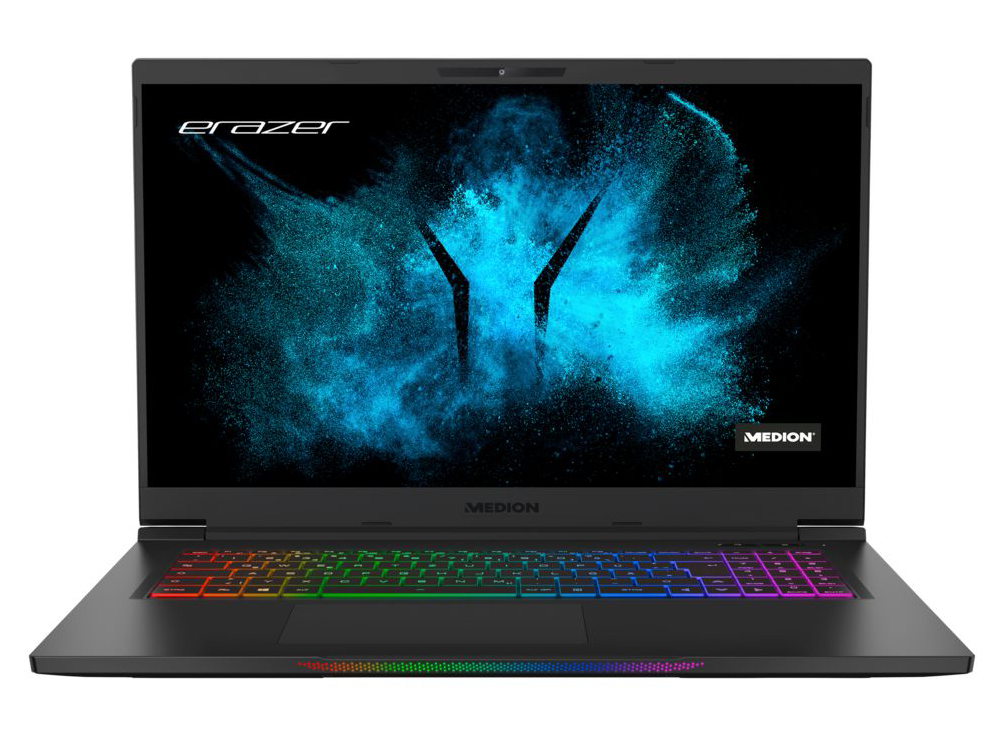
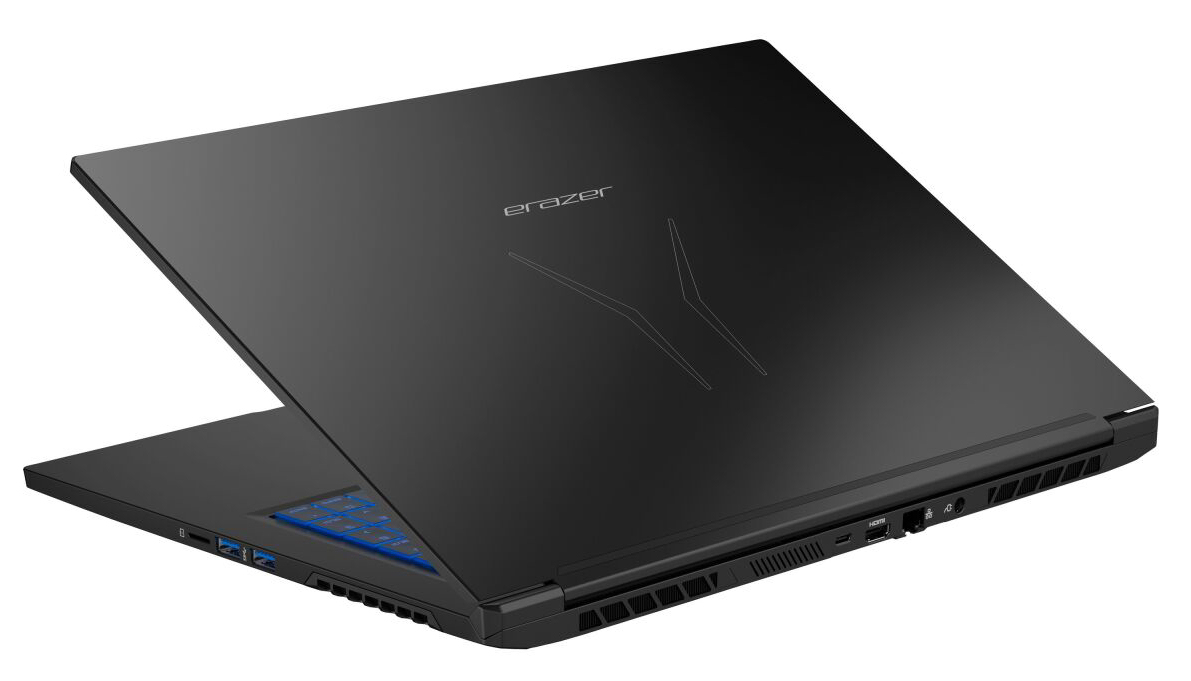
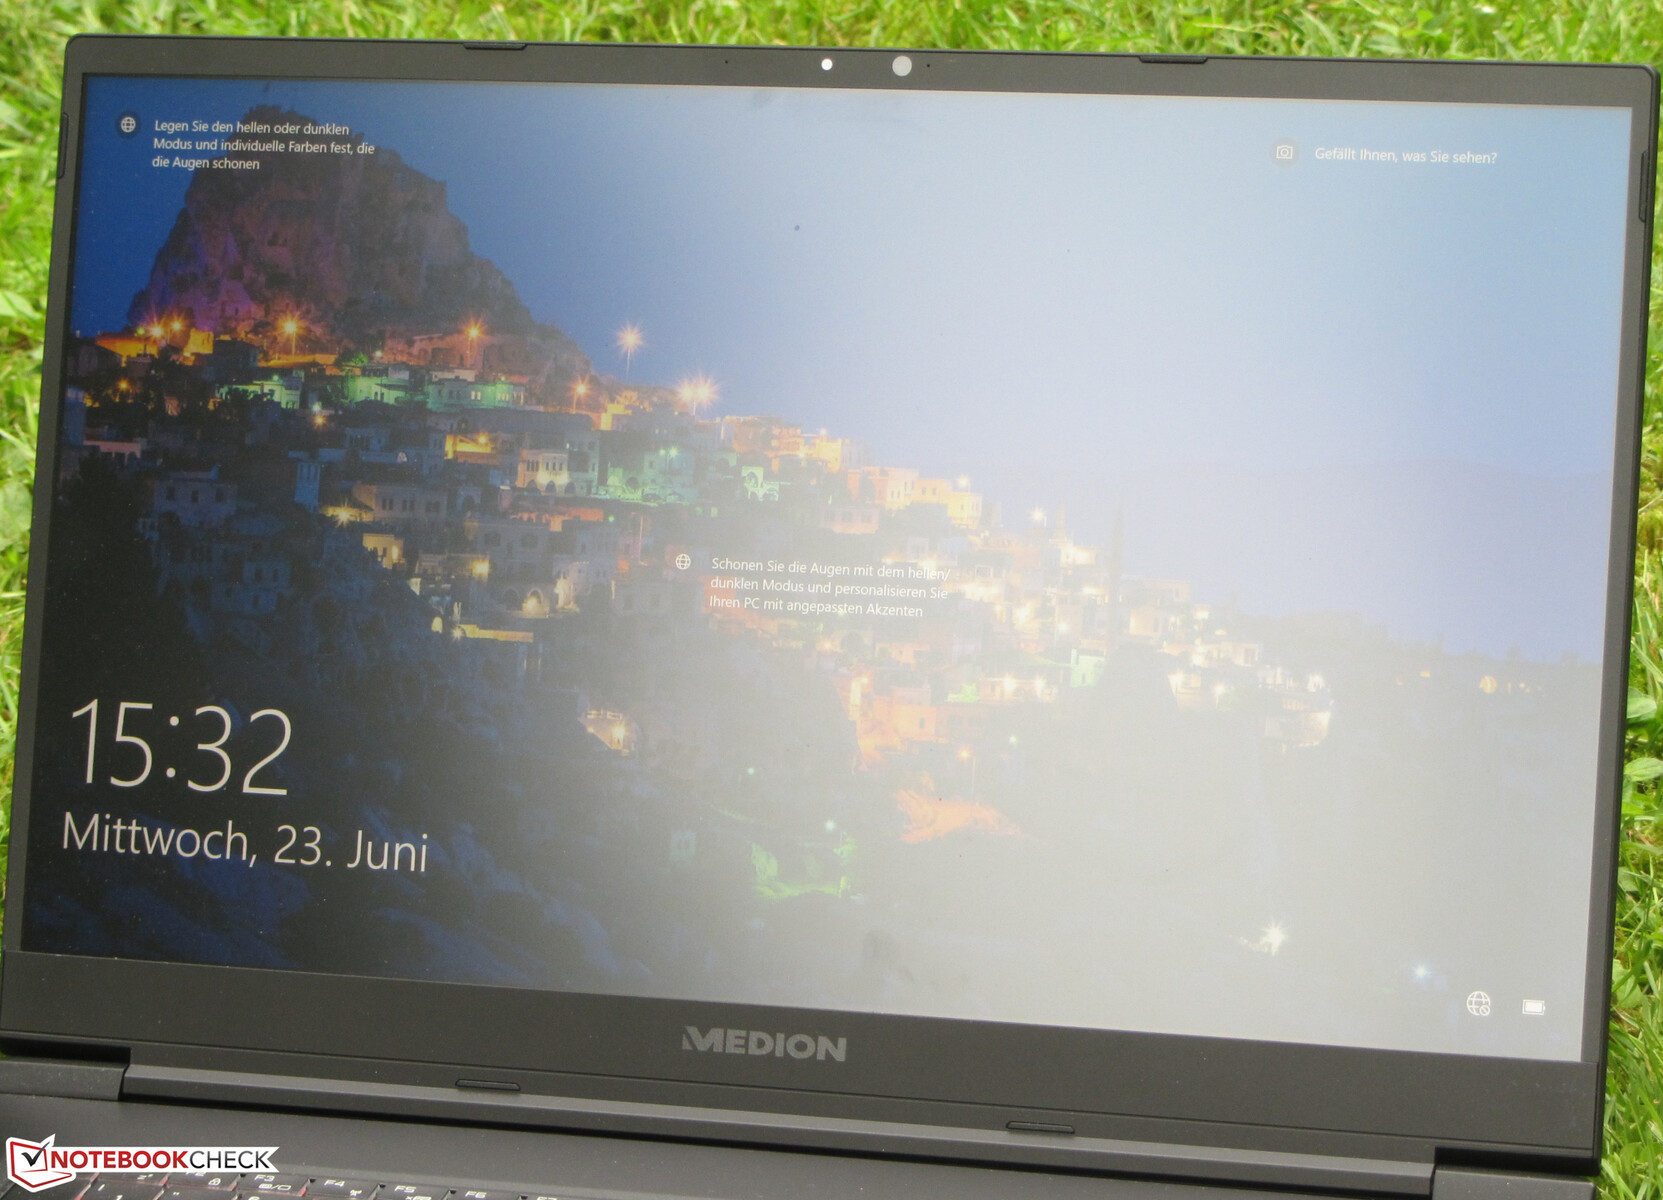
Case - The X20 comes with a metal chassis
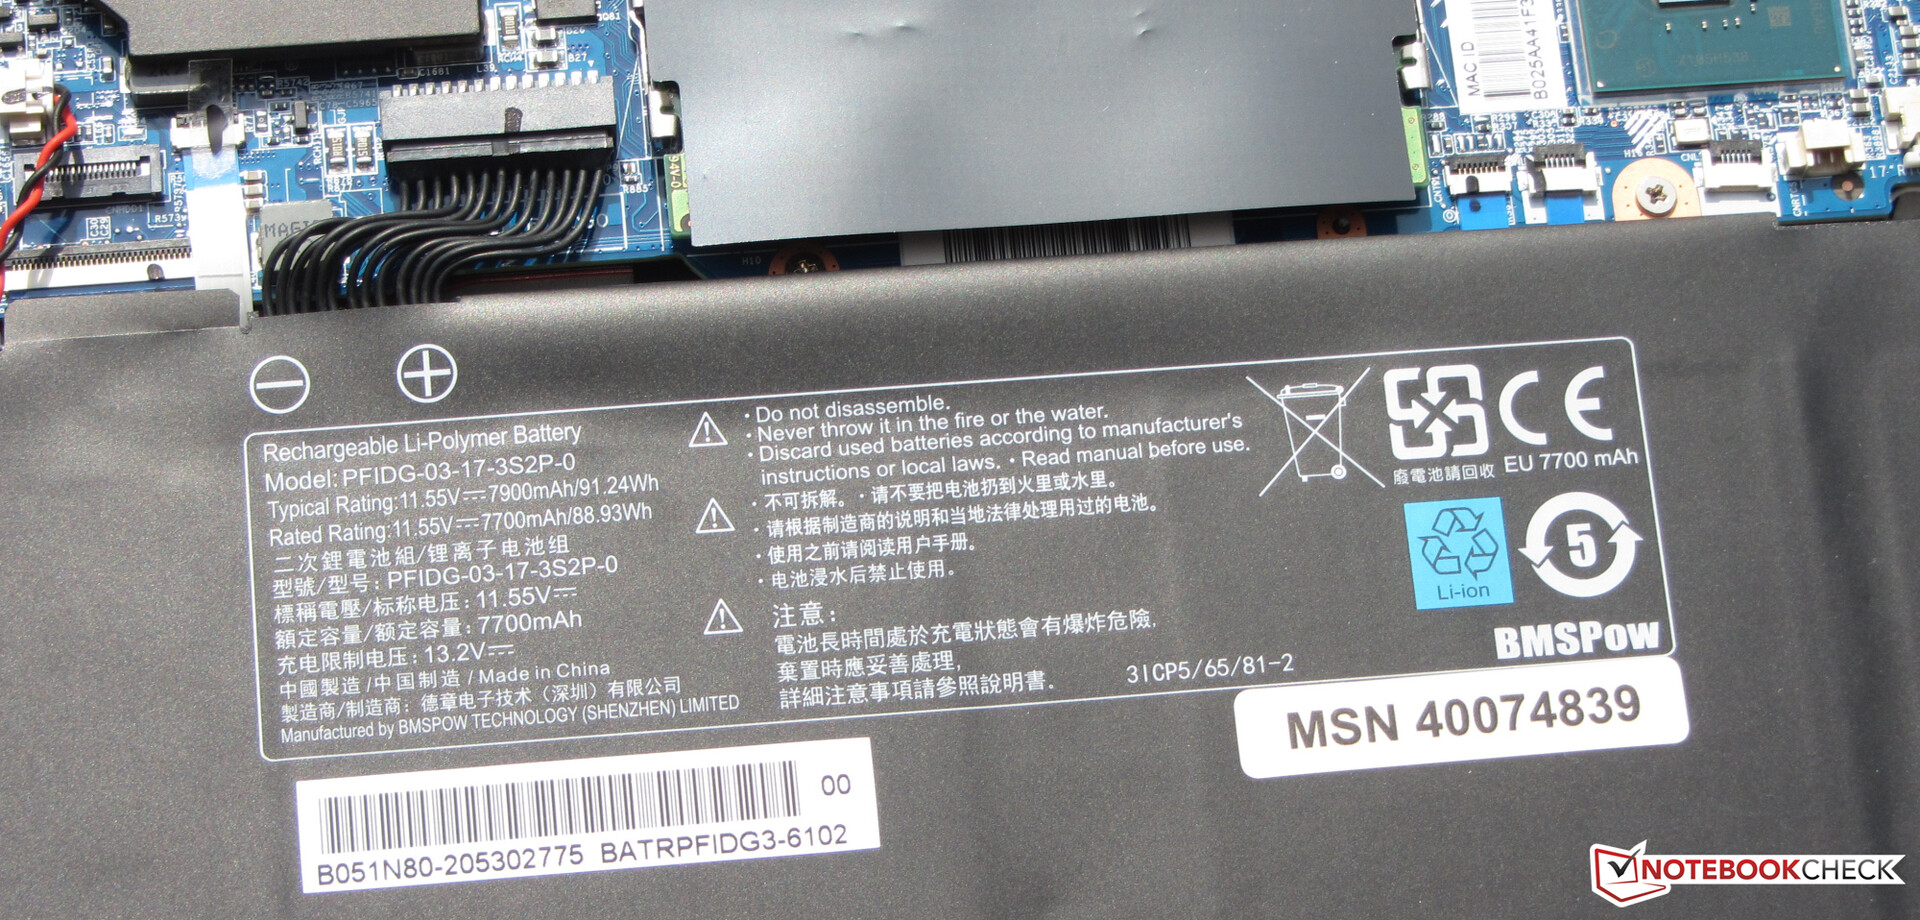
Medion relies on the chic, matte-black metal case for the X20, which we already know from the X10. There is only a small difference between the chassis: The webcam is located below the display in the X10, and above the display in the X20. Both chassis have a slim display bezel. The innards can be accessed after removing the bottom shell. The battery is permanently installed.
The notebook is well manufactured. The gaps are correct and there are no material protrusions. Stability and rigidity are pleasing: The base unit cannot be twisted, the lid to a small extent. However, the latter is completely within limits. Pressure on the lid's back doesn't lead to image changes. The hinges keep the lid firmly in position. The maximum opening angle is around 130 degrees. Opening the lid with one hand is possible.
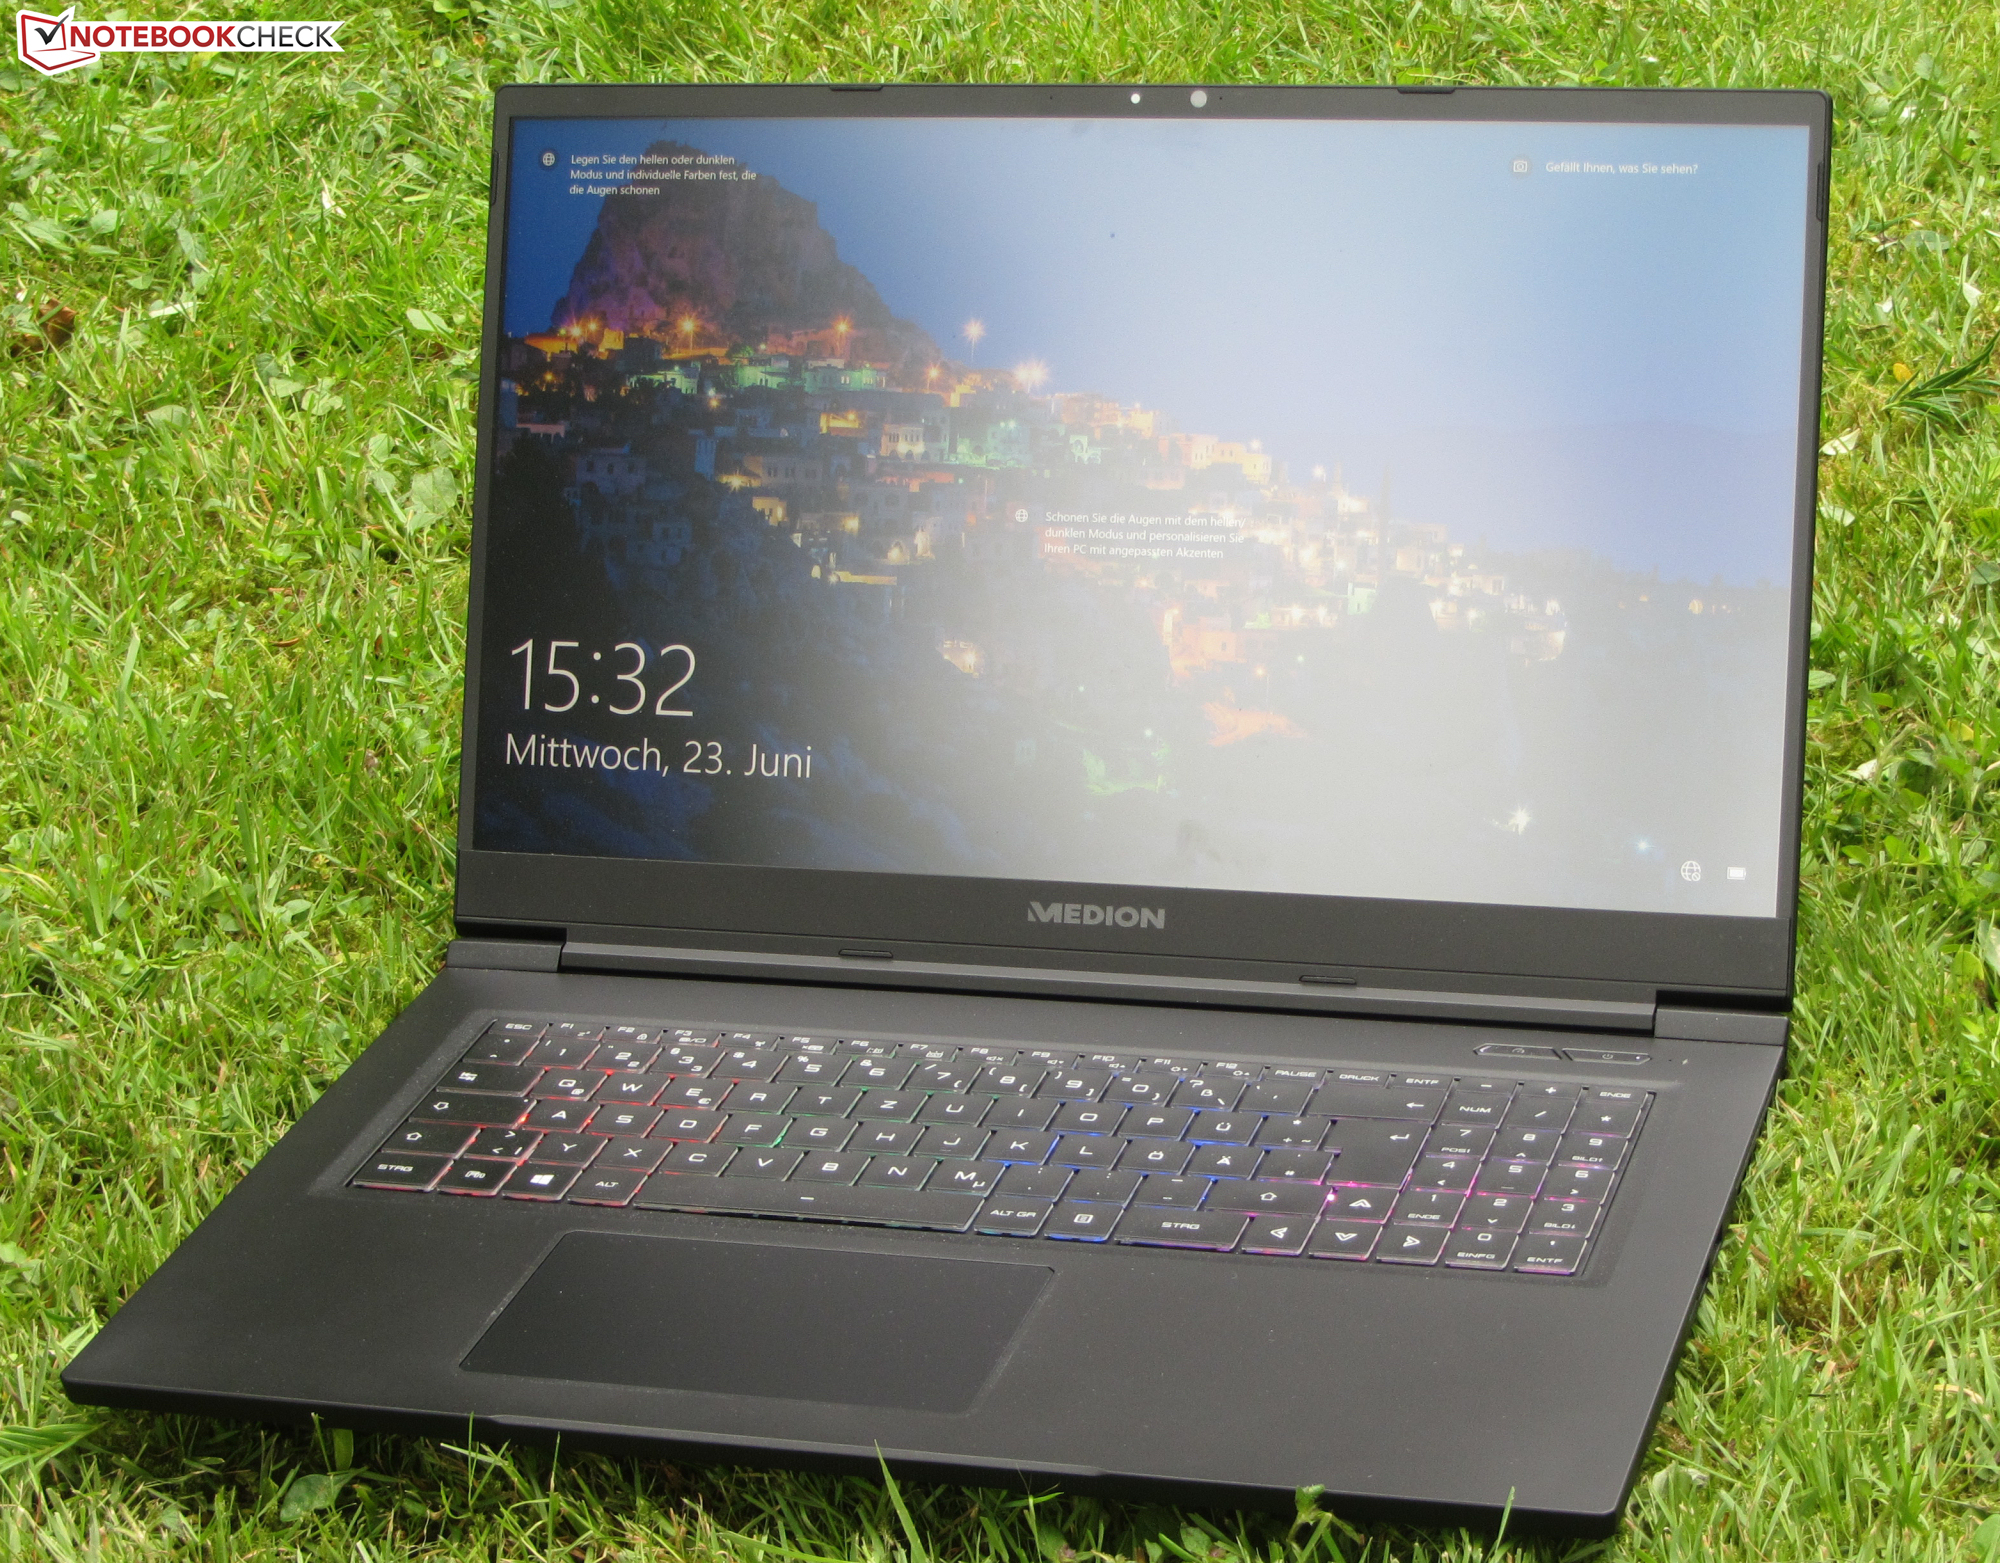
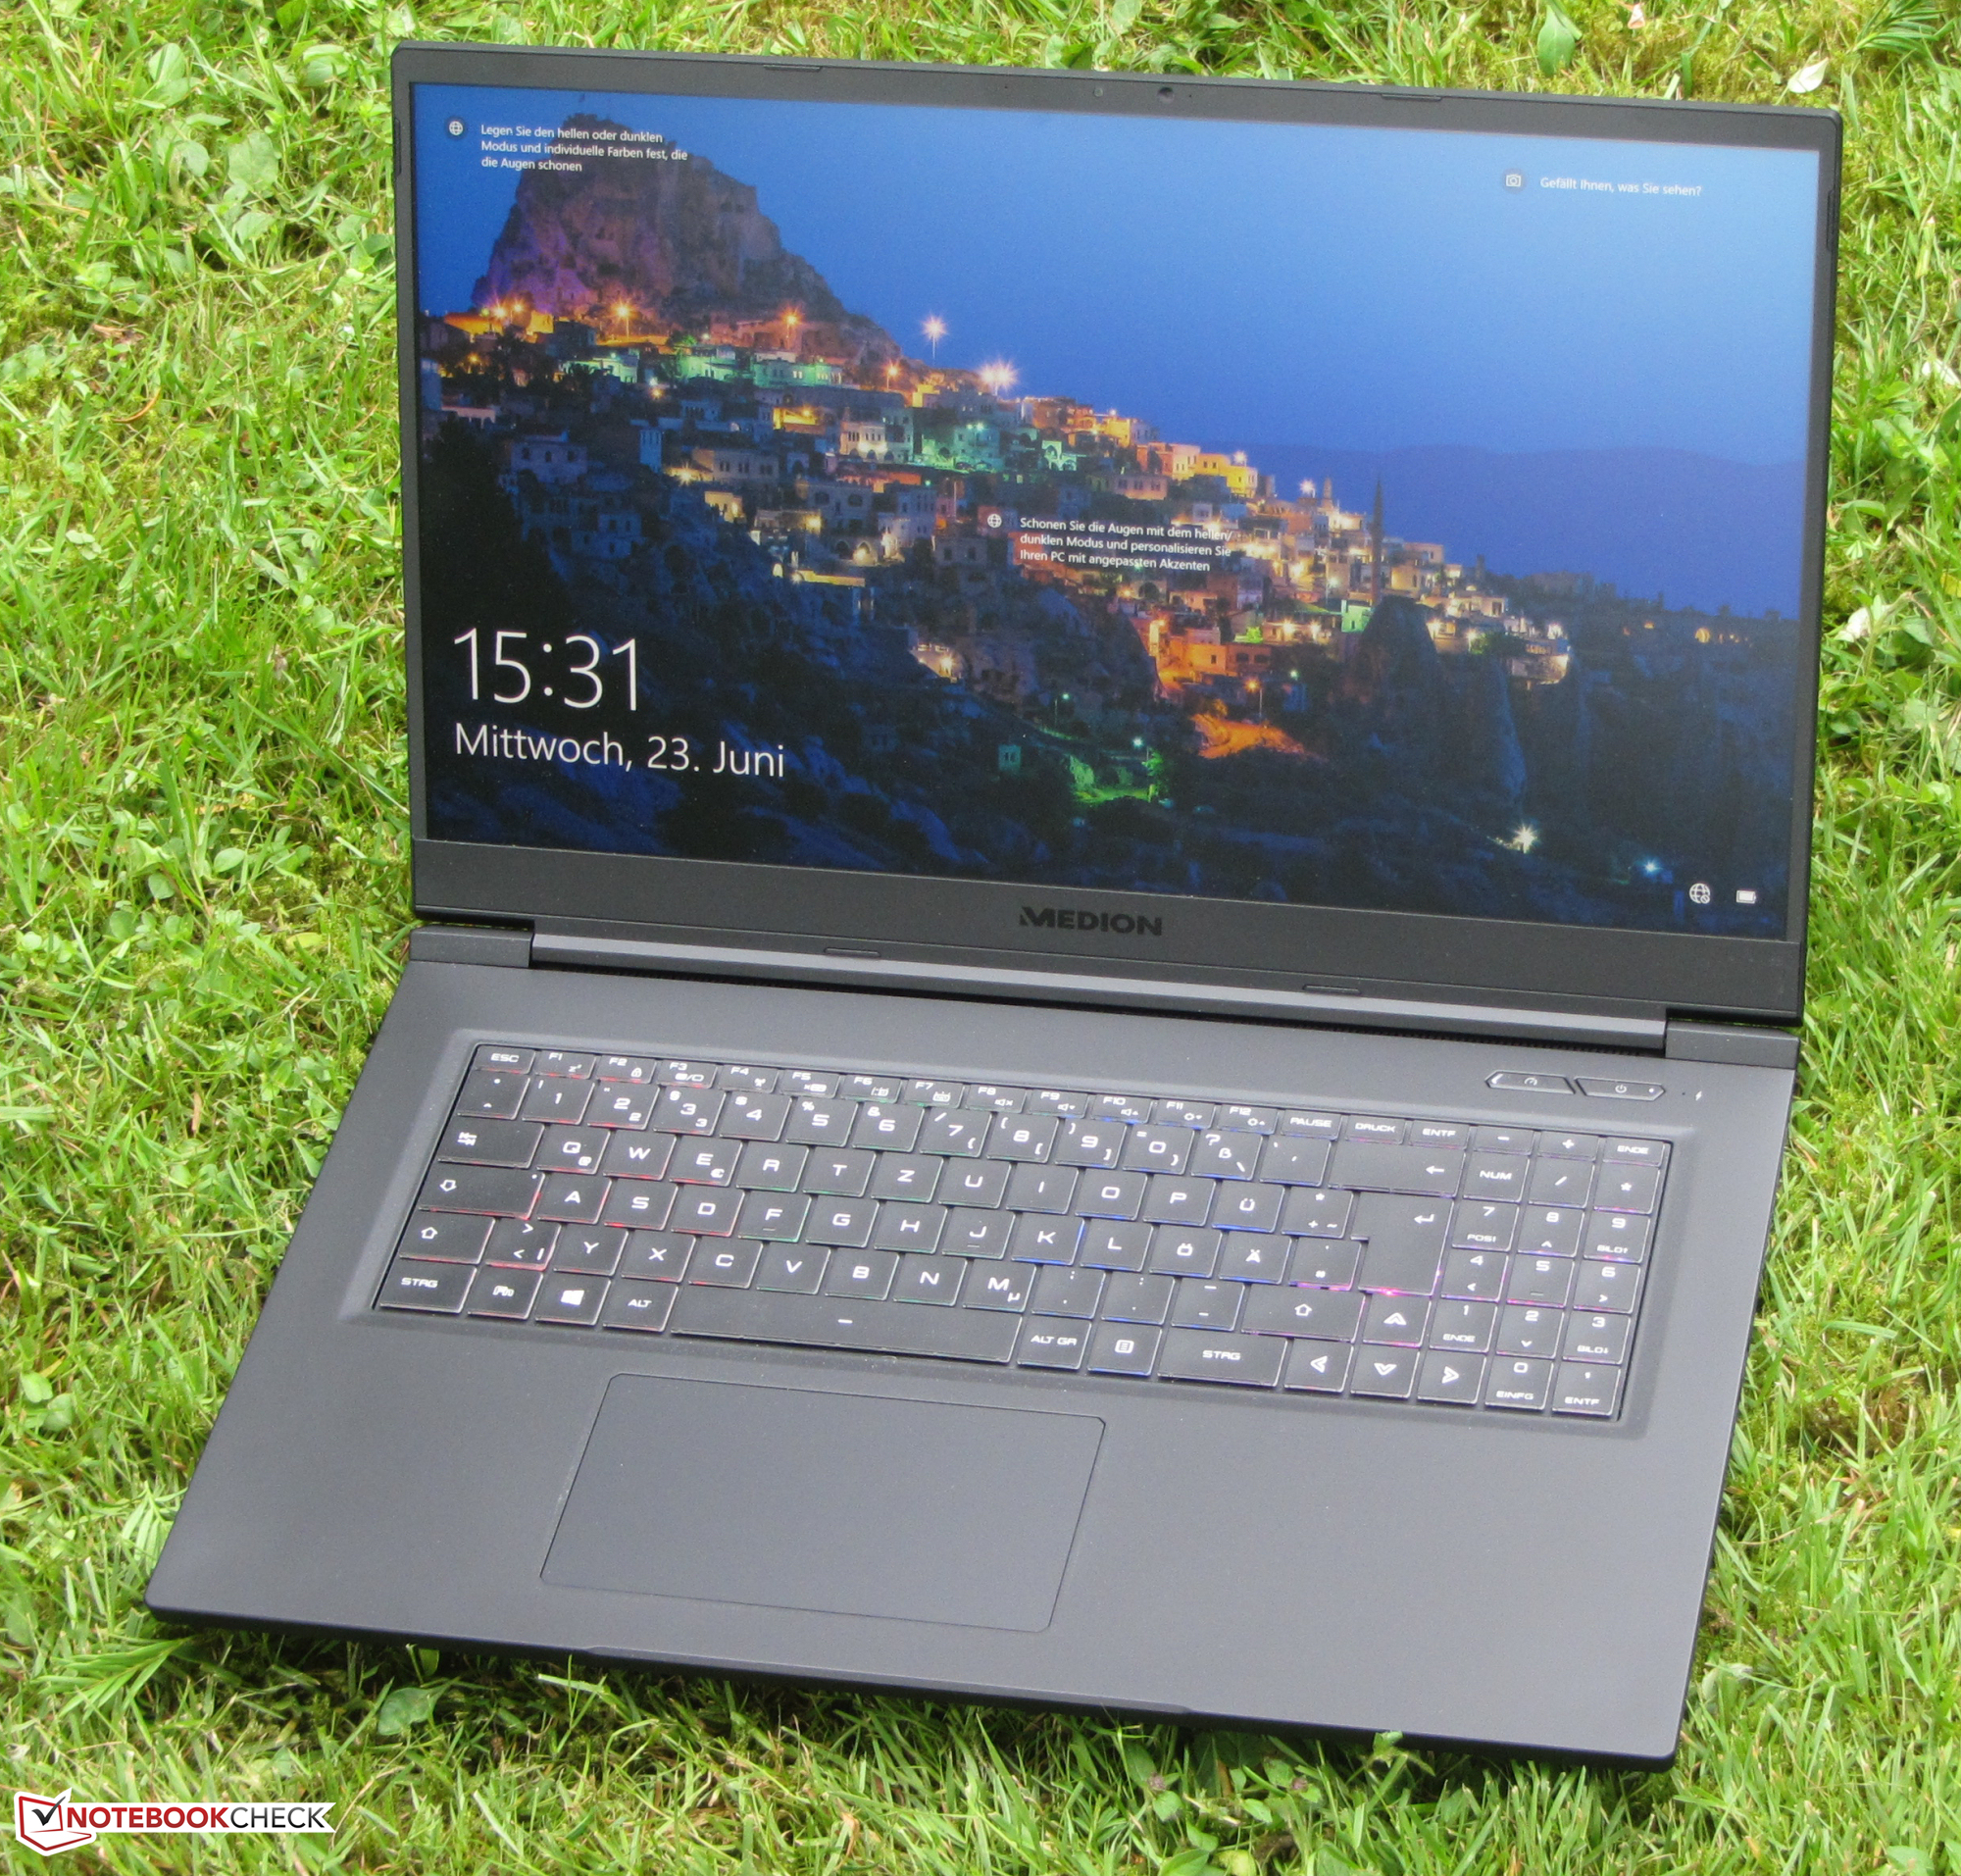
Within our comparison field, the Erazer represents the most compact and lightest device.
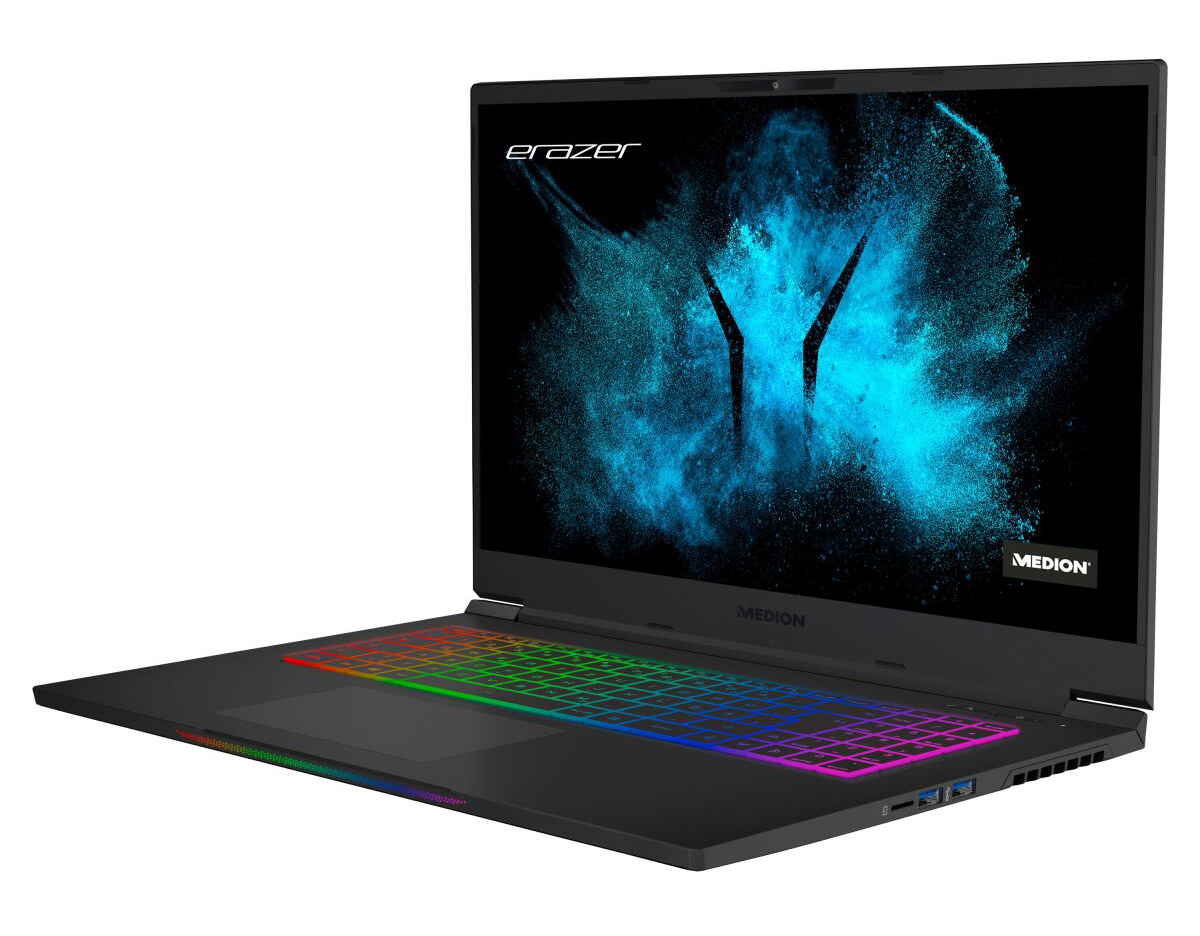
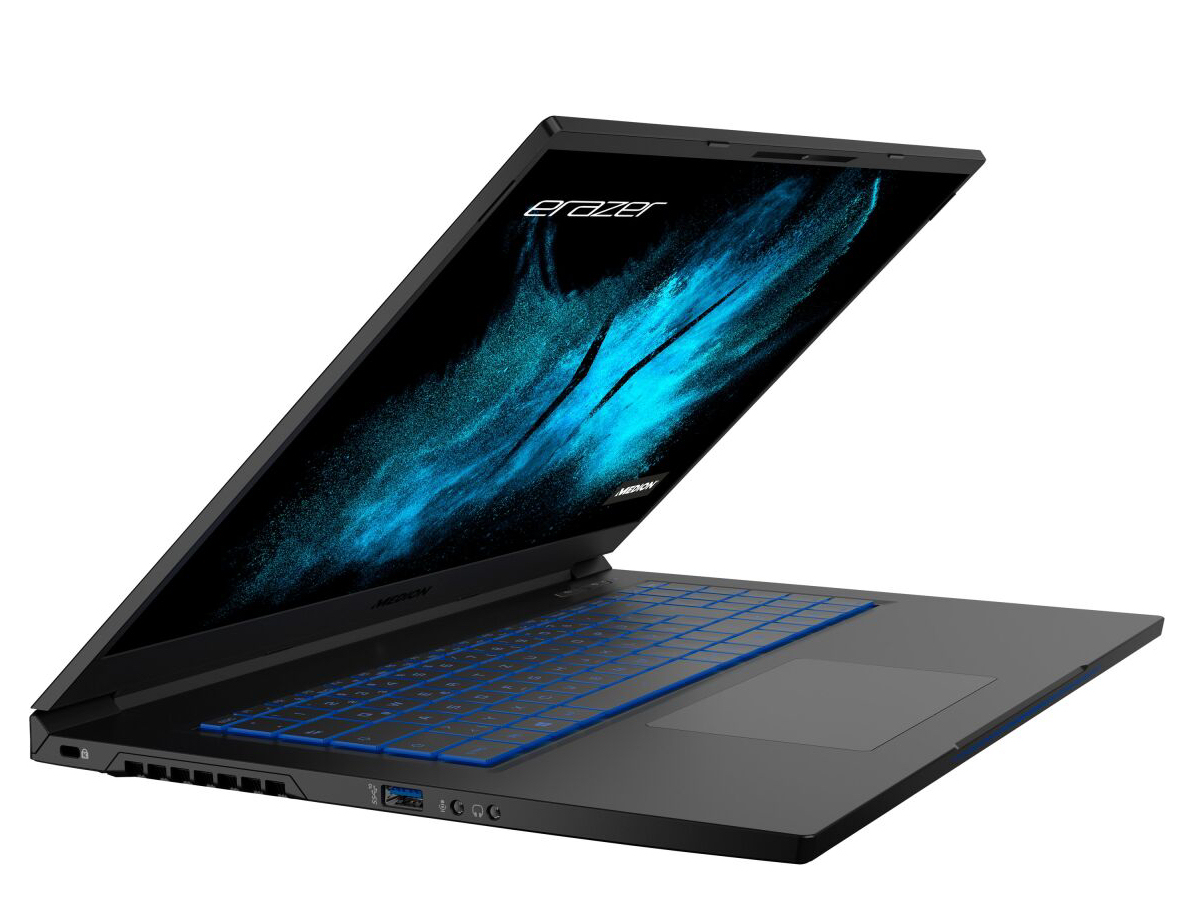
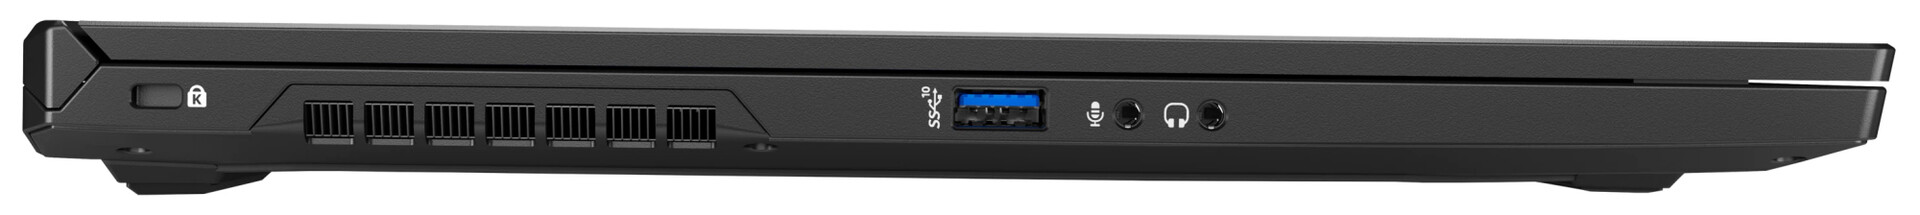
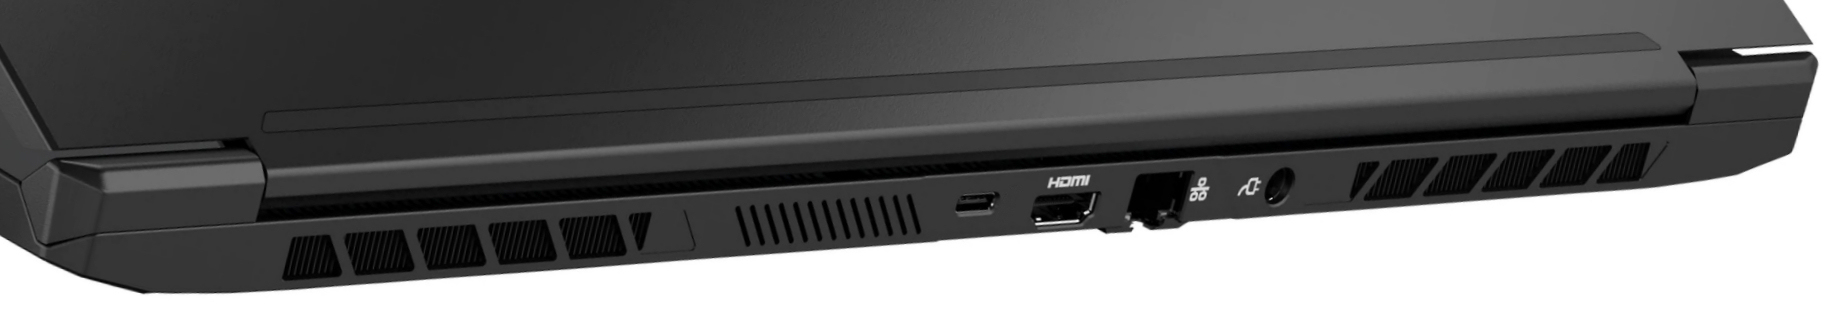
Features - The Erazer Beast does not have Thunderbolt
While the USB-C slot of the Erazer Beast X10 supports Thunderbolt 3, the corresponding slot of the X20 "only" works with the USB 3.2 Gen 2 standard. The latter offers DisplayPort via USB-C. Thus, the laptop has two video outputs together with the HDMI 2.1 slot, three USB-A ports (2x USB 3.1 Gen 1, 1x USB 3.2 Gen 2), two audio jacks (headphone output, microphone input), a Gigabit Ethernet slot, and an opening for a cable lock.
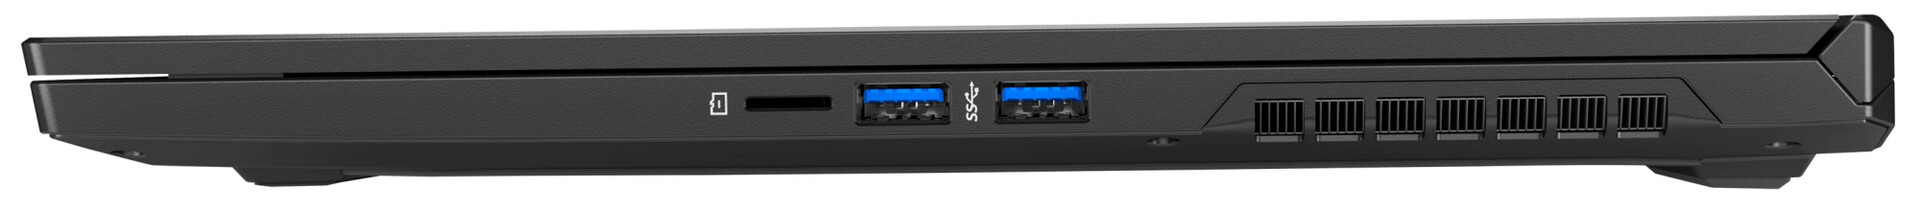
SDCardreader
The microSD memory card reader (reference card: AV PRO microSD 128 GB V60) belongs to the medium-fast models with maximum transfer rates of 64 MB/s (transfer of 250 jpg image files with around 5 MB each) and 77 MB/s (copying large data blocks).
| SD Card Reader | |
| average JPG Copy Test (av. of 3 runs) | |
| Aorus 17G YD (AV PRO microSD 128 GB V60) | |
| Average of class Gaming (20.9 - 210, n=54, last 2 years) | |
| Schenker XMG Neo 17 (Early 2021, RTX 3070, 5800H) (Toshiba Exceria Pro SDXC 64 GB UHS-II) | |
| Medion Erazer Beast X20 (AV PRO microSD 128 GB V60) | |
| maximum AS SSD Seq Read Test (1GB) | |
| Aorus 17G YD (AV PRO microSD 128 GB V60) | |
| Average of class Gaming (25.5 - 261, n=51, last 2 years) | |
| Schenker XMG Neo 17 (Early 2021, RTX 3070, 5800H) (Toshiba Exceria Pro SDXC 64 GB UHS-II) | |
| Medion Erazer Beast X20 (AV PRO microSD 128 GB V60) | |
Communication
The WLAN chip (Intel AX201) supports the 802.11 a/b/g/n/ac/ax standards and offers Bluetooth 5 functionality. The data rates determined under optimal conditions (no other WLAN devices in the near vicinity, short distance between notebook and server PC) turn out good to very good. Wired network connections are handled by a Gigabit Ethernet chip (RTL8125) from Realtek.
Webcam
The webcam (0.9 MP) produces pictures in a maximum resolution of 1,280 x 720 pixels. The color accuracy is a problem. With a color deviation of almost 16, the target (DeltaE less than 3) is missed very clearly.


 GeForce RTX 3070 Laptop GPU, R7 5800H, Samsung SSD 970 EVO Plus 500GB")
 GeForce RTX 3070 Laptop GPU, R7 5800H, Samsung SSD 970 EVO Plus 500GB")


Accessories
The notebook comes with the usual documents: a quick start guide and warranty information.
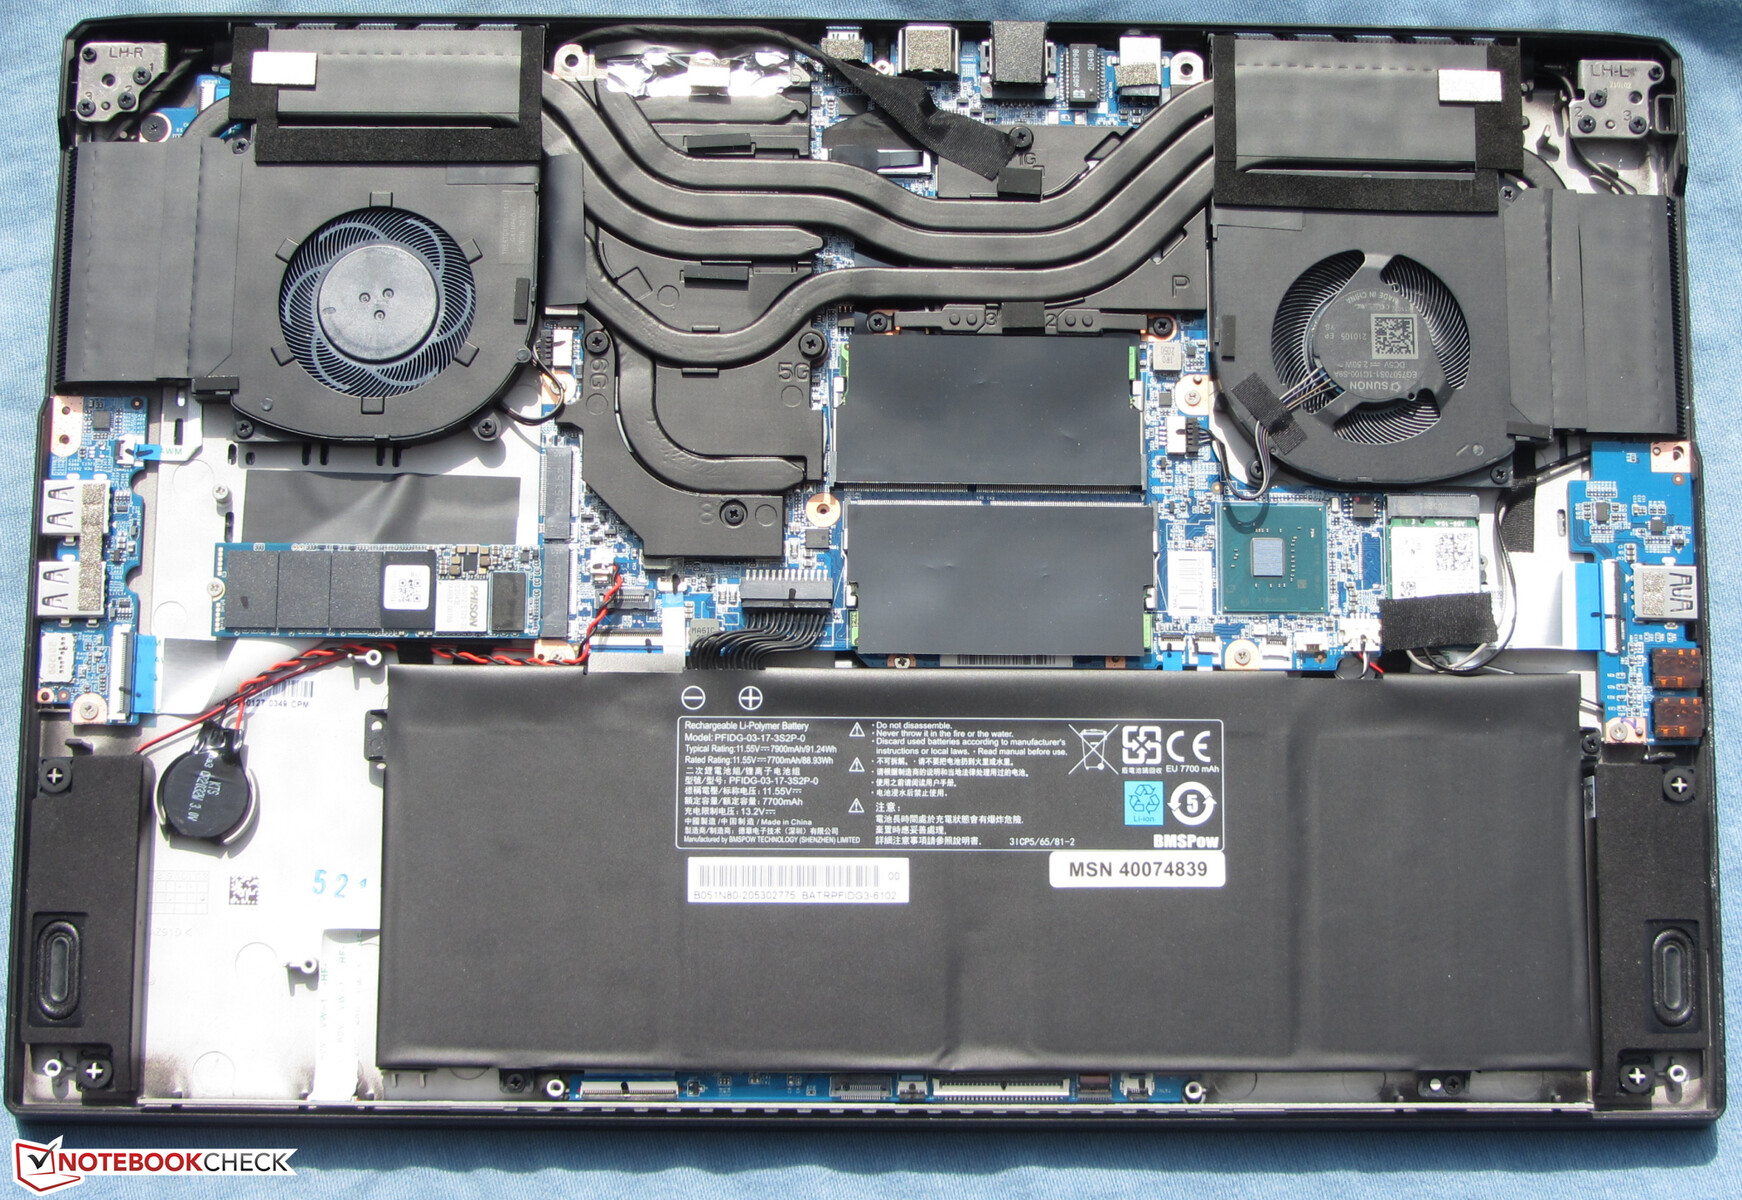
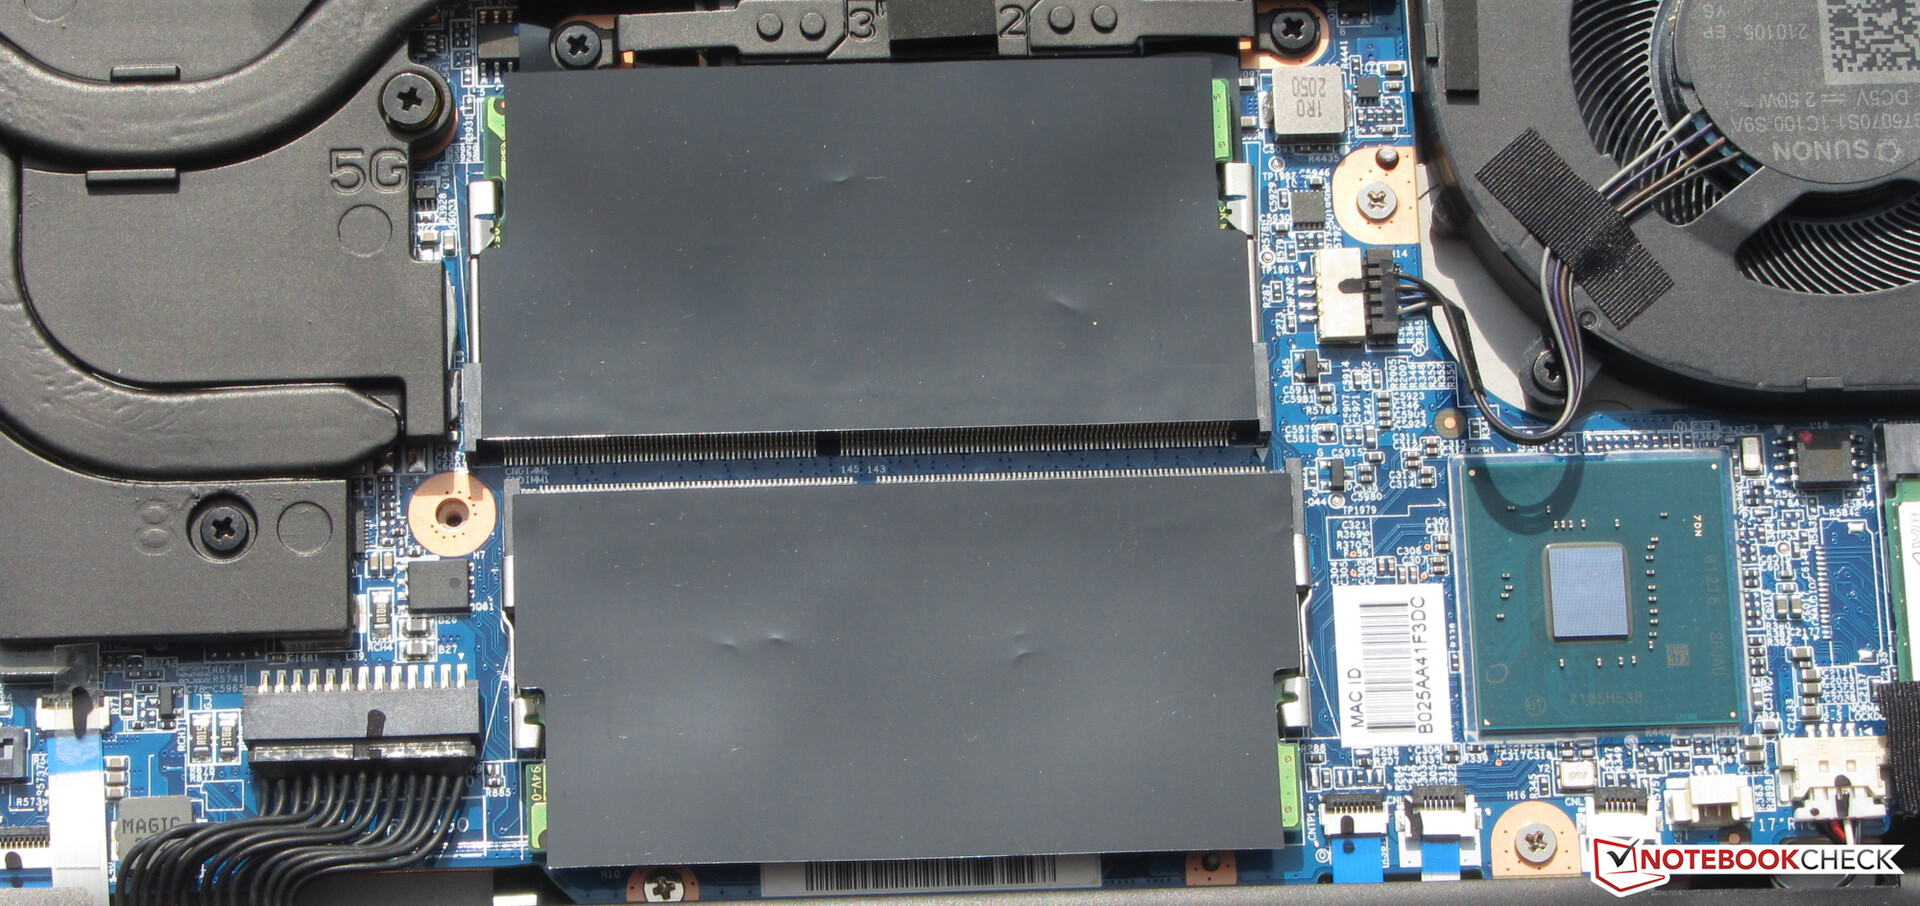
Maintenance
After removing all screws on the bottom of the device, the bottom tray of our test device can be removed quite easily. You might need a joint smoother or a thin spatula to remove the bottom shell in other models. After that, there is access to the working memory banks (both occupied), the two M.2-2280 slots (one occupied), the WLAN module, the fans, the BIOS battery and the battery.
Warranty
Medion grants the Erazer a two-year warranty. Warranty extensions are not available.
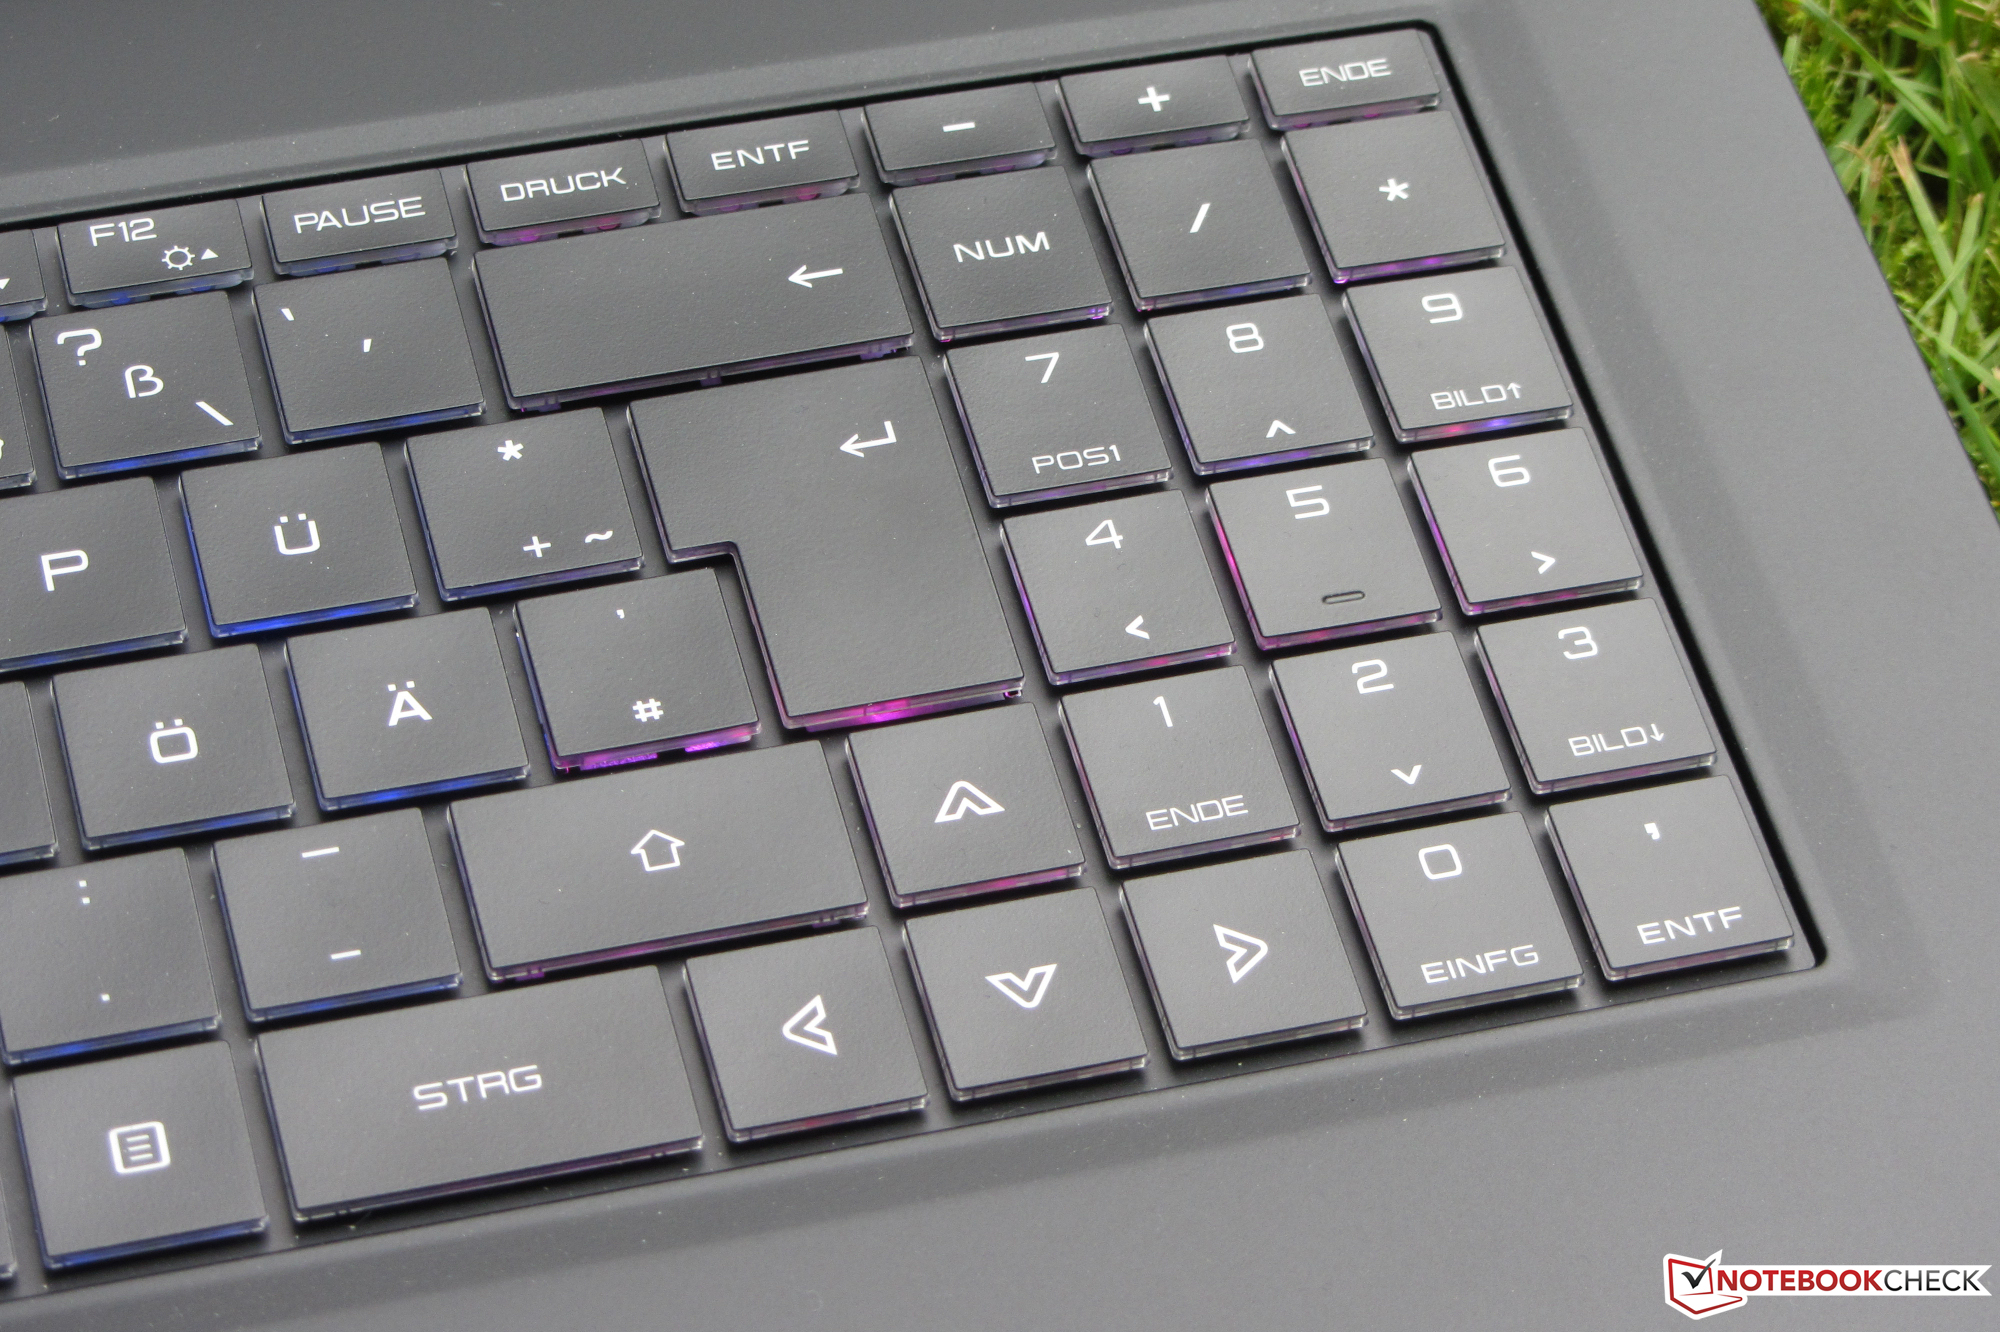
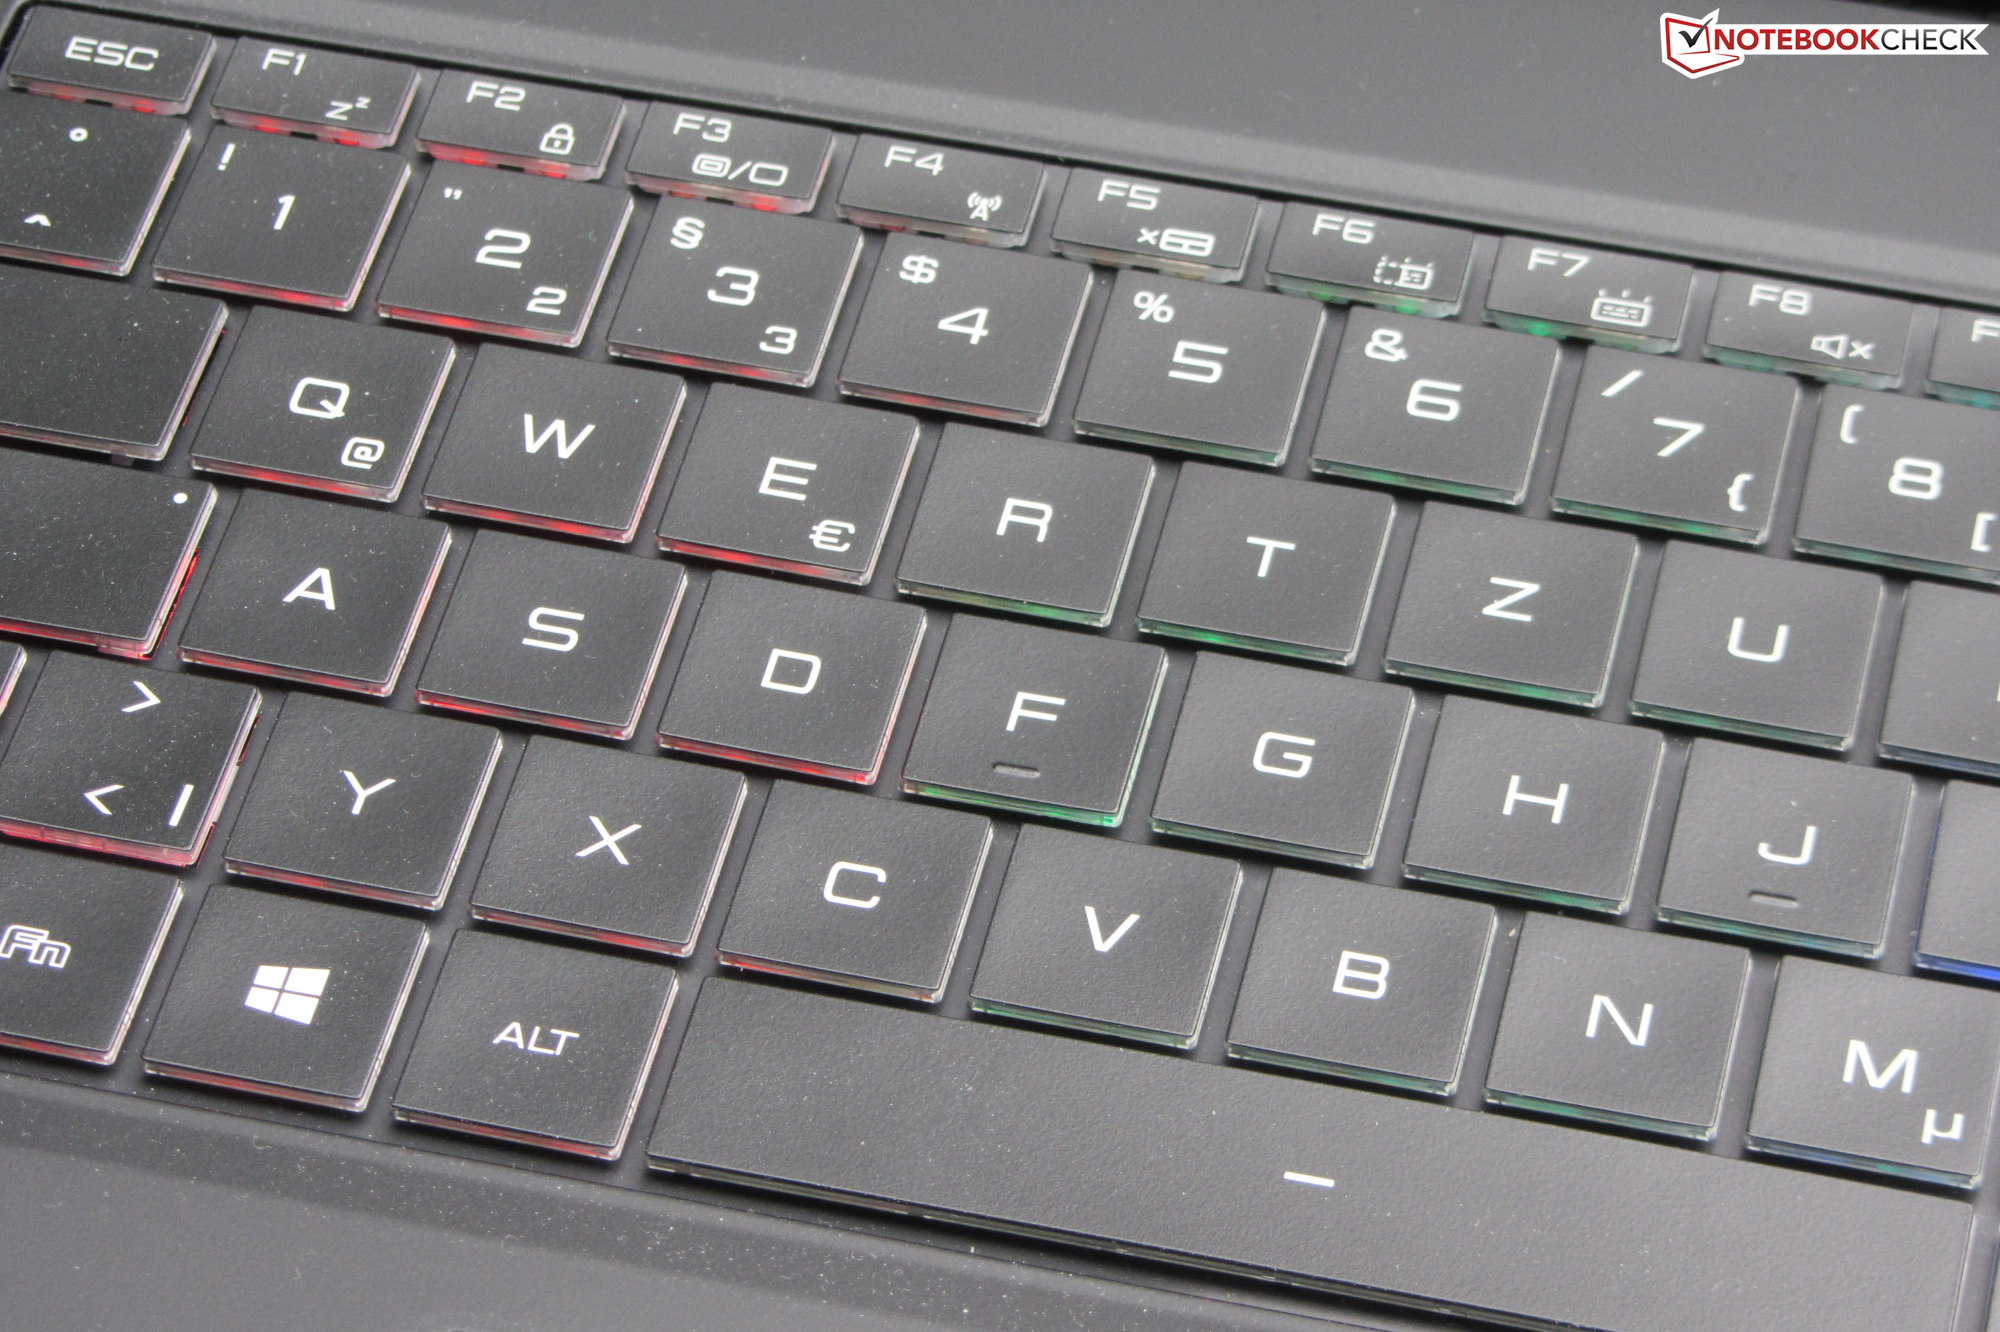
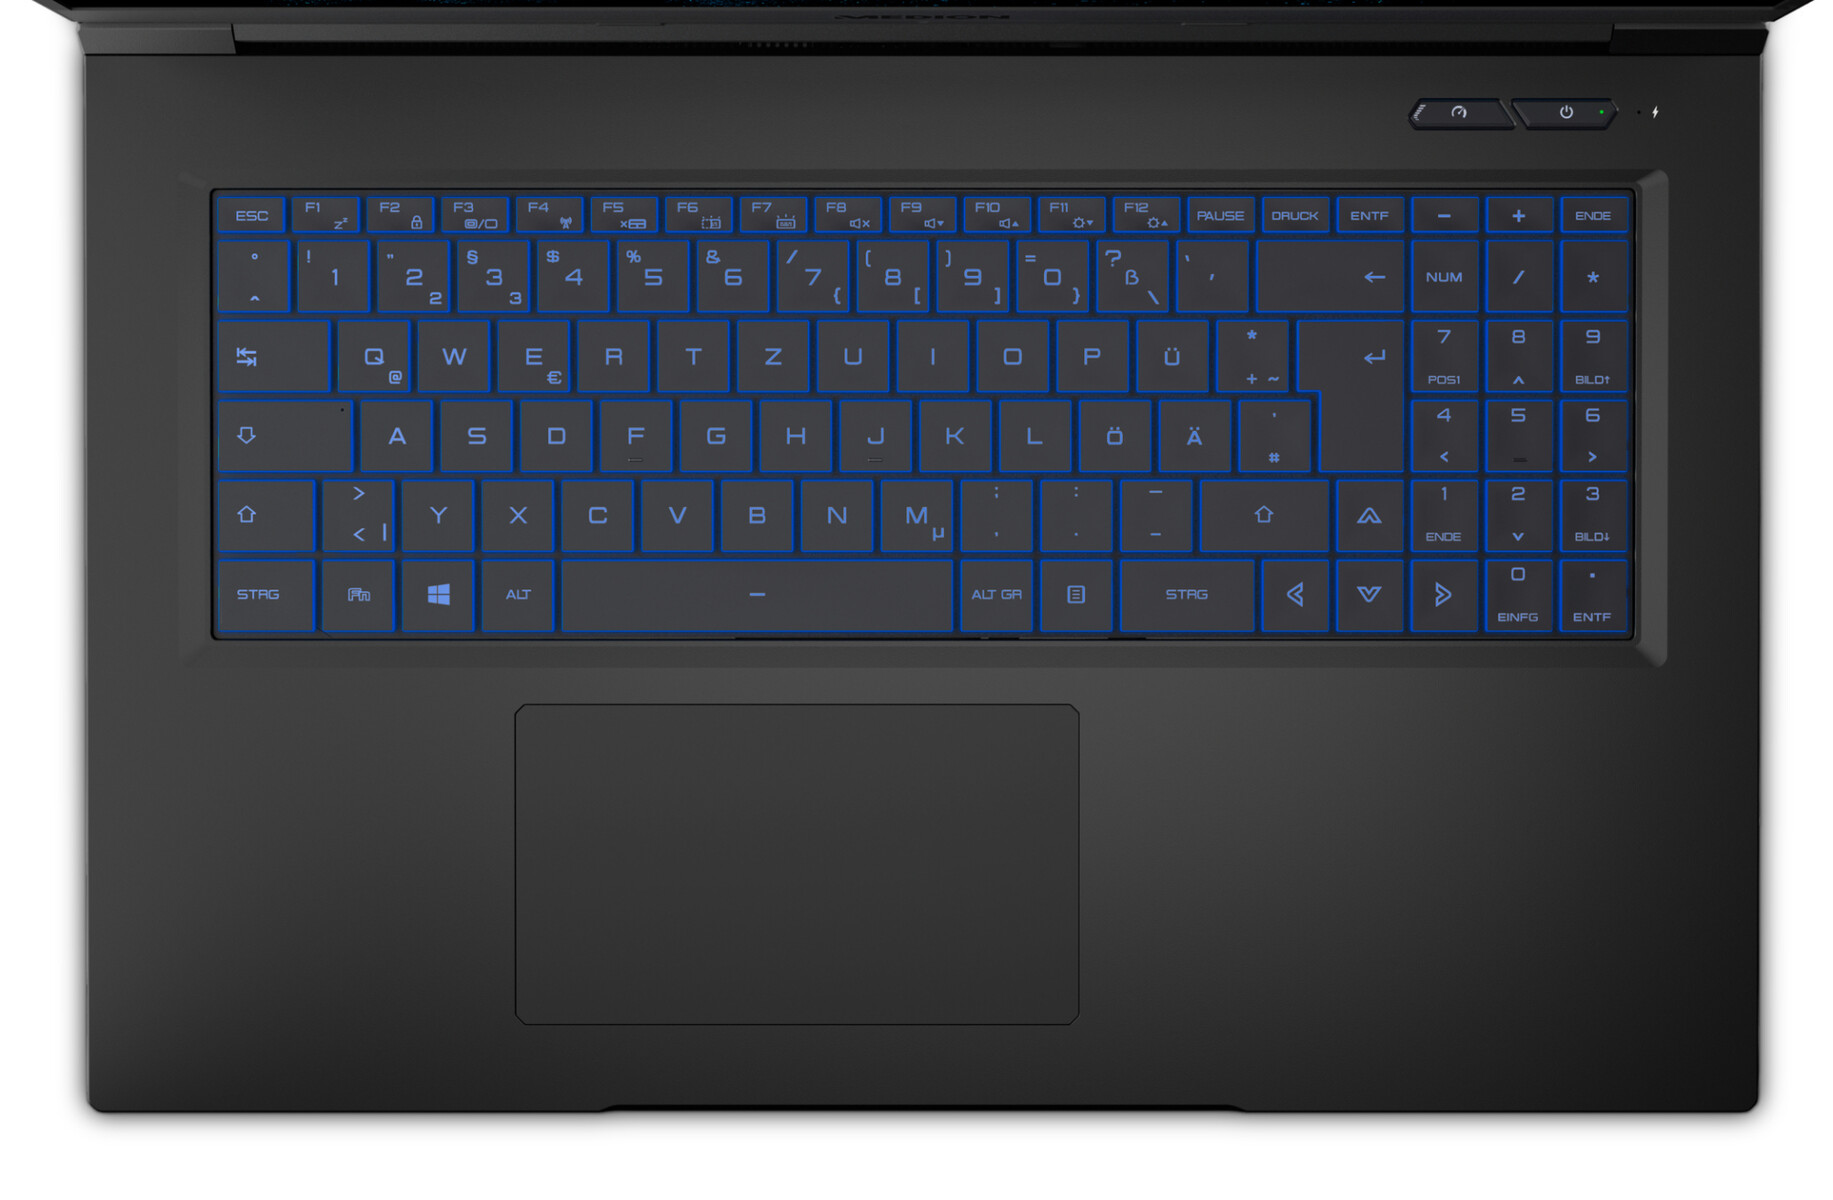
Input devices - Keyboard with RGB lighting
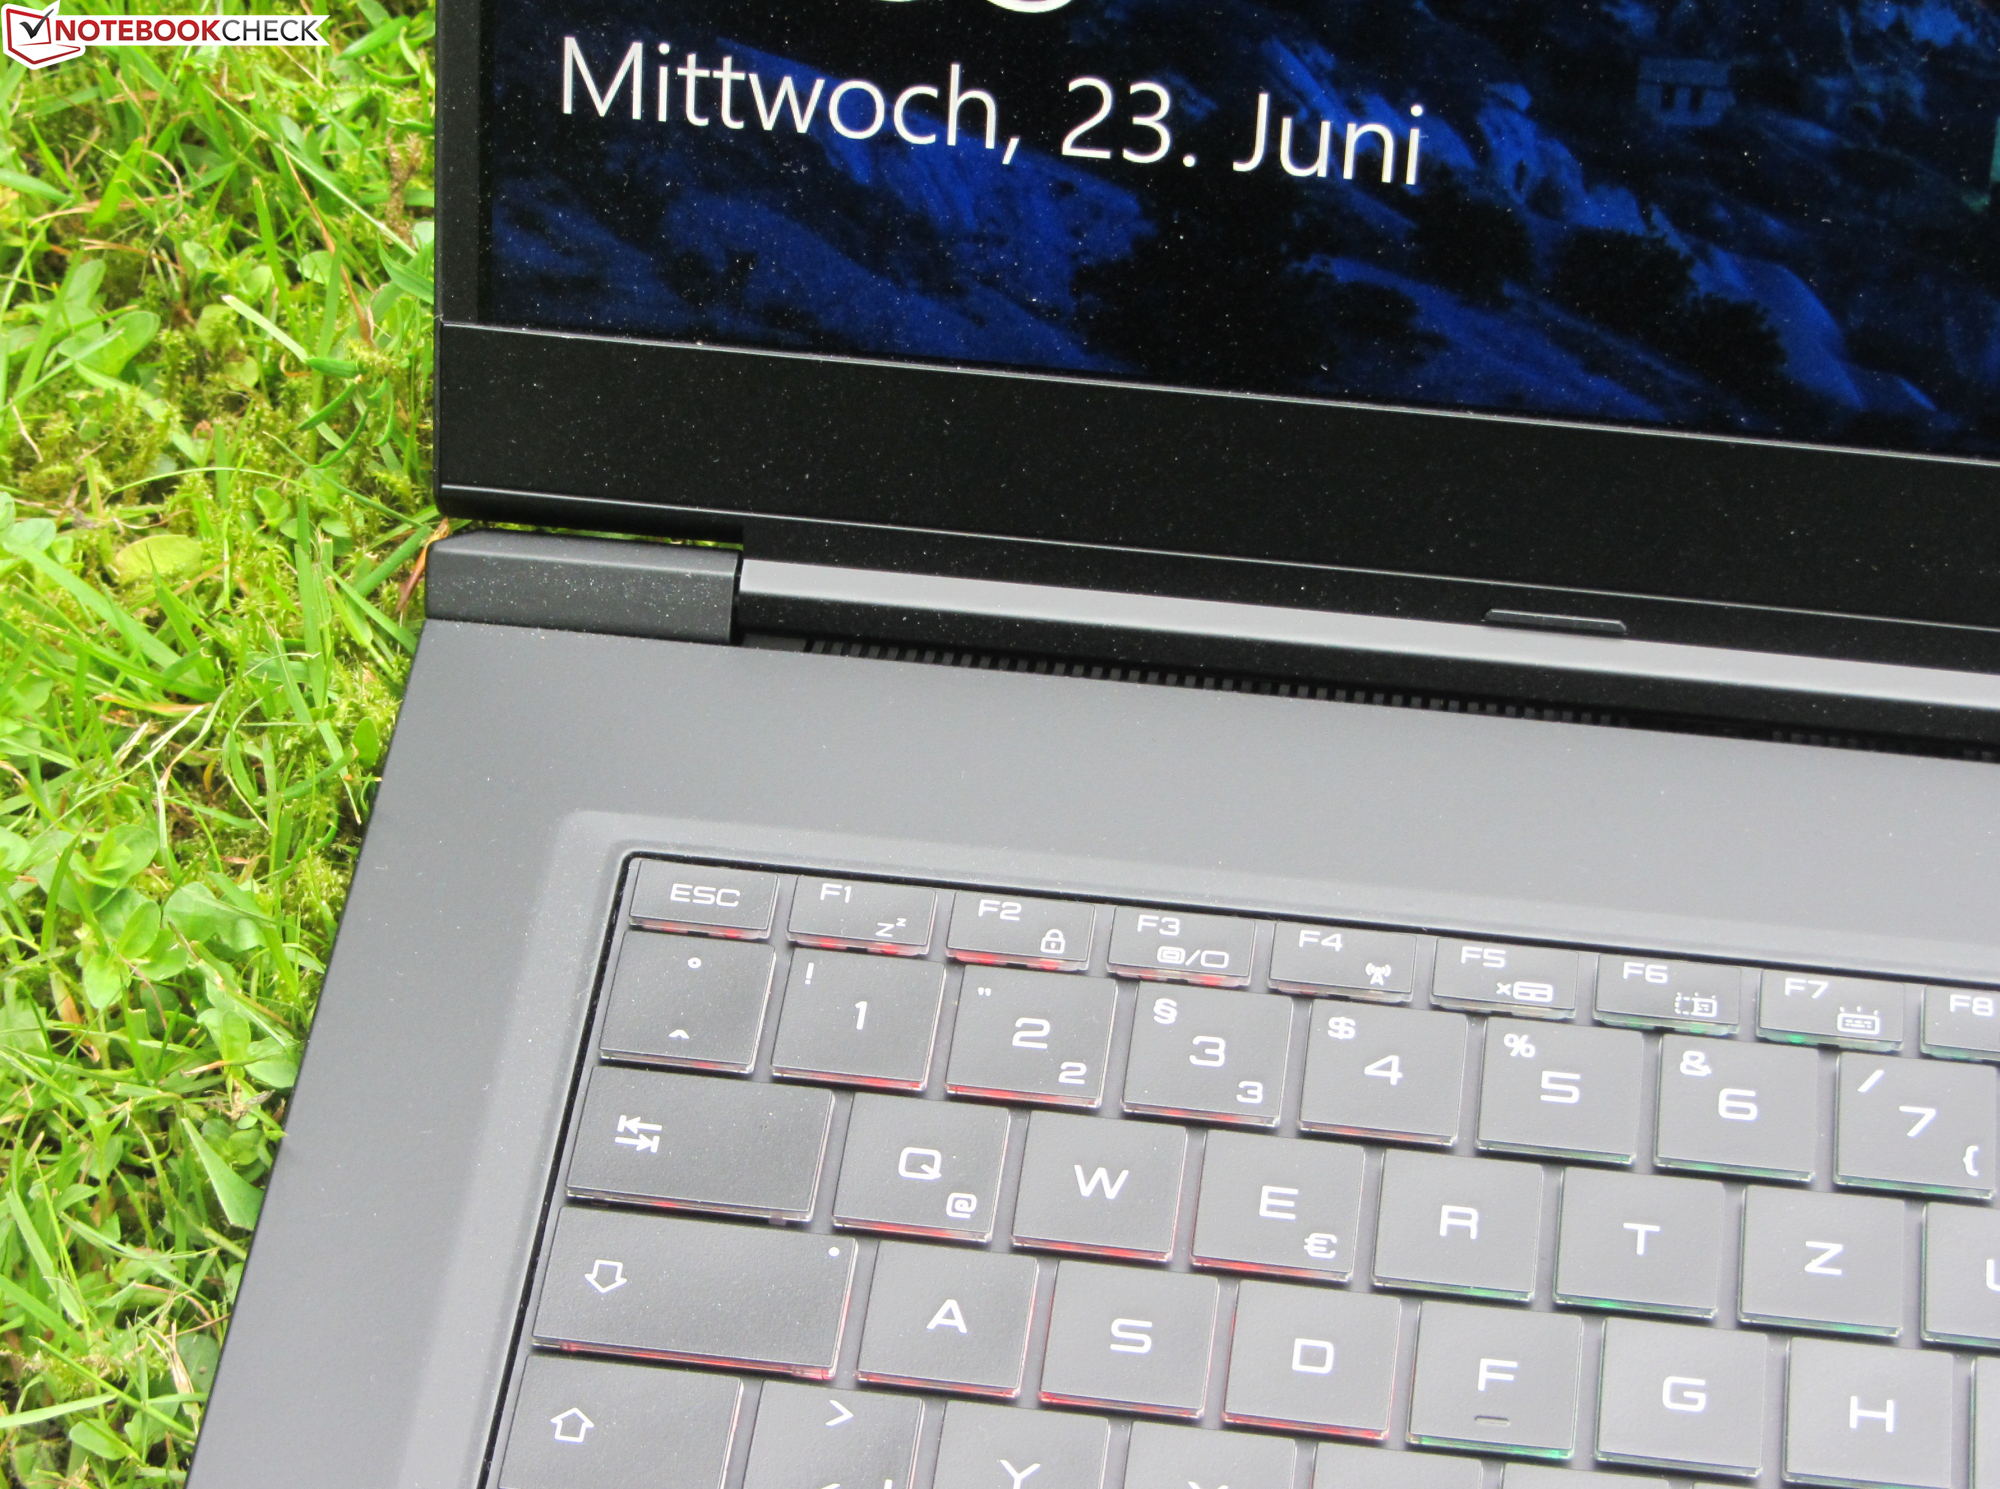
Keyboard
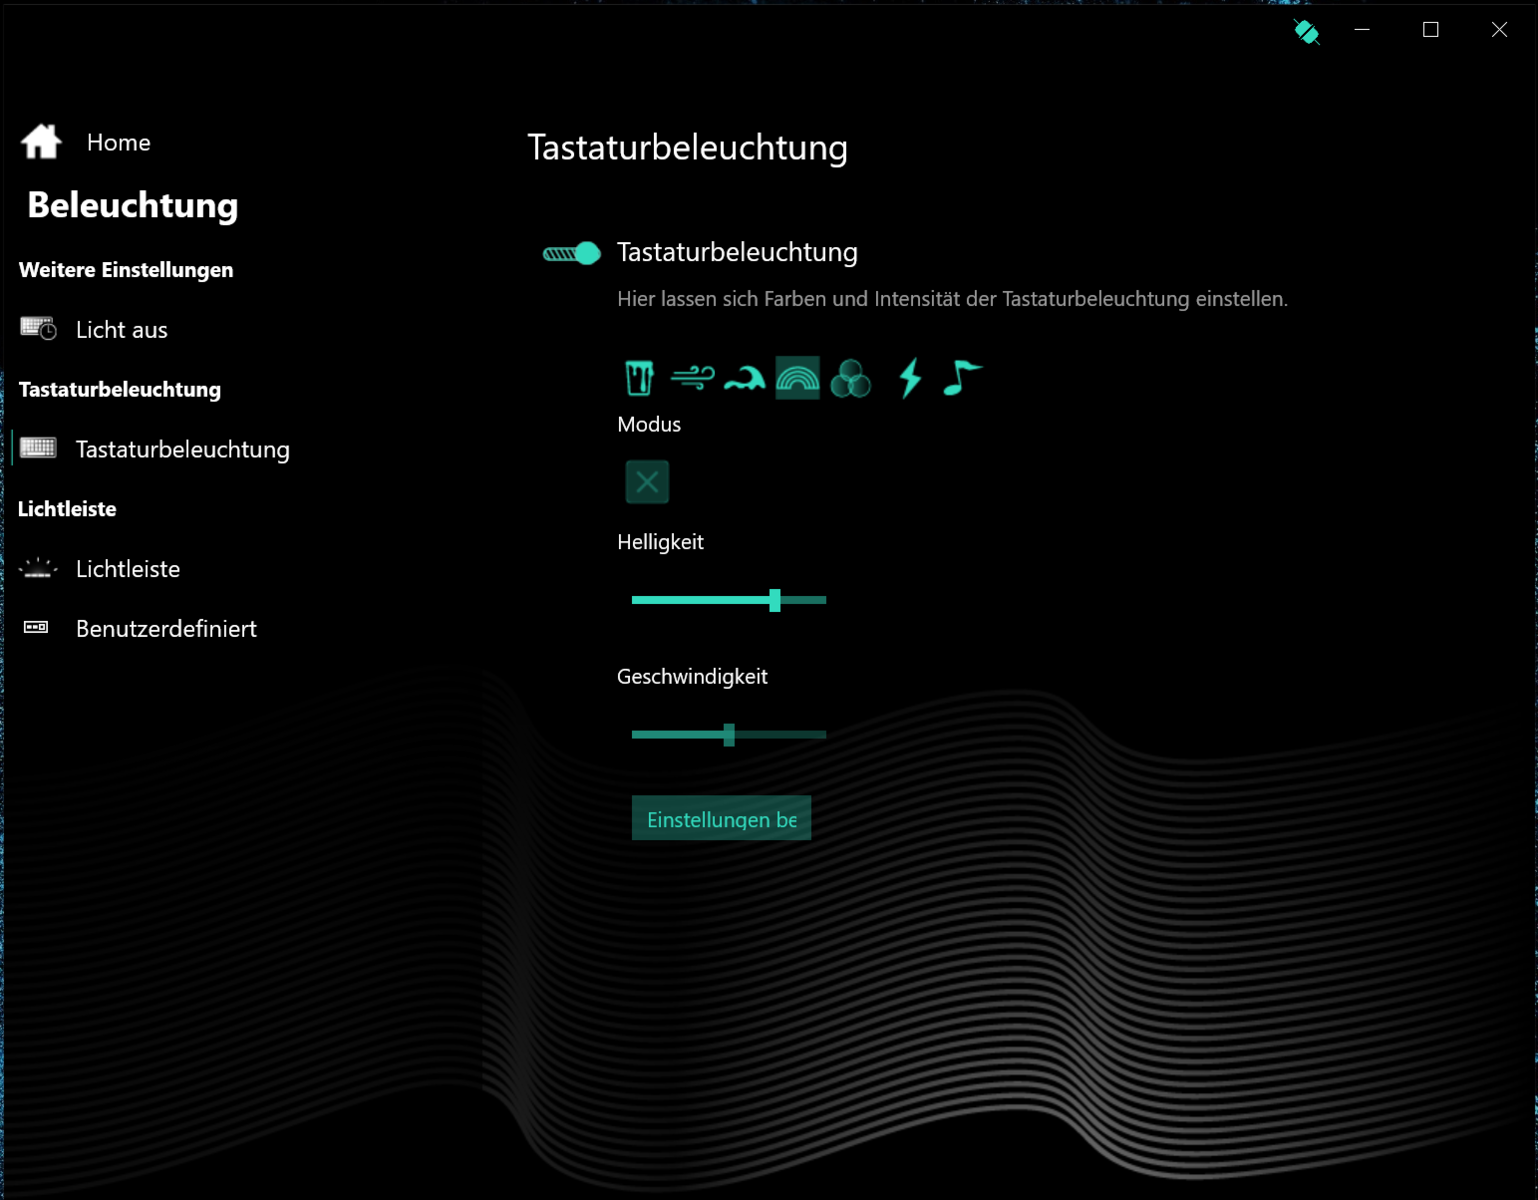
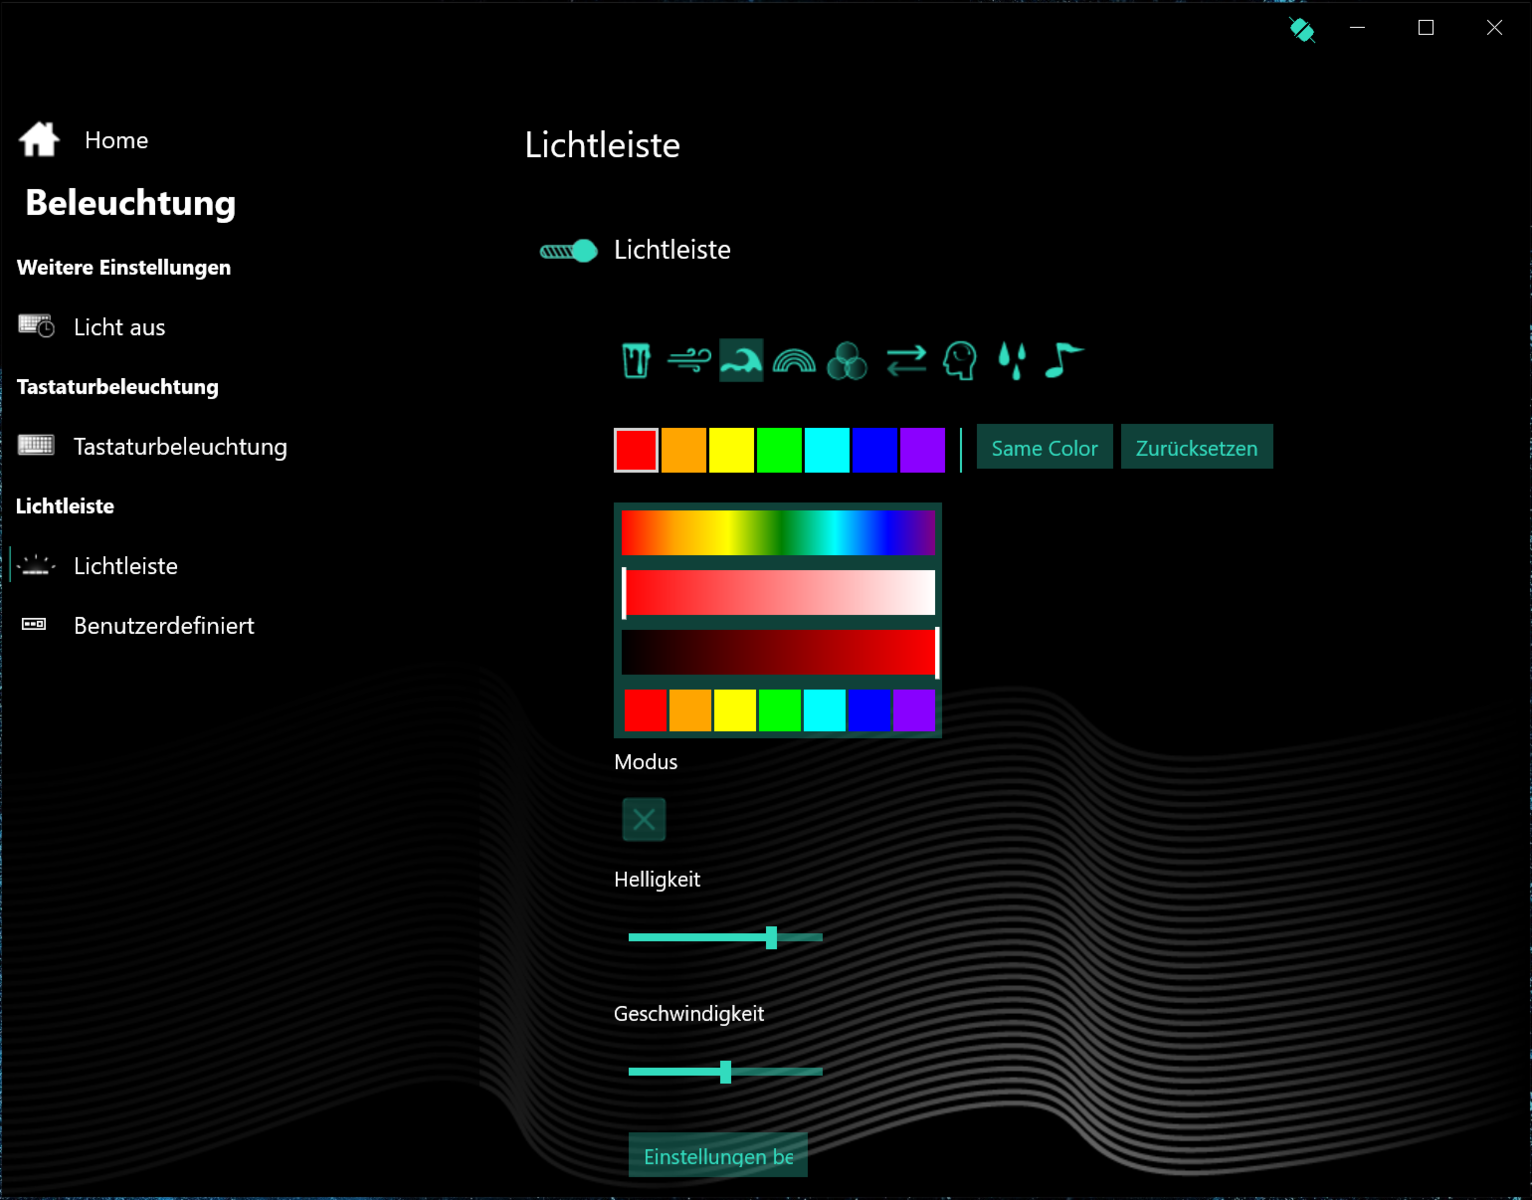
The concave keys of the illuminated chiclet keyboard offer a short stroke and a clear pressure point. The resistance could be a bit crisper for our taste. Good: The keyboard does not bounce during typing. The four-level key illumination (RGB) is controlled via two function keys. All in all, Medion delivers a keyboard that is suitable for everyday use.
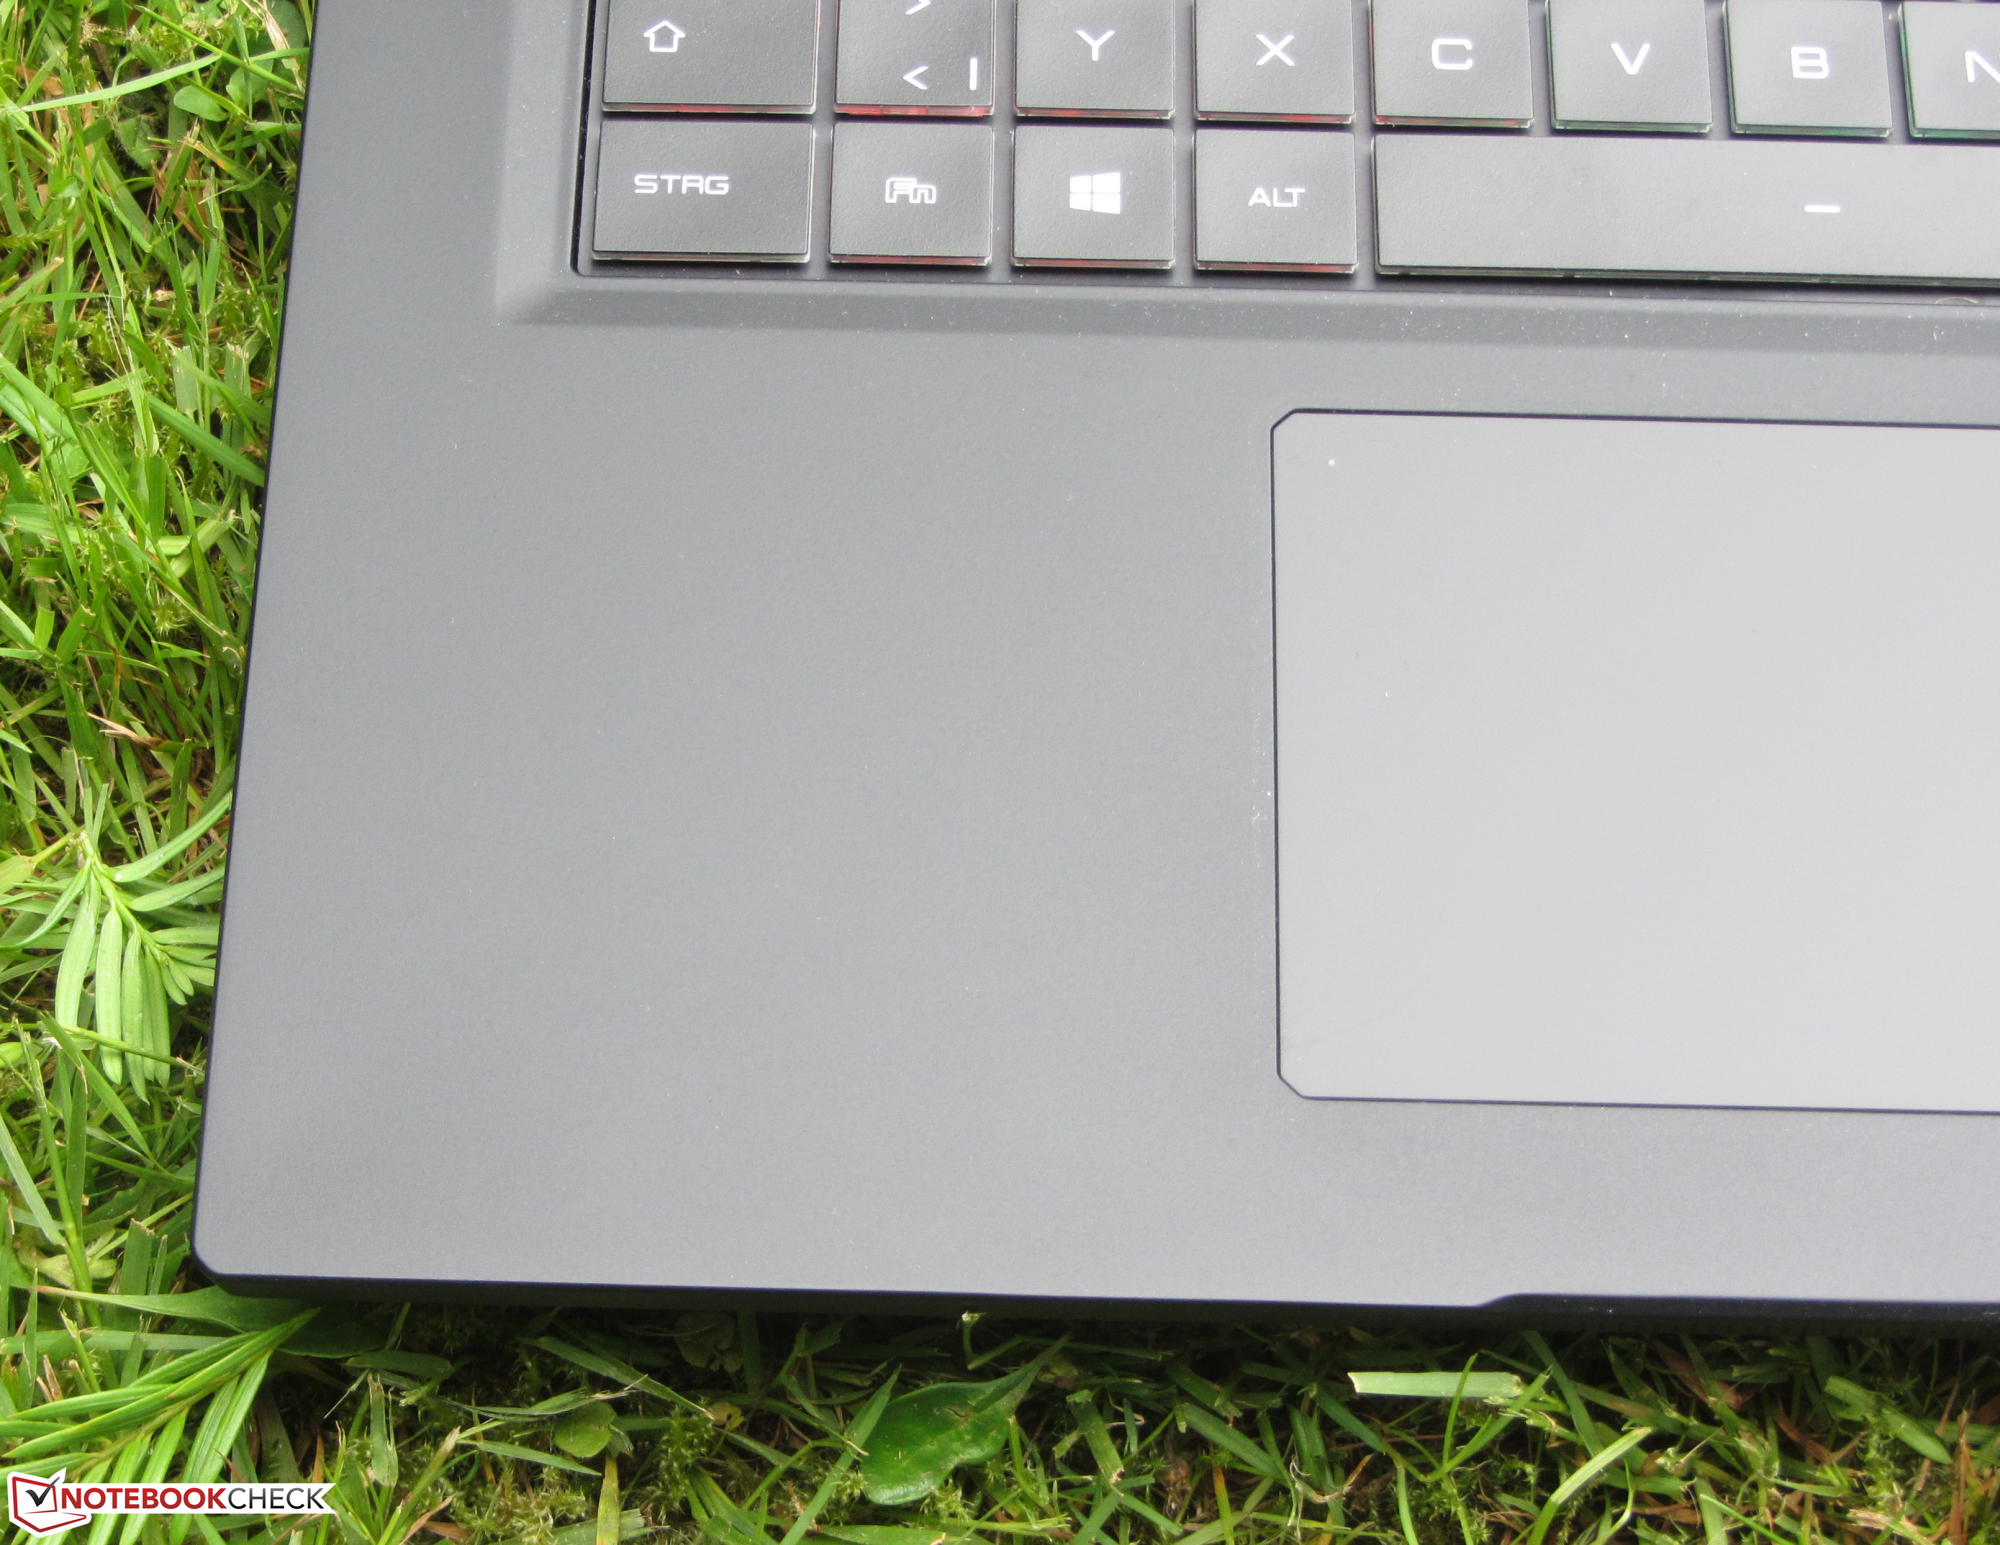
Touchpad
A multitouch-capable ClickPad (approx. 13.2 x 7.5 cm/~5.2 x 3.0 in) serves as a mouse replacement. Its smooth surface makes it easy for the fingers to glide. The pad also responds to inputs in the corners. It offers a short stroke and a clear pressure point.
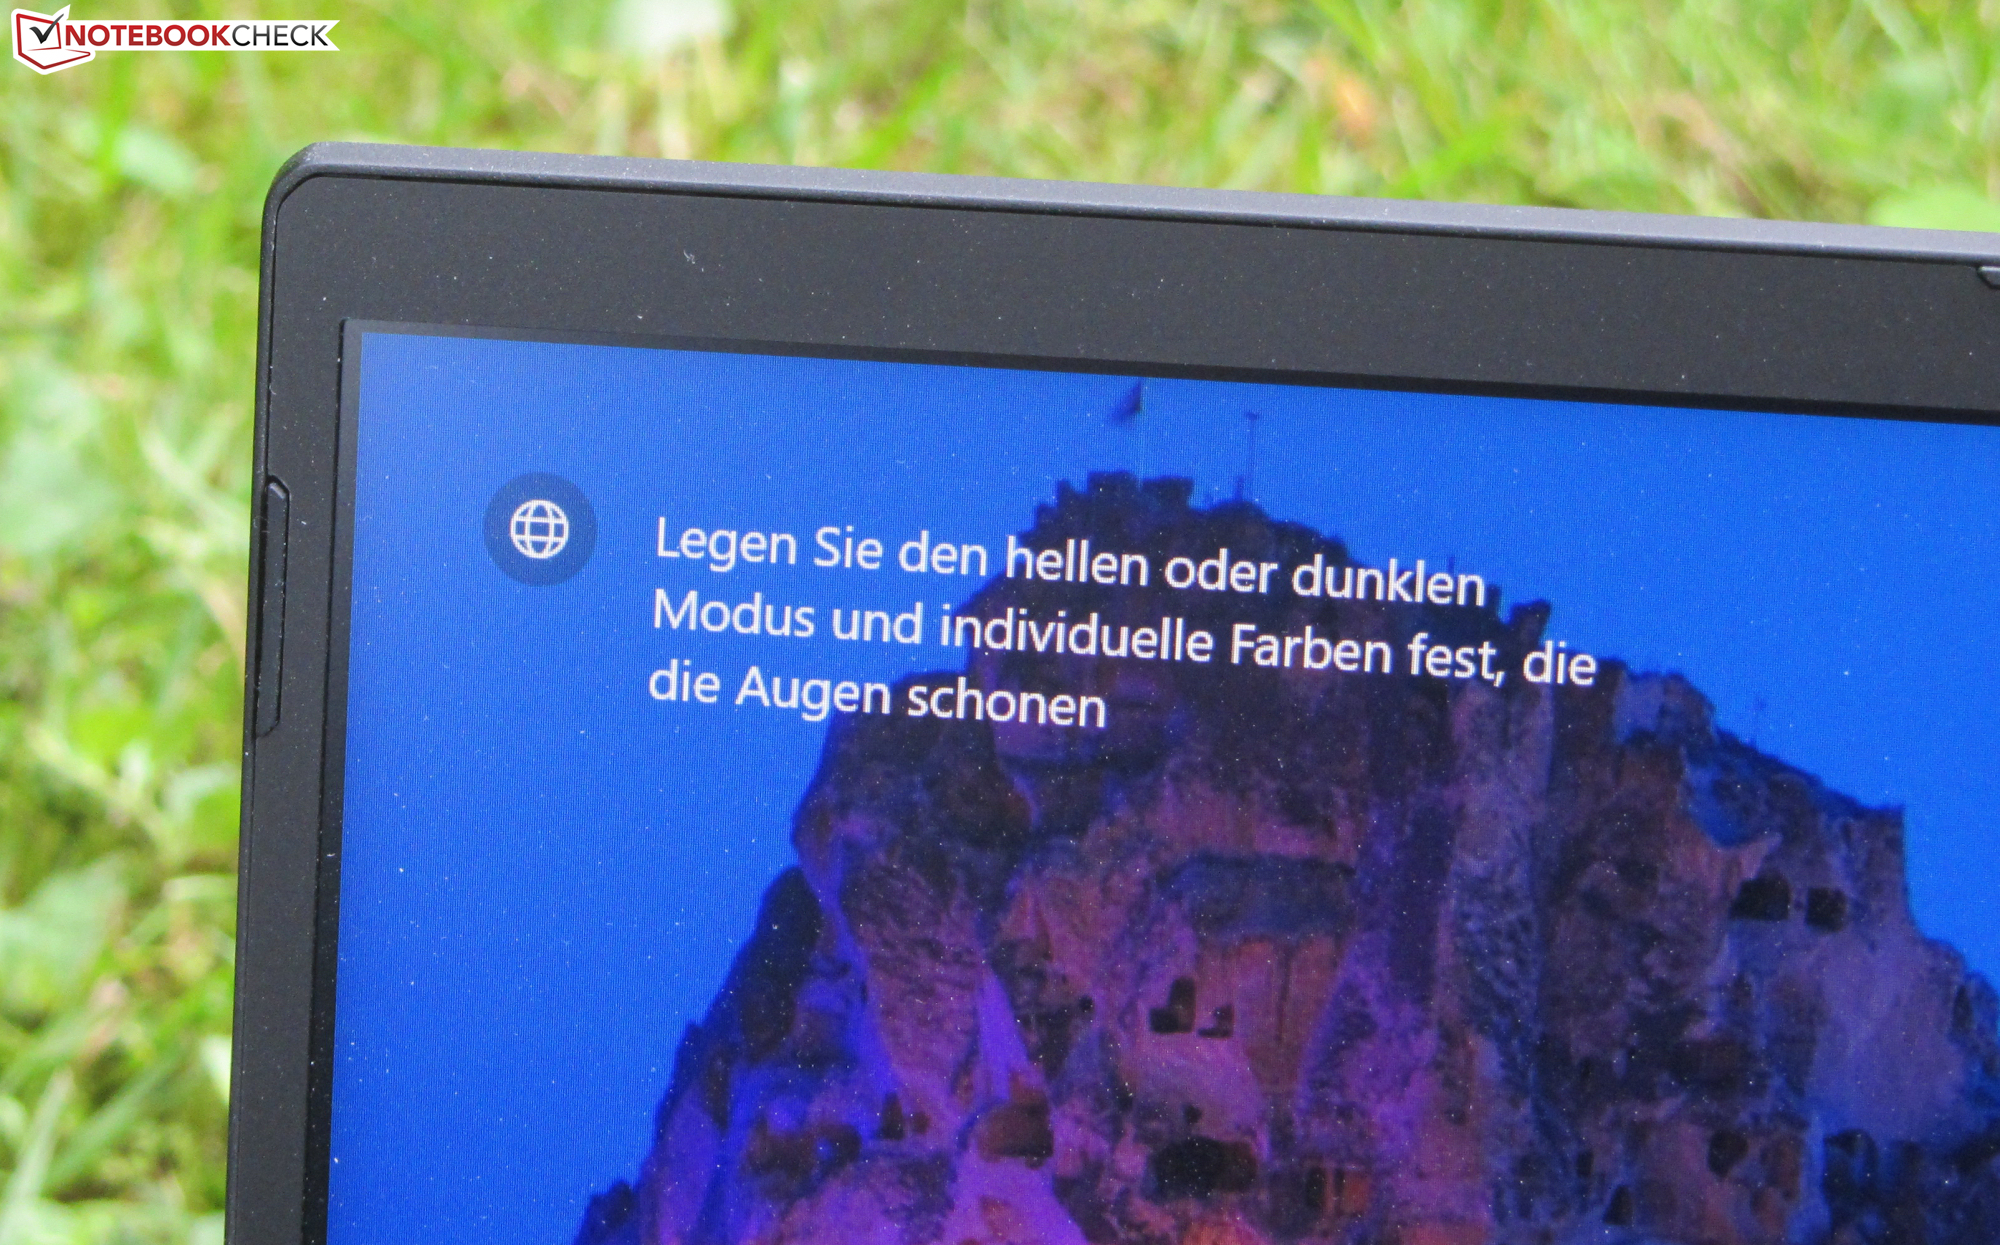
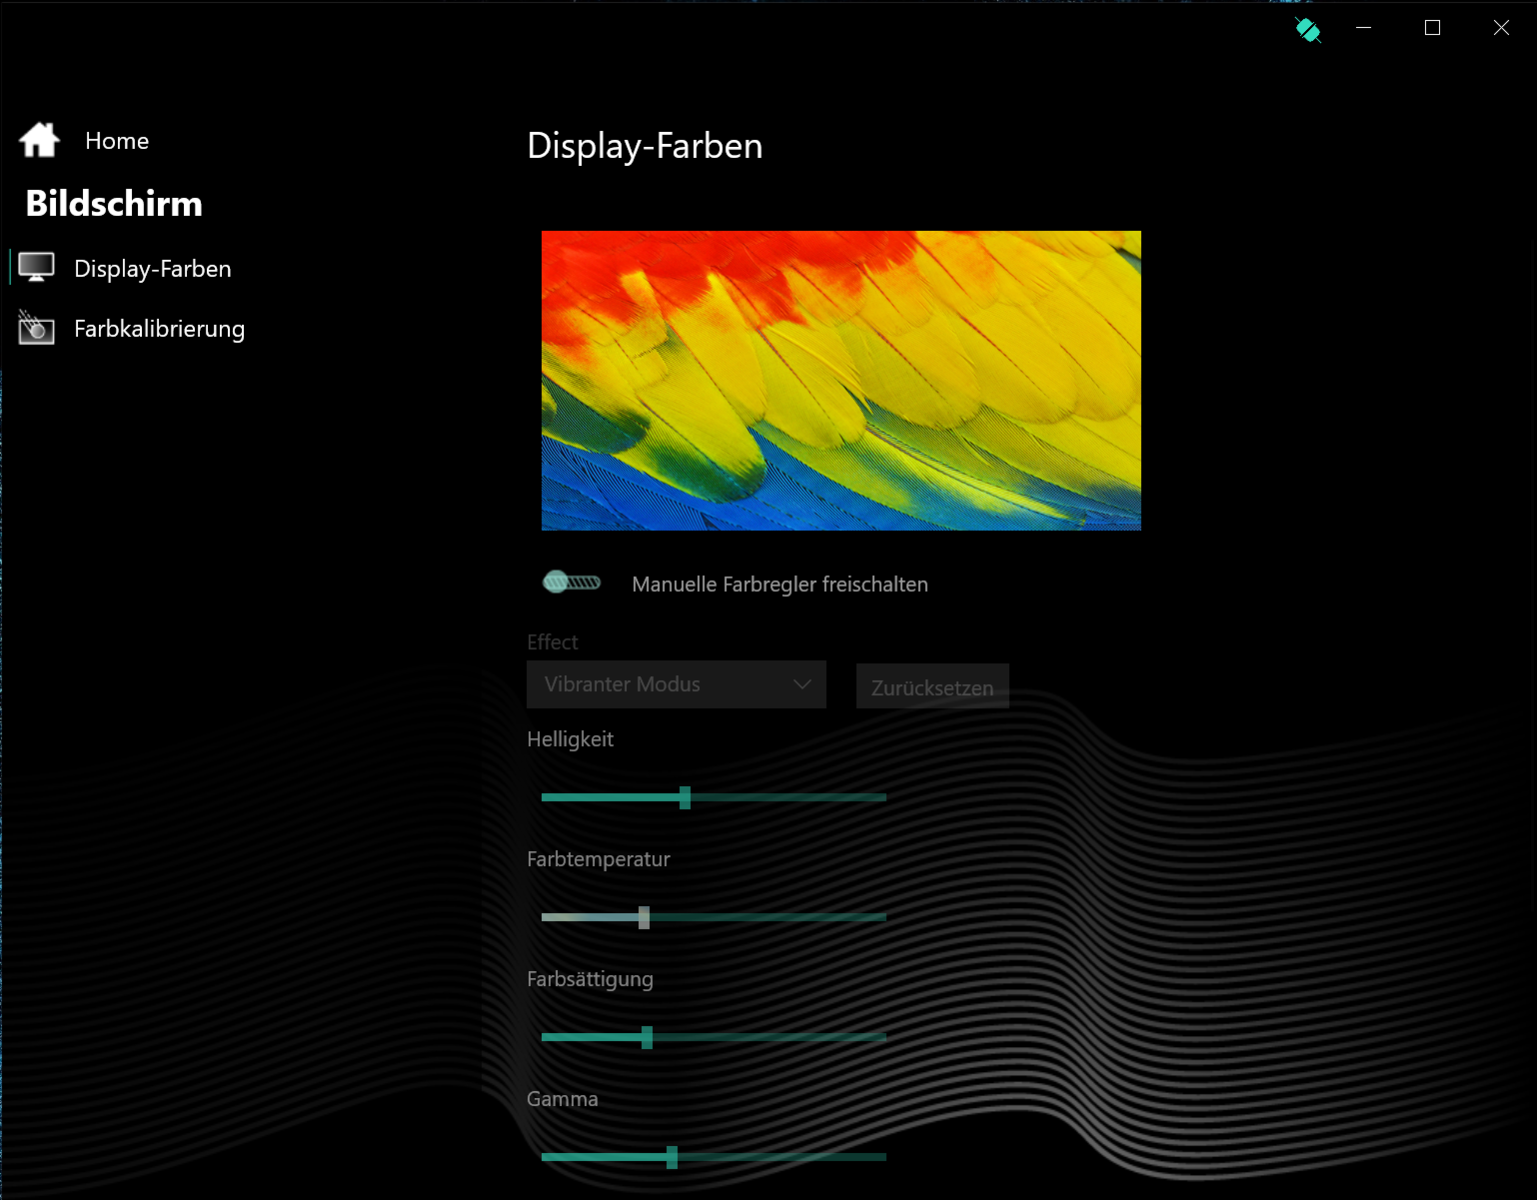
Display - 165 Hz IPS
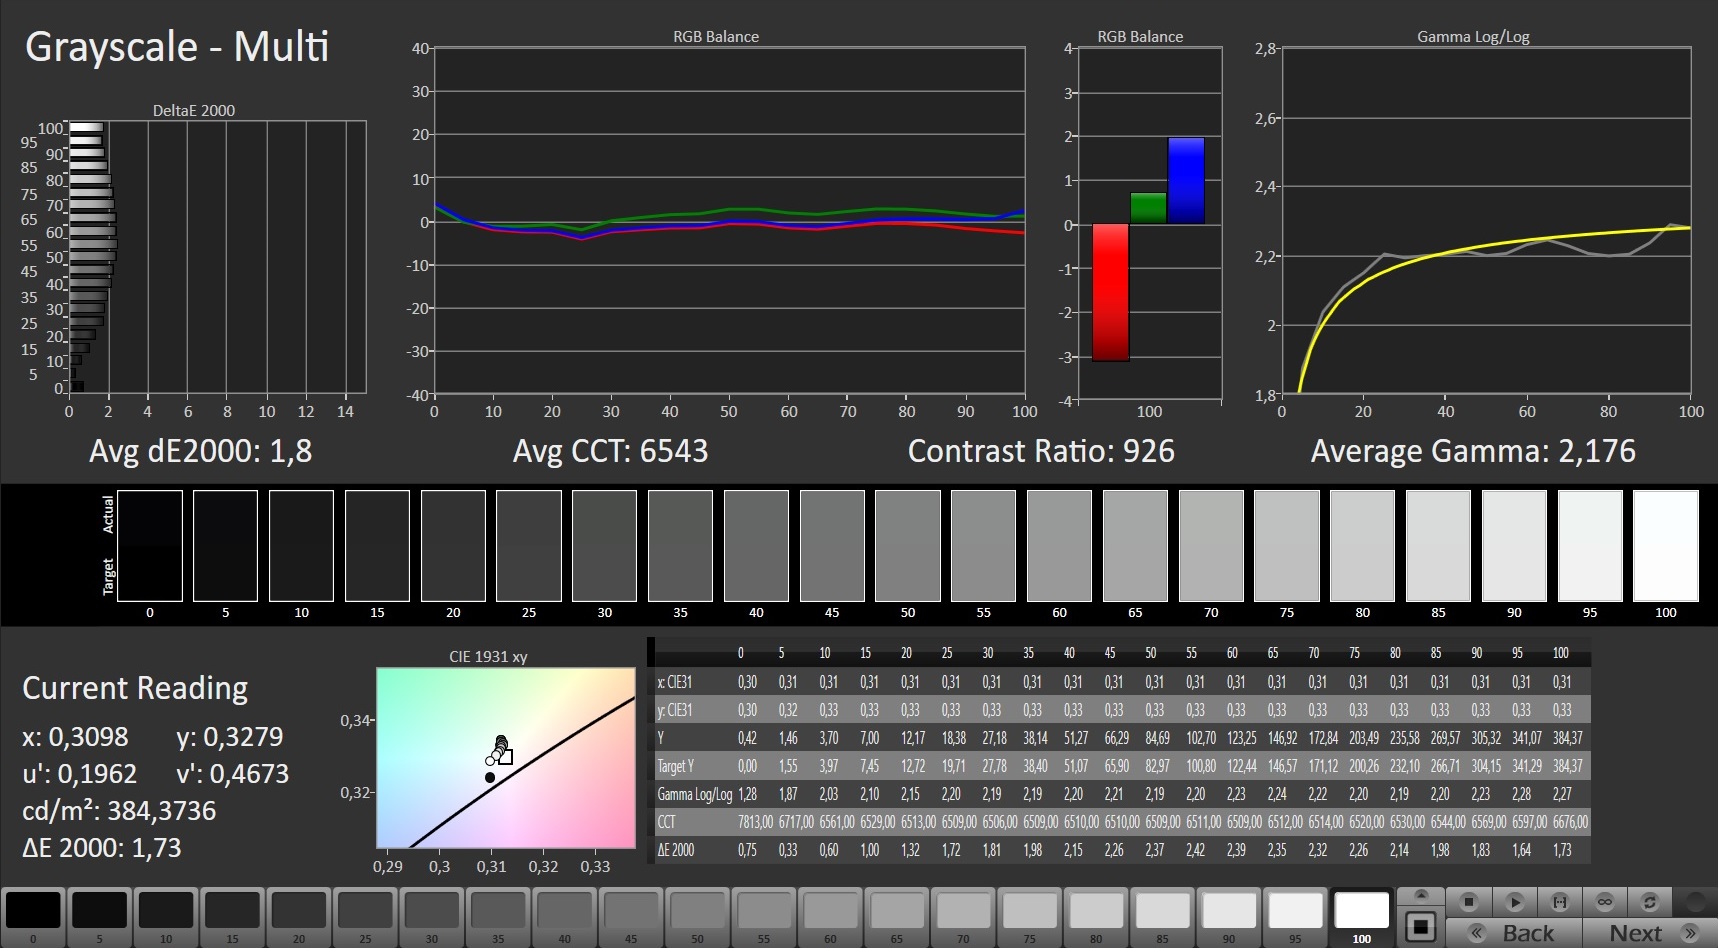
While the average brightness (340.7 cd/m²) of the matte 17.3-inch screen (1,920 x 1,080 pixels) meets the target (> 300 cd/m²), the contrast (881:1) is a bit too low. We consider values beyond 1000:1 to be good. The 165 Hz panel has short response times and does not exhibit PWM flickering.
| |||||||||||||||||||||||||
Brightness Distribution: 82 %
Center on Battery: 370 cd/m²
Contrast: 881:1 (Black: 0.42 cd/m²)
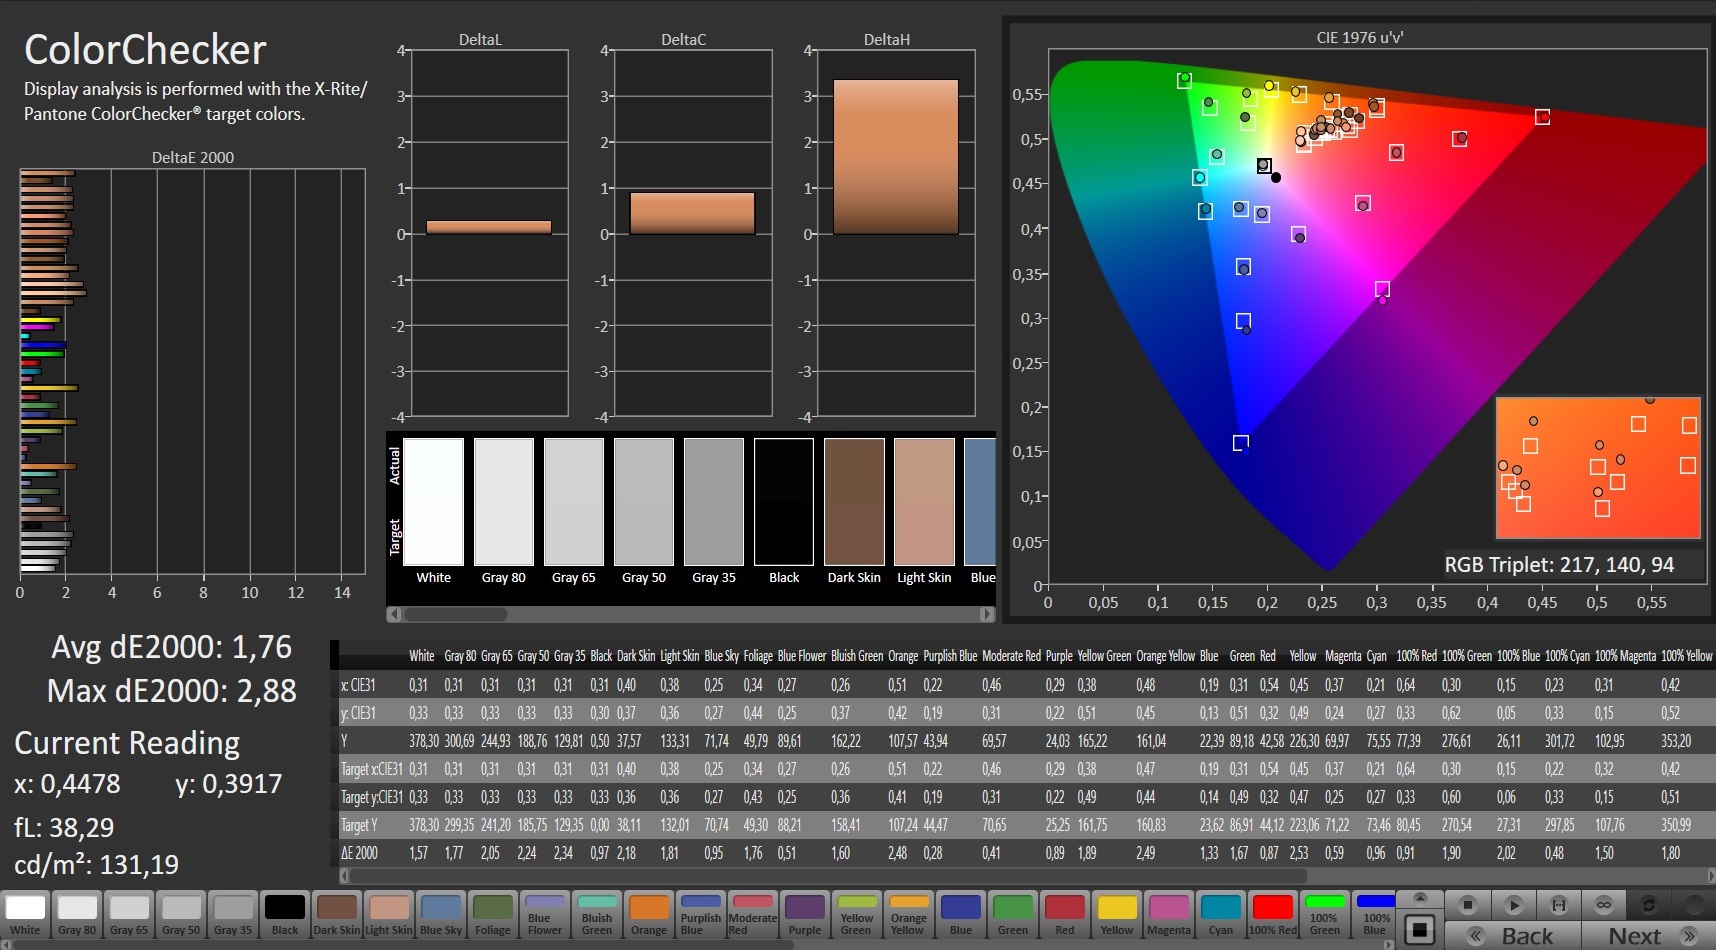
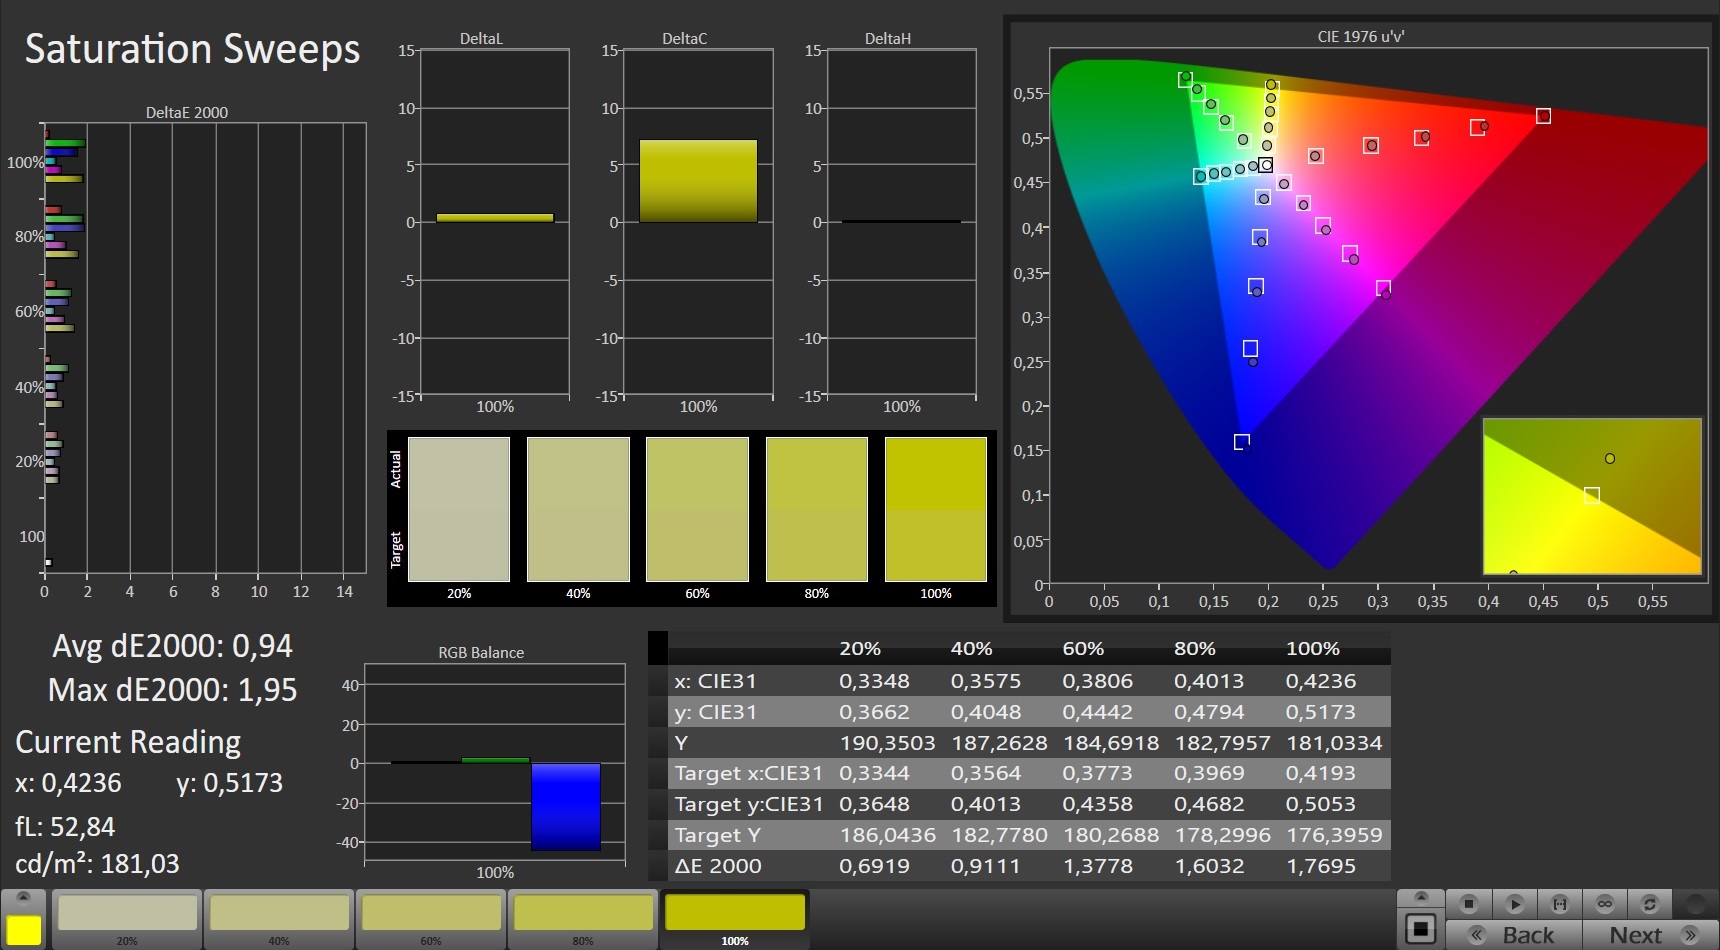
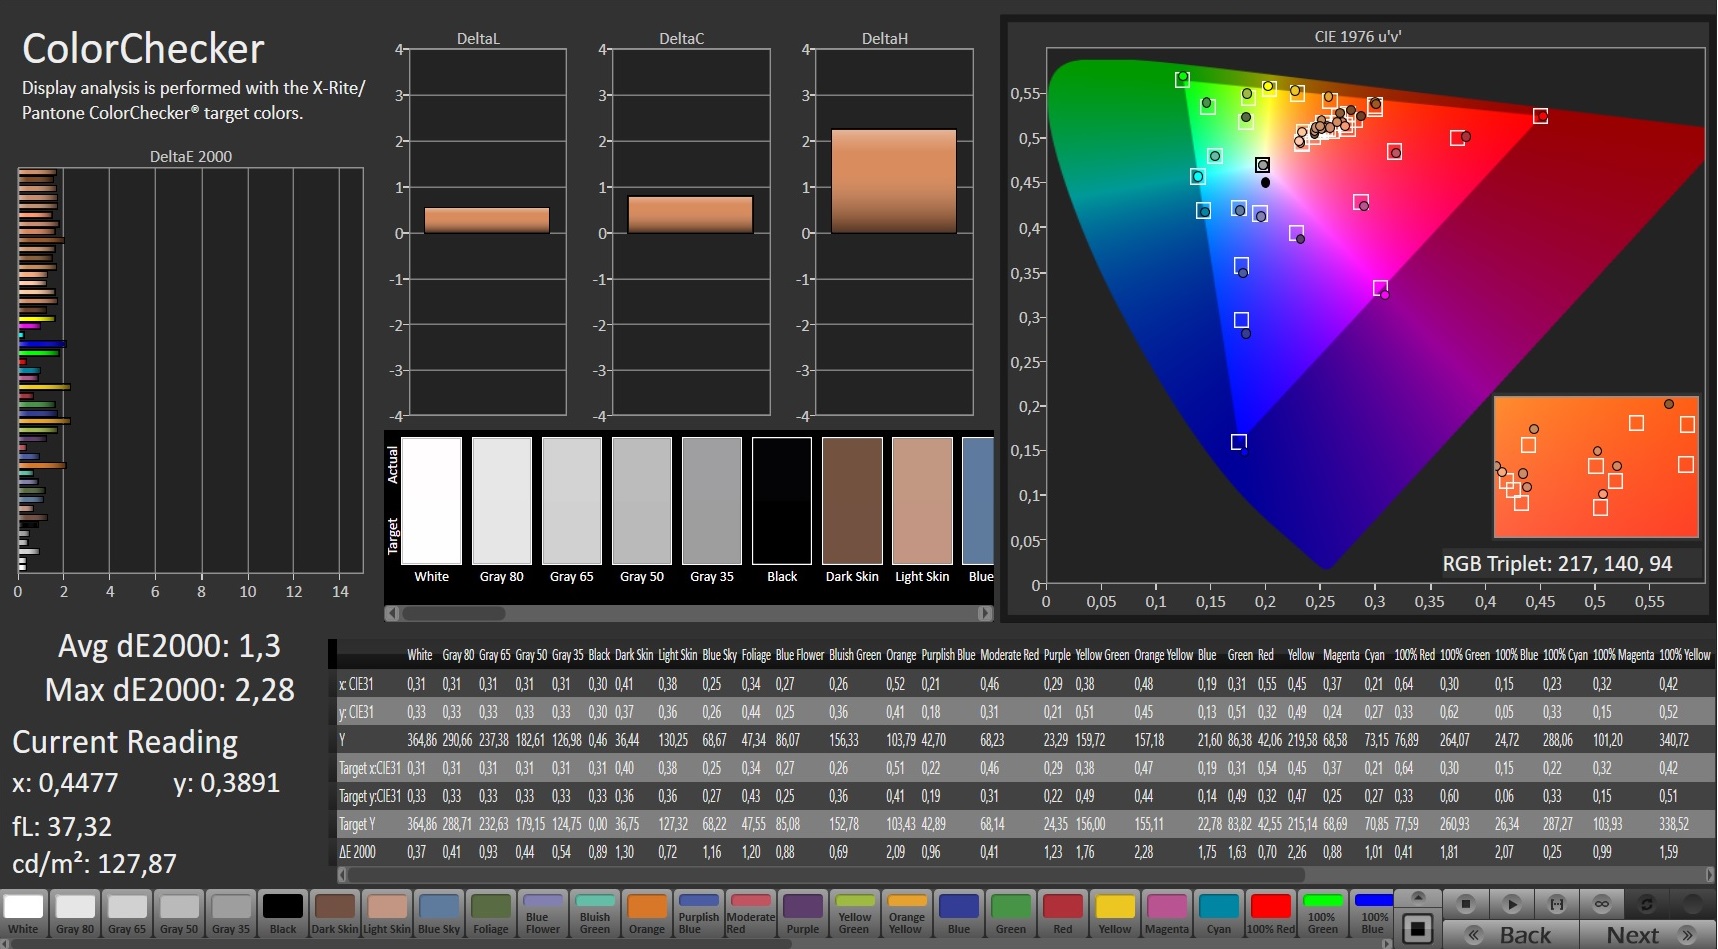
ΔE ColorChecker Calman: 1.76 | ∀{0.5-29.43 Ø4.73}
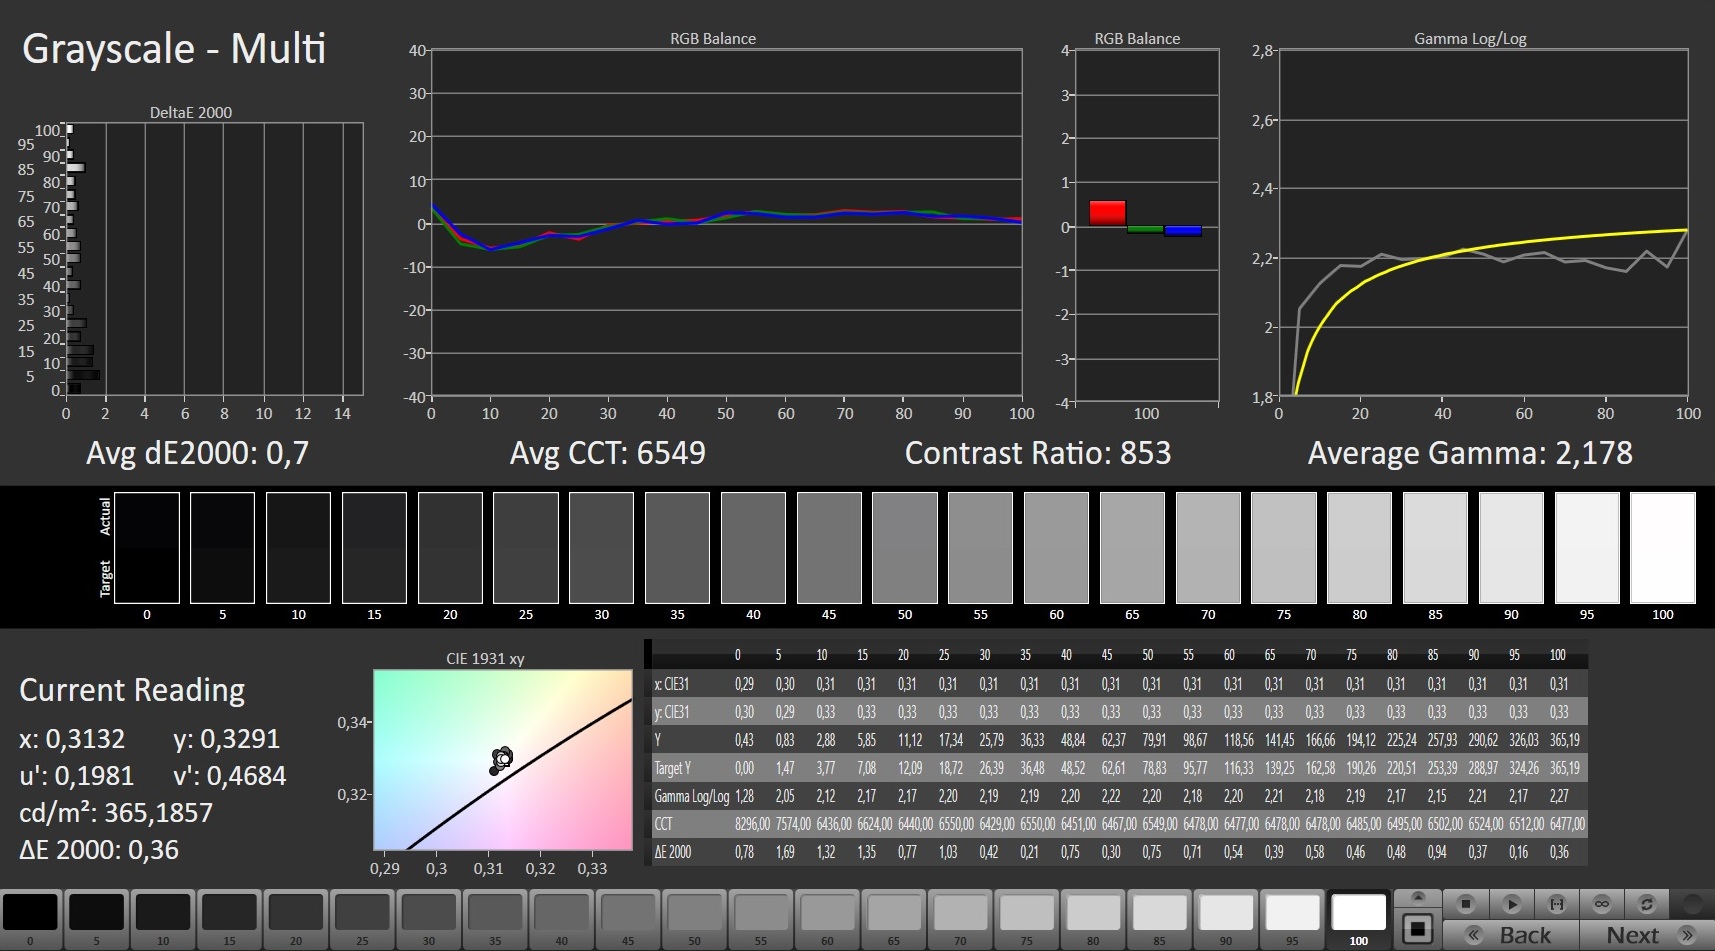
calibrated: 1.3
ΔE Greyscale Calman: 1.8 | ∀{0.09-98 Ø4.97}
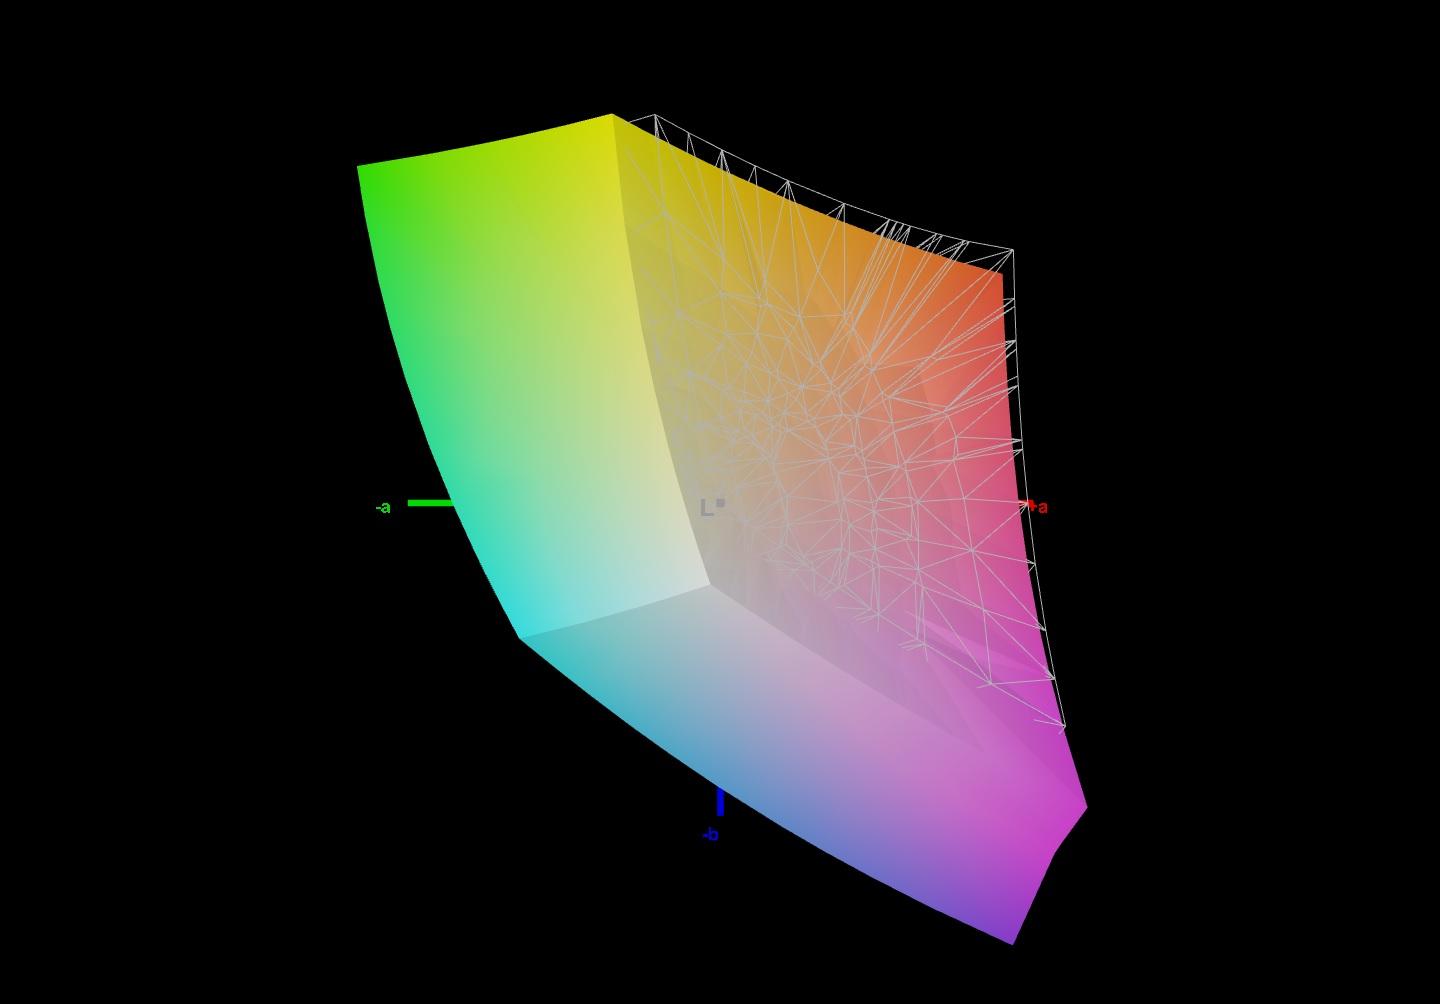
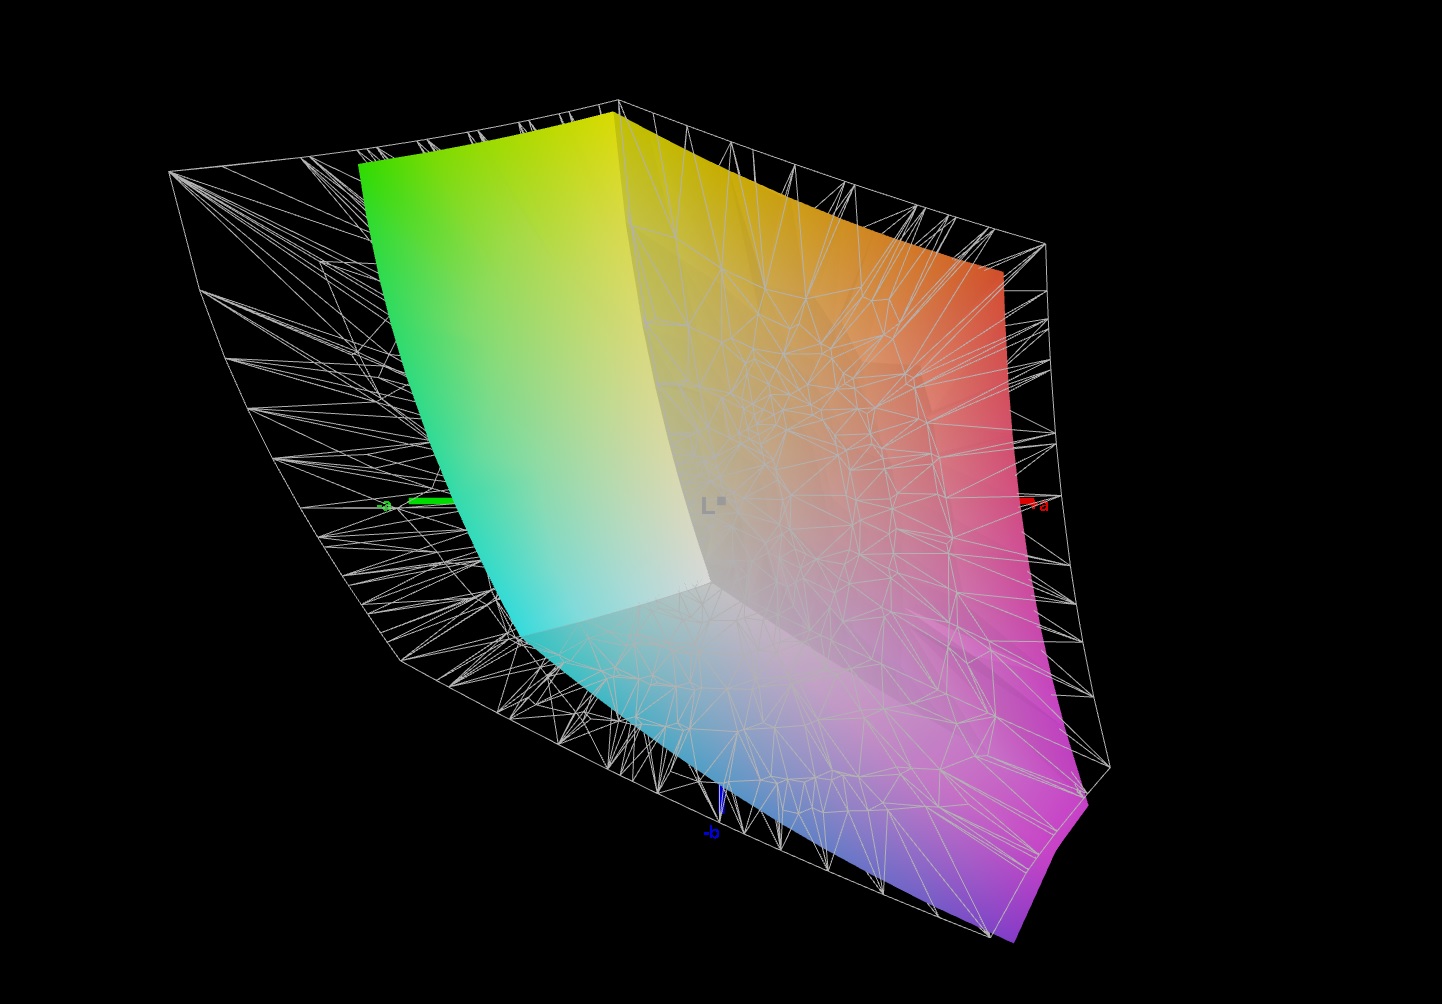
71.3% AdobeRGB 1998 (Argyll 3D)
99% sRGB (Argyll 3D)
70.1% Display P3 (Argyll 3D)
Gamma: 2.176
CCT: 6543 K
| Medion Erazer Beast X20 BOE CQ NE173QHM-NY2, IPS, 2560x1440, 17.3" | Schenker XMG Neo 17 (Early 2021, RTX 3070, 5800H) BOE NE173QHM-NY2 (BOE0977), IPS, 2560x1440, 17.3" | MSI GP76 Leopard 10UG Chi Mei CMN176E, IPS, 1920x1080, 17.3" | Aorus 17G YD Sharp LQ173M1JW04, IPS, 1920x1080, 17.3" | Medion Erazer Beast X10 MD61804 LG Phillips LP173WFG-SPB3, IPS, 1920x1080, 17.3" | |
|---|---|---|---|---|---|
| Display | 1% | -6% | 2% | -6% | |
| Display P3 Coverage (%) | 70.1 | 70.5 1% | 64.7 -8% | 72.3 3% | 64.5 -8% |
| sRGB Coverage (%) | 99 | 99.5 1% | 96.4 -3% | 100 1% | 95.6 -3% |
| AdobeRGB 1998 Coverage (%) | 71.3 | 71.8 1% | 66.9 -6% | 73.7 3% | 65.6 -8% |
| Response Times | -5% | 21% | 10% | 3% | |
| Response Time Grey 50% / Grey 80% * (ms) | 16 ? | 16.8 ? -5% | 7.4 ? 54% | 13.6 ? 15% | 14.4 ? 10% |
| Response Time Black / White * (ms) | 9.6 ? | 10 ? -4% | 10.8 ? -13% | 9.2 ? 4% | 10 ? -4% |
| PWM Frequency (Hz) | 24510 ? | ||||
| Screen | -13% | -5% | -23% | -46% | |
| Brightness middle (cd/m²) | 370 | 410 11% | 328 -11% | 286 -23% | 313 -15% |
| Brightness (cd/m²) | 341 | 381 12% | 314 -8% | 282 -17% | 297 -13% |
| Brightness Distribution (%) | 82 | 88 7% | 87 6% | 73 -11% | 88 7% |
| Black Level * (cd/m²) | 0.42 | 0.37 12% | 0.29 31% | 0.24 43% | 0.27 36% |
| Contrast (:1) | 881 | 1108 26% | 1131 28% | 1192 35% | 1159 32% |
| Colorchecker dE 2000 * | 1.76 | 2.55 -45% | 1.93 -10% | 2.79 -59% | 2.96 -68% |
| Colorchecker dE 2000 max. * | 2.88 | 4.33 -50% | 4.94 -72% | 6.23 -116% | 9.83 -241% |
| Colorchecker dE 2000 calibrated * | 1.3 | 1.28 2% | 0.68 48% | 0.82 37% | 1.03 21% |
| Greyscale dE 2000 * | 1.8 | 3.4 -89% | 2.8 -56% | 3.5 -94% | 4.9 -172% |
| Gamma | 2.176 101% | 2.275 97% | 2.18 101% | 2.358 93% | 2.187 101% |
| CCT | 6543 99% | 6637 98% | 7023 93% | 6147 106% | 7559 86% |
| Color Space (Percent of AdobeRGB 1998) (%) | 72 | 67 | 74 | 66 | |
| Color Space (Percent of sRGB) (%) | 95 | 89 | 96 | 89 | |
| Total Average (Program / Settings) | -6% /
-9% | 3% /
-1% | -4% /
-13% | -16% /
-30% |
* ... smaller is better
The screen shows a good color reproduction in its state of delivery and meets the target with a color deviation of just under 1.8 (Delta E less than 3). It does not suffer from a blue cast. Slight improvements can be achieved with a calibration. The deviation drops to 1.3 and the grayscale levels are displayed more balanced. The sRGB color space is reproduced to 99%, the AdobeRGB color space to 71%.

Display Response Times
| ↔ Response Time Black to White | ||
|---|---|---|
| 9.6 ms ... rise ↗ and fall ↘ combined | ↗ 4.4 ms rise | 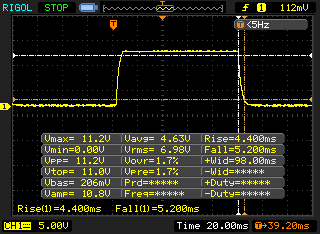 |
| ↘ 5.2 ms fall | ||
| The screen shows fast response rates in our tests and should be suited for gaming. In comparison, all tested devices range from 0.1 (minimum) to 240 (maximum) ms. » 26 % of all devices are better. This means that the measured response time is better than the average of all tested devices (19.9 ms). | ||
| ↔ Response Time 50% Grey to 80% Grey | ||
| 16 ms ... rise ↗ and fall ↘ combined | ↗ 8.4 ms rise | 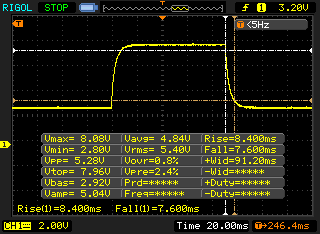 |
| ↘ 7.6 ms fall | ||
| The screen shows good response rates in our tests, but may be too slow for competitive gamers. In comparison, all tested devices range from 0.165 (minimum) to 636 (maximum) ms. » 30 % of all devices are better. This means that the measured response time is better than the average of all tested devices (31.1 ms). | ||
Screen Flickering / PWM (Pulse-Width Modulation)
| Screen flickering / PWM not detected | 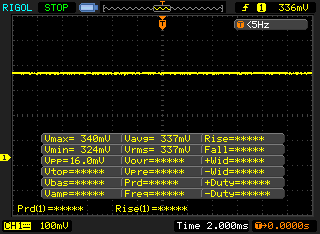 | ||
In comparison: 52 % of all tested devices do not use PWM to dim the display. If PWM was detected, an average of 7810 (minimum: 5 - maximum: 343500) Hz was measured. | |||
The viewing-angle stable IPS panel can be read from any position. Outdoor reading of the display is possible when the sun does not shine too brightly.

Performance - Eight-core power
Medion's Erazer Beast X20 is a 17.3-inch gaming notebook that brings every current game smoothly to the screen.


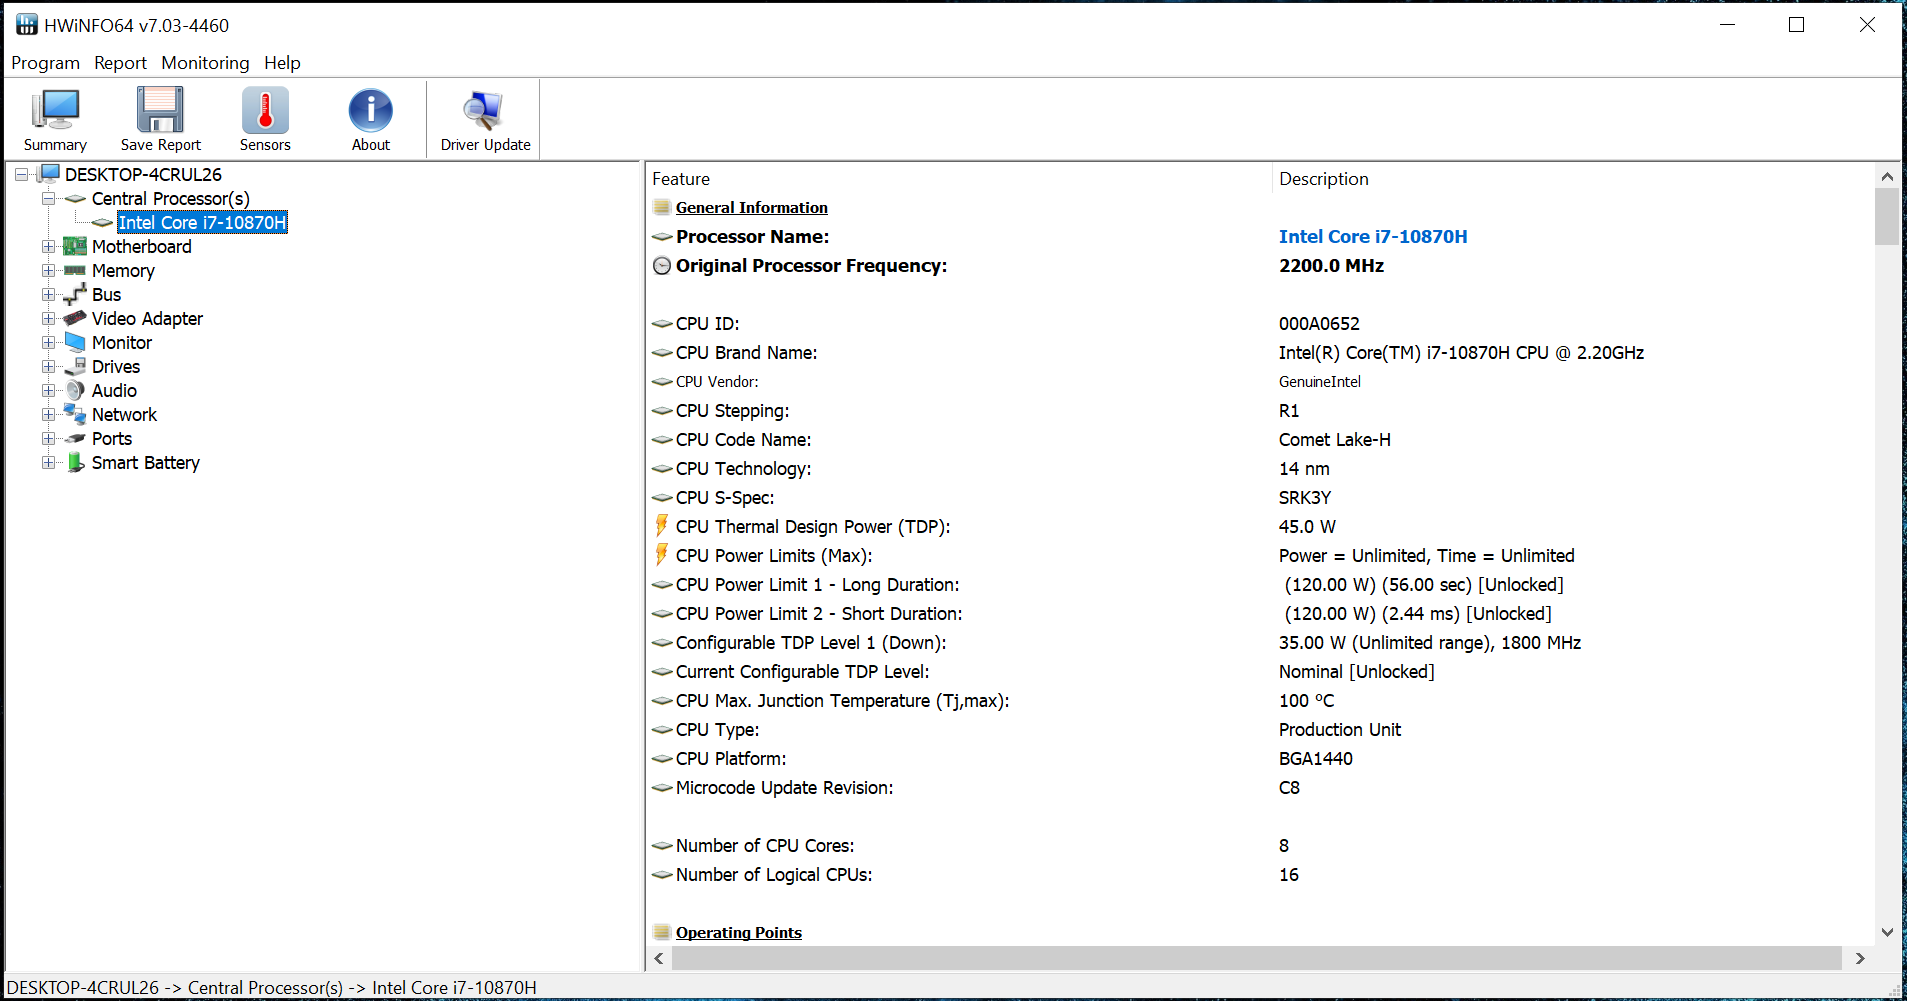
Test conditions
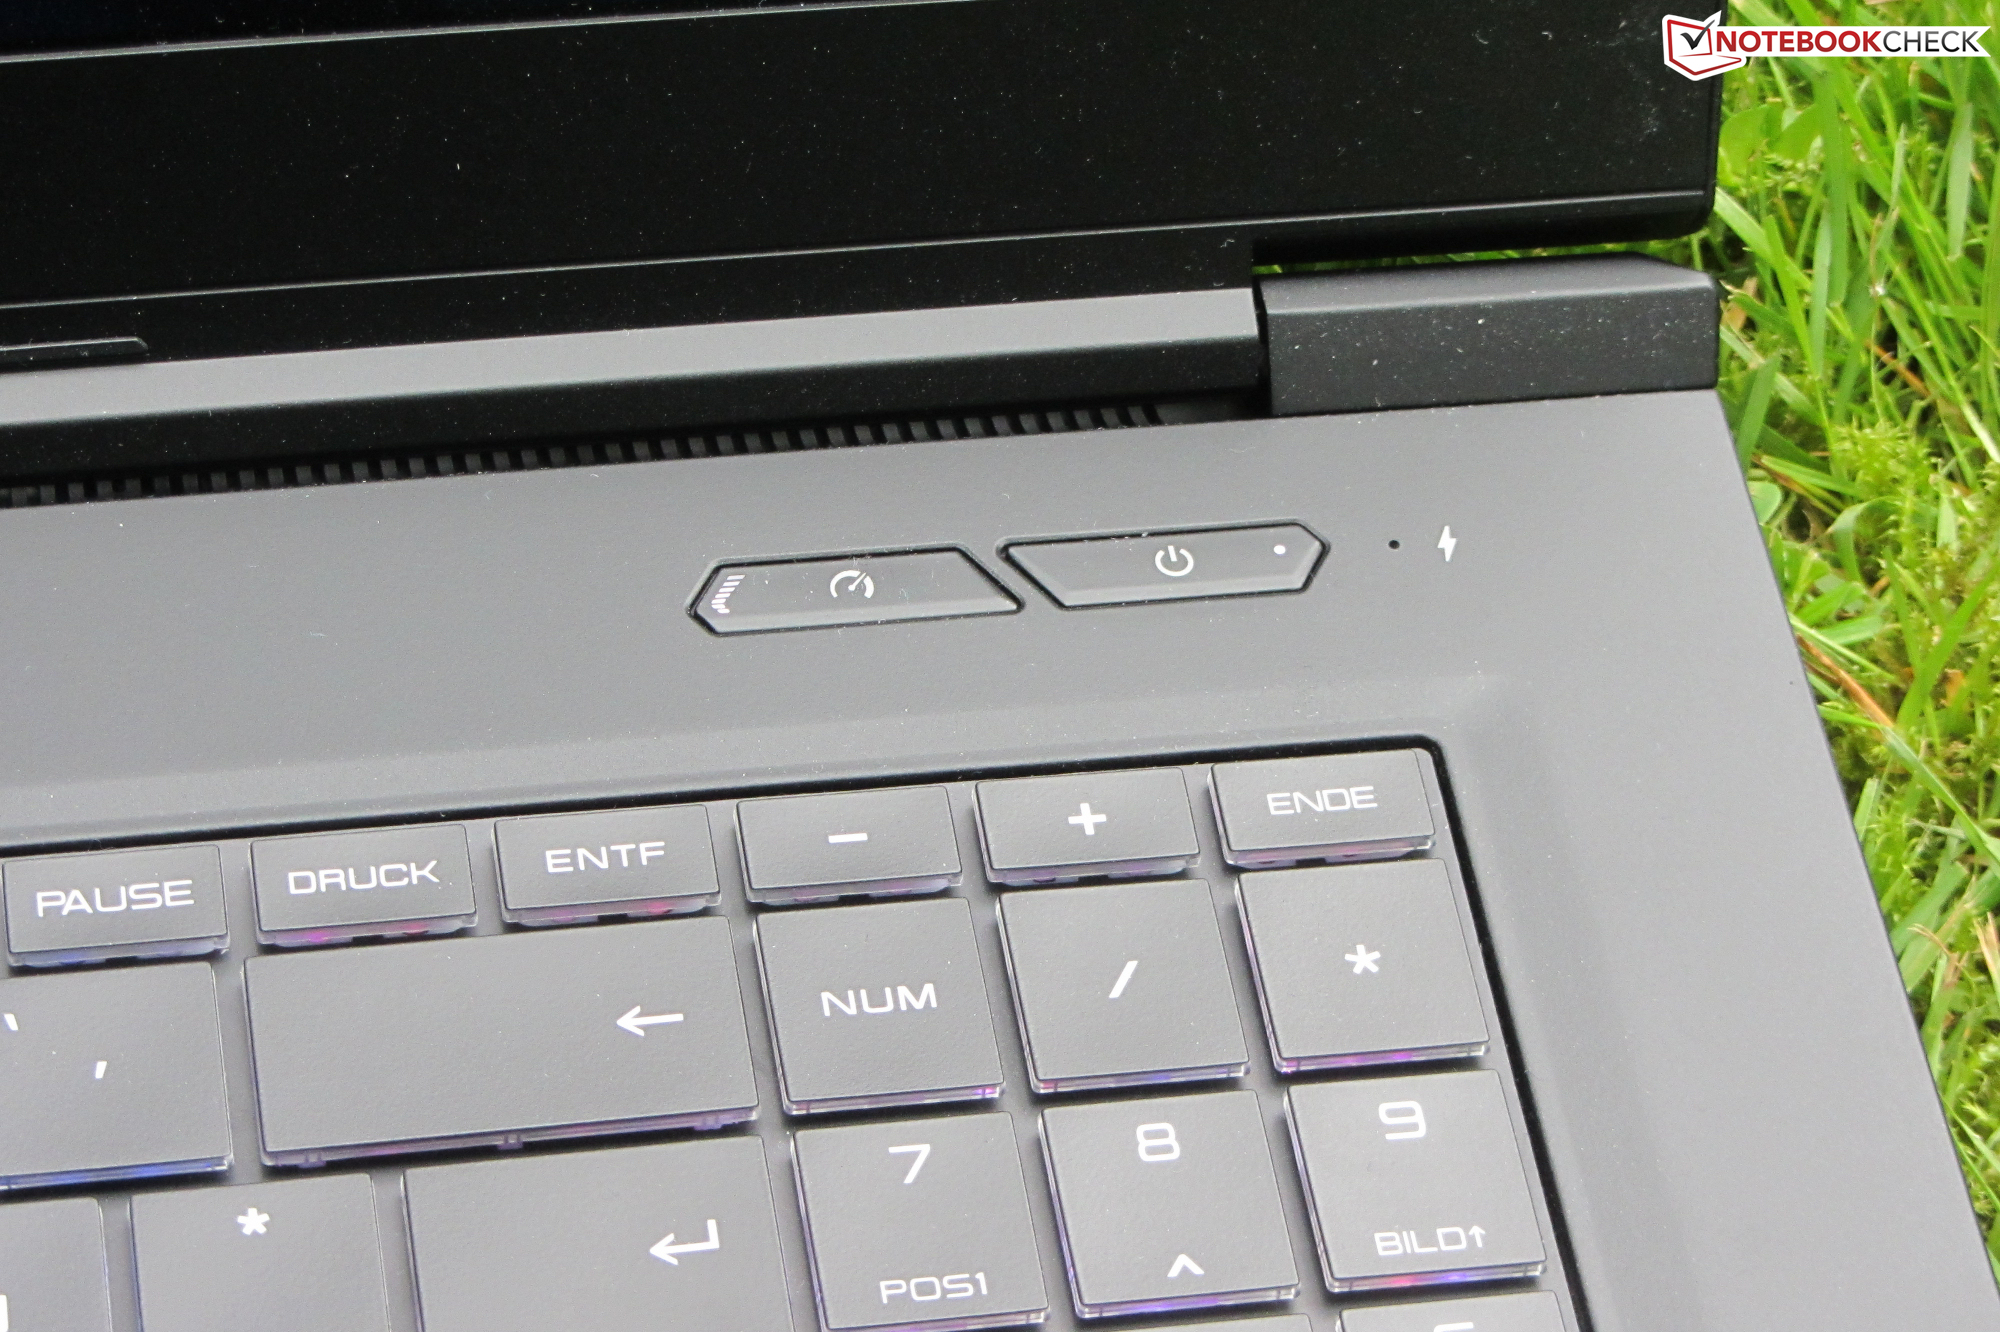
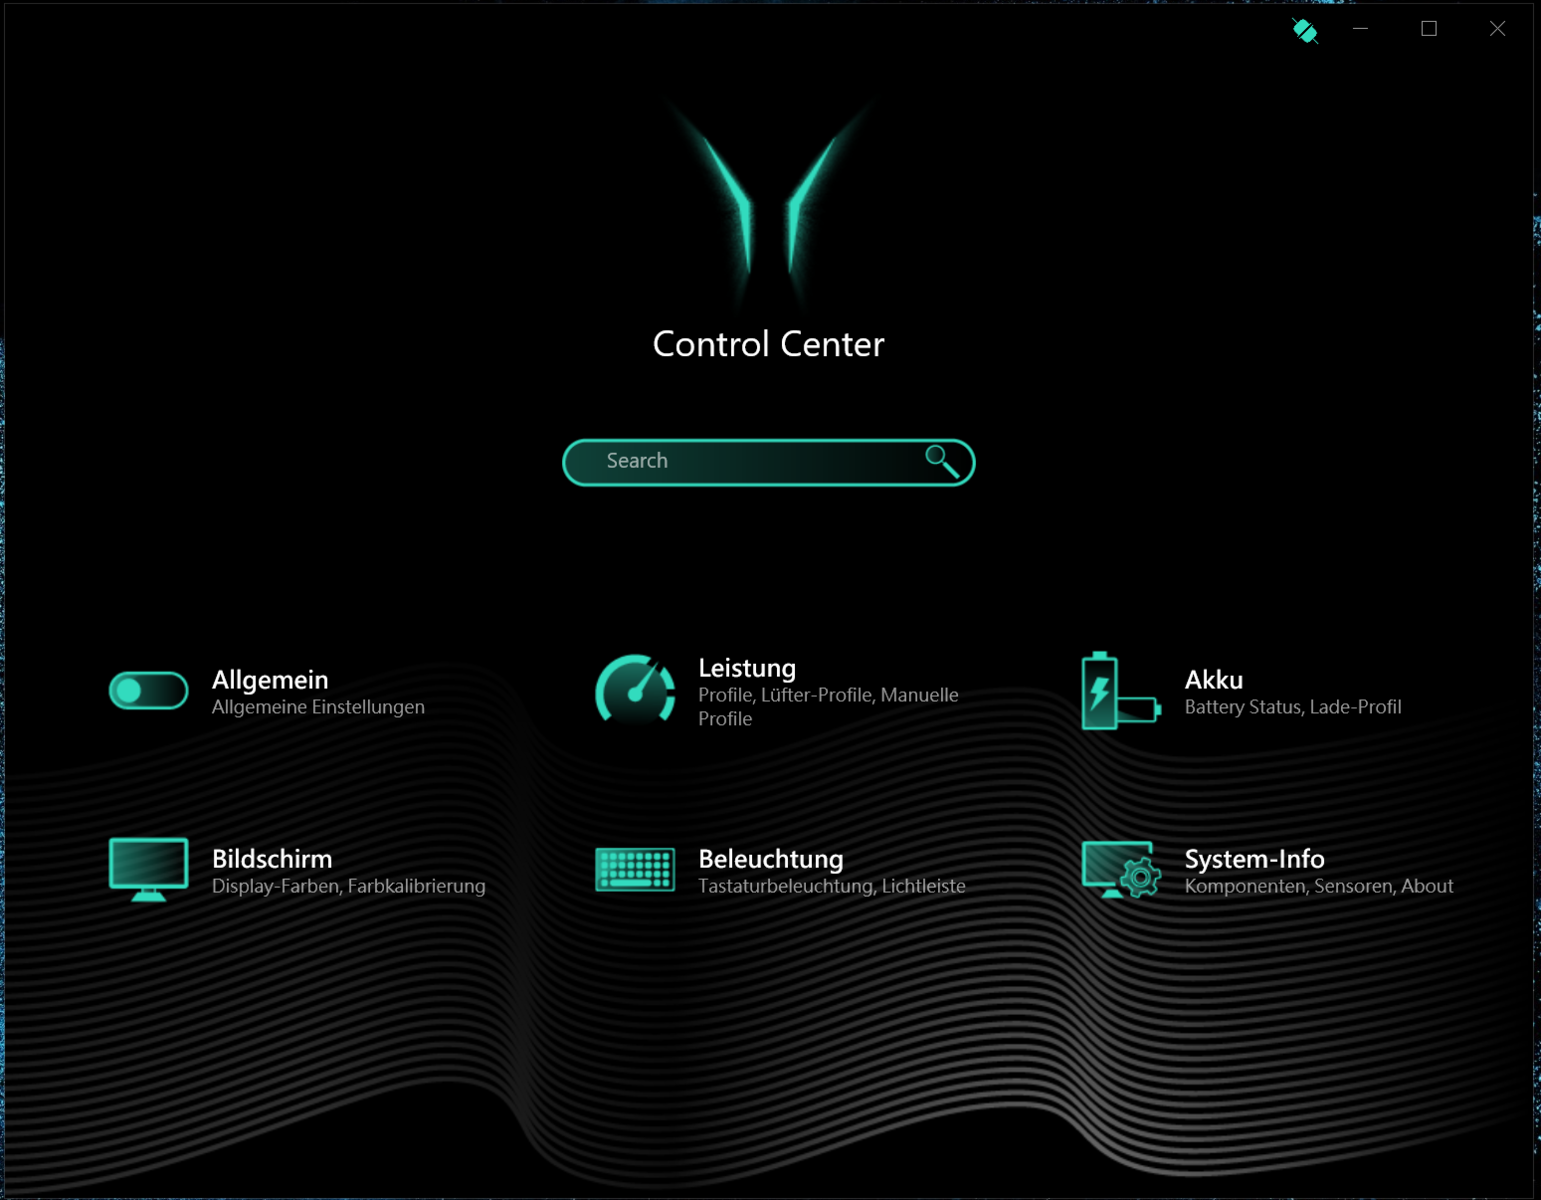
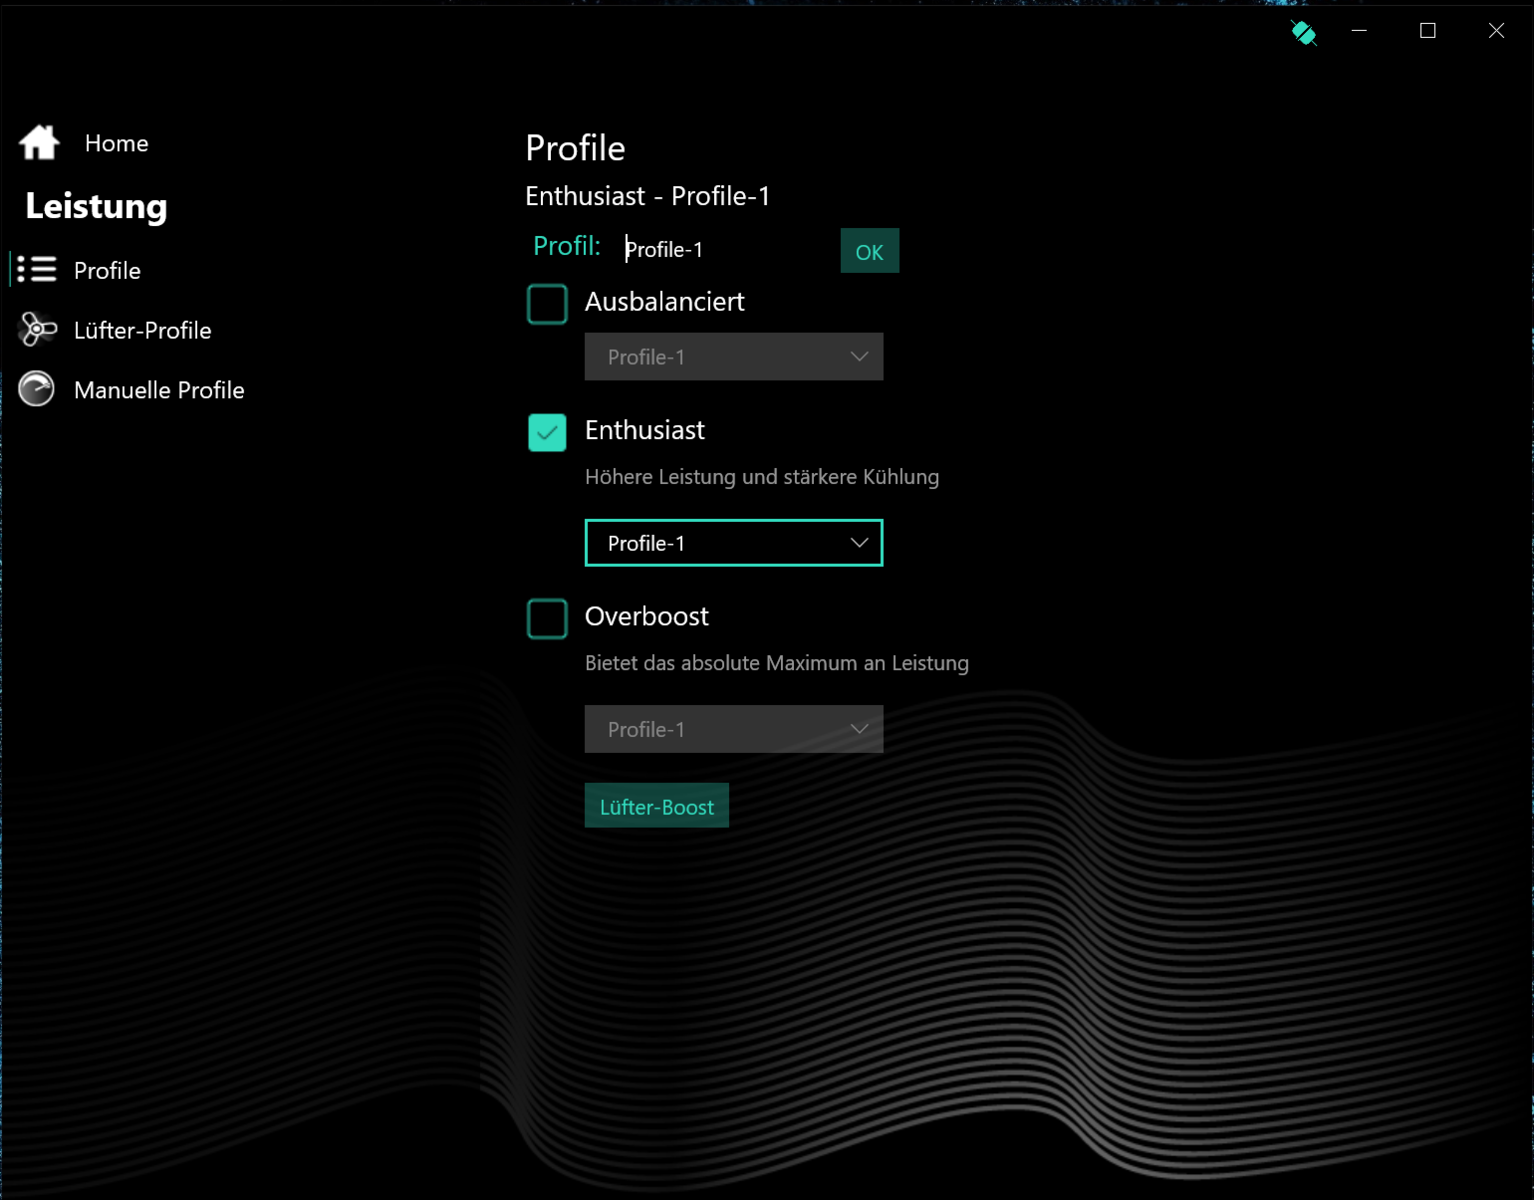
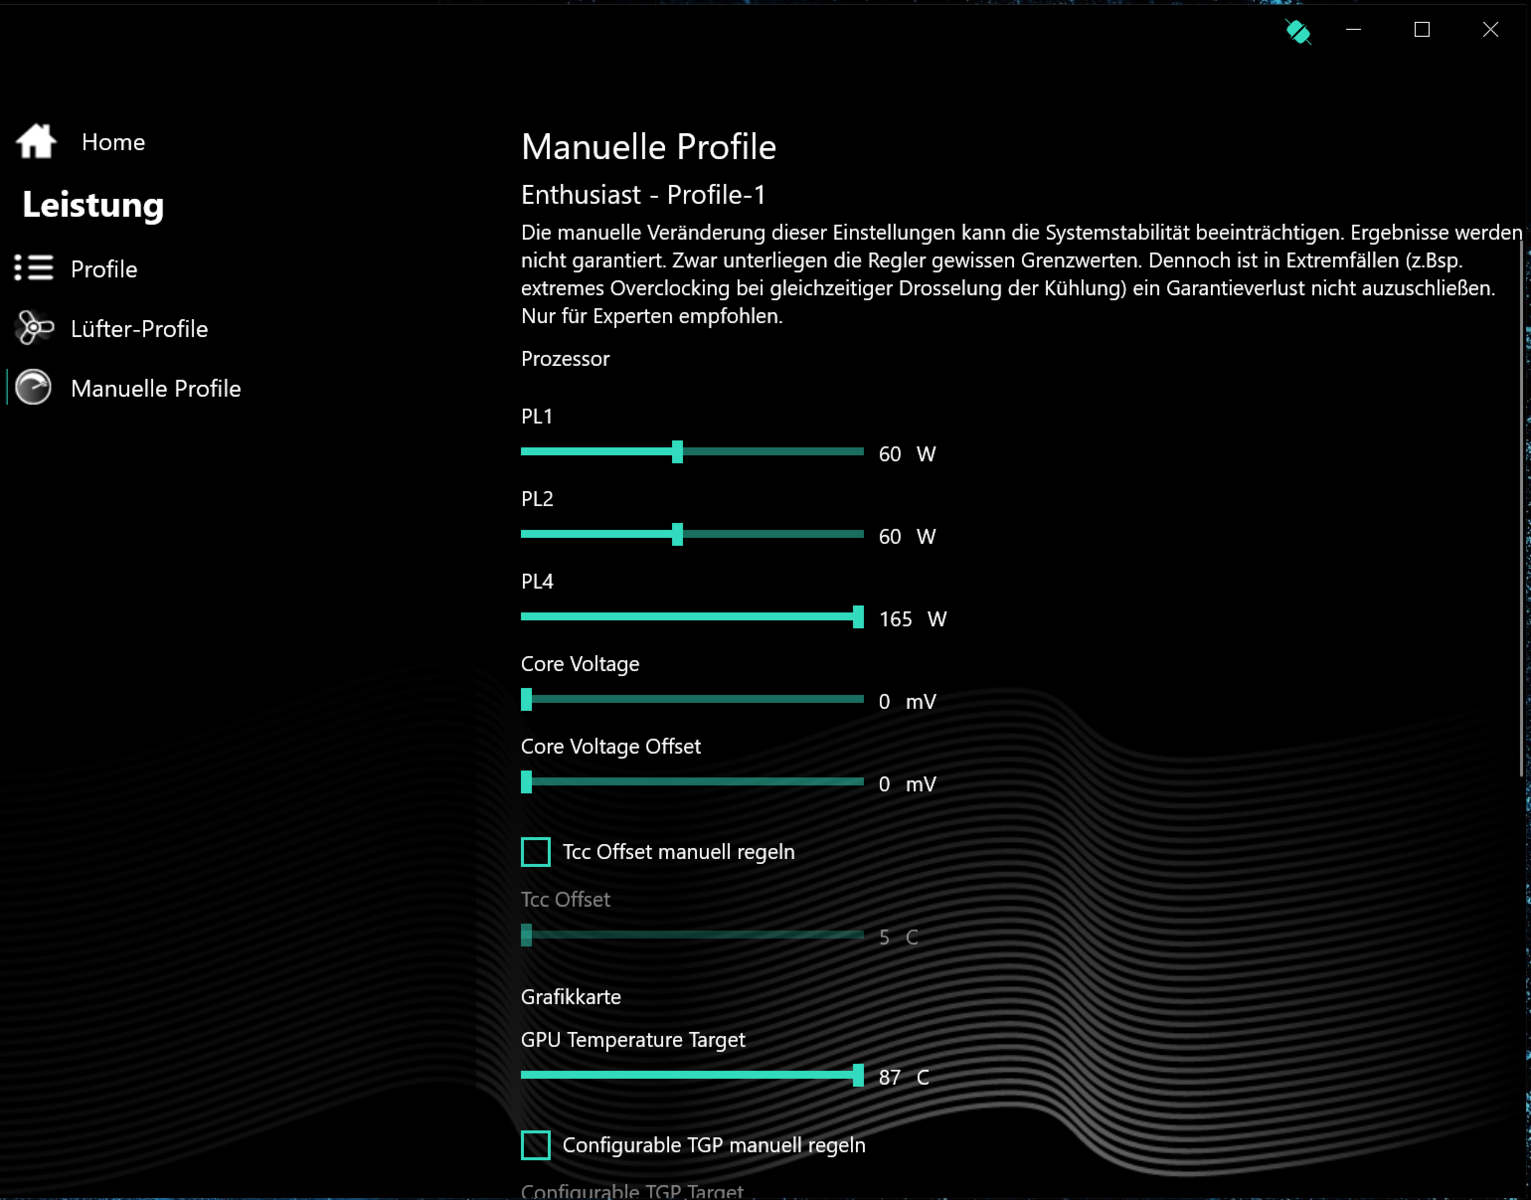
The pre-installed Control Center allows choosing a performance profile ("Balanced", "Enthusiast", "Overboost"), among other things. We used the "Enthusiast" profile and the automatic fan control. The battery tests were performed with the "Balanced" profile active. A button next to the power button allows quick switching between the performance profiles.
| Balanced | Enthusiast | Overboost | |
|---|---|---|---|
| Power Limit 1 | 35 Watt | 60 Watt | 75 Watt |
| Power Limit 2 | 35 Watt | 60 Watt | 75 Watt |
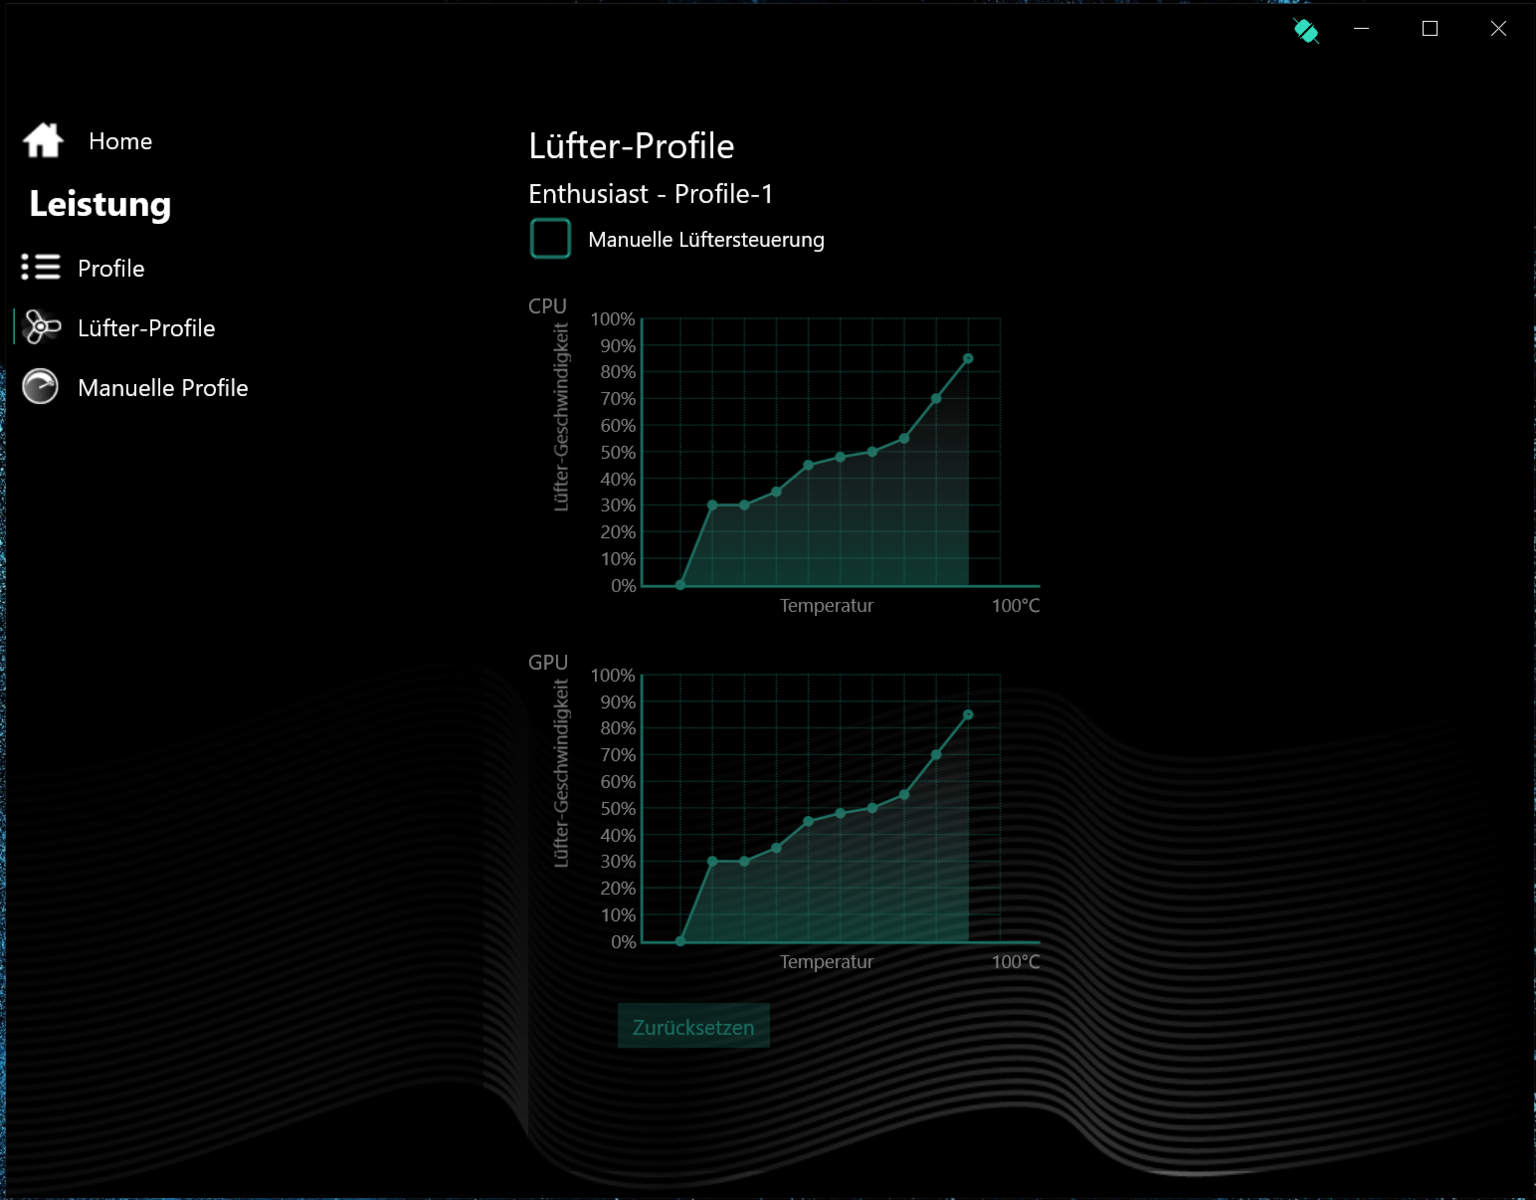
Five subprofiles can - but do not have to - be defined for each of the three performance profiles. For example, the CPU's power limits, the GPU's TGP and/or the temperature upper limits could be adjusted to individual usage scenarios.

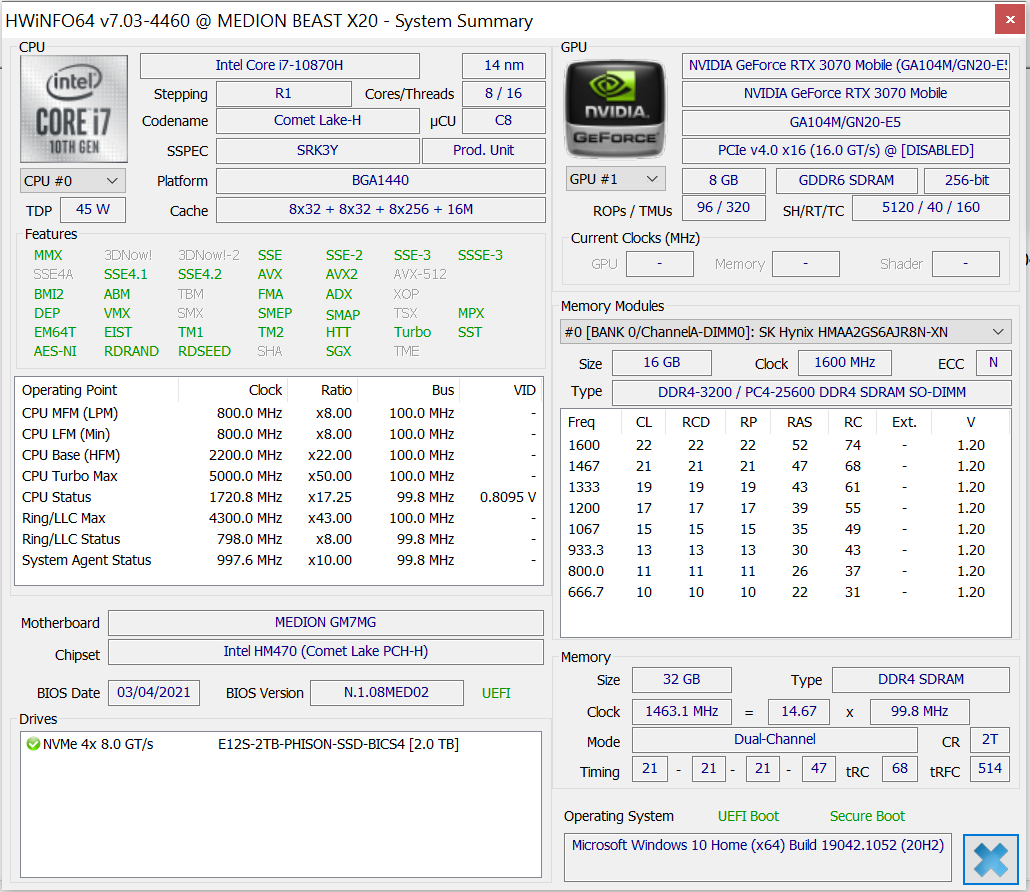
Processor
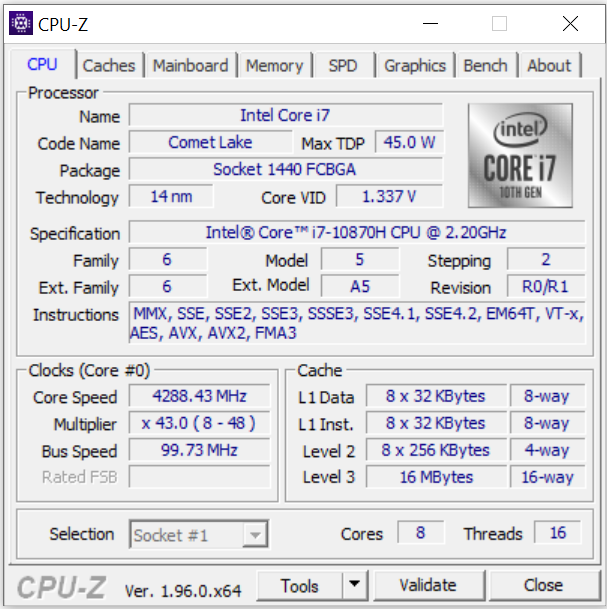
The Core i7-10870H eight-core processor (Comet Lake) works with a base clock of 2.2 GHz. An increase to 4.2 GHz (eight cores) to 5 GHz (one core) is possible via Turbo. Hyperthreading (two threads per core) is supported.
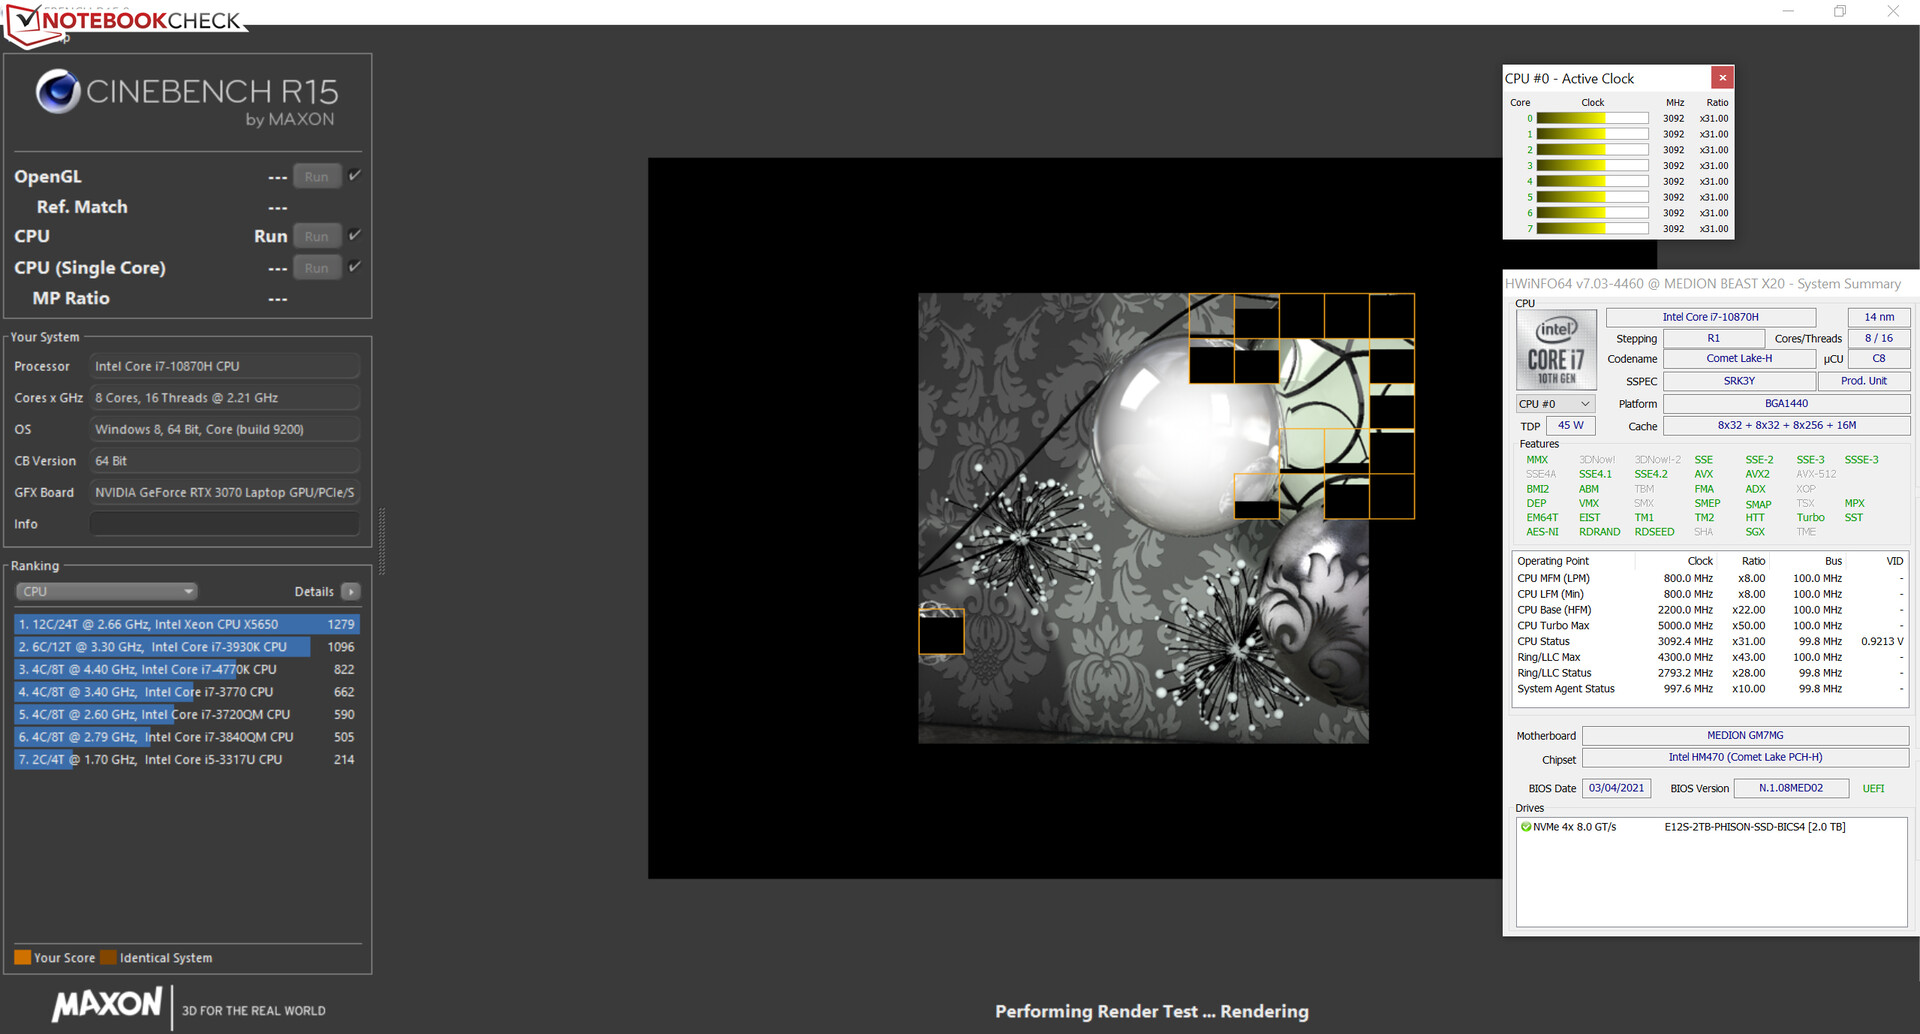
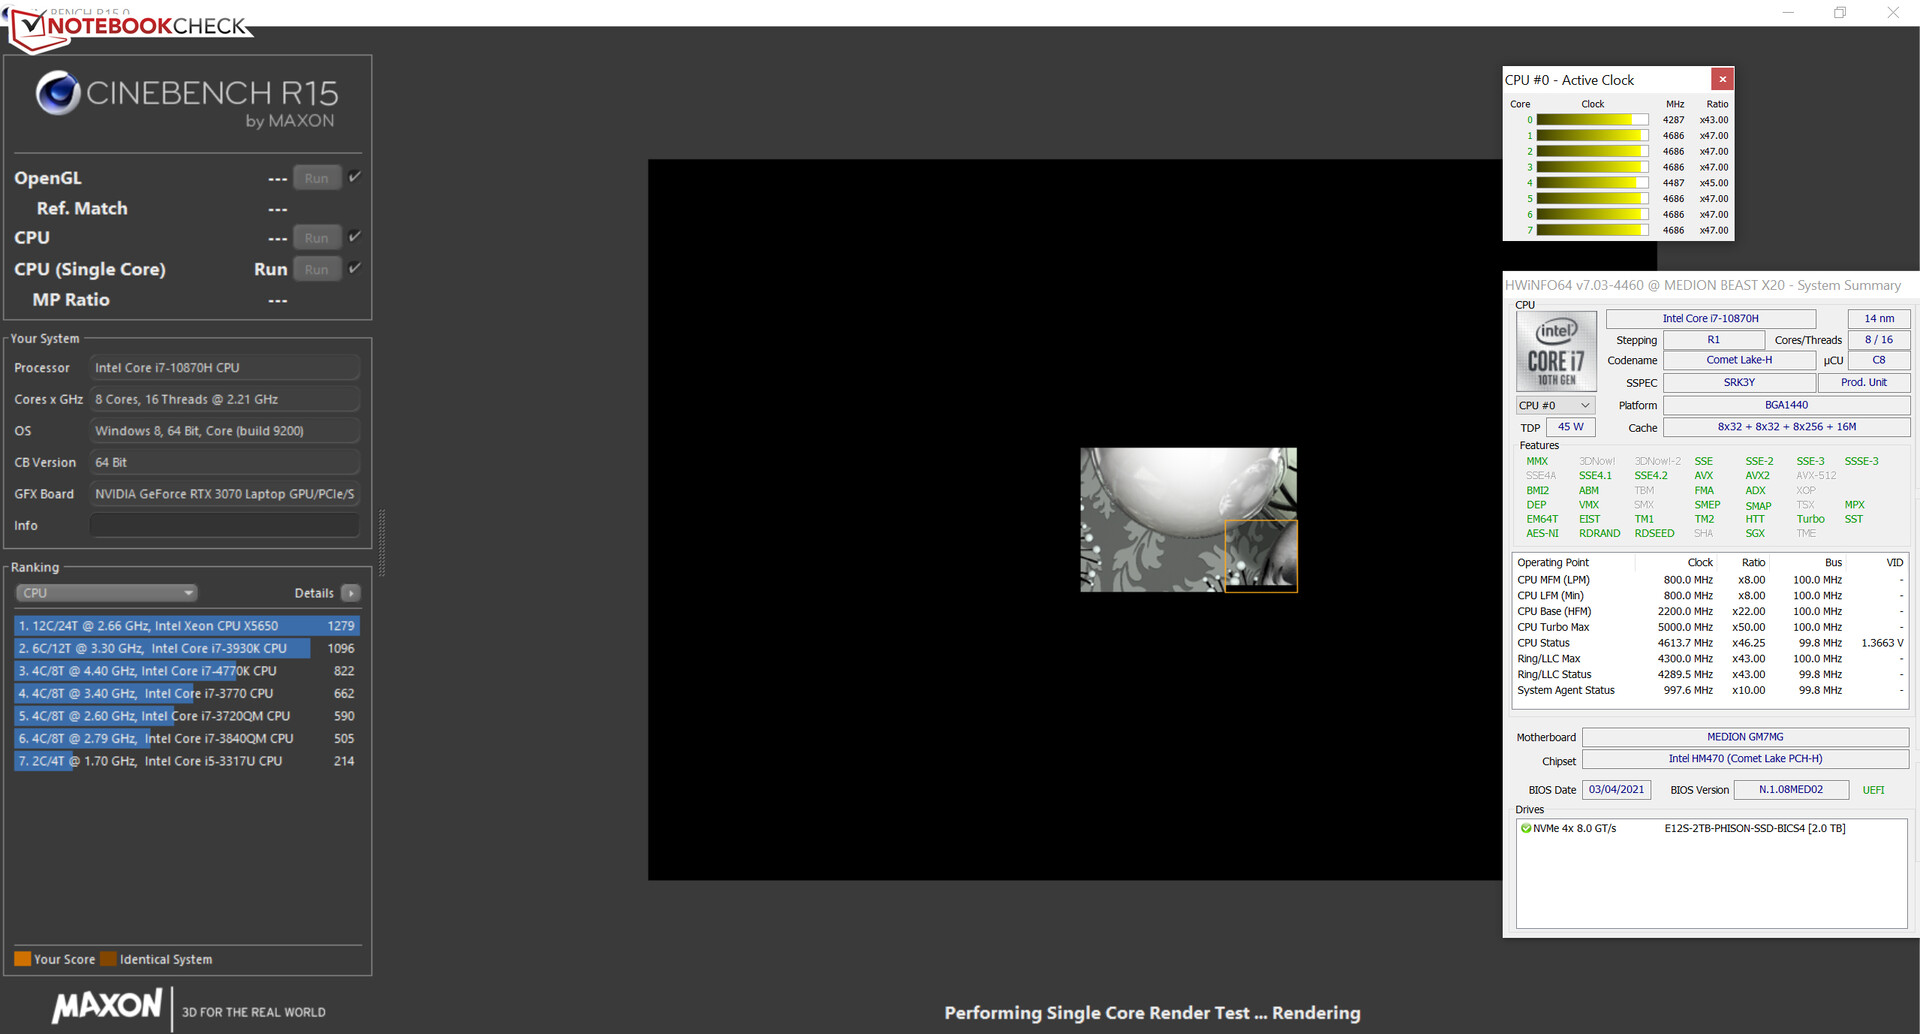
The processor runs the CPU tests of the Cinebench R15 benchmark with 2.2 to 3.8 GHz (multi-thread) and 4 to 4.7 GHz (single-thread). In battery mode, the CPU runs at 2.3 to 2.5 GHz (multi-thread) and 1.8 to 3.8 GHz (single-thread).
Despite two additional CPU cores, the Core i7 achieves roughly the same test results as the one in the Erazer Beast X10, a Core i7-10750H six-core processor (Comet Lake). The relatively low power limits are responsible for this. The power limits would have to be increased via the Control Center for more multi-thread performance. This has hardly any impact on the single-thread performance.
The CPU remains stable at maximum power limits (PL1/PL2: 120 watts). We additionally ran some benchmarks under these conditions. The results can be found in the comparison tables.
We check whether the CPU Turbo is used permanently in mains operation by running the multi-thread test of the Cinebench R15 benchmark in a loop for at least 30 minutes. The Turbo is used on medium level. Increasing the power limits to 120 watts causes the Turbo clock to increase.
| Performance rating - Percent | |
| Average of class Gaming | |
| Aorus 17G YD | |
| Schenker XMG Neo 17 (Early 2021, RTX 3070, 5800H) | |
| Medion Erazer Beast X20 | |
| Average Intel Core i7-10870H | |
| Medion Erazer Beast X20 | |
| Medion Erazer Beast X10 MD61804 -2! | |
| MSI GP76 Leopard 10UG -2! | |
| Cinebench R23 | |
| Single Core | |
| Average of class Gaming (1166 - 2356, n=112, last 2 years) | |
| Aorus 17G YD | |
| Schenker XMG Neo 17 (Early 2021, RTX 3070, 5800H) | |
| Medion Erazer Beast X20 | |
| Medion Erazer Beast X20 (PL1/2 120W) | |
| Average Intel Core i7-10870H (1177 - 1253, n=12) | |
| Medion Erazer Beast X10 MD61804 | |
| Multi Core | |
| Average of class Gaming (10488 - 40970, n=112, last 2 years) | |
| Aorus 17G YD | |
| Schenker XMG Neo 17 (Early 2021, RTX 3070, 5800H) | |
| Medion Erazer Beast X20 (PL1/2 120W) | |
| Average Intel Core i7-10870H (8250 - 10450, n=12) | |
| Medion Erazer Beast X20 | |
| Medion Erazer Beast X10 MD61804 | |
| Cinebench R20 | |
| CPU (Single Core) | |
| Average of class Gaming (442 - 895, n=111, last 2 years) | |
| Aorus 17G YD | |
| Schenker XMG Neo 17 (Early 2021, RTX 3070, 5800H) | |
| Medion Erazer Beast X20 (PL1/2 120W) | |
| Average Intel Core i7-10870H (460 - 484, n=12) | |
| Medion Erazer Beast X20 | |
| MSI GP76 Leopard 10UG | |
| CPU (Multi Core) | |
| Average of class Gaming (4029 - 16108, n=111, last 2 years) | |
| Aorus 17G YD | |
| Schenker XMG Neo 17 (Early 2021, RTX 3070, 5800H) | |
| Medion Erazer Beast X20 (PL1/2 120W) | |
| Average Intel Core i7-10870H (3027 - 4020, n=12) | |
| Medion Erazer Beast X20 | |
| MSI GP76 Leopard 10UG | |
| Cinebench R15 | |
| CPU Single 64Bit | |
| Average of class Gaming (188.8 - 343, n=111, last 2 years) | |
| Schenker XMG Neo 17 (Early 2021, RTX 3070, 5800H) | |
| Aorus 17G YD | |
| Medion Erazer Beast X20 | |
| Average Intel Core i7-10870H (196 - 204, n=11) | |
| Medion Erazer Beast X20 (PL1/2 120W) | |
| MSI GP76 Leopard 10UG | |
| Medion Erazer Beast X10 MD61804 | |
| CPU Multi 64Bit | |
| Average of class Gaming (1578 - 6271, n=112, last 2 years) | |
| Schenker XMG Neo 17 (Early 2021, RTX 3070, 5800H) | |
| Aorus 17G YD | |
| Medion Erazer Beast X20 (PL1/2 120W) | |
| Average Intel Core i7-10870H (1336 - 1740, n=14) | |
| Medion Erazer Beast X10 MD61804 | |
| Medion Erazer Beast X20 | |
| MSI GP76 Leopard 10UG | |
| Blender - v2.79 BMW27 CPU | |
| MSI GP76 Leopard 10UG | |
| Medion Erazer Beast X20 | |
| Medion Erazer Beast X10 MD61804 | |
| Average Intel Core i7-10870H (272 - 333, n=12) | |
| Aorus 17G YD | |
| Medion Erazer Beast X20 (PL1/2 120W) | |
| Schenker XMG Neo 17 (Early 2021, RTX 3070, 5800H) | |
| Average of class Gaming (80 - 330, n=109, last 2 years) | |
| Geekbench 5.5 | |
| Single-Core | |
| Average of class Gaming (986 - 2474, n=110, last 2 years) | |
| Aorus 17G YD | |
| Schenker XMG Neo 17 (Early 2021, RTX 3070, 5800H) | |
| Medion Erazer Beast X10 MD61804 | |
| MSI GP76 Leopard 10UG | |
| Medion Erazer Beast X20 (PL1/2 120W) | |
| Average Intel Core i7-10870H (1191 - 1295, n=12) | |
| Medion Erazer Beast X20 | |
| Multi-Core | |
| Average of class Gaming (6460 - 27010, n=110, last 2 years) | |
| Aorus 17G YD | |
| Schenker XMG Neo 17 (Early 2021, RTX 3070, 5800H) | |
| Medion Erazer Beast X20 (PL1/2 120W) | |
| Average Intel Core i7-10870H (6403 - 7882, n=12) | |
| Medion Erazer Beast X10 MD61804 | |
| Medion Erazer Beast X20 | |
| MSI GP76 Leopard 10UG | |
| HWBOT x265 Benchmark v2.2 - 4k Preset | |
| Average of class Gaming (11.5 - 44.3, n=110, last 2 years) | |
| Aorus 17G YD | |
| Schenker XMG Neo 17 (Early 2021, RTX 3070, 5800H) | |
| Medion Erazer Beast X20 (PL1/2 120W) | |
| Average Intel Core i7-10870H (10.7 - 13.5, n=12) | |
| Medion Erazer Beast X10 MD61804 | |
| Medion Erazer Beast X20 | |
| MSI GP76 Leopard 10UG | |
| LibreOffice - 20 Documents To PDF | |
| Average Intel Core i7-10870H (46 - 64.4, n=12) | |
| Medion Erazer Beast X20 | |
| Medion Erazer Beast X20 (PL1/2 120W) | |
| MSI GP76 Leopard 10UG | |
| Schenker XMG Neo 17 (Early 2021, RTX 3070, 5800H) | |
| Average of class Gaming (19 - 88.8, n=110, last 2 years) | |
| Medion Erazer Beast X10 MD61804 | |
| Aorus 17G YD | |
| R Benchmark 2.5 - Overall mean | |
| Medion Erazer Beast X20 | |
| Medion Erazer Beast X20 (PL1/2 120W) | |
| Medion Erazer Beast X10 MD61804 | |
| MSI GP76 Leopard 10UG | |
| Average Intel Core i7-10870H (0.573 - 0.614, n=12) | |
| Aorus 17G YD | |
| Schenker XMG Neo 17 (Early 2021, RTX 3070, 5800H) | |
| Average of class Gaming (0.3439 - 0.759, n=111, last 2 years) | |
* ... smaller is better
System performance
The nimble and smoothly working system offers enough computing power for performance demanding applications like gaming for years. This is complemented by good PCMark results.
| PCMark 8 Home Score Accelerated v2 | 4011 points | |
| PCMark 8 Creative Score Accelerated v2 | 6129 points | |
| PCMark 8 Work Score Accelerated v2 | 5405 points | |
| PCMark 10 Score | 5908 points | |
Help | ||
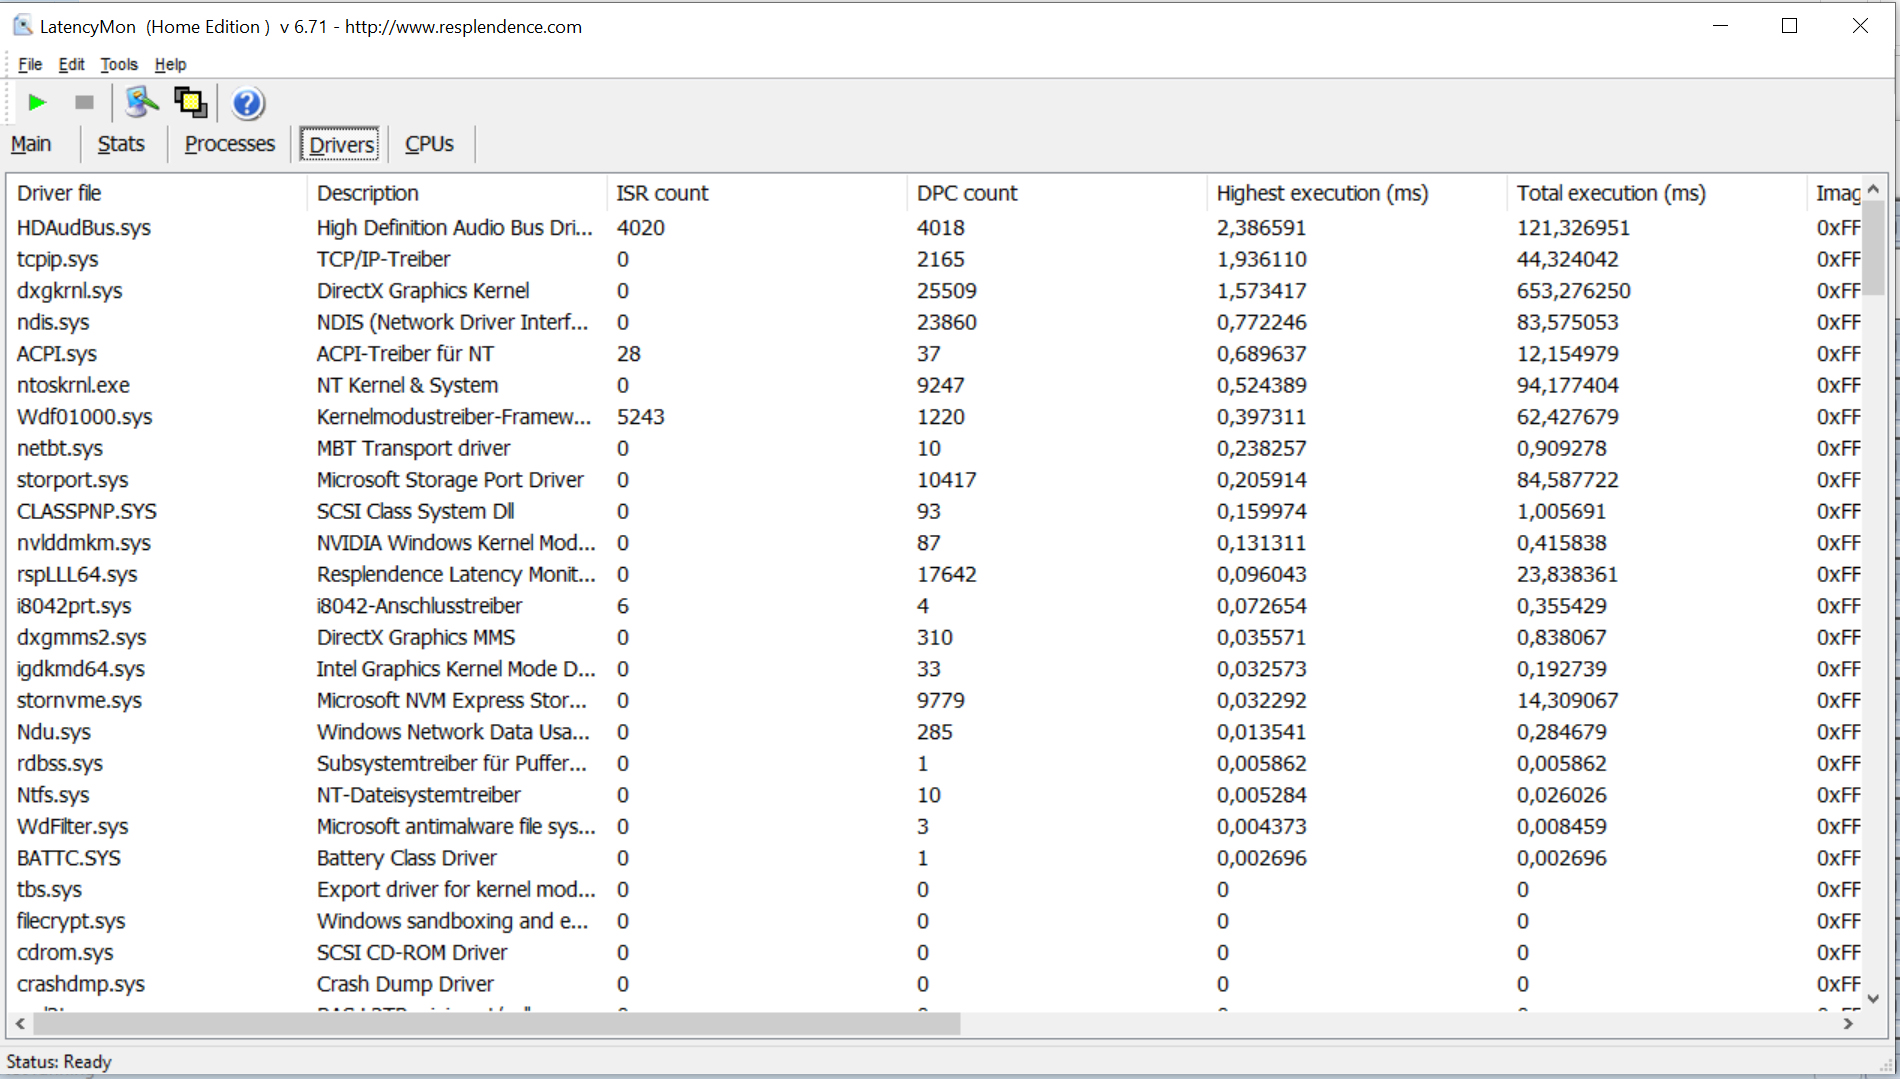
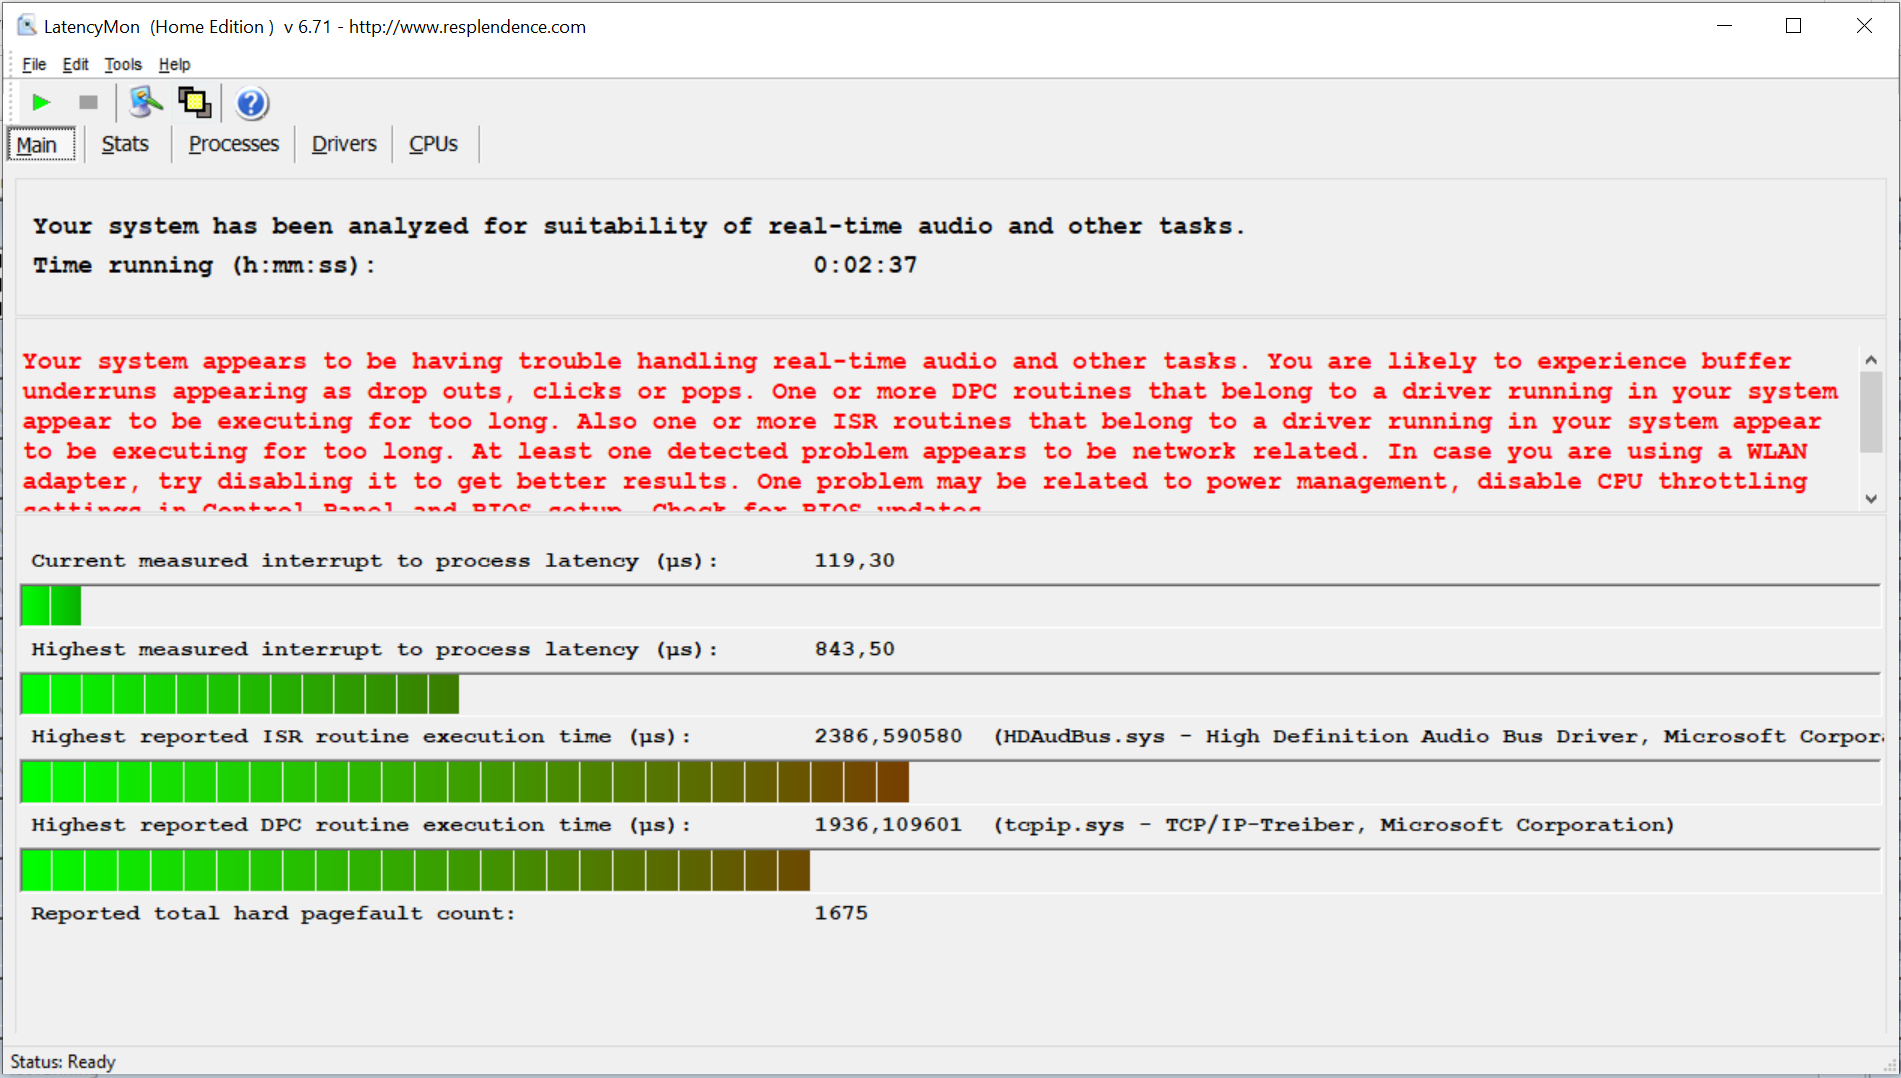
DPC latencies
The standardized latency monitor test (web surfing, 4K video playback, Prime95 high-load) revealed conspicuous DPC latencies. The system does not seem to be suitable for real-time video and audio editing.
| DPC Latencies / LatencyMon - interrupt to process latency (max), Web, Youtube, Prime95 | |
| Schenker XMG Neo 17 (Early 2021, RTX 3070, 5800H) | |
| MSI GP76 Leopard 10UG | |
| Aorus 17G YD | |
| Medion Erazer Beast X20 | |
| Medion Erazer Beast X10 MD61804 | |
* ... smaller is better
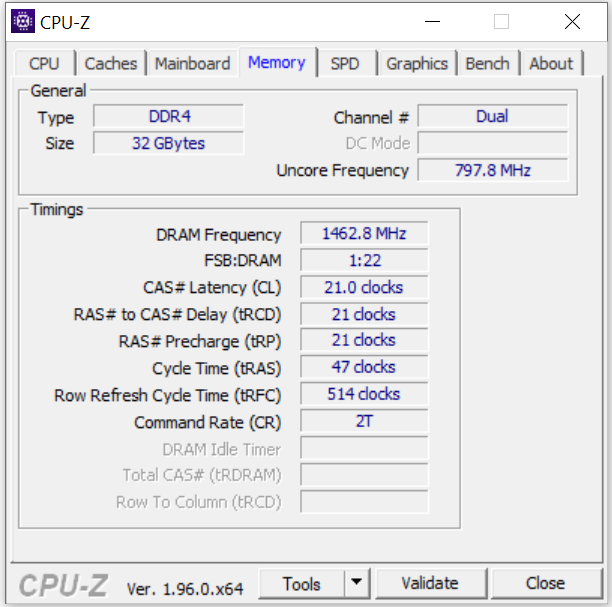
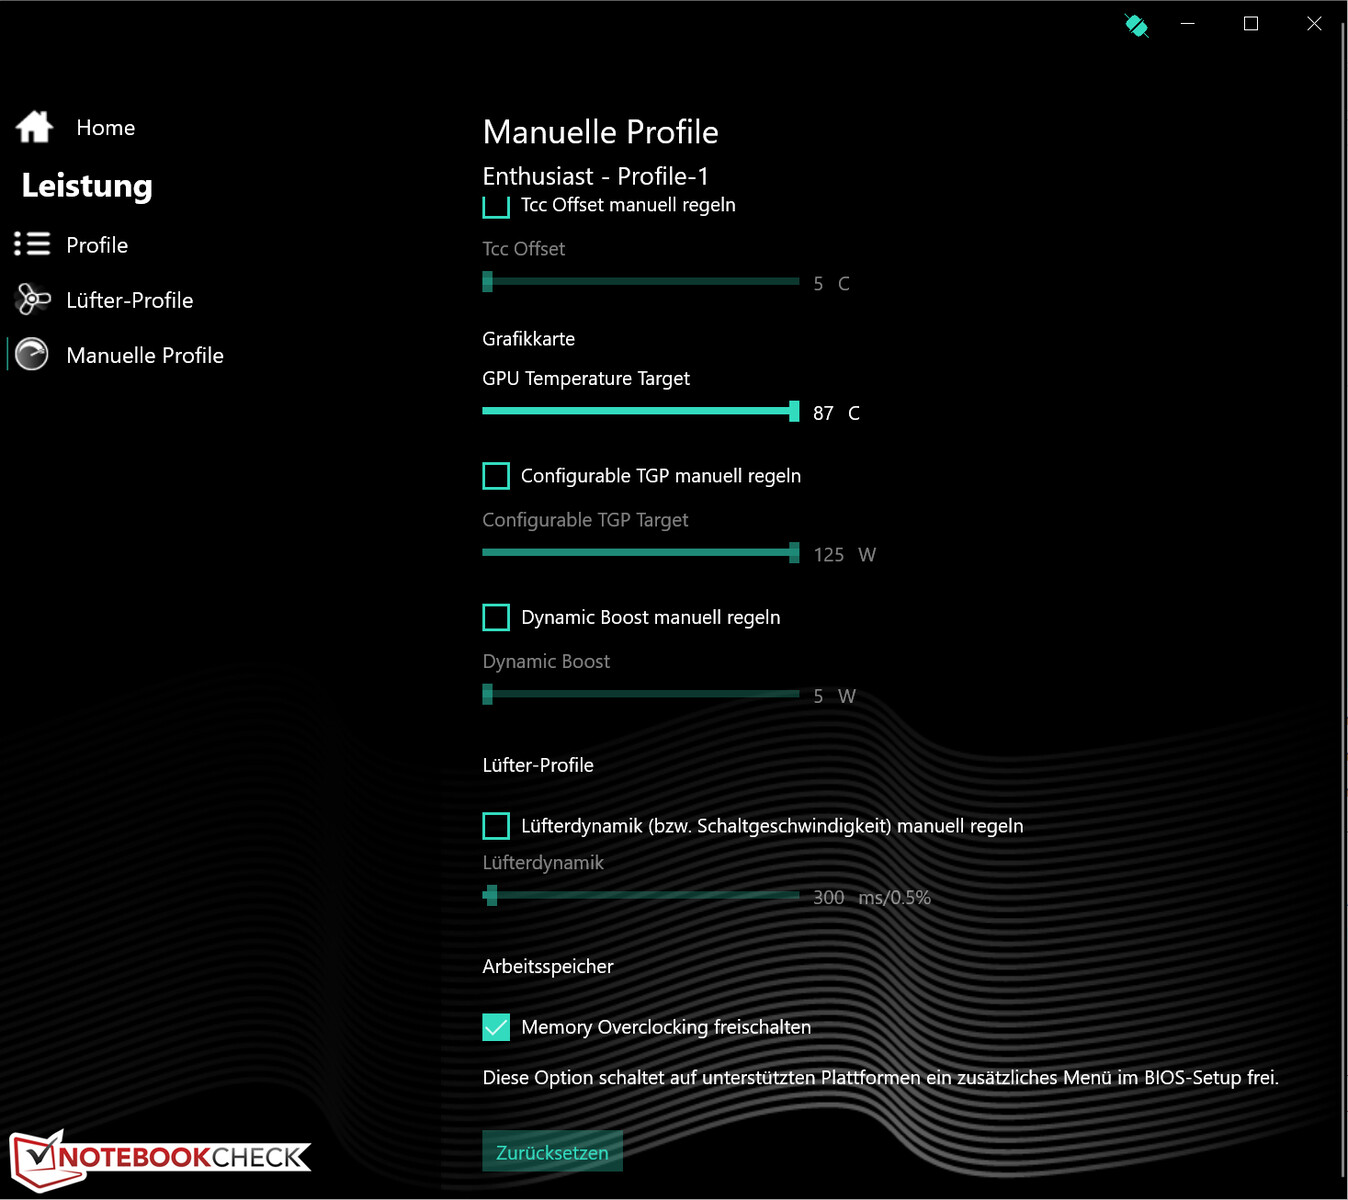
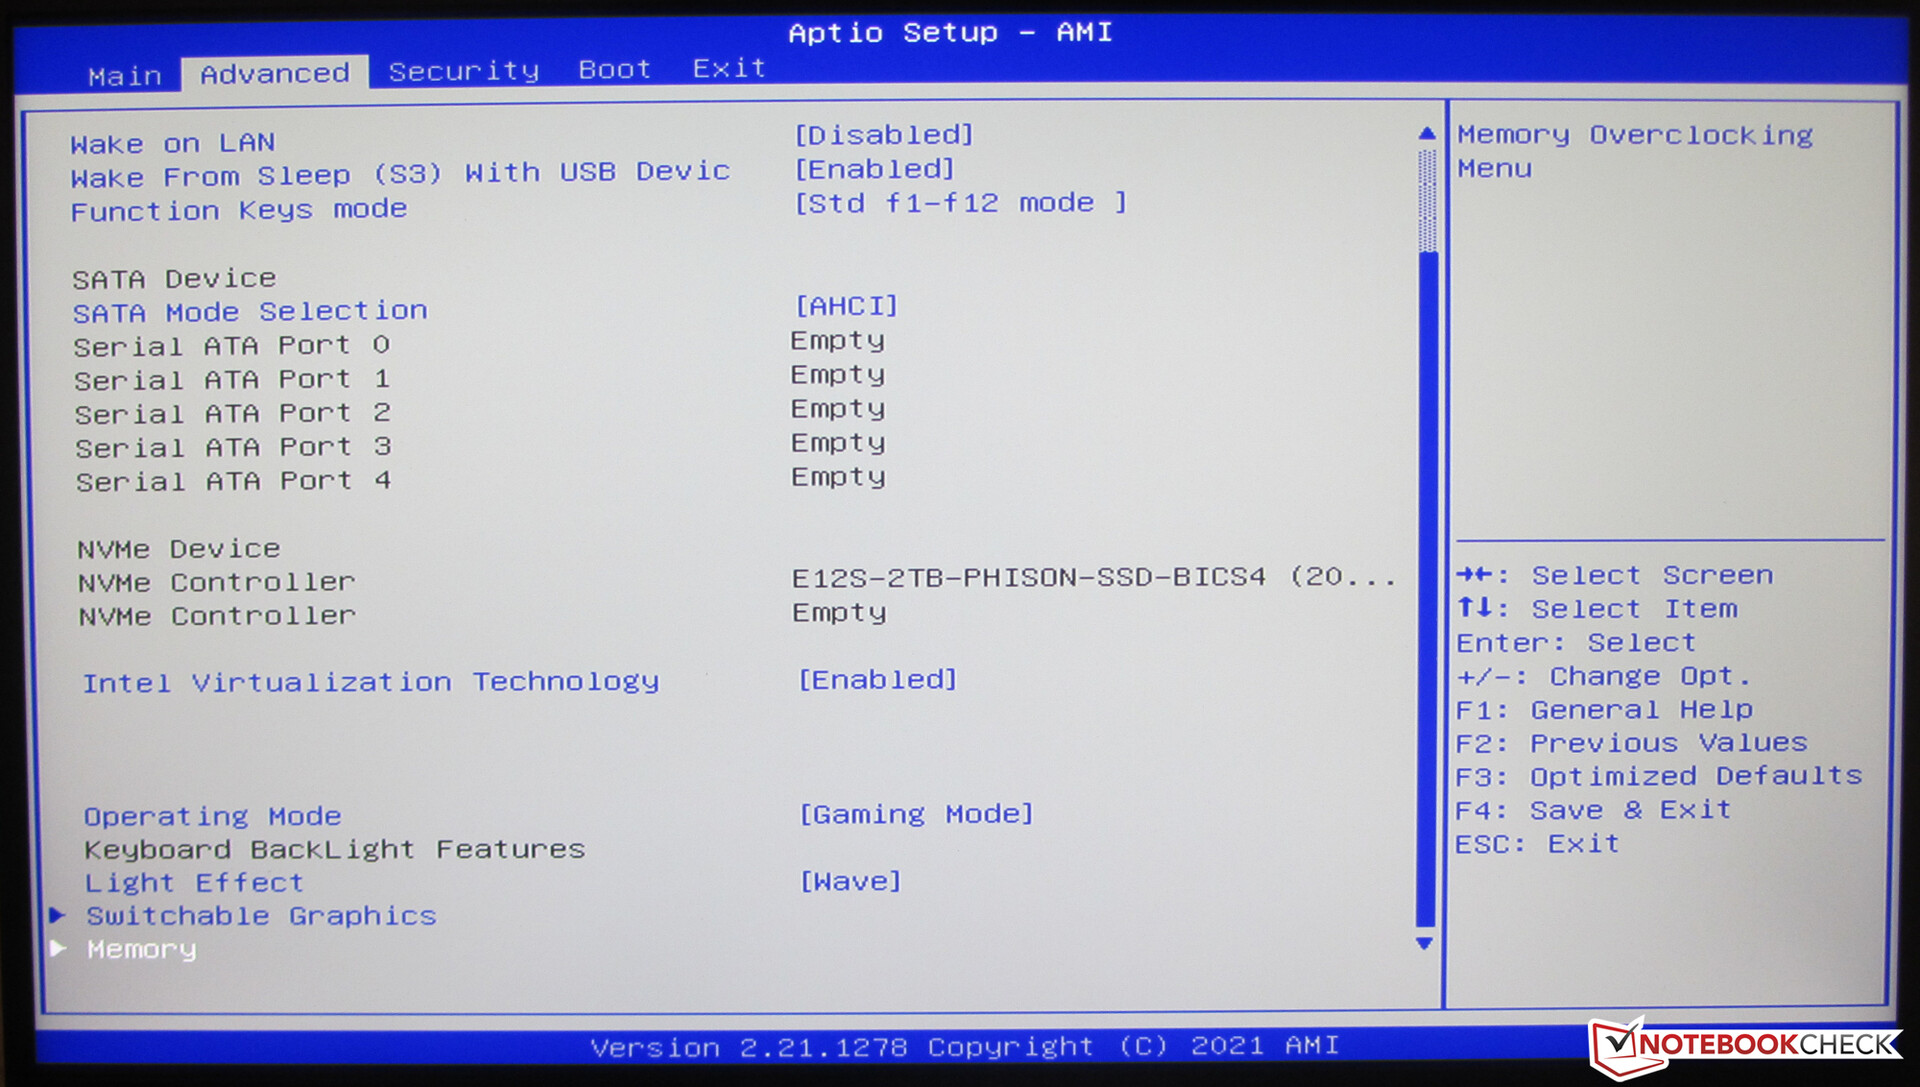
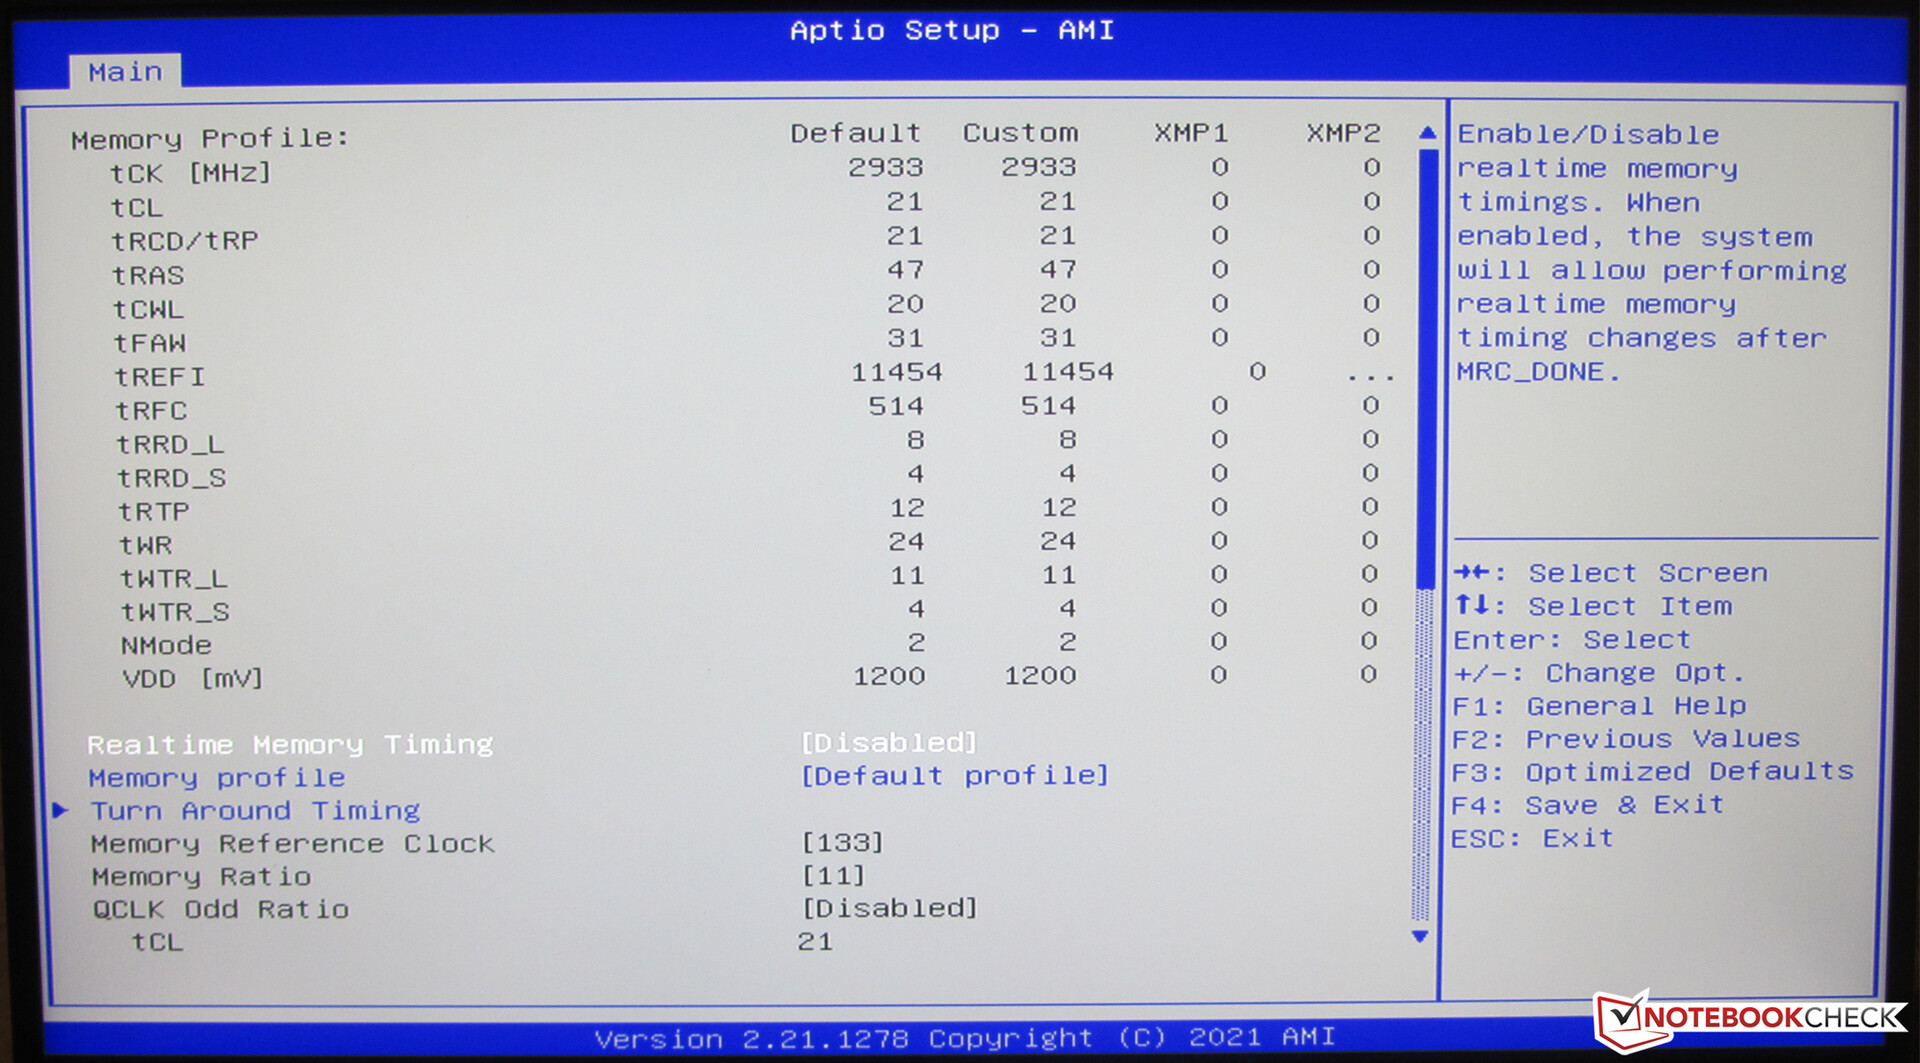
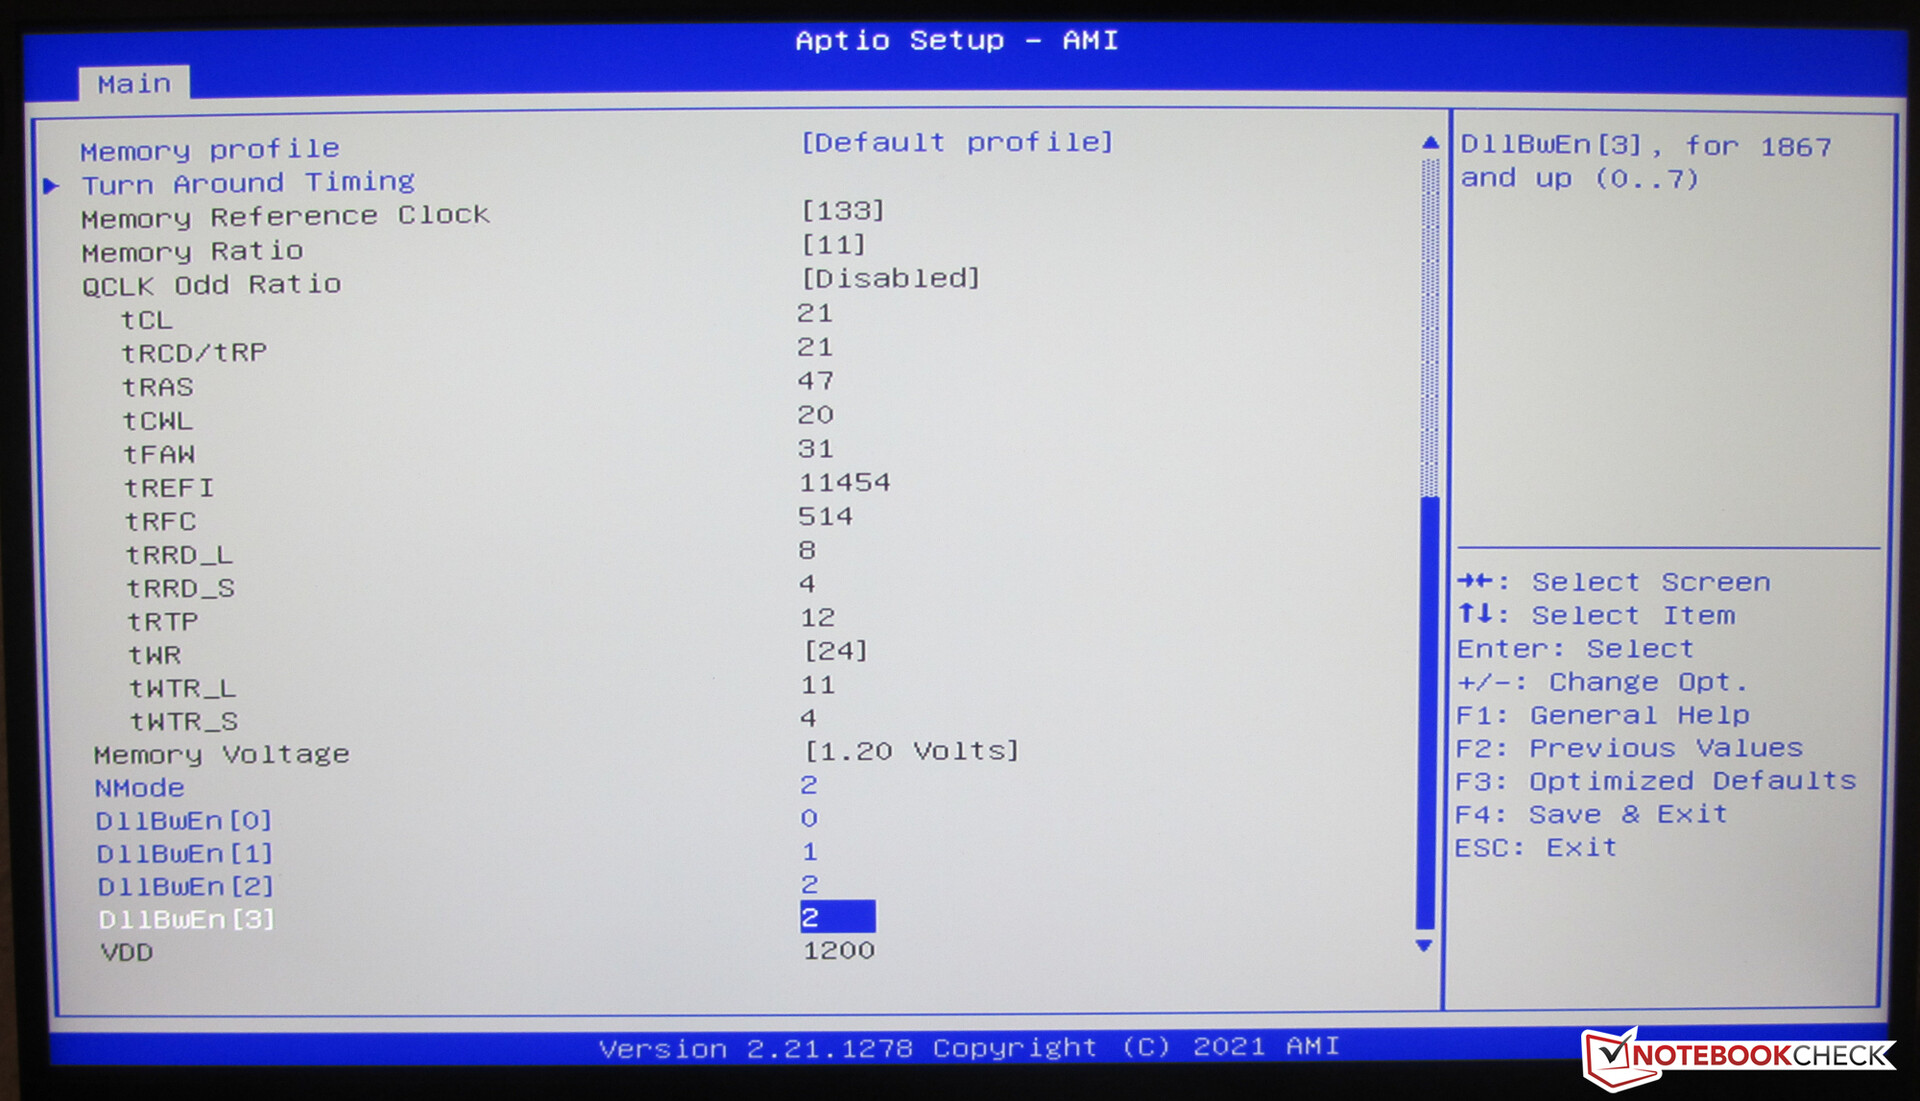
The overclocking of the working memory would be possible
The BIOS of the computer offers the possibility of memory overclocking. The whole thing is done at your own risk. Possible damage would be the owner's responsibility. However, the corresponding overclocking option has to be enabled via the Control Center first.
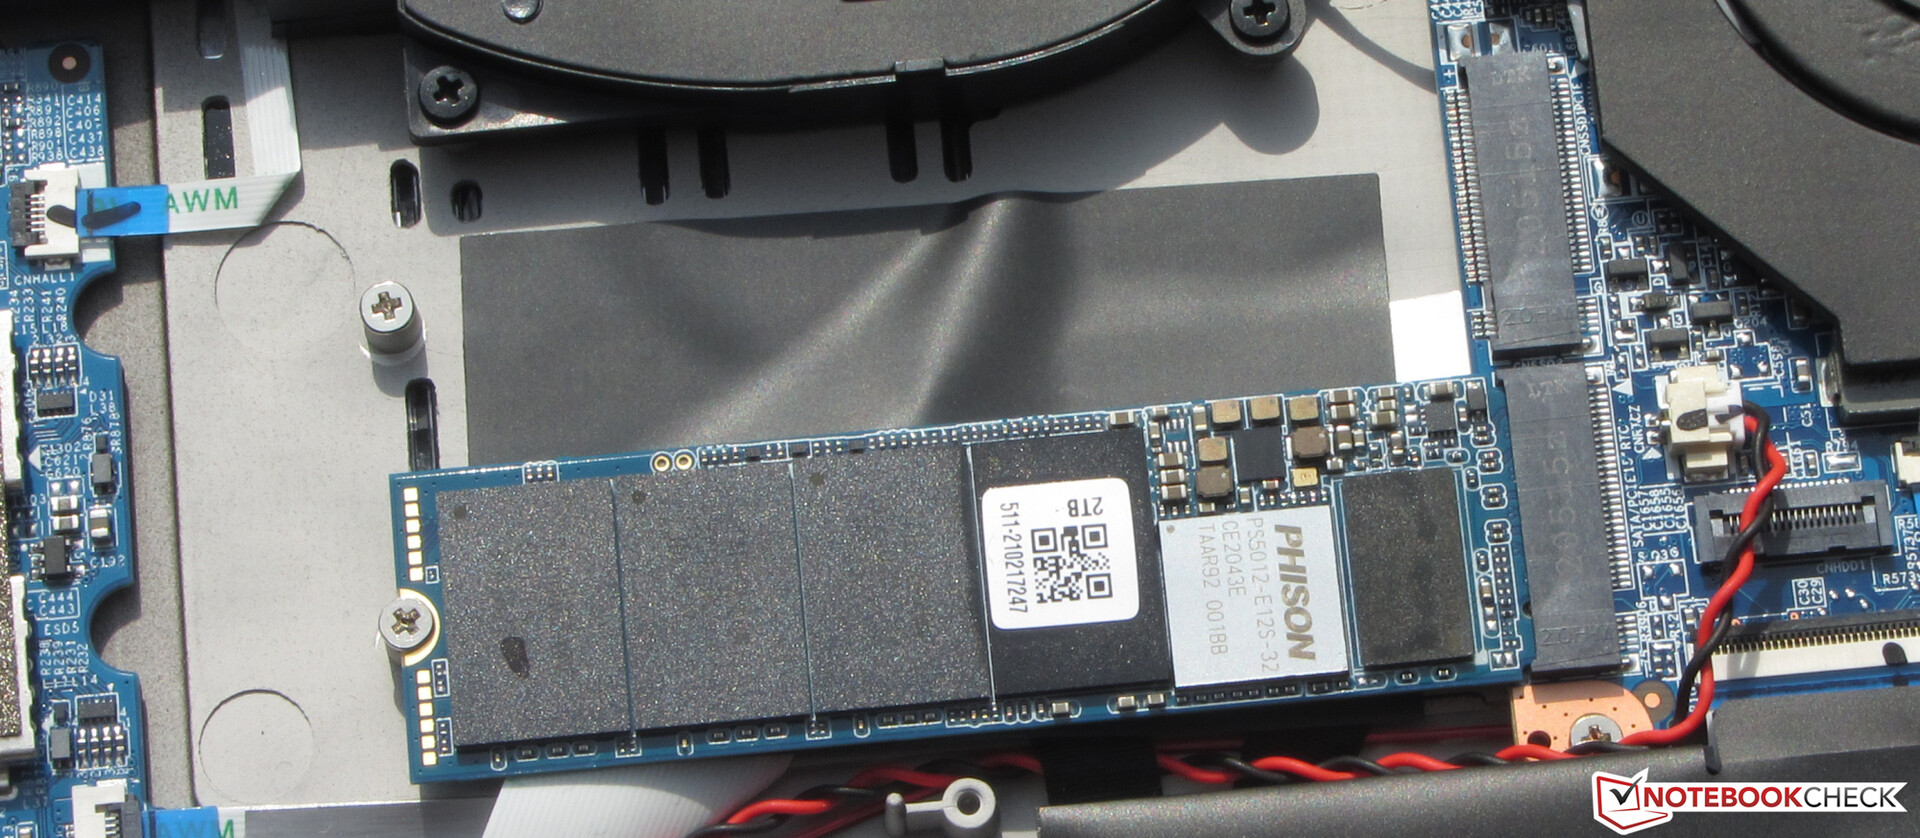
Mass storage
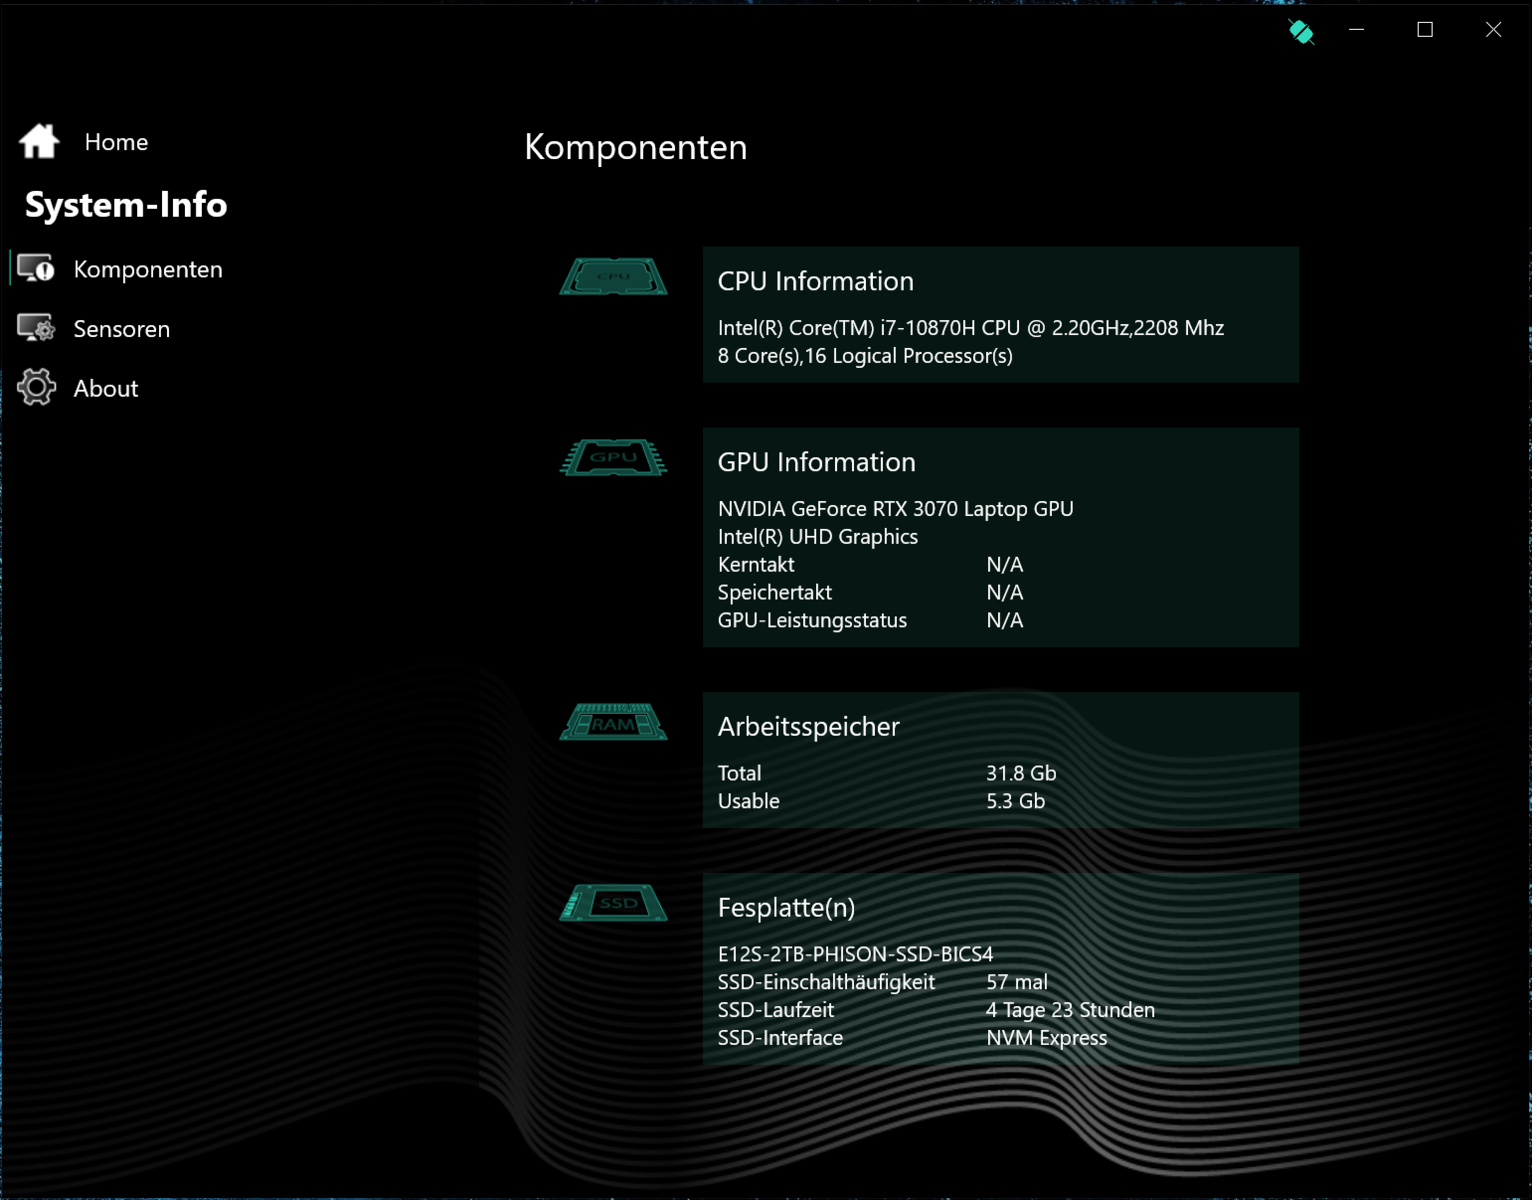
An NVMe SSD (M.2-2280) from Phison serves as the system drive. It provides 2 TB of storage space and delivers very good transfer rates. The notebook still has room for a second NVMe-SSD.

| Medion Erazer Beast X20 Phison E12S-2TB-Phison-SSD-BICS4 | Schenker XMG Neo 17 (Early 2021, RTX 3070, 5800H) Samsung SSD 970 EVO Plus 500GB | MSI GP76 Leopard 10UG Kingston OM8PCP3512F-AB | Aorus 17G YD Samsung PM9A1 MZVL2512HCJQ | Medion Erazer Beast X10 MD61804 Samsung PM981a MZVLB1T0HBLR | |
|---|---|---|---|---|---|
| CrystalDiskMark 5.2 / 6 | 29% | -29% | 62% | -8% | |
| Write 4K (MB/s) | 155.5 | 206.1 33% | 143.7 -8% | 227.4 46% | 151 -3% |
| Read 4K (MB/s) | 47.96 | 53 11% | 45.1 -6% | 91.3 90% | 49.29 3% |
| Write Seq (MB/s) | 1591 | 3018 90% | 978 -39% | 2241 41% | 1109 -30% |
| Read Seq (MB/s) | 1371 | 2575 88% | 1163 -15% | 4496 228% | 1049 -23% |
| Write 4K Q32T1 (MB/s) | 532 | 535 1% | 519 -2% | 661 24% | 494.4 -7% |
| Read 4K Q32T1 (MB/s) | 627 | 608 -3% | 302.7 -52% | 712 14% | 569 -9% |
| Write Seq Q32T1 (MB/s) | 3017 | 3242 7% | 981 -67% | 1540 -49% | 3017 0% |
| Read Seq Q32T1 (MB/s) | 3440 | 3617 5% | 1983 -42% | 6806 98% | 3542 3% |
| AS SSD | 14% | -45% | 39% | 1% | |
| Seq Read (MB/s) | 2849 | 3020 6% | 1659 -42% | 5150 81% | 2470 -13% |
| Seq Write (MB/s) | 2831 | 2631 -7% | 921 -67% | 3920 38% | 2473 -13% |
| 4K Read (MB/s) | 51.3 | 60.3 18% | 51 -1% | 46.6 -9% | 50.2 -2% |
| 4K Write (MB/s) | 106.3 | 171.6 61% | 120.1 13% | 145.8 37% | 124.4 17% |
| 4K-64 Read (MB/s) | 1763 | 1410 -20% | 463.5 -74% | 2071 17% | 1711 -3% |
| 4K-64 Write (MB/s) | 2010 | 2324 16% | 909 -55% | 3267 63% | 1848 -8% |
| Access Time Read * (ms) | 0.093 | 0.045 52% | 0.179 -92% | 0.078 16% | 0.039 58% |
| Access Time Write * (ms) | 0.035 | 0.024 31% | 0.032 9% | 0.029 17% | 0.029 17% |
| Score Read (Points) | 2099 | 1773 -16% | 680 -68% | 2633 25% | 2008 -4% |
| Score Write (Points) | 2399 | 2759 15% | 1121 -53% | 2805 17% | 2220 -7% |
| Score Total (Points) | 5573 | 5429 -3% | 2130 -62% | 7716 38% | 5257 -6% |
| Copy ISO MB/s (MB/s) | 1601 | 3190 99% | 1909 19% | ||
| Copy Program MB/s (MB/s) | 645 | 987 53% | 588 -9% | ||
| Copy Game MB/s (MB/s) | 1328 | 2096 58% | 975 -27% | ||
| Total Average (Program / Settings) | 22% /
20% | -37% /
-38% | 51% /
47% | -4% /
-2% |
* ... smaller is better
Continuous load read: DiskSpd Read Loop, Queue Depth 8
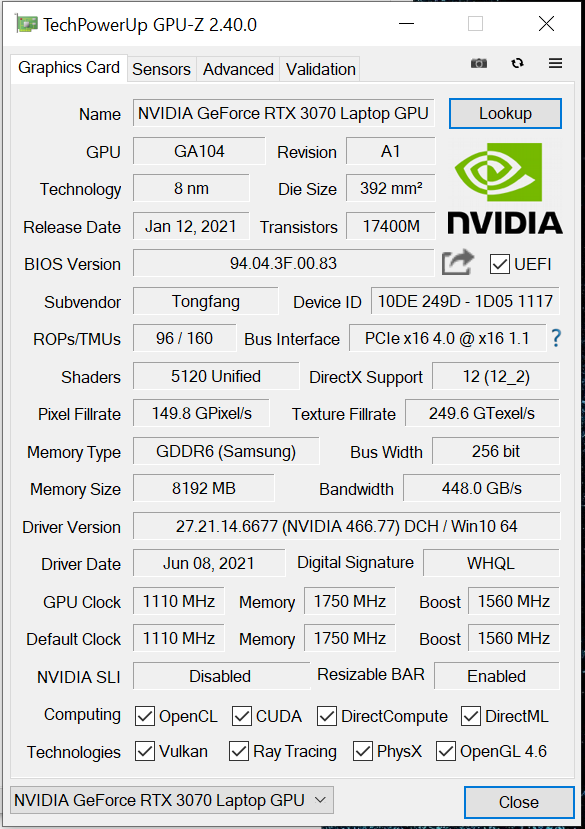
Graphics card
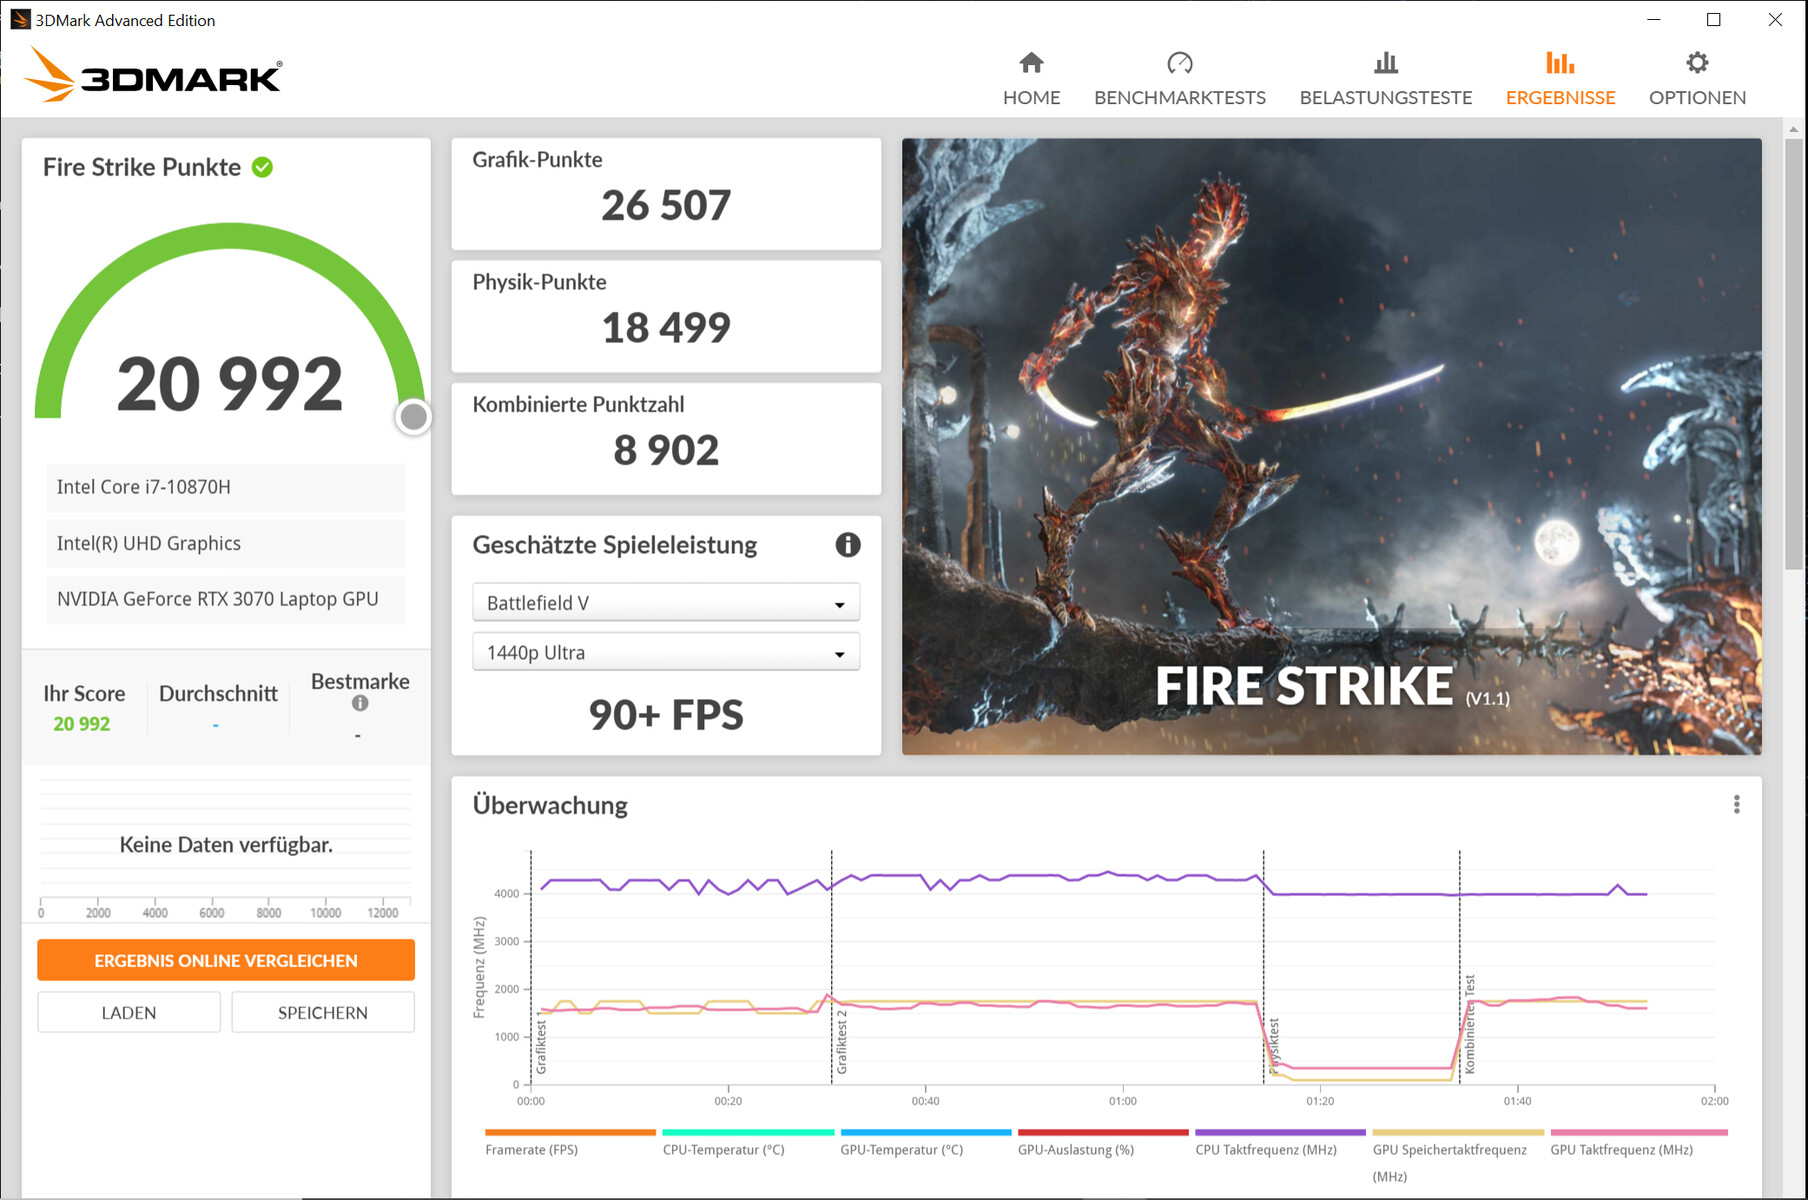
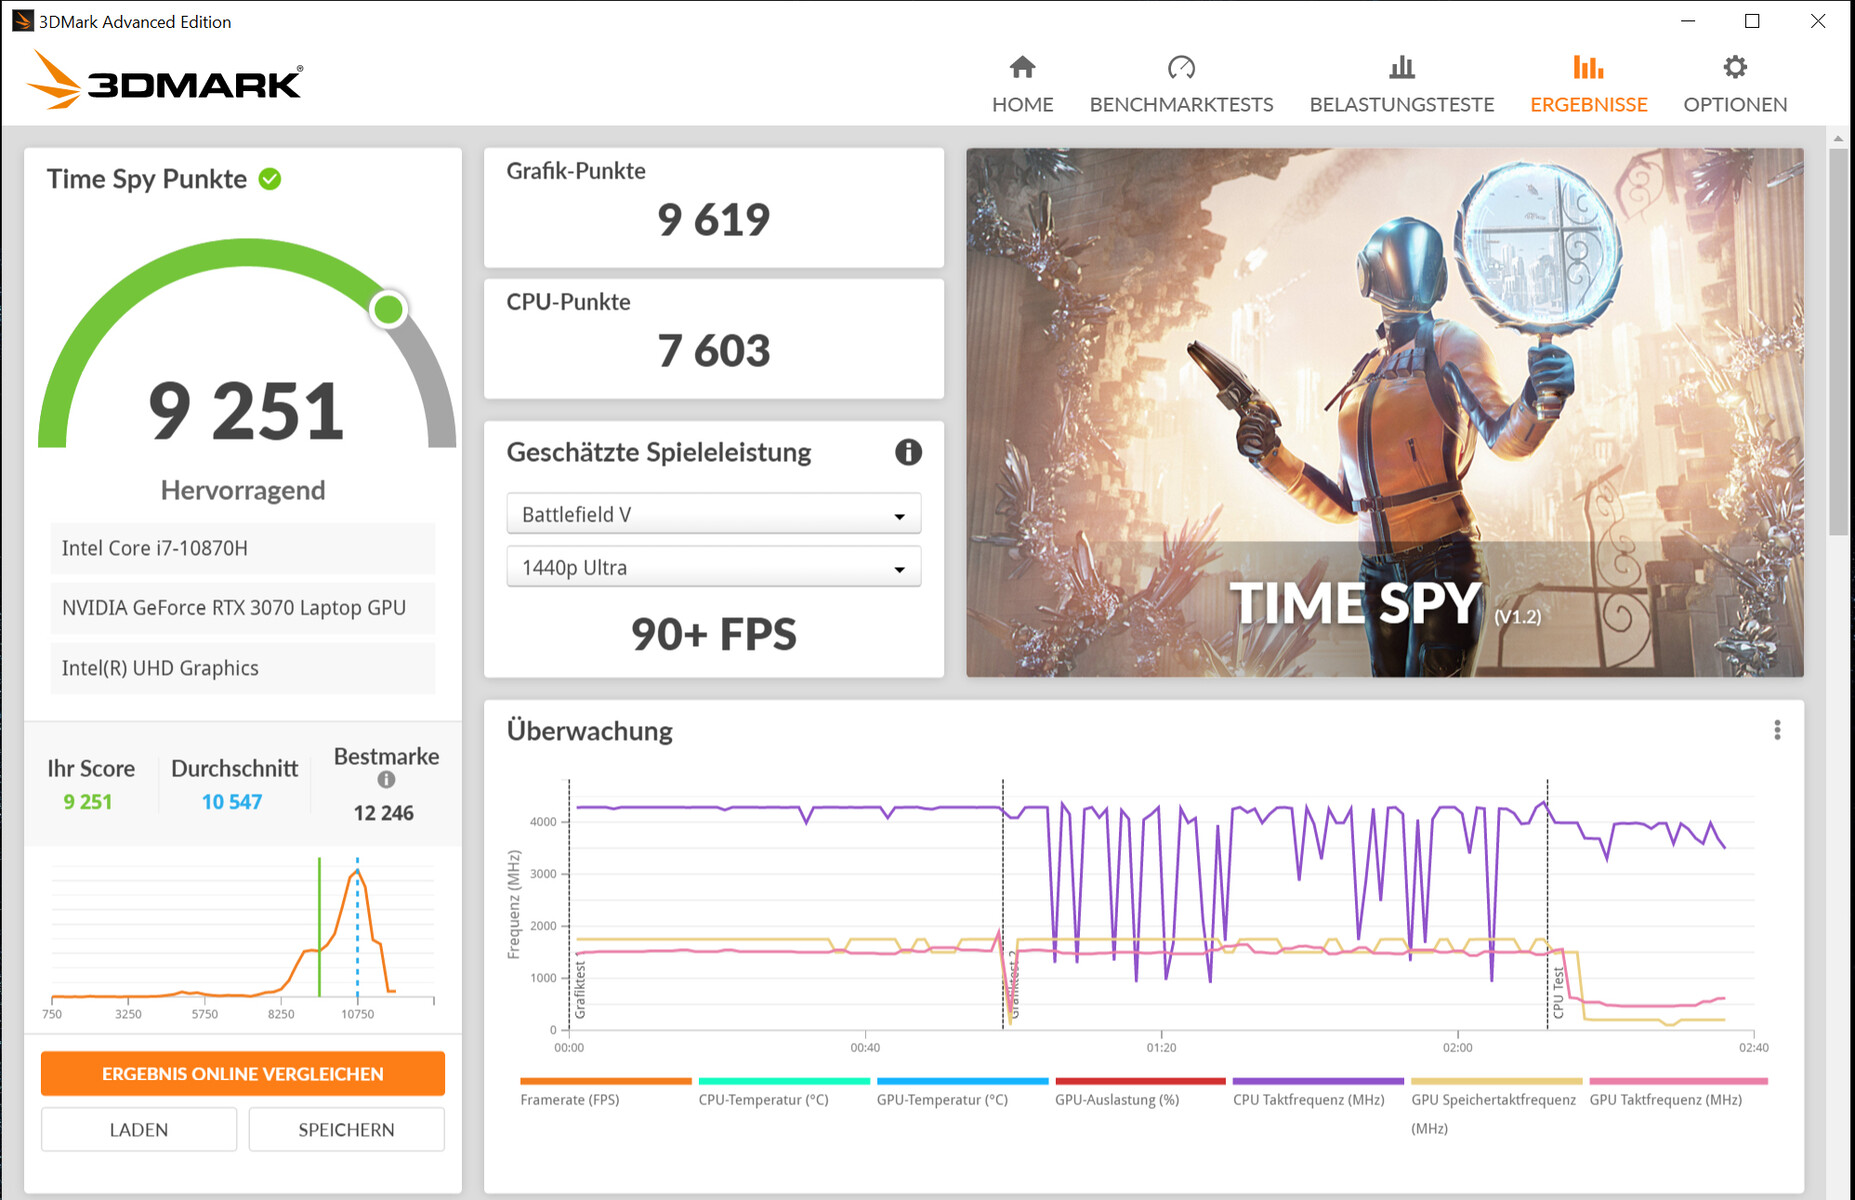
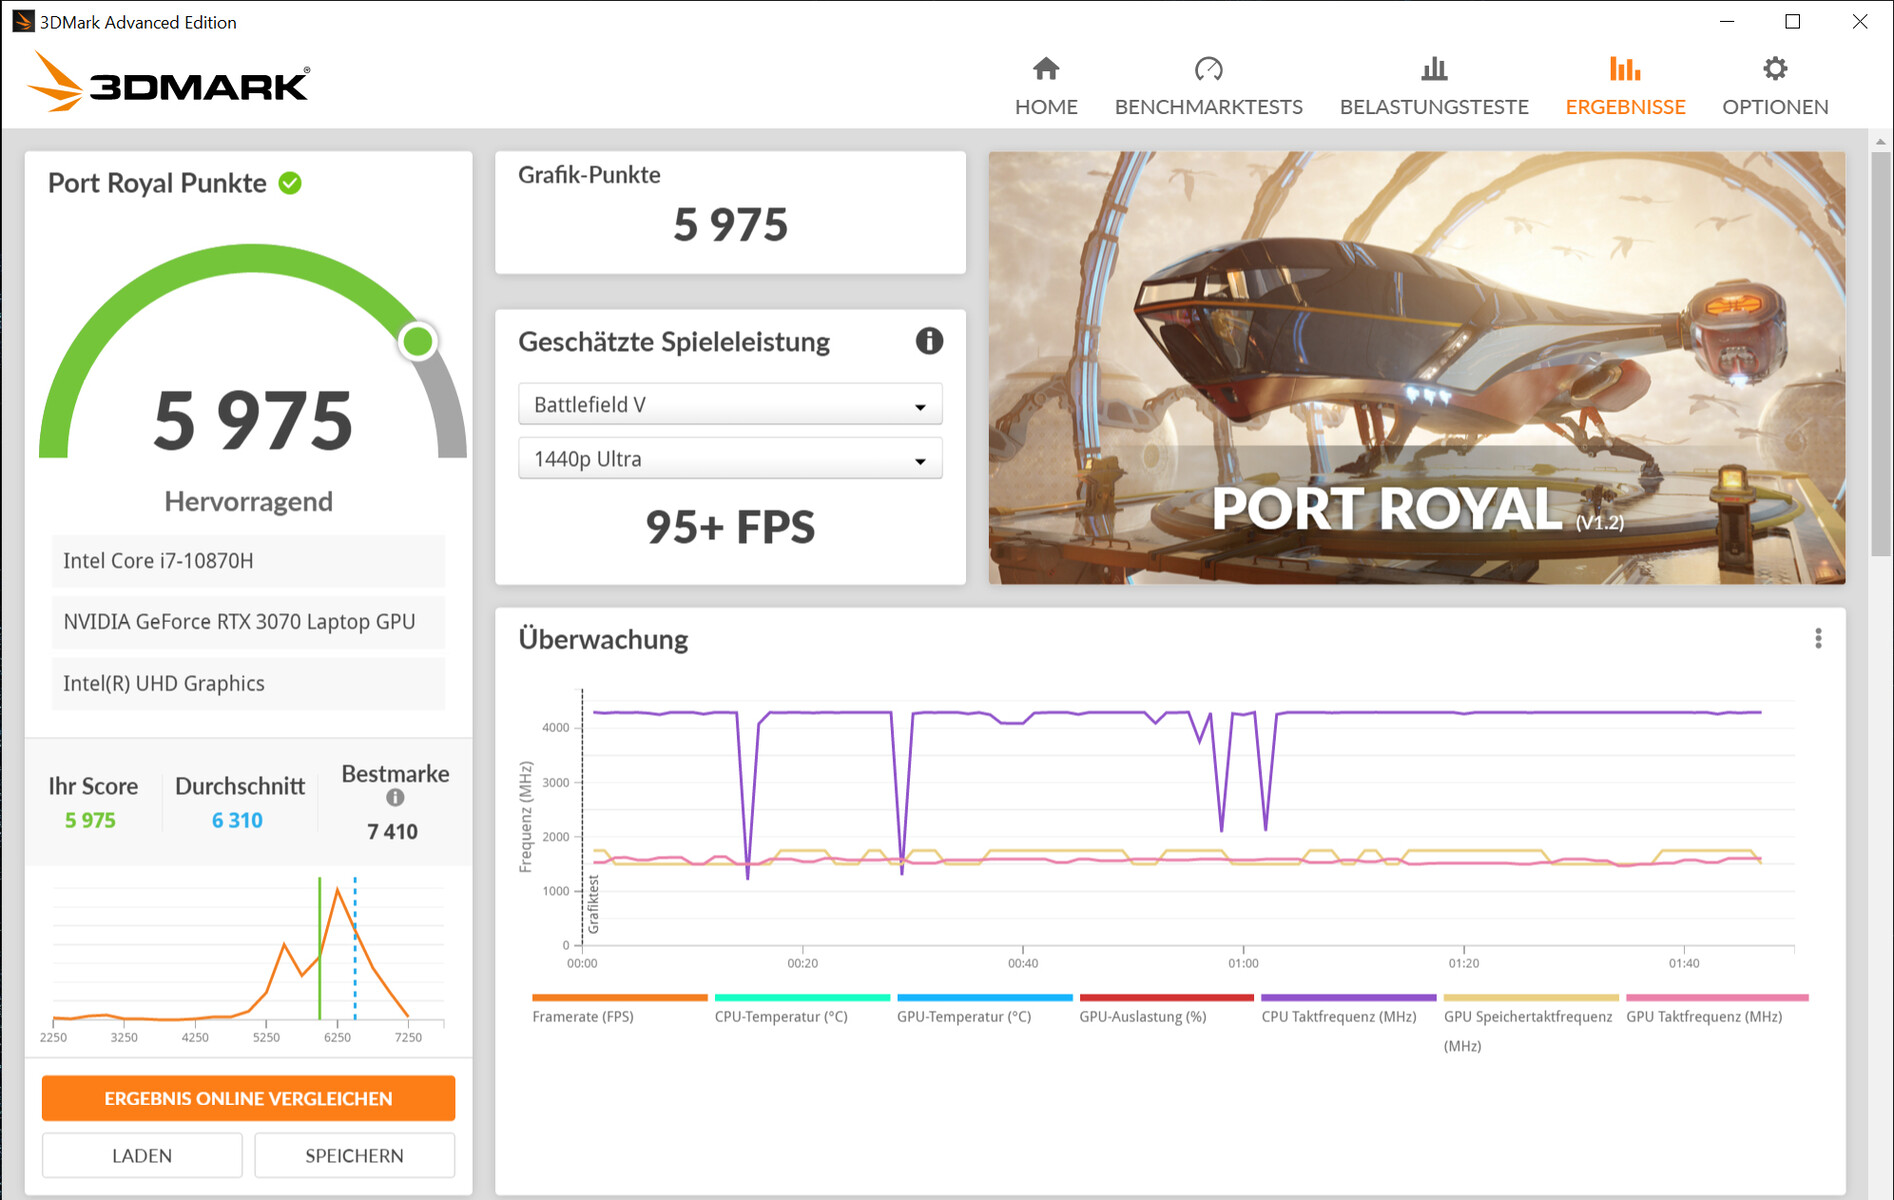
The actual performance of an RTX-3000 graphics core depends on the maximum TGP that a notebook manufacturer chooses within the limits defined by Nvidia. Medion grants the GeForce-RTX-3070-Laptop-GPU (Overview of all RTX-3070 laptops including the TGPs) the possible TGP maximum of 140 watts (125 watts + 15 watts Dynamic Boost).
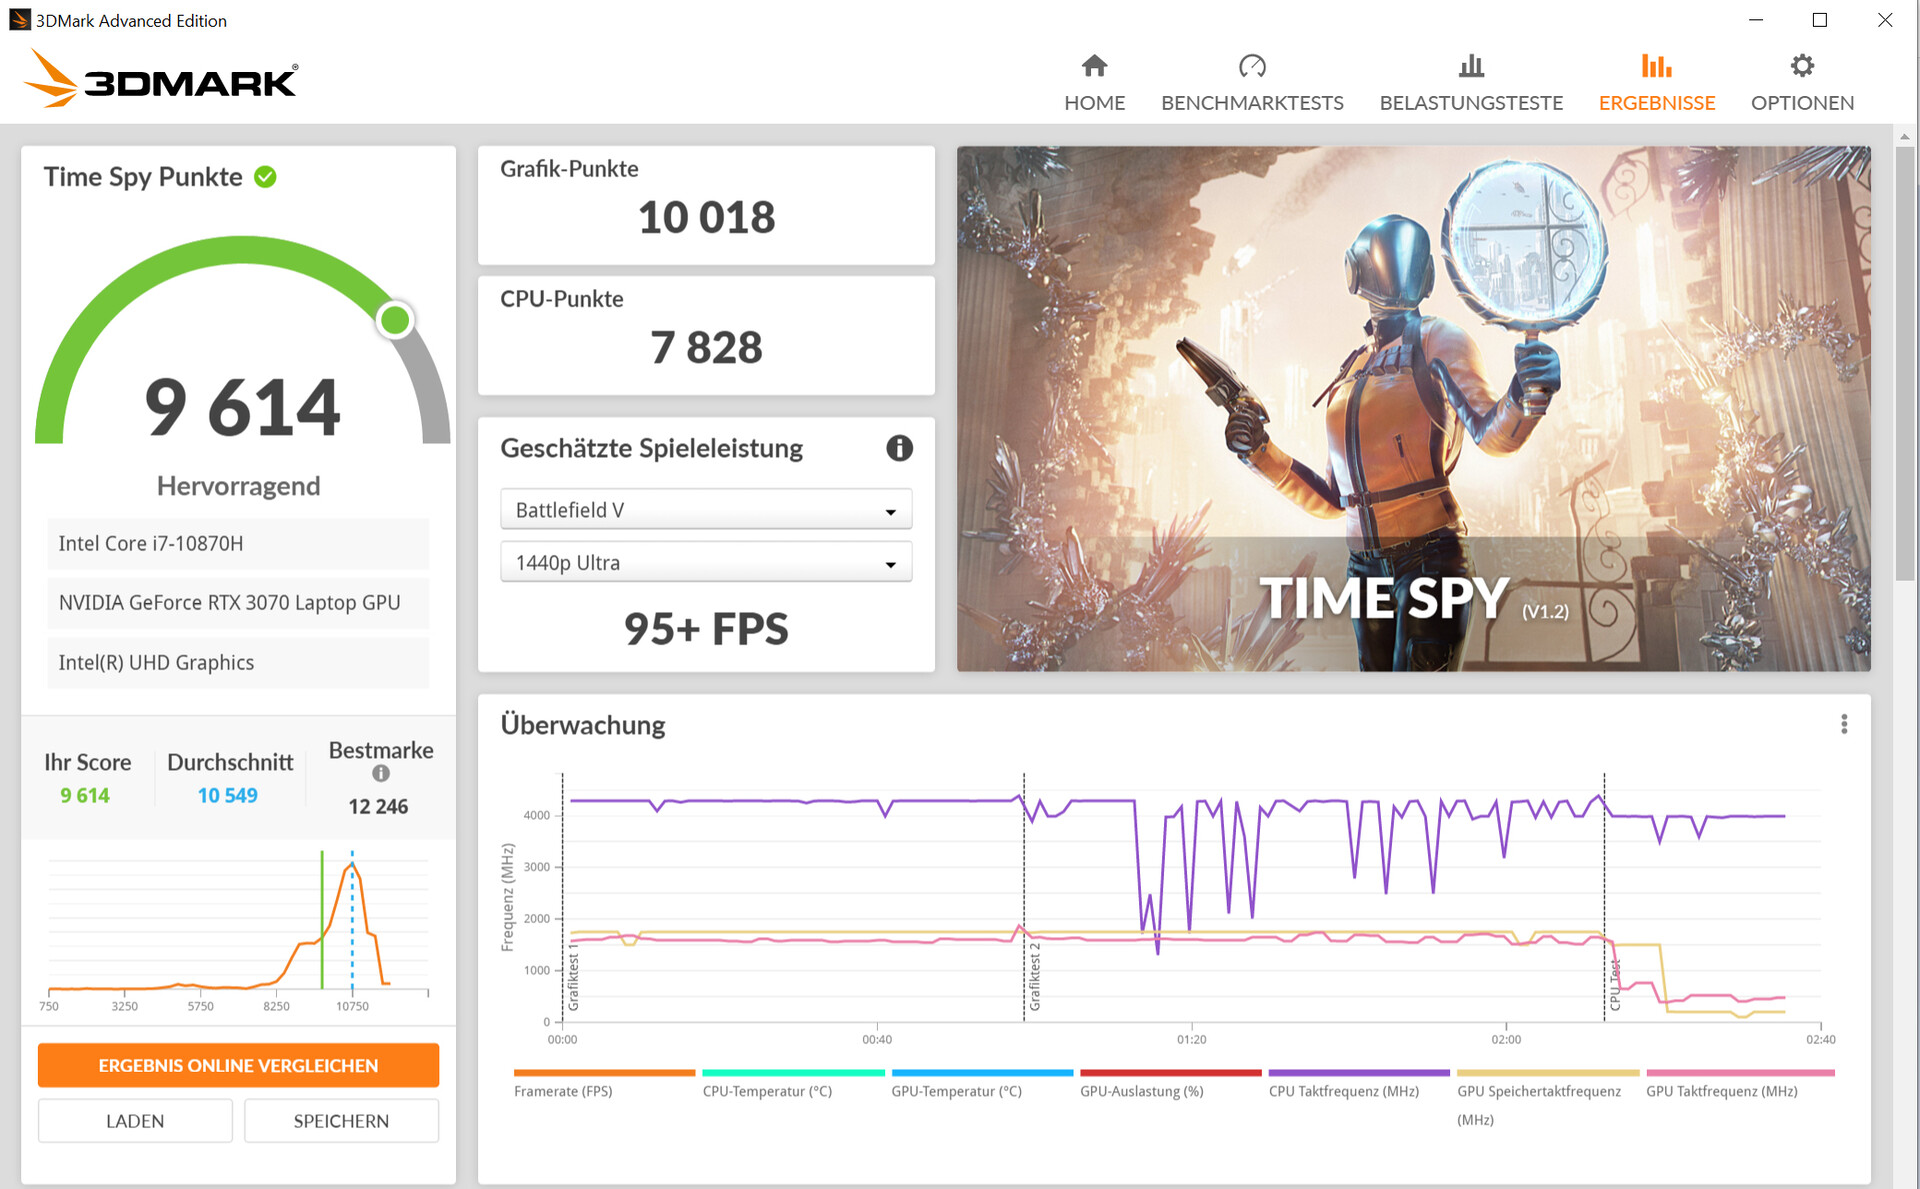
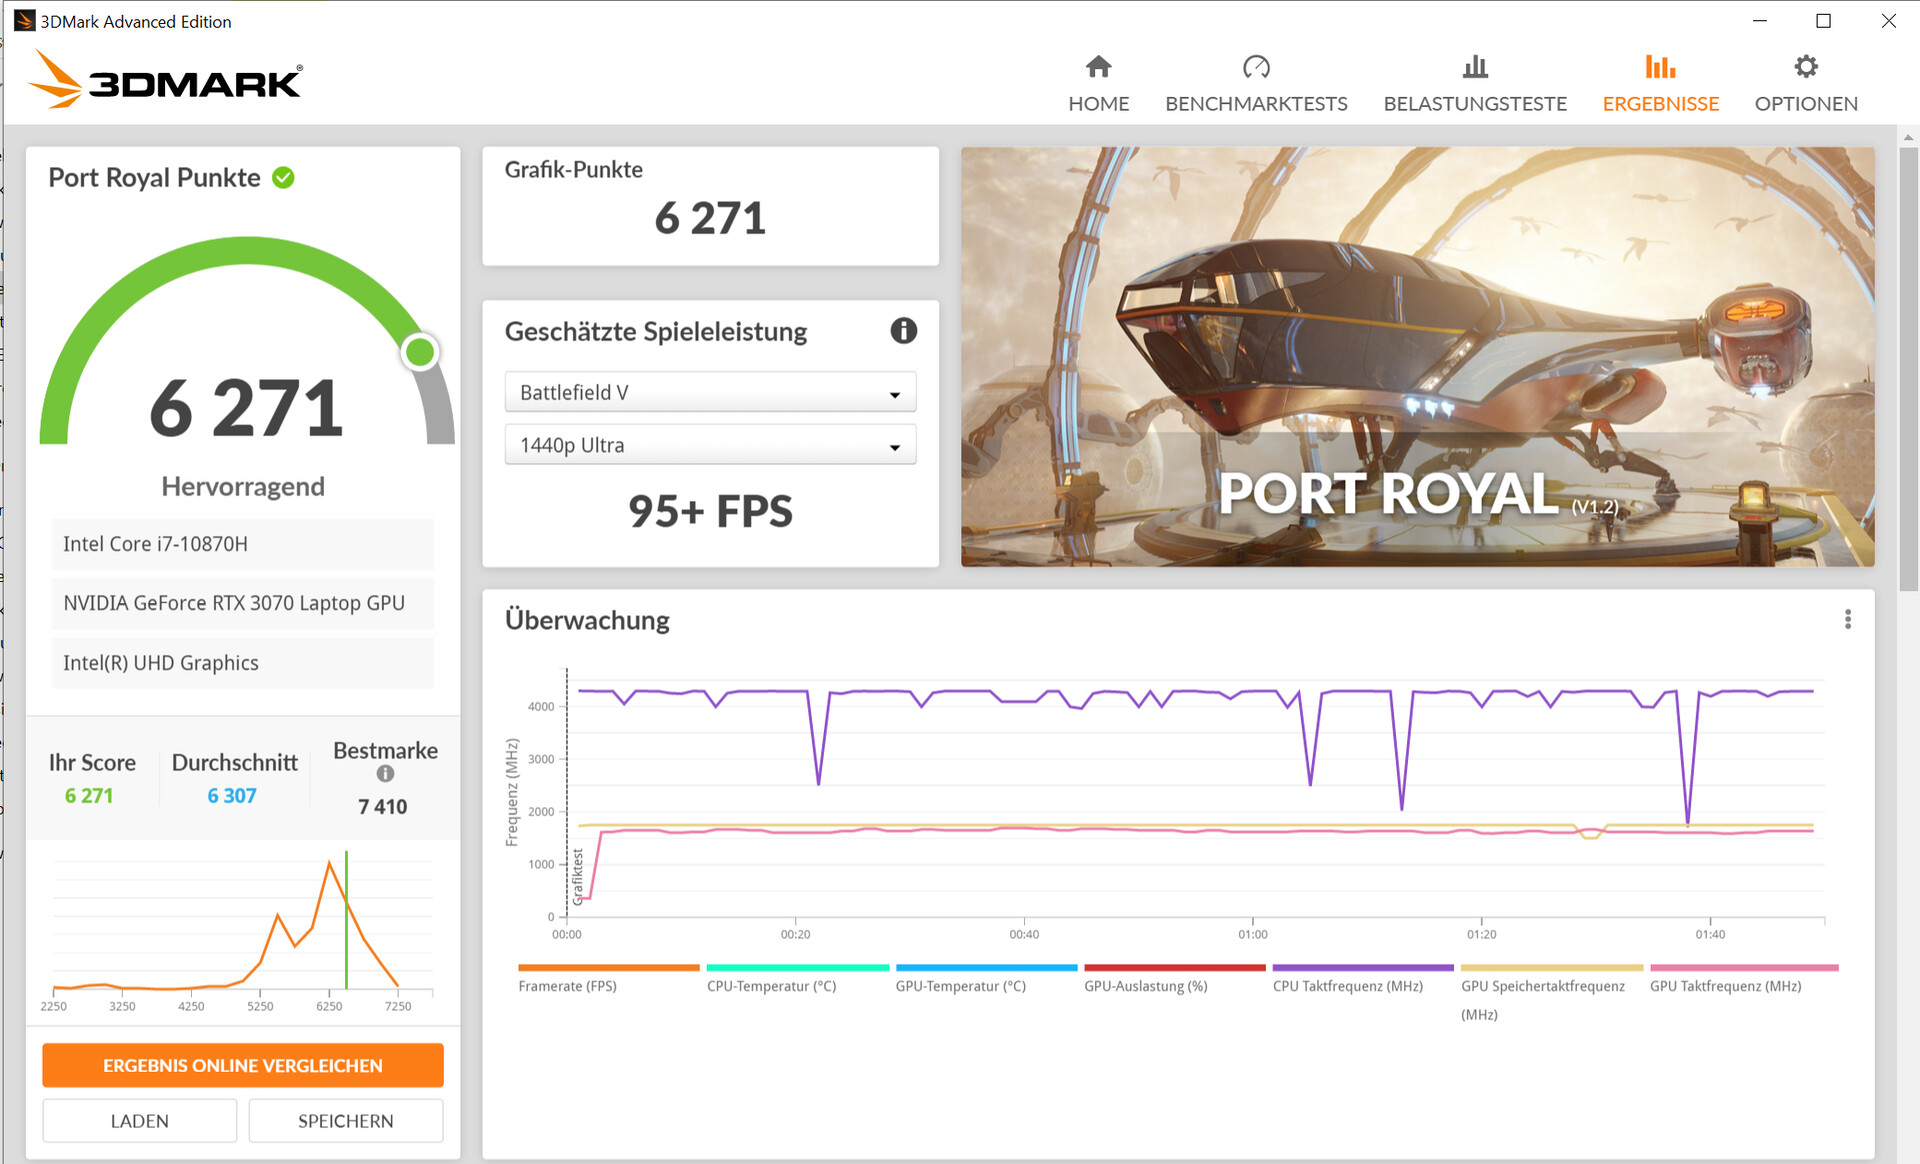
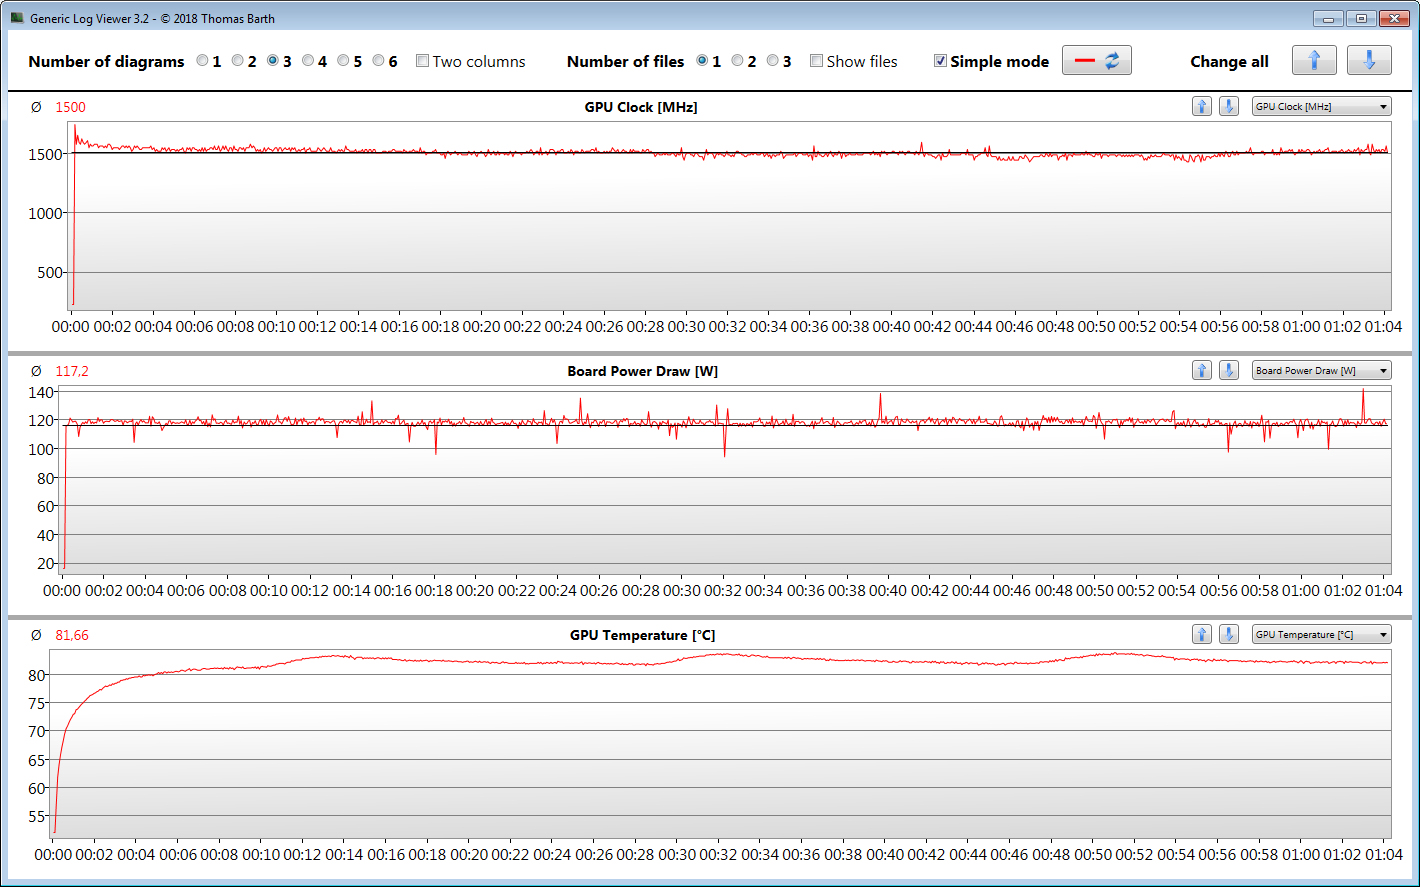
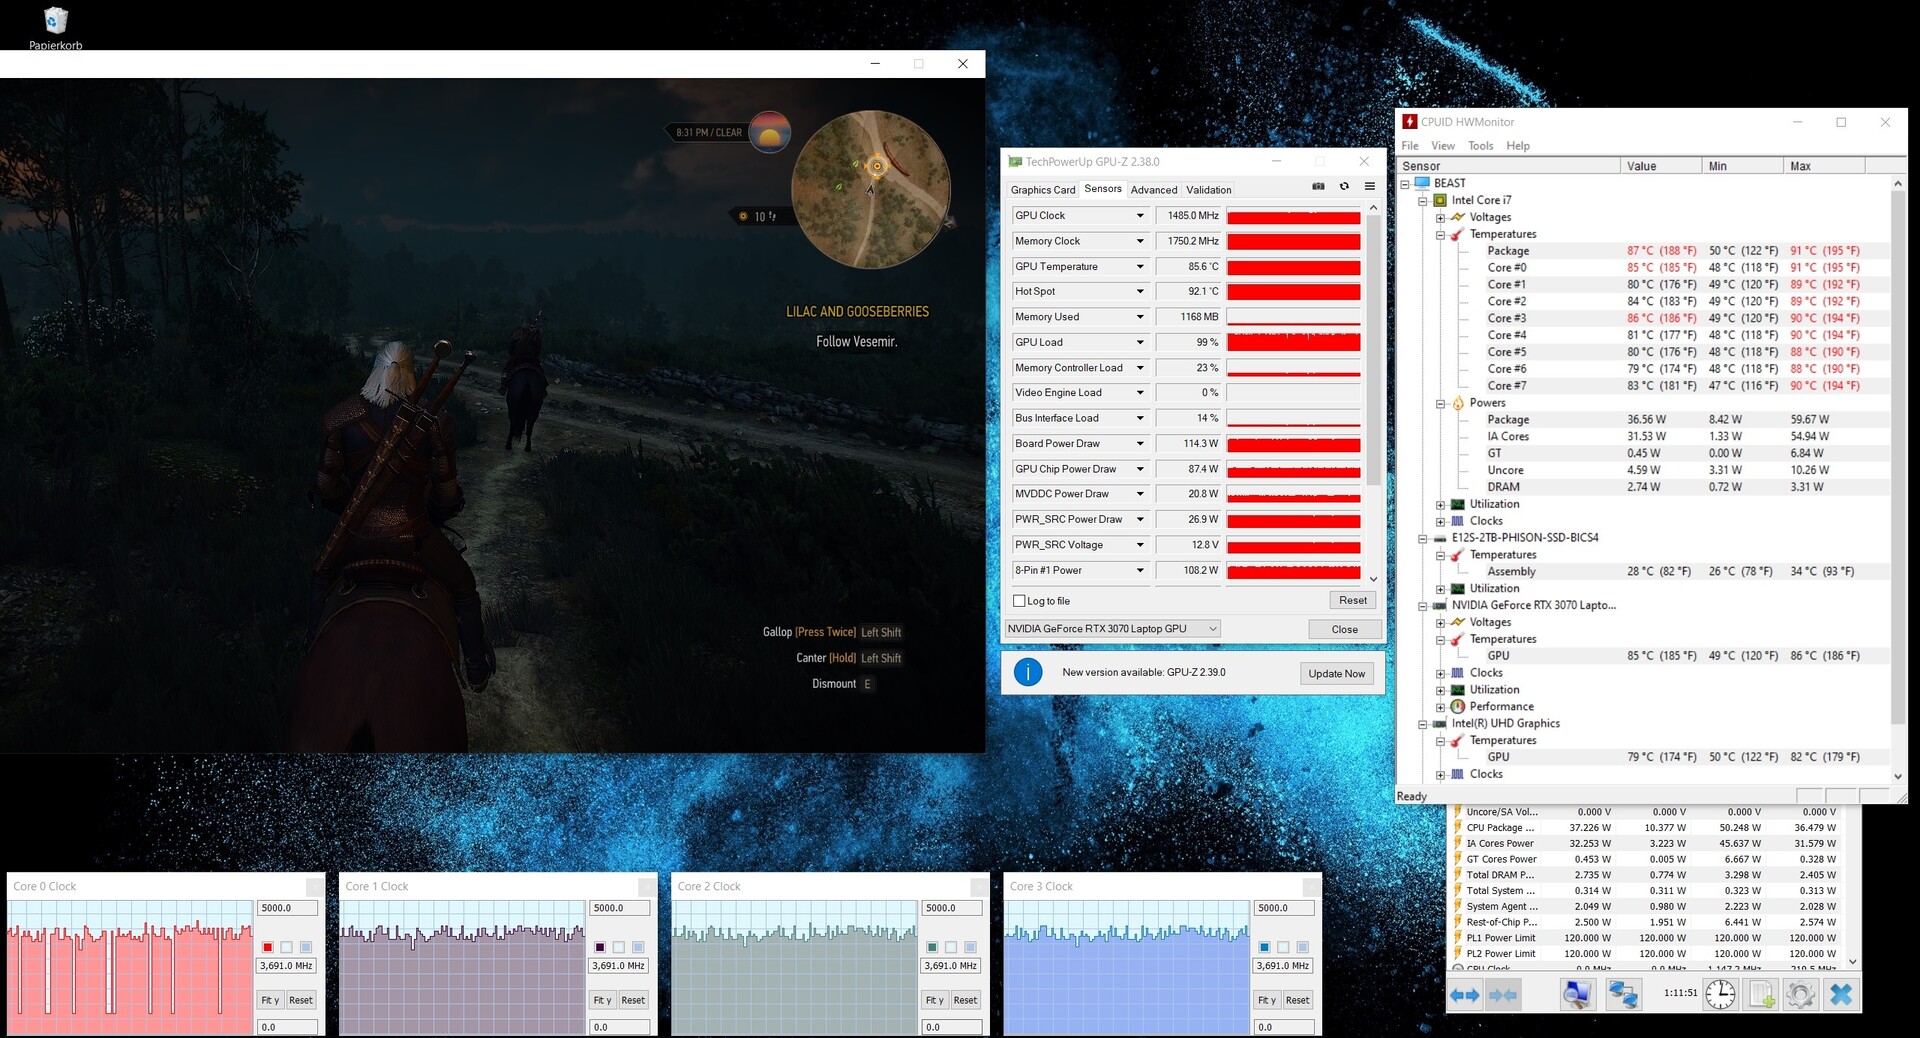
The 3DMark results are on an average level compared with the RTX 3070 notebooks tested so far. The Erazer does not quite reach the results of the MSI GP76 Leopard 10UG even when the TGP is fully enabled manually (see comparison table) - an indication that the Dynamic Boost is not used much or not at all. This is also confirmed by the Witcher 3 test. For cross-checking, we only ran the "FurMark" tool and were able to measure the maximum TGP of 140 watts.
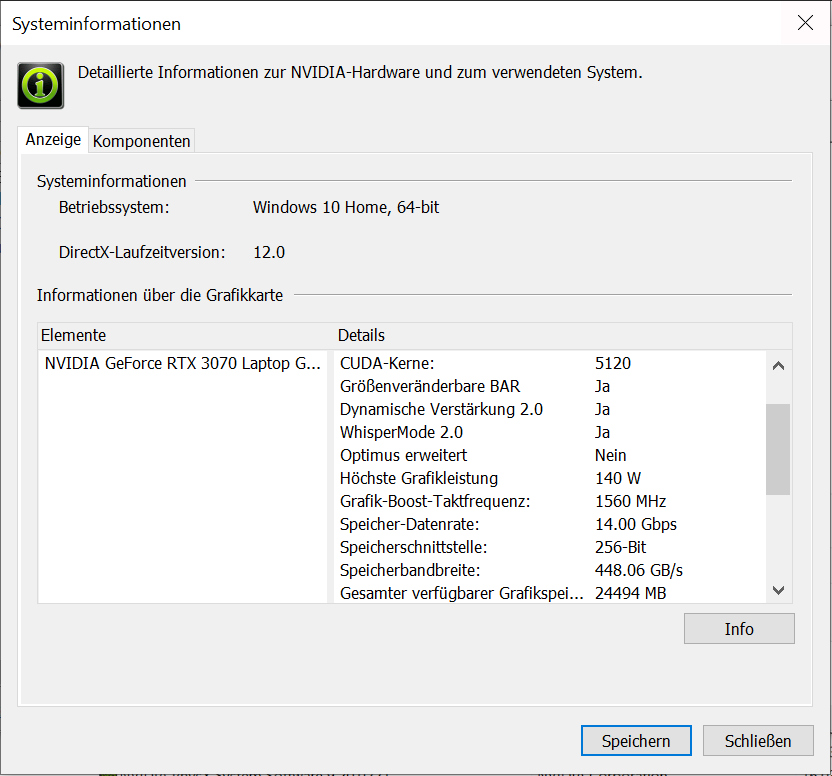
The integrated UHD Graphics 630-GPU is active and the notebook works with Nvidia's Optimus switching graphics solution. Both iGPU and dGPU could be disabled. The BIOS of the computer offers three options: "MSHybrid" (= Optimus), "iGPU Only" (= UHD Graphics 630), "dGPU Only" (= RTX 3070).
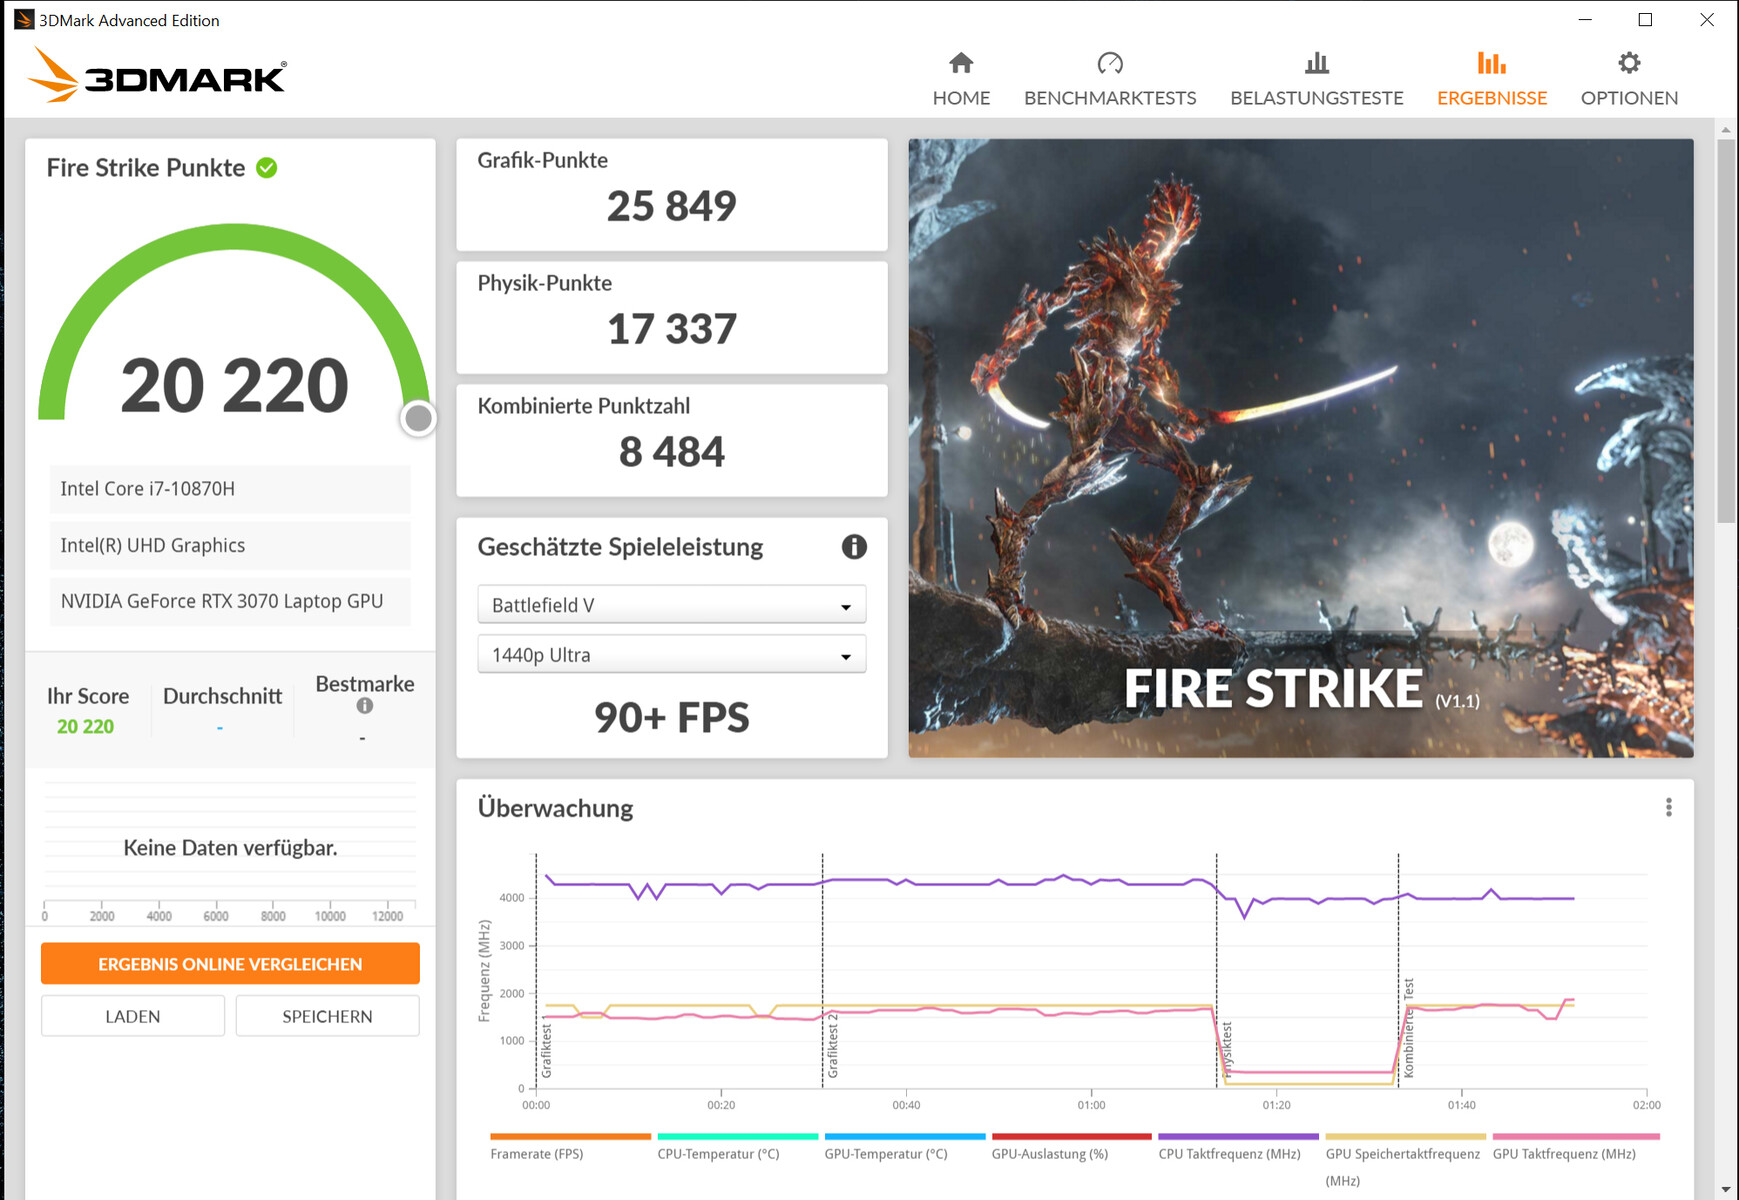

| 3DMark 11 Performance | 24901 points | |
| 3DMark Cloud Gate Standard Score | 41008 points | |
| 3DMark Fire Strike Score | 20220 points | |
| 3DMark Time Spy Score | 9251 points | |
Help | ||
| 3DMark 11 - 1280x720 Performance GPU | |
| Average of class Gaming (21841 - 80022, n=108, last 2 years) | |
| MSI GP76 Leopard 10UG | |
| Aorus 17G YD | |
| Medion Erazer Beast X20 (Overboost, TGP 140W) | |
| Medion Erazer Beast X20 | |
| Average NVIDIA GeForce RTX 3070 Laptop GPU (12535 - 38275, n=54) | |
| Medion Erazer Beast X10 MD61804 | |
| 3DMark | |
| 1920x1080 Fire Strike Graphics | |
| Average of class Gaming (12242 - 62849, n=120, last 2 years) | |
| MSI GP76 Leopard 10UG | |
| Schenker XMG Neo 17 (Early 2021, RTX 3070, 5800H) | |
| Aorus 17G YD | |
| Medion Erazer Beast X20 (Overboost, TGP 140W) | |
| Medion Erazer Beast X20 | |
| Average NVIDIA GeForce RTX 3070 Laptop GPU (7178 - 29128, n=52) | |
| Medion Erazer Beast X10 MD61804 | |
| 2560x1440 Time Spy Graphics | |
| Average of class Gaming (5012 - 26212, n=119, last 2 years) | |
| Schenker XMG Neo 17 (Early 2021, RTX 3070, 5800H) | |
| MSI GP76 Leopard 10UG | |
| Aorus 17G YD | |
| Medion Erazer Beast X20 (Overboost, TGP 140W) | |
| Medion Erazer Beast X20 | |
| Average NVIDIA GeForce RTX 3070 Laptop GPU (2644 - 11019, n=53) | |
| Medion Erazer Beast X10 MD61804 | |
Gaming performance
The computer brings all current games smoothly to the screen. The full screen resolution (2,560 x 1,440 pixels) and high to maximum quality settings can usually be selected.
Compared with the RTX 3070 notebooks tested so far, the Beast X20 does decently and delivers (slightly) above-average frame rates. Manually setting the TGP to the maximum of 140 watts lets the rates increase a bit more.
| The Witcher 3 - 1920x1080 Ultra Graphics & Postprocessing (HBAO+) | |
| Average of class Gaming (95 - 240, n=8, last 2 years) | |
| MSI GP76 Leopard 10UG | |
| Medion Erazer Beast X20 (Overboost, TGP 140W) | |
| Aorus 17G YD | |
| Medion Erazer Beast X20 | |
| Schenker XMG Neo 17 (Early 2021, RTX 3070, 5800H) | |
| Medion Erazer Beast X10 MD61804 | |
| Average NVIDIA GeForce RTX 3070 Laptop GPU (34.9 - 109, n=52) | |
| Dota 2 Reborn - 1920x1080 ultra (3/3) best looking | |
| Average of class Gaming (84.8 - 248, n=112, last 2 years) | |
| Aorus 17G YD | |
| Schenker XMG Neo 17 (Early 2021, RTX 3070, 5800H) | |
| Average NVIDIA GeForce RTX 3070 Laptop GPU (26.9 - 163.9, n=58) | |
| MSI GP76 Leopard 10UG | |
| Medion Erazer Beast X20 (Overboost, TGP 140W) | |
| Medion Erazer Beast X20 | |
| X-Plane 11.11 - 1920x1080 high (fps_test=3) | |
| Average of class Gaming (52.1 - 143.5, n=115, last 2 years) | |
| Aorus 17G YD | |
| Average NVIDIA GeForce RTX 3070 Laptop GPU (12.4 - 118.8, n=61) | |
| MSI GP76 Leopard 10UG | |
| Schenker XMG Neo 17 (Early 2021, RTX 3070, 5800H) | |
| Medion Erazer Beast X20 (Overboost, TGP 140W) | |
| Medion Erazer Beast X20 | |
| Strange Brigade | |
| 1920x1080 ultra AA:ultra AF:16 | |
| Average of class Gaming (76.3 - 456, n=93, last 2 years) | |
| Medion Erazer Beast X20 (1.47.22.14 D3D12, Overboost, TGP 140W) | |
| Medion Erazer Beast X20 (1.47.22.14 D3D12) | |
| Aorus 17G YD (1.47.22.14 D3D12) | |
| Average NVIDIA GeForce RTX 3070 Laptop GPU (36.2 - 194, n=46) | |
| 2560x1440 ultra AA:ultra AF:16 | |
| Average of class Gaming (52.8 - 350, n=78, last 2 years) | |
| Medion Erazer Beast X20 (1.47.22.14 D3D12, Overboost, TGP 140W) | |
| Medion Erazer Beast X20 (1.47.22.14 D3D12) | |
| Average NVIDIA GeForce RTX 3070 Laptop GPU (82.3 - 140.5, n=18) | |
| Final Fantasy XV Benchmark | |
| 1920x1080 High Quality | |
| Average of class Gaming (41 - 215, n=103, last 2 years) | |
| Medion Erazer Beast X20 (1.3, Overboost, TGP 140W) | |
| Aorus 17G YD (1.3) | |
| Medion Erazer Beast X20 (1.3) | |
| MSI GP76 Leopard 10UG | |
| Average NVIDIA GeForce RTX 3070 Laptop GPU (27.9 - 107, n=49) | |
| 2560x1440 High Quality | |
| Average of class Gaming (32.5 - 184.3, n=88, last 2 years) | |
| Medion Erazer Beast X20 (1.3, Overboost, TGP 140W) | |
| Medion Erazer Beast X20 (1.3) | |
| Average NVIDIA GeForce RTX 3070 Laptop GPU (19.8 - 79.9, n=25) | |
| GTA V | |
| 1920x1080 Highest AA:4xMSAA + FX AF:16x | |
| Average of class Gaming (48.3 - 186.9, n=102, last 2 years) | |
| Schenker XMG Neo 17 (Early 2021, RTX 3070, 5800H) | |
| Aorus 17G YD | |
| Average NVIDIA GeForce RTX 3070 Laptop GPU (21.7 - 125.8, n=50) | |
| Medion Erazer Beast X20 (Overboost, TGP 140W) | |
| Medion Erazer Beast X20 | |
| 2560x1440 Highest AA:4xMSAA + FX AF:16x | |
| Average of class Gaming (36.9 - 183.9, n=74, last 2 years) | |
| Medion Erazer Beast X20 | |
| Medion Erazer Beast X20 (Overboost, TGP 140W) | |
| Average NVIDIA GeForce RTX 3070 Laptop GPU (70.8 - 97.1, n=19) | |
| Far Cry 5 | |
| 1920x1080 Ultra Preset AA:T | |
| Average of class Gaming (70 - 151, n=10, last 2 years) | |
| MSI GP76 Leopard 10UG | |
| Medion Erazer Beast X20 (Overboost, TGP 140W) | |
| Average NVIDIA GeForce RTX 3070 Laptop GPU (89 - 140, n=36) | |
| Aorus 17G YD | |
| Medion Erazer Beast X20 | |
| 2560x1440 Ultra Preset AA:T | |
| Average of class Gaming (90 - 149, n=8, last 2 years) | |
| Medion Erazer Beast X20 (Overboost, TGP 140W) | |
| Average NVIDIA GeForce RTX 3070 Laptop GPU (81 - 101, n=18) | |
| Medion Erazer Beast X20 | |
| Dirt 5 | |
| 1920x1080 Ultra High Preset | |
| Aorus 17G YD | |
| Medion Erazer Beast X20 (86.1) | |
| Medion Erazer Beast X20 | |
| Average NVIDIA GeForce RTX 3070 Laptop GPU (50 - 96, n=11) | |
| Medion Erazer Beast X10 MD61804 | |
| 2560x1440 Ultra High Preset | |
| Medion Erazer Beast X20 (Overboost, TGP 140W) | |
| Average NVIDIA GeForce RTX 3070 Laptop GPU (58.6 - 75, n=6) | |
| Medion Erazer Beast X20 | |
To check whether the frame rates remain largely constant over a longer period, we run the game "The Witcher 3" for about 60 minutes with Full HD resolution and maximum quality settings. The game character is not moved. A drop in the frame rates is not noticed.
| low | med. | high | ultra | QHD | |
|---|---|---|---|---|---|
| GTA V (2015) | 179 | 171 | 153 | 88.5 | 83.4 |
| The Witcher 3 (2015) | 323 | 259 | 180 | 103 | |
| Dota 2 Reborn (2015) | 146 | 130 | 123 | 115 | |
| Final Fantasy XV Benchmark (2018) | 144 | 118 | 91.6 | 71.5 | |
| X-Plane 11.11 (2018) | 91.1 | 84.2 | 69.9 | ||
| Far Cry 5 (2018) | 143 | 116 | 110 | 105 | 90 |
| Strange Brigade (2018) | 369 | 233 | 192 | 168 | 126 |
| Gears Tactics (2020) | 240.2 | 176.6 | 127 | 99.2 | 75.6 |
| Dirt 5 (2020) | 175 | 120 | 105 | 82.6 | 67.5 |
| Yakuza Like a Dragon (2020) | 128 | 115 | 113 | 106 | 76.5 |
| Hitman 3 (2021) | 185.6 | 147.8 | 140.1 | 135.6 | 97.8 |
| Outriders (2021) | 114 | 99.5 | 108 | 106 | 79.3 |
| Resident Evil Village (2021) | 162 | 137 | 136 | 134 | 97.4 |
| Mass Effect Legendary Edition (2021) | 107 | 100 | 94.3 | ||
| Days Gone (2021) | 160 | 138 | 123 | 95.9 | 71.3 |
Emissions - Loud under load
Noise emissions
When idling and under low load, the fans usually operate at low speeds and produce an audible but acceptable background noise. Under full load, it gets loud with a maximum sound pressure level of 54 dB(A) (stress test, Witcher 3 test). The use of a headset is virtually indispensable.
Noise level
| Idle |
| 26 / 34 / 36 dB(A) |
| Load |
| 53 / 54 dB(A) |
 | ||
30 dB silent 40 dB(A) audible 50 dB(A) loud |
||
min: | ||
| Medion Erazer Beast X20 i7-10870H, GeForce RTX 3070 Laptop GPU | Schenker XMG Neo 17 (Early 2021, RTX 3070, 5800H) R7 5800H, GeForce RTX 3070 Laptop GPU | MSI GP76 Leopard 10UG i7-10750H, GeForce RTX 3070 Laptop GPU | Aorus 17G YD i7-11800H, GeForce RTX 3080 Laptop GPU | Medion Erazer Beast X10 MD61804 i7-10750H, GeForce RTX 2070 Super Max-Q | Average of class Gaming | |
|---|---|---|---|---|---|---|
| Noise | -0% | 3% | -3% | 3% | 10% | |
| off / environment * (dB) | 25 | 24 4% | 24 4% | 25 -0% | 25 -0% | 24.1 ? 4% |
| Idle Minimum * (dB) | 26 | 29 -12% | 25 4% | 32 -23% | 26 -0% | 25.8 ? 1% |
| Idle Average * (dB) | 34 | 32 6% | 32 6% | 33 3% | 29 15% | 27.4 ? 19% |
| Idle Maximum * (dB) | 36 | 38 -6% | 34 6% | 39 -8% | 35 3% | 30 ? 17% |
| Load Average * (dB) | 53 | 49 8% | 54 -2% | 43 19% | 52 2% | 43.2 ? 18% |
| Witcher 3 ultra * (dB) | 53 | 53 -0% | 51 4% | 52 2% | 53 -0% | |
| Load Maximum * (dB) | 54 | 55 -2% | 54 -0% | 61 -13% | 55 -2% | 54 ? -0% |
* ... smaller is better
Temperature
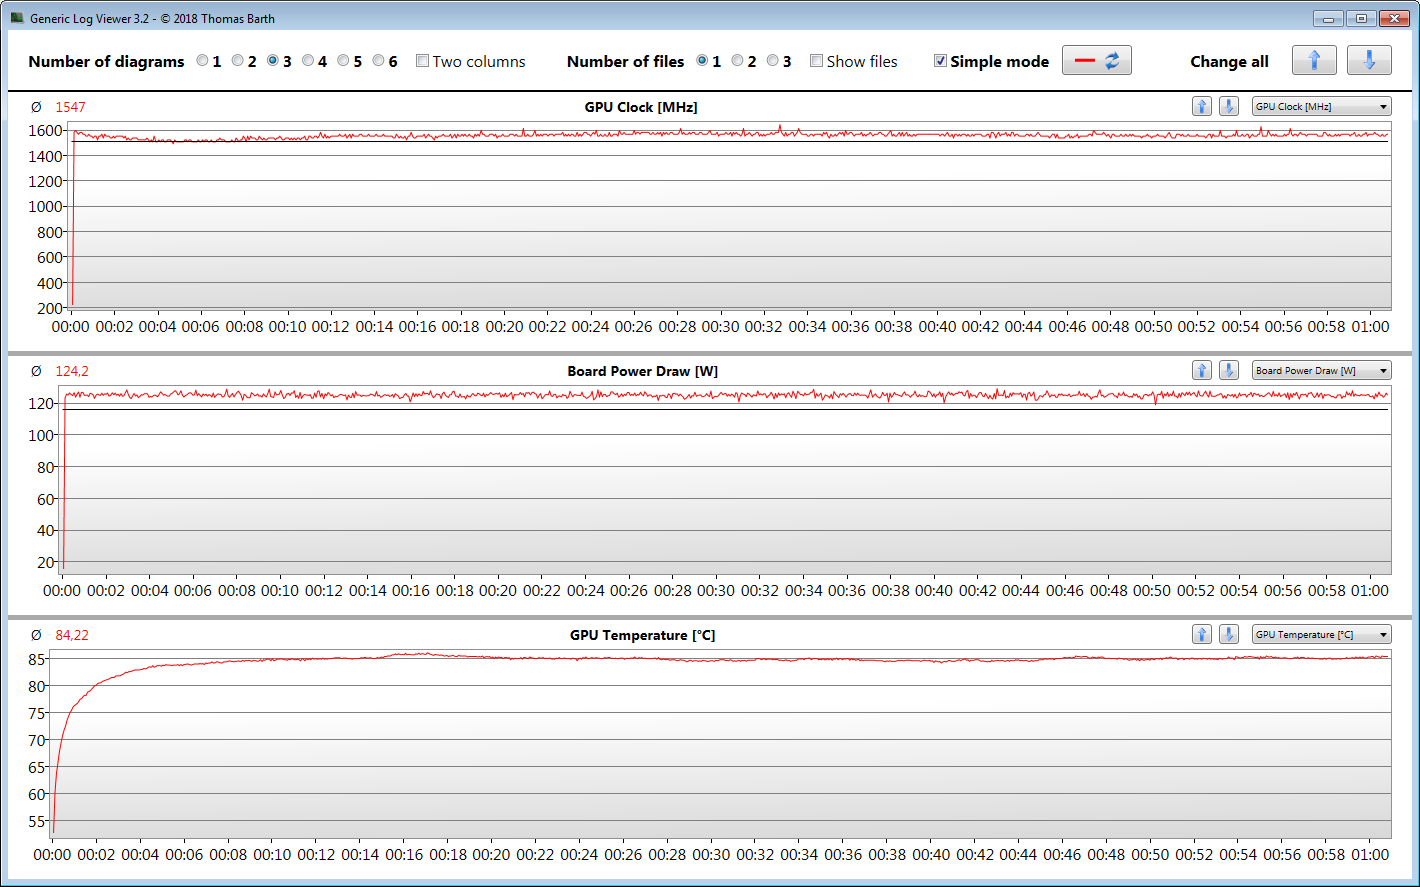
The CPU and GPU completed our stress test (Prime95 and FurMark run for at least one hour) with 2.2 to 2.3 GHz and 1,350 MHz, respectively. The stress test represents an extreme scenario. We use this test to check whether the system runs stably at full load.
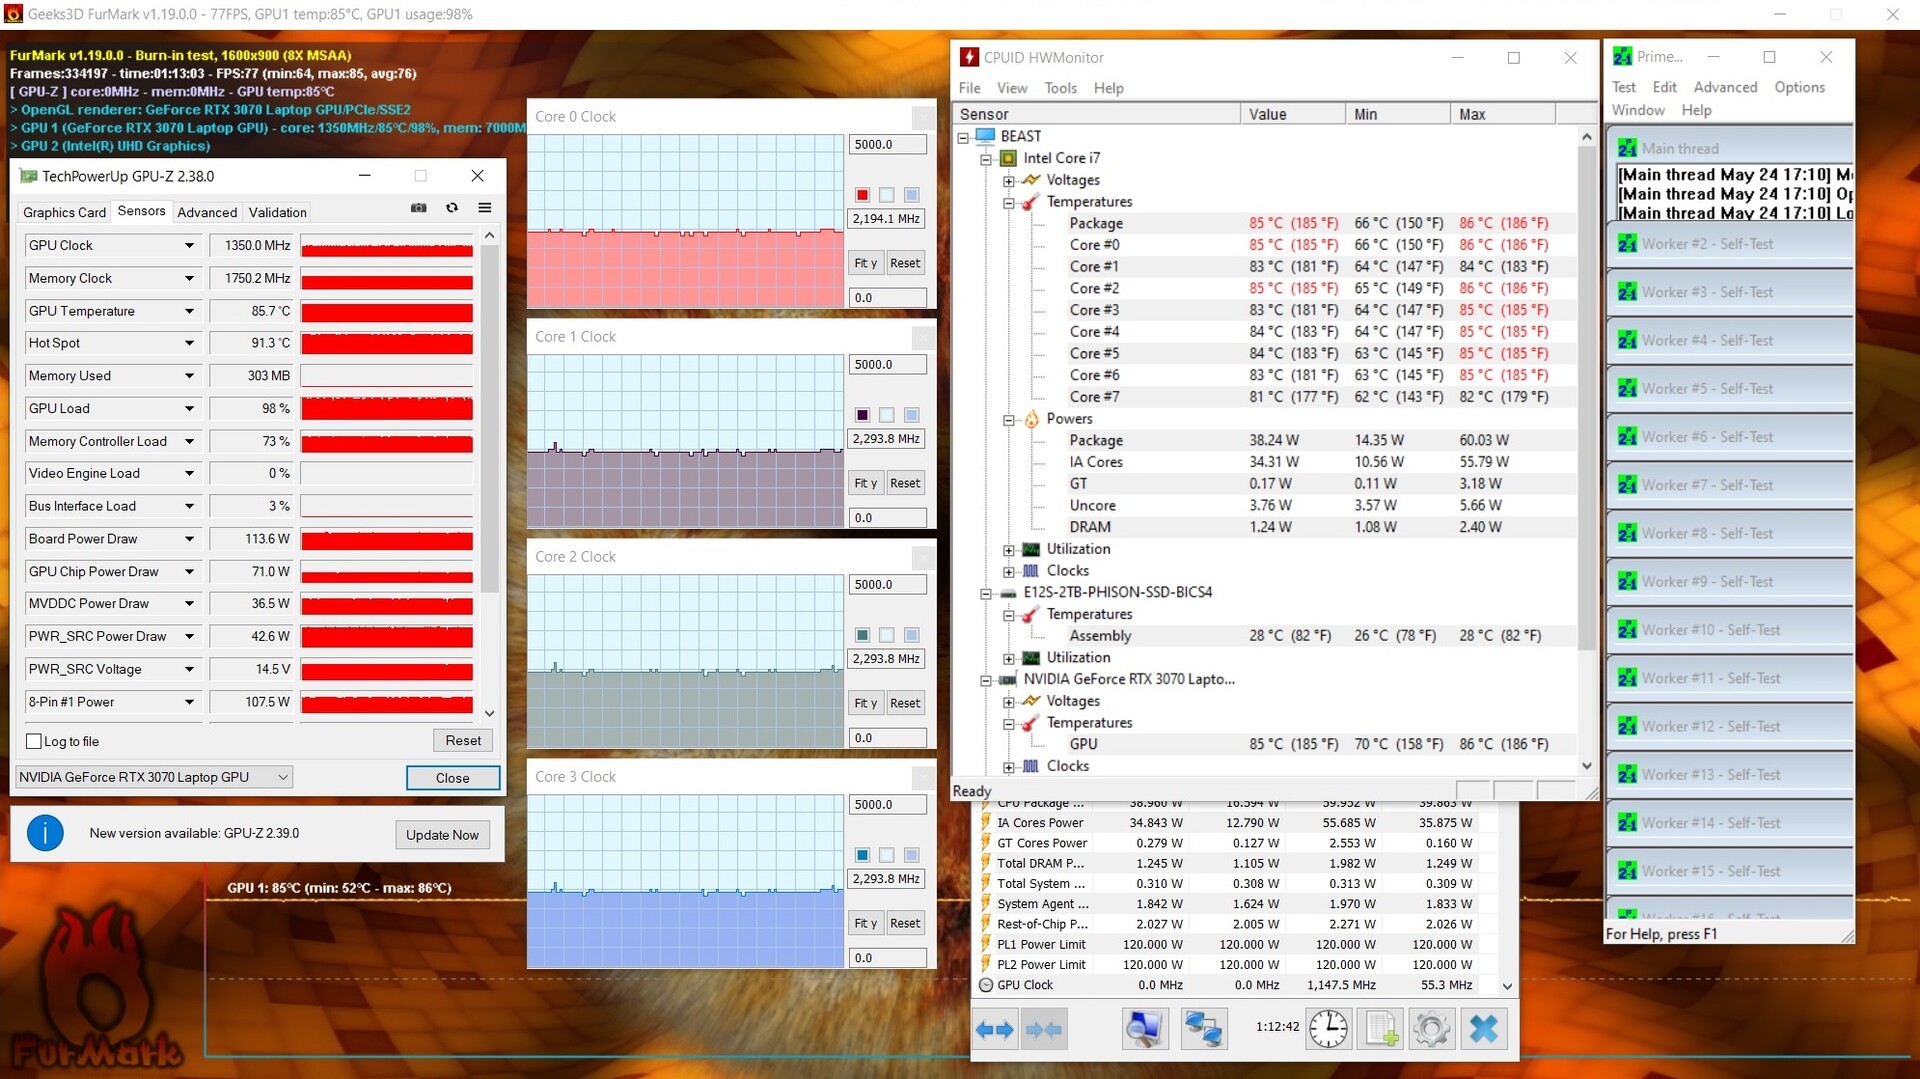
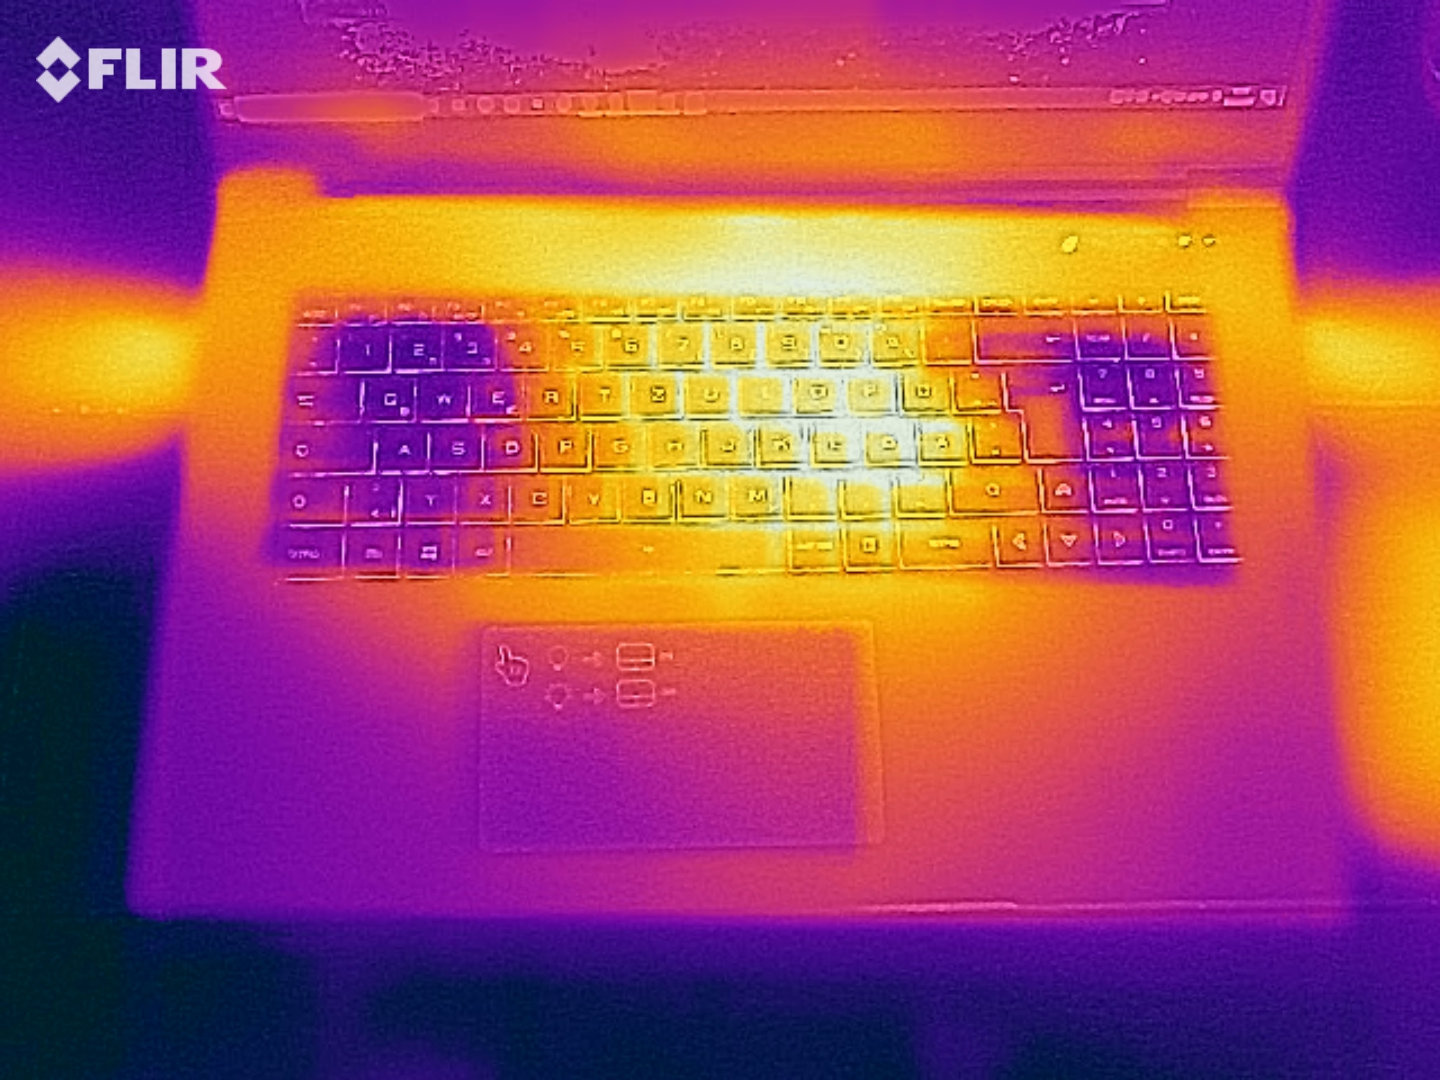
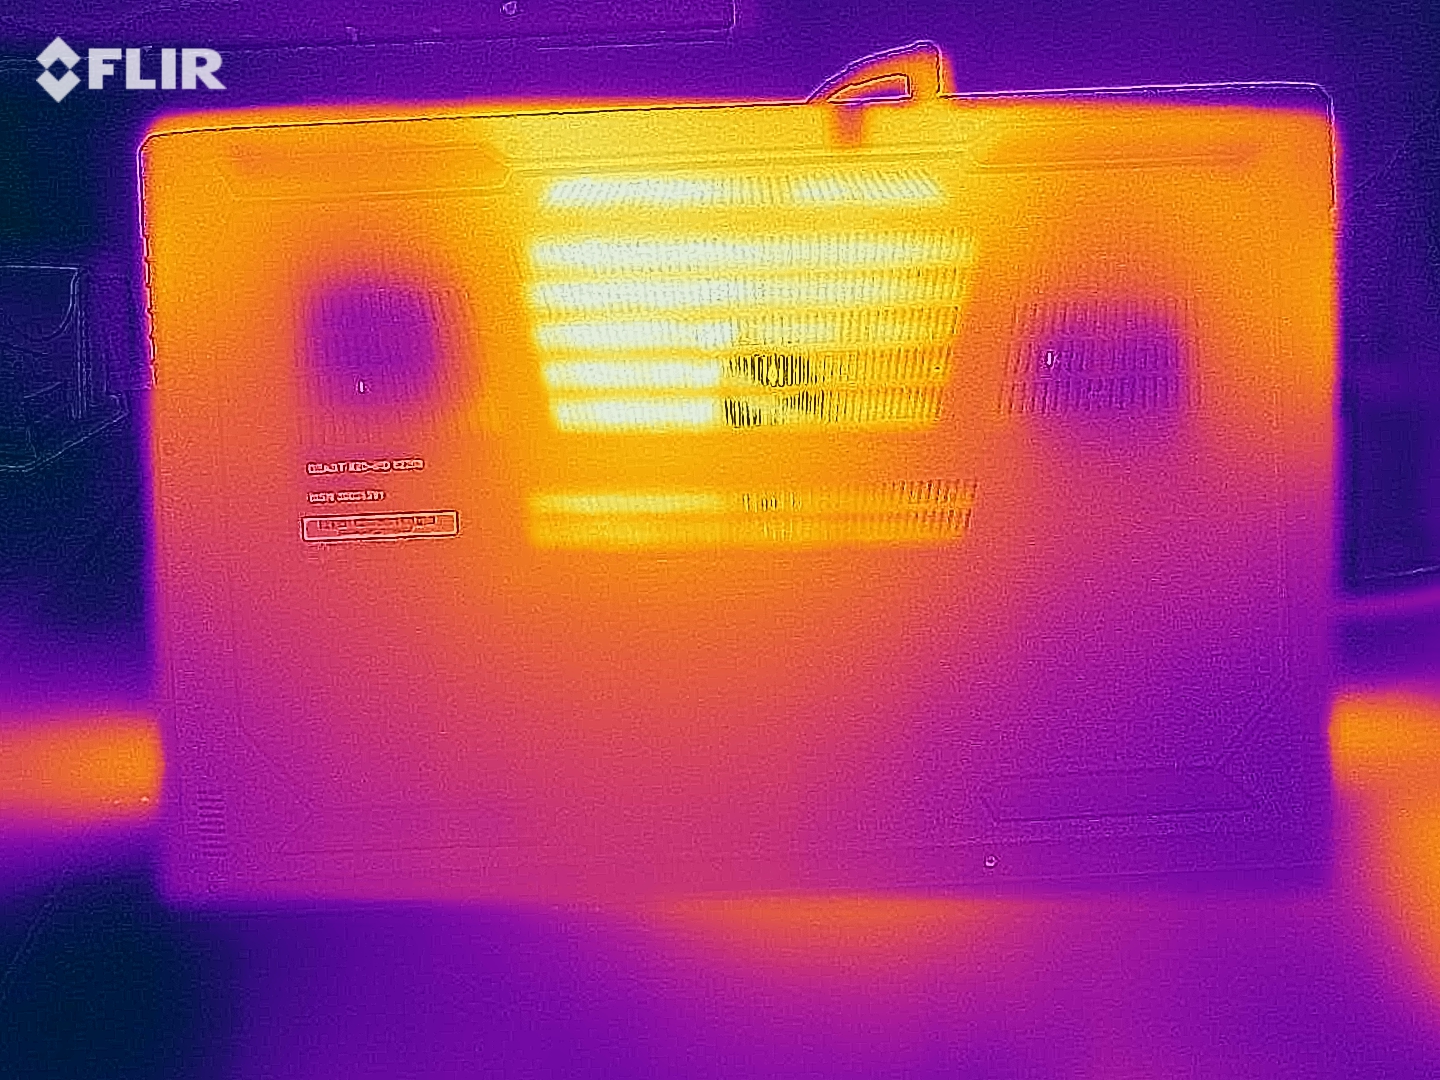
The notebook heats up noticeably. Temperatures in the mid to upper 50 degrees Celsius (122 degrees Fahrenheit) range are observed at several measuring points during the stress test. The warming is slightly lower when running the Witcher 3 test. The laptop should not be placed on the thighs under load.
(-) The maximum temperature on the upper side is 53 °C / 127 F, compared to the average of 40.4 °C / 105 F, ranging from 21.2 to 68.8 °C for the class Gaming.
(-) The bottom heats up to a maximum of 59 °C / 138 F, compared to the average of 43.2 °C / 110 F
(+) In idle usage, the average temperature for the upper side is 29.6 °C / 85 F, compared to the device average of 33.9 °C / 93 F.
(-) Playing The Witcher 3, the average temperature for the upper side is 44 °C / 111 F, compared to the device average of 33.9 °C / 93 F.
(-) The palmrests and touchpad can get very hot to the touch with a maximum of 40 °C / 104 F.
(-) The average temperature of the palmrest area of similar devices was 28.8 °C / 83.8 F (-11.2 °C / -20.2 F).
| Medion Erazer Beast X20 i7-10870H, GeForce RTX 3070 Laptop GPU | Schenker XMG Neo 17 (Early 2021, RTX 3070, 5800H) R7 5800H, GeForce RTX 3070 Laptop GPU | MSI GP76 Leopard 10UG i7-10750H, GeForce RTX 3070 Laptop GPU | Aorus 17G YD i7-11800H, GeForce RTX 3080 Laptop GPU | Medion Erazer Beast X10 MD61804 i7-10750H, GeForce RTX 2070 Super Max-Q | Average of class Gaming | |
|---|---|---|---|---|---|---|
| Heat | 2% | 11% | 13% | 5% | 7% | |
| Maximum Upper Side * (°C) | 53 | 47 11% | 43 19% | 36 32% | 51 4% | 45.3 ? 15% |
| Maximum Bottom * (°C) | 59 | 51 14% | 47 20% | 52 12% | 56 5% | 48.2 ? 18% |
| Idle Upper Side * (°C) | 32 | 32 -0% | 30 6% | 29 9% | 31 3% | 31.2 ? 2% |
| Idle Bottom * (°C) | 32 | 37 -16% | 33 -3% | 33 -3% | 30 6% | 34.4 ? -8% |
* ... smaller is better
Speaker
The stereo speakers produce a decent sound, but there is hardly any bass. We recommend using headphones or external speakers for a better sound experience.
Medion Erazer Beast X20 audio analysis
(+) | speakers can play relatively loud (86 dB)
Bass 100 - 315 Hz
(-) | nearly no bass - on average 25.8% lower than median
(-) | bass is not linear (15.7% delta to prev. frequency)
Mids 400 - 2000 Hz
(+) | balanced mids - only 2.2% away from median
(+) | mids are linear (2.8% delta to prev. frequency)
Highs 2 - 16 kHz
(±) | higher highs - on average 5.8% higher than median
(±) | linearity of highs is average (8.4% delta to prev. frequency)
Overall 100 - 16.000 Hz
(±) | linearity of overall sound is average (17.6% difference to median)
Compared to same class
» 50% of all tested devices in this class were better, 11% similar, 39% worse
» The best had a delta of 6%, average was 18%, worst was 132%
Compared to all devices tested
» 34% of all tested devices were better, 8% similar, 57% worse
» The best had a delta of 4%, average was 24%, worst was 134%
Power management - Medion laptop with good battery runtimes
Energy consumption
The X20 does not show any conspicuous energy consumption. The stress test and Witcher 3 test increase the power consumption up to 232 watts and 192 watts on average, respectively. The power supply's nominal power is 230 watts.
The following diagram illustrates the fairly constant power consumption of the notebook during various tests. There was no drop in computing power.
| Off / Standby | |
| Idle | |
| Load |
|
Key:
min: | |
| Medion Erazer Beast X20 i7-10870H, GeForce RTX 3070 Laptop GPU | Schenker XMG Neo 17 (Early 2021, RTX 3070, 5800H) R7 5800H, GeForce RTX 3070 Laptop GPU | MSI GP76 Leopard 10UG i7-10750H, GeForce RTX 3070 Laptop GPU | Aorus 17G YD i7-11800H, GeForce RTX 3080 Laptop GPU | Medion Erazer Beast X10 MD61804 i7-10750H, GeForce RTX 2070 Super Max-Q | Average of class Gaming | |
|---|---|---|---|---|---|---|
| Power Consumption | 1% | 8% | -21% | -14% | 1% | |
| Idle Minimum * (Watt) | 13 | 13 -0% | 12 8% | 24 -85% | 19 -46% | 13.4 ? -3% |
| Idle Average * (Watt) | 18 | 16 11% | 16 11% | 26 -44% | 22 -22% | 19.1 ? -6% |
| Idle Maximum * (Watt) | 32 | 26 19% | 28 12% | 38 -19% | 30 6% | 24.7 ? 23% |
| Load Average * (Watt) | 106 | 125 -18% | 92 13% | 101 5% | 118 -11% | 108.4 ? -2% |
| Witcher 3 ultra * (Watt) | 192 | 187 3% | 198 -3% | 164 15% | 176 8% | |
| Load Maximum * (Watt) | 232 | 259 -12% | 210 9% | 230 1% | 274 -18% | 254 ? -9% |
* ... smaller is better
Battery life
The 17.3 incher achieves runtimes of 6:13 h and 9:01 h in the WLAN test (calling up websites via a script) and video test (short movie Big Buck Bunny (H.264 encoding, FHD) in a loop), respectively. During both tests, the notebook's energy-saving features are disabled and the display brightness is set to about 150 cd/m². The wireless modules are also disabled for the video test.
| Medion Erazer Beast X20 i7-10870H, GeForce RTX 3070 Laptop GPU, 91 Wh | Schenker XMG Neo 17 (Early 2021, RTX 3070, 5800H) R7 5800H, GeForce RTX 3070 Laptop GPU, 62 Wh | MSI GP76 Leopard 10UG i7-10750H, GeForce RTX 3070 Laptop GPU, 65 Wh | Aorus 17G YD i7-11800H, GeForce RTX 3080 Laptop GPU, 99 Wh | Medion Erazer Beast X10 MD61804 i7-10750H, GeForce RTX 2070 Super Max-Q, 91.2 Wh | Average of class Gaming | |
|---|---|---|---|---|---|---|
| Battery runtime | -58% | -50% | -22% | -4% | -15% | |
| Reader / Idle (h) | 12 | 4.7 -61% | 5.6 -53% | 9 -25% | 11.4 -5% | 8.71 ? -27% |
| H.264 (h) | 9 | 6.2 -31% | 8.5 -6% | 8.26 ? -8% | ||
| WiFi v1.3 (h) | 6.2 | 3.5 -44% | 4.2 -32% | 6 -3% | 6.8 10% | 6.94 ? 12% |
| Load (h) | 2.3 | 0.7 -70% | 0.8 -65% | 1.6 -30% | 2 -13% | 1.47 ? -36% |
Pros
Cons
Verdict - A successful successor to the X10
Compared with the RTX-3070 notebooks we have tested so far, the X20 does well and delivers (slightly) above-average frame rates. By manually setting the TGP of the GeForce-RTX-3070-Laptop-GPU to 140 watts (= maximum), a slight increase is still possible.
The slim, compact gaming notebook Medion Erazer Beast X20 left a good impression overall.
The CPU's power limits are set relatively low. As a result, the CPU remains behind its possibilities in terms of multi-thread performance. To use the CPU to its full potential, the power limits would have to be increased manually via the Control Center. This hardly has an impact on the single-thread performance.
An increase of the power limits would not be absolutely necessary. The CPU provides enough computing power for current computer games and other applications in the default settings. Throttling doesn't cause any problems. CPU and GPU can always unfold their performance constantly - independent of the selected power limits or the selected TGP. The computer's noise development is on a normal level for the hardware installed here, the heating turns out to be quite high.
The battery runtimes are more than okay for a gaming notebook. The screen (WQHD, IPS, 165 Hz) offers stable viewing angles, a good average brightness, a matte surface, short response times, a great color reproduction and a good color space coverage. There is room for improvement in terms of contrast.
Alternatives to the Beast X20 would be the MSI GP76 Leopard 10UG and the Schenker XMG Neo 17 would be a good choice. Both devices also have a GeForce RTX 3070 laptop graphics core on board, which has a maximum TGP of 140 watts in each case. However, the MSI machine gets a bit more graphics and gaming performance out of the GPU. The Schenker notebook scores with a high level of CPU performance. The installed Ryzen-7-5800H-APU leaves the Core i7-10870H-Processor of the X20 behind - even at maximum power limits.
Price and availability
The Medion Erazer Beast X20 is available in the configuration variant we have at a price of €2,399.95 (~$2,840.99) in the Medion Shop.
Medion Erazer Beast X20
- 07/05/2021 v7 (old)
Sascha Mölck
Price comparison

