XMG Apex 17 (late 23) review: a QHD gaming laptop with an RTX 4060

The XMG Apex 17 (late 23) is a mid-range, QHD gaming laptop based on a TongFang barebone (GM7XG0) and is available in this variant for just under 1,800 euros. The package consists of a Ryzen 7 7840HS, GeForce RTX 4060 (alternatively: RTX 4050), 32 GB of RAM and a 1 TB SSD. Competition can be found in the form of the Acer Nitro 17 AN17-51, the Alienware m16 R1, the Lenovo Legion Pro 5 16IRX8, the MSI Katana 17 B13VFK, and the Medion Erazer Defender P40.
Possible competitors compared
Rating | Date | Model | Weight | Height | Size | Resolution | Price |
|---|---|---|---|---|---|---|---|
| 87.1 % v7 (old) | 10 / 2023 | Schenker XMG Apex 17 (Late 23) R7 7840HS, GeForce RTX 4060 Laptop GPU | 2.5 kg | 24.9 mm | 17.30" | 2560x1440 | |
| 88.3 % v7 (old) | 09 / 2023 | Alienware m16 R1 Intel i7-13700HX, GeForce RTX 4060 Laptop GPU | 3 kg | 25.4 mm | 16.00" | 2560x1600 | |
| 87.9 % v7 (old) | 05 / 2023 | Lenovo Legion Pro 5 16IRX8 i7-13700HX, GeForce RTX 4060 Laptop GPU | 2.5 kg | 26.8 mm | 16.00" | 2560x1600 | |
| 87.2 % v7 (old) | 07 / 2023 | Acer Nitro 17 AN17-51-71ER i7-13700H, GeForce RTX 4060 Laptop GPU | 3 kg | 30.3 mm | 17.30" | 2560x1440 | |
| 84.6 % v7 (old) | 05 / 2023 | Medion Erazer Defender P40 i7-13700HX, GeForce RTX 4060 Laptop GPU | 2.9 kg | 33 mm | 17.30" | 2560x1440 | |
| 82.1 % v7 (old) | 02 / 2023 | MSI Katana 17 B13VFK i7-13620H, GeForce RTX 4060 Laptop GPU | 2.8 kg | 25.2 mm | 17.30" | 1920x1080 |
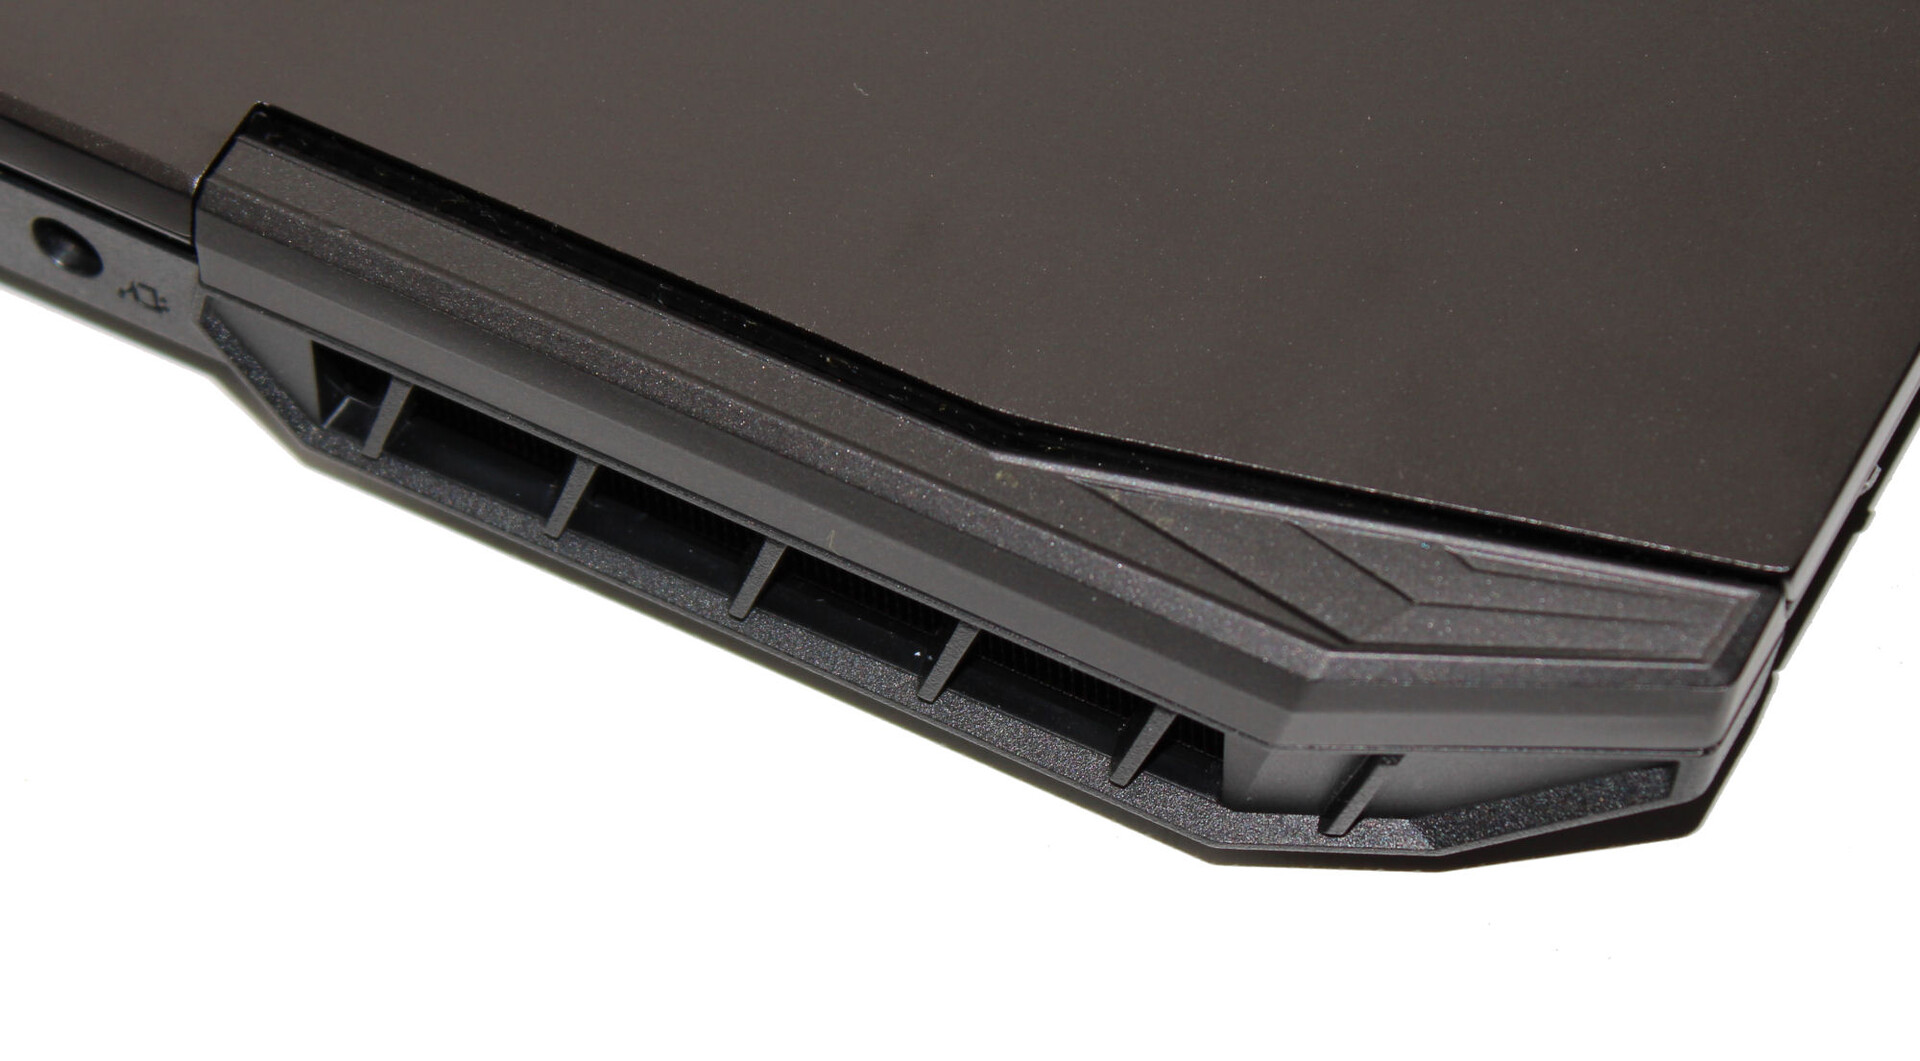
Case - The rear of the case is made of aluminum
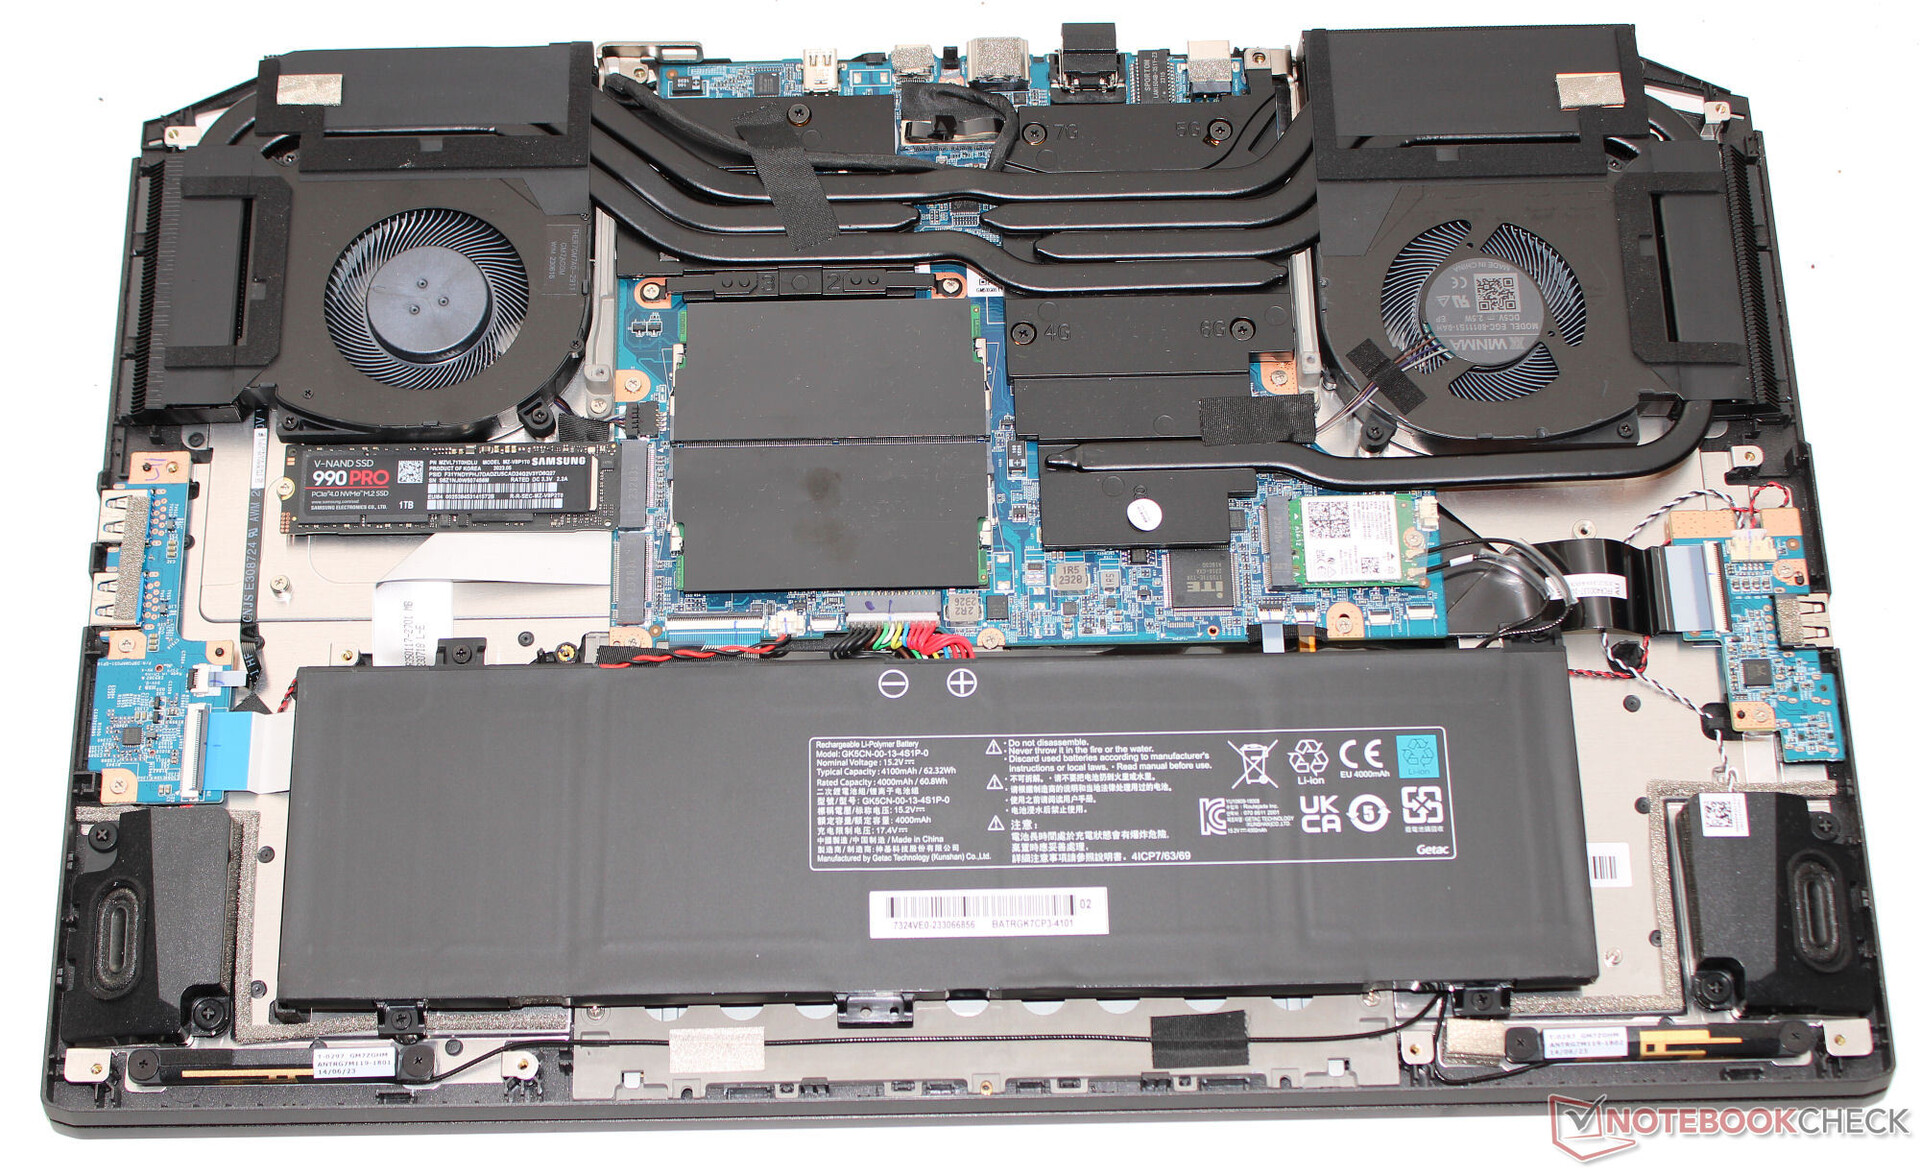
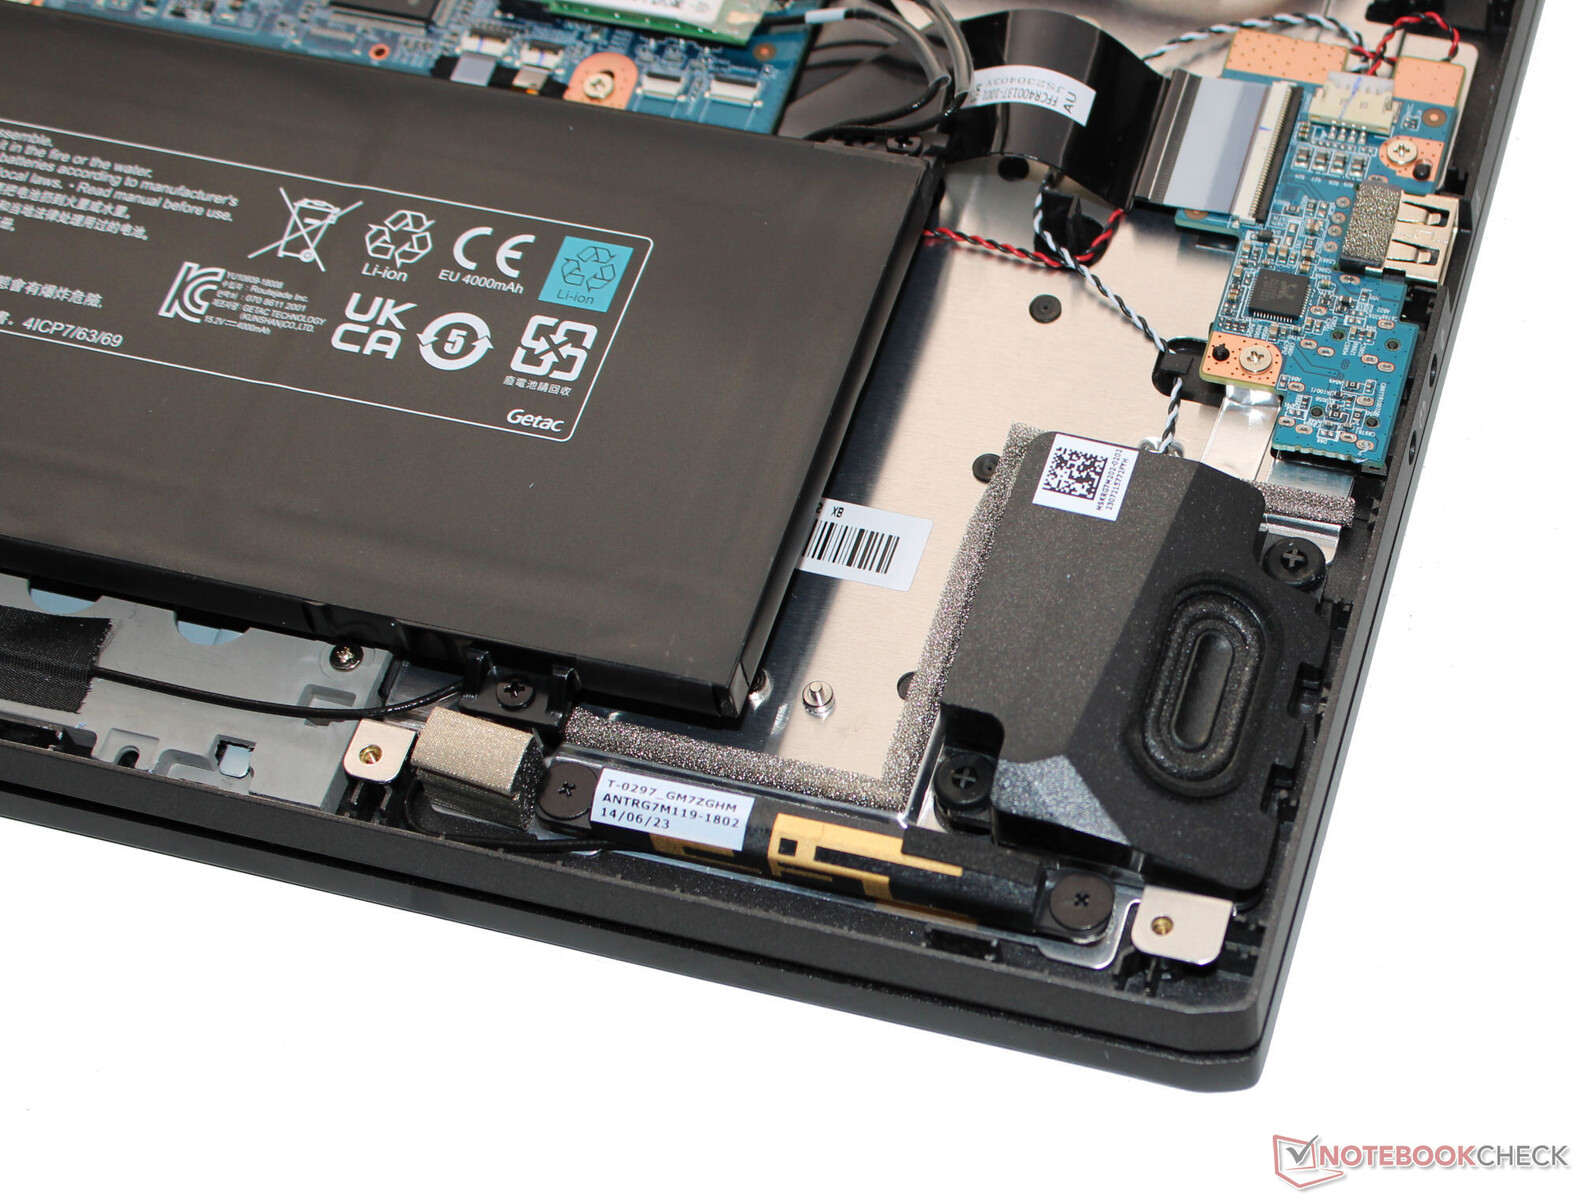
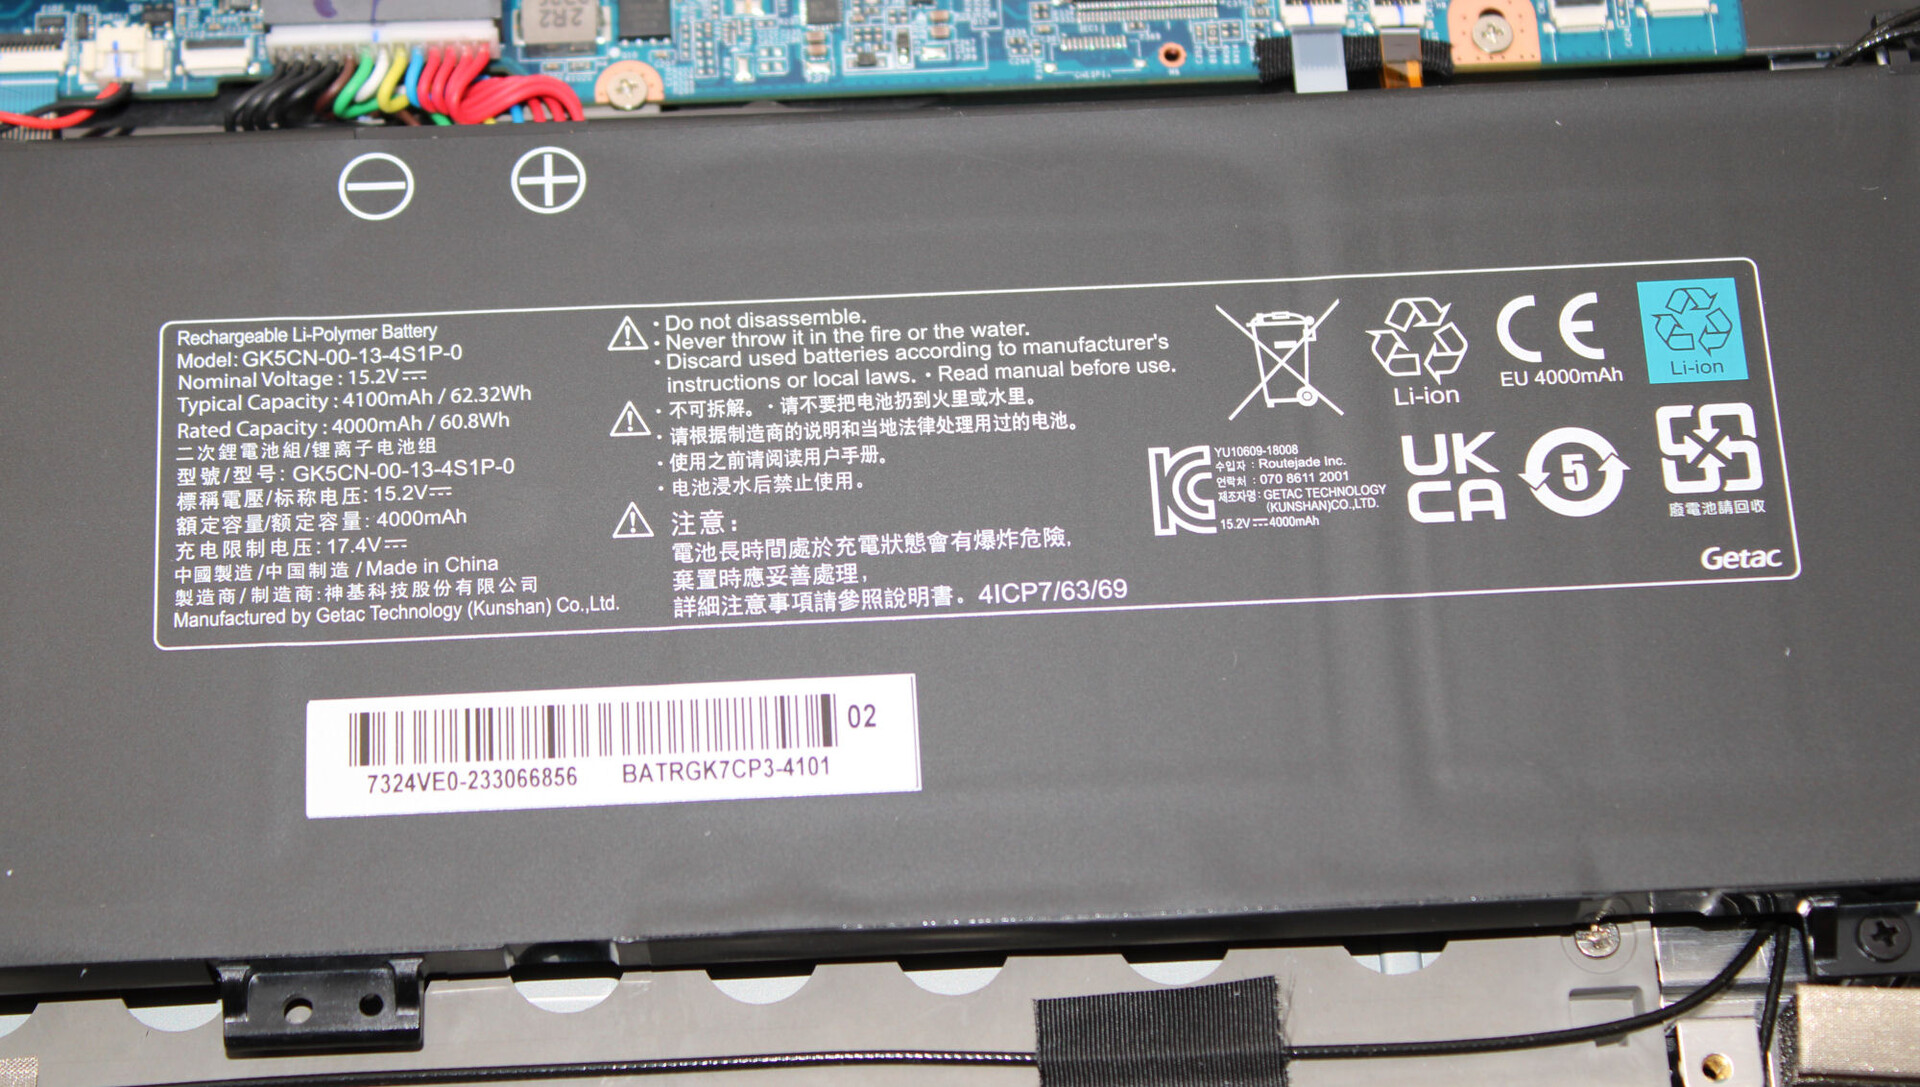
The matte-black case has smooth surfaces (except for the base unit) and no flashy design features. LED light elements are not present - with the exception of the key lighting. Schenker has opted for a mix of materials: The rear of the aluminum lid is also complemented by plastic components. After dismantling the base unit, the battery (screwed, not glued) as well as the usual hardware, are all exposed.
Manufacturing flaws are not noticeable and the gap dimensions are good. The lid and base unit can be twisted slightly but all within an acceptable range. Any pressure exerted on the lid doesn't lead to image distortions. The hinges keep the lid securely in place but wobble somewhat. The maximum opening angle sits at 140 degrees. Opening the laptop one-handed is possible.


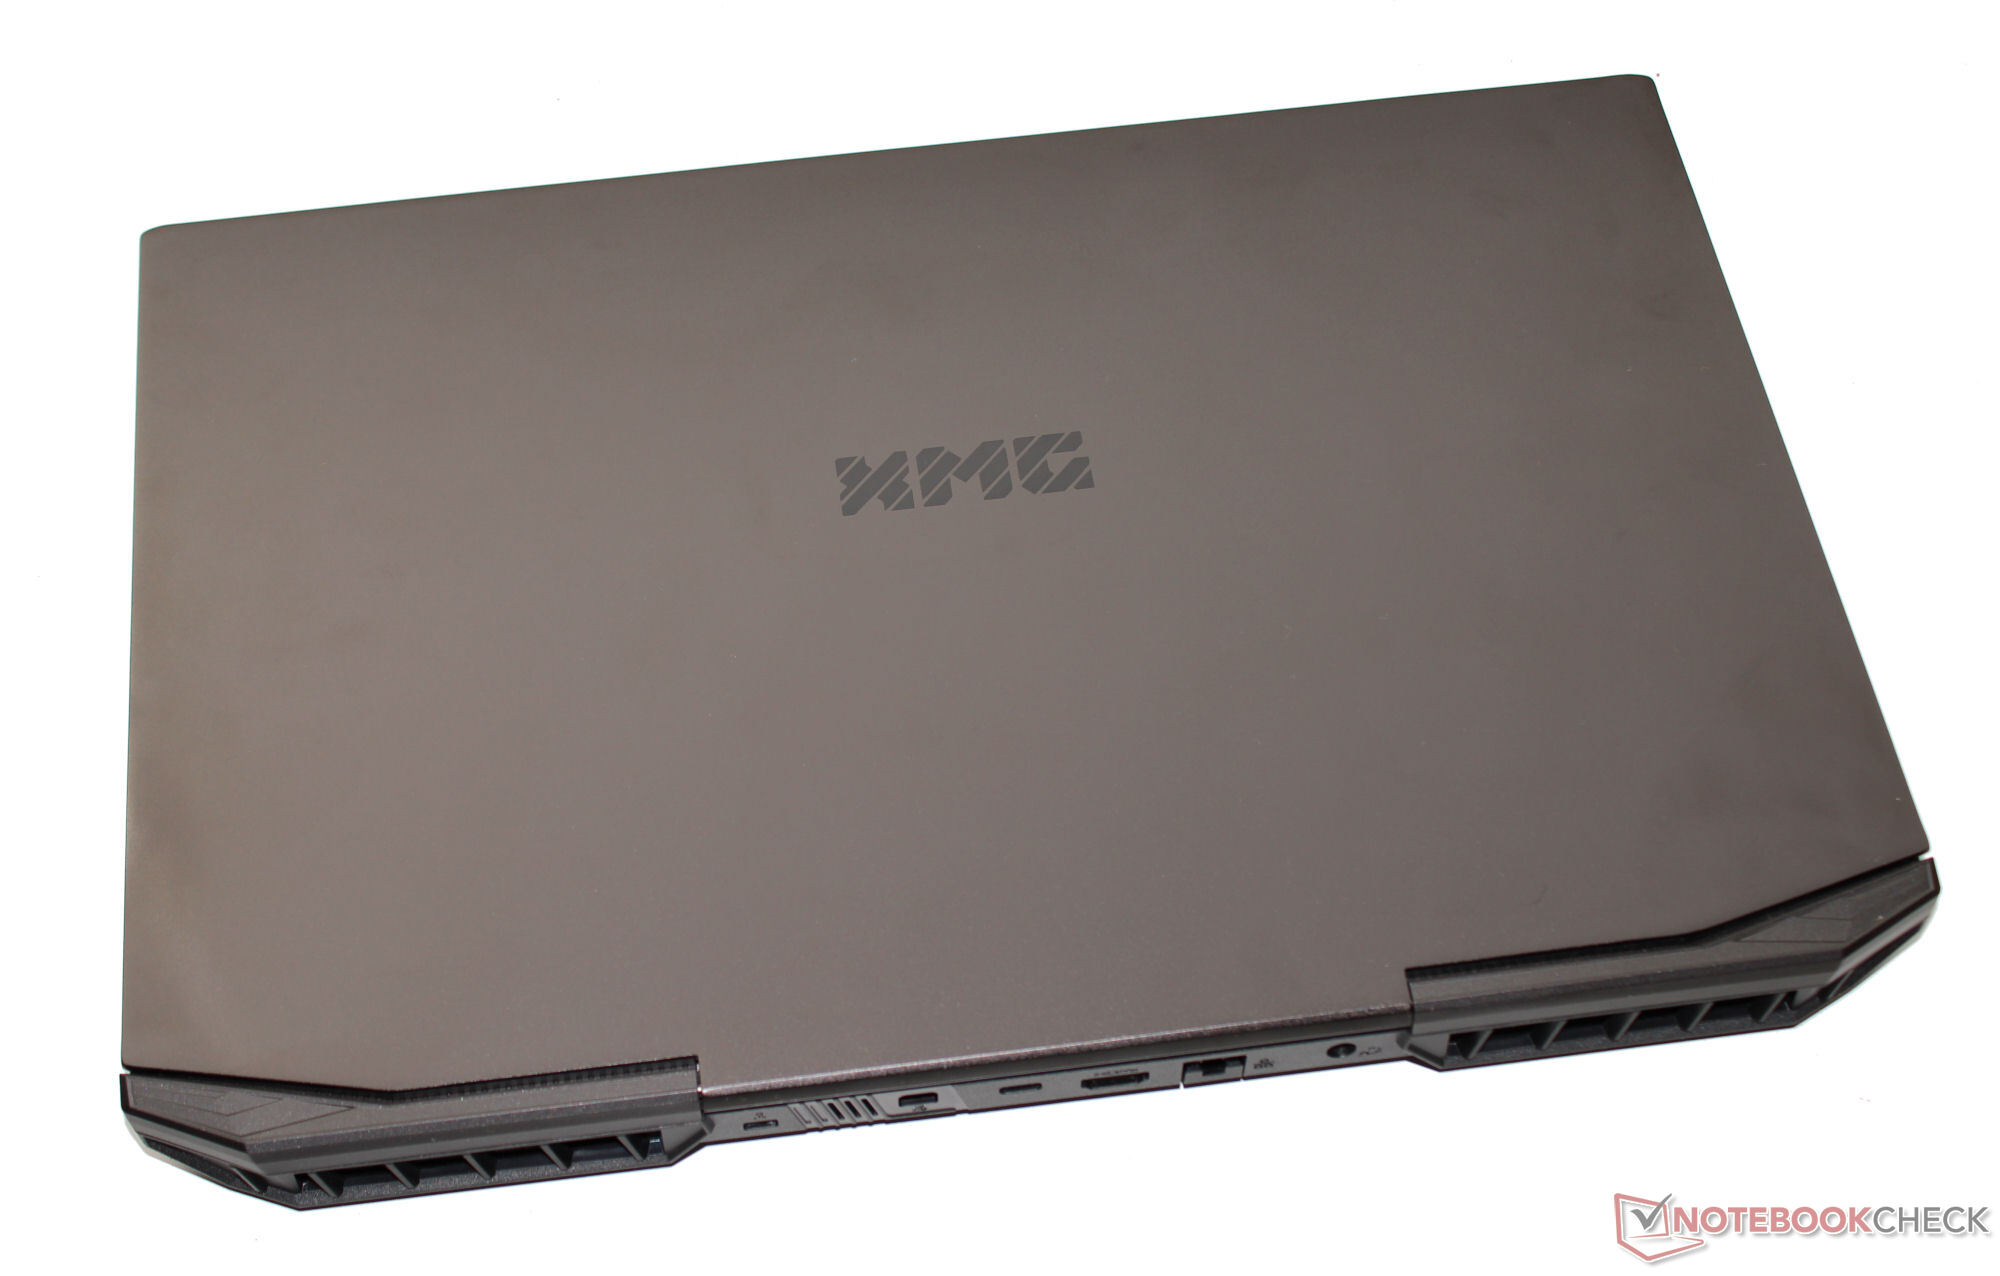
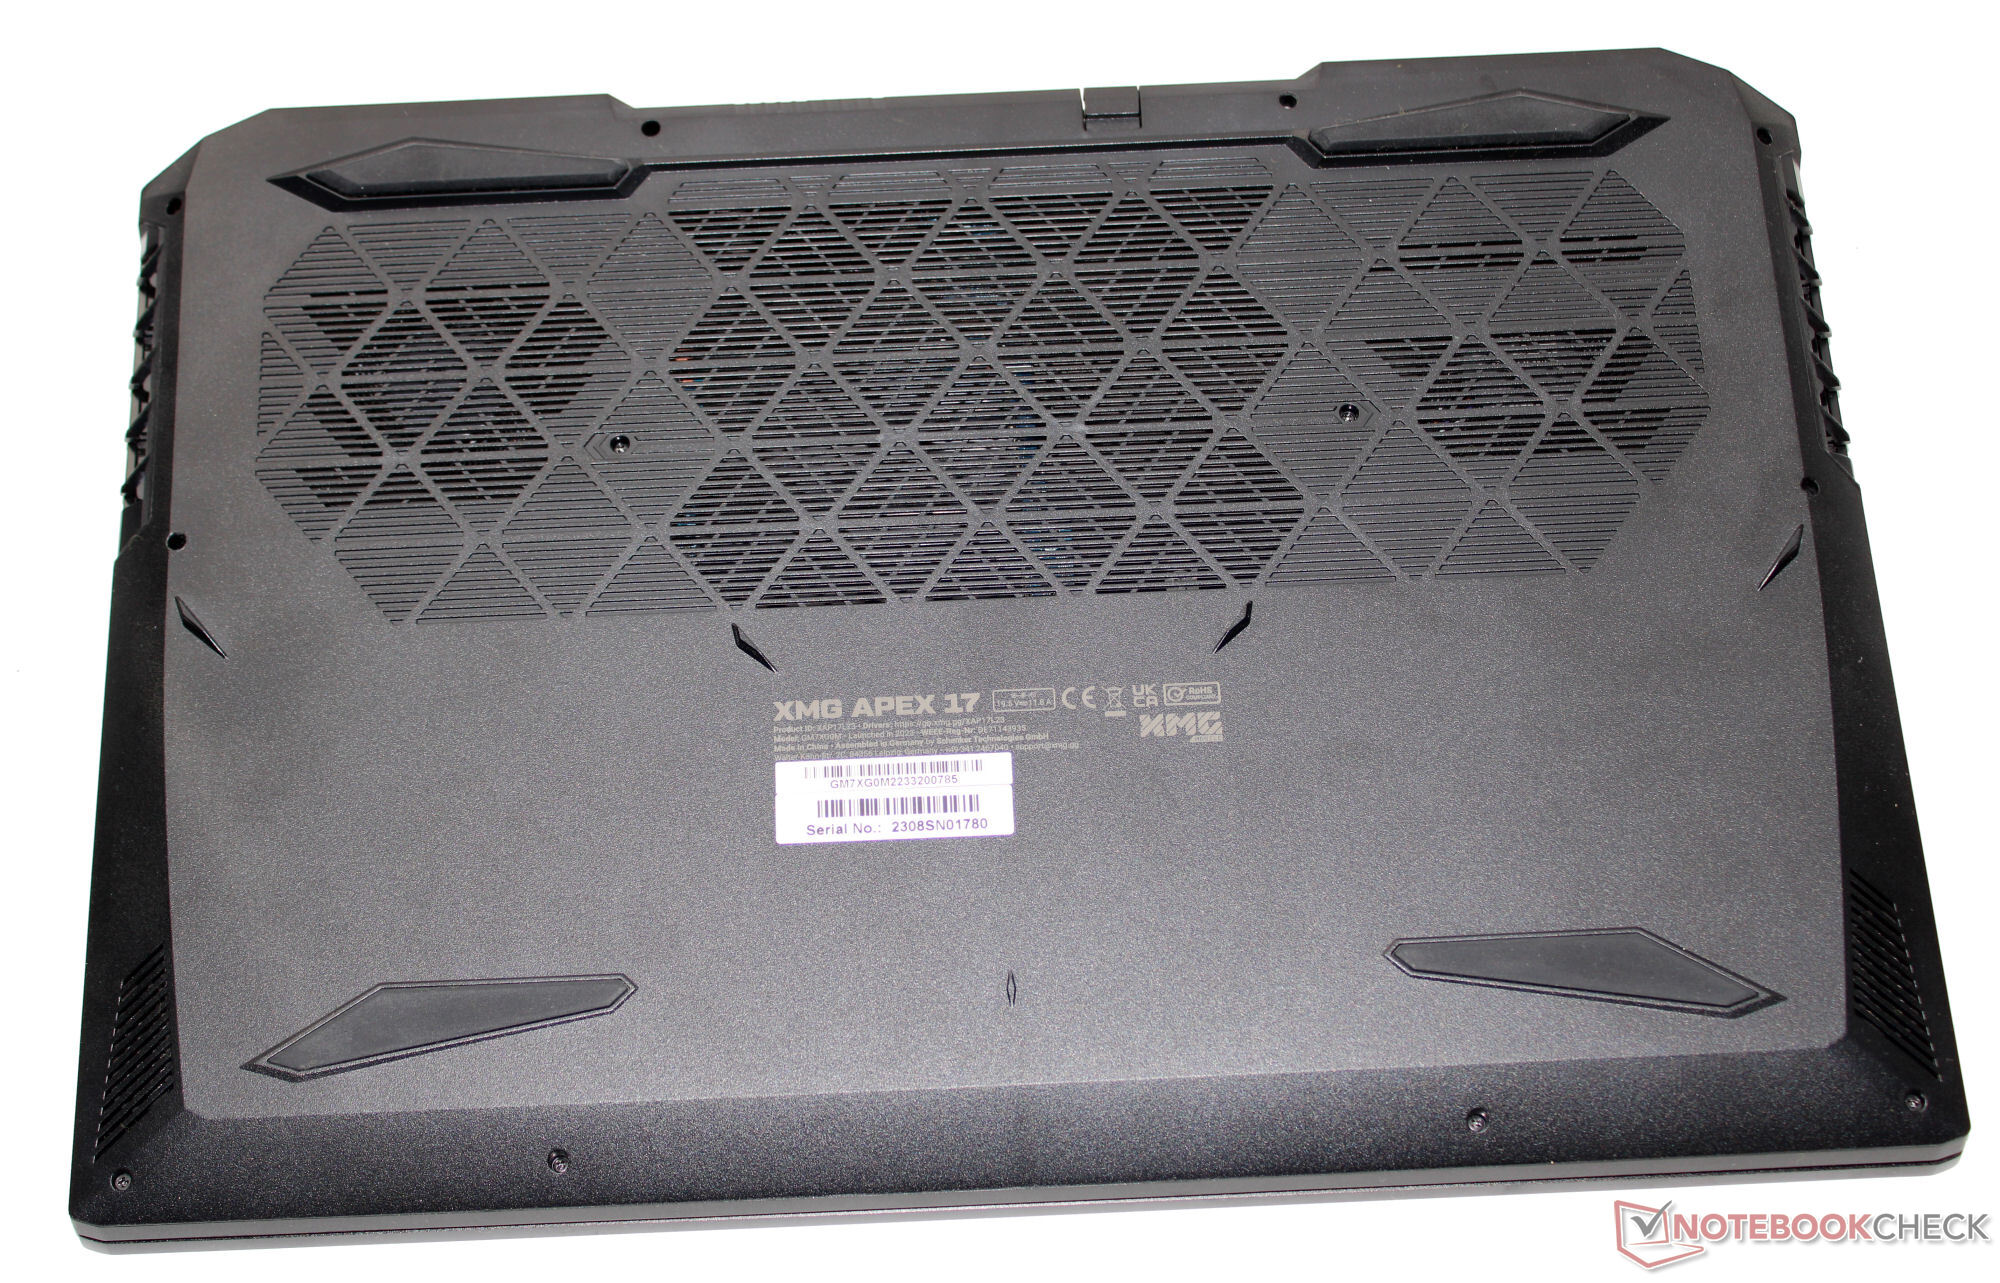
The XMG computer is the lightest and most compact among the competing 17.3-inch laptops. Tipping the scales at around 2.5 kg, it generally belongs to the lightest representatives of its kind.
Features - The XMG laptop comes without Thunderbolt
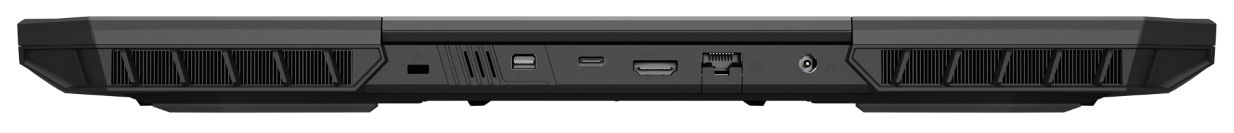
The Apex has three USB-A ports (1x USB 2.0, 2x USB 3.2 Gen 1) and a USB-C port (USB 3.2 Gen 2) at the ready. The latter can neither output a Displayport signal nor does it offer Power Delivery support. Two video outputs (HDMI 2.1, DP 1.4a), audio jacks and a Gigabit Ethernet port round off the package.
The video outputs, power connector and LAN port can be found on the rear of the device. Their corresponding cables would run to the rear and therefore not get in the way.

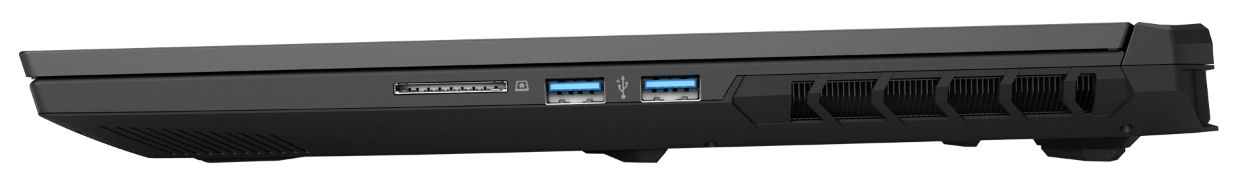
SD Card Reader
With a maximum transfer speed of 35 MB/s (transferring 250 jpg image files, at around 5 MB each) and 36 MB/s (copying large data blocks), the memory card reader (reference card: AV PRO microSD 128 GB V60) belongs to the slow models. In this regard, the competition offers more.
| SD Card Reader | |
| average JPG Copy Test (av. of 3 runs) | |
| Alienware m16 R1 Intel (AV PRO microSD 128 GB V60) | |
| Average of class Gaming (20 - 210, n=65, last 2 years) | |
| Medion Erazer Defender P40 (AV PRO microSD 128 GB V60) | |
| Acer Nitro 17 AN17-51-71ER | |
| Schenker XMG Apex 17 (Late 23) (AV PRO microSD 128 GB V60) | |
| maximum AS SSD Seq Read Test (1GB) | |
| Alienware m16 R1 Intel (AV PRO microSD 128 GB V60) | |
| Average of class Gaming (25.5 - 261, n=62, last 2 years) | |
| Medion Erazer Defender P40 (AV PRO microSD 128 GB V60) | |
| Acer Nitro 17 AN17-51-71ER | |
| Schenker XMG Apex 17 (Late 23) (AV PRO microSD 128 GB V60) | |
Communication
Under optimum conditions (no Wi-Fi devices nearby, a short distance between the laptop and the server PC) it is possible to achieve good to very good Wi-Fi data speeds. The Schenker laptop uses a Wi-Fi 6E chip (Intel AX200). A Realtek controller (RTL8168/8111; 1 GBit/s) takes care of wired connections.
Webcam
Quality-wise, the webcam delivers (2.1 MP, max. 1,920 x 1,080 pixels) standard fare. A color deviation of around 8.7 (target: DeltaE < 3) is quite decent. The camera doesn't offer a mechanical shutter.

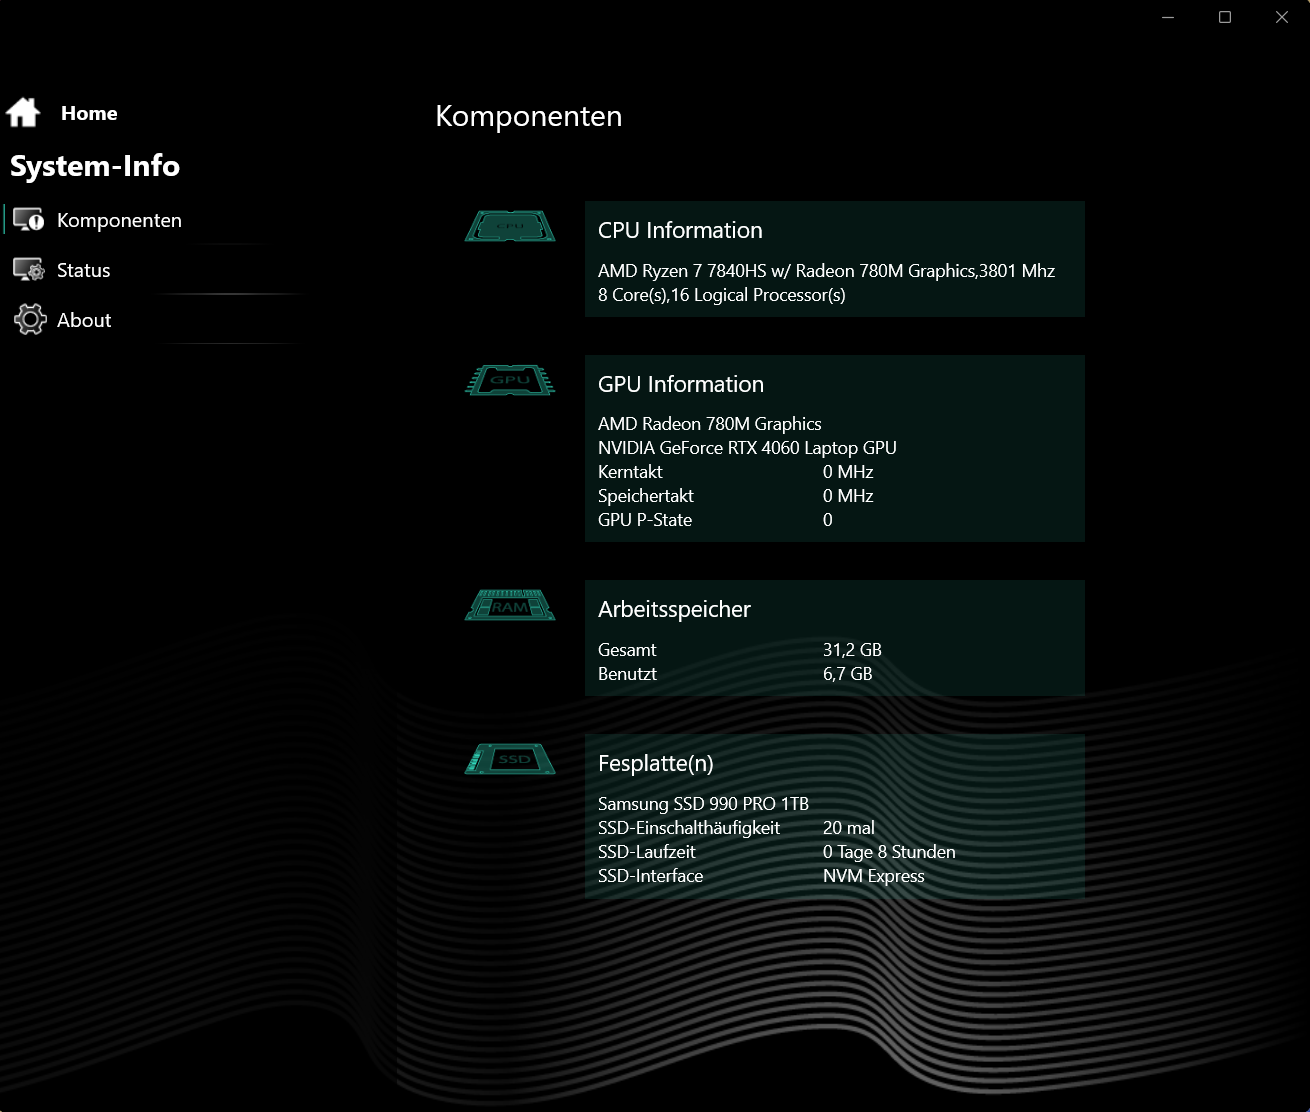
 GeForce RTX 4060 Laptop GPU, R7 7840HS, Samsung 990 Pro 1 TB")
 GeForce RTX 4060 Laptop GPU, R7 7840HS, Samsung 990 Pro 1 TB")
Accessories
In addition to the usual documents, the laptop comes with a USB stick (drivers, software), a key ring including a bottle opener and a large mousepad.
Maintenance
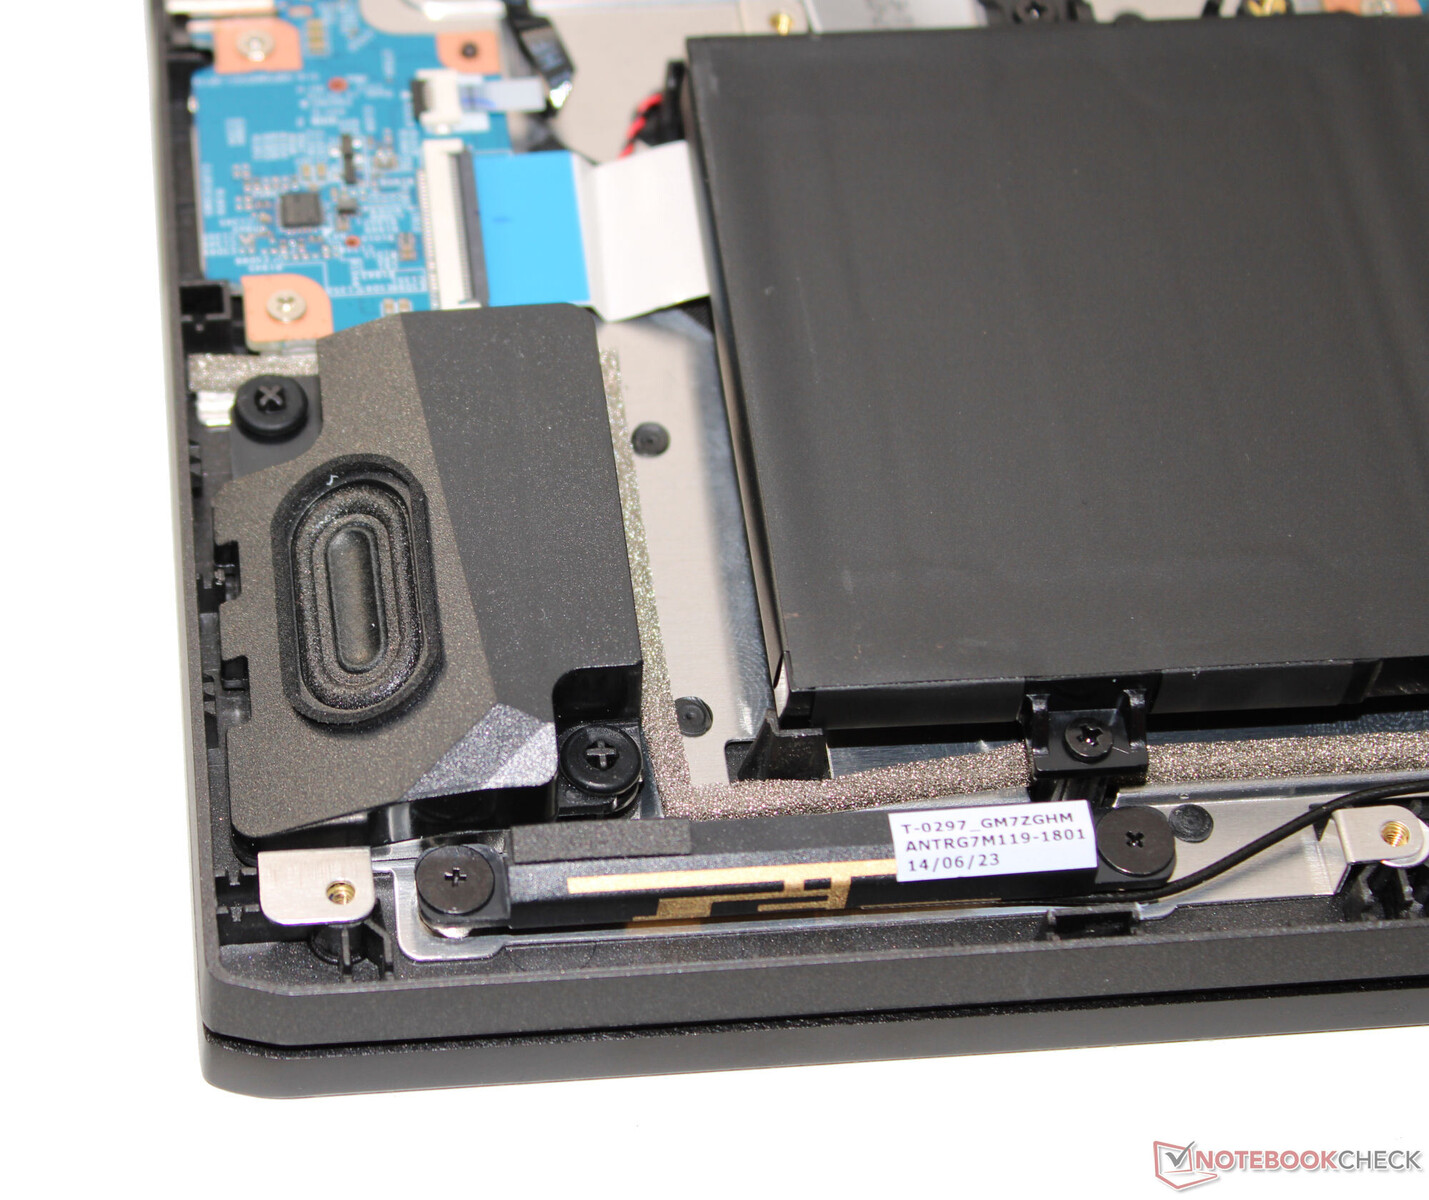
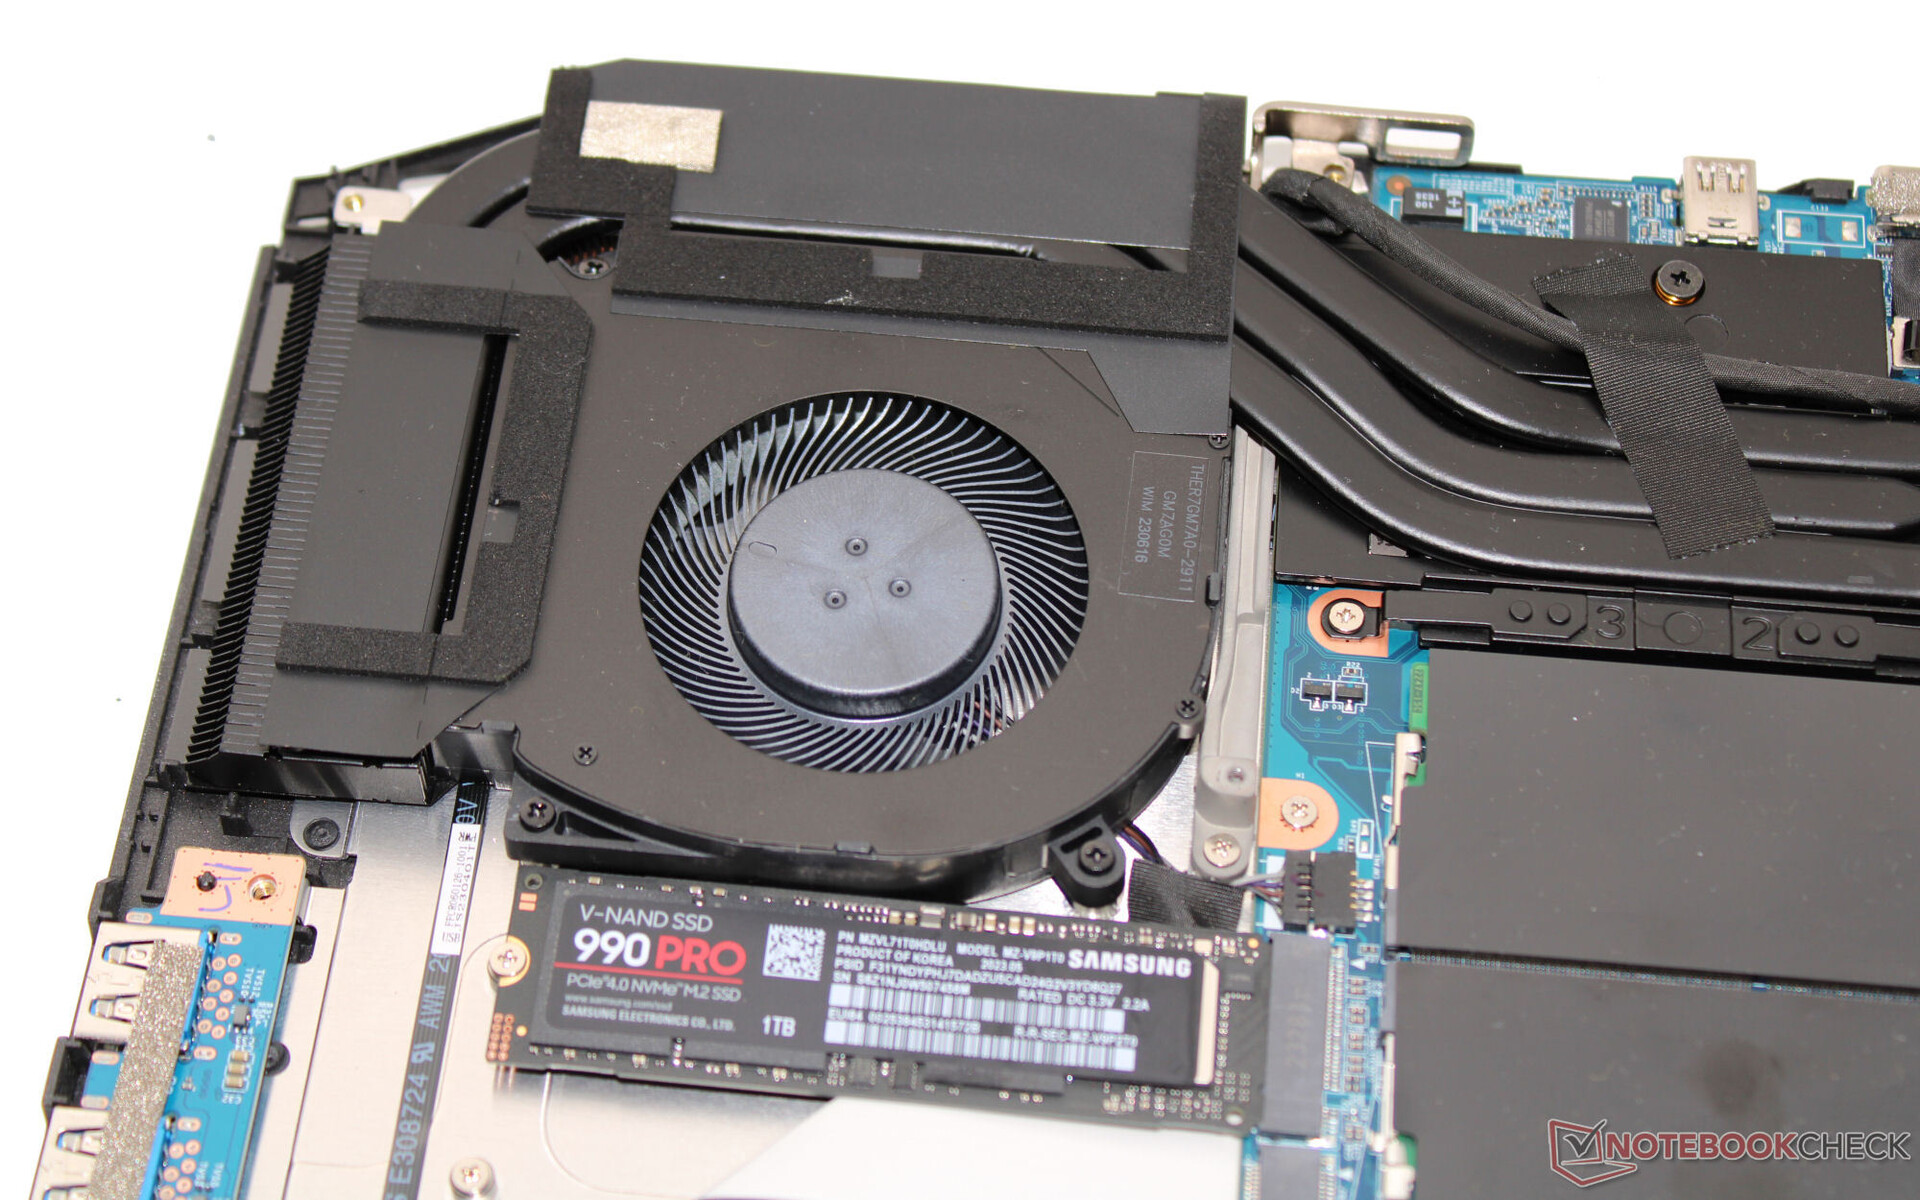
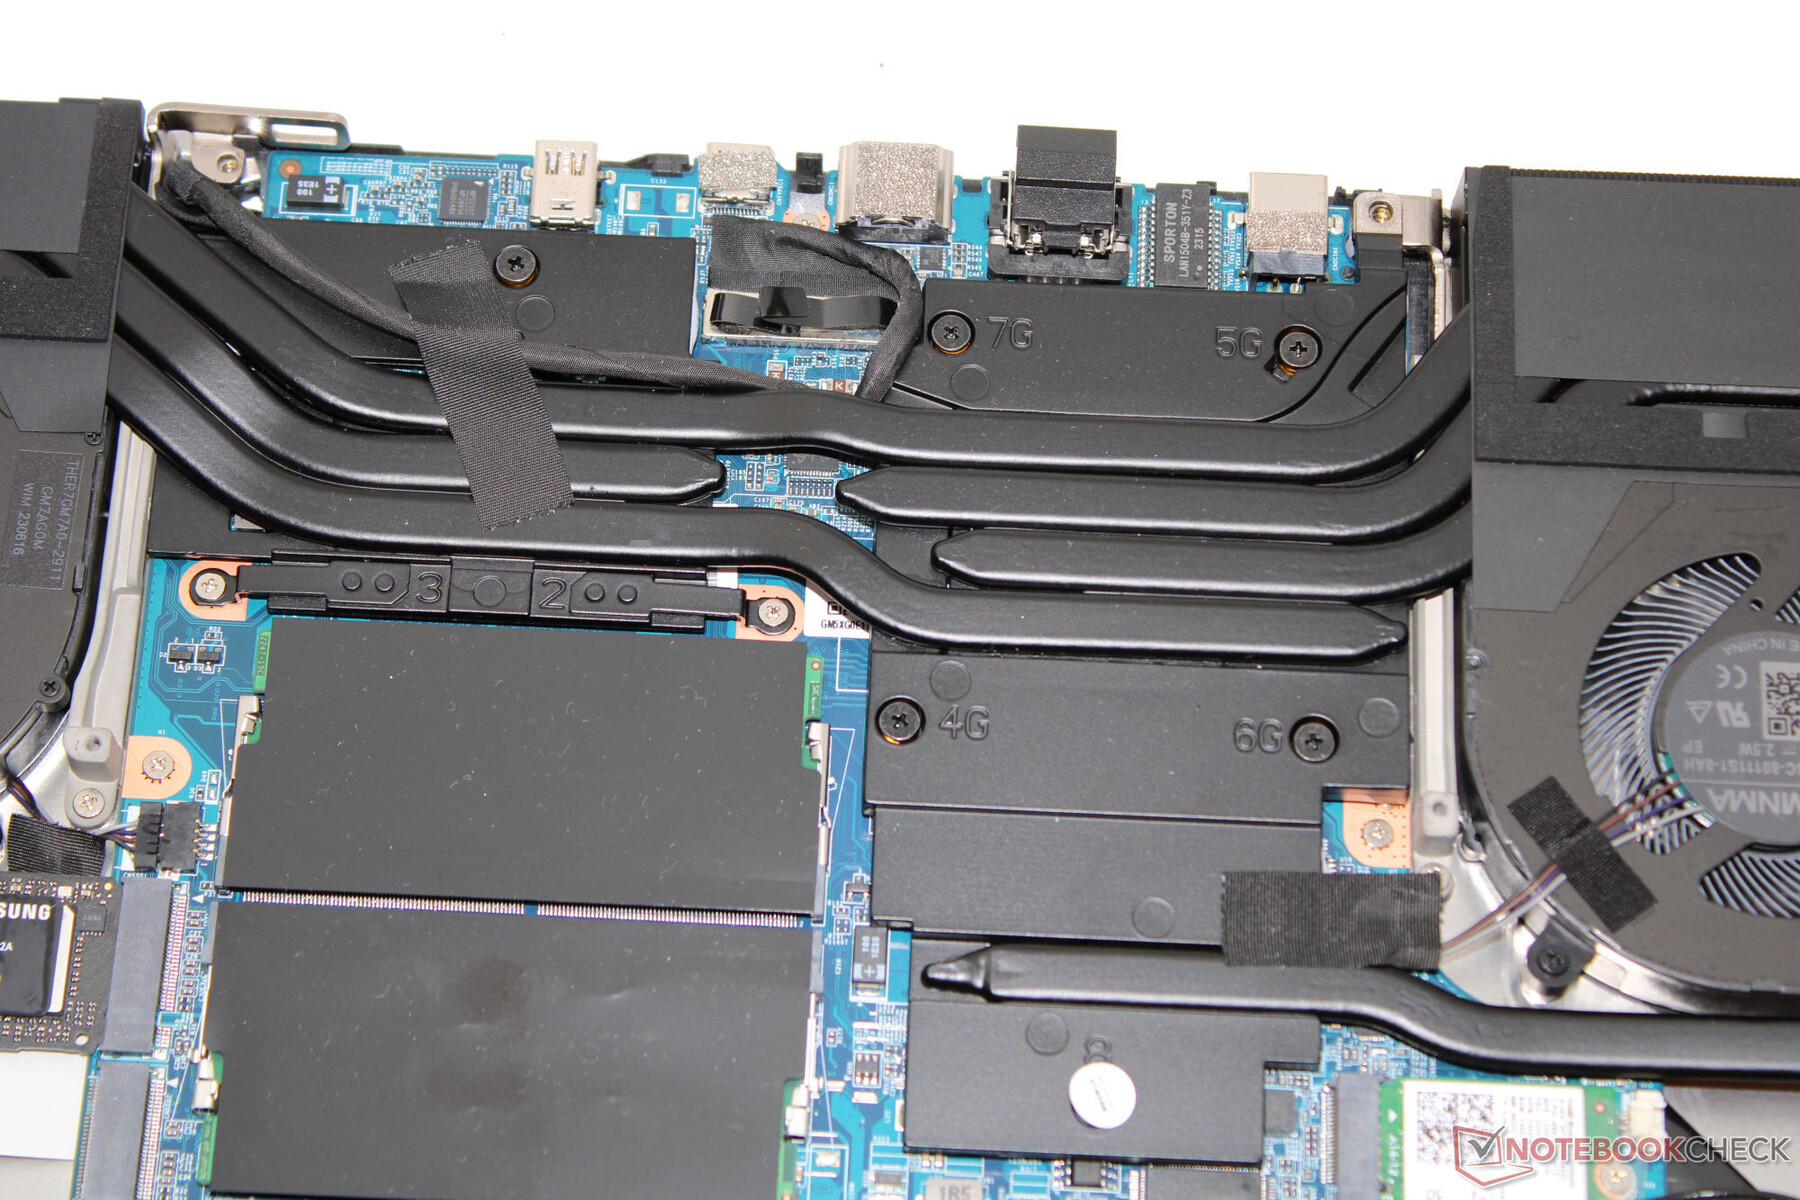
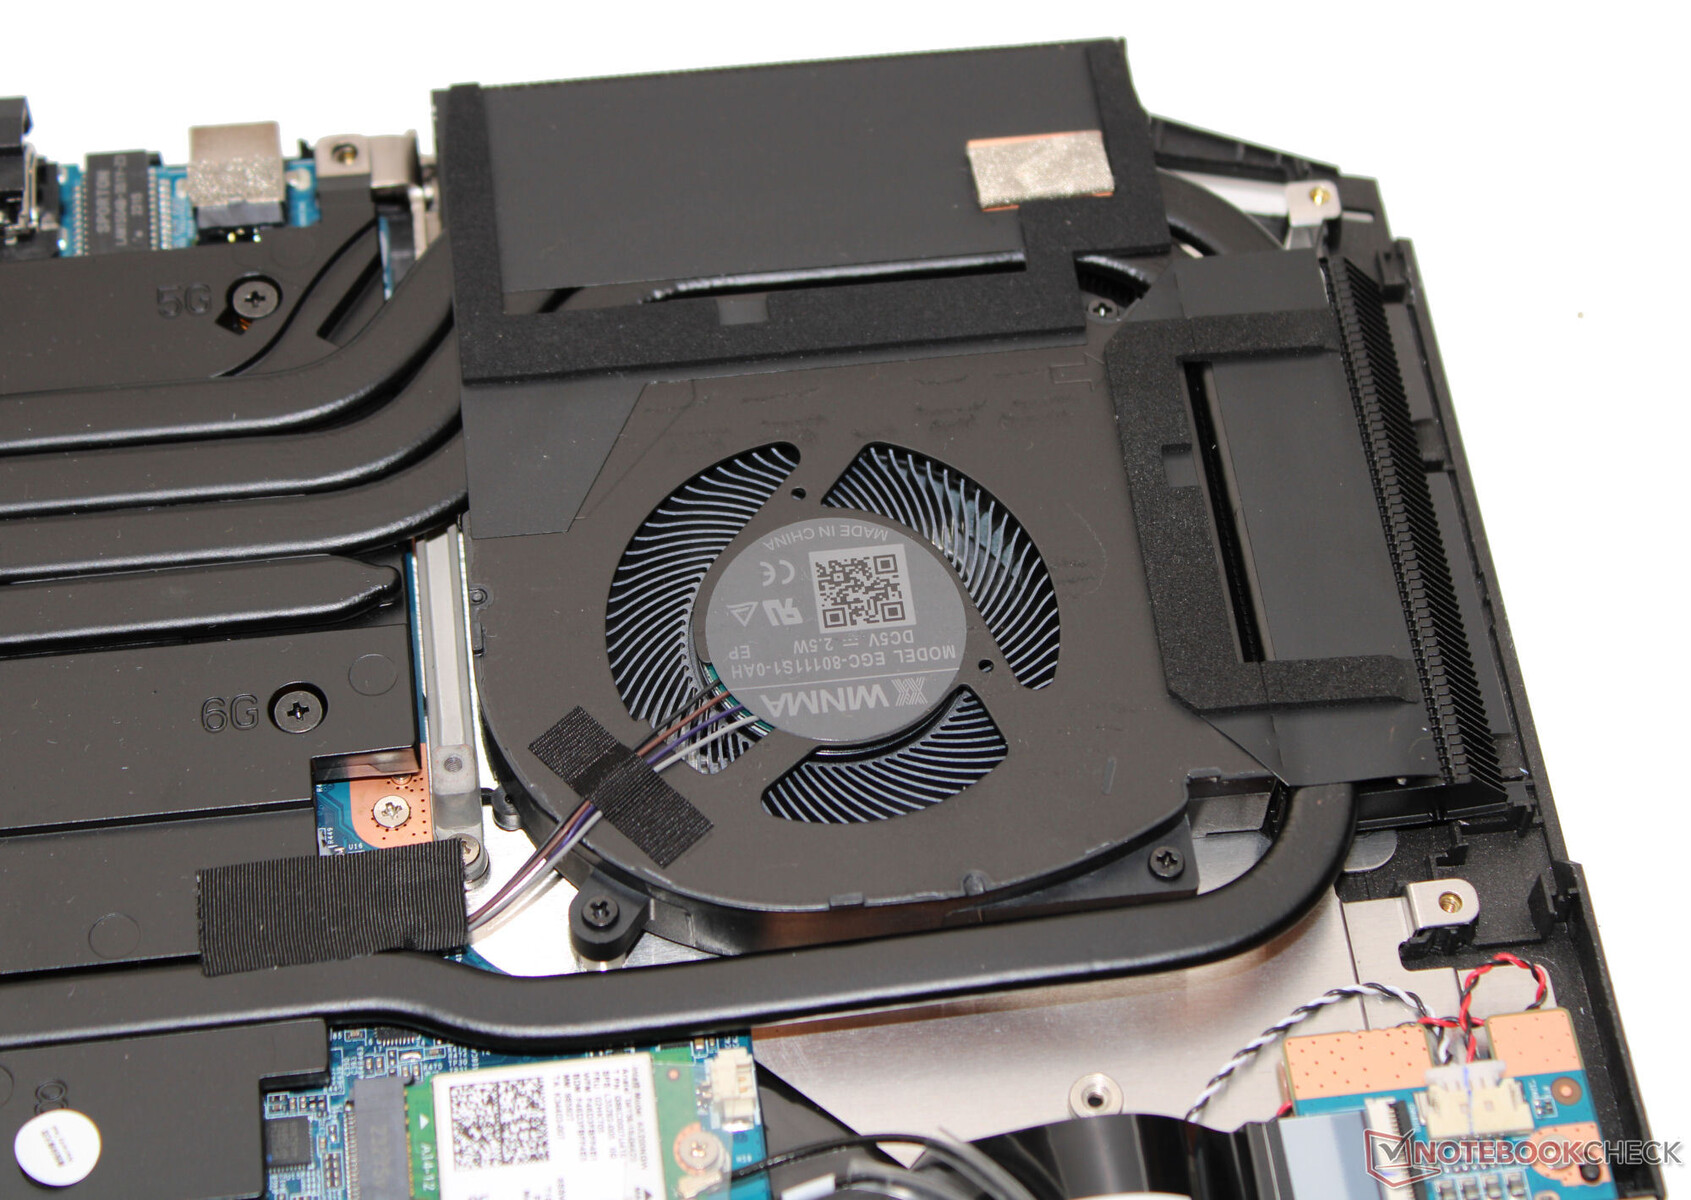
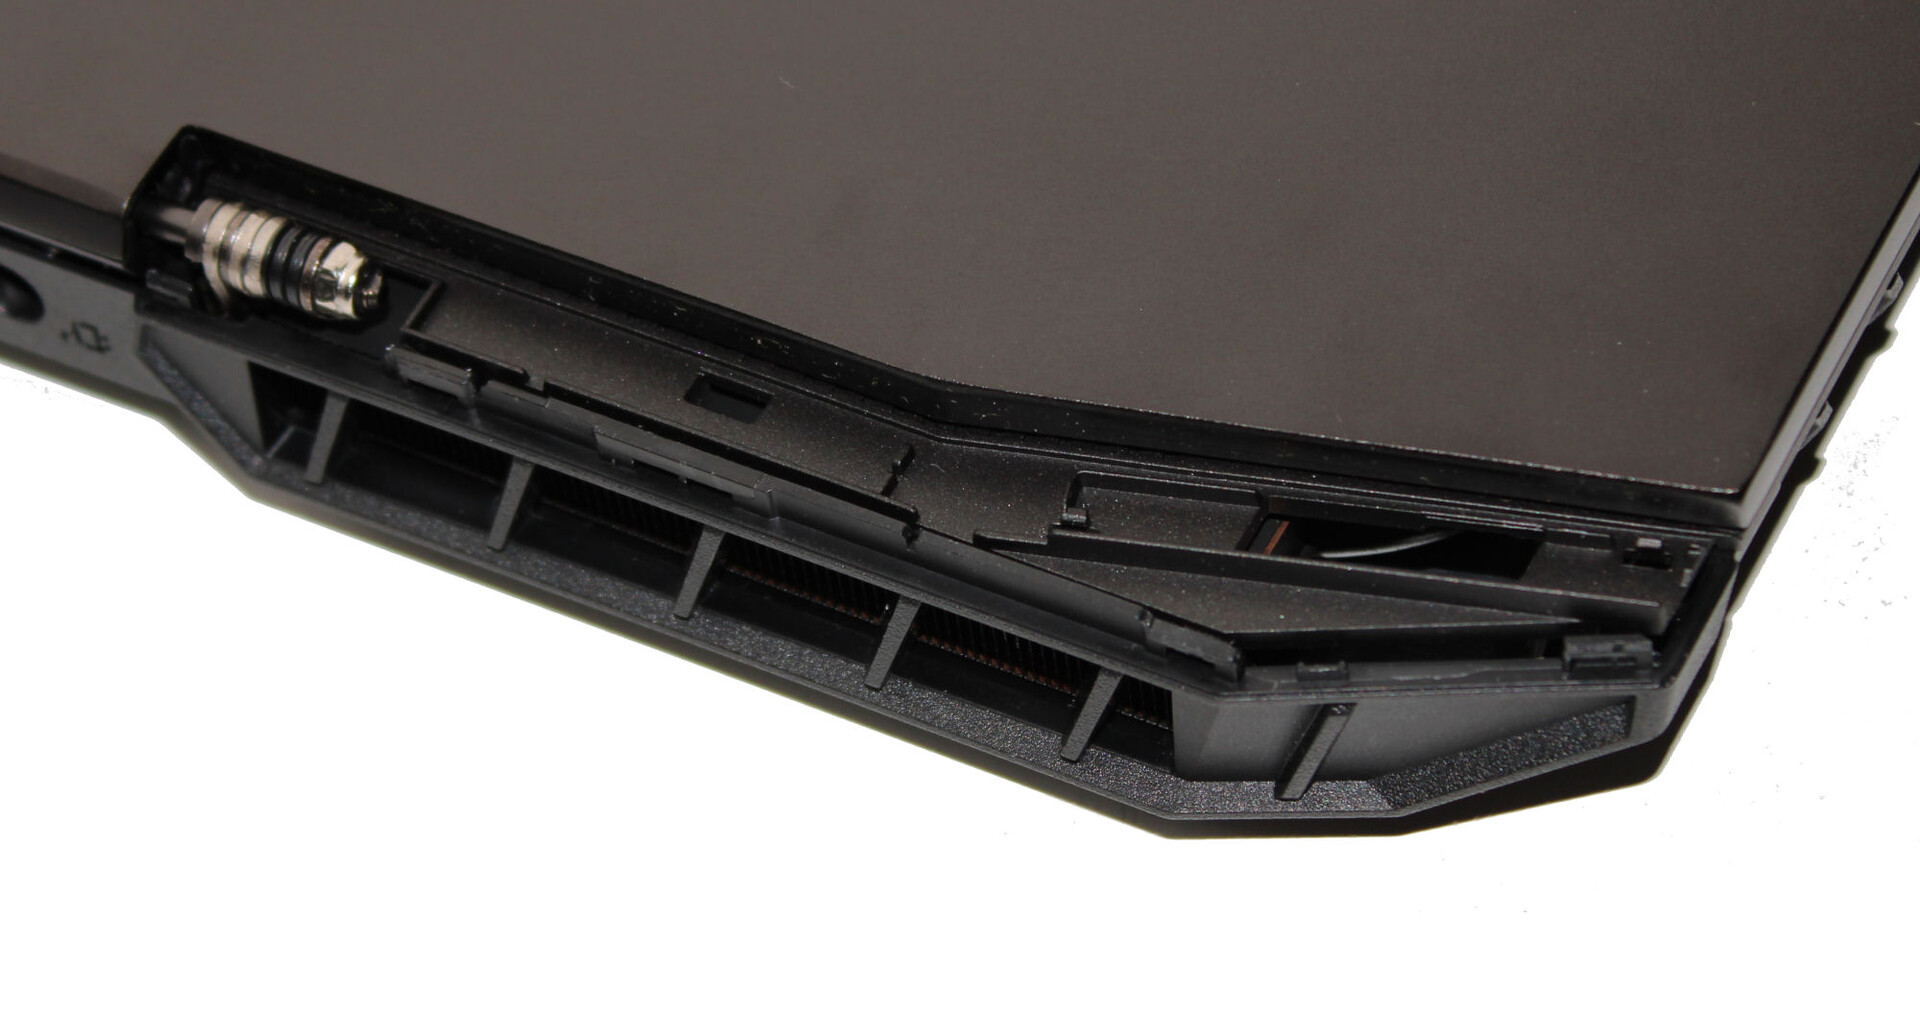
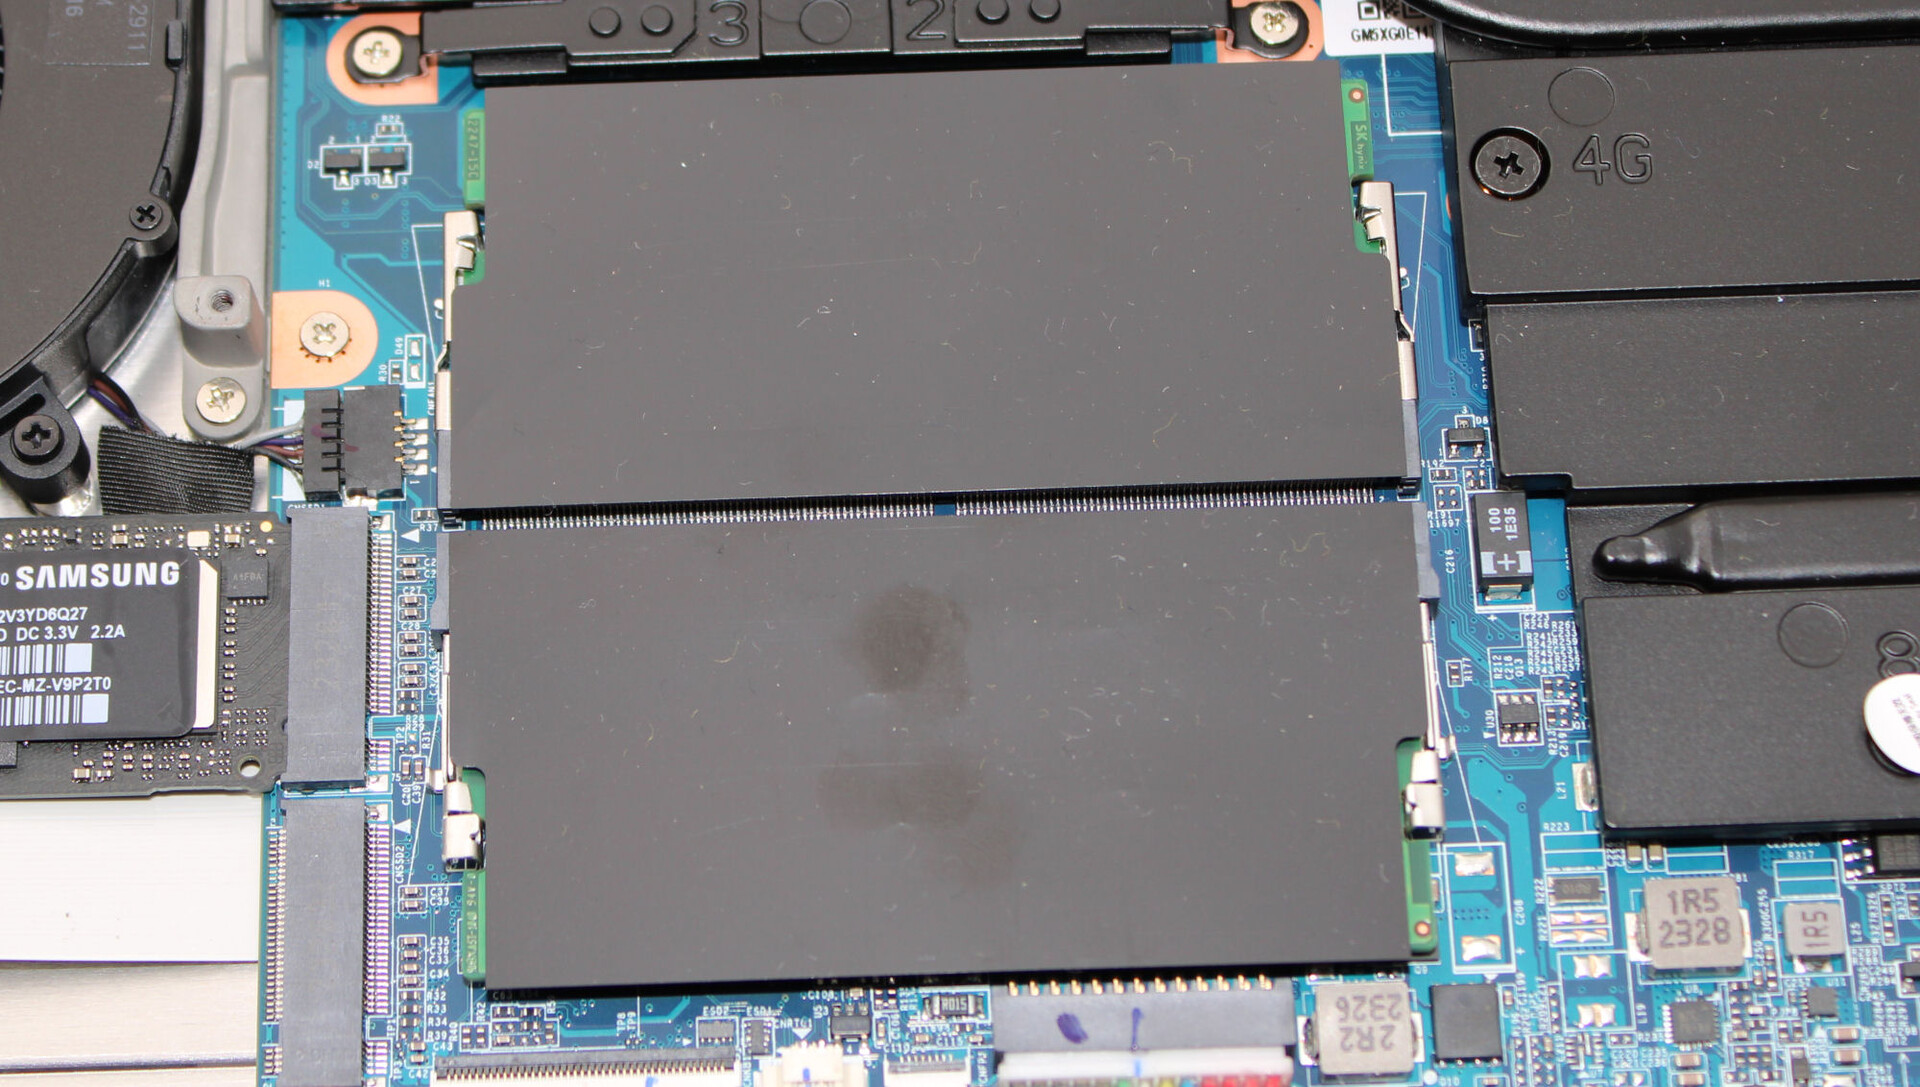
After dismantling the base plate, the hardware becomes accessible. The first step on this journey is presented by the removal of the hinge covers (above the air vents). These are only slotted in and not screwed on. Following this, the removal of all of the screws on the bottom of the device means the base shell can be separated from the rest of the device by using a thin spatula or a plectrum. This then allows access to memory banks (both occupied), the SSD (PCIe 4, M.2 2280), the second SSD slot (PCIe 4, M.2 2280), the Wi-Fi module, the BIOS battery, the fans and the battery.

Warranty
The basic warranty is for two years - including a pick-up service and six months quick repair (repair within 48 hours). In Germany, the asking price for a 36-month warranty is from 80 to 119 euros - depending on the selected quick repair time period.
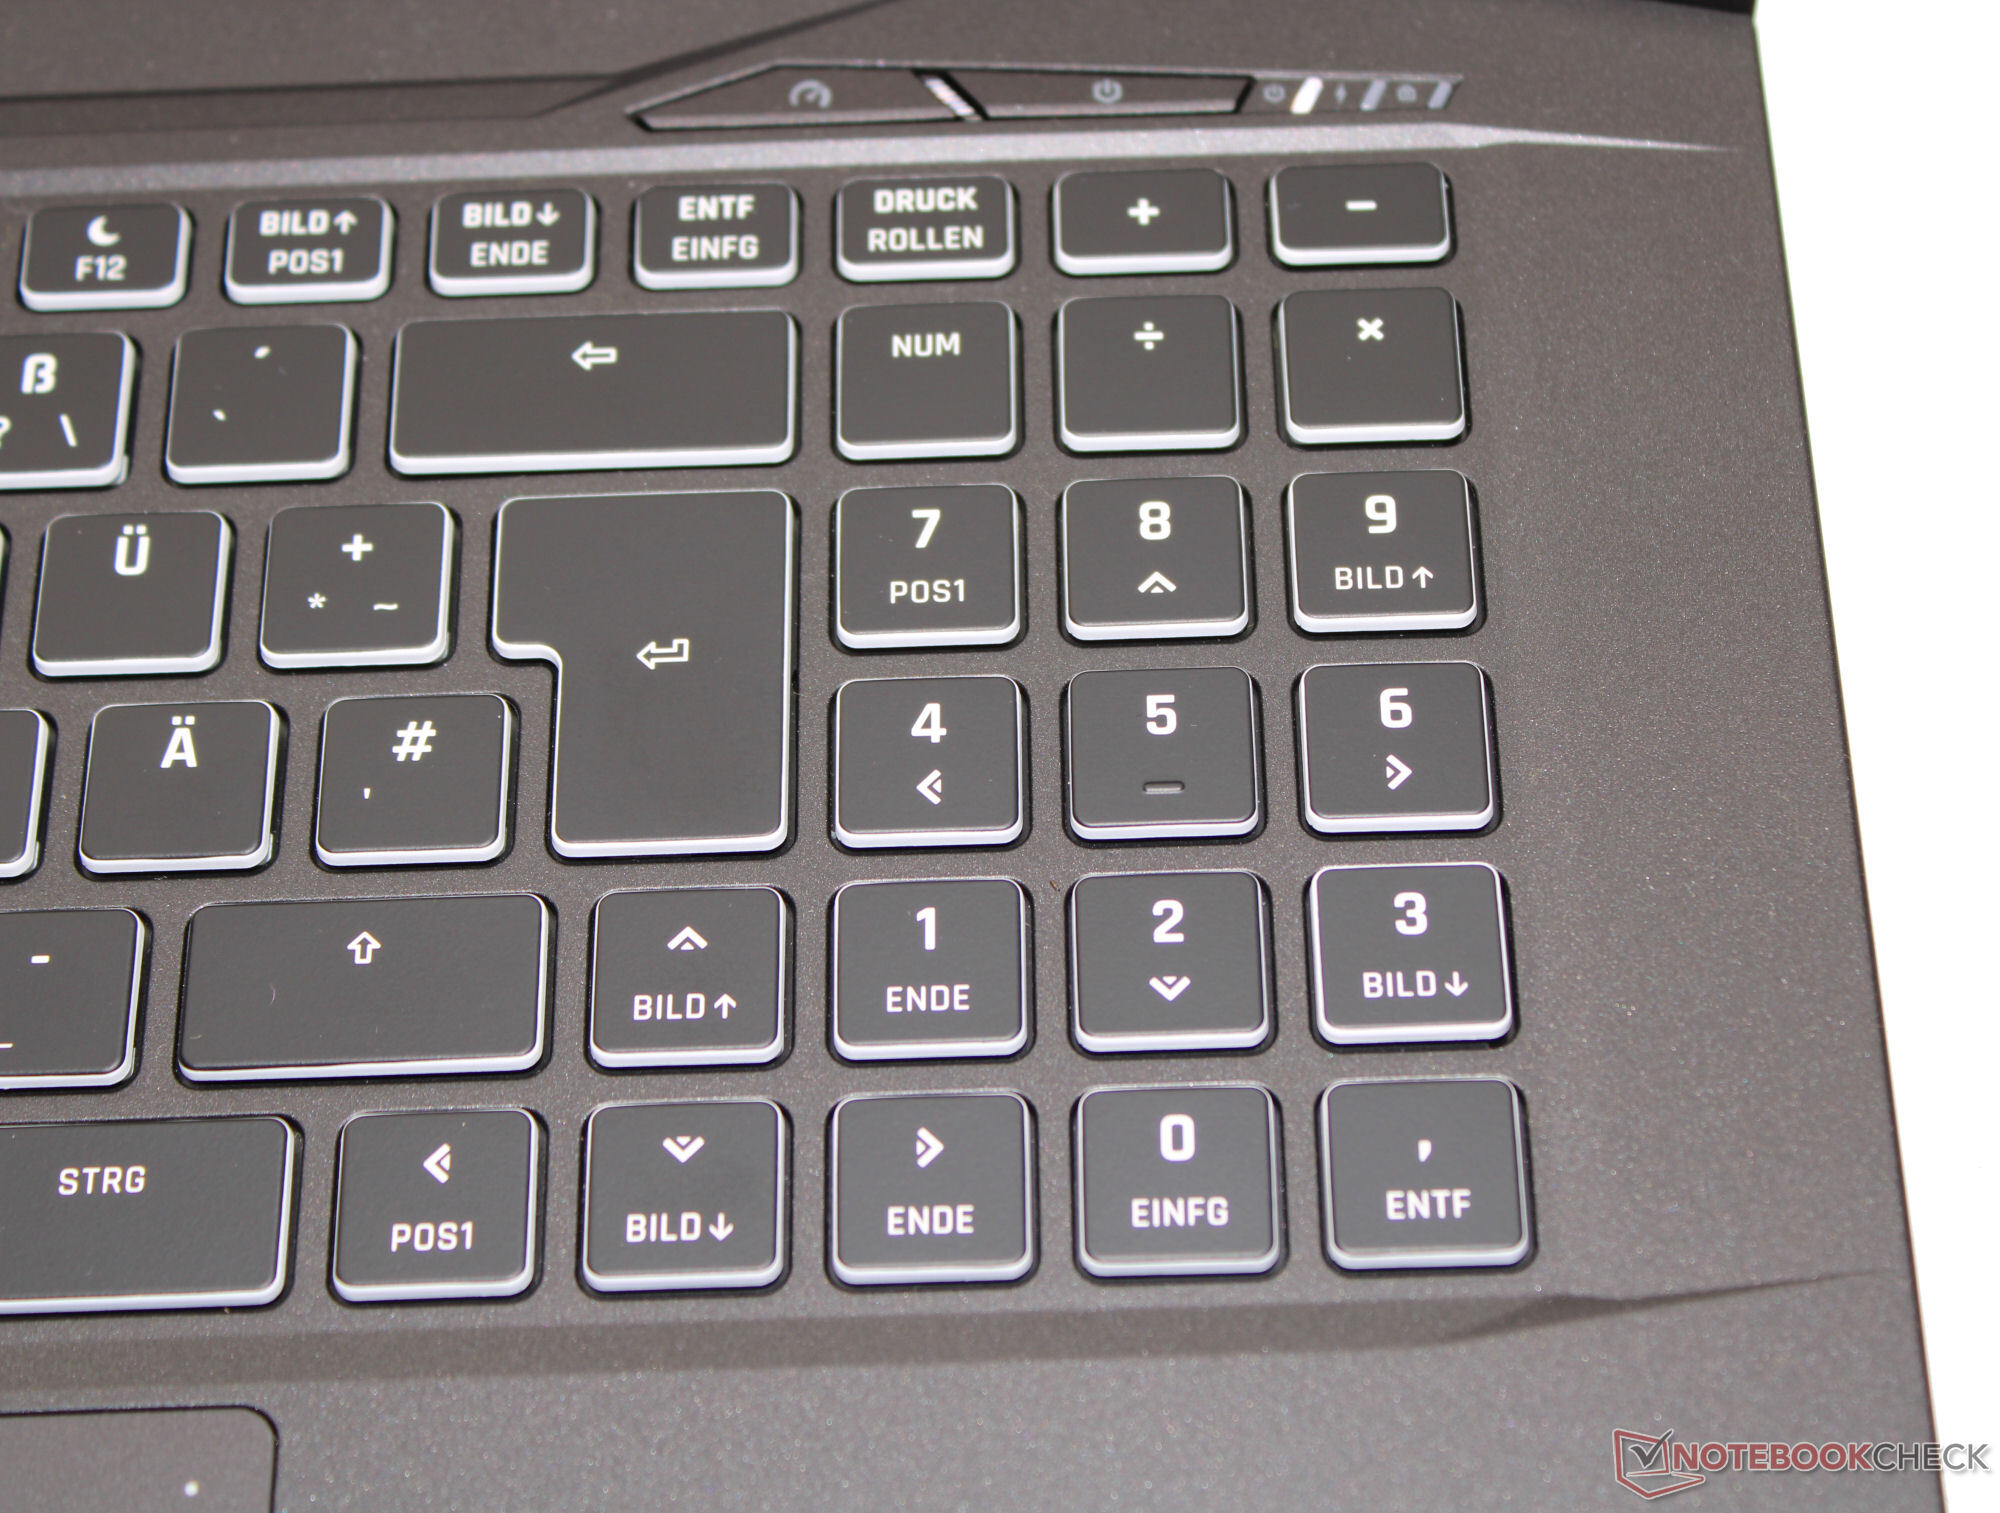
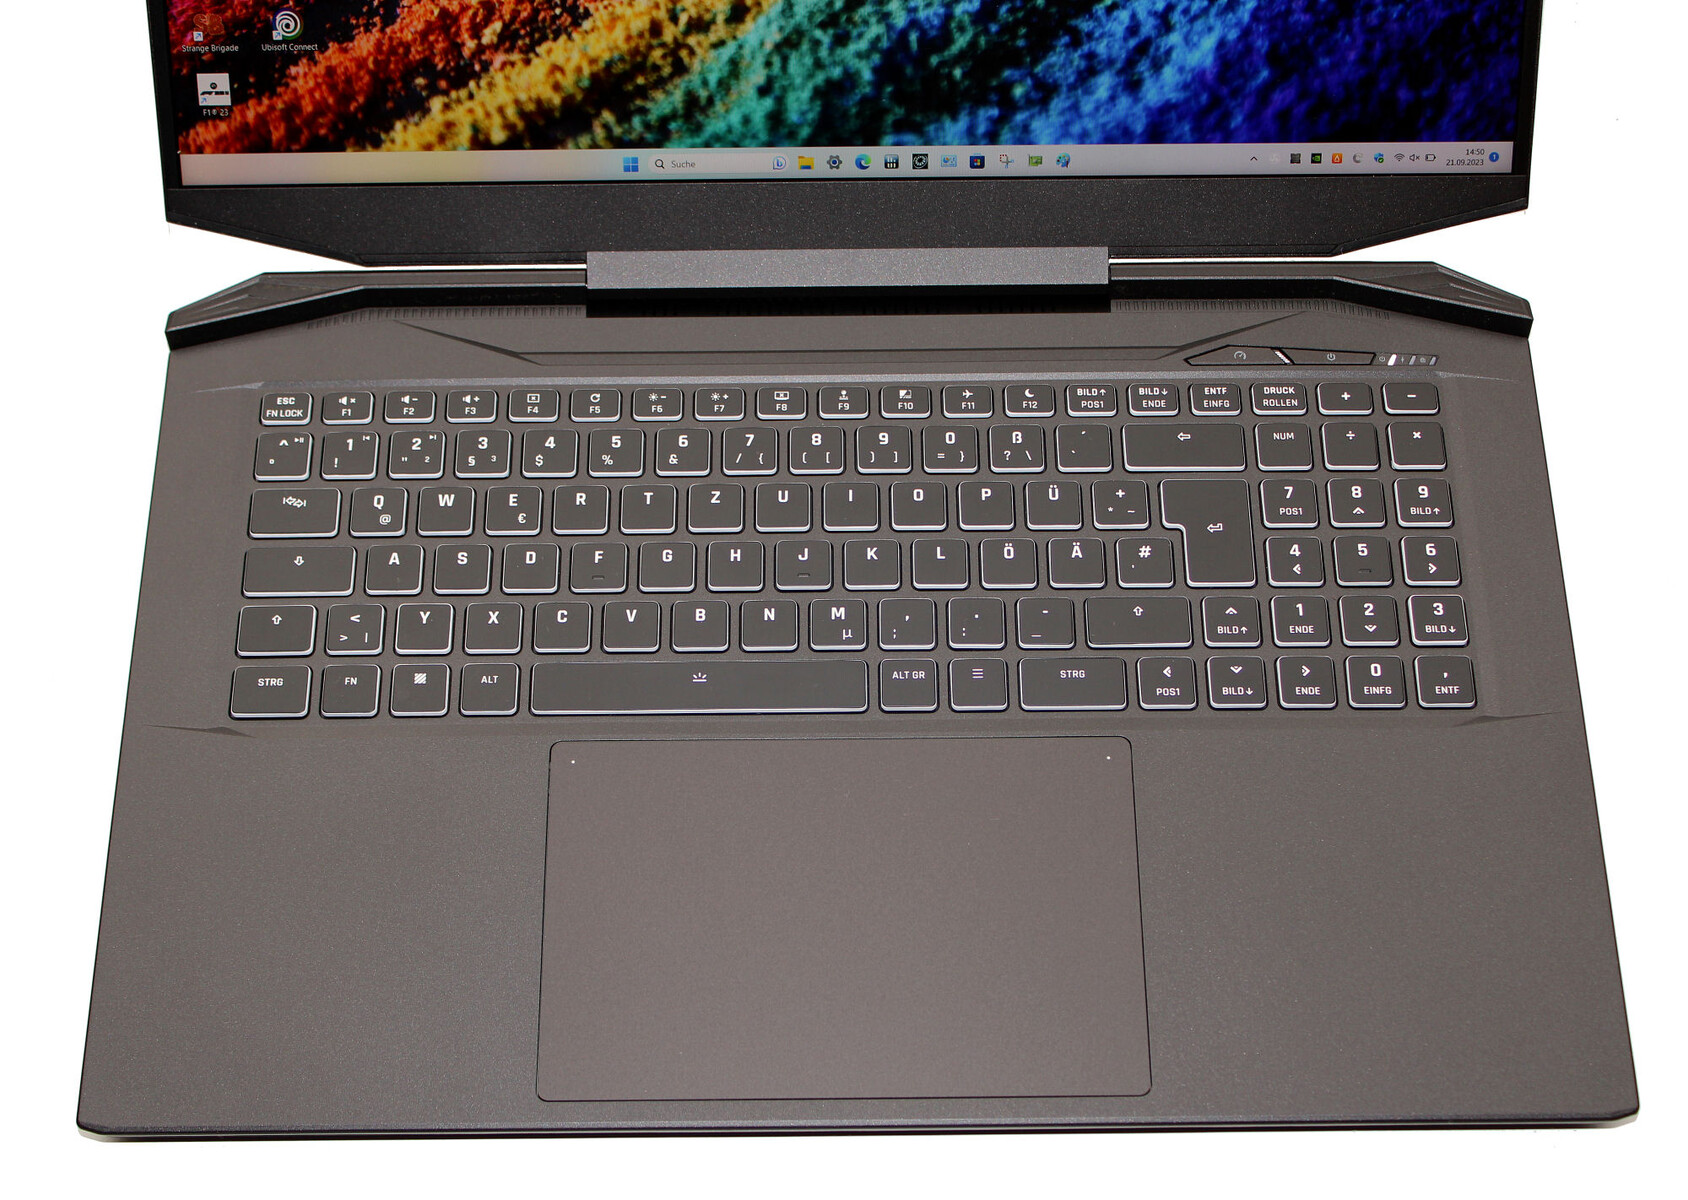
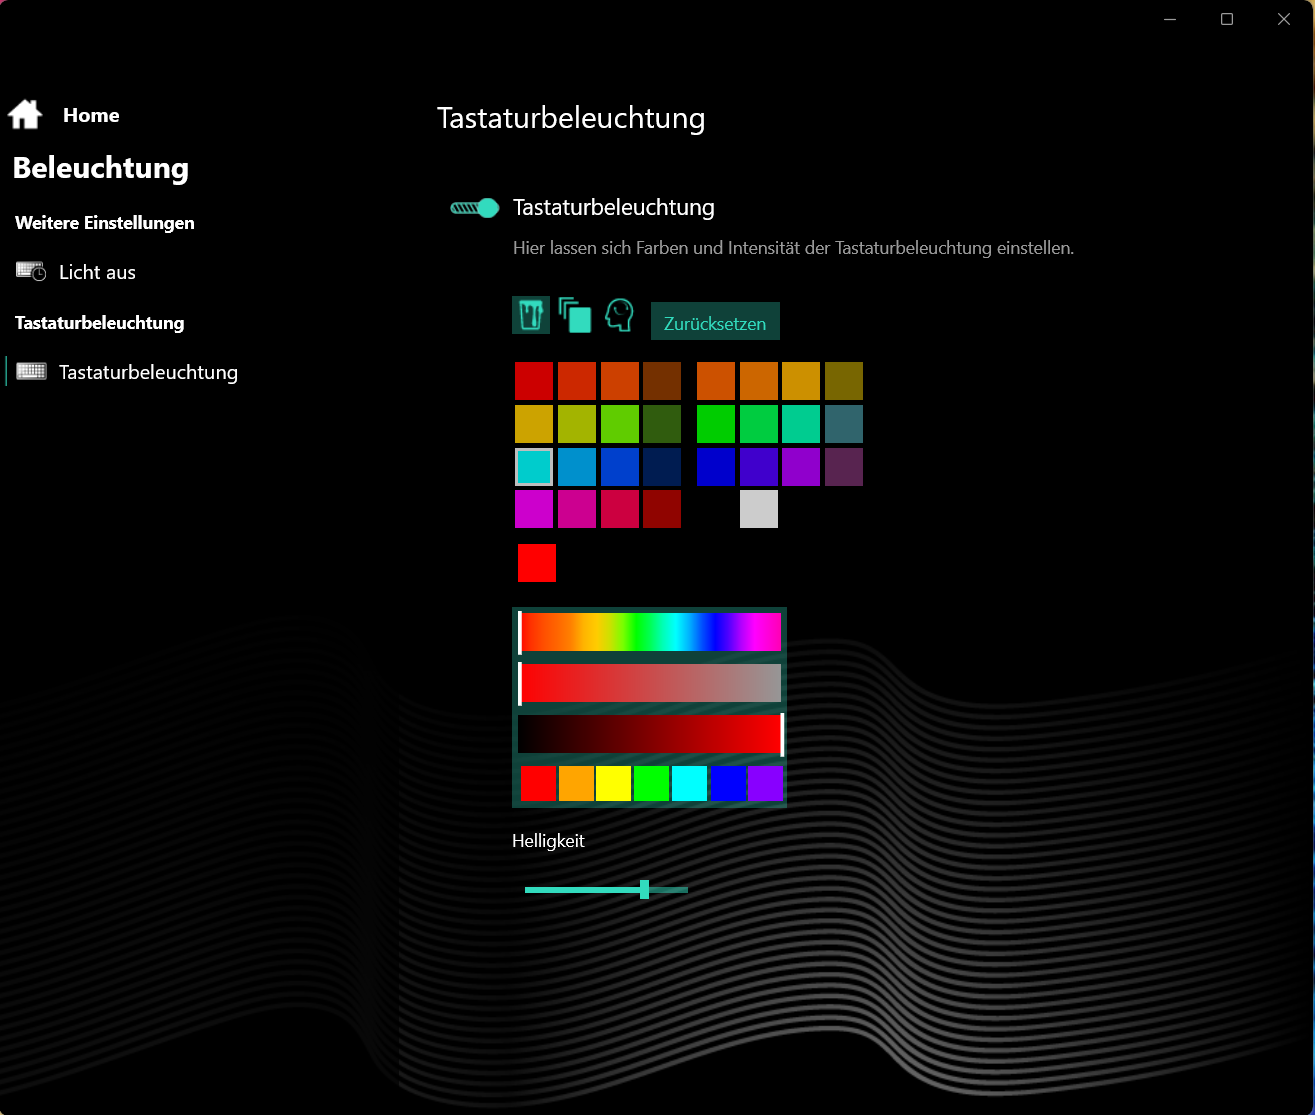
Input devices - The Apex 17 has RGB key lighting
Keyboard
The backlit, chiclet keyboard's (RGB) flat, smooth keys enjoy medium key travel as well as having a distinct pressure point and nice resistance. When typing, the keyboard doesn't yield. All in all, you get a keyboard fit for everyday use.
Touchpad
A substitute mouse is provided by the Clickpad (around 15.4 x 10 cm) that has short travel and a clear pressure point. A tap on the LED in the top left-hand corner switches the entire pad either off or on. A tap on the LED in the top right-hand corner switches the right side of the pad off or on.
Display - A QHD panel with sRGB coverage
The responsive, 16:9 aspect ratio 240 Hz panel displays no PWM flickering, regardless of the brightness setting. The matte, 17.3-inch screen's brightness and contrast (2,560 x 1,440 pixels) meet their respective goals (> 300 cd/m² and 1,000:1).
In addition to the review device's QHD display, Schenker offers the Apex 17 with an alternative FHD (1,920 x 1,080 pixels, 144 Hz, IPS) panel.
| |||||||||||||||||||||||||
Brightness Distribution: 90 %
Center on Battery: 403 cd/m²
Contrast: 1089:1 (Black: 0.37 cd/m²)
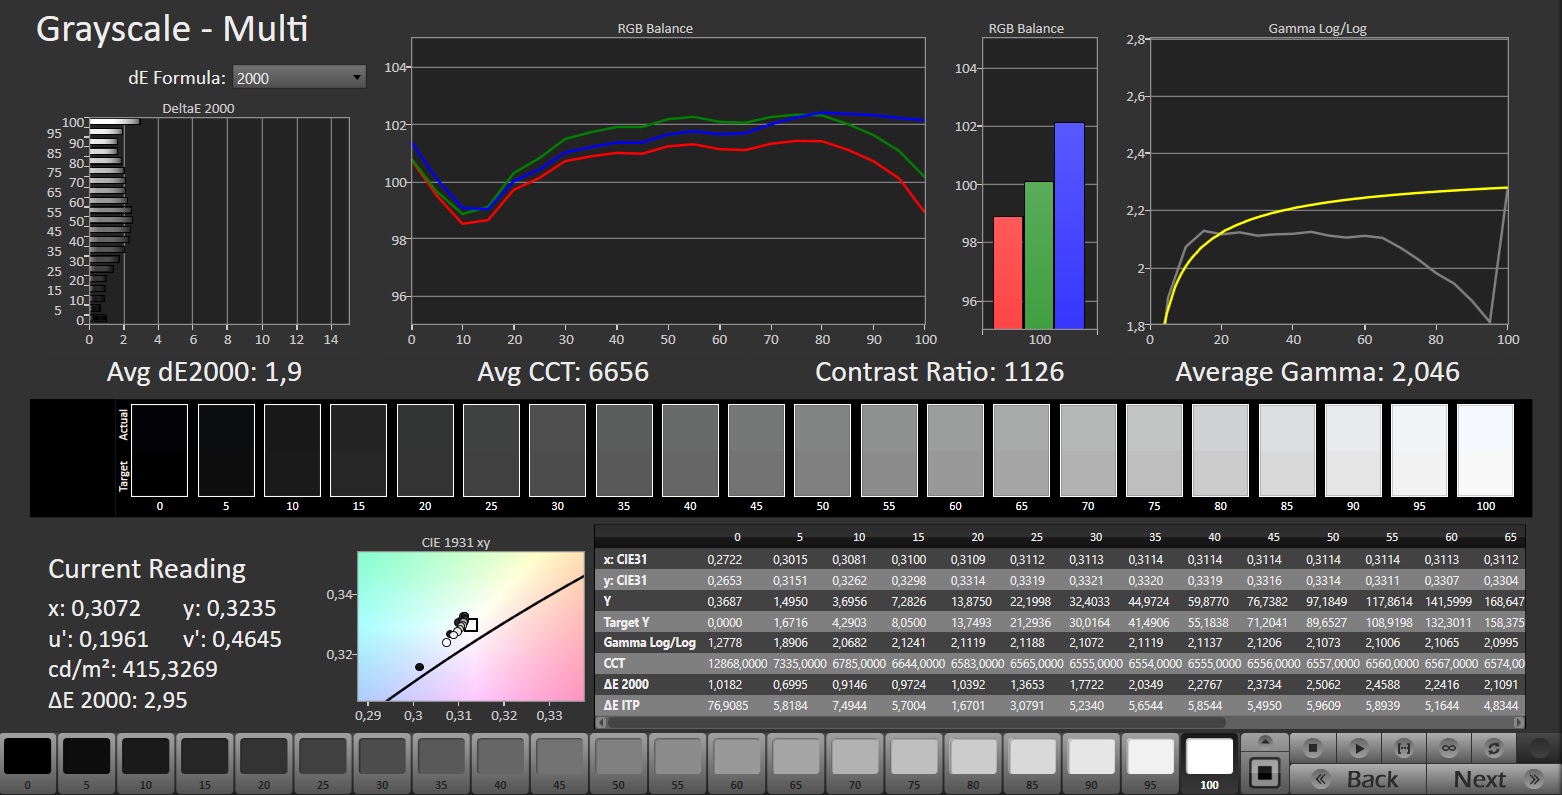
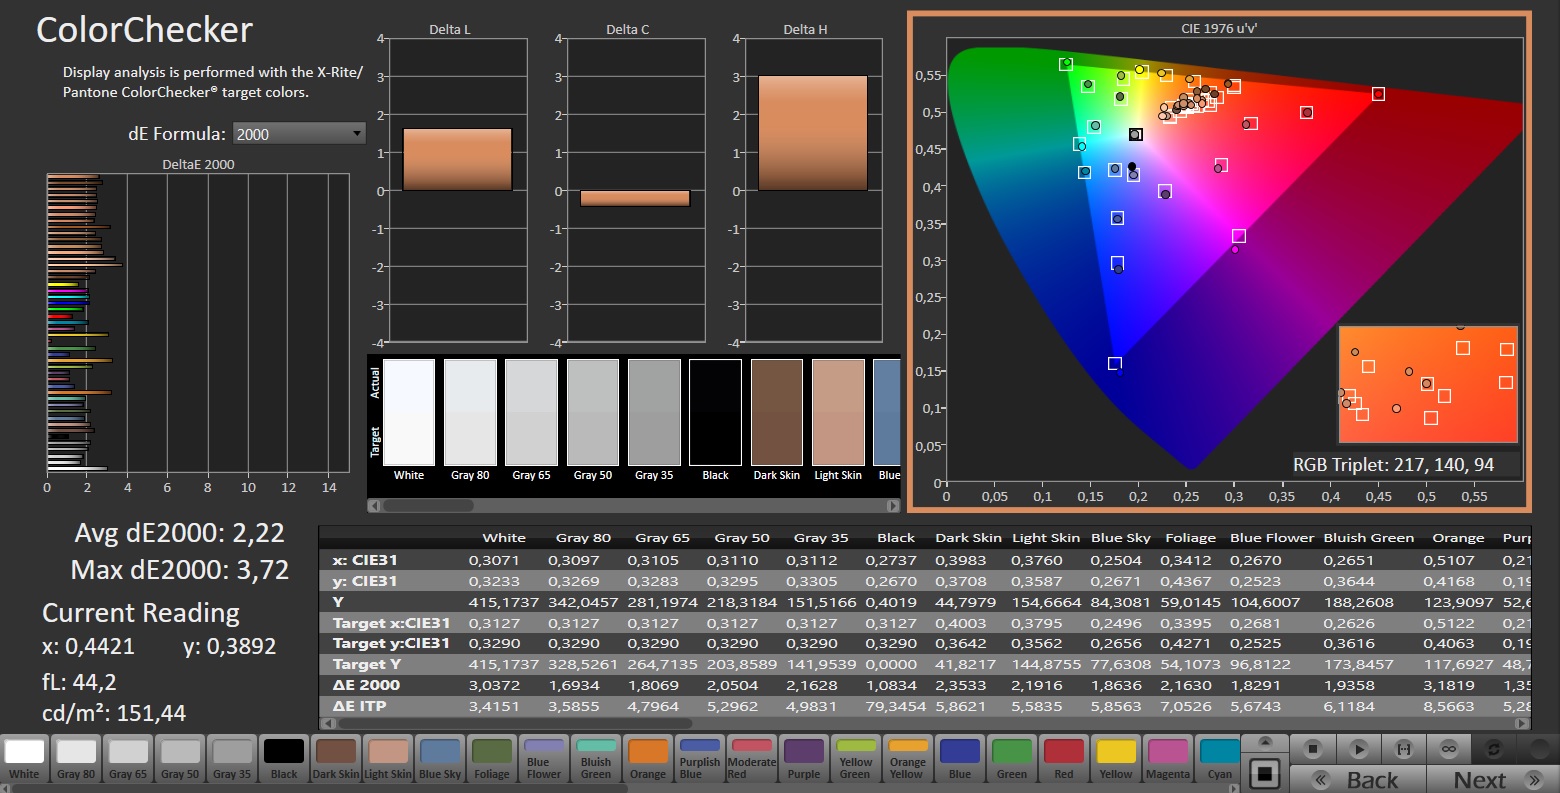
ΔE ColorChecker Calman: 2.22 | ∀{0.5-29.43 Ø4.77}
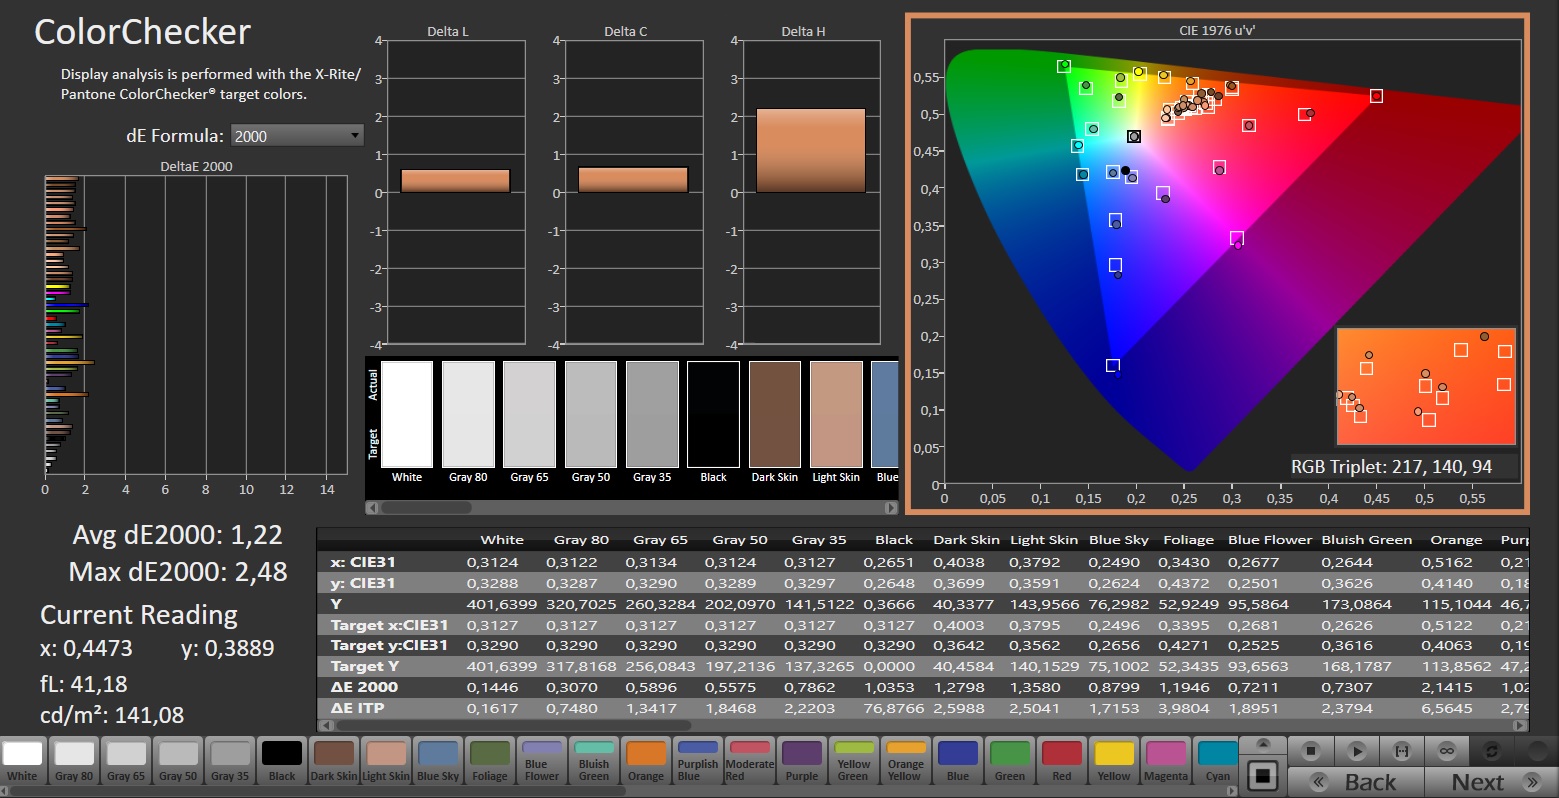
calibrated: 1.22
ΔE Greyscale Calman: 1.9 | ∀{0.09-98 Ø5}
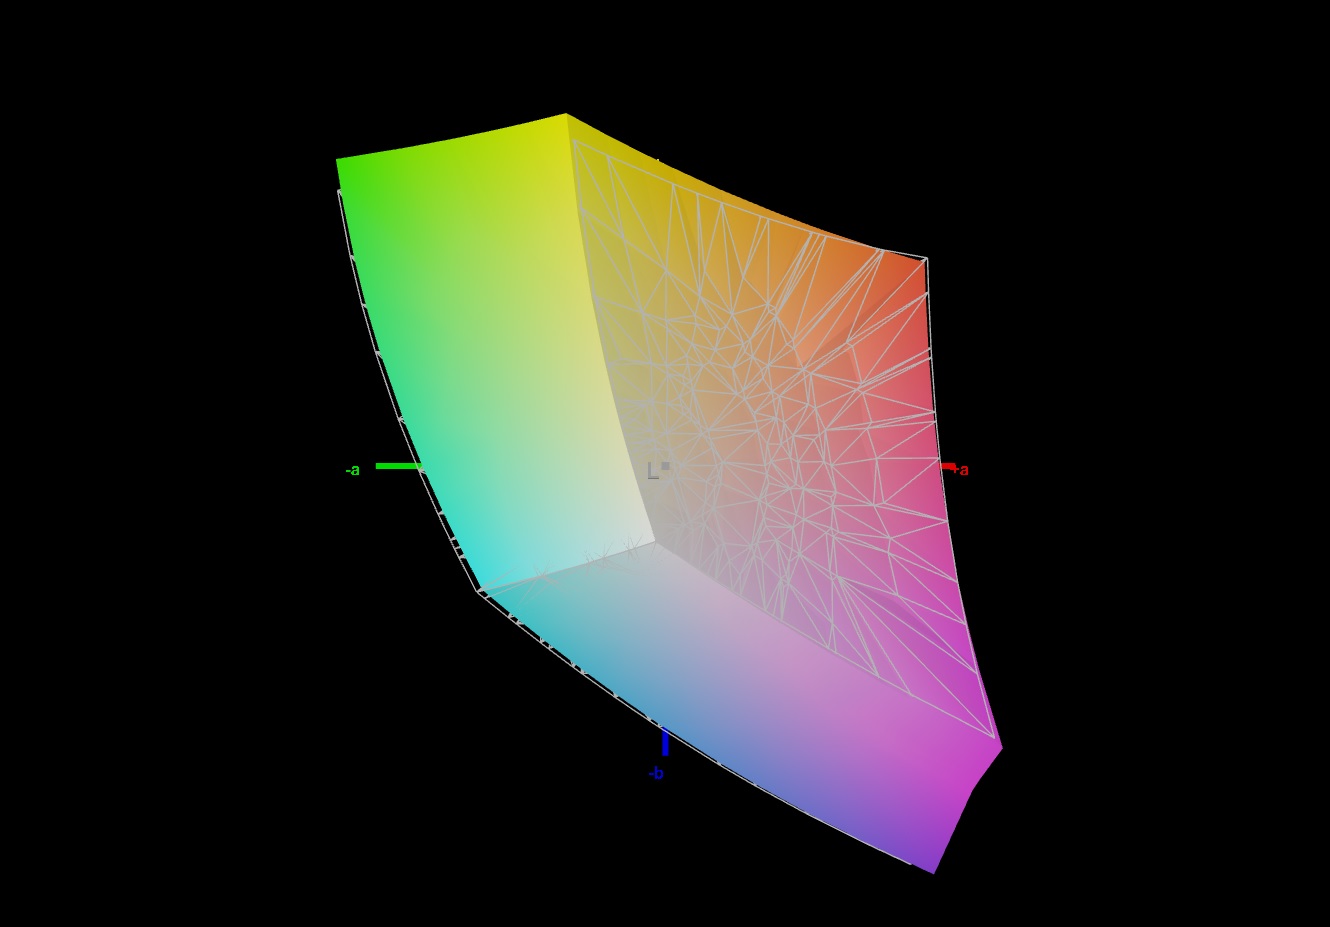
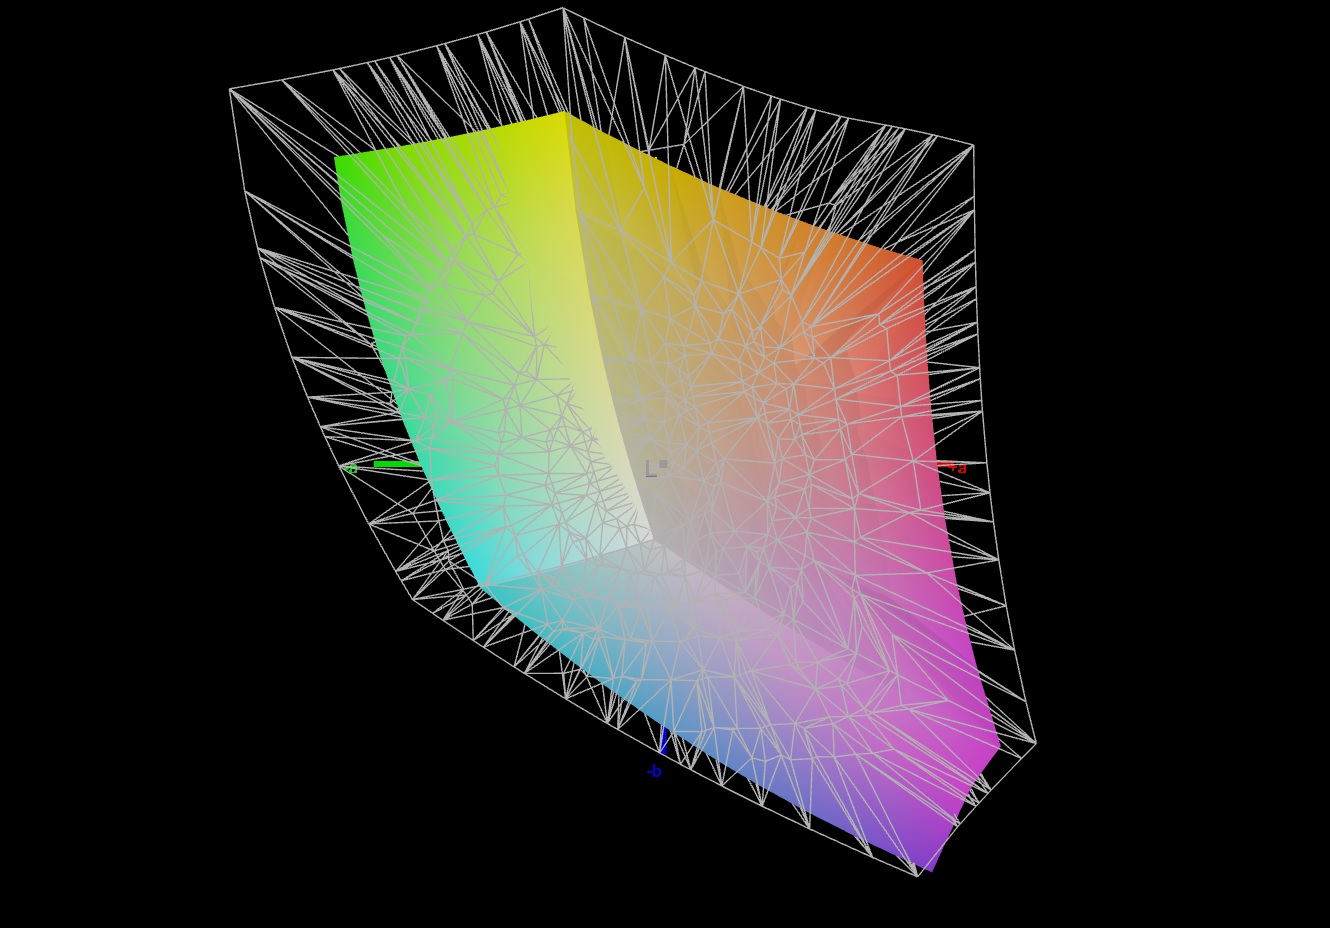
69.5% AdobeRGB 1998 (Argyll 3D)
97.7% sRGB (Argyll 3D)
68.1% Display P3 (Argyll 3D)
Gamma: 2.046
CCT: 6656 K
| Schenker XMG Apex 17 (Late 23) BOE CQ NE173QHM-NZ3, IPS, 2560x1440, 17.3" | Alienware m16 R1 Intel BOE NE16NYB, IPS, 2560x1600, 16" | Lenovo Legion Pro 5 16IRX8 AU Optronics B160QAN03.1, IPS, 2560x1600, 16" | Acer Nitro 17 AN17-51-71ER BOE0B7C NE173QHM-NY6, , 2560x1440, 17.3" | Medion Erazer Defender P40 BOE CQ NE173QHM-NZ3, IPS, 2560x1440, 17.3" | MSI Katana 17 B13VFK B173HAN04.9, IPS LED, 1920x1080, 17.3" | |
|---|---|---|---|---|---|---|
| Display | -0% | 4% | 23% | 0% | -39% | |
| Display P3 Coverage (%) | 68.1 | 67.7 -1% | 71.2 5% | 98.3 44% | 68.3 0% | 40.8 -40% |
| sRGB Coverage (%) | 97.7 | 97.2 -1% | 98.8 1% | 100 2% | 98.1 0% | 61 -38% |
| AdobeRGB 1998 Coverage (%) | 69.5 | 70 1% | 73.3 5% | 85.7 23% | 69.8 0% | 42.2 -39% |
| Response Times | 39% | -20% | -6% | -9% | -187% | |
| Response Time Grey 50% / Grey 80% * (ms) | 13.5 ? | 4 ? 70% | 14.5 ? -7% | 14.8 ? -10% | 14.6 ? -8% | 33 ? -144% |
| Response Time Black / White * (ms) | 7.9 ? | 7.3 ? 8% | 10.4 ? -32% | 8 ? -1% | 8.7 ? -10% | 26 ? -229% |
| PWM Frequency (Hz) | ||||||
| Screen | -12% | 11% | -57% | 11% | -90% | |
| Brightness middle (cd/m²) | 403 | 306 -24% | 405.7 1% | 361 -10% | 364 -10% | 267 -34% |
| Brightness (cd/m²) | 381 | 302 -21% | 368 -3% | 326 -14% | 343 -10% | 256 -33% |
| Brightness Distribution (%) | 90 | 89 -1% | 87 -3% | 87 -3% | 86 -4% | 93 3% |
| Black Level * (cd/m²) | 0.37 | 0.3 19% | 0.38 -3% | 0.6 -62% | 0.28 24% | 0.21 43% |
| Contrast (:1) | 1089 | 1020 -6% | 1068 -2% | 602 -45% | 1300 19% | 1271 17% |
| Colorchecker dE 2000 * | 2.22 | 2.57 -16% | 1.65 26% | 3.83 -73% | 1.67 25% | 4.7 -112% |
| Colorchecker dE 2000 max. * | 3.76 | 4.26 -13% | 4.2 -12% | 5.71 -52% | 2.78 26% | 20.4 -443% |
| Colorchecker dE 2000 calibrated * | 1.22 | 0.85 30% | 0.53 57% | 3.48 -185% | 1.14 7% | 4.5 -269% |
| Greyscale dE 2000 * | 1.9 | 3.3 -74% | 1.2 37% | 3.29 -73% | 1.4 26% | 1.5 21% |
| Gamma | 2.046 108% | 1.997 110% | 2.3 96% | 2.29 96% | 2.091 105% | 2.12 104% |
| CCT | 6656 98% | 6895 94% | 6453 101% | 6679 97% | 6568 99% | 6552 99% |
| Total Average (Program / Settings) | 9% /
-2% | -2% /
5% | -13% /
-33% | 1% /
6% | -105% /
-93% |
* ... smaller is better
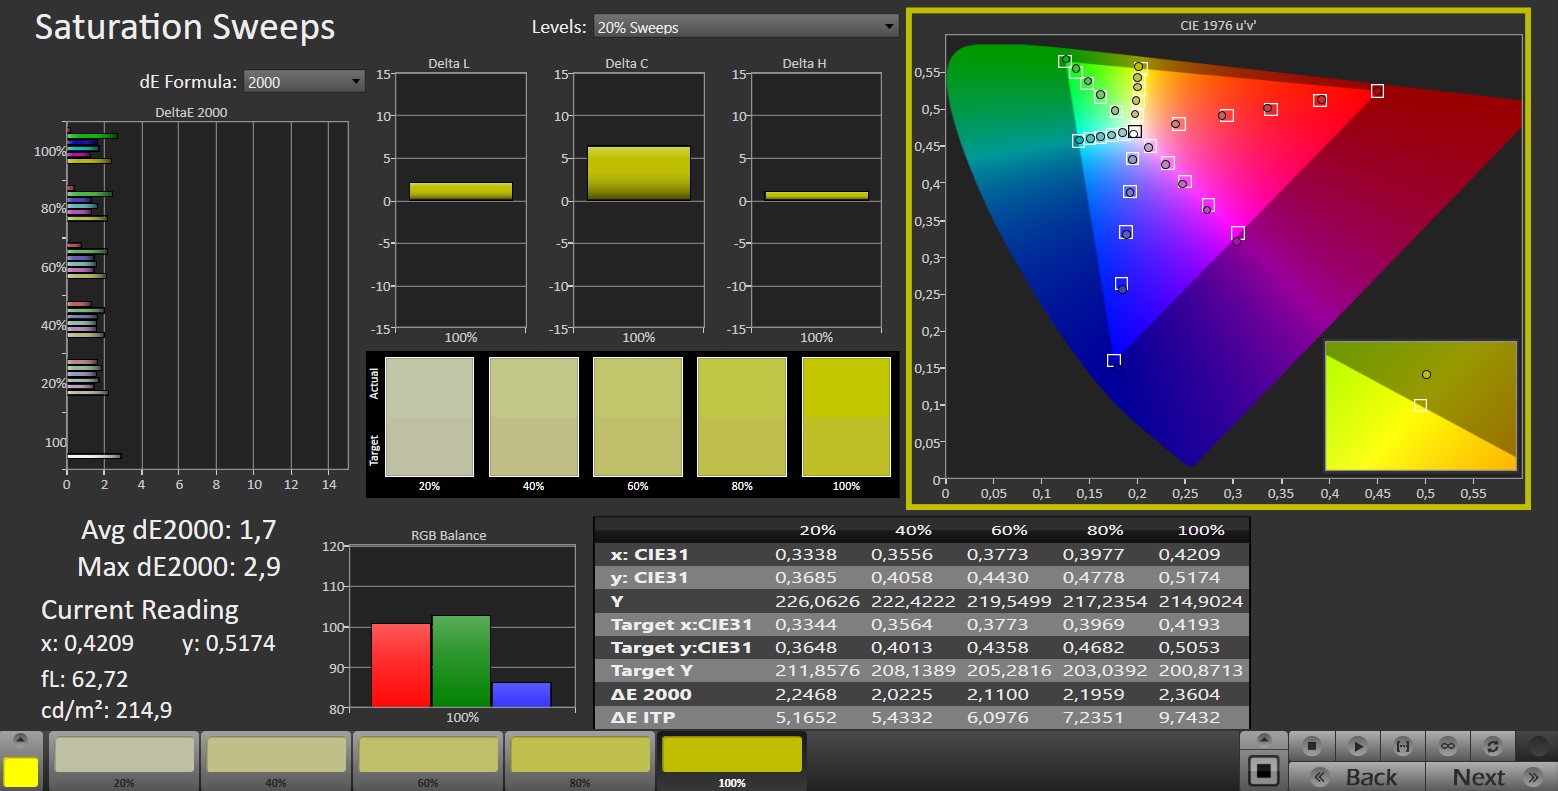
Out-of-the-box, the display demonstrates good color reproduction. With a deviation of around 2.2, the target value (DeltaE < 3) is achieved. A calibration reduces the deviation to 1.2 and ensures balanced gray scales. The panel covers the sRGB color space almost entirely but not the AdobeRGB and DCI P3 color spaces. Most of the competing device's displays paint a similar picture. Only the Nitro 17's display covers the P3 color space.


Display Response Times
| ↔ Response Time Black to White | ||
|---|---|---|
| 7.9 ms ... rise ↗ and fall ↘ combined | ↗ 3 ms rise |  |
| ↘ 4.9 ms fall | ||
| The screen shows very fast response rates in our tests and should be very well suited for fast-paced gaming. In comparison, all tested devices range from 0.1 (minimum) to 240 (maximum) ms. » 21 % of all devices are better. This means that the measured response time is better than the average of all tested devices (20.1 ms). | ||
| ↔ Response Time 50% Grey to 80% Grey | ||
| 13.5 ms ... rise ↗ and fall ↘ combined | ↗ 6.4 ms rise |  |
| ↘ 7.1 ms fall | ||
| The screen shows good response rates in our tests, but may be too slow for competitive gamers. In comparison, all tested devices range from 0.165 (minimum) to 636 (maximum) ms. » 26 % of all devices are better. This means that the measured response time is better than the average of all tested devices (31.5 ms). | ||
Screen Flickering / PWM (Pulse-Width Modulation)
| Screen flickering / PWM not detected | 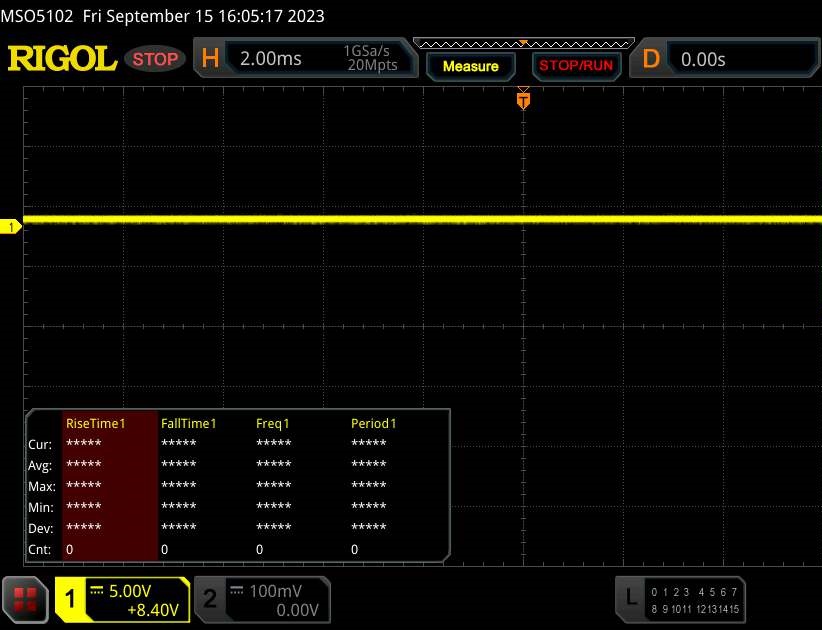 | ||
In comparison: 53 % of all tested devices do not use PWM to dim the display. If PWM was detected, an average of 8042 (minimum: 5 - maximum: 343500) Hz was measured. | |||
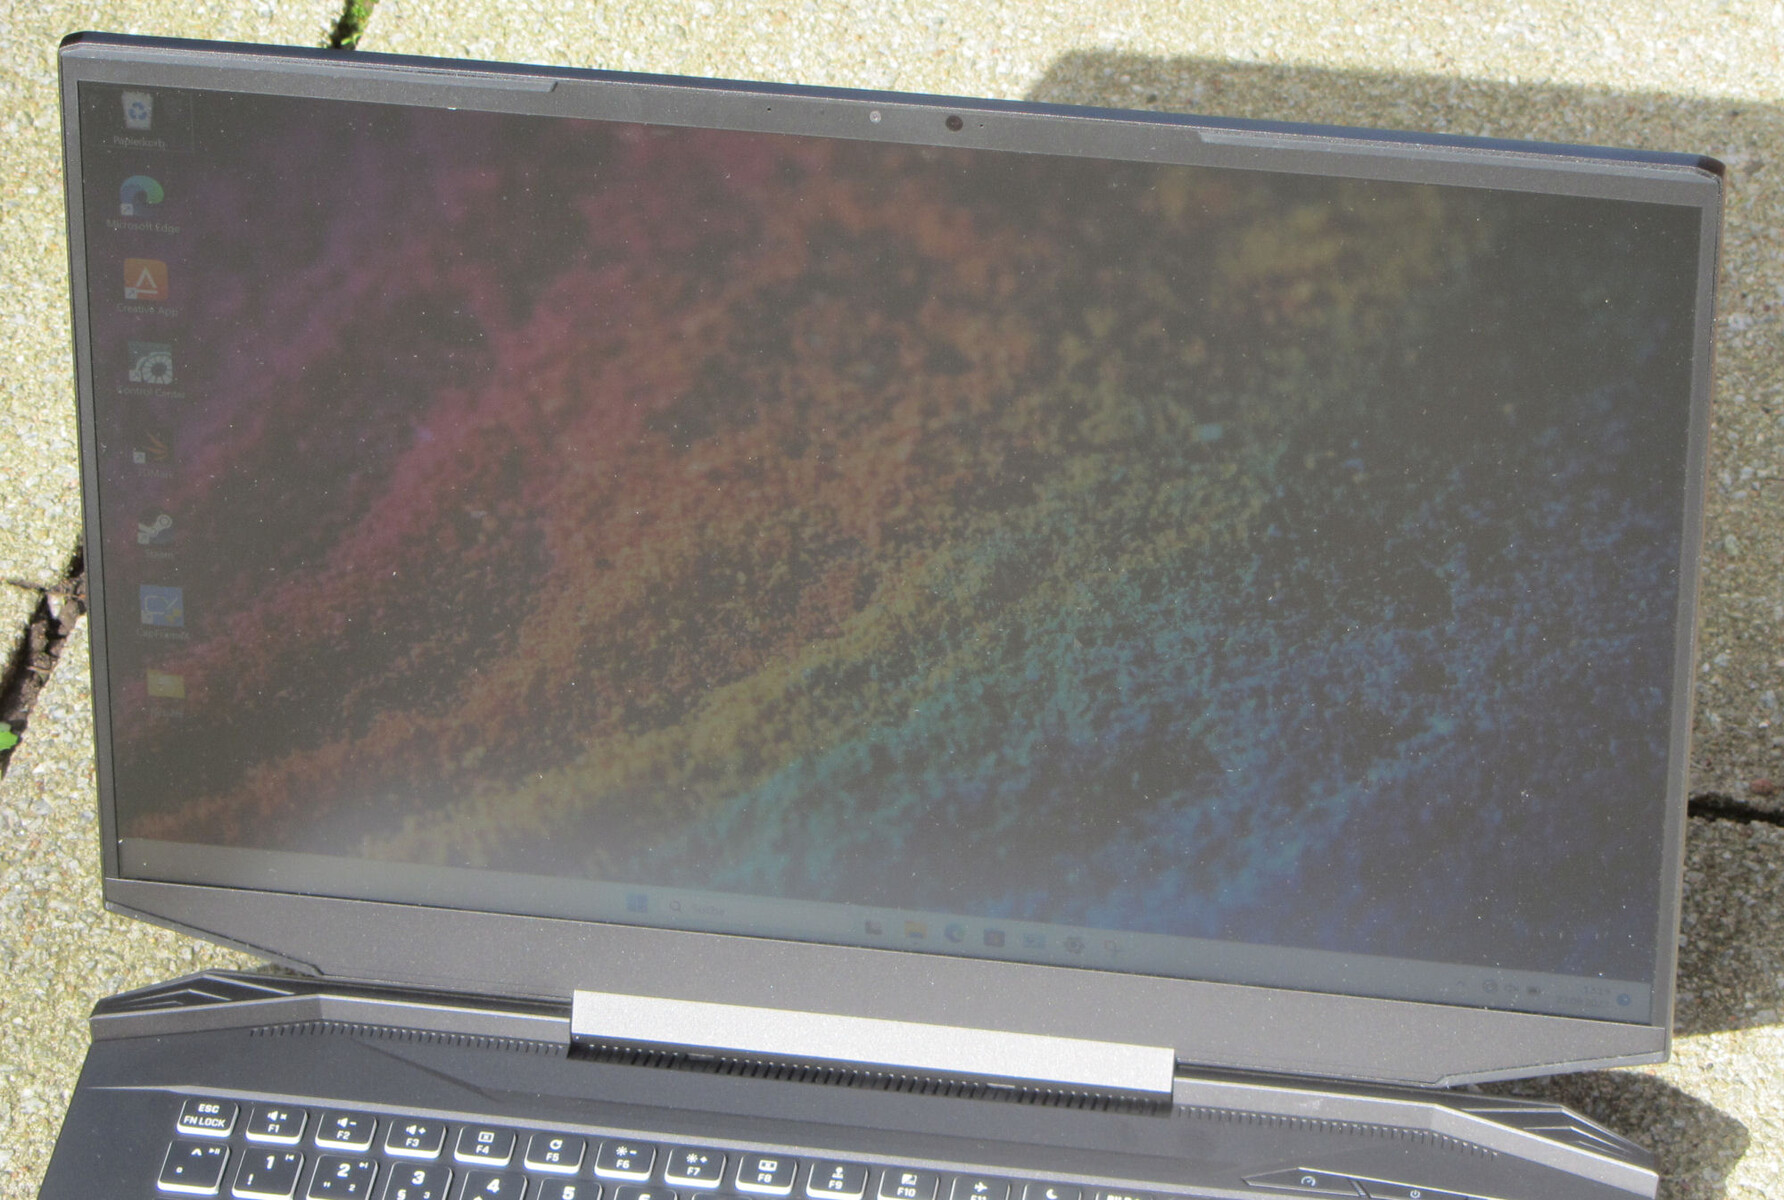
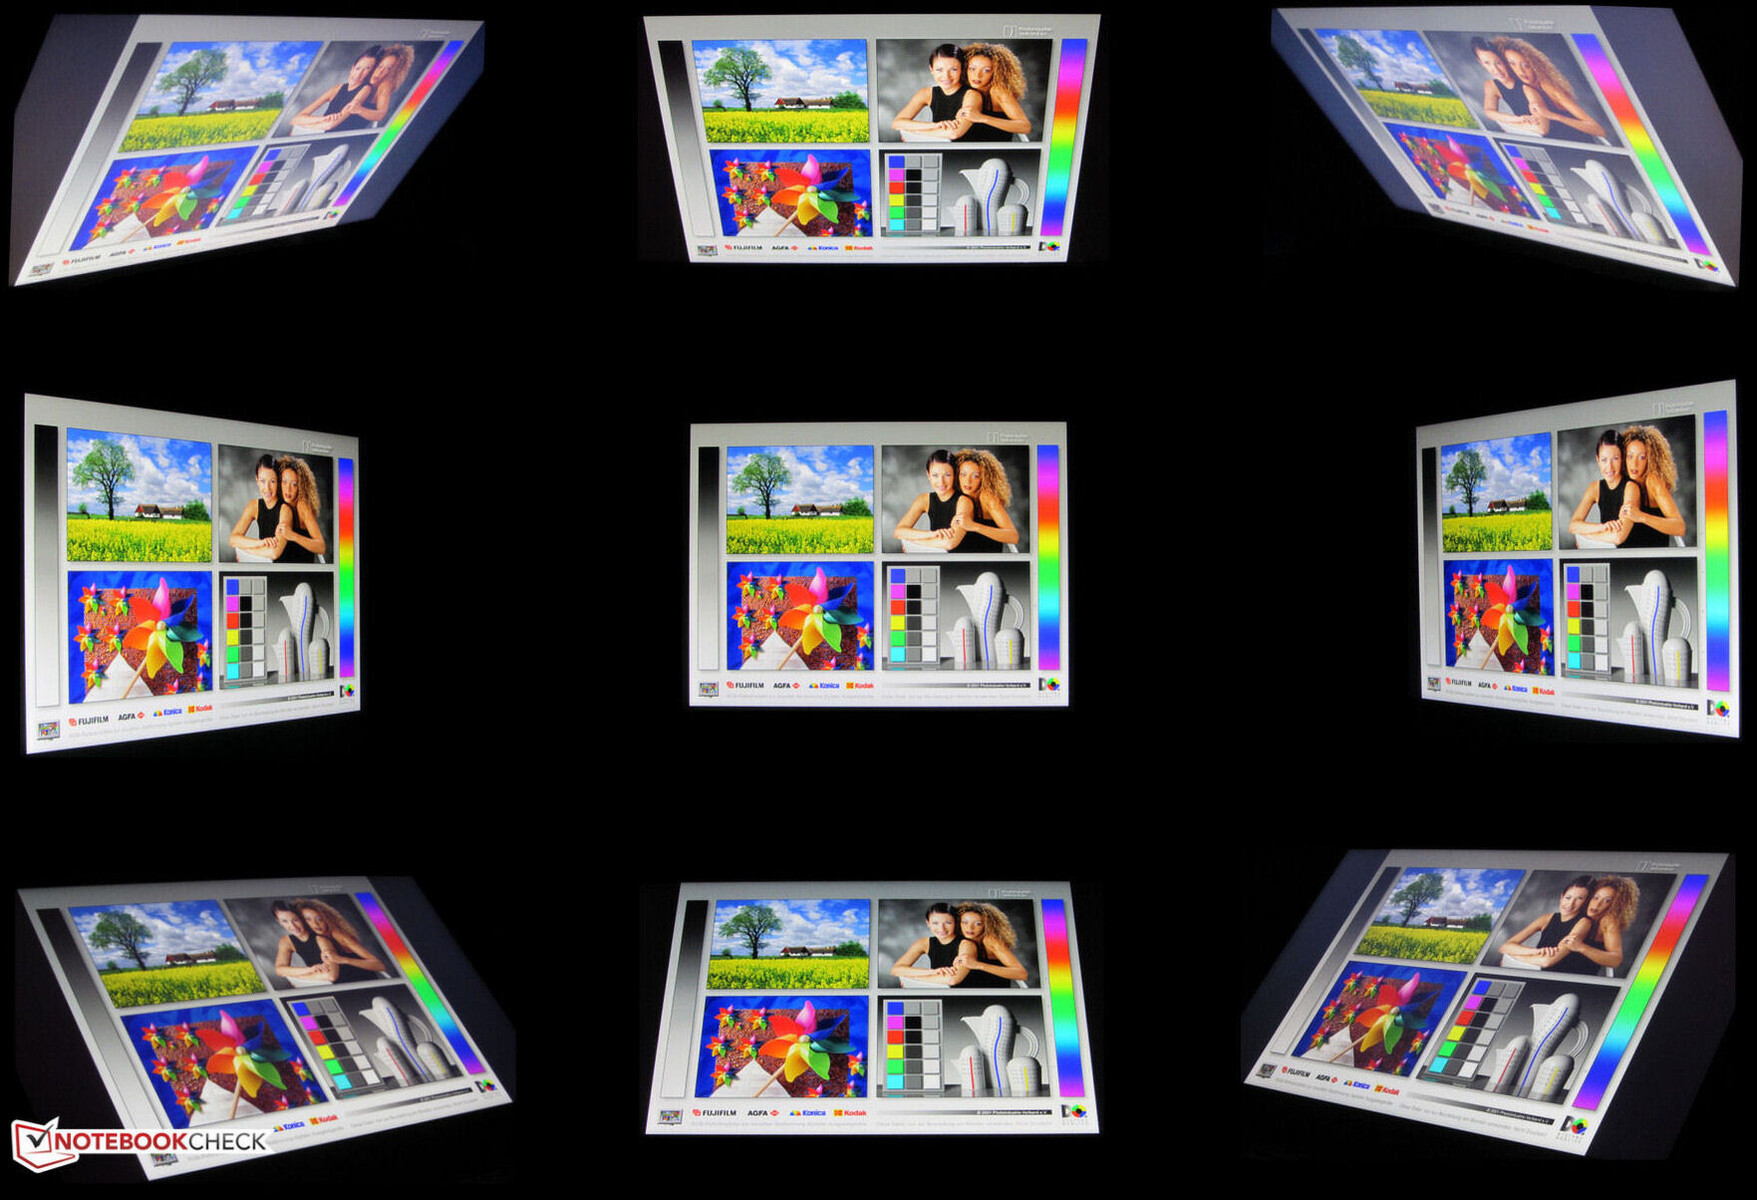
The IPS panel has good viewing angle stability and is legible from every position. Outdoors, the screen is legible as long as the sunlight isn't too bright.
Performance - Phoenix and Ada Lovelace power the Schenker laptop
The Schenker Apex 17 is a mid-range QHD gaming laptop with its computational power being provided by Phoenix and Ada Lovelace. The laptop be custom-configured and purchased on Bestware.com. Our review device can be had for 1,750 euros with prices starting at around 1,200 euros.

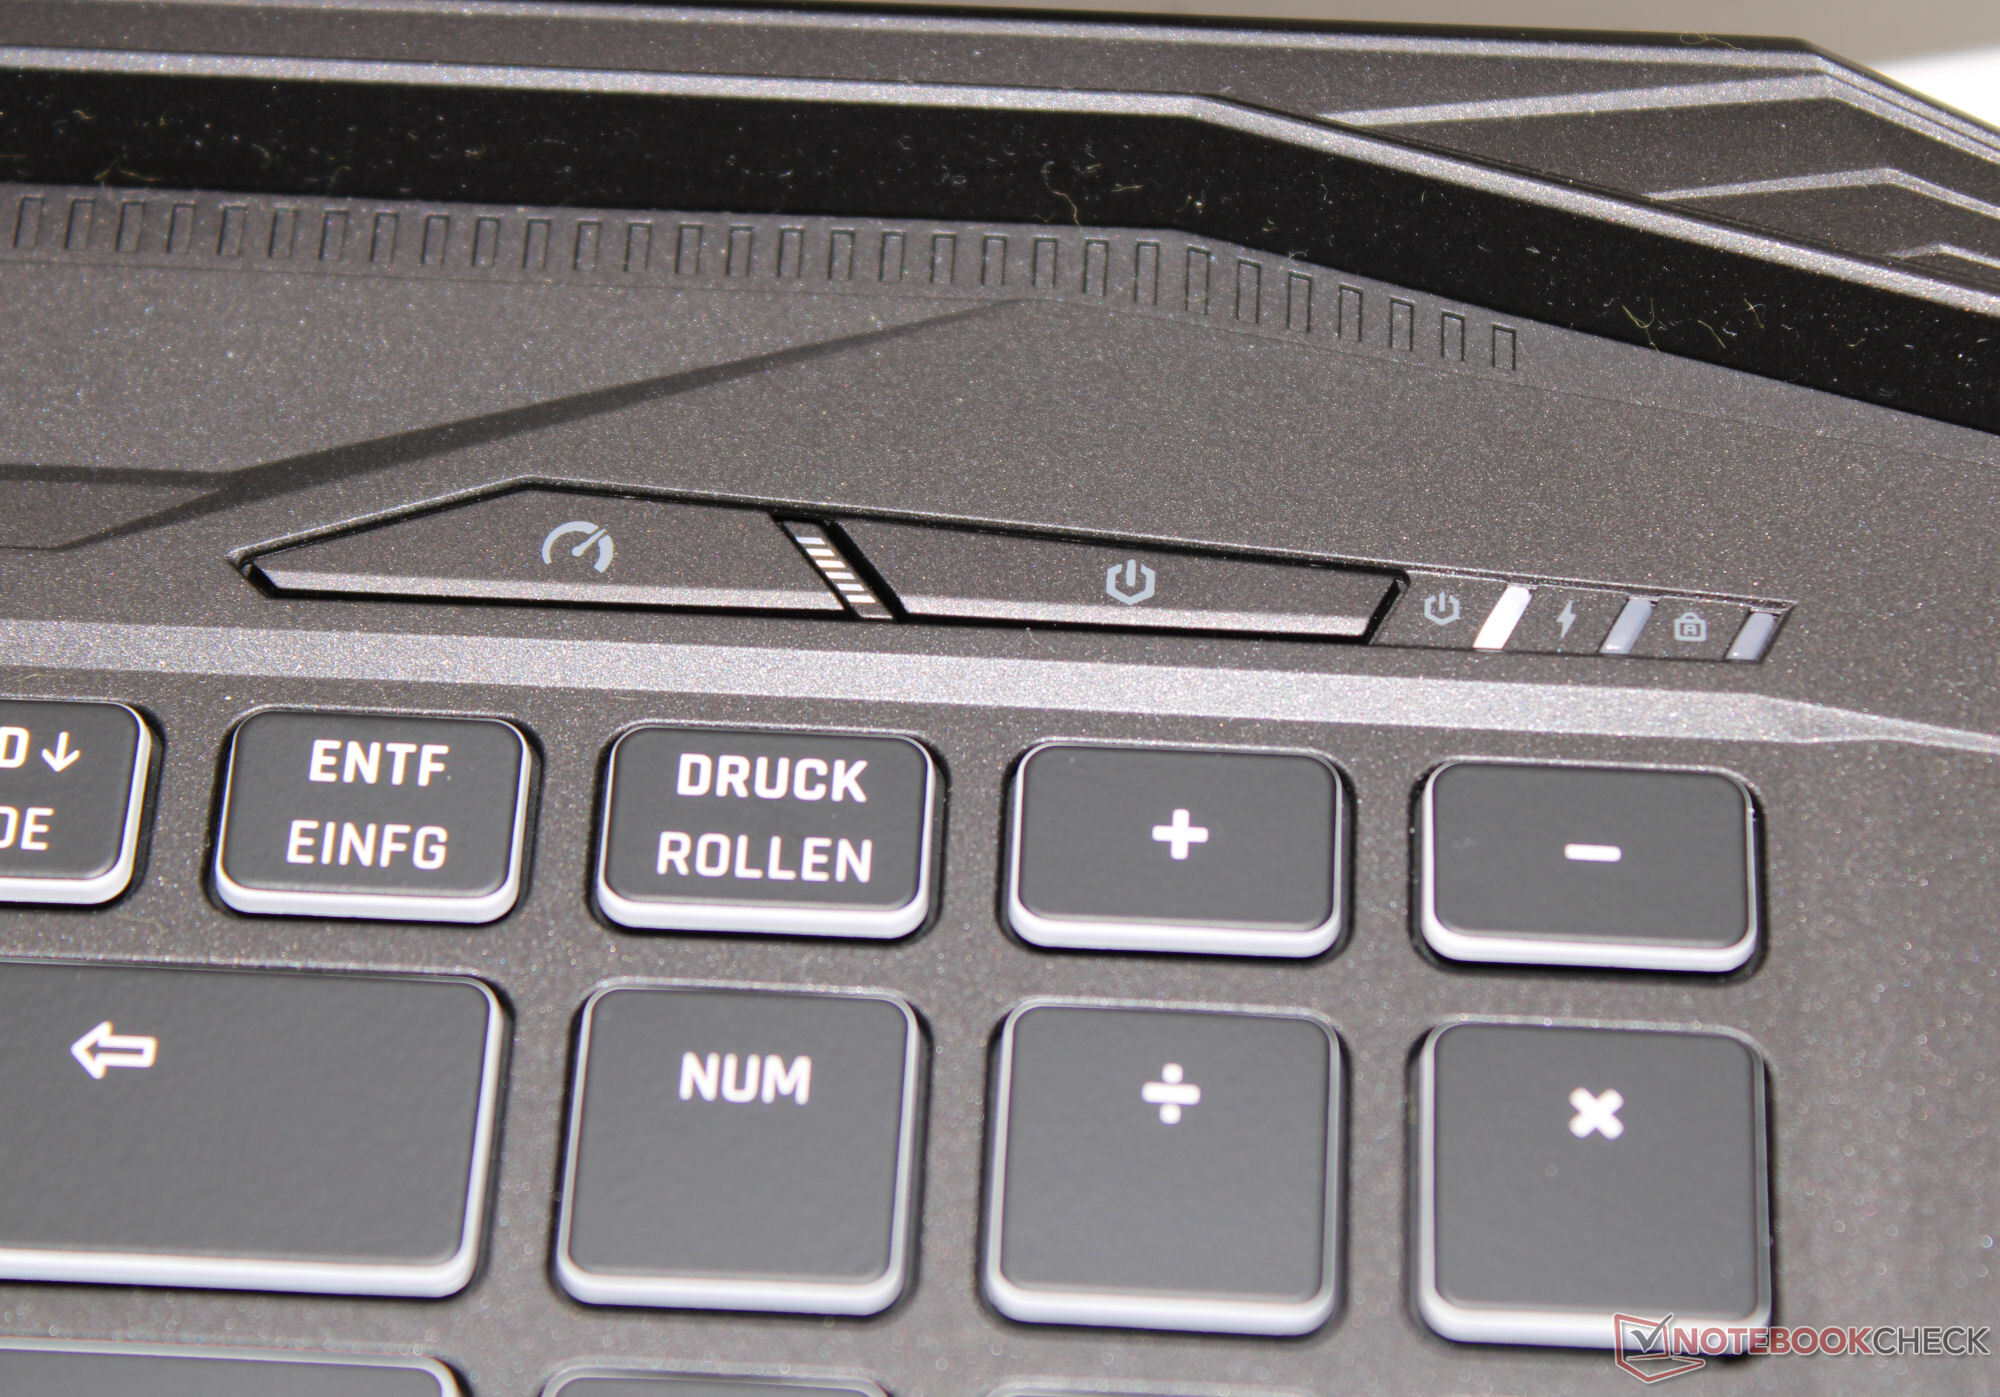
Test conditions
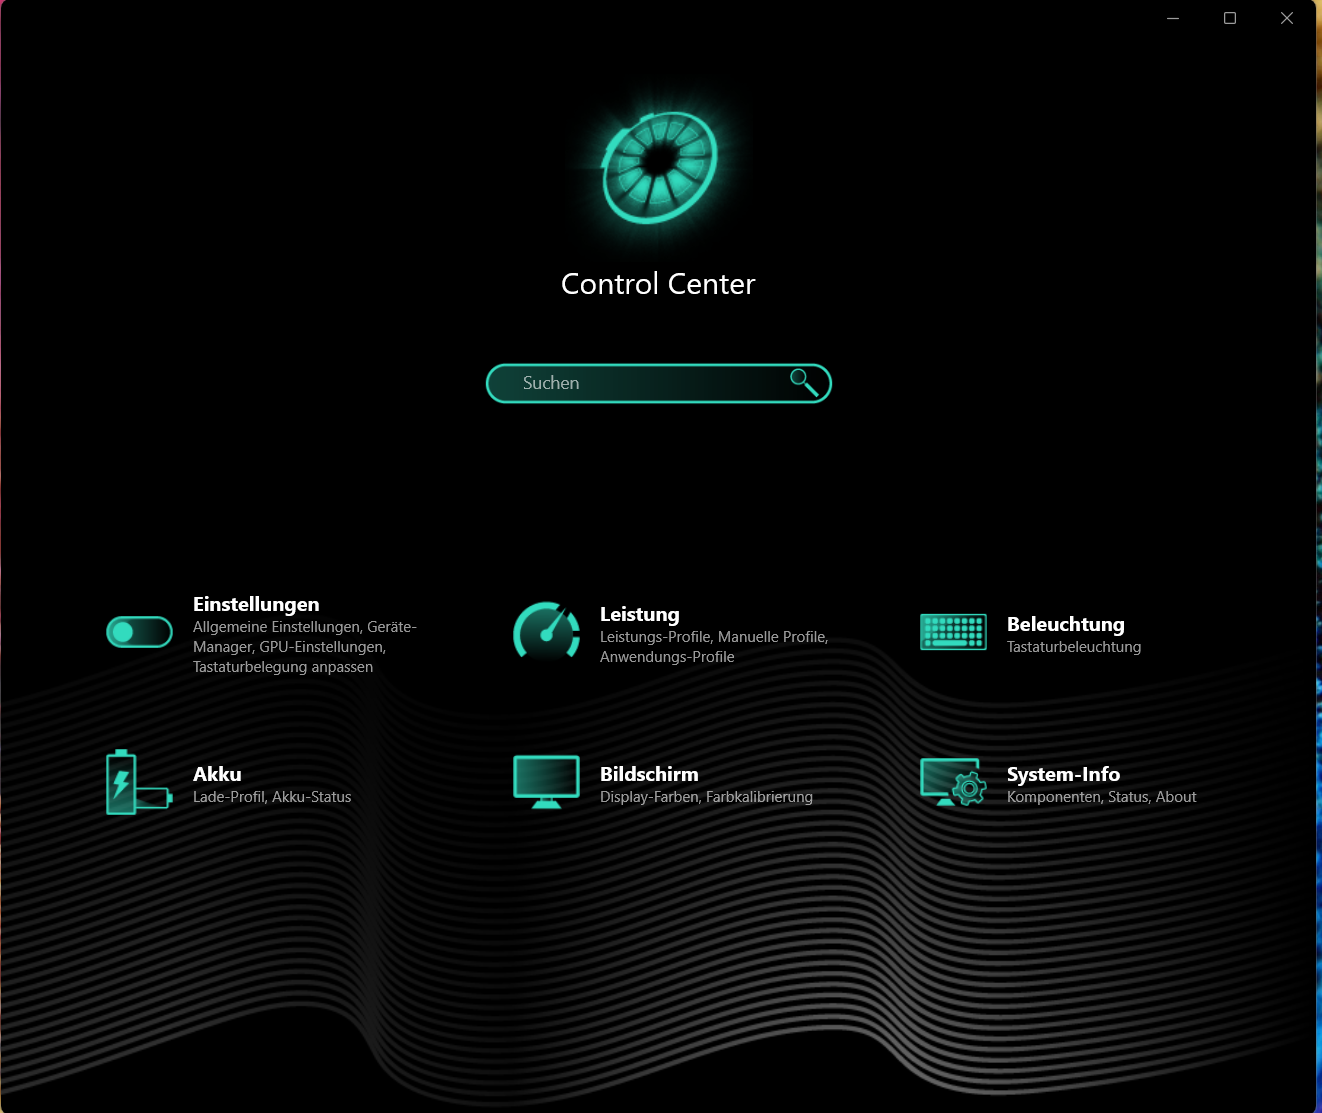
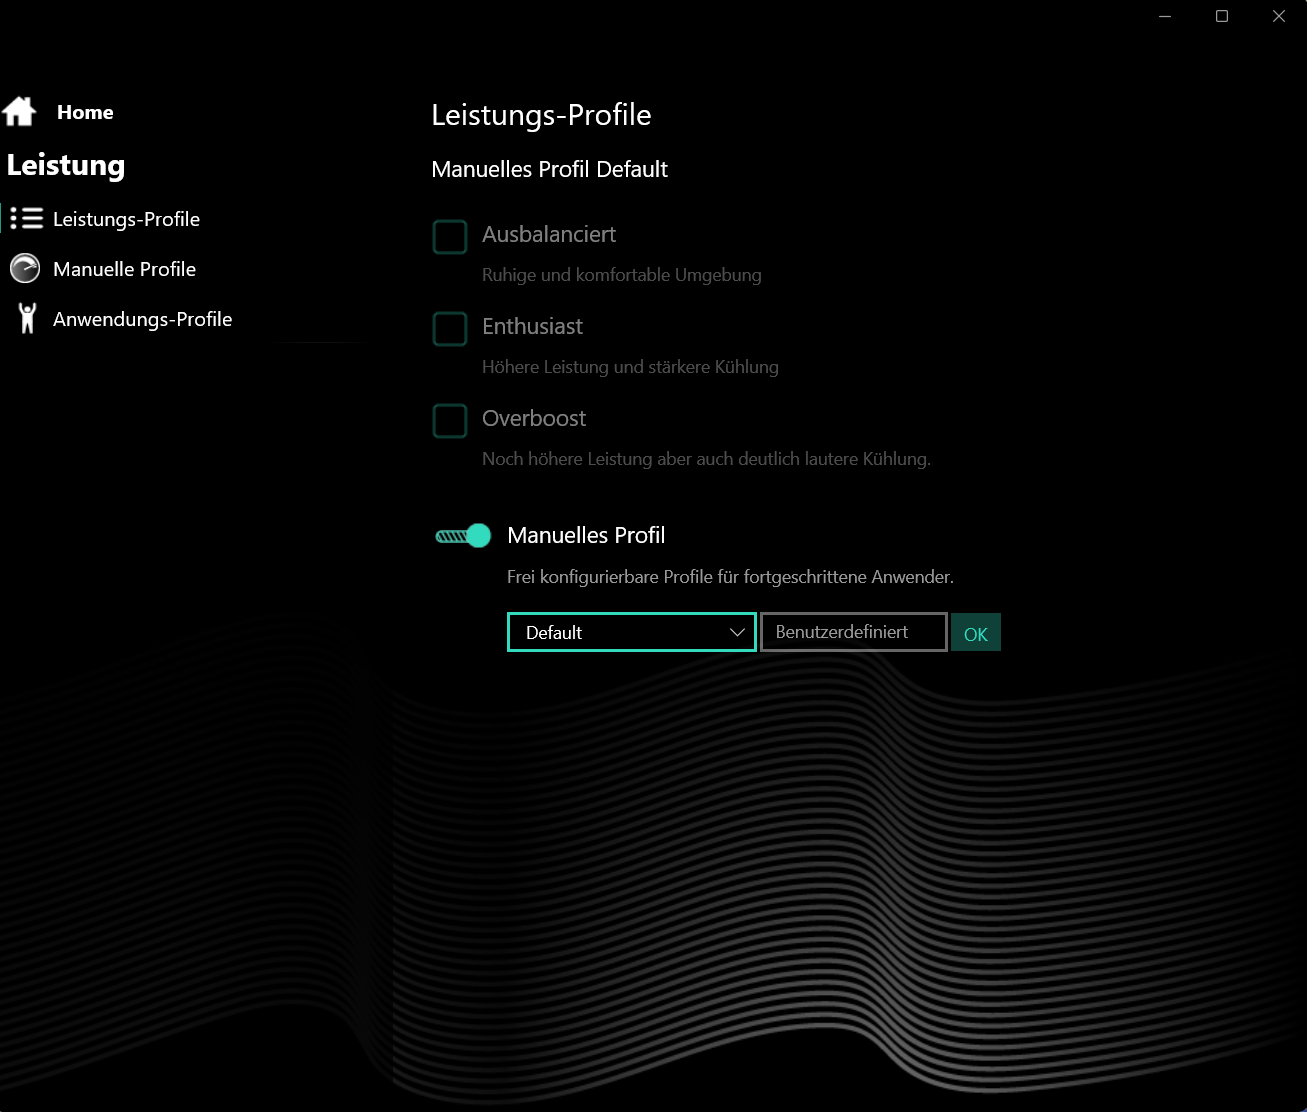
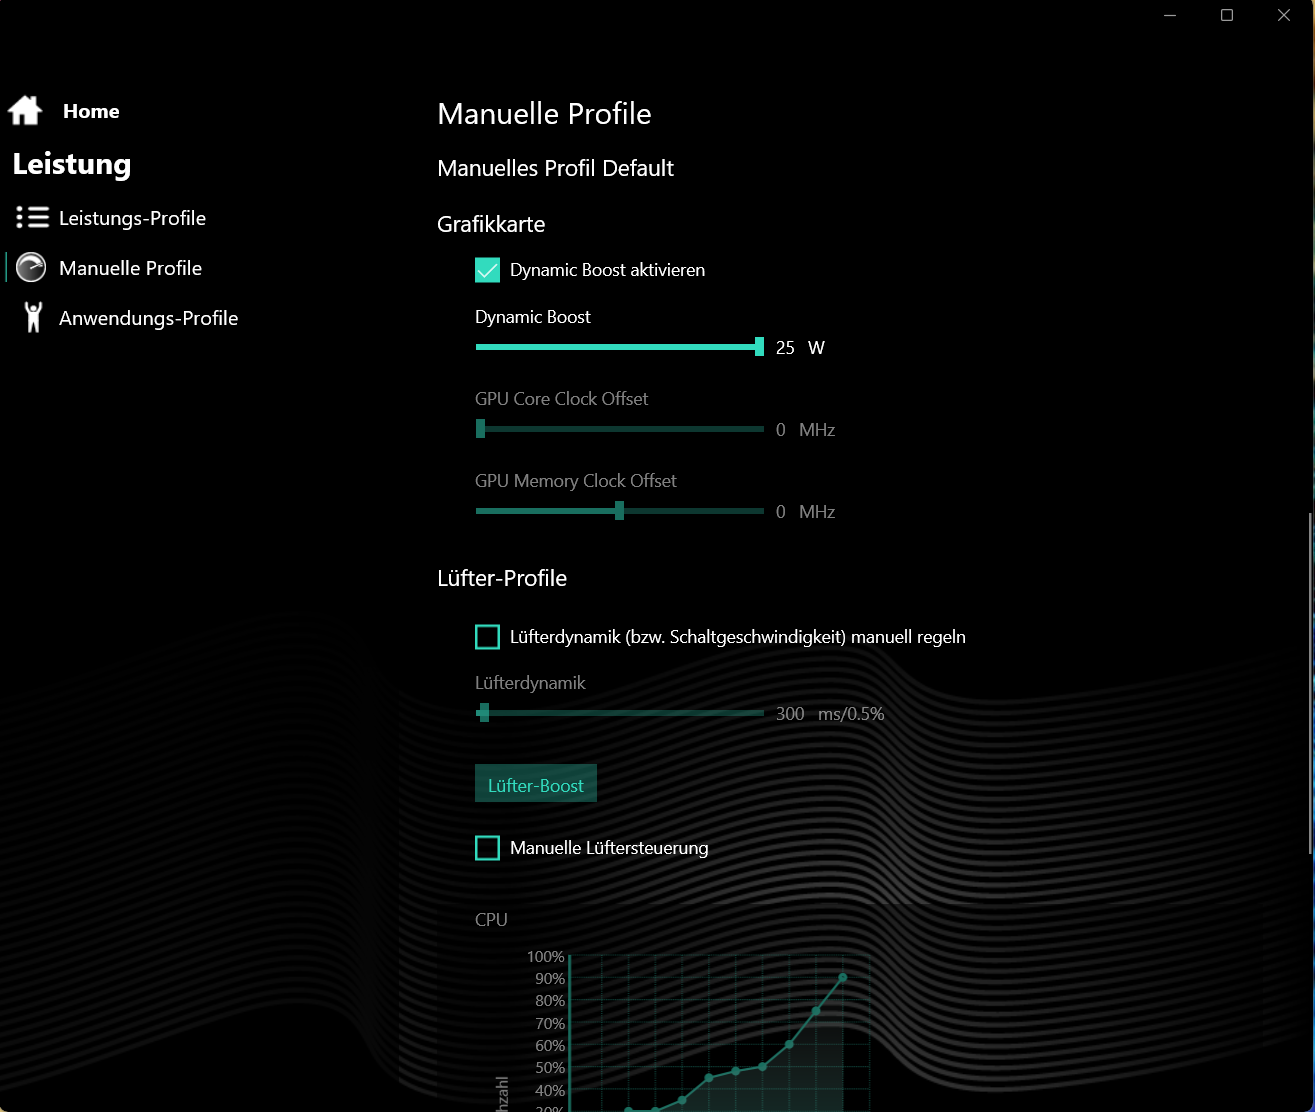
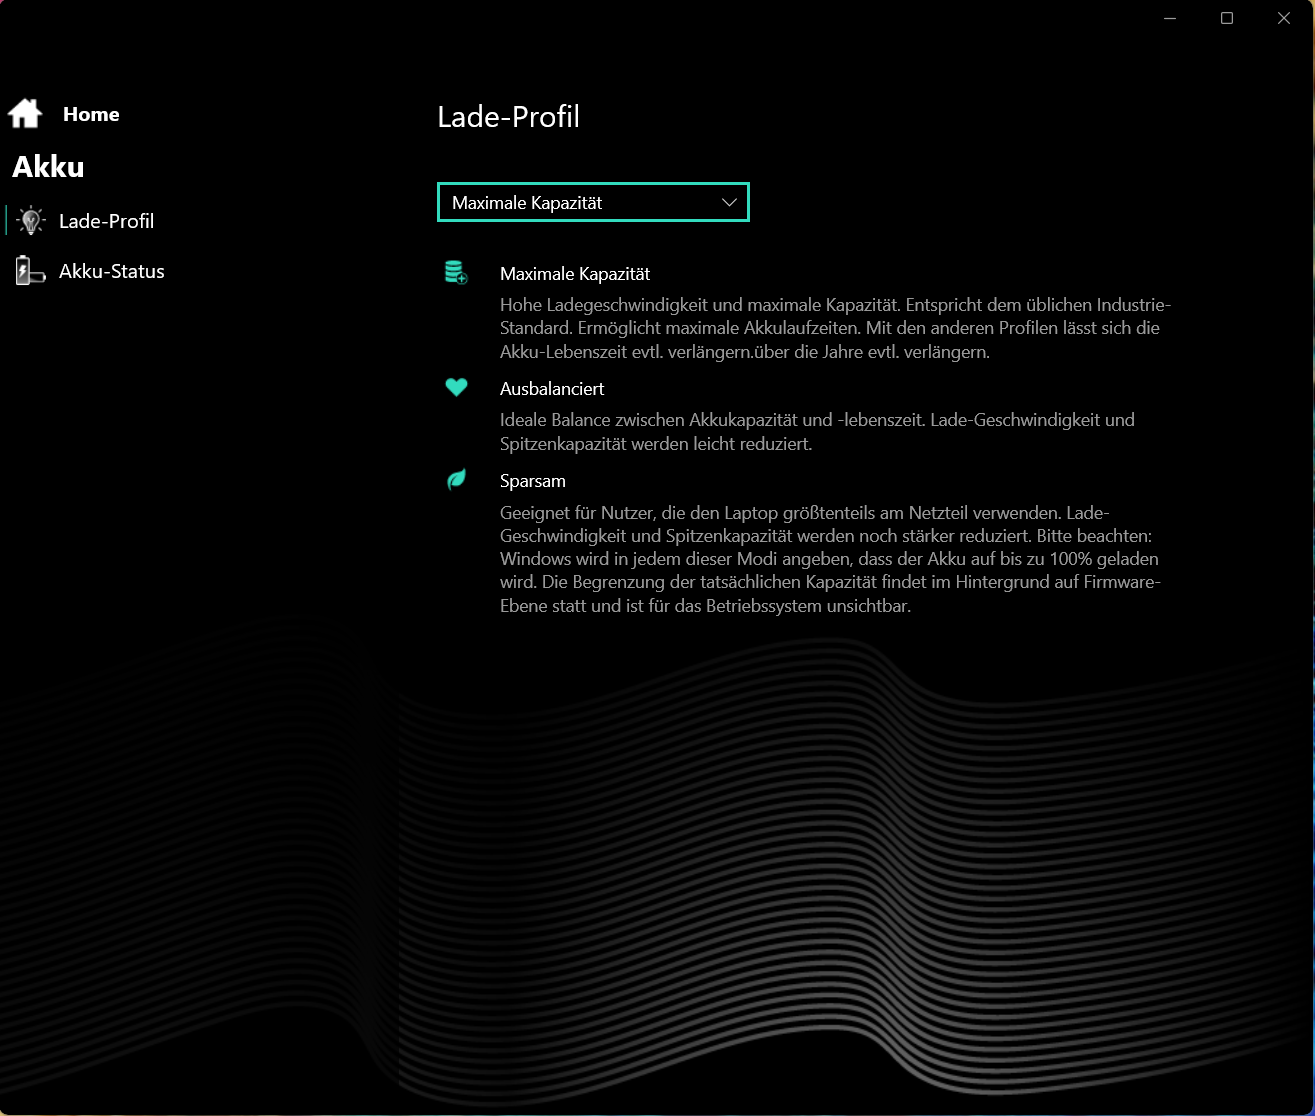
The Apex offers three manufacturer-specific performance modes (see table) which you can switch between via a separate key (next to the power button). A status LED indicates which mode is active. We used the "enthusiast" (benchmarks) and "balanced" (battery tests) modes. Optimus was active.
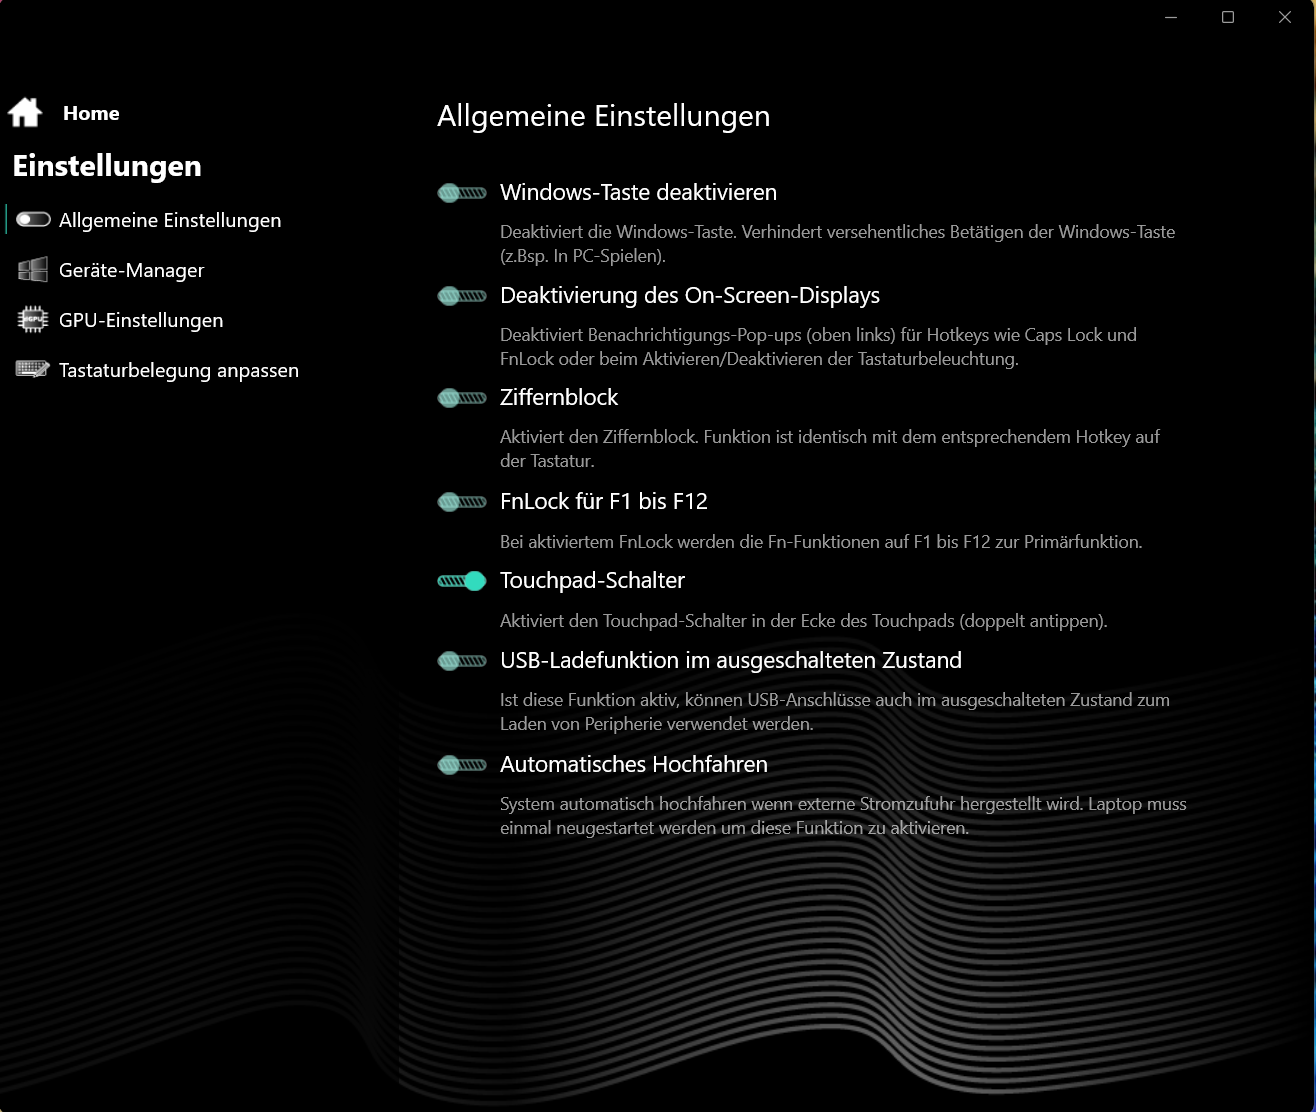
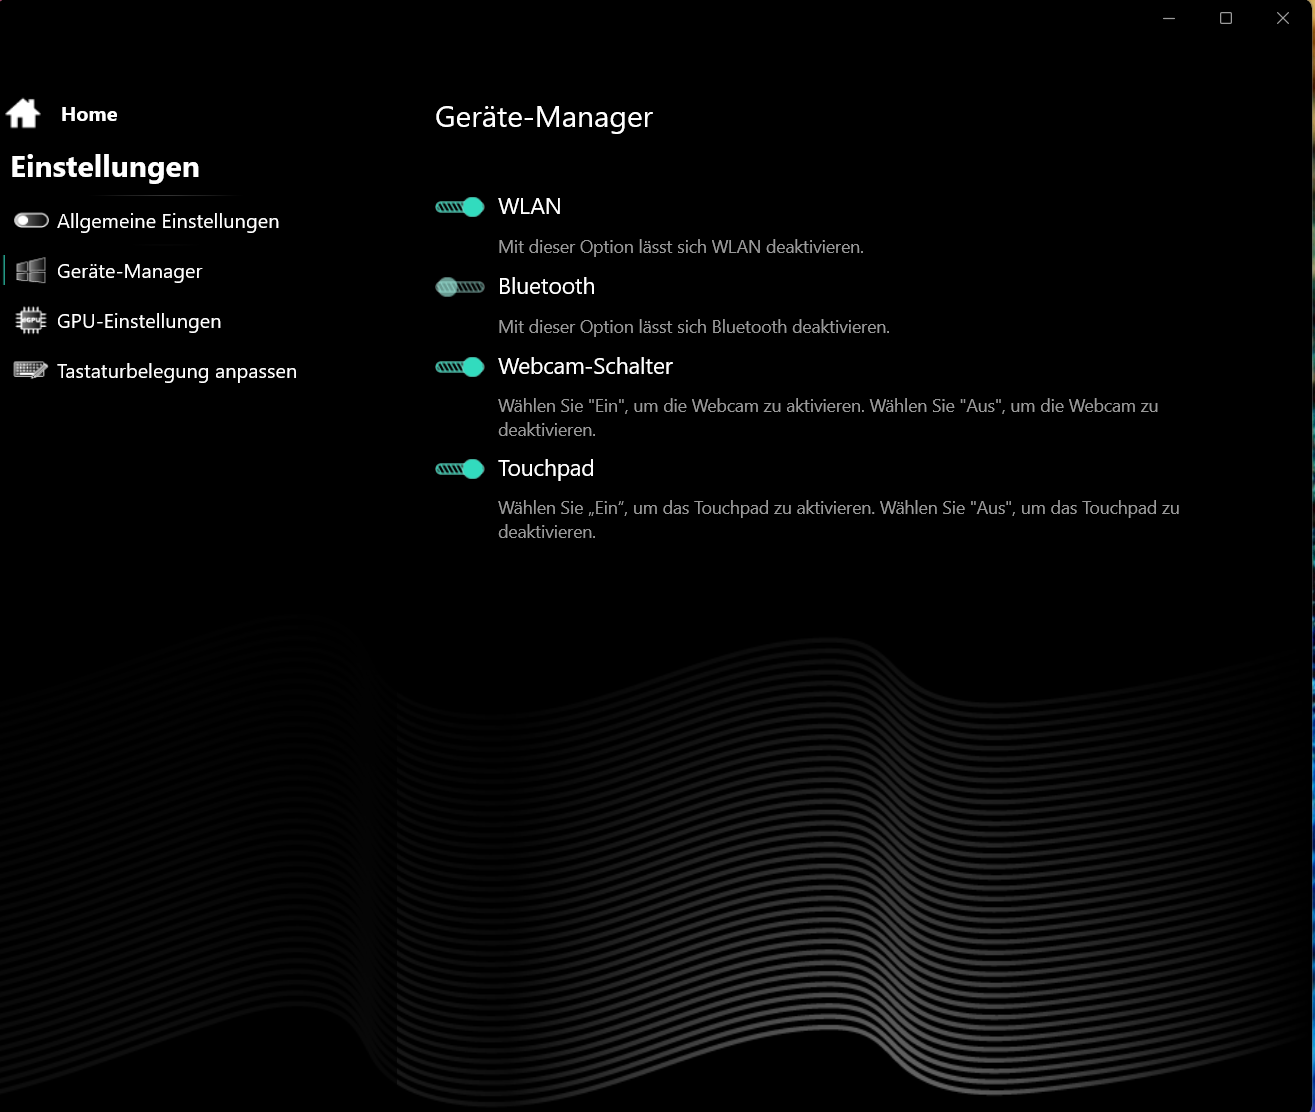
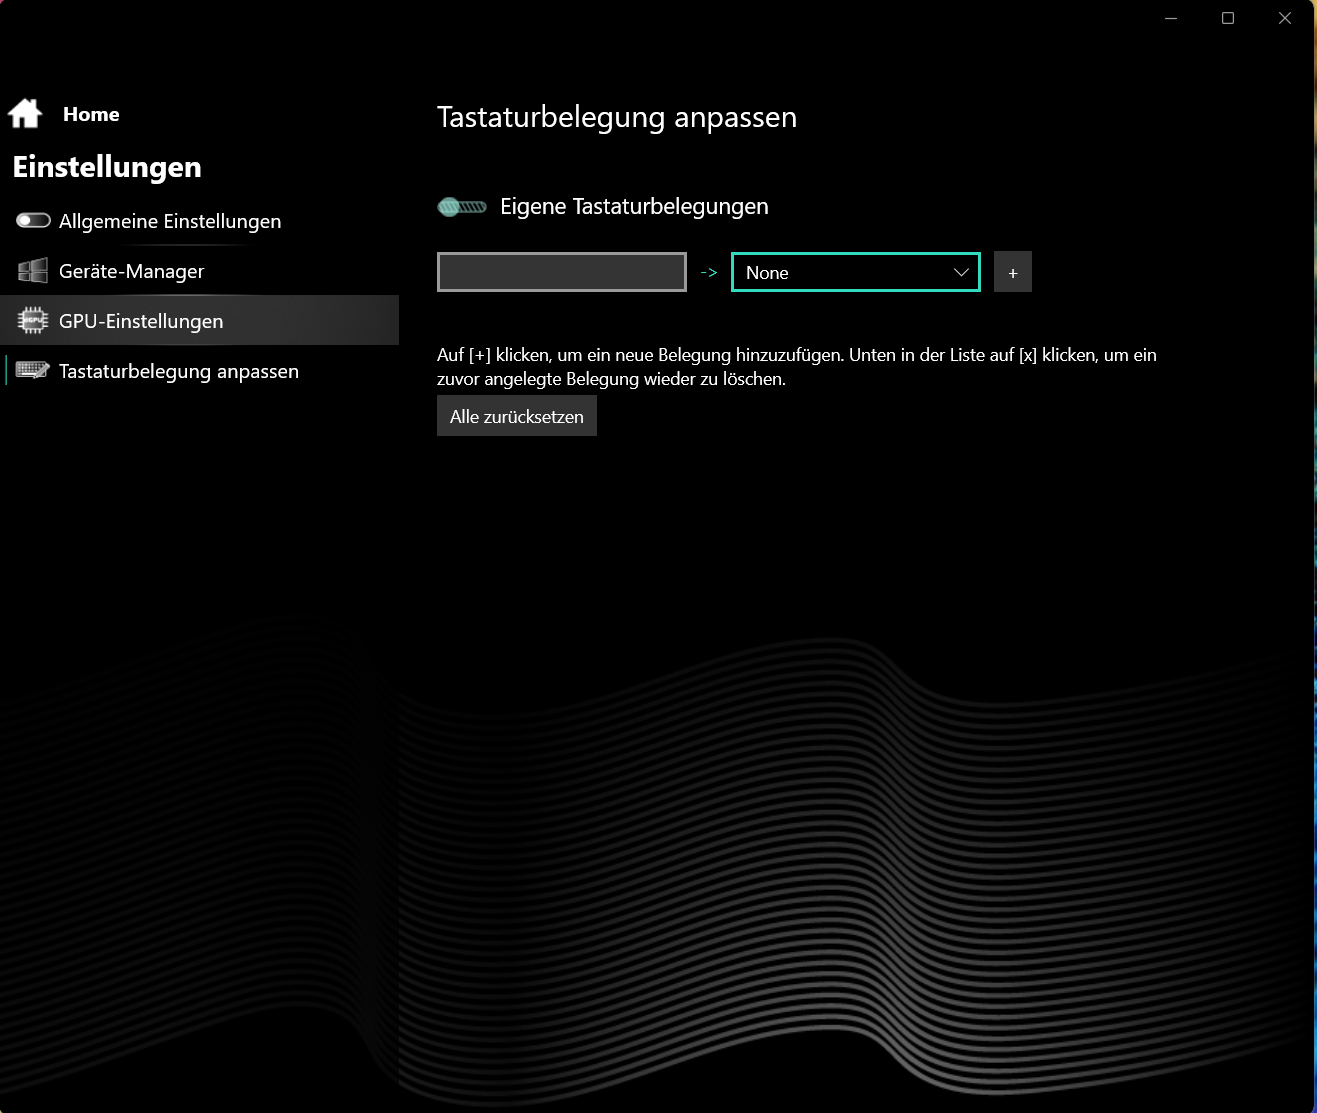
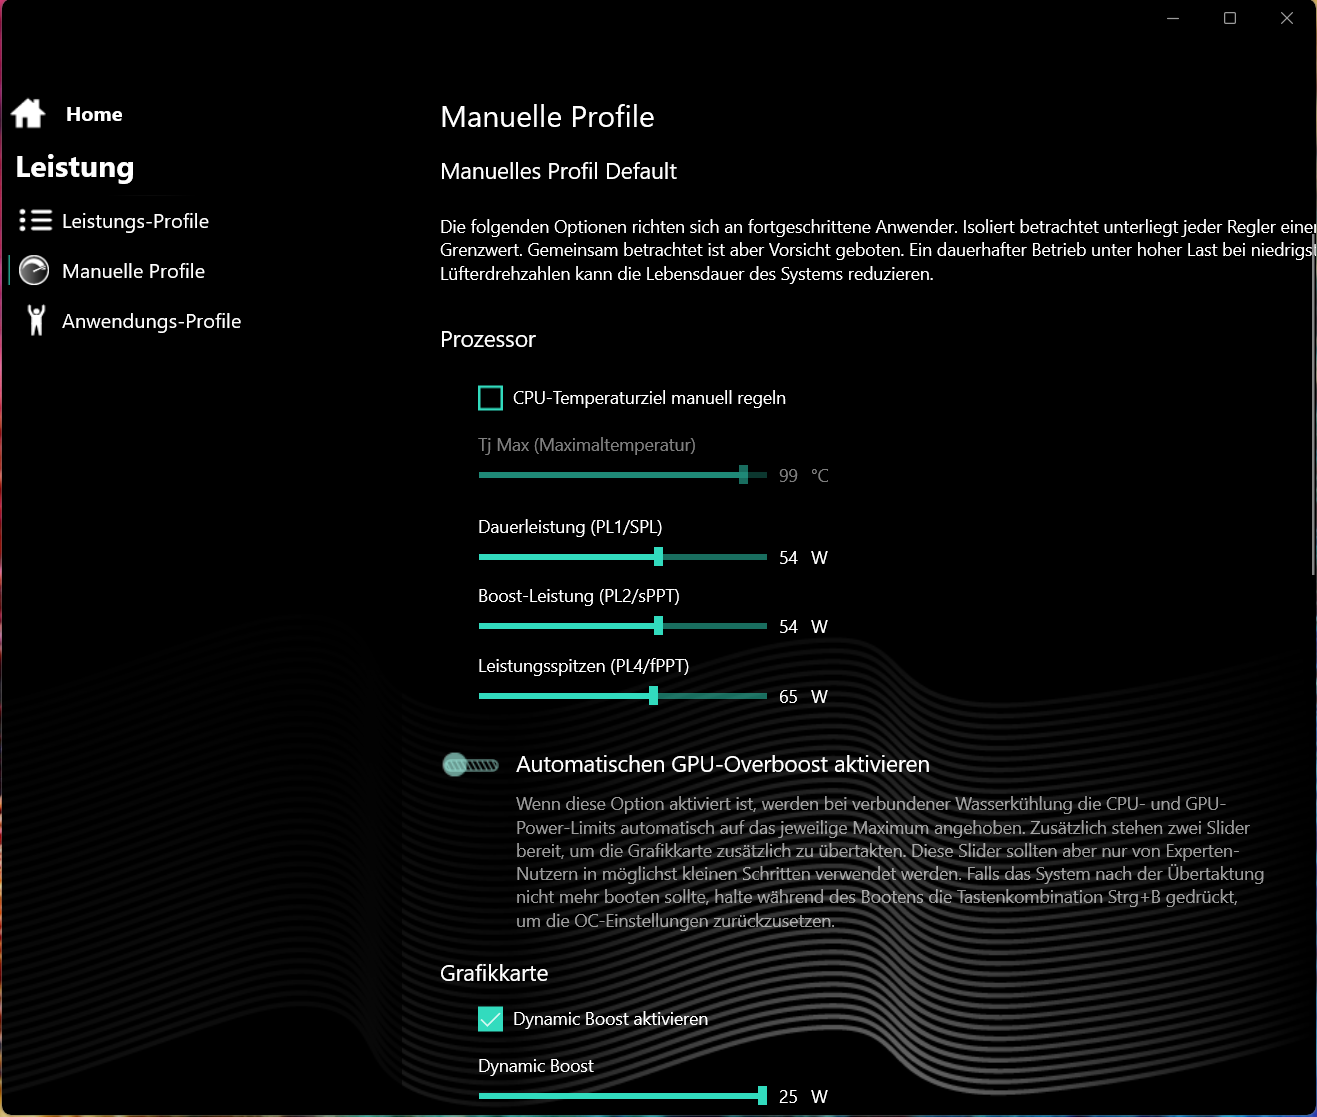
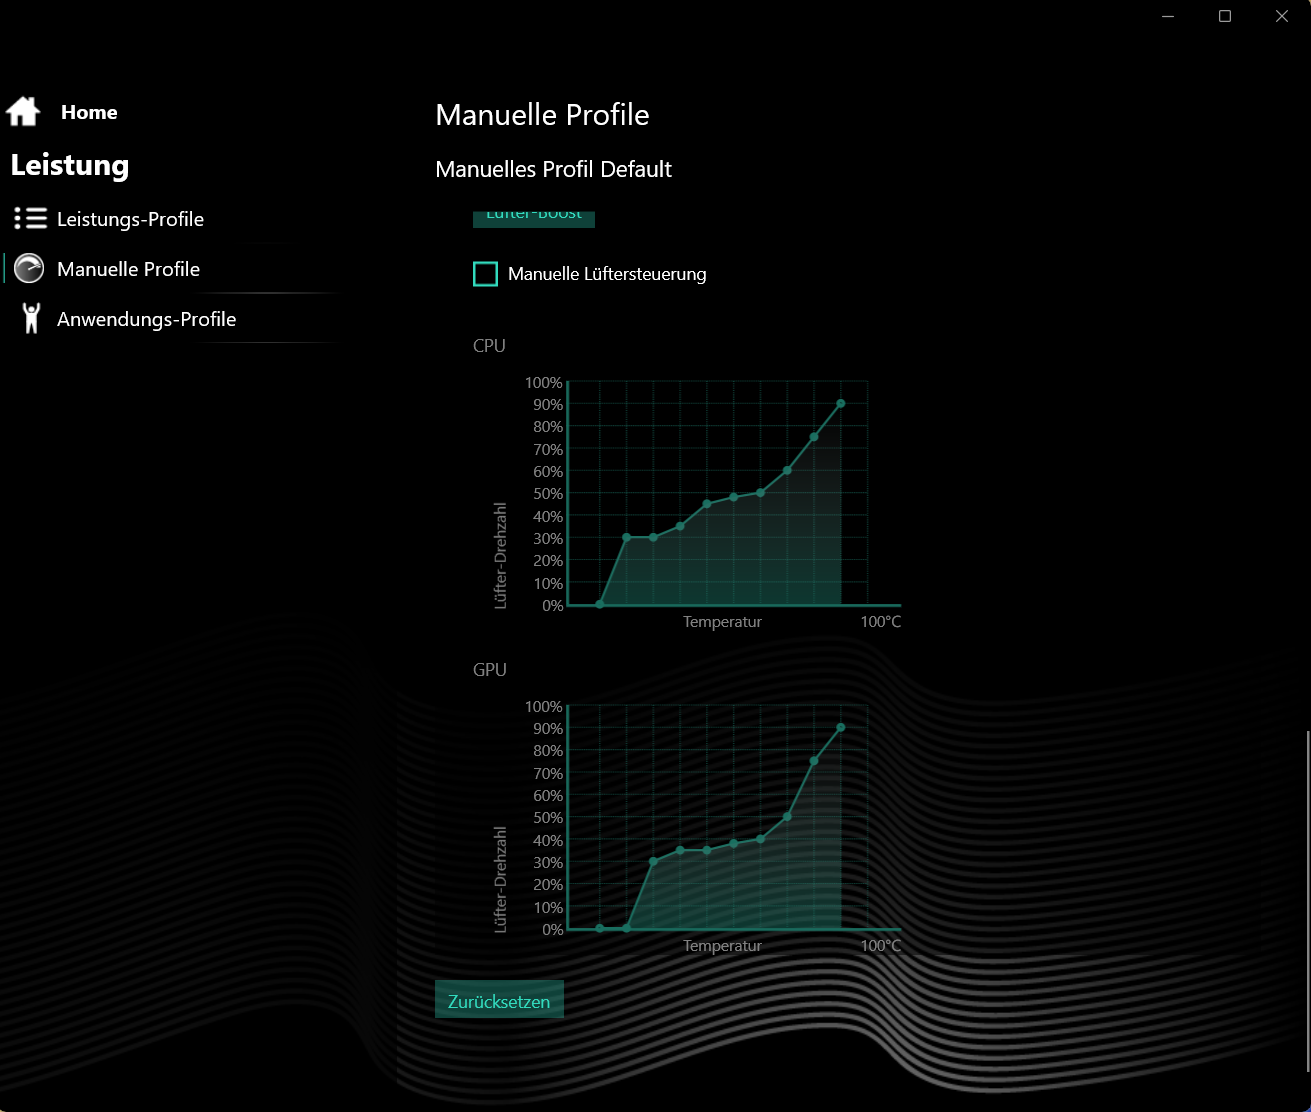
The preinstalled Control Center enables individual profiles: This makes adjusting, for example, the CPU's power limits, the GPU's TGP and/or the fan control possible.
| Enthusiast | Overboost | Balanced | |
|---|---|---|---|
| Power Limit 1 (HWInfo) | 54 watts | 80 watts | 35 watts |
| Power Limit 2 (HWInfo) | 65 watts | 80 watts | 65 watts |
| Noise (Witcher 3) | ~50 dB(A) | ~54 dB(A) | ~34 dB(A) |
| Performance (Witcher 3) | ~102 fps | ~105 fps | ~60 fps |


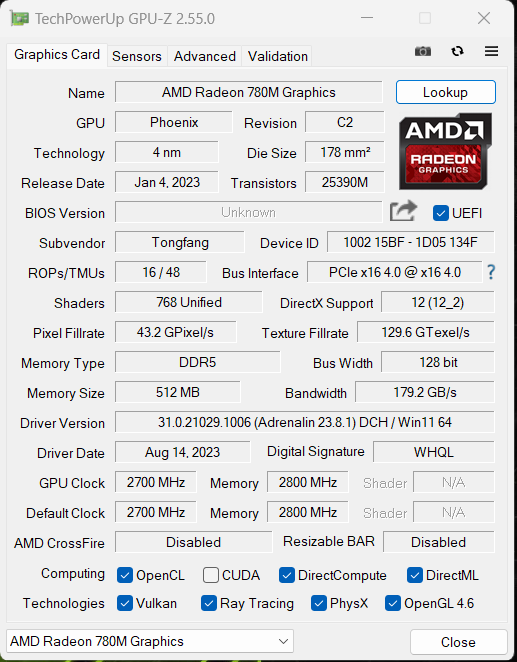
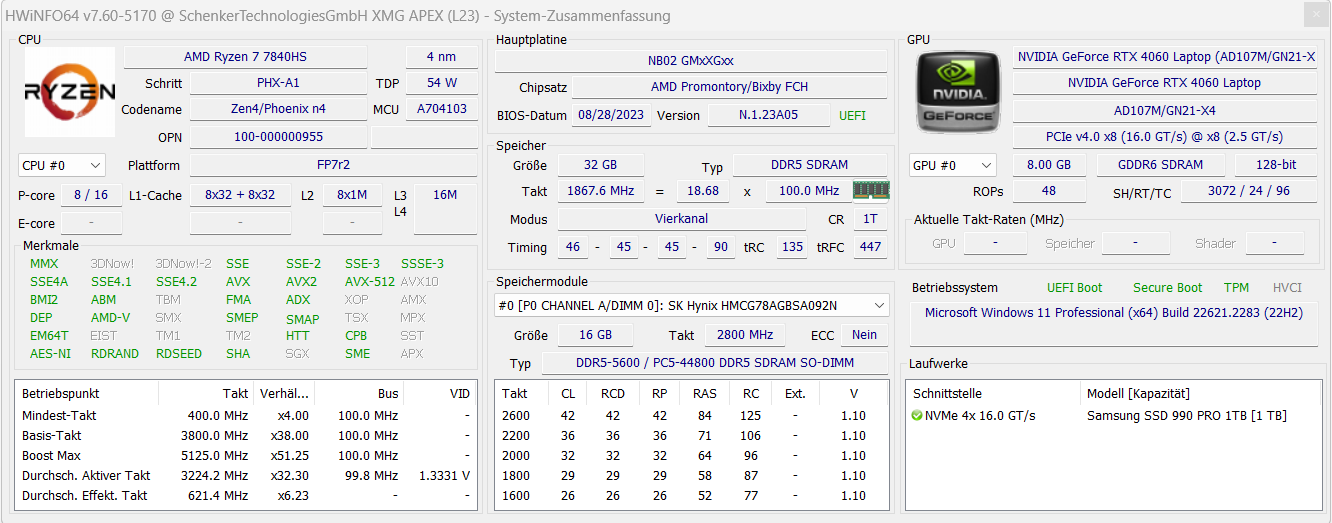
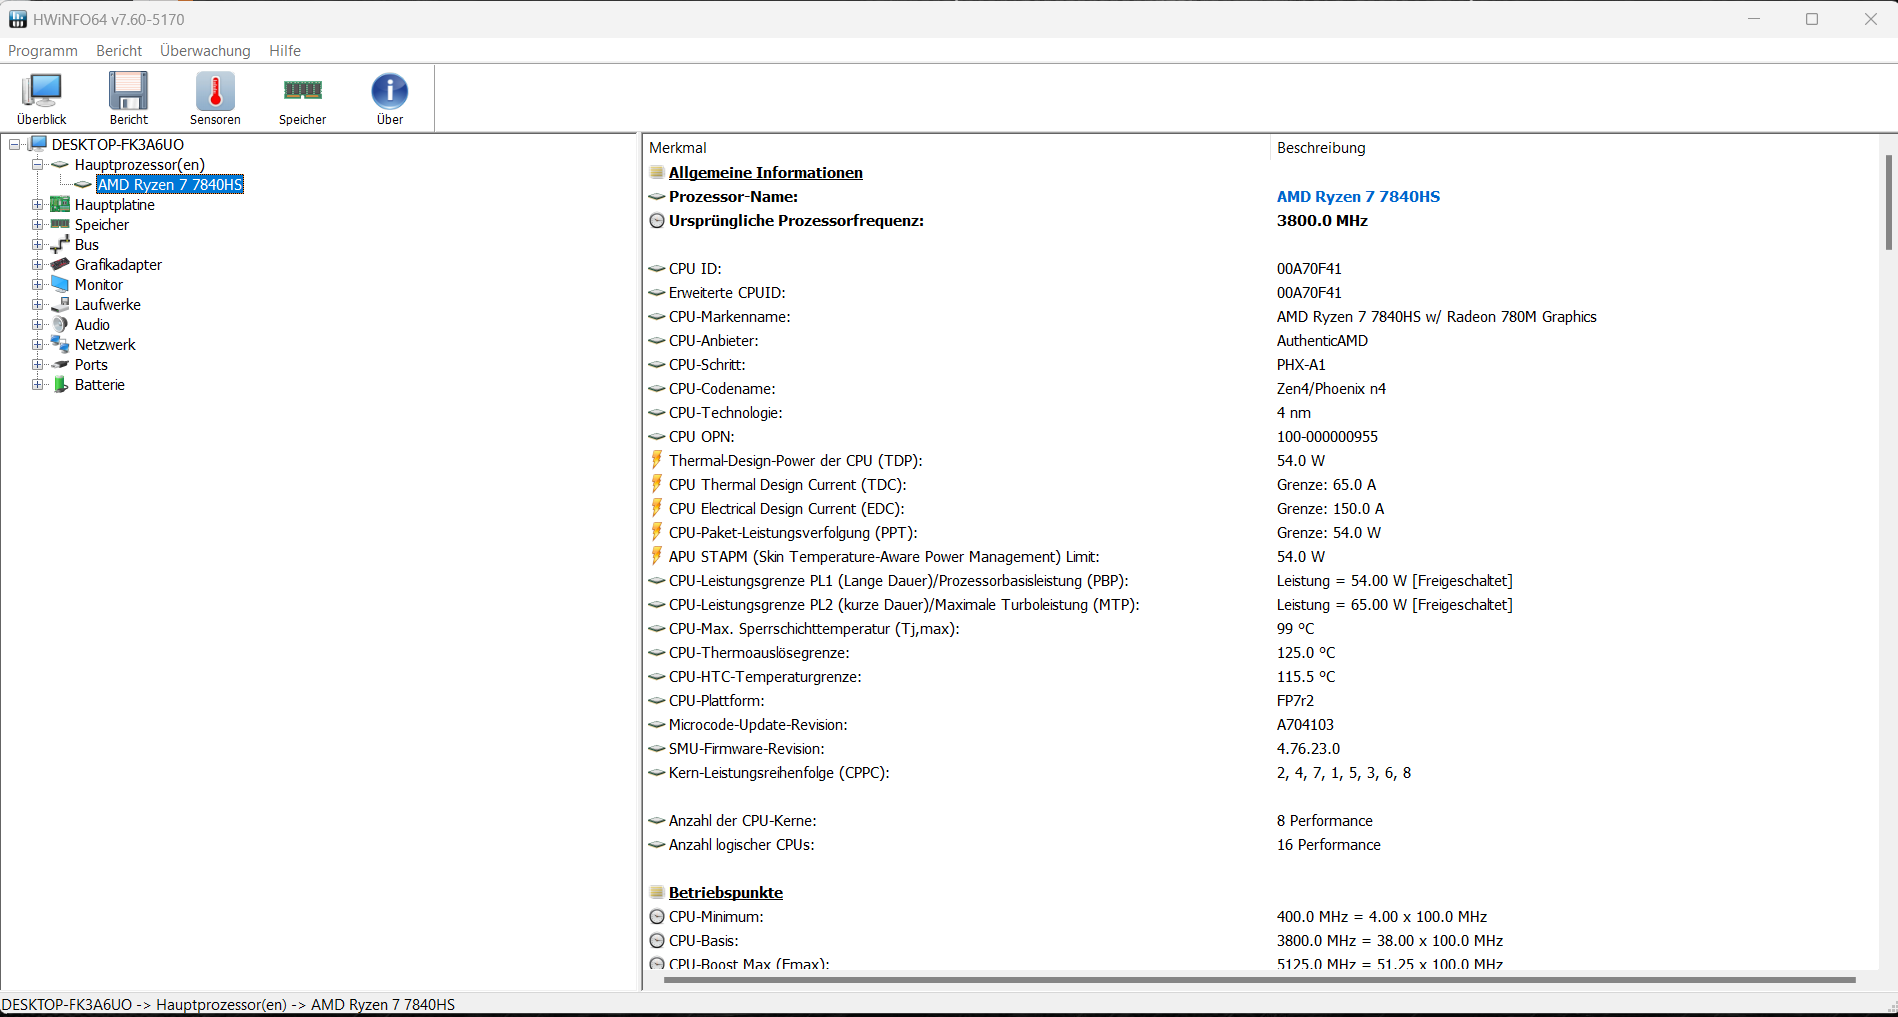
Processor
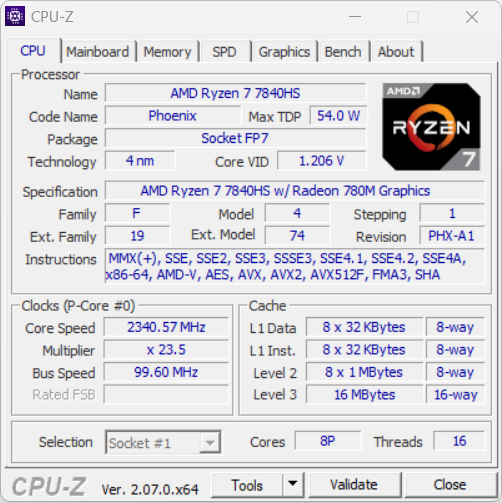
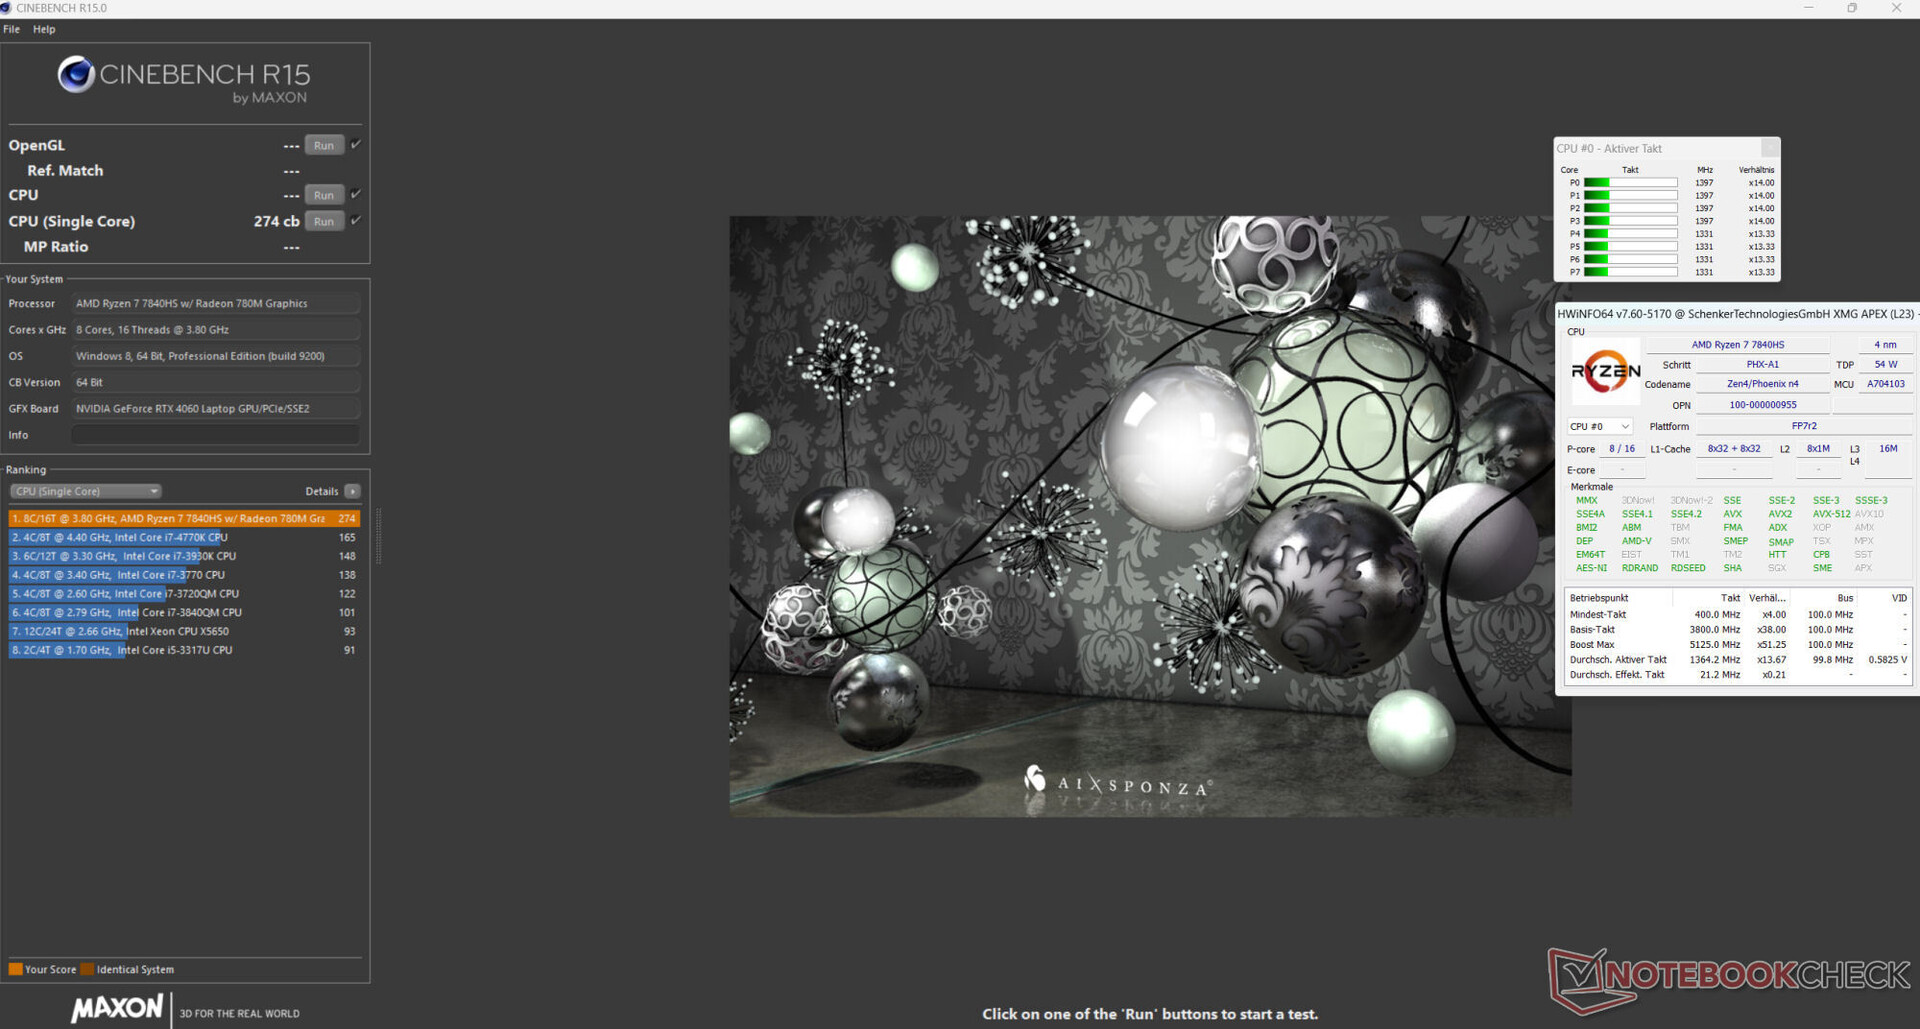
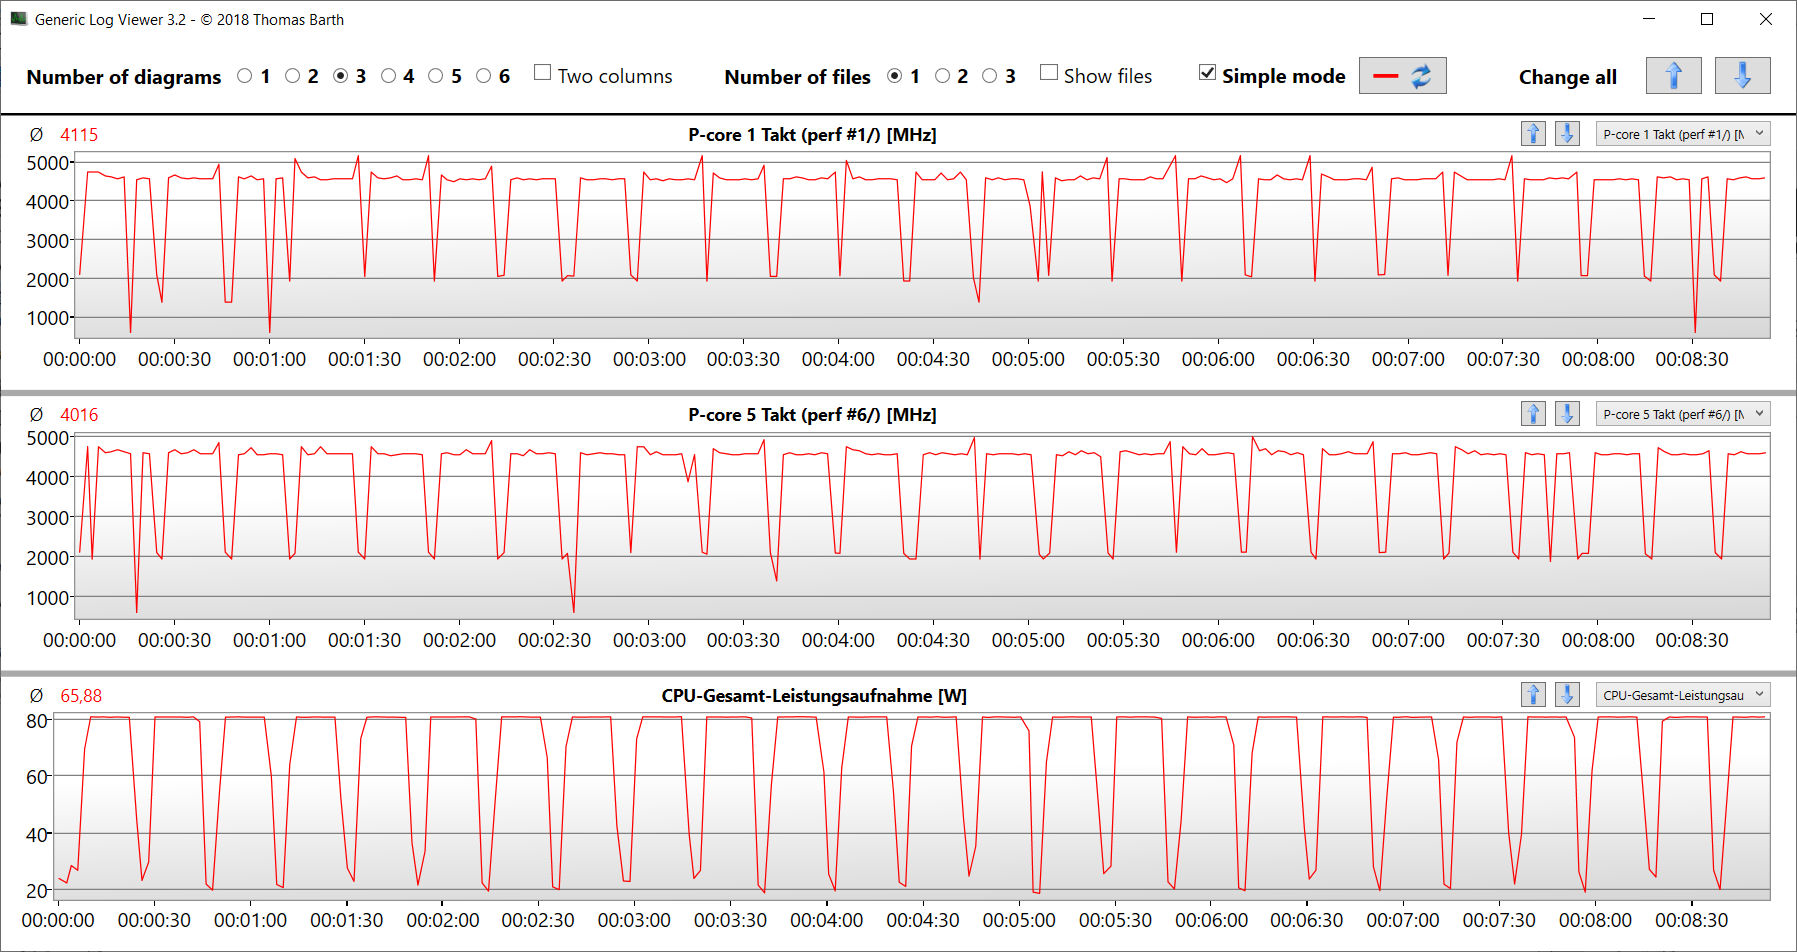
The Ryzen 7 7840HS APU (Phoenix, Zen 4) offers 8 CPU cores with a total of 16 threads at a maximum clock speed of 5.1 GHz (one core). The CPU acknowledges continuous multi-thread load (CB15 loop) with a consistently high turbo speed - irrespective of the selected performance mode.
In mains operation, the benchmark results are around the CPU average. In battery mode, the more relevant single-thread performance (216 points) drops to a lesser extent than the multi-thread performance (1,715 points).
Note: More detailed informationen concerning the Zen 4 architecture can be found in this related analysis article.
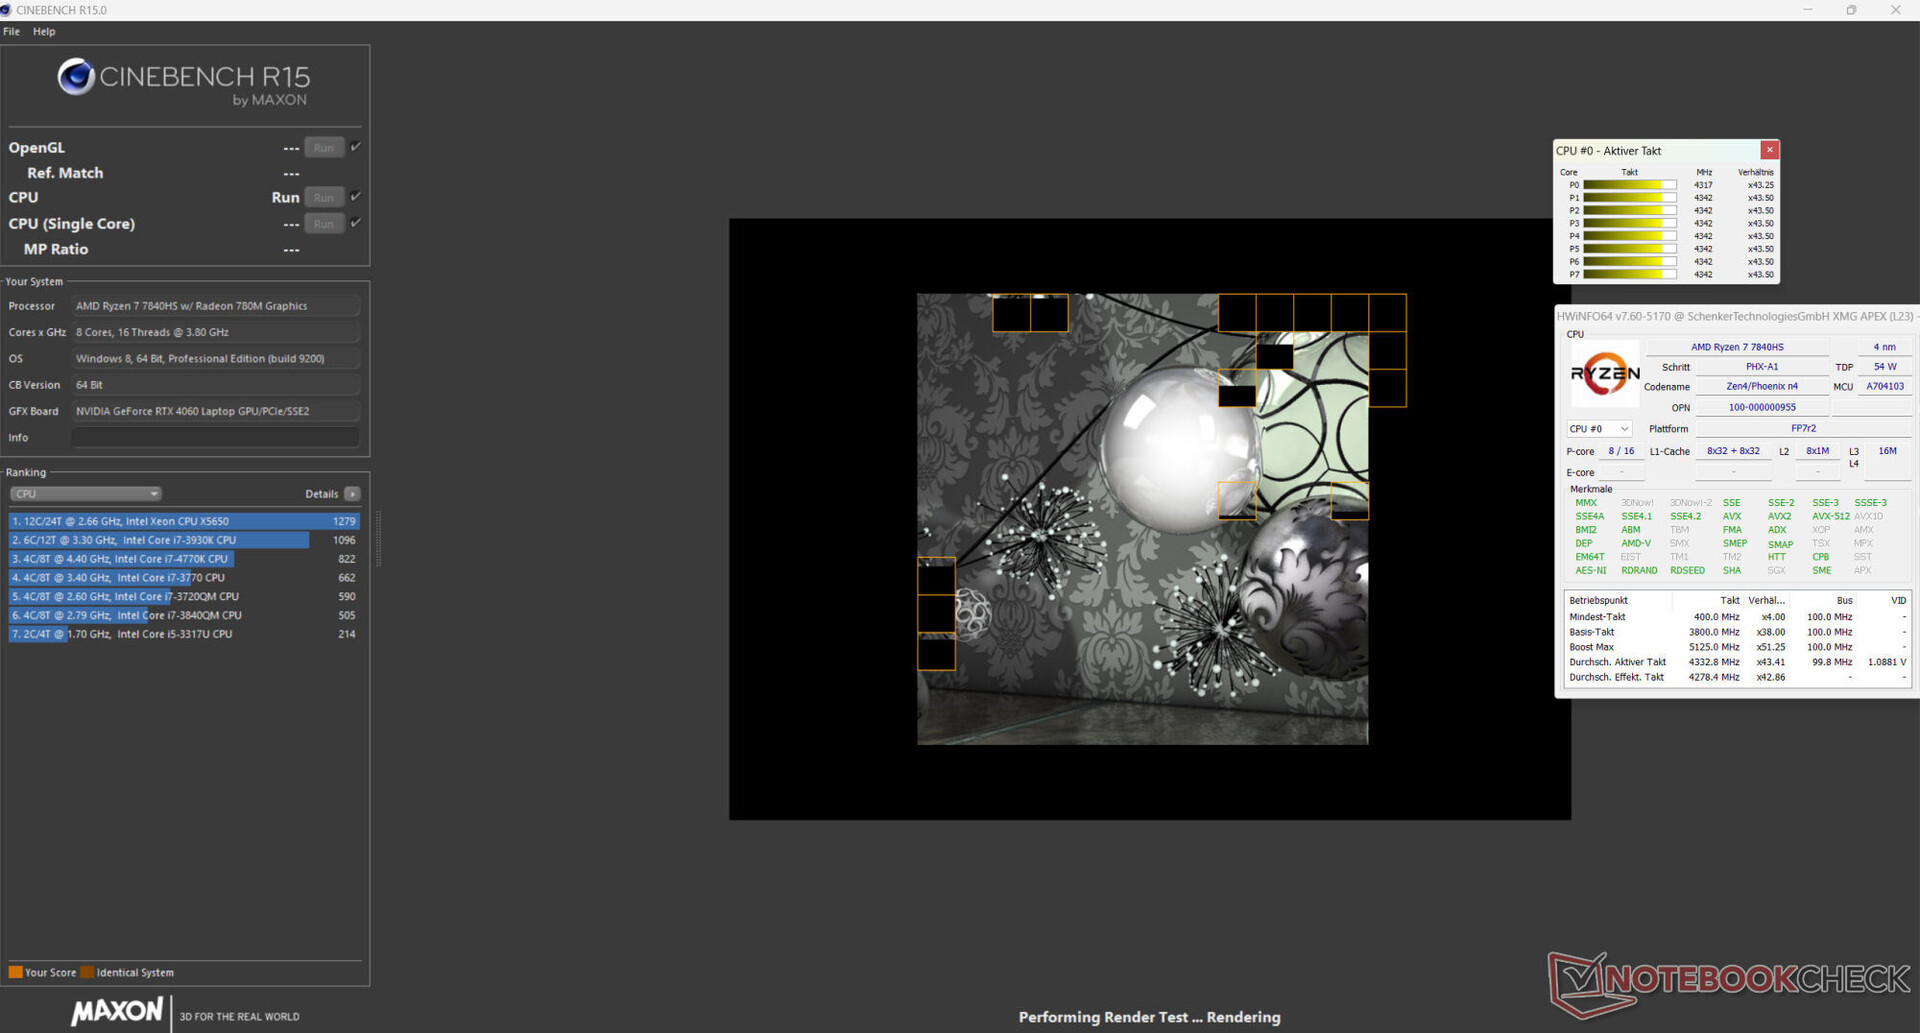
Cinebench R15 Multi Continuous Test

* ... smaller is better
AIDA64: FP32 Ray-Trace | FPU Julia | CPU SHA3 | CPU Queen | FPU SinJulia | FPU Mandel | CPU AES | CPU ZLib | FP64 Ray-Trace | CPU PhotoWorxx
| Performance rating | |
| Average of class Gaming | |
| Average AMD Ryzen 7 7840HS | |
| Schenker XMG Apex 17 (Late 23) | |
| Alienware m16 R1 Intel | |
| Lenovo Legion Pro 5 16IRX8 | |
| Acer Nitro 17 AN17-51-71ER | |
| Medion Erazer Defender P40 | |
| MSI Katana 17 B13VFK | |
| AIDA64 / FP32 Ray-Trace | |
| Average of class Gaming (7192 - 85542, n=135, last 2 years) | |
| Average AMD Ryzen 7 7840HS (22845 - 28921, n=21) | |
| Schenker XMG Apex 17 (Late 23) | |
| Lenovo Legion Pro 5 16IRX8 | |
| Alienware m16 R1 Intel | |
| Acer Nitro 17 AN17-51-71ER | |
| Medion Erazer Defender P40 | |
| MSI Katana 17 B13VFK | |
| AIDA64 / FPU Julia | |
| Average of class Gaming (35040 - 238426, n=135, last 2 years) | |
| Average AMD Ryzen 7 7840HS (97164 - 123167, n=21) | |
| Schenker XMG Apex 17 (Late 23) | |
| Lenovo Legion Pro 5 16IRX8 | |
| Alienware m16 R1 Intel | |
| Acer Nitro 17 AN17-51-71ER | |
| Medion Erazer Defender P40 | |
| MSI Katana 17 B13VFK | |
| AIDA64 / CPU SHA3 | |
| Average of class Gaming (1728 - 9817, n=135, last 2 years) | |
| Alienware m16 R1 Intel | |
| Average AMD Ryzen 7 7840HS (4293 - 5155, n=21) | |
| Lenovo Legion Pro 5 16IRX8 | |
| Schenker XMG Apex 17 (Late 23) | |
| Acer Nitro 17 AN17-51-71ER | |
| Medion Erazer Defender P40 | |
| MSI Katana 17 B13VFK | |
| AIDA64 / CPU Queen | |
| Average of class Gaming (49785 - 173351, n=135, last 2 years) | |
| Average AMD Ryzen 7 7840HS (102271 - 125820, n=21) | |
| Schenker XMG Apex 17 (Late 23) | |
| Alienware m16 R1 Intel | |
| Lenovo Legion Pro 5 16IRX8 | |
| Medion Erazer Defender P40 | |
| Acer Nitro 17 AN17-51-71ER | |
| MSI Katana 17 B13VFK | |
| AIDA64 / FPU SinJulia | |
| Average AMD Ryzen 7 7840HS (13767 - 15525, n=21) | |
| Schenker XMG Apex 17 (Late 23) | |
| Average of class Gaming (4424 - 33636, n=135, last 2 years) | |
| Alienware m16 R1 Intel | |
| Lenovo Legion Pro 5 16IRX8 | |
| Acer Nitro 17 AN17-51-71ER | |
| Medion Erazer Defender P40 | |
| MSI Katana 17 B13VFK | |
| AIDA64 / FPU Mandel | |
| Average of class Gaming (17585 - 128721, n=135, last 2 years) | |
| Average AMD Ryzen 7 7840HS (52084 - 65812, n=21) | |
| Schenker XMG Apex 17 (Late 23) | |
| Lenovo Legion Pro 5 16IRX8 | |
| Alienware m16 R1 Intel | |
| Acer Nitro 17 AN17-51-71ER | |
| Medion Erazer Defender P40 | |
| MSI Katana 17 B13VFK | |
| AIDA64 / CPU AES | |
| Alienware m16 R1 Intel | |
| Schenker XMG Apex 17 (Late 23) | |
| Acer Nitro 17 AN17-51-71ER | |
| Average AMD Ryzen 7 7840HS (67389 - 177158, n=21) | |
| Average of class Gaming (19065 - 247074, n=135, last 2 years) | |
| Lenovo Legion Pro 5 16IRX8 | |
| Medion Erazer Defender P40 | |
| MSI Katana 17 B13VFK | |
| AIDA64 / CPU ZLib | |
| Average of class Gaming (373 - 2531, n=135, last 2 years) | |
| Alienware m16 R1 Intel | |
| Lenovo Legion Pro 5 16IRX8 | |
| Acer Nitro 17 AN17-51-71ER | |
| Average AMD Ryzen 7 7840HS (944 - 1123, n=21) | |
| Schenker XMG Apex 17 (Late 23) | |
| Medion Erazer Defender P40 | |
| MSI Katana 17 B13VFK | |
| AIDA64 / FP64 Ray-Trace | |
| Average of class Gaming (3856 - 45446, n=135, last 2 years) | |
| Average AMD Ryzen 7 7840HS (12248 - 15599, n=21) | |
| Schenker XMG Apex 17 (Late 23) | |
| Lenovo Legion Pro 5 16IRX8 | |
| Alienware m16 R1 Intel | |
| Acer Nitro 17 AN17-51-71ER | |
| Medion Erazer Defender P40 | |
| MSI Katana 17 B13VFK | |
| AIDA64 / CPU PhotoWorxx | |
| Average of class Gaming (10805 - 62916, n=135, last 2 years) | |
| Acer Nitro 17 AN17-51-71ER | |
| Average AMD Ryzen 7 7840HS (17615 - 41516, n=21) | |
| Lenovo Legion Pro 5 16IRX8 | |
| Schenker XMG Apex 17 (Late 23) | |
| Medion Erazer Defender P40 | |
| Alienware m16 R1 Intel | |
| MSI Katana 17 B13VFK | |
System performance
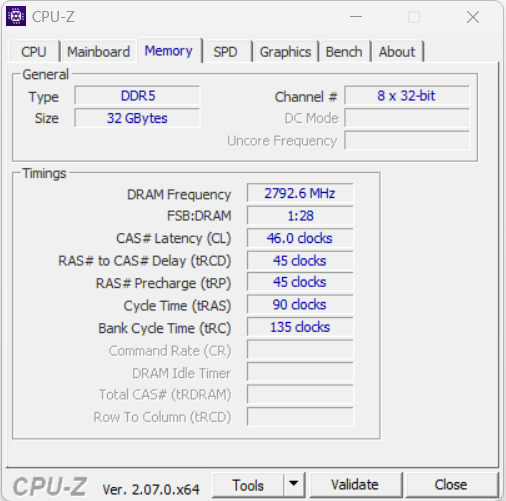
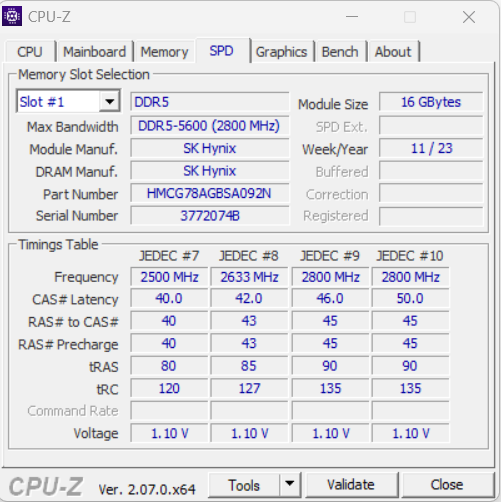
The smooth running system is designed to handle performance-hungry use case scenarios such as rendering and gaming - the good PC Mark results confirm this. The RAM's transfer rates are on a normal level for DDR5 5600 RAM.
CrossMark: Overall | Productivity | Creativity | Responsiveness
| PCMark 10 / Score | |
| Average of class Gaming (5776 - 10060, n=114, last 2 years) | |
| Schenker XMG Apex 17 (Late 23) | |
| Average AMD Ryzen 7 7840HS, NVIDIA GeForce RTX 4060 Laptop GPU (7502 - 7946, n=4) | |
| Lenovo Legion Pro 5 16IRX8 | |
| Alienware m16 R1 Intel | |
| MSI Katana 17 B13VFK | |
| Acer Nitro 17 AN17-51-71ER | |
| Medion Erazer Defender P40 | |
| PCMark 10 / Essentials | |
| Lenovo Legion Pro 5 16IRX8 | |
| Average AMD Ryzen 7 7840HS, NVIDIA GeForce RTX 4060 Laptop GPU (10441 - 11169, n=4) | |
| MSI Katana 17 B13VFK | |
| Alienware m16 R1 Intel | |
| Average of class Gaming (8810 - 12600, n=118, last 2 years) | |
| Schenker XMG Apex 17 (Late 23) | |
| Acer Nitro 17 AN17-51-71ER | |
| Medion Erazer Defender P40 | |
| PCMark 10 / Productivity | |
| Schenker XMG Apex 17 (Late 23) | |
| Average of class Gaming (6662 - 16716, n=116, last 2 years) | |
| Average AMD Ryzen 7 7840HS, NVIDIA GeForce RTX 4060 Laptop GPU (9575 - 10273, n=4) | |
| Medion Erazer Defender P40 | |
| Alienware m16 R1 Intel | |
| MSI Katana 17 B13VFK | |
| Lenovo Legion Pro 5 16IRX8 | |
| Acer Nitro 17 AN17-51-71ER | |
| PCMark 10 / Digital Content Creation | |
| Average of class Gaming (7440 - 19351, n=116, last 2 years) | |
| Lenovo Legion Pro 5 16IRX8 | |
| Schenker XMG Apex 17 (Late 23) | |
| Average AMD Ryzen 7 7840HS, NVIDIA GeForce RTX 4060 Laptop GPU (11464 - 12418, n=4) | |
| Acer Nitro 17 AN17-51-71ER | |
| Alienware m16 R1 Intel | |
| MSI Katana 17 B13VFK | |
| Medion Erazer Defender P40 | |
| CrossMark / Overall | |
| Alienware m16 R1 Intel | |
| Average of class Gaming (1247 - 2344, n=114, last 2 years) | |
| MSI Katana 17 B13VFK | |
| Average AMD Ryzen 7 7840HS, NVIDIA GeForce RTX 4060 Laptop GPU (1800 - 1866, n=3) | |
| Schenker XMG Apex 17 (Late 23) | |
| Medion Erazer Defender P40 | |
| Lenovo Legion Pro 5 16IRX8 | |
| Acer Nitro 17 AN17-51-71ER | |
| CrossMark / Productivity | |
| Alienware m16 R1 Intel | |
| Average of class Gaming (1299 - 2211, n=114, last 2 years) | |
| Average AMD Ryzen 7 7840HS, NVIDIA GeForce RTX 4060 Laptop GPU (1743 - 1821, n=3) | |
| MSI Katana 17 B13VFK | |
| Schenker XMG Apex 17 (Late 23) | |
| Medion Erazer Defender P40 | |
| Lenovo Legion Pro 5 16IRX8 | |
| Acer Nitro 17 AN17-51-71ER | |
| CrossMark / Creativity | |
| Alienware m16 R1 Intel | |
| Average of class Gaming (1275 - 2729, n=114, last 2 years) | |
| MSI Katana 17 B13VFK | |
| Medion Erazer Defender P40 | |
| Average AMD Ryzen 7 7840HS, NVIDIA GeForce RTX 4060 Laptop GPU (1908 - 1966, n=3) | |
| Schenker XMG Apex 17 (Late 23) | |
| Lenovo Legion Pro 5 16IRX8 | |
| Acer Nitro 17 AN17-51-71ER | |
| CrossMark / Responsiveness | |
| Alienware m16 R1 Intel | |
| MSI Katana 17 B13VFK | |
| Average of class Gaming (1030 - 2330, n=114, last 2 years) | |
| Schenker XMG Apex 17 (Late 23) | |
| Lenovo Legion Pro 5 16IRX8 | |
| Average AMD Ryzen 7 7840HS, NVIDIA GeForce RTX 4060 Laptop GPU (1522 - 1776, n=3) | |
| Acer Nitro 17 AN17-51-71ER | |
| Medion Erazer Defender P40 | |
| PCMark 10 Score | 7854 points | |
Help | ||
| AIDA64 / Memory Copy | |
| Average of class Gaming (21750 - 108104, n=135, last 2 years) | |
| Schenker XMG Apex 17 (Late 23) | |
| Average AMD Ryzen 7 7840HS (30937 - 72158, n=21) | |
| Lenovo Legion Pro 5 16IRX8 | |
| Acer Nitro 17 AN17-51-71ER | |
| Medion Erazer Defender P40 | |
| Alienware m16 R1 Intel | |
| MSI Katana 17 B13VFK | |
| AIDA64 / Memory Read | |
| Average of class Gaming (22956 - 104349, n=135, last 2 years) | |
| Lenovo Legion Pro 5 16IRX8 | |
| Medion Erazer Defender P40 | |
| Alienware m16 R1 Intel | |
| Acer Nitro 17 AN17-51-71ER | |
| Schenker XMG Apex 17 (Late 23) | |
| MSI Katana 17 B13VFK | |
| Average AMD Ryzen 7 7840HS (30497 - 62147, n=21) | |
| AIDA64 / Memory Write | |
| Schenker XMG Apex 17 (Late 23) | |
| Average AMD Ryzen 7 7840HS (34590 - 93323, n=21) | |
| Average of class Gaming (22297 - 133486, n=135, last 2 years) | |
| Lenovo Legion Pro 5 16IRX8 | |
| Acer Nitro 17 AN17-51-71ER | |
| Alienware m16 R1 Intel | |
| Medion Erazer Defender P40 | |
| MSI Katana 17 B13VFK | |
| AIDA64 / Memory Latency | |
| Acer Nitro 17 AN17-51-71ER | |
| Average of class Gaming (59.5 - 259, n=135, last 2 years) | |
| MSI Katana 17 B13VFK | |
| Medion Erazer Defender P40 | |
| Average AMD Ryzen 7 7840HS (85.1 - 112, n=21) | |
| Alienware m16 R1 Intel | |
| Schenker XMG Apex 17 (Late 23) | |
| Lenovo Legion Pro 5 16IRX8 | |
* ... smaller is better
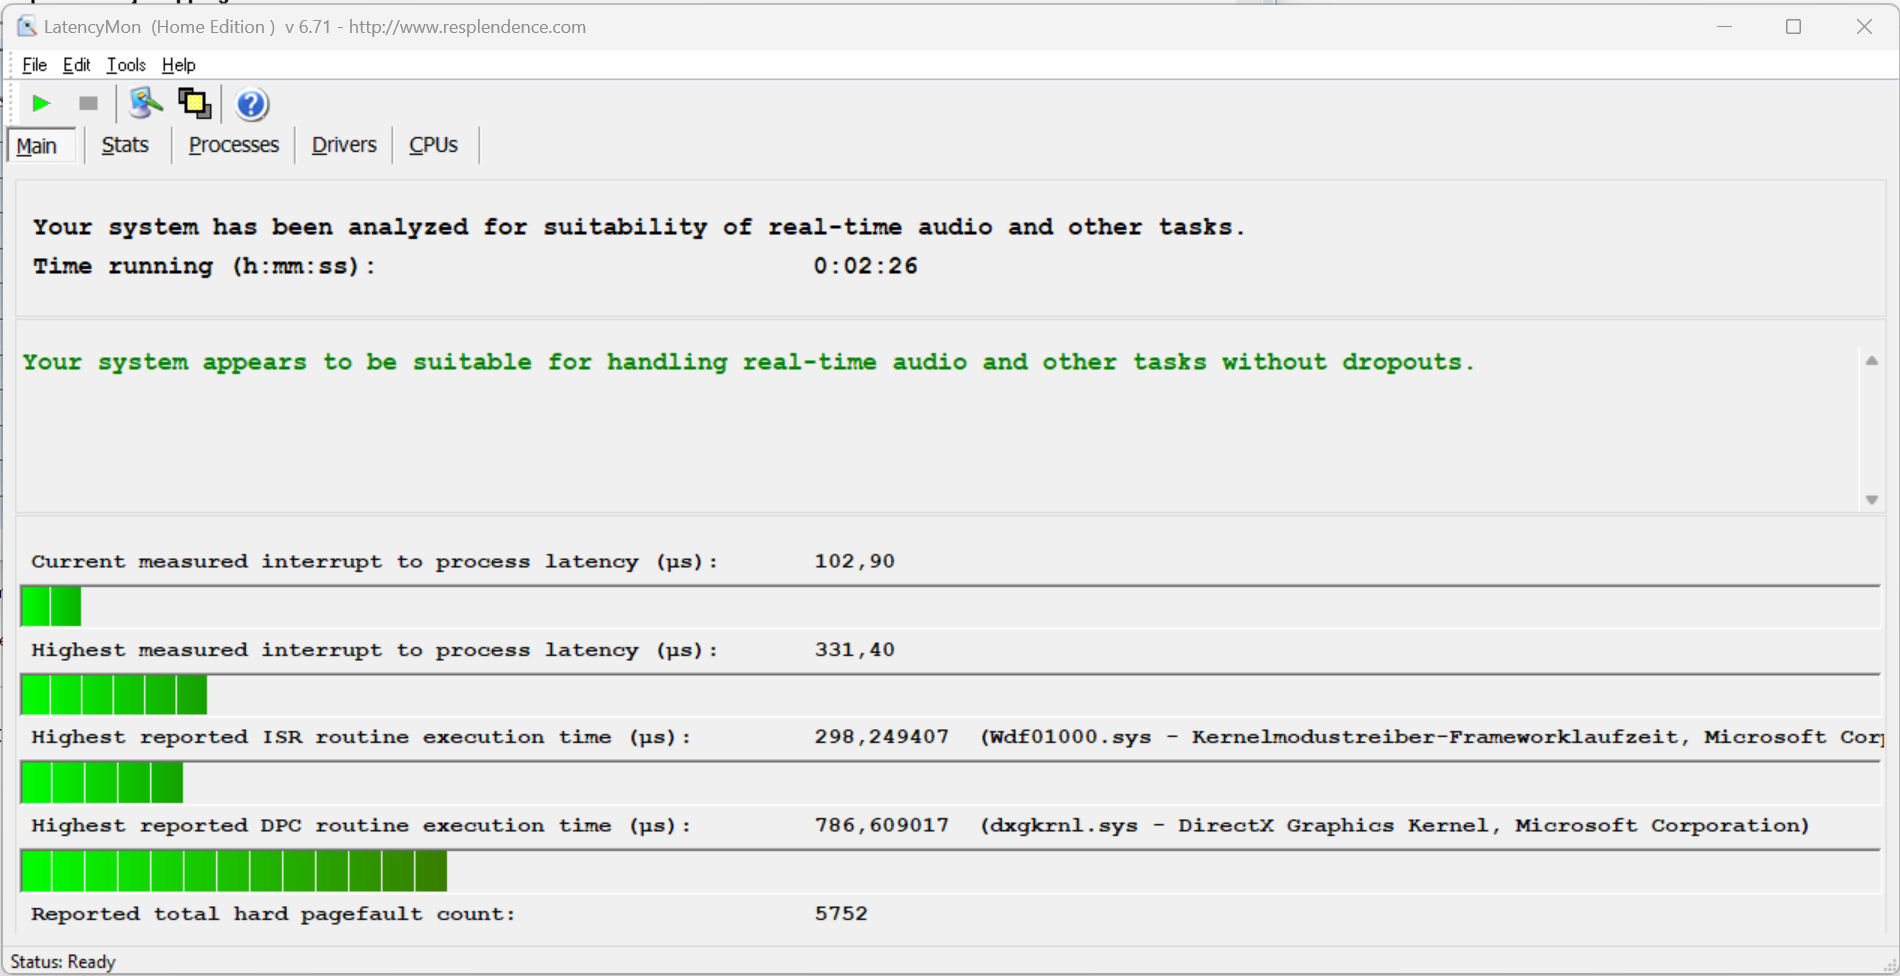
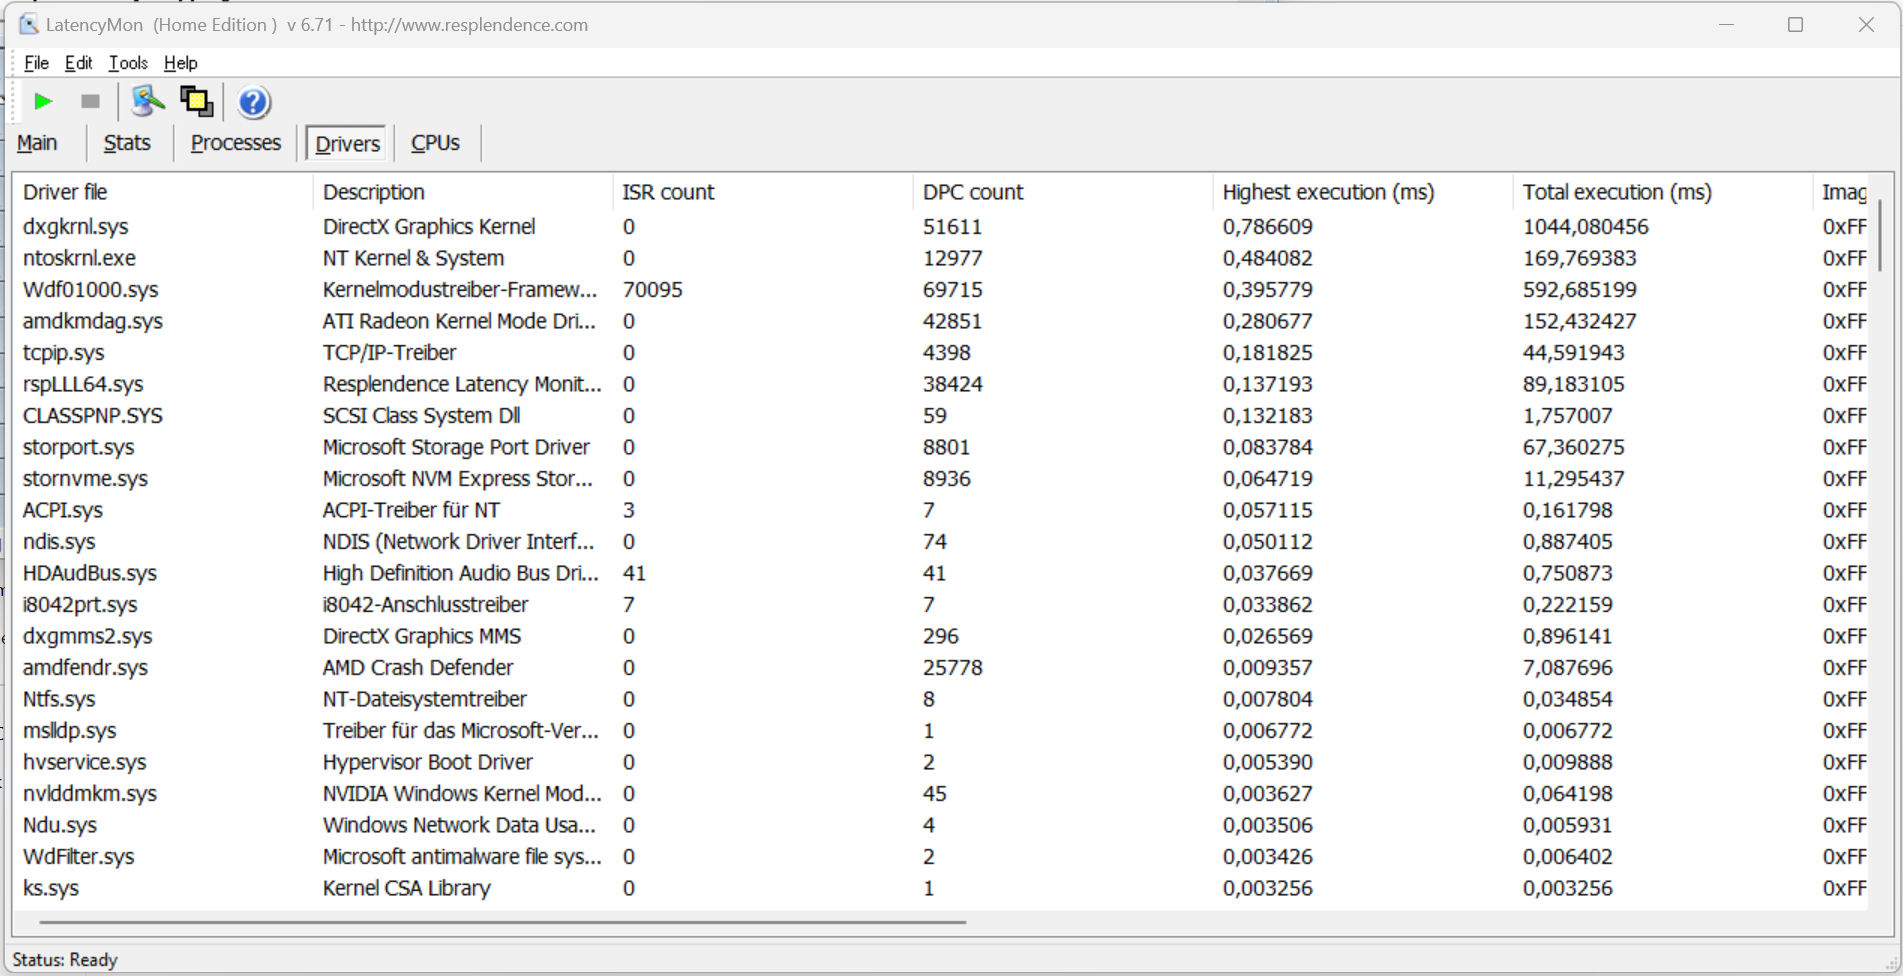
DPC latencies
The standardized Latency Monitor test (surfing the internet, 4k video playback, Prime95 high load) didn't reveal any abnormalities. The system seems to be suitable for real-time video and audio editing. Future software updates could either improve or worsen this performance area.
| DPC Latencies / LatencyMon - interrupt to process latency (max), Web, Youtube, Prime95 | |
| Medion Erazer Defender P40 | |
| Alienware m16 R1 Intel | |
| MSI Katana 17 B13VFK | |
| Acer Nitro 17 AN17-51-71ER | |
| Lenovo Legion Pro 5 16IRX8 | |
| Schenker XMG Apex 17 (Late 23) | |
* ... smaller is better
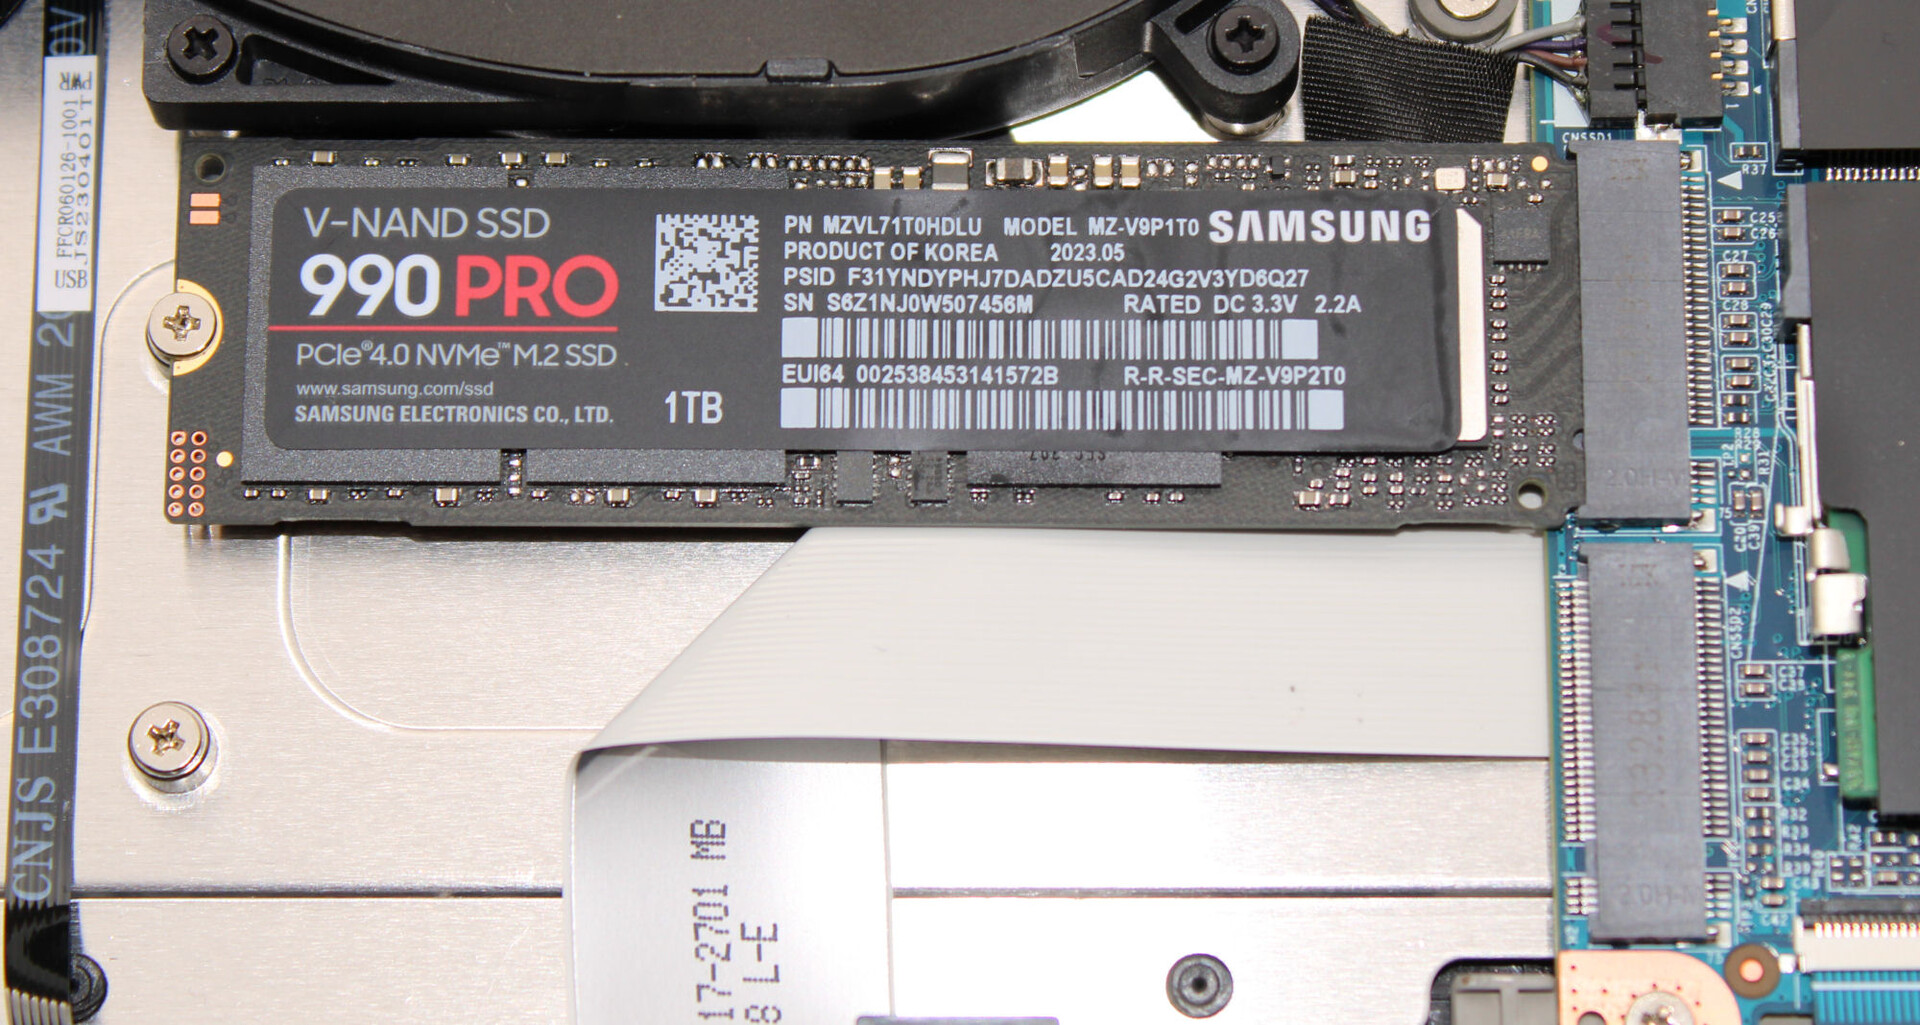
Mass storage
The Apex can accommodate a total of two PCIe 4 SSDs in the M.2 2280 format. RAID-0/1 is supported. The review device provided to us has a Samsung 1 TB SSD (PCIe 4, M.2 2280) on board that delivers excellent transfer speeds. Positive: Thermally-related throttling did not occur.

* ... smaller is better
Continuous Performance Read: DiskSpd Read Loop, Queue Depth 8
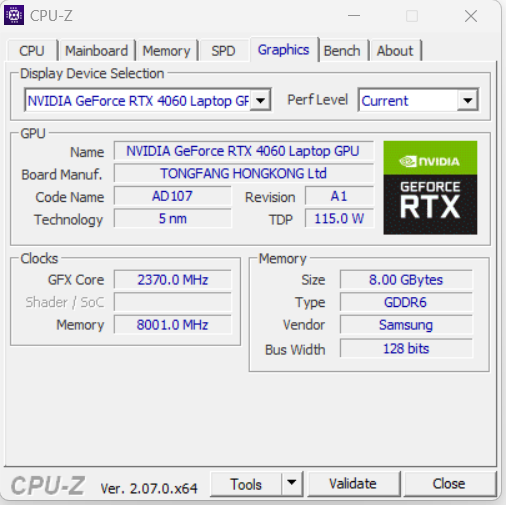
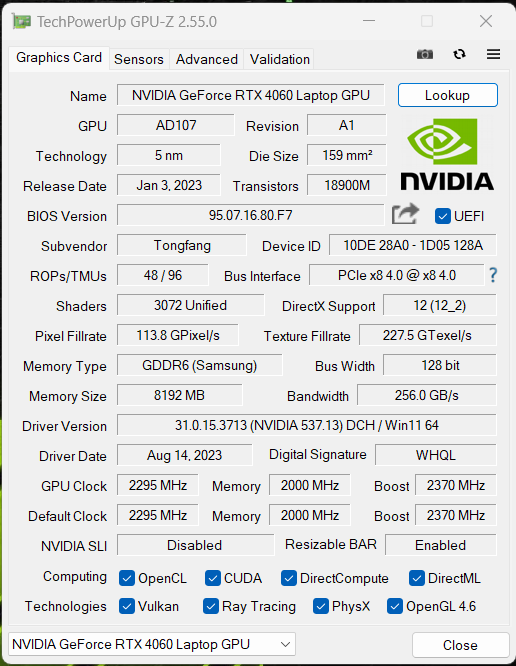
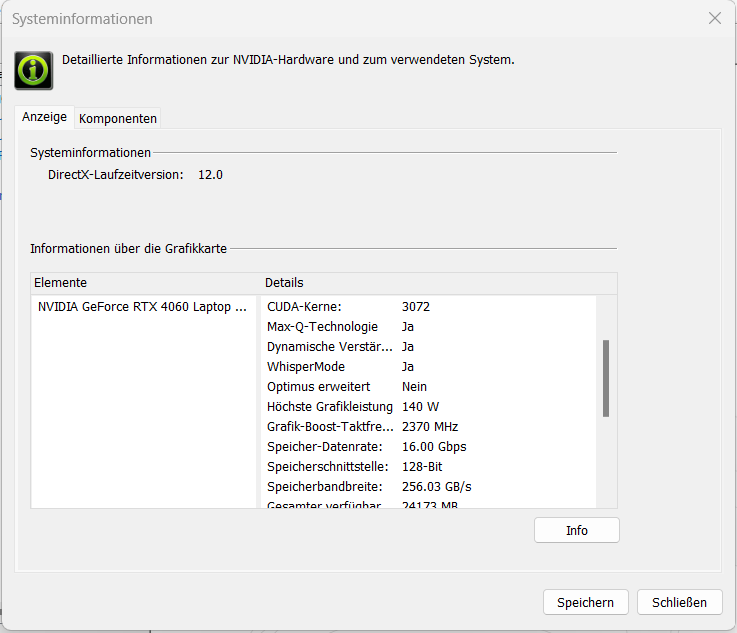
Graphics card
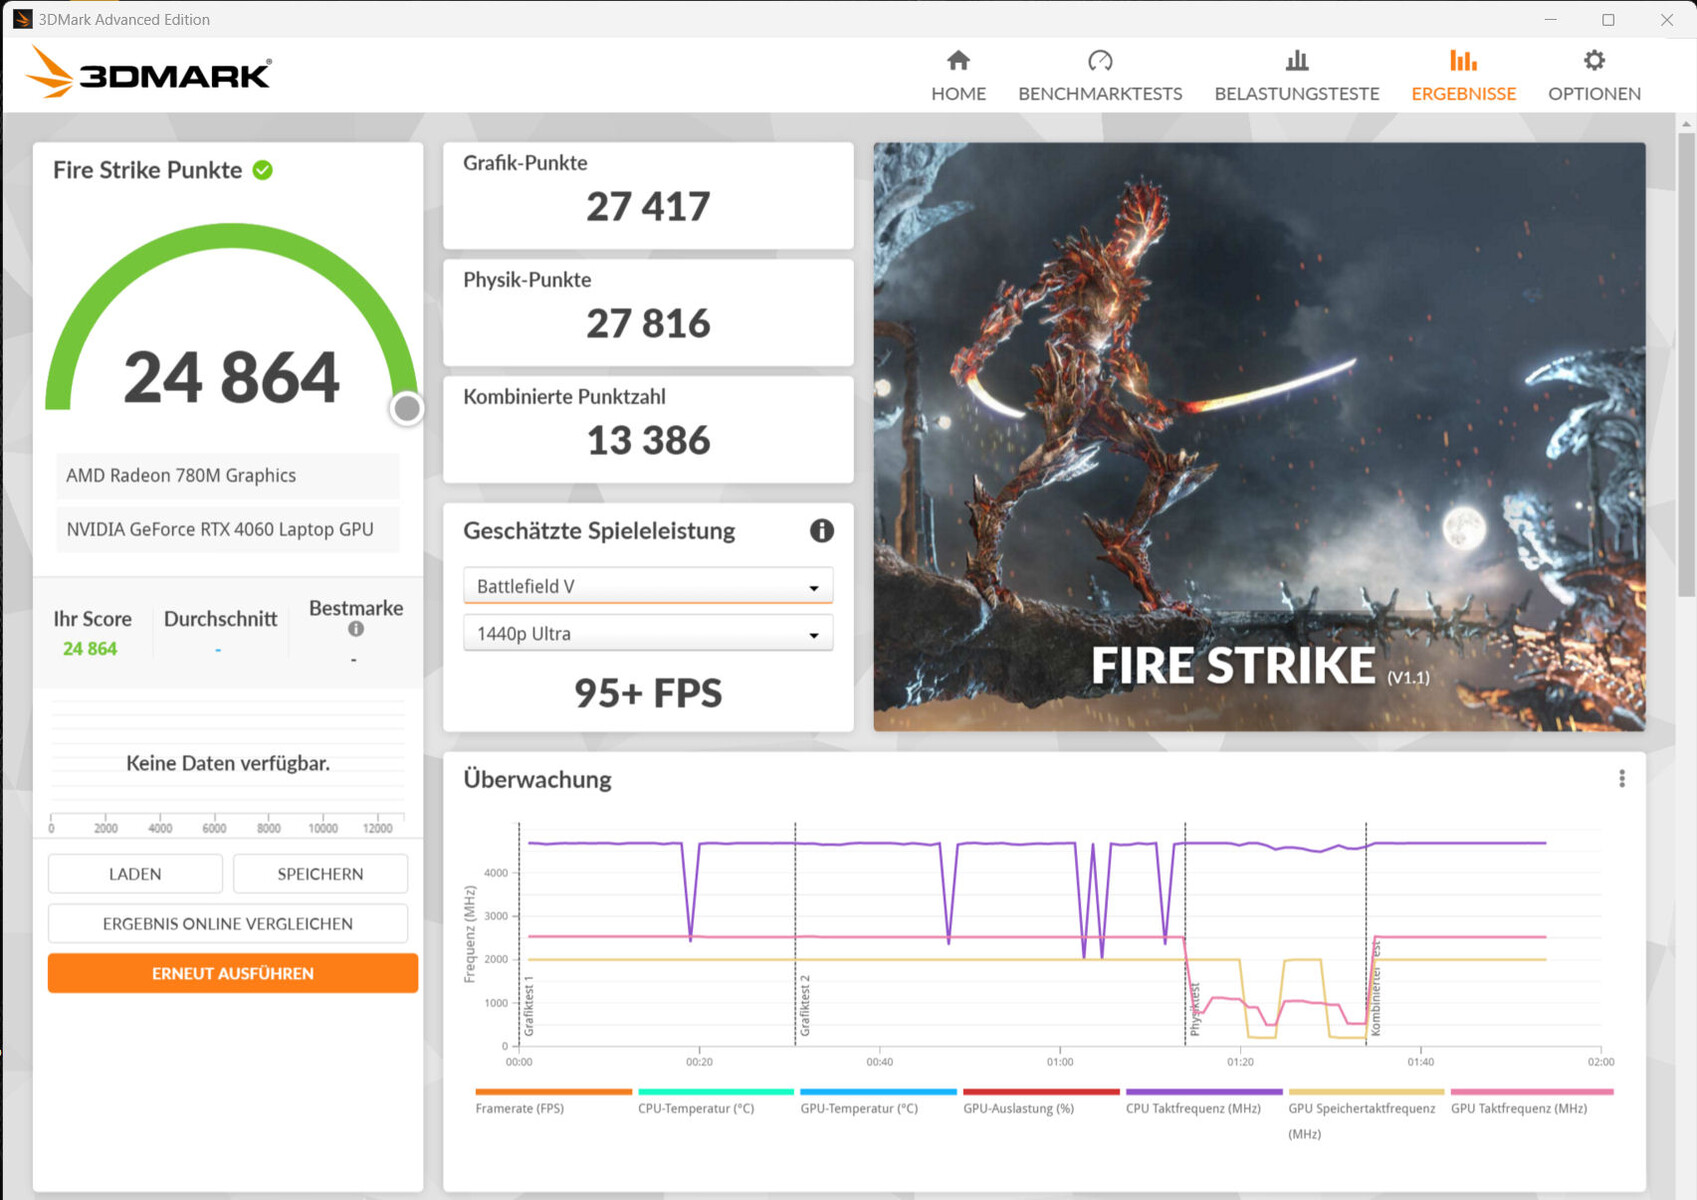
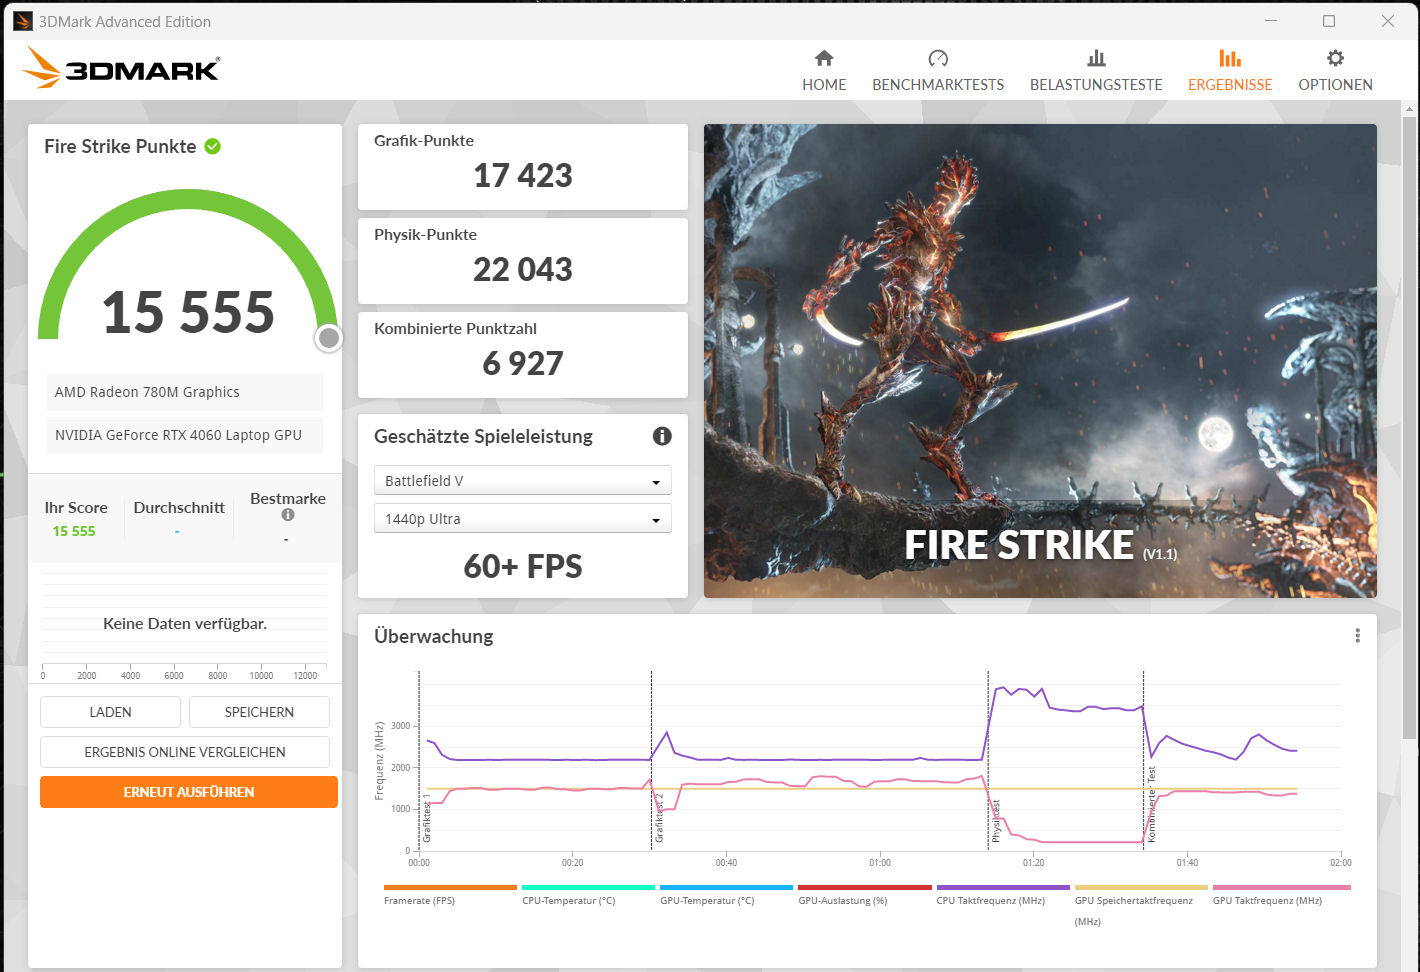
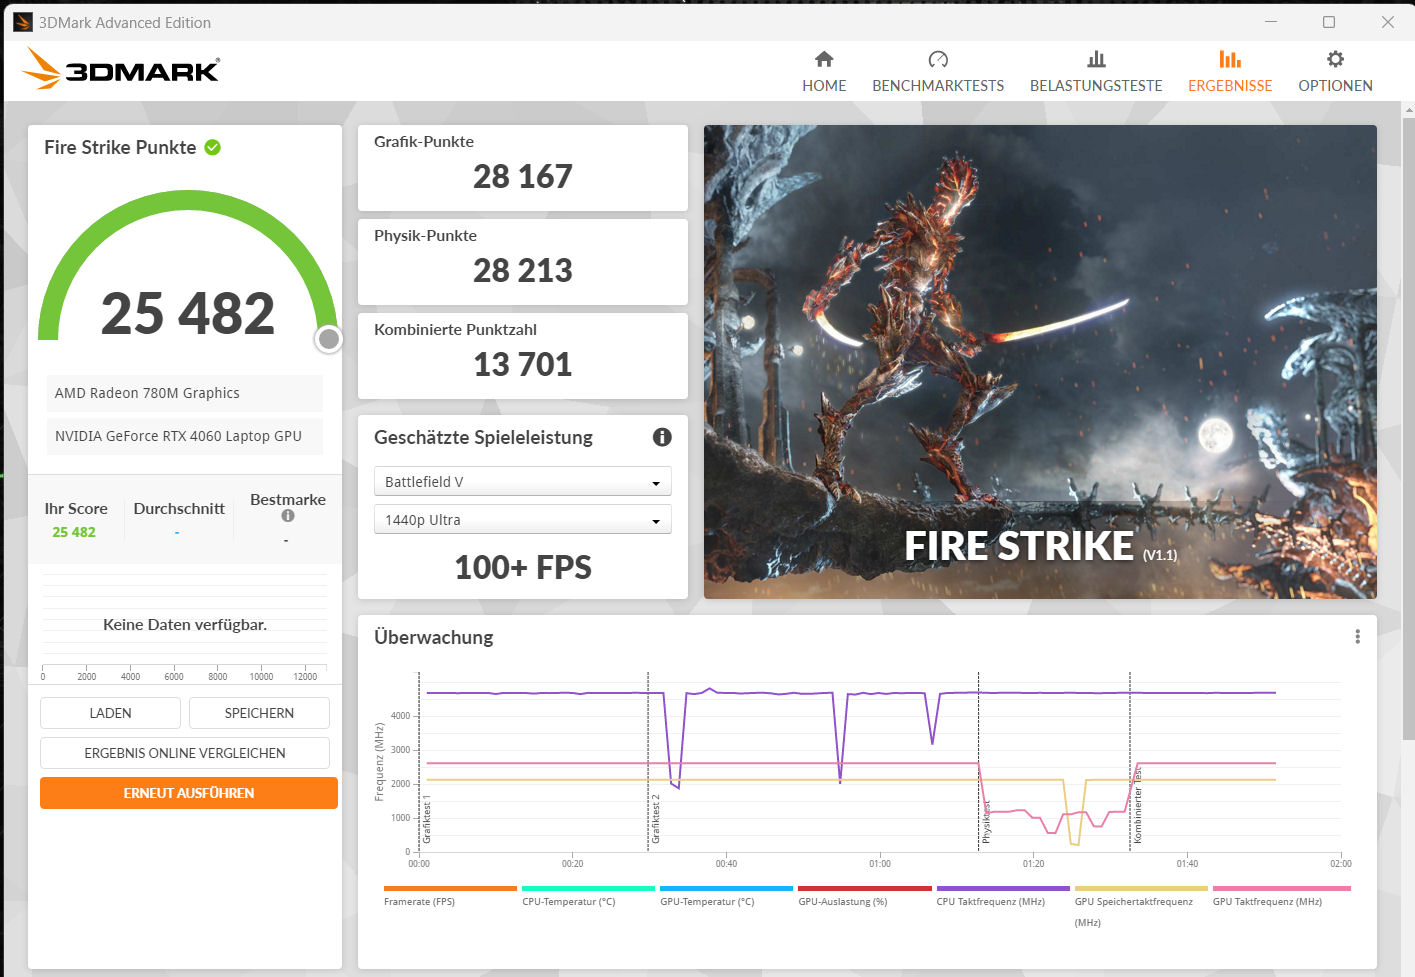
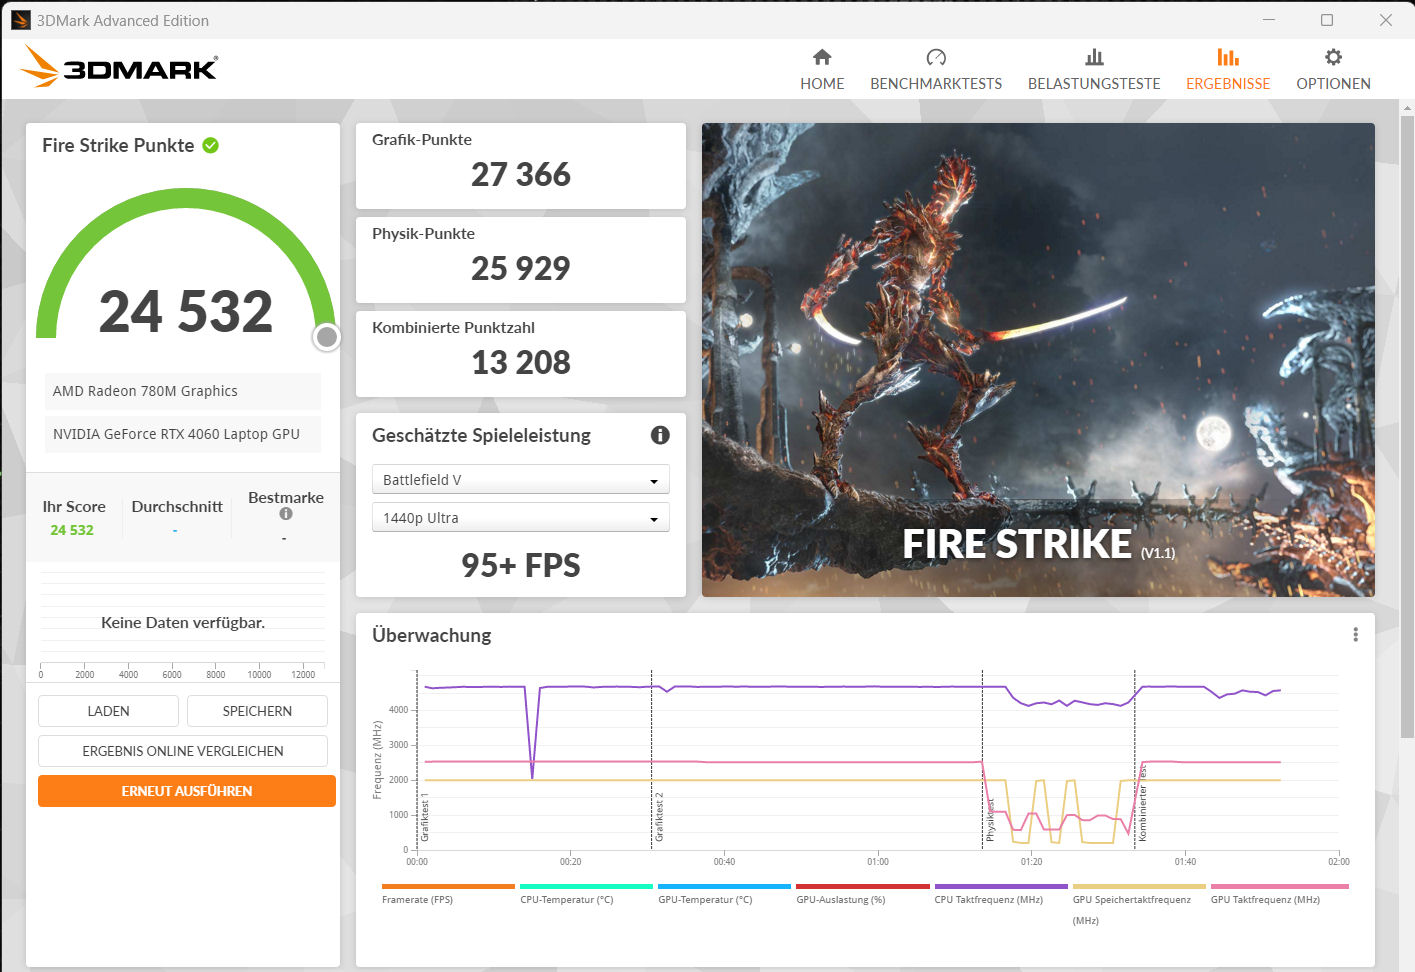
The GeForce RTX 4060 offers 3,072 shaders, a 128-bit wide bus and fast GDDR6 RAM (8,192 MB). Schenker has set the maximum TGP to a value of 140 watts (115 watts + 25 watts of dynamic boost) - more is not possible. According to the Witcher 3 test, the TGP is not maxed out.
The benchmark results are higher than the previous RTX 4060 average. The dGPU mode does not result in any increase in performance. The switch between dGPU and Optimus requires a reboot - Advanced Optimus is not supported.
| 3DMark 06 Standard Score | 49011 points | |
| 3DMark 11 Performance | 32639 points | |
| 3DMark Cloud Gate Standard Score | 64881 points | |
| 3DMark Fire Strike Score | 24864 points | |
| 3DMark Time Spy Score | 10640 points | |
Help | ||
* ... smaller is better
Gaming performance
The Schenker computer is designed for QHD gaming at high to maximum settings. Higher resolutions would be usable at sometimes reduced settings when connected to an appropriate monitor. Frame rates typical for the RTX 4060 average can be achieved. Generally, the dGP mode does not result in an increase in performance. Only in the game "X Plane 11" was a 10 to 20 percent frame rate increase recorded.
| The Witcher 3 - 1920x1080 Ultra Graphics & Postprocessing (HBAO+) | |
| Average of class Gaming (29.6 - 240, n=40, last 2 years) | |
| Lenovo Legion Pro 5 16IRX8 | |
| Alienware m16 R1 Intel | |
| Acer Nitro 17 AN17-51-71ER | |
| MSI Katana 17 B13VFK | |
| Schenker XMG Apex 17 (Late 23) | |
| Medion Erazer Defender P40 | |
| Average NVIDIA GeForce RTX 4060 Laptop GPU (77 - 159.7, n=42) | |
| Cyberpunk 2077 1.6 - 1920x1080 Ultra Preset | |
| Lenovo Legion Pro 5 16IRX8 | |
| Alienware m16 R1 Intel | |
| Schenker XMG Apex 17 (Late 23) | |
| Acer Nitro 17 AN17-51-71ER | |
| Average NVIDIA GeForce RTX 4060 Laptop GPU (57.9 - 93.2, n=18) | |
| MSI Katana 17 B13VFK | |
| Ratchet & Clank Rift Apart | |
| 1920x1080 Very High Preset AA:T | |
| Alienware m16 R1 Intel | |
| Schenker XMG Apex 17 (Late 23) | |
| Average NVIDIA GeForce RTX 4060 Laptop GPU (51.6 - 54.8, n=4) | |
| Average of class Gaming (28.5 - 36.3, n=3, last 2 years) | |
| 2560x1440 Very High Preset AA:T | |
| Alienware m16 R1 Intel | |
| Average NVIDIA GeForce RTX 4060 Laptop GPU (45.6 - 46.6, n=3) | |
| Schenker XMG Apex 17 (Late 23) | |
| Average of class Gaming (n=1last 2 years) | |
| 1920x1080 Very High Preset + Very High Raytracing AA:T | |
| Alienware m16 R1 Intel | |
| Average NVIDIA GeForce RTX 4060 Laptop GPU (39.1 - 44.5, n=3) | |
| Schenker XMG Apex 17 (Late 23) | |
| Average of class Gaming (n=1last 2 years) | |
| Immortals of Aveum | |
| 1920x1080 Ultra AF:16x | |
| Alienware m16 R1 Intel | |
| Schenker XMG Apex 17 (Late 23) | |
| Average NVIDIA GeForce RTX 4060 Laptop GPU (33 - 48.9, n=4) | |
| Average of class Gaming (26.5 - 37.8, n=2, last 2 years) | |
| 2560x1440 Ultra AF:16x | |
| Alienware m16 R1 Intel | |
| Schenker XMG Apex 17 (Late 23) | |
| Average NVIDIA GeForce RTX 4060 Laptop GPU (20.5 - 32.8, n=4) | |
| Armored Core 6 | |
| 1920x1080 Maximum Preset | |
| Schenker XMG Apex 17 (Late 23) | |
| Average NVIDIA GeForce RTX 4060 Laptop GPU (95.6 - 100.8, n=3) | |
| Average of class Gaming (23 - 103.5, n=5, last 2 years) | |
| 2560x1440 Maximum Preset | |
| Schenker XMG Apex 17 (Late 23) | |
| Average NVIDIA GeForce RTX 4060 Laptop GPU (73.2 - 74.6, n=3) | |
| Average of class Gaming (15.8 - 92, n=3, last 2 years) | |
| Starfield | |
| 1920x1080 Ultra Preset | |
| Average NVIDIA GeForce RTX 4060 Laptop GPU (39.7 - 41, n=3) | |
| Schenker XMG Apex 17 (Late 23) | |
| Average of class Gaming (23.1 - 26.3, n=2, last 2 years) | |
| 2560x1440 Ultra Preset | |
| Schenker XMG Apex 17 (Late 23) | |
| Average NVIDIA GeForce RTX 4060 Laptop GPU (32.5 - 32.6, n=2) | |
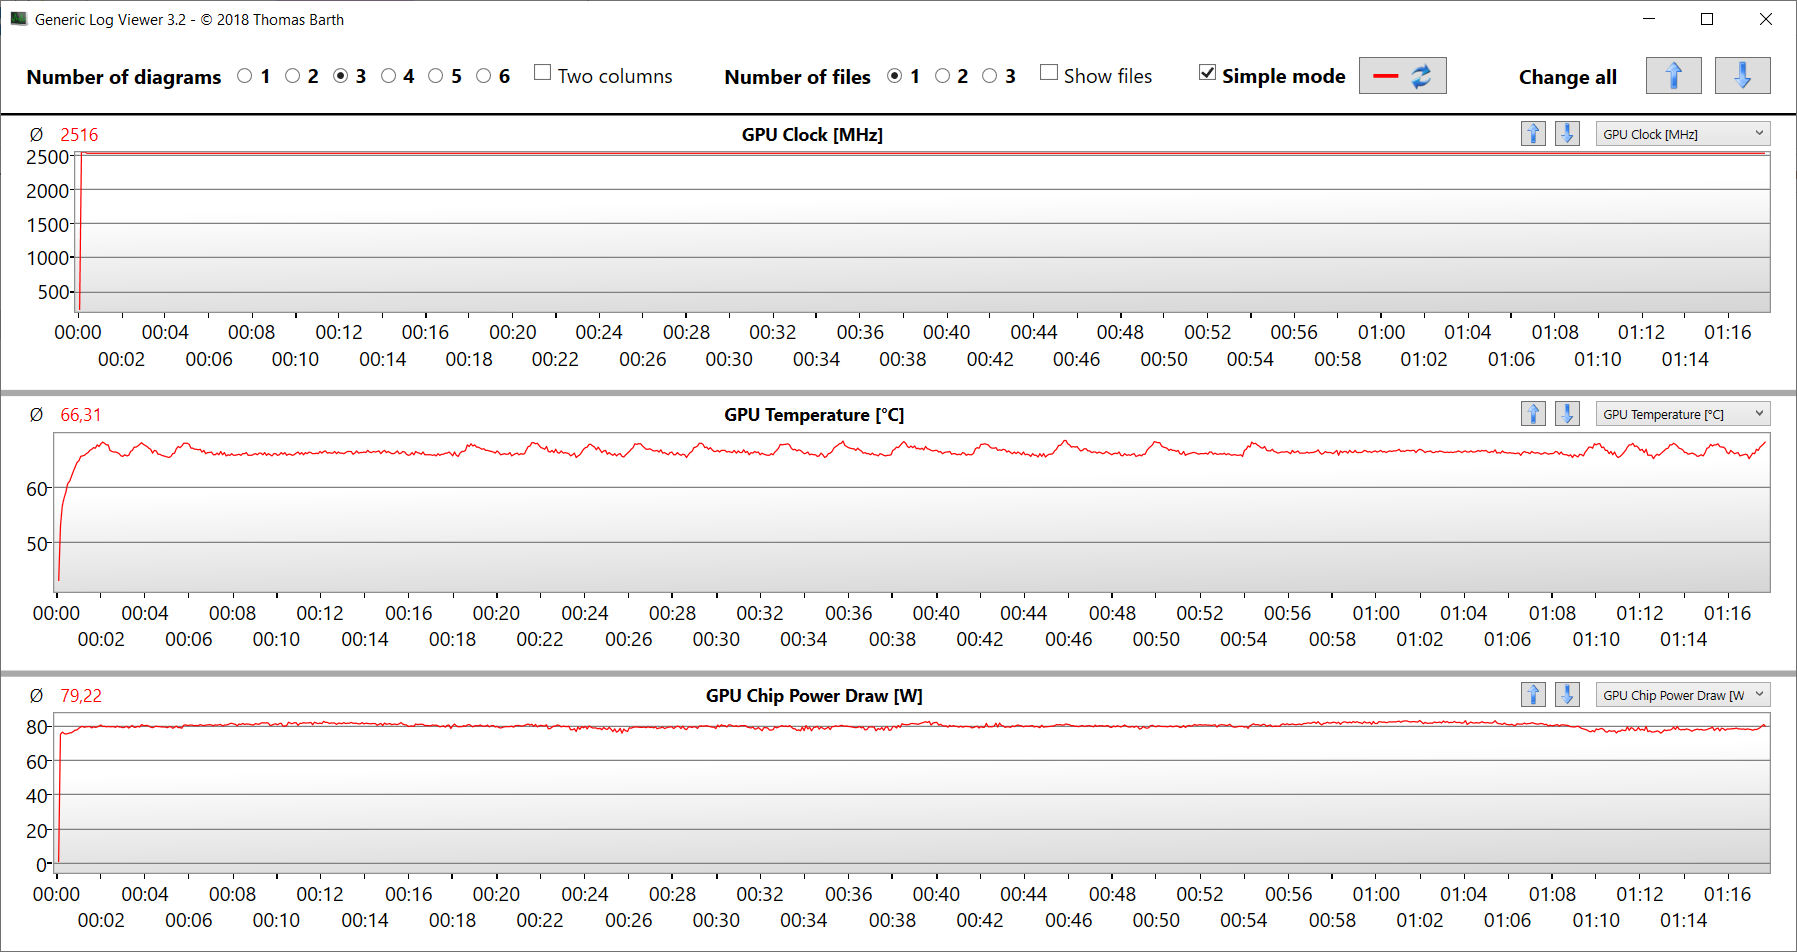
In order to check whether the frame rates remained mainly consistent over a longer period of time, we ran the game "The Witcher 3" for around 60 minutes at Full HD resolution and maximum quality settings. The game character was not moved. We didn't notice a dip in the frame rate.
Witcher 3 FPS diagram

| low | med. | high | ultra | QHD | |
|---|---|---|---|---|---|
| The Witcher 3 (2015) | 401.8 | 316.1 | 198.2 | 103.4 | 76.3 |
| Dota 2 Reborn (2015) | 169.4 | 154.1 | 147.6 | 139.8 | |
| Final Fantasy XV Benchmark (2018) | 223 | 148.4 | 103.4 | 76.8 | |
| X-Plane 11.11 (2018) | 127.3 | 110.9 | 88.2 | ||
| Far Cry 5 (2018) | 163 | 145 | 139 | 130 | 106 |
| Strange Brigade (2018) | 399 | 279 | 221 | 190.1 | 126.9 |
| Gears Tactics (2020) | 320.2 | 255 | 180.5 | 125.9 | 85.8 |
| GRID Legends (2022) | 152.8 | 141.6 | 132.4 | 120.6 | 103.2 |
| Cyberpunk 2077 1.6 (2022) | 129.9 | 101 | 87.5 | 79.8 | 49.1 |
| Spider-Man Miles Morales (2022) | 123.7 | 115.9 | 110.3 | 103.8 | 77.8 |
| F1 23 (2023) | 249 | 244 | 186.2 | 60.1 | 37.8 |
| Ratchet & Clank Rift Apart (2023) | 85.4 | 74.7 | 60.6 | 54.6 | 45.6 |
| Atlas Fallen (2023) | 146 | 143.2 | 133.3 | 112.6 | 79.1 |
| Immortals of Aveum (2023) | 65.7 | 53.1 | 44 | 30.2 | |
| Armored Core 6 (2023) | 111.1 | 108.7 | 109.4 | 100.8 | 74.6 |
| Starfield (2023) | 70.3 | 62.5 | 47.1 | 39.7 | 32.6 |
| The Crew Motorfest (2023) | 60 | 60 | 60 | 60 | 54 |
| Lies of P (2023) | 186.6 | 163.8 | 141.9 | 126.6 | 85.6 |
Emissions - The gaming laptop can run quietly
Noise emissions
Generally, we rate the Apex as having low to moderate noise levels. In everyday use, (office, internet, banking,...) the fans often spin slowly or even stand still. They also lie low under medium load. This is different in the area of gaming: The sound pressure levels can rise to 54 dB(A) ("overboost"). In "enthusiast" mode, at 50 dB(A), the noise levels can be described as quite low. The "balanced" mode is considerably quieter: however, a level of 34 dB(A) results in a significant loss in GPU performance.
The fans primarily emit a sonorous noise. Annoying background noises are imperceptible.
Noise level
| Idle |
| 25 / 29 / 33 dB(A) |
| Load |
| 37 / 54 dB(A) |
 | ||
30 dB silent 40 dB(A) audible 50 dB(A) loud |
||
min: | ||
| Schenker XMG Apex 17 (Late 23) R7 7840HS, GeForce RTX 4060 Laptop GPU | Alienware m16 R1 Intel i7-13700HX, GeForce RTX 4060 Laptop GPU | Lenovo Legion Pro 5 16IRX8 i7-13700HX, GeForce RTX 4060 Laptop GPU | Acer Nitro 17 AN17-51-71ER i7-13700H, GeForce RTX 4060 Laptop GPU | Medion Erazer Defender P40 i7-13700HX, GeForce RTX 4060 Laptop GPU | MSI Katana 17 B13VFK i7-13620H, GeForce RTX 4060 Laptop GPU | |
|---|---|---|---|---|---|---|
| Noise | -2% | 9% | 2% | -10% | -8% | |
| off / environment * (dB) | 24 | 25 -4% | 23 4% | 24 -0% | 25 -4% | 24.5 -2% |
| Idle Minimum * (dB) | 25 | 25 -0% | 23.1 8% | 24 4% | 26 -4% | 24.5 2% |
| Idle Average * (dB) | 29 | 26 10% | 23.1 20% | 24 17% | 27 7% | 24.5 16% |
| Idle Maximum * (dB) | 33 | 27 18% | 26.6 19% | 32.32 2% | 32 3% | 40 -21% |
| Load Average * (dB) | 37 | 52 -41% | 34.7 6% | 35.18 5% | 53 -43% | 48.3 -31% |
| Witcher 3 ultra * (dB) | 50 | 51 -2% | 47.6 5% | 54.78 -10% | 56 -12% | 56 -12% |
| Load Maximum * (dB) | 54 | 53 2% | 54.8 -1% | 54.78 -1% | 64 -19% | 59.1 -9% |
* ... smaller is better
Temperature
The stress test and the Witcher 3 test caused the laptop to warm up noticeably in certain places. However, everything is still with acceptable dimensions. In everyday use (office, internet) the case temperatures remain in the green zone.
(-) The maximum temperature on the upper side is 51 °C / 124 F, compared to the average of 40.4 °C / 105 F, ranging from 21.2 to 68.8 °C for the class Gaming.
(-) The bottom heats up to a maximum of 54 °C / 129 F, compared to the average of 43.3 °C / 110 F
(+) In idle usage, the average temperature for the upper side is 30.3 °C / 87 F, compared to the device average of 33.9 °C / 93 F.
(-) Playing The Witcher 3, the average temperature for the upper side is 38.2 °C / 101 F, compared to the device average of 33.9 °C / 93 F.
(+) The palmrests and touchpad are cooler than skin temperature with a maximum of 31 °C / 87.8 F and are therefore cool to the touch.
(-) The average temperature of the palmrest area of similar devices was 28.8 °C / 83.8 F (-2.2 °C / -4 F).
| Schenker XMG Apex 17 (Late 23) AMD Ryzen 7 7840HS, NVIDIA GeForce RTX 4060 Laptop GPU | Alienware m16 R1 Intel Intel Core i7-13700HX, NVIDIA GeForce RTX 4060 Laptop GPU | Lenovo Legion Pro 5 16IRX8 Intel Core i7-13700HX, NVIDIA GeForce RTX 4060 Laptop GPU | Acer Nitro 17 AN17-51-71ER Intel Core i7-13700H, NVIDIA GeForce RTX 4060 Laptop GPU | Medion Erazer Defender P40 Intel Core i7-13700HX, NVIDIA GeForce RTX 4060 Laptop GPU | MSI Katana 17 B13VFK Intel Core i7-13620H, NVIDIA GeForce RTX 4060 Laptop GPU | |
|---|---|---|---|---|---|---|
| Heat | -5% | 8% | 4% | 16% | 9% | |
| Maximum Upper Side * (°C) | 51 | 49 4% | 42.8 16% | 46 10% | 42 18% | 41.6 18% |
| Maximum Bottom * (°C) | 54 | 48 11% | 50 7% | 51 6% | 45 17% | 43.1 20% |
| Idle Upper Side * (°C) | 33 | 40 -21% | 29.6 10% | 34 -3% | 28 15% | 32 3% |
| Idle Bottom * (°C) | 34 | 39 -15% | 34 -0% | 33 3% | 30 12% | 35.8 -5% |
* ... smaller is better
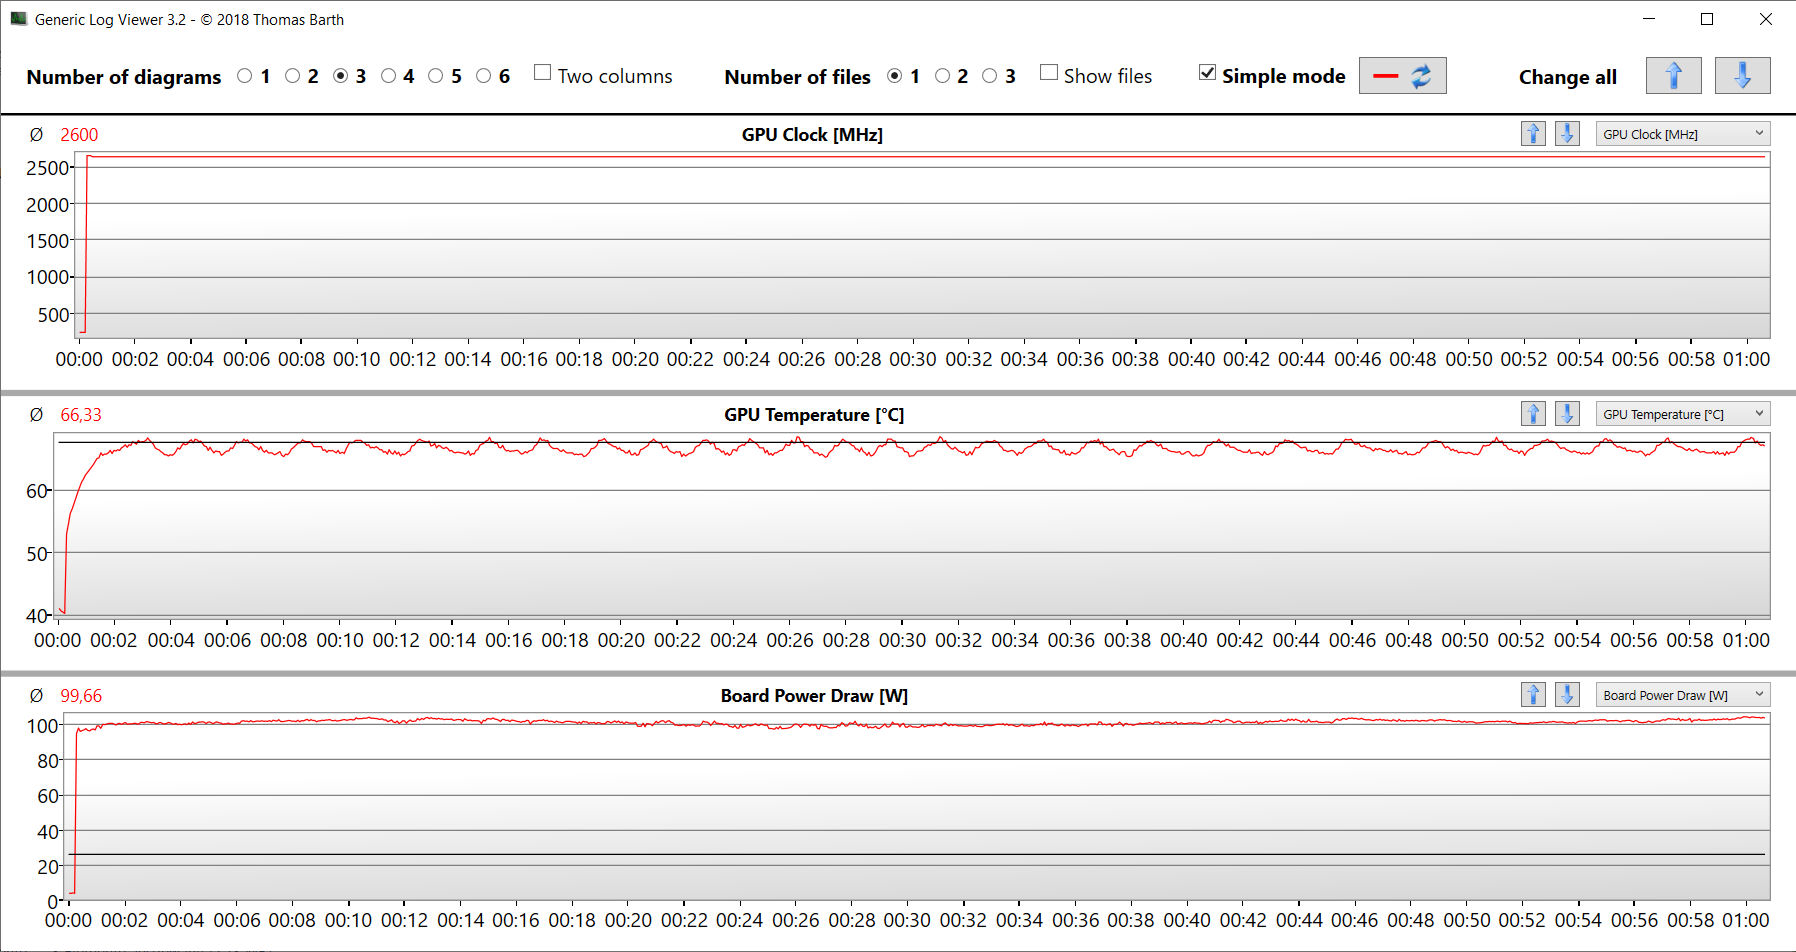
Stress test
The stress test (Prime95 and Furmark in continuous operation) represents an extreme scenario that allows us to check the system's stability under full load. The CPU ran throughout the test with clock speeds of 3.8 to 3.9 GHz and the graphics cores operated from 2.2 to 2.4 GHz.


Speakers
The stereo speakers produce decent sound but lack bass. For a better sound experience, we recommend the use of headphones or external speakers.
Schenker XMG Apex 17 (Late 23) audio analysis
(±) | speaker loudness is average but good (80 dB)
Bass 100 - 315 Hz
(-) | nearly no bass - on average 29% lower than median
(±) | linearity of bass is average (10.4% delta to prev. frequency)
Mids 400 - 2000 Hz
(+) | balanced mids - only 2.7% away from median
(+) | mids are linear (4.7% delta to prev. frequency)
Highs 2 - 16 kHz
(+) | balanced highs - only 2.1% away from median
(+) | highs are linear (4.9% delta to prev. frequency)
Overall 100 - 16.000 Hz
(±) | linearity of overall sound is average (18.3% difference to median)
Compared to same class
» 58% of all tested devices in this class were better, 9% similar, 34% worse
» The best had a delta of 6%, average was 18%, worst was 132%
Compared to all devices tested
» 39% of all tested devices were better, 8% similar, 53% worse
» The best had a delta of 4%, average was 24%, worst was 134%
Alienware m16 R1 Intel audio analysis
(+) | speakers can play relatively loud (87 dB)
Bass 100 - 315 Hz
(-) | nearly no bass - on average 24% lower than median
(±) | linearity of bass is average (13.5% delta to prev. frequency)
Mids 400 - 2000 Hz
(+) | balanced mids - only 1.4% away from median
(+) | mids are linear (3.3% delta to prev. frequency)
Highs 2 - 16 kHz
(+) | balanced highs - only 3.5% away from median
(+) | highs are linear (4.6% delta to prev. frequency)
Overall 100 - 16.000 Hz
(+) | overall sound is linear (13.4% difference to median)
Compared to same class
» 19% of all tested devices in this class were better, 7% similar, 74% worse
» The best had a delta of 6%, average was 18%, worst was 132%
Compared to all devices tested
» 13% of all tested devices were better, 4% similar, 83% worse
» The best had a delta of 4%, average was 24%, worst was 134%
Energy management - The Schenker XMG delivers decent battery life
Power consumption
Worthy of praise: Among its comparison devices, the Apex 17 is the most economical laptop. All in all, the competitors have much greater power requirements. The stress test und Witcher 3 ran with consistent power consumption. The PSU (230-watt) is suitably-sized.
| Off / Standby | |
| Idle | |
| Load |
|
Key:
min: | |
| Schenker XMG Apex 17 (Late 23) R7 7840HS, GeForce RTX 4060 Laptop GPU | Alienware m16 R1 Intel i7-13700HX, GeForce RTX 4060 Laptop GPU | Lenovo Legion Pro 5 16IRX8 i7-13700HX, GeForce RTX 4060 Laptop GPU | Acer Nitro 17 AN17-51-71ER i7-13700H, GeForce RTX 4060 Laptop GPU | Medion Erazer Defender P40 i7-13700HX, GeForce RTX 4060 Laptop GPU | MSI Katana 17 B13VFK i7-13620H, GeForce RTX 4060 Laptop GPU | Average NVIDIA GeForce RTX 4060 Laptop GPU | Average of class Gaming | |
|---|---|---|---|---|---|---|---|---|
| Power Consumption | -38% | -90% | -8% | -20% | -16% | -28% | -56% | |
| Idle Minimum * (Watt) | 9 | 10 -11% | 24.5 -172% | 8.3 8% | 8 11% | 12.2 -36% | 11.5 ? -28% | 13.8 ? -53% |
| Idle Average * (Watt) | 12 | 14 -17% | 29.2 -143% | 13.5 -13% | 12 -0% | 14.9 -24% | 16 ? -33% | 19.5 ? -63% |
| Idle Maximum * (Watt) | 14 | 21 -50% | 34.3 -145% | 14.8 -6% | 18 -29% | 15.8 -13% | 20.3 ? -45% | 25.7 ? -84% |
| Load Average * (Watt) | 67 | 119 -78% | 98.7 -47% | 77 -15% | 101 -51% | 85.22 -27% | 92.9 ? -39% | 109.9 ? -64% |
| Witcher 3 ultra * (Watt) | 147.6 | 186.7 -26% | 178.6 -21% | 154 -4% | 180.8 -22% | 151.1 -2% | ||
| Load Maximum * (Watt) | 223 | 323 -45% | 249.6 -12% | 263 -18% | 284 -27% | 212.8 5% | 210 ? 6% | 257 ? -15% |
* ... smaller is better
Power consumption Witcher 3 / stress test
Power consumption with an external monitor
Battery life
In the Wi-Fi test (using a script to load websites) and video test (Big Buck Bunny short film (H.264 coding, FHD), the 17.3-inch device achieved runtimes of 5.06 and 6.51 hours, respectively. During the tests, the laptop's energy-saving functions were deactivated and the display brightness was set to around 150 cd/m². In addition, the video test was carried out with the radio modules switched off.
Although the Apex possesses a relatively low battery capacity, it manages very respectable runtimes. The computer leaves some of the larger battery competitors in its trail.
| Schenker XMG Apex 17 (Late 23) R7 7840HS, GeForce RTX 4060 Laptop GPU, 62.32 Wh | Alienware m16 R1 Intel i7-13700HX, GeForce RTX 4060 Laptop GPU, 86 Wh | Lenovo Legion Pro 5 16IRX8 i7-13700HX, GeForce RTX 4060 Laptop GPU, 80 Wh | Acer Nitro 17 AN17-51-71ER i7-13700H, GeForce RTX 4060 Laptop GPU, 90 Wh | Medion Erazer Defender P40 i7-13700HX, GeForce RTX 4060 Laptop GPU, 73 Wh | MSI Katana 17 B13VFK i7-13620H, GeForce RTX 4060 Laptop GPU, 53.5 Wh | Average of class Gaming | |
|---|---|---|---|---|---|---|---|
| Battery runtime | -20% | -34% | 31% | -0% | -40% | 15% | |
| Reader / Idle (h) | 7.8 | 6.4 -18% | 6.7 -14% | 8.8 13% | 9.17 ? 18% | ||
| H.264 (h) | 6.9 | 5.6 -19% | 6.9 0% | 5.7 -17% | 8.05 ? 17% | ||
| WiFi v1.3 (h) | 5.1 | 4.8 -6% | 3.4 -33% | 8.2 61% | 6.2 22% | 2.9 -43% | 6.74 ? 32% |
| Load (h) | 1.6 | 1 -37% | 0.7 -56% | 1.3 -19% | 1 -37% | 1.458 ? -9% | |
| Witcher 3 ultra (h) | 2.5 | 0.958 ? |
Pros
Cons
Verdict - A modest, mid-range gaming machine
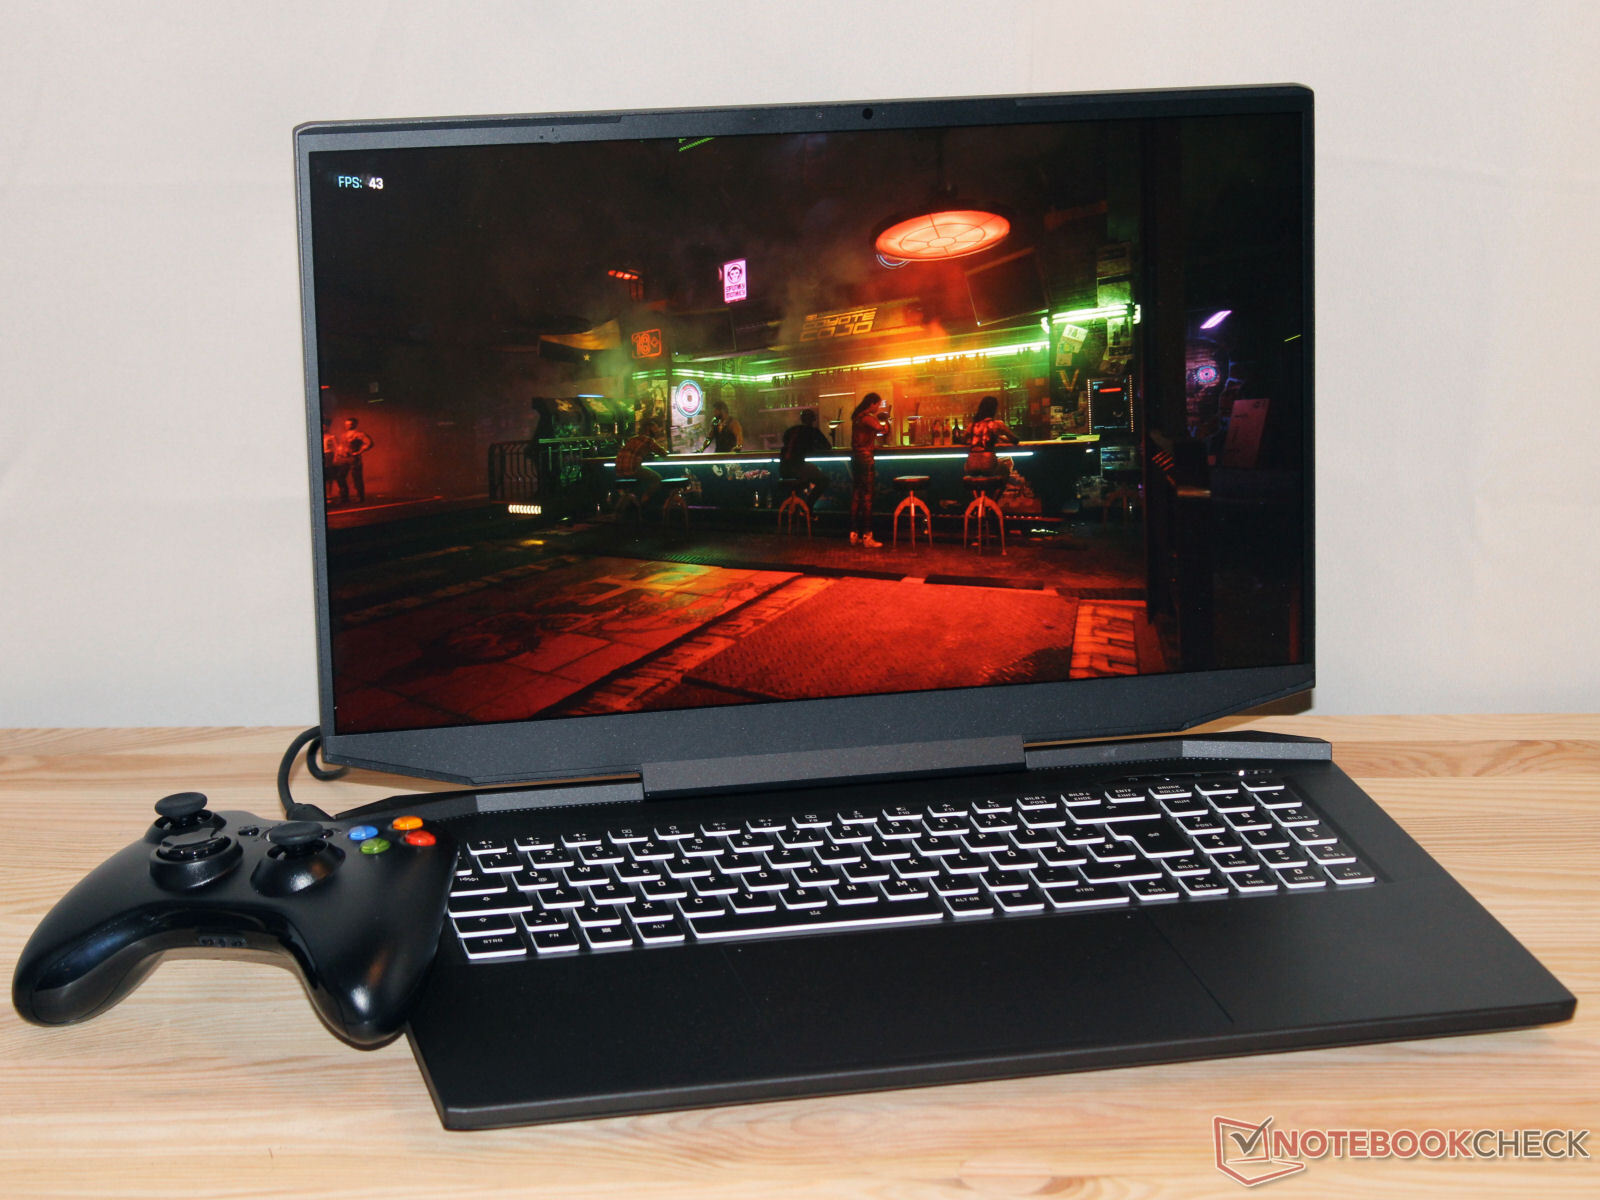
Das Apex 17 fulfils its intended tasks (QHD gaming, rendering, video editing) without difficulty - The Ryzen 7 7840HS and GeForce RTX 4060 make it possible. Both chips can run at consistently high clock speeds.
With the XMG Apex 17 (late 23), Schenker has delivered a well-rounded, mid-range, QHD laptop.
The computer doesn't produce much noise in everyday use, but, when gaming, it is possible to strike a compromise between performance and noise by selecting the appropriate profile. A real-life battery runtime of around 5 to 7 hours - when measured against the battery capacity - is perfectly acceptable. The battery cannot be charged via the USB-C port (USB 3.2 Gen 2).
The laptop offers space for two PCIe 4 SSDs (M.2 2280). RAID 0/1 is supported. The Schenker online store allows you to select your preferred SSD or SSDs. The review device is equipped with a blazingly fast PCIe 4 SSD (1 TB). Overall, the installed QHD display (17.3-inch, 2,560 x 1,440 pixels, sRGB, IPS, 240 Hz) made a good impression. Alternatively, a cheaper, FHD panel is available.
The Medion Erazer Defender P40 would be an alternative with comparable performance and specs. Unlike the Apex, the P40 has a Thunderbolt 4 port on board.
Notebookcheck.com will soon be publishing a review of the 15.6-inch sister model, the XMG Apex 15 (late 23) in a variant with a Ryzen 7 7840HS and a GeForce RTX 4050.
Price and availability
A variant similar to our review device (16 instead of 32 GB RAM) is available for 1,739 euros at Notebooksbilliger.de. They also offer a cheaper, entry-level model with a GeForce RTX 4050 for 1,399 euros. Alternatively, it's possible to custom configure your own device on the Schenker online shop.
Schenker XMG Apex 17 (Late 23)
- 10/04/2023 v7 (old)
Sascha Mölck
Transparency
The selection of devices to be reviewed is made by our editorial team. The test sample was provided to the author as a loan by the manufacturer or retailer for the purpose of this review. The lender had no influence on this review, nor did the manufacturer receive a copy of this review before publication. There was no obligation to publish this review. As an independent media company, Notebookcheck is not subjected to the authority of manufacturers, retailers or publishers.
This is how Notebookcheck is testing
Every year, Notebookcheck independently reviews hundreds of laptops and smartphones using standardized procedures to ensure that all results are comparable. We have continuously developed our test methods for around 20 years and set industry standards in the process. In our test labs, high-quality measuring equipment is utilized by experienced technicians and editors. These tests involve a multi-stage validation process. Our complex rating system is based on hundreds of well-founded measurements and benchmarks, which maintains objectivity. Further information on our test methods can be found here.
Price comparison

