Schenker XMG Apex 15 in gaming laptop review: This time with laptop CPU, but still with desktop cooling

Last year, the unusual Apex series started with a socketed AMD processor, i.e. a desktop CPU! This year's Apex, on the other hand, uses a laptop CPU from AMD.
Despite the soldered CPU, this year's Apex does a few things differently than its competitors. For example, the battery is removable - we can only welcome that, as once upon a time this life-extending method was standard!
Of course, the Apex is again extensively configurable at Bestware: RTX 3070 or RTX 3060, Ryzen 7 5800H or Ryzen 9 5900HX, and RAM and mass storage can be chosen freely. Only the screen seems to be limited to Full HD.
The competitors for us include the Lenovo Legion 5 15 G6, the Asus TUF Gaming F15, the Alienware M15 R5 and the HP Victus 16, even though the screen is slightly larger at 16 inches. We also use the predecessor for comparison.
Possible competitors in comparison
Rating | Date | Model | Weight | Height | Size | Resolution | Price |
|---|---|---|---|---|---|---|---|
| 84.4 % v7 (old) | 11 / 2021 | Schenker XMG Apex 15 NH57E PS R7 5800H, GeForce RTX 3060 Laptop GPU | 2.1 kg | 29 mm | 15.60" | 1920x1080 | |
| 81.2 % v7 (old) | 05 / 2020 | Schenker XMG Apex 15 NH57AF1 R9 3900, GeForce RTX 2070 Mobile | 2.7 kg | 32.5 mm | 15.60" | 1920x1080 | |
| 83.4 % v7 (old) | 09 / 2021 | Lenovo Legion 5 15ACH-82JU00C6GE-FL R7 5800H, GeForce RTX 3060 Laptop GPU | 2.5 kg | 26 mm | 15.60" | 1920x1080 | |
| 85.9 % v7 (old) | 06 / 2021 | Asus TUF Gaming F15 FX506HM i7-11800H, GeForce RTX 3060 Laptop GPU | 2.3 kg | 24.9 mm | 15.60" | 1920x1080 | |
| 84.7 % v7 (old) | 06 / 2021 | Alienware m15 R5 Ryzen Edition R7 5800H, GeForce RTX 3060 Laptop GPU | 2.5 kg | 22.85 mm | 15.60" | 1920x1080 | |
| 84.3 % v7 (old) | 09 / 2021 | HP Victus 16-e0179ng R7 5800H, GeForce RTX 3060 Laptop GPU | 2.5 kg | 23.5 mm | 16.10" | 1920x1080 |
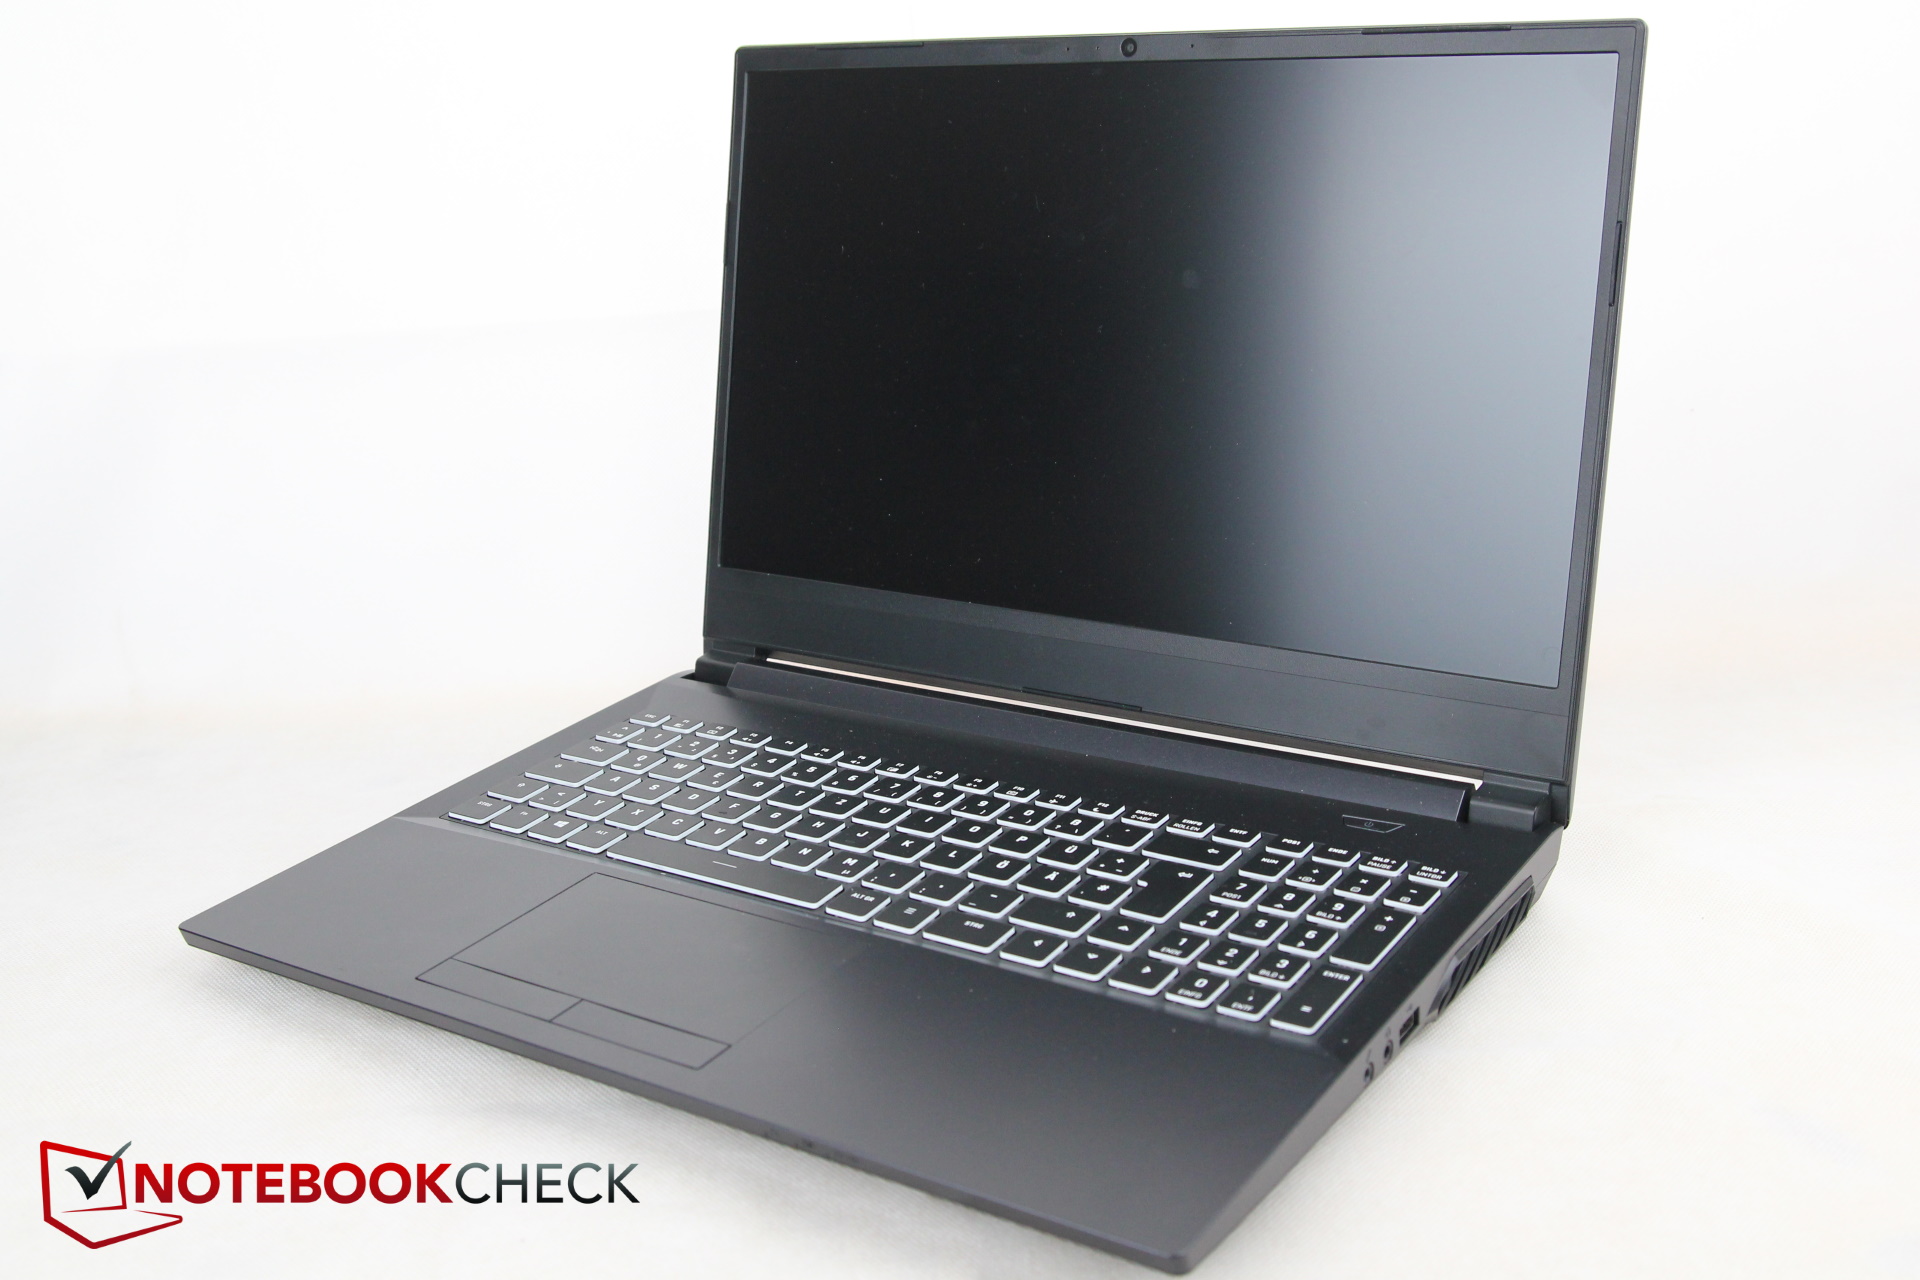
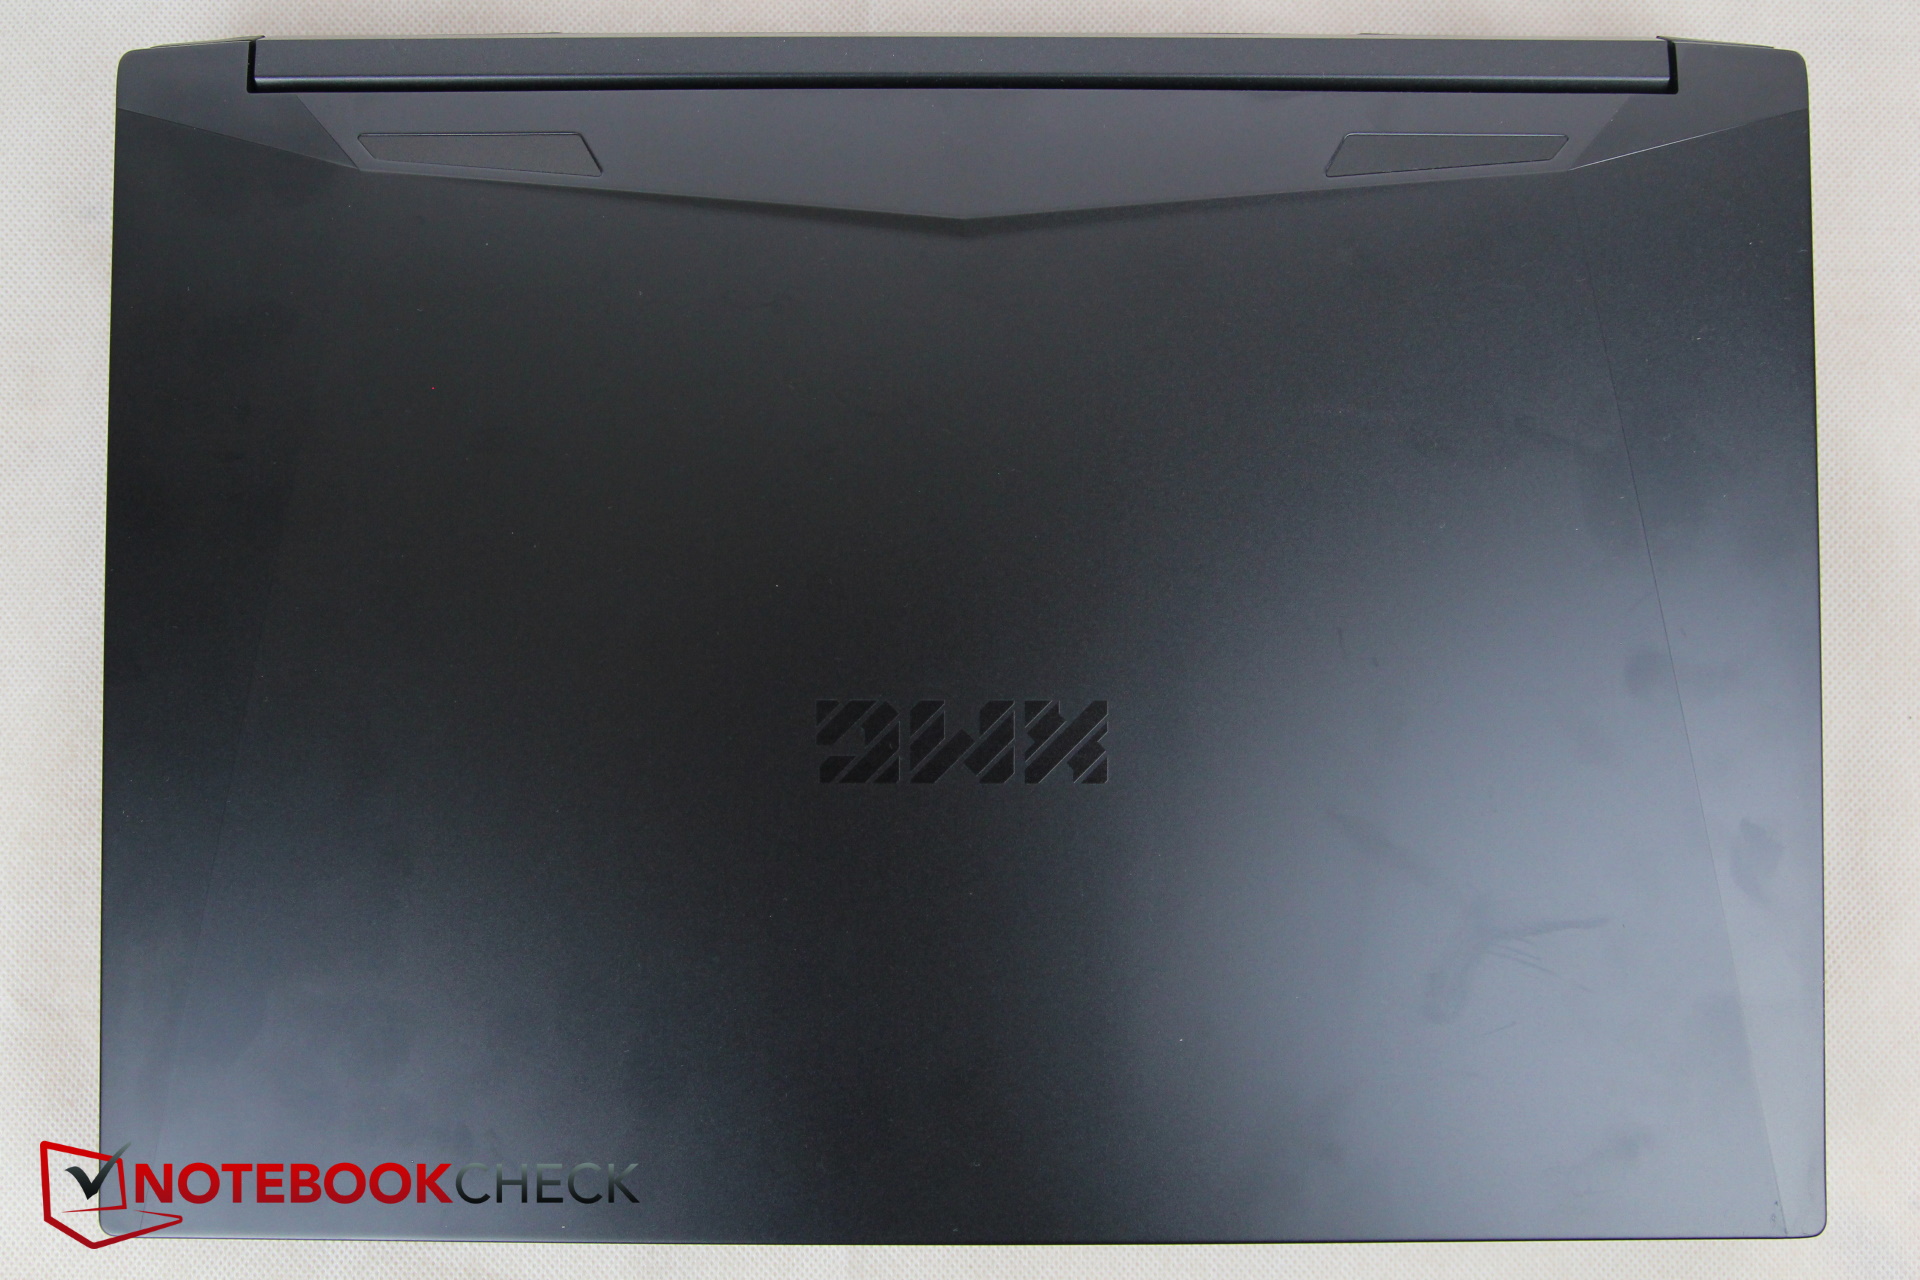
Case - Metal only on the lid
The case has been slightly changed compared to the predecessor, so there is now an additional fan outlet on the left side, and the ports have also changed. However, the materials remain the same: metal on the lid, plastic on the base. Thus, the lid is comparatively stable, but can of course still be warped, which the IPS panel accepts surprisingly stoically, i.e. without major color changes or screen bleeding. The base looks very stable and can hardly be bent, creaking noises are almost non-existent.
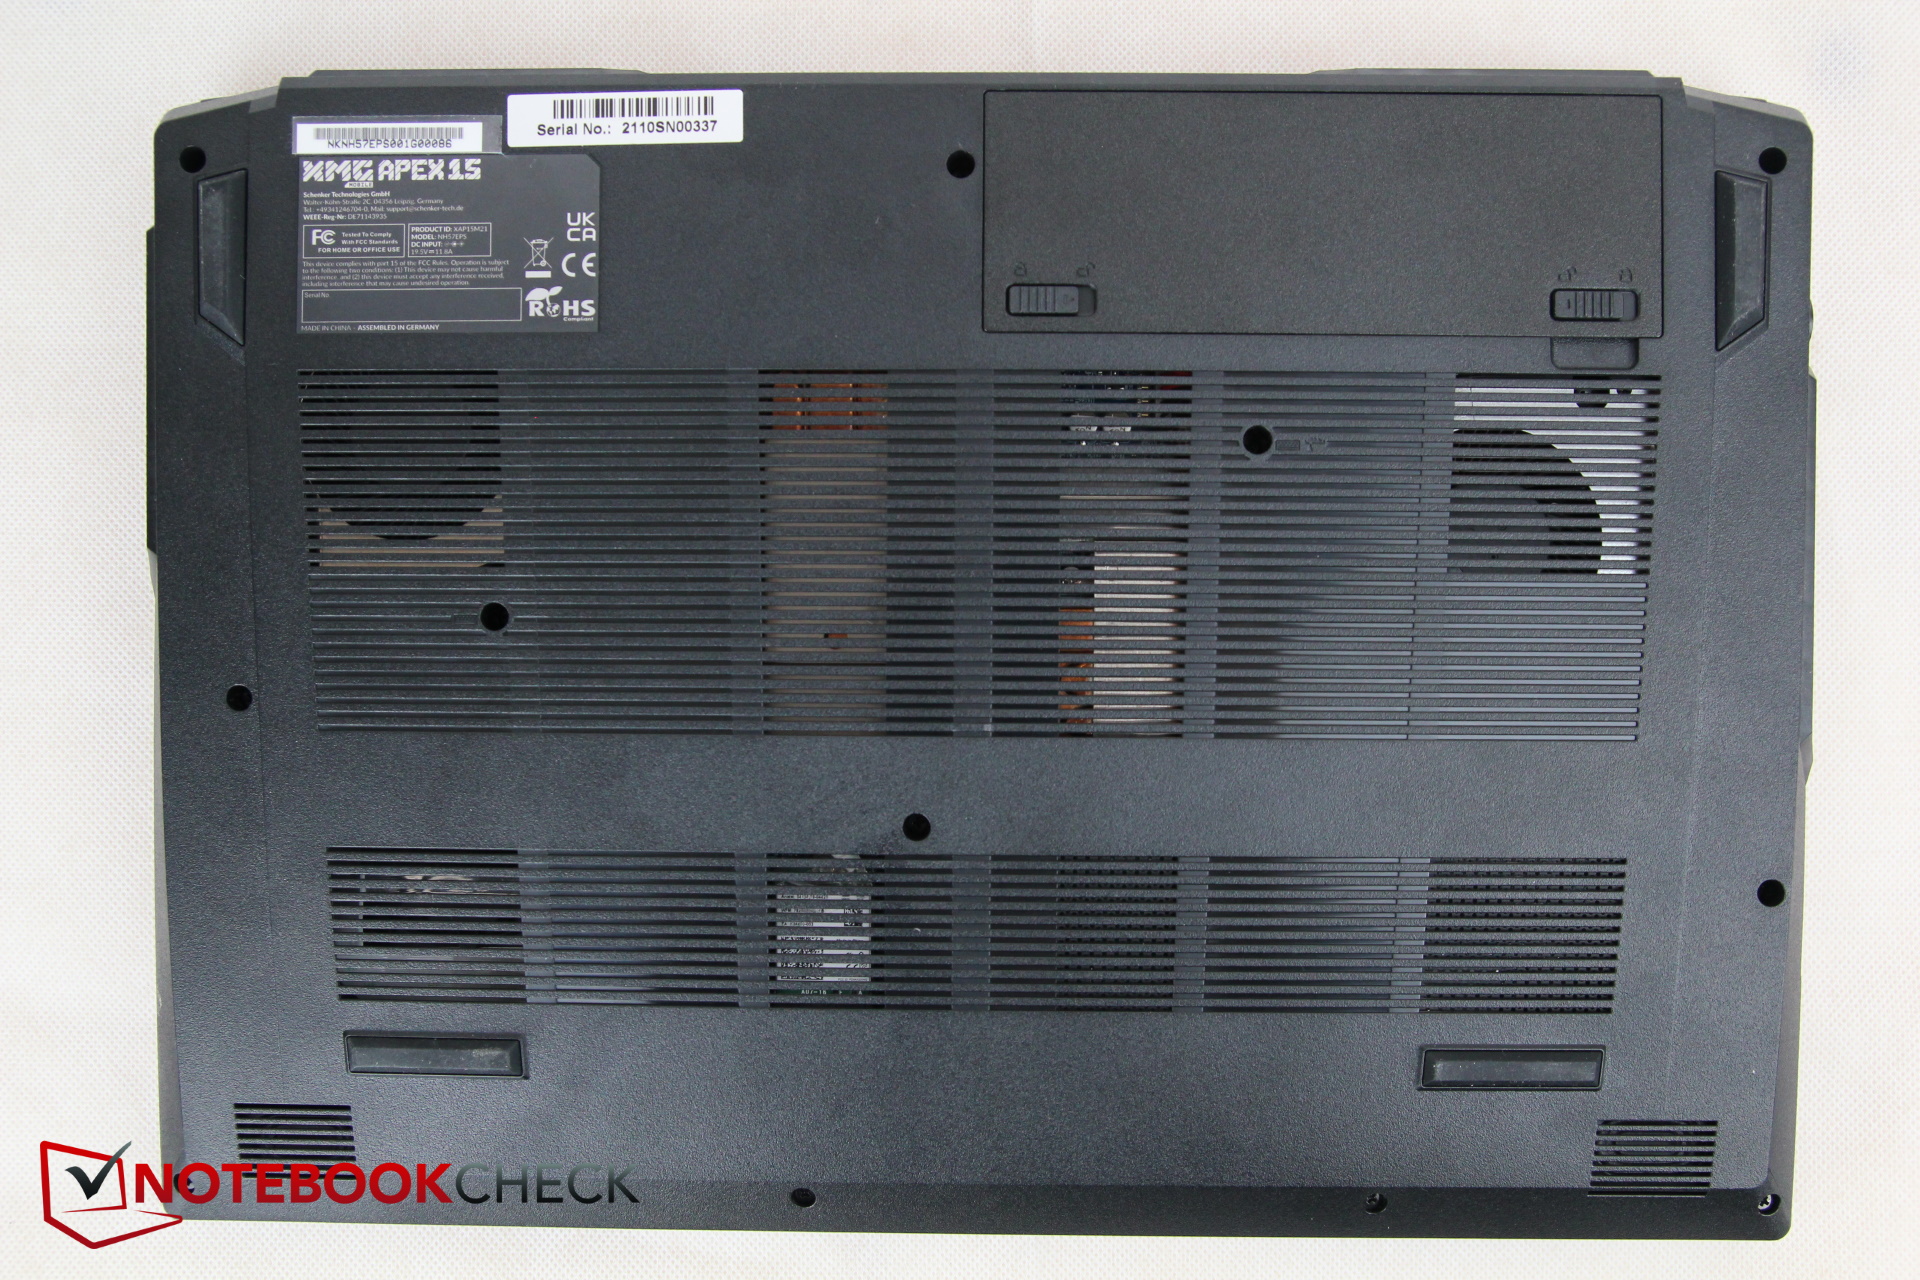
The design is rather restrained, even though some slanted lines and two small, superfluous-looking black inlays adorn the lid, which is also black. The underside mainly consists of fan grilles. The narrow strips do not look very robust due to the soft plastic and can be quickly pressed in, unlike the base. Gaps are not noticeable.
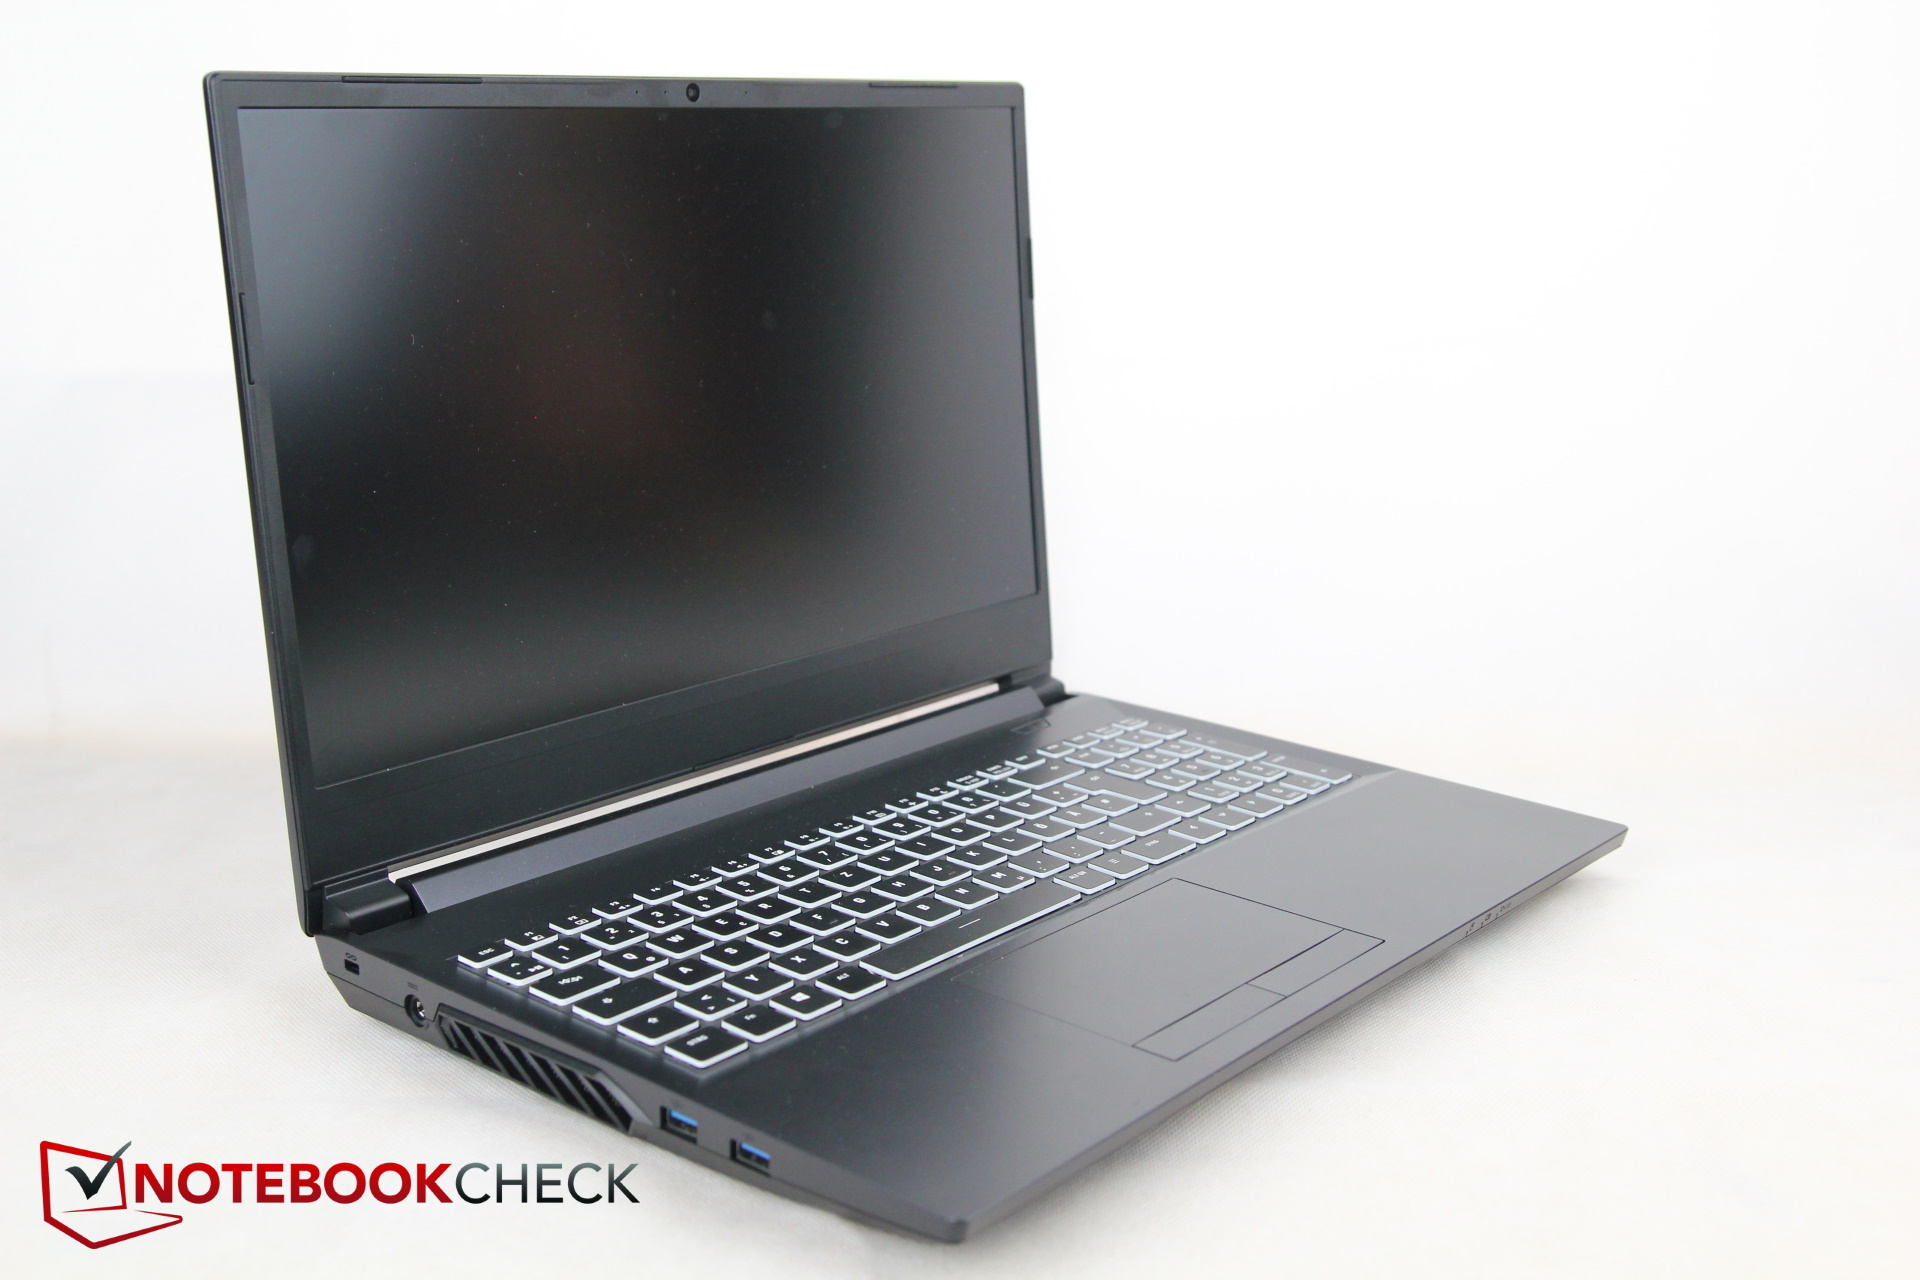
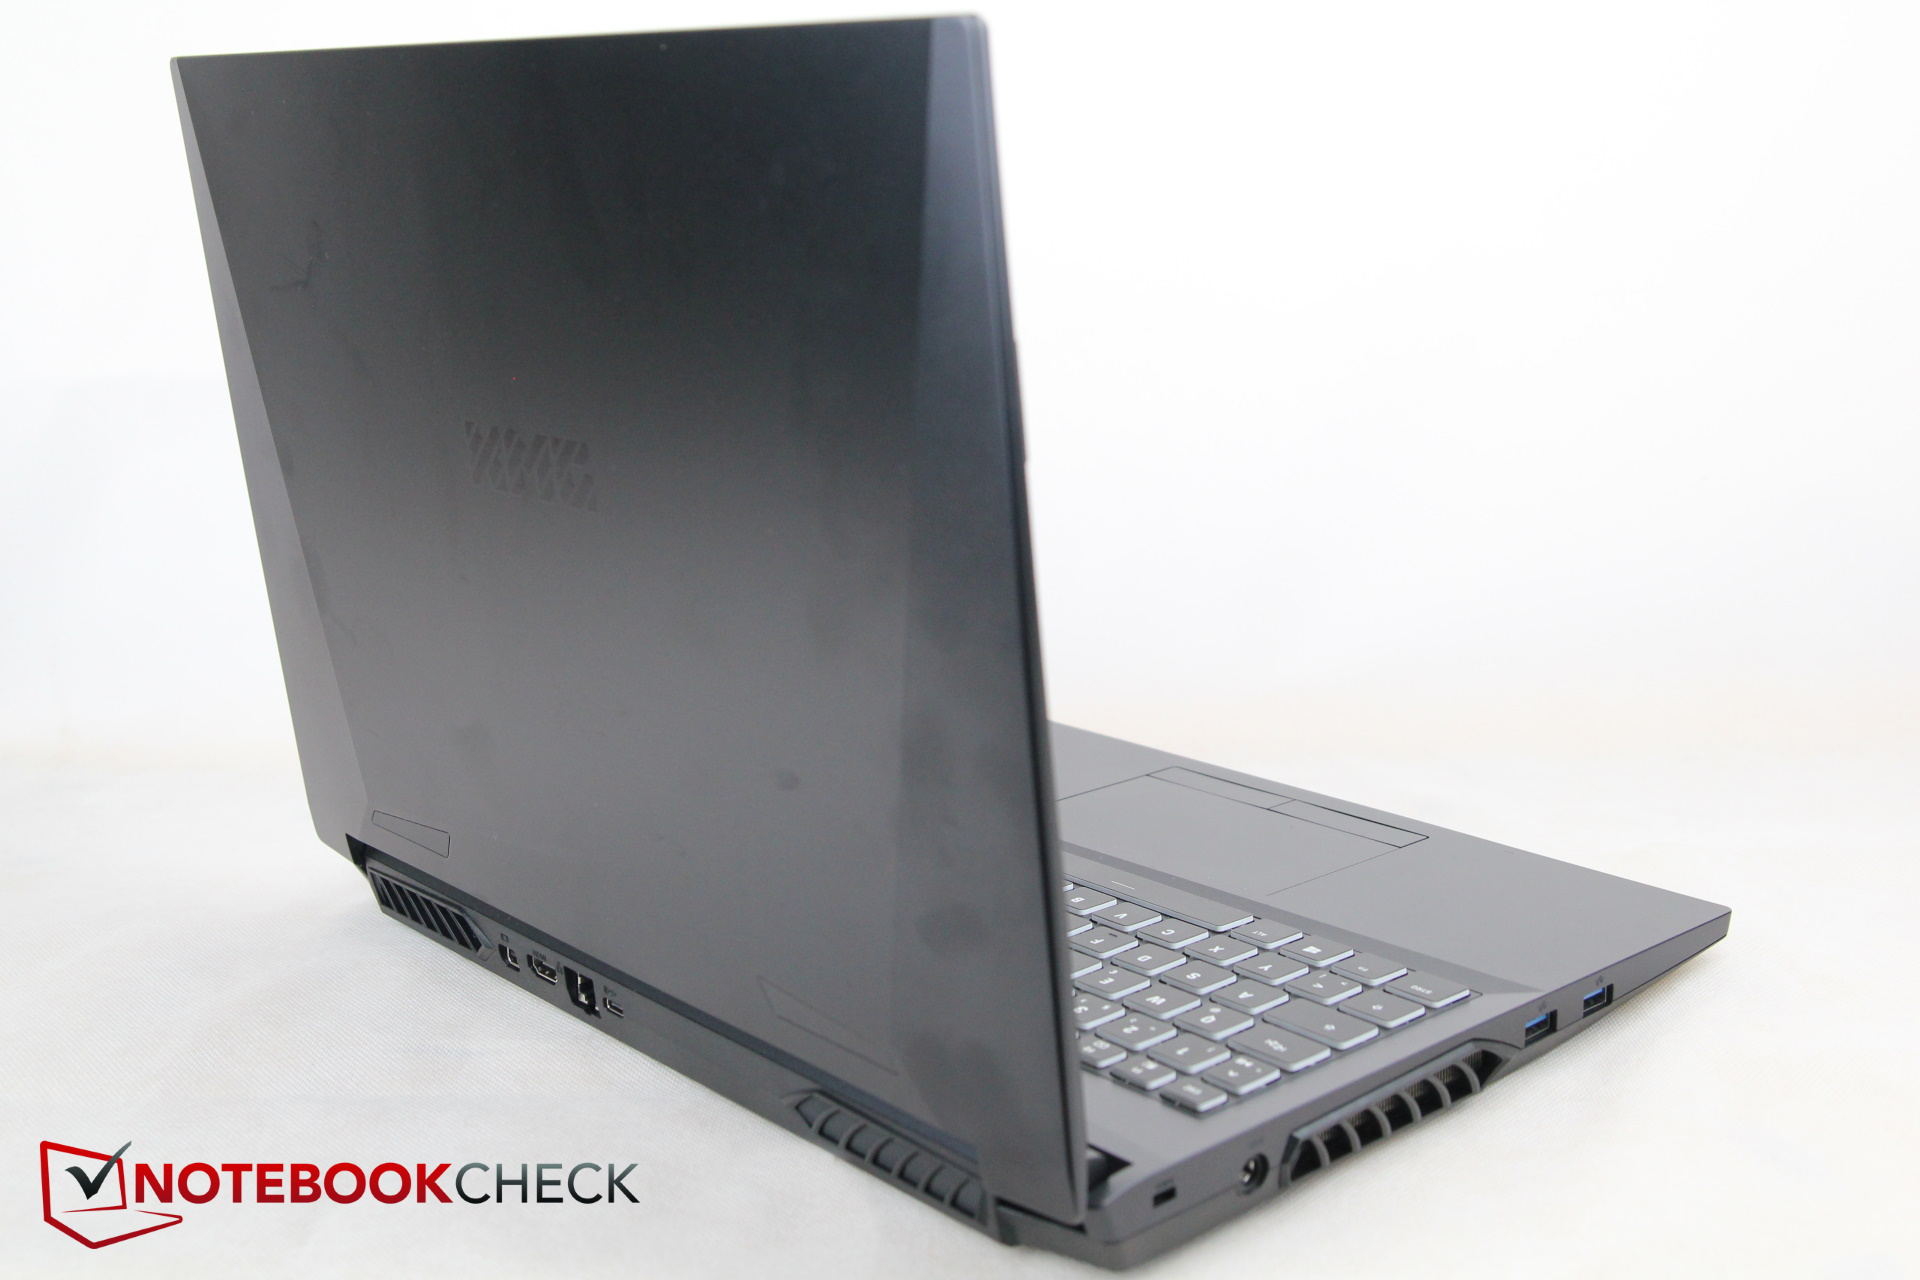
The Apex does not pass for slim; those who often deal with ultrabooks or thin gaming laptops might be surprised by the thickness. At least it is 3 mm (~0.12 inches) thinner compared to its predecessor, but the other competitors are still thinner.
However, the new Apex is the lightest device in the comparison at 2.1 kg (~4.6 lb). The other dimensions are rather small; the Asus TUF is about the same size, and the other devices are often a bit bigger.
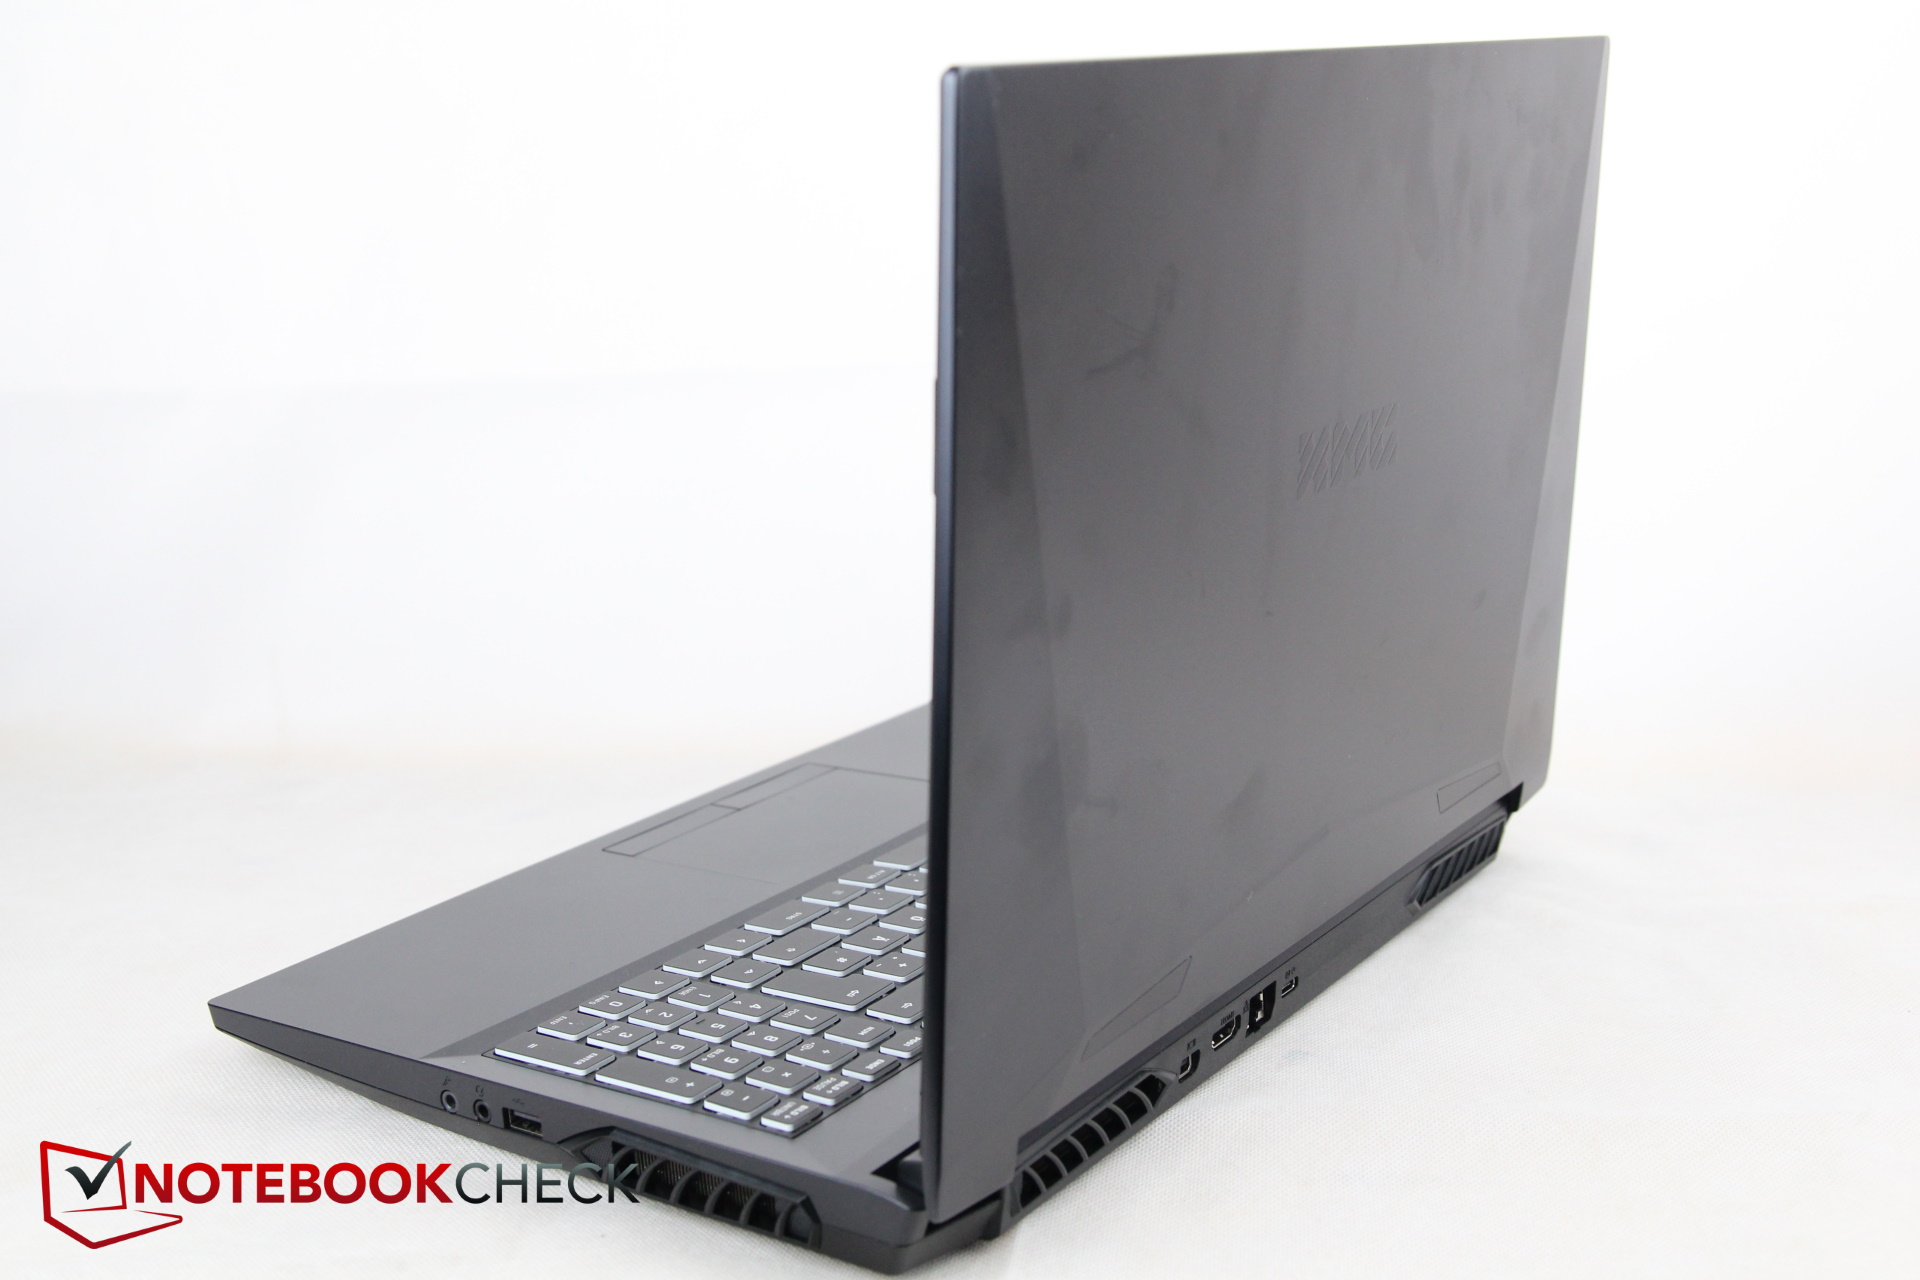
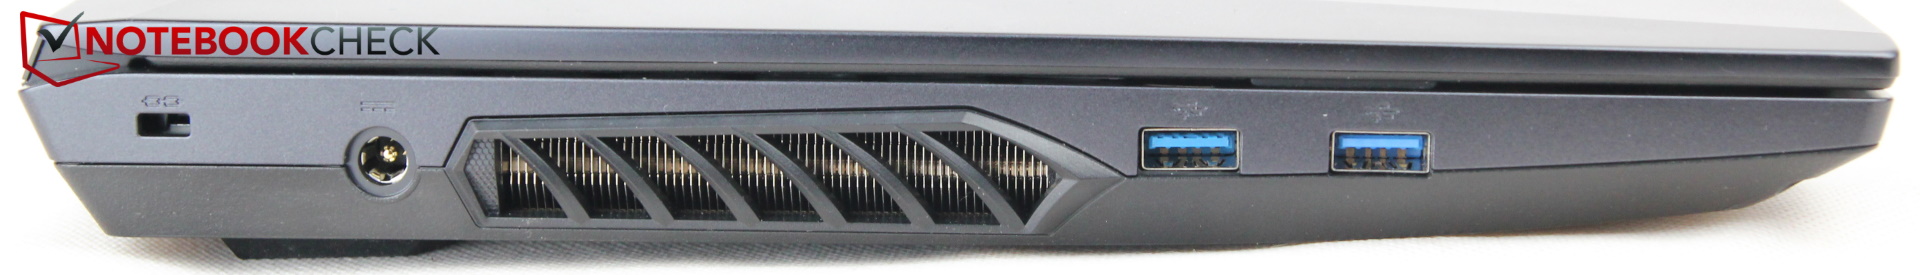
Equipment - 3 external monitors and USB 2.0
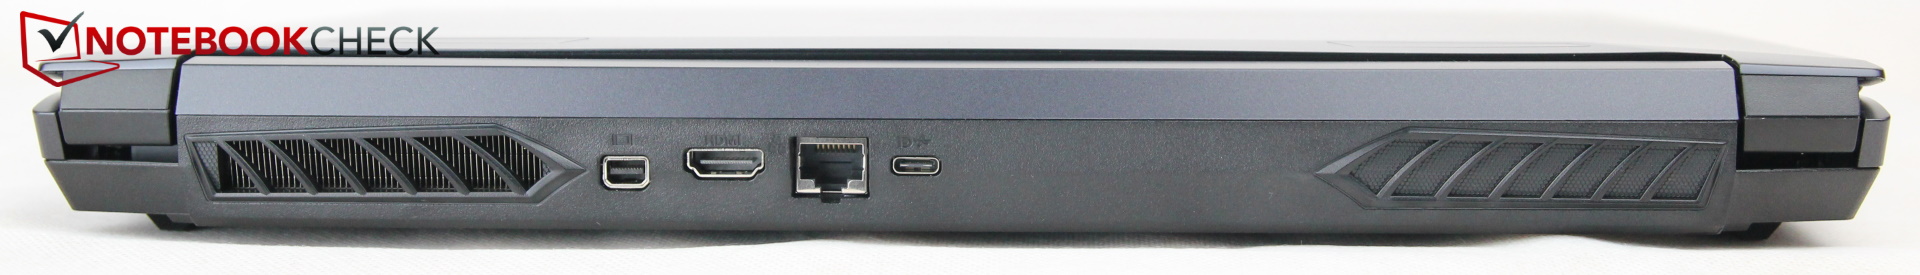
Unfortunately, Schenker omits the (micro-)SD card reader. The power port now moves from the back to the left side, and the LAN port moves to the back. Due to AMD's CPU, Thunderbolt is unfortunately missing, but the USB-C port supports Displayport 1.4, so you can connect three external monitors simultaneously via the additional dedicated mini-Displayport and HDMI port. All three monitor ports are directly connected to the RTX GPU, so VR and G-Sync are also natively supported.
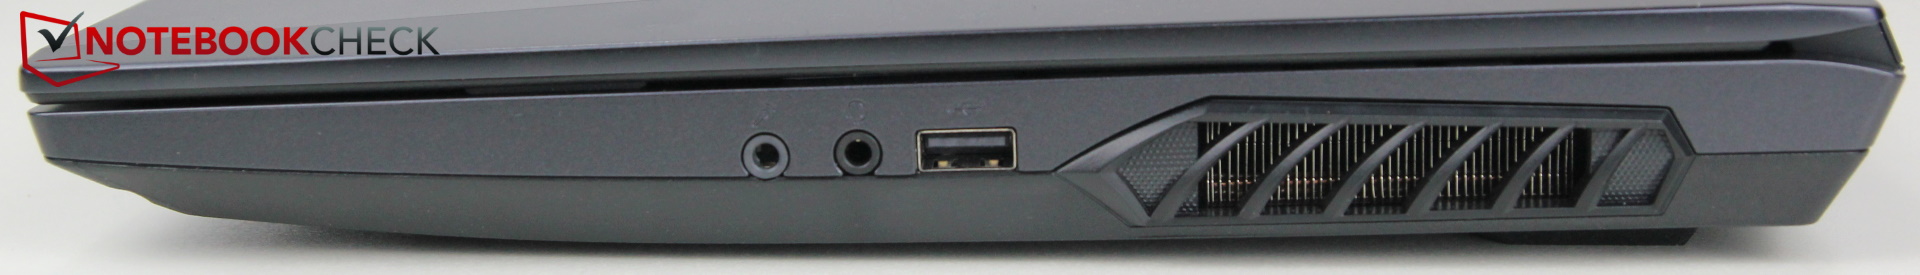
We find the two USB-A ports on the left somewhat unfavorable. These two are next to each other and look identical. However, according to the spec sheet, one is type 3.2 Gen 1 (quasi-3.0) and the other is type 3.2 Gen 2x1, so theoretically twice as fast. As a user, you naturally want to see at a glance which port is the fastest for your USB storage media, but here you have to test the ports beforehand and remember them.
A relic of the old days: On the right side there is still a USB A 2.0 port, which can be upgraded in the future. On the other hand, the two audio ports for headsets/headphones and microphones are positive.
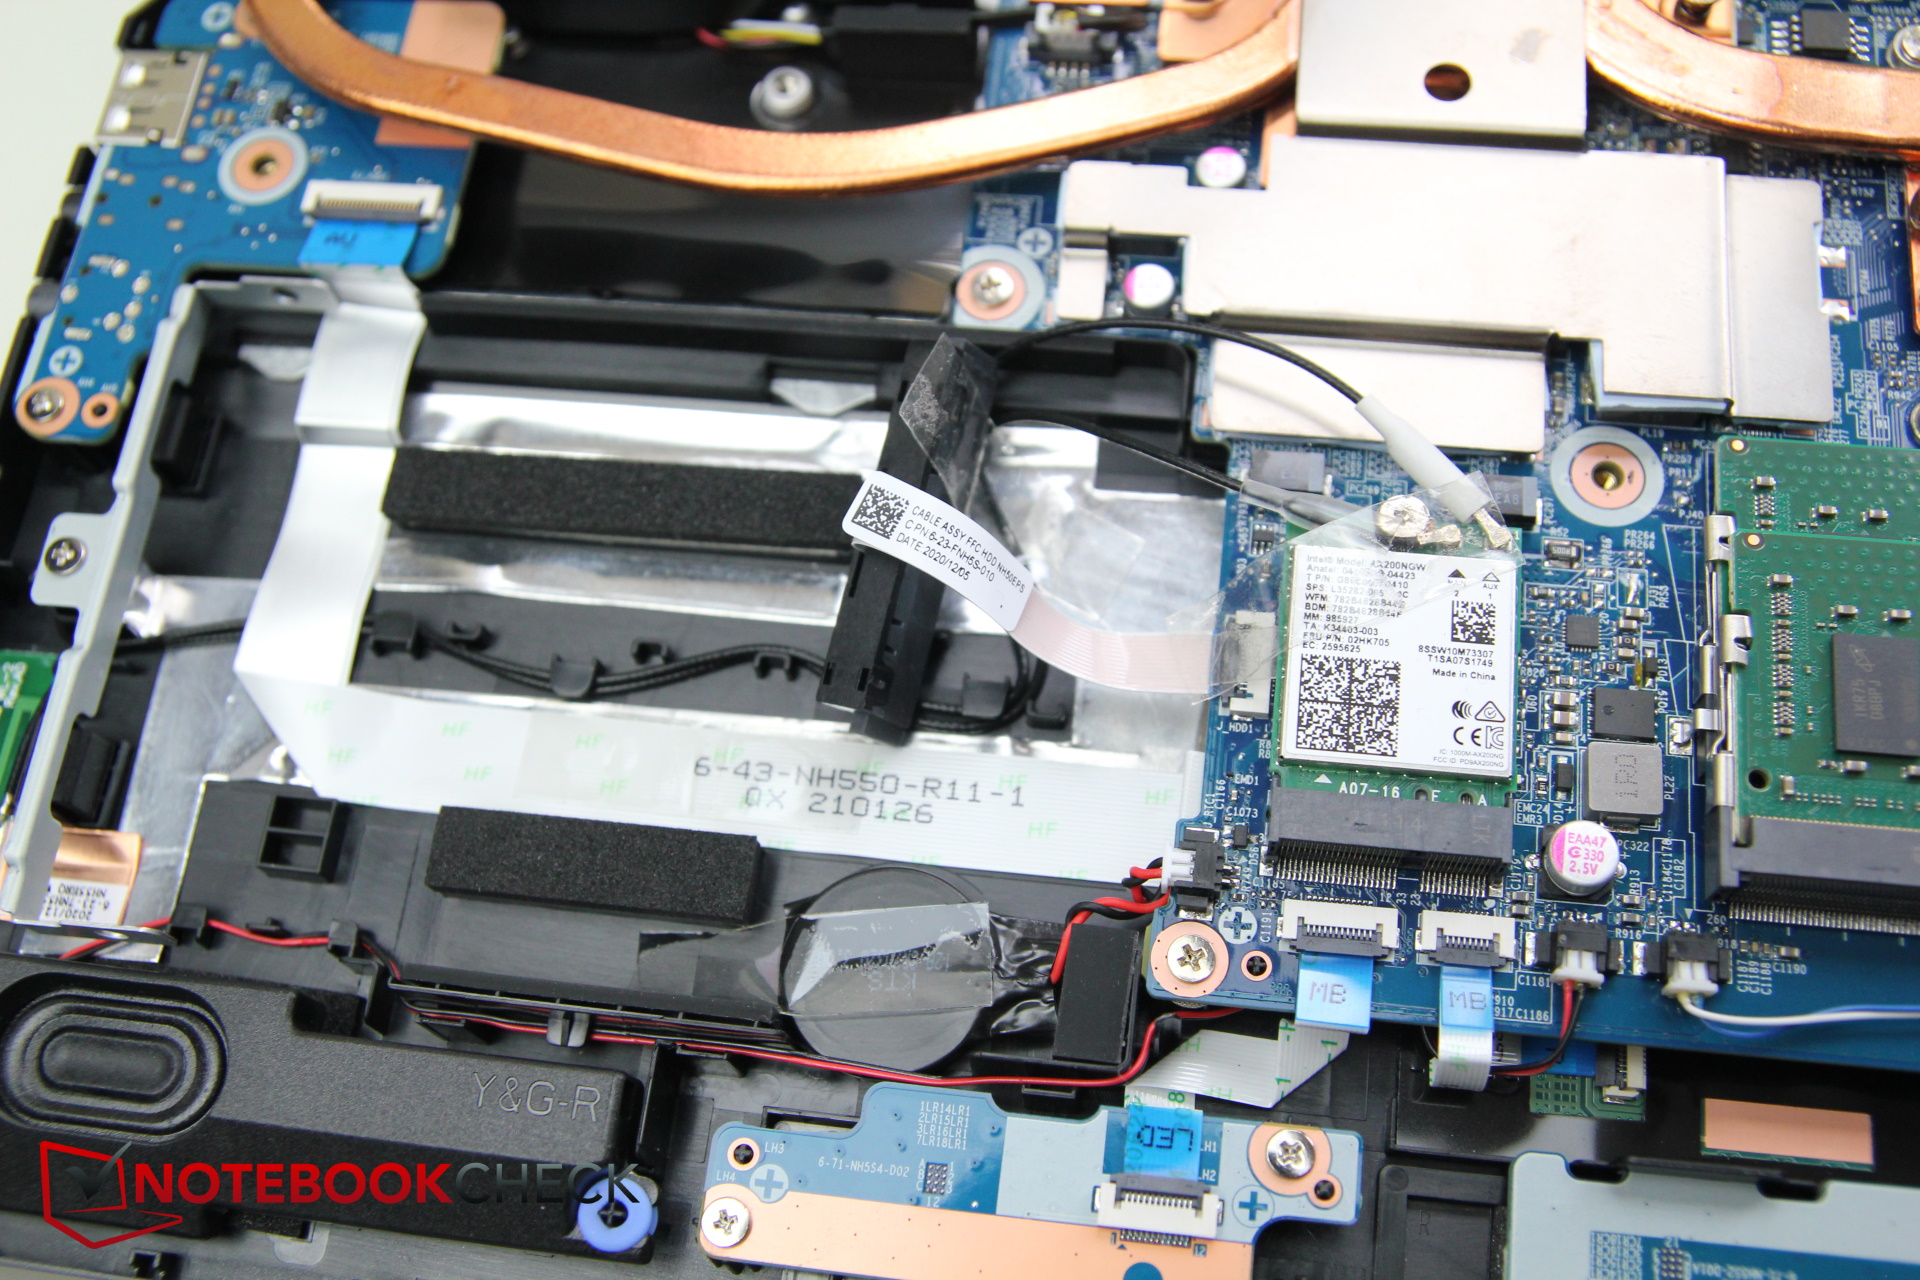
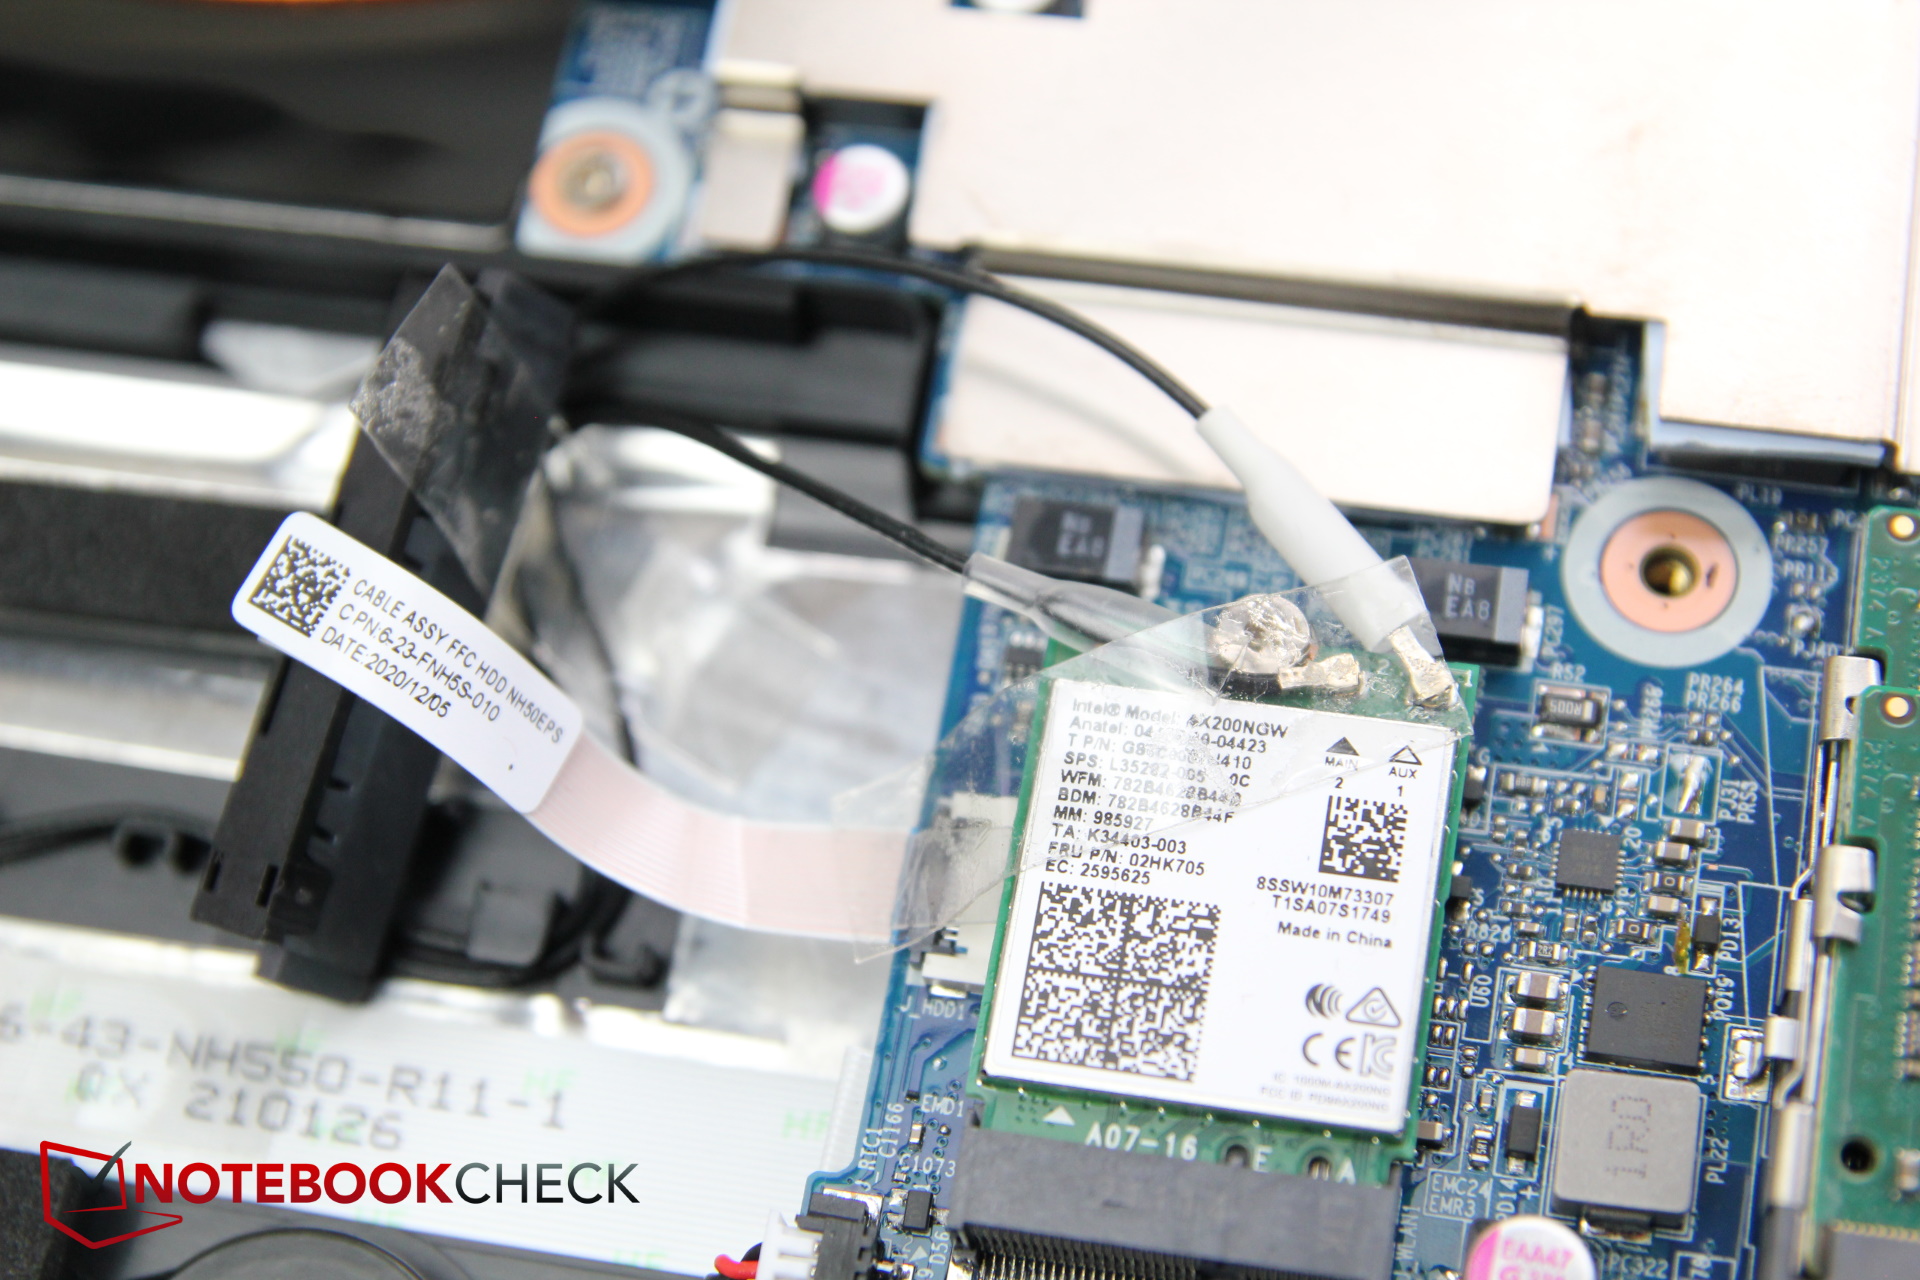
Communication
Schenker relies on Intel's Wi-Fi 6 AX200 as well as Bluetooth 5 for wireless communication. The transfer rates are roughly on the expected level, and the Apex thus places itself in the midfield overall.
Webcam
We are dealing with a standard HD webcam here, which only fulfills the lowest quality requirements for video calls. At least the color deviations are surprisingly low, but the picture is washed out and littered with a lot of noise.


")
")
Security
Besides the card reader, the fingerprint sensor of the predecessor has also been omitted, which we can get over. TPM 2.0 is of course on board, as is a Kensington port.
Accessories
Schenker packs a large, green-black XMG mouse pad in the box, to the delight of its gamer customers. There is also a driver CD and the laudable Schenker-typical driver USB stick. Last but not least, the buyer gets a quick guide to the most important special functions of the keys.
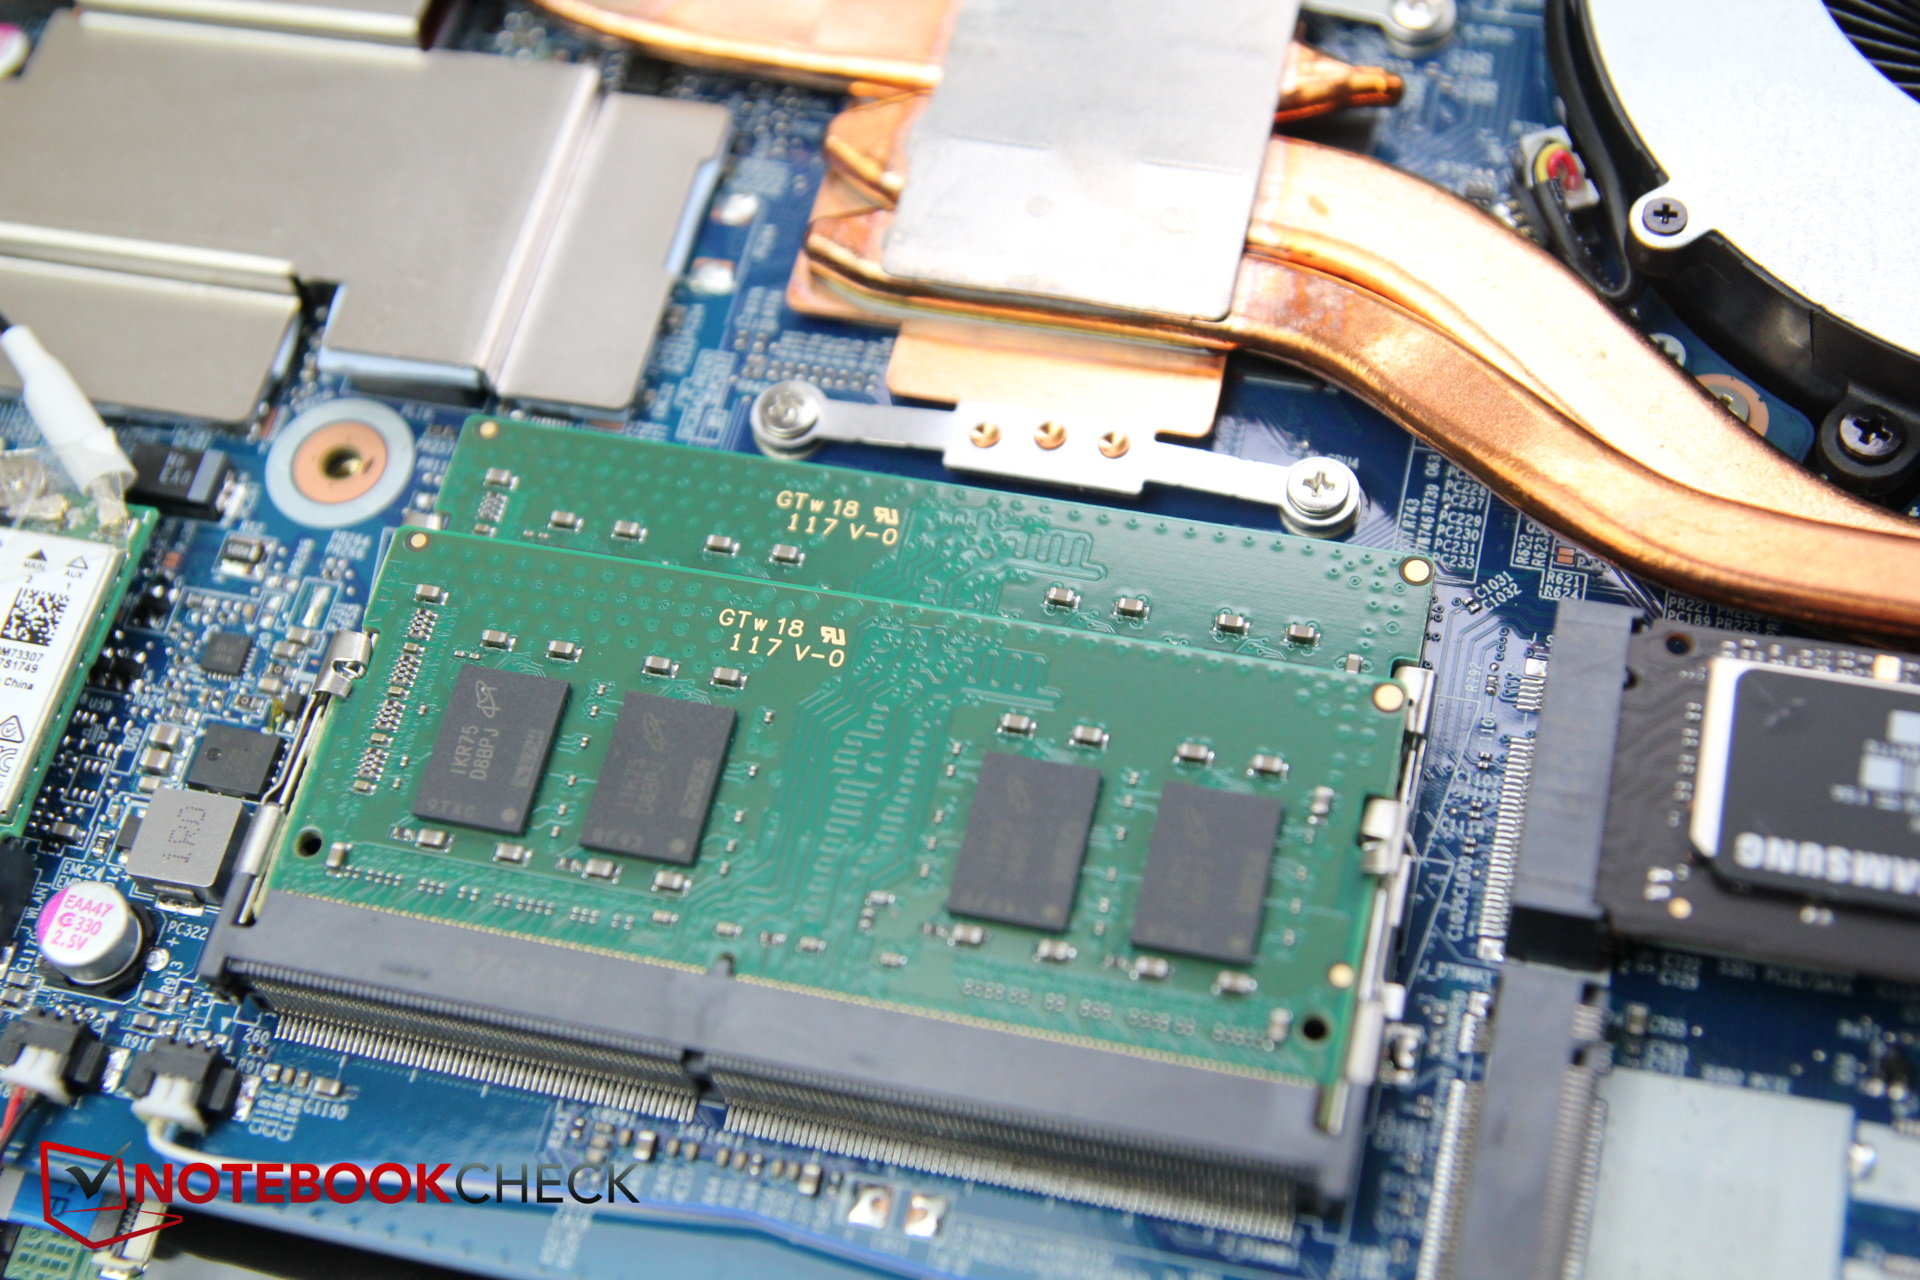
Maintenance
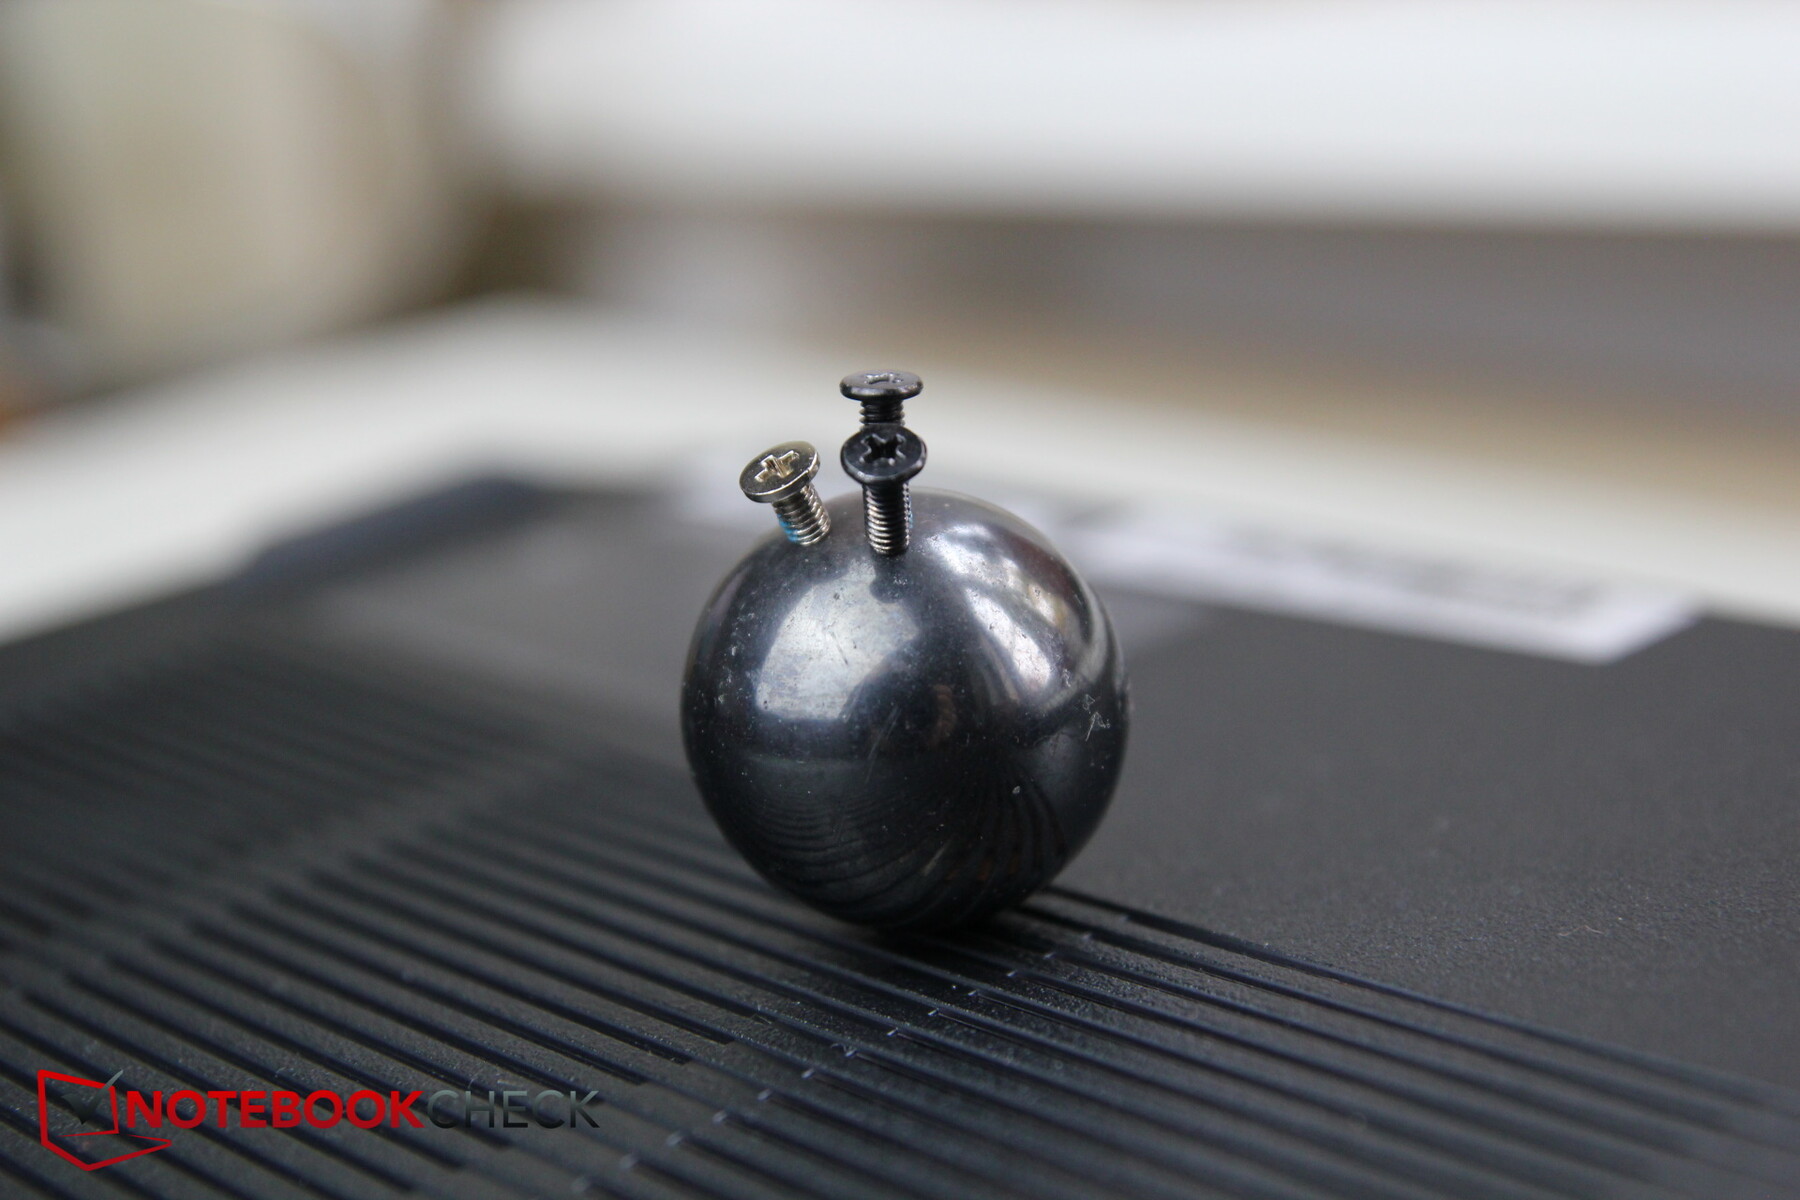
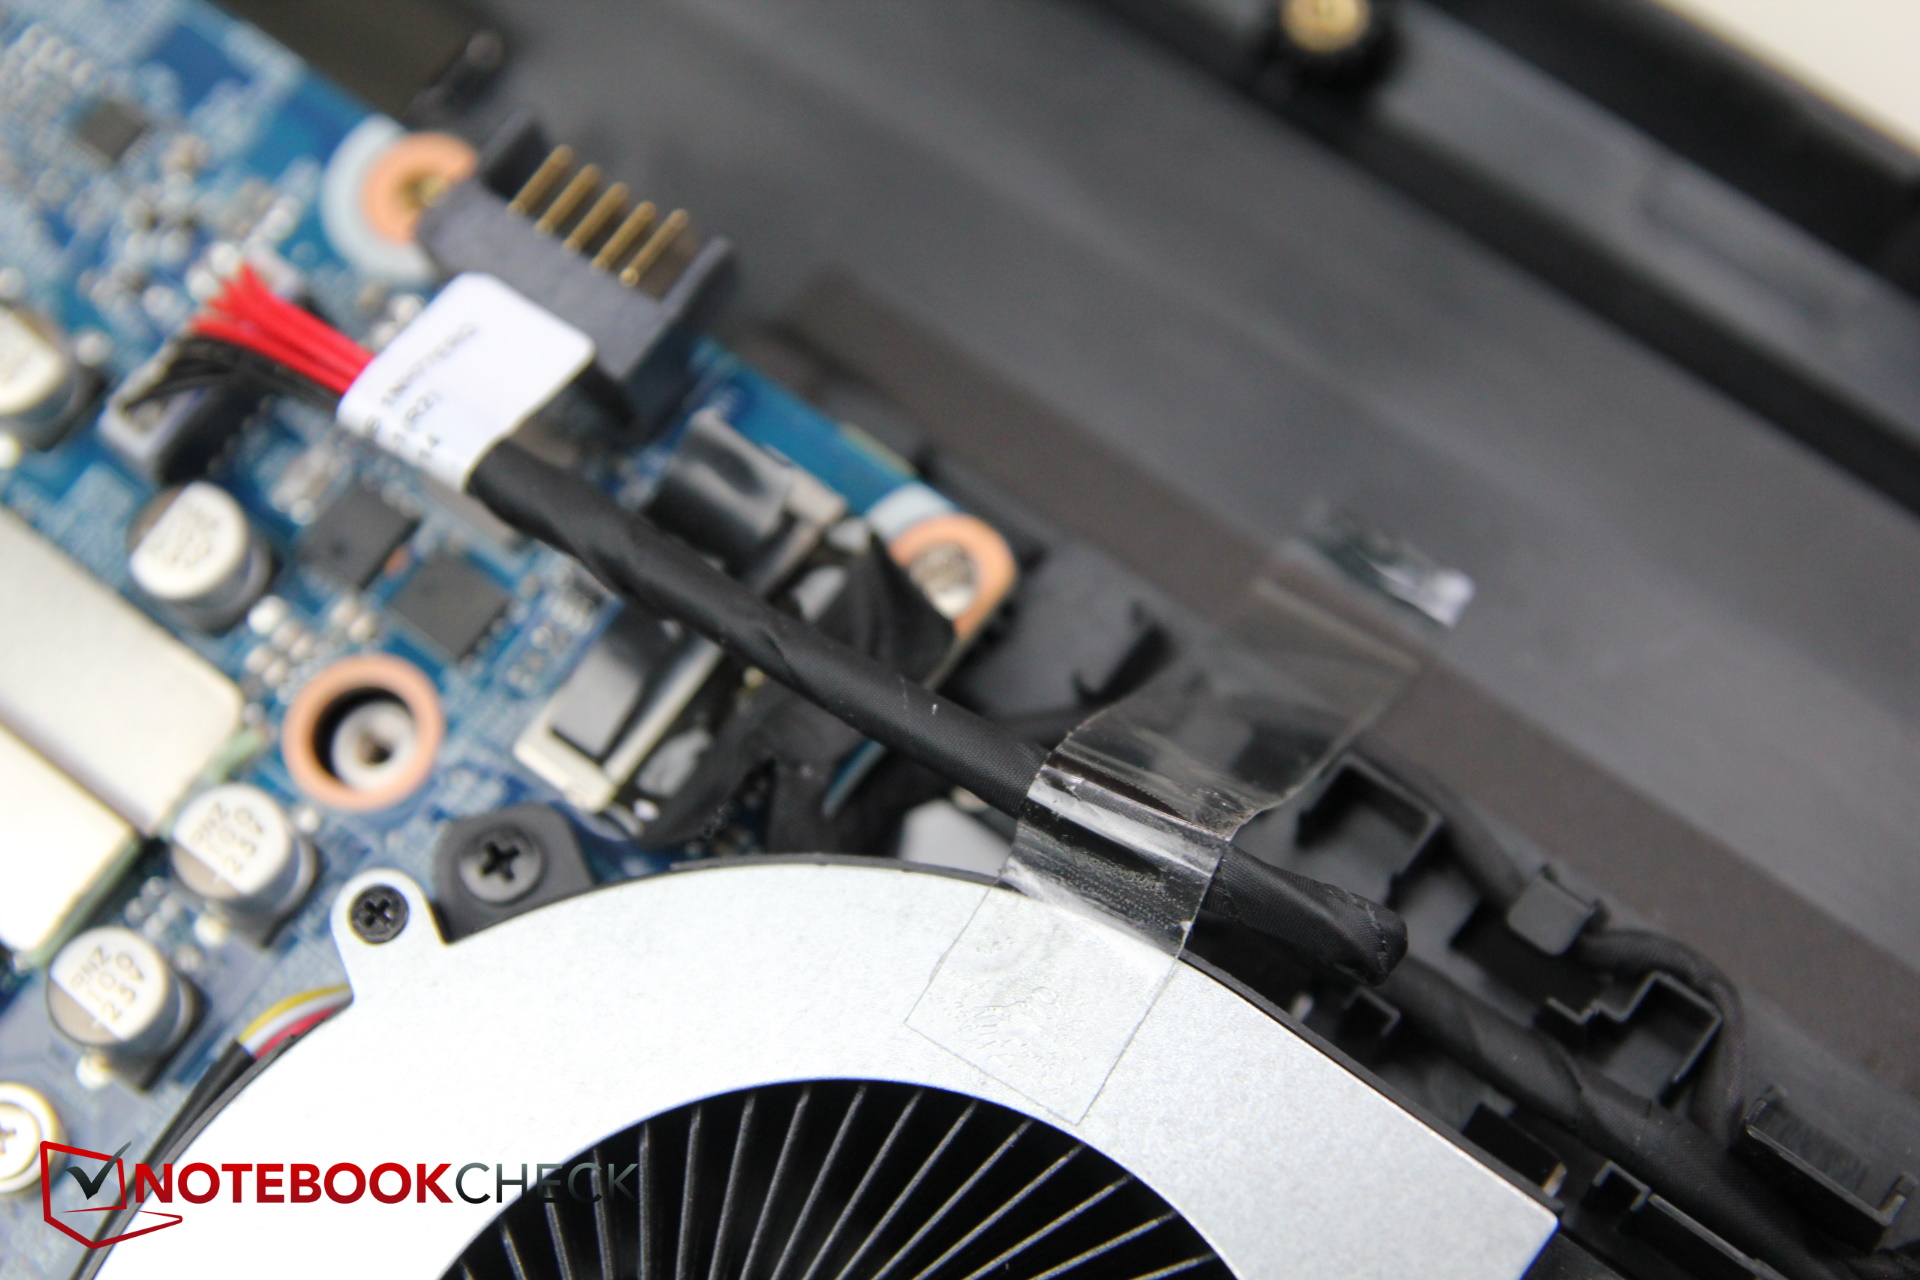
A whole 16 screws need to be removed (four of them in the battery compartment, only one is a different size). First, the battery has to be removed.
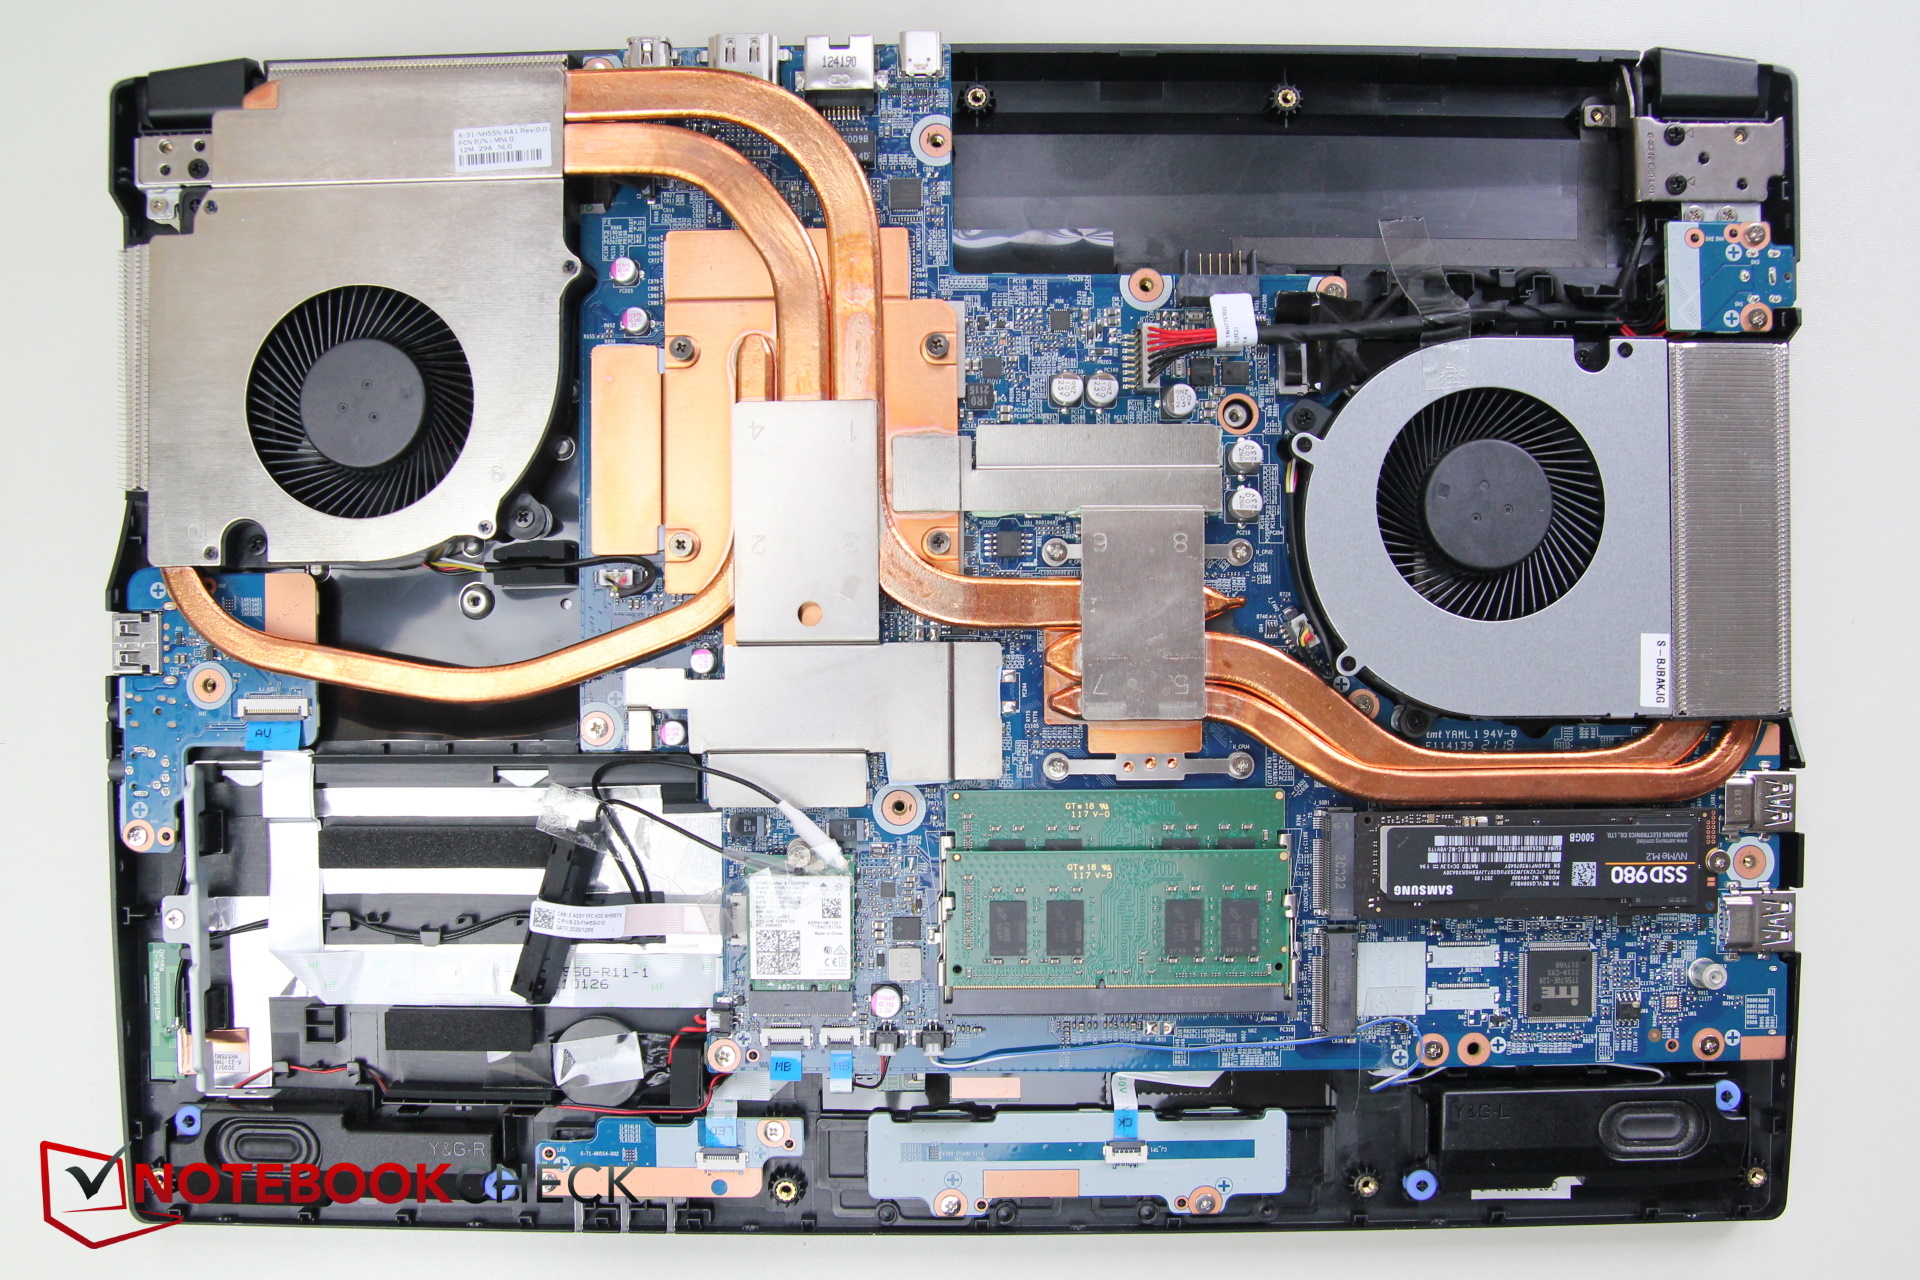
Once all the Phillips screws have been removed, you have to press against the inside of the battery compartment to release the base plate from the strong retaining clips. Then you get access to the fans, the RAM slots, the Wi-Fi module and the SSD. Additionally, there is a special feature, namely a hardly-used 2.5-inch bay for older storage drives.
Warranty
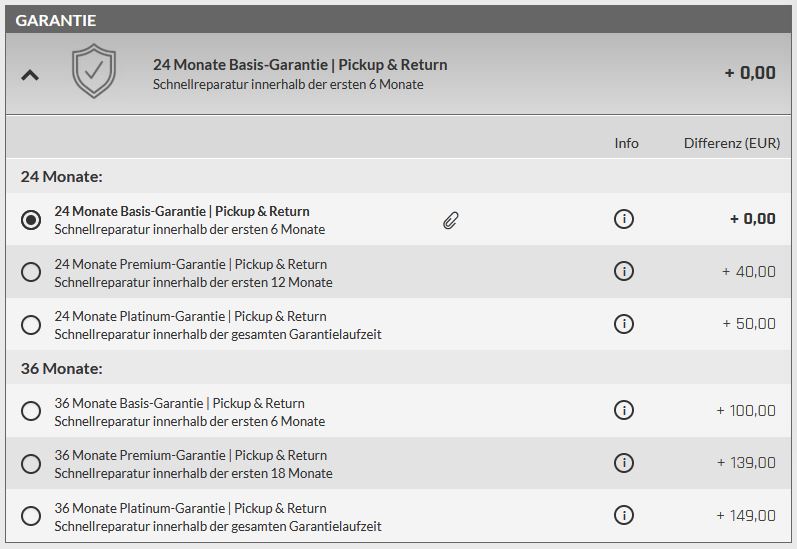
Schenker grants a 24-month basic warranty. This includes a pickup & return quick repair within the first six months.
The warranty can be extended for a fee.
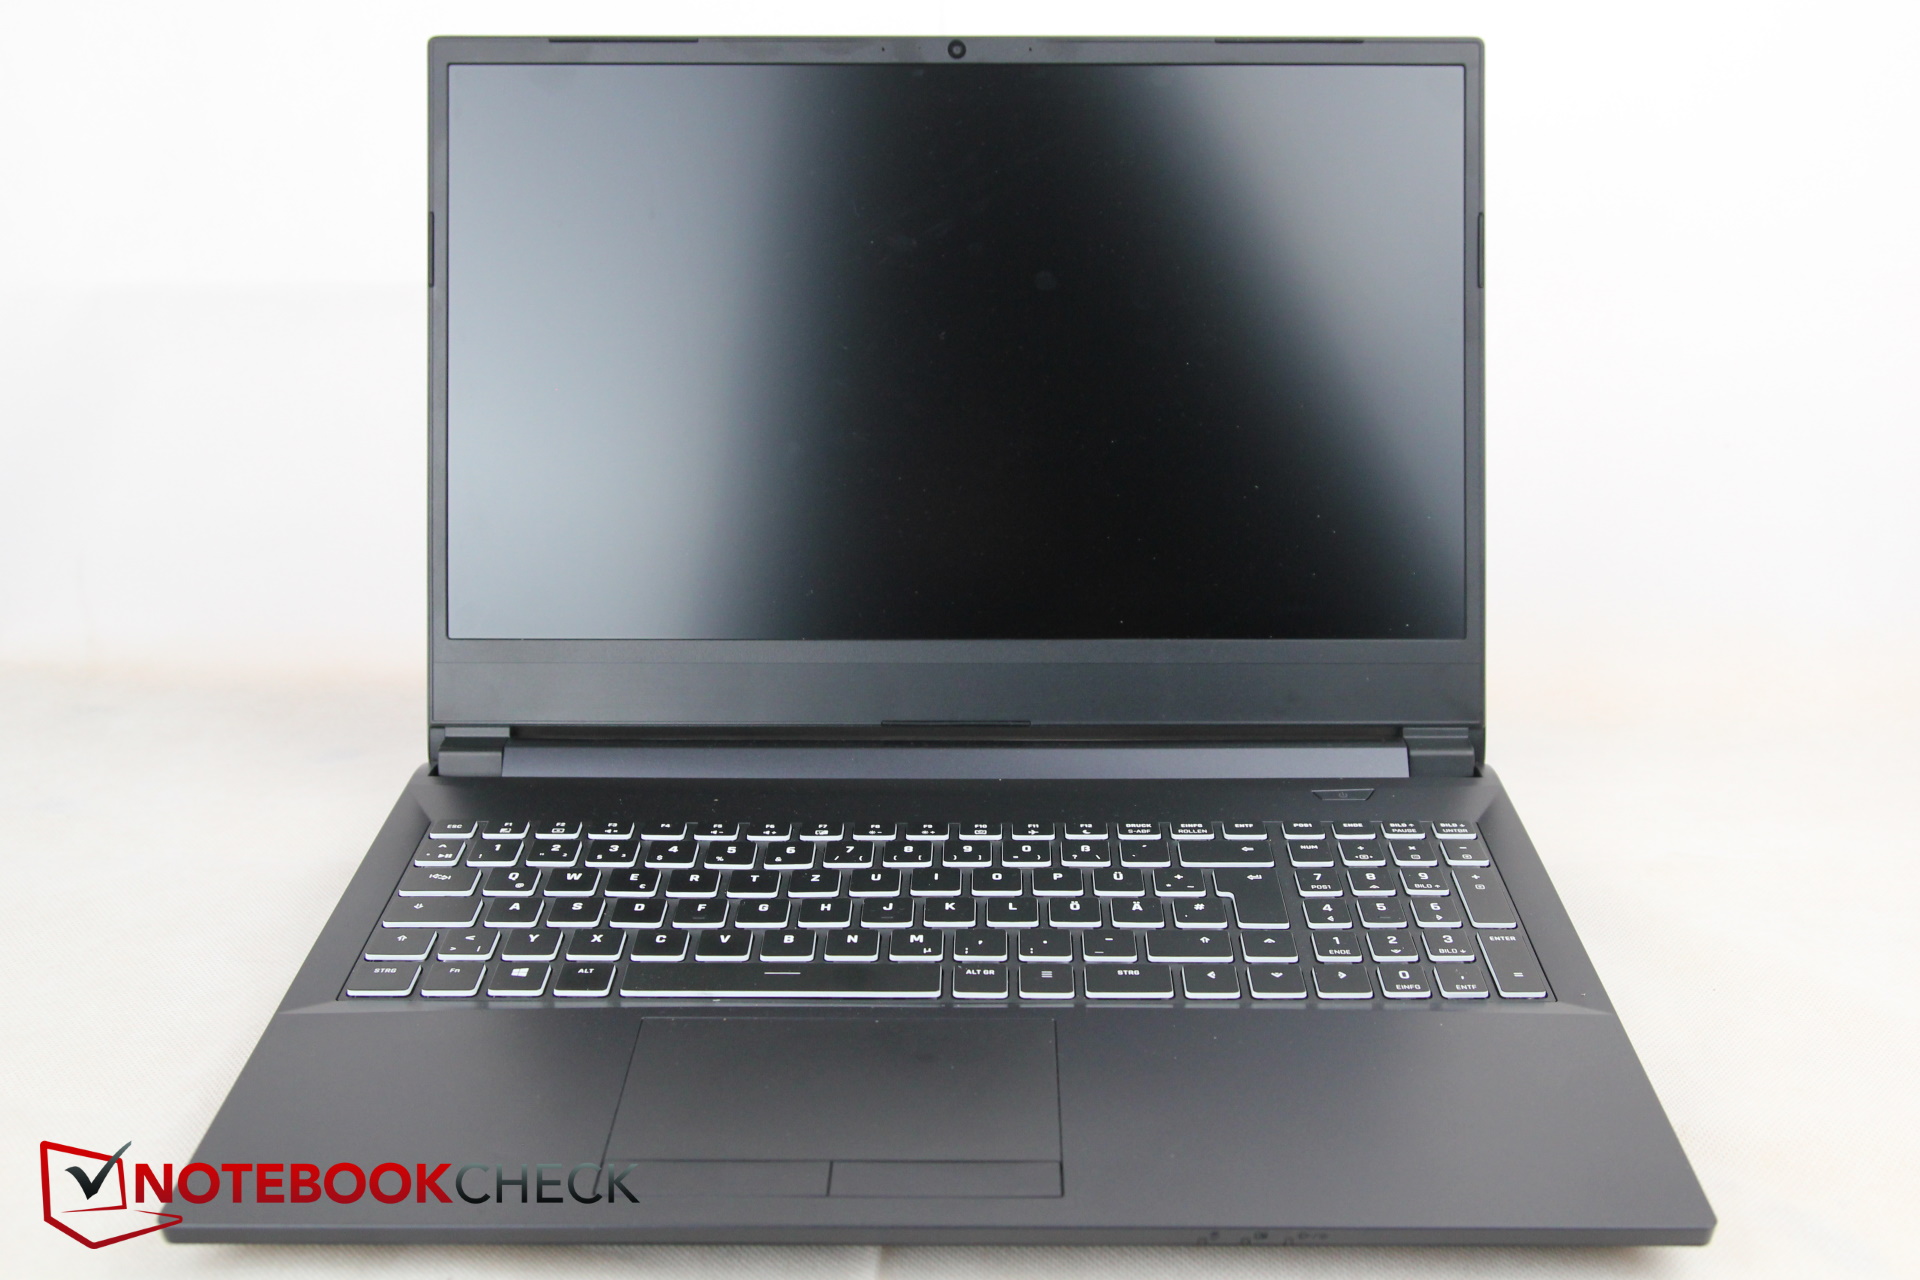
Input devices - Small keys
Keyboard
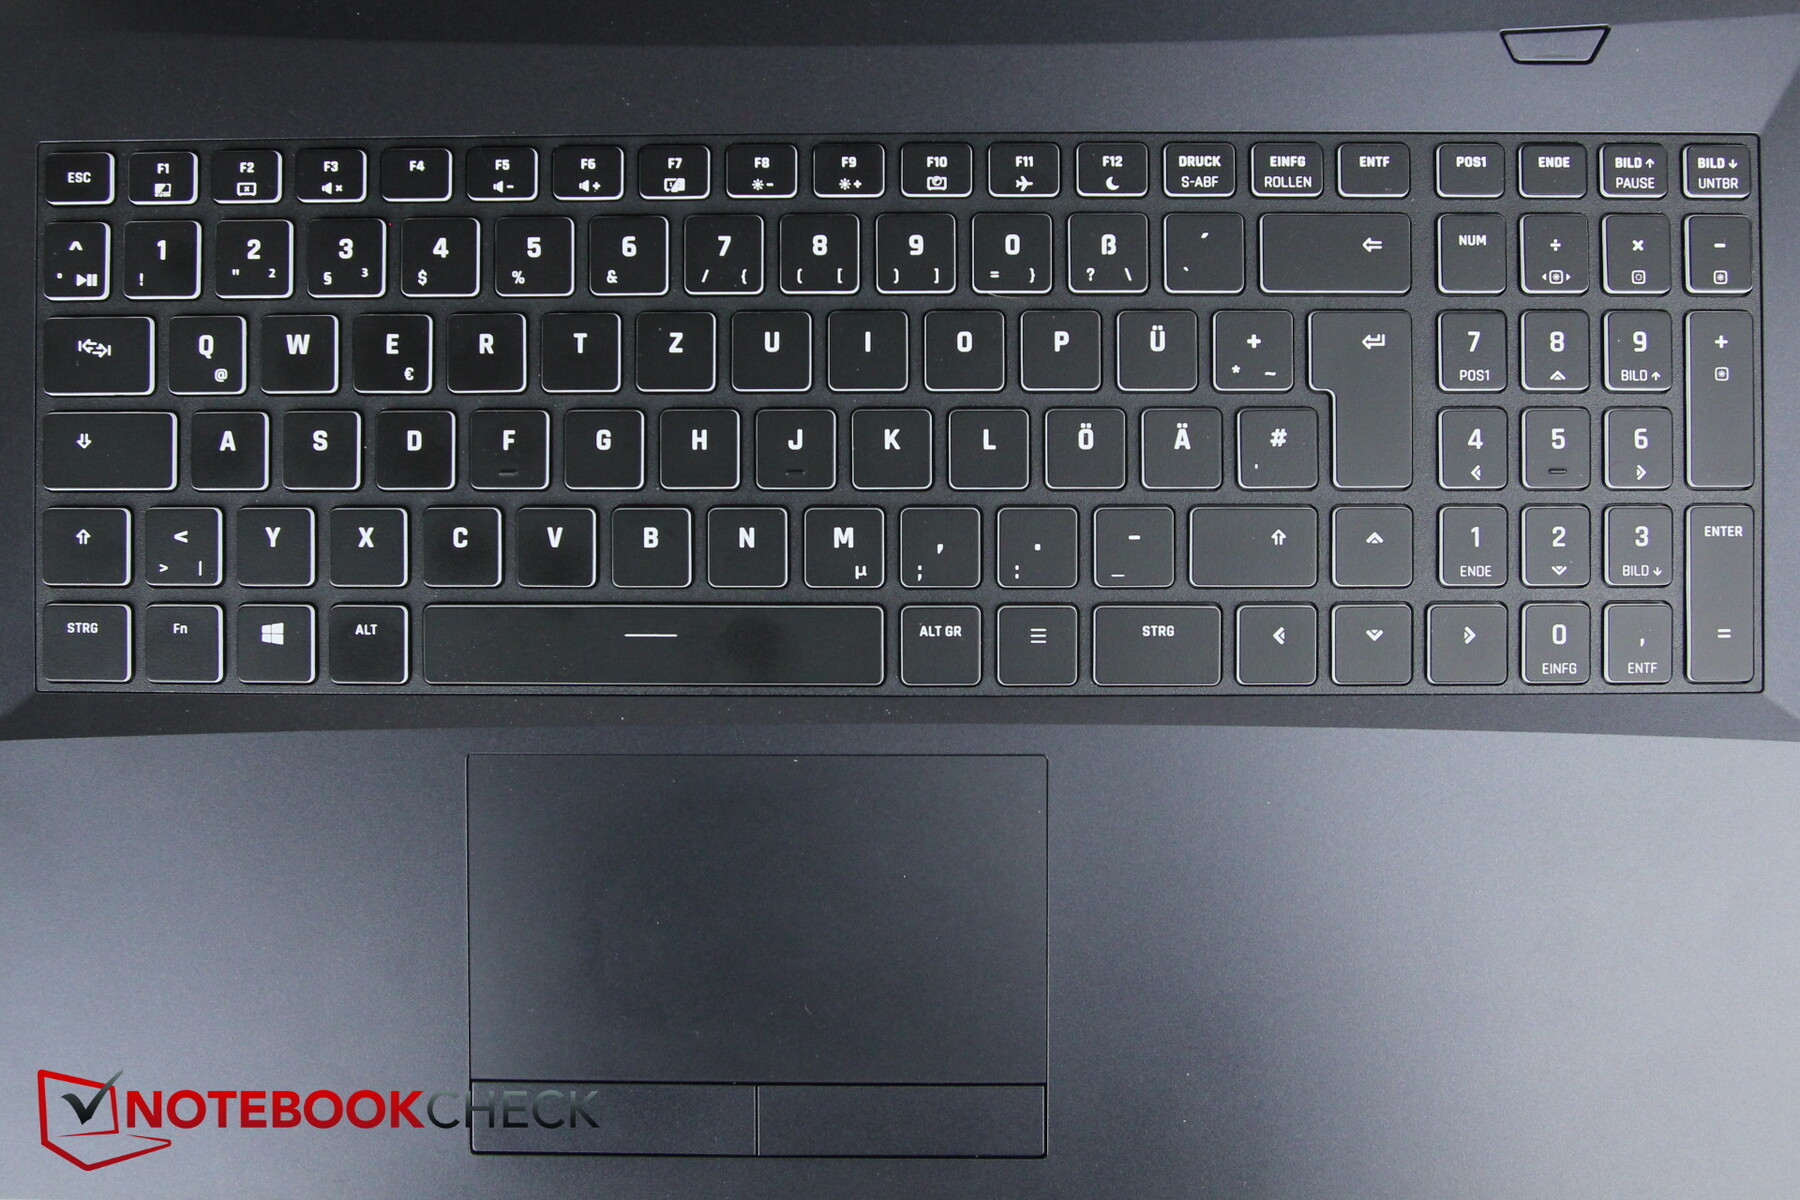
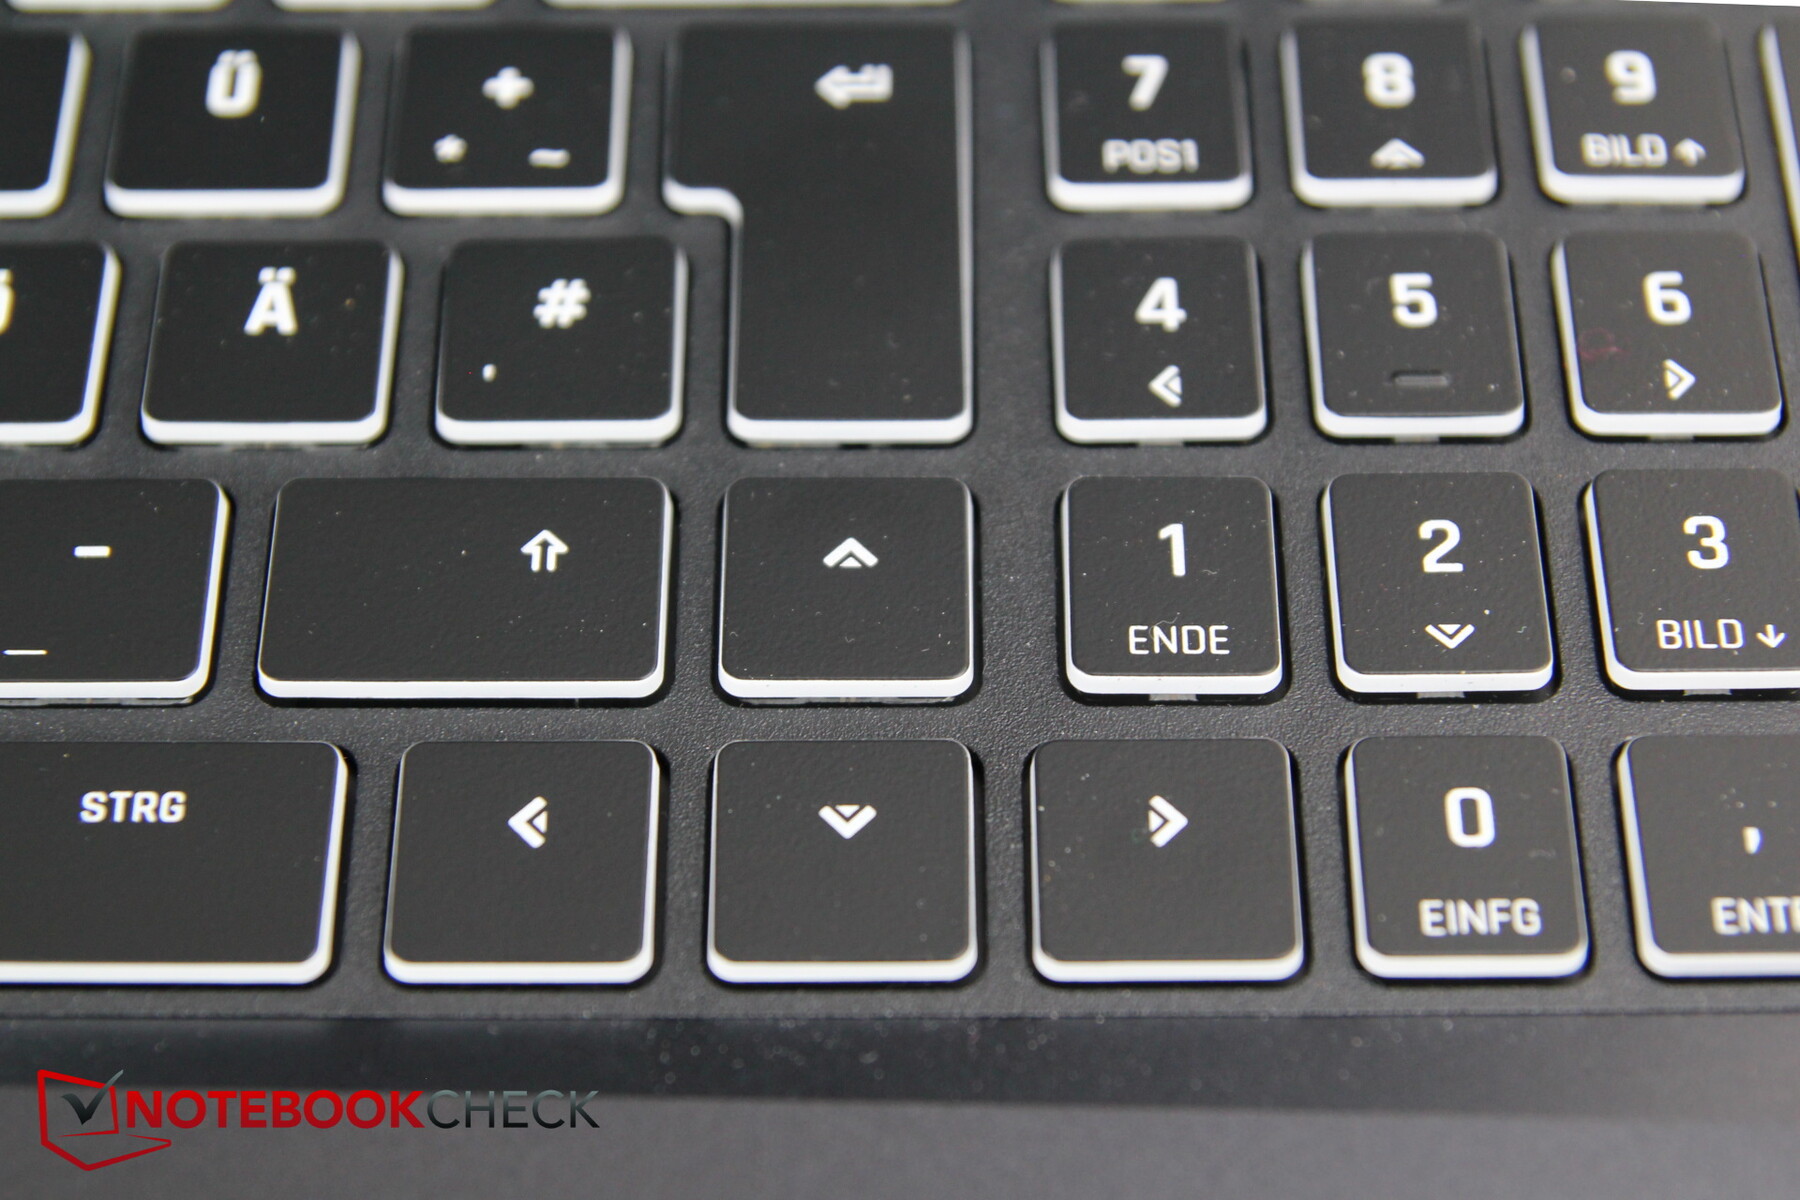
The layout looks tight but tidy due to the numpad. The keys themselves are quite small, measuring less than 1.5 cm. Even smaller and thus borderline is the F-key row including Esc, (Diablo 2: Resurrected can be very fiddly with it), but also correcting the typing position via Home, End, etc. is difficult.
You also have to take a closer look at the arrow keys. They aren't spatially separated, but are embedded between various other keys. A backlight offers various colors, but only illuminates the keyboard in unison and not per zone or key.
When typing, the small keys make a somewhat strange impression at first. However, the stroke is by no means too flat, and the feedback is clear. The click noise is also not too loud. The surface yields slightly when typing, but that is not a real problem.
Touchpad
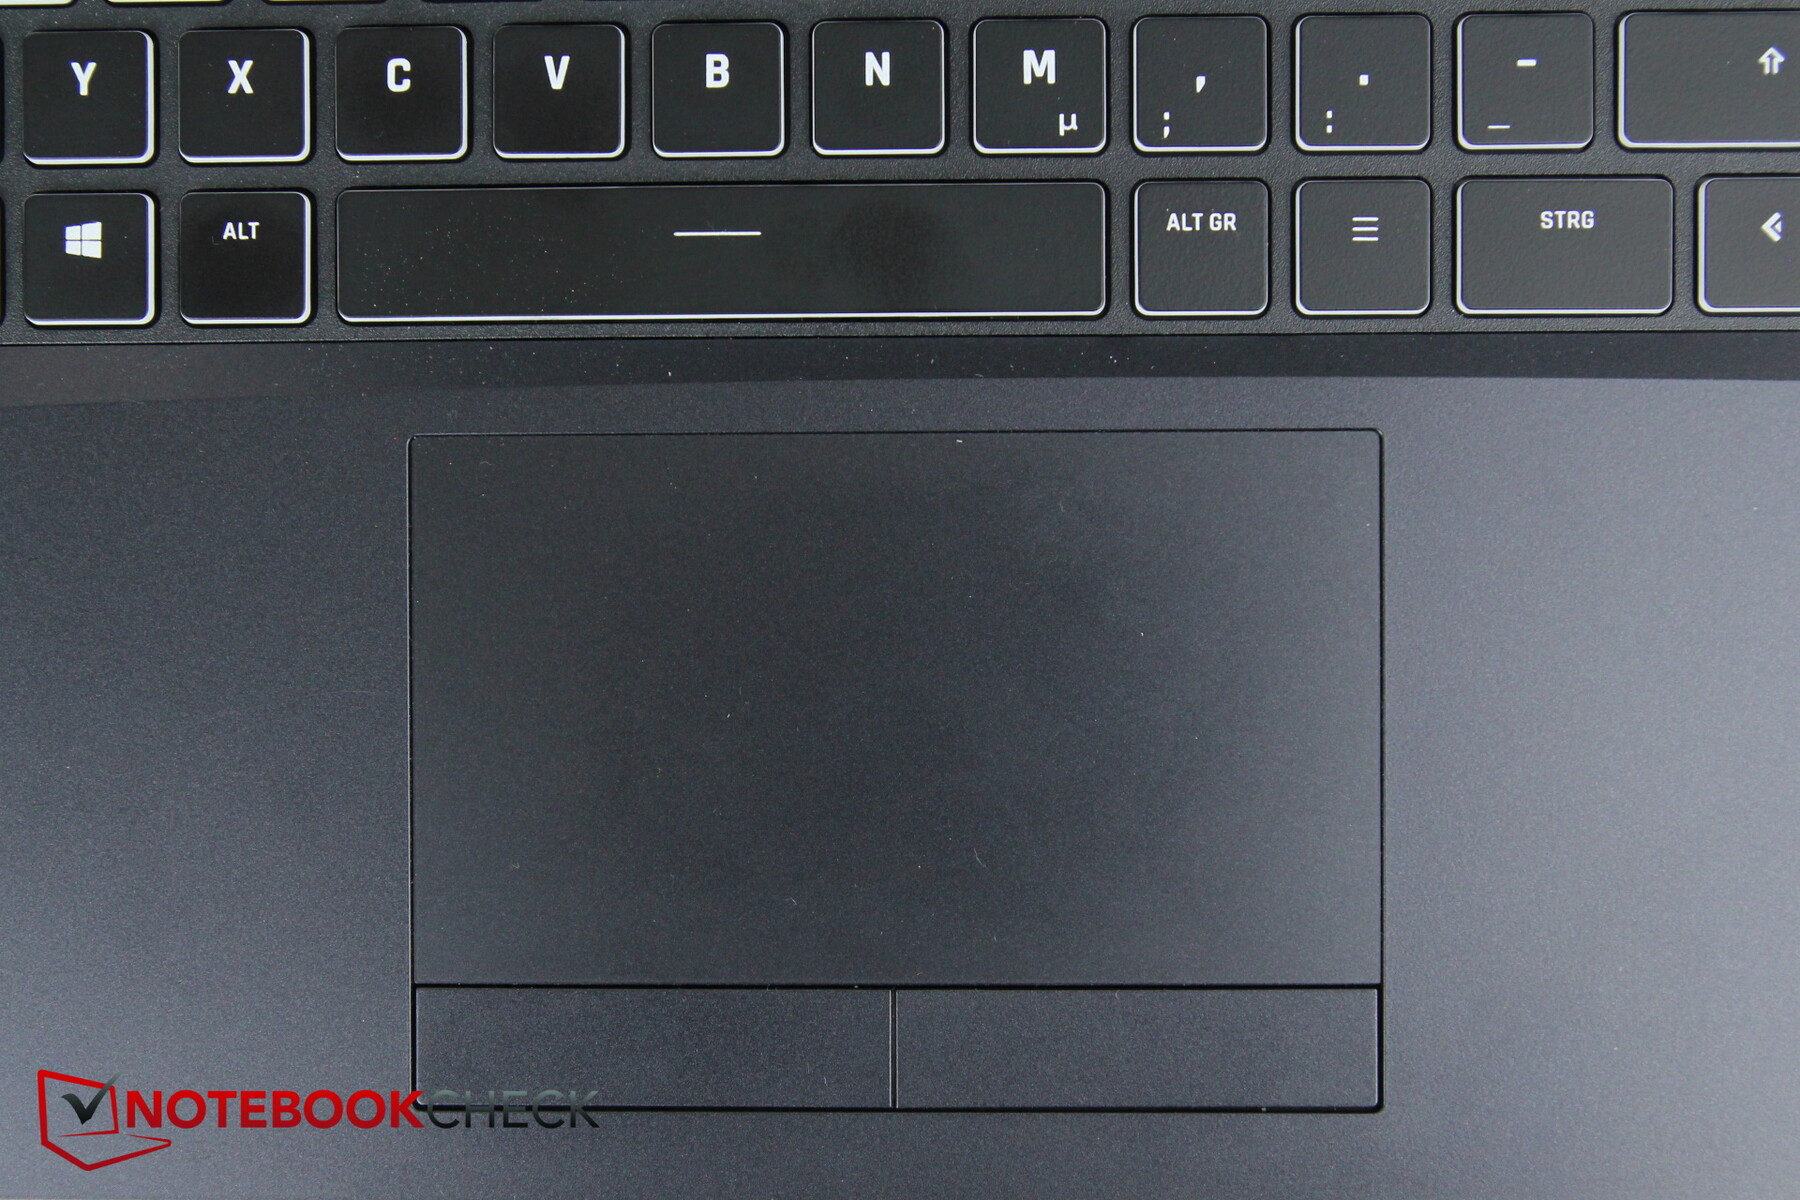
The touchpad is sufficiently large (~10.9 x 6.2 cm, or ~4.3 x 2.4 in) and now offers quite good gliding properties. It only falters a bit during very slow movements.
The dedicated mouse buttons work reliably, but their loud clicking sound is not overly high-quality.
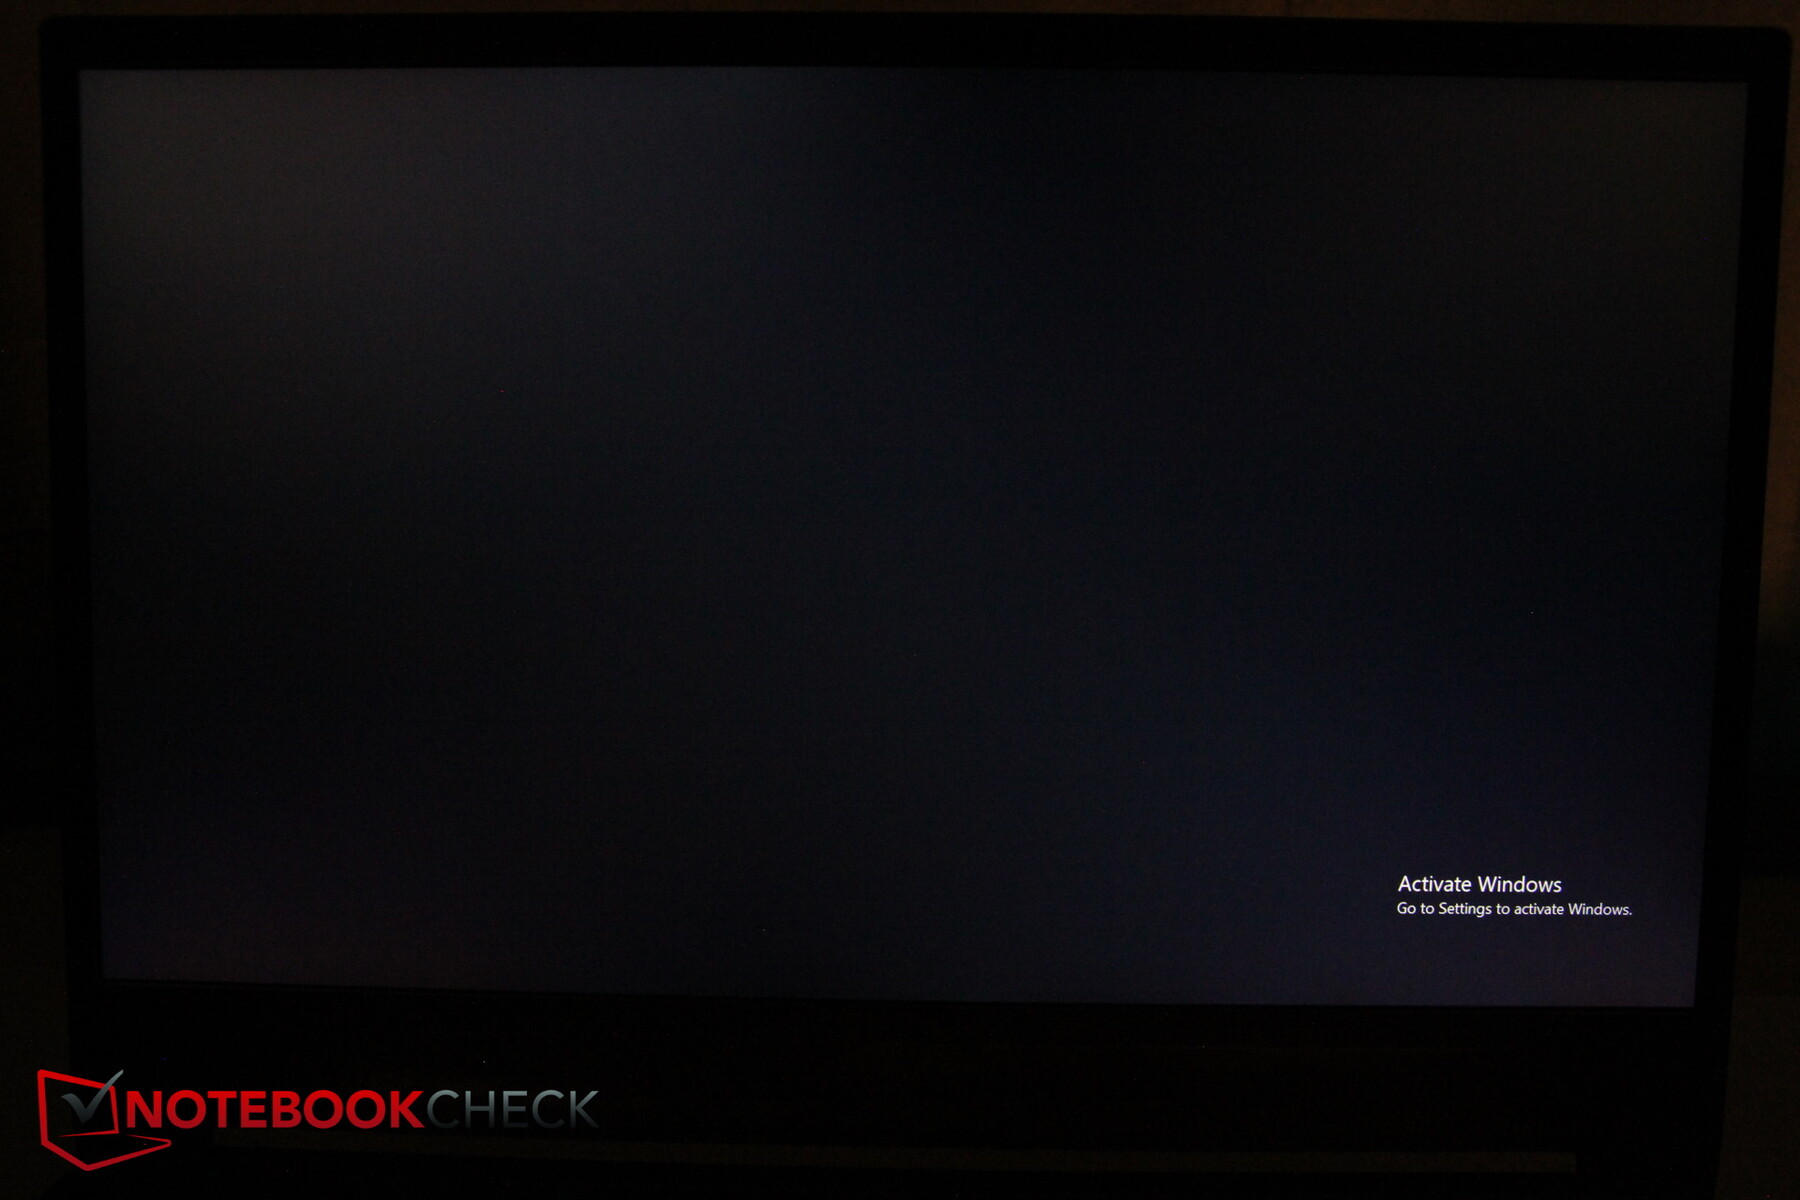
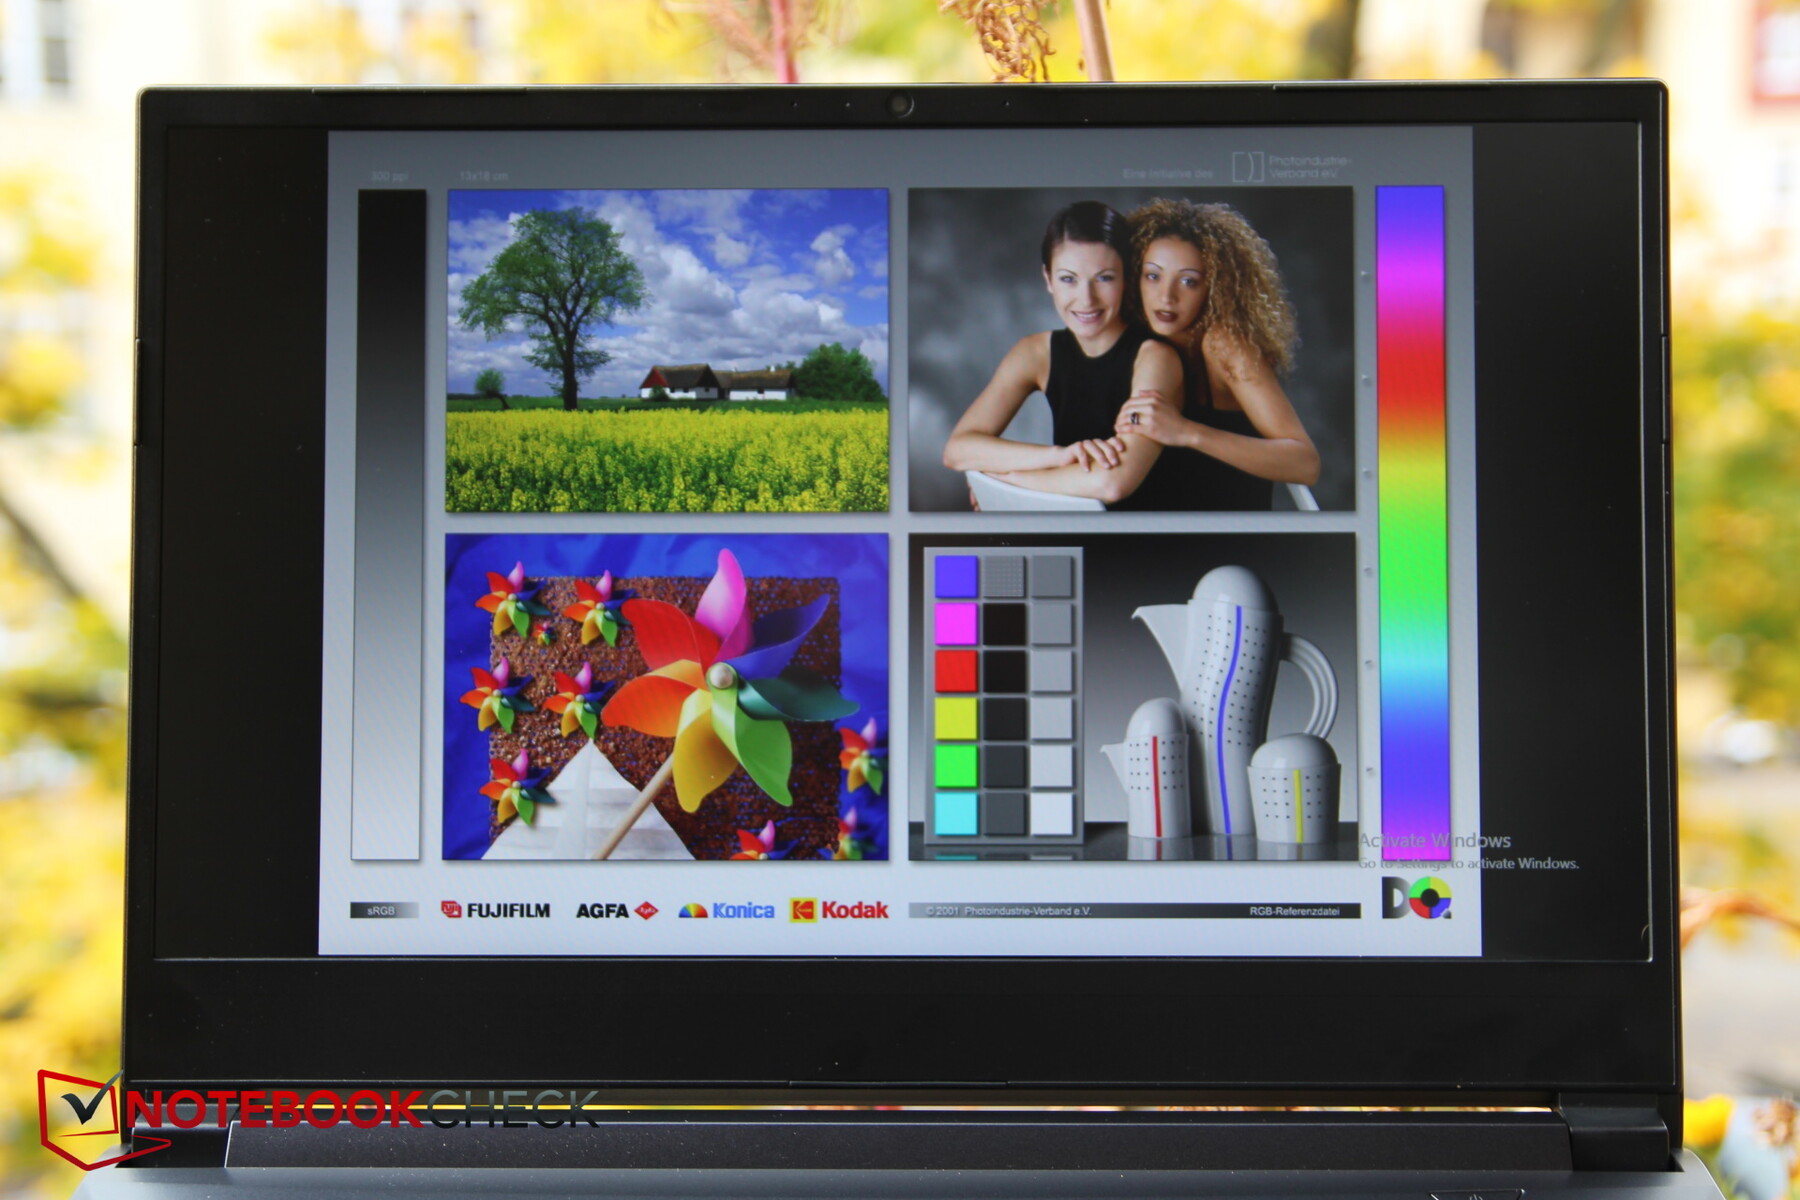
Display - Bright, but only mediocre contrast
Schenker installs a matte Full HD IPS panel with 144 Hz from LG Philips in the MSI GP65. There are no 4K options.
The panel has an average brightness of about 350 nits and is thus just about the brightest display in the comparison. However, the brightness distribution of 83% is in need of optimization; it decreases especially towards the right side towards the bottom.
The response times are decent, but not outstanding; PWM is not used for brightness control.
| |||||||||||||||||||||||||
Brightness Distribution: 83 %
Center on Battery: 395 cd/m²
Contrast: 836:1 (Black: 0.47 cd/m²)
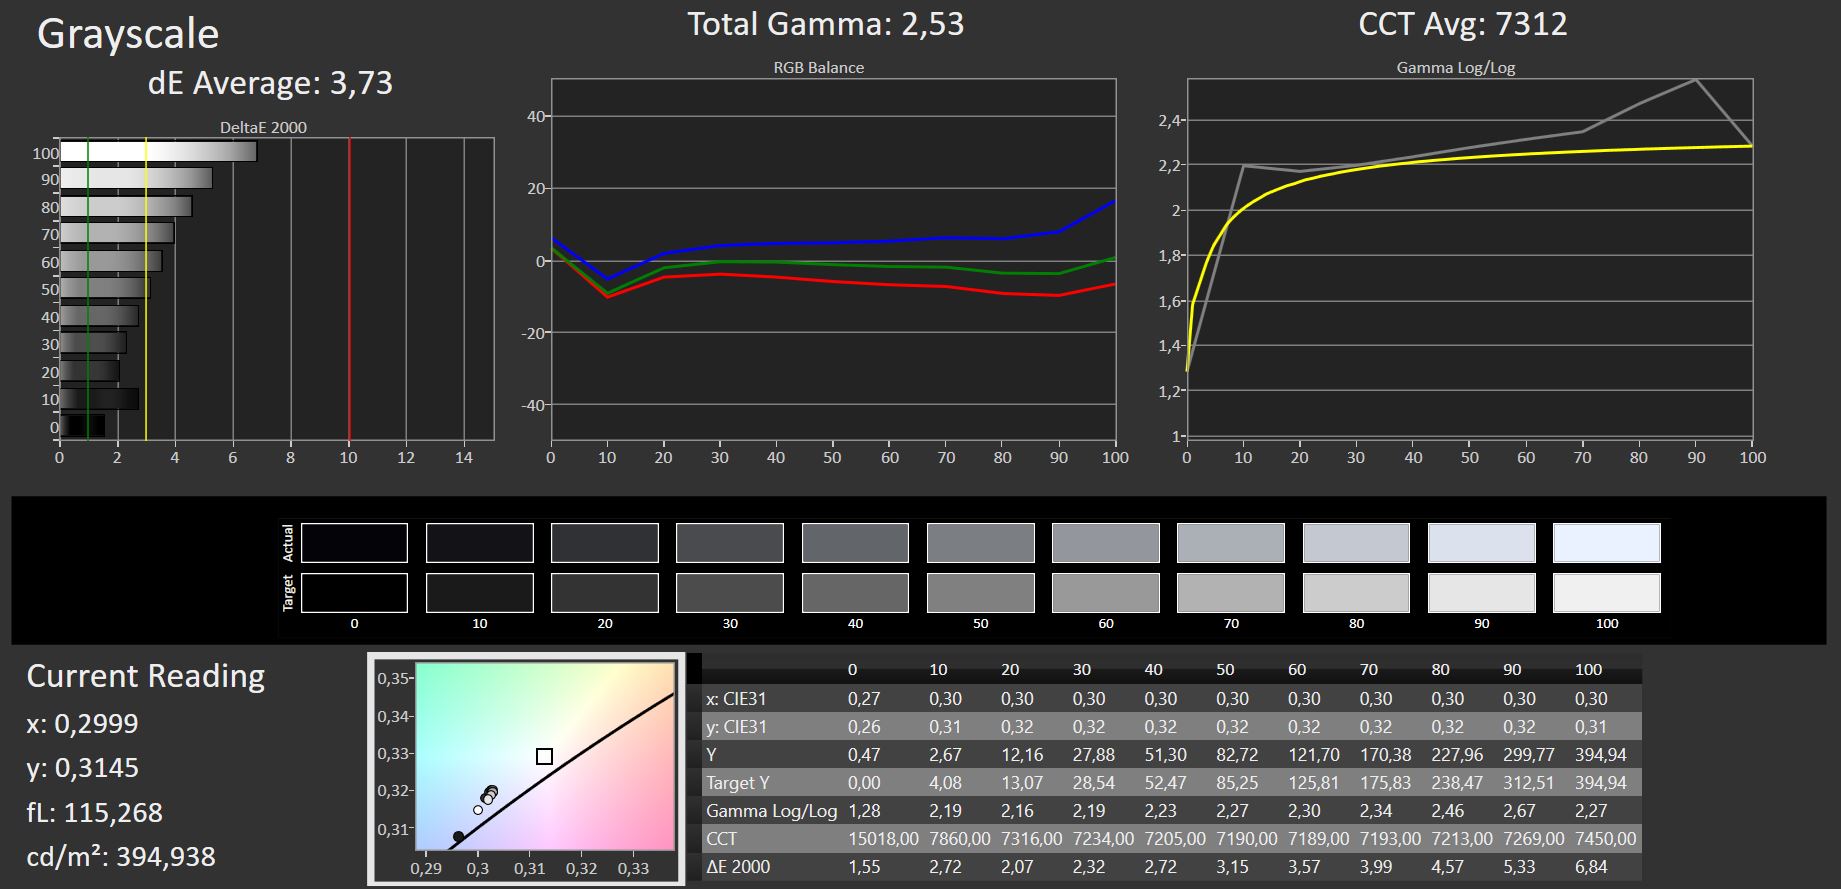
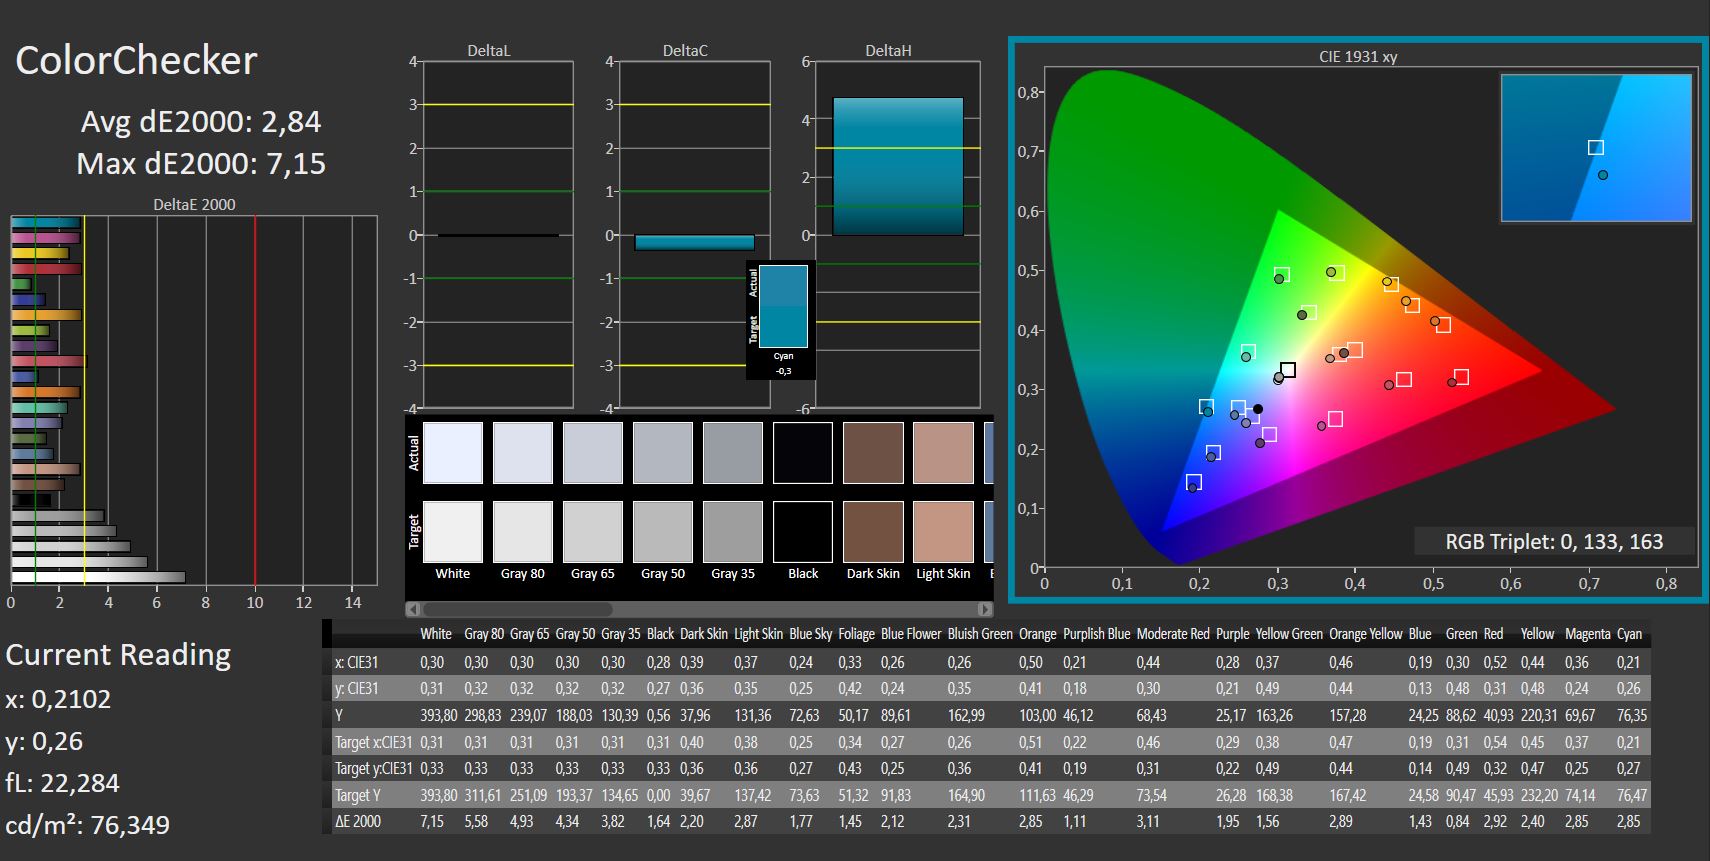
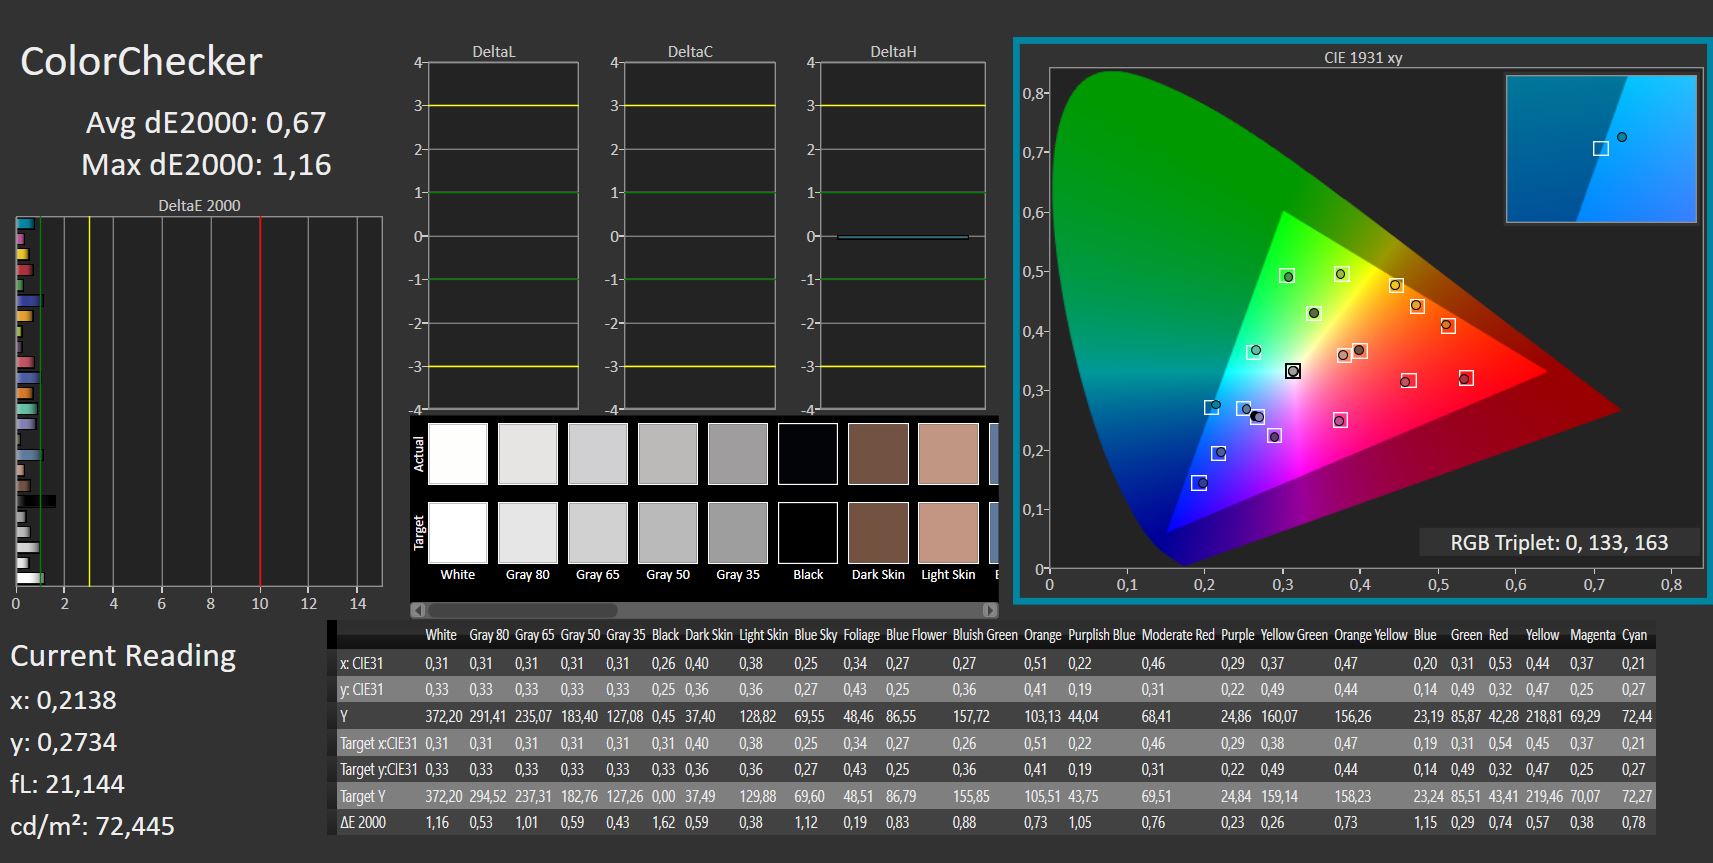
ΔE ColorChecker Calman: 2.84 | ∀{0.5-29.43 Ø4.75}
calibrated: 0.67
ΔE Greyscale Calman: 3.73 | ∀{0.09-98 Ø5}
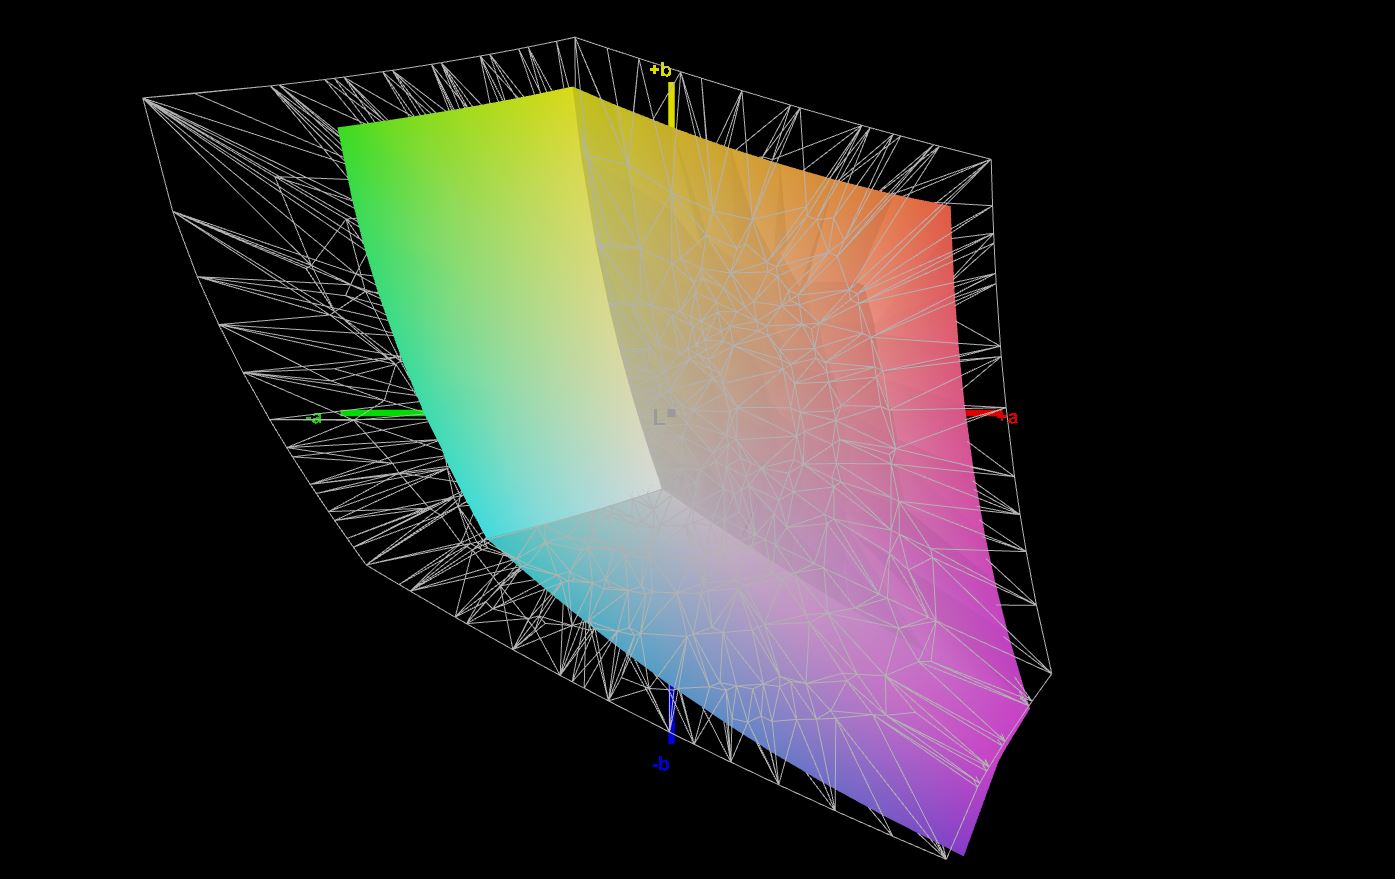
65.8% AdobeRGB 1998 (Argyll 3D)
95.9% sRGB (Argyll 3D)
64.5% Display P3 (Argyll 3D)
Gamma: 2.53
CCT: 7312 K
| Schenker XMG Apex 15 NH57E PS LG Philips LGD0625 (LP156WFG-SPB3), IPS, 1920x1080, 15.6" | Schenker XMG Apex 15 NH57AF1 AU Optronics B156HAN (AUO80ED), IPS, 1920x1080, 15.6" | Lenovo Legion 5 15ACH-82JU00C6GE-FL B156HAN12.H, , 1920x1080, 15.6" | Asus TUF Gaming F15 FX506HM Chi Mei N156HRA-EA1, IPS, 1920x1080, 15.6" | Alienware m15 R5 Ryzen Edition B156HAN, IPS, 1920x1080, 15.6" | HP Victus 16-e0179ng BOE09BE, IPS, 1920x1080, 16.1" | |
|---|---|---|---|---|---|---|
| Display | 0% | 1% | -34% | 10% | ||
| Display P3 Coverage (%) | 64.5 | 67.3 4% | 65.4 1% | 41.9 -35% | 72.6 13% | |
| sRGB Coverage (%) | 95.9 | 91.3 -5% | 96.3 0% | 62.9 -34% | 100 4% | |
| AdobeRGB 1998 Coverage (%) | 65.8 | 66.8 2% | 67.5 3% | 43.3 -34% | 73.5 12% | |
| Response Times | -7% | 15% | -88% | 51% | 6% | |
| Response Time Grey 50% / Grey 80% * (ms) | 15 | 17.6 ? -17% | 13.6 ? 9% | 28.4 ? -89% | 4 ? 73% | 9.6 ? 36% |
| Response Time Black / White * (ms) | 11.6 | 11.2 ? 3% | 9.2 ? 21% | 21.6 ? -86% | 8.4 ? 28% | 14.4 ? -24% |
| PWM Frequency (Hz) | ||||||
| Screen | -25% | -18% | -73% | -0% | -1% | |
| Brightness middle (cd/m²) | 393 | 317 -19% | 350 -11% | 268.3 -32% | 329 -16% | 361 -8% |
| Brightness (cd/m²) | 353 | 316 -10% | 350 -1% | 257 -27% | 321 -9% | 341 -3% |
| Brightness Distribution (%) | 83 | 84 1% | 96 16% | 84 1% | 92 11% | 88 6% |
| Black Level * (cd/m²) | 0.47 | 0.28 40% | 0.3 36% | 0.34 28% | 0.27 43% | 0.3 36% |
| Contrast (:1) | 836 | 1132 35% | 1167 40% | 789 -6% | 1219 46% | 1203 44% |
| Colorchecker dE 2000 * | 2.84 | 3.52 -24% | 3.9 -37% | 5.05 -78% | 2.78 2% | 2.44 14% |
| Colorchecker dE 2000 max. * | 7.15 | 6.93 3% | 8.2 -15% | 15.43 -116% | 4.88 32% | 6.37 11% |
| Colorchecker dE 2000 calibrated * | 0.67 | 2.49 -272% | 1.6 -139% | 3.21 -379% | 1.63 -143% | 1.26 -88% |
| Greyscale dE 2000 * | 3.73 | 2.81 25% | 5.5 -47% | 5.5 -47% | 2.5 33% | 4.6 -23% |
| Gamma | 2.53 87% | 2.54 87% | 2.15 102% | 2.35 94% | 2.106 104% | 2.268 97% |
| CCT | 7312 89% | 6877 95% | 7414 88% | 7392 88% | 6201 105% | 6609 98% |
| Color Space (Percent of AdobeRGB 1998) (%) | 67 | 76 | ||||
| Color Space (Percent of sRGB) (%) | 91 | 99 | ||||
| Total Average (Program / Settings) | -11% /
-17% | -1% /
-9% | -65% /
-67% | 26% /
9% | 5% /
2% |
* ... smaller is better
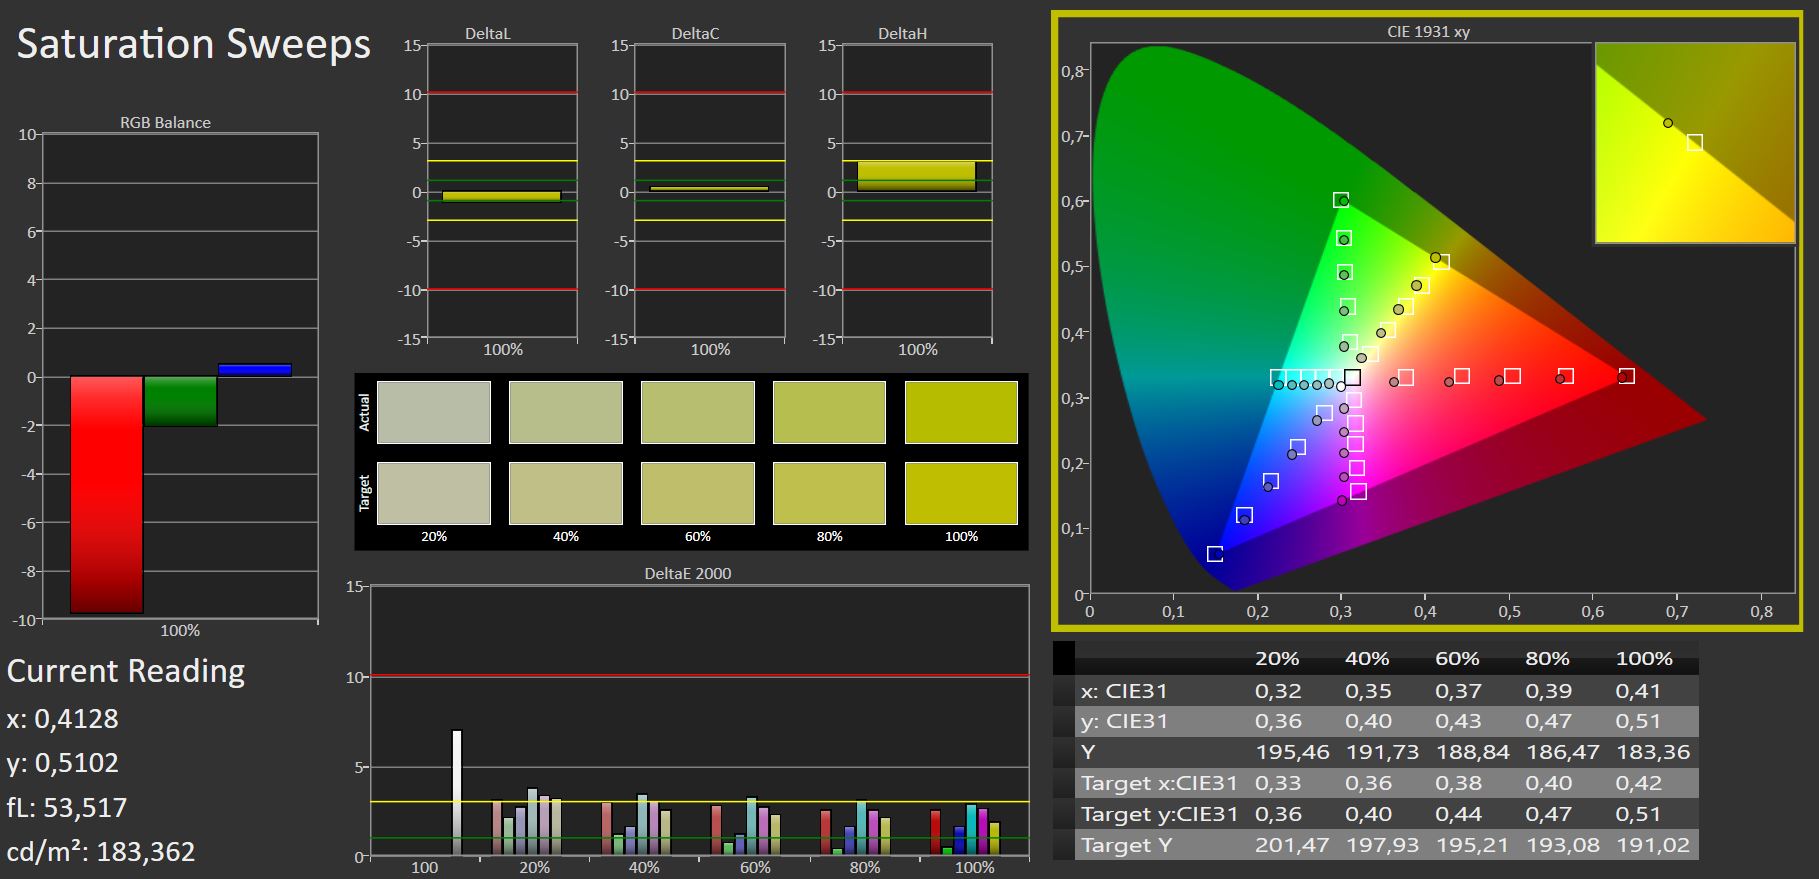
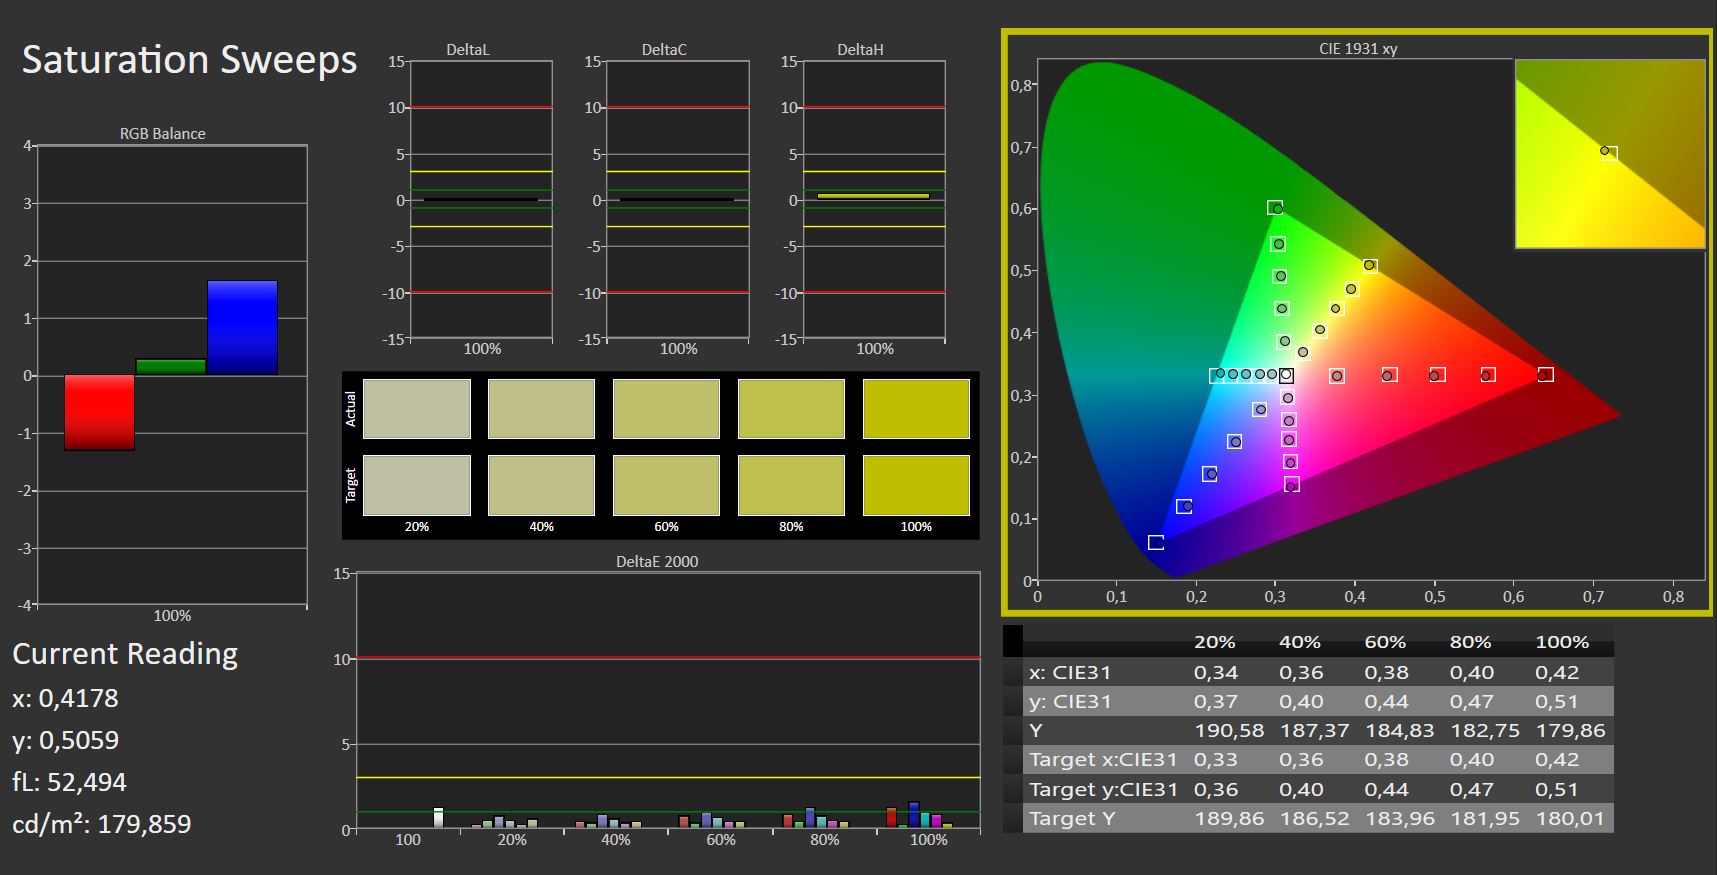
Black level and contrast are slightly worse than in the competition, but the display can be calibrated very well so that the color deviations are only very minimal.
Schenker speaks of 90% sRGB coverage, and we even measured around 96%. The Adobe RGB color space is still covered by about 66%. The rates are average, the Asus is much worse, the HP Victus and the Alienware are slightly better.


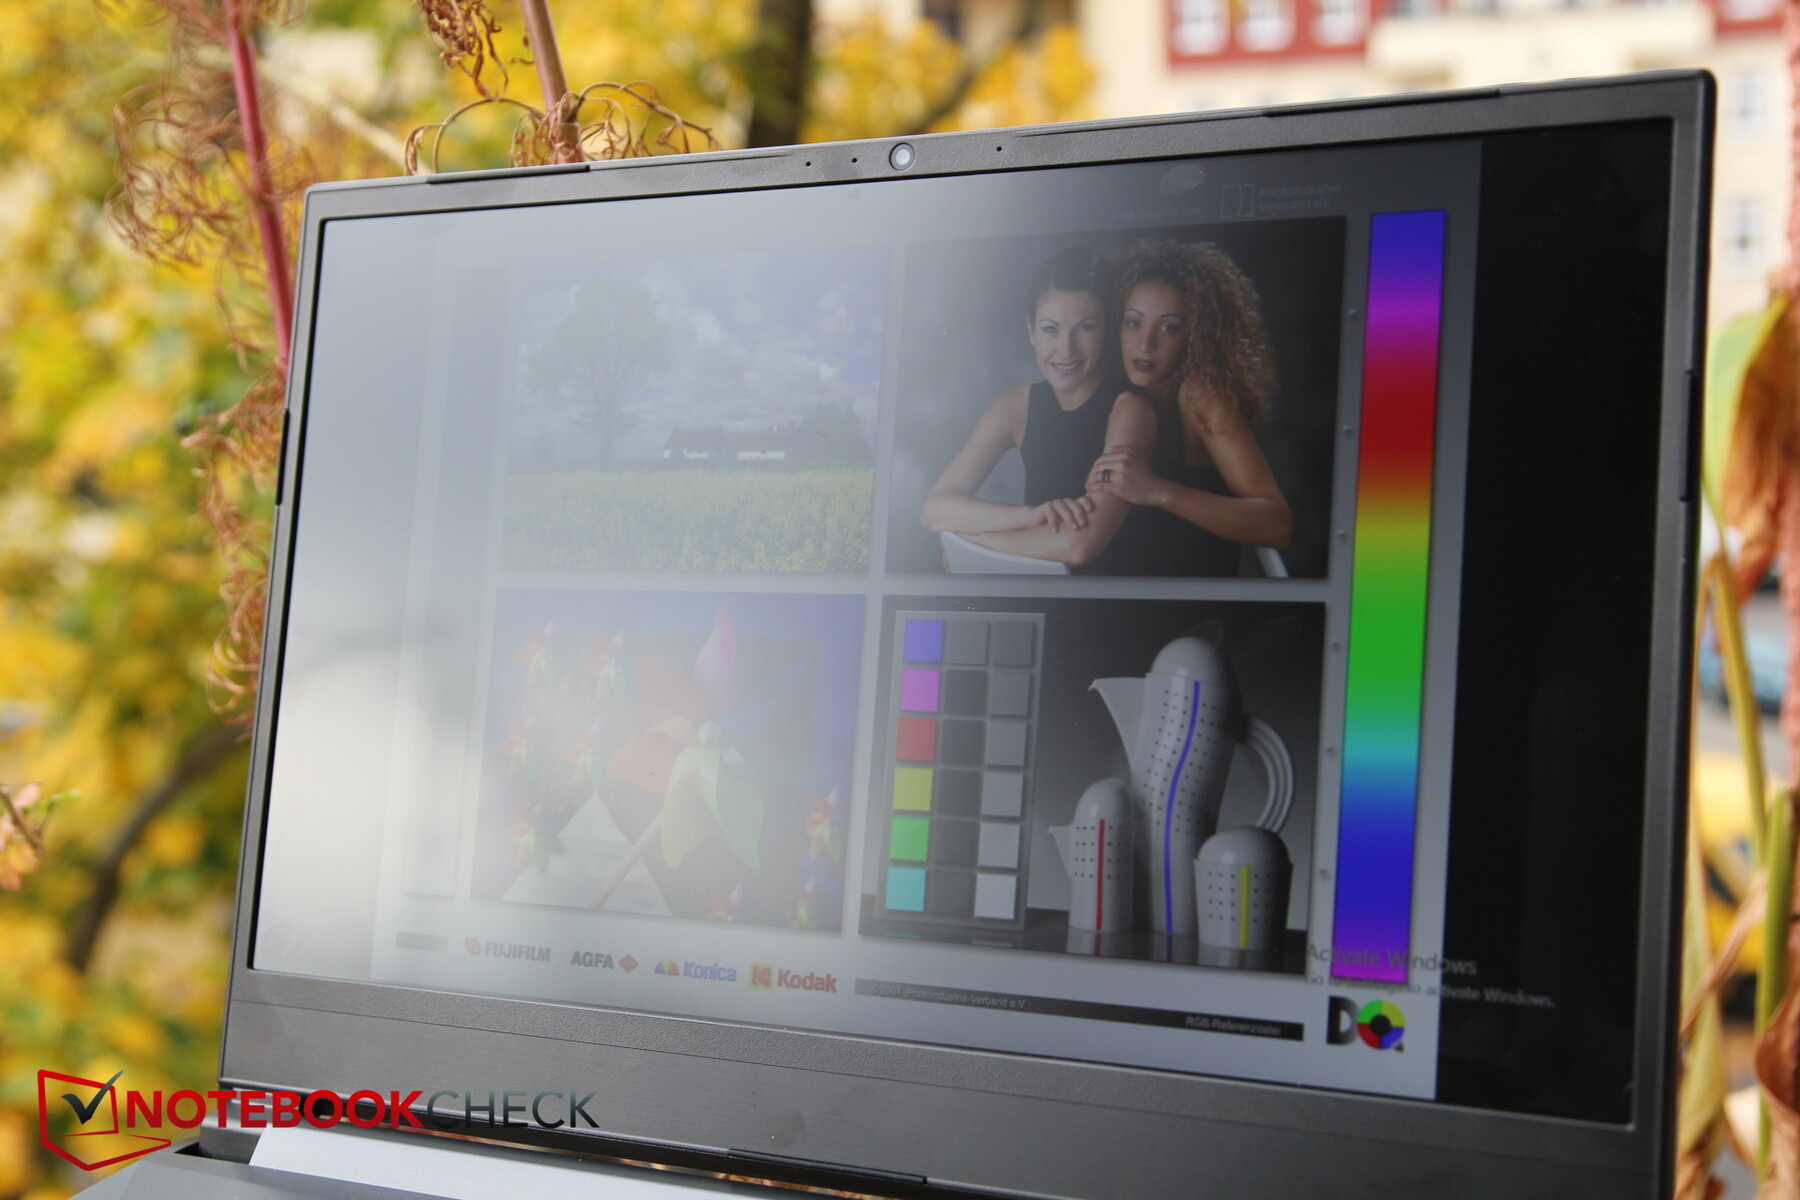
Outdoors, the matte display eliminates most reflections, and the brightness of 350 nits ensures good visibility at least in the shade. Oblique viewing angles should be avoided in both shade and sun.
Display Response Times
| ↔ Response Time Black to White | ||
|---|---|---|
| 11.6 ms ... rise ↗ and fall ↘ combined | ↗ ms rise |  |
| ↘ ms fall | ||
| The screen shows good response rates in our tests, but may be too slow for competitive gamers. In comparison, all tested devices range from 0.1 (minimum) to 240 (maximum) ms. » 30 % of all devices are better. This means that the measured response time is better than the average of all tested devices (20.1 ms). | ||
| ↔ Response Time 50% Grey to 80% Grey | ||
| 15 ms ... rise ↗ and fall ↘ combined | ↗ ms rise |  |
| ↘ ms fall | ||
| The screen shows good response rates in our tests, but may be too slow for competitive gamers. In comparison, all tested devices range from 0.165 (minimum) to 636 (maximum) ms. » 28 % of all devices are better. This means that the measured response time is better than the average of all tested devices (31.4 ms). | ||
Screen Flickering / PWM (Pulse-Width Modulation)
| Screen flickering / PWM not detected |  | ||
In comparison: 53 % of all tested devices do not use PWM to dim the display. If PWM was detected, an average of 7996 (minimum: 5 - maximum: 343500) Hz was measured. | |||
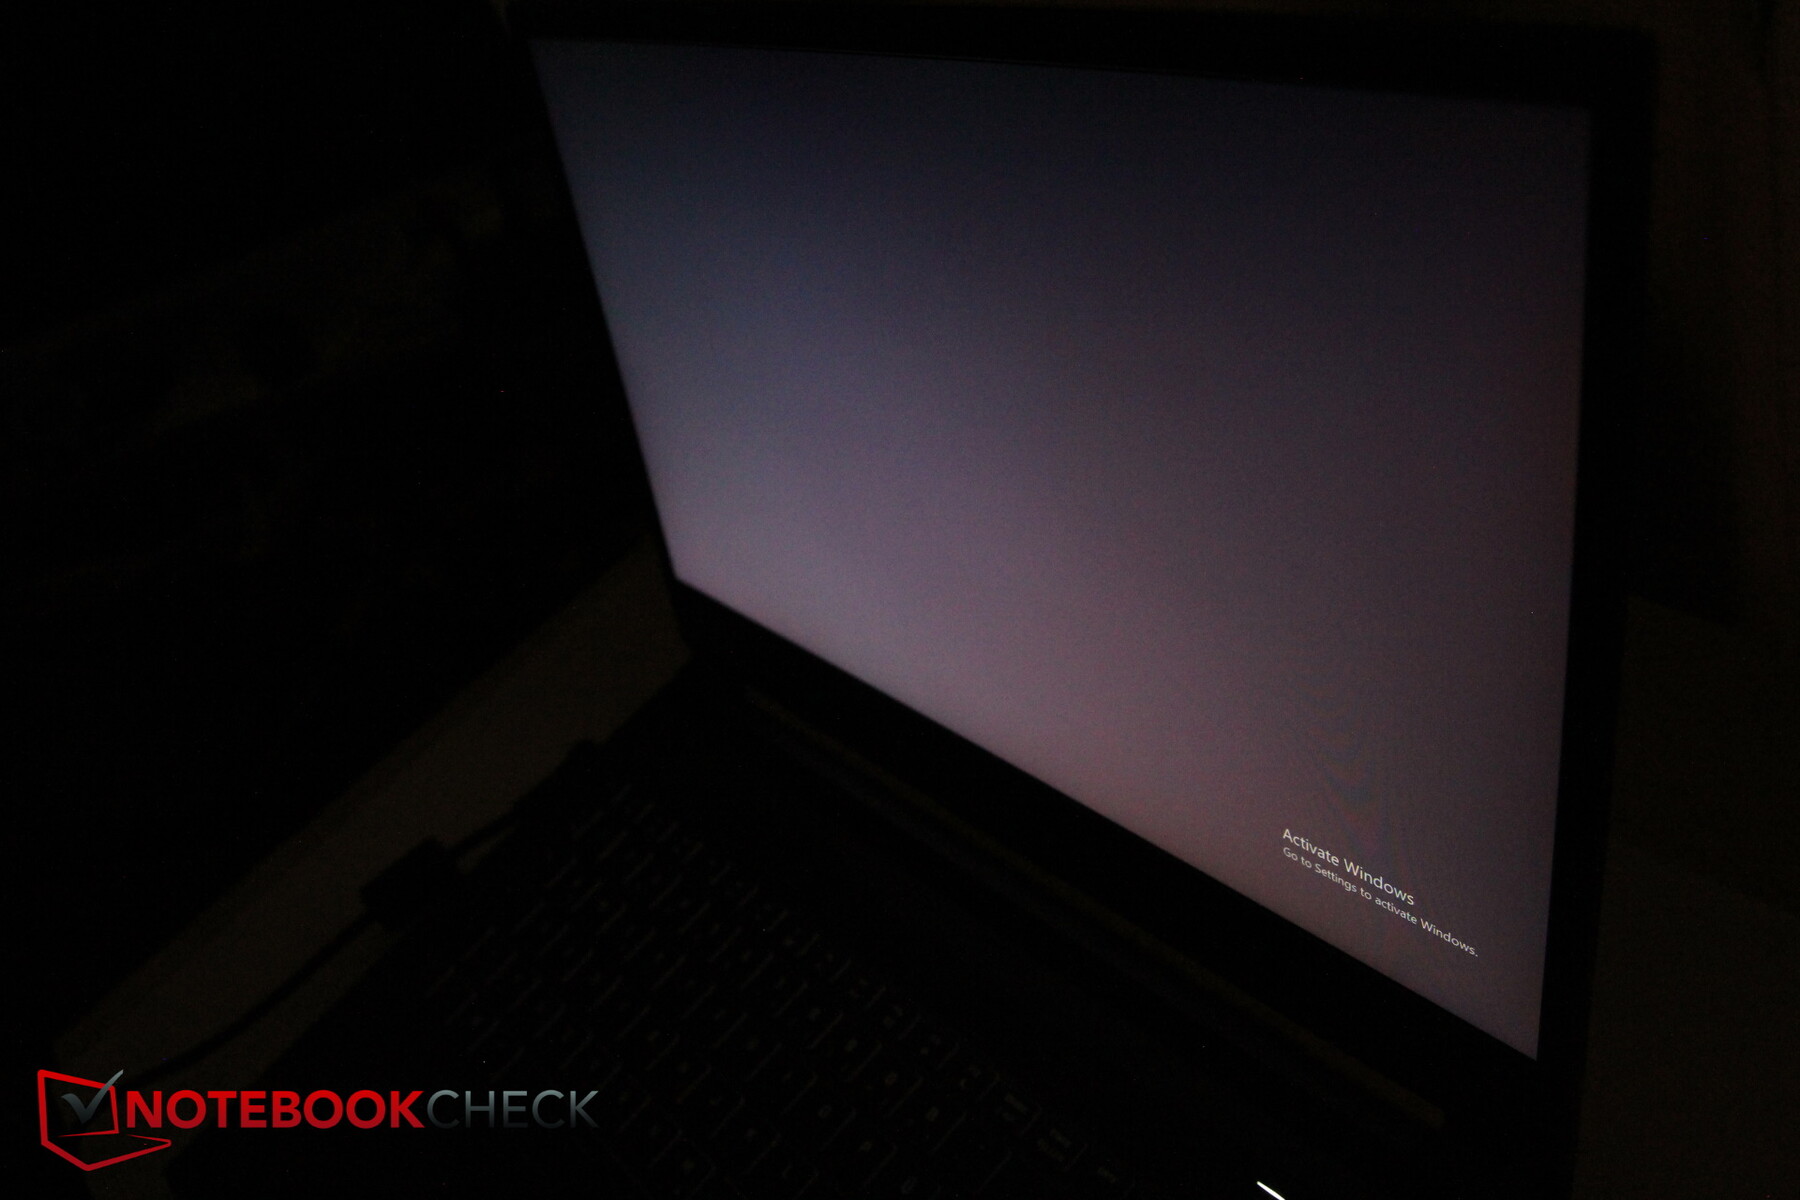
The viewing-angle stability is good, as is typical for IPS. Brightness and contrasts only drop a bit under extreme viewing angles.

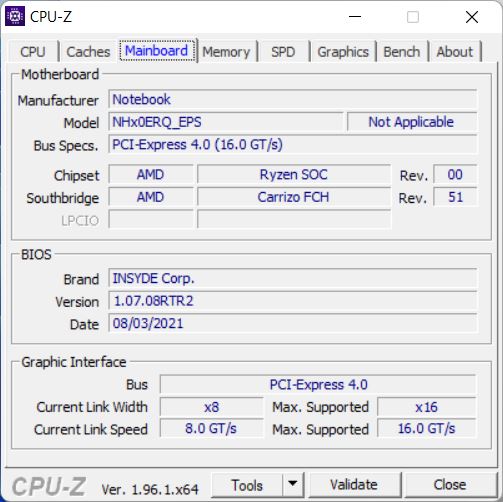
Performance - Full on target
With its 8-core processor, the AMD Ryzen 7 5800H, and the Nvidia GeForce RTX 3060 laptop GPU, the Apex 15 joins the ranks of upper mid-range gamers. The Apex is also optionally available with the upper-class RTX 3070 GPU, but our test model should still be able to render almost all modern games smoothly in the native resolution. Since the RTX 3060 consumes comparatively little energy and produces less waste heat than its more powerful sister models, the Apex is also suitable as a work device or multimedia station.
All performance settings can be found in the Apex's Control Center. Schenker also recommends the entertainment mode for higher loads, since the performance only increases minimally in performance mode, but the fan gets significantly louder according to the manufacturer. However, gaming laptops are designed for maximum performance, and we run all benchmarks in performance mode for a better comparison. Therefore, we will partly discuss the differences between the two modes in the text.

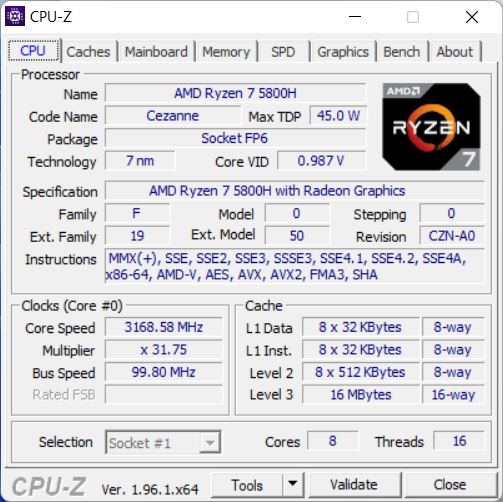
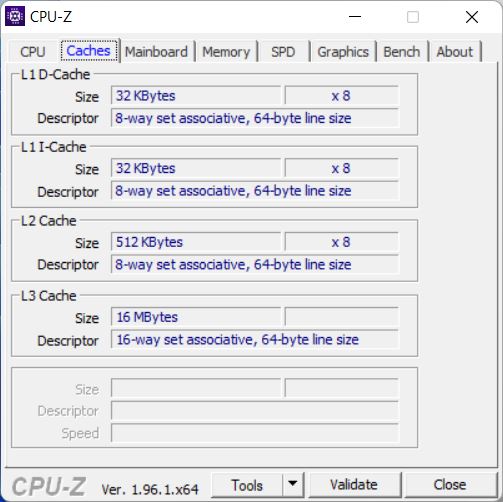
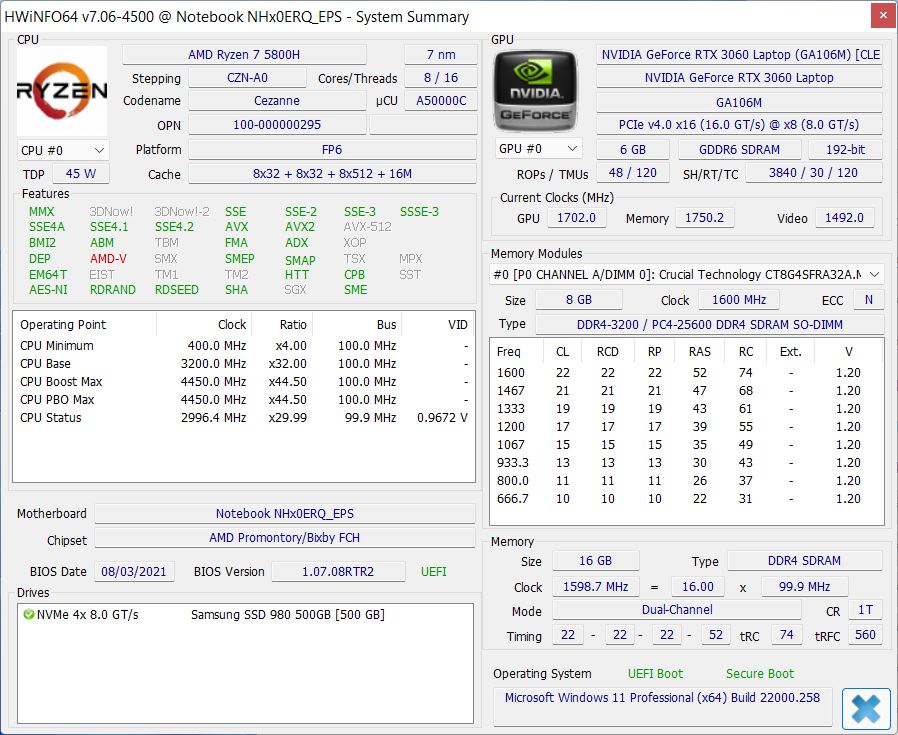
Processor
The AMD Ryzen 7 5800H has eight cores and theoretically clocks from 3.2 to 4.4 GHz. It also integrates a Radeon RX Vega 8 as GPU. The TDP is slightly higher in performance mode than in entertainment mode.
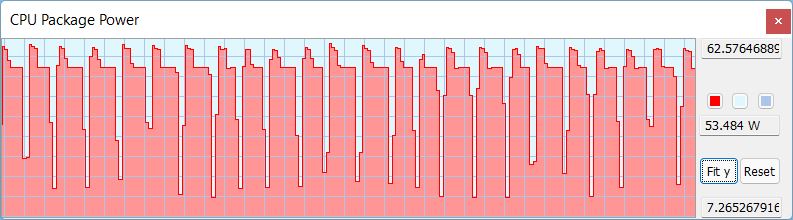
In our Cinebench loop, the consistent performance of the Apex 15 places itself squarely between the marginally faster Lenovo Legion and the slightly slower Alienware M15, all of which feature the same CPU. During the runs, the Apex initially reaches a TDP of around 62 W, which then drops to about 54 W. When starting a new run, it is again at 60-62 W. In entertainment mode, the Cinebench score is about five percent lower.
Across all Cinebench tests, our Apex is roughly on par with the marginally faster Legion and Asus TUF Gaming. However, the other laptops cannot compete with the multi-thread performance of the desktop processor AMD Ryzen 9 3900 from the predecessor. In return, the single-thread performance of the "old" socket CPU is significantly worse than in the current Apex.
In battery mode, about 44% of the performance is lost in a new Cinebench R15 multi-thread run.
Cinebench R15 Multi Endurance test
Cinebench R23: Multi Core | Single Core
Cinebench R20: CPU (Multi Core) | CPU (Single Core)
Cinebench R15: CPU Multi 64Bit | CPU Single 64Bit
Blender: v2.79 BMW27 CPU
7-Zip 18.03: 7z b 4 | 7z b 4 -mmt1
Geekbench 5.5: Multi-Core | Single-Core
HWBOT x265 Benchmark v2.2: 4k Preset
LibreOffice : 20 Documents To PDF
R Benchmark 2.5: Overall mean
| CPU Performance rating | |
| Average of class Gaming | |
| Schenker XMG Apex 15 NH57AF1 -2! | |
| Schenker XMG Apex 15 NH57E PS | |
| Asus TUF Gaming F15 FX506HM -2! | |
| Alienware m15 R5 Ryzen Edition | |
| HP Victus 16-e0179ng | |
| Average AMD Ryzen 7 5800H | |
| Lenovo Legion 5 15ACH-82JU00C6GE-FL | |
| Cinebench R23 / Multi Core | |
| Average of class Gaming (9107 - 40970, n=130, last 2 years) | |
| Asus TUF Gaming F15 FX506HM | |
| Lenovo Legion 5 15ACH-82JU00C6GE-FL | |
| Schenker XMG Apex 15 NH57E PS | |
| Alienware m15 R5 Ryzen Edition | |
| Average AMD Ryzen 7 5800H (8812 - 13214, n=29) | |
| HP Victus 16-e0179ng | |
| Cinebench R23 / Single Core | |
| Average of class Gaming (1166 - 2267, n=130, last 2 years) | |
| Asus TUF Gaming F15 FX506HM | |
| Alienware m15 R5 Ryzen Edition | |
| Schenker XMG Apex 15 NH57E PS | |
| Lenovo Legion 5 15ACH-82JU00C6GE-FL | |
| Average AMD Ryzen 7 5800H (1294 - 1441, n=29) | |
| HP Victus 16-e0179ng | |
| Cinebench R20 / CPU (Multi Core) | |
| Average of class Gaming (3504 - 16108, n=129, last 2 years) | |
| Schenker XMG Apex 15 NH57AF1 | |
| Asus TUF Gaming F15 FX506HM | |
| Lenovo Legion 5 15ACH-82JU00C6GE-FL | |
| Schenker XMG Apex 15 NH57E PS | |
| Alienware m15 R5 Ryzen Edition | |
| Average AMD Ryzen 7 5800H (3430 - 5020, n=31) | |
| HP Victus 16-e0179ng | |
| Cinebench R20 / CPU (Single Core) | |
| Average of class Gaming (442 - 870, n=129, last 2 years) | |
| Asus TUF Gaming F15 FX506HM | |
| Alienware m15 R5 Ryzen Edition | |
| Schenker XMG Apex 15 NH57E PS | |
| HP Victus 16-e0179ng | |
| Lenovo Legion 5 15ACH-82JU00C6GE-FL | |
| Average AMD Ryzen 7 5800H (502 - 560, n=30) | |
| Schenker XMG Apex 15 NH57AF1 | |
| Cinebench R15 / CPU Multi 64Bit | |
| Average of class Gaming (1537 - 6271, n=130, last 2 years) | |
| Schenker XMG Apex 15 NH57AF1 | |
| Lenovo Legion 5 15ACH-82JU00C6GE-FL | |
| Asus TUF Gaming F15 FX506HM | |
| Schenker XMG Apex 15 NH57E PS | |
| Alienware m15 R5 Ryzen Edition | |
| HP Victus 16-e0179ng | |
| Average AMD Ryzen 7 5800H (1487 - 2119, n=28) | |
| Cinebench R15 / CPU Single 64Bit | |
| Average of class Gaming (188.8 - 343, n=129, last 2 years) | |
| Alienware m15 R5 Ryzen Edition | |
| HP Victus 16-e0179ng | |
| Schenker XMG Apex 15 NH57E PS | |
| Asus TUF Gaming F15 FX506HM | |
| Average AMD Ryzen 7 5800H (209 - 234, n=29) | |
| Lenovo Legion 5 15ACH-82JU00C6GE-FL | |
| Schenker XMG Apex 15 NH57AF1 | |
| Blender / v2.79 BMW27 CPU | |
| Average AMD Ryzen 7 5800H (237 - 340, n=29) | |
| HP Victus 16-e0179ng | |
| Alienware m15 R5 Ryzen Edition | |
| Schenker XMG Apex 15 NH57E PS | |
| Lenovo Legion 5 15ACH-82JU00C6GE-FL | |
| Asus TUF Gaming F15 FX506HM | |
| Schenker XMG Apex 15 NH57AF1 | |
| Average of class Gaming (80 - 334, n=126, last 2 years) | |
| 7-Zip 18.03 / 7z b 4 | |
| Average of class Gaming (33491 - 148086, n=127, last 2 years) | |
| Schenker XMG Apex 15 NH57AF1 | |
| Schenker XMG Apex 15 NH57E PS | |
| HP Victus 16-e0179ng | |
| Average AMD Ryzen 7 5800H (45773 - 59986, n=28) | |
| Alienware m15 R5 Ryzen Edition | |
| Lenovo Legion 5 15ACH-82JU00C6GE-FL | |
| Asus TUF Gaming F15 FX506HM | |
| 7-Zip 18.03 / 7z b 4 -mmt1 | |
| Average of class Gaming (4199 - 7508, n=127, last 2 years) | |
| Asus TUF Gaming F15 FX506HM | |
| Alienware m15 R5 Ryzen Edition | |
| Schenker XMG Apex 15 NH57E PS | |
| HP Victus 16-e0179ng | |
| Average AMD Ryzen 7 5800H (5038 - 5632, n=29) | |
| Lenovo Legion 5 15ACH-82JU00C6GE-FL | |
| Schenker XMG Apex 15 NH57AF1 | |
| Geekbench 5.5 / Multi-Core | |
| Average of class Gaming (5847 - 27010, n=127, last 2 years) | |
| Schenker XMG Apex 15 NH57AF1 | |
| Schenker XMG Apex 15 NH57E PS | |
| HP Victus 16-e0179ng | |
| Average AMD Ryzen 7 5800H (6551 - 9062, n=28) | |
| Alienware m15 R5 Ryzen Edition | |
| Lenovo Legion 5 15ACH-82JU00C6GE-FL | |
| Geekbench 5.5 / Single-Core | |
| Average of class Gaming (986 - 2474, n=127, last 2 years) | |
| Schenker XMG Apex 15 NH57E PS | |
| Alienware m15 R5 Ryzen Edition | |
| Lenovo Legion 5 15ACH-82JU00C6GE-FL | |
| Average AMD Ryzen 7 5800H (1336 - 1505, n=28) | |
| HP Victus 16-e0179ng | |
| Schenker XMG Apex 15 NH57AF1 | |
| HWBOT x265 Benchmark v2.2 / 4k Preset | |
| Average of class Gaming (11 - 44.3, n=127, last 2 years) | |
| Schenker XMG Apex 15 NH57AF1 | |
| Asus TUF Gaming F15 FX506HM | |
| Schenker XMG Apex 15 NH57E PS | |
| HP Victus 16-e0179ng | |
| Lenovo Legion 5 15ACH-82JU00C6GE-FL | |
| Alienware m15 R5 Ryzen Edition | |
| Average AMD Ryzen 7 5800H (11.6 - 16.1, n=29) | |
| LibreOffice / 20 Documents To PDF | |
| Lenovo Legion 5 15ACH-82JU00C6GE-FL | |
| Average AMD Ryzen 7 5800H (47.4 - 113, n=29) | |
| Schenker XMG Apex 15 NH57AF1 | |
| Alienware m15 R5 Ryzen Edition | |
| HP Victus 16-e0179ng | |
| Schenker XMG Apex 15 NH57E PS | |
| Average of class Gaming (19 - 88.8, n=127, last 2 years) | |
| Asus TUF Gaming F15 FX506HM | |
| R Benchmark 2.5 / Overall mean | |
| Asus TUF Gaming F15 FX506HM | |
| Schenker XMG Apex 15 NH57AF1 | |
| Lenovo Legion 5 15ACH-82JU00C6GE-FL | |
| Average AMD Ryzen 7 5800H (0.511 - 0.559, n=28) | |
| Alienware m15 R5 Ryzen Edition | |
| HP Victus 16-e0179ng | |
| Schenker XMG Apex 15 NH57E PS | |
| Average of class Gaming (0.3439 - 0.759, n=128, last 2 years) | |
* ... smaller is better
AIDA64: FP32 Ray-Trace | FPU Julia | CPU SHA3 | CPU Queen | FPU SinJulia | FPU Mandel | CPU AES | CPU ZLib | FP64 Ray-Trace | CPU PhotoWorxx
| Performance rating | |
| Average of class Gaming | |
| Schenker XMG Apex 15 NH57E PS | |
| Average AMD Ryzen 7 5800H | |
| AIDA64 / FP32 Ray-Trace | |
| Average of class Gaming (10227 - 85542, n=127, last 2 years) | |
| Schenker XMG Apex 15 NH57E PS | |
| Average AMD Ryzen 7 5800H (10349 - 15169, n=29) | |
| AIDA64 / FPU Julia | |
| Average of class Gaming (51376 - 238426, n=127, last 2 years) | |
| Schenker XMG Apex 15 NH57E PS | |
| Average AMD Ryzen 7 5800H (63663 - 95954, n=29) | |
| AIDA64 / CPU SHA3 | |
| Average of class Gaming (2180 - 9817, n=127, last 2 years) | |
| Schenker XMG Apex 15 NH57E PS | |
| Average AMD Ryzen 7 5800H (2096 - 3287, n=29) | |
| AIDA64 / CPU Queen | |
| Average of class Gaming (49785 - 173351, n=127, last 2 years) | |
| Schenker XMG Apex 15 NH57E PS | |
| Average AMD Ryzen 7 5800H (91846 - 99215, n=29) | |
| AIDA64 / FPU SinJulia | |
| Average of class Gaming (4424 - 33636, n=127, last 2 years) | |
| Schenker XMG Apex 15 NH57E PS | |
| Average AMD Ryzen 7 5800H (9962 - 11871, n=29) | |
| AIDA64 / FPU Mandel | |
| Average of class Gaming (25115 - 128721, n=127, last 2 years) | |
| Schenker XMG Apex 15 NH57E PS | |
| Average AMD Ryzen 7 5800H (36083 - 52732, n=29) | |
| AIDA64 / CPU AES | |
| Schenker XMG Apex 15 NH57E PS | |
| Average AMD Ryzen 7 5800H (50226 - 127832, n=29) | |
| Average of class Gaming (39258 - 247074, n=127, last 2 years) | |
| AIDA64 / CPU ZLib | |
| Average of class Gaming (574 - 2531, n=127, last 2 years) | |
| Schenker XMG Apex 15 NH57E PS | |
| Average AMD Ryzen 7 5800H (591 - 828, n=29) | |
| AIDA64 / FP64 Ray-Trace | |
| Average of class Gaming (5509 - 45446, n=127, last 2 years) | |
| Schenker XMG Apex 15 NH57E PS | |
| Average AMD Ryzen 7 5800H (5457 - 7884, n=29) | |
| AIDA64 / CPU PhotoWorxx | |
| Average of class Gaming (10805 - 62916, n=127, last 2 years) | |
| Schenker XMG Apex 15 NH57E PS | |
| Average AMD Ryzen 7 5800H (14445 - 25421, n=29) | |
System performance
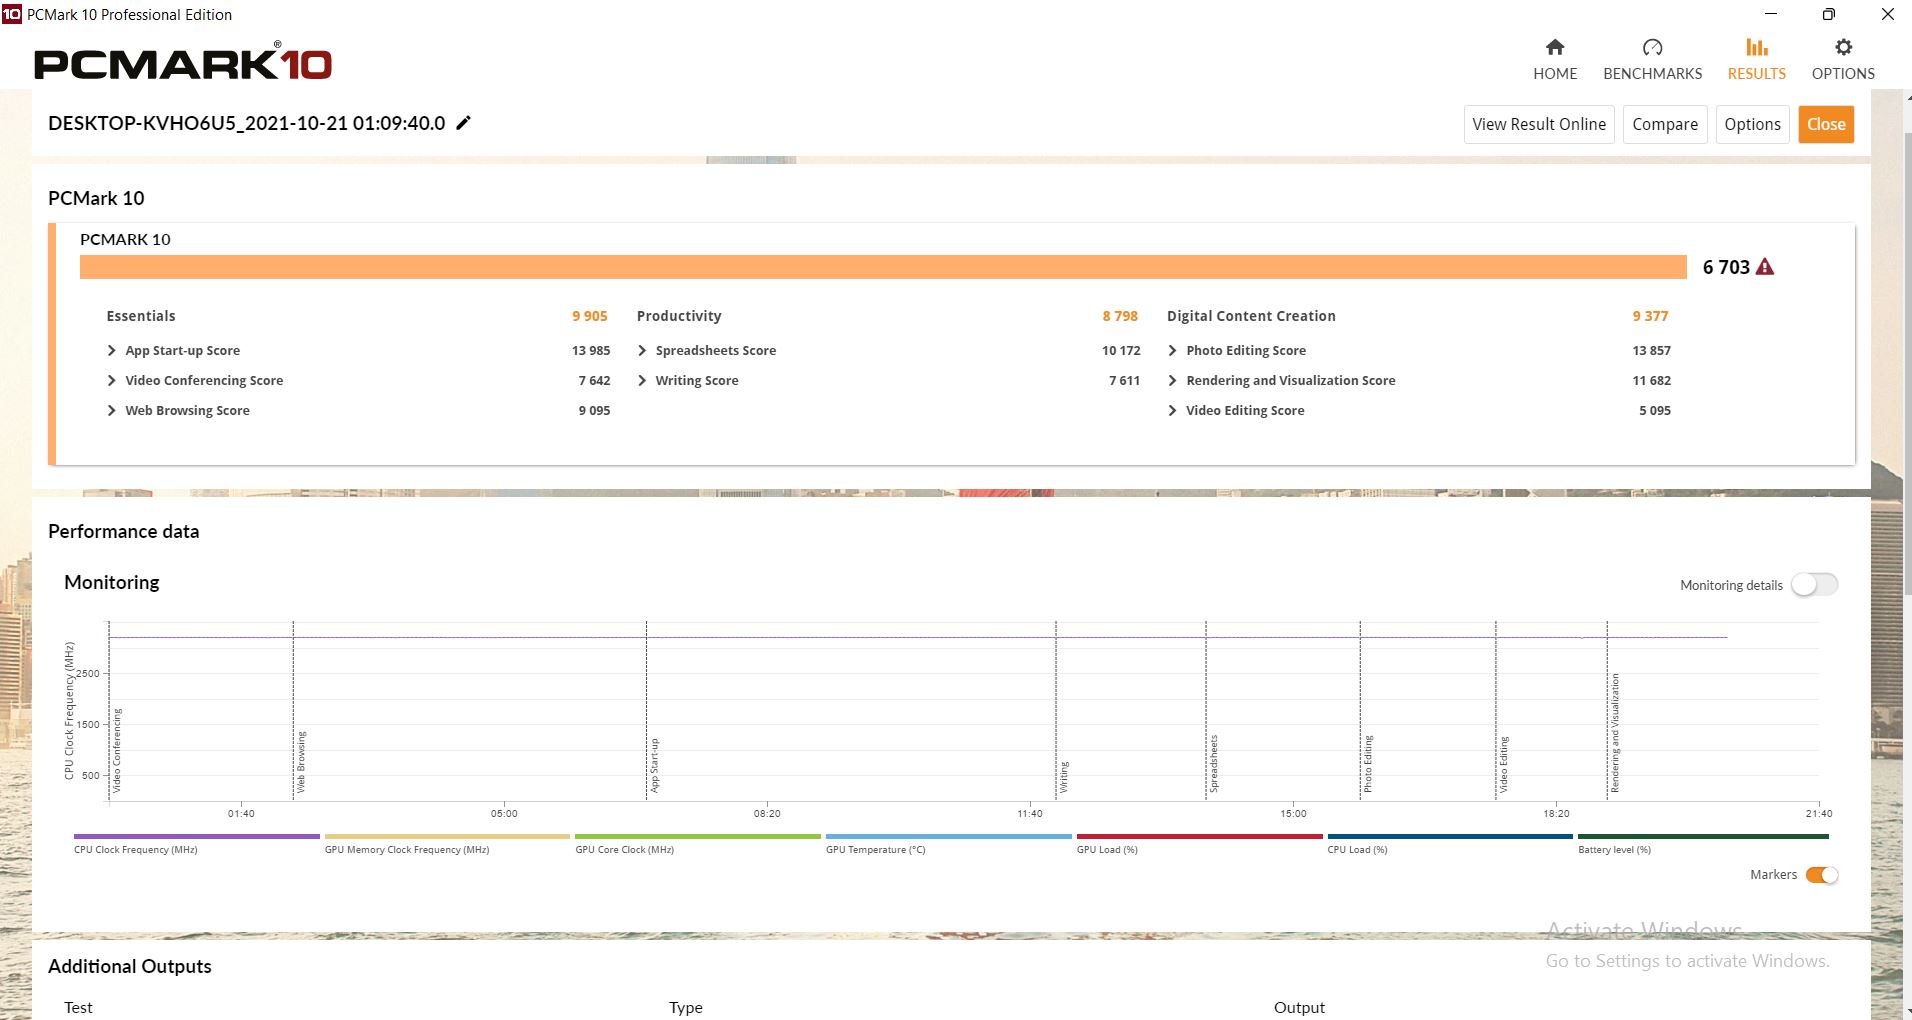
All comparison devices are close to each other in PCMark 10. What is striking is that the "old" Apex often still occupies the first rank.
| PCMark 10 / Score | |
| Average of class Gaming (5828 - 10060, n=108, last 2 years) | |
| Schenker XMG Apex 15 NH57AF1 | |
| Asus TUF Gaming F15 FX506HM | |
| Schenker XMG Apex 15 NH57E PS | |
| Average AMD Ryzen 7 5800H, NVIDIA GeForce RTX 3060 Laptop GPU (6465 - 6855, n=6) | |
| Lenovo Legion 5 15ACH-82JU00C6GE-FL | |
| HP Victus 16-e0179ng | |
| Alienware m15 R5 Ryzen Edition | |
| PCMark 10 / Essentials | |
| Average of class Gaming (8810 - 12600, n=112, last 2 years) | |
| Schenker XMG Apex 15 NH57AF1 | |
| Asus TUF Gaming F15 FX506HM | |
| Lenovo Legion 5 15ACH-82JU00C6GE-FL | |
| Average AMD Ryzen 7 5800H, NVIDIA GeForce RTX 3060 Laptop GPU (9589 - 10414, n=6) | |
| HP Victus 16-e0179ng | |
| Schenker XMG Apex 15 NH57E PS | |
| Alienware m15 R5 Ryzen Edition | |
| PCMark 10 / Productivity | |
| Average of class Gaming (6662 - 16716, n=110, last 2 years) | |
| Lenovo Legion 5 15ACH-82JU00C6GE-FL | |
| Average AMD Ryzen 7 5800H, NVIDIA GeForce RTX 3060 Laptop GPU (8798 - 9728, n=6) | |
| HP Victus 16-e0179ng | |
| Alienware m15 R5 Ryzen Edition | |
| Asus TUF Gaming F15 FX506HM | |
| Schenker XMG Apex 15 NH57E PS | |
| Schenker XMG Apex 15 NH57AF1 | |
| PCMark 10 / Digital Content Creation | |
| Average of class Gaming (7505 - 19351, n=110, last 2 years) | |
| Schenker XMG Apex 15 NH57AF1 | |
| Asus TUF Gaming F15 FX506HM | |
| Schenker XMG Apex 15 NH57E PS | |
| Average AMD Ryzen 7 5800H, NVIDIA GeForce RTX 3060 Laptop GPU (7884 - 9497, n=6) | |
| HP Victus 16-e0179ng | |
| Alienware m15 R5 Ryzen Edition | |
| Lenovo Legion 5 15ACH-82JU00C6GE-FL | |
| PCMark 10 Score | 6703 points | |
Help | ||
| AIDA64 / Memory Copy | |
| Average of class Gaming (21750 - 108104, n=127, last 2 years) | |
| Schenker XMG Apex 15 NH57AF1 | |
| Schenker XMG Apex 15 NH57E PS | |
| HP Victus 16-e0179ng | |
| Average AMD Ryzen 7 5800H (34964 - 44180, n=29) | |
| Alienware m15 R5 Ryzen Edition | |
| Lenovo Legion 5 15ACH-82JU00C6GE-FL | |
| AIDA64 / Memory Read | |
| Average of class Gaming (22956 - 104349, n=127, last 2 years) | |
| Schenker XMG Apex 15 NH57AF1 | |
| Schenker XMG Apex 15 NH57E PS | |
| HP Victus 16-e0179ng | |
| Average AMD Ryzen 7 5800H (39548 - 47260, n=29) | |
| Alienware m15 R5 Ryzen Edition | |
| Lenovo Legion 5 15ACH-82JU00C6GE-FL | |
| AIDA64 / Memory Write | |
| Average of class Gaming (22297 - 133486, n=127, last 2 years) | |
| Schenker XMG Apex 15 NH57AF1 | |
| Schenker XMG Apex 15 NH57E PS | |
| HP Victus 16-e0179ng | |
| Average AMD Ryzen 7 5800H (28456 - 47022, n=29) | |
| Alienware m15 R5 Ryzen Edition | |
| Lenovo Legion 5 15ACH-82JU00C6GE-FL | |
| AIDA64 / Memory Latency | |
| Average of class Gaming (75.3 - 259, n=127, last 2 years) | |
| HP Victus 16-e0179ng | |
| Average AMD Ryzen 7 5800H (76.3 - 105.1, n=29) | |
| Lenovo Legion 5 15ACH-82JU00C6GE-FL | |
| Schenker XMG Apex 15 NH57AF1 | |
| Alienware m15 R5 Ryzen Edition | |
| Schenker XMG Apex 15 NH57E PS | |
| Asus TUF Gaming F15 FX506HM | |
* ... smaller is better
DPC latencies
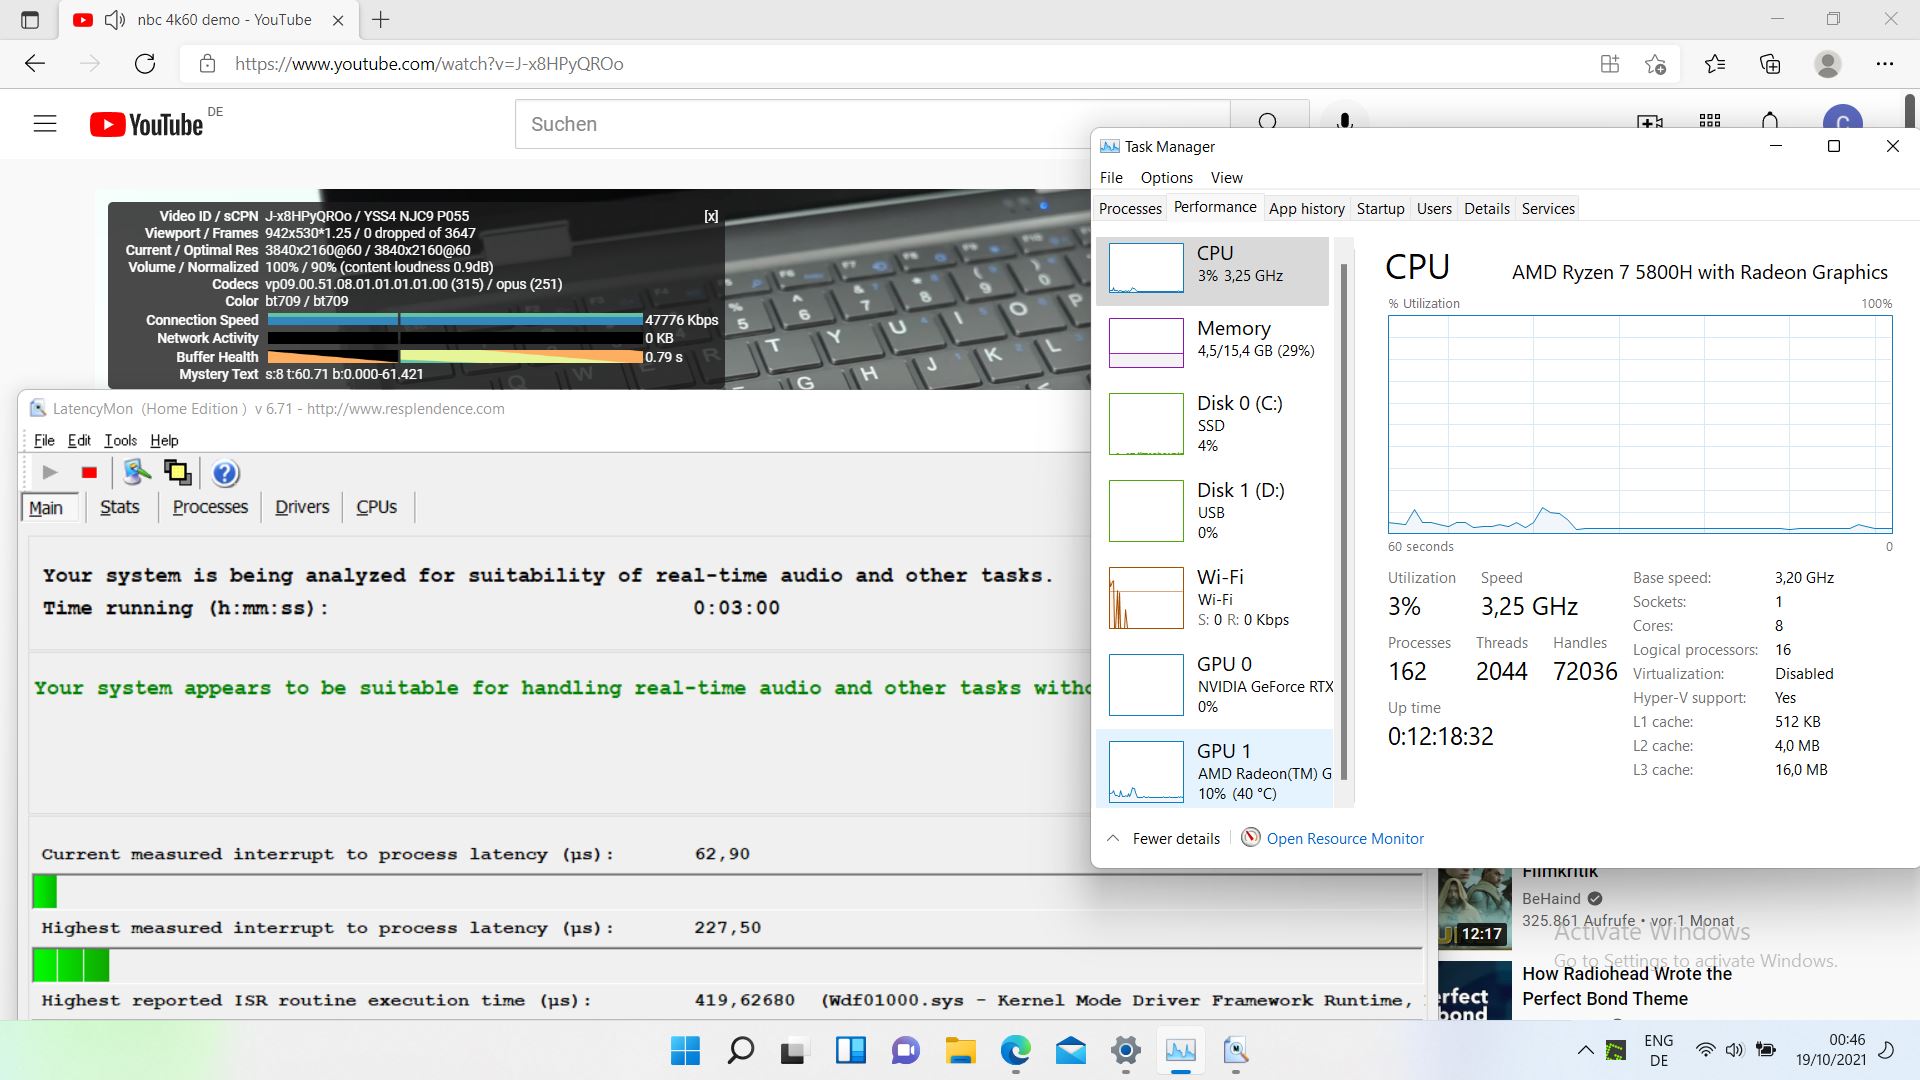
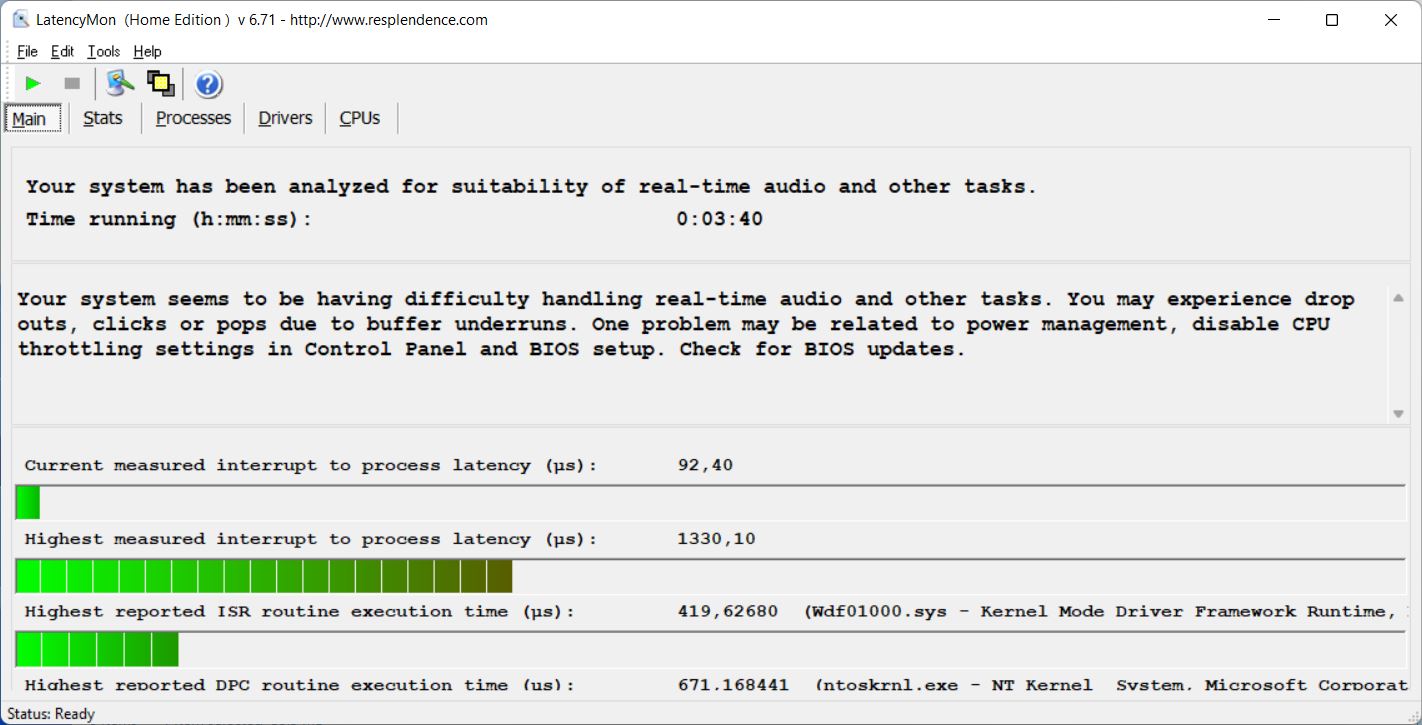
Neither opening multiple browser tabs nor playing our 4K/60-fps YouTube video caused the Apex any problems. But latencies suddenly appear when closing the browser, of all things - a rather unusual phenomenon, which is possibly still related to driver problems under the new Windows 11.
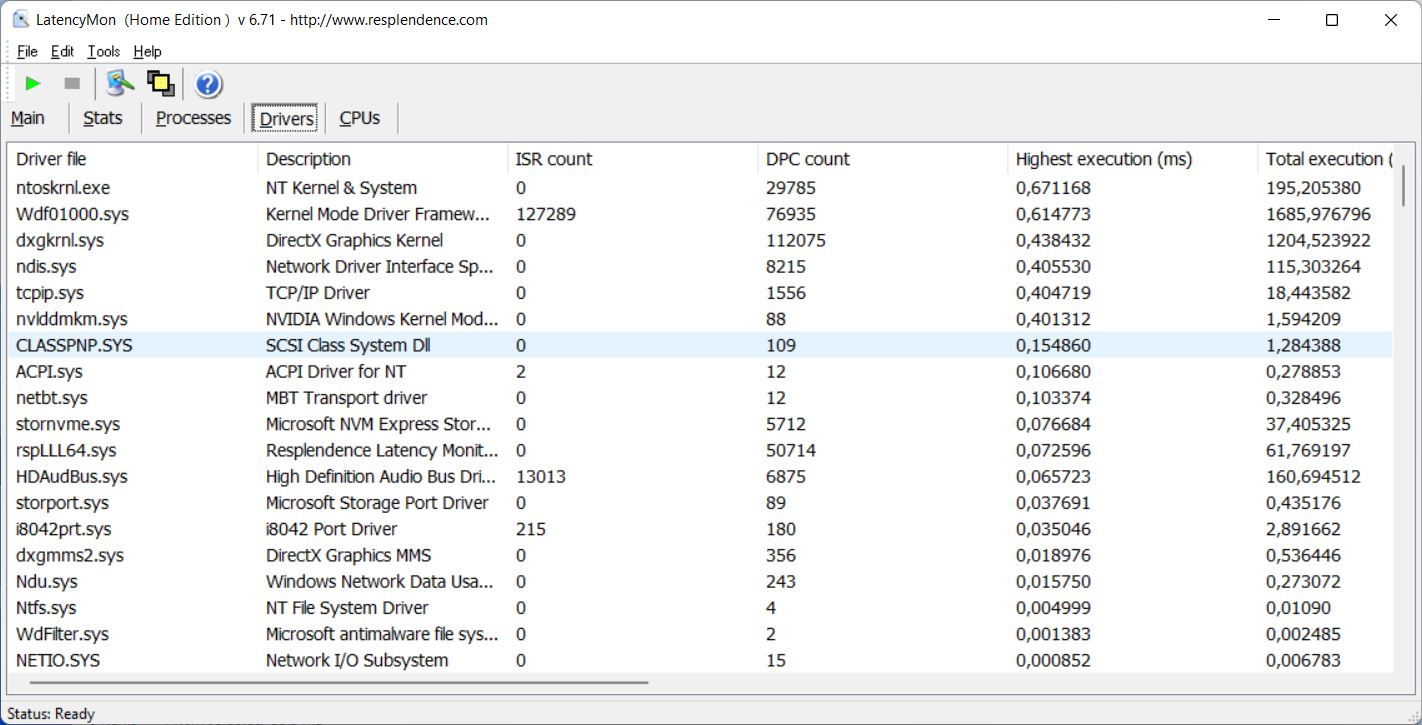
| DPC Latencies / LatencyMon - interrupt to process latency (max), Web, Youtube, Prime95 | |
| Asus TUF Gaming F15 FX506HM | |
| Schenker XMG Apex 15 NH57E PS | |
| HP Victus 16-e0179ng | |
| Schenker XMG Apex 15 NH57AF1 | |
| Lenovo Legion 5 15ACH-82JU00C6GE-FL | |
| Alienware m15 R5 Ryzen Edition | |
* ... smaller is better
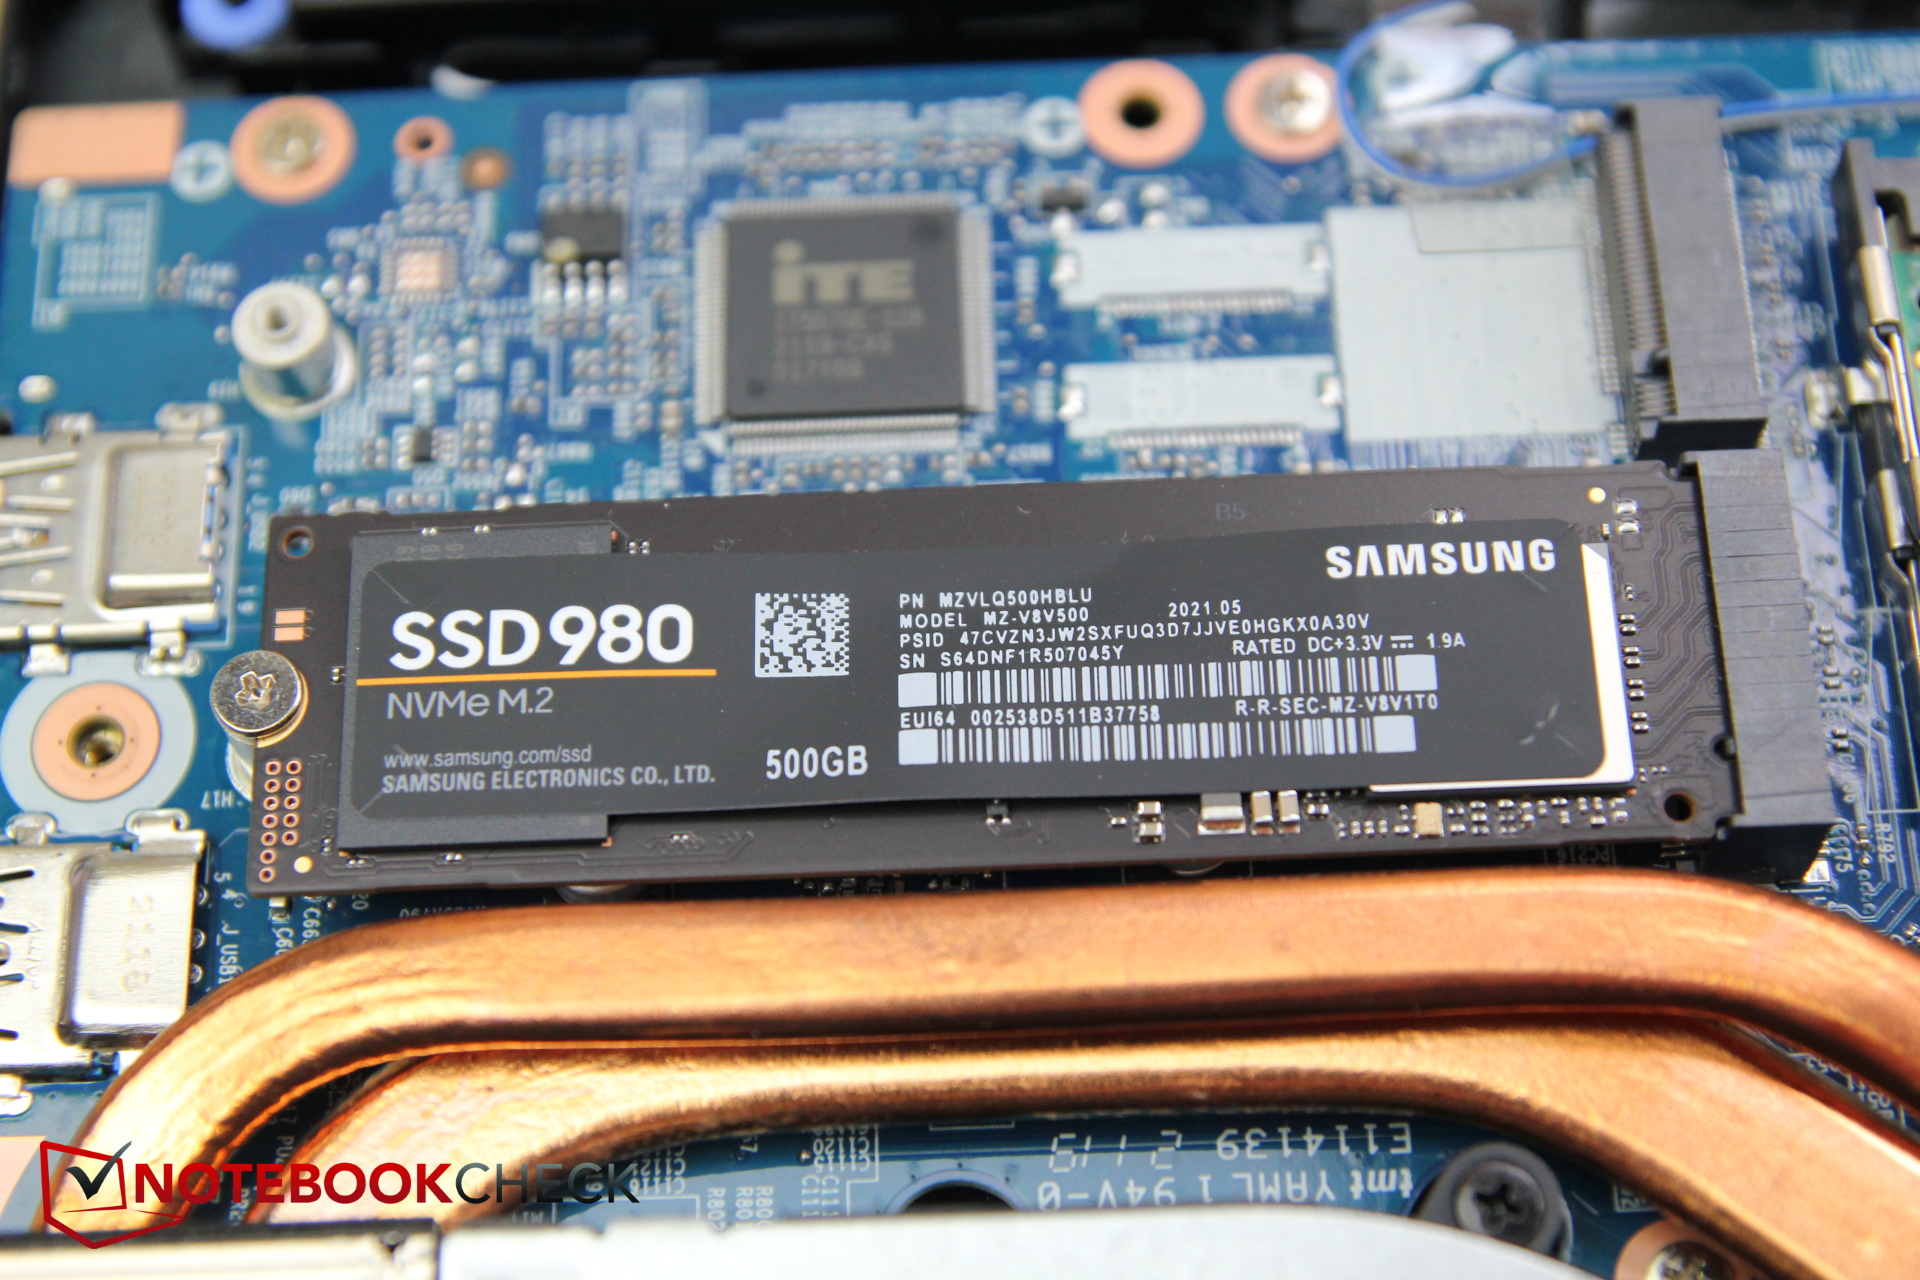
Mass storage
Schenker installs a Samsung SSD 980 with 512 GB in the Apex. The SSD hardly lives up to the good reputation of Samsung SSDs. Across all our tests, only the Alienware performs worse; the rest of the competition is usually better, the old Apex even significantly so.
There is another M.2 slot in the case, and users also have the option to install a 2.5-inch drive.
* ... smaller is better

Continuous Reading: DiskSpd Read Loop, Queue Depth 8
Graphics performance
The AMD Ryzen 7 5800H still has an integrated Radeon RX Vega 8, but the Nvidia GeForce RTX 3060 laptop GPU is more suitable for demanding tasks. Alternatively, you can also buy the Apex with RTX 3070. Depending on the performance profile, the GPUs call up a different performance. The RTX 3060 is theoretically equally fast in the Entertainment and Performance profiles, but it lacks the Dynamic Boost of 15 W in Quiet and Power Saving modes.
The Apex usually takes the top spot in the synthetic 3DMark tests, and Lenovo's Legion is its fiercest competitor for the performance crown. However, the old Apex is only a few percentage points behind its official successor with its RTX 2070. Across all tests, the current model performs about 8% better than the calculated average of all laptops with RTX 3060 in our database.
However, most of the GPU performance is lost in battery mode. We measured a drop of 67% in 3DMark 11.
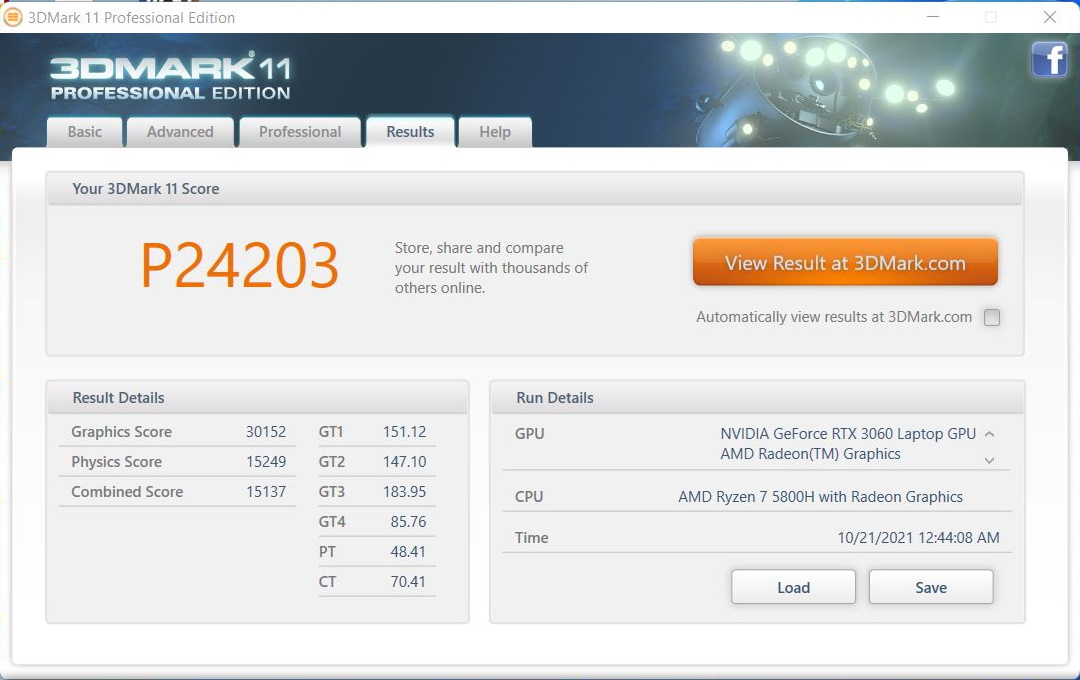


| 3DMark 11 Performance | 24203 points | |
| 3DMark Cloud Gate Standard Score | 47847 points | |
| 3DMark Fire Strike Score | 20158 points | |
| 3DMark Time Spy Score | 8932 points | |
Help | ||
Gaming performance
In gaming, the Apex performs as expected or even slightly above an average RTX 3060. The old Apex with RTX 2070 is almost always a few percentage points ahead of the new model, which is certainly also due to the faster processor. Nevertheless, the graphics performance is completely on target. The differences to the rest of the competition are small, and the Apex always has a good ranking.
All tested games can still be played smoothly in the native Full HD resolution even in maximum details. The gaming performance in Witcher 3 was about 5 to 7 percent lower in entertainment mode than in performance mode.
| New World | |
| 1920x1080 Medium Video Quality | |
| Schenker XMG Apex 15 NH57E PS | |
| Average NVIDIA GeForce RTX 3060 Laptop GPU (71 - 95, n=3) | |
| 1920x1080 High Video Quality | |
| Schenker XMG Apex 15 NH57E PS | |
| Average NVIDIA GeForce RTX 3060 Laptop GPU (66.1 - 91, n=4) | |
| 1920x1080 Very High Video Quality | |
| Schenker XMG Apex 15 NH57E PS | |
| Average NVIDIA GeForce RTX 3060 Laptop GPU (62.3 - 84, n=4) | |
| Final Fantasy XV Benchmark - 1920x1080 Standard Quality | |
| Average of class Gaming (62.1 - 236, n=100, last 2 years) | |
| Schenker XMG Apex 15 NH57E PS | |
| Lenovo Legion 5 15ACH-82JU00C6GE-FL | |
| Average NVIDIA GeForce RTX 3060 Laptop GPU (70.4 - 133.5, n=37) | |
| Asus TUF Gaming F15 FX506HM | |
| Alienware m15 R5 Ryzen Edition | |
The frames per second in Witcher 3 fluctuate a bit over the test period of one hour, but overall remain at about the same level. A significant drop in performance is not noticeable.
Witcher 3 FPS diagram
| low | med. | high | ultra | |
|---|---|---|---|---|
| GTA V (2015) | 178 | 170 | 148 | 83.7 |
| The Witcher 3 (2015) | 285 | 217 | 149 | 86 |
| Dota 2 Reborn (2015) | 145 | 133 | 127 | 119 |
| Final Fantasy XV Benchmark (2018) | 113 | |||
| X-Plane 11.11 (2018) | 105 | 94.3 | 76 | |
| Far Cry 5 (2018) | 123 | 116 | 111 | 104 |
| Strange Brigade (2018) | 298 | 180 | 159 | 144 |
| New World (2021) | 116 | 95 | 91 | 84 |
Emissions - Still louder than the others
Fan noise
The good news: The new Apex is now quieter than the old one with the socket processor. The fans even stay quiet most of the time when idling, apart from the performance mode (and partly even here).
Under load, however, the two fans turn up quite a bit. More than 58 dB(A) in gaming and the stress test are negative peak values in comparison, not including the predecessor. In entertainment mode it is still 55 dB(A), louder than most competitors. Only under low load (1st benchmark of 3DMark06) does the device remain comparatively quiet.
| Schenker XMG Apex 15 NH57E PS GeForce RTX 3060 Laptop GPU, R7 5800H, Samsung SSD 980 500GB (MZ-V8V500BW) | Schenker XMG Apex 15 NH57AF1 GeForce RTX 2070 Mobile, R9 3900, Samsung SSD 970 EVO Plus 1TB | Lenovo Legion 5 15ACH-82JU00C6GE-FL GeForce RTX 3060 Laptop GPU, R7 5800H, Micron 2300 512GB MTFDHBA512TDV | Asus TUF Gaming F15 FX506HM GeForce RTX 3060 Laptop GPU, i7-11800H, SK Hynix HFM001TD3JX013N | Alienware m15 R5 Ryzen Edition GeForce RTX 3060 Laptop GPU, R7 5800H, Toshiba KBG40ZNS512G NVMe | HP Victus 16-e0179ng GeForce RTX 3060 Laptop GPU, R7 5800H, WDC PC SN730 SDBPNTY-1T00 | |
|---|---|---|---|---|---|---|
| Noise | -39% | -15% | 6% | -7% | -7% | |
| off / environment * (dB) | 23 | 30 -30% | 24.2 -5% | 24.8 -8% | 24 -4% | 24 -4% |
| Idle Minimum * (dB) | 23 | 35 -52% | 29 -26% | 24.6 -7% | 24 -4% | 24 -4% |
| Idle Average * (dB) | 23 | 36 -57% | 29 -26% | 24.9 -8% | 25 -9% | 25 -9% |
| Idle Maximum * (dB) | 26.4 | 39 -48% | 29 -10% | 24.9 6% | 35 -33% | 34 -29% |
| Load Average * (dB) | 34.25 | 59 -72% | 53.5 -56% | 27.1 21% | 44 -28% | 44 -28% |
| Witcher 3 ultra * (dB) | 58.4 | 62 -6% | 53.5 8% | 46.4 21% | 48 18% | 50 14% |
| Load Maximum * (dB) | 58.42 | 63 -8% | 53.5 8% | 49 16% | 50 14% | 52 11% |
* ... smaller is better
Noise level
| Idle |
| 23 / 23 / 26.4 dB(A) |
| Load |
| 34.25 / 58.42 dB(A) |
 | ||
30 dB silent 40 dB(A) audible 50 dB(A) loud |
||
min: | ||
Temperature
The Apex 15 can score here. The loud fans must be good for something. The temperatures are even slightly lower in performance mode under load than in entertainment mode. Overall, they are so low that one wonders why Schenker does not use the leeway here to create a better balance between temperature and volume. As a result, the Apex is the coolest, but also clearly the loudest device in the comparison. When gaming, the Apex gets hotter than in our stress test.
| Schenker XMG Apex 15 NH57E PS GeForce RTX 3060 Laptop GPU, R7 5800H, Samsung SSD 980 500GB (MZ-V8V500BW) | Schenker XMG Apex 15 NH57AF1 GeForce RTX 2070 Mobile, R9 3900, Samsung SSD 970 EVO Plus 1TB | Lenovo Legion 5 15ACH-82JU00C6GE-FL GeForce RTX 3060 Laptop GPU, R7 5800H, Micron 2300 512GB MTFDHBA512TDV | Asus TUF Gaming F15 FX506HM GeForce RTX 3060 Laptop GPU, i7-11800H, SK Hynix HFM001TD3JX013N | Alienware m15 R5 Ryzen Edition GeForce RTX 3060 Laptop GPU, R7 5800H, Toshiba KBG40ZNS512G NVMe | HP Victus 16-e0179ng GeForce RTX 3060 Laptop GPU, R7 5800H, WDC PC SN730 SDBPNTY-1T00 | |
|---|---|---|---|---|---|---|
| Heat | -20% | -3% | -4% | -37% | -38% | |
| Maximum Upper Side * (°C) | 36 | 44 -22% | 42.6 -18% | 46.4 -29% | 62 -72% | 51 -42% |
| Maximum Bottom * (°C) | 38 | 48 -26% | 52.2 -37% | 45.4 -19% | 61 -61% | 52 -37% |
| Idle Upper Side * (°C) | 31 | 33 -6% | 24.9 20% | 26 16% | 36 -16% | 46 -48% |
| Idle Bottom * (°C) | 33 | 41 -24% | 25.3 23% | 27.4 17% | 33 -0% | 41 -24% |
* ... smaller is better
Stress test
The CPU cores start our stress test with 4.1 GHz. After a few seconds, the clock drops until it finally settles between 3.2 and 3.5 GHz. The core temperature is around 88 °C (~190 °F) after one hour, and the maximum is 98 °C (~208 °F).
The GPU clock drops from 1,950 to 1,340 MHz in the same period. A subsequent 3DMark 11 test did not reveal any performance loss due to the previous stress test.


(+) The maximum temperature on the upper side is 36 °C / 97 F, compared to the average of 40.4 °C / 105 F, ranging from 21.2 to 68.8 °C for the class Gaming.
(+) The bottom heats up to a maximum of 38 °C / 100 F, compared to the average of 43.3 °C / 110 F
(+) In idle usage, the average temperature for the upper side is 29 °C / 84 F, compared to the device average of 33.9 °C / 93 F.
(±) Playing The Witcher 3, the average temperature for the upper side is 35.1 °C / 95 F, compared to the device average of 33.9 °C / 93 F.
(±) The palmrests and touchpad can get very hot to the touch with a maximum of 36 °C / 96.8 F.
(-) The average temperature of the palmrest area of similar devices was 28.8 °C / 83.8 F (-7.2 °C / -13 F).
Speaker
The speakers are not among the highlights in the Apex. Overall, they are too quiet and lack bass. They cannot shine even in the mid and high tones. At least there are two separate audio ports for external analog devices.
Schenker XMG Apex 15 NH57E PS audio analysis
(±) | speaker loudness is average but good (78.5 dB)
Bass 100 - 315 Hz
(-) | nearly no bass - on average 24.2% lower than median
(-) | bass is not linear (15.1% delta to prev. frequency)
Mids 400 - 2000 Hz
(±) | higher mids - on average 7.3% higher than median
(±) | linearity of mids is average (8.3% delta to prev. frequency)
Highs 2 - 16 kHz
(±) | higher highs - on average 5.6% higher than median
(+) | highs are linear (5.3% delta to prev. frequency)
Overall 100 - 16.000 Hz
(±) | linearity of overall sound is average (24.9% difference to median)
Compared to same class
» 89% of all tested devices in this class were better, 3% similar, 7% worse
» The best had a delta of 6%, average was 18%, worst was 132%
Compared to all devices tested
» 76% of all tested devices were better, 5% similar, 19% worse
» The best had a delta of 4%, average was 24%, worst was 134%
Lenovo Legion 5 15ACH-82JU00C6GE-FL audio analysis
(±) | speaker loudness is average but good (81 dB)
Bass 100 - 315 Hz
(-) | nearly no bass - on average 22.1% lower than median
(±) | linearity of bass is average (11.4% delta to prev. frequency)
Mids 400 - 2000 Hz
(+) | balanced mids - only 4.5% away from median
(+) | mids are linear (5% delta to prev. frequency)
Highs 2 - 16 kHz
(+) | balanced highs - only 2.9% away from median
(+) | highs are linear (4.5% delta to prev. frequency)
Overall 100 - 16.000 Hz
(±) | linearity of overall sound is average (17.8% difference to median)
Compared to same class
» 53% of all tested devices in this class were better, 10% similar, 38% worse
» The best had a delta of 6%, average was 18%, worst was 132%
Compared to all devices tested
» 35% of all tested devices were better, 8% similar, 56% worse
» The best had a delta of 4%, average was 24%, worst was 134%
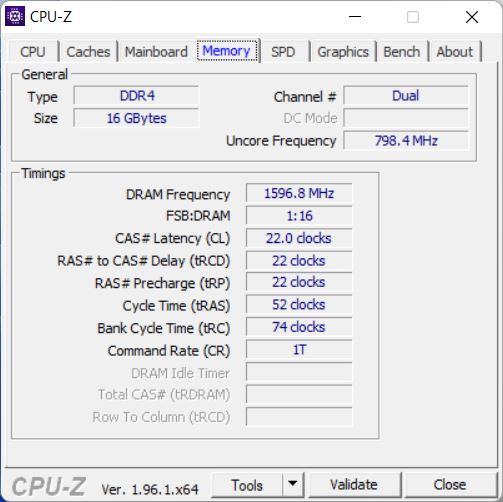
Energy consumption - A new apex
Thanks to its laptop CPU and Optimus, the new Apex is now significantly more frugal than its predecessor. However, it is not more frugal than the rest of the competition. Our test device consumes a bit more than the rivals during gaming, but the consumption is comparable under average load or idle.
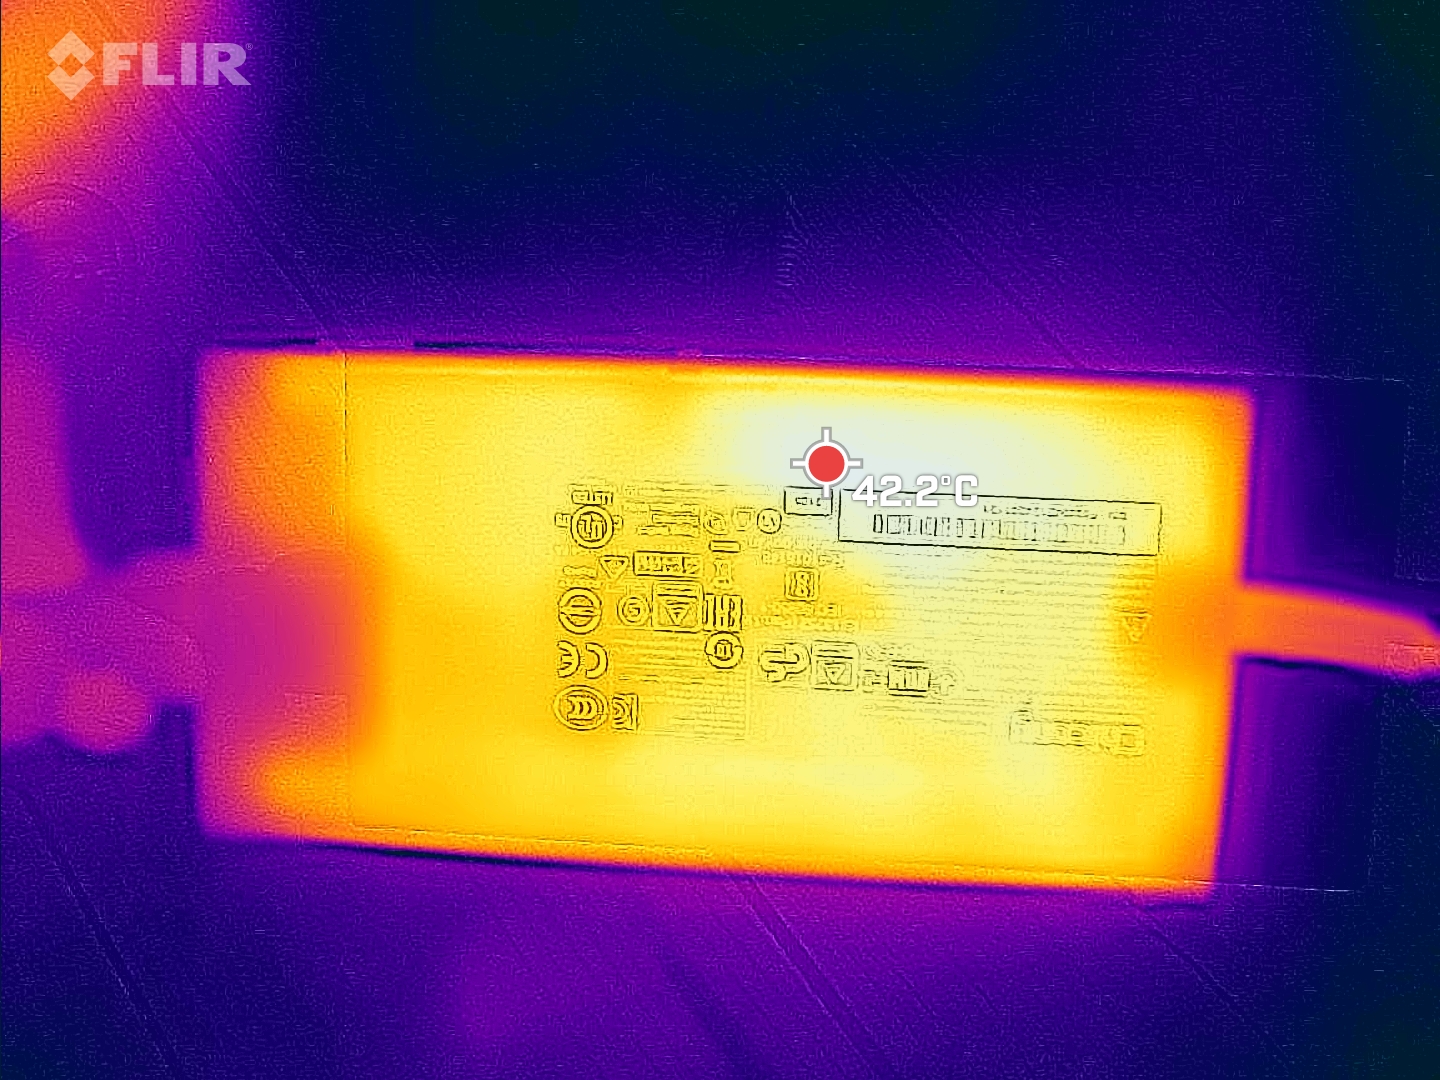
We measured a maximum consumption of 186 W during gaming, so the 230 W power supply should have enough reserves for reliable charging in every situation.
| Idle | |
| Load |
|
Key:
min: | |
| Schenker XMG Apex 15 NH57E PS R7 5800H, GeForce RTX 3060 Laptop GPU, Samsung SSD 980 500GB (MZ-V8V500BW), IPS, 1920x1080, 15.6" | Schenker XMG Apex 15 NH57AF1 R9 3900, GeForce RTX 2070 Mobile, Samsung SSD 970 EVO Plus 1TB, IPS, 1920x1080, 15.6" | Lenovo Legion 5 15ACH-82JU00C6GE-FL R7 5800H, GeForce RTX 3060 Laptop GPU, Micron 2300 512GB MTFDHBA512TDV, , 1920x1080, 15.6" | Asus TUF Gaming F15 FX506HM i7-11800H, GeForce RTX 3060 Laptop GPU, SK Hynix HFM001TD3JX013N, IPS, 1920x1080, 15.6" | Alienware m15 R5 Ryzen Edition R7 5800H, GeForce RTX 3060 Laptop GPU, Toshiba KBG40ZNS512G NVMe, IPS, 1920x1080, 15.6" | HP Victus 16-e0179ng R7 5800H, GeForce RTX 3060 Laptop GPU, WDC PC SN730 SDBPNTY-1T00, IPS, 1920x1080, 16.1" | Average NVIDIA GeForce RTX 3060 Laptop GPU | Average of class Gaming | |
|---|---|---|---|---|---|---|---|---|
| Power Consumption | -181% | 9% | 5% | -13% | 15% | -7% | -29% | |
| Idle Minimum * (Watt) | 10.5 | 55 -424% | 7.3 30% | 9.5 10% | 11 -5% | 5 52% | 10.4 ? 1% | 13.5 ? -29% |
| Idle Average * (Watt) | 15 | 59 -293% | 10.5 30% | 12.1 19% | 14 7% | 10 33% | 14.5 ? 3% | 19.3 ? -29% |
| Idle Maximum * (Watt) | 17 | 63 -271% | 15.7 8% | 22.5 -32% | 25 -47% | 20 -18% | 21.4 ? -26% | 24.9 ? -46% |
| Load Average * (Watt) | 109 | 141 -29% | 108 1% | 99.5 9% | 123 -13% | 108 1% | 109.3 ? -0% | 110 ? -1% |
| Witcher 3 ultra * (Watt) | 186 | 238 -28% | 175 6% | 157 16% | 176 5% | 145 22% | ||
| Load Maximum * (Watt) | 186 | 259 -39% | 228 -23% | 173.5 7% | 226 -22% | 189 -2% | 206 ? -11% | 256 ? -38% |
* ... smaller is better
Power consumption Witcher 3 / Stress test
Battery life
The removable battery is wonderful in principle and absolutely to be welcomed. Less wonderful, however, is that the capacity of the removable battery is only 49 Wh. The competition has 70 to 90 Wh batteries installed without exception!
The different manufacturer-owned power modes make it difficult to compare. It seems that the Apex gets quite a bit of runtime out of its small battery, but it lacks a balanced mode, which we usually use for our WLAN test. The "Power Saving" mode used in this way restricts the performance more and thus saves more energy, but it is difficult to compare with the results of the rivals.
You can plan a movie night for about 4.5 hours in power-saving mode. Web browsing is possible for almost 6.5 hours with reduced brightness, and the runtime is reduced to less than 4.5 hours with maximum brightness.
| Schenker XMG Apex 15 NH57E PS R7 5800H, GeForce RTX 3060 Laptop GPU, 49 Wh | Schenker XMG Apex 15 NH57AF1 R9 3900, GeForce RTX 2070 Mobile, 62 Wh | Lenovo Legion 5 15ACH-82JU00C6GE-FL R7 5800H, GeForce RTX 3060 Laptop GPU, 80 Wh | Asus TUF Gaming F15 FX506HM i7-11800H, GeForce RTX 3060 Laptop GPU, 90 Wh | Alienware m15 R5 Ryzen Edition R7 5800H, GeForce RTX 3060 Laptop GPU, 86 Wh | HP Victus 16-e0179ng R7 5800H, GeForce RTX 3060 Laptop GPU, 70 Wh | Average of class Gaming | |
|---|---|---|---|---|---|---|---|
| Battery runtime | -75% | -1% | 33% | 11% | -8% | 28% | |
| H.264 (h) | 4.6 | 4.3 -7% | 8.8 91% | 7.93 ? 72% | |||
| WiFi v1.3 (h) | 6.5 | 1 -85% | 4.8 -26% | 7.9 22% | 5.1 -22% | 5.9 -9% | 6.73 ? 4% |
| Load (h) | 1.4 | 0.5 -64% | 1.8 29% | 2 43% | 0.9 -36% | 1.3 -7% | 1.502 ? 7% |
| Reader / Idle (h) | 1.2 | 11 | 14.7 | 8.5 | 8.99 ? | ||
| Witcher 3 ultra (h) | 1.6 | 0.958 ? |
Pros
Cons
Verdict - Optimize cooling system, please!

Schenker's Apex 15 is quite inexpensive in its basic configuration, but plays among the top in terms of performance. It is also positive that maintenance is quite easy, and the removable battery improves longevity and environmental compatibility enormously.
However, Schenker has to accept real criticism for the poorly balanced cooling system. This ensures that the Apex is kept cooler than all competitors, but is far too loud, even in entertainment mode!
Overall, the Apex's origins and original purpose are apparent. The thick case with its aggressive cooling system is namely still designed for a socket processor, and probably a model with a desktop CPU will come here in the future. However, the current Apex 15 is primarily too loud for its laptop hardware.
The Schenker XMG Apex 15 has a good performance, but it is designed for a socket CPU and is a bit too thick and above all needlessly loud in the laptop comparison.
With the current driver state/cooling system, there are actually hardly any reasons to prefer the Apex over its rivals Lenovo Legion 5 or Asus TUF Gaming. The performance of the three rivals is comparable, but the Apex is simply too loud in the same performance mode. At the same time, the Apex cannot really stand out positively in any discipline. Only the removable battery can be a positive argument for the Apex's longevity. However, it is smaller than the competition's.
Price and availability
In Schenker's own store Bestware, our test configuration costs €1,506 (~$1705) plus shipping. At mail-order retailers like Cyberport, the same model costs even more at around €1,629 (~$1844).
Schenker XMG Apex 15 NH57E PS
- 11/15/2021 v7 (old)
Christian Hintze
Price comparison

