
Verdict – Is the XMG Apex 17 worth it?
With the Apex 17, Schenker/XMG once again delivers unrestricted performance in a clean, understated chassis. The combination of a very fast Ryzen 9 9955HX, an unleashed RTX 5060, a solid 1440p display, fast Wi-Fi, and a speedy SSD makes for a compelling overall package.
The Apex 17 is aimed squarely at gamers who want the fastest possible RTX 5060 laptop at a reasonable price. Even in the noticeably quieter Entertainment mode, performance does not fall behind the competition.
The downside of that high performance is equally high noise levels and power consumption in Performance mode. Port selection could also be more modern.
Pros
Cons
Price and availability
Pricing starts at €1,899 via bestware (approx. $2,251). Our test configuration, equipped with the larger SSD, comes in at €2,084.
Table of Contents
- Verdict – Is the XMG Apex 17 worth it?
- Specifications - Ryzen 9 9955HX & RTX 5060
- Chassis & connectivity – Clean 17-inch design with some port limitations
- Input devices – Shallow key travel, large 15 cm touchpad
- Display – How good is the QHD 240 Hz panel?
- Performance - How fast is the Apex 17 really?
- Emissions & power – How loud does the Apex 17 get under gaming load?
- Possible alternatives in comparison
We recently reviewed the Apex 16 Max, which offered full gaming performance and a Mini-LED panel — but at €2,800, it’s not for everyone. That’s why we’re taking a closer look at the Apex 17 at €1,899. Does it deliver a similar level of performance and experience for significantly less money? Let’s find out.
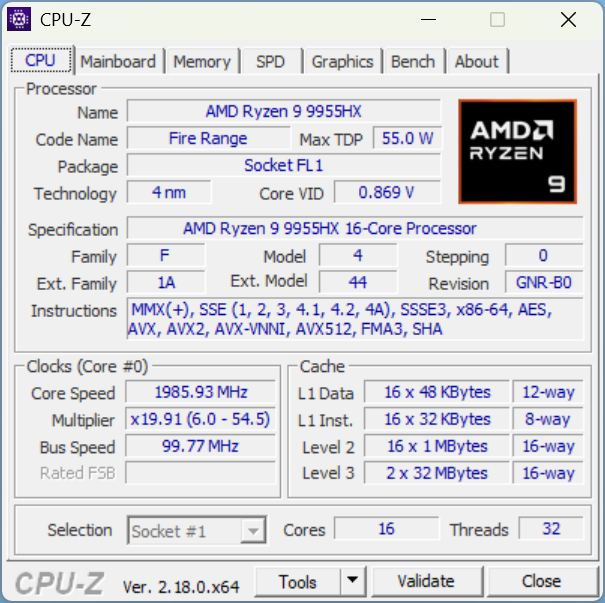
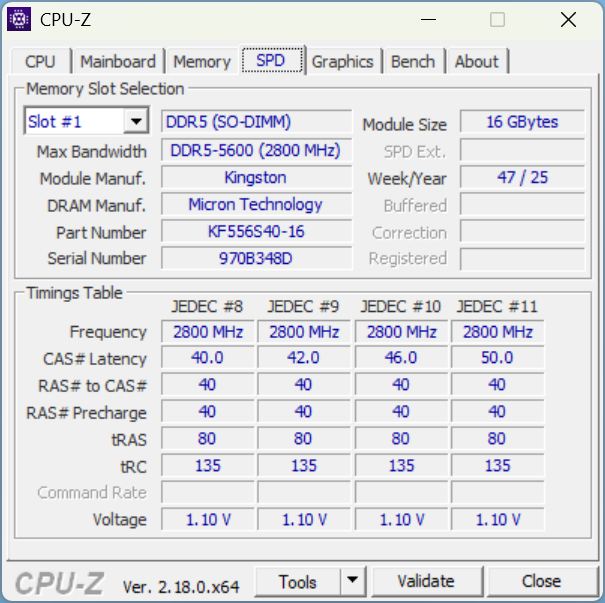
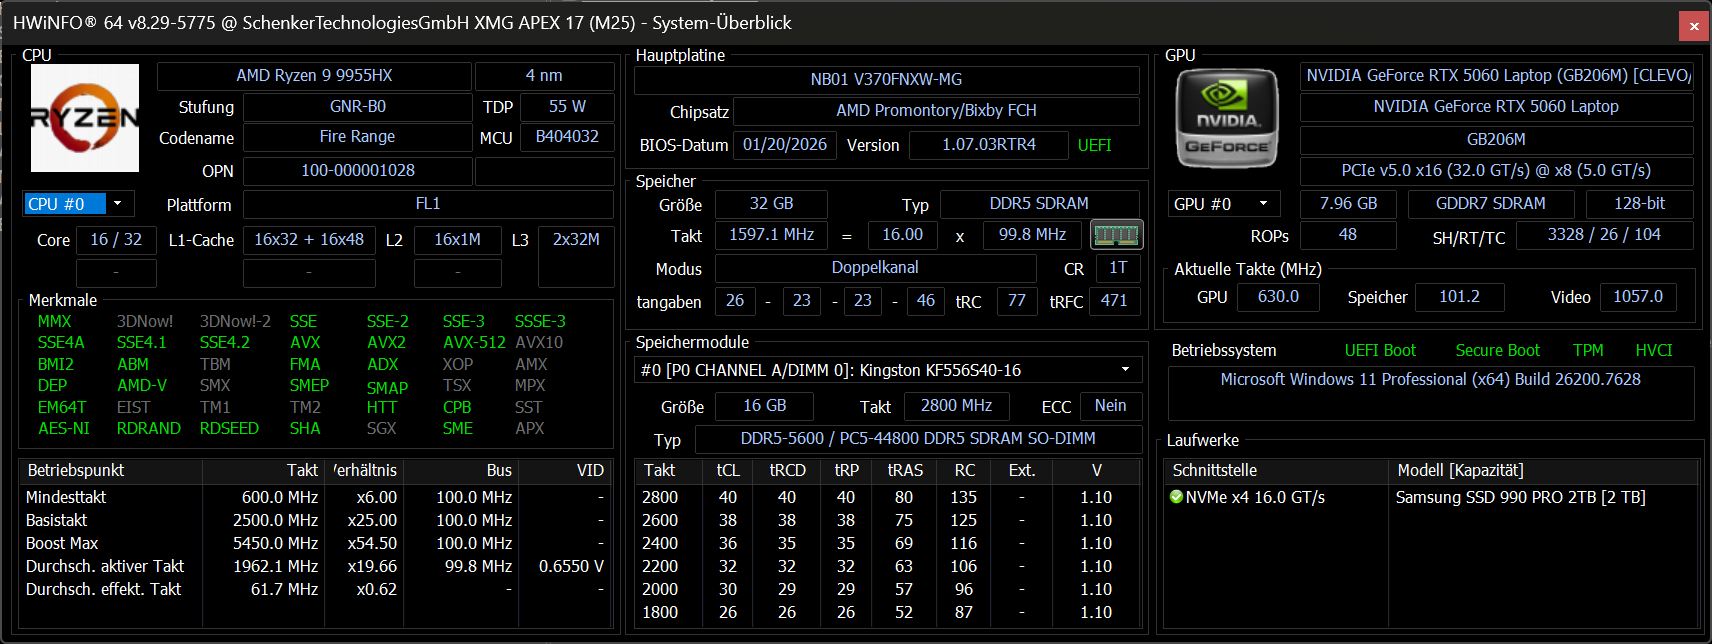
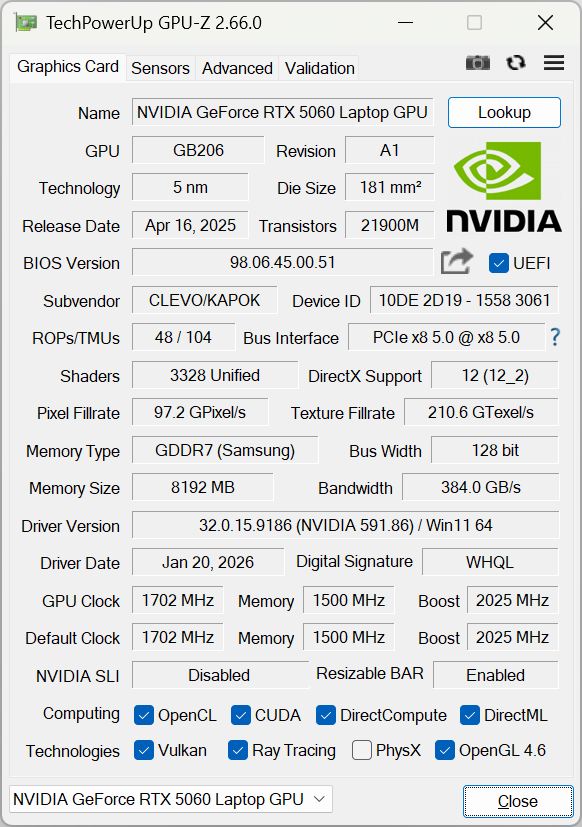
Specifications - Ryzen 9 9955HX & RTX 5060
Chassis & connectivity – Clean 17-inch design with some port limitations
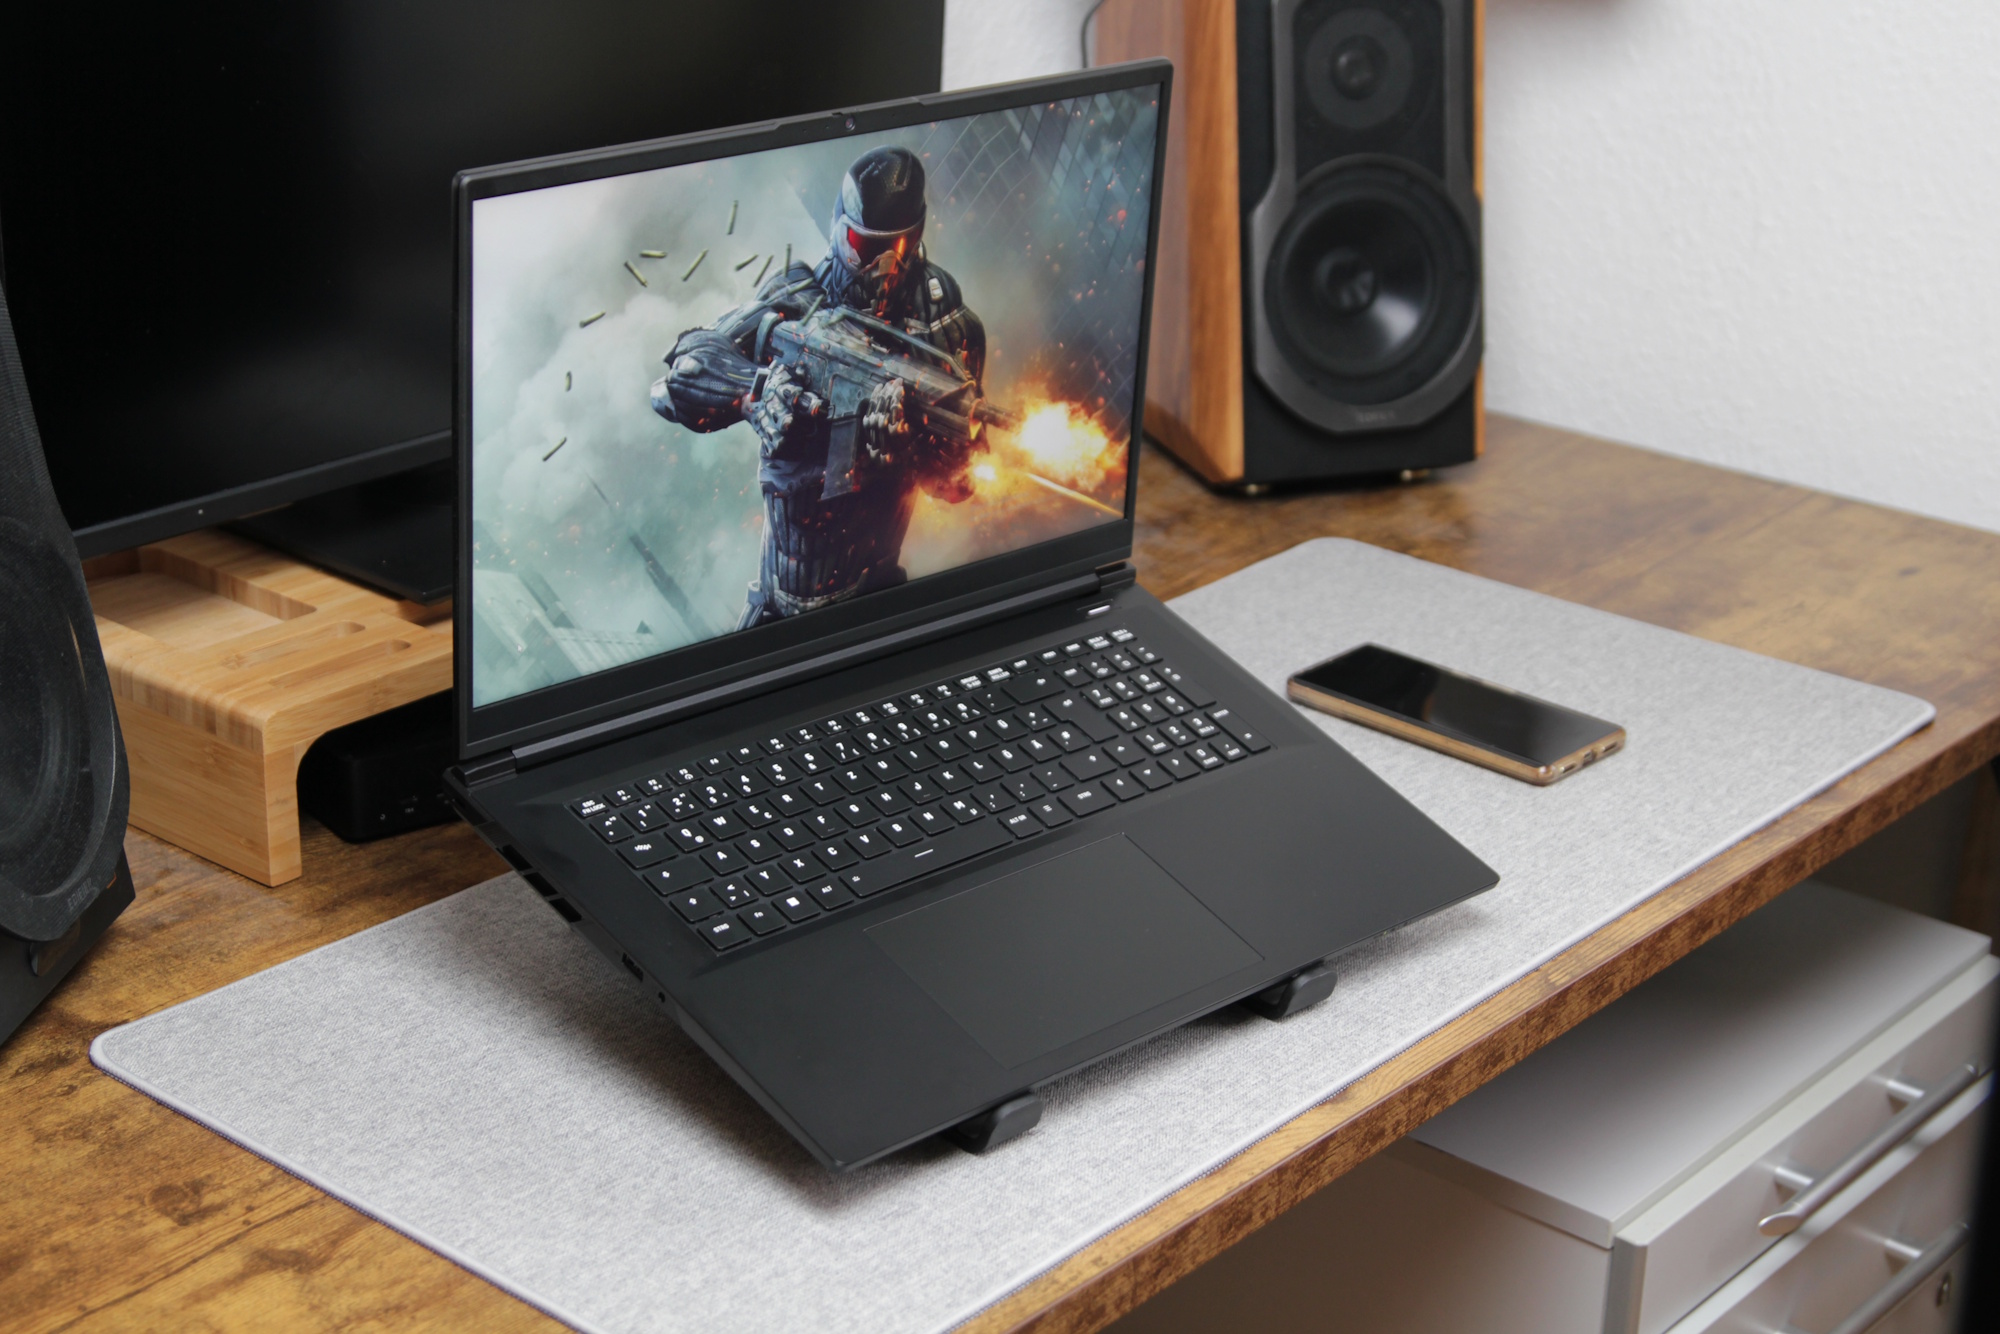
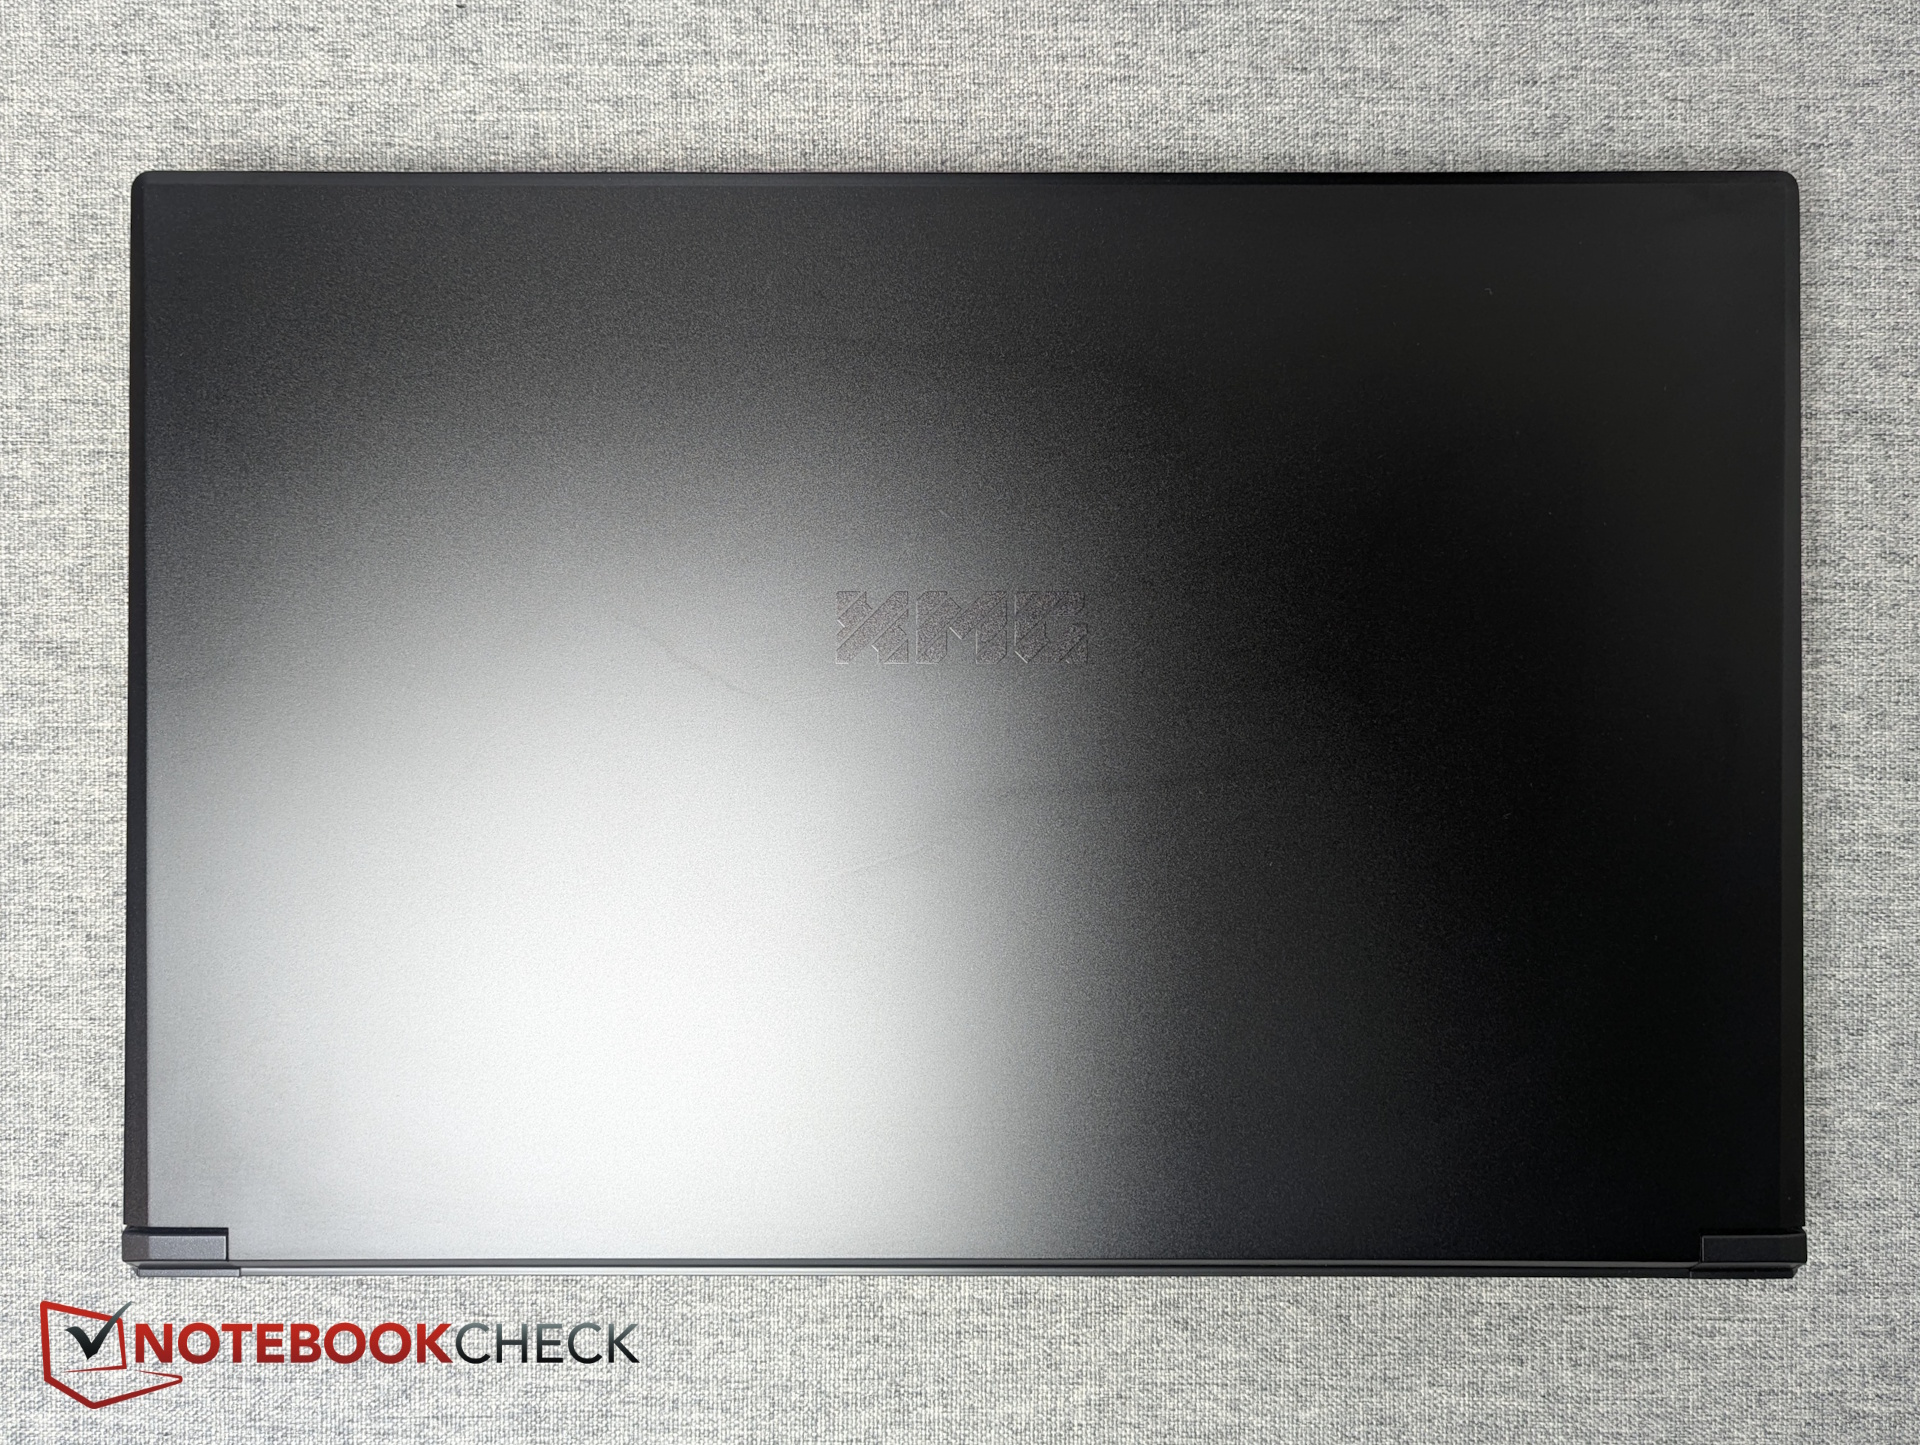
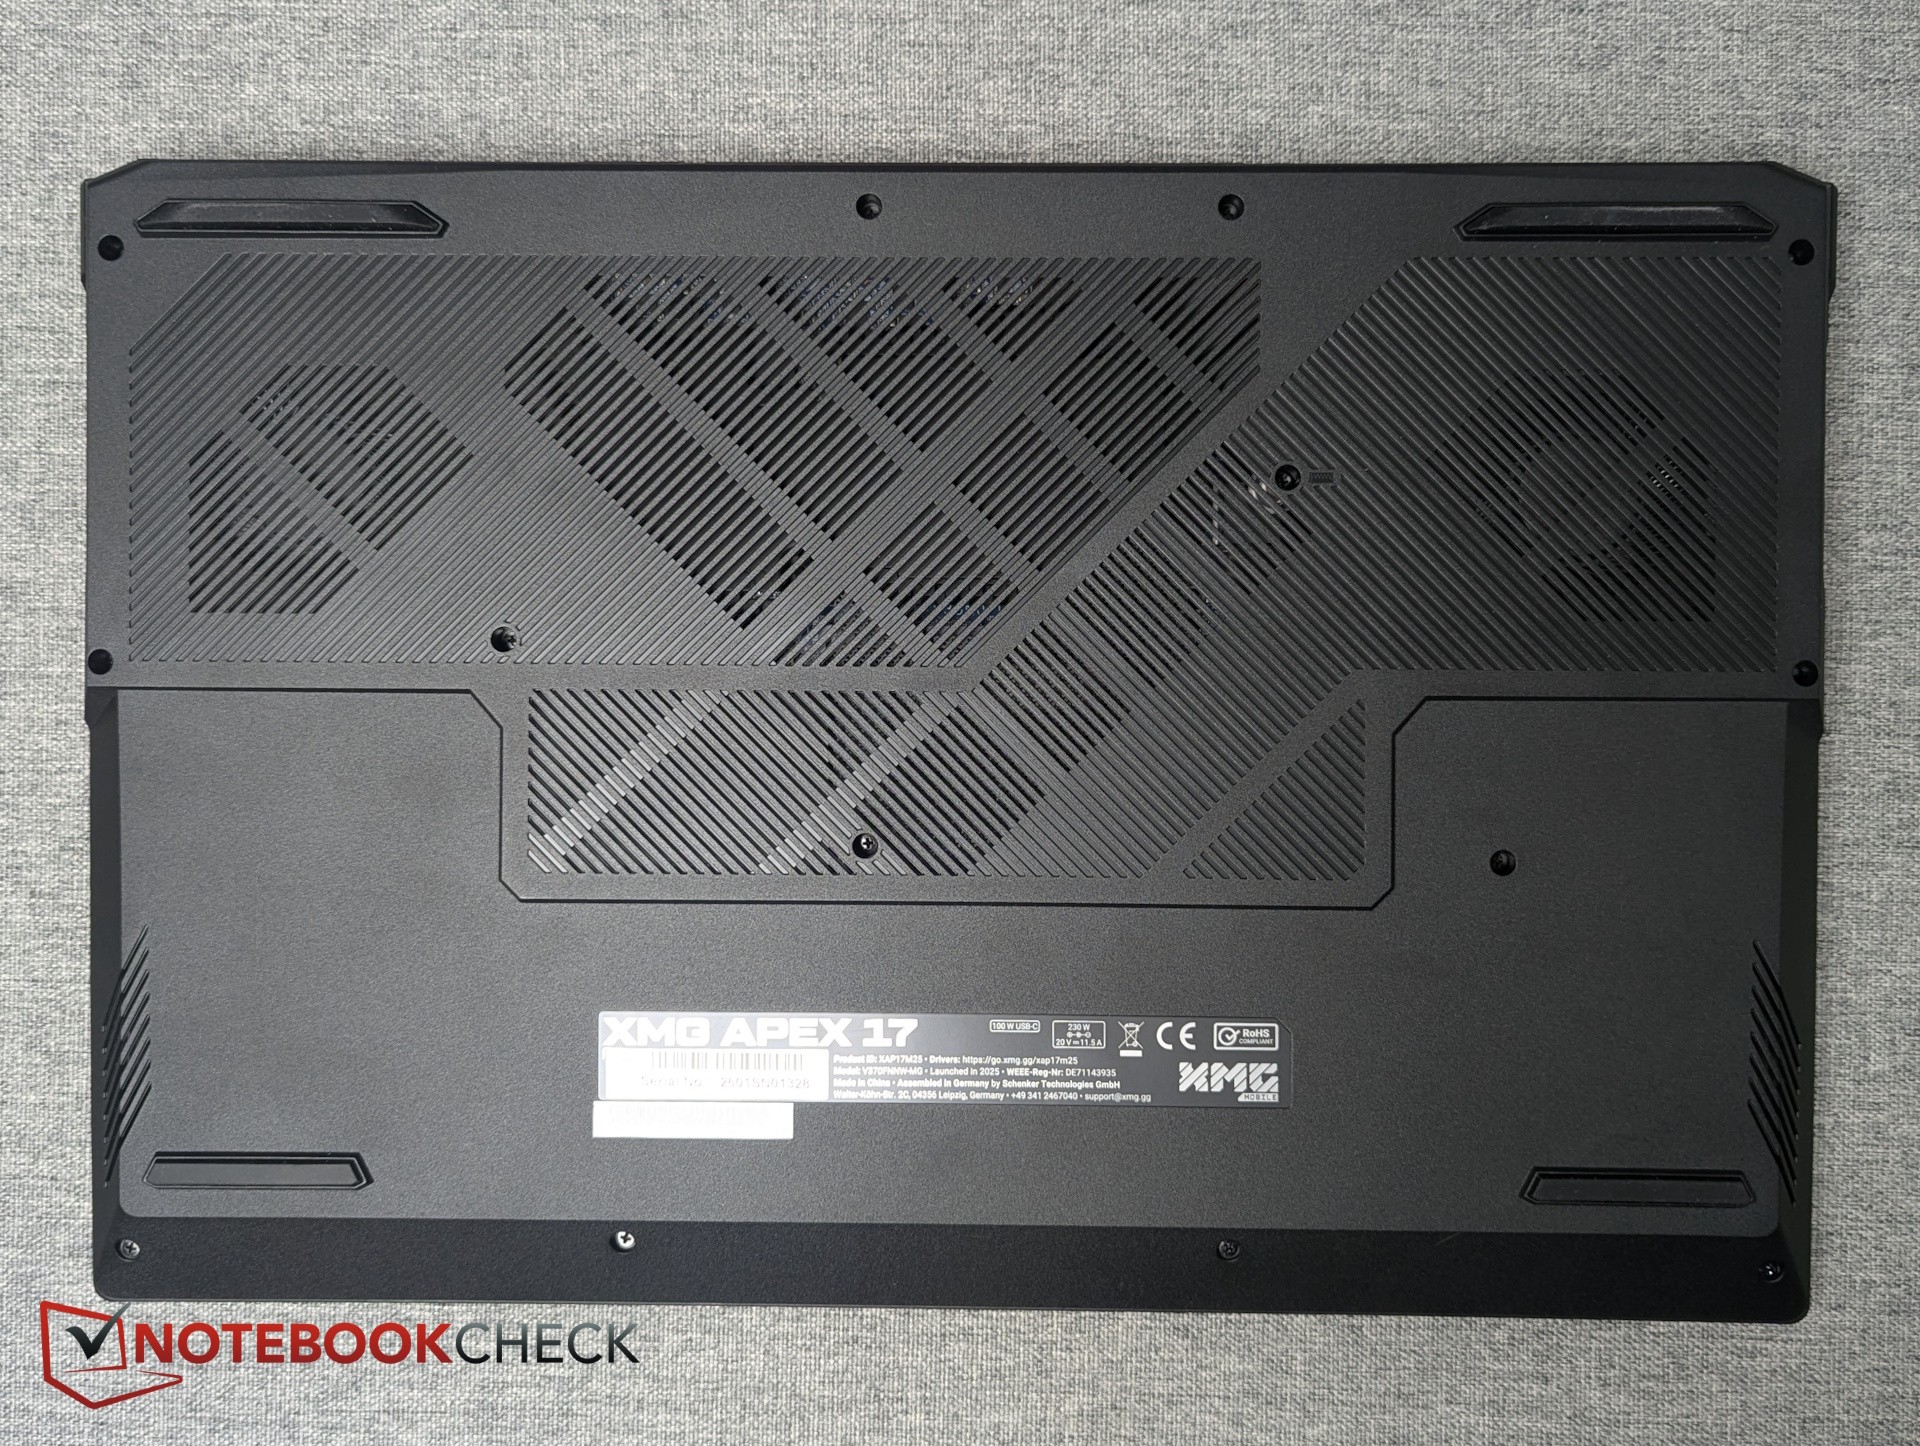
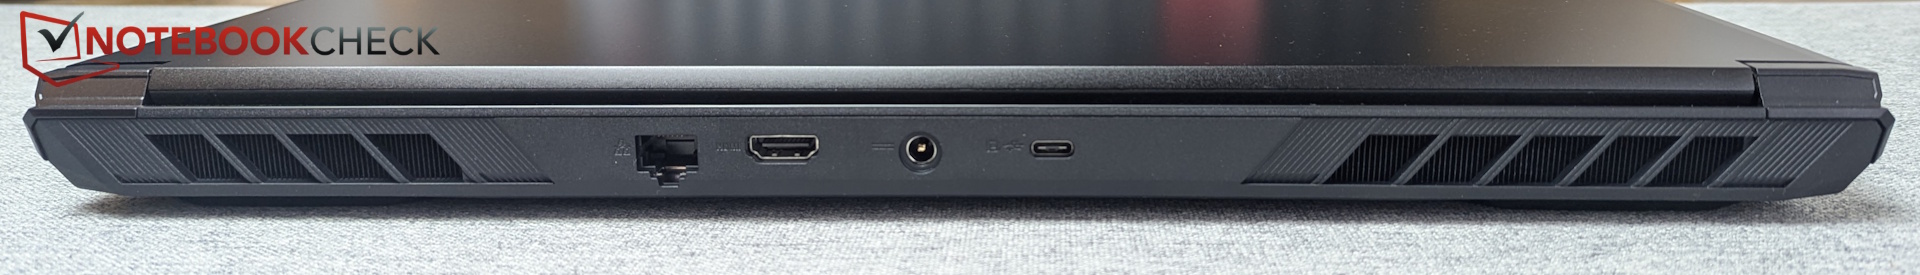
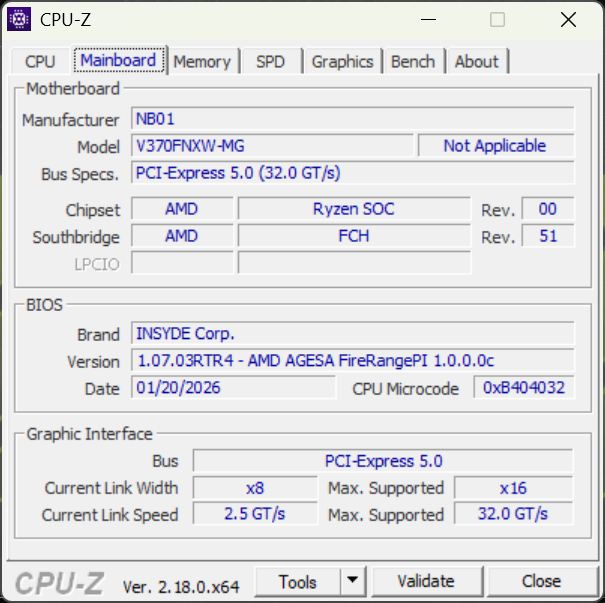
Visually, the sturdy, understated black chassis is closer to the Focus 17 M25 than to the Apex 16 Max. The lid is made of metal (and prone to fingerprints), while the rest of the chassis uses rigid plastic. Inside, you’ll find two SO-DIMM slots and two M.2 PCIe 4.0 slots.
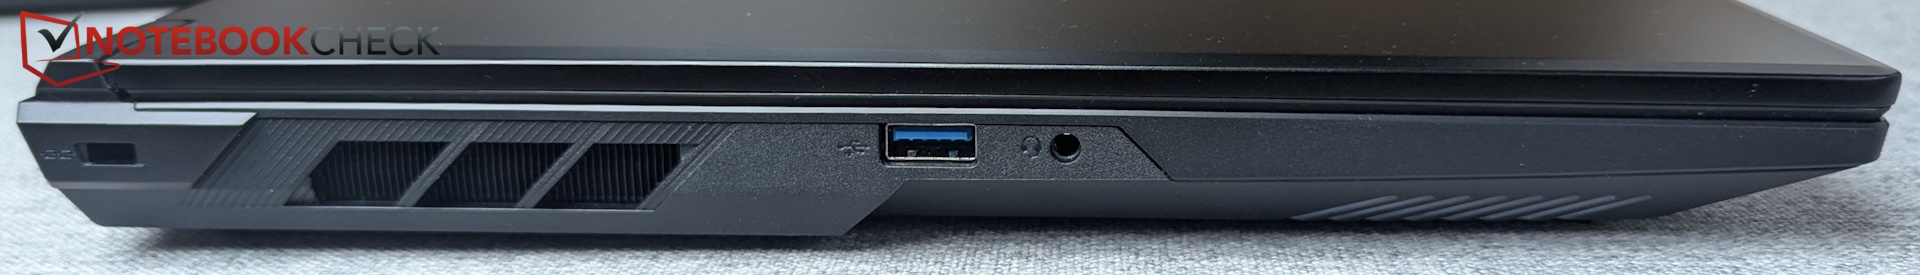
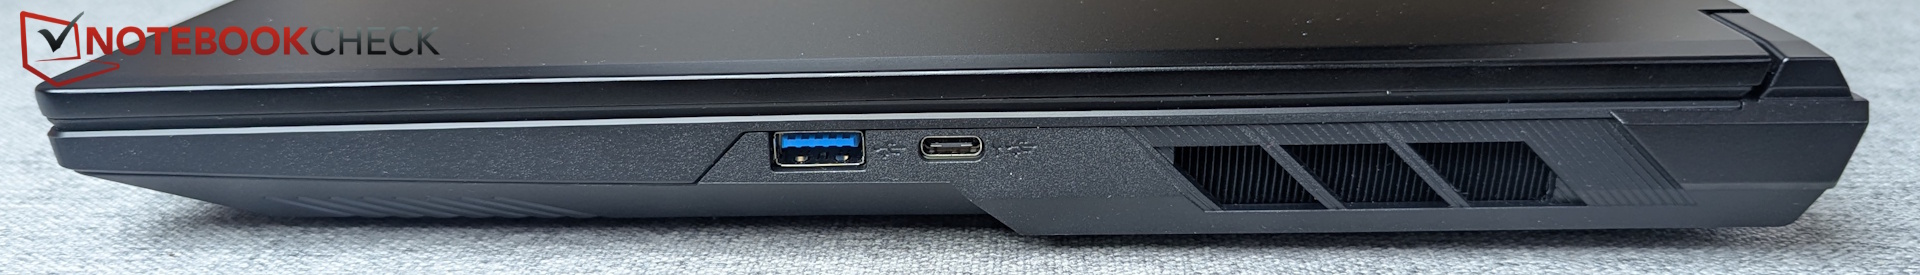
Port selection lacks an SD card reader as well as USB4 and Thunderbolt, meaning you’re limited to a maximum of 10 Gb/s. In terms of size and weight, it sits roughly in the middle of the 17-inch segment. Thanks to its 16:9 display, it’s often narrower than competing 17-inch models.
Webcam
The Full HD IR webcam includes a physical shutter. Color reproduction is acceptable, though image sharpness could be better.


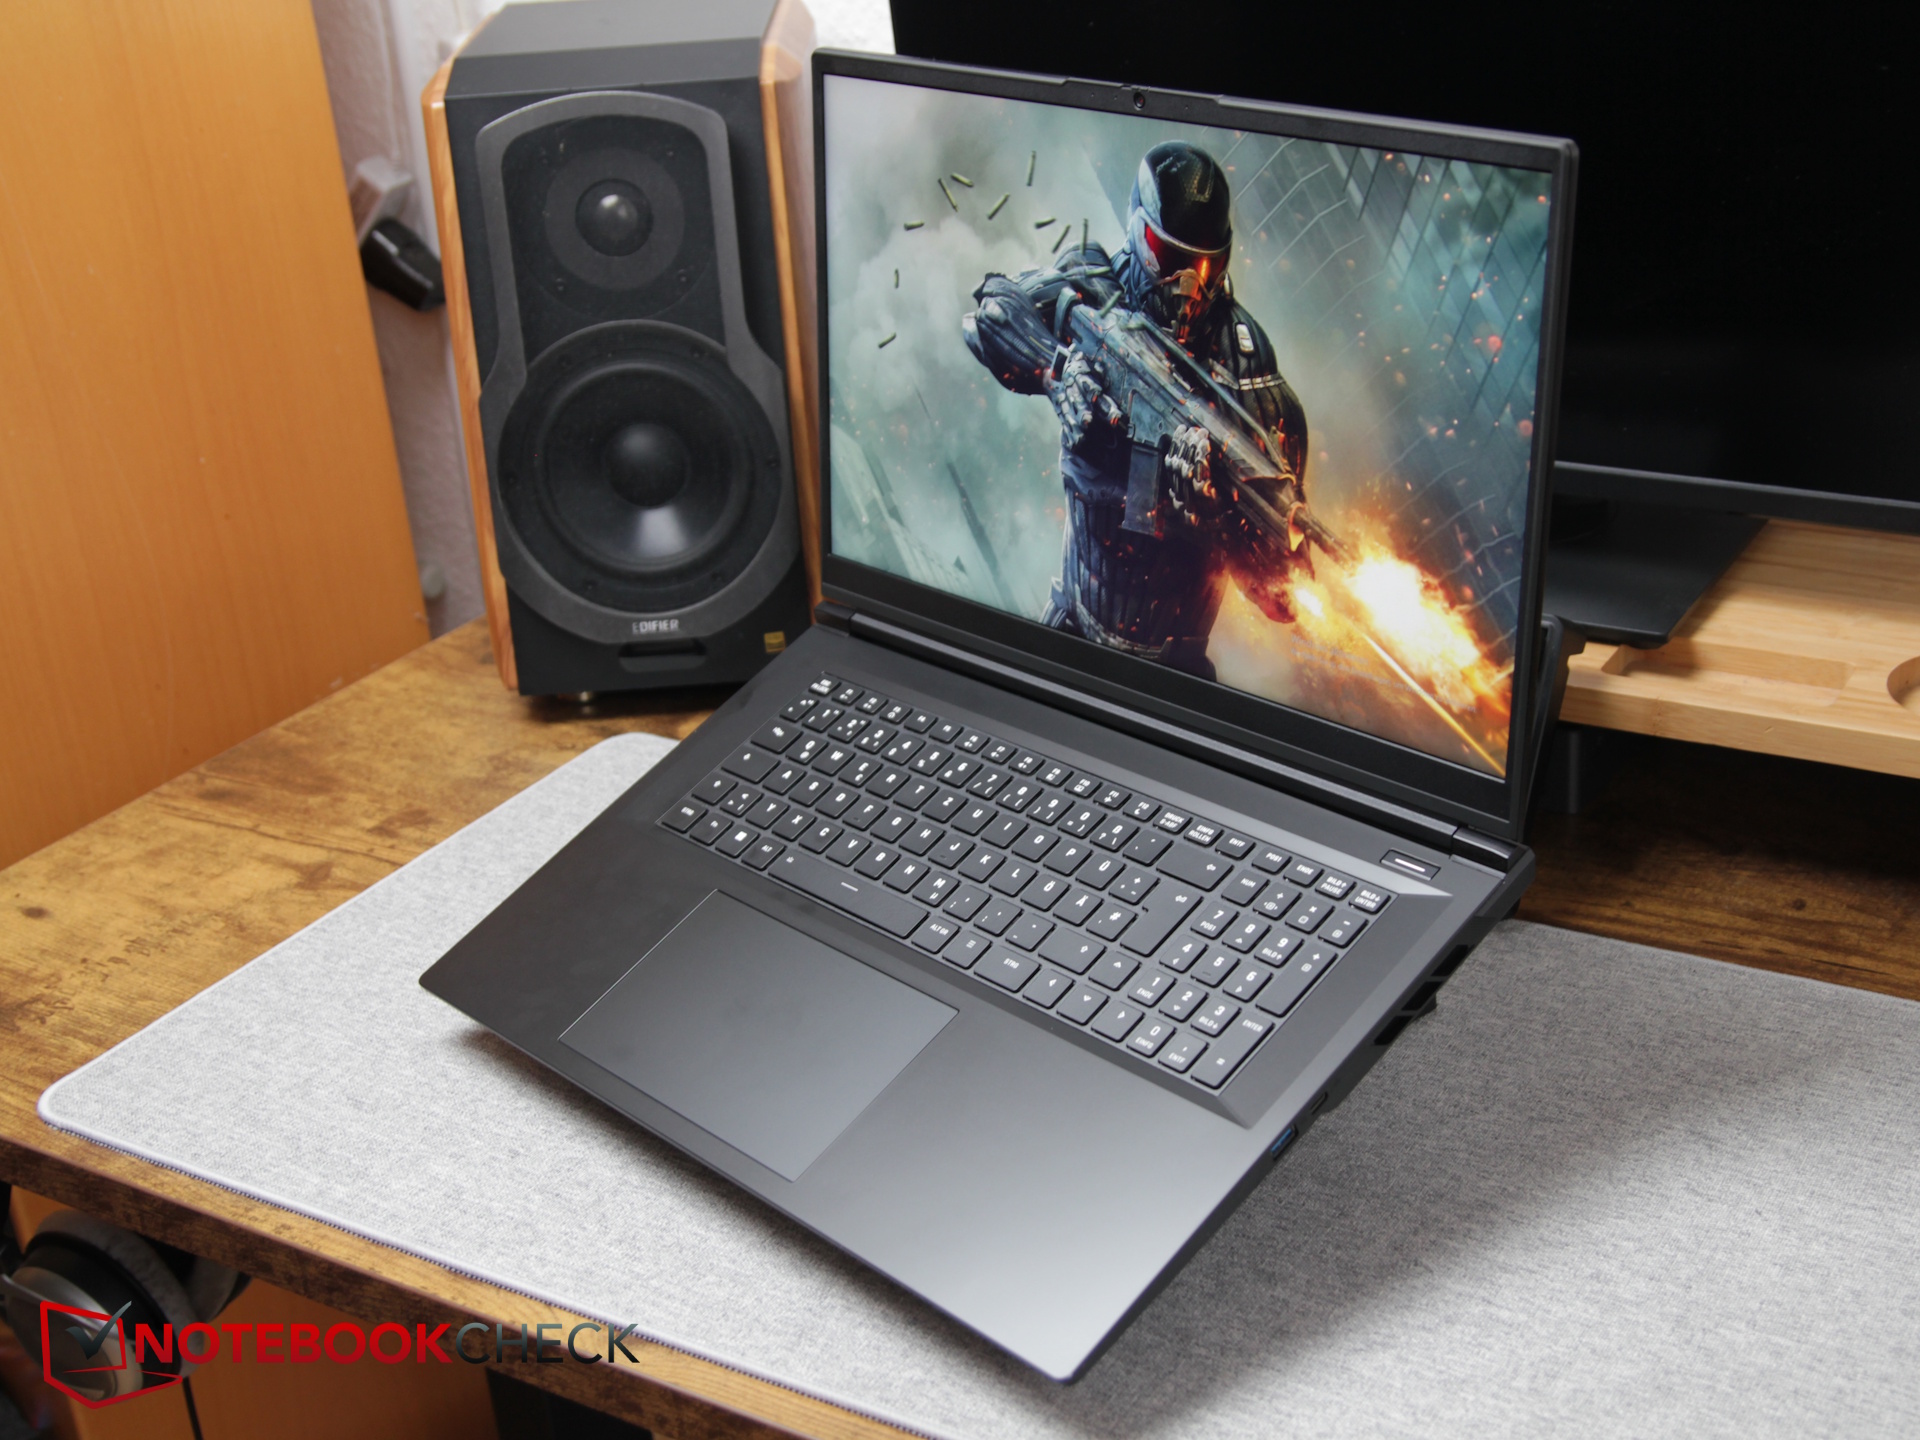
Input devices – Shallow key travel, large 15 cm touchpad
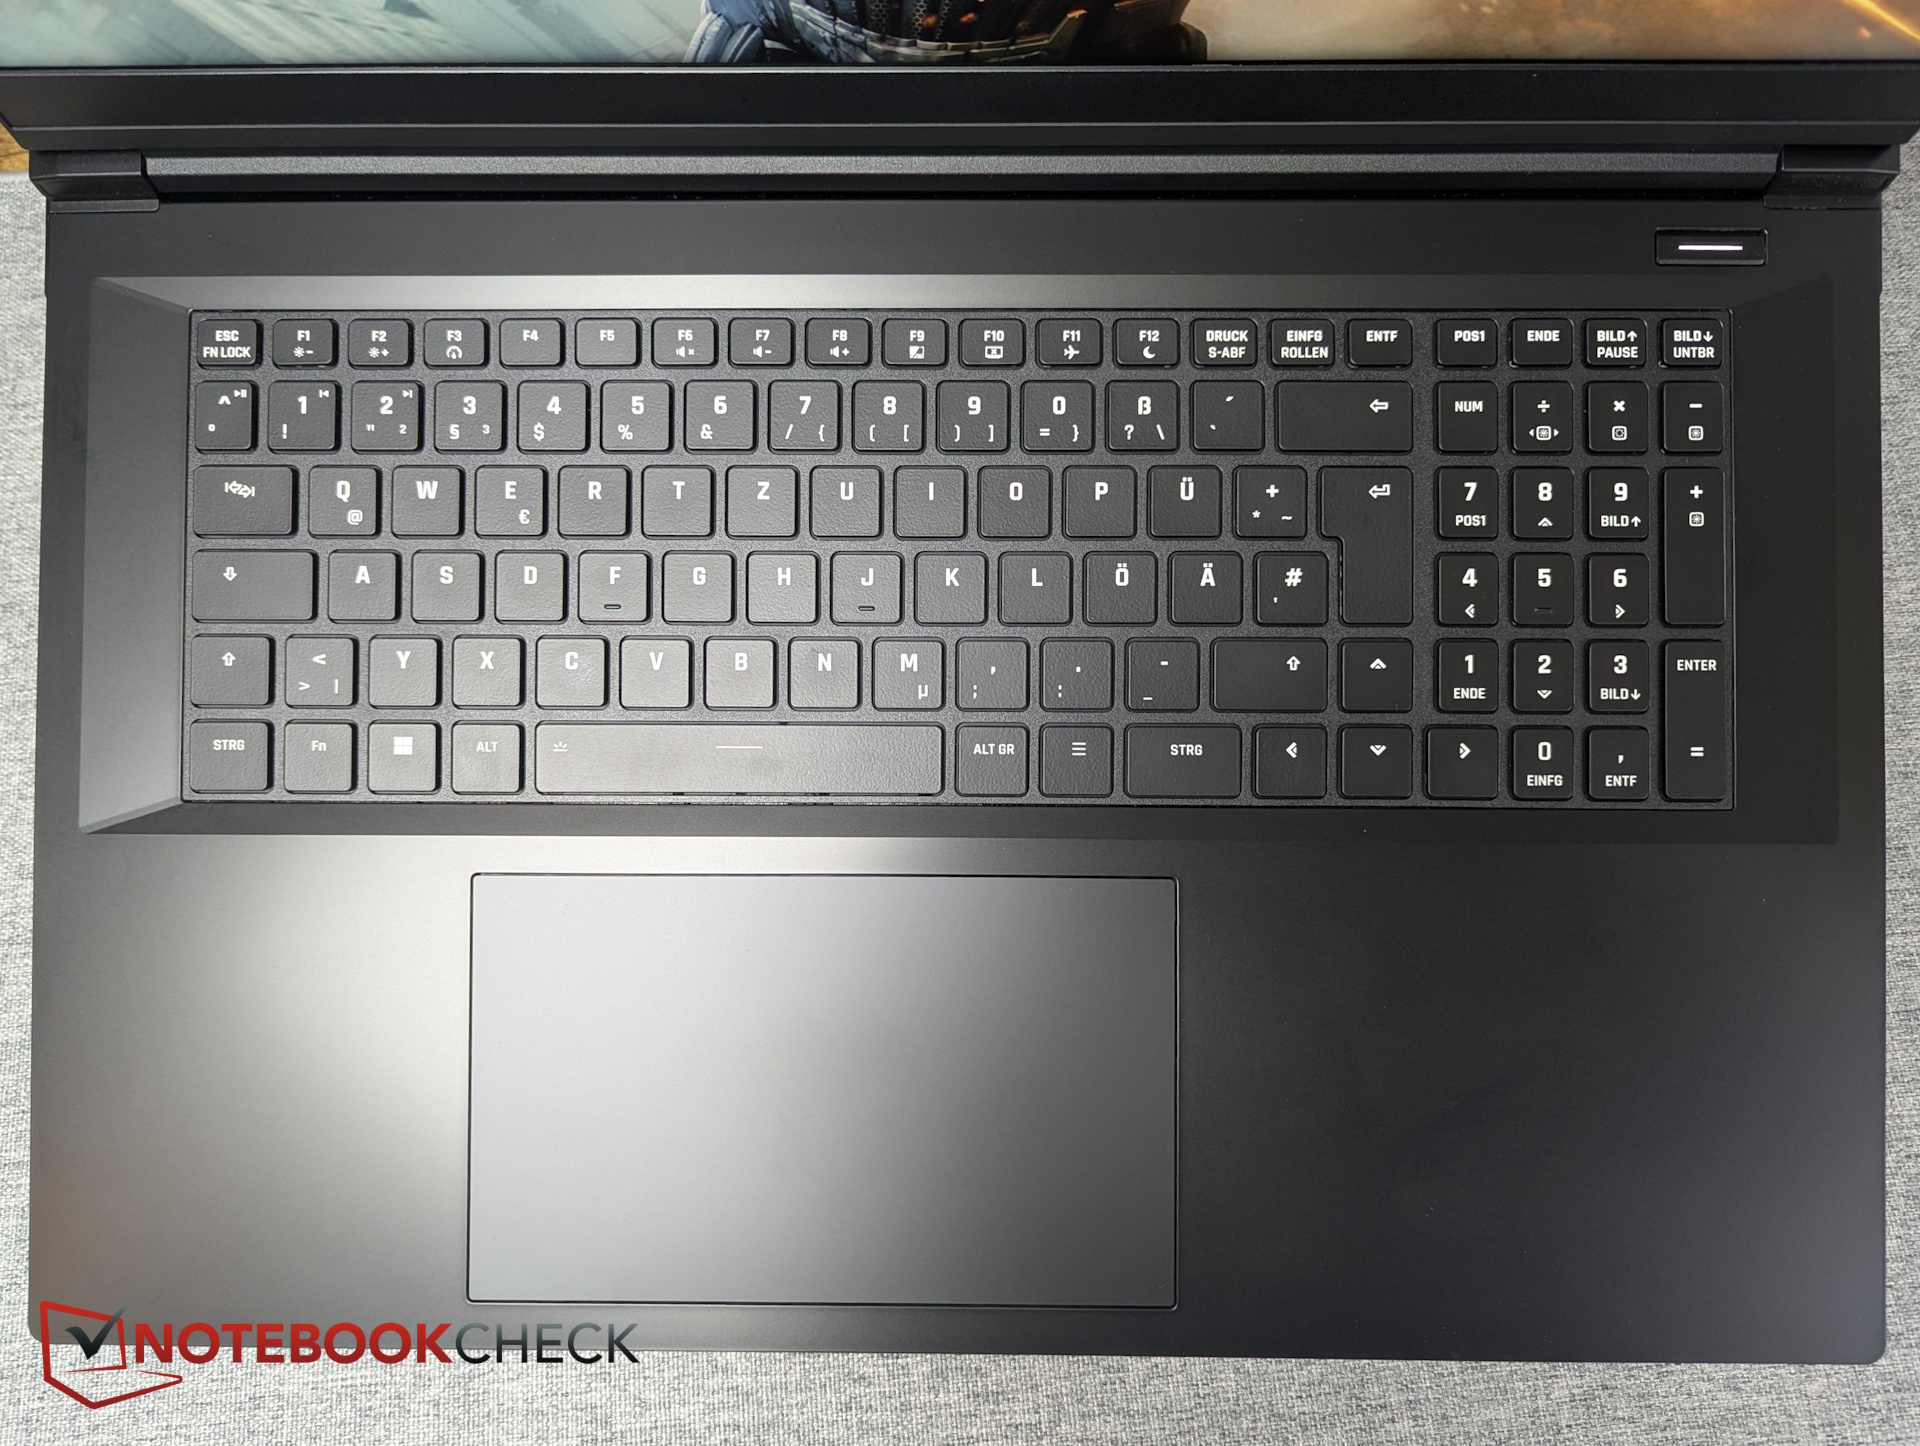
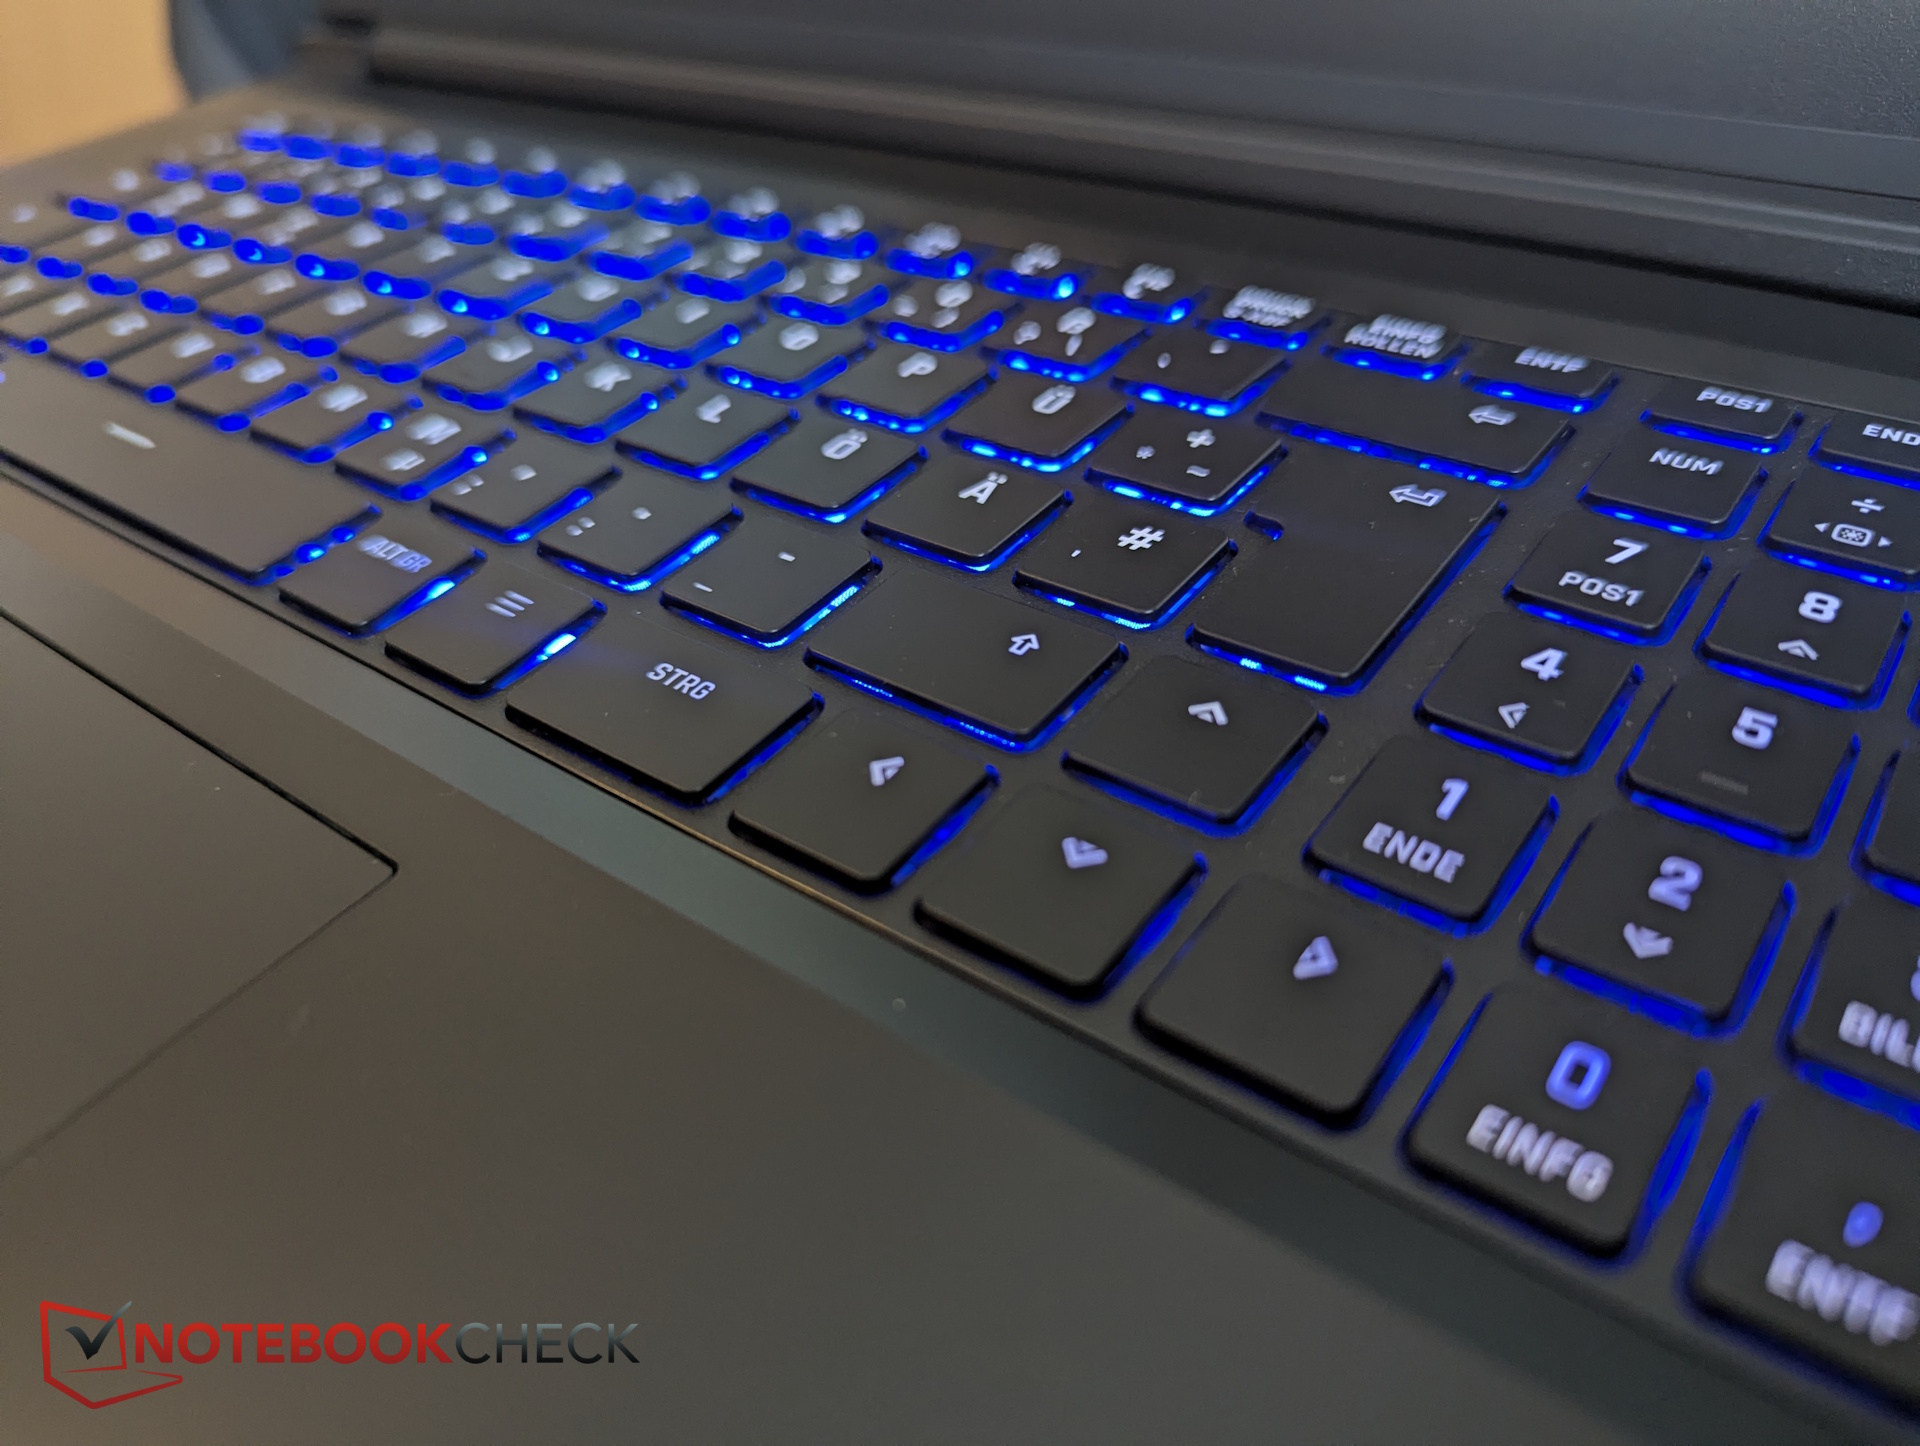
Unlike most XMG laptops, the arrow keys are not separated from the main key cluster, similar to the Focus 17. Otherwise, the layout is clean and includes a dedicated numpad on the right.
Key travel is very shallow, and while the pressure point is noticeable, feedback could be more pronounced. Still, typing remains fast and comfortable.
The large 15 x 9 cm touchpad offers good glide properties. Its integrated buttons respond reliably with moderate noise levels, and there’s no rattling when tapping.
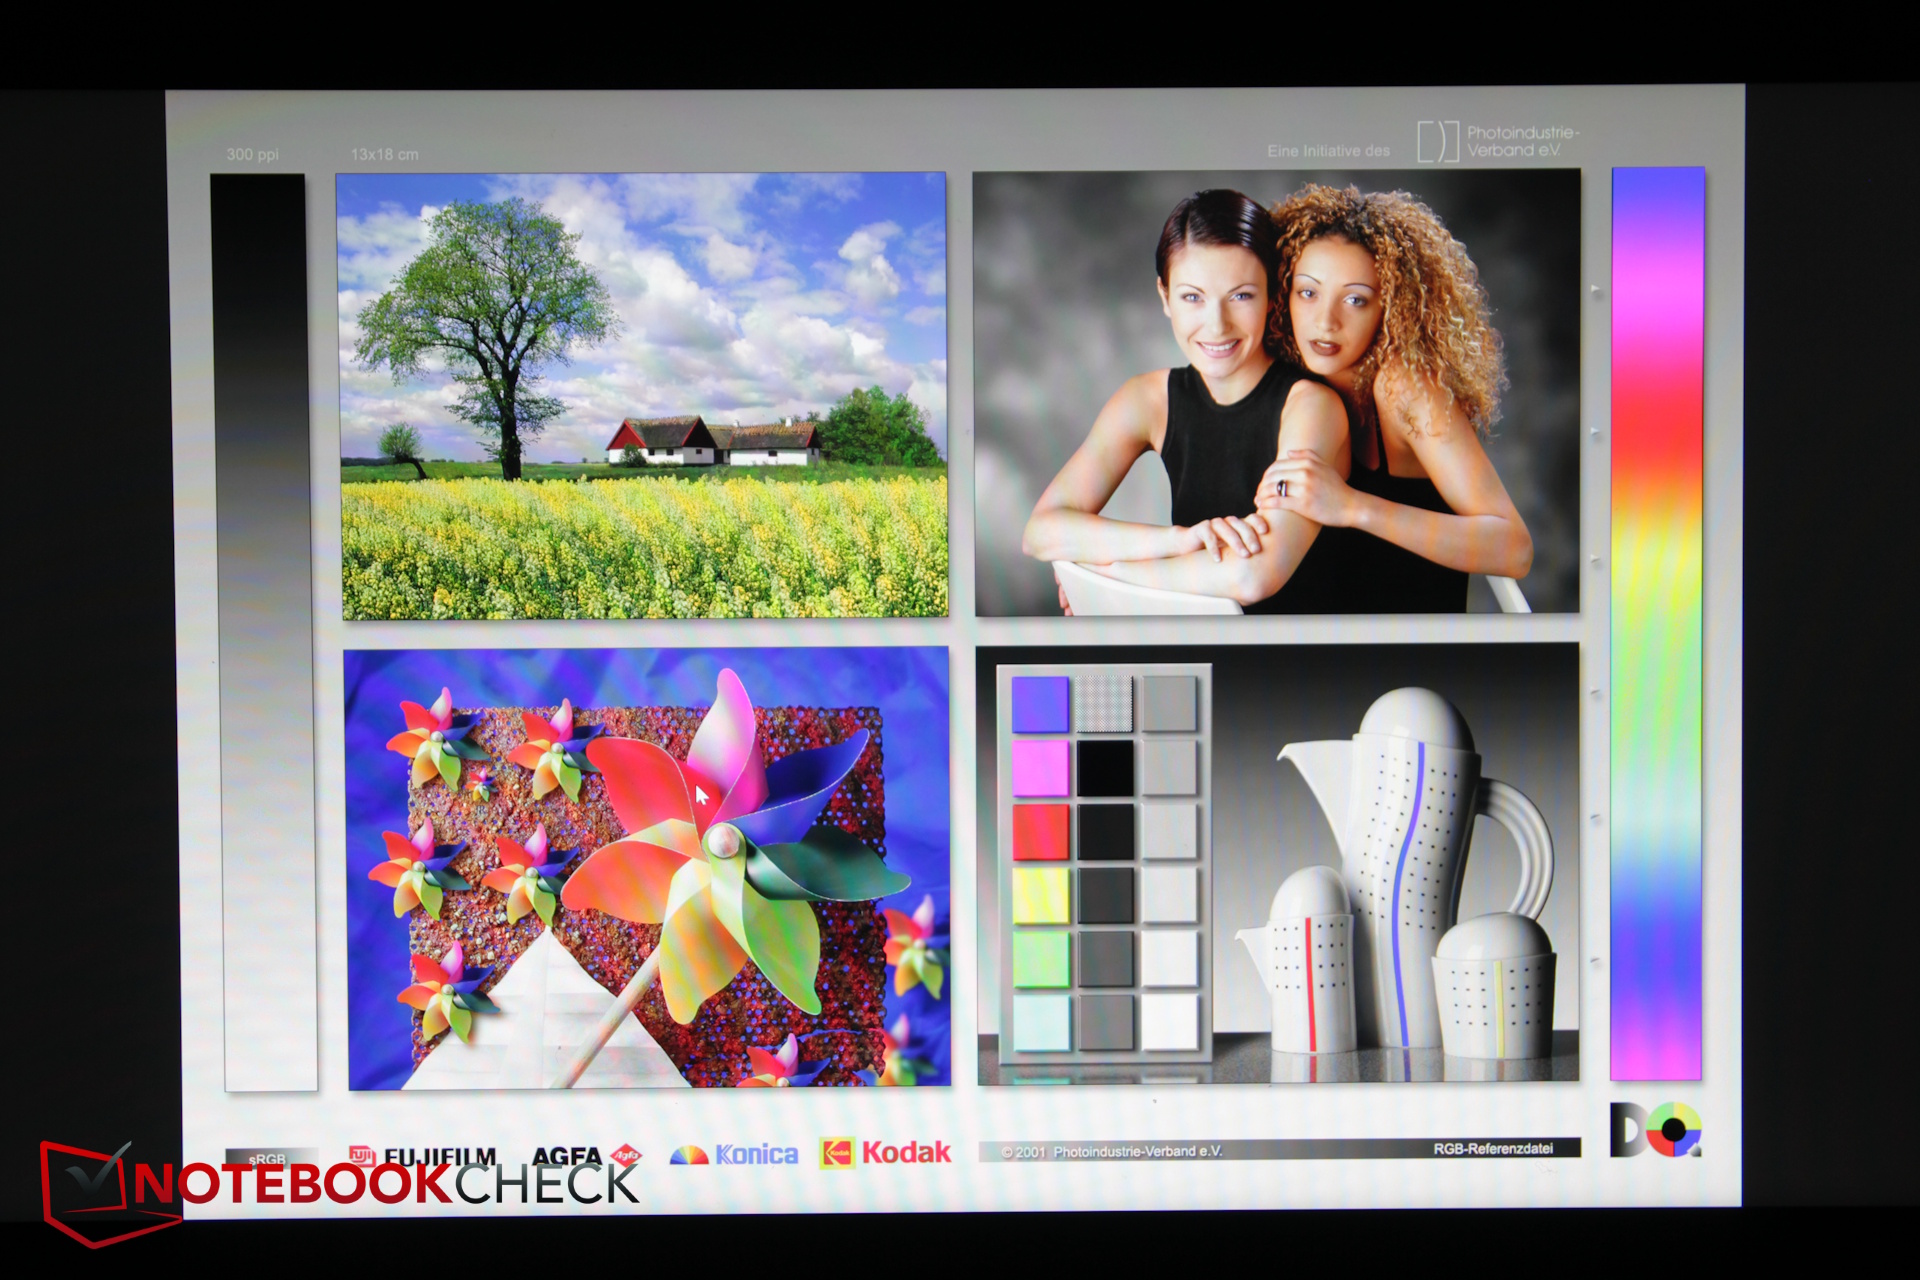
Display – How good is the QHD 240 Hz panel?
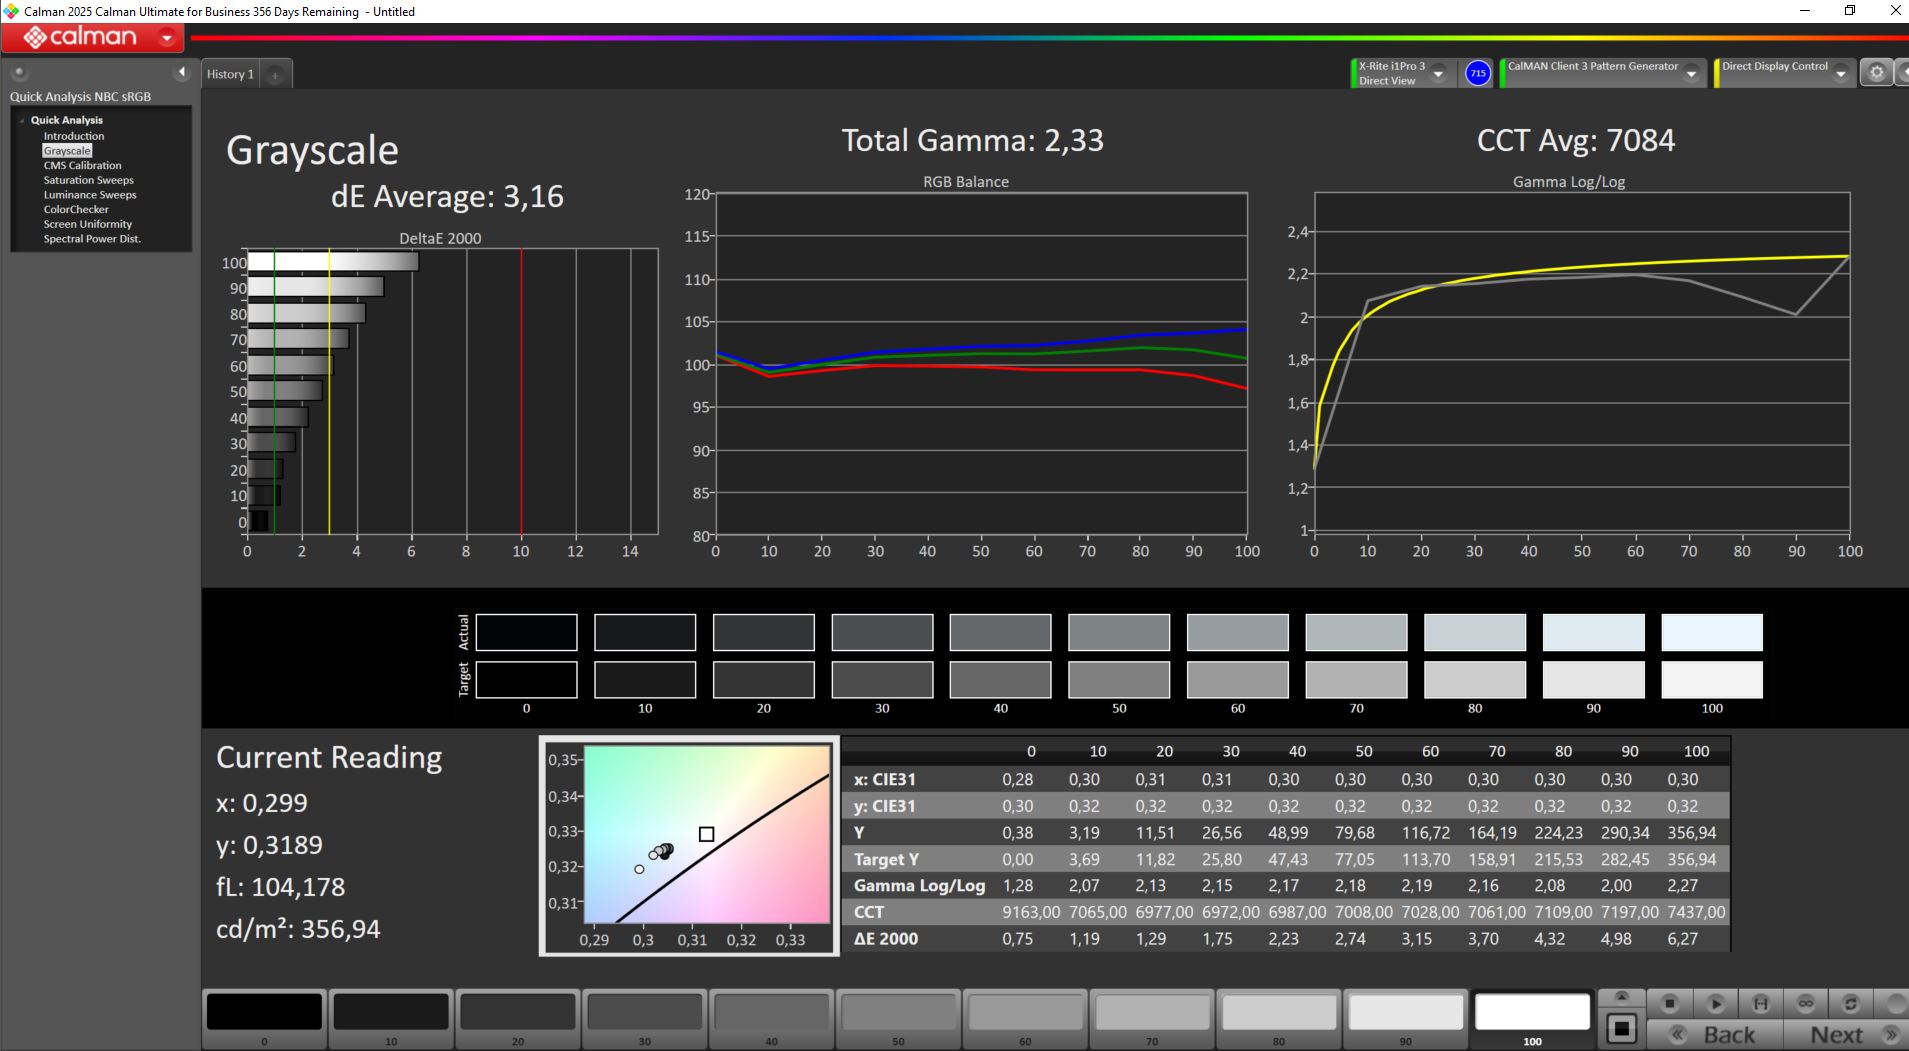
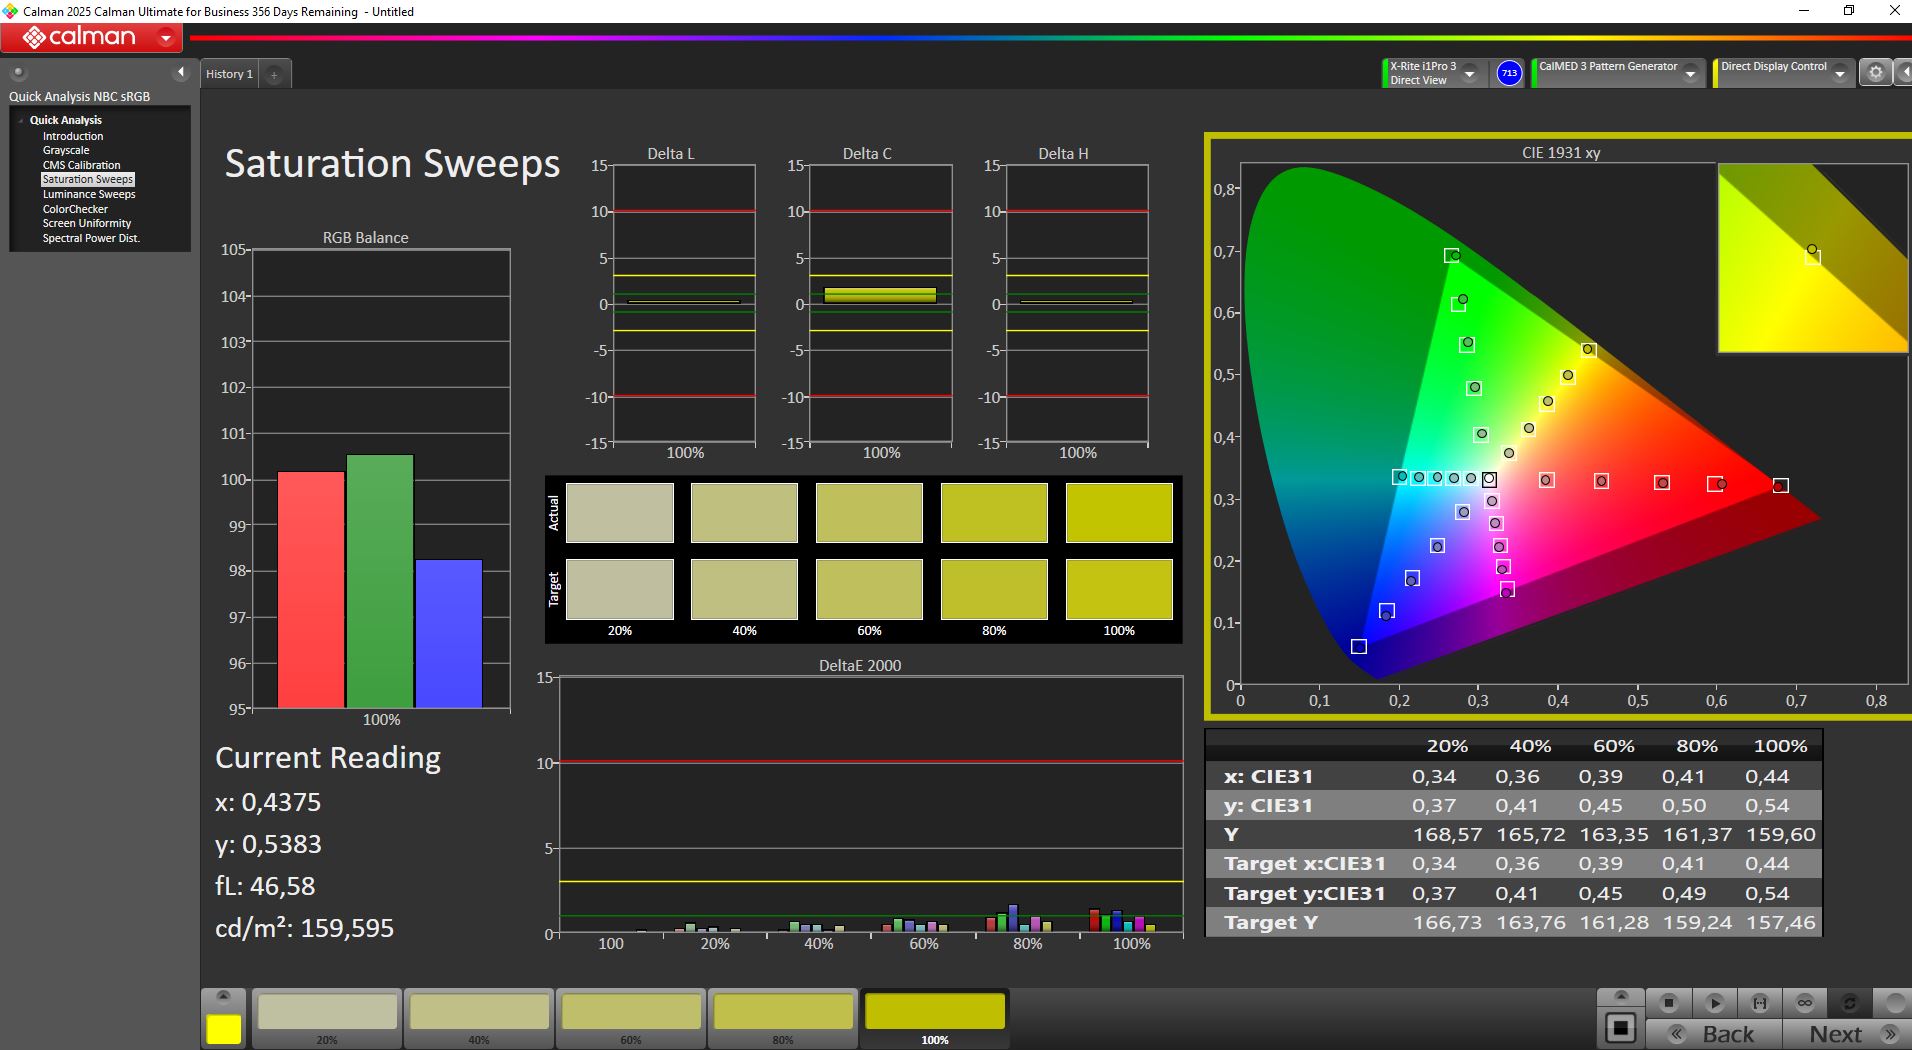
The matte 17.3-inch panel (240 Hz) features a resolution of 2,560 x 1,440 and covers both sRGB and DCI-P3.
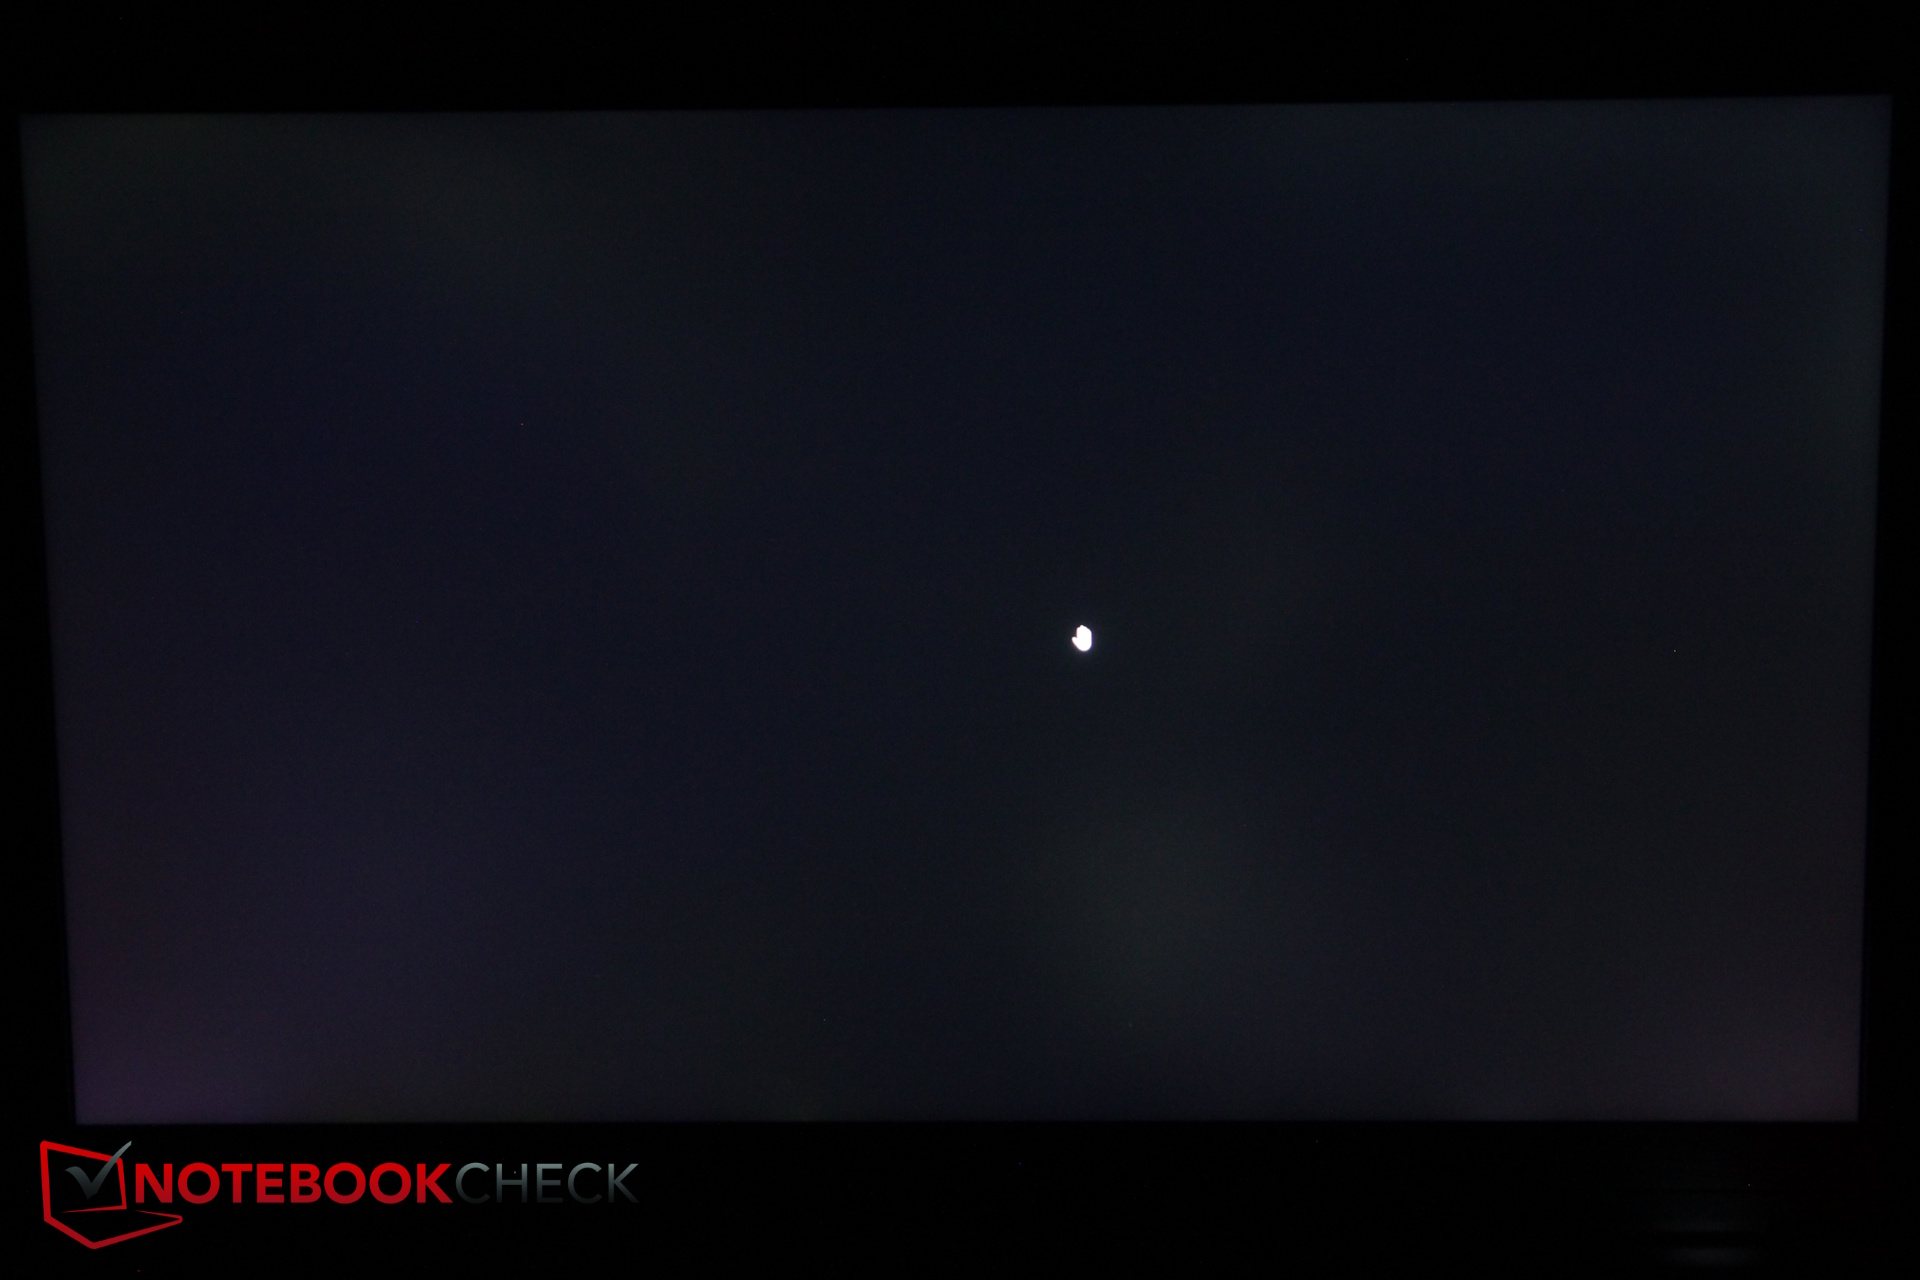
We measured an average brightness of 325 nits. Black levels are somewhat elevated, which slightly reduces contrast. PWM is not used, and response times are fast enough.

| |||||||||||||||||||||||||
Brightness Distribution: 85 %
Center on Battery: 355 cd/m²
Contrast: 890:1 (Black: 0.4 cd/m²)
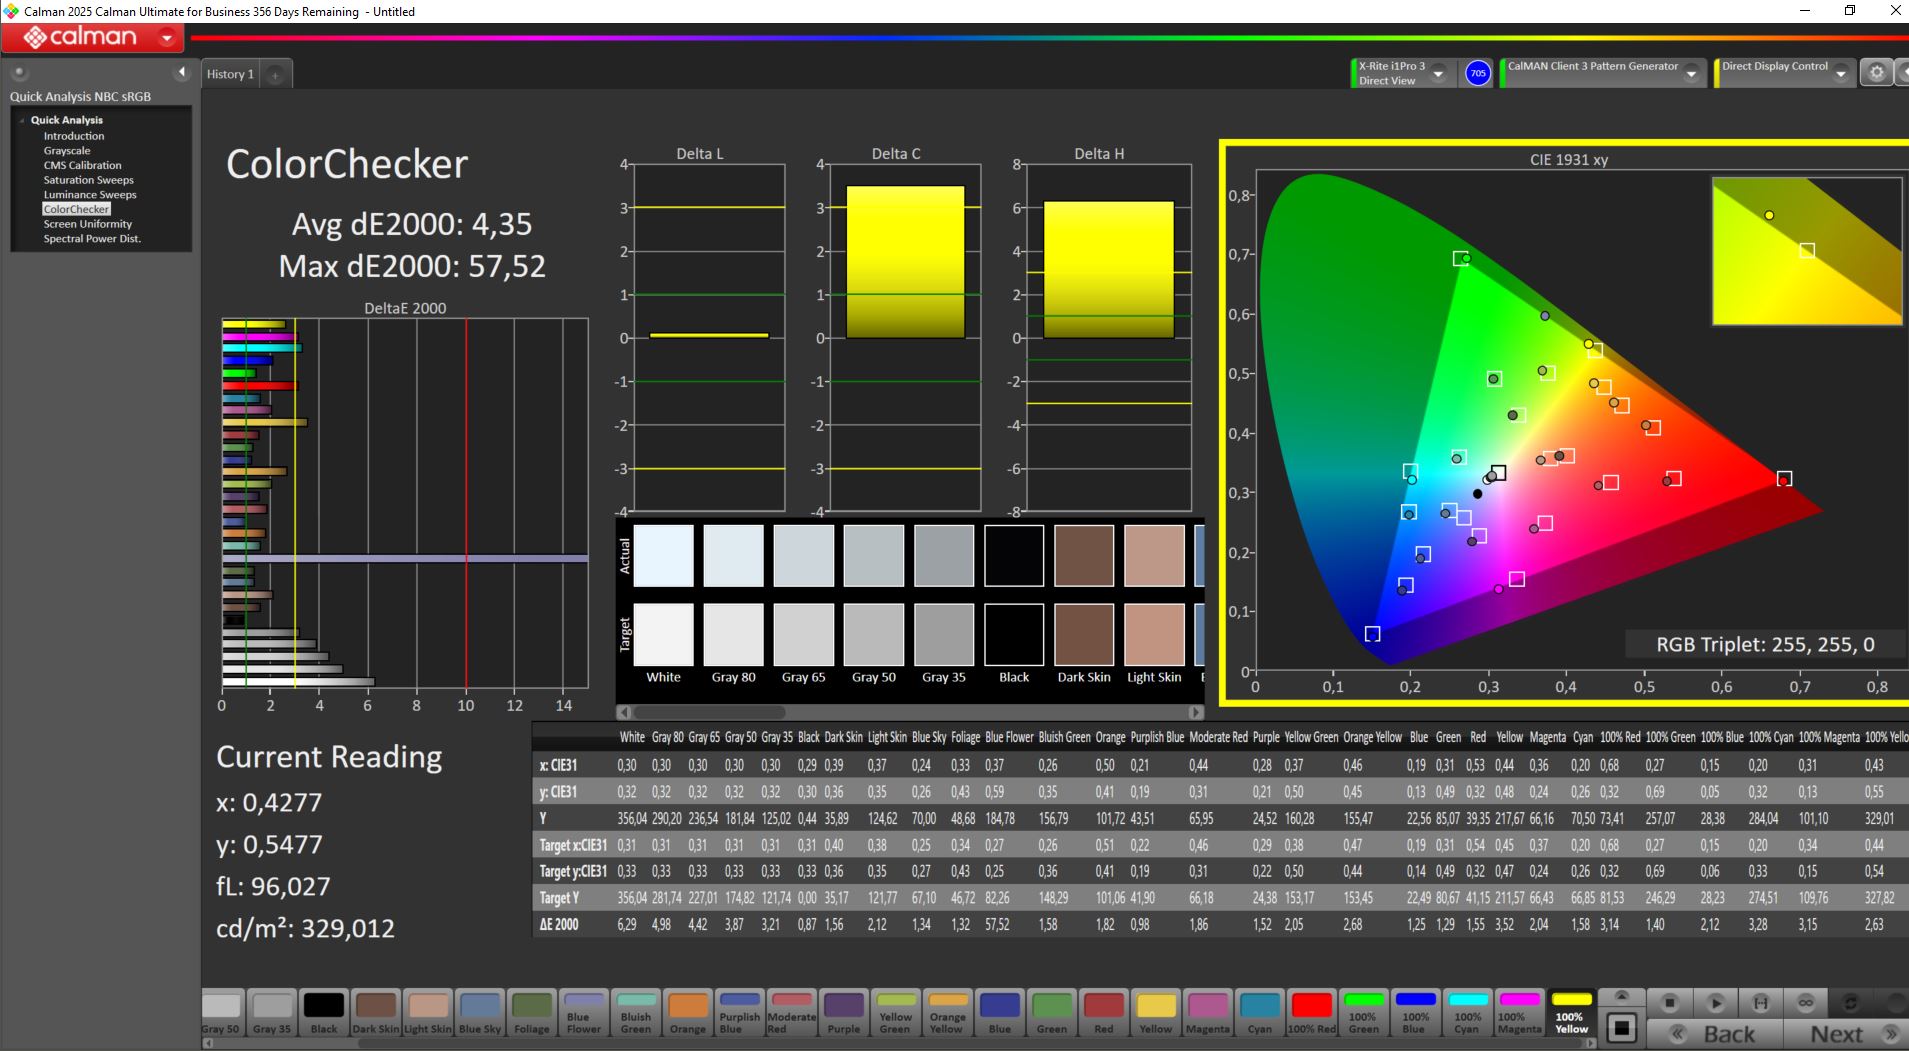
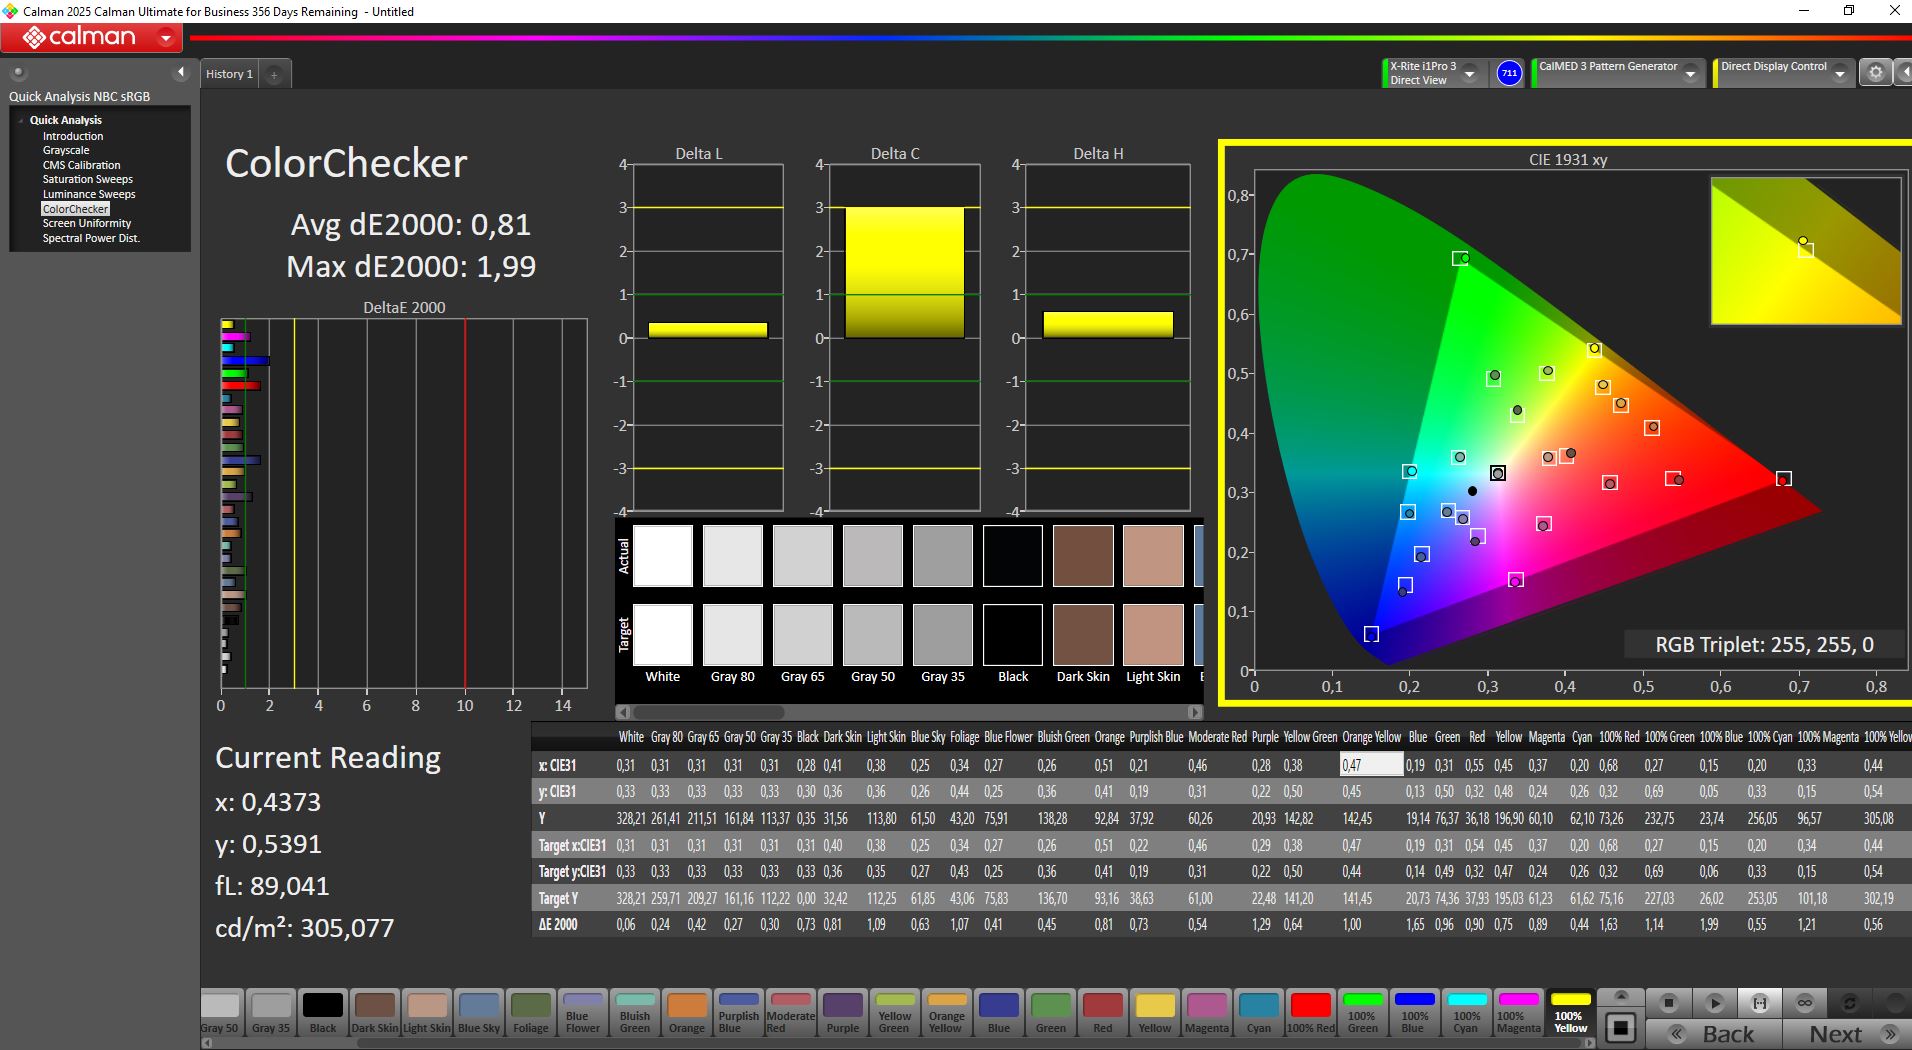
ΔE ColorChecker Calman: 4.35 | ∀{0.5-29.43 Ø4.73}
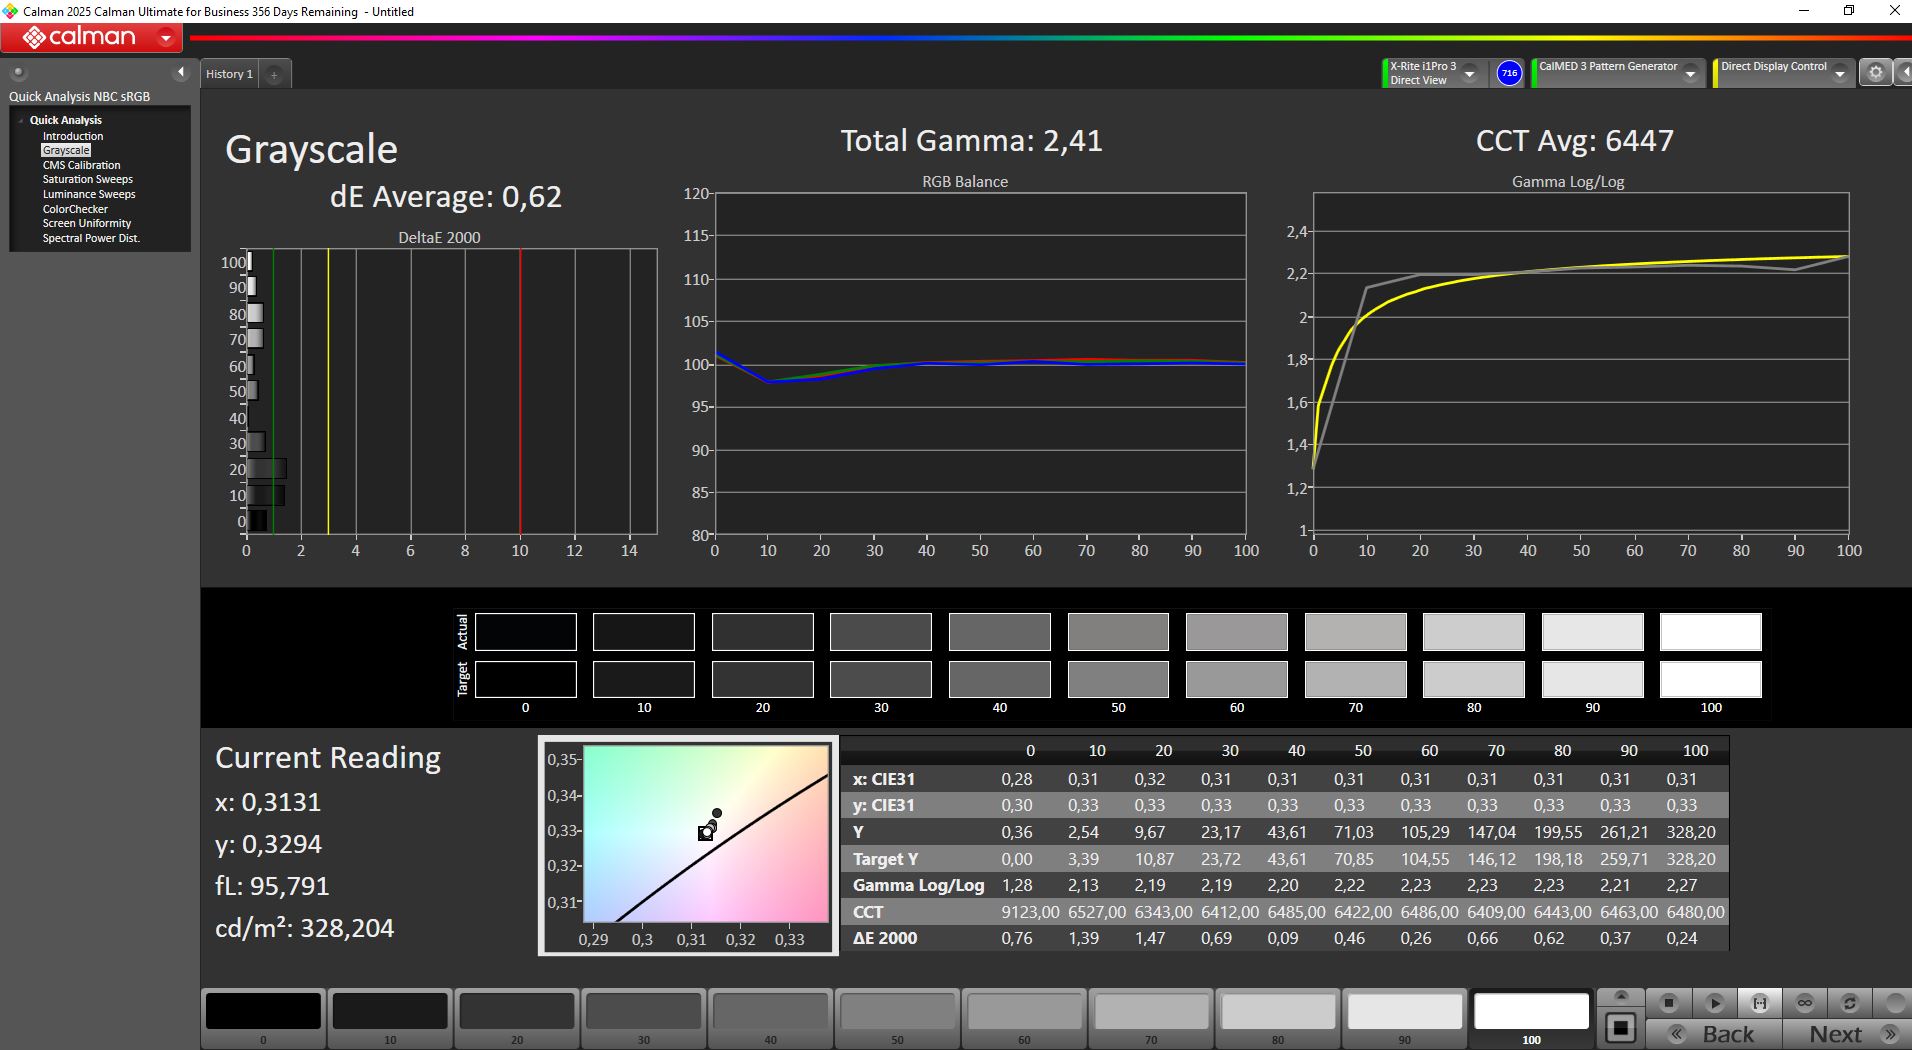
calibrated: 0.81
ΔE Greyscale Calman: 3.16 | ∀{0.09-98 Ø4.97}
85.1% AdobeRGB 1998 (Argyll 3D)
99.9% sRGB (Argyll 3D)
97.4% Display P3 (Argyll 3D)
Gamma: 2.33
CCT: 7084 K
| Schenker XMG Apex 17 M25 BOE09F9 (NE173QHM-NZ1), IPS, 2560x1440, 17.3", 240 Hz | HP Omen 17z-db100 BOE0B67, IPS, 2560x1440, 17.3", 240 Hz | Acer Nitro v 17 (ANV17-41-R4CJ) AUOB39E (B173HAN04.9), IPS, 1920x1080, 17.3", 144 Hz | MSI Crosshair A17 HX D8WGKG B170QAN01.2, IPS, 2560x1600, 17", 240 Hz | MSI Katana 17 HX B14WGK CSOT MNH301CA3-1, IPS, 2560x1440, 17.3", 240 Hz | |
|---|---|---|---|---|---|
| Display | -18% | -49% | 0% | 2% | |
| Display P3 Coverage (%) | 97.4 | 66.6 -32% | 42.2 -57% | 97.1 0% | 97.3 0% |
| sRGB Coverage (%) | 99.9 | 96.8 -3% | 60.9 -39% | 99.9 0% | 99.6 0% |
| AdobeRGB 1998 Coverage (%) | 85.1 | 68.6 -19% | 40.8 -52% | 84.9 0% | 89 5% |
| Response Times | -18% | -218% | 20% | 29% | |
| Response Time Grey 50% / Grey 80% * (ms) | 14 ? | 15.1 ? -8% | 42 ? -200% | 13.3 ? 5% | 5.2 ? 63% |
| Response Time Black / White * (ms) | 8.8 ? | 11.3 ? -28% | 29.6 ? -236% | 5.7 ? 35% | 9.2 ? -5% |
| PWM Frequency (Hz) | |||||
| PWM Amplitude * (%) | |||||
| Screen | -5% | -66% | 23% | 23% | |
| Brightness middle (cd/m²) | 356 | 373.2 5% | 258 -28% | 471 32% | 296 -17% |
| Brightness (cd/m²) | 325 | 341 5% | 238 -27% | 468 44% | 272 -16% |
| Brightness Distribution (%) | 85 | 84 -1% | 82 -4% | 96 13% | 87 2% |
| Black Level * (cd/m²) | 0.4 | 0.62 -55% | 0.19 52% | 0.4 -0% | 0.27 32% |
| Contrast (:1) | 890 | 602 -32% | 1358 53% | 1178 32% | 1096 23% |
| Colorchecker dE 2000 * | 4.35 | 2.53 42% | 7.4 -70% | 2.72 37% | 1.35 69% |
| Colorchecker dE 2000 max. * | 57.52 | 5.03 91% | 19.59 66% | 5.49 90% | 4.76 92% |
| Colorchecker dE 2000 calibrated * | 0.81 | 1.39 -72% | 5.88 -626% | 1.12 -38% | 0.78 4% |
| Greyscale dE 2000 * | 3.16 | 4.1 -30% | 3.54 -12% | 3.2 -1% | 2.7 15% |
| Gamma | 2.33 94% | 2.23 99% | 2.1 105% | 2.227 99% | 2.201 100% |
| CCT | 7084 92% | 6257 104% | 6836 95% | 6925 94% | 6770 96% |
| Total Average (Program / Settings) | -14% /
-10% | -111% /
-84% | 14% /
18% | 18% /
19% |
* ... smaller is better
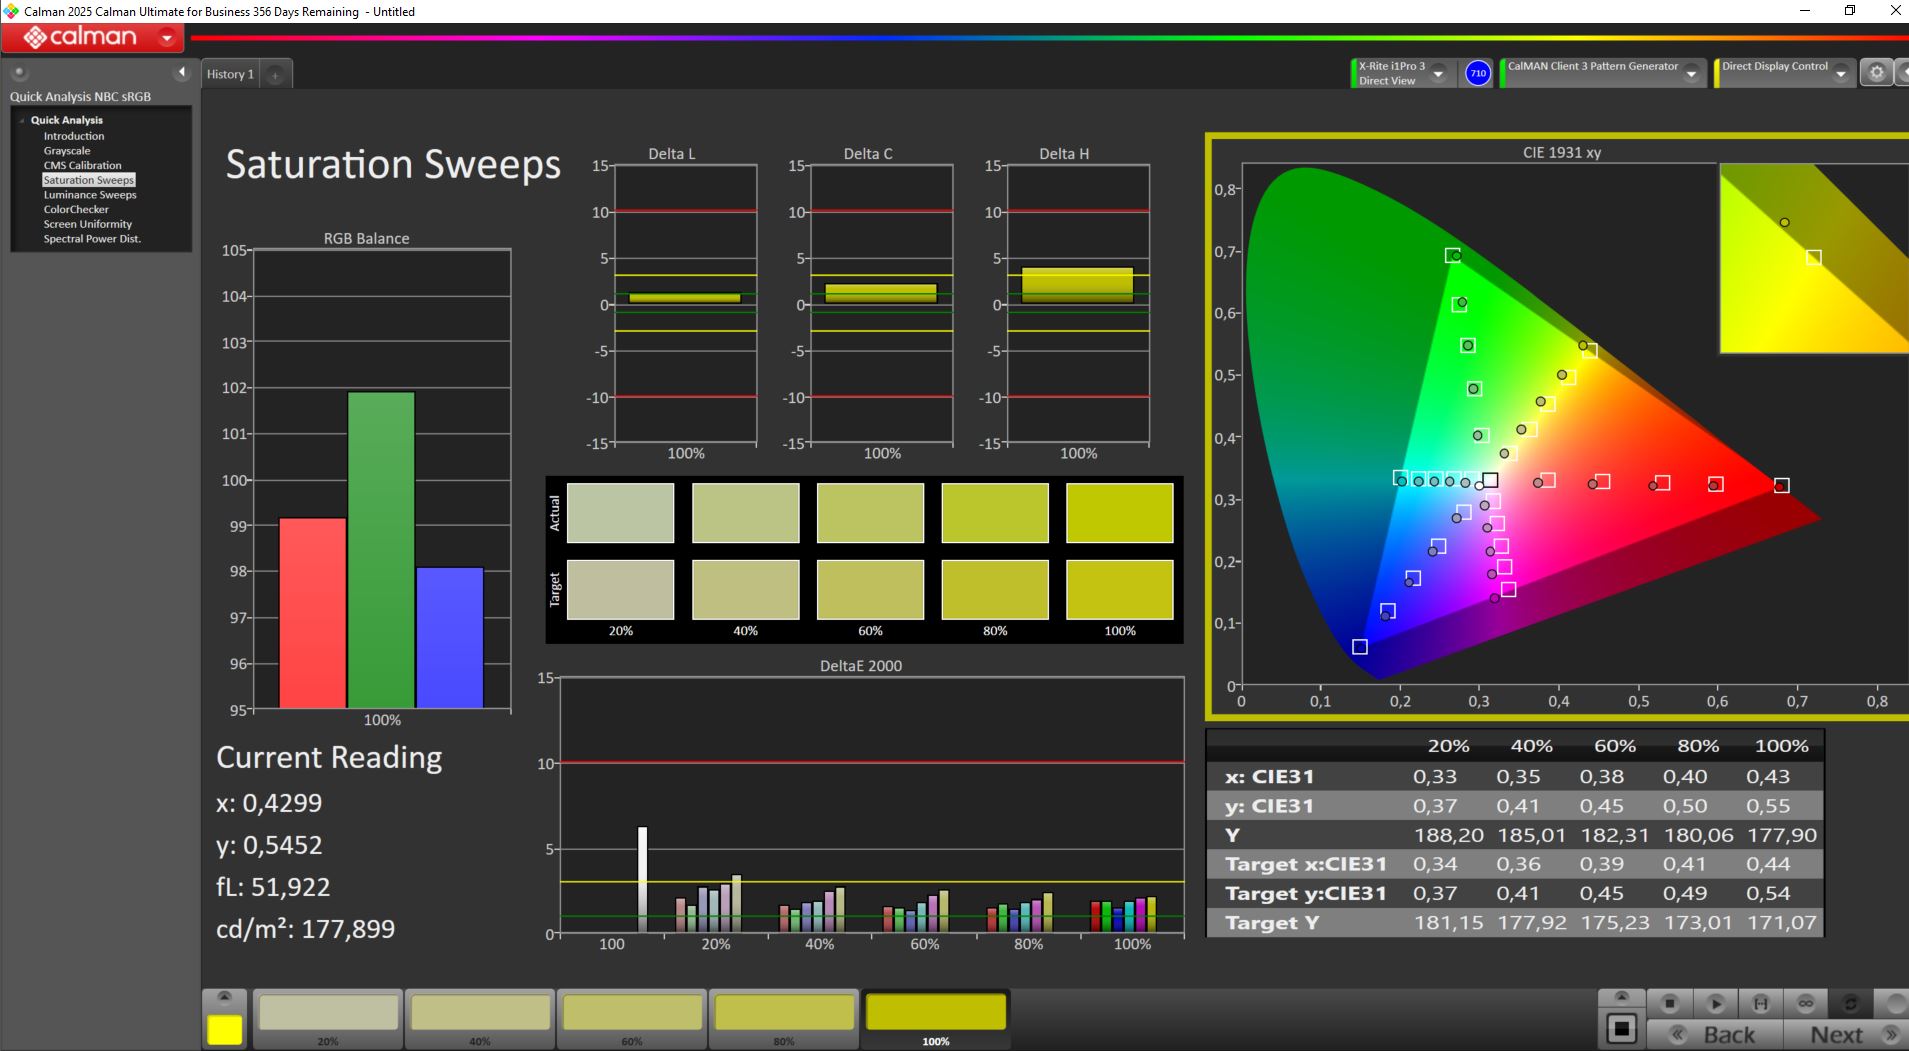
Out of the box, calibration is poor, with high DeltaE deviations. After manual recalibration, we reduced grayscale and color deviations to below 1 — excellent results. Our calibrated ICC profile is available for download above.
Display Response Times
| ↔ Response Time Black to White | ||
|---|---|---|
| 8.8 ms ... rise ↗ and fall ↘ combined | ↗ 3.4 ms rise | 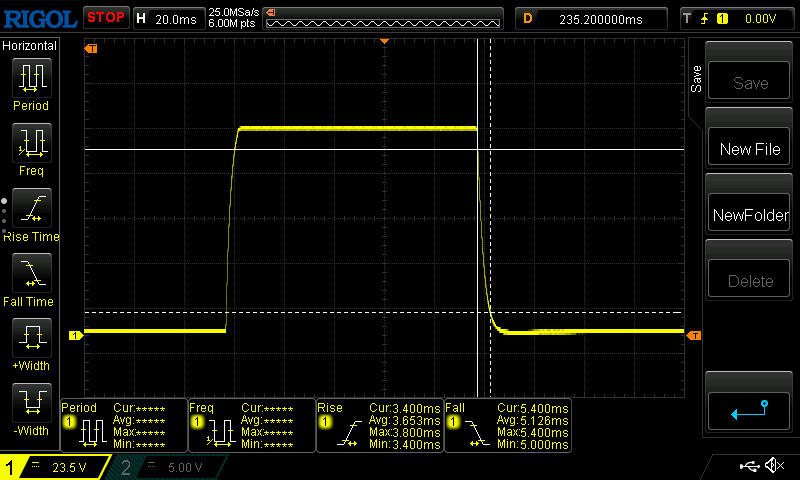 |
| ↘ 5.4 ms fall | ||
| The screen shows fast response rates in our tests and should be suited for gaming. In comparison, all tested devices range from 0.1 (minimum) to 240 (maximum) ms. » 24 % of all devices are better. This means that the measured response time is better than the average of all tested devices (19.9 ms). | ||
| ↔ Response Time 50% Grey to 80% Grey | ||
| 14 ms ... rise ↗ and fall ↘ combined | ↗ 6.6 ms rise | 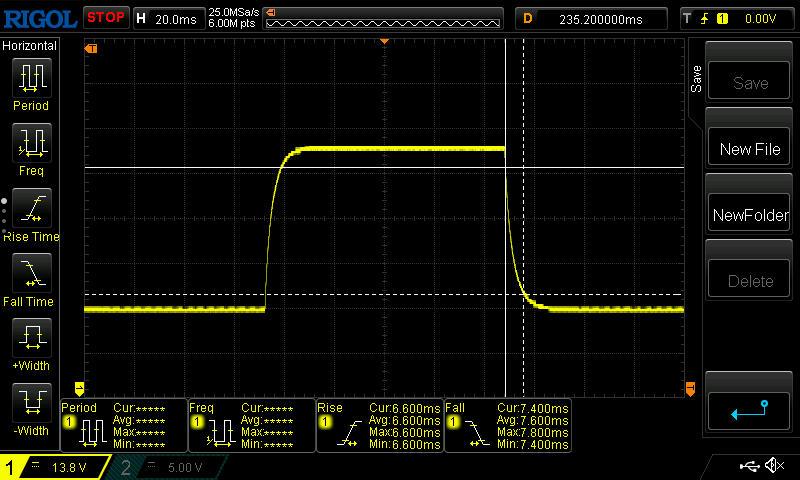 |
| ↘ 7.4 ms fall | ||
| The screen shows good response rates in our tests, but may be too slow for competitive gamers. In comparison, all tested devices range from 0.165 (minimum) to 636 (maximum) ms. » 28 % of all devices are better. This means that the measured response time is better than the average of all tested devices (31.1 ms). | ||
Screen Flickering / PWM (Pulse-Width Modulation)
| Screen flickering / PWM not detected |  | ||
In comparison: 52 % of all tested devices do not use PWM to dim the display. If PWM was detected, an average of 7791 (minimum: 5 - maximum: 343500) Hz was measured. | |||

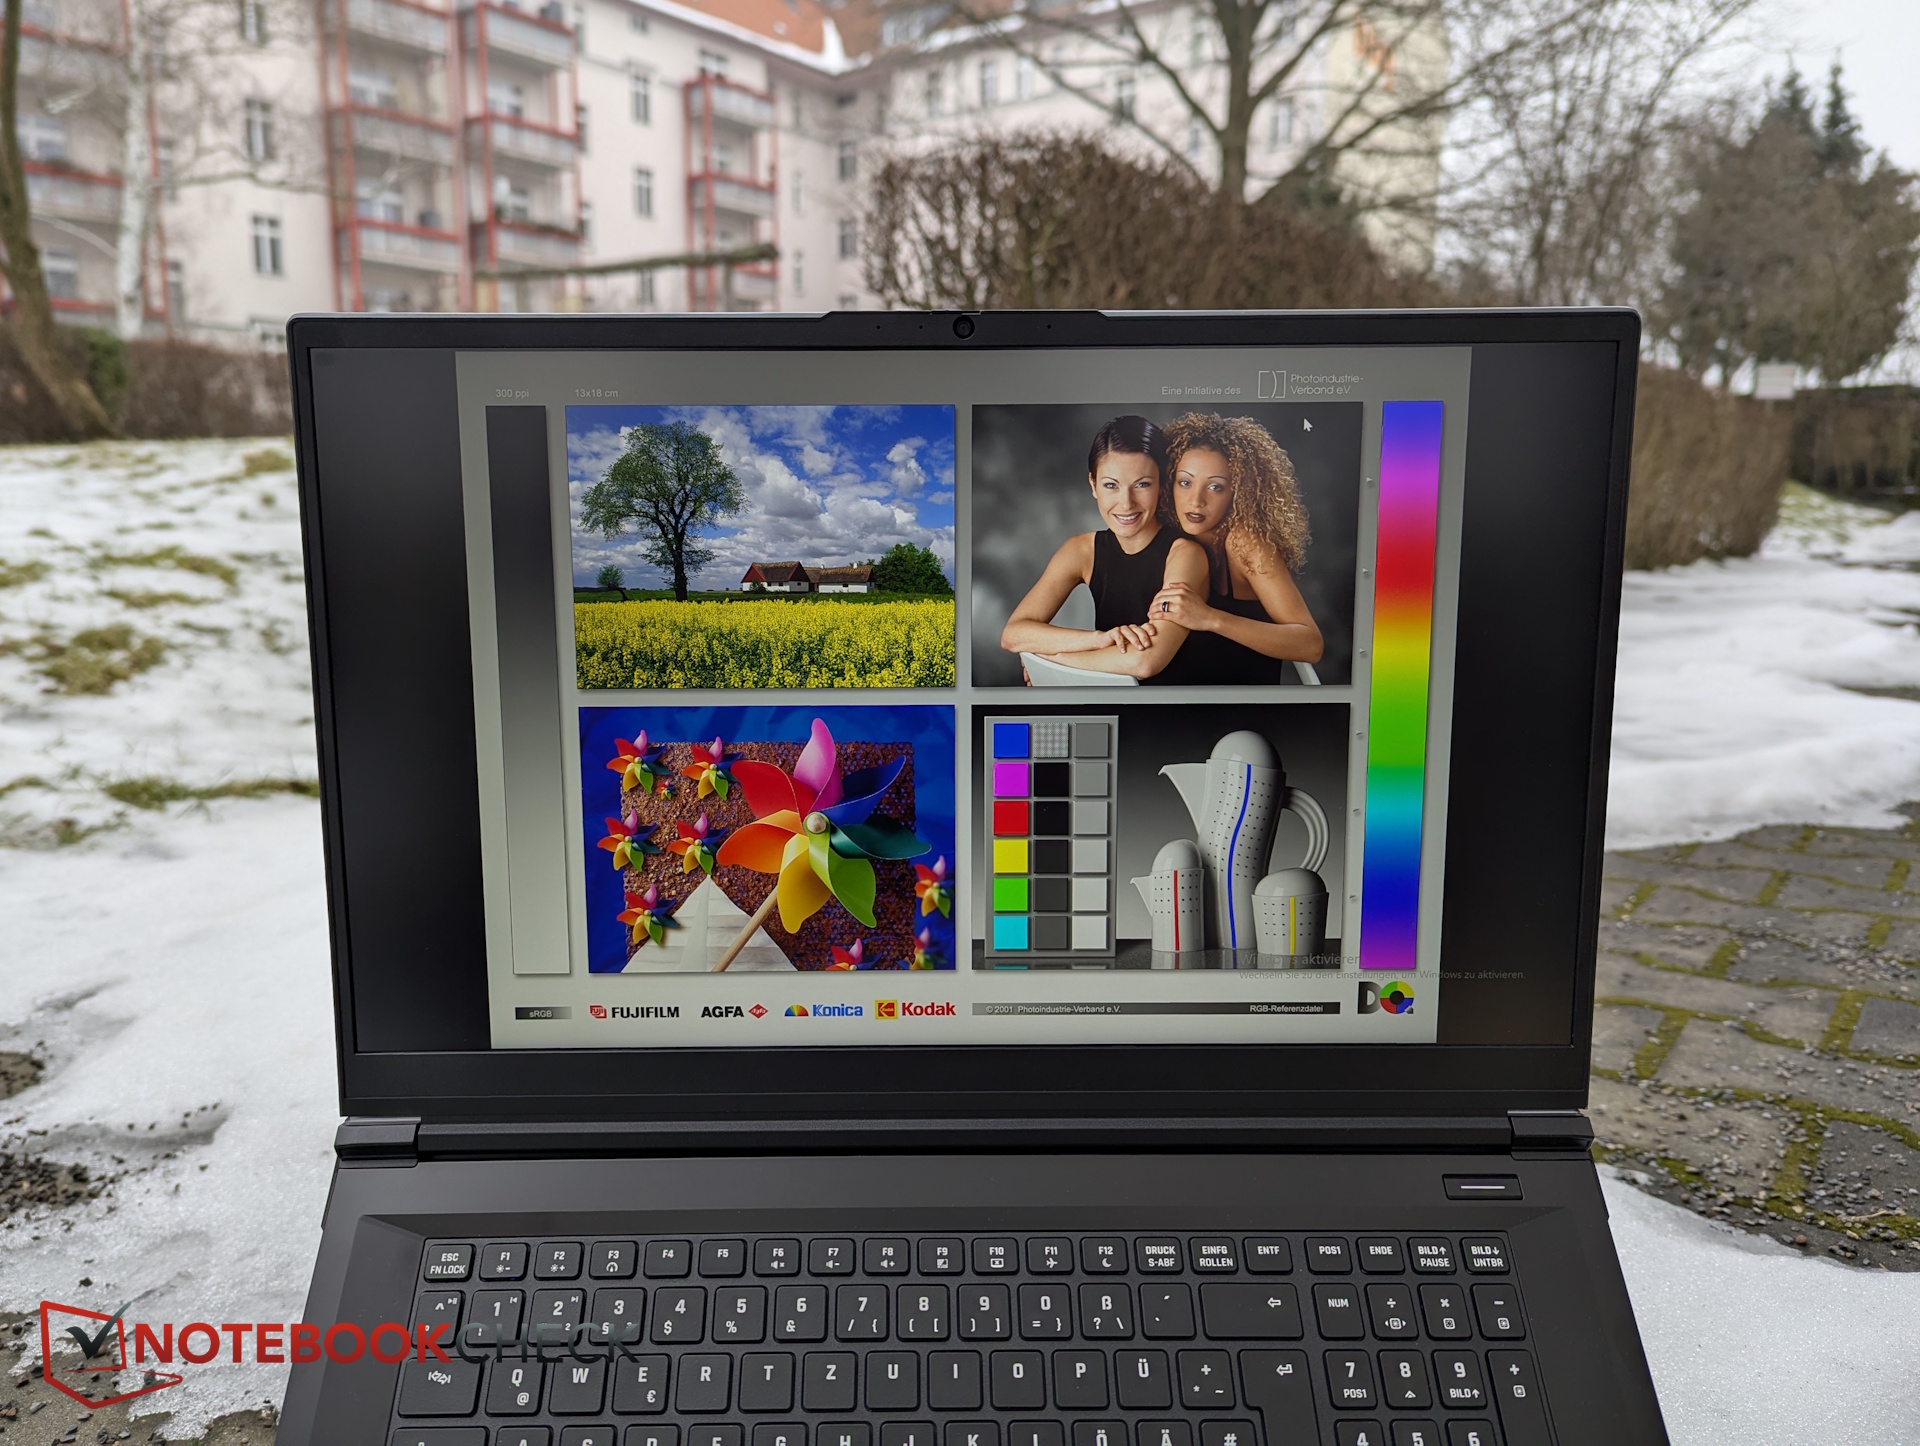
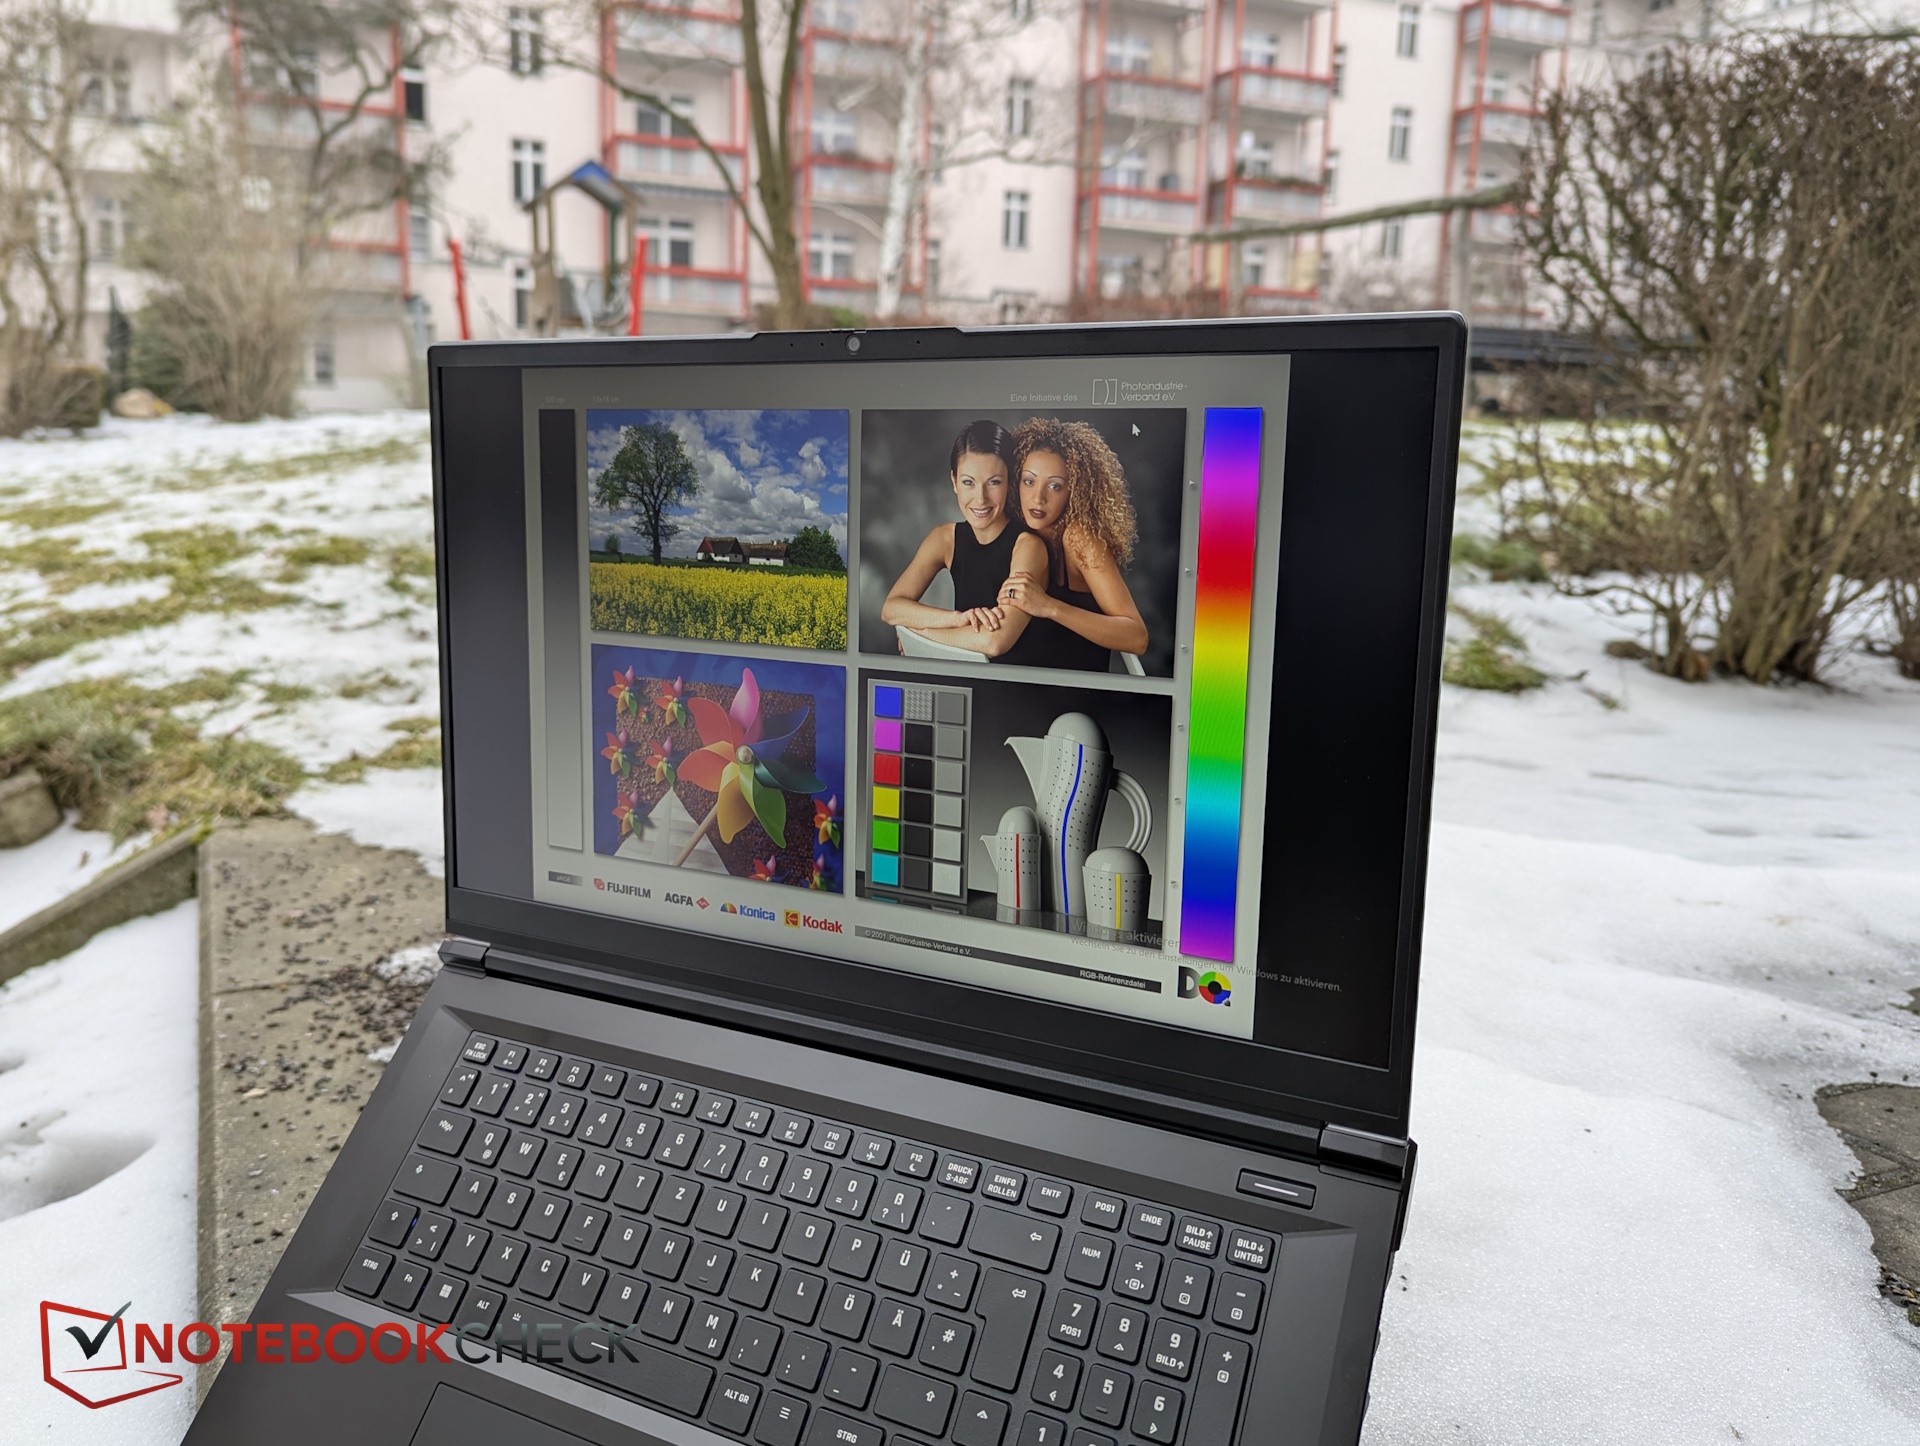
Thanks to the matte finish and brightness above 300 nits, content remains easily visible in shaded outdoor conditions.


Performance - How fast is the Apex 17 really?
Equipped with the AMD Ryzen 9 9955HX, RTX 5060, and 32 GB of RAM, the Apex is well-suited for Full HD gaming. Its understated design and well-calibrated QHD display may also appeal to content creators.
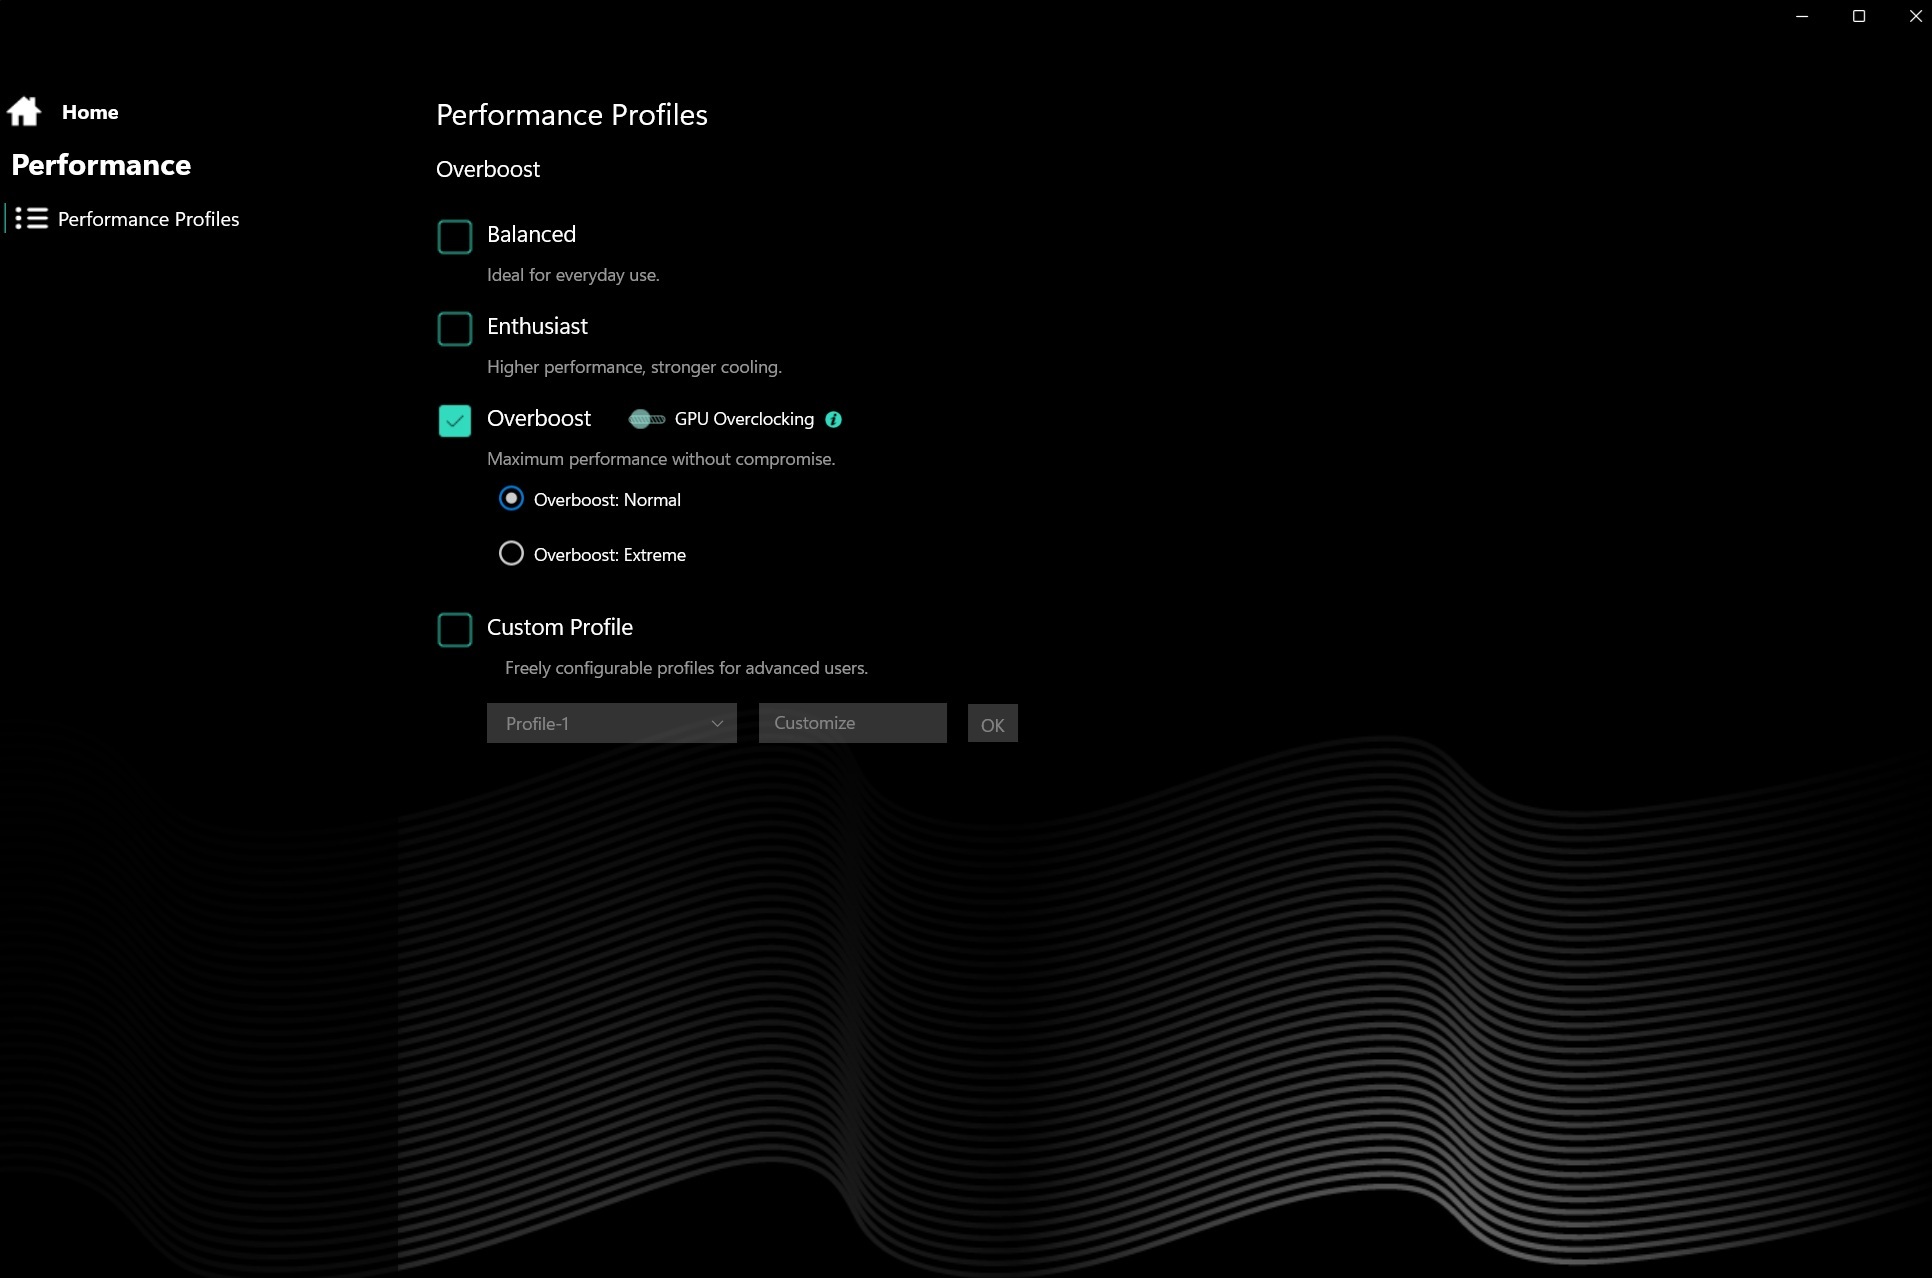
Test conditions
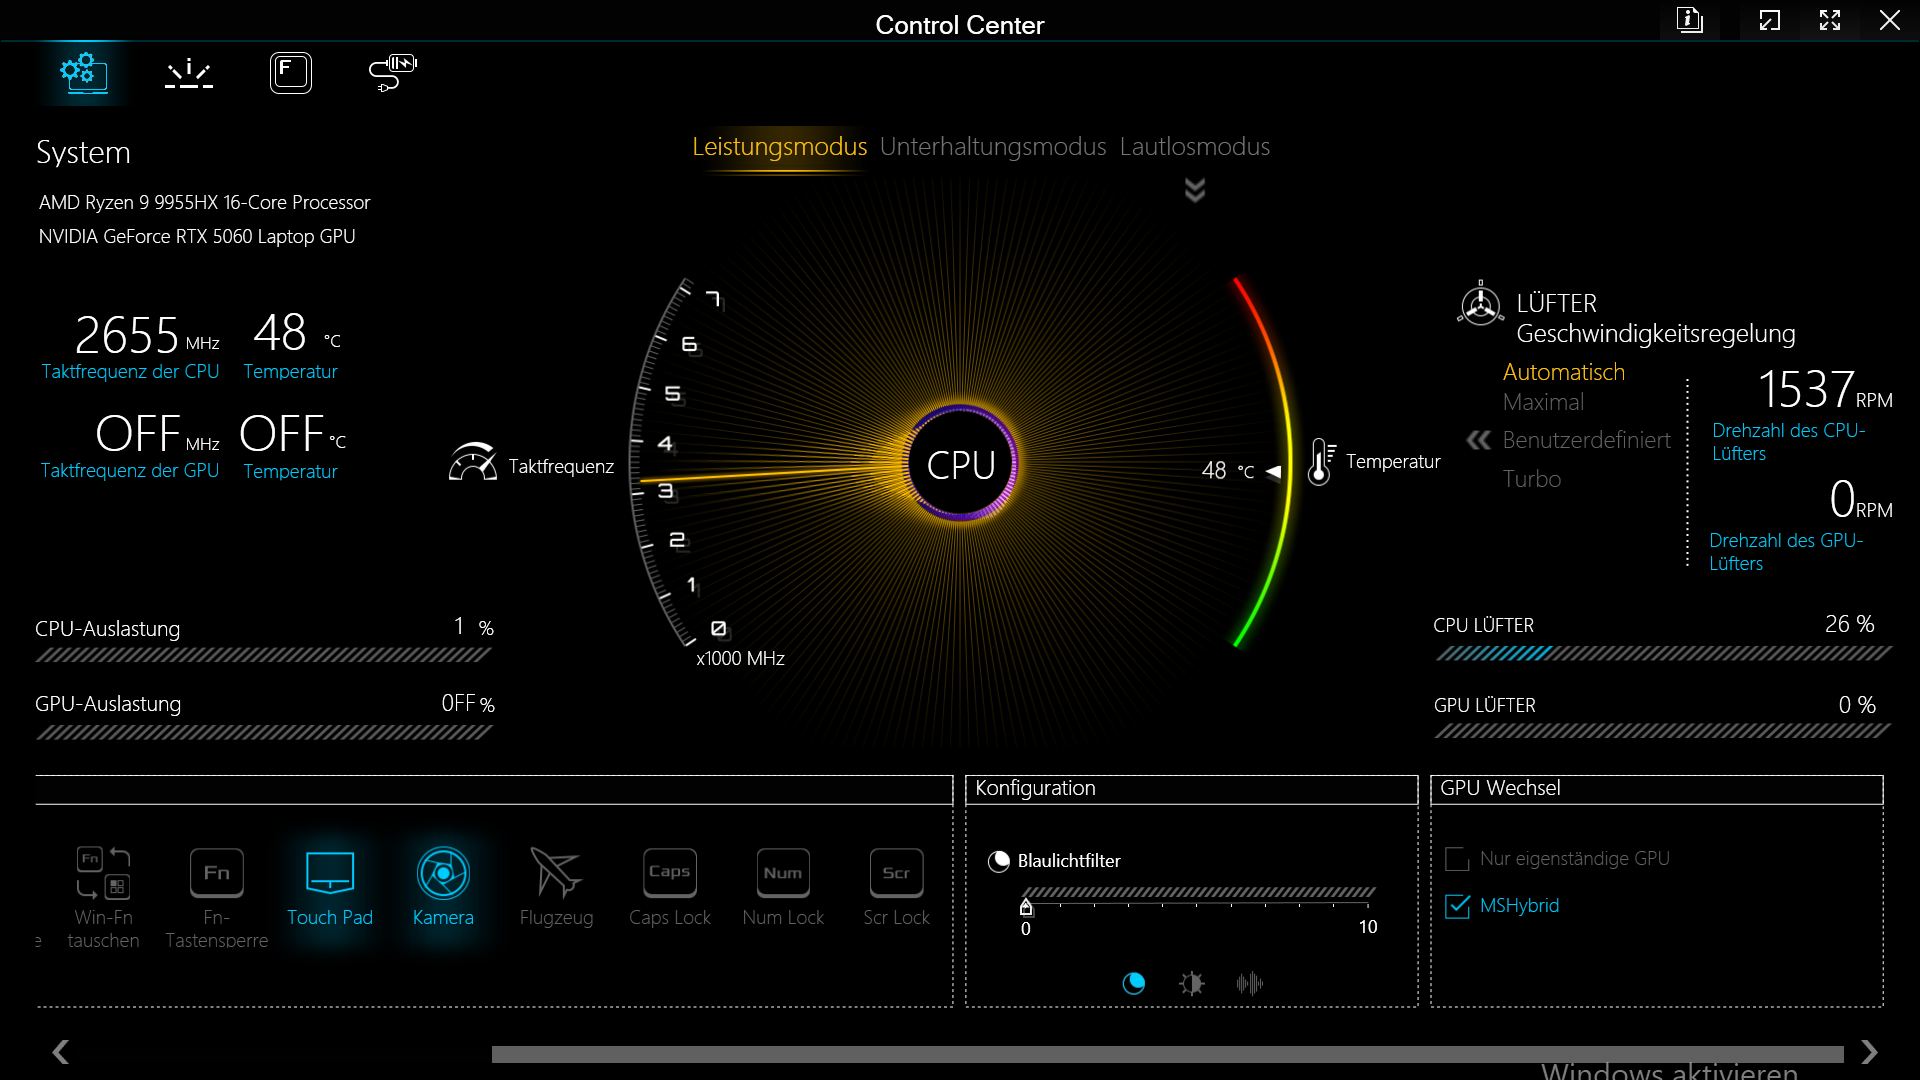
For benchmarking, we used Performance mode (Performance, Entertainment, Silent) in the Control Center.
| Performance Mode | Cinebench R15 Multi | Fire Strike Graphics | Cyberpunk 2077 FHD Ultra (fps) | Fan noise Cyberpunk (dB) | Power consumption Cyberpunk (W) |
|---|---|---|---|---|---|
| Performance | 5739 | 33011 | 84.4 | 55.05 | 220 |
| Entertainment | 4921 | 29792 | 74.4 | 40.5 - 43.5 | 170 |
| Quiet | 1227 | 23364 | 34.9 | 29 | 100 |
| Battery (Performance) | 2759 | 2578 | 30 | 23.5 - 33.5 |
Processor – Top spot in the Cinebench loop
The AMD Ryzen 9 9955HX with 16 Zen 5 cores delivers extremely consistent performance in the Cinebench loop — and the highest CPU scores in the comparison field.
In the quieter Entertainment mode, Cinebench R15 performance still matches the Legion 7. On battery power, CPU performance drops by over 50 percent, but still remains on par with the plugged-in performance of a Katana 17 or Omen 17z.
Cinebench R15 Multi Loop
Cinebench R23: Multi Core | Single Core
Cinebench R20: CPU (Multi Core) | CPU (Single Core)
Cinebench R15: CPU Multi 64Bit | CPU Single 64Bit
Blender: v2.79 BMW27 CPU
7-Zip 18.03: 7z b 4 | 7z b 4 -mmt1
Geekbench 6.7: Multi-Core | Single-Core
Geekbench 5.5: Multi-Core | Single-Core
HWBOT x265 Benchmark v2.2: 4k Preset
LibreOffice : 20 Documents To PDF
R Benchmark 2.5: Overall mean
| CPU Performance rating | |
| Average AMD Ryzen 9 9955HX | |
| Schenker XMG Apex 17 M25 | |
| Lenovo Legion 7 16IAX10 | |
| MSI Crosshair A17 HX D8WGKG | |
| Average of class Gaming | |
| MSI Katana 17 HX B14WGK | |
| HP Omen 17z-db100 | |
| Acer Nitro v 17 (ANV17-41-R4CJ) | |
| Cinebench R23 / Multi Core | |
| Average AMD Ryzen 9 9955HX (35960 - 39690, n=9) | |
| Schenker XMG Apex 17 M25 | |
| Lenovo Legion 7 16IAX10 | |
| MSI Crosshair A17 HX D8WGKG | |
| Average of class Gaming (10488 - 40970, n=110, last 2 years) | |
| HP Omen 17z-db100 | |
| MSI Katana 17 HX B14WGK | |
| Acer Nitro v 17 (ANV17-41-R4CJ) | |
| Cinebench R23 / Single Core | |
| Schenker XMG Apex 17 M25 | |
| Lenovo Legion 7 16IAX10 | |
| Average AMD Ryzen 9 9955HX (1828 - 2183, n=9) | |
| Average of class Gaming (1166 - 2356, n=110, last 2 years) | |
| MSI Katana 17 HX B14WGK | |
| HP Omen 17z-db100 | |
| MSI Crosshair A17 HX D8WGKG | |
| Acer Nitro v 17 (ANV17-41-R4CJ) | |
| Cinebench R20 / CPU (Multi Core) | |
| Average AMD Ryzen 9 9955HX (13963 - 15524, n=9) | |
| Schenker XMG Apex 17 M25 | |
| Lenovo Legion 7 16IAX10 | |
| MSI Crosshair A17 HX D8WGKG | |
| Average of class Gaming (4029 - 16108, n=109, last 2 years) | |
| HP Omen 17z-db100 | |
| Acer Nitro v 17 (ANV17-41-R4CJ) | |
| MSI Katana 17 HX B14WGK | |
| Cinebench R20 / CPU (Single Core) | |
| Schenker XMG Apex 17 M25 | |
| Average AMD Ryzen 9 9955HX (819 - 856, n=9) | |
| Lenovo Legion 7 16IAX10 | |
| Average of class Gaming (442 - 895, n=109, last 2 years) | |
| HP Omen 17z-db100 | |
| MSI Katana 17 HX B14WGK | |
| MSI Crosshair A17 HX D8WGKG | |
| Acer Nitro v 17 (ANV17-41-R4CJ) | |
| Cinebench R15 / CPU Multi 64Bit | |
| Average AMD Ryzen 9 9955HX (5624 - 6103, n=9) | |
| Schenker XMG Apex 17 M25 | |
| MSI Crosshair A17 HX D8WGKG | |
| Lenovo Legion 7 16IAX10 | |
| Average of class Gaming (1578 - 6271, n=109, last 2 years) | |
| MSI Katana 17 HX B14WGK | |
| HP Omen 17z-db100 | |
| Acer Nitro v 17 (ANV17-41-R4CJ) | |
| Cinebench R15 / CPU Single 64Bit | |
| Schenker XMG Apex 17 M25 | |
| Average AMD Ryzen 9 9955HX (320 - 338, n=9) | |
| Lenovo Legion 7 16IAX10 | |
| HP Omen 17z-db100 | |
| Average of class Gaming (188.8 - 343, n=109, last 2 years) | |
| MSI Crosshair A17 HX D8WGKG | |
| MSI Katana 17 HX B14WGK | |
| Acer Nitro v 17 (ANV17-41-R4CJ) | |
| Blender / v2.79 BMW27 CPU | |
| MSI Katana 17 HX B14WGK | |
| Acer Nitro v 17 (ANV17-41-R4CJ) | |
| HP Omen 17z-db100 | |
| Average of class Gaming (80 - 330, n=107, last 2 years) | |
| Lenovo Legion 7 16IAX10 | |
| MSI Crosshair A17 HX D8WGKG | |
| Schenker XMG Apex 17 M25 | |
| Average AMD Ryzen 9 9955HX (80 - 91, n=9) | |
| 7-Zip 18.03 / 7z b 4 | |
| Average AMD Ryzen 9 9955HX (132435 - 144064, n=9) | |
| MSI Crosshair A17 HX D8WGKG | |
| Schenker XMG Apex 17 M25 | |
| Lenovo Legion 7 16IAX10 | |
| Average of class Gaming (33491 - 148086, n=108, last 2 years) | |
| MSI Katana 17 HX B14WGK | |
| Acer Nitro v 17 (ANV17-41-R4CJ) | |
| HP Omen 17z-db100 | |
| 7-Zip 18.03 / 7z b 4 -mmt1 | |
| Schenker XMG Apex 17 M25 | |
| MSI Crosshair A17 HX D8WGKG | |
| Average AMD Ryzen 9 9955HX (7061 - 7462, n=9) | |
| Acer Nitro v 17 (ANV17-41-R4CJ) | |
| Lenovo Legion 7 16IAX10 | |
| Average of class Gaming (4199 - 7436, n=108, last 2 years) | |
| MSI Katana 17 HX B14WGK | |
| HP Omen 17z-db100 | |
| Geekbench 6.7 / Multi-Core | |
| Schenker XMG Apex 17 M25 | |
| Average AMD Ryzen 9 9955HX (16313 - 19725, n=9) | |
| Lenovo Legion 7 16IAX10 | |
| MSI Crosshair A17 HX D8WGKG | |
| Average of class Gaming (6625 - 22104, n=109, last 2 years) | |
| MSI Katana 17 HX B14WGK | |
| HP Omen 17z-db100 | |
| Acer Nitro v 17 (ANV17-41-R4CJ) | |
| Geekbench 6.7 / Single-Core | |
| Schenker XMG Apex 17 M25 | |
| Average AMD Ryzen 9 9955HX (3156 - 3259, n=9) | |
| Lenovo Legion 7 16IAX10 | |
| MSI Crosshair A17 HX D8WGKG | |
| Average of class Gaming (1490 - 3259, n=109, last 2 years) | |
| MSI Katana 17 HX B14WGK | |
| Acer Nitro v 17 (ANV17-41-R4CJ) | |
| HP Omen 17z-db100 | |
| Geekbench 5.5 / Multi-Core | |
| Average AMD Ryzen 9 9955HX (20576 - 22716, n=9) | |
| Schenker XMG Apex 17 M25 | |
| MSI Crosshair A17 HX D8WGKG | |
| Lenovo Legion 7 16IAX10 | |
| Average of class Gaming (6460 - 27010, n=108, last 2 years) | |
| MSI Katana 17 HX B14WGK | |
| HP Omen 17z-db100 | |
| Acer Nitro v 17 (ANV17-41-R4CJ) | |
| Geekbench 5.5 / Single-Core | |
| Schenker XMG Apex 17 M25 | |
| Average AMD Ryzen 9 9955HX (2307 - 2474, n=9) | |
| Lenovo Legion 7 16IAX10 | |
| Average of class Gaming (986 - 2474, n=108, last 2 years) | |
| MSI Katana 17 HX B14WGK | |
| MSI Crosshair A17 HX D8WGKG | |
| Acer Nitro v 17 (ANV17-41-R4CJ) | |
| HP Omen 17z-db100 | |
| HWBOT x265 Benchmark v2.2 / 4k Preset | |
| Average AMD Ryzen 9 9955HX (38.9 - 43, n=9) | |
| Schenker XMG Apex 17 M25 | |
| MSI Crosshair A17 HX D8WGKG | |
| Lenovo Legion 7 16IAX10 | |
| Average of class Gaming (11.5 - 44.3, n=108, last 2 years) | |
| HP Omen 17z-db100 | |
| Acer Nitro v 17 (ANV17-41-R4CJ) | |
| MSI Katana 17 HX B14WGK | |
| LibreOffice / 20 Documents To PDF | |
| Acer Nitro v 17 (ANV17-41-R4CJ) | |
| MSI Katana 17 HX B14WGK | |
| Schenker XMG Apex 17 M25 | |
| HP Omen 17z-db100 | |
| Average of class Gaming (19 - 88.8, n=108, last 2 years) | |
| Average AMD Ryzen 9 9955HX (42.2 - 52.4, n=9) | |
| MSI Crosshair A17 HX D8WGKG | |
| Lenovo Legion 7 16IAX10 | |
| R Benchmark 2.5 / Overall mean | |
| Acer Nitro v 17 (ANV17-41-R4CJ) | |
| MSI Crosshair A17 HX D8WGKG | |
| Average of class Gaming (0.3439 - 0.759, n=109, last 2 years) | |
| Lenovo Legion 7 16IAX10 | |
| MSI Katana 17 HX B14WGK | |
| HP Omen 17z-db100 | |
| Schenker XMG Apex 17 M25 | |
| Average AMD Ryzen 9 9955HX (0.3439 - 0.3737, n=9) | |
* ... smaller is better
AIDA64: FP32 Ray-Trace | FPU Julia | CPU SHA3 | CPU Queen | FPU SinJulia | FPU Mandel | CPU AES | CPU ZLib | FP64 Ray-Trace | CPU PhotoWorxx
| Performance rating | |
| Average AMD Ryzen 9 9955HX | |
| Schenker XMG Apex 17 M25 | |
| MSI Crosshair A17 HX D8WGKG | |
| Lenovo Legion 7 16IAX10 | |
| Average of class Gaming | |
| HP Omen 17z-db100 | |
| Acer Nitro v 17 (ANV17-41-R4CJ) | |
| MSI Katana 17 HX B14WGK | |
| AIDA64 / FP32 Ray-Trace | |
| Average AMD Ryzen 9 9955HX (66596 - 85542, n=9) | |
| Schenker XMG Apex 17 M25 | |
| MSI Crosshair A17 HX D8WGKG | |
| Average of class Gaming (10227 - 85542, n=107, last 2 years) | |
| Lenovo Legion 7 16IAX10 | |
| HP Omen 17z-db100 | |
| Acer Nitro v 17 (ANV17-41-R4CJ) | |
| MSI Katana 17 HX B14WGK | |
| AIDA64 / FPU Julia | |
| Average AMD Ryzen 9 9955HX (191535 - 232031, n=9) | |
| Schenker XMG Apex 17 M25 | |
| MSI Crosshair A17 HX D8WGKG | |
| Lenovo Legion 7 16IAX10 | |
| Average of class Gaming (51376 - 238426, n=107, last 2 years) | |
| Acer Nitro v 17 (ANV17-41-R4CJ) | |
| HP Omen 17z-db100 | |
| MSI Katana 17 HX B14WGK | |
| AIDA64 / CPU SHA3 | |
| Average AMD Ryzen 9 9955HX (8489 - 9780, n=9) | |
| MSI Crosshair A17 HX D8WGKG | |
| Schenker XMG Apex 17 M25 | |
| Lenovo Legion 7 16IAX10 | |
| Average of class Gaming (2180 - 9817, n=107, last 2 years) | |
| Acer Nitro v 17 (ANV17-41-R4CJ) | |
| HP Omen 17z-db100 | |
| MSI Katana 17 HX B14WGK | |
| AIDA64 / CPU Queen | |
| MSI Crosshair A17 HX D8WGKG | |
| Average AMD Ryzen 9 9955HX (153027 - 164154, n=9) | |
| Schenker XMG Apex 17 M25 | |
| Lenovo Legion 7 16IAX10 | |
| Acer Nitro v 17 (ANV17-41-R4CJ) | |
| Average of class Gaming (49785 - 173351, n=98, last 2 years) | |
| MSI Katana 17 HX B14WGK | |
| HP Omen 17z-db100 | |
| AIDA64 / FPU SinJulia | |
| Average AMD Ryzen 9 9955HX (29876 - 32647, n=9) | |
| Schenker XMG Apex 17 M25 | |
| MSI Crosshair A17 HX D8WGKG | |
| Acer Nitro v 17 (ANV17-41-R4CJ) | |
| Average of class Gaming (4424 - 33636, n=107, last 2 years) | |
| HP Omen 17z-db100 | |
| Lenovo Legion 7 16IAX10 | |
| MSI Katana 17 HX B14WGK | |
| AIDA64 / FPU Mandel | |
| Average AMD Ryzen 9 9955HX (101131 - 128721, n=9) | |
| MSI Crosshair A17 HX D8WGKG | |
| Schenker XMG Apex 17 M25 | |
| Lenovo Legion 7 16IAX10 | |
| Average of class Gaming (25115 - 128721, n=107, last 2 years) | |
| HP Omen 17z-db100 | |
| Acer Nitro v 17 (ANV17-41-R4CJ) | |
| MSI Katana 17 HX B14WGK | |
| AIDA64 / CPU AES | |
| Average AMD Ryzen 9 9955HX (146979 - 218385, n=9) | |
| MSI Crosshair A17 HX D8WGKG | |
| Schenker XMG Apex 17 M25 | |
| Lenovo Legion 7 16IAX10 | |
| Average of class Gaming (39258 - 247074, n=107, last 2 years) | |
| HP Omen 17z-db100 | |
| Acer Nitro v 17 (ANV17-41-R4CJ) | |
| MSI Katana 17 HX B14WGK | |
| AIDA64 / CPU ZLib | |
| Average AMD Ryzen 9 9955HX (2186 - 2531, n=9) | |
| Schenker XMG Apex 17 M25 | |
| MSI Crosshair A17 HX D8WGKG | |
| Lenovo Legion 7 16IAX10 | |
| Average of class Gaming (574 - 2531, n=107, last 2 years) | |
| HP Omen 17z-db100 | |
| Acer Nitro v 17 (ANV17-41-R4CJ) | |
| MSI Katana 17 HX B14WGK | |
| AIDA64 / FP64 Ray-Trace | |
| Average AMD Ryzen 9 9955HX (35252 - 45446, n=9) | |
| Schenker XMG Apex 17 M25 | |
| MSI Crosshair A17 HX D8WGKG | |
| Average of class Gaming (5509 - 45446, n=107, last 2 years) | |
| Lenovo Legion 7 16IAX10 | |
| HP Omen 17z-db100 | |
| Acer Nitro v 17 (ANV17-41-R4CJ) | |
| MSI Katana 17 HX B14WGK | |
| AIDA64 / CPU PhotoWorxx | |
| Lenovo Legion 7 16IAX10 | |
| HP Omen 17z-db100 | |
| Average of class Gaming (12271 - 89891, n=107, last 2 years) | |
| Schenker XMG Apex 17 M25 | |
| Average AMD Ryzen 9 9955HX (35974 - 42495, n=9) | |
| MSI Crosshair A17 HX D8WGKG | |
| MSI Katana 17 HX B14WGK | |
| Acer Nitro v 17 (ANV17-41-R4CJ) | |
System performance
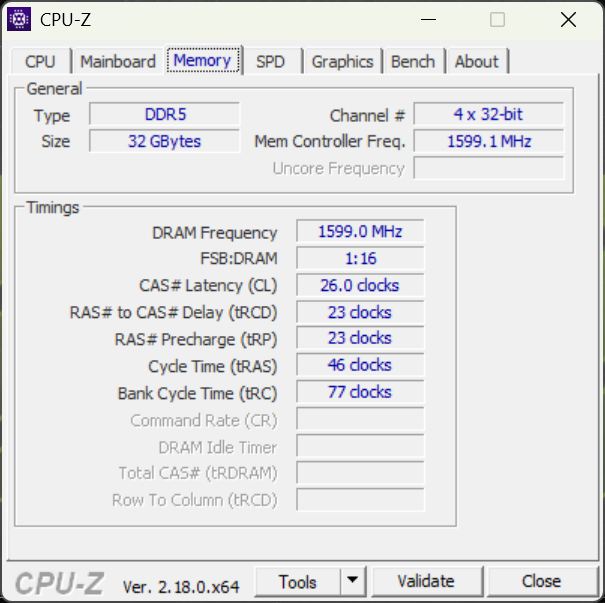
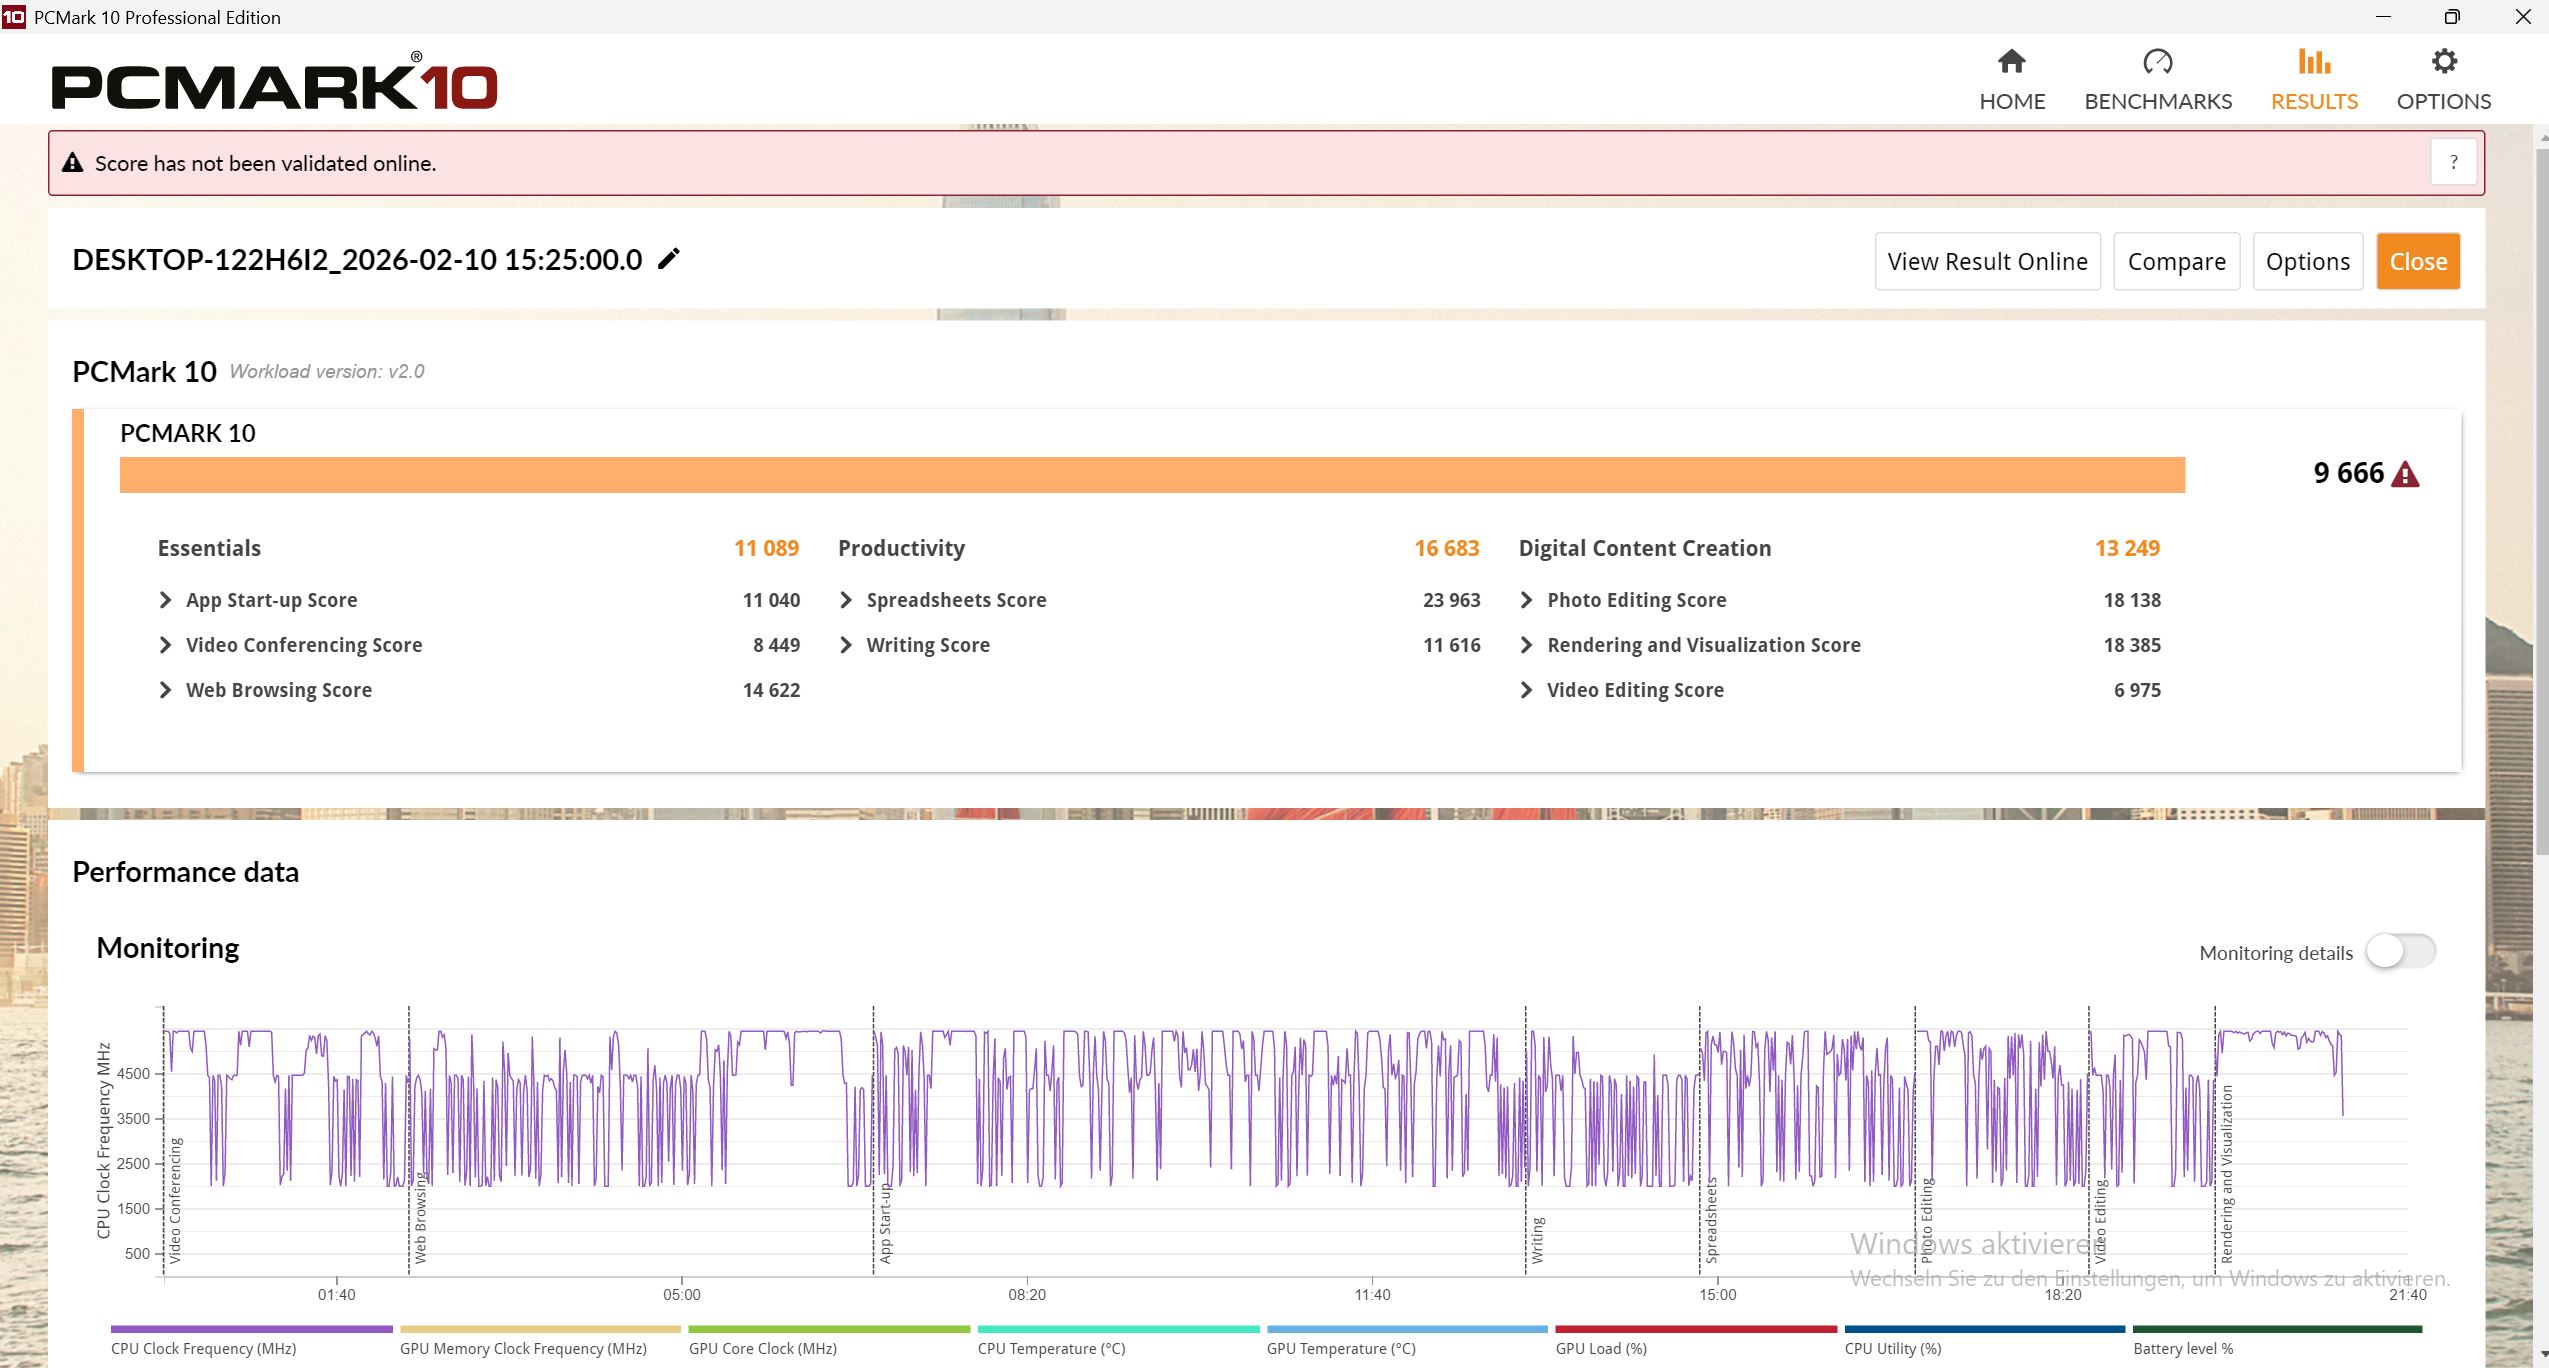
In both PCMark 10 and CrossMark, the Apex leads the comparison group. Subjectively, the system feels very responsive. AIDA memory benchmark results are average.
PCMark 10: Score | Essentials | Productivity | Digital Content Creation
CrossMark: Overall | Productivity | Creativity | Responsiveness
WebXPRT 3: Overall
WebXPRT 4: Overall
Mozilla Kraken 1.1: Total
| Performance rating | |
| Schenker XMG Apex 17 M25 | |
| Average AMD Ryzen 9 9955HX, NVIDIA GeForce RTX 5060 Laptop | |
| Lenovo Legion 7 16IAX10 | |
| Average of class Gaming | |
| MSI Crosshair A17 HX D8WGKG | |
| MSI Katana 17 HX B14WGK | |
| HP Omen 17z-db100 | |
| Acer Nitro v 17 (ANV17-41-R4CJ) | |
| PCMark 10 / Score | |
| Schenker XMG Apex 17 M25 | |
| Average AMD Ryzen 9 9955HX, NVIDIA GeForce RTX 5060 Laptop (n=1) | |
| Average of class Gaming (5828 - 11574, n=94, last 2 years) | |
| MSI Crosshair A17 HX D8WGKG | |
| Acer Nitro v 17 (ANV17-41-R4CJ) | |
| HP Omen 17z-db100 | |
| Lenovo Legion 7 16IAX10 | |
| MSI Katana 17 HX B14WGK | |
| PCMark 10 / Essentials | |
| HP Omen 17z-db100 | |
| Lenovo Legion 7 16IAX10 | |
| MSI Crosshair A17 HX D8WGKG | |
| Schenker XMG Apex 17 M25 | |
| Average AMD Ryzen 9 9955HX, NVIDIA GeForce RTX 5060 Laptop (n=1) | |
| Average of class Gaming (8810 - 12600, n=98, last 2 years) | |
| MSI Katana 17 HX B14WGK | |
| Acer Nitro v 17 (ANV17-41-R4CJ) | |
| PCMark 10 / Productivity | |
| Schenker XMG Apex 17 M25 | |
| Average AMD Ryzen 9 9955HX, NVIDIA GeForce RTX 5060 Laptop (n=1) | |
| Acer Nitro v 17 (ANV17-41-R4CJ) | |
| HP Omen 17z-db100 | |
| Average of class Gaming (6845 - 18766, n=96, last 2 years) | |
| Lenovo Legion 7 16IAX10 | |
| MSI Crosshair A17 HX D8WGKG | |
| MSI Katana 17 HX B14WGK | |
| PCMark 10 / Digital Content Creation | |
| Average of class Gaming (7602 - 19657, n=96, last 2 years) | |
| MSI Crosshair A17 HX D8WGKG | |
| Schenker XMG Apex 17 M25 | |
| Average AMD Ryzen 9 9955HX, NVIDIA GeForce RTX 5060 Laptop (n=1) | |
| MSI Katana 17 HX B14WGK | |
| Acer Nitro v 17 (ANV17-41-R4CJ) | |
| Lenovo Legion 7 16IAX10 | |
| HP Omen 17z-db100 | |
| CrossMark / Overall | |
| Schenker XMG Apex 17 M25 | |
| Average AMD Ryzen 9 9955HX, NVIDIA GeForce RTX 5060 Laptop (n=1) | |
| Lenovo Legion 7 16IAX10 | |
| Average of class Gaming (1366 - 2409, n=96, last 2 years) | |
| MSI Crosshair A17 HX D8WGKG | |
| MSI Katana 17 HX B14WGK | |
| HP Omen 17z-db100 | |
| Acer Nitro v 17 (ANV17-41-R4CJ) | |
| CrossMark / Productivity | |
| Schenker XMG Apex 17 M25 | |
| Average AMD Ryzen 9 9955HX, NVIDIA GeForce RTX 5060 Laptop (n=1) | |
| Lenovo Legion 7 16IAX10 | |
| MSI Katana 17 HX B14WGK | |
| Average of class Gaming (1386 - 2254, n=96, last 2 years) | |
| MSI Crosshair A17 HX D8WGKG | |
| HP Omen 17z-db100 | |
| Acer Nitro v 17 (ANV17-41-R4CJ) | |
| CrossMark / Creativity | |
| Schenker XMG Apex 17 M25 | |
| Average AMD Ryzen 9 9955HX, NVIDIA GeForce RTX 5060 Laptop (n=1) | |
| Lenovo Legion 7 16IAX10 | |
| Average of class Gaming (1343 - 2729, n=96, last 2 years) | |
| MSI Crosshair A17 HX D8WGKG | |
| HP Omen 17z-db100 | |
| MSI Katana 17 HX B14WGK | |
| Acer Nitro v 17 (ANV17-41-R4CJ) | |
| CrossMark / Responsiveness | |
| Schenker XMG Apex 17 M25 | |
| Average AMD Ryzen 9 9955HX, NVIDIA GeForce RTX 5060 Laptop (n=1) | |
| MSI Katana 17 HX B14WGK | |
| Lenovo Legion 7 16IAX10 | |
| MSI Crosshair A17 HX D8WGKG | |
| Average of class Gaming (1226 - 2334, n=96, last 2 years) | |
| HP Omen 17z-db100 | |
| Acer Nitro v 17 (ANV17-41-R4CJ) | |
| WebXPRT 3 / Overall | |
| Lenovo Legion 7 16IAX10 | |
| Average of class Gaming (242 - 532, n=99, last 2 years) | |
| Schenker XMG Apex 17 M25 | |
| Average AMD Ryzen 9 9955HX, NVIDIA GeForce RTX 5060 Laptop (n=1) | |
| MSI Katana 17 HX B14WGK | |
| HP Omen 17z-db100 | |
| Acer Nitro v 17 (ANV17-41-R4CJ) | |
| MSI Crosshair A17 HX D8WGKG | |
| WebXPRT 4 / Overall | |
| Lenovo Legion 7 16IAX10 | |
| Schenker XMG Apex 17 M25 | |
| Average AMD Ryzen 9 9955HX, NVIDIA GeForce RTX 5060 Laptop (n=1) | |
| Average of class Gaming (176.4 - 354, n=99, last 2 years) | |
| MSI Katana 17 HX B14WGK | |
| HP Omen 17z-db100 | |
| Acer Nitro v 17 (ANV17-41-R4CJ) | |
| MSI Crosshair A17 HX D8WGKG | |
| Mozilla Kraken 1.1 / Total | |
| Acer Nitro v 17 (ANV17-41-R4CJ) | |
| MSI Crosshair A17 HX D8WGKG | |
| MSI Katana 17 HX B14WGK | |
| HP Omen 17z-db100 | |
| Average of class Gaming (391 - 590, n=104, last 2 years) | |
| Lenovo Legion 7 16IAX10 | |
| Schenker XMG Apex 17 M25 | |
| Average AMD Ryzen 9 9955HX, NVIDIA GeForce RTX 5060 Laptop (n=1) | |
* ... smaller is better
| PCMark 10 Score | 9666 points | |
Help | ||
| AIDA64 / Memory Copy | |
| Lenovo Legion 7 16IAX10 | |
| Average of class Gaming (21750 - 129946, n=107, last 2 years) | |
| HP Omen 17z-db100 | |
| Schenker XMG Apex 17 M25 | |
| Average AMD Ryzen 9 9955HX (53598 - 62777, n=9) | |
| MSI Katana 17 HX B14WGK | |
| MSI Crosshair A17 HX D8WGKG | |
| Acer Nitro v 17 (ANV17-41-R4CJ) | |
| AIDA64 / Memory Read | |
| Lenovo Legion 7 16IAX10 | |
| Average of class Gaming (22956 - 118858, n=107, last 2 years) | |
| MSI Katana 17 HX B14WGK | |
| Schenker XMG Apex 17 M25 | |
| Average AMD Ryzen 9 9955HX (63953 - 67256, n=9) | |
| HP Omen 17z-db100 | |
| MSI Crosshair A17 HX D8WGKG | |
| Acer Nitro v 17 (ANV17-41-R4CJ) | |
| AIDA64 / Memory Write | |
| HP Omen 17z-db100 | |
| Lenovo Legion 7 16IAX10 | |
| Average of class Gaming (22297 - 135096, n=107, last 2 years) | |
| Schenker XMG Apex 17 M25 | |
| Average AMD Ryzen 9 9955HX (65421 - 72060, n=9) | |
| MSI Crosshair A17 HX D8WGKG | |
| MSI Katana 17 HX B14WGK | |
| Acer Nitro v 17 (ANV17-41-R4CJ) | |
| AIDA64 / Memory Latency | |
| Average of class Gaming (75.3 - 259, n=107, last 2 years) | |
| Lenovo Legion 7 16IAX10 | |
| HP Omen 17z-db100 | |
| Average AMD Ryzen 9 9955HX (92.1 - 103.5, n=9) | |
| Schenker XMG Apex 17 M25 | |
| MSI Katana 17 HX B14WGK | |
| Acer Nitro v 17 (ANV17-41-R4CJ) | |
| MSI Crosshair A17 HX D8WGKG | |
* ... smaller is better
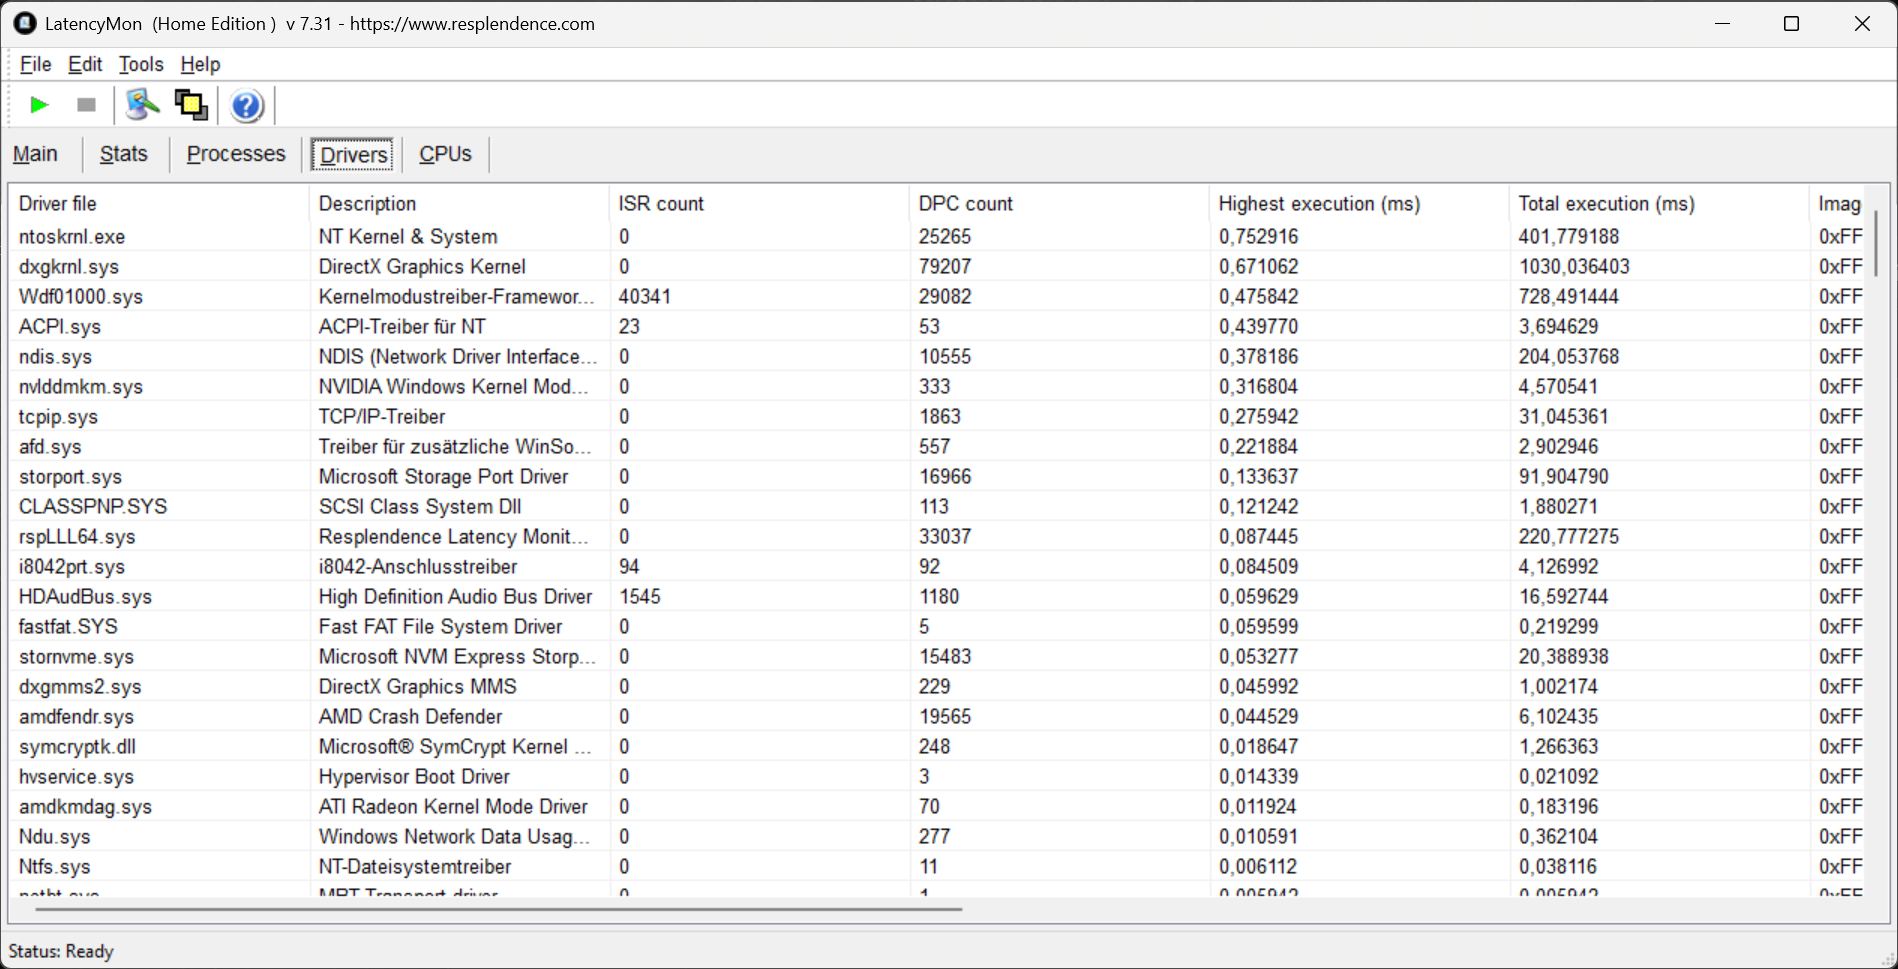
DPC latencies
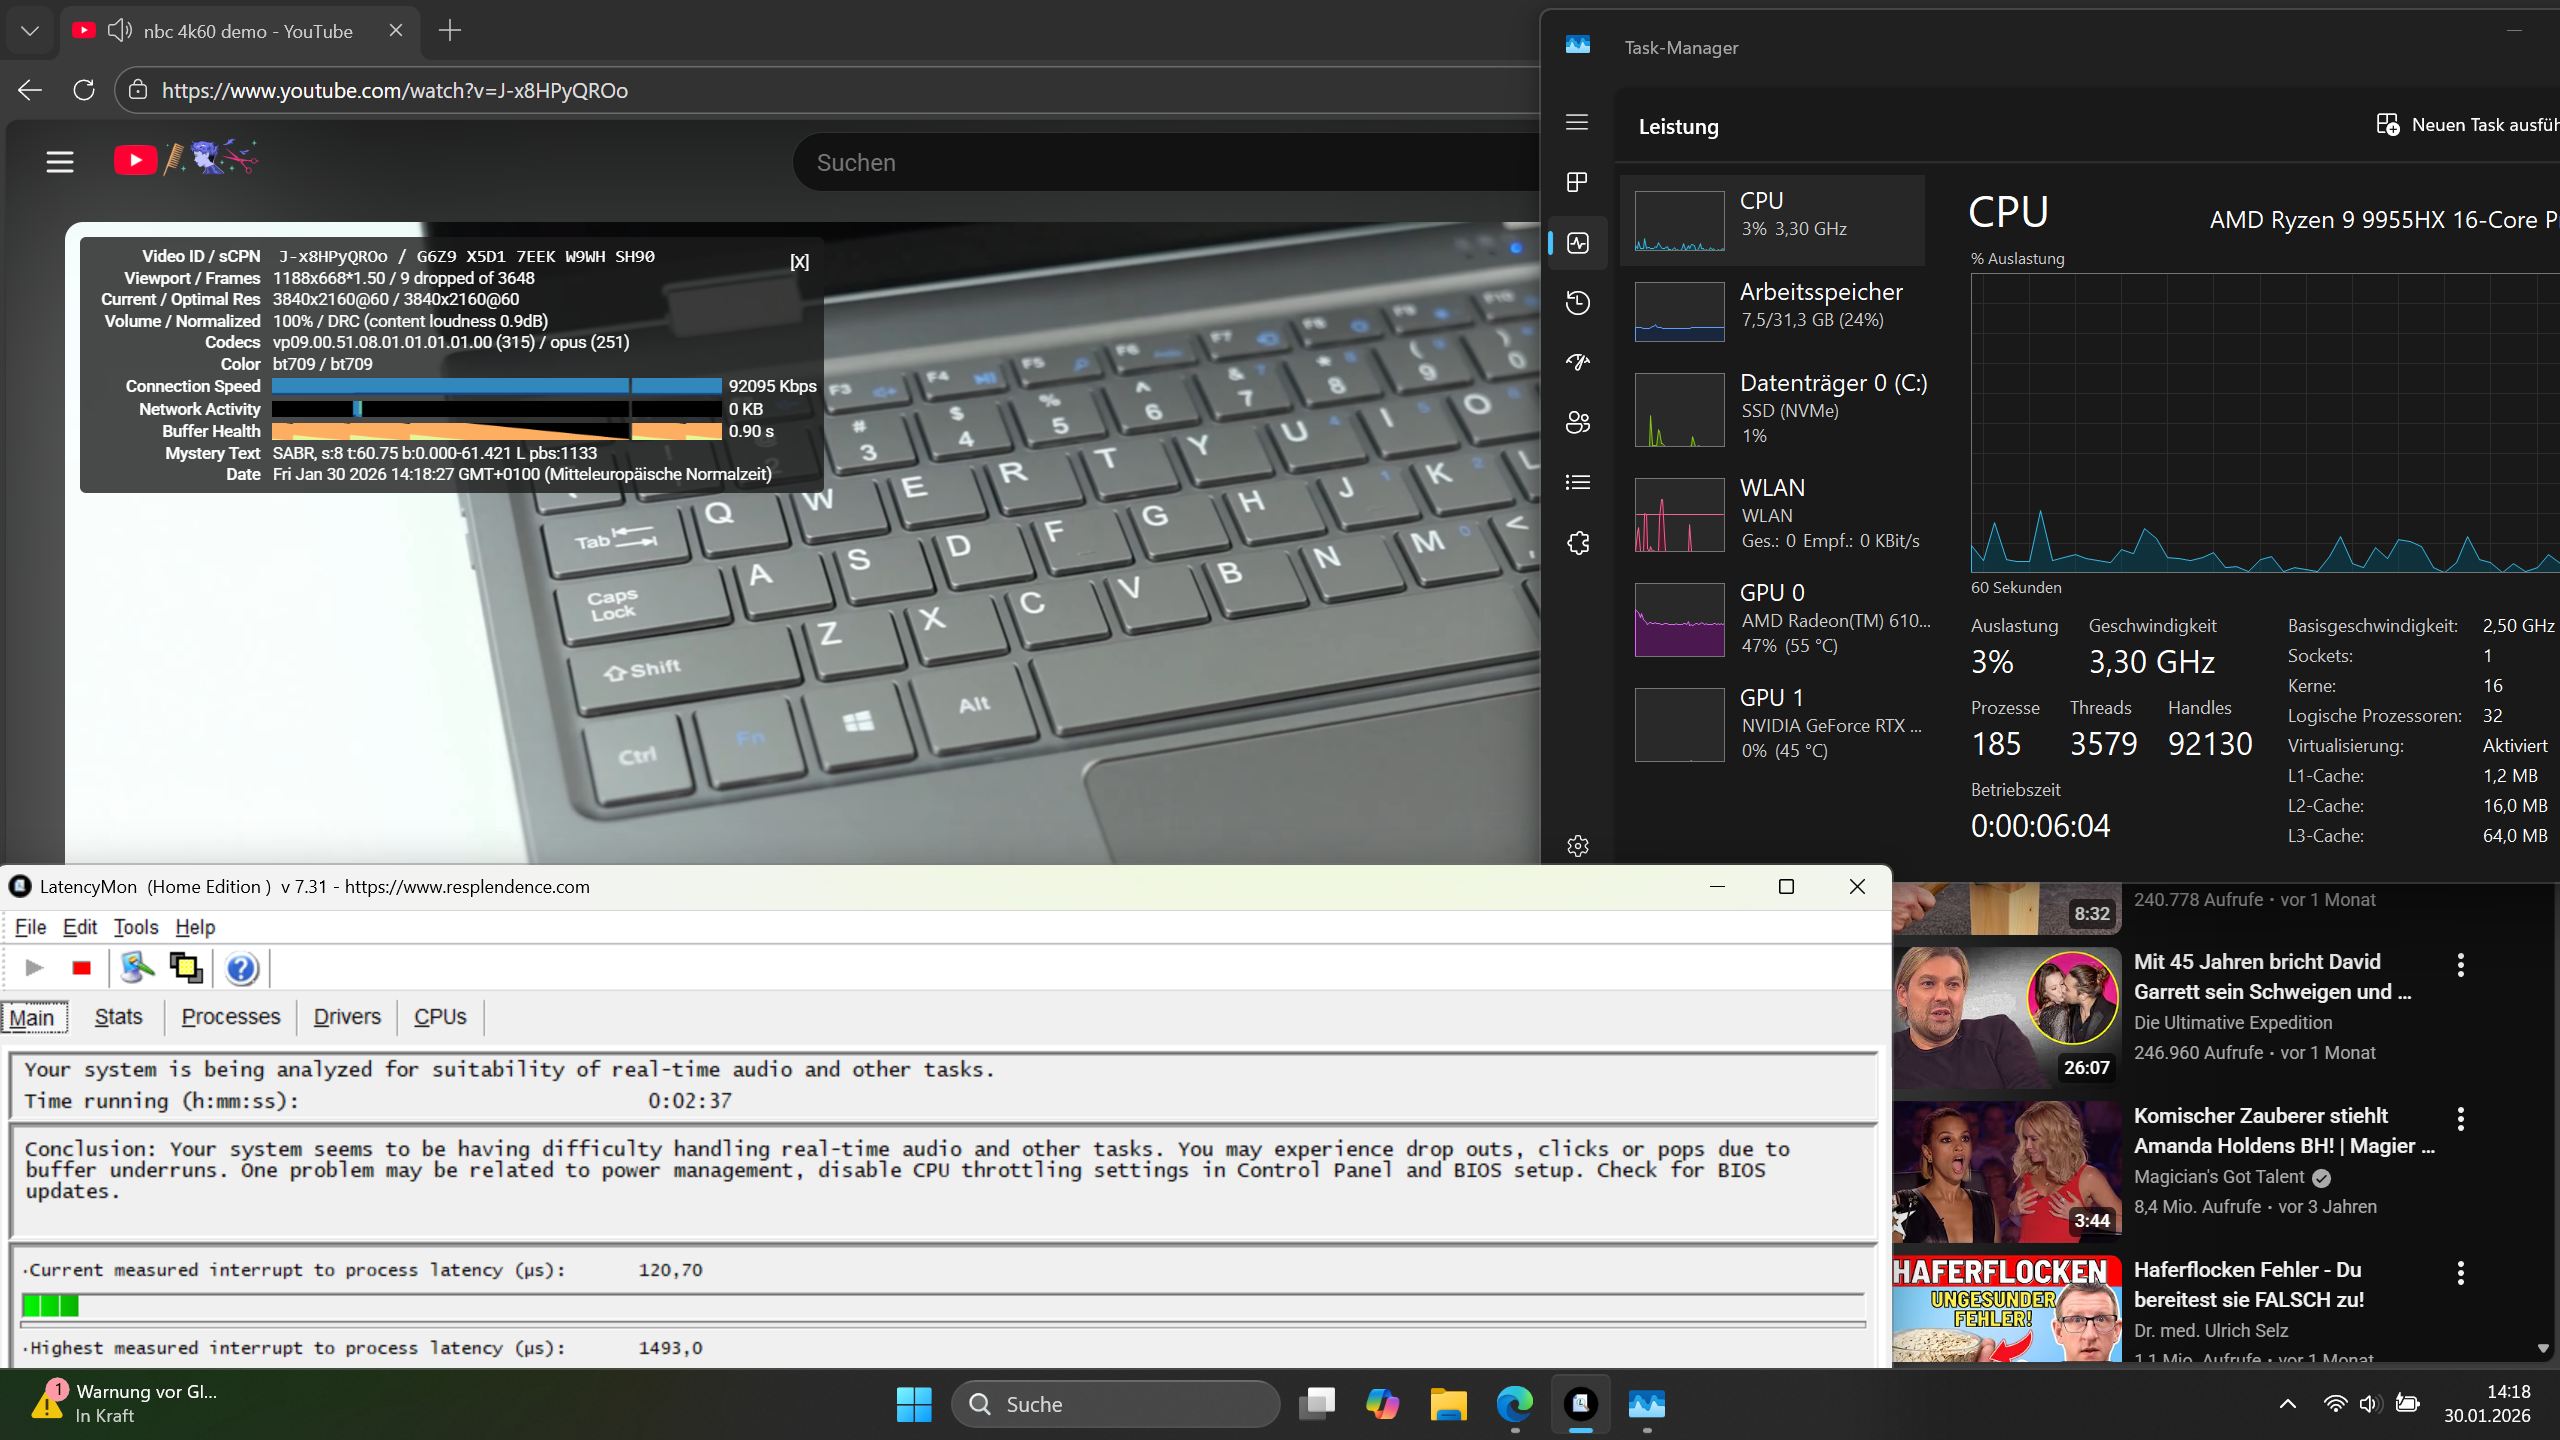
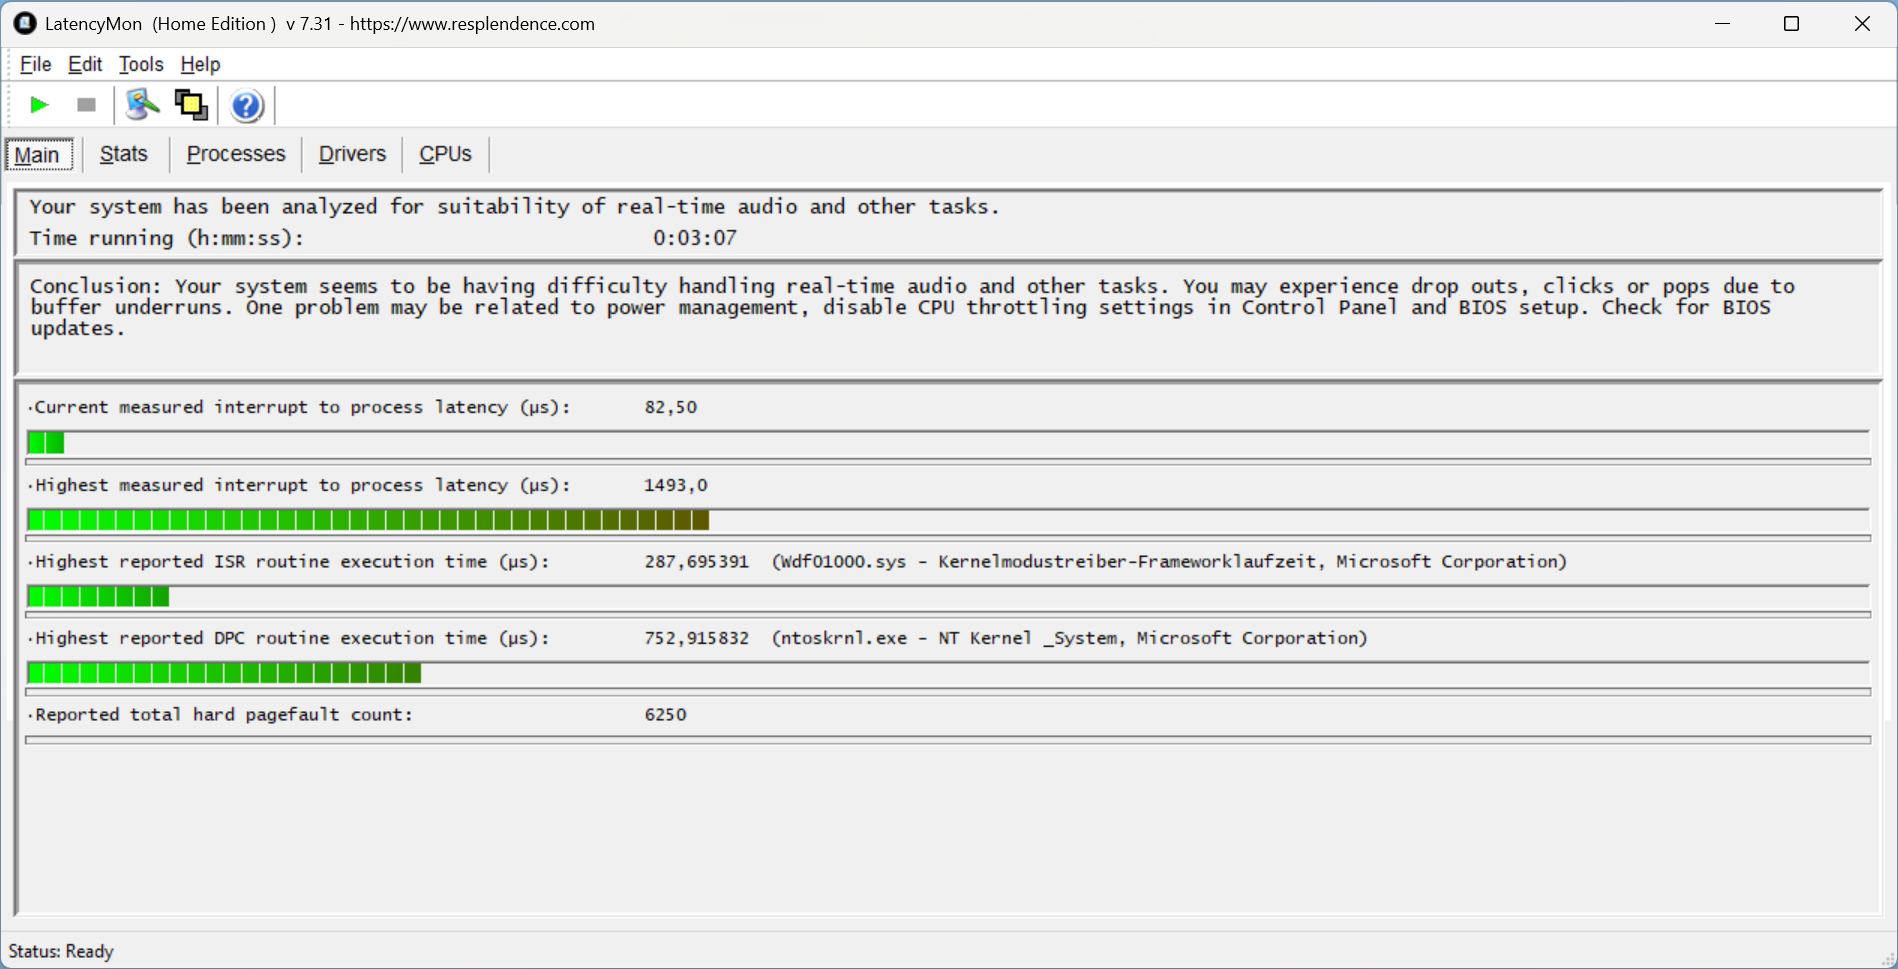
Latency spikes occur when opening multiple browser tabs. Overall, values remain within an acceptable range, though nine dropped frames were recorded during YouTube playback.
| DPC Latencies / LatencyMon - interrupt to process latency (max), Web, Youtube, Prime95 | |
| HP Omen 17z-db100 | |
| MSI Katana 17 HX B14WGK | |
| Acer Nitro v 17 (ANV17-41-R4CJ) | |
| Schenker XMG Apex 17 M25 | |
| HP Omen 16-ap0091ng | |
| Lenovo Legion 7 16IAX10 | |
| MSI Crosshair A17 HX D8WGKG | |
* ... smaller is better
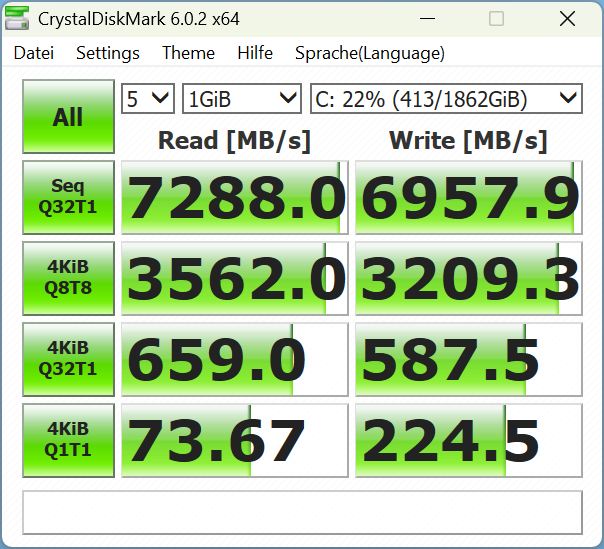
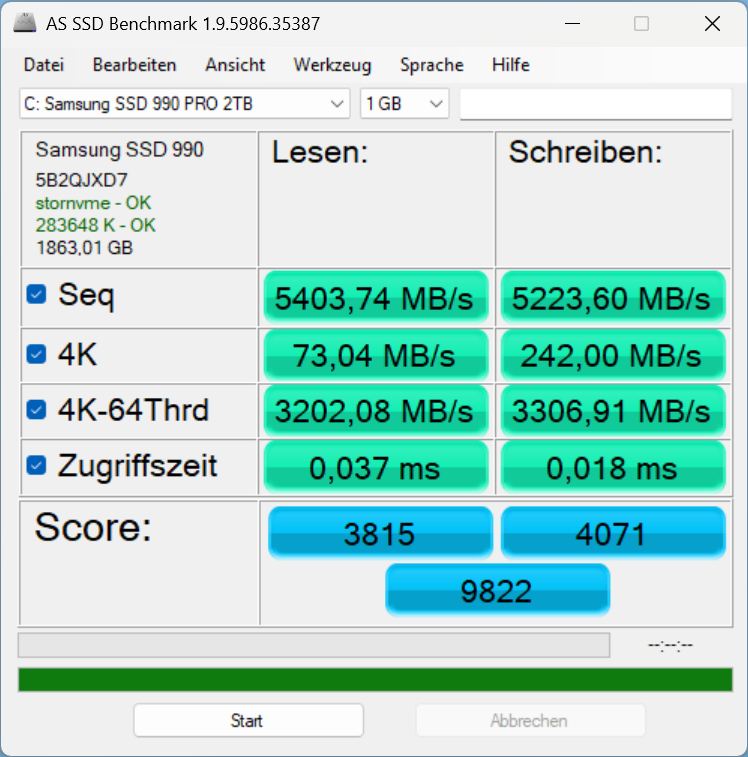
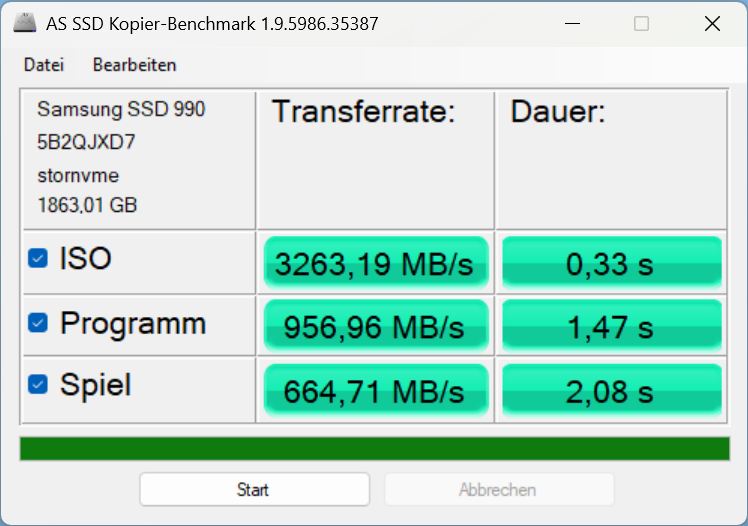
Mass storage
Our Samsung 990 Pro (2 TB) carries a €146 surcharge over the standard 1 TB WD Blue SN5100. Performance remains stable even under sustained load and exceeds that of competing systems.

* ... smaller is better
Continuous Read: DiskSpd Read Loop, Queue Depth 8
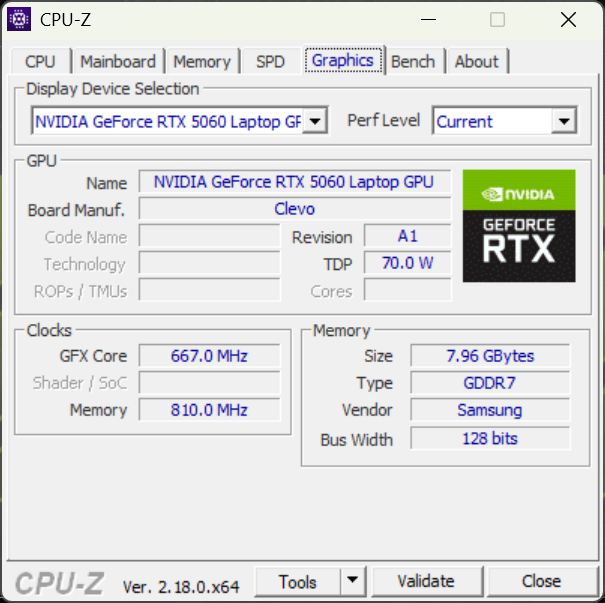
GPU performance – The fastest RTX 5060 laptop in comparison?
In synthetic 3DMark tests, the RTX 5060 in the Apex 17 clearly outperforms other RTX 5060 competitors. In Entertainment mode, it performs on par with the competition. On battery power, the GPU throttles to 30 fps in Cyberpunk.
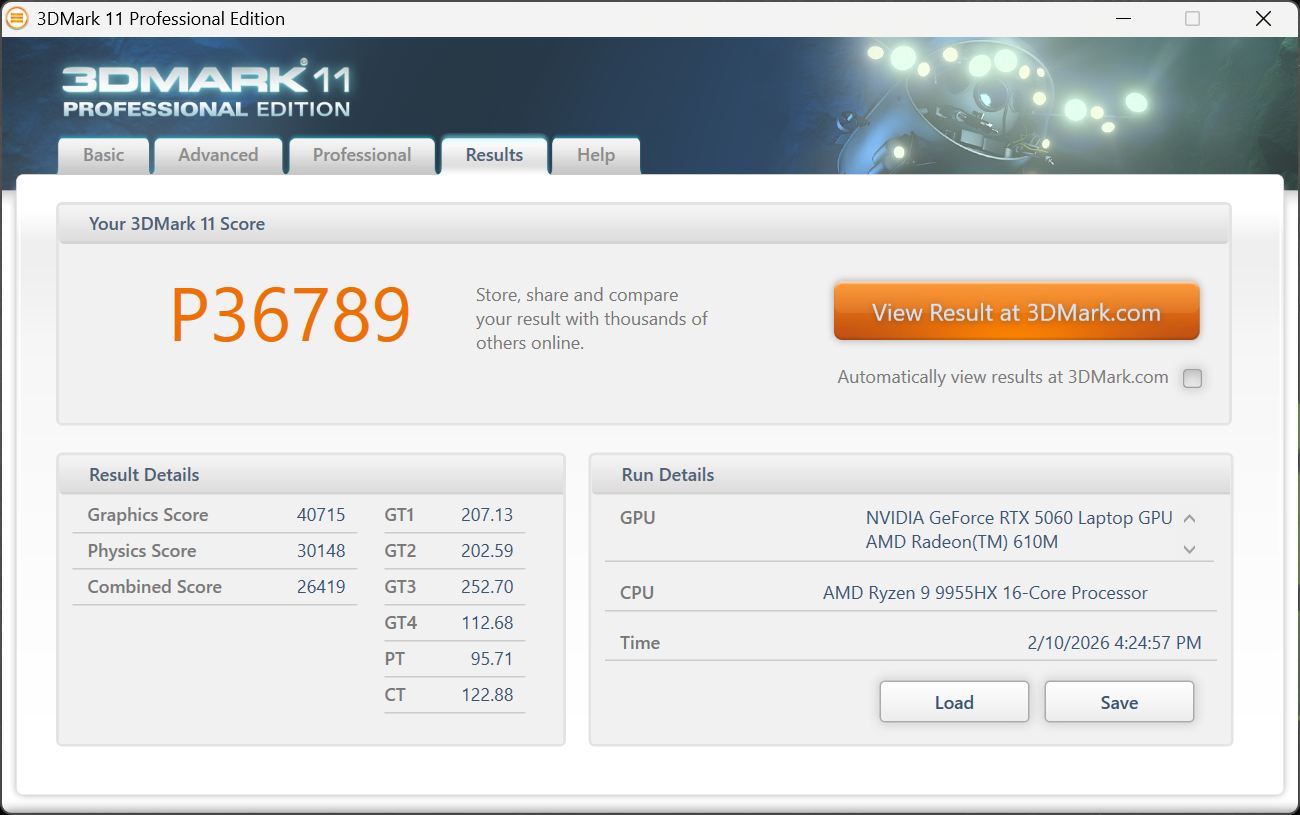
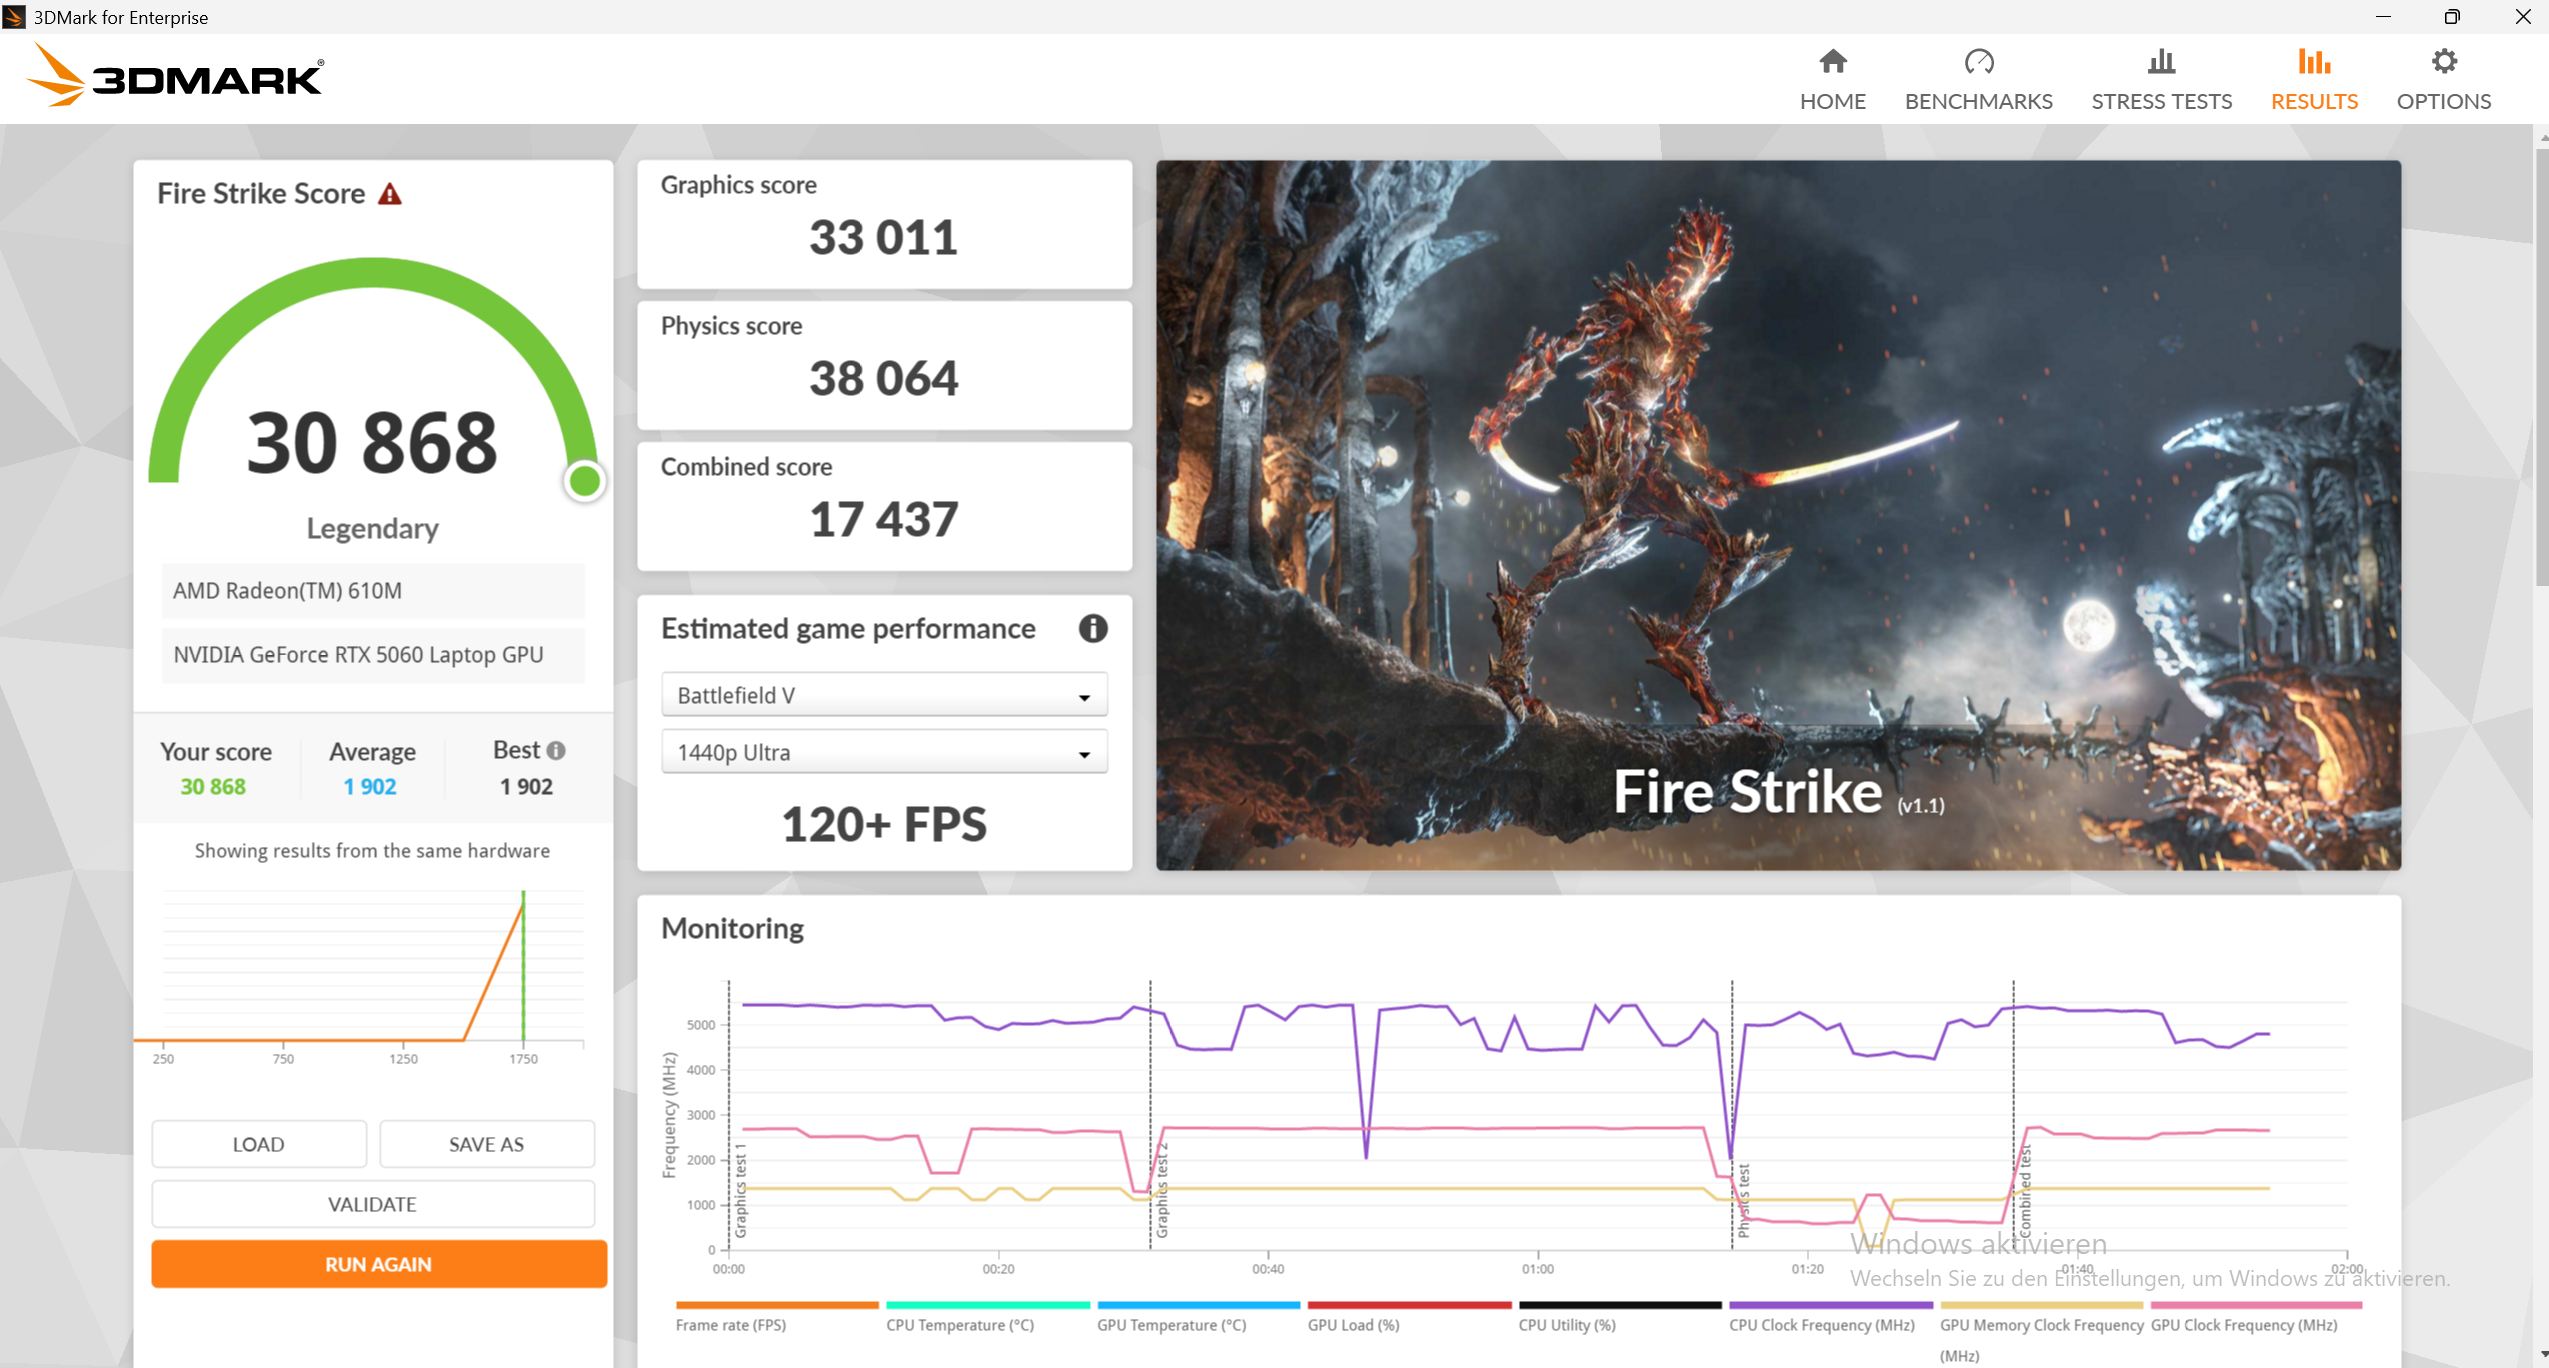
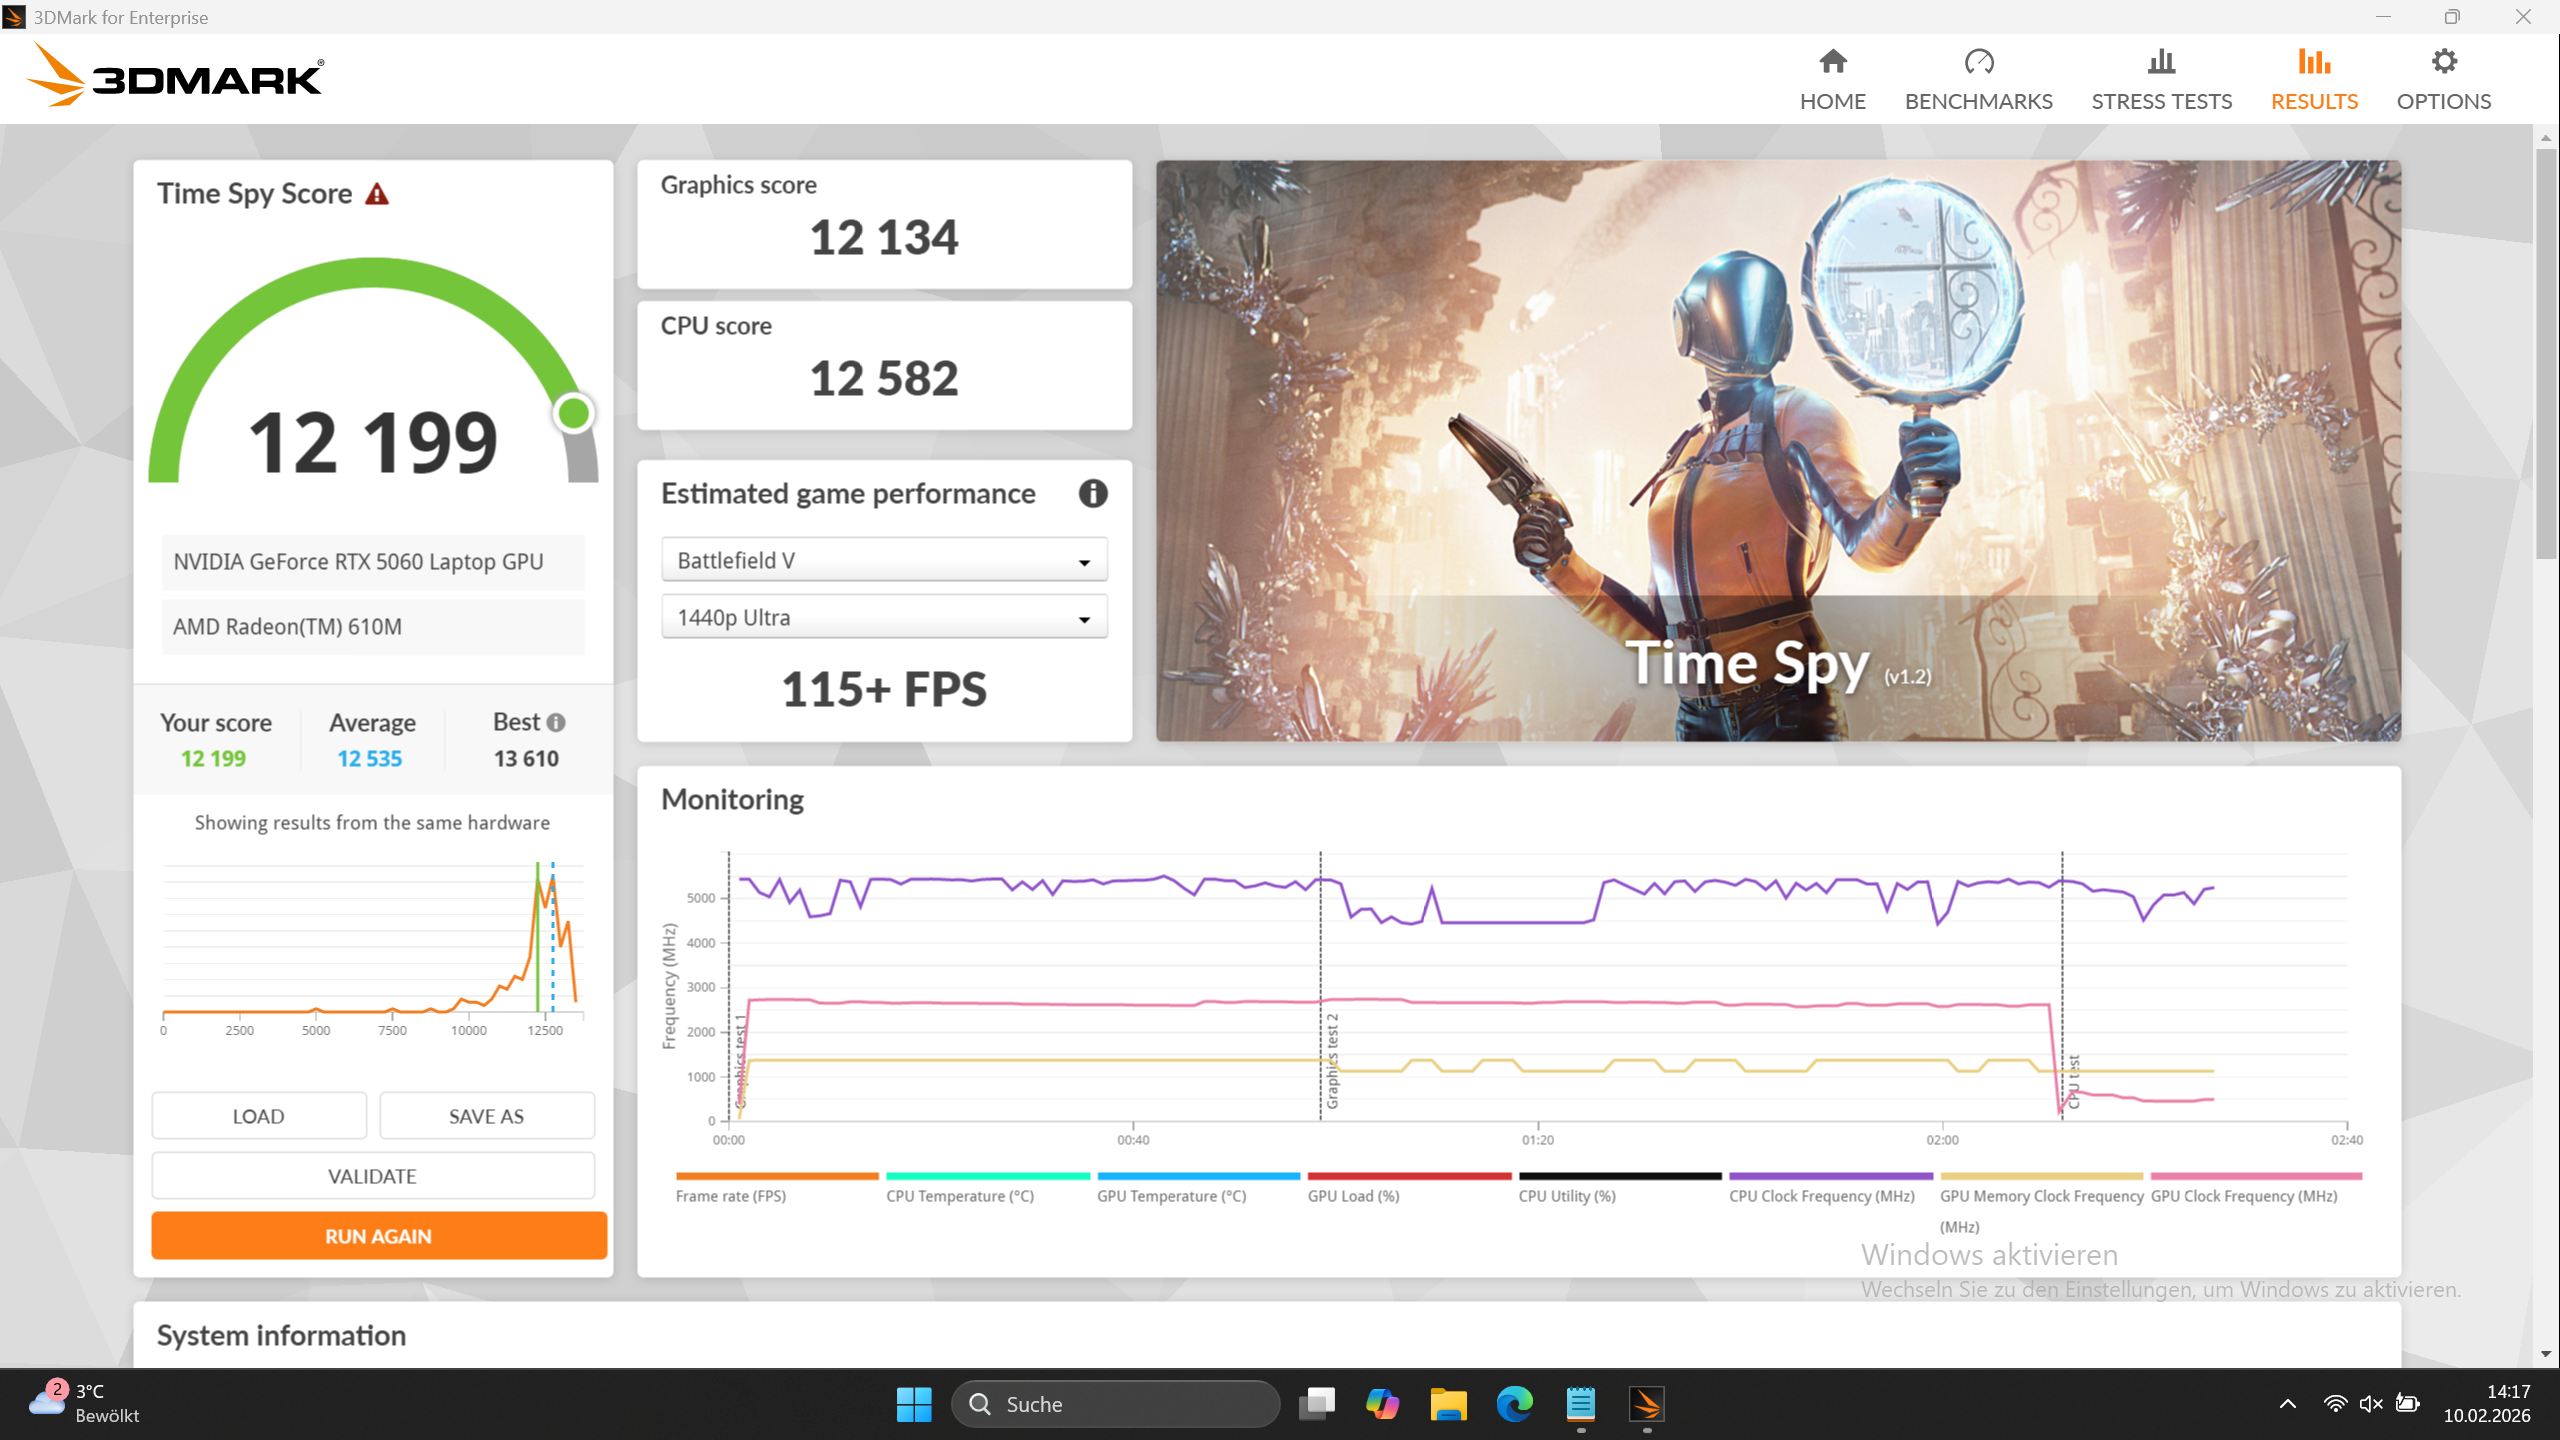
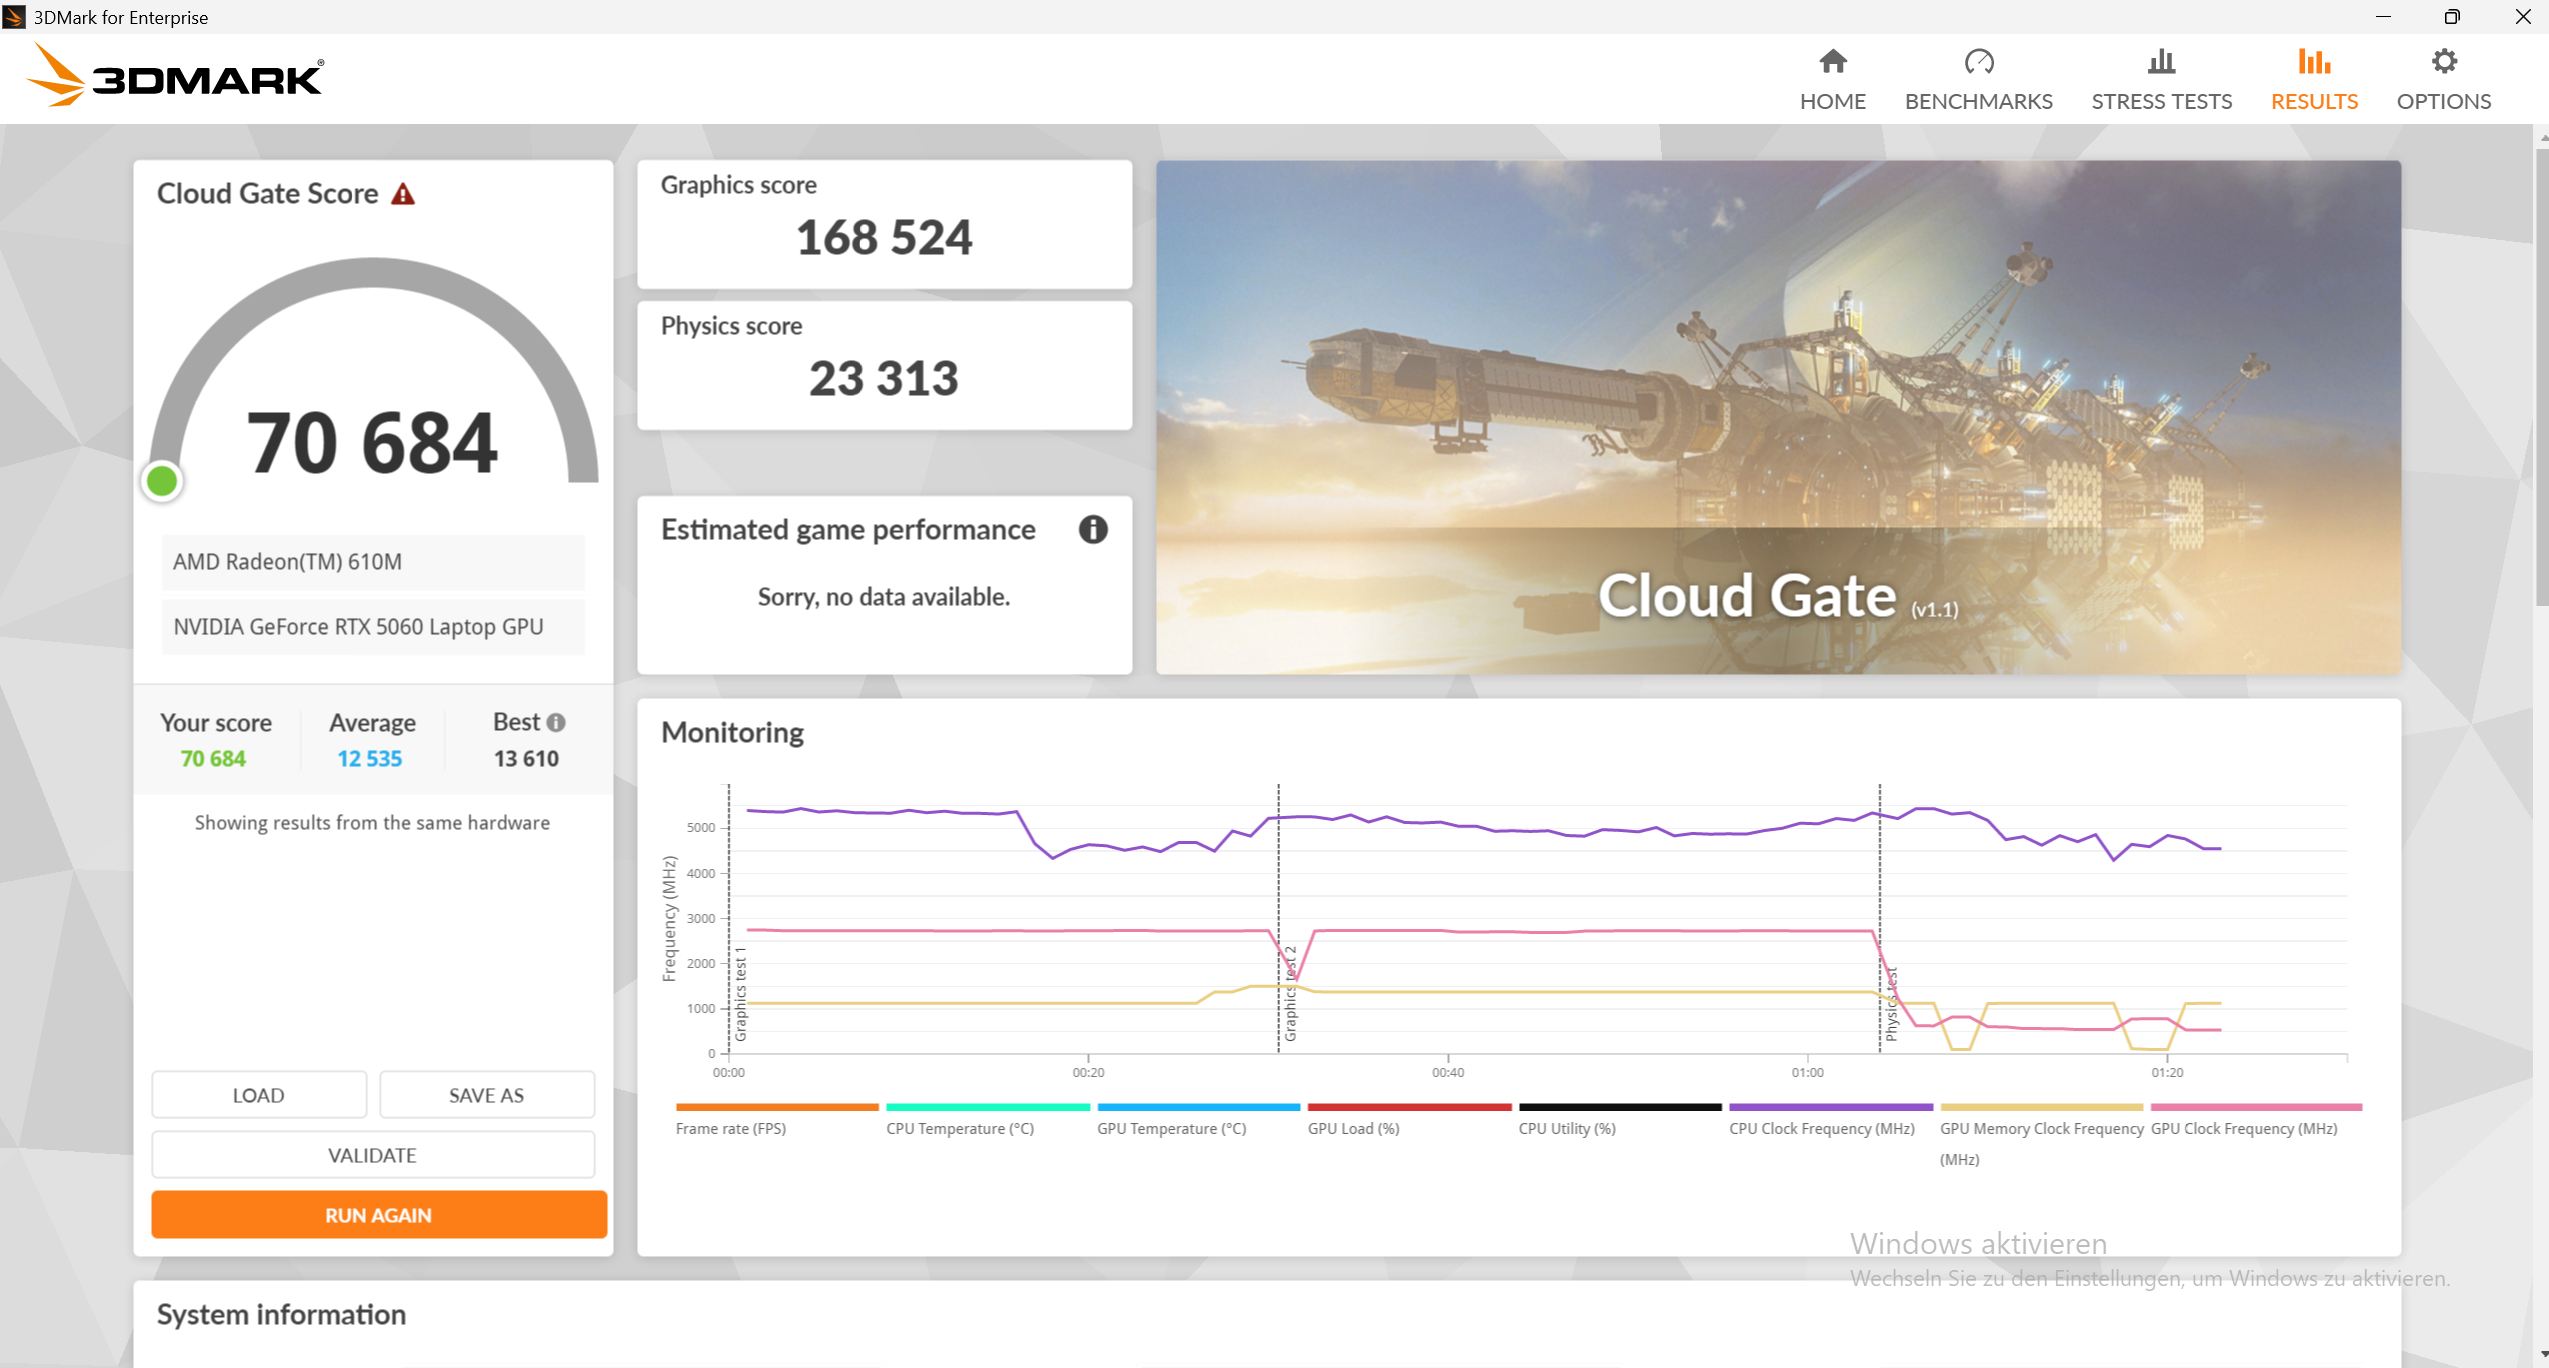
| 3DMark 11 Performance | 36789 points | |
| 3DMark Cloud Gate Standard Score | 70684 points | |
| 3DMark Fire Strike Score | 30868 points | |
| 3DMark Time Spy Score | 12199 points | |
Help | ||
* ... smaller is better
Gaming performance
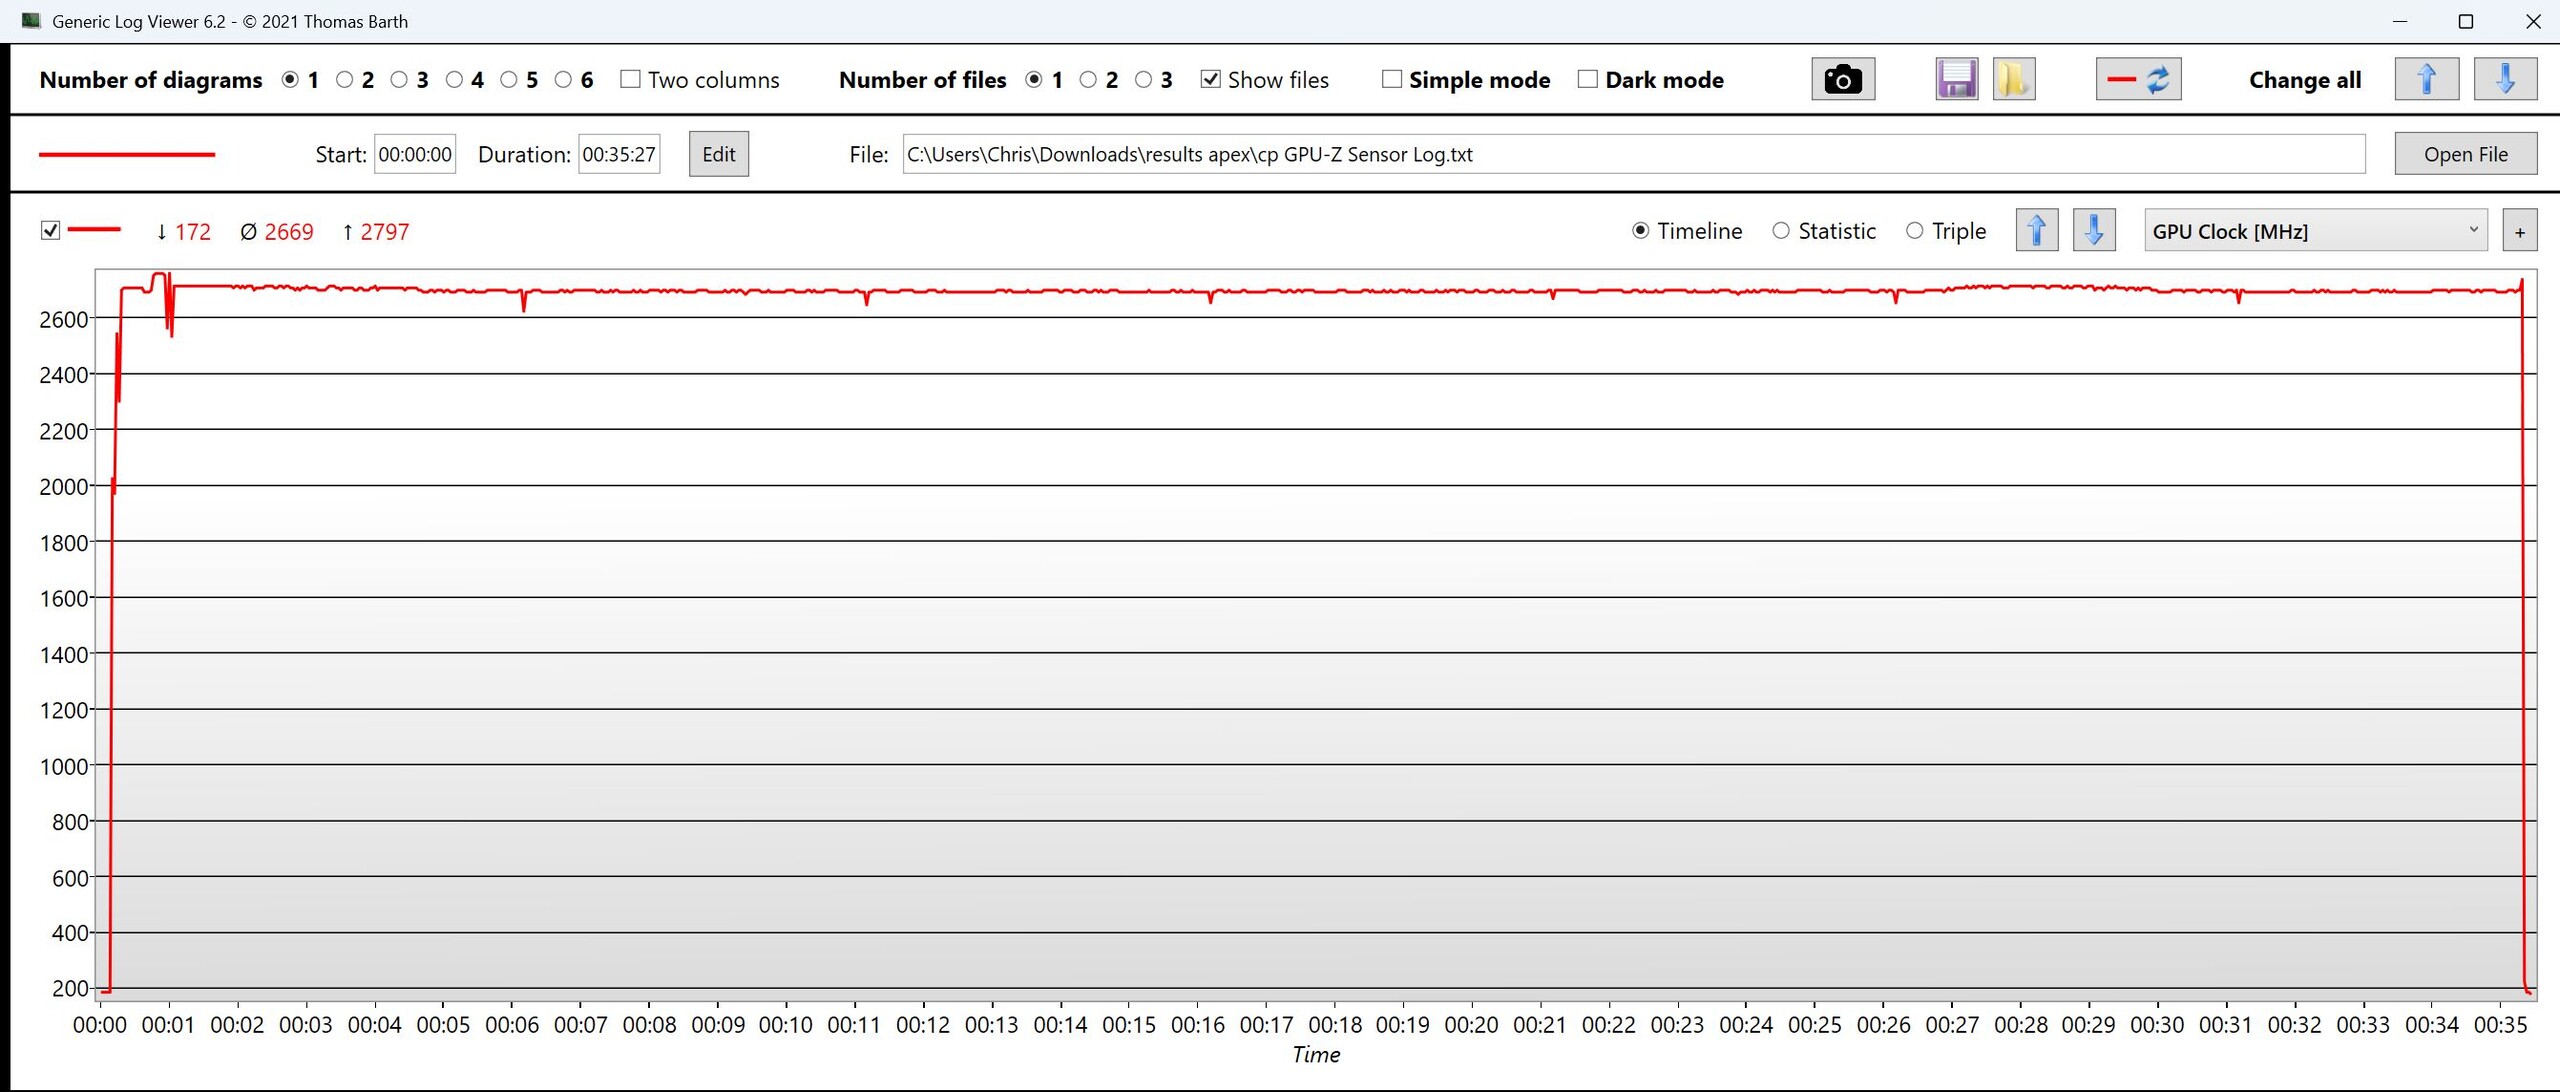
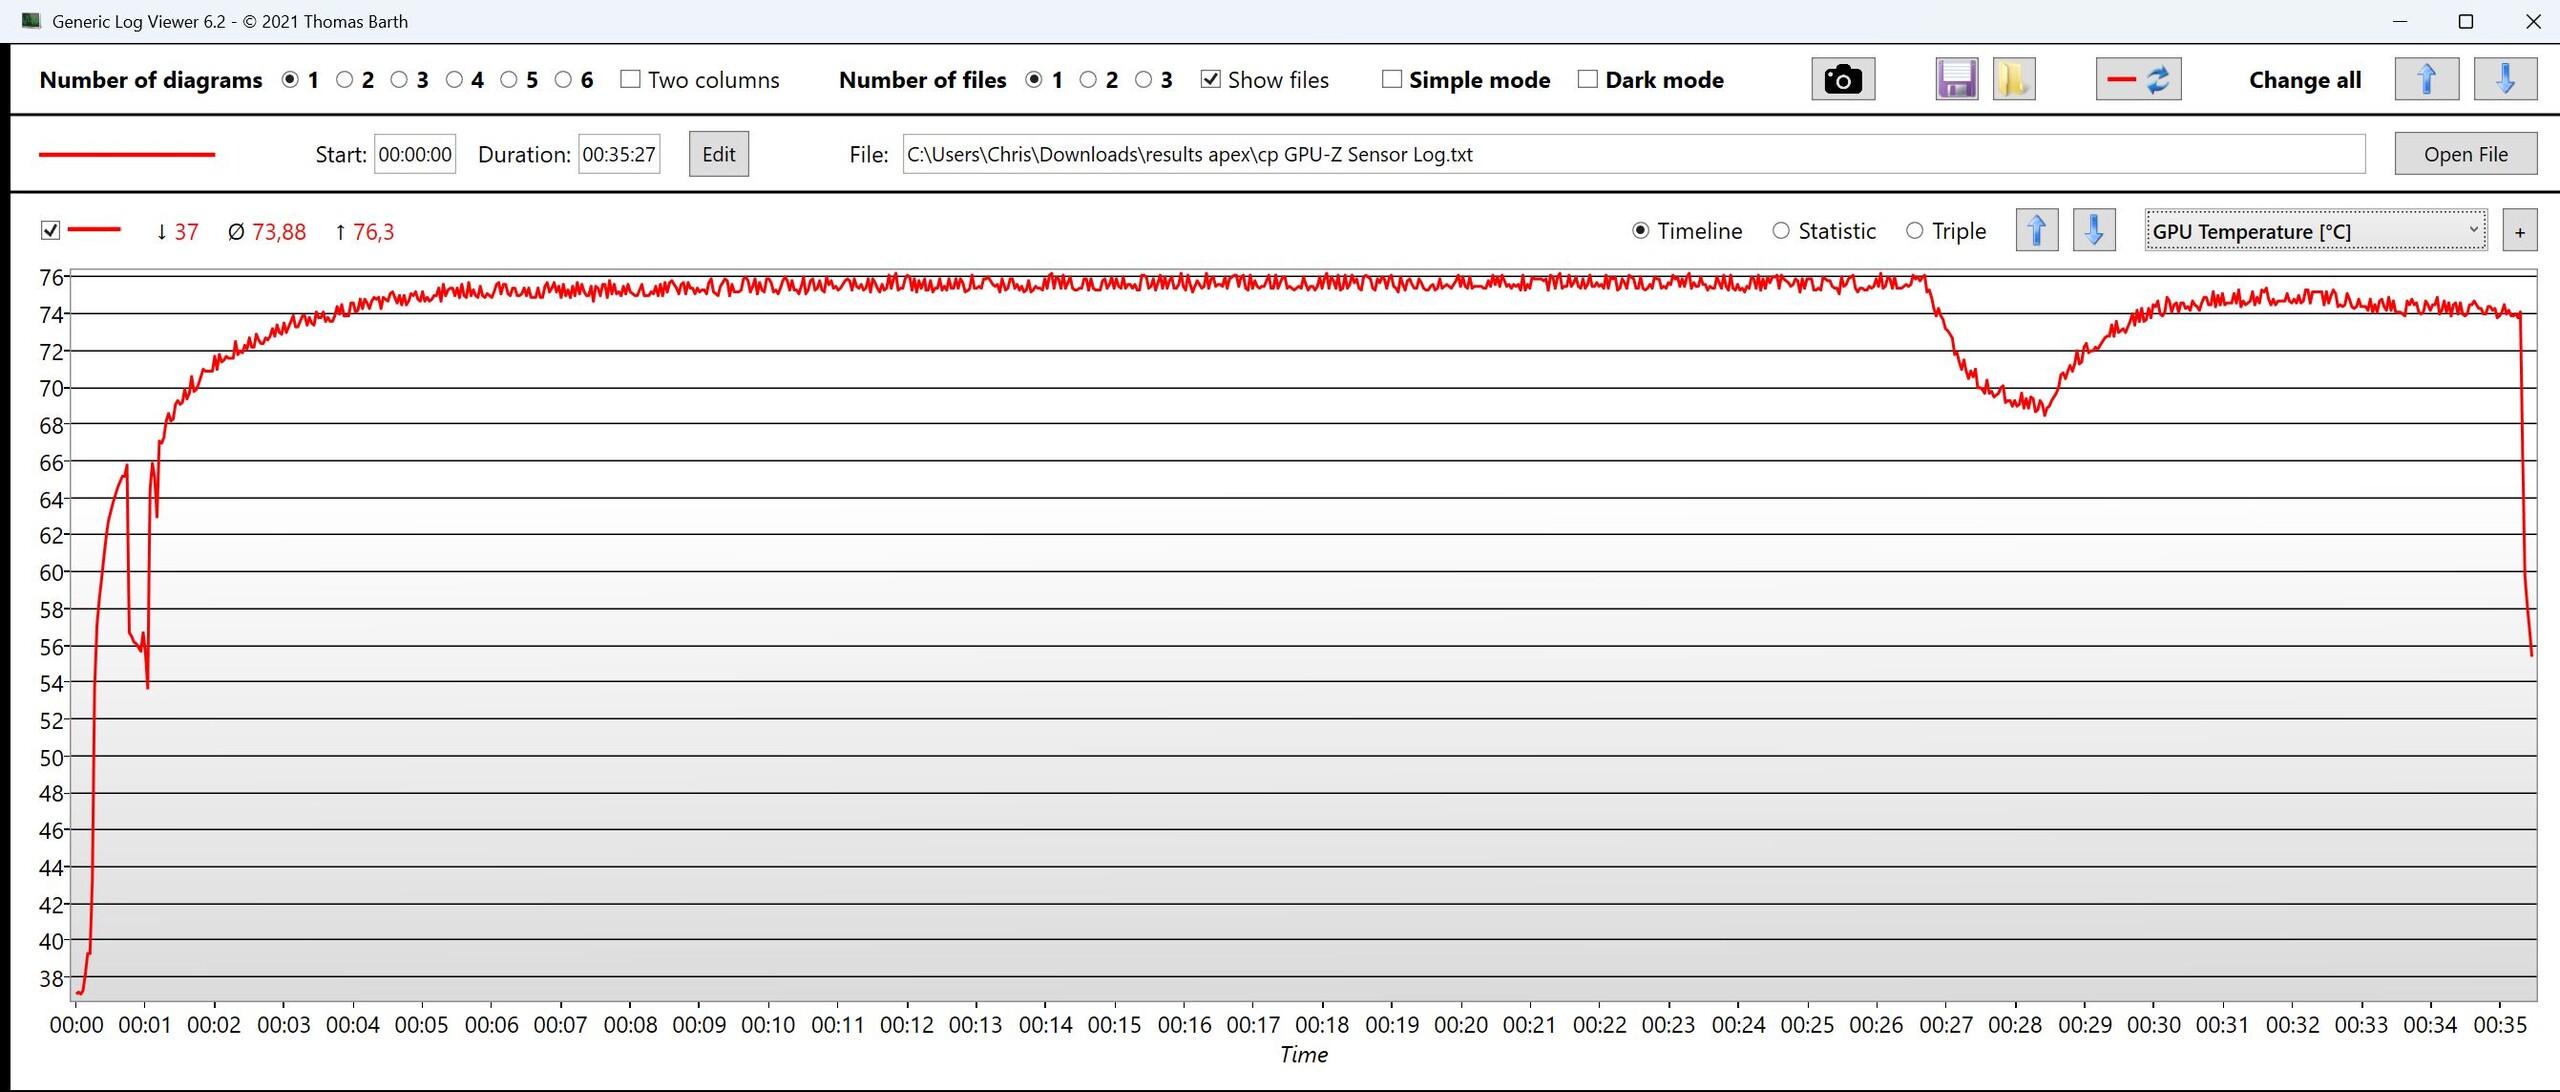
Across all tested games, the Apex even outperforms some weaker RTX 5070 laptops (Acer Nitro V17, Omen 17z). It also delivers very high and completely stable sustained performance in Cyberpunk.
In Entertainment mode, gaming performance drops by around 12 percent.
Without ray tracing or path tracing, all games run smoothly at native resolution with high settings. There is headroom for QHD, though DLSS is often required. At 4K, mainly older titles remain playable, while modern games struggle even with upscaling.
| Final Fantasy XV Benchmark - 1920x1080 High Quality | |
| Average of class Gaming (41 - 215, n=101, last 2 years) | |
| HP Omen 17z-db100 | |
| Lenovo Legion 7 16IAX10 | |
| Acer Nitro v 17 (ANV17-41-R4CJ) | |
| Schenker XMG Apex 17 M25 | |
| HP Omen 16-ap0091ng | |
| Tulpar T6 V3.5 | |
| Alienware 16 Aurora | |
| Strange Brigade - 1920x1080 ultra AA:ultra AF:16 | |
| Average of class Gaming (76.3 - 456, n=91, last 2 years) | |
| HP Omen 17z-db100 | |
| Lenovo Legion 7 16IAX10 | |
| Acer Nitro v 17 (ANV17-41-R4CJ) | |
| Schenker XMG Apex 17 M25 | |
| HP Omen 16-ap0091ng | |
| Tulpar T6 V3.5 | |
| Alienware 16 Aurora | |
Cyberpunk 2077 ultra FPS diagram

| low | med. | high | ultra | QHD DLSS | QHD | 4K DLSS | 4K | |
|---|---|---|---|---|---|---|---|---|
| GTA V (2015) | 187.9 | 187.8 | 185.7 | 146.3 | 114.3 | 106 | ||
| Dota 2 Reborn (2015) | 268 | 232 | 223 | 201 | 124.4 | |||
| Final Fantasy XV Benchmark (2018) | 227 | 167.4 | 119.5 | 89.9 | 50.7 | |||
| X-Plane 11.11 (2018) | 164.2 | 142.9 | 118.4 | 99.2 | ||||
| Strange Brigade (2018) | 648 | 348 | 273 | 231 | 162 | 86.1 | ||
| Baldur's Gate 3 (2023) | 170 | 133 | 118 | 113.4 | 114.1 | 78.1 | 65.8 | 38.8 |
| Cyberpunk 2077 (2023) | 128.9 | 124.5 | 104 | 87.2 | 70 | 58.8 | 32.7 | 25.1 |
| Doom: The Dark Ages (2025) | 58.5 | 49.6 | 44.1 | 43.8 | 48 | 30.4 | 22.7 | 11.7 |
| F1 25 (2025) | 263 | 217 | 174.4 | 25.8 |
Emissions & power – How loud does the Apex 17 get under gaming load?
Noise emissions
Under load, the fans are generally louder than those of partially power-limited competitors. Even in 3DMark06, noise levels exceed 50 dB. During gaming, it’s the loudest system in the comparison, though the weaker Legion 7 is not far behind.
In the much quieter Entertainment mode, it runs more quietly than competitors while maintaining competitive performance.
Fan behavior is somewhat aggressive and volatile, occasionally ramping up briefly even at idle.
Noise level
| Idle |
| 23 / 23 / 23 dB(A) |
| Load |
| 51.41 / 55.5 dB(A) |
 | ||
30 dB silent 40 dB(A) audible 50 dB(A) loud |
||
min: | ||
| Schenker XMG Apex 17 M25 R9 9955HX, GeForce RTX 5060 Laptop | Lenovo Legion 7 16IAX10 Ultra 7 255HX, GeForce RTX 5060 Laptop | HP Omen 16-ap0091ng R9 8940HX, GeForce RTX 5060 Laptop | MSI Cyborg 17 B13WFKG i7-13620H, GeForce RTX 5060 Laptop | Tulpar T6 V3.5 i7-14700HX, GeForce RTX 5060 Laptop | Alienware 16 Aurora Core 7 240H, GeForce RTX 5060 Laptop | |
|---|---|---|---|---|---|---|
| Noise | -2% | 0% | -6% | -10% | -1% | |
| off / environment * (dB) | 23 | 23.9 -4% | 23 -0% | 25 -9% | 24 -4% | 22.9 -0% |
| Idle Minimum * (dB) | 23 | 24 -4% | 23 -0% | 25 -9% | 26 -13% | 24 -4% |
| Idle Average * (dB) | 23 | 26 -13% | 23 -0% | 27 -17% | 29 -26% | 25.6 -11% |
| Idle Maximum * (dB) | 23 | 29.4 -28% | 27.64 -20% | 34 -48% | 31 -35% | 25.6 -11% |
| Load Average * (dB) | 51.41 | 35.4 31% | 49.5 4% | 44 14% | 52 -1% | 46.8 9% |
| Cyberpunk 2077 ultra * (dB) | 55.5 | 54.6 2% | 49.5 11% | 48 14% | 52 6% | 49.9 10% |
| Load Maximum * (dB) | 55.5 | 54.7 1% | 52.73 5% | 50 10% | 53 5% | 55.6 -0% |
* ... smaller is better
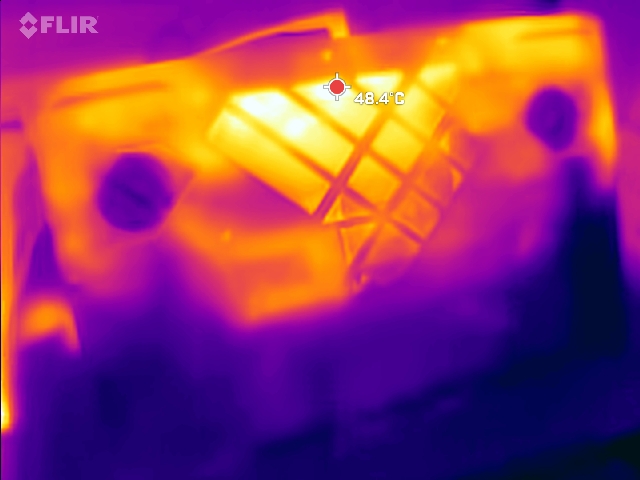
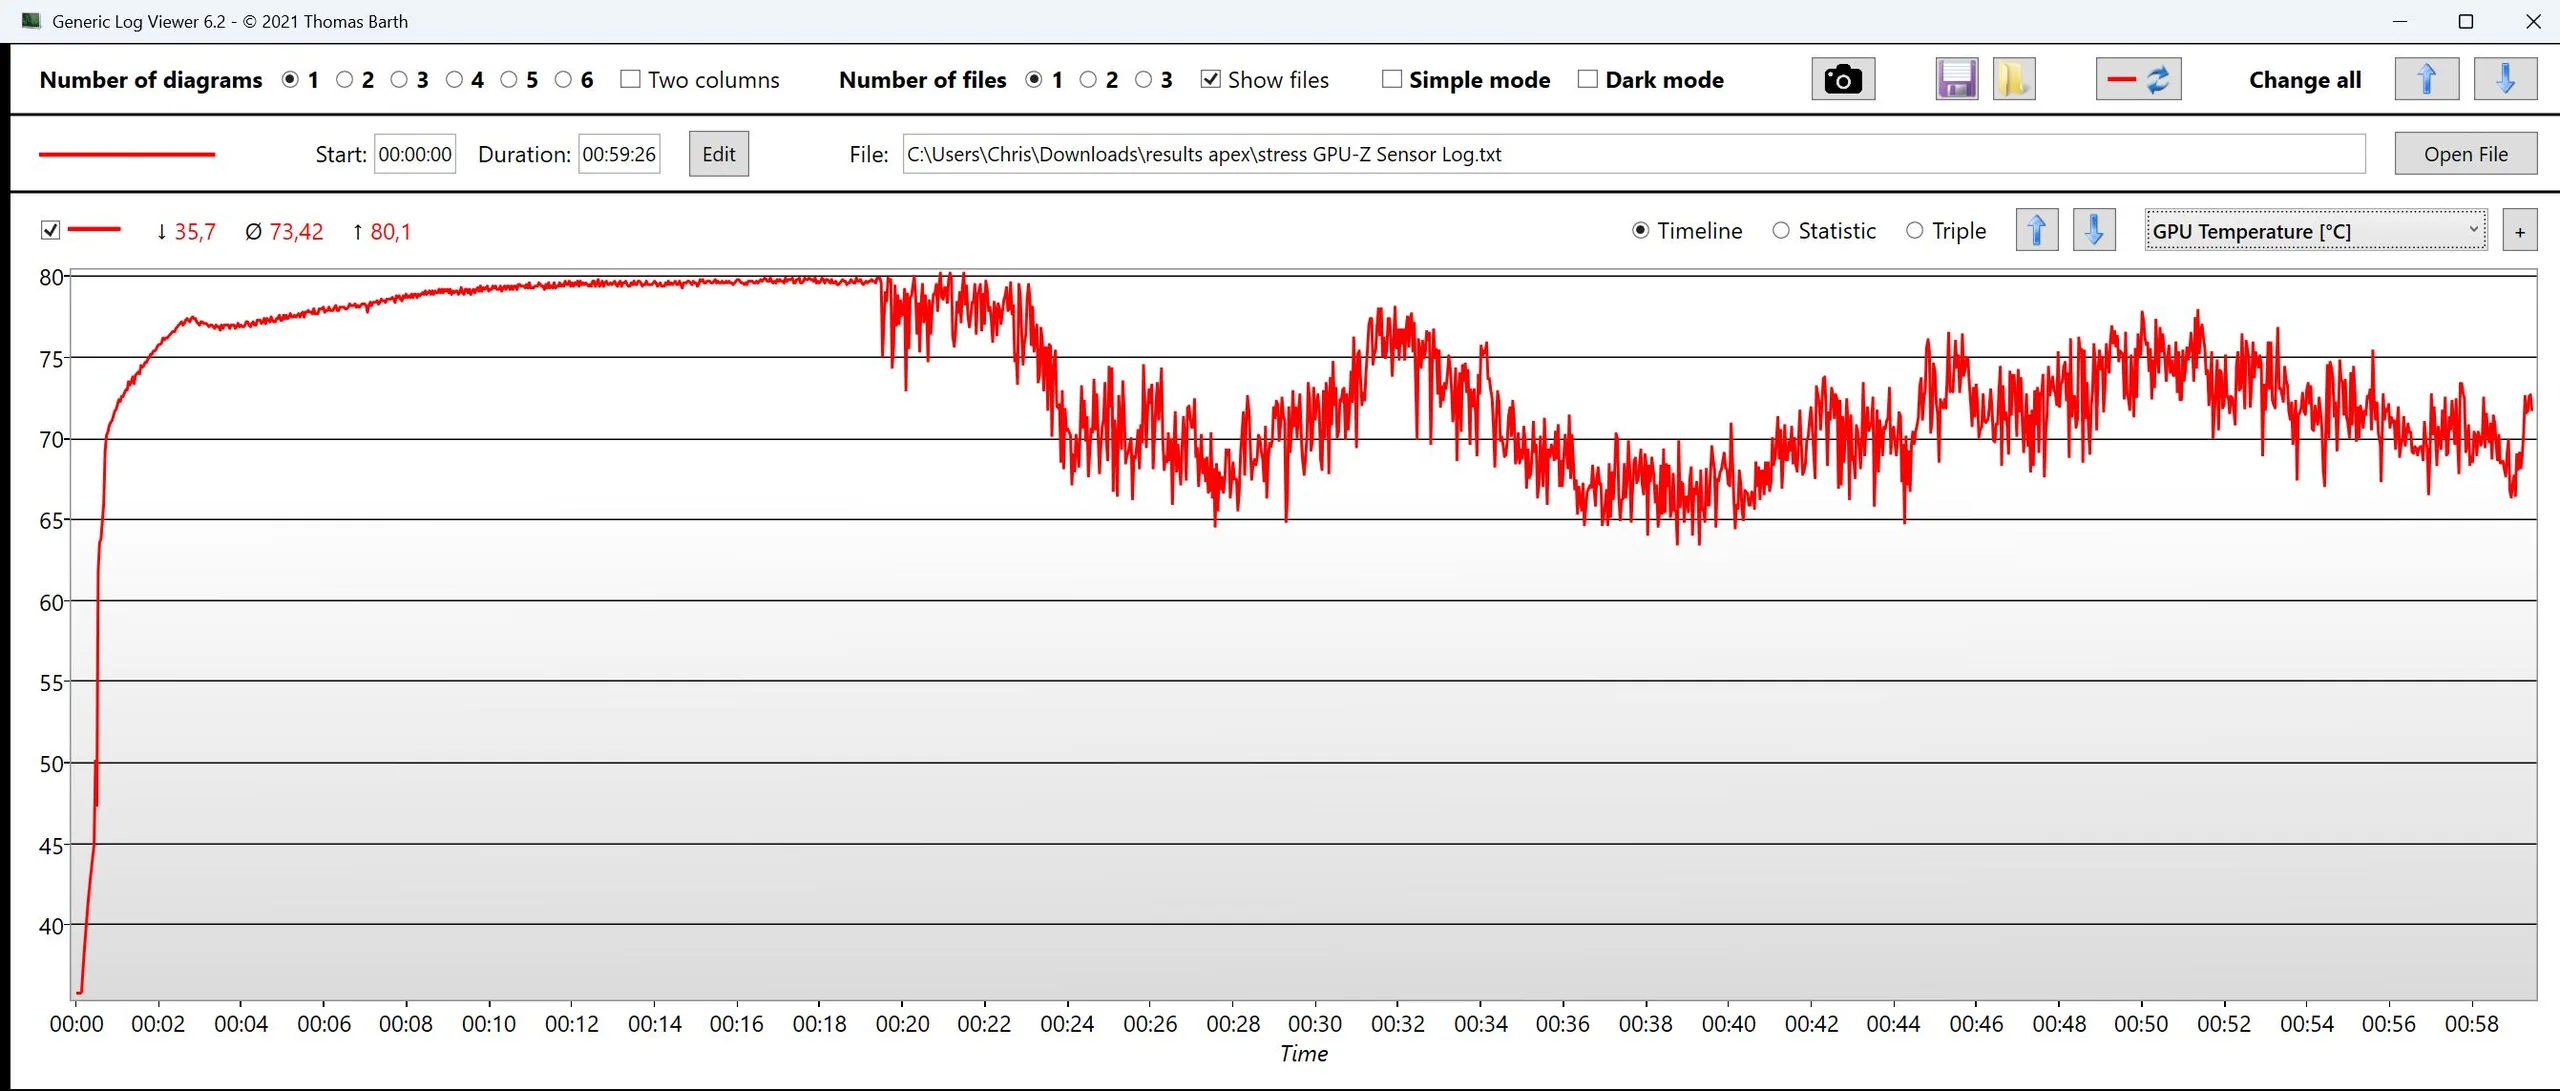
Temperature
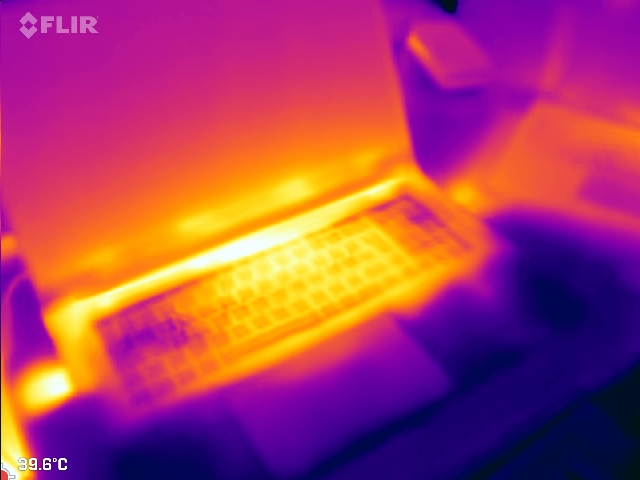
The loud cooling system keeps temperatures generally low. Under load, hot spots of around 45°C are measured centrally on the underside, while other areas remain significantly cooler.
(+) The maximum temperature on the upper side is 36 °C / 97 F, compared to the average of 40.4 °C / 105 F, ranging from 21.2 to 68.8 °C for the class Gaming.
(±) The bottom heats up to a maximum of 43 °C / 109 F, compared to the average of 43.2 °C / 110 F
(+) In idle usage, the average temperature for the upper side is 24.4 °C / 76 F, compared to the device average of 33.9 °C / 93 F.
(+) 3: The average temperature for the upper side is 29.4 °C / 85 F, compared to the average of 33.9 °C / 93 F for the class Gaming.
(+) The palmrests and touchpad are cooler than skin temperature with a maximum of 27 °C / 80.6 F and are therefore cool to the touch.
(±) The average temperature of the palmrest area of similar devices was 28.8 °C / 83.8 F (+1.8 °C / 3.2 F).
| Schenker XMG Apex 17 M25 R9 9955HX, GeForce RTX 5060 Laptop | Lenovo Legion 7 16IAX10 Ultra 7 255HX, GeForce RTX 5060 Laptop | HP Omen 16-ap0091ng R9 8940HX, GeForce RTX 5060 Laptop | MSI Cyborg 17 B13WFKG i7-13620H, GeForce RTX 5060 Laptop | Tulpar T6 V3.5 i7-14700HX, GeForce RTX 5060 Laptop | |
|---|---|---|---|---|---|
| Heat | -24% | -4% | -33% | -15% | |
| Maximum Upper Side * (°C) | 36 | 47 -31% | 36 -0% | 49 -36% | 40 -11% |
| Maximum Bottom * (°C) | 43 | 44 -2% | 37 14% | 49 -14% | 47 -9% |
| Idle Upper Side * (°C) | 27 | 35.6 -32% | 30 -11% | 37 -37% | 30 -11% |
| Idle Bottom * (°C) | 27 | 35.2 -30% | 32 -19% | 39 -44% | 35 -30% |
* ... smaller is better
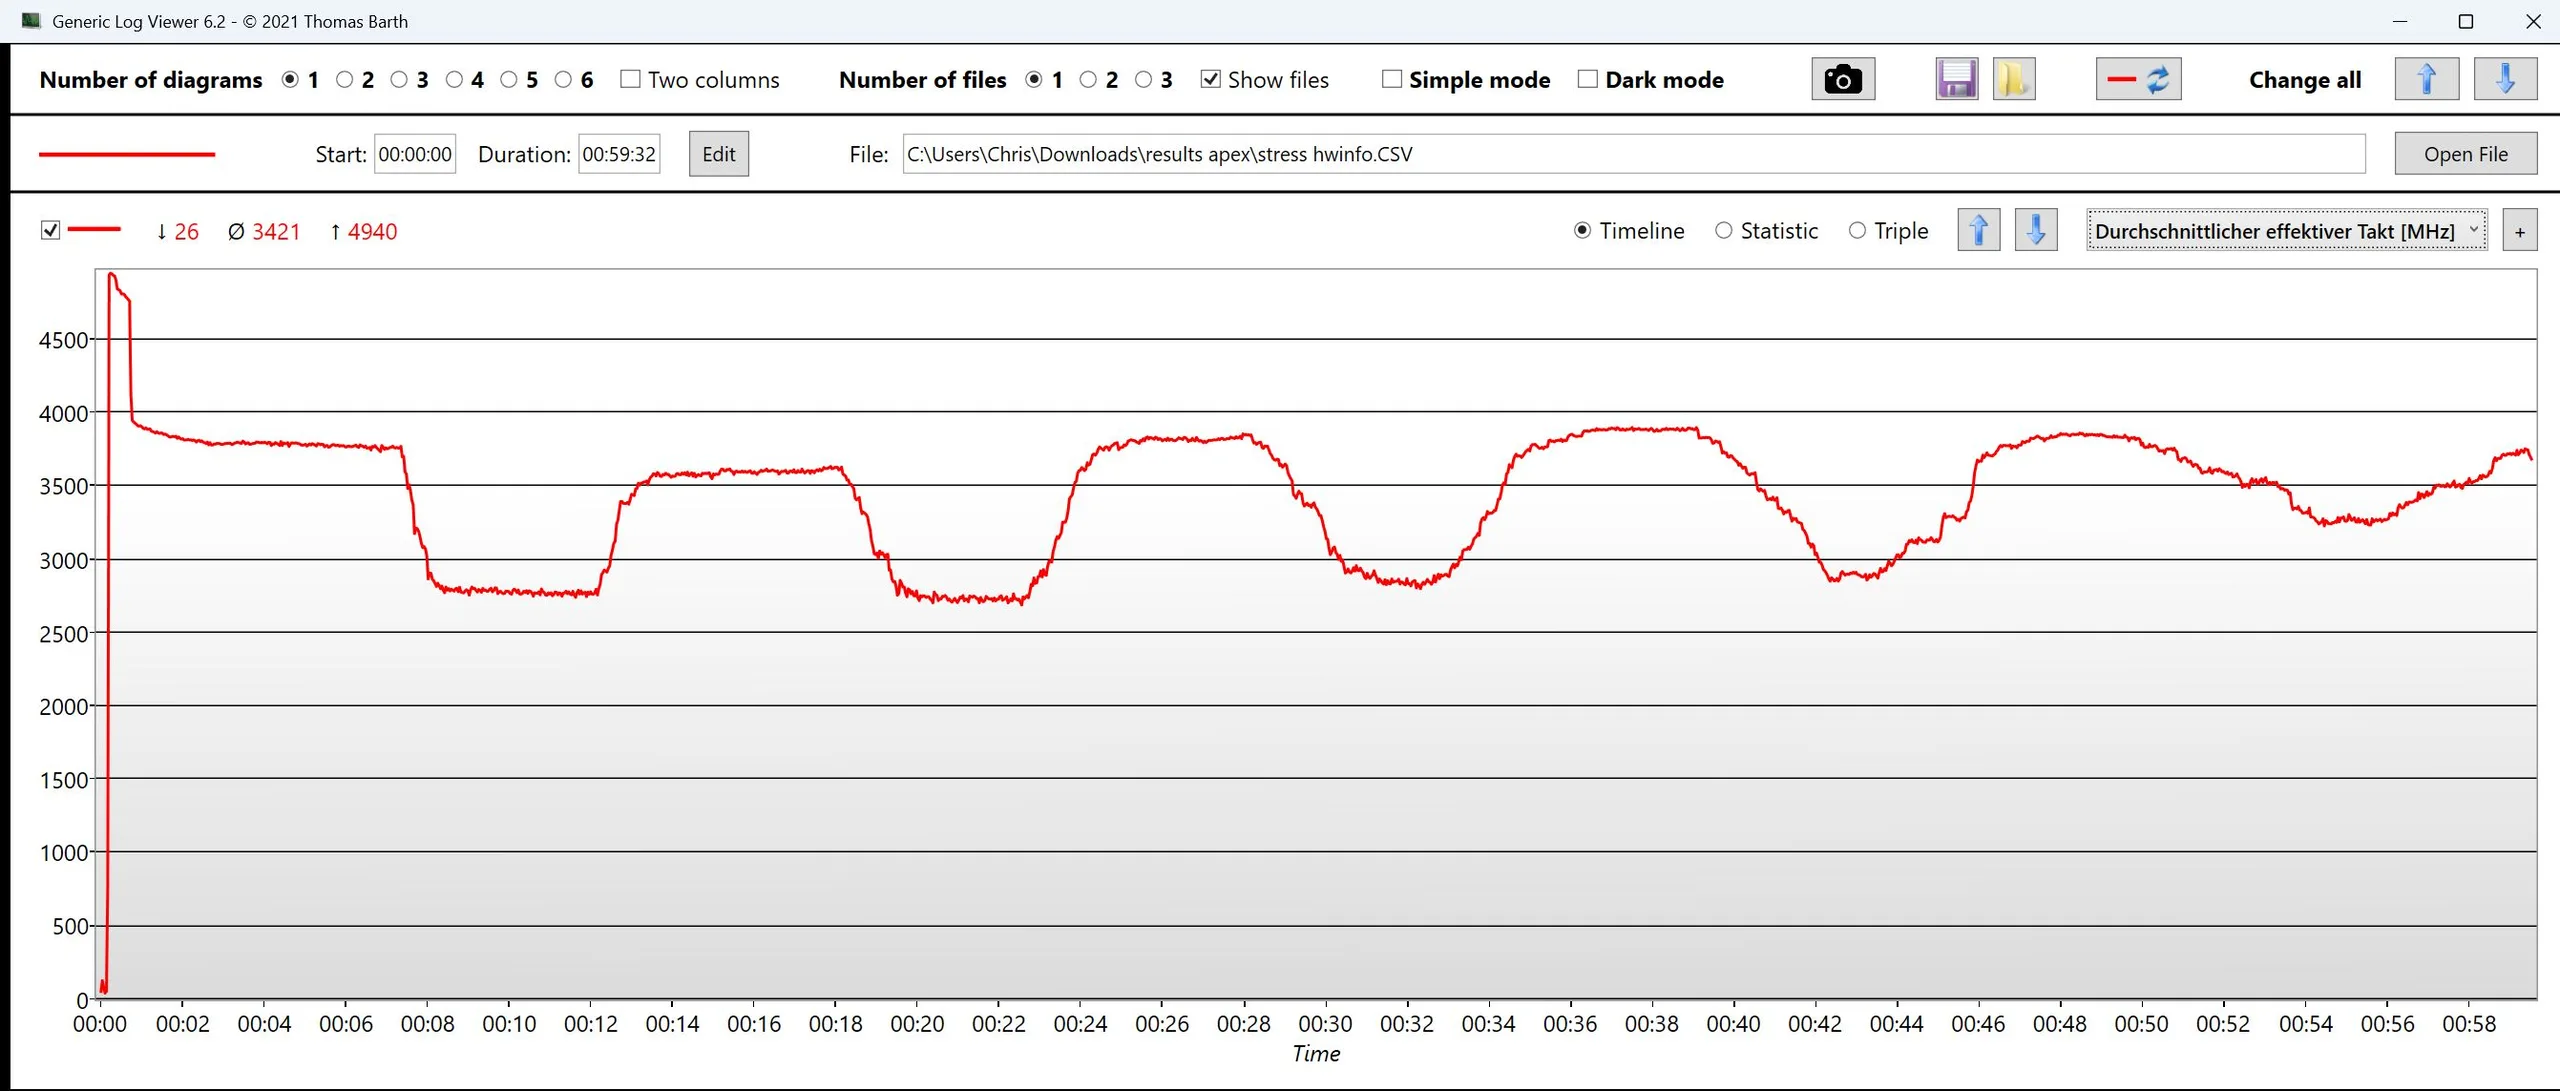
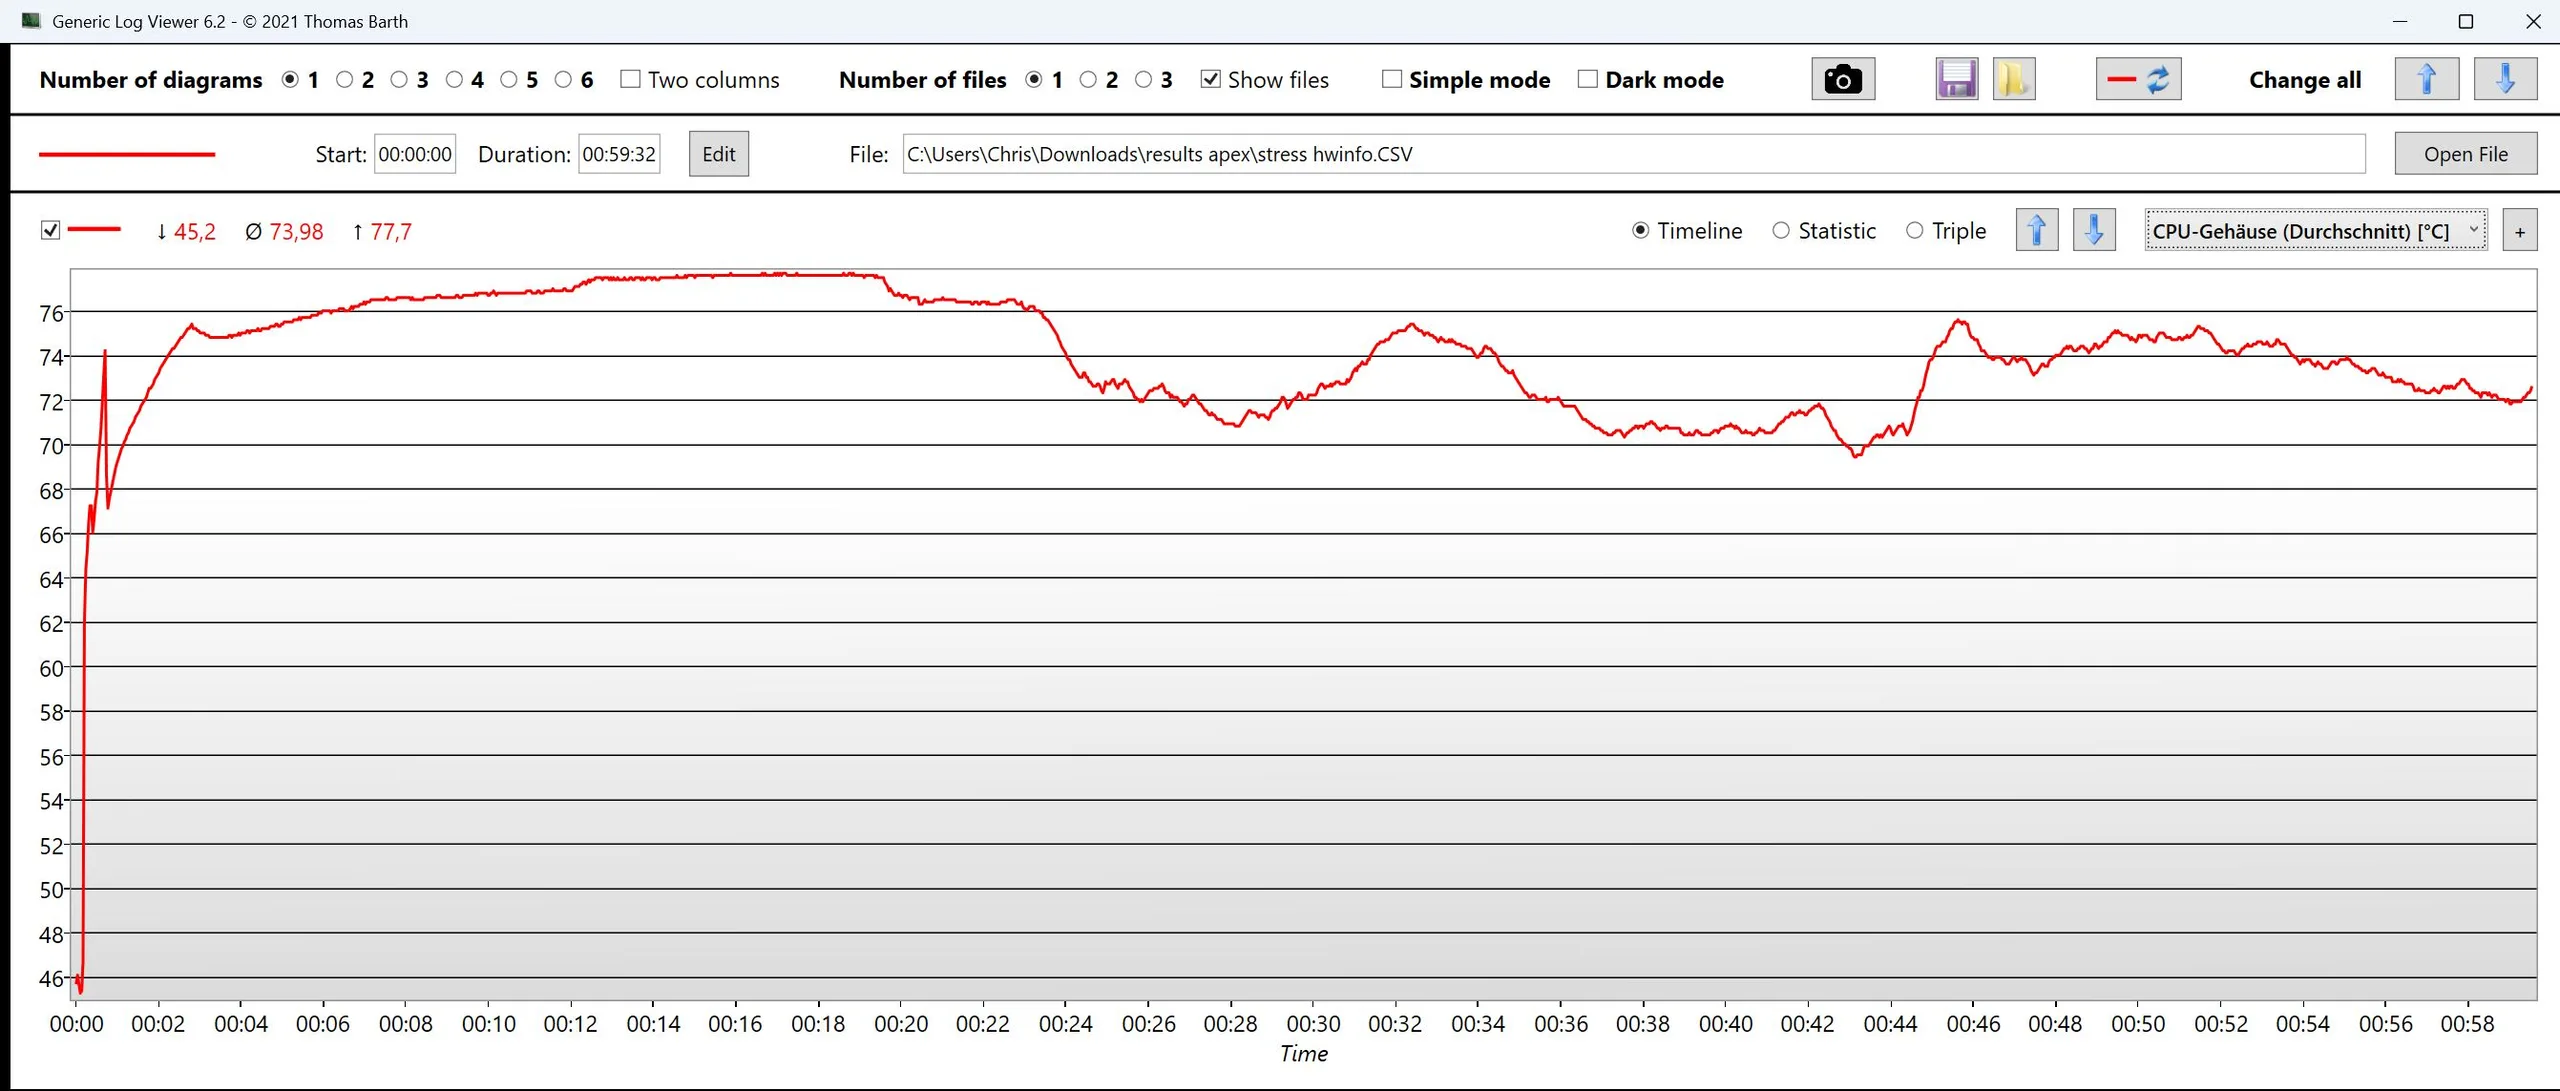
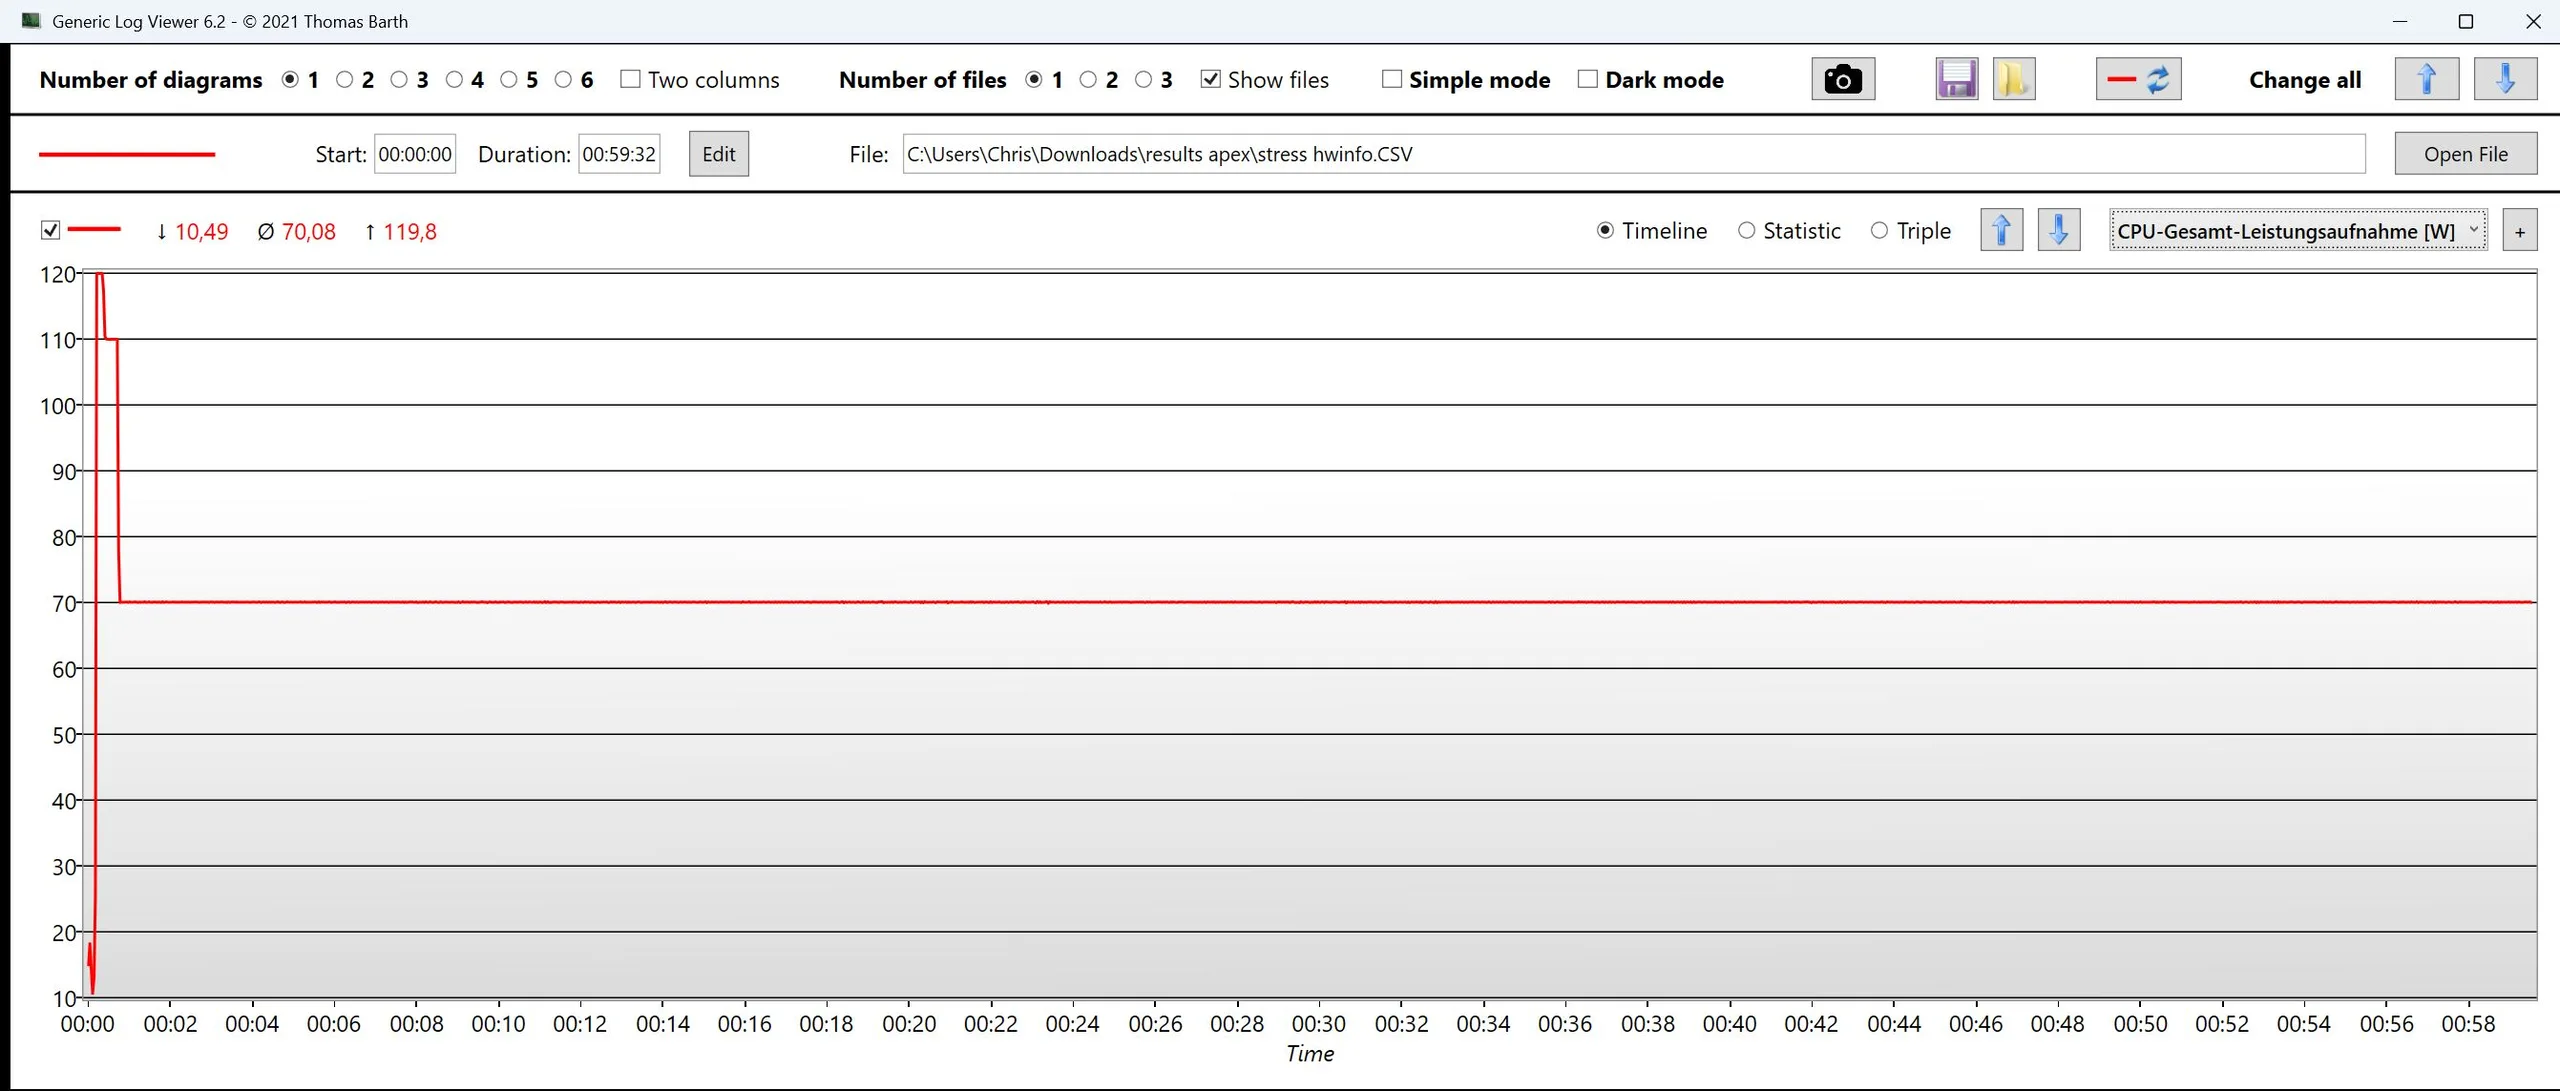
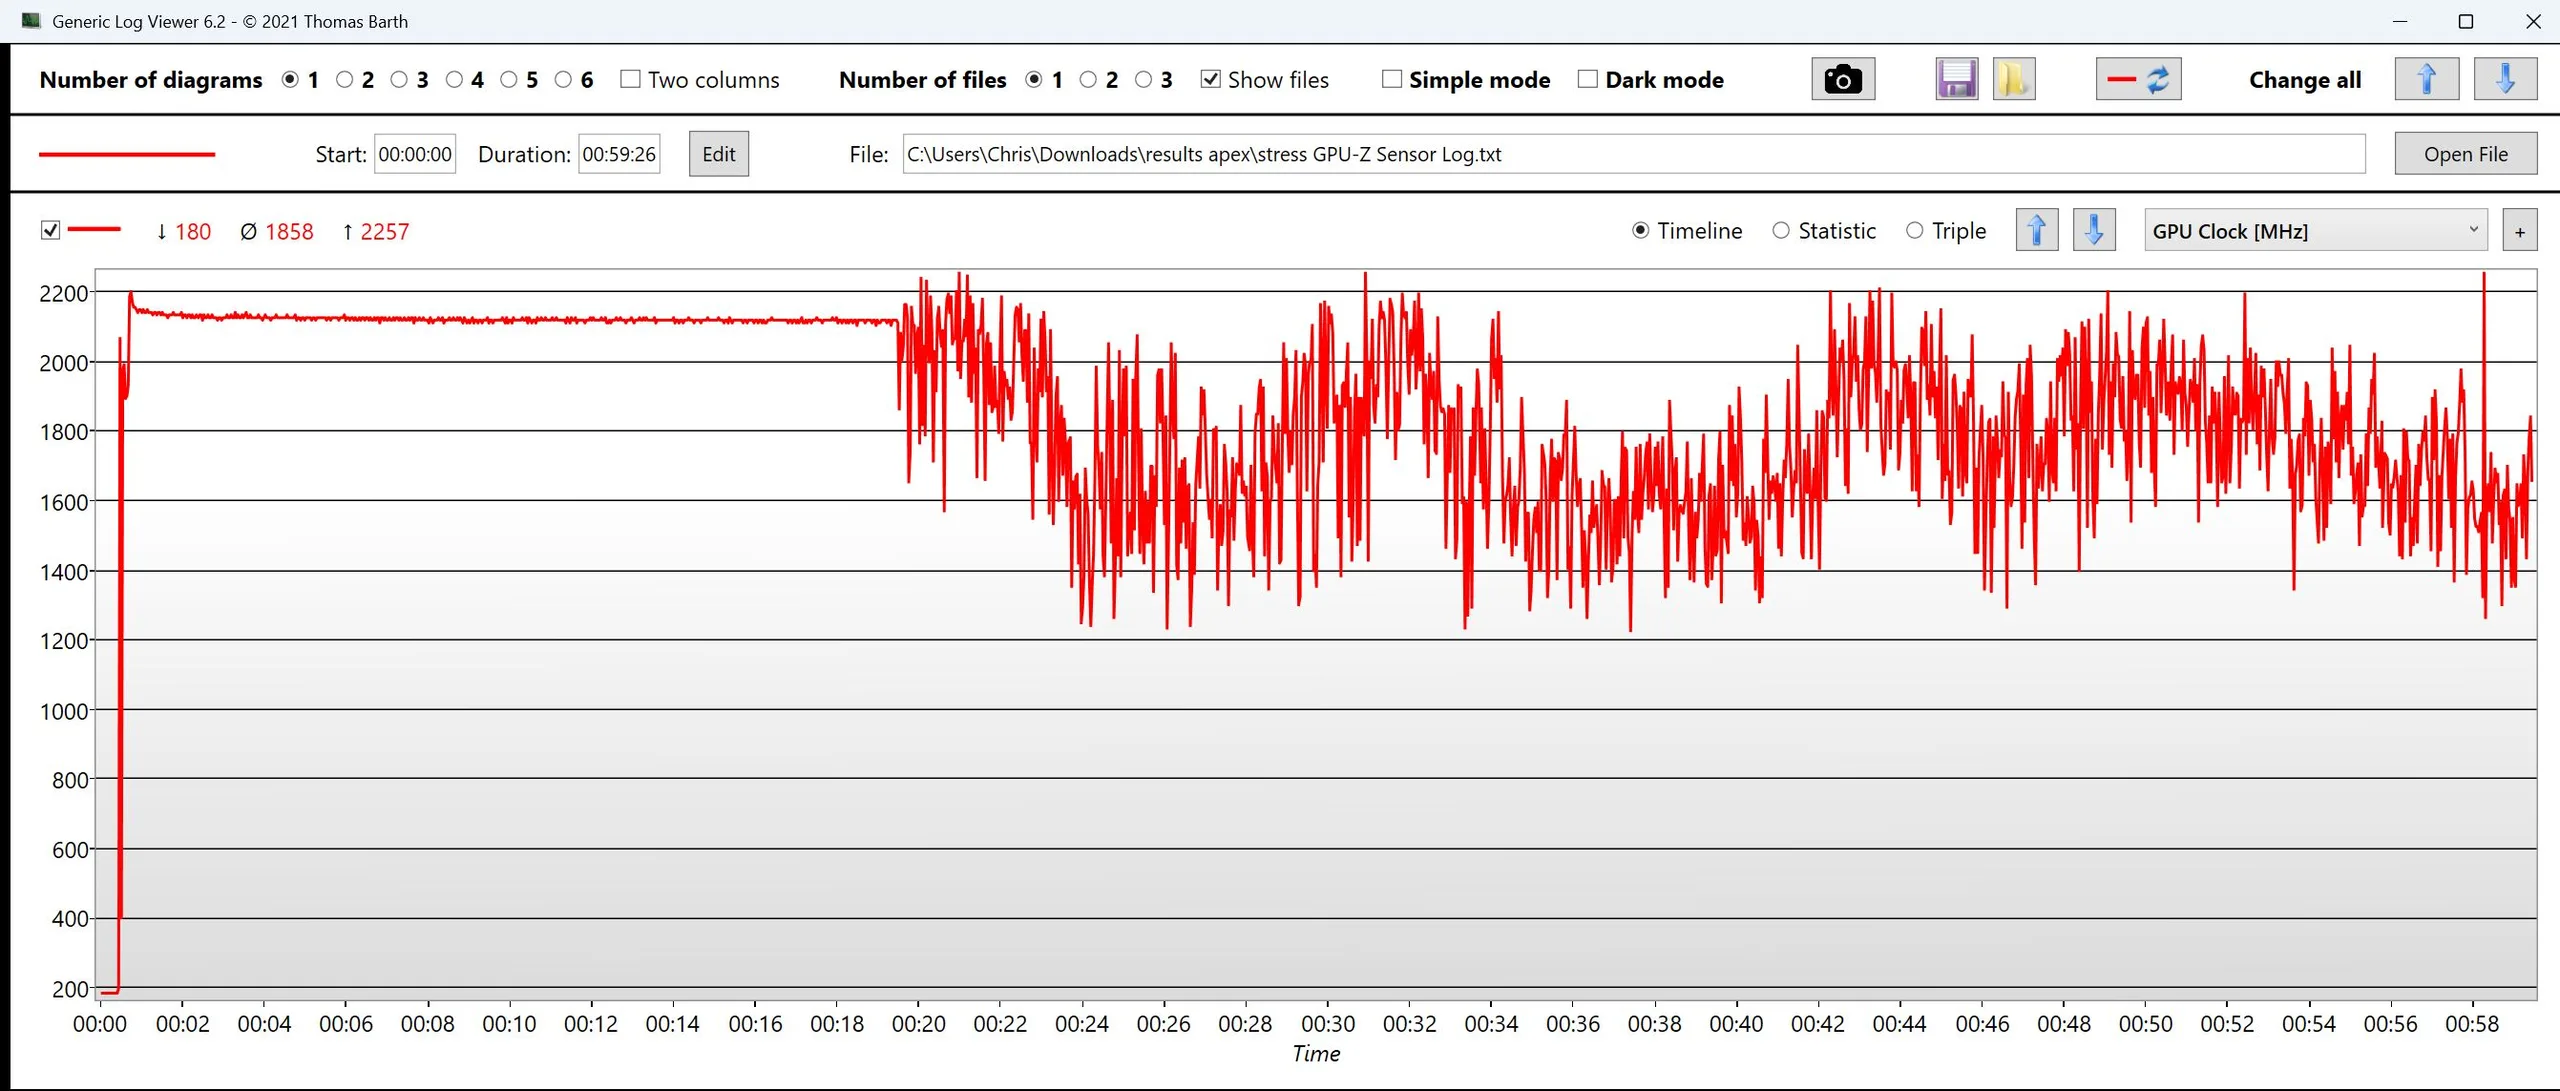
| CPU Clock (GHz) | GPU Clock (MHz) | Average CPU Temperature (°C) | Average GPU Temperature (°C) | |
| Prime95 + FurMark Stress | 3.4 | 1853 | 74 | 73 |
| Cyberpunk 2077 Stress | 1.1 | 2700 | 84 | 74 |
Speakers
Highs and mids are balanced, but bass is nearly absent and overall output is slightly underpowered. Speaker quality is average. A combo audio jack is included.
Schenker XMG Apex 17 M25 audio analysis
(±) | speaker loudness is average but good (80.19 dB)
Bass 100 - 315 Hz
(-) | nearly no bass - on average 29.9% lower than median
(±) | linearity of bass is average (14.6% delta to prev. frequency)
Mids 400 - 2000 Hz
(+) | balanced mids - only 4.7% away from median
(+) | mids are linear (6.7% delta to prev. frequency)
Highs 2 - 16 kHz
(+) | balanced highs - only 4.1% away from median
(+) | highs are linear (6% delta to prev. frequency)
Overall 100 - 16.000 Hz
(±) | linearity of overall sound is average (22.3% difference to median)
Compared to same class
» 80% of all tested devices in this class were better, 6% similar, 14% worse
» The best had a delta of 6%, average was 18%, worst was 132%
Compared to all devices tested
» 65% of all tested devices were better, 6% similar, 29% worse
» The best had a delta of 4%, average was 24%, worst was 134%
Lenovo Legion 7 16IAX10 audio analysis
(±) | speaker loudness is average but good (77.6 dB)
Bass 100 - 315 Hz
(±) | reduced bass - on average 9.5% lower than median
(±) | linearity of bass is average (9.8% delta to prev. frequency)
Mids 400 - 2000 Hz
(+) | balanced mids - only 1.5% away from median
(+) | mids are linear (4% delta to prev. frequency)
Highs 2 - 16 kHz
(+) | balanced highs - only 3% away from median
(+) | highs are linear (4.9% delta to prev. frequency)
Overall 100 - 16.000 Hz
(+) | overall sound is linear (11.5% difference to median)
Compared to same class
» 10% of all tested devices in this class were better, 3% similar, 87% worse
» The best had a delta of 6%, average was 18%, worst was 132%
Compared to all devices tested
» 8% of all tested devices were better, 2% similar, 90% worse
» The best had a delta of 4%, average was 24%, worst was 134%
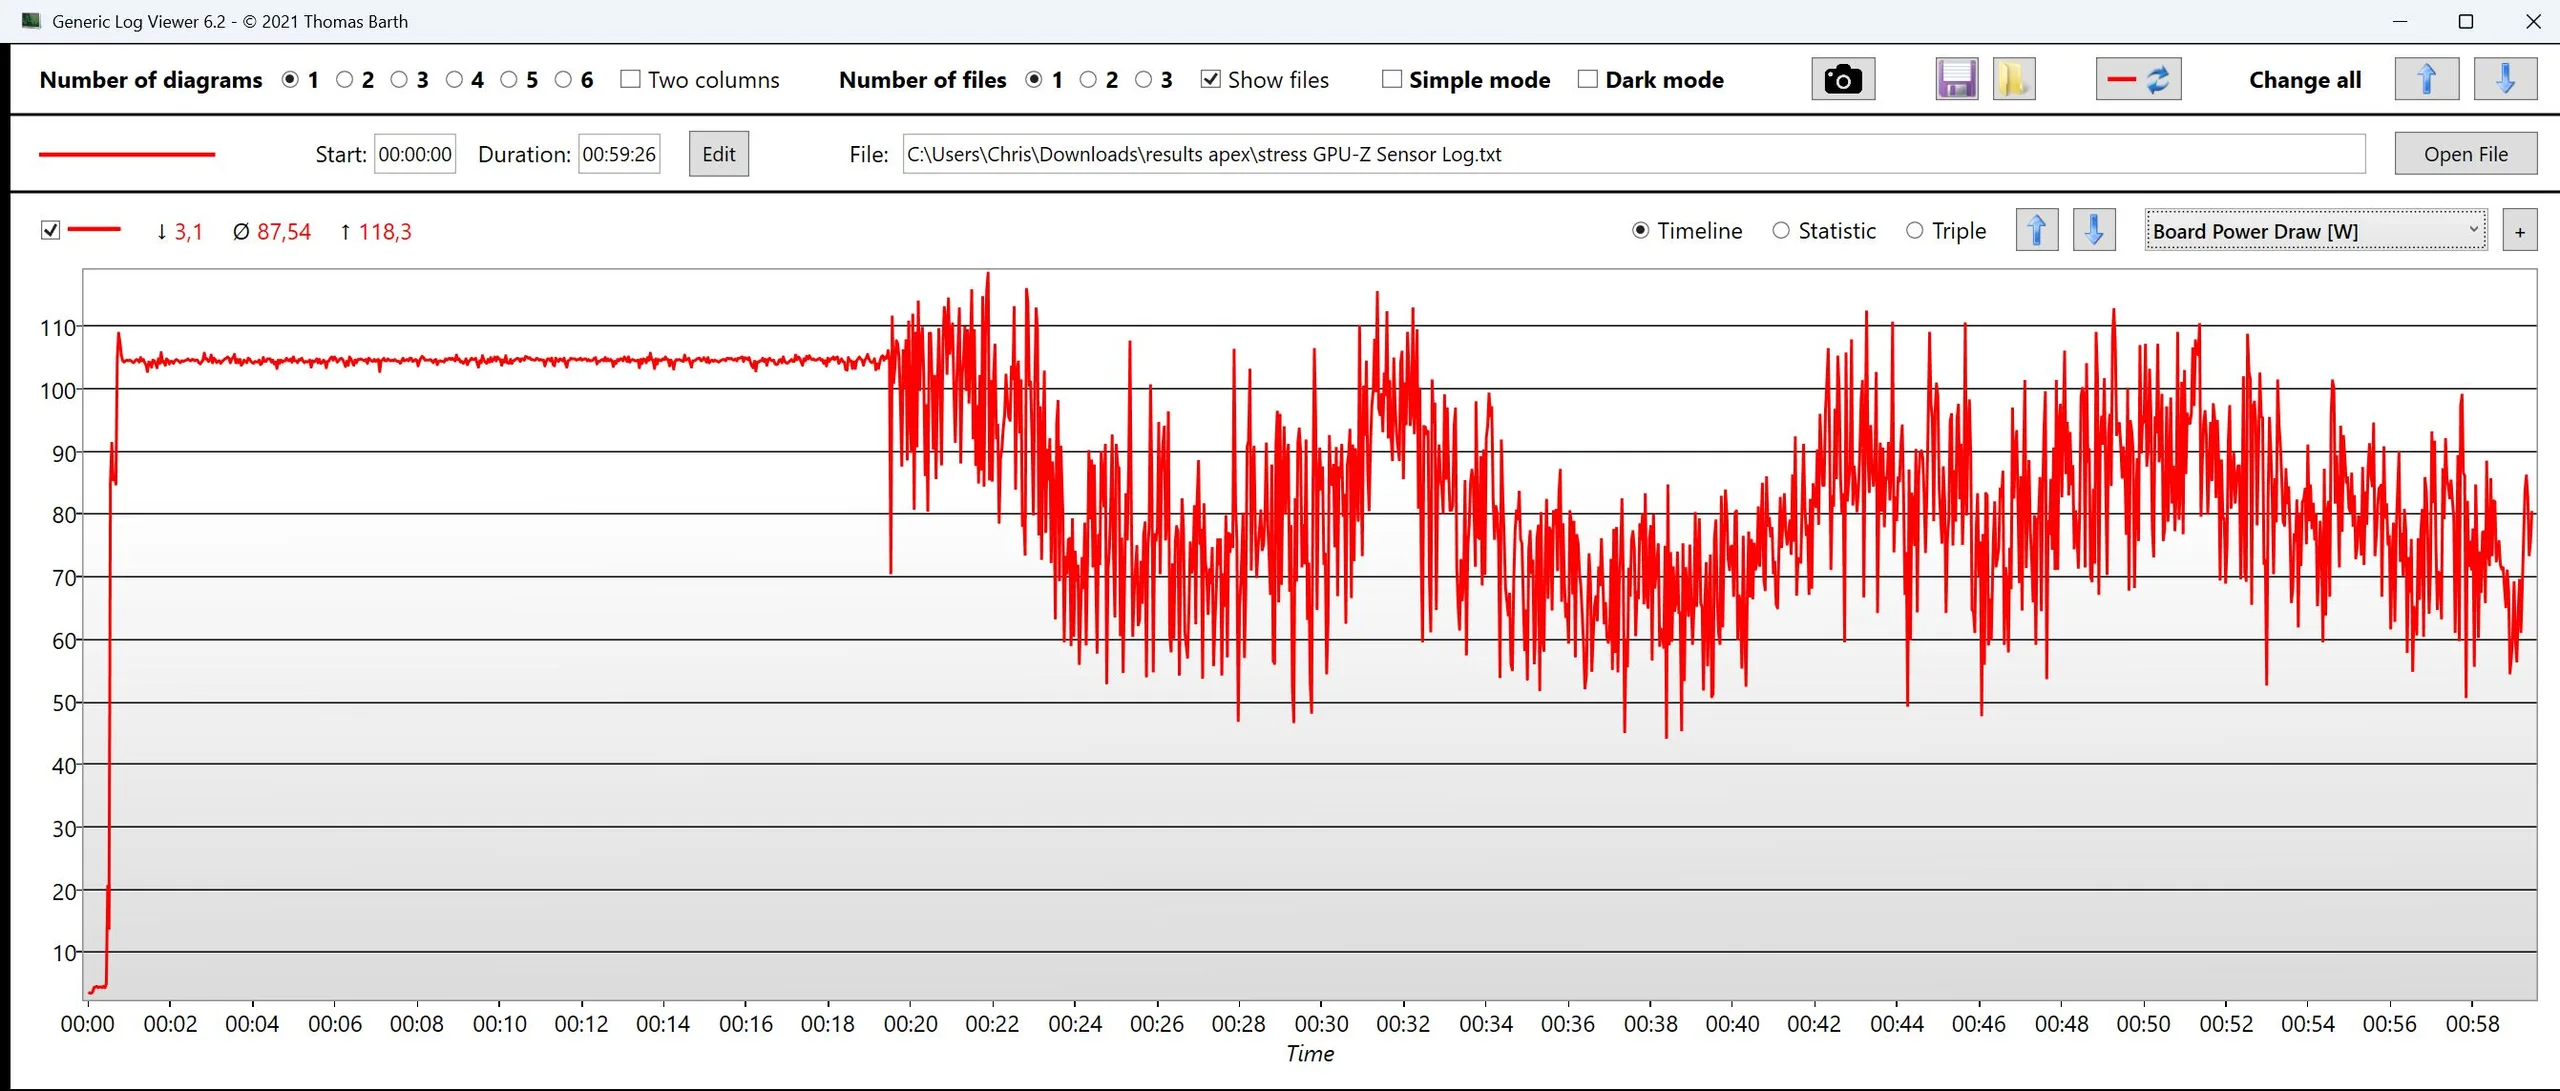
Power consumption
High performance comes at the cost of higher power draw under load compared to competitors. Idle power consumption is particularly in need of optimization, as the system takes an unusually long time to settle at its relatively high idle level.
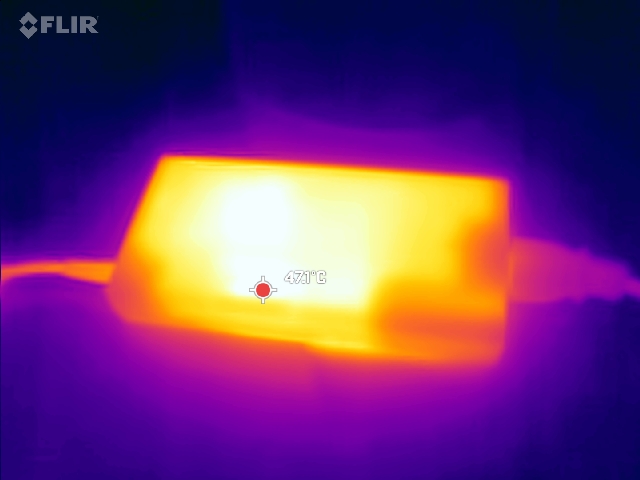
The included 230 W power adapter may be somewhat undersized. While gaming consumption averages around 220 W, short spikes of up to 280 W occur.
| Off / Standby | |
| Idle | |
| Load |
|
Key:
min: | |
| Schenker XMG Apex 17 M25 R9 9955HX, GeForce RTX 5060 Laptop, Samsung 990 Pro 2 TB MZVL72T0HDLB, IPS, 2560x1440, 17.3" | Lenovo Legion 7 16IAX10 Ultra 7 255HX, GeForce RTX 5060 Laptop, WD PC SN7100S SDFPMSL-1T00-1101, OLED, 2560x1600, 16" | HP Omen 16-ap0091ng R9 8940HX, GeForce RTX 5060 Laptop, Samsung PM9C1b MZVL81T0HFLB-00BH1, IPS, 1920x1200, 16" | MSI Cyborg 17 B13WFKG i7-13620H, GeForce RTX 5060 Laptop, Western Digital PC SN5000S SDEPMSJ-512G, IPS, 1920x1080, 17.3" | Tulpar T6 V3.5 i7-14700HX, GeForce RTX 5060 Laptop, Western Digital PC SN5000S SDEPNSJ-1T00-1006, IPS, 1920x1200, 16" | Alienware 16 Aurora Core 7 240H, GeForce RTX 5060 Laptop, , IPS, 2560x1600, 16" | Average NVIDIA GeForce RTX 5060 Laptop | Average of class Gaming | |
|---|---|---|---|---|---|---|---|---|
| Power Consumption | 4% | 19% | 36% | 17% | 31% | 17% | -5% | |
| Idle Minimum * (Watt) | 11.3 | 9.4 17% | 7.8 31% | 7.9 30% | 6.7 41% | 4.4 61% | 9.32 ? 18% | 13.2 ? -17% |
| Idle Average * (Watt) | 16.7 | 10.6 37% | 8.8 47% | 12.7 24% | 13.7 18% | 18 -8% | 13.9 ? 17% | 18.9 ? -13% |
| Idle Maximum * (Watt) | 20.7 | 36.4 -76% | 21.5 -4% | 18.1 13% | 21.8 -5% | 18.2 12% | 19.6 ? 5% | 24.3 ? -17% |
| Load Average * (Watt) | 121 | 107.7 11% | 119 2% | 90 26% | 127 -5% | 87.1 28% | 94.9 ? 22% | 108.3 ? 10% |
| Cyberpunk 2077 ultra * (Watt) | 220 | 188 15% | 192 13% | 109.7 50% | 156.7 29% | 123 44% | ||
| Cyberpunk 2077 ultra external monitor * (Watt) | 209 | 187.5 10% | 164.5 21% | 108.4 48% | 151.9 27% | 120.6 42% | ||
| Load Maximum * (Watt) | 281 | 247 12% | 208 26% | 115 59% | 242 14% | 183 35% | 211 ? 25% | 254 ? 10% |
* ... smaller is better
Power consumption Cyberpunk / Stress test
Power consumption with external monitor
Battery life
At 73 Wh, battery capacity is on the lower end for this class. Nevertheless, the Apex achieves just under six hours in our Wi-Fi test, which is a solid result.
| Schenker XMG Apex 17 M25 R9 9955HX, GeForce RTX 5060 Laptop, 73 Wh | HP Omen 17z-db100 Ryzen AI 7 350, GeForce RTX 5070 Laptop, 83 Wh | Acer Nitro v 17 (ANV17-41-R4CJ) R7 260, GeForce RTX 5070 Laptop, 76 Wh | MSI Katana 17 HX B14WGK i7-14650HX, GeForce RTX 5070 Laptop, 75 Wh | Lenovo Legion 7 16IAX10 Ultra 7 255HX, GeForce RTX 5060 Laptop, 84 Wh | Average of class Gaming | |
|---|---|---|---|---|---|---|
| Battery runtime | ||||||
| WiFi v1.3 (h) | 5.8 | 8 38% | 4.7 -19% | 5.1 -12% | 4.7 -19% | 7.04 ? 21% |
Schenker XMG Apex 17 M25
- 02/12/2026 v8
Christian Hintze
 Total Sustainability Score:
 Possible alternatives in comparison
Image | Model / Review | Price | Weight | Height | Display |
|---|---|---|---|---|---|
1. 82.1%  | Schenker XMG Apex 17 M25 AMD Ryzen 9 9955HX ⎘ NVIDIA GeForce RTX 5060 Laptop ⎘ 32 GB Memory, 2048 GB SSD | Amazon: List Price: 1899 Euro | 2.8 kg | 28.6 mm | 17.30" 2560x1440 170 PPI IPS |
2. 81.8%  | HP Omen 17z-db100 AMD Ryzen AI 7 350 ⎘ NVIDIA GeForce RTX 5070 Laptop ⎘ 96 GB Memory, 4000 GB SSD | Amazon: List Price: 1550 USD | 2.9 kg | 30.1 mm | 17.30" 2560x1440 170 PPI IPS |
3. 80.2%  | Acer Nitro v 17 (ANV17-41-R4CJ) AMD Ryzen 7 260 ⎘ NVIDIA GeForce RTX 5070 Laptop ⎘ 16 GB Memory, 1024 GB SSD | Amazon: List Price: 1199 Euro | 2.7 kg | 24 mm | 17.30" 1920x1080 127 PPI IPS |
4. 79.6%  | MSI Crosshair A17 HX D8WGKG AMD Ryzen 9 8940HX ⎘ NVIDIA GeForce RTX 5070 Laptop ⎘ 32 GB Memory, 1024 GB SSD | Amazon: List Price: 2000 EUR | 2.9 kg | 29.7 mm | 17.00" 2560x1600 178 PPI IPS |
5. 77.3%  | MSI Katana 17 HX B14WGK Intel Core i7-14650HX ⎘ NVIDIA GeForce RTX 5070 Laptop ⎘ 16 GB Memory, 1024 GB SSD | Amazon: List Price: 1800 EUR | 2.7 kg | 28 mm | 17.30" 2560x1440 170 PPI IPS |
6. 86.6% 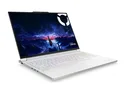 | Lenovo Legion 7 16IAX10 Intel Core Ultra 7 255HX ⎘ NVIDIA GeForce RTX 5060 Laptop ⎘ 32 GB Memory, 1024 GB SSD | Amazon: List Price: 1650 USD | 2 kg | 17.9 mm | 16.00" 2560x1600 189 PPI OLED |
7. 82.5% 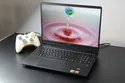 | HP Omen 16-ap0091ng AMD Ryzen 9 8940HX ⎘ NVIDIA GeForce RTX 5060 Laptop ⎘ 16 GB Memory, 1000 GB SSD | Amazon: List Price: 1500 Euro | 2.4 kg | 23.7 mm | 16.00" 1920x1200 162 PPI IPS |
Transparency
The selection of devices to be reviewed is made by our editorial team. The test sample was provided to the author as a loan by the manufacturer or retailer for the purpose of this review. The lender had no influence on this review, nor did the manufacturer receive a copy of this review before publication. There was no obligation to publish this review. As an independent media company, Notebookcheck is not subjected to the authority of manufacturers, retailers or publishers.
This is how Notebookcheck is testing
Every year, Notebookcheck independently reviews hundreds of laptops and smartphones using standardized procedures to ensure that all results are comparable. We have continuously developed our test methods for around 20 years and set industry standards in the process. In our test labs, high-quality measuring equipment is utilized by experienced technicians and editors. These tests involve a multi-stage validation process. Our complex rating system is based on hundreds of well-founded measurements and benchmarks, which maintains objectivity. Further information on our test methods can be found here.
