
Verdict – Who should buy the Acer Nitro V 17?
The Acer Nitro V 17 is aimed squarely at budget-conscious gamers who value quiet and power-efficient gaming over maximum frame rates. As an example: the Lenovo LOQ 17 is five percent faster in Cyberpunk 2077, but also 17 percent louder and consumes 56 percent more power.
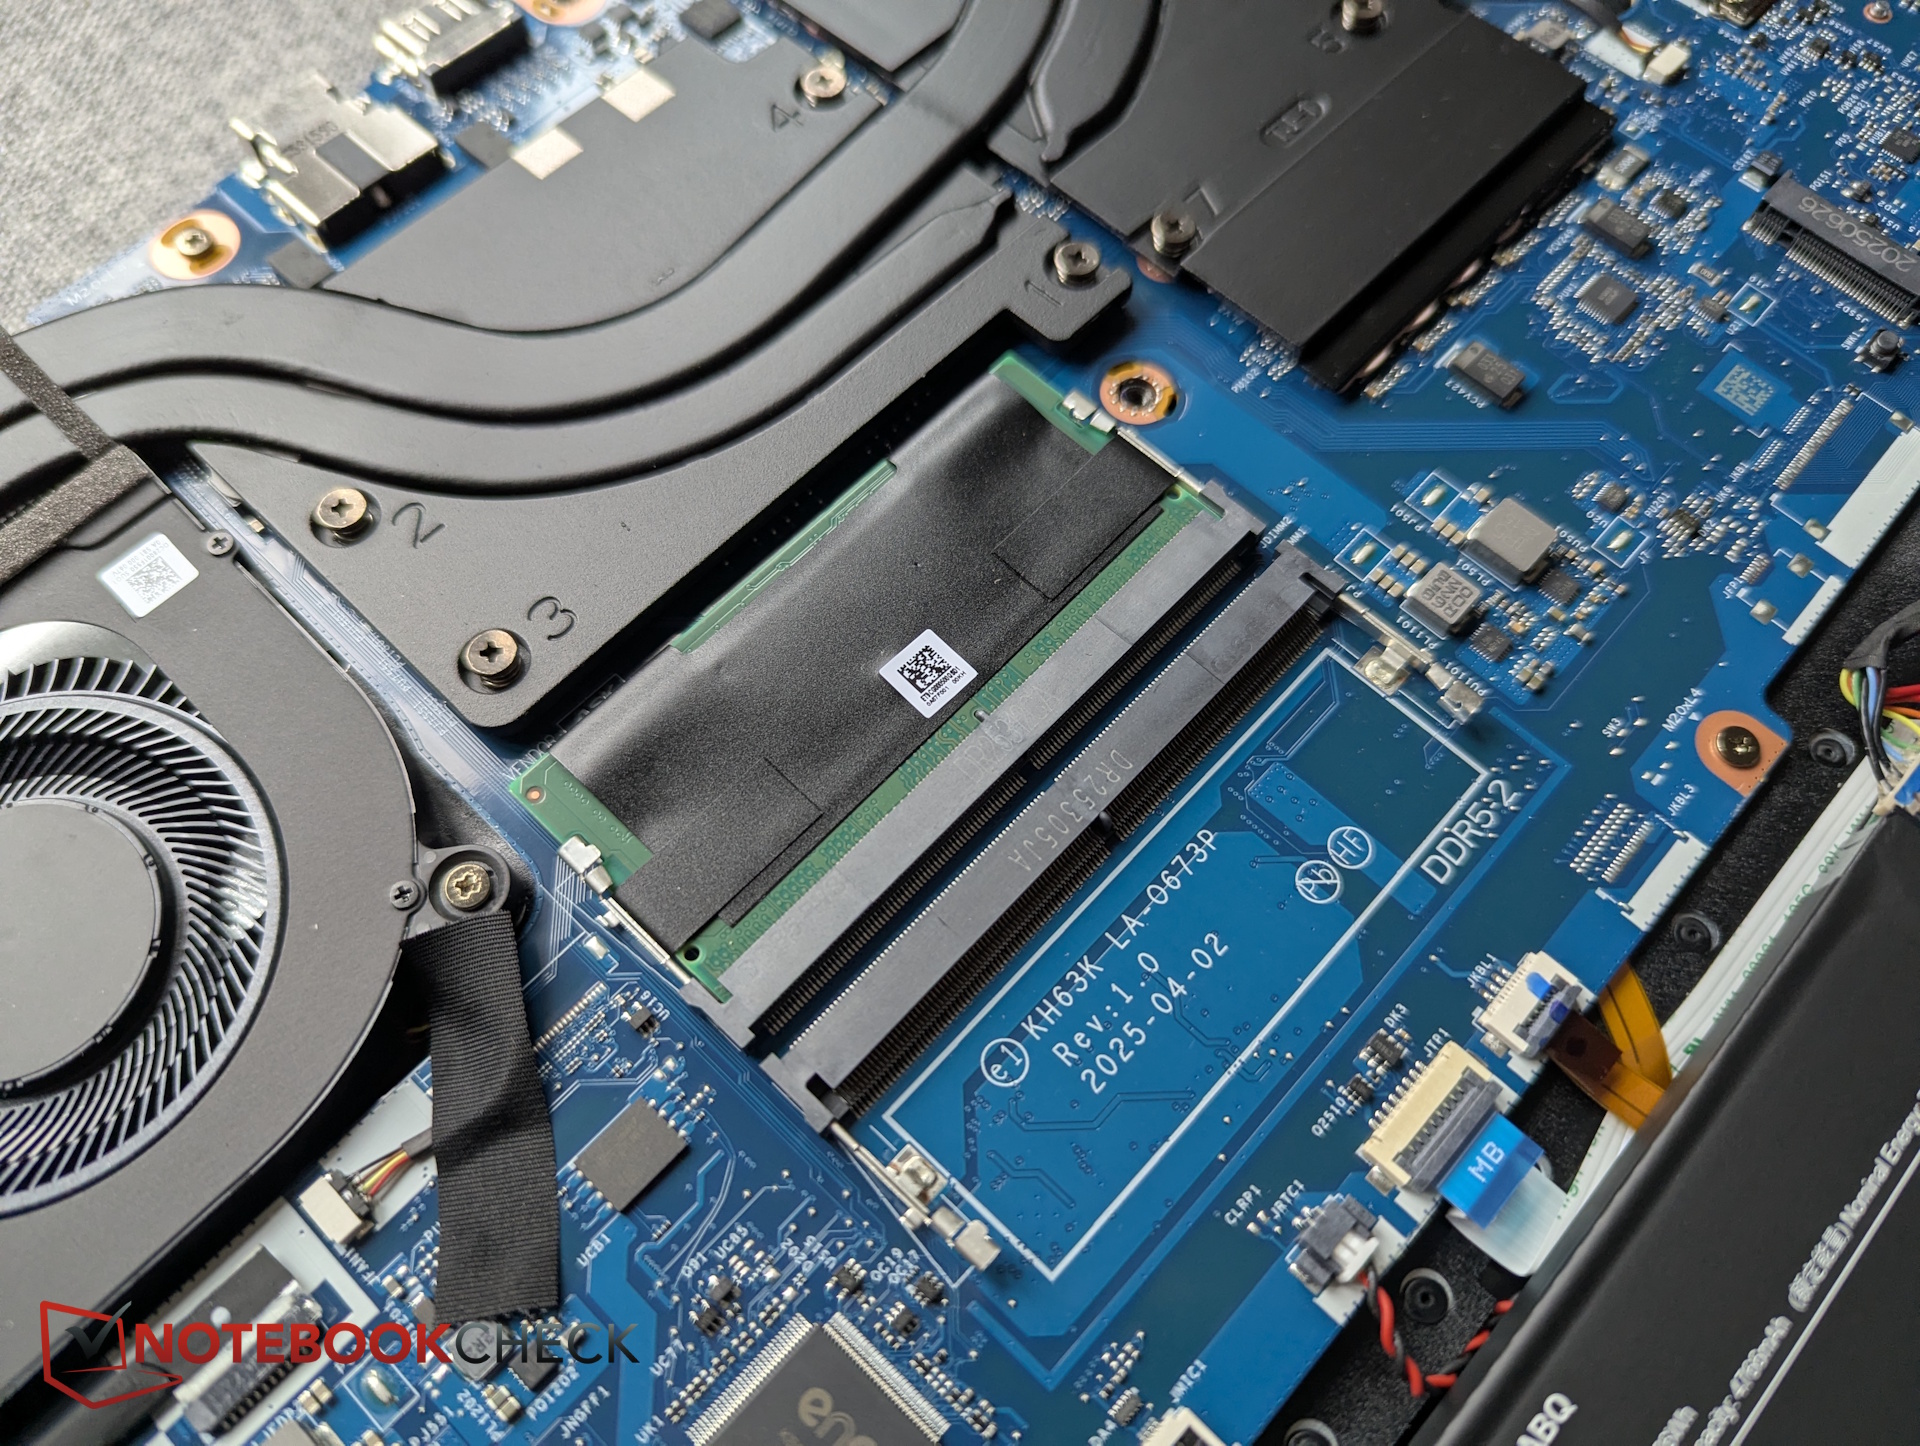
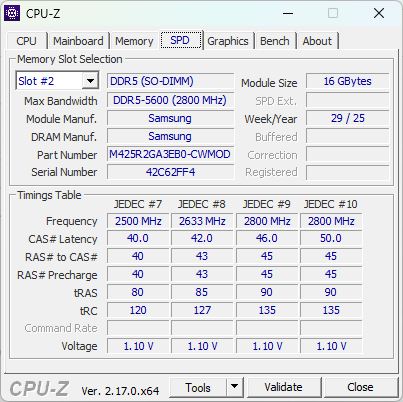
The main drawbacks are the dim Full HD panel with no sRGB coverage, although a QHD option is available. Adding a second RAM module could also unlock a bit more performance.
Pros
Cons
Price and availability

At the time of testing, our loan unit from retailer notebooksbilliger is priced at €1,249 without Windows. On amazon.com it costs $1.449.
- $1,199.00Acer Nitro V 17.3in Gaming Laptop ANV17-41-R8ML 16GB RAM 512GB SSD
- $96.99Compatible with Acer Nitro 17 AN17-41-R9LN AN17-41-R5Y5 AN17-41-R7G3 AN17-41-R182 17.3 inches 165Hz 2560x1440 QHD IPS 40Pin LCD LED Display Screen Panel Replacement
- $1,399.99Acer Nitro V Slim ANV16S-41-R3Q0 Gaming Laptop | 16" WQXGA IPS | NVIDIA GeForce RTX 5070 | AMD Ryzen Processor | 16GB RAM | 512GB SSD | WiFi 6E | Backlit Keyboard | HDMI | USB4 | RJ-45 | Win 11 Home
Table of Contents
- Verdict – Who should buy the Acer Nitro V 17?
- Specifications – Gaming with Ryzen 7 and RTX 5070
- Chassis and connectivity – How good is the build quality?
- Input devices – What is typing like on the Nitro V 17?
- Display – How good is the 17-inch panel?
- Performance – Is the RTX 5070 enough for AAA games in QHD or 4K?
- Emissions & Energy – How loud is the Acer Nitro V 17 during gaming?
- Possible alternatives in comparison
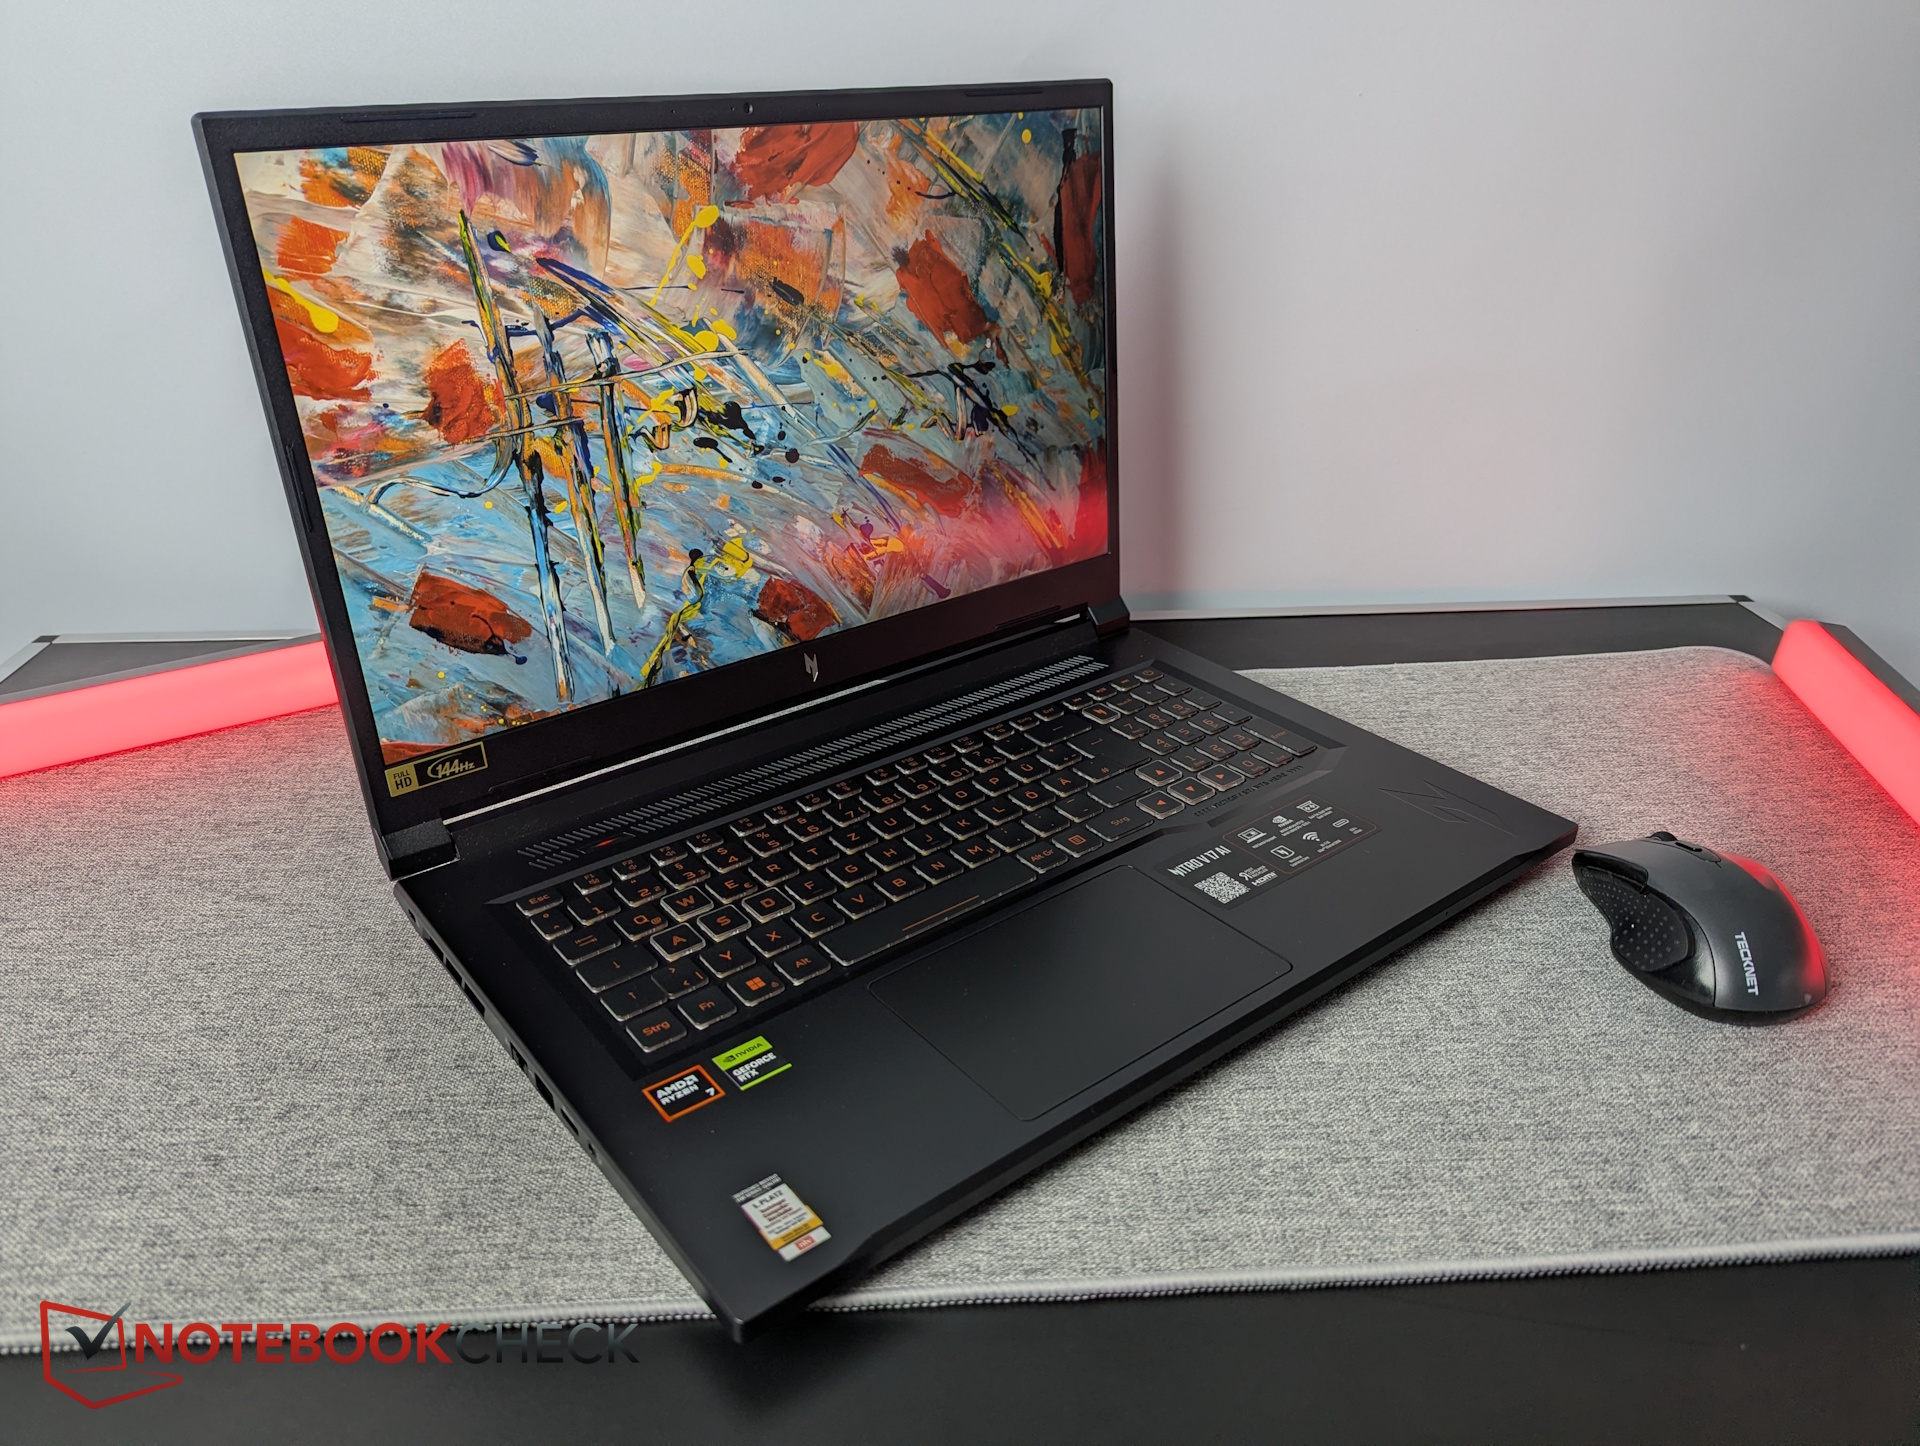
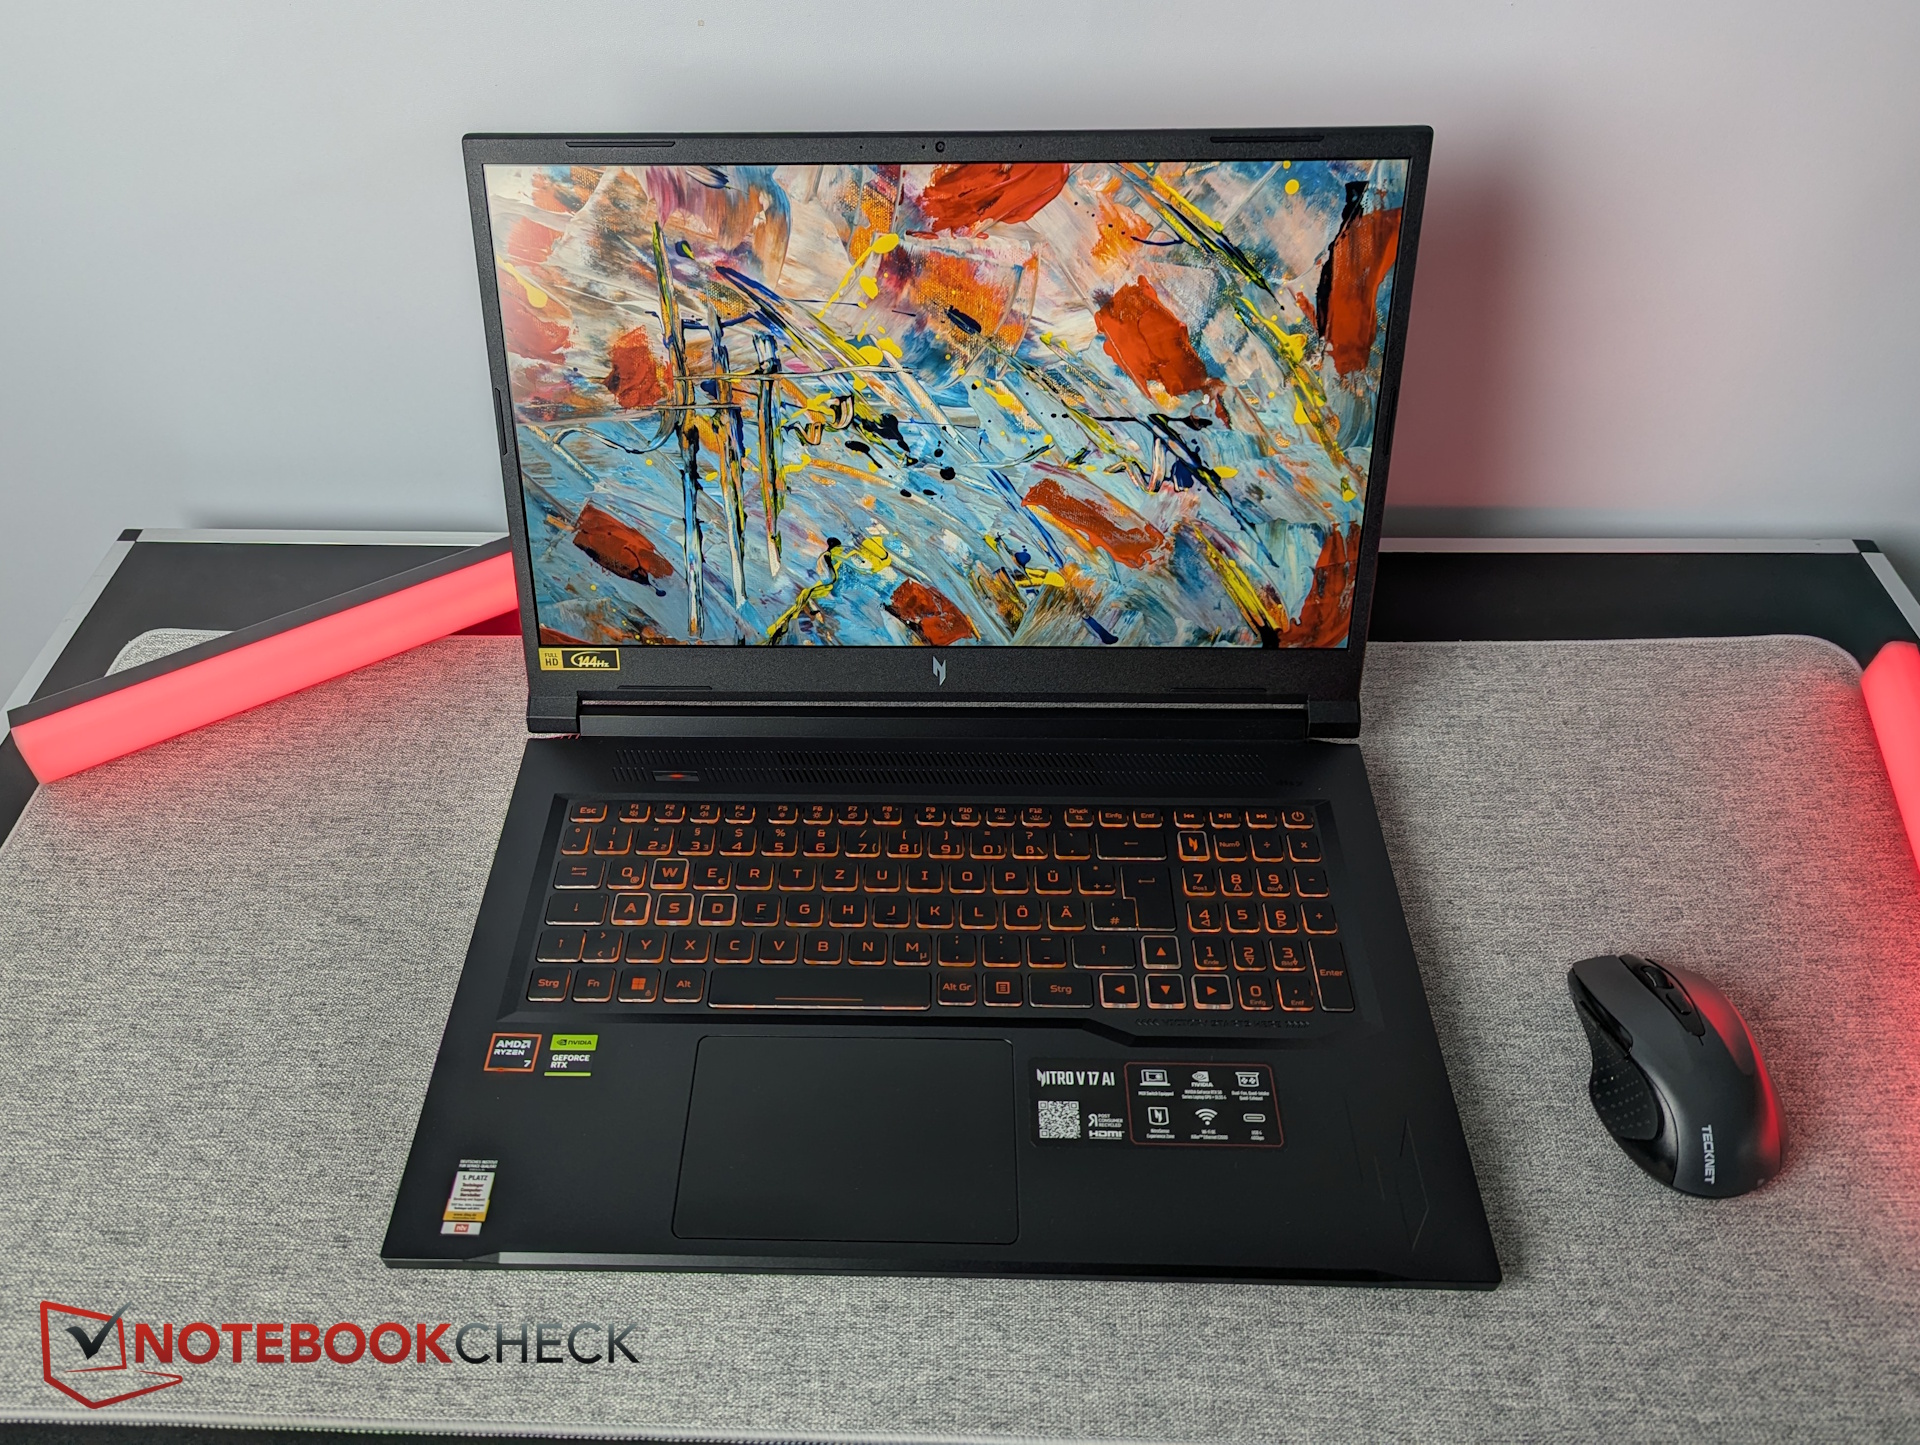
The Acer Nitro V 17 ANV17-41-R4CJ is a 17-inch gaming laptop combining an Ryzen 7 260 and an RTX 5070 at an attractive price point. We take a closer look at how well Acer balances performance and cost.
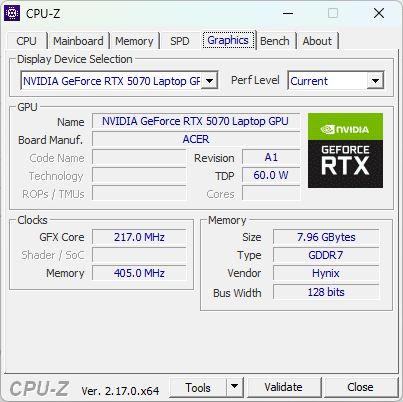
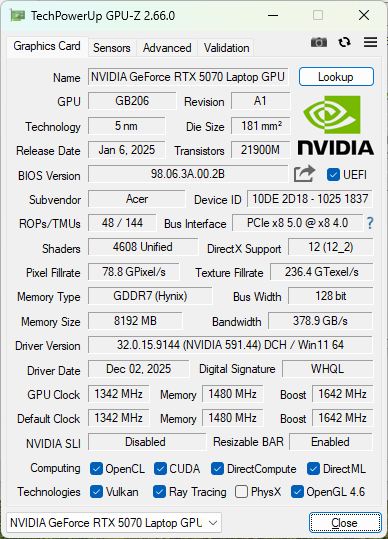
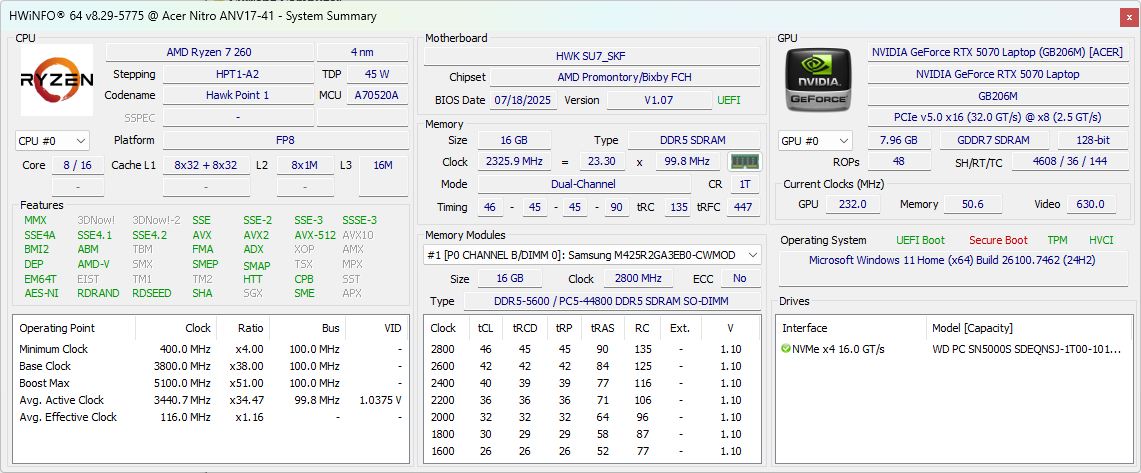
Specifications – Gaming with Ryzen 7 and RTX 5070
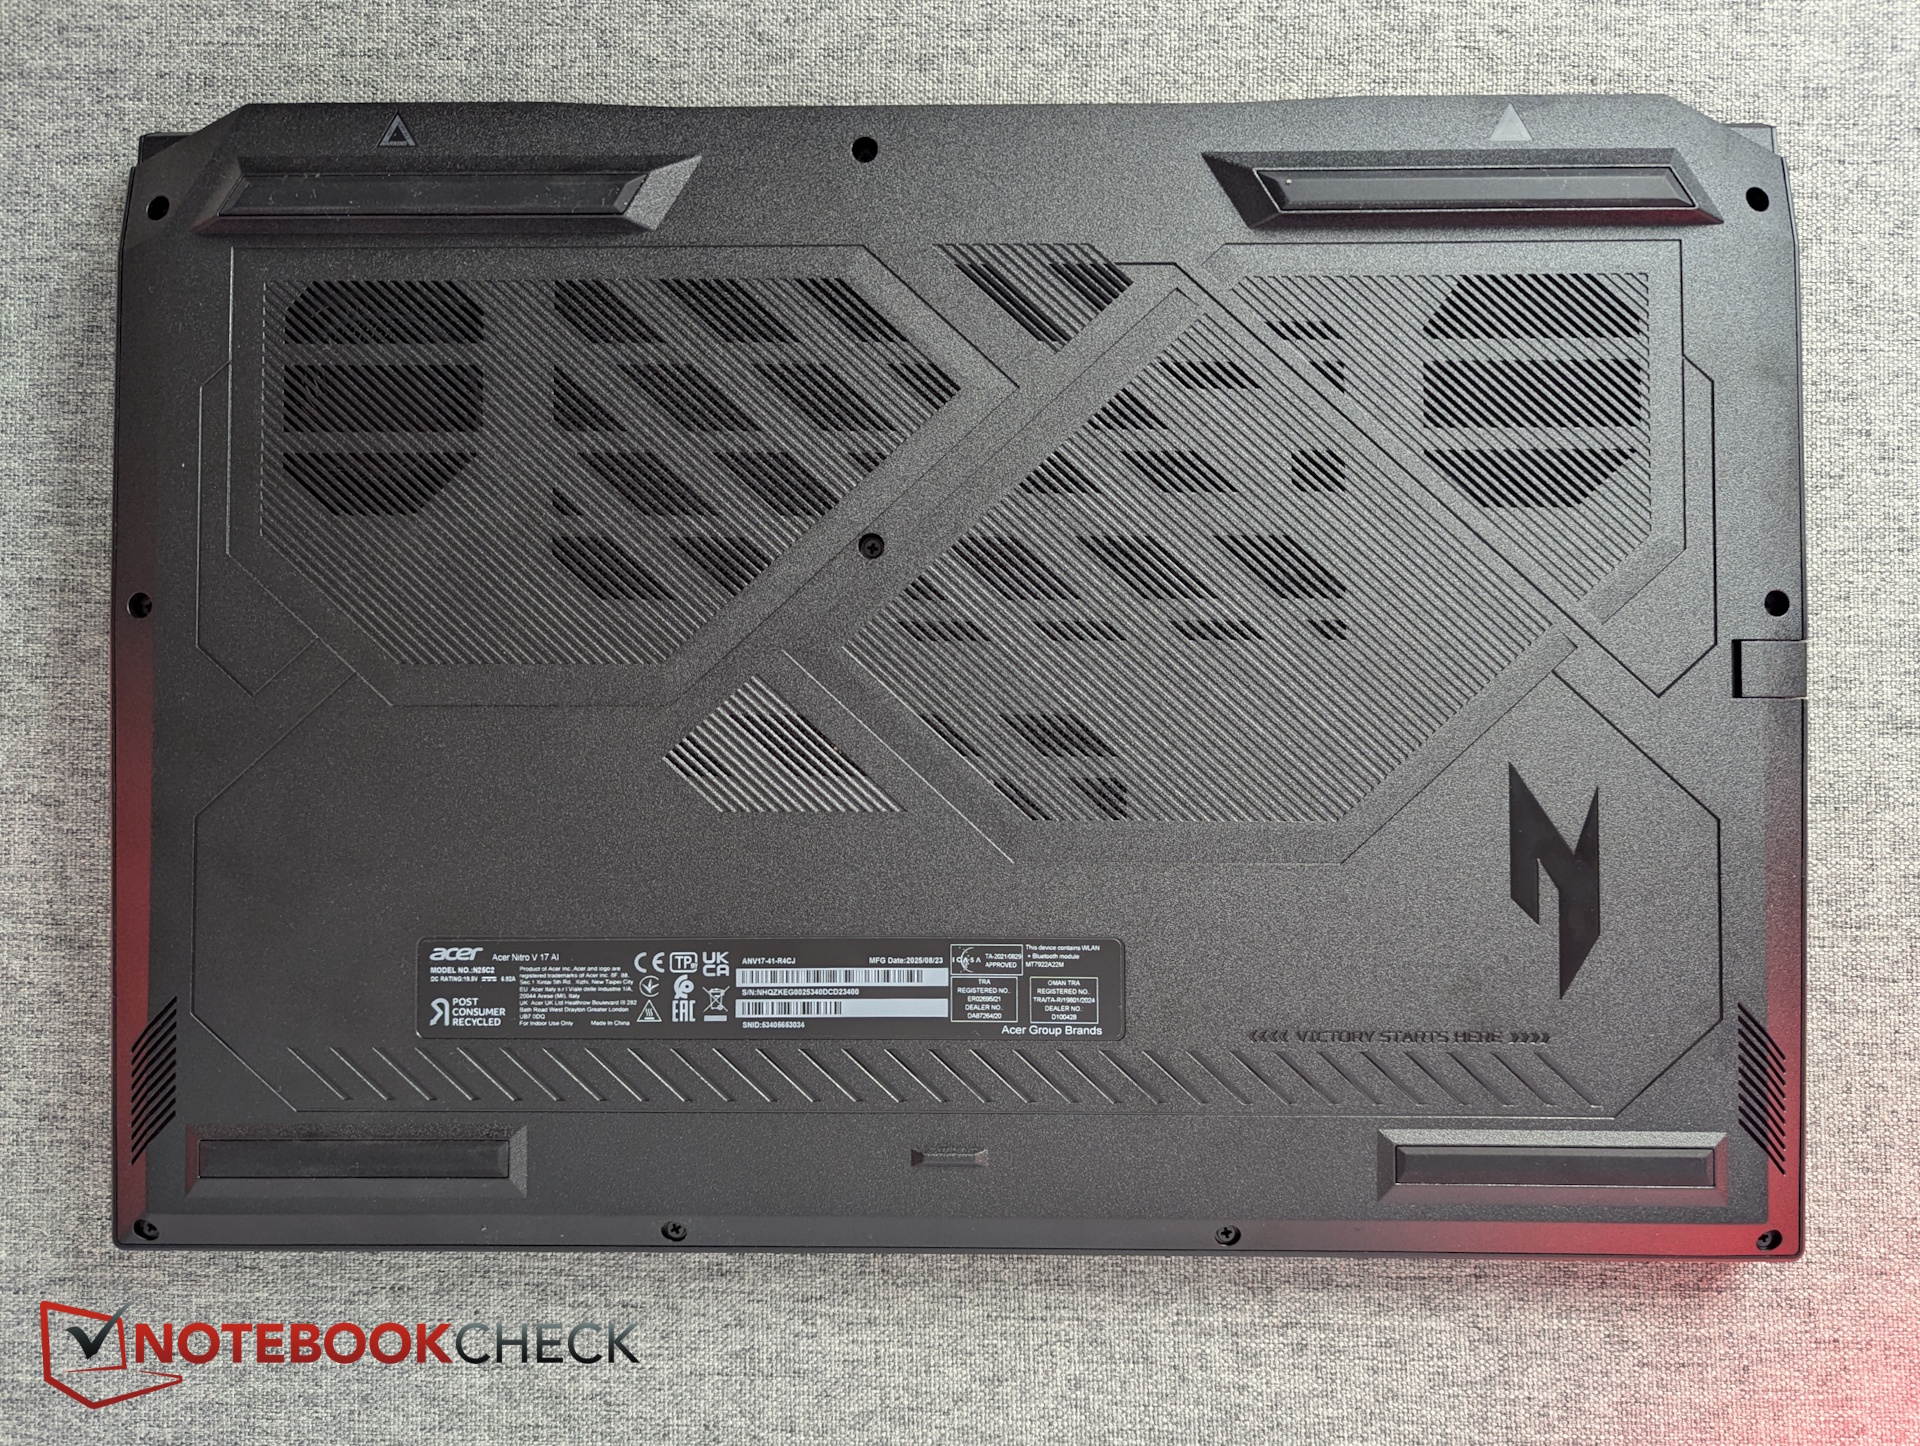
Chassis and connectivity – How good is the build quality?
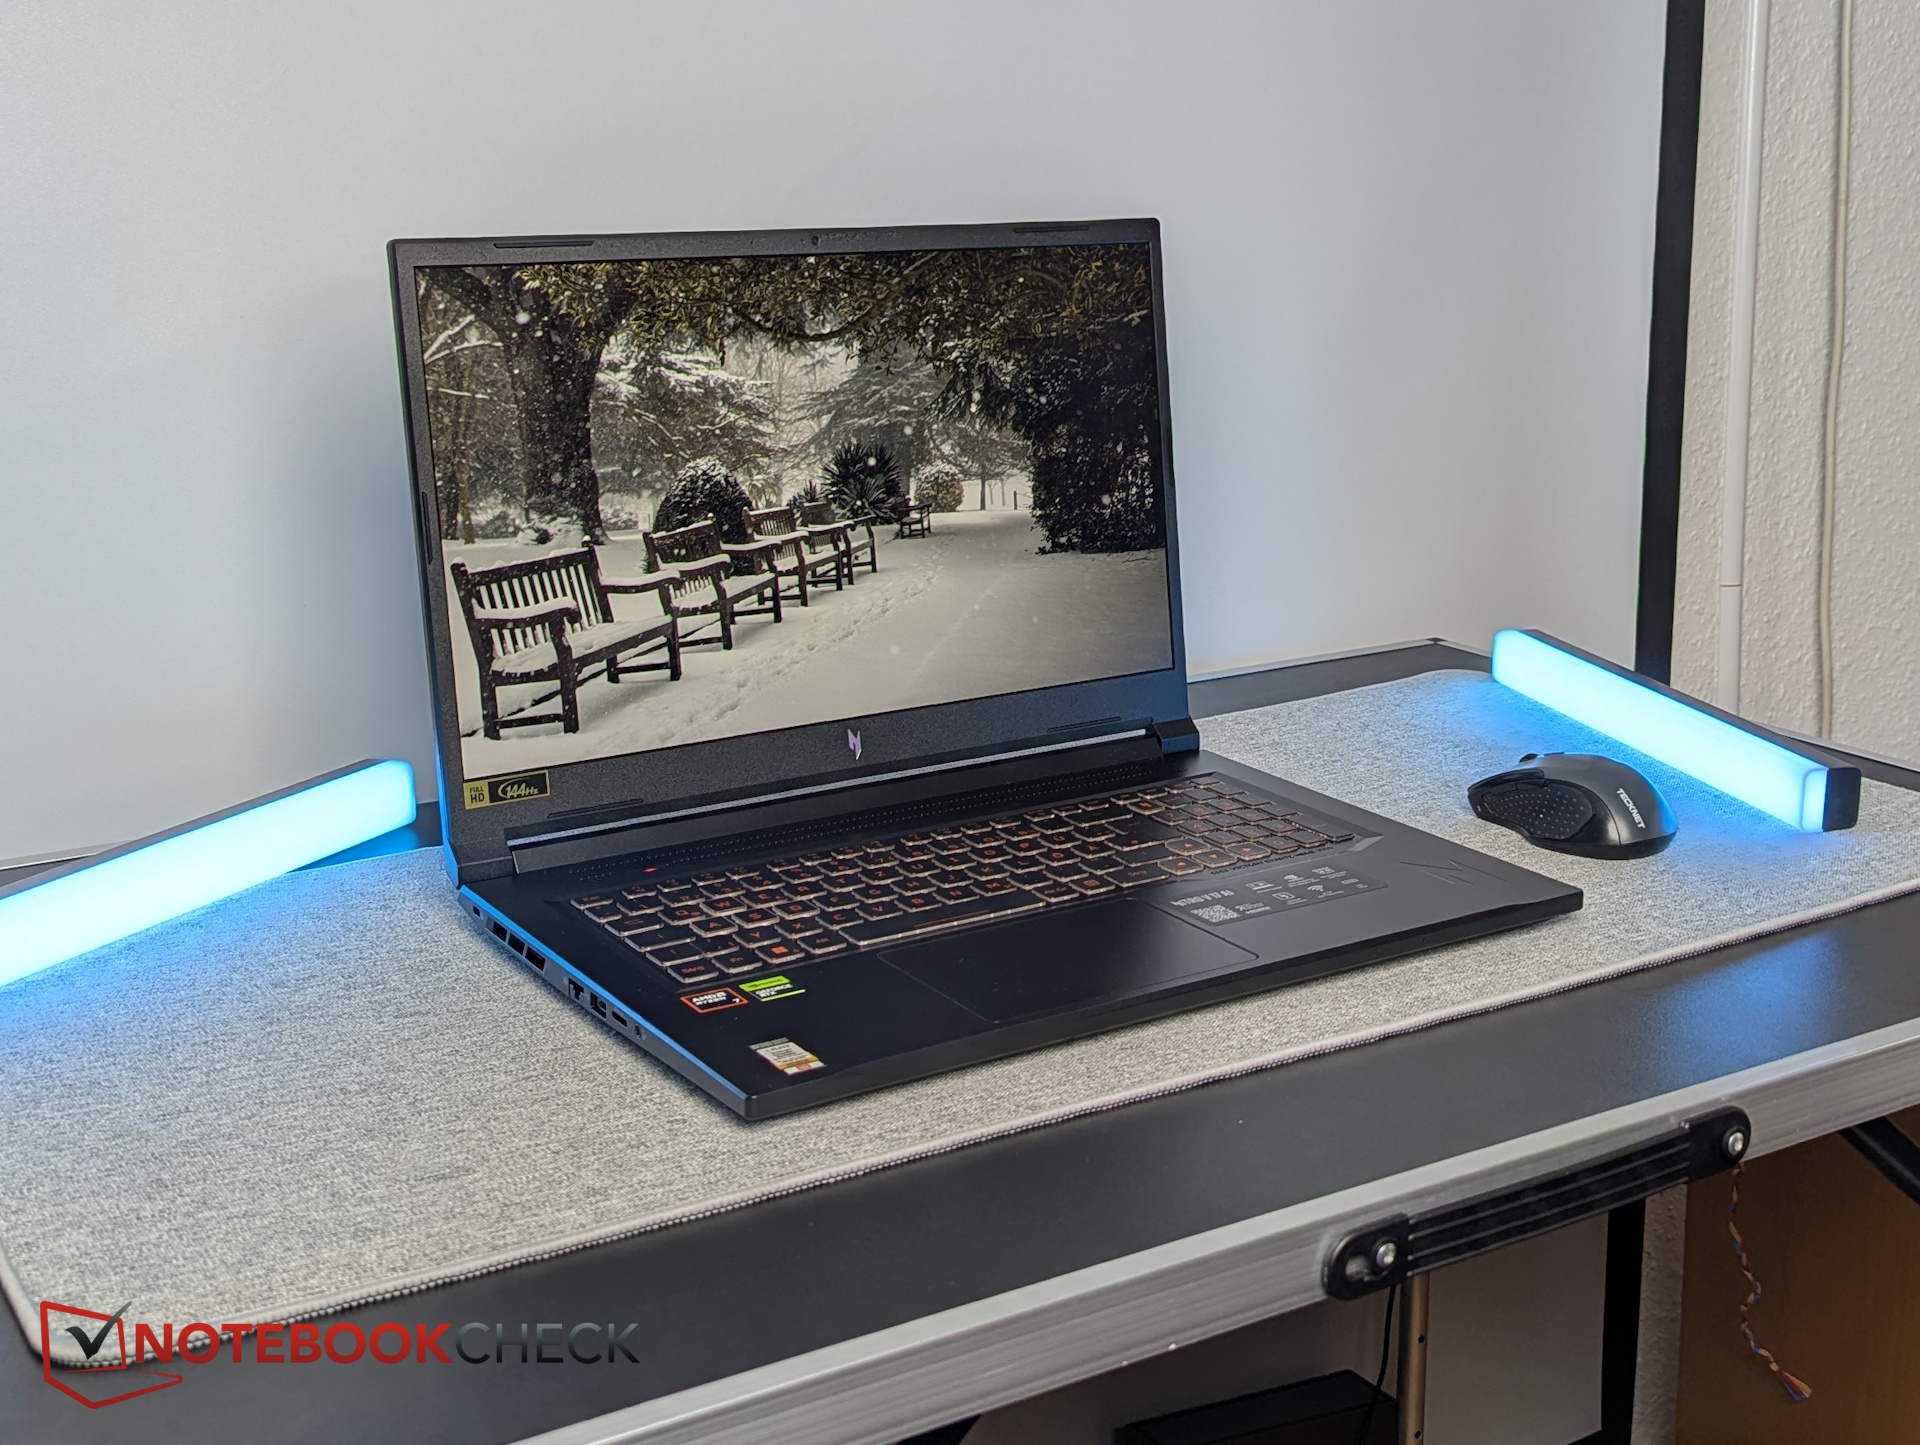
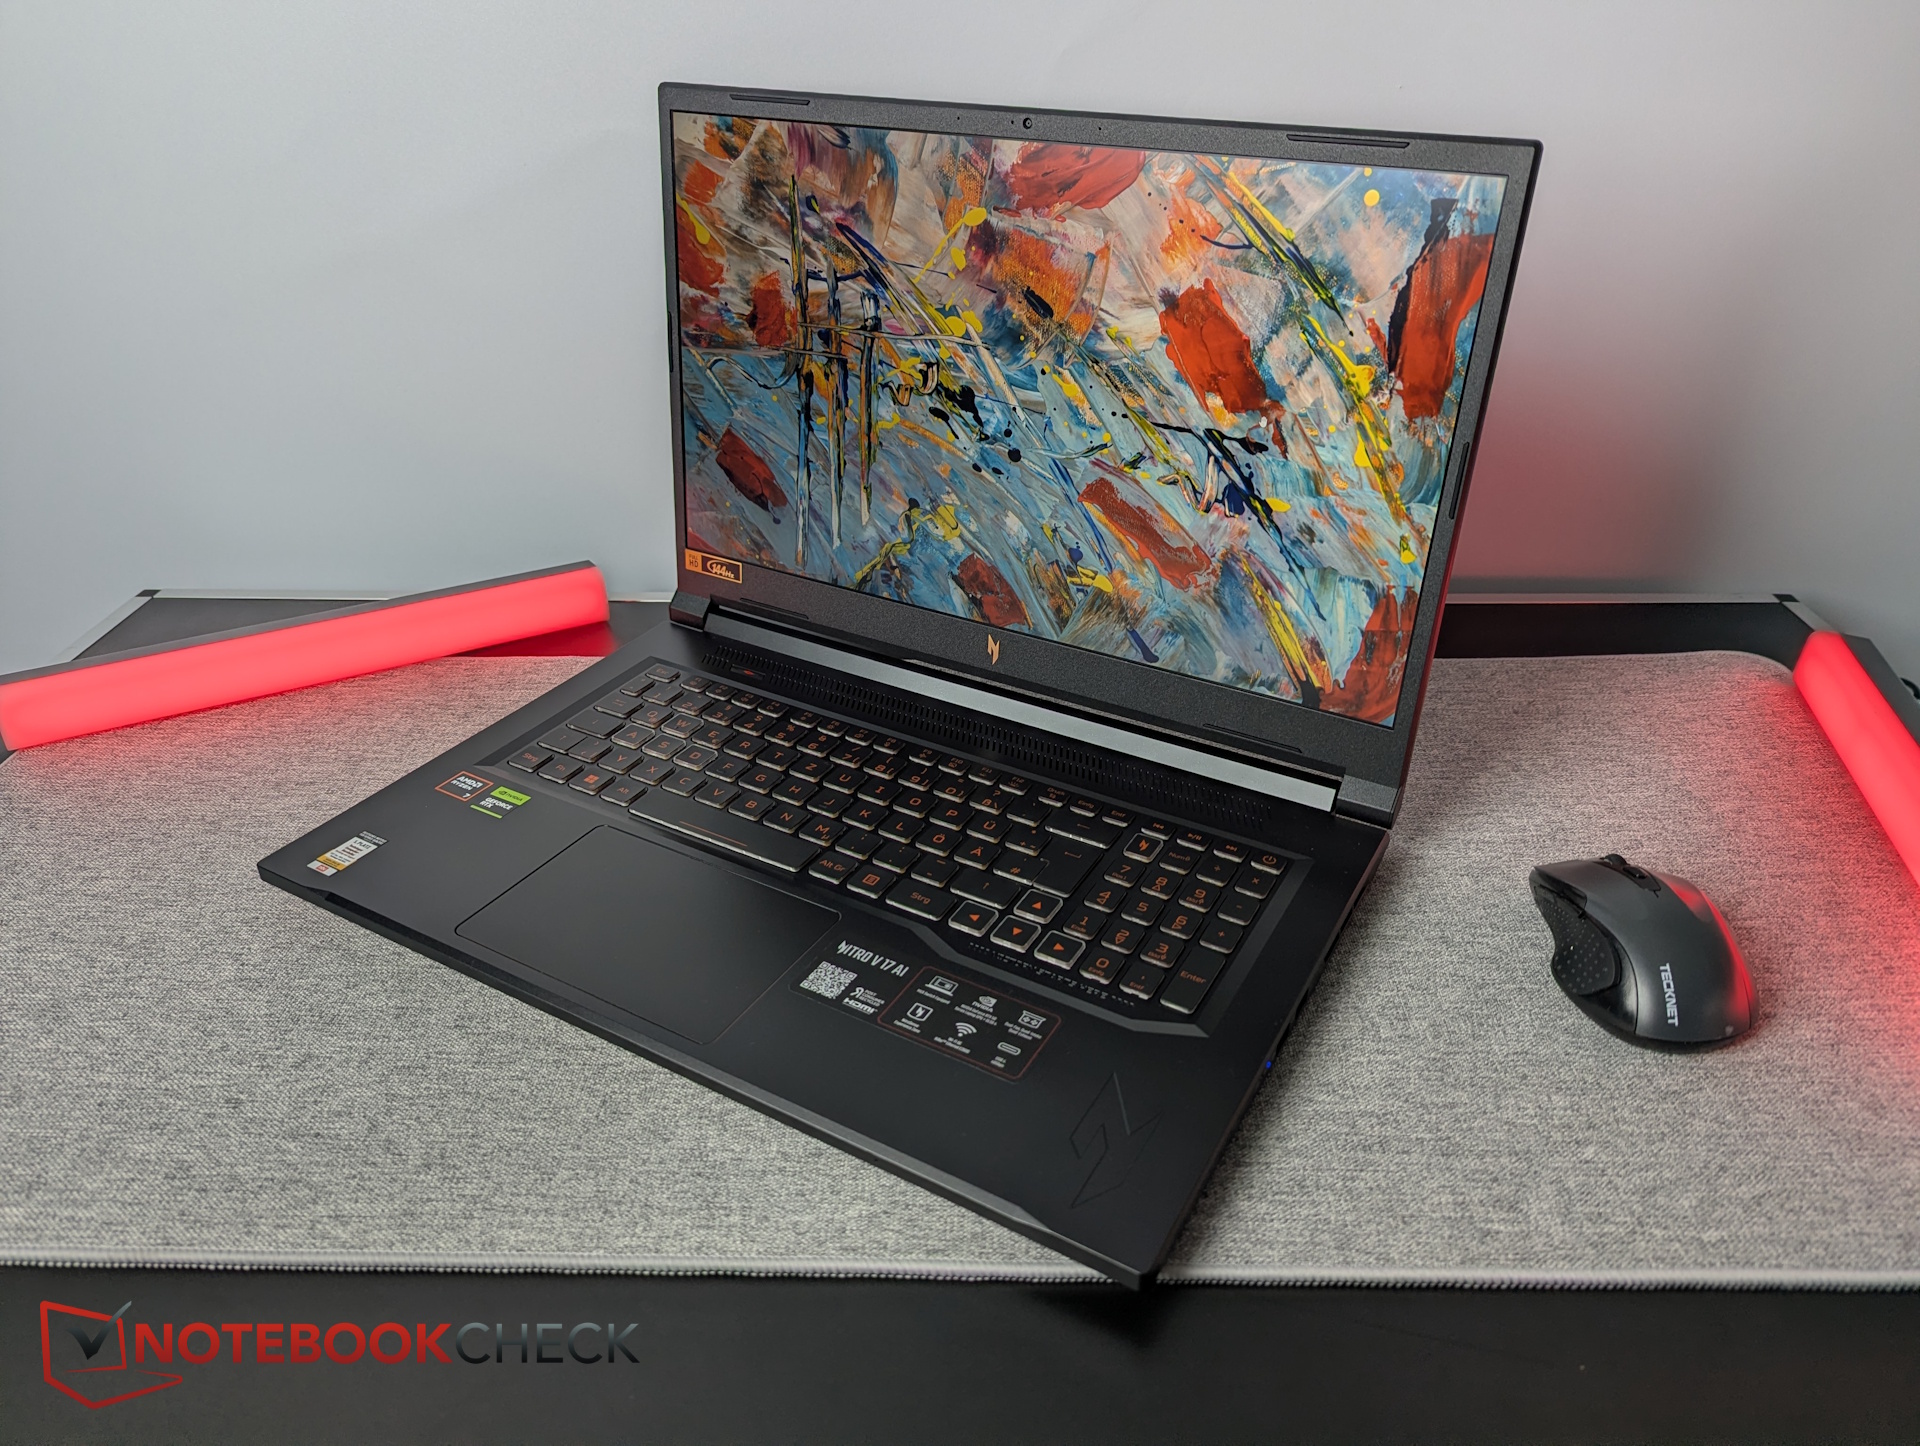
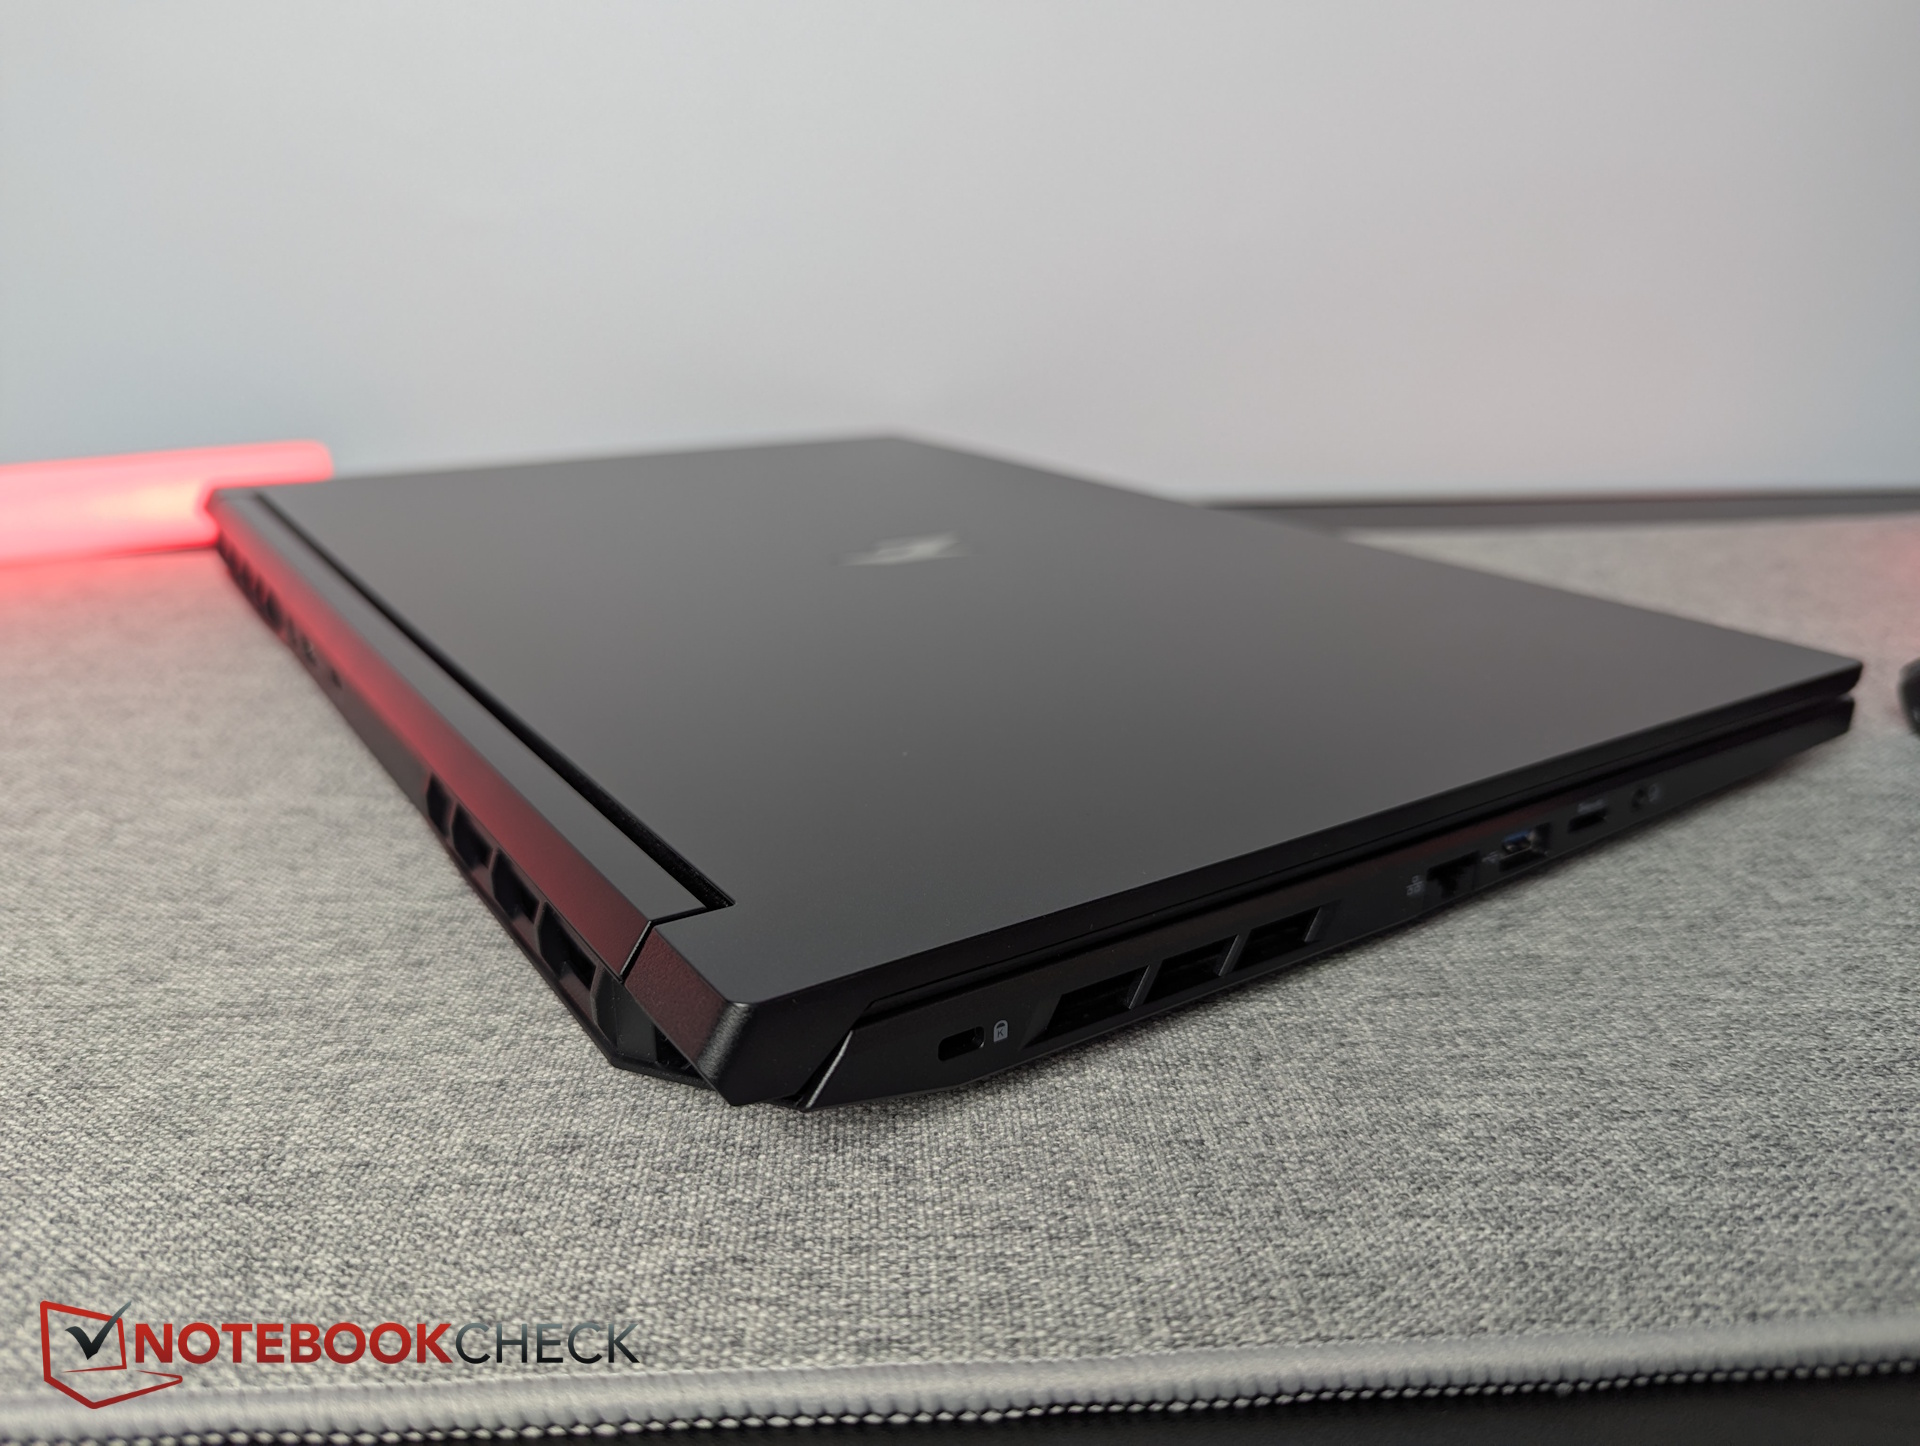
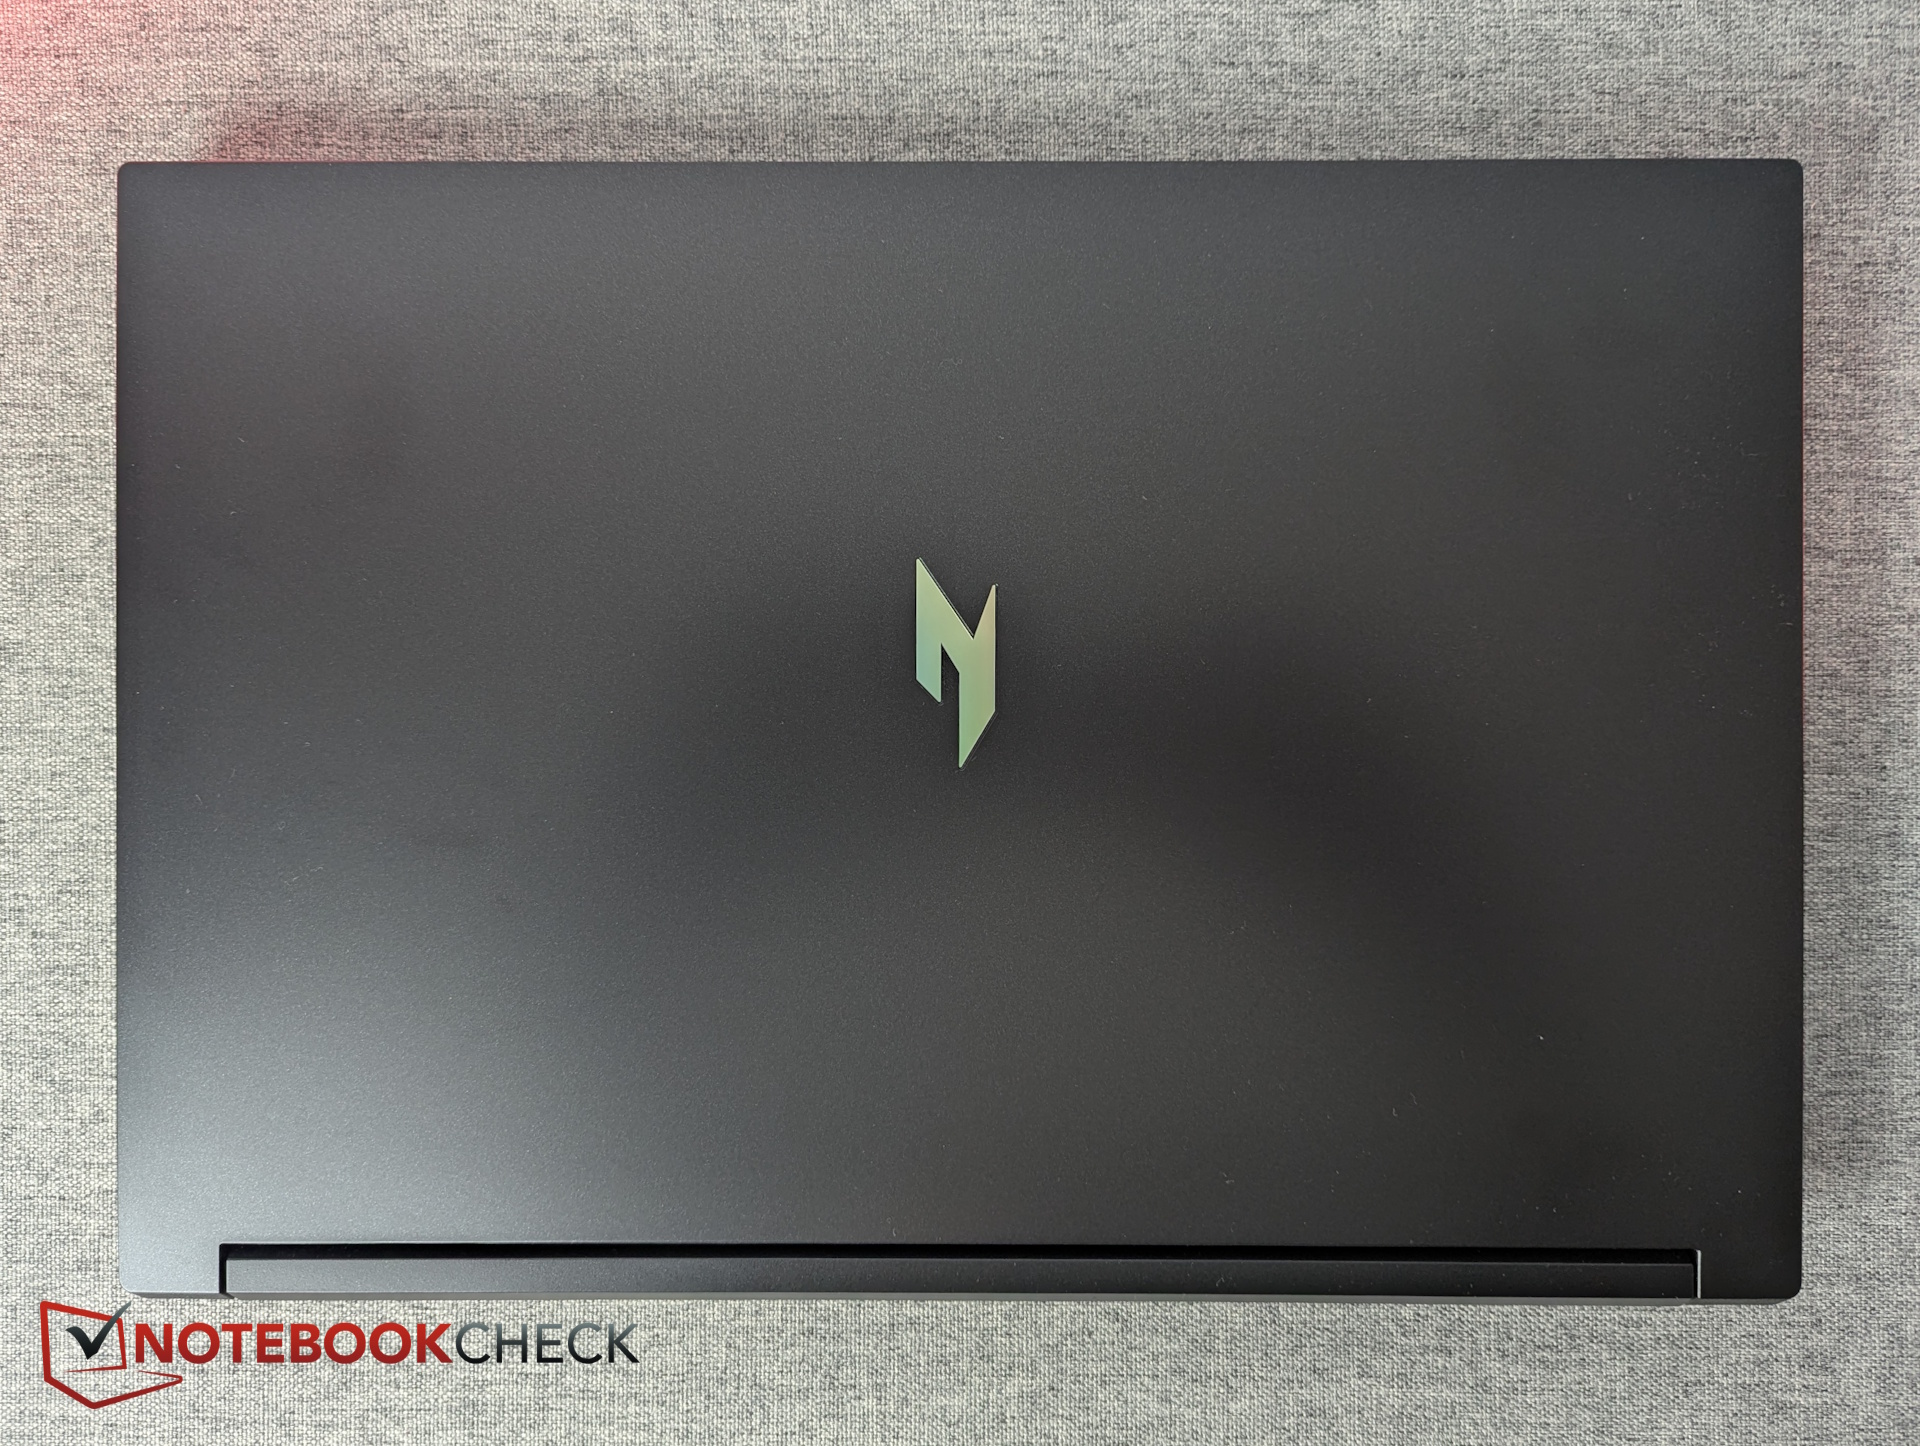
The smooth black plastic chassis is relatively thin for a 17-inch laptop and flexes slightly under pressure, but it does not produce any creaking noises. Panel gaps are even and unobtrusive.
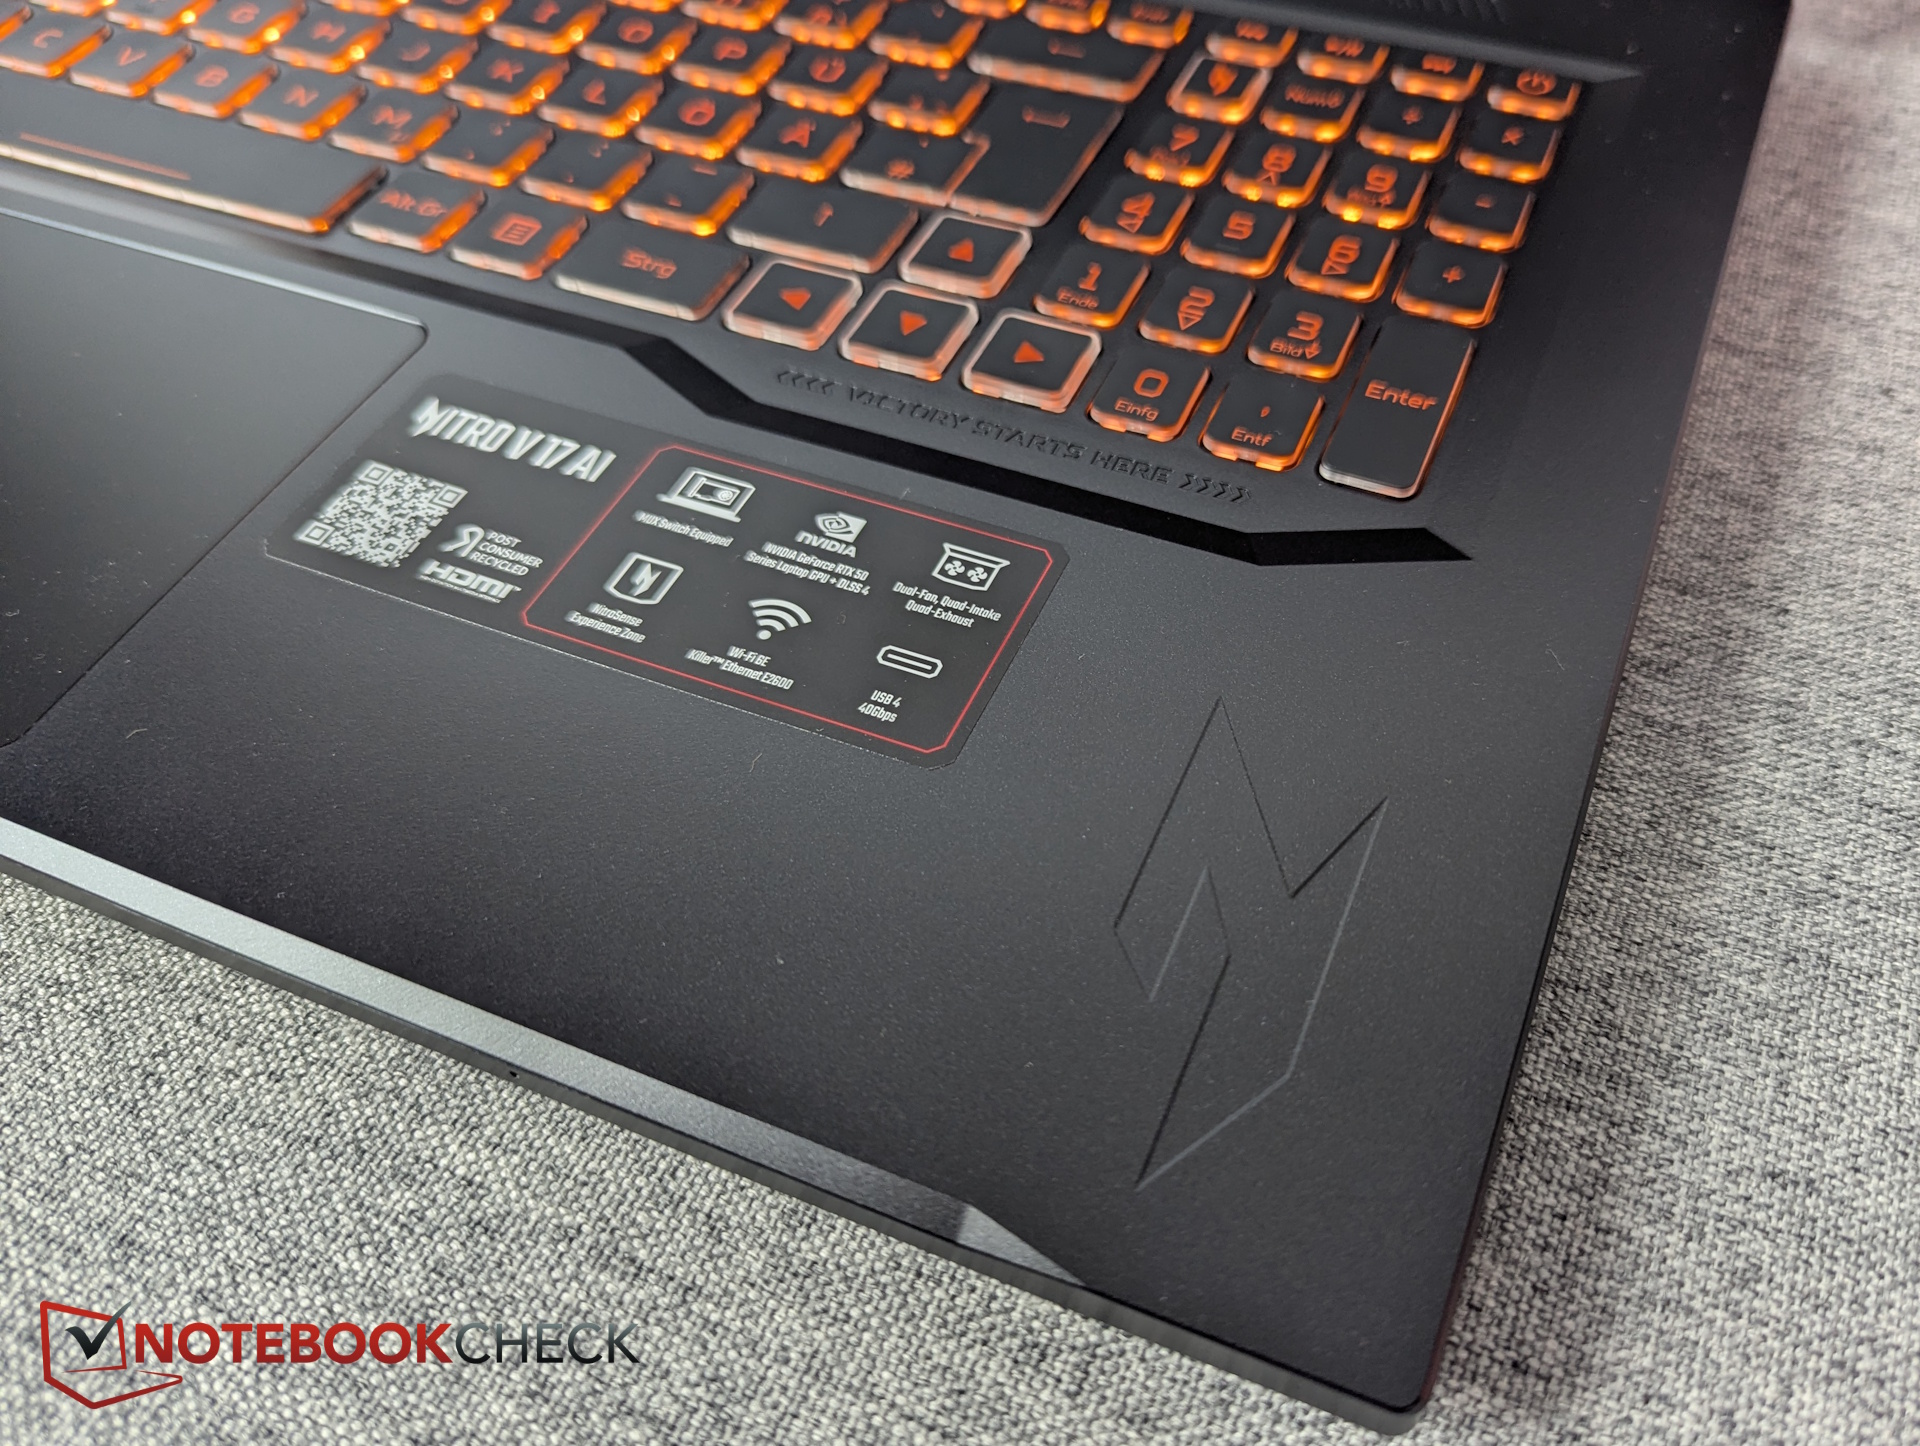
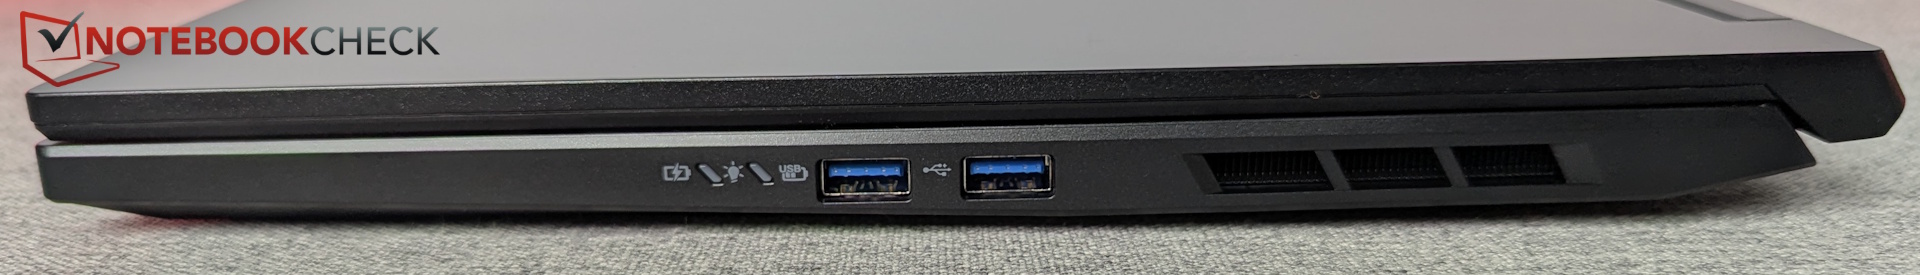
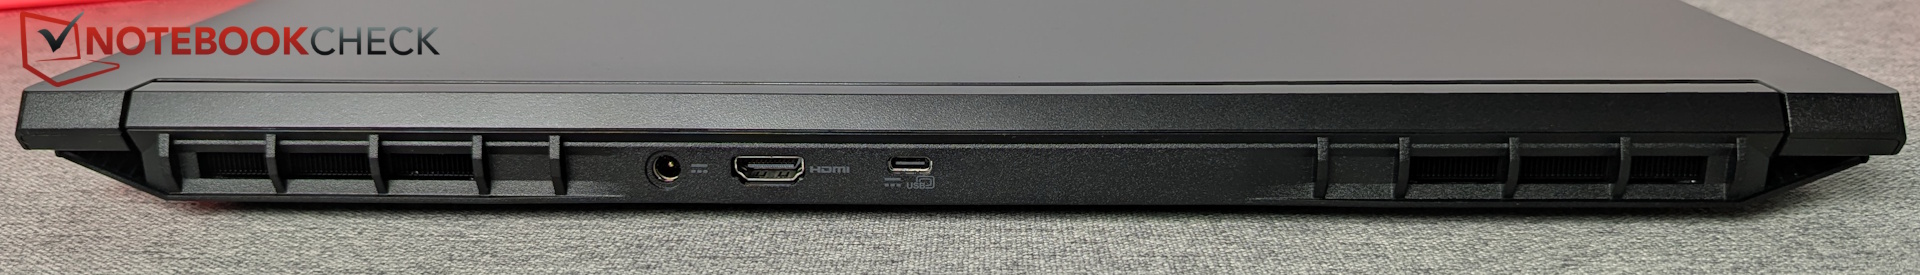
USB 4 and Wi-Fi 6E are the standout features, while the 720p webcam is a clear downside. Ports are distributed on all sides except the front; we would have preferred the USB-C port on the side.
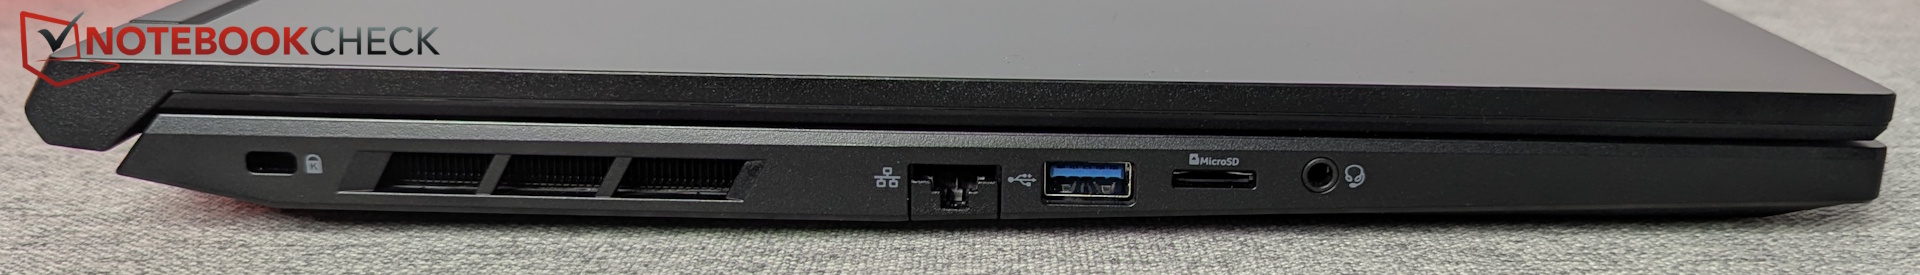
SD Card Reader
Im Gegensatz zu allen direkten Konkurrenten ist ein SD-Reader vorhanden, dieser liest aber nur MicroSD-Karten und ist sehr langsam.
| SD Card Reader | |
| average JPG Copy Test (av. of 3 runs) | |
| Schenker XMG Core 16 VE M25 (AV PRO microSD 128 GB V60) | |
| Aorus Elite 16 AE6H (AV PRO microSD 128 GB V60) | |
| Average of class Gaming (20.9 - 210, n=54, last 2 years) | |
| Lenovo Legion 7 16IAX10 (Toshiba Exceria Pro SDXC 64 GB UHS-II) | |
| Schenker XMG APEX 16 MAX (Angelbird AV Pro V60) | |
| Acer Nitro V14 AI ANV14-62-R9LT (AV PRO microSD 128 GB V60) | |
| Acer Nitro v 17 (ANV17-41-R4CJ) | |
| maximum AS SSD Seq Read Test (1GB) | |
| Lenovo Legion 7 16IAX10 (Toshiba Exceria Pro SDXC 64 GB UHS-II) | |
| Aorus Elite 16 AE6H (AV PRO microSD 128 GB V60) | |
| Average of class Gaming (25.5 - 261, n=51, last 2 years) | |
| Schenker XMG APEX 16 MAX (Angelbird AV Pro V60) | |
| Acer Nitro V14 AI ANV14-62-R9LT (AV PRO microSD 128 GB V60) | |
| Acer Nitro v 17 (ANV17-41-R4CJ) | |
 GeForce RTX 5070 Laptop, R7 260, Western Digital PC SN5000S SDEQNSJ-1T00")
 GeForce RTX 5070 Laptop, R7 260, Western Digital PC SN5000S SDEQNSJ-1T00")
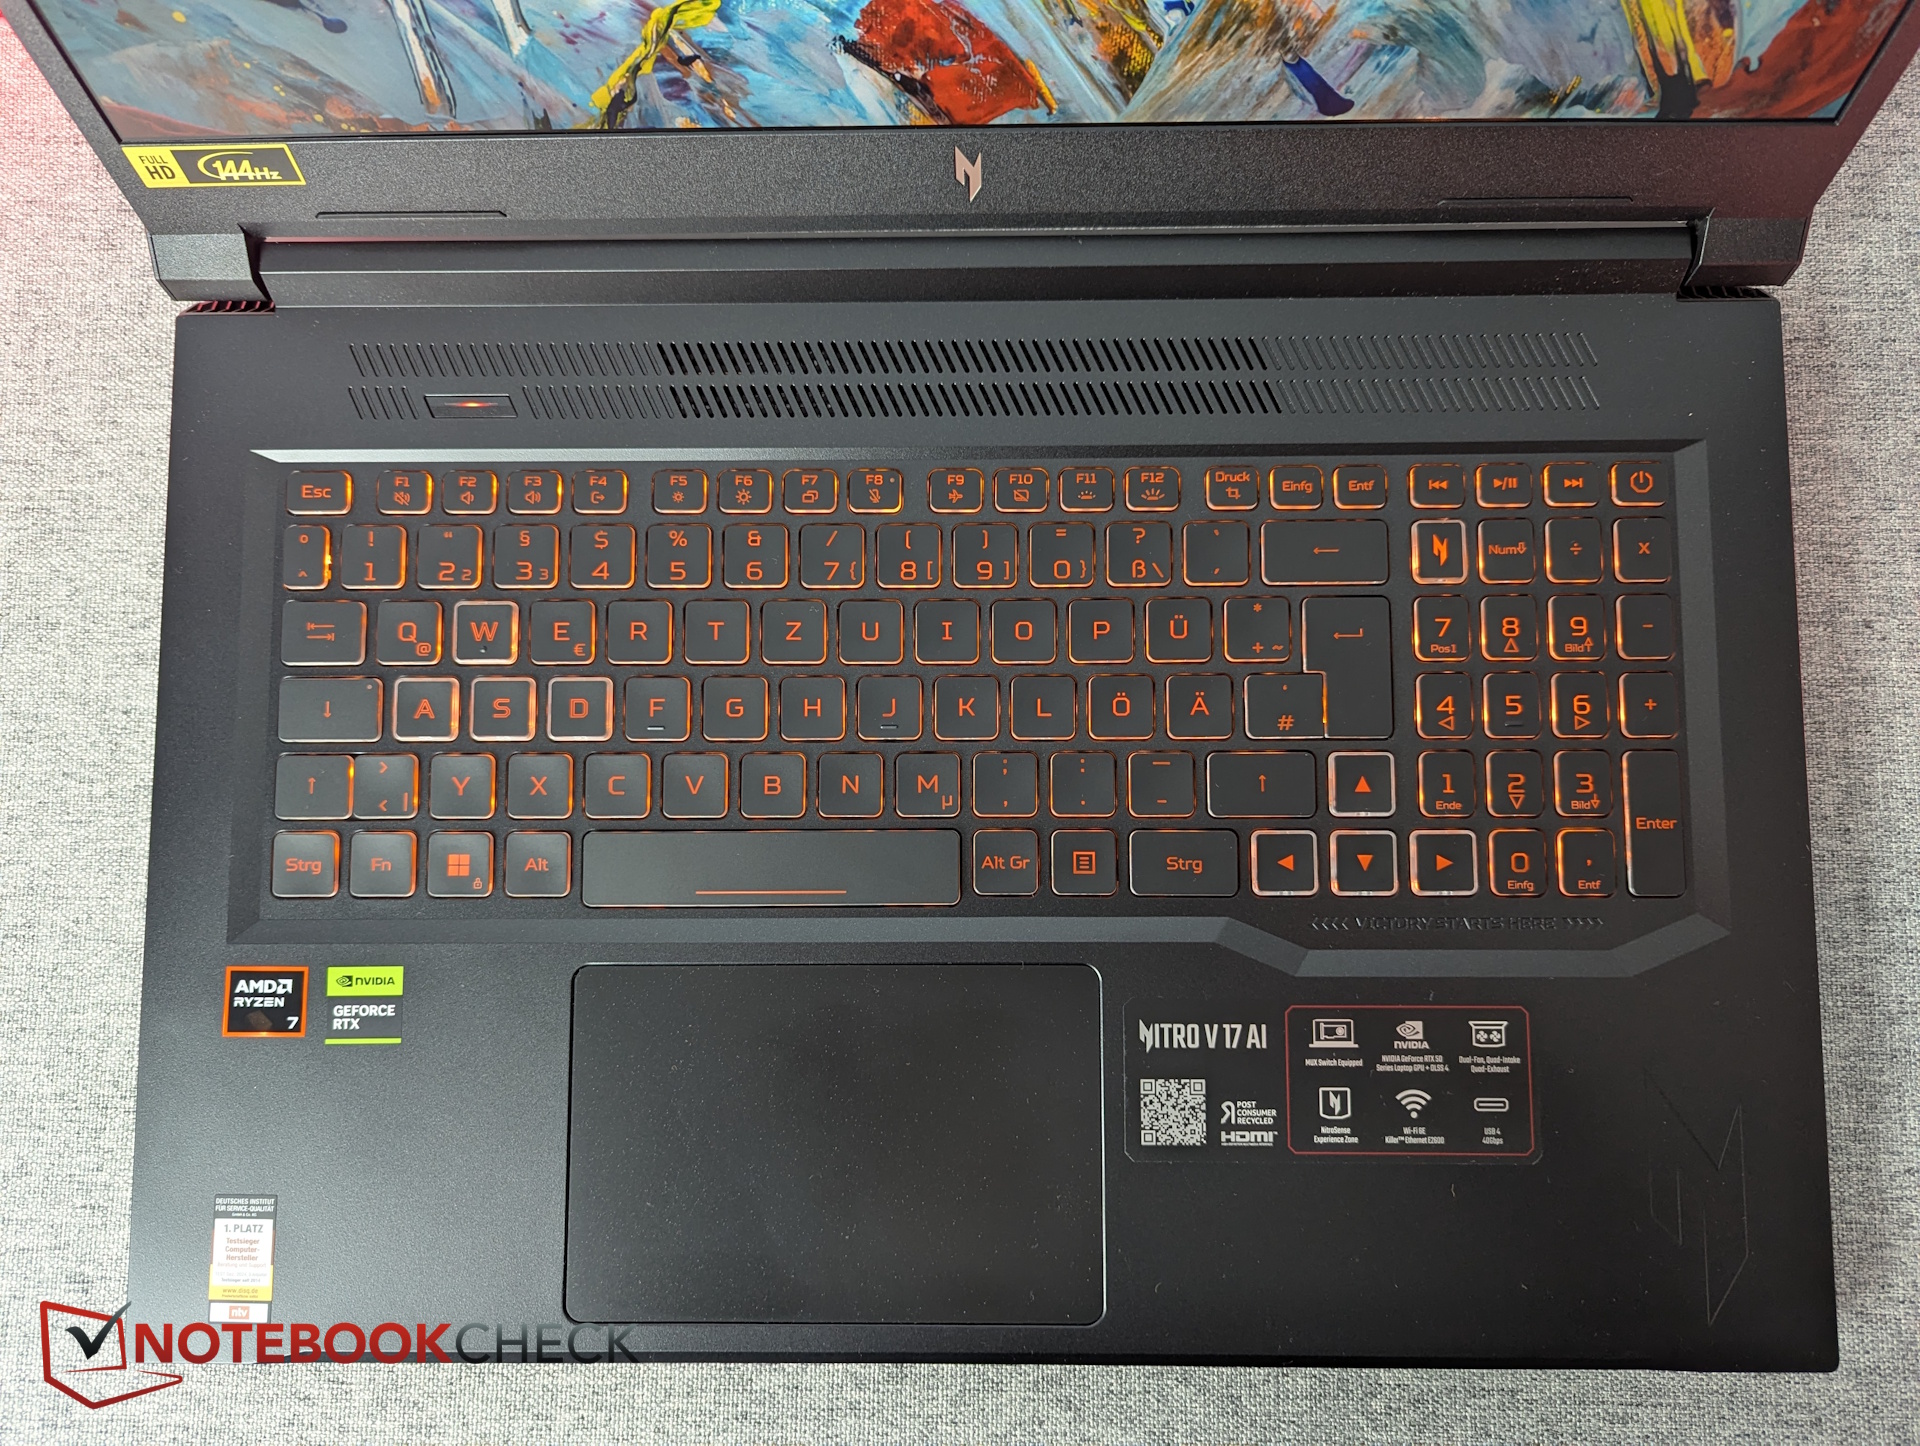
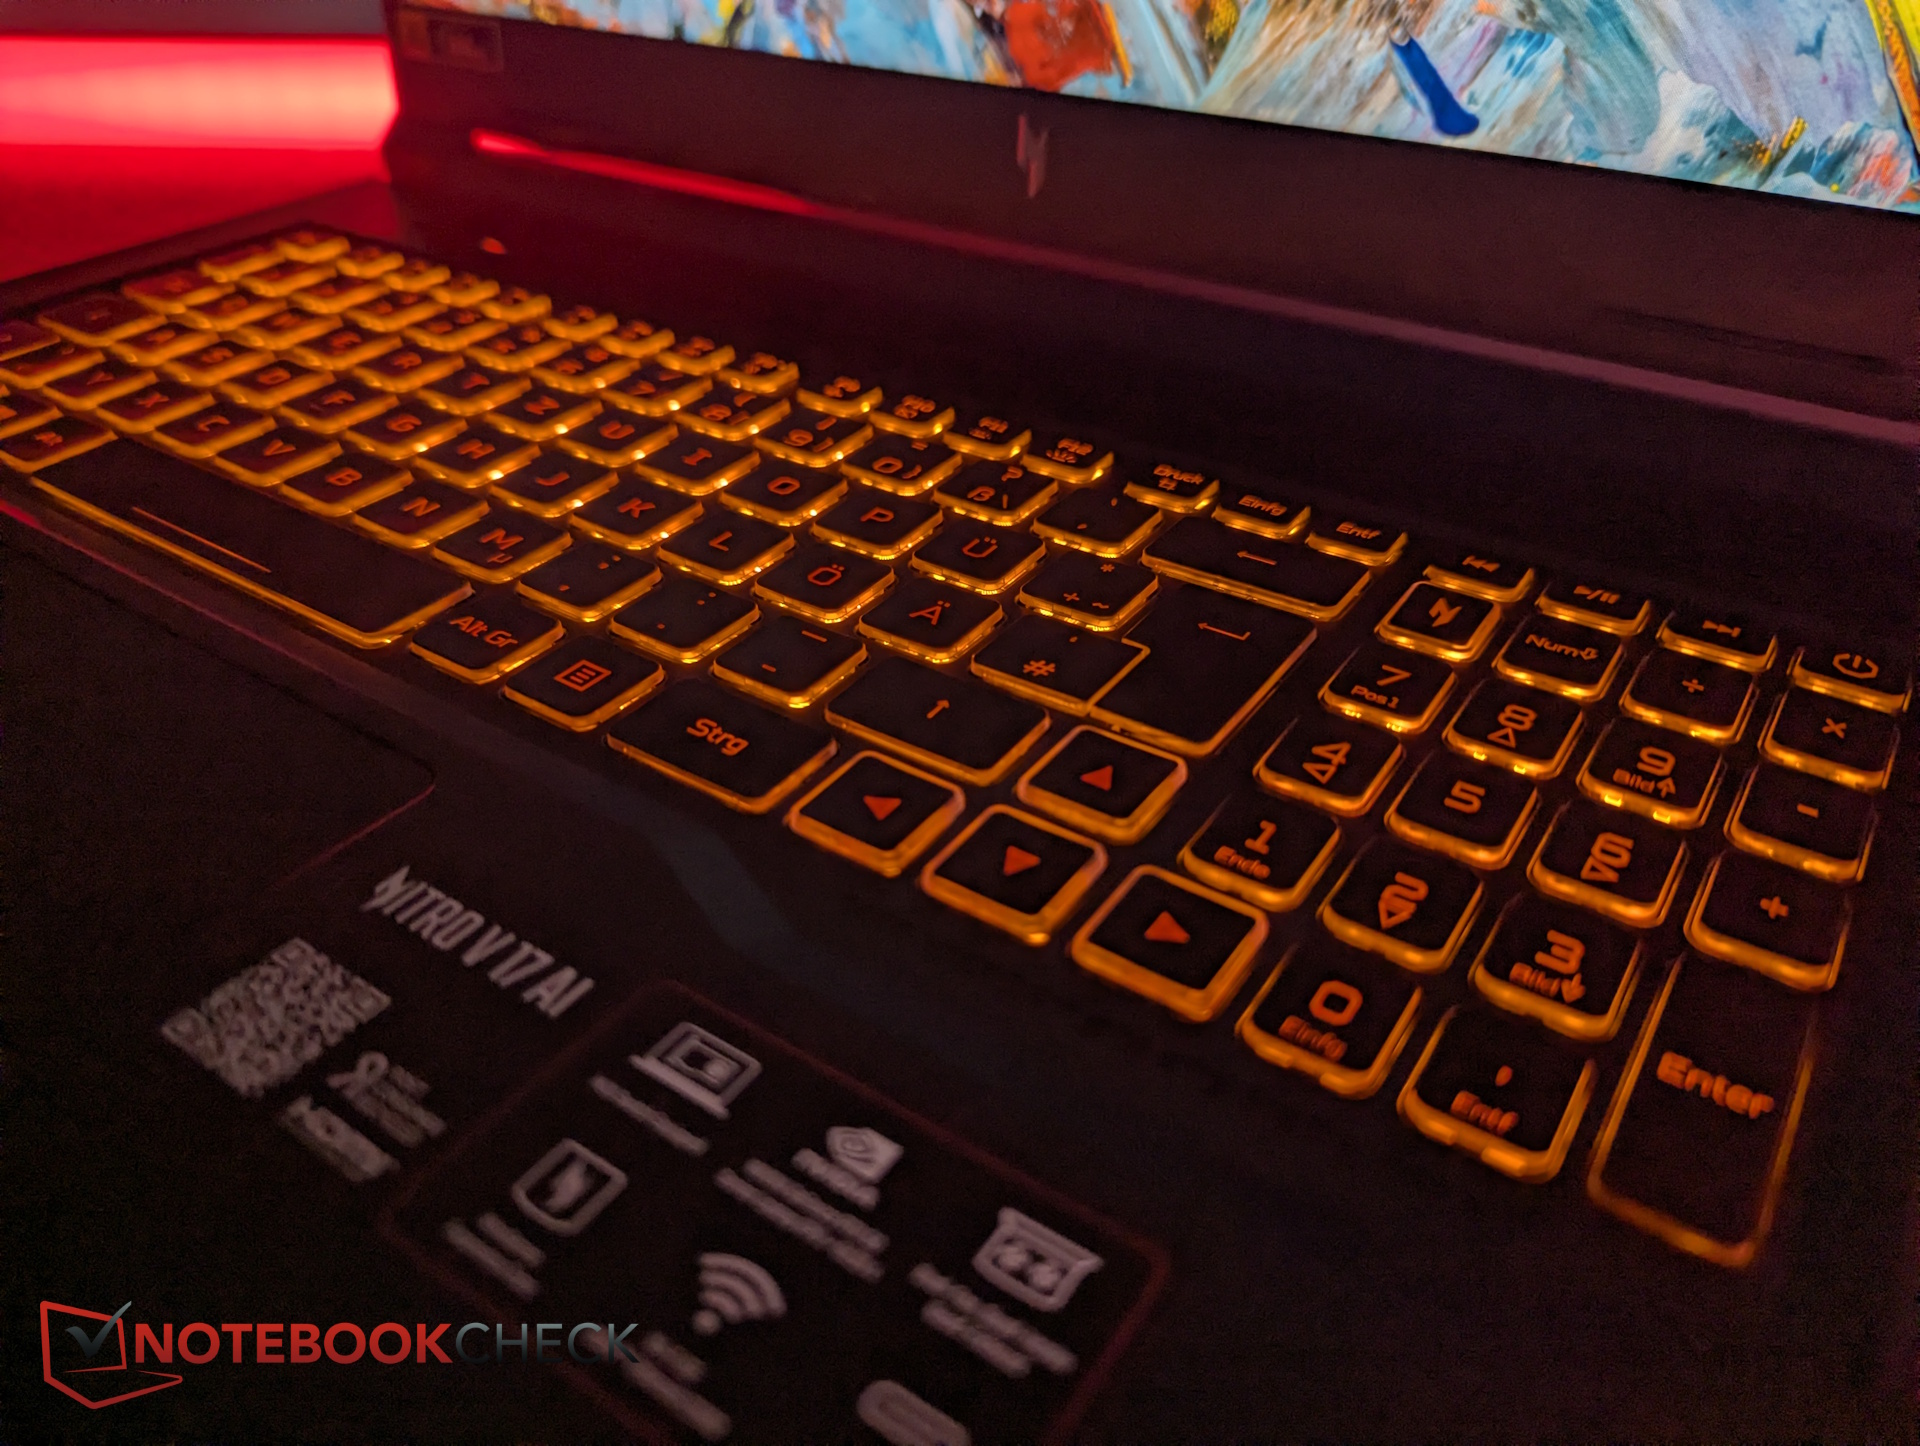
Input devices – What is typing like on the Nitro V 17?
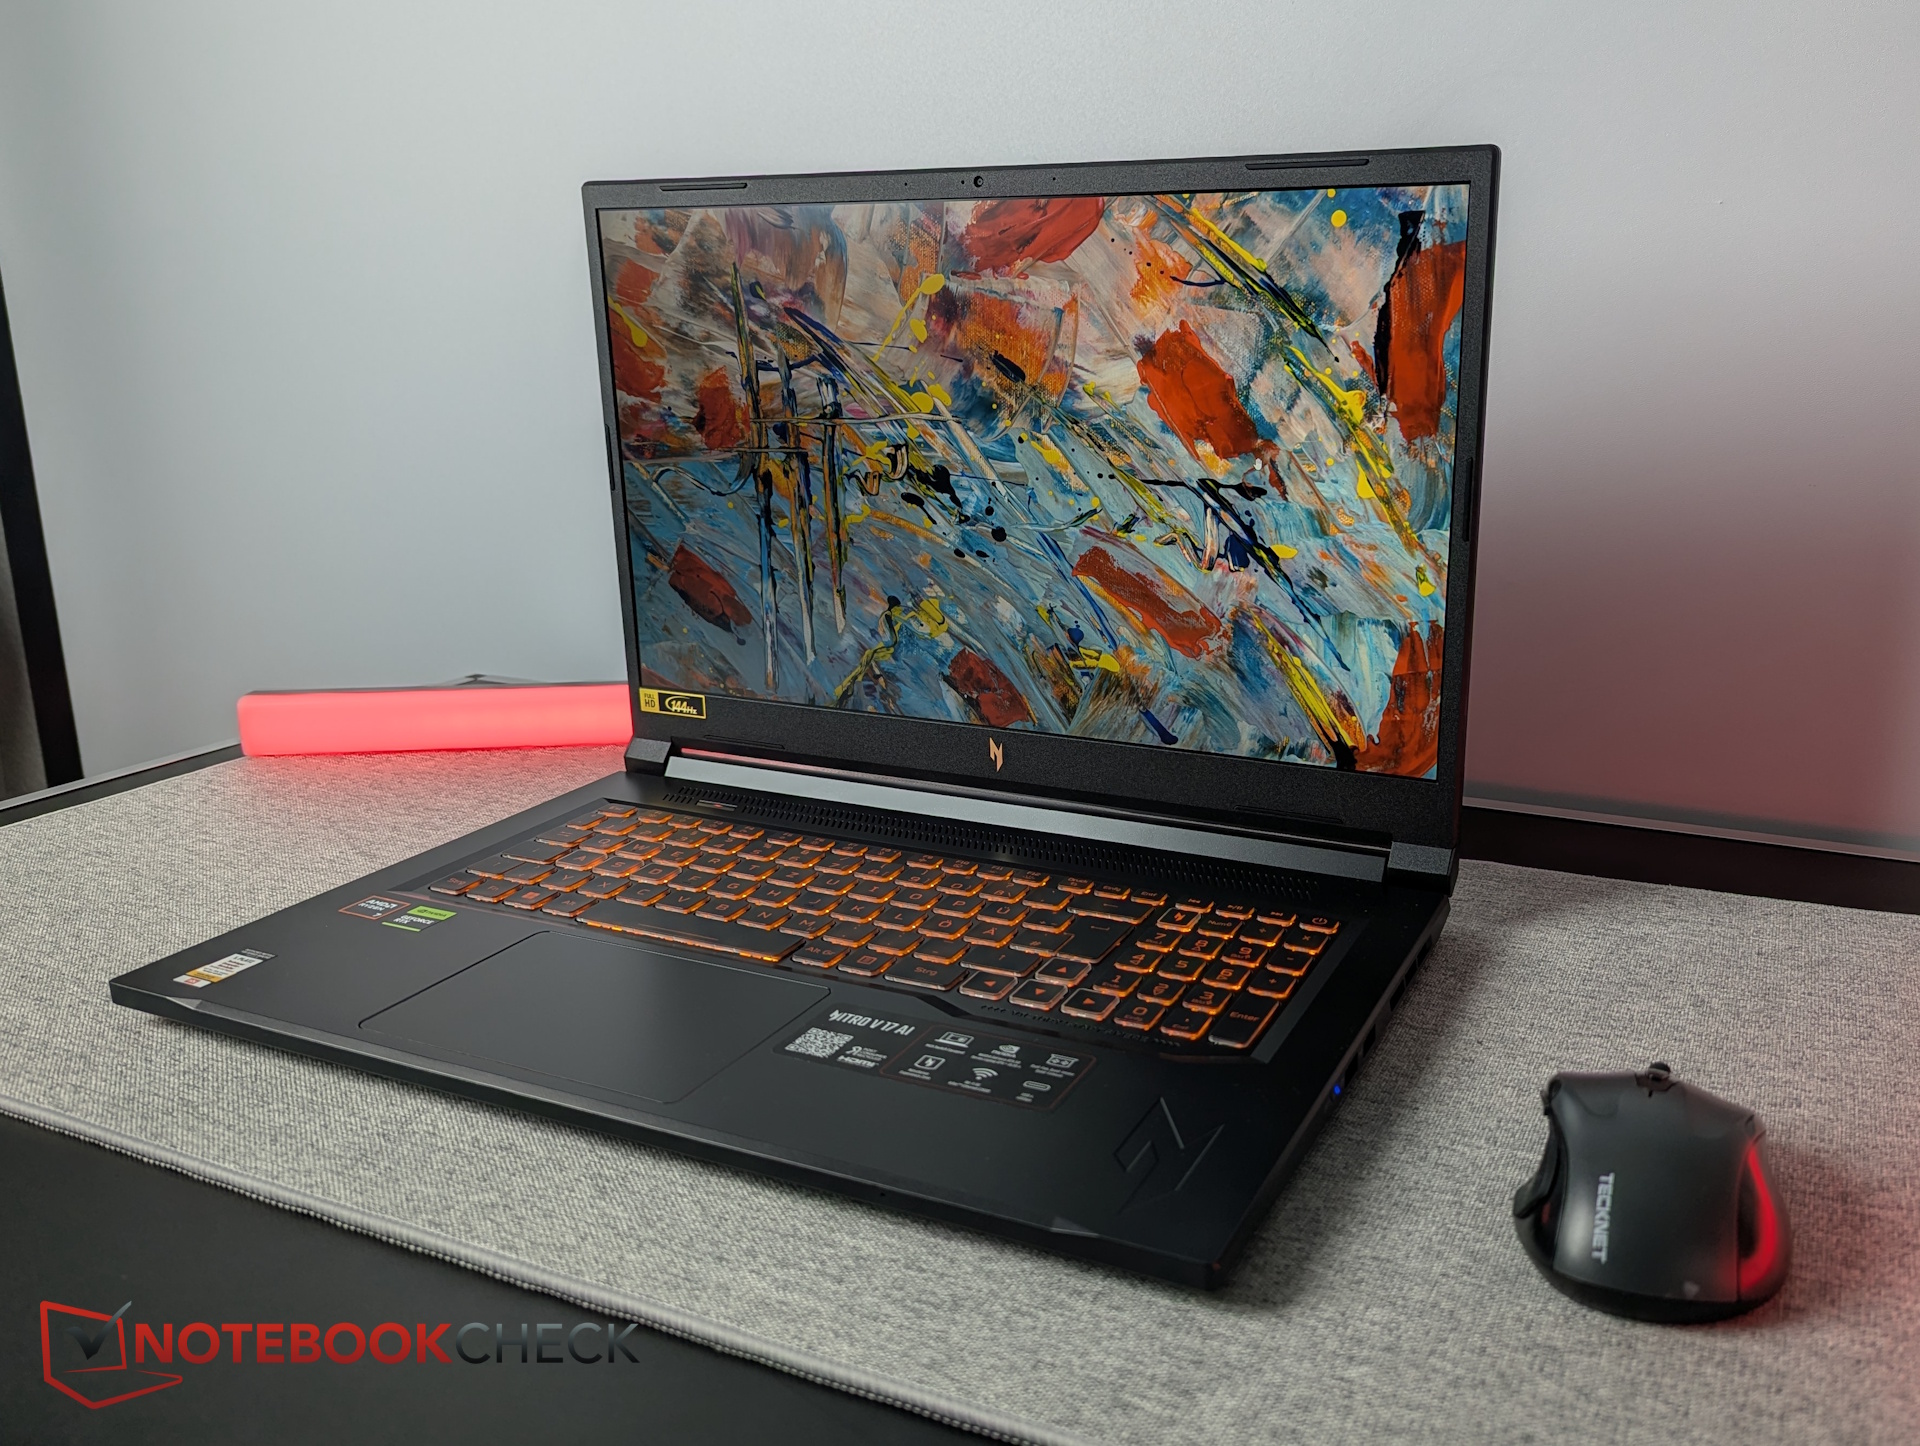
Despite the 17-inch chassis, the numeric keypad keys are noticeably small. Key labels are printed in orange, resulting in weak contrast. There is a dedicated NitroSense key, and the RGB keyboard backlight is limited to a single zone.
Key travel is short but feedback is clearly defined, allowing for fast and surprisingly quiet typing.
The touchpad measures 12.6 × 8.3 cm and offers smooth gliding characteristics. Physical clicks have a firm pressure point and do not rattle.
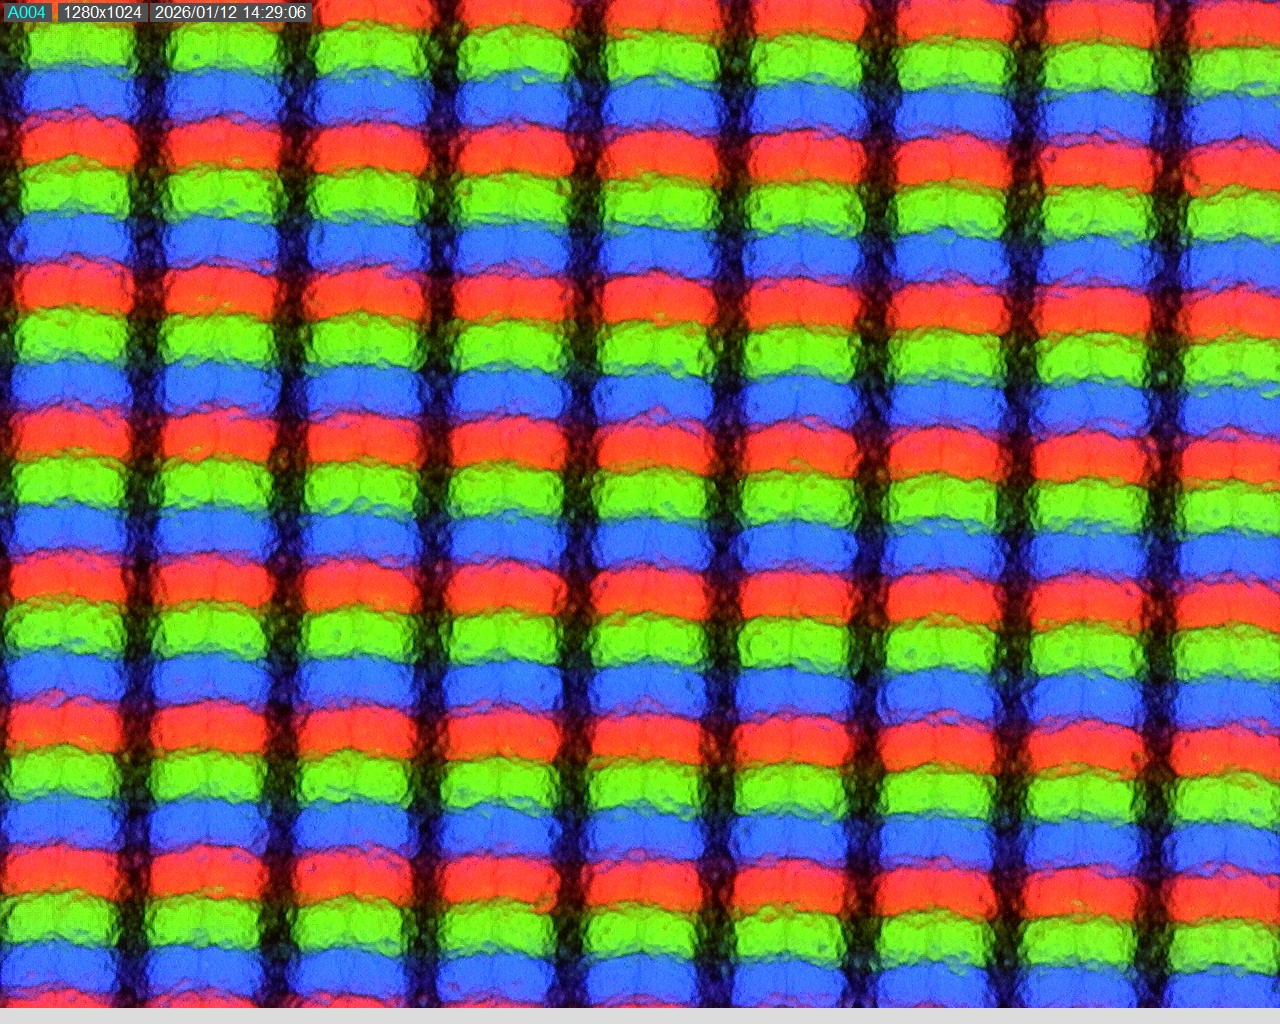
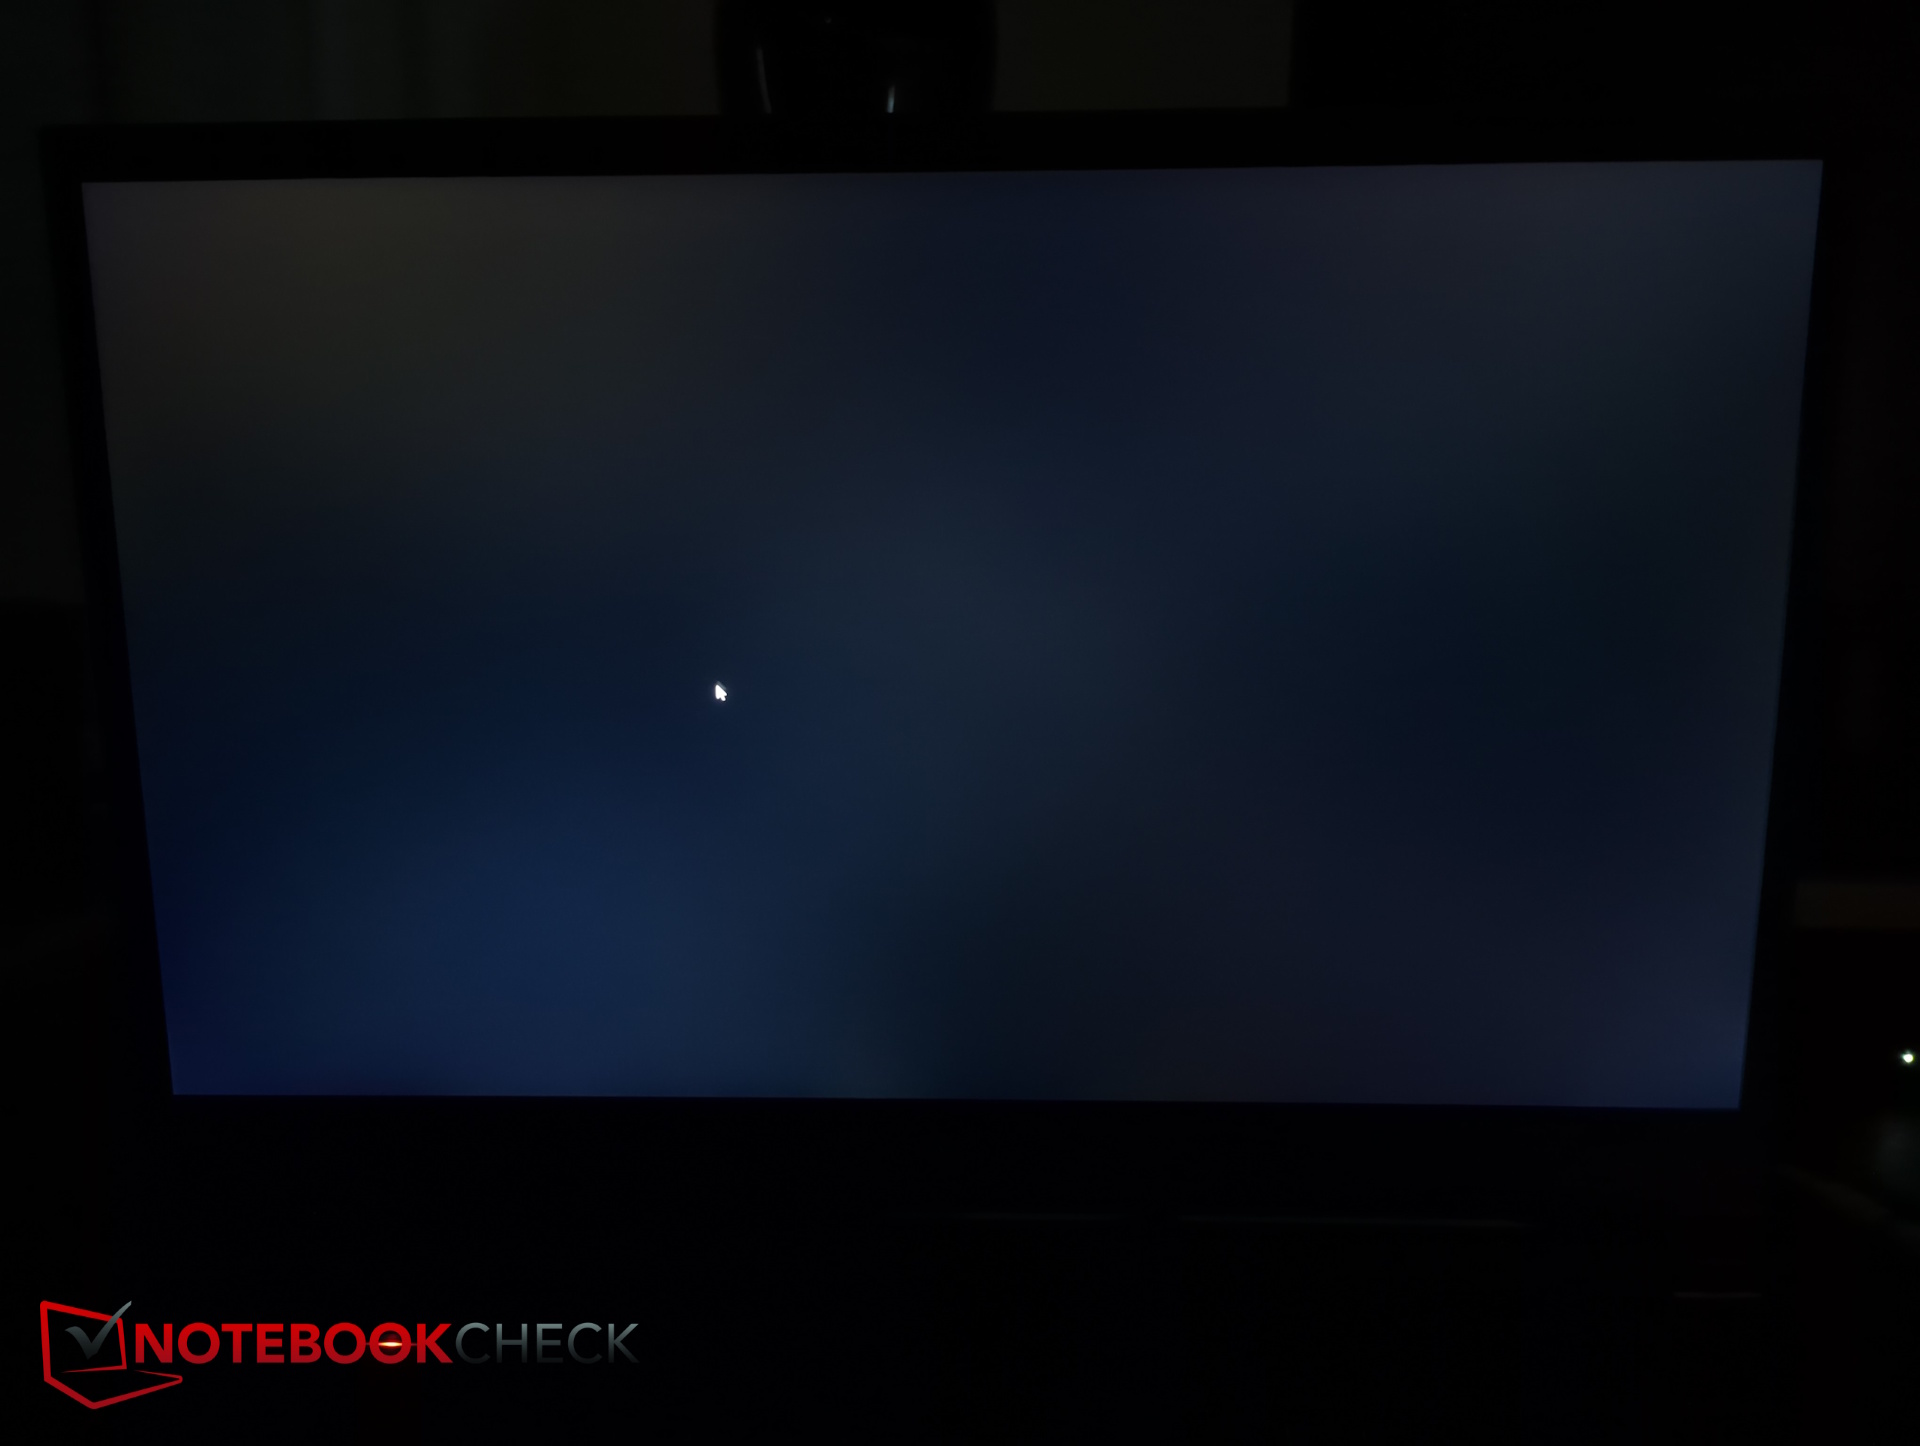
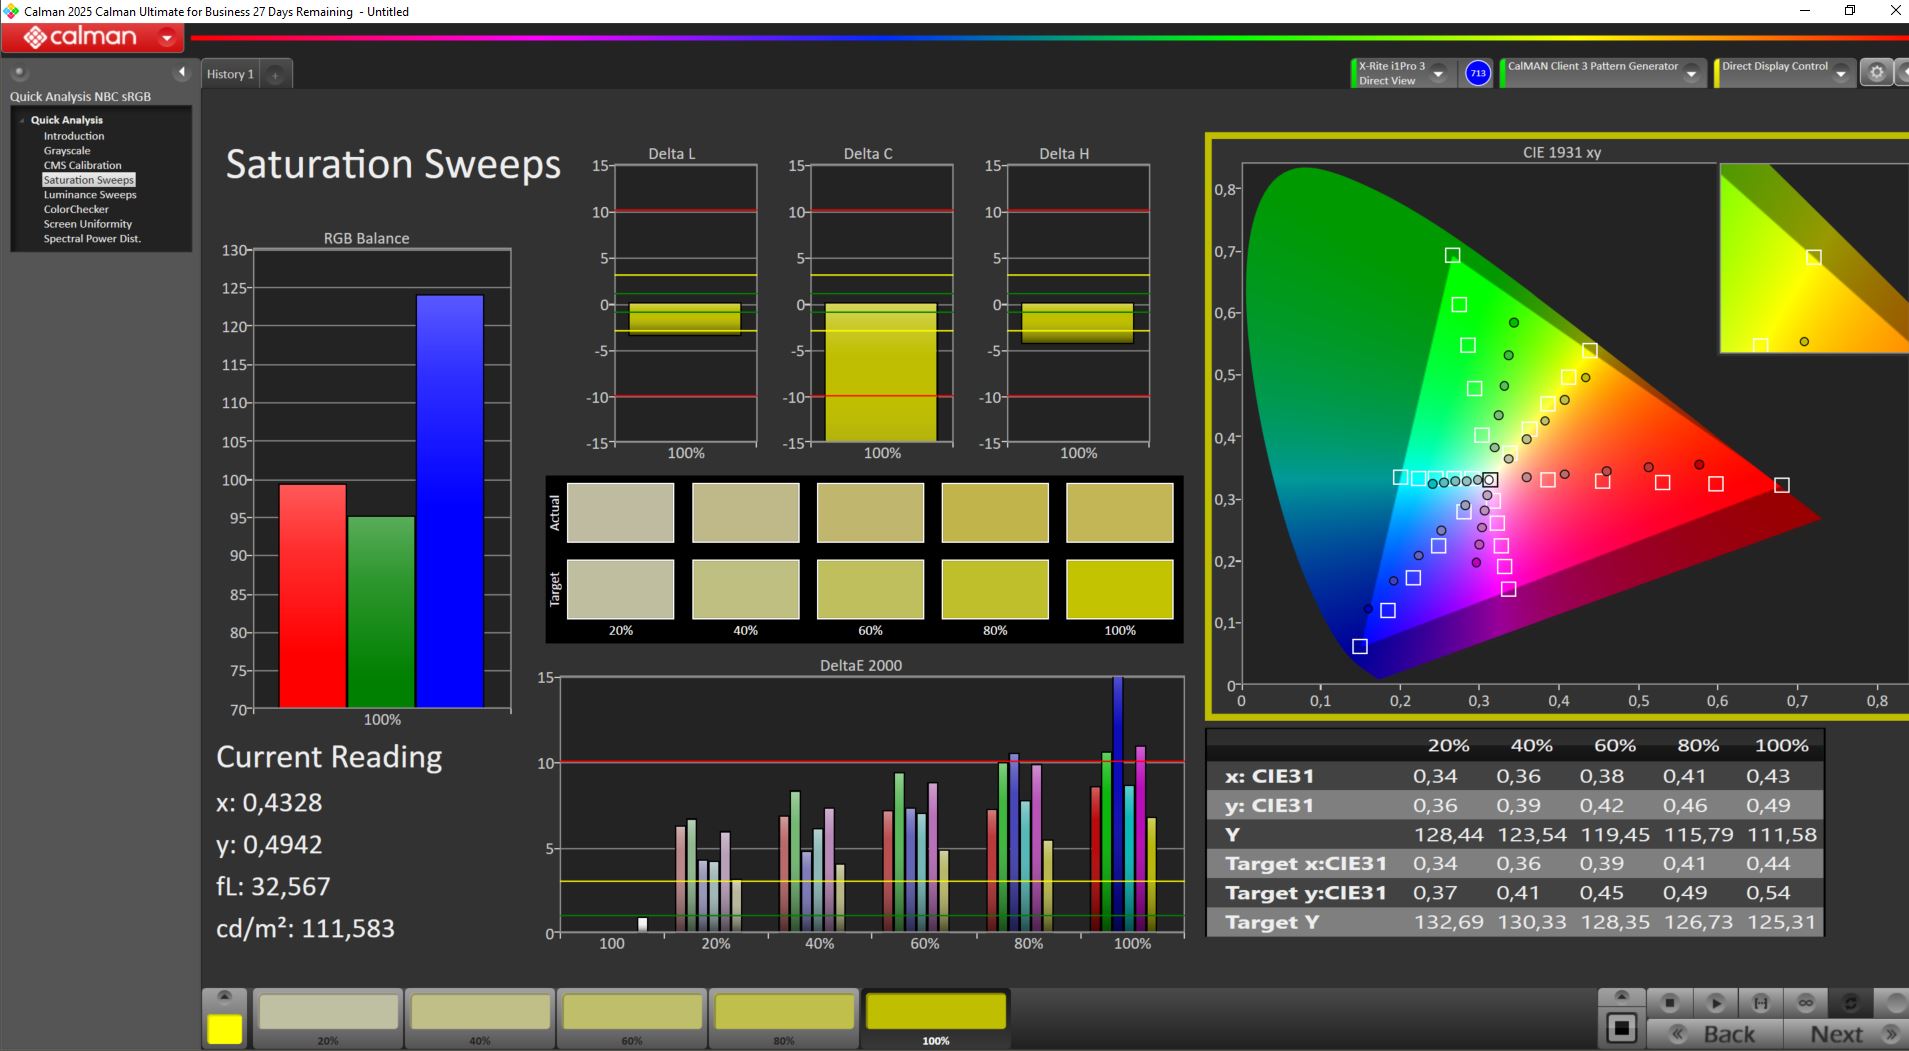
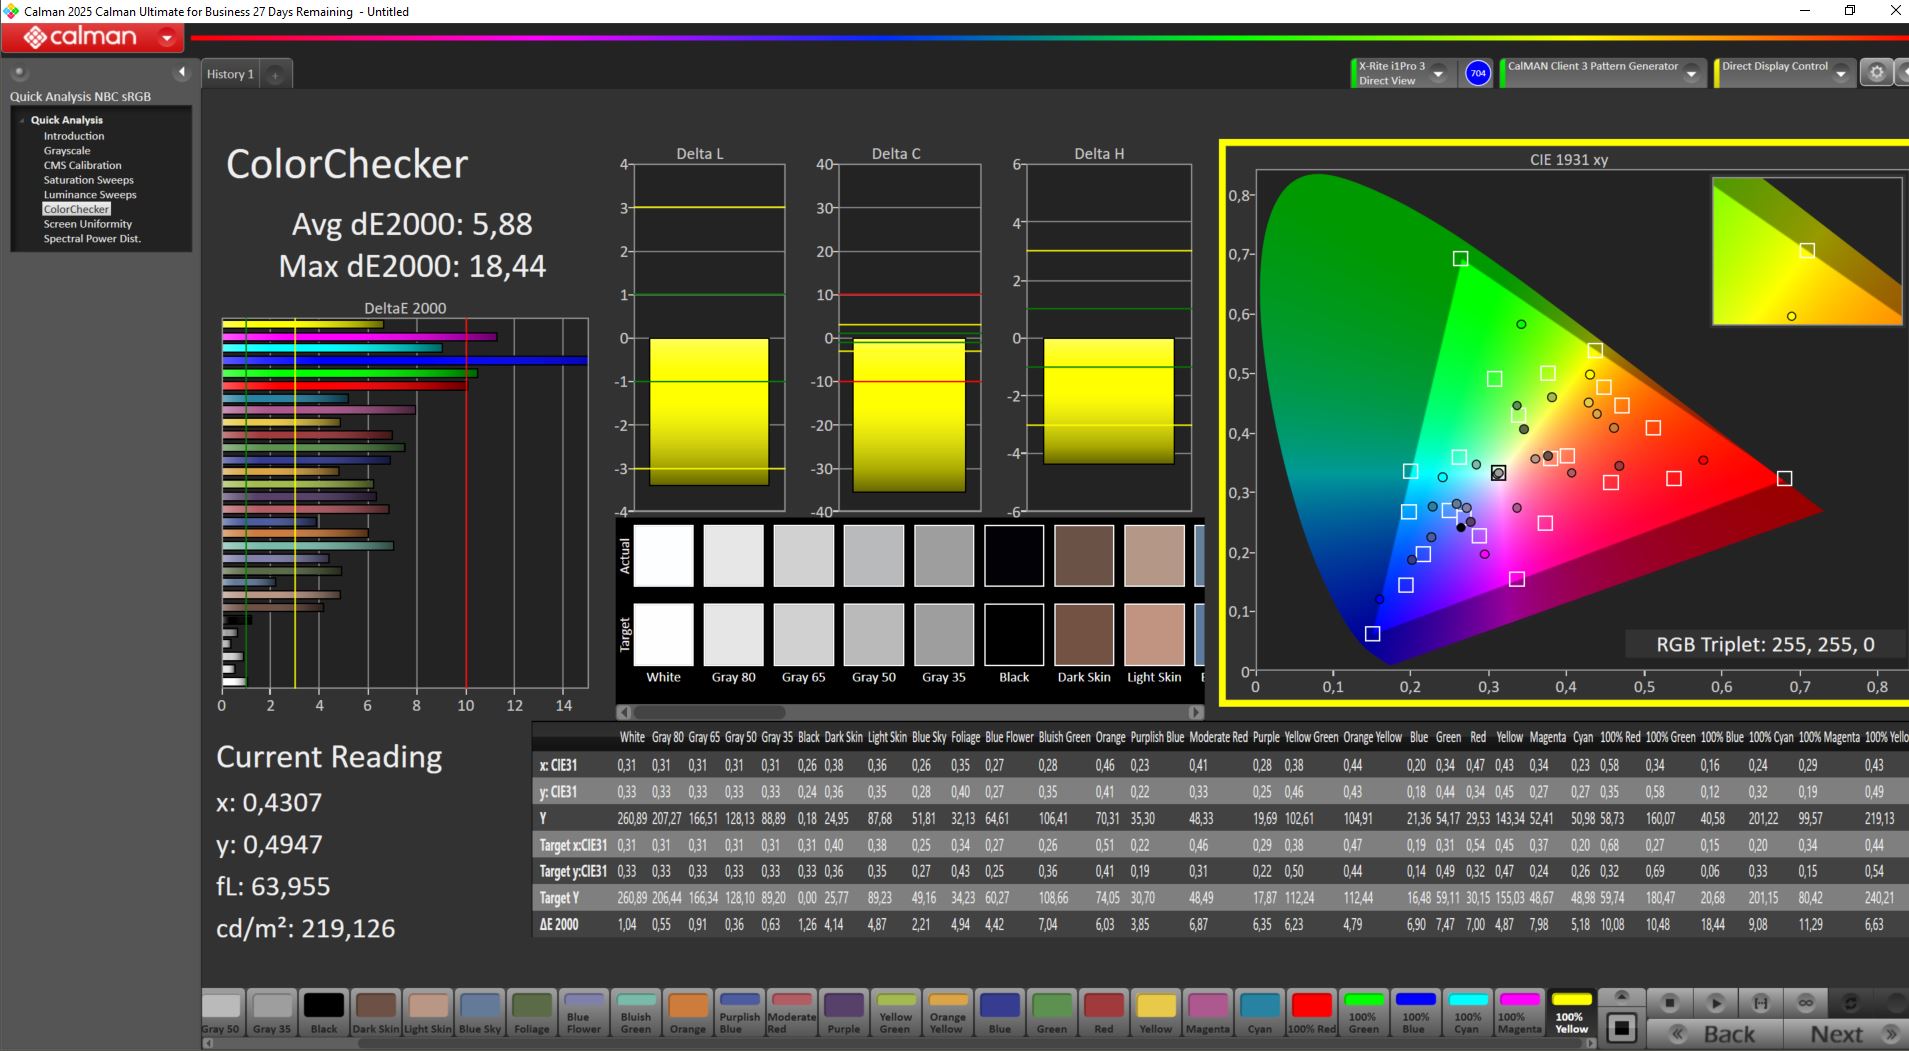
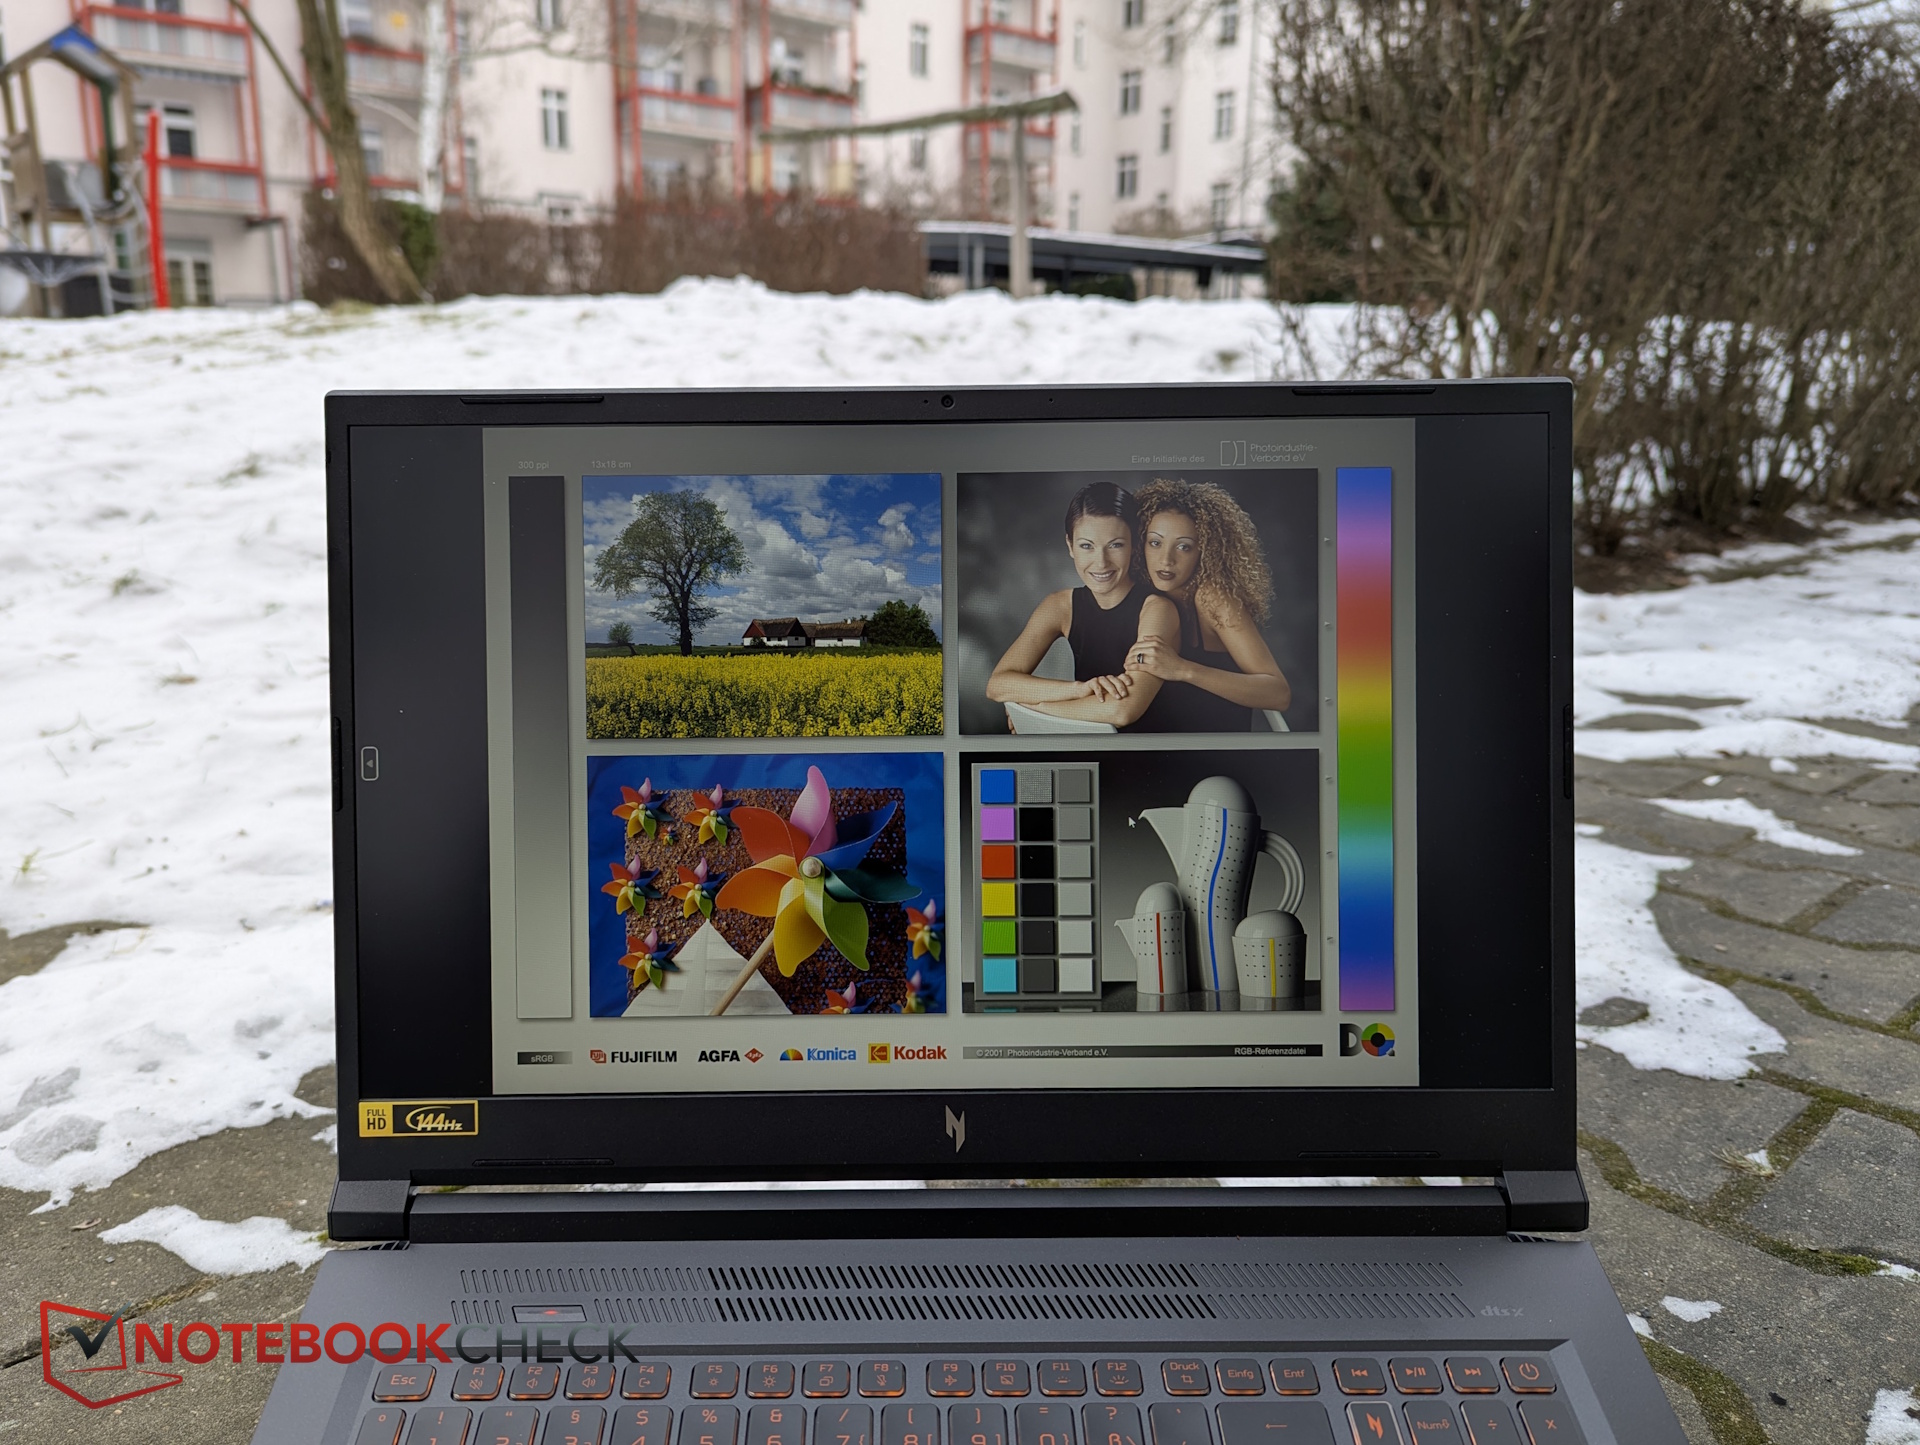
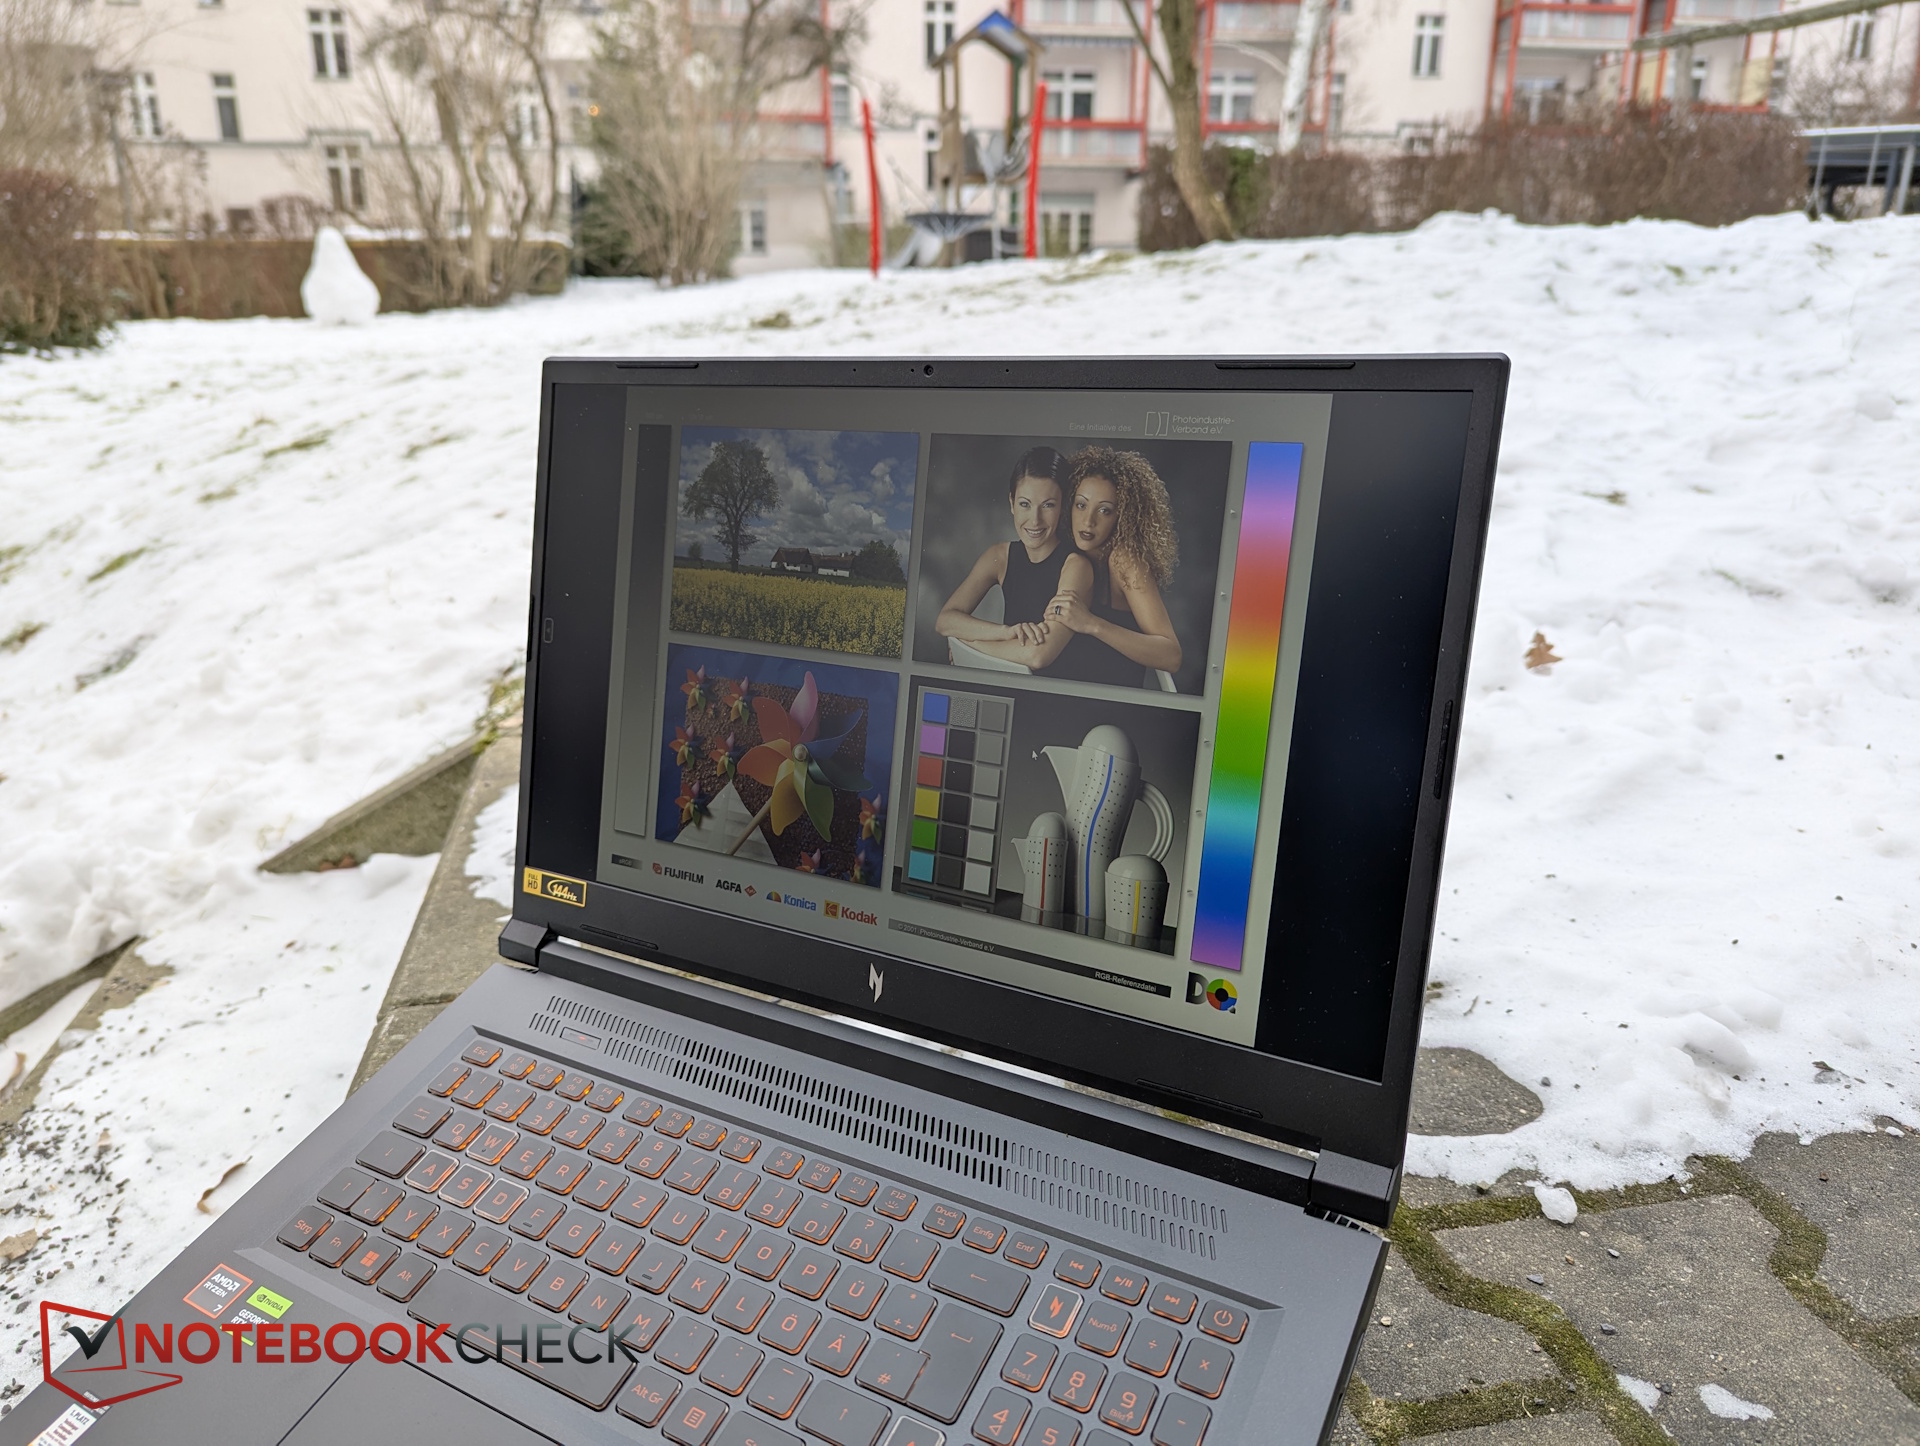
Display – How good is the 17-inch panel?
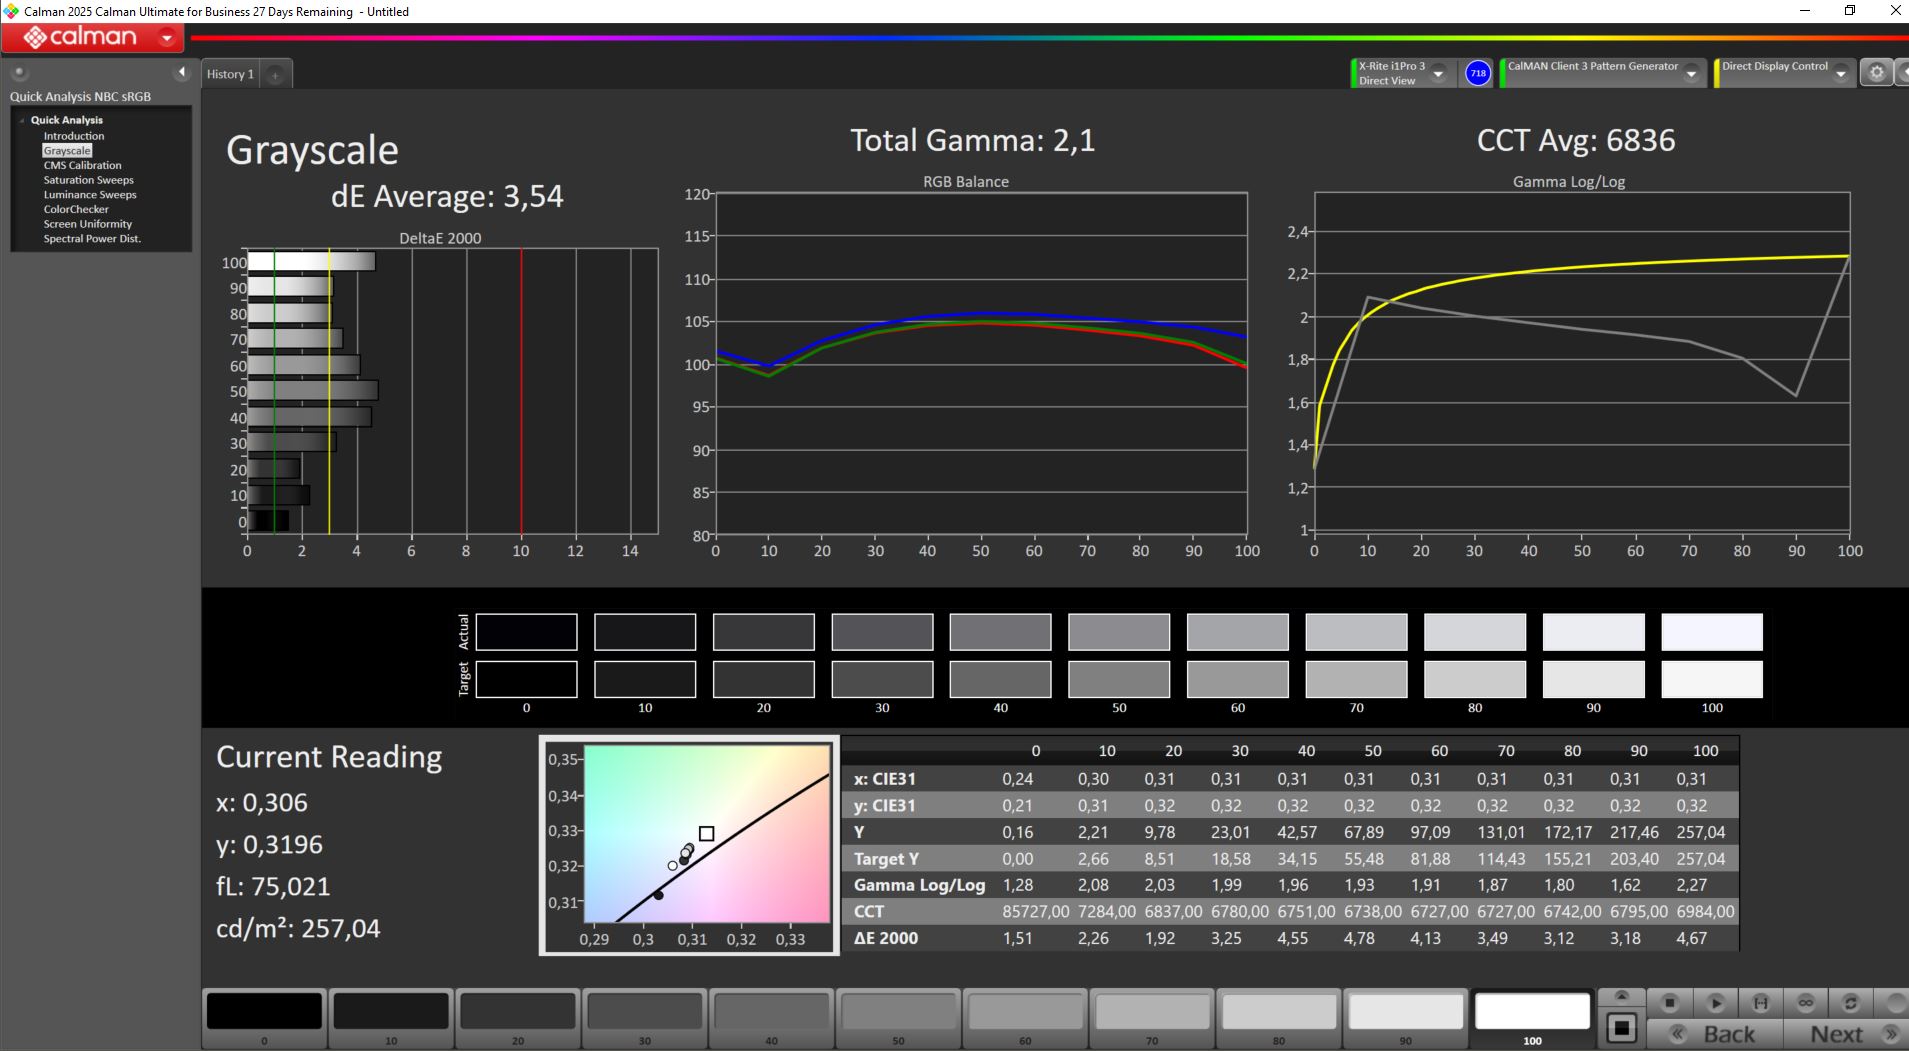
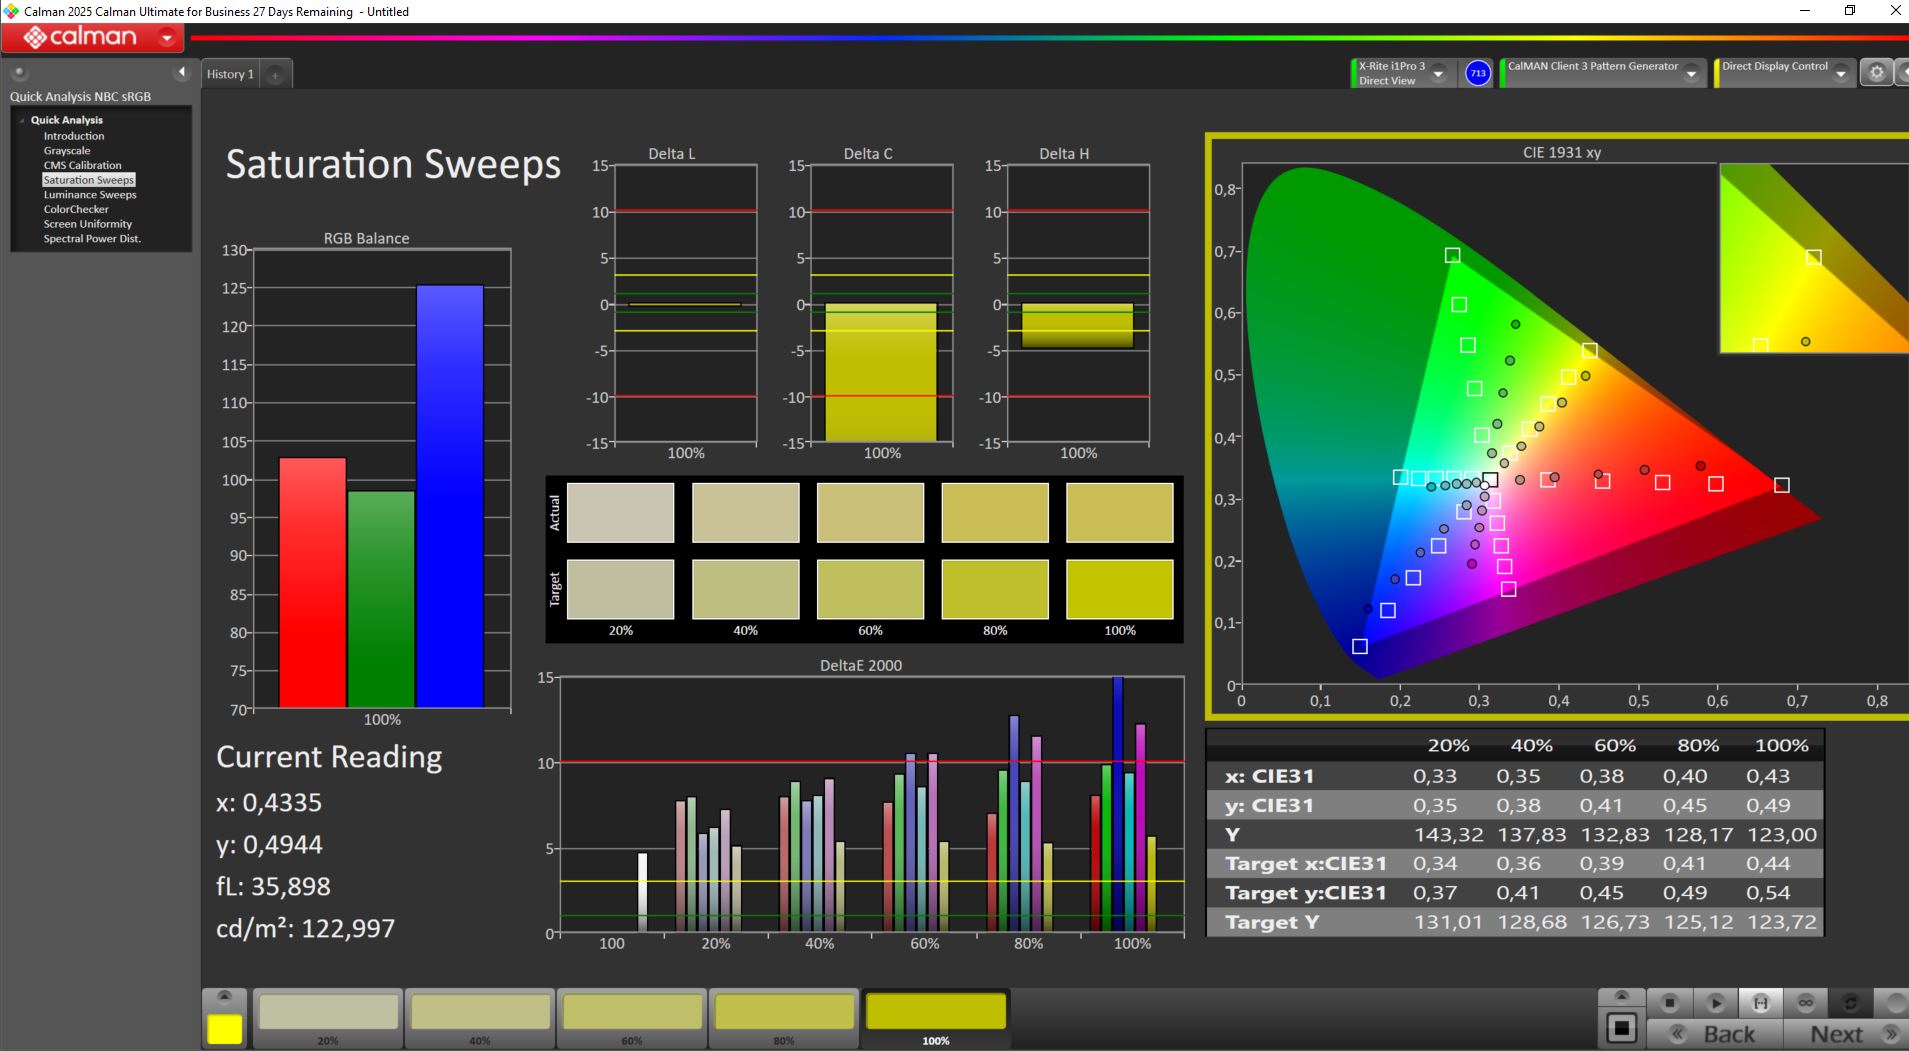
Our unit features a matte Full HD IPS display (1,920 × 1,080) with a 144 Hz refresh rate and not even full sRGB coverage. Brightness is disappointing at just 238 nits. Contrast is acceptable, but the image looks washed out overall. Response times are also subpar for gaming.
A QHD panel with 165 Hz and full DCI-P3 coverage is available as an alternative.
| |||||||||||||||||||||||||
Brightness Distribution: 82 %
Center on Battery: 258 cd/m²
Contrast: 1358:1 (Black: 0.19 cd/m²)
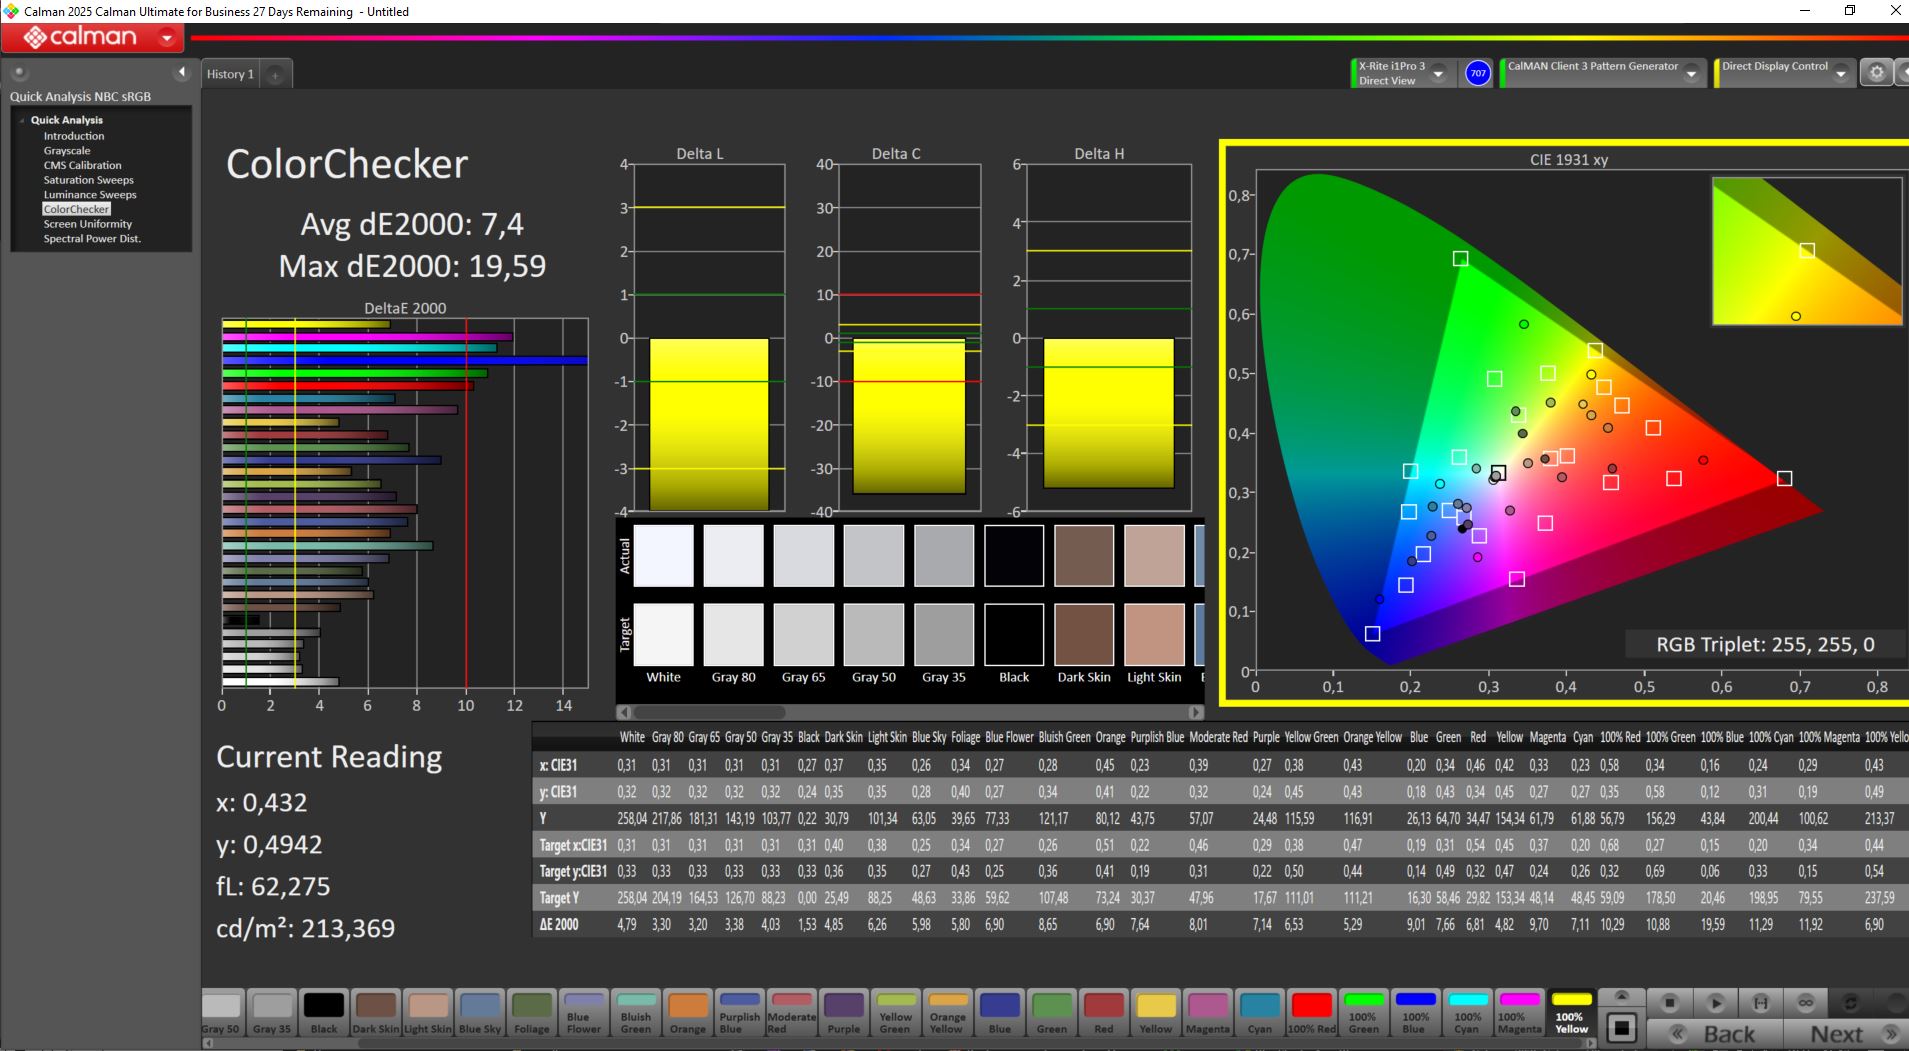
ΔE ColorChecker Calman: 7.4 | ∀{0.5-29.43 Ø4.72}
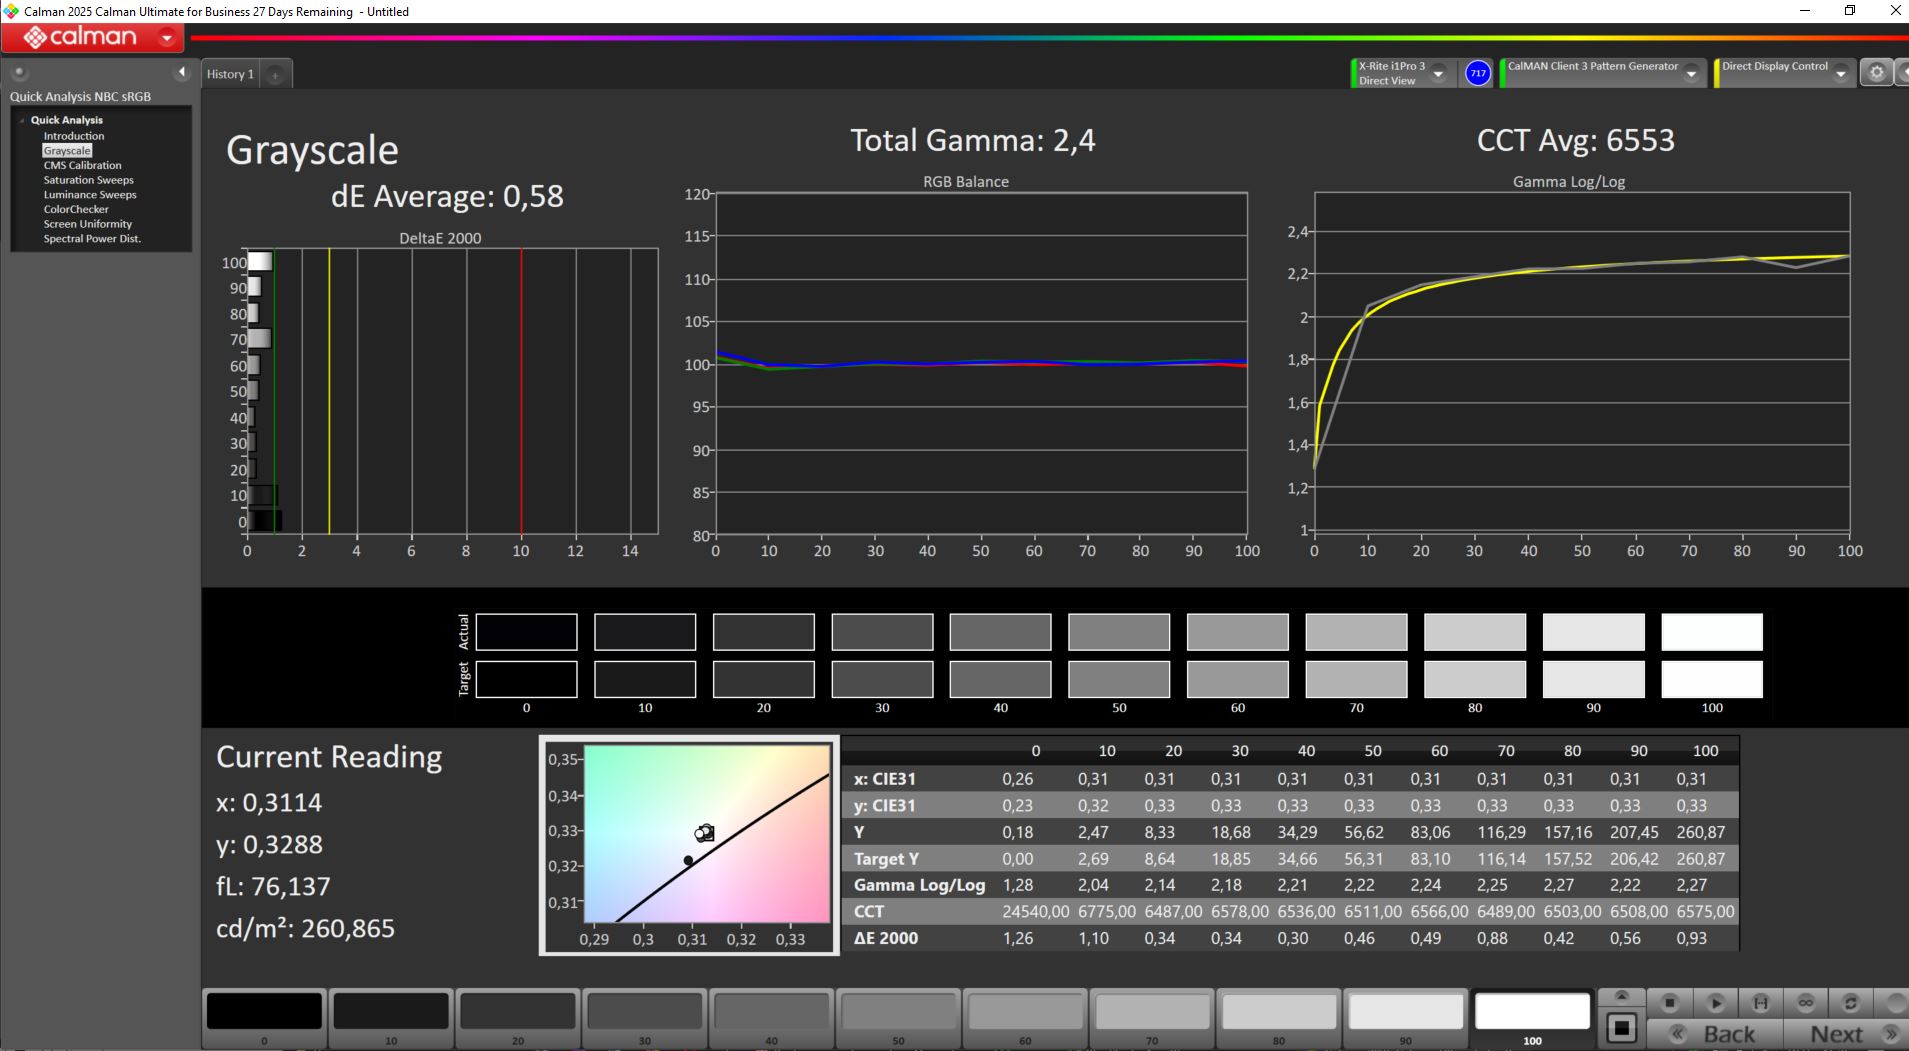
calibrated: 5.88
ΔE Greyscale Calman: 3.54 | ∀{0.09-98 Ø4.97}
40.8% AdobeRGB 1998 (Argyll 3D)
60.9% sRGB (Argyll 3D)
42.2% Display P3 (Argyll 3D)
Gamma: 2.1
CCT: 6836 K
| Acer Nitro v 17 (ANV17-41-R4CJ) AUOB39E (B173HAN04.9), IPS, 1920x1080, 17.3", 144 Hz | HP Omen 17z-db100 BOE0B67, IPS, 2560x1440, 17.3", 240 Hz | Lenovo LOQ 17IRX10 N173HME-G31 (CMN174C), IPS, 1920x1080, 17.3", 165 Hz | MSI Crosshair A17 HX D8WGKG B170QAN01.2, IPS, 2560x1600, 17", 240 Hz | MSI Katana 17 HX B14WGK CSOT MNH301CA3-1, IPS, 2560x1440, 17.3", 240 Hz | Alienware 16X Aurora, RTX 5070 LG Philips 160WQG, IPS, 2560x1600, 16", 240 Hz | |
|---|---|---|---|---|---|---|
| Display | 62% | 62% | 101% | 104% | 105% | |
| Display P3 Coverage (%) | 42.2 | 66.6 58% | 66.3 57% | 97.1 130% | 97.3 131% | 96.9 130% |
| sRGB Coverage (%) | 60.9 | 96.8 59% | 97.5 60% | 99.9 64% | 99.6 64% | 99.8 64% |
| AdobeRGB 1998 Coverage (%) | 40.8 | 68.6 68% | 68.4 68% | 84.9 108% | 89 118% | 89.7 120% |
| Response Times | 63% | 64% | 75% | 79% | 81% | |
| Response Time Grey 50% / Grey 80% * (ms) | 42 ? | 15.1 ? 64% | 16 ? 62% | 13.3 ? 68% | 5.2 ? 88% | 4.3 ? 90% |
| Response Time Black / White * (ms) | 29.6 ? | 11.3 ? 62% | 10.1 ? 66% | 5.7 ? 81% | 9.2 ? 69% | 8.7 ? 71% |
| PWM Frequency (Hz) | ||||||
| PWM Amplitude * (%) | ||||||
| Screen | 1% | 26% | 33% | 27% | 24% | |
| Brightness middle (cd/m²) | 258 | 373.2 45% | 315 22% | 471 83% | 296 15% | 493.2 91% |
| Brightness (cd/m²) | 238 | 341 43% | 297 25% | 468 97% | 272 14% | 477 100% |
| Brightness Distribution (%) | 82 | 84 2% | 87 6% | 96 17% | 87 6% | 93 13% |
| Black Level * (cd/m²) | 0.19 | 0.62 -226% | 0.29 -53% | 0.4 -111% | 0.27 -42% | 0.5 -163% |
| Contrast (:1) | 1358 | 602 -56% | 1086 -20% | 1178 -13% | 1096 -19% | 986 -27% |
| Colorchecker dE 2000 * | 7.4 | 2.53 66% | 2.38 68% | 2.72 63% | 1.35 82% | 3.57 52% |
| Colorchecker dE 2000 max. * | 19.59 | 5.03 74% | 3.66 81% | 5.49 72% | 4.76 76% | 7.03 64% |
| Colorchecker dE 2000 calibrated * | 5.88 | 1.39 76% | 0.96 84% | 1.12 81% | 0.78 87% | 0.68 88% |
| Greyscale dE 2000 * | 3.54 | 4.1 -16% | 2.9 18% | 3.2 10% | 2.7 24% | 3.7 -5% |
| Gamma | 2.1 105% | 2.23 99% | 2.052 107% | 2.227 99% | 2.201 100% | 2.16 102% |
| CCT | 6836 95% | 6257 104% | 6319 103% | 6925 94% | 6770 96% | 5876 111% |
| Total Average (Program / Settings) | 42% /
23% | 51% /
39% | 70% /
54% | 70% /
51% | 70% /
49% |
* ... smaller is better
Our own calibration reduces grayscale DeltaE values to below 1, but color deviations remain relatively high.
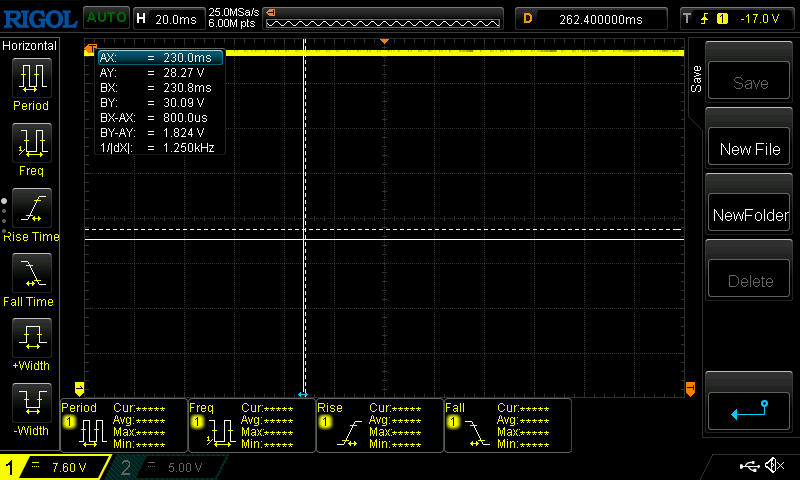
Display Response Times
| ↔ Response Time Black to White | ||
|---|---|---|
| 29.6 ms ... rise ↗ and fall ↘ combined | ↗ 15.4 ms rise | 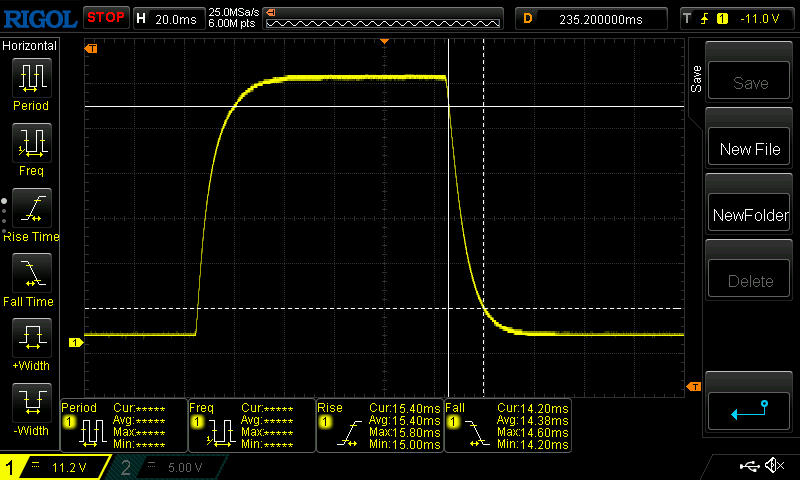 |
| ↘ 14.2 ms fall | ||
| The screen shows relatively slow response rates in our tests and may be too slow for gamers. In comparison, all tested devices range from 0.1 (minimum) to 240 (maximum) ms. » 79 % of all devices are better. This means that the measured response time is worse than the average of all tested devices (19.8 ms). | ||
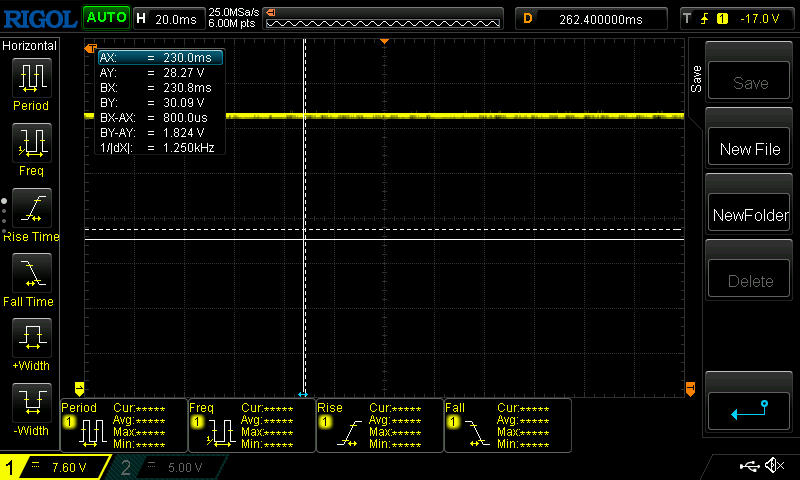
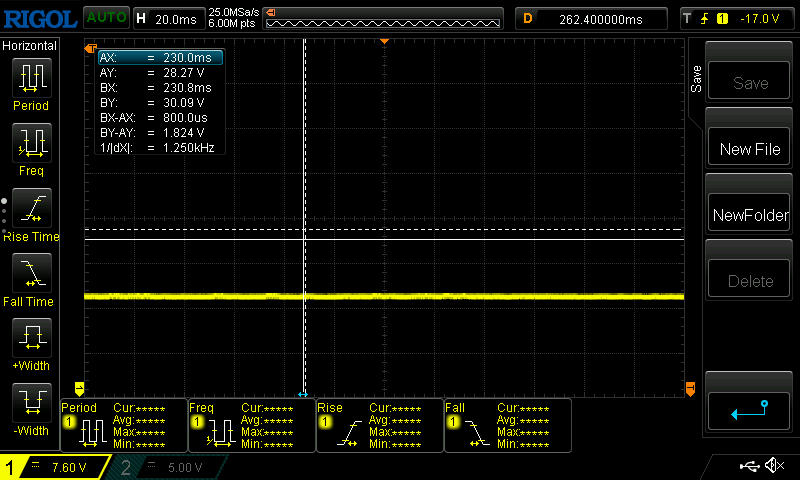
| ↔ Response Time 50% Grey to 80% Grey | ||
| 42 ms ... rise ↗ and fall ↘ combined | ↗ 19.4 ms rise | 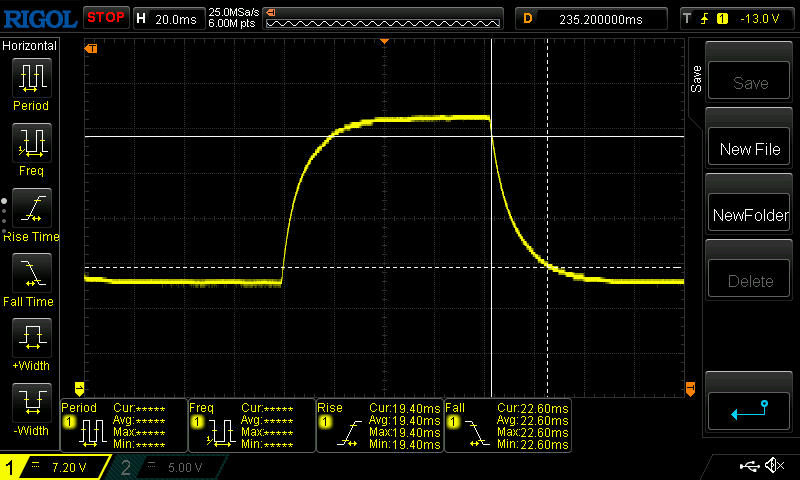 |
| ↘ 22.6 ms fall | ||
| The screen shows slow response rates in our tests and will be unsatisfactory for gamers. In comparison, all tested devices range from 0.165 (minimum) to 636 (maximum) ms. » 67 % of all devices are better. This means that the measured response time is worse than the average of all tested devices (31 ms). | ||
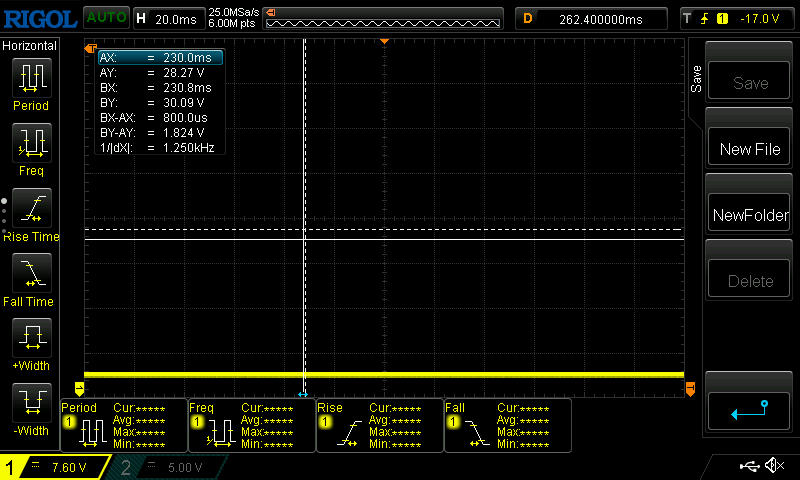
Screen Flickering / PWM (Pulse-Width Modulation)
| Screen flickering / PWM not detected | 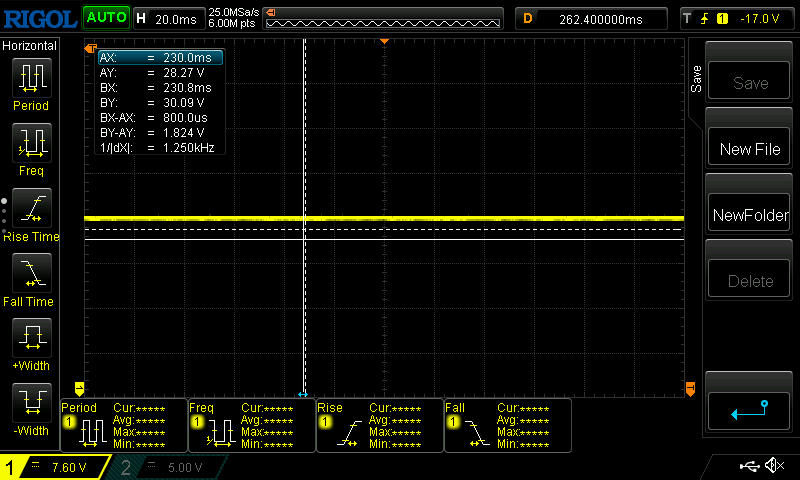 | ||
In comparison: 52 % of all tested devices do not use PWM to dim the display. If PWM was detected, an average of 7747 (minimum: 5 - maximum: 343500) Hz was measured. | |||

The limited brightness makes outdoor use difficult.
Performance – Is the RTX 5070 enough for AAA games in QHD or 4K?
With its RTX 5070 and Nitro branding, the V 17 positions itself as a budget-friendly gaming laptop designed primarily for its native resolution, with some headroom for QHD gaming.
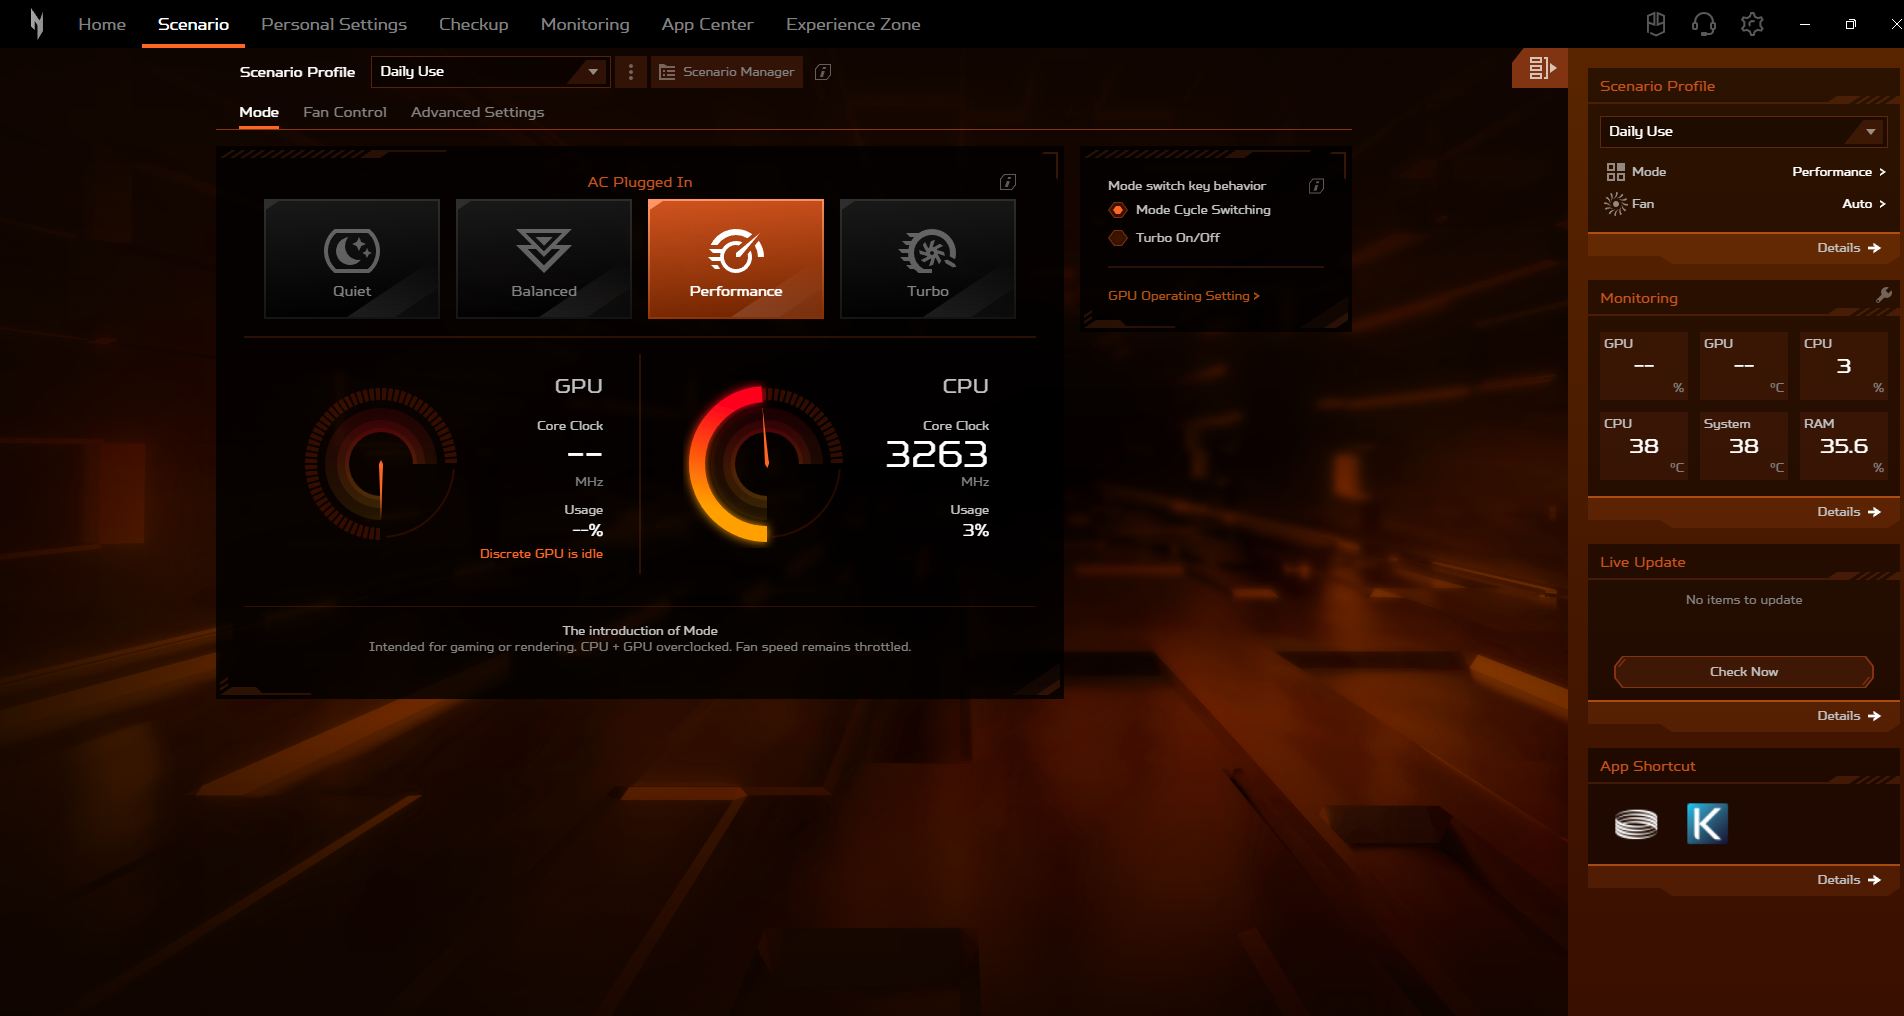
Test conditions
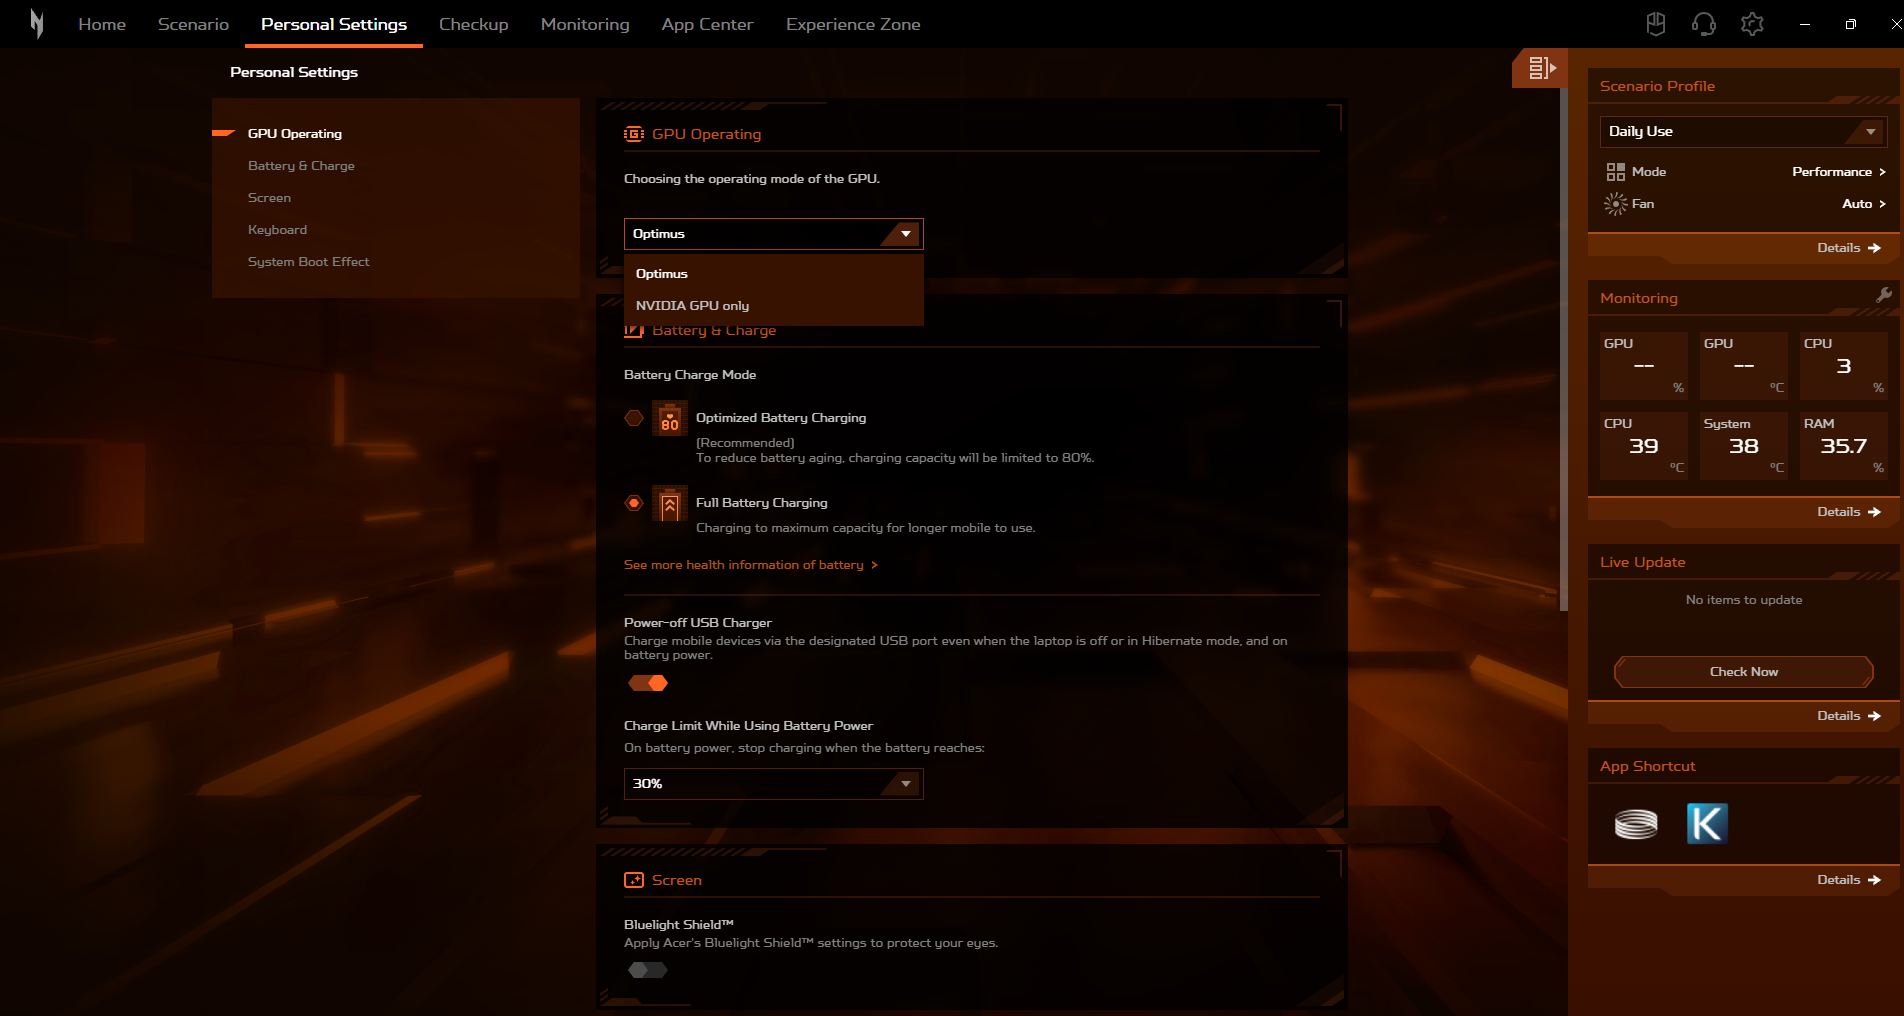
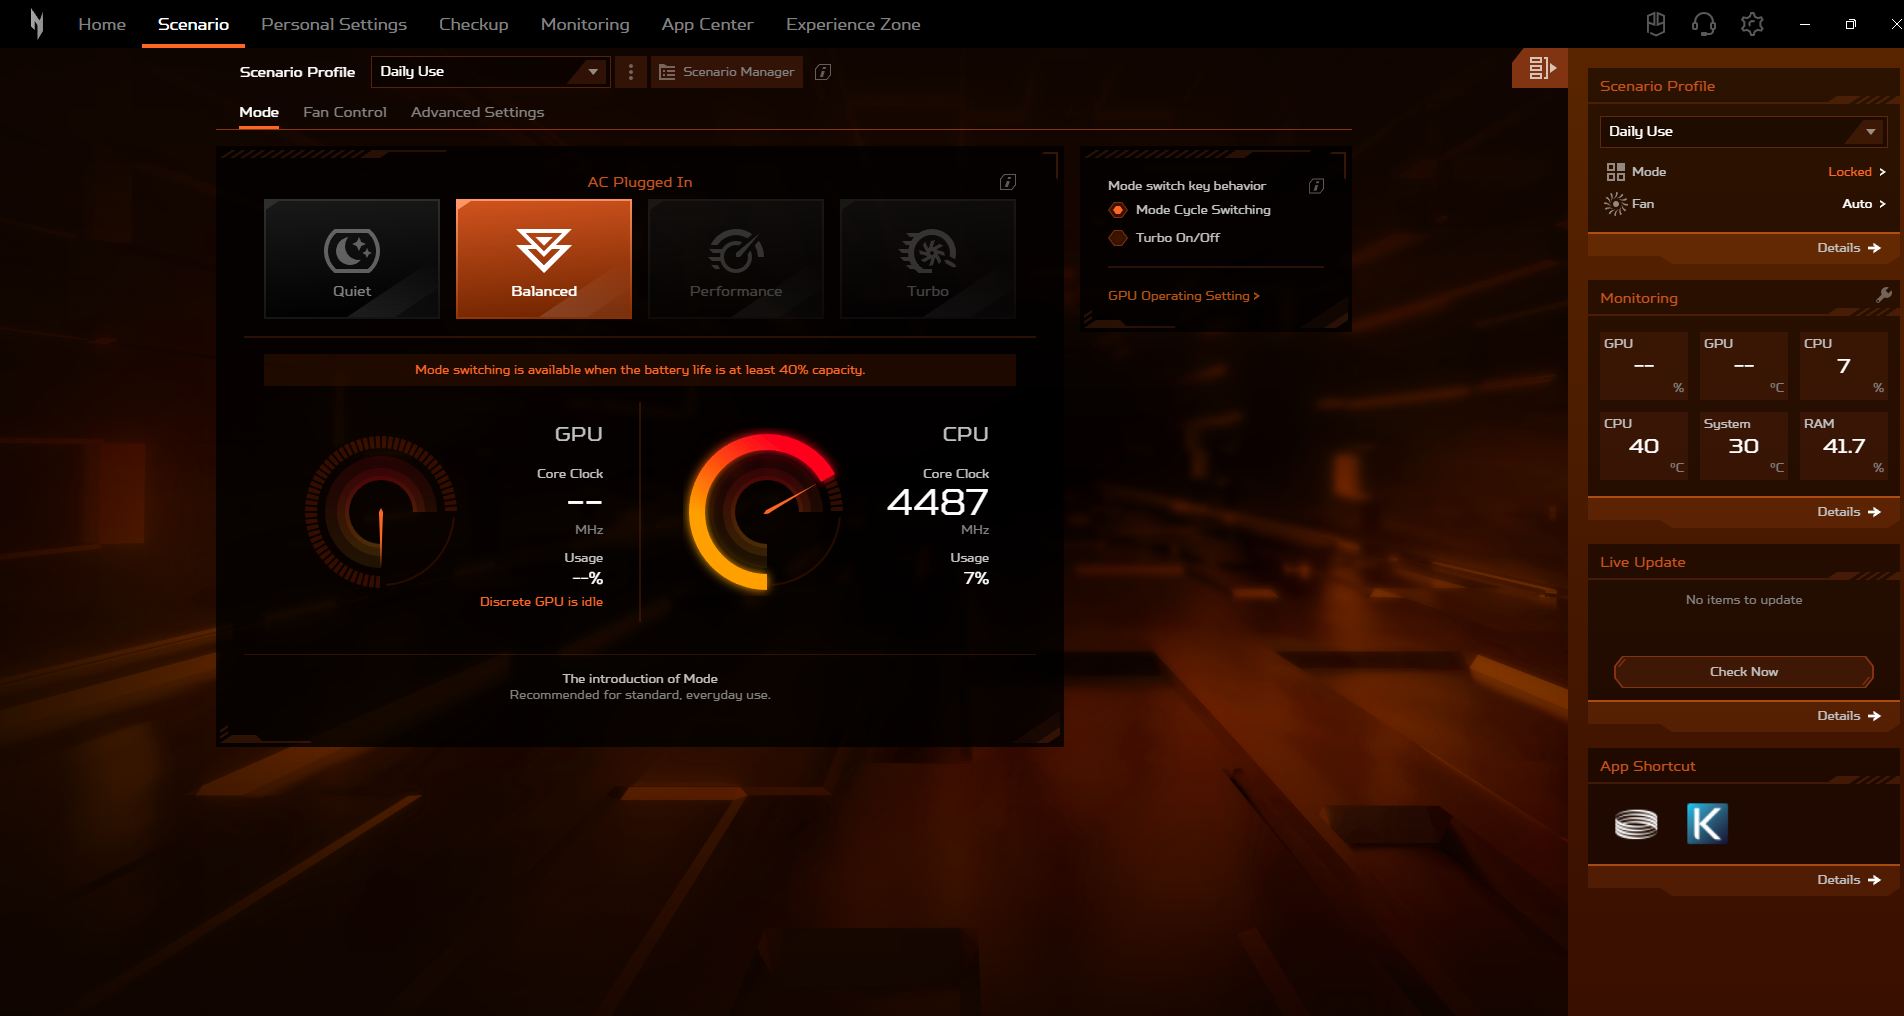
From the four NitroSense profiles (Quiet, Balanced, Performance, Turbo), we use “Performance,” which also enables access to the MUX switch.
On battery power, only Balanced and Quiet are available, and the display does not automatically switch to 60 Hz.
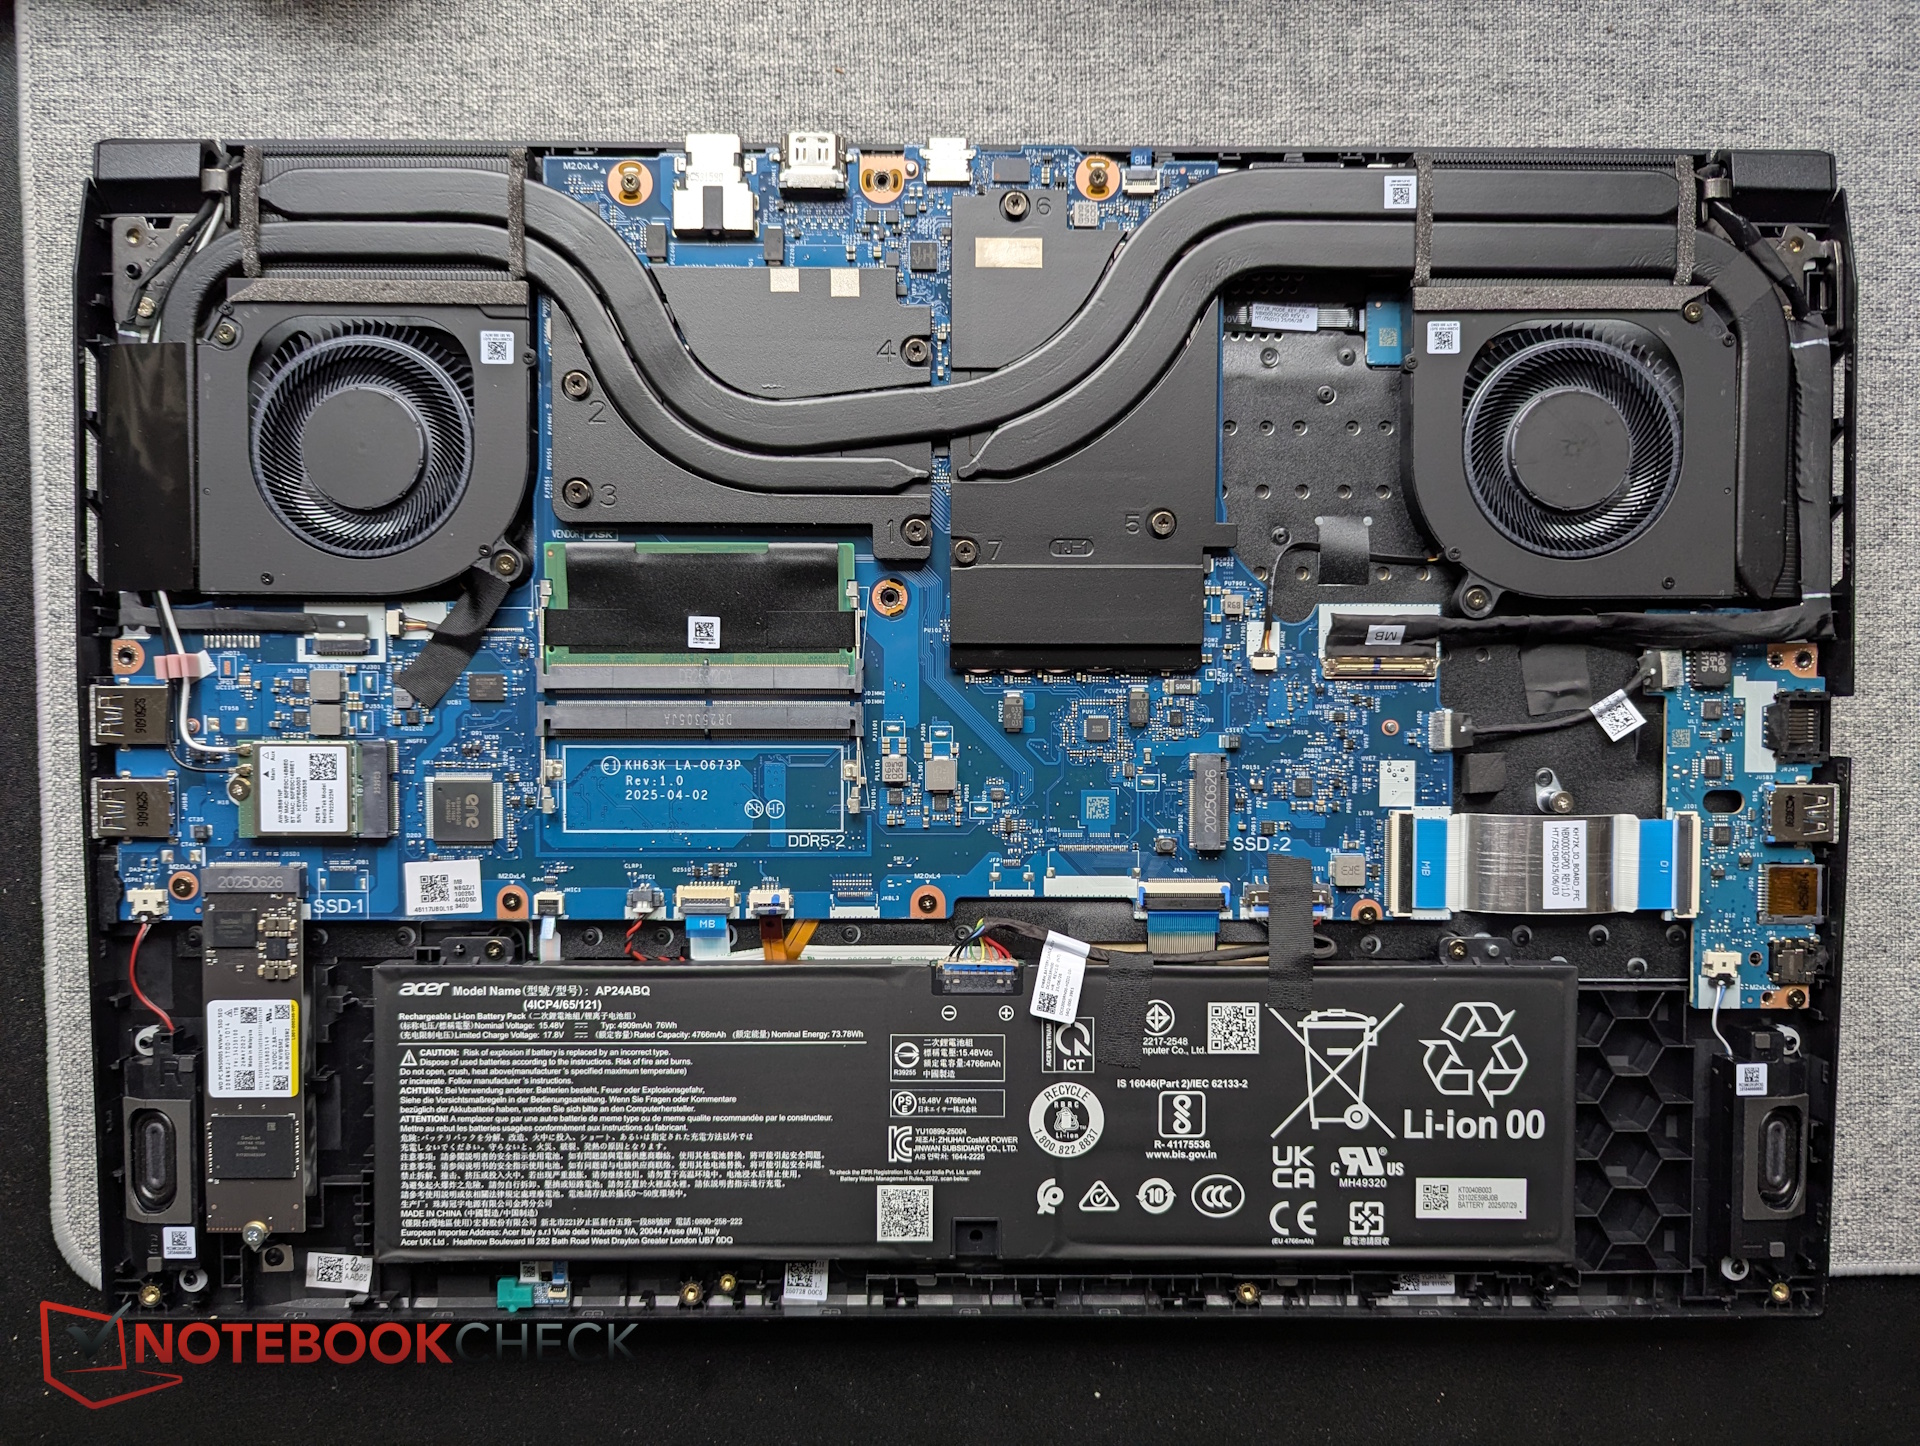
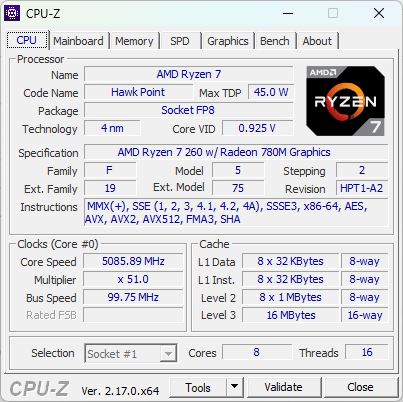
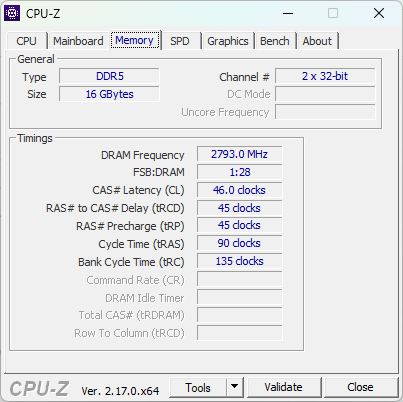
The system memory is configured in single-channel mode.
| Performance Mode | Cinebench R15 Multi | Fire Strike Graphics | Cyberpunk 2077 FHD Ultra (fps) | Noise Cyberpunk (dB) |
|---|---|---|---|---|
| Turbo | 2545 | 36736 | 88.7 | 50.14 |
| Performance | 2543 | 37312 | 87.7 | 47 |
| Balanced | 2436 | 34693 | 84.4 | 44.23 |
| Quiet | 2433 | 33076 | 77 | 36.45 |
| Battery | 2070 | 13800 | 30 | 25 |
Processor
The AMD Ryzen 7 260 is a more affordable CPU, but far from weak. Its 8 cores and 16 threads boost up to 5.1 GHz.
In Cinebench loop testing, CPU performance remains very consistent and roughly matches the Core i7-14650HX found in the Katana 17. Across all benchmarks, however, the Nitro V 17 trails the Katana 17 and the Omen 17z by around five percent.
When running on battery, CPU performance drops by 19 percent.
Cinebench R15 Multi Loop
Cinebench R23: Multi Core | Single Core
Cinebench R20: CPU (Multi Core) | CPU (Single Core)
Cinebench R15: CPU Multi 64Bit | CPU Single 64Bit
Blender: v2.79 BMW27 CPU
7-Zip 18.03: 7z b 4 | 7z b 4 -mmt1
Geekbench 6.7: Multi-Core | Single-Core
Geekbench 5.5: Multi-Core | Single-Core
HWBOT x265 Benchmark v2.2: 4k Preset
LibreOffice : 20 Documents To PDF
R Benchmark 2.5: Overall mean
| CPU Performance rating | |
| Alienware 16X Aurora, RTX 5070 | |
| MSI Crosshair A17 HX D8WGKG | |
| Lenovo LOQ 17IRX10 | |
| Average of class Gaming | |
| MSI Katana 17 HX B14WGK | |
| HP Omen 17z-db100 | |
| Average AMD Ryzen 7 260 | |
| Acer Nitro v 17 (ANV17-41-R4CJ) | |
| Cinebench R23 / Multi Core | |
| Alienware 16X Aurora, RTX 5070 | |
| MSI Crosshair A17 HX D8WGKG | |
| Lenovo LOQ 17IRX10 | |
| Average of class Gaming (10488 - 40970, n=106, last 2 years) | |
| HP Omen 17z-db100 | |
| Average AMD Ryzen 7 260 (15864 - 17712, n=6) | |
| MSI Katana 17 HX B14WGK | |
| Acer Nitro v 17 (ANV17-41-R4CJ) | |
| Cinebench R23 / Single Core | |
| Alienware 16X Aurora, RTX 5070 | |
| Lenovo LOQ 17IRX10 | |
| Average of class Gaming (1166 - 2387, n=106, last 2 years) | |
| MSI Katana 17 HX B14WGK | |
| HP Omen 17z-db100 | |
| MSI Crosshair A17 HX D8WGKG | |
| Acer Nitro v 17 (ANV17-41-R4CJ) | |
| Average AMD Ryzen 7 260 (1760 - 1801, n=6) | |
| Cinebench R20 / CPU (Multi Core) | |
| Alienware 16X Aurora, RTX 5070 | |
| MSI Crosshair A17 HX D8WGKG | |
| Lenovo LOQ 17IRX10 | |
| Average of class Gaming (4029 - 16108, n=105, last 2 years) | |
| HP Omen 17z-db100 | |
| Average AMD Ryzen 7 260 (6161 - 6969, n=6) | |
| Acer Nitro v 17 (ANV17-41-R4CJ) | |
| MSI Katana 17 HX B14WGK | |
| Cinebench R20 / CPU (Single Core) | |
| Alienware 16X Aurora, RTX 5070 | |
| Lenovo LOQ 17IRX10 | |
| Average of class Gaming (442 - 904, n=105, last 2 years) | |
| HP Omen 17z-db100 | |
| MSI Katana 17 HX B14WGK | |
| MSI Crosshair A17 HX D8WGKG | |
| Acer Nitro v 17 (ANV17-41-R4CJ) | |
| Average AMD Ryzen 7 260 (679 - 697, n=6) | |
| Cinebench R15 / CPU Multi 64Bit | |
| Alienware 16X Aurora, RTX 5070 | |
| MSI Crosshair A17 HX D8WGKG | |
| Lenovo LOQ 17IRX10 | |
| Average of class Gaming (1578 - 6271, n=104, last 2 years) | |
| MSI Katana 17 HX B14WGK | |
| Average AMD Ryzen 7 260 (2543 - 2831, n=6) | |
| HP Omen 17z-db100 | |
| Acer Nitro v 17 (ANV17-41-R4CJ) | |
| Cinebench R15 / CPU Single 64Bit | |
| Alienware 16X Aurora, RTX 5070 | |
| HP Omen 17z-db100 | |
| Lenovo LOQ 17IRX10 | |
| Average of class Gaming (188.8 - 344, n=105, last 2 years) | |
| MSI Crosshair A17 HX D8WGKG | |
| MSI Katana 17 HX B14WGK | |
| Average AMD Ryzen 7 260 (275 - 283, n=6) | |
| Acer Nitro v 17 (ANV17-41-R4CJ) | |
| Blender / v2.79 BMW27 CPU | |
| MSI Katana 17 HX B14WGK | |
| Acer Nitro v 17 (ANV17-41-R4CJ) | |
| Average AMD Ryzen 7 260 (182 - 204, n=6) | |
| HP Omen 17z-db100 | |
| Average of class Gaming (80 - 330, n=103, last 2 years) | |
| Lenovo LOQ 17IRX10 | |
| MSI Crosshair A17 HX D8WGKG | |
| Alienware 16X Aurora, RTX 5070 | |
| 7-Zip 18.03 / 7z b 4 | |
| MSI Crosshair A17 HX D8WGKG | |
| Alienware 16X Aurora, RTX 5070 | |
| Lenovo LOQ 17IRX10 | |
| Average of class Gaming (33491 - 148086, n=104, last 2 years) | |
| Average AMD Ryzen 7 260 (63076 - 73490, n=6) | |
| MSI Katana 17 HX B14WGK | |
| Acer Nitro v 17 (ANV17-41-R4CJ) | |
| HP Omen 17z-db100 | |
| 7-Zip 18.03 / 7z b 4 -mmt1 | |
| MSI Crosshair A17 HX D8WGKG | |
| Lenovo LOQ 17IRX10 | |
| Alienware 16X Aurora, RTX 5070 | |
| Acer Nitro v 17 (ANV17-41-R4CJ) | |
| Average AMD Ryzen 7 260 (6101 - 6575, n=6) | |
| Average of class Gaming (4199 - 7436, n=104, last 2 years) | |
| MSI Katana 17 HX B14WGK | |
| HP Omen 17z-db100 | |
| Geekbench 6.7 / Multi-Core | |
| Alienware 16X Aurora, RTX 5070 | |
| MSI Crosshair A17 HX D8WGKG | |
| Average of class Gaming (6625 - 22104, n=105, last 2 years) | |
| Lenovo LOQ 17IRX10 | |
| MSI Katana 17 HX B14WGK | |
| HP Omen 17z-db100 | |
| Average AMD Ryzen 7 260 (9977 - 13349, n=6) | |
| Acer Nitro v 17 (ANV17-41-R4CJ) | |
| Geekbench 6.7 / Single-Core | |
| Alienware 16X Aurora, RTX 5070 | |
| Lenovo LOQ 17IRX10 | |
| Average of class Gaming (1490 - 3259, n=105, last 2 years) | |
| MSI Crosshair A17 HX D8WGKG | |
| MSI Katana 17 HX B14WGK | |
| Average AMD Ryzen 7 260 (2622 - 2686, n=6) | |
| Acer Nitro v 17 (ANV17-41-R4CJ) | |
| HP Omen 17z-db100 | |
| Geekbench 5.5 / Multi-Core | |
| Alienware 16X Aurora, RTX 5070 | |
| MSI Crosshair A17 HX D8WGKG | |
| Average of class Gaming (6460 - 27010, n=104, last 2 years) | |
| Lenovo LOQ 17IRX10 | |
| MSI Katana 17 HX B14WGK | |
| HP Omen 17z-db100 | |
| Average AMD Ryzen 7 260 (9837 - 12597, n=6) | |
| Acer Nitro v 17 (ANV17-41-R4CJ) | |
| Geekbench 5.5 / Single-Core | |
| Alienware 16X Aurora, RTX 5070 | |
| Average of class Gaming (986 - 2474, n=104, last 2 years) | |
| Lenovo LOQ 17IRX10 | |
| MSI Katana 17 HX B14WGK | |
| Average AMD Ryzen 7 260 (1836 - 1986, n=6) | |
| MSI Crosshair A17 HX D8WGKG | |
| Acer Nitro v 17 (ANV17-41-R4CJ) | |
| HP Omen 17z-db100 | |
| HWBOT x265 Benchmark v2.2 / 4k Preset | |
| Alienware 16X Aurora, RTX 5070 | |
| MSI Crosshair A17 HX D8WGKG | |
| Average of class Gaming (11.5 - 44.3, n=104, last 2 years) | |
| Lenovo LOQ 17IRX10 | |
| HP Omen 17z-db100 | |
| Average AMD Ryzen 7 260 (17.6 - 22.4, n=6) | |
| Acer Nitro v 17 (ANV17-41-R4CJ) | |
| MSI Katana 17 HX B14WGK | |
| LibreOffice / 20 Documents To PDF | |
| Acer Nitro v 17 (ANV17-41-R4CJ) | |
| Average AMD Ryzen 7 260 (49.6 - 66.3, n=6) | |
| MSI Katana 17 HX B14WGK | |
| Lenovo LOQ 17IRX10 | |
| HP Omen 17z-db100 | |
| Average of class Gaming (33.2 - 88.8, n=104, last 2 years) | |
| MSI Crosshair A17 HX D8WGKG | |
| Alienware 16X Aurora, RTX 5070 | |
| R Benchmark 2.5 / Overall mean | |
| Average AMD Ryzen 7 260 (0.4416 - 0.4479, n=6) | |
| Acer Nitro v 17 (ANV17-41-R4CJ) | |
| MSI Crosshair A17 HX D8WGKG | |
| Average of class Gaming (0.3439 - 0.759, n=105, last 2 years) | |
| MSI Katana 17 HX B14WGK | |
| Alienware 16X Aurora, RTX 5070 | |
| HP Omen 17z-db100 | |
| Lenovo LOQ 17IRX10 | |
* ... smaller is better
AIDA64: FP32 Ray-Trace | FPU Julia | CPU SHA3 | CPU Queen | FPU SinJulia | FPU Mandel | CPU AES | CPU ZLib | FP64 Ray-Trace | CPU PhotoWorxx
| Performance rating | |
| MSI Crosshair A17 HX D8WGKG | |
| Alienware 16X Aurora, RTX 5070 | |
| Average of class Gaming | |
| Average AMD Ryzen 7 260 | |
| Lenovo LOQ 17IRX10 | |
| HP Omen 17z-db100 | |
| Acer Nitro v 17 (ANV17-41-R4CJ) | |
| MSI Katana 17 HX B14WGK | |
| AIDA64 / FP32 Ray-Trace | |
| MSI Crosshair A17 HX D8WGKG | |
| Alienware 16X Aurora, RTX 5070 | |
| Average of class Gaming (10227 - 85542, n=103, last 2 years) | |
| Average AMD Ryzen 7 260 (25995 - 29330, n=6) | |
| HP Omen 17z-db100 | |
| Acer Nitro v 17 (ANV17-41-R4CJ) | |
| Lenovo LOQ 17IRX10 | |
| MSI Katana 17 HX B14WGK | |
| AIDA64 / FPU Julia | |
| MSI Crosshair A17 HX D8WGKG | |
| Alienware 16X Aurora, RTX 5070 | |
| Average of class Gaming (51376 - 238426, n=103, last 2 years) | |
| Average AMD Ryzen 7 260 (106250 - 121427, n=6) | |
| Lenovo LOQ 17IRX10 | |
| Acer Nitro v 17 (ANV17-41-R4CJ) | |
| HP Omen 17z-db100 | |
| MSI Katana 17 HX B14WGK | |
| AIDA64 / CPU SHA3 | |
| MSI Crosshair A17 HX D8WGKG | |
| Alienware 16X Aurora, RTX 5070 | |
| Average of class Gaming (2180 - 9817, n=103, last 2 years) | |
| Lenovo LOQ 17IRX10 | |
| Average AMD Ryzen 7 260 (4636 - 5026, n=6) | |
| Acer Nitro v 17 (ANV17-41-R4CJ) | |
| HP Omen 17z-db100 | |
| MSI Katana 17 HX B14WGK | |
| AIDA64 / CPU Queen | |
| MSI Crosshair A17 HX D8WGKG | |
| Lenovo LOQ 17IRX10 | |
| Alienware 16X Aurora, RTX 5070 | |
| Average AMD Ryzen 7 260 (115108 - 123832, n=5) | |
| Acer Nitro v 17 (ANV17-41-R4CJ) | |
| Average of class Gaming (49785 - 173351, n=89, last 2 years) | |
| MSI Katana 17 HX B14WGK | |
| HP Omen 17z-db100 | |
| AIDA64 / FPU SinJulia | |
| MSI Crosshair A17 HX D8WGKG | |
| Average AMD Ryzen 7 260 (14810 - 15497, n=6) | |
| Acer Nitro v 17 (ANV17-41-R4CJ) | |
| Average of class Gaming (4424 - 33636, n=103, last 2 years) | |
| Lenovo LOQ 17IRX10 | |
| HP Omen 17z-db100 | |
| Alienware 16X Aurora, RTX 5070 | |
| MSI Katana 17 HX B14WGK | |
| AIDA64 / FPU Mandel | |
| MSI Crosshair A17 HX D8WGKG | |
| Alienware 16X Aurora, RTX 5070 | |
| Average of class Gaming (25115 - 128721, n=103, last 2 years) | |
| Average AMD Ryzen 7 260 (56974 - 65308, n=6) | |
| HP Omen 17z-db100 | |
| Acer Nitro v 17 (ANV17-41-R4CJ) | |
| Lenovo LOQ 17IRX10 | |
| MSI Katana 17 HX B14WGK | |
| AIDA64 / CPU AES | |
| MSI Crosshair A17 HX D8WGKG | |
| Alienware 16X Aurora, RTX 5070 | |
| Average of class Gaming (39258 - 247074, n=103, last 2 years) | |
| Lenovo LOQ 17IRX10 | |
| HP Omen 17z-db100 | |
| Average AMD Ryzen 7 260 (66825 - 91381, n=6) | |
| Acer Nitro v 17 (ANV17-41-R4CJ) | |
| MSI Katana 17 HX B14WGK | |
| AIDA64 / CPU ZLib | |
| MSI Crosshair A17 HX D8WGKG | |
| Alienware 16X Aurora, RTX 5070 | |
| Average of class Gaming (574 - 2531, n=103, last 2 years) | |
| Lenovo LOQ 17IRX10 | |
| HP Omen 17z-db100 | |
| Average AMD Ryzen 7 260 (1039 - 1133, n=6) | |
| Acer Nitro v 17 (ANV17-41-R4CJ) | |
| MSI Katana 17 HX B14WGK | |
| AIDA64 / FP64 Ray-Trace | |
| MSI Crosshair A17 HX D8WGKG | |
| Alienware 16X Aurora, RTX 5070 | |
| Average of class Gaming (5509 - 45446, n=103, last 2 years) | |
| HP Omen 17z-db100 | |
| Average AMD Ryzen 7 260 (13944 - 15751, n=6) | |
| Acer Nitro v 17 (ANV17-41-R4CJ) | |
| Lenovo LOQ 17IRX10 | |
| MSI Katana 17 HX B14WGK | |
| AIDA64 / CPU PhotoWorxx | |
| Alienware 16X Aurora, RTX 5070 | |
| HP Omen 17z-db100 | |
| Average of class Gaming (12271 - 89891, n=103, last 2 years) | |
| MSI Crosshair A17 HX D8WGKG | |
| MSI Katana 17 HX B14WGK | |
| Average AMD Ryzen 7 260 (23097 - 40796, n=6) | |
| Lenovo LOQ 17IRX10 | |
| Acer Nitro v 17 (ANV17-41-R4CJ) | |
System Performance
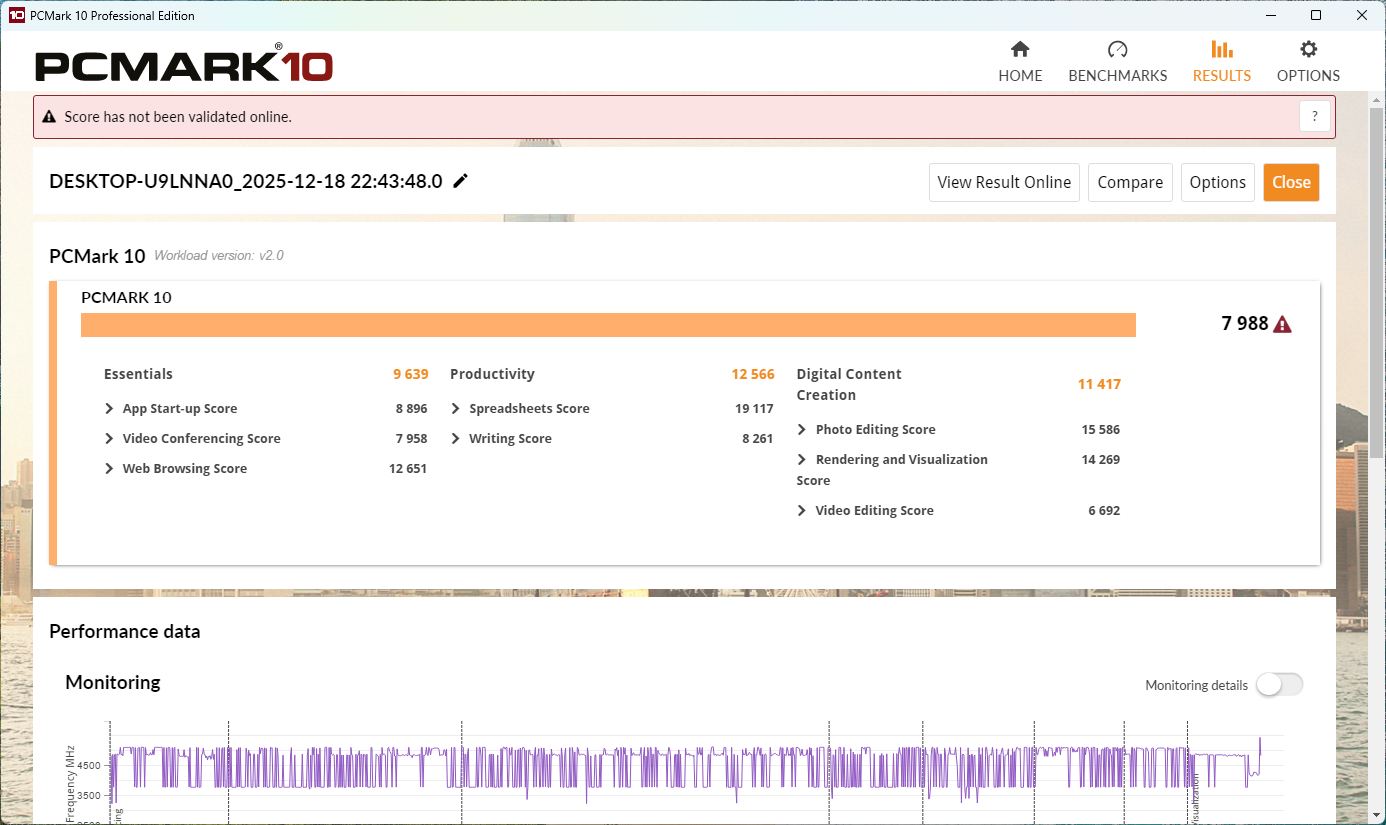
Last place in CrossMark, average results in PCMark 10. Subjectively, the system feels responsive, but measured performance places the Nitro in the lower mid-range.
PCMark 10: Score | Essentials | Productivity | Digital Content Creation
CrossMark: Overall | Productivity | Creativity | Responsiveness
WebXPRT 3: Overall
WebXPRT 4: Overall
Mozilla Kraken 1.1: Total
| Performance rating | |
| Alienware 16X Aurora, RTX 5070 -4! | |
| Average of class Gaming | |
| Lenovo LOQ 17IRX10 -3! | |
| MSI Crosshair A17 HX D8WGKG | |
| HP Omen 17z-db100 | |
| MSI Katana 17 HX B14WGK | |
| Acer Nitro v 17 (ANV17-41-R4CJ) | |
| Average AMD Ryzen 7 260, NVIDIA GeForce RTX 5070 Laptop | |
| PCMark 10 / Score | |
| Average of class Gaming (5828 - 11730, n=92, last 2 years) | |
| MSI Crosshair A17 HX D8WGKG | |
| Acer Nitro v 17 (ANV17-41-R4CJ) | |
| Average AMD Ryzen 7 260, NVIDIA GeForce RTX 5070 Laptop (7645 - 7988, n=2) | |
| HP Omen 17z-db100 | |
| MSI Katana 17 HX B14WGK | |
| PCMark 10 / Essentials | |
| HP Omen 17z-db100 | |
| MSI Crosshair A17 HX D8WGKG | |
| Lenovo LOQ 17IRX10 | |
| Average of class Gaming (8810 - 11935, n=96, last 2 years) | |
| MSI Katana 17 HX B14WGK | |
| Average AMD Ryzen 7 260, NVIDIA GeForce RTX 5070 Laptop (9639 - 10273, n=2) | |
| Acer Nitro v 17 (ANV17-41-R4CJ) | |
| PCMark 10 / Productivity | |
| Acer Nitro v 17 (ANV17-41-R4CJ) | |
| Average of class Gaming (6845 - 21327, n=94, last 2 years) | |
| Average AMD Ryzen 7 260, NVIDIA GeForce RTX 5070 Laptop (9406 - 12566, n=2) | |
| HP Omen 17z-db100 | |
| MSI Crosshair A17 HX D8WGKG | |
| MSI Katana 17 HX B14WGK | |
| PCMark 10 / Digital Content Creation | |
| Average of class Gaming (7602 - 19954, n=94, last 2 years) | |
| MSI Crosshair A17 HX D8WGKG | |
| MSI Katana 17 HX B14WGK | |
| Average AMD Ryzen 7 260, NVIDIA GeForce RTX 5070 Laptop (11417 - 12548, n=2) | |
| Acer Nitro v 17 (ANV17-41-R4CJ) | |
| HP Omen 17z-db100 | |
| CrossMark / Overall | |
| Alienware 16X Aurora, RTX 5070 | |
| Lenovo LOQ 17IRX10 | |
| Average of class Gaming (1366 - 2409, n=93, last 2 years) | |
| MSI Crosshair A17 HX D8WGKG | |
| MSI Katana 17 HX B14WGK | |
| HP Omen 17z-db100 | |
| Average AMD Ryzen 7 260, NVIDIA GeForce RTX 5070 Laptop (1712 - 1758, n=3) | |
| Acer Nitro v 17 (ANV17-41-R4CJ) | |
| CrossMark / Productivity | |
| Alienware 16X Aurora, RTX 5070 | |
| Lenovo LOQ 17IRX10 | |
| MSI Katana 17 HX B14WGK | |
| Average of class Gaming (1386 - 2254, n=93, last 2 years) | |
| MSI Crosshair A17 HX D8WGKG | |
| HP Omen 17z-db100 | |
| Acer Nitro v 17 (ANV17-41-R4CJ) | |
| Average AMD Ryzen 7 260, NVIDIA GeForce RTX 5070 Laptop (1648 - 1725, n=3) | |
| CrossMark / Creativity | |
| Alienware 16X Aurora, RTX 5070 | |
| Average of class Gaming (1343 - 2729, n=93, last 2 years) | |
| Lenovo LOQ 17IRX10 | |
| MSI Crosshair A17 HX D8WGKG | |
| HP Omen 17z-db100 | |
| MSI Katana 17 HX B14WGK | |
| Average AMD Ryzen 7 260, NVIDIA GeForce RTX 5070 Laptop (1782 - 1986, n=3) | |
| Acer Nitro v 17 (ANV17-41-R4CJ) | |
| CrossMark / Responsiveness | |
| Alienware 16X Aurora, RTX 5070 | |
| MSI Katana 17 HX B14WGK | |
| Lenovo LOQ 17IRX10 | |
| MSI Crosshair A17 HX D8WGKG | |
| Average of class Gaming (1226 - 2334, n=93, last 2 years) | |
| HP Omen 17z-db100 | |
| Acer Nitro v 17 (ANV17-41-R4CJ) | |
| Average AMD Ryzen 7 260, NVIDIA GeForce RTX 5070 Laptop (1441 - 1578, n=3) | |
| WebXPRT 3 / Overall | |
| Alienware 16X Aurora, RTX 5070 | |
| Average of class Gaming (220 - 532, n=97, last 2 years) | |
| Lenovo LOQ 17IRX10 | |
| Average AMD Ryzen 7 260, NVIDIA GeForce RTX 5070 Laptop (288 - 297, n=3) | |
| MSI Katana 17 HX B14WGK | |
| HP Omen 17z-db100 | |
| Acer Nitro v 17 (ANV17-41-R4CJ) | |
| MSI Crosshair A17 HX D8WGKG | |
| WebXPRT 4 / Overall | |
| Alienware 16X Aurora, RTX 5070 | |
| Lenovo LOQ 17IRX10 | |
| Average of class Gaming (165 - 354, n=97, last 2 years) | |
| MSI Katana 17 HX B14WGK | |
| HP Omen 17z-db100 | |
| Average AMD Ryzen 7 260, NVIDIA GeForce RTX 5070 Laptop (237 - 239, n=3) | |
| Acer Nitro v 17 (ANV17-41-R4CJ) | |
| MSI Crosshair A17 HX D8WGKG | |
| Mozilla Kraken 1.1 / Total | |
| Average AMD Ryzen 7 260, NVIDIA GeForce RTX 5070 Laptop (522 - 565, n=3) | |
| Acer Nitro v 17 (ANV17-41-R4CJ) | |
| MSI Crosshair A17 HX D8WGKG | |
| MSI Katana 17 HX B14WGK | |
| HP Omen 17z-db100 | |
| Average of class Gaming (391 - 590, n=99, last 2 years) | |
| Lenovo LOQ 17IRX10 | |
| Alienware 16X Aurora, RTX 5070 | |
* ... smaller is better
| PCMark 10 Score | 7988 points | |
Help | ||
| AIDA64 / Memory Copy | |
| Alienware 16X Aurora, RTX 5070 | |
| HP Omen 17z-db100 | |
| Average of class Gaming (21750 - 129946, n=103, last 2 years) | |
| MSI Katana 17 HX B14WGK | |
| Average AMD Ryzen 7 260 (35762 - 69413, n=6) | |
| MSI Crosshair A17 HX D8WGKG | |
| Lenovo LOQ 17IRX10 | |
| Acer Nitro v 17 (ANV17-41-R4CJ) | |
| AIDA64 / Memory Read | |
| Alienware 16X Aurora, RTX 5070 | |
| Average of class Gaming (22956 - 118858, n=103, last 2 years) | |
| MSI Katana 17 HX B14WGK | |
| HP Omen 17z-db100 | |
| MSI Crosshair A17 HX D8WGKG | |
| Average AMD Ryzen 7 260 (30070 - 61363, n=6) | |
| Lenovo LOQ 17IRX10 | |
| Acer Nitro v 17 (ANV17-41-R4CJ) | |
| AIDA64 / Memory Write | |
| HP Omen 17z-db100 | |
| Alienware 16X Aurora, RTX 5070 | |
| Average of class Gaming (22297 - 135096, n=103, last 2 years) | |
| Average AMD Ryzen 7 260 (42757 - 87114, n=6) | |
| MSI Crosshair A17 HX D8WGKG | |
| MSI Katana 17 HX B14WGK | |
| Acer Nitro v 17 (ANV17-41-R4CJ) | |
| Lenovo LOQ 17IRX10 | |
| AIDA64 / Memory Latency | |
| Alienware 16X Aurora, RTX 5070 | |
| Average of class Gaming (75.3 - 259, n=103, last 2 years) | |
| HP Omen 17z-db100 | |
| MSI Katana 17 HX B14WGK | |
| Acer Nitro v 17 (ANV17-41-R4CJ) | |
| Average AMD Ryzen 7 260 (90.8 - 94.1, n=6) | |
| Lenovo LOQ 17IRX10 | |
| MSI Crosshair A17 HX D8WGKG | |
* ... smaller is better
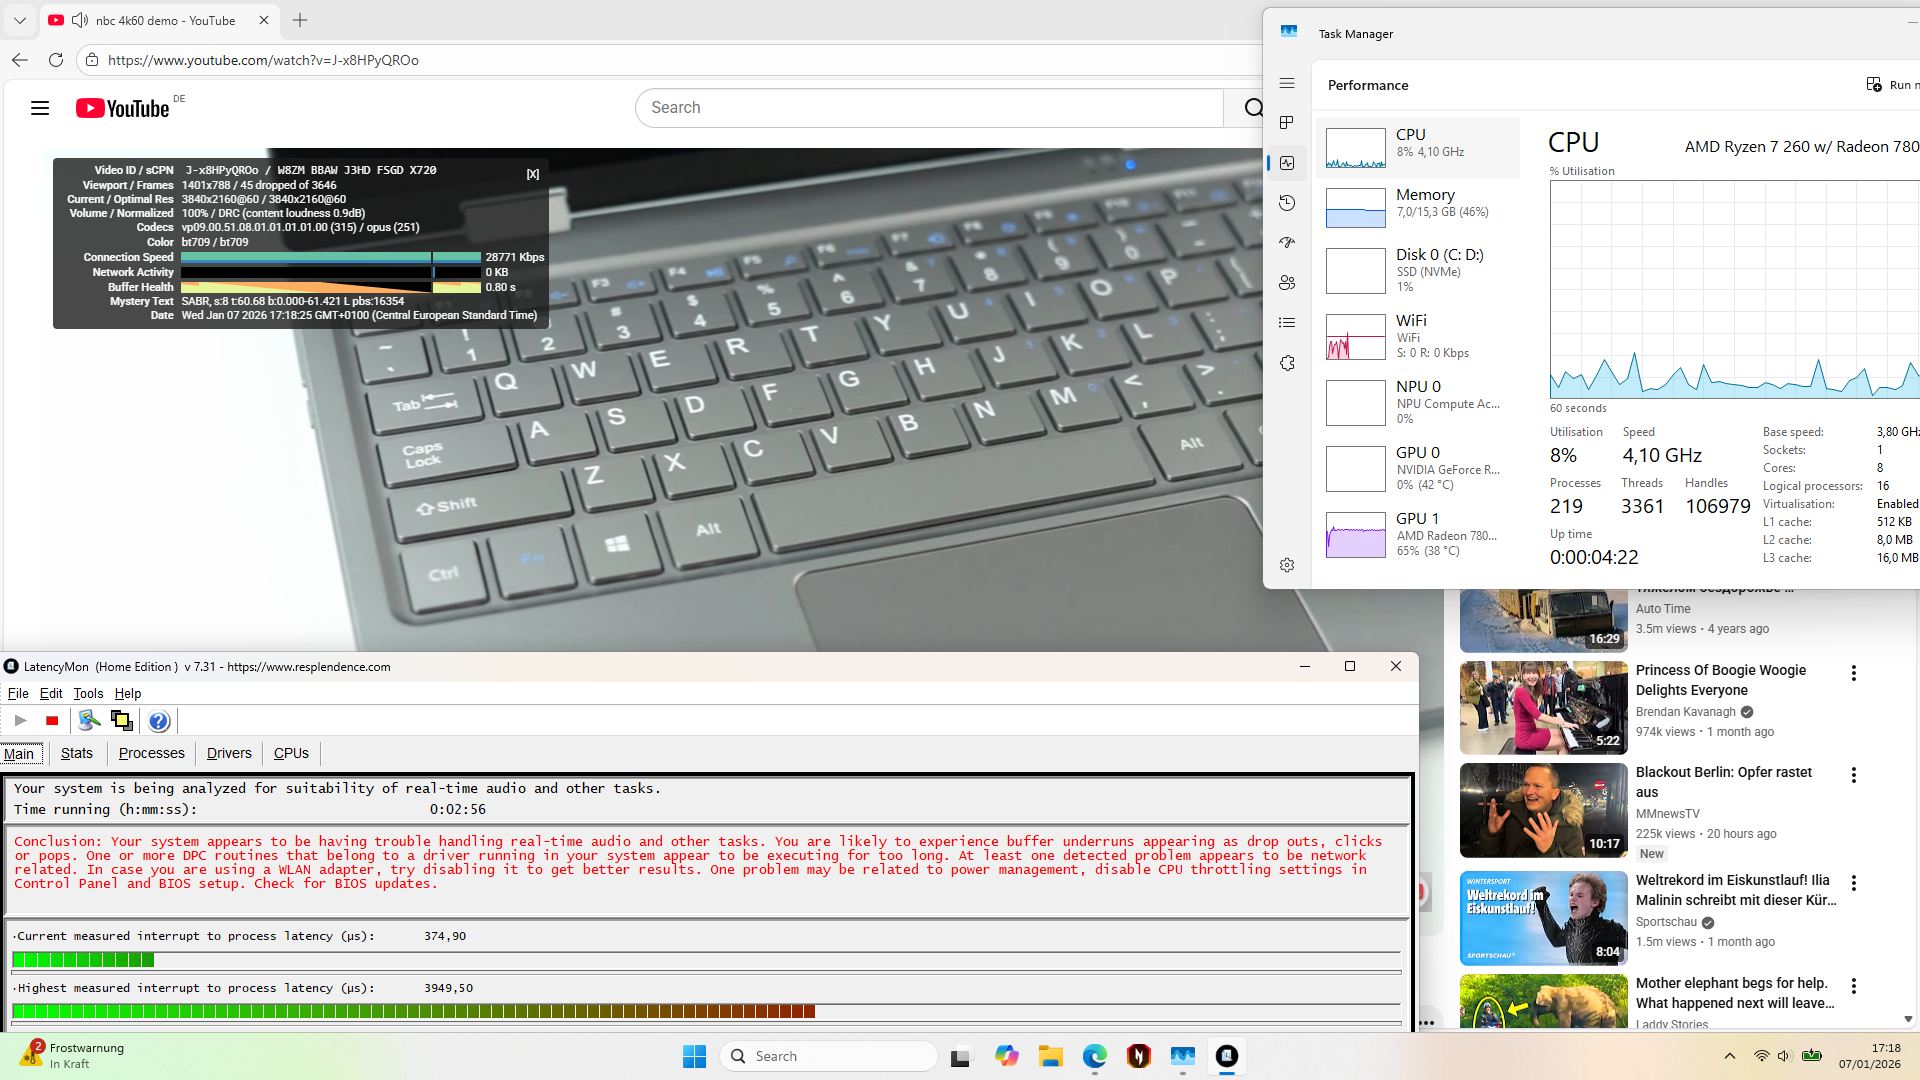
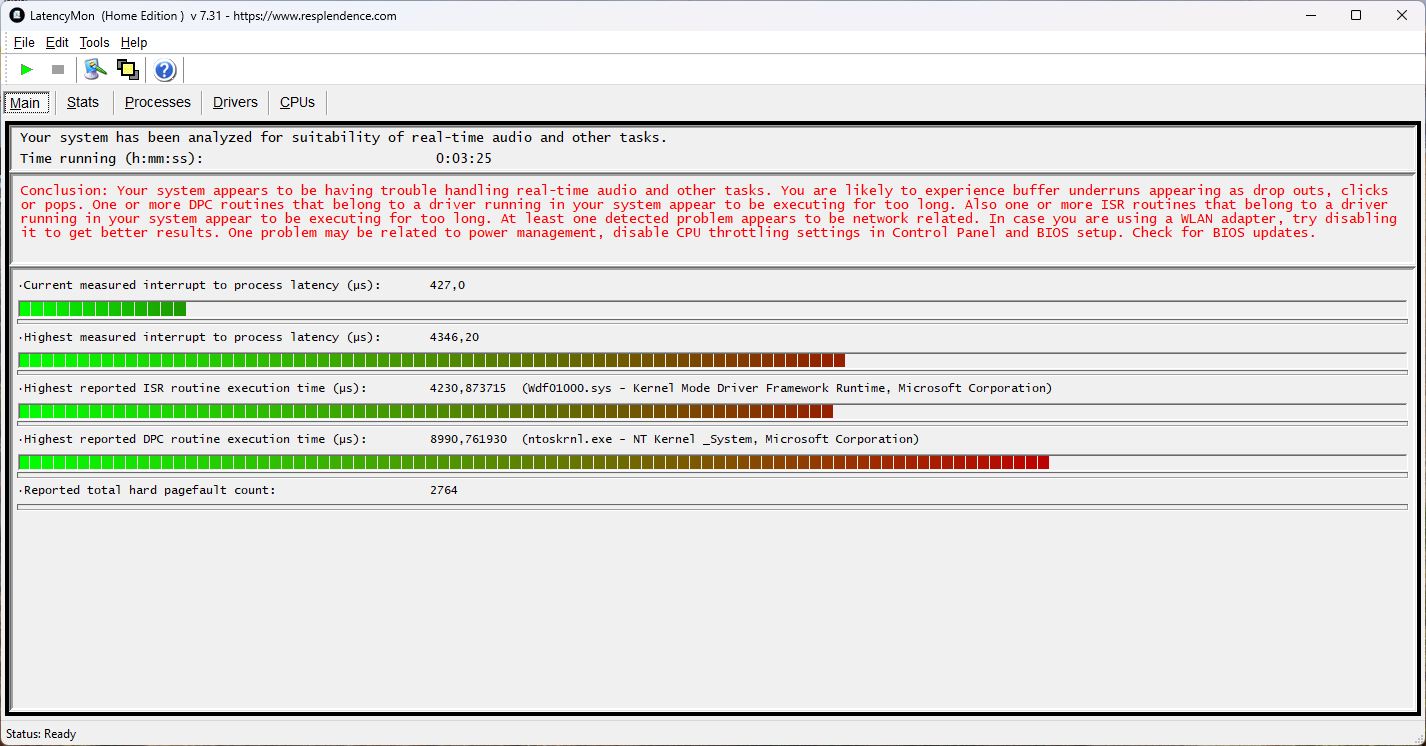
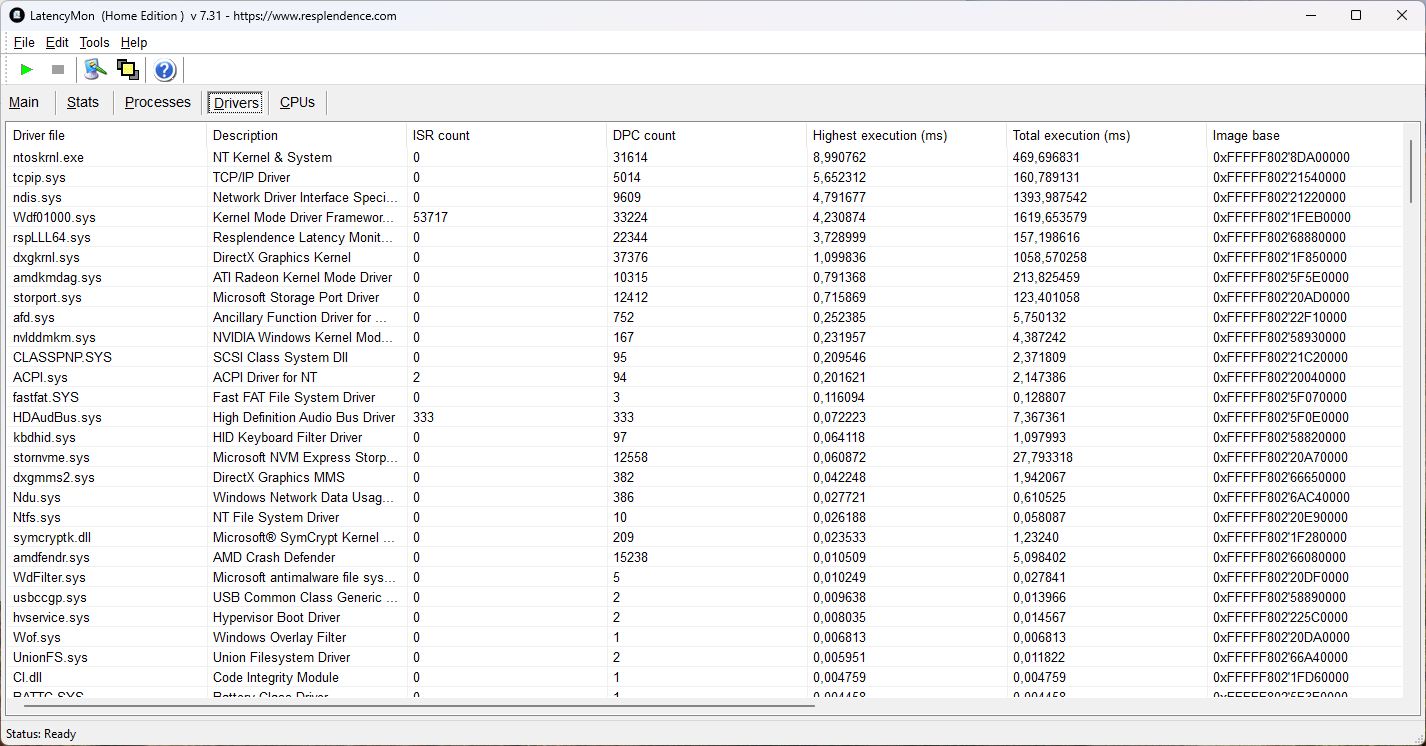
DPC latency
Latency issues appear as soon as applications are launched. They increase when opening multiple browser tabs and during playback of our 4K/60 fps YouTube test video, which also results in 45 dropped frames.
| DPC Latencies / LatencyMon - interrupt to process latency (max), Web, Youtube, Prime95 | |
| HP Omen 17z-db100 | |
| MSI Katana 17 HX B14WGK | |
| Acer Nitro v 17 (ANV17-41-R4CJ) | |
| Alienware 16X Aurora, RTX 5070 | |
| Lenovo LOQ 17IRX10 | |
| MSI Crosshair A17 HX D8WGKG | |
* ... smaller is better
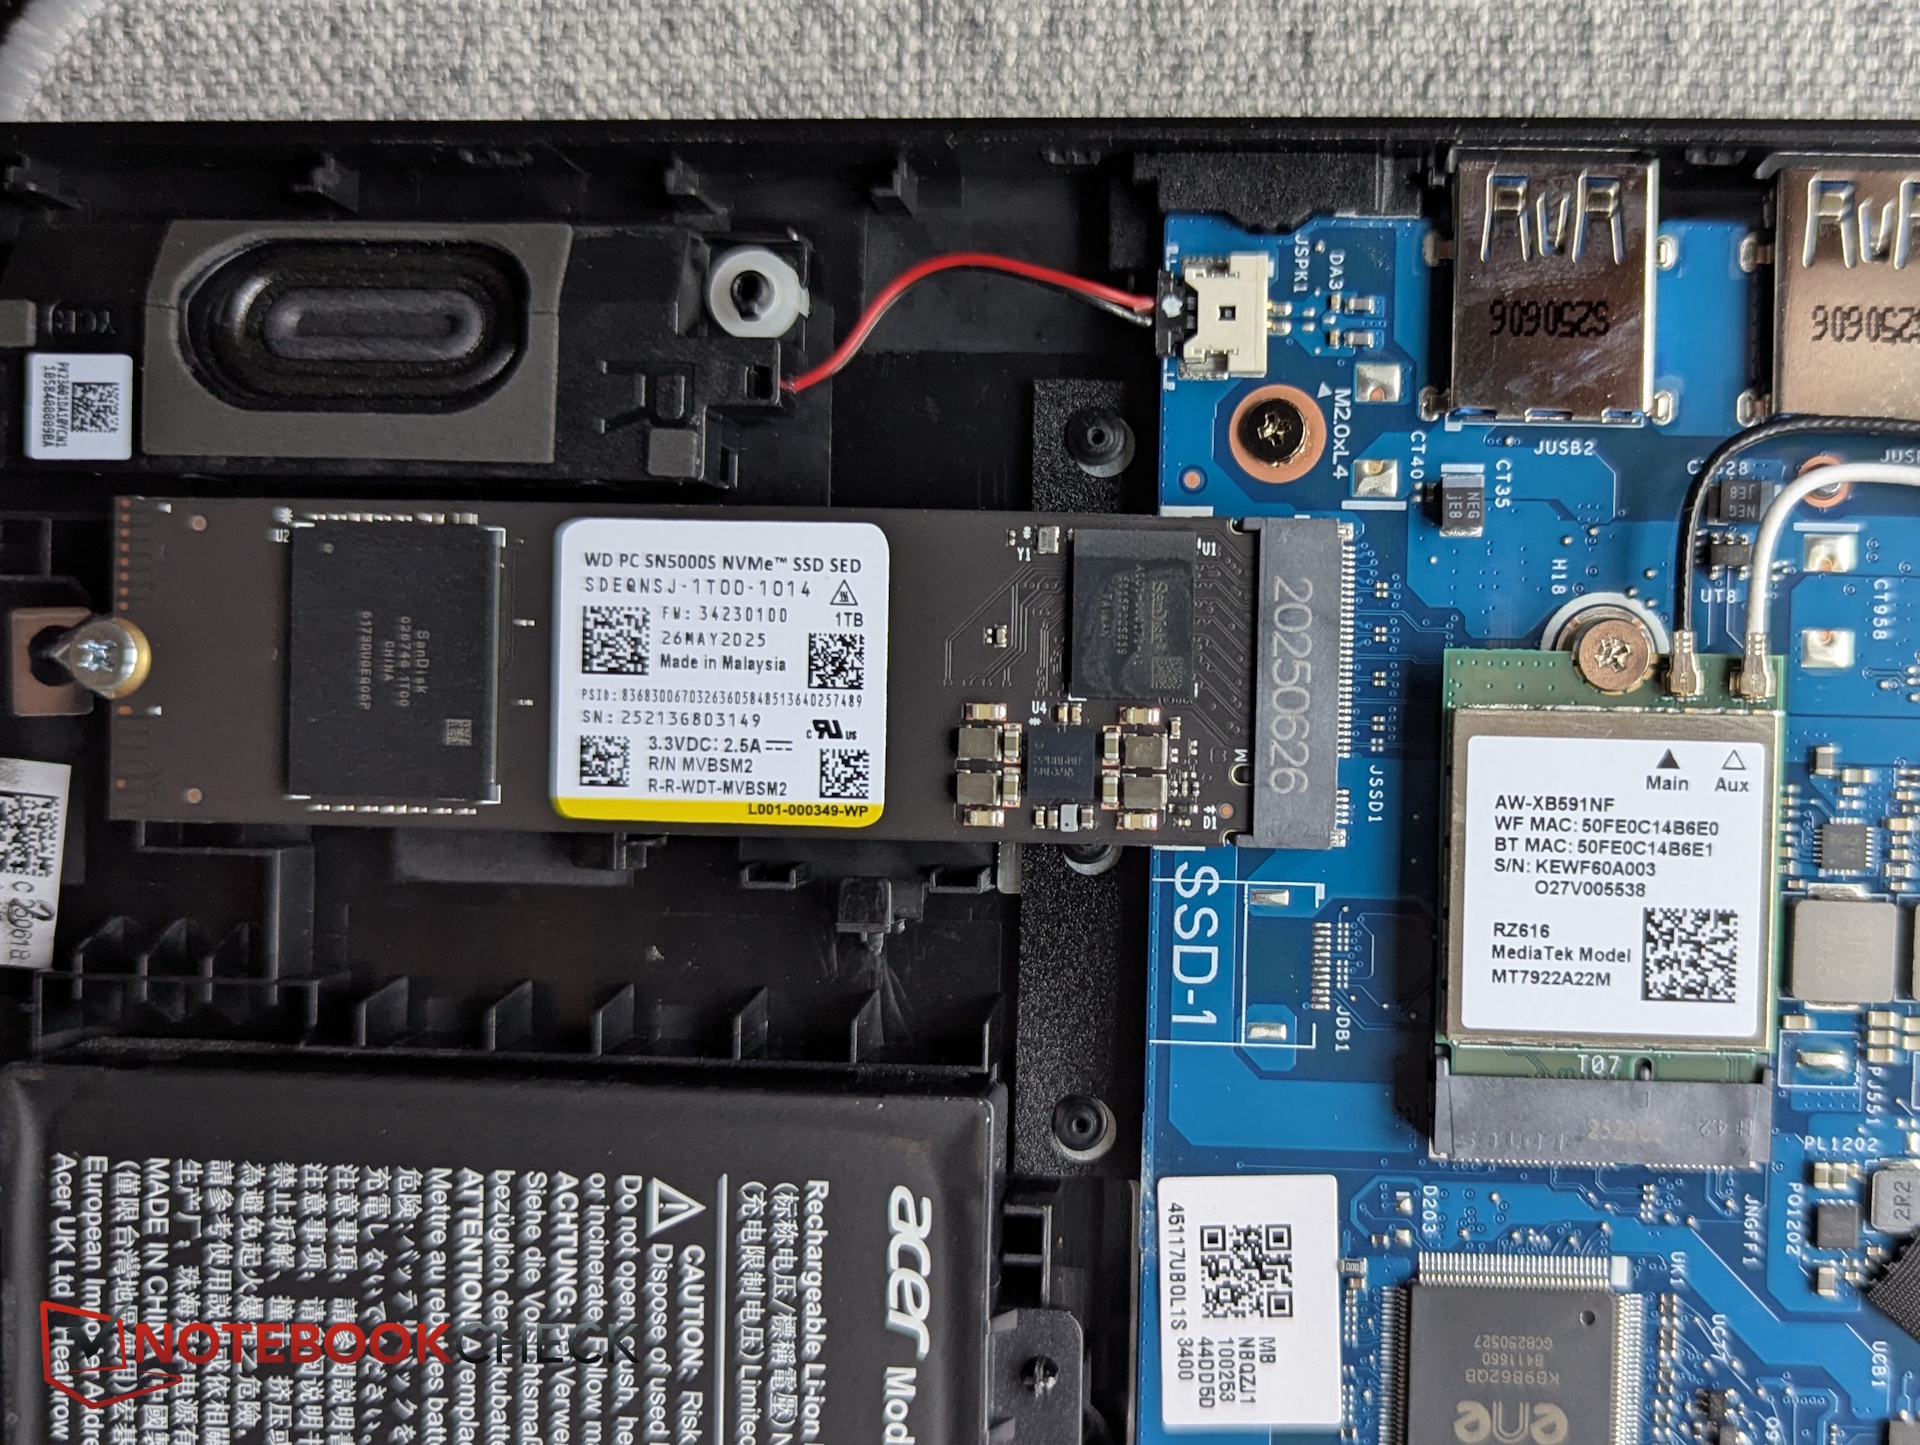
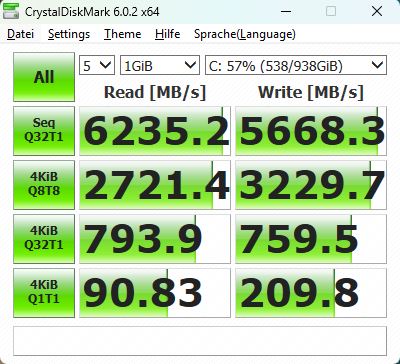
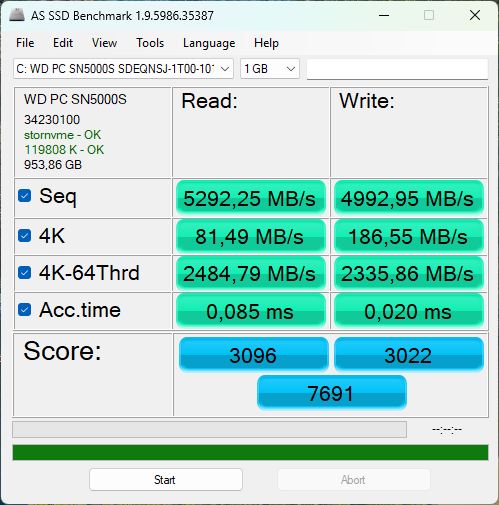
Mass storage
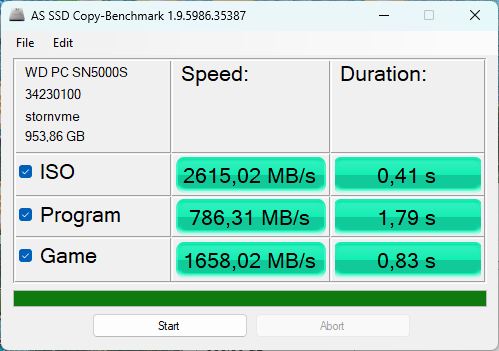
The 1 TB Western Digital SSD throttles only late in sustained load tests, which is still less than ideal. While performance is solid in AS SSD, poor DiskSpd results (sequential write, 4K read/write) leave the Nitro V 17 in last place overall.

* ... smaller is better
Read continuous performance: DiskSpd Read Loop, Queue Depth 8
GPU Performance
Unlike the CPU benchmarks, the Nitro V 17 performs well in 3DMark tests, securing second place among competitors.
Unplugged, roughly 37 percent of GPU performance remains available.
| 3DMark 11 Performance | 33702 points | |
| 3DMark Cloud Gate Standard Score | 61925 points | |
| 3DMark Fire Strike Score | 30799 points | |
| 3DMark Time Spy Score | 12505 points | |
Help | ||
* ... smaller is better
Gaming performance
Compared to competing systems, gaming performance falls slightly behind, not only in CPU-heavy titles. The sole positive outlier is Baldur’s Gate 3.
Games generally run smoothly at the native resolution, often exceeding 100 fps. Depending on the title, there is some headroom for QHD, with DLSS handling the rest effectively (our VRAM article). However, the dark display makes games appear less vibrant than on some competing laptops.
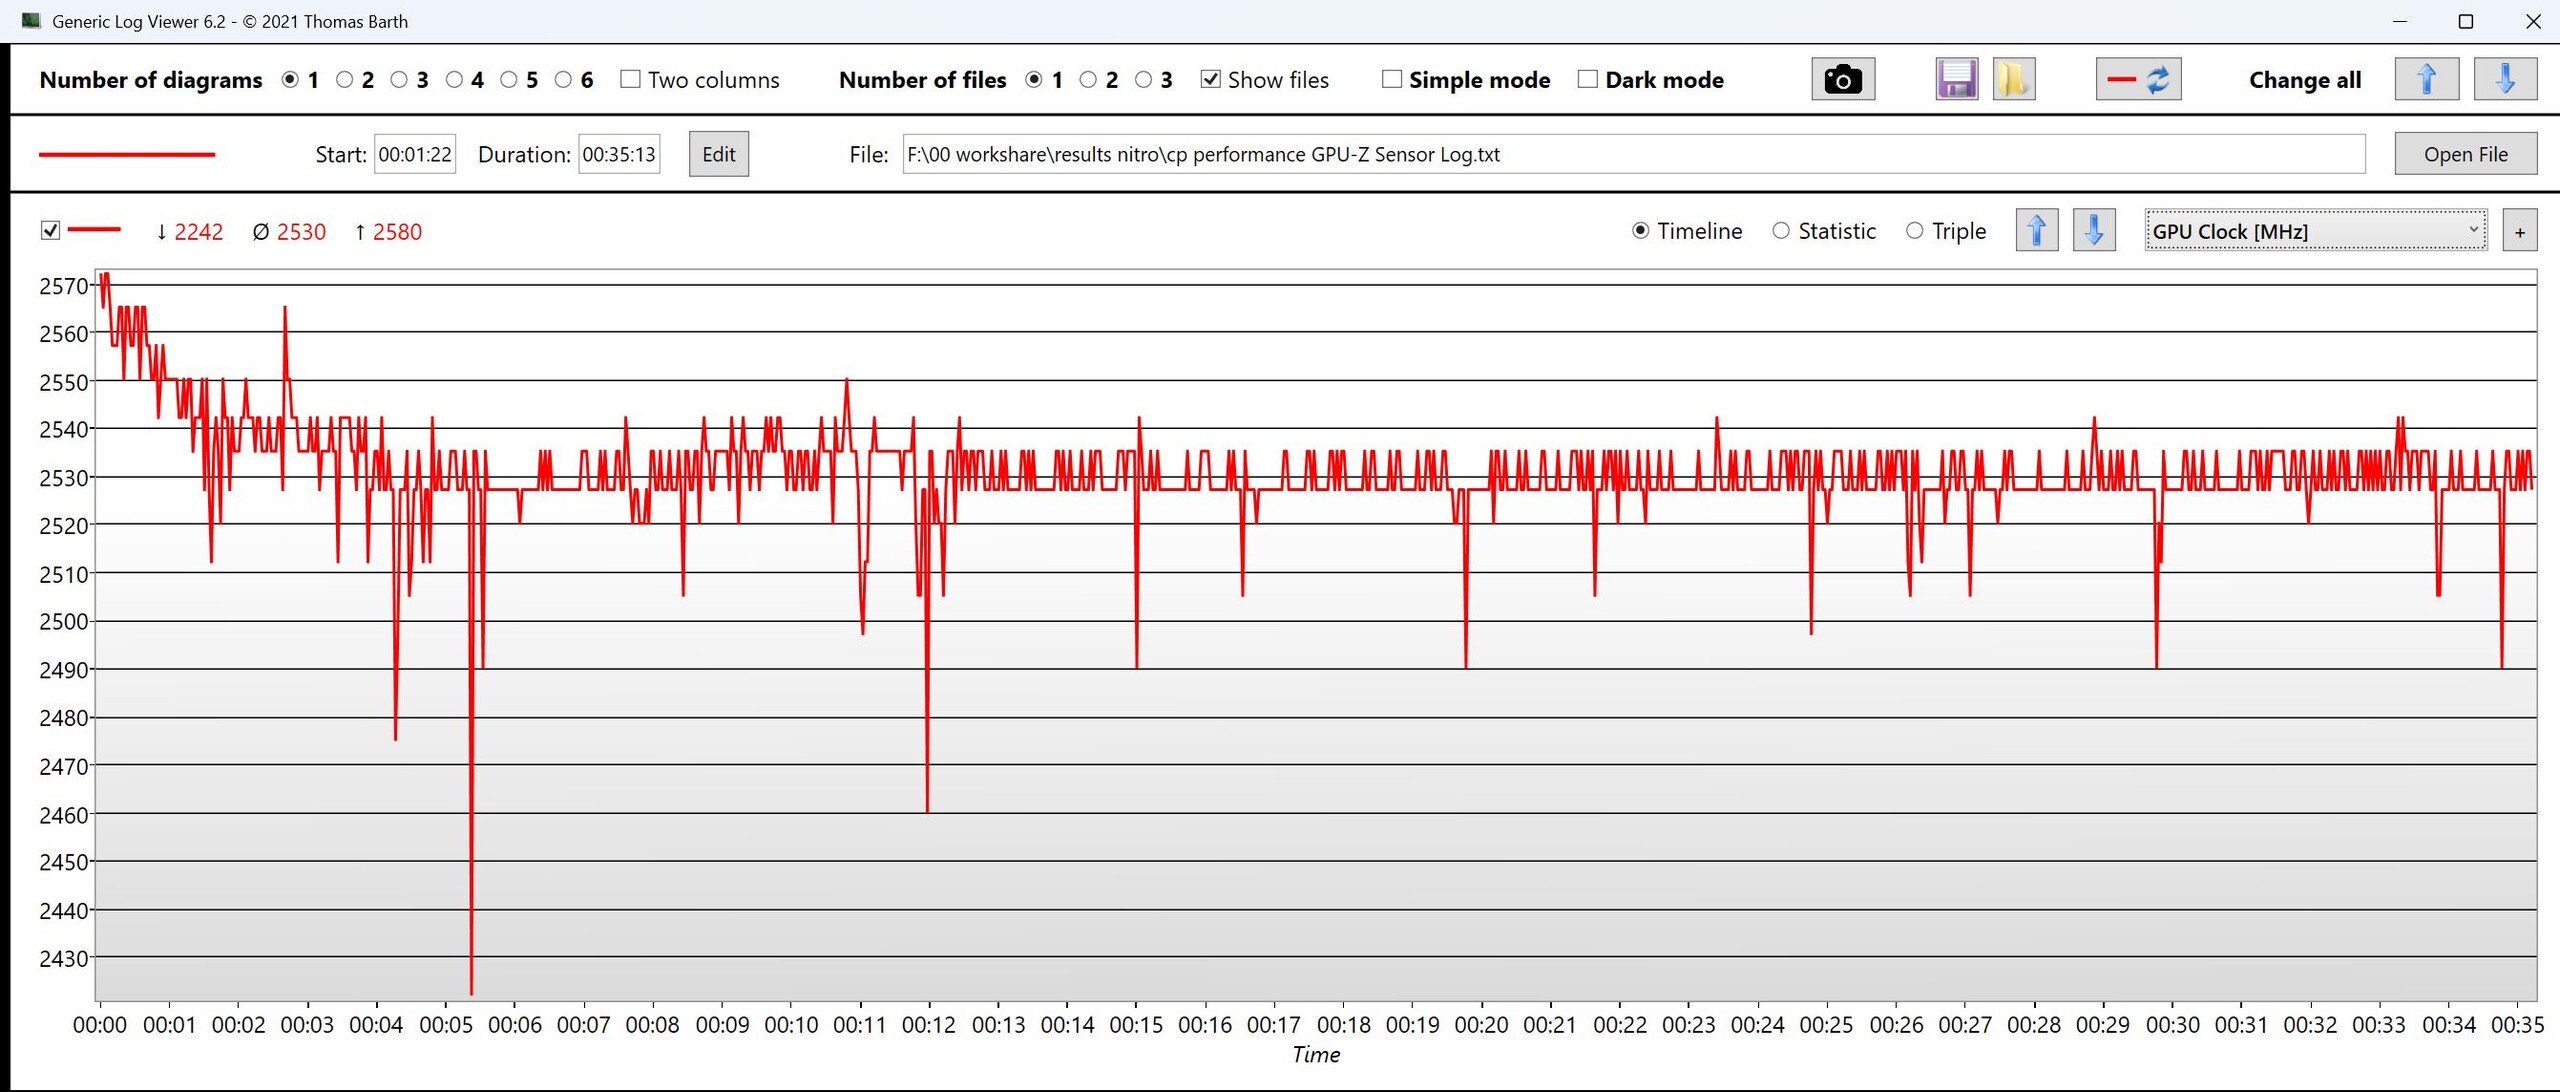
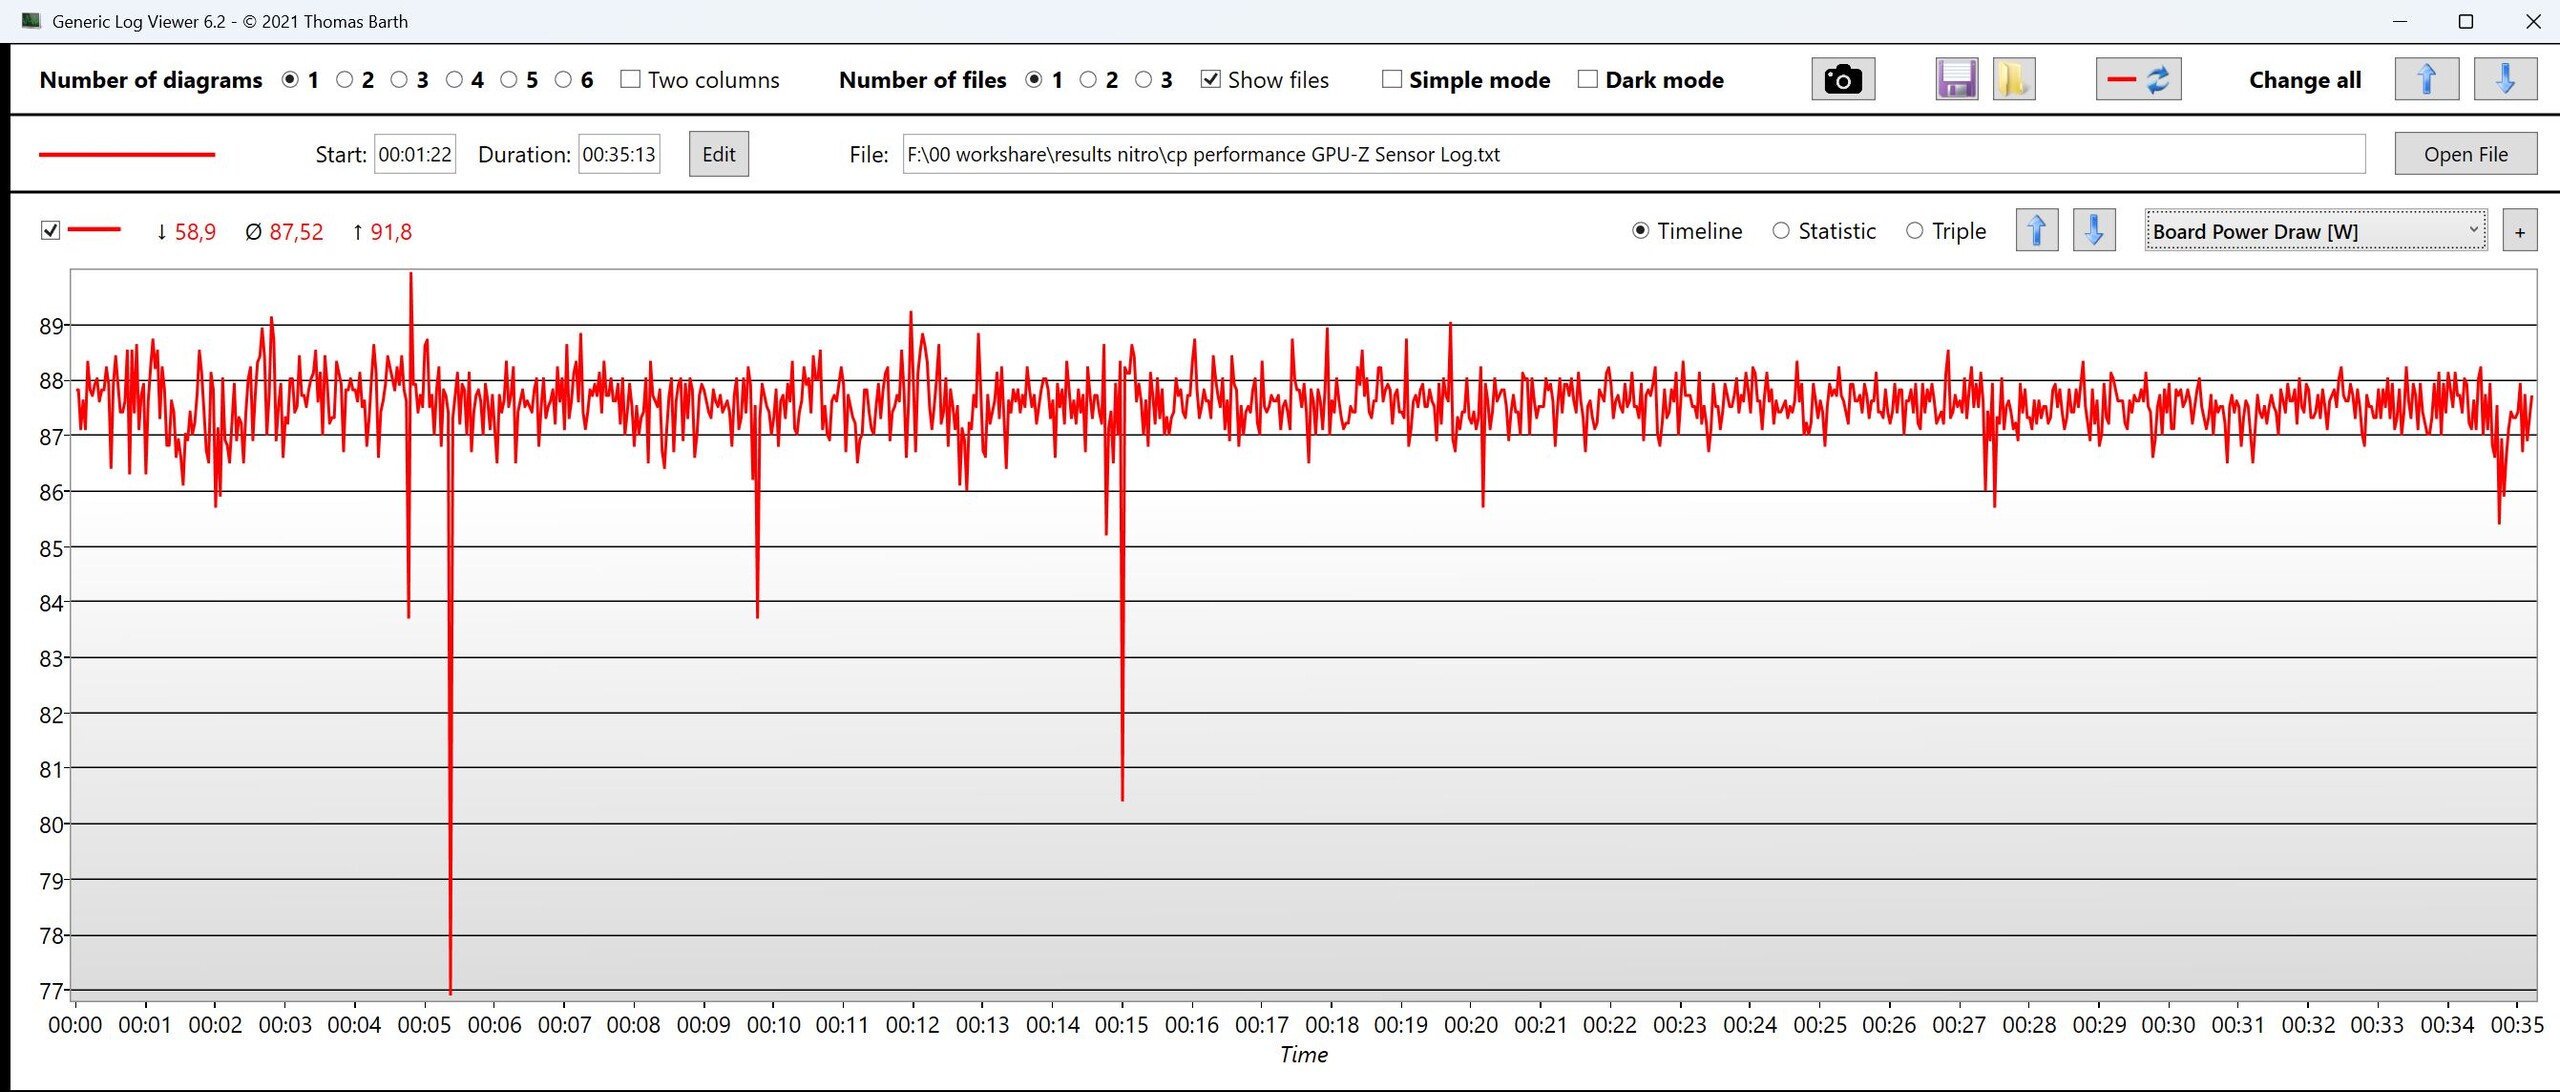
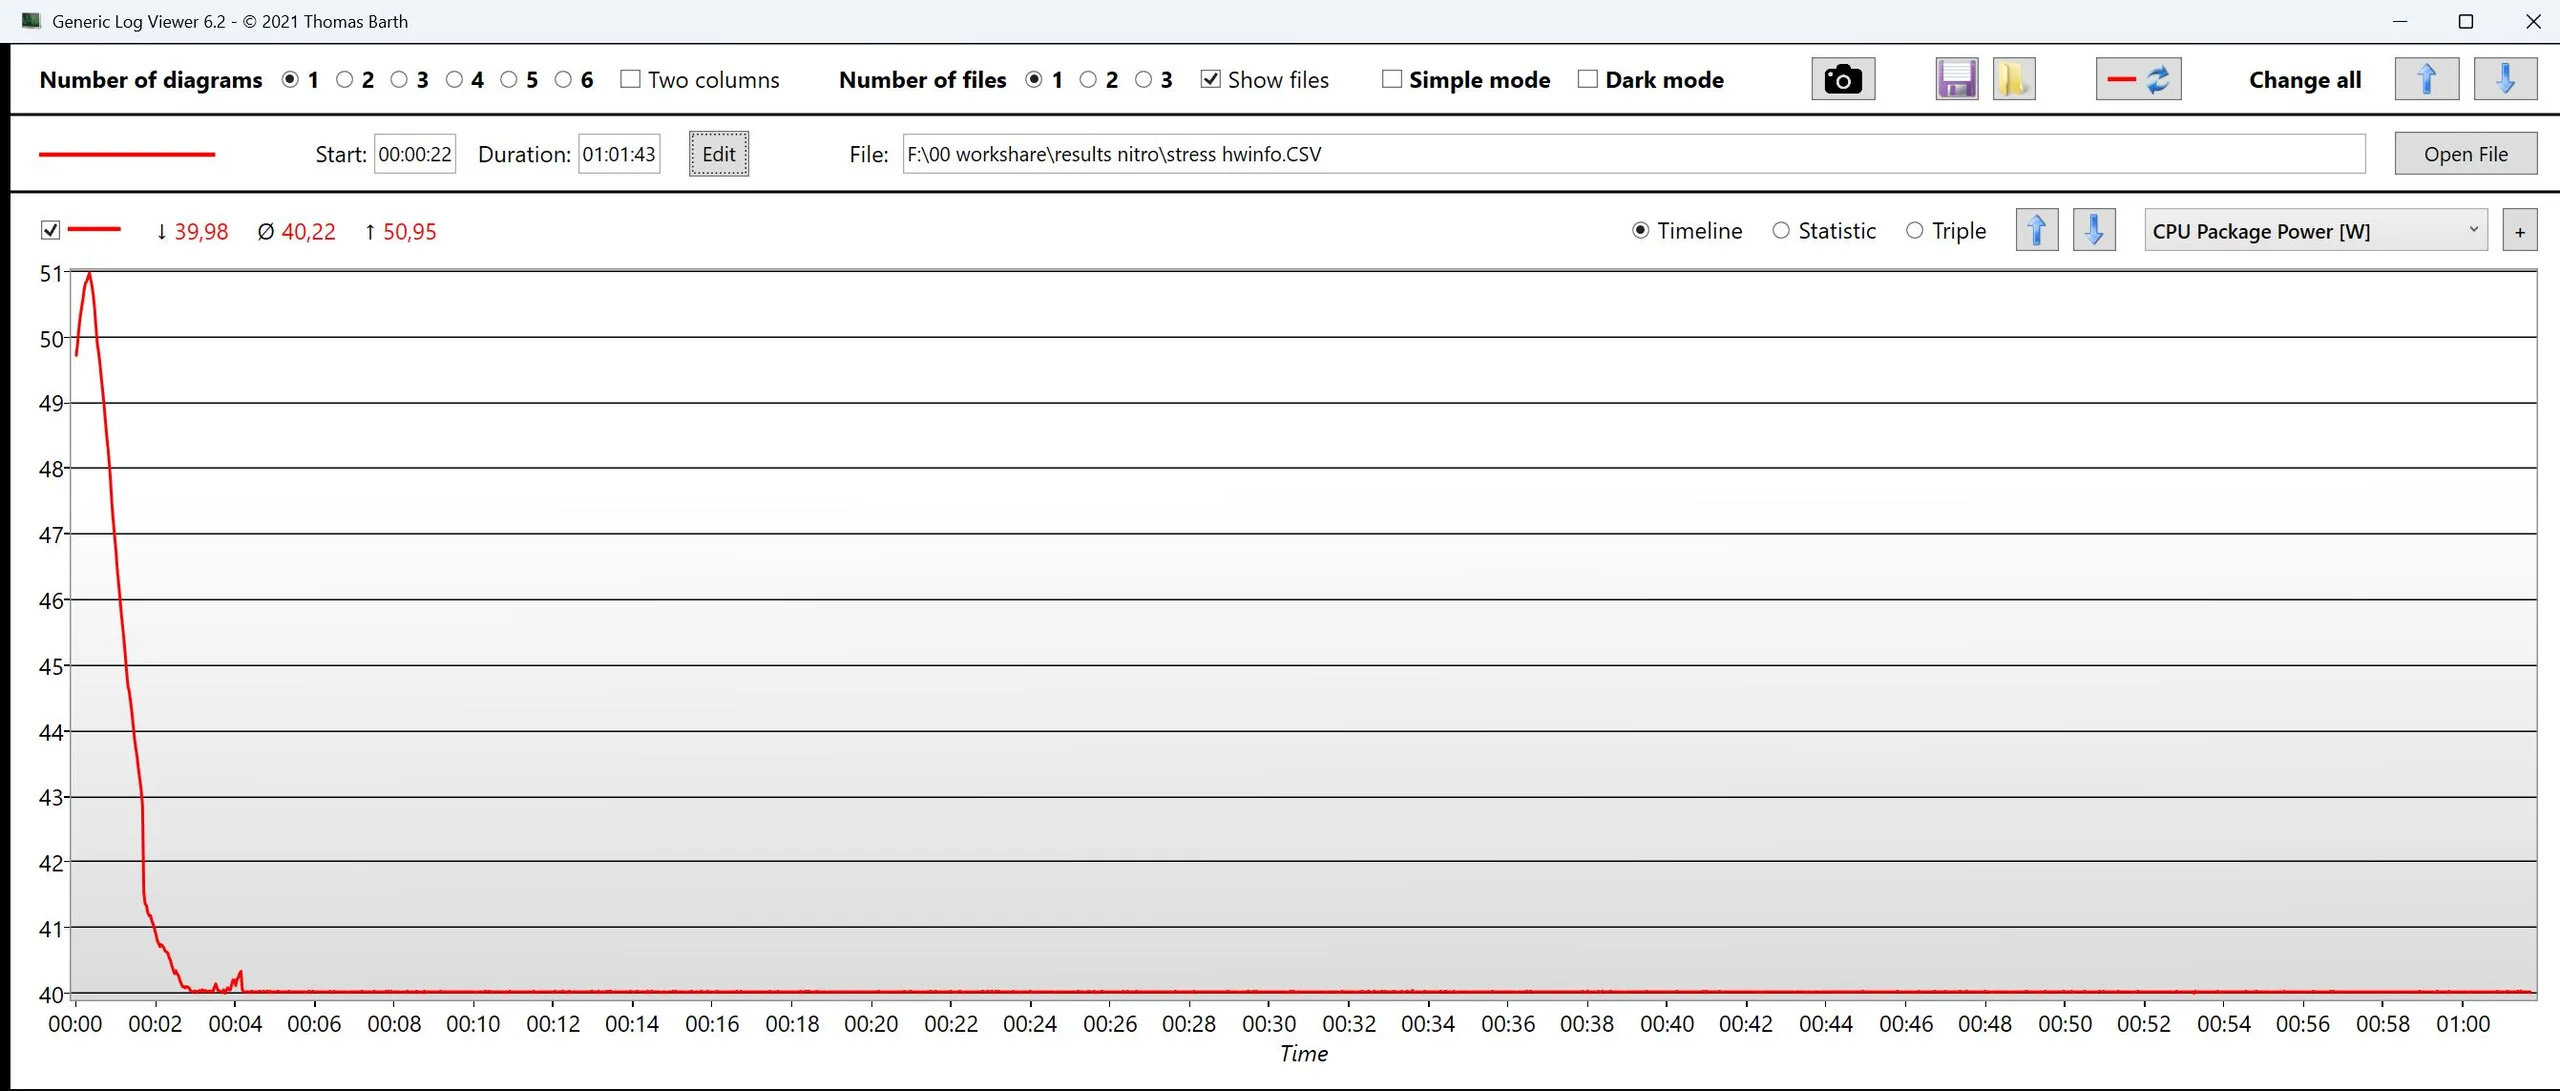
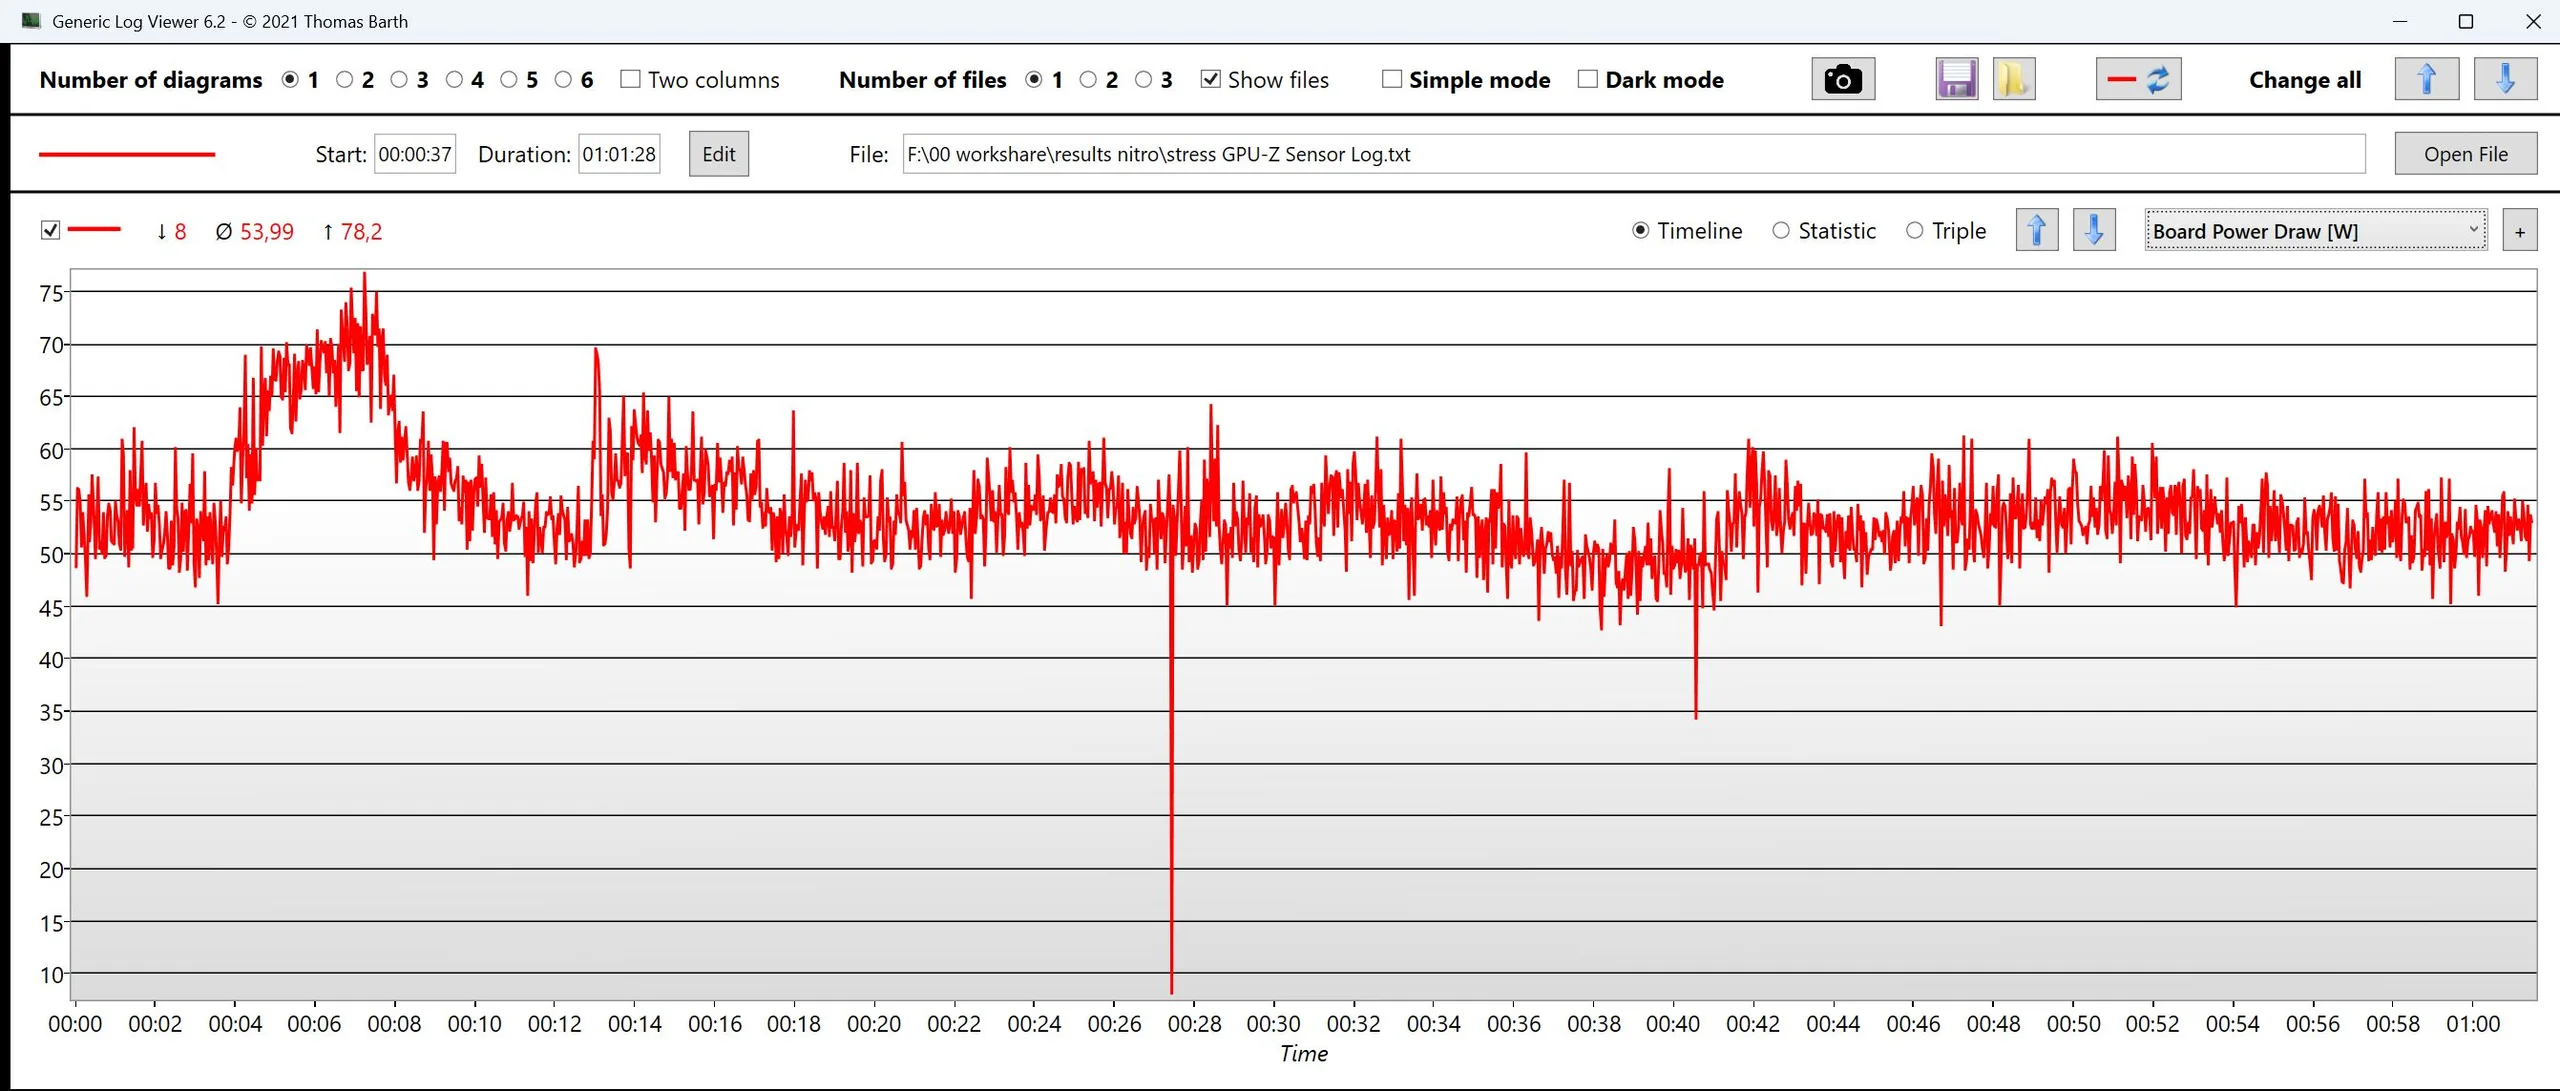
In the Cyberpunk 2077 loop, GPU power consumption stabilizes around 87 W, although a TGP of 95 W would be expected.
| Cyberpunk 2077 - 1920x1080 Ultra Preset (FSR off) | |
| Average of class Gaming (17.7 - 169.9, n=114, last 2 years) | |
| MSI Crosshair A17 HX D8WGKG | |
| HP Omen 17z-db100 | |
| Alienware 16X Aurora, RTX 5070 | |
| MSI Katana 17 HX B14WGK | |
| Lenovo LOQ 17IRX10 | |
| Acer Nitro v 17 (ANV17-41-R4CJ) | |
| GTA V - 1920x1080 Highest AA:4xMSAA + FX AF:16x | |
| MSI Crosshair A17 HX D8WGKG | |
| Alienware 16X Aurora, RTX 5070 | |
| Lenovo LOQ 17IRX10 | |
| Average of class Gaming (48.3 - 186.9, n=93, last 2 years) | |
| MSI Katana 17 HX B14WGK | |
| HP Omen 17z-db100 | |
| Acer Nitro v 17 (ANV17-41-R4CJ) | |
| Final Fantasy XV Benchmark - 1920x1080 High Quality | |
| Alienware 16X Aurora, RTX 5070 | |
| Average of class Gaming (41 - 215, n=94, last 2 years) | |
| MSI Crosshair A17 HX D8WGKG | |
| HP Omen 17z-db100 | |
| Lenovo LOQ 17IRX10 | |
| Acer Nitro v 17 (ANV17-41-R4CJ) | |
| Strange Brigade - 1920x1080 ultra AA:ultra AF:16 | |
| Average of class Gaming (76.3 - 456, n=86, last 2 years) | |
| Alienware 16X Aurora, RTX 5070 | |
| HP Omen 17z-db100 | |
| Lenovo LOQ 17IRX10 | |
| Acer Nitro v 17 (ANV17-41-R4CJ) | |
| Dota 2 Reborn - 1920x1080 ultra (3/3) best looking | |
| MSI Crosshair A17 HX D8WGKG | |
| Alienware 16X Aurora, RTX 5070 | |
| Lenovo LOQ 17IRX10 | |
| Average of class Gaming (84.8 - 248, n=106, last 2 years) | |
| MSI Katana 17 HX B14WGK | |
| HP Omen 17z-db100 | |
| Acer Nitro v 17 (ANV17-41-R4CJ) | |
Cyberpunk 2077 ultra FPS diagram
| low | med. | high | ultra | QHD DLSS | QHD | 4K DLSS | 4K | |
|---|---|---|---|---|---|---|---|---|
| GTA V (2015) | 178.3 | 170.2 | 157.8 | 105.2 | 100.5 | 64 | ||
| Dota 2 Reborn (2015) | 147.9 | 131.7 | 128 | 123.1 | 115.1 | |||
| Final Fantasy XV Benchmark (2018) | 183.9 | 159.2 | 122.6 | 97.3 | 52.2 | |||
| X-Plane 11.11 (2018) | 97.1 | 88.5 | 73.5 | 60 | ||||
| Strange Brigade (2018) | 332 | 277 | 259 | 237 | 161.9 | 87.8 | ||
| Baldur's Gate 3 (2023) | 160 | 145 | 130 | 127 | 128 | 85.6 | 73 | 44 |
| Cyberpunk 2077 (2023) | 123.4 | 121.3 | 108.1 | 95.6 | 71.2 | 61.3 | 34.8 | 26.7 |
| Doom: The Dark Ages (2025) | 88.4 | 75 | 69 | 67 | 65.4 | 46 | 14.2 | 12 |
| F1 25 (2025) | 156.8 | 147.2 | 142.5 | 26.9 |
Emissions & Energy – How loud is the Acer Nitro V 17 during gaming?
Noise
At idle, the Nitro V 17 is usually silent, and even during 3DMark 06 testing, fan noise measures just 34 dB. During gaming, the V 17 remains one of the quietest systems in its class.
In sleep mode, however, the fans periodically spin up for short bursts. The same behavior occurs when powering the system on or off.
Noise level
| Idle |
| 23 / 23 / 23 dB(A) |
| Load |
| 34.23 / 47 dB(A) |
 | ||
30 dB silent 40 dB(A) audible 50 dB(A) loud |
||
min: | ||
| Acer Nitro v 17 (ANV17-41-R4CJ) R7 260, GeForce RTX 5070 Laptop | HP Omen 17z-db100 Ryzen AI 7 350, GeForce RTX 5070 Laptop | Lenovo LOQ 17IRX10 i7-14700HX, GeForce RTX 5070 Laptop | MSI Crosshair A17 HX D8WGKG R9 8940HX, GeForce RTX 5070 Laptop | MSI Katana 17 HX B14WGK i7-14650HX, GeForce RTX 5070 Laptop | Alienware 16X Aurora, RTX 5070 Ultra 9 275HX, GeForce RTX 5070 Laptop | |
|---|---|---|---|---|---|---|
| Noise | -6% | -24% | -37% | -32% | -5% | |
| off / environment * (dB) | 23 | 23.4 -2% | 24 -4% | 24 -4% | 25 -9% | 23.7 -3% |
| Idle Minimum * (dB) | 23 | 23.7 -3% | 25 -9% | 25 -9% | 31 -35% | 23.9 -4% |
| Idle Average * (dB) | 23 | 23.7 -3% | 26 -13% | 30 -30% | 32 -39% | 23.9 -4% |
| Idle Maximum * (dB) | 23 | 26.4 -15% | 32 -39% | 47 -104% | 34 -48% | 26.1 -13% |
| Load Average * (dB) | 34.23 | 33.7 2% | 56 -64% | 57 -67% | 50 -46% | 26.8 22% |
| Cyberpunk 2077 ultra * (dB) | 47 | 49.8 -6% | 55 -17% | 57 -21% | 58 -23% | 51.8 -10% |
| Load Maximum * (dB) | 47 | 52.5 -12% | 56 -19% | 58 -23% | 59 -26% | 58 -23% |
* ... smaller is better
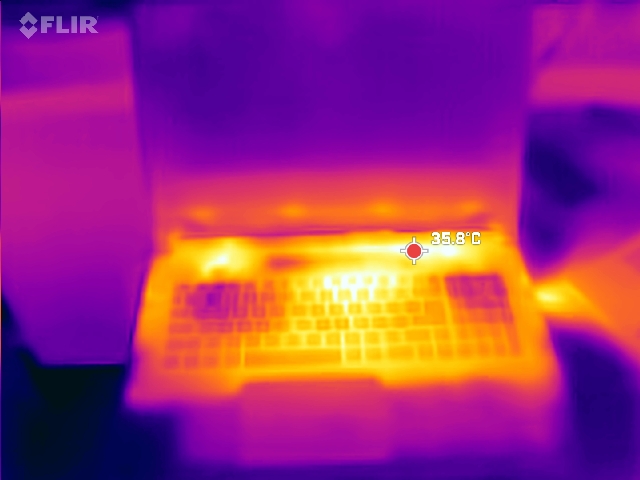
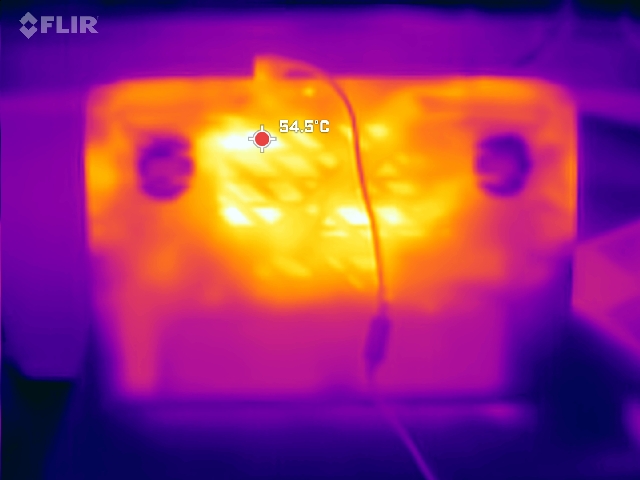
Temperature
Gaming hot spots reach around 40 °C, while the underside can heat up to 50 °C under maximum load. The keyboard deck stays cooler overall, especially the palm rests and WASD area.
(±) The maximum temperature on the upper side is 42 °C / 108 F, compared to the average of 40.4 °C / 105 F, ranging from 21.2 to 68.8 °C for the class Gaming.
(-) The bottom heats up to a maximum of 51 °C / 124 F, compared to the average of 43.2 °C / 110 F
(+) In idle usage, the average temperature for the upper side is 22.7 °C / 73 F, compared to the device average of 33.9 °C / 93 F.
(±) 3: The average temperature for the upper side is 32.6 °C / 91 F, compared to the average of 33.9 °C / 93 F for the class Gaming.
(+) The palmrests and touchpad are cooler than skin temperature with a maximum of 27 °C / 80.6 F and are therefore cool to the touch.
(±) The average temperature of the palmrest area of similar devices was 28.8 °C / 83.8 F (+1.8 °C / 3.2 F).
| Acer Nitro v 17 (ANV17-41-R4CJ) R7 260, GeForce RTX 5070 Laptop | HP Omen 17z-db100 Ryzen AI 7 350, GeForce RTX 5070 Laptop | Lenovo LOQ 17IRX10 i7-14700HX, GeForce RTX 5070 Laptop | MSI Crosshair A17 HX D8WGKG R9 8940HX, GeForce RTX 5070 Laptop | MSI Katana 17 HX B14WGK i7-14650HX, GeForce RTX 5070 Laptop | Alienware 16X Aurora, RTX 5070 Ultra 9 275HX, GeForce RTX 5070 Laptop | |
|---|---|---|---|---|---|---|
| Heat | 7% | -14% | -31% | -24% | -10% | |
| Maximum Upper Side * (°C) | 42 | 39.8 5% | 45 -7% | 51 -21% | 52 -24% | 51 -21% |
| Maximum Bottom * (°C) | 51 | 47 8% | 49 4% | 49 4% | 56 -10% | 45.6 11% |
| Idle Upper Side * (°C) | 24 | 23.2 3% | 32 -33% | 40 -67% | 33 -38% | 29.8 -24% |
| Idle Bottom * (°C) | 26 | 23.2 11% | 31 -19% | 36 -38% | 32 -23% | 27.4 -5% |
* ... smaller is better
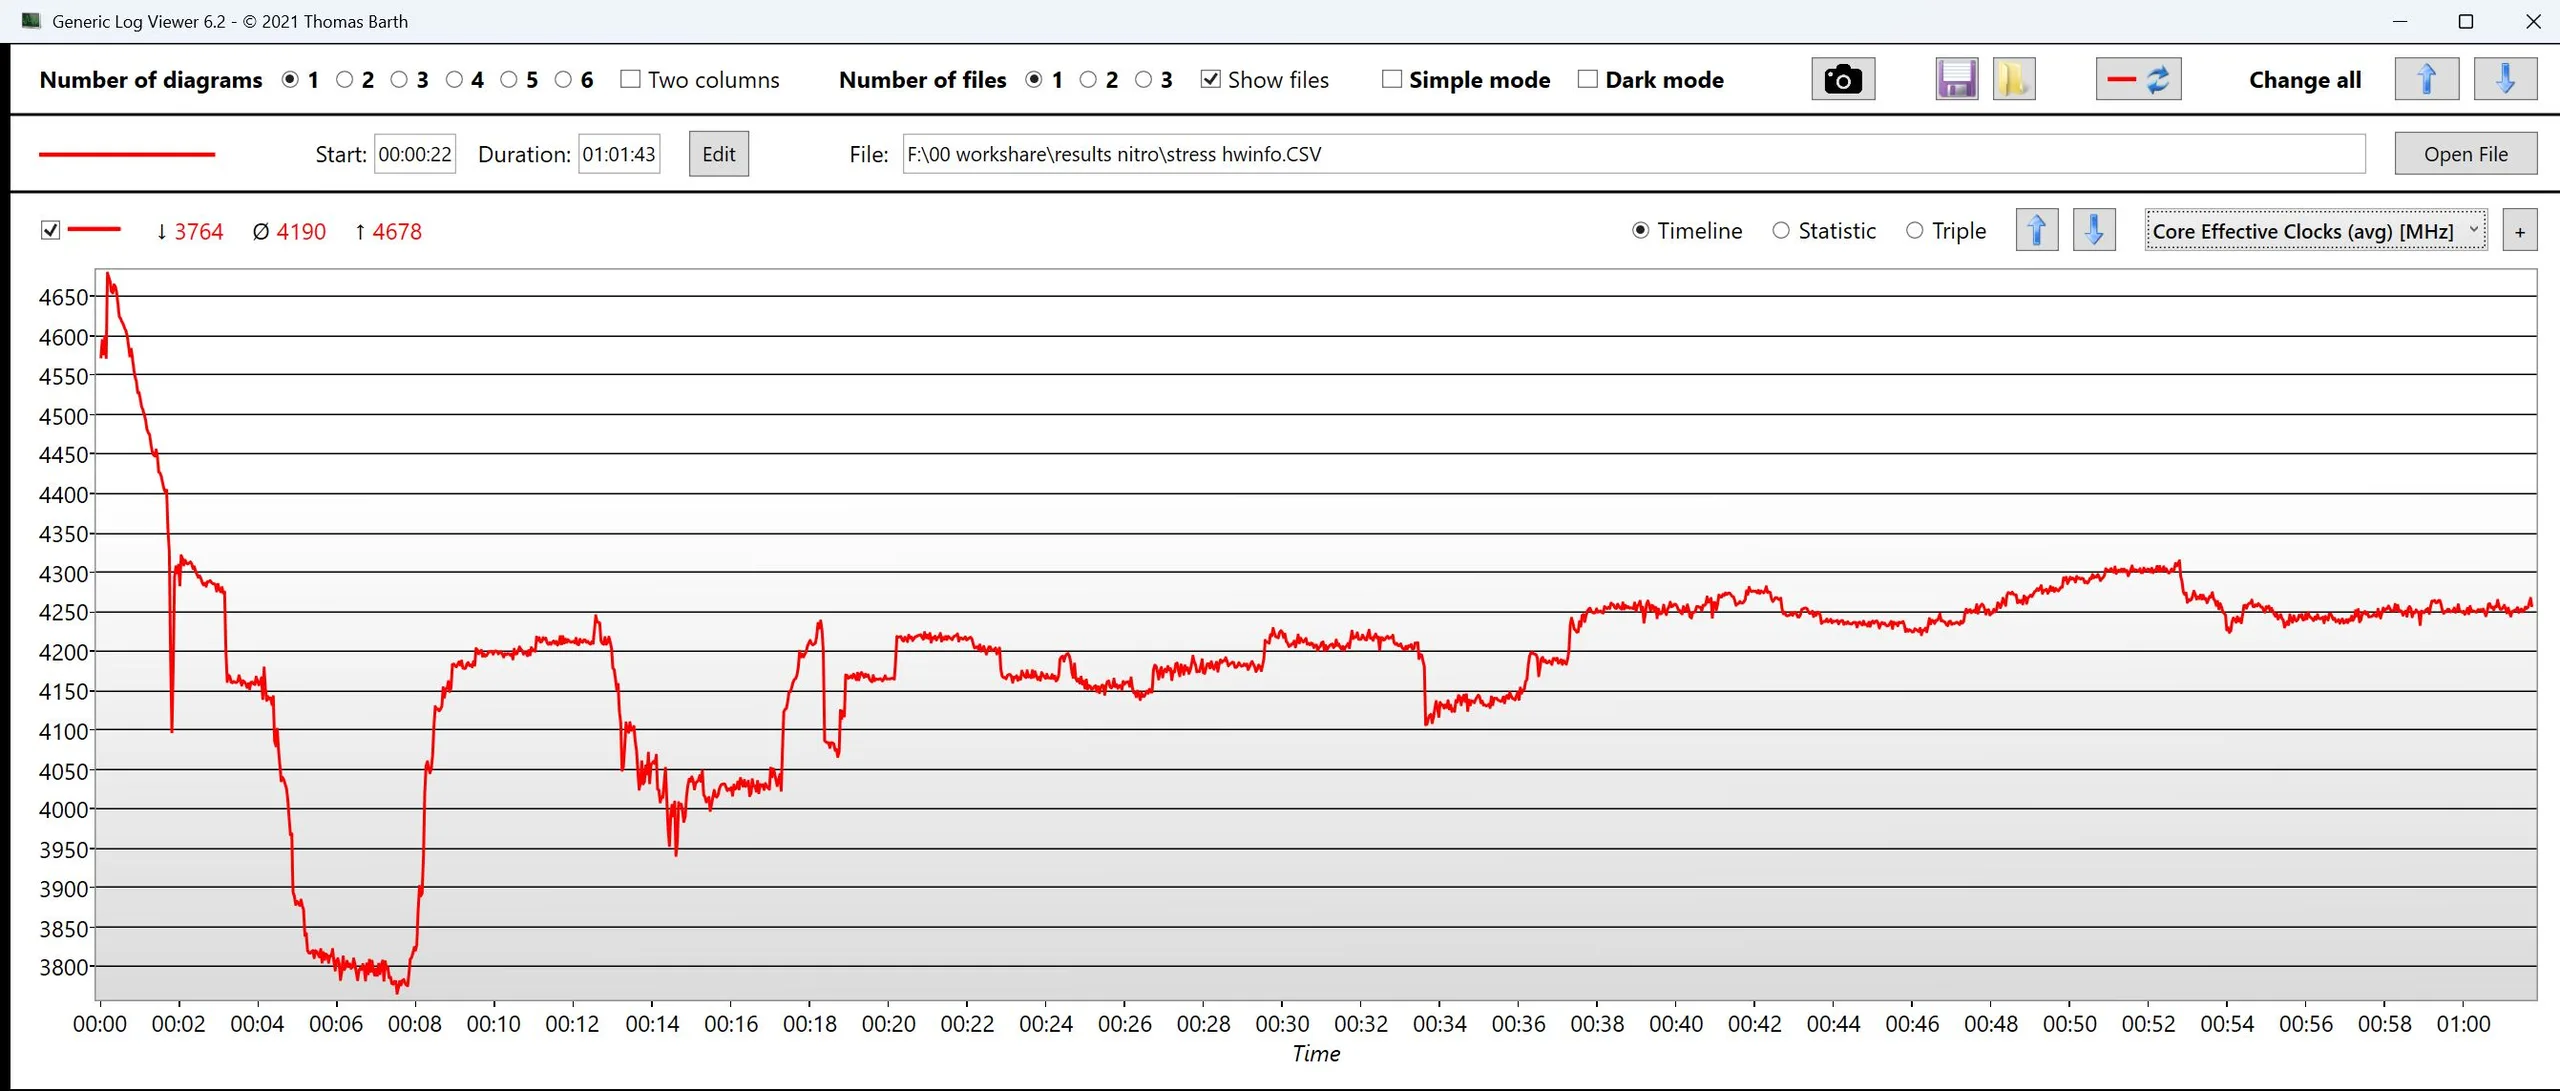
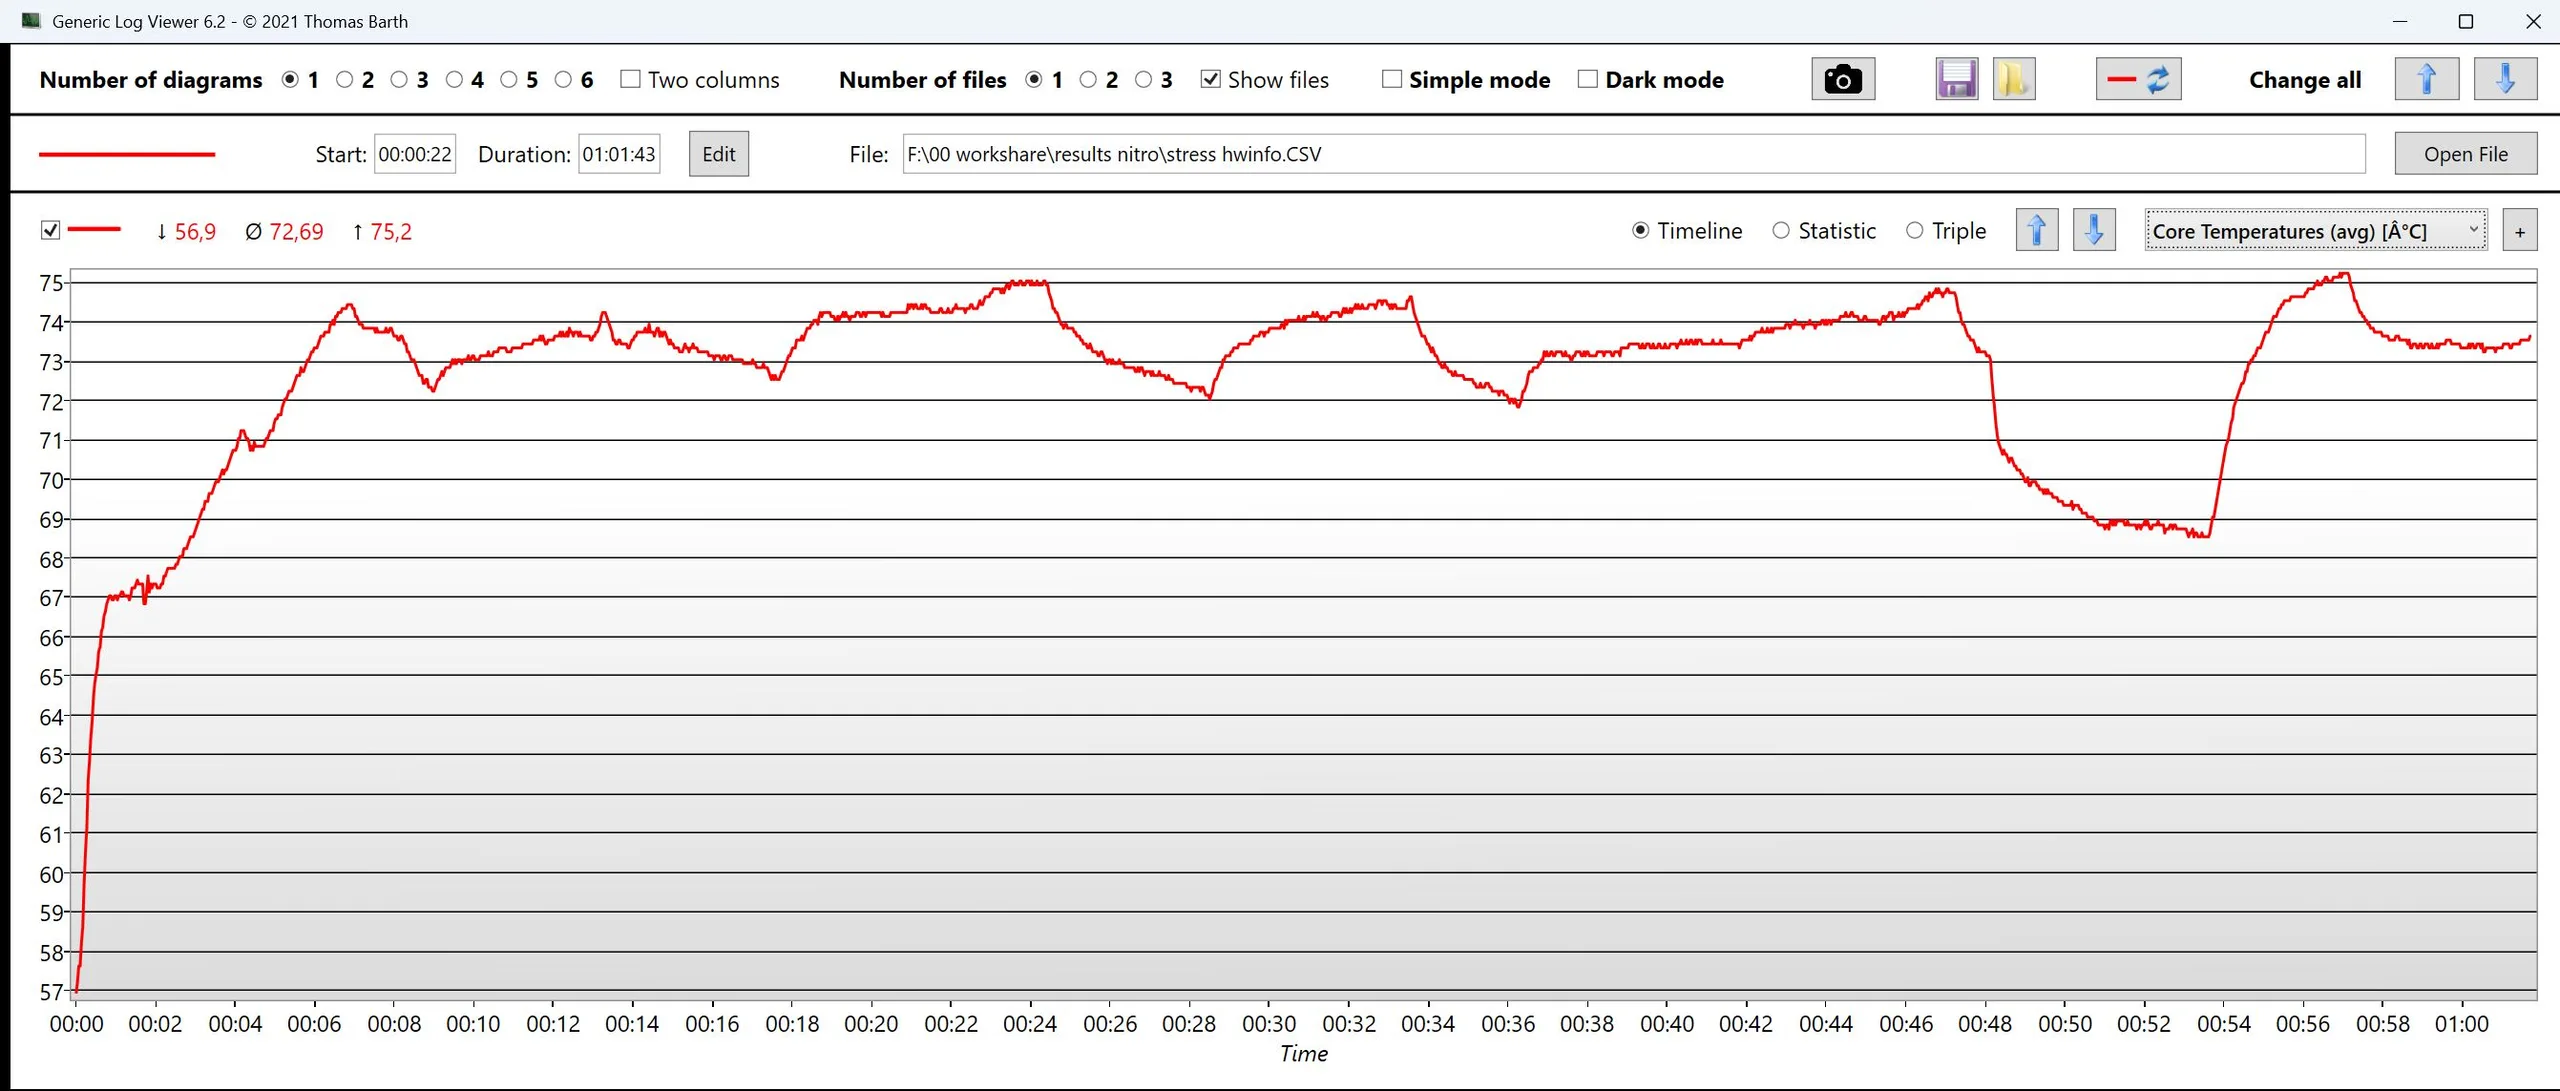
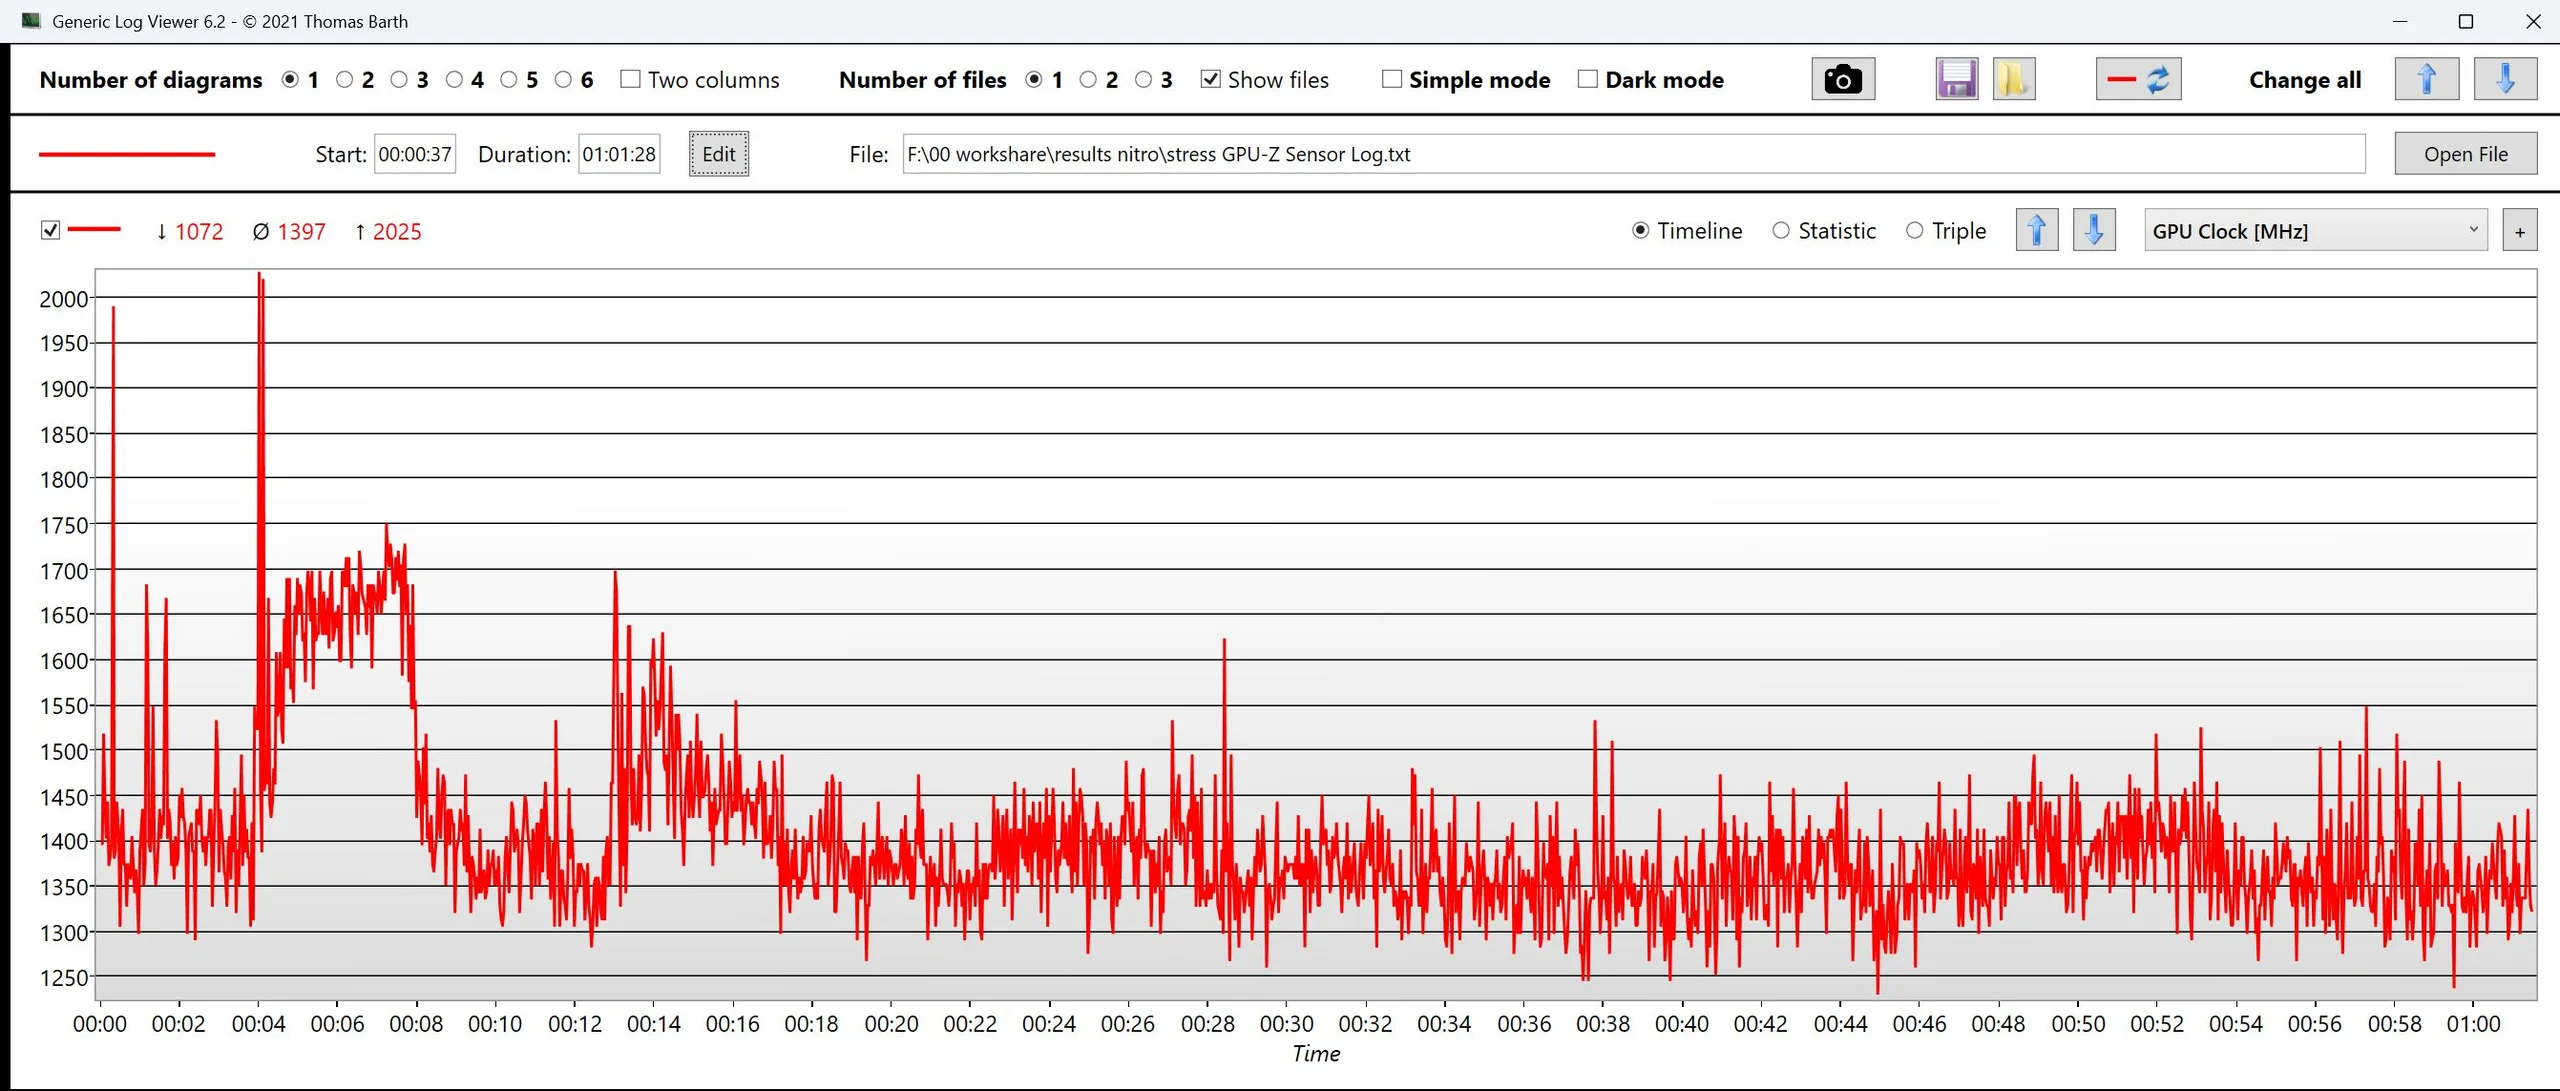
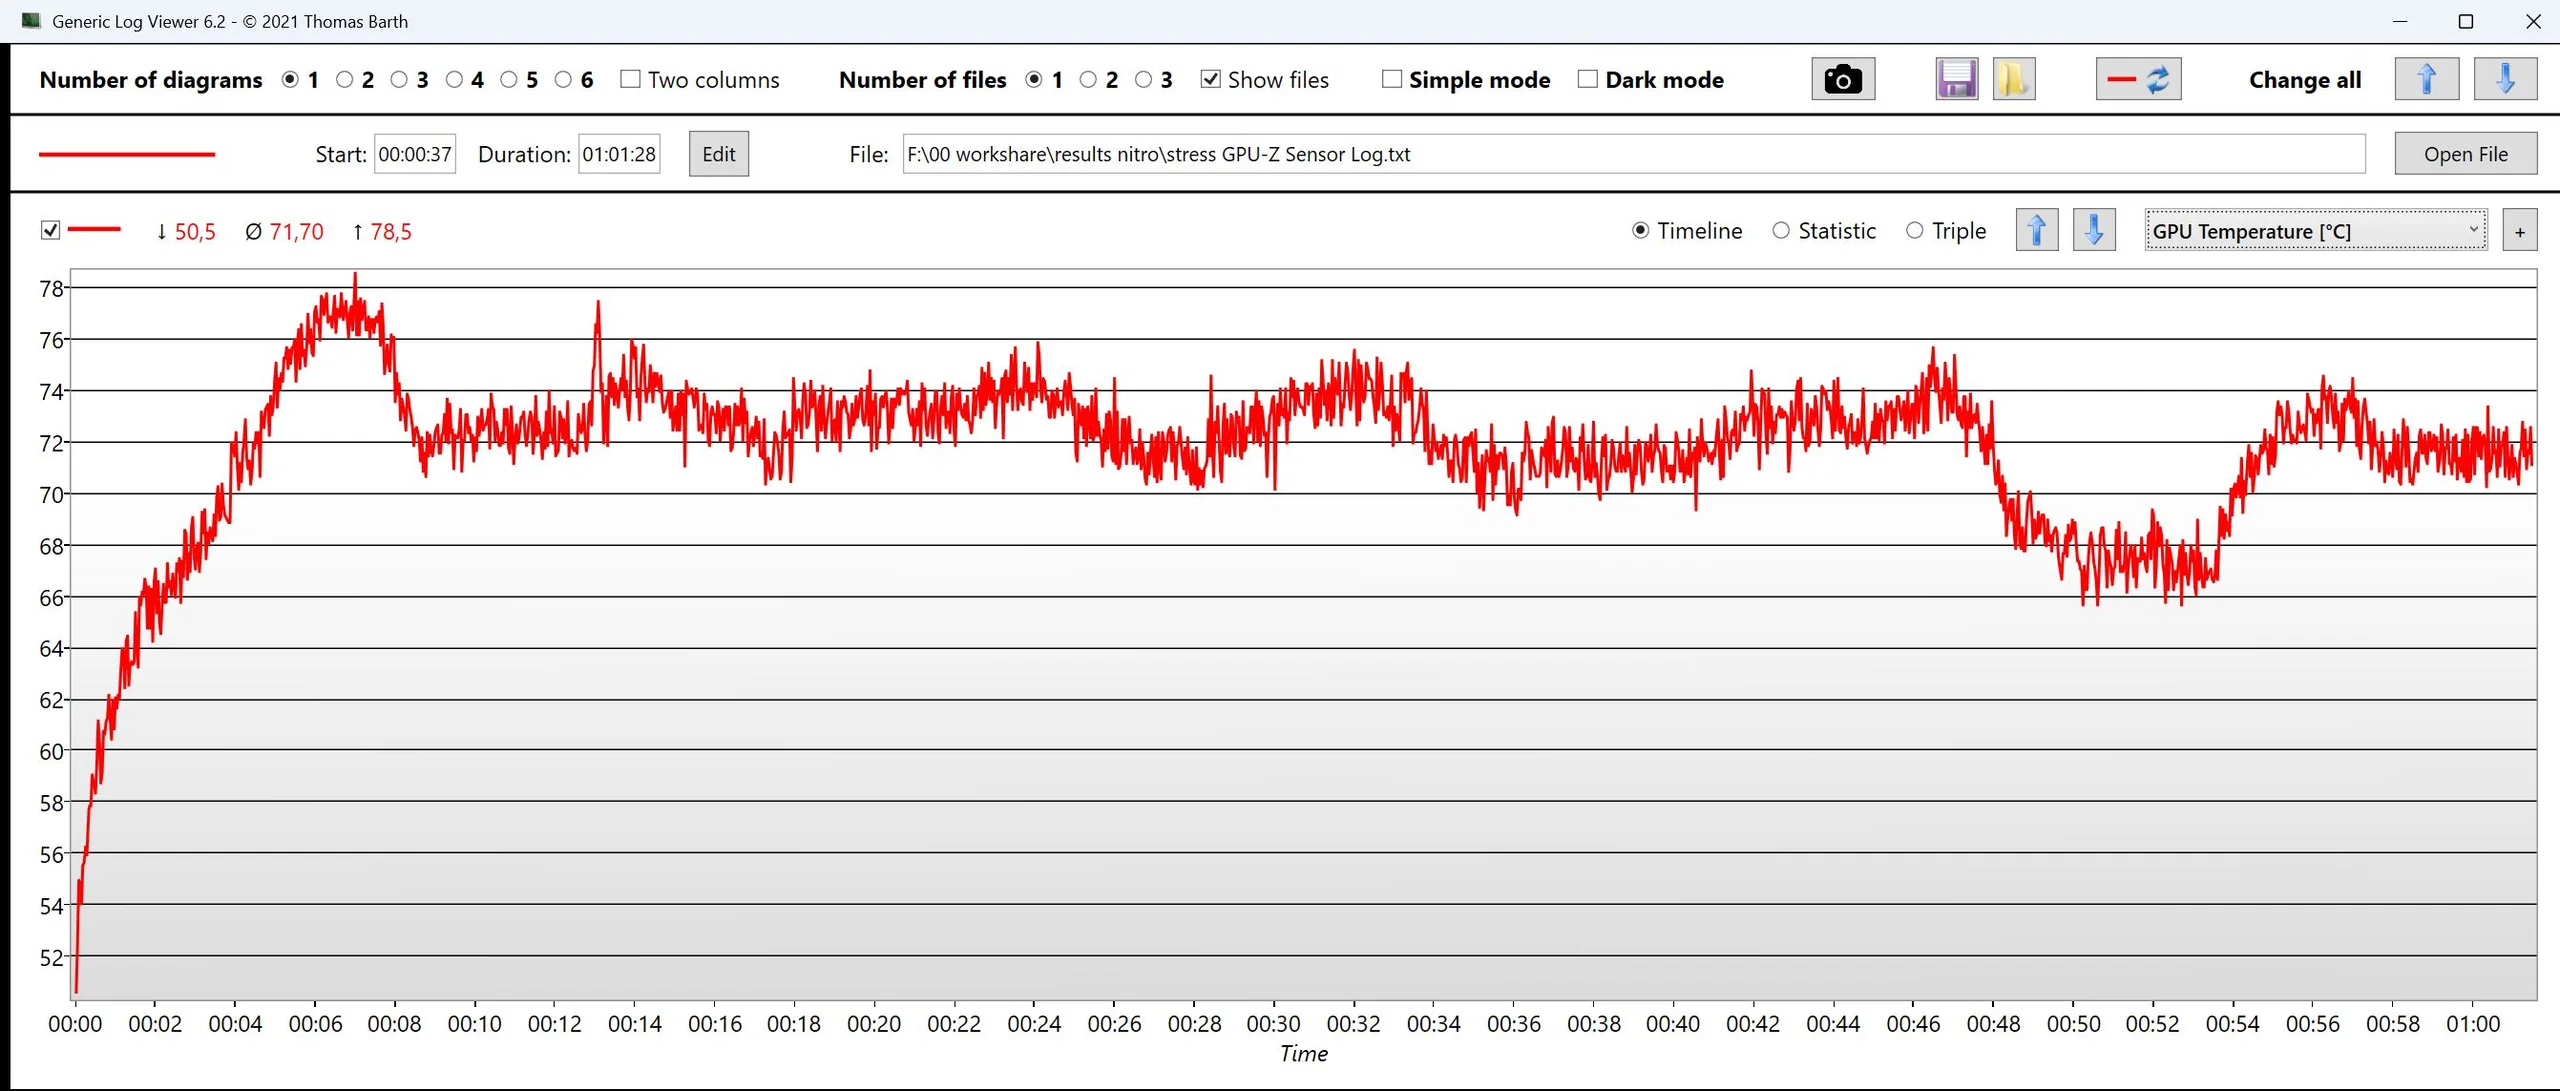
| CPU Clock (GHz) | GPU Clock (MHz) | Average CPU Temperature (°C) | Average GPU Temperature (°C) | |
| Prime95 + FurMark Stress | 4.2 | 1400 | 73 | 72 |
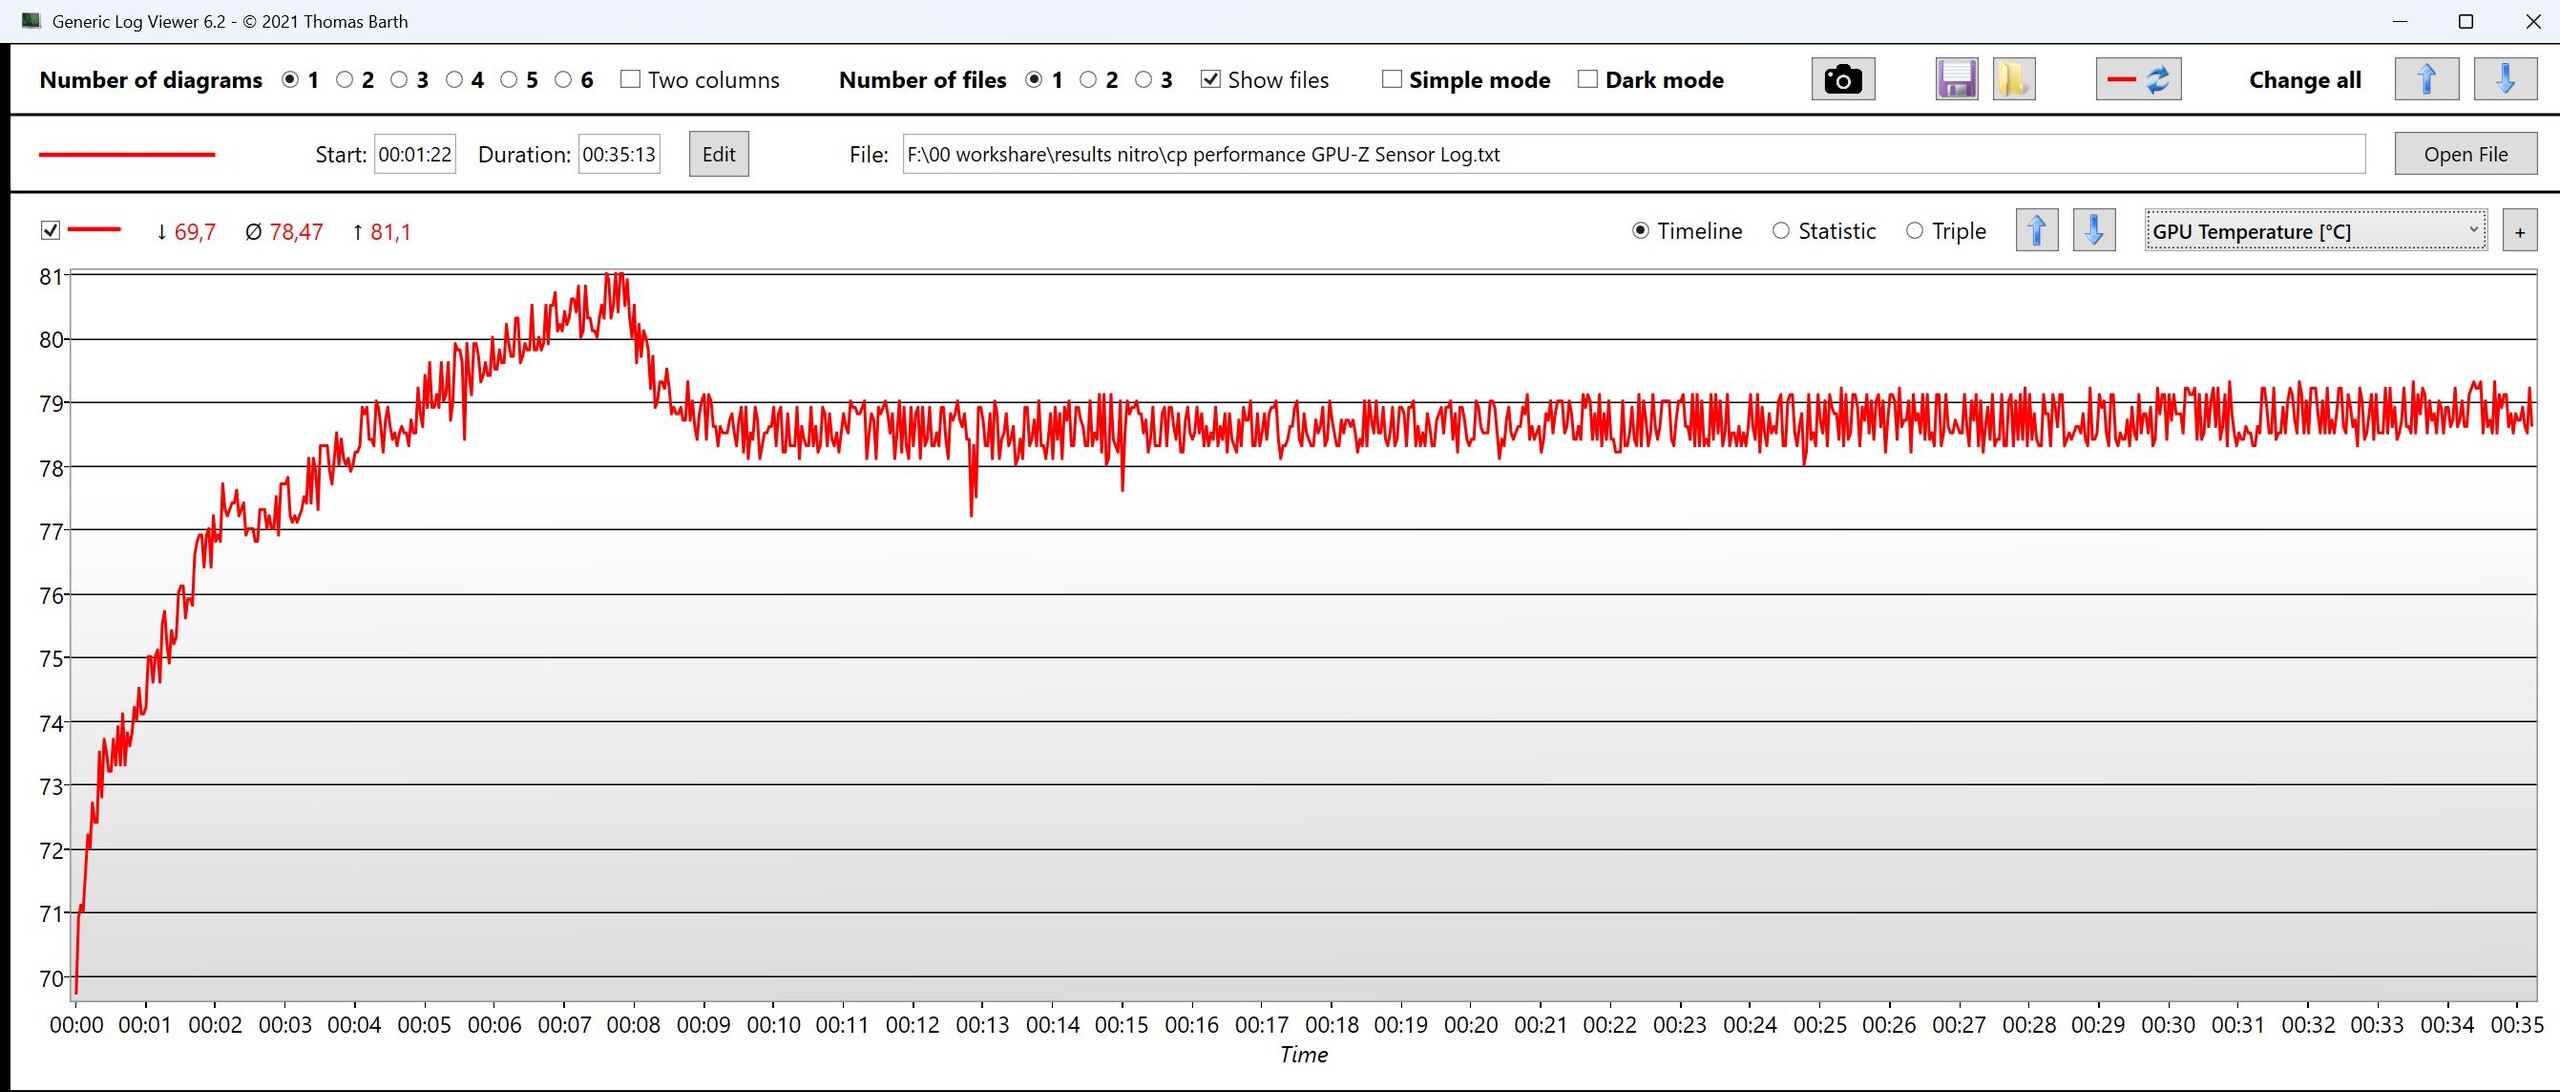
| Cyberpunk 2077 Stress | 2.6 | 2530 | 62 | 78 |
Speakers
Balanced highs and linear mids, but overall volume is low and bass is virtually nonexistent. The speakers deliver exactly what is expected from a budget gaming laptop.
Acer Nitro v 17 (ANV17-41-R4CJ) audio analysis
(±) | speaker loudness is average but good (79.77 dB)
Bass 100 - 315 Hz
(-) | nearly no bass - on average 22.2% lower than median
(-) | bass is not linear (15.1% delta to prev. frequency)
Mids 400 - 2000 Hz
(±) | higher mids - on average 7.2% higher than median
(+) | mids are linear (5.9% delta to prev. frequency)
Highs 2 - 16 kHz
(+) | balanced highs - only 3.9% away from median
(+) | highs are linear (6.8% delta to prev. frequency)
Overall 100 - 16.000 Hz
(±) | linearity of overall sound is average (20.3% difference to median)
Compared to same class
» 72% of all tested devices in this class were better, 6% similar, 23% worse
» The best had a delta of 6%, average was 18%, worst was 132%
Compared to all devices tested
» 53% of all tested devices were better, 8% similar, 39% worse
» The best had a delta of 4%, average was 23%, worst was 134%
MSI Katana 17 HX B14WGK audio analysis
(+) | speakers can play relatively loud (84 dB)
Bass 100 - 315 Hz
(-) | nearly no bass - on average 19% lower than median
(±) | linearity of bass is average (10.6% delta to prev. frequency)
Mids 400 - 2000 Hz
(±) | higher mids - on average 8.7% higher than median
(±) | linearity of mids is average (7.5% delta to prev. frequency)
Highs 2 - 16 kHz
(+) | balanced highs - only 4.6% away from median
(±) | linearity of highs is average (9.7% delta to prev. frequency)
Overall 100 - 16.000 Hz
(±) | linearity of overall sound is average (20.6% difference to median)
Compared to same class
» 74% of all tested devices in this class were better, 5% similar, 21% worse
» The best had a delta of 6%, average was 18%, worst was 132%
Compared to all devices tested
» 55% of all tested devices were better, 8% similar, 37% worse
» The best had a delta of 4%, average was 23%, worst was 134%
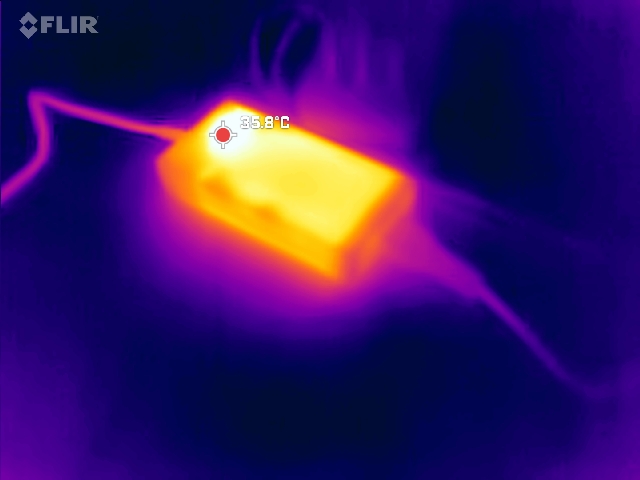
Power consumption
Under gaming load, the Nitro V 17 consumes noticeably less power than slightly more powerful competitors. The included 135 W power adapter further underlines Acer’s focus on quiet, efficient gaming.
In sleep mode, however, power draw is far too high at 8 W due to the periodically spinning fans. When using an external monitor via HDMI, the dedicated GPU remains active
| Off / Standby | |
| Idle | |
| Load |
|
Key:
min: | |
| Acer Nitro v 17 (ANV17-41-R4CJ) R7 260, GeForce RTX 5070 Laptop, Western Digital PC SN5000S SDEQNSJ-1T00, IPS, 1920x1080, 17.3" | HP Omen 17z-db100 Ryzen AI 7 350, GeForce RTX 5070 Laptop, TeamGroup T-Force G50 TM8FFE004T, IPS, 2560x1440, 17.3" | Lenovo LOQ 17IRX10 i7-14700HX, GeForce RTX 5070 Laptop, WD PC SN7100S SDFPMSL-1T00-1101, IPS, 1920x1080, 17.3" | MSI Crosshair A17 HX D8WGKG R9 8940HX, GeForce RTX 5070 Laptop, Samsung PM9C1 MZVL81T0HELB-00BTW, IPS, 2560x1600, 17" | MSI Katana 17 HX B14WGK i7-14650HX, GeForce RTX 5070 Laptop, Micron 2500 1TB MTFDKBA1T0QGN, IPS, 2560x1440, 17.3" | Alienware 16X Aurora, RTX 5070 Ultra 9 275HX, GeForce RTX 5070 Laptop, , IPS, 2560x1600, 16" | Average NVIDIA GeForce RTX 5070 Laptop | Average of class Gaming | |
|---|---|---|---|---|---|---|---|---|
| Power Consumption | -52% | -100% | -192% | -74% | -127% | -68% | -97% | |
| Idle Minimum * (Watt) | 6.9 | 6.2 10% | 14.4 -109% | 32 -364% | 9.7 -41% | 20.1 -191% | 10.8 ? -57% | 13 ? -88% |
| Idle Average * (Watt) | 10 | 19.1 -91% | 17.2 -72% | 36 -260% | 15 -50% | 27.6 -176% | 15.4 ? -54% | 18.7 ? -87% |
| Idle Maximum * (Watt) | 10 | 19.3 -93% | 28 -180% | 47 -370% | 23.7 -137% | 31.8 -218% | 21 ? -110% | 24.3 ? -143% |
| Load Average * (Watt) | 64 | 91 -42% | 158 -147% | 132 -106% | 126 -97% | 102.7 -60% | 98.7 ? -54% | 110.2 ? -72% |
| Cyberpunk 2077 ultra * (Watt) | 128 | 175.9 -37% | 203 -59% | 222 -73% | 205 -60% | 217 -70% | ||
| Cyberpunk 2077 ultra external monitor * (Watt) | 128 | 173 -35% | 199.3 -56% | 216 -69% | 202 -58% | 192.3 -50% | ||
| Load Maximum * (Watt) | 131 | 227.9 -74% | 232 -77% | 261 -99% | 227 -73% | 292 -123% | 218 ? -66% | 258 ? -97% |
* ... smaller is better
Power consumption Cyberpunk / Stresstest
Power consumption with external monitor
Battery life
The 76 Wh battery is average in size and delivers around four and a half hours of web browsing.
| Acer Nitro v 17 (ANV17-41-R4CJ) R7 260, GeForce RTX 5070 Laptop, 76 Wh | HP Omen 17z-db100 Ryzen AI 7 350, GeForce RTX 5070 Laptop, 83 Wh | Lenovo LOQ 17IRX10 i7-14700HX, GeForce RTX 5070 Laptop, 60 Wh | MSI Crosshair A17 HX D8WGKG R9 8940HX, GeForce RTX 5070 Laptop, 90 Wh | MSI Katana 17 HX B14WGK i7-14650HX, GeForce RTX 5070 Laptop, 75 Wh | Alienware 16X Aurora, RTX 5070 Ultra 9 275HX, GeForce RTX 5070 Laptop, 96 Wh | Average of class Gaming | |
|---|---|---|---|---|---|---|---|
| Battery runtime | |||||||
| WiFi v1.3 (h) | 4.7 | 8 70% | 3.1 -34% | 4.4 -6% | 5.1 9% | 4.3 -9% | 7.15 ? 52% |
Acer Nitro v 17 (ANV17-41-R4CJ)
- 01/20/2026 v8
Christian Hintze
 Total Sustainability Score:
 Possible alternatives in comparison
Image | Model / Review | Price | Weight | Height | Display |
|---|---|---|---|---|---|
1. 80.2%  | Acer Nitro v 17 (ANV17-41-R4CJ) AMD Ryzen 7 260 ⎘ NVIDIA GeForce RTX 5070 Laptop ⎘ 16 GB Memory, 1024 GB SSD | Amazon: List Price: 1199 Euro | 2.7 kg | 24 mm | 17.30" 1920x1080 127 PPI IPS |
2. 81.8%  | HP Omen 17z-db100 AMD Ryzen AI 7 350 ⎘ NVIDIA GeForce RTX 5070 Laptop ⎘ 96 GB Memory, 4000 GB SSD | Amazon: List Price: 1550 USD | 2.9 kg | 30.1 mm | 17.30" 2560x1440 170 PPI IPS |
3. 79.8%  | Lenovo LOQ 17IRX10 Intel Core i7-14700HX ⎘ NVIDIA GeForce RTX 5070 Laptop ⎘ 16 GB Memory, 1024 GB SSD | Amazon: List Price: 1500 EUR | 2.9 kg | 25 mm | 17.30" 1920x1080 127 PPI IPS |
4. 79.6%  | MSI Crosshair A17 HX D8WGKG AMD Ryzen 9 8940HX ⎘ NVIDIA GeForce RTX 5070 Laptop ⎘ 32 GB Memory, 1024 GB SSD | Amazon: List Price: 2000 EUR | 2.9 kg | 29.7 mm | 17.00" 2560x1600 178 PPI IPS |
5. 77.3%  | MSI Katana 17 HX B14WGK Intel Core i7-14650HX ⎘ NVIDIA GeForce RTX 5070 Laptop ⎘ 16 GB Memory, 1024 GB SSD | Amazon: List Price: 1800 EUR | 2.7 kg | 28 mm | 17.30" 2560x1440 170 PPI IPS |
6. 84.9%  | Alienware 16X Aurora, RTX 5070 Intel Core Ultra 9 275HX ⎘ NVIDIA GeForce RTX 5070 Laptop ⎘ 32 GB Memory | Amazon: List Price: 1800 USD | 2.5 kg | 23.4 mm | 16.00" 2560x1600 189 PPI IPS |
Transparency
The selection of devices to be reviewed is made by our editorial team. The test sample was provided to the author as a loan by the manufacturer or retailer for the purpose of this review. The lender had no influence on this review, nor did the manufacturer receive a copy of this review before publication. There was no obligation to publish this review. As an independent media company, Notebookcheck is not subjected to the authority of manufacturers, retailers or publishers.
This is how Notebookcheck is testing
Every year, Notebookcheck independently reviews hundreds of laptops and smartphones using standardized procedures to ensure that all results are comparable. We have continuously developed our test methods for around 20 years and set industry standards in the process. In our test labs, high-quality measuring equipment is utilized by experienced technicians and editors. These tests involve a multi-stage validation process. Our complex rating system is based on hundreds of well-founded measurements and benchmarks, which maintains objectivity. Further information on our test methods can be found here.
