GMK NucBox K6 mini PC review: As powerful as the latest Intel Core Ultra laptops

The GMK NucBox K6 is one of the company's newest mini PCs designed for home multimedia and streaming purposes. It competes directly with Intel NUC and Beelink mini PCs in the $500 price range.
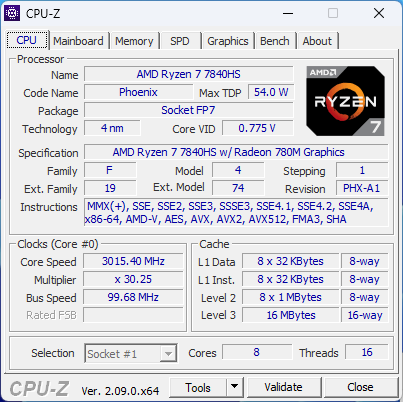
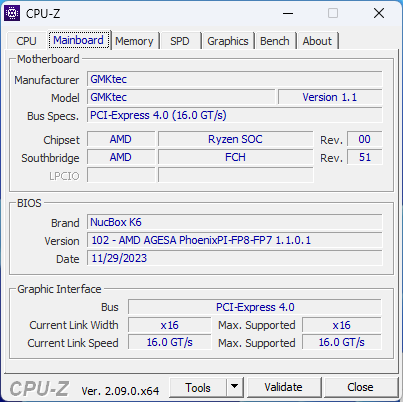
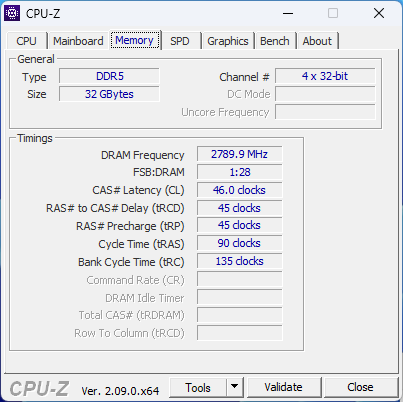
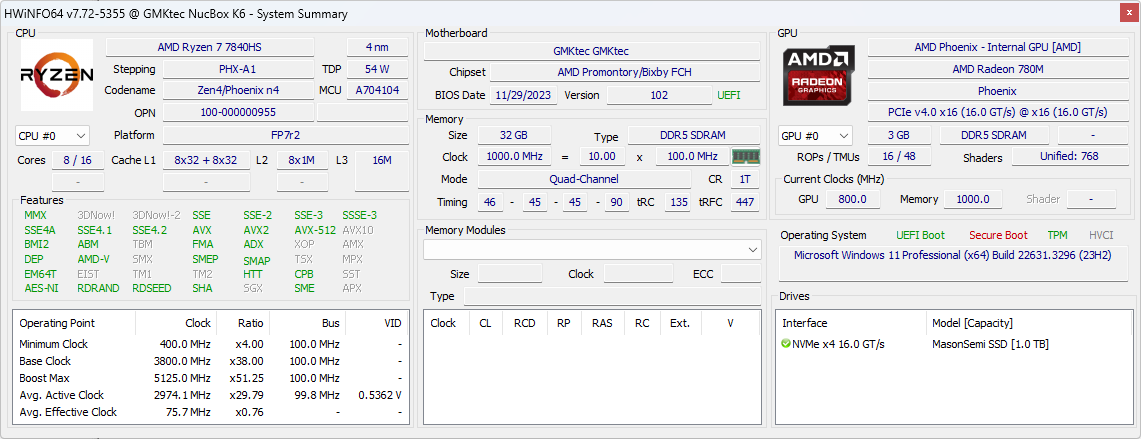
All current configurations come with the AMD Ryzen 7 7840HS Zen 4 CPU with integrated Radeon 780M graphics. Barebone SKUs are available from $400 up to $730 if configured with 32 GB of RAM, 1 TB of storage, and Windows 11 Pro pre-installed. Alternatives to the NucBox K6 include the Intel NUC 13 Pro, Beelink SER5, or the Geekom A7.
More GMKtec reviews:
Potential Competitors in Comparison
Rating | Date | Model | Weight | Height | Size | Resolution | Price |
|---|---|---|---|---|---|---|---|
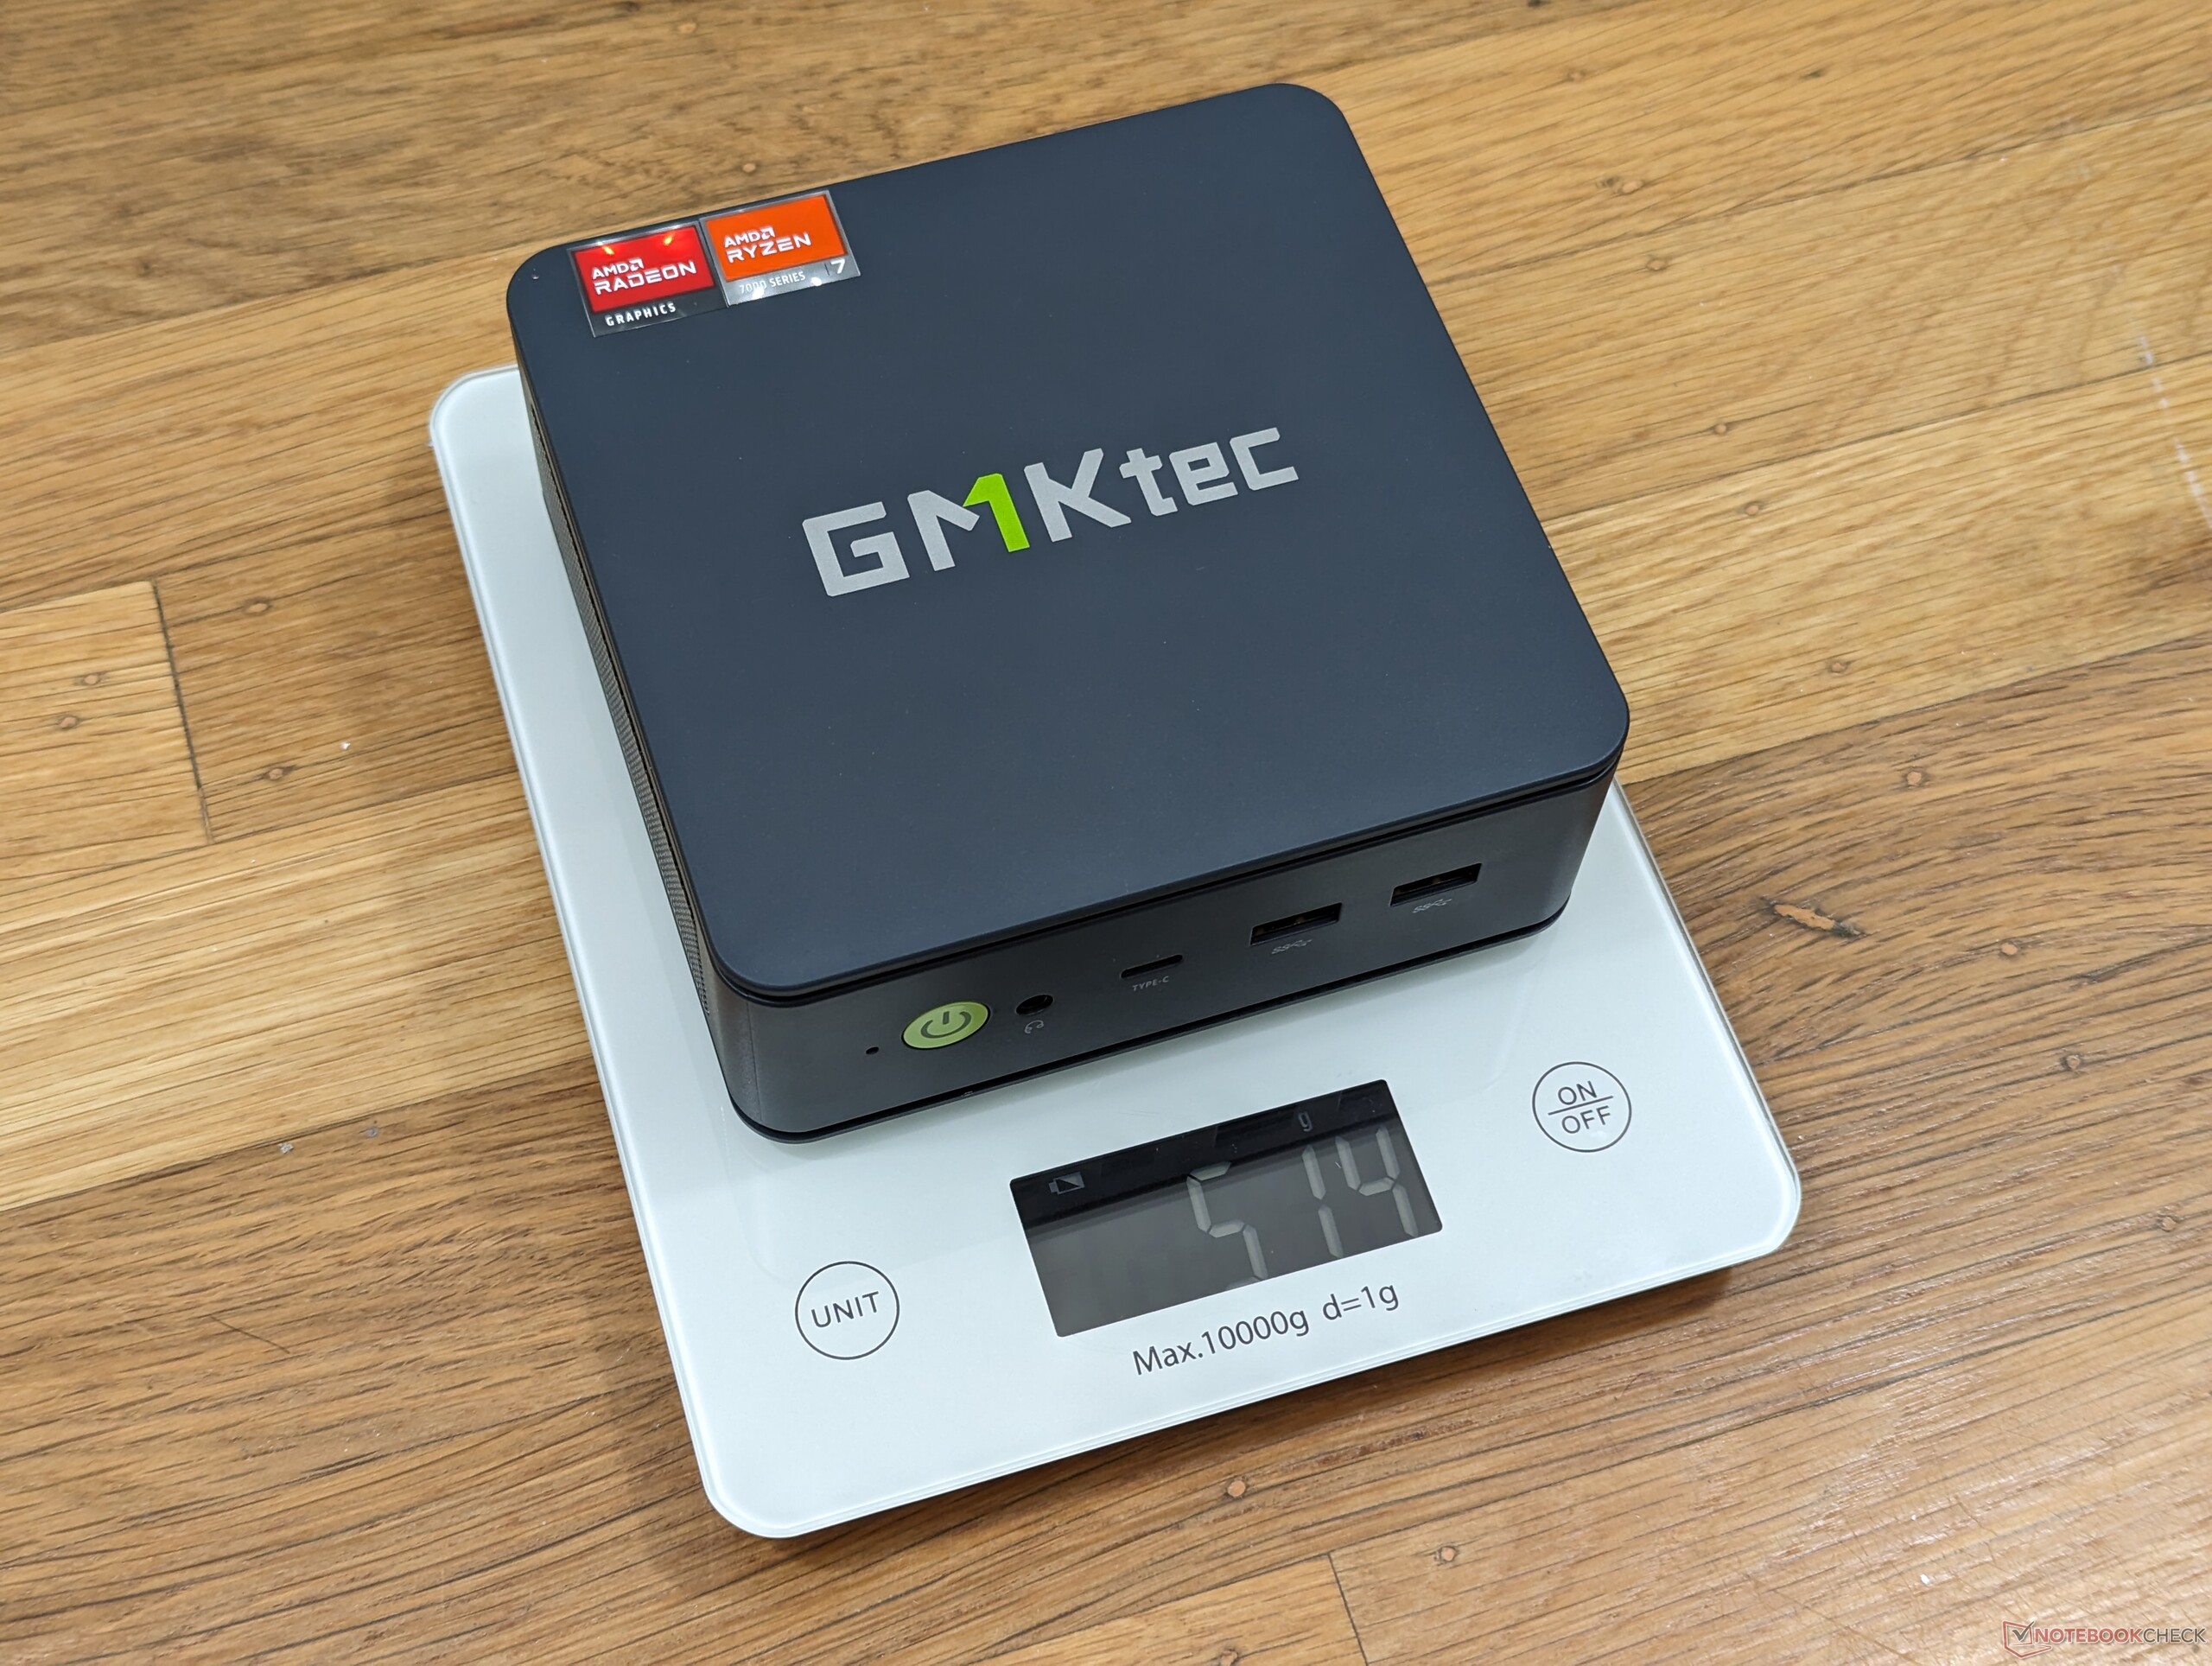
| 83.6 % v7 (old) | 04 / 2024 | GMK NucBox K6 R7 7840HS, Radeon 780M | 514 g | 47 mm | x | ||
| 82.8 % v7 (old) | 10 / 2023 | GMK NucBox K3 Pro i7-12650H, UHD Graphics 64EUs | 396 g | 43.2 mm | x | ||
| 83.1 % v7 (old) | 08 / 2023 | Intel NUC 13 Pro Desk Edition Kit i7-1360P, Iris Xe G7 96EUs | 558 g | 37 mm | x | ||
| 82.1 % v7 (old) | 11 / 2023 | Beelink SER5 R5 5560U, Vega 6 | 439 g | 42 mm | x | ||
| 85.2 % v7 (old) | 04 / 2024 | AcePC Wizbox AI Ultra 7 155H, Arc 8-Core | 840 g | 55.55 mm | x | ||
| 82.6 % v7 (old) | 03 / 2024 | Geekom A7 R9 7940HS, Radeon 780M | 417 g | 38 mm | x |
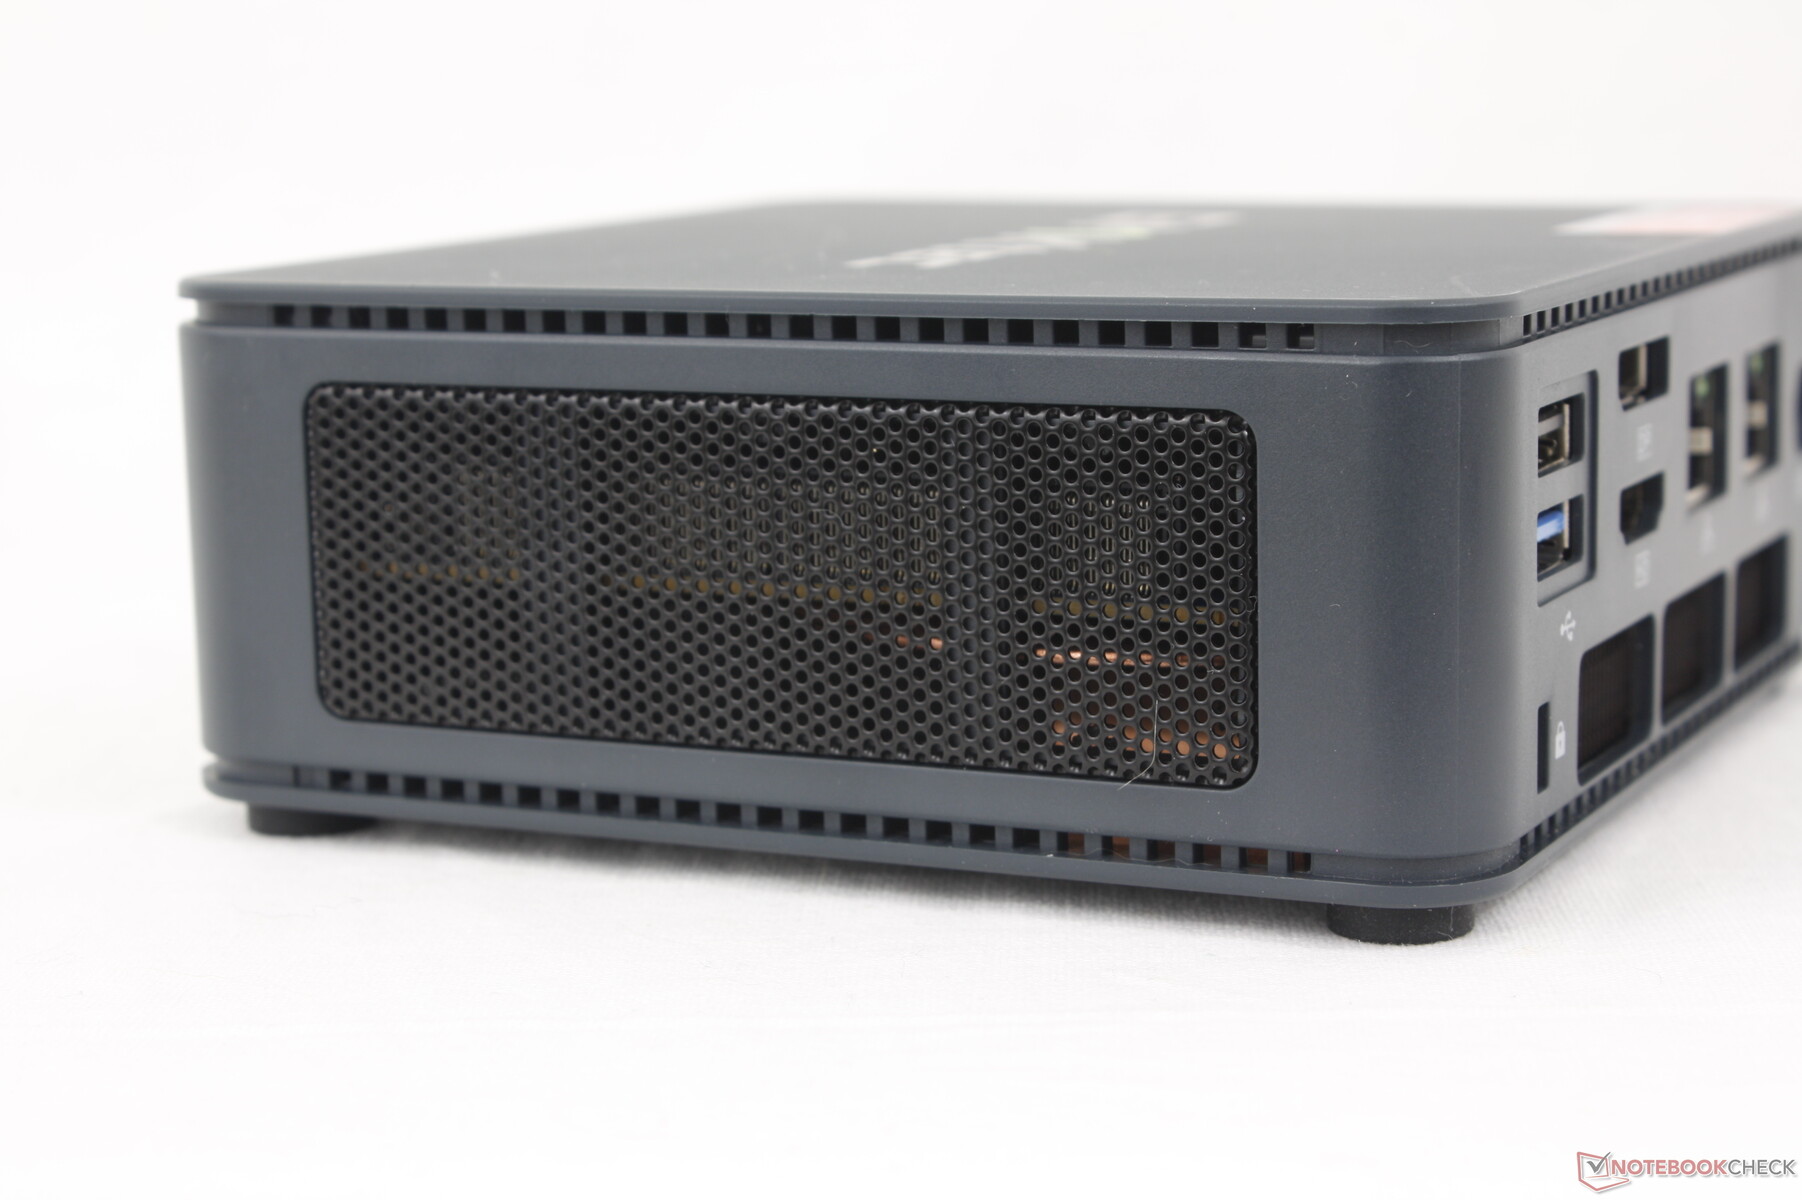
Case
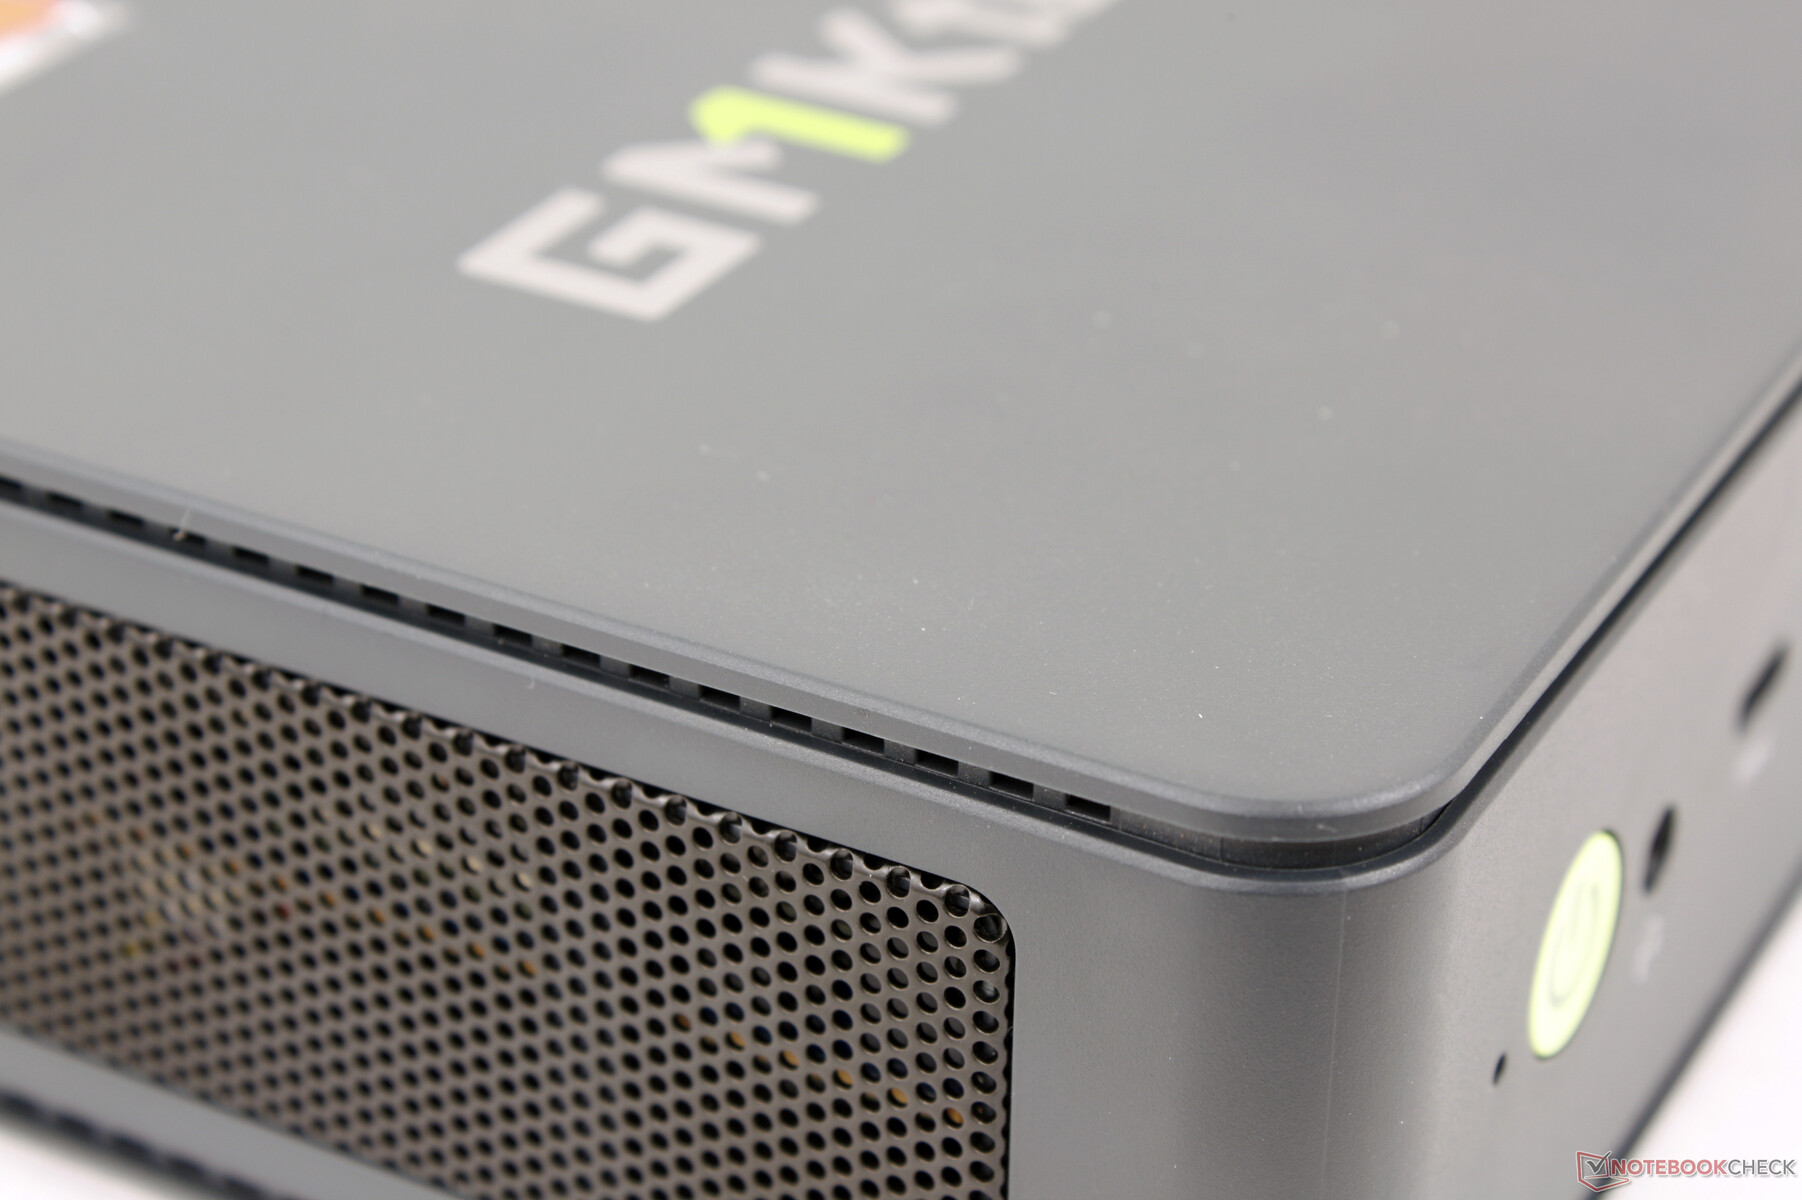
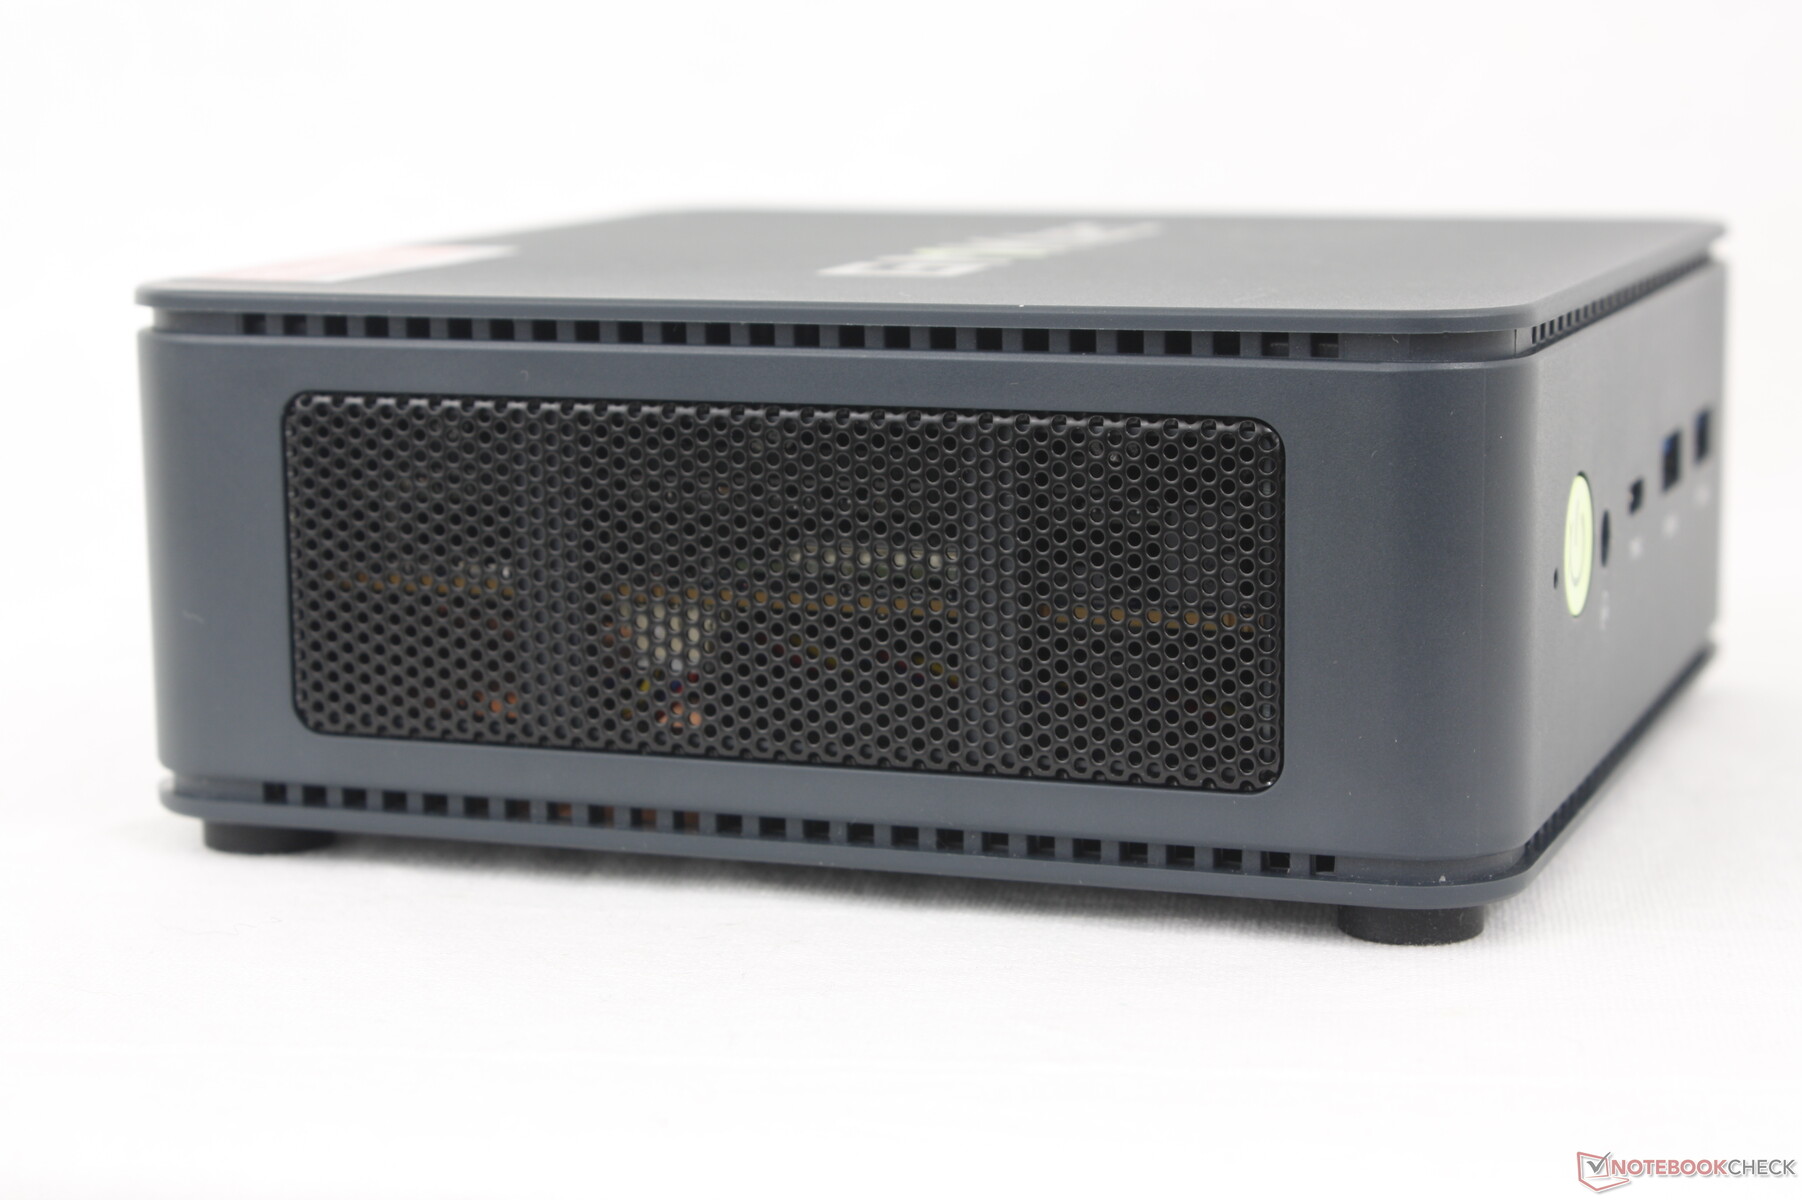
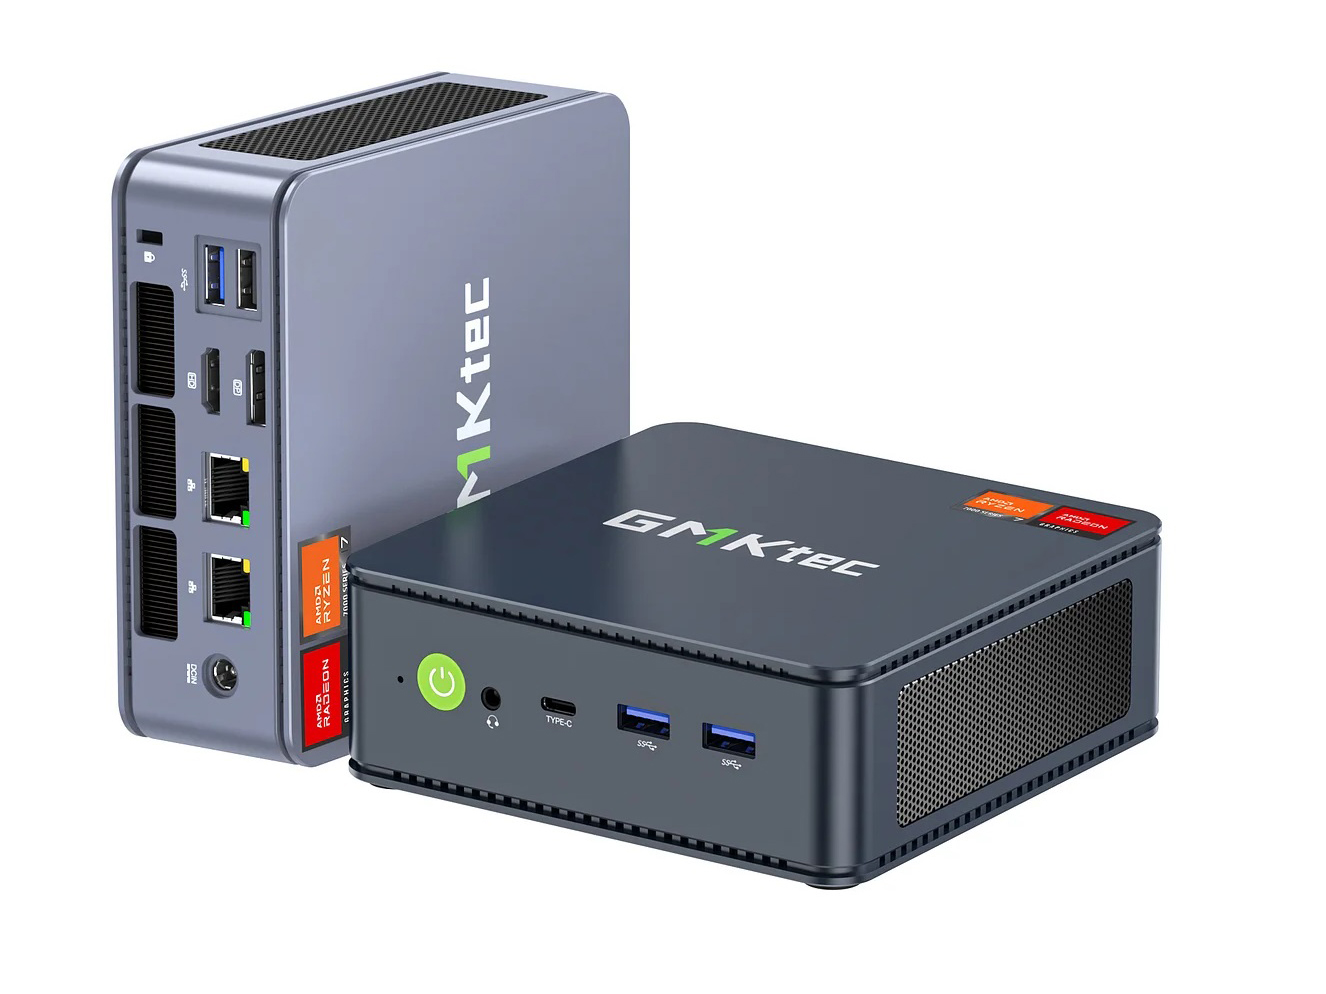
The chassis consists of plastic for the top and bottom with metal for the sides or faces much like on previous generation models. New to this year, however, are the ventilation slits all along the sides as shown by the picture below. This approach allows for the top to be hole-free and more visibly appealing without reducing airflow or cooling.
Overall size and weight are slightly larger and lighter, respectively, than the Intel NUC 13 Pro. The thinner chassis utilizes less metal than an Intel NUC which makes the NucBox K6 slightly more susceptible to damage. This isn't really a problem, however, as we don't see many buyers mishandling the mini PC as if it were a travel laptop.
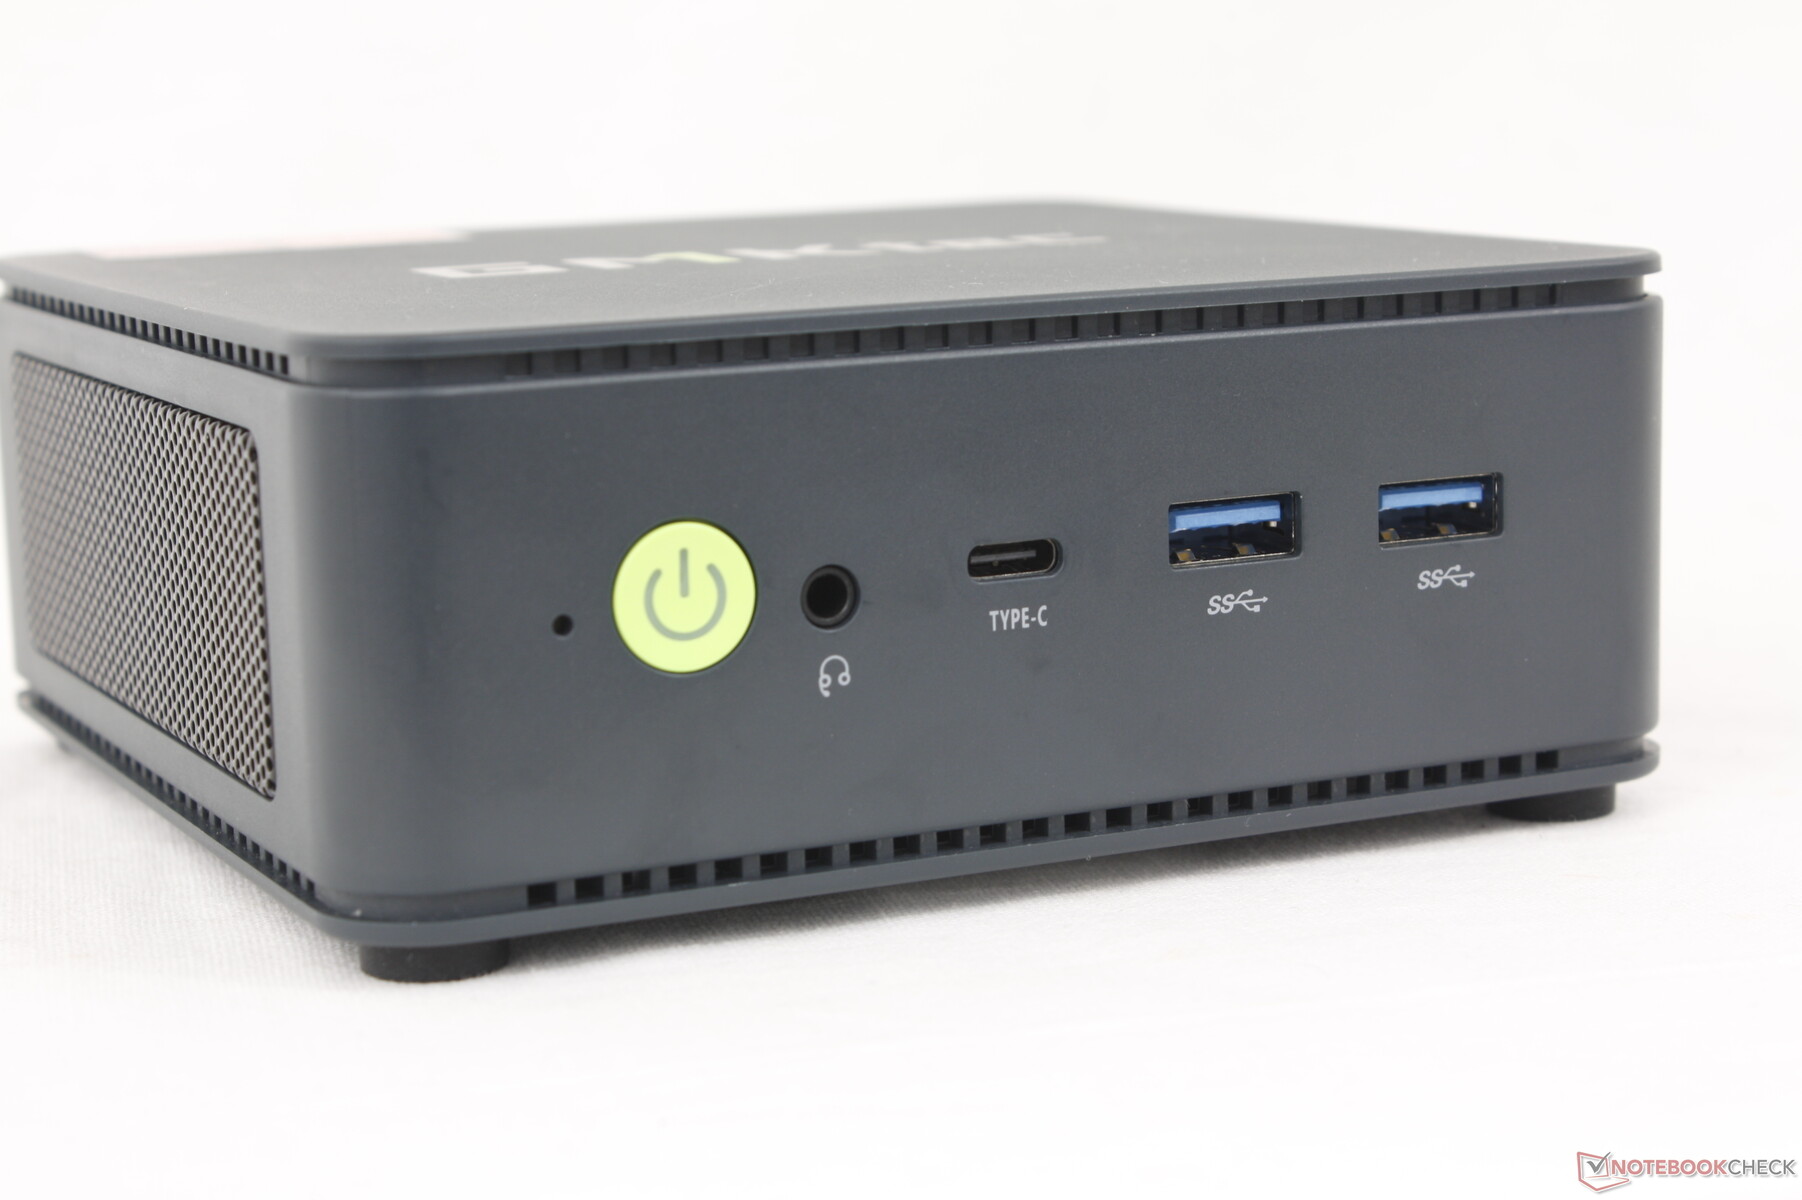
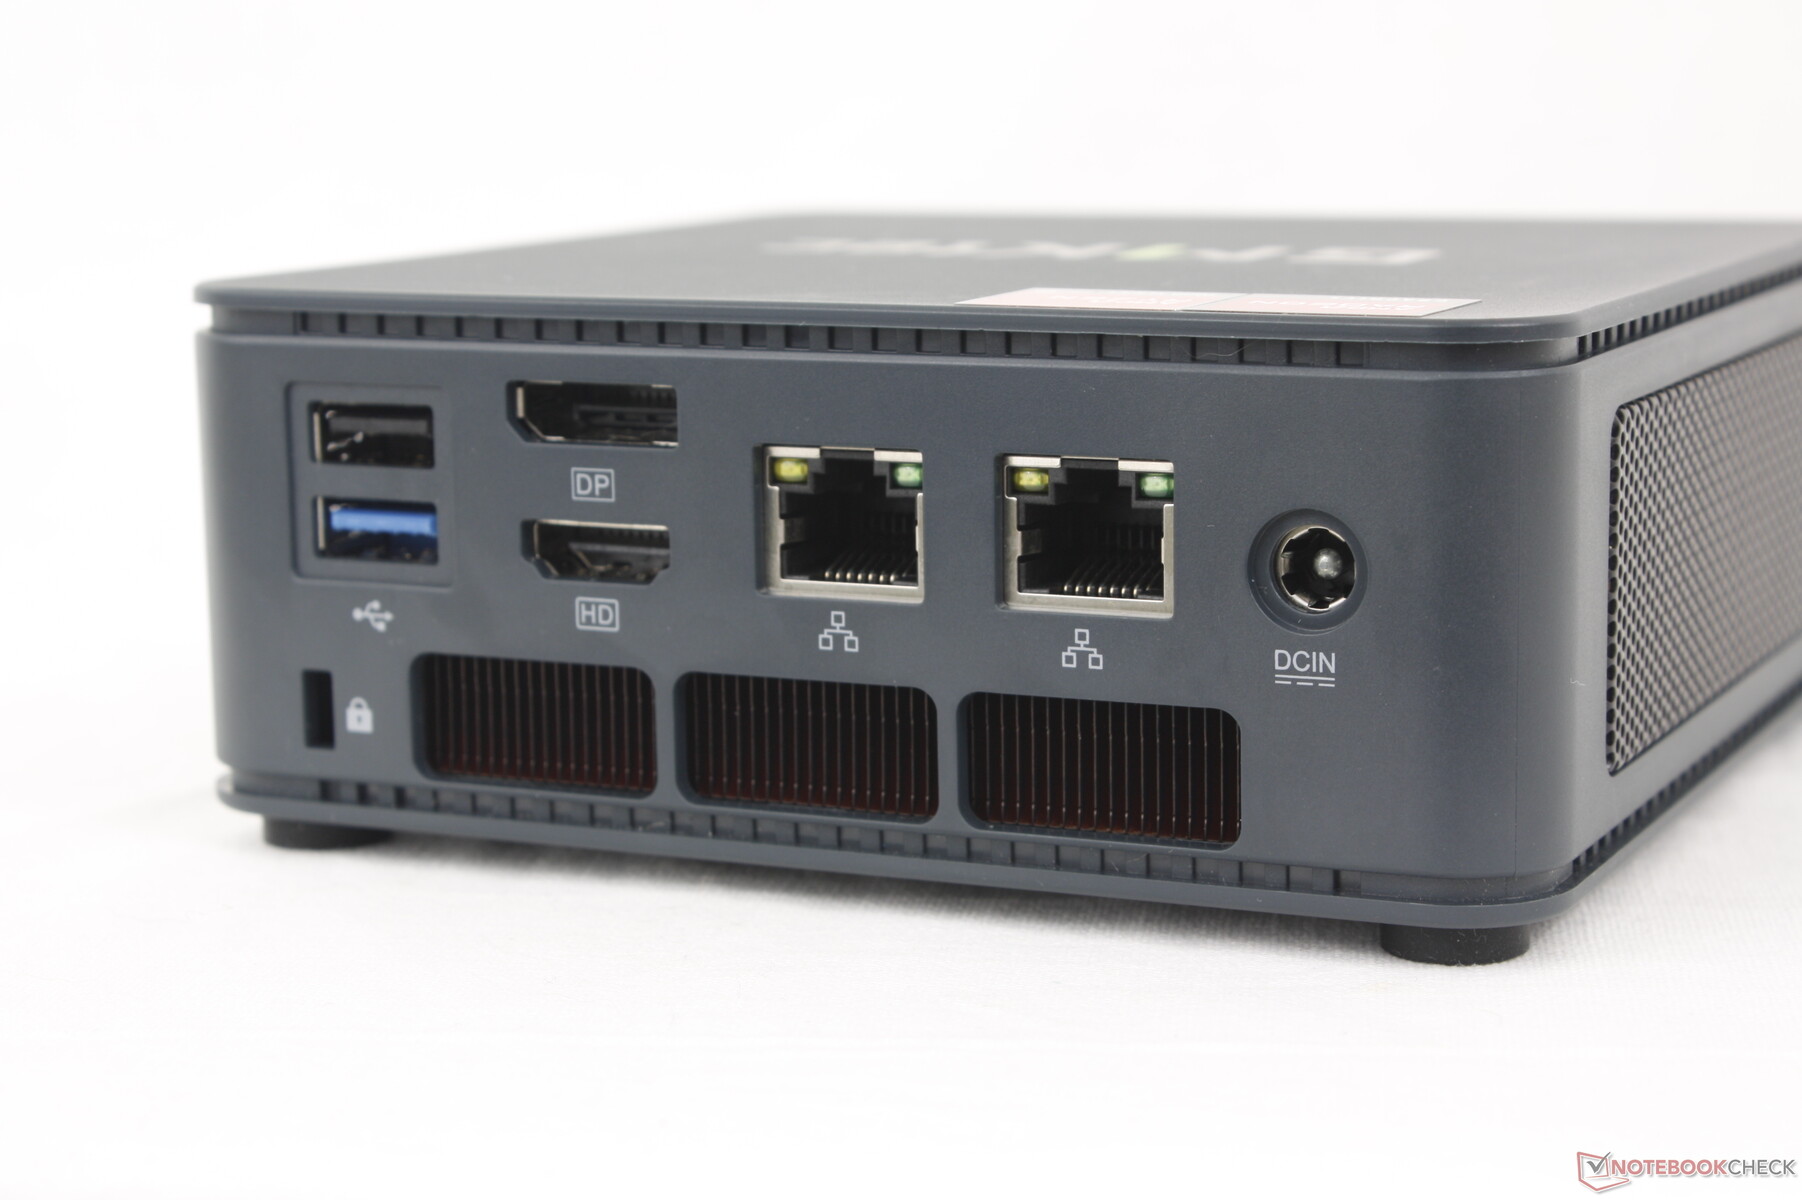
Connectivity
Port options are hit or miss depending on preferences. When compared to the Intel NUC 13 Pro, for example, the GMK includes more RJ-45 ports and a full-size DisplayPort. On the other hand, it has just a single USB-C port whereas the Intel model integrates two.
Thunderbolt devices are supported through the USB-C 4 port. It is also possible to power the mini PC with third-party USB-C AC adapters instead of relying on the proprietary barrel adapter; our 135 W USB-C AC adapter from Lenovo would work without any issues.
Communication
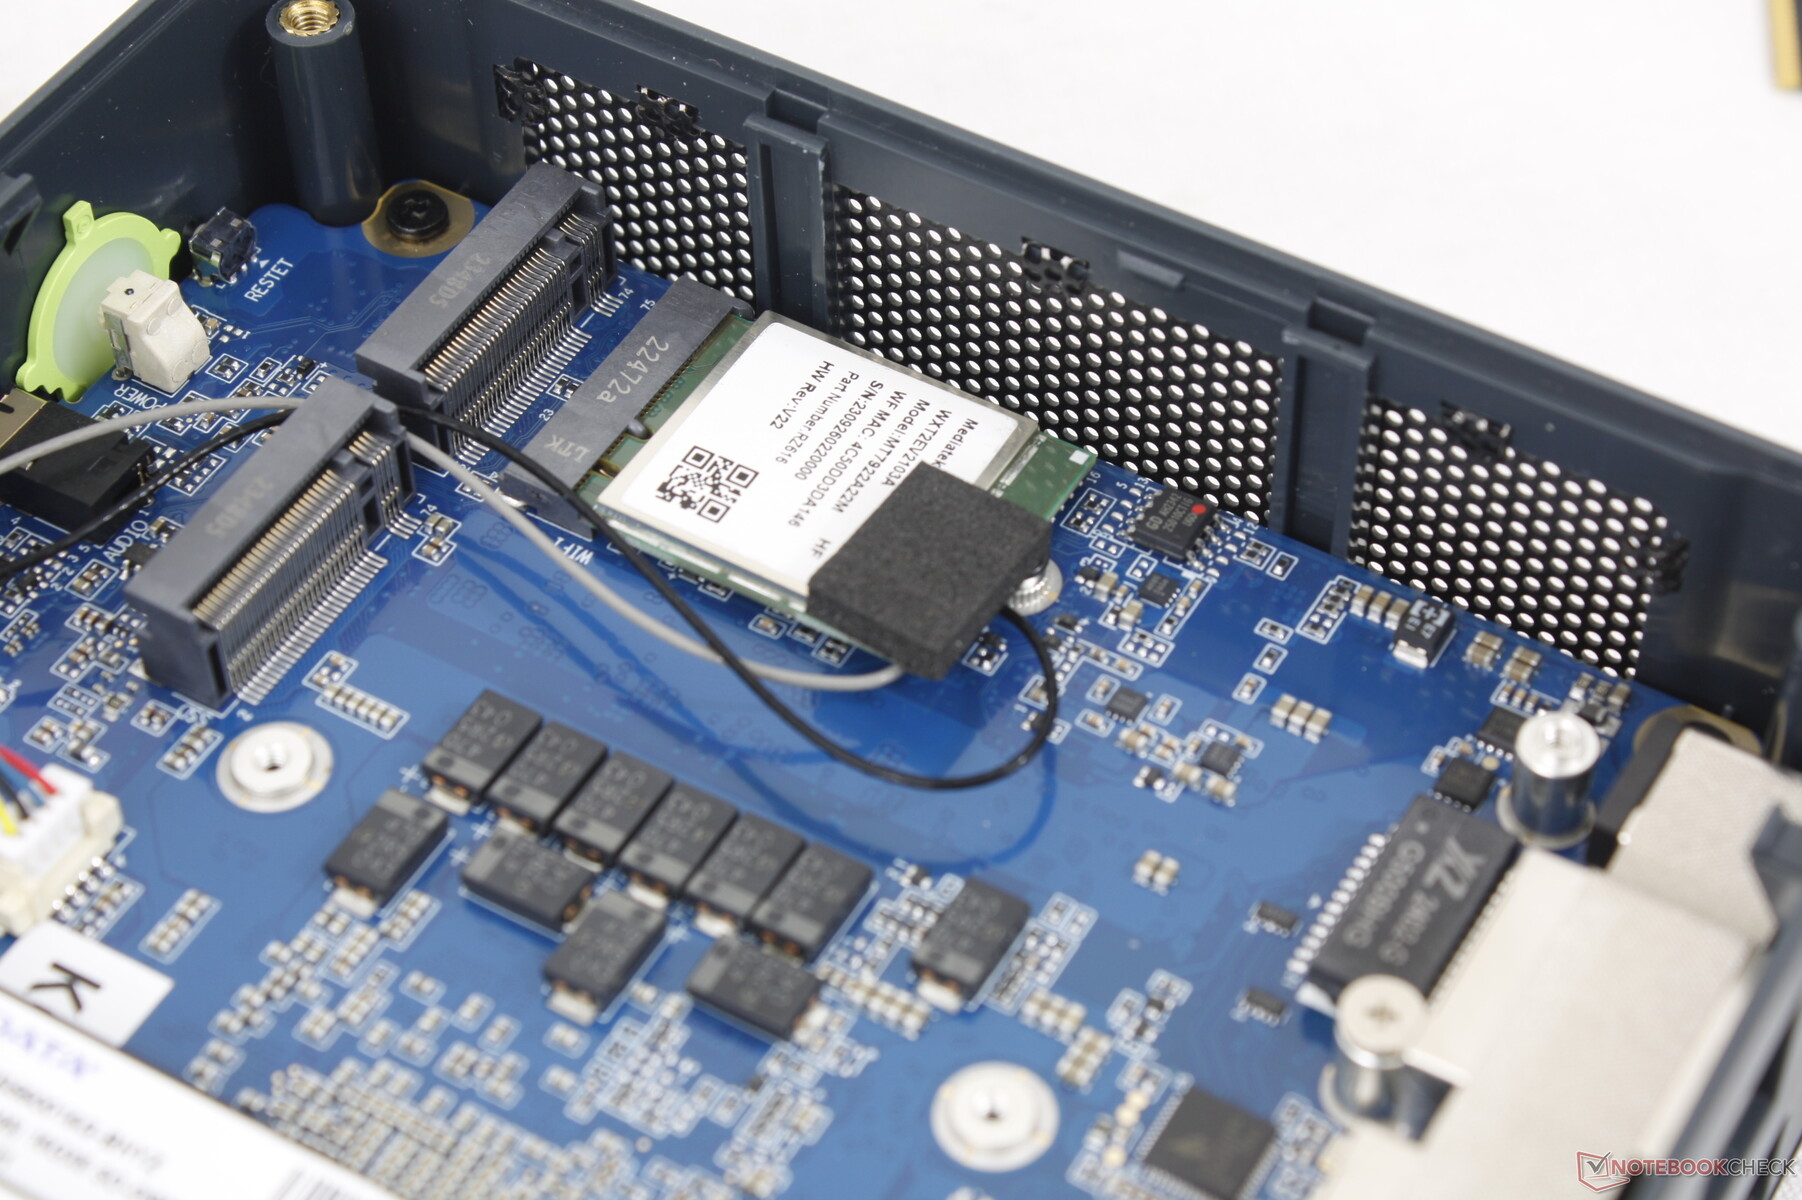
The AMD-only machine ships with the MediaTek RZ616 instead of the usual Intel AX solution for Wi-Fi 6E and Bluetooth 5.3 connectivity. Performance is steady and reliable albeit with slower transmit rates.
| Networking | |
| iperf3 transmit AXE11000 | |
| Intel NUC 13 Pro Desk Edition Kit | |
| Beelink SER5 | |
| GMK NucBox K3 Pro | |
| AcePC Wizbox AI | |
| Geekom A7 | |
| GMK NucBox K6 | |
| iperf3 receive AXE11000 | |
| Beelink SER5 | |
| GMK NucBox K3 Pro | |
| GMK NucBox K6 | |
| Intel NUC 13 Pro Desk Edition Kit | |
| AcePC Wizbox AI | |
| Geekom A7 | |
| iperf3 transmit AXE11000 6GHz | |
| AcePC Wizbox AI | |
| Intel NUC 13 Pro Desk Edition Kit | |
| Geekom A7 | |
| GMK NucBox K6 | |
| iperf3 receive AXE11000 6GHz | |
| AcePC Wizbox AI | |
| Intel NUC 13 Pro Desk Edition Kit | |
| Geekom A7 | |
| GMK NucBox K6 | |
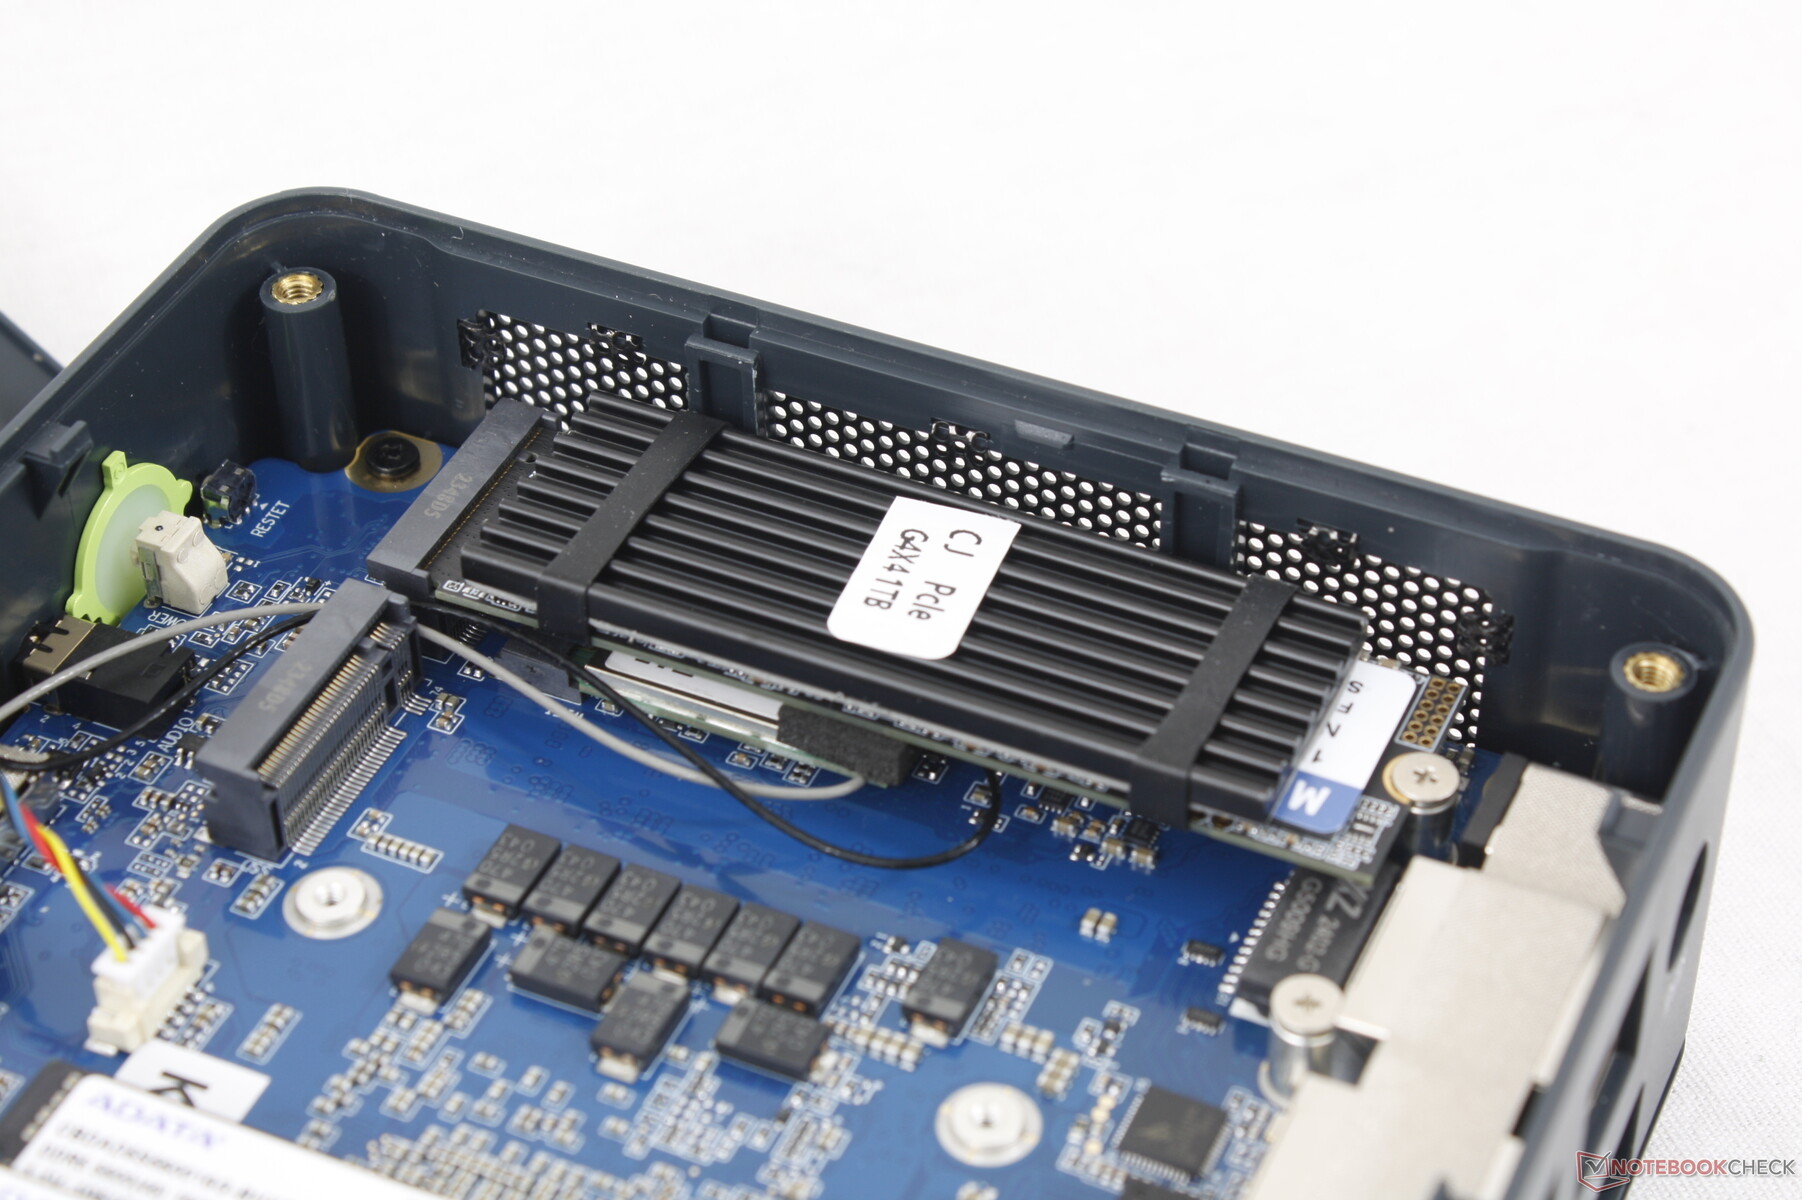
Maintenance
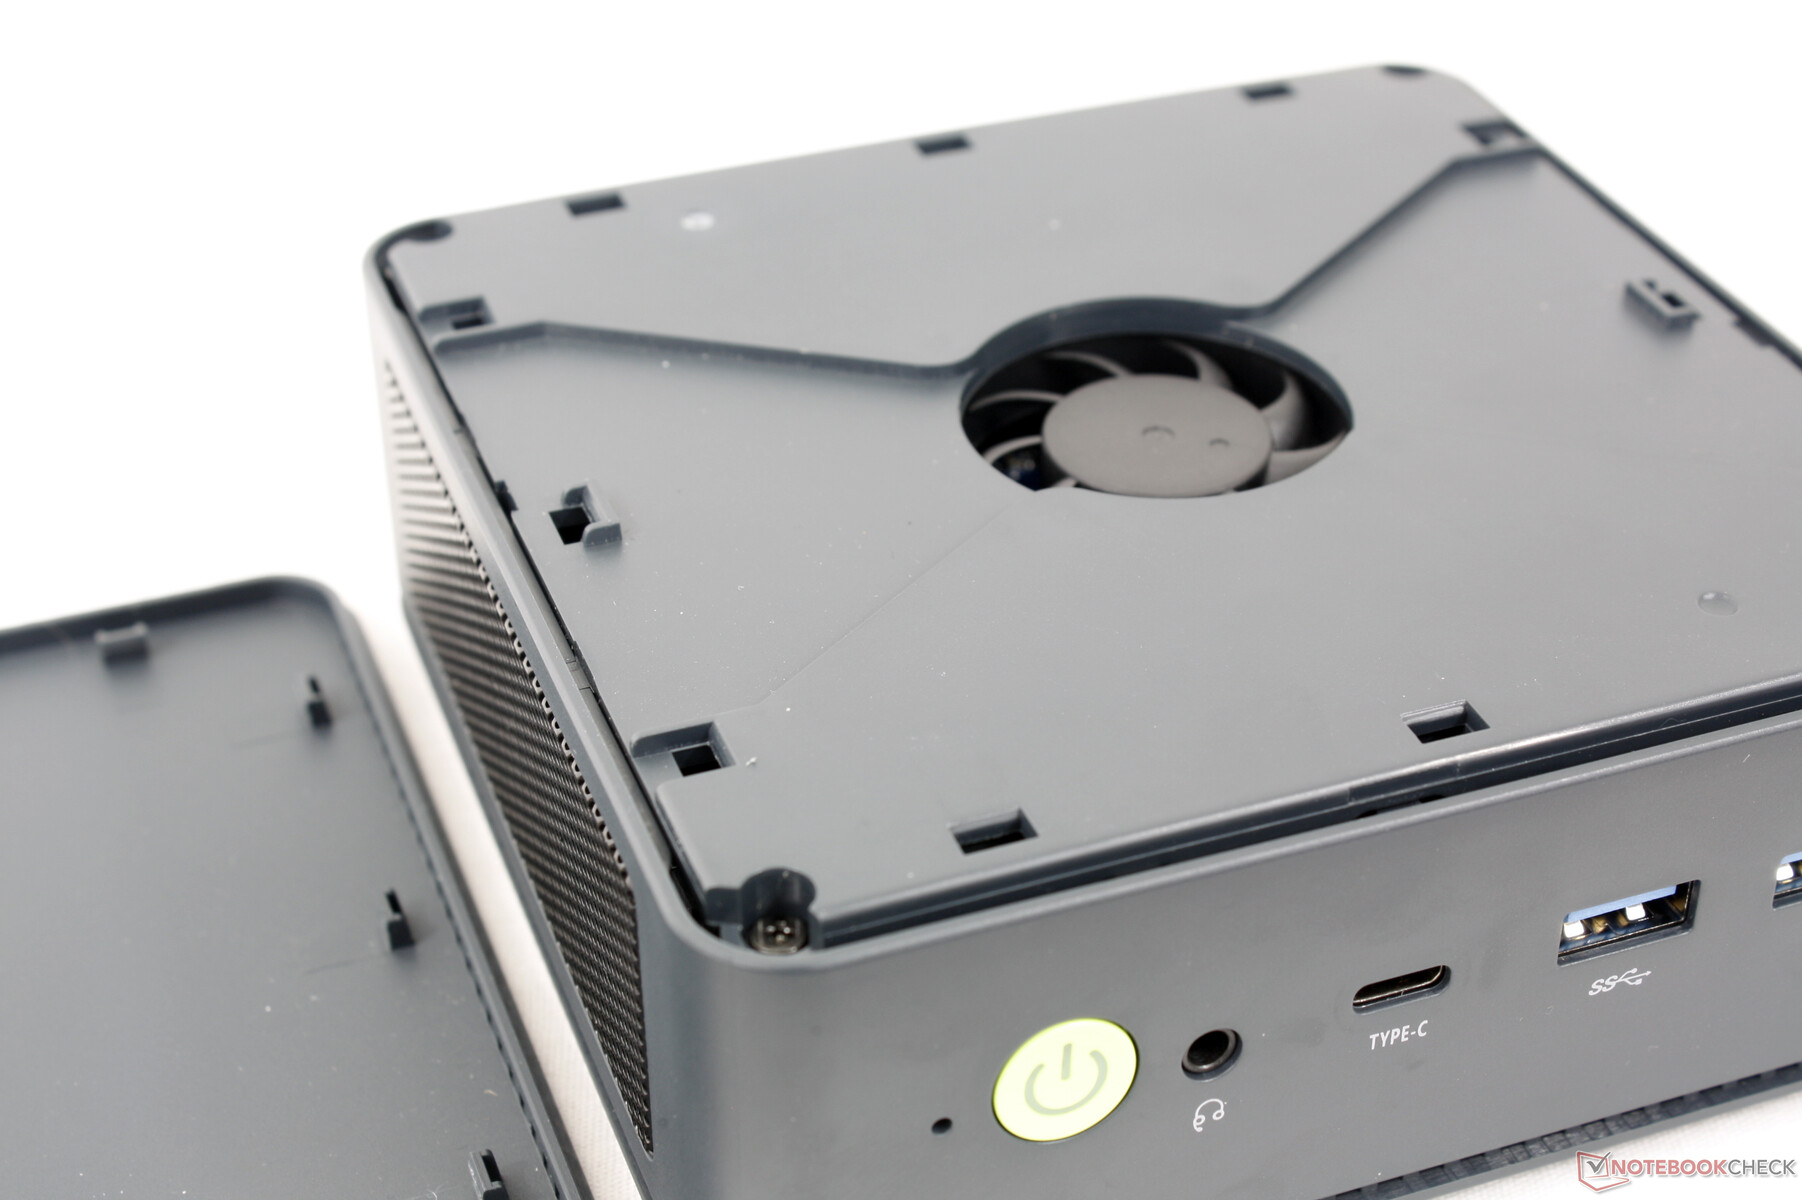
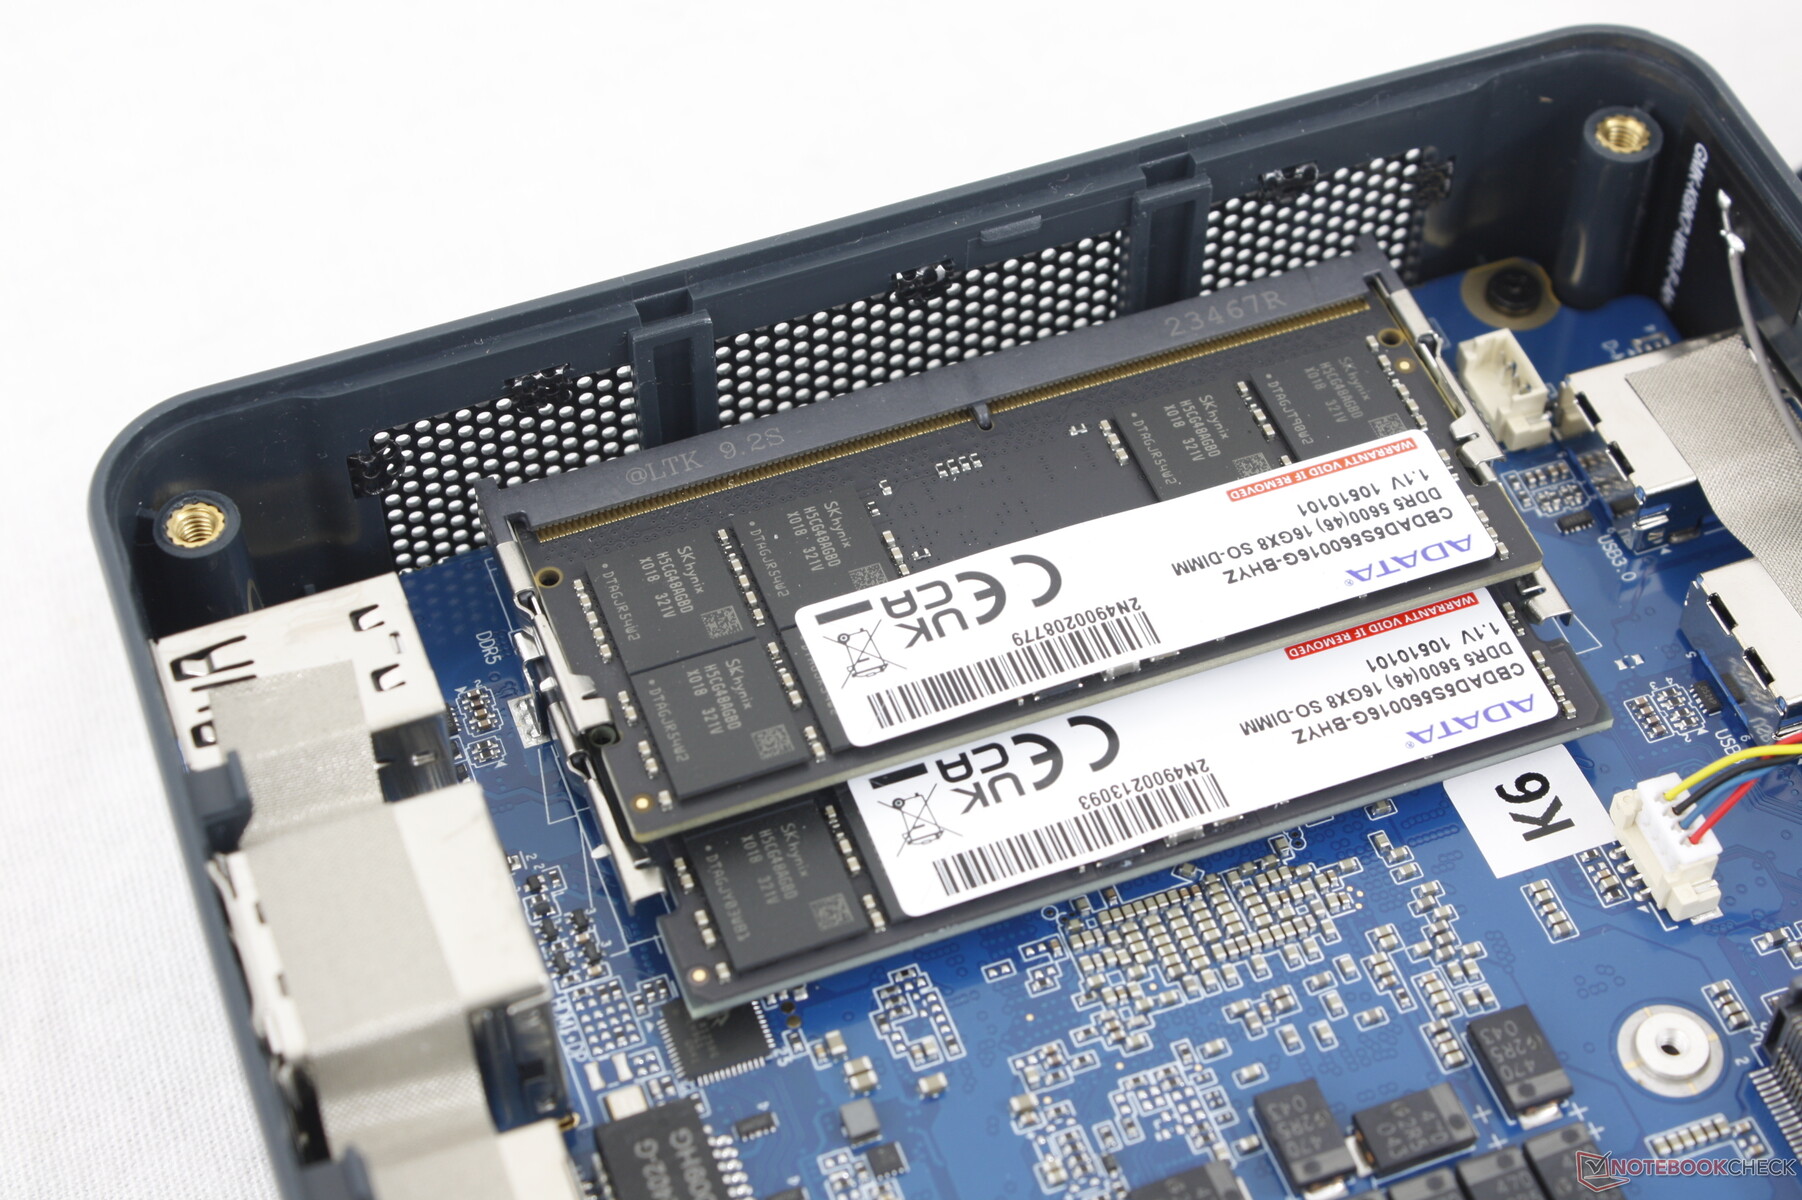
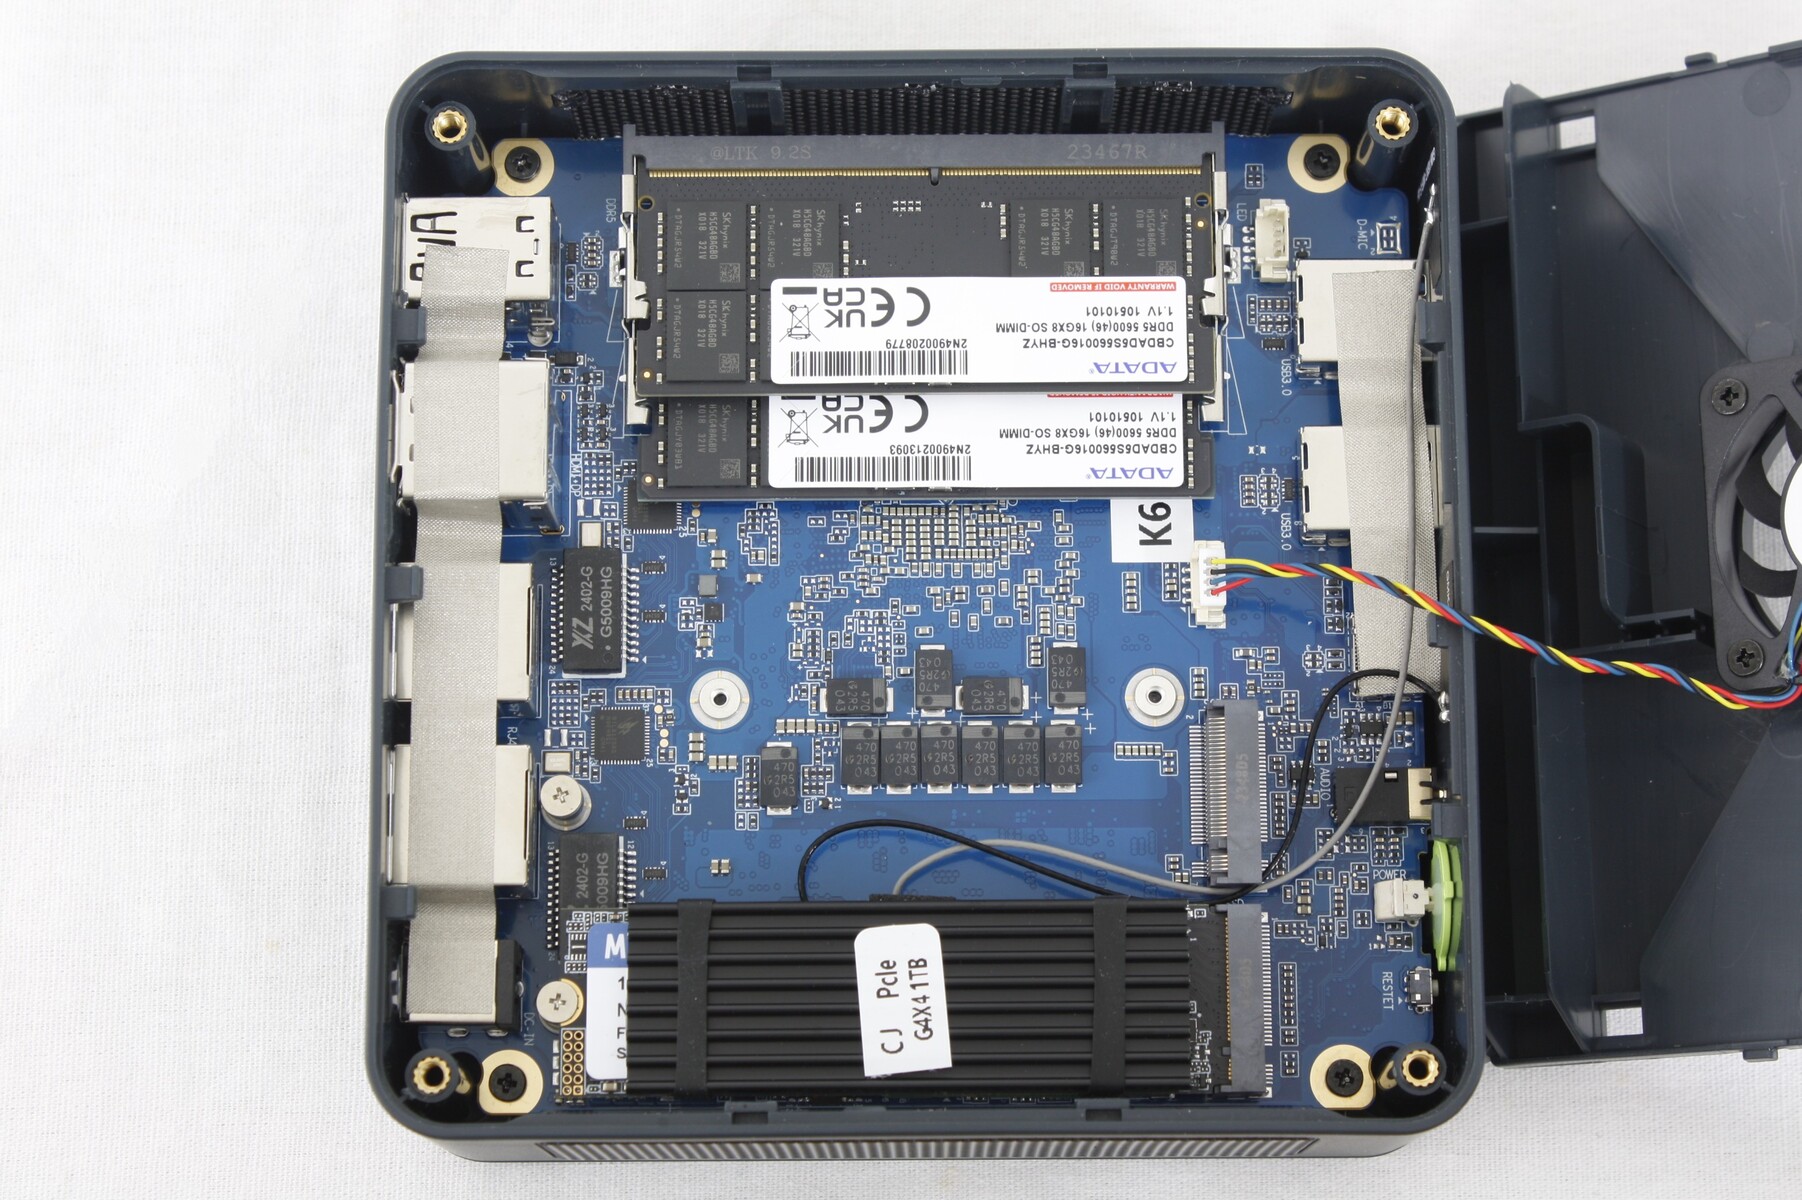
Upgradeable components are accessible from the top but not the bottom unlike on most other mini PCs. While the outer lid is removable without any tools, the fan cover underneath still requires a screwdriver.
Users have direct access to two SODIMM RAM slots, WLAN module, and two M.2 PCIe4 x4 2280 SSD slots as shown by the image below. There is no 2.5-inch SATA III support. Accessing the cooling solution, processor, and secondary fan requires flipping the motherboard over.
Accessories And Warranty
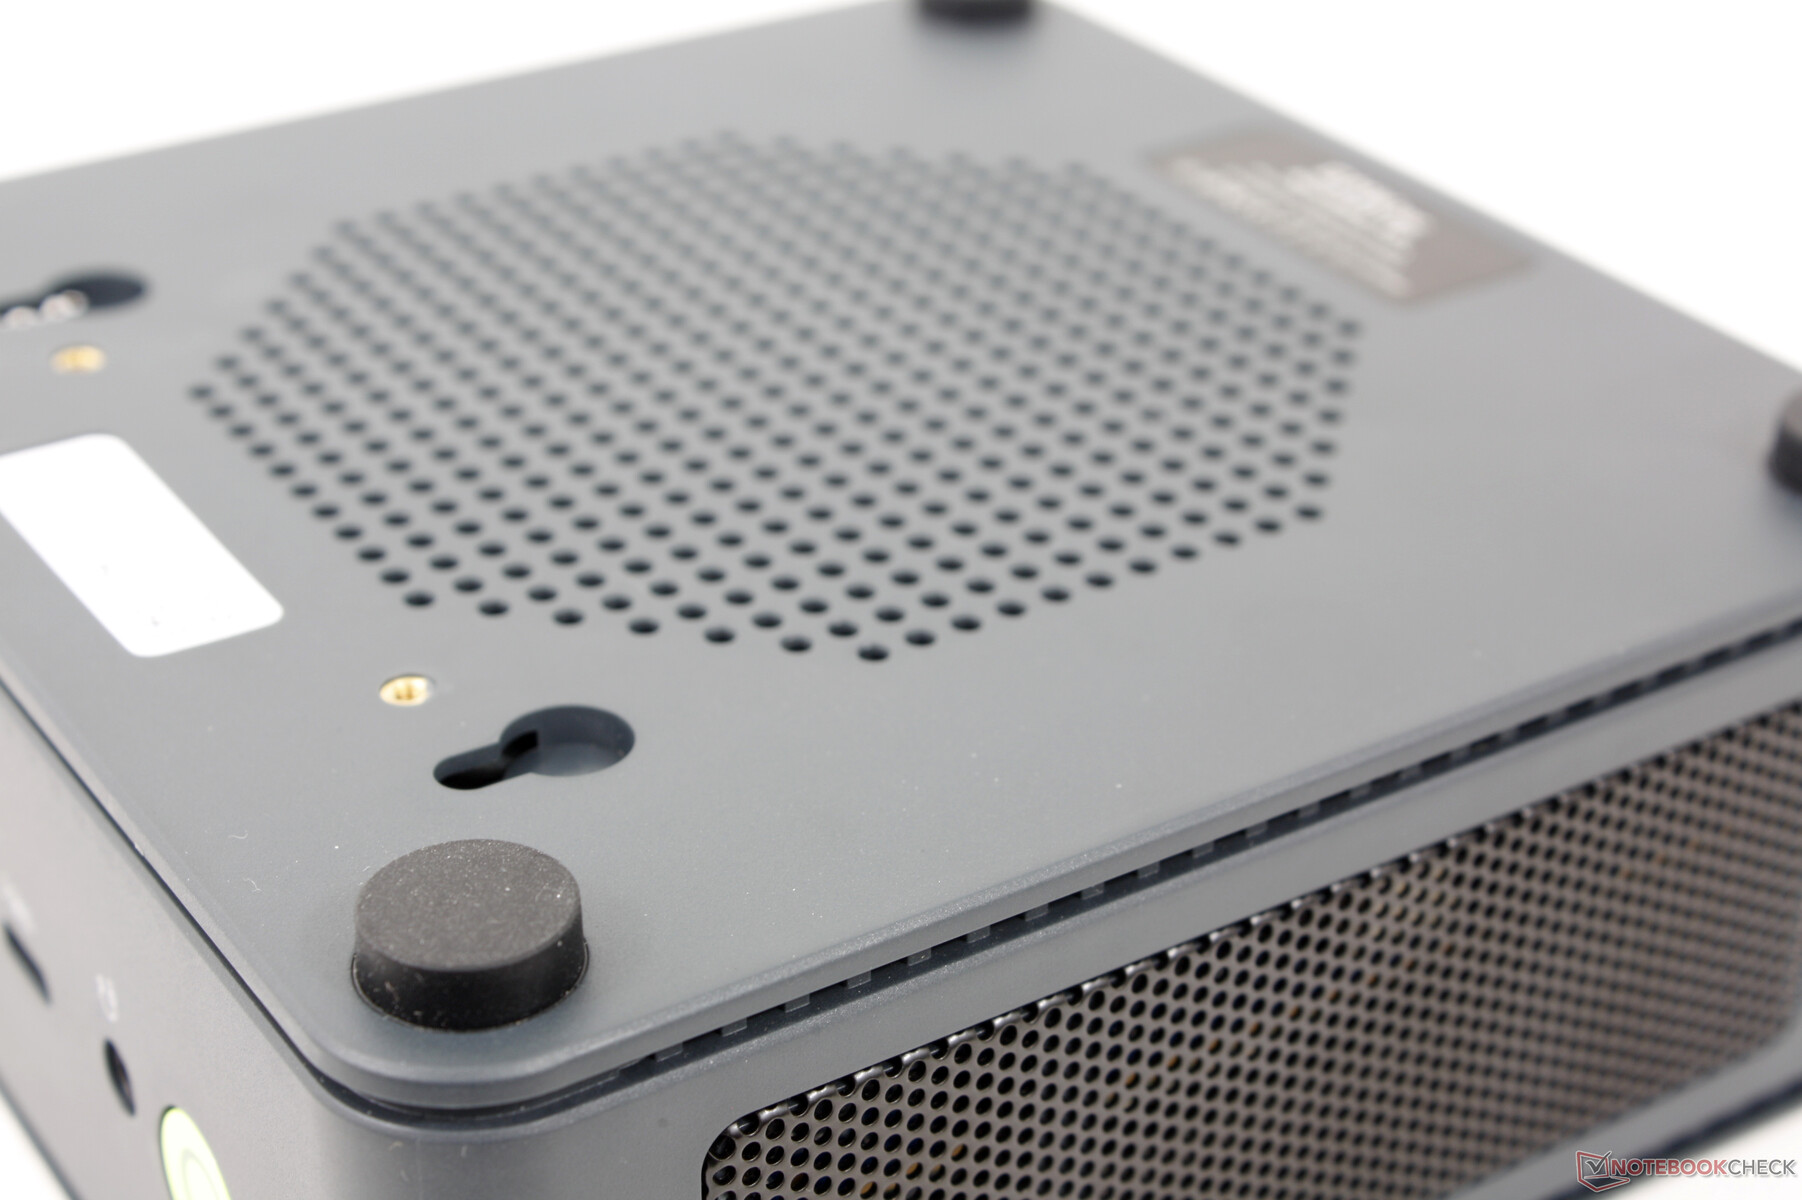
The retail box includes an HDMI cable and removable VESA mount with screws. The standard one-year limited manufacturer warranty applies if purchased in the US.
Performance — AMD Zen 4 Is Still Very Powerful
Testing Conditions
We set Windows to Performance mode prior to running the benchmarks below. There are no pre-installed applications for a clean Windows user experience.
Processor
The Ryzen 7 7840HS runs well with no major throttling issues even when stress testing. It remains one of the fastest CPUs for NUC-sized mini PCs. Overall performance is comparable to the pricier Ryzen 9 7940HS and competing Core i7-13700H in the Lenovo IdeaCentre Mini.
Cinebench R15 Multi Loop
Cinebench R20: CPU (Multi Core) | CPU (Single Core)
Cinebench R15: CPU Multi 64Bit | CPU Single 64Bit
Blender: v2.79 BMW27 CPU
7-Zip 18.03: 7z b 4 | 7z b 4 -mmt1
Geekbench 6.7: Multi-Core | Single-Core
Geekbench 5.5: Multi-Core | Single-Core
HWBOT x265 Benchmark v2.2: 4k Preset
LibreOffice : 20 Documents To PDF
R Benchmark 2.5: Overall mean
| Cinebench R20 / CPU (Multi Core) | |
| Average AMD Ryzen 7 7840HS (5761 - 6744, n=19) | |
| Geekom A7 | |
| GMK NucBox K6 | |
| AcePC Wizbox AI | |
| Lenovo IdeaCentre Mini 01IRH8 | |
| Geekom Mini IT13 | |
| Aoostar GOD77 | |
| Intel NUC 13 Pro Desk Edition Kit | |
| Beelink GTR6 | |
| Beelink SER6 Pro | |
| GMK NucBox M4 | |
| GMK NucBox K3 Pro | |
| Beelink SER5 | |
| GMK NucBox M3 | |
| Acemagic Tank03 | |
| Cinebench R20 / CPU (Single Core) | |
| Intel NUC 13 Pro Desk Edition Kit | |
| Lenovo IdeaCentre Mini 01IRH8 | |
| Geekom A7 | |
| GMK NucBox K3 Pro | |
| GMK NucBox K6 | |
| Average AMD Ryzen 7 7840HS (661 - 705, n=19) | |
| AcePC Wizbox AI | |
| Geekom Mini IT13 | |
| GMK NucBox M3 | |
| Beelink GTR6 | |
| Acemagic Tank03 | |
| GMK NucBox M4 | |
| Aoostar GOD77 | |
| Beelink SER6 Pro | |
| Beelink SER5 | |
| Geekbench 6.7 / Multi-Core | |
| Geekom A7 | |
| GMK NucBox K6 | |
| Average AMD Ryzen 7 7840HS (11804 - 13538, n=21) | |
| AcePC Wizbox AI | |
| GMK NucBox K3 Pro | |
| Intel NUC 13 Pro Desk Edition Kit | |
| Lenovo IdeaCentre Mini 01IRH8 | |
| Aoostar GOD77 | |
| GMK NucBox M4 | |
| Acemagic Tank03 | |
| GMK NucBox M3 | |
| Beelink SER5 | |
| Geekbench 6.7 / Single-Core | |
| Geekom A7 | |
| GMK NucBox K6 | |
| Average AMD Ryzen 7 7840HS (2585 - 2721, n=21) | |
| Lenovo IdeaCentre Mini 01IRH8 | |
| Intel NUC 13 Pro Desk Edition Kit | |
| GMK NucBox K3 Pro | |
| AcePC Wizbox AI | |
| GMK NucBox M4 | |
| GMK NucBox M3 | |
| Acemagic Tank03 | |
| Aoostar GOD77 | |
| Beelink SER5 | |
| HWBOT x265 Benchmark v2.2 / 4k Preset | |
| Geekom A7 | |
| GMK NucBox K6 | |
| Average AMD Ryzen 7 7840HS (11.7 - 21.8, n=20) | |
| AcePC Wizbox AI | |
| Lenovo IdeaCentre Mini 01IRH8 | |
| Aoostar GOD77 | |
| Beelink GTR6 | |
| Beelink SER6 Pro | |
| Geekom Mini IT13 | |
| Intel NUC 13 Pro Desk Edition Kit | |
| GMK NucBox M4 | |
| GMK NucBox K3 Pro | |
| Beelink SER5 | |
| GMK NucBox M3 | |
| Acemagic Tank03 | |
| LibreOffice / 20 Documents To PDF | |
| Beelink SER5 | |
| Geekom A7 | |
| AcePC Wizbox AI | |
| Aoostar GOD77 | |
| Beelink SER6 Pro | |
| Average AMD Ryzen 7 7840HS (38.3 - 68.3, n=20) | |
| Intel NUC 13 Pro Desk Edition Kit | |
| Beelink GTR6 | |
| GMK NucBox K6 | |
| GMK NucBox M4 | |
| GMK NucBox M3 | |
| GMK NucBox K3 Pro | |
| Acemagic Tank03 | |
| Lenovo IdeaCentre Mini 01IRH8 | |
| Geekom Mini IT13 | |
Cinebench R20: CPU (Multi Core) | CPU (Single Core)
Cinebench R15: CPU Multi 64Bit | CPU Single 64Bit
Blender: v2.79 BMW27 CPU
7-Zip 18.03: 7z b 4 | 7z b 4 -mmt1
Geekbench 6.7: Multi-Core | Single-Core
Geekbench 5.5: Multi-Core | Single-Core
HWBOT x265 Benchmark v2.2: 4k Preset
LibreOffice : 20 Documents To PDF
R Benchmark 2.5: Overall mean
* ... smaller is better
AIDA64: FP32 Ray-Trace | FPU Julia | CPU SHA3 | CPU Queen | FPU SinJulia | FPU Mandel | CPU AES | CPU ZLib | FP64 Ray-Trace | CPU PhotoWorxx
| Performance rating | |
| Geekom A7 | |
| GMK NucBox K6 | |
| Average AMD Ryzen 7 7840HS | |
| AcePC Wizbox AI | |
| Intel NUC 13 Pro Desk Edition Kit | |
| GMK NucBox K3 Pro | |
| Beelink SER5 | |
| AIDA64 / FP32 Ray-Trace | |
| Average AMD Ryzen 7 7840HS (22845 - 28921, n=21) | |
| GMK NucBox K6 | |
| Geekom A7 | |
| AcePC Wizbox AI | |
| Intel NUC 13 Pro Desk Edition Kit | |
| GMK NucBox K3 Pro | |
| Beelink SER5 | |
| AIDA64 / FPU Julia | |
| Average AMD Ryzen 7 7840HS (97164 - 123167, n=21) | |
| GMK NucBox K6 | |
| Geekom A7 | |
| AcePC Wizbox AI | |
| Intel NUC 13 Pro Desk Edition Kit | |
| Beelink SER5 | |
| GMK NucBox K3 Pro | |
| AIDA64 / CPU SHA3 | |
| Average AMD Ryzen 7 7840HS (4293 - 5155, n=21) | |
| GMK NucBox K6 | |
| Geekom A7 | |
| AcePC Wizbox AI | |
| Intel NUC 13 Pro Desk Edition Kit | |
| GMK NucBox K3 Pro | |
| Beelink SER5 | |
| AIDA64 / CPU Queen | |
| Geekom A7 | |
| Average AMD Ryzen 7 7840HS (102271 - 125820, n=21) | |
| GMK NucBox K6 | |
| AcePC Wizbox AI | |
| Intel NUC 13 Pro Desk Edition Kit | |
| GMK NucBox K3 Pro | |
| Beelink SER5 | |
| AIDA64 / FPU SinJulia | |
| Average AMD Ryzen 7 7840HS (13767 - 15525, n=21) | |
| GMK NucBox K6 | |
| Geekom A7 | |
| AcePC Wizbox AI | |
| Beelink SER5 | |
| Intel NUC 13 Pro Desk Edition Kit | |
| GMK NucBox K3 Pro | |
| AIDA64 / FPU Mandel | |
| Average AMD Ryzen 7 7840HS (52084 - 65812, n=21) | |
| GMK NucBox K6 | |
| Geekom A7 | |
| AcePC Wizbox AI | |
| Beelink SER5 | |
| Intel NUC 13 Pro Desk Edition Kit | |
| GMK NucBox K3 Pro | |
| AIDA64 / CPU AES | |
| Geekom A7 | |
| GMK NucBox K6 | |
| AcePC Wizbox AI | |
| Average AMD Ryzen 7 7840HS (67389 - 177158, n=21) | |
| GMK NucBox K3 Pro | |
| Beelink SER5 | |
| Intel NUC 13 Pro Desk Edition Kit | |
| AIDA64 / CPU ZLib | |
| AcePC Wizbox AI | |
| Average AMD Ryzen 7 7840HS (944 - 1123, n=21) | |
| GMK NucBox K6 | |
| Geekom A7 | |
| Intel NUC 13 Pro Desk Edition Kit | |
| GMK NucBox K3 Pro | |
| Beelink SER5 | |
| AIDA64 / FP64 Ray-Trace | |
| Average AMD Ryzen 7 7840HS (12248 - 15599, n=21) | |
| GMK NucBox K6 | |
| Geekom A7 | |
| AcePC Wizbox AI | |
| Intel NUC 13 Pro Desk Edition Kit | |
| GMK NucBox K3 Pro | |
| Beelink SER5 | |
| AIDA64 / CPU PhotoWorxx | |
| GMK NucBox K3 Pro | |
| GMK NucBox K6 | |
| Geekom A7 | |
| Average AMD Ryzen 7 7840HS (17615 - 41516, n=21) | |
| AcePC Wizbox AI | |
| Intel NUC 13 Pro Desk Edition Kit | |
| Beelink SER5 | |
Stress Test
When running Prime95 stress, the CPU would boost to 4 GHz and 54 W for just a couple of seconds before falling slightly to 3.8 GHz and 52 W. Core temperature when running demanding loads like games would stablize in the mid 70 C range compared to 65 C on the older but weaker Beelink SER5.
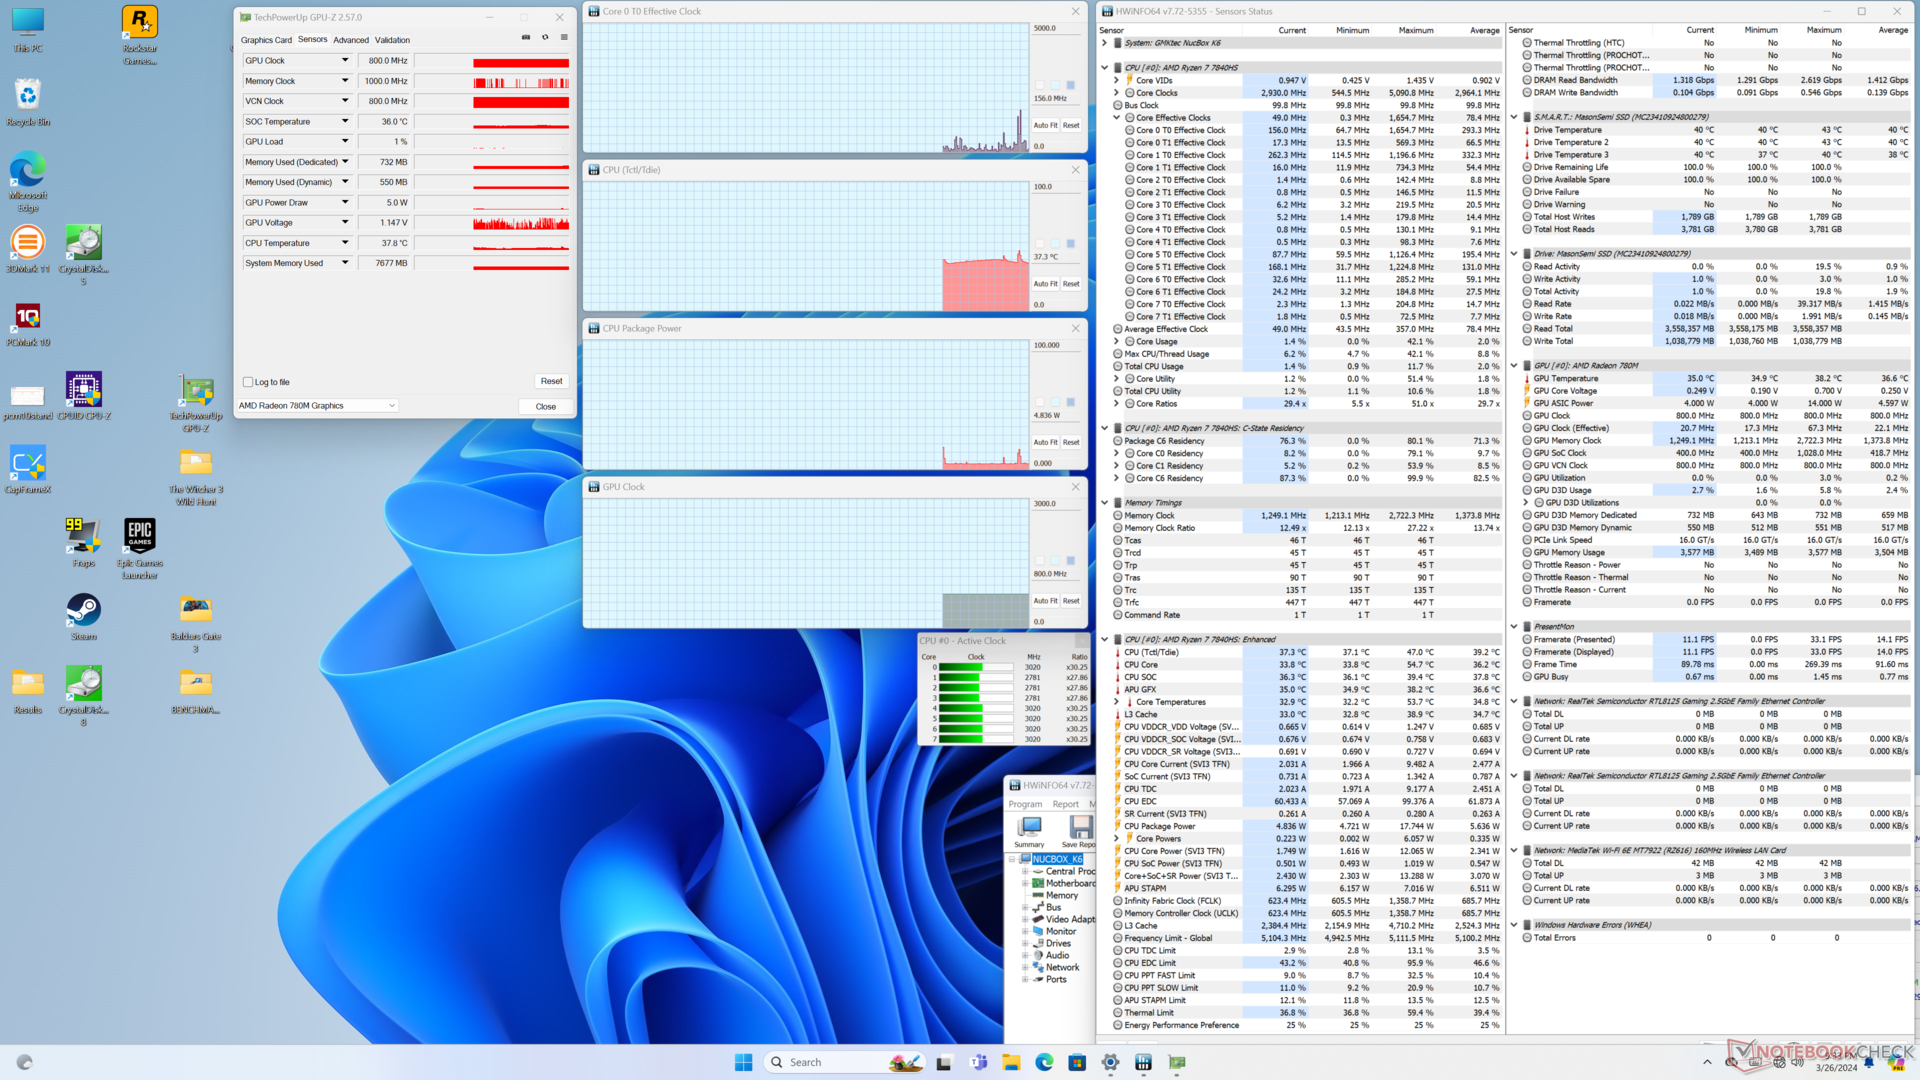
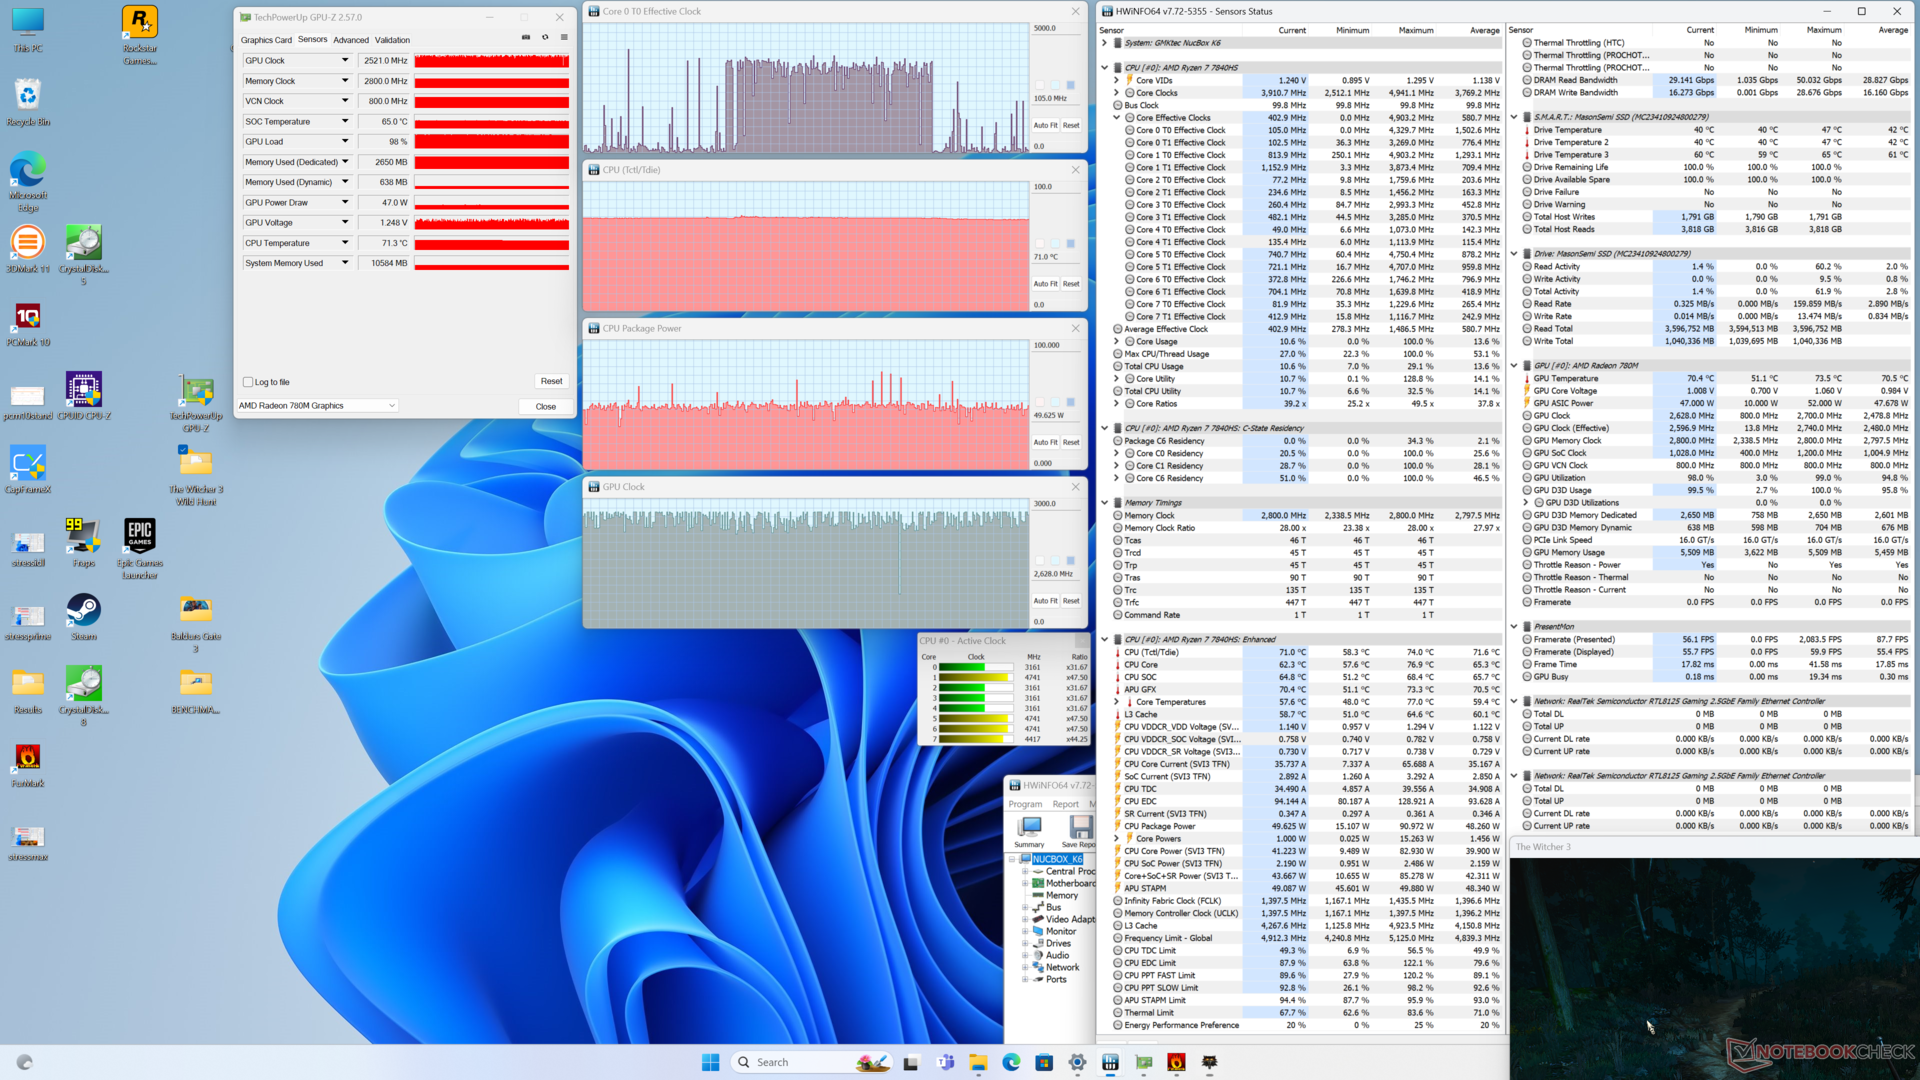
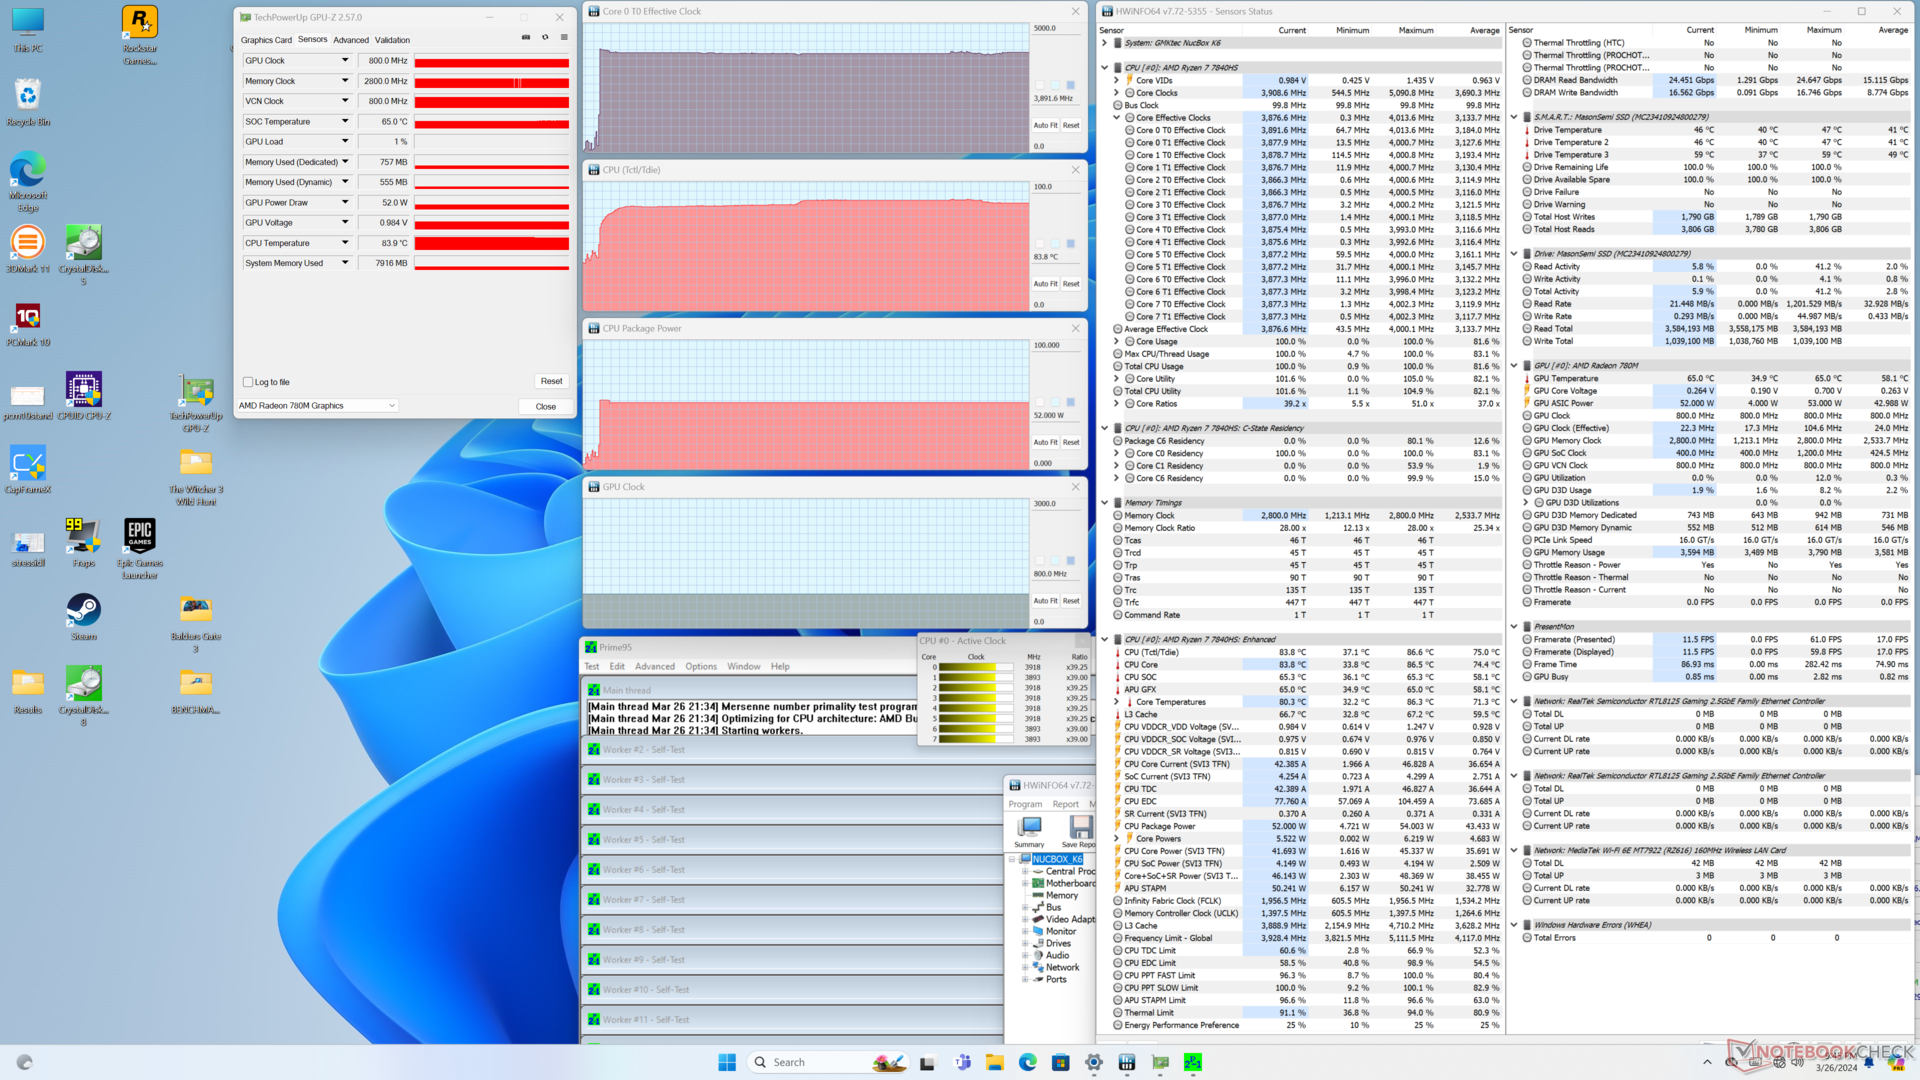
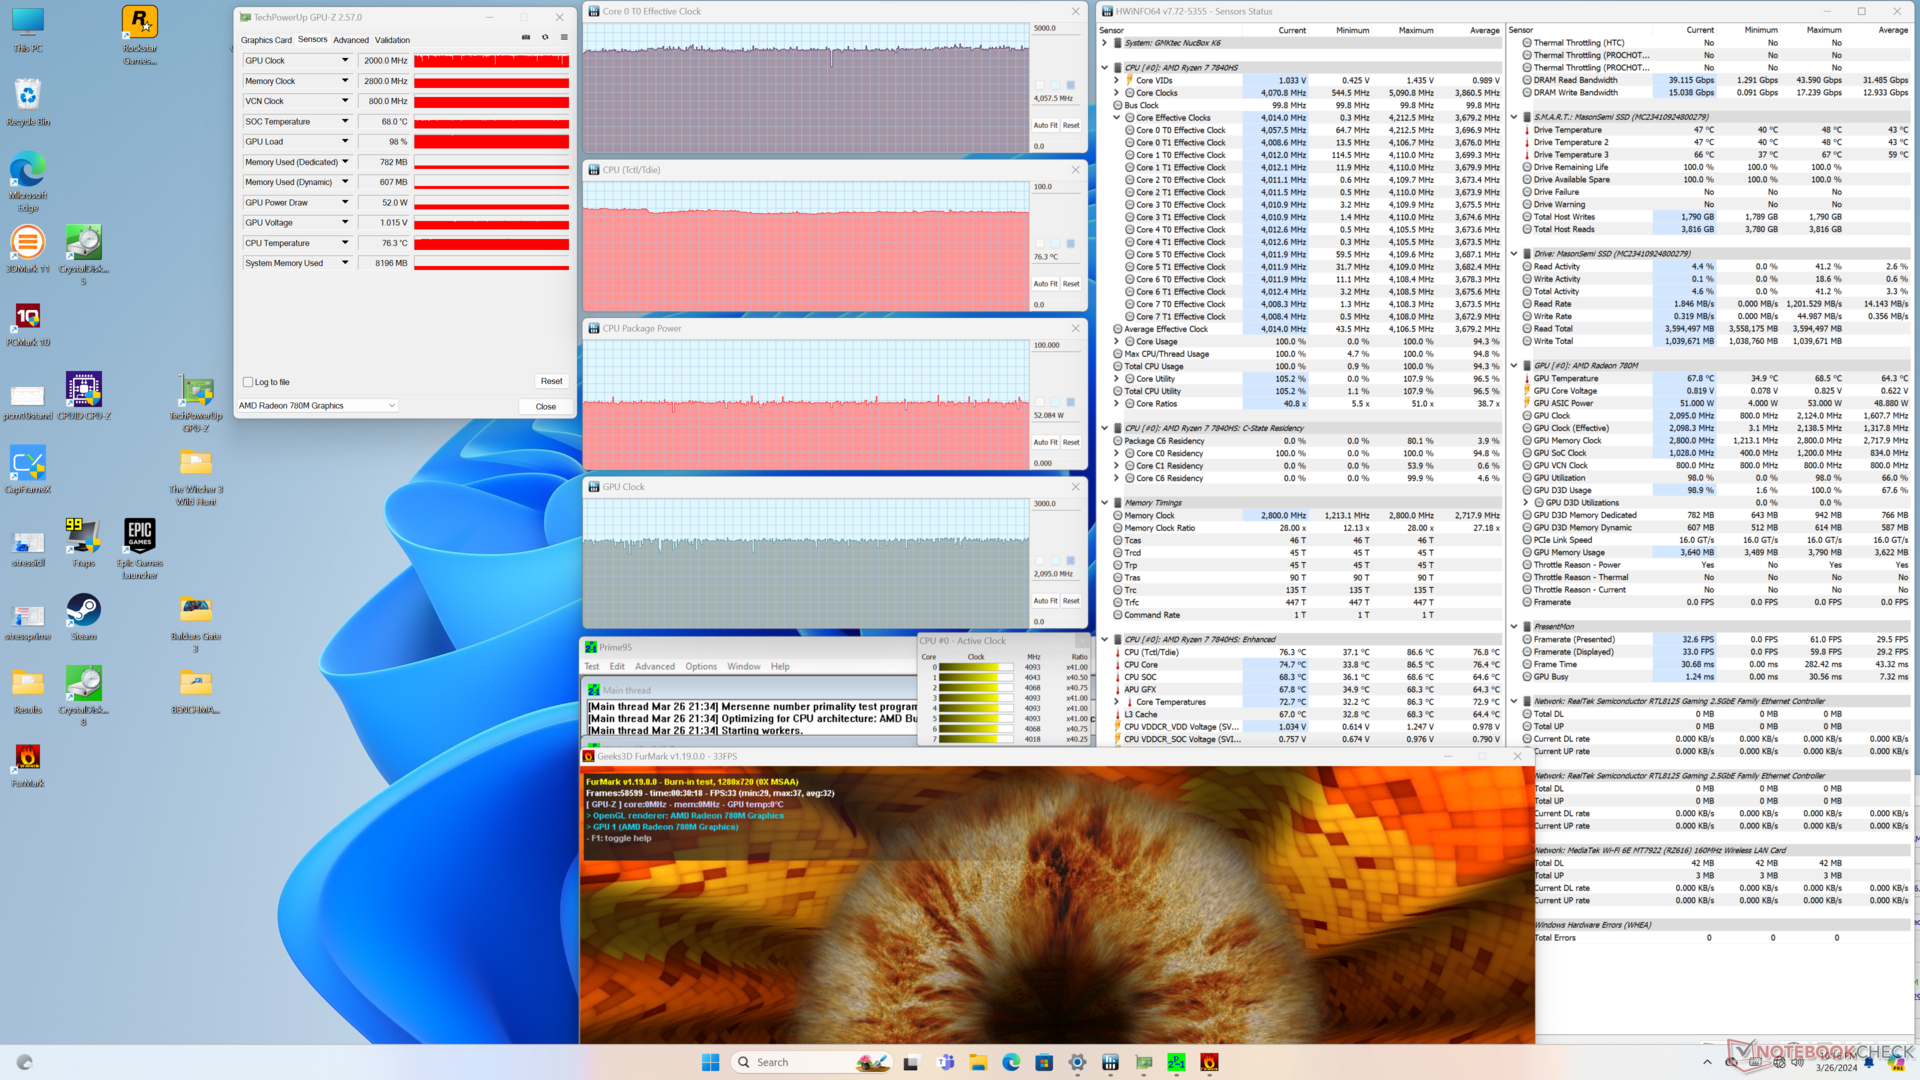
| CPU Clock (GHz) | GPU Clock (MHz) | Average CPU Temperature (°C) | |
| System Idle | -- | -- | 37 |
| Prime95 Stress | 3.9 | 800 | 84 |
| Prime95 + FurMark Stress | 4.1 | 2000 | 76 |
| Witcher 3 Stress | ~0.4 | 2200 - 2700 | 71 |
System Performance
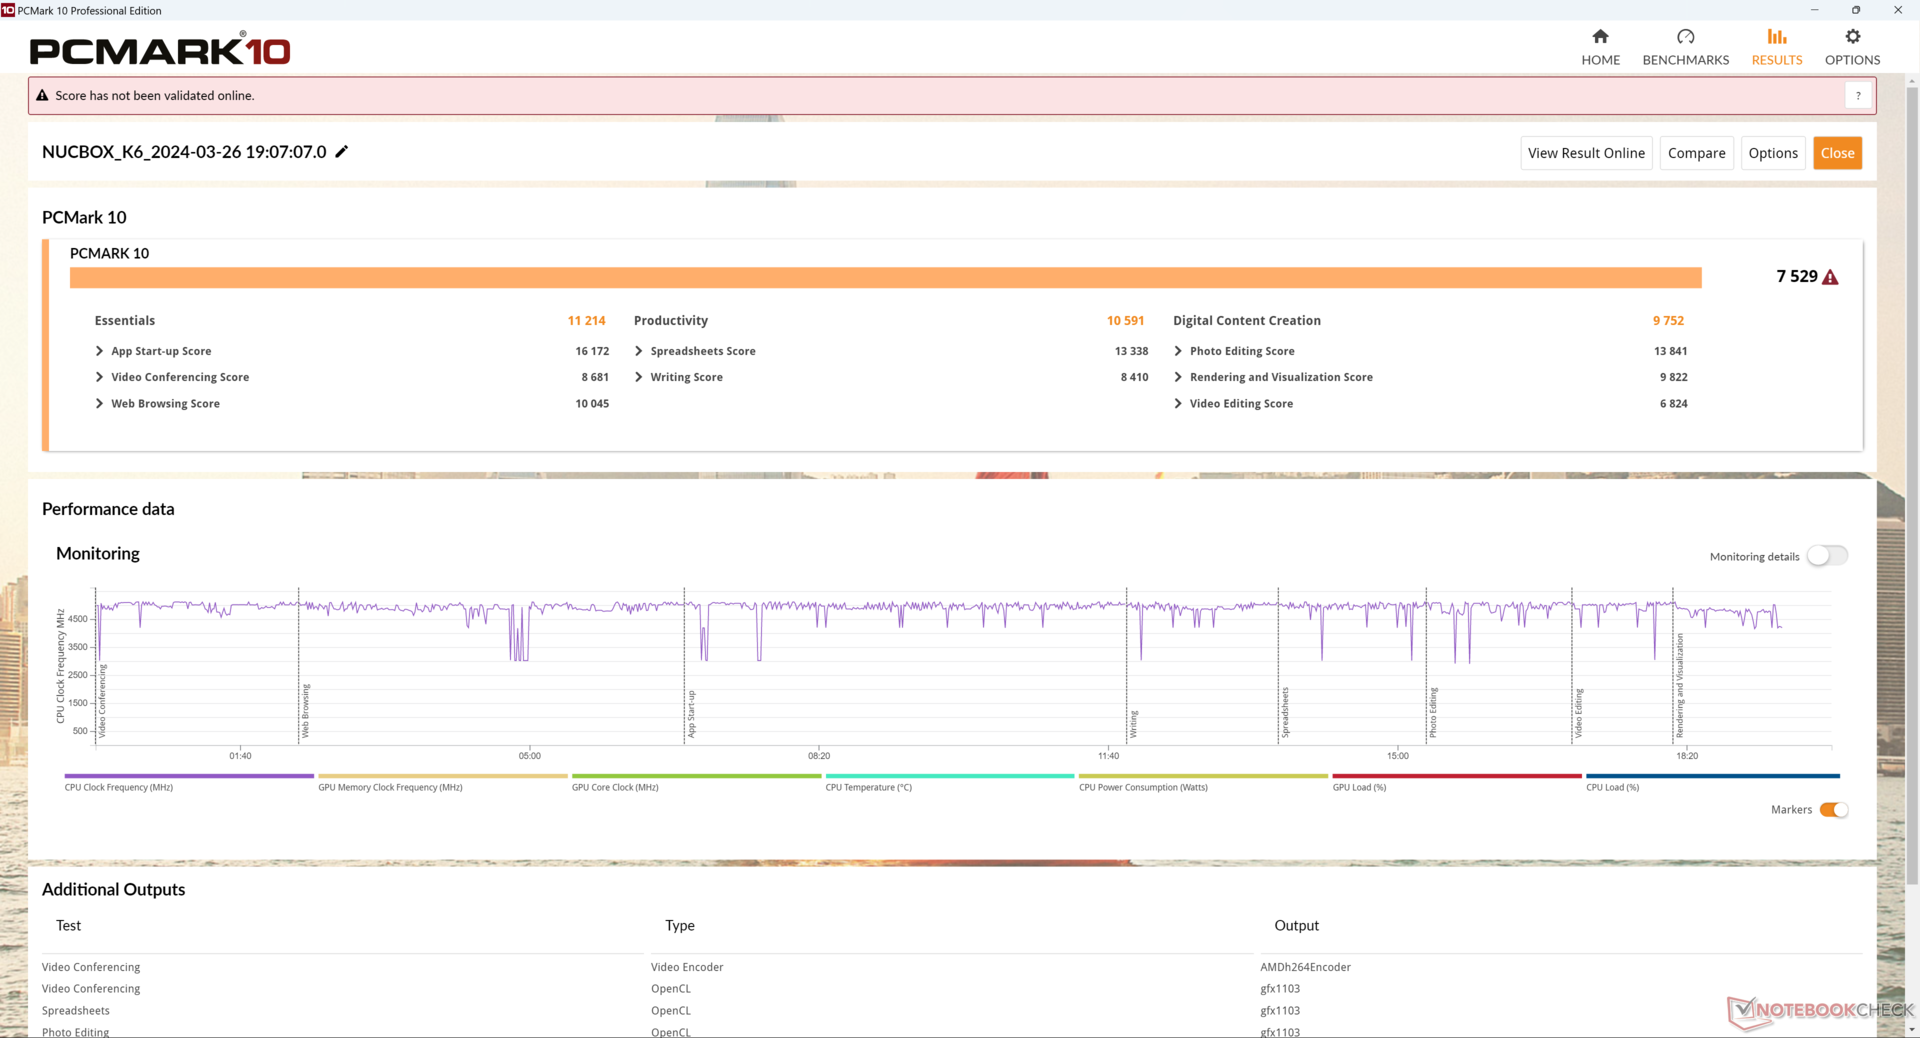
PCMark results are comparable to the Geekom A7 even though the Geekom comes with the more expensive Ryzen 9 7940HS. As for Intel, mini PCs equipped with Meteor Lake-H CPUs like the AcePC are the closest equivalents to our GMK.
CrossMark: Overall | Productivity | Creativity | Responsiveness
WebXPRT 3: Overall
WebXPRT 4: Overall
Mozilla Kraken 1.1: Total
| PCMark 10 / Score | |
| GMK NucBox K6 | |
| Geekom A7 | |
| Average AMD Ryzen 7 7840HS, AMD Radeon 780M (6914 - 7651, n=10) | |
| AcePC Wizbox AI | |
| Intel NUC 13 Pro Desk Edition Kit | |
| GMK NucBox K3 Pro | |
| Beelink SER5 | |
| PCMark 10 / Essentials | |
| GMK NucBox K6 | |
| Geekom A7 | |
| Intel NUC 13 Pro Desk Edition Kit | |
| Average AMD Ryzen 7 7840HS, AMD Radeon 780M (10519 - 11214, n=10) | |
| AcePC Wizbox AI | |
| GMK NucBox K3 Pro | |
| Beelink SER5 | |
| PCMark 10 / Productivity | |
| GMK NucBox K6 | |
| Geekom A7 | |
| Average AMD Ryzen 7 7840HS, AMD Radeon 780M (9075 - 10970, n=10) | |
| AcePC Wizbox AI | |
| Beelink SER5 | |
| GMK NucBox K3 Pro | |
| Intel NUC 13 Pro Desk Edition Kit | |
| PCMark 10 / Digital Content Creation | |
| AcePC Wizbox AI | |
| Geekom A7 | |
| GMK NucBox K6 | |
| Average AMD Ryzen 7 7840HS, AMD Radeon 780M (9052 - 9987, n=10) | |
| Intel NUC 13 Pro Desk Edition Kit | |
| GMK NucBox K3 Pro | |
| Beelink SER5 | |
| CrossMark / Overall | |
| GMK NucBox K6 | |
| Geekom A7 | |
| Average AMD Ryzen 7 7840HS, AMD Radeon 780M (1566 - 1891, n=10) | |
| AcePC Wizbox AI | |
| Intel NUC 13 Pro Desk Edition Kit | |
| GMK NucBox K3 Pro | |
| Beelink SER5 | |
| CrossMark / Productivity | |
| GMK NucBox K6 | |
| Geekom A7 | |
| Average AMD Ryzen 7 7840HS, AMD Radeon 780M (1535 - 1823, n=10) | |
| AcePC Wizbox AI | |
| Intel NUC 13 Pro Desk Edition Kit | |
| GMK NucBox K3 Pro | |
| Beelink SER5 | |
| CrossMark / Creativity | |
| Geekom A7 | |
| GMK NucBox K6 | |
| Average AMD Ryzen 7 7840HS, AMD Radeon 780M (1556 - 2040, n=10) | |
| AcePC Wizbox AI | |
| Intel NUC 13 Pro Desk Edition Kit | |
| GMK NucBox K3 Pro | |
| Beelink SER5 | |
| CrossMark / Responsiveness | |
| GMK NucBox K6 | |
| Average AMD Ryzen 7 7840HS, AMD Radeon 780M (1293 - 1749, n=10) | |
| Geekom A7 | |
| AcePC Wizbox AI | |
| Intel NUC 13 Pro Desk Edition Kit | |
| GMK NucBox K3 Pro | |
| Beelink SER5 | |
| WebXPRT 3 / Overall | |
| Geekom A7 | |
| GMK NucBox K6 | |
| Average AMD Ryzen 7 7840HS, AMD Radeon 780M (297 - 339, n=10) | |
| Intel NUC 13 Pro Desk Edition Kit | |
| GMK NucBox K3 Pro | |
| AcePC Wizbox AI | |
| Beelink SER5 | |
| WebXPRT 4 / Overall | |
| Geekom A7 | |
| GMK NucBox K6 | |
| Intel NUC 13 Pro Desk Edition Kit | |
| Average AMD Ryzen 7 7840HS, AMD Radeon 780M (245 - 319, n=9) | |
| Beelink SER5 | |
| Mozilla Kraken 1.1 / Total | |
| Beelink SER5 | |
| AcePC Wizbox AI | |
| GMK NucBox K6 | |
| GMK NucBox K3 Pro | |
| Average AMD Ryzen 7 7840HS, AMD Radeon 780M (485 - 544, n=10) | |
| Geekom A7 | |
| Intel NUC 13 Pro Desk Edition Kit | |
* ... smaller is better
| PCMark 10 Score | 7529 points | |
Help | ||
| AIDA64 / Memory Copy | |
| GMK NucBox K3 Pro | |
| GMK NucBox K6 | |
| Geekom A7 | |
| Average AMD Ryzen 7 7840HS (30937 - 72158, n=21) | |
| AcePC Wizbox AI | |
| Intel NUC 13 Pro Desk Edition Kit | |
| Beelink SER5 | |
| AIDA64 / Memory Read | |
| GMK NucBox K3 Pro | |
| GMK NucBox K6 | |
| Geekom A7 | |
| AcePC Wizbox AI | |
| Average AMD Ryzen 7 7840HS (30497 - 62147, n=21) | |
| Intel NUC 13 Pro Desk Edition Kit | |
| Beelink SER5 | |
| AIDA64 / Memory Write | |
| Geekom A7 | |
| GMK NucBox K6 | |
| Average AMD Ryzen 7 7840HS (34590 - 93323, n=21) | |
| AcePC Wizbox AI | |
| GMK NucBox K3 Pro | |
| Intel NUC 13 Pro Desk Edition Kit | |
| Beelink SER5 | |
| AIDA64 / Memory Latency | |
| AcePC Wizbox AI | |
| GMK NucBox K3 Pro | |
| Intel NUC 13 Pro Desk Edition Kit | |
| Beelink SER5 | |
| Average AMD Ryzen 7 7840HS (85.1 - 112, n=21) | |
| Geekom A7 | |
| GMK NucBox K6 | |
* ... smaller is better
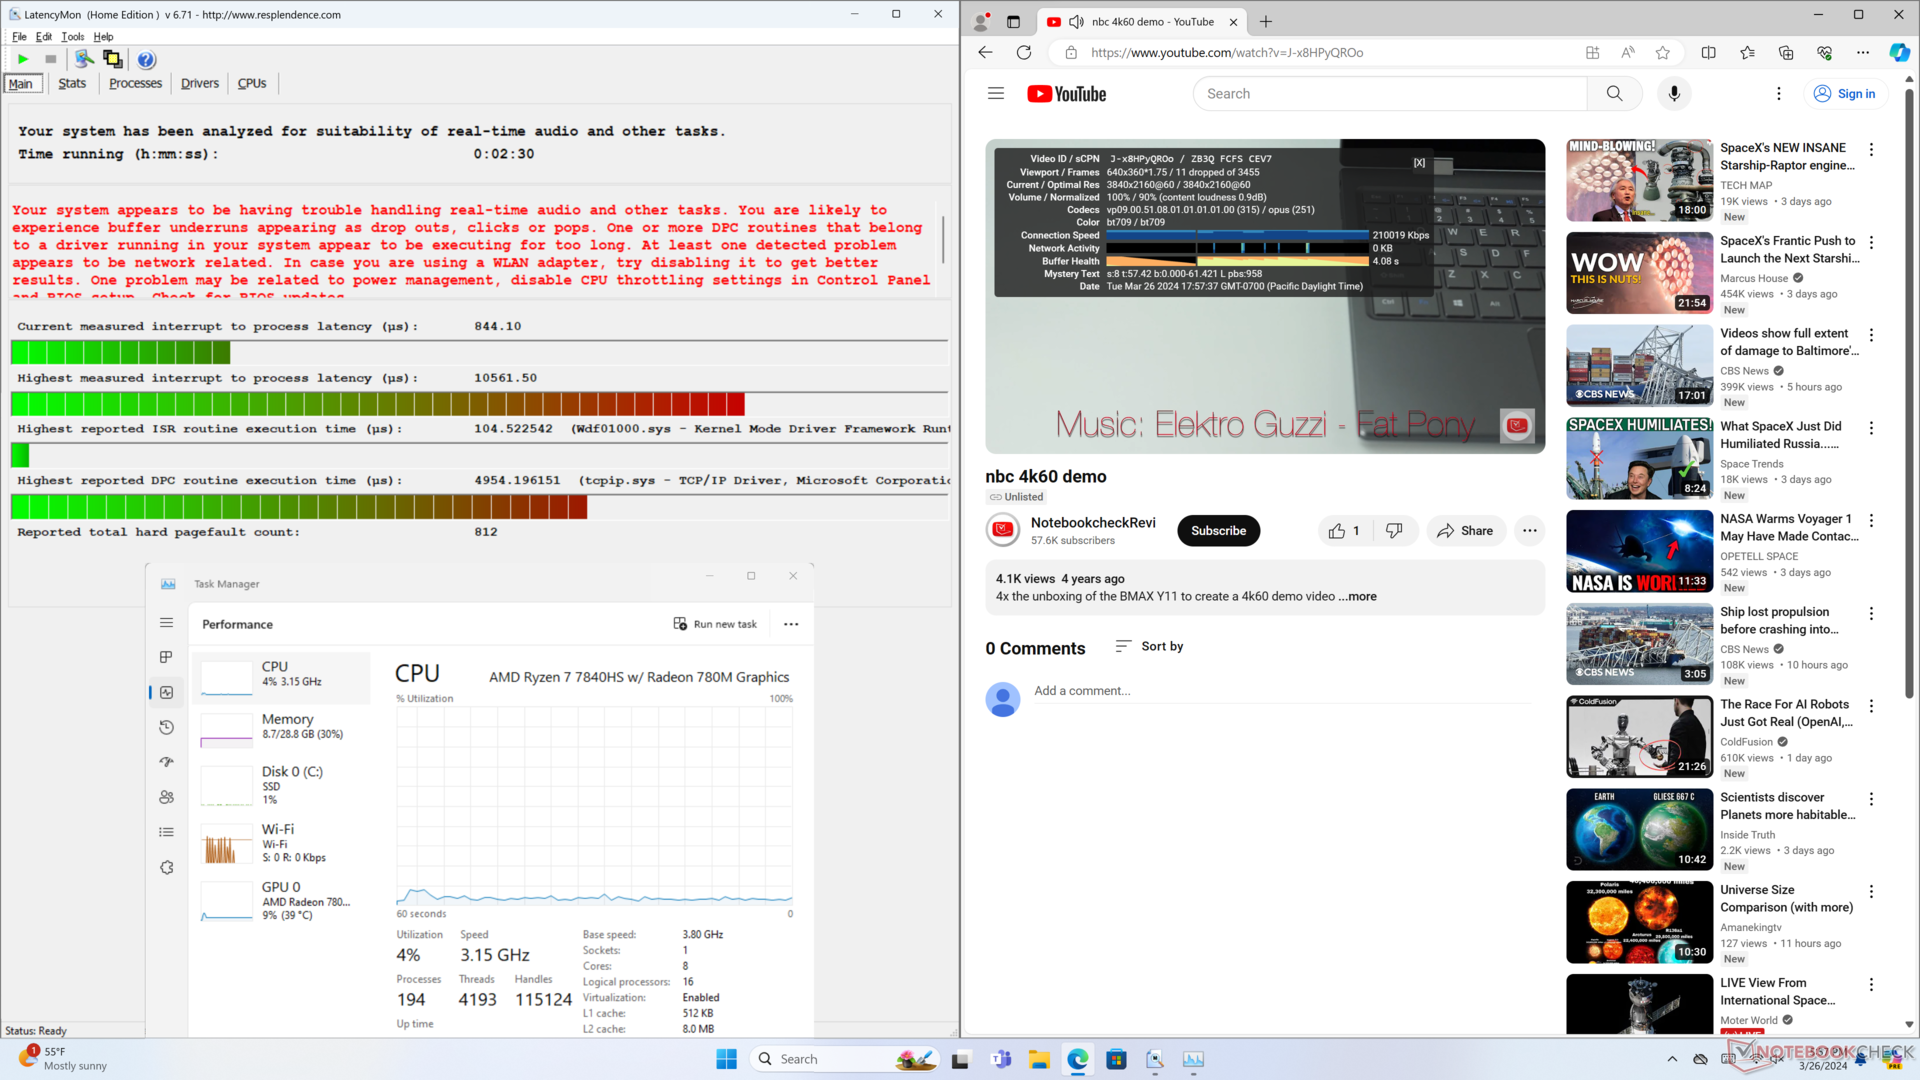
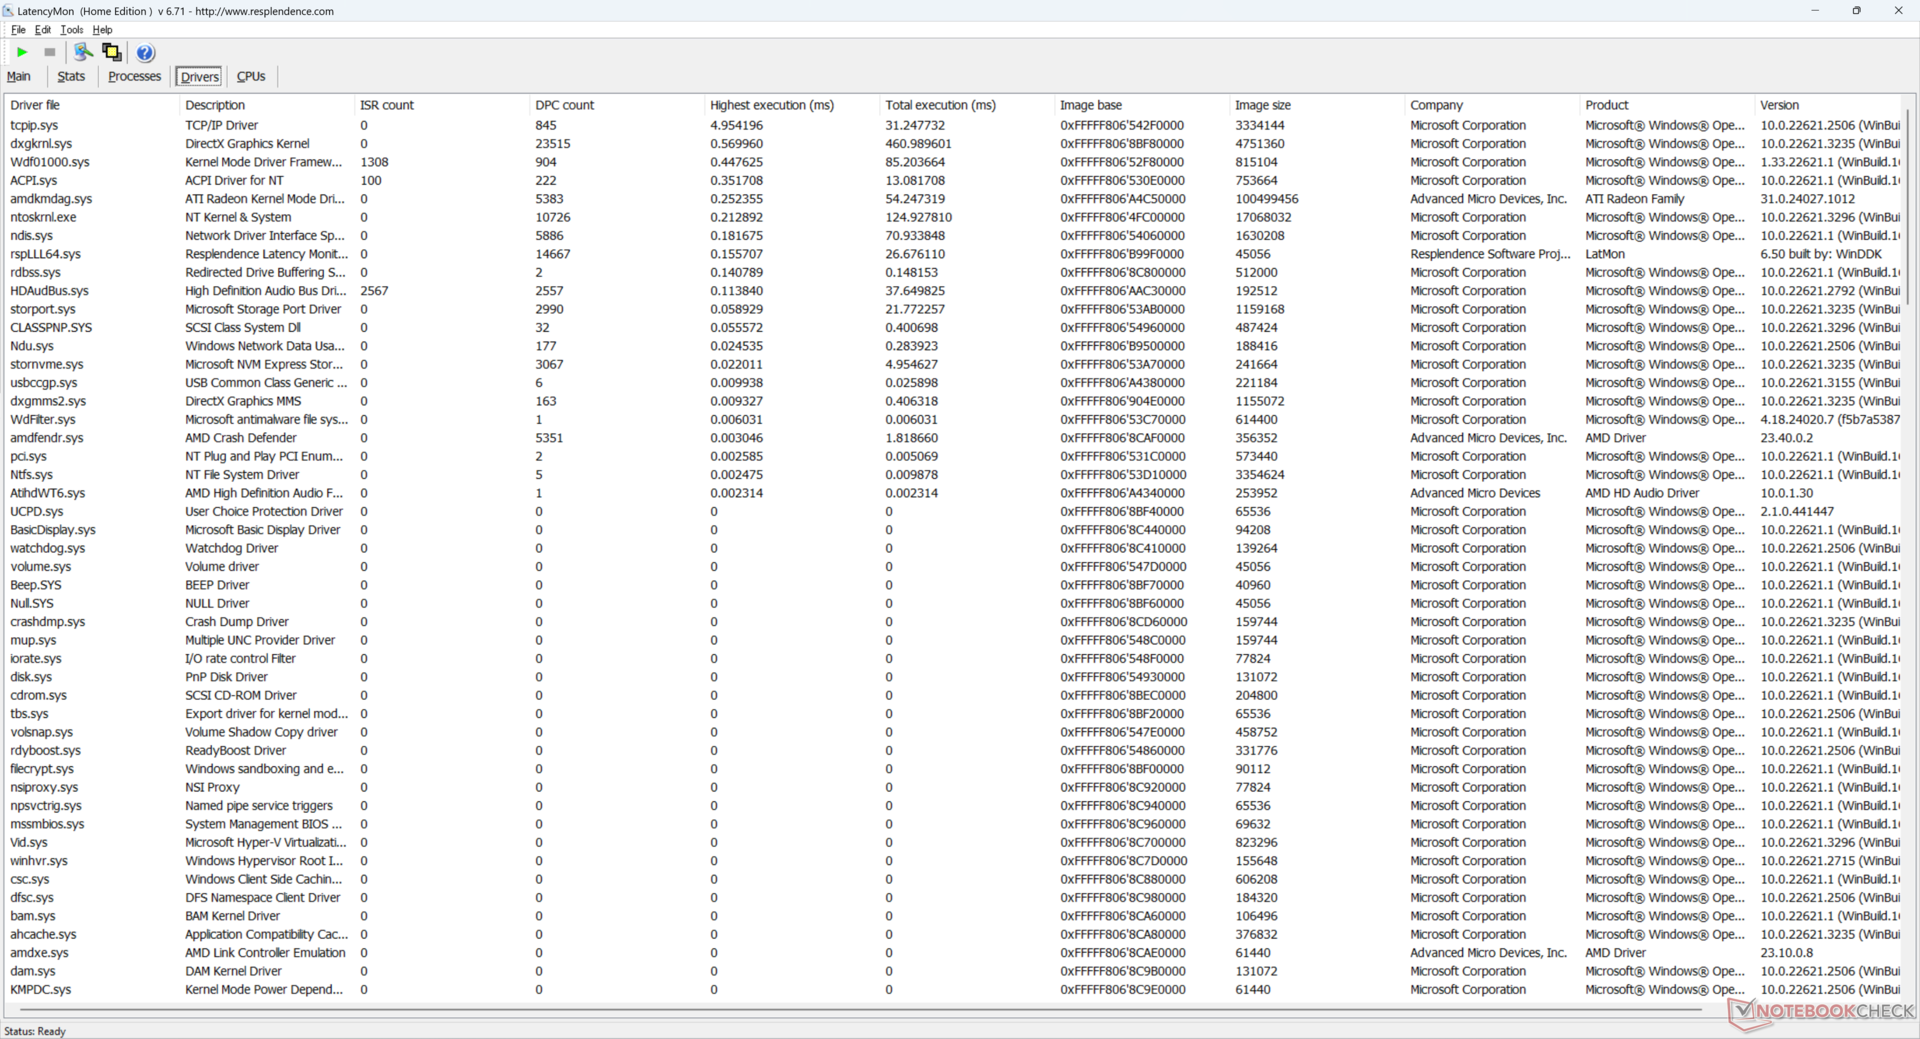
DPC Latency
Unfortunately, the system suffers from DPC latency issues affecting video playback. Our minute-long 4K60 video would return 11 dropped frames when it should be zero. Expect some minor stuttering when streaming video as a result.
| DPC Latencies / LatencyMon - interrupt to process latency (max), Web, Youtube, Prime95 | |
| GMK NucBox K6 | |
| Geekom A7 | |
| GMK NucBox K3 Pro | |
| Intel NUC 13 Pro Desk Edition Kit | |
| AcePC Wizbox AI | |
| Beelink SER5 | |
* ... smaller is better
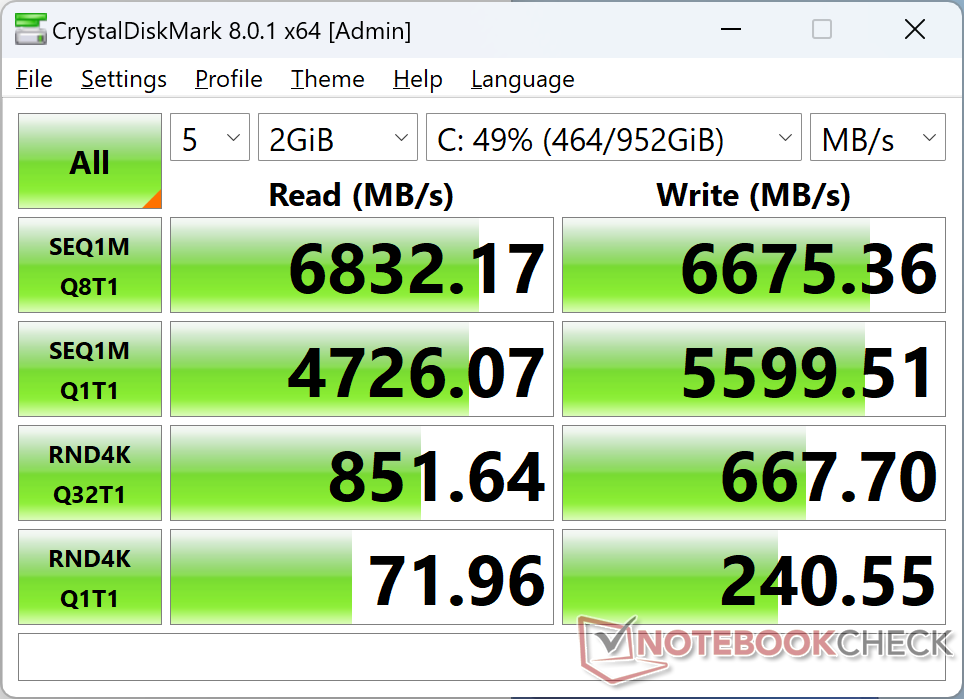
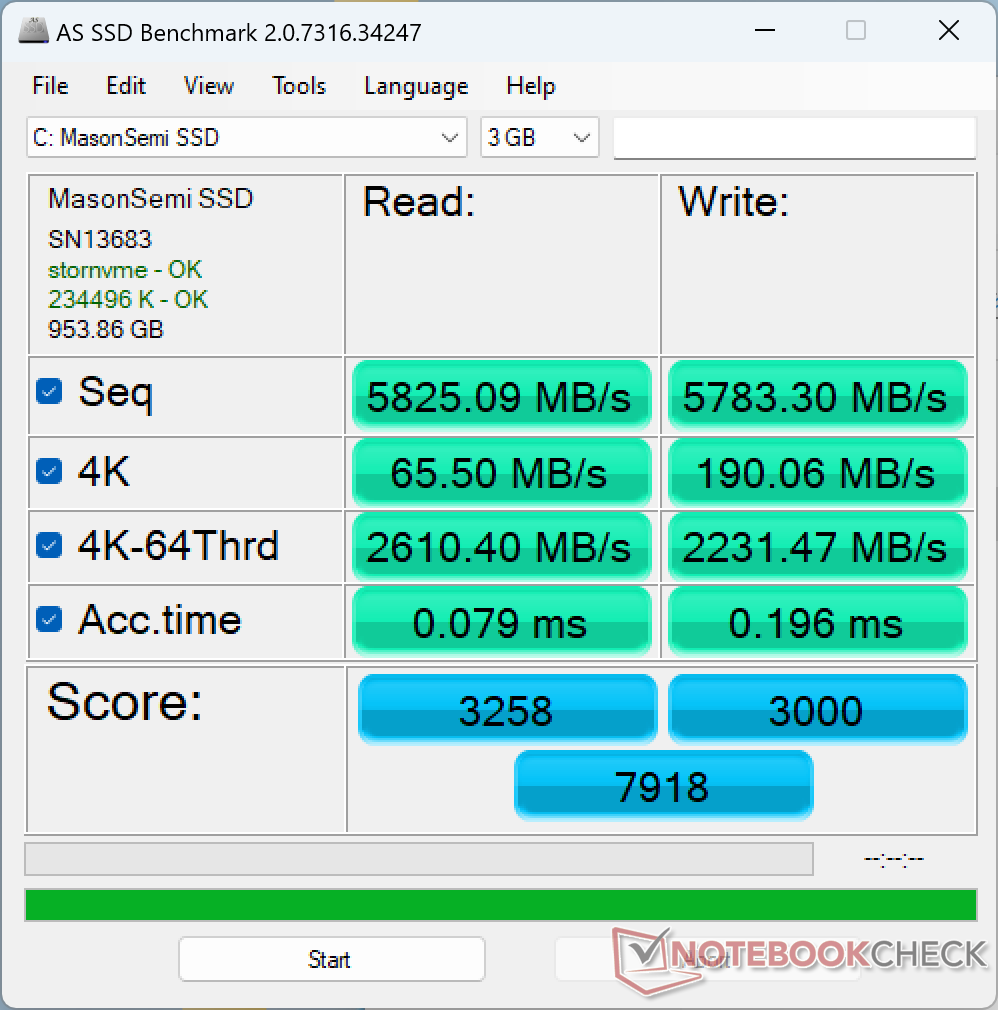
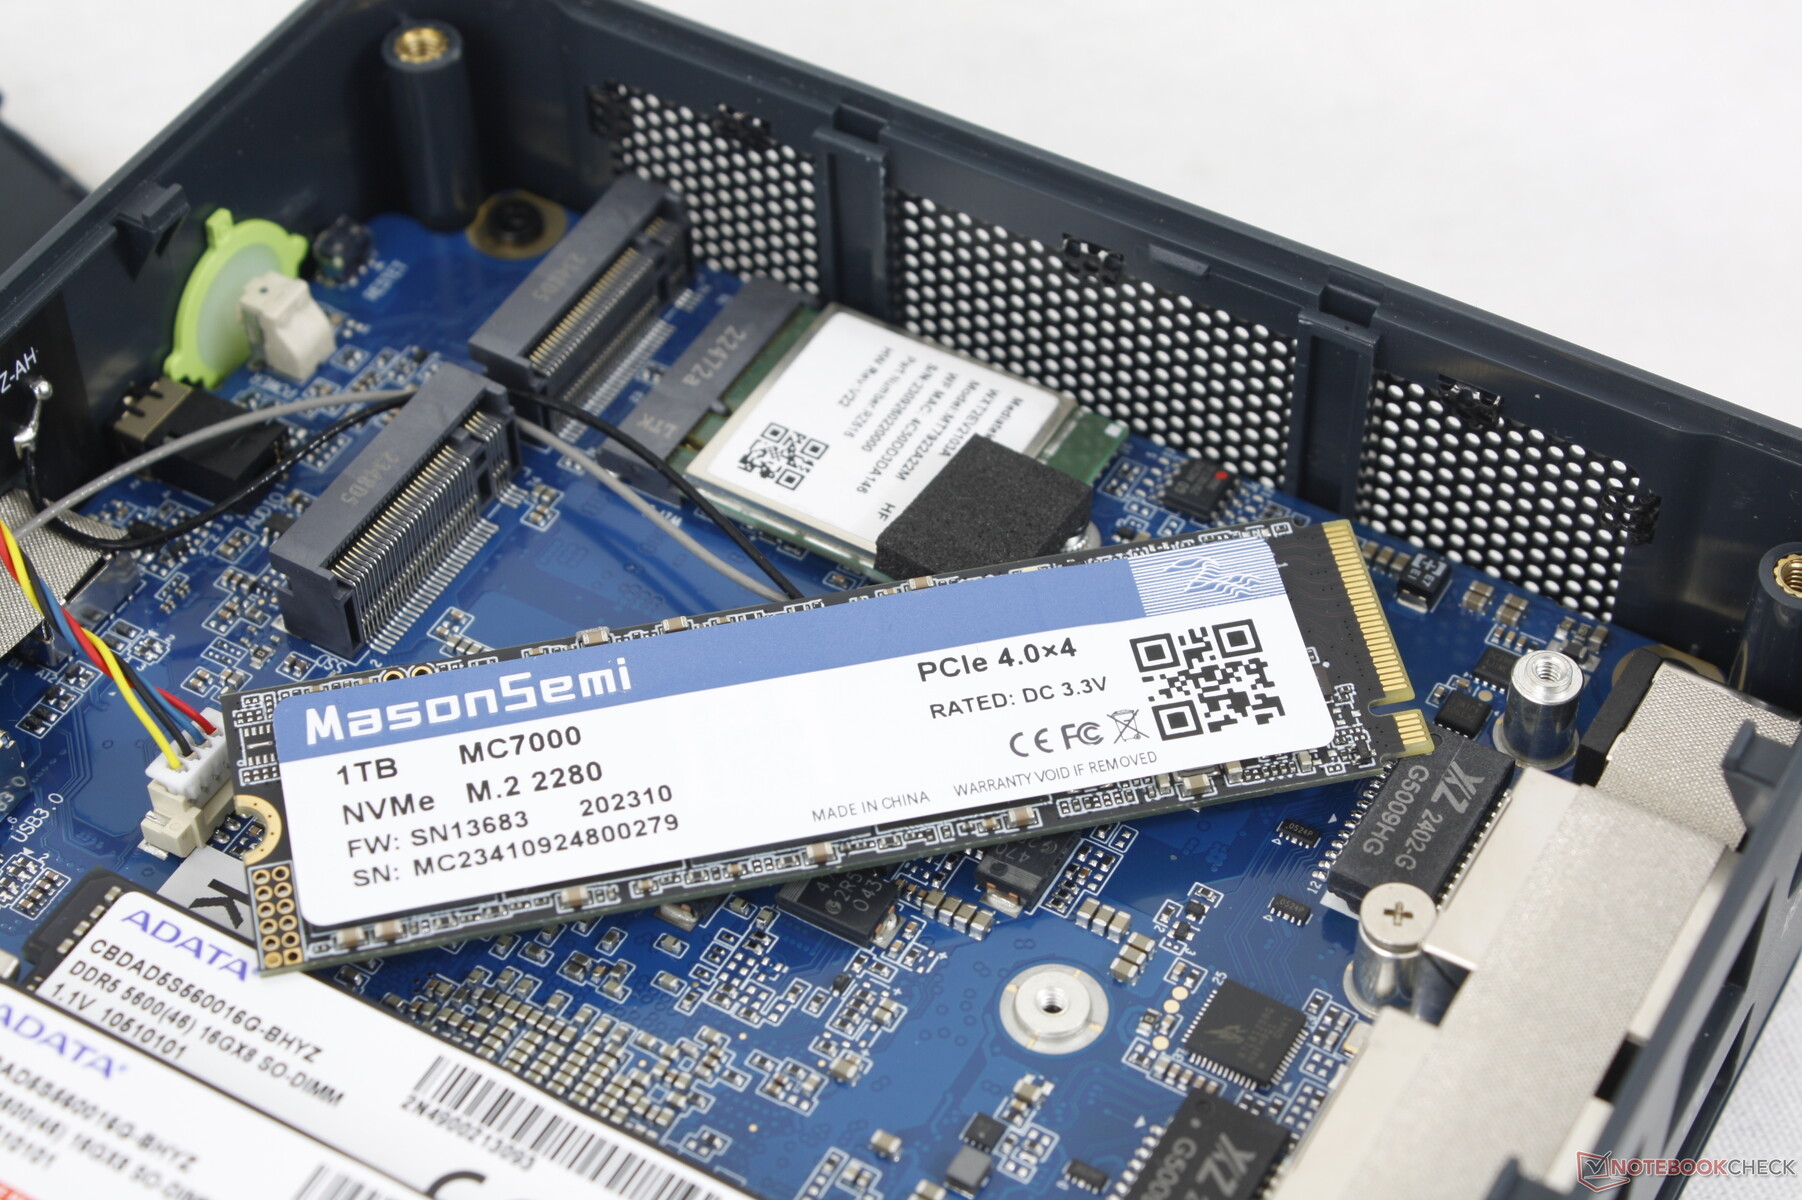
Storage Devices
GMK mini PCs usually ship with lesser-known SSD brands likely to keep costs low. The MasonSemi MC7000 may not be a household name, but performance is nevertheless excellent with results that are comparable to the popular Samsung PM9A1 series. Read rates are sustainable at ~7000 MB/s which is near the upper limit for PCIe4 x4 drives.
Note that only one heat spreader is included even though the system can support up to two drives.

| Drive Performance rating - Percent | |
| GMK NucBox K6 | |
| Intel NUC 13 Pro Desk Edition Kit | |
| Geekom A7 | |
| Beelink SER5 | |
| AcePC Wizbox AI | |
| GMK NucBox K3 Pro | |
* ... smaller is better
Disk Throttling: DiskSpd Read Loop, Queue Depth 8
GPU Performance — Powerful Enough For Most Games
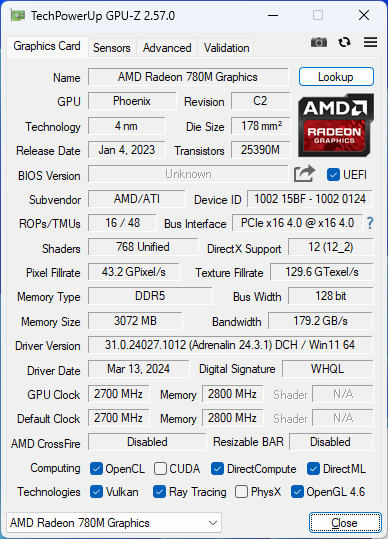
The Radeon 780M has proven itself to be a potent integrated GPU and it can even run faster on mini PCs than laptops since the thicker form factor generally allows for higher power envelopes. In this case, the iGPU in our NucBox K6 runs about 10 percent faster than the average laptop in our database equipped with the same graphics option. The performance advantage can be even greater in games like Tiny Tina's Wonderlands or F1 22 where we can observe a delta of up to 20 percent. Users upgrading from UHD Graphics or Iris Xe should see a significant boost.
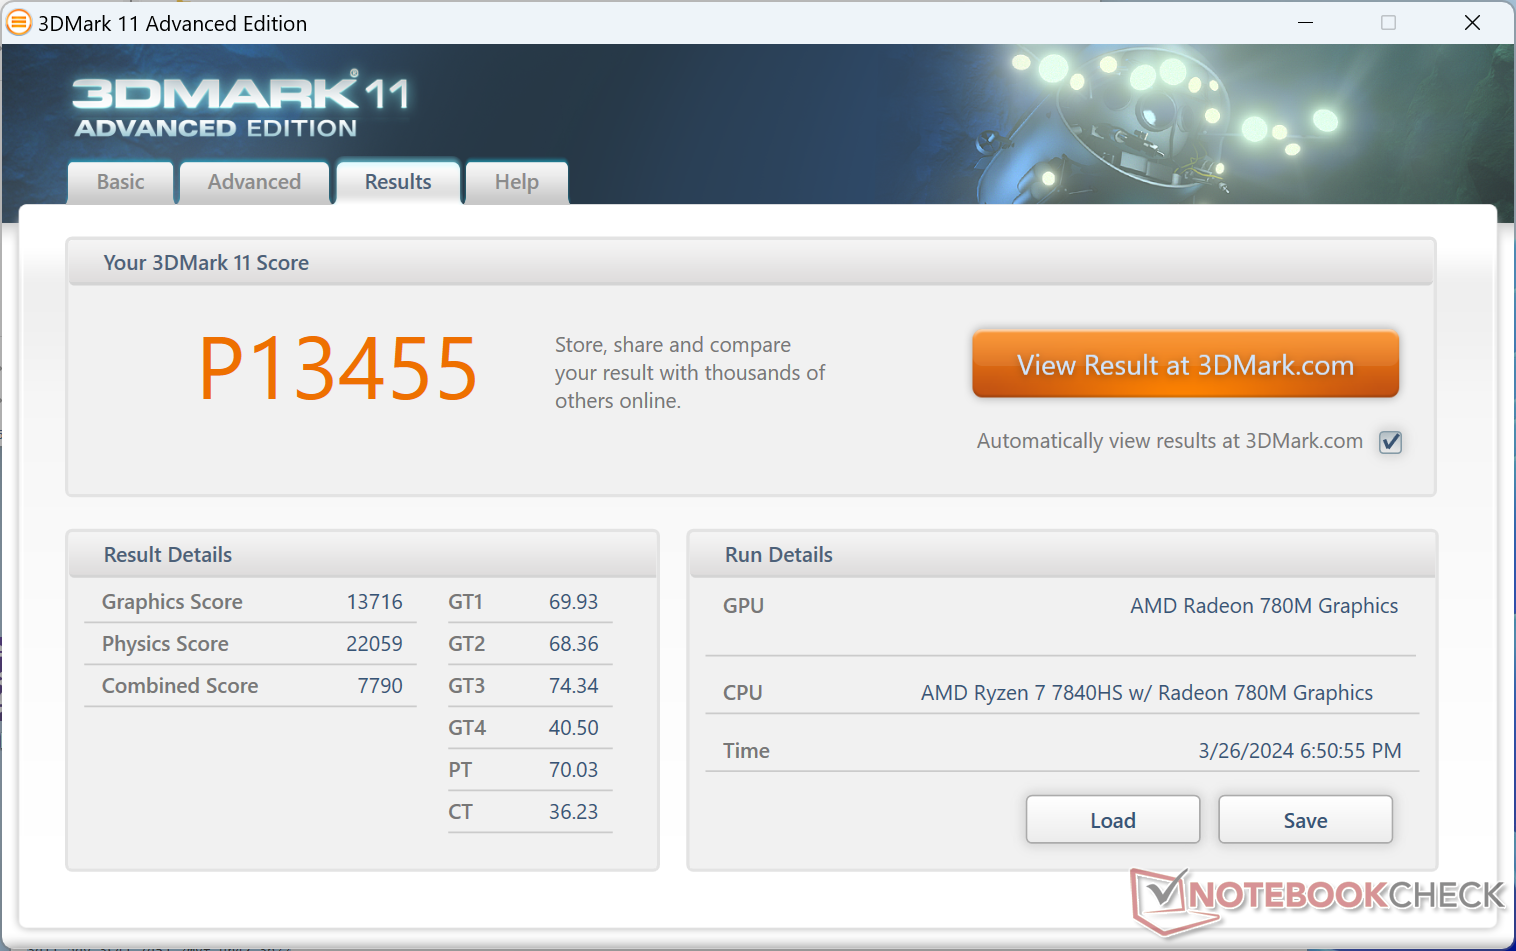
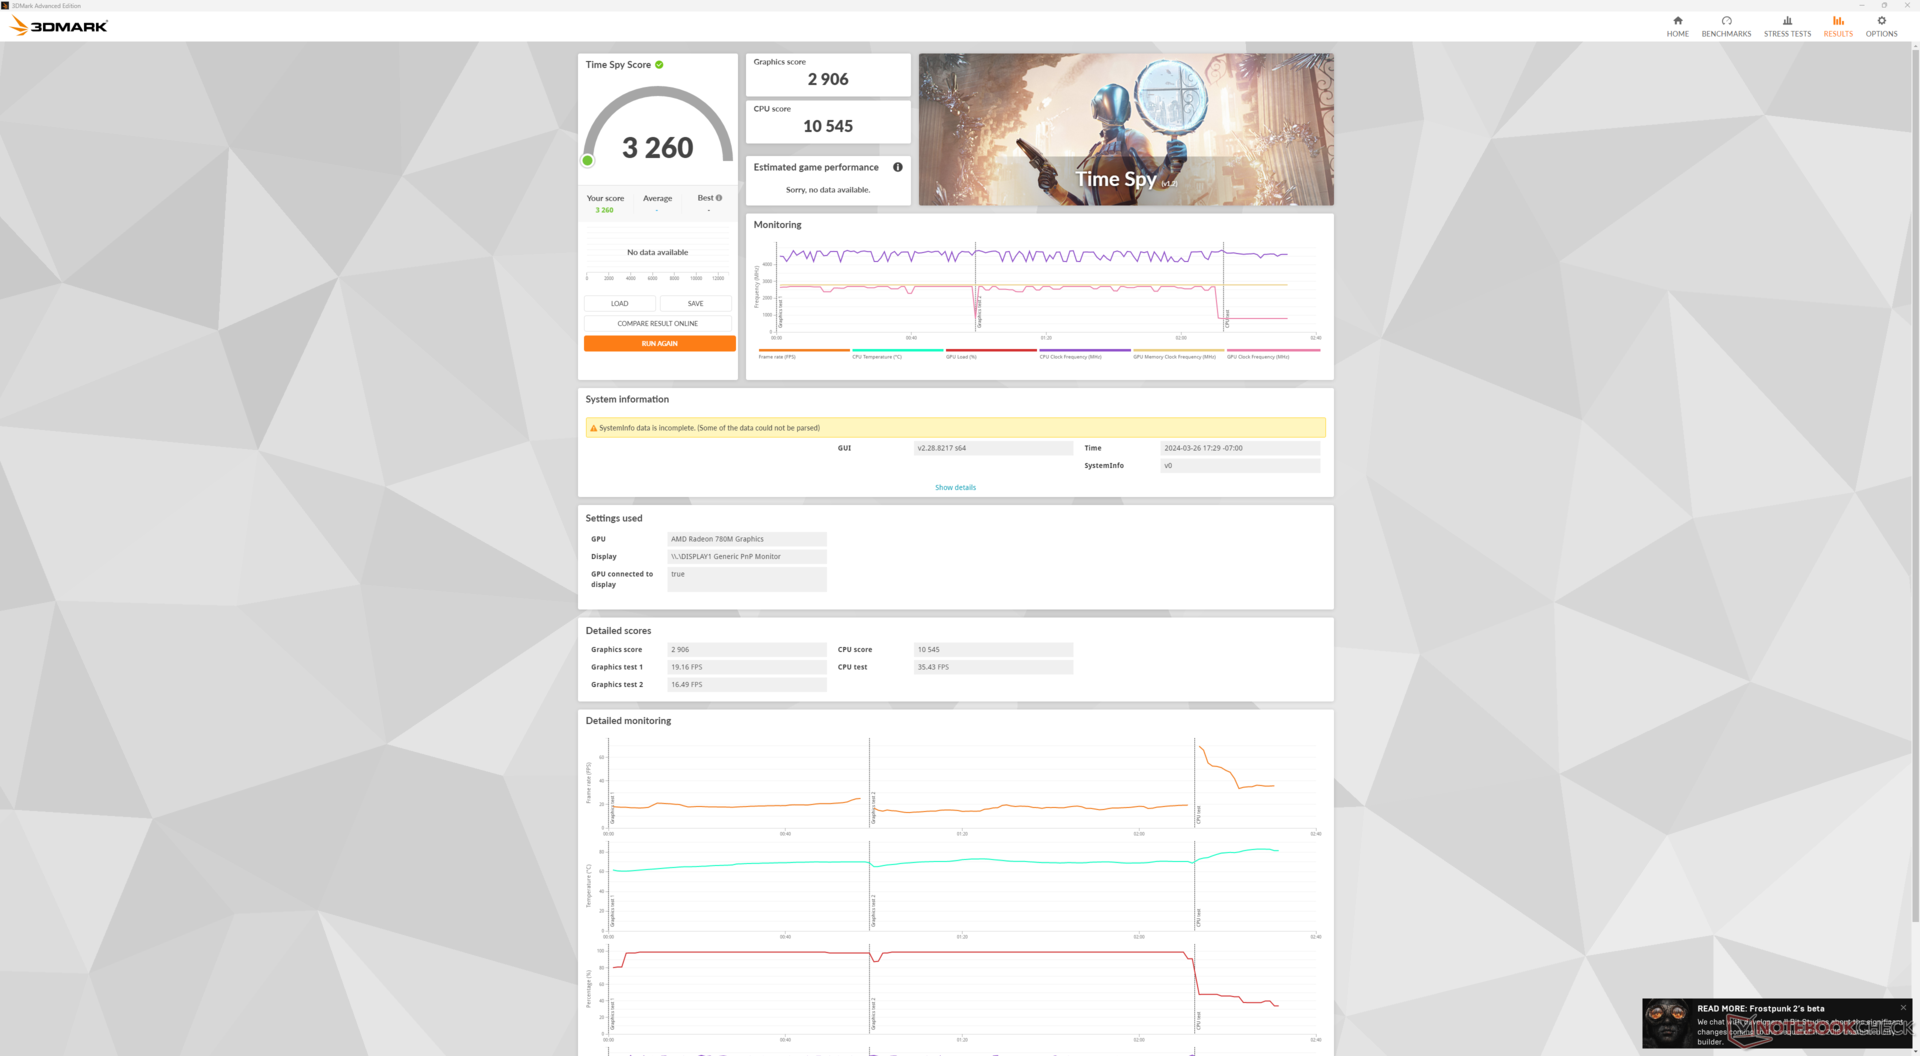
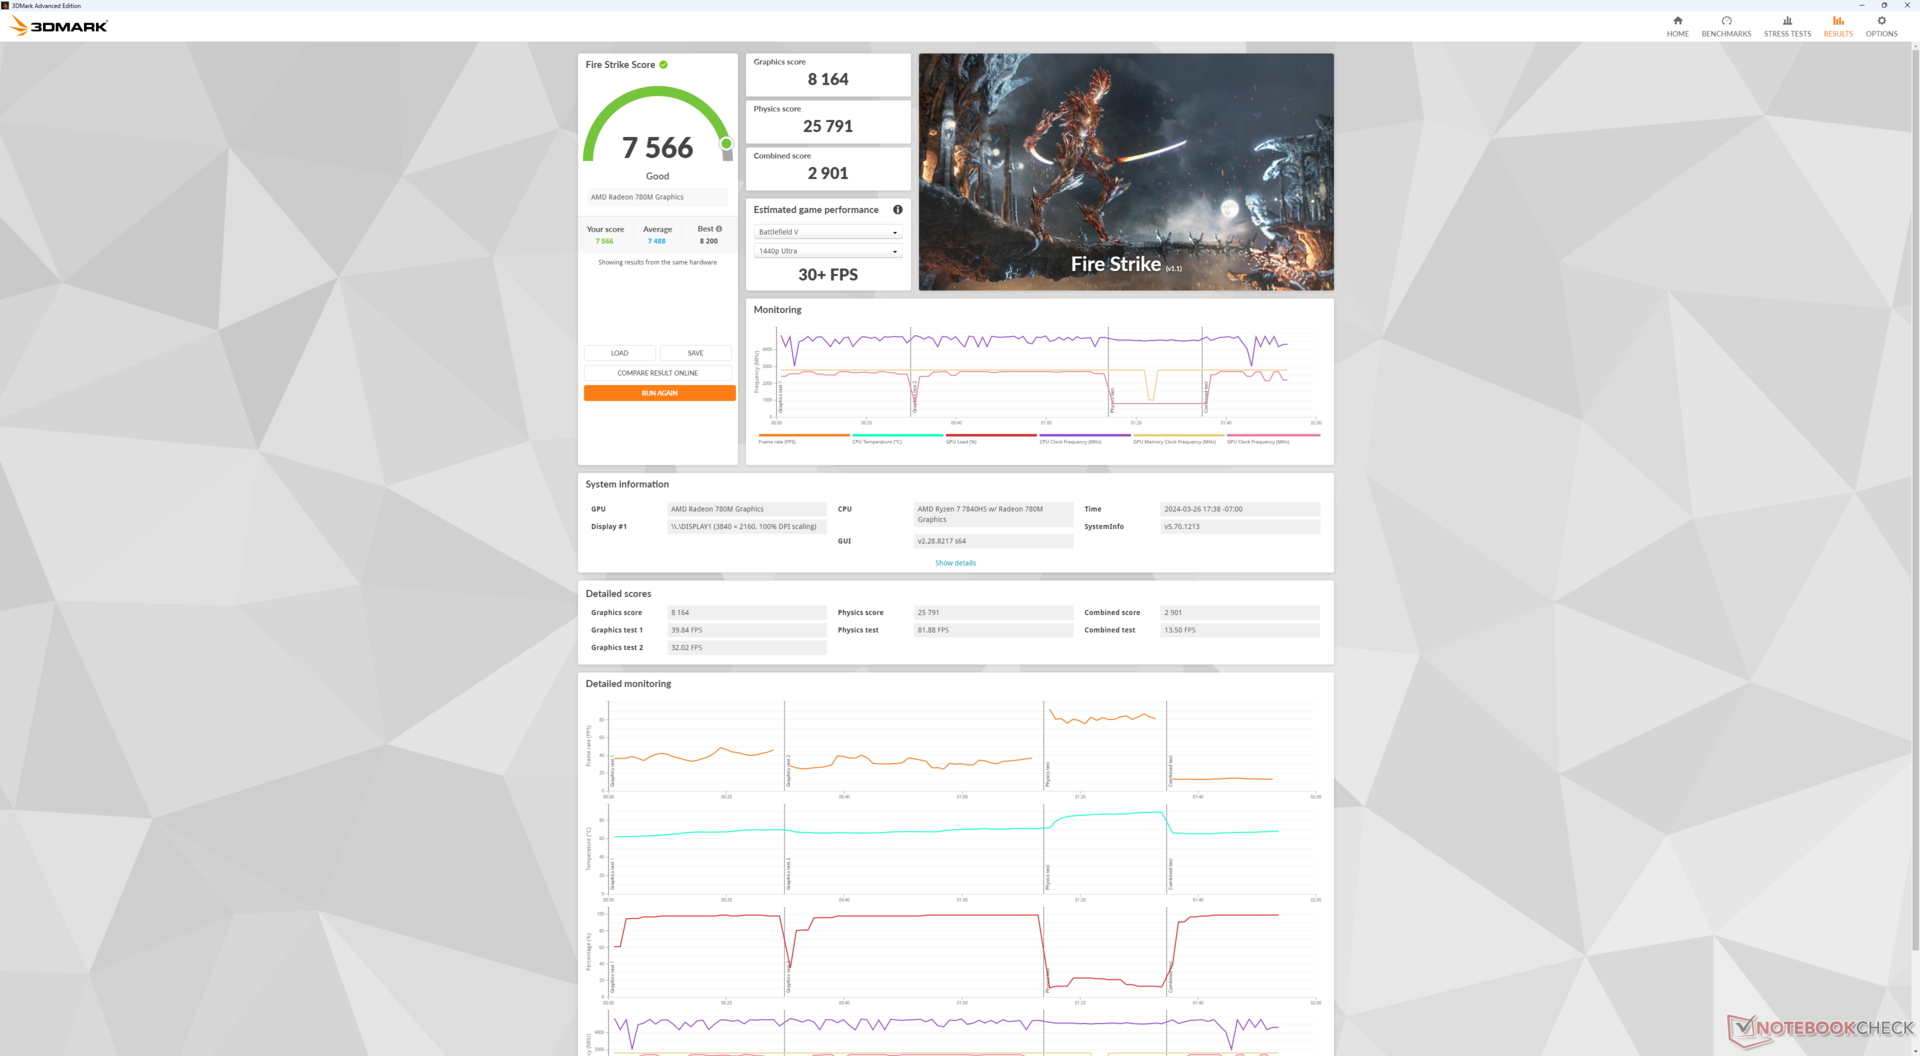
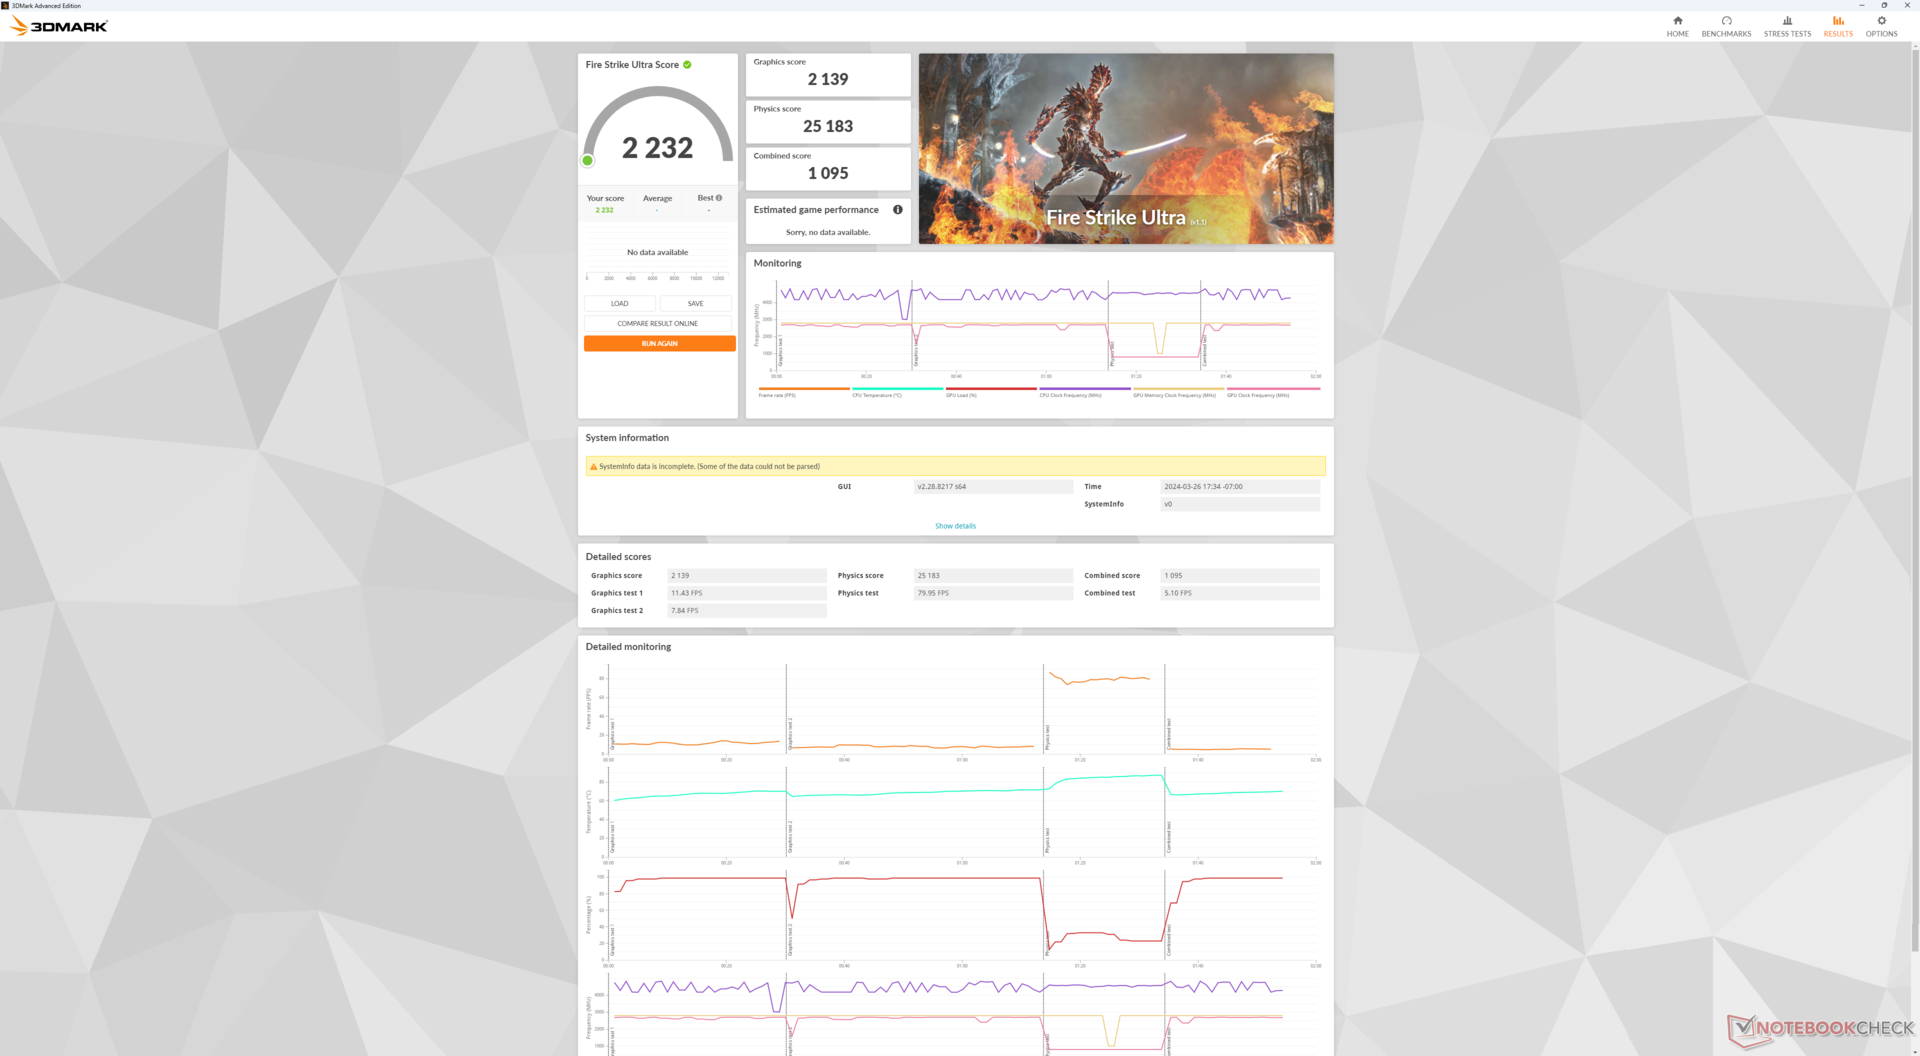
| 3DMark 11 Performance | 13455 points | |
| 3DMark Fire Strike Score | 7566 points | |
| 3DMark Time Spy Score | 3260 points | |
Help | ||
| Blender | |
| v3.3 Classroom HIP/AMD | |
| Beelink SER5 | |
| Beelink GTR6 | |
| Aoostar GOD77 | |
| Beelink SER6 Pro | |
| v3.3 Classroom CPU | |
| GMK NucBox M3 | |
| Beelink SER5 | |
| GMK NucBox K3 Pro | |
| GMK NucBox M4 | |
| Intel NUC 13 Pro Desk Edition Kit | |
| Beelink SER6 Pro | |
| Lenovo IdeaCentre Mini 01IRH8 | |
| Beelink GTR6 | |
| Aoostar GOD77 | |
| Average AMD Radeon 780M (300 - 664, n=76) | |
| AcePC Wizbox AI | |
| Geekom A7 | |
| GMK NucBox K6 | |
| v3.3 Classroom oneAPI/Intel | |
| AcePC Wizbox AI | |
* ... smaller is better
| Performance rating - Percent | |
| GMK NucBox K6 | |
| AcePC Wizbox AI | |
| Intel NUC 13 Pro Desk Edition Kit | |
| Beelink SER5 | |
| The Witcher 3 - 1920x1080 Ultra Graphics & Postprocessing (HBAO+) | |
| GMK NucBox K6 | |
| AcePC Wizbox AI | |
| Intel NUC 13 Pro Desk Edition Kit | |
| Beelink SER5 | |
| GTA V - 1920x1080 Highest AA:4xMSAA + FX AF:16x | |
| GMK NucBox K6 | |
| AcePC Wizbox AI | |
| Beelink SER5 | |
| Intel NUC 13 Pro Desk Edition Kit | |
| Final Fantasy XV Benchmark - 1920x1080 High Quality | |
| GMK NucBox K6 | |
| AcePC Wizbox AI | |
| Intel NUC 13 Pro Desk Edition Kit | |
| Beelink SER5 | |
| Strange Brigade - 1920x1080 ultra AA:ultra AF:16 | |
| GMK NucBox K6 | |
| AcePC Wizbox AI | |
| Intel NUC 13 Pro Desk Edition Kit | |
| Beelink SER5 | |
| Dota 2 Reborn - 1920x1080 ultra (3/3) best looking | |
| GMK NucBox K6 | |
| AcePC Wizbox AI | |
| Intel NUC 13 Pro Desk Edition Kit | |
| Beelink SER5 | |
| X-Plane 11.11 - 1920x1080 high (fps_test=3) | |
| GMK NucBox K6 | |
| AcePC Wizbox AI | |
| Intel NUC 13 Pro Desk Edition Kit | |
| Beelink SER5 | |
| Baldur's Gate 3 | |
| 1920x1080 Low Preset AA:SM | |
| GMK NucBox K6 | |
| Average AMD Radeon 780M (20.2 - 44.1, n=47) | |
| 1920x1080 Medium Preset AA:T | |
| GMK NucBox K6 | |
| Average AMD Radeon 780M (15.7 - 36.8, n=50) | |
| 1920x1080 High Preset AA:T | |
| GMK NucBox K6 | |
| Average AMD Radeon 780M (13.3 - 30.6, n=50) | |
| 1920x1080 Ultra Preset AA:T | |
| GMK NucBox K6 | |
| Average AMD Radeon 780M (12.8 - 29.6, n=49) | |
| Cyberpunk 2077 | |
| 1280x720 Low Preset (FSR off) | |
| GMK NucBox K6 | |
| Average AMD Radeon 780M (41.8 - 80.6, n=38) | |
| 1920x1080 Low Preset (FSR off) | |
| GMK NucBox K6 | |
| Average AMD Radeon 780M (23.9 - 52.1, n=63) | |
| 1920x1080 Medium Preset (FSR off) | |
| GMK NucBox K6 | |
| Average AMD Radeon 780M (16.3 - 37.5, n=59) | |
| AcePC Wizbox AI | |
| 1920x1080 High Preset (FSR off) | |
| GMK NucBox K6 | |
| Average AMD Radeon 780M (13.8 - 29.6, n=59) | |
| AcePC Wizbox AI | |
| 1920x1080 Ultra Preset (FSR off) | |
| GMK NucBox K6 | |
| Average AMD Radeon 780M (11.5 - 26.3, n=54) | |
Witcher 3 FPS Chart
| low | med. | high | ultra | |
|---|---|---|---|---|
| GTA V (2015) | 163.4 | 153.8 | 65.7 | 26 |
| The Witcher 3 (2015) | 155.1 | 99 | 50.9 | 30.8 |
| Dota 2 Reborn (2015) | 161.2 | 124.8 | 96.8 | 87.4 |
| Final Fantasy XV Benchmark (2018) | 80.8 | 39.3 | 29.3 | |
| X-Plane 11.11 (2018) | 65.9 | 47.3 | 39.7 | |
| Far Cry 5 (2018) | 86 | 49 | 45 | 43 |
| Strange Brigade (2018) | 167.7 | 67.9 | 57.9 | 48.8 |
| Tiny Tina's Wonderlands (2022) | 74.6 | 52.2 | 36.6 | 29.5 |
| F1 22 (2022) | 99.8 | 85.9 | 66.7 | 18.4 |
| Baldur's Gate 3 (2023) | 40.5 | 33.7 | 28.1 | 27 |
| Cyberpunk 2077 (2023) | 46.3 | 35.2 | 27.7 | 24.5 |
Emissions — Not Afraid To Be Loud
System Noise
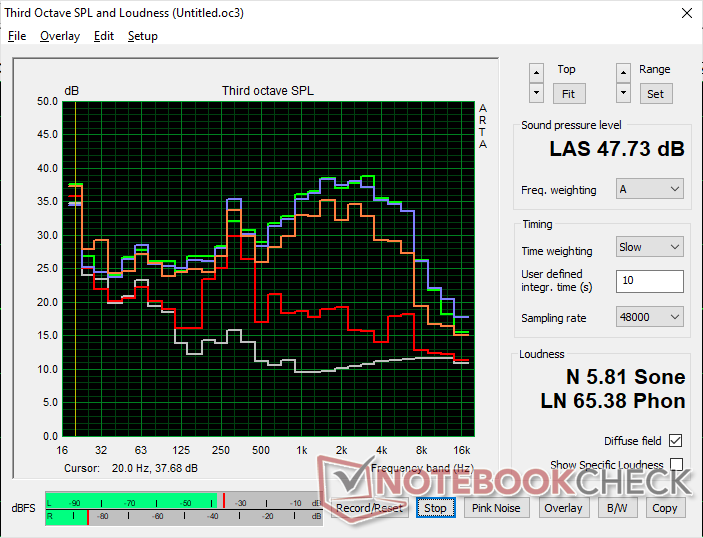
Fan noise is always present at a base 31.3 dB(A) against a silent background of 23.2 dB(A) which automatically makes the NucBox K6 louder than most laptops running on U-series CPUs. However, keep in mind that users normally sit further away from mini PCs when compared to laptops and so noise levels may be less noticeable overall. The system becomes slightly louder at 33.4 dB(A) if video streaming or web browsing, but any RPM changes are thankfully steady and with no sudden spikes.
Running more demanding loads like games would induce a fan noise between 44 and 48 dB(A) to be more noticeable and almost as loud as some gaming laptops like the MSI Stealth GS66. Interestingly, fan noise range and behavior almost matches what we observed on the Geekom A7.
Noise level
| Idle |
| 31.3 / 31.3 / 33.4 dB(A) |
| Load |
| 47.5 / 47.7 dB(A) |
 | ||
30 dB silent 40 dB(A) audible 50 dB(A) loud |
||
min: | ||
| GMK NucBox K6 Radeon 780M, R7 7840HS, MasonSemi 1TB MC7000 | GMK NucBox K3 Pro UHD Graphics 64EUs, i7-12650H, Lexar NM610 Pro NM610P001T-HNNNG | Intel NUC 13 Pro Desk Edition Kit Iris Xe G7 96EUs, i7-1360P, Samsung PM9A1 MZVL2512HCJQ | Beelink SER5 Vega 6, R5 5560U, Crucial P3 Plus CT1000P3PSSD8 | AcePC Wizbox AI Arc 8-Core, Ultra 7 155H, Rayson RS512GSSD710 512 GB PCIe 4.0 NVMe | Geekom A7 Radeon 780M, R9 7940HS, Acer N5000 | |
|---|---|---|---|---|---|---|
| Noise | 15% | 8% | 26% | 19% | -1% | |
| off / environment * (dB) | 23.2 | 23.1 -0% | 25.2 -9% | 23.7 -2% | 23.54 -1% | 25.4 -9% |
| Idle Minimum * (dB) | 31.3 | 25 20% | 28.1 10% | 23.9 24% | 23.54 25% | 33.3 -6% |
| Idle Average * (dB) | 31.3 | 25.5 19% | 28.2 10% | 23.9 24% | 24.9 20% | 33.6 -7% |
| Idle Maximum * (dB) | 33.4 | 25.5 24% | 28.3 15% | 23.9 28% | 24.9 25% | 33.7 -1% |
| Load Average * (dB) | 47.5 | 39.9 16% | 42 12% | 28 41% | 35.78 25% | 43.3 9% |
| Witcher 3 ultra * (dB) | 43.6 | 39.9 8% | 27.6 37% | 43.2 1% | ||
| Load Maximum * (dB) | 47.7 | 39.9 16% | 42.1 12% | 32.8 31% | 37.57 21% | 43.3 9% |
* ... smaller is better
Temperature
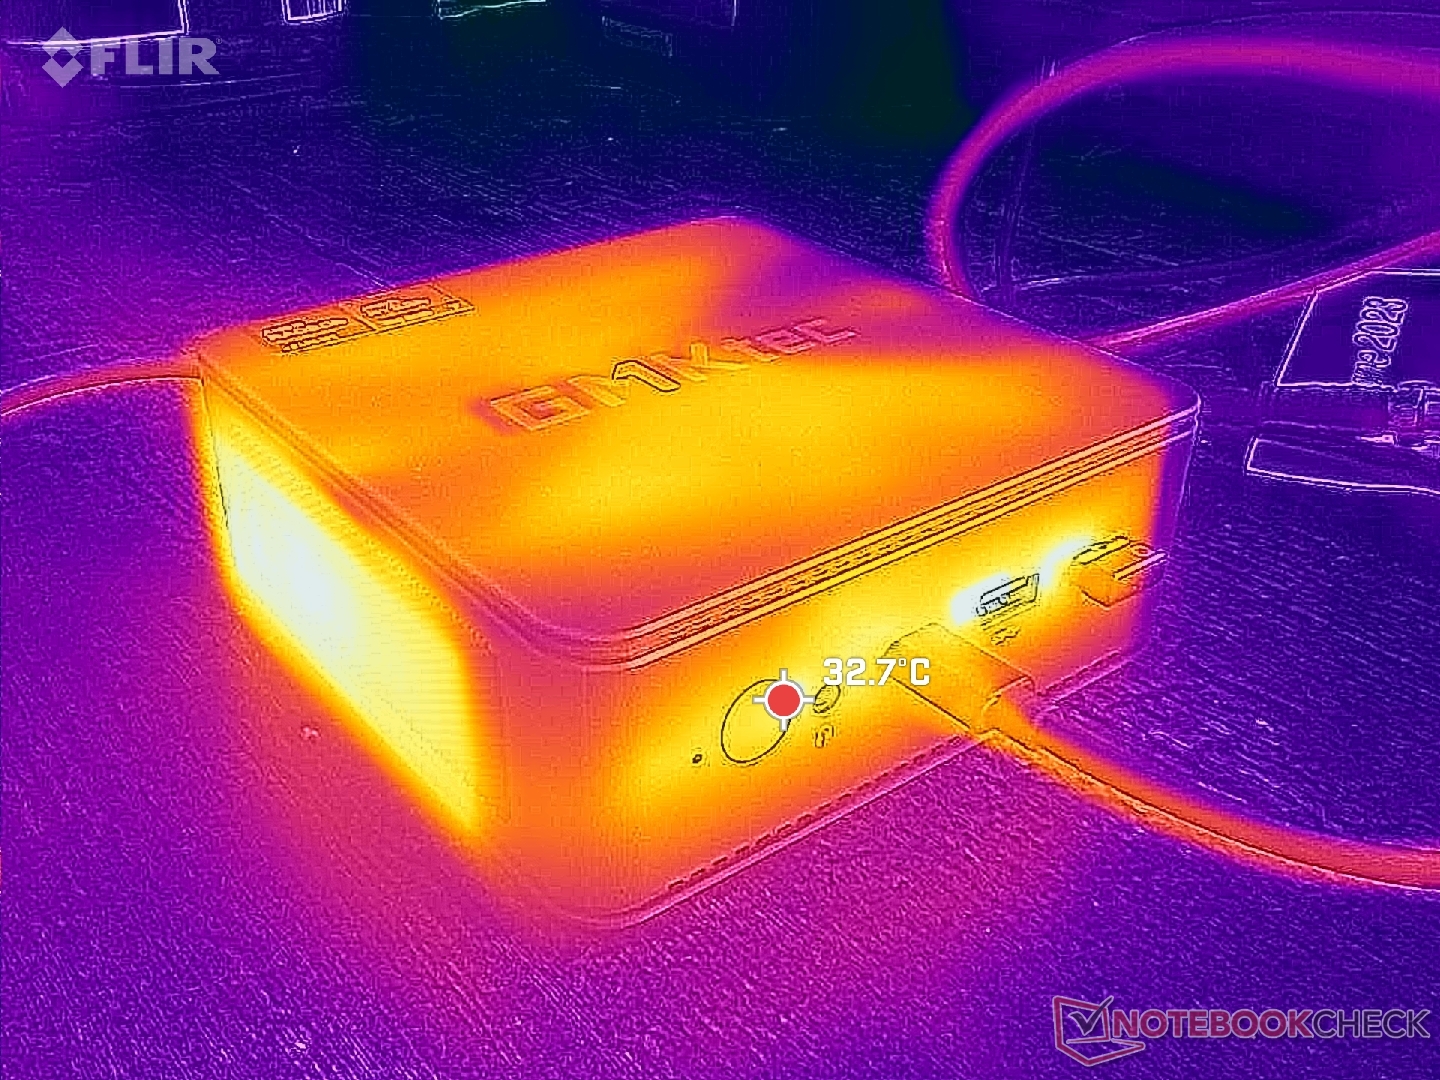
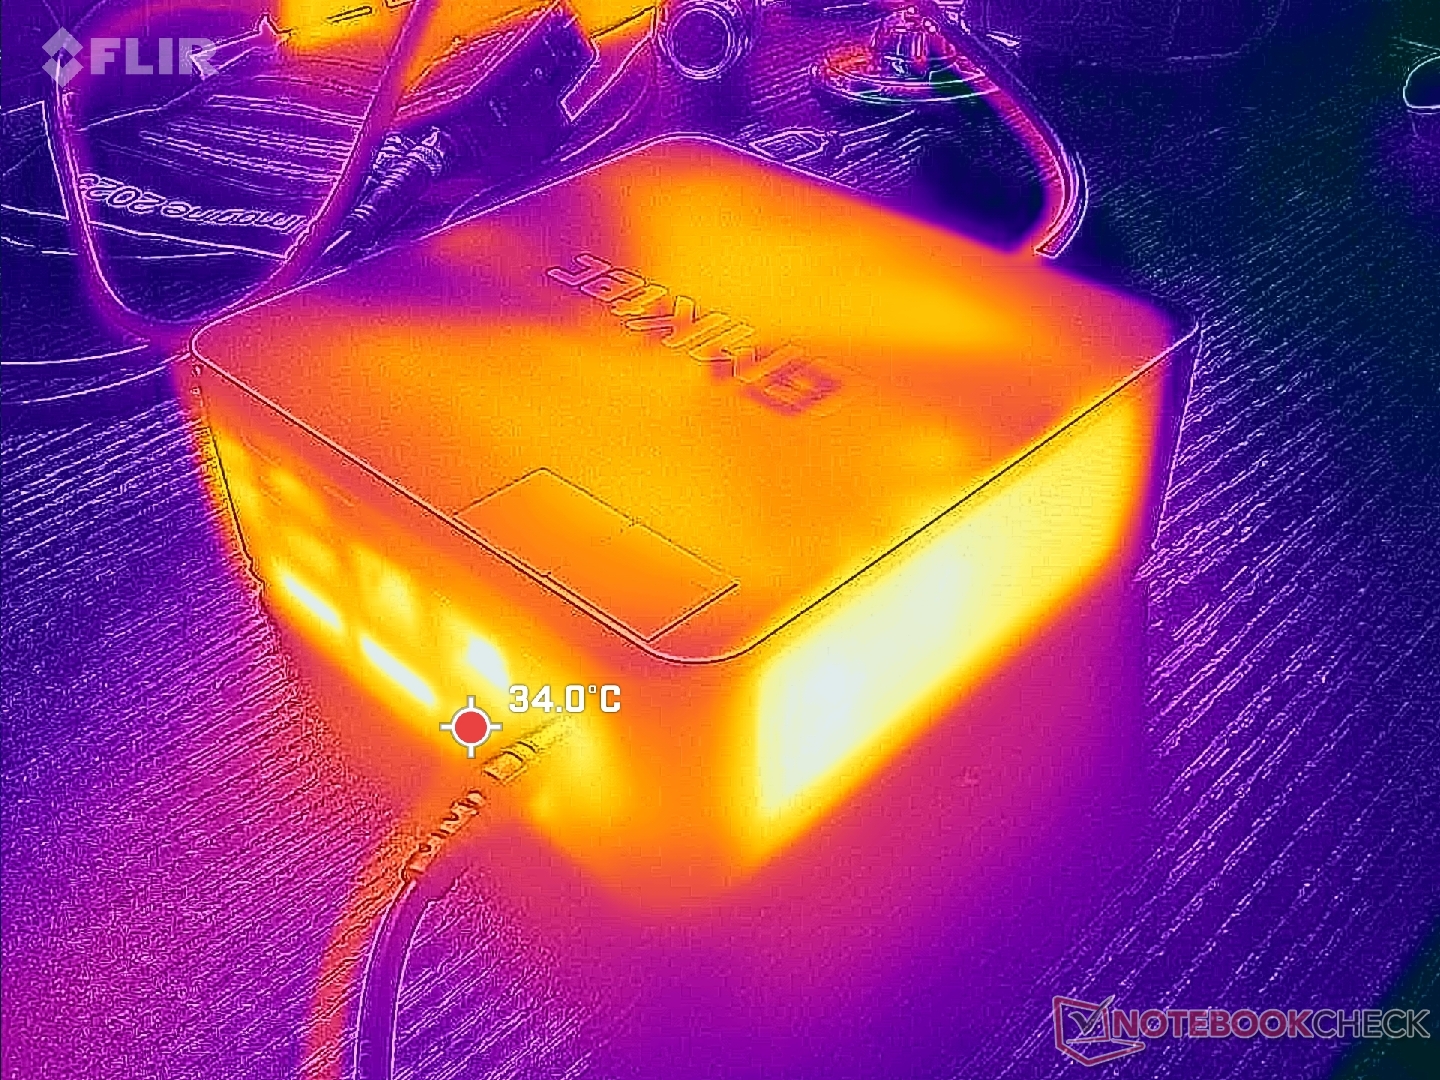
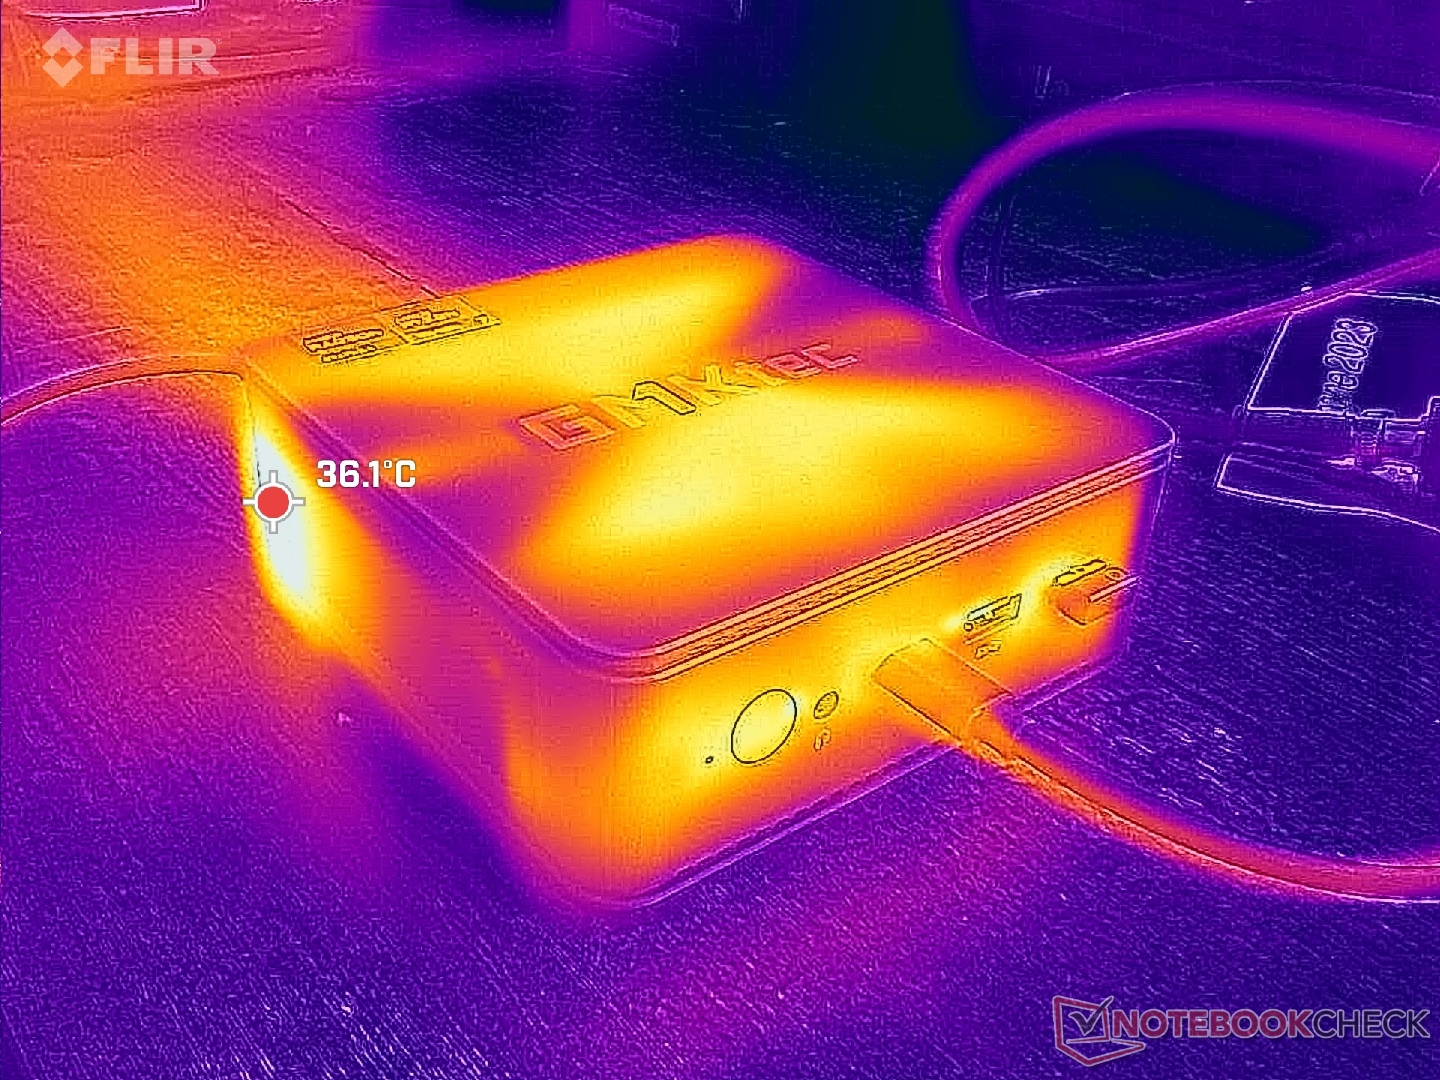
Fresh air enters from the bottom and along the perimeter of the top edge while exhaust escapes from the rear. This design makes the unit more friendly for either horizontal or vertical positions without impeding airflow.
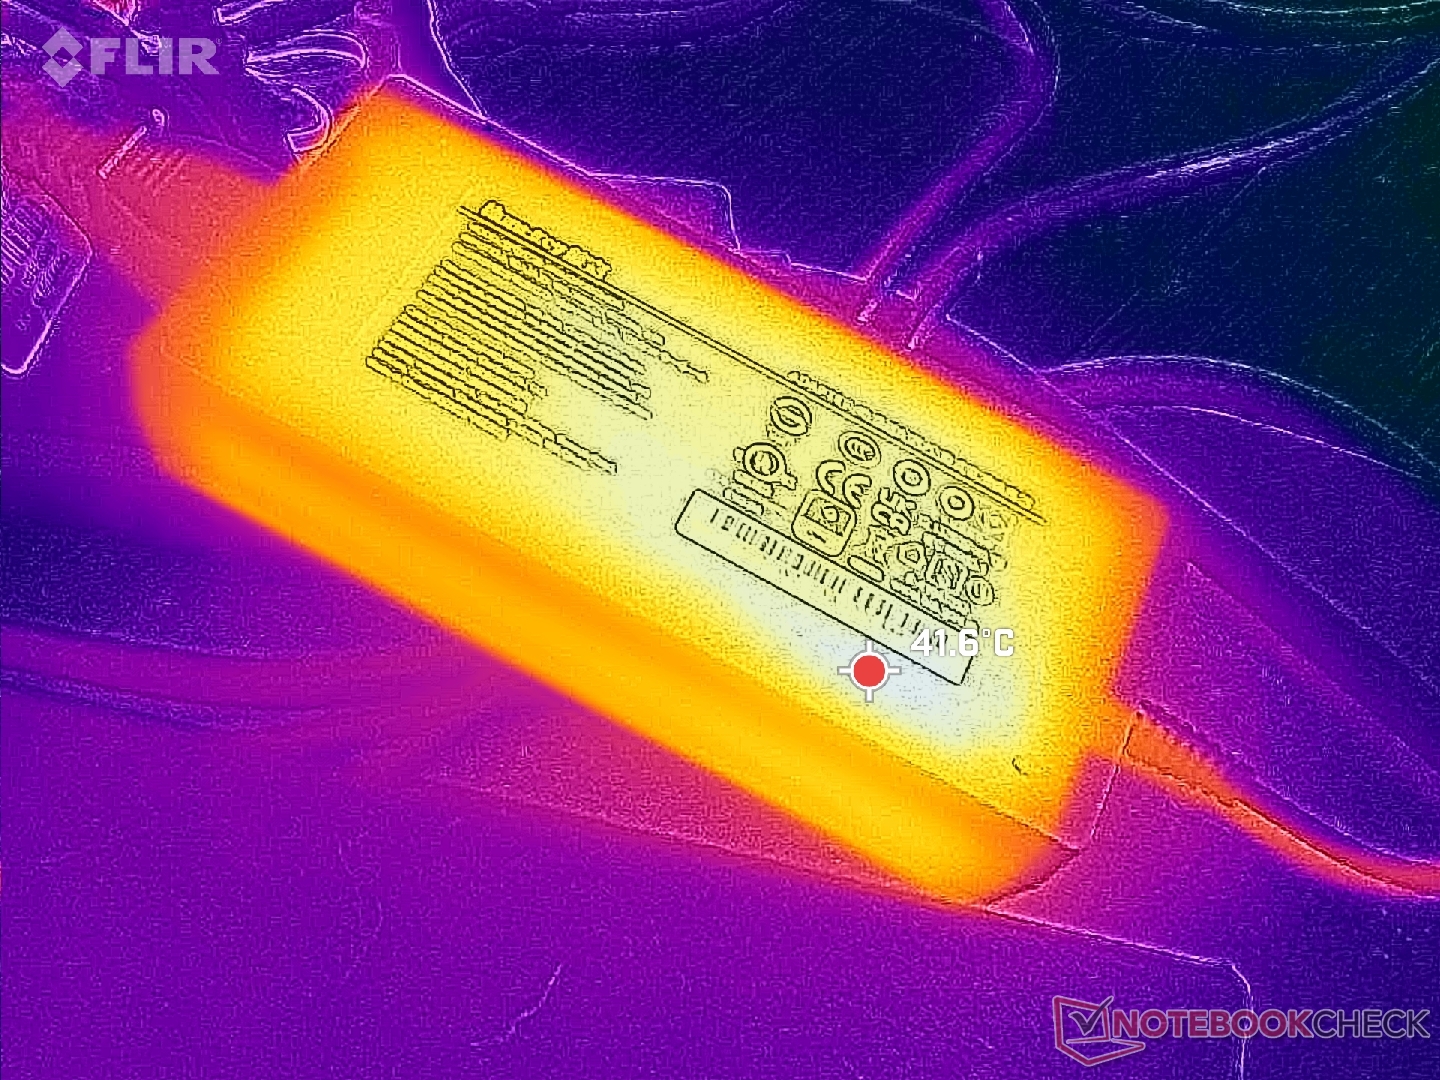
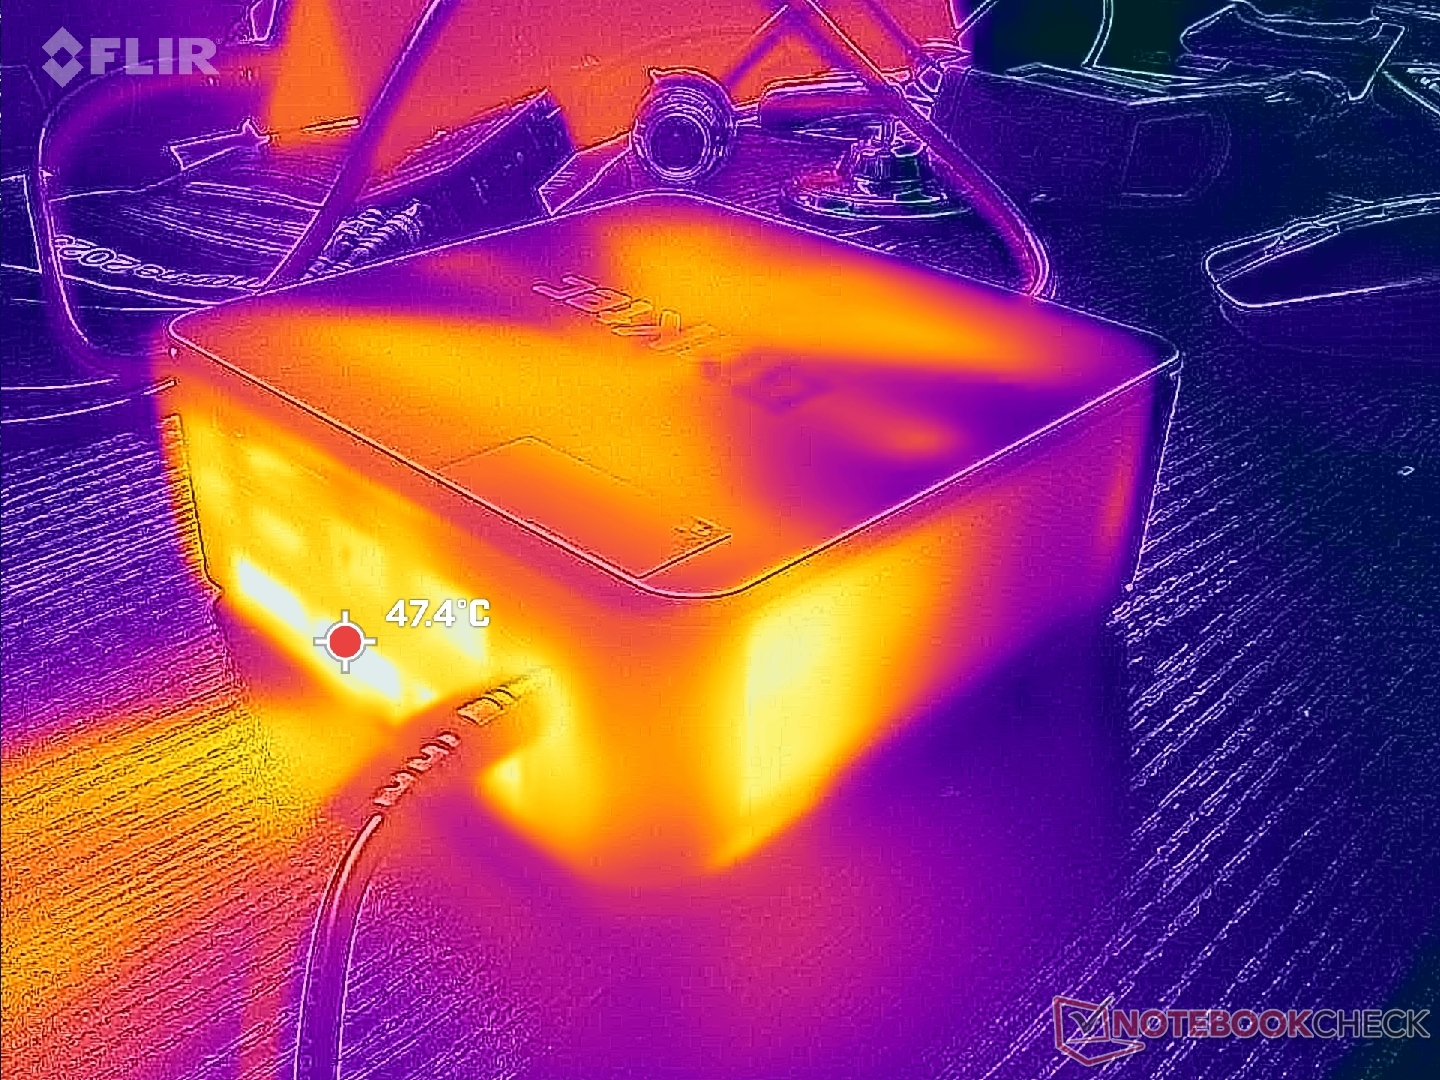
The AC adapter can reach over 42 C when running demanding loads for long periods.
Energy Management
Power Consumption
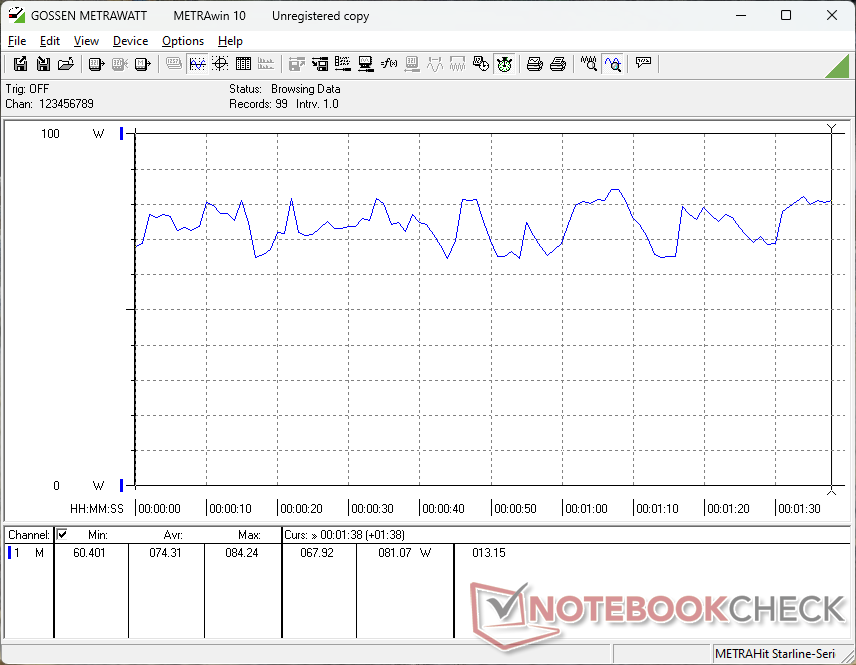
The system draws about 73 W when gaming which is relatively high for a mini PC with only integrated graphics. The slower NUC 13 Pro, for example, would demand just 45 W under similar conditions. The high consumption is in line with our findings above related to the higher power envelope on the NucBox K6.
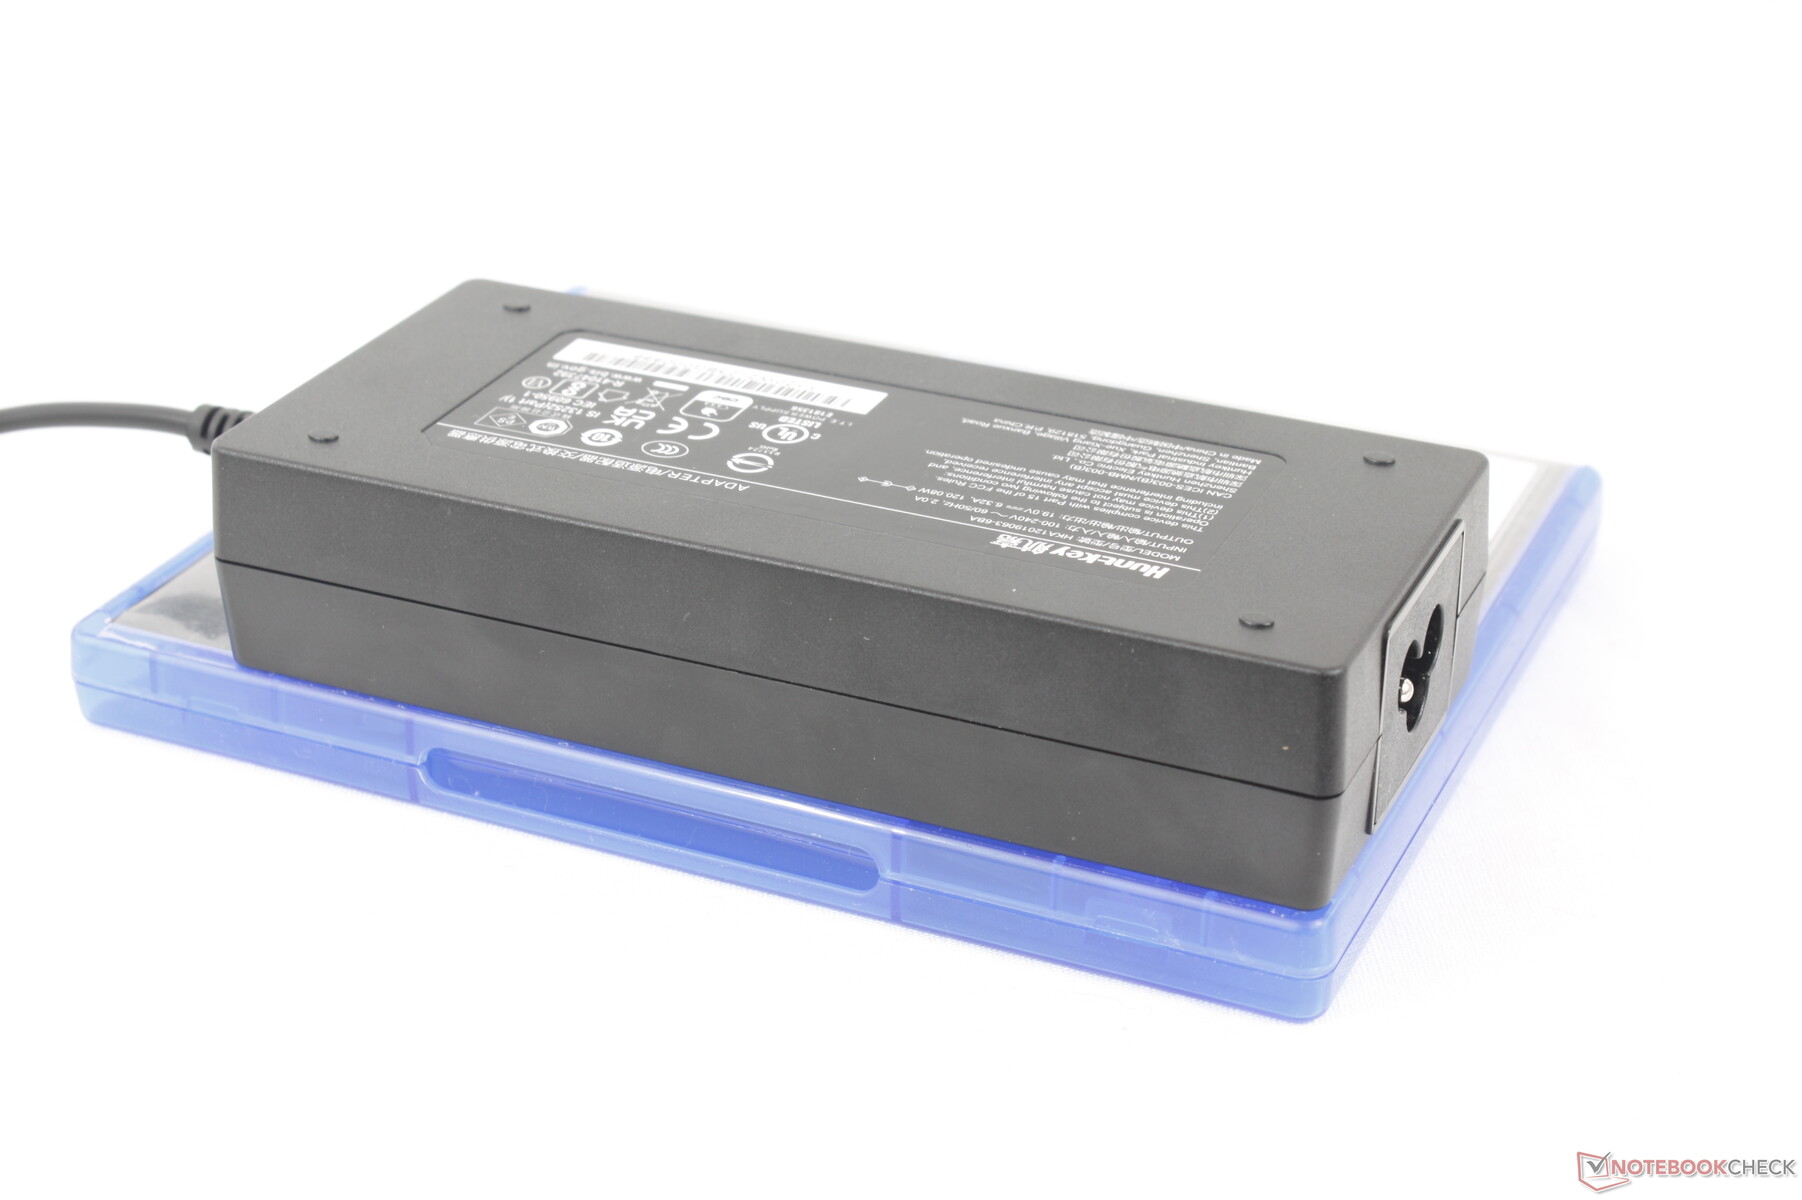
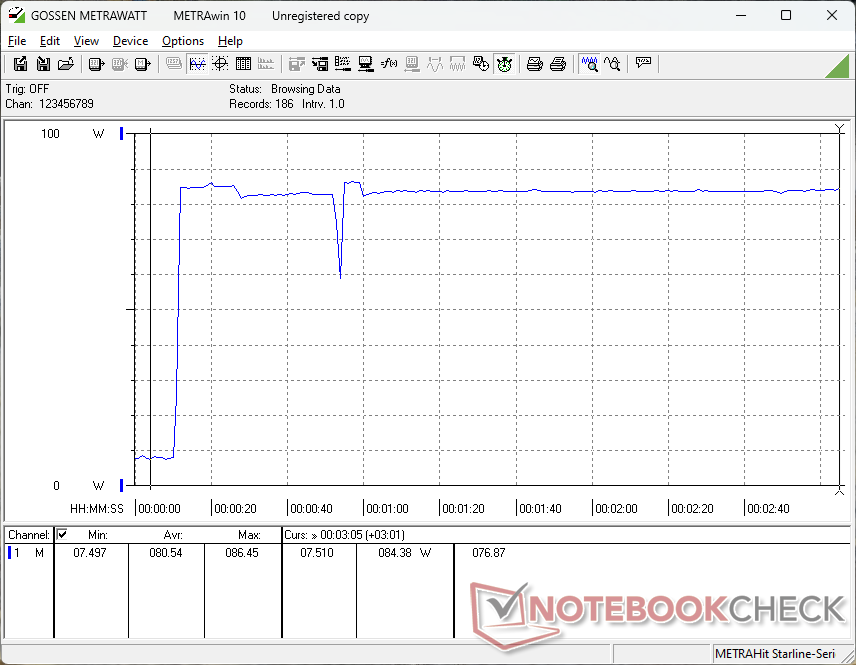
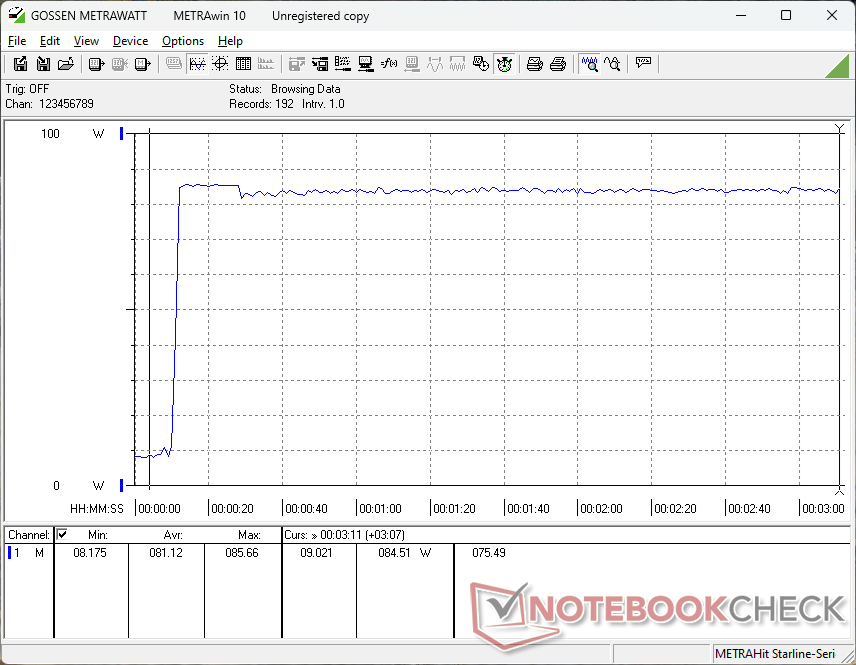
We're able to record a maximum draw of about 86 W from the medium-sized (~14.9 x 6.3 x 3 cm) 130 W AC adapter when the CPU is at 100 percent utilization. The power overhead can be used for external USB-C devices like SSDs.

| Off / Standby | |
| Idle | |
| Load |
|
Key:
min: | |
| GMK NucBox K6 R7 7840HS, Radeon 780M, MasonSemi 1TB MC7000, , x, | GMK NucBox K3 Pro i7-12650H, UHD Graphics 64EUs, Lexar NM610 Pro NM610P001T-HNNNG, , x, | Intel NUC 13 Pro Desk Edition Kit i7-1360P, Iris Xe G7 96EUs, Samsung PM9A1 MZVL2512HCJQ, , x, | Beelink SER5 R5 5560U, Vega 6, Crucial P3 Plus CT1000P3PSSD8, , x, | AcePC Wizbox AI Ultra 7 155H, Arc 8-Core, Rayson RS512GSSD710 512 GB PCIe 4.0 NVMe, , x, | Geekom A7 R9 7940HS, Radeon 780M, Acer N5000, , x, | |
|---|---|---|---|---|---|---|
| Power Consumption | -15% | -13% | 45% | -115% | 16% | |
| Idle Minimum * (Watt) | 6.7 | 7.1 -6% | 7 -4% | 4.4 34% | 7.23 -8% | 3.8 43% |
| Idle Average * (Watt) | 7 | 10.1 -44% | 9.2 -31% | 5 29% | 10 -43% | 4.8 31% |
| Idle Maximum * (Watt) | 7.6 | 18.6 -145% | 11.8 -55% | 5.3 30% | 49 -545% | 6.5 14% |
| Load Average * (Watt) | 74.3 | 45.3 39% | 45 39% | 29.8 60% | 53 29% | 71.9 3% |
| Witcher 3 ultra * (Watt) | 75 | 55.2 26% | 28.8 62% | |||
| Load Maximum * (Watt) | 85.7 | 52.9 38% | 97.2 -13% | 40.4 53% | 91 -6% | 94.7 -11% |
* ... smaller is better
Power Consumption Witcher 3 / Stresstest
Power Consumption external Monitor
Pros
Cons
Verdict — Powerful And Relatively Inexpensive
The NucBox K6 is one of the most compelling mini PCs we've tested yet from GMK. It checks off several key boxes including an affordable $500 price range, strong CPU and iGPU performance, upgradeable RAM and storage, and a small NUC-size form factor. Its performance in particular is especially impressive for the category as alternatives like the Intel NUC 13 Pro or Geekom A7 are slower, more expensive, or even both.
The strong performance and attractive price overshadow the short list of drawbacks to make the GMK NucBox K6 an easy recommendation for HTPC and casual 1080p gaming purposes.
There are only a few minor drawbacks. The single USB-C port, for example, can feel limiting if you have a lot of accessories or monitors to connect. We would also like to see tool-less servicing similar to the Lenovo IdeaCentre Mini or certain Intel NUCs. The DPC latency issues should be addressed as well for a smoother video playback experience. And finally, a switch to USB-C AC adapters would make the mini PC more travel friendly and increase compatibility with existing USB-C adapters.
Price and Availability
GMKtec is now shipping the NucBox K6 starting at $400 for a barebones kit or $500 with 16 GB RAM, 1 TB SSD, and Windows 11 Pro. Coupon codes 'K6-0-NBC' and 'K6-2T-NBC' may apply at checkout for the barebone and 32 GB SKUs to reduce the price by $20 and $30, respectively. Lighter Steel Blue And darker Space Blue colors are also available.
Alternatively, Amazon is also shipping the NucBox K6 in black and gray-blue colors.
GMK NucBox K6
- 04/03/2024 v7 (old)
Allen Ngo
Transparency
The selection of devices to be reviewed is made by our editorial team. The test sample was provided to the author as a loan by the manufacturer or retailer for the purpose of this review. The lender had no influence on this review, nor did the manufacturer receive a copy of this review before publication. There was no obligation to publish this review. As an independent media company, Notebookcheck is not subjected to the authority of manufacturers, retailers or publishers.
This is how Notebookcheck is testing
Every year, Notebookcheck independently reviews hundreds of laptops and smartphones using standardized procedures to ensure that all results are comparable. We have continuously developed our test methods for around 20 years and set industry standards in the process. In our test labs, high-quality measuring equipment is utilized by experienced technicians and editors. These tests involve a multi-stage validation process. Our complex rating system is based on hundreds of well-founded measurements and benchmarks, which maintains objectivity. Further information on our test methods can be found here.
Price comparison
