GMK NucBox M4 mini PC review: 11th gen Core i9 for under $500

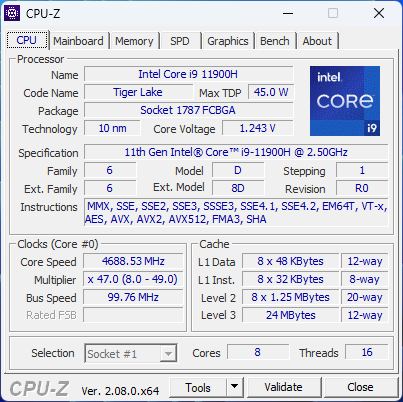
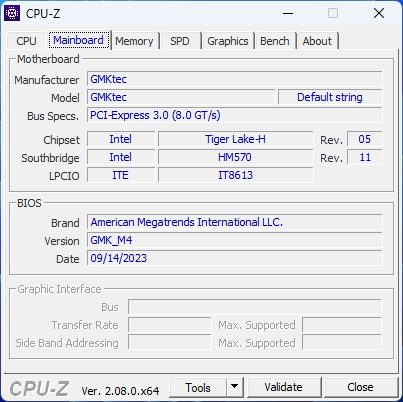
The NucBox M4 is the latest mini PC from GMK sporting an 11th gen Core i9 Tiger Lake-H CPU. It is notable for being one of the least expensive mini PCs with such a processor option.
Our review configuration can be found online for $450 to $500 USD with the Core i9-11900H, 16 GB DDR4 RAM, 512 TB M.2 SSD, and Windows 11 Pro preinstalled. Competitors to the NucBox M4 include other inexpensive mini PCs like the Beelink SER6 Pro, Lenovo IdeaCentre Mini, or Minisforum Neptune Series HX77G.
More GMKtec reviews:
Potential Competitors in Comparison
Rating | Date | Model | Weight | Height | Size | Resolution | Price |
|---|---|---|---|---|---|---|---|
| 81.1 % v7 (old) | 12 / 2023 | GMK NucBox M4 i9-11900H, UHD Graphics Xe 32EUs (Tiger Lake-H) | 951 g | 37 mm | x | ||
| 78.7 % v7 (old) | 11 / 2023 | GMK NucBox M3 i5-12450H, UHD Graphics Xe G4 48EUs | 440 g | 42.4 mm | x | ||
| 82.8 % v7 (old) | 10 / 2023 | GMK NucBox K3 Pro i7-12650H, UHD Graphics 64EUs | 396 g | 43.2 mm | x | ||
| 81 % v7 (old) | 09 / 2023 | Lenovo IdeaCentre Mini 01IRH8 i7-13700H, Iris Xe G7 96EUs | 1.8 kg | 39 mm | x | ||
v (old) | 01 / 2023 | Beelink SER6 Pro R7 6800H, Radeon 680M | 511 g | 42 mm | x | ||
| 80.8 % v7 (old) | 04 / 2023 | Intel NUC 13 Pro Kit NUC13ANK i7-1360P, Iris Xe G7 96EUs | 538 g | 37 mm | x |
Case
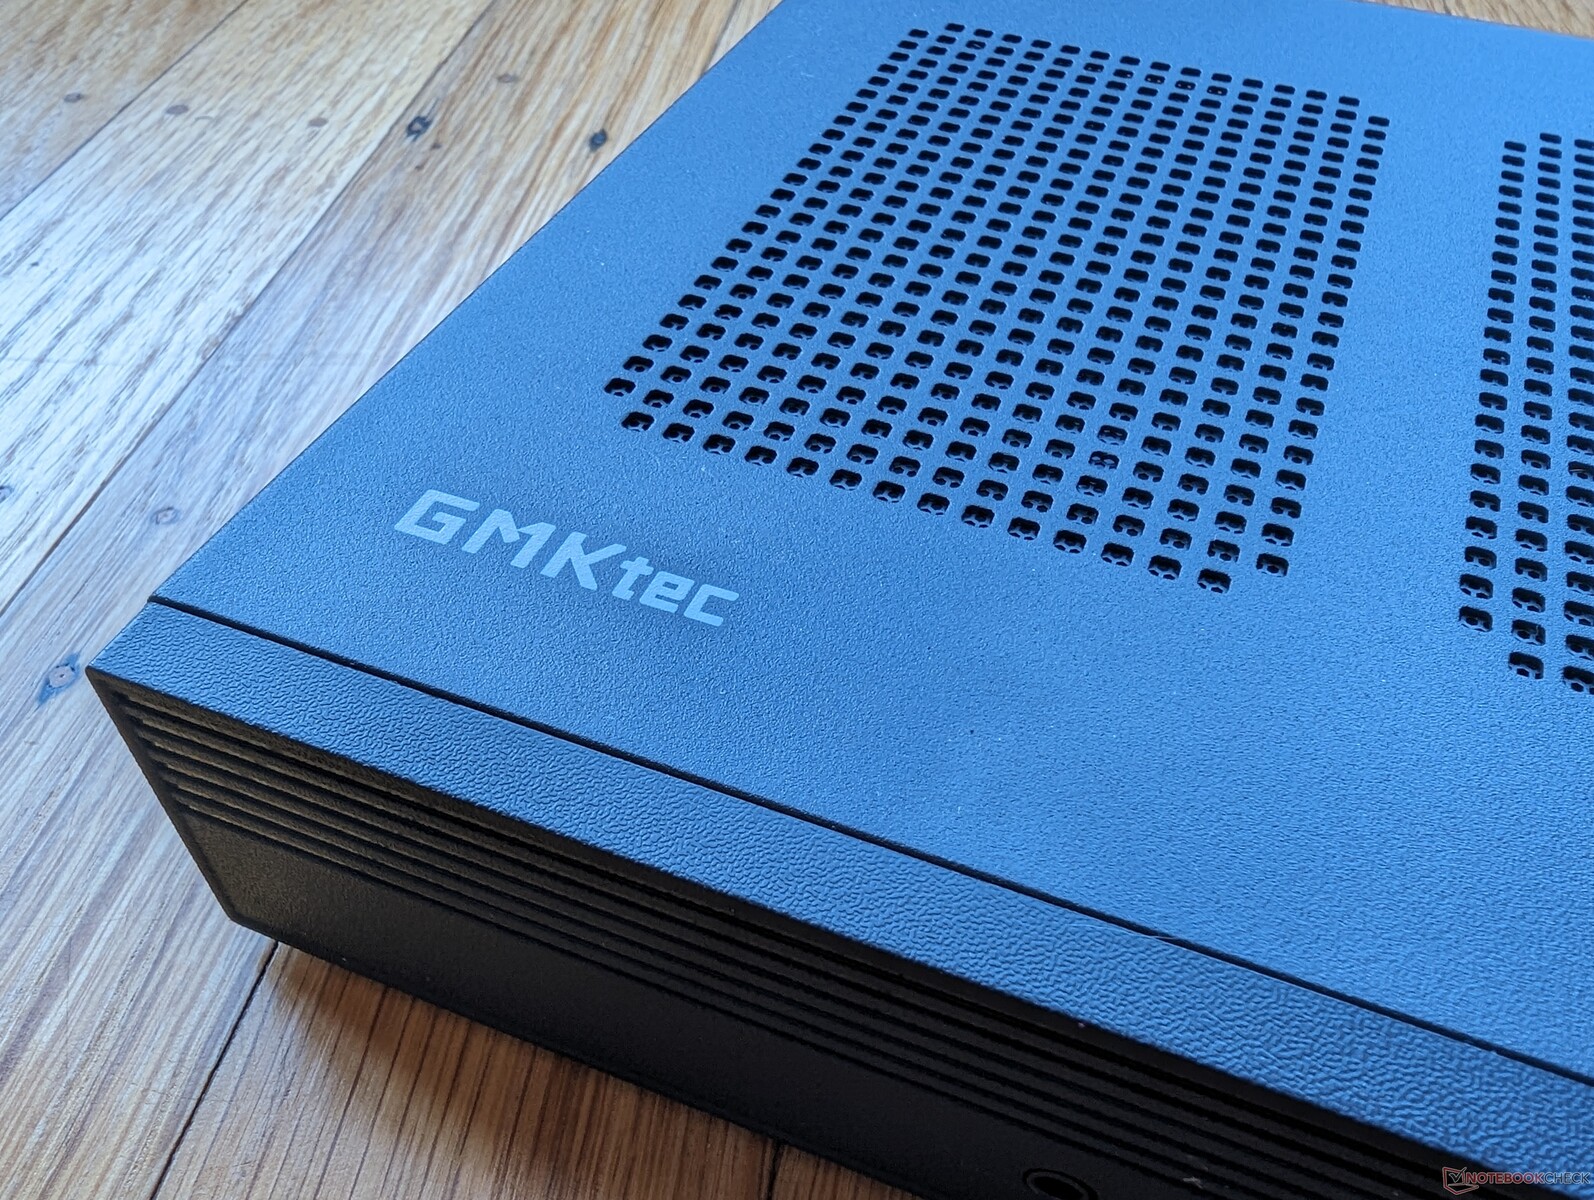
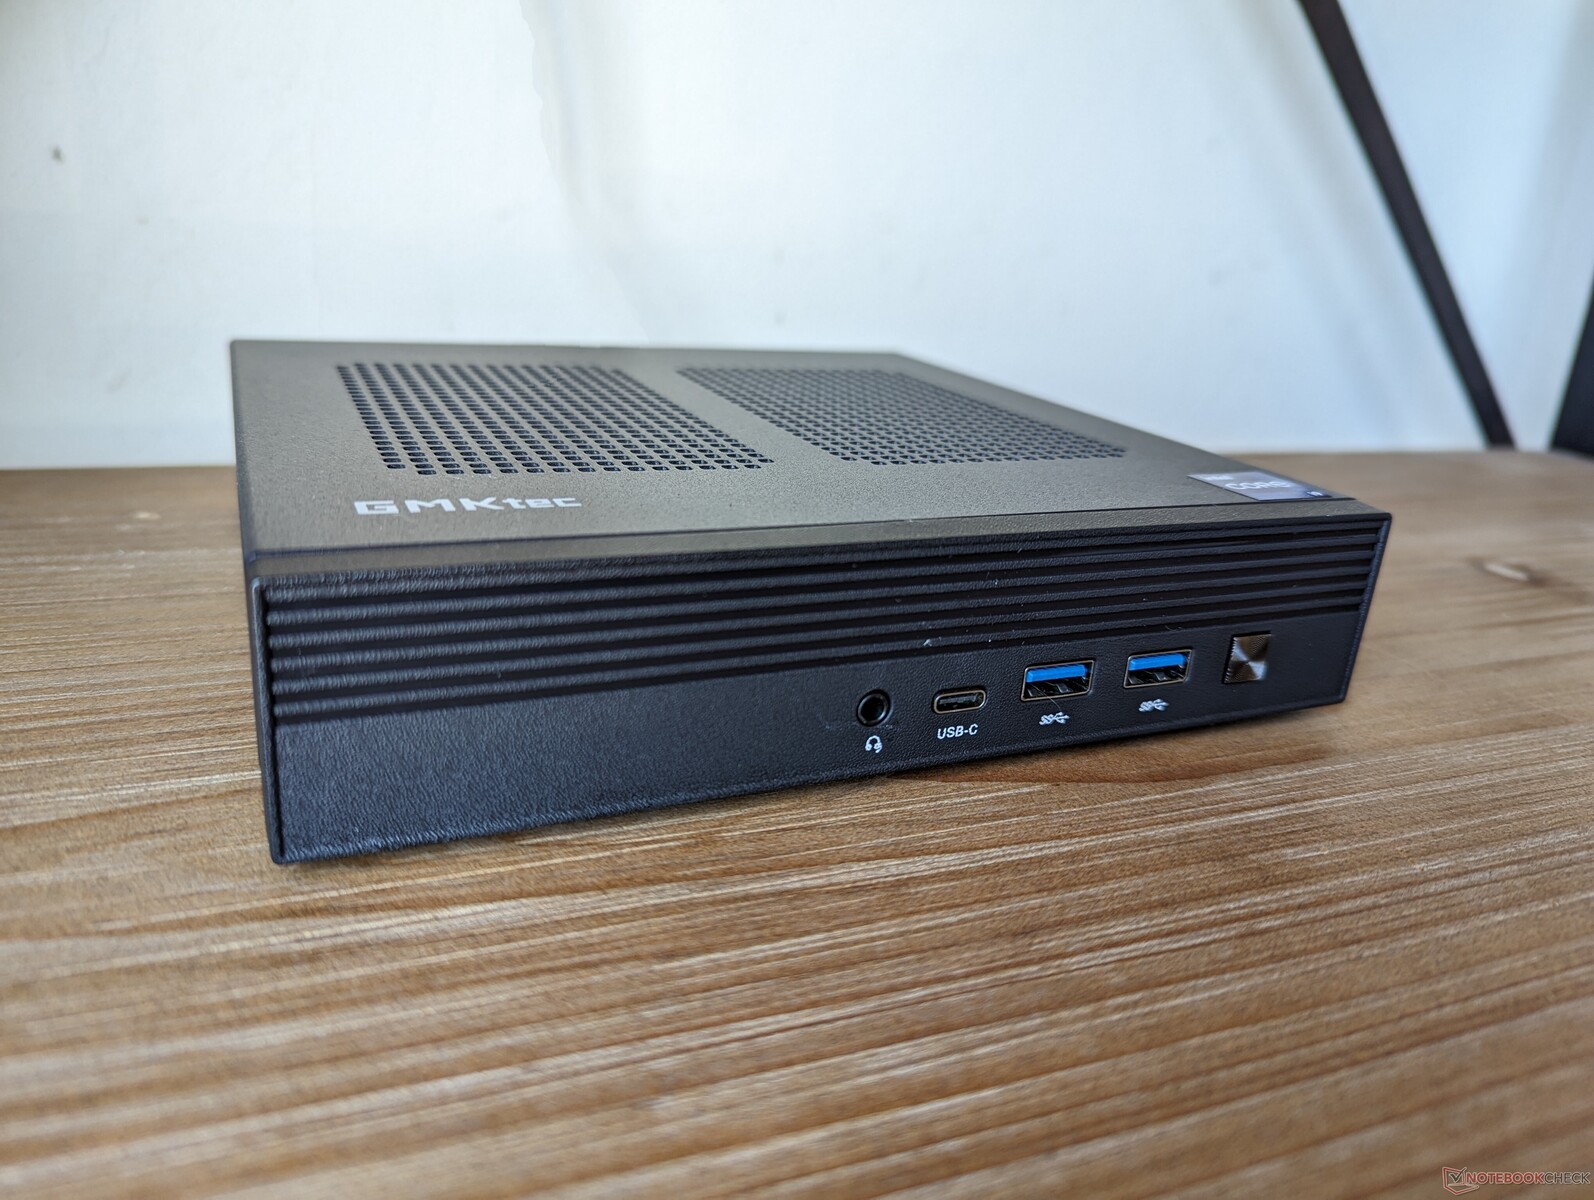
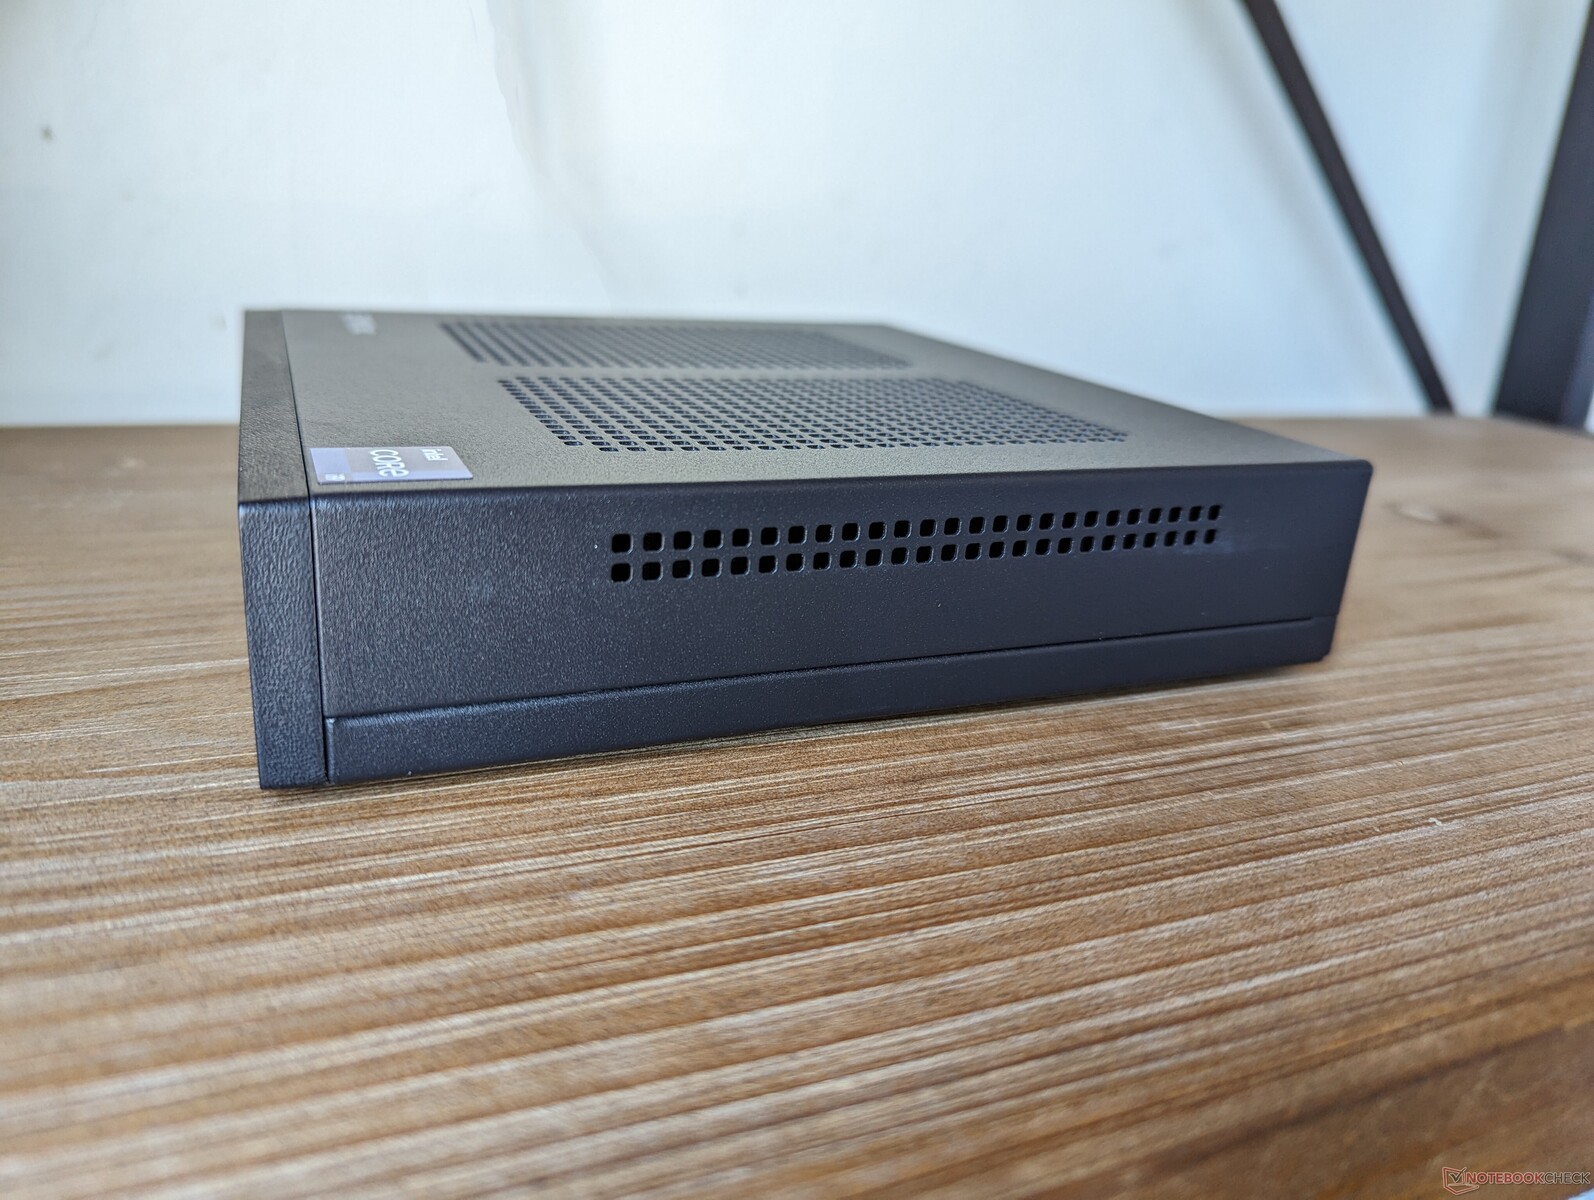
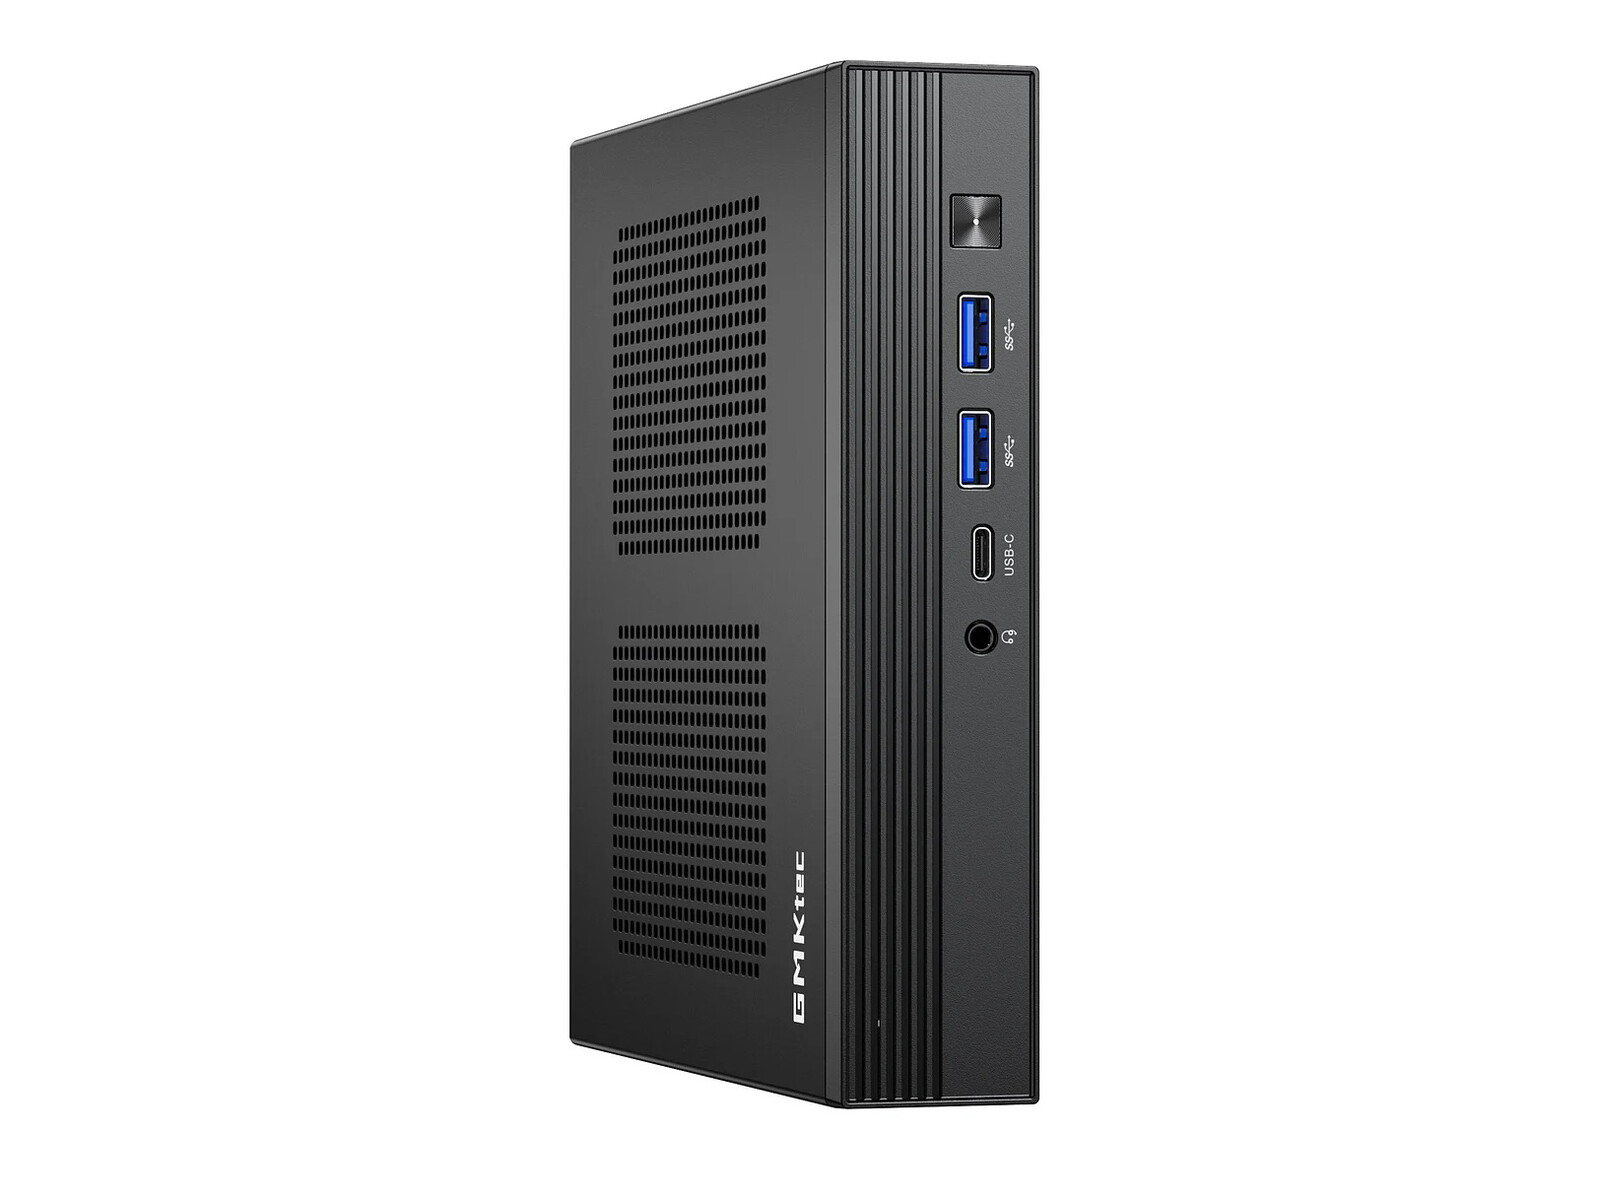
Unlike most other mini PCs in this price range, the NucBox M4 is almost all metal on all sides for an industrial or professional look. However, it's also both larger and heavier by noticeable margins especially when compared to your typical Intel NUC.
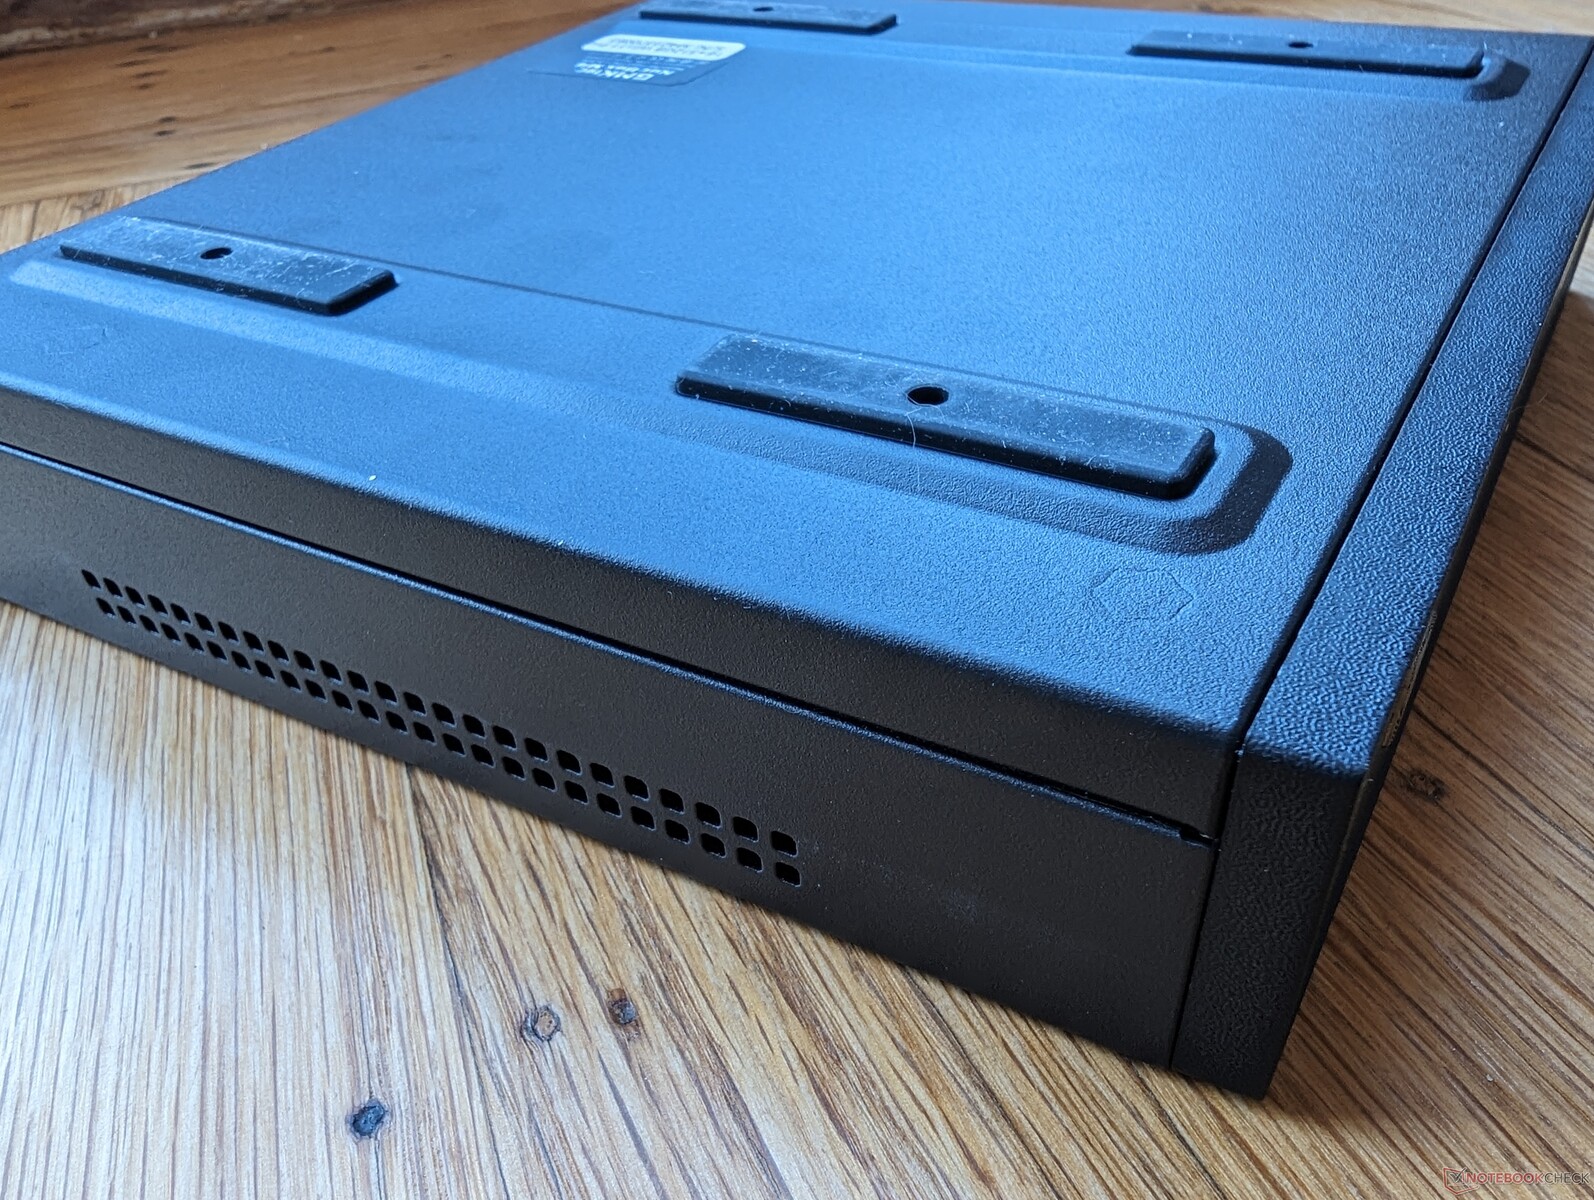
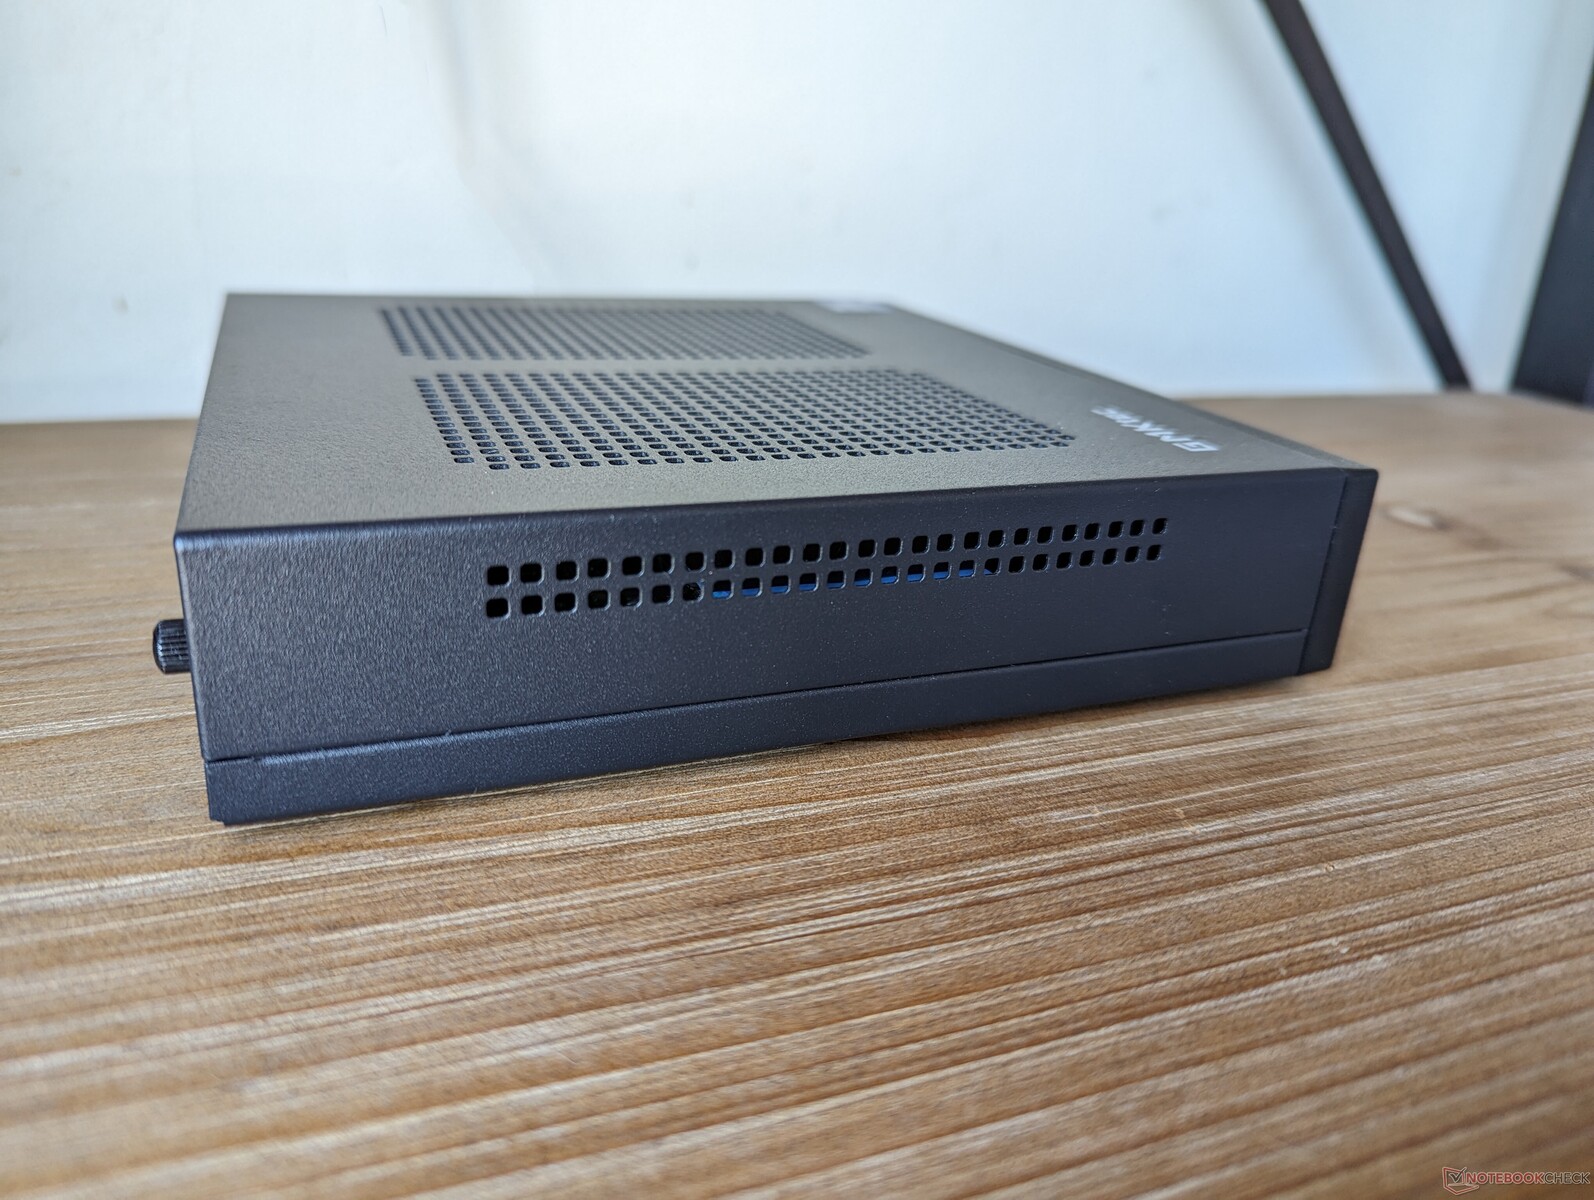
Note that while GMK advertises the NucBox m4 in both horizontal and vertical orientations, the model is susceptible to tipping if positioned vertically. There is no specialized stand to secure the unit in the vertical position.

Connectivity
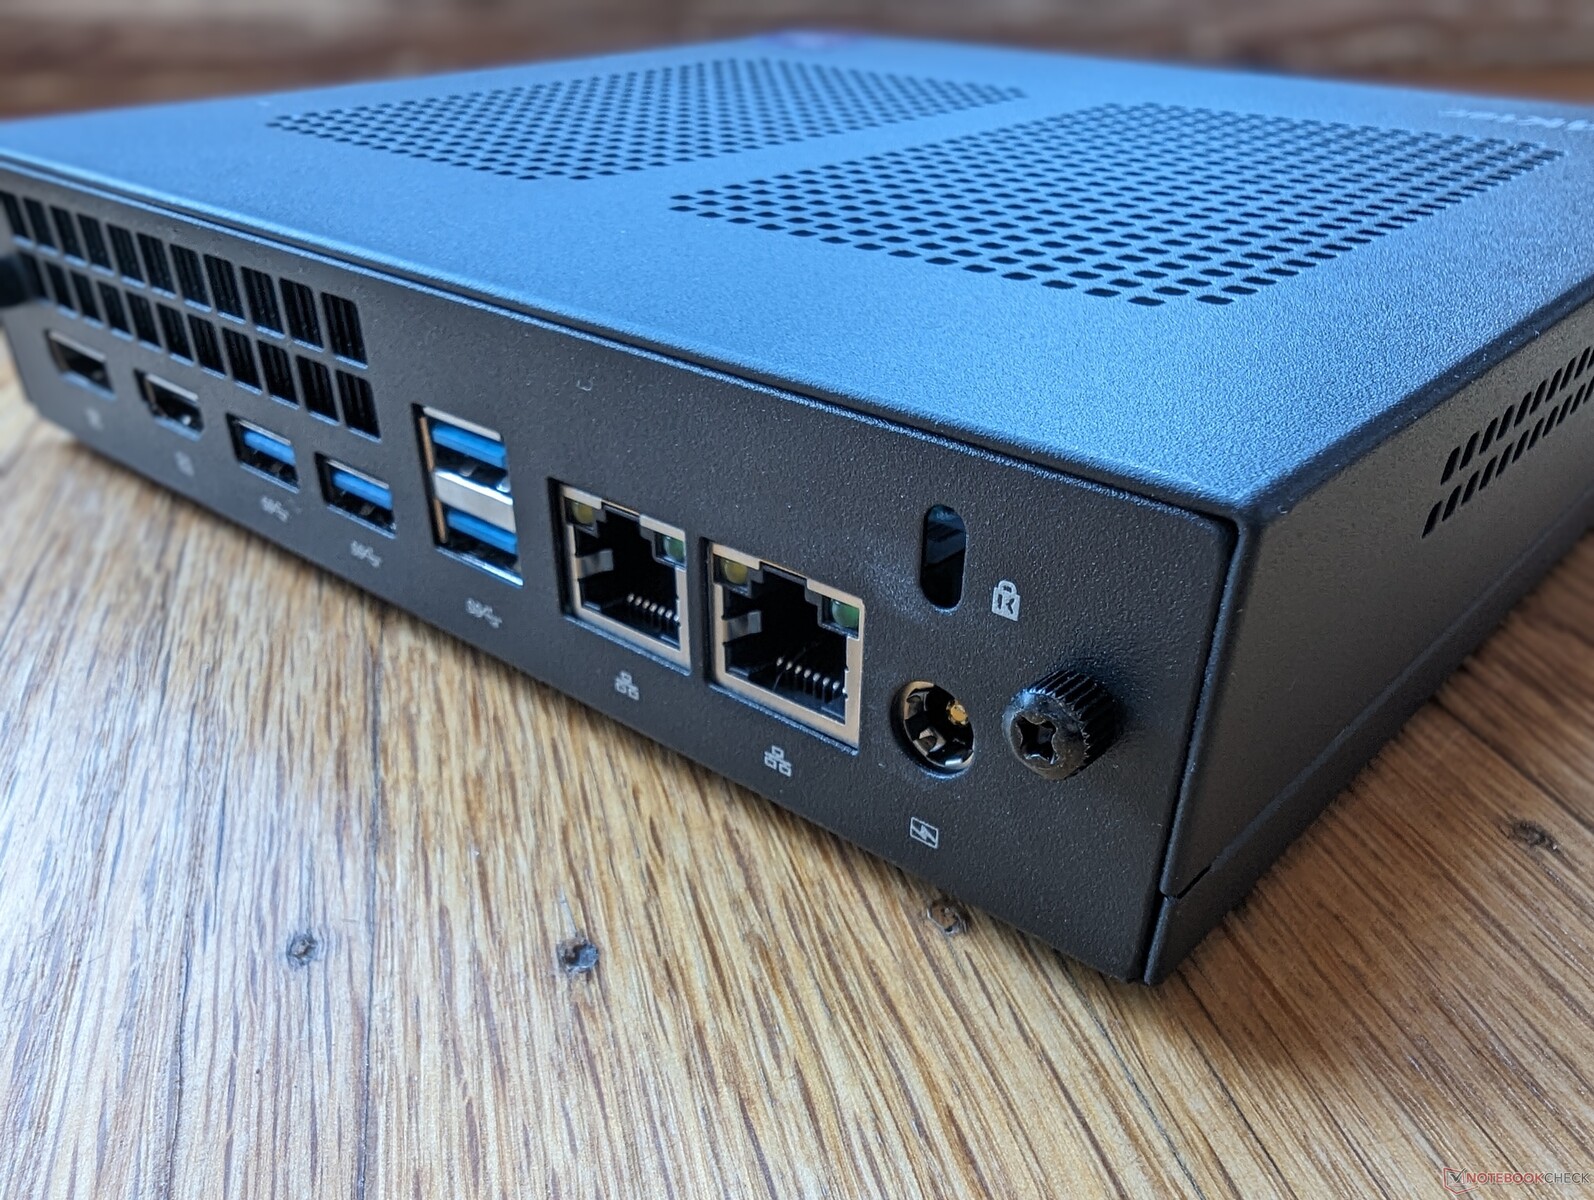
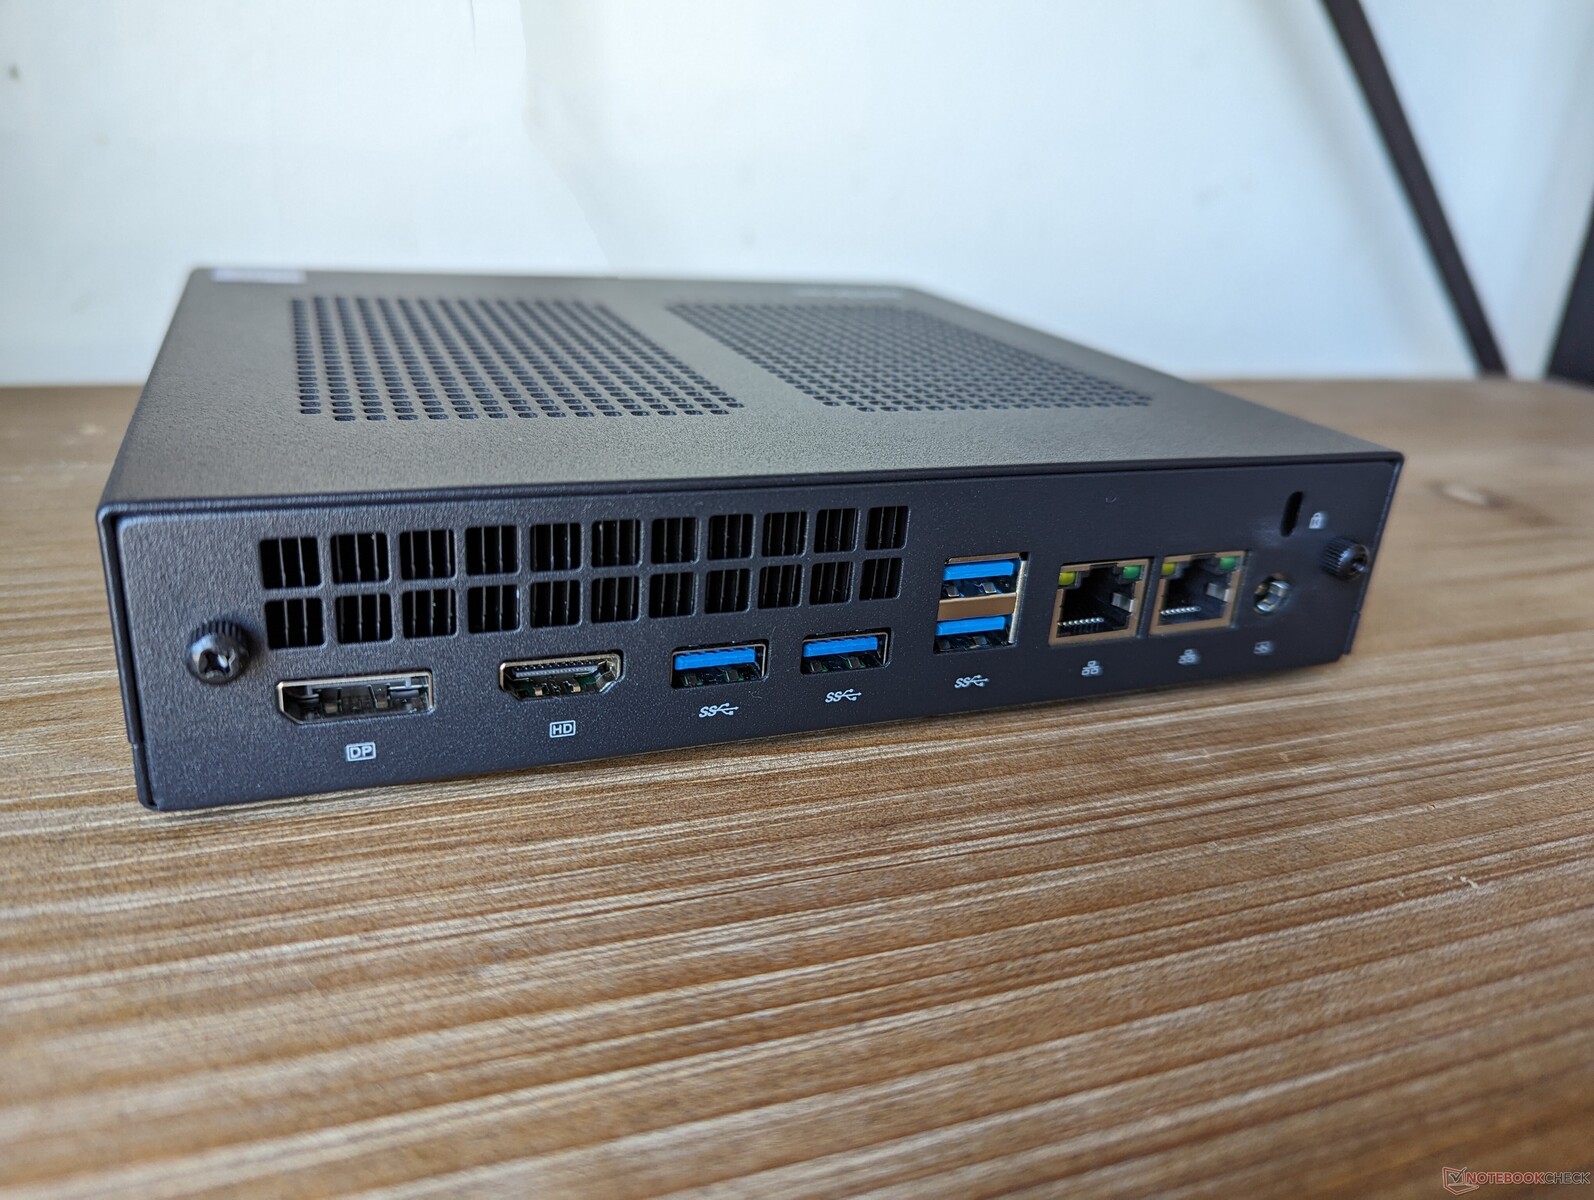
There is no shortage of ports as users are getting a total of seven USB ports, three video-out ports, and dual 2.5 Gbit Ethernet. However, there is no Thunderbolt or eGPU support which would have boosted the versatility of the model.
Communication
Wi-Fi 6E does not come standard in order to keep costs low. Transfer rates are nonetheless steady and reliable when paired to our Wi-Fi 6 network.
| Networking | |
| iperf3 transmit AXE11000 | |
| Beelink SER6 Pro | |
| GMK NucBox K3 Pro | |
| GMK NucBox M3 | |
| Intel NUC 13 Pro Kit NUC13ANK | |
| Lenovo IdeaCentre Mini 01IRH8 | |
| GMK NucBox M4 | |
| iperf3 receive AXE11000 | |
| GMK NucBox K3 Pro | |
| Beelink SER6 Pro | |
| Intel NUC 13 Pro Kit NUC13ANK | |
| GMK NucBox M3 | |
| Lenovo IdeaCentre Mini 01IRH8 | |
| GMK NucBox M4 | |
| iperf3 transmit AXE11000 6GHz | |
| Intel NUC 13 Pro Kit NUC13ANK | |
| iperf3 receive AXE11000 6GHz | |
| Intel NUC 13 Pro Kit NUC13ANK | |
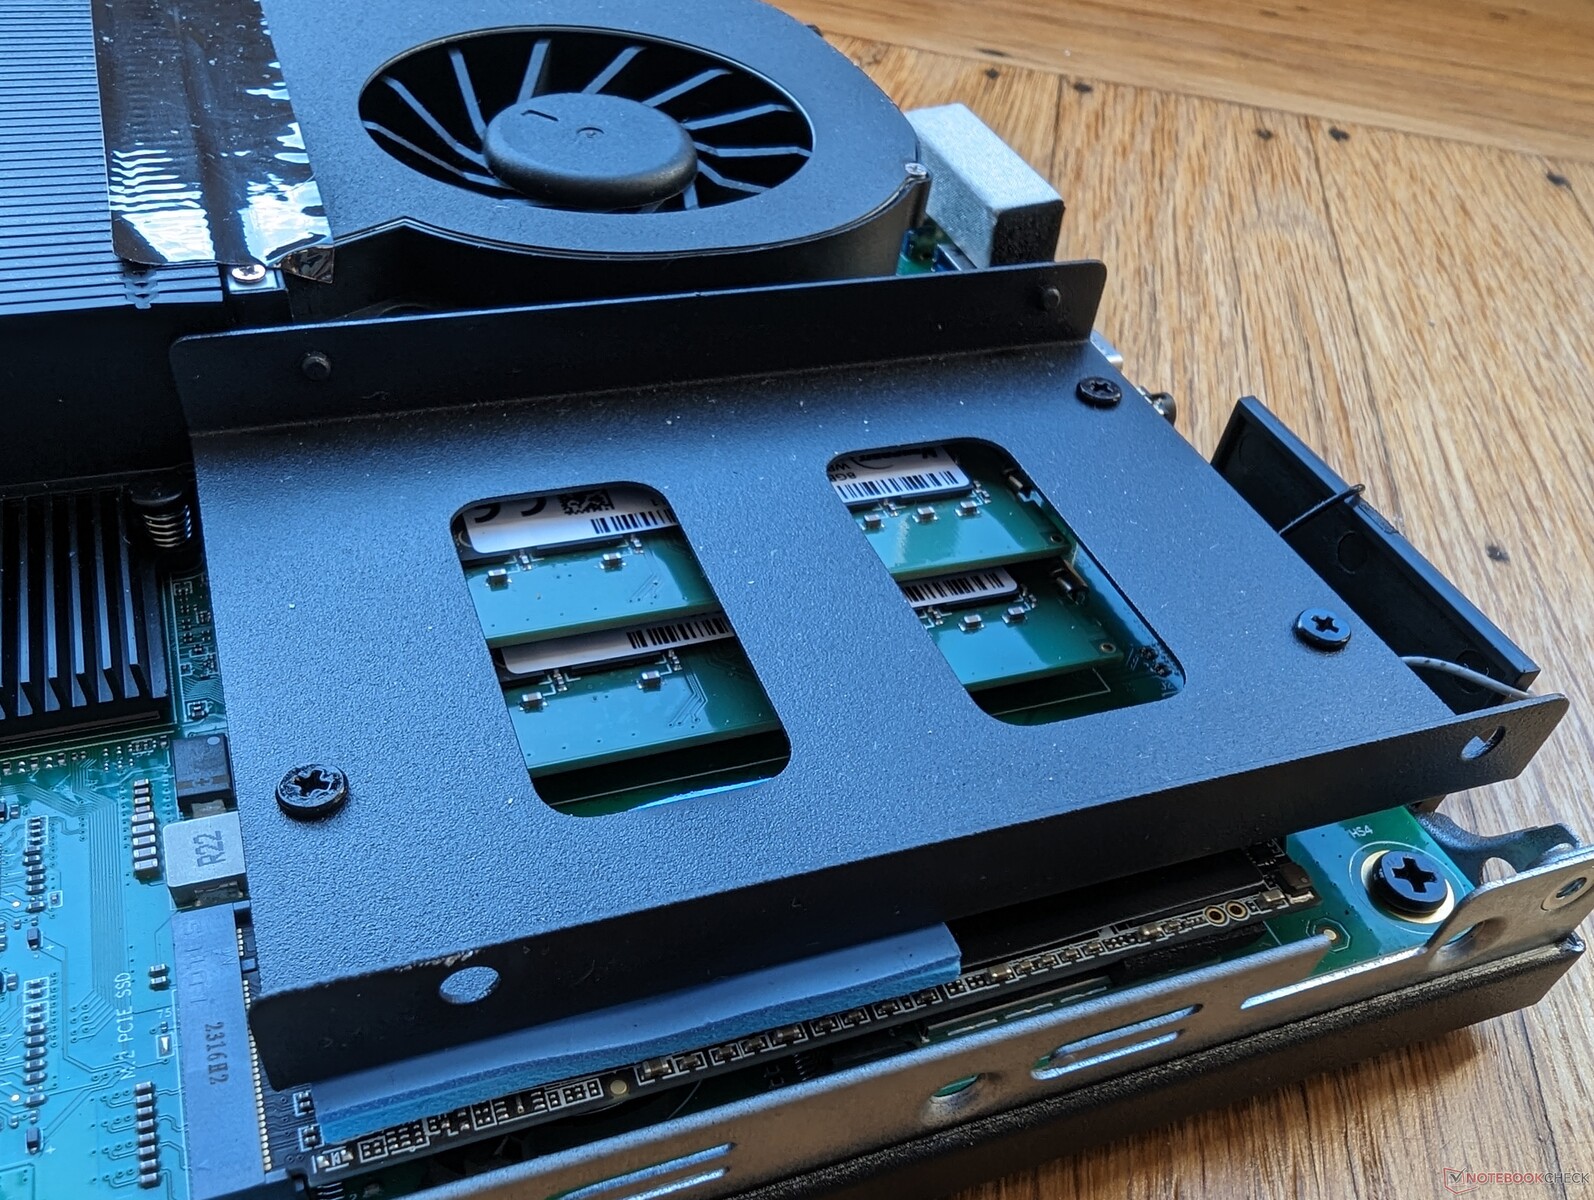
Maintenance
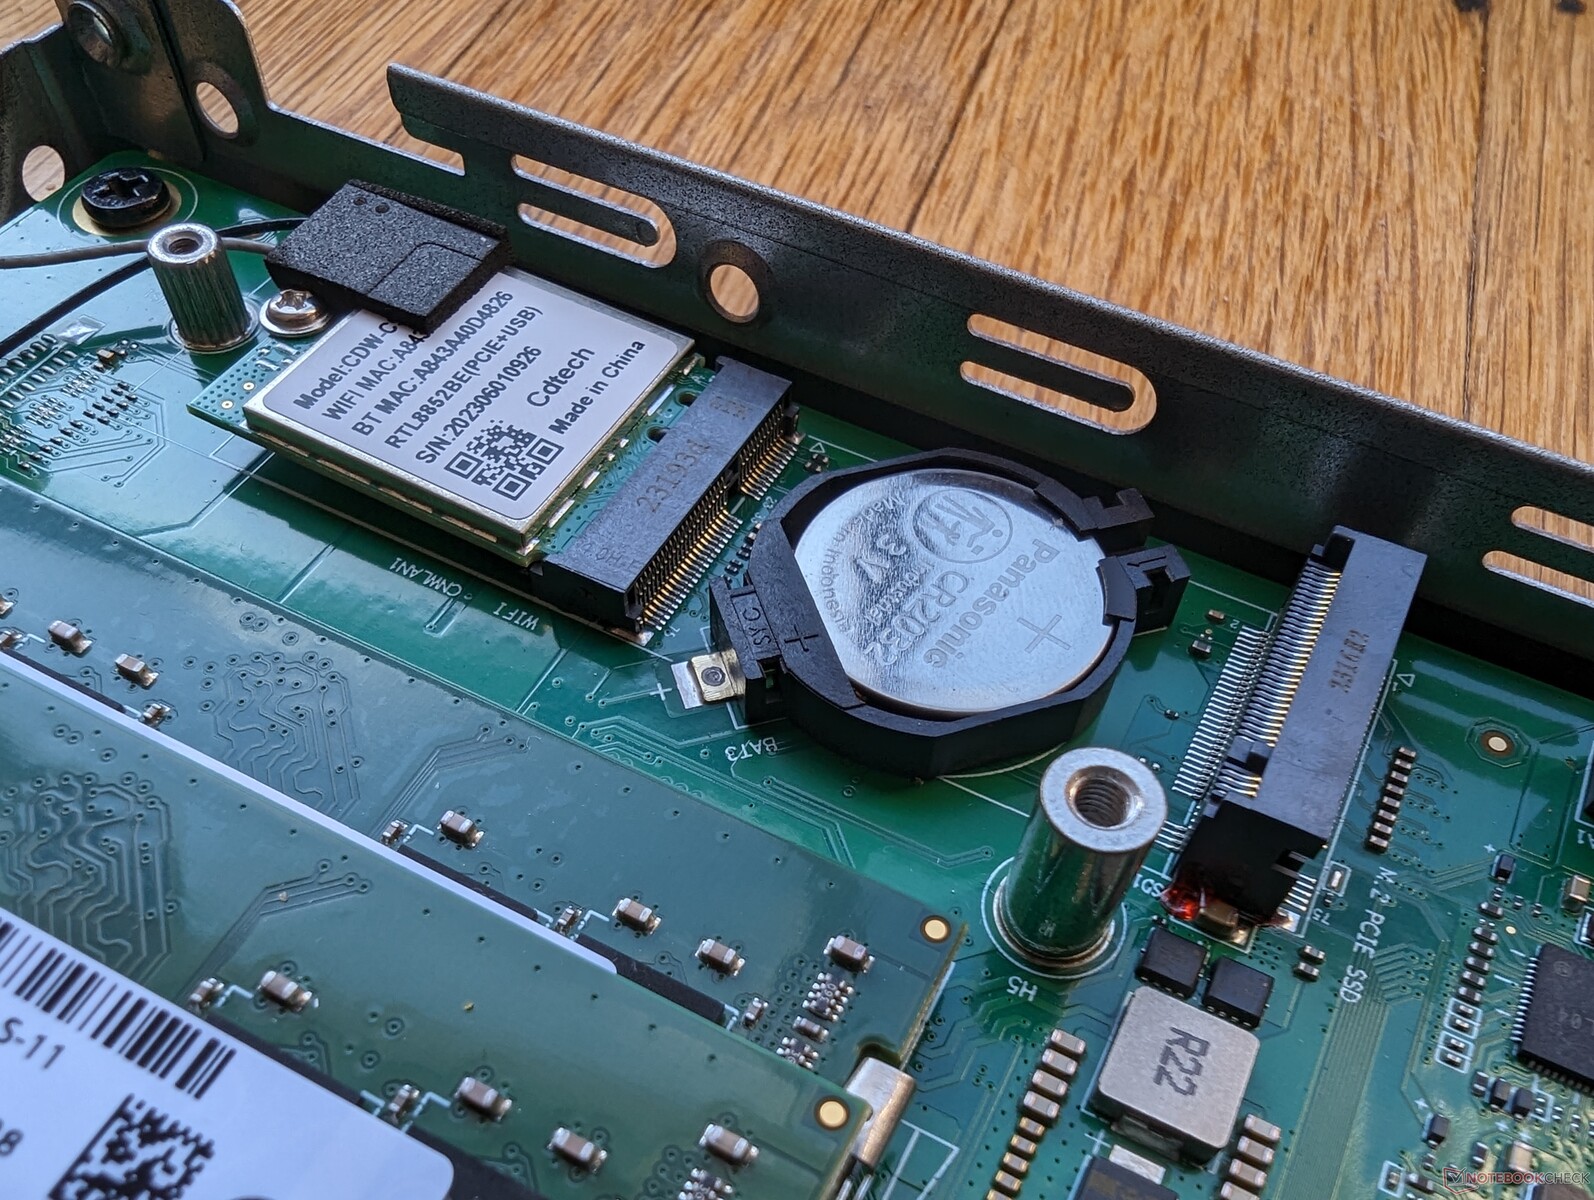
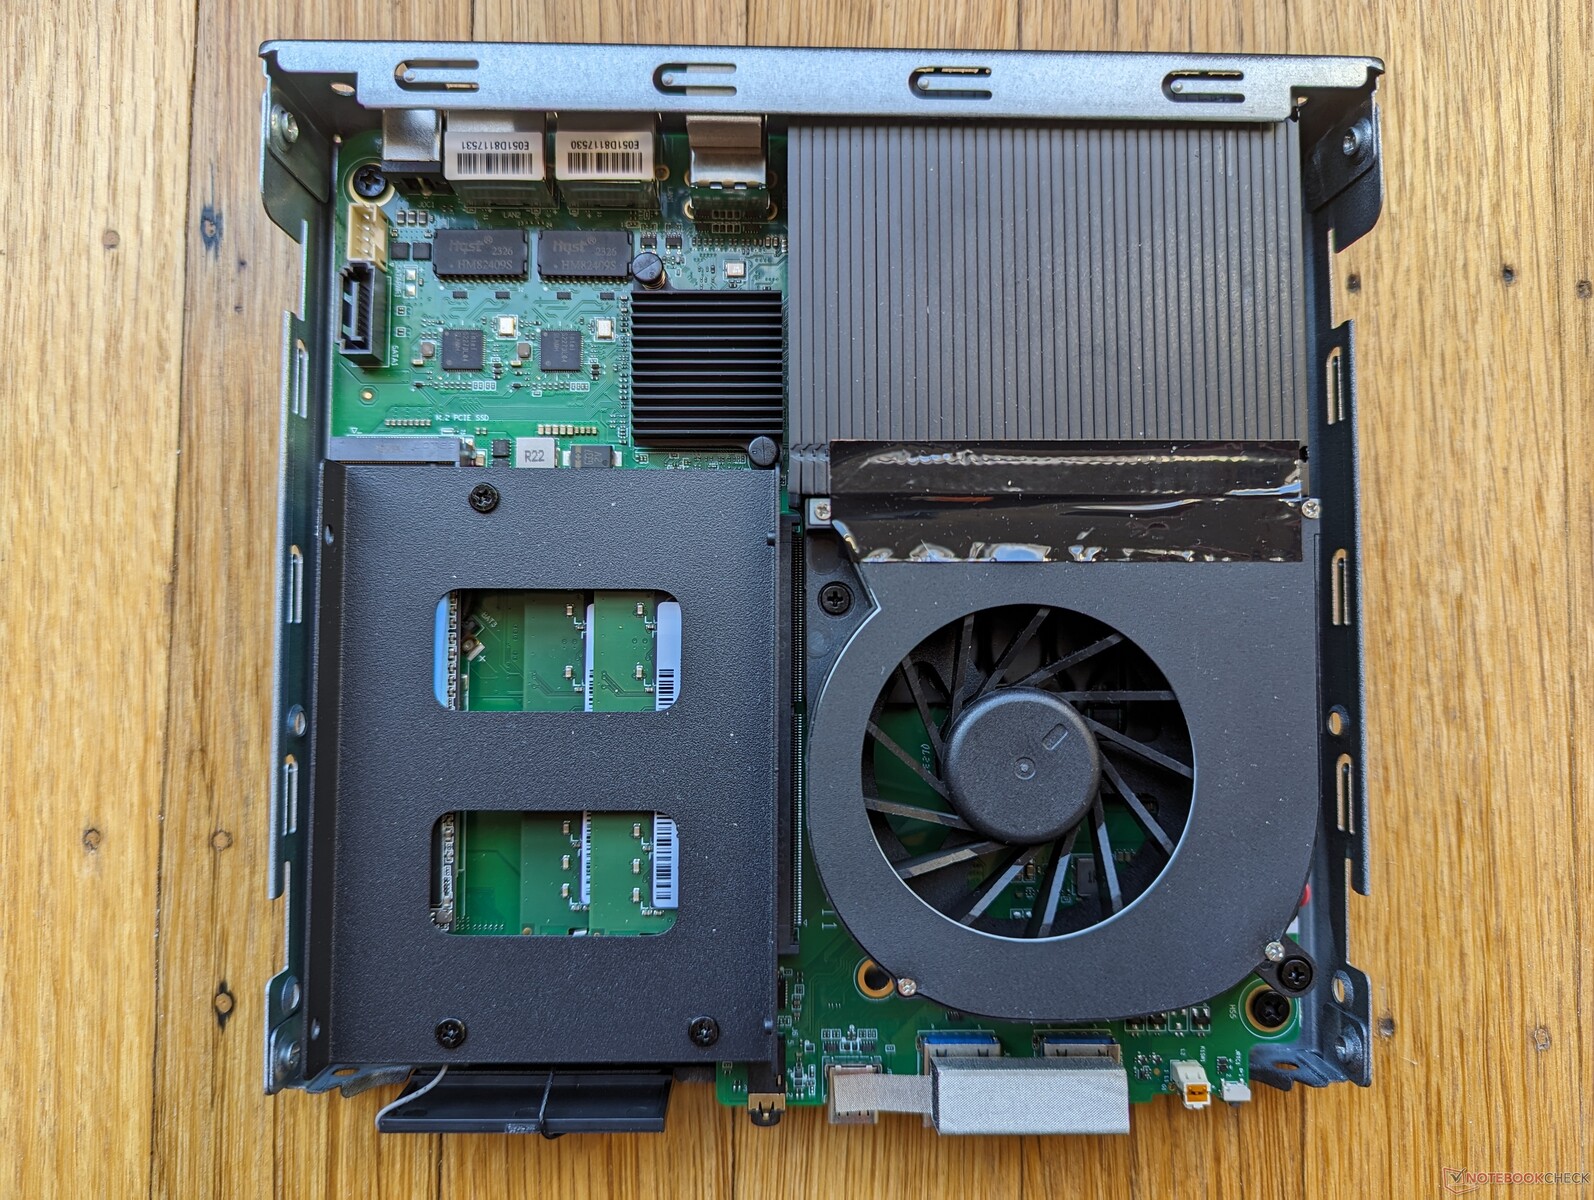
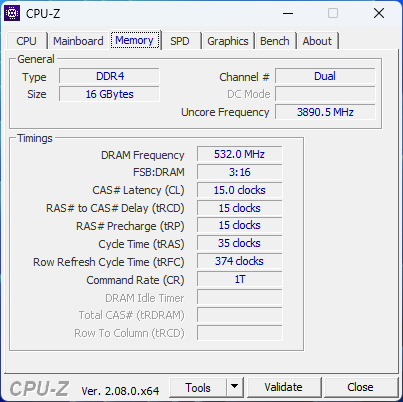
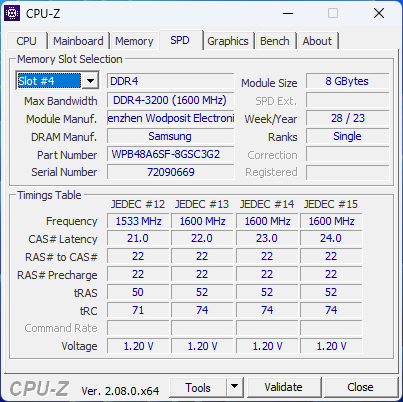
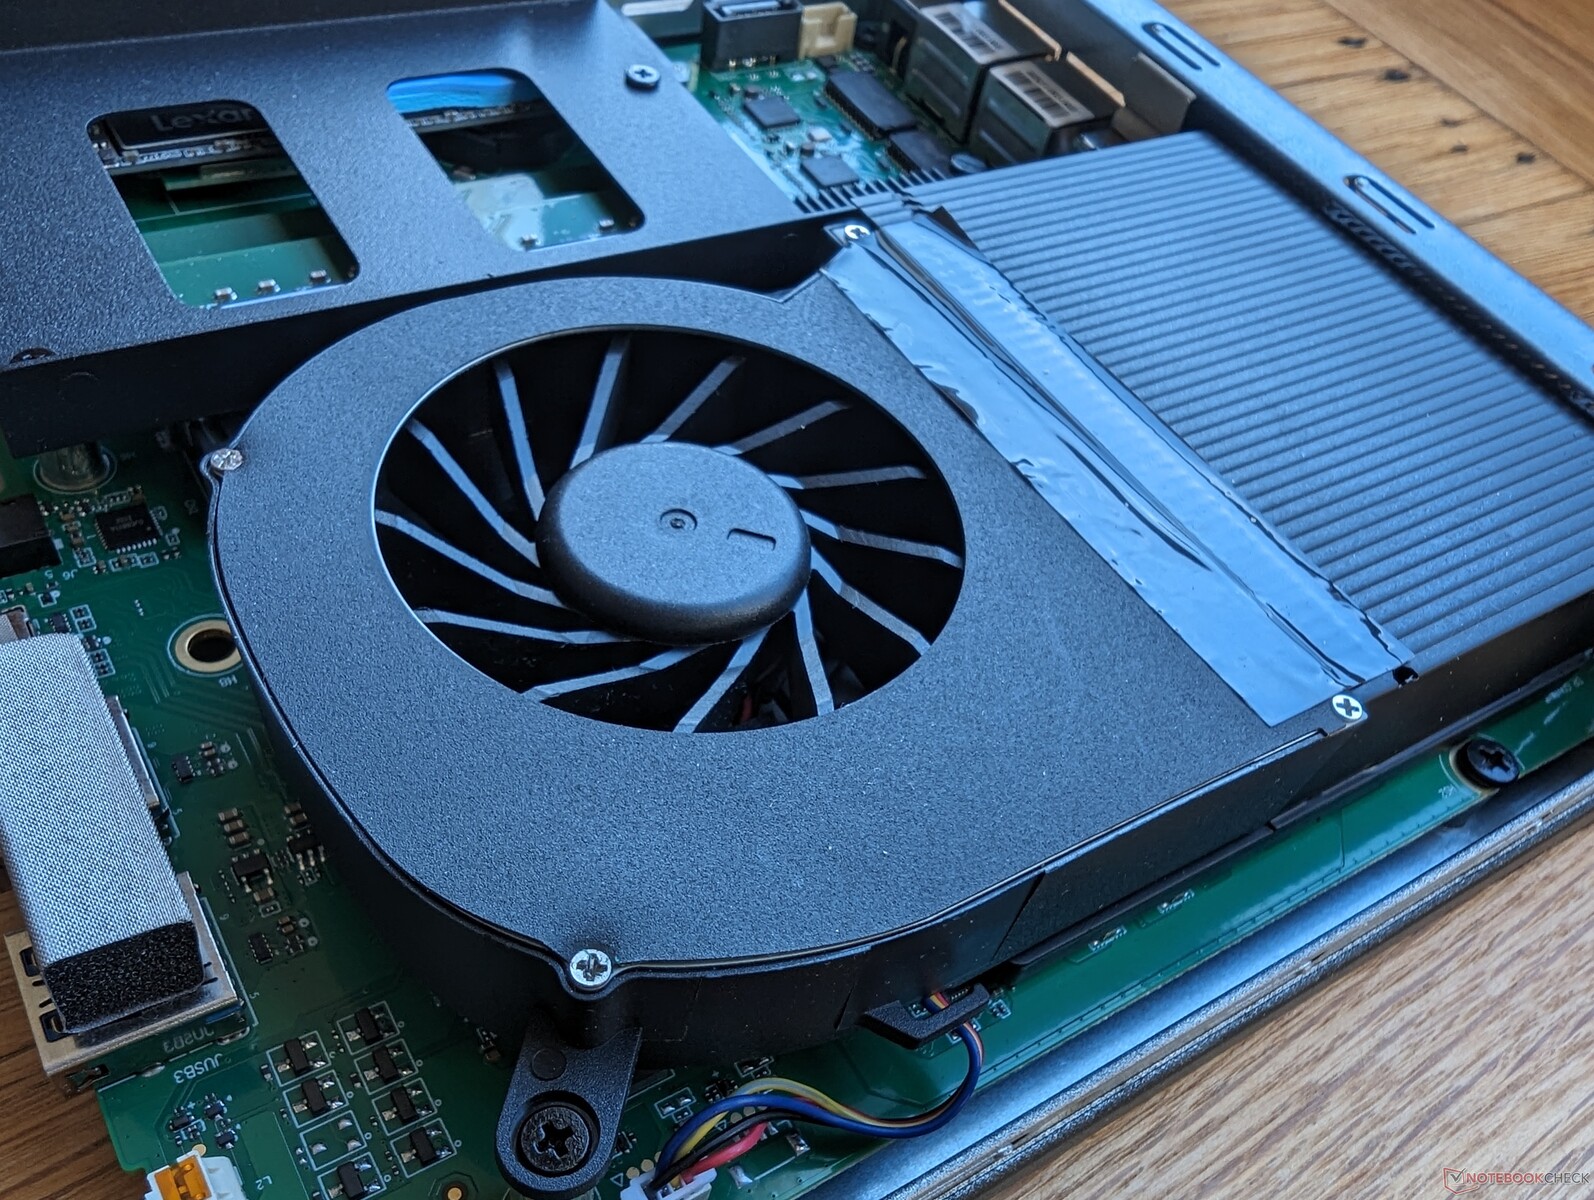
The top cover slides off after removing two screws from the rear to reveal two storage bays (2.5-inch SATA III + M.2 2280) and two SODIMM slots. Upgrades are relatively painless and require only a screwdriver.
Accessories And Warranty
The retail box includes an HDMI cable and VESA mounting screws alongside the power adapter and manual. A one-year limited manufacturer warranty applies if purchased in the US.
Performance
Testing Conditions
We set Windows to Performance mode prior to running the benchmarks below.
Processor
As a three-year old Core i9 CPU, the i9-11900H has trouble keeping up with newer Core i7 and Ryzen 7 offerings like the Core i7-13700H, Core i7-1360P, or Ryzen 7 7735HS. It is nonetheless faster than the Core i5-12450H in the NucBox M3 and most Core U CPUs including the 13th gen Core i7-1365U.
Cinebench R15 Multi Loop
Cinebench R23: Multi Core | Single Core
Cinebench R20: CPU (Multi Core) | CPU (Single Core)
Cinebench R15: CPU Multi 64Bit | CPU Single 64Bit
Blender: v2.79 BMW27 CPU
7-Zip 18.03: 7z b 4 | 7z b 4 -mmt1
Geekbench 5.5: Multi-Core | Single-Core
HWBOT x265 Benchmark v2.2: 4k Preset
LibreOffice : 20 Documents To PDF
R Benchmark 2.5: Overall mean
| Cinebench R23 / Multi Core | |
| Minisforum EliteMini UM780 XTX | |
| Lenovo IdeaCentre Mini 01IRH8 | |
| Minisforum Neptune Series HX77G | |
| Intel NUC 13 Pro Kit NUC13ANK | |
| Average Intel Core i9-11900H (11135 - 13012, n=4) | |
| GMK NucBox K2 | |
| Beelink SER6 Pro | |
| GMK NucBox M4 | |
| Geekom A5 | |
| GMK NucBox K3 Pro | |
| Beelink SER5 | |
| GMK NucBox M3 | |
| Cinebench R23 / Single Core | |
| Intel NUC 13 Pro Kit NUC13ANK | |
| Lenovo IdeaCentre Mini 01IRH8 | |
| GMK NucBox K3 Pro | |
| Minisforum EliteMini UM780 XTX | |
| GMK NucBox M3 | |
| GMK NucBox M4 | |
| Average Intel Core i9-11900H (1574 - 1605, n=4) | |
| Minisforum Neptune Series HX77G | |
| Beelink SER6 Pro | |
| GMK NucBox K2 | |
| Geekom A5 | |
| Beelink SER5 | |
| Cinebench R20 / CPU (Multi Core) | |
| Minisforum EliteMini UM780 XTX | |
| Lenovo IdeaCentre Mini 01IRH8 | |
| Minisforum Neptune Series HX77G | |
| Intel NUC 13 Pro Kit NUC13ANK | |
| Average Intel Core i9-11900H (4324 - 5160, n=5) | |
| GMK NucBox K2 | |
| Beelink SER6 Pro | |
| GMK NucBox M4 | |
| Geekom A5 | |
| GMK NucBox K3 Pro | |
| Beelink SER5 | |
| GMK NucBox M3 | |
| Cinebench R20 / CPU (Single Core) | |
| Intel NUC 13 Pro Kit NUC13ANK | |
| Lenovo IdeaCentre Mini 01IRH8 | |
| GMK NucBox K3 Pro | |
| Minisforum EliteMini UM780 XTX | |
| GMK NucBox M3 | |
| GMK NucBox M4 | |
| Minisforum Neptune Series HX77G | |
| Average Intel Core i9-11900H (600 - 615, n=5) | |
| GMK NucBox K2 | |
| Beelink SER6 Pro | |
| Geekom A5 | |
| Beelink SER5 | |
| Cinebench R15 / CPU Multi 64Bit | |
| Minisforum EliteMini UM780 XTX | |
| Minisforum Neptune Series HX77G | |
| Lenovo IdeaCentre Mini 01IRH8 | |
| Average Intel Core i9-11900H (1770 - 2211, n=5) | |
| Intel NUC 13 Pro Kit NUC13ANK | |
| GMK NucBox K2 | |
| Beelink SER6 Pro | |
| Geekom A5 | |
| GMK NucBox M4 | |
| GMK NucBox K3 Pro | |
| Beelink SER5 | |
| GMK NucBox M3 | |
| Cinebench R15 / CPU Single 64Bit | |
| Minisforum EliteMini UM780 XTX | |
| Intel NUC 13 Pro Kit NUC13ANK | |
| Lenovo IdeaCentre Mini 01IRH8 | |
| GMK NucBox K3 Pro | |
| Minisforum Neptune Series HX77G | |
| GMK NucBox K2 | |
| GMK NucBox M4 | |
| Beelink SER6 Pro | |
| Average Intel Core i9-11900H (236 - 243, n=5) | |
| GMK NucBox M3 | |
| Geekom A5 | |
| Beelink SER5 | |
| Blender / v2.79 BMW27 CPU | |
| GMK NucBox M3 | |
| Beelink SER5 | |
| GMK NucBox K3 Pro | |
| Geekom A5 | |
| Intel NUC 13 Pro Kit NUC13ANK | |
| GMK NucBox M4 | |
| Beelink SER6 Pro | |
| GMK NucBox K2 | |
| Average Intel Core i9-11900H (231 - 270, n=5) | |
| Minisforum Neptune Series HX77G | |
| Lenovo IdeaCentre Mini 01IRH8 | |
| Minisforum EliteMini UM780 XTX | |
| 7-Zip 18.03 / 7z b 4 -mmt1 | |
| Minisforum EliteMini UM780 XTX | |
| GMK NucBox M4 | |
| Lenovo IdeaCentre Mini 01IRH8 | |
| Intel NUC 13 Pro Kit NUC13ANK | |
| Minisforum Neptune Series HX77G | |
| GMK NucBox K2 | |
| Average Intel Core i9-11900H (5582 - 6018, n=5) | |
| GMK NucBox K3 Pro | |
| Beelink SER6 Pro | |
| Geekom A5 | |
| GMK NucBox M3 | |
| Beelink SER5 | |
| Geekbench 5.5 / Multi-Core | |
| Minisforum EliteMini UM780 XTX | |
| Intel NUC 13 Pro Kit NUC13ANK | |
| Lenovo IdeaCentre Mini 01IRH8 | |
| Minisforum Neptune Series HX77G | |
| GMK NucBox K3 Pro | |
| GMK NucBox K2 | |
| Beelink SER6 Pro | |
| Average Intel Core i9-11900H (7725 - 9856, n=5) | |
| GMK NucBox M4 | |
| Geekom A5 | |
| GMK NucBox M3 | |
| Beelink SER5 | |
| Geekbench 5.5 / Single-Core | |
| Minisforum EliteMini UM780 XTX | |
| Intel NUC 13 Pro Kit NUC13ANK | |
| Lenovo IdeaCentre Mini 01IRH8 | |
| GMK NucBox K3 Pro | |
| GMK NucBox M4 | |
| GMK NucBox M3 | |
| Average Intel Core i9-11900H (1576 - 1692, n=5) | |
| Minisforum Neptune Series HX77G | |
| GMK NucBox K2 | |
| Beelink SER6 Pro | |
| Geekom A5 | |
| Beelink SER5 | |
| HWBOT x265 Benchmark v2.2 / 4k Preset | |
| Minisforum EliteMini UM780 XTX | |
| Minisforum Neptune Series HX77G | |
| Lenovo IdeaCentre Mini 01IRH8 | |
| GMK NucBox K2 | |
| Beelink SER6 Pro | |
| Average Intel Core i9-11900H (13.6 - 16.7, n=5) | |
| Intel NUC 13 Pro Kit NUC13ANK | |
| GMK NucBox M4 | |
| Geekom A5 | |
| GMK NucBox K3 Pro | |
| Beelink SER5 | |
| GMK NucBox M3 | |
| LibreOffice / 20 Documents To PDF | |
| Beelink SER5 | |
| Geekom A5 | |
| Minisforum EliteMini UM780 XTX | |
| Minisforum Neptune Series HX77G | |
| Beelink SER6 Pro | |
| GMK NucBox K2 | |
| Average Intel Core i9-11900H (40.5 - 49.3, n=5) | |
| Intel NUC 13 Pro Kit NUC13ANK | |
| GMK NucBox M4 | |
| GMK NucBox M3 | |
| GMK NucBox K3 Pro | |
| Lenovo IdeaCentre Mini 01IRH8 | |
| R Benchmark 2.5 / Overall mean | |
| Beelink SER5 | |
| Average Intel Core i9-11900H (0.52 - 0.544, n=5) | |
| Geekom A5 | |
| GMK NucBox M4 | |
| Beelink SER6 Pro | |
| GMK NucBox M3 | |
| GMK NucBox K2 | |
| Minisforum Neptune Series HX77G | |
| GMK NucBox K3 Pro | |
| Lenovo IdeaCentre Mini 01IRH8 | |
| Intel NUC 13 Pro Kit NUC13ANK | |
| Minisforum EliteMini UM780 XTX | |
* ... smaller is better
AIDA64: FP32 Ray-Trace | FPU Julia | CPU SHA3 | CPU Queen | FPU SinJulia | FPU Mandel | CPU AES | CPU ZLib | FP64 Ray-Trace | CPU PhotoWorxx
| Performance rating | |
| Beelink SER6 Pro | |
| GMK NucBox M4 | |
| Lenovo IdeaCentre Mini 01IRH8 | |
| Average Intel Core i9-11900H | |
| Intel NUC 13 Pro Kit NUC13ANK | |
| GMK NucBox K3 Pro | |
| GMK NucBox M3 | |
| AIDA64 / FP32 Ray-Trace | |
| GMK NucBox M4 | |
| Average Intel Core i9-11900H (n=1) | |
| Lenovo IdeaCentre Mini 01IRH8 | |
| Beelink SER6 Pro | |
| Intel NUC 13 Pro Kit NUC13ANK | |
| GMK NucBox K3 Pro | |
| GMK NucBox M3 | |
| AIDA64 / FPU Julia | |
| Beelink SER6 Pro | |
| Lenovo IdeaCentre Mini 01IRH8 | |
| GMK NucBox M4 | |
| Average Intel Core i9-11900H (n=1) | |
| Intel NUC 13 Pro Kit NUC13ANK | |
| GMK NucBox K3 Pro | |
| GMK NucBox M3 | |
| AIDA64 / CPU SHA3 | |
| GMK NucBox M4 | |
| Average Intel Core i9-11900H (n=1) | |
| Lenovo IdeaCentre Mini 01IRH8 | |
| Beelink SER6 Pro | |
| Intel NUC 13 Pro Kit NUC13ANK | |
| GMK NucBox K3 Pro | |
| GMK NucBox M3 | |
| AIDA64 / CPU Queen | |
| Lenovo IdeaCentre Mini 01IRH8 | |
| Beelink SER6 Pro | |
| GMK NucBox M4 | |
| Average Intel Core i9-11900H (n=1) | |
| Intel NUC 13 Pro Kit NUC13ANK | |
| GMK NucBox K3 Pro | |
| GMK NucBox M3 | |
| AIDA64 / FPU SinJulia | |
| Beelink SER6 Pro | |
| GMK NucBox M4 | |
| Average Intel Core i9-11900H (n=1) | |
| Lenovo IdeaCentre Mini 01IRH8 | |
| Intel NUC 13 Pro Kit NUC13ANK | |
| GMK NucBox K3 Pro | |
| GMK NucBox M3 | |
| AIDA64 / FPU Mandel | |
| Beelink SER6 Pro | |
| GMK NucBox M4 | |
| Average Intel Core i9-11900H (n=1) | |
| Lenovo IdeaCentre Mini 01IRH8 | |
| Intel NUC 13 Pro Kit NUC13ANK | |
| GMK NucBox K3 Pro | |
| GMK NucBox M3 | |
| AIDA64 / CPU AES | |
| GMK NucBox M4 | |
| Average Intel Core i9-11900H (n=1) | |
| Beelink SER6 Pro | |
| Intel NUC 13 Pro Kit NUC13ANK | |
| GMK NucBox K3 Pro | |
| Lenovo IdeaCentre Mini 01IRH8 | |
| GMK NucBox M3 | |
| AIDA64 / CPU ZLib | |
| Lenovo IdeaCentre Mini 01IRH8 | |
| Intel NUC 13 Pro Kit NUC13ANK | |
| GMK NucBox M4 | |
| Beelink SER6 Pro | |
| GMK NucBox K3 Pro | |
| GMK NucBox M3 | |
| Average Intel Core i9-11900H (738 - 738, n=4) | |
| AIDA64 / FP64 Ray-Trace | |
| GMK NucBox M4 | |
| Average Intel Core i9-11900H (n=1) | |
| Lenovo IdeaCentre Mini 01IRH8 | |
| Beelink SER6 Pro | |
| Intel NUC 13 Pro Kit NUC13ANK | |
| GMK NucBox K3 Pro | |
| GMK NucBox M3 | |
| AIDA64 / CPU PhotoWorxx | |
| GMK NucBox K3 Pro | |
| Beelink SER6 Pro | |
| Intel NUC 13 Pro Kit NUC13ANK | |
| GMK NucBox M3 | |
| GMK NucBox M4 | |
| Average Intel Core i9-11900H (n=1) | |
| Lenovo IdeaCentre Mini 01IRH8 | |
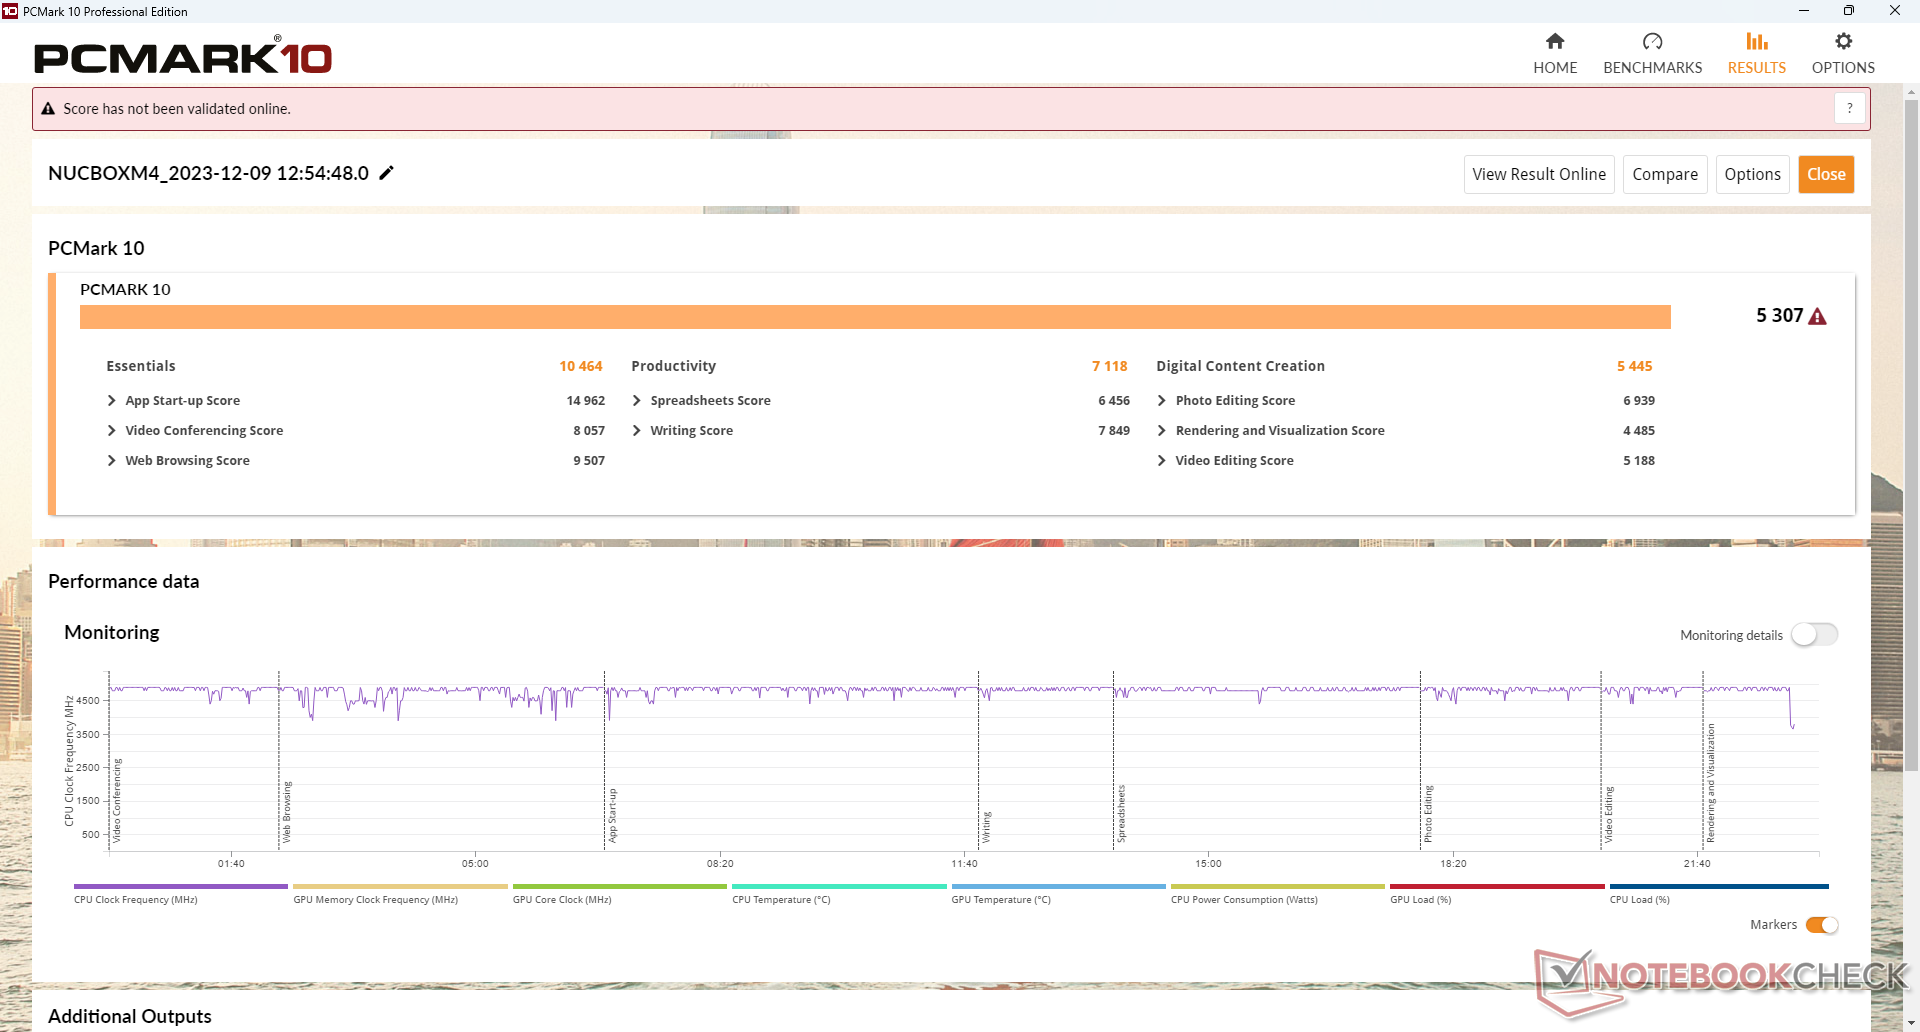
System Performance
PCMark results are lower than many mini PCs running on newer 12th gen, 13th gen, or Zen 3+ CPUs due largely to the slow integrated GPU in our NucBox M4.
CrossMark: Overall | Productivity | Creativity | Responsiveness
WebXPRT 3: Overall
WebXPRT 4: Overall
Mozilla Kraken 1.1: Total
| PCMark 10 / Score | |
| Beelink SER6 Pro | |
| Intel NUC 13 Pro Kit NUC13ANK | |
| Lenovo IdeaCentre Mini 01IRH8 | |
| GMK NucBox K3 Pro | |
| GMK NucBox M3 | |
| GMK NucBox M4 | |
| Average Intel Core i9-11900H, Intel UHD Graphics Xe 32EUs (Tiger Lake-H) (n=1) | |
| PCMark 10 / Essentials | |
| Intel NUC 13 Pro Kit NUC13ANK | |
| Lenovo IdeaCentre Mini 01IRH8 | |
| Beelink SER6 Pro | |
| GMK NucBox K3 Pro | |
| GMK NucBox M3 | |
| GMK NucBox M4 | |
| Average Intel Core i9-11900H, Intel UHD Graphics Xe 32EUs (Tiger Lake-H) (n=1) | |
| PCMark 10 / Productivity | |
| Beelink SER6 Pro | |
| Intel NUC 13 Pro Kit NUC13ANK | |
| GMK NucBox K3 Pro | |
| Lenovo IdeaCentre Mini 01IRH8 | |
| GMK NucBox M3 | |
| GMK NucBox M4 | |
| Average Intel Core i9-11900H, Intel UHD Graphics Xe 32EUs (Tiger Lake-H) (n=1) | |
| PCMark 10 / Digital Content Creation | |
| Beelink SER6 Pro | |
| Lenovo IdeaCentre Mini 01IRH8 | |
| Intel NUC 13 Pro Kit NUC13ANK | |
| GMK NucBox K3 Pro | |
| GMK NucBox M4 | |
| Average Intel Core i9-11900H, Intel UHD Graphics Xe 32EUs (Tiger Lake-H) (n=1) | |
| GMK NucBox M3 | |
| CrossMark / Overall | |
| Intel NUC 13 Pro Kit NUC13ANK | |
| Lenovo IdeaCentre Mini 01IRH8 | |
| Beelink SER6 Pro | |
| GMK NucBox M4 | |
| Average Intel Core i9-11900H, Intel UHD Graphics Xe 32EUs (Tiger Lake-H) (n=1) | |
| GMK NucBox K3 Pro | |
| GMK NucBox M3 | |
| CrossMark / Productivity | |
| Intel NUC 13 Pro Kit NUC13ANK | |
| Lenovo IdeaCentre Mini 01IRH8 | |
| Beelink SER6 Pro | |
| GMK NucBox M4 | |
| Average Intel Core i9-11900H, Intel UHD Graphics Xe 32EUs (Tiger Lake-H) (n=1) | |
| GMK NucBox M3 | |
| GMK NucBox K3 Pro | |
| CrossMark / Creativity | |
| Intel NUC 13 Pro Kit NUC13ANK | |
| Lenovo IdeaCentre Mini 01IRH8 | |
| Beelink SER6 Pro | |
| GMK NucBox K3 Pro | |
| GMK NucBox M4 | |
| Average Intel Core i9-11900H, Intel UHD Graphics Xe 32EUs (Tiger Lake-H) (n=1) | |
| GMK NucBox M3 | |
| CrossMark / Responsiveness | |
| Beelink SER6 Pro | |
| Intel NUC 13 Pro Kit NUC13ANK | |
| GMK NucBox M3 | |
| GMK NucBox M4 | |
| Average Intel Core i9-11900H, Intel UHD Graphics Xe 32EUs (Tiger Lake-H) (n=1) | |
| Lenovo IdeaCentre Mini 01IRH8 | |
| GMK NucBox K3 Pro | |
| WebXPRT 3 / Overall | |
| Intel NUC 13 Pro Kit NUC13ANK | |
| GMK NucBox K3 Pro | |
| Beelink SER6 Pro | |
| GMK NucBox M3 | |
| GMK NucBox M4 | |
| Average Intel Core i9-11900H, Intel UHD Graphics Xe 32EUs (Tiger Lake-H) (n=1) | |
| WebXPRT 4 / Overall | |
| Intel NUC 13 Pro Kit NUC13ANK | |
| GMK NucBox M3 | |
| GMK NucBox M4 | |
| Average Intel Core i9-11900H, Intel UHD Graphics Xe 32EUs (Tiger Lake-H) (n=1) | |
| Beelink SER6 Pro | |
| Mozilla Kraken 1.1 / Total | |
| GMK NucBox M4 | |
| Average Intel Core i9-11900H, Intel UHD Graphics Xe 32EUs (Tiger Lake-H) (n=1) | |
| Beelink SER6 Pro | |
| GMK NucBox M3 | |
| GMK NucBox K3 Pro | |
| Lenovo IdeaCentre Mini 01IRH8 | |
| Intel NUC 13 Pro Kit NUC13ANK | |
* ... smaller is better
| PCMark 10 Score | 5307 points | |
Help | ||
| AIDA64 / Memory Copy | |
| GMK NucBox K3 Pro | |
| Beelink SER6 Pro | |
| Intel NUC 13 Pro Kit NUC13ANK | |
| GMK NucBox M4 | |
| Average Intel Core i9-11900H (n=1) | |
| GMK NucBox M3 | |
| Lenovo IdeaCentre Mini 01IRH8 | |
| AIDA64 / Memory Read | |
| GMK NucBox K3 Pro | |
| Beelink SER6 Pro | |
| GMK NucBox M4 | |
| Average Intel Core i9-11900H (n=1) | |
| Intel NUC 13 Pro Kit NUC13ANK | |
| Lenovo IdeaCentre Mini 01IRH8 | |
| GMK NucBox M3 | |
| AIDA64 / Memory Write | |
| GMK NucBox K3 Pro | |
| Beelink SER6 Pro | |
| GMK NucBox M4 | |
| Average Intel Core i9-11900H (n=1) | |
| GMK NucBox M3 | |
| Intel NUC 13 Pro Kit NUC13ANK | |
| Lenovo IdeaCentre Mini 01IRH8 | |
| AIDA64 / Memory Latency | |
| GMK NucBox K3 Pro | |
| Intel NUC 13 Pro Kit NUC13ANK | |
| Beelink SER6 Pro | |
| Lenovo IdeaCentre Mini 01IRH8 | |
| GMK NucBox M3 | |
| GMK NucBox M4 | |
| Average Intel Core i9-11900H (71.2 - 71.2, n=4) | |
* ... smaller is better
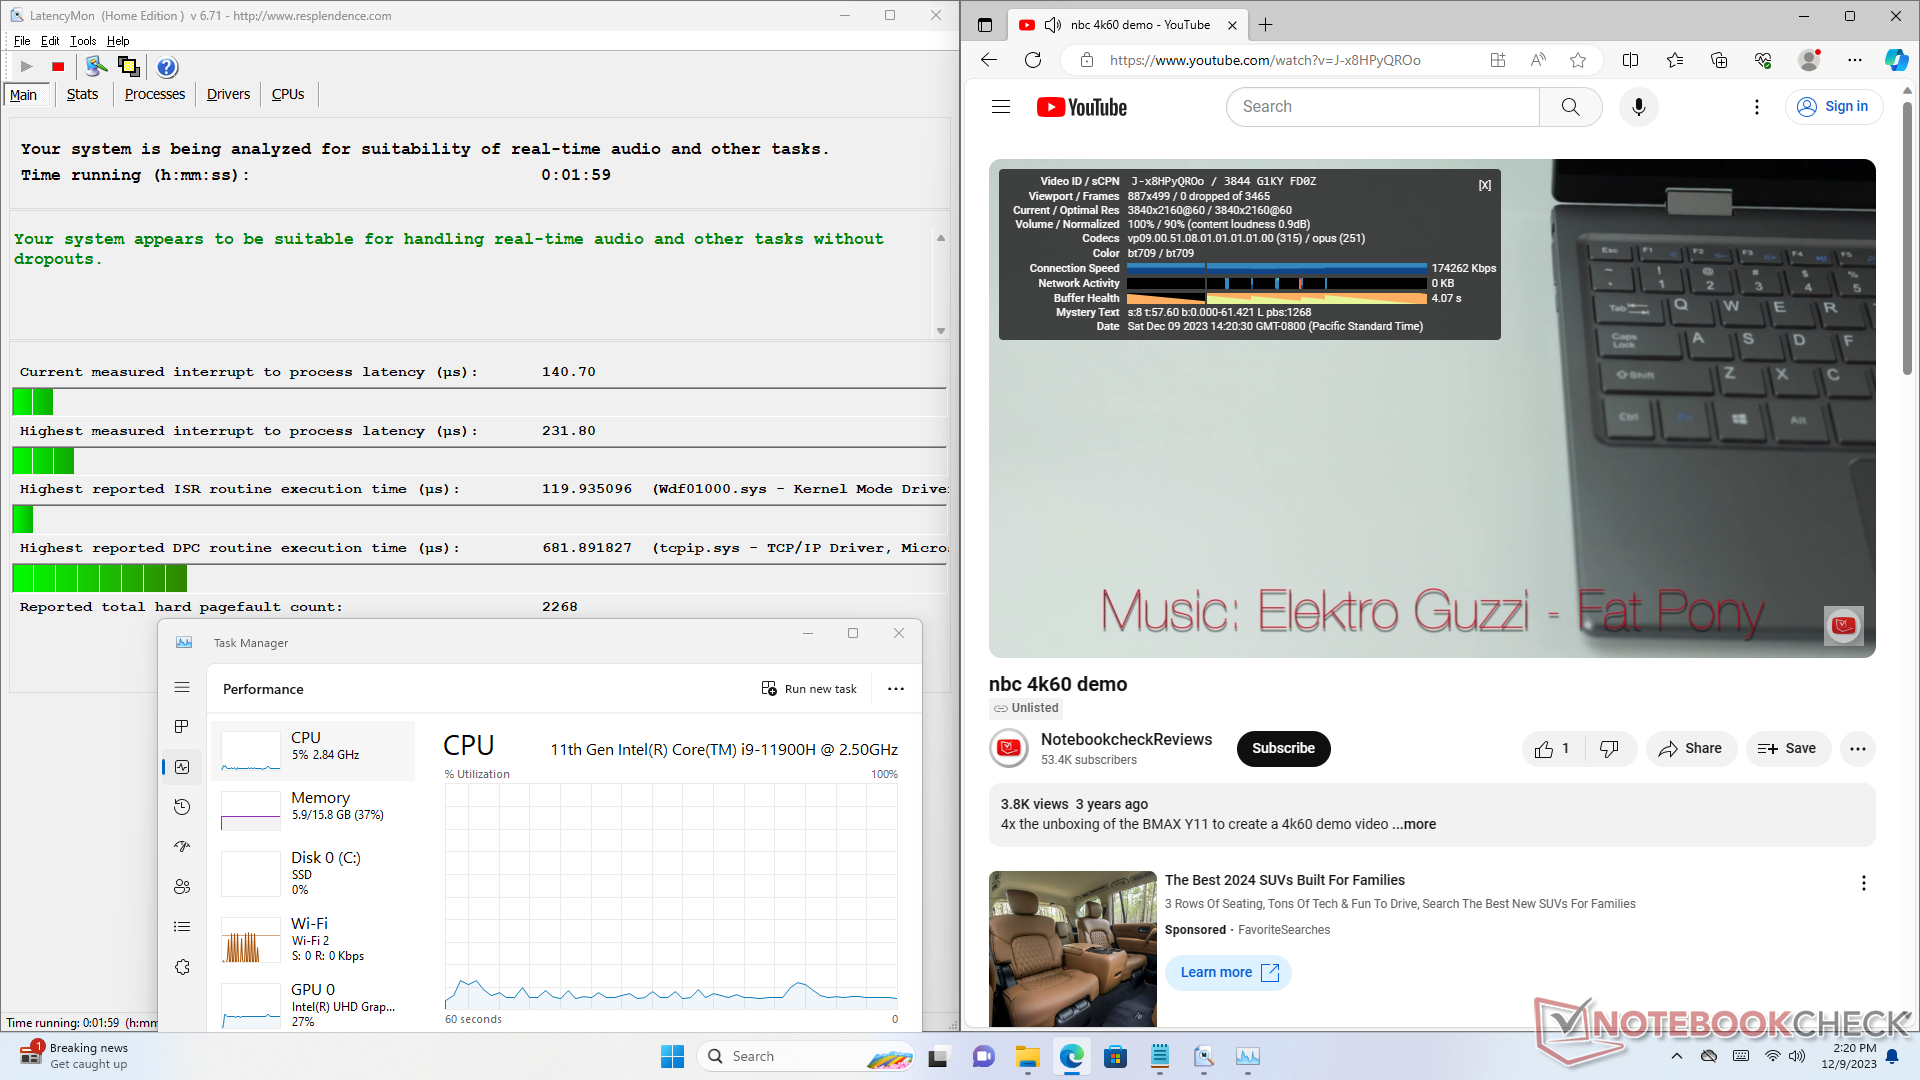
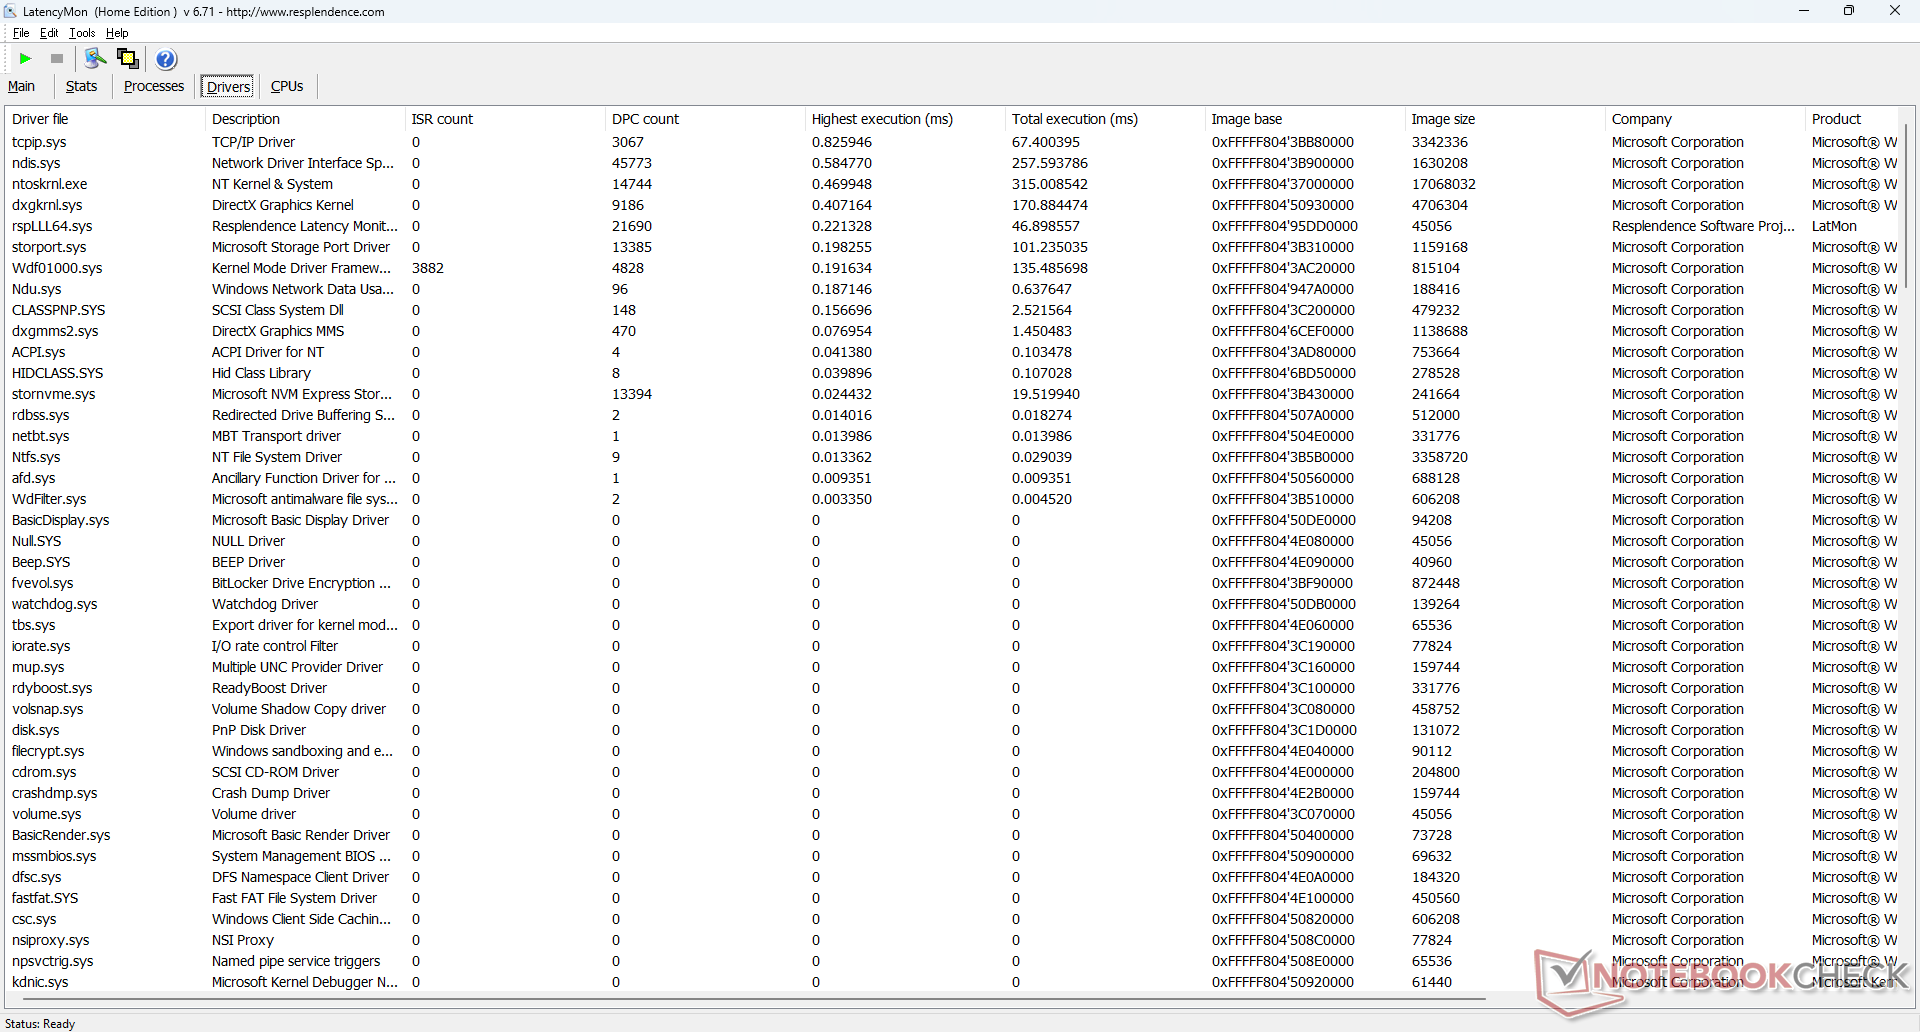
DPC Latency
LatencyMon reveals no DPC issues when opening multiple browser tabs of our homepage. 4K video playback at 60 FPS is also perfect with no dropped frames recorded to make this an excellent mini PC for streaming purposes.
| DPC Latencies / LatencyMon - interrupt to process latency (max), Web, Youtube, Prime95 | |
| GMK NucBox M3 | |
| Lenovo IdeaCentre Mini 01IRH8 | |
| GMK NucBox K3 Pro | |
| Beelink SER6 Pro | |
| Intel NUC 13 Pro Kit NUC13ANK | |
| GMK NucBox M4 | |
* ... smaller is better
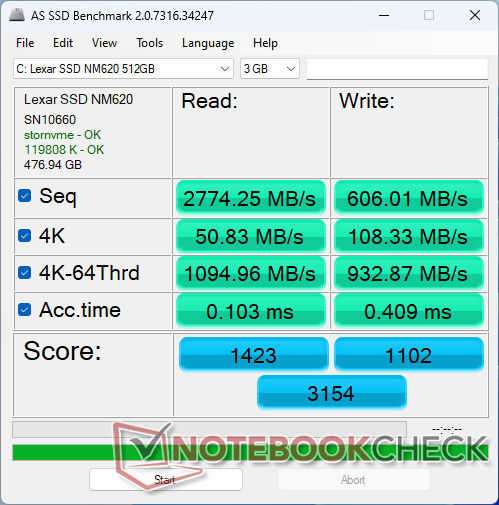
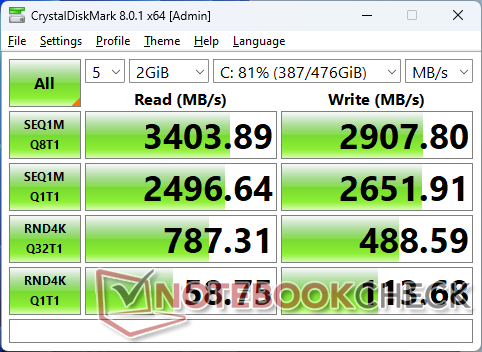
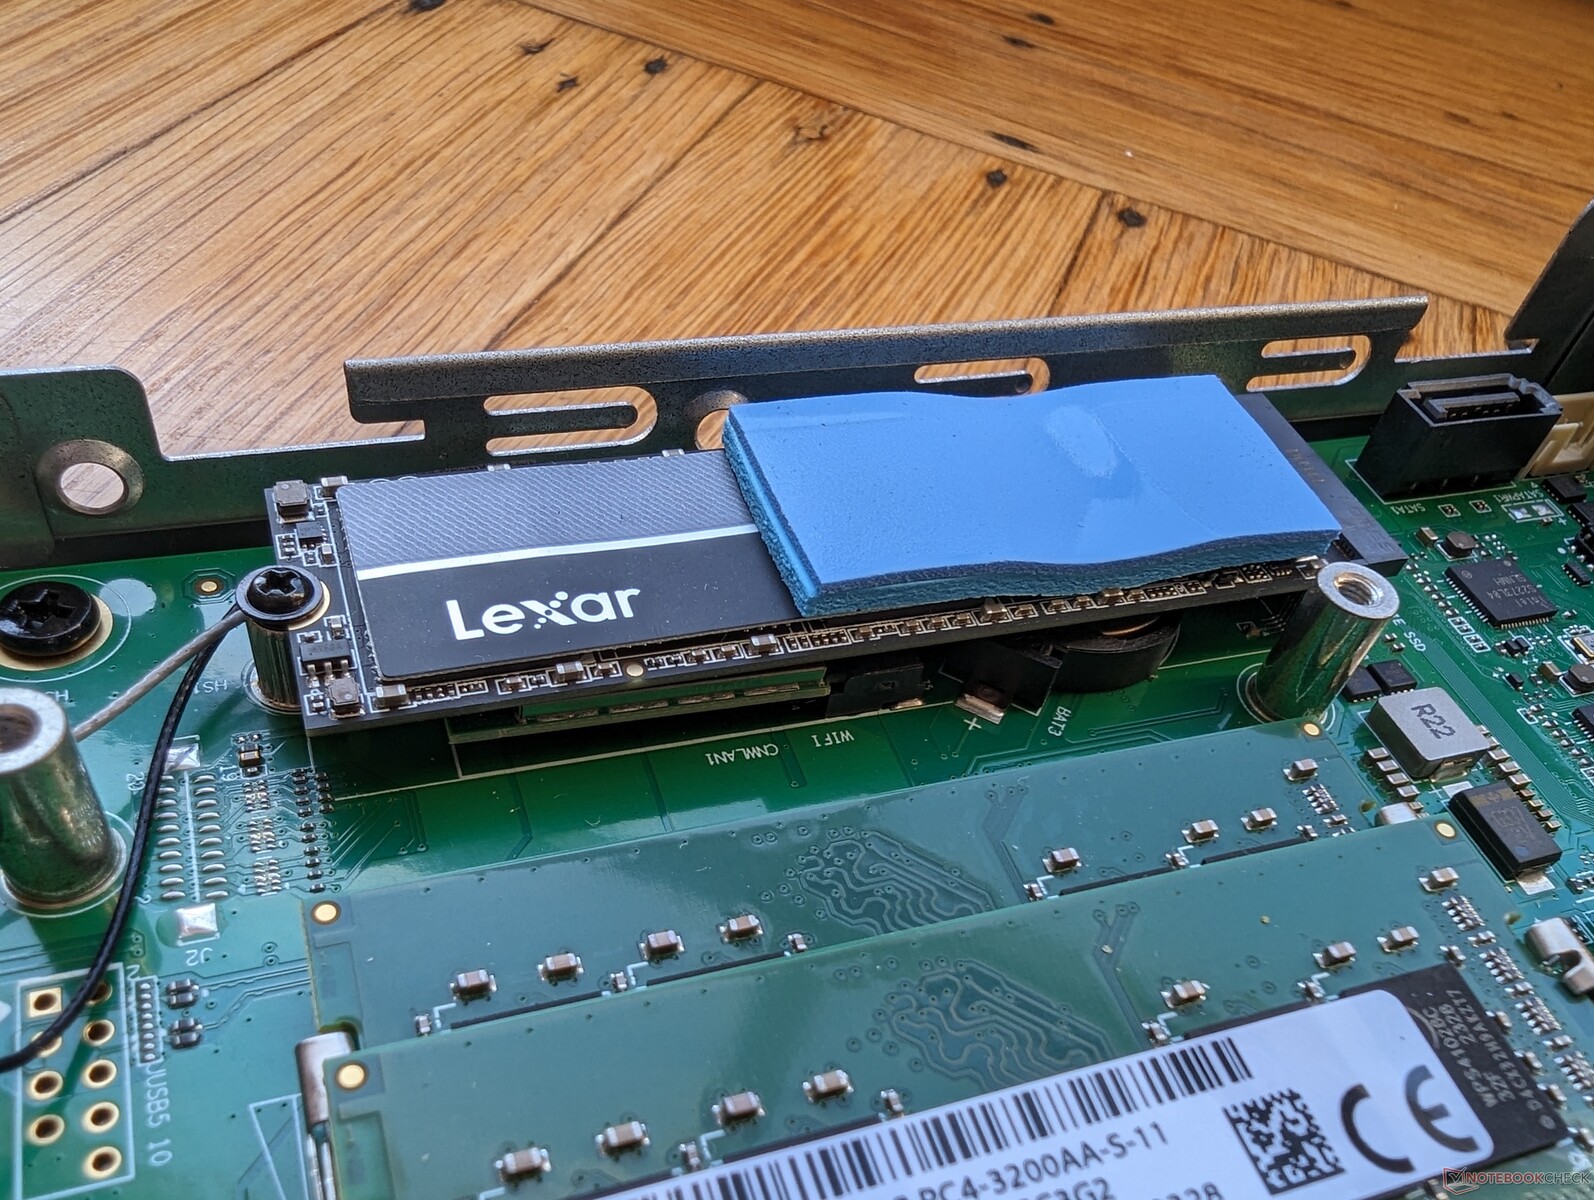
Storage Devices
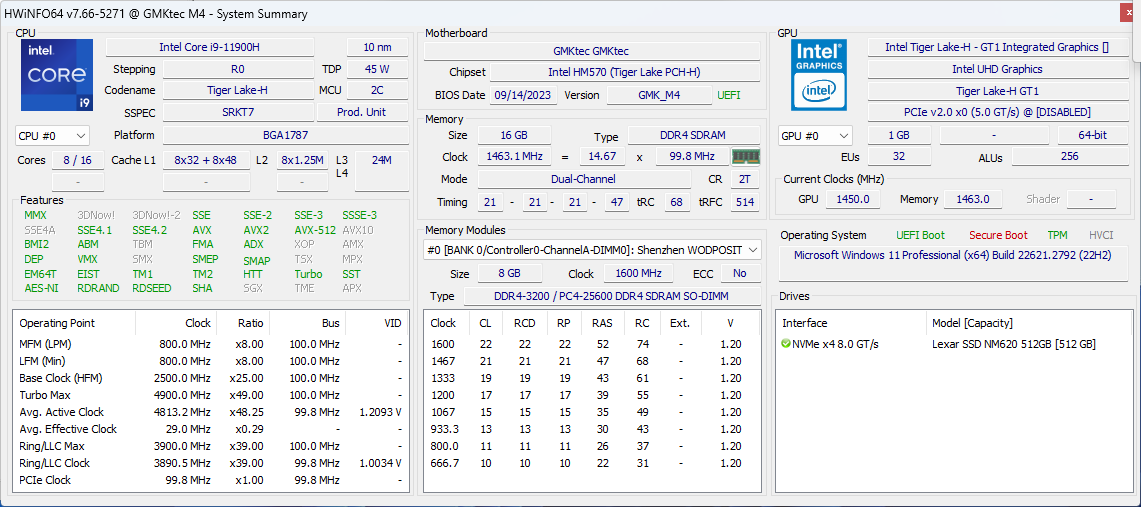
Our unit ships with a 512 GB Lexar NM620 PCIe3 x4 NVMe SSD offering sequential read and write rates of up to 3500 MB/s and 2400 MB/s, respectively. The drive would exhibit no throttling issues maintaining its maximum performance rates over long periods.

| Drive Performance rating - Percent | |
| Intel NUC 13 Pro Kit NUC13ANK | |
| GMK NucBox M3 | |
| Beelink SER6 Pro | |
| Lenovo IdeaCentre Mini 01IRH8 | |
| GMK NucBox K3 Pro | |
| GMK NucBox M4 | |
* ... smaller is better
Disk Throttling: DiskSpd Read Loop, Queue Depth 8
GPU Performance
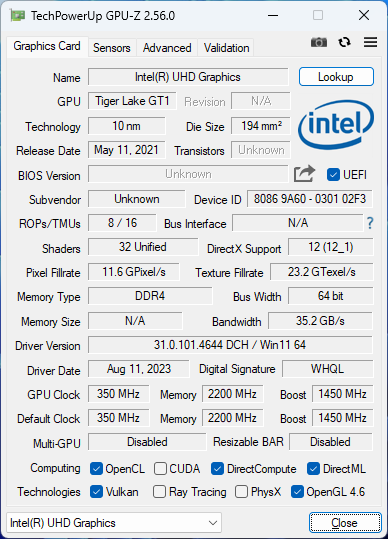
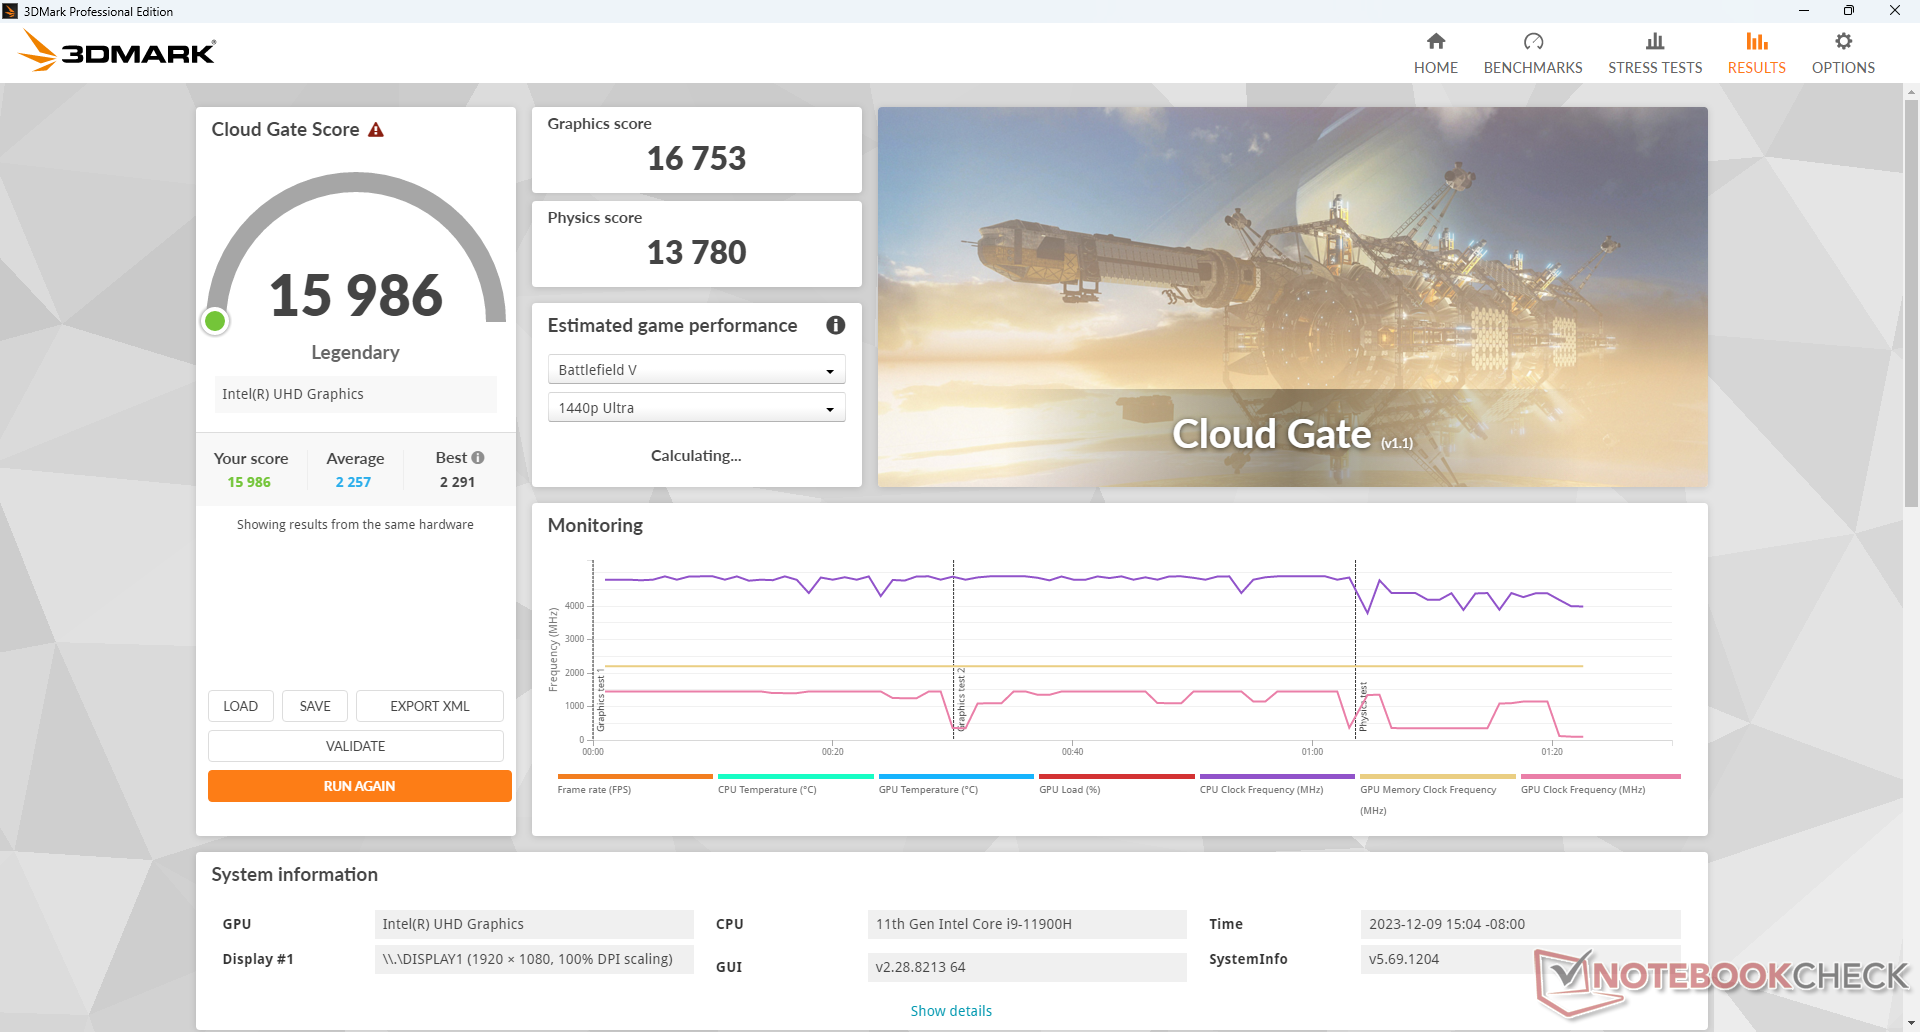
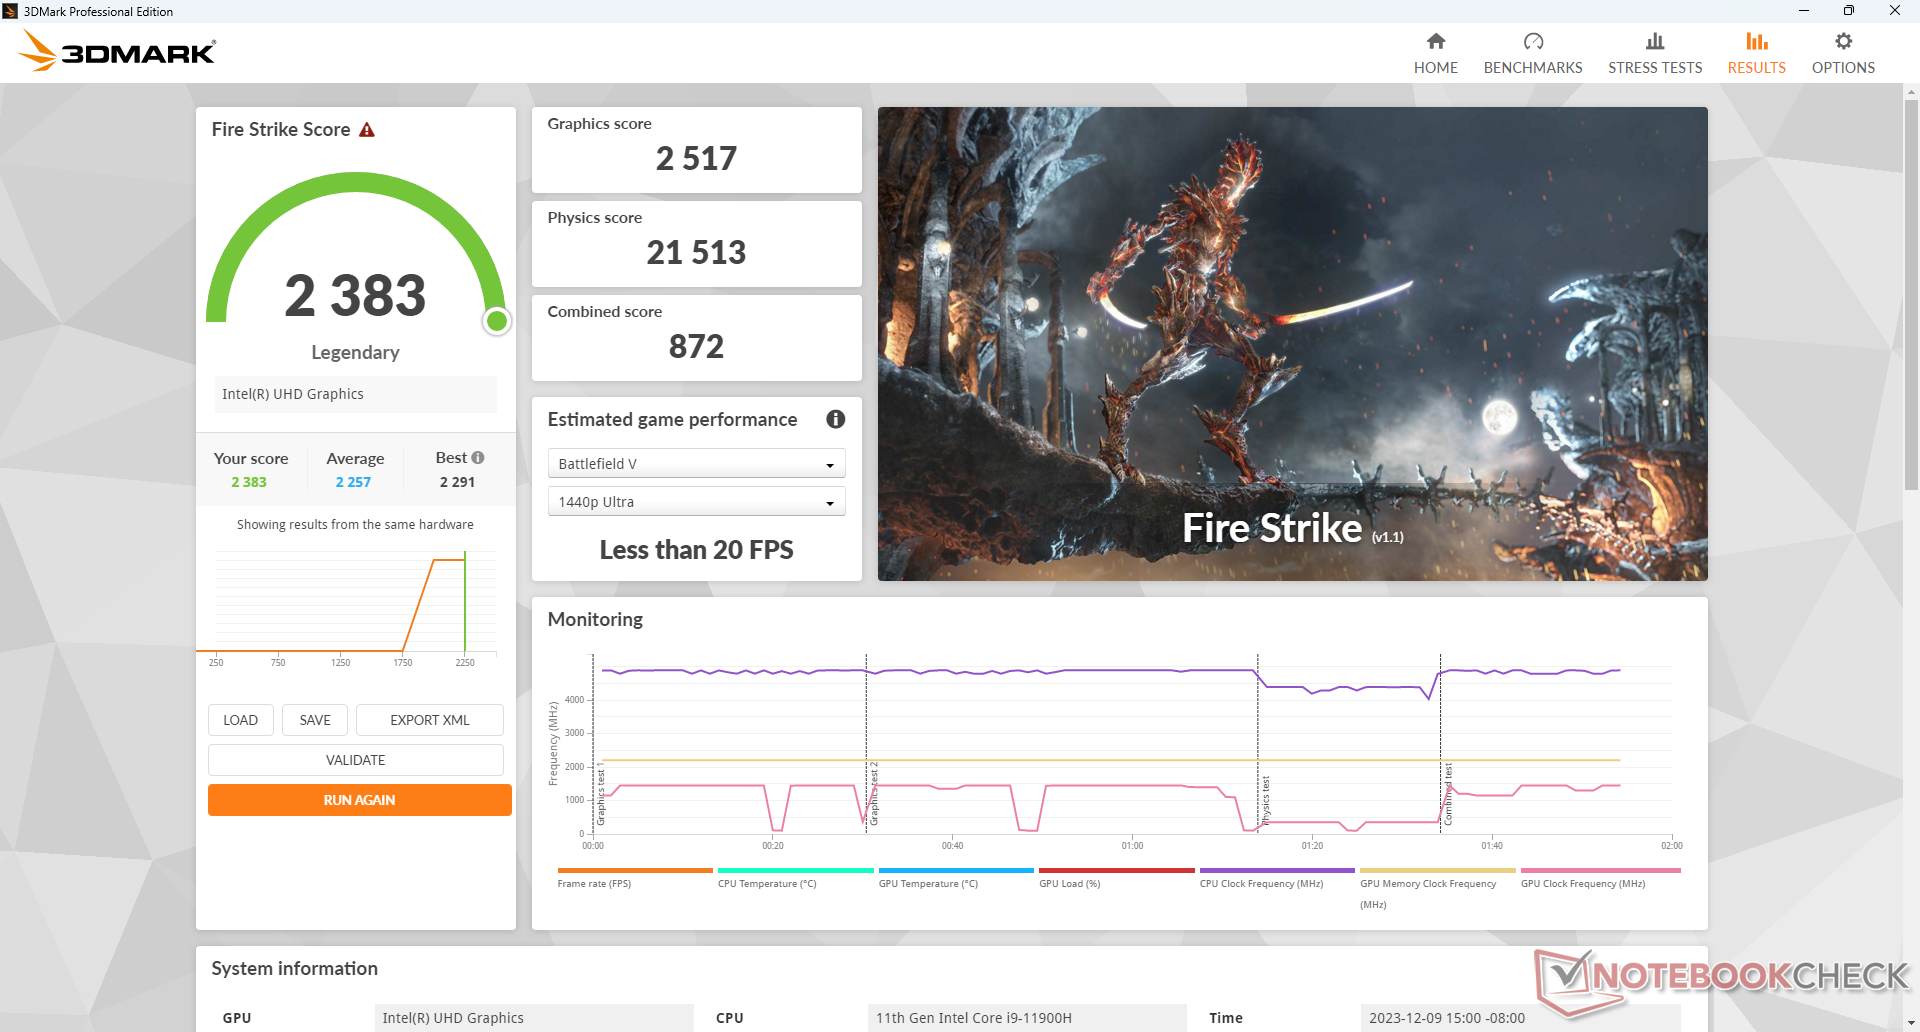
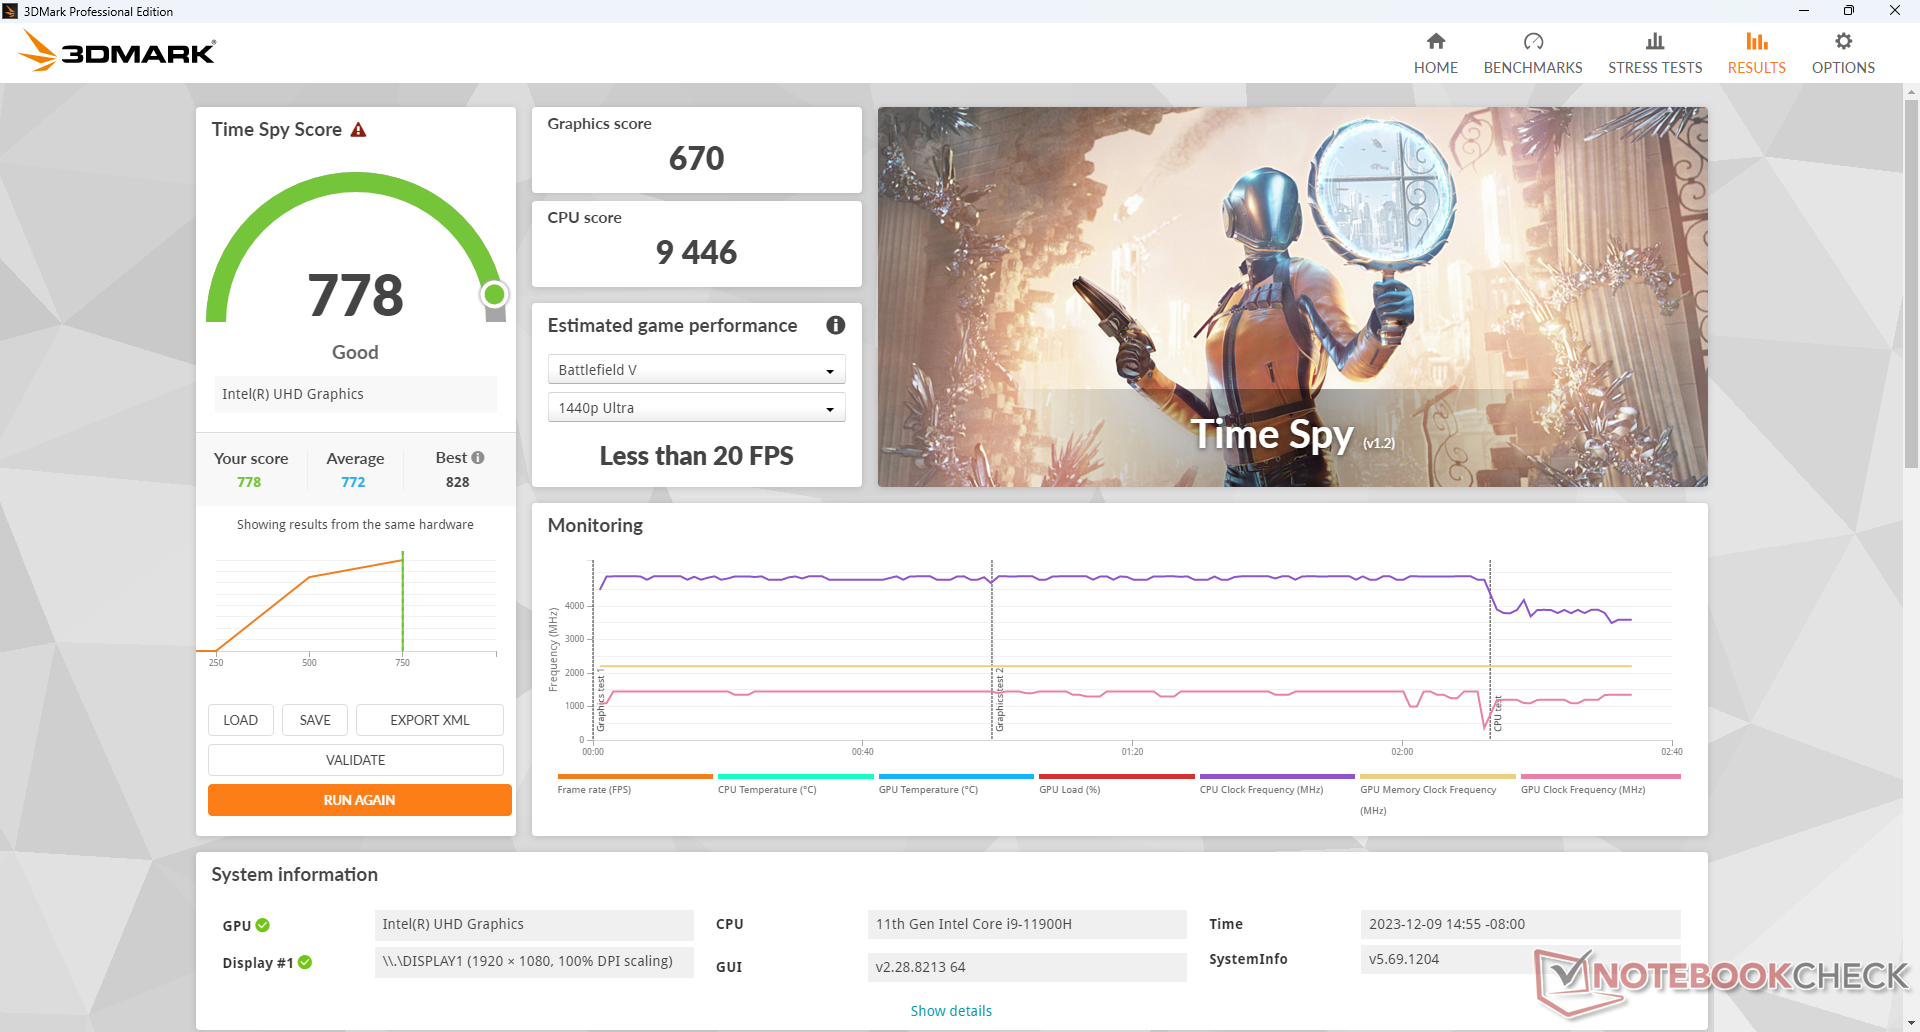
The integrated UHD Graphics Xe 32 EUs is one of the slowest GPUs in the Intel Xe family. The NucBox M4 is therefore not designed for any sort of native gaming. Game streaming, however, runs excellently on the machine.
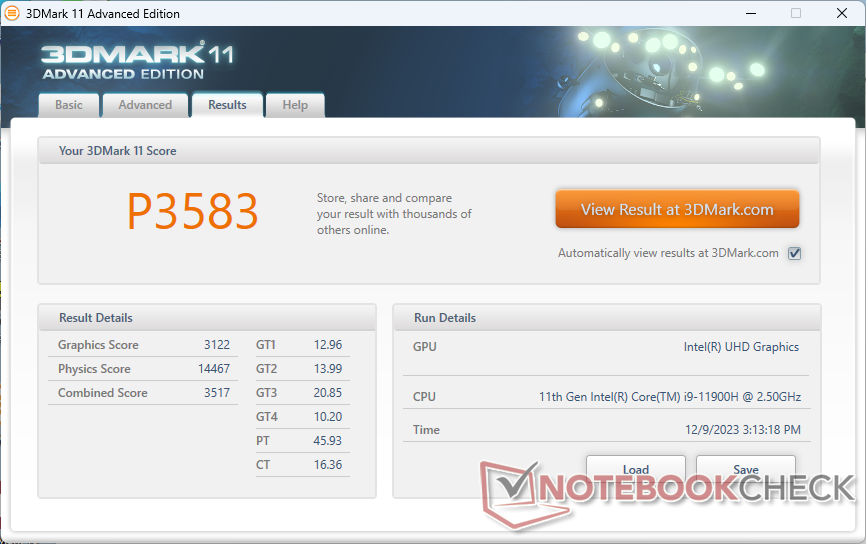
| 3DMark 11 Performance | 3583 points | |
| 3DMark Cloud Gate Standard Score | 15986 points | |
| 3DMark Fire Strike Score | 2383 points | |
Help | ||
* ... smaller is better
| Final Fantasy XV Benchmark - 1280x720 Lite Quality | |
| Minisforum EliteMini UM780 XTX | |
| Beelink SER6 Pro | |
| GMK NucBox K2 | |
| Geekom A5 | |
| GMK NucBox K3 Pro | |
| Lenovo IdeaCentre Mini 01IRH8 | |
| Beelink SER5 | |
| GMK NucBox M3 | |
| Average Intel UHD Graphics Xe 32EUs (Tiger Lake-H) (23 - 24.6, n=3) | |
| GMK NucBox M4 | |
Witcher 3 FPS Chart
| low | med. | high | ultra | |
|---|---|---|---|---|
| The Witcher 3 (2015) | 49.7 | 29.8 | 16.7 | 8.2 |
| Dota 2 Reborn (2015) | 112.3 | 70.1 | 36.1 | 32.8 |
| Final Fantasy XV Benchmark (2018) | 23 | |||
| X-Plane 11.11 (2018) | 38.8 | 26.3 | 23.3 | |
| Strange Brigade (2018) | 56.5 | 22.4 | 17.2 | 16.4 |
Emissions
System Noise
Fan noise when running undemanding loads like browsers or video streams is quieter than on most other smaller mini PCs. When running 3DMark 06 to represent medium loads, for example, fan noise would be steady at just 28 dB(A) compared to 37 dB(A) on the NucBox M3. Pulsing is also at a minimum.
Running extremely demanding loads like Prime95 can cause the internal fan to be as loud as 45 dB(A) which is louder than on most other mini PCs. Thus, the NucBox M4 is a loud machine only when the workload demands it as it is otherwise reasonably quiet.
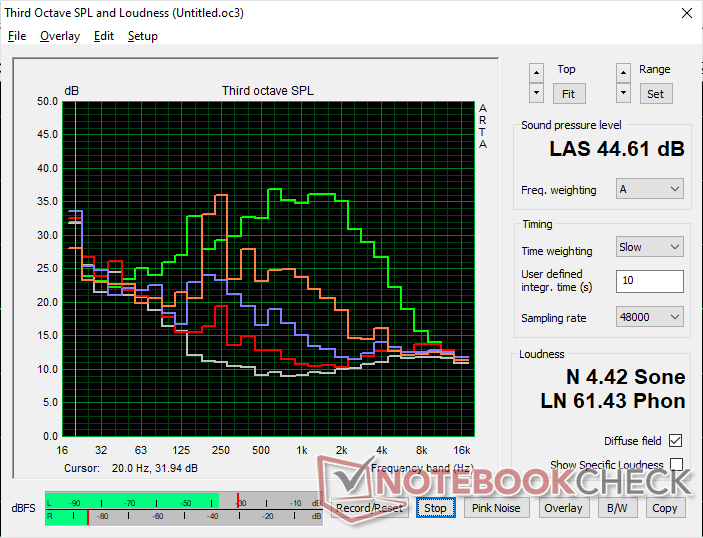
Noise level
| Idle |
| 24.4 / 24.4 / 28 dB(A) |
| Load |
| 28 / 44.6 dB(A) |
 | ||
30 dB silent 40 dB(A) audible 50 dB(A) loud |
||
min: | ||
| GMK NucBox M4 UHD Graphics Xe 32EUs (Tiger Lake-H), i9-11900H, Lexar NM620 512GB | GMK NucBox M3 UHD Graphics Xe G4 48EUs, i5-12450H, Lexar NM610 Pro NM610P001T-HNNNG | GMK NucBox K3 Pro UHD Graphics 64EUs, i7-12650H, Lexar NM610 Pro NM610P001T-HNNNG | Lenovo IdeaCentre Mini 01IRH8 Iris Xe G7 96EUs, i7-13700H, Samsung PM9B1 512GB MZVL4512HBLU | Beelink SER6 Pro Radeon 680M, R7 6800H, Kingston NV2 500GB SNV2S/500G | Intel NUC 13 Pro Kit NUC13ANK Iris Xe G7 96EUs, i7-1360P, Samsung PM9A1 MZVL2512HCJQ | |
|---|---|---|---|---|---|---|
| Noise | -16% | -7% | -9% | -10% | -22% | |
| off / environment * (dB) | 22.7 | 23.9 -5% | 23.1 -2% | 23.4 -3% | 22.8 -0% | 29.8 -31% |
| Idle Minimum * (dB) | 24.4 | 25.7 -5% | 25 -2% | 30.4 -25% | 24.1 1% | 30.2 -24% |
| Idle Average * (dB) | 24.4 | 25.7 -5% | 25.5 -5% | 30.4 -25% | 24.1 1% | 31.1 -27% |
| Idle Maximum * (dB) | 28 | 39.1 -40% | 25.5 9% | 30.4 -9% | 33.8 -21% | 31.9 -14% |
| Load Average * (dB) | 28 | 37 -32% | 39.9 -43% | 30.7 -10% | 40.1 -43% | 40 -43% |
| Witcher 3 ultra * (dB) | 33.7 | 43.5 -29% | 39.9 -18% | 33.9 -1% | 38.7 -15% | |
| Load Maximum * (dB) | 44.6 | 43.5 2% | 39.9 11% | 41 8% | 40.1 10% | 40.5 9% |
* ... smaller is better
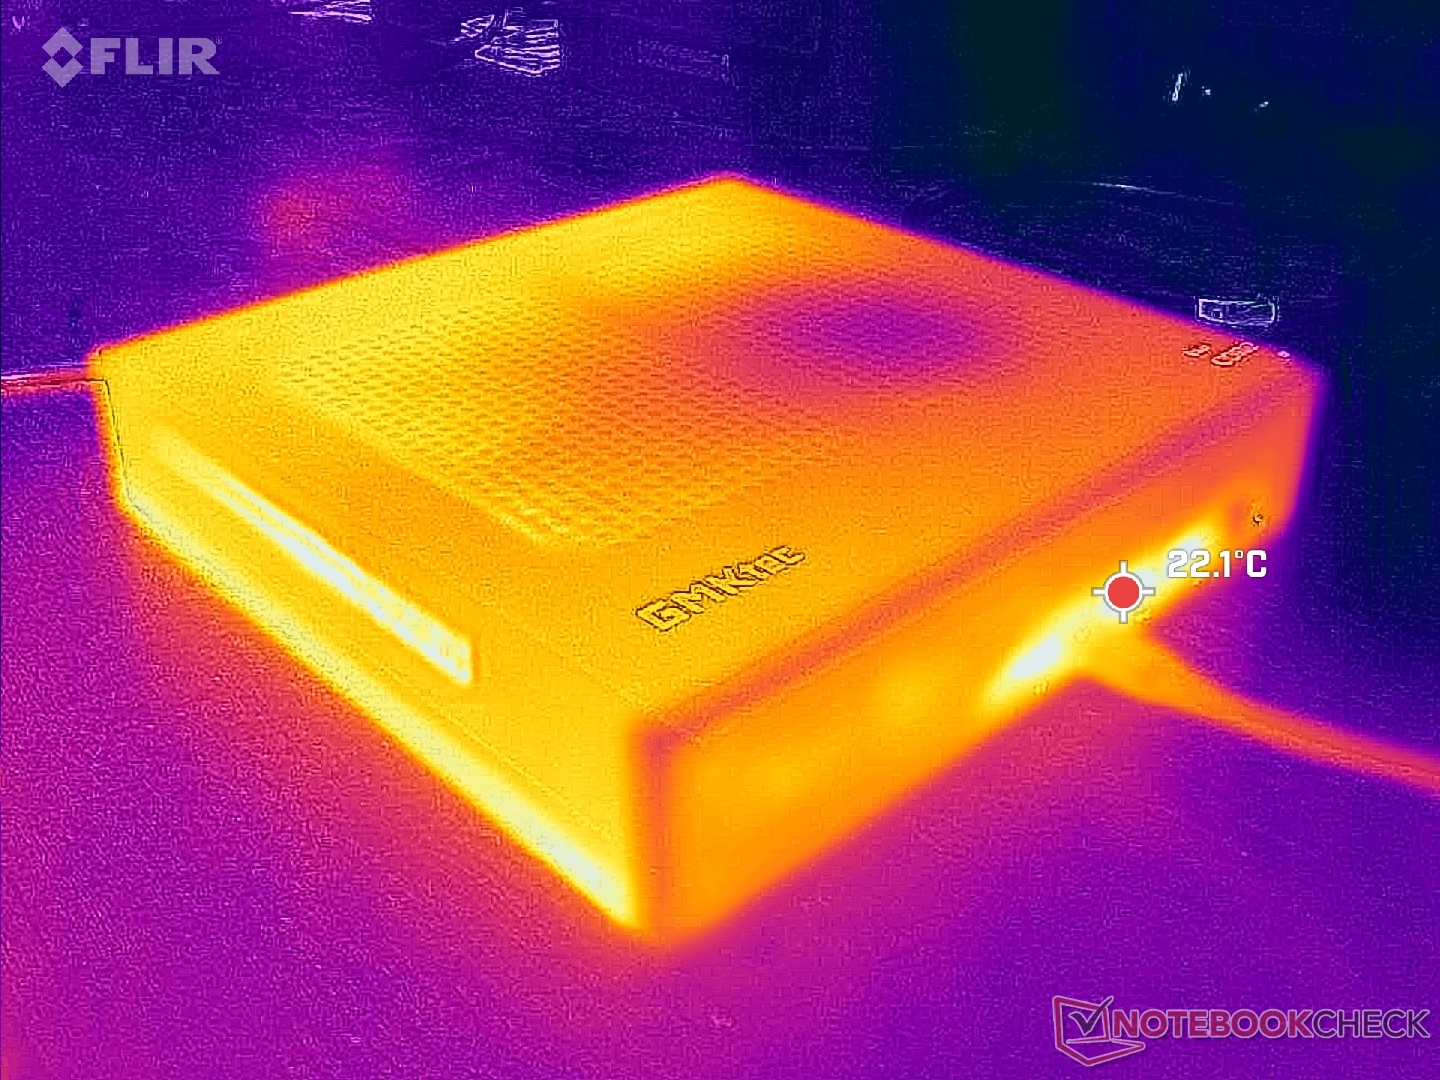
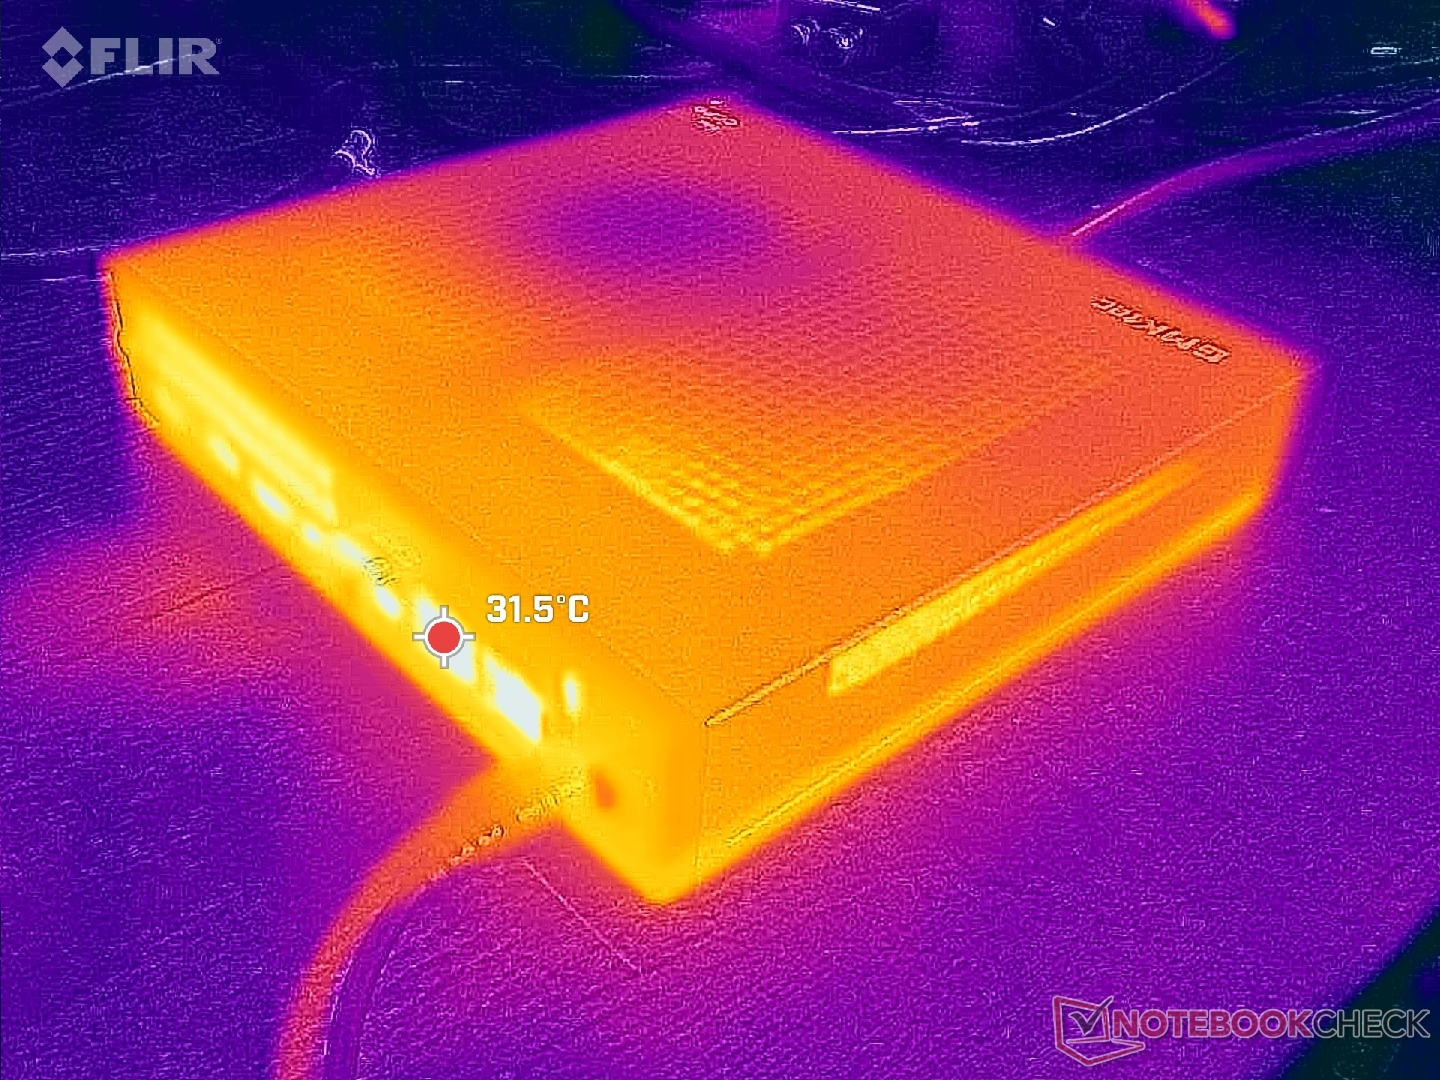
Temperature
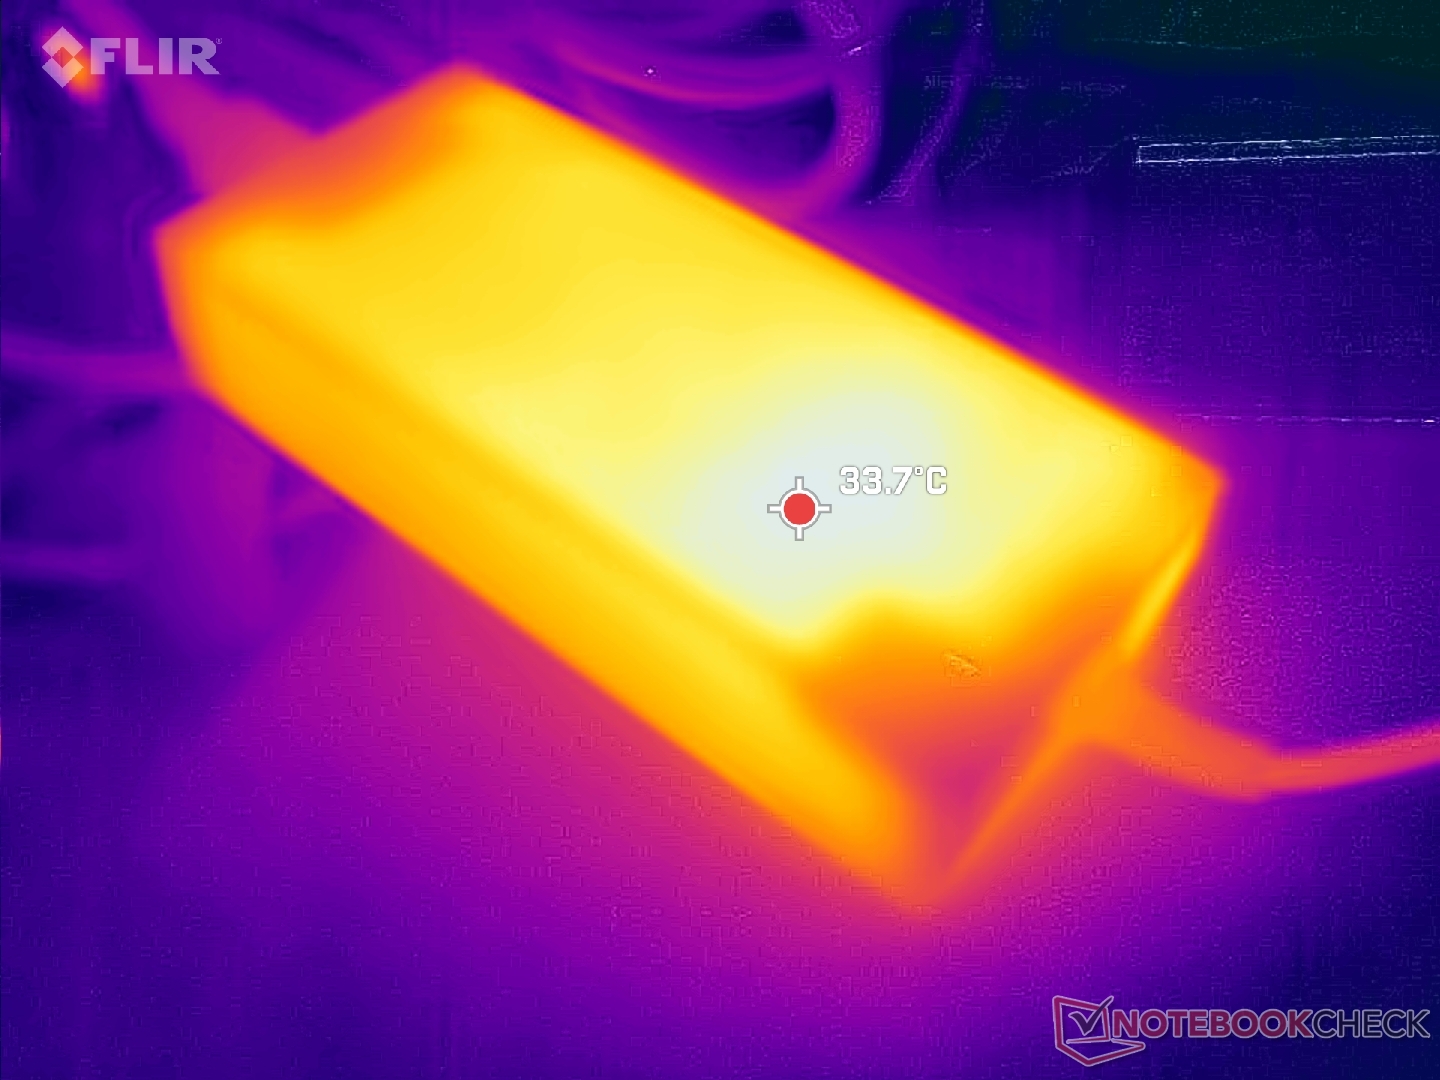
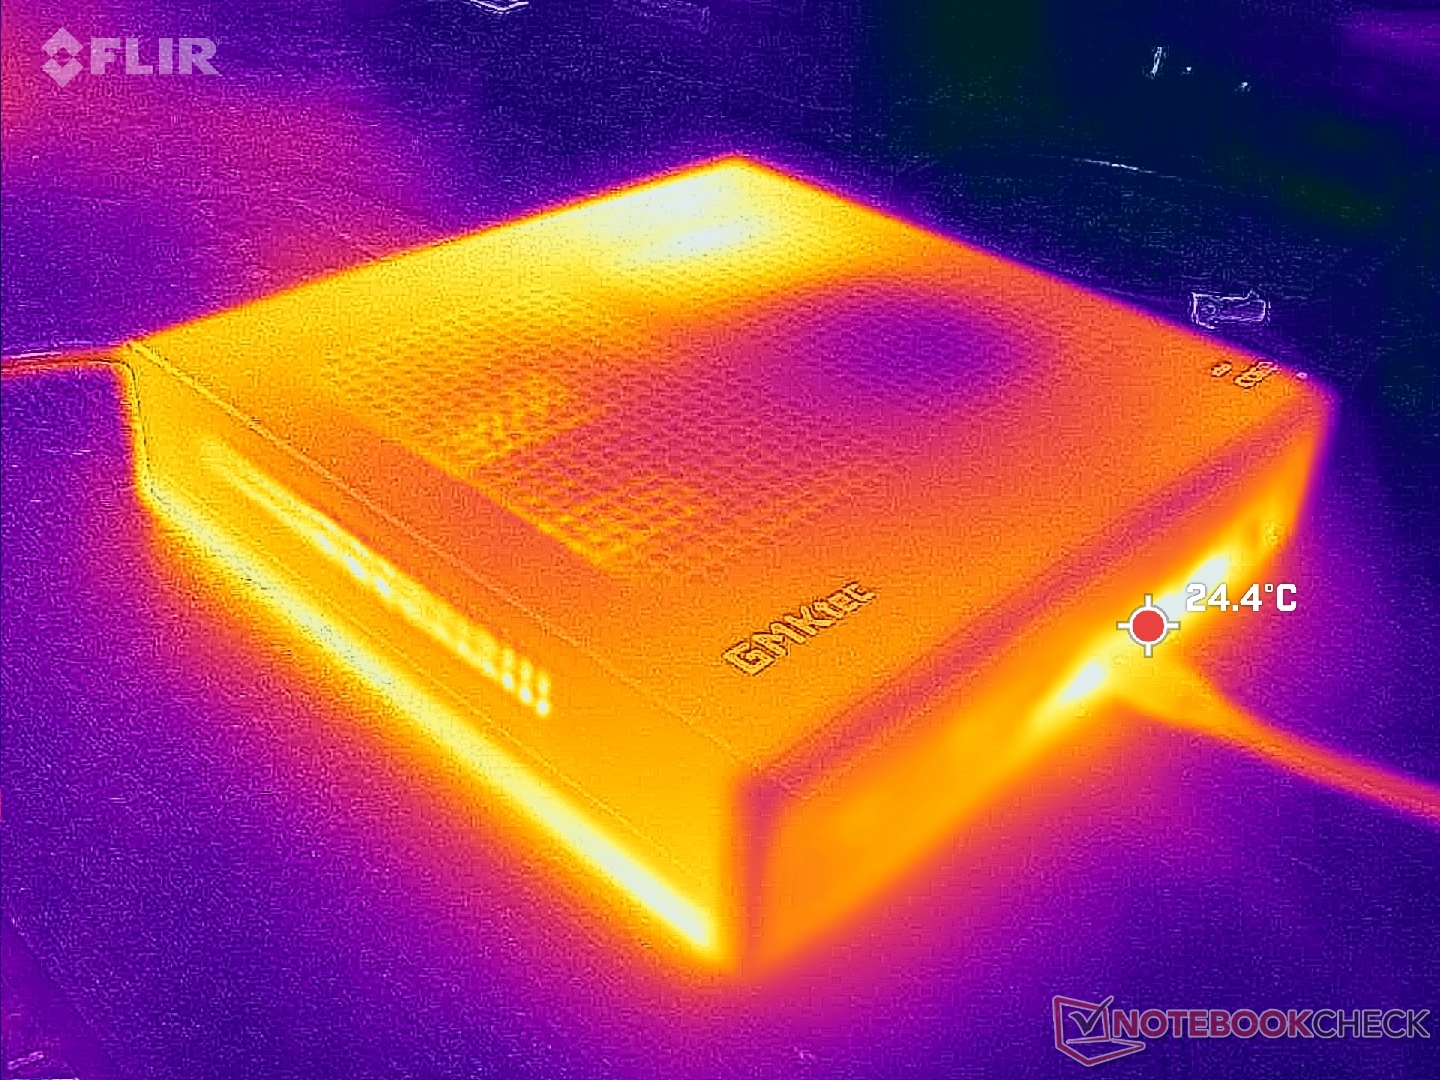
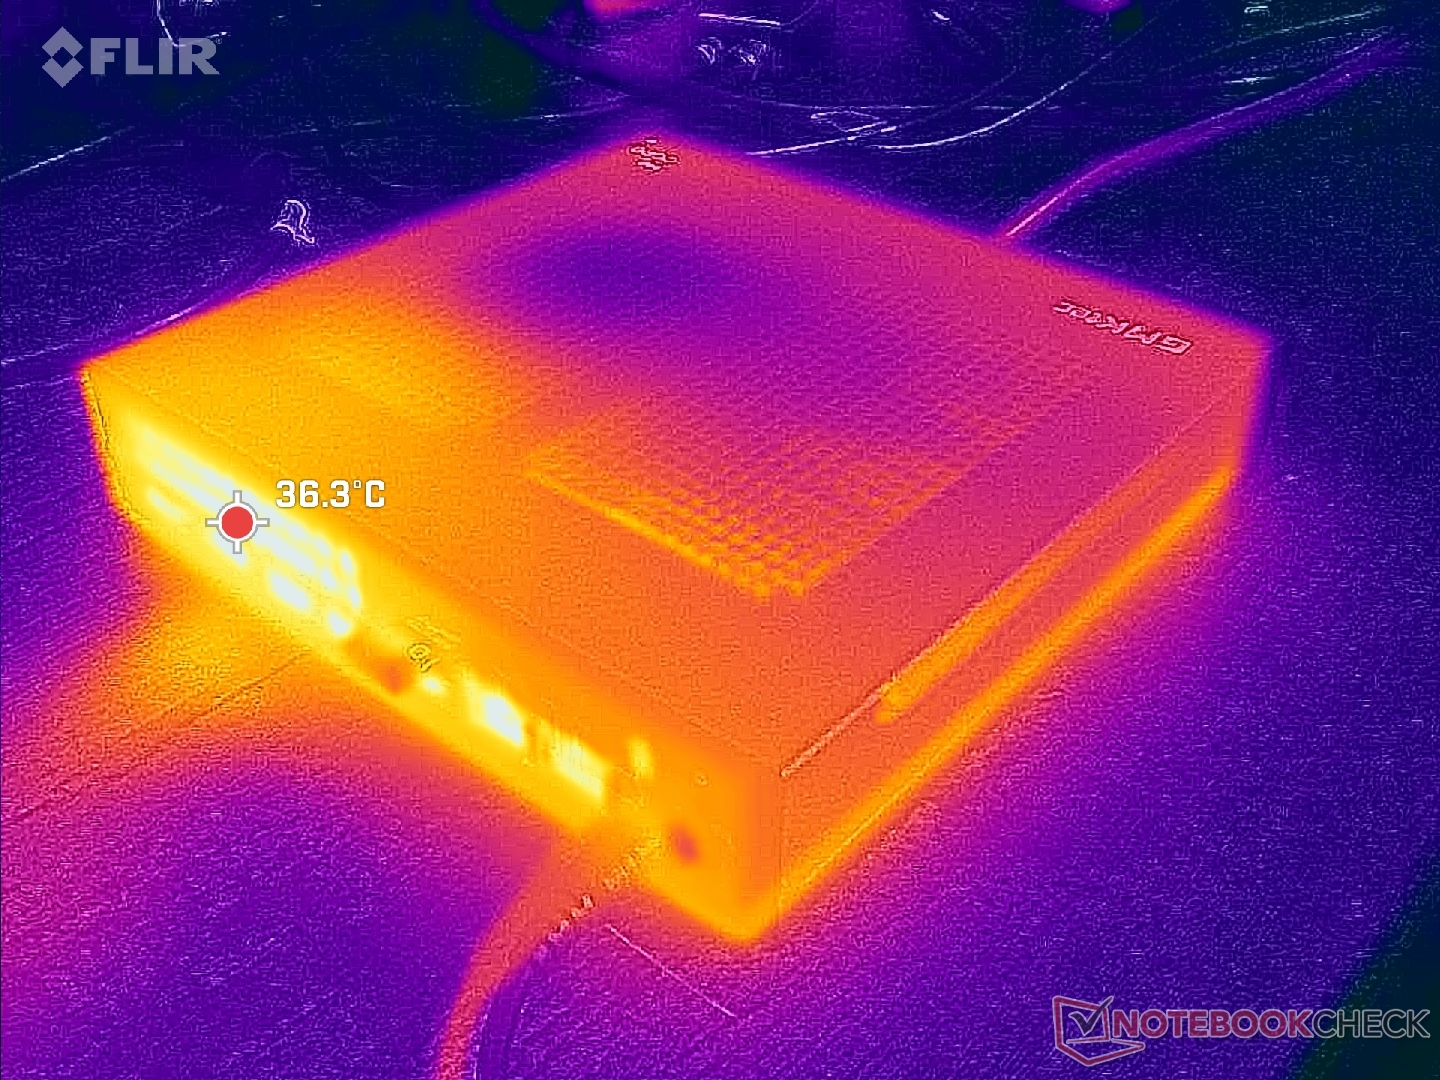
Surface temperatures are never uncomfortably warm due to the relatively large footprint and metal chassis. Fresh air enters from the top and waste heat exists from the rear. Thus, placing items like books or paper on top of the unit is not recommended.
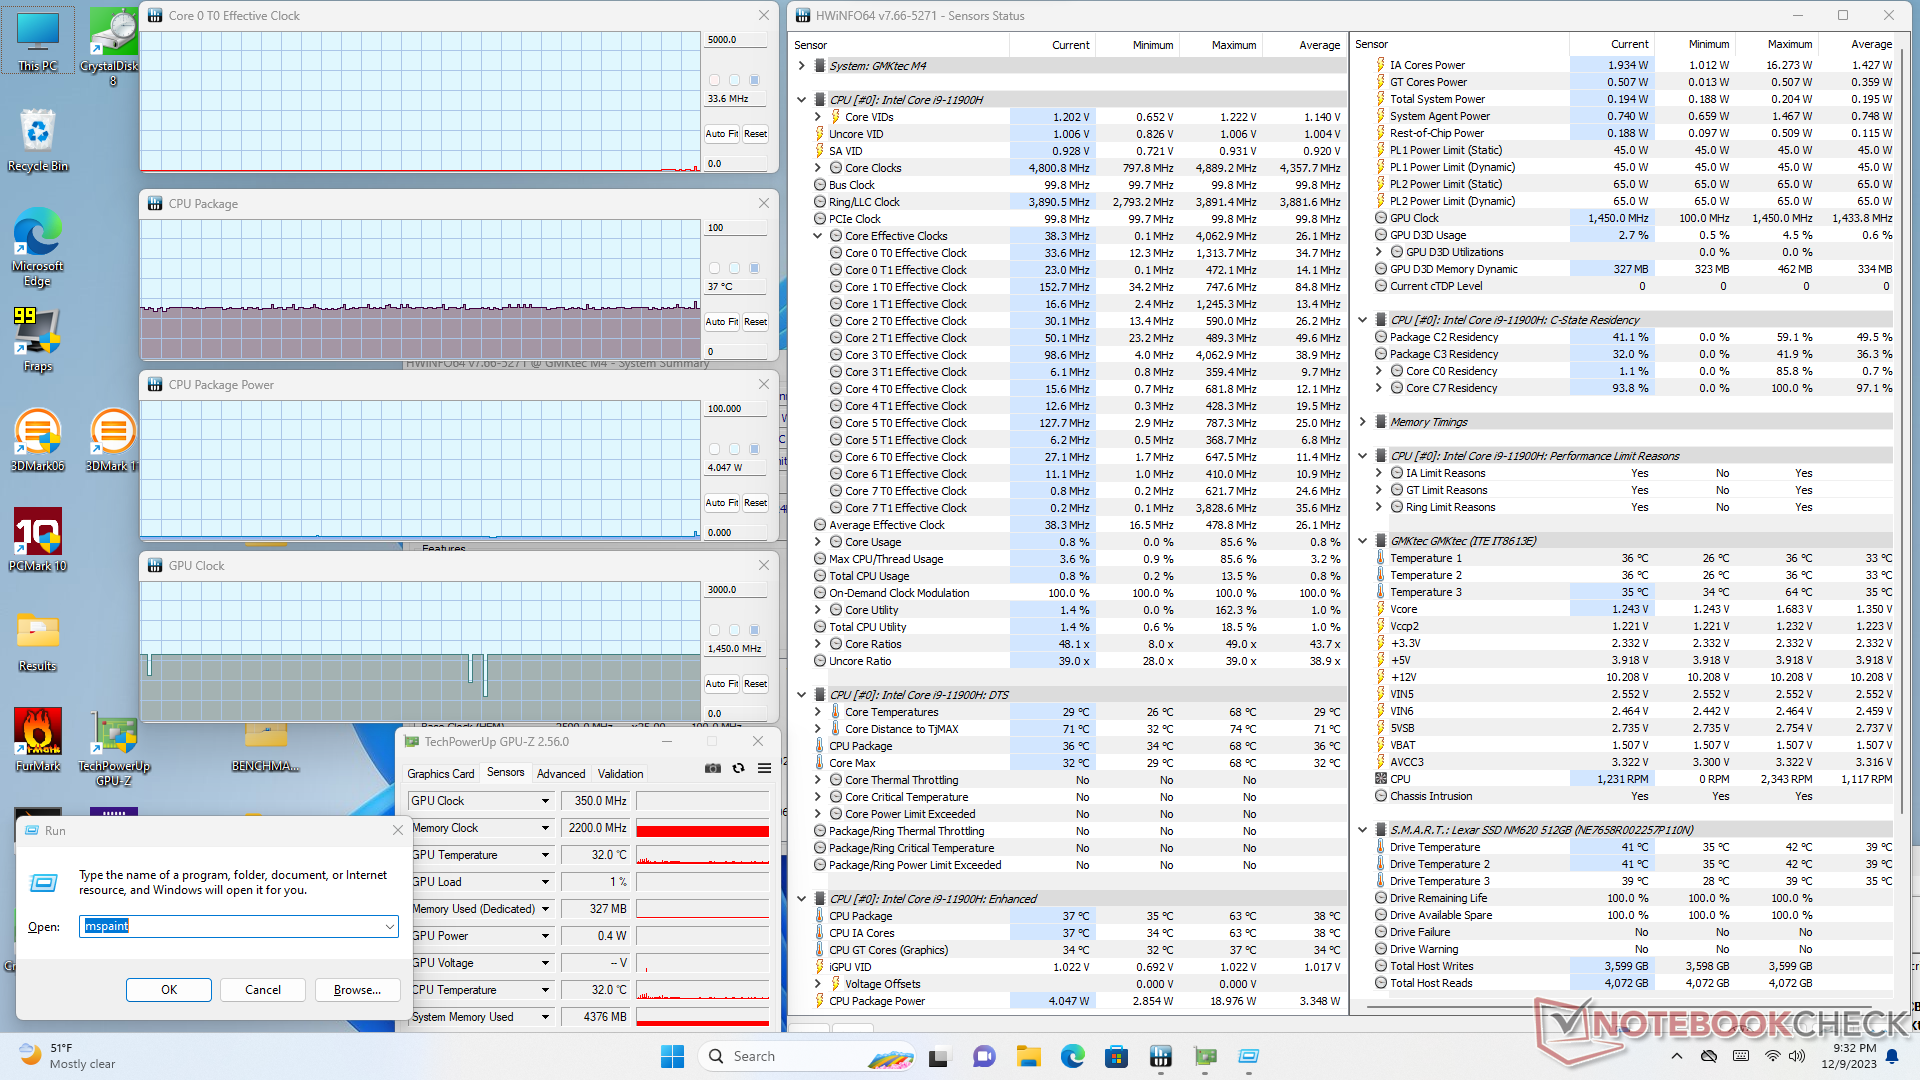
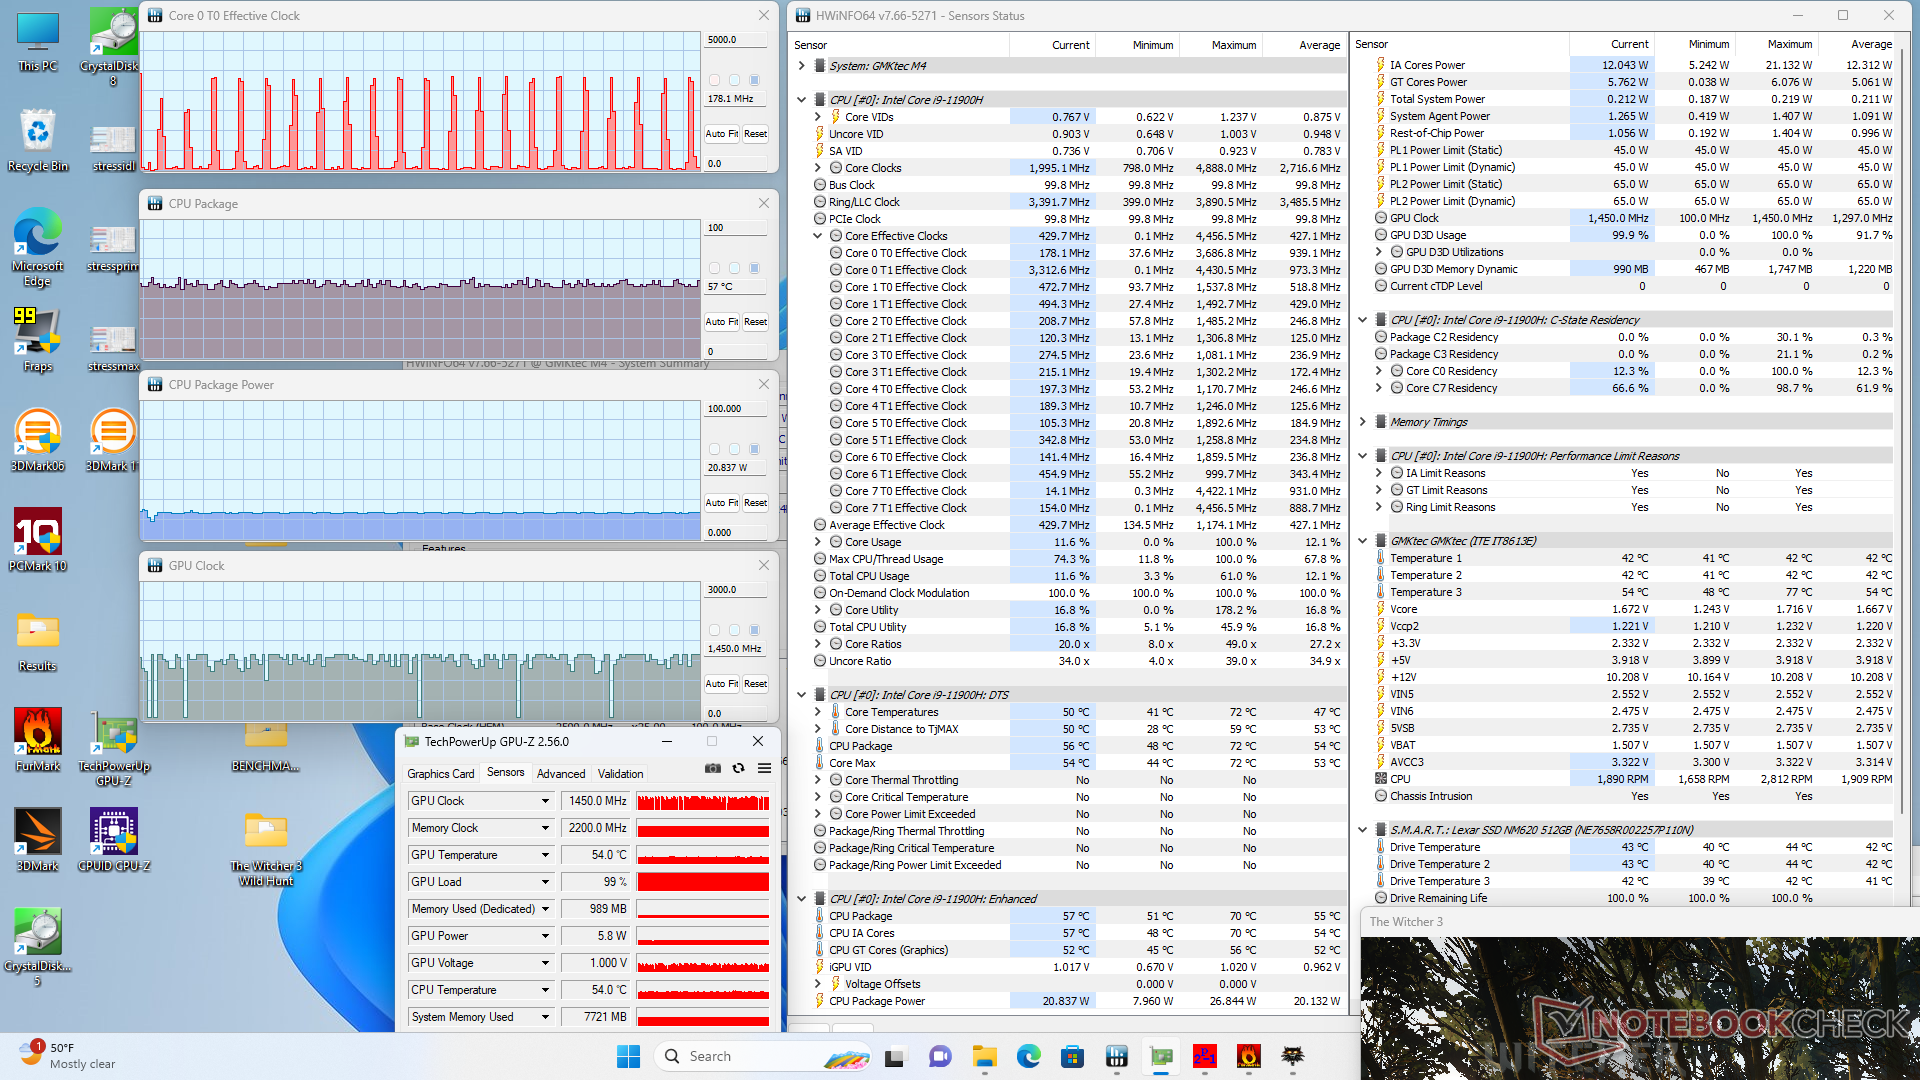
Stress Test
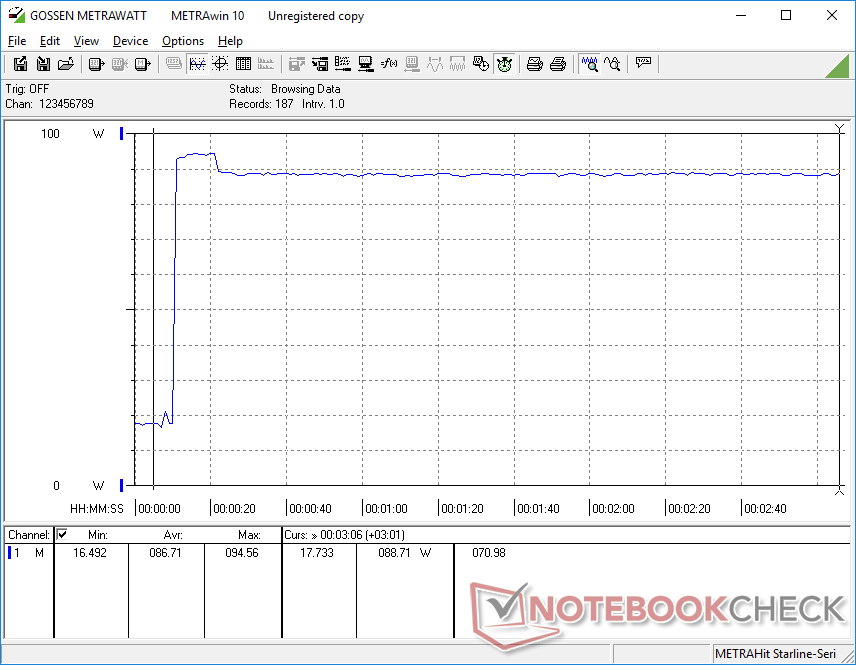
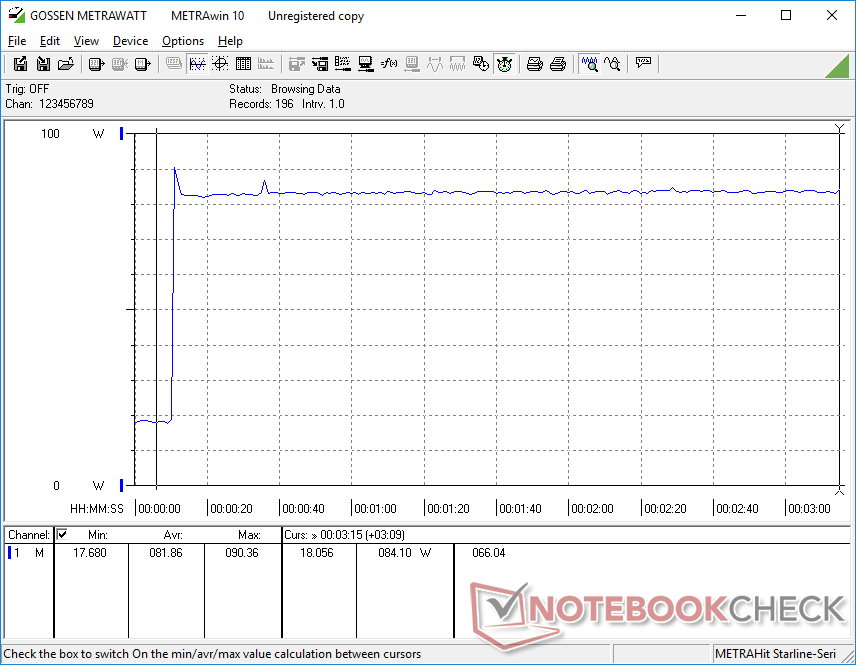
The CPU would boost to 3.4 GHz and 47 W for only the first few seconds of Prime95 stress before eventually falling and stabilizing at 2.7 GHz, 45 W, and 76 C. Core temperature would remain relatively low at just 57 C when running more realistic loads like games likely owing to the large chassis size. Repeating this same test on the smaller NucBox K3 Pro, for example, would result in a much warmer core temperature of 80 C.
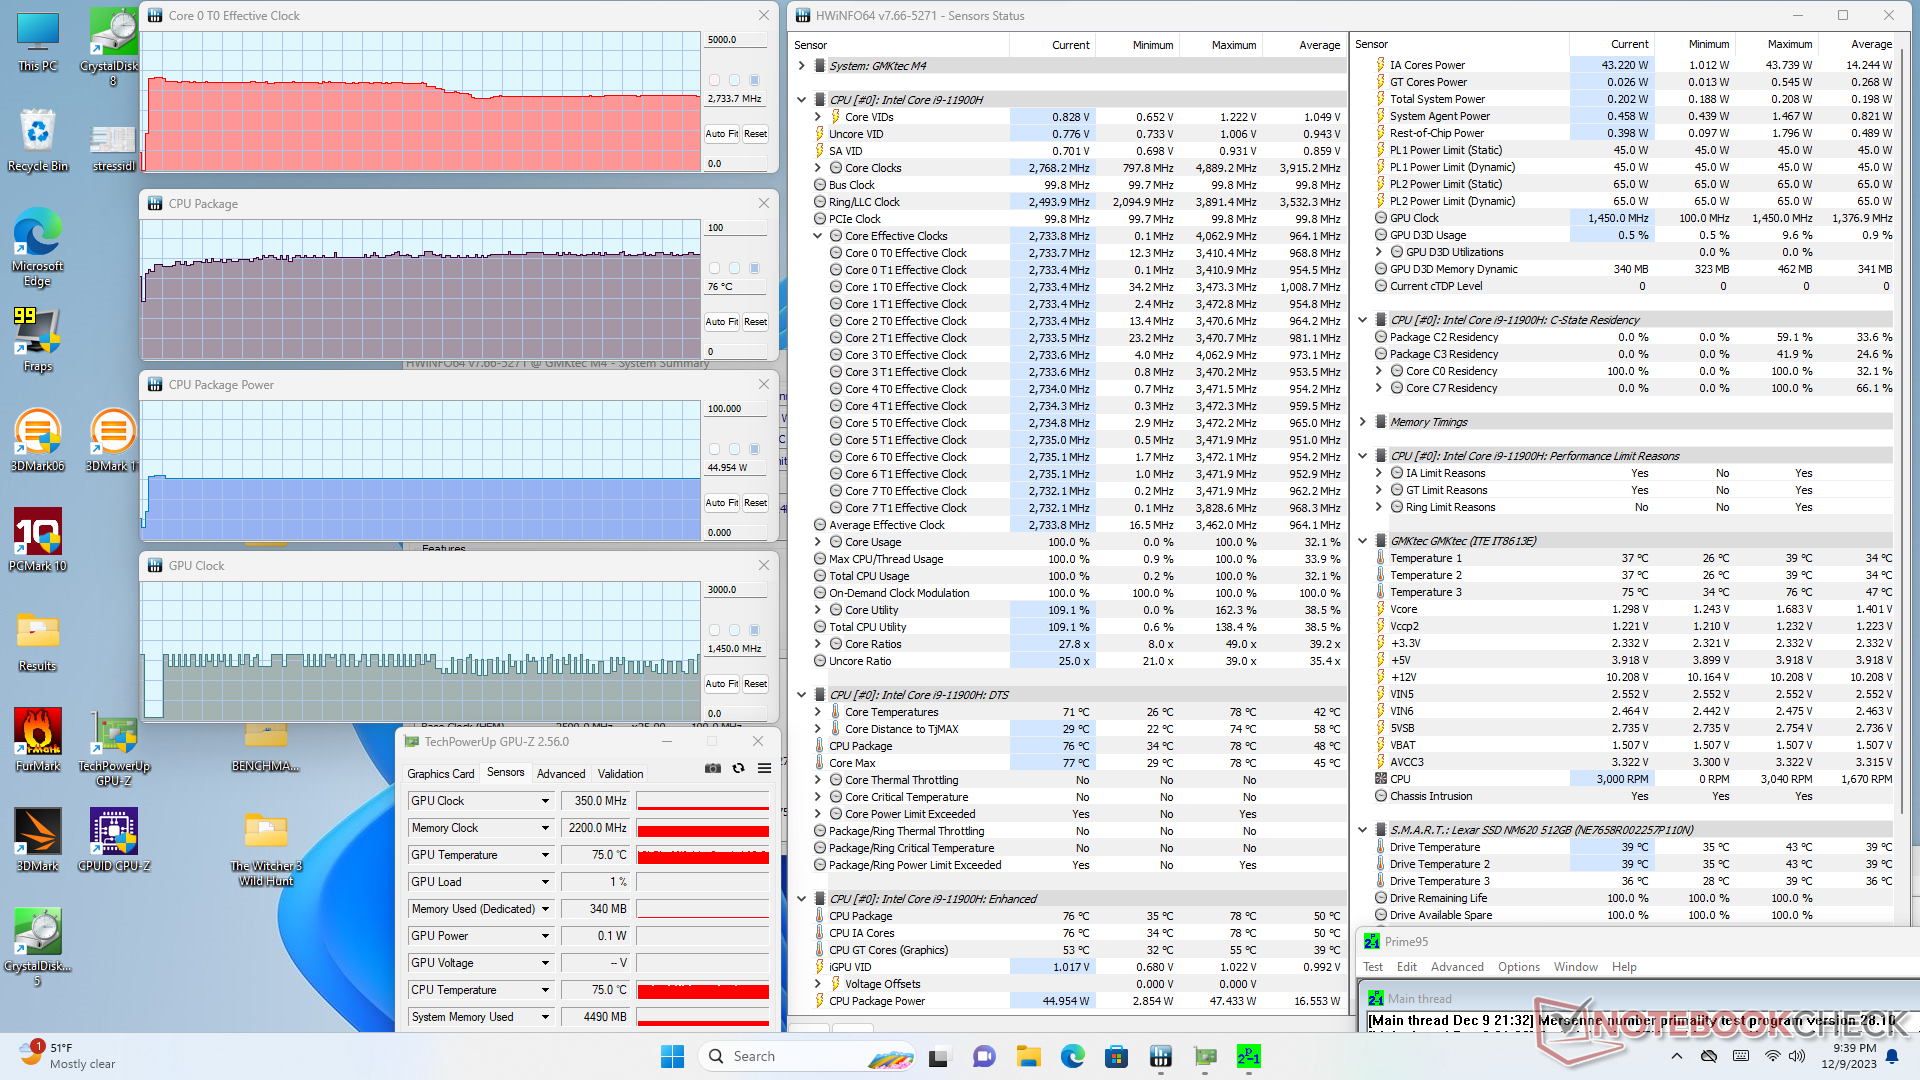
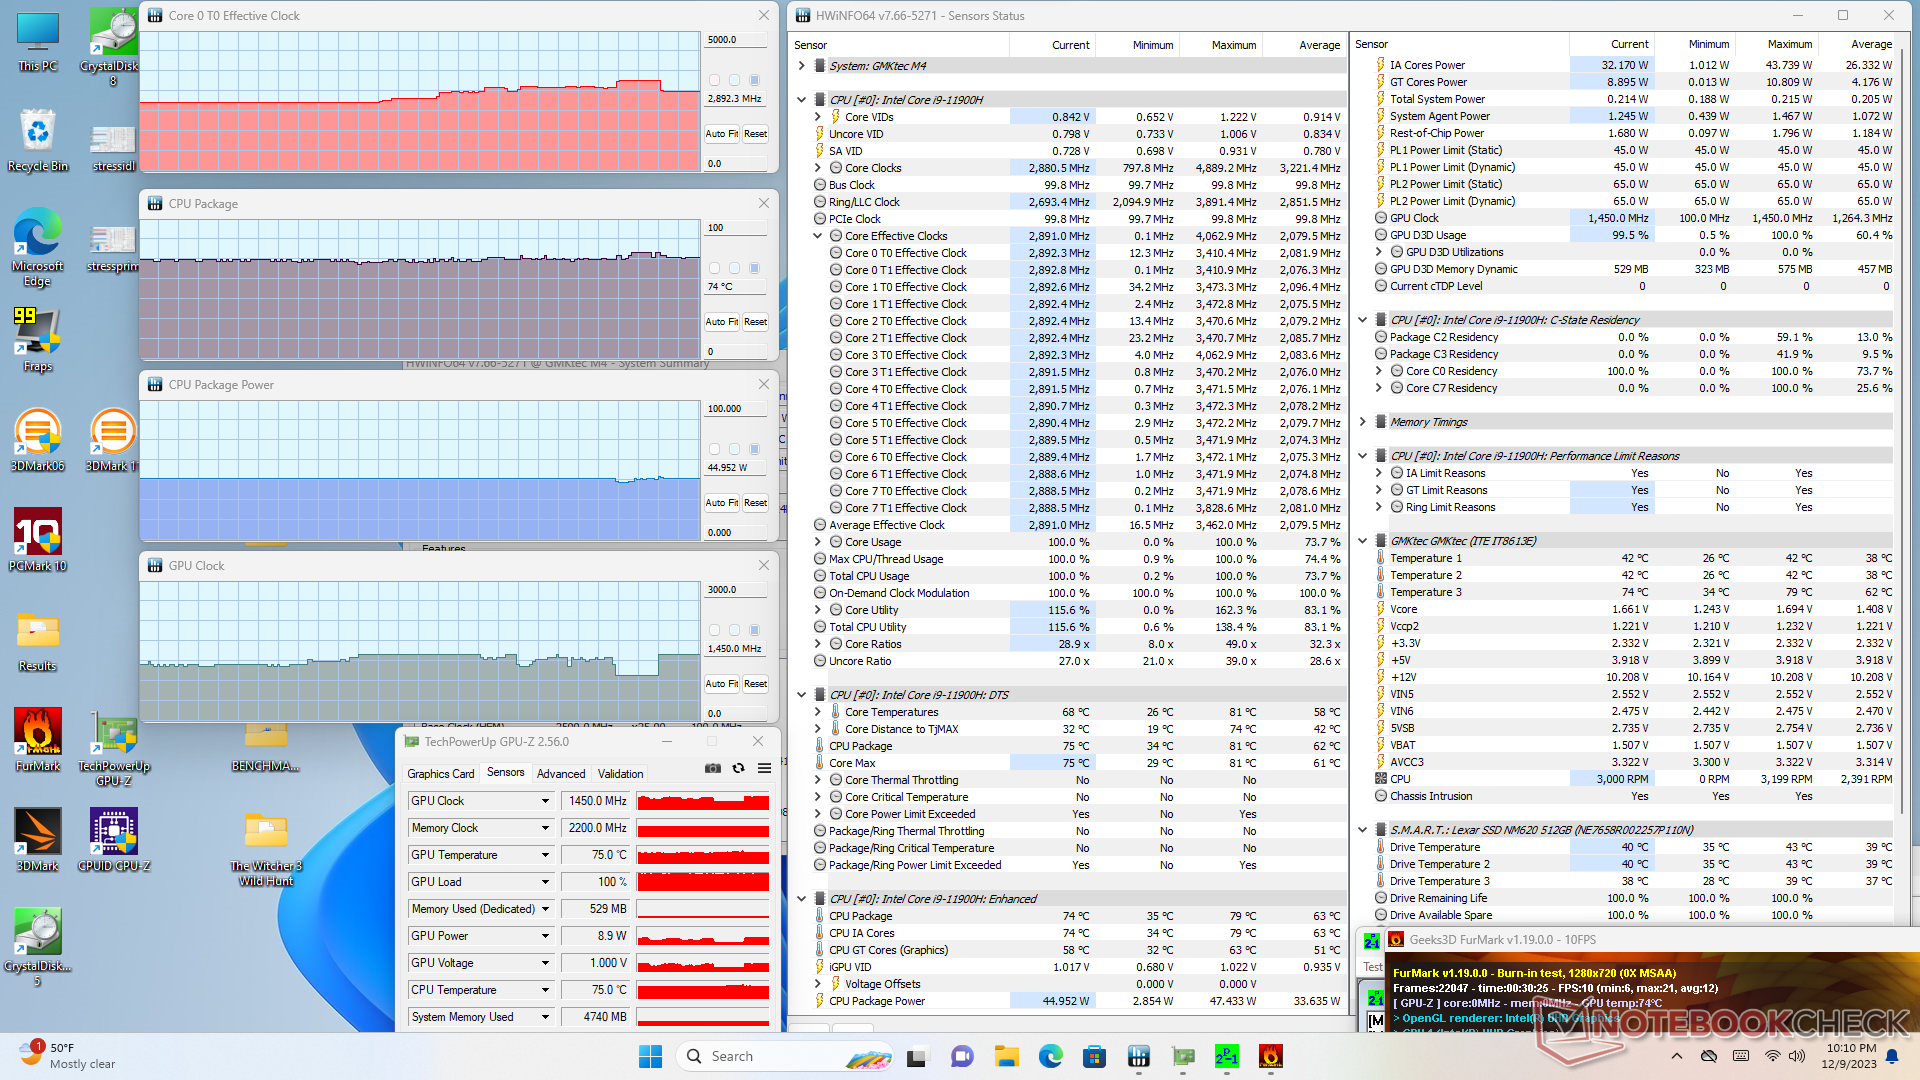
| CPU Clock (GHz) | GPU Clock (MHz) | Average CPU Temperature (°C) | |
| System Idle | -- | -- | 37 |
| Prime95 Stress | 2.7 | -- | 76 |
| Prime95 + FurMark Stress | 2.5 - 3.0 | 1000 - 1450 | 74 |
| Witcher 3 Stress | ~3.3 | 1450 | 57 |
Energy Management
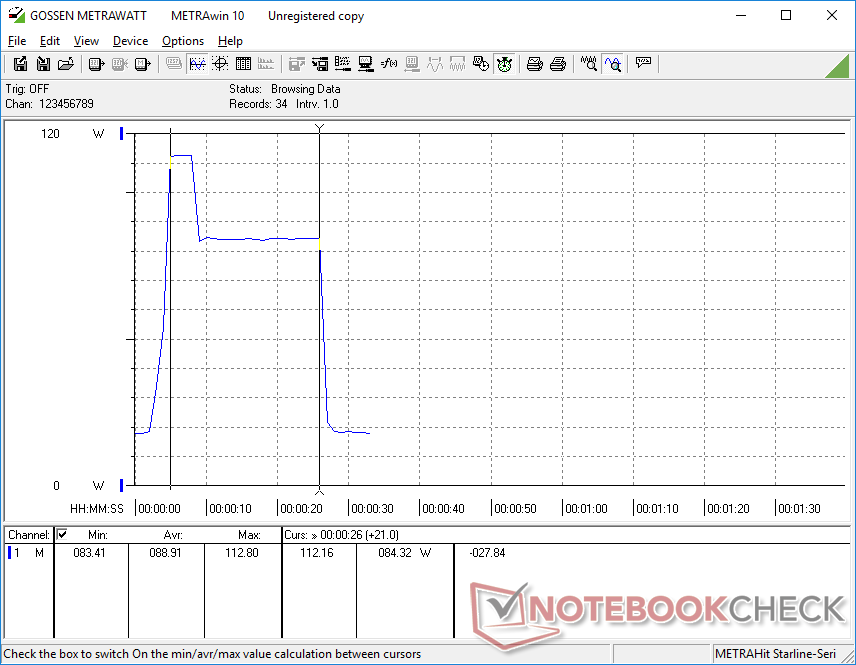
Power Consumption
Overall consumption is relatively high when idling on desktop while being relatively low when running demanding loads. This is to be expected as the older 11th gen Intel CPUs are generally less efficient. Note that the AMD-powered Beelink SER6 Pro offers both faster performance and lower consumption for superior performance-per-watt.
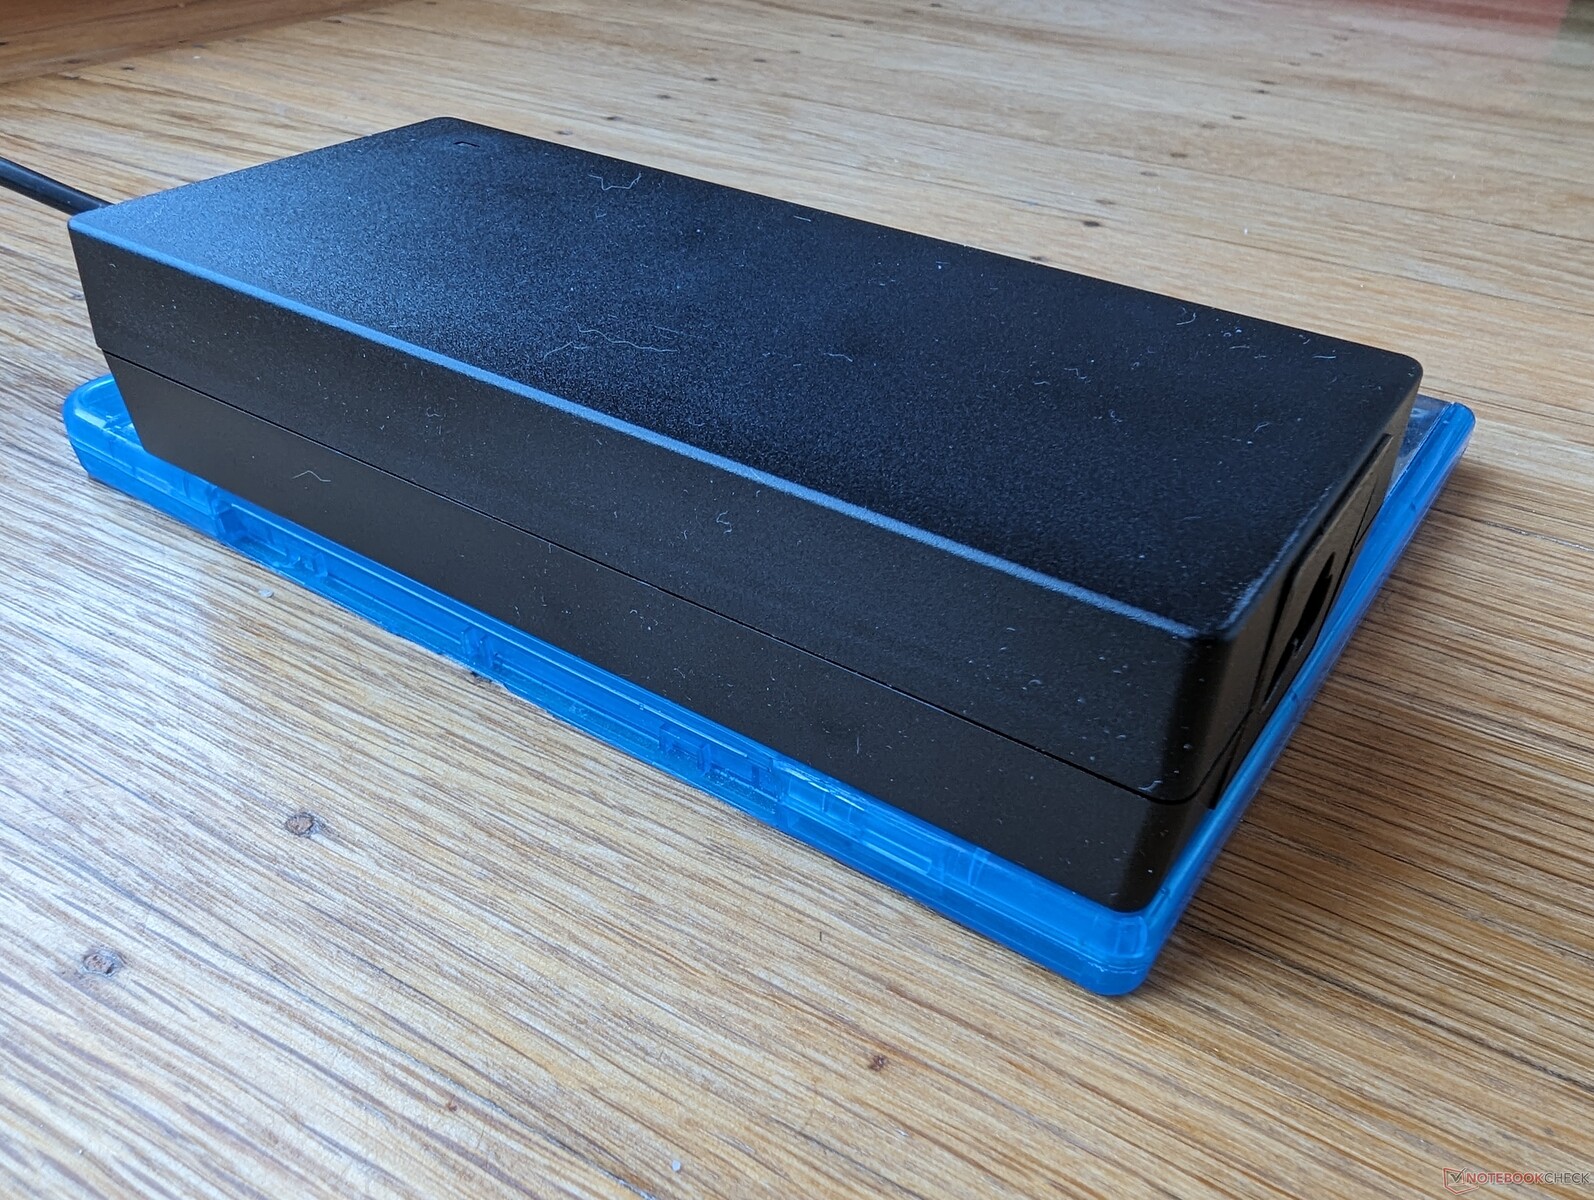
The USB-C port does not support power-in and so the proprietary AC power brick must be used.
| Off / Standby | |
| Idle | |
| Load |
|
Key:
min: | |
| GMK NucBox M4 i9-11900H, UHD Graphics Xe 32EUs (Tiger Lake-H), Lexar NM620 512GB, , x, | GMK NucBox M3 i5-12450H, UHD Graphics Xe G4 48EUs, Lexar NM610 Pro NM610P001T-HNNNG, , x, | GMK NucBox K3 Pro i7-12650H, UHD Graphics 64EUs, Lexar NM610 Pro NM610P001T-HNNNG, , x, | Lenovo IdeaCentre Mini 01IRH8 i7-13700H, Iris Xe G7 96EUs, Samsung PM9B1 512GB MZVL4512HBLU, , x, | Beelink SER6 Pro R7 6800H, Radeon 680M, Kingston NV2 500GB SNV2S/500G, , x, | Intel NUC 13 Pro Kit NUC13ANK i7-1360P, Iris Xe G7 96EUs, Samsung PM9A1 MZVL2512HCJQ, , x, | |
|---|---|---|---|---|---|---|
| Power Consumption | 16% | 20% | 16% | 18% | 21% | |
| Idle Minimum * (Watt) | 15.2 | 10.6 30% | 7.1 53% | 6.7 56% | 8.3 45% | 5.1 66% |
| Idle Average * (Watt) | 17.2 | 11.9 31% | 10.1 41% | 6.7 61% | 8.4 51% | 5.8 66% |
| Idle Maximum * (Watt) | 17.4 | 12.5 28% | 18.6 -7% | 7.1 59% | 8.7 50% | 10.2 41% |
| Load Average * (Watt) | 40 | 54.9 -37% | 45.3 -13% | 68.5 -71% | 60.8 -52% | 68.1 -70% |
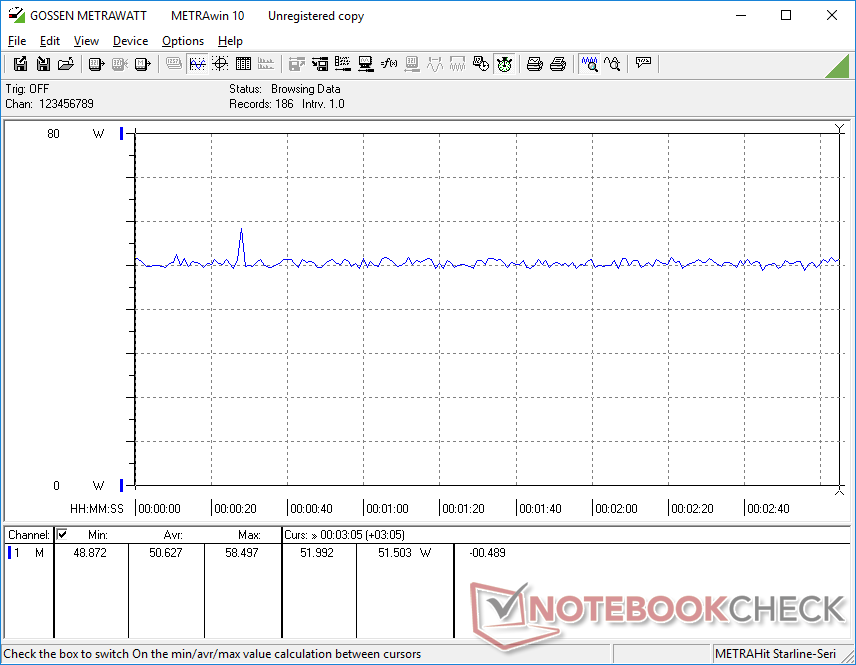
| Witcher 3 ultra * (Watt) | 50.6 | 46.4 8% | 55.2 -9% | 58.3 -15% | 61.4 -21% | |
| Load Maximum * (Watt) | 112.8 | 75.6 33% | 52.9 53% | 104.3 8% | 72 36% | 108.3 4% |
* ... smaller is better
Power Consumption Witcher 3 / Stresstest
Power Consumption external Monitor
Pros
Cons
Verdict — Older Core i9 Outperformend and Outpriced By The Ryzen 7 6800H
The NucBox M4 may have just launched, but its Core i9 CPU from 2021 hasn't aged very well. Most specifically, mini PCs with the Ryzen 7 6800H or Ryzen 7 7735HS like the Beelink SER6 Pro or NucBox K2 offer similar processor performance and significantly faster graphics performance for around the same price. The biggest reasons for choosing the NucBox M4 are therefore for its generally quieter fan noise and Core i9 badge.
The NucBox M4 is fast, quiet, and inexpensive. However, its aging CPU is outperformed by similarly priced modern alternatives like the Ryzen 7 6800H.
The rest of the model is otherwise excellent ranging from the sturdy metal chassis, easy serviceability, and wide variety of integrated ports. The relatively large size lends itself to both cooler running temperatures and a quieter fan. Even so, the weak GPU and lack of Thunderbolt support don't give the NucBox M4 very long legs.
Price and Availability
The NucBox M4 is currently in stock on Amazon for $470 USD with double the RAM and storage as our review configuration.
The manufacturer is also offering the barebones option starting at just $380.
GMK NucBox M4
- 12/12/2023 v7 (old)
Allen Ngo
Transparency
The selection of devices to be reviewed is made by our editorial team. The test sample was provided to the author as a loan by the manufacturer or retailer for the purpose of this review. The lender had no influence on this review, nor did the manufacturer receive a copy of this review before publication. There was no obligation to publish this review. As an independent media company, Notebookcheck is not subjected to the authority of manufacturers, retailers or publishers.
This is how Notebookcheck is testing
Every year, Notebookcheck independently reviews hundreds of laptops and smartphones using standardized procedures to ensure that all results are comparable. We have continuously developed our test methods for around 20 years and set industry standards in the process. In our test labs, high-quality measuring equipment is utilized by experienced technicians and editors. These tests involve a multi-stage validation process. Our complex rating system is based on hundreds of well-founded measurements and benchmarks, which maintains objectivity. Further information on our test methods can be found here.
Price comparison
