Verdict — Superlight And Ultra Efficient
The NucBox K13 was designed specifically with the benefits of Intel Lunar Lake in mind. Its ultracompact design, very low weight, and even smaller AC adapter would not have been possible with an H-series processor like the Core Ultra 7 255H or Ryzen AI 9. The system is even smaller than the already small MSI Cubi NUC AI+ 2MG for users needing to fit a mini PC into tighter or more inconspicuous spaces.
The diminutive size, however, entails several drawbacks. Unlike the aforementioned MSI, the GMK doesn't have an integrated speaker nor does it feature as many ports as on the more powerful NucBox K12. GPU performance is slightly slower than expected, maximum RAM is limited to 16 GB, and fan noise is unfortunately quite noticeable when running anything demanding. Nonetheless, we appreciate that the model still supports up to two internal M.2 SSDs in spite of the tight volume and that the price isn't unreasonable given its balanced specifications and footprint.
Pros
Cons
Price and Availability
The NucBox K13 is now shipping directly from the manufacturer starting at $670 for the base 16 GB RAM/512 GB SSD configuration up to $720 for the 16 GB RAM/1 TB SSD configuration.
GMKtec mini PCs cover the entire spectrum of processors ranging from 15 W U-series CPUs like the Core Ultra 5 125U up to the hulking 100 W Ryzen AI Max+ 395. The new NucBox K13 is a middle-ground solution that should prove more relevant to the majority of home or office users looking for a small but balanced mini PC.
Alternatives to the GMK NucBox K13 include other mini PCs powered by ULV processors like the MSI Cubi NUC, Ninkear M7, or NiPoGi AM06 Pro.
More GMK reviews:
Specifications
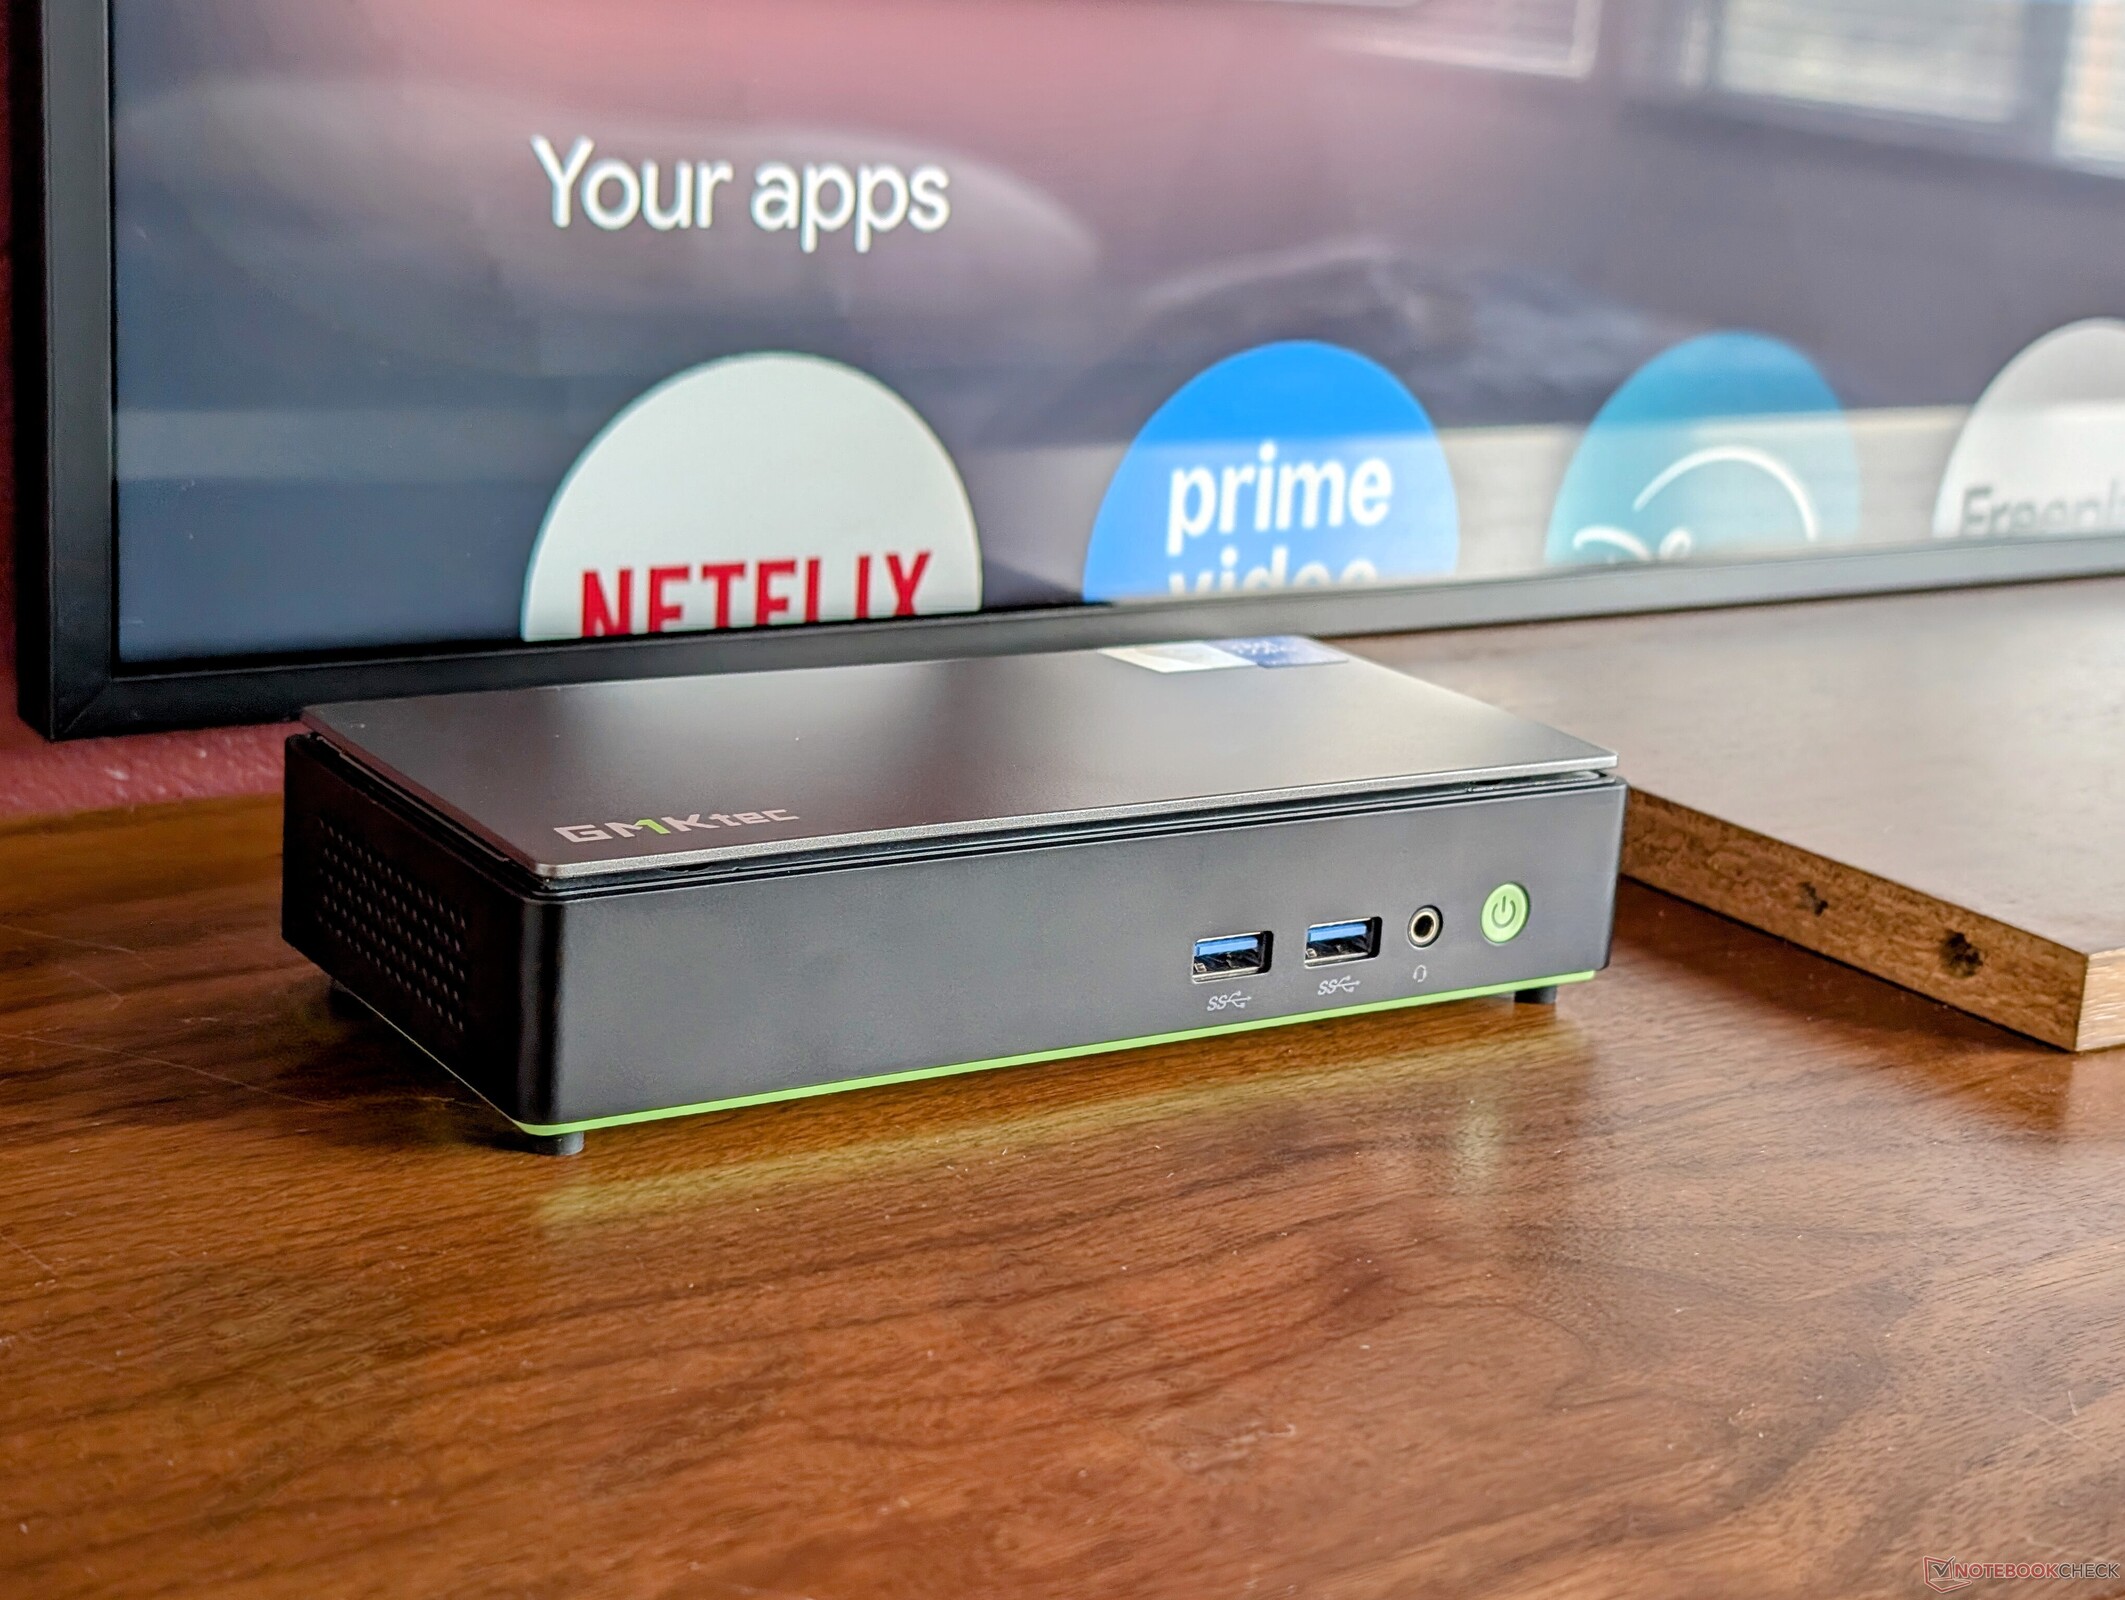
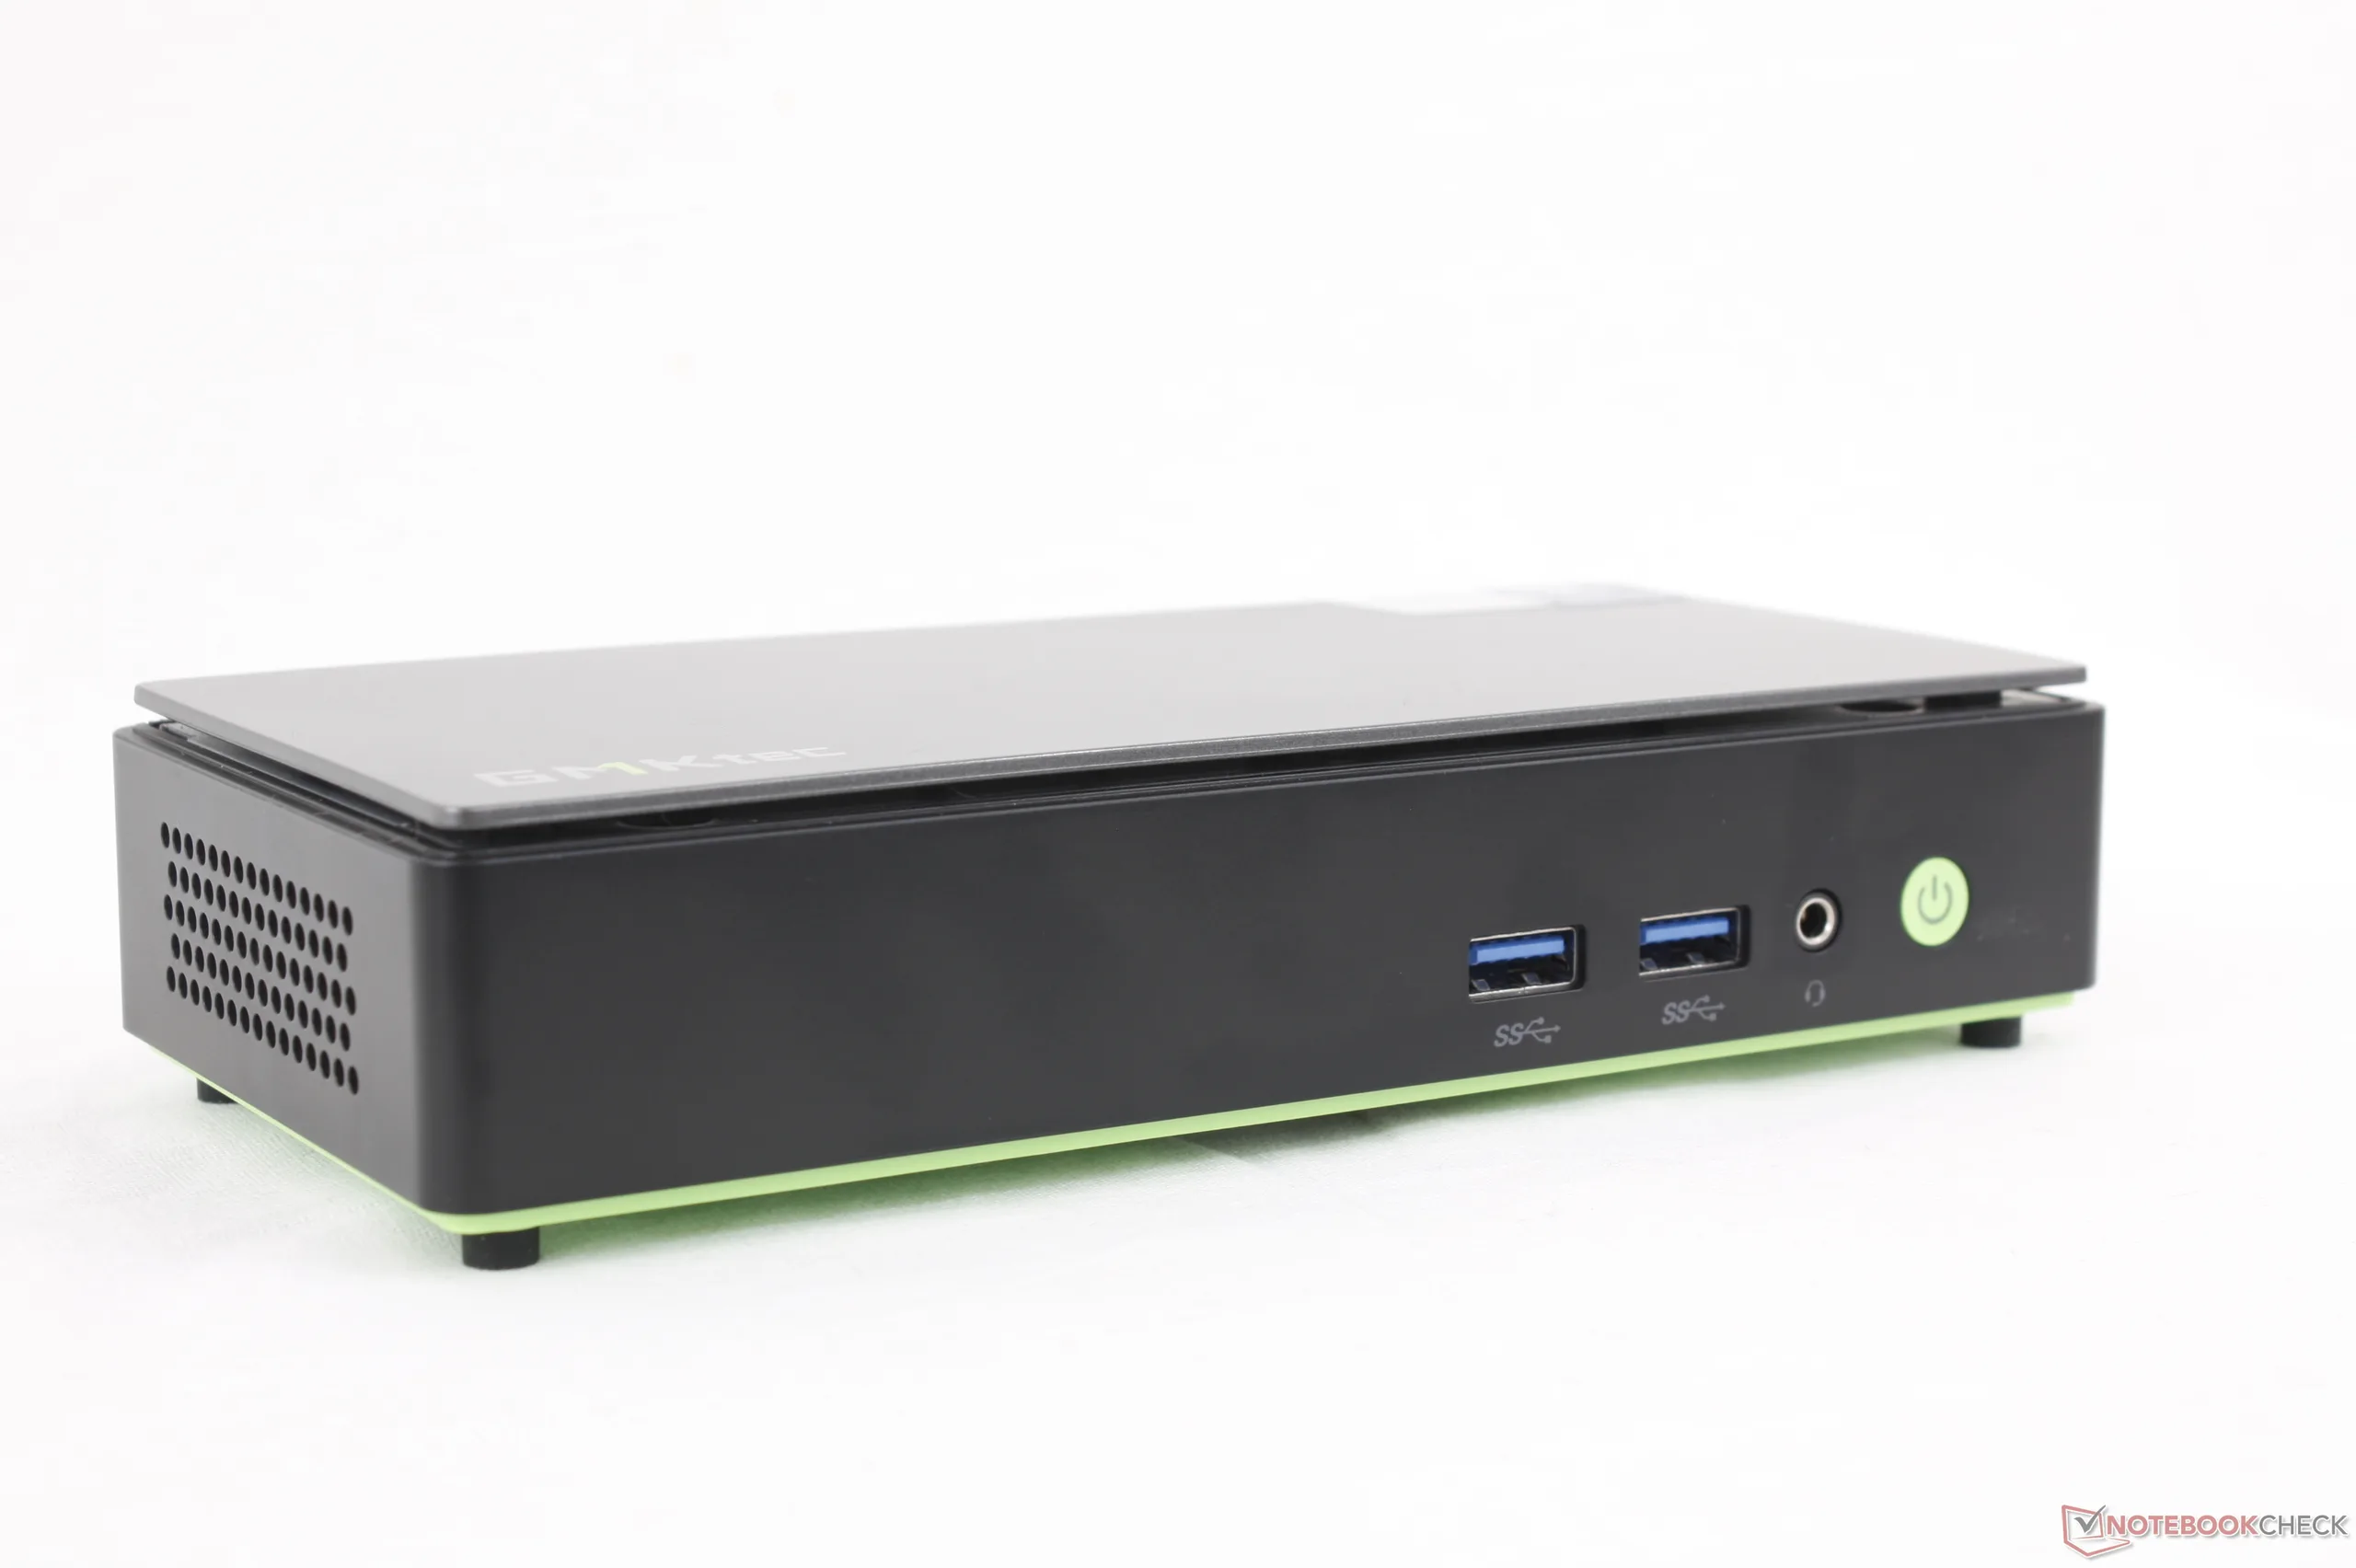
Case
The firm chassis consists of dark gray metal but with a plastic green bottom to match the color tone of the GMKtec logo. Its most striking feature is arguably the small size and narrow dimensions when compared to the squarer designs of most other mini PCs including those from the same manufacturer. The model is also nearly 25 percent lighter than the MSI Cubi NUC which carries similar Intel Lunar Lake-V processor options.
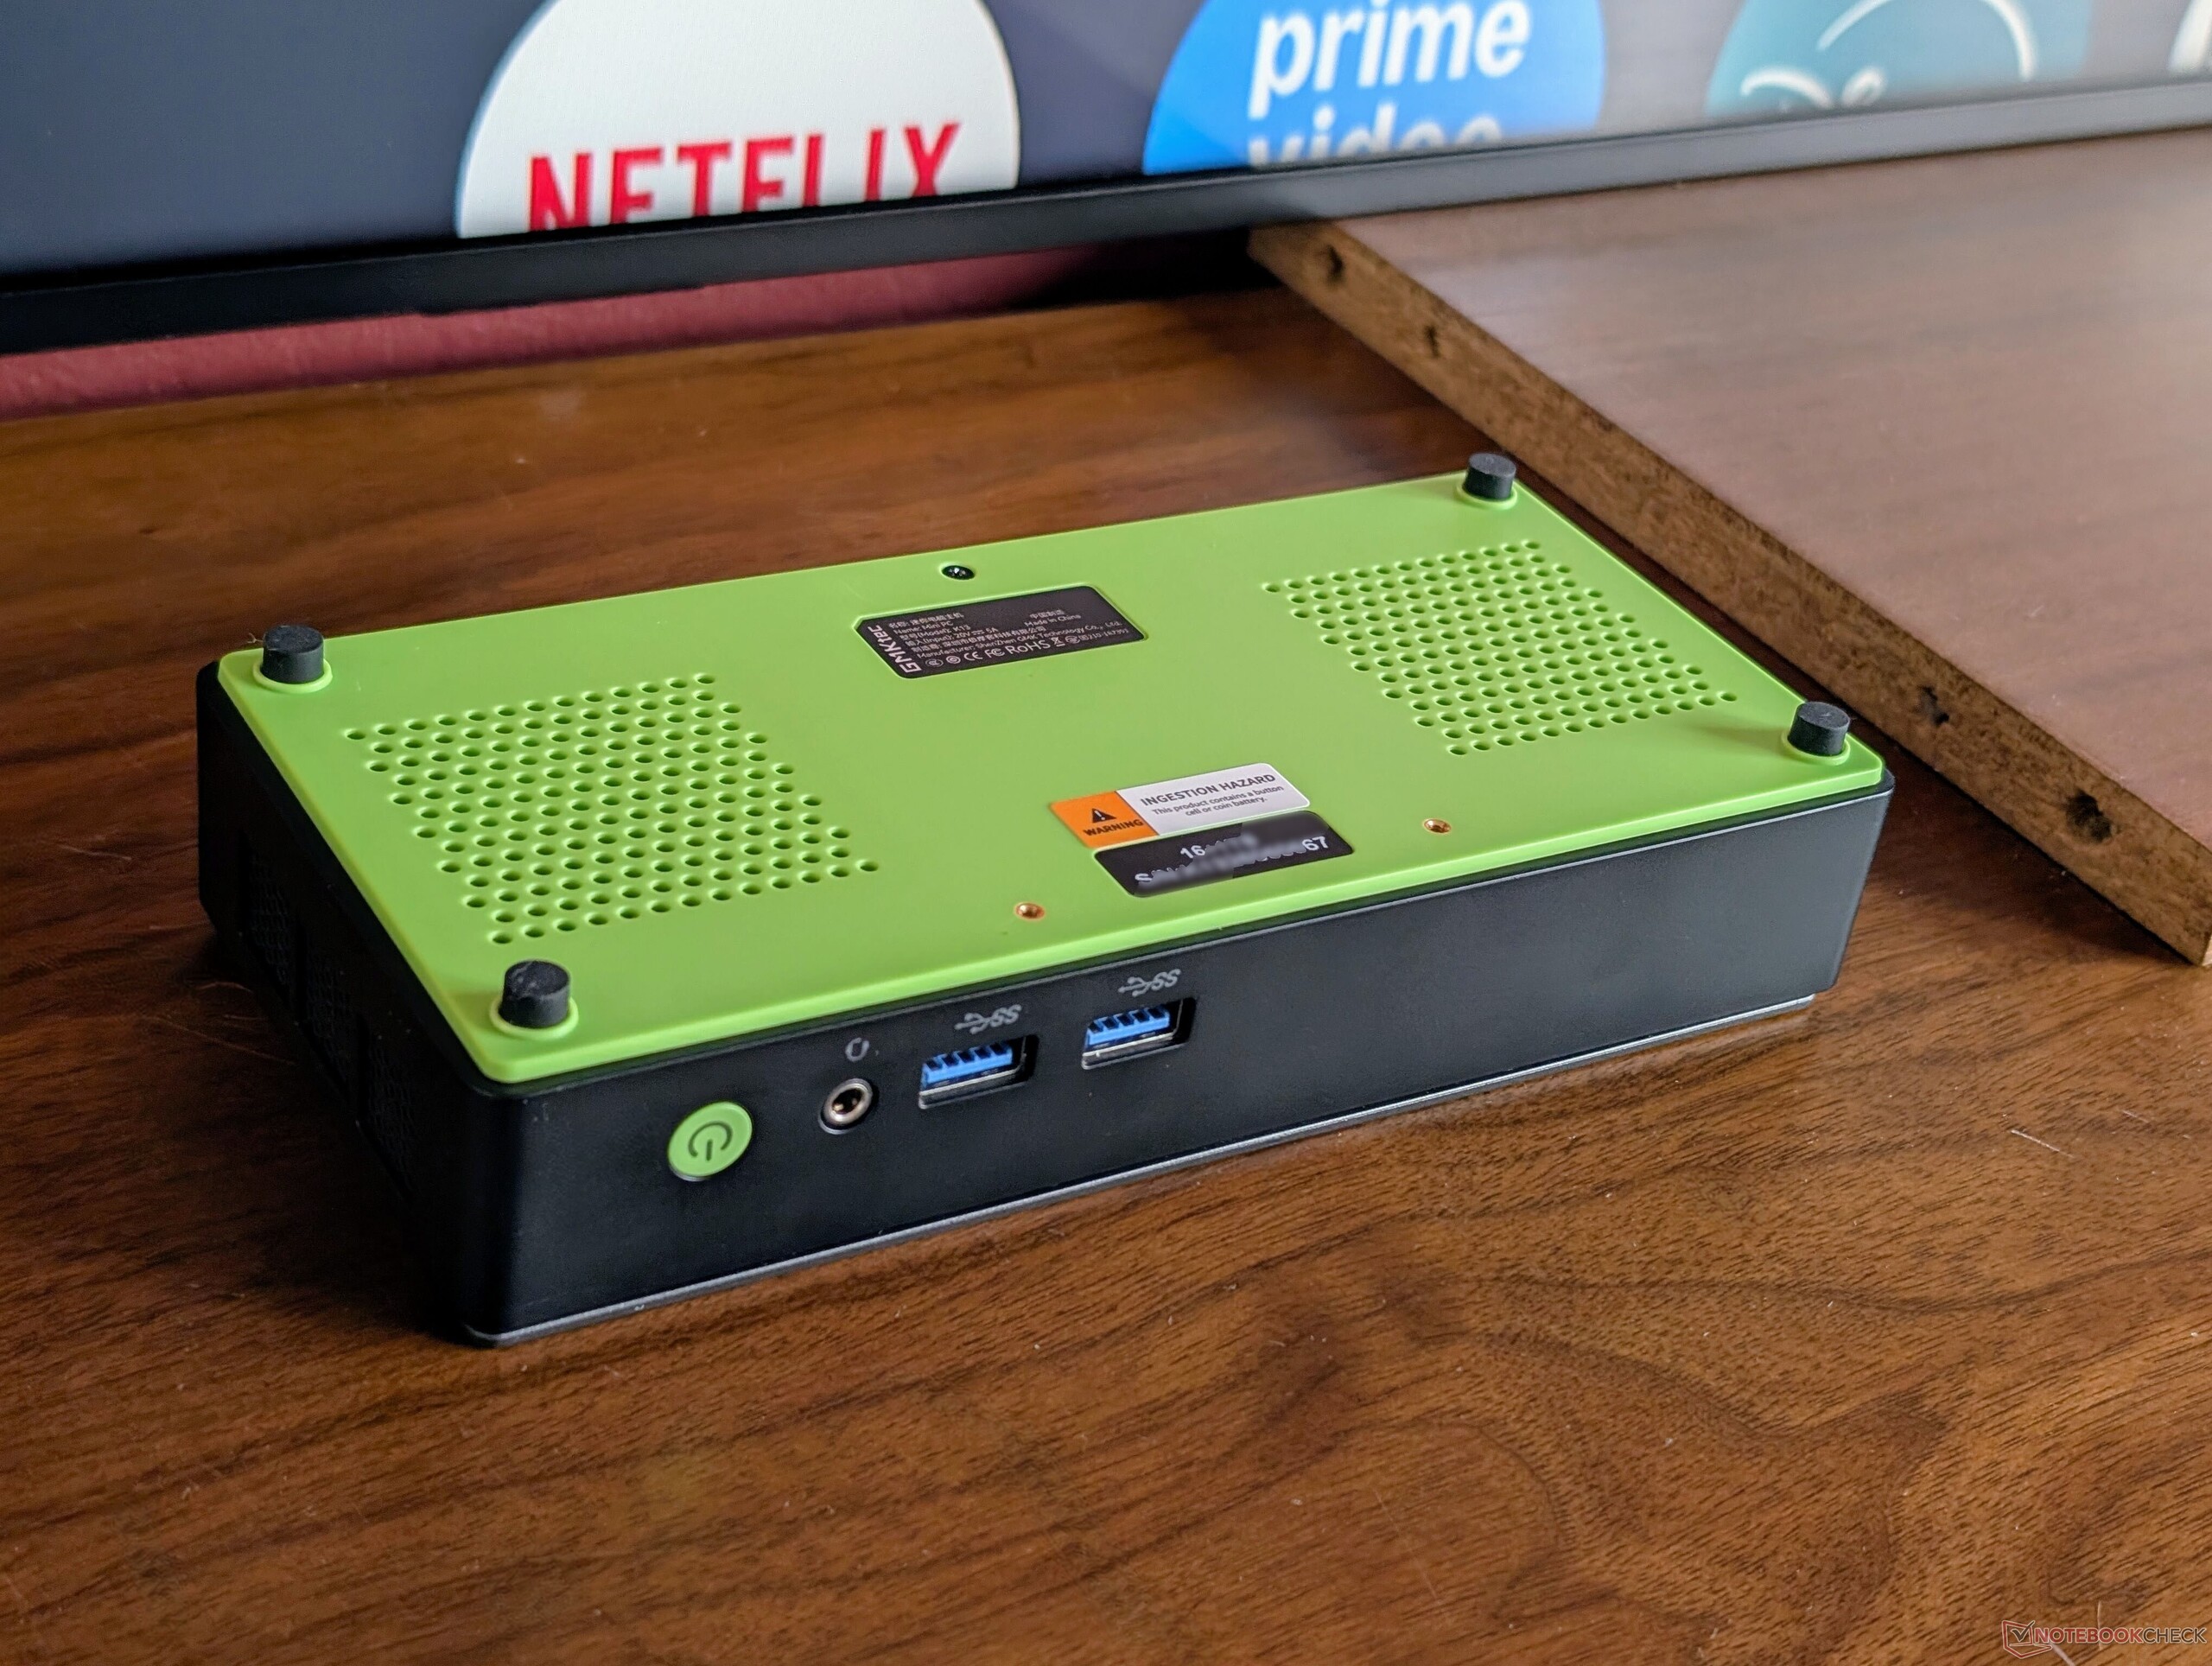
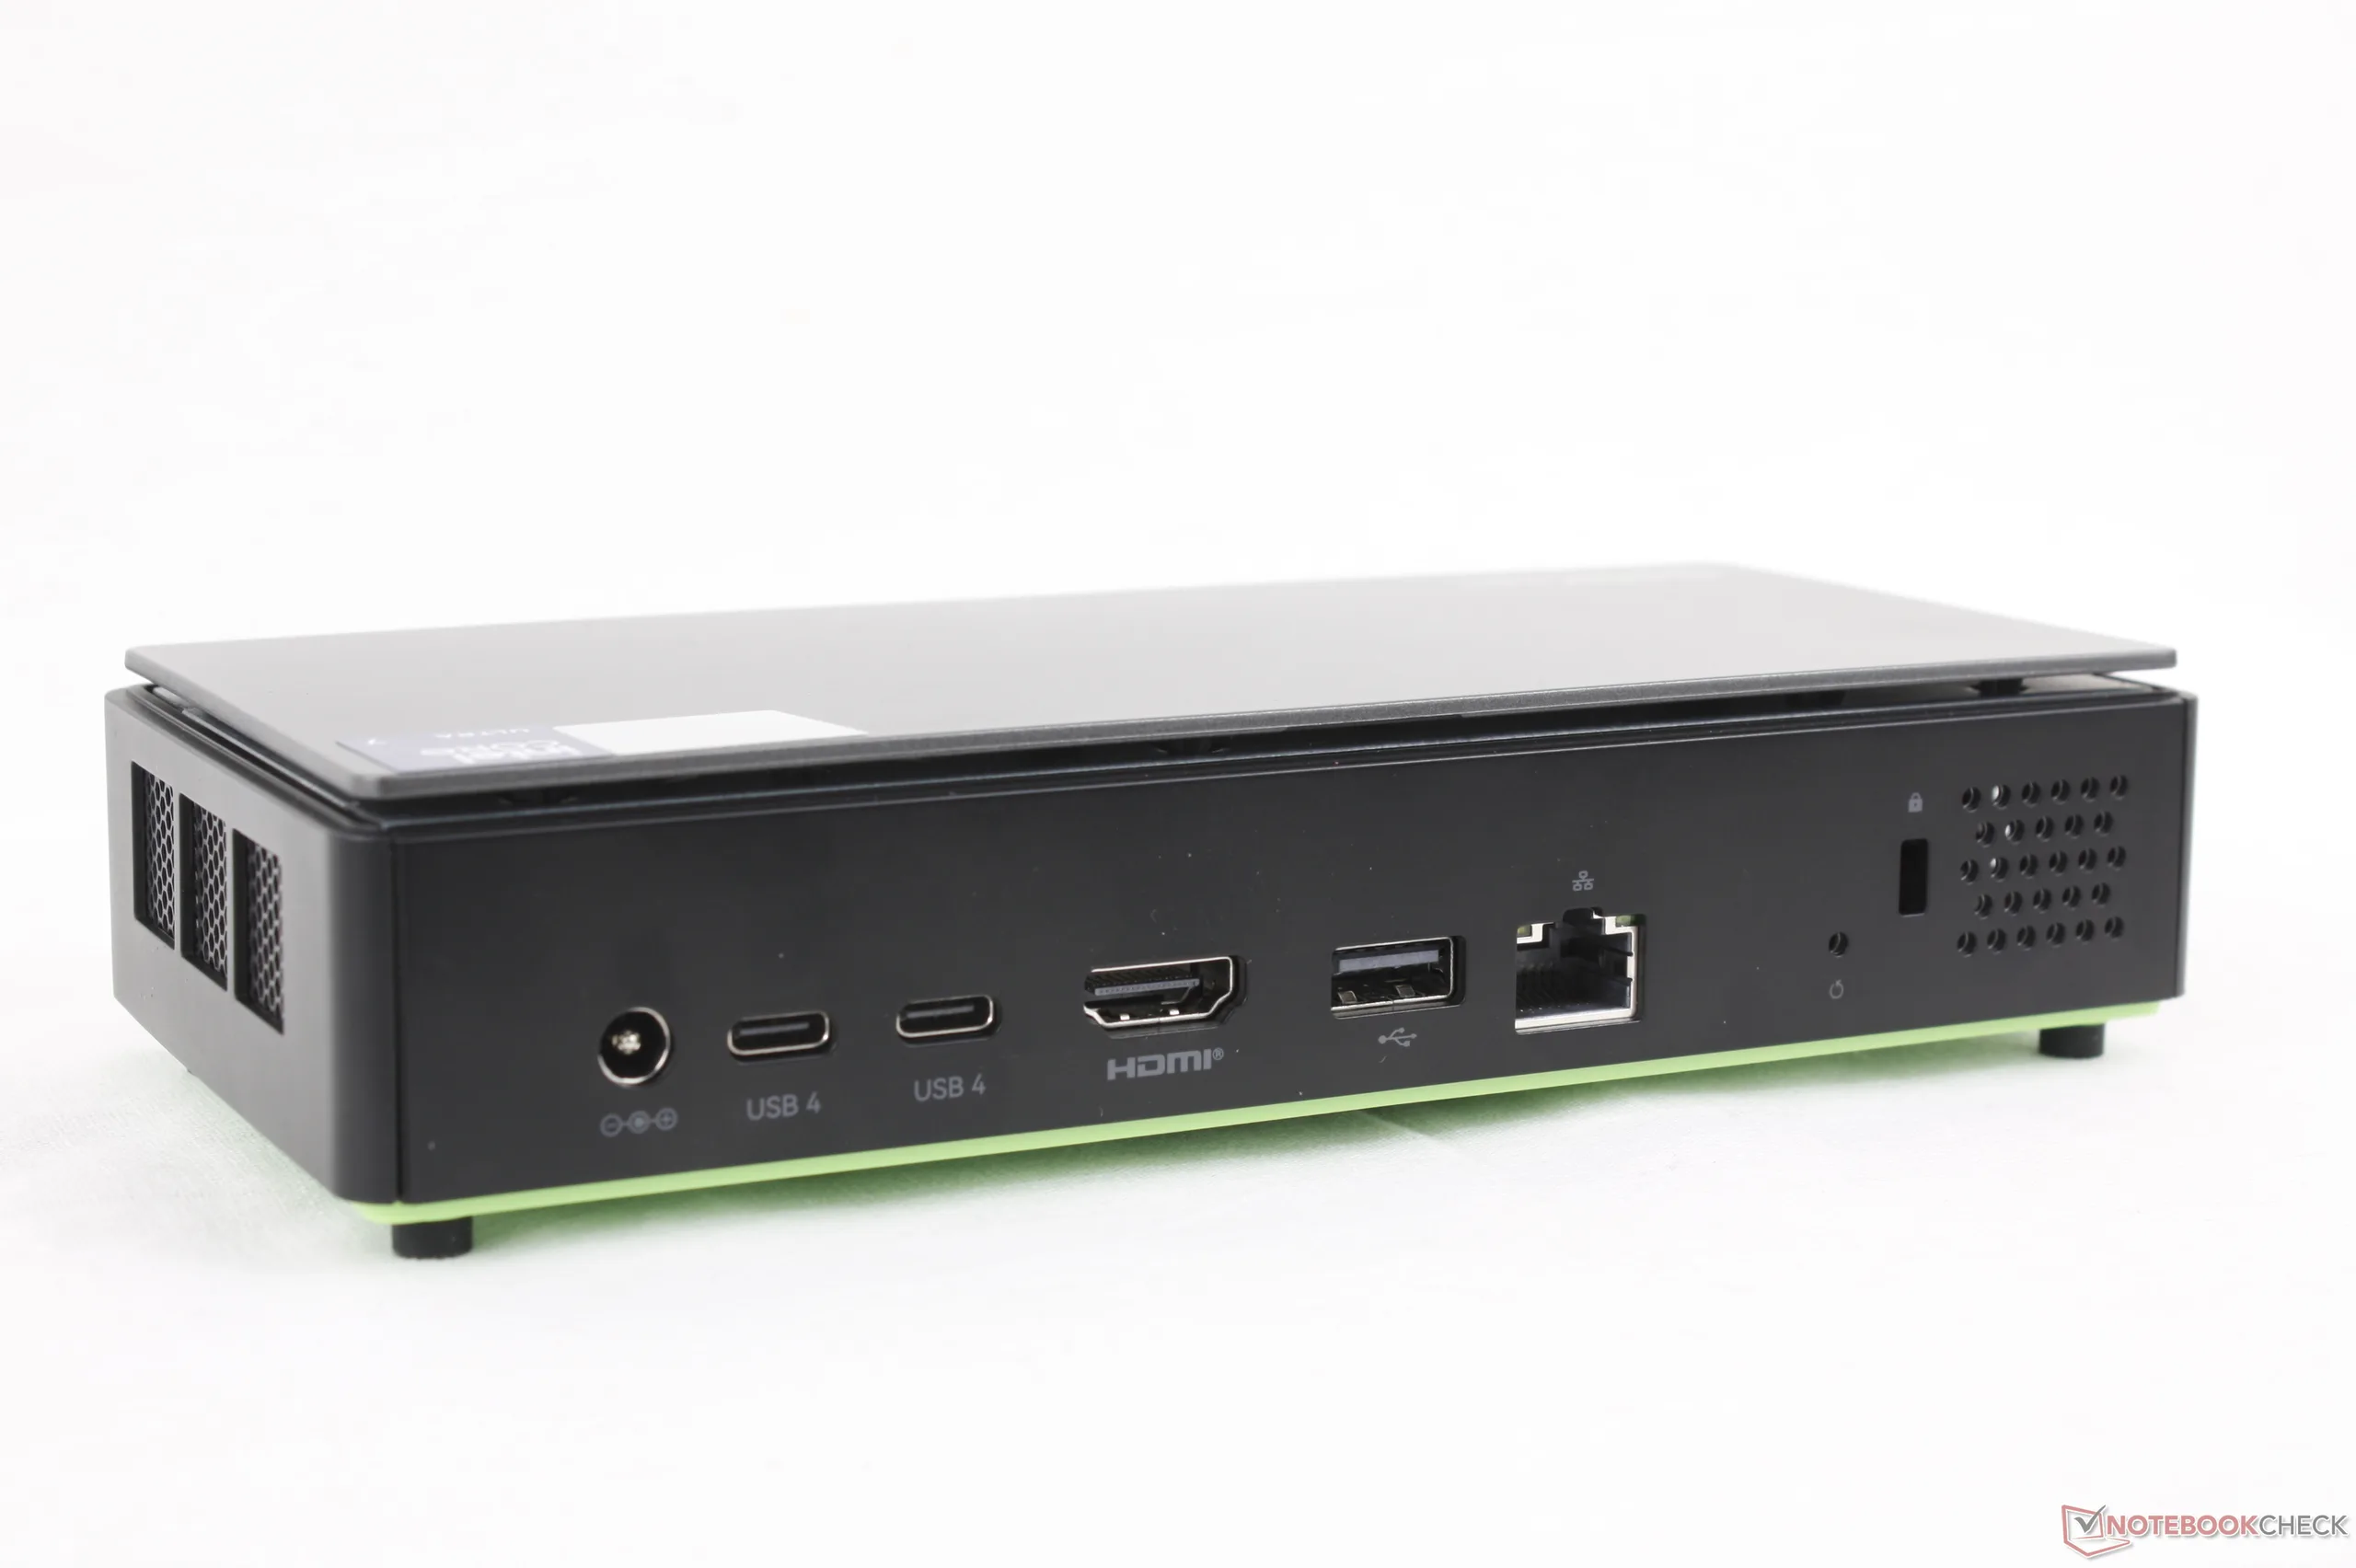
Connectivity
Port options are slightly more limited when compared to competitors. The model features no OcuLink or full-size DisplayPort, for example, as well as fewer USB-A ports than on the NucBox K12.
Note that while the system ships with a barrel AC adapter, it can be powered by most generic USB-C AC adapters instead.
Communication
The system does not ship with Wi-Fi 7 support likely to save on costs.
| Networking | |
| iperf3 transmit AXE11000 | |
| Asus NUC 15 Pro+ | |
| GMK EVO-T1 | |
| MSI Cubi NUC AI+ 2MG | |
| GMK NucBox K12 | |
| GMK NucBox K13 | |
| Beelink SER9 Pro | |
| iperf3 receive AXE11000 | |
| Asus NUC 15 Pro+ | |
| GMK EVO-T1 | |
| MSI Cubi NUC AI+ 2MG | |
| Beelink SER9 Pro | |
| GMK NucBox K12 | |
| GMK NucBox K13 | |
| iperf3 transmit AXE11000 6GHz | |
| Asus NUC 15 Pro+ | |
| MSI Cubi NUC AI+ 2MG | |
| GMK NucBox K13 | |
| GMK NucBox K12 | |
| iperf3 receive AXE11000 6GHz | |
| GMK NucBox K13 | |
| MSI Cubi NUC AI+ 2MG | |
| Asus NUC 15 Pro+ | |
| GMK NucBox K12 | |
Maintenance
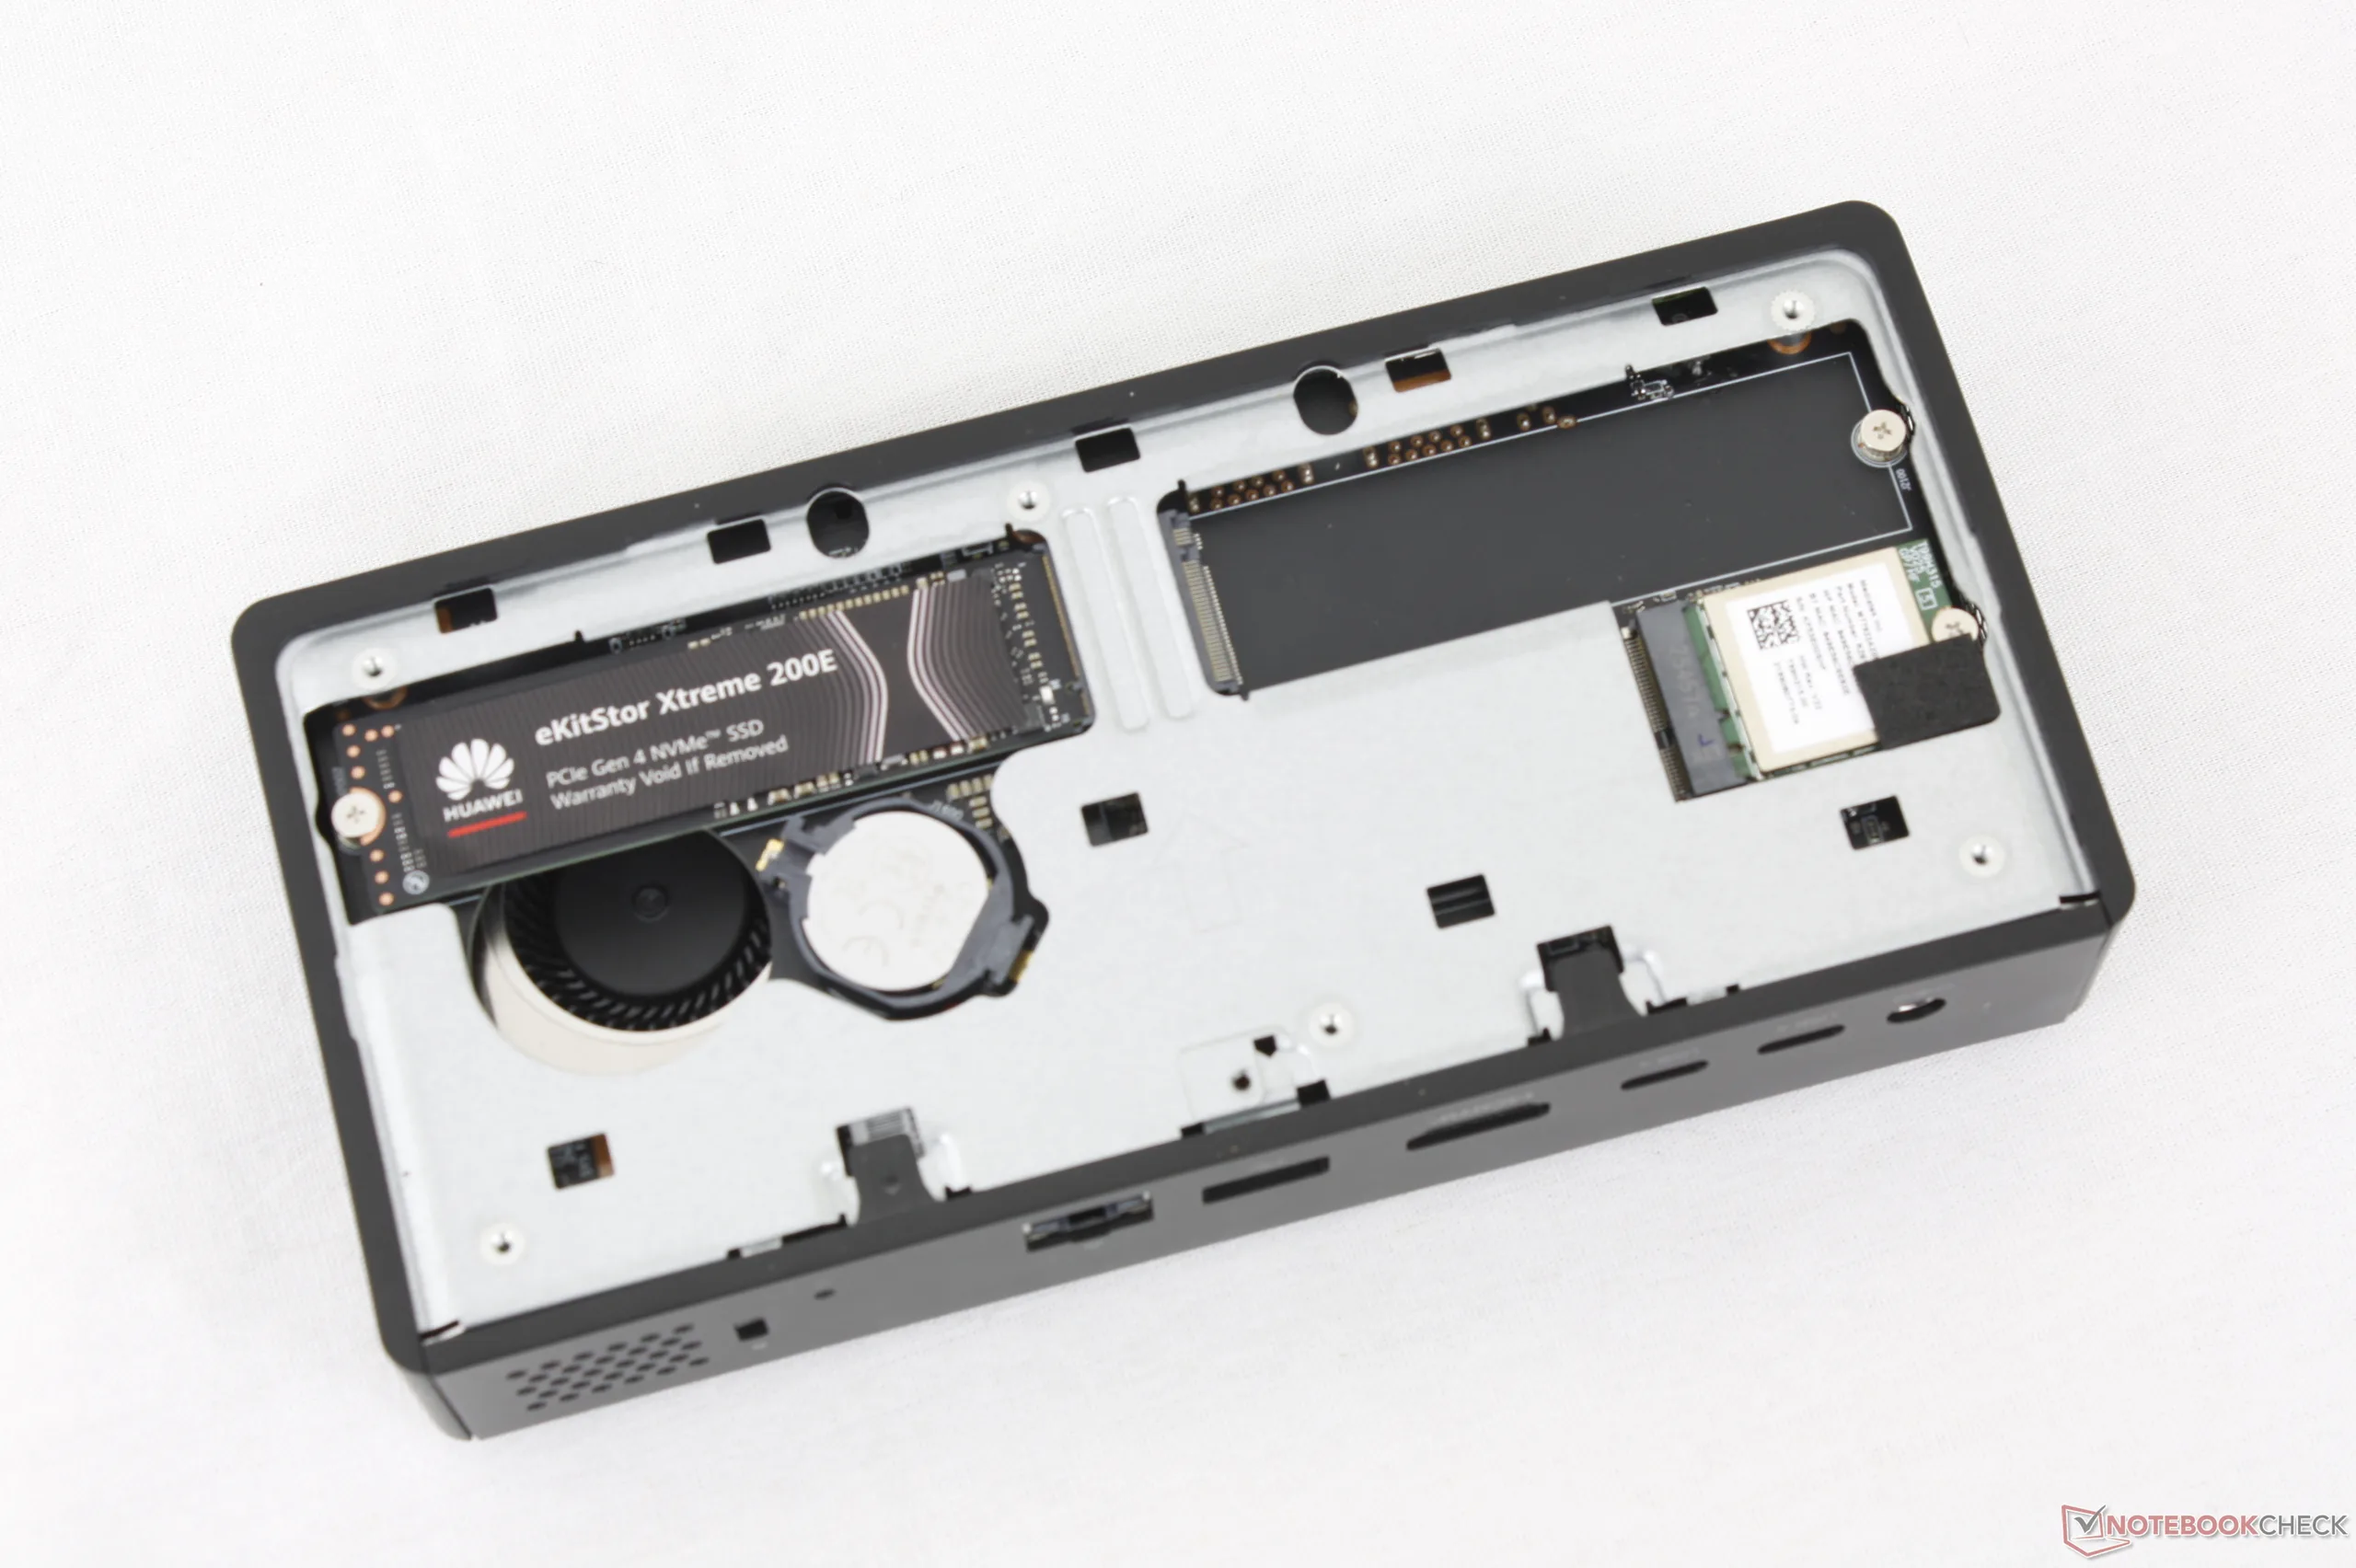
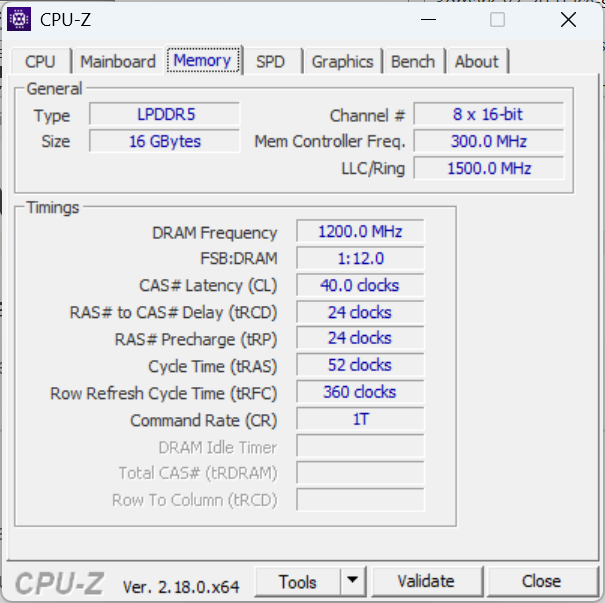
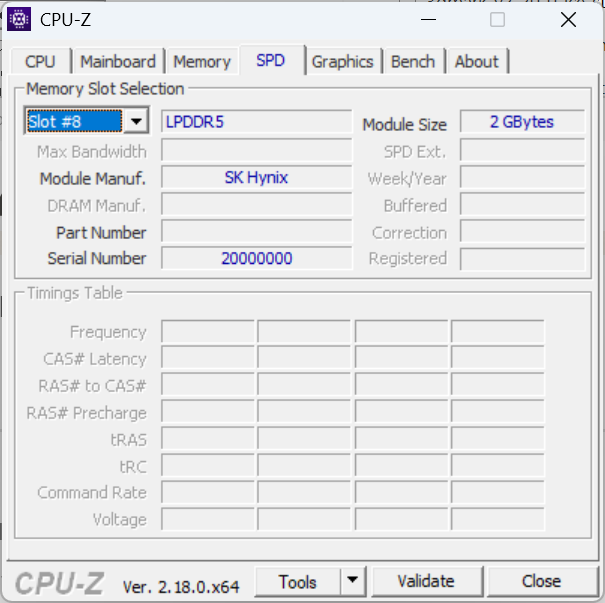
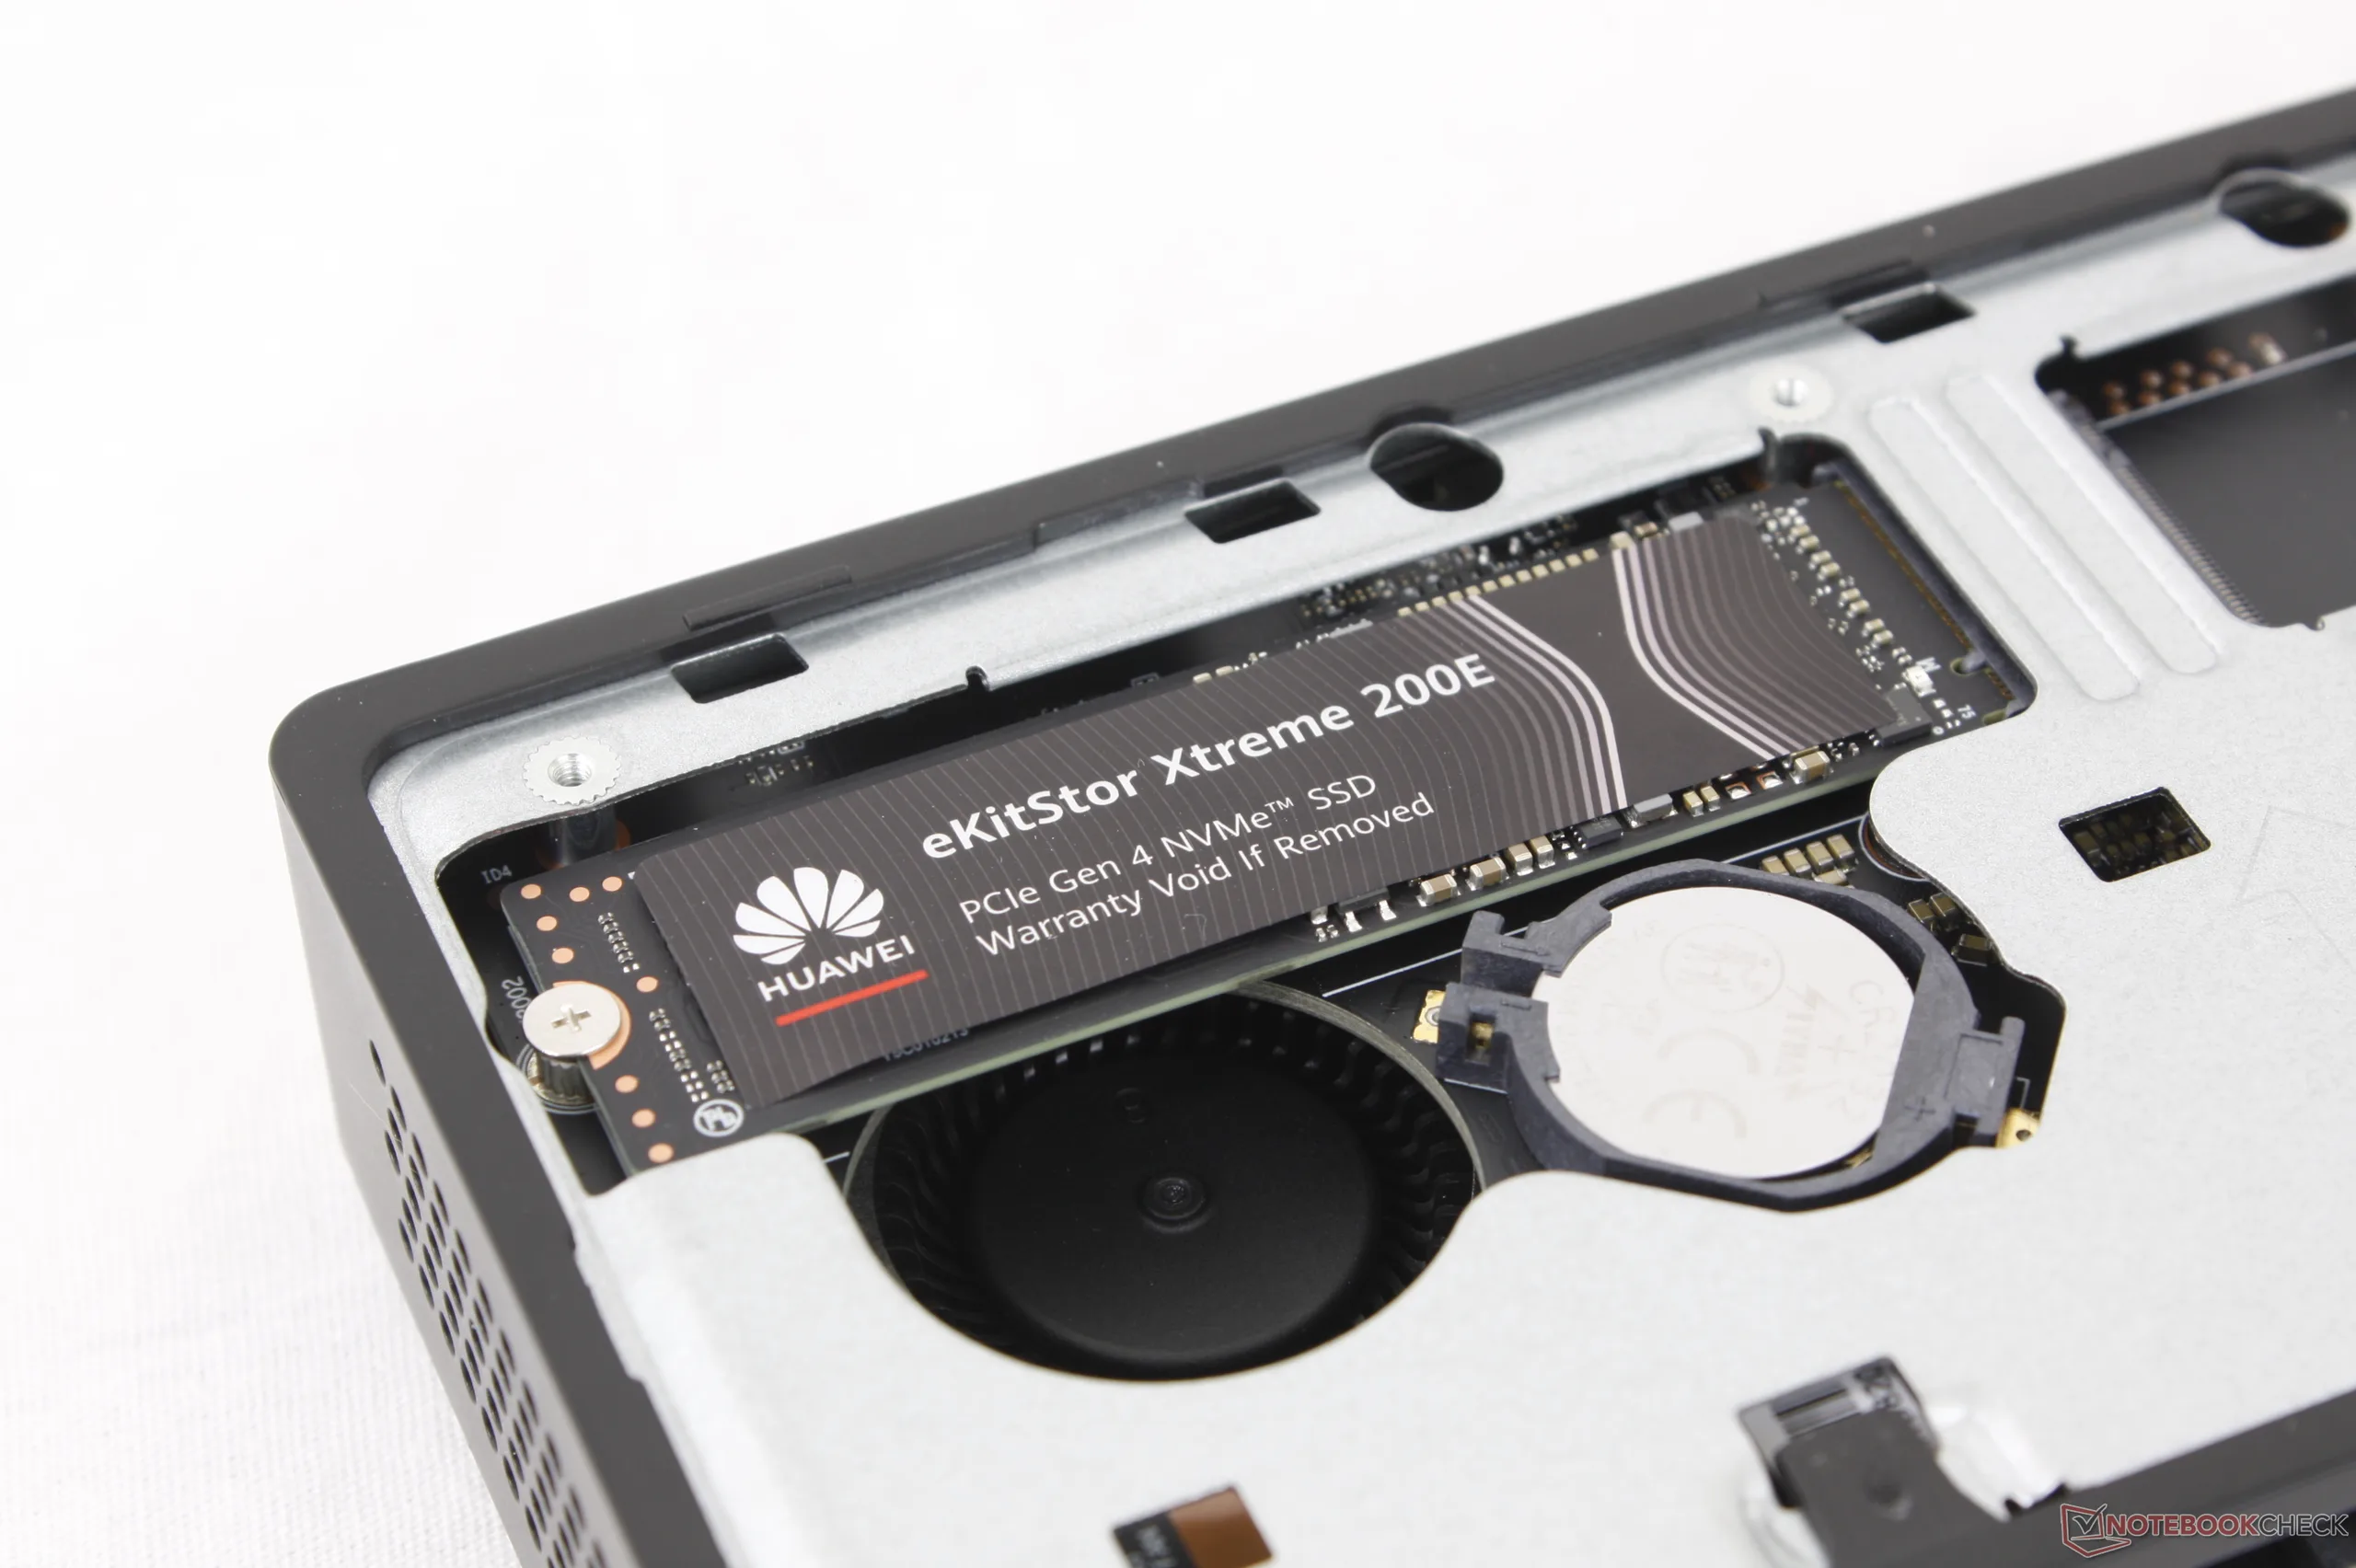
The bottom panel can be easily removed with a Philips screwdriver to reveal the two M.2 2280 SSD slots, BIOS battery, and removable M.2 WLAN module. RAM is soldered and not upgradeable.
Sustainability
The manufacturer makes no mention of recycled materials used during manufacturing. The packaging is otherwise mostly paper and cardboard with a bit of plastic wrapping.
Accessories And Warranty
The retail box includes an HDMI cable and removable VESA mounting bracket alongside a barrel AC adapter. The usual one-year limited manufacturer warranty applies if purchased in the US.
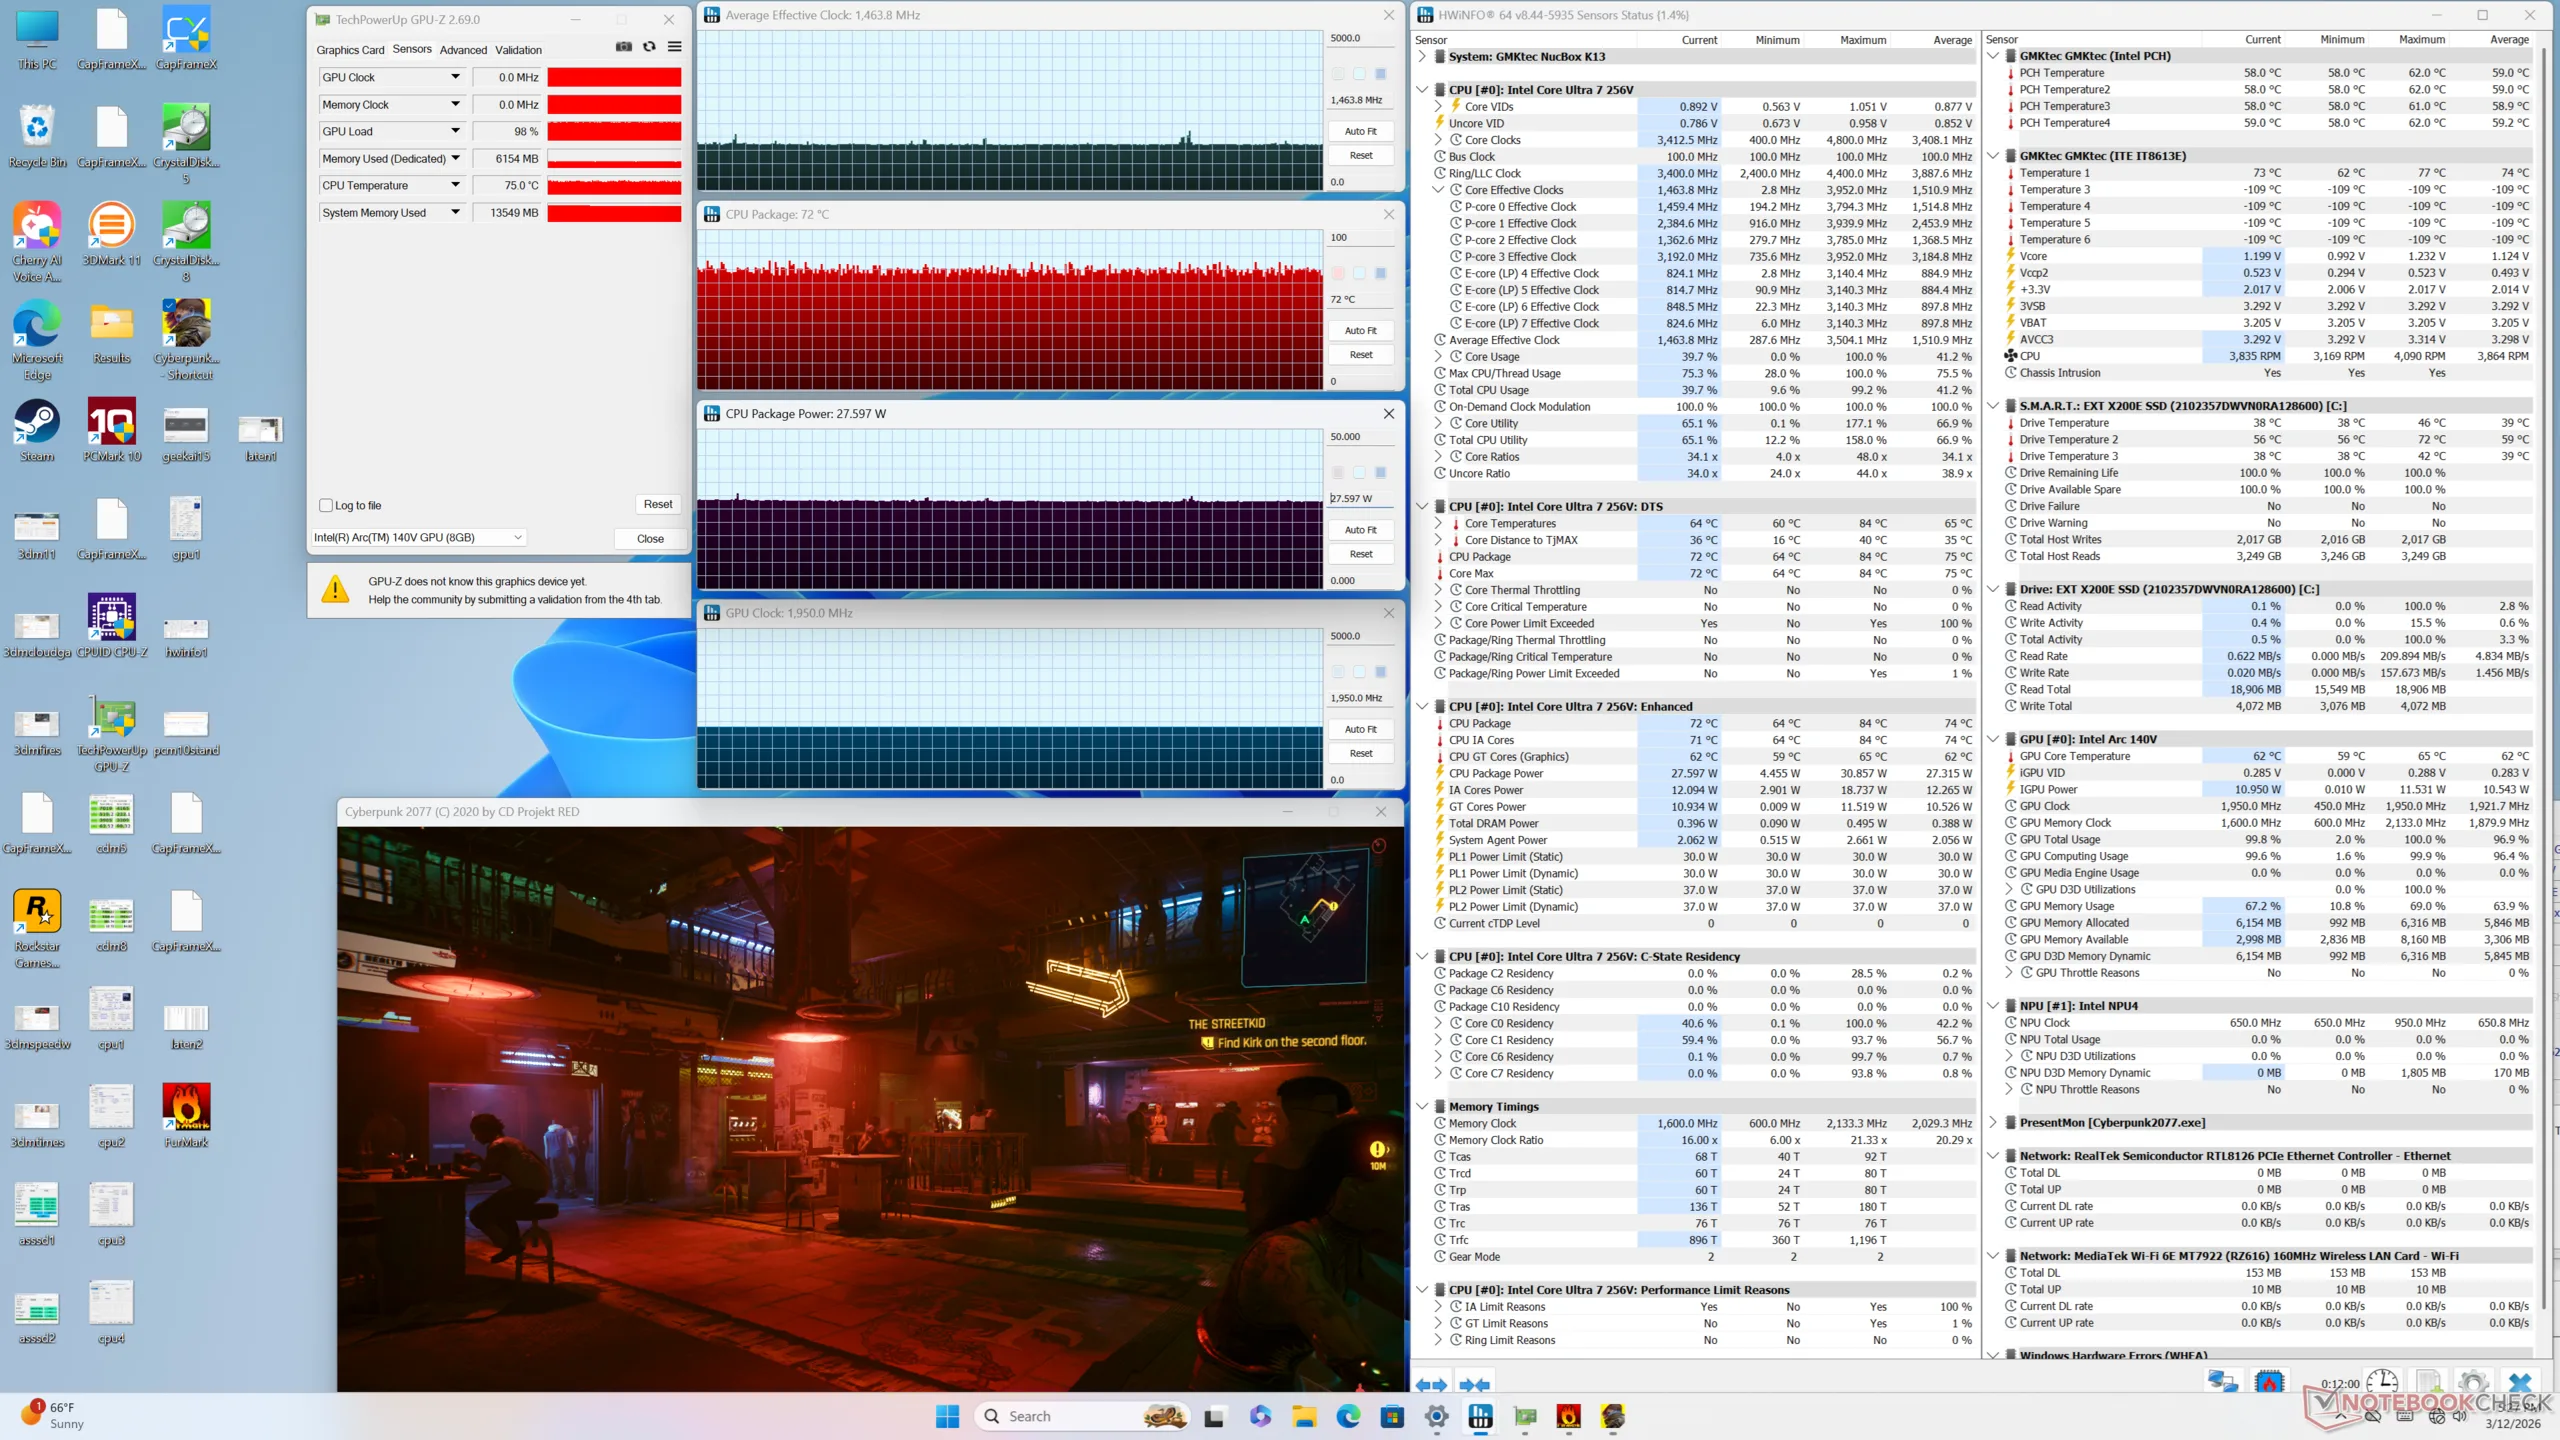
Performance — Lunar Lake Efficiency

Testing Conditions
We set both Windows and BIOS to Performance mode prior to running the benchmarks below. It's worth noting that the BIOS is set to Balanced mode by default.
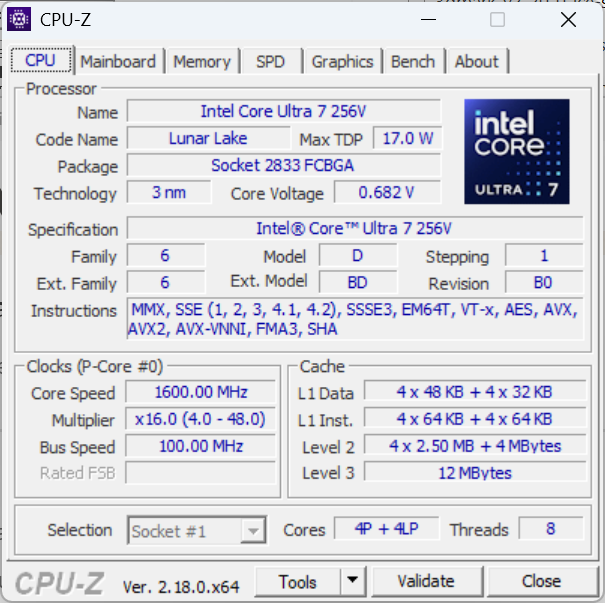
Processor
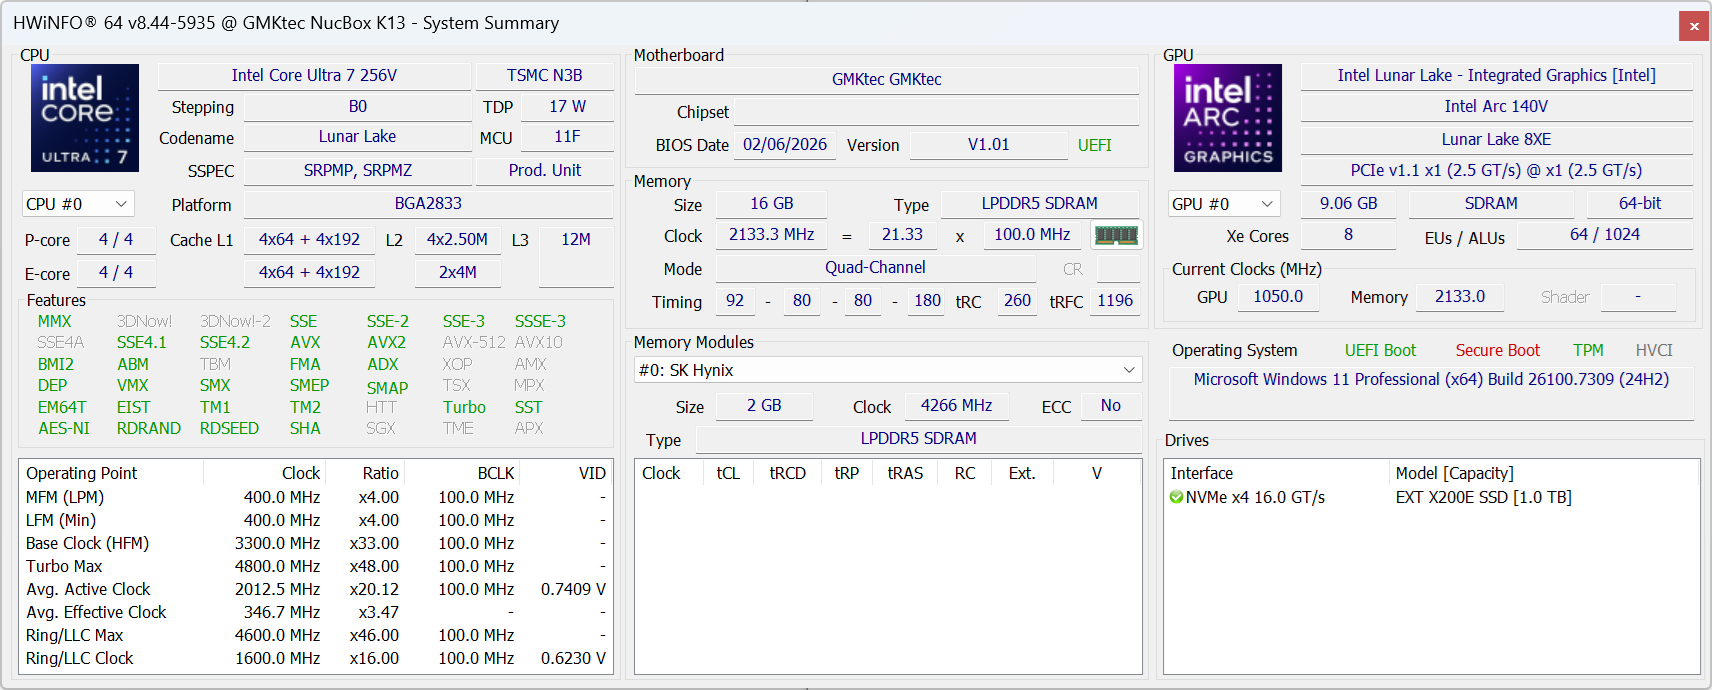
CPU performance is where we expect it to be relative to other PCs with the same Core Ultra 7 256V processor. Raw performance is on the weaker side with most older H-series CPUs outperforming our Lunar Lake-V CPU. Instead, the CPU excels in performance-per-watt and a relatively fast 47 TOPS NPU for AI acceleration.
Cinebench R15 Multi Loop
Cinebench R23: Multi Core | Single Core
Cinebench R20: CPU (Multi Core) | CPU (Single Core)
Cinebench R15: CPU Multi 64Bit | CPU Single 64Bit
Blender: v2.79 BMW27 CPU
7-Zip 18.03: 7z b 4 | 7z b 4 -mmt1
Geekbench 6.7: Multi-Core | Single-Core
Geekbench 5.5: Multi-Core | Single-Core
HWBOT x265 Benchmark v2.2: 4k Preset
LibreOffice : 20 Documents To PDF
R Benchmark 2.5: Overall mean
| Cinebench R23 / Multi Core | |
| Acemagic M1A Pro+ | |
| Minisforum AI X1 Pro, HX 470 | |
| Asus NUC 15 Pro+ | |
| Beelink SER8 | |
| Geekom A7 Max, R9 7940HS | |
| GMK NucBox K12 | |
| GMK NucBox M7 Ultra | |
| Alliwava H90 Pro | |
| GMK NucBox K13 | |
| MSI Cubi NUC AI+ 2MG | |
| GMK NucBox M6 | |
| GMK NucBox M3 Ultra | |
| Average Intel Core Ultra 7 256V (8589 - 10864, n=8) | |
| MSI Cubi NUC 1M | |
| Cinebench R23 / Single Core | |
| Asus NUC 15 Pro+ | |
| Minisforum AI X1 Pro, HX 470 | |
| Acemagic M1A Pro+ | |
| MSI Cubi NUC AI+ 2MG | |
| GMK NucBox K13 | |
| MSI Cubi NUC 1M | |
| Average Intel Core Ultra 7 256V (1799 - 1909, n=8) | |
| Geekom A7 Max, R9 7940HS | |
| GMK NucBox M3 Ultra | |
| Beelink SER8 | |
| GMK NucBox K12 | |
| GMK NucBox M7 Ultra | |
| GMK NucBox M6 | |
| Alliwava H90 Pro | |
| Cinebench R20 / CPU (Multi Core) | |
| Acemagic M1A Pro+ | |
| Minisforum AI X1 Pro, HX 470 | |
| Asus NUC 15 Pro+ | |
| Geekom A7 Max, R9 7940HS | |
| Beelink SER8 | |
| GMK NucBox K12 | |
| Alliwava H90 Pro | |
| GMK NucBox M7 Ultra | |
| GMK NucBox K13 | |
| MSI Cubi NUC AI+ 2MG | |
| GMK NucBox M6 | |
| Average Intel Core Ultra 7 256V (3822 - 4233, n=7) | |
| GMK NucBox M3 Ultra | |
| MSI Cubi NUC 1M | |
| Cinebench R20 / CPU (Single Core) | |
| Asus NUC 15 Pro+ | |
| Minisforum AI X1 Pro, HX 470 | |
| Acemagic M1A Pro+ | |
| MSI Cubi NUC AI+ 2MG | |
| GMK NucBox K13 | |
| Average Intel Core Ultra 7 256V (700 - 733, n=7) | |
| MSI Cubi NUC 1M | |
| Beelink SER8 | |
| GMK NucBox M3 Ultra | |
| Geekom A7 Max, R9 7940HS | |
| GMK NucBox K12 | |
| Alliwava H90 Pro | |
| GMK NucBox M7 Ultra | |
| GMK NucBox M6 | |
| Cinebench R15 / CPU Multi 64Bit | |
| Acemagic M1A Pro+ | |
| Minisforum AI X1 Pro, HX 470 | |
| Asus NUC 15 Pro+ | |
| Beelink SER8 | |
| Geekom A7 Max, R9 7940HS | |
| GMK NucBox K12 | |
| GMK NucBox M7 Ultra | |
| Alliwava H90 Pro | |
| GMK NucBox M6 | |
| GMK NucBox K13 | |
| Average Intel Core Ultra 7 256V (1500 - 1627, n=6) | |
| GMK NucBox M3 Ultra | |
| MSI Cubi NUC AI+ 2MG | |
| MSI Cubi NUC 1M | |
| Cinebench R15 / CPU Single 64Bit | |
| Asus NUC 15 Pro+ | |
| Minisforum AI X1 Pro, HX 470 | |
| Acemagic M1A Pro+ | |
| MSI Cubi NUC AI+ 2MG | |
| GMK NucBox K13 | |
| Average Intel Core Ultra 7 256V (275 - 290, n=6) | |
| Beelink SER8 | |
| Geekom A7 Max, R9 7940HS | |
| GMK NucBox K12 | |
| MSI Cubi NUC 1M | |
| GMK NucBox M3 Ultra | |
| Alliwava H90 Pro | |
| GMK NucBox M7 Ultra | |
| GMK NucBox M6 | |
| 7-Zip 18.03 / 7z b 4 -mmt1 | |
| Beelink SER8 | |
| Geekom A7 Max, R9 7940HS | |
| Acemagic M1A Pro+ | |
| Minisforum AI X1 Pro, HX 470 | |
| GMK NucBox K12 | |
| Asus NUC 15 Pro+ | |
| Alliwava H90 Pro | |
| MSI Cubi NUC 1M | |
| GMK NucBox M3 Ultra | |
| MSI Cubi NUC AI+ 2MG | |
| GMK NucBox K13 | |
| GMK NucBox M6 | |
| Average Intel Core Ultra 7 256V (5528 - 5763, n=7) | |
| GMK NucBox M7 Ultra | |
| Geekbench 6.7 / Multi-Core | |
| Acemagic M1A Pro+ | |
| Asus NUC 15 Pro+ | |
| Beelink SER8 | |
| GMK NucBox K12 | |
| Minisforum AI X1 Pro, HX 470 | |
| Alliwava H90 Pro | |
| Average Intel Core Ultra 7 256V (9852 - 11085, n=8) | |
| GMK NucBox K13 | |
| Geekom A7 Max, R9 7940HS | |
| GMK NucBox M7 Ultra | |
| GMK NucBox M6 | |
| MSI Cubi NUC AI+ 2MG | |
| MSI Cubi NUC 1M | |
| GMK NucBox M3 Ultra | |
| Geekbench 6.7 / Single-Core | |
| Acemagic M1A Pro+ | |
| Minisforum AI X1 Pro, HX 470 | |
| GMK NucBox K13 | |
| MSI Cubi NUC AI+ 2MG | |
| Average Intel Core Ultra 7 256V (2680 - 2784, n=8) | |
| Beelink SER8 | |
| Asus NUC 15 Pro+ | |
| MSI Cubi NUC 1M | |
| Geekom A7 Max, R9 7940HS | |
| GMK NucBox K12 | |
| Alliwava H90 Pro | |
| GMK NucBox M3 Ultra | |
| GMK NucBox M7 Ultra | |
| GMK NucBox M6 | |
| Geekbench 5.5 / Multi-Core | |
| Acemagic M1A Pro+ | |
| Asus NUC 15 Pro+ | |
| Minisforum AI X1 Pro, HX 470 | |
| Beelink SER8 | |
| GMK NucBox K12 | |
| Alliwava H90 Pro | |
| Geekom A7 Max, R9 7940HS | |
| Average Intel Core Ultra 7 256V (9044 - 9715, n=7) | |
| GMK NucBox M7 Ultra | |
| GMK NucBox K13 | |
| GMK NucBox M3 Ultra | |
| GMK NucBox M6 | |
| MSI Cubi NUC 1M | |
| MSI Cubi NUC AI+ 2MG | |
| Geekbench 5.5 / Single-Core | |
| Acemagic M1A Pro+ | |
| MSI Cubi NUC AI+ 2MG | |
| Beelink SER8 | |
| GMK NucBox K13 | |
| Average Intel Core Ultra 7 256V (1972 - 2013, n=7) | |
| Minisforum AI X1 Pro, HX 470 | |
| Geekom A7 Max, R9 7940HS | |
| MSI Cubi NUC 1M | |
| GMK NucBox K12 | |
| Alliwava H90 Pro | |
| GMK NucBox M3 Ultra | |
| Asus NUC 15 Pro+ | |
| GMK NucBox M7 Ultra | |
| GMK NucBox M6 | |
| HWBOT x265 Benchmark v2.2 / 4k Preset | |
| Acemagic M1A Pro+ | |
| Asus NUC 15 Pro+ | |
| Minisforum AI X1 Pro, HX 470 | |
| Beelink SER8 | |
| GMK NucBox K12 | |
| Geekom A7 Max, R9 7940HS | |
| GMK NucBox M7 Ultra | |
| Alliwava H90 Pro | |
| GMK NucBox M6 | |
| GMK NucBox K13 | |
| MSI Cubi NUC AI+ 2MG | |
| Average Intel Core Ultra 7 256V (11.9 - 13.9, n=7) | |
| GMK NucBox M3 Ultra | |
| MSI Cubi NUC 1M | |
| LibreOffice / 20 Documents To PDF | |
| GMK NucBox M7 Ultra | |
| GMK NucBox M3 Ultra | |
| Minisforum AI X1 Pro, HX 470 | |
| Asus NUC 15 Pro+ | |
| Geekom A7 Max, R9 7940HS | |
| Acemagic M1A Pro+ | |
| GMK NucBox M6 | |
| Alliwava H90 Pro | |
| GMK NucBox K12 | |
| GMK NucBox K13 | |
| Average Intel Core Ultra 7 256V (42.7 - 55.6, n=7) | |
| Beelink SER8 | |
| MSI Cubi NUC AI+ 2MG | |
| MSI Cubi NUC 1M | |
| R Benchmark 2.5 / Overall mean | |
| Alliwava H90 Pro | |
| GMK NucBox M6 | |
| GMK NucBox M7 Ultra | |
| GMK NucBox M3 Ultra | |
| GMK NucBox K12 | |
| Average Intel Core Ultra 7 256V (0.439 - 0.4645, n=7) | |
| MSI Cubi NUC AI+ 2MG | |
| GMK NucBox K13 | |
| MSI Cubi NUC 1M | |
| Geekom A7 Max, R9 7940HS | |
| Asus NUC 15 Pro+ | |
| Beelink SER8 | |
| Minisforum AI X1 Pro, HX 470 | |
| Acemagic M1A Pro+ | |
Cinebench R23: Multi Core | Single Core
Cinebench R20: CPU (Multi Core) | CPU (Single Core)
Cinebench R15: CPU Multi 64Bit | CPU Single 64Bit
Blender: v2.79 BMW27 CPU
7-Zip 18.03: 7z b 4 | 7z b 4 -mmt1
Geekbench 6.7: Multi-Core | Single-Core
Geekbench 5.5: Multi-Core | Single-Core
HWBOT x265 Benchmark v2.2: 4k Preset
LibreOffice : 20 Documents To PDF
R Benchmark 2.5: Overall mean
* ... smaller is better
AIDA64: FP32 Ray-Trace | FPU Julia | CPU SHA3 | CPU Queen | FPU SinJulia | FPU Mandel | CPU AES | CPU ZLib | FP64 Ray-Trace | CPU PhotoWorxx | CPU CheckMate
| Performance rating | |
| Beelink SER9 Pro -1! | |
| GMK NucBox K12 -1! | |
| Asus NUC 15 Pro+ -1! | |
| GMK EVO-T1 | |
| GMK NucBox K13 -1! | |
| Average Intel Core Ultra 7 256V | |
| MSI Cubi NUC AI+ 2MG -1! | |
| AIDA64 / FP32 Ray-Trace | |
| Beelink SER9 Pro (v6.92.6600) | |
| GMK NucBox K12 (v6.92.6600) | |
| Asus NUC 15 Pro+ (v6.92.6600) | |
| GMK EVO-T1 (v6.92.6600) | |
| GMK EVO-T1 (v8.20.8100) | |
| GMK NucBox K13 (v8.20.8100) | |
| Average Intel Core Ultra 7 256V (10524 - 12898, n=7) | |
| MSI Cubi NUC AI+ 2MG (v6.92.6600) | |
| AIDA64 / FPU Julia | |
| Asus NUC 15 Pro+ (v6.92.6600) | |
| GMK EVO-T1 (v6.92.6600) | |
| GMK EVO-T1 (v8.20.8100) | |
| Beelink SER9 Pro (v6.92.6600) | |
| GMK NucBox K12 (v6.92.6600) | |
| GMK NucBox K13 (v8.20.8100) | |
| MSI Cubi NUC AI+ 2MG (v6.92.6600) | |
| Average Intel Core Ultra 7 256V (52443 - 62522, n=7) | |
| AIDA64 / CPU SHA3 | |
| Asus NUC 15 Pro+ (v6.92.6600) | |
| GMK EVO-T1 (v6.92.6600) | |
| GMK EVO-T1 (v8.20.8100) | |
| Beelink SER9 Pro (v6.92.6600) | |
| GMK NucBox K12 (v6.92.6600) | |
| GMK NucBox K13 (v8.20.8100) | |
| MSI Cubi NUC AI+ 2MG (v6.92.6600) | |
| Average Intel Core Ultra 7 256V (2364 - 2915, n=7) | |
| AIDA64 / CPU Queen | |
| Beelink SER9 Pro (v6.92.6600) | |
| GMK NucBox K12 (v6.92.6600) | |
| Asus NUC 15 Pro+ (v6.92.6600) | |
| GMK EVO-T1 (v6.92.6600) | |
| Average Intel Core Ultra 7 256V (49622 - 49794, n=6) | |
| MSI Cubi NUC AI+ 2MG (v6.92.6600) | |
| AIDA64 / FPU SinJulia | |
| Beelink SER9 Pro (v6.92.6600) | |
| GMK NucBox K12 (v6.92.6600) | |
| Asus NUC 15 Pro+ (v6.92.6600) | |
| GMK EVO-T1 (v6.92.6600) | |
| GMK EVO-T1 (v8.20.8100) | |
| GMK NucBox K13 (v8.20.8100) | |
| MSI Cubi NUC AI+ 2MG (v6.92.6600) | |
| Average Intel Core Ultra 7 256V (4401 - 4434, n=7) | |
| AIDA64 / FPU Mandel | |
| GMK EVO-T1 (v6.92.6600) | |
| GMK EVO-T1 (v8.20.8100) | |
| Asus NUC 15 Pro+ (v6.92.6600) | |
| Beelink SER9 Pro (v6.92.6600) | |
| GMK NucBox K12 (v6.92.6600) | |
| GMK NucBox K13 (v8.20.8100) | |
| MSI Cubi NUC AI+ 2MG (v6.92.6600) | |
| Average Intel Core Ultra 7 256V (27382 - 33019, n=7) | |
| AIDA64 / CPU AES | |
| Beelink SER9 Pro (v6.92.6600) | |
| GMK NucBox K12 (v6.92.6600) | |
| Asus NUC 15 Pro+ (v6.92.6600) | |
| GMK NucBox K13 (v8.20.8100) | |
| GMK EVO-T1 (v6.92.6600) | |
| GMK EVO-T1 (v8.20.8100) | |
| Average Intel Core Ultra 7 256V (38495 - 75938, n=7) | |
| MSI Cubi NUC AI+ 2MG (v6.92.6600) | |
| AIDA64 / CPU ZLib | |
| Asus NUC 15 Pro+ (v6.92.6600) | |
| GMK EVO-T1 (v6.92.6600) | |
| GMK EVO-T1 (v8.20.8100) | |
| Beelink SER9 Pro (v6.92.6600) | |
| GMK NucBox K12 (v6.92.6600) | |
| GMK NucBox K13 (v8.20.8100) | |
| MSI Cubi NUC AI+ 2MG (v6.92.6600) | |
| Average Intel Core Ultra 7 256V (536 - 632, n=7) | |
| AIDA64 / FP64 Ray-Trace | |
| Beelink SER9 Pro (v6.92.6600) | |
| GMK NucBox K12 (v6.92.6600) | |
| Asus NUC 15 Pro+ (v6.92.6600) | |
| GMK EVO-T1 (v6.92.6600) | |
| GMK EVO-T1 (v8.20.8100) | |
| GMK NucBox K13 (v8.20.8100) | |
| MSI Cubi NUC AI+ 2MG (v6.92.6600) | |
| Average Intel Core Ultra 7 256V (5655 - 6878, n=7) | |
| AIDA64 / CPU PhotoWorxx | |
| GMK NucBox K13 (v8.20.8100) | |
| GMK EVO-T1 (v8.20.8100) | |
| GMK EVO-T1 (v6.92.6600) | |
| Asus NUC 15 Pro+ (v6.92.6600) | |
| MSI Cubi NUC AI+ 2MG (v6.92.6600) | |
| Average Intel Core Ultra 7 256V (49906 - 57060, n=7) | |
| Beelink SER9 Pro (v6.92.6600) | |
| GMK NucBox K12 (v6.92.6600) | |
| AIDA64 / CPU CheckMate | |
| GMK EVO-T1 (v8.20.8100) | |
| GMK NucBox K13 (v8.20.8100) | |
| Average Intel Core Ultra 7 256V (n=1) | |
System Performance
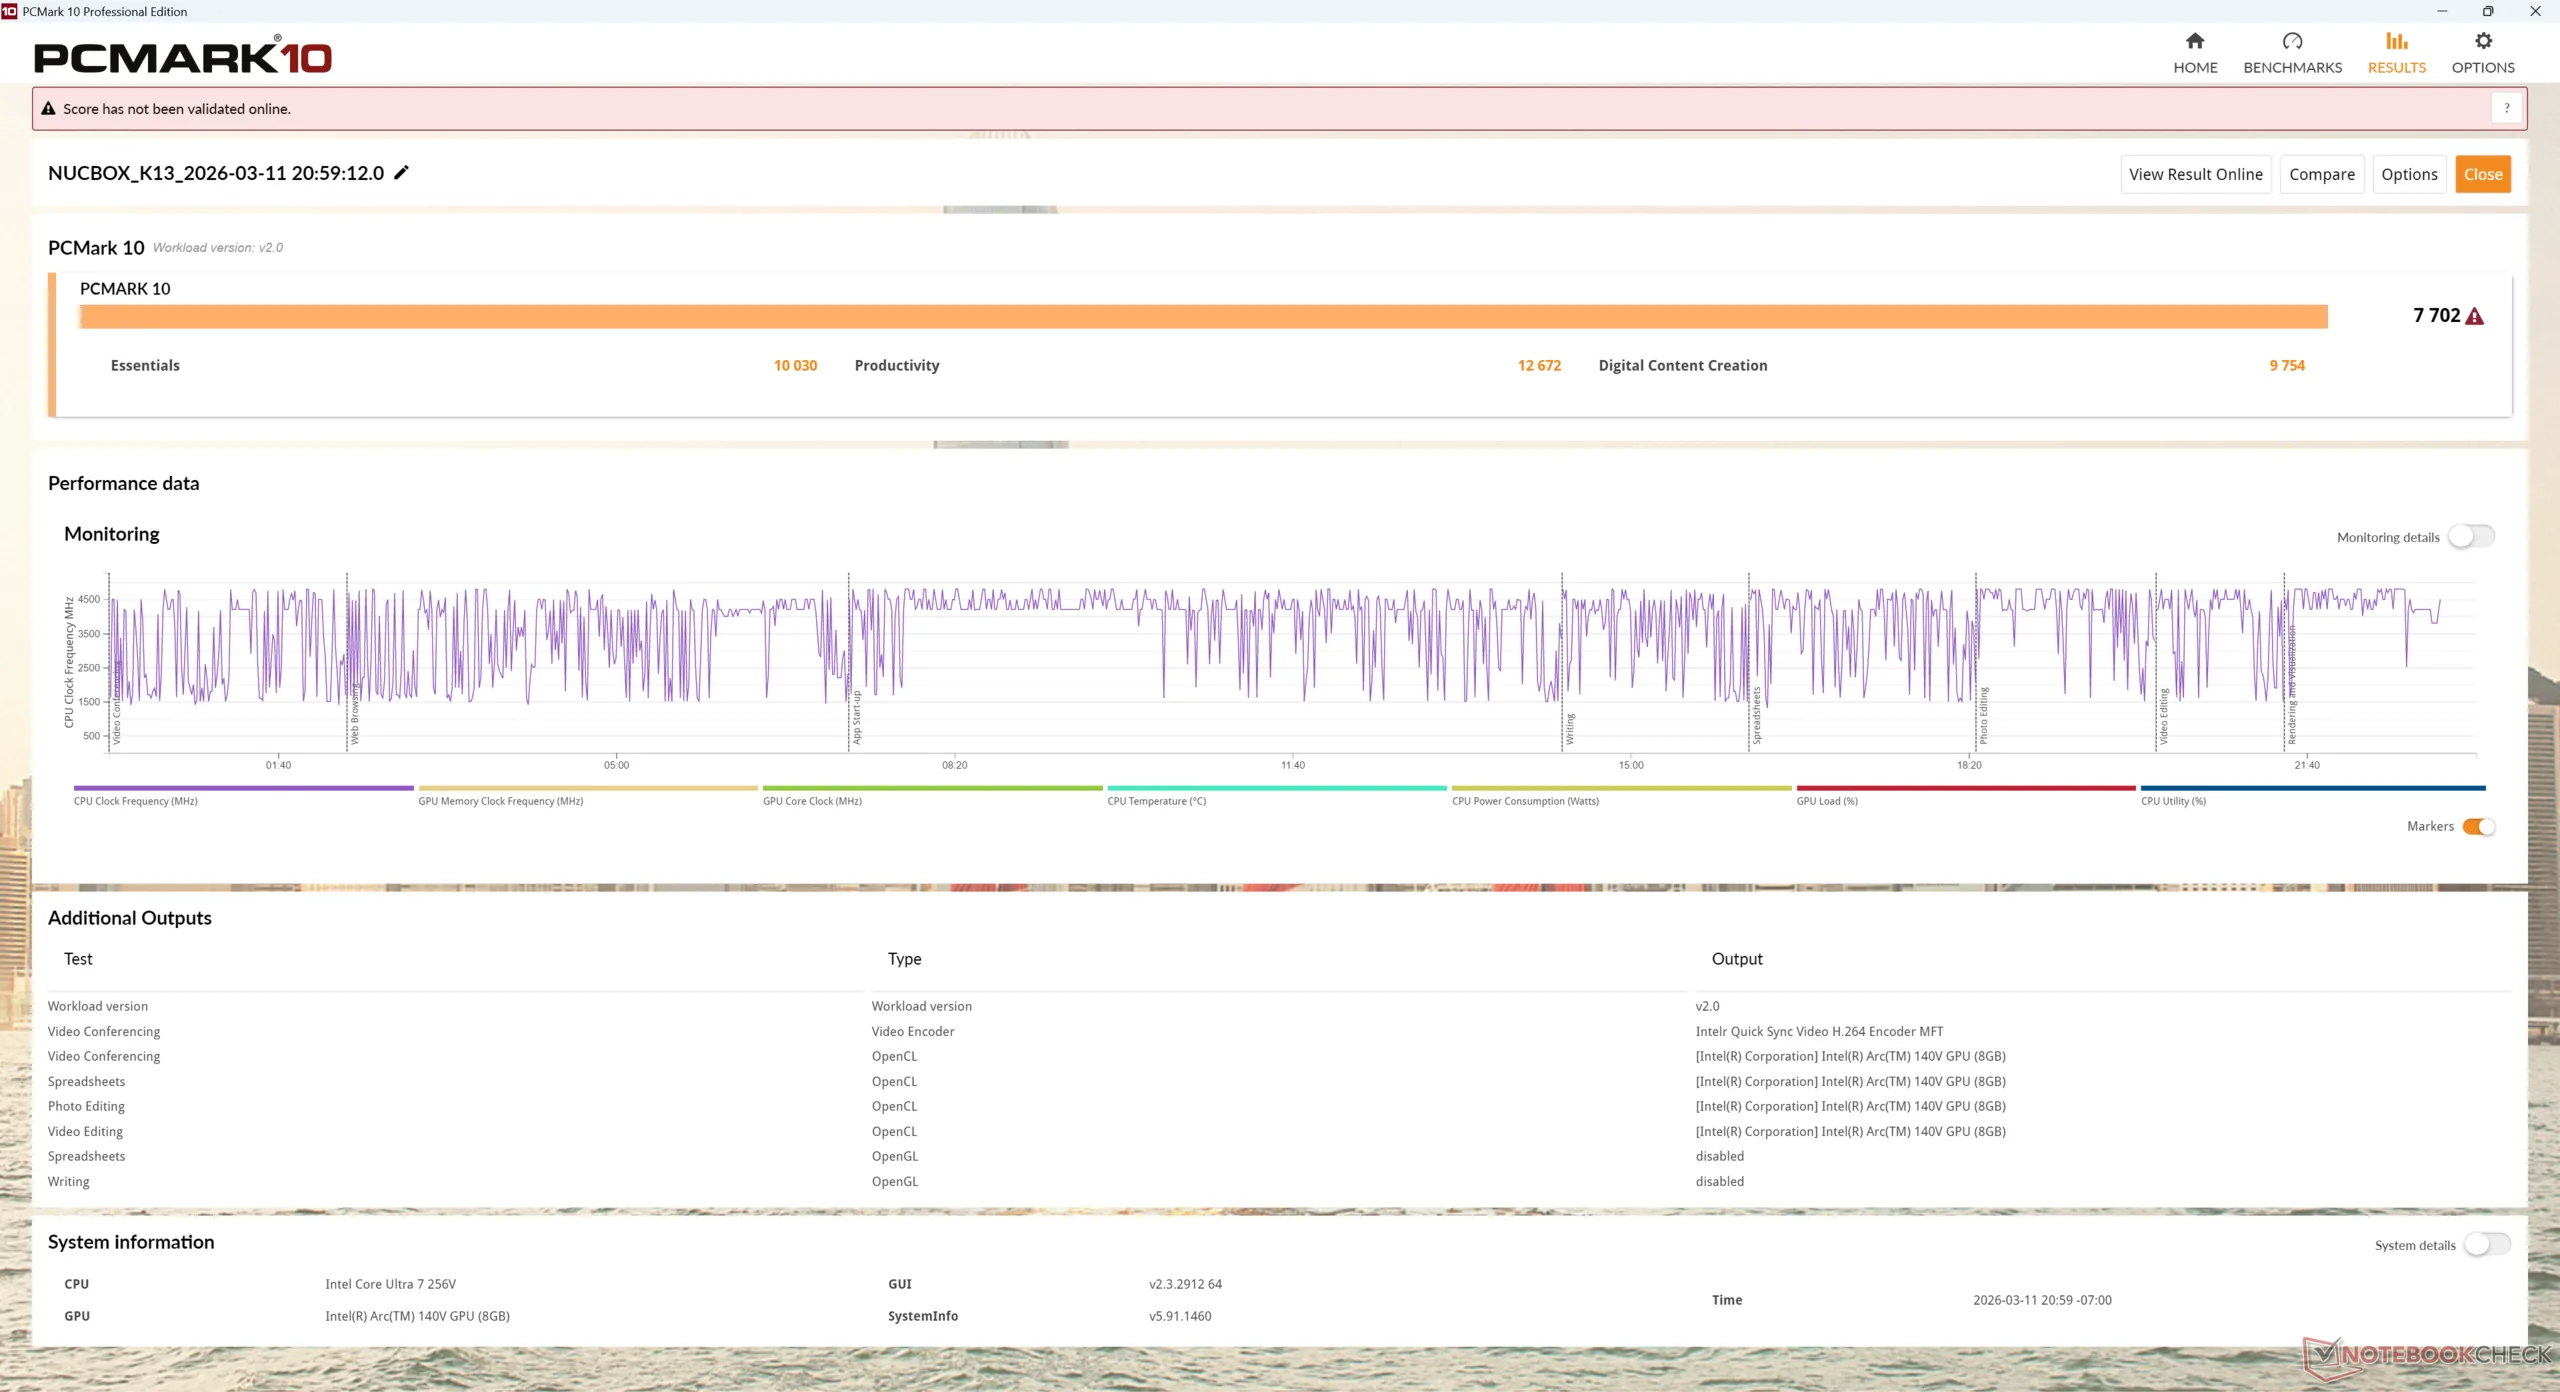
PCMark scores are slightly higher than expected due to the Productivity subtest being overestimated even after updating to the latest version of the benchmark at the time of writing. Interestingly, we experienced similar issues with the recent MSI Venture 16 AI.
PCMark 10: Score | Essentials | Productivity | Digital Content Creation
CrossMark: Overall | Productivity | Creativity | Responsiveness
WebXPRT 3: Overall
WebXPRT 4: Overall
Mozilla Kraken 1.1: Total
Geekbench AI: Single Precision GPU 1.7 | Half Precision GPU 1.7 | Quantized GPU 1.7
| Performance rating | |
| GMK EVO-T1 | |
| Average Intel Core Ultra 7 256V, Intel Arc Graphics 140V | |
| GMK NucBox K13 | |
| Beelink SER9 Pro | |
| MSI Cubi NUC AI+ 2MG | |
| Asus NUC 15 Pro+ | |
| GMK NucBox K12 | |
| PCMark 10 / Score | |
| GMK EVO-T1 | |
| GMK NucBox K13 | |
| Asus NUC 15 Pro+ | |
| Average Intel Core Ultra 7 256V, Intel Arc Graphics 140V (6677 - 7702, n=7) | |
| GMK NucBox K12 | |
| Beelink SER9 Pro | |
| MSI Cubi NUC AI+ 2MG | |
| PCMark 10 / Essentials | |
| GMK NucBox K12 | |
| Beelink SER9 Pro | |
| GMK EVO-T1 | |
| Average Intel Core Ultra 7 256V, Intel Arc Graphics 140V (9627 - 11365, n=7) | |
| MSI Cubi NUC AI+ 2MG | |
| GMK NucBox K13 | |
| Asus NUC 15 Pro+ | |
| PCMark 10 / Productivity | |
| GMK NucBox K13 | |
| GMK EVO-T1 | |
| Average Intel Core Ultra 7 256V, Intel Arc Graphics 140V (8161 - 12672, n=7) | |
| GMK NucBox K12 | |
| Beelink SER9 Pro | |
| MSI Cubi NUC AI+ 2MG | |
| Asus NUC 15 Pro+ | |
| PCMark 10 / Digital Content Creation | |
| GMK EVO-T1 | |
| Asus NUC 15 Pro+ | |
| Average Intel Core Ultra 7 256V, Intel Arc Graphics 140V (9481 - 10126, n=7) | |
| GMK NucBox K13 | |
| MSI Cubi NUC AI+ 2MG | |
| Beelink SER9 Pro | |
| GMK NucBox K12 | |
| CrossMark / Overall | |
| GMK EVO-T1 | |
| Beelink SER9 Pro | |
| Asus NUC 15 Pro+ | |
| GMK NucBox K12 | |
| GMK NucBox K13 | |
| Average Intel Core Ultra 7 256V, Intel Arc Graphics 140V (1636 - 1736, n=7) | |
| MSI Cubi NUC AI+ 2MG | |
| CrossMark / Productivity | |
| GMK EVO-T1 | |
| Beelink SER9 Pro | |
| GMK NucBox K12 | |
| GMK NucBox K13 | |
| Asus NUC 15 Pro+ | |
| Average Intel Core Ultra 7 256V, Intel Arc Graphics 140V (1563 - 1682, n=7) | |
| MSI Cubi NUC AI+ 2MG | |
| CrossMark / Creativity | |
| GMK EVO-T1 | |
| Asus NUC 15 Pro+ | |
| GMK NucBox K13 | |
| Average Intel Core Ultra 7 256V, Intel Arc Graphics 140V (1862 - 1962, n=7) | |
| Beelink SER9 Pro | |
| GMK NucBox K12 | |
| MSI Cubi NUC AI+ 2MG | |
| CrossMark / Responsiveness | |
| GMK EVO-T1 | |
| Beelink SER9 Pro | |
| GMK NucBox K12 | |
| GMK NucBox K13 | |
| Asus NUC 15 Pro+ | |
| Average Intel Core Ultra 7 256V, Intel Arc Graphics 140V (1215 - 1371, n=7) | |
| MSI Cubi NUC AI+ 2MG | |
| WebXPRT 3 / Overall | |
| GMK EVO-T1 | |
| MSI Cubi NUC AI+ 2MG | |
| Beelink SER9 Pro | |
| GMK NucBox K13 | |
| Average Intel Core Ultra 7 256V, Intel Arc Graphics 140V (243 - 310, n=7) | |
| GMK NucBox K12 | |
| Asus NUC 15 Pro+ | |
| WebXPRT 4 / Overall | |
| GMK EVO-T1 | |
| GMK NucBox K13 | |
| Average Intel Core Ultra 7 256V, Intel Arc Graphics 140V (282 - 286, n=7) | |
| MSI Cubi NUC AI+ 2MG | |
| Beelink SER9 Pro | |
| GMK NucBox K12 | |
| Asus NUC 15 Pro+ | |
| Mozilla Kraken 1.1 / Total | |
| GMK NucBox K12 | |
| Beelink SER9 Pro | |
| MSI Cubi NUC AI+ 2MG | |
| Asus NUC 15 Pro+ | |
| GMK NucBox K13 | |
| Average Intel Core Ultra 7 256V, Intel Arc Graphics 140V (470 - 480, n=7) | |
| GMK EVO-T1 | |
| Geekbench AI / Single Precision GPU 1.7 | |
| MSI Cubi NUC AI+ 2MG | |
| Asus NUC 15 Pro+ | |
| Beelink SER9 Pro | |
| GMK EVO-T1 | |
| Average Intel Core Ultra 7 256V, Intel Arc Graphics 140V (6698 - 8212, n=4) | |
| GMK NucBox K12 | |
| GMK NucBox K13 | |
| Geekbench AI / Half Precision GPU 1.7 | |
| MSI Cubi NUC AI+ 2MG | |
| Average Intel Core Ultra 7 256V, Intel Arc Graphics 140V (11542 - 16259, n=4) | |
| GMK EVO-T1 | |
| Asus NUC 15 Pro+ | |
| GMK NucBox K13 | |
| Beelink SER9 Pro | |
| GMK NucBox K12 | |
| Geekbench AI / Quantized GPU 1.7 | |
| Beelink SER9 Pro | |
| MSI Cubi NUC AI+ 2MG | |
| GMK NucBox K12 | |
| Asus NUC 15 Pro+ | |
| GMK EVO-T1 | |
| Average Intel Core Ultra 7 256V, Intel Arc Graphics 140V (4150 - 5483, n=4) | |
| GMK NucBox K13 | |
* ... smaller is better
| PCMark 10 Score | 7702 points | |
Help | ||
| AIDA64 / Memory Copy | |
| MSI Cubi NUC AI+ 2MG | |
| GMK NucBox K13 | |
| Average Intel Core Ultra 7 256V (99227 - 104459, n=7) | |
| Asus NUC 15 Pro+ | |
| GMK EVO-T1 | |
| GMK EVO-T1 | |
| Beelink SER9 Pro | |
| GMK NucBox K12 | |
| AIDA64 / Memory Read | |
| GMK NucBox K13 | |
| Asus NUC 15 Pro+ | |
| Average Intel Core Ultra 7 256V (86352 - 89848, n=7) | |
| MSI Cubi NUC AI+ 2MG | |
| GMK EVO-T1 | |
| GMK EVO-T1 | |
| GMK NucBox K12 | |
| Beelink SER9 Pro | |
| AIDA64 / Memory Write | |
| MSI Cubi NUC AI+ 2MG | |
| Average Intel Core Ultra 7 256V (108692 - 117933, n=7) | |
| GMK NucBox K13 | |
| Beelink SER9 Pro | |
| GMK NucBox K12 | |
| Asus NUC 15 Pro+ | |
| GMK EVO-T1 | |
| GMK EVO-T1 | |
| AIDA64 / Memory Latency | |
| GMK EVO-T1 | |
| GMK EVO-T1 | |
| Asus NUC 15 Pro+ | |
| Beelink SER9 Pro | |
| GMK NucBox K13 | |
| Average Intel Core Ultra 7 256V (96.1 - 99.6, n=7) | |
| MSI Cubi NUC AI+ 2MG | |
| GMK NucBox K12 | |
* ... smaller is better
DPC Latency
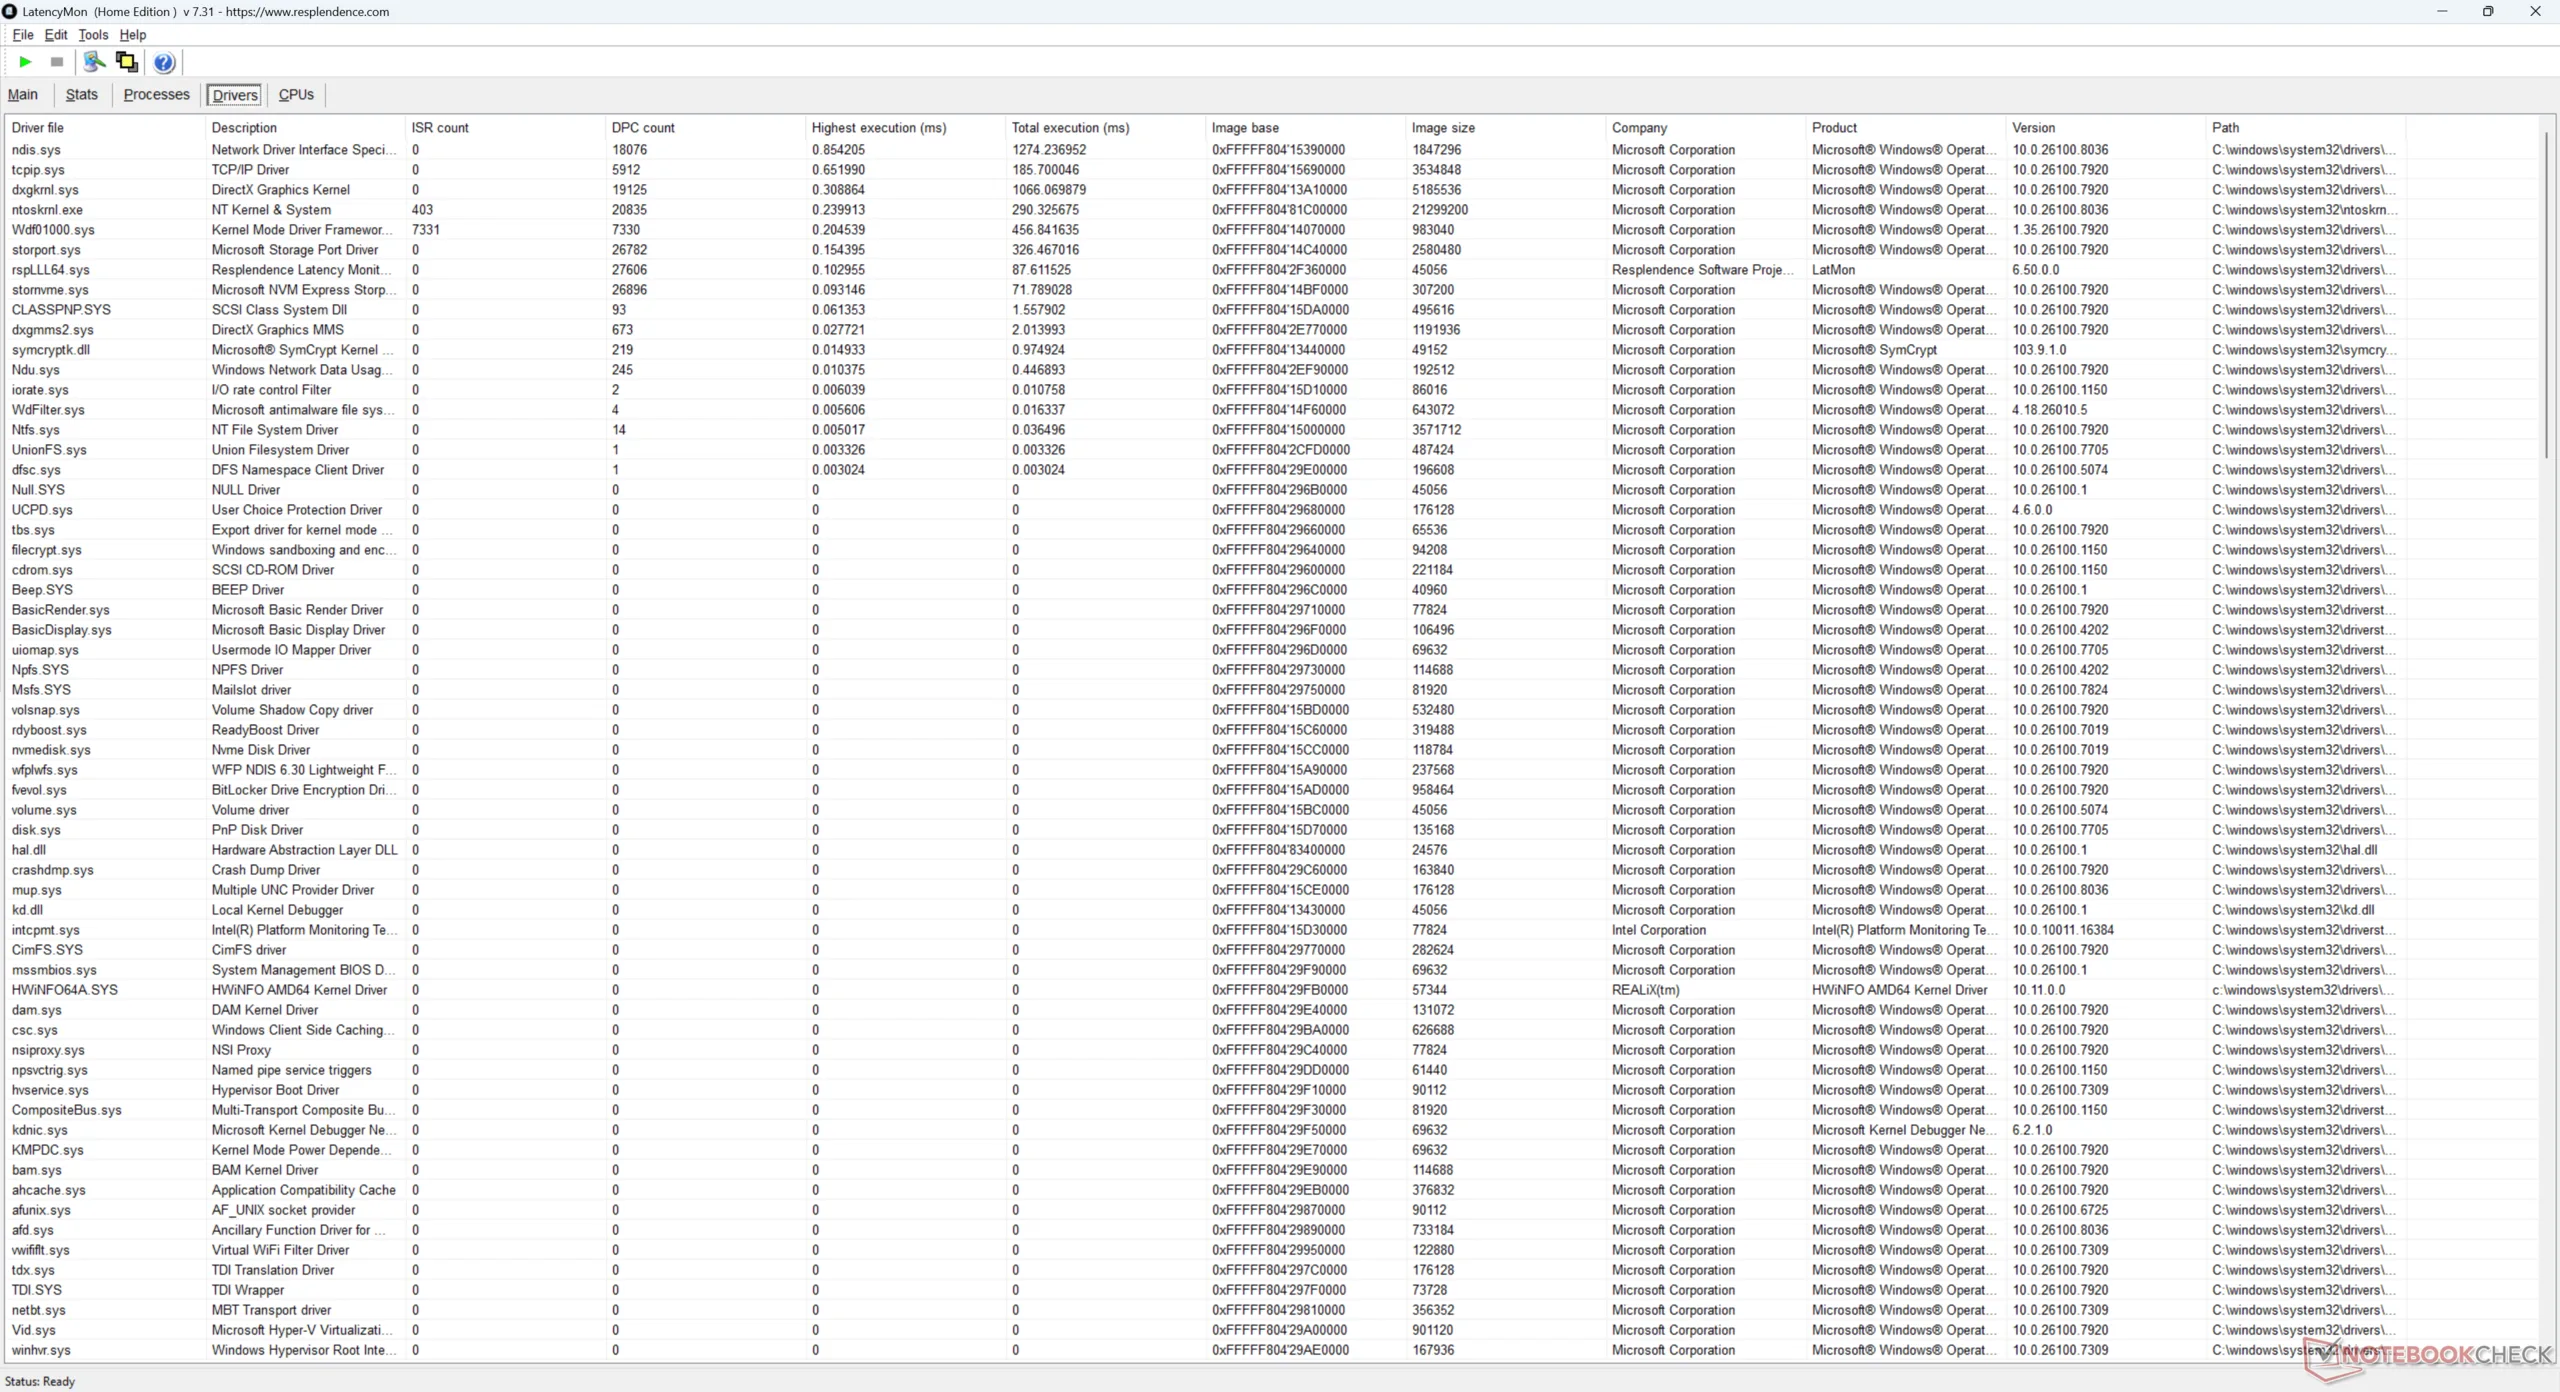
| DPC Latencies / LatencyMon - interrupt to process latency (max), Web, Youtube, Prime95 | |
| GMK NucBox K13 | |
| GMK NucBox K12 | |
| Asus NUC 15 Pro+ | |
| GMK EVO-T1 | |
| MSI Cubi NUC AI+ 2MG | |
| Beelink SER9 Pro | |
* ... smaller is better
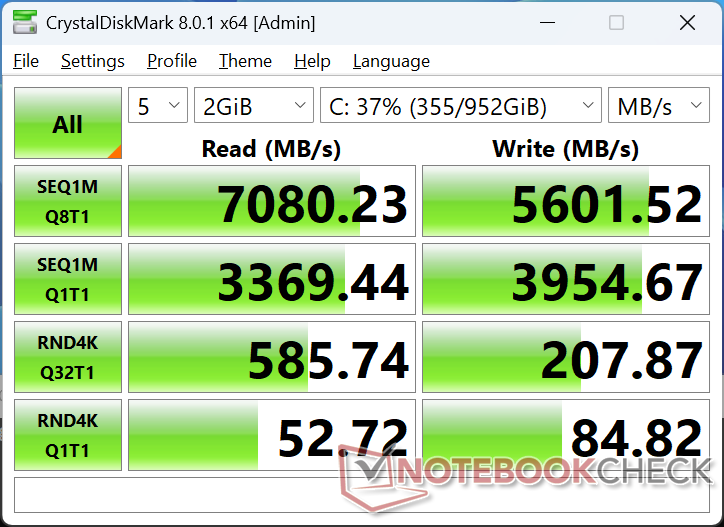
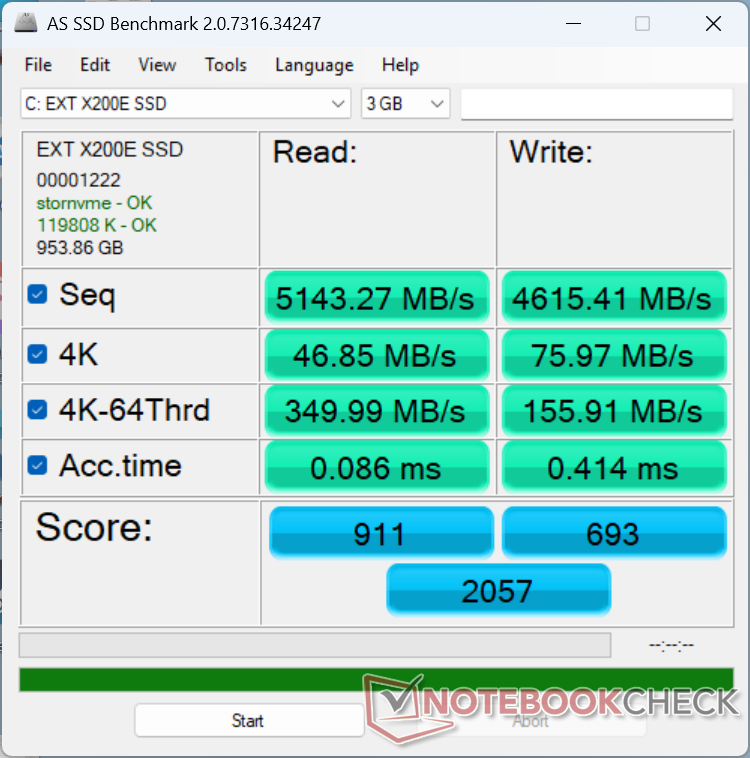
Storage Devices
Transfer rates with the Huawei eKitStor Xtreme 200E top out at 6800 MB/s, but performance would quickly throttle to just 3600 MB/s when stressed as shown by our DiskSpd loop test results below.

| Drive Performance rating - Percent | |
| GMK EVO-T1 | |
| Asus NUC 15 Pro+ | |
| Beelink SER9 Pro | |
| GMK NucBox K12 | |
| MSI Cubi NUC AI+ 2MG | |
| GMK NucBox K13 | |
| Average Huawei eKitStor Xtreme 200e 1 TB | |
* ... smaller is better
Disk Throttling: DiskSpd Read Loop, Queue Depth 8
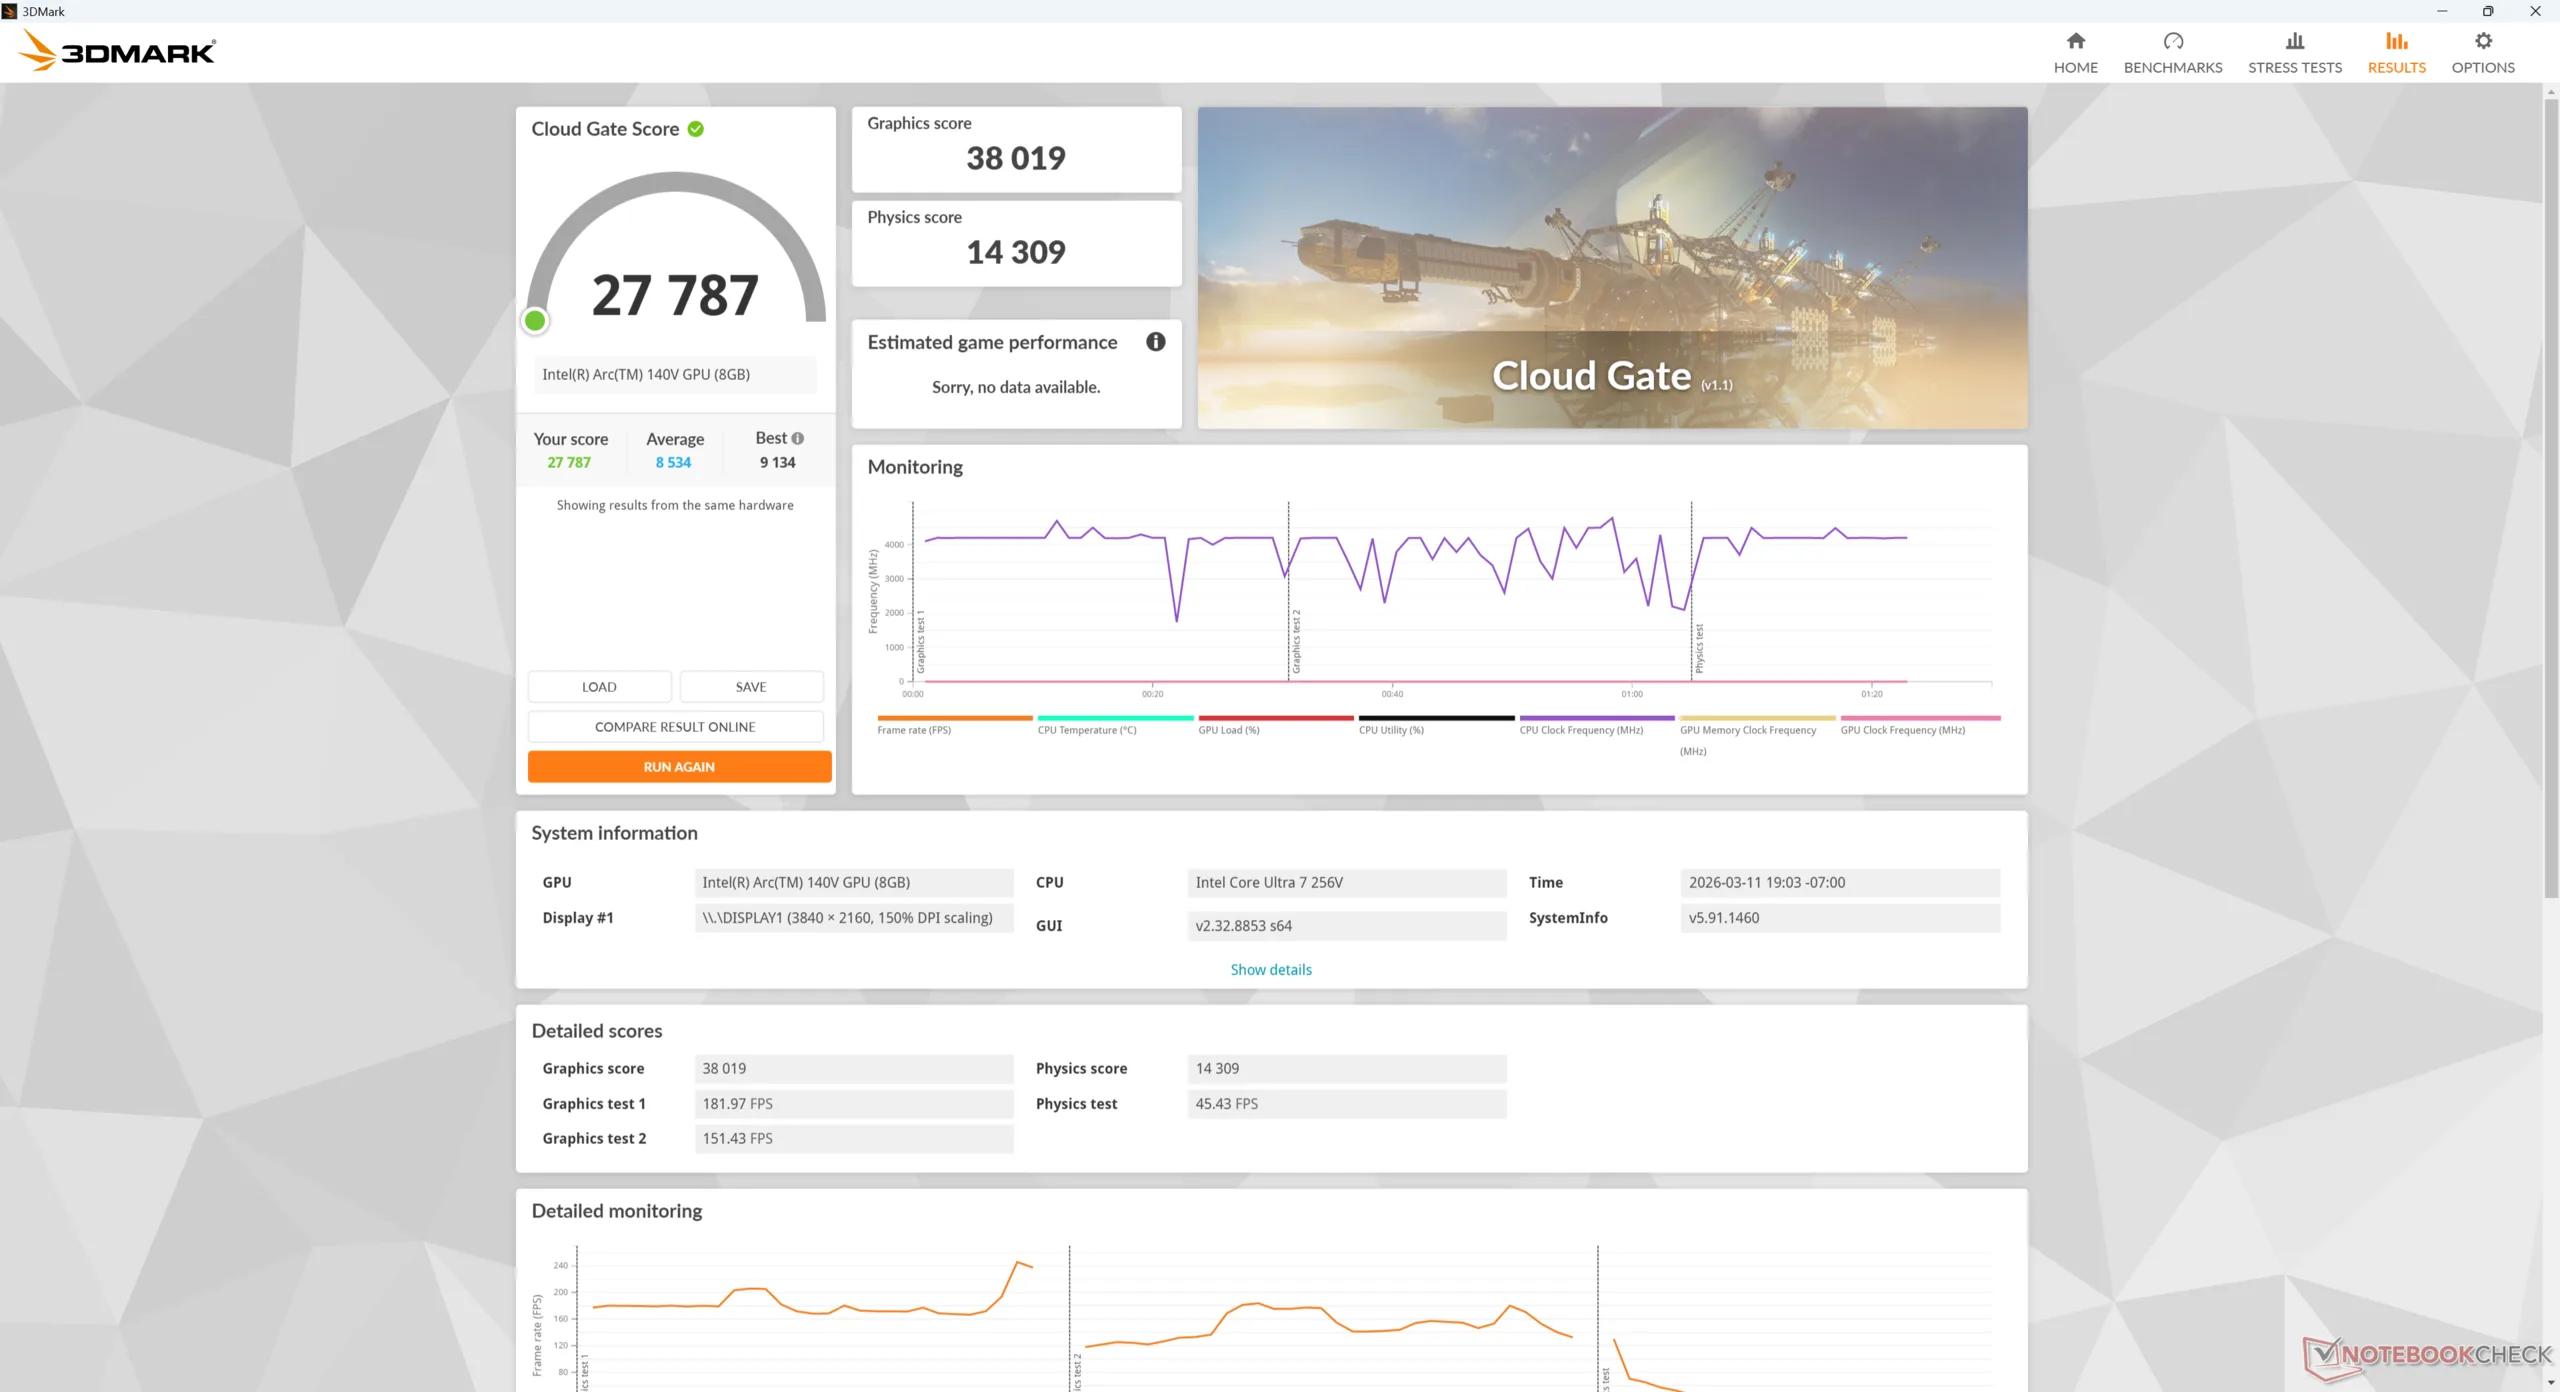
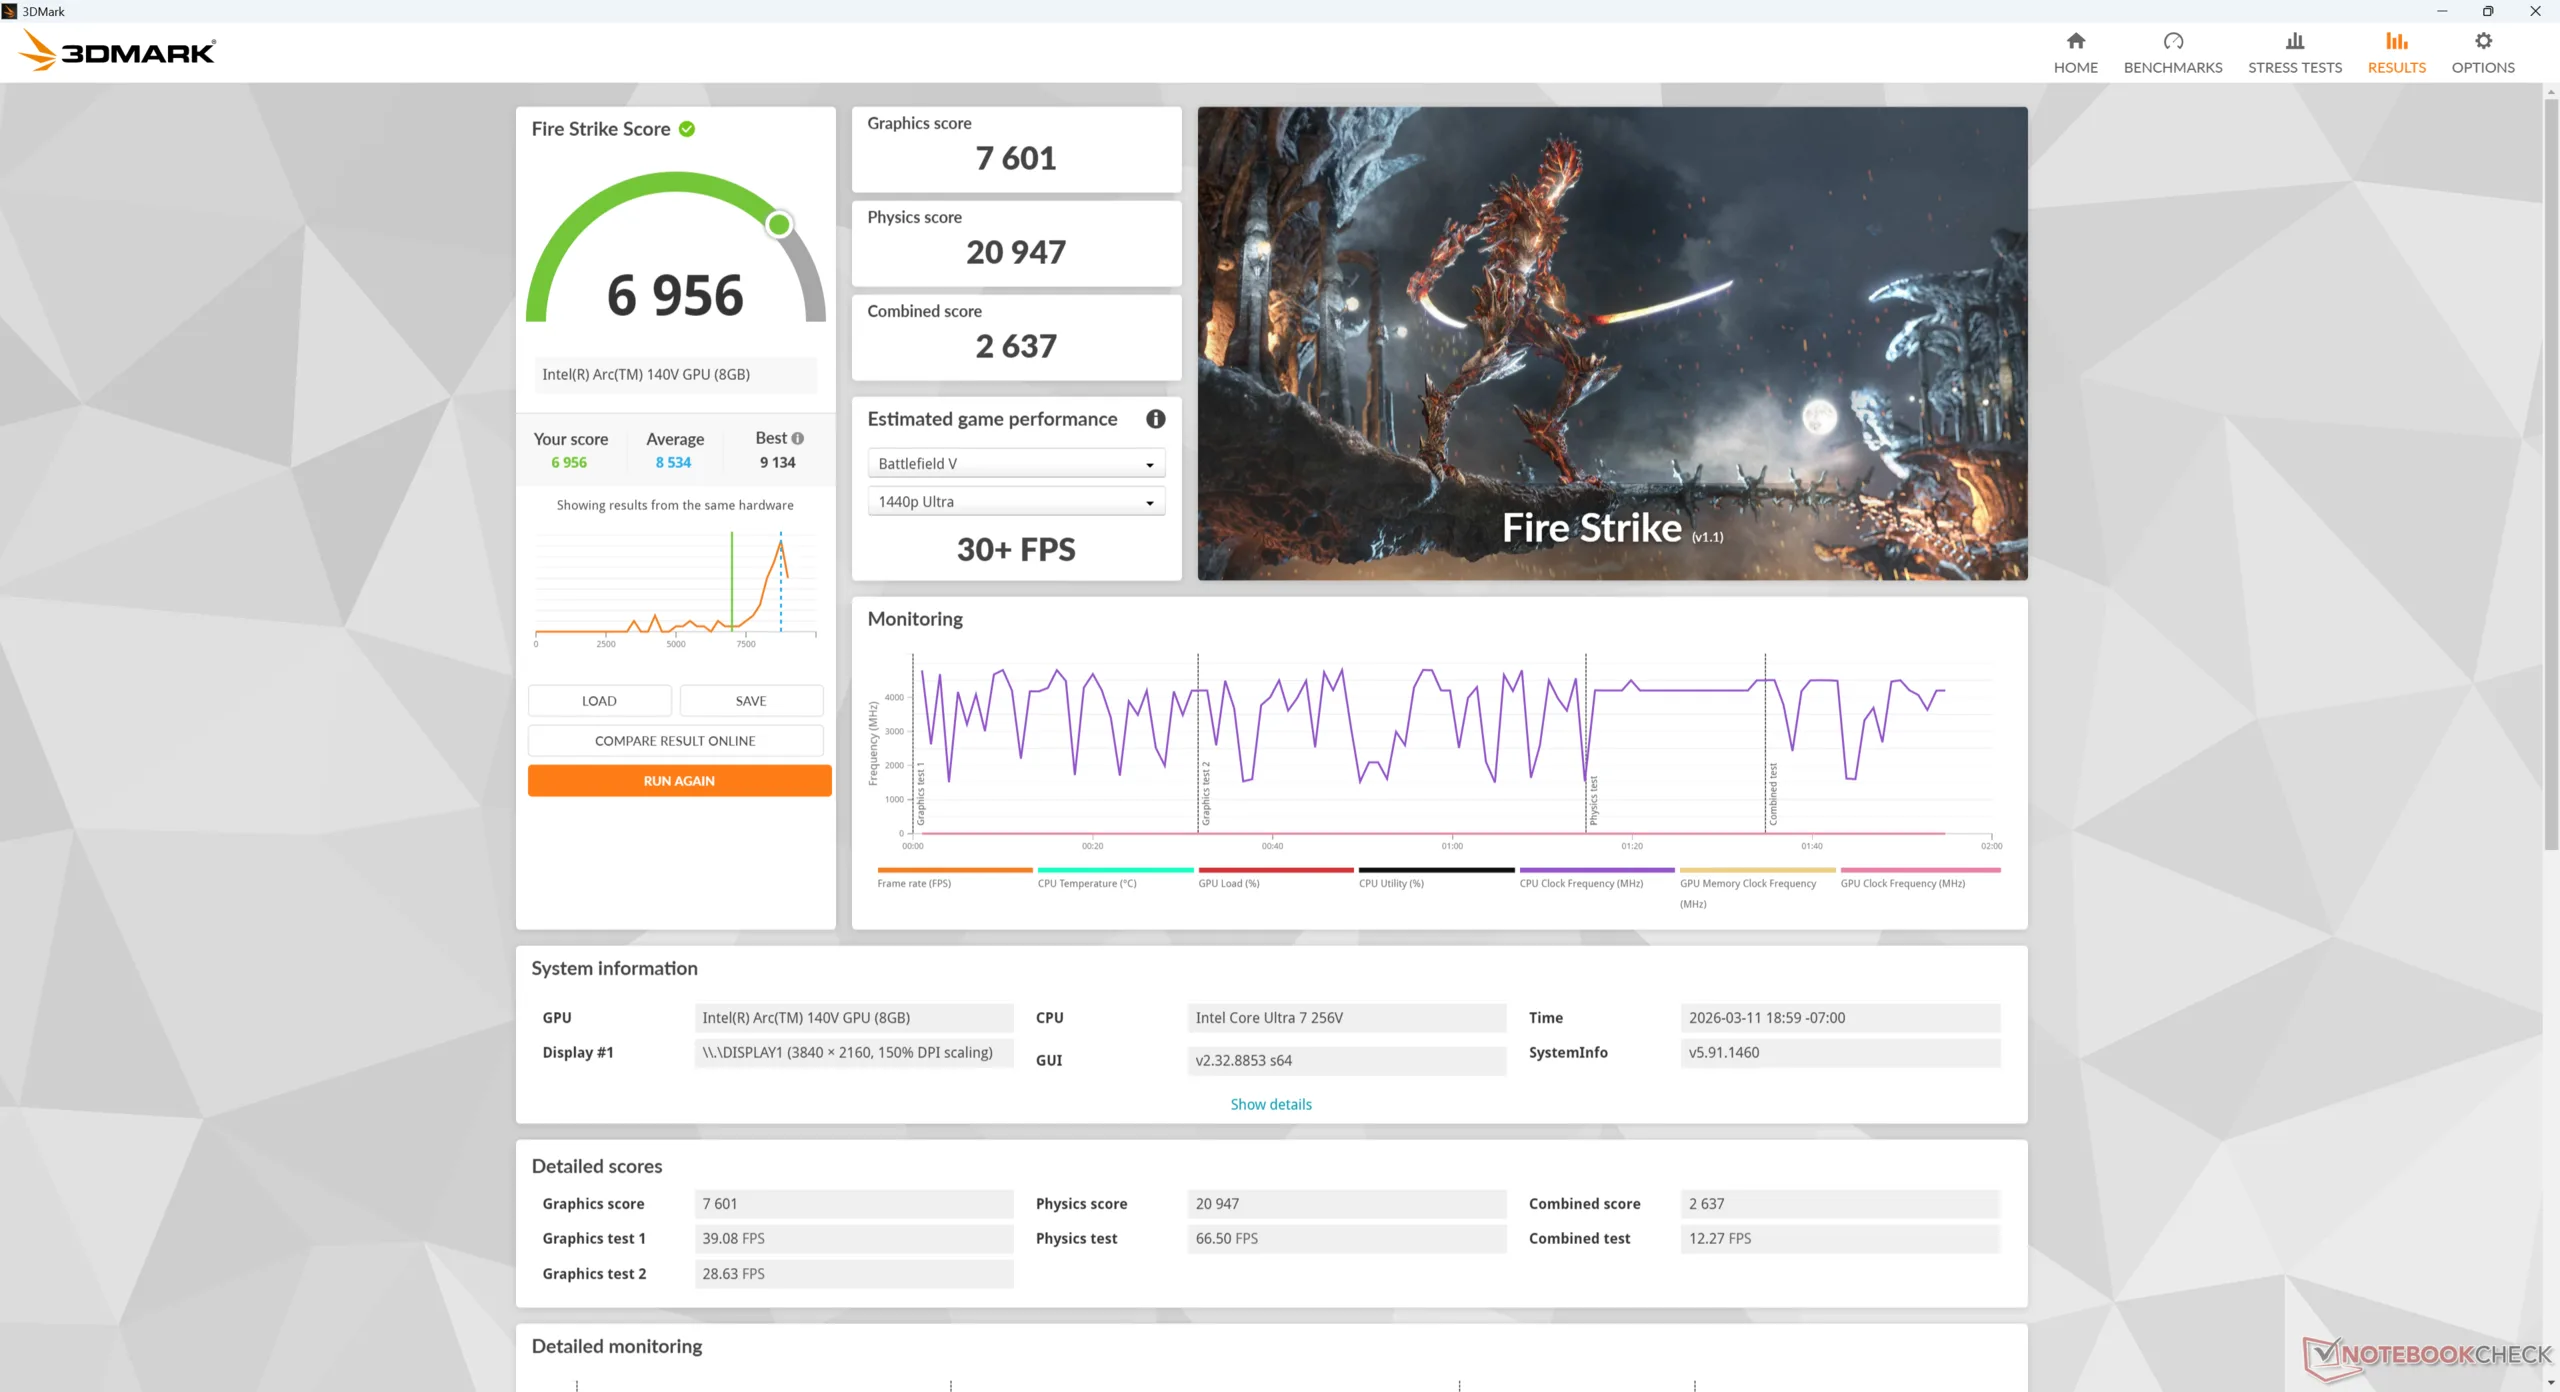
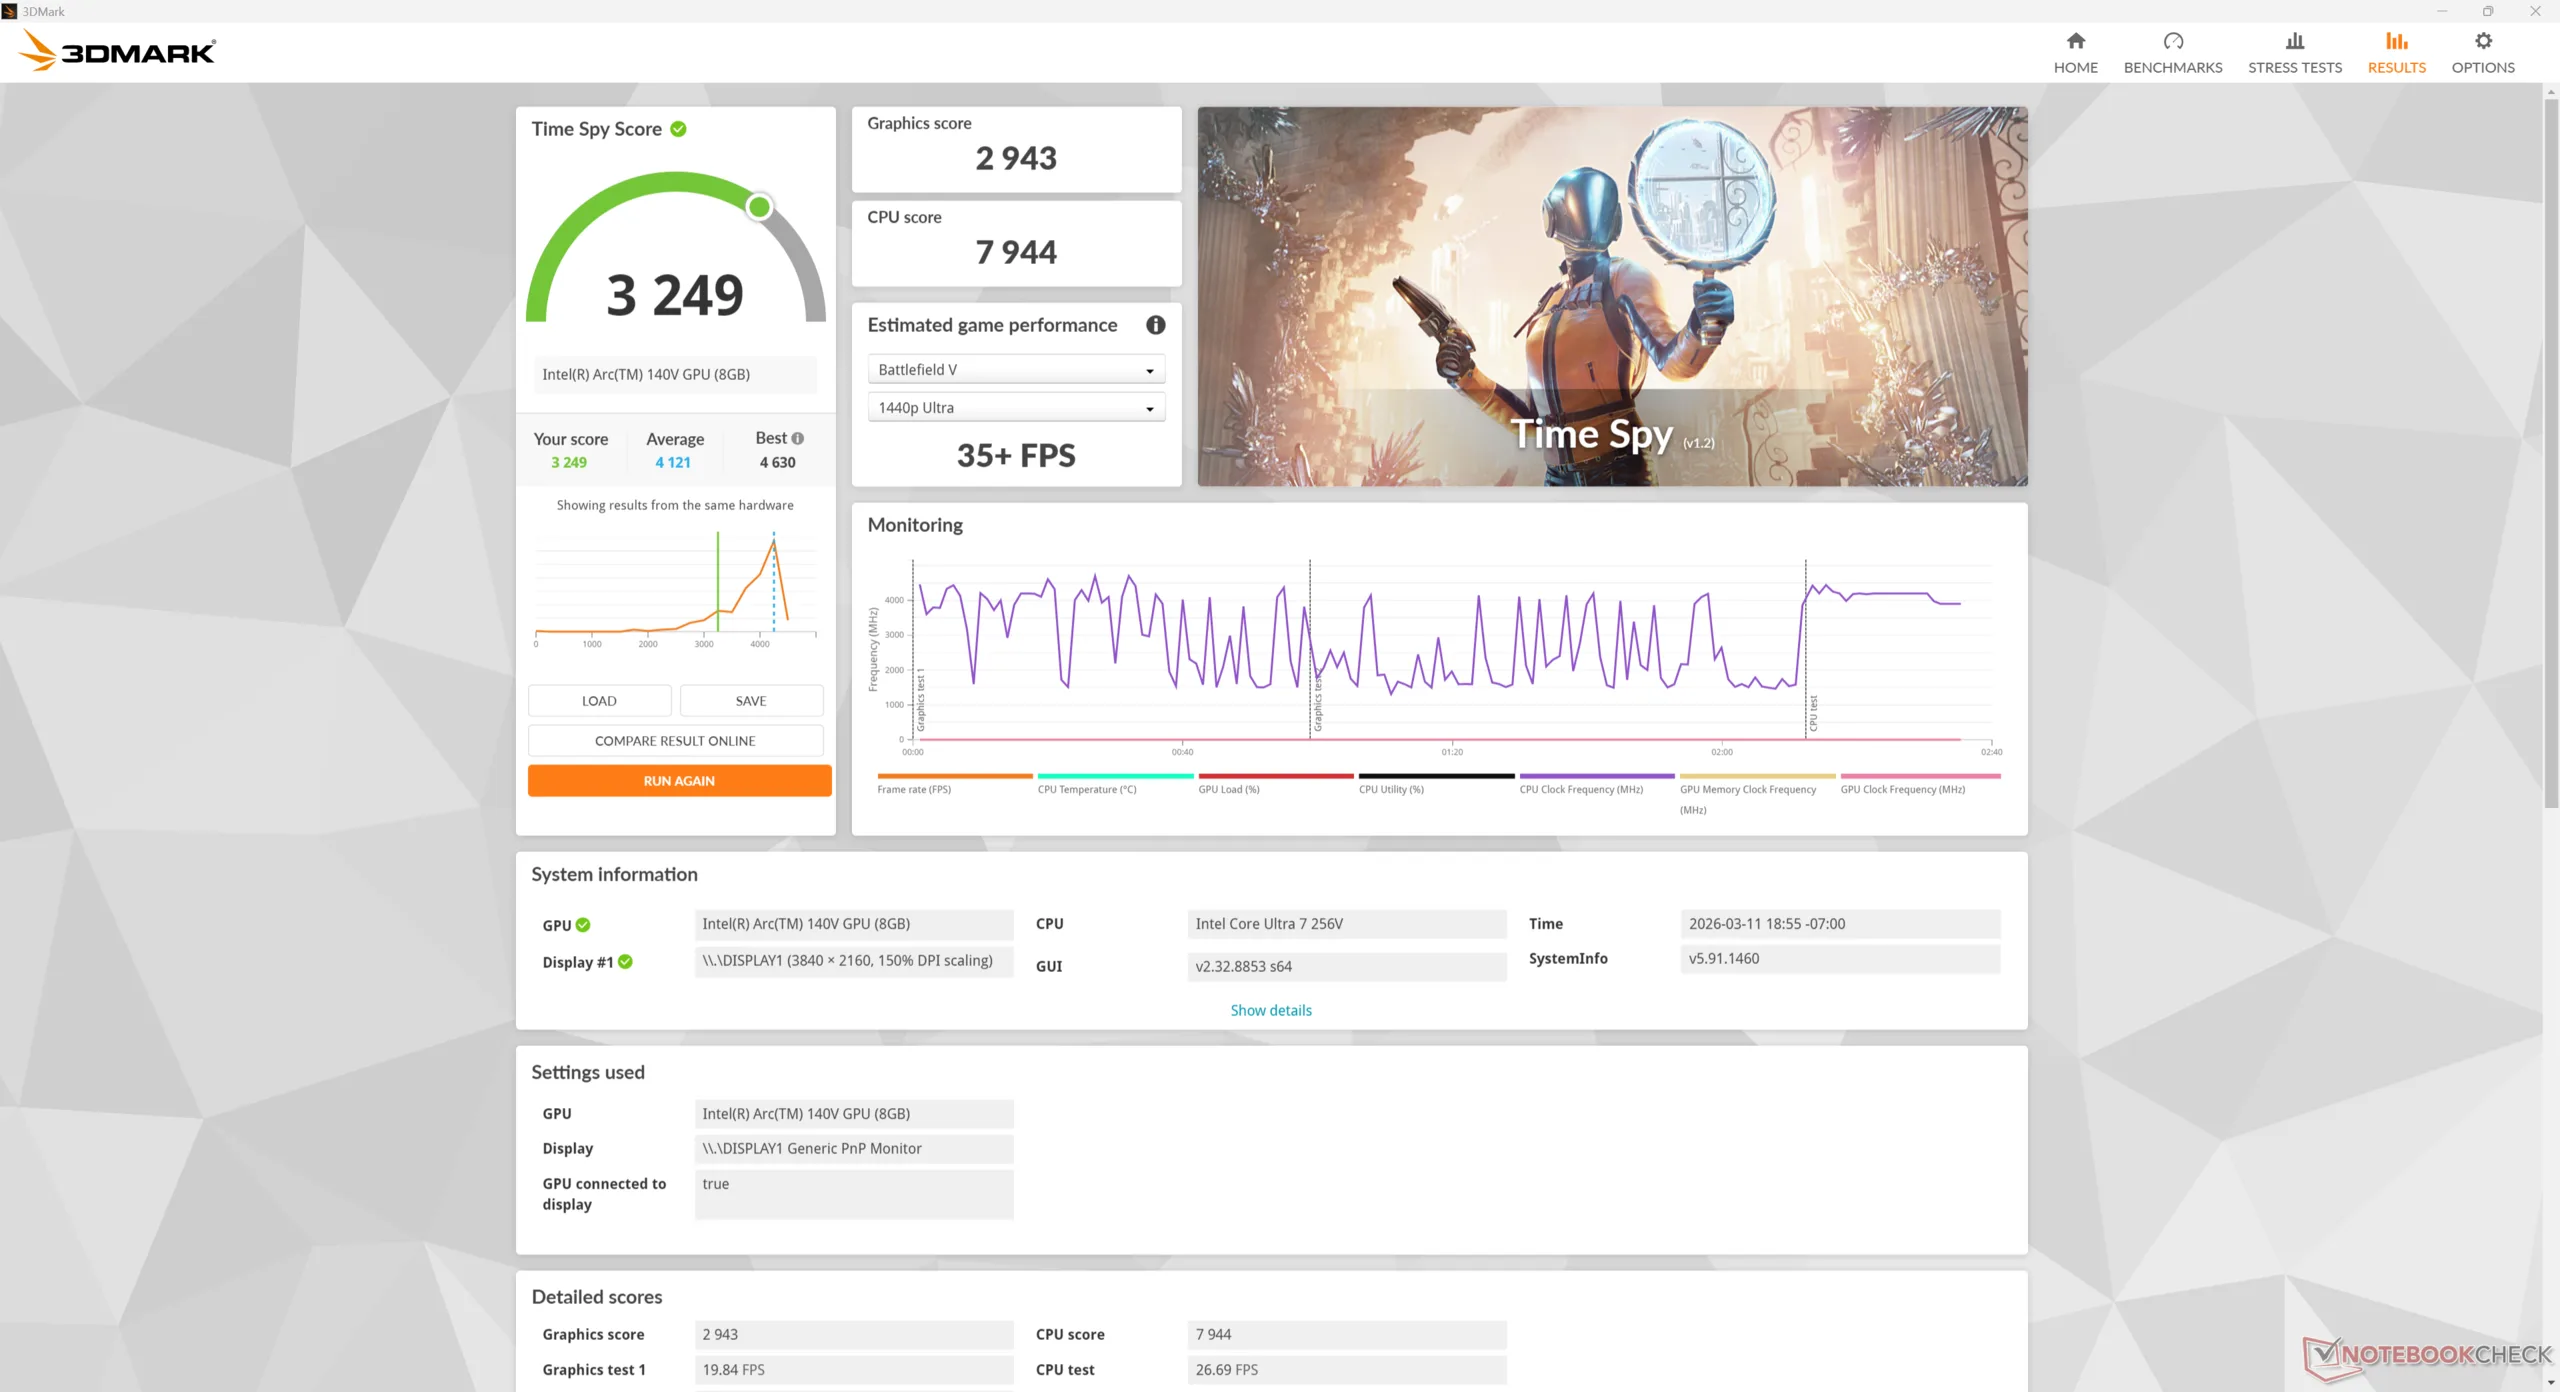
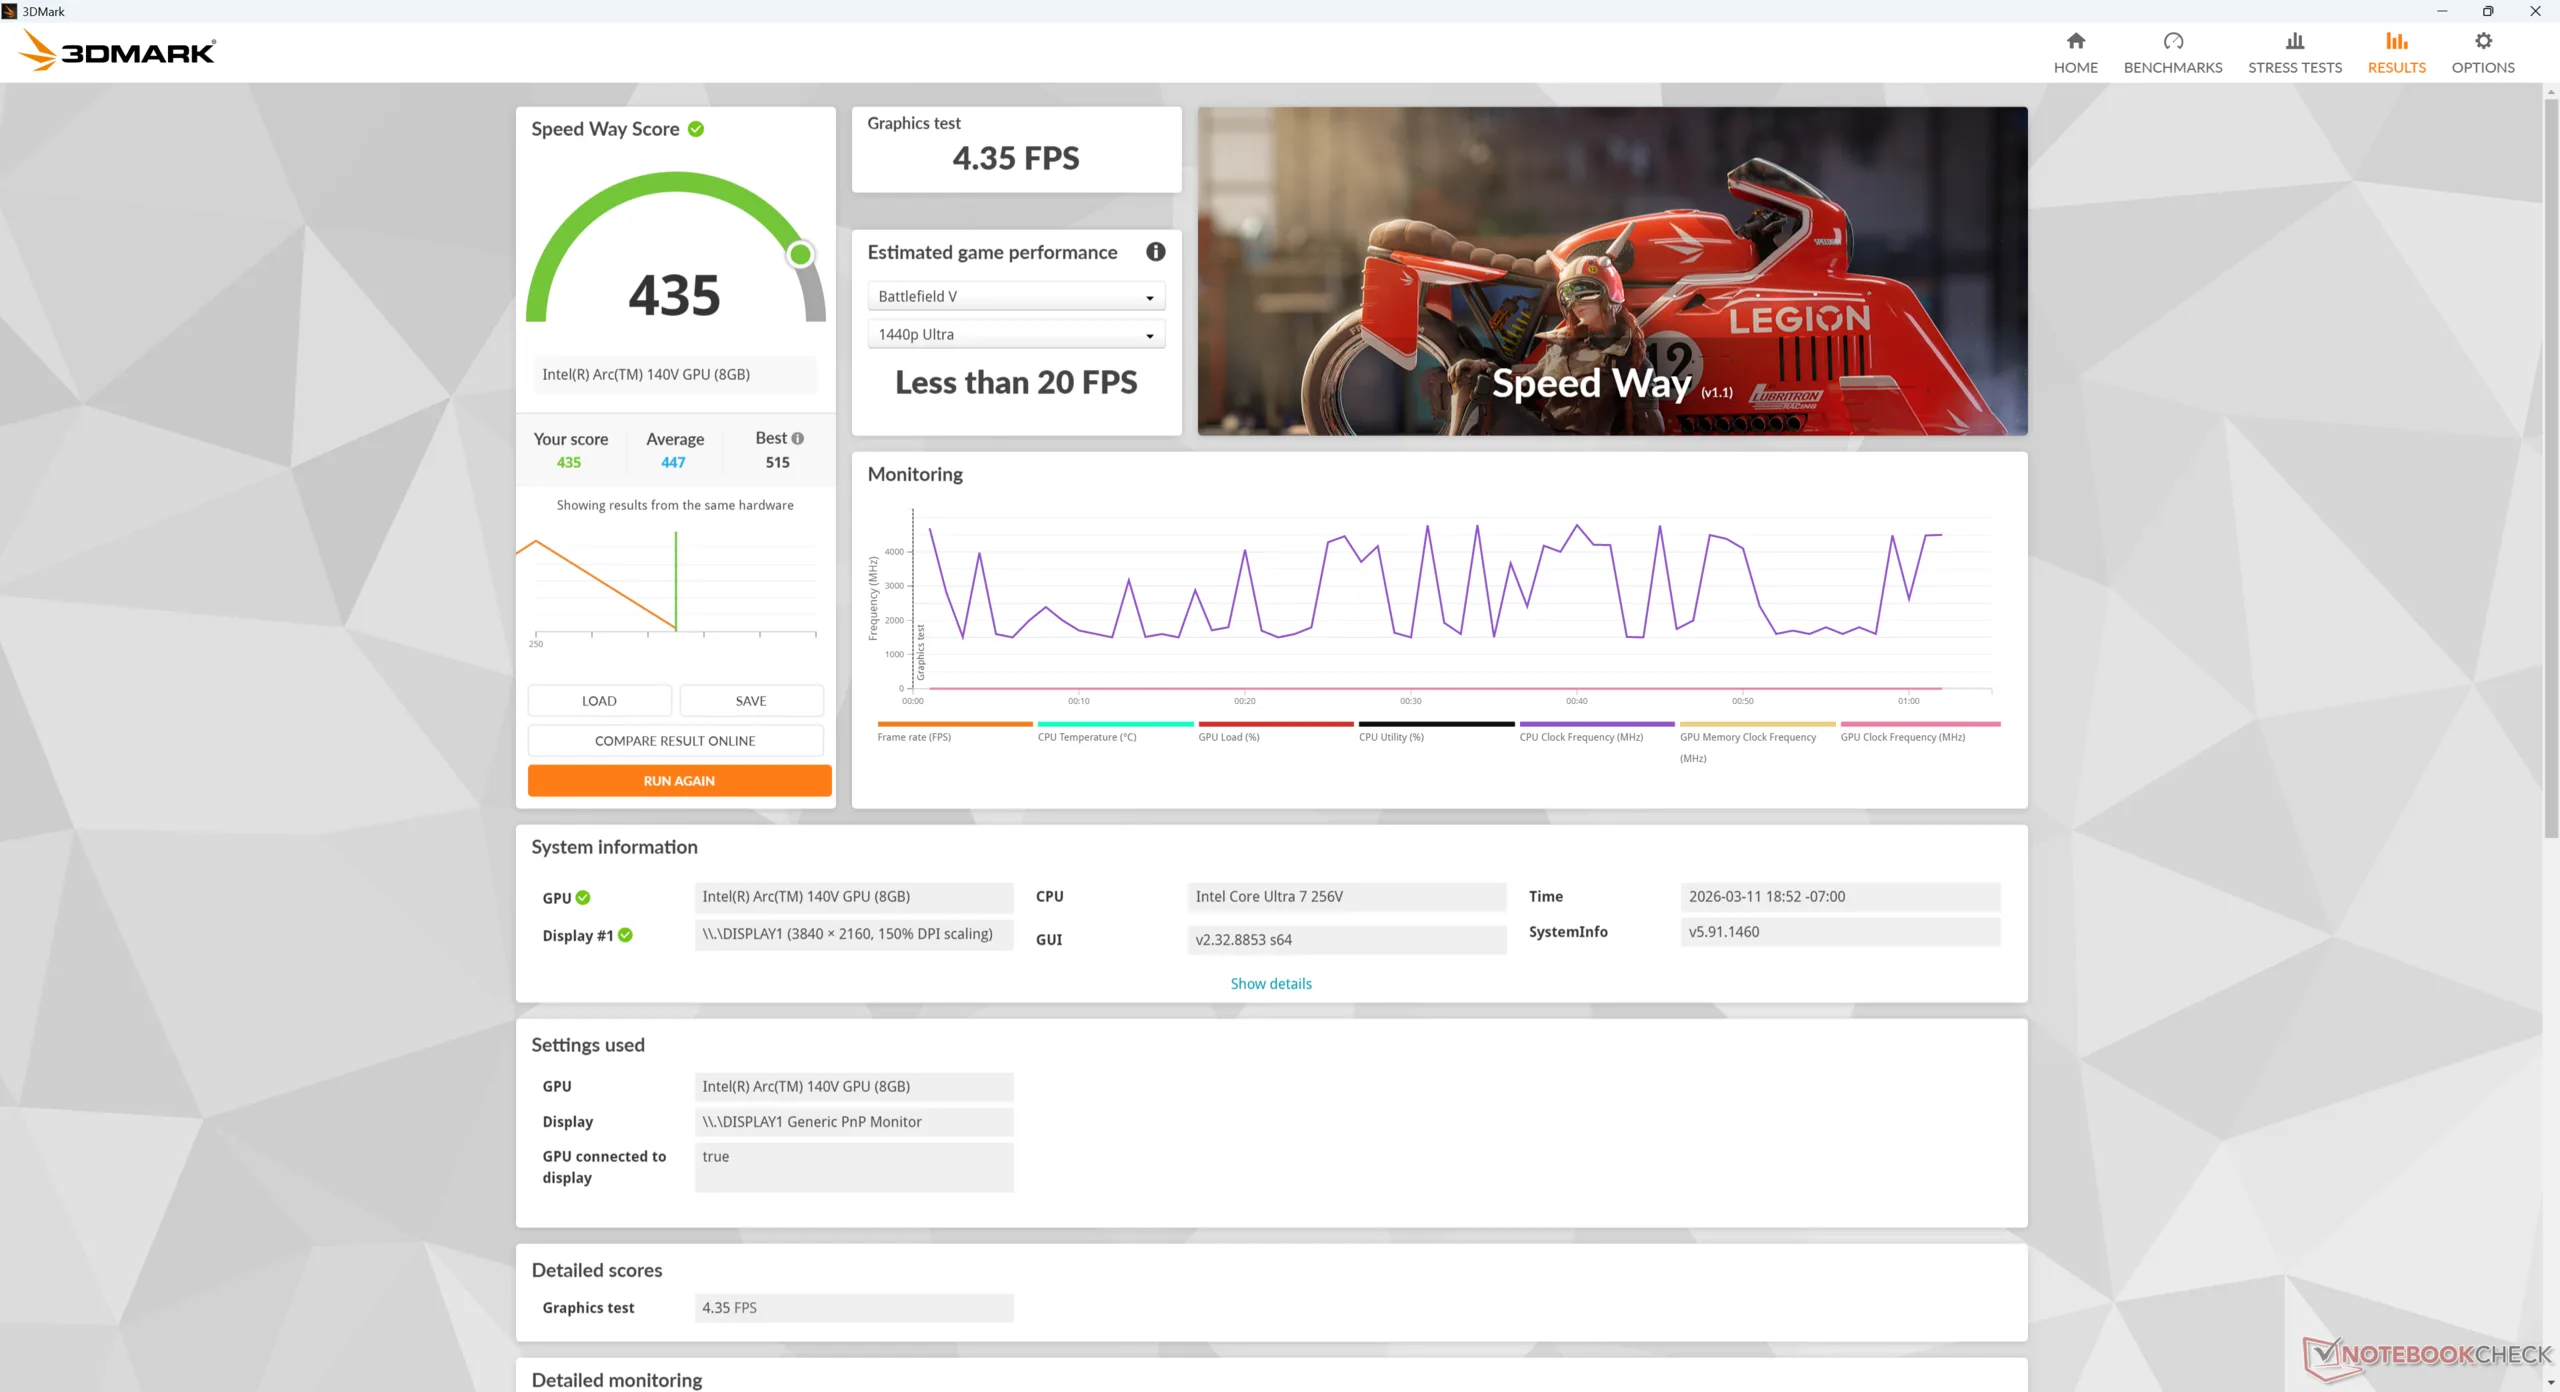
GPU Performance
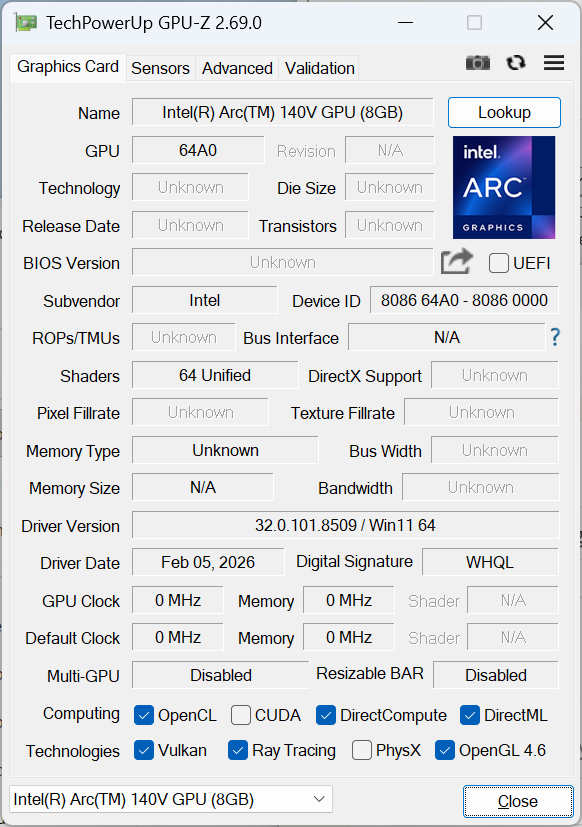
Though still relatively fast for an integrated GPU, the Arc 140V in our GMK is around 15 to 25 percent slower than the average PC in our database with the same iGPU according to 3DMark benchmarks. This unfortunately carries over when running actual games where our GMK would almost consistently perform slightly slower than expected.
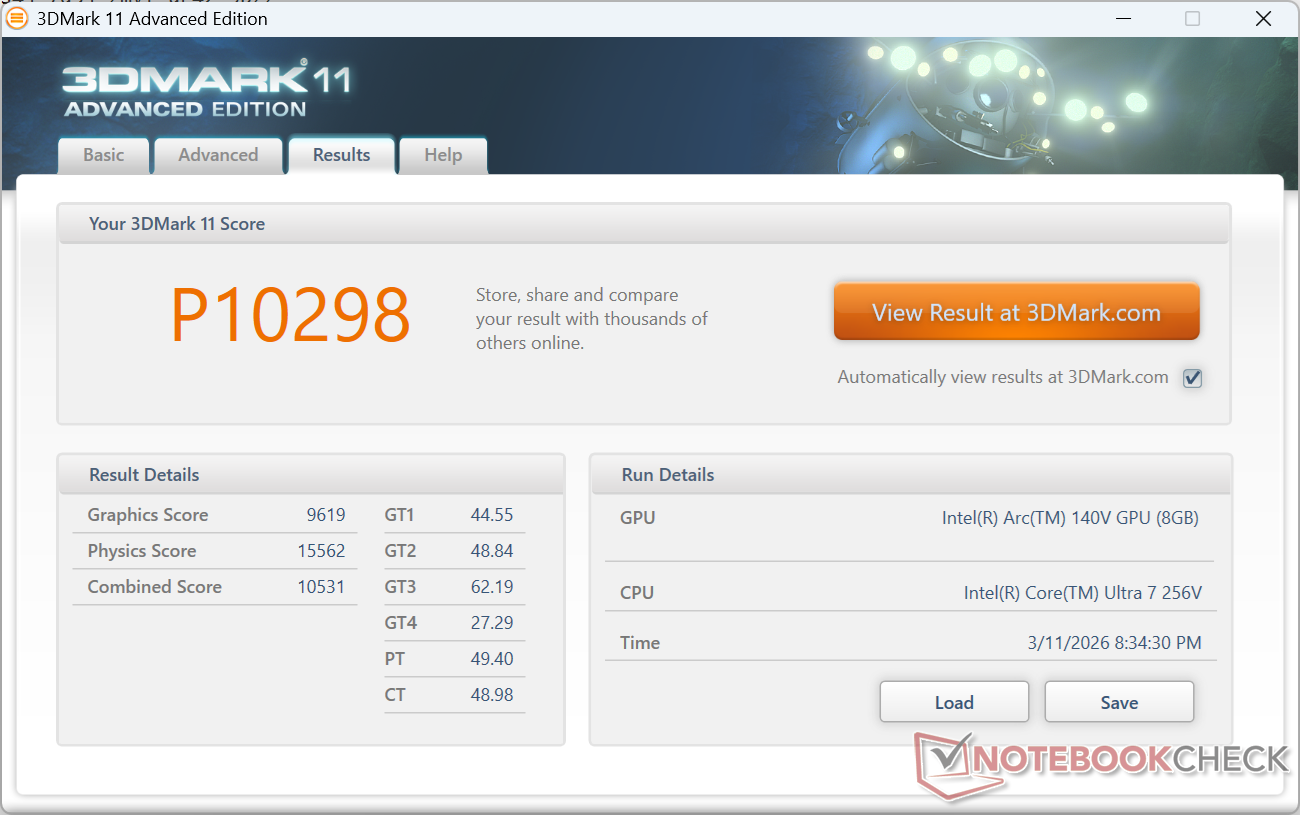
| 3DMark 11 Performance | 10298 points | |
| 3DMark Cloud Gate Standard Score | 27787 points | |
| 3DMark Fire Strike Score | 6956 points | |
| 3DMark Time Spy Score | 3249 points | |
Help | ||
* ... smaller is better
| Performance rating - Percent | |
| Asus NUC 15 Pro+ | |
| Beelink SER9 Pro | |
| GMK NucBox K12 | |
| GMK EVO-T1 -1! | |
| MSI Cubi NUC AI+ 2MG | |
| GMK NucBox K13 | |
| Cyberpunk 2077 - 1920x1080 Ultra Preset (FSR off) | |
| Asus NUC 15 Pro+ | |
| GMK EVO-T1 | |
| GMK NucBox K12 | |
| Beelink SER9 Pro | |
| GMK NucBox K13 | |
| MSI Cubi NUC AI+ 2MG | |
| Baldur's Gate 3 - 1920x1080 Ultra Preset AA:T | |
| Beelink SER9 Pro | |
| GMK NucBox K12 | |
| MSI Cubi NUC AI+ 2MG | |
| Asus NUC 15 Pro+ | |
| GMK NucBox K13 | |
| GMK EVO-T1 | |
| GTA V - 1920x1080 Highest AA:4xMSAA + FX AF:16x | |
| Beelink SER9 Pro | |
| GMK NucBox K12 | |
| MSI Cubi NUC AI+ 2MG | |
| GMK NucBox K13 | |
| Asus NUC 15 Pro+ | |
| GMK EVO-T1 | |
| Final Fantasy XV Benchmark - 1920x1080 High Quality | |
| GMK EVO-T1 | |
| Asus NUC 15 Pro+ | |
| Beelink SER9 Pro | |
| MSI Cubi NUC AI+ 2MG | |
| GMK NucBox K13 | |
| GMK NucBox K12 | |
| Strange Brigade - 1920x1080 ultra AA:ultra AF:16 | |
| MSI Cubi NUC AI+ 2MG | |
| Asus NUC 15 Pro+ | |
| GMK NucBox K13 | |
| Beelink SER9 Pro | |
| GMK NucBox K12 | |
| Dota 2 Reborn - 1920x1080 ultra (3/3) best looking | |
| Asus NUC 15 Pro+ | |
| GMK NucBox K12 | |
| GMK EVO-T1 | |
| GMK NucBox K13 | |
| Beelink SER9 Pro | |
| MSI Cubi NUC AI+ 2MG | |
| X-Plane 11.11 - 1920x1080 high (fps_test=3) | |
| Asus NUC 15 Pro+ | |
| GMK EVO-T1 | |
| GMK NucBox K12 | |
| Beelink SER9 Pro | |
| MSI Cubi NUC AI+ 2MG | |
| GMK NucBox K13 | |
Cyberpunk 2077 ultra FPS Chart
| low | med. | high | ultra | |
|---|---|---|---|---|
| GTA V (2015) | 164.2 | 157.7 | 57.4 | 22.8 |
| Dota 2 Reborn (2015) | 104.5 | 88.7 | 68.9 | 78.5 |
| Final Fantasy XV Benchmark (2018) | 78.7 | 42.8 | 28.5 | |
| X-Plane 11.11 (2018) | 31.5 | 28.4 | 22.2 | |
| Strange Brigade (2018) | 231 | 83.5 | 65.8 | 54.5 |
| Baldur's Gate 3 (2023) | 36.6 | 30.6 | 26.5 | 25.8 |
| Cyberpunk 2077 (2023) | 38.4 | 30.2 | 23.7 | 21.7 |
| F1 24 (2024) | 76.8 | 78.4 | 58.7 | 17.2 |
Emissions
System Noise
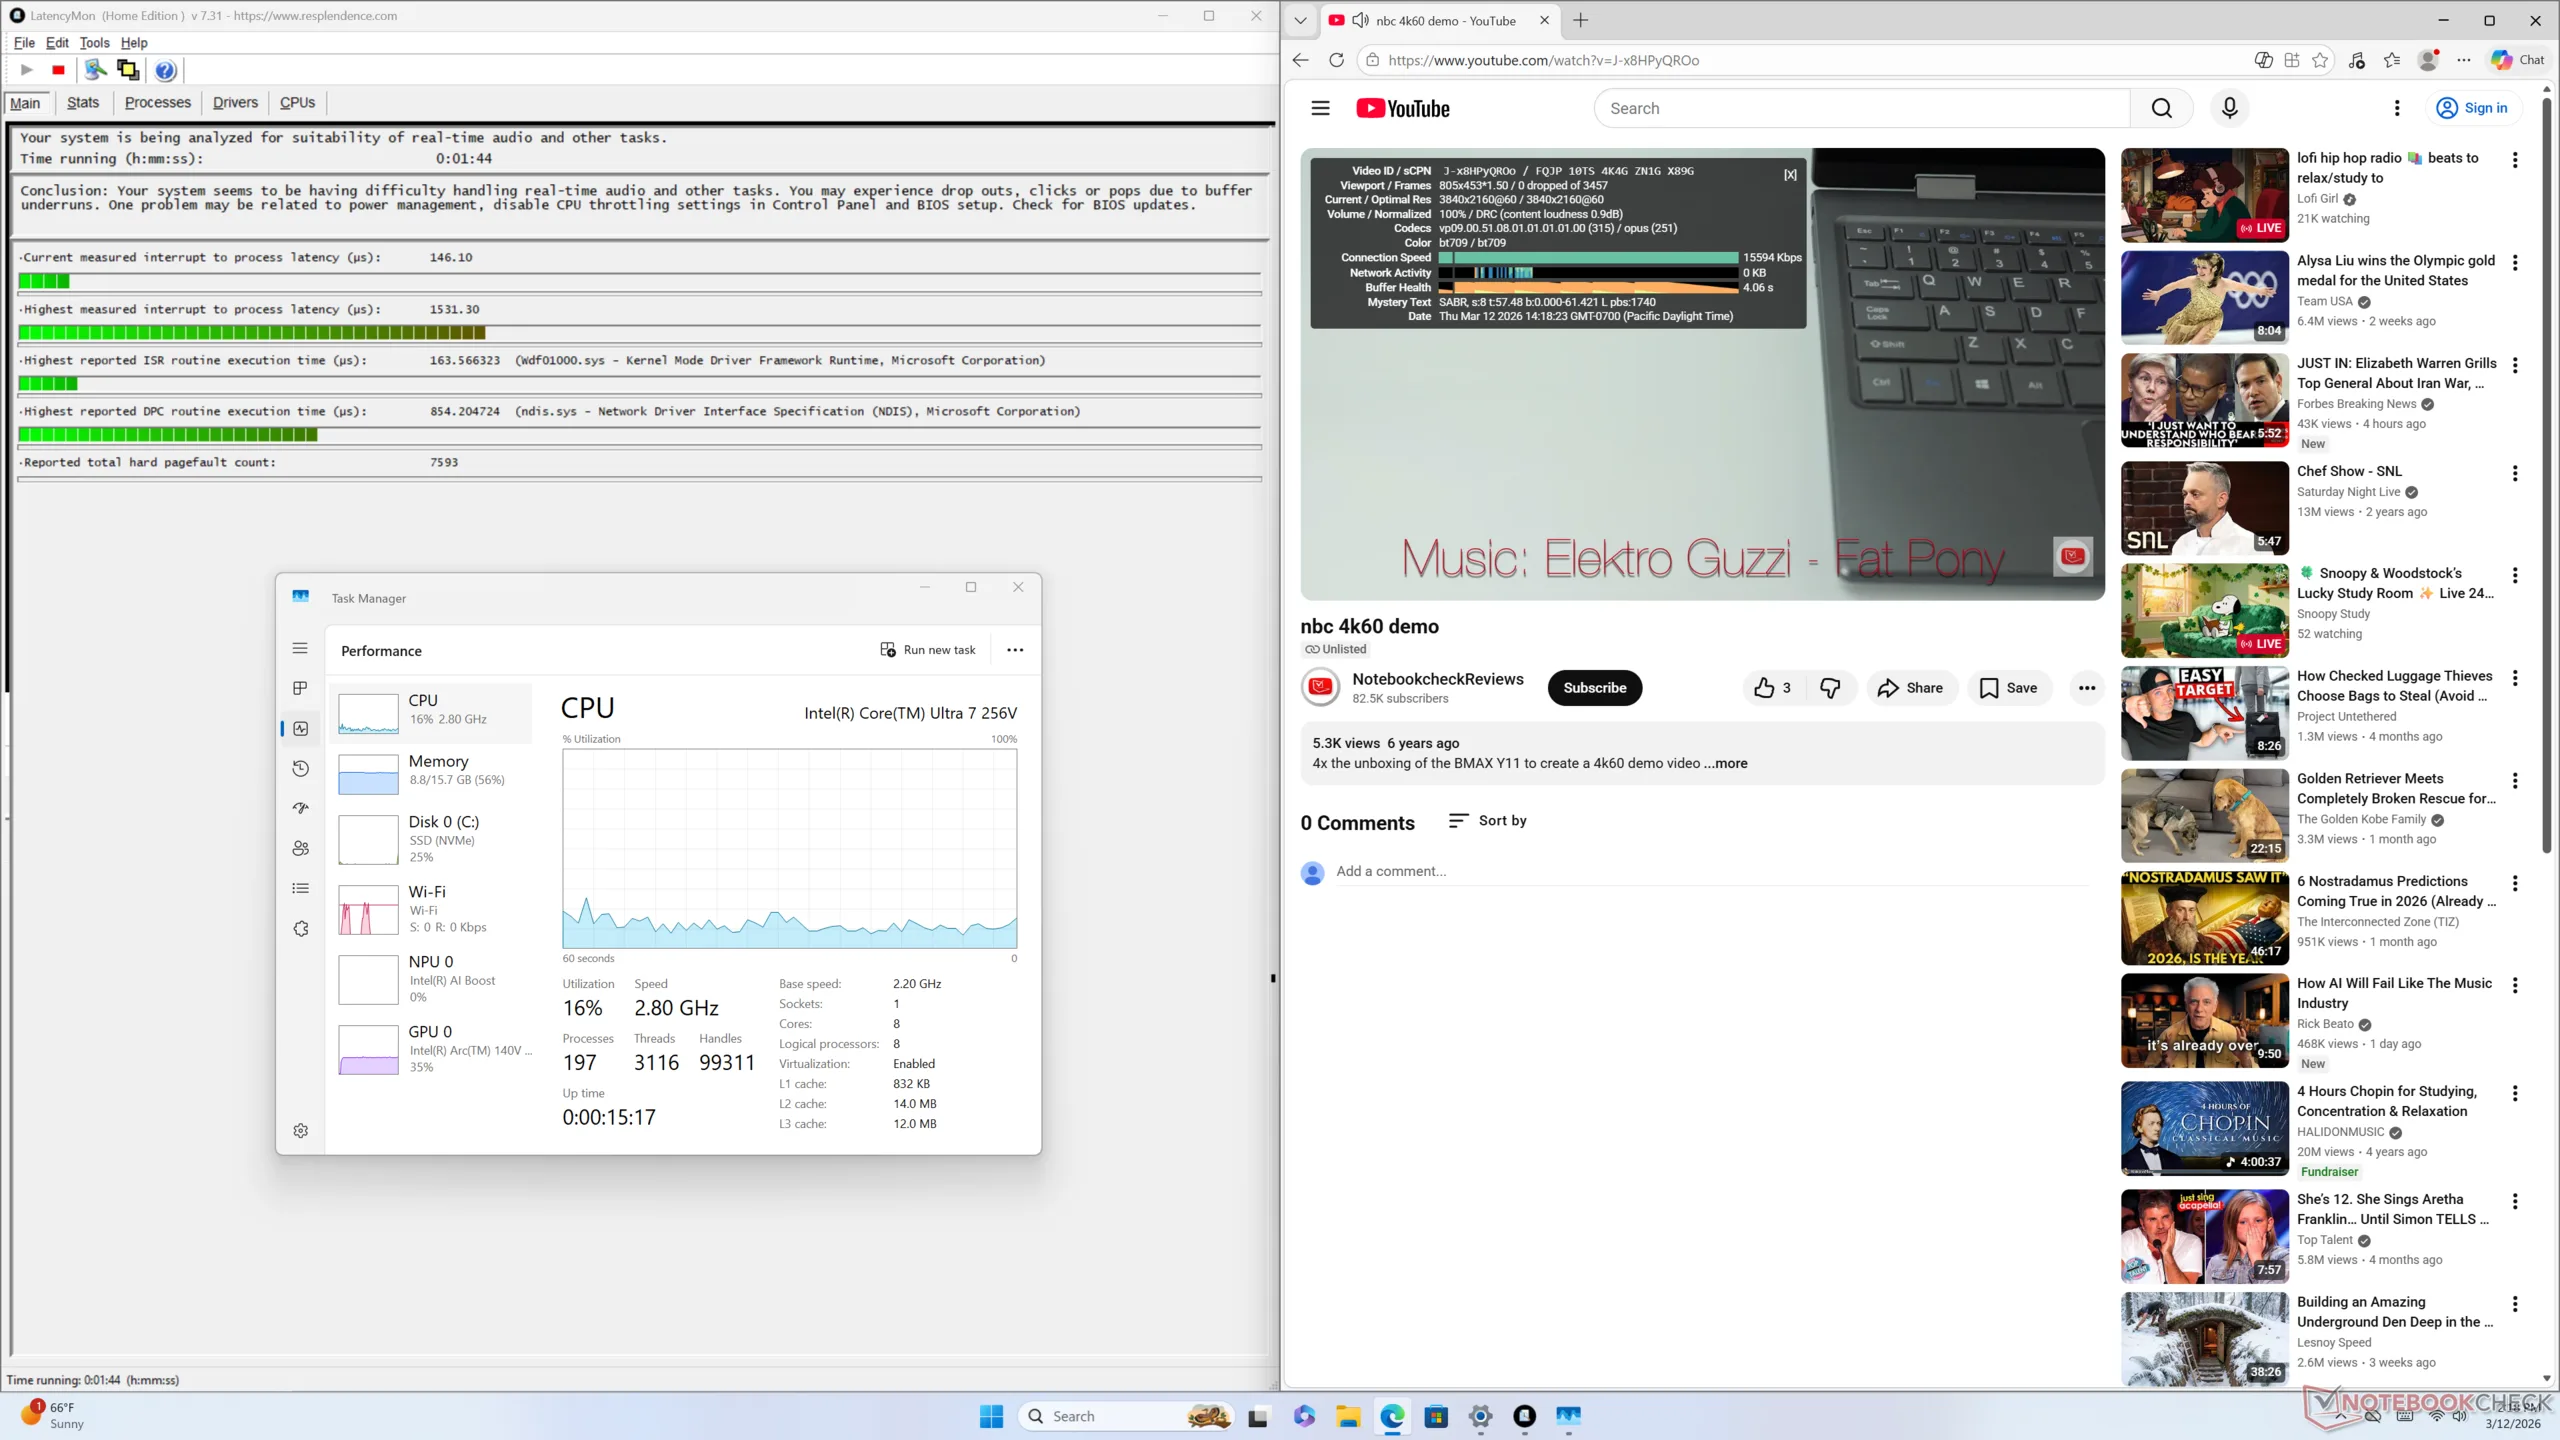
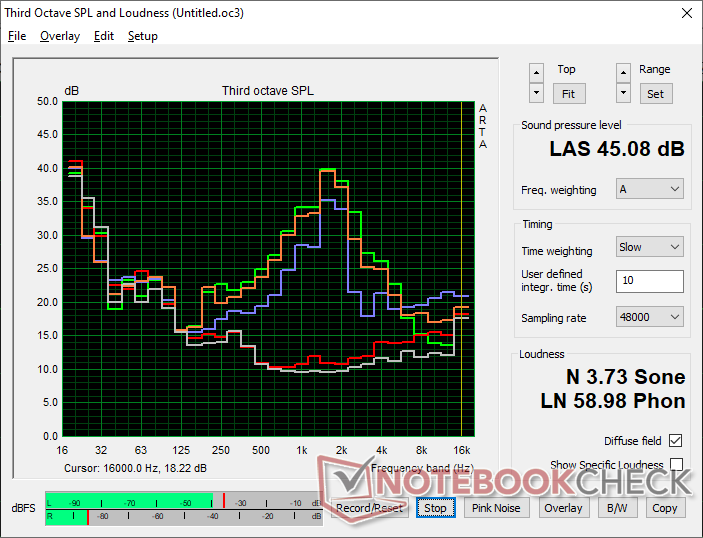
Fan noise is a mixed bag. While the system is generally quiet when web browsing or running other undemanding loads, fan noise would pick up rather quickly to over 40 dB(A) when running more intense applications such as games. Furthermore, the fan is high-pitched as shown by our sharp graph below which means any RPM changes will be more noticeable to the ears.
Noise level
| Idle |
| 24.5 / 25 / 25.1 dB(A) |
| Load |
| 40.1 / 45.1 dB(A) |
 | ||
30 dB silent 40 dB(A) audible 50 dB(A) loud |
||
min: | ||
| GMK NucBox K13 Core Ultra 7 256V, Arc 140V | GMK NucBox K12 Ryzen 7 H 255, Radeon 780M | GMK EVO-T1 Ultra 9 285H, Arc 140T | Beelink SER9 Pro Ryzen 7 H 255, Radeon 780M | Asus NUC 15 Pro+ Ultra 9 285H, Arc 140T | MSI Cubi NUC AI+ 2MG Core Ultra 7 258V, Arc 140V | |
|---|---|---|---|---|---|---|
| Noise | -19% | -34% | -0% | -14% | -14% | |
| off / environment * (dB) | 23.3 | 23.5 -1% | 24.7 -6% | 23 1% | 25.3 -9% | 24.8 -6% |
| Idle Minimum * (dB) | 24.5 | 35.4 -44% | 38.7 -58% | 29.1 -19% | 25.4 -4% | 28 -14% |
| Idle Average * (dB) | 25 | 35.4 -42% | 38.8 -55% | 30.1 -20% | 25.5 -2% | 36.1 -44% |
| Idle Maximum * (dB) | 25.1 | 39 -55% | 38.9 -55% | 31.7 -26% | 37.3 -49% | 36.1 -44% |
| Load Average * (dB) | 40.1 | 42.4 -6% | 51.6 -29% | 33.7 16% | 44.4 -11% | 38.9 3% |
| Cyberpunk 2077 ultra * (dB) | 44.2 | 40.4 9% | 52 -18% | 33.8 24% | 46.2 -5% | 37 16% |
| Load Maximum * (dB) | 45.1 | 41.4 8% | 51.6 -14% | 35.2 22% | 52.7 -17% | 49.2 -9% |
| Witcher 3 ultra * (dB) | 38.7 | 47.7 |
* ... smaller is better
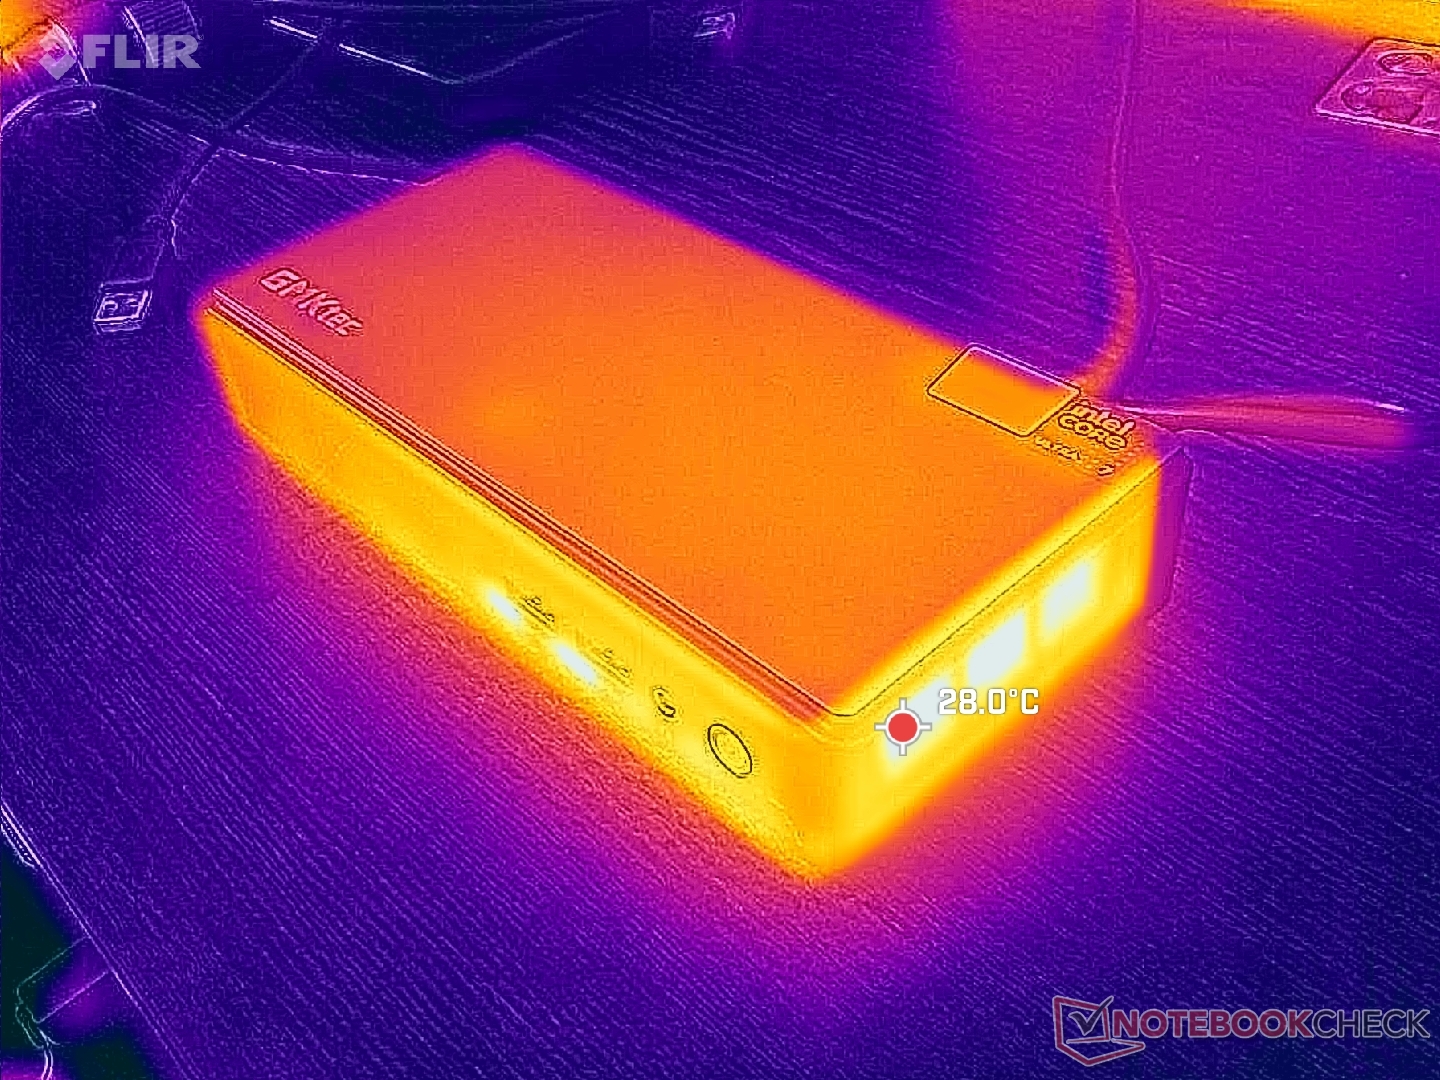
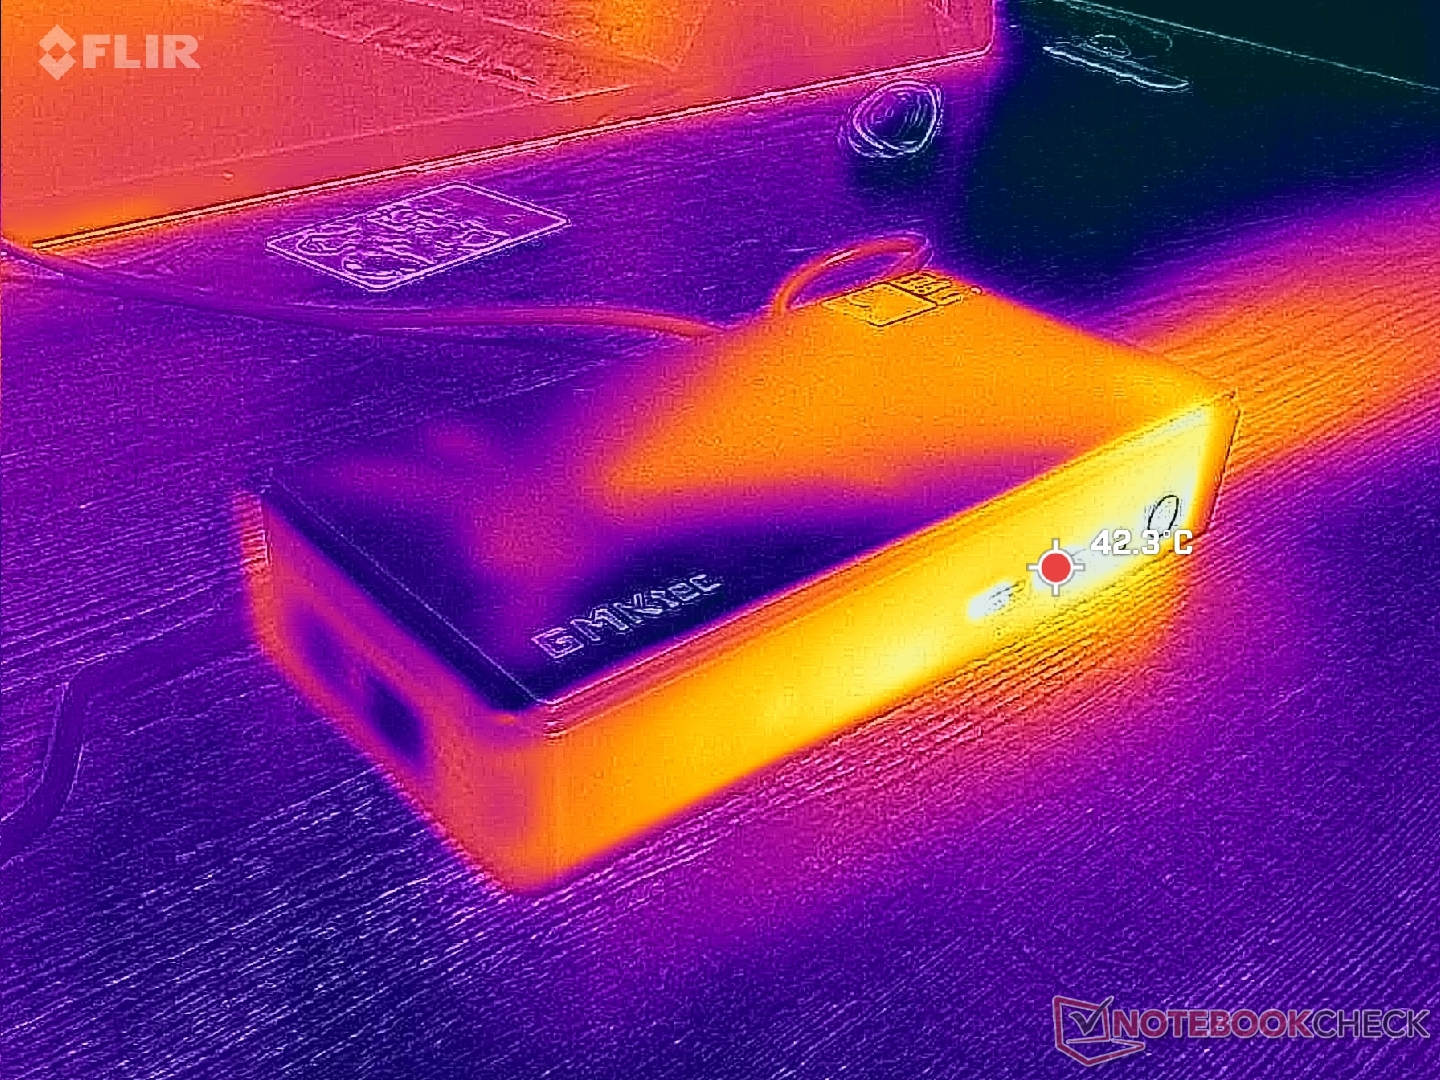
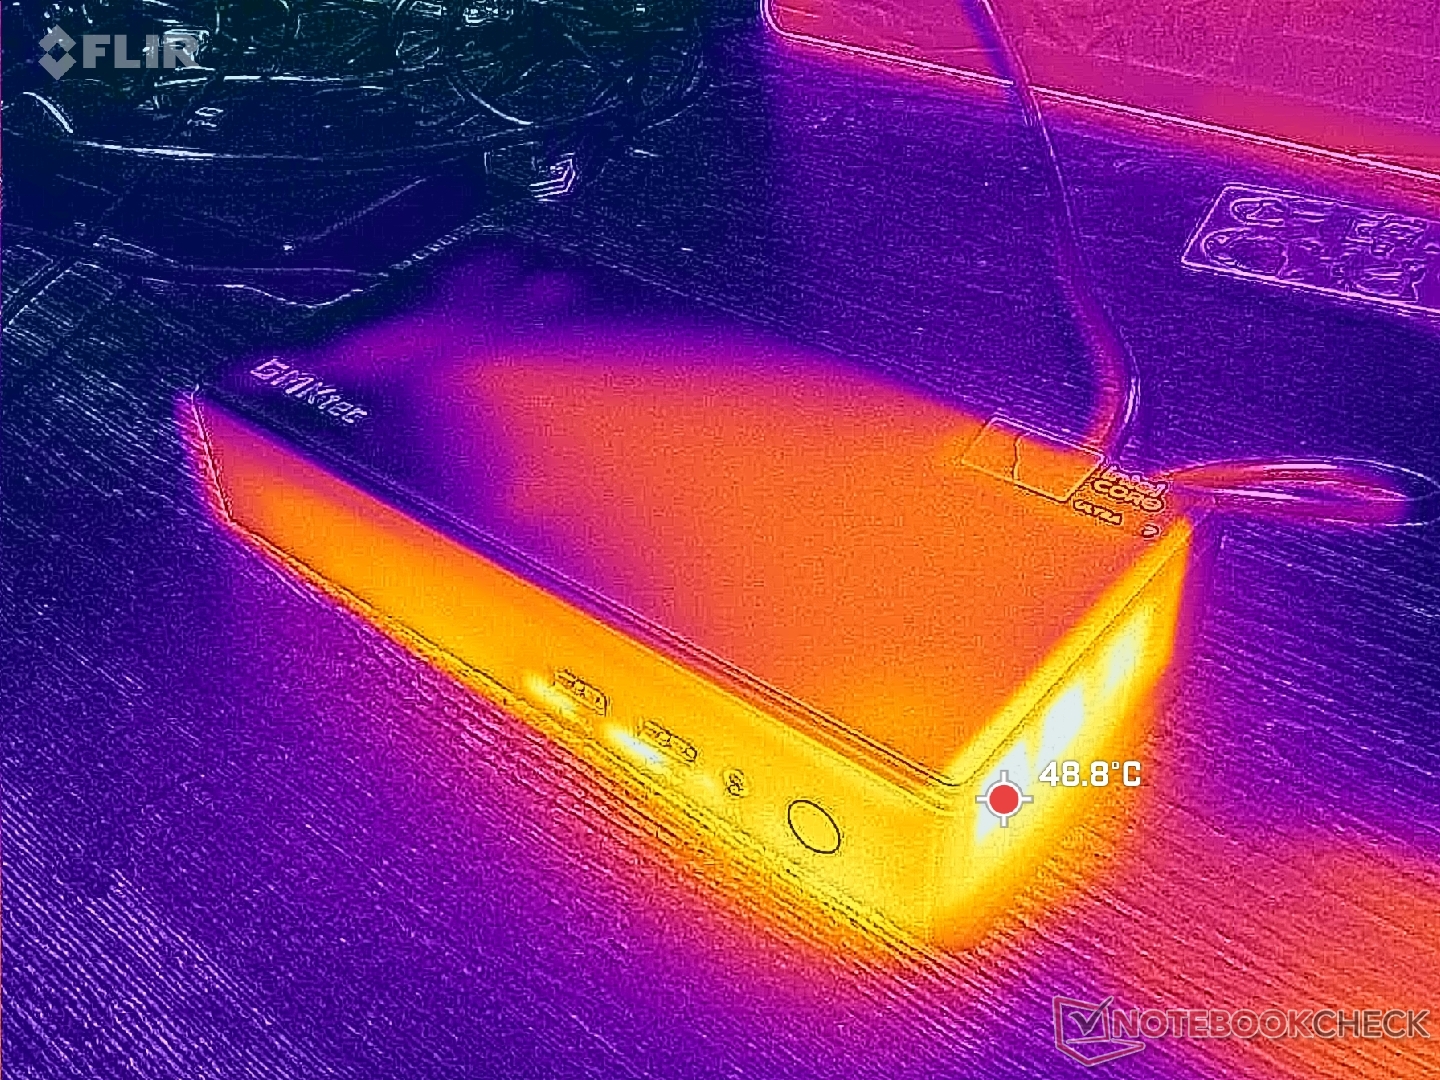
Temperature
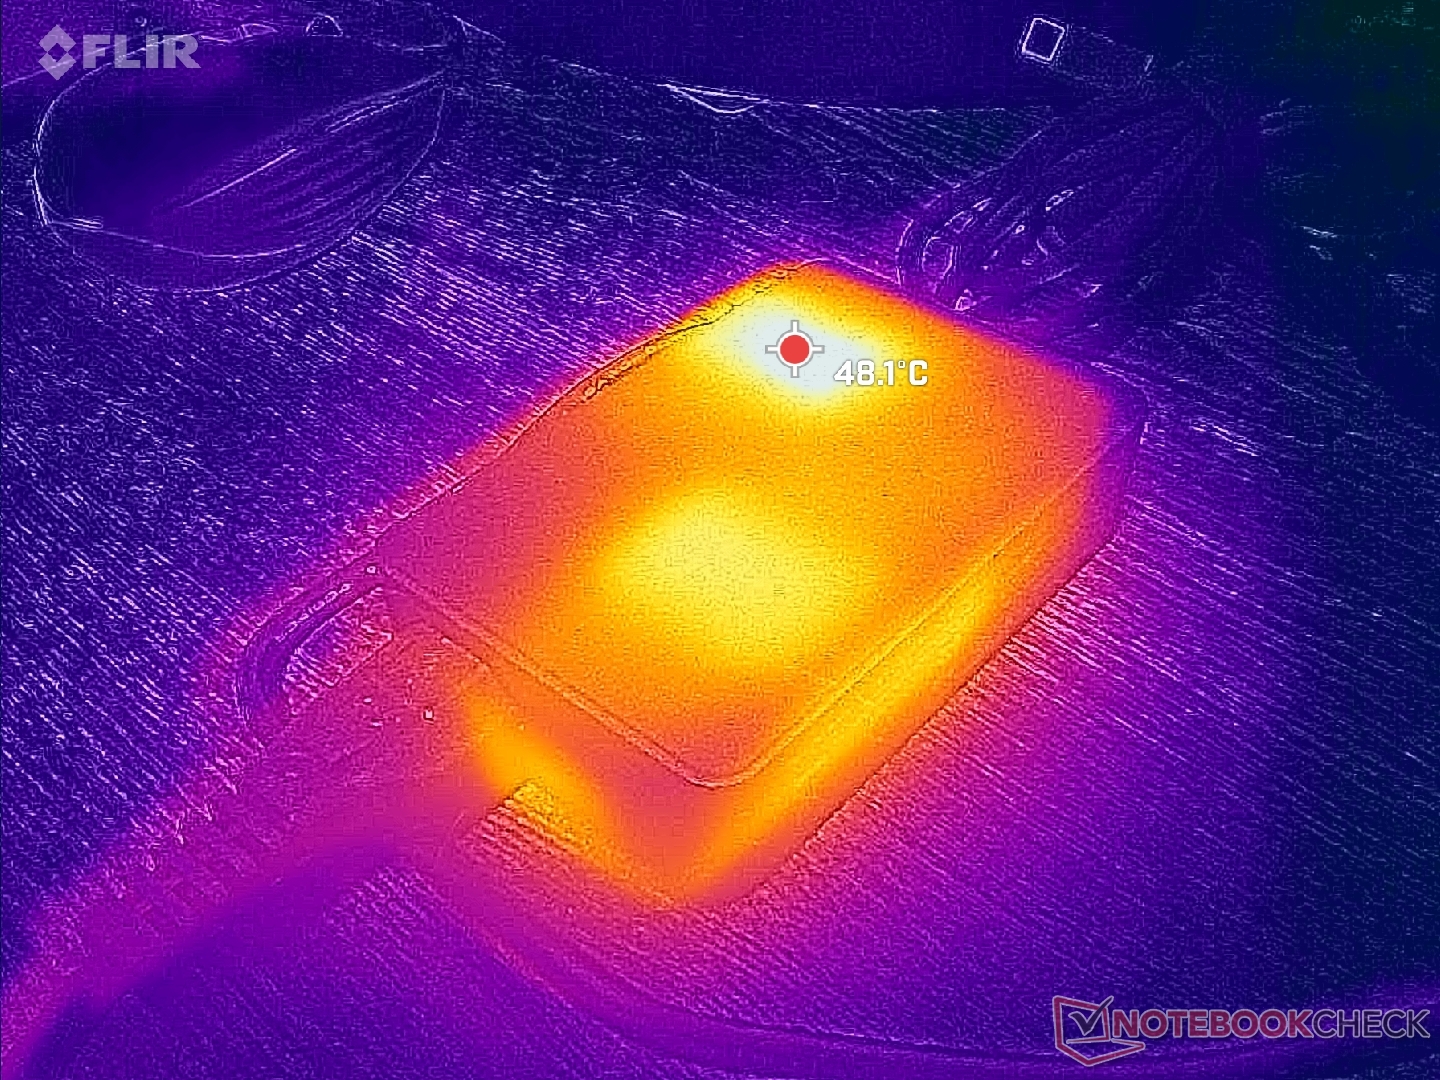
The right half of the system will always be warmer than the left half due to how the cooling solution is designed. Waste heat escapes from the right edge as shown by the temperature maps below and so it is important to orient the unit correctly if positioned vertically.
(+) The maximum temperature on the upper side is 31.6 °C / 89 F, compared to the average of 35.4 °C / 96 F, ranging from 20.6 to 69.5 °C for the class Mini PC.
(-) The bottom heats up to a maximum of 50.6 °C / 123 F, compared to the average of 36.1 °C / 97 F
(+) In idle usage, the average temperature for the upper side is 26.3 °C / 79 F, compared to the device average of 32.1 °C / 90 F.
| GMK NucBox K13 Core Ultra 7 256V, Arc 140V | GMK NucBox K12 Ryzen 7 H 255, Radeon 780M | GMK EVO-T1 Ultra 9 285H, Arc 140T | Beelink SER9 Pro Ryzen 7 H 255, Radeon 780M | Asus NUC 15 Pro+ Ultra 9 285H, Arc 140T | MSI Cubi NUC AI+ 2MG Core Ultra 7 258V, Arc 140V | |
|---|---|---|---|---|---|---|
| Heat | 6% | -4% | 9% | -7% | 18% | |
| Maximum Upper Side * (°C) | 31.6 | 31.6 -0% | 36.4 -15% | 26.8 15% | 42.2 -34% | 30.8 3% |
| Maximum Bottom * (°C) | 50.6 | 35.8 29% | 48.5 4% | 31.3 38% | 26.4 48% | |
| Idle Upper Side * (°C) | 27 | 28.2 -4% | 29.6 -10% | 26.2 3% | 34.9 -29% | 26.4 2% |
| Idle Bottom * (°C) | 31.2 | 31.4 -1% | 30 4% | 32.2 -3% | 25.4 19% |
* ... smaller is better
Stress Test
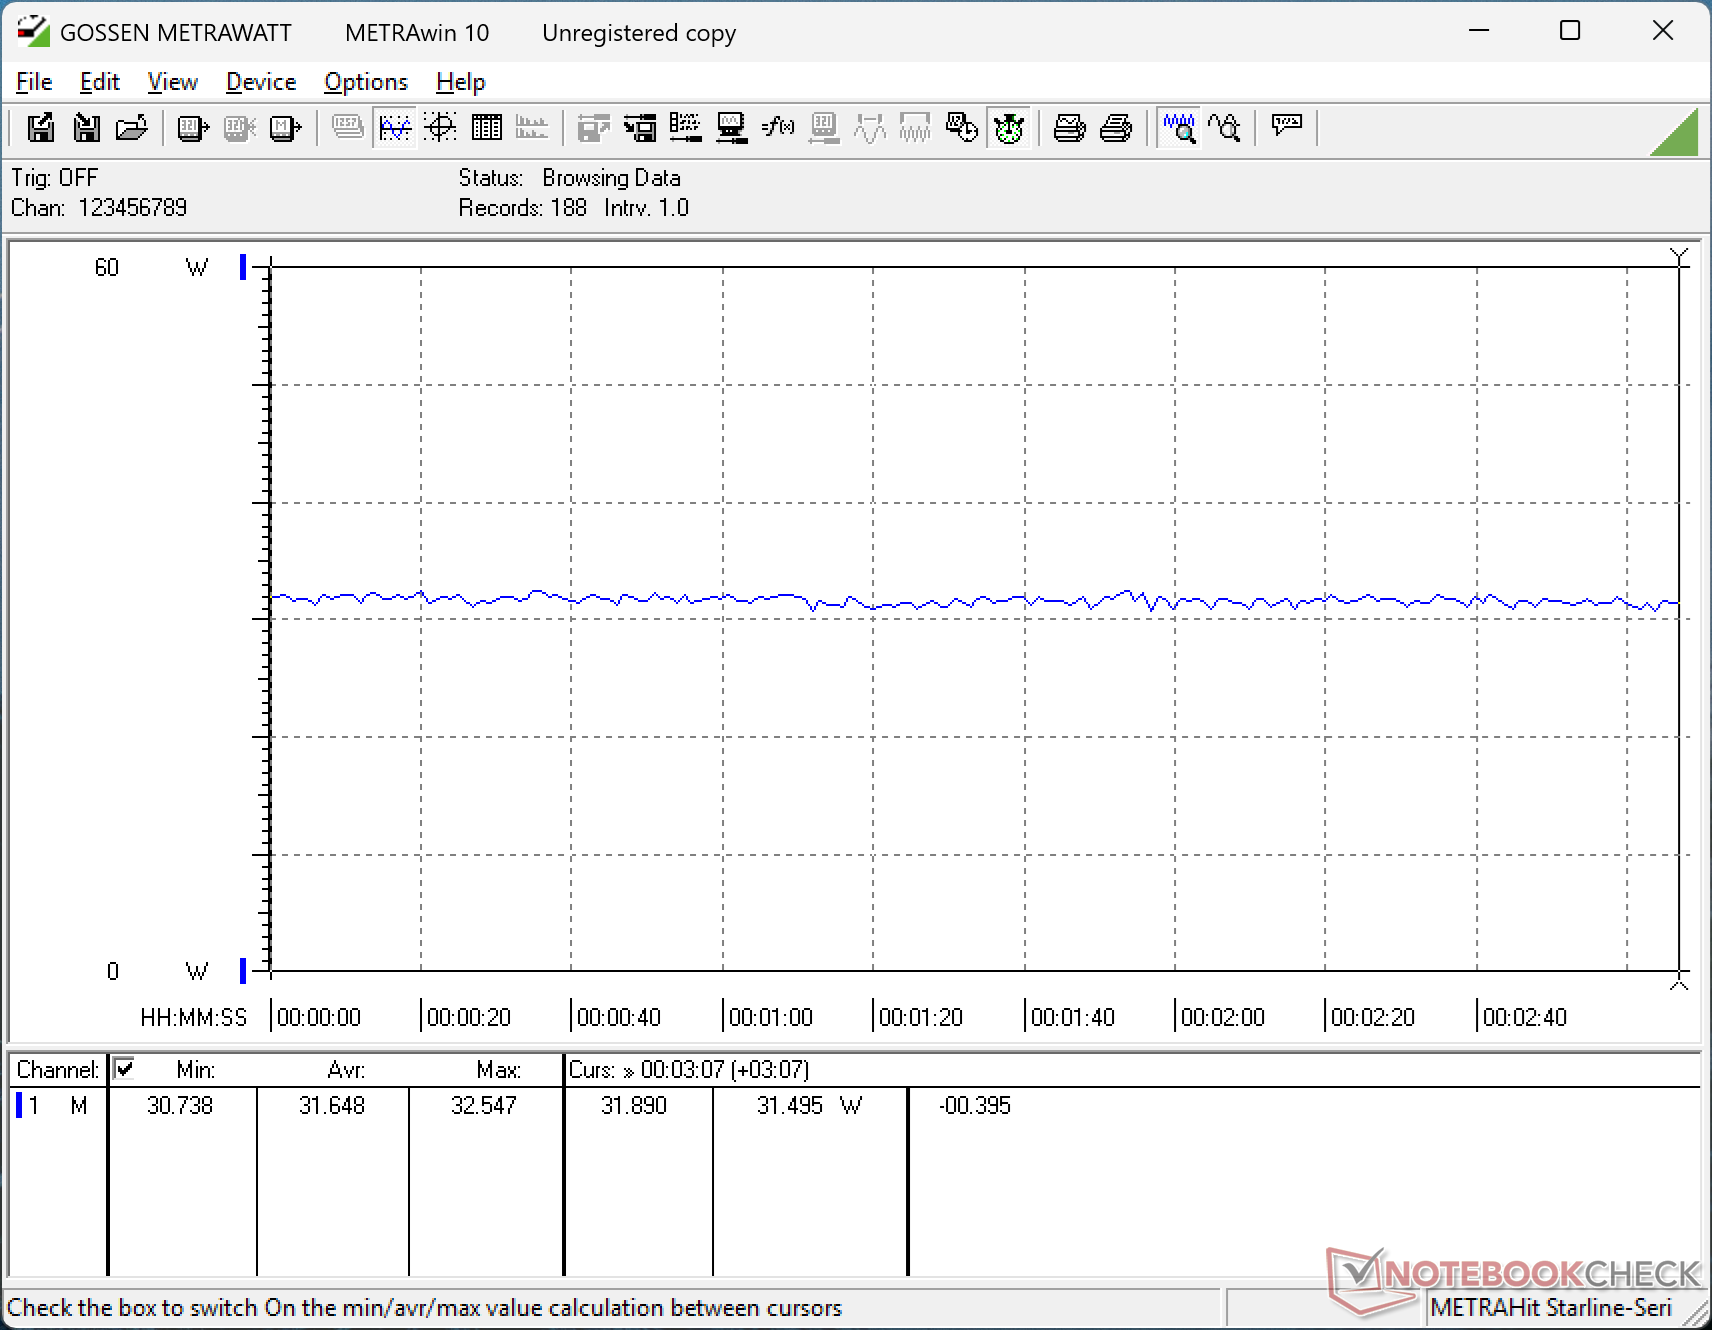
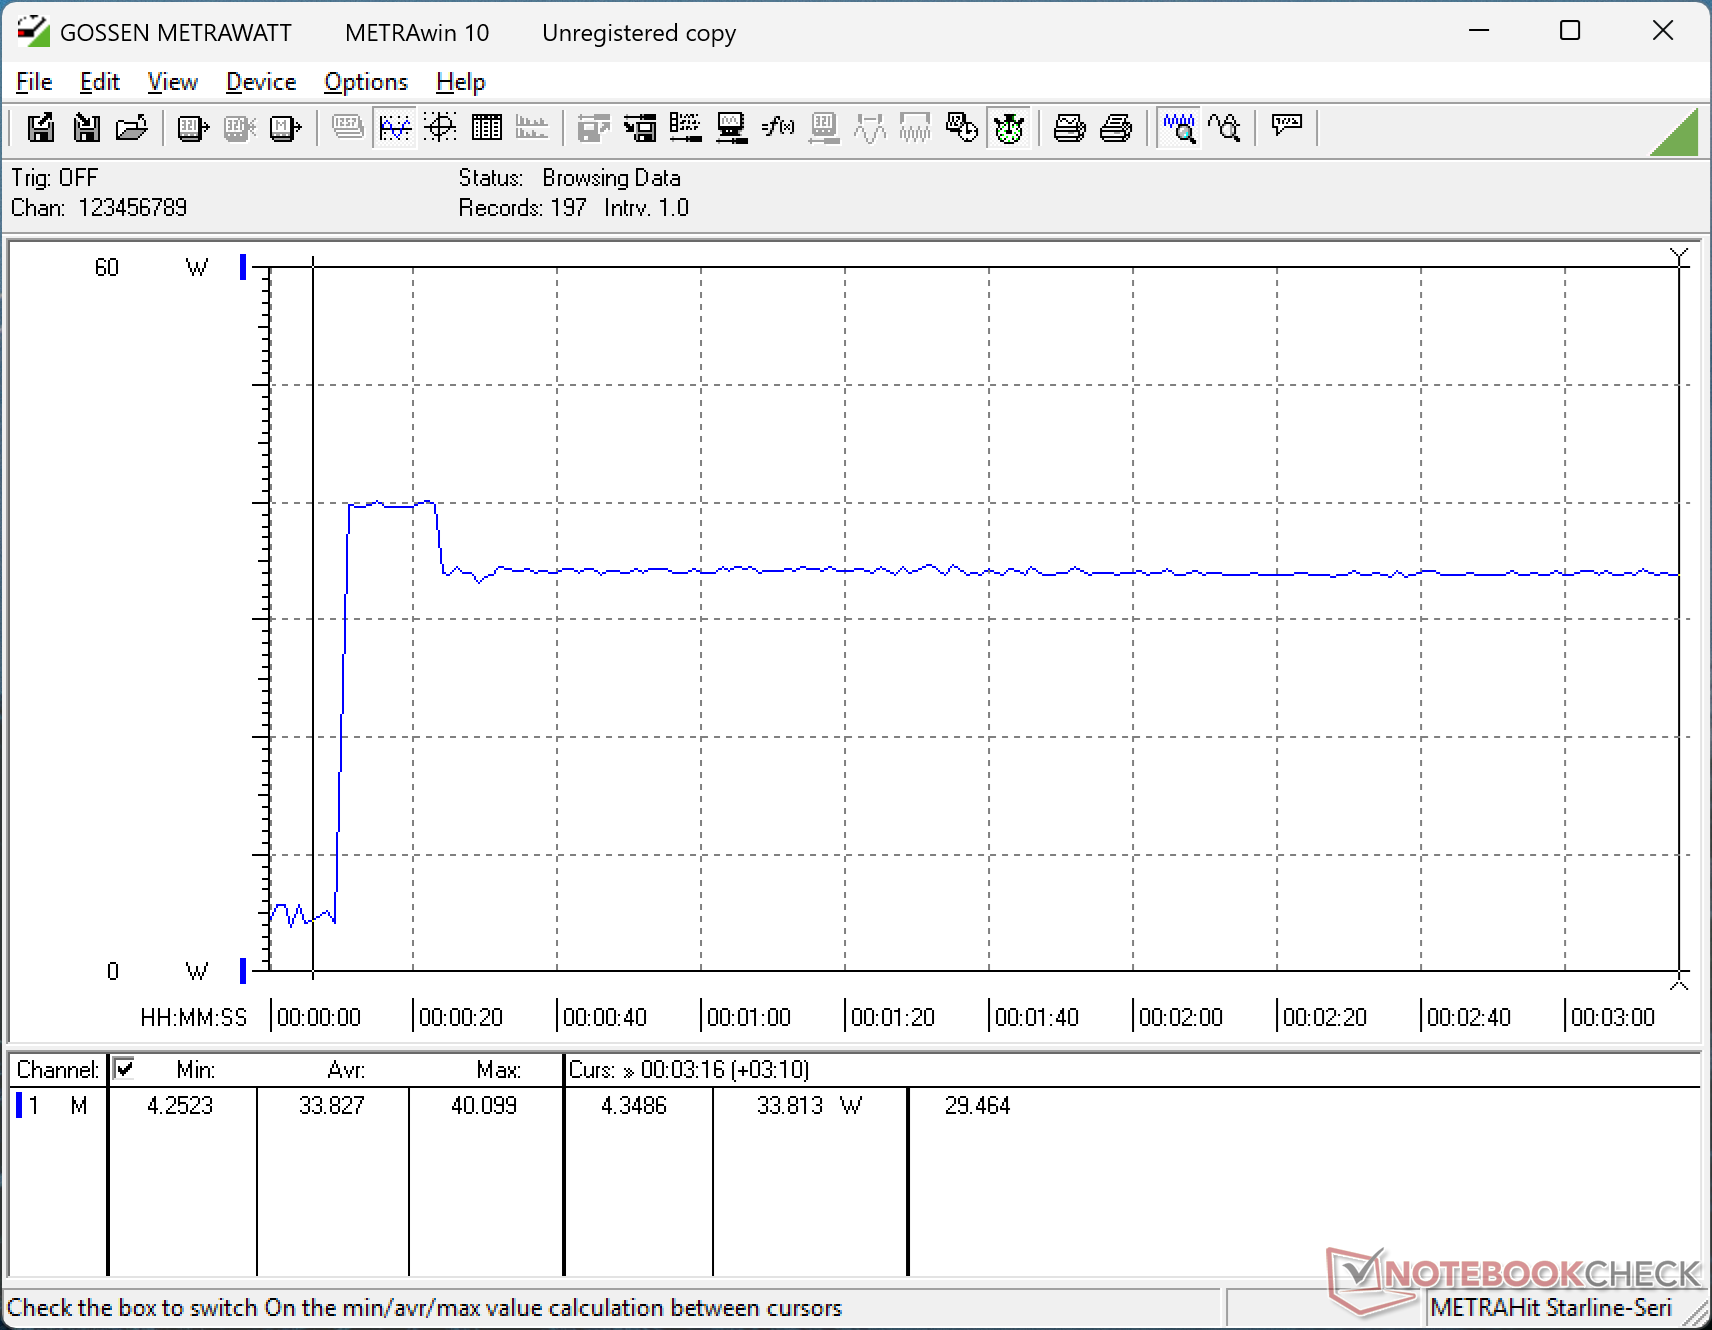
When running Prime95 stress, the CPU would boost to 3.5 GHz and 37 W before quickly dropping to 3.2 GHz and 30 W a few seconds later to signify limited Turbo Boost sustainability. Core temperature plateaus at the low 70 C range which is similar to what we observed on the NucBox K12 despite their differences in size and performance.
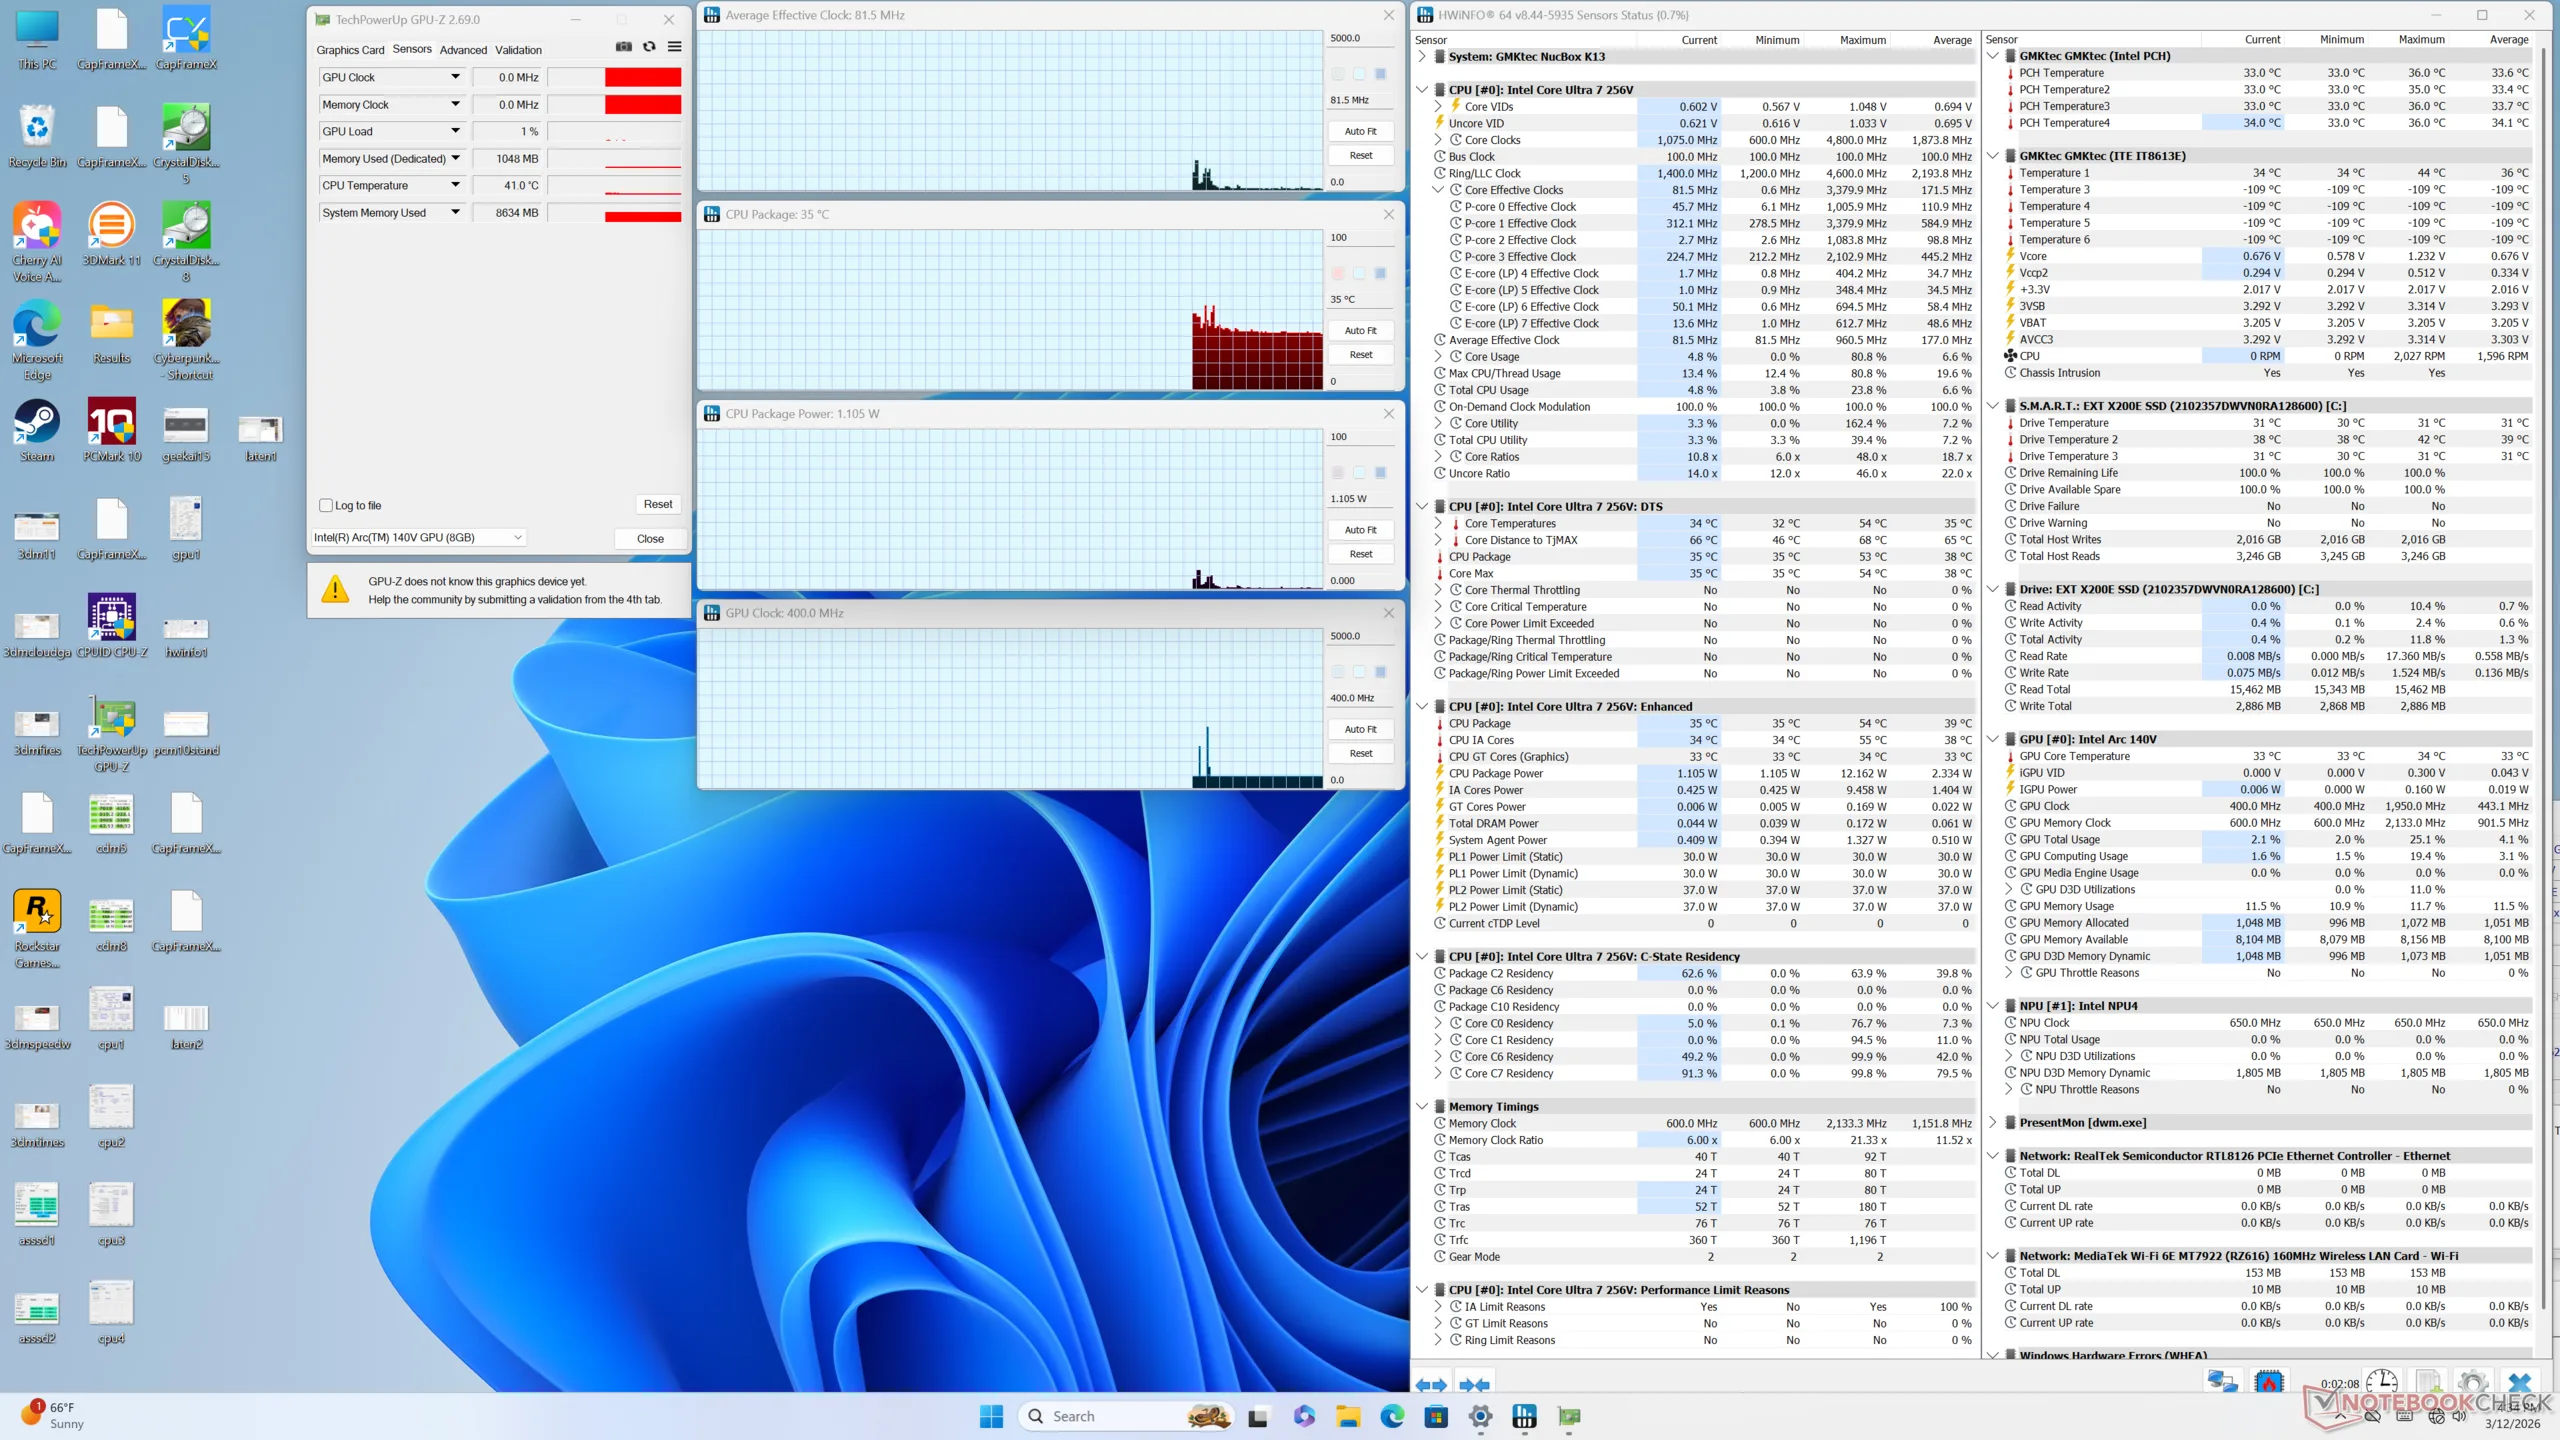
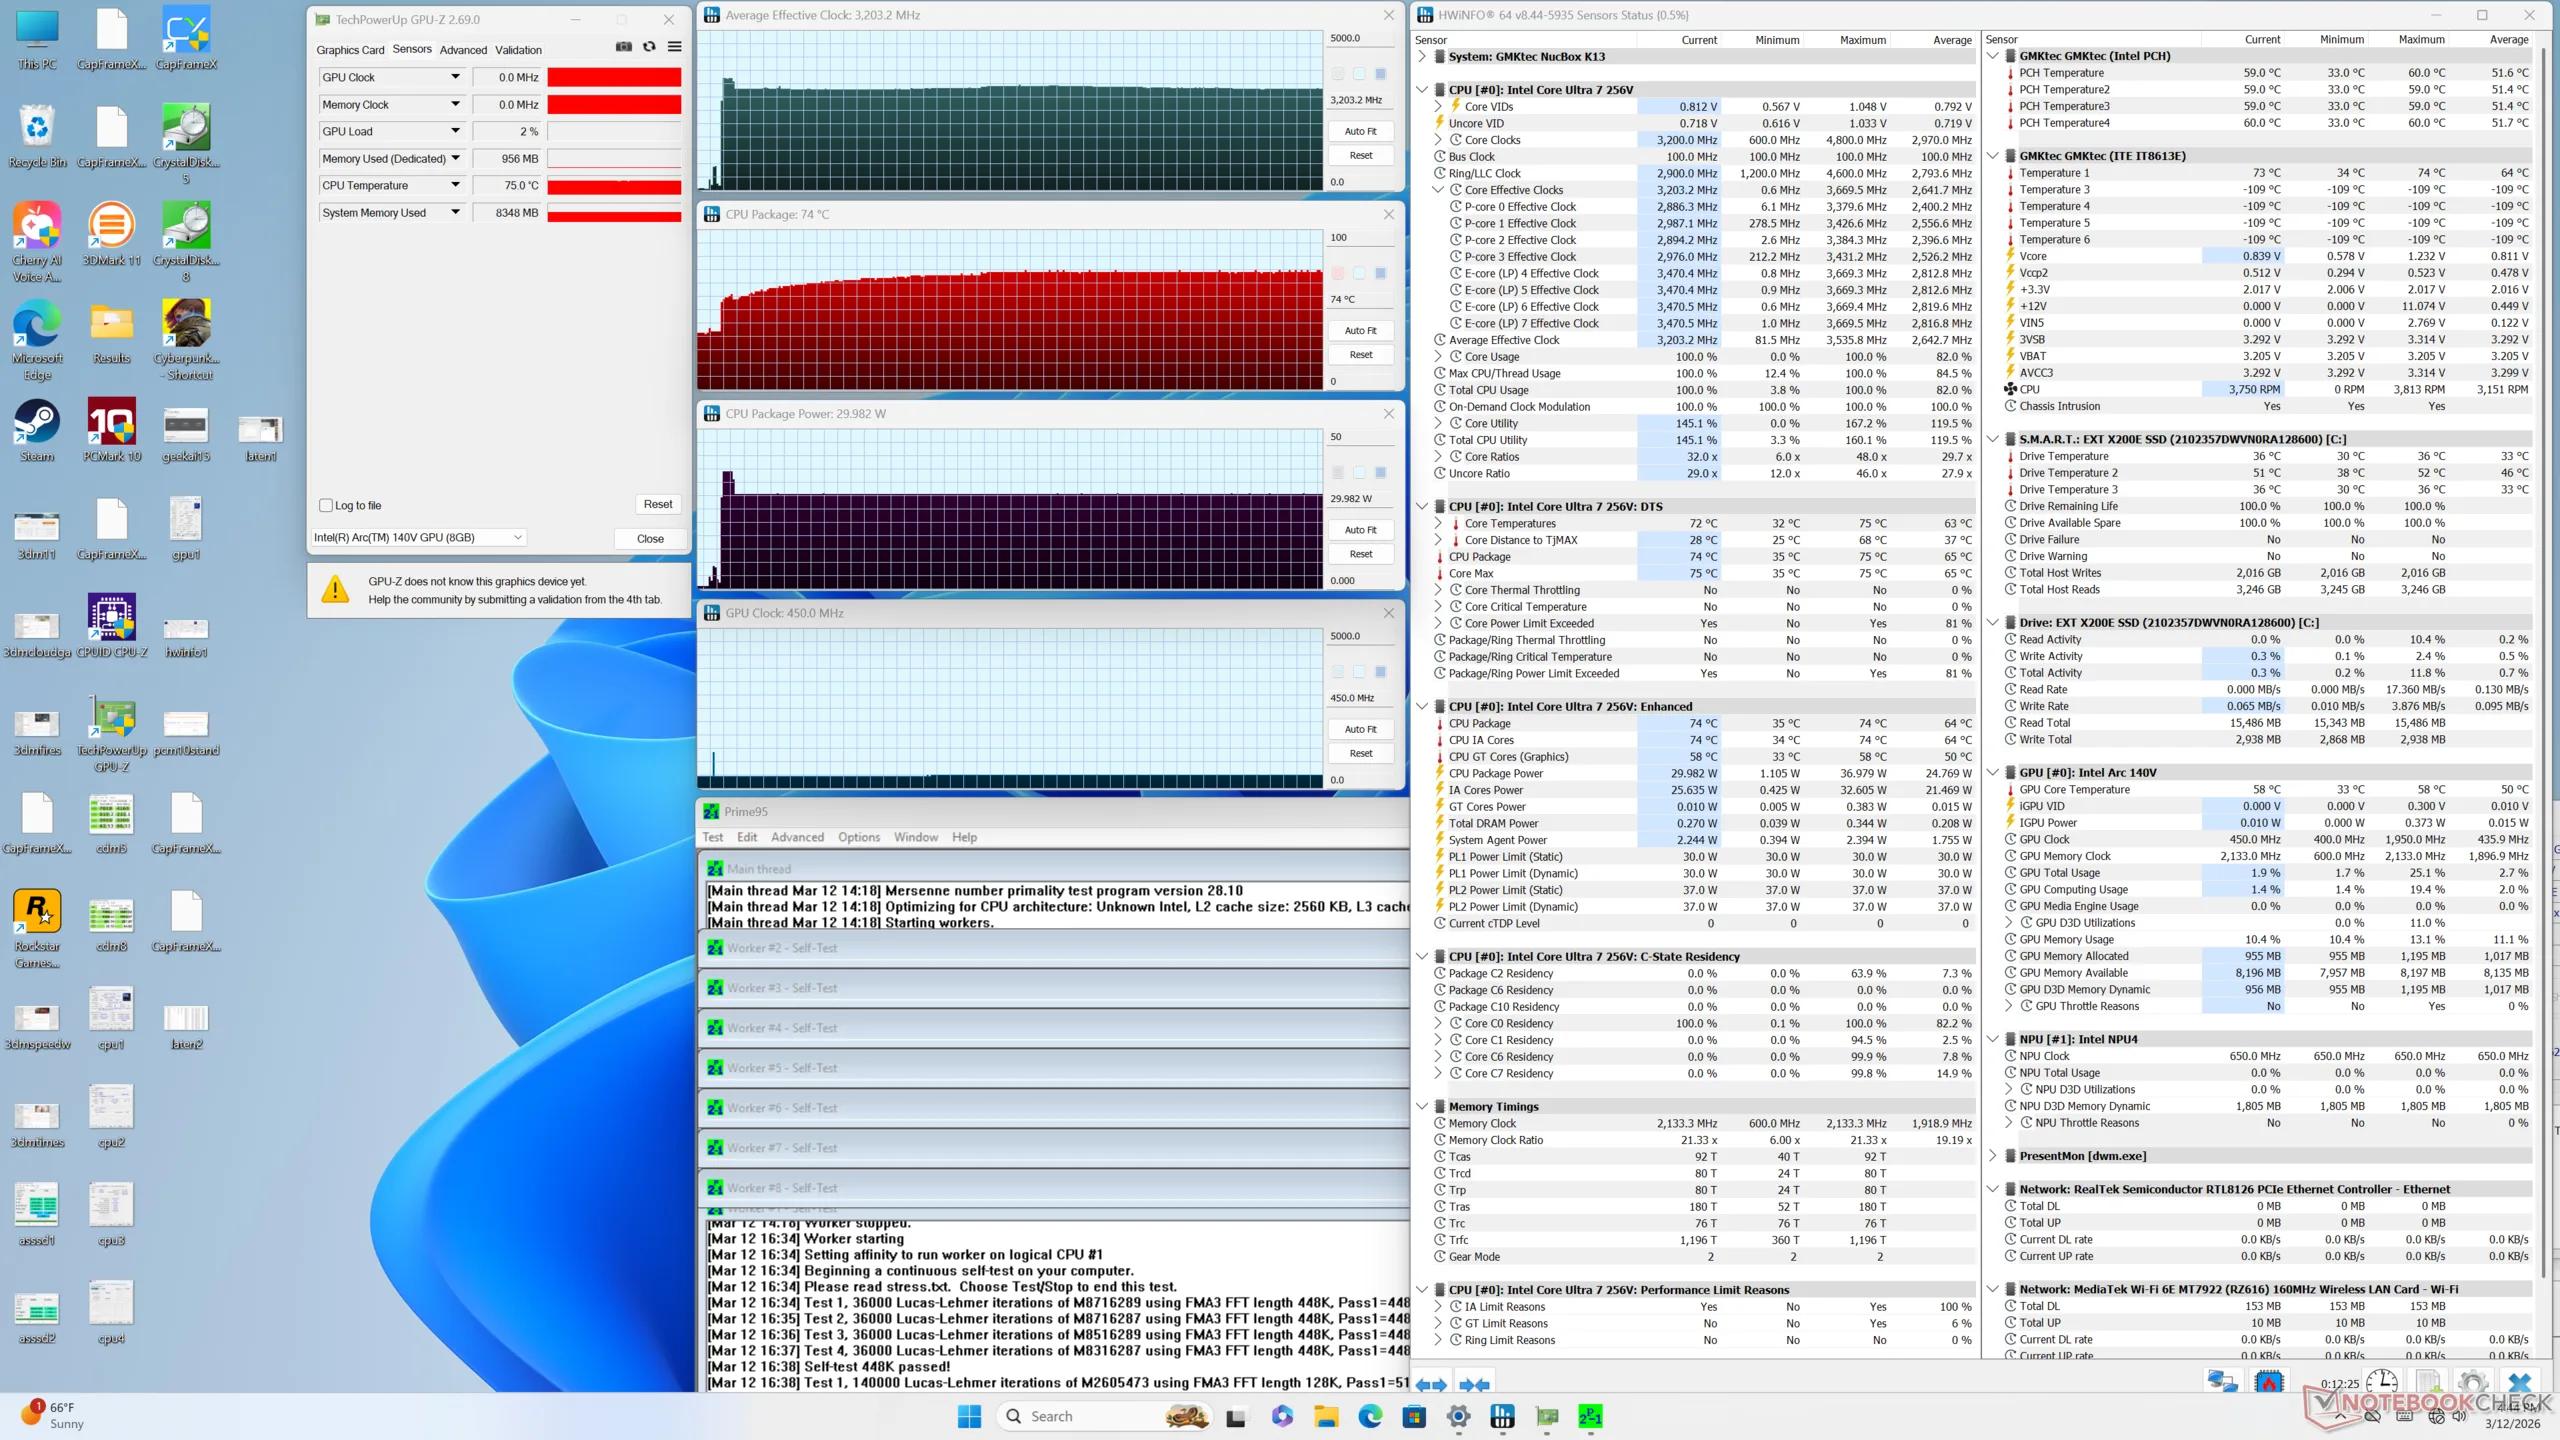
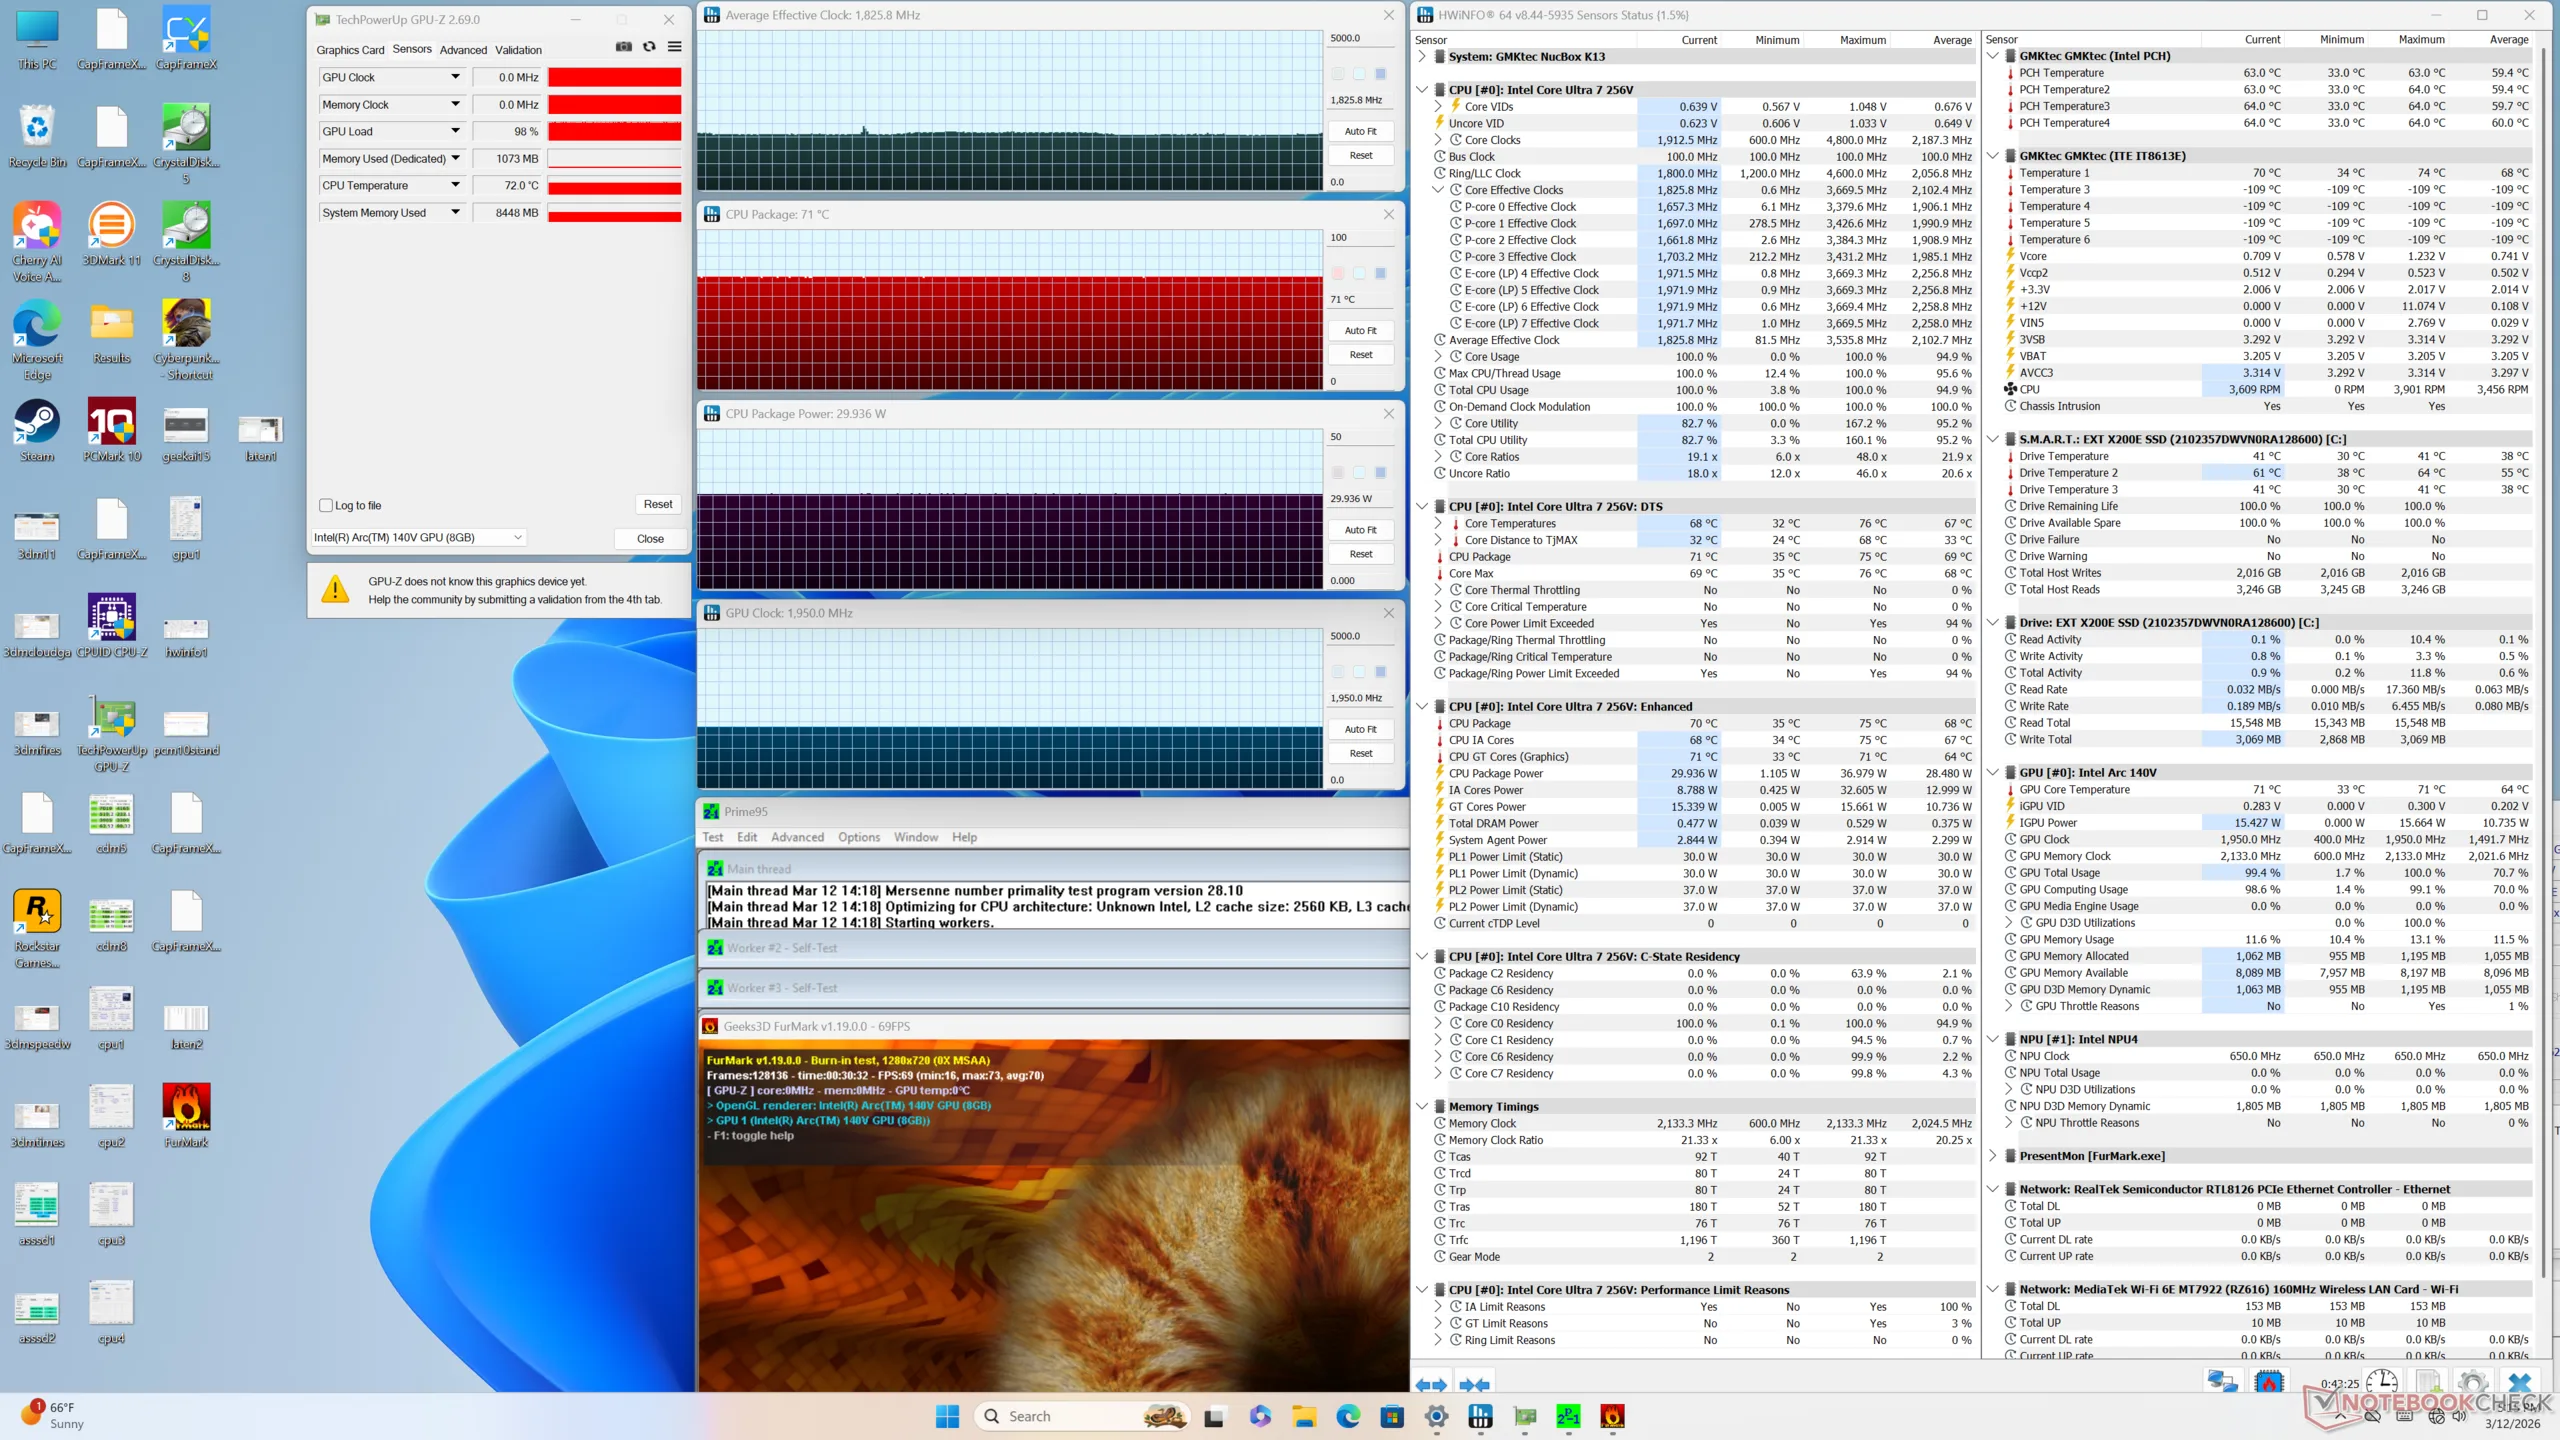
| CPU Clock (GHz) | GPU Clock (MHz) | Average CPU Temperature (°C) | |
| System Idle | -- | -- | 35 |
| Prime95 Stress | 3.2 | -- | 74 |
| Prime95 + FurMark Stress | 1.8 | 1950 | 71 |
| Cyberpunk 2077 Stress | 1.5 | 1950 | 72 |
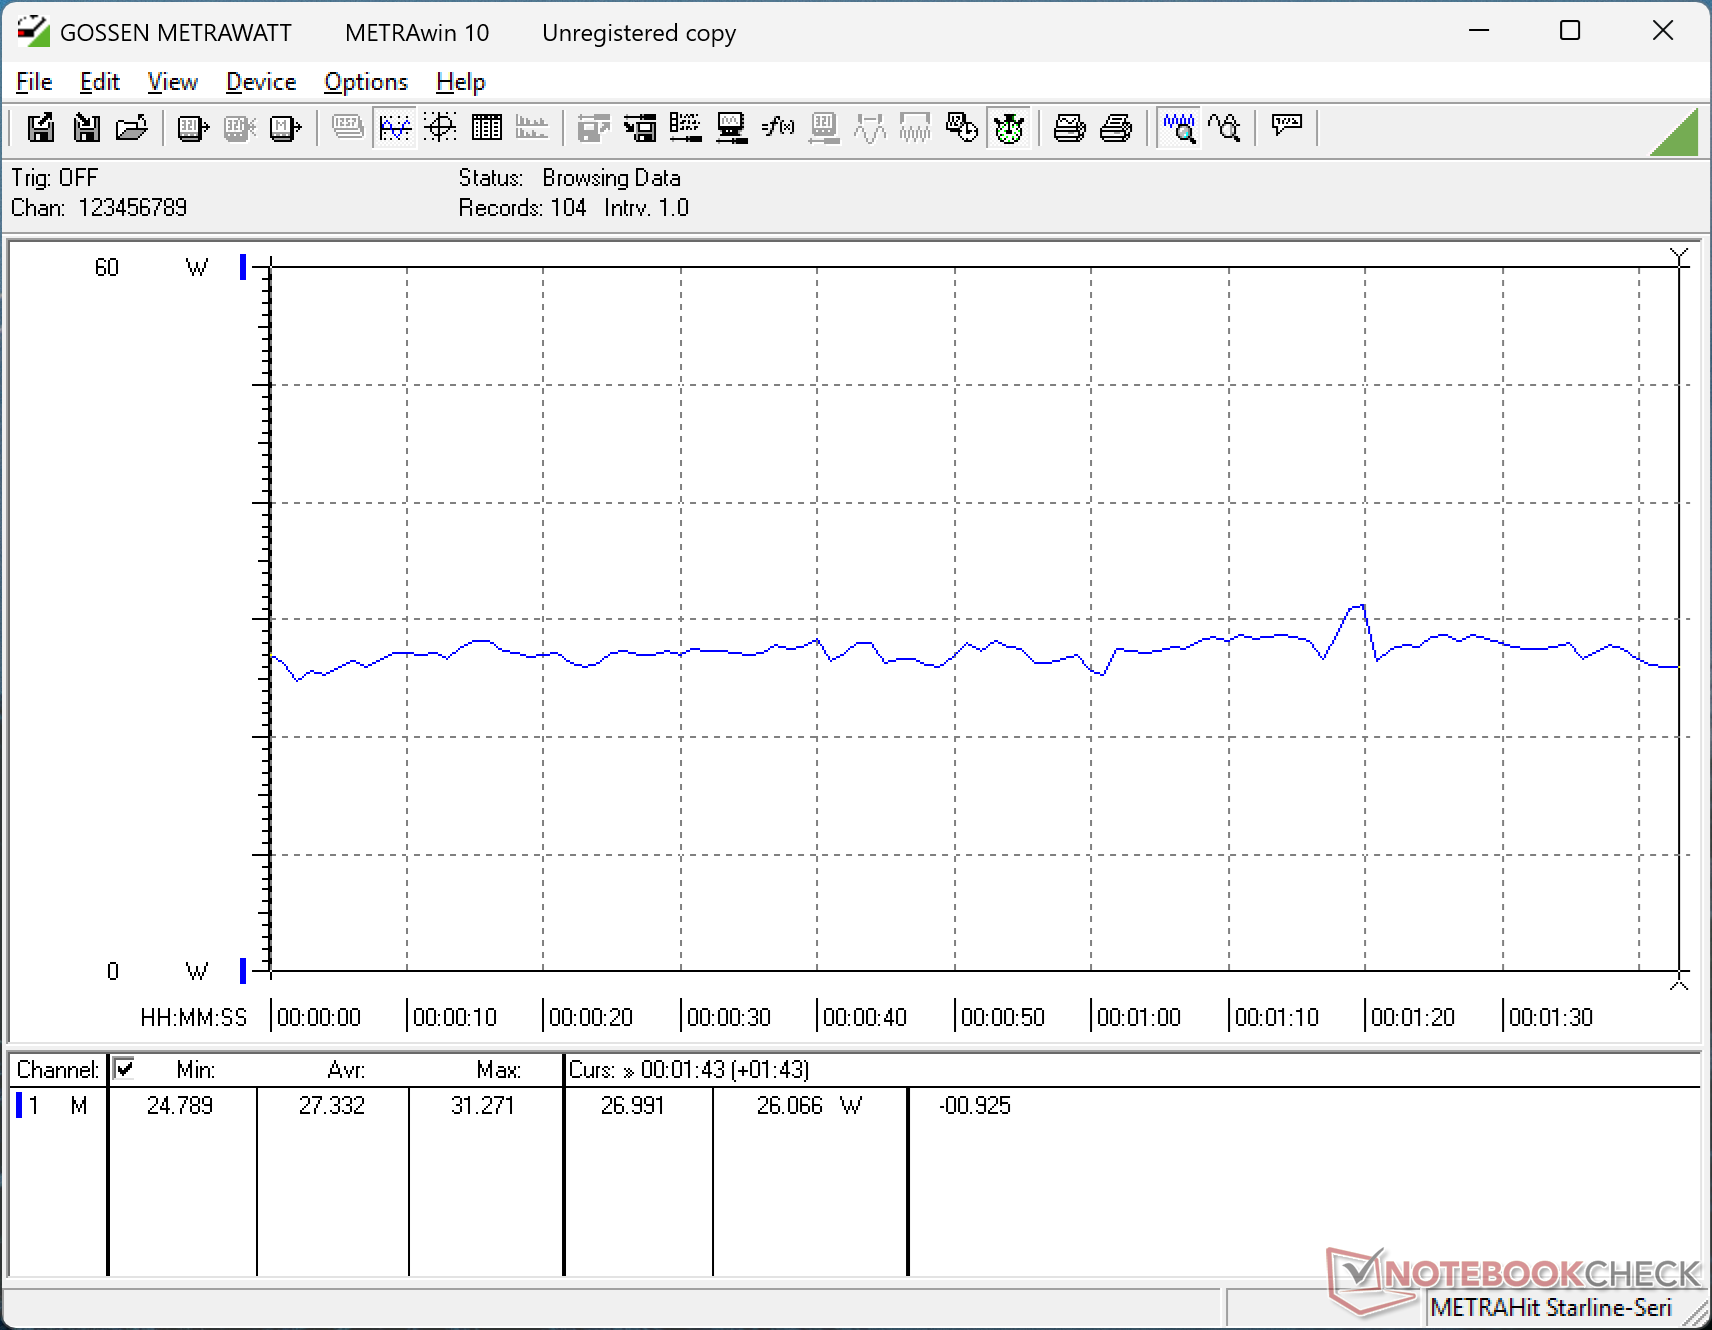
Energy Management
Power Consumption
Lunar Lake-V is extremely efficient as shown by the tables below. The system consumes just 32 W on average when running Cyberpunk 2077 compared to 86 W on the NucBox K12 powered by the Radeon 780M. While the latter may be faster, it is definitely not 2x or 3x than our Intel solution.
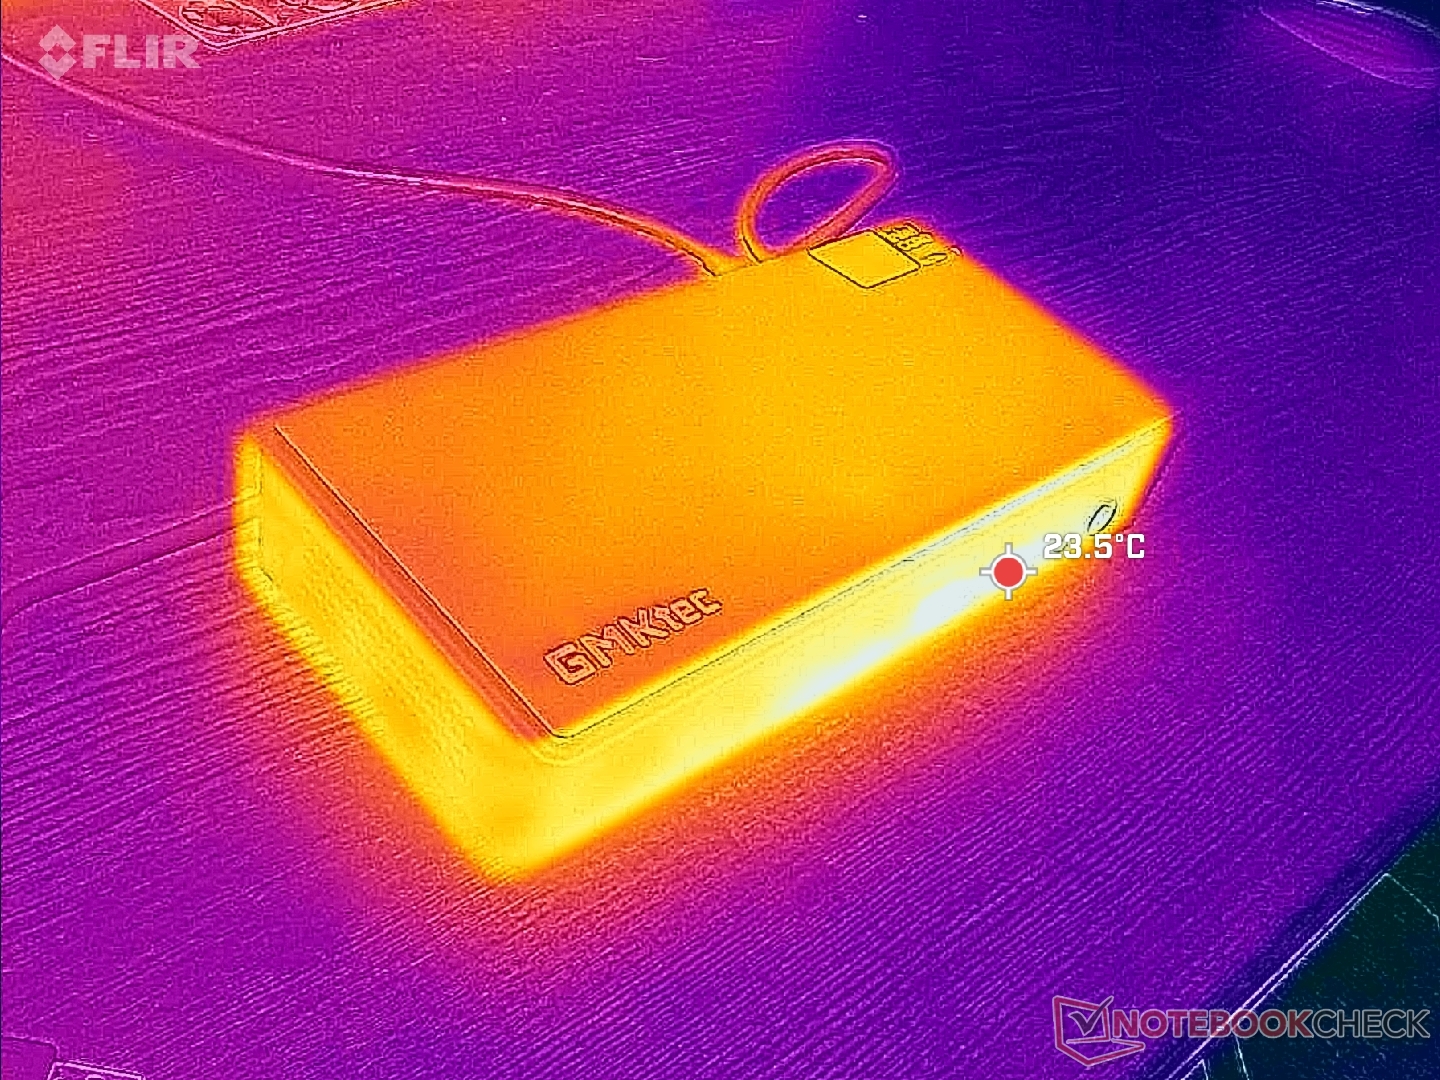
The 100 W power brick is quite compact at just ~9.9 x 6.3 x 2.3 cm.

| Off / Standby | |
| Idle | |
| Load |
|
Key:
min: | |
| GMK NucBox K13 Core Ultra 7 256V, Arc 140V, Huawei eKitStor Xtreme 200e 1 TB, , x, | GMK NucBox K12 Ryzen 7 H 255, Radeon 780M, Crucial P3 Plus CT1000P3PSSD8, , x, | GMK EVO-T1 Ultra 9 285H, Arc 140T, Crucial P3 Plus CT1000P3PSSD8, , x, | Beelink SER9 Pro Ryzen 7 H 255, Radeon 780M, Crucial P3 Plus CT1000P3PSSD8, , x, | Asus NUC 15 Pro+ Ultra 9 285H, Arc 140T, Micron 3500 1TB MTFDKBA1T0TGD, , x, | MSI Cubi NUC AI+ 2MG Core Ultra 7 258V, Arc 140V, Phison 1 TB ESR01TBTCCZ-27J, , x, | |
|---|---|---|---|---|---|---|
| Power Consumption | -183% | -141% | -120% | -116% | -47% | |
| Idle Minimum * (Watt) | 2.3 | 9.9 -330% | 6.1 -165% | 7 -204% | 3.9 -70% | 2.9 -26% |
| Idle Average * (Watt) | 3.6 | 10.1 -181% | 7.9 -119% | 7.1 -97% | 6.1 -69% | 5.7 -58% |
| Idle Maximum * (Watt) | 5.8 | 13.1 -126% | 13.2 -128% | 7.5 -29% | 8.2 -41% | 10.2 -76% |
| Load Average * (Watt) | 27.3 | 69.8 -156% | 60.7 -122% | 62.3 -128% | 56.1 -105% | 38.7 -42% |
| Cyberpunk 2077 ultra external monitor * (Watt) | 31.6 | 86.3 -173% | 67.4 -113% | 80.1 -153% | 63.9 -102% | 41.1 -30% |
| Load Maximum * (Watt) | 39.6 | 92.8 -134% | 117.1 -196% | 82.9 -109% | 160.6 -306% | 60 -52% |
* ... smaller is better
Power Consumption Cyberpunk / Stress Test
Power Consumption external Monitor
Notebookcheck Rating
The very compact GMK NucBox K13 balances size and performance very well albeit at the cost of louder fan noise and a few missing auxiliary features.
GMK NucBox K13
- 03/16/2026 v8
Allen Ngo
 Total Sustainability Score:
 Potential Competitors in Comparison
Image | Model / Review | Price | Weight | Height | Display |
|---|---|---|---|---|---|
1. 77.4%  | GMK NucBox K13 Intel Core Ultra 7 256V ⎘ Intel Arc Graphics 140V ⎘ 16 GB Memory, 1024 GB SSD | Amazon: List Price: 670 USD | 506 g | 36.6 mm | x |
2. 73.7%  | GMK NucBox K12 AMD Ryzen 7 H 255 ⎘ AMD Radeon 780M ⎘ 32 GB Memory, 1024 GB SSD | Amazon: 1. $29.99 19V~20V Charger for GMKtec M... | 938 g | 78 mm | x |
3. 75.4%  | GMK EVO-T1 Intel Core Ultra 9 285H ⎘ Intel Arc Graphics 140T ⎘ 64 GB Memory, 1024 GB SSD | Amazon: List Price: 999€ | 946 g | 73.6 mm | x |
4. 80.2% 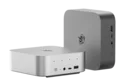 | Beelink SER9 Pro AMD Ryzen 7 H 255 ⎘ AMD Radeon 780M ⎘ 32 GB Memory, 1024 GB SSD | Amazon: List Price: 520 USD | 812 g | 44.7 mm | x |
5. 77.5%  | Asus NUC 15 Pro+ Intel Core Ultra 9 285H ⎘ Intel Arc Graphics 140T ⎘ 32 GB Memory, 1024 GB SSD | Amazon: $1,232.00 List Price: 991€ | 690 g | 42 mm | x |
6. 75.2%  | MSI Cubi NUC AI+ 2MG Intel Core Ultra 7 258V ⎘ Intel Arc Graphics 140V ⎘ 32 GB Memory, 1000 GB SSD | Amazon: List Price: 900 USD | 669 g | 50.1 mm | x |
Transparency
The selection of devices to be reviewed is made by our editorial team. The test sample was provided to the author as a loan by the manufacturer or retailer for the purpose of this review. The lender had no influence on this review, nor did the manufacturer receive a copy of this review before publication. There was no obligation to publish this review. As an independent media company, Notebookcheck is not subjected to the authority of manufacturers, retailers or publishers.
This is how Notebookcheck is testing
Every year, Notebookcheck independently reviews hundreds of laptops and smartphones using standardized procedures to ensure that all results are comparable. We have continuously developed our test methods for around 20 years and set industry standards in the process. In our test labs, high-quality measuring equipment is utilized by experienced technicians and editors. These tests involve a multi-stage validation process. Our complex rating system is based on hundreds of well-founded measurements and benchmarks, which maintains objectivity. Further information on our test methods can be found here.
