Verdict — Integrated Stereo Speakers And Quad Microphones for Home And Conferences
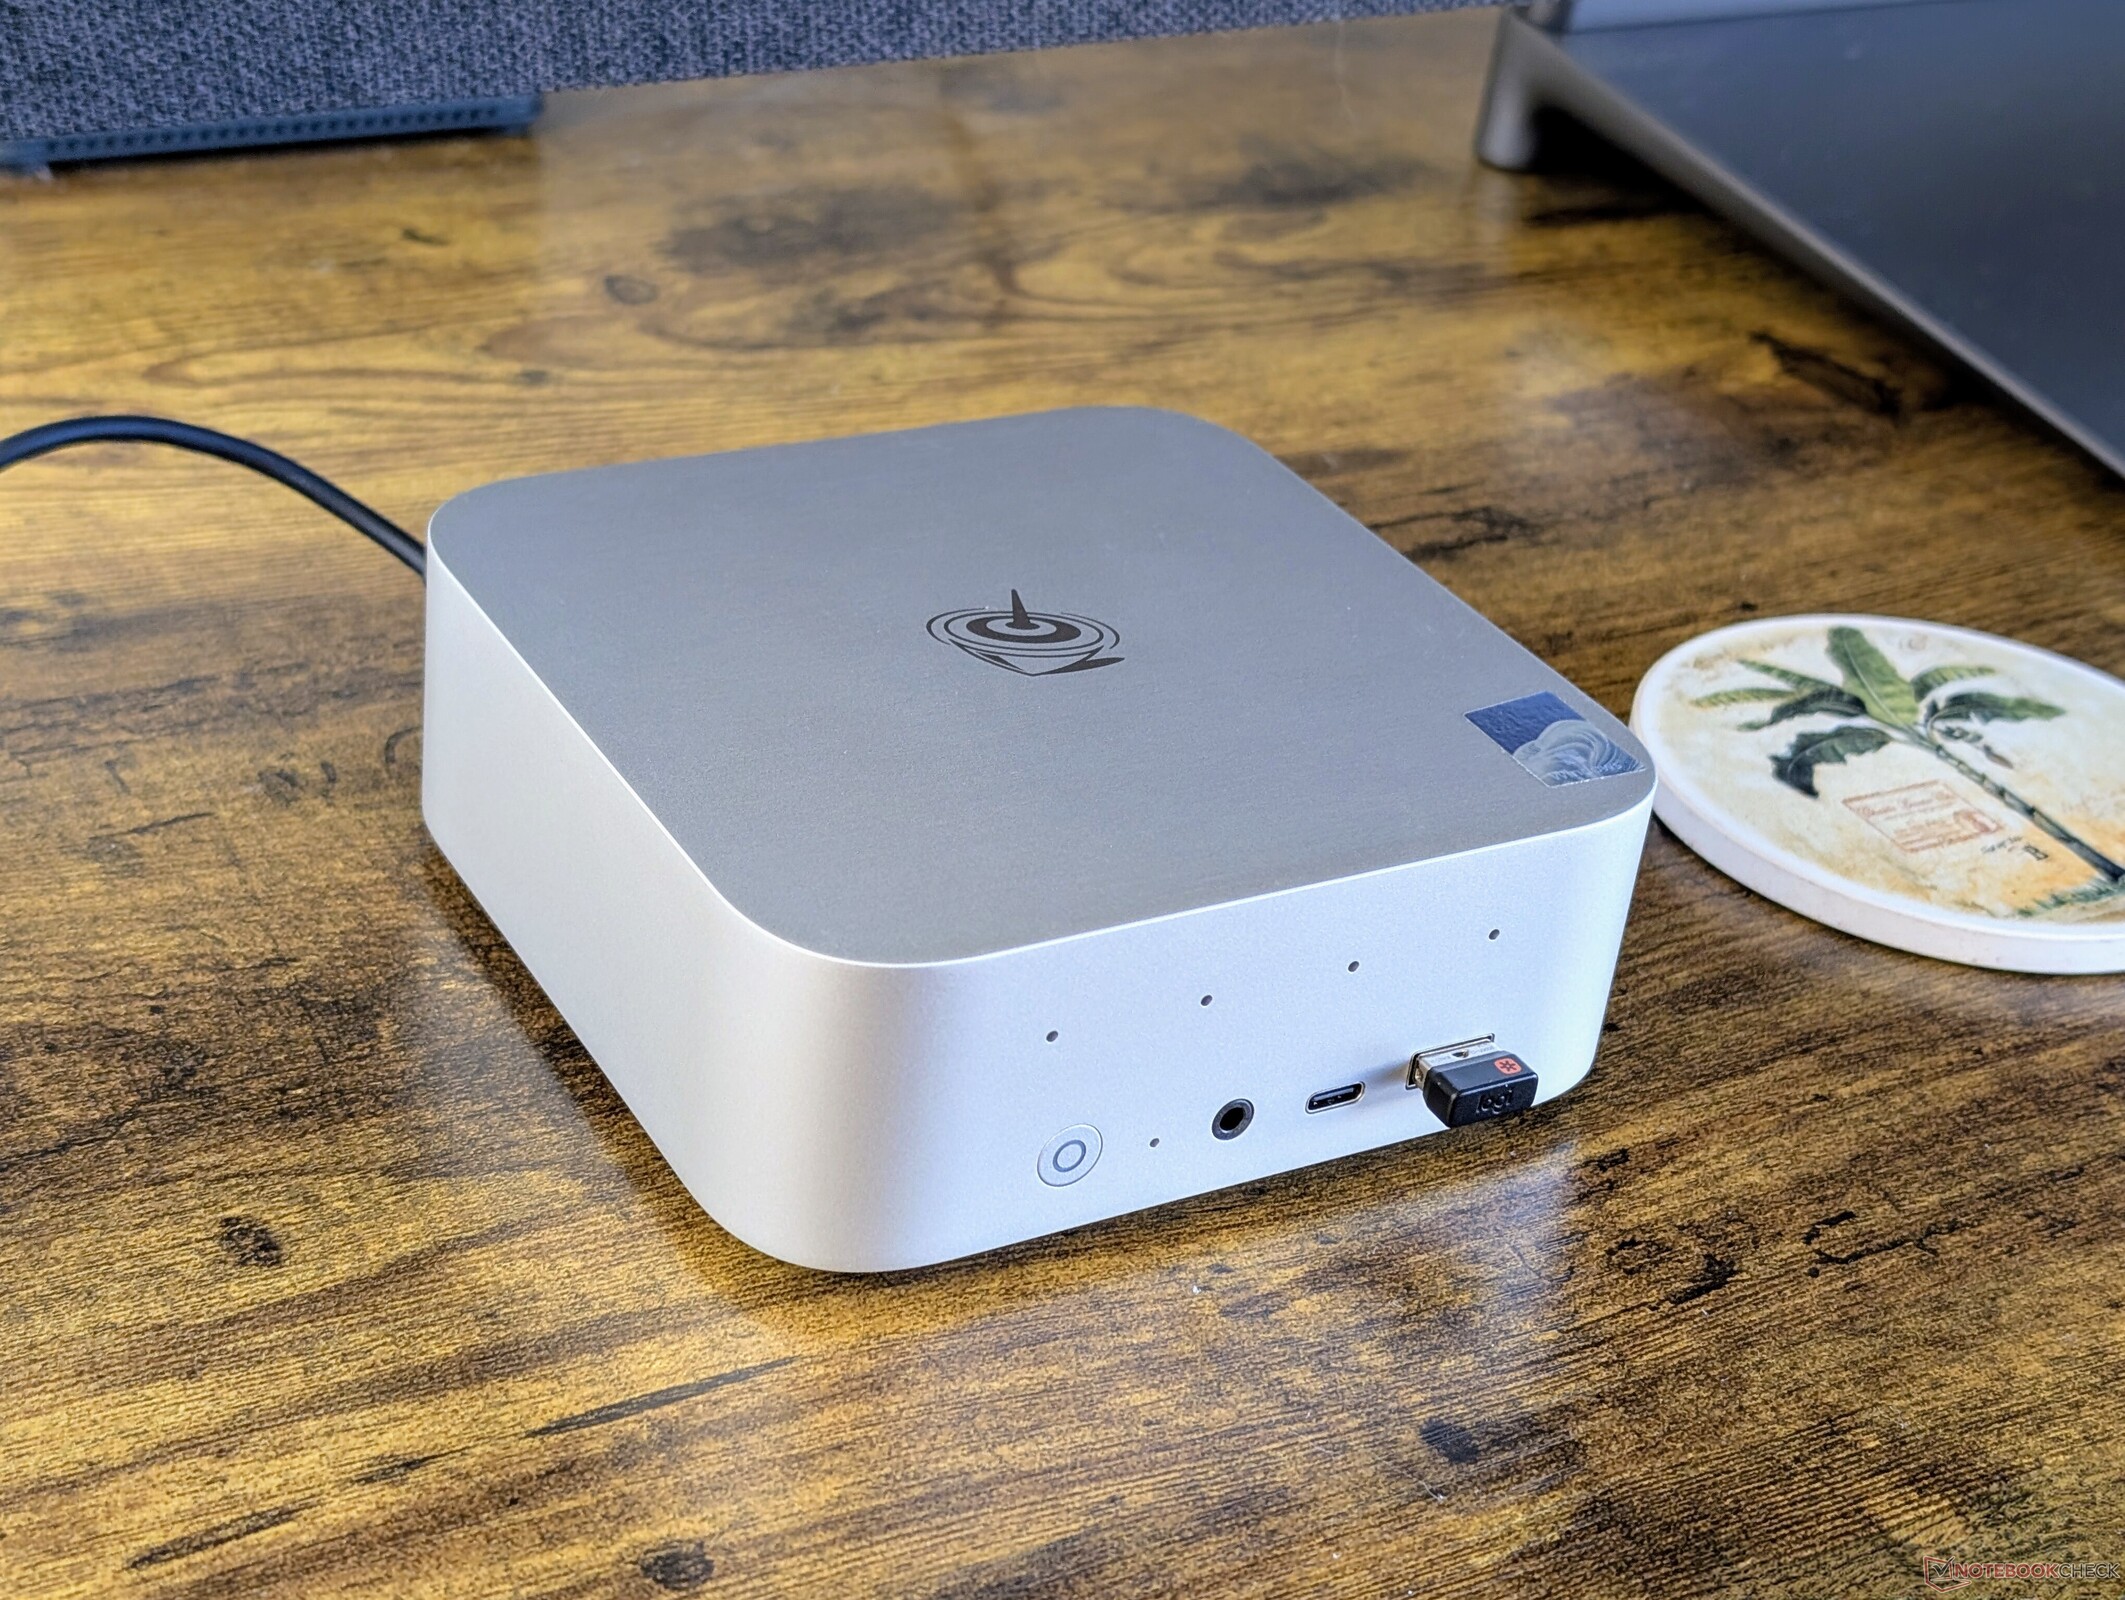
Beelink has been hitting it out of the park ever since it introduced the redesigned SER8. While obviously inspired by the Mac Mini, the new design is still of higher quality than the older models while being much more visually appealing for home or office environments. The internal changes are equally as impressive with its AI-powered quad mics and dual speakers — integrated features that aren't commonly found on competitors in the same $500 price range.
The naming convention deserves criticism as it can be confusing for shoppers. For example, the regular SER9 can be configured with the Ryzen AI 9 HX 370 processor which is faster than our "SER9 Pro" configuration. They even share the exact same chassis design and so the "Pro" suffix is arguably unnecessary and potentially misleading since "Pro" is often associated with faster performance.
Beyond the naming, we would like to see more organized USB ports to better distinguish between USB 2.0, 3.0, or 4.0 ports. The 100 W barrel AC adapter could be universal USB-C instead as well. And finally, integrating a Kensington lock and providing a way to select CPU power profiles via Windows instead of only through BIOS would improve usability.
Pros
Cons
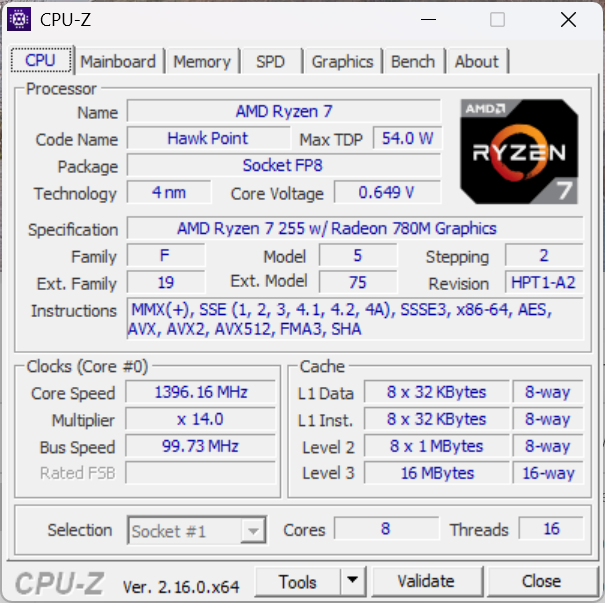
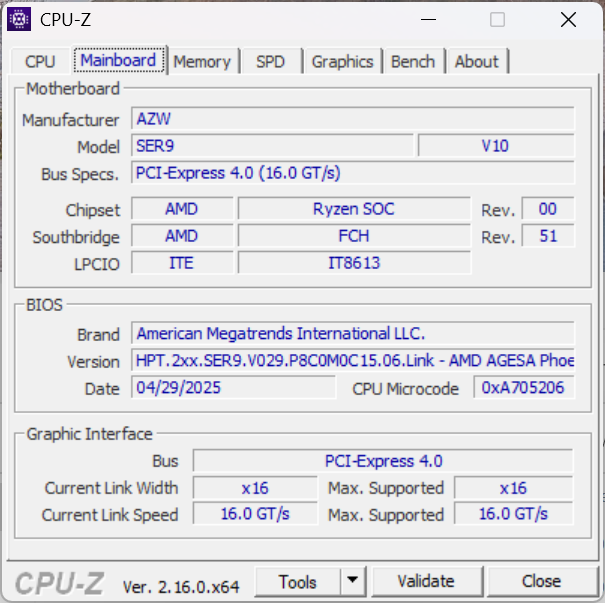
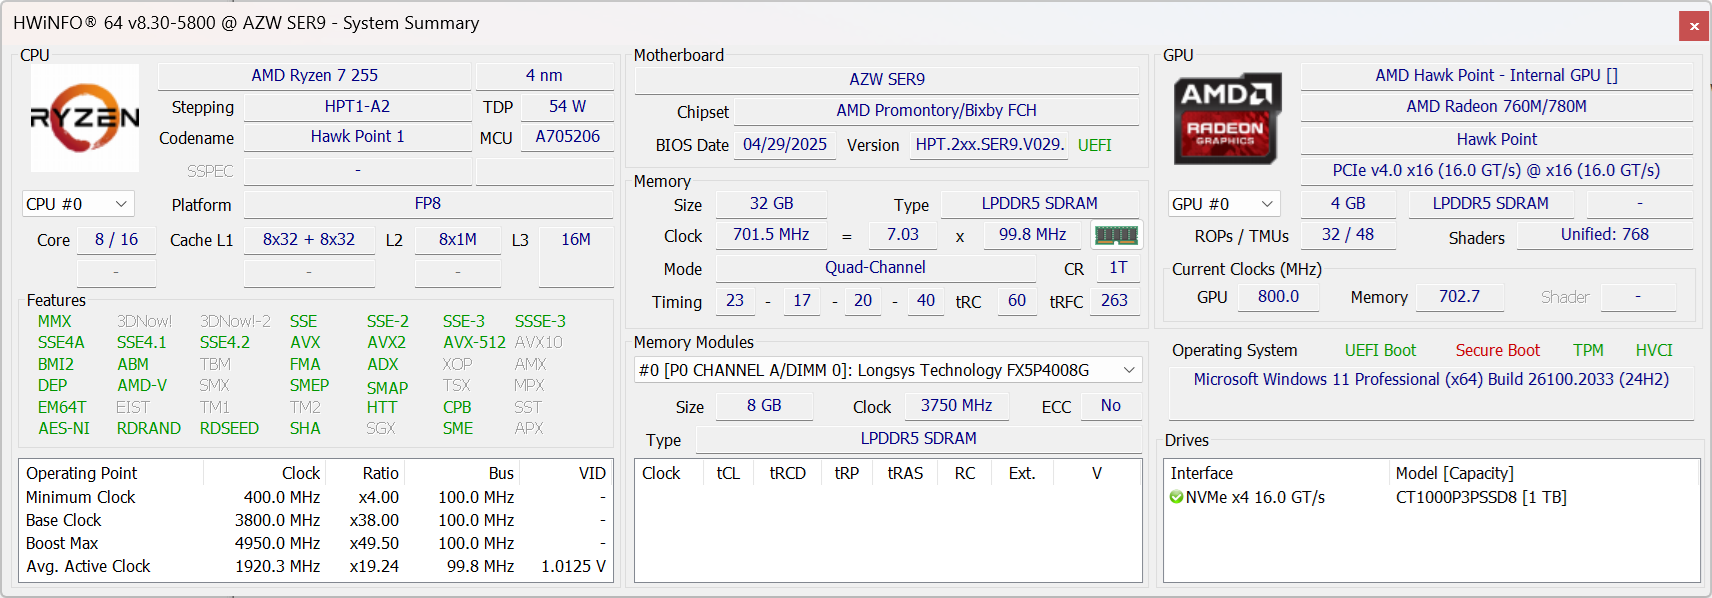
The Beelink SER9 Pro ships with the recently released Zen 4 AMD Ryzen 7 H 255 processor whereas the regular SER9 would ship with the Zen 5 Ryzen AI 9 HX 370. Both models are otherwise share the same chassis design and physical features.
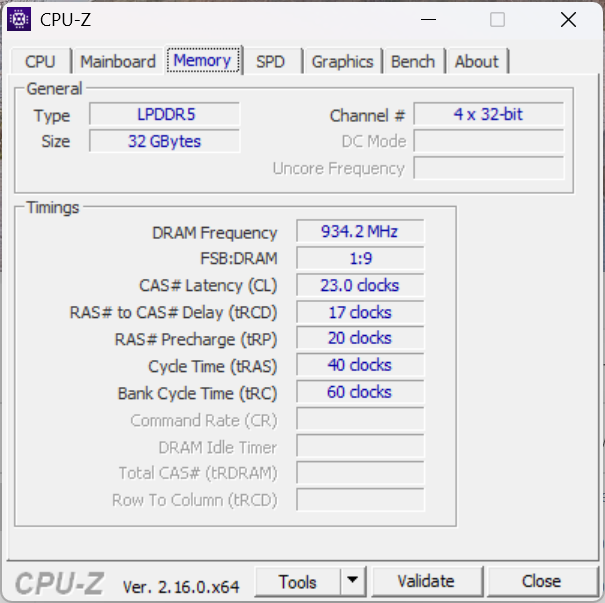
Our test unit comes configured with 32 GB of RAM and 1 TB SSD for approximately $520. Barebones options are not available at the time of writing.
Competitors to the SER9 Pro include other multimedia mini PCs like the BOSGAME M2, GMK EVO-X1, or GMK NucBox K11.
More Beelink reviews:
Specifications
Case
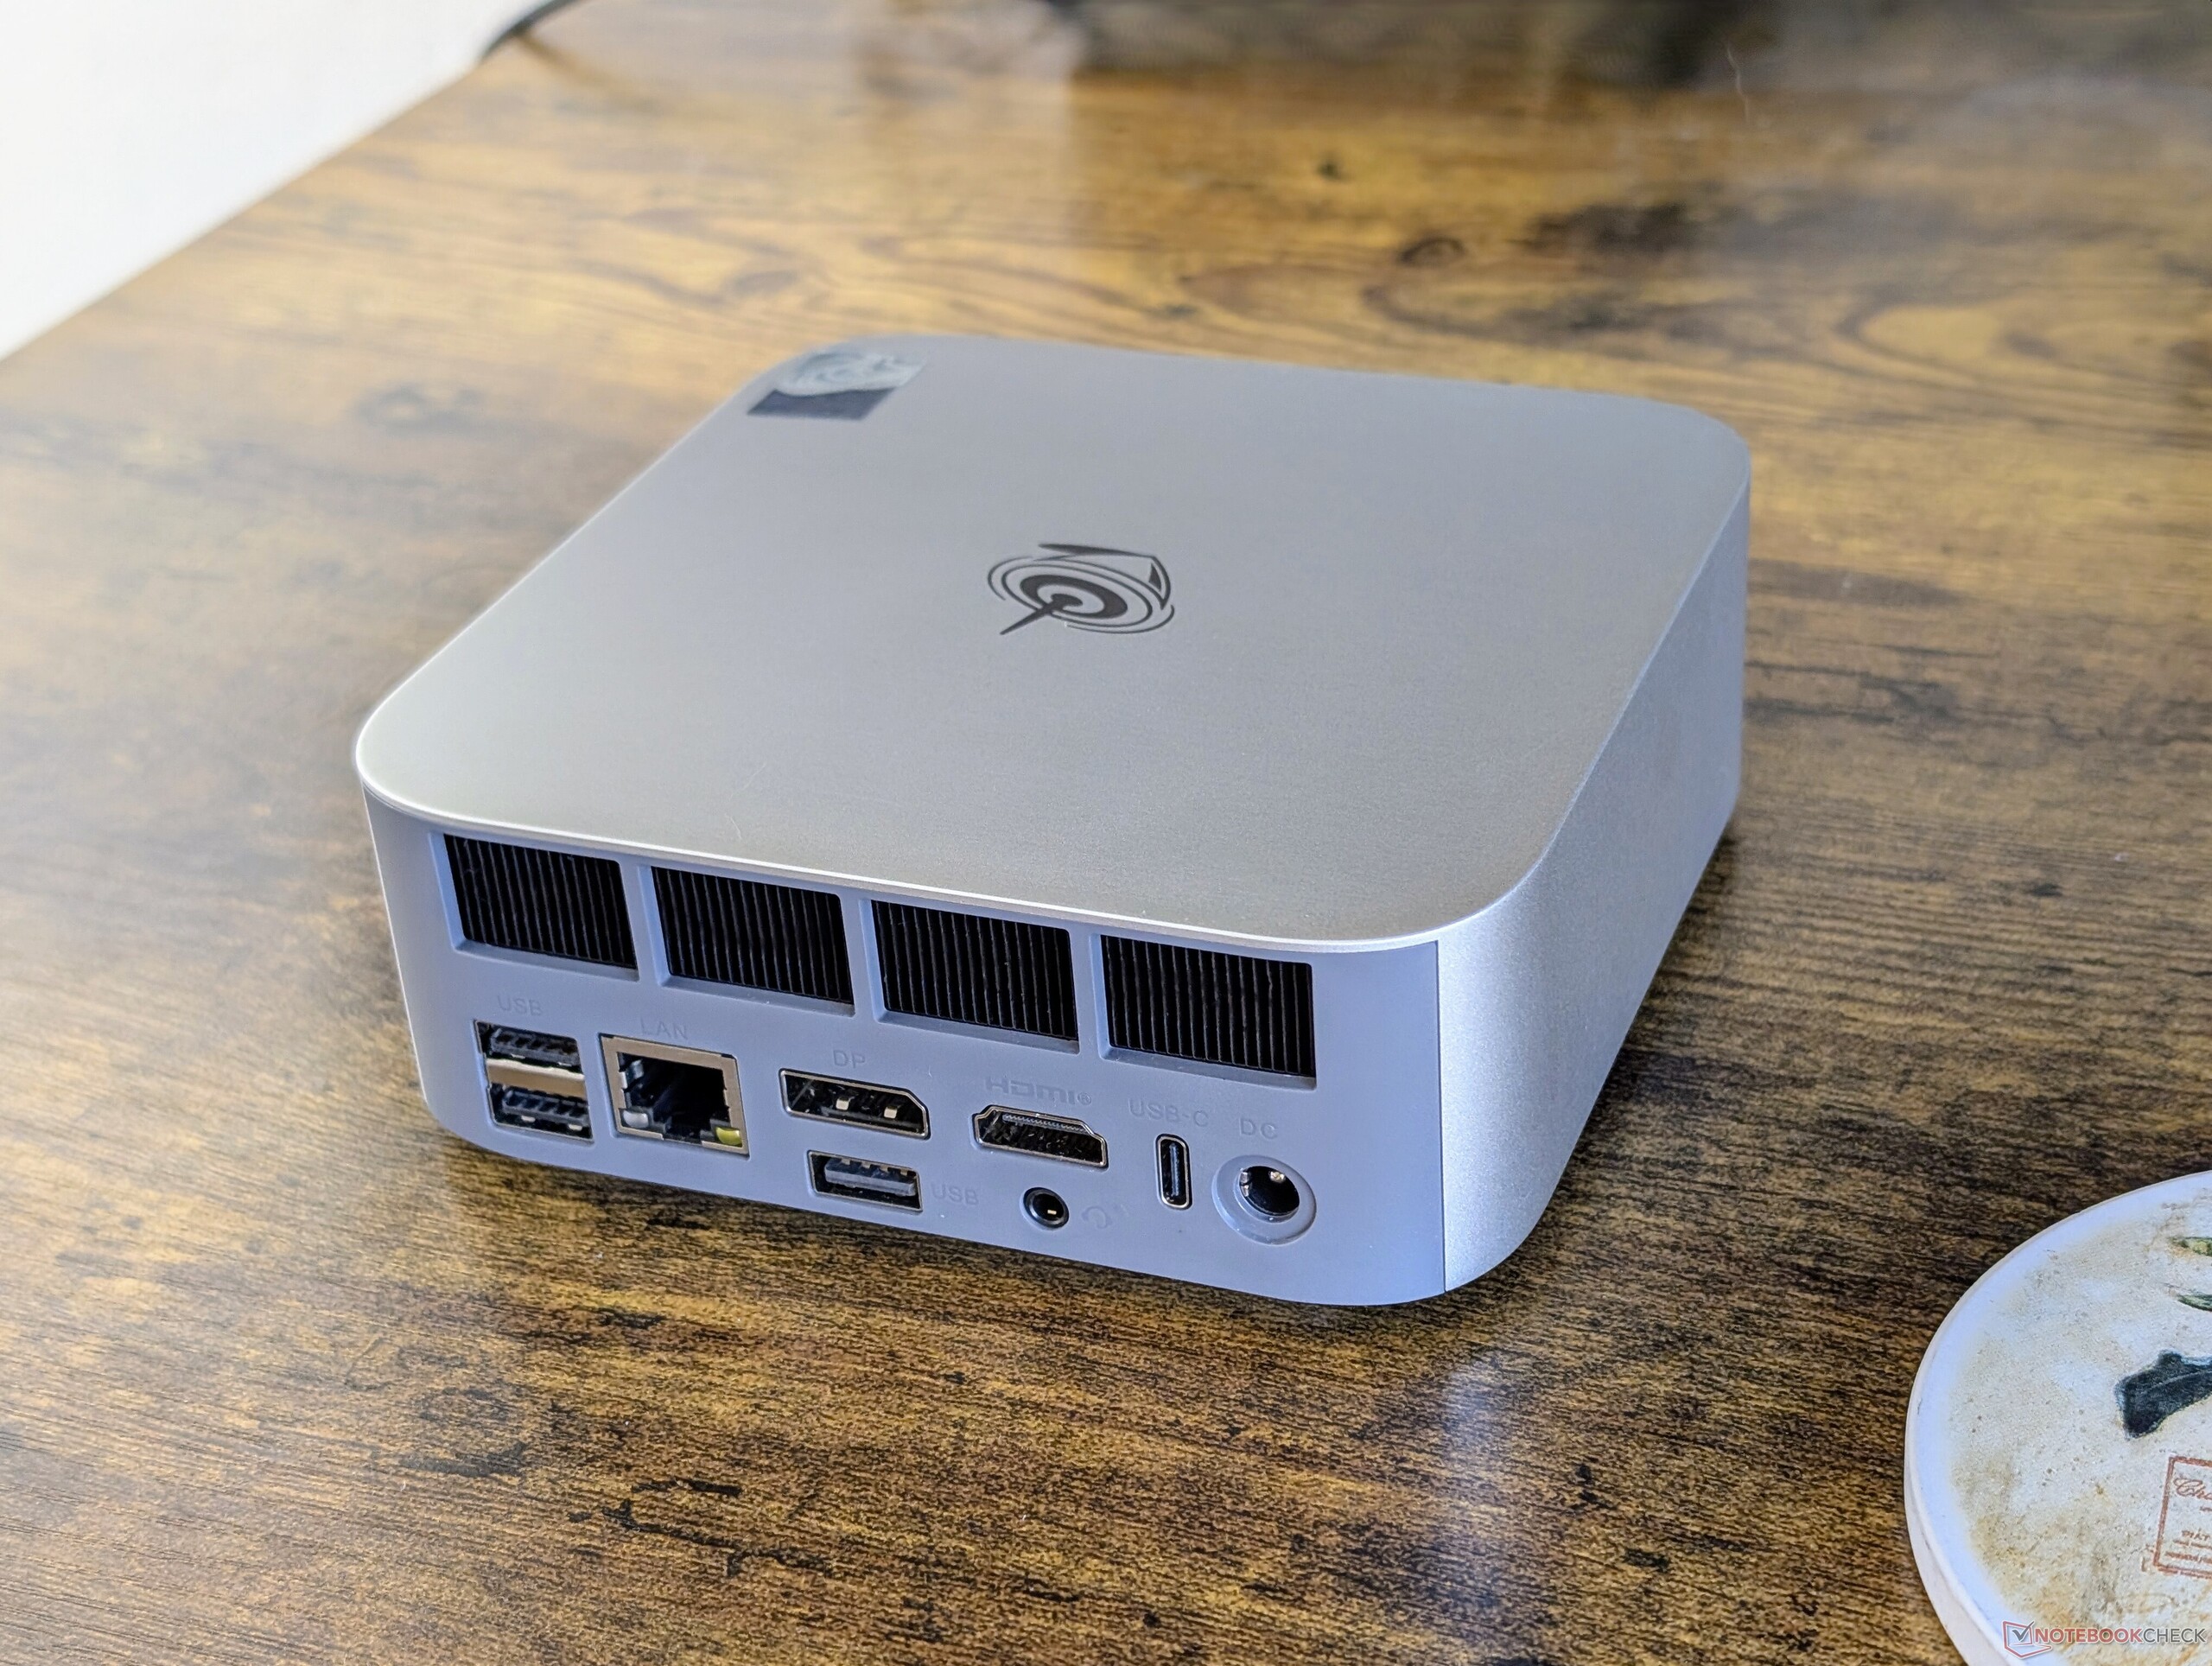
Chassis features and dimensions are exactly the same as on the regular SER9. Owners will want to keep in mind that while the system sports four USB-A ports and two USB-C ports, they are confusingly of different versions. For example, two of the USB-A ports are USB 2.0 only while only the rear USB-C port supports USB 4.0 features.
Communication
| Networking | |
| iperf3 transmit AXE11000 | |
| BOSGAME M2 | |
| GMK EVO-X1 | |
| GMK NucBox K11 | |
| MSI Cubi NUC 1M | |
| Beelink SEi13 Pro | |
| Beelink SER9 Pro | |
| iperf3 receive AXE11000 | |
| GMK EVO-X1 | |
| BOSGAME M2 | |
| Beelink SER9 Pro | |
| MSI Cubi NUC 1M | |
| GMK NucBox K11 | |
| Beelink SEi13 Pro | |
| iperf3 transmit AXE11000 6GHz | |
| MSI Cubi NUC 1M | |
| BOSGAME M2 | |
| iperf3 receive AXE11000 6GHz | |
| MSI Cubi NUC 1M | |
| BOSGAME M2 | |
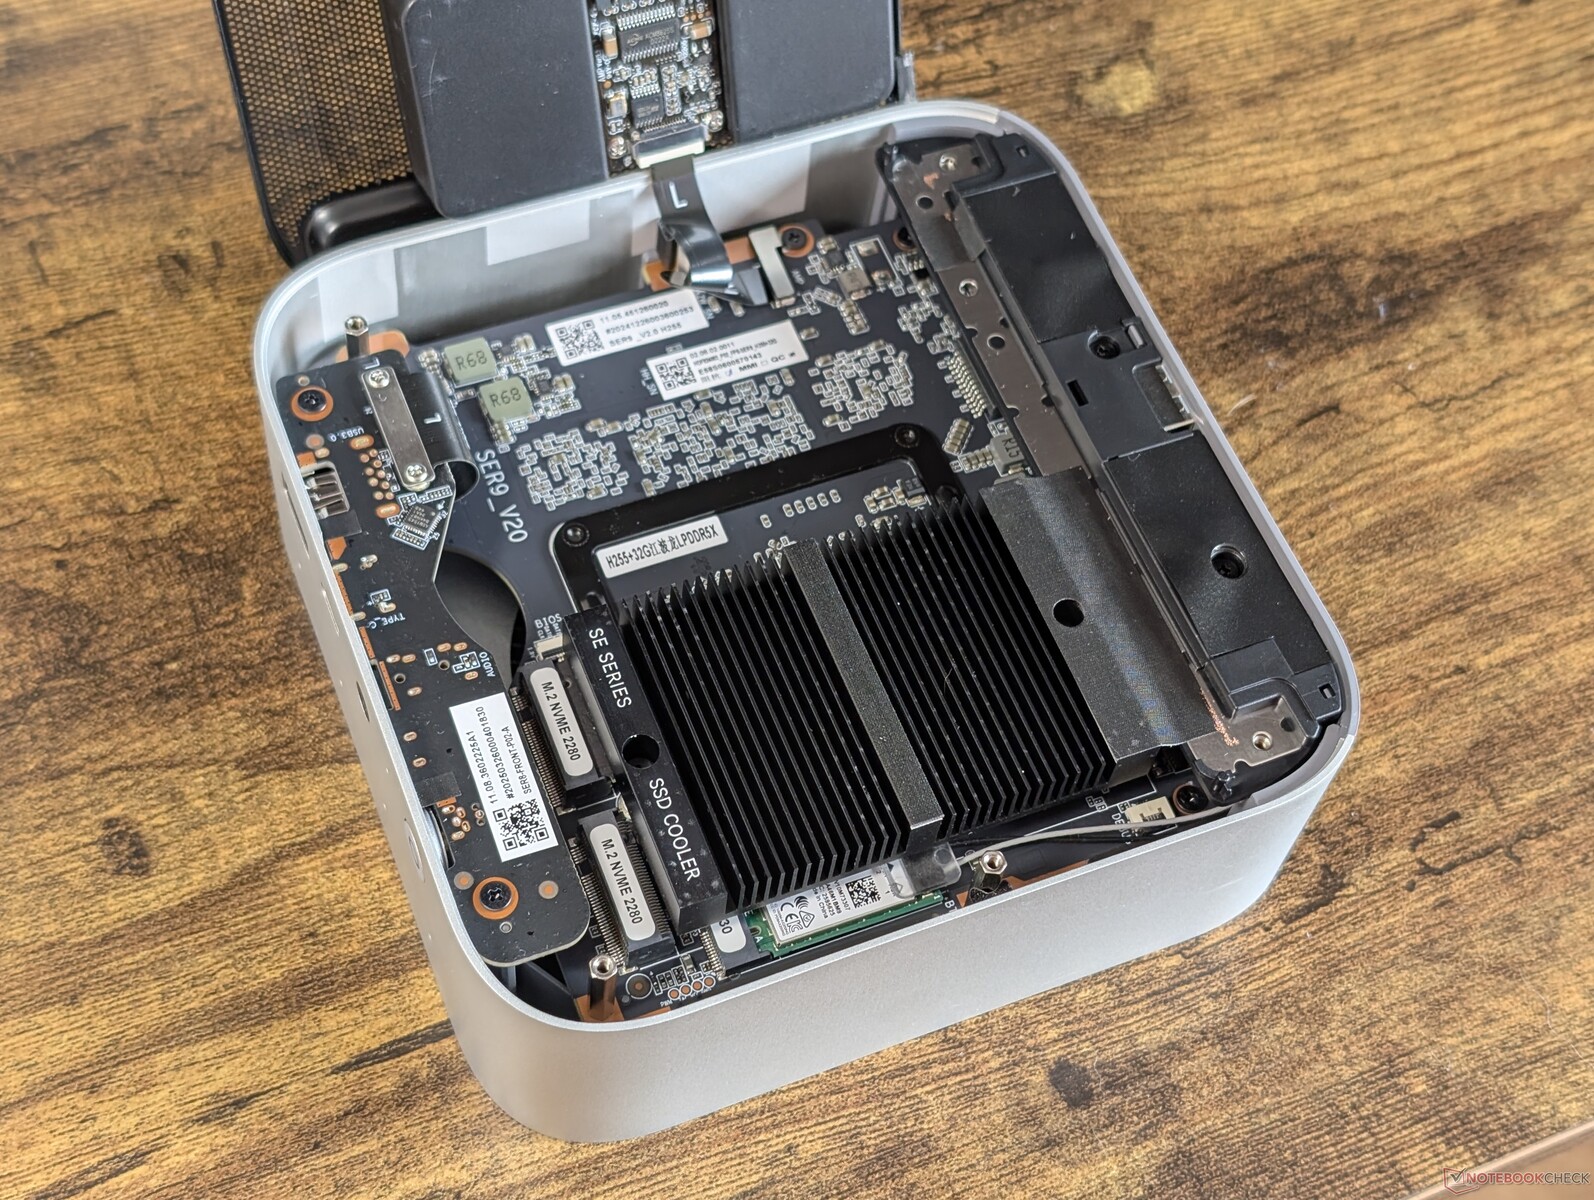
Maintenance
Accessories And Warranty
The retail box includes an HDMI cable alongside the usual AC adapter and paperwork. A one-year manufacturer warranty applies if purchased in the US.
Performance
Testing Conditions
We set Windows to Performance mode prior to running the benchmarks below.
Processor
The Ryzen 7 H 255 performs almost identically to the Ryzen 9 7940HS or Ryzen 7 8845HS. It can be considered a rebrand since it utilizes the older Zen 4 architecture instead Zen 5. The Zen 5-based Ryzen AI 9 HX 370 in the SER9, for example, runs 30 to 35 percent faster.
Keep in mind that the system is not compatible with Copilot+ as its integrated NPU performance is below the minimum requirement.
Cinebench R15 Multi Loop
Cinebench R23: Multi Core | Single Core
Cinebench R20: CPU (Multi Core) | CPU (Single Core)
Cinebench R15: CPU Multi 64Bit | CPU Single 64Bit
Blender: v2.79 BMW27 CPU
7-Zip 18.03: 7z b 4 | 7z b 4 -mmt1
Geekbench 6.5: Multi-Core | Single-Core
Geekbench 5.5: Multi-Core | Single-Core
HWBOT x265 Benchmark v2.2: 4k Preset
LibreOffice : 20 Documents To PDF
R Benchmark 2.5: Overall mean
| CPU Performance rating | |
| BOSGAME M5 | |
| Beelink SER9 | |
| GMK EVO-T1 | |
| Beelink SER8 | |
| GMK NucBox K11 | |
| BOSGAME M2 | |
| Beelink SER9 Pro | |
| Average AMD Ryzen 7 H 255 | |
| GMK NucBox M7 Pro | |
| GMK NucBox K2 | |
| MSI Cubi NUC 1M | |
| Beelink SEi13 Pro | |
| BMAX B9 Power | |
| Beelink SER5 | |
| Trigkey Speed S -2! | |
| Cinebench R23 / Multi Core | |
| BOSGAME M5 | |
| Beelink SER9 | |
| GMK EVO-T1 | |
| Beelink SER8 | |
| GMK NucBox K11 | |
| Beelink SER9 Pro | |
| BOSGAME M2 | |
| Average AMD Ryzen 7 H 255 (15871 - 16402, n=2) | |
| Beelink SEi13 Pro | |
| GMK NucBox M7 Pro | |
| BMAX B9 Power | |
| GMK NucBox K2 | |
| Beelink SER5 | |
| MSI Cubi NUC 1M | |
| Trigkey Speed S | |
| Cinebench R23 / Single Core | |
| GMK EVO-T1 | |
| BOSGAME M5 | |
| Beelink SER9 | |
| MSI Cubi NUC 1M | |
| GMK NucBox K11 | |
| Beelink SER8 | |
| BOSGAME M2 | |
| Beelink SER9 Pro | |
| Average AMD Ryzen 7 H 255 (1697 - 1718, n=2) | |
| GMK NucBox M7 Pro | |
| GMK NucBox K2 | |
| Trigkey Speed S | |
| Beelink SEi13 Pro | |
| BMAX B9 Power | |
| Beelink SER5 | |
| Cinebench R20 / CPU (Multi Core) | |
| BOSGAME M5 | |
| Beelink SER9 | |
| GMK EVO-T1 | |
| Beelink SER9 Pro | |
| GMK NucBox K11 | |
| Beelink SER8 | |
| Average AMD Ryzen 7 H 255 (6255 - 6480, n=2) | |
| BOSGAME M2 | |
| Beelink SEi13 Pro | |
| GMK NucBox M7 Pro | |
| BMAX B9 Power | |
| GMK NucBox K2 | |
| Beelink SER5 | |
| MSI Cubi NUC 1M | |
| Trigkey Speed S | |
| Cinebench R20 / CPU (Single Core) | |
| GMK EVO-T1 | |
| BOSGAME M5 | |
| Beelink SER9 | |
| MSI Cubi NUC 1M | |
| GMK NucBox K11 | |
| Beelink SER8 | |
| BOSGAME M2 | |
| Beelink SER9 Pro | |
| Average AMD Ryzen 7 H 255 (660 - 677, n=2) | |
| GMK NucBox M7 Pro | |
| GMK NucBox K2 | |
| Trigkey Speed S | |
| Beelink SEi13 Pro | |
| Beelink SER5 | |
| BMAX B9 Power | |
| Cinebench R15 / CPU Multi 64Bit | |
| BOSGAME M5 | |
| Beelink SER9 | |
| GMK EVO-T1 | |
| Beelink SER8 | |
| GMK NucBox K11 | |
| Beelink SER9 Pro | |
| BOSGAME M2 | |
| Average AMD Ryzen 7 H 255 (2514 - 2588, n=2) | |
| Beelink SEi13 Pro | |
| GMK NucBox M7 Pro | |
| BMAX B9 Power | |
| GMK NucBox K2 | |
| Beelink SER5 | |
| MSI Cubi NUC 1M | |
| Trigkey Speed S | |
| Cinebench R15 / CPU Single 64Bit | |
| BOSGAME M5 | |
| Beelink SER9 | |
| GMK EVO-T1 | |
| GMK NucBox K11 | |
| Beelink SER8 | |
| Beelink SER9 Pro | |
| Average AMD Ryzen 7 H 255 (266 - 276, n=2) | |
| GMK NucBox M7 Pro | |
| MSI Cubi NUC 1M | |
| BOSGAME M2 | |
| GMK NucBox K2 | |
| Trigkey Speed S | |
| Beelink SEi13 Pro | |
| Beelink SER5 | |
| BMAX B9 Power | |
| Blender / v2.79 BMW27 CPU | |
| Trigkey Speed S | |
| MSI Cubi NUC 1M | |
| Beelink SER5 | |
| GMK NucBox K2 | |
| BMAX B9 Power | |
| GMK NucBox M7 Pro | |
| Beelink SEi13 Pro | |
| Average AMD Ryzen 7 H 255 (194 - 203, n=2) | |
| BOSGAME M2 | |
| Beelink SER9 Pro | |
| GMK NucBox K11 | |
| Beelink SER8 | |
| GMK EVO-T1 | |
| Beelink SER9 | |
| BOSGAME M5 | |
| 7-Zip 18.03 / 7z b 4 -mmt1 | |
| Beelink SER8 | |
| GMK NucBox K11 | |
| BOSGAME M5 | |
| BOSGAME M2 | |
| Average AMD Ryzen 7 H 255 (6237 - 6261, n=2) | |
| Beelink SER9 Pro | |
| Beelink SER9 | |
| GMK EVO-T1 | |
| GMK NucBox M7 Pro | |
| MSI Cubi NUC 1M | |
| GMK NucBox K2 | |
| Trigkey Speed S | |
| Beelink SER5 | |
| Beelink SEi13 Pro | |
| BMAX B9 Power | |
| Geekbench 6.5 / Multi-Core | |
| BOSGAME M5 | |
| GMK EVO-T1 | |
| Beelink SER9 | |
| Beelink SER8 | |
| BOSGAME M2 | |
| GMK NucBox K11 | |
| Beelink SER9 Pro | |
| Average AMD Ryzen 7 H 255 (12515 - 12825, n=2) | |
| GMK NucBox M7 Pro | |
| GMK NucBox K2 | |
| BMAX B9 Power | |
| MSI Cubi NUC 1M | |
| Beelink SEi13 Pro | |
| Beelink SER5 | |
| Geekbench 6.5 / Single-Core | |
| GMK EVO-T1 | |
| Beelink SER9 | |
| BOSGAME M5 | |
| GMK NucBox K11 | |
| BOSGAME M2 | |
| Beelink SER8 | |
| MSI Cubi NUC 1M | |
| Beelink SER9 Pro | |
| Average AMD Ryzen 7 H 255 (2545 - 2546, n=2) | |
| GMK NucBox M7 Pro | |
| GMK NucBox K2 | |
| Beelink SEi13 Pro | |
| BMAX B9 Power | |
| Beelink SER5 | |
| Geekbench 5.5 / Multi-Core | |
| BOSGAME M5 | |
| GMK EVO-T1 | |
| Beelink SER9 | |
| BOSGAME M2 | |
| Beelink SER8 | |
| GMK NucBox K11 | |
| Beelink SER9 Pro | |
| Average AMD Ryzen 7 H 255 (11604 - 11614, n=2) | |
| BMAX B9 Power | |
| GMK NucBox M7 Pro | |
| GMK NucBox K2 | |
| Beelink SEi13 Pro | |
| MSI Cubi NUC 1M | |
| Beelink SER5 | |
| Trigkey Speed S | |
| Geekbench 5.5 / Single-Core | |
| BOSGAME M5 | |
| GMK EVO-T1 | |
| Beelink SER8 | |
| GMK NucBox K11 | |
| BOSGAME M2 | |
| Beelink SER9 | |
| MSI Cubi NUC 1M | |
| Average AMD Ryzen 7 H 255 (1810 - 1880, n=2) | |
| Beelink SER9 Pro | |
| GMK NucBox M7 Pro | |
| GMK NucBox K2 | |
| Trigkey Speed S | |
| Beelink SER5 | |
| Beelink SEi13 Pro | |
| BMAX B9 Power | |
| HWBOT x265 Benchmark v2.2 / 4k Preset | |
| BOSGAME M5 | |
| Beelink SER9 | |
| GMK EVO-T1 | |
| BOSGAME M2 | |
| Beelink SER8 | |
| GMK NucBox K11 | |
| Beelink SER9 Pro | |
| Average AMD Ryzen 7 H 255 (19.9 - 20.4, n=2) | |
| GMK NucBox M7 Pro | |
| Beelink SEi13 Pro | |
| GMK NucBox K2 | |
| BMAX B9 Power | |
| Beelink SER5 | |
| MSI Cubi NUC 1M | |
| Trigkey Speed S | |
| LibreOffice / 20 Documents To PDF | |
| BMAX B9 Power | |
| Beelink SER5 | |
| Beelink SEi13 Pro | |
| GMK EVO-T1 | |
| BOSGAME M5 | |
| Beelink SER9 | |
| Average AMD Ryzen 7 H 255 (51 - 51.4, n=2) | |
| Beelink SER9 Pro | |
| GMK NucBox K11 | |
| GMK NucBox M7 Pro | |
| Beelink SER8 | |
| GMK NucBox K2 | |
| Trigkey Speed S | |
| BOSGAME M2 | |
| MSI Cubi NUC 1M | |
| R Benchmark 2.5 / Overall mean | |
| Beelink SEi13 Pro | |
| BMAX B9 Power | |
| Trigkey Speed S | |
| Beelink SER5 | |
| Beelink SER9 Pro | |
| GMK NucBox K2 | |
| Average AMD Ryzen 7 H 255 (0.4587 - 0.503, n=2) | |
| GMK NucBox M7 Pro | |
| MSI Cubi NUC 1M | |
| GMK EVO-T1 | |
| Beelink SER8 | |
| GMK NucBox K11 | |
| BOSGAME M2 | |
| BOSGAME M5 | |
| Beelink SER9 | |
Cinebench R23: Multi Core | Single Core
Cinebench R20: CPU (Multi Core) | CPU (Single Core)
Cinebench R15: CPU Multi 64Bit | CPU Single 64Bit
Blender: v2.79 BMW27 CPU
7-Zip 18.03: 7z b 4 | 7z b 4 -mmt1
Geekbench 6.5: Multi-Core | Single-Core
Geekbench 5.5: Multi-Core | Single-Core
HWBOT x265 Benchmark v2.2: 4k Preset
LibreOffice : 20 Documents To PDF
R Benchmark 2.5: Overall mean
* ... smaller is better
AIDA64: FP32 Ray-Trace | FPU Julia | CPU SHA3 | CPU Queen | FPU SinJulia | FPU Mandel | CPU AES | CPU ZLib | FP64 Ray-Trace | CPU PhotoWorxx
| Performance rating | |
| BOSGAME M2 | |
| GMK EVO-X1 | |
| GMK NucBox K11 | |
| Beelink SER9 Pro | |
| Average AMD Ryzen 7 H 255 | |
| Beelink SEi13 Pro | |
| MSI Cubi NUC 1M | |
| AIDA64 / FP32 Ray-Trace | |
| GMK EVO-X1 | |
| BOSGAME M2 | |
| GMK NucBox K11 | |
| Beelink SER9 Pro | |
| Average AMD Ryzen 7 H 255 (25404 - 26120, n=2) | |
| Beelink SEi13 Pro | |
| MSI Cubi NUC 1M | |
| AIDA64 / FPU Julia | |
| GMK EVO-X1 | |
| BOSGAME M2 | |
| GMK NucBox K11 | |
| Beelink SER9 Pro | |
| Average AMD Ryzen 7 H 255 (104302 - 106590, n=2) | |
| Beelink SEi13 Pro | |
| MSI Cubi NUC 1M | |
| AIDA64 / CPU SHA3 | |
| GMK EVO-X1 | |
| BOSGAME M2 | |
| GMK NucBox K11 | |
| Beelink SER9 Pro | |
| Average AMD Ryzen 7 H 255 (4604 - 4764, n=2) | |
| Beelink SEi13 Pro | |
| MSI Cubi NUC 1M | |
| AIDA64 / CPU Queen | |
| BOSGAME M2 | |
| Beelink SER9 Pro | |
| GMK NucBox K11 | |
| Average AMD Ryzen 7 H 255 (111673 - 115748, n=2) | |
| Beelink SEi13 Pro | |
| MSI Cubi NUC 1M | |
| GMK EVO-X1 | |
| AIDA64 / FPU SinJulia | |
| GMK EVO-X1 | |
| BOSGAME M2 | |
| Beelink SER9 Pro | |
| GMK NucBox K11 | |
| Average AMD Ryzen 7 H 255 (14626 - 15123, n=2) | |
| Beelink SEi13 Pro | |
| MSI Cubi NUC 1M | |
| AIDA64 / FPU Mandel | |
| GMK EVO-X1 | |
| BOSGAME M2 | |
| GMK NucBox K11 | |
| Beelink SER9 Pro | |
| Average AMD Ryzen 7 H 255 (56019 - 57378, n=2) | |
| Beelink SEi13 Pro | |
| MSI Cubi NUC 1M | |
| AIDA64 / CPU AES | |
| BOSGAME M2 | |
| GMK NucBox K11 | |
| Beelink SER9 Pro | |
| Average AMD Ryzen 7 H 255 (83999 - 86090, n=2) | |
| GMK EVO-X1 | |
| Beelink SEi13 Pro | |
| MSI Cubi NUC 1M | |
| AIDA64 / CPU ZLib | |
| GMK EVO-X1 | |
| Beelink SER9 Pro | |
| GMK NucBox K11 | |
| BOSGAME M2 | |
| Average AMD Ryzen 7 H 255 (1036 - 1066, n=2) | |
| Beelink SEi13 Pro | |
| MSI Cubi NUC 1M | |
| AIDA64 / FP64 Ray-Trace | |
| GMK EVO-X1 | |
| BOSGAME M2 | |
| GMK NucBox K11 | |
| Beelink SER9 Pro | |
| Average AMD Ryzen 7 H 255 (13694 - 13941, n=2) | |
| Beelink SEi13 Pro | |
| MSI Cubi NUC 1M | |
| AIDA64 / CPU PhotoWorxx | |
| GMK EVO-X1 | |
| Beelink SER9 Pro | |
| BOSGAME M2 | |
| Average AMD Ryzen 7 H 255 (40115 - 41649, n=2) | |
| GMK NucBox K11 | |
| MSI Cubi NUC 1M | |
| Beelink SEi13 Pro | |
System Performance
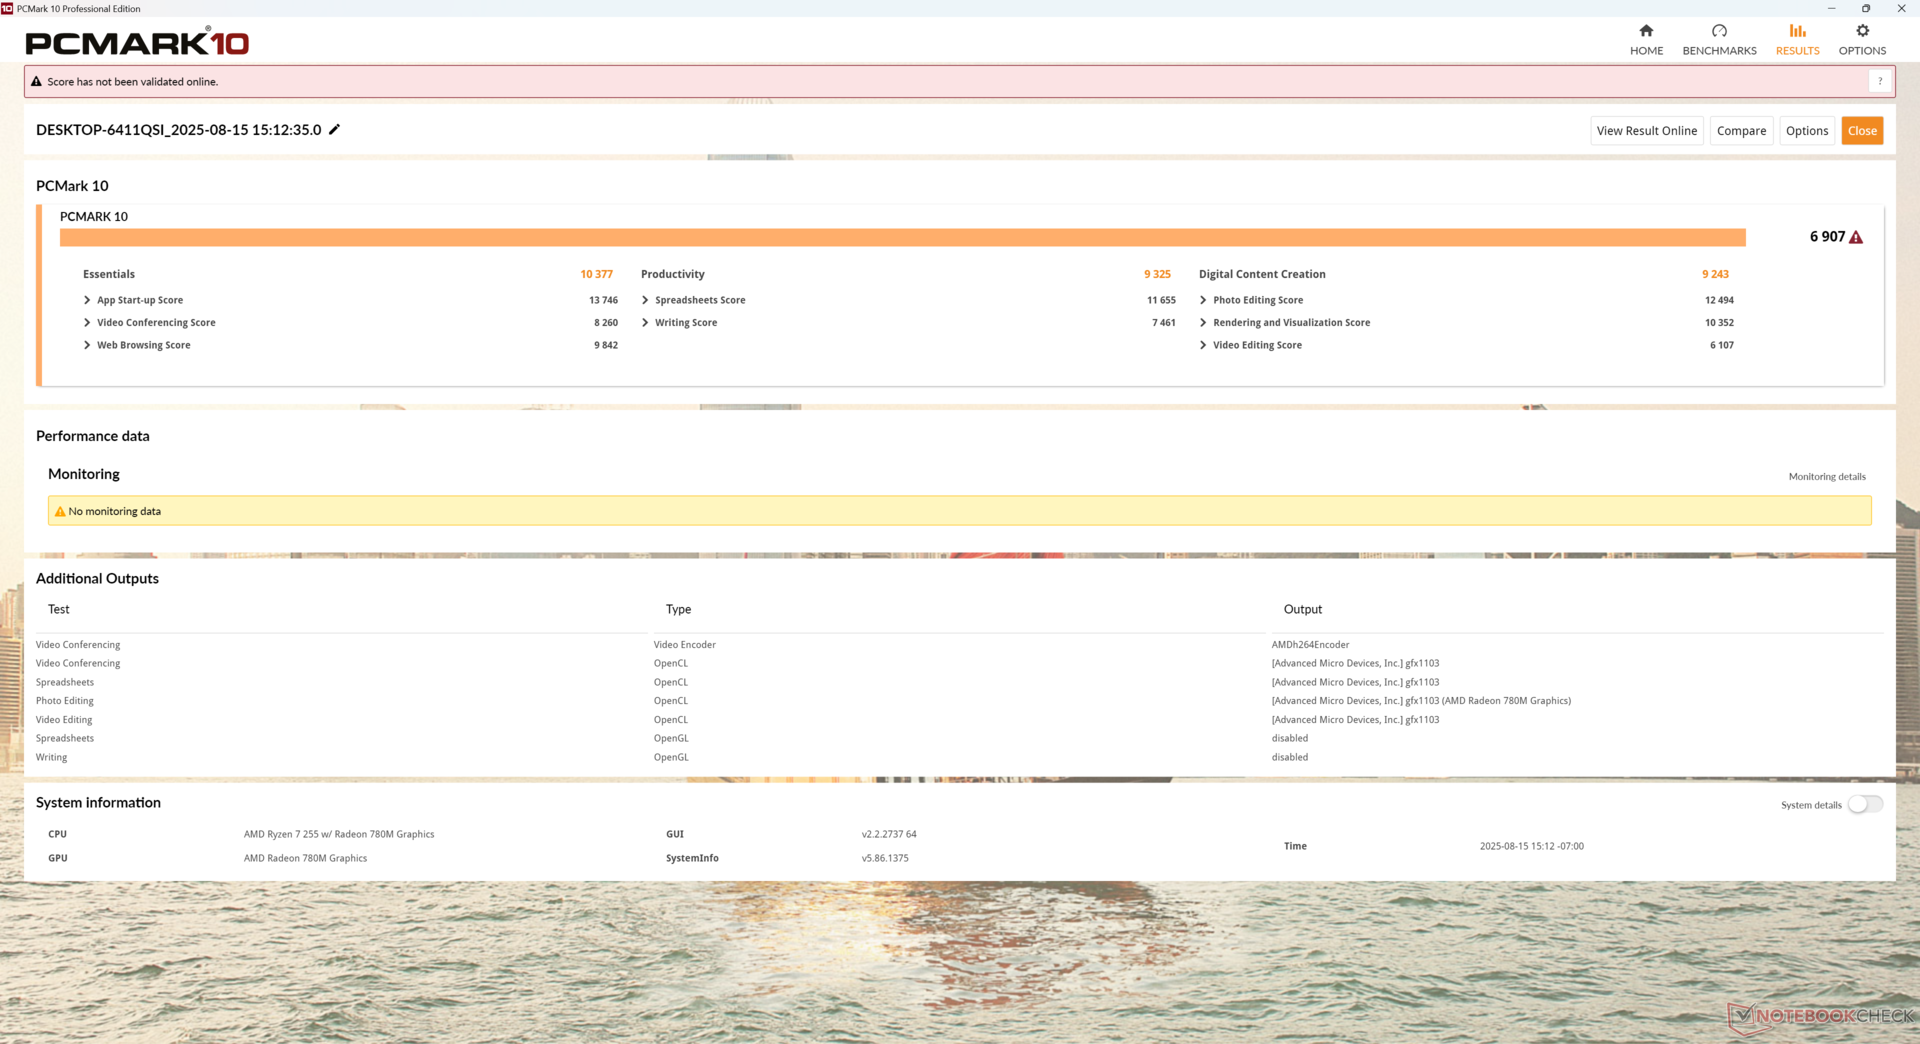
PCMark 10: Score | Essentials | Productivity | Digital Content Creation
CrossMark: Overall | Productivity | Creativity | Responsiveness
WebXPRT 3: Overall
WebXPRT 4: Overall
Mozilla Kraken 1.1: Total
| Performance rating | |
| GMK NucBox K11 | |
| BOSGAME M2 | |
| GMK EVO-X1 | |
| Beelink SER9 Pro | |
| Average AMD Ryzen 7 H 255, AMD Radeon 780M | |
| MSI Cubi NUC 1M | |
| Beelink SEi13 Pro -4! | |
| PCMark 10 / Score | |
| GMK NucBox K11 | |
| BOSGAME M2 | |
| GMK EVO-X1 | |
| Average AMD Ryzen 7 H 255, AMD Radeon 780M (6907 - 6959, n=2) | |
| Beelink SER9 Pro | |
| MSI Cubi NUC 1M | |
| PCMark 10 / Essentials | |
| GMK NucBox K11 | |
| BOSGAME M2 | |
| GMK EVO-X1 | |
| MSI Cubi NUC 1M | |
| Average AMD Ryzen 7 H 255, AMD Radeon 780M (10377 - 10502, n=2) | |
| Beelink SER9 Pro | |
| PCMark 10 / Productivity | |
| GMK NucBox K11 | |
| BOSGAME M2 | |
| Average AMD Ryzen 7 H 255, AMD Radeon 780M (9325 - 9440, n=2) | |
| Beelink SER9 Pro | |
| GMK EVO-X1 | |
| MSI Cubi NUC 1M | |
| PCMark 10 / Digital Content Creation | |
| GMK EVO-X1 | |
| GMK NucBox K11 | |
| BOSGAME M2 | |
| Beelink SER9 Pro | |
| Average AMD Ryzen 7 H 255, AMD Radeon 780M (9227 - 9243, n=2) | |
| MSI Cubi NUC 1M | |
| CrossMark / Overall | |
| Beelink SER9 Pro | |
| Average AMD Ryzen 7 H 255, AMD Radeon 780M (1769 - 1791, n=2) | |
| GMK NucBox K11 | |
| BOSGAME M2 | |
| MSI Cubi NUC 1M | |
| GMK EVO-X1 | |
| Beelink SEi13 Pro | |
| CrossMark / Productivity | |
| MSI Cubi NUC 1M | |
| Beelink SER9 Pro | |
| GMK NucBox K11 | |
| Average AMD Ryzen 7 H 255, AMD Radeon 780M (1709 - 1733, n=2) | |
| BOSGAME M2 | |
| GMK EVO-X1 | |
| Beelink SEi13 Pro | |
| CrossMark / Creativity | |
| BOSGAME M2 | |
| GMK NucBox K11 | |
| Beelink SER9 Pro | |
| Average AMD Ryzen 7 H 255, AMD Radeon 780M (1887 - 1895, n=2) | |
| GMK EVO-X1 | |
| MSI Cubi NUC 1M | |
| Beelink SEi13 Pro | |
| CrossMark / Responsiveness | |
| MSI Cubi NUC 1M | |
| Beelink SER9 Pro | |
| Average AMD Ryzen 7 H 255, AMD Radeon 780M (1617 - 1666, n=2) | |
| BOSGAME M2 | |
| GMK NucBox K11 | |
| Beelink SEi13 Pro | |
| GMK EVO-X1 | |
| WebXPRT 3 / Overall | |
| GMK NucBox K11 | |
| BOSGAME M2 | |
| GMK EVO-X1 | |
| MSI Cubi NUC 1M | |
| Beelink SER9 Pro | |
| Average AMD Ryzen 7 H 255, AMD Radeon 780M (290 - 300, n=2) | |
| Beelink SEi13 Pro | |
| WebXPRT 4 / Overall | |
| GMK NucBox K11 | |
| BOSGAME M2 | |
| MSI Cubi NUC 1M | |
| GMK EVO-X1 | |
| Beelink SER9 Pro | |
| Average AMD Ryzen 7 H 255, AMD Radeon 780M (245 - 245, n=2) | |
| Beelink SEi13 Pro | |
| Mozilla Kraken 1.1 / Total | |
| Beelink SEi13 Pro | |
| Average AMD Ryzen 7 H 255, AMD Radeon 780M (566 - 577, n=2) | |
| Beelink SER9 Pro | |
| BOSGAME M2 | |
| GMK NucBox K11 | |
| MSI Cubi NUC 1M | |
| GMK EVO-X1 | |
* ... smaller is better
| PCMark 10 Score | 6907 points | |
Help | ||
| AIDA64 / Memory Copy | |
| GMK EVO-X1 | |
| Beelink SER9 Pro | |
| Average AMD Ryzen 7 H 255 (67673 - 74184, n=2) | |
| BOSGAME M2 | |
| GMK NucBox K11 | |
| Beelink SEi13 Pro | |
| MSI Cubi NUC 1M | |
| AIDA64 / Memory Read | |
| GMK EVO-X1 | |
| MSI Cubi NUC 1M | |
| BOSGAME M2 | |
| GMK NucBox K11 | |
| Average AMD Ryzen 7 H 255 (58305 - 61129, n=2) | |
| Beelink SER9 Pro | |
| Beelink SEi13 Pro | |
| AIDA64 / Memory Write | |
| Beelink SER9 Pro | |
| GMK EVO-X1 | |
| Average AMD Ryzen 7 H 255 (85497 - 106026, n=2) | |
| BOSGAME M2 | |
| GMK NucBox K11 | |
| Beelink SEi13 Pro | |
| MSI Cubi NUC 1M | |
| AIDA64 / Memory Latency | |
| Beelink SEi13 Pro | |
| GMK EVO-X1 | |
| Beelink SER9 Pro | |
| Average AMD Ryzen 7 H 255 (93.7 - 103.9, n=2) | |
| BOSGAME M2 | |
| GMK NucBox K11 | |
| MSI Cubi NUC 1M | |
* ... smaller is better
DPC Latency
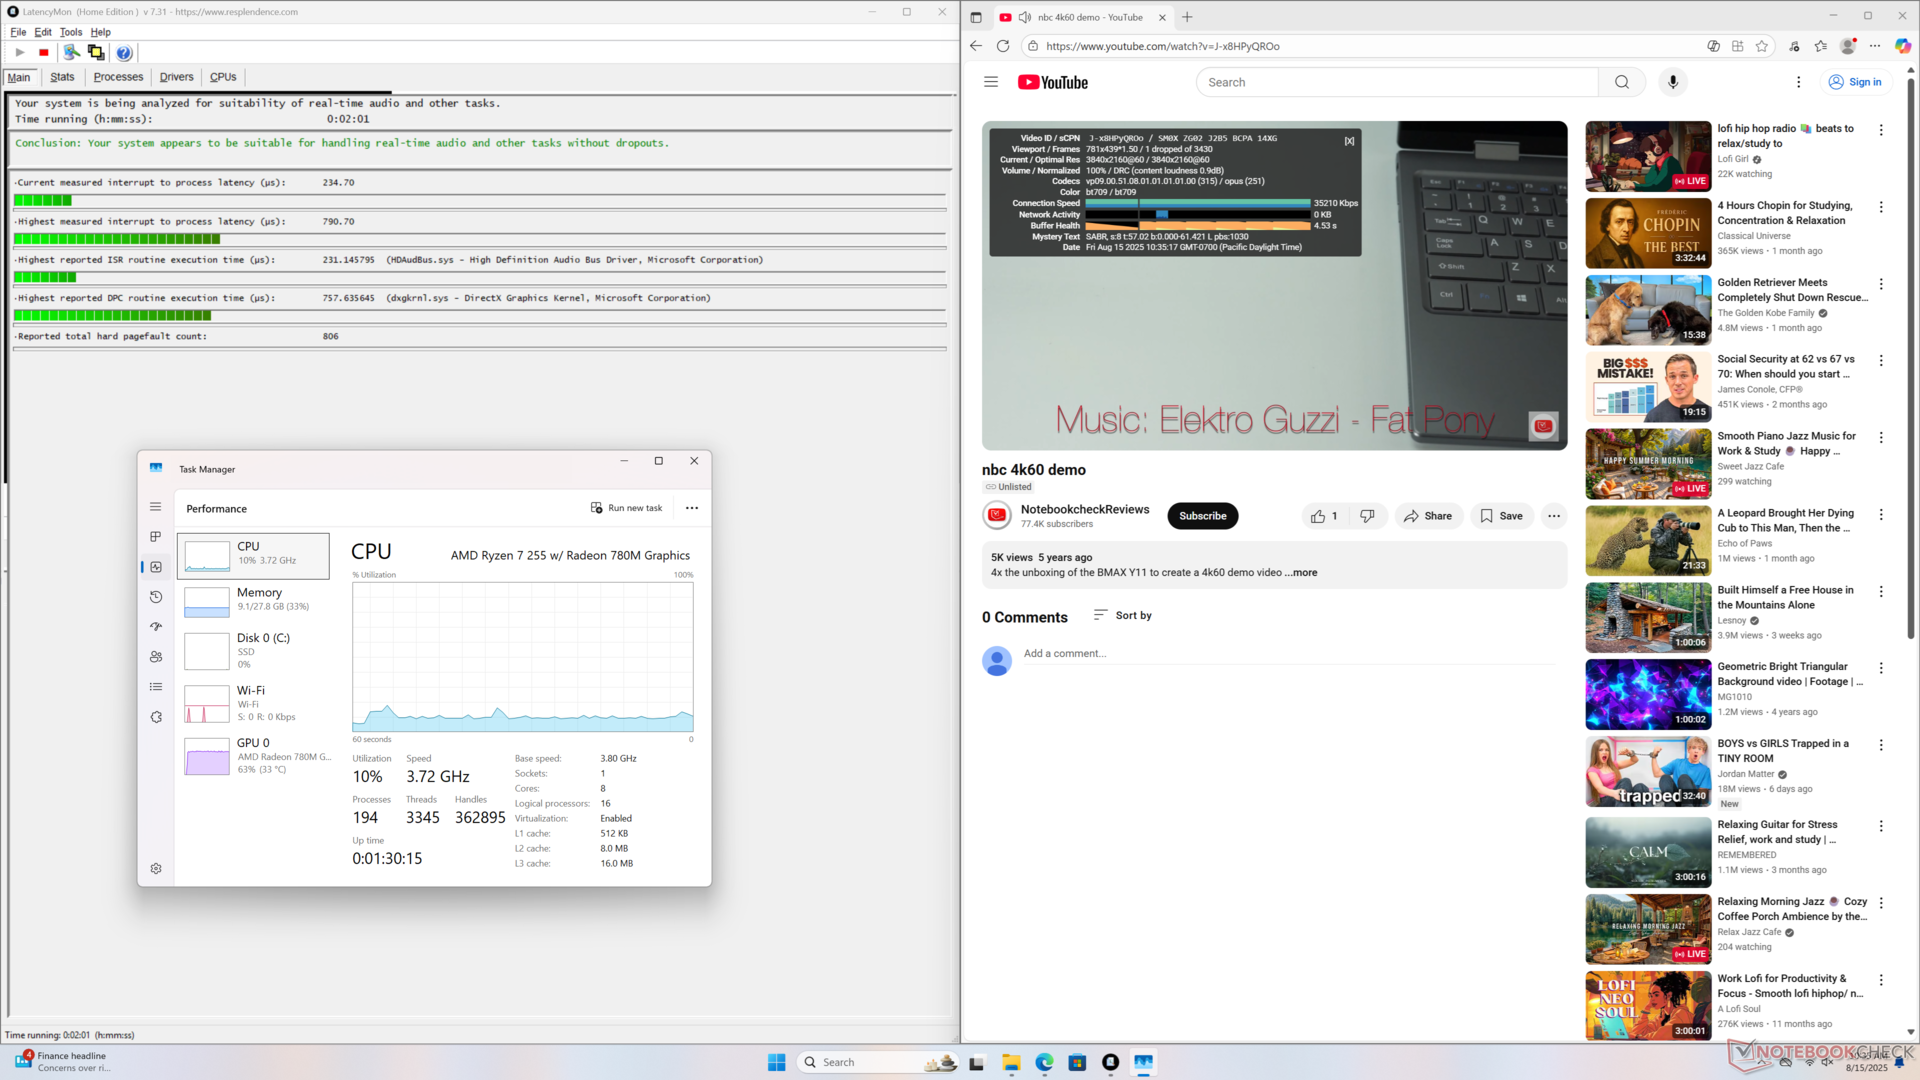
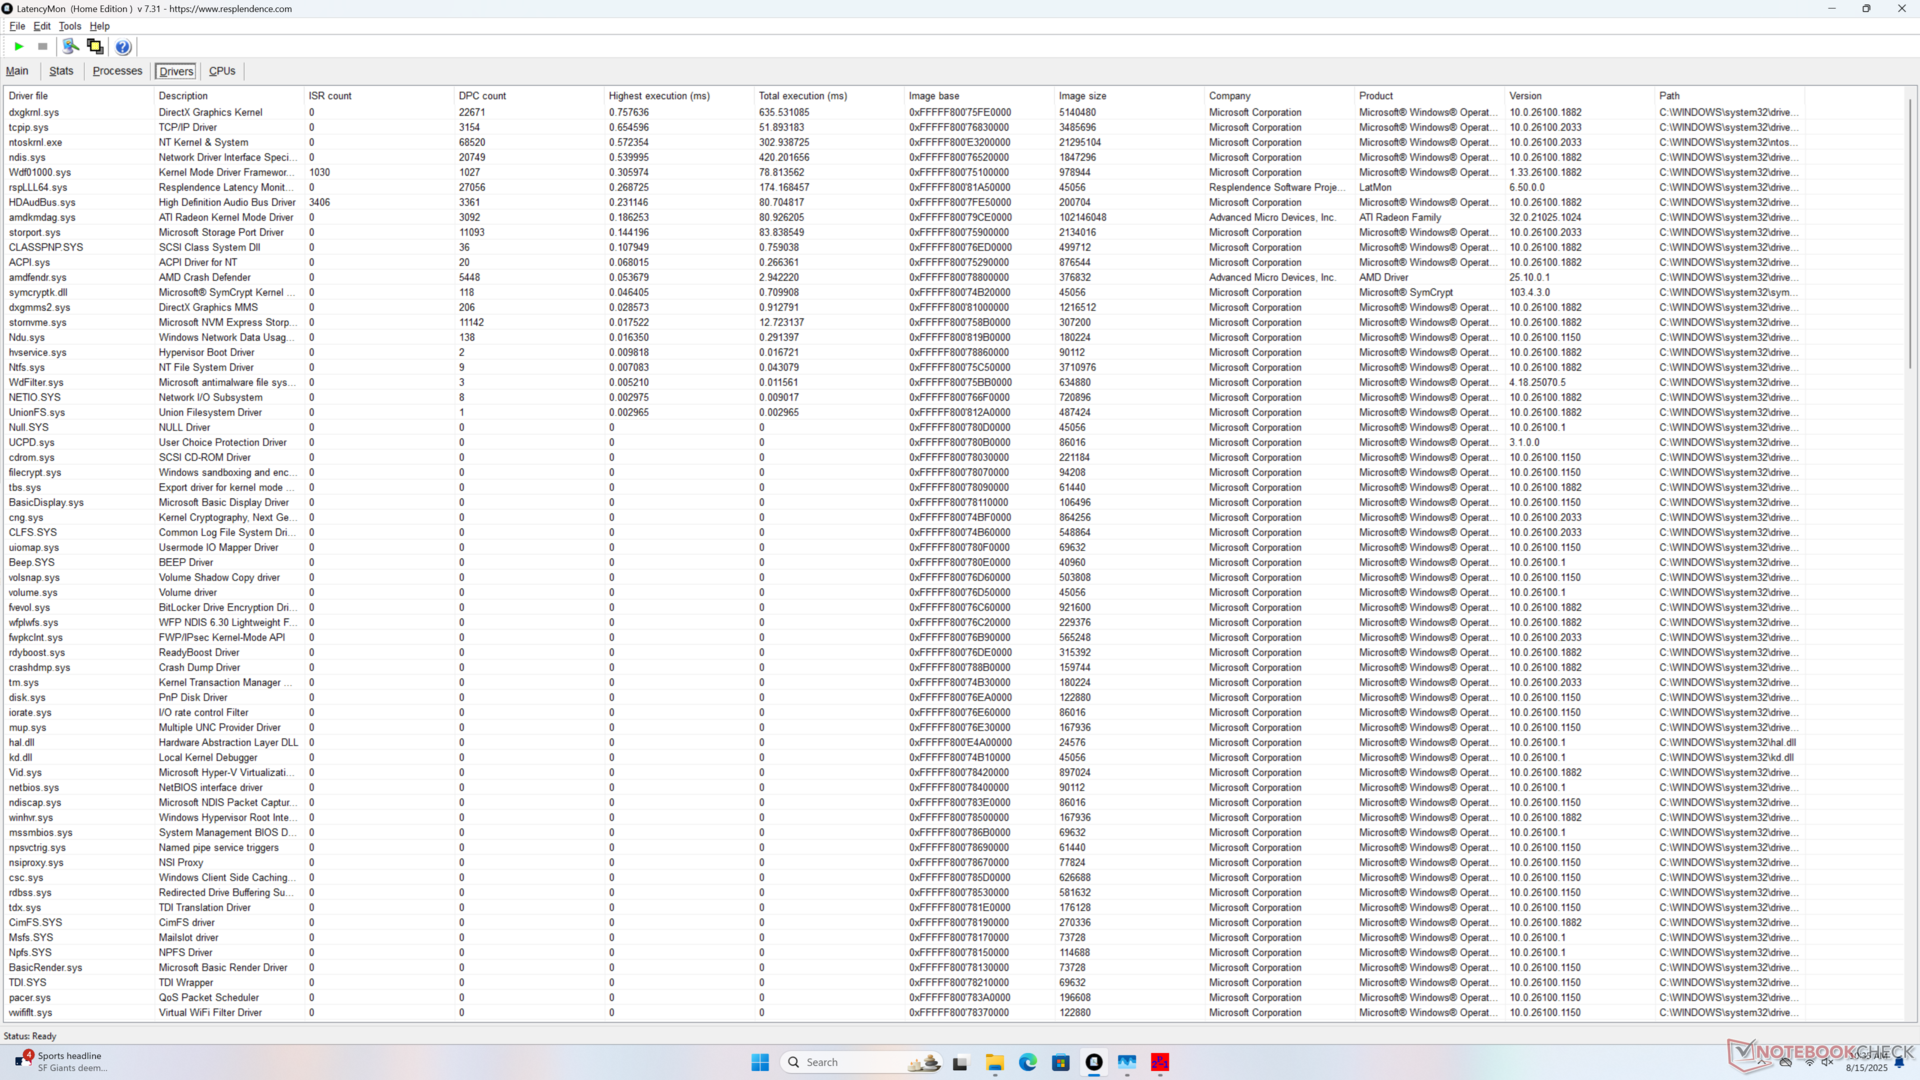
| DPC Latencies / LatencyMon - interrupt to process latency (max), Web, Youtube, Prime95 | |
| MSI Cubi NUC 1M | |
| Beelink SEi13 Pro | |
| BOSGAME M2 | |
| GMK EVO-X1 | |
| Beelink SER9 Pro | |
| GMK NucBox K11 | |
* ... smaller is better
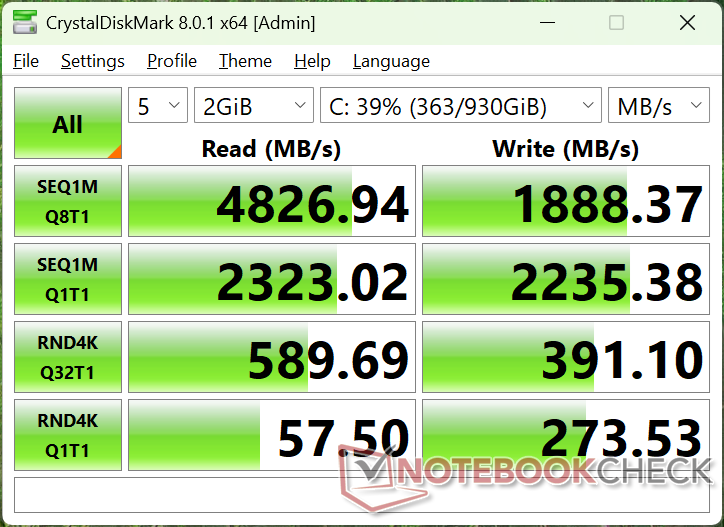
Storage Devices


| Drive Performance rating - Percent | |
| Beelink SEi13 Pro | |
| BOSGAME M2 | |
| GMK NucBox K11 | |
| MSI Cubi NUC 1M | |
| GMK EVO-X1 | |
| Beelink SER9 Pro | |
* ... smaller is better
Disk Throttling: DiskSpd Read Loop, Queue Depth 8
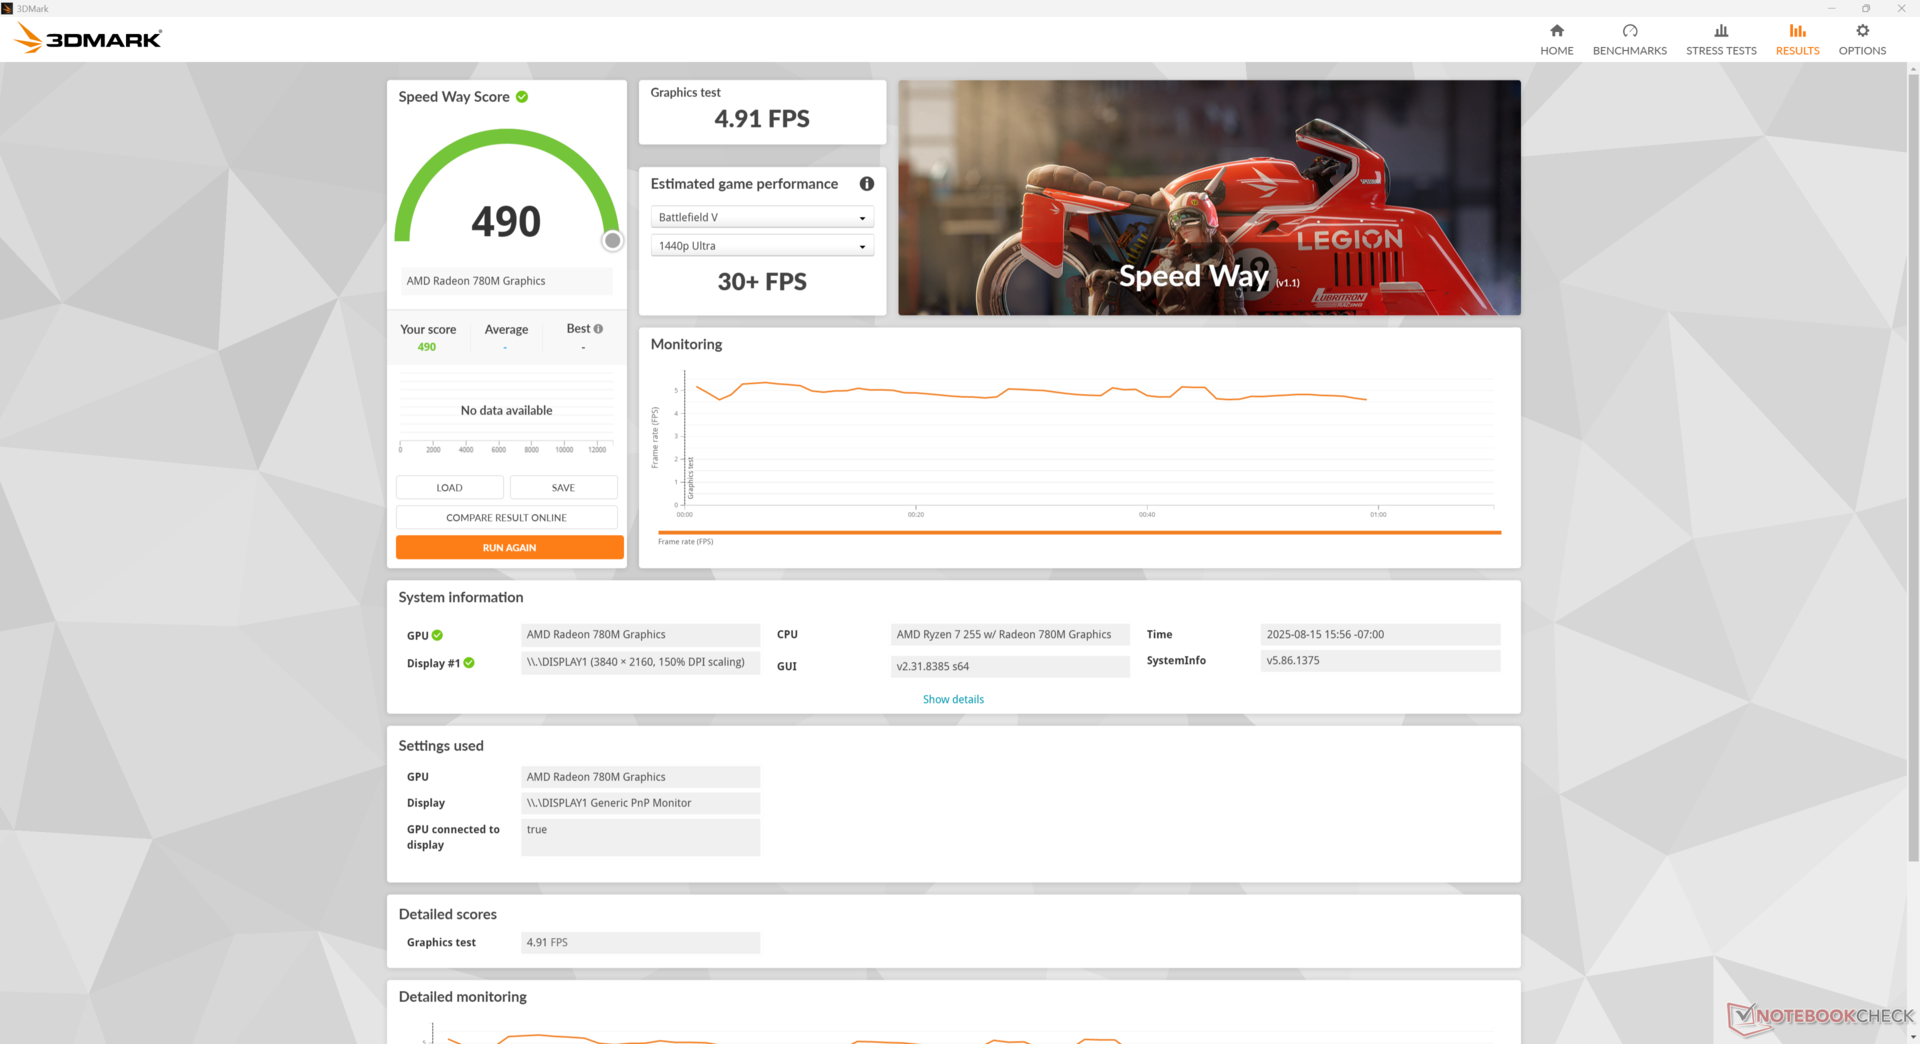
GPU Performance
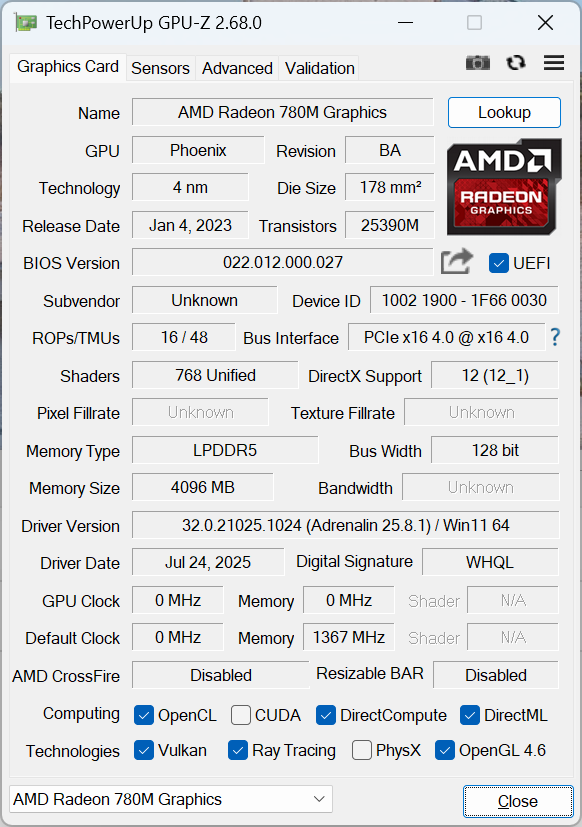
The Radeon 780M continues to one of the faster integrated solutions available. It is nonetheless around 15 percent slower than the Radeon 890M in the newer Ryzen AI 9 HX 370 series.
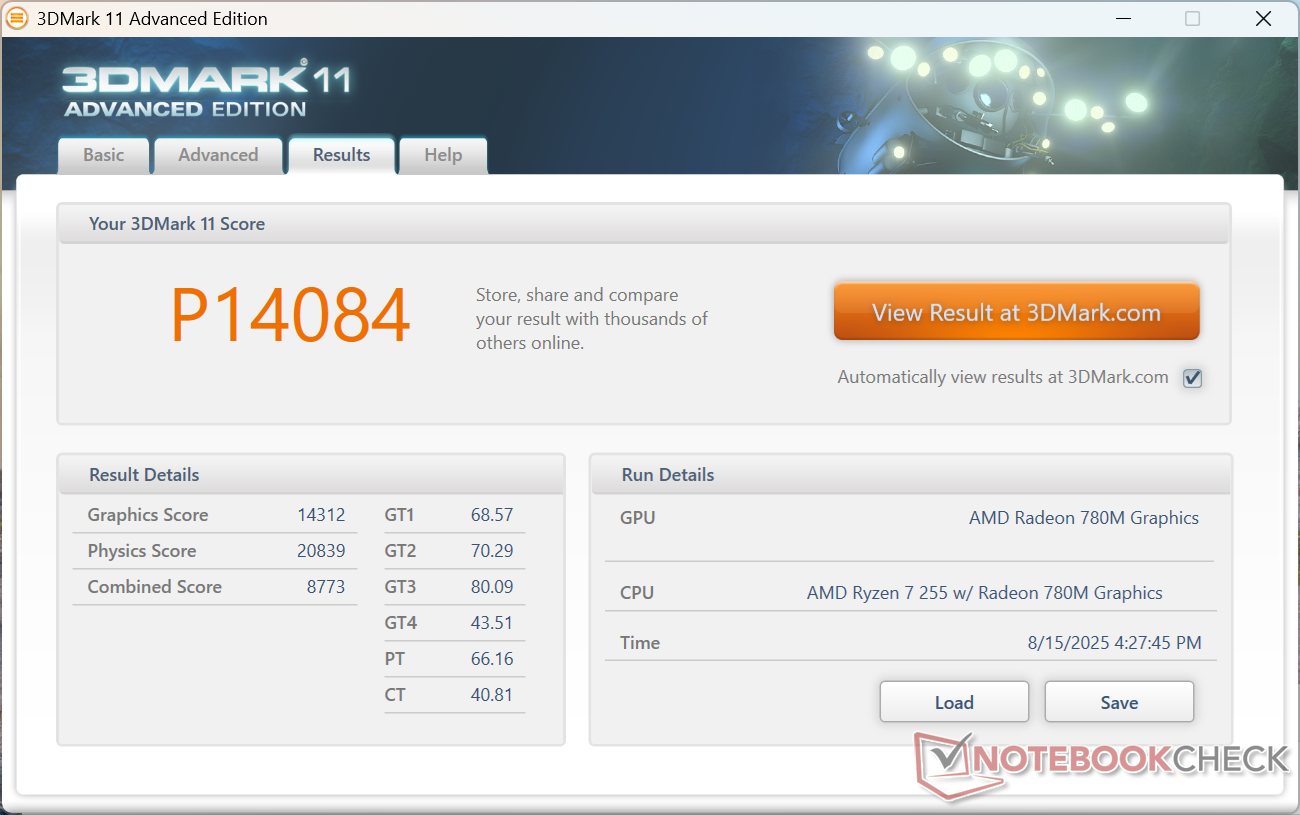
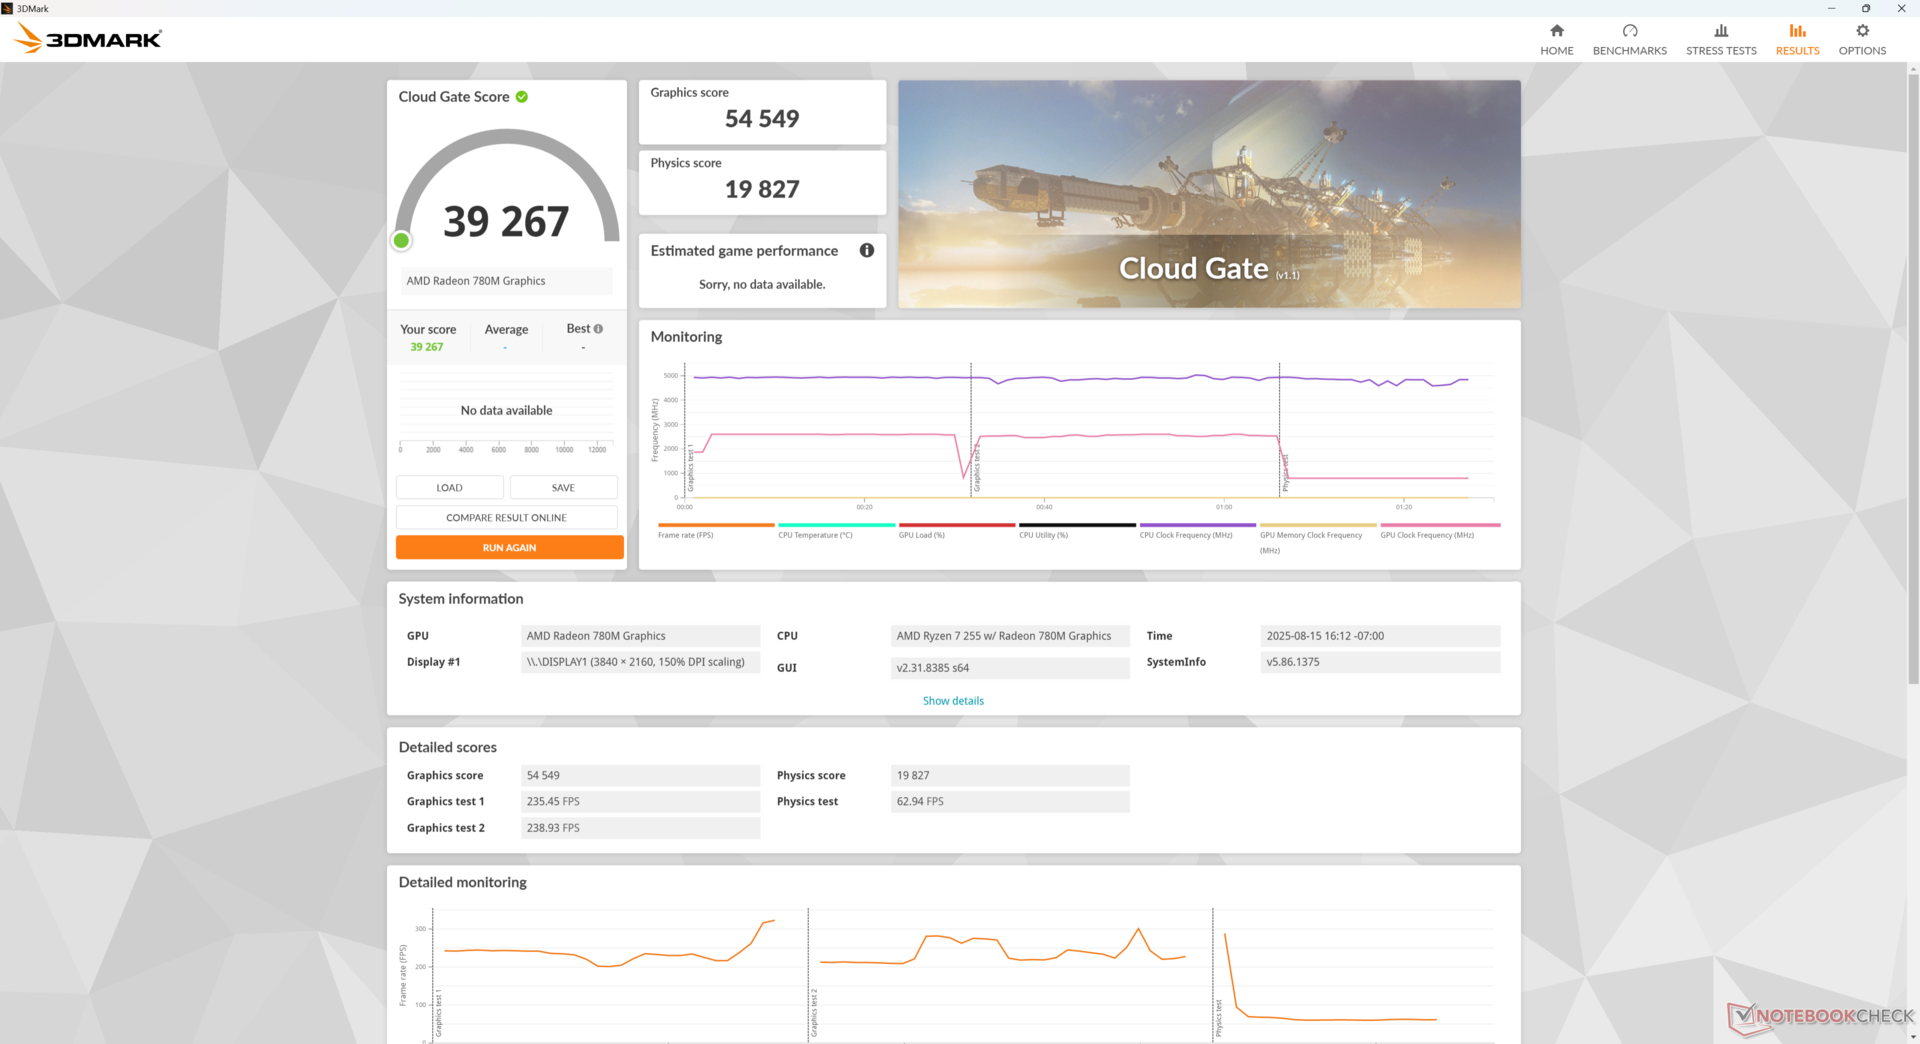
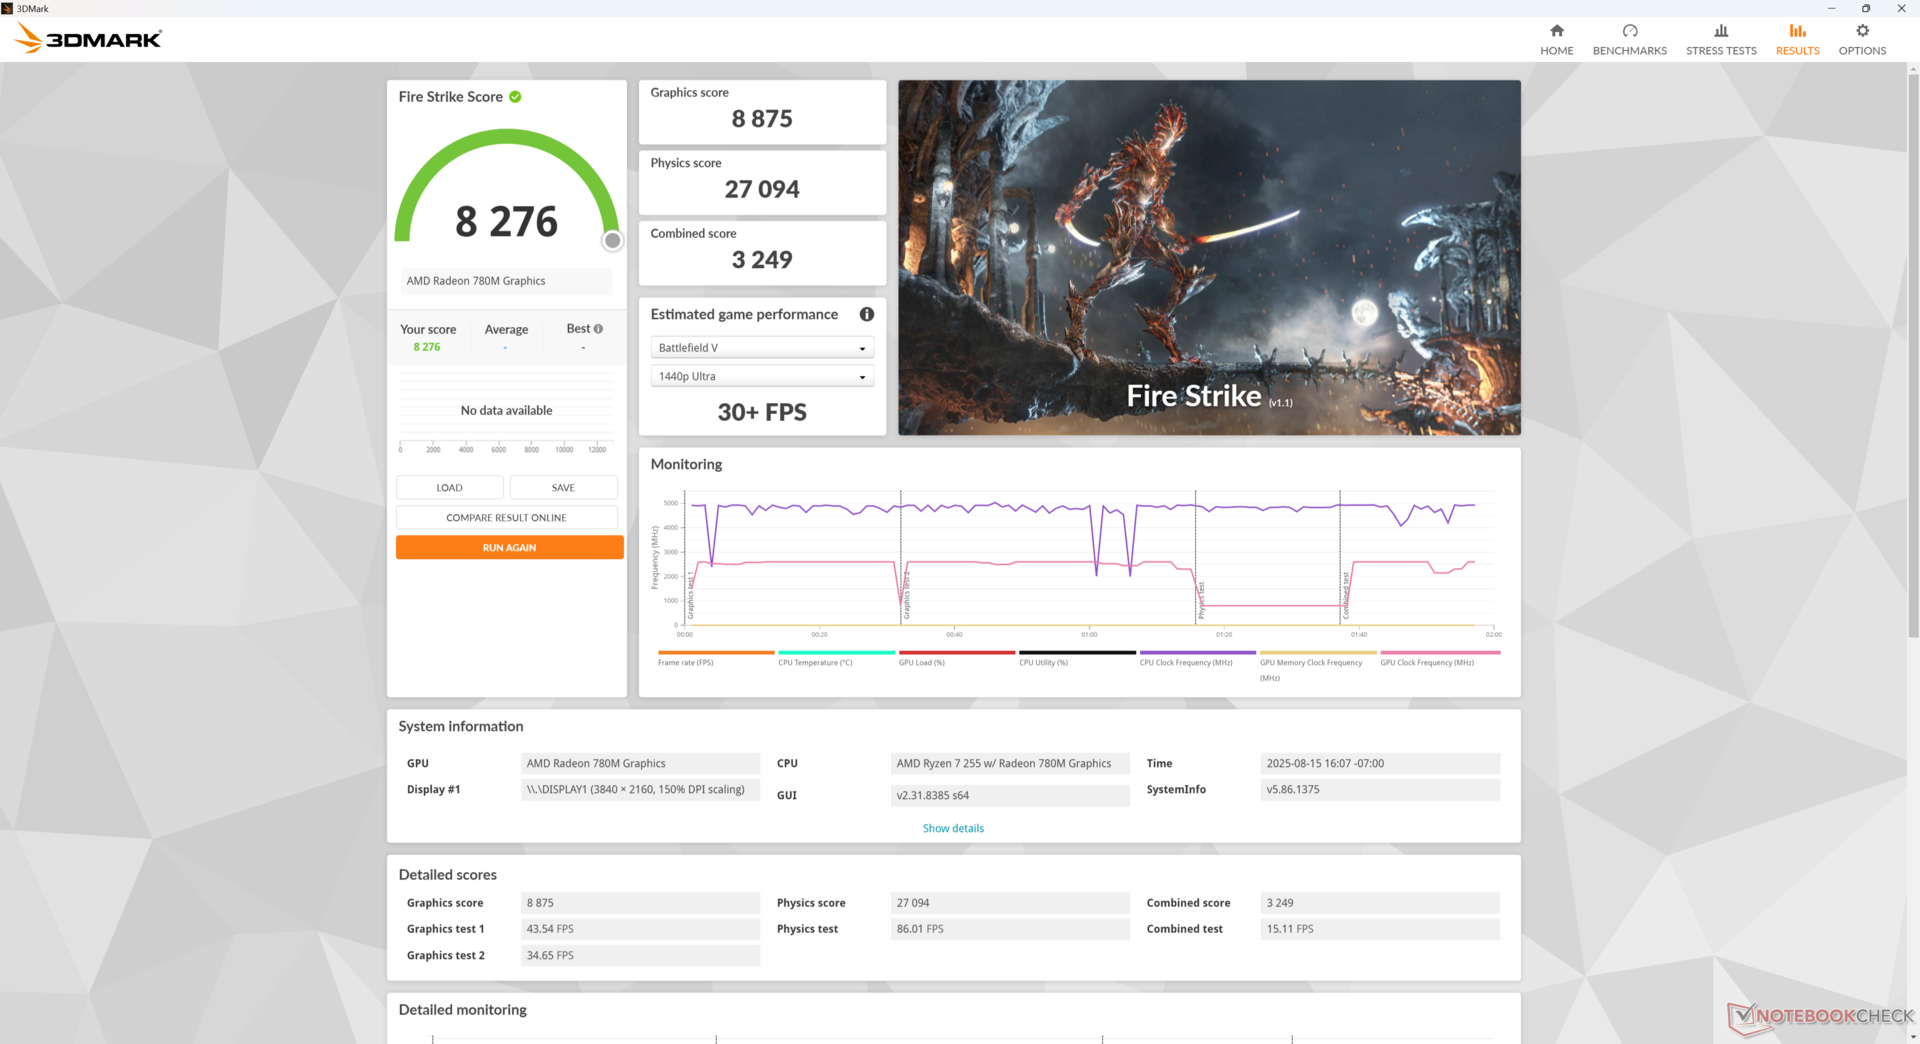
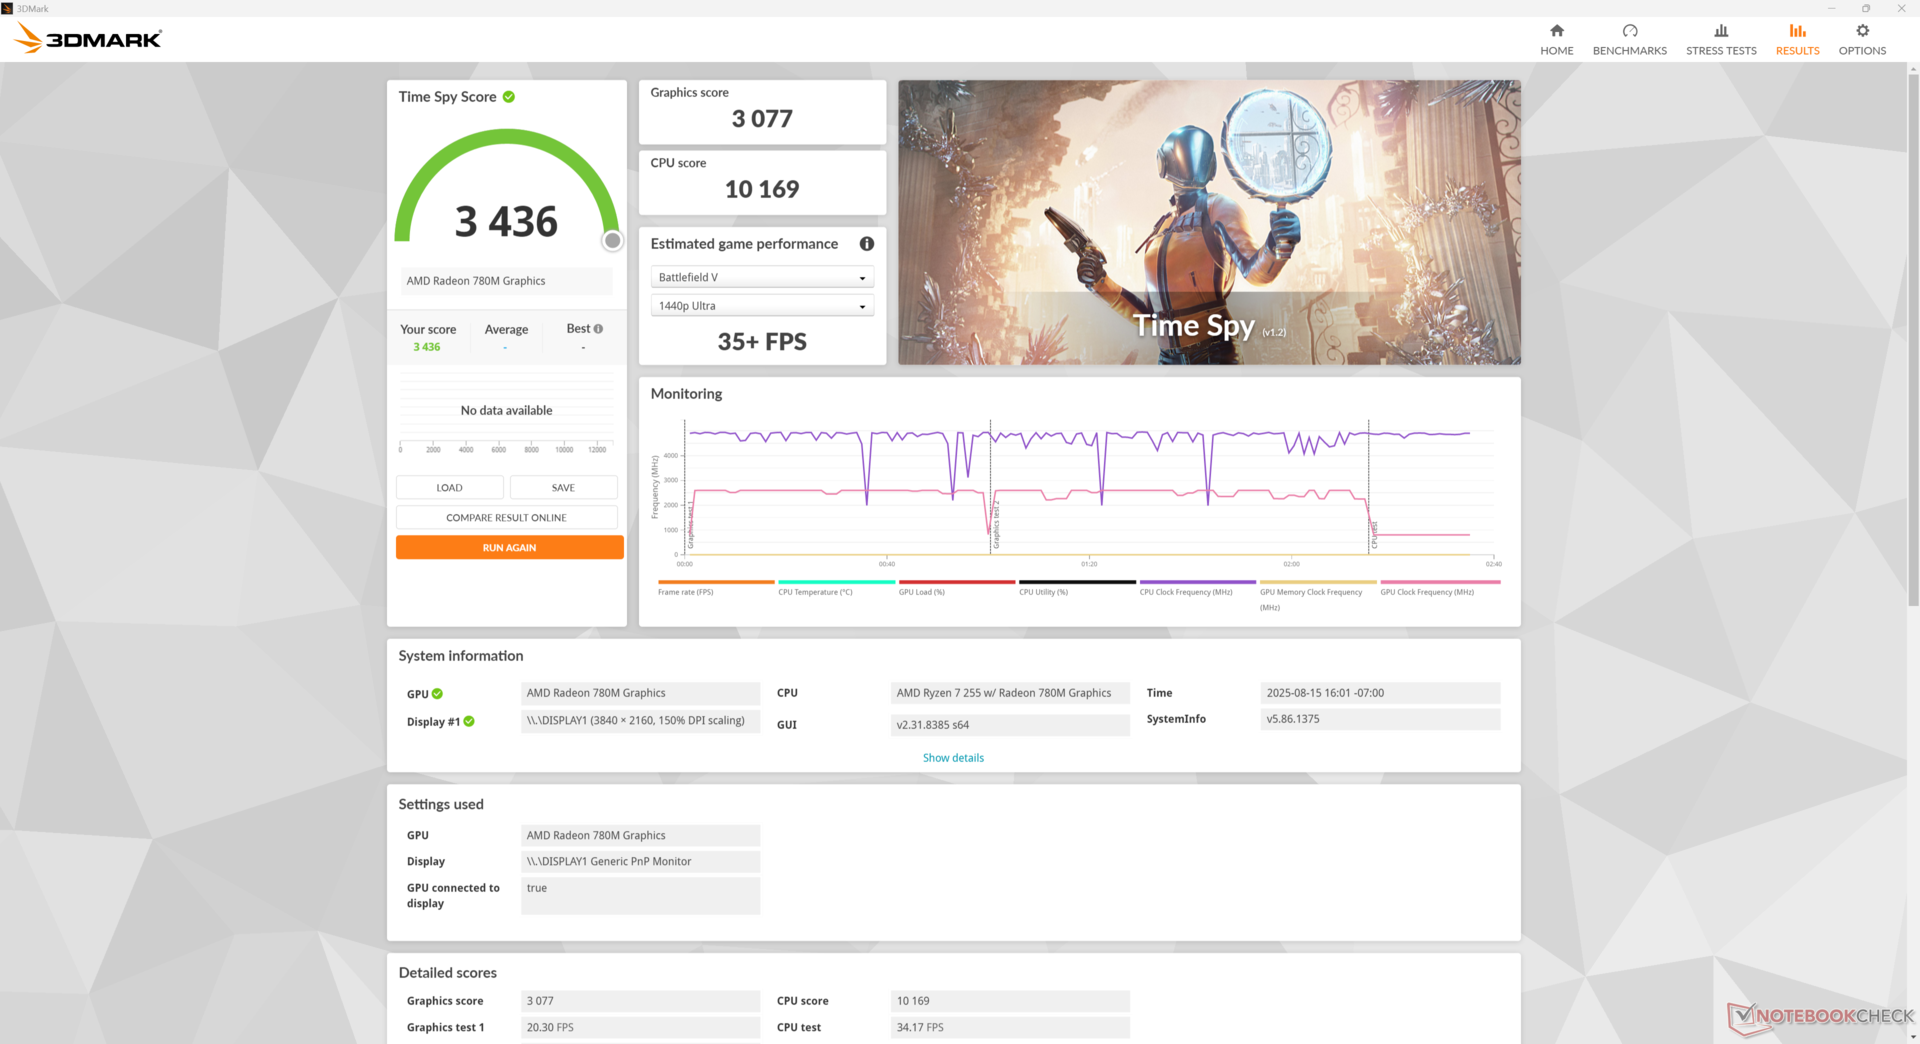
| 3DMark 11 Performance | 14084 points | |
| 3DMark Cloud Gate Standard Score | 39267 points | |
| 3DMark Fire Strike Score | 8276 points | |
| 3DMark Time Spy Score | 3436 points | |
Help | ||
* ... smaller is better
Gaming Performance
| Performance rating - Percent | |
| GMK EVO-X1 | |
| BOSGAME M2 | |
| GMK NucBox K11 | |
| Beelink SER9 Pro | |
| MSI Cubi NUC 1M -2! | |
| Beelink SEi13 Pro -2! | |
| Cyberpunk 2077 - 1920x1080 Ultra Preset (FSR off) | |
| BOSGAME M2 | |
| GMK EVO-X1 | |
| GMK NucBox K11 | |
| Beelink SER9 Pro | |
| MSI Cubi NUC 1M | |
| Baldur's Gate 3 - 1920x1080 Ultra Preset AA:T | |
| BOSGAME M2 | |
| GMK NucBox K11 | |
| GMK EVO-X1 | |
| Beelink SER9 Pro | |
| Beelink SEi13 Pro | |
| GTA V - 1920x1080 Highest AA:4xMSAA + FX AF:16x | |
| GMK EVO-X1 | |
| Beelink SER9 Pro | |
| BOSGAME M2 | |
| GMK NucBox K11 | |
| MSI Cubi NUC 1M | |
| Beelink SEi13 Pro | |
| Final Fantasy XV Benchmark - 1920x1080 High Quality | |
| GMK EVO-X1 | |
| Beelink SER9 Pro | |
| BOSGAME M2 | |
| GMK NucBox K11 | |
| MSI Cubi NUC 1M | |
| Beelink SEi13 Pro | |
| Strange Brigade - 1920x1080 ultra AA:ultra AF:16 | |
| GMK EVO-X1 | |
| Beelink SER9 Pro | |
| BOSGAME M2 | |
| GMK NucBox K11 | |
| MSI Cubi NUC 1M | |
| Beelink SEi13 Pro | |
| Dota 2 Reborn - 1920x1080 ultra (3/3) best looking | |
| BOSGAME M2 | |
| GMK NucBox K11 | |
| GMK EVO-X1 | |
| Beelink SER9 Pro | |
| MSI Cubi NUC 1M | |
| Beelink SEi13 Pro | |
| X-Plane 11.11 - 1920x1080 high (fps_test=3) | |
| GMK EVO-X1 | |
| BOSGAME M2 | |
| GMK NucBox K11 | |
| Beelink SER9 Pro | |
| F1 24 | |
| 1920x1080 Low Preset AA:T AF:16x | |
| BOSGAME M5 | |
| GMK EVO-T1 | |
| Beelink SER9 Pro | |
| Average AMD Radeon 780M (43.3 - 94.8, n=31) | |
| Beelink SEi13 Pro | |
| 1920x1080 Medium Preset AA:T AF:16x | |
| BOSGAME M5 | |
| GMK EVO-T1 | |
| Beelink SER9 Pro | |
| Average AMD Radeon 780M (36.4 - 80.2, n=32) | |
| Beelink SEi13 Pro | |
| 1920x1080 High Preset AA:T AF:16x | |
| BOSGAME M5 | |
| GMK EVO-T1 | |
| Beelink SER9 Pro | |
| Average AMD Radeon 780M (23.3 - 59.9, n=31) | |
| Beelink SEi13 Pro | |
| 1920x1080 Ultra High Preset AA:T AF:16x | |
| BOSGAME M5 | |
| GMK EVO-T1 | |
| Beelink SEi13 Pro | |
| Beelink SER9 Pro | |
| Average AMD Radeon 780M (6.39 - 14.5, n=20) | |
Cyberpunk 2077 ultra FPS Chart
| low | med. | high | ultra | |
|---|---|---|---|---|
| GTA V (2015) | 158.4 | 144.9 | 69.4 | 29.1 |
| Dota 2 Reborn (2015) | 134.5 | 102 | 90 | 78.1 |
| Final Fantasy XV Benchmark (2018) | 84.9 | 42.3 | 30.5 | |
| X-Plane 11.11 (2018) | 60.3 | 44.5 | 37 | |
| Strange Brigade (2018) | 185.2 | 73.7 | 62.6 | 53.4 |
| Baldur's Gate 3 (2023) | 40.8 | 33.5 | 27.1 | 26.9 |
| Cyberpunk 2077 (2023) | 44.5 | 34.3 | 26.4 | 22.6 |
| F1 24 (2024) | 83.6 | 75.6 | 55.8 | 13 |
Emissions
System Noise
Fan noise is always present no matter the onscreen load, but the full range is thankfully much lower when compared to most laptops.
Noise level
| Idle |
| 29.1 / 30.1 / 31.7 dB(A) |
| Load |
| 33.7 / 35.2 dB(A) |
 | ||
30 dB silent 40 dB(A) audible 50 dB(A) loud |
||
min: | ||
| Beelink SER9 Pro Radeon 780M, Ryzen 7 H 255, Crucial P3 Plus CT1000P3PSSD8 | Beelink SEi13 Pro Iris Xe G7 96EUs, i9-13900HK, Crucial P3 Plus CT1000P3PSSD8 | BOSGAME M2 Radeon 780M, R9 7940HS, Kingston OM8PGP41024N-A0 | GMK NucBox K11 Radeon 780M, R9 8945HS, Crucial P3 Plus CT1000P3PSSD8 | GMK EVO-X1 Radeon 890M, Ryzen AI 9 HX 370, Crucial P3 Plus CT1000P3PSSD8 | MSI Cubi NUC 1M Iris Xe G7 96EUs, Core 7 150U, WD PC SN560 SDDPNQE-1T00 | |
|---|---|---|---|---|---|---|
| Noise | 3% | -12% | -2% | -13% | -5% | |
| off / environment * (dB) | 23 | 23.1 -0% | 23 -0% | 24 -4% | 23.3 -1% | 23.5 -2% |
| Idle Minimum * (dB) | 29.1 | 28 4% | 31.5 -8% | 25.2 13% | 27.8 4% | 29.9 -3% |
| Idle Average * (dB) | 30.1 | 28 7% | 32.3 -7% | 30.2 -0% | 30.3 -1% | 29.9 1% |
| Idle Maximum * (dB) | 31.7 | 28 12% | 34.9 -10% | 30.2 5% | 30.4 4% | 32 -1% |
| Load Average * (dB) | 33.7 | 32.6 3% | 39 -16% | 36.4 -8% | 44.6 -32% | 33.5 1% |
| Cyberpunk 2077 ultra * (dB) | 33.8 | 34.3 -1% | 40.3 -19% | 36.6 -8% | 44.2 -31% | 39.1 -16% |
| Load Maximum * (dB) | 35.2 | 36.3 -3% | 42.5 -21% | 39 -11% | 46.1 -31% | 40.5 -15% |
* ... smaller is better
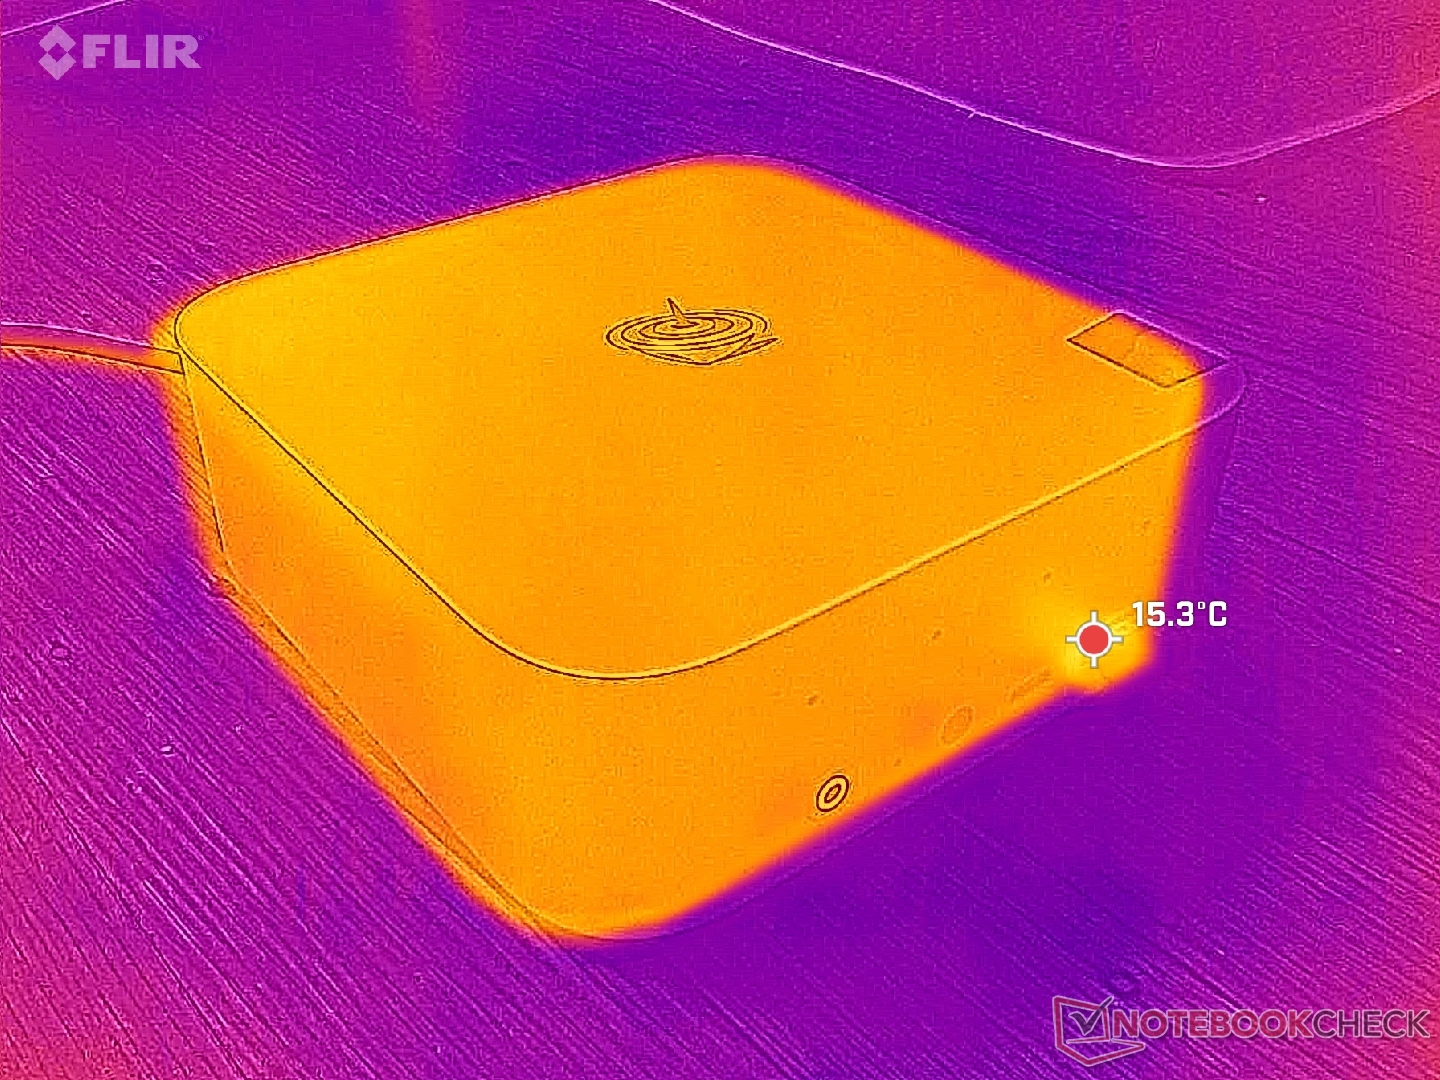
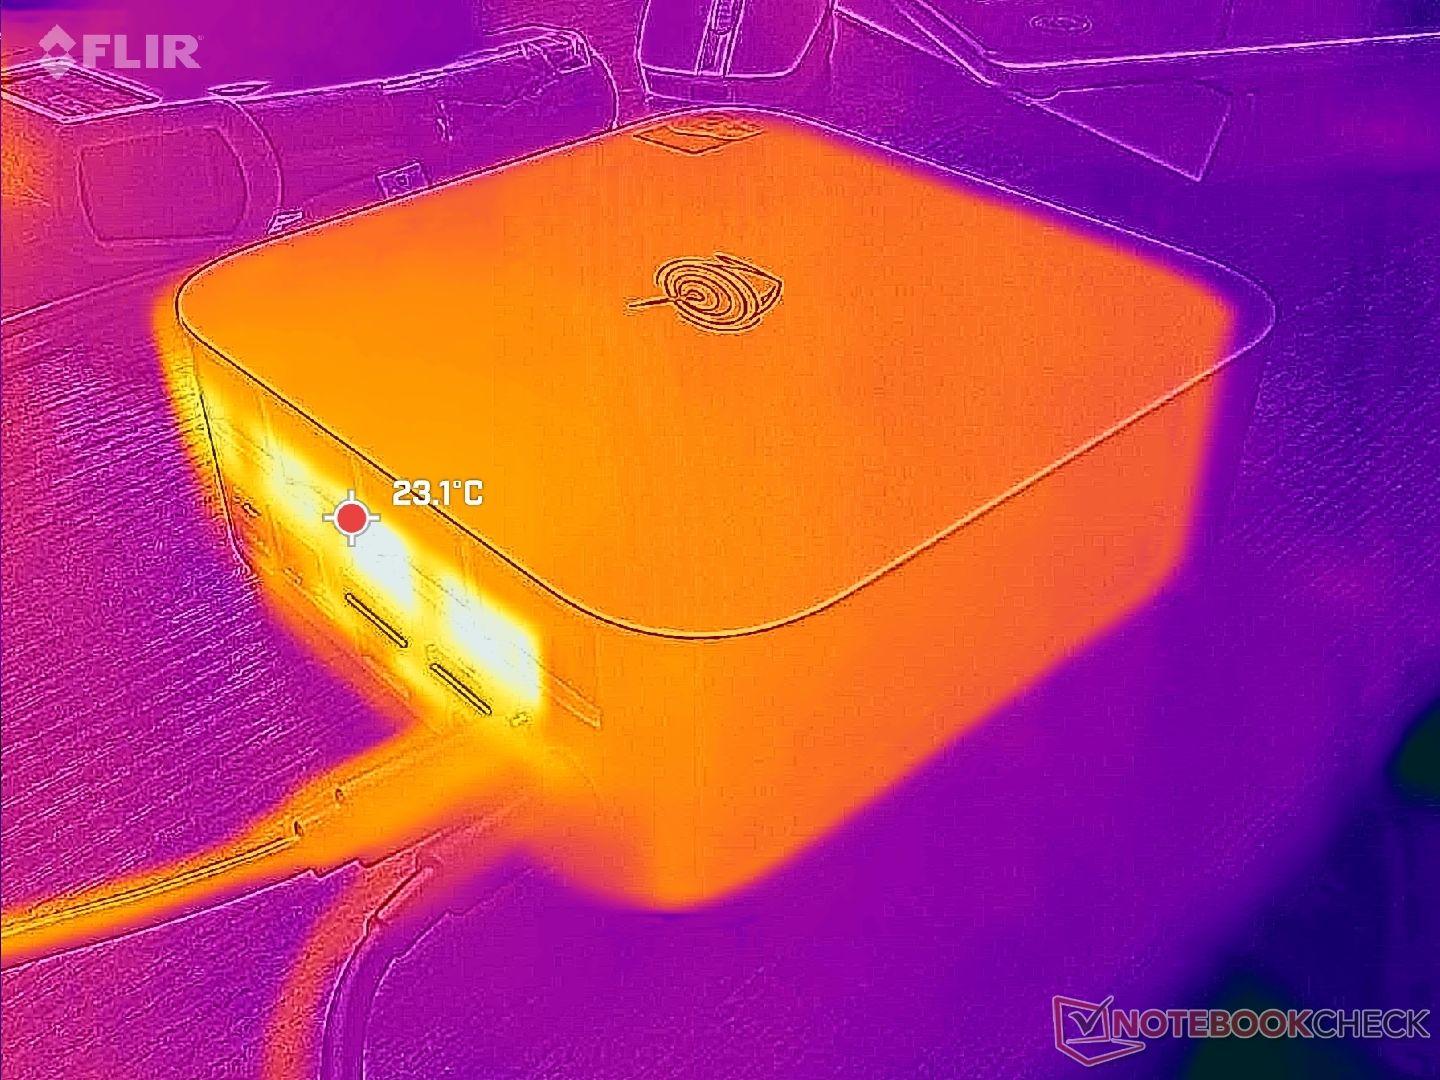
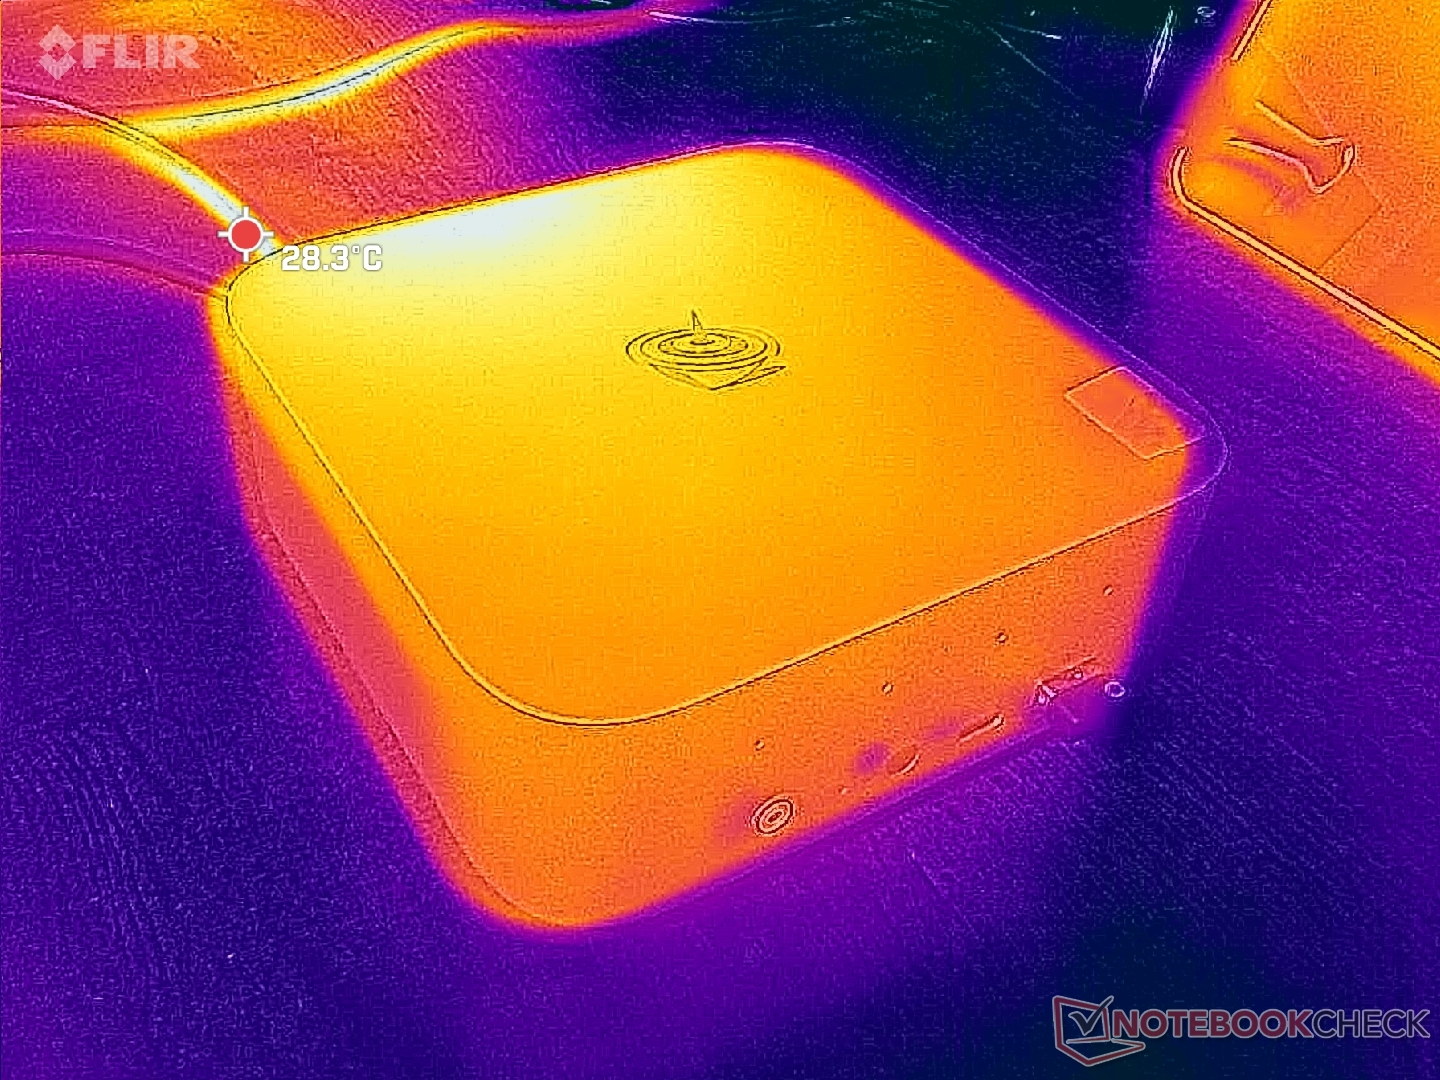
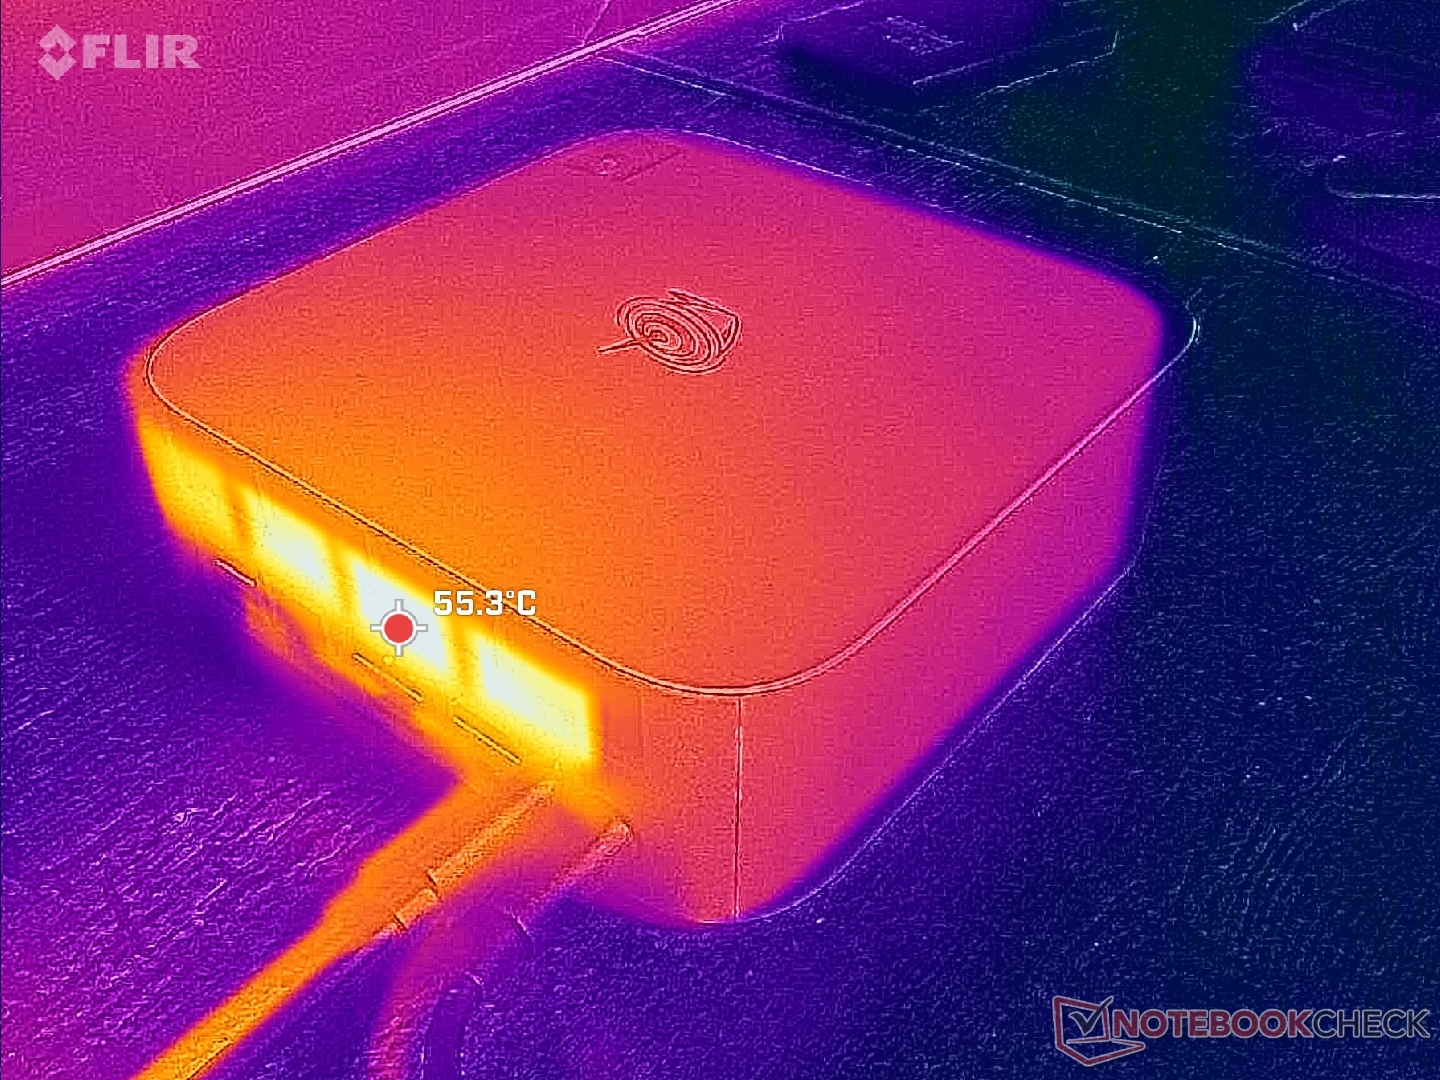
Temperature
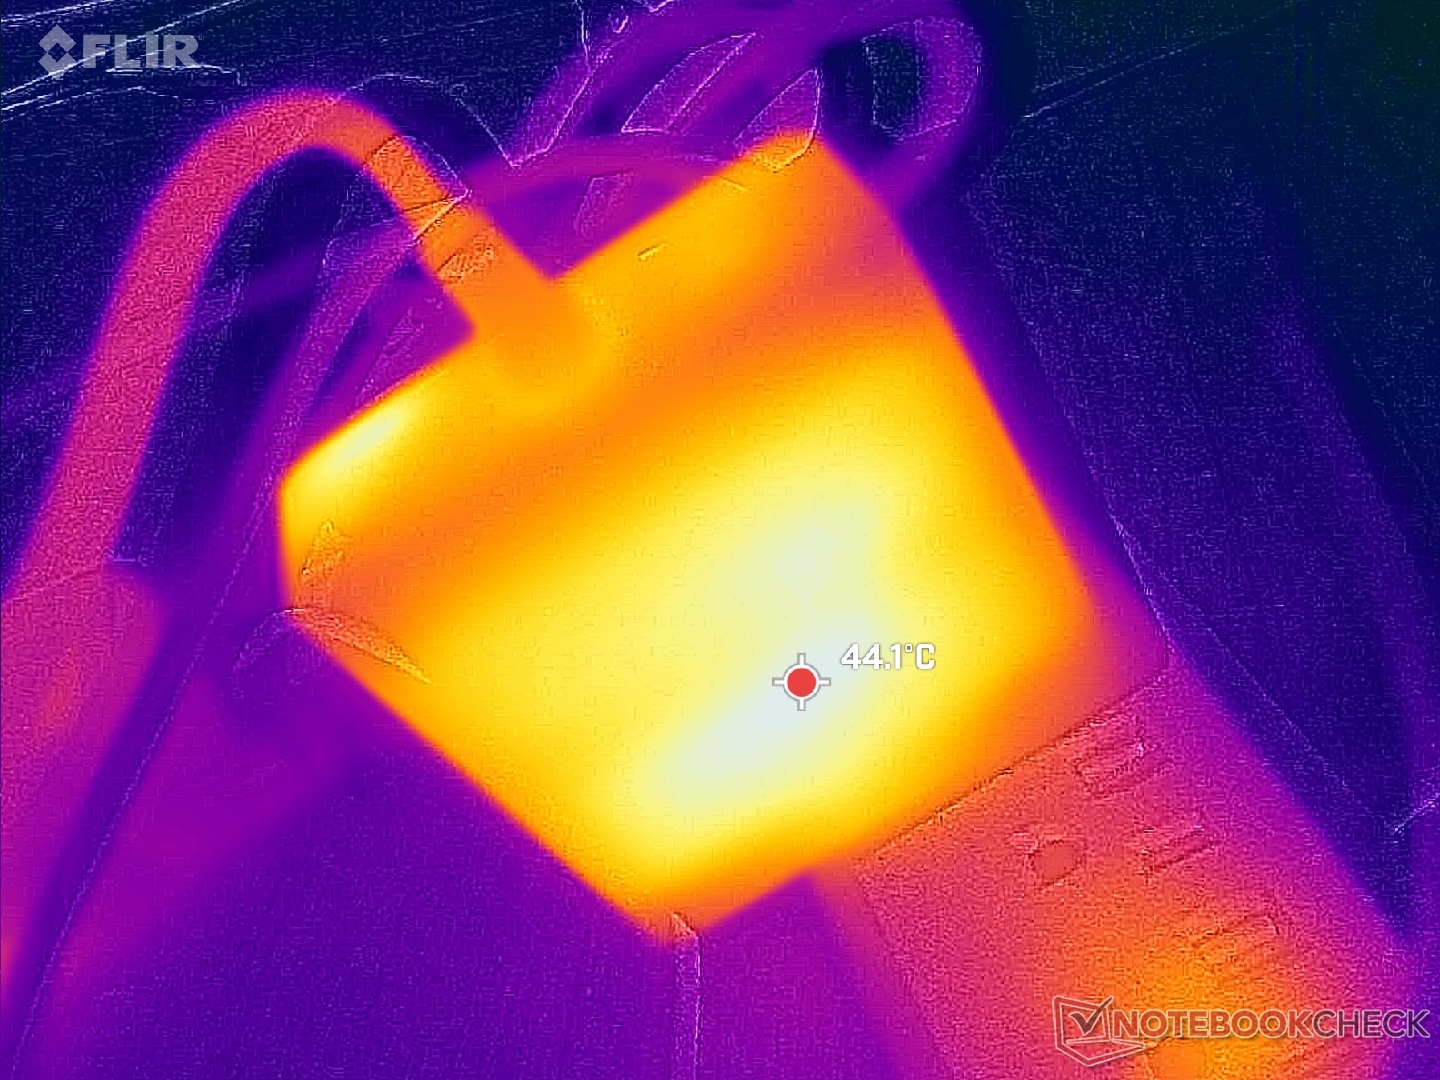
Cool air enters through hidden ventilation grilles on the bottom while waste heat exits from the rear. This design allows a cleaner and smoother look from the front or top.
Stress Test
The CPU would boost to 4.2 GHz when initiating Prime95 stress before quickly stabilizing at 4 GHz, 54 W, and 80 C.
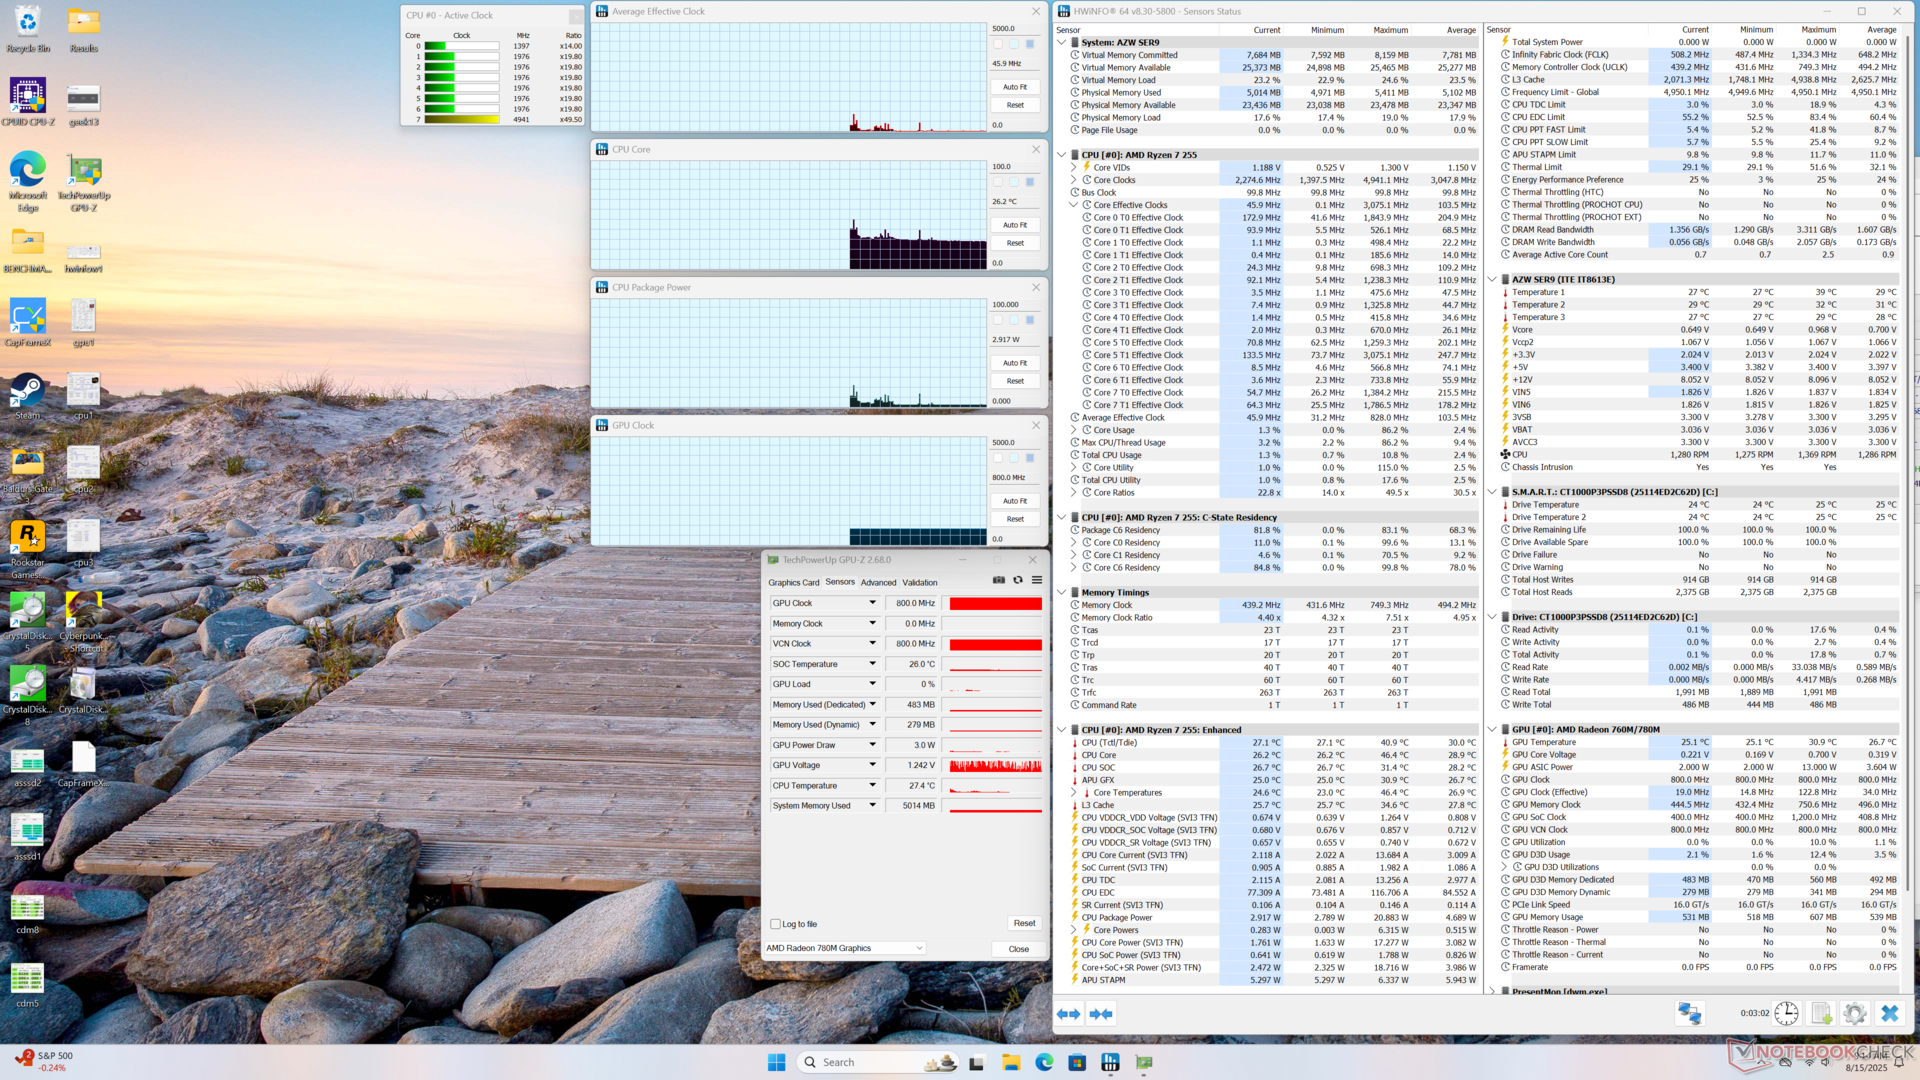
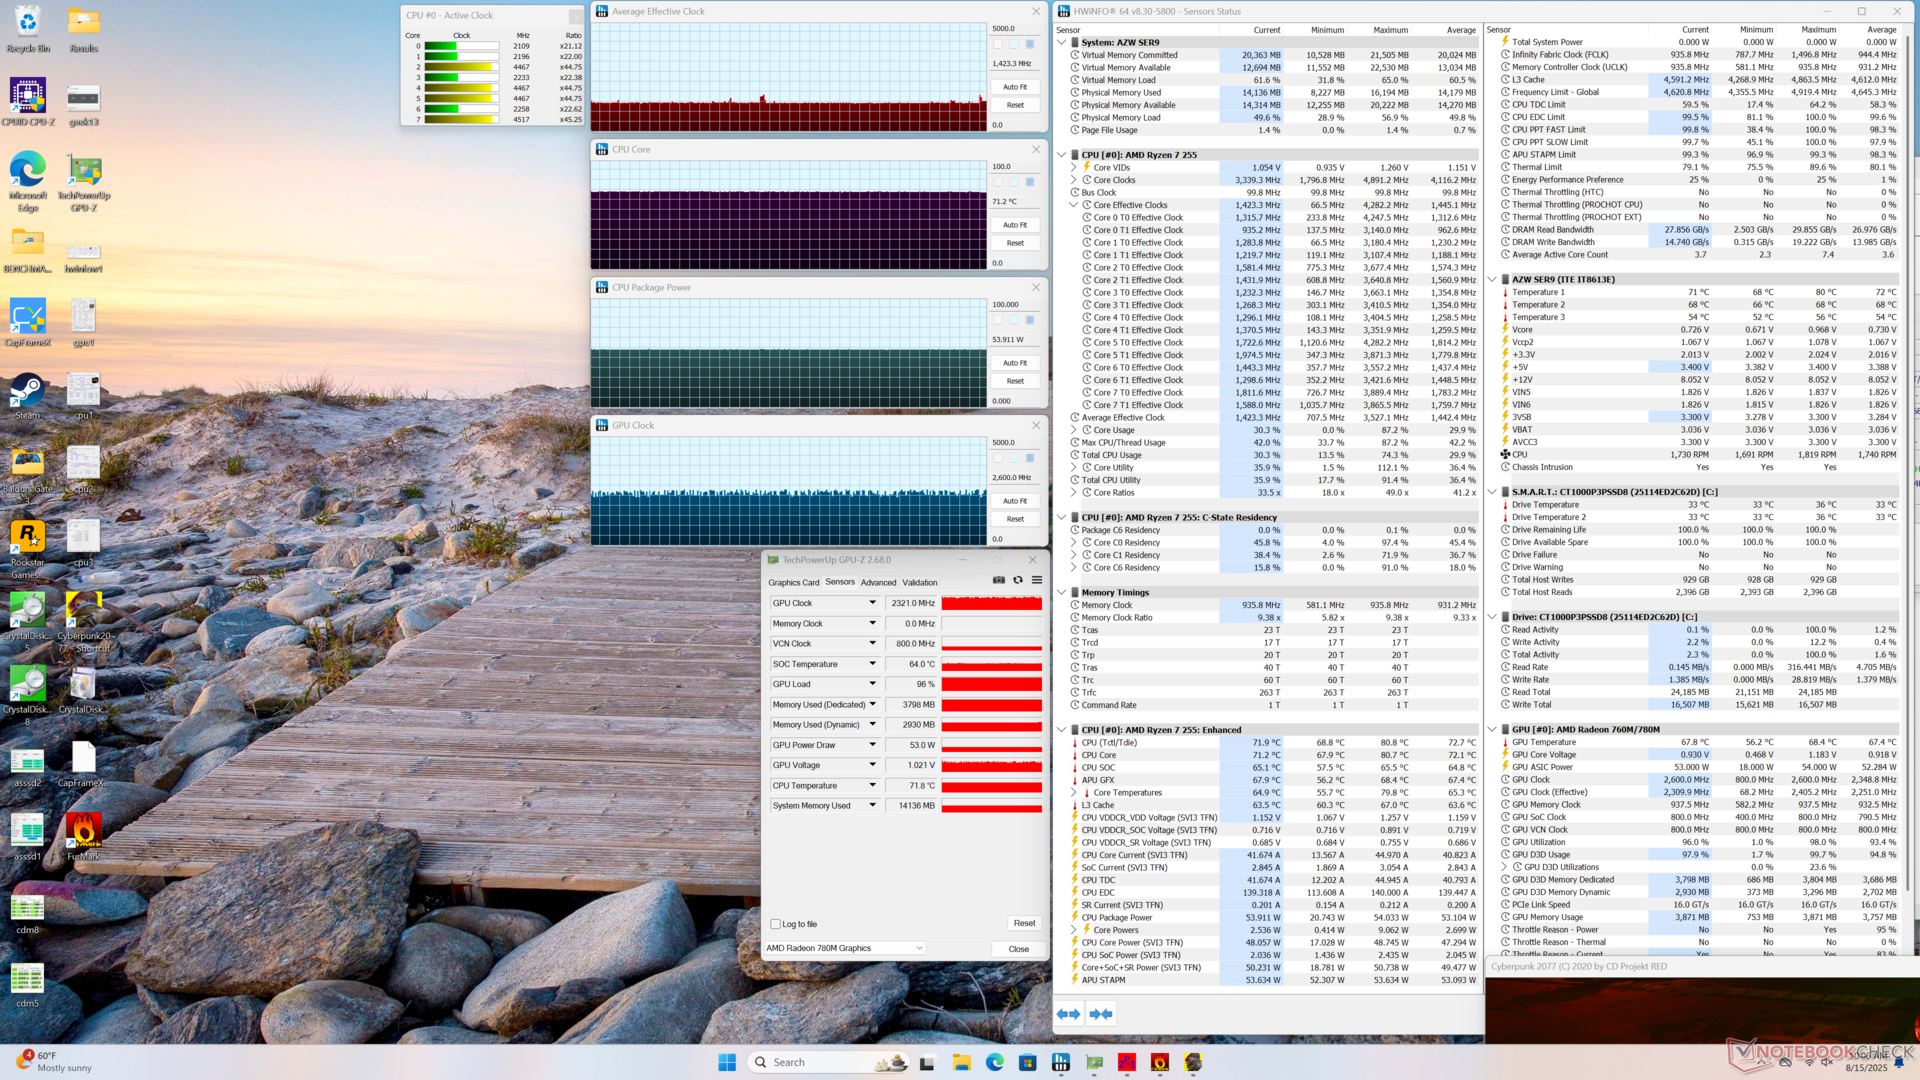
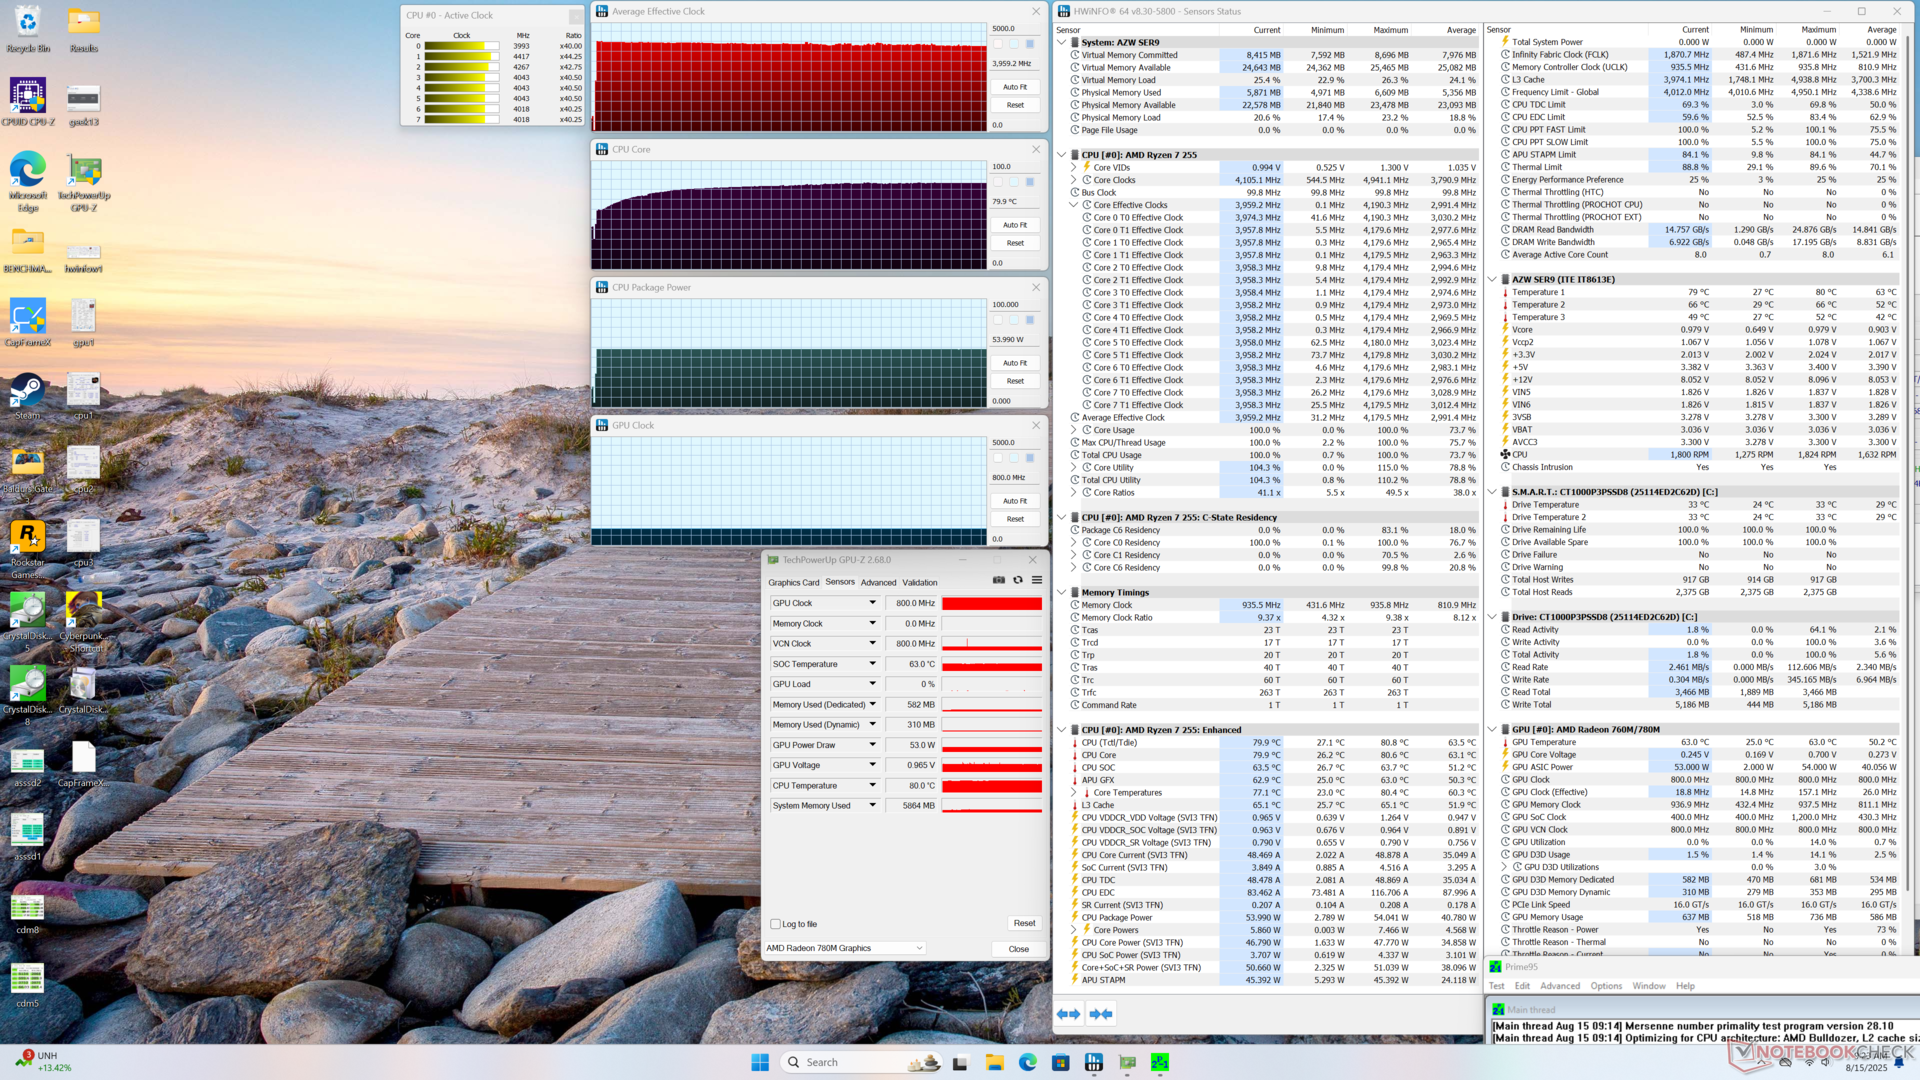

| Average CPU Clock (GHz) | GPU Clock (MHz) | Average CPU Temperature (°C) | |
| System Idle | -- | -- | 26 |
| Prime95 Stress | 4.0 | -- | 80 |
| Prime95 + FurMark Stress | 3.8 | 2138 | 71 |
| Cyberpunk 2077 Stress | 1.4 | 2600 | 71 |
Speakers
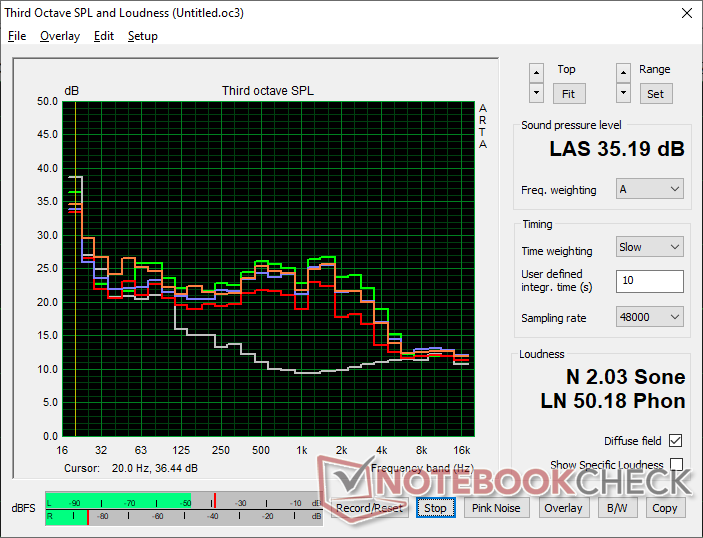
The system has built-in stereo speakers which is an uncommon feature on mini PCs. Unfortunately, audio quality is imbalanced while maximum volume is quieter when compared to many thin-and-light laptops like the HP Spectre. We would've preferred louder speakers to better fill a medium-sized conference room or at least higher quality ones for better music or multimedia playback. The internal speakers are instead best for confirming voice-activated features.
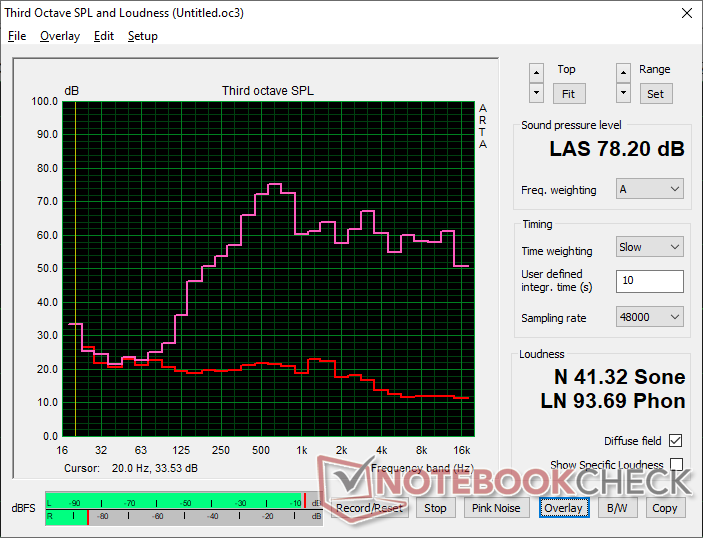
Beelink SER9 Pro audio analysis
(±) | speaker loudness is average but good (78.2 dB)
Bass 100 - 315 Hz
(±) | reduced bass - on average 14.8% lower than median
(±) | linearity of bass is average (12.9% delta to prev. frequency)
Mids 400 - 2000 Hz
(±) | higher mids - on average 6.6% higher than median
(±) | linearity of mids is average (13.1% delta to prev. frequency)
Highs 2 - 16 kHz
(+) | balanced highs - only 2.6% away from median
(±) | linearity of highs is average (10.1% delta to prev. frequency)
Overall 100 - 16.000 Hz
(±) | linearity of overall sound is average (20.2% difference to median)
Compared to same class
» 28% of all tested devices in this class were better, 16% similar, 56% worse
» The best had a delta of 13%, average was 25%, worst was 64%
Compared to all devices tested
» 52% of all tested devices were better, 8% similar, 40% worse
» The best had a delta of 4%, average was 24%, worst was 134%
Apple MacBook Pro 16 2021 M1 Pro audio analysis
(+) | speakers can play relatively loud (84.7 dB)
Bass 100 - 315 Hz
(+) | good bass - only 3.8% away from median
(+) | bass is linear (5.2% delta to prev. frequency)
Mids 400 - 2000 Hz
(+) | balanced mids - only 1.3% away from median
(+) | mids are linear (2.1% delta to prev. frequency)
Highs 2 - 16 kHz
(+) | balanced highs - only 1.9% away from median
(+) | highs are linear (2.7% delta to prev. frequency)
Overall 100 - 16.000 Hz
(+) | overall sound is linear (4.6% difference to median)
Compared to same class
» 0% of all tested devices in this class were better, 0% similar, 100% worse
» The best had a delta of 5%, average was 17%, worst was 45%
Compared to all devices tested
» 0% of all tested devices were better, 0% similar, 100% worse
» The best had a delta of 4%, average was 24%, worst was 134%
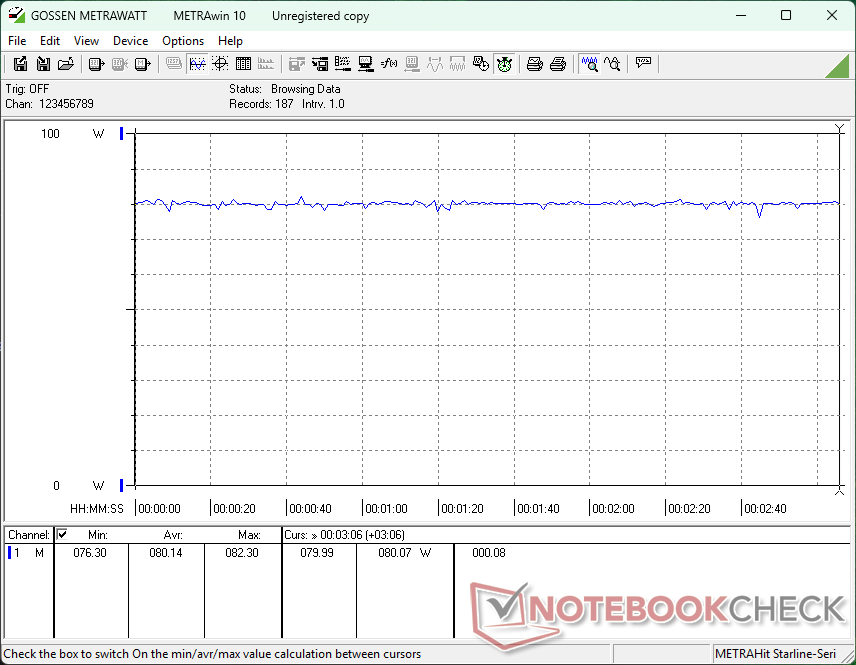
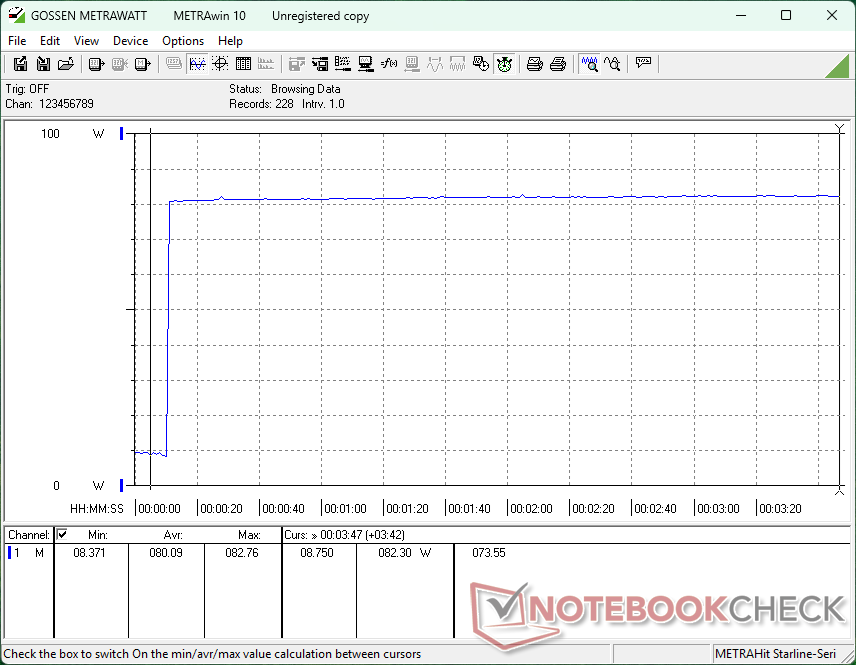
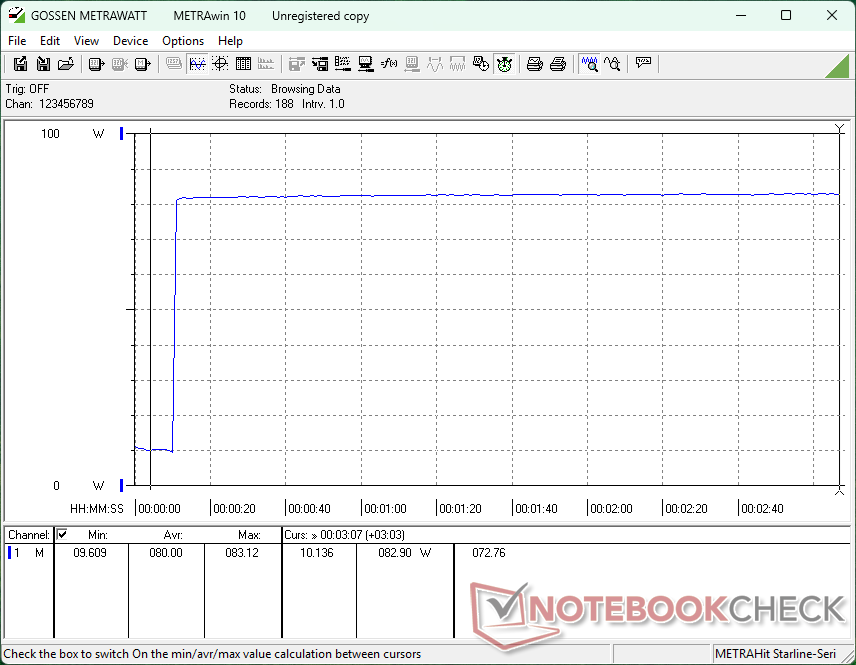
Energy Management
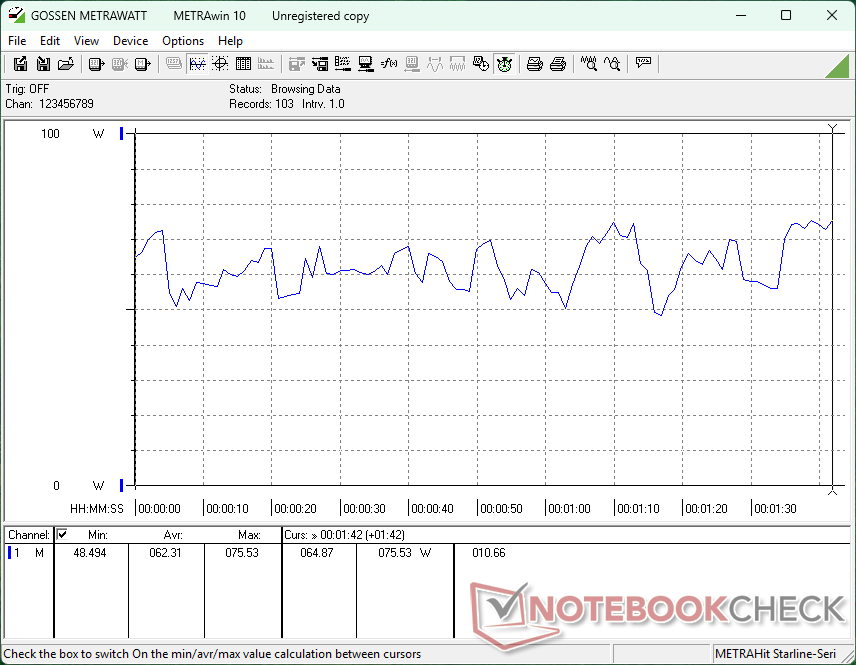
Power Consumption
The system tops out at around 80 W when running demanding loads like games which is similar to mini PCs running on last generation AMD hardware like the BOSGAME M2.
| Off / Standby | |
| Idle | |
| Load |
|
Key:
min: | |
| Beelink SER9 Pro Ryzen 7 H 255, Radeon 780M, Crucial P3 Plus CT1000P3PSSD8, , x, | Beelink SEi13 Pro i9-13900HK, Iris Xe G7 96EUs, Crucial P3 Plus CT1000P3PSSD8, , x, | BOSGAME M2 R9 7940HS, Radeon 780M, Kingston OM8PGP41024N-A0, , x, | GMK NucBox K11 R9 8945HS, Radeon 780M, Crucial P3 Plus CT1000P3PSSD8, , x, | GMK EVO-X1 Ryzen AI 9 HX 370, Radeon 890M, Crucial P3 Plus CT1000P3PSSD8, , x, | MSI Cubi NUC 1M Core 7 150U, Iris Xe G7 96EUs, WD PC SN560 SDDPNQE-1T00, , x, | |
|---|---|---|---|---|---|---|
| Power Consumption | -46% | -7% | -18% | 11% | 14% | |
| Idle Minimum * (Watt) | 7 | 14.5 -107% | 6.4 9% | 6.6 6% | 5.4 23% | 6.4 9% |
| Idle Average * (Watt) | 7.1 | 14.9 -110% | 7.3 -3% | 9.1 -28% | 5.8 18% | 8.3 -17% |
| Idle Maximum * (Watt) | 7.5 | 15.8 -111% | 7.5 -0% | 11.3 -51% | 5.8 23% | 10.4 -39% |
| Load Average * (Watt) | 62.3 | 47.1 24% | 75 -20% | 76.8 -23% | 72.1 -16% | 38.5 38% |
| Cyberpunk 2077 ultra external monitor * (Watt) | 80.1 | 53.4 33% | 83 -4% | 83 -4% | 72.5 9% | 36.1 55% |
| Load Maximum * (Watt) | 82.9 | 85.7 -3% | 99.9 -21% | 88 -6% | 76.1 8% | 52.5 37% |
* ... smaller is better
Power Consumption Cyberpunk / Stress Test
Power Consumption external Monitor
Notebookcheck Rating
Beelink SER9 Pro
- 08/20/2025 v8
Allen Ngo
 Total Sustainability Score:
 Potential Competitors in Comparison
Image | Model / Review | Price | Weight | Height | Display |
|---|---|---|---|---|---|
1. 80.2%  | Beelink SER9 Pro AMD Ryzen 7 H 255 ⎘ AMD Radeon 780M ⎘ 32 GB Memory, 1024 GB SSD | Amazon: List Price: 520 USD | 812 g | 44.7 mm | x |
2. 71% 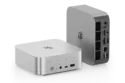 | Beelink SEi13 Pro Intel Core i9-13900HK ⎘ Intel Iris Xe Graphics G7 96EUs ⎘ 32 GB Memory, 1024 GB SSD | Amazon: List Price: 540 USD | 808 g | 44.7 mm | x |
3. 79%  | BOSGAME M2 AMD Ryzen 9 7940HS ⎘ AMD Radeon 780M ⎘ 32 GB Memory, 1024 GB SSD | Amazon: List Price: 600 USD | 819 g | 51 mm | x |
4. 78.3%  | GMK NucBox K11 AMD Ryzen 9 8945HS ⎘ AMD Radeon 780M ⎘ 32 GB Memory, 1024 GB SSD | Amazon: List Price: 600 USD | 630 g | 58 mm | x |
5. 72%  | GMK EVO-X1 AMD Ryzen AI 9 HX 370 ⎘ AMD Radeon 890M ⎘ 32 GB Memory, 1024 GB SSD | Amazon: List Price: 900 USD | 595 g | 63.2 mm | x |
6. 66.1% 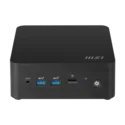 | MSI Cubi NUC 1M Intel Core 7 150U ⎘ Intel Iris Xe Graphics G7 96EUs ⎘ 16 GB Memory, 1024 GB SSD | Amazon: List Price: 950 USD | 660 g | 50.1 mm | x |
Transparency
The selection of devices to be reviewed is made by our editorial team. The test sample was provided to the author as a loan by the manufacturer or retailer for the purpose of this review. The lender had no influence on this review, nor did the manufacturer receive a copy of this review before publication. There was no obligation to publish this review. As an independent media company, Notebookcheck is not subjected to the authority of manufacturers, retailers or publishers.
This is how Notebookcheck is testing
Every year, Notebookcheck independently reviews hundreds of laptops and smartphones using standardized procedures to ensure that all results are comparable. We have continuously developed our test methods for around 20 years and set industry standards in the process. In our test labs, high-quality measuring equipment is utilized by experienced technicians and editors. These tests involve a multi-stage validation process. Our complex rating system is based on hundreds of well-founded measurements and benchmarks, which maintains objectivity. Further information on our test methods can be found here.
