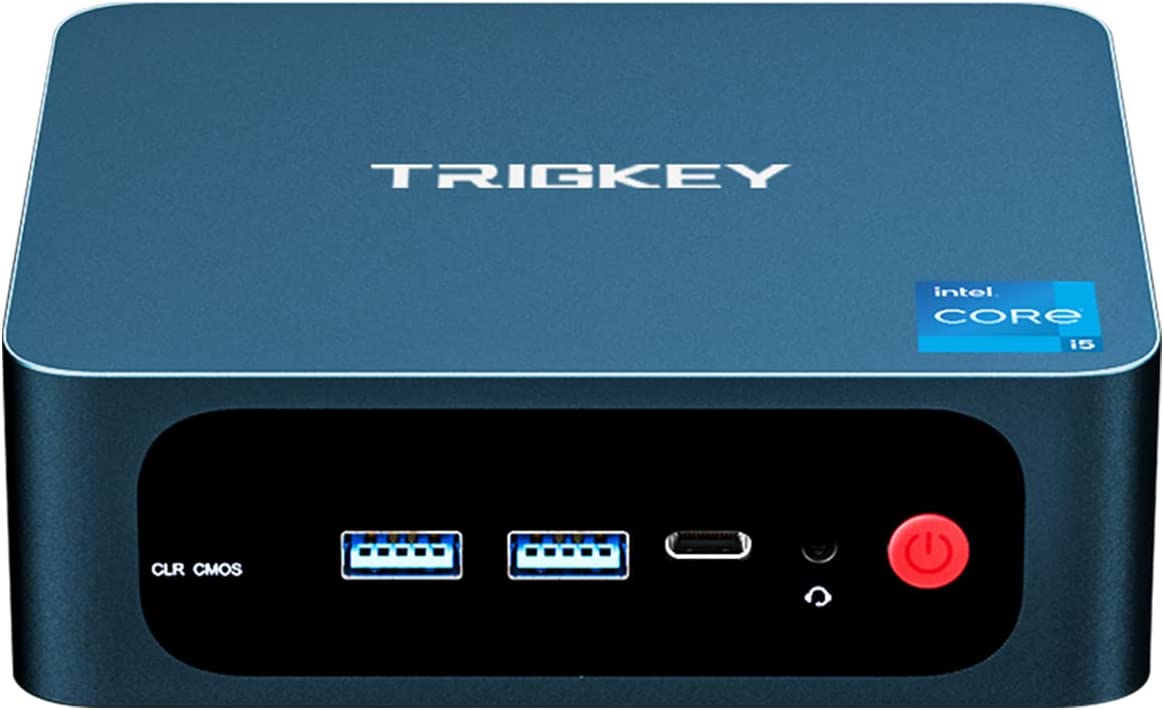
Trigkey Speed S review: Ready-to-go Core i5-11320H mini PC for cheap
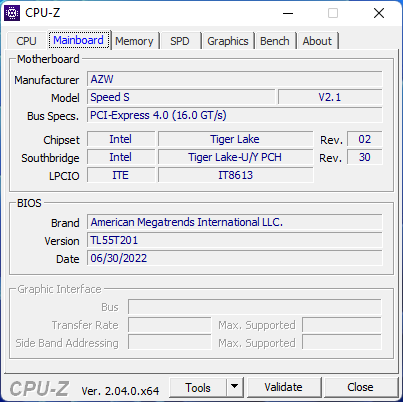
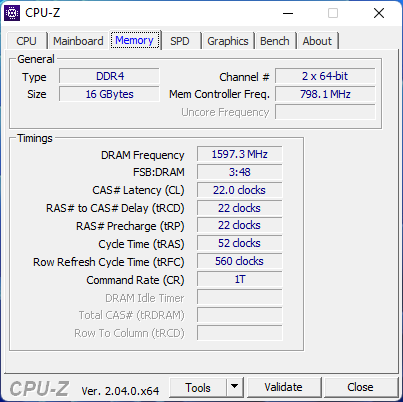
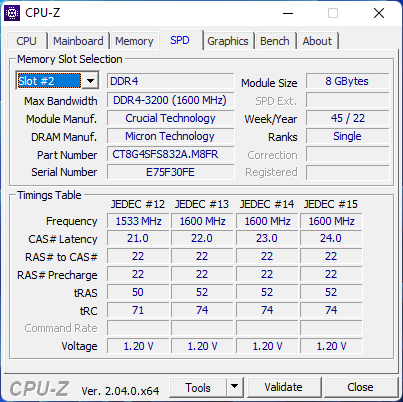
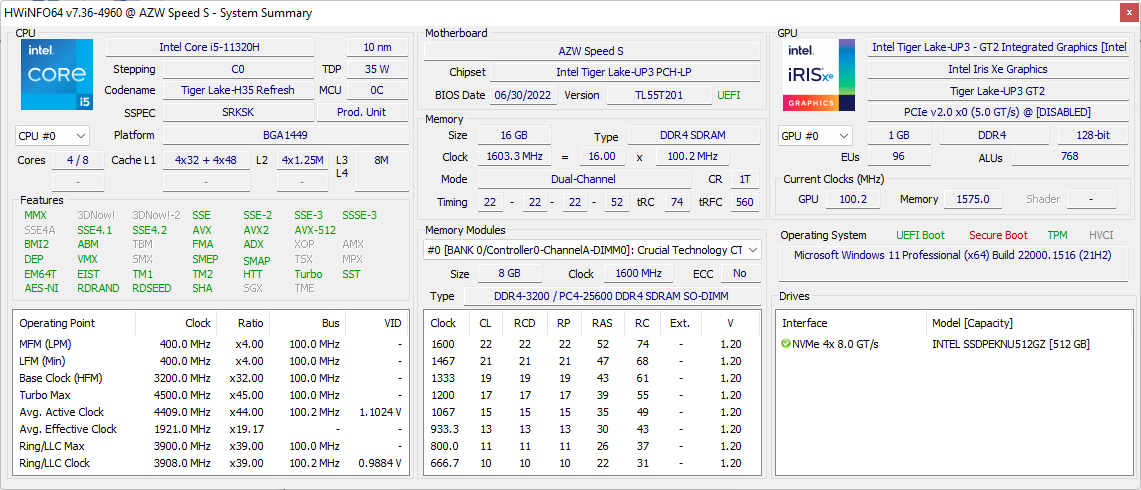
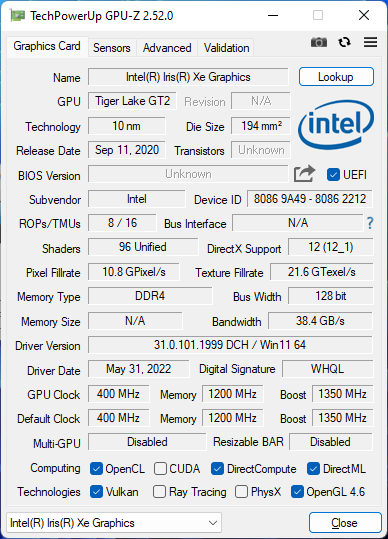
The Trigkey Speed S is the faster version of the Trigkey S3. Instead of the aging Ryzen 5 3550H, the Speed S utilizes the 11th gen Core i5-11320H while keeping prices in the very affordable sub $400 USD range. Our specific review configuration comes with 16 GB of DDR4-3200 RAM and a 512 GB M.2 PCIe3 x4 SSD.
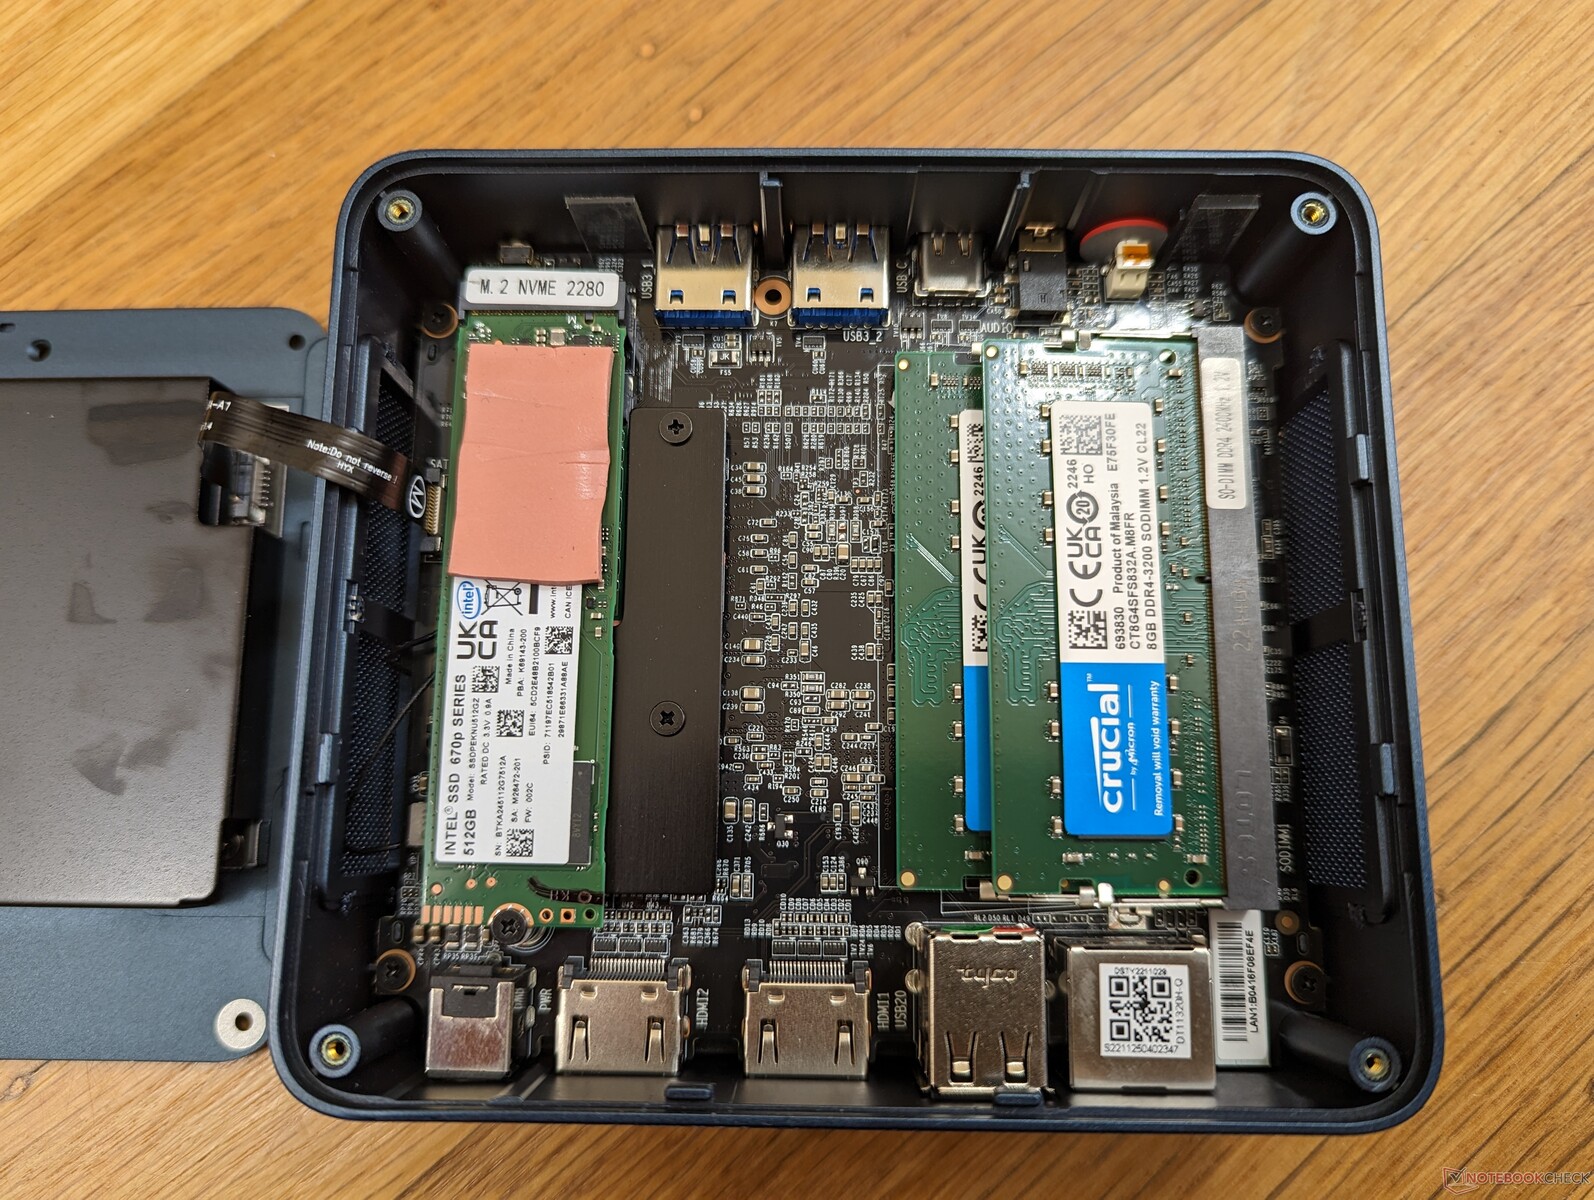
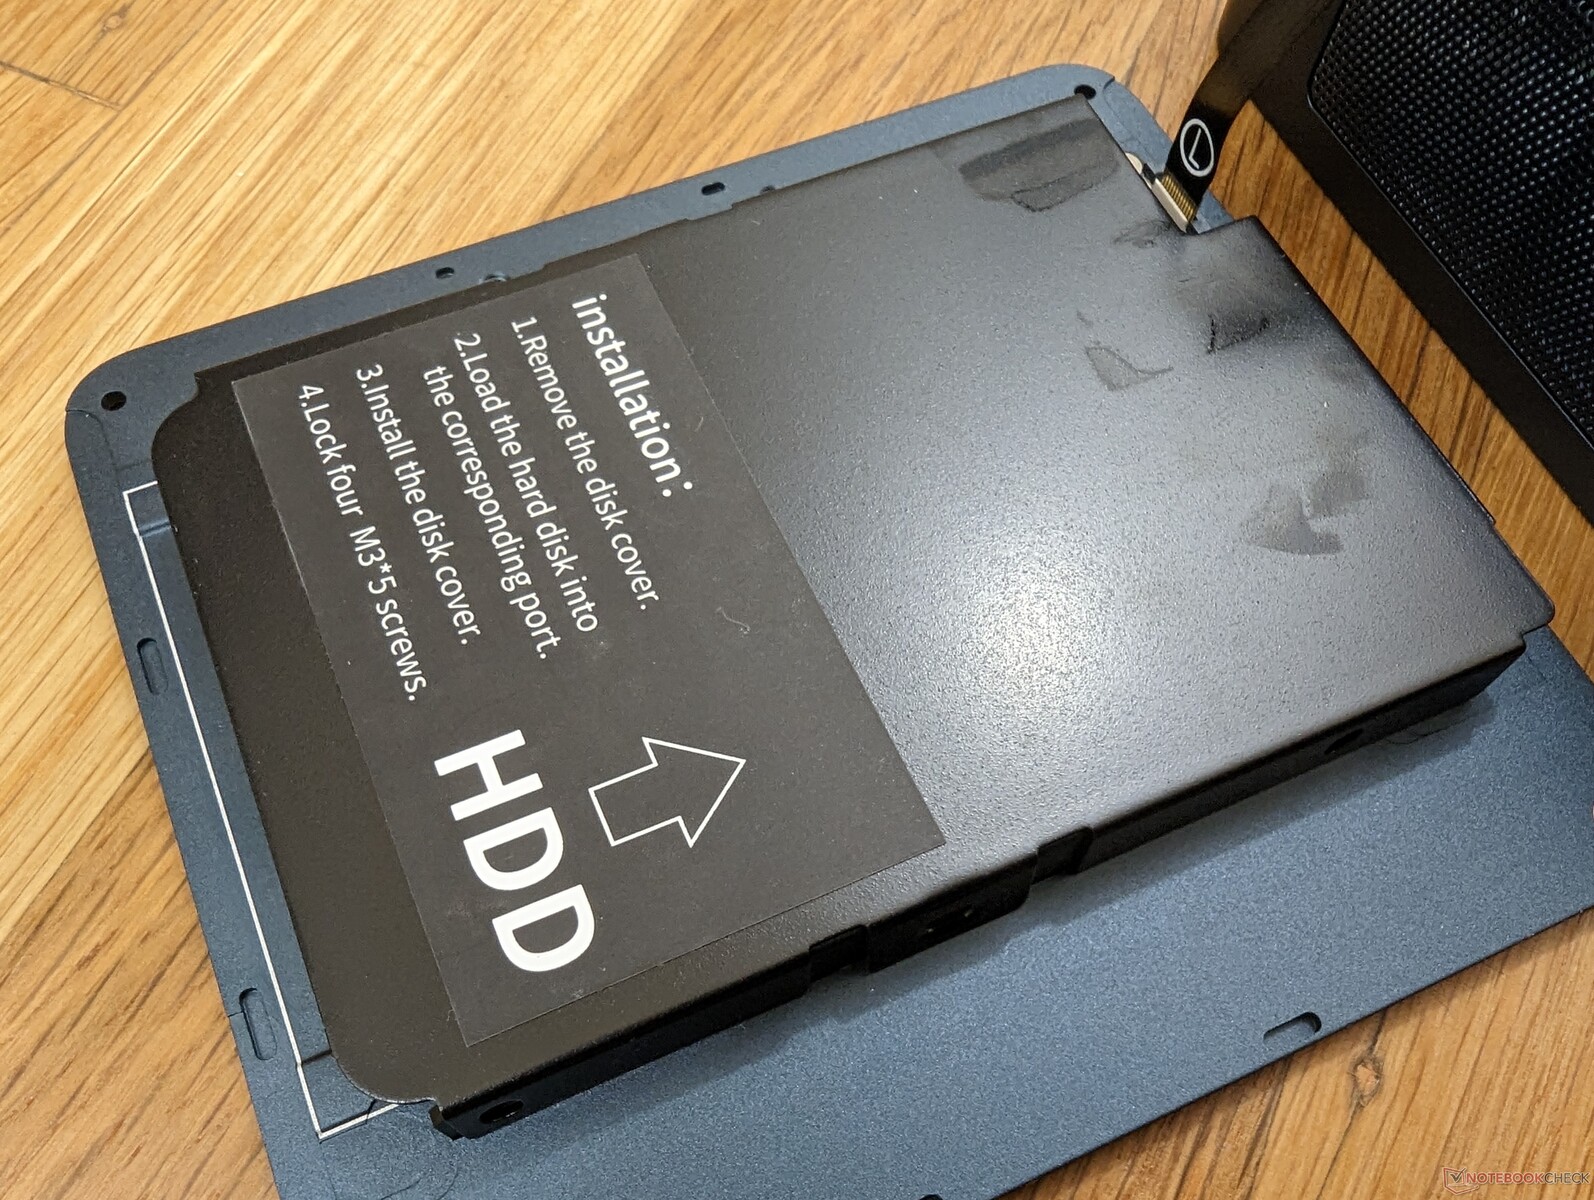
Other than the above differences, the Speed S shares the same chassis design and features as the S3 and so we recommend checking out our existing review on the S3 to learn more about the physical features of the series. This review will show what performance advantages users can expect between the two models.
Alternatives to the Speed S include other budget-oriented mini PCs like the BMax B5 Pro and the Beelink SEi or SER series.
More Trigkey reviews:
Potential Competitors in Comparison
Rating | Date | Model | Weight | Height | Size | Resolution | Price |
|---|---|---|---|---|---|---|---|
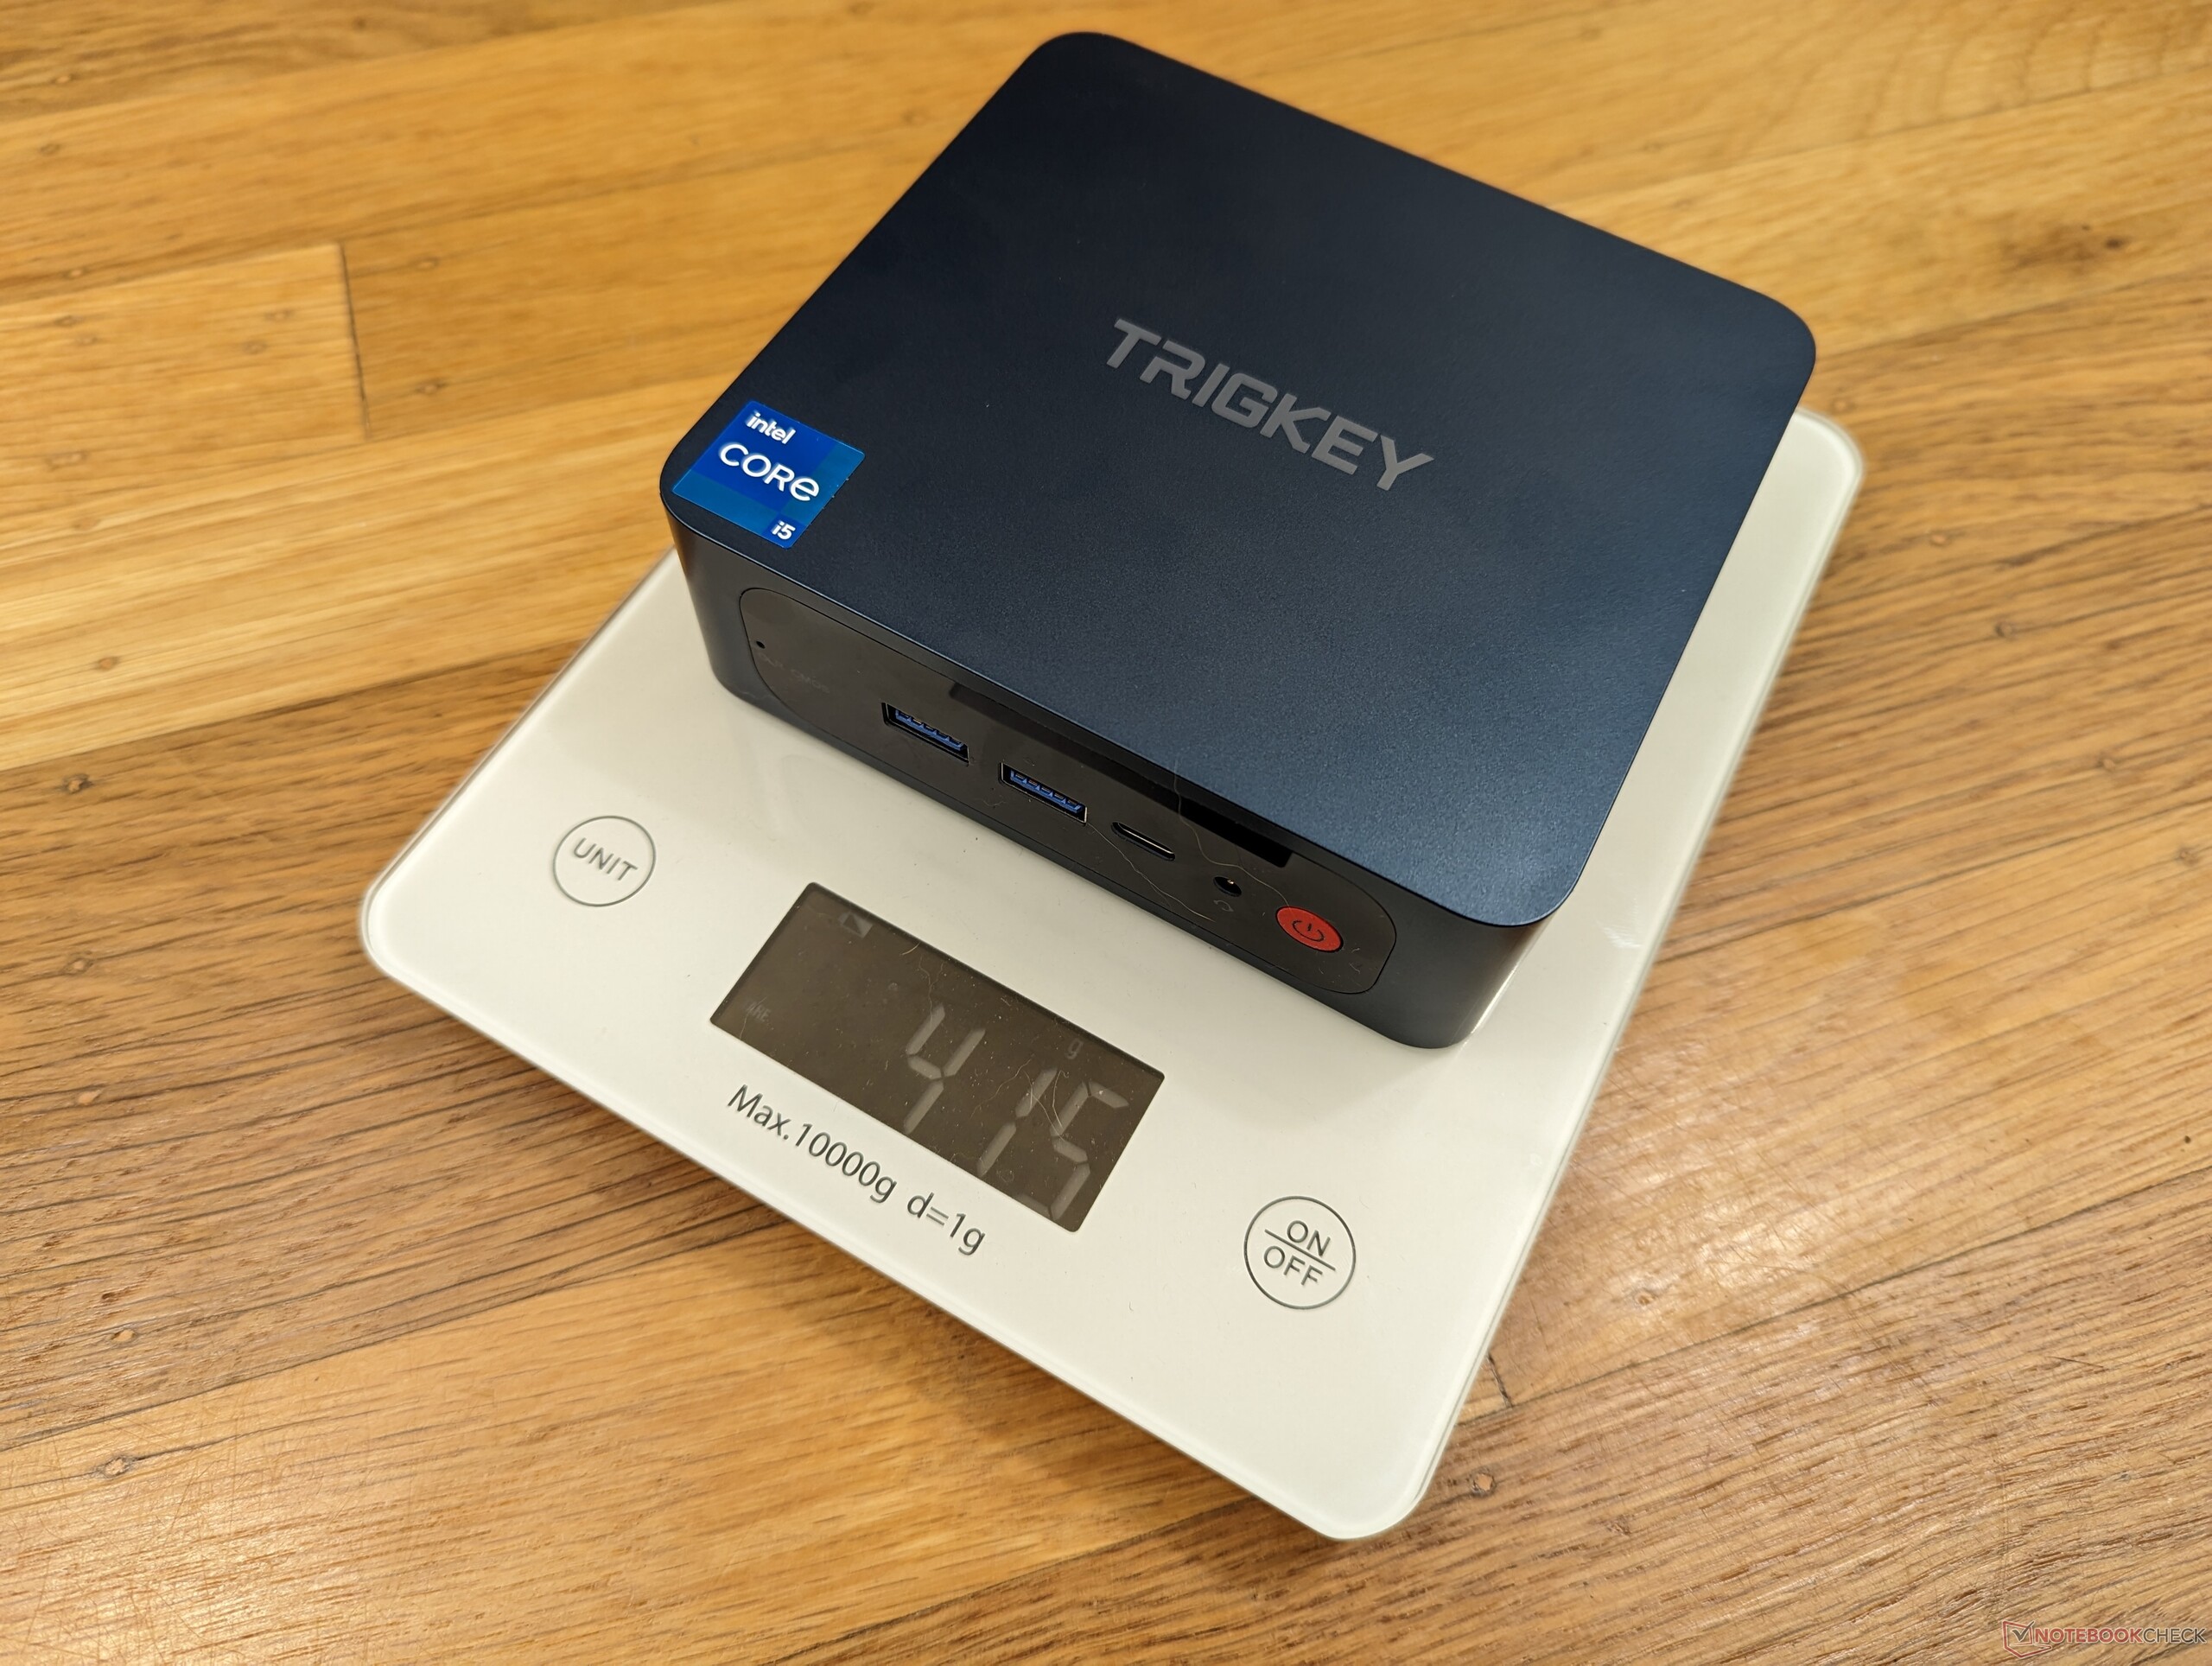
v (old) | 03 / 2023 | Trigkey Speed S i5-11320H, Iris Xe G7 96EUs | 415 g | 40.7 mm | x | ||
v (old) | 01 / 2023 | Trigkey S3 R5 3550H, Vega 8 | 419 g | 40.7 mm | x | ||
v (old) | 12 / 2022 | Beelink SEi12 Core i5-1235U i5-1235U, Iris Xe G7 80EUs | 465 g | 42 mm | x | ||
v (old) | 10 / 2022 | Beelink SER Pro Ryzen 5 5600H R5 5600H, Vega 7 | 498 g | 42 mm | x | ||
| 78.9 % v7 (old) | 11 / 2022 | Intel NUC 12 Pro Kit NUC12WSKi7 i7-1260P, Iris Xe G7 96EUs | 511 g | 37 mm | x | ||
v (old) | 11 / 2022 | BMAX B5 Pro G7H8 i5-8260U, UHD Graphics 620 | 369 g | 43.2 mm | x |
Case
Communication
Wireless performance fluctuates more than expected as shown by the graph below even after multiple retries. It is nonetheless fast enough for 4K video streaming.
The Intel AX201 does not support Wi-Fi 6E.
| Networking | |
| iperf3 transmit AXE11000 | |
| Beelink SEi12 Core i5-1235U | |
| Trigkey Speed S | |
| BMAX B5 Pro G7H8 | |
| Trigkey S3 | |
| iperf3 receive AXE11000 | |
| Beelink SEi12 Core i5-1235U | |
| Trigkey Speed S | |
| BMAX B5 Pro G7H8 | |
| Trigkey S3 | |
| iperf3 transmit AXE11000 6GHz | |
| Intel NUC 12 Pro Kit NUC12WSKi7 | |
| Beelink SER Pro Ryzen 5 5600H | |
| iperf3 receive AXE11000 6GHz | |
| Intel NUC 12 Pro Kit NUC12WSKi7 | |
| Beelink SER Pro Ryzen 5 5600H | |
Performance
Processor — Core i5-11320H
Cinebench R15 Multi Loop
Cinebench R23: Multi Core | Single Core
Cinebench R20: CPU (Multi Core) | CPU (Single Core)
Cinebench R15: CPU Multi 64Bit | CPU Single 64Bit
Blender: v2.79 BMW27 CPU
7-Zip 18.03: 7z b 4 | 7z b 4 -mmt1
Geekbench 5.5: Multi-Core | Single-Core
HWBOT x265 Benchmark v2.2: 4k Preset
LibreOffice : 20 Documents To PDF
R Benchmark 2.5: Overall mean
| CPU Performance rating | |
| Intel NUC 12 Pro Kit NUC12WSKi7 | |
| Beelink SEi12 Core i5-1235U | |
| Beelink SER Pro Ryzen 5 5600H | |
| Average Intel Core i5-11320H | |
| Trigkey Speed S | |
| Trigkey S3 | |
| BMAX B5 Pro G7H8 | |
| Cinebench R23 / Multi Core | |
| Intel NUC 12 Pro Kit NUC12WSKi7 | |
| Beelink SEi12 Core i5-1235U | |
| Beelink SER Pro Ryzen 5 5600H | |
| Average Intel Core i5-11320H (5720 - 6051, n=4) | |
| Trigkey Speed S | |
| Trigkey S3 | |
| BMAX B5 Pro G7H8 | |
| Cinebench R23 / Single Core | |
| Intel NUC 12 Pro Kit NUC12WSKi7 | |
| Beelink SEi12 Core i5-1235U | |
| Trigkey Speed S | |
| Average Intel Core i5-11320H (1341 - 1467, n=4) | |
| Beelink SER Pro Ryzen 5 5600H | |
| Trigkey S3 | |
| BMAX B5 Pro G7H8 | |
| Cinebench R20 / CPU (Multi Core) | |
| Intel NUC 12 Pro Kit NUC12WSKi7 | |
| Beelink SEi12 Core i5-1235U | |
| Beelink SER Pro Ryzen 5 5600H | |
| Average Intel Core i5-11320H (2208 - 2349, n=4) | |
| Trigkey Speed S | |
| BMAX B5 Pro G7H8 | |
| Trigkey S3 | |
| Cinebench R20 / CPU (Single Core) | |
| Intel NUC 12 Pro Kit NUC12WSKi7 | |
| Beelink SEi12 Core i5-1235U | |
| Trigkey Speed S | |
| Average Intel Core i5-11320H (557 - 567, n=4) | |
| Beelink SER Pro Ryzen 5 5600H | |
| BMAX B5 Pro G7H8 | |
| Trigkey S3 | |
| Cinebench R15 / CPU Multi 64Bit | |
| Intel NUC 12 Pro Kit NUC12WSKi7 | |
| Beelink SEi12 Core i5-1235U | |
| Beelink SER Pro Ryzen 5 5600H | |
| Average Intel Core i5-11320H (857 - 1019, n=4) | |
| Trigkey Speed S | |
| Trigkey S3 | |
| BMAX B5 Pro G7H8 | |
| Cinebench R15 / CPU Single 64Bit | |
| Intel NUC 12 Pro Kit NUC12WSKi7 | |
| Beelink SEi12 Core i5-1235U | |
| Beelink SER Pro Ryzen 5 5600H | |
| Trigkey Speed S | |
| Average Intel Core i5-11320H (212 - 215, n=4) | |
| BMAX B5 Pro G7H8 | |
| Trigkey S3 | |
| Blender / v2.79 BMW27 CPU | |
| BMAX B5 Pro G7H8 | |
| Trigkey S3 | |
| Trigkey Speed S | |
| Average Intel Core i5-11320H (507 - 543, n=4) | |
| Beelink SEi12 Core i5-1235U | |
| Beelink SER Pro Ryzen 5 5600H | |
| Intel NUC 12 Pro Kit NUC12WSKi7 | |
| 7-Zip 18.03 / 7z b 4 | |
| Intel NUC 12 Pro Kit NUC12WSKi7 | |
| Beelink SER Pro Ryzen 5 5600H | |
| Beelink SEi12 Core i5-1235U | |
| Average Intel Core i5-11320H (24718 - 26858, n=4) | |
| Trigkey Speed S | |
| BMAX B5 Pro G7H8 | |
| Trigkey S3 | |
| 7-Zip 18.03 / 7z b 4 -mmt1 | |
| Intel NUC 12 Pro Kit NUC12WSKi7 | |
| Beelink SER Pro Ryzen 5 5600H | |
| Beelink SEi12 Core i5-1235U | |
| Trigkey Speed S | |
| Average Intel Core i5-11320H (4813 - 5119, n=4) | |
| BMAX B5 Pro G7H8 | |
| Trigkey S3 | |
| Geekbench 5.5 / Multi-Core | |
| Intel NUC 12 Pro Kit NUC12WSKi7 | |
| Beelink SEi12 Core i5-1235U | |
| Beelink SER Pro Ryzen 5 5600H | |
| Average Intel Core i5-11320H (4927 - 5955, n=4) | |
| Trigkey Speed S | |
| Trigkey S3 | |
| BMAX B5 Pro G7H8 | |
| Geekbench 5.5 / Single-Core | |
| Intel NUC 12 Pro Kit NUC12WSKi7 | |
| Beelink SEi12 Core i5-1235U | |
| Trigkey Speed S | |
| Average Intel Core i5-11320H (1453 - 1523, n=4) | |
| Beelink SER Pro Ryzen 5 5600H | |
| Trigkey S3 | |
| BMAX B5 Pro G7H8 | |
| HWBOT x265 Benchmark v2.2 / 4k Preset | |
| Intel NUC 12 Pro Kit NUC12WSKi7 | |
| Beelink SER Pro Ryzen 5 5600H | |
| Beelink SEi12 Core i5-1235U | |
| Average Intel Core i5-11320H (7.25 - 7.91, n=4) | |
| Trigkey Speed S | |
| Trigkey S3 | |
| BMAX B5 Pro G7H8 | |
| LibreOffice / 20 Documents To PDF | |
| BMAX B5 Pro G7H8 | |
| Trigkey S3 | |
| Beelink SER Pro Ryzen 5 5600H | |
| Beelink SEi12 Core i5-1235U | |
| Average Intel Core i5-11320H (44 - 50, n=4) | |
| Intel NUC 12 Pro Kit NUC12WSKi7 | |
| Trigkey Speed S | |
| R Benchmark 2.5 / Overall mean | |
| BMAX B5 Pro G7H8 | |
| Trigkey S3 | |
| Average Intel Core i5-11320H (0.581 - 0.622, n=4) | |
| Trigkey Speed S | |
| Beelink SER Pro Ryzen 5 5600H | |
| Beelink SEi12 Core i5-1235U | |
| Intel NUC 12 Pro Kit NUC12WSKi7 | |
* ... smaller is better
| Blender | |
| v3.3 Classroom HIP/AMD | |
| Trigkey S3 | |
| v3.3 Classroom CPU | |
| BMAX B5 Pro G7H8 | |
| Trigkey S3 | |
| Trigkey Speed S | |
| Beelink SEi12 Core i5-1235U | |
| Average Intel Iris Xe Graphics G7 96EUs (336 - 1259, n=109) | |
| Beelink SER Pro Ryzen 5 5600H | |
| Intel NUC 12 Pro Kit NUC12WSKi7 | |
* ... smaller is better
AIDA64: FP32 Ray-Trace | FPU Julia | CPU SHA3 | CPU Queen | FPU SinJulia | FPU Mandel | CPU AES | CPU ZLib | FP64 Ray-Trace | CPU PhotoWorxx
| Performance rating | |
| Intel NUC 12 Pro Kit NUC12WSKi7 | |
| Beelink SER Pro Ryzen 5 5600H | |
| Beelink SEi12 Core i5-1235U | |
| Average Intel Core i5-11320H | |
| Trigkey Speed S | |
| BMAX B5 Pro G7H8 | |
| Trigkey S3 | |
| AIDA64 / FP32 Ray-Trace | |
| Intel NUC 12 Pro Kit NUC12WSKi7 | |
| Beelink SER Pro Ryzen 5 5600H | |
| Trigkey Speed S | |
| Average Intel Core i5-11320H (6369 - 7489, n=4) | |
| Beelink SEi12 Core i5-1235U | |
| BMAX B5 Pro G7H8 | |
| Trigkey S3 | |
| AIDA64 / FPU Julia | |
| Beelink SER Pro Ryzen 5 5600H | |
| Intel NUC 12 Pro Kit NUC12WSKi7 | |
| Beelink SEi12 Core i5-1235U | |
| Trigkey Speed S | |
| Average Intel Core i5-11320H (27391 - 31637, n=4) | |
| BMAX B5 Pro G7H8 | |
| Trigkey S3 | |
| AIDA64 / CPU SHA3 | |
| Intel NUC 12 Pro Kit NUC12WSKi7 | |
| Beelink SER Pro Ryzen 5 5600H | |
| Trigkey Speed S | |
| Average Intel Core i5-11320H (1847 - 2099, n=4) | |
| Beelink SEi12 Core i5-1235U | |
| BMAX B5 Pro G7H8 | |
| Trigkey S3 | |
| AIDA64 / CPU Queen | |
| Intel NUC 12 Pro Kit NUC12WSKi7 | |
| Beelink SER Pro Ryzen 5 5600H | |
| Beelink SEi12 Core i5-1235U | |
| Trigkey Speed S | |
| Average Intel Core i5-11320H (43565 - 52477, n=4) | |
| BMAX B5 Pro G7H8 | |
| Trigkey S3 | |
| AIDA64 / FPU SinJulia | |
| Beelink SER Pro Ryzen 5 5600H | |
| Intel NUC 12 Pro Kit NUC12WSKi7 | |
| Trigkey S3 | |
| Trigkey Speed S | |
| Average Intel Core i5-11320H (4381 - 5011, n=4) | |
| Beelink SEi12 Core i5-1235U | |
| BMAX B5 Pro G7H8 | |
| AIDA64 / FPU Mandel | |
| Beelink SER Pro Ryzen 5 5600H | |
| Intel NUC 12 Pro Kit NUC12WSKi7 | |
| Trigkey Speed S | |
| Average Intel Core i5-11320H (16659 - 18770, n=4) | |
| Beelink SEi12 Core i5-1235U | |
| BMAX B5 Pro G7H8 | |
| Trigkey S3 | |
| AIDA64 / CPU AES | |
| Intel NUC 12 Pro Kit NUC12WSKi7 | |
| Beelink SER Pro Ryzen 5 5600H | |
| Trigkey Speed S | |
| Average Intel Core i5-11320H (59851 - 76500, n=4) | |
| Beelink SEi12 Core i5-1235U | |
| Trigkey S3 | |
| BMAX B5 Pro G7H8 | |
| AIDA64 / CPU ZLib | |
| Intel NUC 12 Pro Kit NUC12WSKi7 | |
| Beelink SEi12 Core i5-1235U | |
| Beelink SER Pro Ryzen 5 5600H | |
| Average Intel Core i5-11320H (330 - 410, n=4) | |
| Trigkey Speed S | |
| Trigkey S3 | |
| BMAX B5 Pro G7H8 | |
| AIDA64 / FP64 Ray-Trace | |
| Intel NUC 12 Pro Kit NUC12WSKi7 | |
| Beelink SER Pro Ryzen 5 5600H | |
| Average Intel Core i5-11320H (3536 - 4021, n=4) | |
| Trigkey Speed S | |
| Beelink SEi12 Core i5-1235U | |
| BMAX B5 Pro G7H8 | |
| Trigkey S3 | |
| AIDA64 / CPU PhotoWorxx | |
| Average Intel Core i5-11320H (25964 - 36644, n=4) | |
| Beelink SEi12 Core i5-1235U | |
| Intel NUC 12 Pro Kit NUC12WSKi7 | |
| Trigkey Speed S | |
| Beelink SER Pro Ryzen 5 5600H | |
| BMAX B5 Pro G7H8 | |
| Trigkey S3 | |
System Performance
CrossMark: Overall | Productivity | Creativity | Responsiveness
| PCMark 10 / Score | |
| Intel NUC 12 Pro Kit NUC12WSKi7 | |
| Beelink SER Pro Ryzen 5 5600H | |
| Beelink SEi12 Core i5-1235U | |
| Trigkey Speed S | |
| Average Intel Core i5-11320H, Intel Iris Xe Graphics G7 96EUs (5095 - 5302, n=3) | |
| Trigkey S3 | |
| BMAX B5 Pro G7H8 | |
| PCMark 10 / Essentials | |
| Beelink SEi12 Core i5-1235U | |
| Intel NUC 12 Pro Kit NUC12WSKi7 | |
| Trigkey Speed S | |
| Beelink SER Pro Ryzen 5 5600H | |
| Average Intel Core i5-11320H, Intel Iris Xe Graphics G7 96EUs (9556 - 10558, n=3) | |
| BMAX B5 Pro G7H8 | |
| Trigkey S3 | |
| PCMark 10 / Productivity | |
| Beelink SER Pro Ryzen 5 5600H | |
| Intel NUC 12 Pro Kit NUC12WSKi7 | |
| Beelink SEi12 Core i5-1235U | |
| Trigkey Speed S | |
| Average Intel Core i5-11320H, Intel Iris Xe Graphics G7 96EUs (6832 - 6963, n=3) | |
| Trigkey S3 | |
| BMAX B5 Pro G7H8 | |
| PCMark 10 / Digital Content Creation | |
| Intel NUC 12 Pro Kit NUC12WSKi7 | |
| Beelink SER Pro Ryzen 5 5600H | |
| Beelink SEi12 Core i5-1235U | |
| Trigkey Speed S | |
| Average Intel Core i5-11320H, Intel Iris Xe Graphics G7 96EUs (5048 - 5615, n=3) | |
| Trigkey S3 | |
| BMAX B5 Pro G7H8 | |
| CrossMark / Overall | |
| Intel NUC 12 Pro Kit NUC12WSKi7 | |
| Beelink SEi12 Core i5-1235U | |
| Trigkey Speed S | |
| Average Intel Core i5-11320H, Intel Iris Xe Graphics G7 96EUs (1300 - 1371, n=3) | |
| Beelink SER Pro Ryzen 5 5600H | |
| Trigkey S3 | |
| BMAX B5 Pro G7H8 | |
| CrossMark / Productivity | |
| Beelink SEi12 Core i5-1235U | |
| Intel NUC 12 Pro Kit NUC12WSKi7 | |
| Trigkey Speed S | |
| Average Intel Core i5-11320H, Intel Iris Xe Graphics G7 96EUs (1376 - 1456, n=3) | |
| Beelink SER Pro Ryzen 5 5600H | |
| Trigkey S3 | |
| BMAX B5 Pro G7H8 | |
| CrossMark / Creativity | |
| Intel NUC 12 Pro Kit NUC12WSKi7 | |
| Beelink SEi12 Core i5-1235U | |
| Beelink SER Pro Ryzen 5 5600H | |
| Trigkey Speed S | |
| Average Intel Core i5-11320H, Intel Iris Xe Graphics G7 96EUs (1241 - 1256, n=3) | |
| Trigkey S3 | |
| BMAX B5 Pro G7H8 | |
| CrossMark / Responsiveness | |
| Beelink SEi12 Core i5-1235U | |
| Trigkey Speed S | |
| Intel NUC 12 Pro Kit NUC12WSKi7 | |
| Average Intel Core i5-11320H, Intel Iris Xe Graphics G7 96EUs (1260 - 1494, n=3) | |
| Beelink SER Pro Ryzen 5 5600H | |
| BMAX B5 Pro G7H8 | |
| Trigkey S3 | |
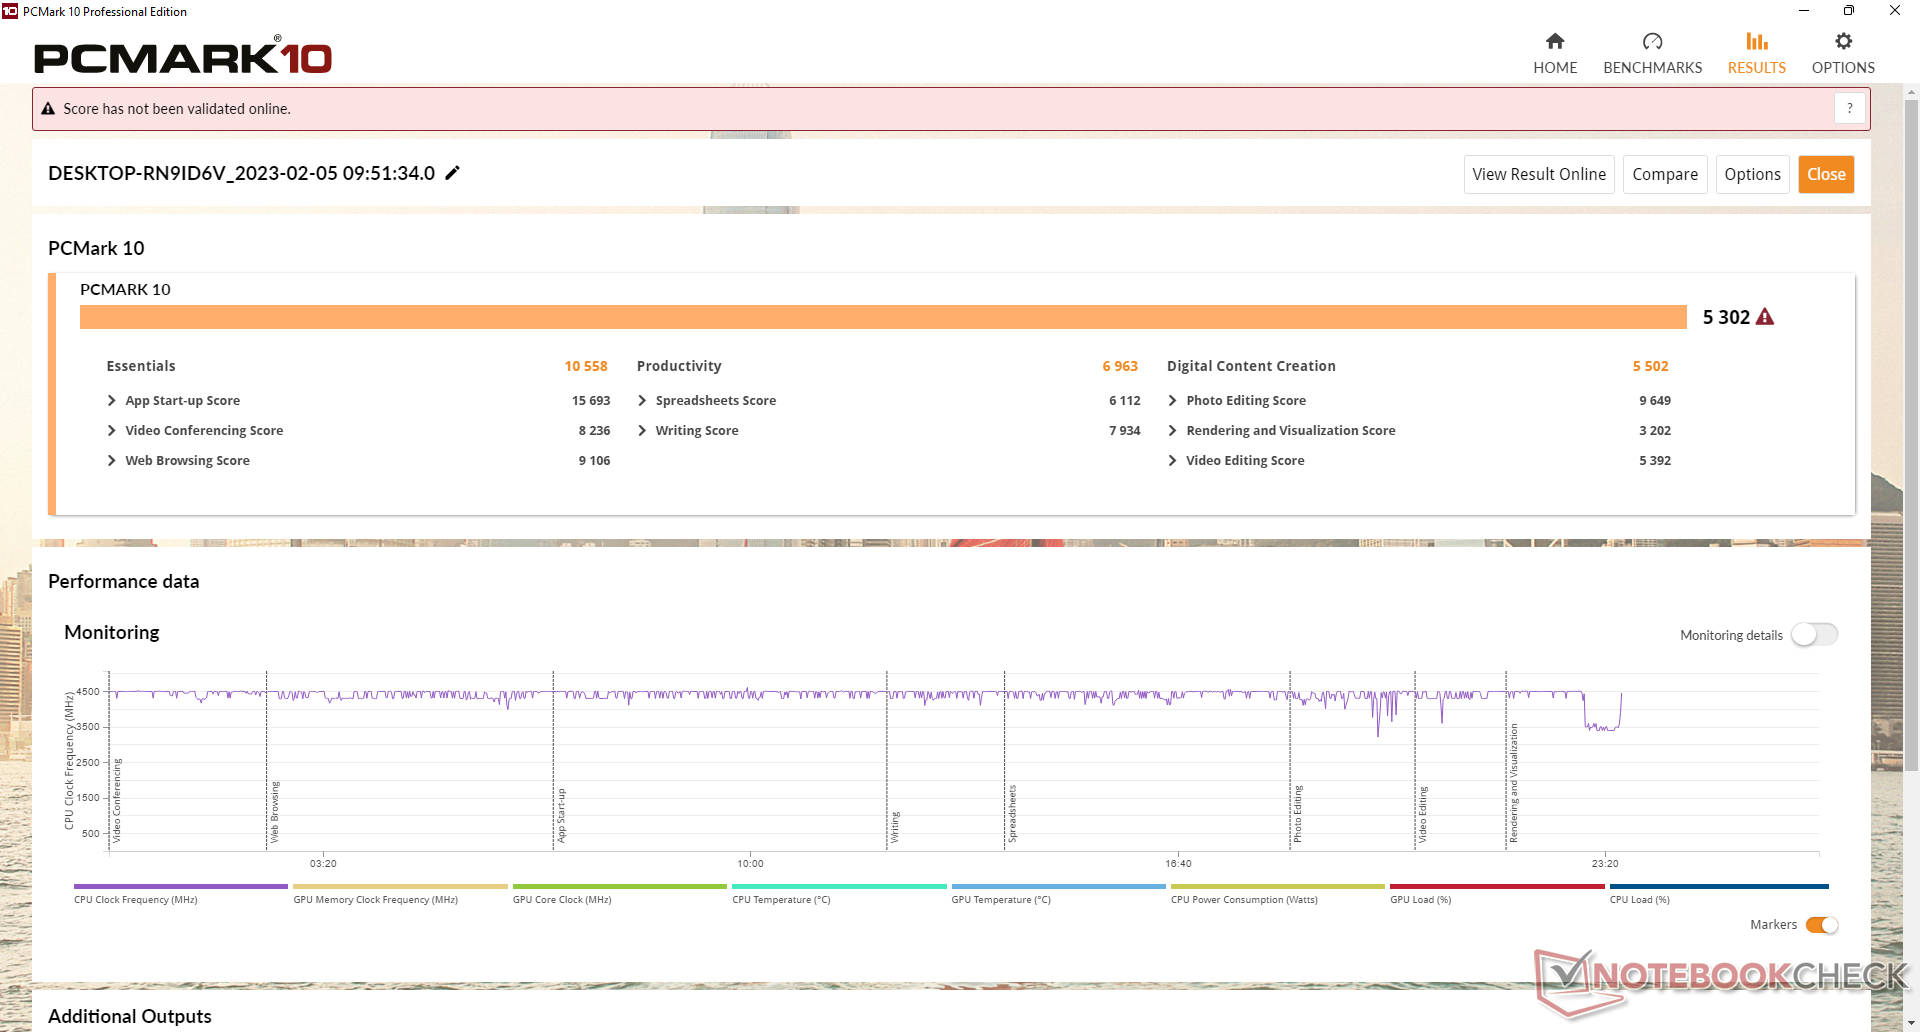
| PCMark 10 Score | 5302 points | |
Help | ||
| AIDA64 / Memory Copy | |
| Average Intel Core i5-11320H (41106 - 55961, n=4) | |
| Intel NUC 12 Pro Kit NUC12WSKi7 | |
| Beelink SEi12 Core i5-1235U | |
| Beelink SER Pro Ryzen 5 5600H | |
| Trigkey Speed S | |
| Trigkey S3 | |
| BMAX B5 Pro G7H8 | |
| AIDA64 / Memory Read | |
| Average Intel Core i5-11320H (46516 - 52799, n=4) | |
| Beelink SER Pro Ryzen 5 5600H | |
| Trigkey Speed S | |
| Intel NUC 12 Pro Kit NUC12WSKi7 | |
| Beelink SEi12 Core i5-1235U | |
| Trigkey S3 | |
| BMAX B5 Pro G7H8 | |
| AIDA64 / Memory Write | |
| Average Intel Core i5-11320H (46760 - 63323, n=4) | |
| Trigkey Speed S | |
| Beelink SEi12 Core i5-1235U | |
| Intel NUC 12 Pro Kit NUC12WSKi7 | |
| Beelink SER Pro Ryzen 5 5600H | |
| Trigkey S3 | |
| BMAX B5 Pro G7H8 | |
| AIDA64 / Memory Latency | |
| Trigkey S3 | |
| BMAX B5 Pro G7H8 | |
| Intel NUC 12 Pro Kit NUC12WSKi7 | |
| Average Intel Core i5-11320H (77.6 - 114.1, n=4) | |
| Beelink SEi12 Core i5-1235U | |
| Beelink SER Pro Ryzen 5 5600H | |
| Trigkey Speed S | |
* ... smaller is better
DPC Latency
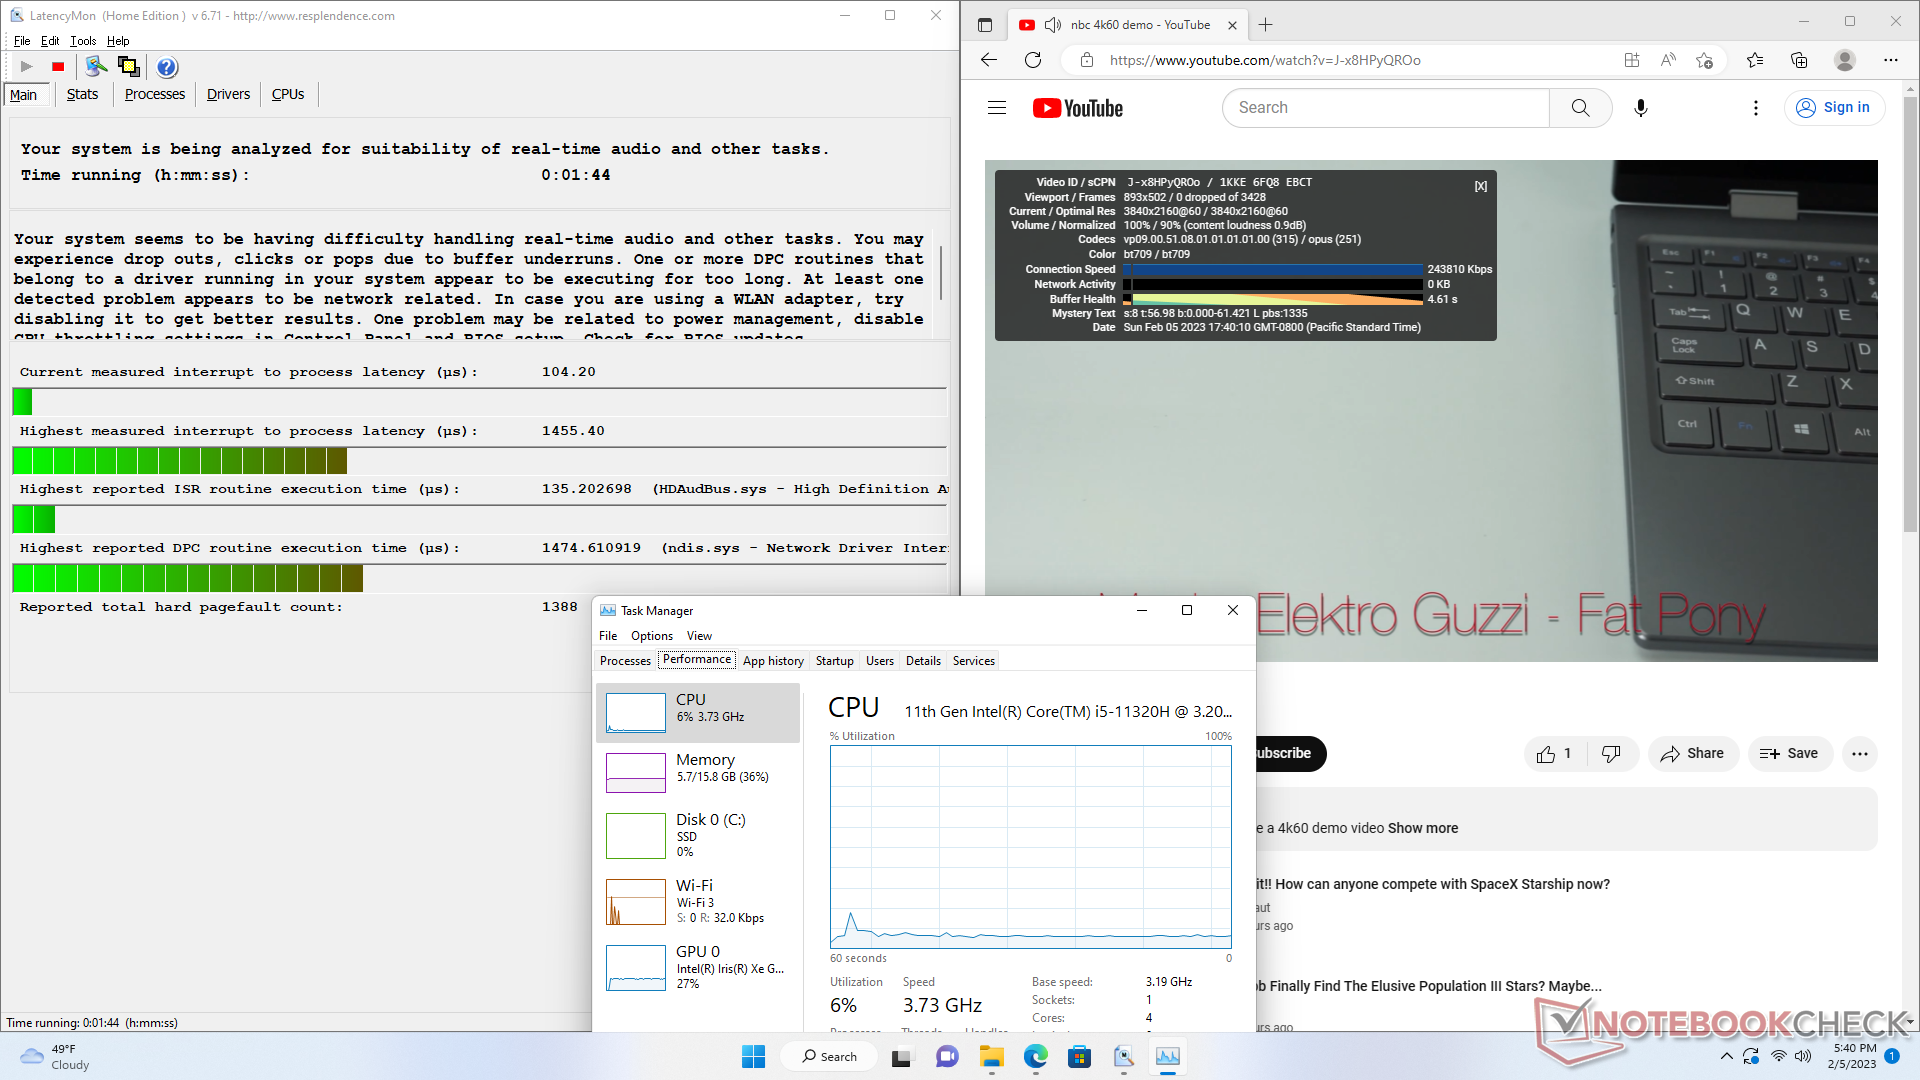
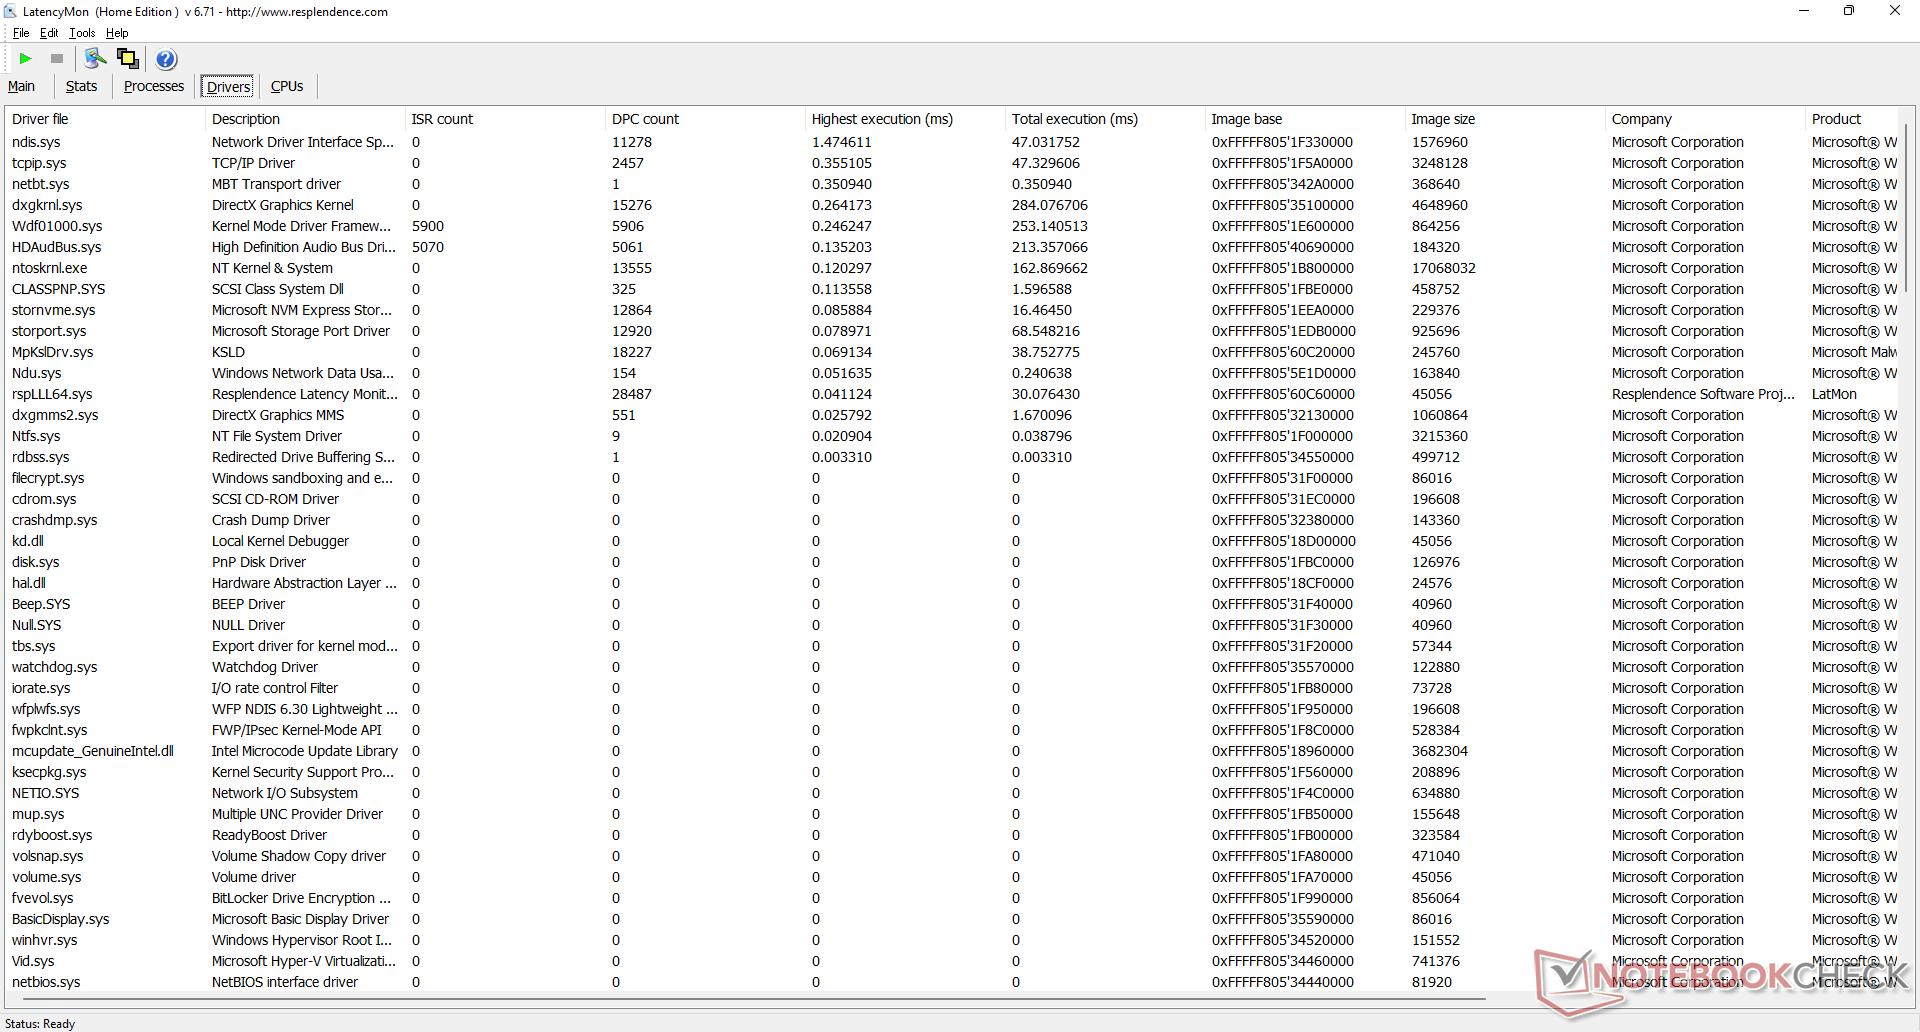
| DPC Latencies / LatencyMon - interrupt to process latency (max), Web, Youtube, Prime95 | |
| Trigkey S3 | |
| Trigkey Speed S | |
| Beelink SEi12 Core i5-1235U | |
| Intel NUC 12 Pro Kit NUC12WSKi7 | |
| Beelink SER Pro Ryzen 5 5600H | |
| BMAX B5 Pro G7H8 | |
* ... smaller is better
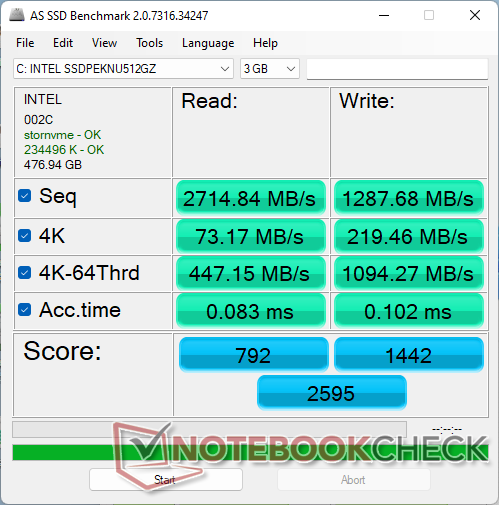
Storage Devices
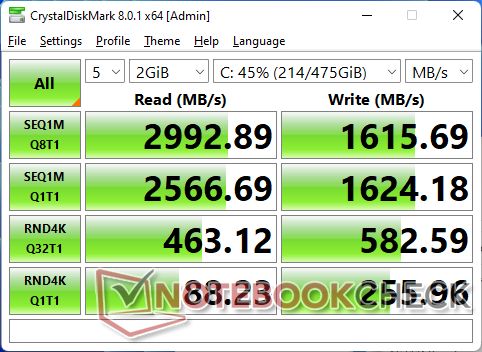

| Drive Performance rating - Percent | |
| Beelink SEi12 Core i5-1235U | |
| Trigkey Speed S | |
| BMAX B5 Pro G7H8 | |
| Average Intel SSD 670p SSDPEKNU512GZ | |
| Beelink SER Pro Ryzen 5 5600H -11! | |
| Trigkey S3 | |
| Intel NUC 12 Pro Kit NUC12WSKi7 | |
* ... smaller is better
Disk Throttling: DiskSpd Read Loop, Queue Depth 8
GPU Performance
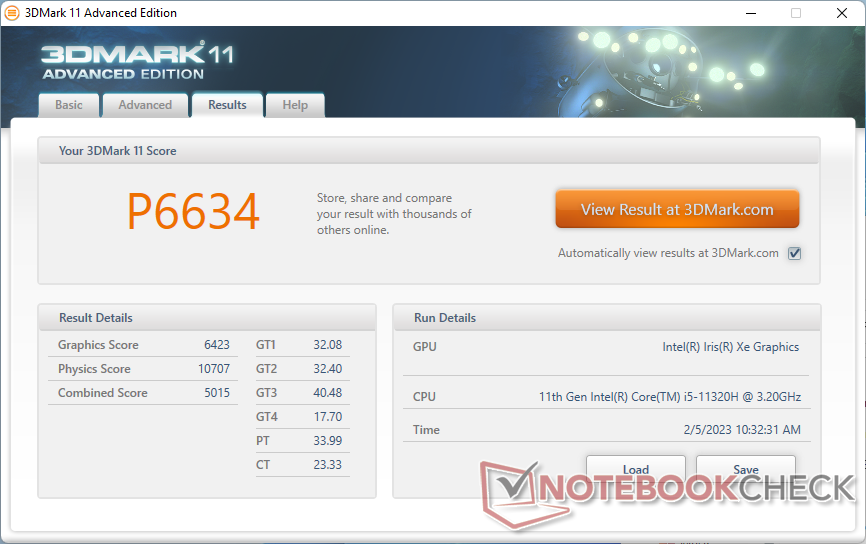
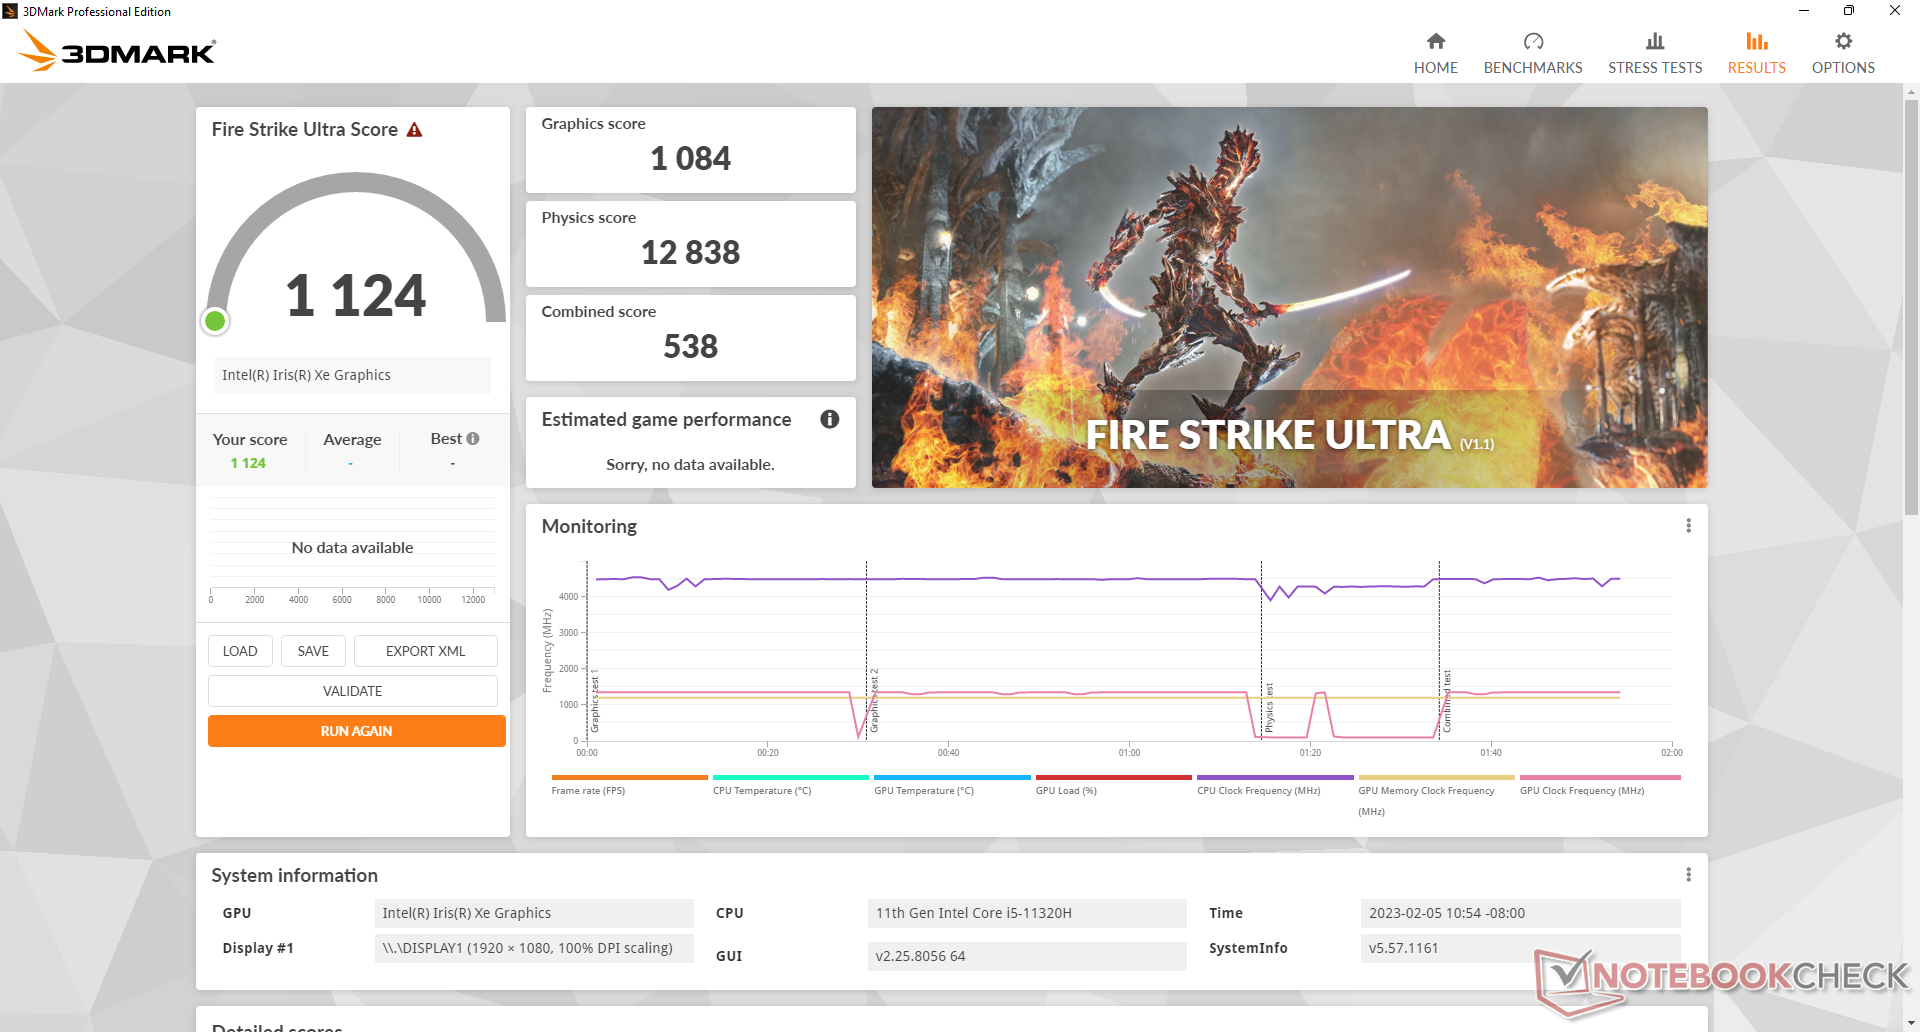
| 3DMark 11 Performance | 6634 points | |
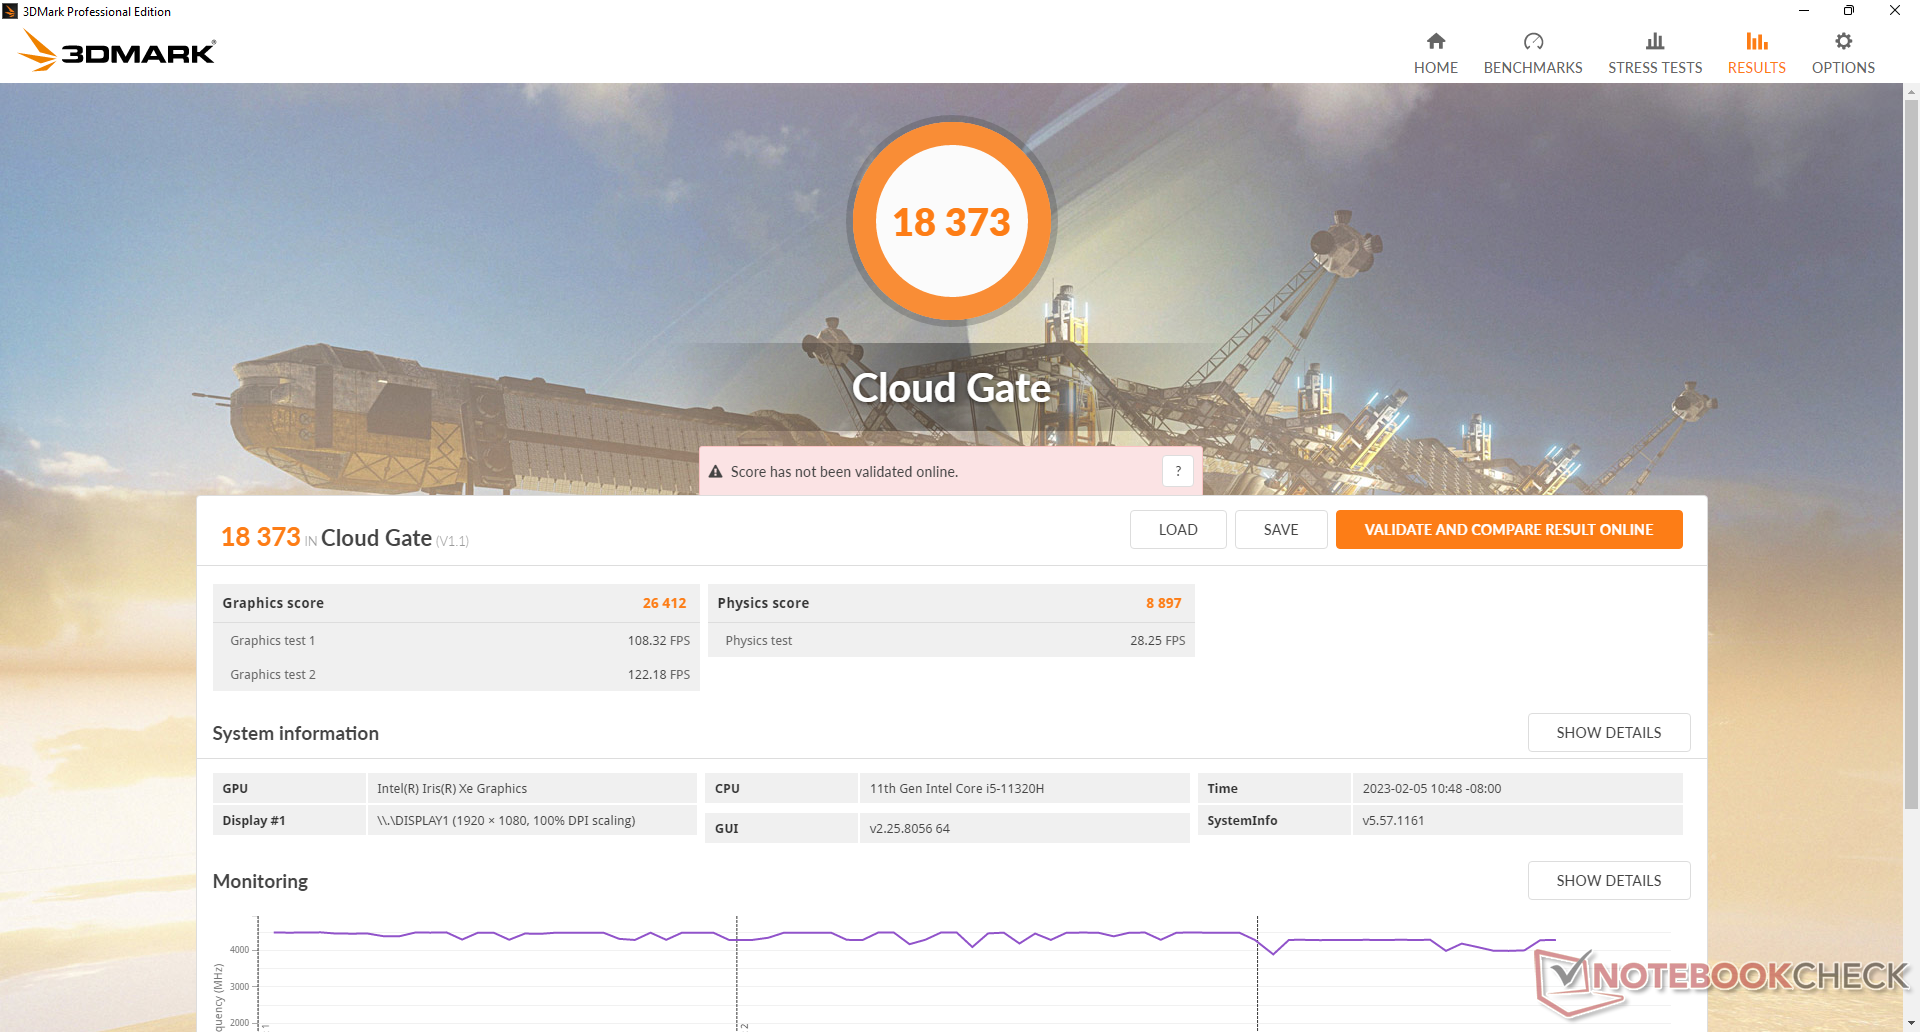
| 3DMark Cloud Gate Standard Score | 18373 points | |
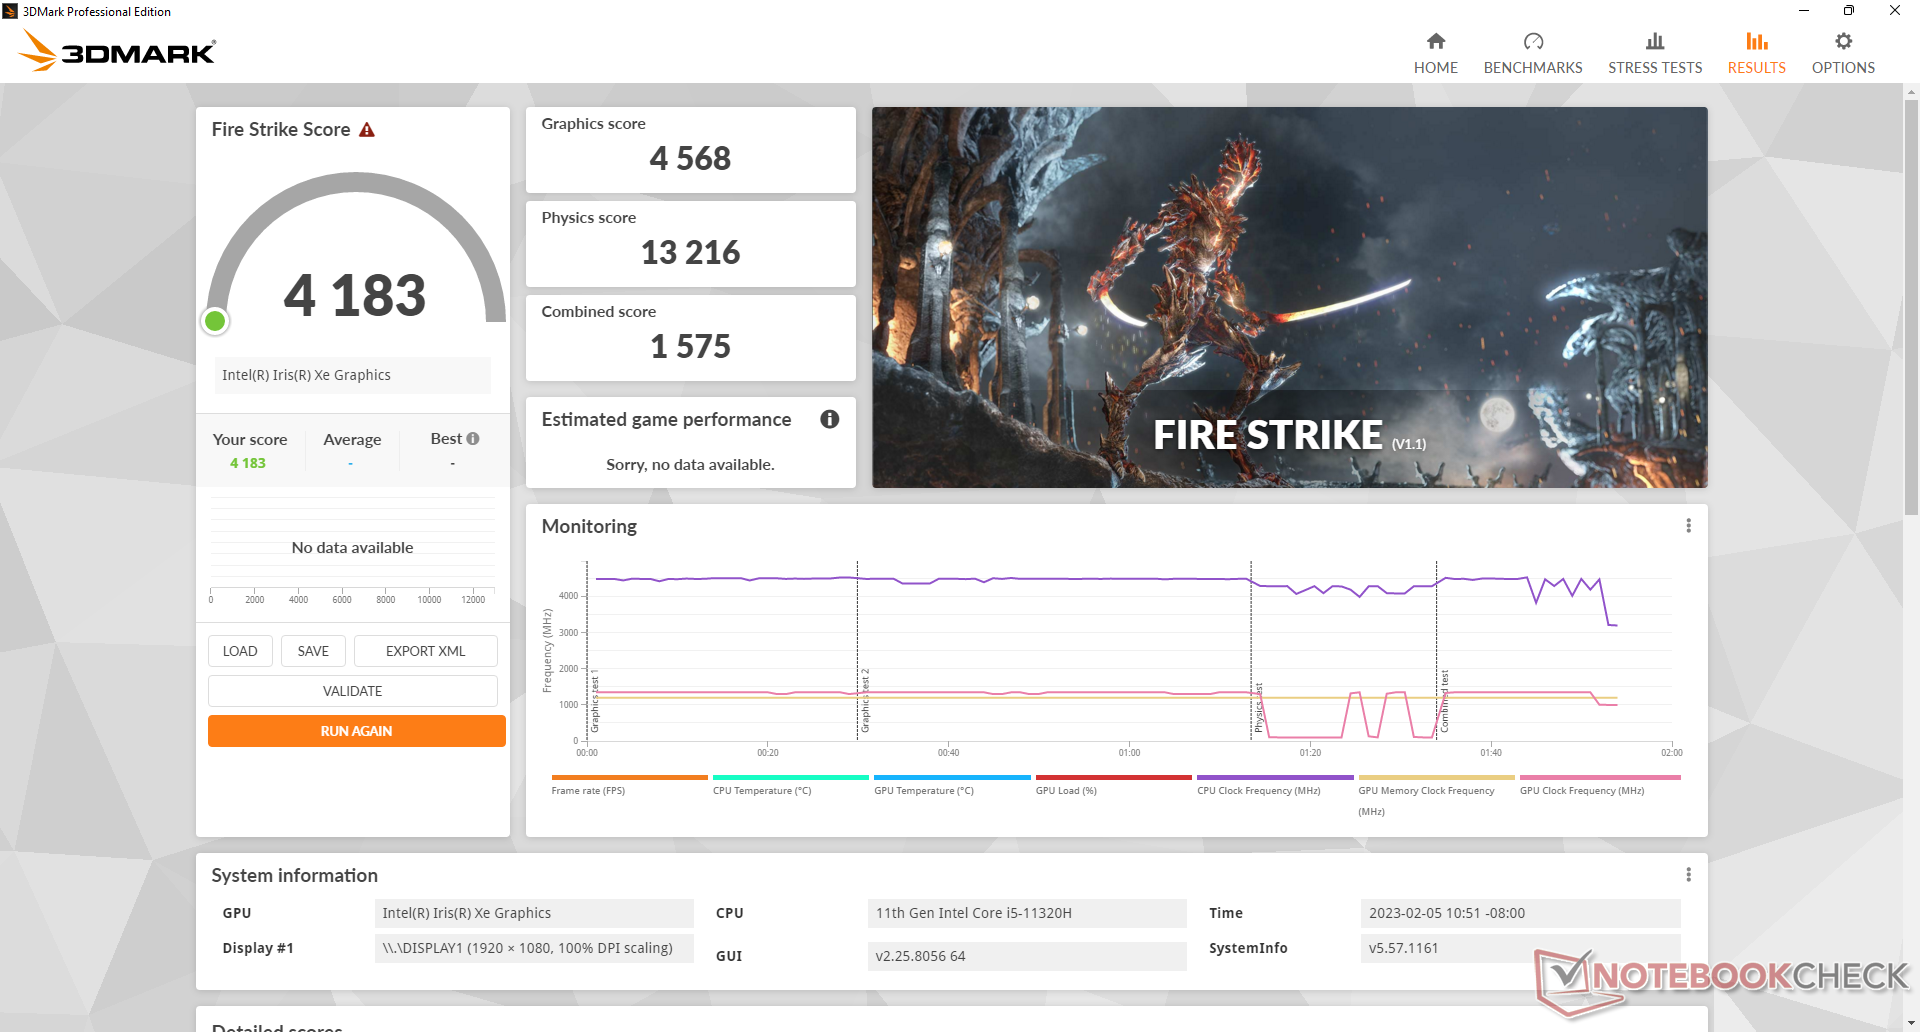
| 3DMark Fire Strike Score | 4183 points | |
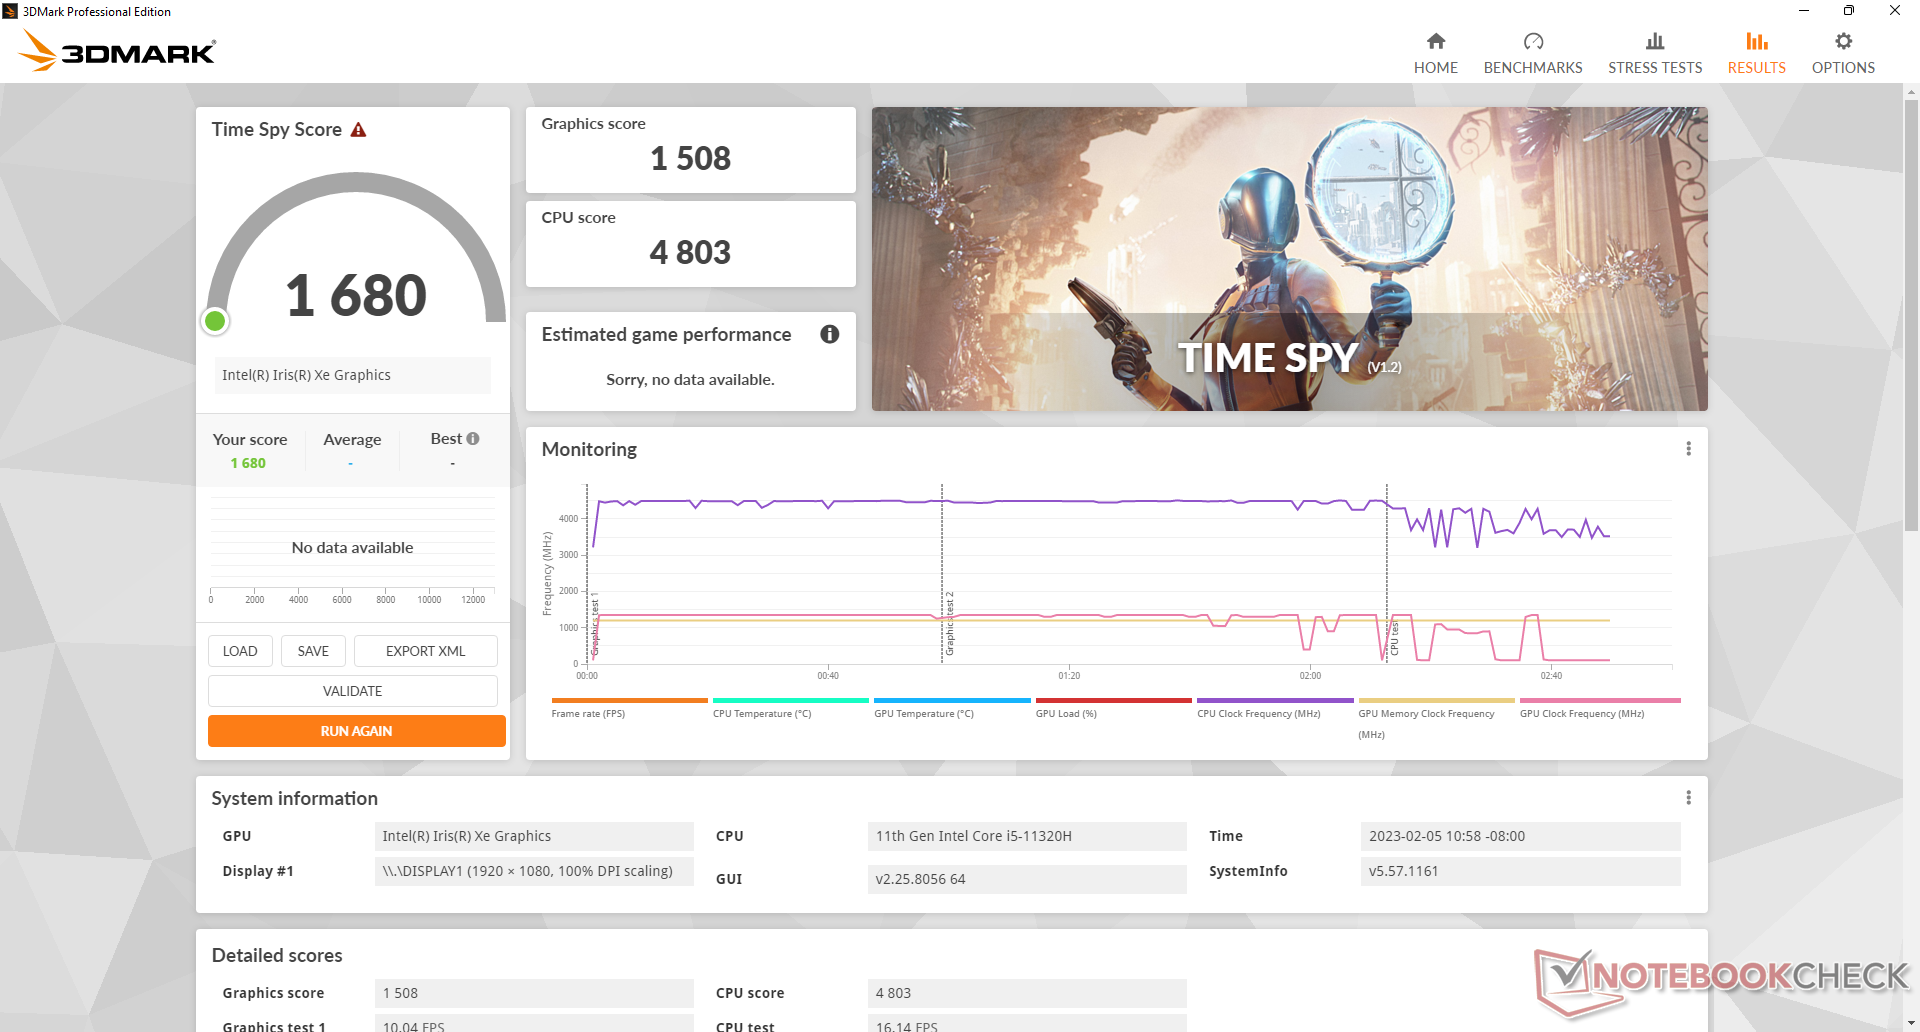
| 3DMark Time Spy Score | 1680 points | |
Help | ||
| The Witcher 3 | |
| 1024x768 Low Graphics & Postprocessing | |
| Intel NUC 12 Pro Kit NUC12WSKi7 | |
| Trigkey Speed S | |
| Average Intel Iris Xe Graphics G7 96EUs (28.9 - 117.2, n=188) | |
| Beelink SER Pro Ryzen 5 5600H | |
| Beelink SEi12 Core i5-1235U | |
| Trigkey S3 | |
| BMAX B5 Pro G7H8 | |
| 1366x768 Medium Graphics & Postprocessing | |
| Average Intel Iris Xe Graphics G7 96EUs (21.4 - 77.8, n=185) | |
| Trigkey Speed S | |
| Beelink SER Pro Ryzen 5 5600H | |
| Beelink SEi12 Core i5-1235U | |
| Trigkey S3 | |
| BMAX B5 Pro G7H8 | |
| 1920x1080 High Graphics & Postprocessing (Nvidia HairWorks Off) | |
| Average Intel Iris Xe Graphics G7 96EUs (10.6 - 45.9, n=191) | |
| Beelink SEi12 Core i5-1235U | |
| Beelink SER Pro Ryzen 5 5600H | |
| Trigkey Speed S | |
| Trigkey S3 | |
| Intel NUC 12 Pro Kit NUC12WSKi7 | |
| BMAX B5 Pro G7H8 | |
| 1920x1080 Ultra Graphics & Postprocessing (HBAO+) | |
| Beelink SER Pro Ryzen 5 5600H | |
| Average Intel Iris Xe Graphics G7 96EUs (8.79 - 20.1, n=181) | |
| Trigkey Speed S | |
| Beelink SEi12 Core i5-1235U | |
| Trigkey S3 | |
| Cyberpunk 2077 1.6 - 1920x1080 Low Preset | |
| Beelink SER Pro Ryzen 5 5600H | |
| Average Intel Iris Xe Graphics G7 96EUs (13 - 25.9, n=42) | |
| Beelink SEi12 Core i5-1235U | |
| Trigkey S3 | |
Witcher 3 FPS Chart
| low | med. | high | ultra | |
|---|---|---|---|---|
| GTA V (2015) | 92.2 | 80.3 | 23.4 | 9.04 |
| The Witcher 3 (2015) | 87.8 | 53.5 | 23.5 | 13.1 |
| Dota 2 Reborn (2015) | 121 | 79.4 | 50.6 | 52.3 |
| Final Fantasy XV Benchmark (2018) | 39.8 | 21.3 | 15.4 | |
| X-Plane 11.11 (2018) | 51.1 | 43.7 | 38.7 | |
| Strange Brigade (2018) | 80.1 | 34.5 | 28.5 | 22.9 |
Emissions
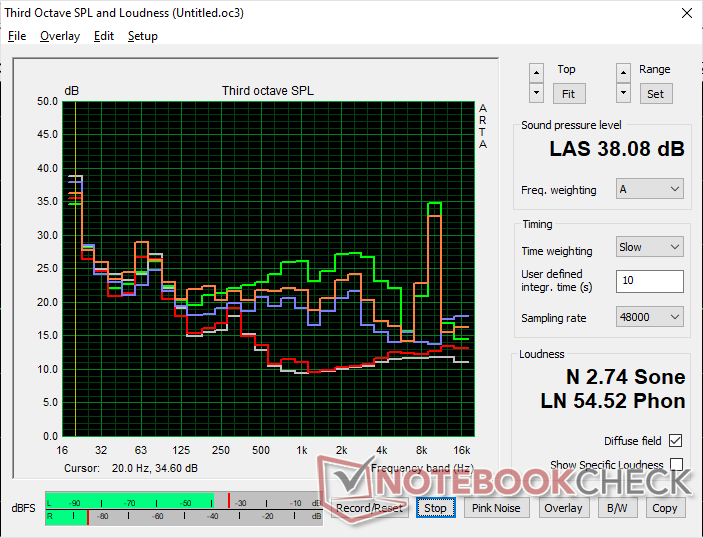
System Noise
Though the internal fan itself is mostly inaudible when streaming content, our specific unit would sometimes exhibit noticeable electronic noise or coil whine at a frequency of ~10 kHz as shown by the graph below. The whine would occur most often when the CPU is heavily stressed such as during gaming. Unfortunately, the whine would not go away even after hours of gaming. Such behavior suggests cheap parts were used to assemble the model.
Hopefully the issue is specific to our review unit and not indicative of any retail units.
Noise level
| Idle |
| 24.1 / 24.1 / 26.6 dB(A) |
| Load |
| 30.4 / 38.1 dB(A) |
 | ||
30 dB silent 40 dB(A) audible 50 dB(A) loud |
||
min: | ||
| Trigkey Speed S Iris Xe G7 96EUs, i5-11320H, Intel SSD 670p SSDPEKNU512GZ | Trigkey S3 Vega 8, R5 3550H, Kingston NV1 SNVS/500GCN | Beelink SEi12 Core i5-1235U Iris Xe G7 80EUs, i5-1235U, Kingston NV1 SNVS/500GCN | Beelink SER Pro Ryzen 5 5600H Vega 7, R5 5600H, Kingston NV1 SNVS/500GCN | Intel NUC 12 Pro Kit NUC12WSKi7 Iris Xe G7 96EUs, i7-1260P, Transcend M.2 SSD 2200S TS512GMTE220S | BMAX B5 Pro G7H8 UHD Graphics 620, i5-8260U | |
|---|---|---|---|---|---|---|
| Noise | 5% | -8% | -4% | -28% | 3% | |
| off / environment * (dB) | 23.5 | 23.2 1% | 23.3 1% | 22.8 3% | 30.4 -29% | 23 2% |
| Idle Minimum * (dB) | 24.1 | 24.5 -2% | 27.8 -15% | 26.1 -8% | 33.1 -37% | 25.1 -4% |
| Idle Average * (dB) | 24.1 | 24.5 -2% | 27.8 -15% | 26.1 -8% | 33.1 -37% | 25.1 -4% |
| Idle Maximum * (dB) | 26.6 | 24.5 8% | 27.8 -5% | 28.7 -8% | 33.1 -24% | 25.1 6% |
| Load Average * (dB) | 30.4 | 27.1 11% | 32 -5% | 32.3 -6% | 38.1 -25% | 28.6 6% |
| Witcher 3 ultra * (dB) | 30.4 | 30.6 -1% | 34.1 -12% | 32.8 -8% | 30.1 1% | |
| Load Maximum * (dB) | 38.1 | 31.3 18% | 39.2 -3% | 36.4 4% | 43.6 -14% | 34 11% |
* ... smaller is better
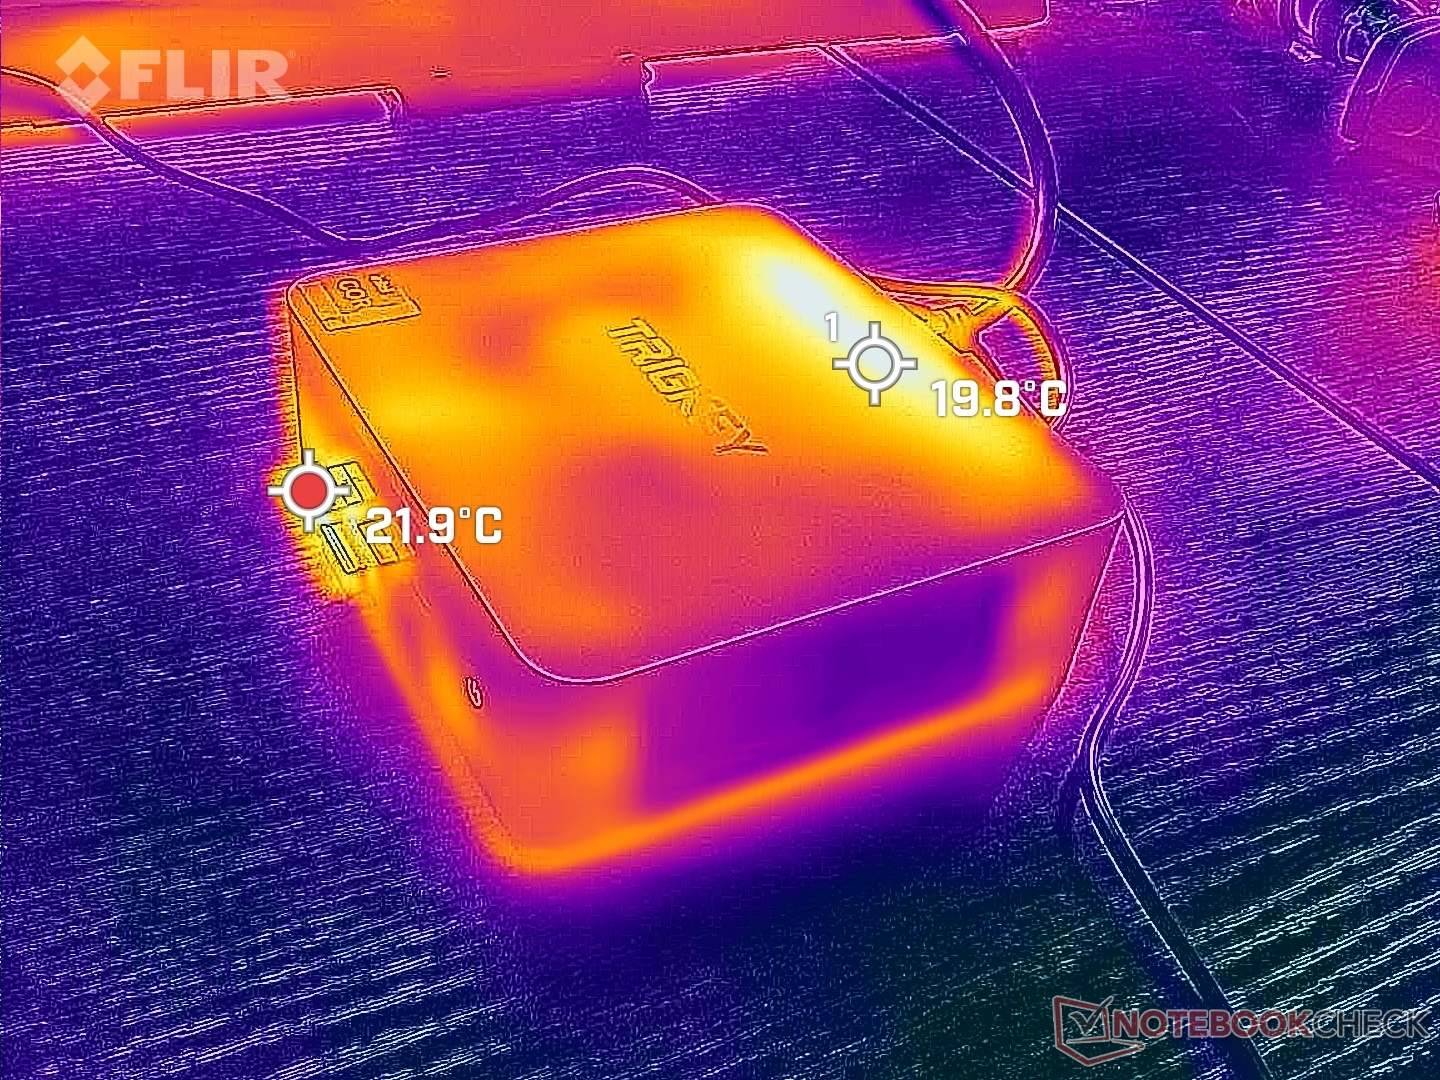
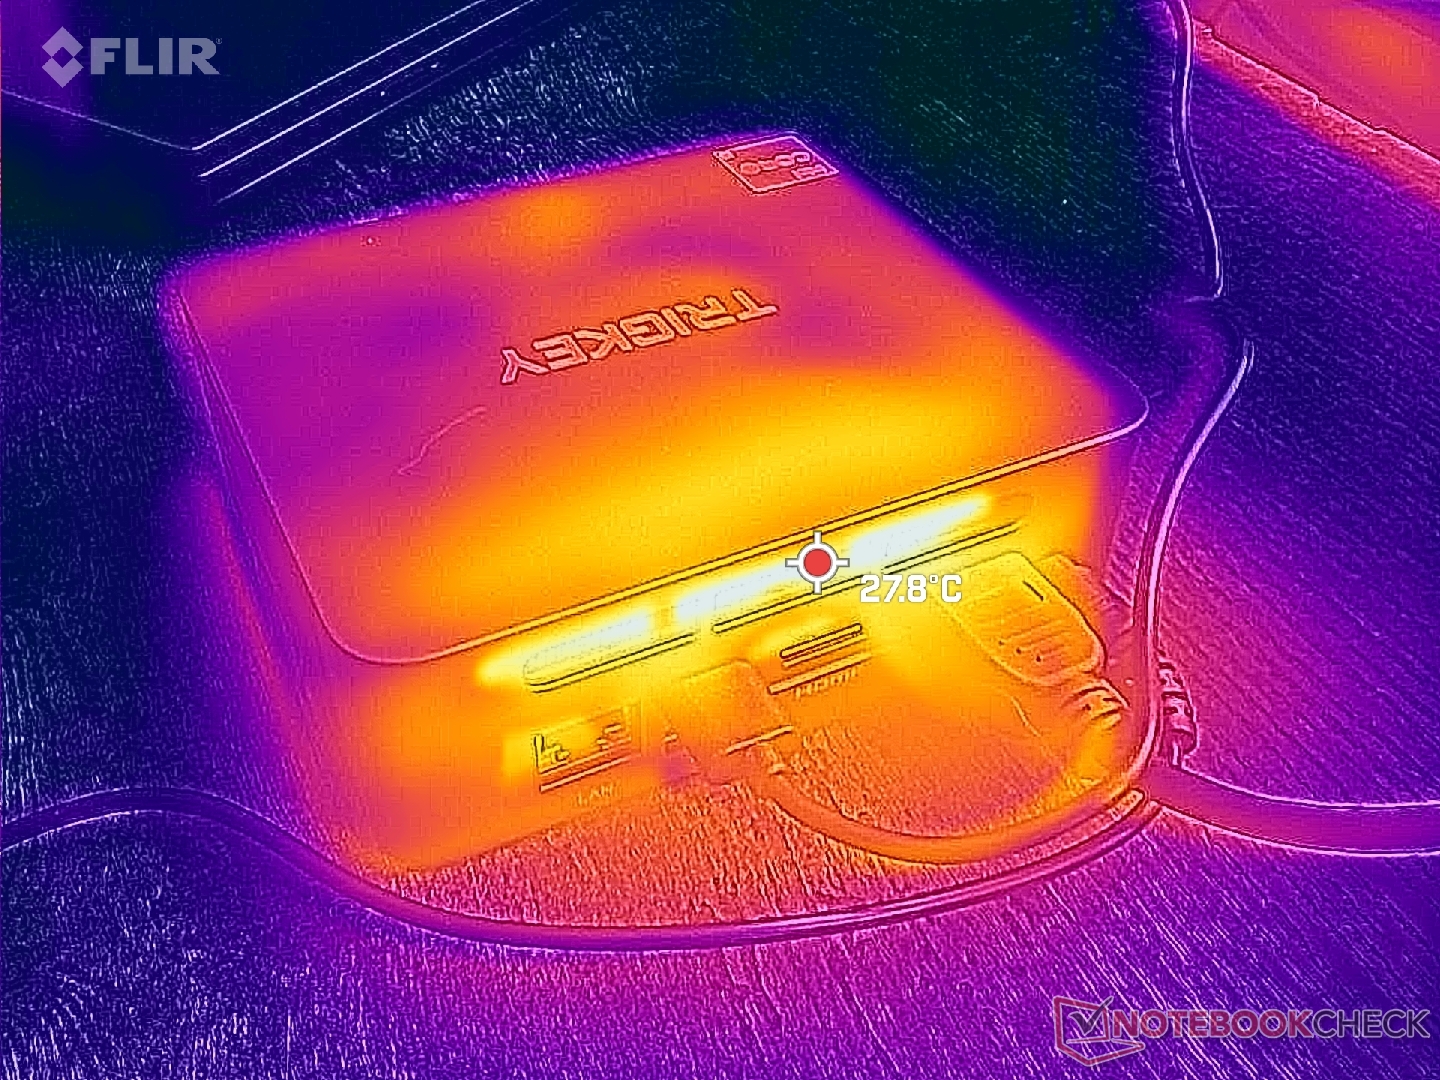
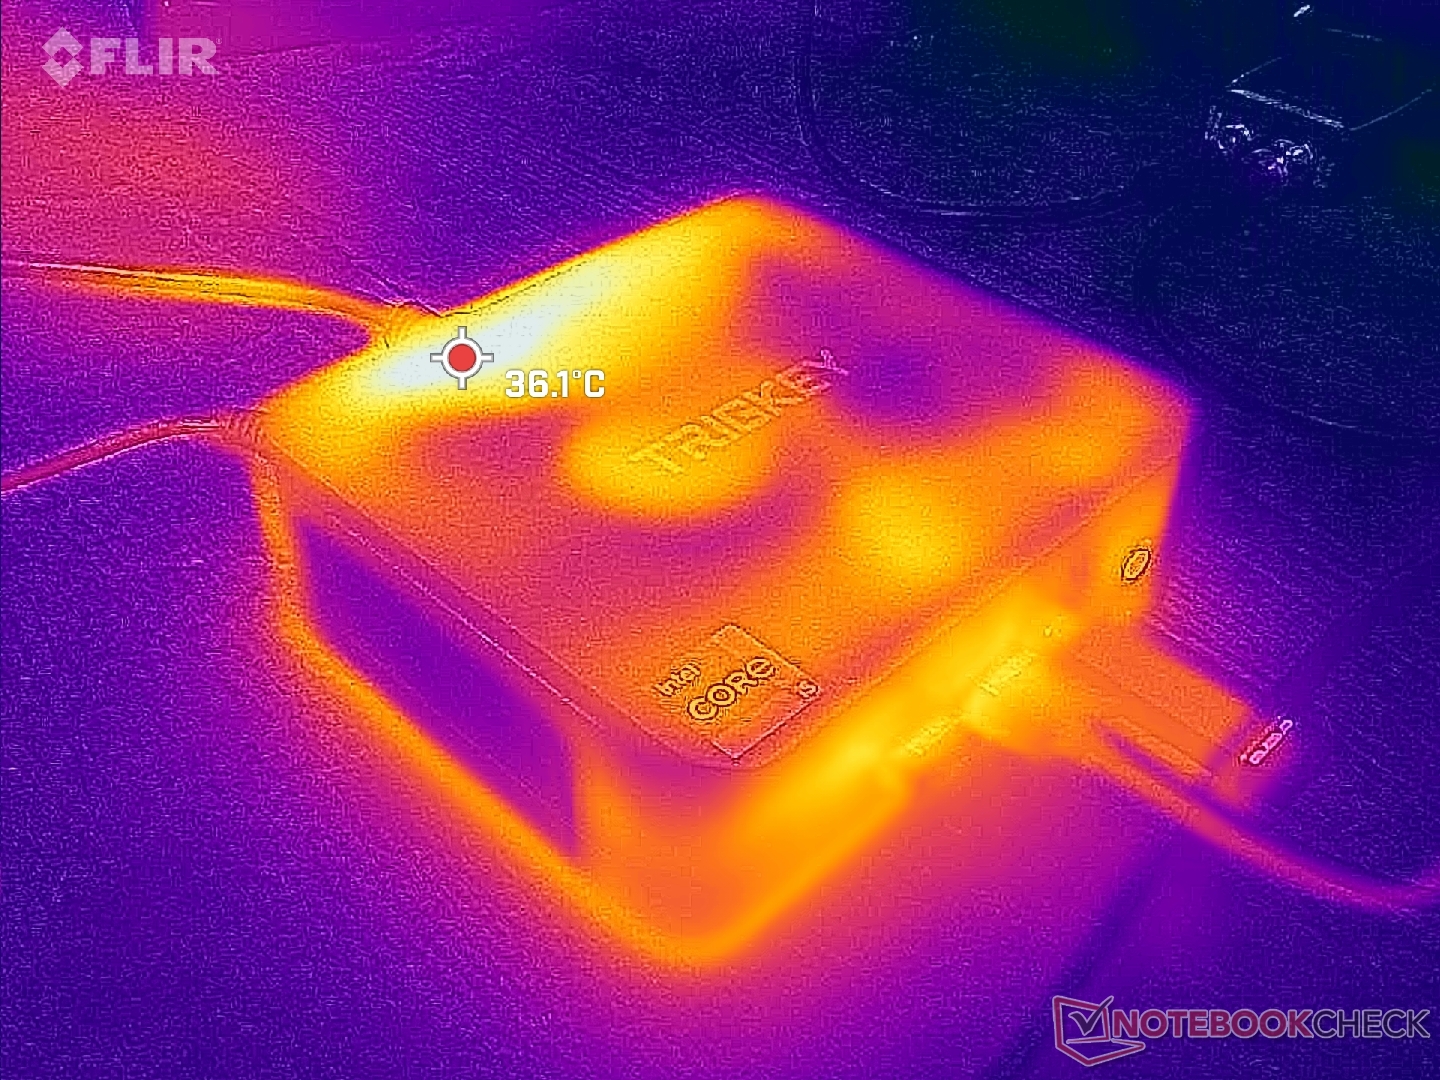
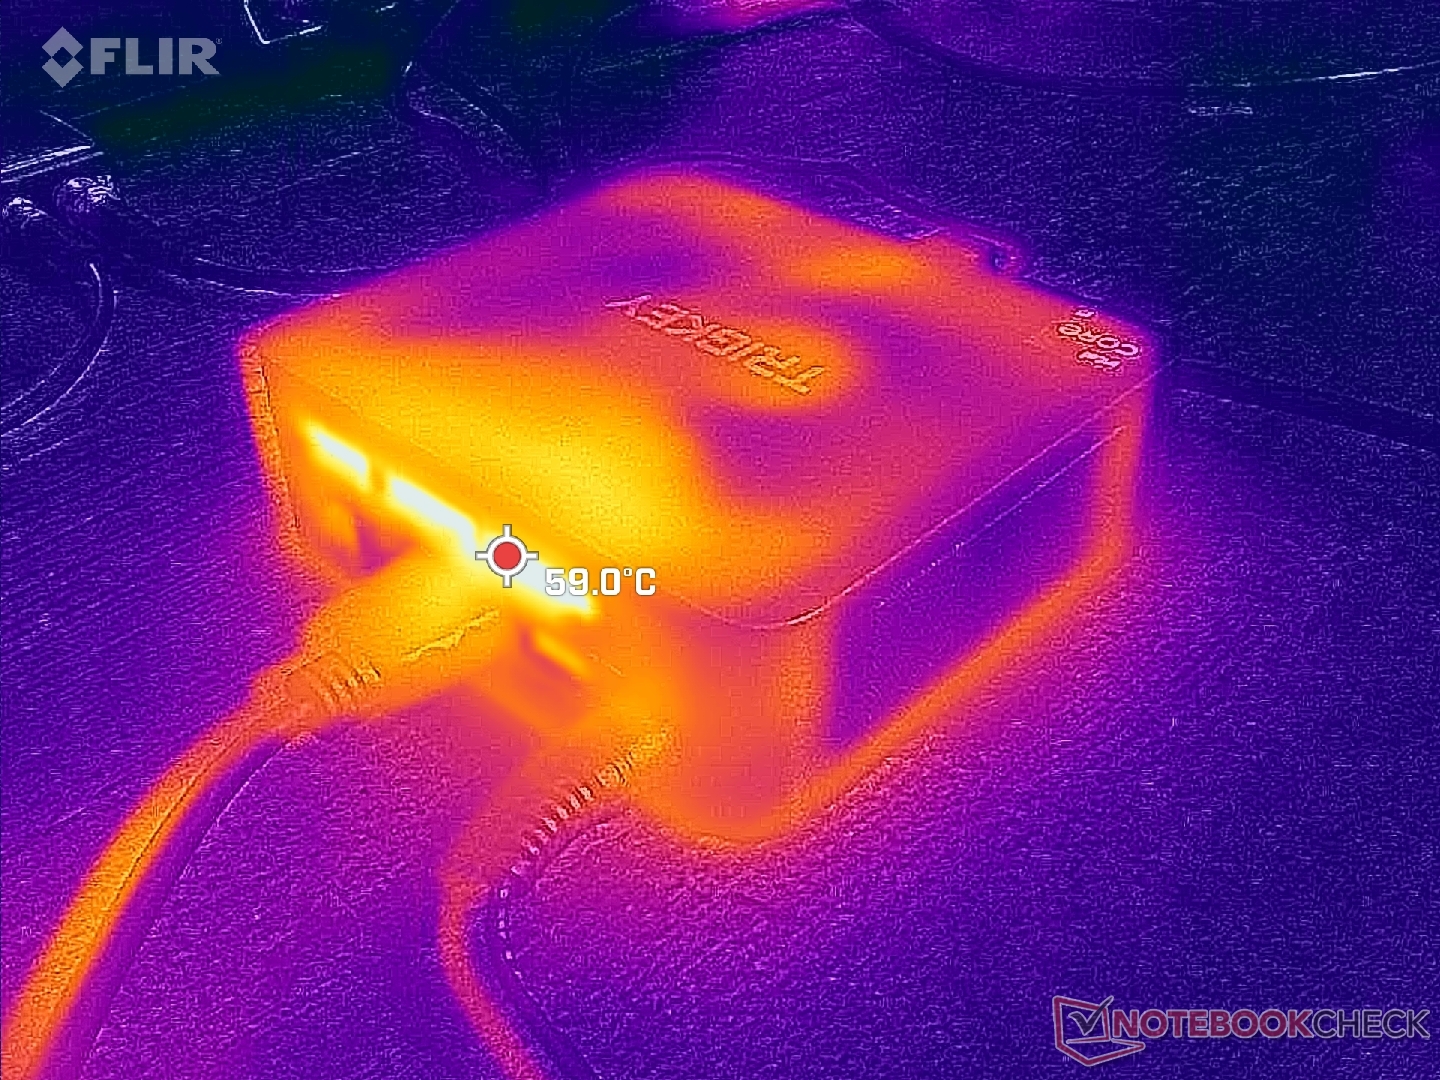
Temperature
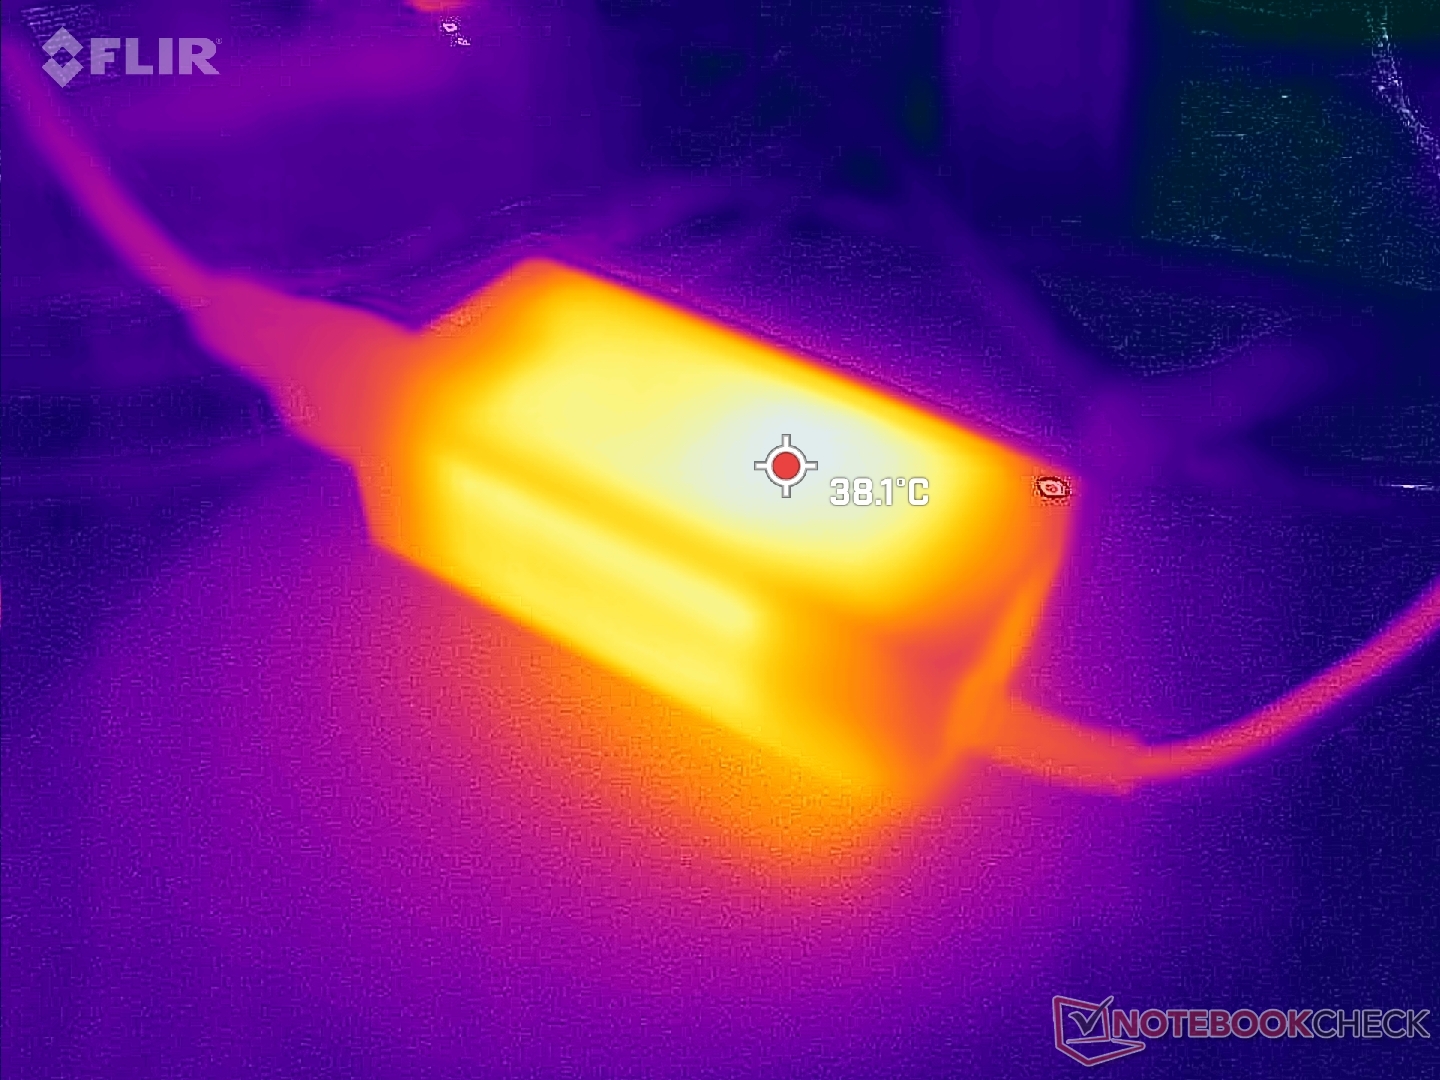
Surface temperatures are warmest along the rear where hot air exits. Cool air enters from the sides of the chassis.
Stress Test
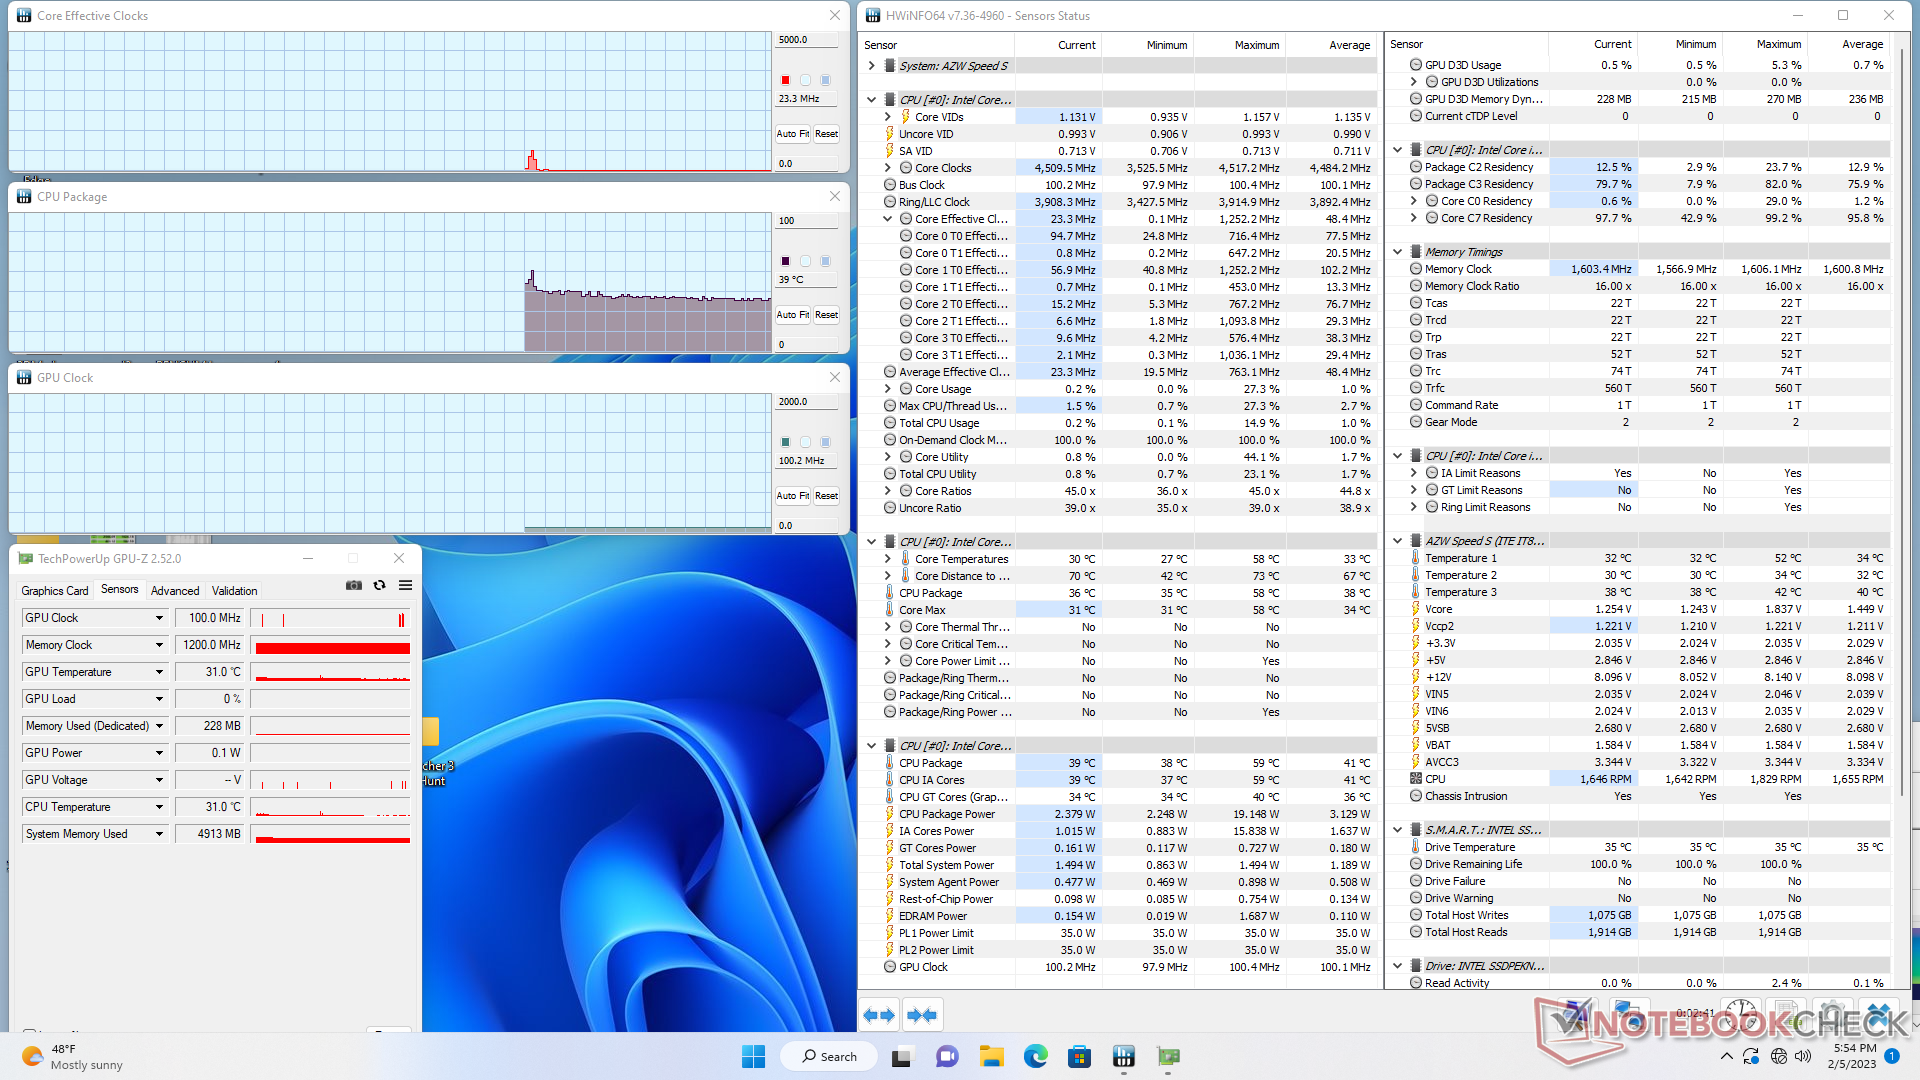
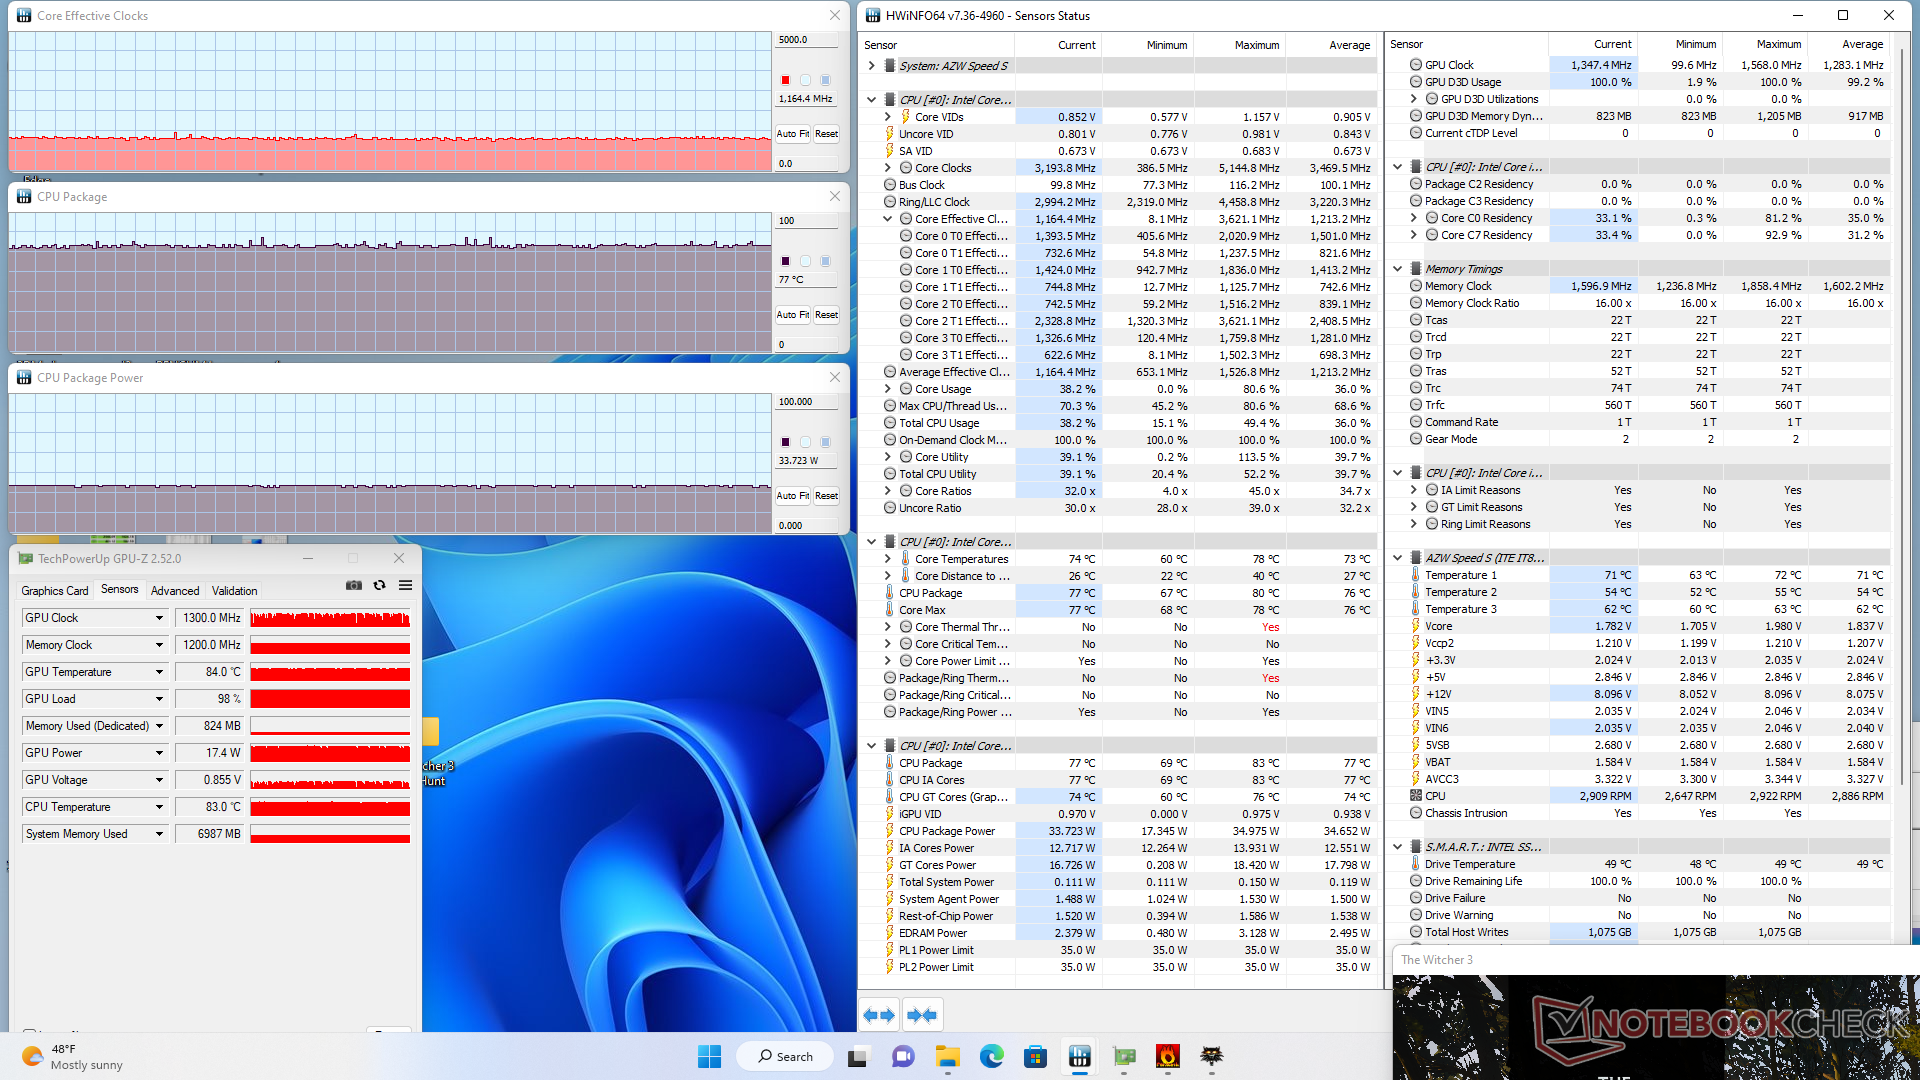
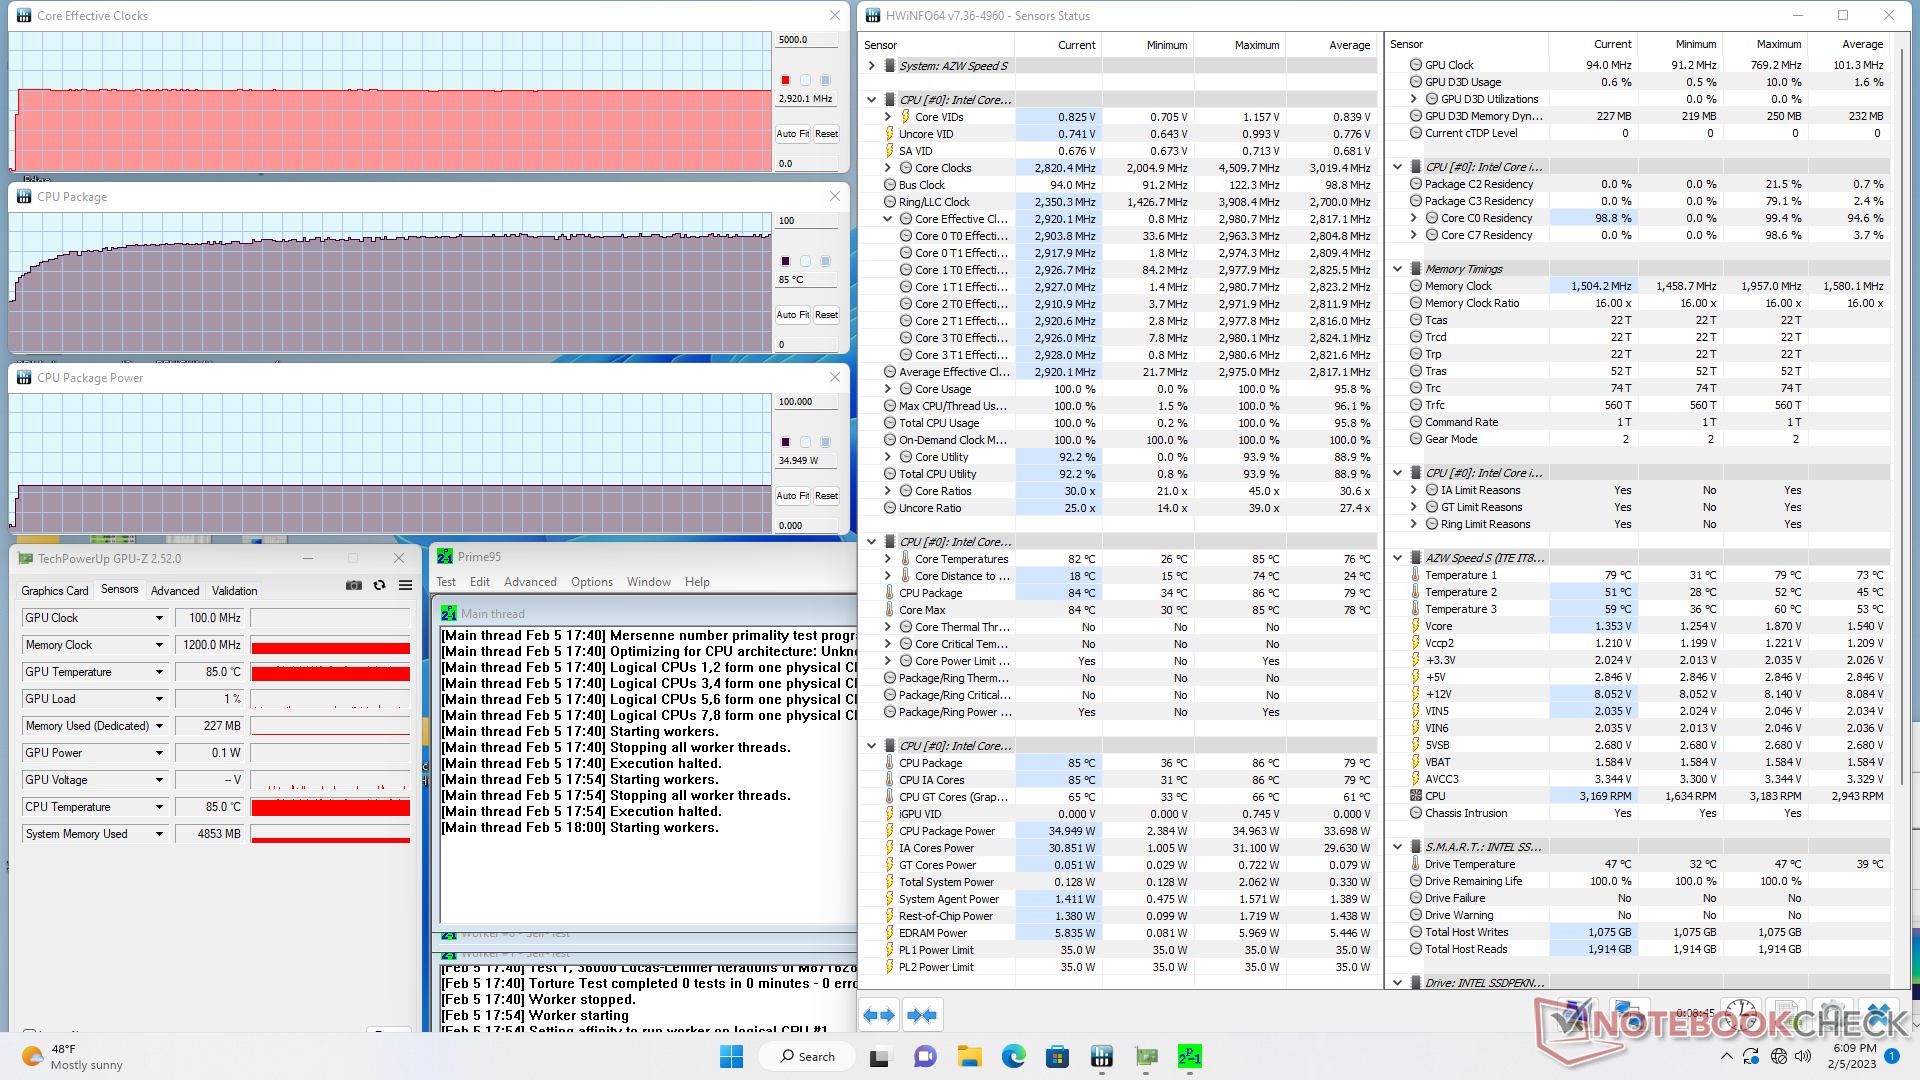
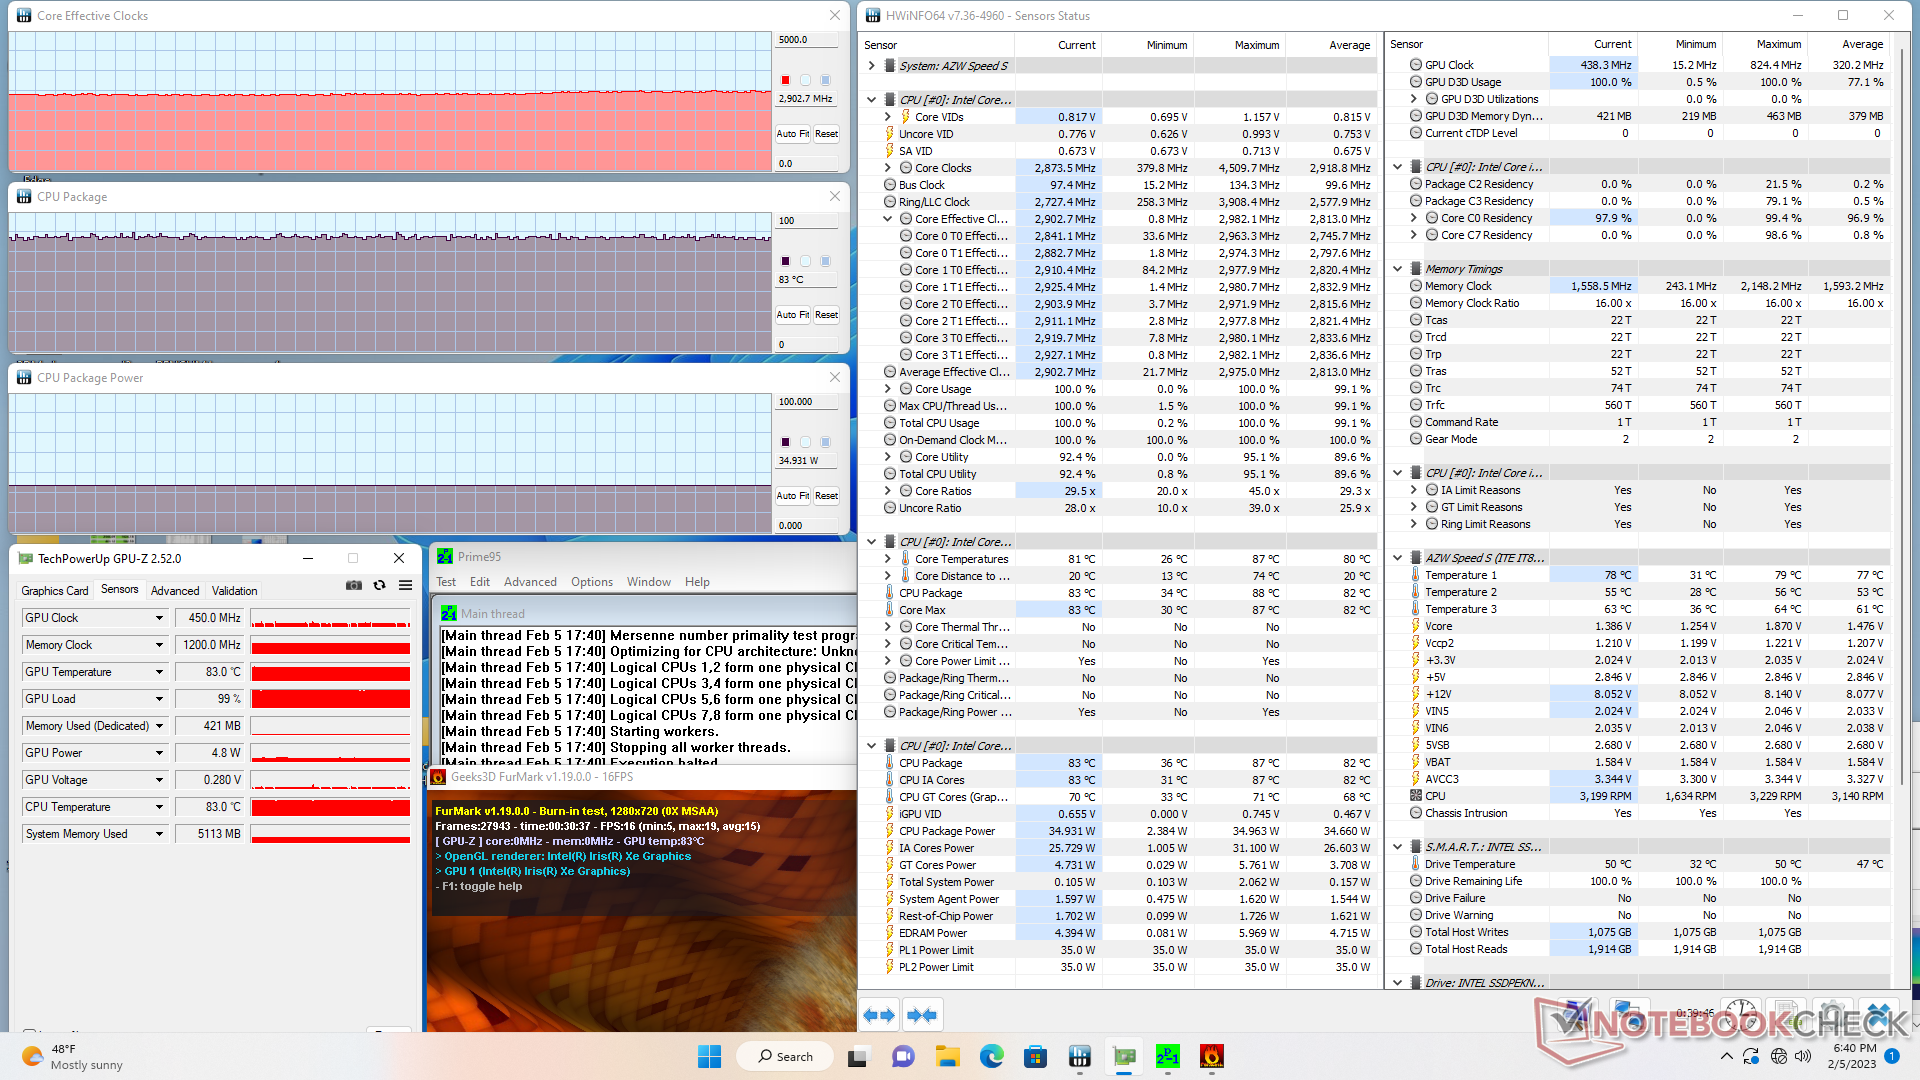
| CPU Clock (GHz) | GPU Clock (MHz) | Average CPU Temperature (°C) | |
| System Idle | -- | -- | 39 |
| Prime95 Stress | 2.9 | -- | 86 |
| Prime95+FurMark Stress | 2.9 | 438 | 83 |
| Witcher 3 Stress | 1.2 | 1347 | 77 |
Energy Management
Power Consumption
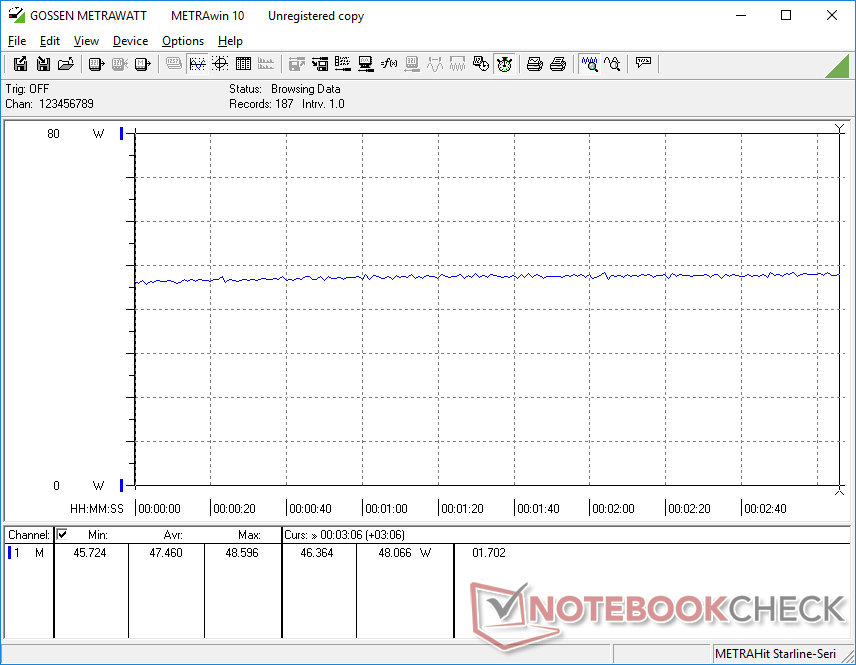

| Off / Standby | |
| Idle | |
| Load |
|
Key:
min: | |
| Trigkey Speed S i5-11320H, Iris Xe G7 96EUs, Intel SSD 670p SSDPEKNU512GZ, , x, | Trigkey S3 R5 3550H, Vega 8, Kingston NV1 SNVS/500GCN, , x, | Beelink SEi12 Core i5-1235U i5-1235U, Iris Xe G7 80EUs, Kingston NV1 SNVS/500GCN, , x, | Beelink SER Pro Ryzen 5 5600H R5 5600H, Vega 7, Kingston NV1 SNVS/500GCN, , x, | Intel NUC 12 Pro Kit NUC12WSKi7 i7-1260P, Iris Xe G7 96EUs, Transcend M.2 SSD 2200S TS512GMTE220S, , x, | BMAX B5 Pro G7H8 i5-8260U, UHD Graphics 620, , , x, | |
|---|---|---|---|---|---|---|
| Power Consumption | -61% | -82% | 4% | -59% | 15% | |
| Idle Minimum * (Watt) | 6.7 | 11.3 -69% | 15.8 -136% | 5.4 19% | 12.1 -81% | 6 10% |
| Idle Average * (Watt) | 8 | 21.8 -173% | 16.8 -110% | 8.2 -2% | 12.2 -53% | 6.2 22% |
| Idle Maximum * (Watt) | 8.1 | 22.2 -174% | 17 -110% | 8.3 -2% | 12.3 -52% | 6.3 22% |
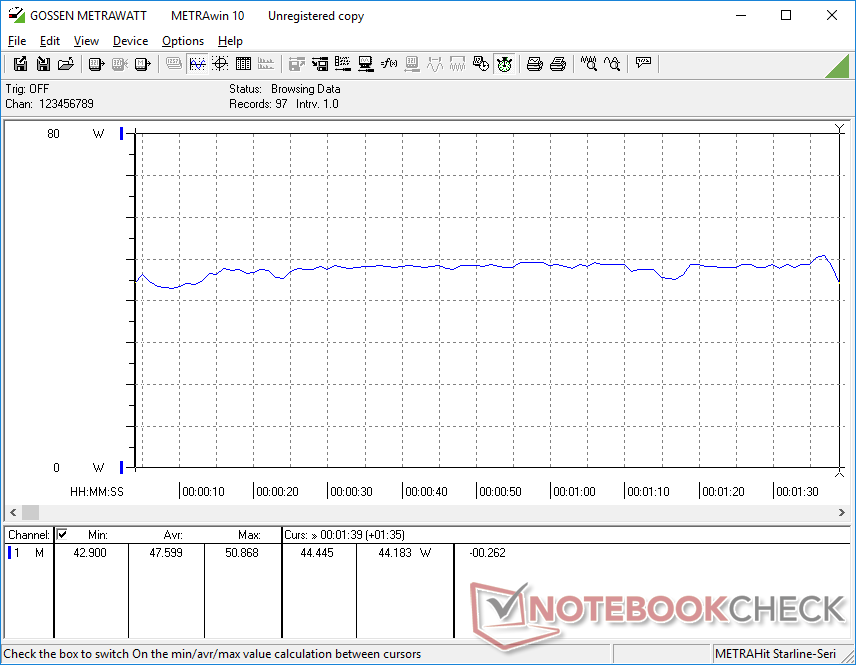
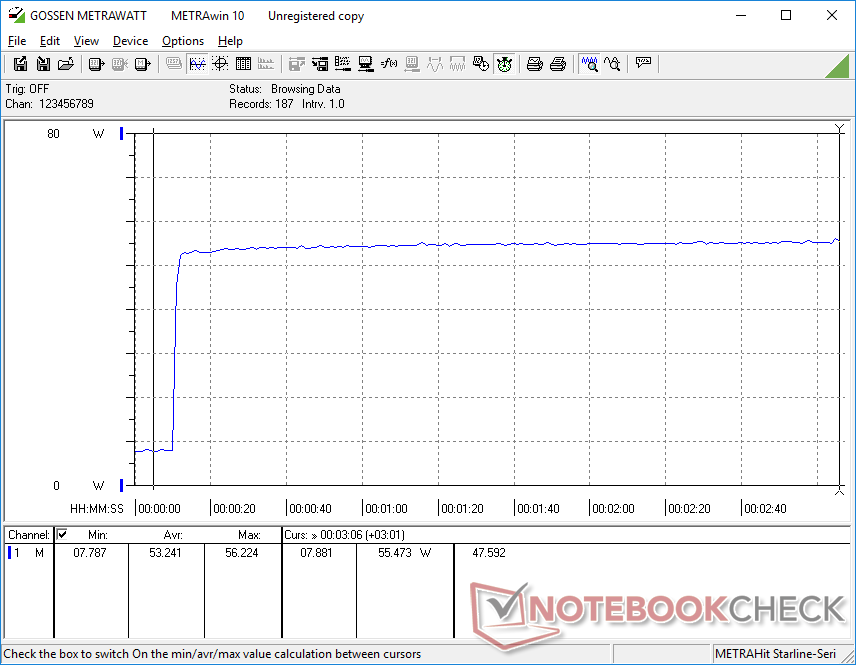
| Load Average * (Watt) | 47.6 | 39.7 17% | 54.4 -14% | 49.3 -4% | 64 -34% | 42.8 10% |
| Witcher 3 ultra * (Watt) | 47.5 | 37.5 21% | 50.7 -7% | 46.1 3% | 35 26% | |
| Load Maximum * (Watt) | 56.3 | 48.9 13% | 119.1 -112% | 50.2 11% | 98.8 -75% | 55.8 1% |
* ... smaller is better
Power Consumption Witcher 3 / Stresstest
Power Consumption external Monitor
Pros
Cons
Verdict
NUC alternatives have been steadily dropping in price without sacrificing performance by shipping with H-series CPUs. Prices are now so low that they are beginning to squeeze out slower Atom or Celeron mini PCs. For $400 USD, the Trigkey Speed S is ready-to-go and at half the price of many Intel NUCs equipped with similar RAM and storage configurations. It doesn't offer some advanced features like Thunderbolt, Wi-Fi 6E, or 2.5 Gbit Ethernet, but many HTPC users are unlikely to mind when it comes to 1080p or 4K video streaming.
The Trigkey Speed S is compelling on every front when compared to other mini PCs in the same price range.
When compared to the Trigkey S3, the Speed S offers 70 to 120 percent faster graphics performance and 50 to 60 percent faster multi-thread CPU performance. It consumes a bit more power in the process when under load, but both performance-per-watt and performance-per-dollar remain high. We recommend checking for any electronic noise or coil whine upon receipt just in case.
Price and Availability
The Trigkey Speed S as reviewed is now available on Amazon for $399 USD.
Transparency
The selection of devices to be reviewed is made by our editorial team. The test sample was provided to the author as a loan by the manufacturer or retailer for the purpose of this review. The lender had no influence on this review, nor did the manufacturer receive a copy of this review before publication. There was no obligation to publish this review. As an independent media company, Notebookcheck is not subjected to the authority of manufacturers, retailers or publishers.
This is how Notebookcheck is testing
Every year, Notebookcheck independently reviews hundreds of laptops and smartphones using standardized procedures to ensure that all results are comparable. We have continuously developed our test methods for around 20 years and set industry standards in the process. In our test labs, high-quality measuring equipment is utilized by experienced technicians and editors. These tests involve a multi-stage validation process. Our complex rating system is based on hundreds of well-founded measurements and benchmarks, which maintains objectivity. Further information on our test methods can be found here.
Price comparison
