Verdict — Just The Right Performance For Just The Right Price
Mini PCs with Core Ultra 9 or Ryzen AI 9 processors may be nice to have, but they often come with exorbitant markups and more performance than most users need. The GMK NucBox M8 dials it back to an older Zen 3+ processor to keep prices low while maintaining a decent level of performance fit for common office tasks. This balanced approach makes the NucBox M8 much more accessible and practical where budget can be a concern. Even the OcuLink port adds a layer of versatility not available on most other mini PCs in the same $300 price range.
Perhaps the most limiting aspects of the NucBox M8 are its graphics performance and lack of an integrated NPU. Such advanced features would require pricier CPUs as mentioned above on models like the Asus ExpertCenter PN54, MSI Cubi NUC AI+ 2MG, or even GMK's own EVO series. Core attributes are otherwise solid for the price including build quality, port options, and serviceability. Fan behavior and USB-C DP compatibility, however, could use some extra tuning.
Pros
Cons
Price and Availability
Amazon is now shipping the 1 TB GMK NucBox M8 for $390. Alternatively, the manufacturer is selling the 512 GB version directly for $360.
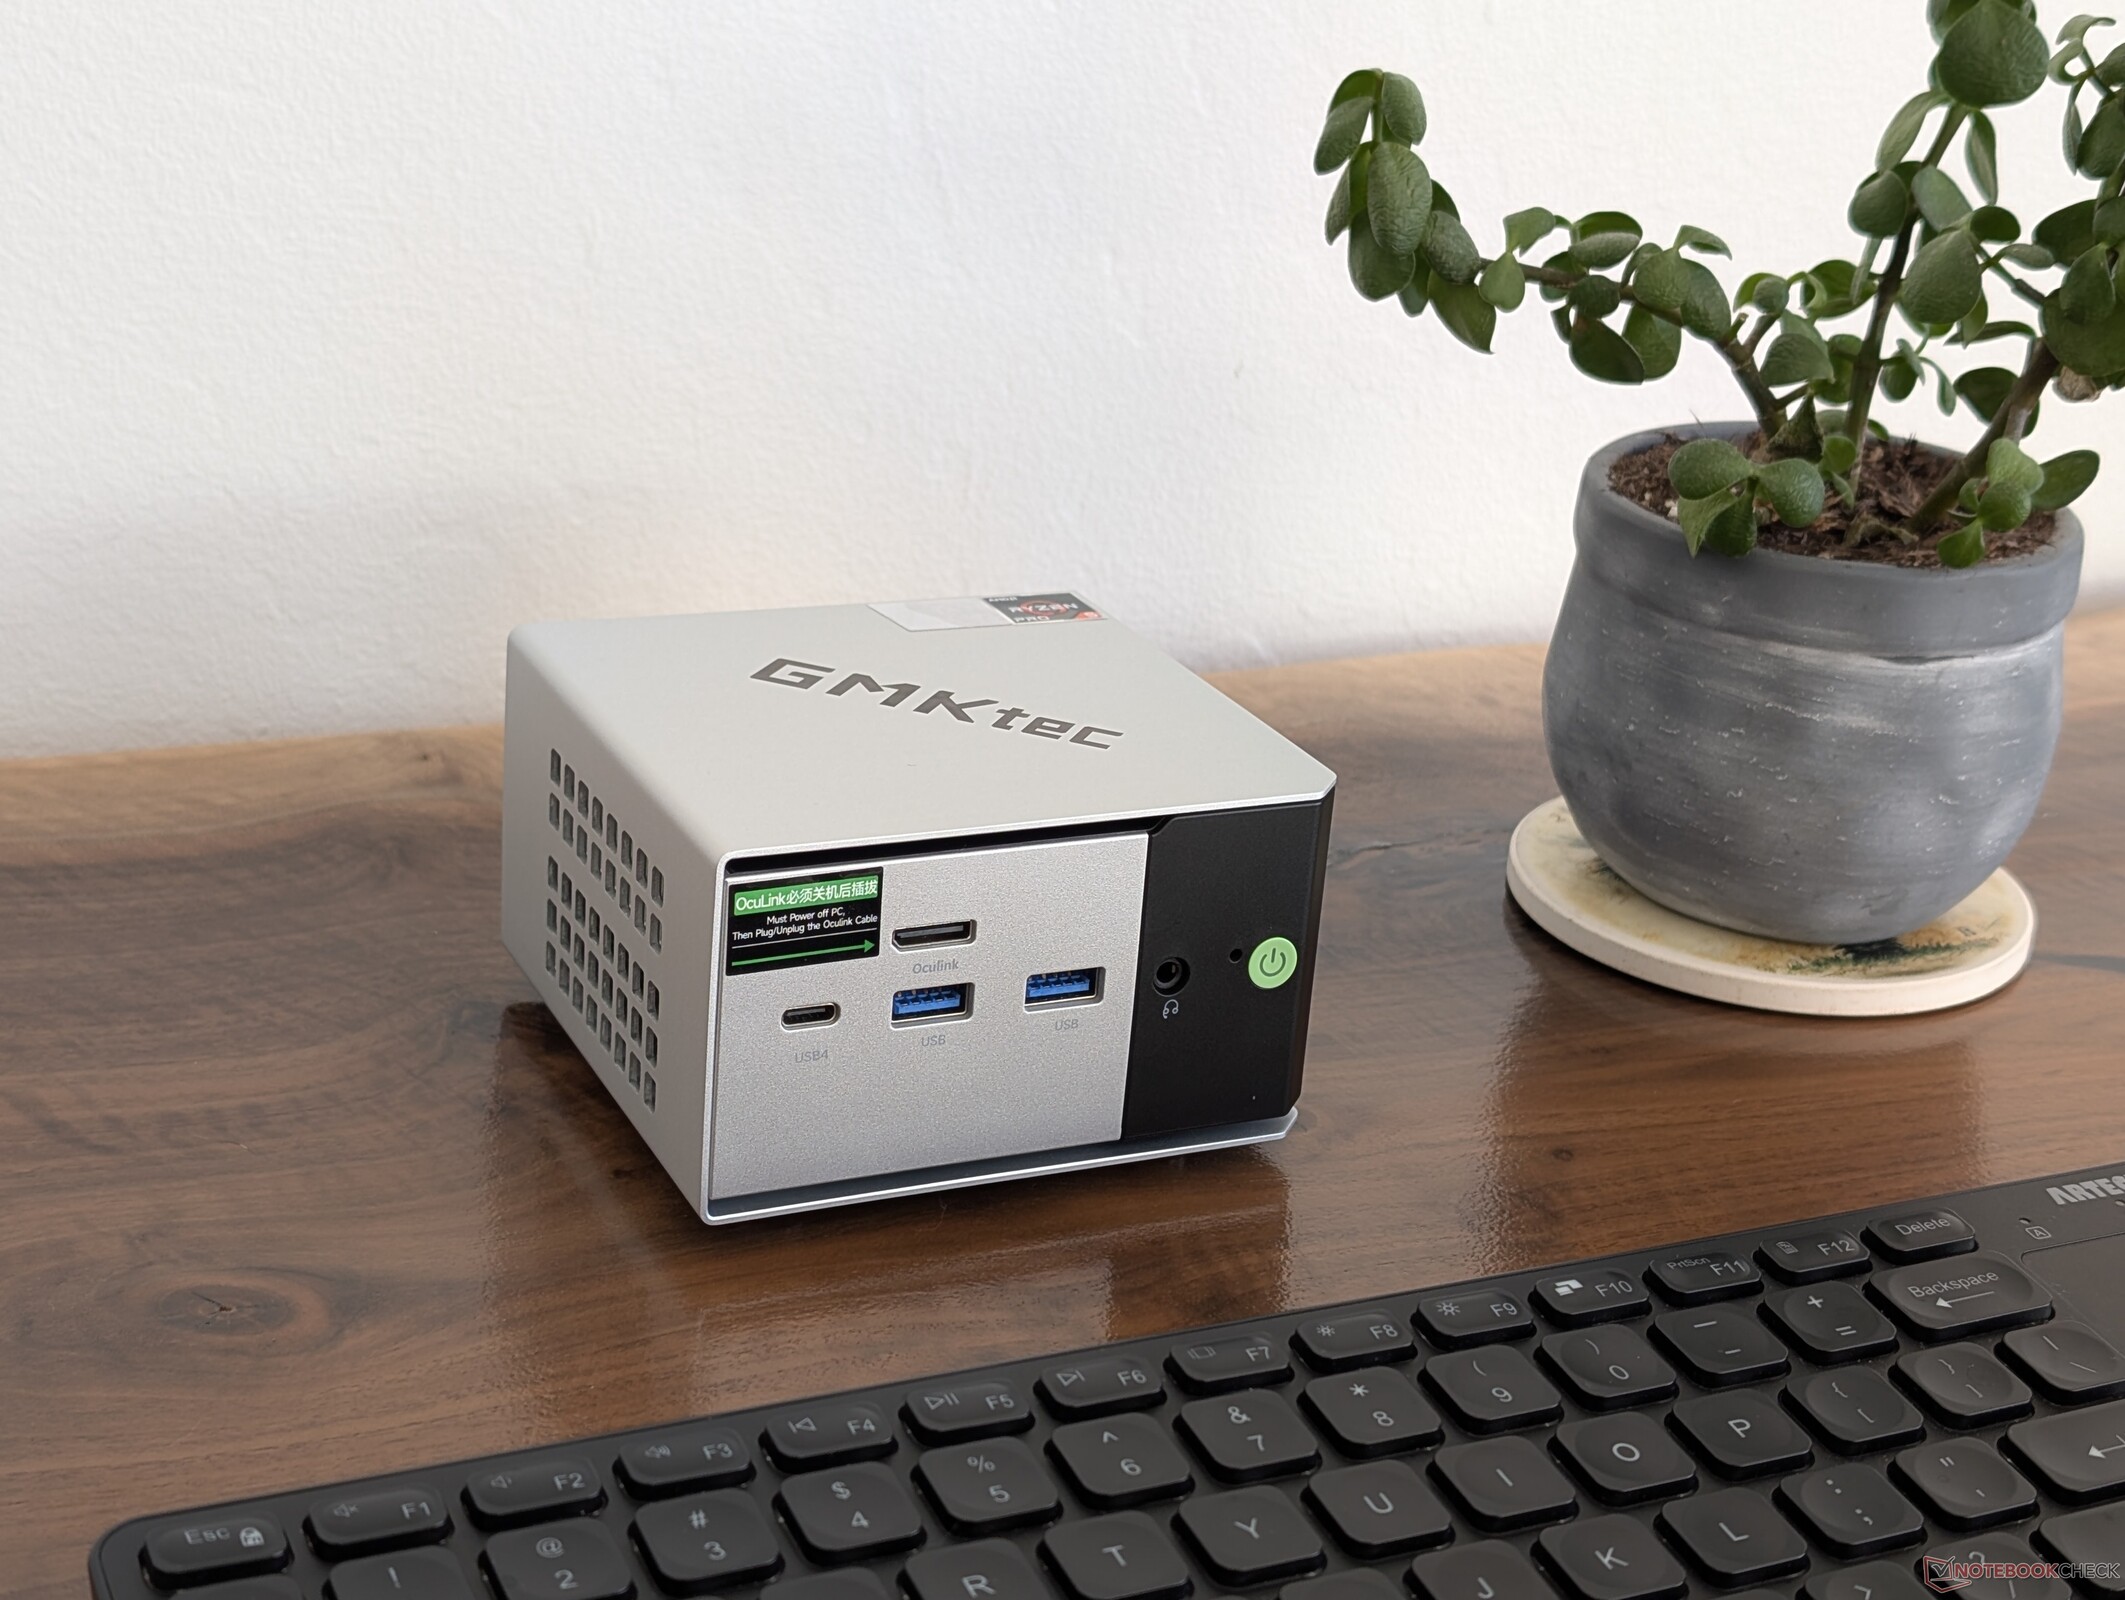
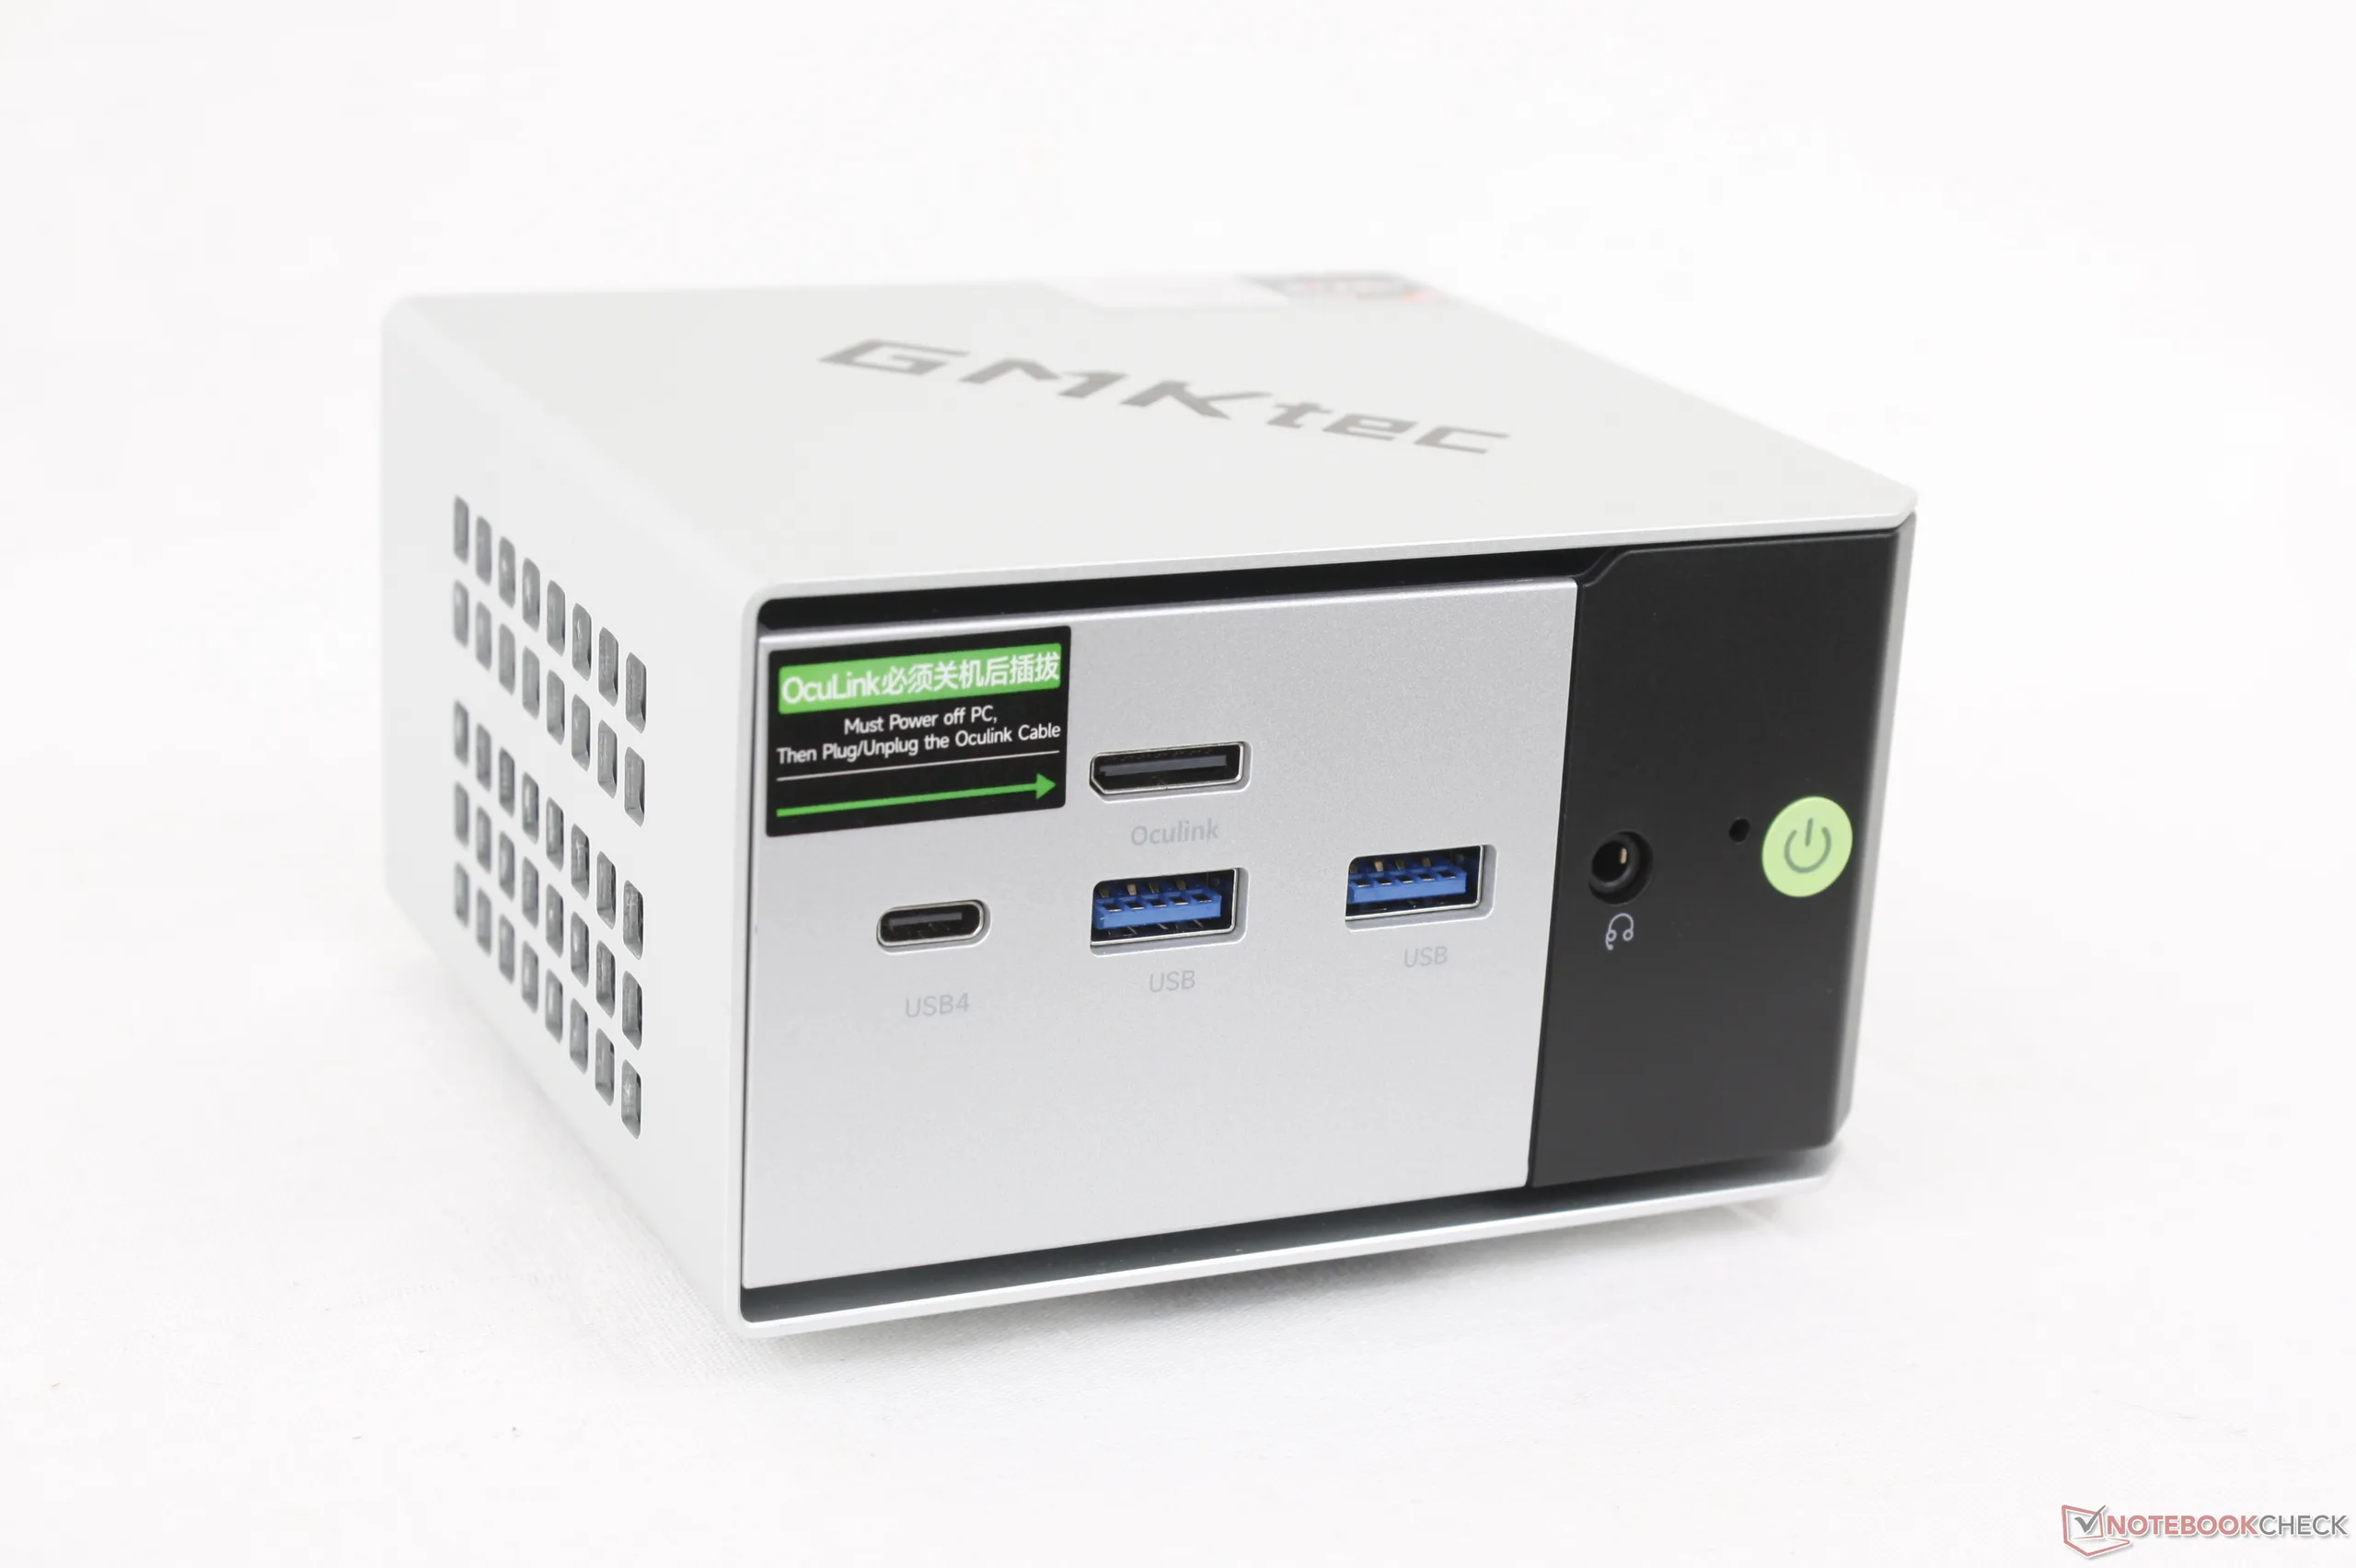
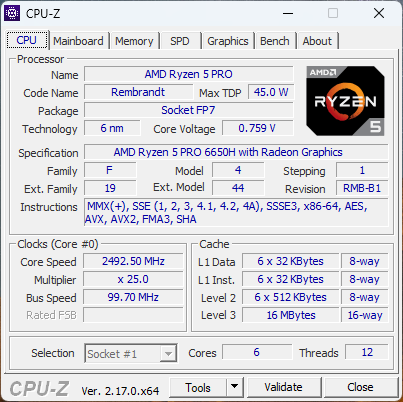
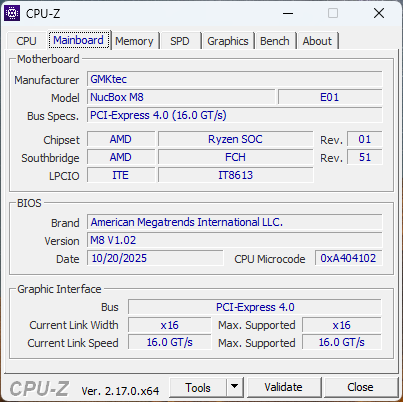
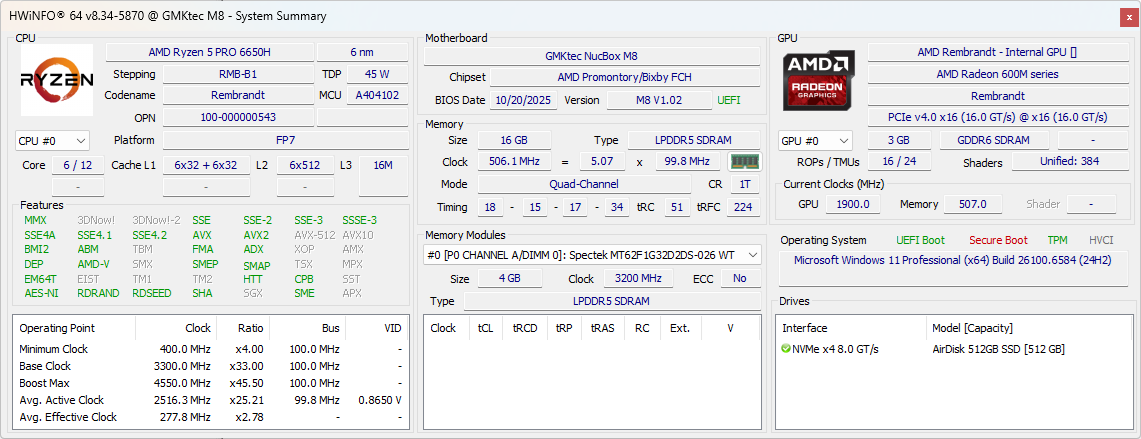
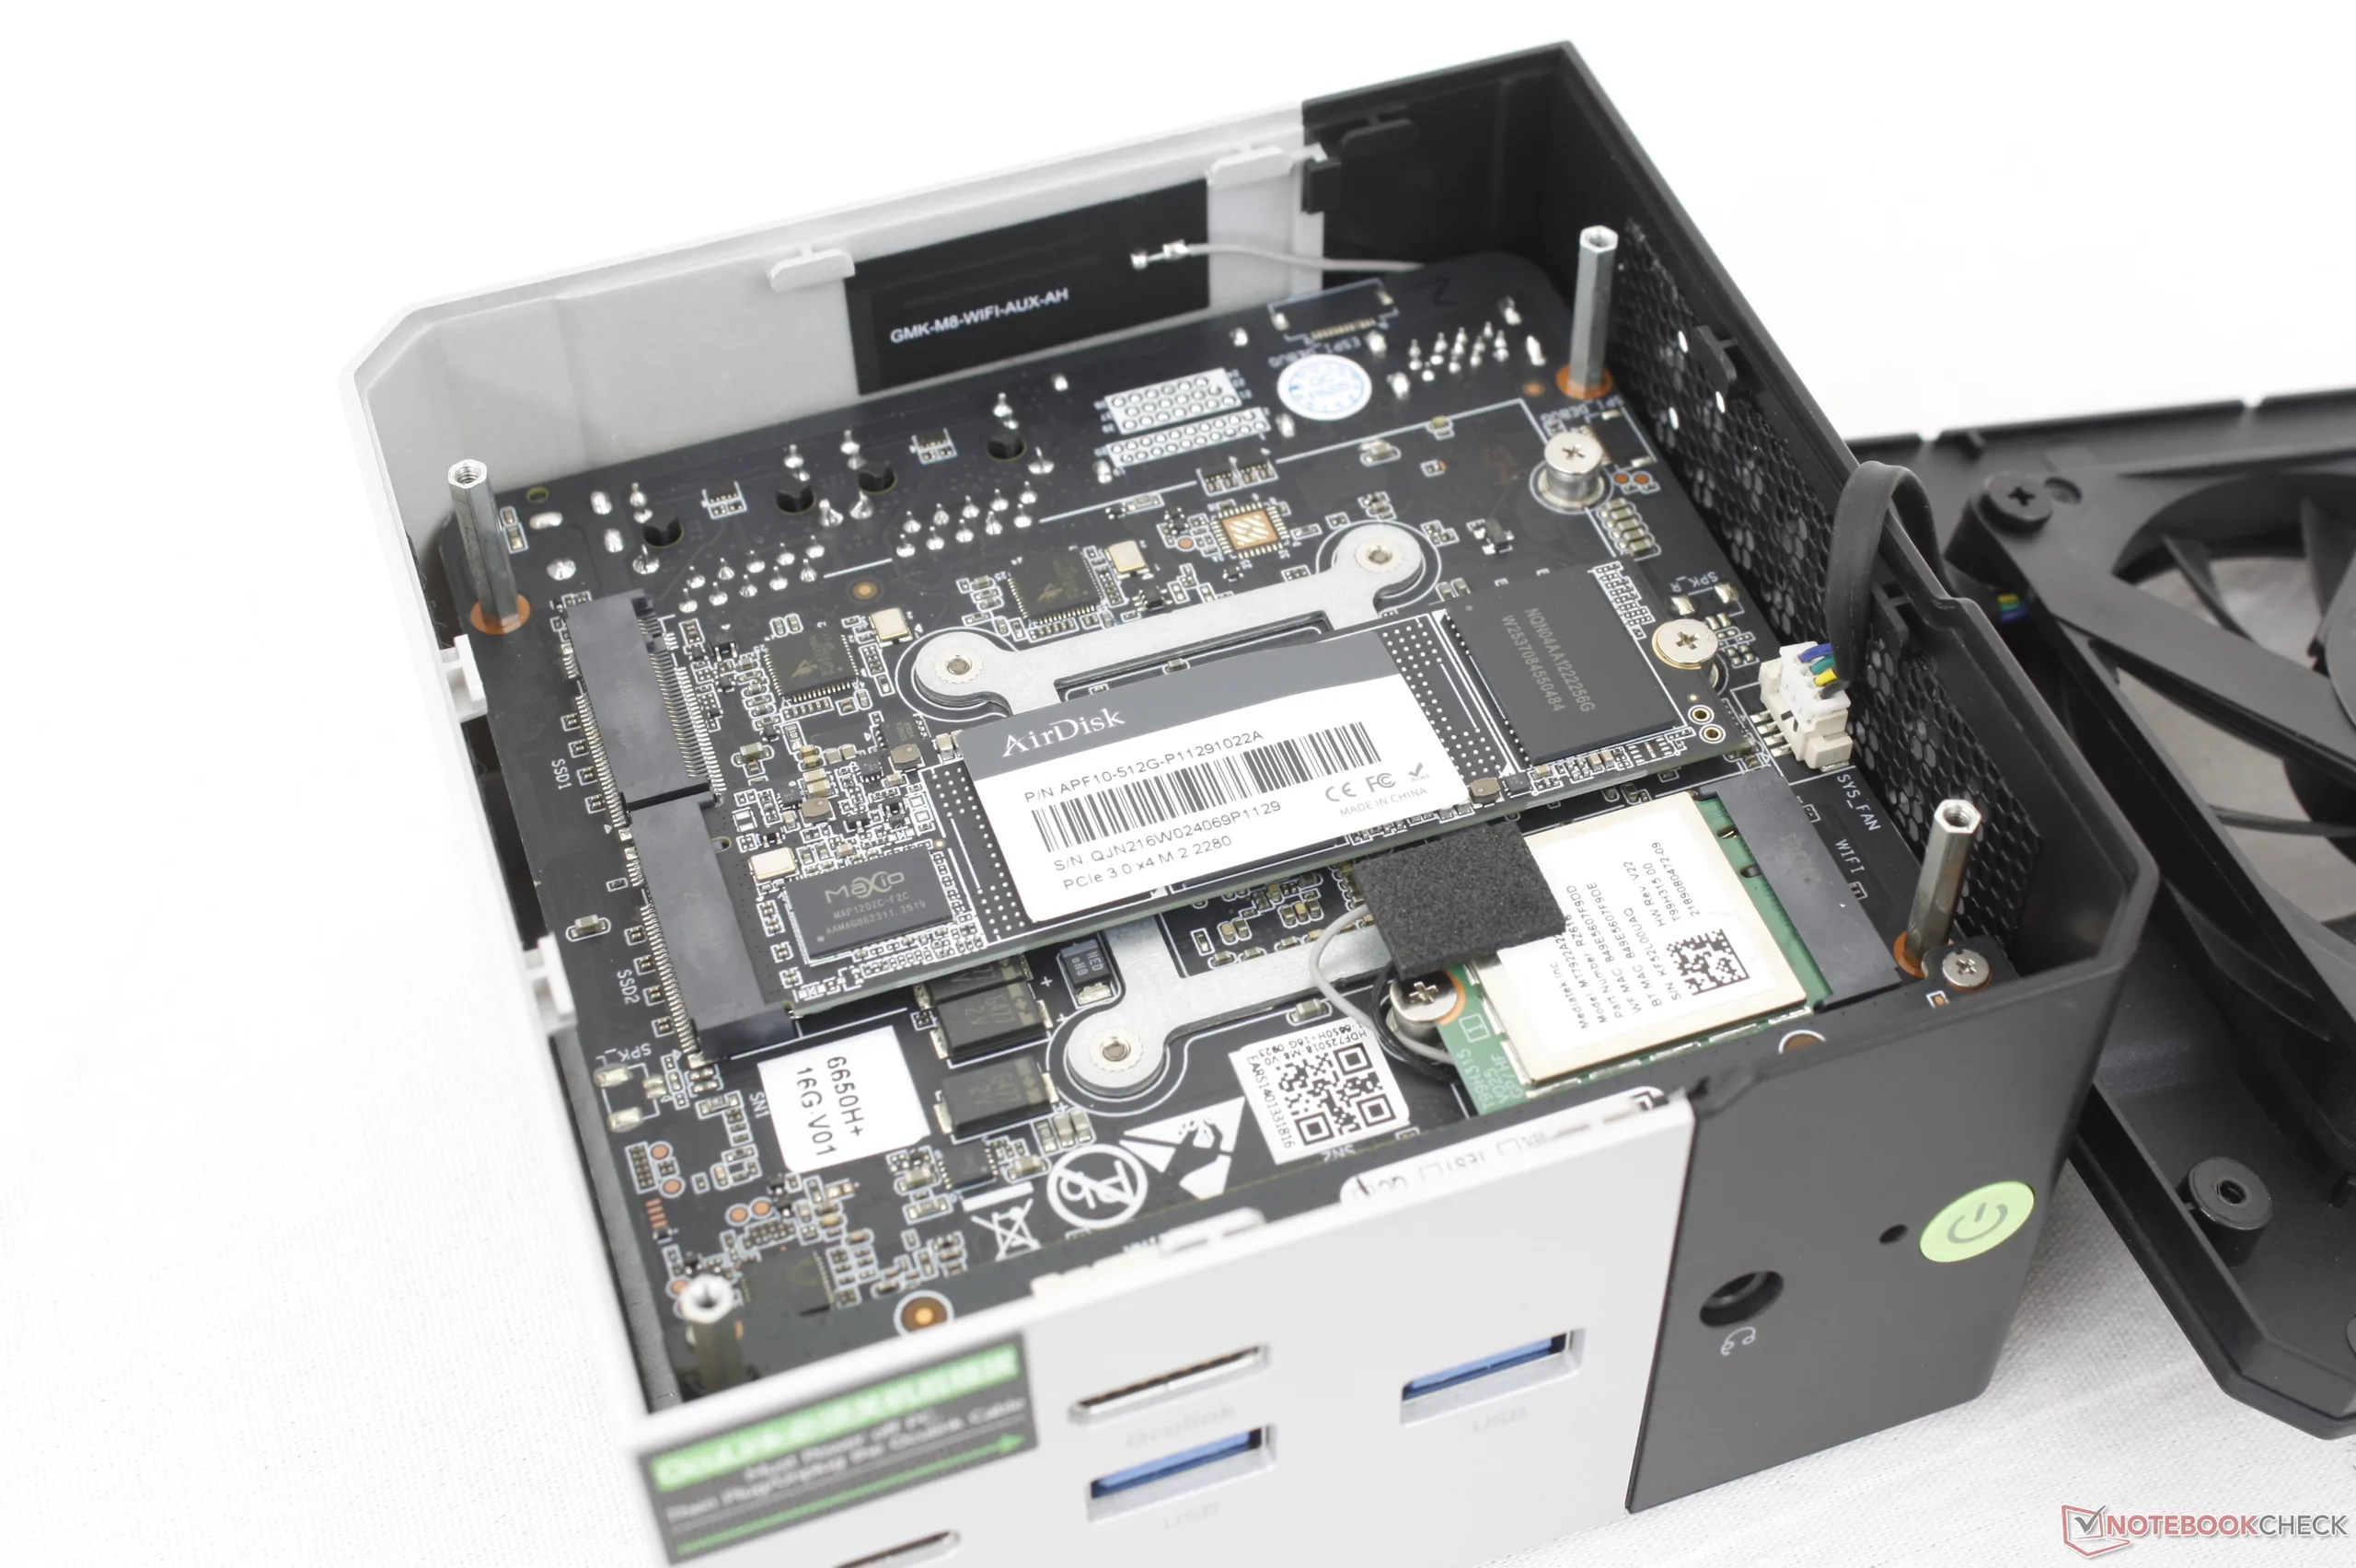
The GMKtec NucBox M8 mini PC targets offices and professional environments where inconspicuousness is preferred over raw performance. It sports an integrated OcuLink port for added versatility to set itself apart from most other mini PCs in the market. The M8 sports an older but reliable AMD Zen 3+ Ryzen 5 Pro 6650H CPU wrapped in a modern, updated chassis design akin to the pricier GMK EVO series.
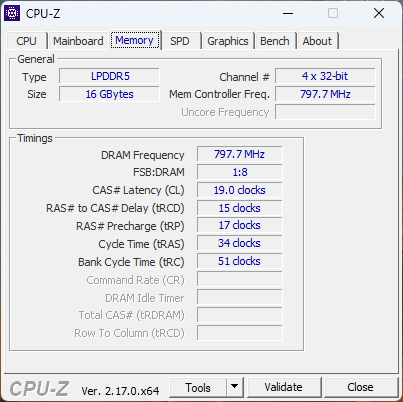
Our test unit ships with a 512 GB M.2 SSD and 16 GB of soldered LPDDR5-6400 RAM for approximately $360. A 1 TB configuration is also available, but the 16 GB of RAM remains constant.
Alternatives to the NucBox M8 include other low-profile business mini PCs like the MSI Cubi NUC AI+, Asus ExpertCenter PN54, or Asus NUC 15 Pro+.
More GMK reviews:
Specifications
Case
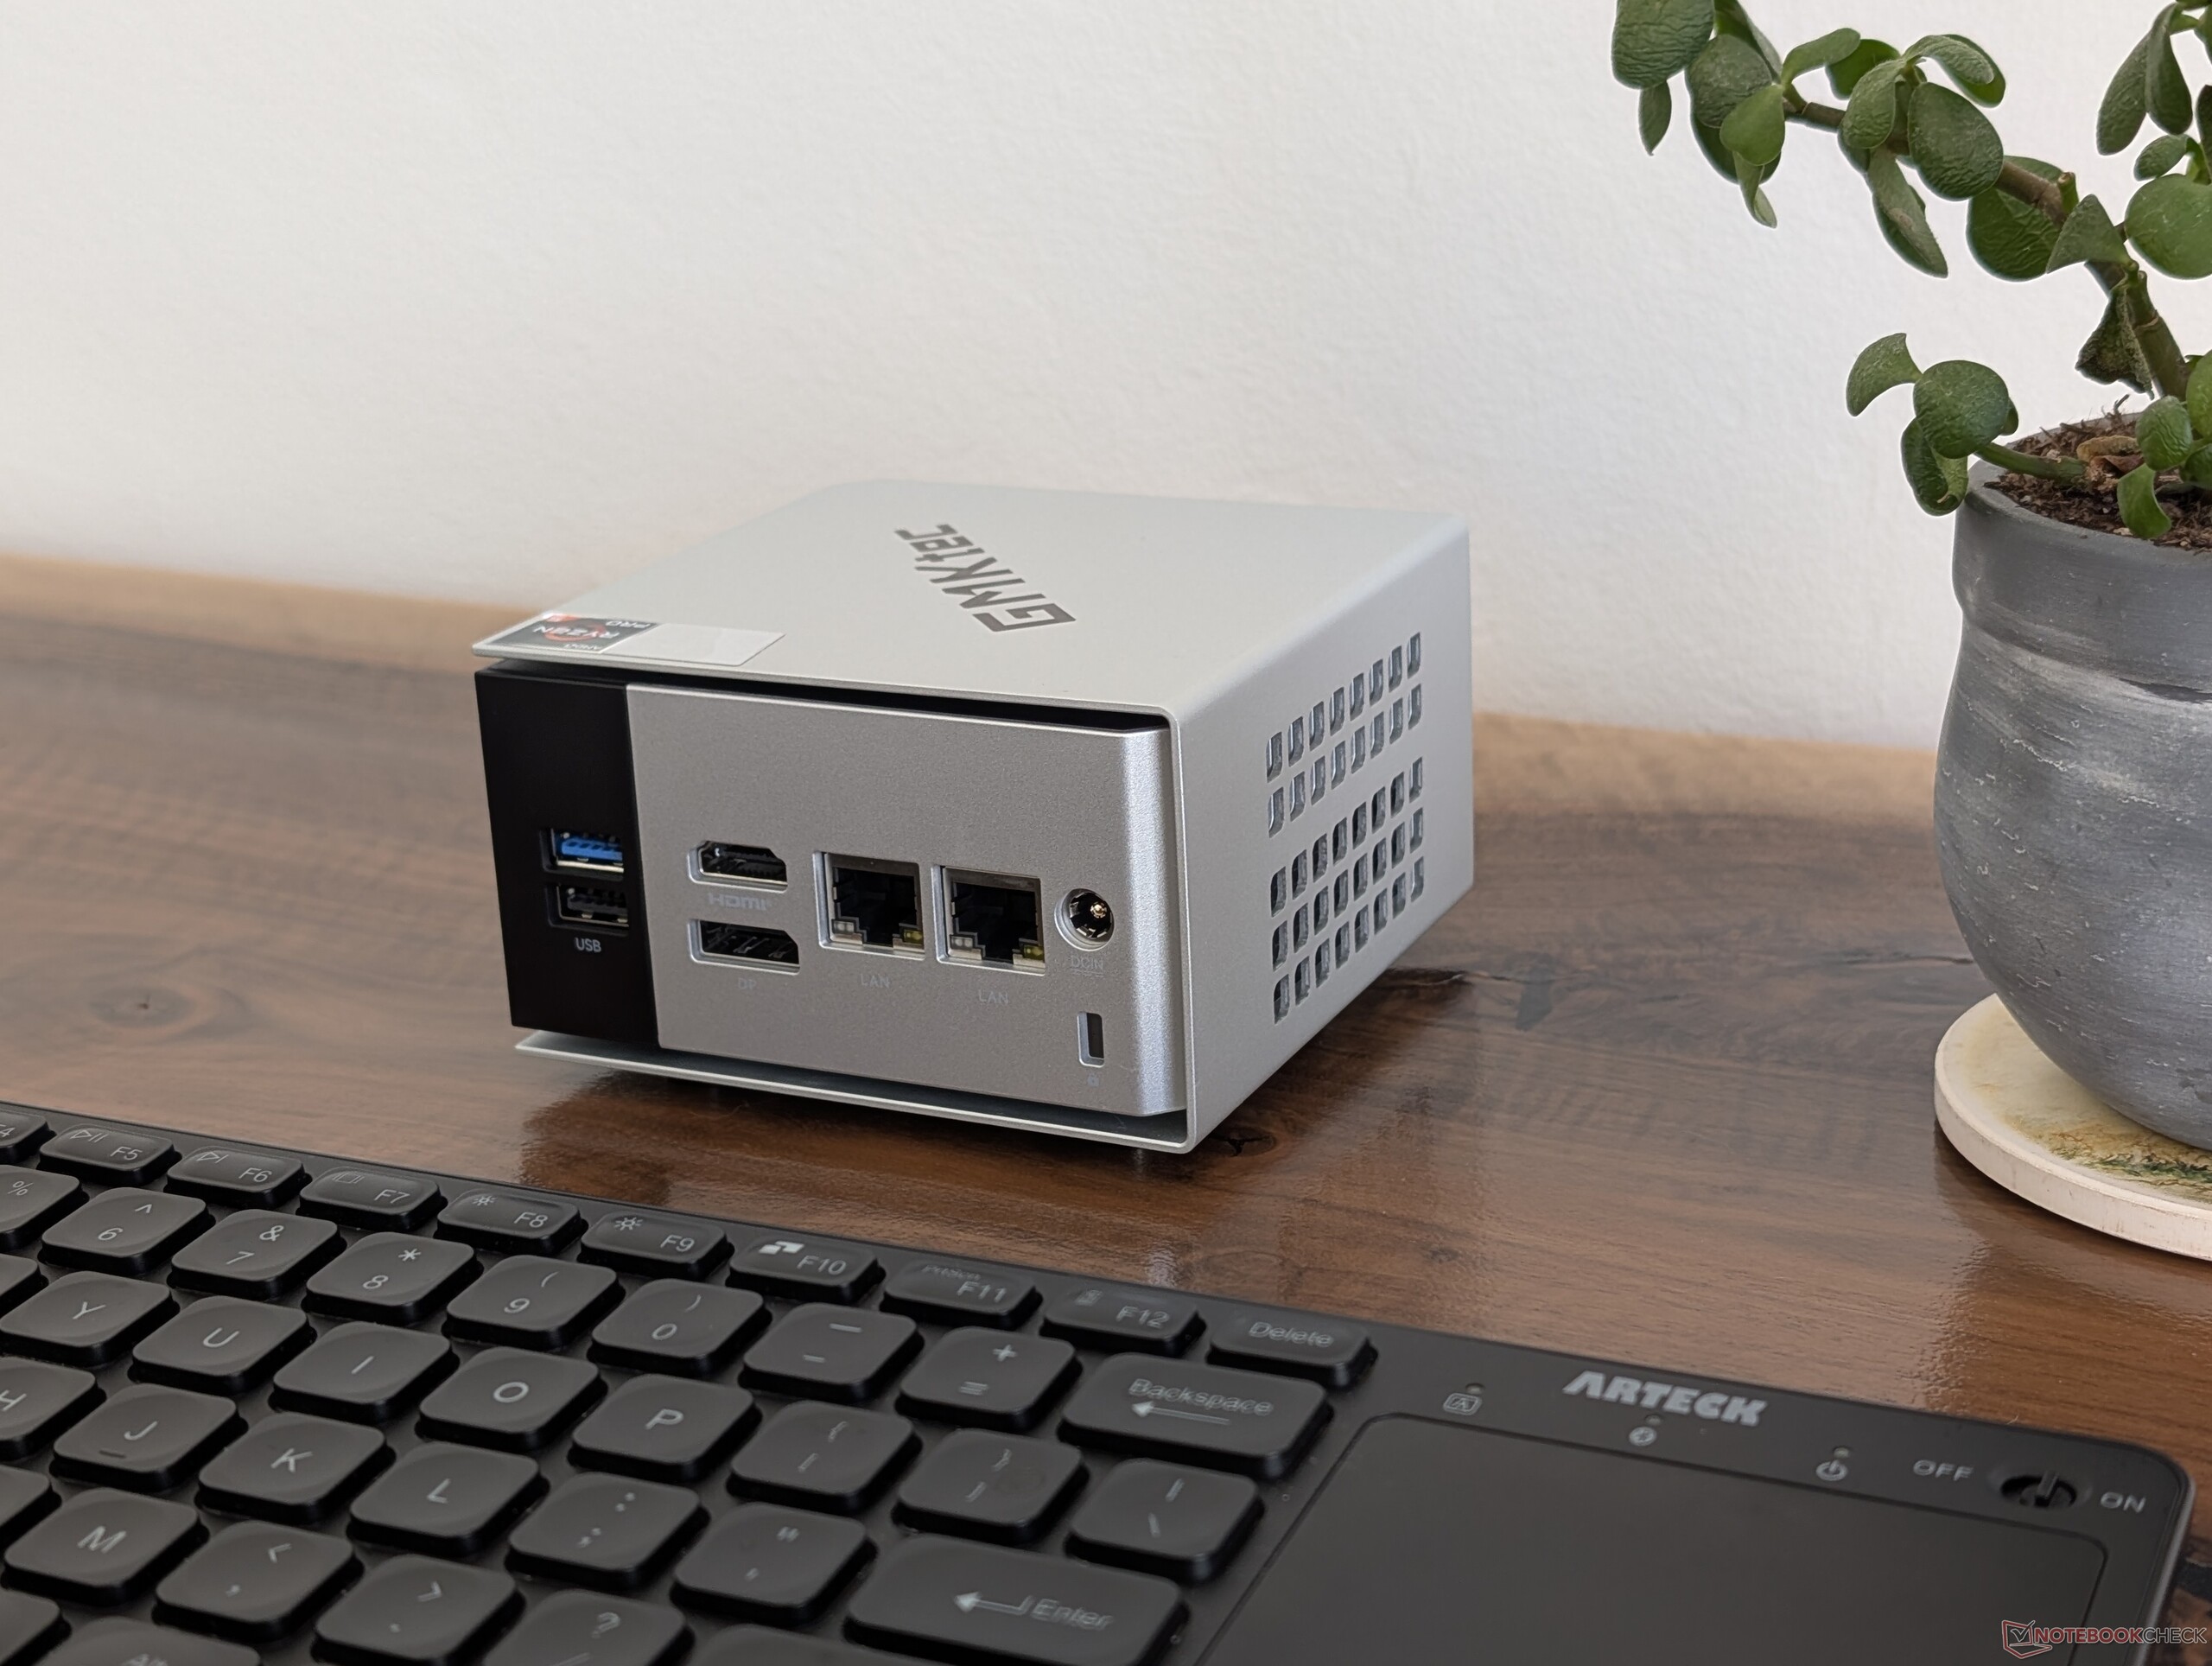
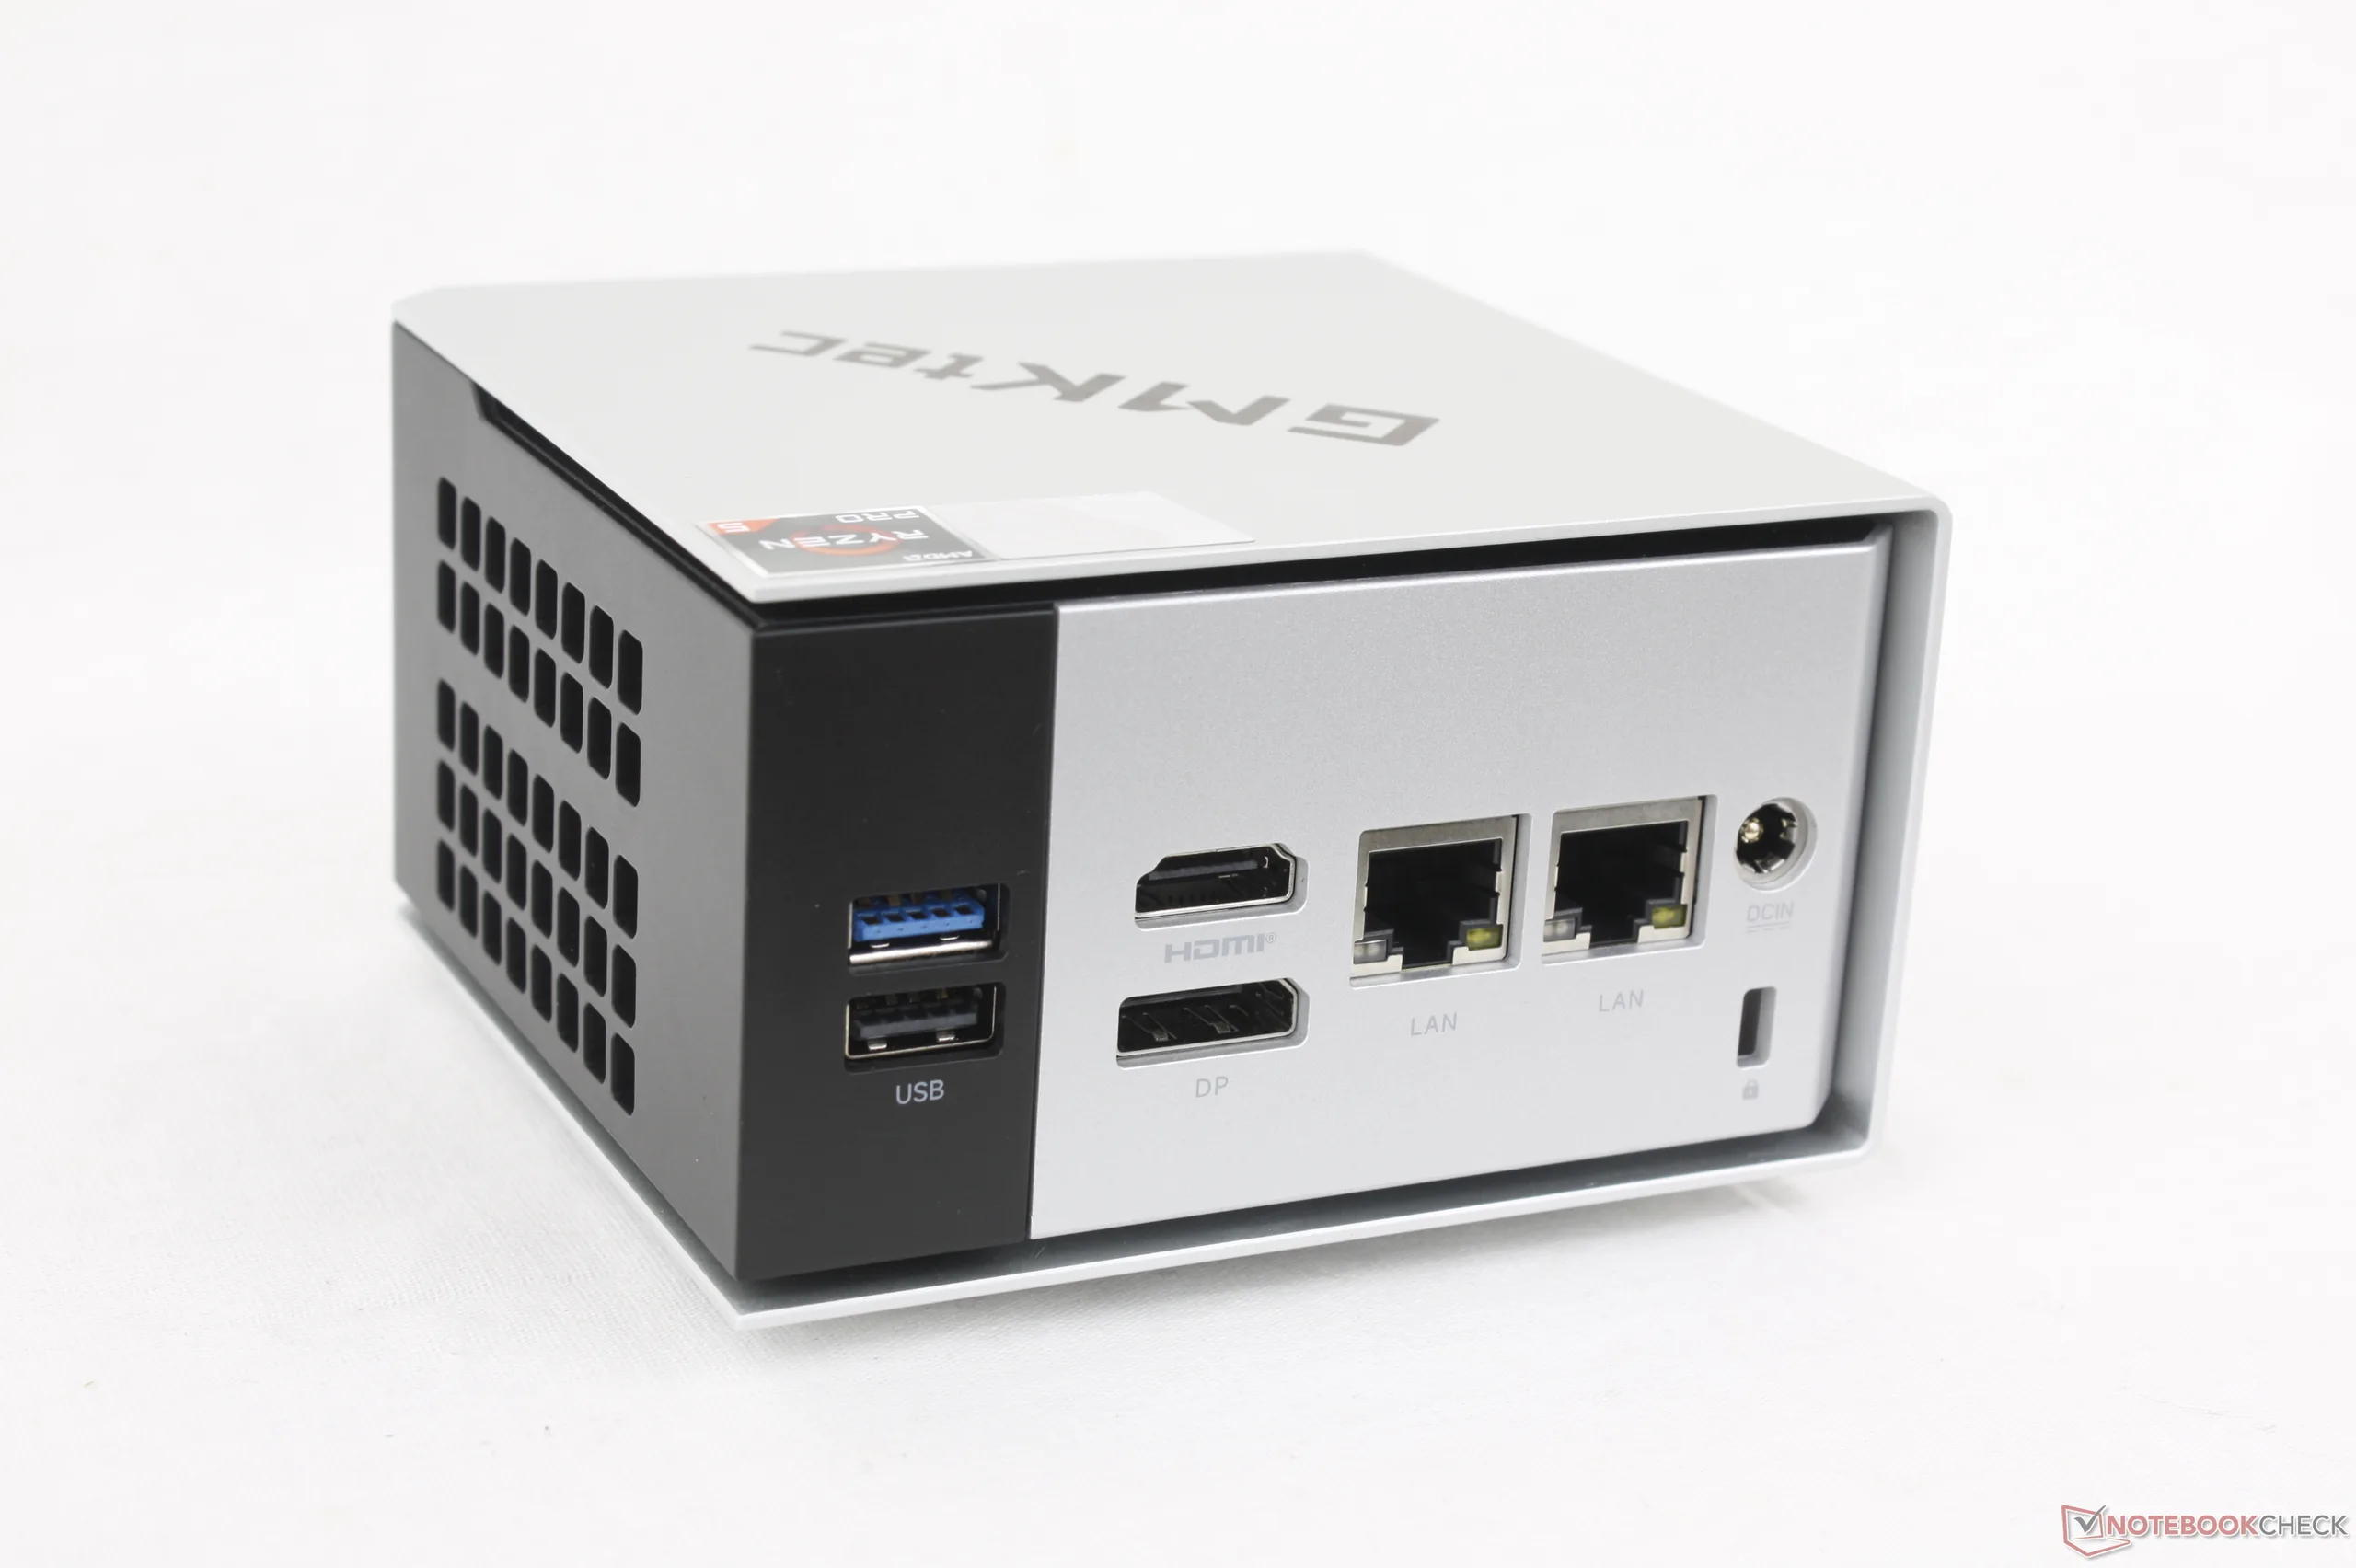
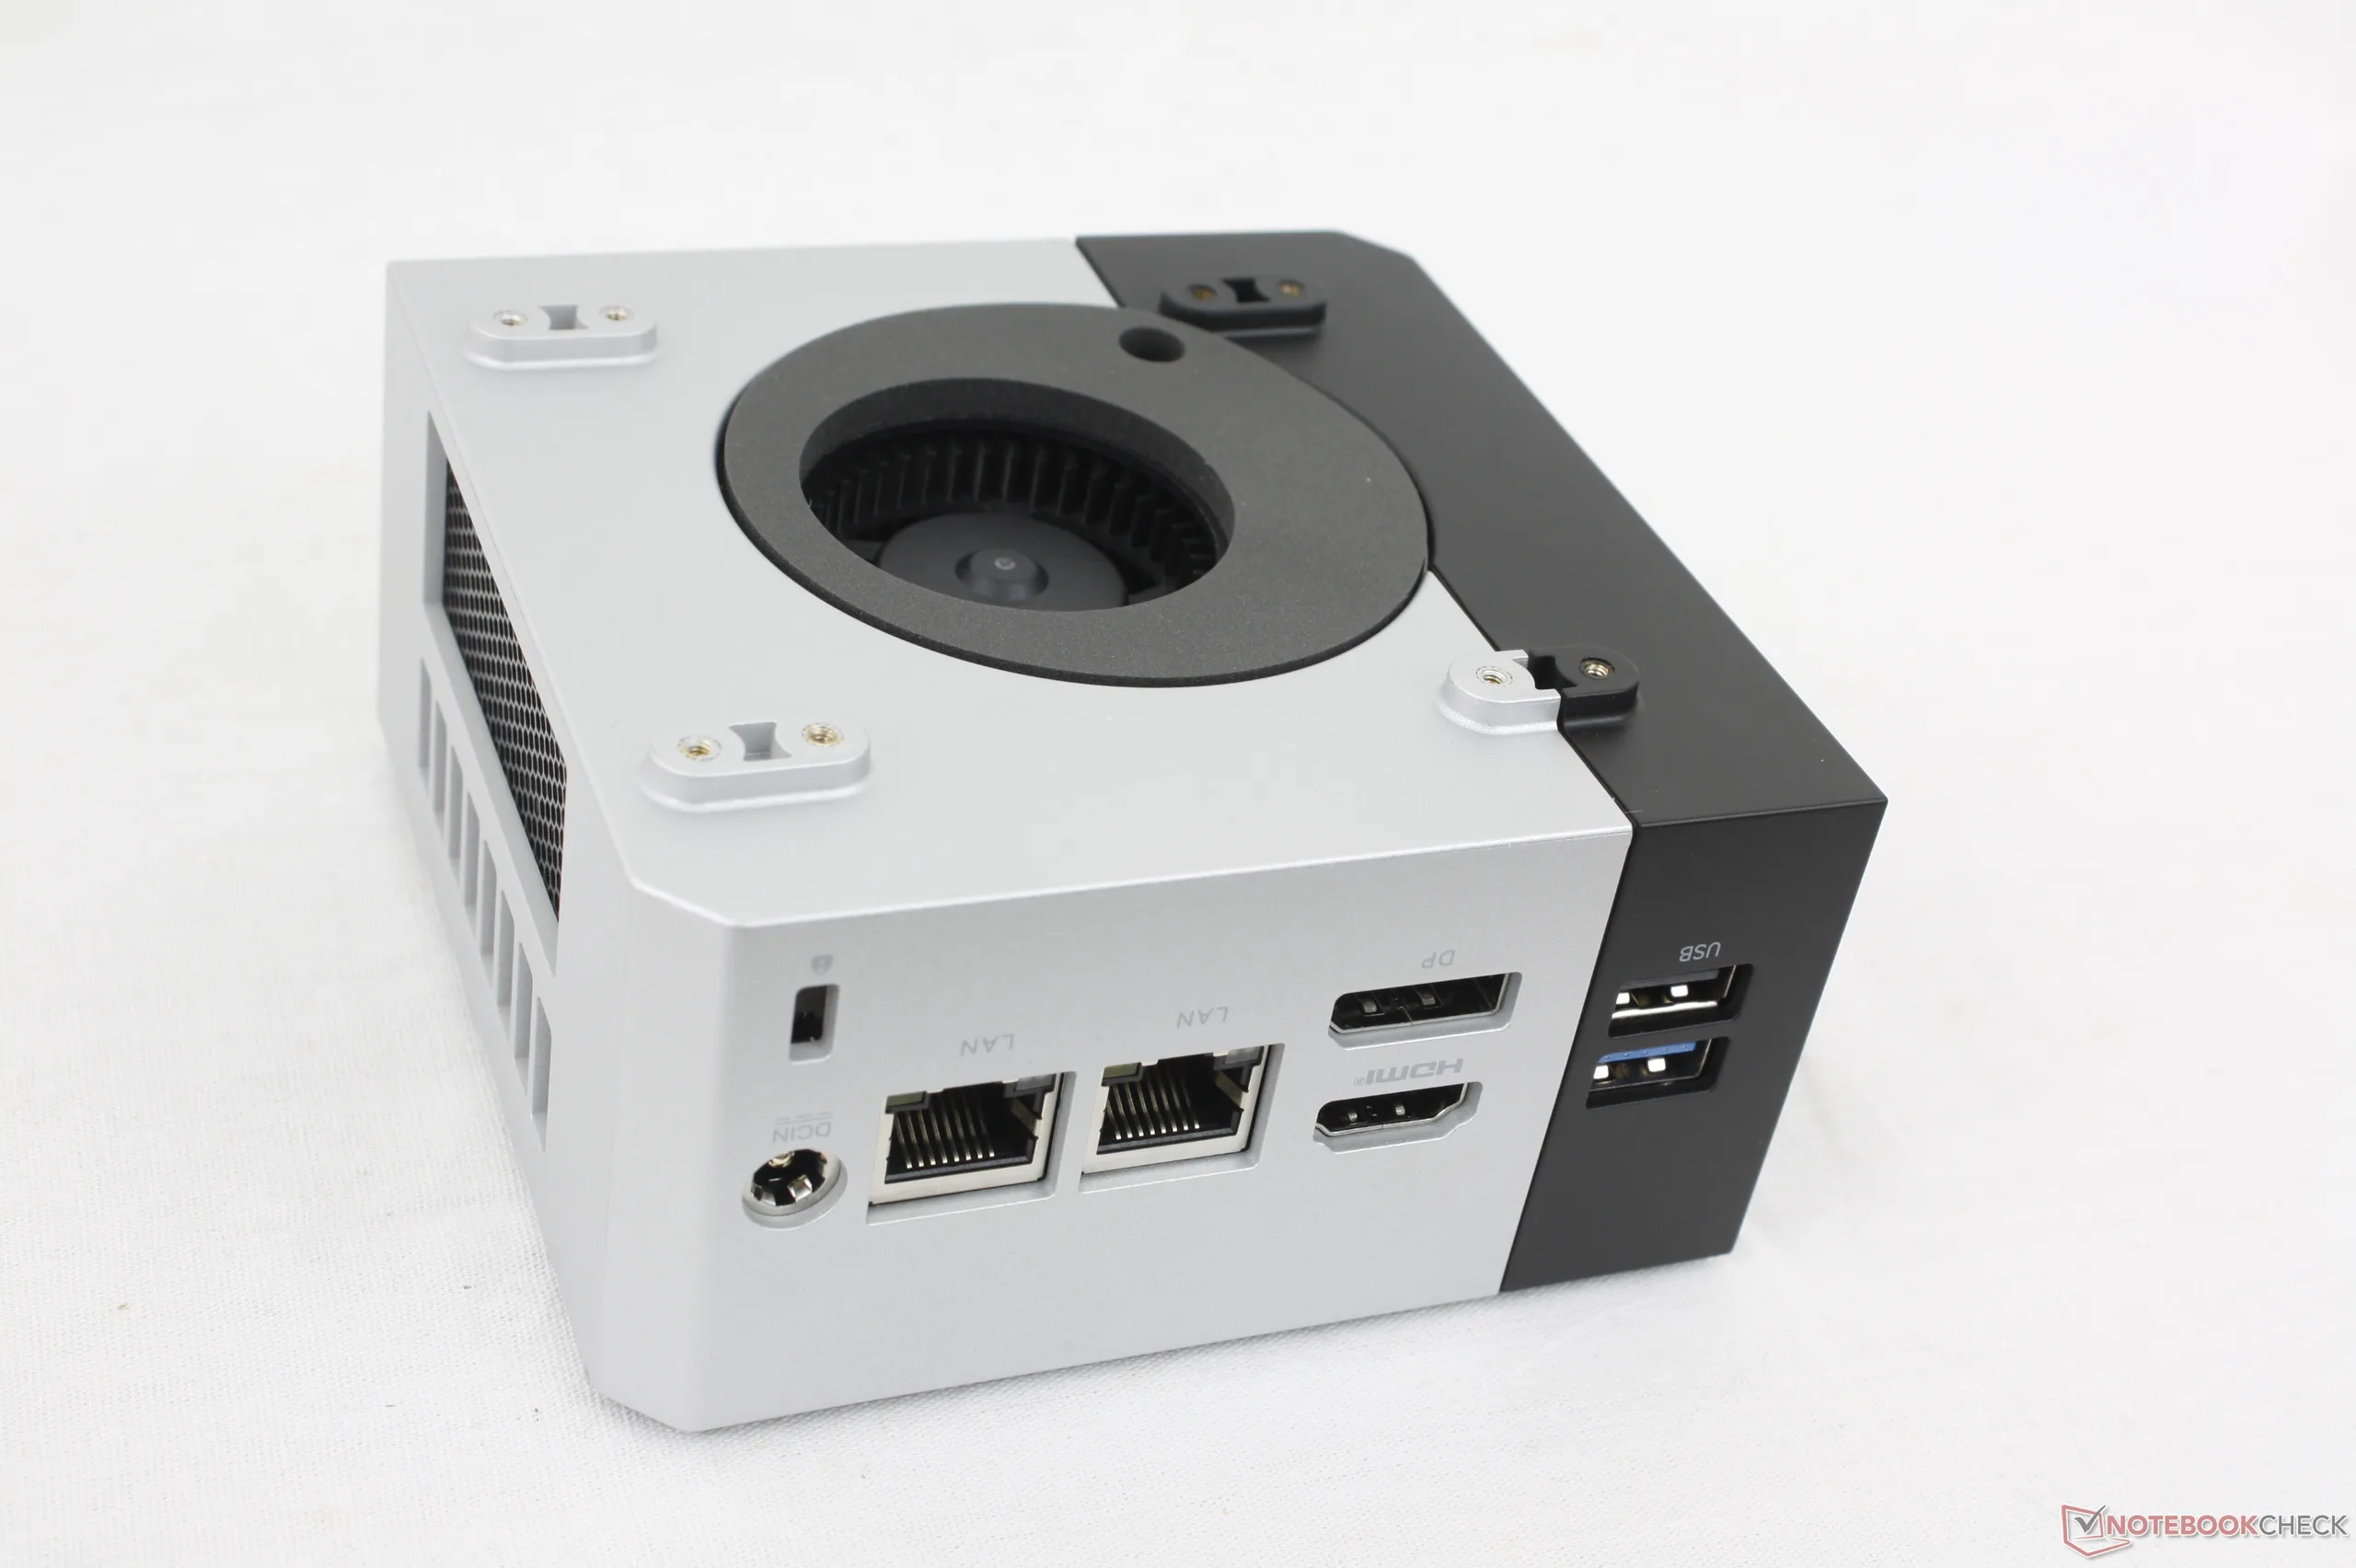
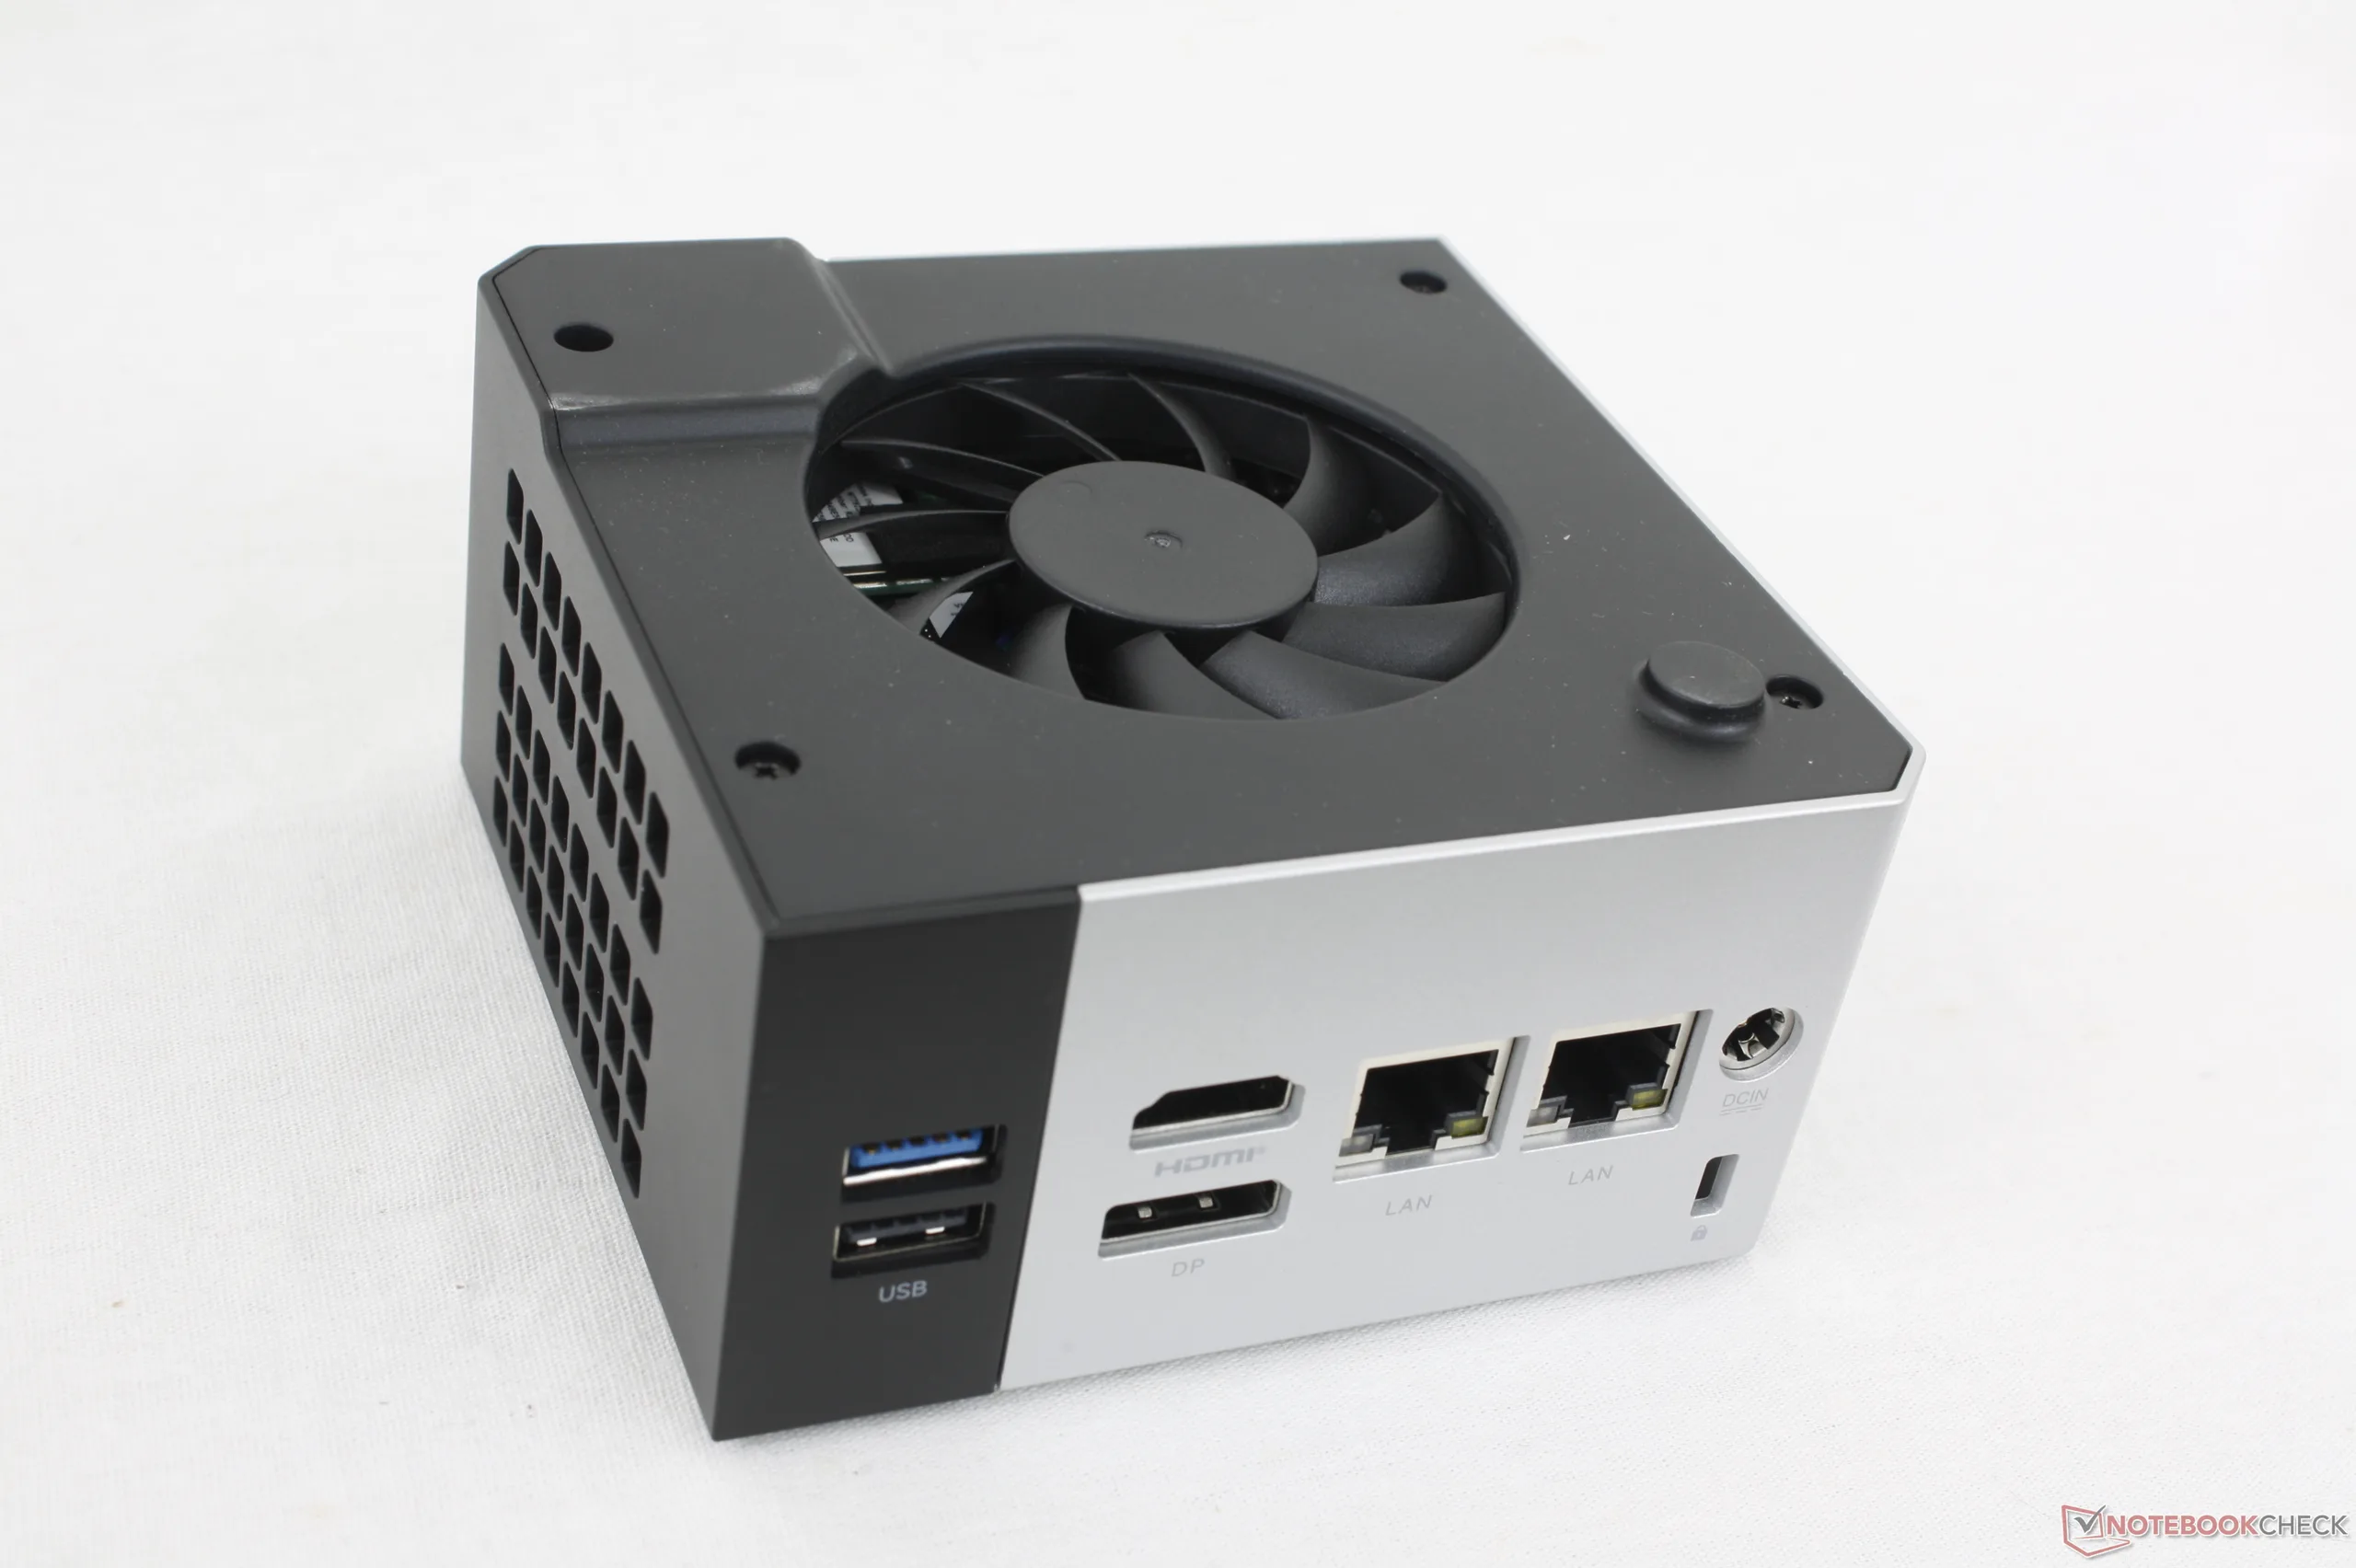
The chassis design and ports are lifted from the EVO-X1 instead of the recent NucBox K12 as the NucBox M8 caters to a similar professional userbase as the EVO-X1. The outer metal casing is not as dark as the one on the EVO-X1, but materials remain the same despite their wide price difference.
Connectivity
Although the manufacturer claims DisplayPort 1.4 support for the front USB-C port, we are unable to make it work with our USB-C external monitor even after several retries and updated drivers.
Communication
| Networking | |
| iperf3 transmit AXE11000 | |
| BOSGAME M4 Neo | |
| MSI Cubi NUC AI+ 2MG | |
| GMK NucBox K12 | |
| Asus ExpertCenter PN54-S70012NN | |
| GMK NucBox M8 | |
| Beelink SER9 Pro | |
| iperf3 receive AXE11000 | |
| BOSGAME M4 Neo | |
| MSI Cubi NUC AI+ 2MG | |
| Asus ExpertCenter PN54-S70012NN | |
| Beelink SER9 Pro | |
| GMK NucBox K12 | |
| GMK NucBox M8 | |
| iperf3 transmit AXE11000 6GHz | |
| Asus ExpertCenter PN54-S70012NN | |
| BOSGAME M4 Neo | |
| GMK NucBox M8 | |
| MSI Cubi NUC AI+ 2MG | |
| GMK NucBox K12 | |
| iperf3 receive AXE11000 6GHz | |
| Asus ExpertCenter PN54-S70012NN | |
| BOSGAME M4 Neo | |
| MSI Cubi NUC AI+ 2MG | |
| GMK NucBox M8 | |
| GMK NucBox K12 | |
Maintenance
The outer casing is secured by just four thumb screws for easy servicing, but a Phillips screwdriver is still required to access the motherboard. The system supports up to two M.2 2280 PCIe4 SSDs and a removable WLAN module.
Sustainability
GMK makes no claims about recycled materials during manufacturing. The retail box is nonetheless mostly paper and cardboard with some plastic wrapping for the cables and outer box.
Accessories And Warranty
The retail box includes an HDMI cable, AC adapter, and paperwork. There is no VESA mounting.
Performance
Testing Conditions
We set Windows to Performance mode prior to running the benchmarks below. Separate Balanced and Performance modes are also available through BIOS. The system ships preset to Balanced mode.
Processor
Despite running on the older Zen 3+ platform, the Ryzen 5 Pro 6650H is still able to stand neck-to-neck with the newer Core Ultra 7 258V when it comes to multi-threaded loads. It nonetheless falls behind in most other benchmarks involving single core, graphics, or AI.
Cinebench R15 Multi Loop
Cinebench R23: Multi Core | Single Core
Cinebench R20: CPU (Multi Core) | CPU (Single Core)
Cinebench R15: CPU Multi 64Bit | CPU Single 64Bit
Blender: v2.79 BMW27 CPU
7-Zip 18.03: 7z b 4 | 7z b 4 -mmt1
Geekbench 6.7: Multi-Core | Single-Core
Geekbench 5.5: Multi-Core | Single-Core
HWBOT x265 Benchmark v2.2: 4k Preset
LibreOffice : 20 Documents To PDF
R Benchmark 2.5: Overall mean
| CPU Performance rating | |
| Asus NUC 15 Pro+ | |
| Asus ExpertCenter PN54-S70012NN | |
| BOSGAME M2 | |
| BOSGAME M4 Neo | |
| Beelink SER9 Pro | |
| GMK NucBox K12 | |
| MSI Cubi NUC AI+ 2MG | |
| Beelink SER6 Pro Ryzen 7 7735HS -2! | |
| Aoostar GEM10 | |
| Beelink SEi13 Pro | |
| GMK NucBox M8 | |
| Average AMD Ryzen 5 PRO 6650H | |
| Trigkey Speed S -2! | |
| Aoostar WTR Pro, N150 | |
| Cinebench R23 / Multi Core | |
| Asus NUC 15 Pro+ | |
| Asus ExpertCenter PN54-S70012NN | |
| Beelink SER9 Pro | |
| BOSGAME M2 | |
| GMK NucBox K12 | |
| Beelink SEi13 Pro | |
| BOSGAME M4 Neo | |
| Aoostar GEM10 | |
| Beelink SER6 Pro Ryzen 7 7735HS | |
| MSI Cubi NUC AI+ 2MG | |
| GMK NucBox M8 | |
| Average AMD Ryzen 5 PRO 6650H (n=1) | |
| Trigkey Speed S | |
| Aoostar WTR Pro, N150 | |
| Cinebench R23 / Single Core | |
| Asus NUC 15 Pro+ | |
| Asus ExpertCenter PN54-S70012NN | |
| MSI Cubi NUC AI+ 2MG | |
| BOSGAME M4 Neo | |
| BOSGAME M2 | |
| Beelink SER9 Pro | |
| GMK NucBox K12 | |
| Aoostar GEM10 | |
| Beelink SER6 Pro Ryzen 7 7735HS | |
| GMK NucBox M8 | |
| Average AMD Ryzen 5 PRO 6650H (n=1) | |
| Trigkey Speed S | |
| Beelink SEi13 Pro | |
| Aoostar WTR Pro, N150 | |
| Cinebench R20 / CPU (Multi Core) | |
| Asus NUC 15 Pro+ | |
| Asus ExpertCenter PN54-S70012NN | |
| Beelink SER9 Pro | |
| BOSGAME M2 | |
| GMK NucBox K12 | |
| BOSGAME M4 Neo | |
| Beelink SEi13 Pro | |
| Aoostar GEM10 | |
| Beelink SER6 Pro Ryzen 7 7735HS | |
| MSI Cubi NUC AI+ 2MG | |
| GMK NucBox M8 | |
| Average AMD Ryzen 5 PRO 6650H (n=1) | |
| Trigkey Speed S | |
| Aoostar WTR Pro, N150 | |
| Cinebench R20 / CPU (Single Core) | |
| Asus NUC 15 Pro+ | |
| Asus ExpertCenter PN54-S70012NN | |
| MSI Cubi NUC AI+ 2MG | |
| BOSGAME M2 | |
| BOSGAME M4 Neo | |
| Beelink SER9 Pro | |
| GMK NucBox K12 | |
| Beelink SER6 Pro Ryzen 7 7735HS | |
| Aoostar GEM10 | |
| GMK NucBox M8 | |
| Average AMD Ryzen 5 PRO 6650H (n=1) | |
| Trigkey Speed S | |
| Beelink SEi13 Pro | |
| Aoostar WTR Pro, N150 | |
| Cinebench R15 / CPU Multi 64Bit | |
| Asus NUC 15 Pro+ | |
| Asus ExpertCenter PN54-S70012NN | |
| Beelink SER9 Pro | |
| BOSGAME M2 | |
| GMK NucBox K12 | |
| BOSGAME M4 Neo | |
| Beelink SEi13 Pro | |
| Aoostar GEM10 | |
| Beelink SER6 Pro Ryzen 7 7735HS | |
| GMK NucBox M8 | |
| Average AMD Ryzen 5 PRO 6650H (n=1) | |
| MSI Cubi NUC AI+ 2MG | |
| Trigkey Speed S | |
| Aoostar WTR Pro, N150 | |
| Cinebench R15 / CPU Single 64Bit | |
| Asus NUC 15 Pro+ | |
| Asus ExpertCenter PN54-S70012NN | |
| MSI Cubi NUC AI+ 2MG | |
| Beelink SER9 Pro | |
| BOSGAME M4 Neo | |
| GMK NucBox K12 | |
| BOSGAME M2 | |
| Beelink SER6 Pro Ryzen 7 7735HS | |
| Aoostar GEM10 | |
| GMK NucBox M8 | |
| Average AMD Ryzen 5 PRO 6650H (n=1) | |
| Trigkey Speed S | |
| Beelink SEi13 Pro | |
| Aoostar WTR Pro, N150 | |
| Blender / v2.79 BMW27 CPU | |
| Aoostar WTR Pro, N150 | |
| Trigkey Speed S | |
| MSI Cubi NUC AI+ 2MG | |
| GMK NucBox M8 | |
| Average AMD Ryzen 5 PRO 6650H (n=1) | |
| Beelink SER6 Pro Ryzen 7 7735HS | |
| Aoostar GEM10 | |
| GMK NucBox K12 | |
| BOSGAME M4 Neo | |
| Beelink SEi13 Pro | |
| BOSGAME M2 | |
| Beelink SER9 Pro | |
| Asus ExpertCenter PN54-S70012NN | |
| Asus NUC 15 Pro+ | |
| 7-Zip 18.03 / 7z b 4 | |
| BOSGAME M4 Neo | |
| Beelink SER9 Pro | |
| BOSGAME M2 | |
| GMK NucBox K12 | |
| Asus NUC 15 Pro+ | |
| Beelink SER6 Pro Ryzen 7 7735HS | |
| Aoostar GEM10 | |
| Asus ExpertCenter PN54-S70012NN | |
| Beelink SEi13 Pro | |
| GMK NucBox M8 | |
| Average AMD Ryzen 5 PRO 6650H (n=1) | |
| MSI Cubi NUC AI+ 2MG | |
| Trigkey Speed S | |
| Aoostar WTR Pro, N150 | |
| 7-Zip 18.03 / 7z b 4 -mmt1 | |
| BOSGAME M4 Neo | |
| BOSGAME M2 | |
| GMK NucBox K12 | |
| Beelink SER9 Pro | |
| Asus NUC 15 Pro+ | |
| MSI Cubi NUC AI+ 2MG | |
| Beelink SER6 Pro Ryzen 7 7735HS | |
| Asus ExpertCenter PN54-S70012NN | |
| Aoostar GEM10 | |
| GMK NucBox M8 | |
| Average AMD Ryzen 5 PRO 6650H (n=1) | |
| Trigkey Speed S | |
| Beelink SEi13 Pro | |
| Aoostar WTR Pro, N150 | |
| Geekbench 6.7 / Multi-Core | |
| Asus NUC 15 Pro+ | |
| Asus ExpertCenter PN54-S70012NN | |
| BOSGAME M2 | |
| BOSGAME M4 Neo | |
| Beelink SER9 Pro | |
| GMK NucBox K12 | |
| Aoostar GEM10 | |
| MSI Cubi NUC AI+ 2MG | |
| GMK NucBox M8 | |
| Average AMD Ryzen 5 PRO 6650H (7528 - 7813, n=2) | |
| Beelink SEi13 Pro | |
| Aoostar WTR Pro, N150 | |
| Geekbench 6.7 / Single-Core | |
| Asus ExpertCenter PN54-S70012NN | |
| MSI Cubi NUC AI+ 2MG | |
| BOSGAME M2 | |
| Asus NUC 15 Pro+ | |
| BOSGAME M4 Neo | |
| Beelink SER9 Pro | |
| GMK NucBox K12 | |
| Aoostar GEM10 | |
| GMK NucBox M8 | |
| Average AMD Ryzen 5 PRO 6650H (1885 - 1982, n=2) | |
| Beelink SEi13 Pro | |
| Aoostar WTR Pro, N150 | |
| Geekbench 5.5 / Multi-Core | |
| Asus NUC 15 Pro+ | |
| BOSGAME M2 | |
| BOSGAME M4 Neo | |
| Asus ExpertCenter PN54-S70012NN | |
| Beelink SER9 Pro | |
| GMK NucBox K12 | |
| Beelink SER6 Pro Ryzen 7 7735HS | |
| Aoostar GEM10 | |
| Beelink SEi13 Pro | |
| MSI Cubi NUC AI+ 2MG | |
| GMK NucBox M8 | |
| Average AMD Ryzen 5 PRO 6650H (n=1) | |
| Trigkey Speed S | |
| Aoostar WTR Pro, N150 | |
| Geekbench 5.5 / Single-Core | |
| Asus ExpertCenter PN54-S70012NN | |
| MSI Cubi NUC AI+ 2MG | |
| BOSGAME M2 | |
| BOSGAME M4 Neo | |
| GMK NucBox K12 | |
| Beelink SER9 Pro | |
| Asus NUC 15 Pro+ | |
| Beelink SER6 Pro Ryzen 7 7735HS | |
| Aoostar GEM10 | |
| Trigkey Speed S | |
| GMK NucBox M8 | |
| Average AMD Ryzen 5 PRO 6650H (n=1) | |
| Beelink SEi13 Pro | |
| Aoostar WTR Pro, N150 | |
| HWBOT x265 Benchmark v2.2 / 4k Preset | |
| Asus NUC 15 Pro+ | |
| BOSGAME M2 | |
| Asus ExpertCenter PN54-S70012NN | |
| BOSGAME M4 Neo | |
| Beelink SER9 Pro | |
| GMK NucBox K12 | |
| Beelink SEi13 Pro | |
| Beelink SER6 Pro Ryzen 7 7735HS | |
| Aoostar GEM10 | |
| MSI Cubi NUC AI+ 2MG | |
| GMK NucBox M8 | |
| Average AMD Ryzen 5 PRO 6650H (n=1) | |
| Trigkey Speed S | |
| Aoostar WTR Pro, N150 | |
| LibreOffice / 20 Documents To PDF | |
| Aoostar WTR Pro, N150 | |
| GMK NucBox M8 | |
| Average AMD Ryzen 5 PRO 6650H (n=1) | |
| Asus NUC 15 Pro+ | |
| Beelink SEi13 Pro | |
| GMK NucBox K12 | |
| Aoostar GEM10 | |
| Beelink SER9 Pro | |
| Asus ExpertCenter PN54-S70012NN | |
| BOSGAME M4 Neo | |
| MSI Cubi NUC AI+ 2MG | |
| Beelink SER6 Pro Ryzen 7 7735HS | |
| Trigkey Speed S | |
| BOSGAME M2 | |
| R Benchmark 2.5 / Overall mean | |
| Aoostar WTR Pro, N150 | |
| Beelink SEi13 Pro | |
| Trigkey Speed S | |
| GMK NucBox M8 | |
| Average AMD Ryzen 5 PRO 6650H (n=1) | |
| Aoostar GEM10 | |
| Beelink SER6 Pro Ryzen 7 7735HS | |
| Beelink SER9 Pro | |
| GMK NucBox K12 | |
| BOSGAME M4 Neo | |
| MSI Cubi NUC AI+ 2MG | |
| Asus NUC 15 Pro+ | |
| BOSGAME M2 | |
| Asus ExpertCenter PN54-S70012NN | |
Cinebench R23: Multi Core | Single Core
Cinebench R20: CPU (Multi Core) | CPU (Single Core)
Cinebench R15: CPU Multi 64Bit | CPU Single 64Bit
Blender: v2.79 BMW27 CPU
7-Zip 18.03: 7z b 4 | 7z b 4 -mmt1
Geekbench 6.7: Multi-Core | Single-Core
Geekbench 5.5: Multi-Core | Single-Core
HWBOT x265 Benchmark v2.2: 4k Preset
LibreOffice : 20 Documents To PDF
R Benchmark 2.5: Overall mean
* ... smaller is better
AIDA64: FP32 Ray-Trace | FPU Julia | CPU SHA3 | CPU Queen | FPU SinJulia | FPU Mandel | CPU AES | CPU ZLib | FP64 Ray-Trace | CPU PhotoWorxx
| Performance rating | |
| Beelink SER9 Pro | |
| BOSGAME M4 Neo | |
| GMK NucBox K12 | |
| Asus ExpertCenter PN54-S70012NN | |
| GMK NucBox M8 | |
| Average AMD Ryzen 5 PRO 6650H | |
| MSI Cubi NUC AI+ 2MG | |
| AIDA64 / FP32 Ray-Trace | |
| Asus ExpertCenter PN54-S70012NN | |
| Beelink SER9 Pro | |
| BOSGAME M4 Neo | |
| GMK NucBox K12 | |
| MSI Cubi NUC AI+ 2MG | |
| GMK NucBox M8 | |
| Average AMD Ryzen 5 PRO 6650H (n=1) | |
| AIDA64 / FPU Julia | |
| Beelink SER9 Pro | |
| BOSGAME M4 Neo | |
| GMK NucBox K12 | |
| Asus ExpertCenter PN54-S70012NN | |
| GMK NucBox M8 | |
| Average AMD Ryzen 5 PRO 6650H (n=1) | |
| MSI Cubi NUC AI+ 2MG | |
| AIDA64 / CPU SHA3 | |
| Beelink SER9 Pro | |
| BOSGAME M4 Neo | |
| GMK NucBox K12 | |
| Asus ExpertCenter PN54-S70012NN | |
| MSI Cubi NUC AI+ 2MG | |
| GMK NucBox M8 | |
| Average AMD Ryzen 5 PRO 6650H (n=1) | |
| AIDA64 / CPU Queen | |
| Beelink SER9 Pro | |
| BOSGAME M4 Neo | |
| GMK NucBox K12 | |
| GMK NucBox M8 | |
| Average AMD Ryzen 5 PRO 6650H (n=1) | |
| Asus ExpertCenter PN54-S70012NN | |
| MSI Cubi NUC AI+ 2MG | |
| AIDA64 / FPU SinJulia | |
| Beelink SER9 Pro | |
| GMK NucBox K12 | |
| BOSGAME M4 Neo | |
| Asus ExpertCenter PN54-S70012NN | |
| GMK NucBox M8 | |
| Average AMD Ryzen 5 PRO 6650H (n=1) | |
| MSI Cubi NUC AI+ 2MG | |
| AIDA64 / FPU Mandel | |
| Beelink SER9 Pro | |
| BOSGAME M4 Neo | |
| GMK NucBox K12 | |
| Asus ExpertCenter PN54-S70012NN | |
| GMK NucBox M8 | |
| Average AMD Ryzen 5 PRO 6650H (n=1) | |
| MSI Cubi NUC AI+ 2MG | |
| AIDA64 / CPU AES | |
| Beelink SER9 Pro | |
| GMK NucBox K12 | |
| BOSGAME M4 Neo | |
| Asus ExpertCenter PN54-S70012NN | |
| GMK NucBox M8 | |
| Average AMD Ryzen 5 PRO 6650H (n=1) | |
| MSI Cubi NUC AI+ 2MG | |
| AIDA64 / CPU ZLib | |
| Asus ExpertCenter PN54-S70012NN | |
| Beelink SER9 Pro | |
| GMK NucBox K12 | |
| BOSGAME M4 Neo | |
| GMK NucBox M8 | |
| Average AMD Ryzen 5 PRO 6650H (n=1) | |
| MSI Cubi NUC AI+ 2MG | |
| AIDA64 / FP64 Ray-Trace | |
| Asus ExpertCenter PN54-S70012NN | |
| Beelink SER9 Pro | |
| BOSGAME M4 Neo | |
| GMK NucBox K12 | |
| MSI Cubi NUC AI+ 2MG | |
| GMK NucBox M8 | |
| Average AMD Ryzen 5 PRO 6650H (n=1) | |
| AIDA64 / CPU PhotoWorxx | |
| MSI Cubi NUC AI+ 2MG | |
| Asus ExpertCenter PN54-S70012NN | |
| Beelink SER9 Pro | |
| BOSGAME M4 Neo | |
| GMK NucBox K12 | |
| GMK NucBox M8 | |
| Average AMD Ryzen 5 PRO 6650H (n=1) | |
System Performance
PCMark results are dragged down by the relatively outdated integrated GPU and slower 16 GB of LPDDR5-6400 RAM.
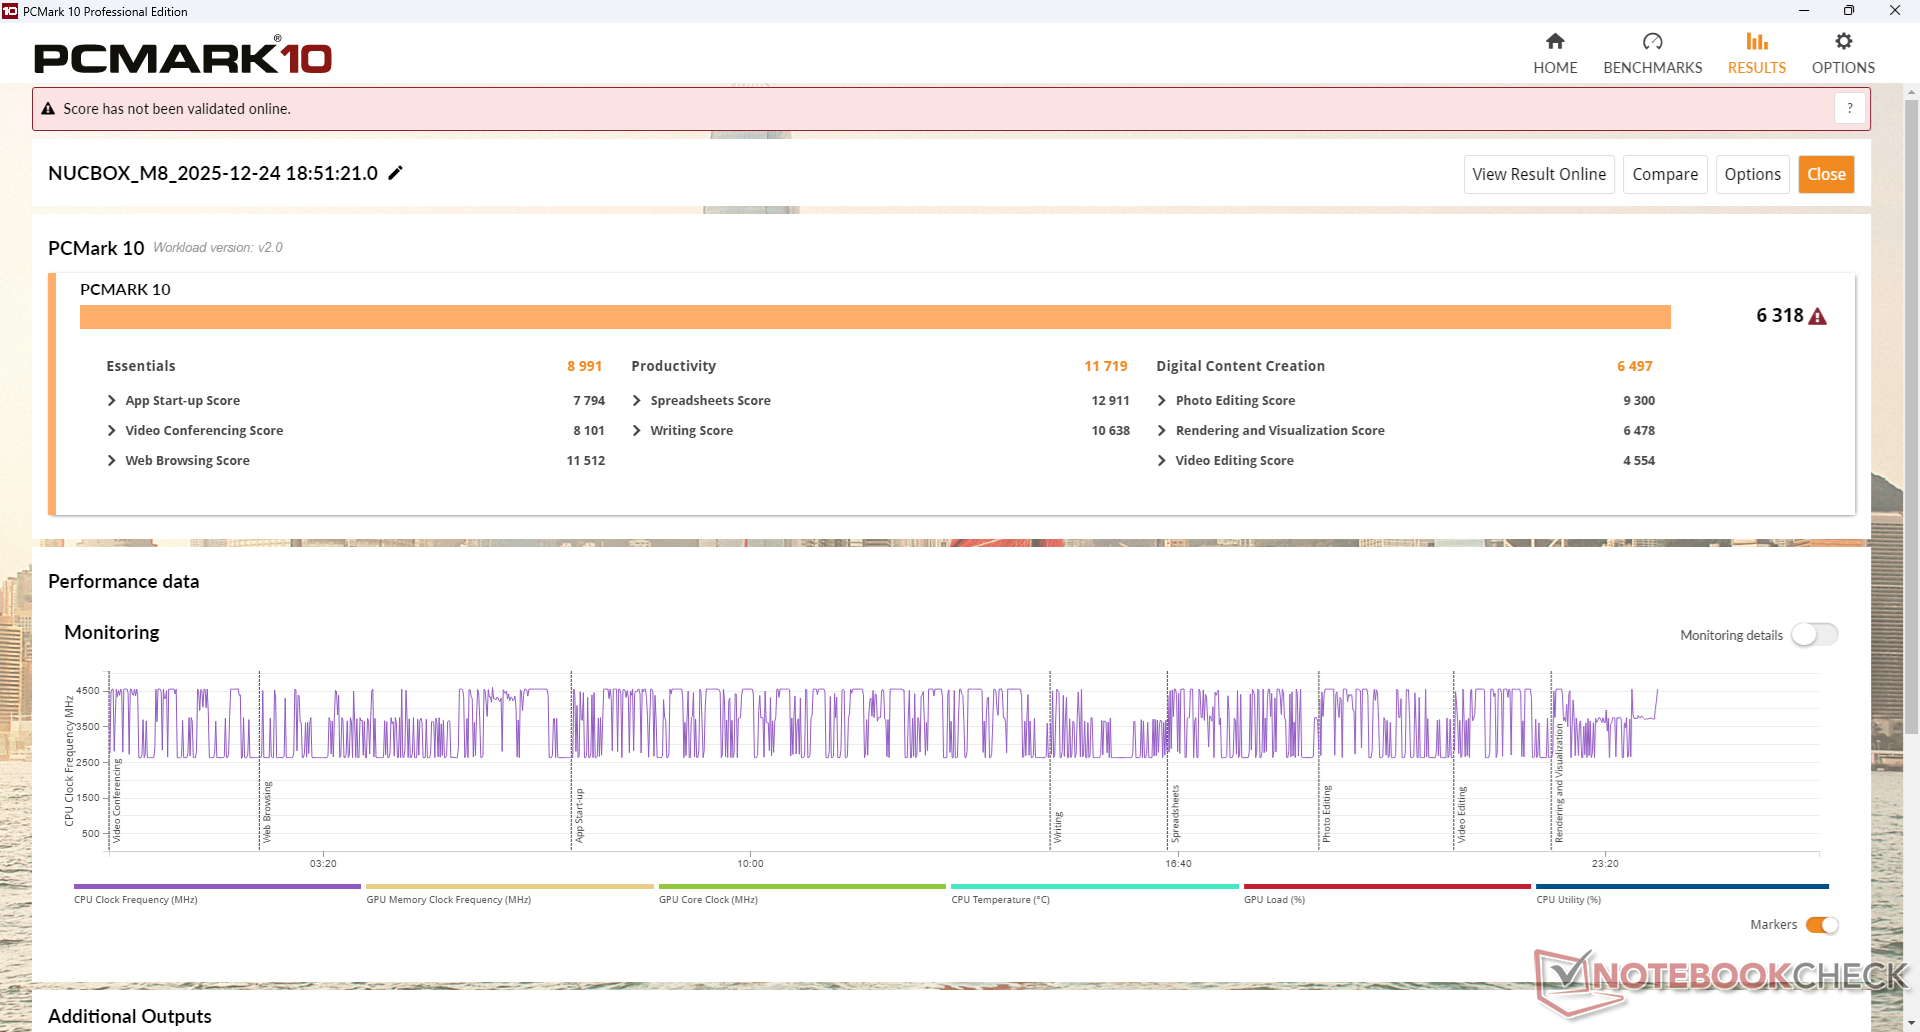
PCMark 10: Score | Essentials | Productivity | Digital Content Creation
CrossMark: Overall | Productivity | Creativity | Responsiveness
WebXPRT 3: Overall
WebXPRT 4: Overall
Mozilla Kraken 1.1: Total
| Performance rating | |
| BOSGAME M4 Neo | |
| Asus ExpertCenter PN54-S70012NN | |
| Beelink SER9 Pro | |
| GMK NucBox K12 | |
| MSI Cubi NUC AI+ 2MG | |
| GMK NucBox M8 | |
| Average AMD Ryzen 5 PRO 6650H, AMD Radeon 660M | |
| PCMark 10 / Score | |
| Asus ExpertCenter PN54-S70012NN | |
| GMK NucBox K12 | |
| BOSGAME M4 Neo | |
| Beelink SER9 Pro | |
| MSI Cubi NUC AI+ 2MG | |
| GMK NucBox M8 | |
| Average AMD Ryzen 5 PRO 6650H, AMD Radeon 660M (n=1) | |
| PCMark 10 / Essentials | |
| Asus ExpertCenter PN54-S70012NN | |
| BOSGAME M4 Neo | |
| GMK NucBox K12 | |
| Beelink SER9 Pro | |
| MSI Cubi NUC AI+ 2MG | |
| GMK NucBox M8 | |
| Average AMD Ryzen 5 PRO 6650H, AMD Radeon 660M (n=1) | |
| PCMark 10 / Productivity | |
| GMK NucBox M8 | |
| Average AMD Ryzen 5 PRO 6650H, AMD Radeon 660M (n=1) | |
| Asus ExpertCenter PN54-S70012NN | |
| GMK NucBox K12 | |
| BOSGAME M4 Neo | |
| Beelink SER9 Pro | |
| MSI Cubi NUC AI+ 2MG | |
| PCMark 10 / Digital Content Creation | |
| Asus ExpertCenter PN54-S70012NN | |
| MSI Cubi NUC AI+ 2MG | |
| Beelink SER9 Pro | |
| GMK NucBox K12 | |
| BOSGAME M4 Neo | |
| GMK NucBox M8 | |
| Average AMD Ryzen 5 PRO 6650H, AMD Radeon 660M (n=1) | |
| CrossMark / Overall | |
| BOSGAME M4 Neo | |
| Beelink SER9 Pro | |
| GMK NucBox K12 | |
| Asus ExpertCenter PN54-S70012NN | |
| MSI Cubi NUC AI+ 2MG | |
| GMK NucBox M8 | |
| Average AMD Ryzen 5 PRO 6650H, AMD Radeon 660M (n=1) | |
| CrossMark / Productivity | |
| BOSGAME M4 Neo | |
| Beelink SER9 Pro | |
| GMK NucBox K12 | |
| Asus ExpertCenter PN54-S70012NN | |
| MSI Cubi NUC AI+ 2MG | |
| GMK NucBox M8 | |
| Average AMD Ryzen 5 PRO 6650H, AMD Radeon 660M (n=1) | |
| CrossMark / Creativity | |
| Asus ExpertCenter PN54-S70012NN | |
| BOSGAME M4 Neo | |
| Beelink SER9 Pro | |
| GMK NucBox K12 | |
| MSI Cubi NUC AI+ 2MG | |
| GMK NucBox M8 | |
| Average AMD Ryzen 5 PRO 6650H, AMD Radeon 660M (n=1) | |
| CrossMark / Responsiveness | |
| BOSGAME M4 Neo | |
| Beelink SER9 Pro | |
| GMK NucBox K12 | |
| Asus ExpertCenter PN54-S70012NN | |
| MSI Cubi NUC AI+ 2MG | |
| GMK NucBox M8 | |
| Average AMD Ryzen 5 PRO 6650H, AMD Radeon 660M (n=1) | |
| WebXPRT 3 / Overall | |
| MSI Cubi NUC AI+ 2MG | |
| BOSGAME M4 Neo | |
| Beelink SER9 Pro | |
| GMK NucBox K12 | |
| Asus ExpertCenter PN54-S70012NN | |
| GMK NucBox M8 | |
| Average AMD Ryzen 5 PRO 6650H, AMD Radeon 660M (n=1) | |
| WebXPRT 4 / Overall | |
| MSI Cubi NUC AI+ 2MG | |
| BOSGAME M4 Neo | |
| Beelink SER9 Pro | |
| GMK NucBox K12 | |
| Asus ExpertCenter PN54-S70012NN | |
| GMK NucBox M8 | |
| Average AMD Ryzen 5 PRO 6650H, AMD Radeon 660M (n=1) | |
| Mozilla Kraken 1.1 / Total | |
| GMK NucBox M8 | |
| Average AMD Ryzen 5 PRO 6650H, AMD Radeon 660M (n=1) | |
| GMK NucBox K12 | |
| Beelink SER9 Pro | |
| BOSGAME M4 Neo | |
| Asus ExpertCenter PN54-S70012NN | |
| MSI Cubi NUC AI+ 2MG | |
* ... smaller is better
| PCMark 10 Score | 6318 points | |
Help | ||
| AIDA64 / Memory Copy | |
| MSI Cubi NUC AI+ 2MG | |
| Beelink SER9 Pro | |
| Asus ExpertCenter PN54-S70012NN | |
| BOSGAME M4 Neo | |
| GMK NucBox K12 | |
| GMK NucBox M8 | |
| Average AMD Ryzen 5 PRO 6650H (n=1) | |
| AIDA64 / Memory Read | |
| MSI Cubi NUC AI+ 2MG | |
| Asus ExpertCenter PN54-S70012NN | |
| BOSGAME M4 Neo | |
| GMK NucBox K12 | |
| Beelink SER9 Pro | |
| GMK NucBox M8 | |
| Average AMD Ryzen 5 PRO 6650H (n=1) | |
| AIDA64 / Memory Write | |
| MSI Cubi NUC AI+ 2MG | |
| Beelink SER9 Pro | |
| Asus ExpertCenter PN54-S70012NN | |
| GMK NucBox K12 | |
| BOSGAME M4 Neo | |
| GMK NucBox M8 | |
| Average AMD Ryzen 5 PRO 6650H (n=1) | |
| AIDA64 / Memory Latency | |
| GMK NucBox M8 | |
| Average AMD Ryzen 5 PRO 6650H (n=1) | |
| Beelink SER9 Pro | |
| MSI Cubi NUC AI+ 2MG | |
| Asus ExpertCenter PN54-S70012NN | |
| GMK NucBox K12 | |
| BOSGAME M4 Neo | |
* ... smaller is better
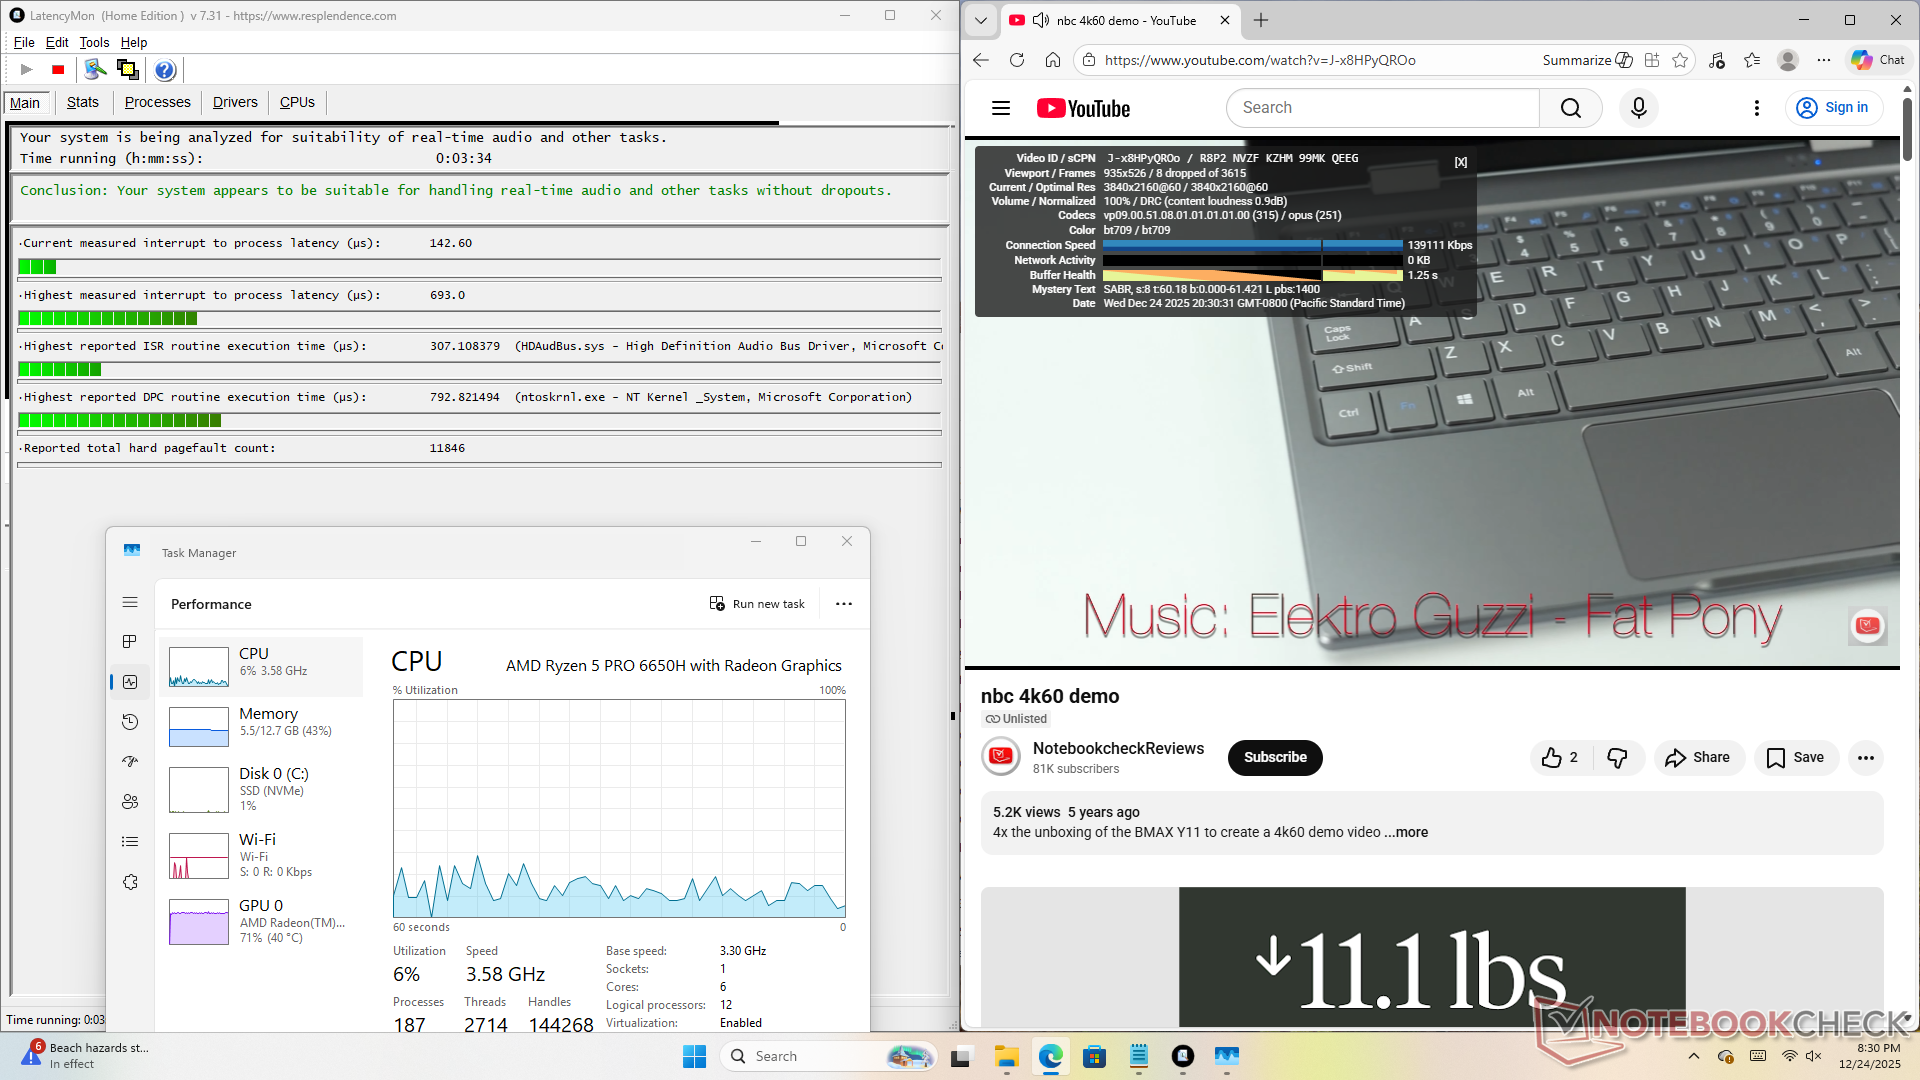
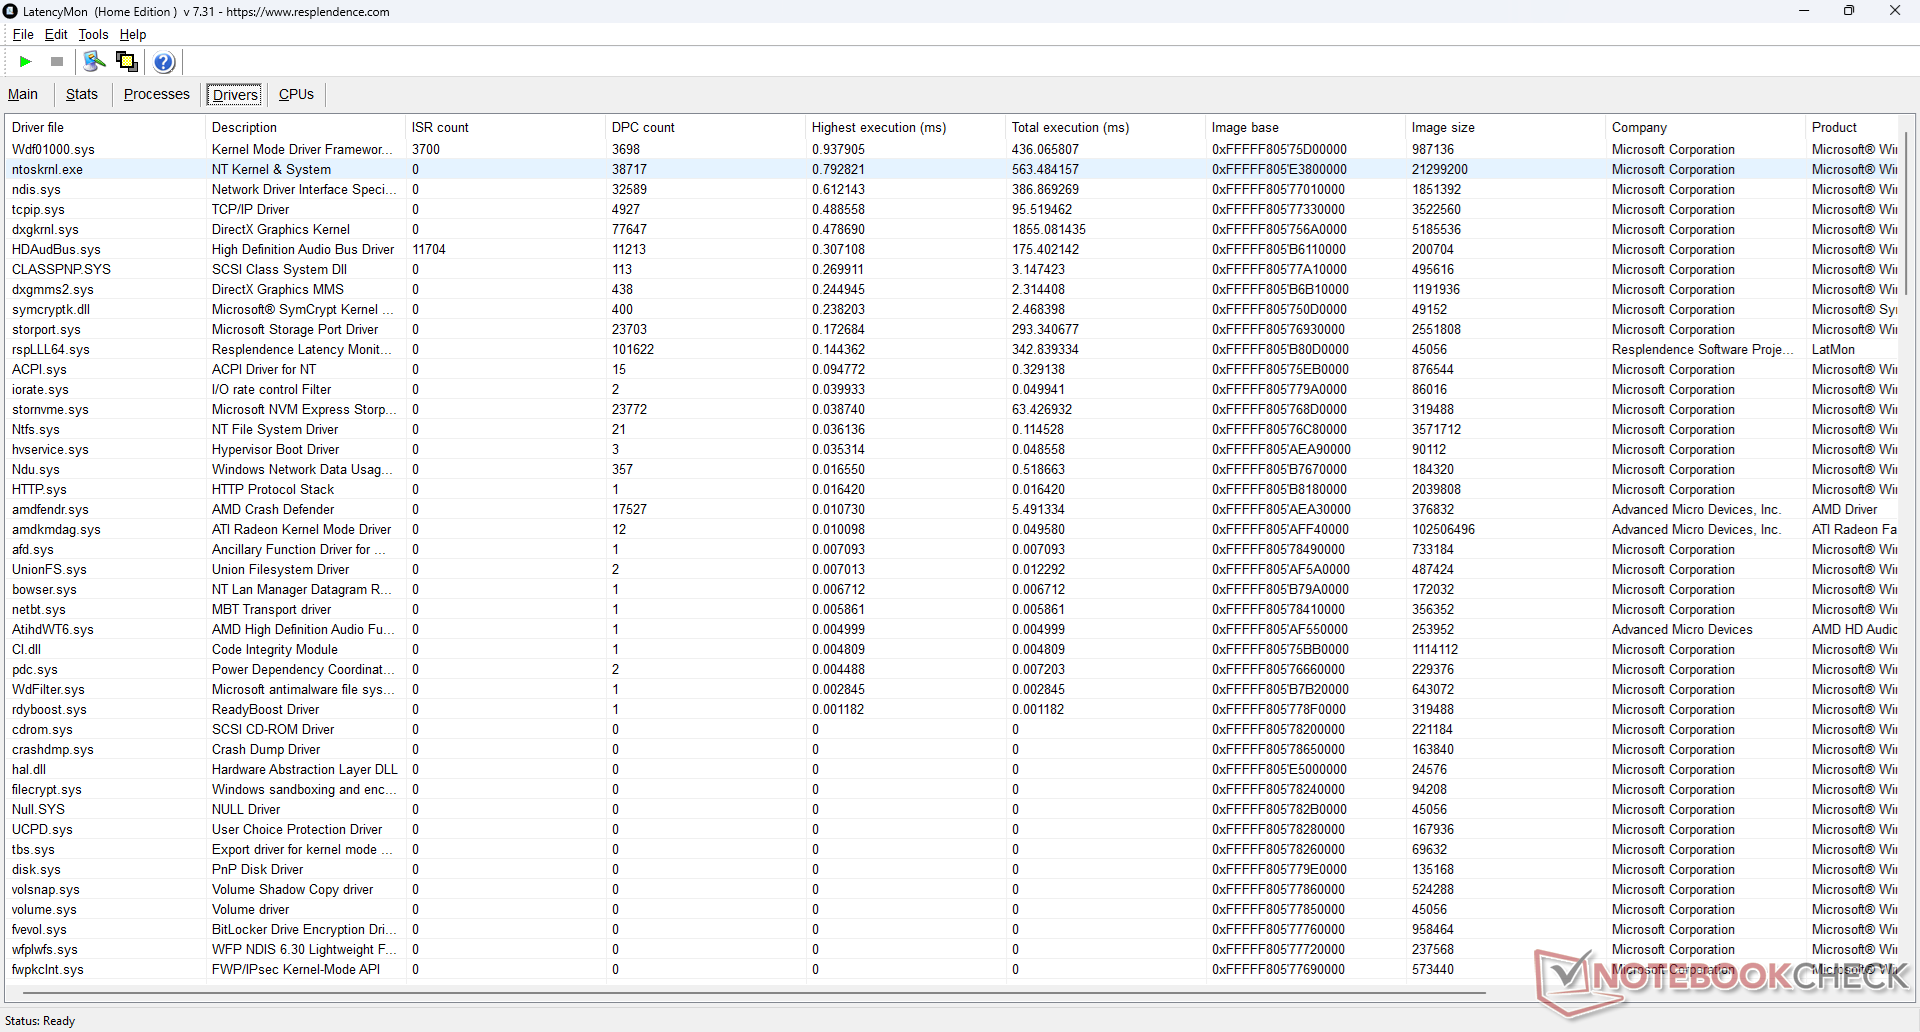
DPC Latency
While LatencyMon reports no major DPC issues, 4K60 video playback is imperfect with 8 dropped frames recorded during a 60-second window. Dropped frames would occur even after repeat testing.
| DPC Latencies / LatencyMon - interrupt to process latency (max), Web, Youtube, Prime95 | |
| Asus ExpertCenter PN54-S70012NN | |
| GMK NucBox K12 | |
| MSI Cubi NUC AI+ 2MG | |
| BOSGAME M4 Neo | |
| Beelink SER9 Pro | |
| GMK NucBox M8 | |
* ... smaller is better
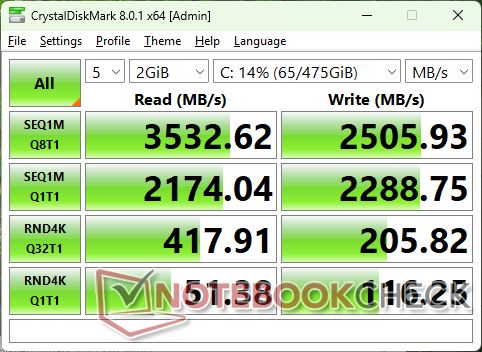
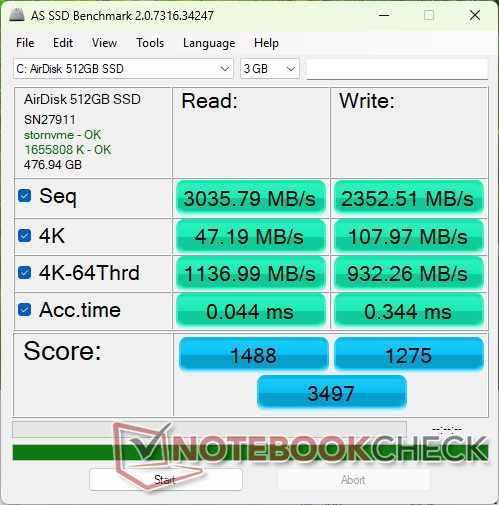
Storage Devices

| Drive Performance rating - Percent | |
| BOSGAME M4 Neo | |
| Asus ExpertCenter PN54-S70012NN | |
| Beelink SER9 Pro | |
| GMK NucBox K12 | |
| MSI Cubi NUC AI+ 2MG | |
| GMK NucBox M8 | |
* ... smaller is better
Disk Throttling: DiskSpd Read Loop, Queue Depth 8
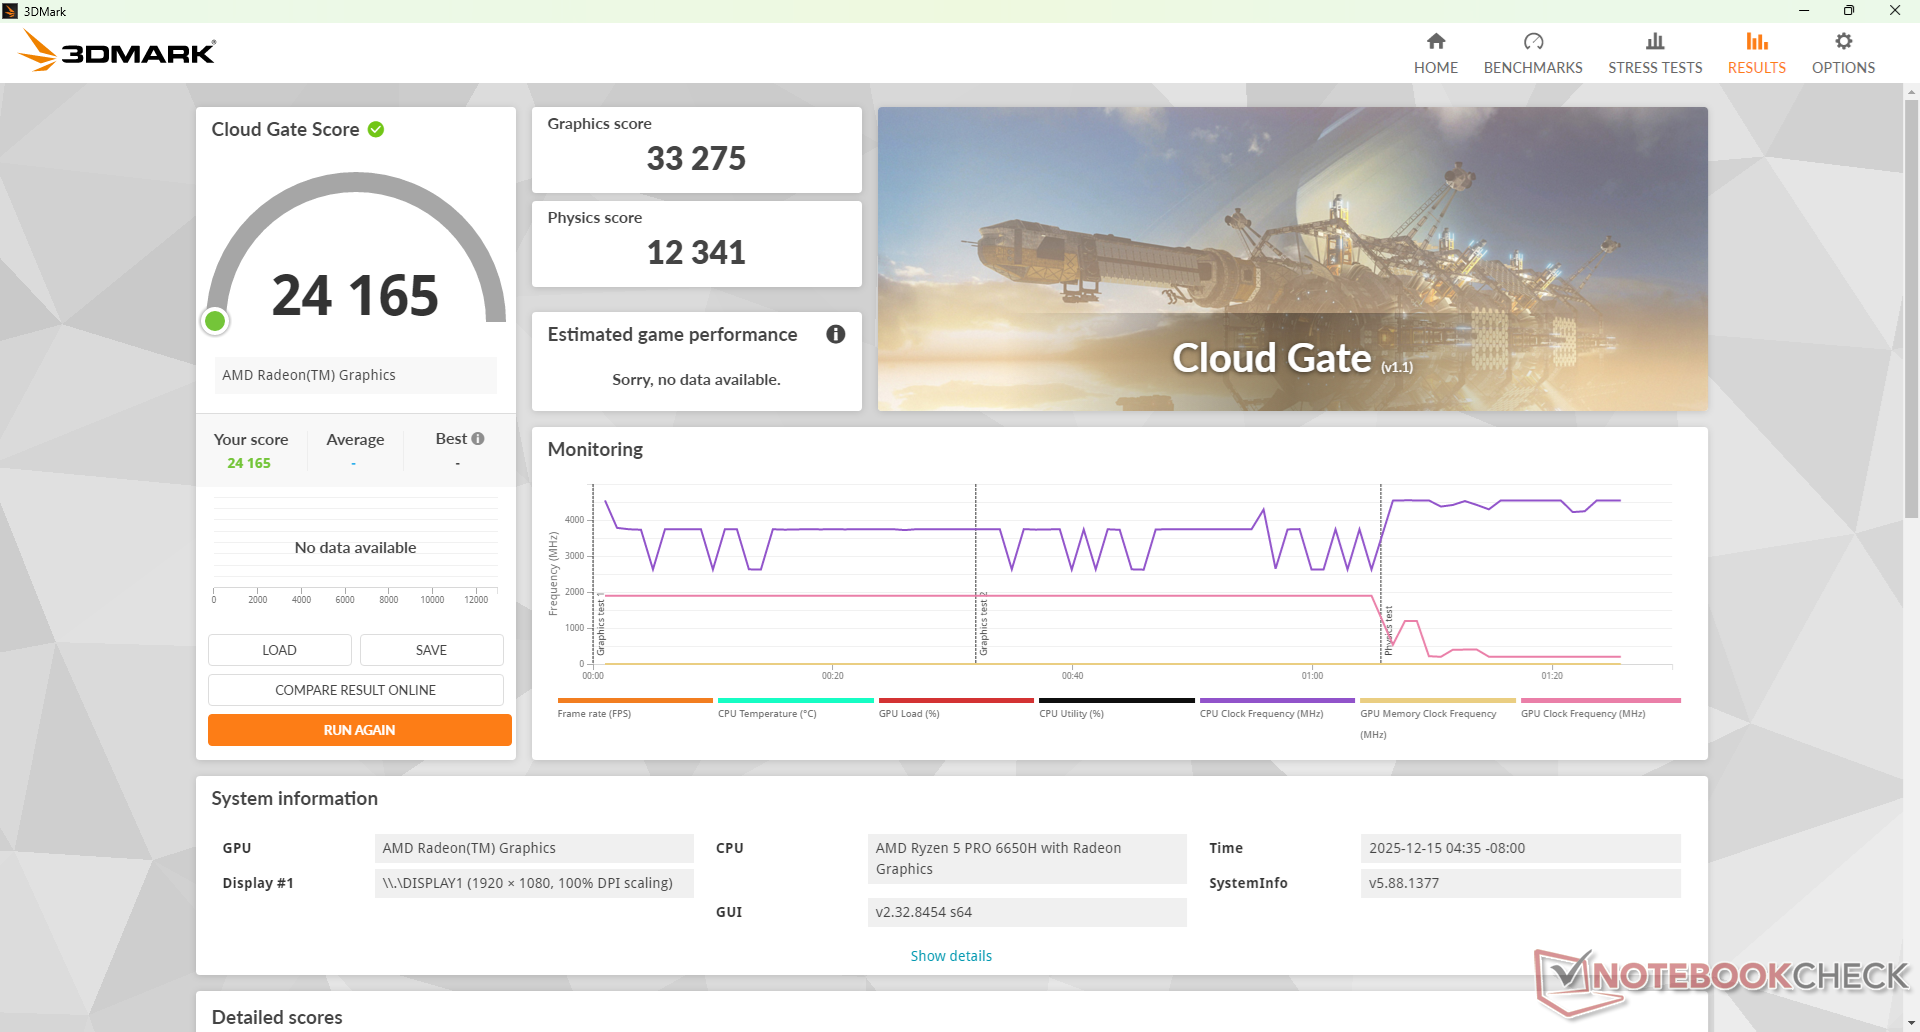
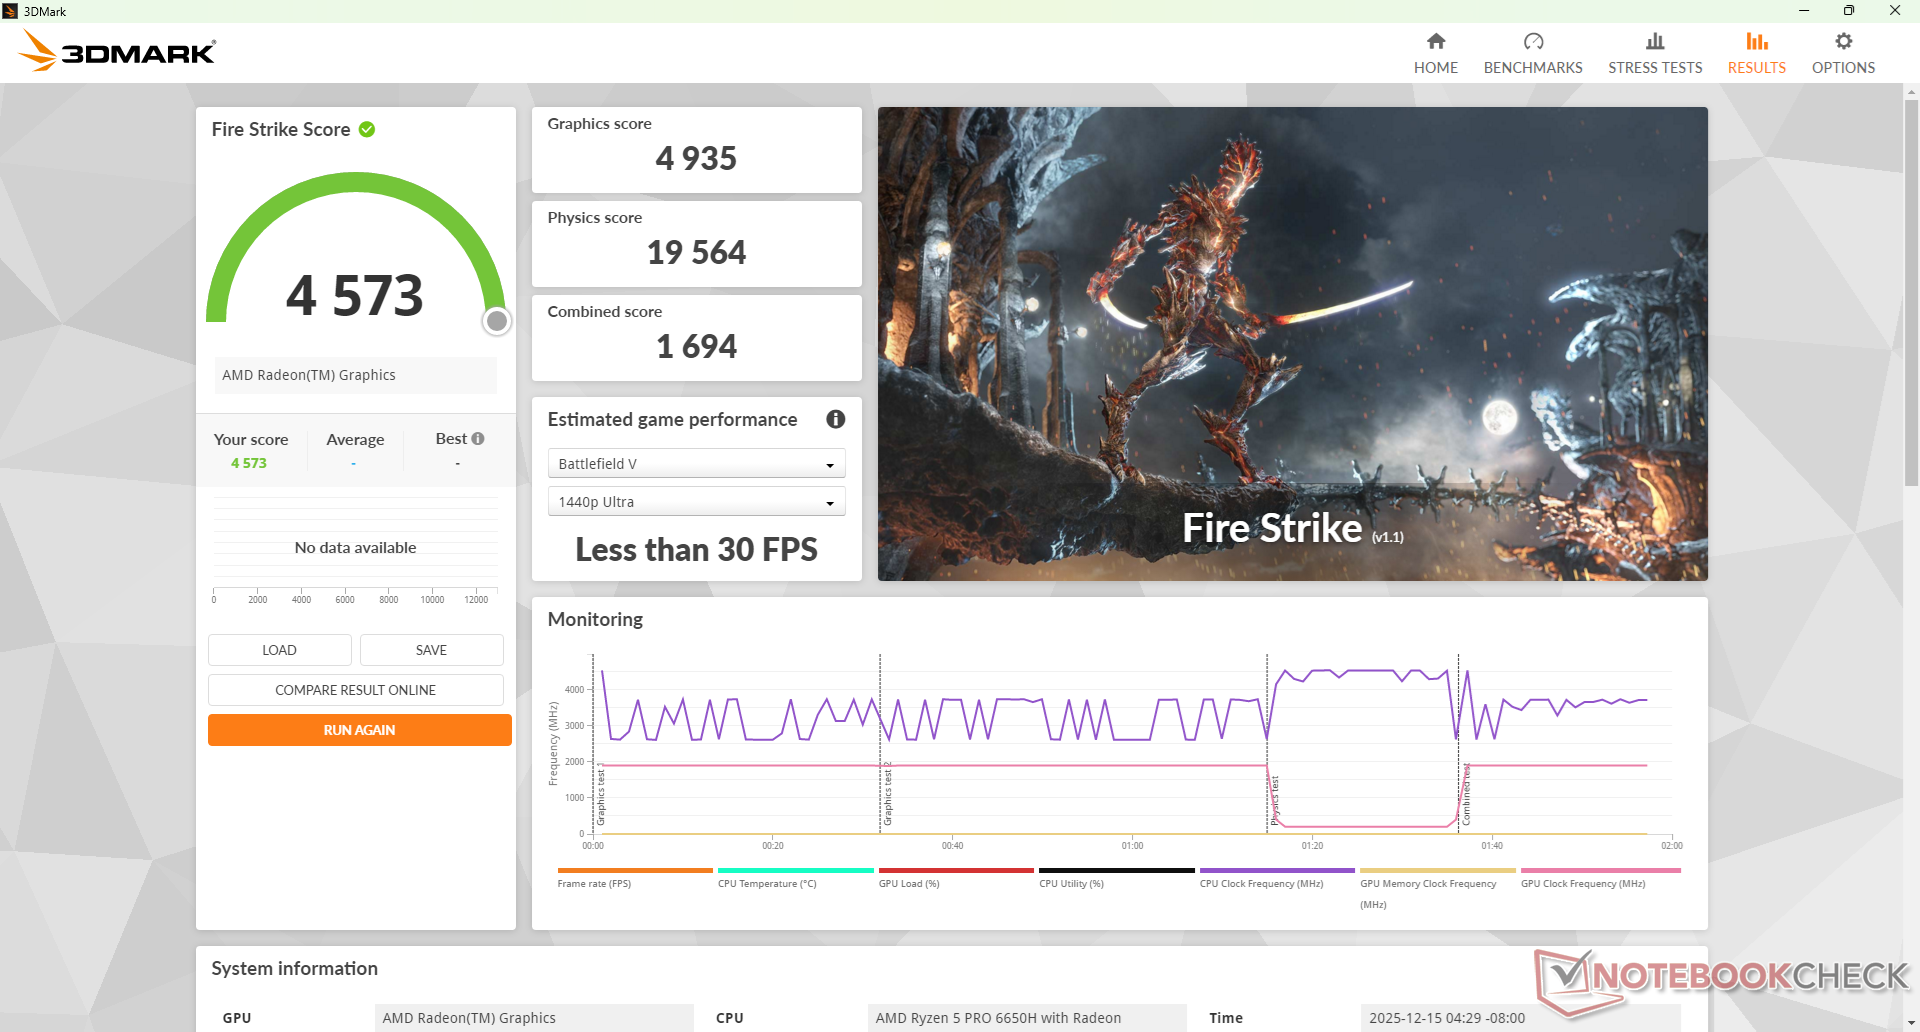
GPU Performance
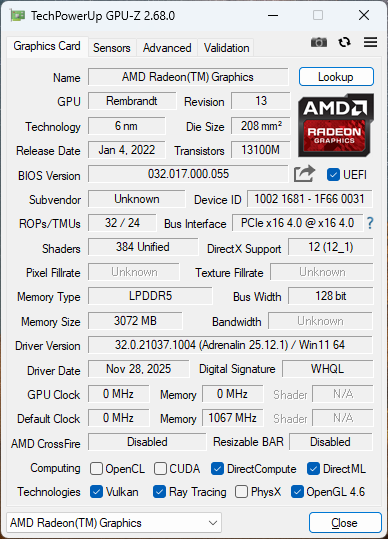
The integrated Radeon 660M is now several generations behind and so its raw performance is on par with the older Intel Iris Xe Graphics G7 96 EUs. Pricier Mini PCs with newer Radeon 890M graphics, such as the Minisforum N5 Pro, can offer 70 to 110 percent faster graphics performance than our NucBox M8.
3DMark 06 and GTA V would launch with errors even after reinstalling Windows and drivers and so their results have been omitted.
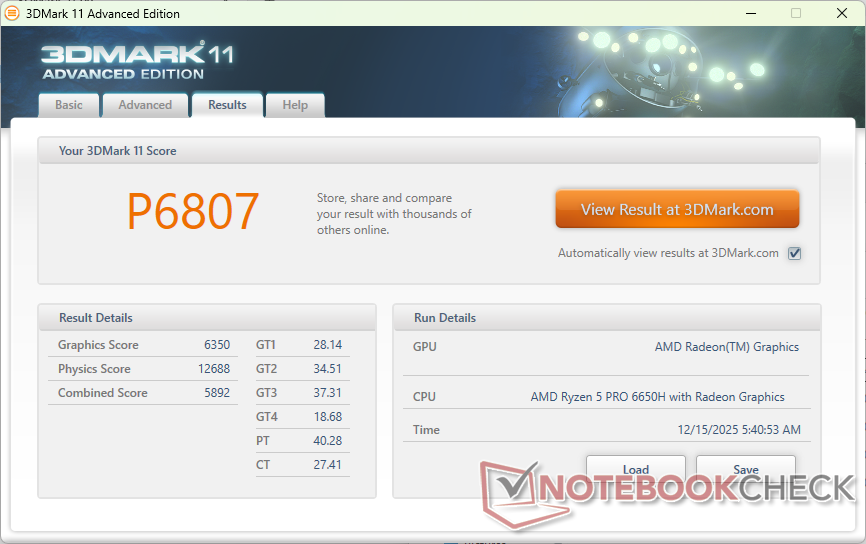
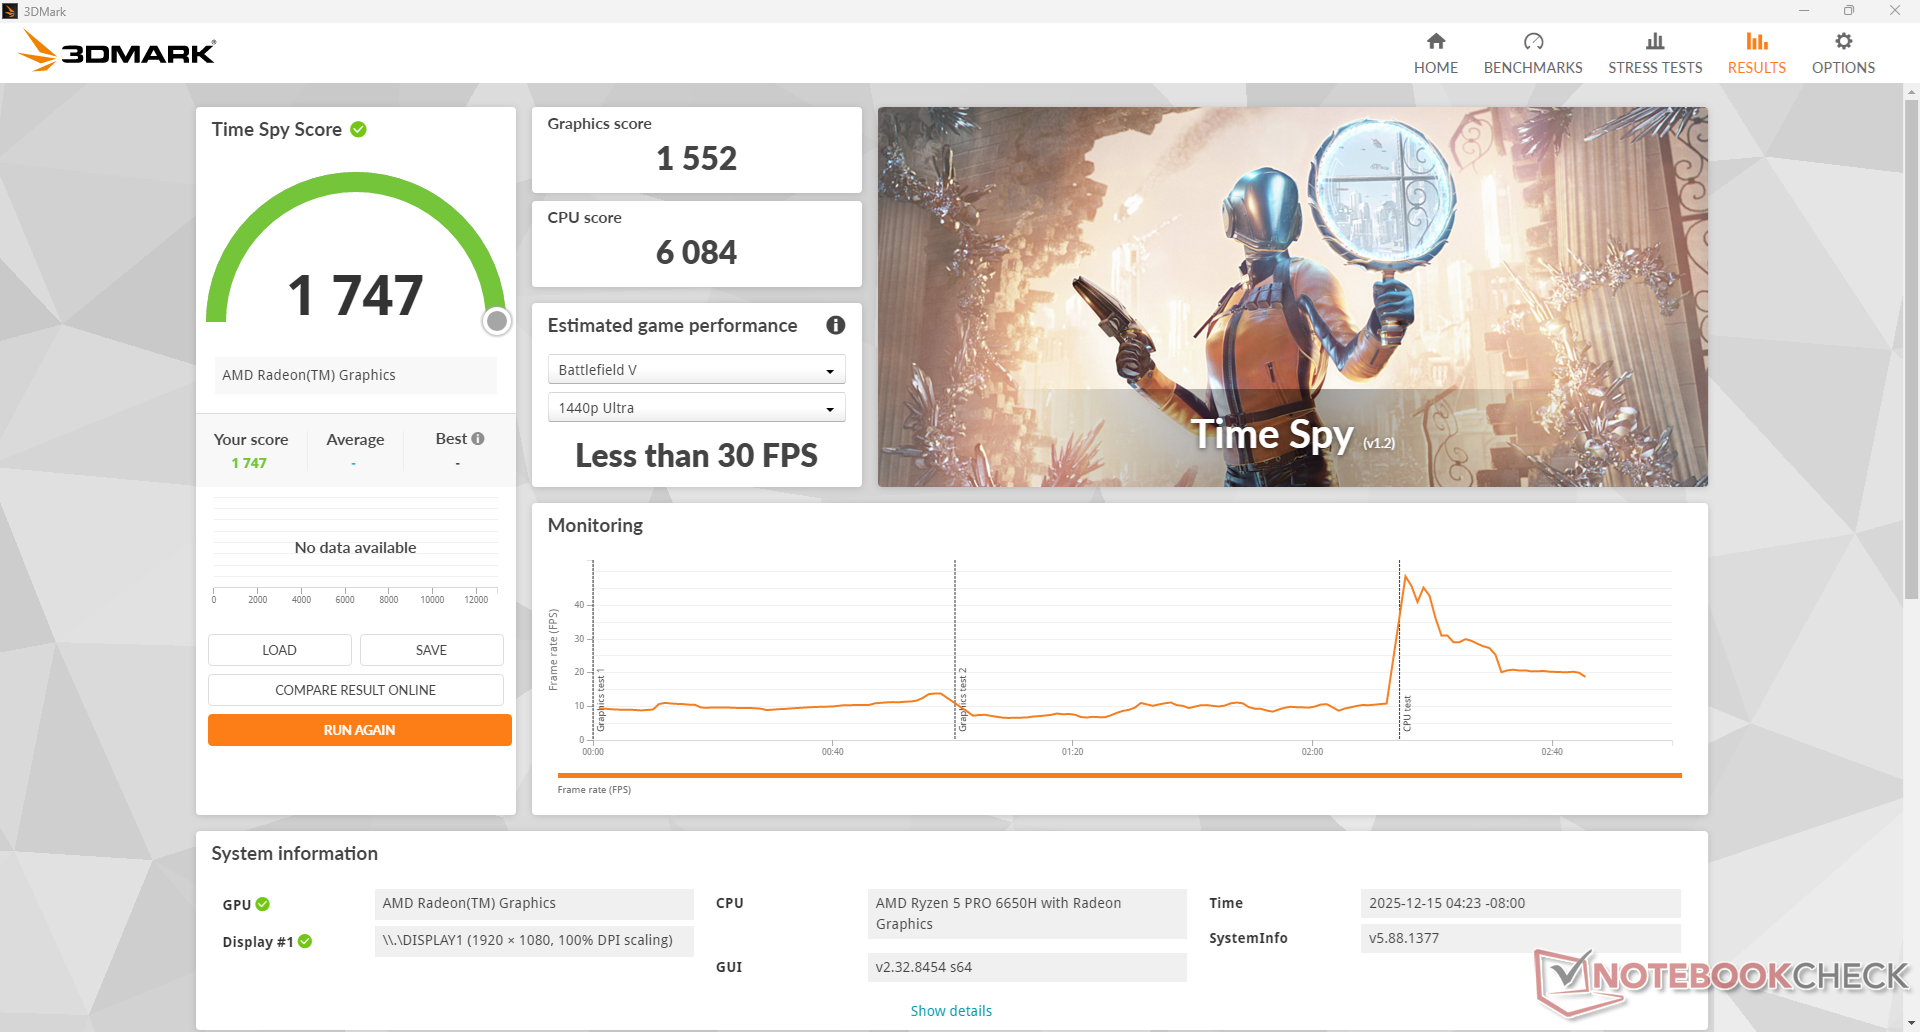
| 3DMark 11 Performance | 6807 points | |
| 3DMark Cloud Gate Standard Score | 24165 points | |
| 3DMark Fire Strike Score | 4573 points | |
| 3DMark Time Spy Score | 1747 points | |
Help | ||
| Blender | |
| v3.3 Classroom HIP/AMD | |
| Average AMD Radeon 660M (438 - 755, n=8) | |
| Beelink SER6 Pro Ryzen 7 7735HS | |
| Aoostar GEM10 | |
| v3.3 Classroom CPU | |
| Aoostar WTR Pro, N150 | |
| Trigkey Speed S | |
| Average AMD Radeon 660M (323 - 968, n=13) | |
| GMK NucBox M8 | |
| Beelink SER6 Pro Ryzen 7 7735HS | |
| Aoostar GEM10 | |
| Beelink SEi13 Pro | |
| BOSGAME M4 Neo | |
| GMK NucBox K12 | |
| Beelink SER9 Pro | |
| BOSGAME M2 | |
| Asus ExpertCenter PN54-S70012NN | |
| Asus NUC 15 Pro+ | |
| v3.3 Classroom oneAPI/Intel | |
| MSI Cubi NUC AI+ 2MG | |
| v4.3 Barbershop CPU | |
| Average AMD Radeon 660M (2828 - 3797, n=4) | |
| GMK NucBox M8 | |
| MSI Cubi NUC AI+ 2MG | |
| Aoostar GEM10 | |
| Beelink SEi13 Pro | |
| Asus ExpertCenter PN54-S70012NN | |
| BOSGAME M4 Neo | |
| GMK NucBox K12 | |
| Beelink SER9 Pro | |
| Asus NUC 15 Pro+ | |
* ... smaller is better
| Performance rating - Percent | |
| Beelink SER9 Pro | |
| GMK NucBox K12 | |
| BOSGAME M4 Neo -1! | |
| MSI Cubi NUC AI+ 2MG | |
| Asus ExpertCenter PN54-S70012NN | |
| GMK NucBox M8 | |
| Cyberpunk 2077 - 1920x1080 Ultra Preset (FSR off) | |
| GMK NucBox K12 | |
| Beelink SER9 Pro | |
| MSI Cubi NUC AI+ 2MG | |
| Asus ExpertCenter PN54-S70012NN | |
| BOSGAME M4 Neo | |
| GMK NucBox M8 | |
| Baldur's Gate 3 - 1920x1080 Ultra Preset AA:T | |
| BOSGAME M4 Neo | |
| Beelink SER9 Pro | |
| GMK NucBox K12 | |
| MSI Cubi NUC AI+ 2MG | |
| Asus ExpertCenter PN54-S70012NN | |
| GMK NucBox M8 | |
| Final Fantasy XV Benchmark - 1920x1080 High Quality | |
| Beelink SER9 Pro | |
| MSI Cubi NUC AI+ 2MG | |
| GMK NucBox K12 | |
| Asus ExpertCenter PN54-S70012NN | |
| BOSGAME M4 Neo | |
| GMK NucBox M8 | |
| Strange Brigade - 1920x1080 ultra AA:ultra AF:16 | |
| MSI Cubi NUC AI+ 2MG | |
| Beelink SER9 Pro | |
| GMK NucBox K12 | |
| Asus ExpertCenter PN54-S70012NN | |
| GMK NucBox M8 | |
| Dota 2 Reborn - 1920x1080 ultra (3/3) best looking | |
| BOSGAME M4 Neo | |
| GMK NucBox K12 | |
| Asus ExpertCenter PN54-S70012NN | |
| Beelink SER9 Pro | |
| MSI Cubi NUC AI+ 2MG | |
| GMK NucBox M8 | |
| X-Plane 11.11 - 1920x1080 high (fps_test=3) | |
| Asus ExpertCenter PN54-S70012NN | |
| BOSGAME M4 Neo | |
| GMK NucBox K12 | |
| Beelink SER9 Pro | |
| MSI Cubi NUC AI+ 2MG | |
| GMK NucBox M8 | |
| F1 24 | |
| 1920x1080 Low Preset AA:T AF:16x | |
| BOSGAME M4 Neo | |
| Beelink SER9 Pro | |
| GMK NucBox K12 | |
| Asus NUC 15 Pro+ | |
| Asus ExpertCenter PN54-S70012NN | |
| Aoostar GEM10 | |
| MSI Cubi NUC AI+ 2MG | |
| GMK NucBox M8 | |
| Average AMD Radeon 660M (31.6 - 42.2, n=5) | |
| Beelink SEi13 Pro | |
| 1920x1080 Medium Preset AA:T AF:16x | |
| BOSGAME M4 Neo | |
| Beelink SER9 Pro | |
| Asus NUC 15 Pro+ | |
| GMK NucBox K12 | |
| Asus ExpertCenter PN54-S70012NN | |
| Aoostar GEM10 | |
| GMK NucBox M8 | |
| Average AMD Radeon 660M (26.8 - 38, n=5) | |
| Beelink SEi13 Pro | |
| 1920x1080 High Preset AA:T AF:16x | |
| BOSGAME M4 Neo | |
| Asus NUC 15 Pro+ | |
| Beelink SER9 Pro | |
| GMK NucBox K12 | |
| MSI Cubi NUC AI+ 2MG | |
| Asus ExpertCenter PN54-S70012NN | |
| Aoostar GEM10 | |
| GMK NucBox M8 | |
| Average AMD Radeon 660M (19.8 - 26.4, n=4) | |
| Beelink SEi13 Pro | |
| 1920x1080 Ultra High Preset AA:T AF:16x | |
| Asus NUC 15 Pro+ | |
| MSI Cubi NUC AI+ 2MG | |
| Beelink SEi13 Pro | |
| Beelink SER9 Pro | |
| GMK NucBox K12 | |
| Asus ExpertCenter PN54-S70012NN | |
| Aoostar GEM10 | |
| Average AMD Radeon 660M (n=1) | |
Cyberpunk 2077 ultra FPS Chart
| low | med. | high | ultra | |
|---|---|---|---|---|
| Dota 2 Reborn (2015) | 110.9 | 92.3 | 64.2 | 54.6 |
| Final Fantasy XV Benchmark (2018) | 46 | 24.1 | 17 | |
| X-Plane 11.11 (2018) | 45.7 | 34.1 | 29 | |
| Strange Brigade (2018) | 123 | 44.2 | 35.6 | 28.9 |
| Baldur's Gate 3 (2023) | 22 | 14.9 | 14.7 | 14.5 |
| Cyberpunk 2077 (2023) | 23.1 | 17.3 | 12.9 | 10.8 |
| F1 24 (2024) | 40.1 | 38 | 26.4 |
Emissions
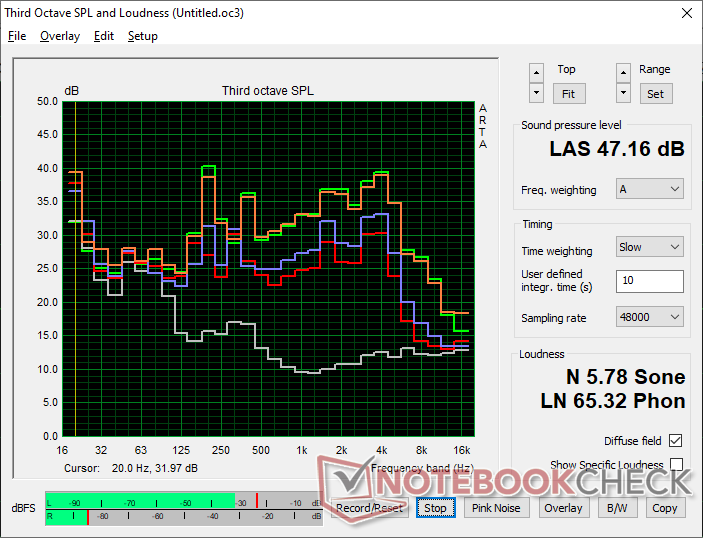
System Noise
The fans unfortunately pulsate quite frequently up to 38 dB(A) from a silent background of 24 dB(A) even when set to Balanced mode or when running undemanding loads like browsers or video.
Noise level
| Idle |
| 24.1 / 24.1 / 38.5 dB(A) |
| Load |
| 41.1 / 47.2 dB(A) |
 | ||
30 dB silent 40 dB(A) audible 50 dB(A) loud |
||
min: | ||
| GMK NucBox M8 R5 PRO 6650H, Radeon 660M | GMK NucBox K12 Ryzen 7 H 255, Radeon 780M | Beelink SER9 Pro Ryzen 7 H 255, Radeon 780M | Asus ExpertCenter PN54-S70012NN Ryzen AI 7 350, Radeon 860M | MSI Cubi NUC AI+ 2MG Core Ultra 7 258V, Arc 140V | BOSGAME M4 Neo R7 7840HS, Radeon 780M | |
|---|---|---|---|---|---|---|
| Noise | -10% | 7% | 4% | -6% | -12% | |
| off / environment * (dB) | 24.1 | 23.5 2% | 23 5% | 24.7 -2% | 24.8 -3% | 24.3 -1% |
| Idle Minimum * (dB) | 24.1 | 35.4 -47% | 29.1 -21% | 25 -4% | 28 -16% | 37.6 -56% |
| Idle Average * (dB) | 24.1 | 35.4 -47% | 30.1 -25% | 25.2 -5% | 36.1 -50% | 37.9 -57% |
| Idle Maximum * (dB) | 38.5 | 39 -1% | 31.7 18% | 25.3 34% | 36.1 6% | 38 1% |
| Load Average * (dB) | 41.1 | 42.4 -3% | 33.7 18% | 42.6 -4% | 38.9 5% | 40.8 1% |
| Cyberpunk 2077 ultra * (dB) | 46.6 | 40.4 13% | 33.8 27% | 42.6 9% | 37 21% | 40.18 14% |
| Load Maximum * (dB) | 47.2 | 41.4 12% | 35.2 25% | 47.1 -0% | 49.2 -4% | 40.2 15% |
| Witcher 3 ultra * (dB) | 42.5 |
* ... smaller is better
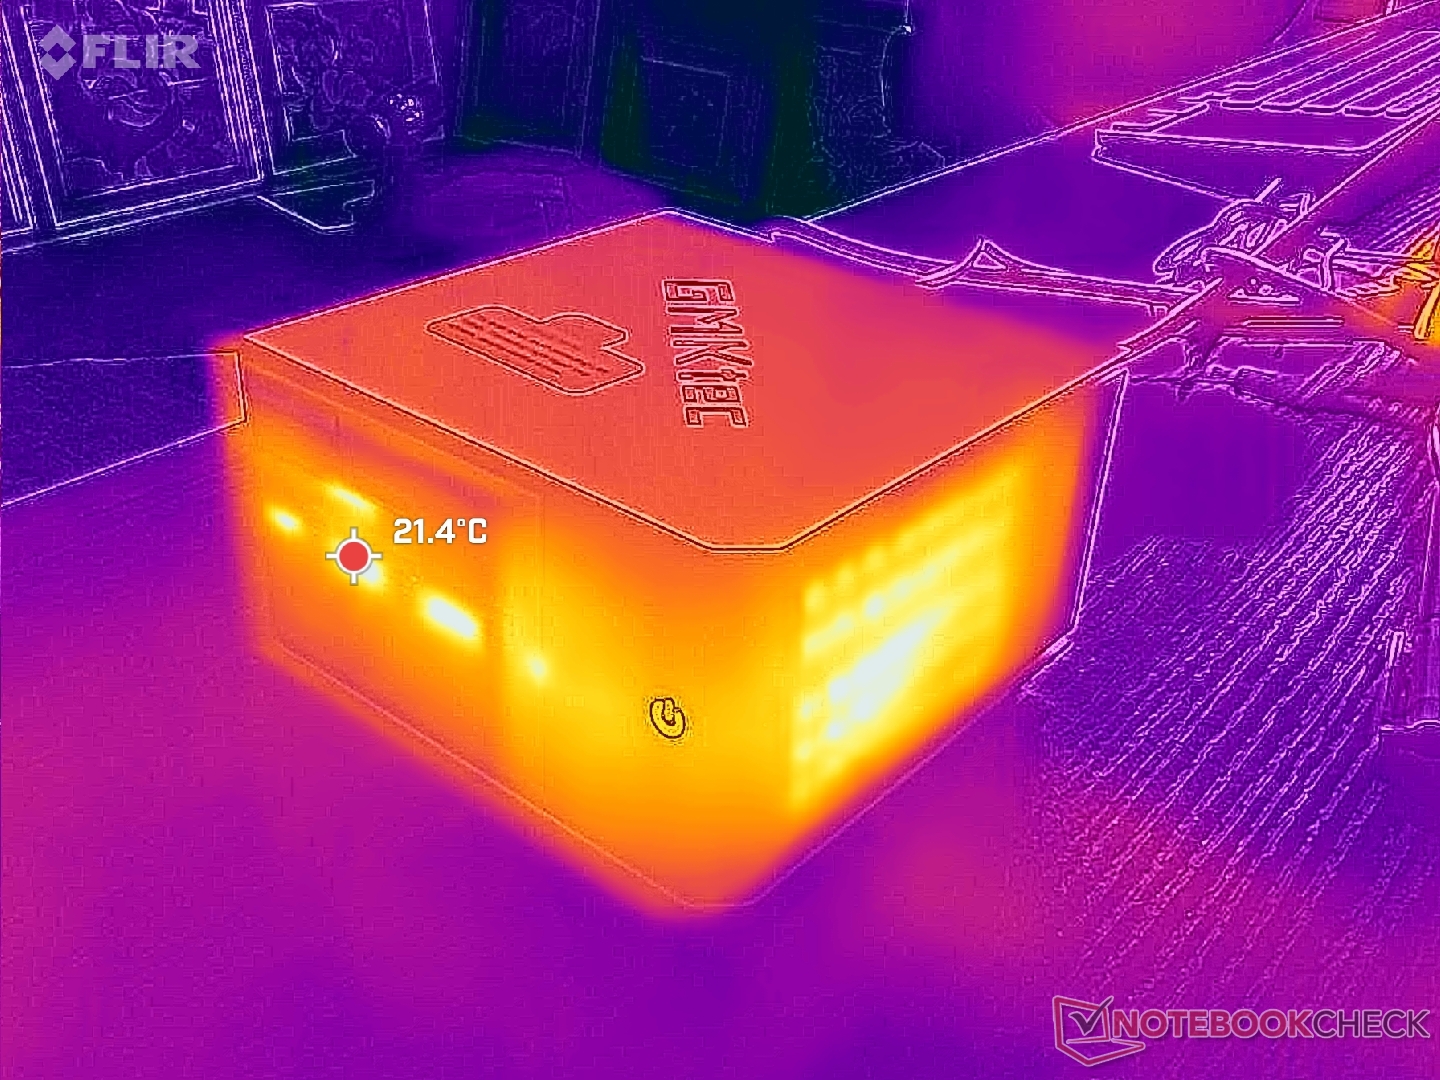
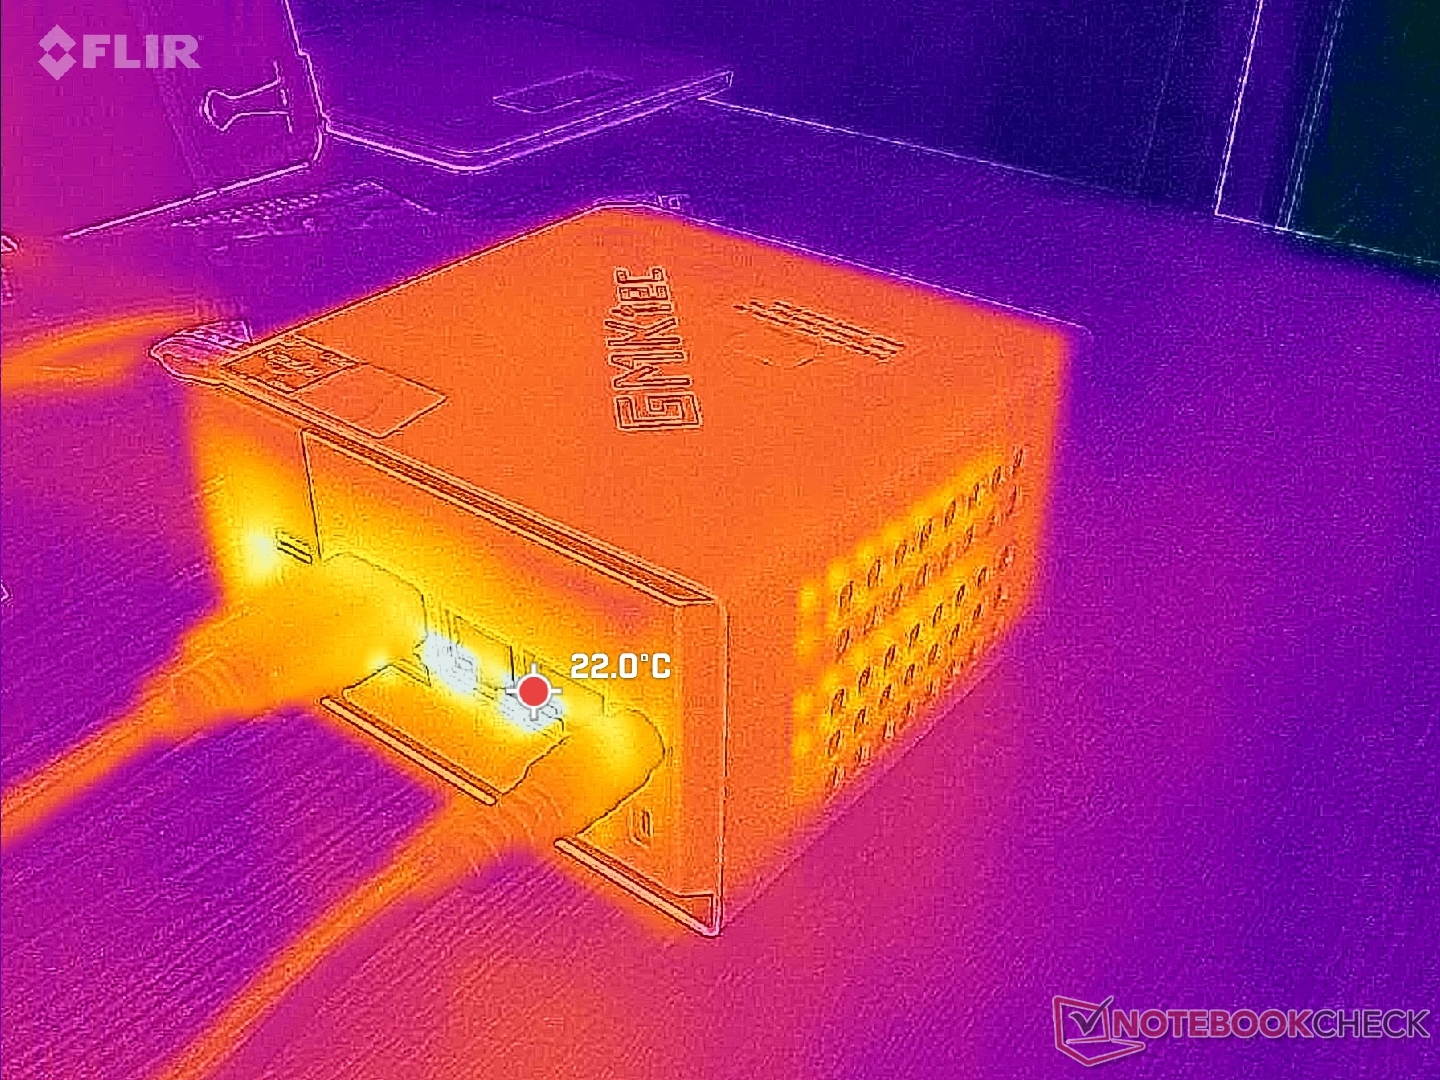
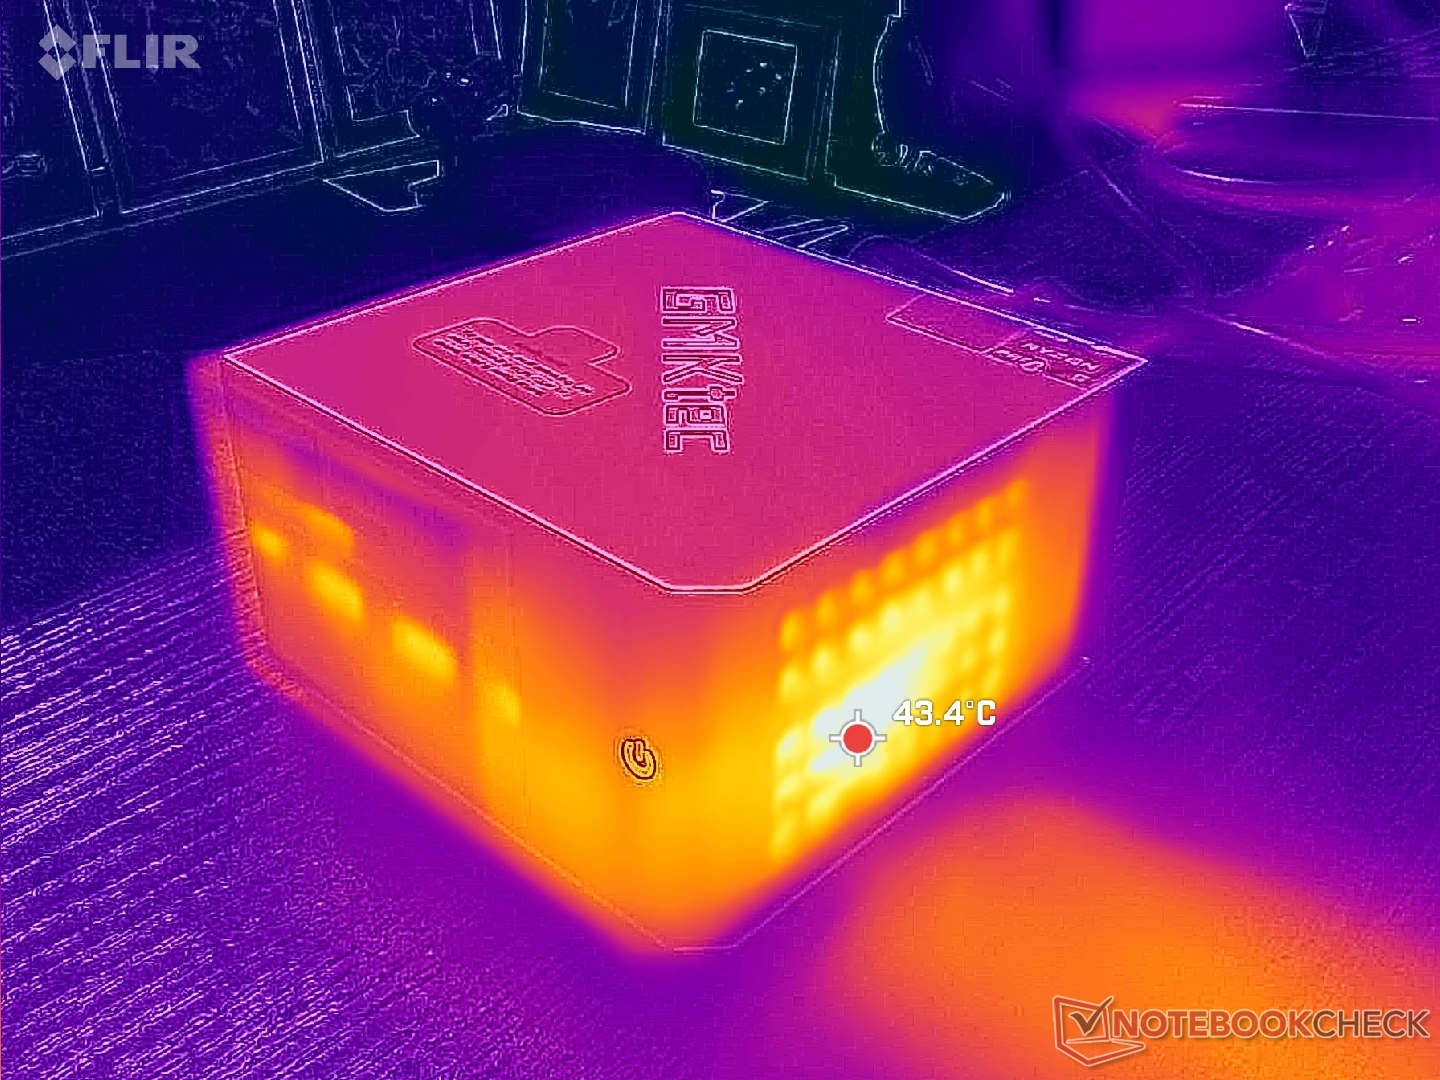
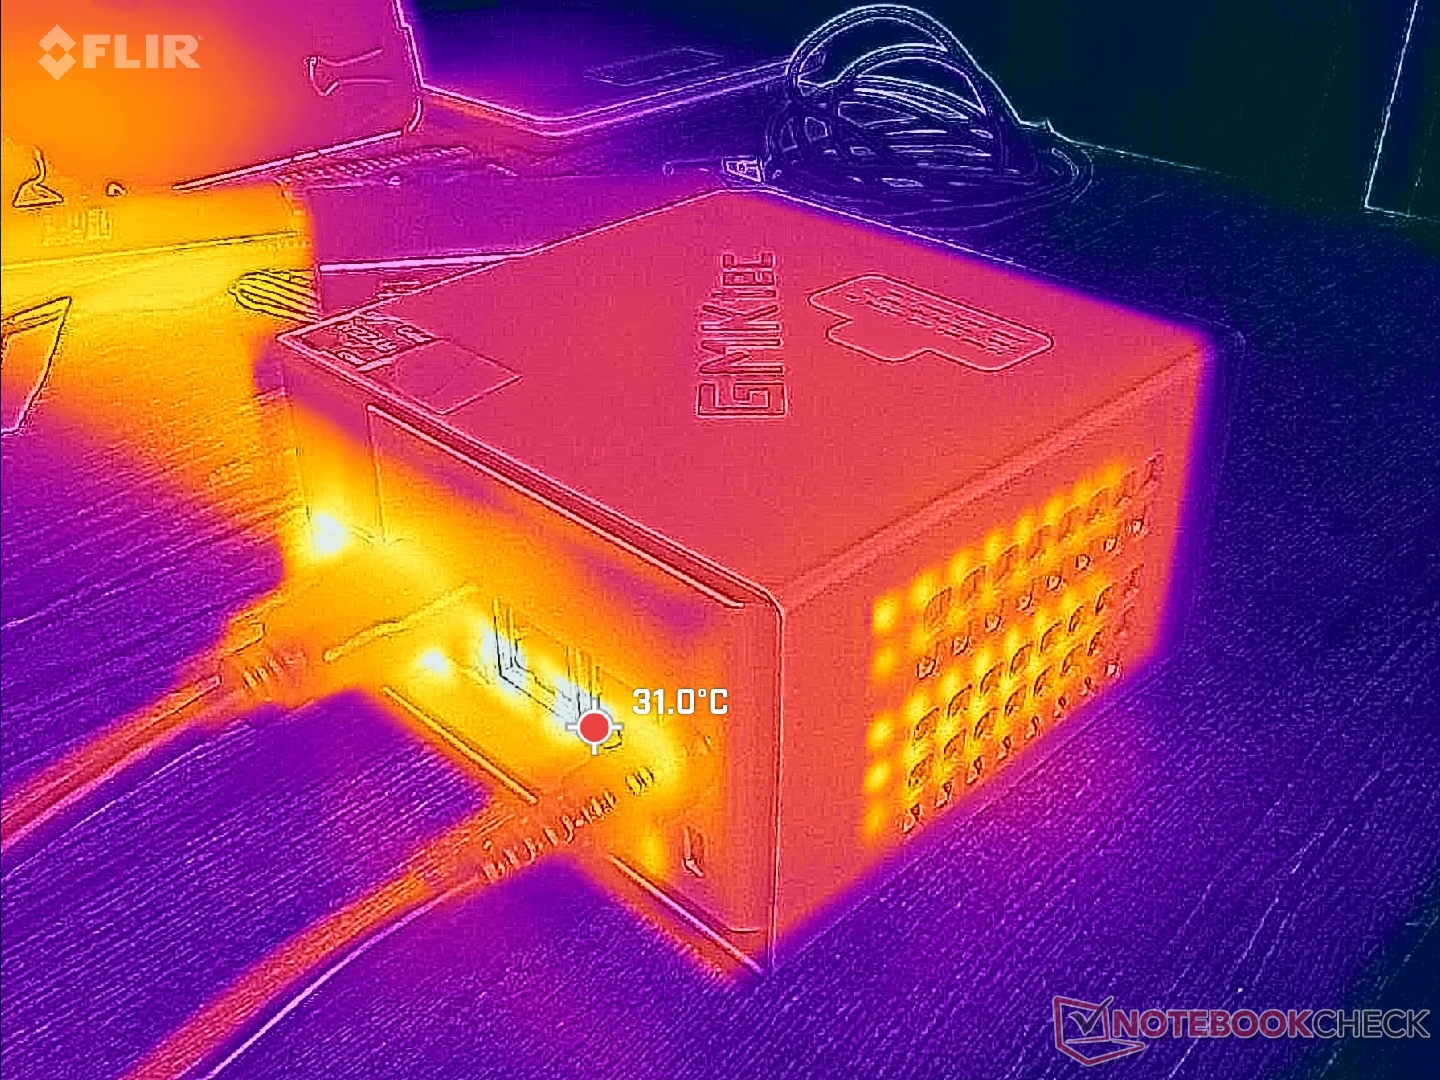
Temperature
Surface temperatures are not an issue as the outer casing makes almost no contact with the inner components. However, make sure airflow is clear along the bottom and right hand sides of the chassis.
Stress Test
The CPU stabilizes at 3.4 GHz, 35 W, and 69 C when running Prime95 stress or 1900 MHz and 67 C when running demanding loads like games. Temperatures are slightly warmer than on the MSI Cubi NUC AI+ 2MG which uses the faster and newer Intel Lunar Lake-V CPU.
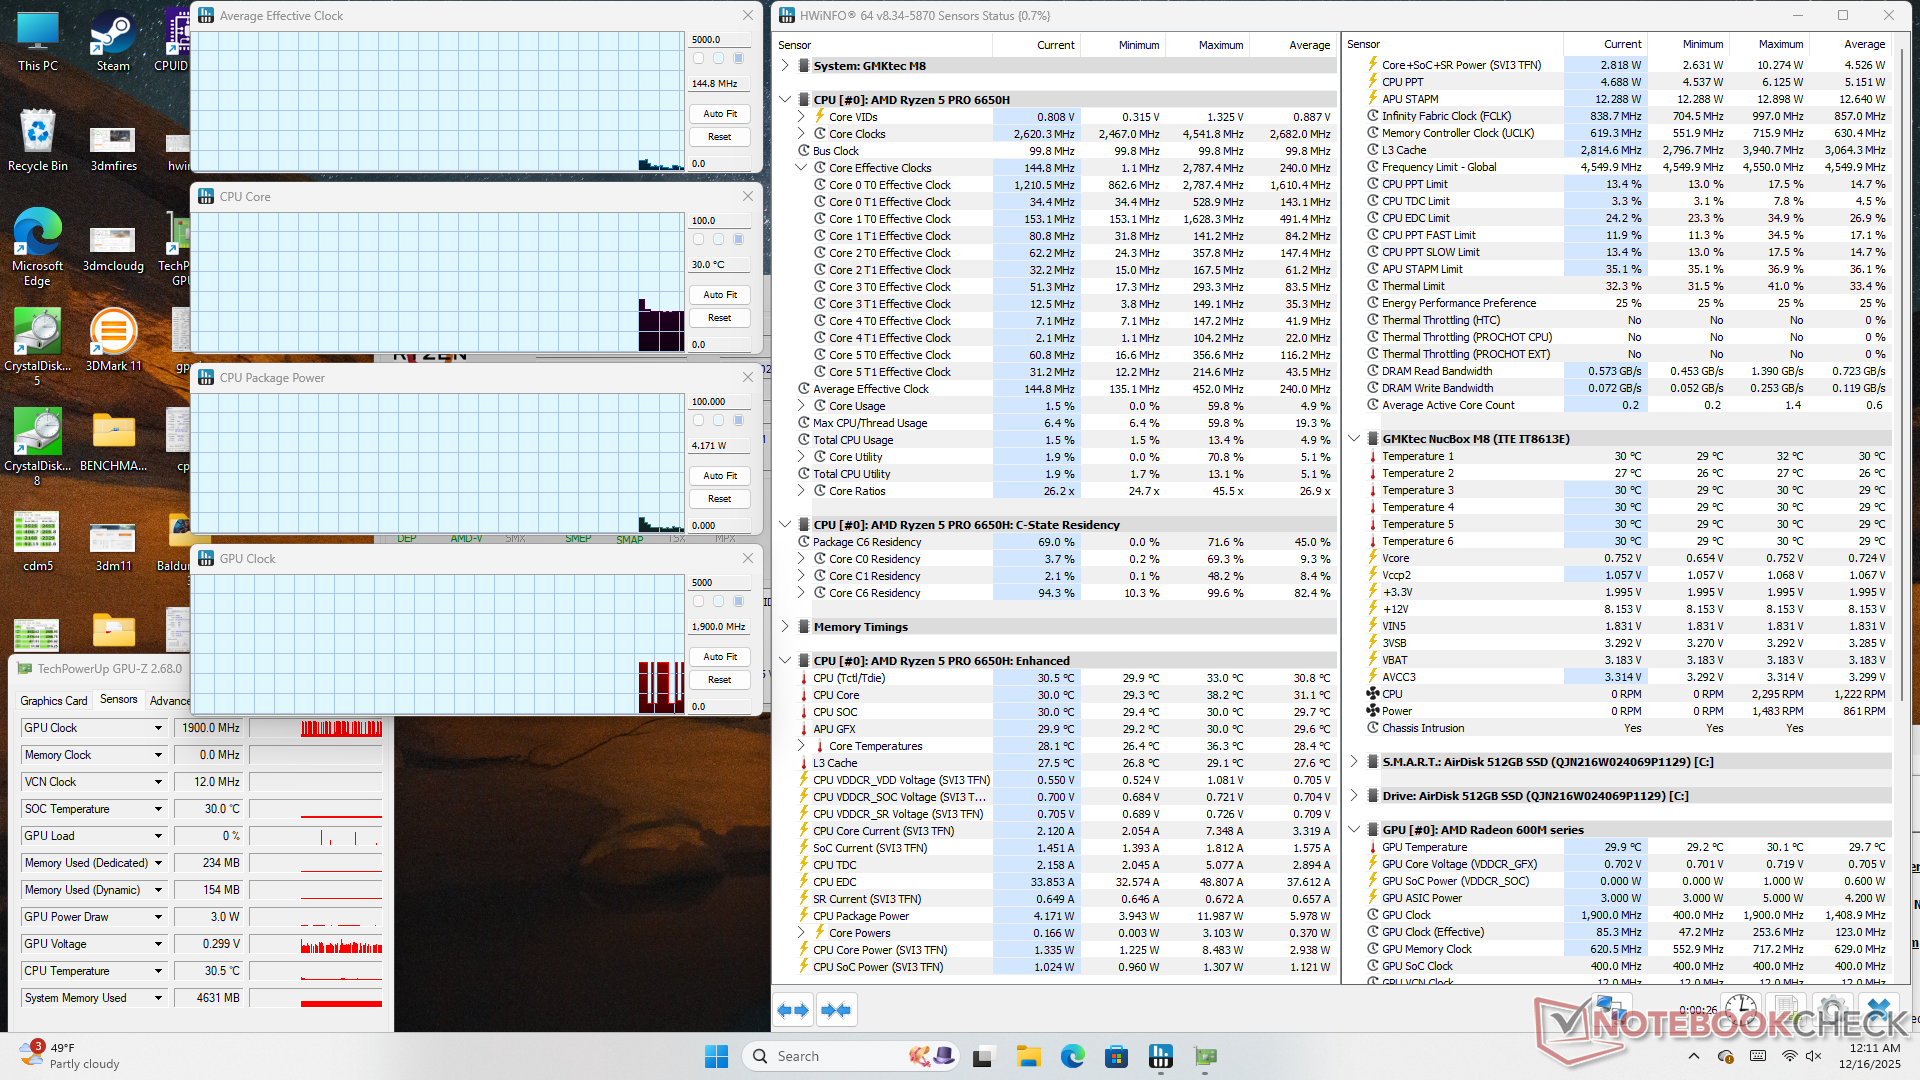
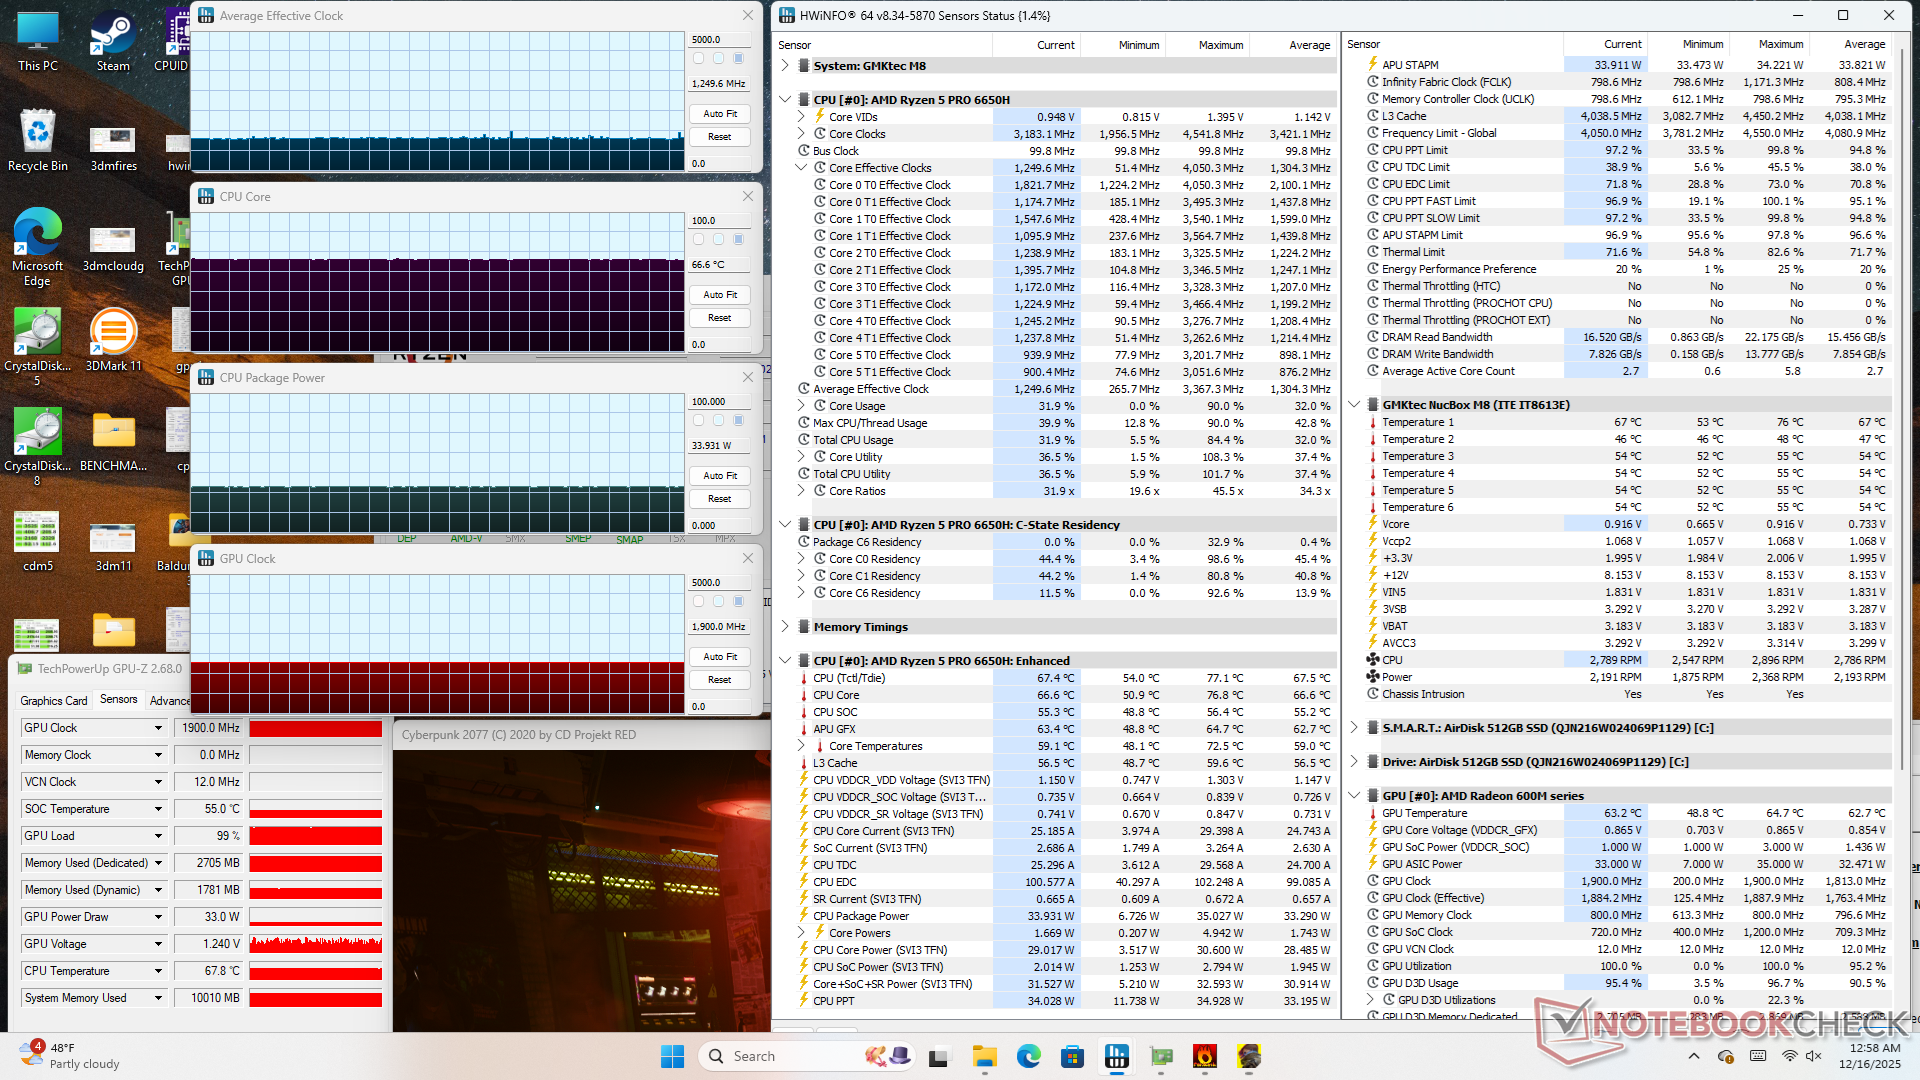
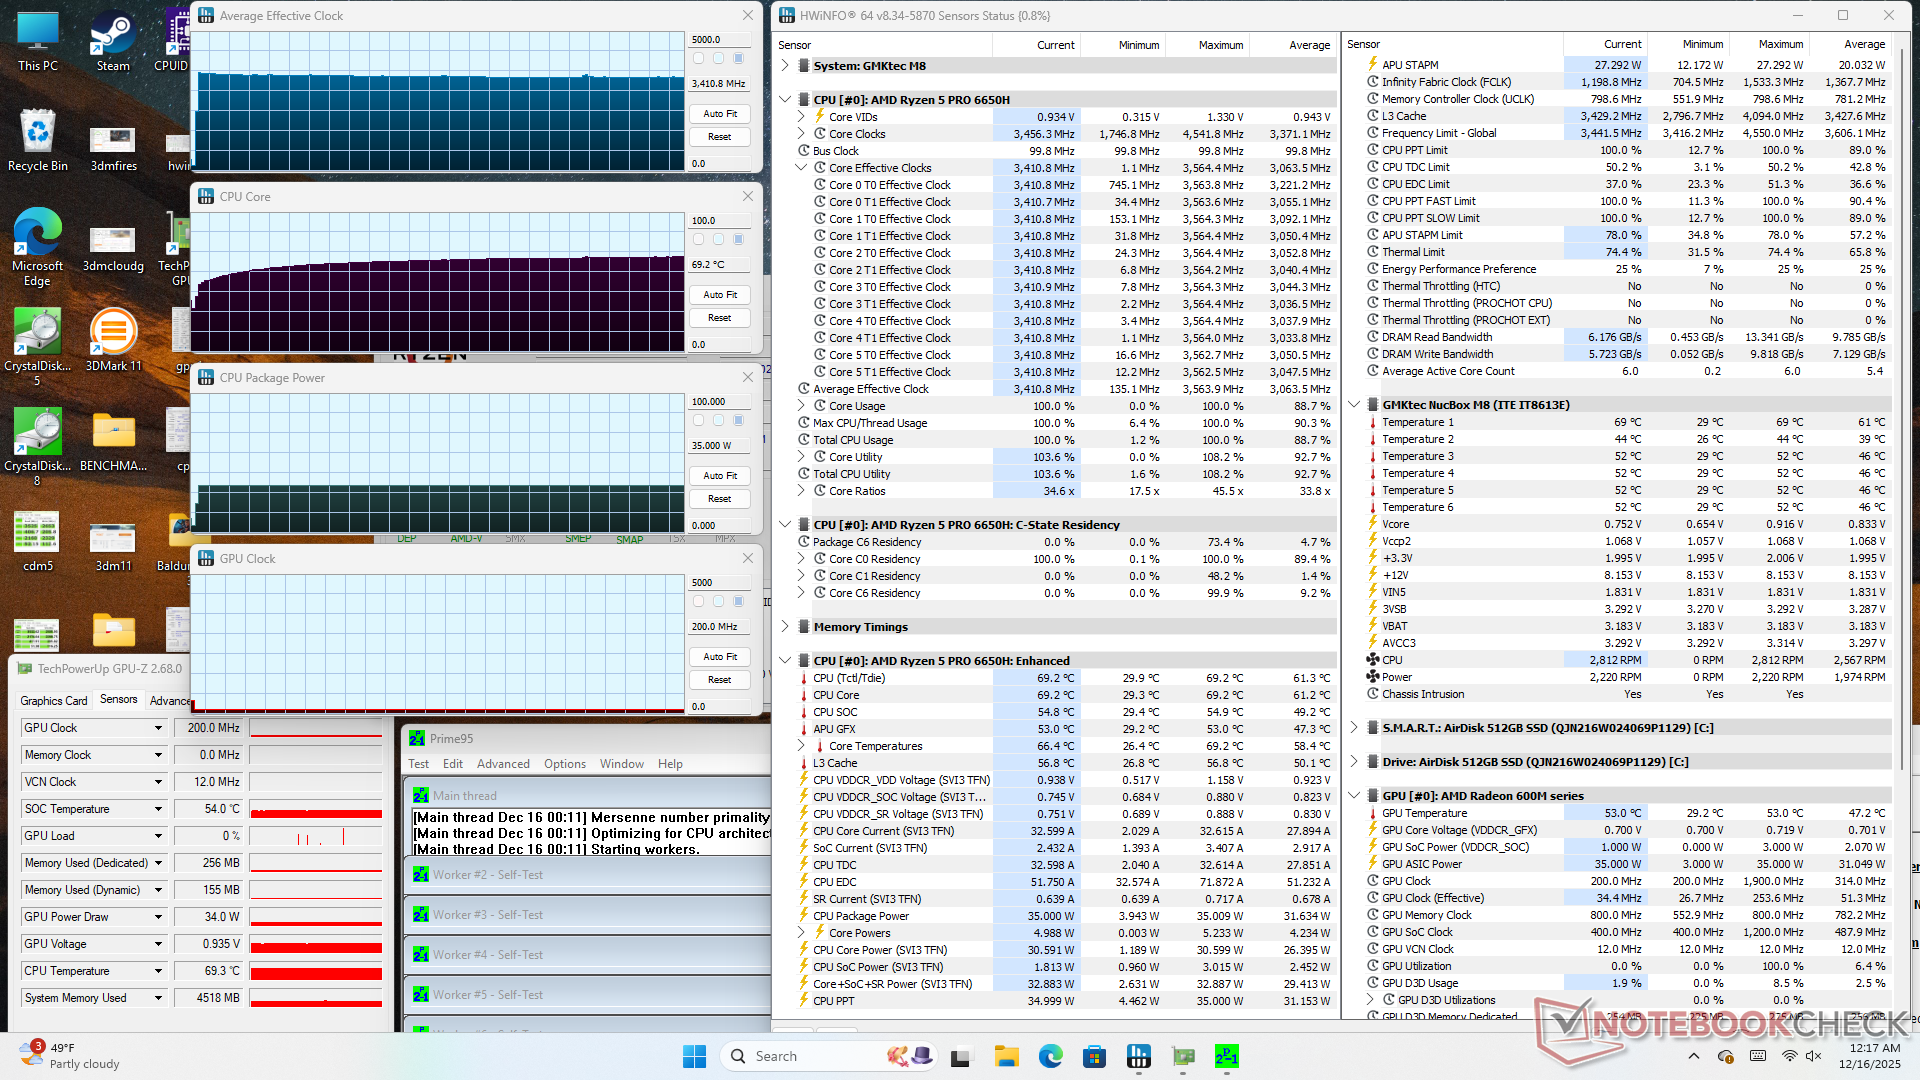
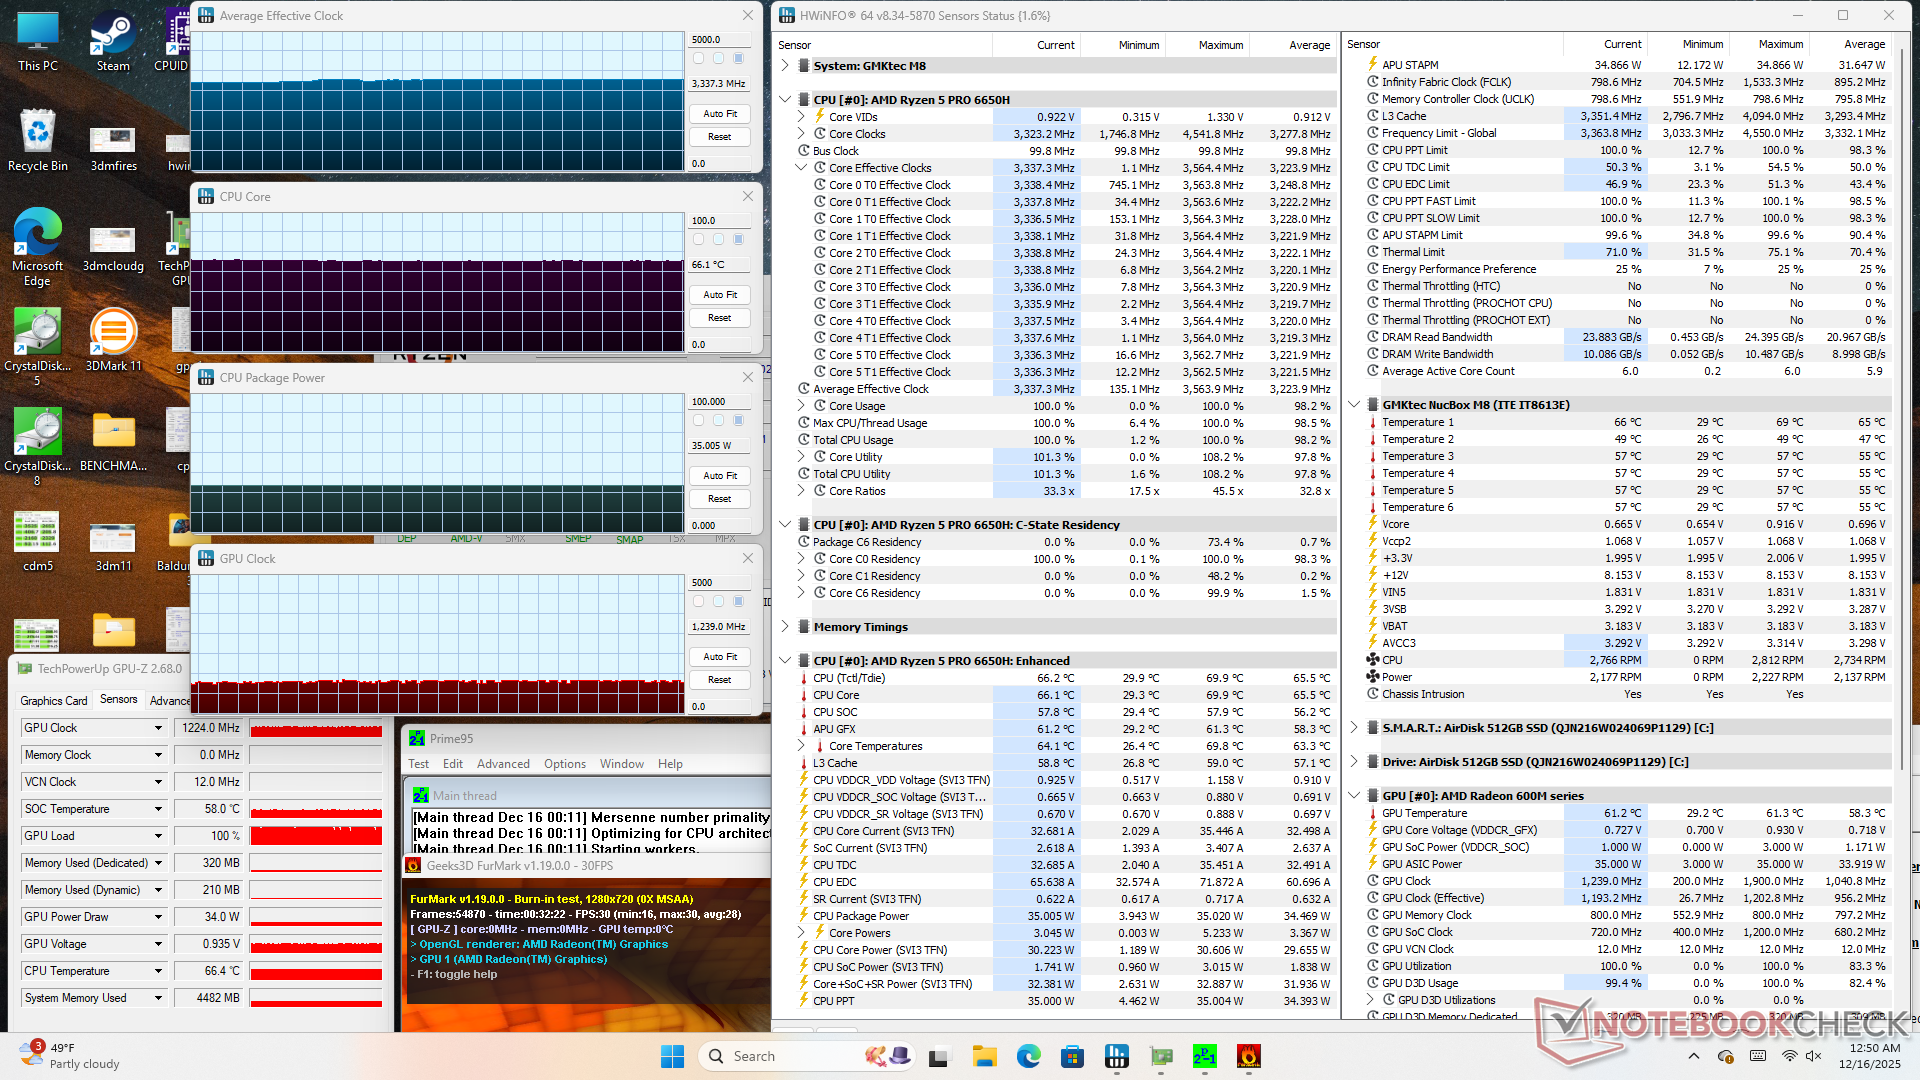
| Average CPU Clock (GHz) | GPU Clock (MHz) | Average CPU Temperature (°C) | |
| System Idle | -- | -- | 30 |
| Prime95 Stress | 3.4 | -- | 69 |
| Prime95 + FurMark Stress | 3.3 | 1239 | 66 |
| Cyberpunk 2077 Stress | 1.3 | 1900 | 67 |
Energy Management
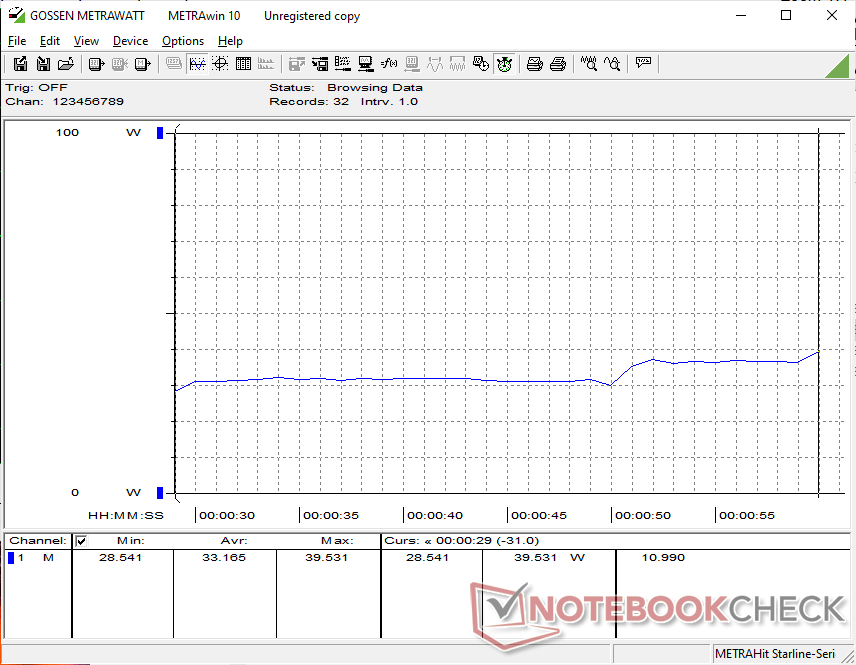
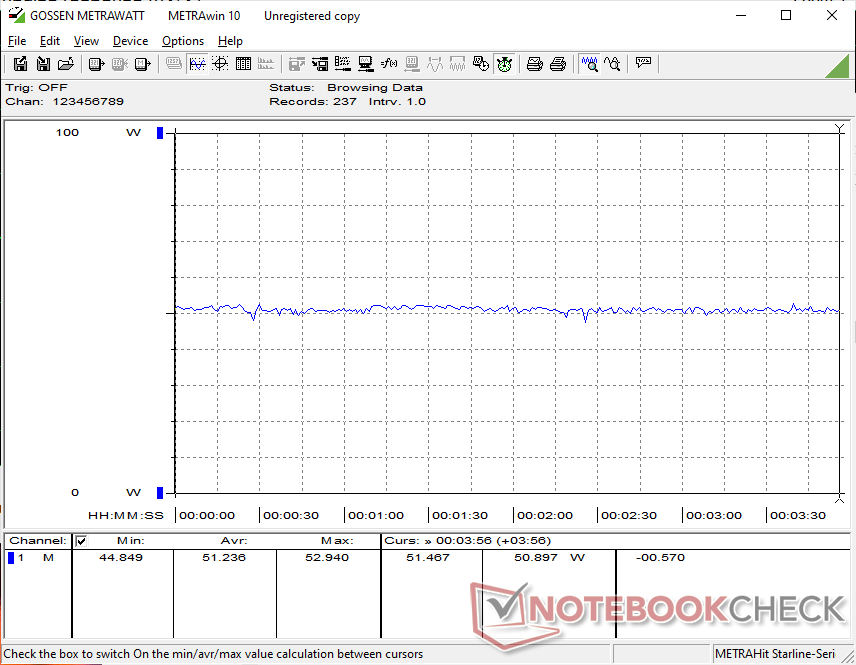
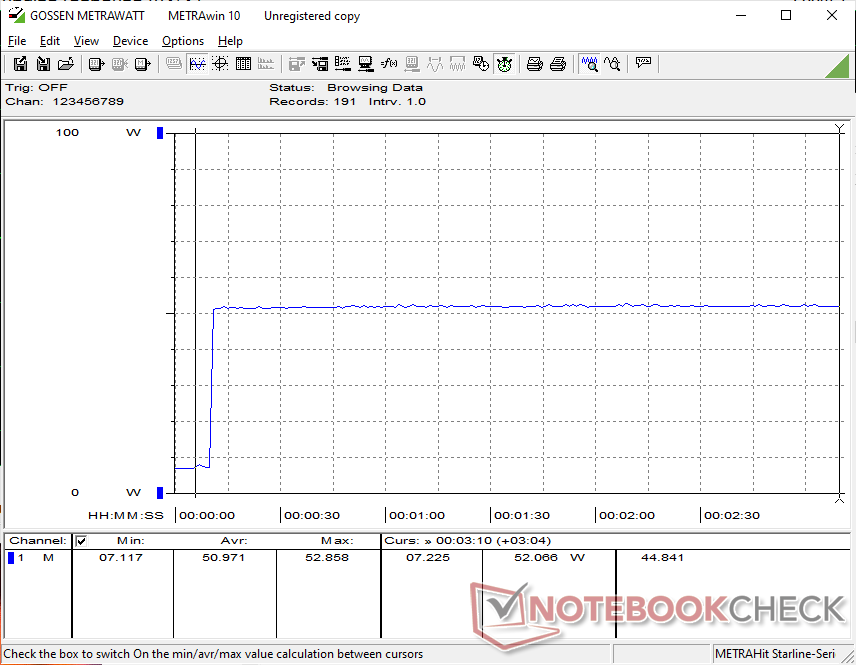
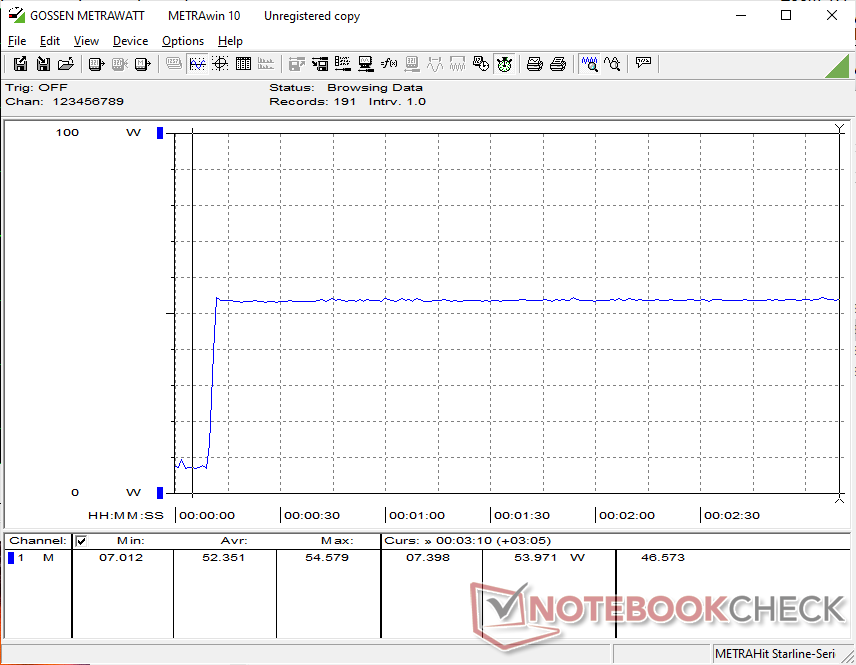
Power Consumption
Overall consumption is higher than on the MSI Cubi NUC AI+ 2MG equipped with the newer and more efficient Core Ultra 7 258V. Performance-per-watt is relatively weak from the Zen 3+ architecture.
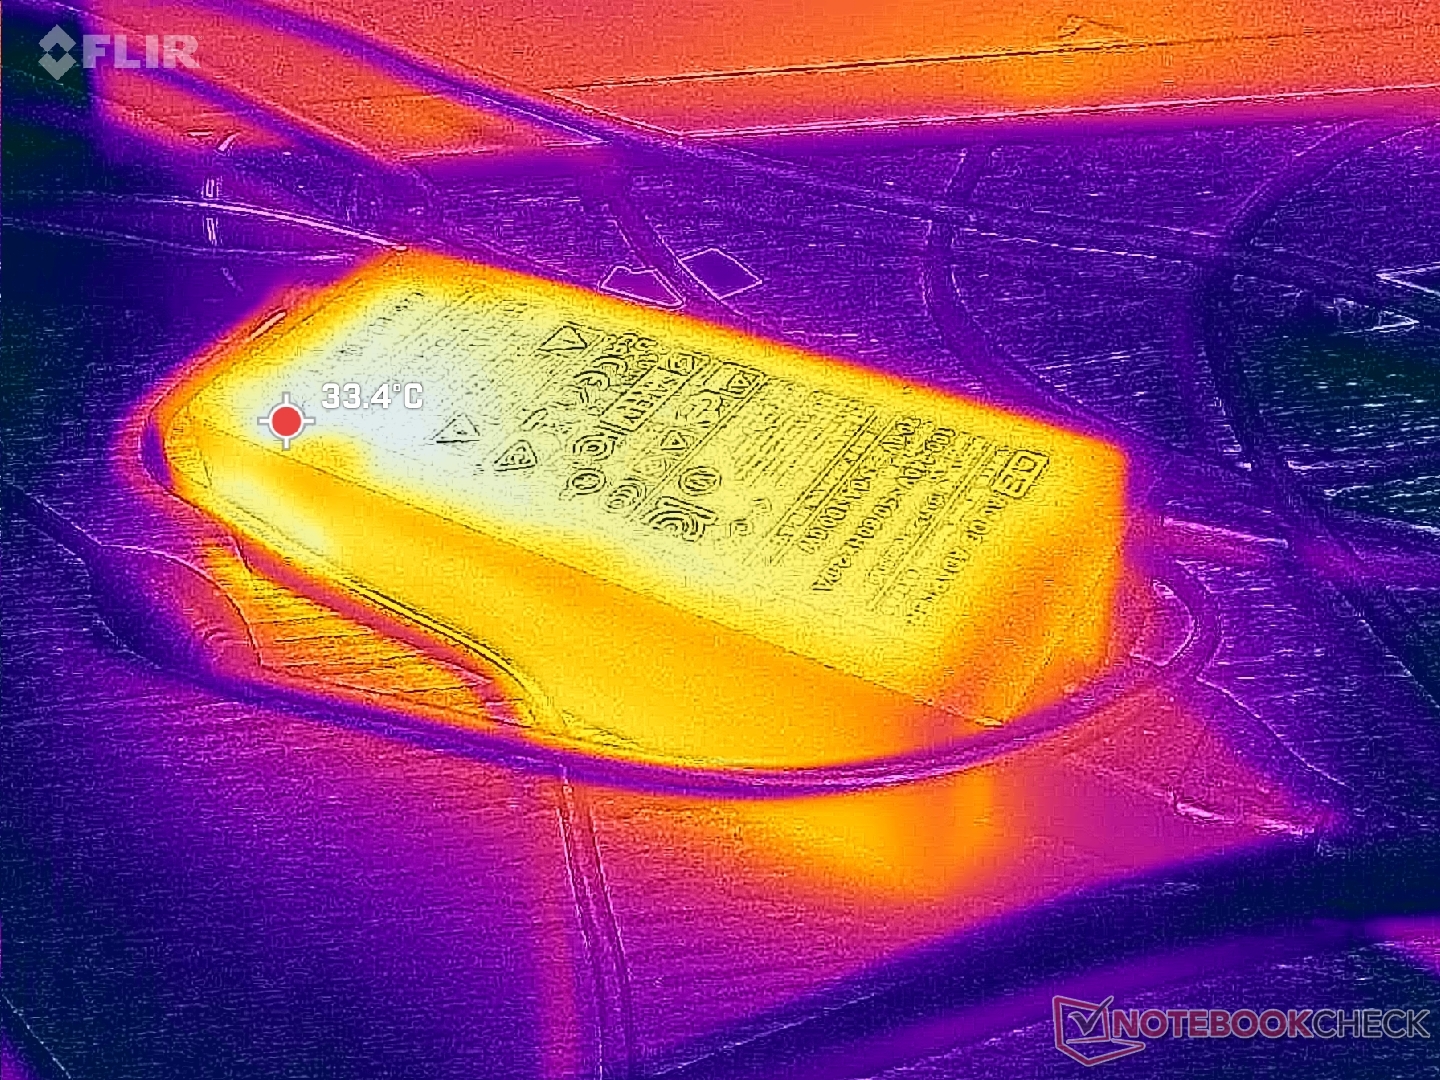
Note that the 100 W AC adapter is quite large (~13.3 x 5.7 x 3.2 cm) despite the small size of the mini PC.
| Off / Standby | |
| Idle | |
| Load |
|
Key:
min: | |
| GMK NucBox M8 R5 PRO 6650H, Radeon 660M, AirDisk APF 10-512G, , x, | GMK NucBox K12 Ryzen 7 H 255, Radeon 780M, Crucial P3 Plus CT1000P3PSSD8, , x, | Beelink SER9 Pro Ryzen 7 H 255, Radeon 780M, Crucial P3 Plus CT1000P3PSSD8, , x, | Asus ExpertCenter PN54-S70012NN Ryzen AI 7 350, Radeon 860M, Western Digital PC SN5000S SDEQNSJ-1T00, , x, | MSI Cubi NUC AI+ 2MG Core Ultra 7 258V, Arc 140V, Phison 1 TB ESR01TBTCCZ-27J, , x, | BOSGAME M4 Neo R7 7840HS, Radeon 780M, Kingston OM8PGP41024N-A0, , x, | |
|---|---|---|---|---|---|---|
| Power Consumption | -57% | -27% | -8% | 16% | -45% | |
| Idle Minimum * (Watt) | 6.6 | 9.9 -50% | 7 -6% | 2.6 61% | 2.9 56% | 7.6 -15% |
| Idle Average * (Watt) | 6.7 | 10.1 -51% | 7.1 -6% | 4.6 31% | 5.7 15% | 9.1 -36% |
| Idle Maximum * (Watt) | 14.5 | 13.1 10% | 7.5 48% | 6.4 56% | 10.2 30% | 11.1 23% |
| Load Average * (Watt) | 33.2 | 69.8 -110% | 62.3 -88% | 68.5 -106% | 38.7 -17% | 67.2 -102% |
| Cyberpunk 2077 ultra external monitor * (Watt) | 51.2 | 86.3 -69% | 80.1 -56% | 60.2 -18% | 41.1 20% | 81.3 -59% |
| Load Maximum * (Watt) | 54.6 | 92.8 -70% | 82.9 -52% | 94 -72% | 60 -10% | 98.4 -80% |
* ... smaller is better
Power Consumption Cyberpunk / Stress Test
Power Consumption external Monitor
Notebookcheck Rating
A relatively barebones office-centric mini PC utilizing the company's latest chassis design but with an older AMD Zen 3+ CPU to keep prices attractive.
GMK NucBox M8
- 12/28/2025 v8
Allen Ngo
 Total Sustainability Score:
 Potential Competitors in Comparison
Image | Model / Review | Price | Weight | Height | Display |
|---|---|---|---|---|---|
1. 70.6% 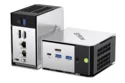 | GMK NucBox M8 AMD Ryzen 5 PRO 6650H ⎘ AMD Radeon 660M ⎘ 16 GB Memory, 512 GB SSD | Amazon: 1. $29.99 19V~20V Charger for GMKtec M... | 494 g | 63 mm | x |
2. 73.7% 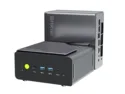 | GMK NucBox K12 AMD Ryzen 7 H 255 ⎘ AMD Radeon 780M ⎘ 32 GB Memory, 1024 GB SSD | 938 g | 78 mm | x | |
3. 80.2% 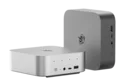 | Beelink SER9 Pro AMD Ryzen 7 H 255 ⎘ AMD Radeon 780M ⎘ 32 GB Memory, 1024 GB SSD | List Price: 520 USD | 812 g | 44.7 mm | x |
4. 80.9% 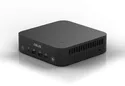 | Asus ExpertCenter PN54-S70012NN AMD Ryzen AI 7 350 ⎘ AMD Radeon 860M ⎘ 32 GB Memory, 1024 GB SSD | List Price: 1249€ | 650 g | 34 mm | x |
5. 75.2%  | MSI Cubi NUC AI+ 2MG Intel Core Ultra 7 258V ⎘ Intel Arc Graphics 140V ⎘ 32 GB Memory, 1000 GB SSD | List Price: 900 USD | 669 g | 50.1 mm | x |
6. 74% 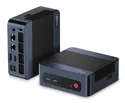 | BOSGAME M4 Neo AMD Ryzen 7 7840HS ⎘ AMD Radeon 780M ⎘ 32 GB Memory, 1024 GB SSD | List Price: 389 EUR | 560 g | 42 mm | x |
Transparency
The selection of devices to be reviewed is made by our editorial team. The test sample was provided to the author as a loan by the manufacturer or retailer for the purpose of this review. The lender had no influence on this review, nor did the manufacturer receive a copy of this review before publication. There was no obligation to publish this review. As an independent media company, Notebookcheck is not subjected to the authority of manufacturers, retailers or publishers.
This is how Notebookcheck is testing
Every year, Notebookcheck independently reviews hundreds of laptops and smartphones using standardized procedures to ensure that all results are comparable. We have continuously developed our test methods for around 20 years and set industry standards in the process. In our test labs, high-quality measuring equipment is utilized by experienced technicians and editors. These tests involve a multi-stage validation process. Our complex rating system is based on hundreds of well-founded measurements and benchmarks, which maintains objectivity. Further information on our test methods can be found here.
