Verdict - Versatile mini server with powerful AMD Ryzen AI 9 SoC
The Minisforum N5 Pro presents itself as a mighty and modern NAS/mini server that delivers impressive computing power with the AMD Ryzen AI 9 HX PRO 370 on the Zen 5 architecture. With 12 cores, DDR5 support, and Radeon 890M graphics, the system is equally suitable for multimedia, virtualization, and AI-based applications. Two fast LAN ports, a wide range of expansion options, and easy maintenance underline the professional standard. Despite its compact design, the cooling system impresses with low temperatures and moderate noise levels.

Energy consumption remains efficient even under load, giving the N5 Pro an excellent power consumption/efficiency balance. Minor points of criticism, such as the sensitive, glossy front, are hardly noticeable. Overall, the Minisforum N5 Pro offers an impressive combination of performance, features, and efficiency - ideal for demanding power users and professional NAS applications.
Pros
Cons
Price and availability
The Minisforum N5 Pro can be ordered as a barebone from $1,019 at Minisforum. Also Amazon offers the same equipment for at least $1,019 as well. In combination with 96 GB RAM, the price is $1,597, also available on Amazon.
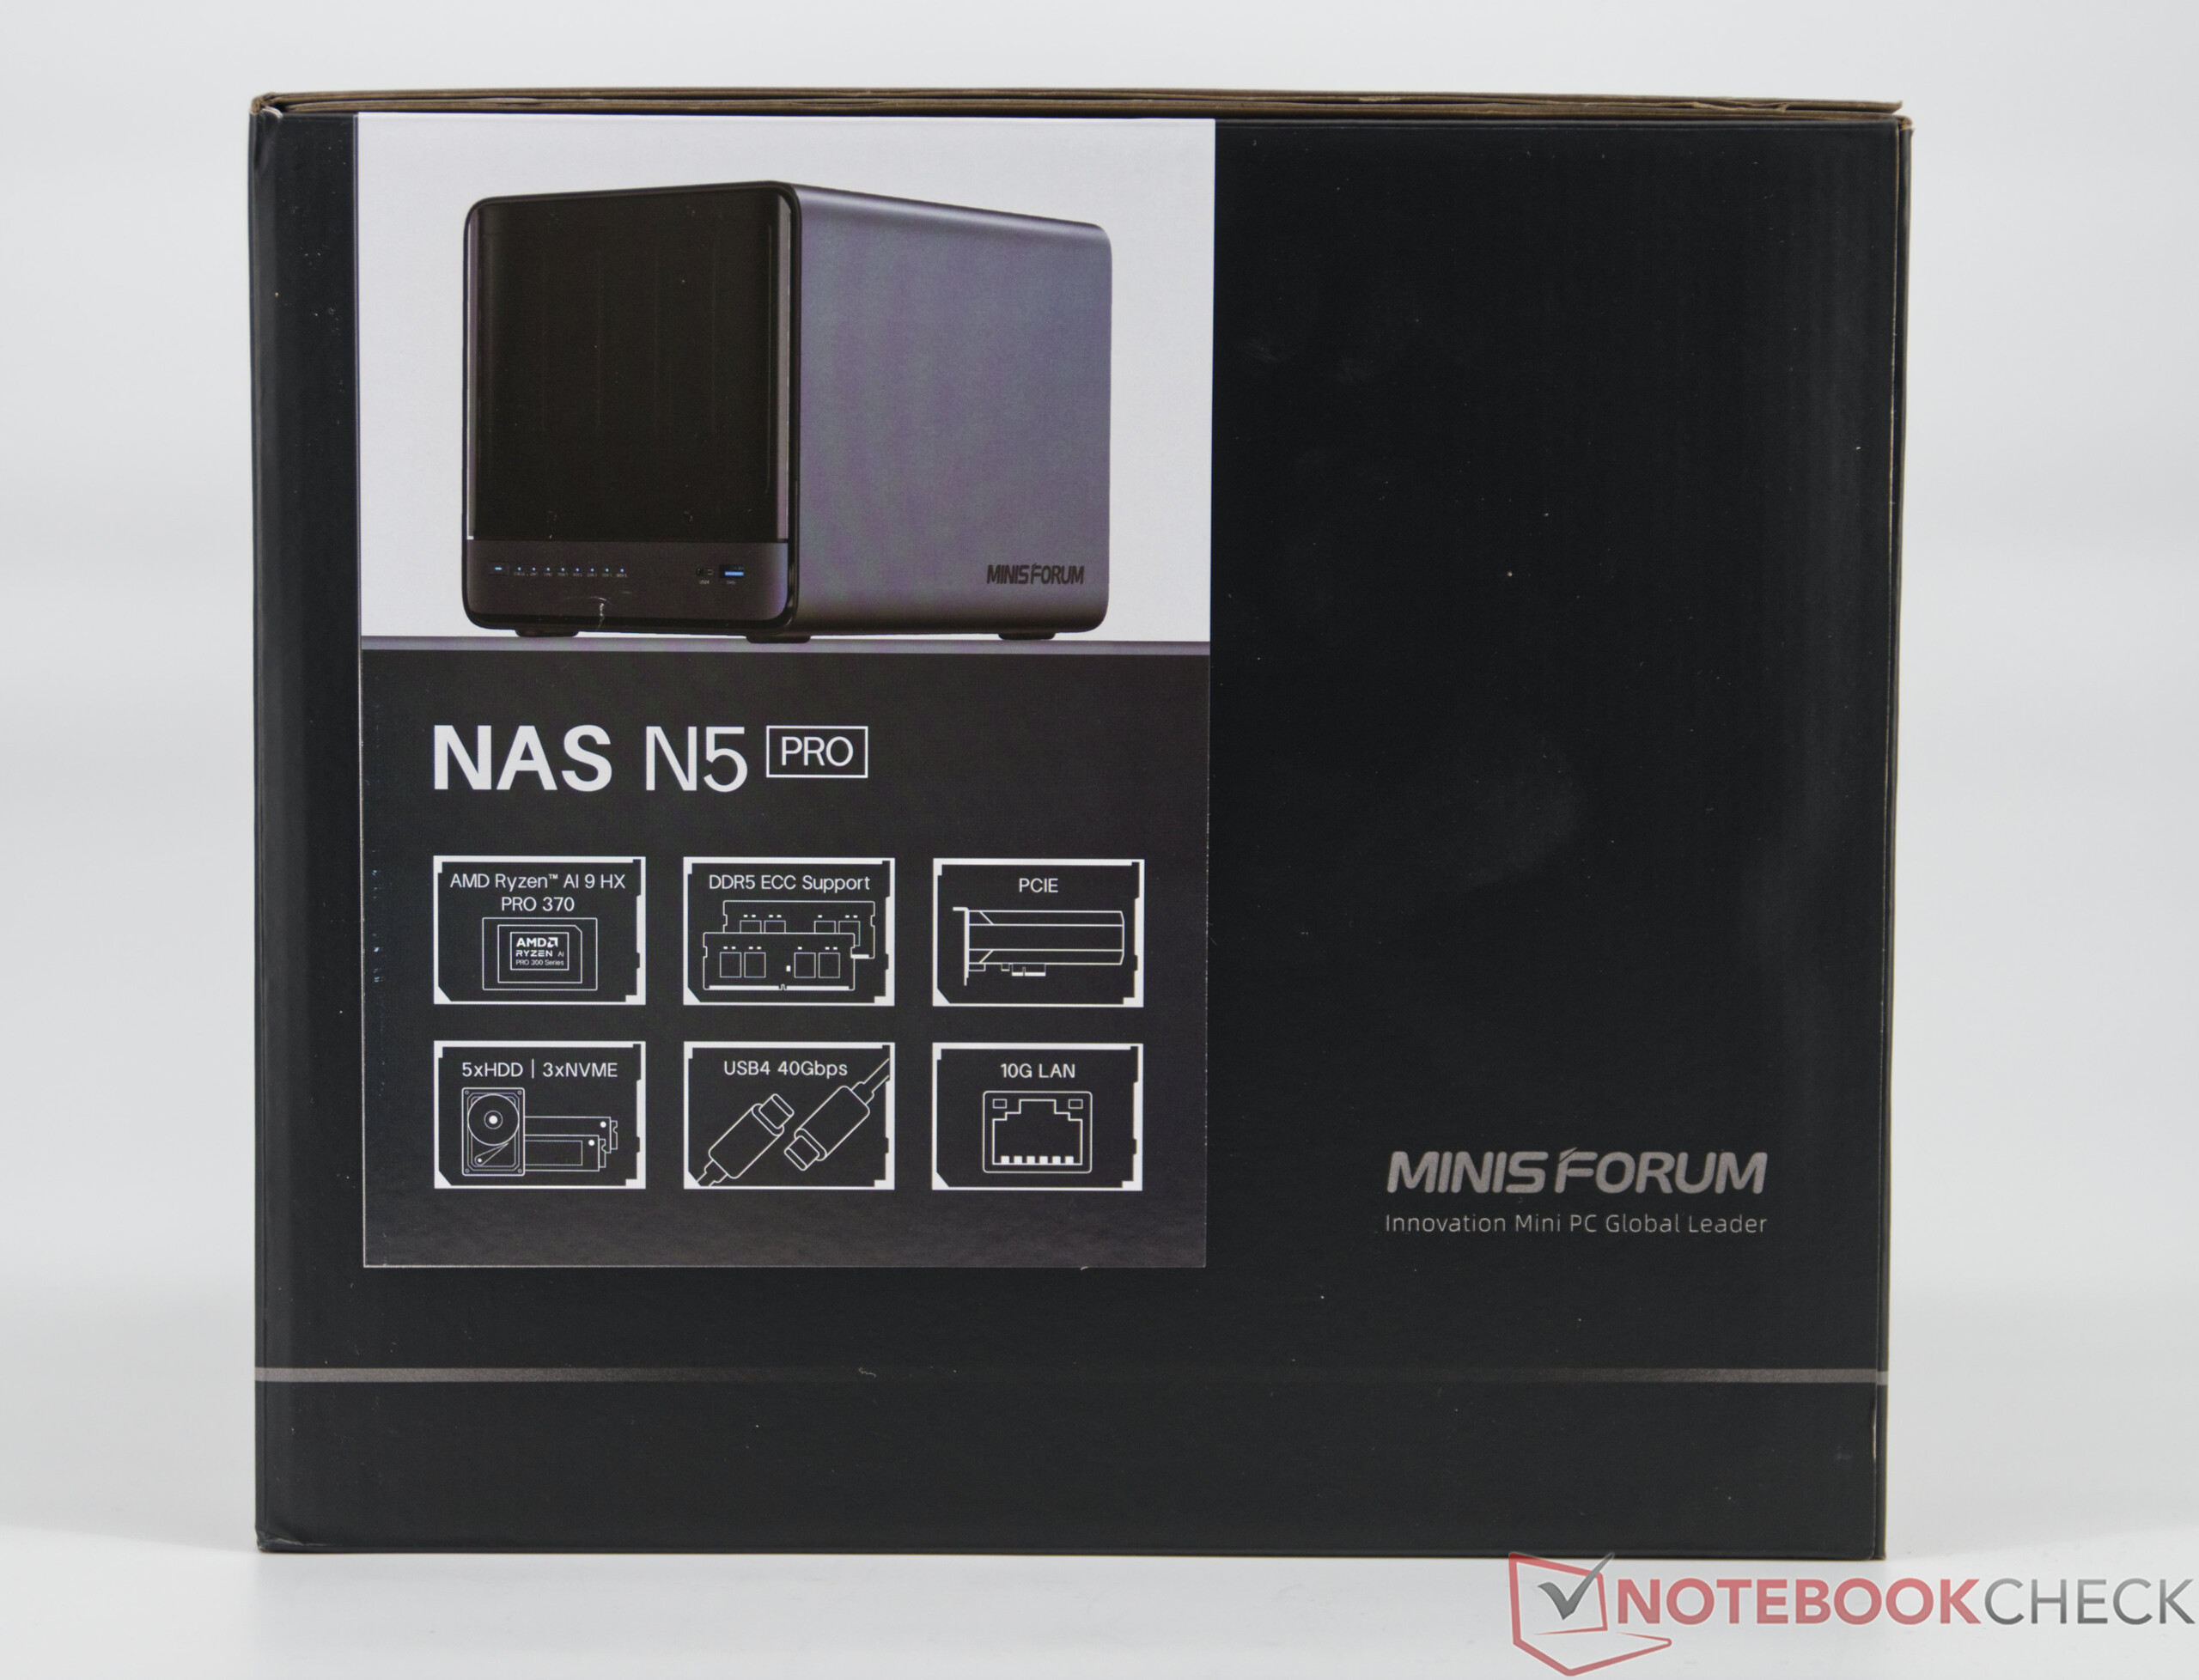
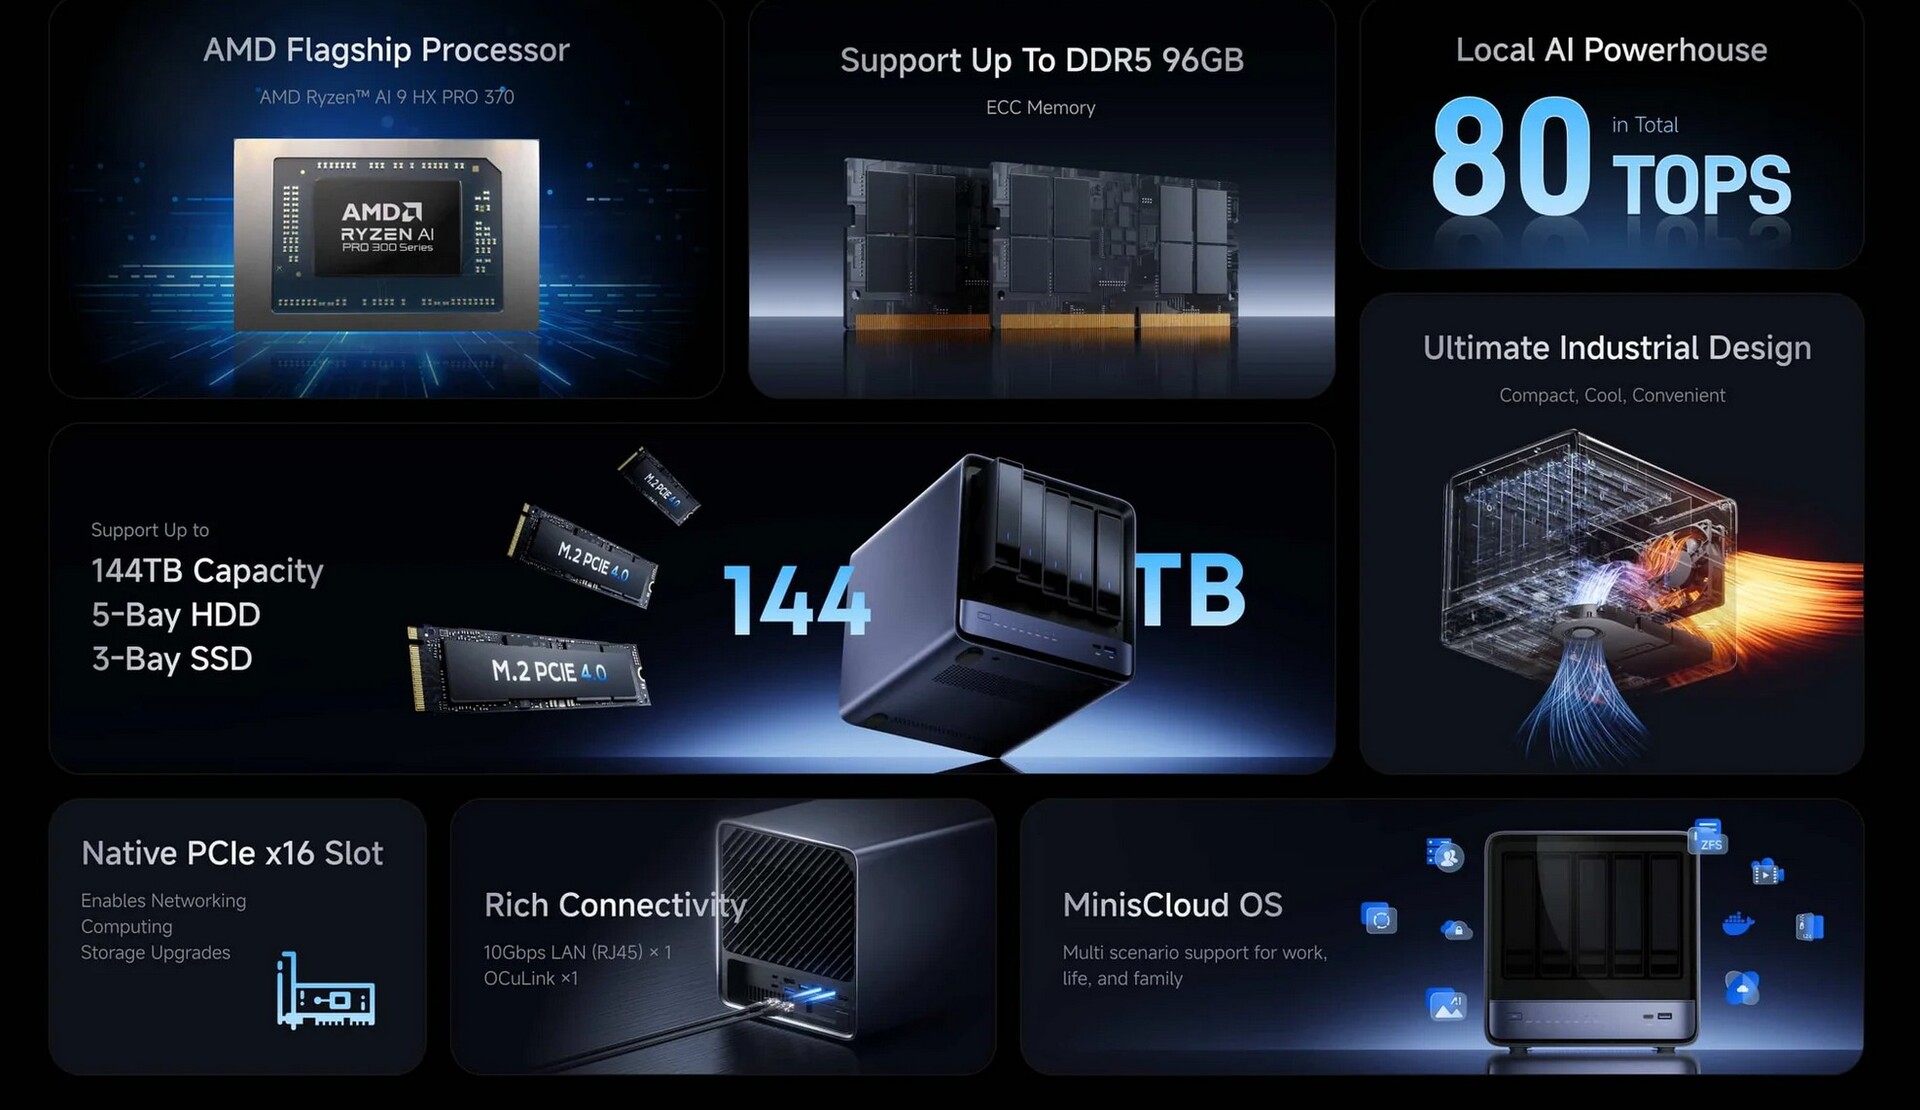
The Minisforum N5 Pro is a state-of-the-art NAS system equipped with the powerful AMD Ryzen AI 9 HX PRO 370 processor. On this basis, Minisforum offers the AI-NAS, which can also be used as a conventional mini PC. In combination with 32 GB ECC RAM, the test unit reached us and competed against comparable mini PCs to be able to classify the system's performance.
Specifications
Case & Connectivity
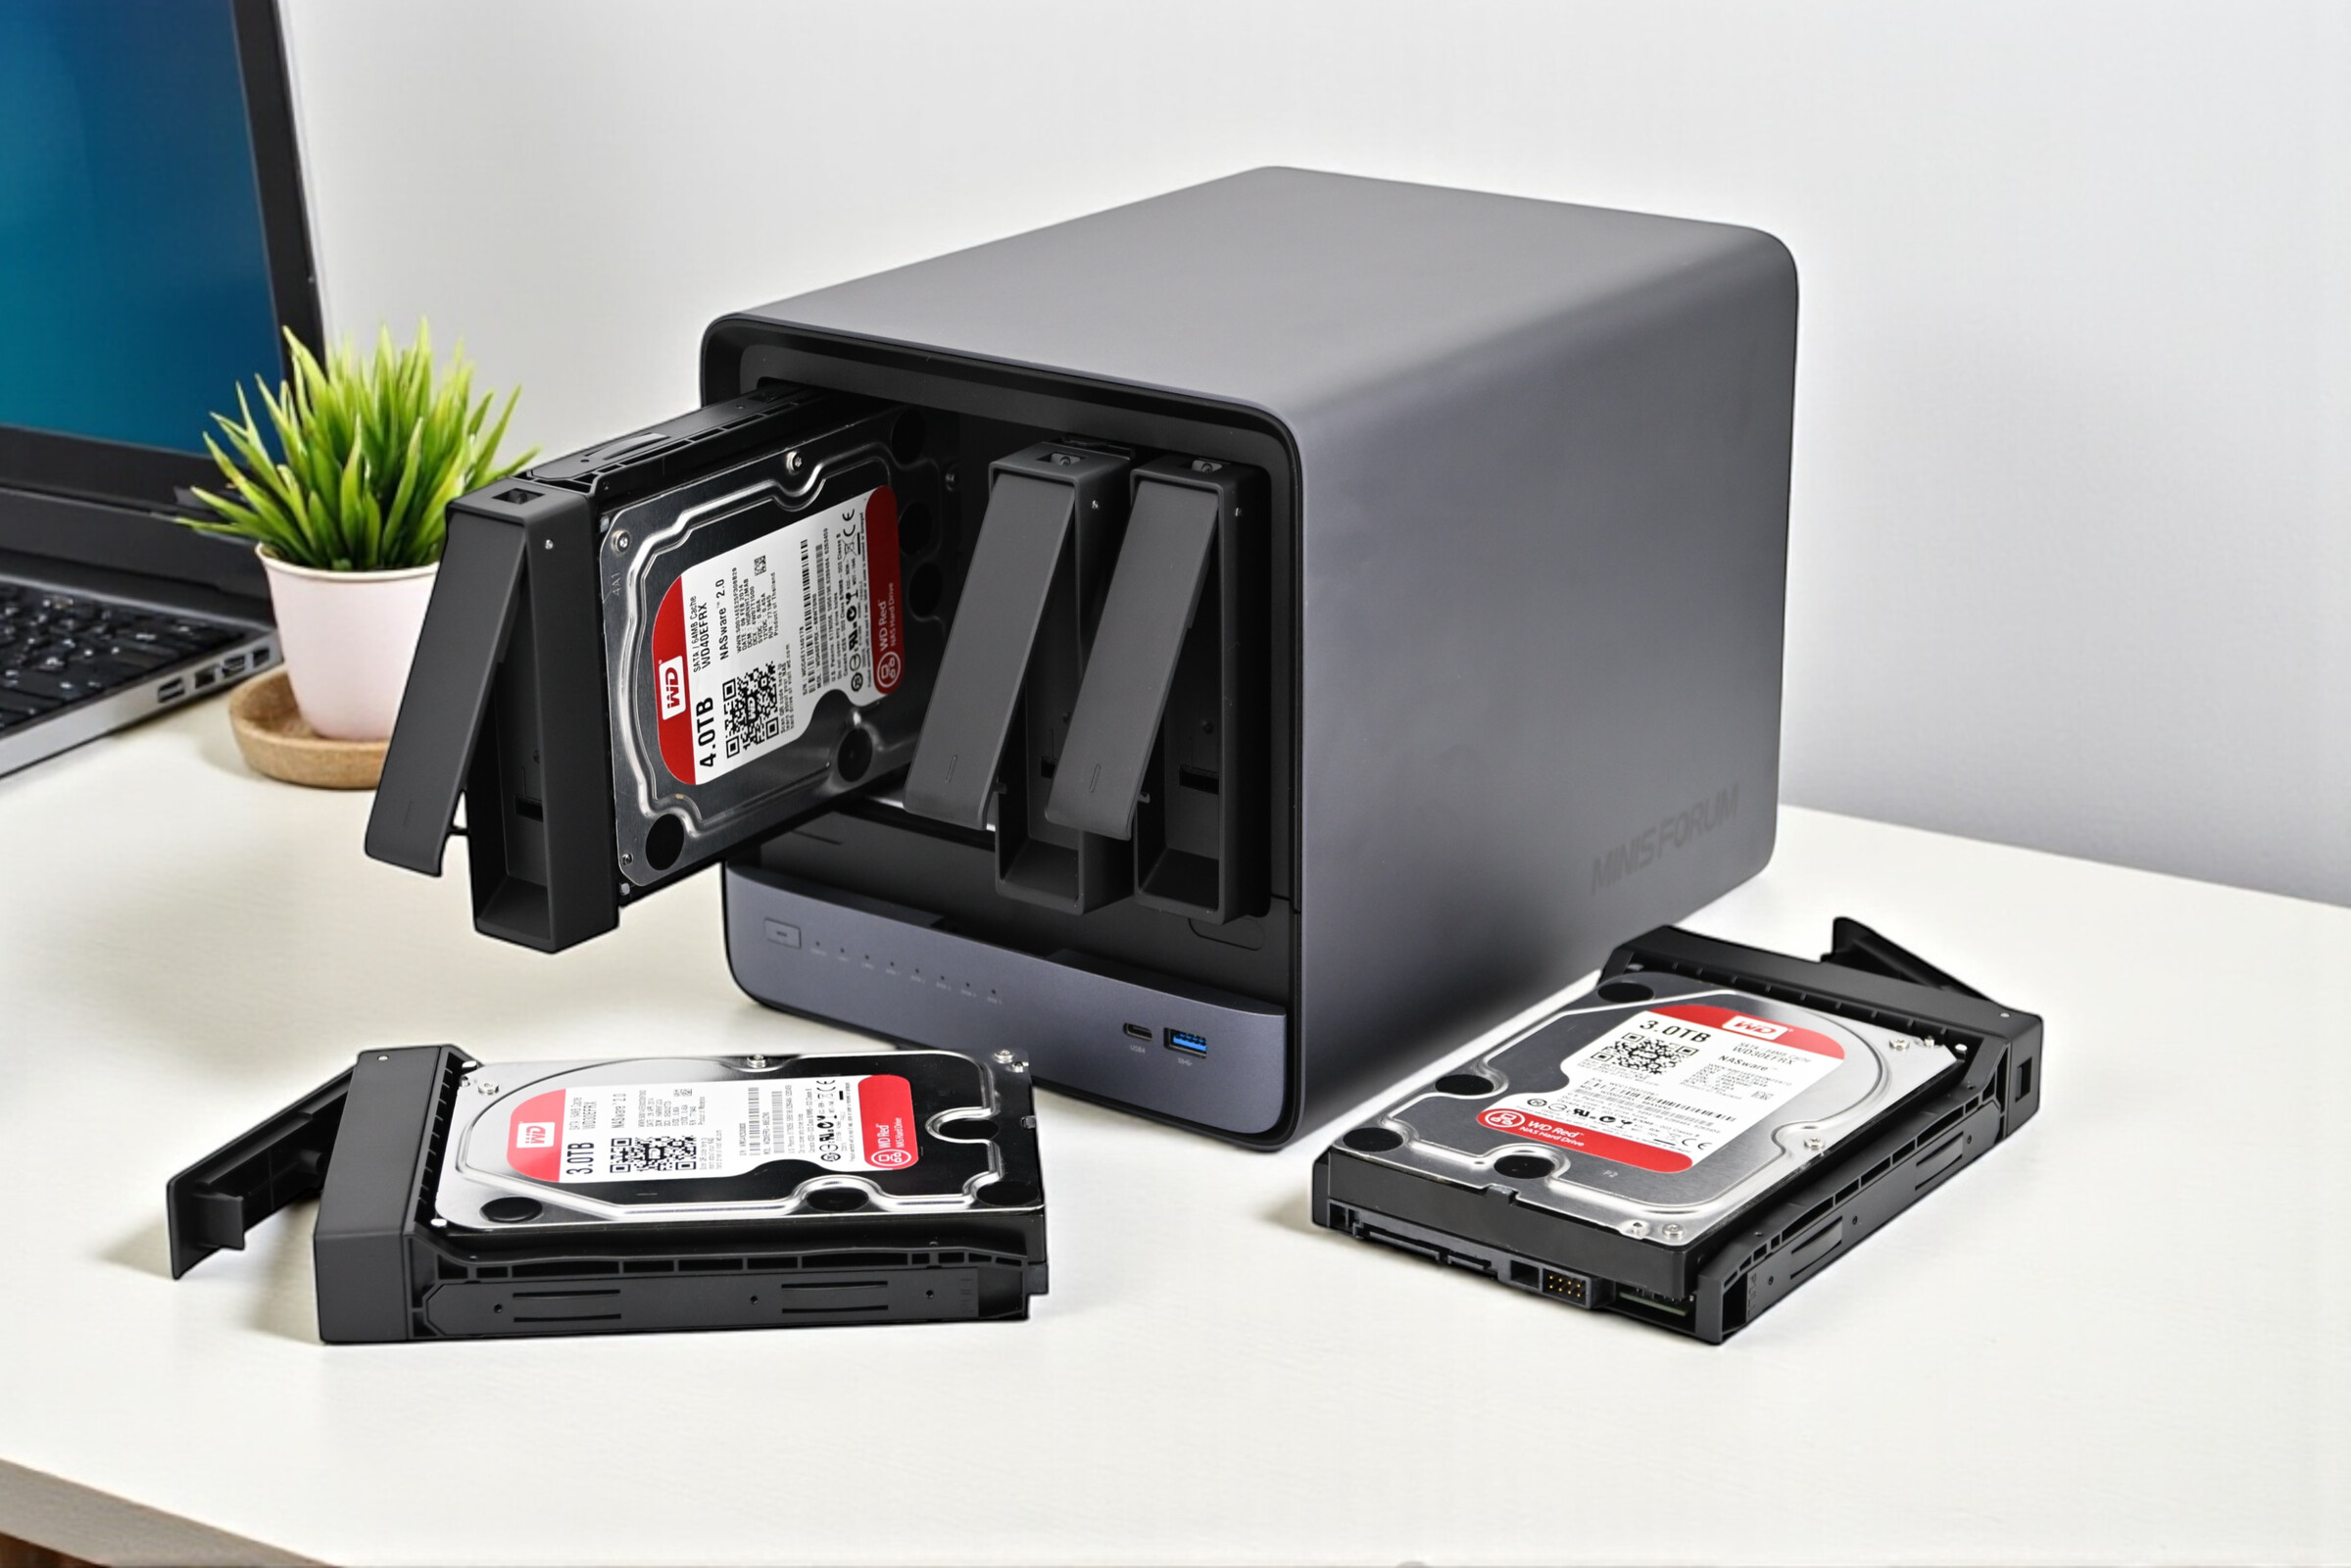
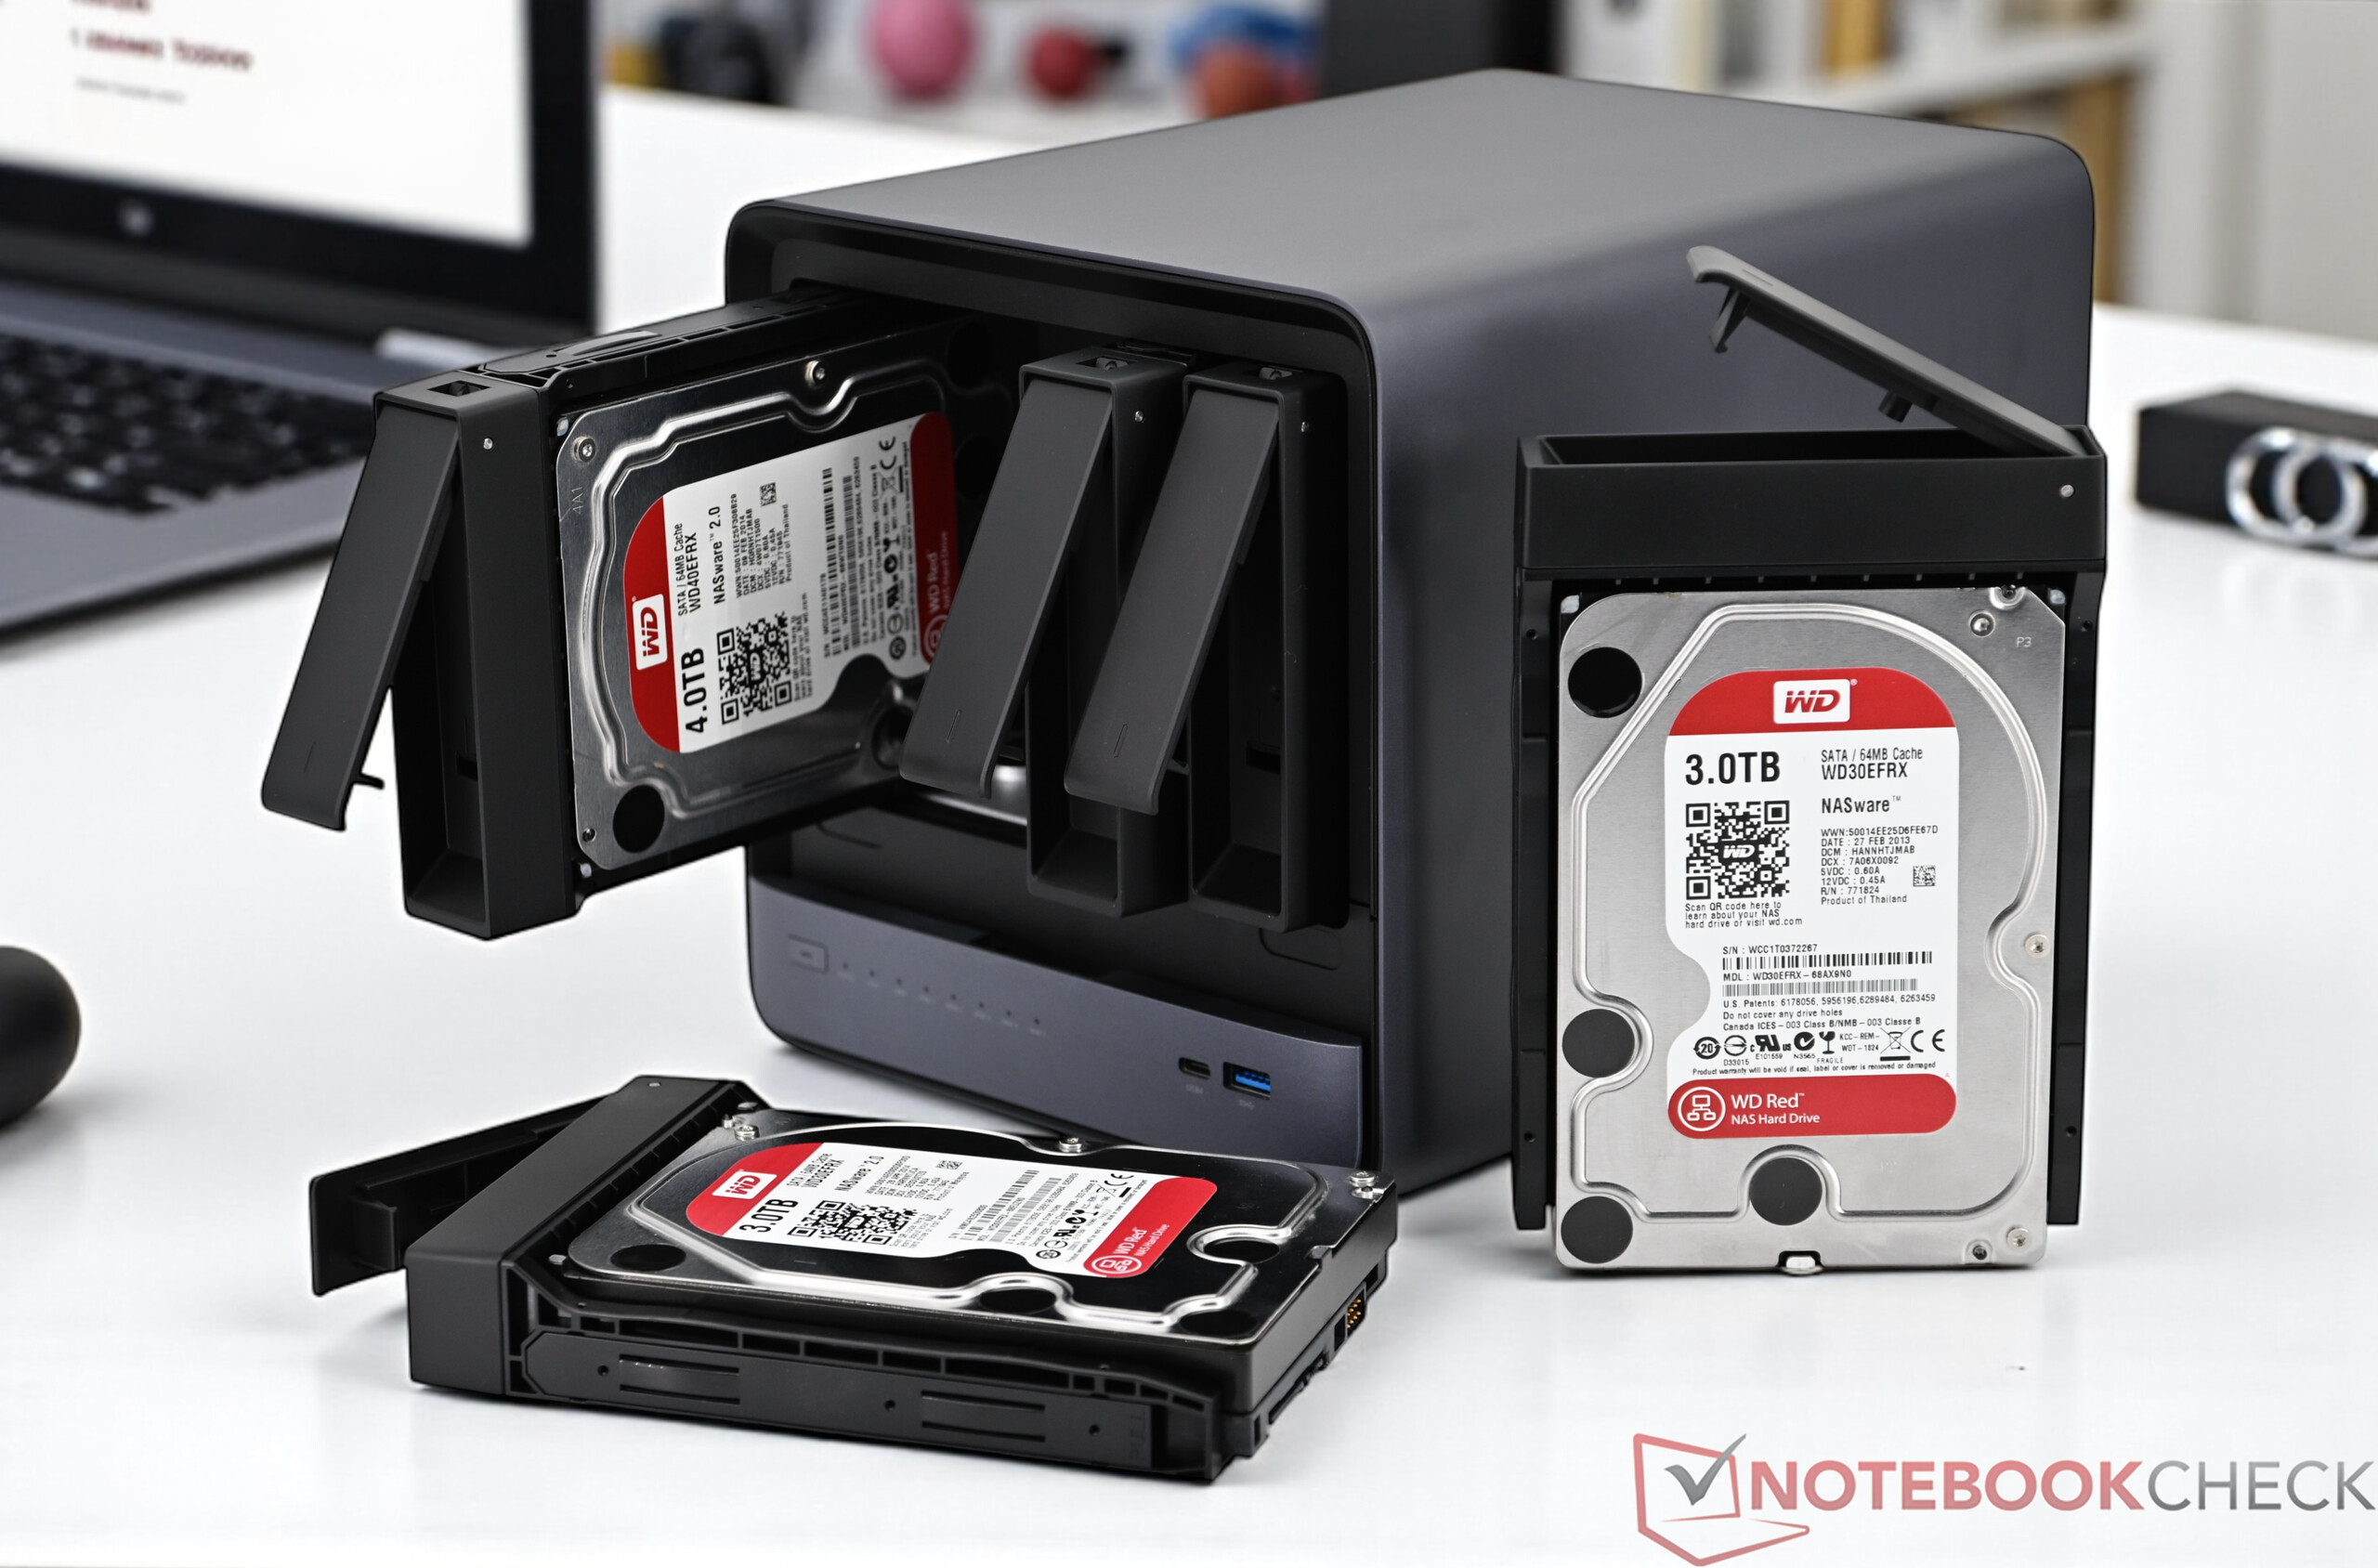
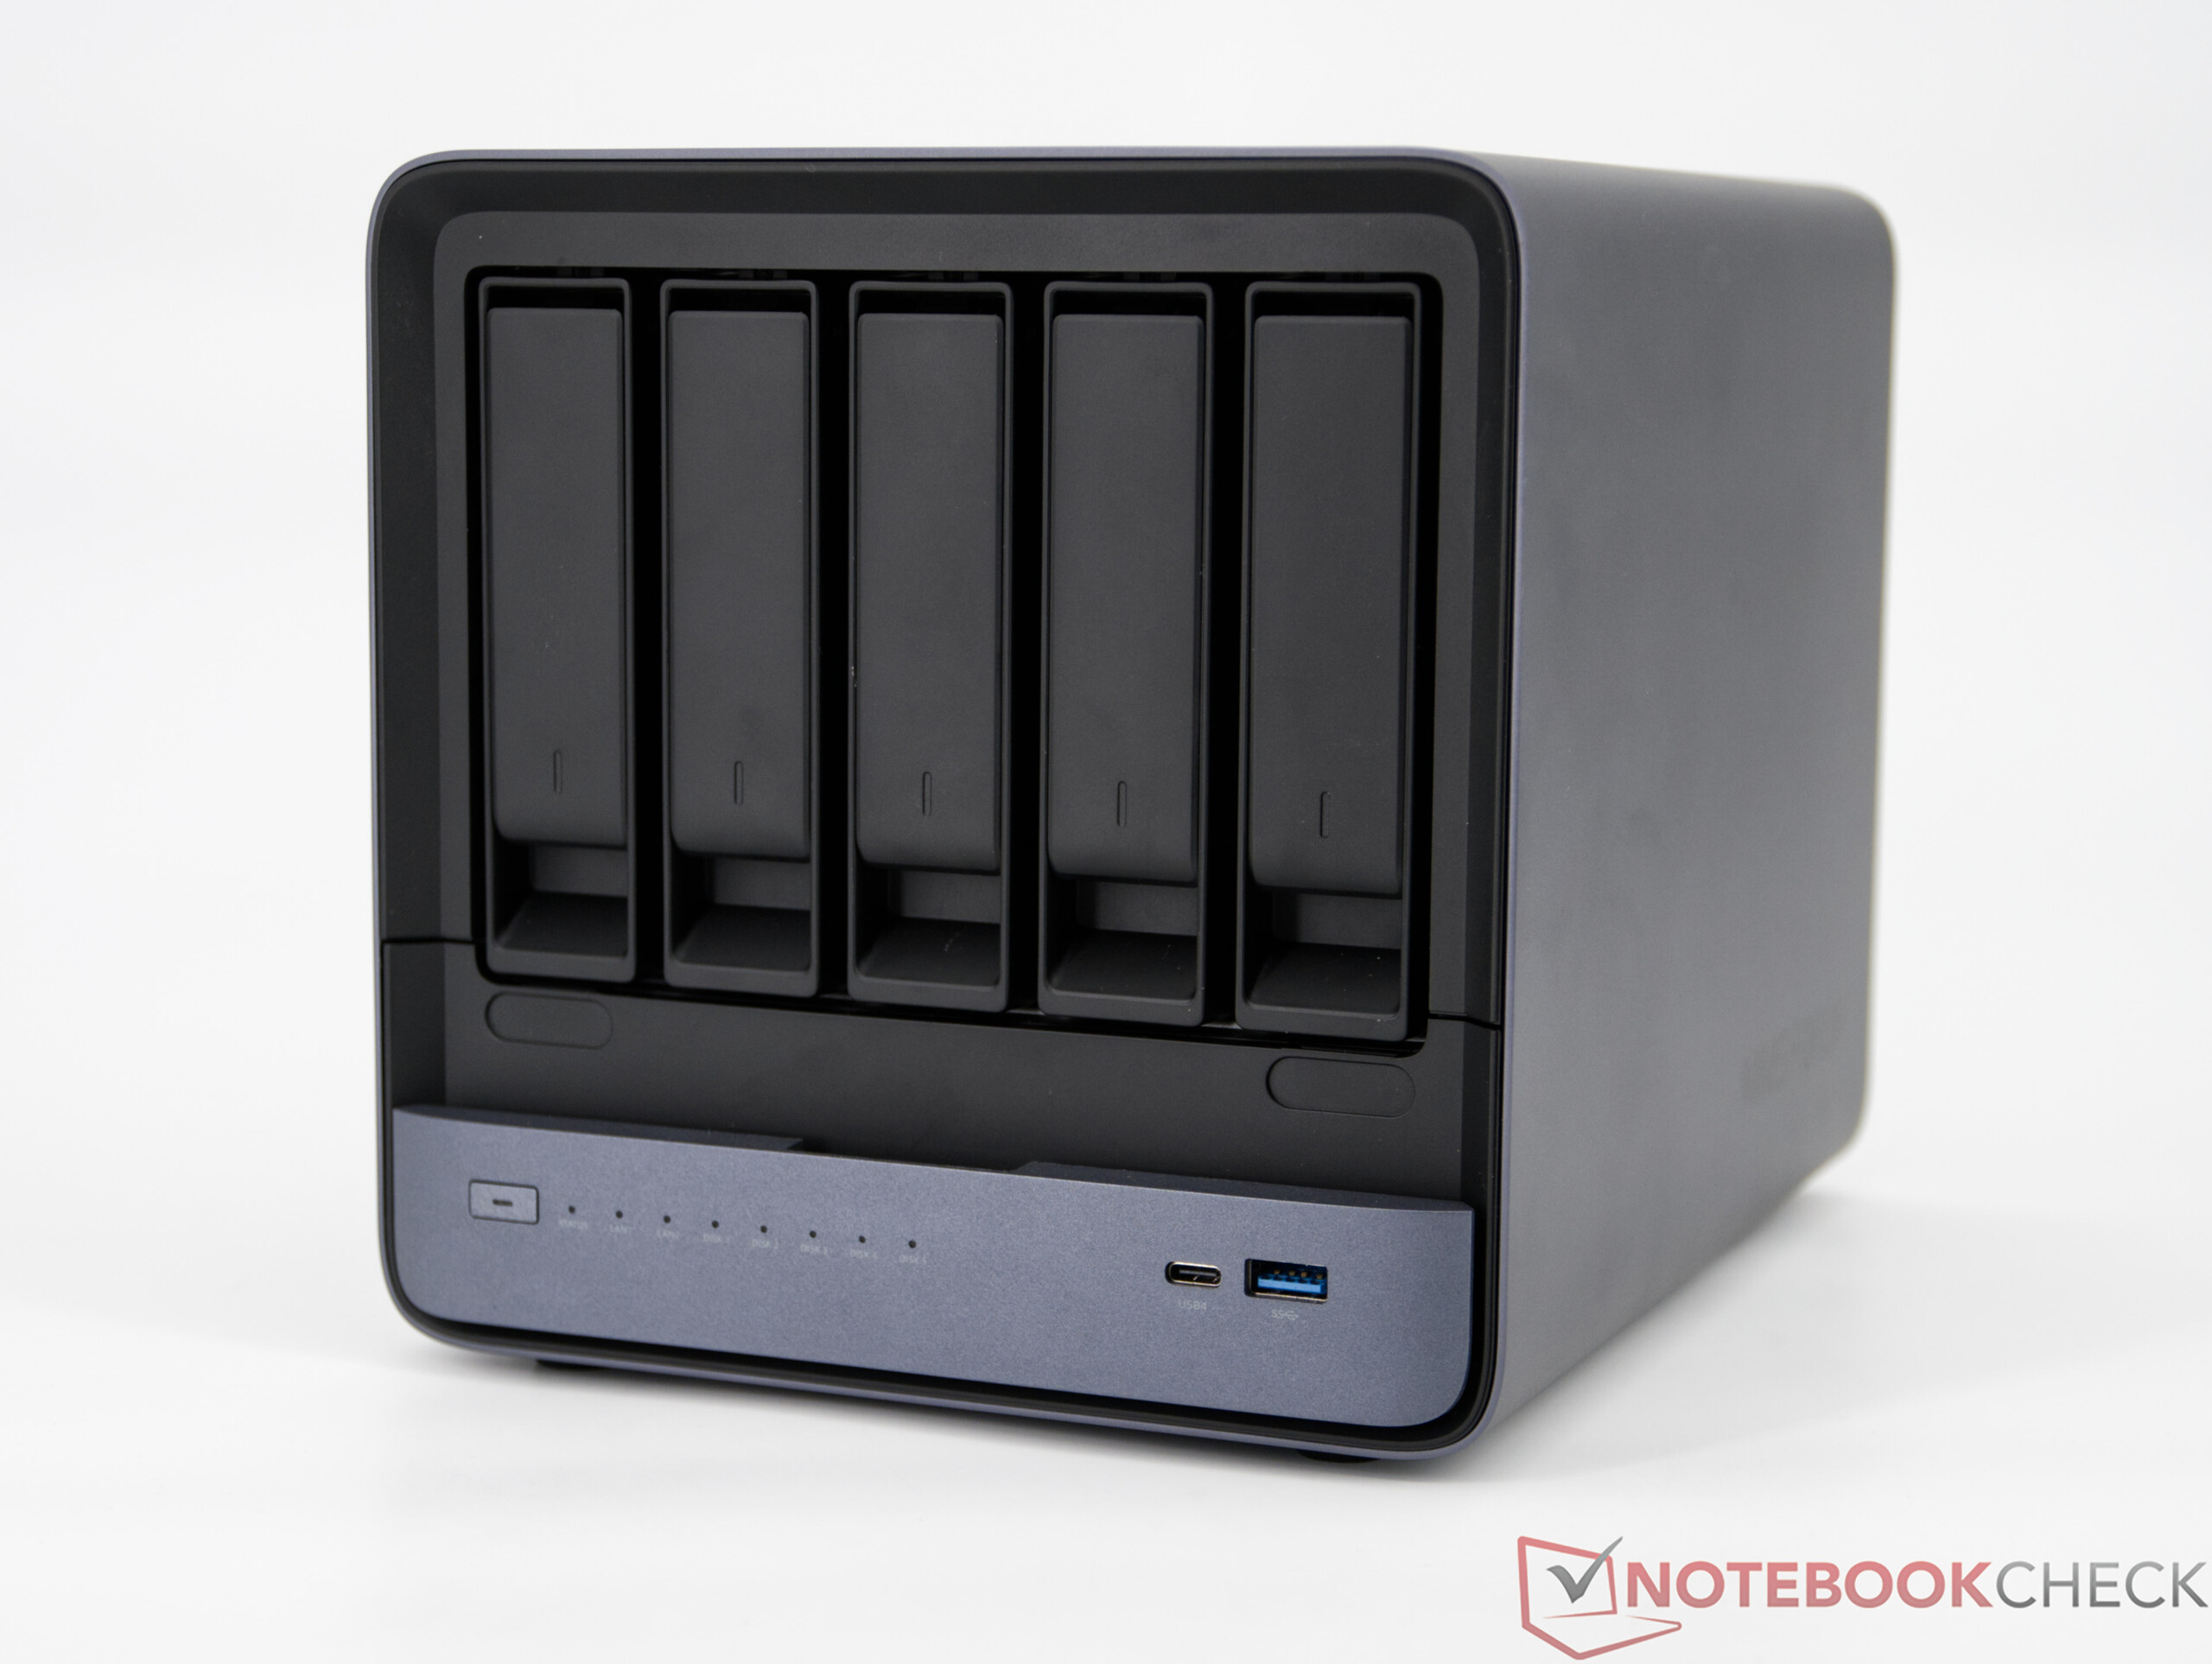
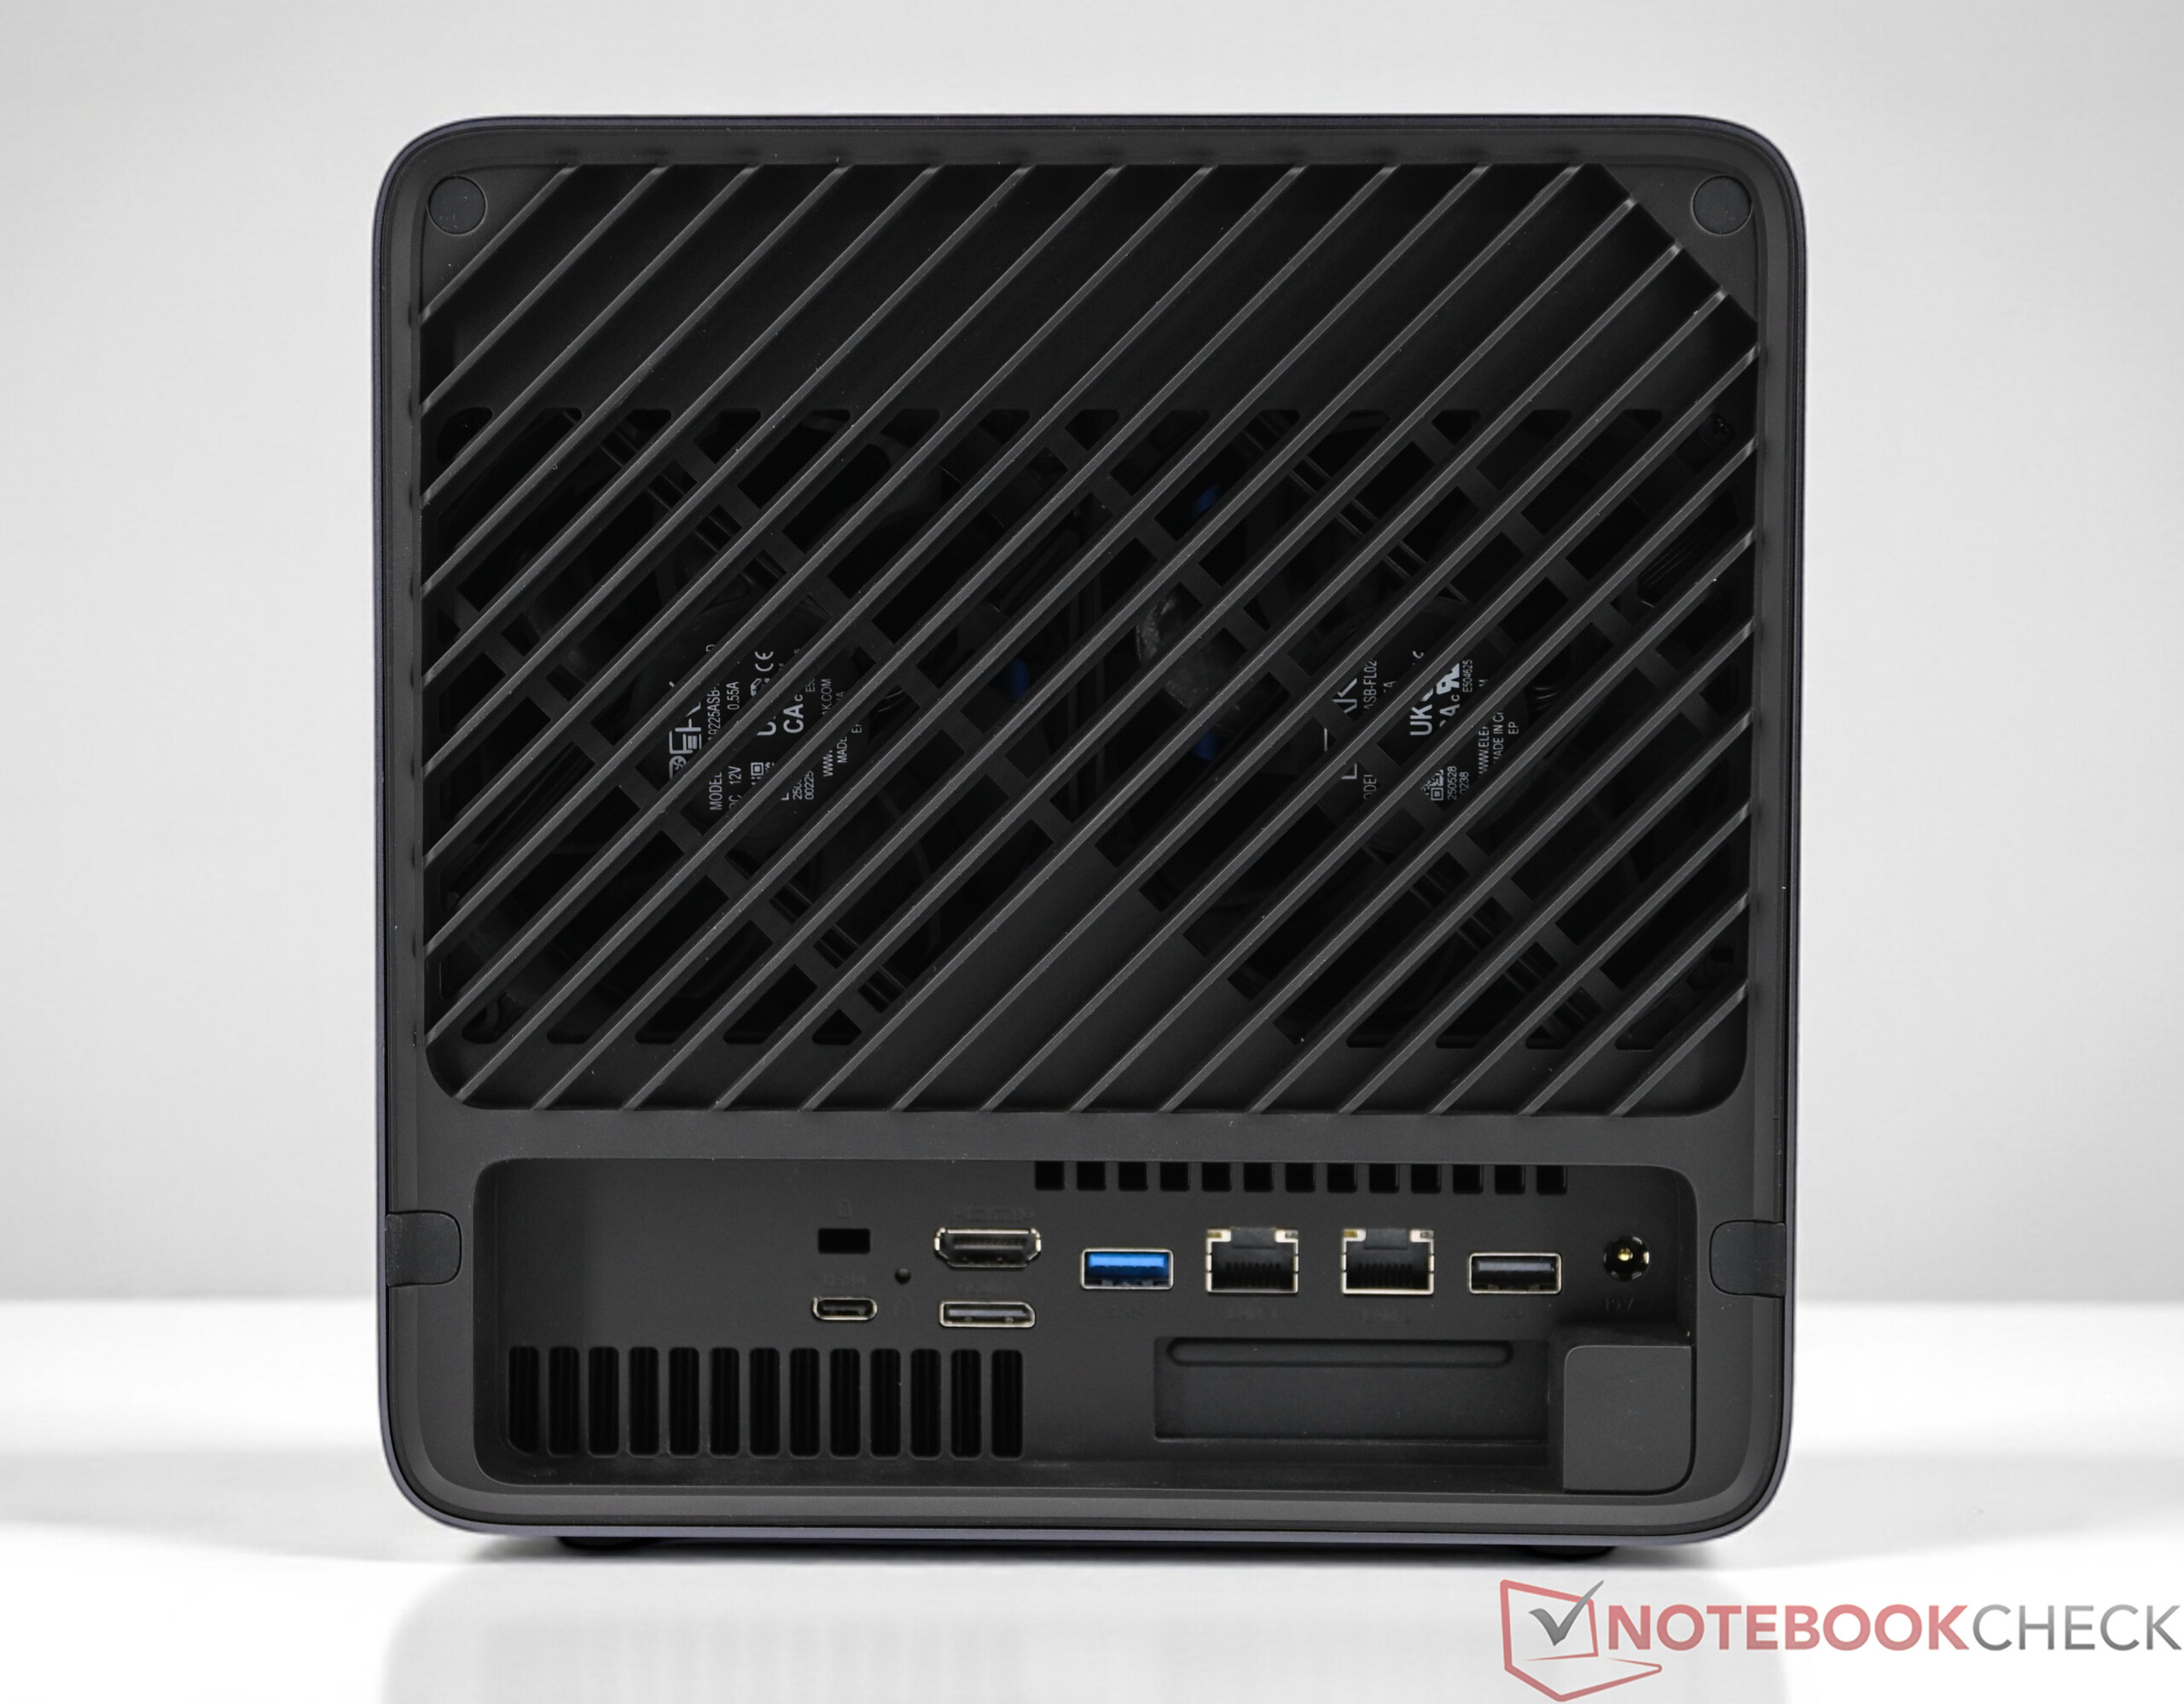
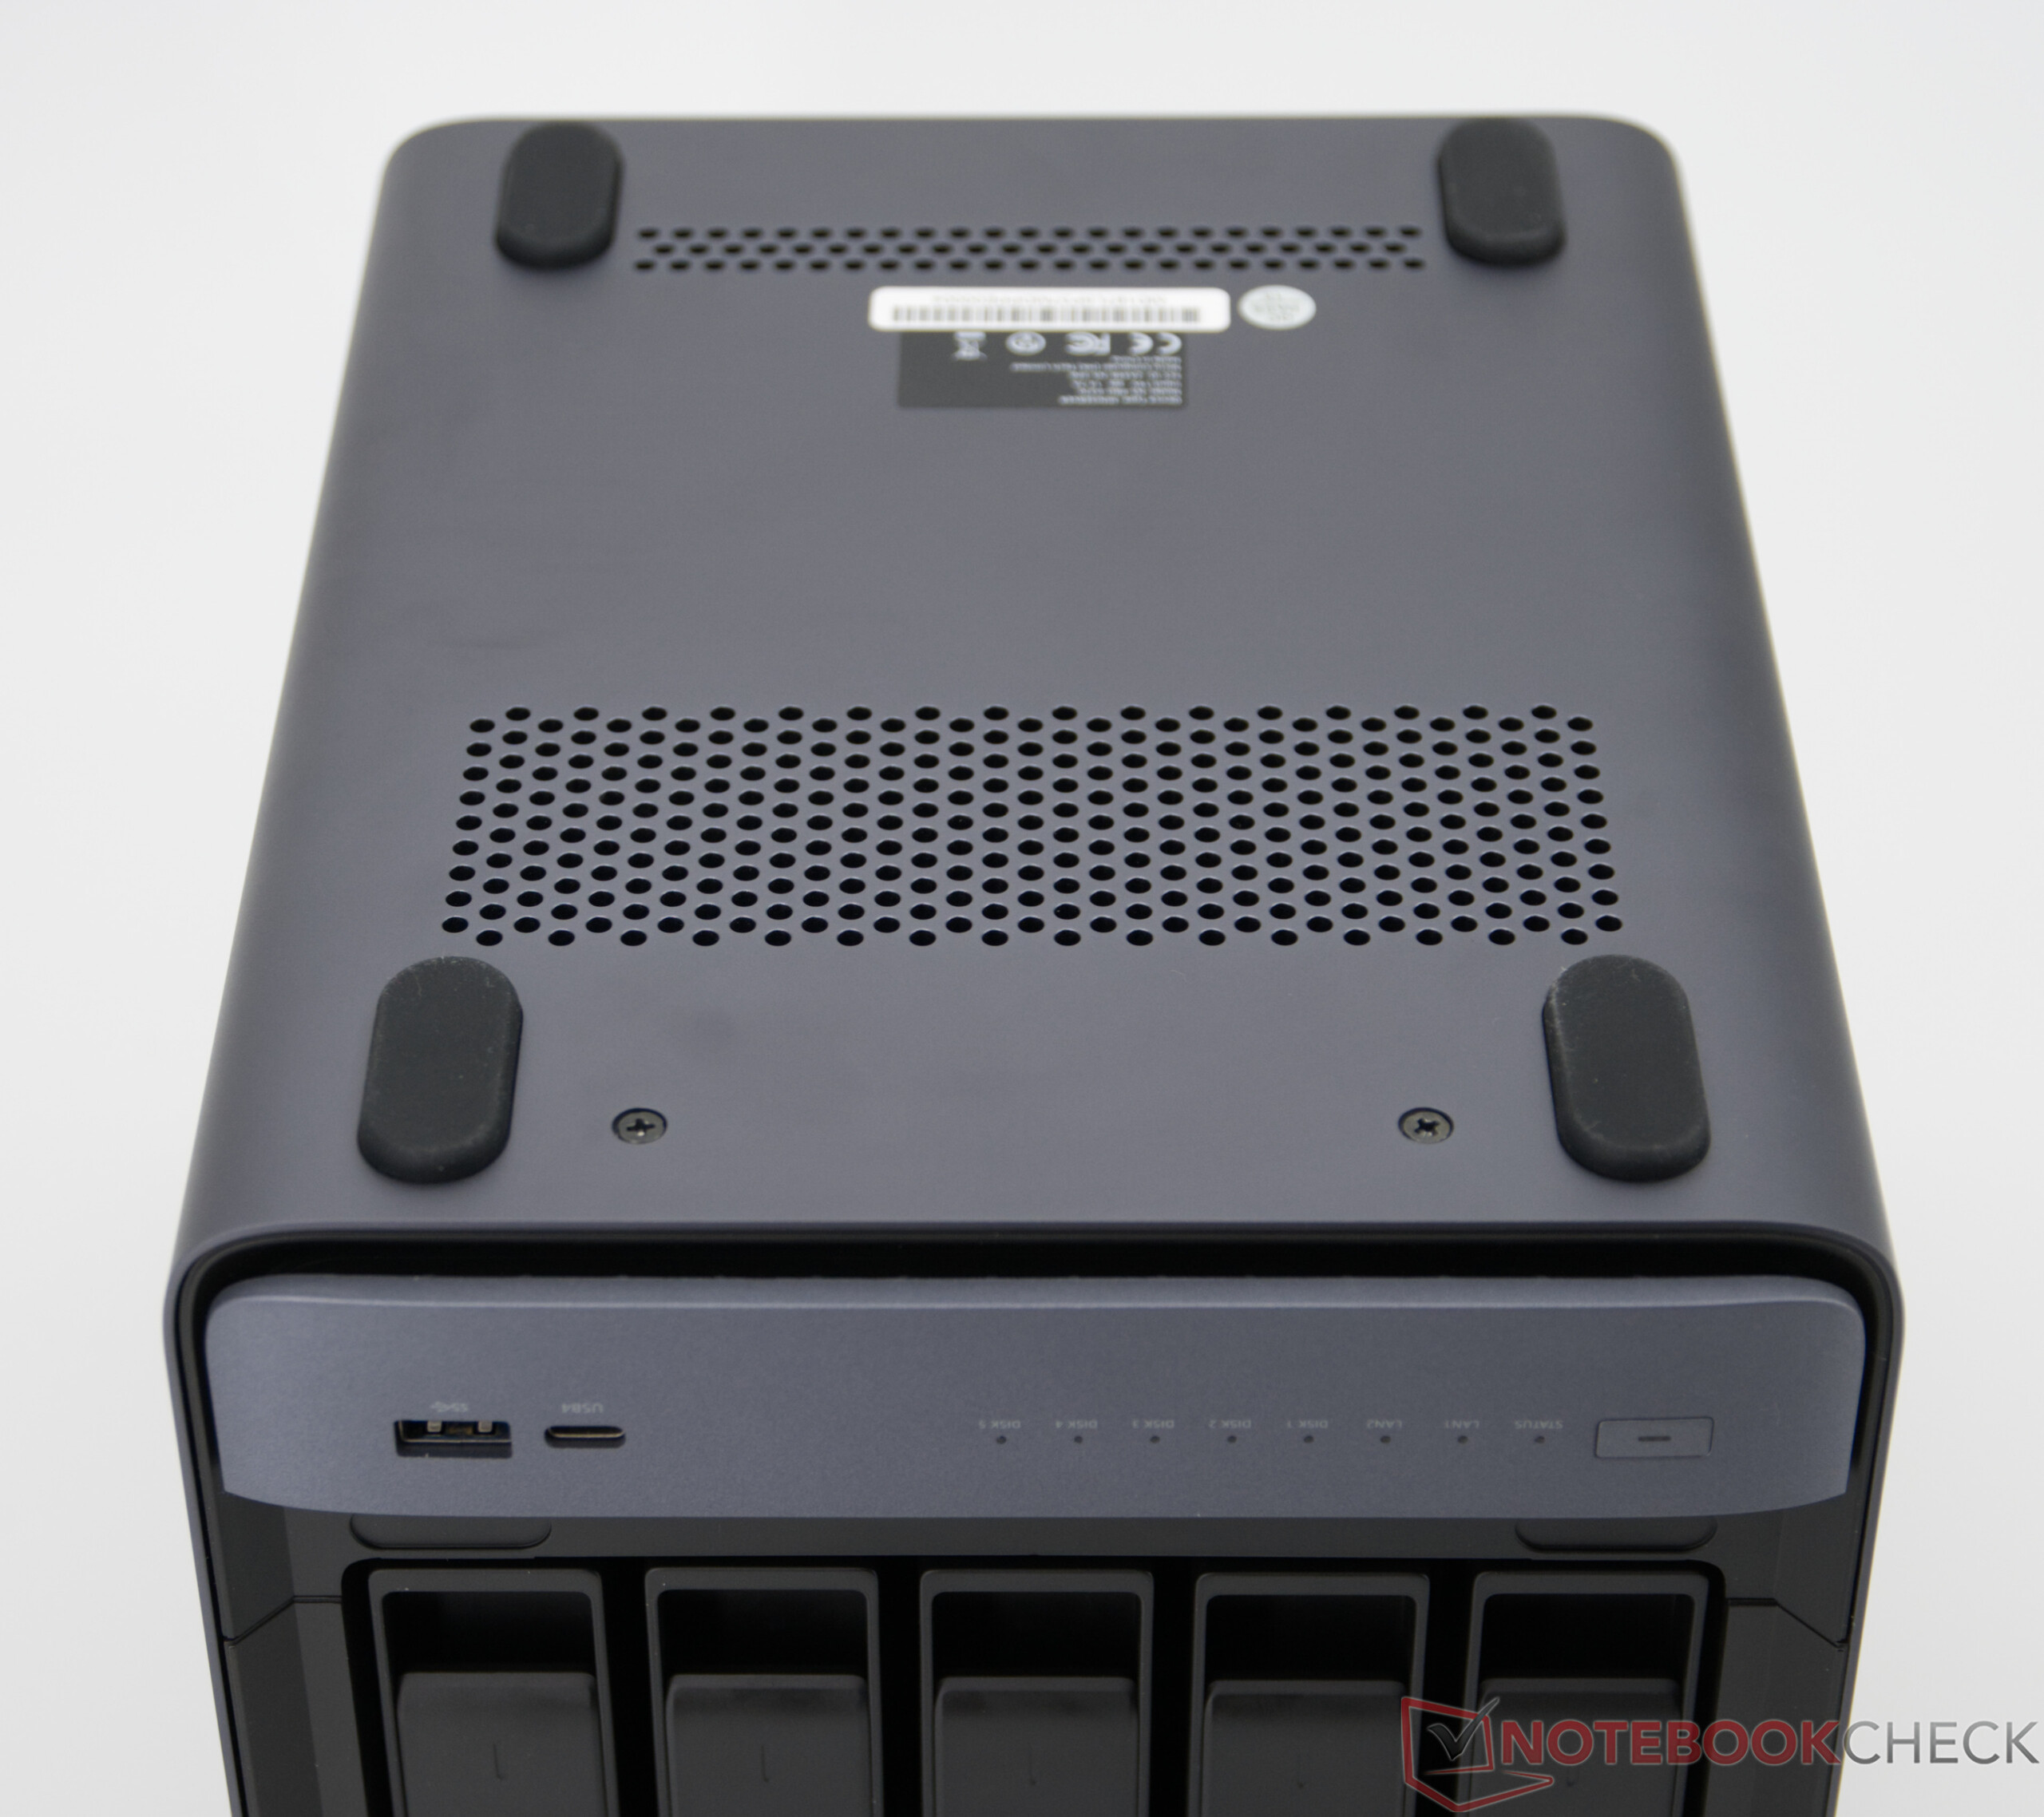
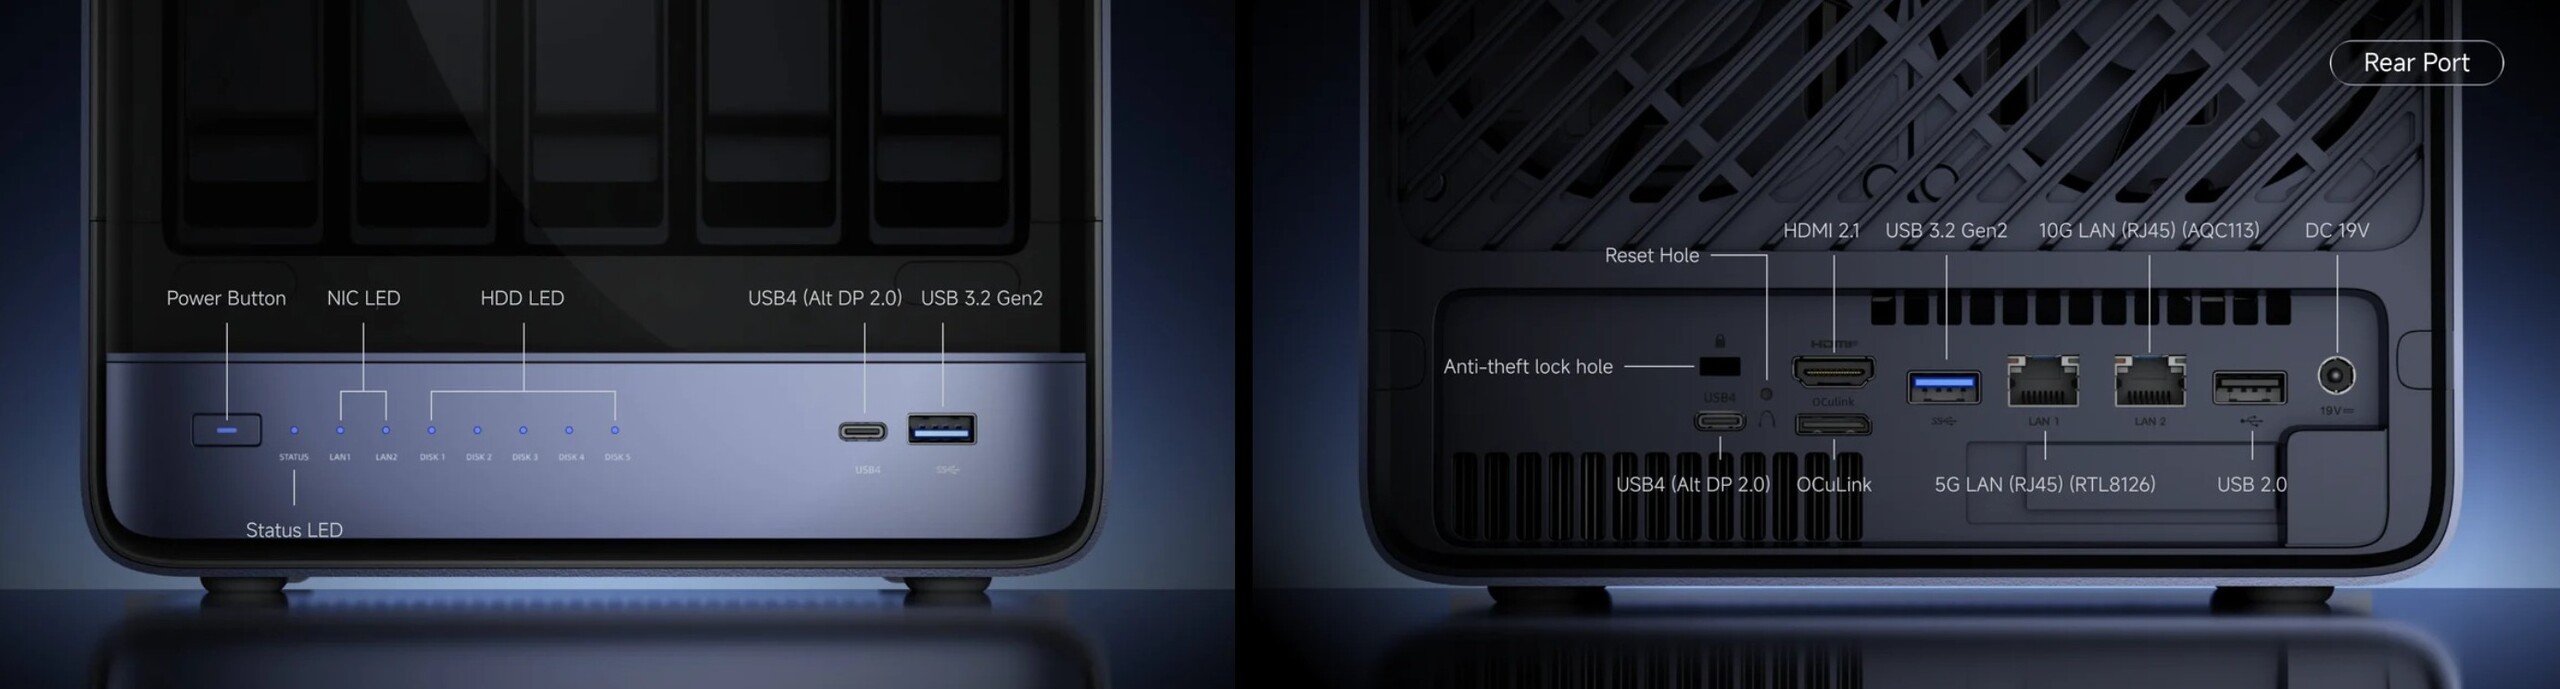
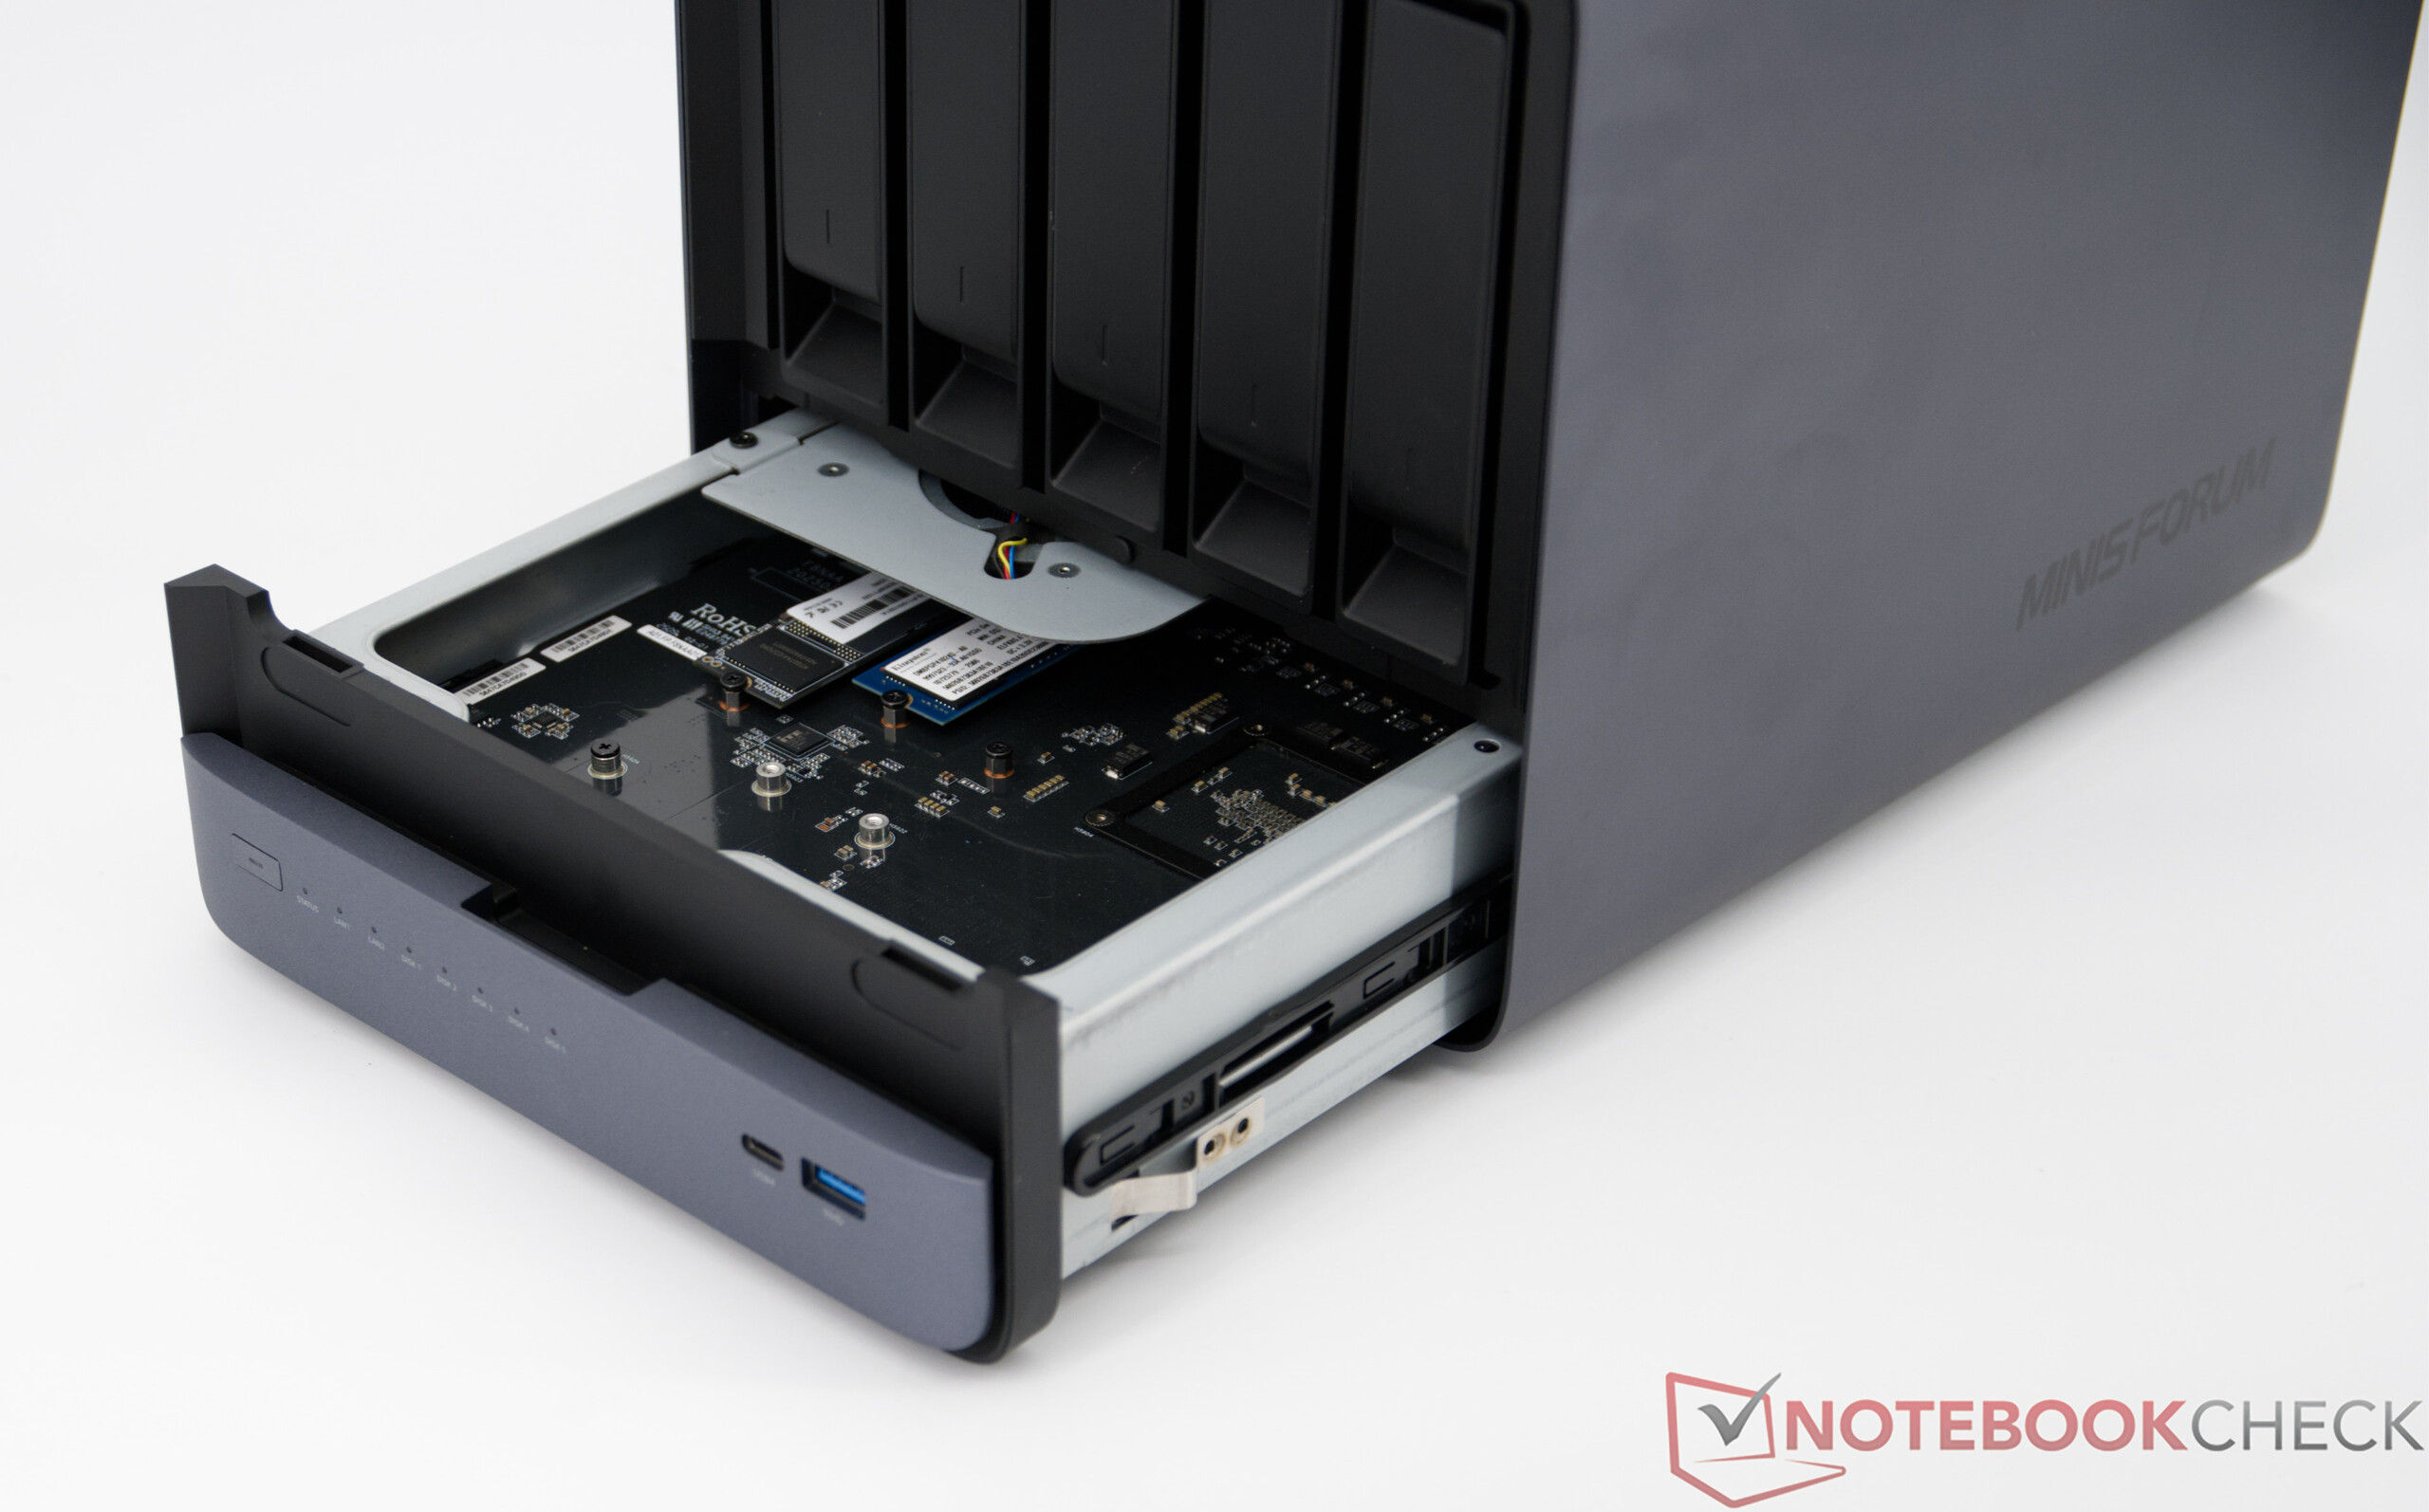
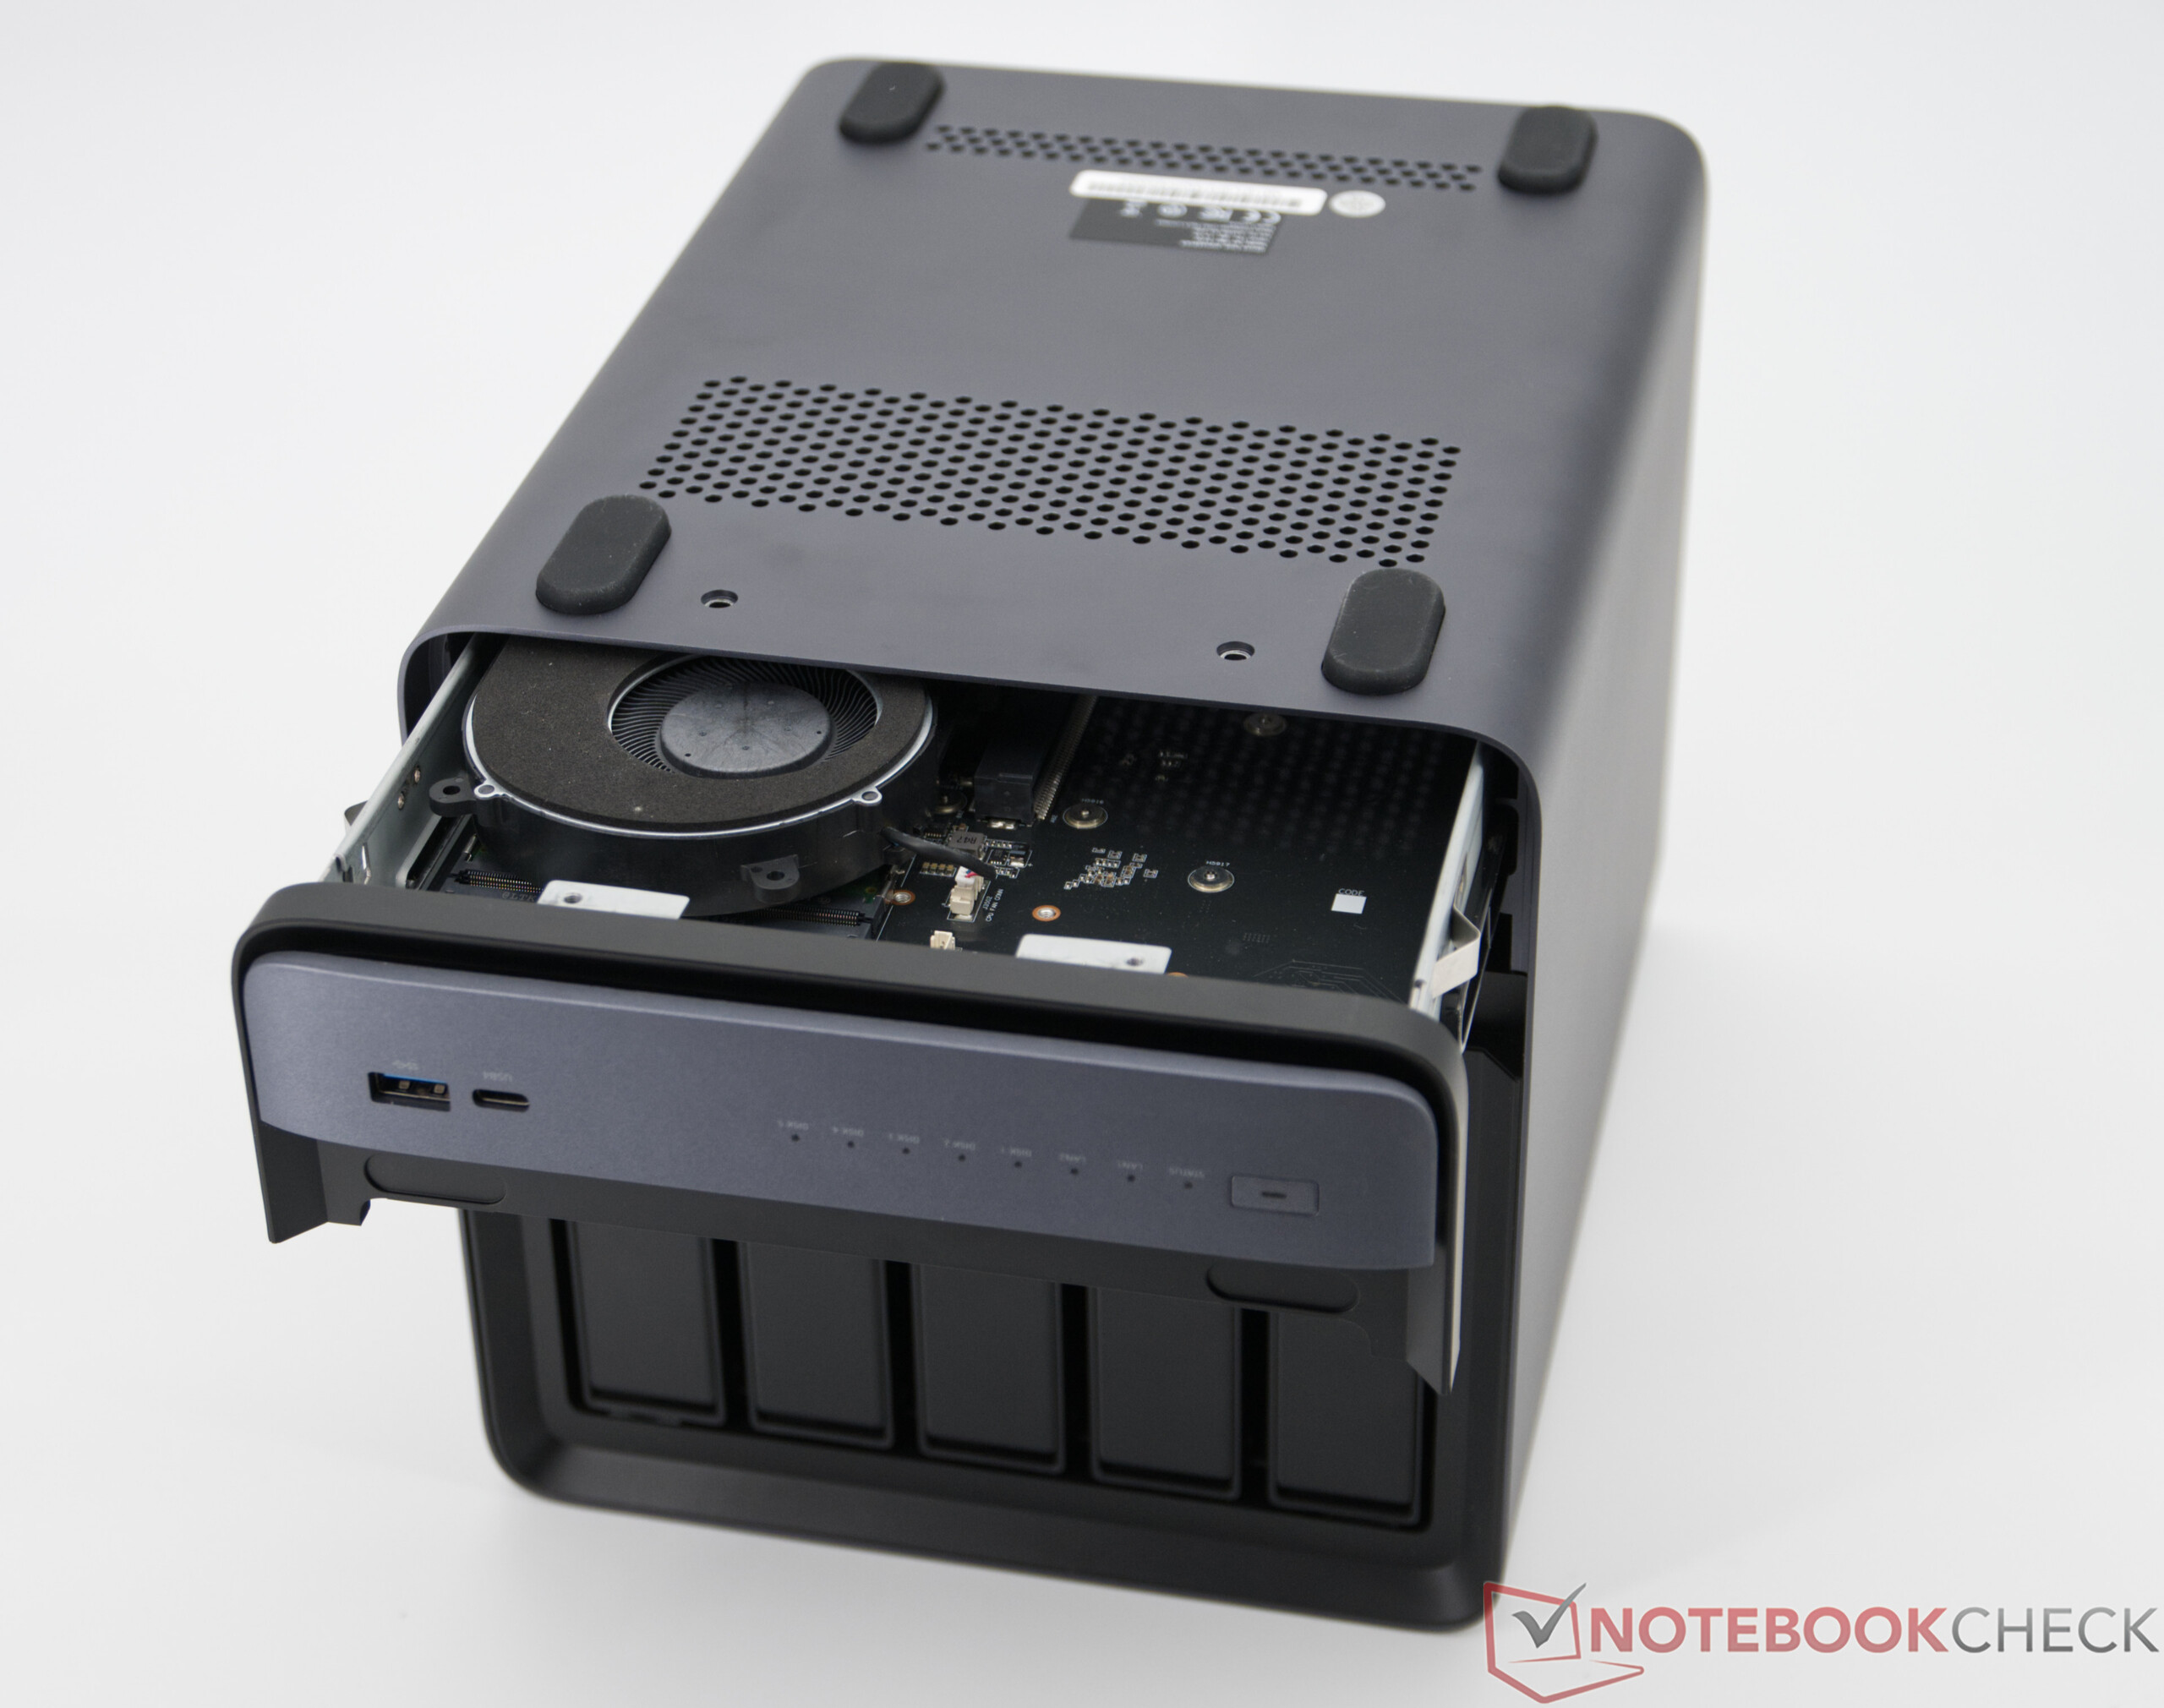
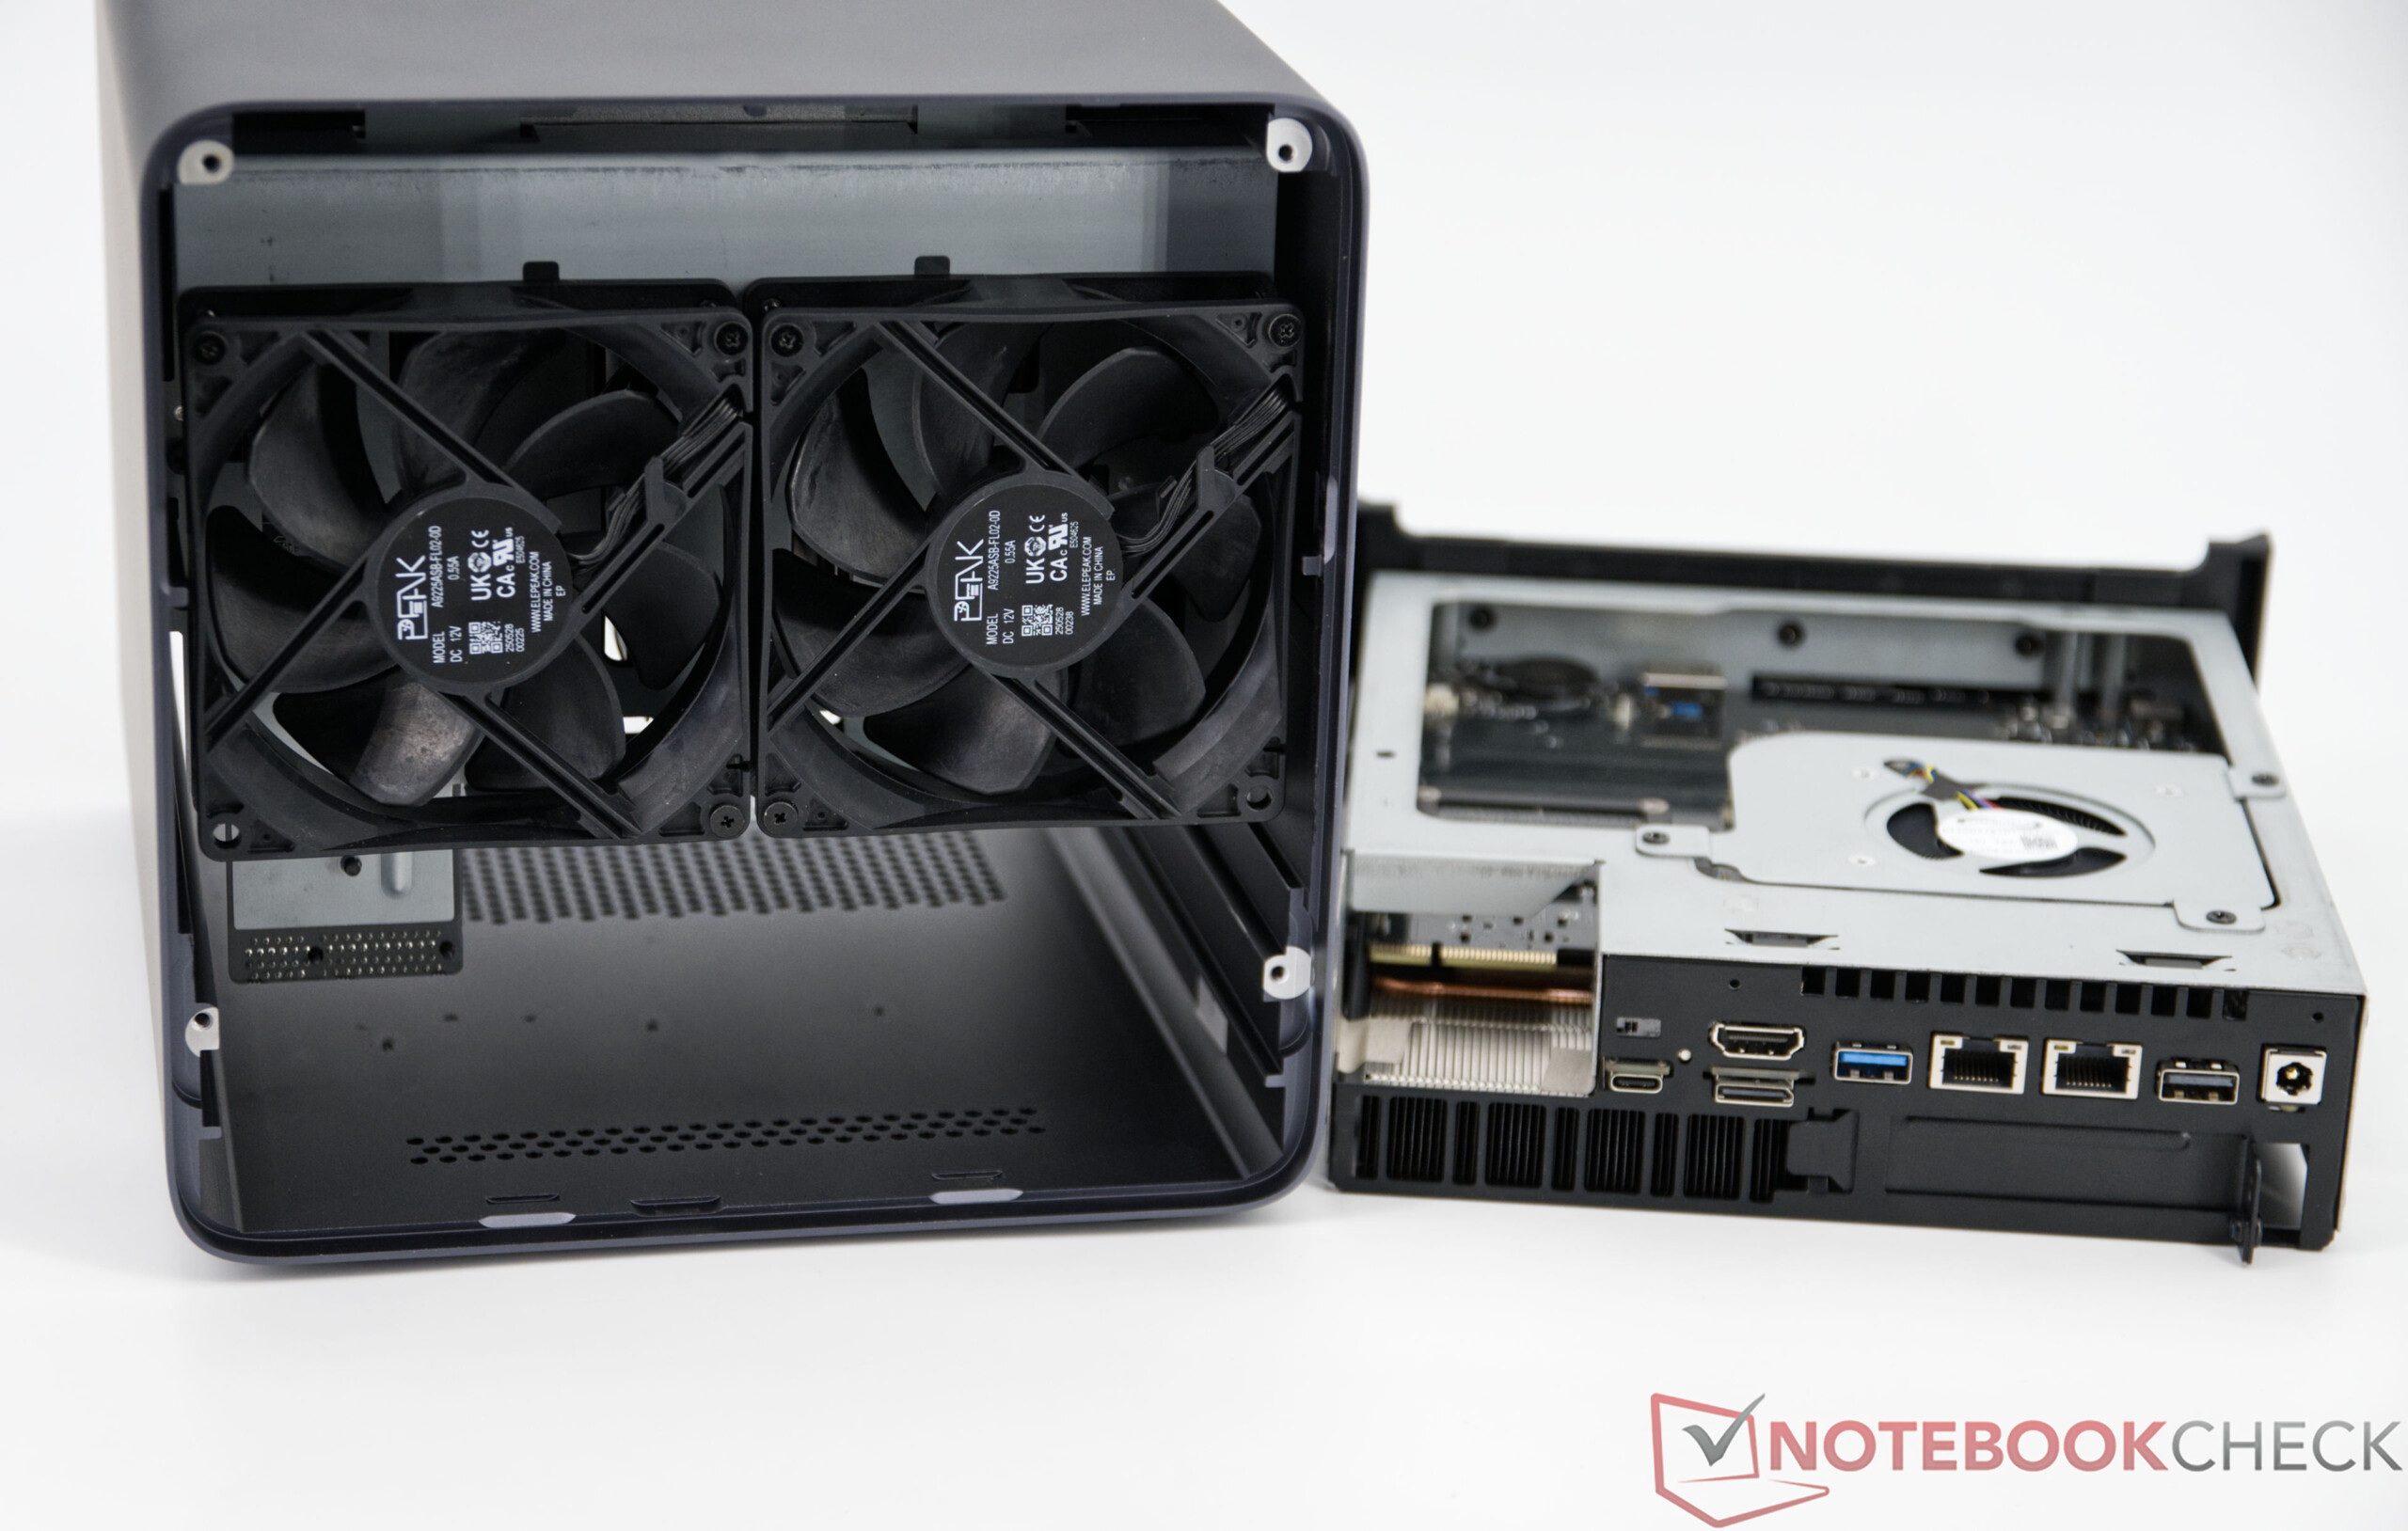
The Minisforum N5 Pro is largely made of metal, supplemented by a few plastic elements that make a very high-quality impression both visually and to the touch. One small point of criticism concerns the glossy front panel, which is susceptible to fingerprints and can lose its appearance over time due to fine scratches. In terms of features, the Minisforum N5 Pro has nothing to hide. A total of five 3.5" HDDs and three SSDs can be accommodated in the NAS. Thanks to numerous external interfaces, the NAS offers a wide range of expansion and connection options. The network connection is particularly successful, with two fast LAN ports (1 × 10 Gbit, 1 × 5 Gbit) enabling an exceptionally high data transfer rate and reliability. We would also like to mention the OCuLink connection and the internal PCIe x16 slot, which allows the system to be equipped with dedicated graphics cards, for example.
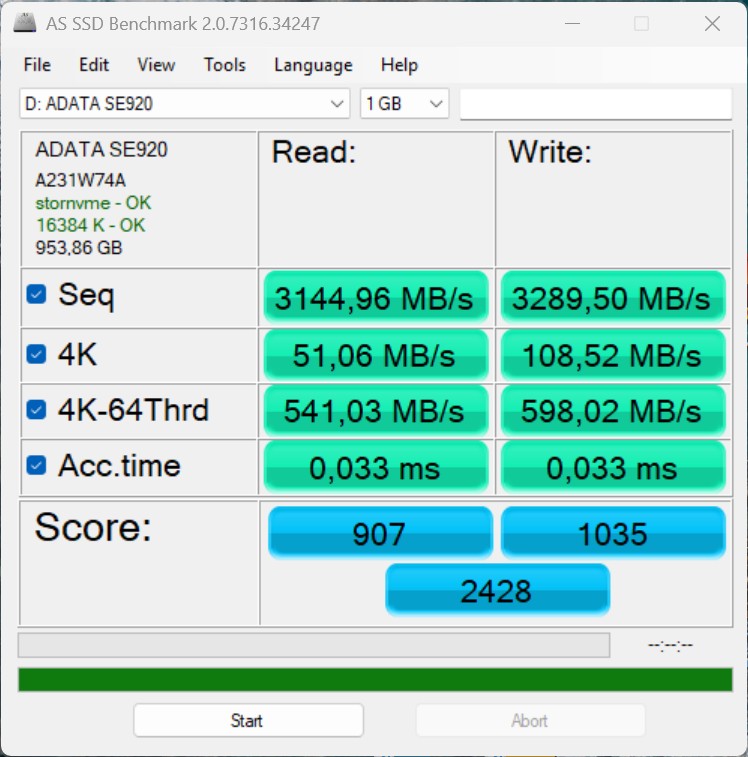
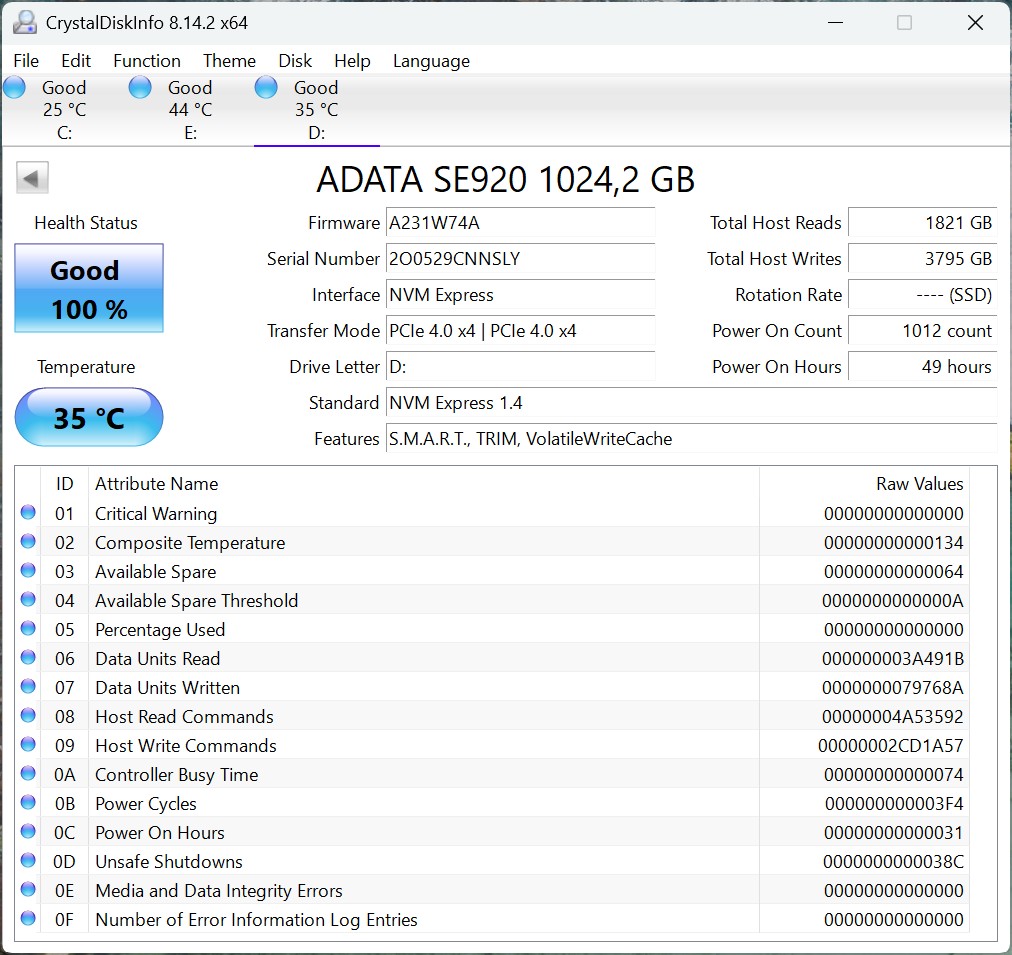
ADATA SE920 USB4-Speed
| Connectivity - USB 3.x / USB4 / TB - AS SSD Seq Read Test (1GB) | |
| Minisforum MS-A1 | |
| Average of class Desktop (n=1last 2 years) | |
| Minisforum N5 Pro | |
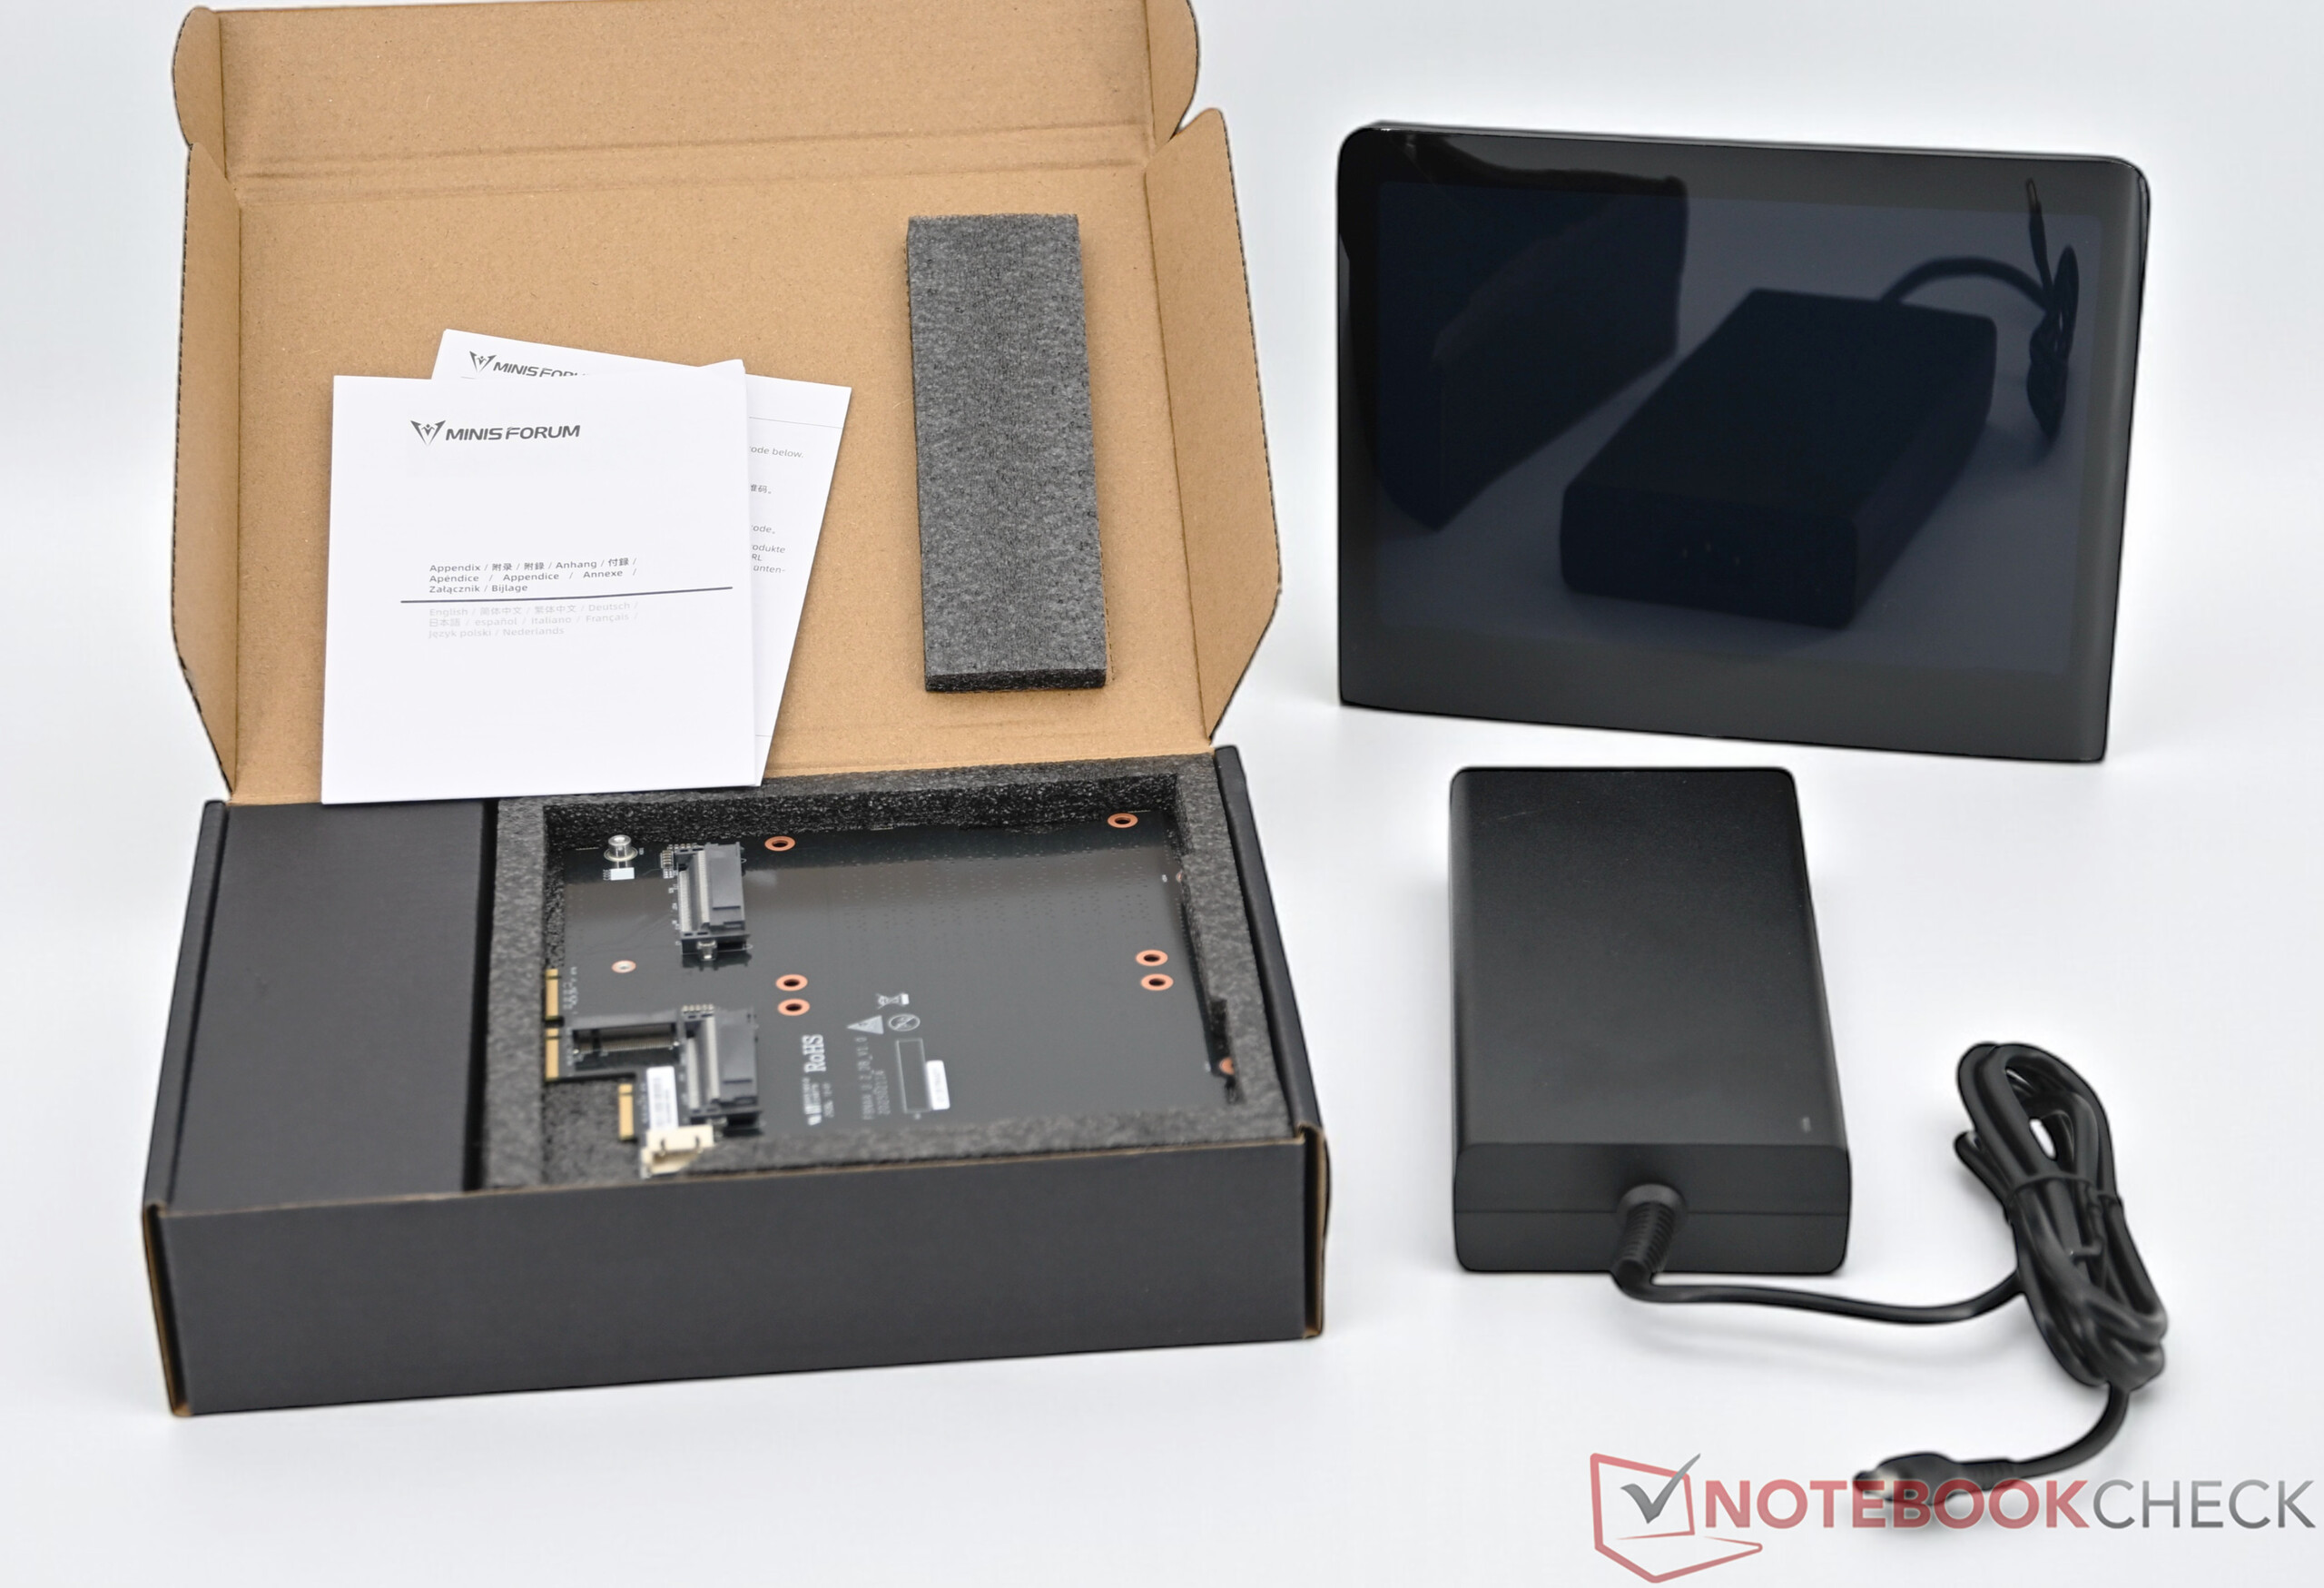
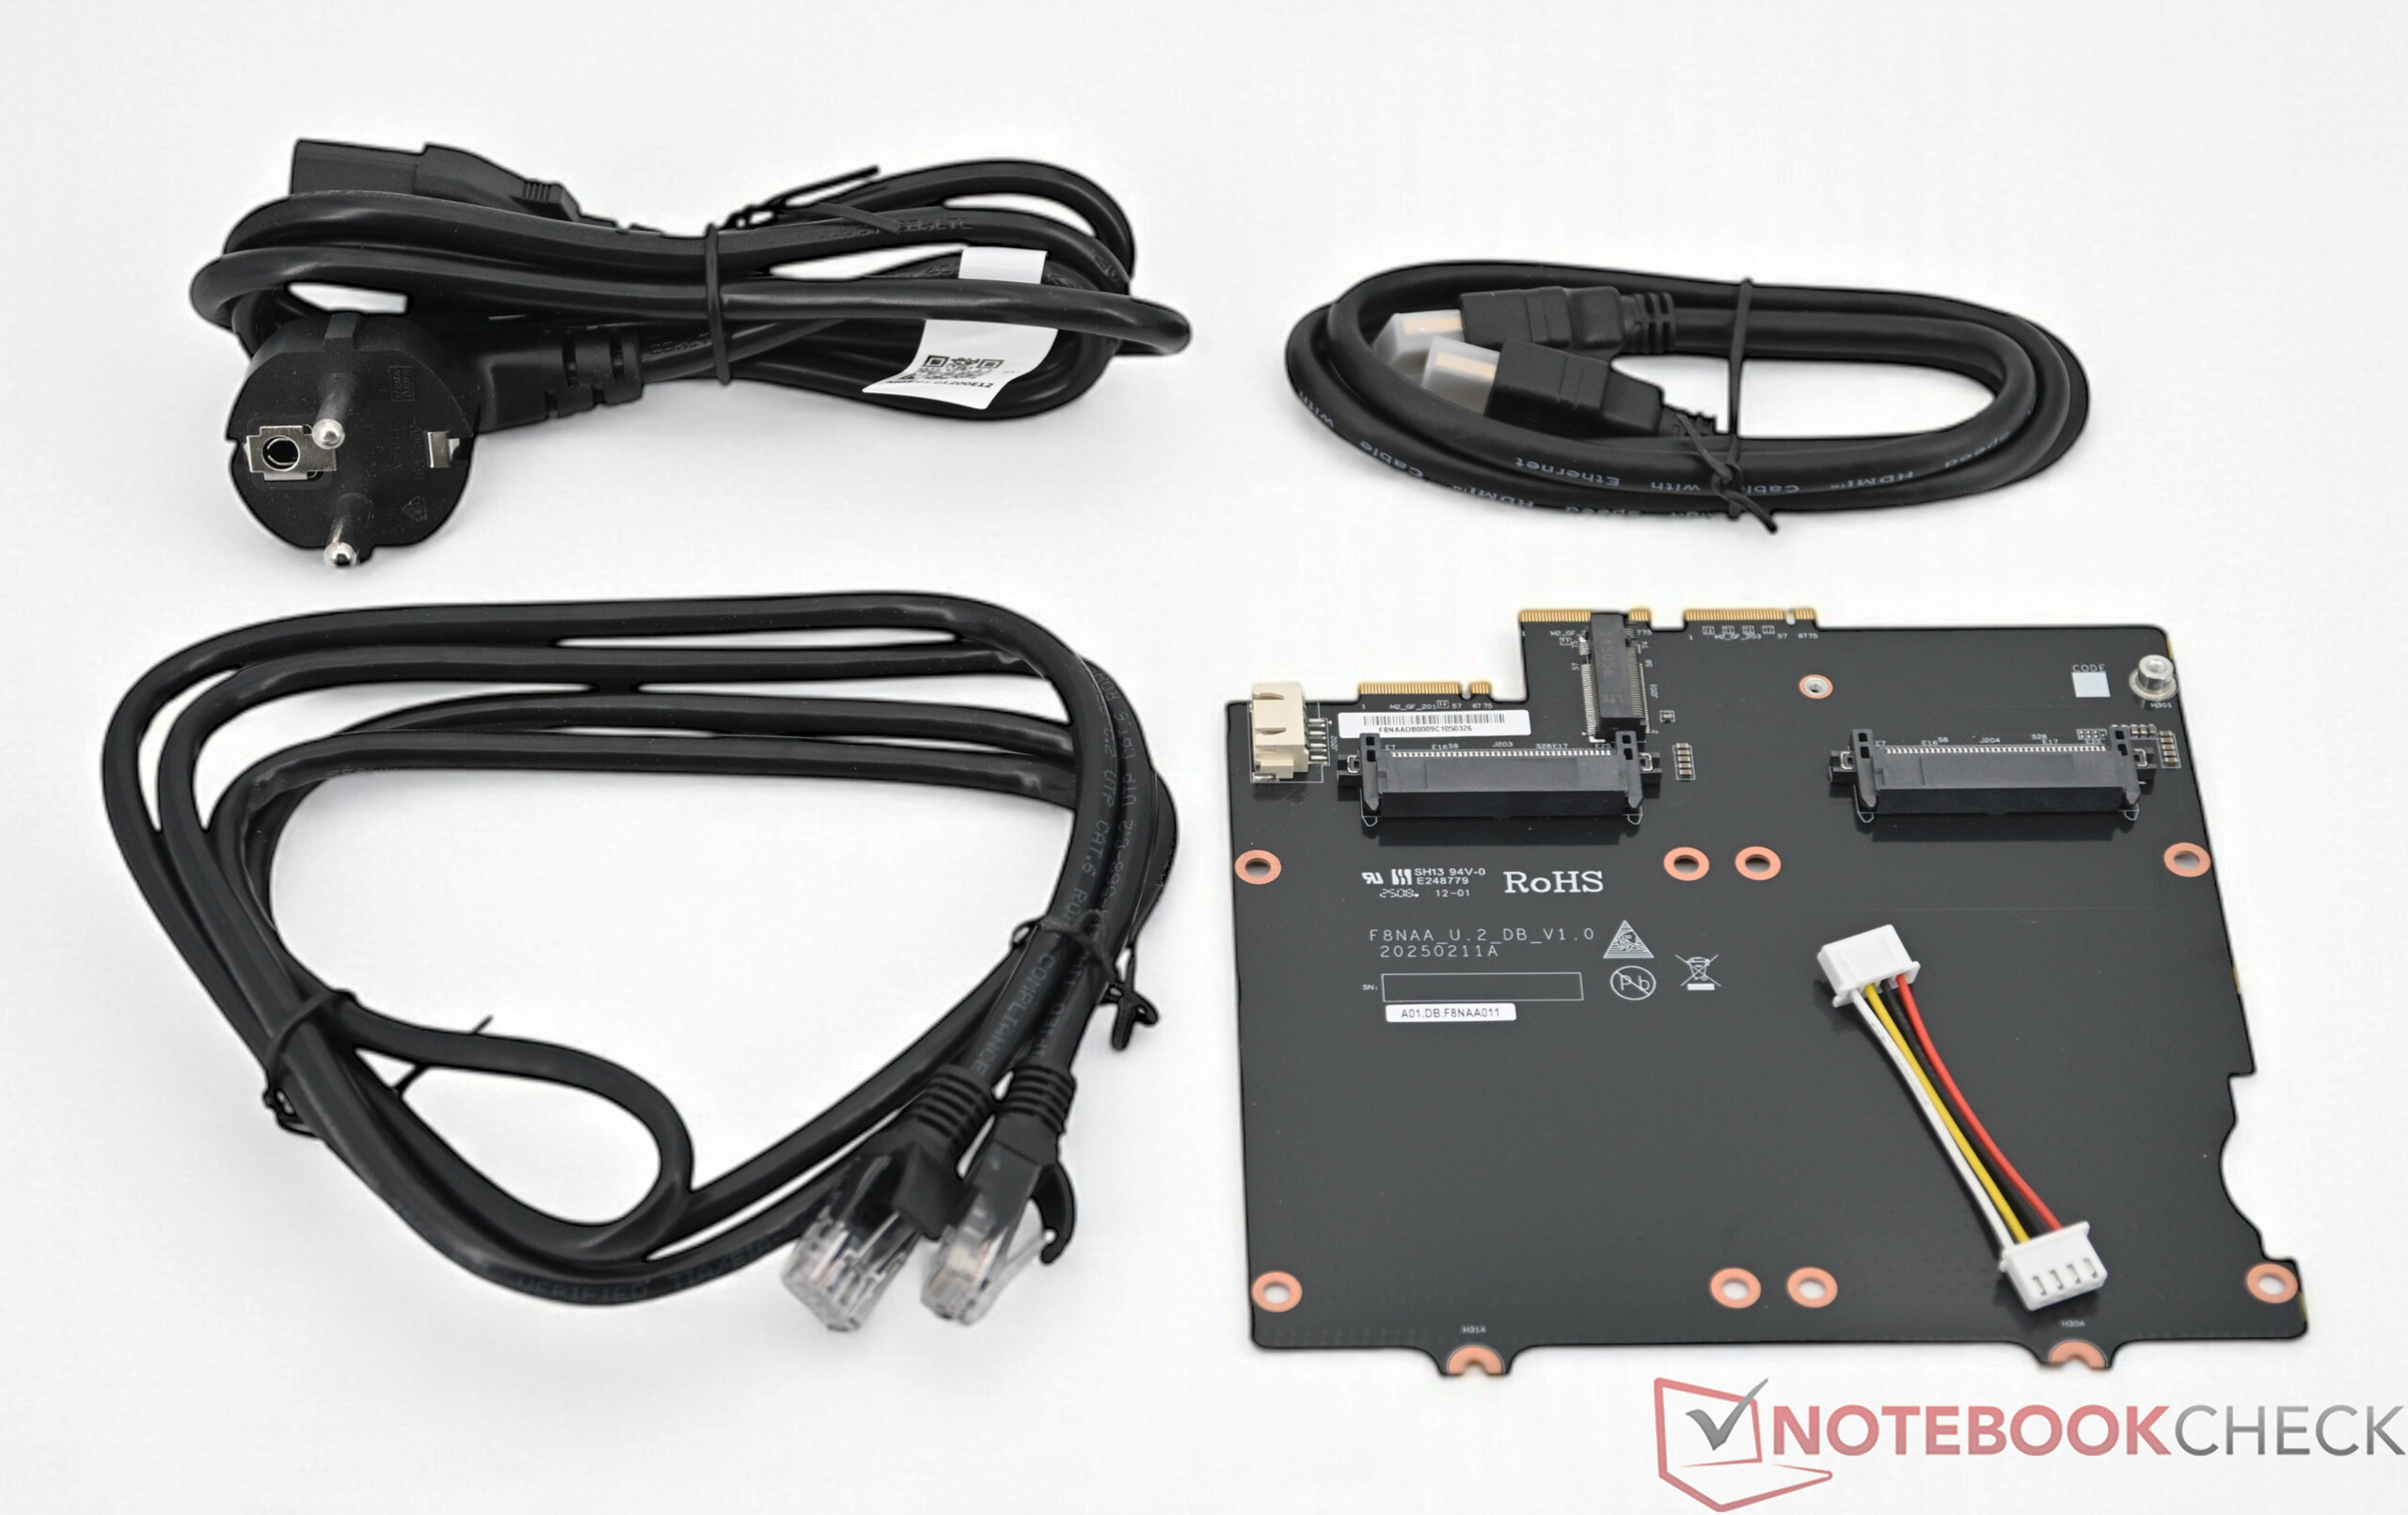
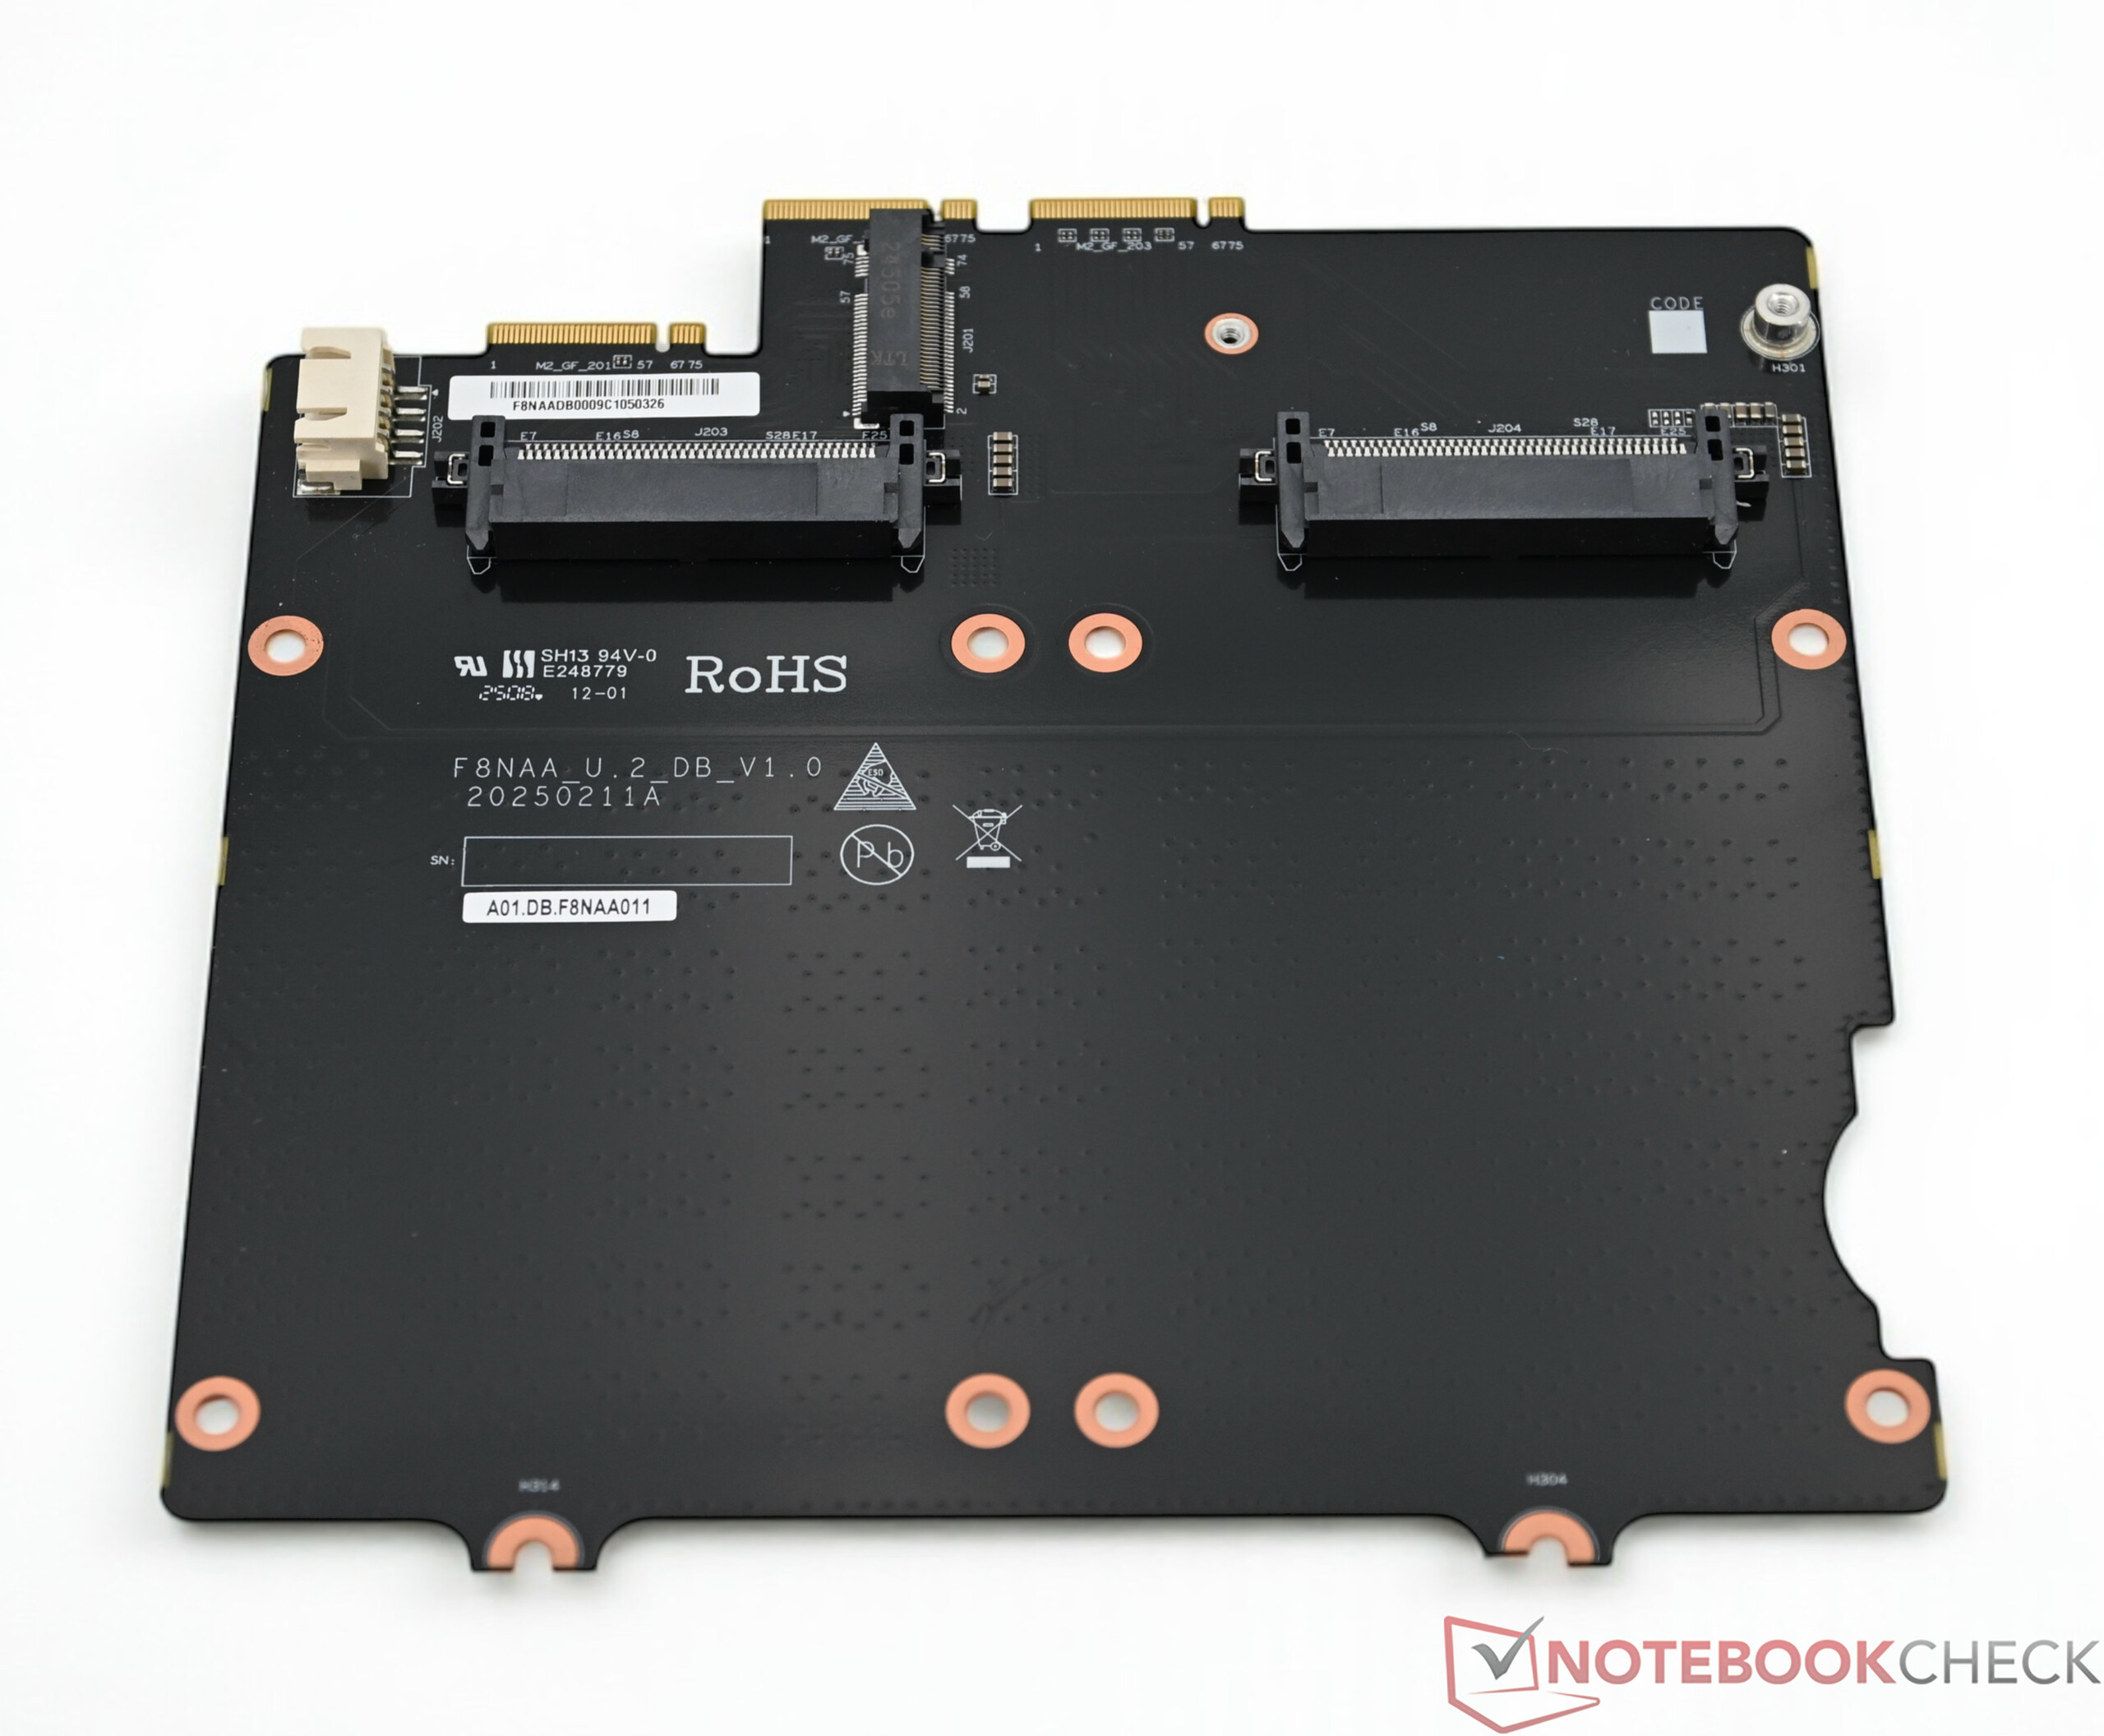
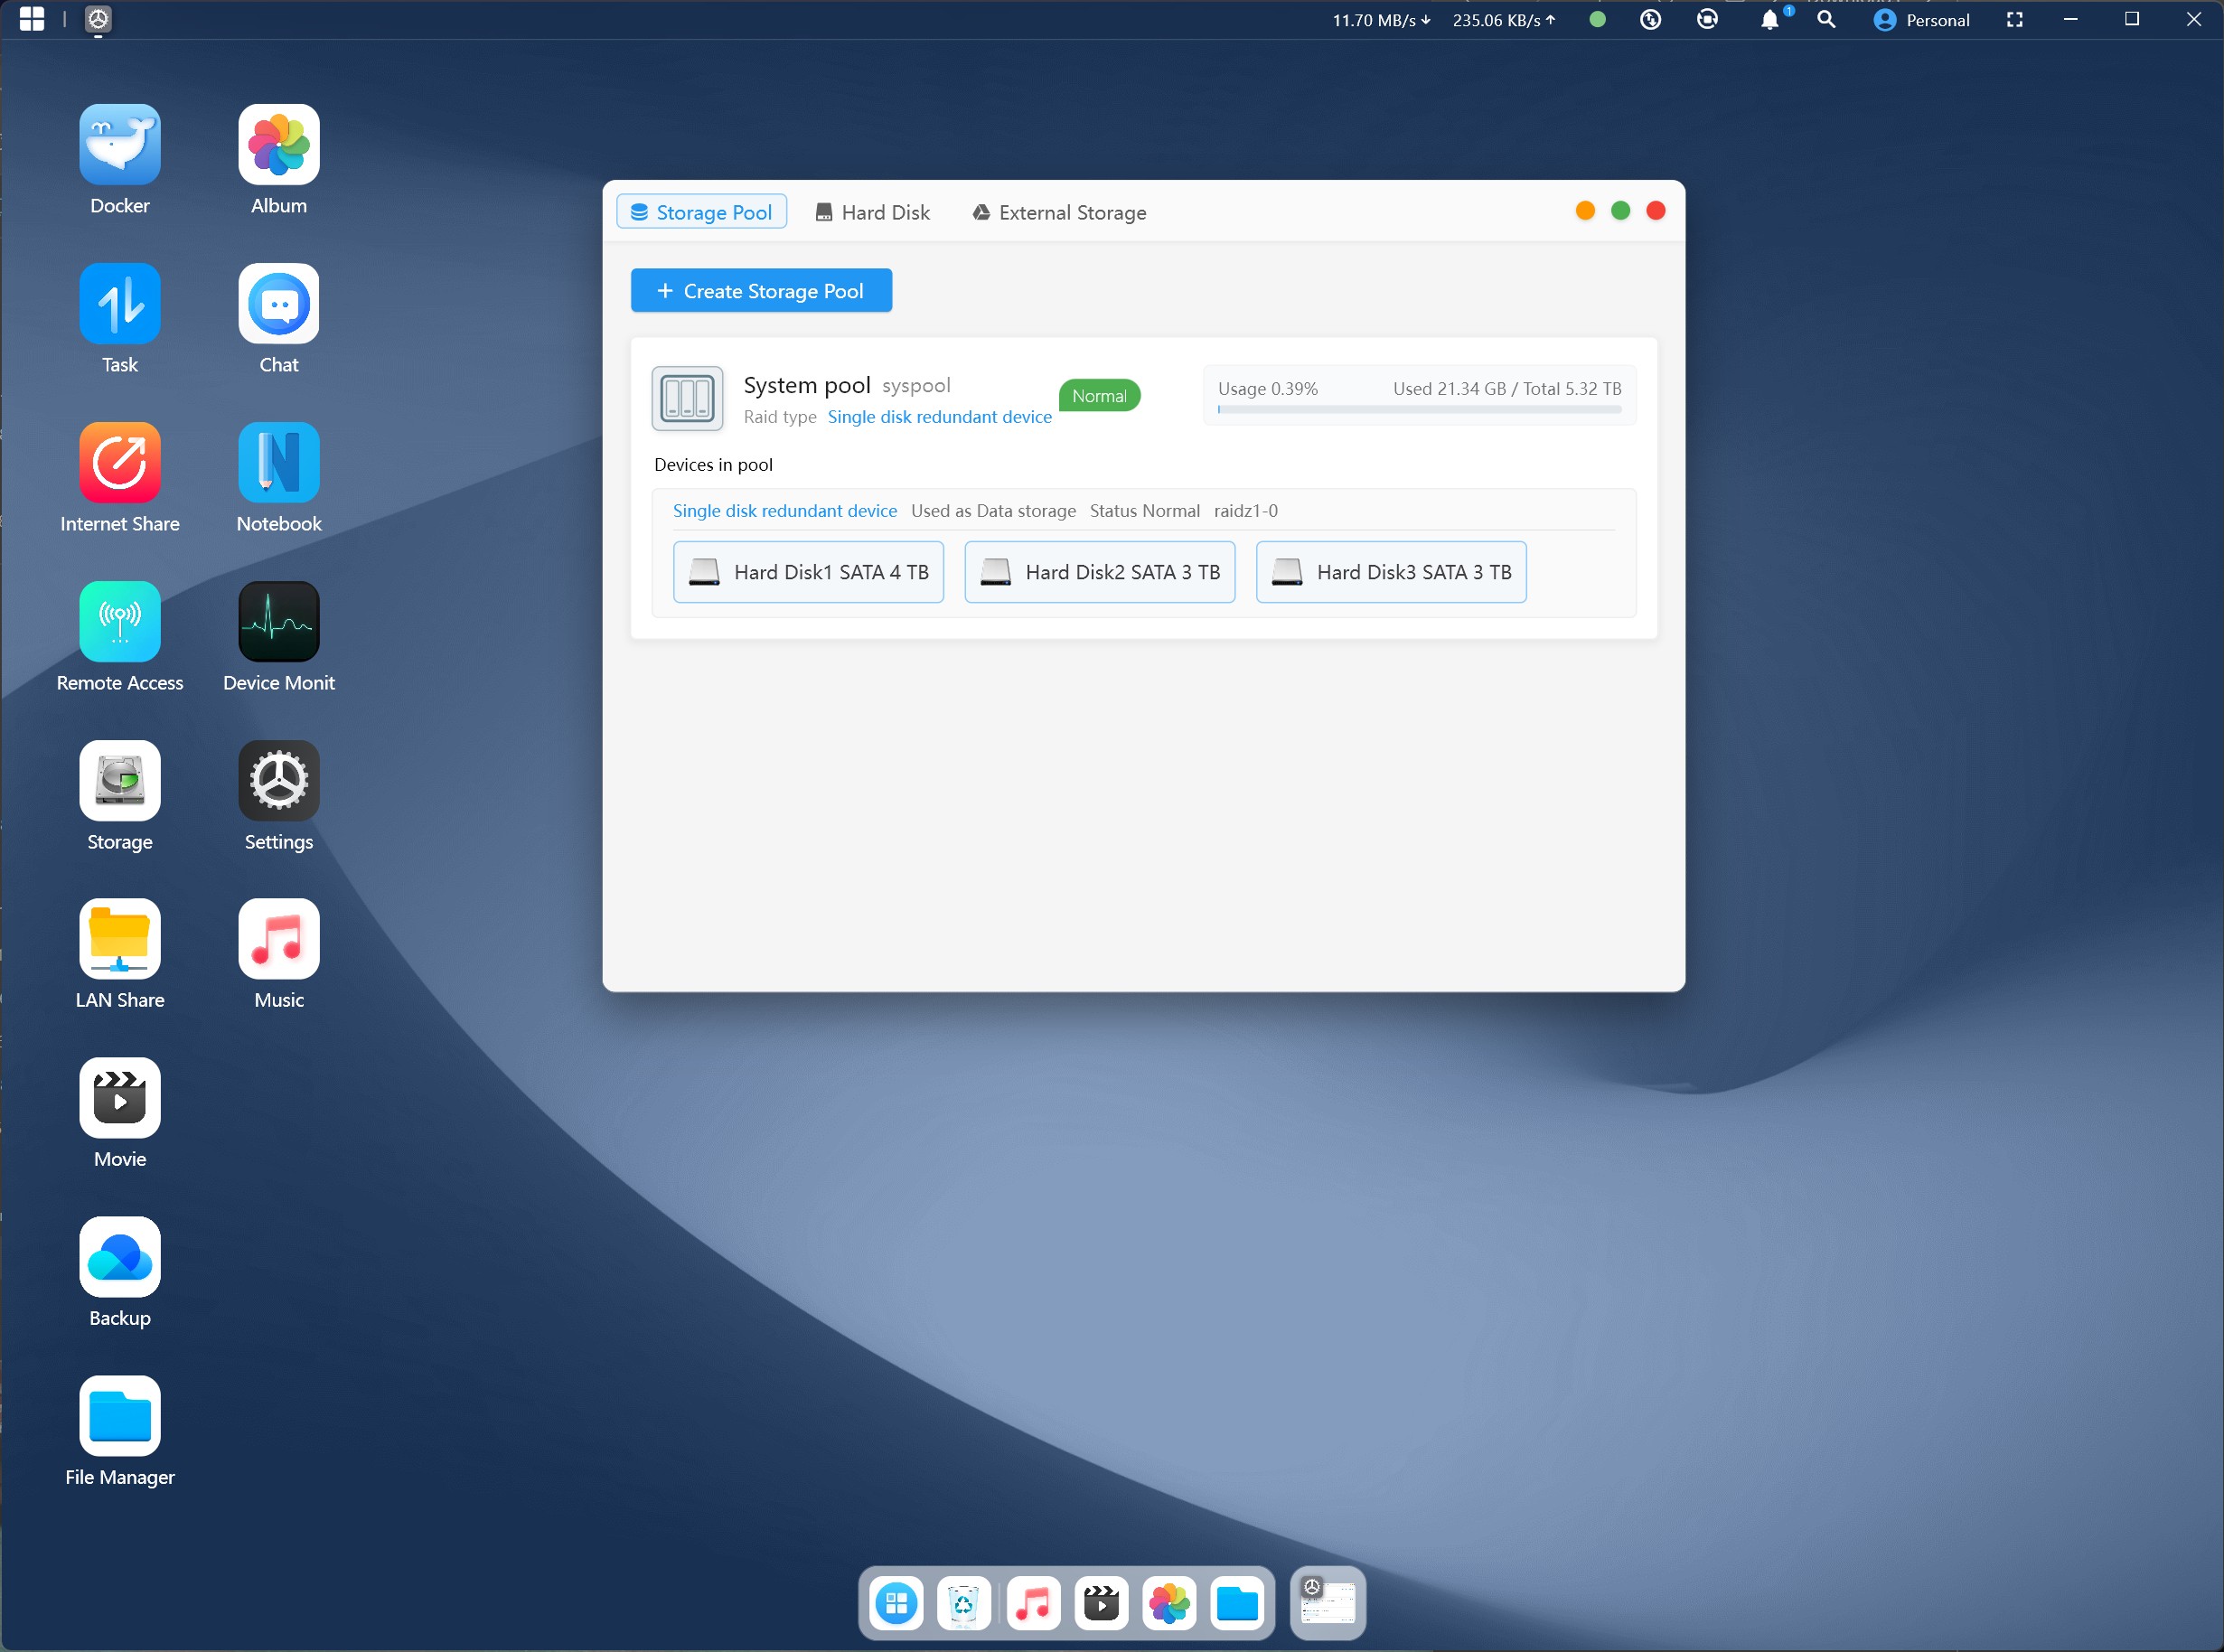
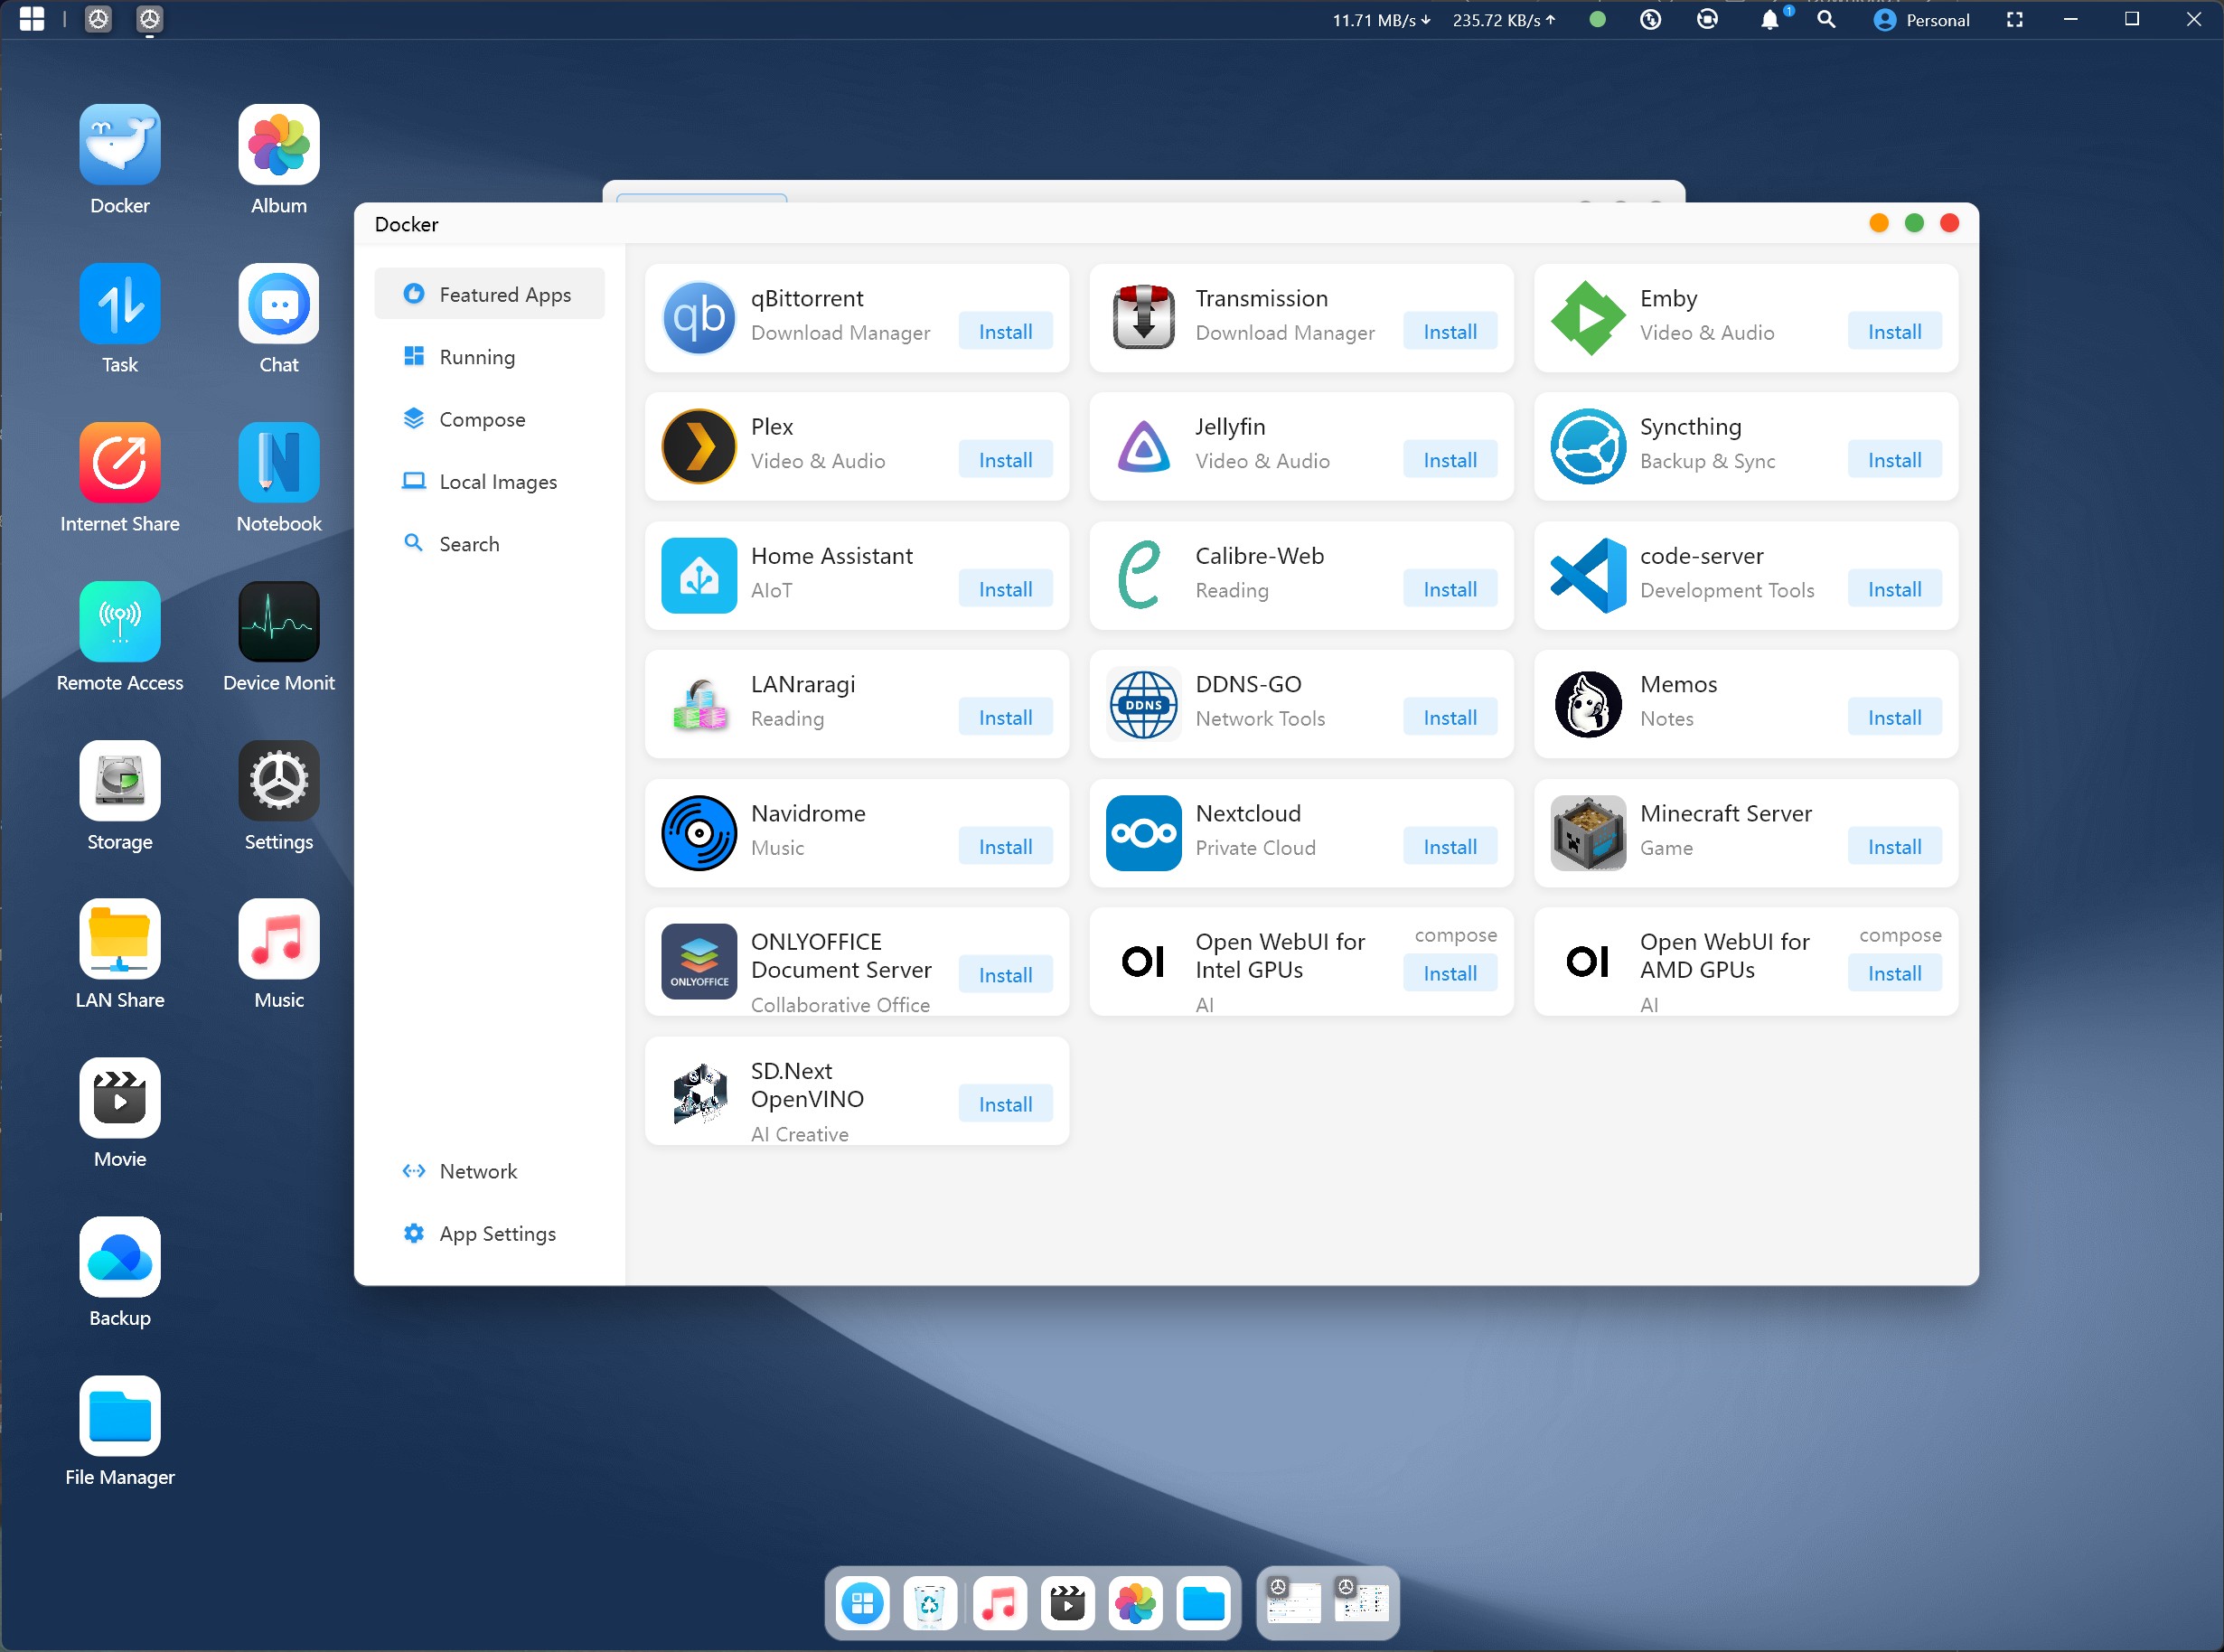
Accessories and MinisCloud OS
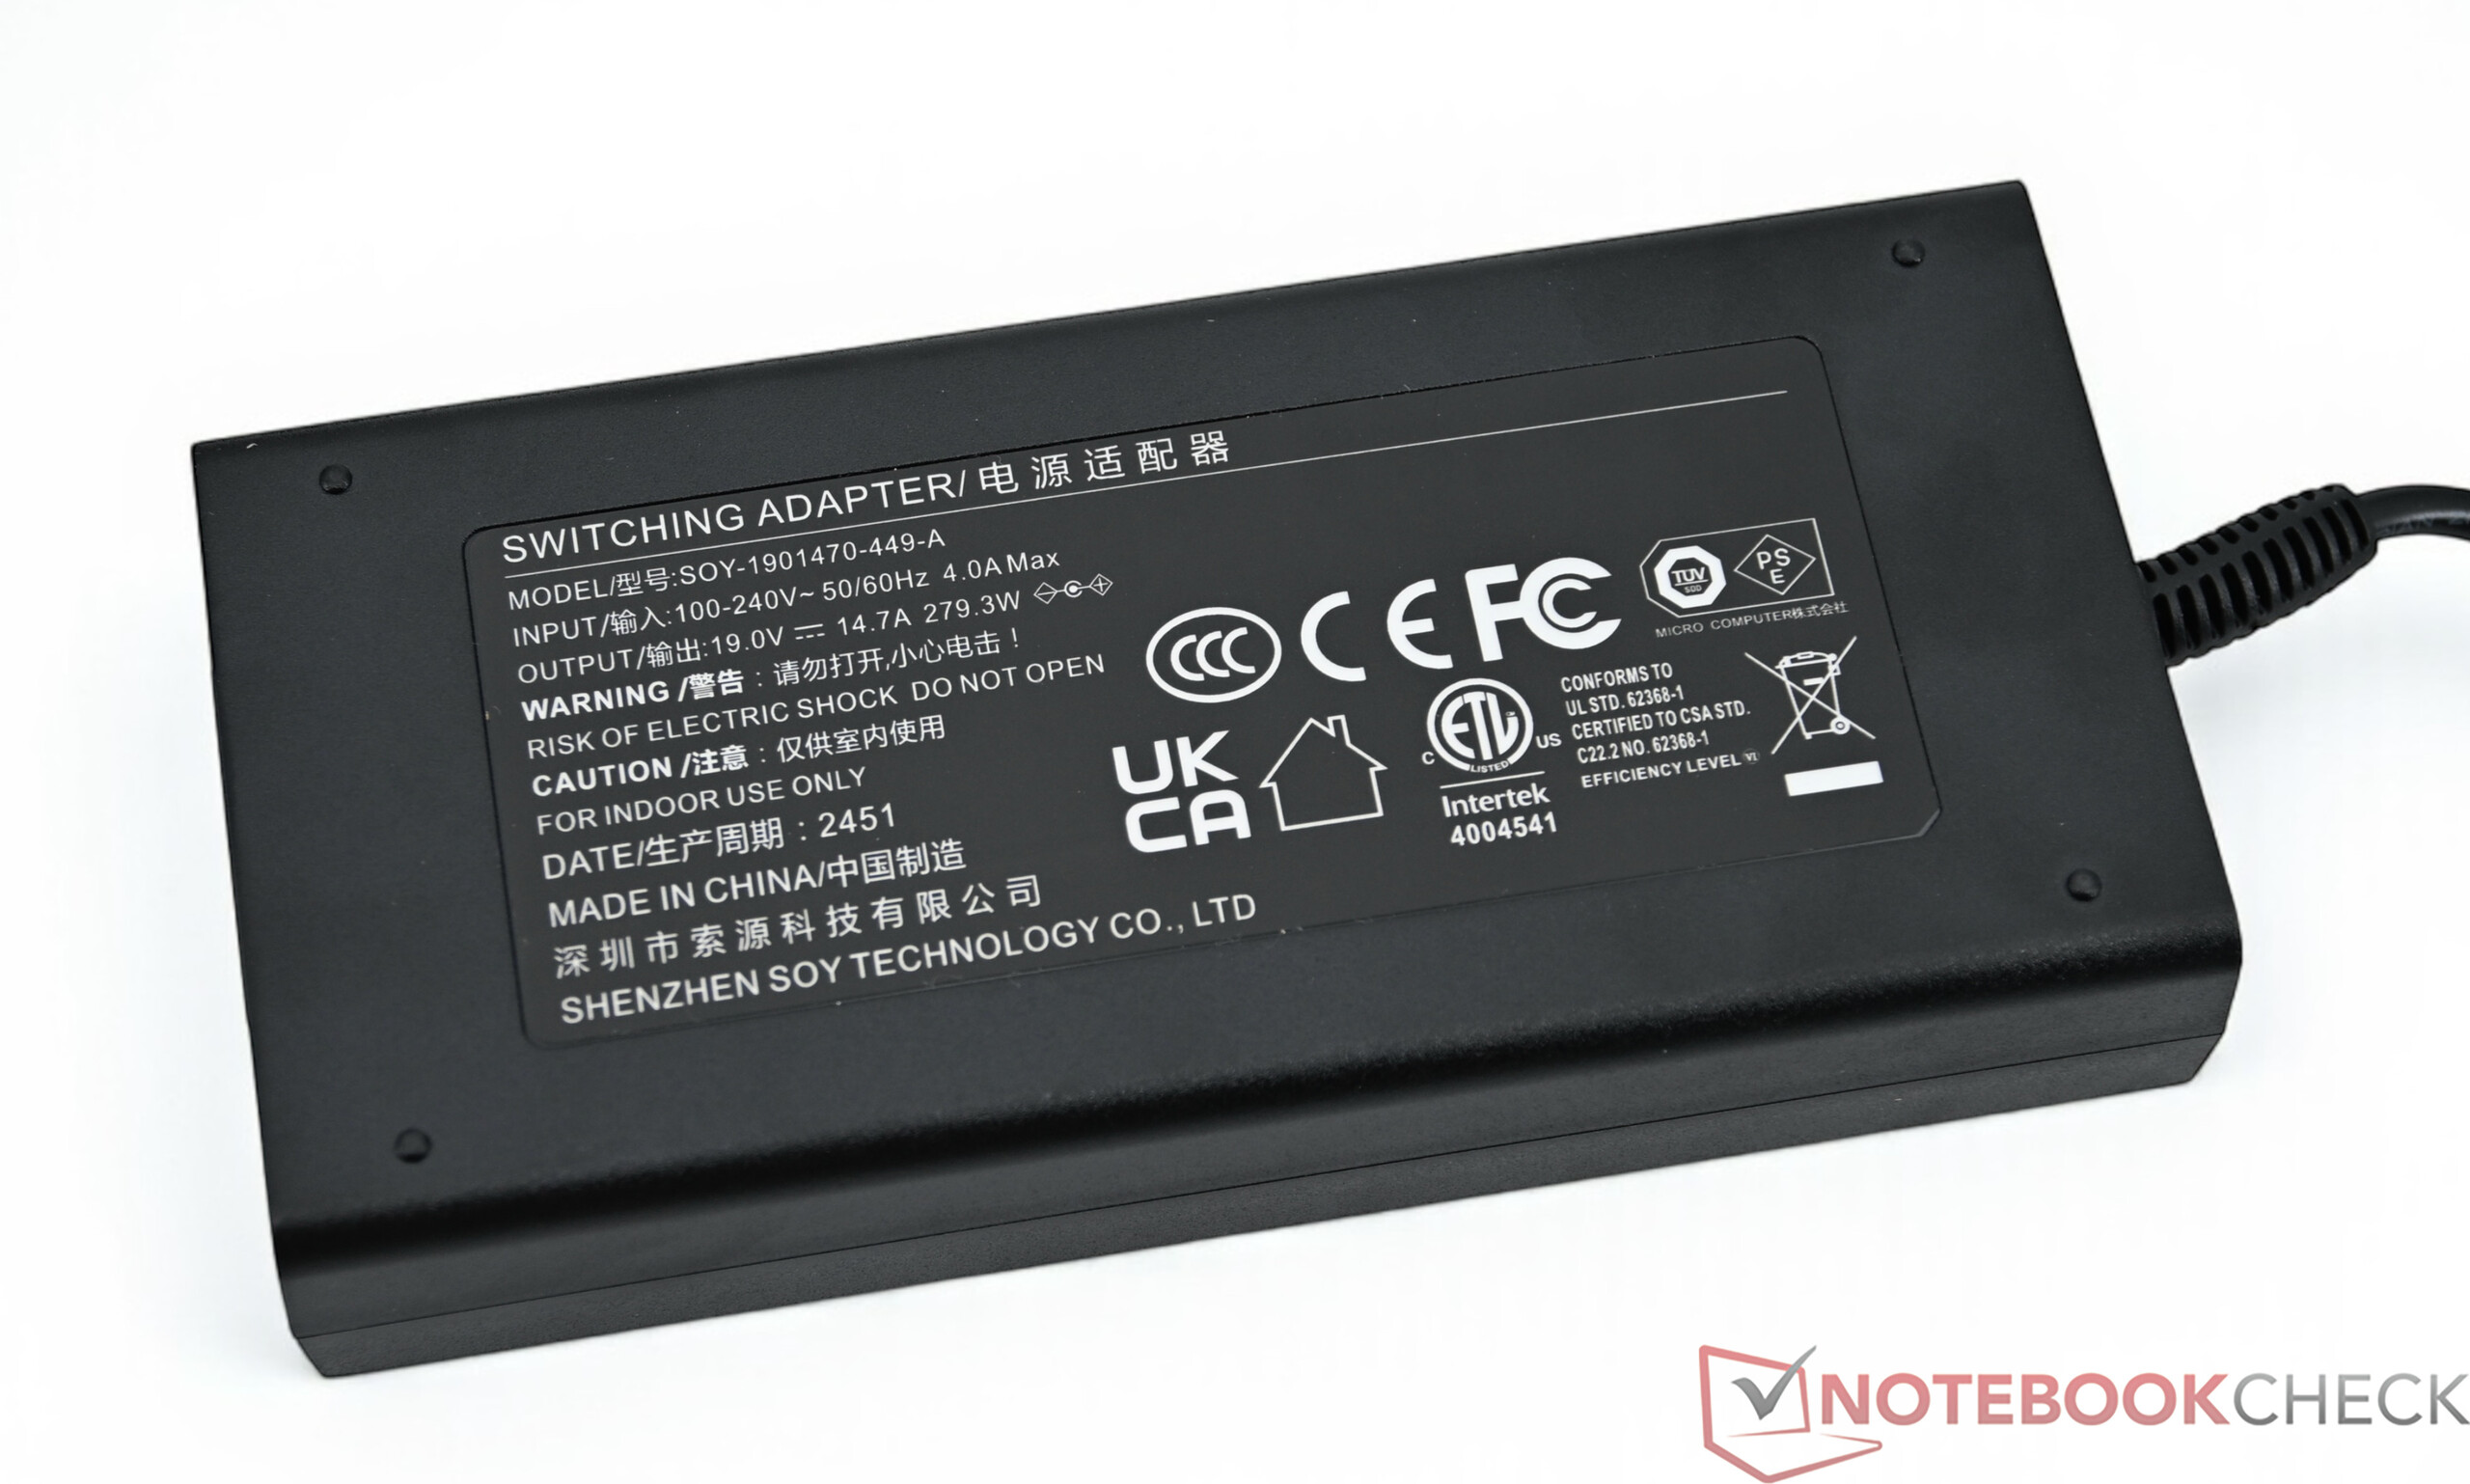
Minisforum includes an extensive selection of accessories in the scope of delivery. These include an adapter board for installing U.2 SSDs, a powerful 280-watt power supply unit, and the necessary connection cables to get the device up and running immediately. Minisforum also supplies a specially developed operating system, the MinisCloud OS. The approach is good for integrating the NAS into your network. Some programs are already pre-installed, and with the option of integrating Docker containers, almost all possibilities are open.
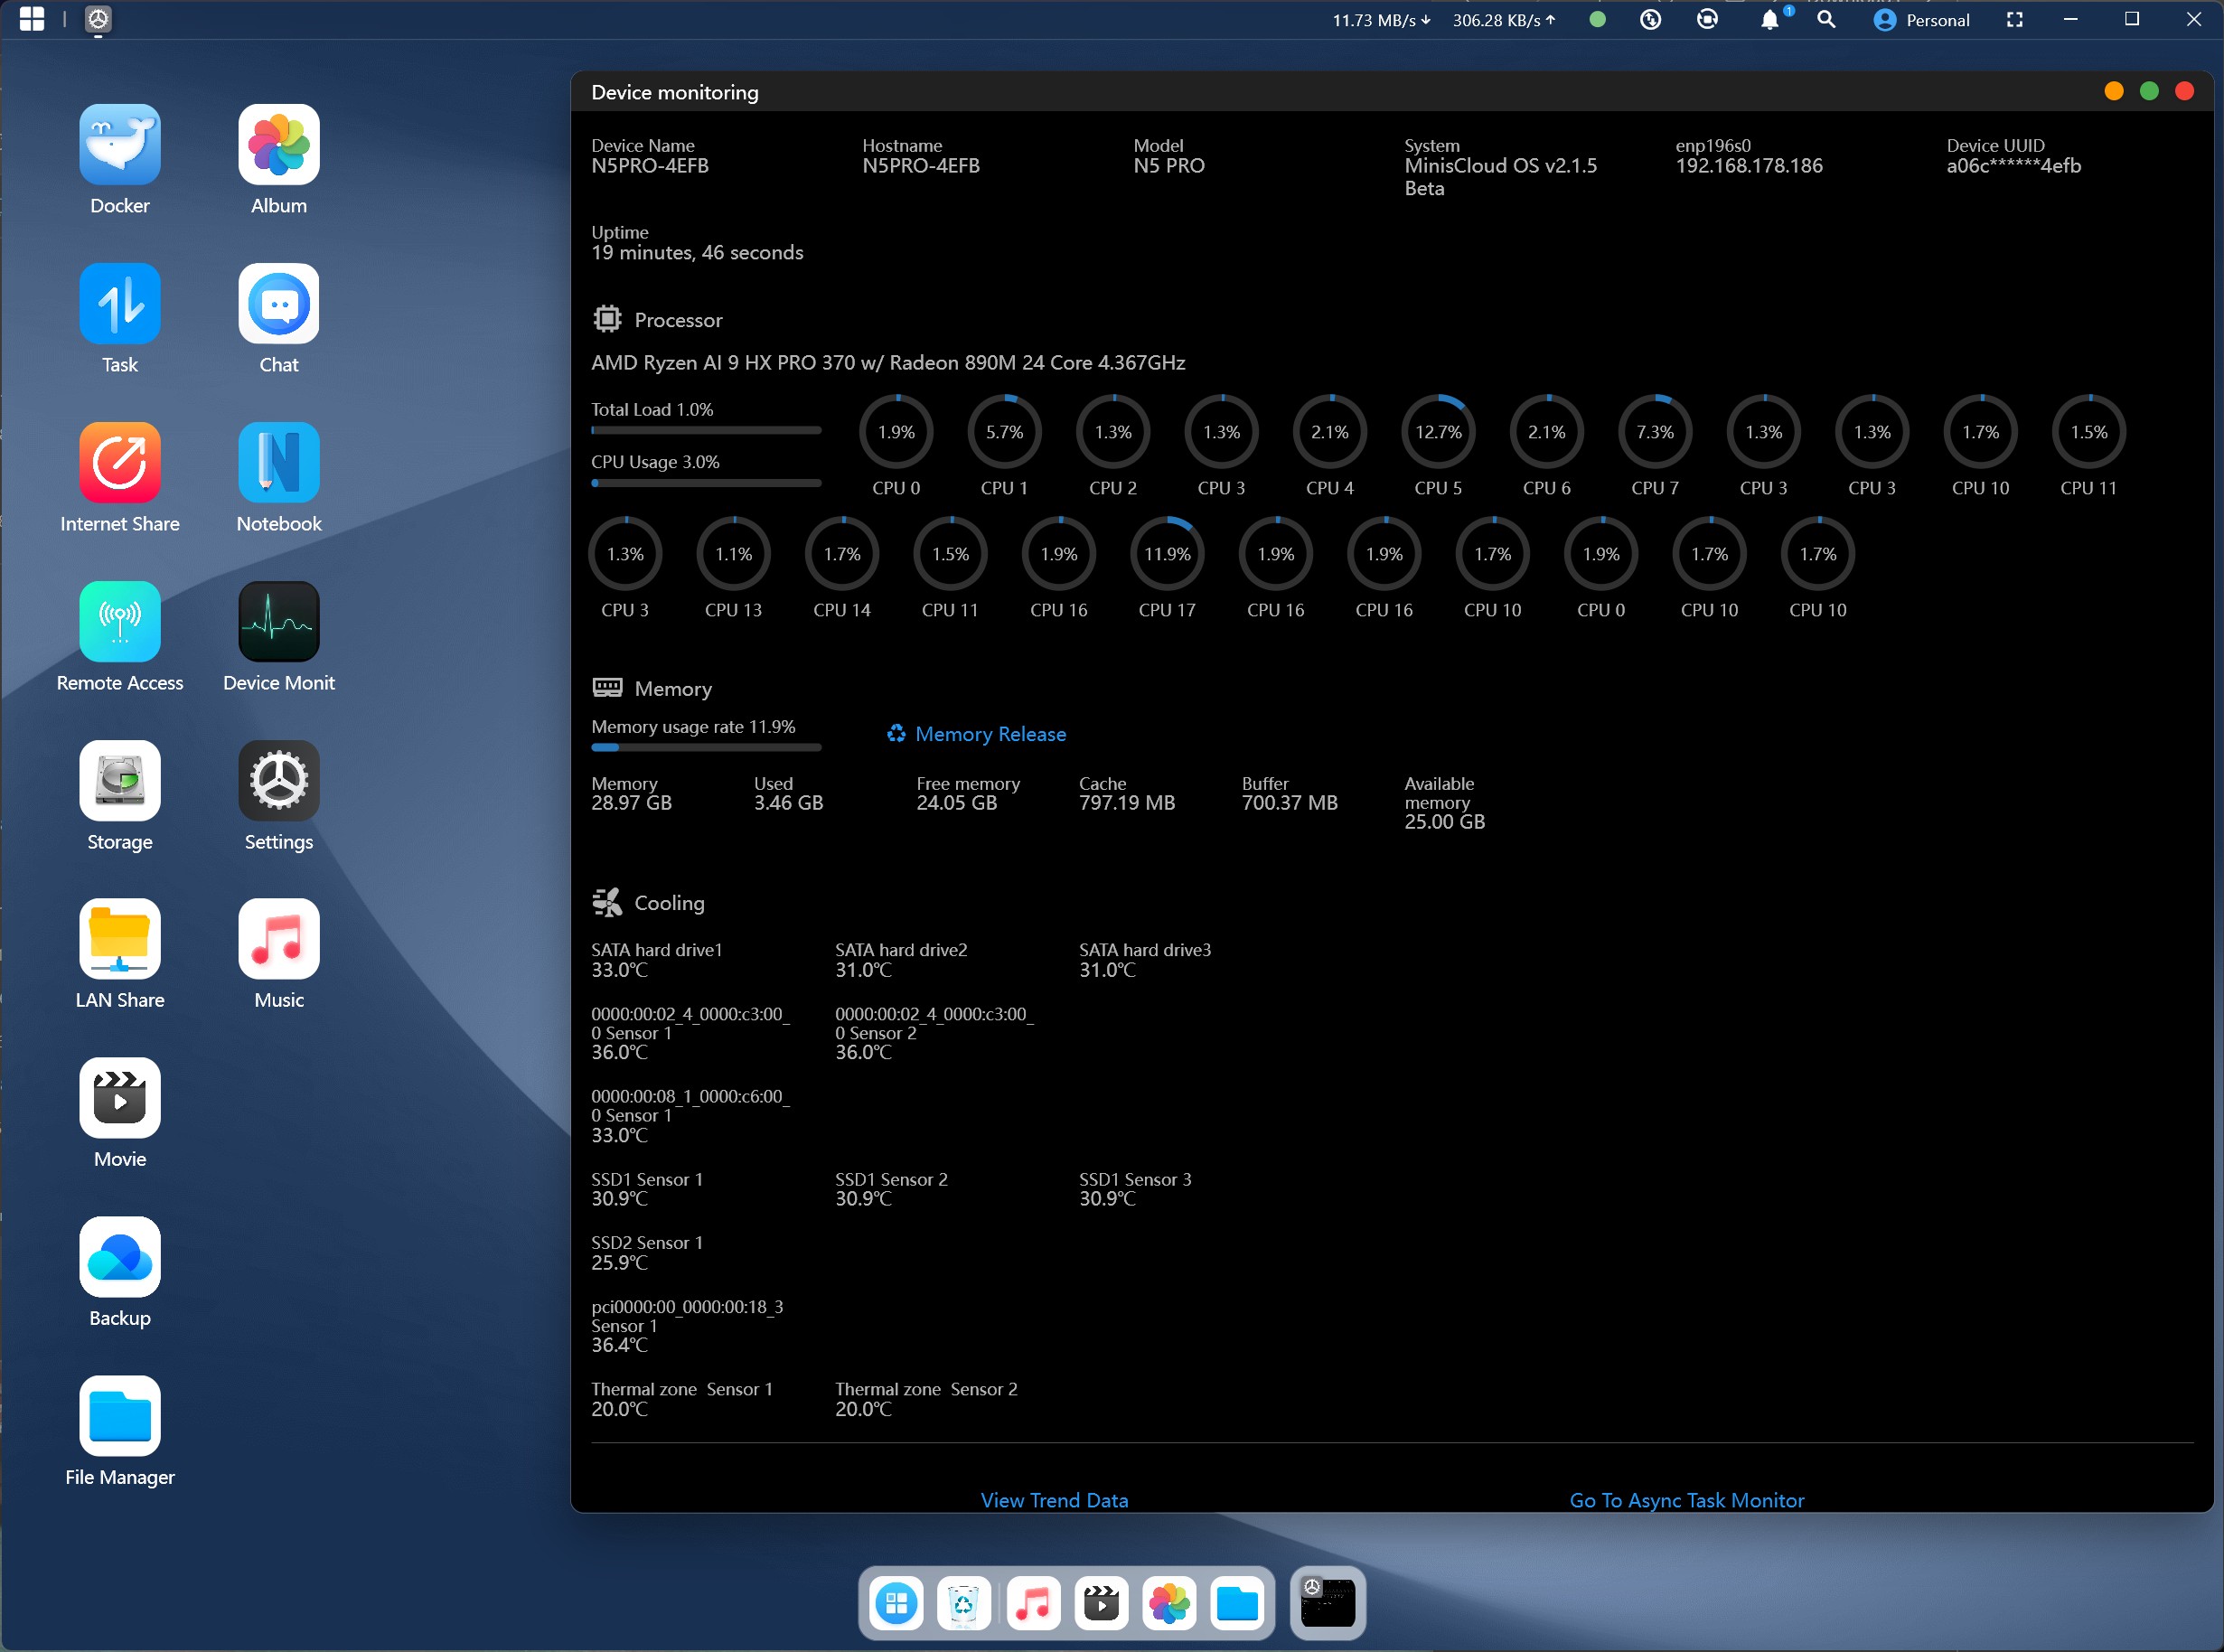
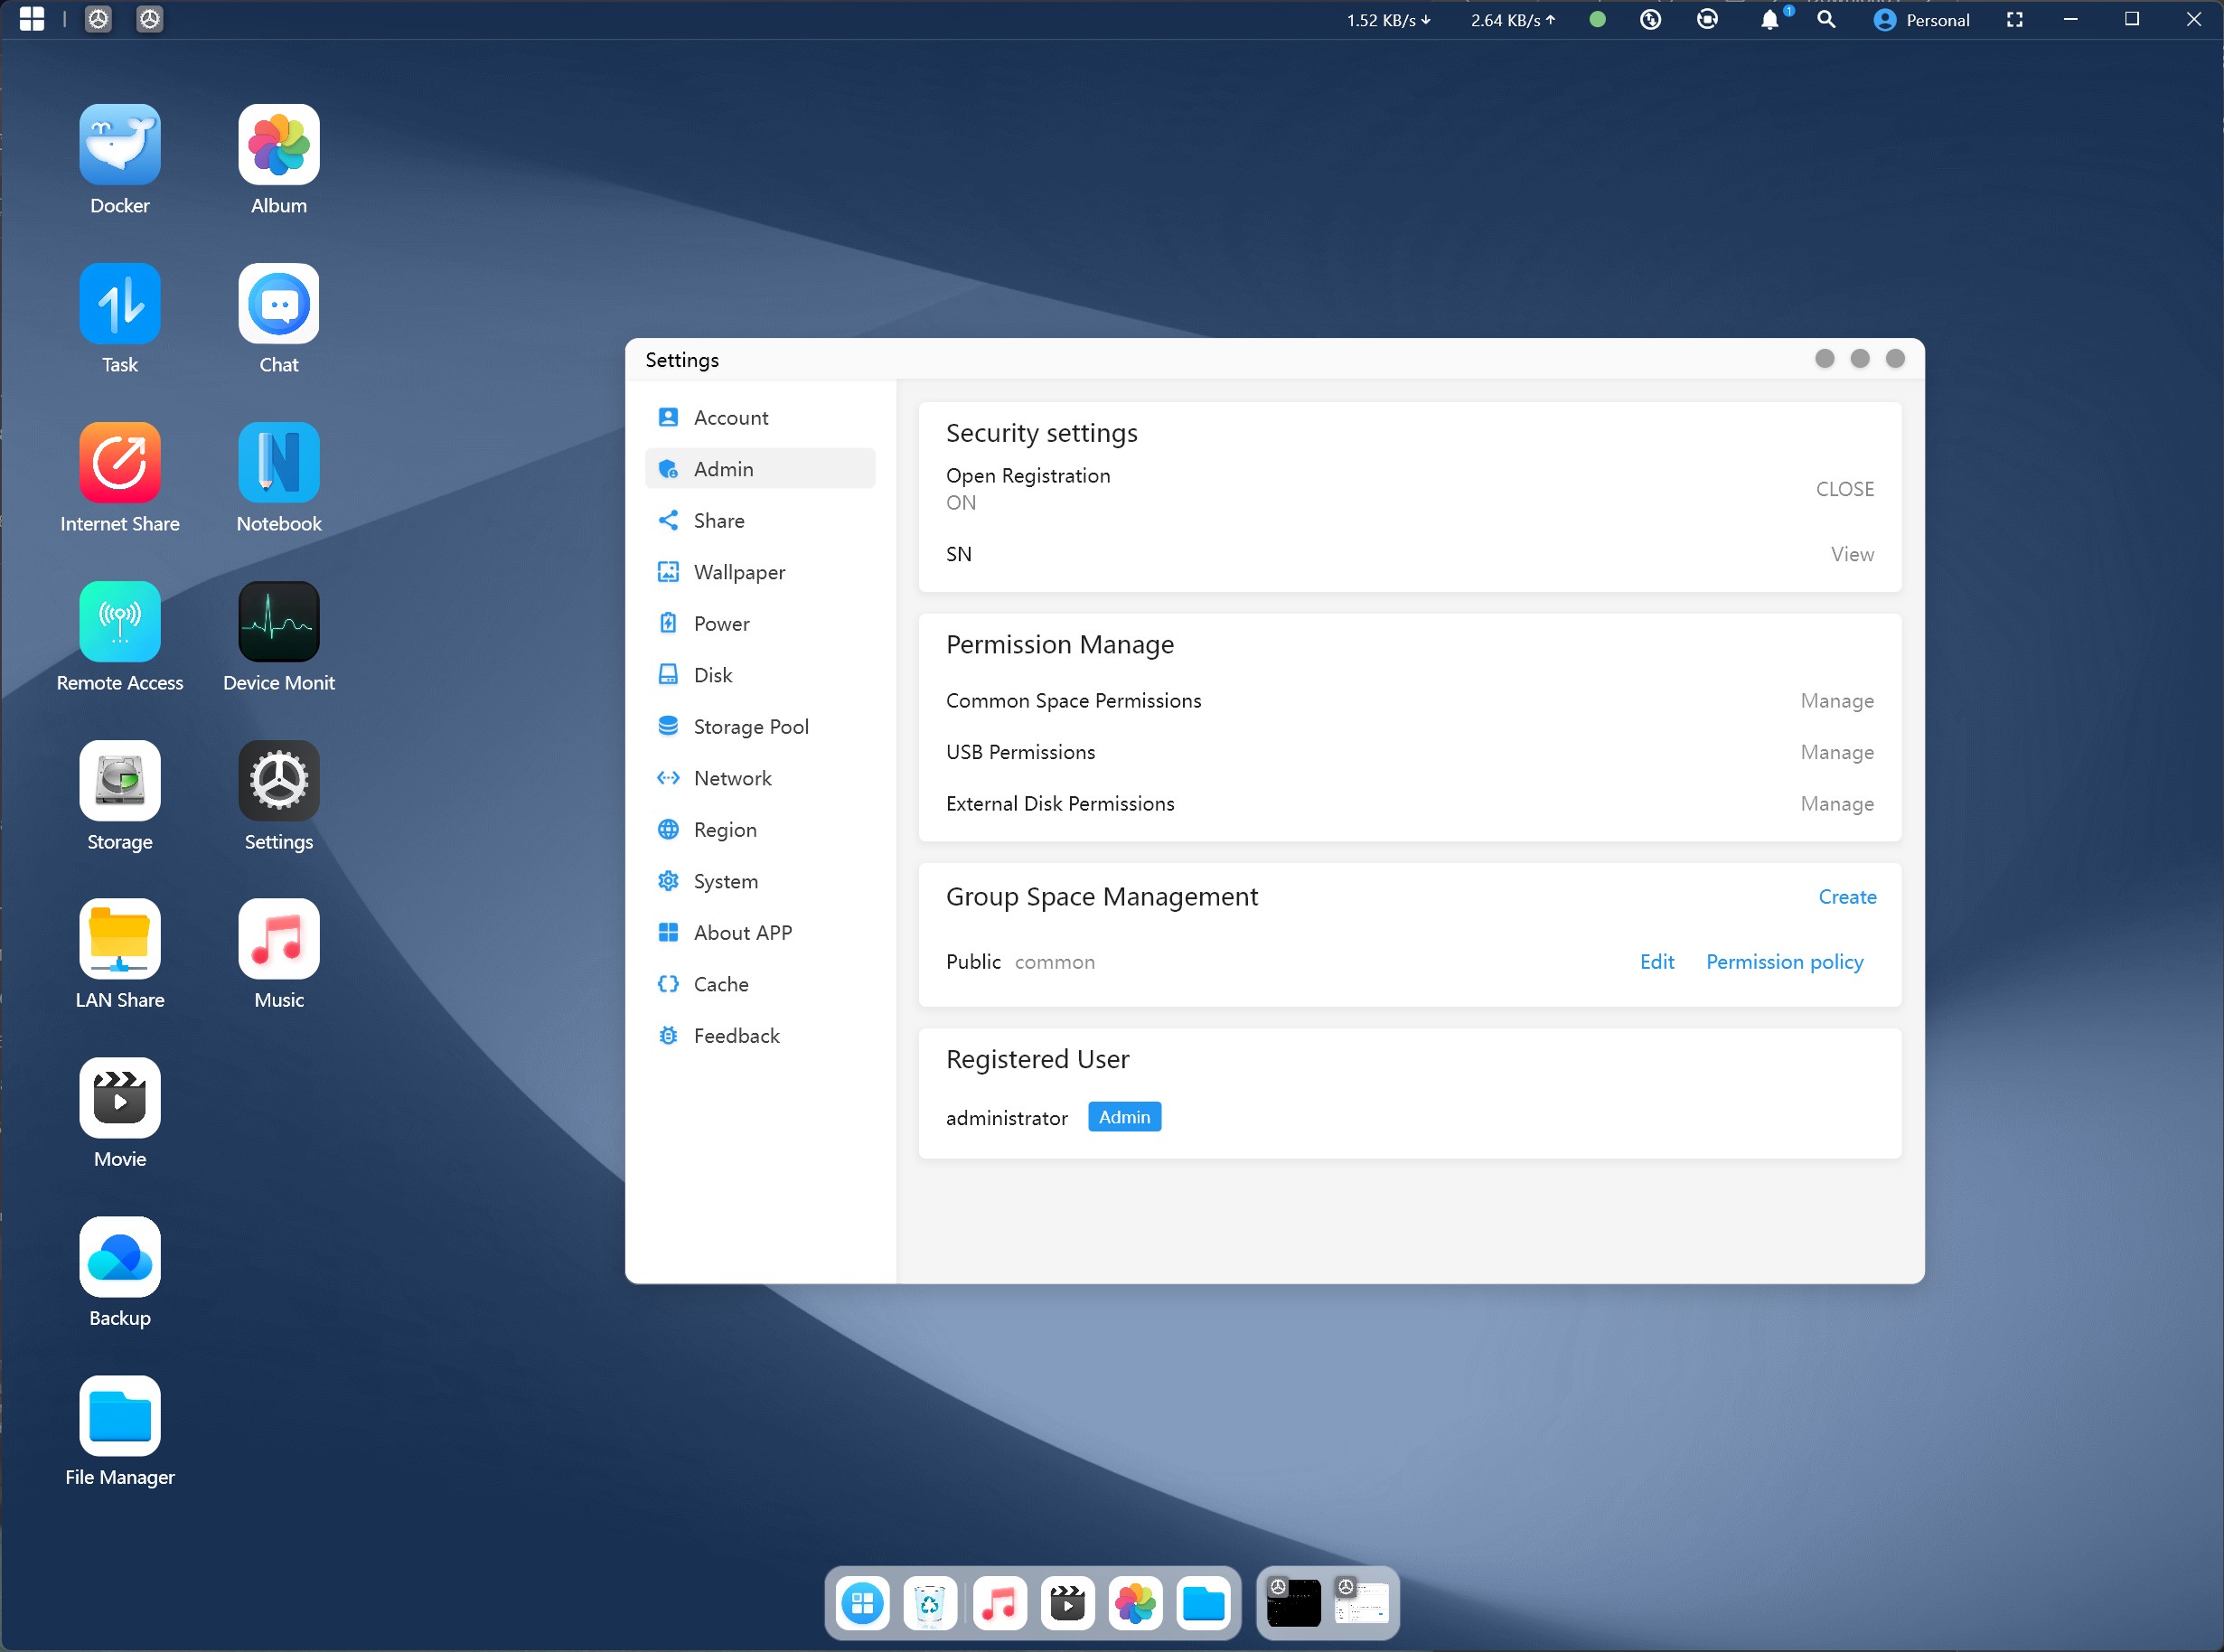
MinisCloud OS
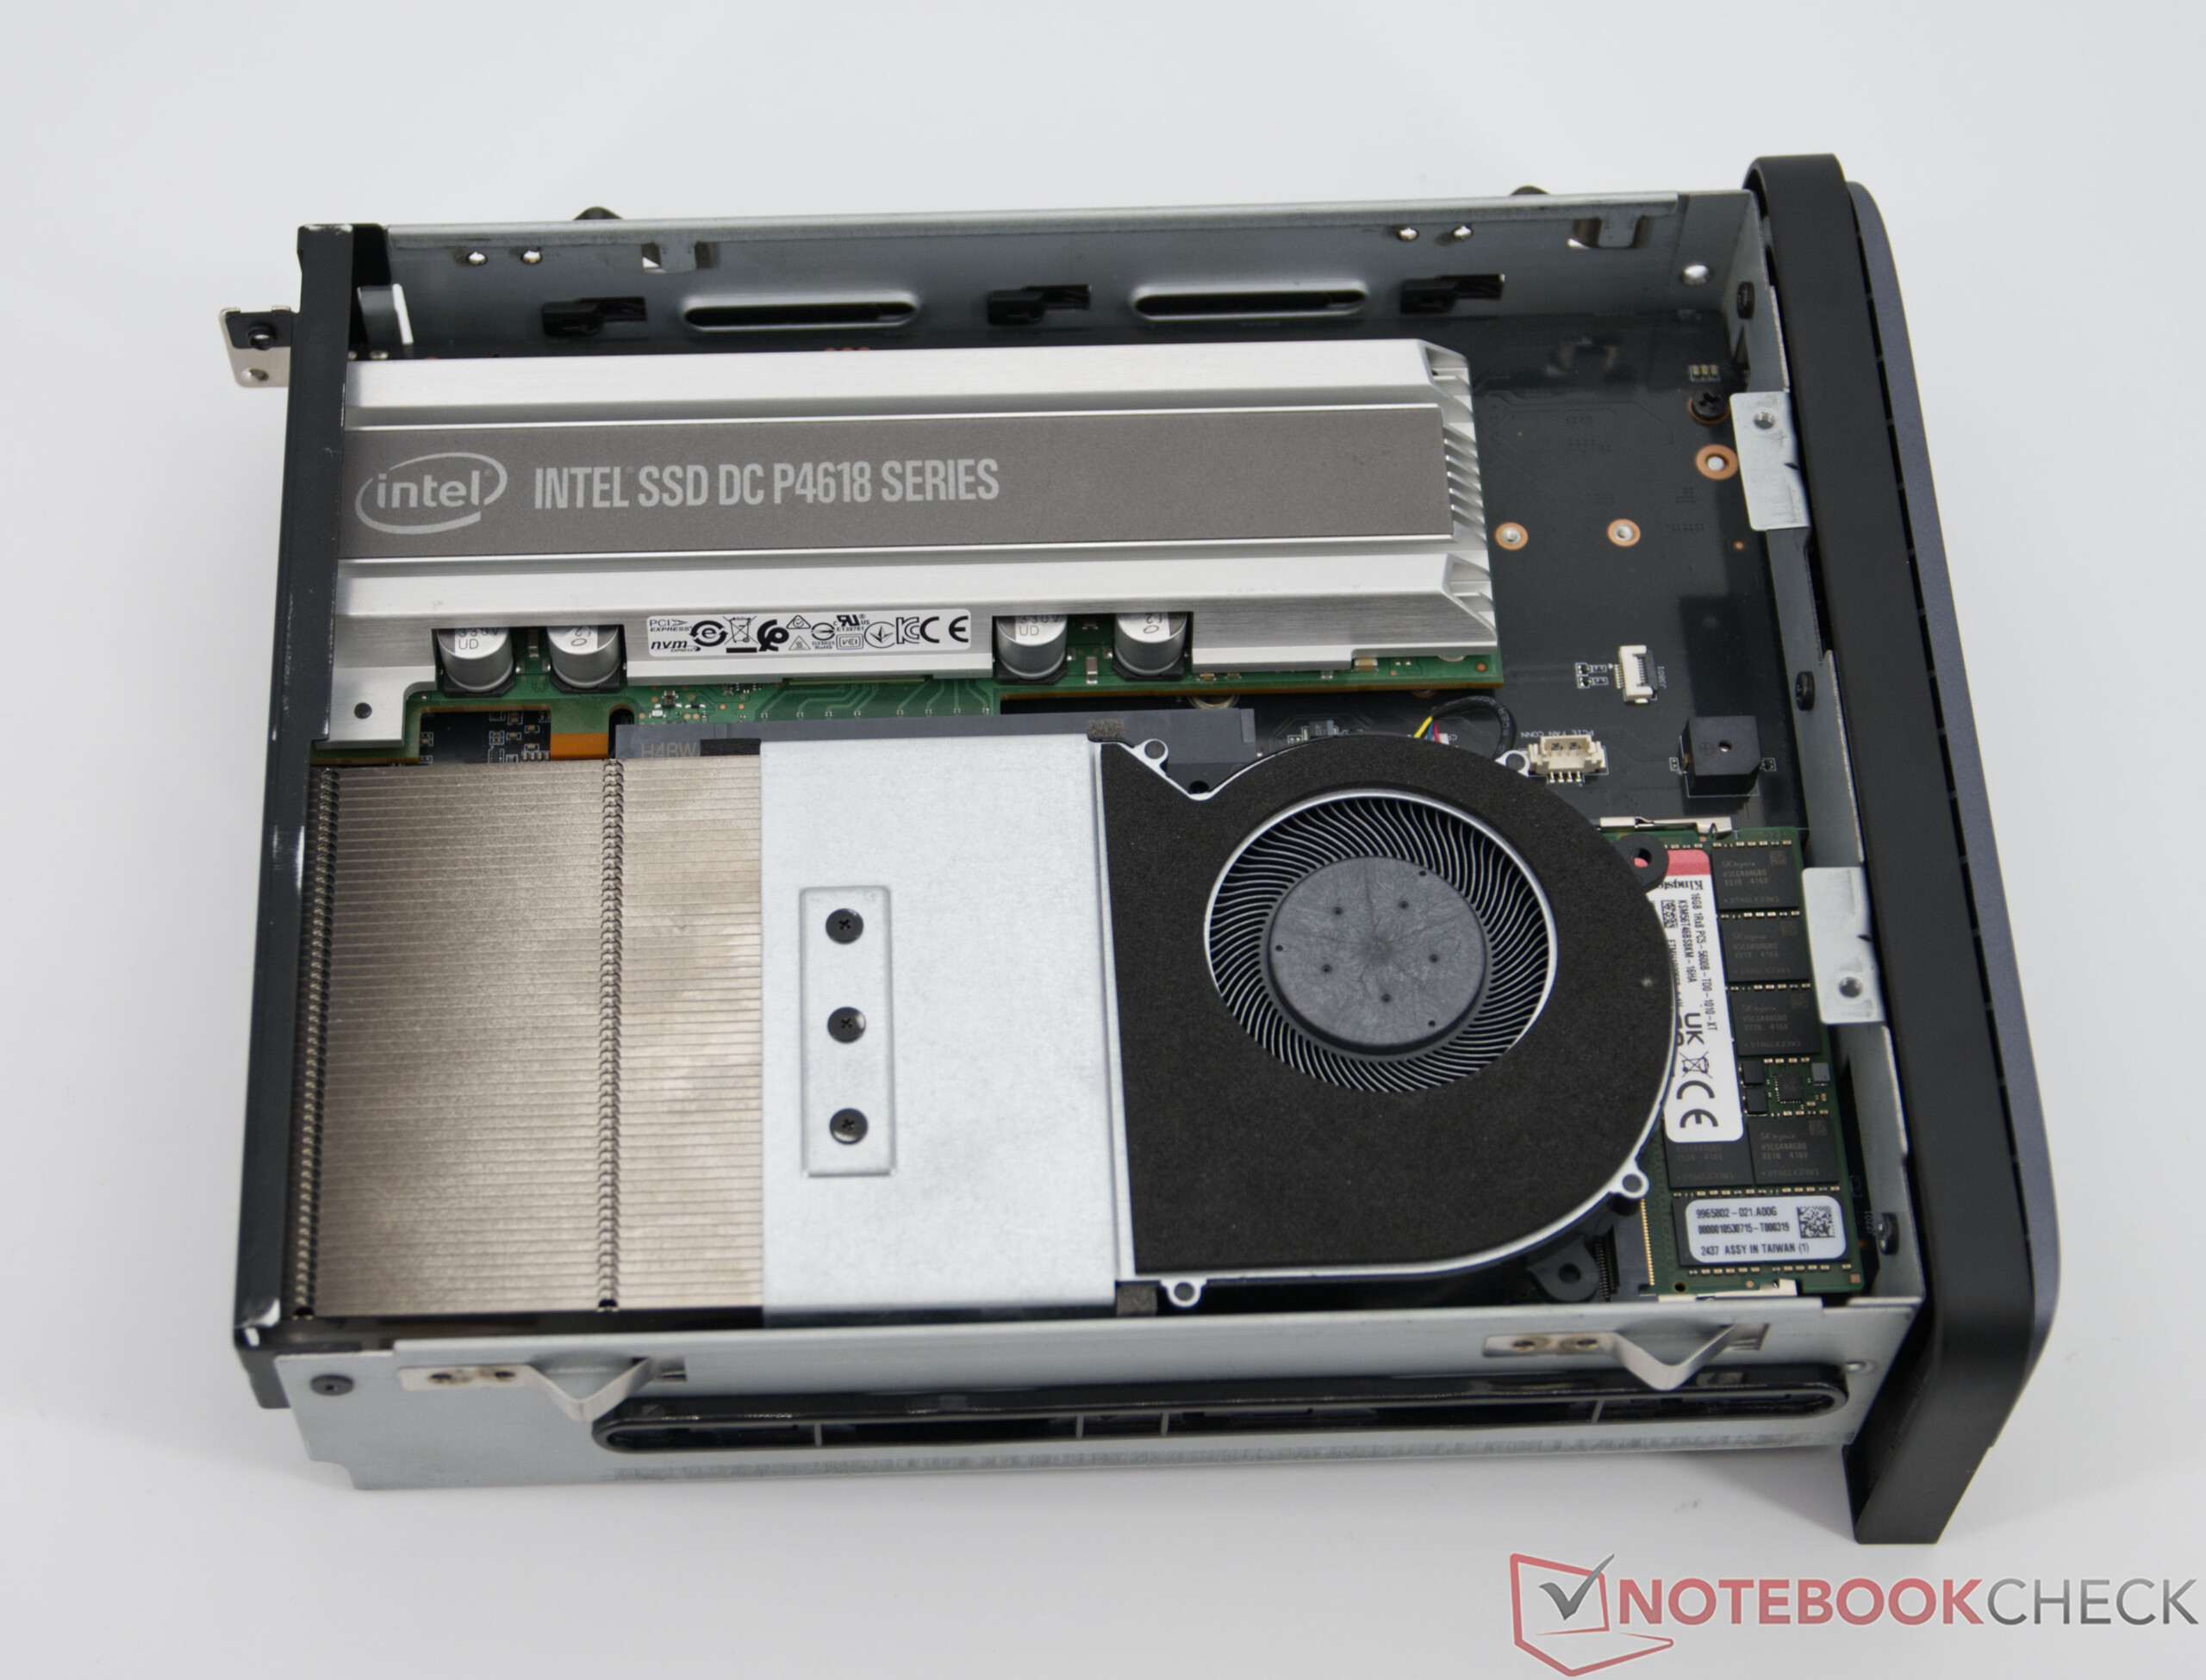
Maintenance
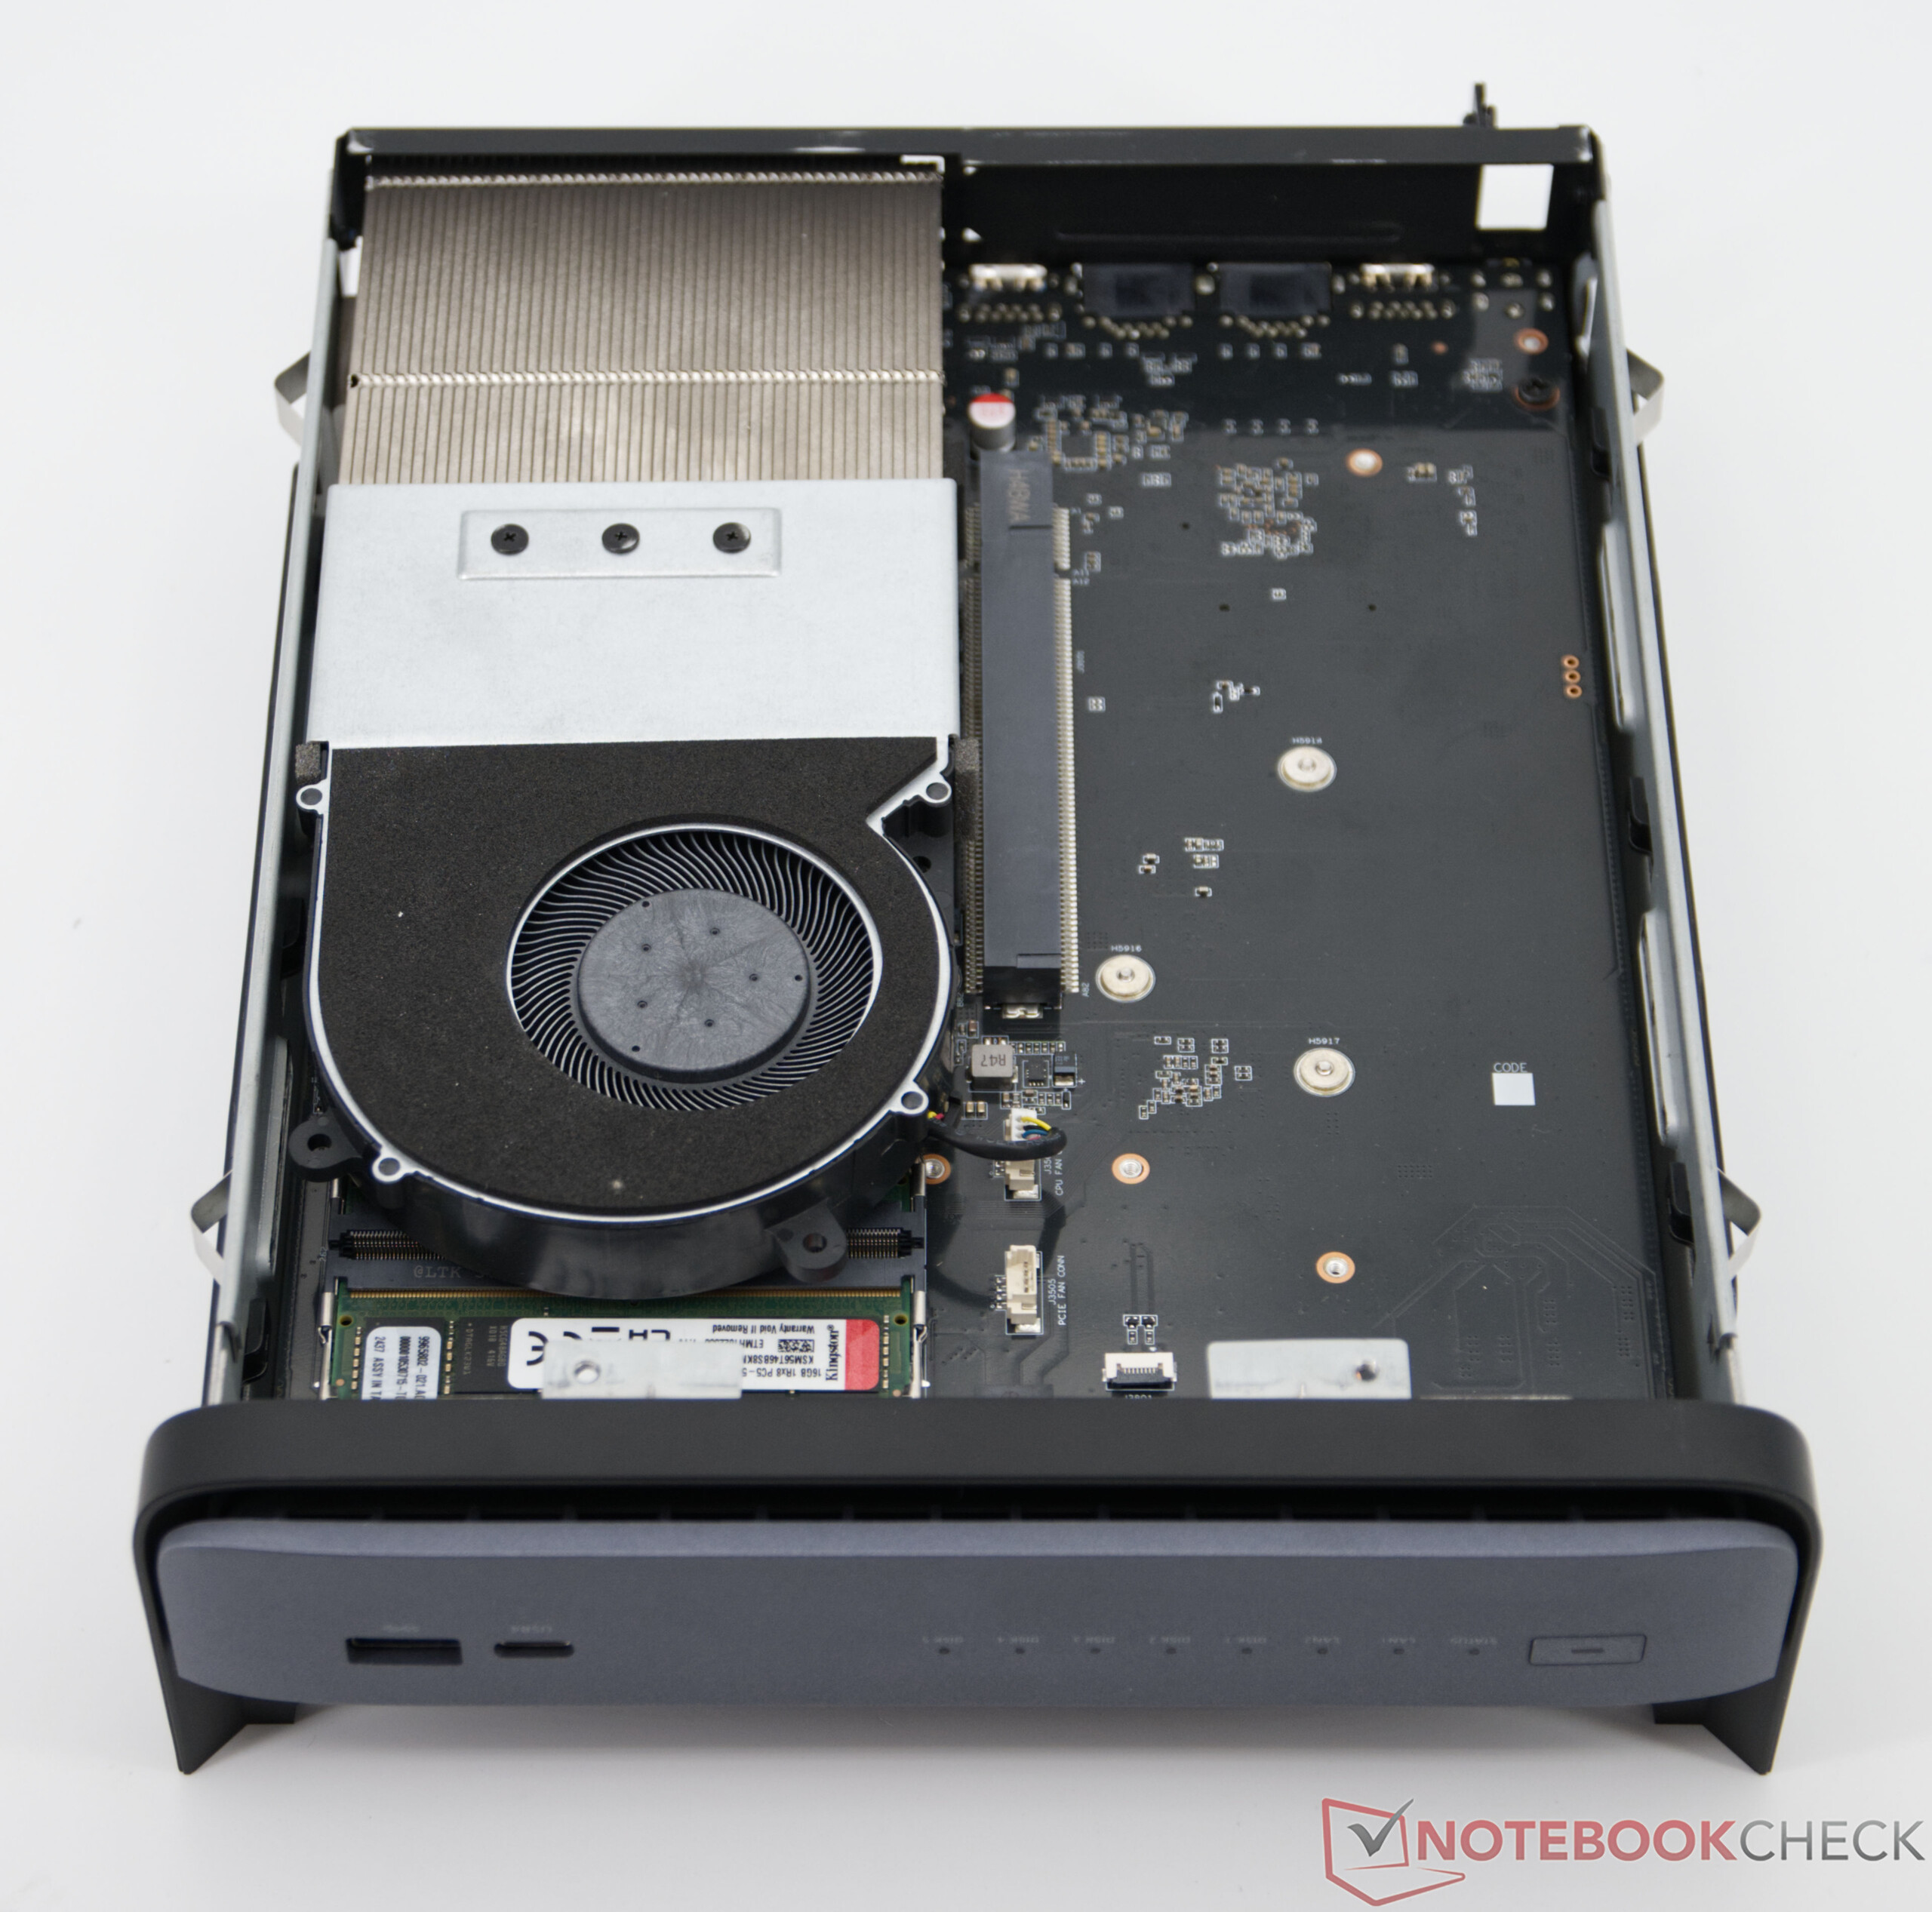
Maintenance work on the Minisforum N5 Pro is pleasingly simple. The hard disk bays can be removed without tools and easily fitted. The actual Mini PC unit is only secured with two screws and can be easily pulled out after removal. Expansions or cleaning work are therefore also possible without much effort.
Sustainability
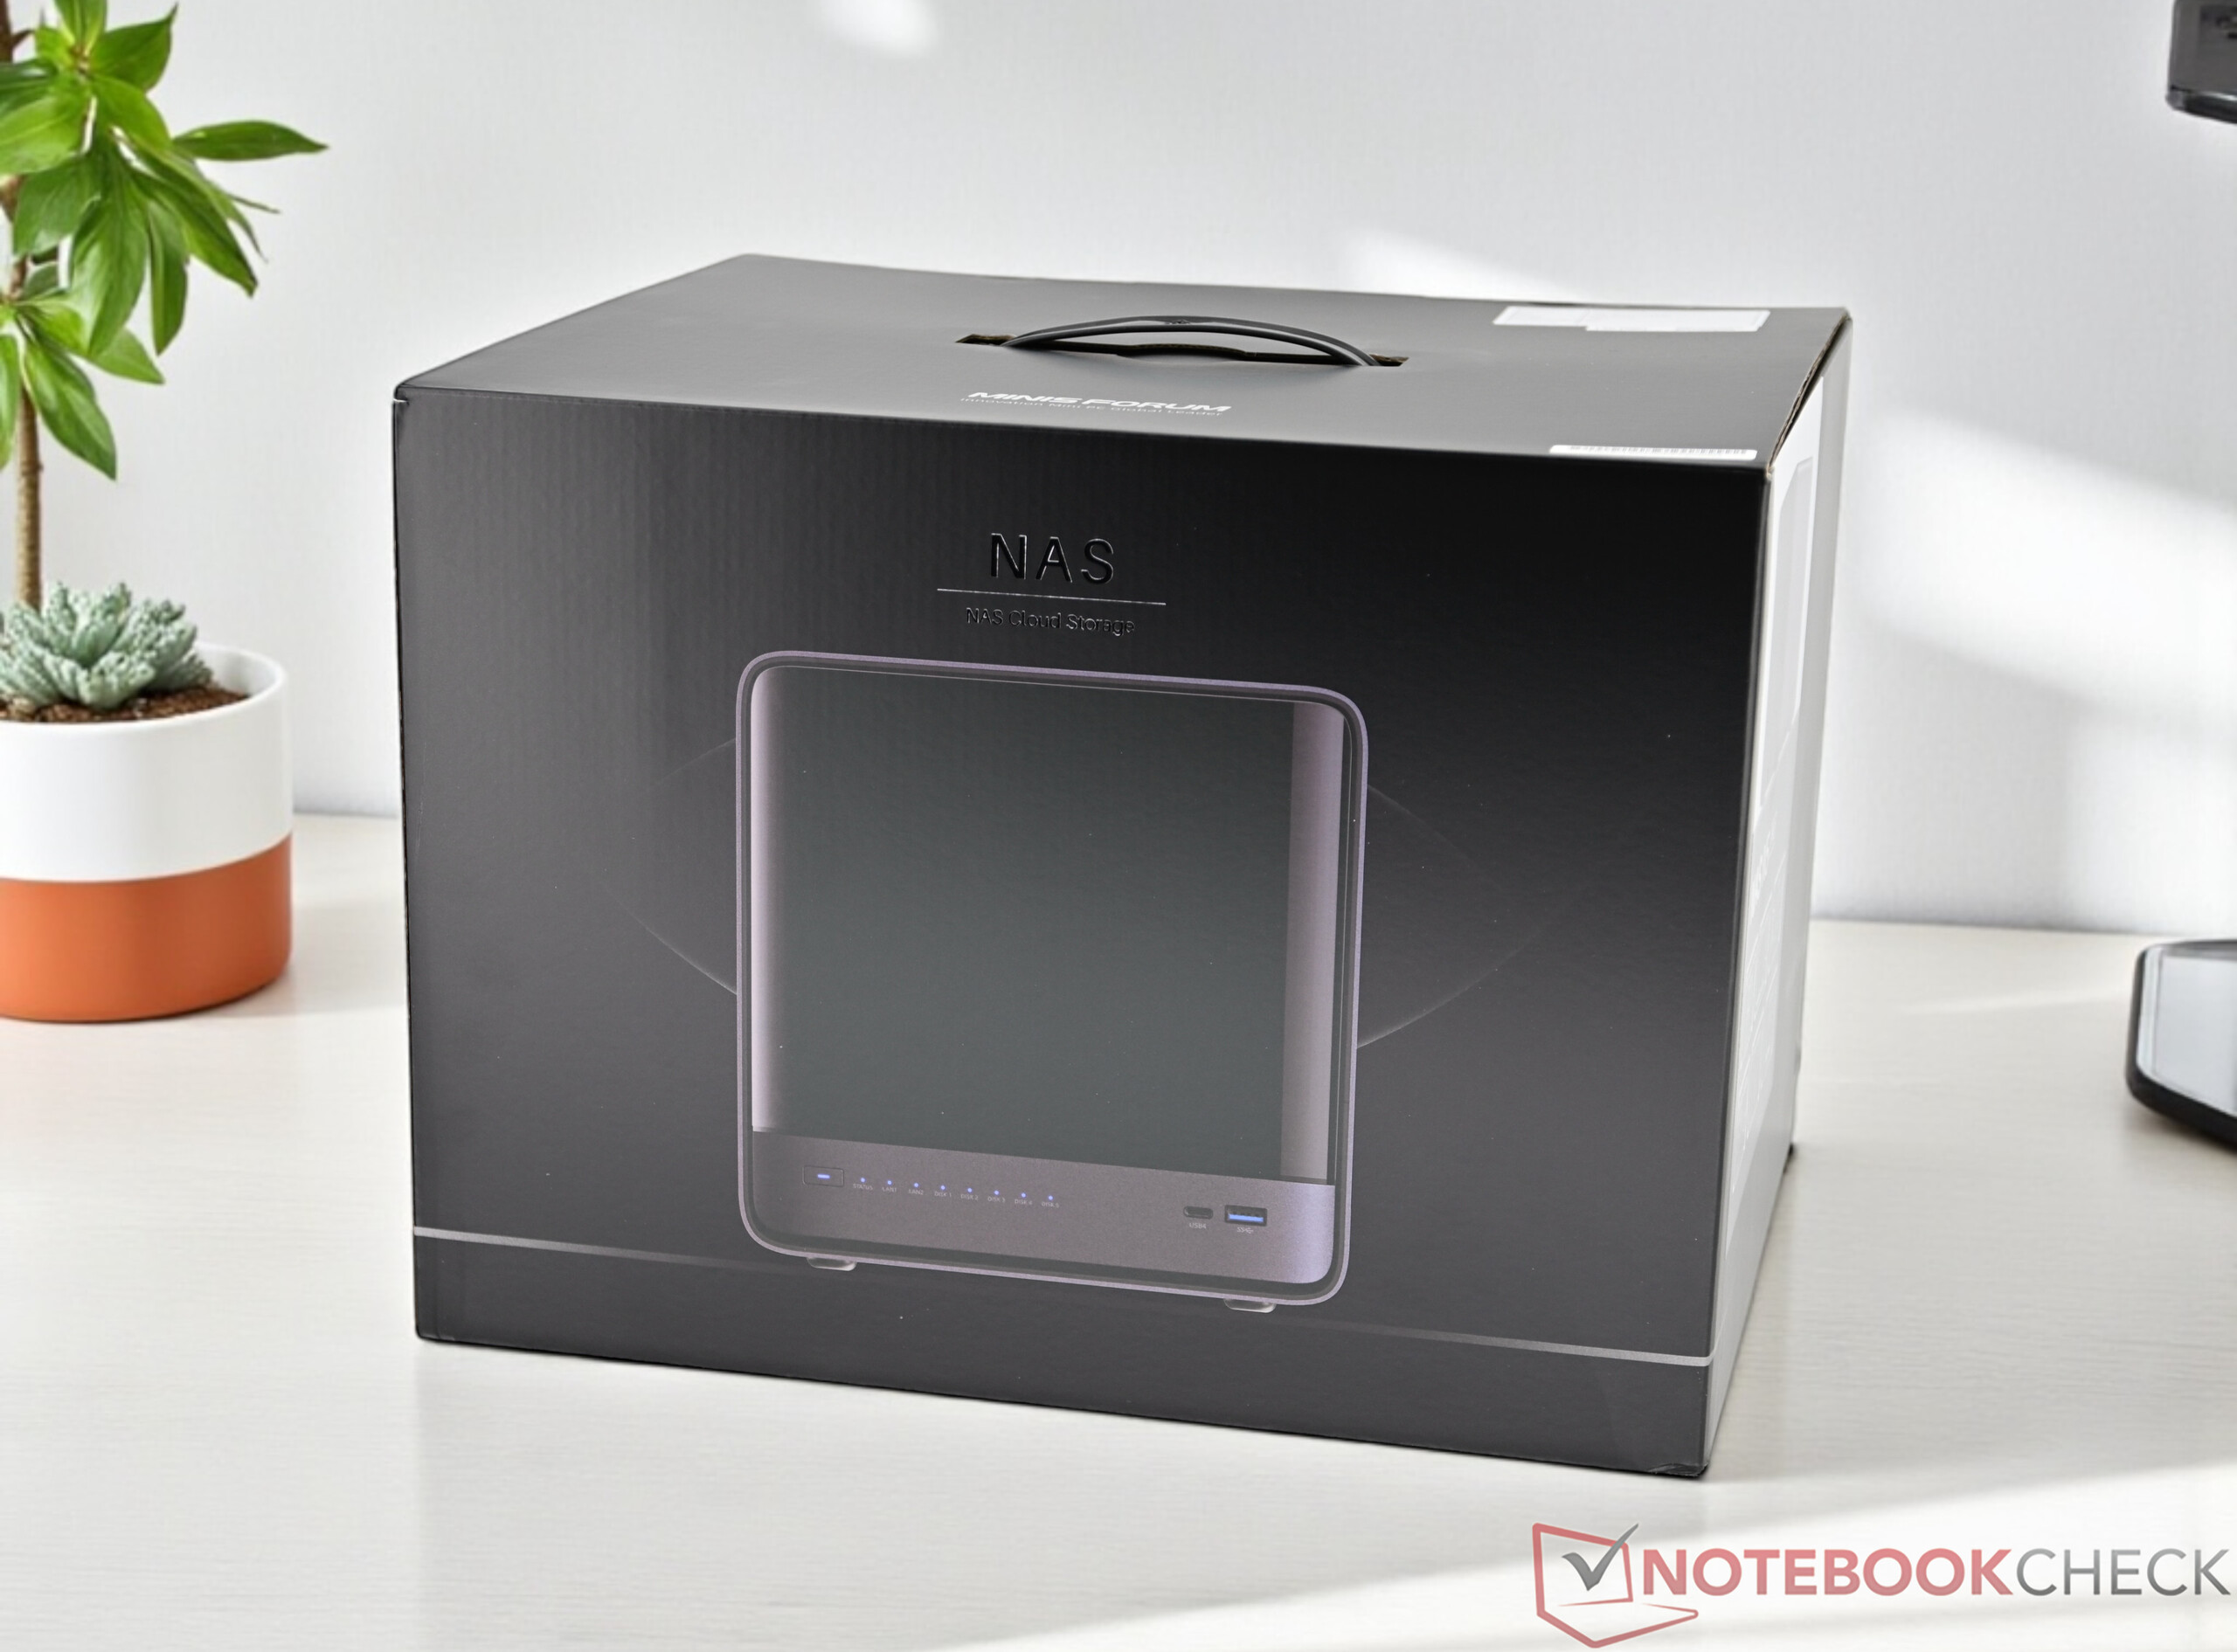
Minisforum does not provide any further details on possible sustainability aspects in the production process for the N5 Pro. The packaging consists mainly of cardboard and is only supplemented by a few foam elements to protect the device during transportation.
Performance
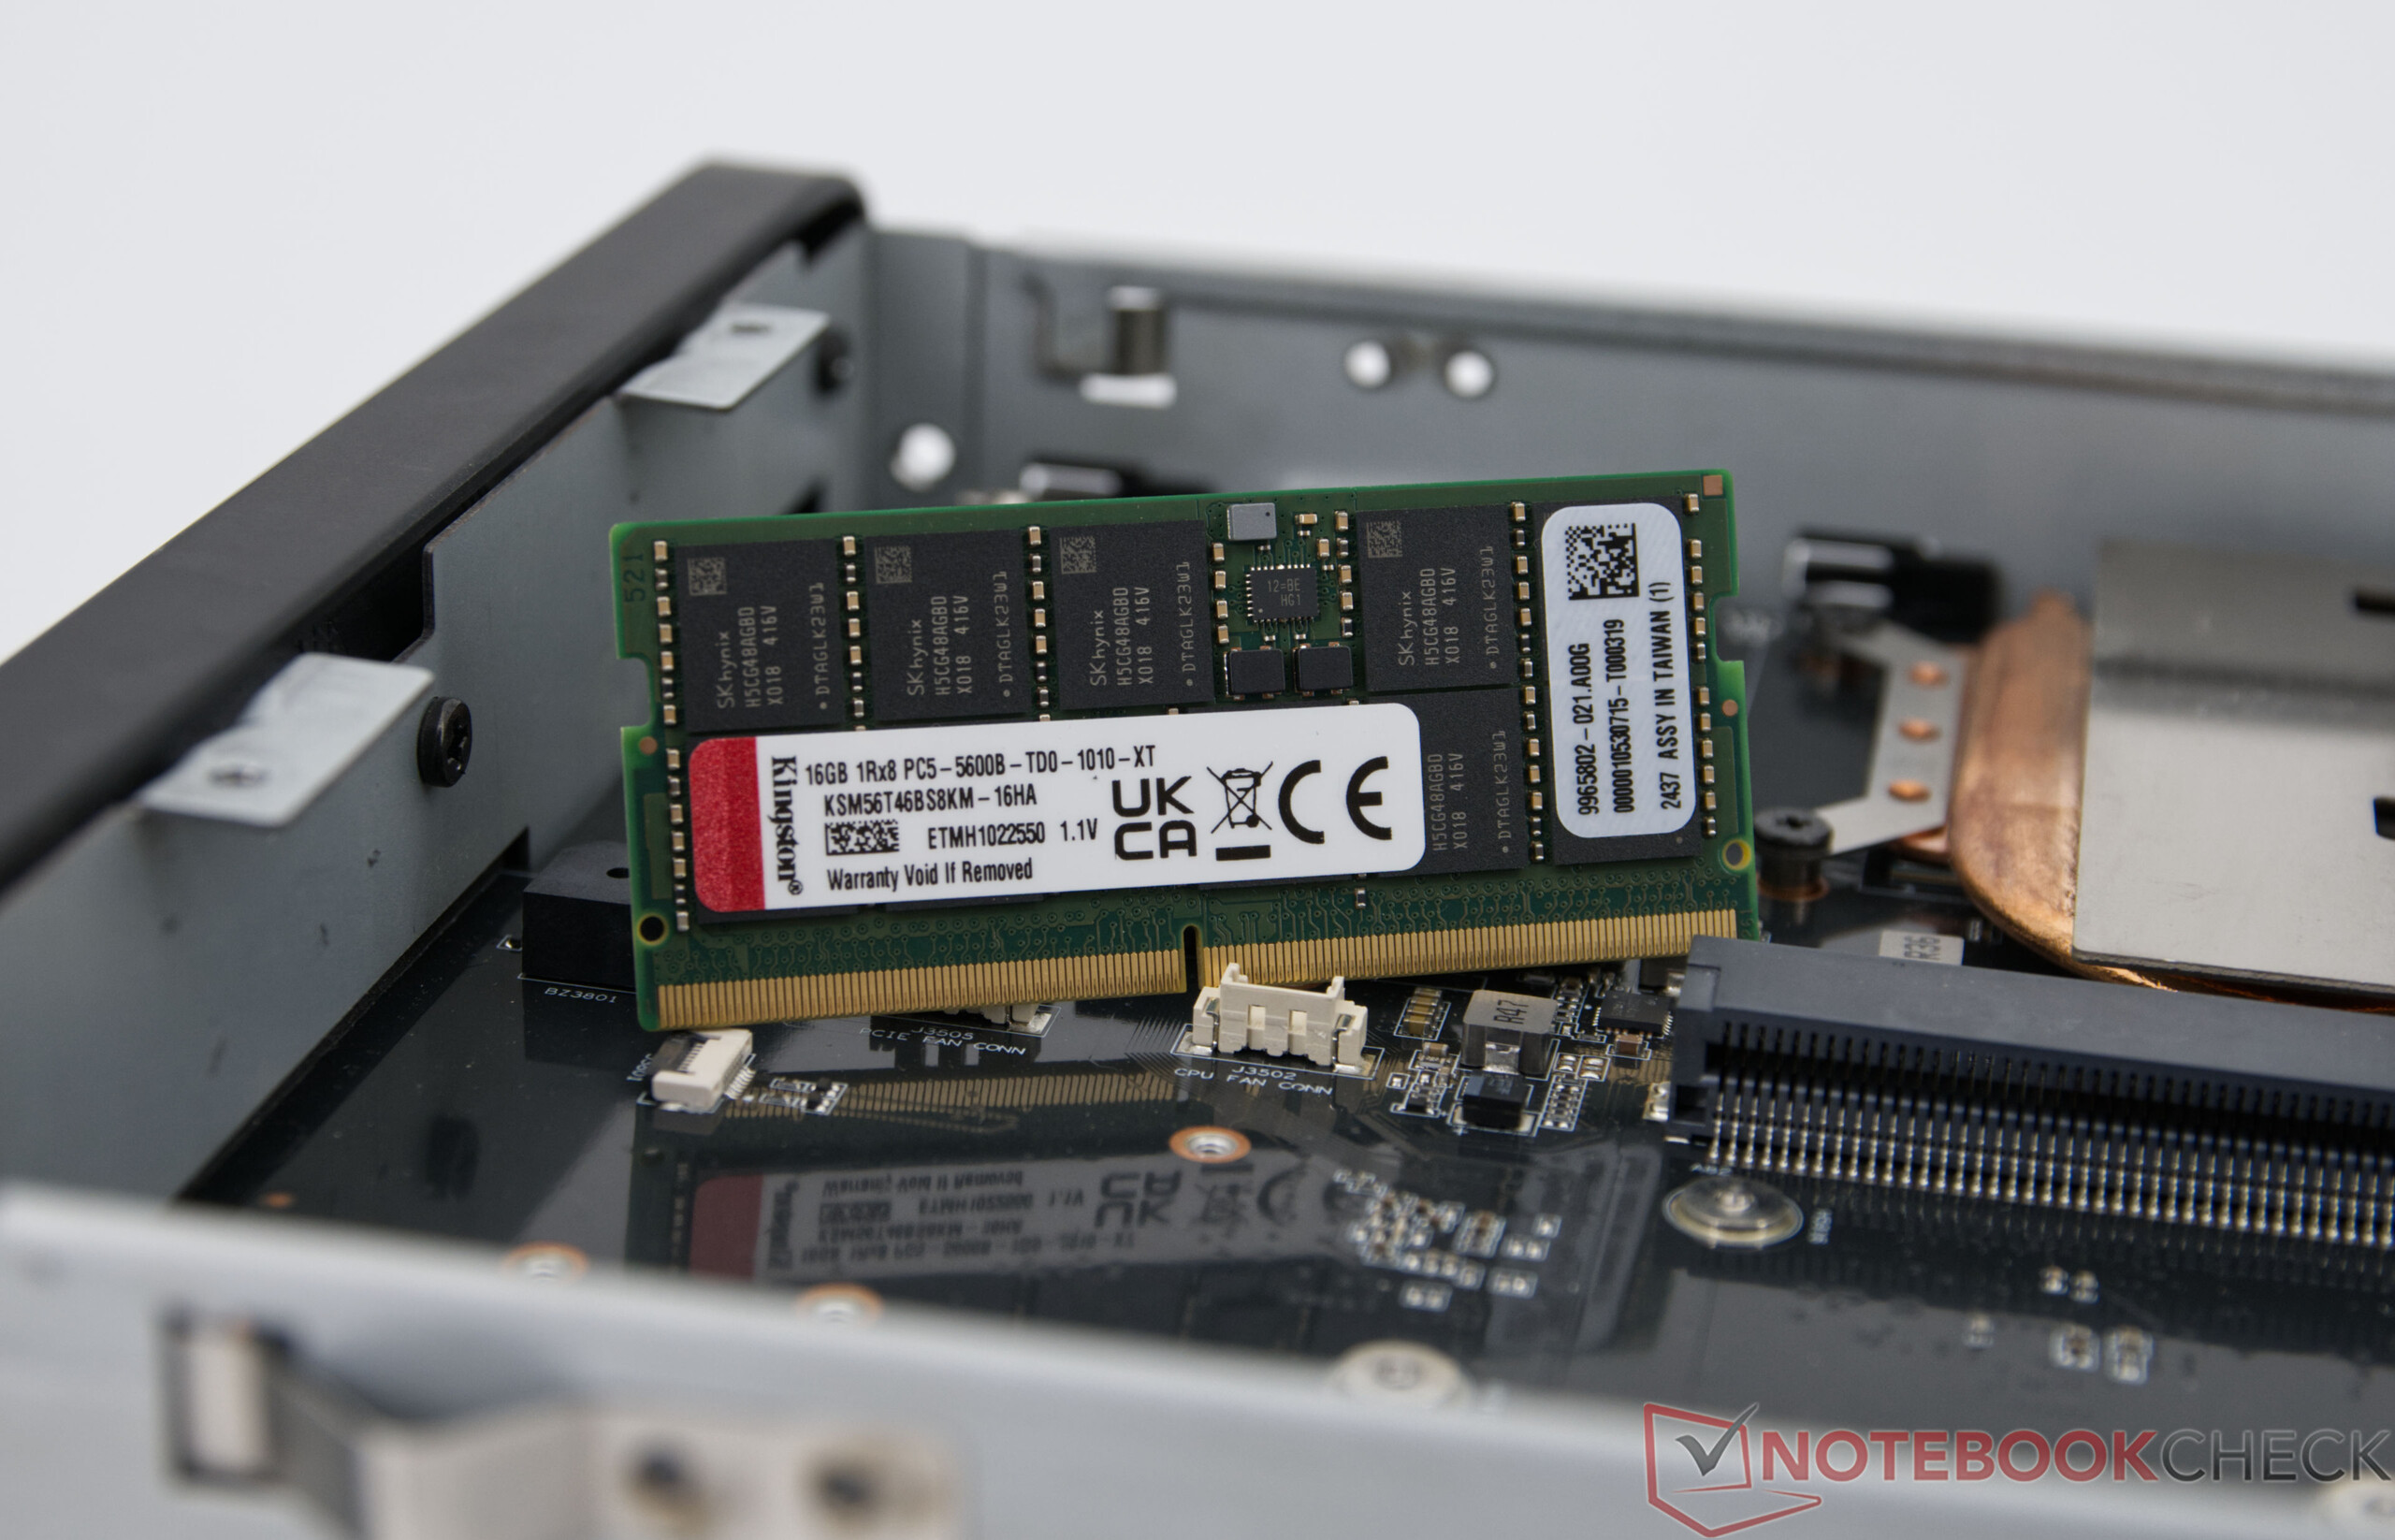
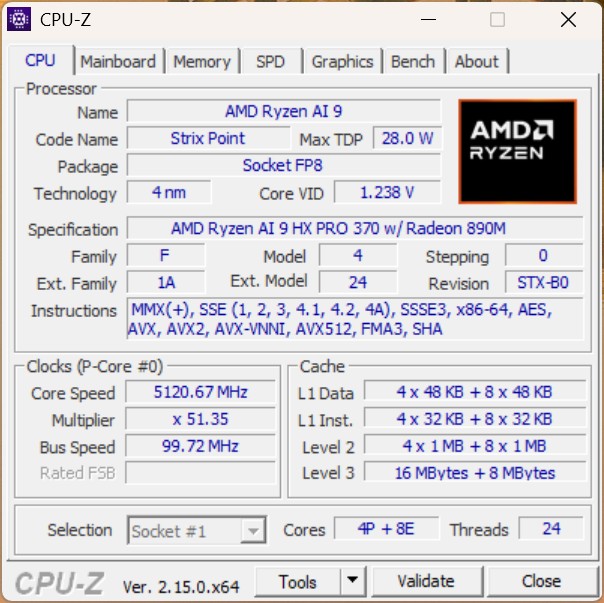
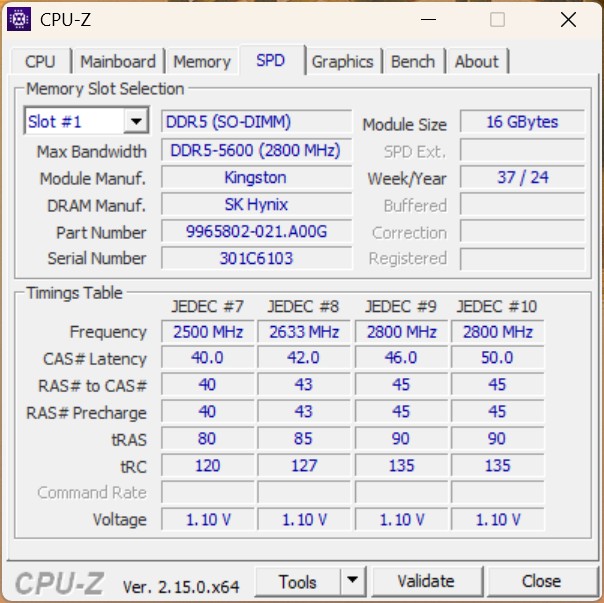
Equipped with the AMD Ryzen AI 9 HX PRO 370, the NAS offers an enormously powerful SoC, which has a separate NPU. The Minisforum N5 Pro can also be equipped with up to 96 GB of ECC RAM.
Test conditions
All performance tests were carried out in balanced mode, which also corresponds to the delivery status of the Minisforum N5 Pro.
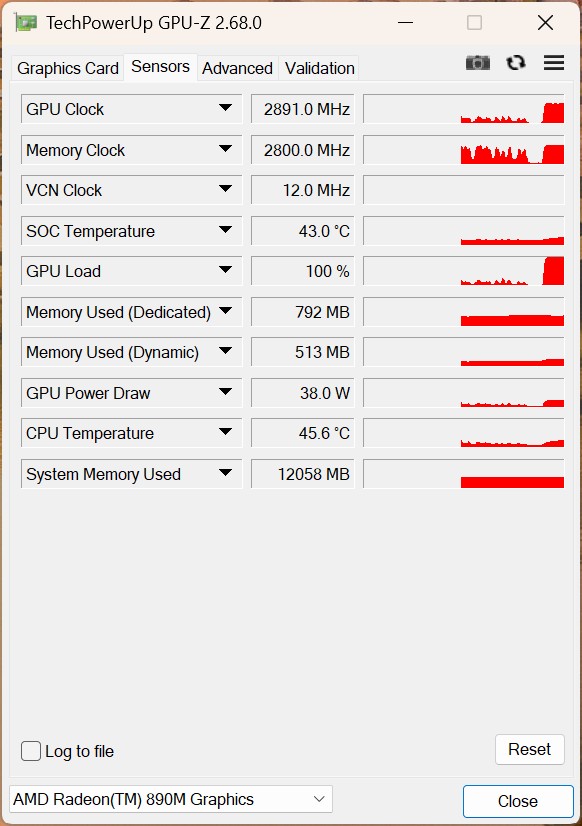
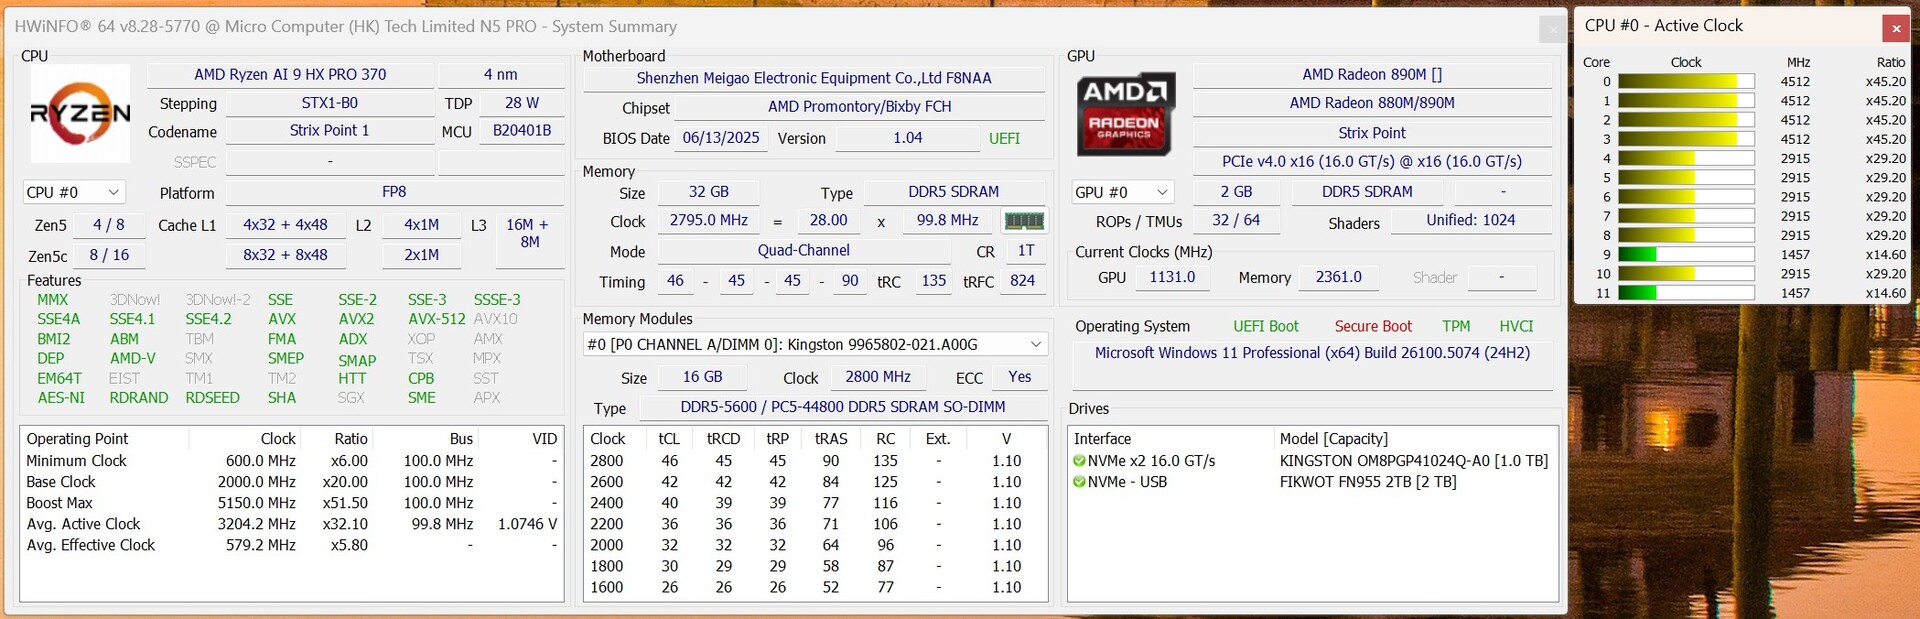
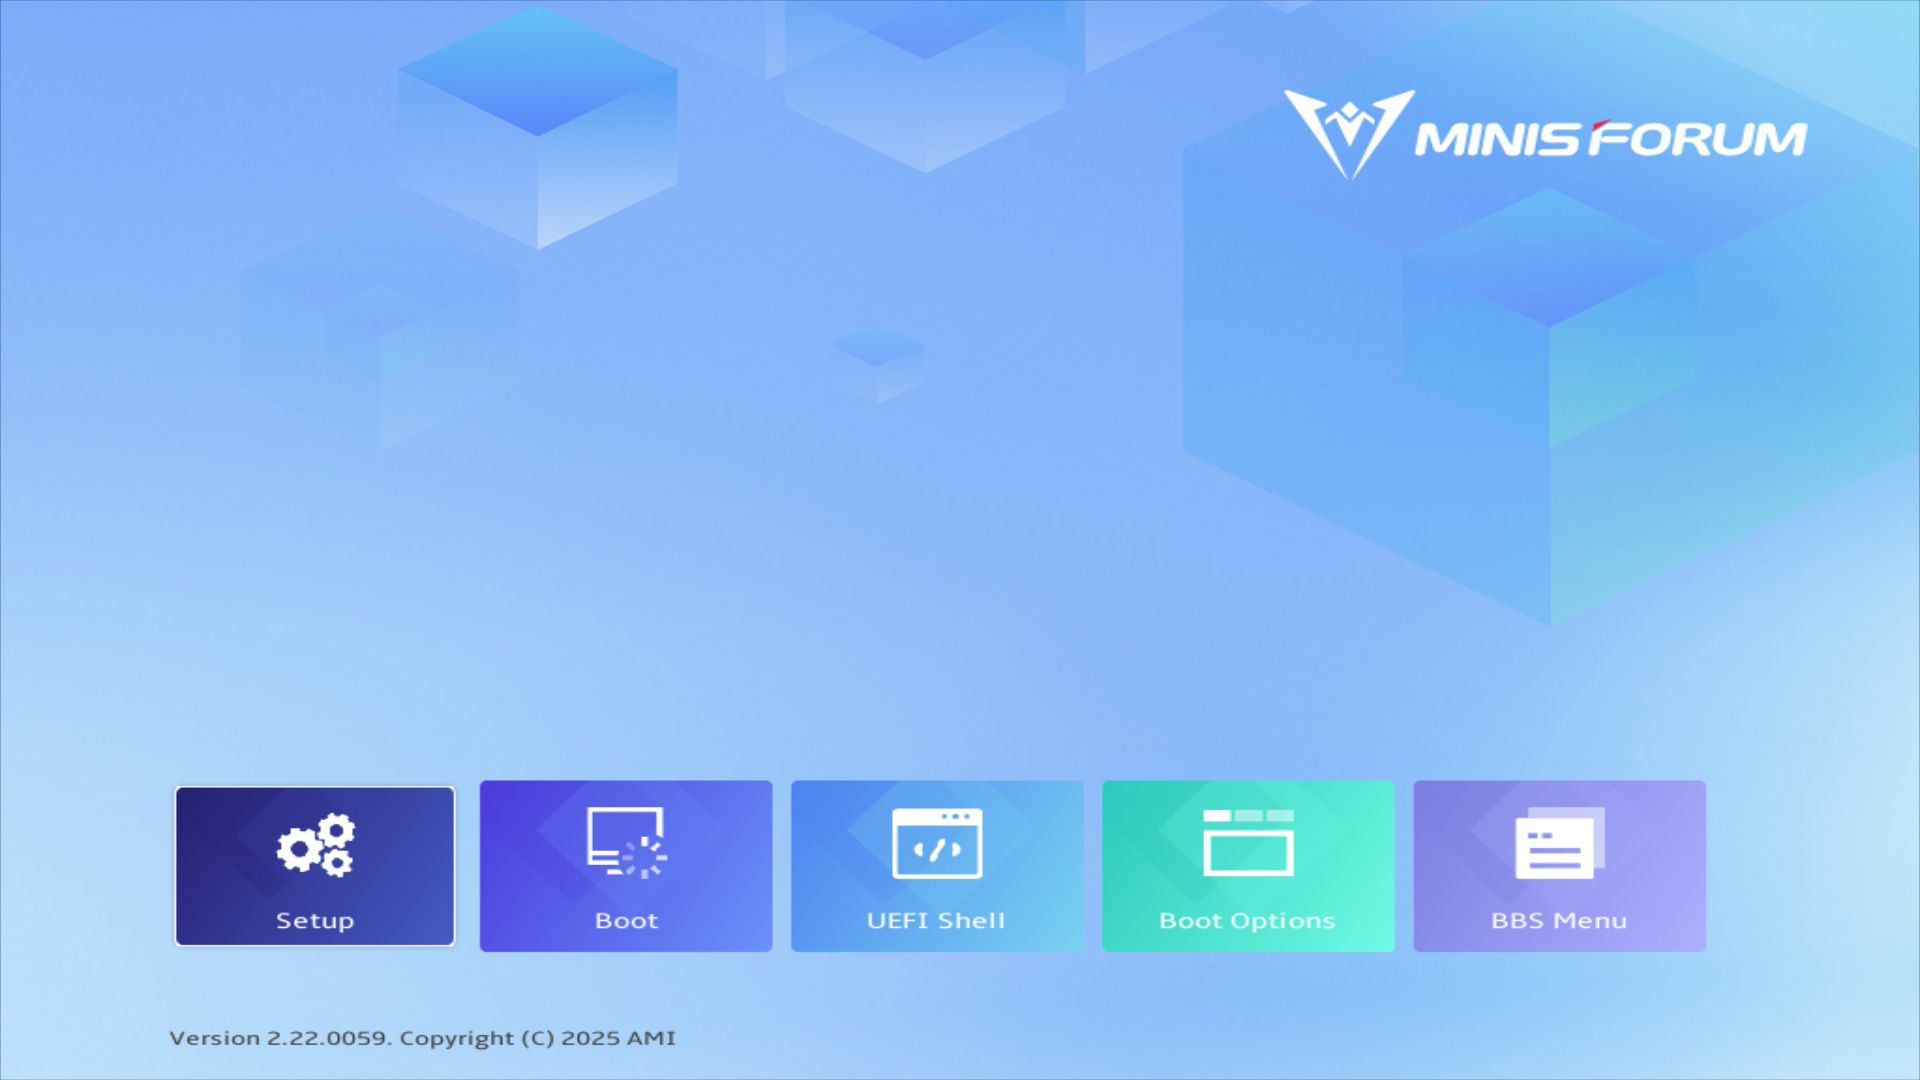
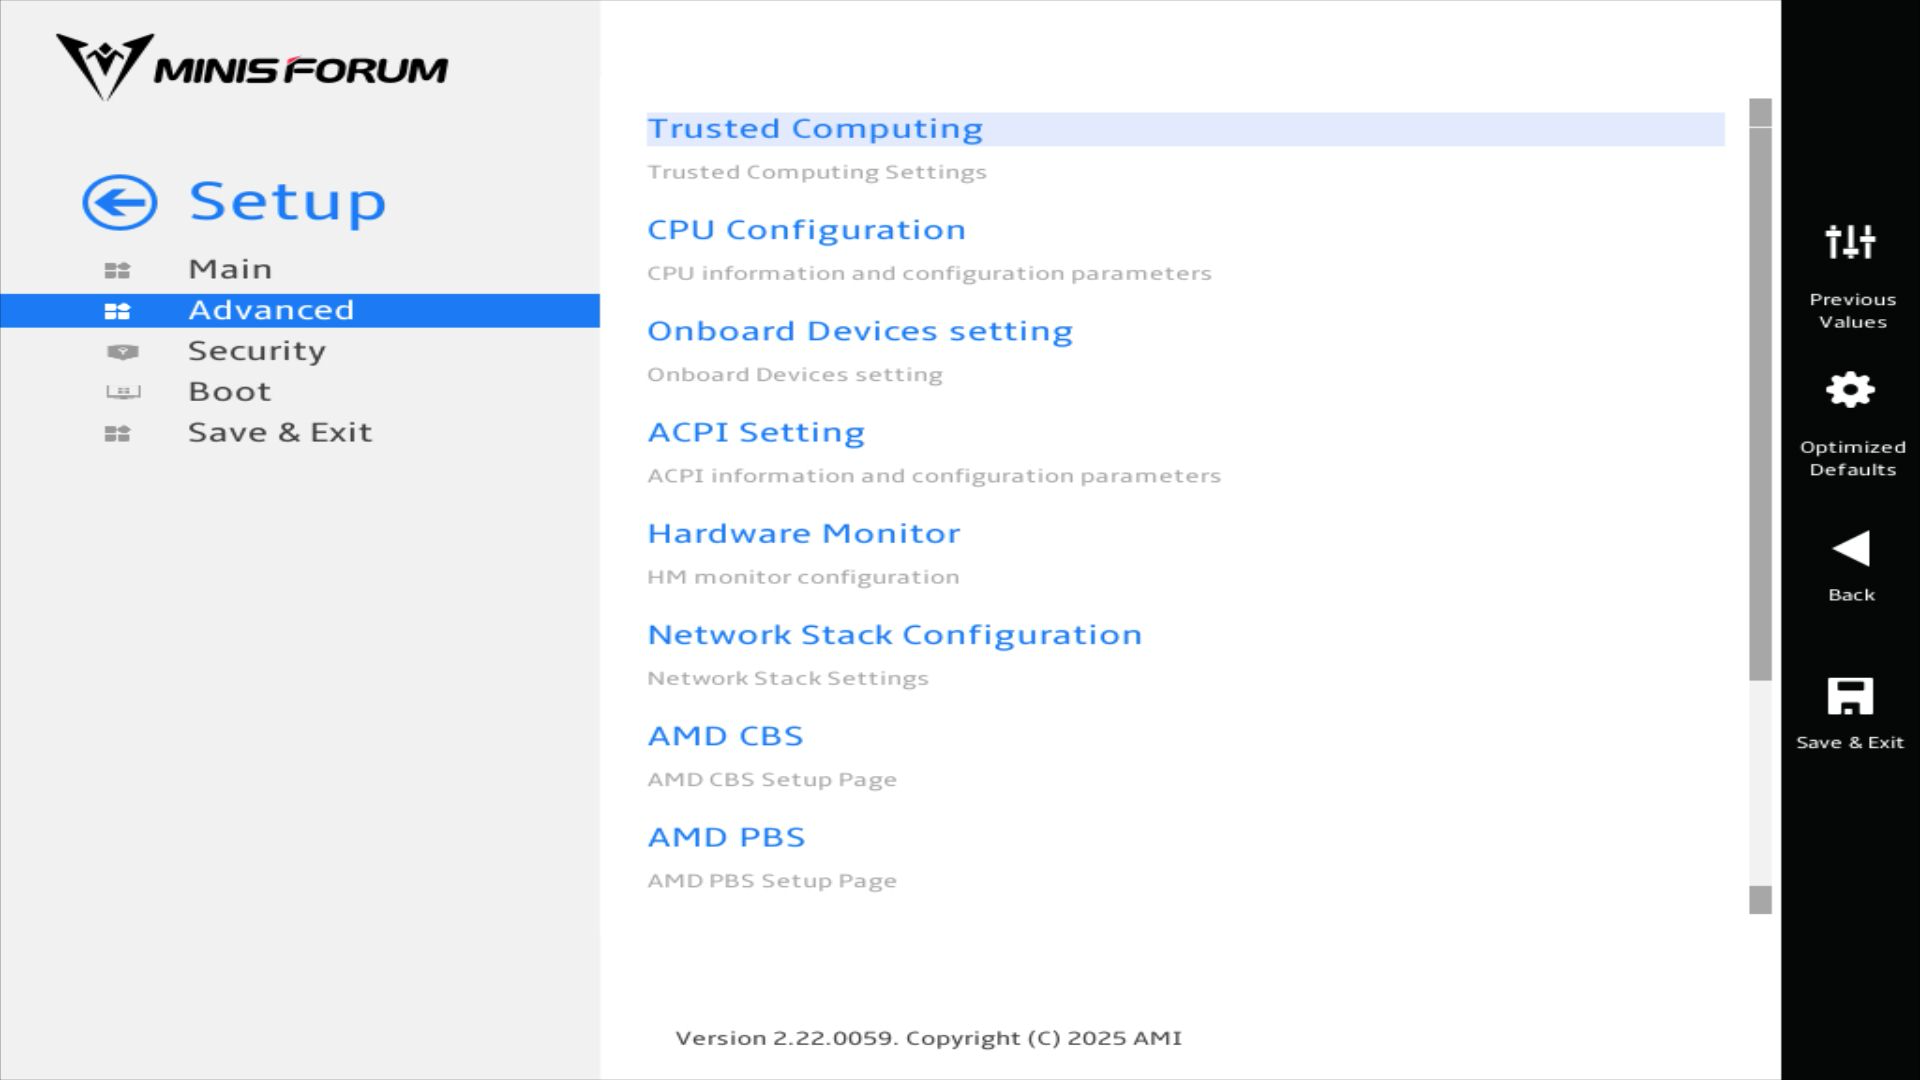
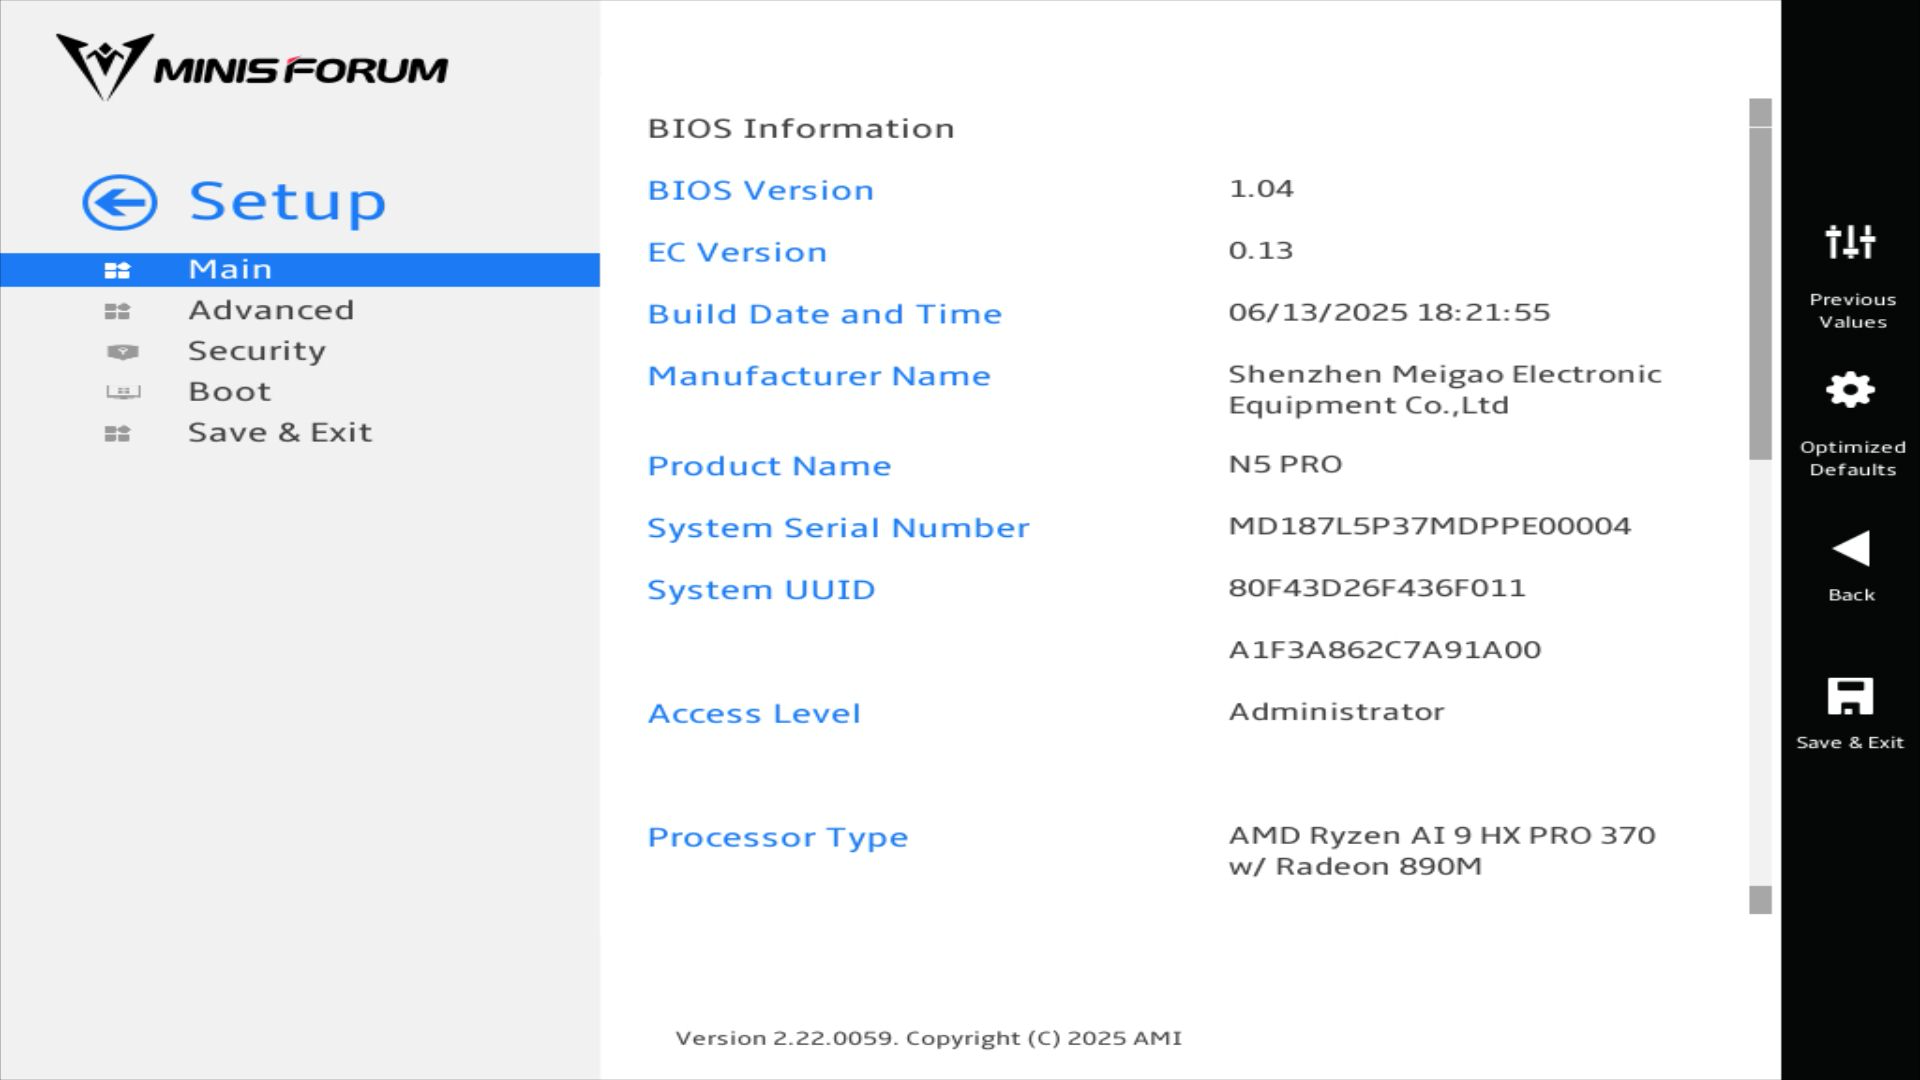
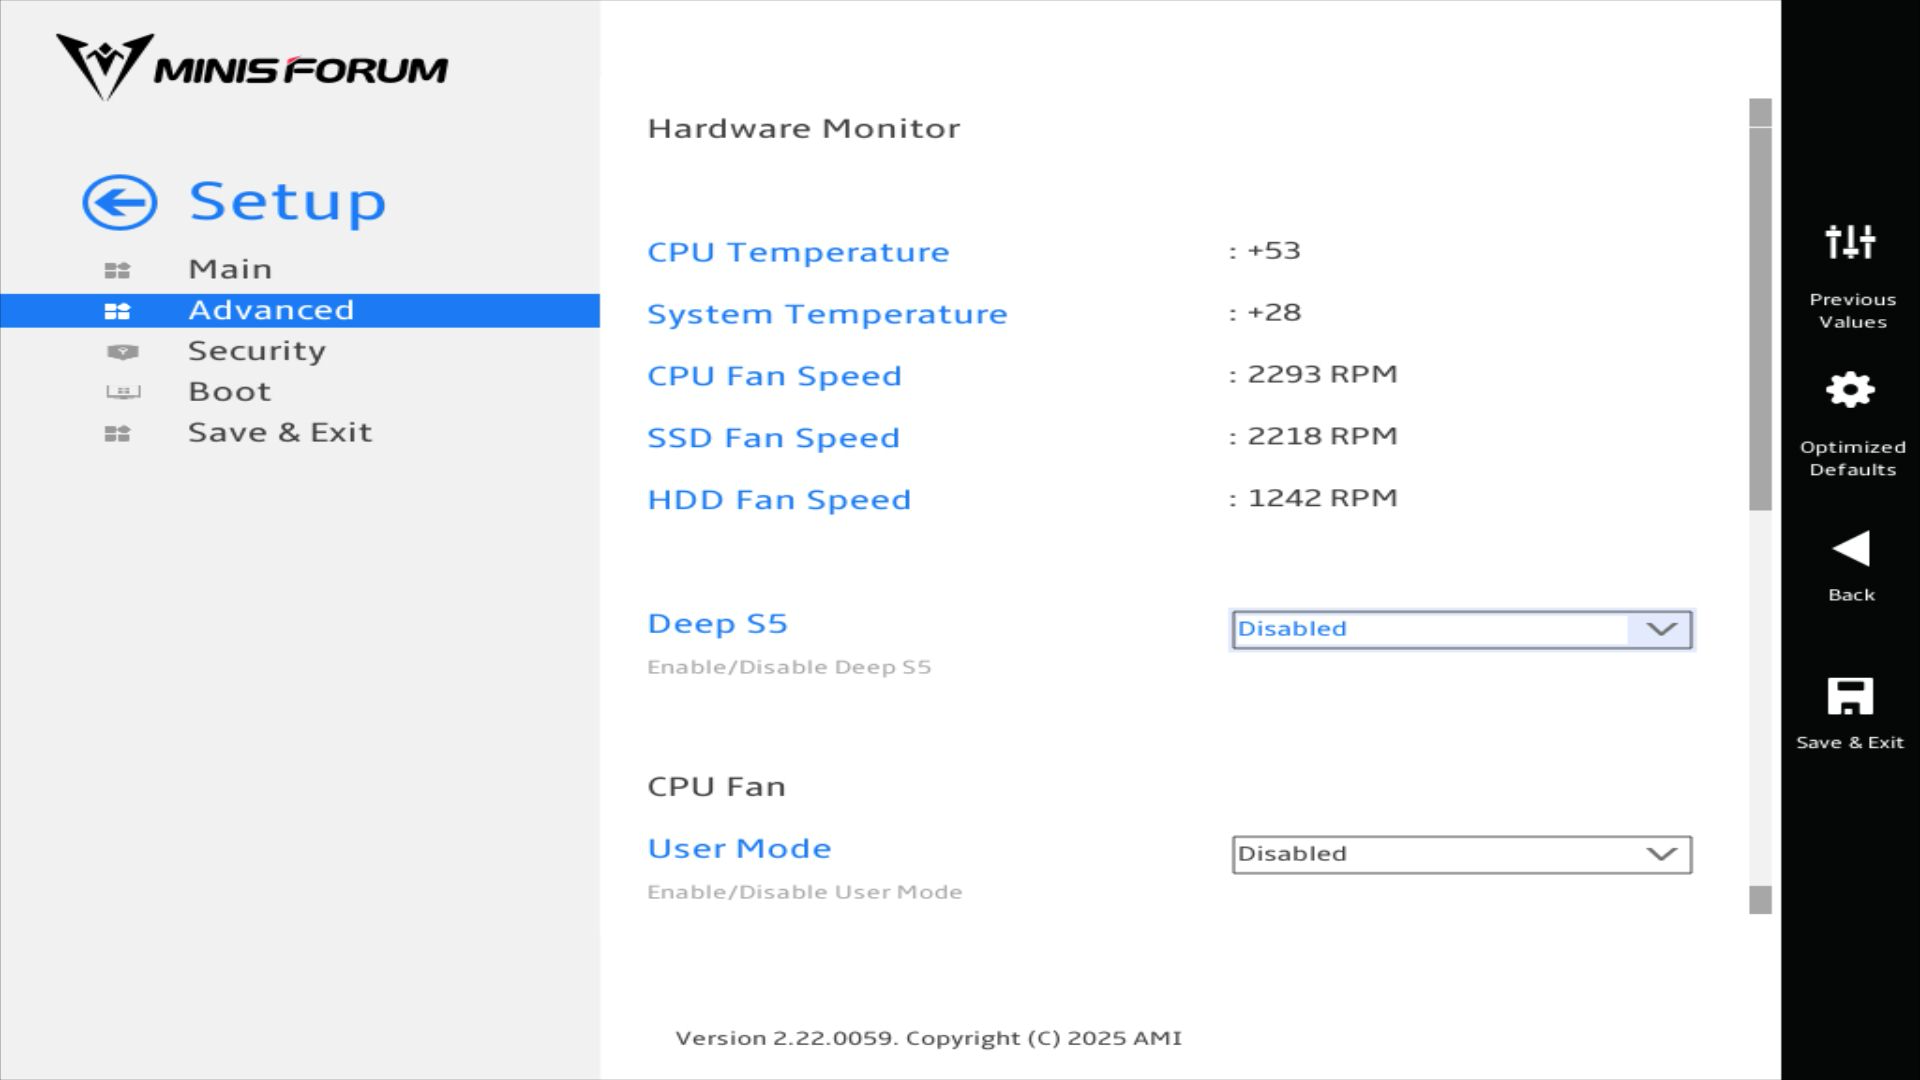
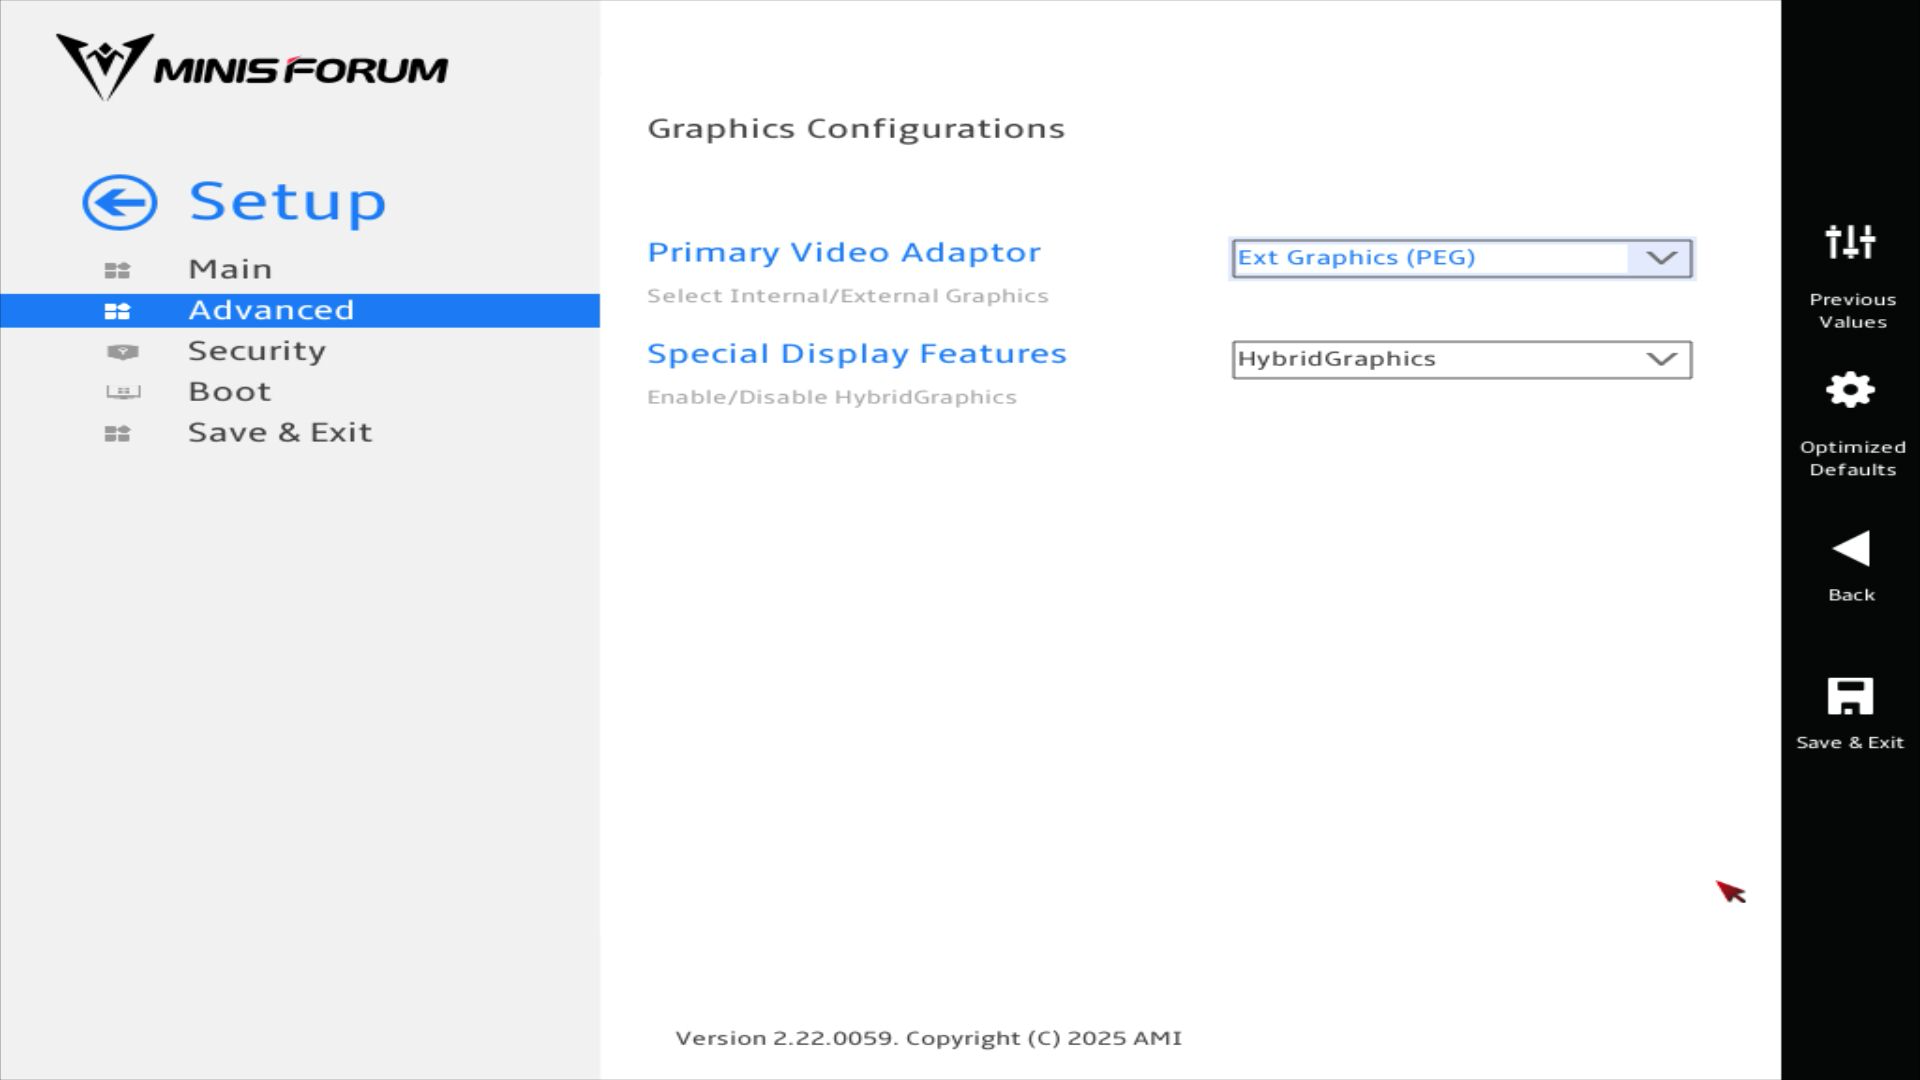
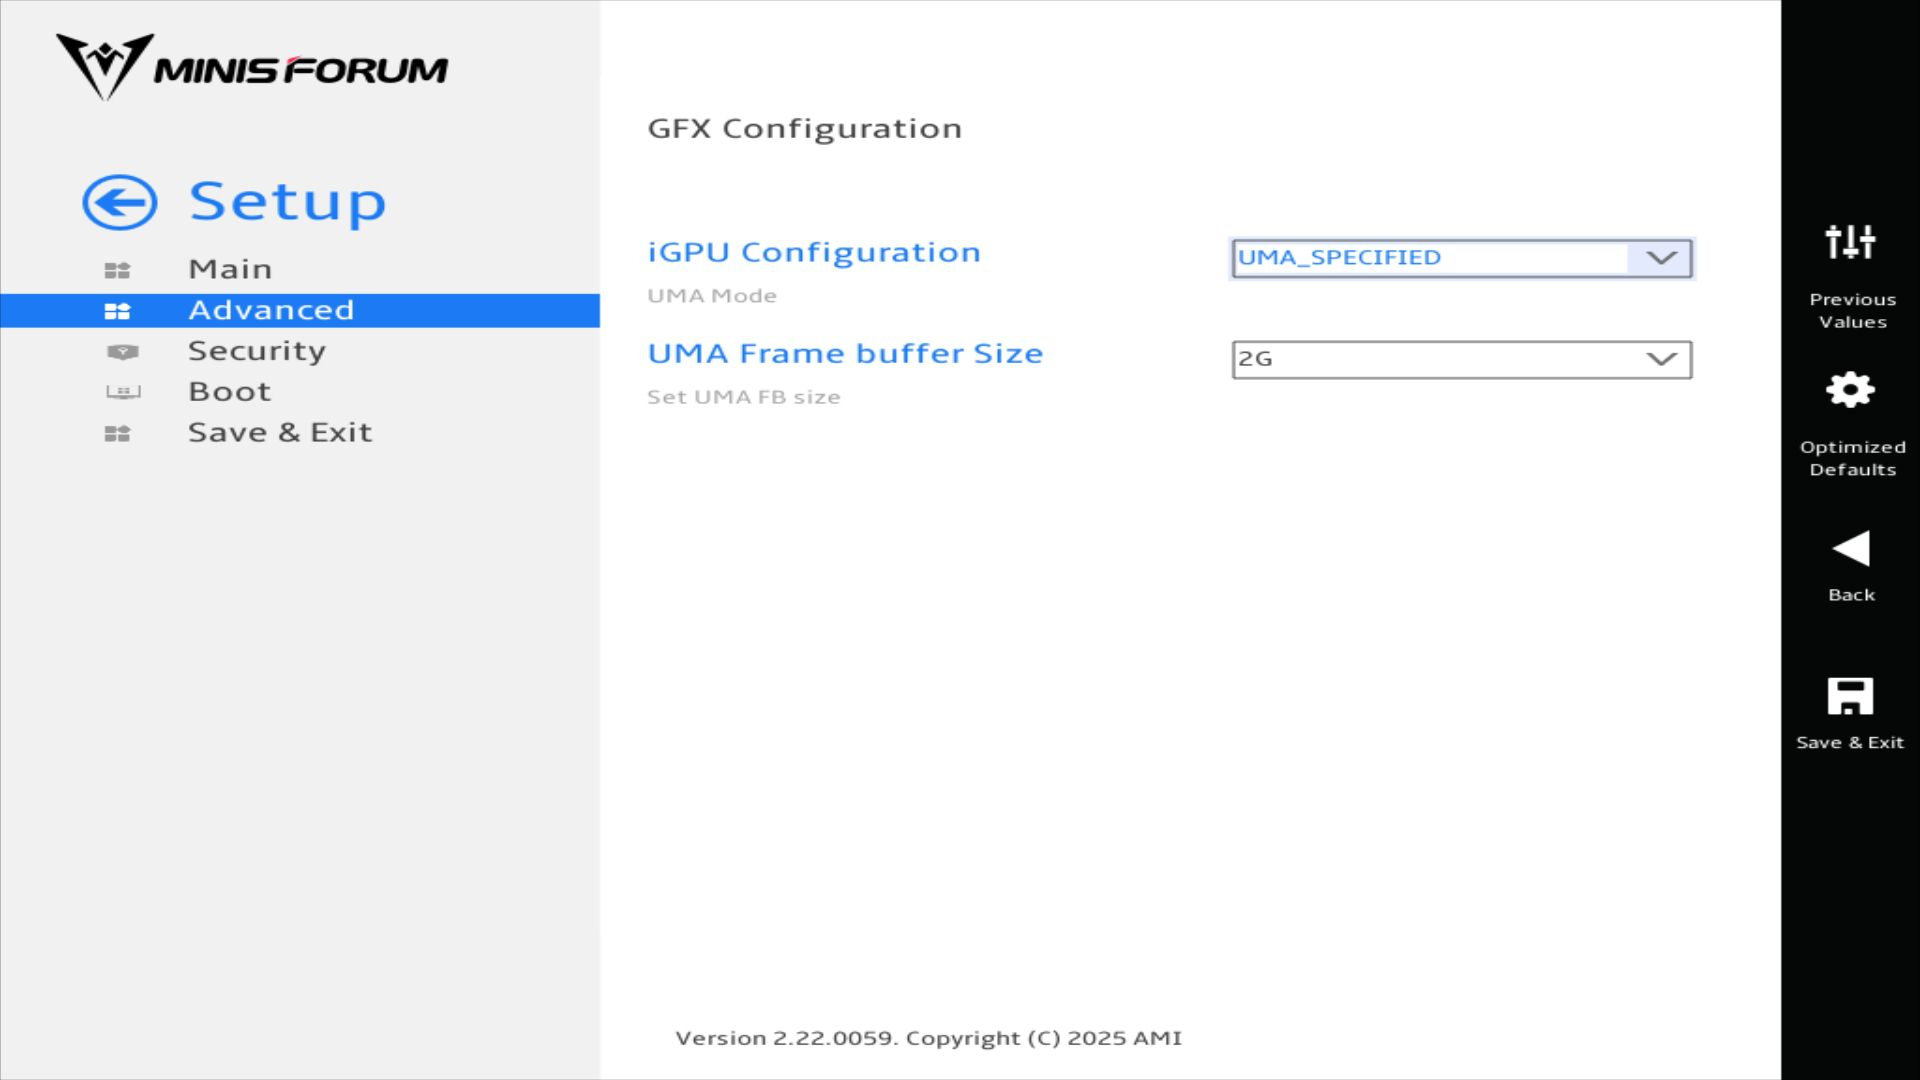
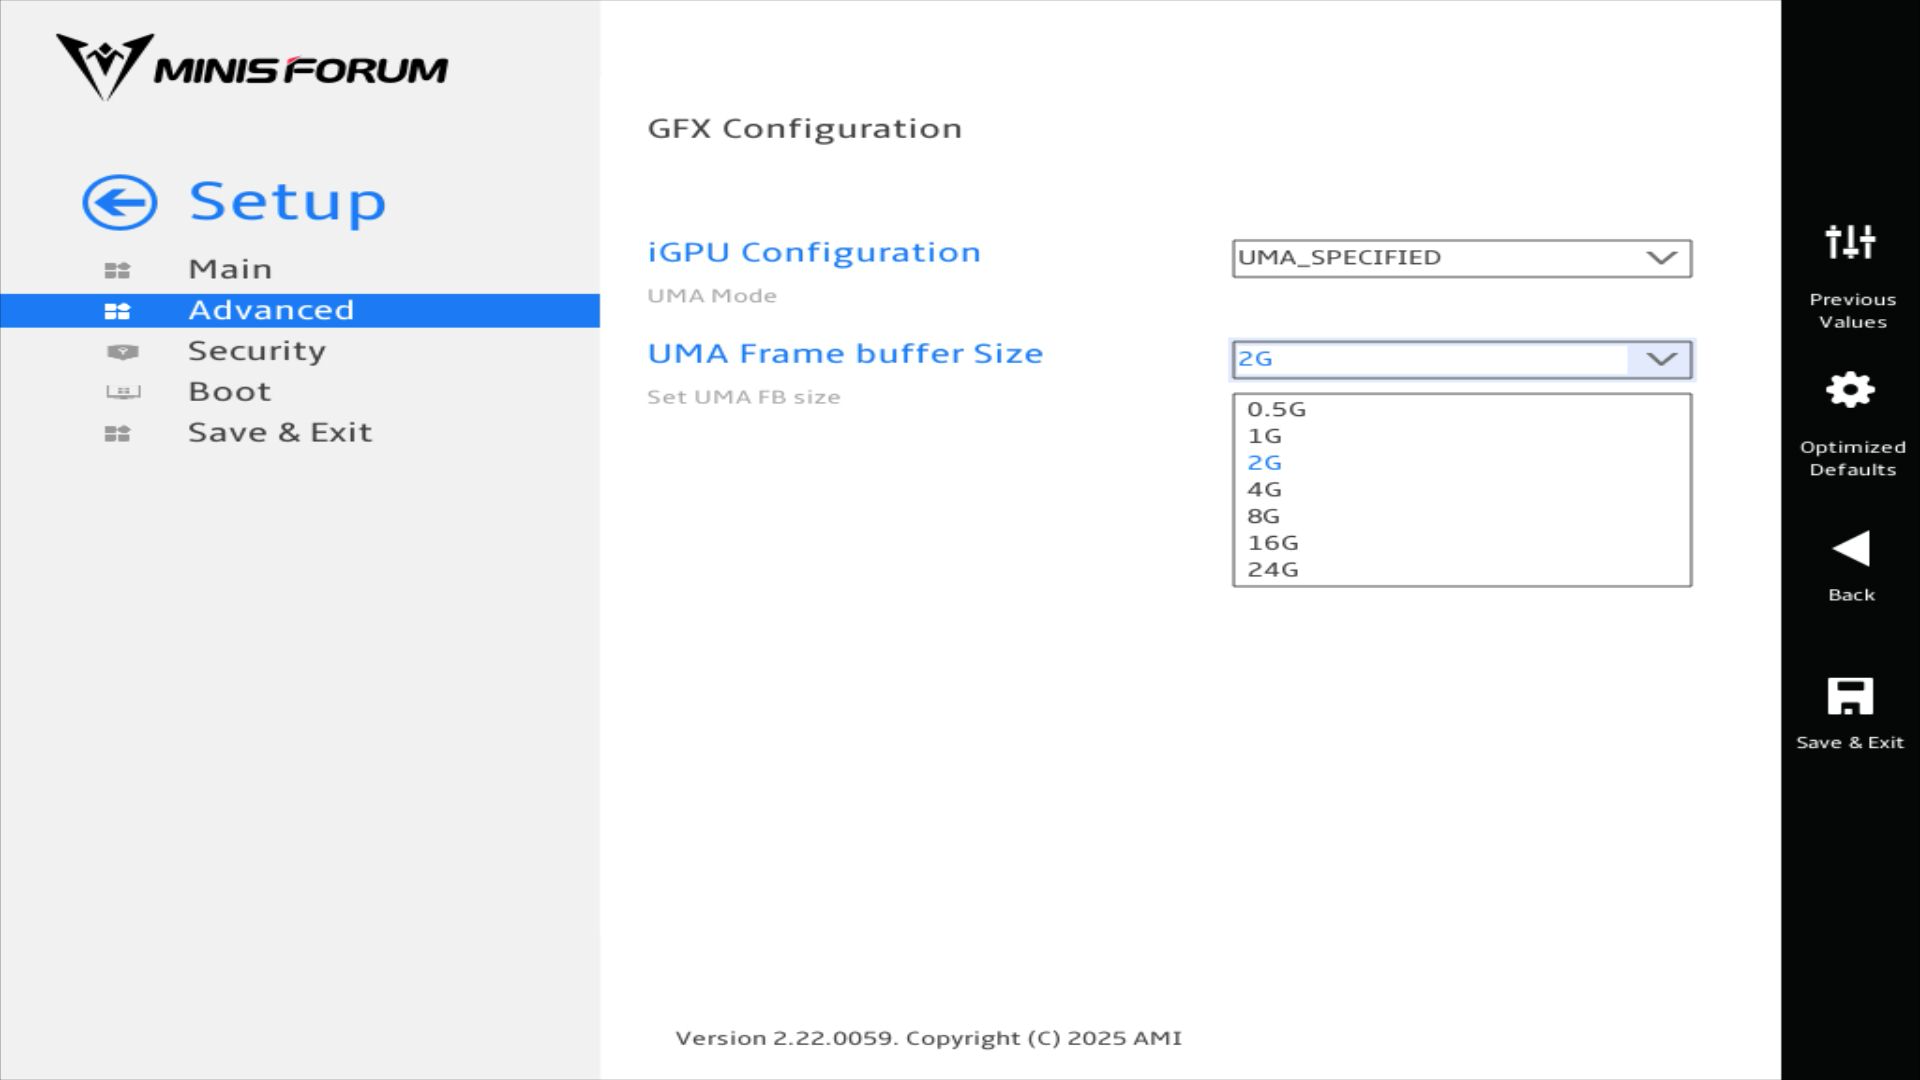
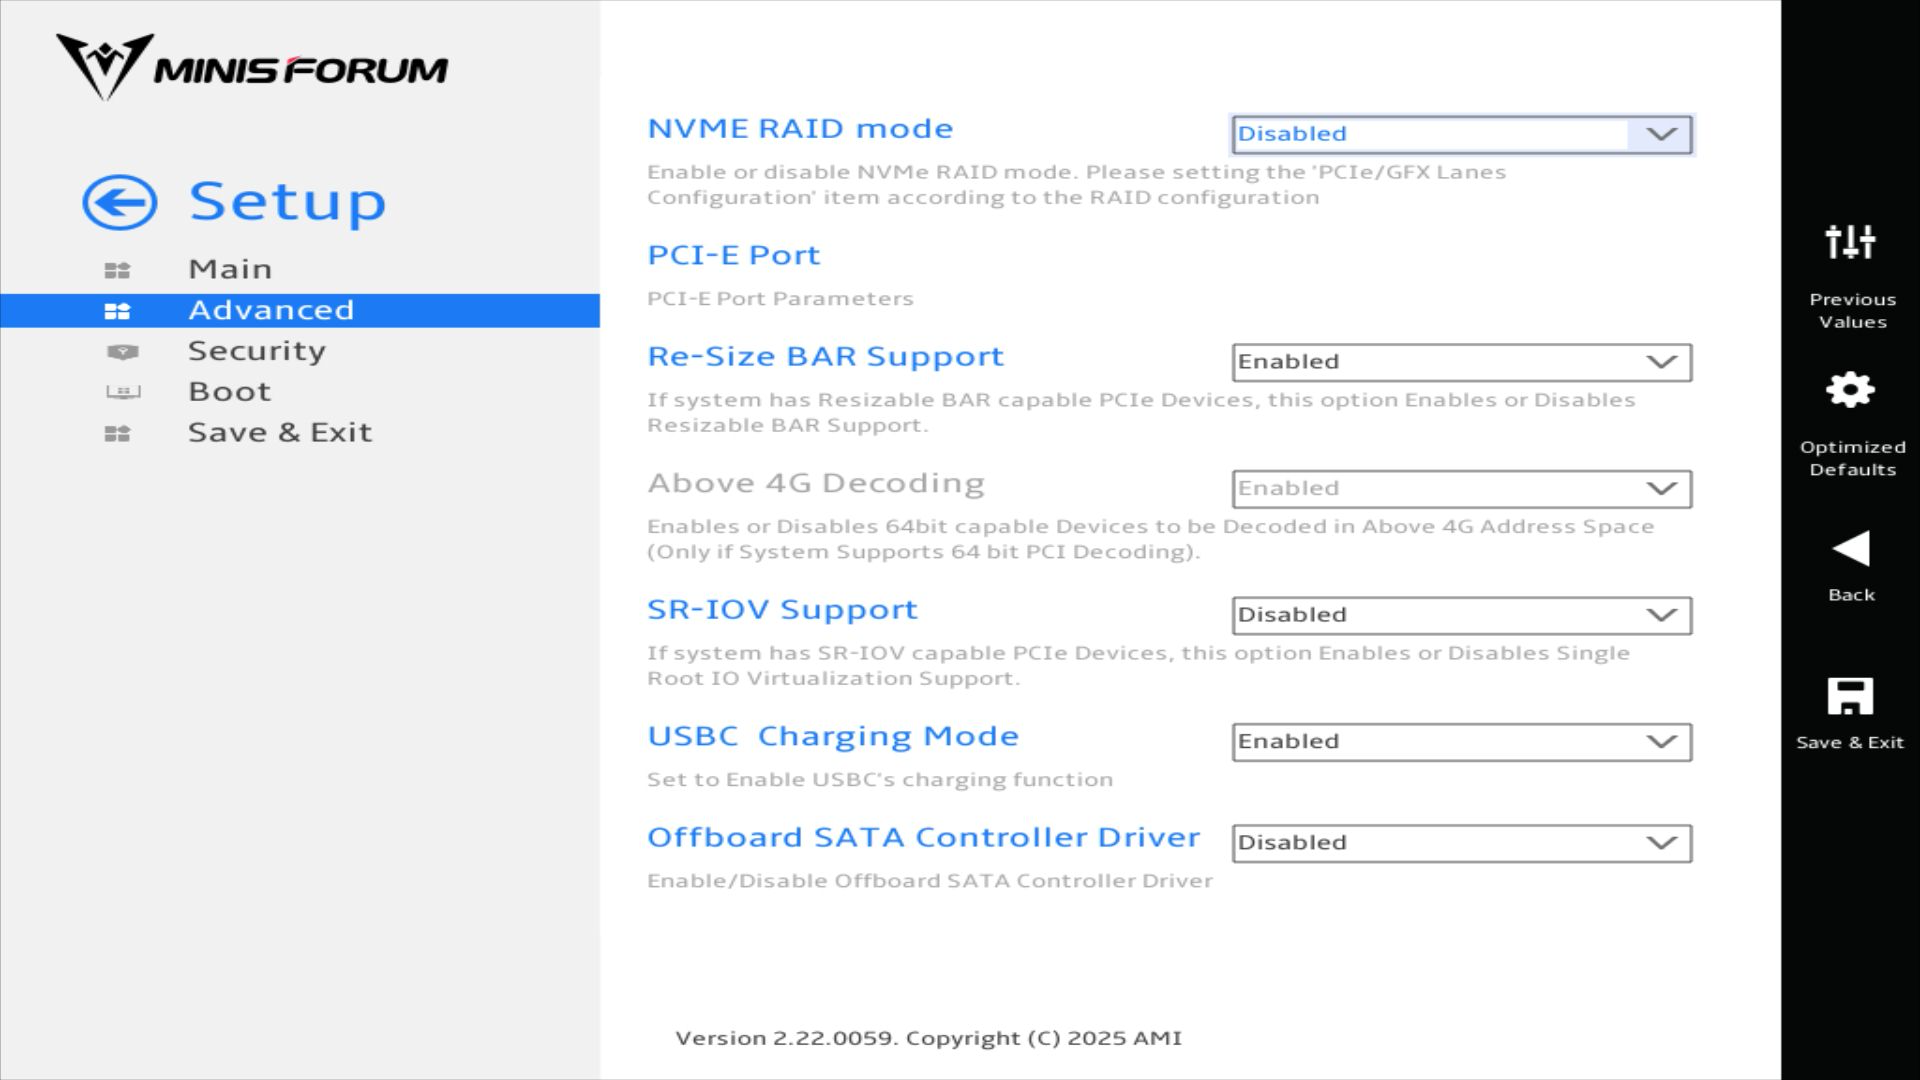
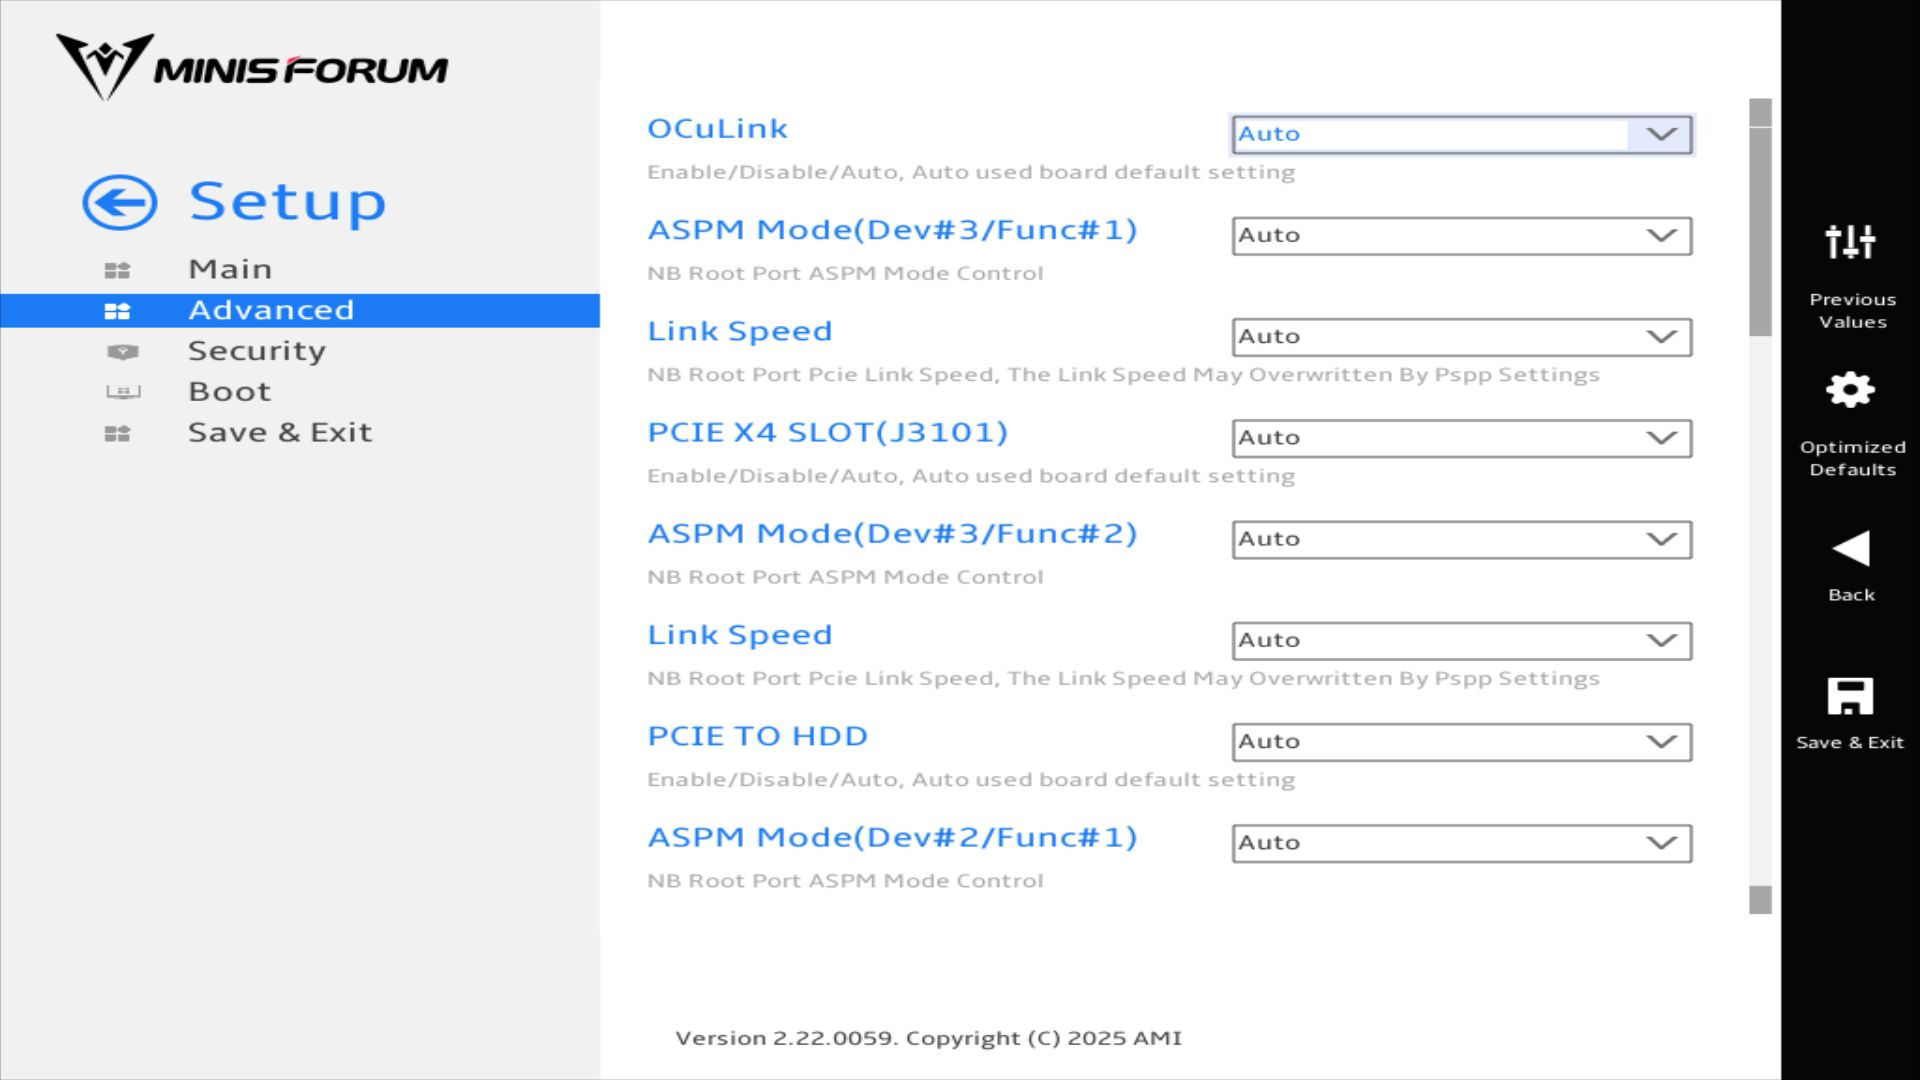
UEFI settings
Processor
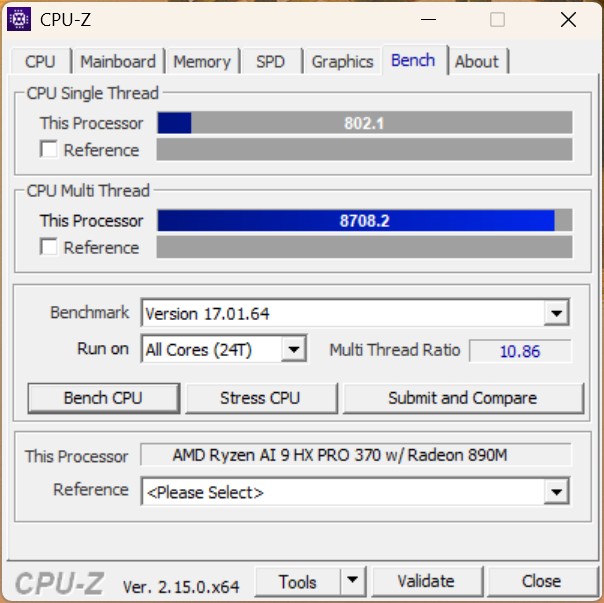
The AMD Ryzen AI 9 HX PRO 370 in the Minisforum N5 Pro is a 12-core processor of the latest Zen 5 architecture and impresses with outstanding performance in both single-core and multi-core tasks. Thanks to this CPU, the NAS achieves exceptional computing power that is on a par with the Intel Core Ultra 9 285H in the GMKtec EVO-T1 moves. In a direct comparison, the Minisforum N5 Pro NAS offers superior performance compared to the Aoostar WTR Pro offering a clearly noticeable increase in performance.
| Performance rating - Percent | |
| GMK EVO-T1 | |
| Minisforum N5 Pro | |
| Geekom A9 Max, AI 9 HX 370 | |
| Geekom Mini IT15, Ultra 9 285H | |
| Peladn HA-4, R7 7840HS | |
| Aoostar WTR Pro, R7 5825U | |
| Cinebench R10 | |
| Rendering Single CPUs 64Bit | |
| Geekom Mini IT15, Ultra 9 285H | |
| GMK EVO-T1 | |
| Minisforum N5 Pro | |
| Geekom A9 Max, AI 9 HX 370 | |
| Peladn HA-4, R7 7840HS | |
| Aoostar WTR Pro, R7 5825U | |
| Rendering Multiple CPUs 64Bit | |
| GMK EVO-T1 | |
| Geekom Mini IT15, Ultra 9 285H | |
| Minisforum N5 Pro | |
| Geekom A9 Max, AI 9 HX 370 | |
| Peladn HA-4, R7 7840HS | |
| Aoostar WTR Pro, R7 5825U | |
| WinRAR - Result | |
| Geekom Mini IT15, Ultra 9 285H | |
| Aoostar WTR Pro, R7 5825U | |
| Peladn HA-4, R7 7840HS | |
| GMK EVO-T1 | |
| Geekom A9 Max, AI 9 HX 370 | |
| Minisforum N5 Pro | |
| 3DMark 11 - 1280x720 Performance Physics | |
| GMK EVO-T1 | |
| Geekom Mini IT15, Ultra 9 285H | |
| Peladn HA-4, R7 7840HS | |
| Geekom A9 Max, AI 9 HX 370 | |
| Minisforum N5 Pro | |
| Aoostar WTR Pro, R7 5825U | |
| HWBOT x265 Benchmark v2.2 - 4k Preset | |
| Geekom A9 Max, AI 9 HX 370 | |
| Minisforum N5 Pro | |
| GMK EVO-T1 | |
| Geekom Mini IT15, Ultra 9 285H | |
| Peladn HA-4, R7 7840HS | |
| Aoostar WTR Pro, R7 5825U | |
| R Benchmark 2.5 - Overall mean | |
| Aoostar WTR Pro, R7 5825U | |
| Peladn HA-4, R7 7840HS | |
| GMK EVO-T1 | |
| Minisforum N5 Pro | |
| Geekom Mini IT15, Ultra 9 285H | |
| Geekom A9 Max, AI 9 HX 370 | |
| LibreOffice - 20 Documents To PDF | |
| Aoostar WTR Pro, R7 5825U | |
| Minisforum N5 Pro | |
| Geekom A9 Max, AI 9 HX 370 | |
| GMK EVO-T1 | |
| Peladn HA-4, R7 7840HS | |
| Geekom Mini IT15, Ultra 9 285H | |
| Super Pi mod 1.5 XS 1M - 1M | |
| Geekom A9 Max, AI 9 HX 370 | |
| Minisforum N5 Pro | |
| Aoostar WTR Pro, R7 5825U | |
| Peladn HA-4, R7 7840HS | |
| GMK EVO-T1 | |
| Geekom Mini IT15, Ultra 9 285H | |
| Super Pi mod 1.5 XS 2M - 2M | |
| Peladn HA-4, R7 7840HS | |
| Geekom A9 Max, AI 9 HX 370 | |
| Minisforum N5 Pro | |
| Aoostar WTR Pro, R7 5825U | |
| GMK EVO-T1 | |
| Geekom Mini IT15, Ultra 9 285H | |
| Affinity Photo 2 - Combined (Multi CPU) | |
| GMK EVO-T1 | |
| Minisforum N5 Pro | |
| Geekom A9 Max, AI 9 HX 370 | |
| Geekom Mini IT15, Ultra 9 285H | |
| Peladn HA-4, R7 7840HS | |
| Aoostar WTR Pro, R7 5825U | |
| SPECworkstation 4.0 - CPU Score | |
| Minisforum N5 Pro | |
| GMK EVO-T1 | |
| Geekom A9 Max, AI 9 HX 370 | |
| Geekom Mini IT15, Ultra 9 285H | |
| Peladn HA-4, R7 7840HS | |
| Aoostar WTR Pro, R7 5825U | |
* ... smaller is better
AIDA64: FP32 Ray-Trace | FPU Julia | CPU SHA3 | CPU Queen | FPU SinJulia | FPU Mandel | CPU AES | CPU ZLib | FP64 Ray-Trace | CPU PhotoWorxx
| Performance rating | |
| Average of class Desktop | |
| Geekom A9 Max, AI 9 HX 370 | |
| Minisforum N5 Pro | |
| Peladn HA-4, R7 7840HS | |
| GMK EVO-T1 | |
| Geekom Mini IT15, Ultra 9 285H | |
| Aoostar WTR Pro, R7 5825U | |
| AIDA64 / CPU Queen | |
| Average of class Desktop (76512 - 187912, n=18, last 2 years) | |
| Peladn HA-4, R7 7840HS | |
| Geekom A9 Max, AI 9 HX 370 | |
| Aoostar WTR Pro, R7 5825U | |
| Minisforum N5 Pro | |
| Geekom Mini IT15, Ultra 9 285H | |
| GMK EVO-T1 | |
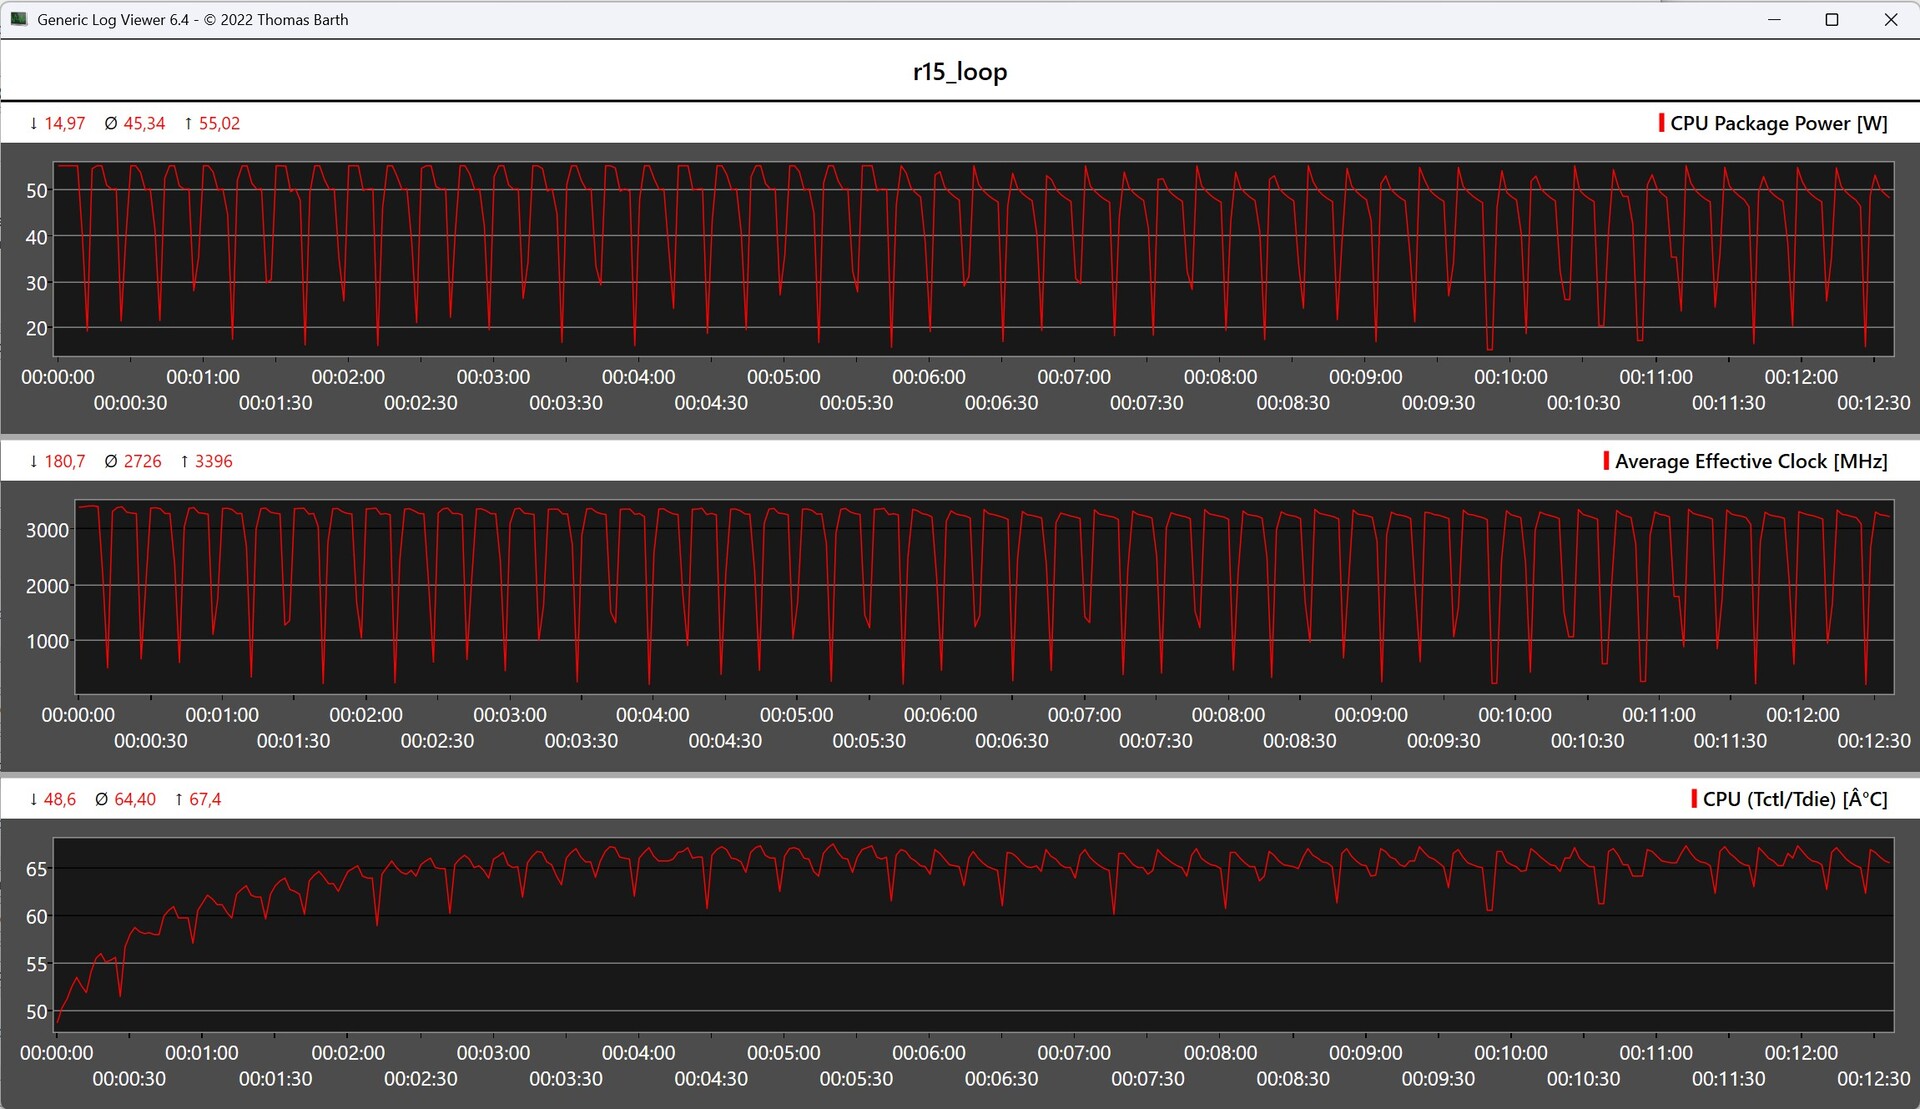
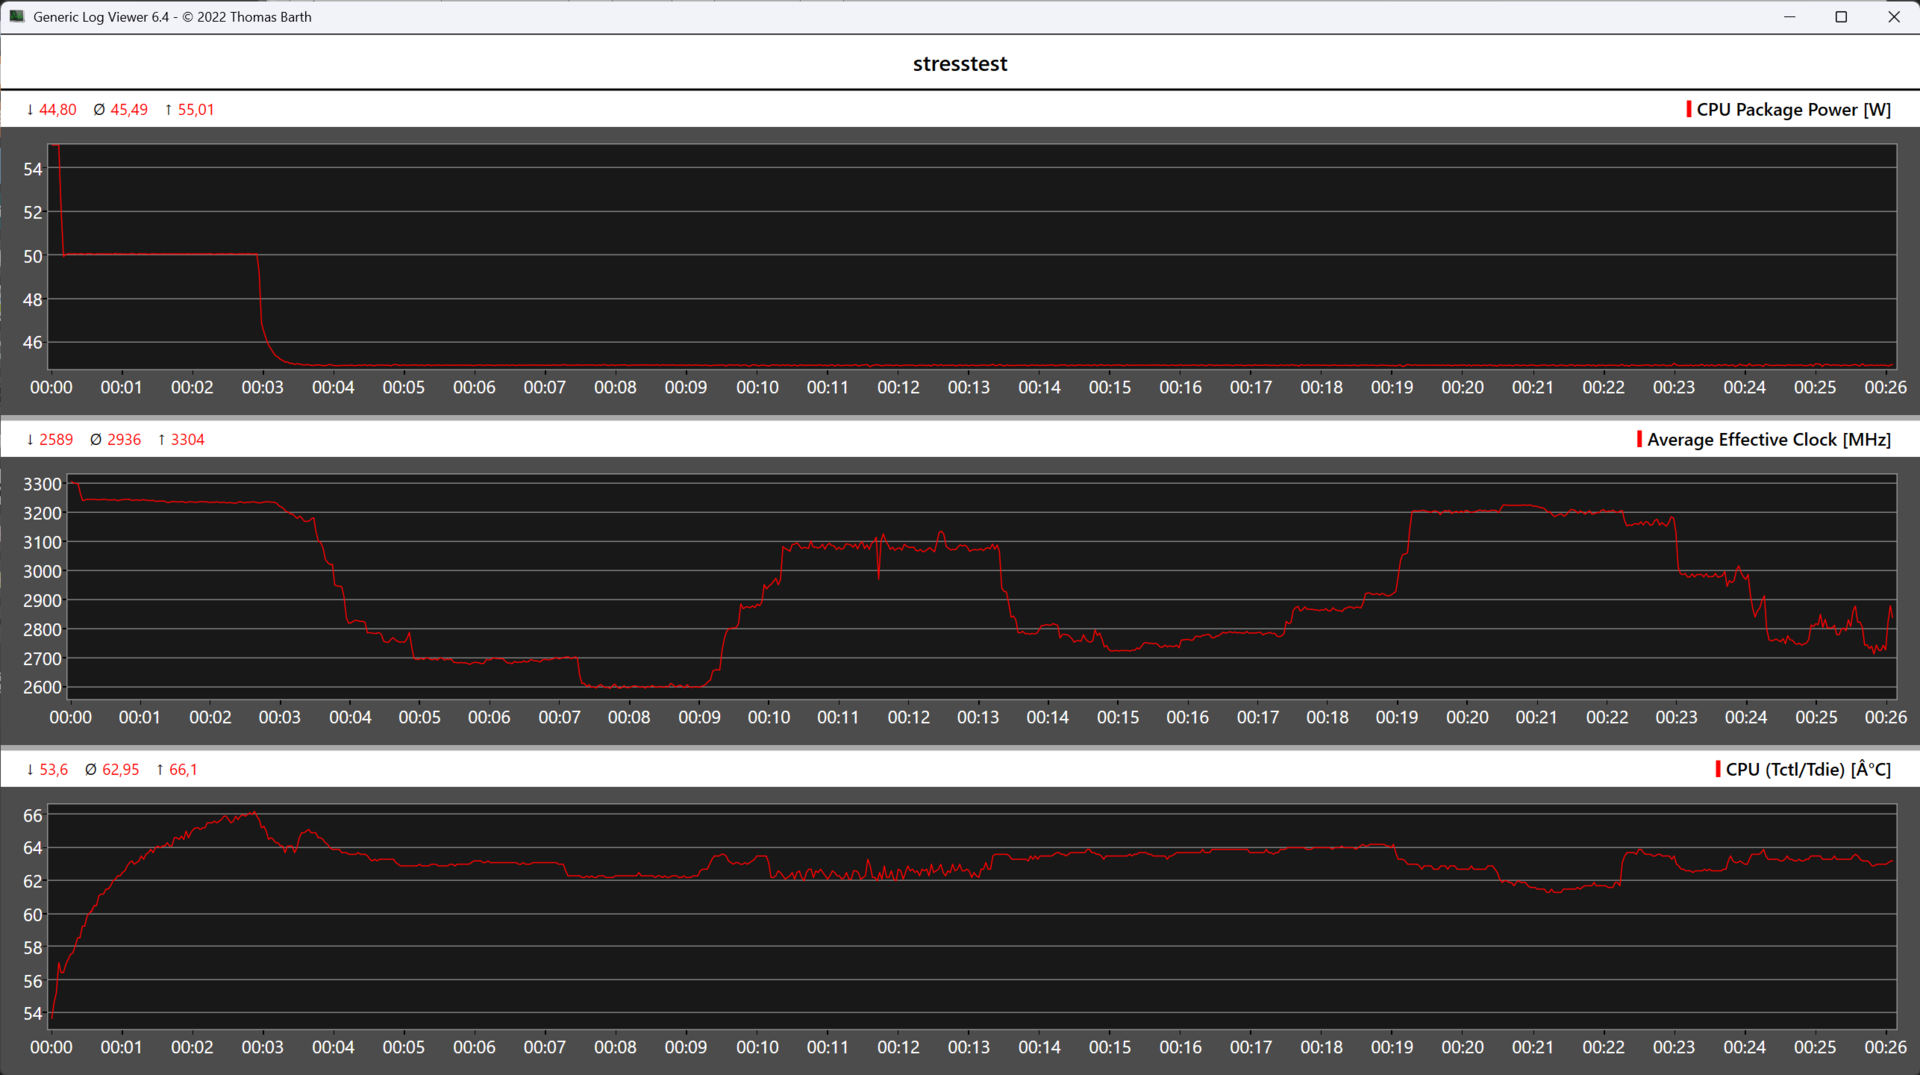
Cinebench R15 Multi Loop
The Cinebench R15 endurance test indicates that the cooling system of the Minisforum N5 Pro is compact but extremely efficient. Even under continuous full load, there is no noticeable loss of performance. The AMD Ryzen AI 9 HX PRO 370 reaches performance peaks of up to 55 watts, while the continuous performance levels off at around 45 watts. The maximum temperature remains pleasingly low at around 67.4 C.
System performance
The Minisforum N5 Pro with Ryzen AI 9 HX PRO 370 impresses in everyday use with high computing power and an all-round smooth working experience. The fast DDR5 RAM, high-performance PCIe SSDs and the integrated NPU, which efficiently accelerates local AI applications, contribute to this.
WebXPRT 4: Overall
WebXPRT 3: Overall
Mozilla Kraken 1.1: Total
CrossMark: Overall | Productivity | Creativity | Responsiveness
* ... smaller is better
* ... smaller is better
| UL Procyon for Windows / Overall Score Integer NPU | |
| Minisforum N5 Pro | |
| Geekom A9 Max, AI 9 HX 370 | |
| GMK EVO-T1 | |
| Geekom Mini IT15, Ultra 9 285H | |
| UL Procyon for Windows / Overall Score Integer GPU | |
| GMK EVO-T1 | |
| Geekom Mini IT15, Ultra 9 285H | |
| Geekom A9 Max, AI 9 HX 370 | |
| Minisforum N5 Pro | |
DPC latencies
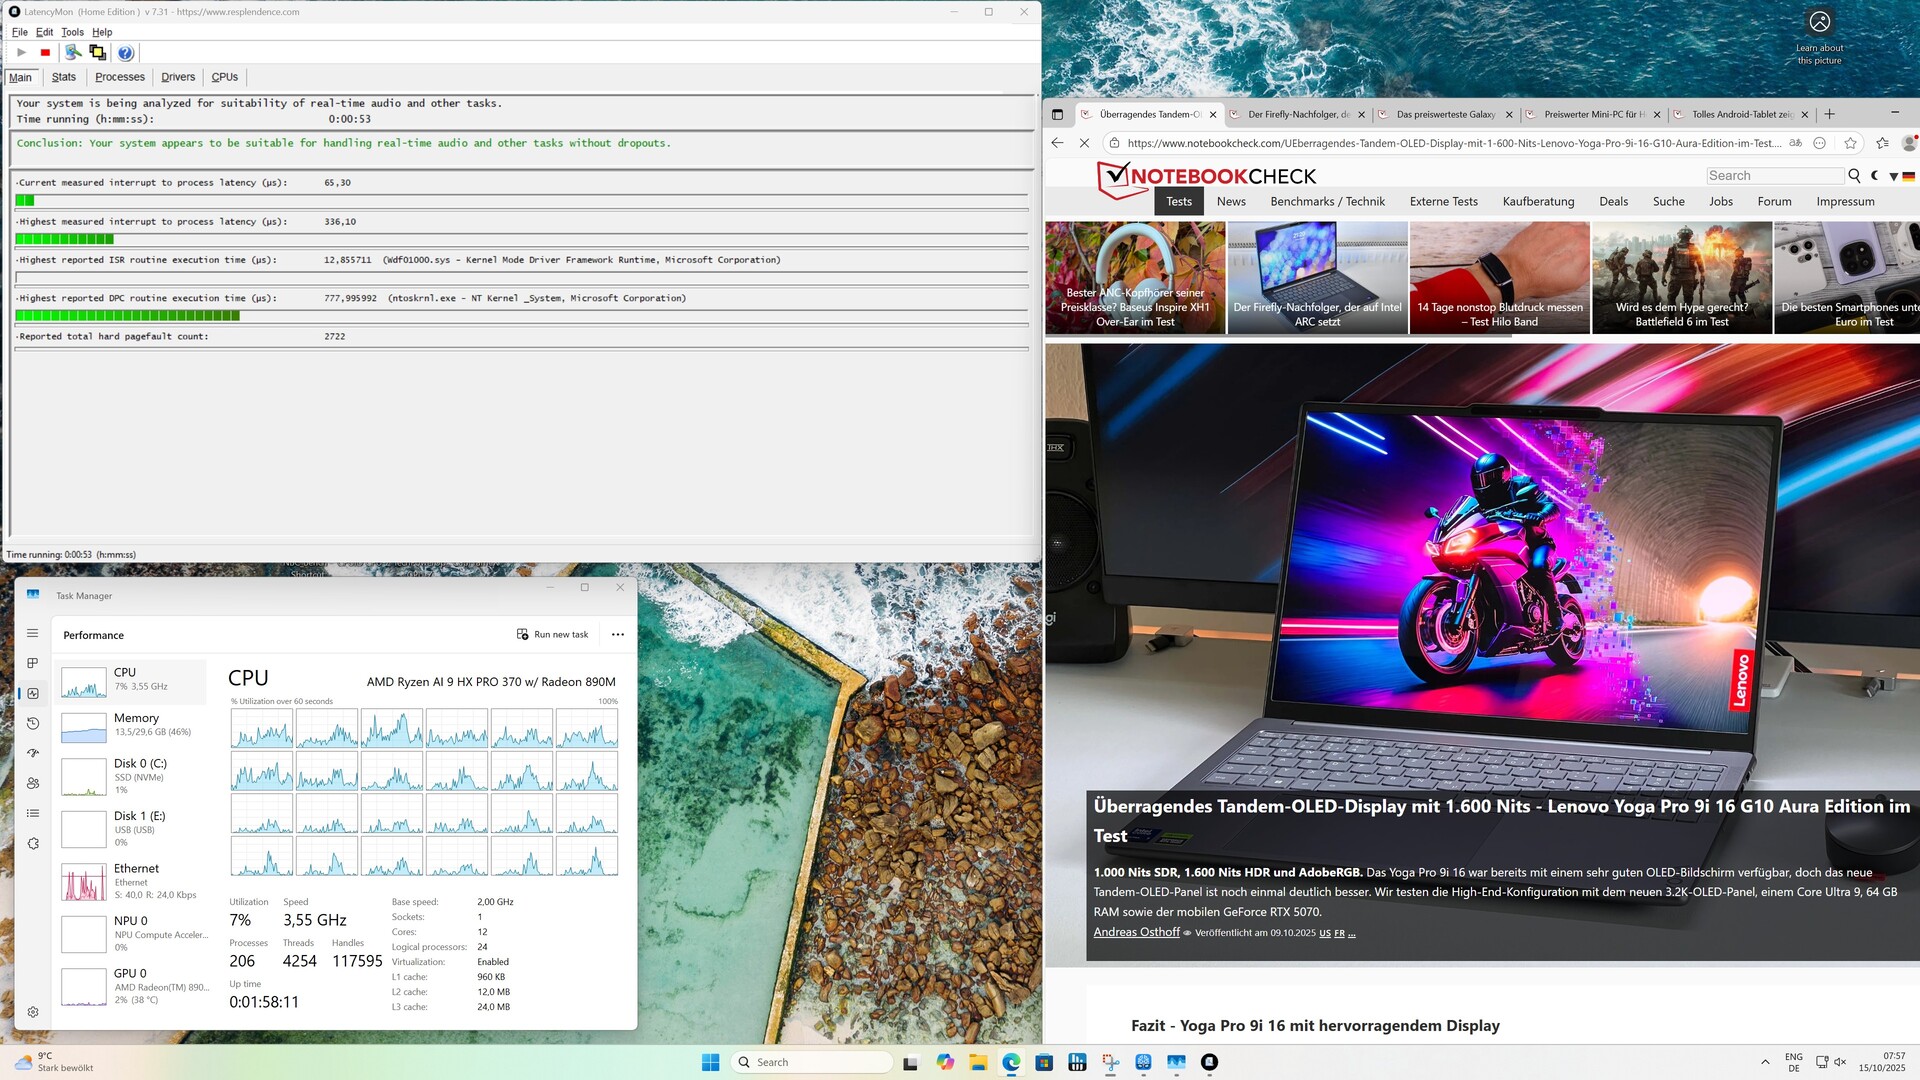
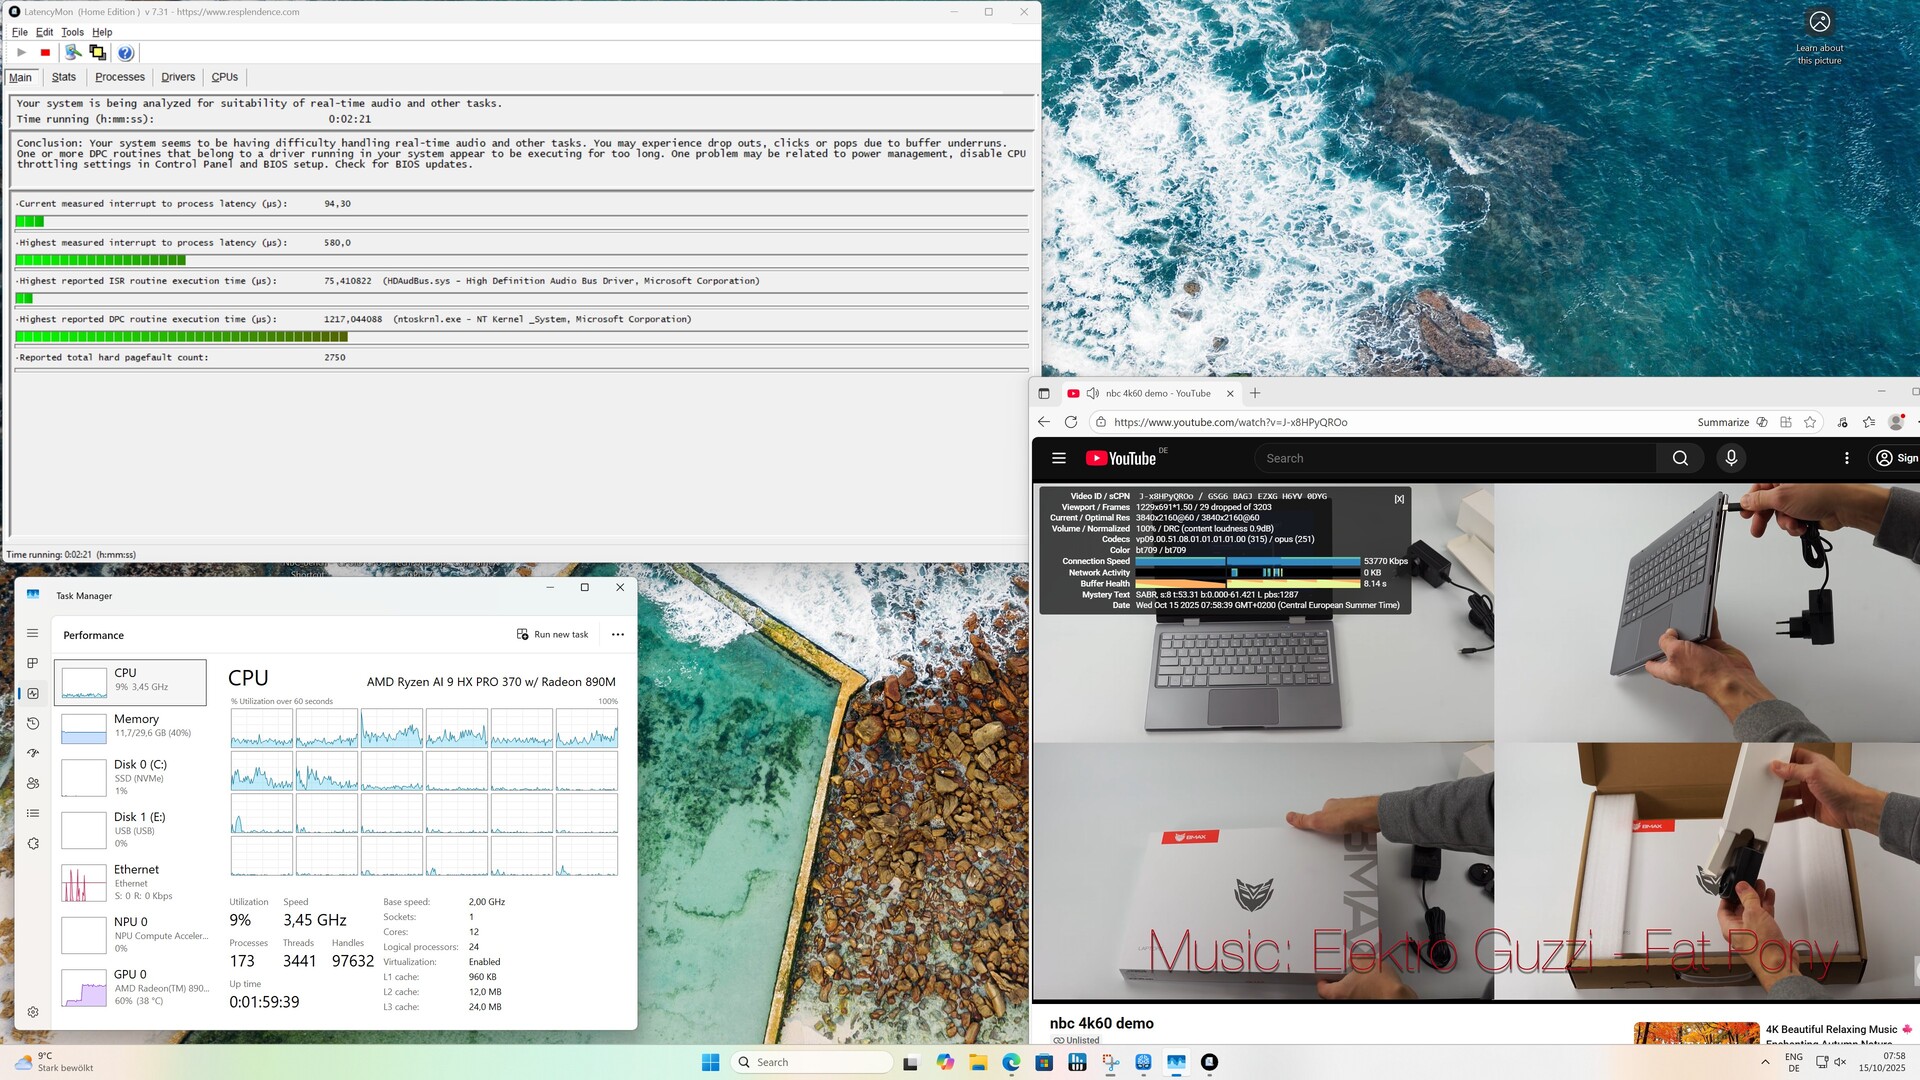
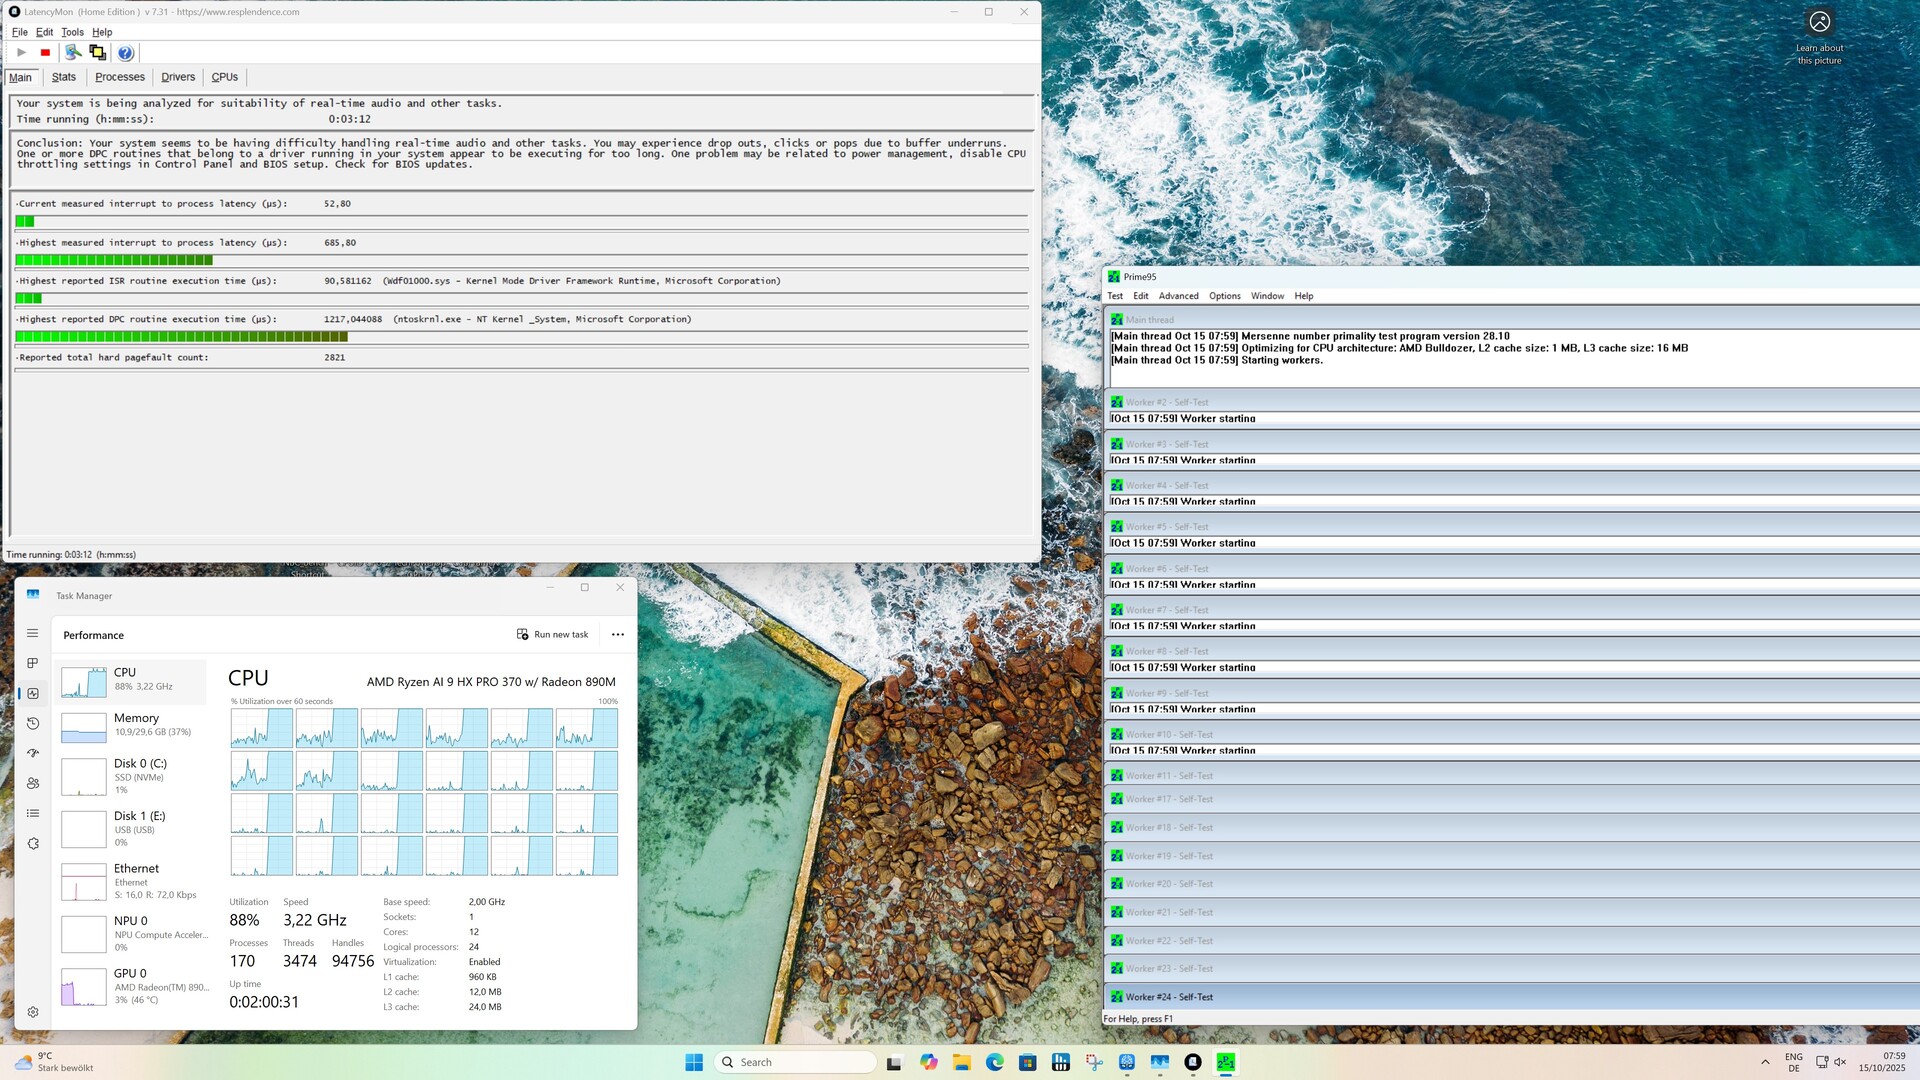
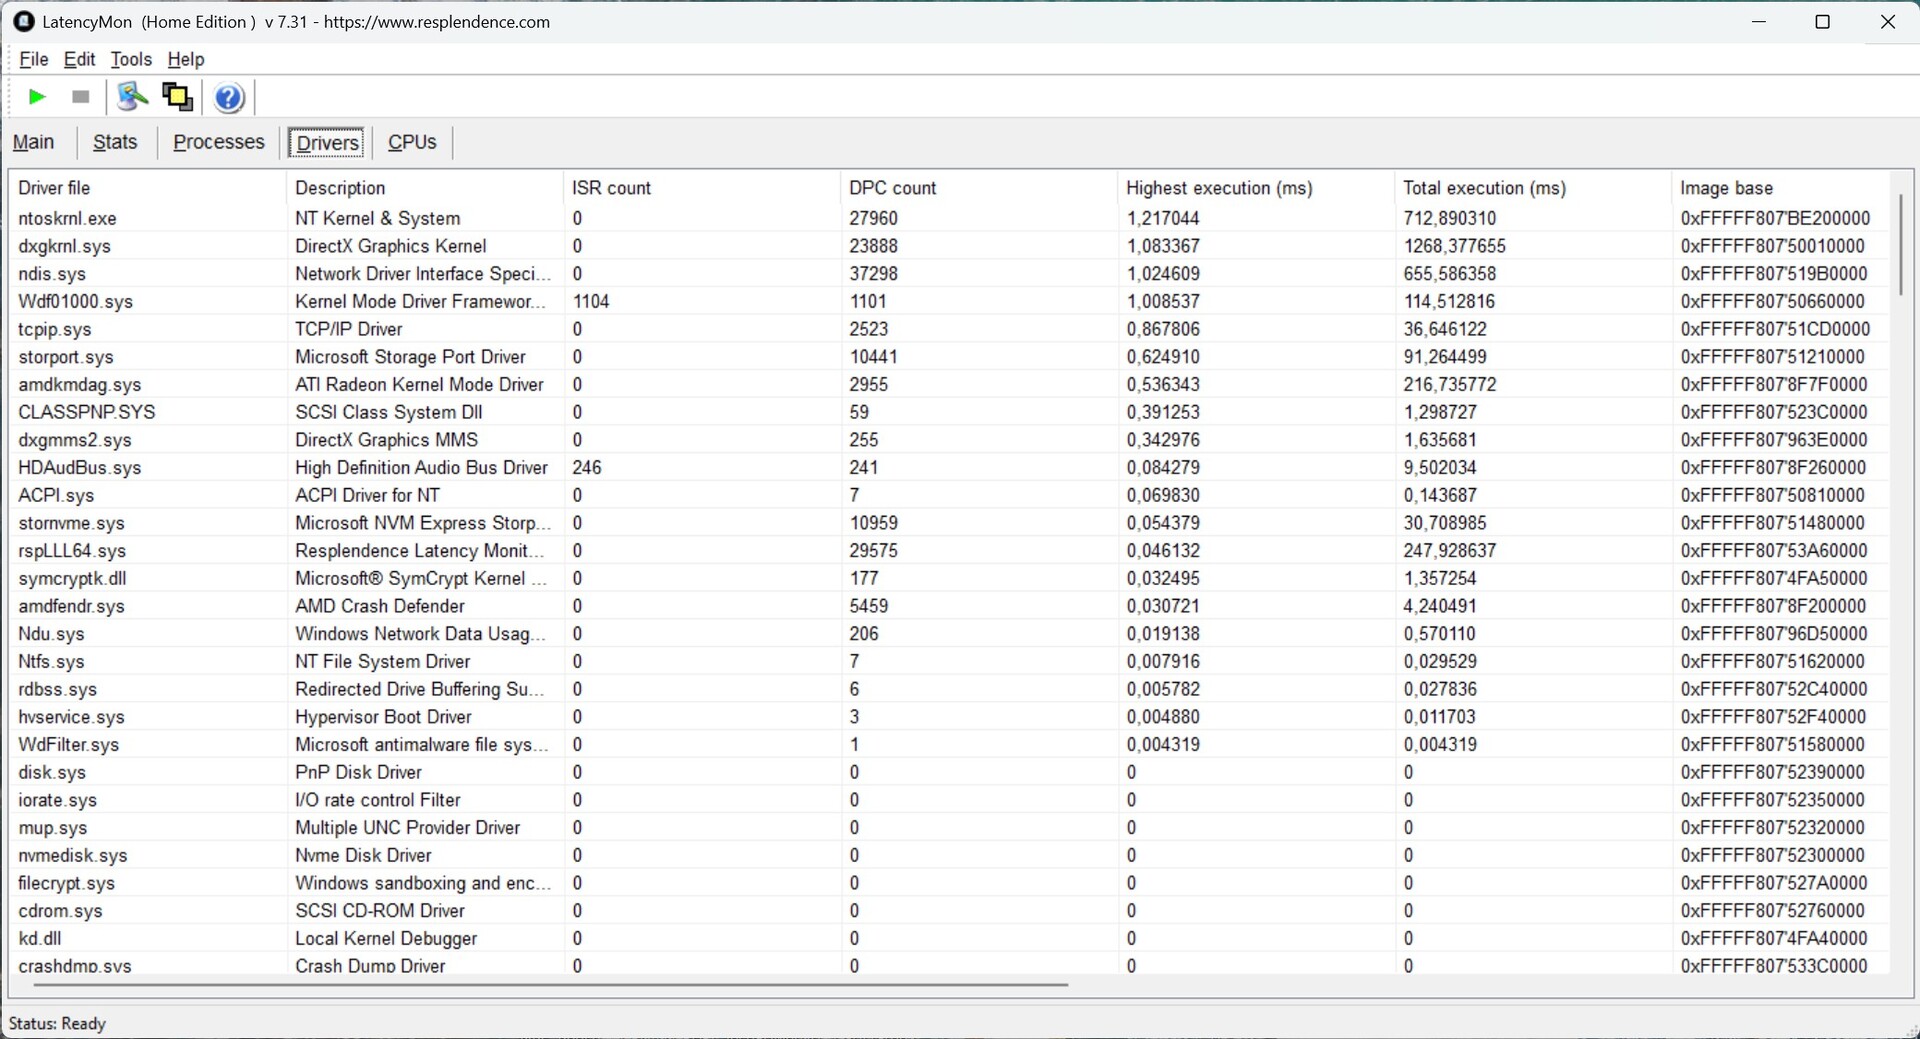
| DPC Latencies / LatencyMon - interrupt to process latency (max), Web, Youtube, Prime95 | |
| Geekom A9 Max, AI 9 HX 370 | |
| Peladn HA-4, R7 7840HS | |
| Minisforum N5 Pro | |
| GMK EVO-T1 | |
| Geekom Mini IT15, Ultra 9 285H | |
* ... smaller is better
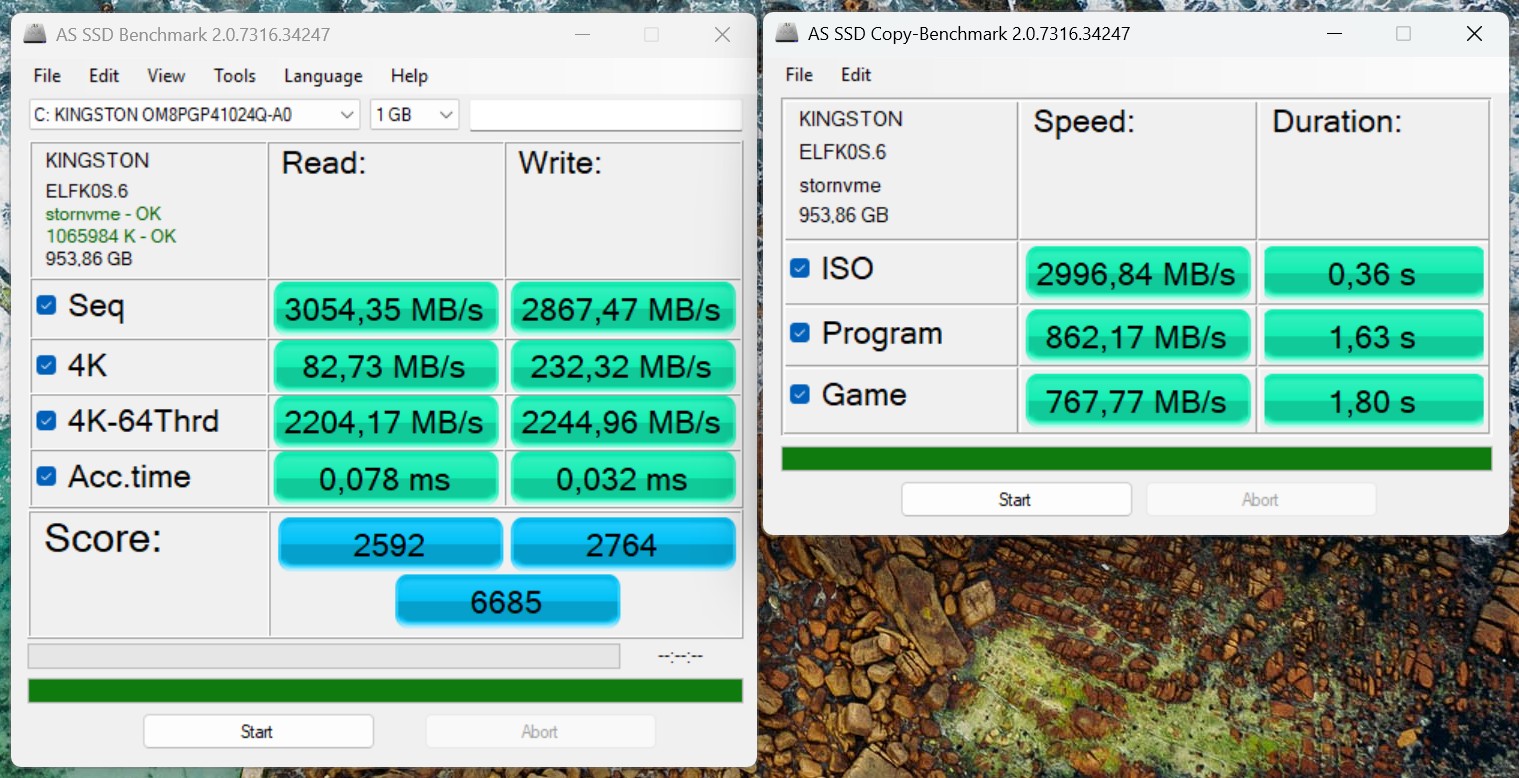
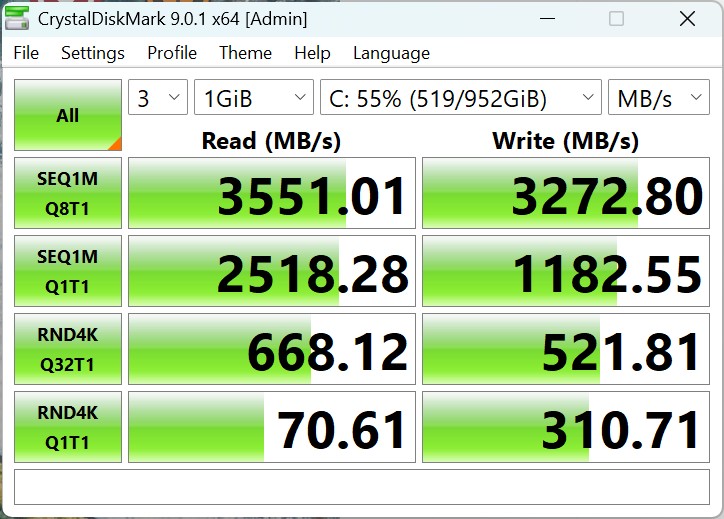
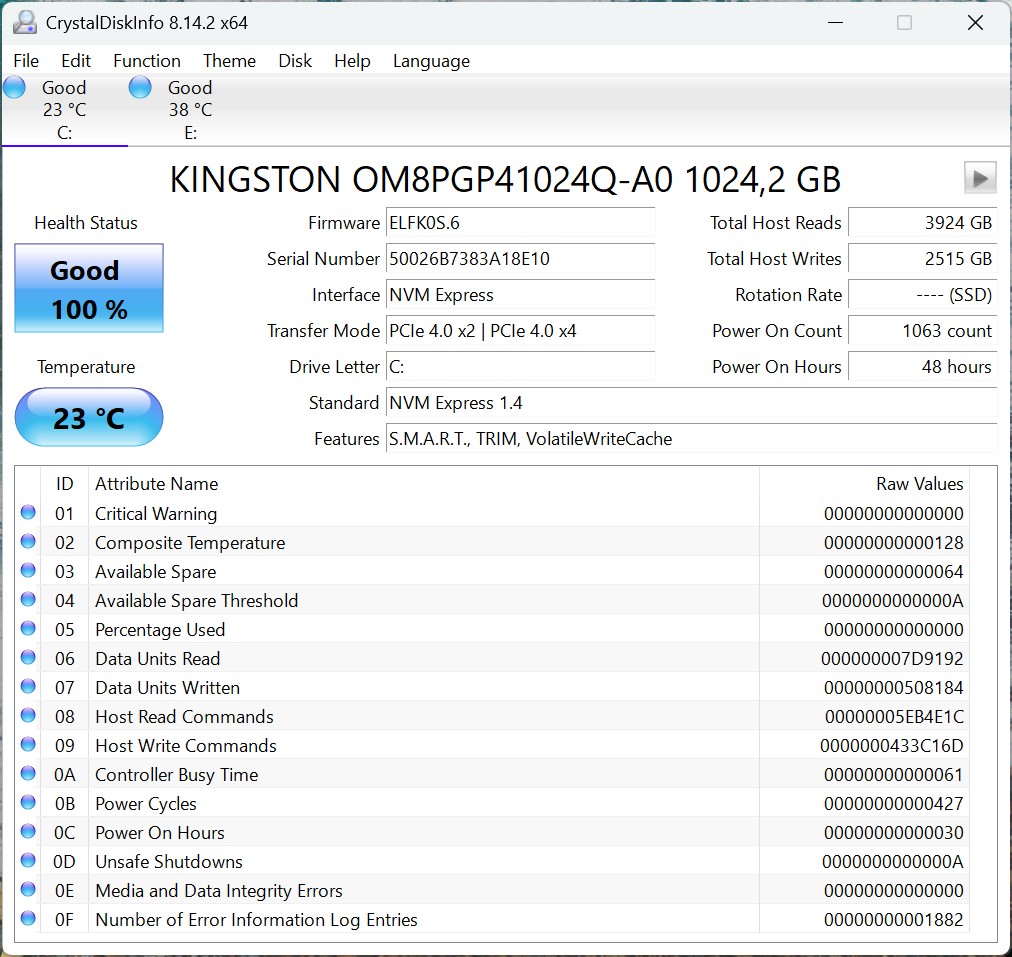
Storage Devices
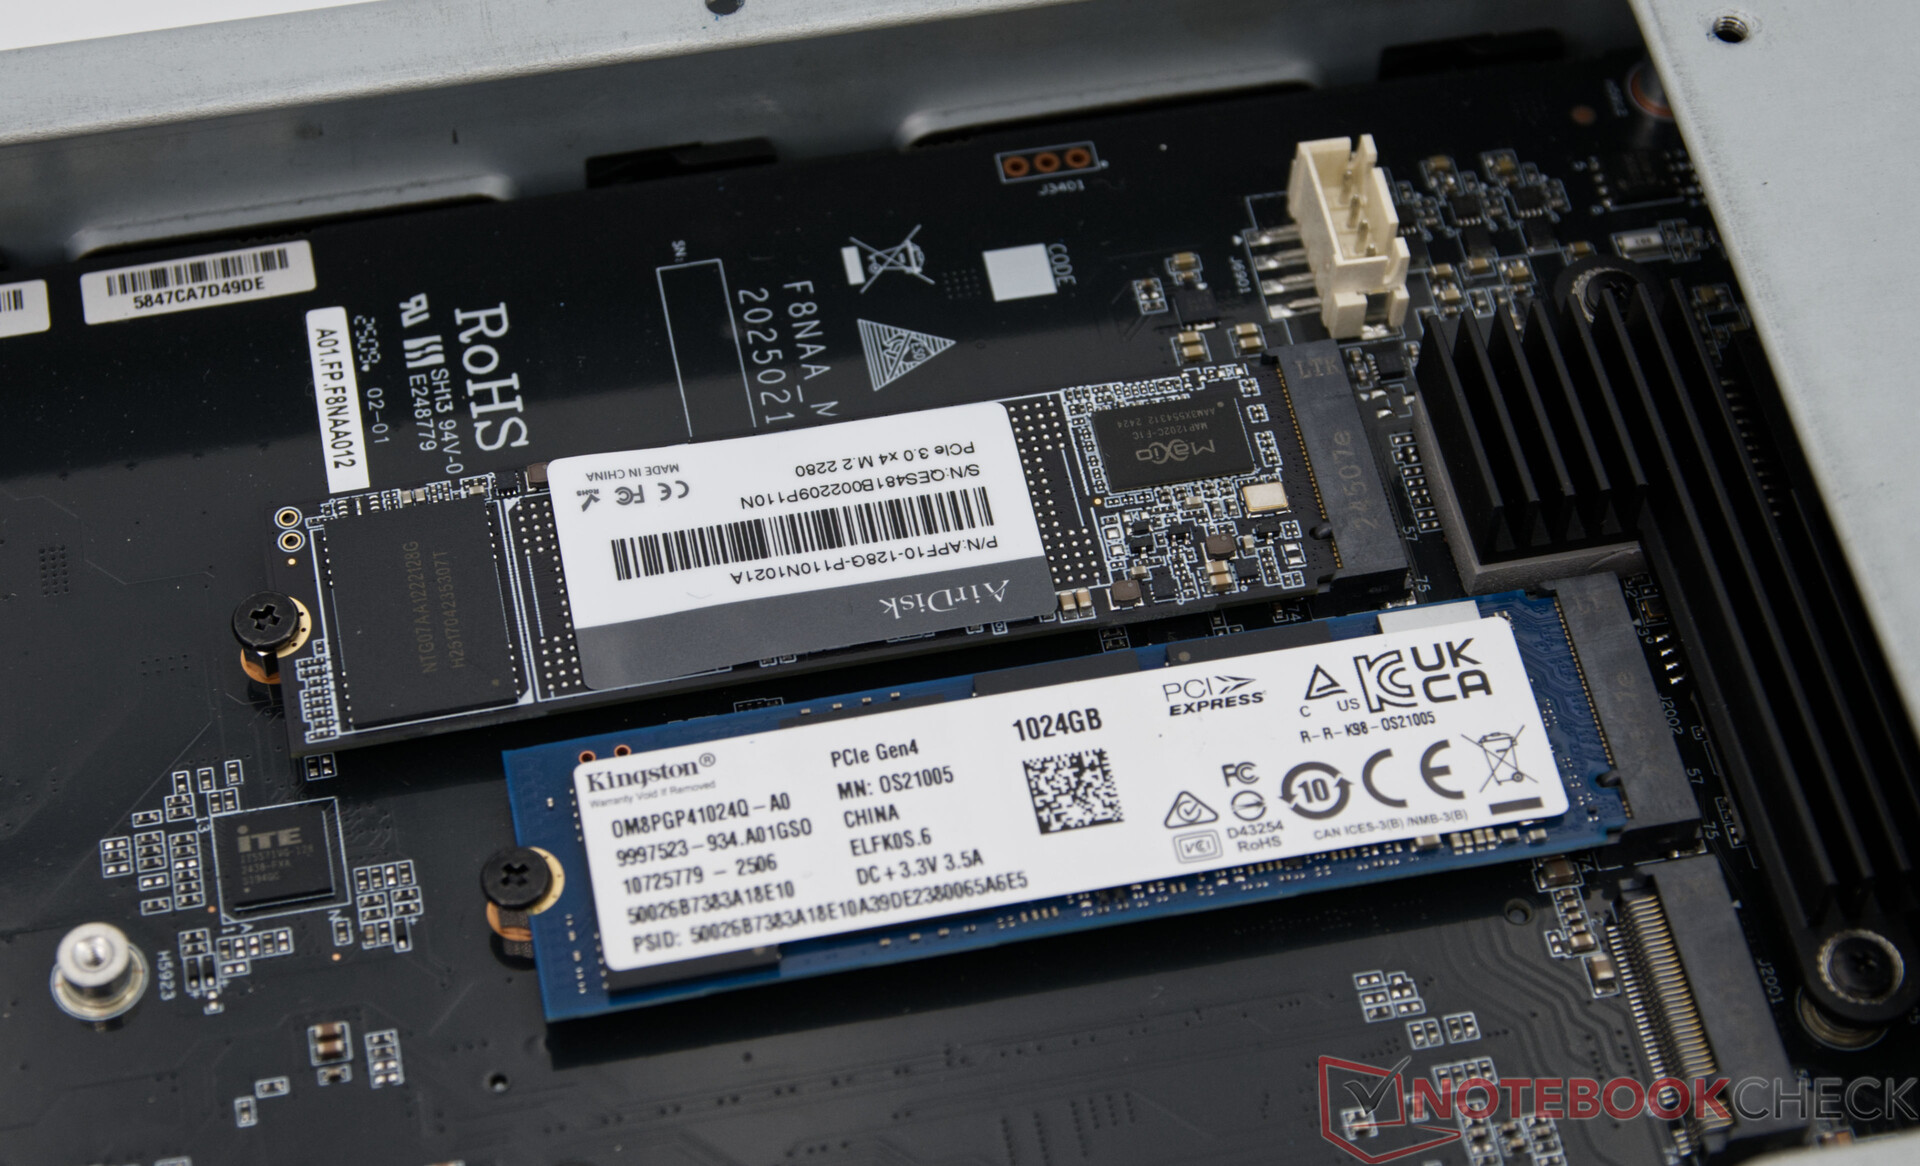
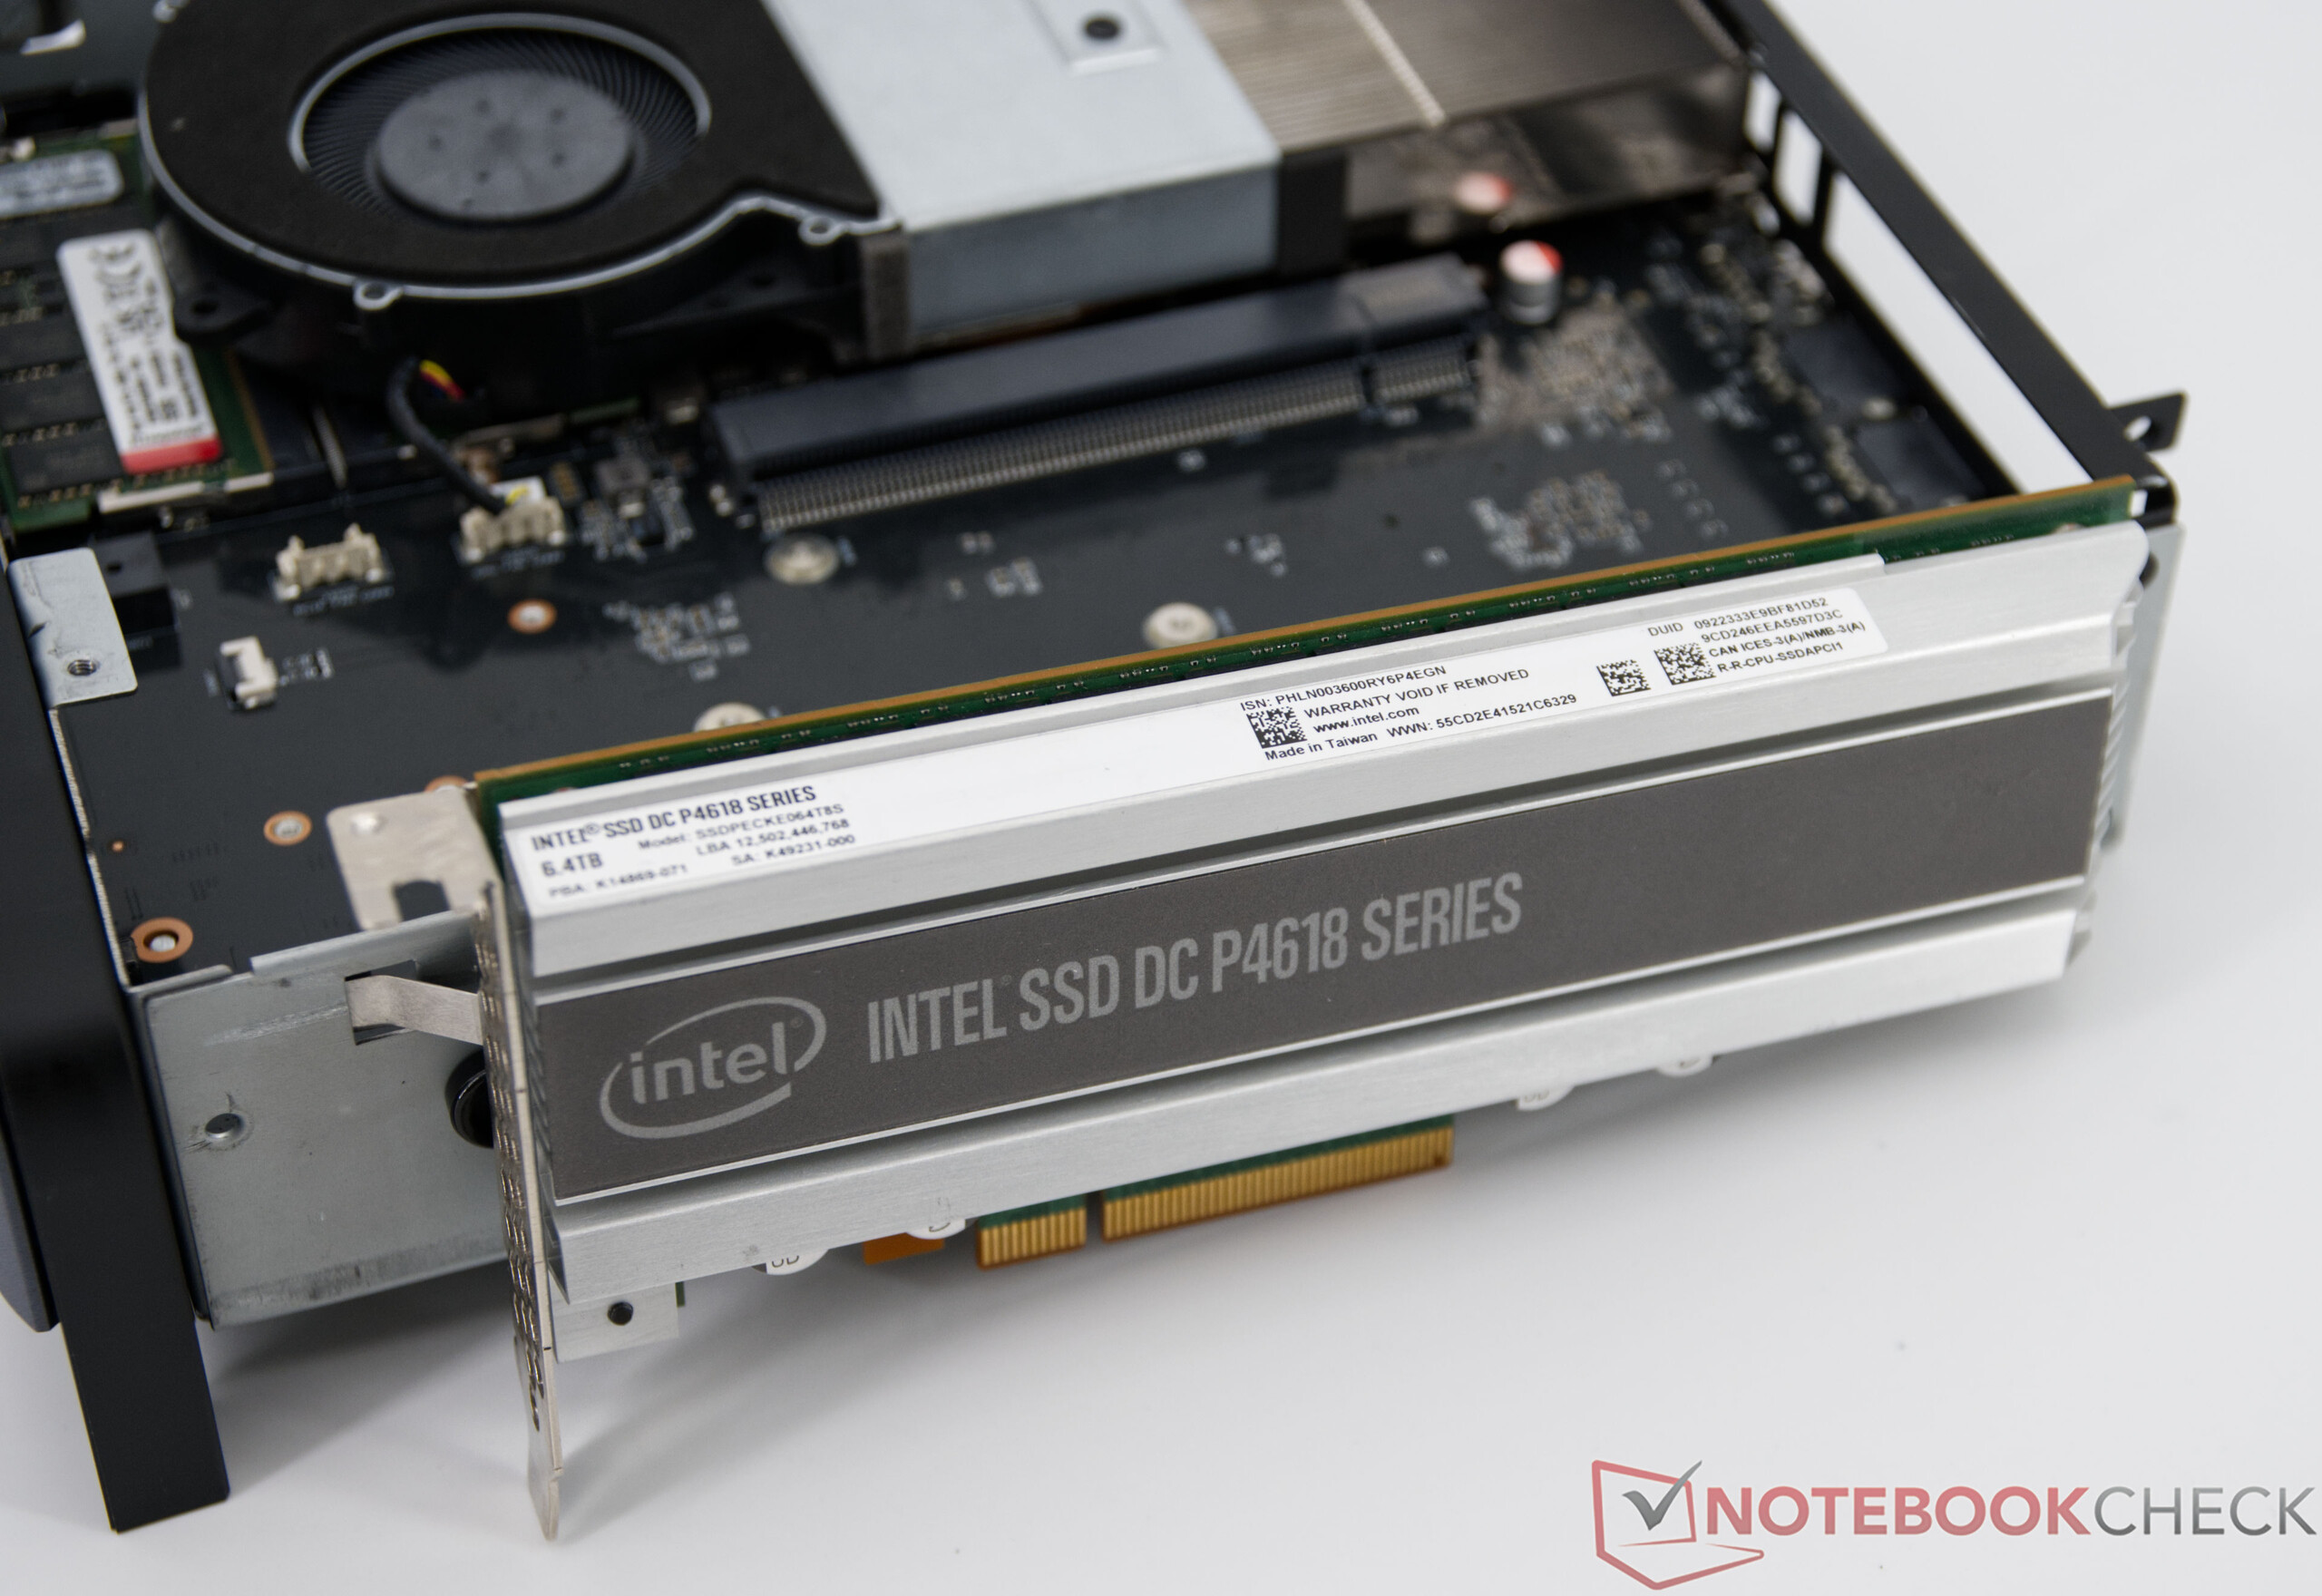
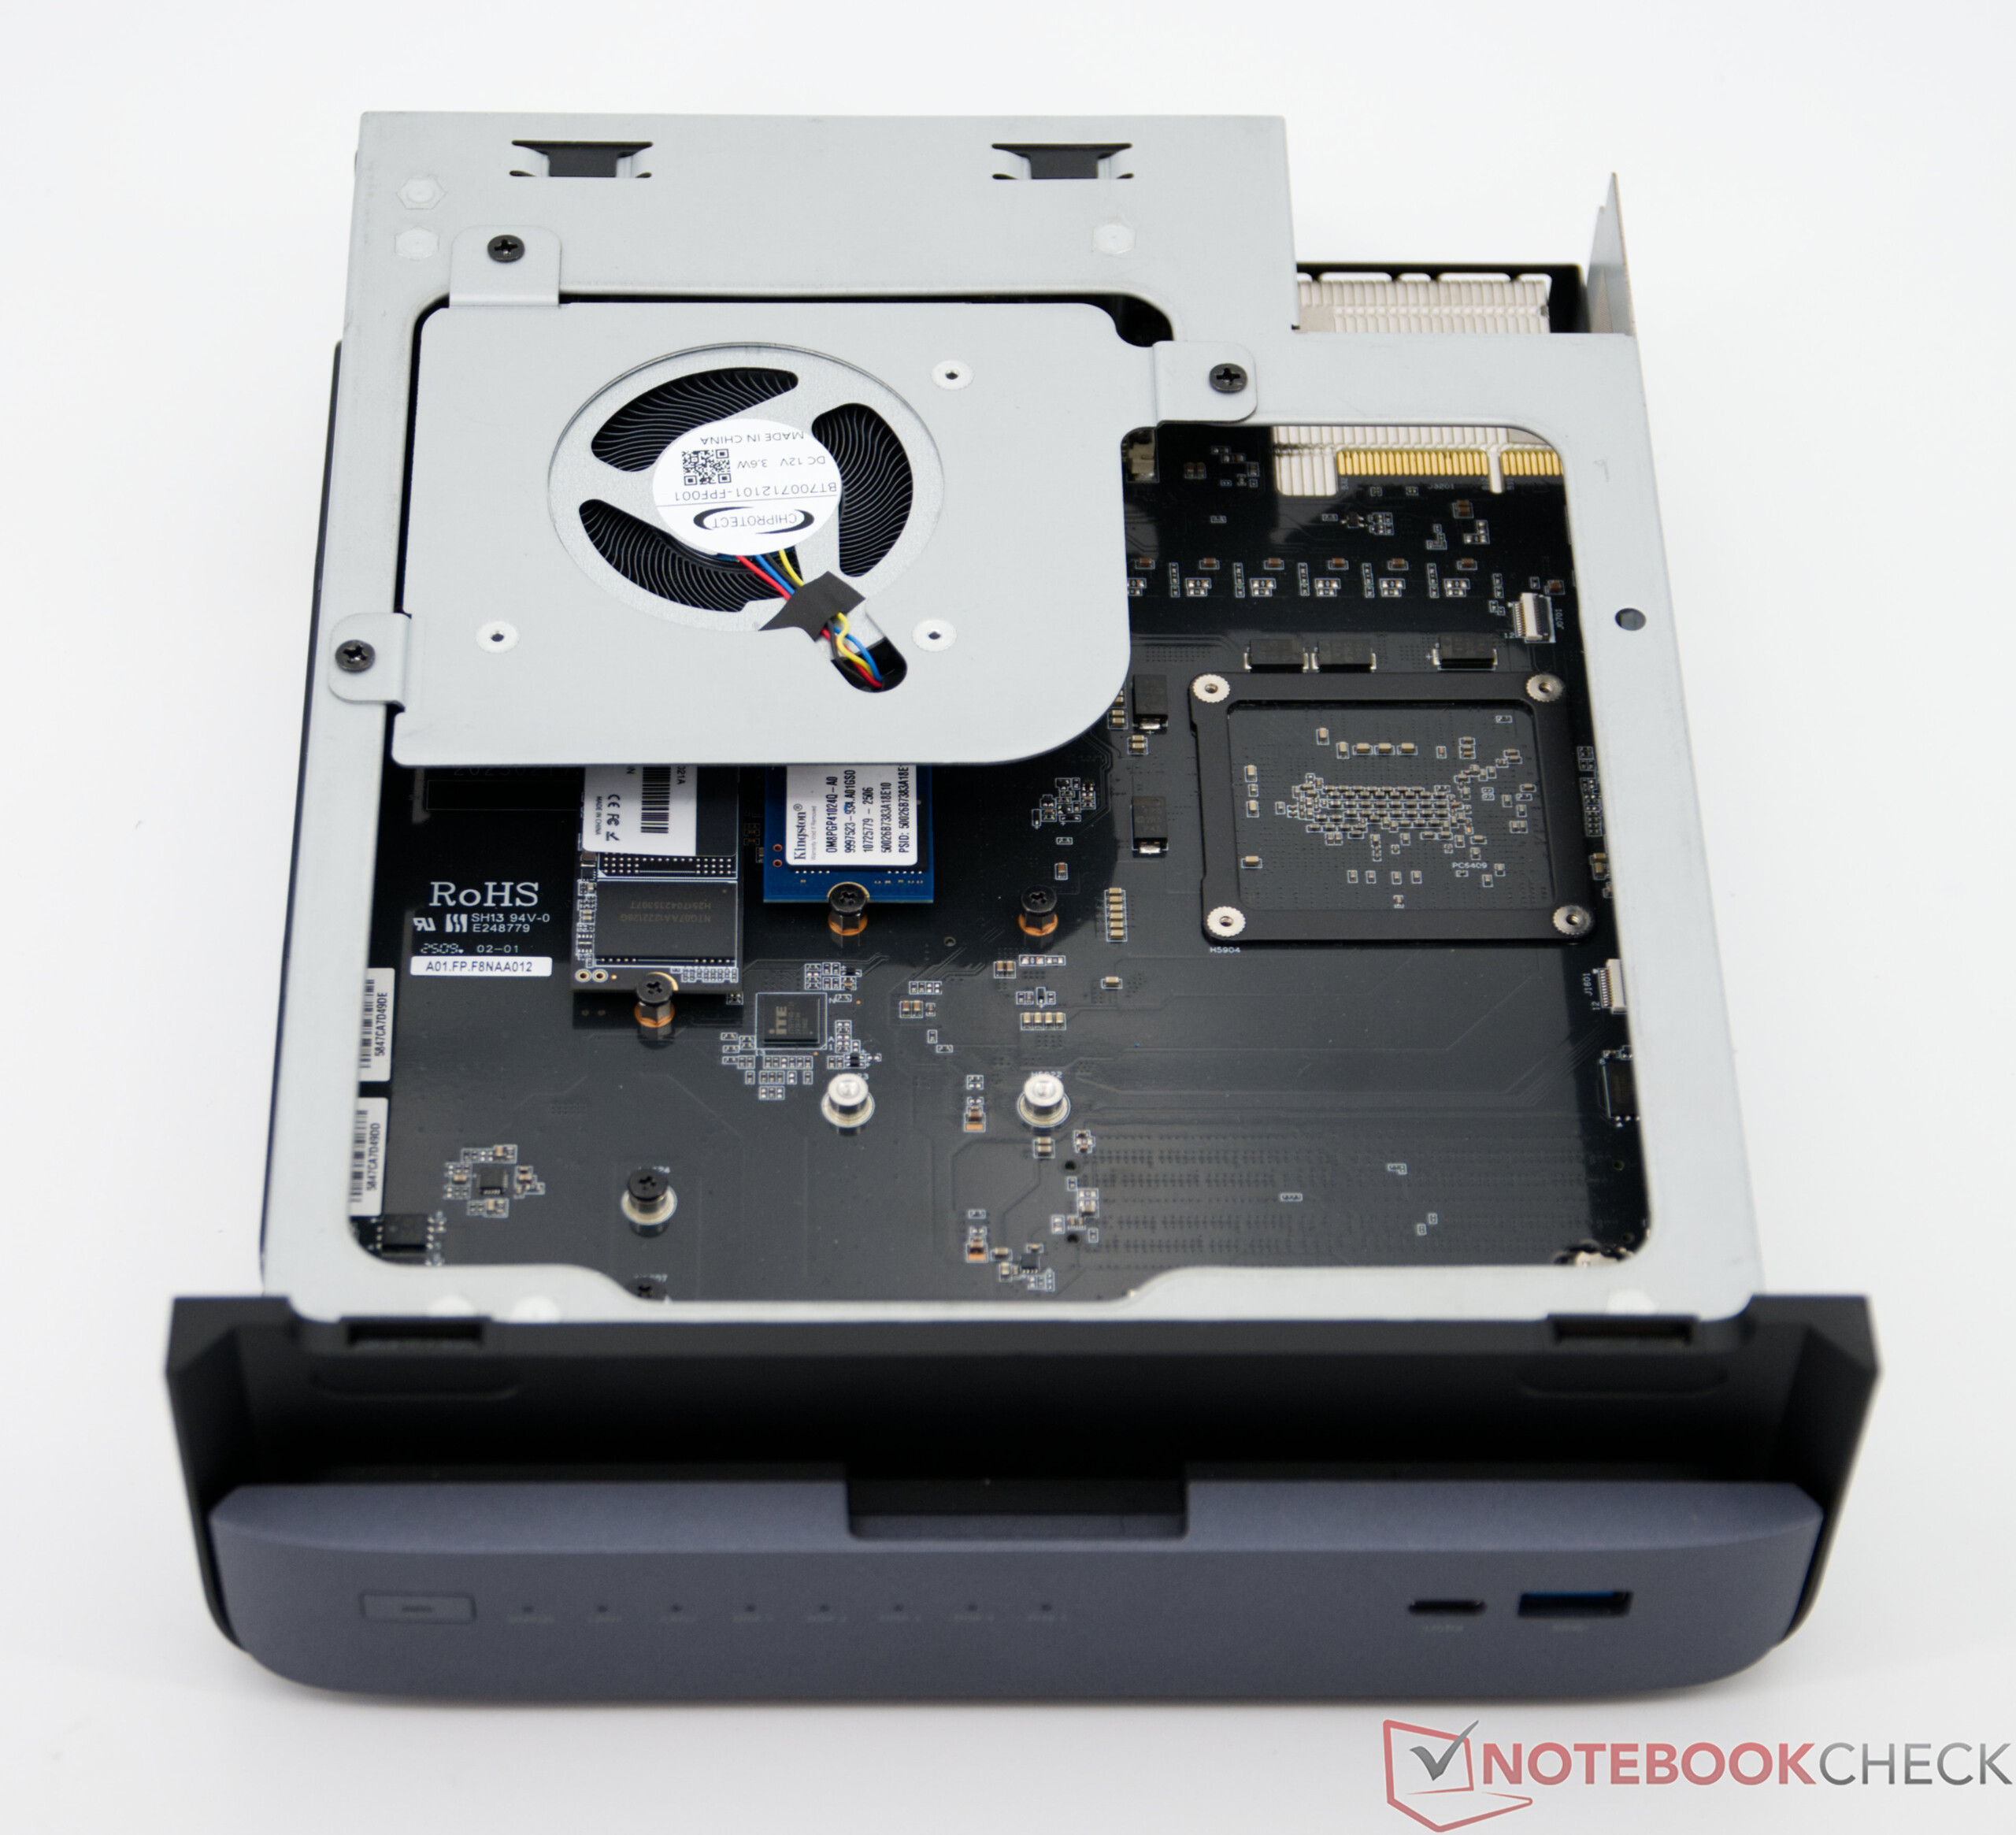
There are two mass storage devices in our test system. One is a 128 GB SSD, which is always present and provides MinisCloud as the operating system. There is also a 1 TB SSD that houses the Windows operating system. Due to the bandwidth limitation (PCIe 4.0 x2), the SSD cannot develop its full performance, but still offers good performance in everyday use. For use as a NAS, the Minisforum N5 Pro can be equipped with a total of five HDDs and three SSDs. The native PCIe x16 slot can also be used for mass storage.

| Drive Performance rating - Percent | |
| Average of class Desktop | |
| Geekom Mini IT15, Ultra 9 285H | |
| GMK EVO-T1 | |
| Minisforum N5 Pro | |
| Geekom A9 Max, AI 9 HX 370 | |
| Peladn HA-4, R7 7840HS | |
| Aoostar WTR Pro, R7 5825U | |
* ... smaller is better
Disk Throttling: DiskSpd Read Loop, Queue Depth 8
Graphics card and gaming performance
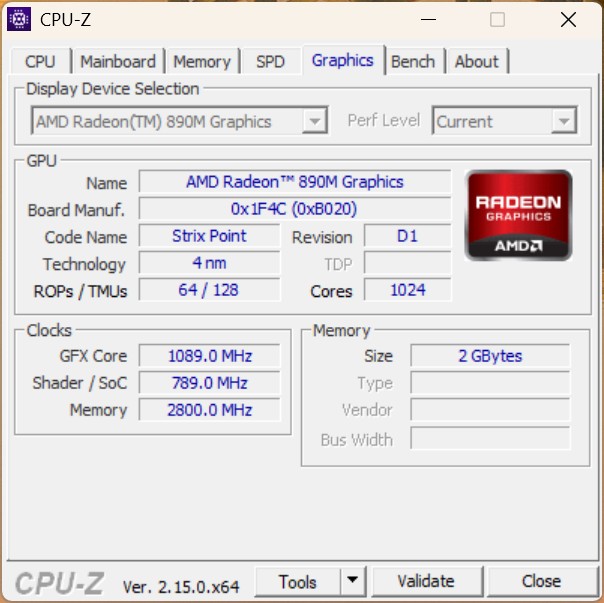
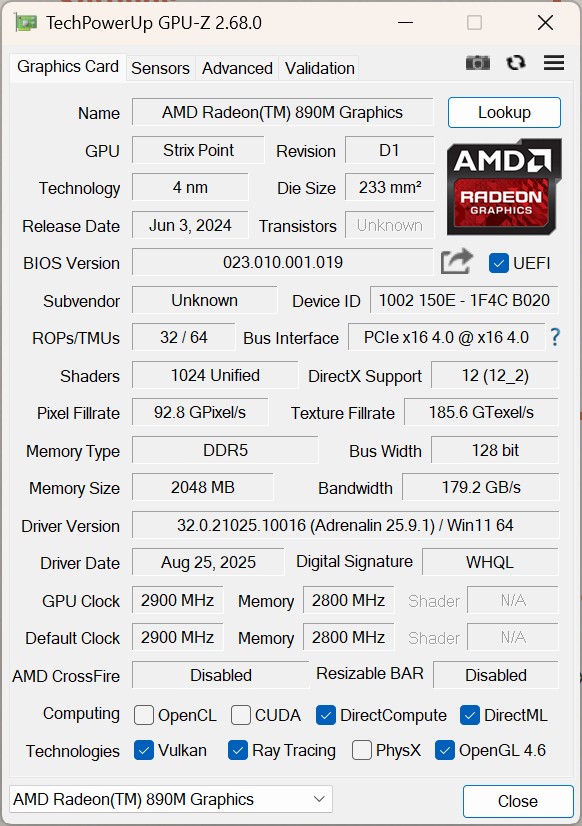
With the integrated AMD Radeon 890M, the Minisforum N5 Pro offers strong graphics performance in the iGPU sector. In comparison, the performance in the Minisforum N5 Pro is on a par with the current iGPUs, which are used here in the GMK EVO-T1 or the Geekom Mini IT15.
| 3DMark Performance rating - Percent | |
| Average AMD Radeon 8060S | |
| GMK EVO-T1 | |
| Geekom A9 Max, AI 9 HX 370 | |
| Geekom Mini IT15, Ultra 9 285H | |
| Minisforum N5 Pro | |
| Peladn HA-4, R7 7840HS | |
| 3DMark 11 - 1280x720 Performance GPU | |
| Average AMD Radeon 8060S (39130 - 49668, n=11) | |
| Geekom A9 Max, AI 9 HX 370 | |
| Minisforum N5 Pro | |
| Geekom Mini IT15, Ultra 9 285H | |
| Peladn HA-4, R7 7840HS | |
| GMK EVO-T1 | |
| Performance rating - Percent | |
| Average AMD Radeon 8060S | |
| GMK EVO-T1 | |
| Geekom A9 Max, AI 9 HX 370 | |
| Geekom Mini IT15, Ultra 9 285H | |
| Minisforum N5 Pro | |
| Peladn HA-4, R7 7840HS | |
| Aoostar WTR Pro, R7 5825U | |
| Unigine Valley 1.0 | |
| 1920x1080 Extreme HD DirectX AA:x8 | |
| Average AMD Radeon 8060S (77.4 - 111.1, n=7) | |
| Geekom A9 Max, AI 9 HX 370 | |
| Minisforum N5 Pro | |
| GMK EVO-T1 | |
| Geekom Mini IT15, Ultra 9 285H | |
| Peladn HA-4, R7 7840HS | |
| Aoostar WTR Pro, R7 5825U | |
| 1920x1080 Extreme HD Preset OpenGL AA:x8 | |
| Average AMD Radeon 8060S (79 - 100.3, n=7) | |
| GMK EVO-T1 | |
| Geekom Mini IT15, Ultra 9 285H | |
| Geekom A9 Max, AI 9 HX 370 | |
| Minisforum N5 Pro | |
| Peladn HA-4, R7 7840HS | |
| Aoostar WTR Pro, R7 5825U | |
| Affinity Photo 2 - Combined (Single / Multi GPU) | |
| GMK EVO-T1 | |
| Geekom Mini IT15, Ultra 9 285H | |
| Average AMD Radeon 8060S (3630 - 4219, n=7) | |
| Geekom A9 Max, AI 9 HX 370 | |
| Minisforum N5 Pro | |
| Peladn HA-4, R7 7840HS | |
| Aoostar WTR Pro, R7 5825U | |
SPECworkstation 4.0: Graphics Score | Accelerator Score | Viewport Graphics | HandBrake | ONNX Inference
| Performance rating | |
| Average AMD Radeon 8060S | |
| Average NVIDIA GeForce RTX 4050 Laptop GPU | |
| Geekom A9 Max, AI 9 HX 370 | |
| Minisforum N5 Pro | |
| Peladn HA-4, R7 7840HS | |
| GMK EVO-T1 | |
| Geekom Mini IT15, Ultra 9 285H | |
| Aoostar WTR Pro, R7 5825U | |
| SPECworkstation 4.0 / Graphics Score | |
| Average AMD Radeon 8060S (6.21 - 7, n=7) | |
| Average NVIDIA GeForce RTX 4050 Laptop GPU (n=1) | |
| Geekom A9 Max, AI 9 HX 370 | |
| Minisforum N5 Pro | |
| Peladn HA-4, R7 7840HS | |
| Geekom Mini IT15, Ultra 9 285H | |
| GMK EVO-T1 | |
| Aoostar WTR Pro, R7 5825U | |
| SPECworkstation 4.0 / Accelerator Score | |
| Average AMD Radeon 8060S (3.91 - 4.8, n=7) | |
| Average NVIDIA GeForce RTX 4050 Laptop GPU (n=1) | |
| Geekom A9 Max, AI 9 HX 370 | |
| Minisforum N5 Pro | |
| Peladn HA-4, R7 7840HS | |
| Geekom Mini IT15, Ultra 9 285H | |
| GMK EVO-T1 | |
| Aoostar WTR Pro, R7 5825U | |
| SPECworkstation 4.0 / Viewport Graphics | |
| Average AMD Radeon 8060S (6.21 - 7, n=7) | |
| Average NVIDIA GeForce RTX 4050 Laptop GPU (n=1) | |
| Geekom A9 Max, AI 9 HX 370 | |
| Minisforum N5 Pro | |
| Peladn HA-4, R7 7840HS | |
| Geekom Mini IT15, Ultra 9 285H | |
| GMK EVO-T1 | |
| Aoostar WTR Pro, R7 5825U | |
| SPECworkstation 4.0 / HandBrake | |
| Average AMD Radeon 8060S (2.02 - 2.65, n=7) | |
| GMK EVO-T1 | |
| Geekom A9 Max, AI 9 HX 370 | |
| Minisforum N5 Pro | |
| Geekom Mini IT15, Ultra 9 285H | |
| Average NVIDIA GeForce RTX 4050 Laptop GPU (n=1) | |
| Peladn HA-4, R7 7840HS | |
| Aoostar WTR Pro, R7 5825U | |
| SPECworkstation 4.0 / ONNX Inference | |
| Average AMD Radeon 8060S (3.16 - 3.87, n=7) | |
| GMK EVO-T1 | |
| Average NVIDIA GeForce RTX 4050 Laptop GPU (n=1) | |
| Geekom A9 Max, AI 9 HX 370 | |
| Minisforum N5 Pro | |
| Geekom Mini IT15, Ultra 9 285H | |
| Peladn HA-4, R7 7840HS | |
| Aoostar WTR Pro, R7 5825U | |
| Minisforum N5 Pro, AMD Radeon 890M Ryzen AI 9 HX PRO 370 | Geekom A9 Max, AI 9 HX 370, AMD Radeon 890M Ryzen AI 9 HX 370 | Geekom Mini IT15, Ultra 9 285H, Intel Arc Graphics 140T Ultra 9 285H | GMK EVO-T1, Intel Arc Graphics 140T Ultra 9 285H | Peladn HA-4, R7 7840HS, AMD Radeon 780M R7 7840HS | Aoostar WTR Pro, R7 5825U, AMD Radeon RX Vega 8 (Ryzen 4000/5000) R7 5825U | Average of class Desktop | |
|---|---|---|---|---|---|---|---|
| SPECviewperf 2020 | 8% | -43% | -51% | -16% | -64% | 337% | |
| 3840x2160 Medical (medical-03) (fps) | 25.1 | 26.1 4% | 7.08 -72% | 7.02 -72% | 16.3 -35% | 3.38 -87% | 44.1 ? 76% |
| 3840x2160 Energy (energy-03) (fps) | 15.6 | 18 15% | 7.94 -49% | 7.4 -53% | 13.8 -12% | 6.11 -61% | 87.2 ? 459% |
| 3840x2160 Creo (creo-03) (fps) | 32.3 | 36.2 12% | 26.7 -17% | 19.9 -38% | 30 -7% | 15.5 -52% | 117.5 ? 264% |
| 3840x2160 CATIA (catia-06) (fps) | 25.1 | 26 4% | 14.6 -42% | 12.8 -49% | 23.5 -6% | 76.6 ? 205% | |
| 3840x2160 3ds Max (3dsmax-07) (fps) | 23.3 | 25.2 8% | 17.8 -24% | 14.6 -37% | 19.6 -16% | 9.01 -61% | 167.9 ? 621% |
| 3840x2160 Siemens NX (snx-04) (fps) | 69.3 | 70.6 2% | 6.81 -90% | 6.13 -91% | 59.9 -14% | 28.3 -59% | 86.2 ? 24% |
| 3840x2160 Maya (maya-06) (fps) | 54.4 | 59.3 9% | 51.3 -6% | 44.9 -17% | 43.7 -20% | 19.8 -64% | 441 ? 711% |
| 3DMark 05 Standard | 61887 points | |
| 3DMark 06 Standard Score | 49473 points | |
| 3DMark Vantage P Result | 43767 points | |
| 3DMark 11 Performance | 13897 points | |
| 3DMark Ice Storm Standard Score | 163856 points | |
| 3DMark Cloud Gate Standard Score | 38945 points | |
| 3DMark Fire Strike Score | 8085 points | |
| 3DMark Fire Strike Extreme Score | 4427 points | |
| 3DMark Time Spy Score | 3506 points | |
| 3DMark Steel Nomad Score | 520 points | |
Help | ||
| GTA V | |
| 1024x768 Lowest Settings possible | |
| Geekom Mini IT15, Ultra 9 285H | |
| Geekom A9 Max, AI 9 HX 370 | |
| Minisforum N5 Pro | |
| GMK EVO-T1 | |
| Peladn HA-4, R7 7840HS | |
| 1920x1080 High/On (Advanced Graphics Off) AA:2xMSAA + FX AF:8x | |
| Geekom A9 Max, AI 9 HX 370 | |
| Minisforum N5 Pro | |
| Peladn HA-4, R7 7840HS | |
| GMK EVO-T1 | |
| Geekom Mini IT15, Ultra 9 285H | |
| Dota 2 Reborn | |
| 1280x720 min (0/3) fastest | |
| Minisforum N5 Pro | |
| Peladn HA-4, R7 7840HS | |
| Geekom A9 Max, AI 9 HX 370 | |
| GMK EVO-T1 | |
| Geekom Mini IT15, Ultra 9 285H | |
| 1920x1080 high (2/3) | |
| Minisforum N5 Pro | |
| Geekom A9 Max, AI 9 HX 370 | |
| Peladn HA-4, R7 7840HS | |
| GMK EVO-T1 | |
| Geekom Mini IT15, Ultra 9 285H | |
| Cyberpunk 2077 | |
| 1920x1080 Low Preset (FSR off) | |
| Geekom A9 Max, AI 9 HX 370 | |
| Minisforum N5 Pro | |
| Peladn HA-4, R7 7840HS | |
| GMK EVO-T1 | |
| Geekom Mini IT15, Ultra 9 285H | |
| 1920x1080 High Preset (FSR off) | |
| Geekom A9 Max, AI 9 HX 370 | |
| Minisforum N5 Pro | |
| GMK EVO-T1 | |
| Geekom Mini IT15, Ultra 9 285H | |
| Peladn HA-4, R7 7840HS | |
| Baldur's Gate 3 | |
| 1280x720 Low Preset AA:SM | |
| Geekom A9 Max, AI 9 HX 370 | |
| Minisforum N5 Pro | |
| Peladn HA-4, R7 7840HS | |
| Geekom Mini IT15, Ultra 9 285H | |
| GMK EVO-T1 | |
| 1920x1080 High Preset AA:T | |
| Geekom A9 Max, AI 9 HX 370 | |
| Minisforum N5 Pro | |
| Peladn HA-4, R7 7840HS | |
| GMK EVO-T1 | |
| Geekom Mini IT15, Ultra 9 285H | |
| F1 24 | |
| 1920x1080 Low Preset AA:T AF:16x | |
| Geekom A9 Max, AI 9 HX 370 | |
| Minisforum N5 Pro | |
| GMK EVO-T1 | |
| Peladn HA-4, R7 7840HS | |
| Geekom Mini IT15, Ultra 9 285H | |
| 1920x1080 High Preset AA:T AF:16x | |
| GMK EVO-T1 | |
| Minisforum N5 Pro | |
| Geekom A9 Max, AI 9 HX 370 | |
| Geekom Mini IT15, Ultra 9 285H | |
| Peladn HA-4, R7 7840HS | |
30 min. Cyberpunk 2077 fps chart (1920 x 1080, Ultra preset, FSR off)
| low | med. | high | ultra | |
|---|---|---|---|---|
| GTA V (2015) | 170.4 | 162.6 | 70.8 | 29.5 |
| The Witcher 3 (2015) | 158.4 | 104.5 | 53.3 | 32.7 |
| Dota 2 Reborn (2015) | 165.2 | 133.2 | 99.5 | 83.4 |
| Final Fantasy XV Benchmark (2018) | 85.5 | 42.1 | 30.1 | |
| X-Plane 11.11 (2018) | 82.2 | 64.9 | 50.6 | |
| Strange Brigade (2018) | 170.3 | 68.1 | 56.1 | 48.3 |
| Baldur's Gate 3 (2023) | 45.4 | 35.6 | 27.9 | 27.5 |
| Cyberpunk 2077 (2023) | 43 | 34.9 | 27.3 | 23.9 |
| F1 24 (2024) | 86.6 | 76.4 | 56.9 | 14.3 |
Minisforum N5 Pro performance check with an Nvidia GeForce RTX 4090 via OCuLink
Thanks to the OCuLink interface, the Minisforum N5 Pro allows an external graphics card (eGPU) to be connected, which significantly increases the graphics performance. In the test, the system was operated in combination with an Nvidia GeForce RTX 4090 and the Minisforum DEG1 eGPU dock.
| Performance rating - Percent | |
| Minisforum MS-A2 (Nvidia GeForce RTX 4090 @OCuLink) | |
| Minisforum N5 Pro (Nvidia GeForce RTX 4090 @OCuLink) | |
| GMK EVO-T1 (Nvidia GeForce RTX 4090 @OCuLink) | |
| Geekom GT1 Mega (Nvidia GeForce RTX 4090 @USB4) | |
| 3DMark 11 - 1280x720 Performance GPU | |
| Minisforum N5 Pro (Nvidia GeForce RTX 4090 @OCuLink) | |
| GMK EVO-T1 (Nvidia GeForce RTX 4090 @OCuLink) | |
| Minisforum MS-A2 (Nvidia GeForce RTX 4090 @OCuLink) | |
| Geekom GT1 Mega (Nvidia GeForce RTX 4090 @USB4) | |
| 3DMark | |
| 2560x1440 Time Spy Graphics | |
| GMK EVO-T1 (Nvidia GeForce RTX 4090 @OCuLink) | |
| Minisforum N5 Pro (Nvidia GeForce RTX 4090 @OCuLink) | |
| Geekom GT1 Mega (Nvidia GeForce RTX 4090 @USB4) | |
| Minisforum MS-A2 (Nvidia GeForce RTX 4090 @OCuLink) | |
| 1920x1080 Fire Strike Graphics | |
| Minisforum MS-A2 (Nvidia GeForce RTX 4090 @OCuLink) | |
| Minisforum N5 Pro (Nvidia GeForce RTX 4090 @OCuLink) | |
| GMK EVO-T1 (Nvidia GeForce RTX 4090 @OCuLink) | |
| Geekom GT1 Mega (Nvidia GeForce RTX 4090 @USB4) | |
| 3840x2160 Fire Strike Ultra Graphics | |
| GMK EVO-T1 (Nvidia GeForce RTX 4090 @OCuLink) | |
| Minisforum MS-A2 (Nvidia GeForce RTX 4090 @OCuLink) | |
| Minisforum N5 Pro (Nvidia GeForce RTX 4090 @OCuLink) | |
| Geekom GT1 Mega (Nvidia GeForce RTX 4090 @USB4) | |
| Unigine Superposition | |
| 1280x720 720p Low | |
| Minisforum MS-A2 (Nvidia GeForce RTX 4090 @OCuLink) | |
| Minisforum N5 Pro (Nvidia GeForce RTX 4090 @OCuLink) | |
| GMK EVO-T1 (Nvidia GeForce RTX 4090 @OCuLink) | |
| Geekom GT1 Mega (Nvidia GeForce RTX 4090 @USB4) | |
| 1920x1080 1080p High | |
| Minisforum MS-A2 (Nvidia GeForce RTX 4090 @OCuLink) | |
| Minisforum N5 Pro (Nvidia GeForce RTX 4090 @OCuLink) | |
| GMK EVO-T1 (Nvidia GeForce RTX 4090 @OCuLink) | |
| Geekom GT1 Mega (Nvidia GeForce RTX 4090 @USB4) | |
| 1920x1080 1080p Extreme | |
| GMK EVO-T1 (Nvidia GeForce RTX 4090 @OCuLink) | |
| Minisforum MS-A2 (Nvidia GeForce RTX 4090 @OCuLink) | |
| Minisforum N5 Pro (Nvidia GeForce RTX 4090 @OCuLink) | |
| Geekom GT1 Mega (Nvidia GeForce RTX 4090 @USB4) | |
| 3840x2160 4k Optimized | |
| Minisforum MS-A2 (Nvidia GeForce RTX 4090 @OCuLink) | |
| GMK EVO-T1 (Nvidia GeForce RTX 4090 @OCuLink) | |
| Minisforum N5 Pro (Nvidia GeForce RTX 4090 @OCuLink) | |
| Geekom GT1 Mega (Nvidia GeForce RTX 4090 @USB4) | |
| 7680x4320 8k Optimized | |
| Minisforum MS-A2 (Nvidia GeForce RTX 4090 @OCuLink) | |
| GMK EVO-T1 (Nvidia GeForce RTX 4090 @OCuLink) | |
| Geekom GT1 Mega (Nvidia GeForce RTX 4090 @USB4) | |
| Minisforum N5 Pro (Nvidia GeForce RTX 4090 @OCuLink) | |
| Unigine Valley 1.0 | |
| 1920x1080 Extreme HD DirectX AA:x8 | |
| Minisforum MS-A2 (Nvidia GeForce RTX 4090 @OCuLink) | |
| Minisforum N5 Pro (Nvidia GeForce RTX 4090 @OCuLink) | |
| GMK EVO-T1 (Nvidia GeForce RTX 4090 @OCuLink) | |
| Geekom GT1 Mega (Nvidia GeForce RTX 4090 @USB4) | |
| 1920x1080 Extreme HD Preset OpenGL AA:x8 | |
| Minisforum MS-A2 (Nvidia GeForce RTX 4090 @OCuLink) | |
| Minisforum N5 Pro (Nvidia GeForce RTX 4090 @OCuLink) | |
| Geekom GT1 Mega (Nvidia GeForce RTX 4090 @USB4) | |
| GMK EVO-T1 (Nvidia GeForce RTX 4090 @OCuLink) | |
| Unigine Heaven 4.0 | |
| Extreme Preset OpenGL | |
| Minisforum MS-A2 (Nvidia GeForce RTX 4090 @OCuLink) | |
| Minisforum N5 Pro (Nvidia GeForce RTX 4090 @OCuLink) | |
| GMK EVO-T1 (Nvidia GeForce RTX 4090 @OCuLink) | |
| Geekom GT1 Mega (Nvidia GeForce RTX 4090 @USB4) | |
| Extreme Preset DX11 | |
| Minisforum MS-A2 (Nvidia GeForce RTX 4090 @OCuLink) | |
| Minisforum N5 Pro (Nvidia GeForce RTX 4090 @OCuLink) | |
| GMK EVO-T1 (Nvidia GeForce RTX 4090 @OCuLink) | |
| Geekom GT1 Mega (Nvidia GeForce RTX 4090 @USB4) | |
| ComputeMark v2.1 | |
| 1024x600 Normal, Score | |
| Minisforum MS-A2 (Nvidia GeForce RTX 4090 @OCuLink) | |
| GMK EVO-T1 (Nvidia GeForce RTX 4090 @OCuLink) | |
| Minisforum N5 Pro (Nvidia GeForce RTX 4090 @OCuLink) | |
| Geekom GT1 Mega (Nvidia GeForce RTX 4090 @USB4) | |
| 1024x600 Normal, Fluid 3DTex | |
| Minisforum MS-A2 (Nvidia GeForce RTX 4090 @OCuLink) | |
| GMK EVO-T1 (Nvidia GeForce RTX 4090 @OCuLink) | |
| Minisforum N5 Pro (Nvidia GeForce RTX 4090 @OCuLink) | |
| Geekom GT1 Mega (Nvidia GeForce RTX 4090 @USB4) | |
| 1024x600 Normal, Fluid 2DTexArr | |
| Minisforum MS-A2 (Nvidia GeForce RTX 4090 @OCuLink) | |
| GMK EVO-T1 (Nvidia GeForce RTX 4090 @OCuLink) | |
| Minisforum N5 Pro (Nvidia GeForce RTX 4090 @OCuLink) | |
| Geekom GT1 Mega (Nvidia GeForce RTX 4090 @USB4) | |
| 1024x600 Normal, Mandel Vector | |
| Minisforum MS-A2 (Nvidia GeForce RTX 4090 @OCuLink) | |
| GMK EVO-T1 (Nvidia GeForce RTX 4090 @OCuLink) | |
| Minisforum N5 Pro (Nvidia GeForce RTX 4090 @OCuLink) | |
| Geekom GT1 Mega (Nvidia GeForce RTX 4090 @USB4) | |
| 1024x600 Normal, Mandel Scalar | |
| Minisforum MS-A2 (Nvidia GeForce RTX 4090 @OCuLink) | |
| GMK EVO-T1 (Nvidia GeForce RTX 4090 @OCuLink) | |
| Minisforum N5 Pro (Nvidia GeForce RTX 4090 @OCuLink) | |
| Geekom GT1 Mega (Nvidia GeForce RTX 4090 @USB4) | |
| 1024x600 Normal, QJuliaRayTrace | |
| Minisforum MS-A2 (Nvidia GeForce RTX 4090 @OCuLink) | |
| GMK EVO-T1 (Nvidia GeForce RTX 4090 @OCuLink) | |
| Minisforum N5 Pro (Nvidia GeForce RTX 4090 @OCuLink) | |
| Geekom GT1 Mega (Nvidia GeForce RTX 4090 @USB4) | |
| Performance rating - Percent | |
| Minisforum MS-A2 (Nvidia GeForce RTX 4090 @OCuLink) | |
| GMK EVO-T1 (Nvidia GeForce RTX 4090 @OCuLink) | |
| Minisforum N5 Pro (Nvidia GeForce RTX 4090 @OCuLink) | |
| Geekom GT1 Mega (Nvidia GeForce RTX 4090 @USB4) | |
| Cyberpunk 2077 | |
| 1280x720 Low Preset (FSR off) | |
| Minisforum MS-A2 (Nvidia GeForce RTX 4090 @OCuLink) | |
| GMK EVO-T1 (Nvidia GeForce RTX 4090 @OCuLink) | |
| Minisforum N5 Pro (Nvidia GeForce RTX 4090 @OCuLink) | |
| Geekom GT1 Mega (Nvidia GeForce RTX 4090 @USB4) | |
| 1920x1080 Medium Preset (FSR off) | |
| Minisforum MS-A2 (Nvidia GeForce RTX 4090 @OCuLink) | |
| GMK EVO-T1 (Nvidia GeForce RTX 4090 @OCuLink) | |
| Minisforum N5 Pro (Nvidia GeForce RTX 4090 @OCuLink) | |
| Geekom GT1 Mega (Nvidia GeForce RTX 4090 @USB4) | |
| 1920x1080 Ultra Preset (FSR off) | |
| Minisforum MS-A2 (Nvidia GeForce RTX 4090 @OCuLink) | |
| GMK EVO-T1 (Nvidia GeForce RTX 4090 @OCuLink) | |
| GMK EVO-T1 (Nvidia GeForce RTX 4090 @OCuLink) | |
| Minisforum N5 Pro (Nvidia GeForce RTX 4090 @OCuLink) | |
| Geekom GT1 Mega (Nvidia GeForce RTX 4090 @USB4) | |
| Baldur's Gate 3 | |
| 1920x1080 Low Preset AA:SM | |
| Minisforum MS-A2 (Nvidia GeForce RTX 4090 @OCuLink) | |
| GMK EVO-T1 (Nvidia GeForce RTX 4090 @OCuLink) | |
| Geekom GT1 Mega (Nvidia GeForce RTX 4090 @USB4) | |
| Minisforum N5 Pro (Nvidia GeForce RTX 4090 @OCuLink) | |
| 1920x1080 Medium Preset AA:T | |
| Minisforum MS-A2 (Nvidia GeForce RTX 4090 @OCuLink) | |
| GMK EVO-T1 (Nvidia GeForce RTX 4090 @OCuLink) | |
| Minisforum N5 Pro (Nvidia GeForce RTX 4090 @OCuLink) | |
| Geekom GT1 Mega (Nvidia GeForce RTX 4090 @USB4) | |
| 1920x1080 Ultra Preset AA:T | |
| Minisforum MS-A2 (Nvidia GeForce RTX 4090 @OCuLink) | |
| GMK EVO-T1 (Nvidia GeForce RTX 4090 @OCuLink) | |
| Minisforum N5 Pro (Nvidia GeForce RTX 4090 @OCuLink) | |
| Geekom GT1 Mega (Nvidia GeForce RTX 4090 @USB4) | |
| F1 24 | |
| 1920x1080 Low Preset AA:T AF:16x | |
| Minisforum MS-A2 (Nvidia GeForce RTX 4090 @OCuLink) | |
| GMK EVO-T1 (Nvidia GeForce RTX 4090 @OCuLink) | |
| Minisforum N5 Pro (Nvidia GeForce RTX 4090 @OCuLink) | |
| Geekom GT1 Mega (Nvidia GeForce RTX 4090 @USB4) | |
| 1920x1080 Medium Preset AA:T AF:16x | |
| Minisforum MS-A2 (Nvidia GeForce RTX 4090 @OCuLink) | |
| GMK EVO-T1 (Nvidia GeForce RTX 4090 @OCuLink) | |
| Minisforum N5 Pro (Nvidia GeForce RTX 4090 @OCuLink) | |
| Geekom GT1 Mega (Nvidia GeForce RTX 4090 @USB4) | |
| 1920x1080 High Preset AA:T AF:16x | |
| Minisforum MS-A2 (Nvidia GeForce RTX 4090 @OCuLink) | |
| GMK EVO-T1 (Nvidia GeForce RTX 4090 @OCuLink) | |
| Minisforum N5 Pro (Nvidia GeForce RTX 4090 @OCuLink) | |
| Geekom GT1 Mega (Nvidia GeForce RTX 4090 @USB4) | |
| Minisforum N5 Pro, AMD Radeon 890M Ryzen AI 9 HX PRO 370 | Minisforum N5 Pro, Ryzen AI 9 HX PRO 370 | Minisforum MS-A2, R9 9955HX | Geekom GT1 Mega (Nvidia GeForce RTX 4090 @USB4) , Ultra 9 185H | GMK EVO-T1, Ultra 9 285H | Average of class Desktop | |
|---|---|---|---|---|---|---|
| SPECviewperf 2020 | 353% | 435% | 296% | 379% | 337% | |
| 3840x2160 Medical (medical-03) (fps) | 25.1 | 42.2 68% | 43.1 72% | 42.1 68% | 43.1 72% | 44.1 ? 76% |
| 3840x2160 Energy (energy-03) (fps) | 15.6 | 92.9 496% | 139 791% | 92.8 495% | 93.7 501% | 87.2 ? 459% |
| 3840x2160 Creo (creo-03) (fps) | 32.3 | 118 265% | 126 290% | 91.1 182% | 109 237% | 117.5 ? 264% |
| 3840x2160 CATIA (catia-06) (fps) | 25.1 | 86.5 245% | 89.8 258% | 77.3 208% | 82.1 227% | 76.6 ? 205% |
| 3840x2160 3ds Max (3dsmax-07) (fps) | 23.3 | 191 720% | 213 814% | 158 578% | 212 810% | 167.9 ? 621% |
| 3840x2160 Siemens NX (snx-04) (fps) | 69.3 | 35.9 -48% | 43.7 -37% | 31.9 -54% | 38.8 -44% | 86.2 ? 24% |
| 3840x2160 Maya (maya-06) (fps) | 54.4 | 447 722% | 522 860% | 378 595% | 517 850% | 441 ? 711% |
| low | med. | high | ultra | QHD | 4K | |
|---|---|---|---|---|---|---|
| The Witcher 3 (2015) | 429 | 387 | 380 | 269 | 240 | 266 |
| Dota 2 Reborn (2015) | 186 | 165 | 149.5 | 142.3 | 138.4 | |
| Final Fantasy XV Benchmark (2018) | 190.7 | 178.8 | 157.2 | 154 | 141.4 | |
| X-Plane 11.11 (2018) | 95.7 | 94.9 | 72.3 | 68.5 | ||
| Baldur's Gate 3 (2023) | 184.3 | 175 | 173.6 | 171.1 | 169.7 | 131.8 |
| Cyberpunk 2077 (2023) | 138.2 | 138.8 | 131.4 | 120.6 | 117.4 | 72.2 |
| F1 24 (2024) | 221 | 235 | 227 | 125 | 127.8 | 90.5 |
Emissions
System noise
The Minisforum N5 Pro generates a noise level of 37 dB(A) when idle, without installed hard disks. The two fans that actively cool the HDD area are responsible for this. The CPU fan remains inconspicuous in normal operation and only becomes audible under load, only reaching a maximum noise level of 40.7 dB(A).
Noise level
| Idle |
| 37.5 / 37.7 / 37.7 dB(A) |
| Load |
| 40.7 / 40.7 dB(A) |
 | ||
30 dB silent 40 dB(A) audible 50 dB(A) loud |
||
min: | ||
| Minisforum N5 Pro Ryzen AI 9 HX PRO 370, Radeon 890M | Geekom A9 Max, AI 9 HX 370 Ryzen AI 9 HX 370, Radeon 890M | Geekom Mini IT15, Ultra 9 285H Ultra 9 285H, Arc 140T | GMK EVO-T1 Ultra 9 285H, Arc 140T | Peladn HA-4, R7 7840HS R7 7840HS, Radeon 780M | Aoostar WTR Pro, R7 5825U R7 5825U, Vega 8 | |
|---|---|---|---|---|---|---|
| Noise | 1% | -3% | -11% | 7% | -0% | |
| off / environment * (dB) | 24.8 | 24.8 -0% | 24.3 2% | 24.7 -0% | 24.8 -0% | 23.8 4% |
| Idle Minimum * (dB) | 37.5 | 25.4 32% | 33.7 10% | 38.7 -3% | 28.5 24% | 37 1% |
| Idle Average * (dB) | 37.7 | 25.4 33% | 33.7 11% | 38.8 -3% | 29.1 23% | 37.3 1% |
| Idle Maximum * (dB) | 37.7 | 25.5 32% | 33.8 10% | 38.9 -3% | 29.2 23% | 37.8 -0% |
| Load Average * (dB) | 40.7 | 49.8 -22% | 47.6 -17% | 51.6 -27% | 39.6 3% | 41.5 -2% |
| Witcher 3 ultra * (dB) | 40.6 | 49.7 -22% | 38.7 5% | 42.3 -4% | ||
| Cyberpunk 2077 ultra * (dB) | 40.2 | 49.6 -23% | 47.7 -19% | 52 -29% | 44.1 -10% | |
| Load Maximum * (dB) | 40.7 | 49.8 -22% | 47.9 -18% | 51.6 -27% | 42.3 -4% | 42.9 -5% |
* ... smaller is better
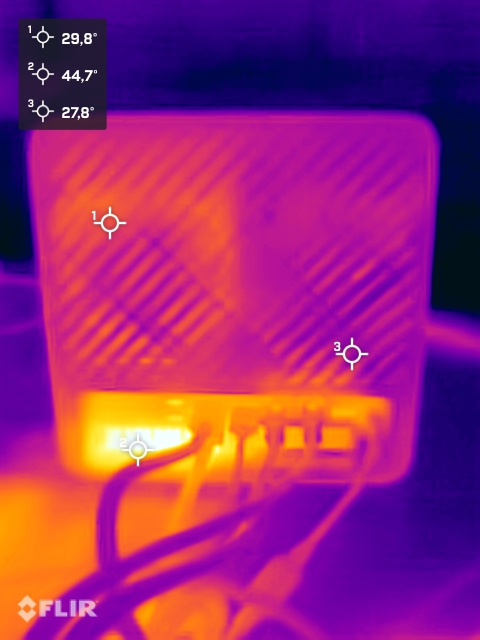
Temperature
The solid metal casing only heats up slightly when idling and under load. The SoC works stably according to the manufacturer's specifications and remains surprisingly cool at just over 66 °C under load.
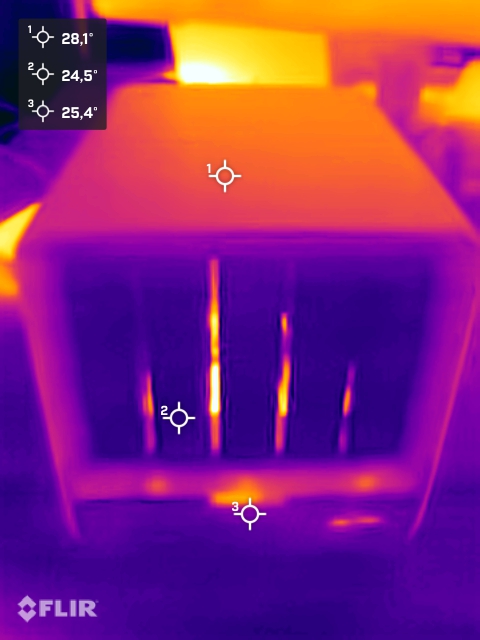
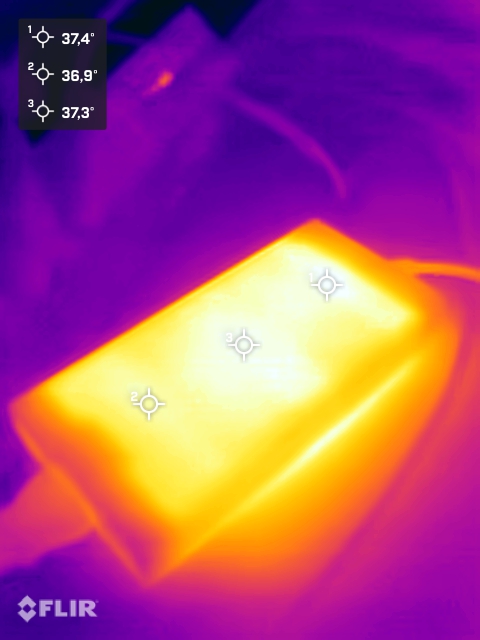
(+) The maximum temperature on the upper side is 28.5 °C / 83 F, compared to the average of 33.9 °C / 93 F, ranging from 25 to 47 °C for the class Desktop.
(+) The bottom heats up to a maximum of 31.5 °C / 89 F, compared to the average of 33.6 °C / 92 F
(+) In idle usage, the average temperature for the upper side is 26 °C / 79 F, compared to the device average of 29.5 °C / 85 F.
Energy management

The Minisforum N5 Pro impresses with its outstanding energy efficiency, which is in no way inferior to the Geekom A9 Max or the Geekom Mini IT15. The power consumption in idle mode could have been slightly better. However, at just under 88 watts under load, the NAS remains frugal. The 280-watt power supply unit therefore still offers sufficient scope for additional hardware, such as mass storage or a dedicated graphics card.
| Off / Standby | |
| Idle | |
| Load |
|
Key:
min: | |
| Minisforum N5 Pro Ryzen AI 9 HX PRO 370, Radeon 890M | Geekom A9 Max, AI 9 HX 370 Ryzen AI 9 HX 370, Radeon 890M | Geekom Mini IT15, Ultra 9 285H Ultra 9 285H, Arc 140T | GMK EVO-T1 Ultra 9 285H, Arc 140T | Peladn HA-4, R7 7840HS R7 7840HS, Radeon 780M | Aoostar WTR Pro, R7 5825U R7 5825U, Vega 8 | Average AMD Radeon 890M | Average of class Desktop | |
|---|---|---|---|---|---|---|---|---|
| Power Consumption | 27% | 38% | 15% | 20% | 32% | 31% | -102% | |
| Idle Minimum * (Watt) | 11.8 | 2.4 80% | 3.8 68% | 6.1 48% | 6.8 42% | 5.5 53% | 5.57 ? 53% | 17.9 ? -52% |
| Idle Average * (Watt) | 12.3 | 4.6 63% | 5.2 58% | 7.9 36% | 9.7 21% | 8.7 29% | 7.73 ? 37% | 37.2 ? -202% |
| Idle Maximum * (Watt) | 15.9 | 9.2 42% | 8.4 47% | 13.2 17% | 13.5 15% | 13 18% | 9.24 ? 42% | 41.3 ? -160% |
| Load Average * (Watt) | 72.7 | 78.4 -8% | 50.1 31% | 60.7 17% | 62.5 14% | 46.2 36% | 64.2 ? 12% | 96.7 ? -33% |
| Cyberpunk 2077 ultra external monitor * (Watt) | 72.4 | 77.8 -7% | 51.6 29% | 67.4 7% | 65.6 9% | |||
| Load Maximum * (Watt) | 87.9 | 95.1 -8% | 91.9 -5% | 117.1 -33% | 70.8 19% | 67.5 23% | 79.8 ? 9% | 141.6 ? -61% |
* ... smaller is better
Power efficiency
| Performance rating - Percent | |
| Geekom Mini IT15, Ultra 9 285H | |
| Geekom A9 Max, AI 9 HX 370 | |
| Minisforum N5 Pro | |
| Peladn HA-4, R7 7840HS | |
| GMK EVO-T1 | |
| Aoostar WTR Pro, R7 5825U -1! | |
| Power Consumption | |
| Cinebench R23 Multi Power Efficiency - external Monitor | |
| Minisforum N5 Pro | |
| Geekom A9 Max, AI 9 HX 370 | |
| Peladn HA-4, R7 7840HS | |
| Geekom Mini IT15, Ultra 9 285H | |
| Aoostar WTR Pro, R7 5825U | |
| GMK EVO-T1 | |
| Cinebench R23 Single Power Efficiency - external Monitor | |
| Geekom Mini IT15, Ultra 9 285H | |
| Geekom A9 Max, AI 9 HX 370 | |
| GMK EVO-T1 | |
| Minisforum N5 Pro | |
| Peladn HA-4, R7 7840HS | |
| Aoostar WTR Pro, R7 5825U | |
| Cinebench R15 Multi Efficiency (external Monitor) | |
| Minisforum N5 Pro | |
| Geekom A9 Max, AI 9 HX 370 | |
| Peladn HA-4, R7 7840HS | |
| Geekom Mini IT15, Ultra 9 285H | |
| Aoostar WTR Pro, R7 5825U | |
| GMK EVO-T1 | |
| Cyberpunk 2077 ultra Efficiency | |
| Geekom Mini IT15, Ultra 9 285H | |
| GMK EVO-T1 | |
| Peladn HA-4, R7 7840HS | |
| Minisforum N5 Pro | |
| Geekom A9 Max, AI 9 HX 370 | |
Power consumption - external monitor
Power consumption - external monitor
Potential Competitors in Comparison
Image | Model / Review | Price | Weight | Dimensions |
|---|---|---|---|---|
1. 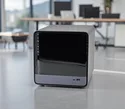 | Minisforum N5 Pro AMD Ryzen AI 9 HX PRO 370 ⎘ AMD Radeon 890M ⎘ 32 GB Memory, 1024 GB SSD | Amazon: List Price: 1119€ | 5 kg | 252 x 199 x 202 mm |
2. 82% 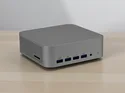 | Geekom A9 Max, AI 9 HX 370 AMD Ryzen AI 9 HX 370 ⎘ AMD Radeon 890M ⎘ 32 GB Memory, 2048 GB SSD | Amazon: List Price: 999€ | 709 g | 132 x 135 x 46.9 mm |
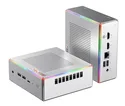
3. 76.5% 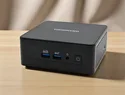 | Geekom Mini IT15, Ultra 9 285H Intel Core Ultra 9 285H ⎘ Intel Arc Graphics 140T ⎘ 32 GB Memory, 2048 GB SSD | Amazon: List Price: 1099€ | 595 g | 112 x 117 x 49.2 mm |
4. 75.4% 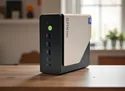 | GMK EVO-T1 Intel Core Ultra 9 285H ⎘ Intel Arc Graphics 140T ⎘ 64 GB Memory, 1024 GB SSD | Amazon: List Price: 999€ | 946 g | 151 x 154 x 73.6 mm |
5.  | Peladn HA-4, R7 7840HS AMD Ryzen 7 7840HS ⎘ AMD Radeon 780M ⎘ , 1024 GB SSD | Amazon: List Price: 439€ | 965 g | 128 x 136 x 52 mm |
6. 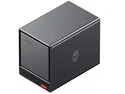 | Aoostar WTR Pro, R7 5825U AMD Ryzen 7 5825U ⎘ AMD Radeon RX Vega 8 (Ryzen 4000/5000) ⎘ 16 GB Memory, 512 GB SSD | Amazon: 1. $399.00 AOOSTAR WTR PRO AMD R7 5825U... 2. AOOSTAR WTR MAX AMD R7 8845H... List Price: 519 EUR | 4.6 kg | 228 x 180 x 185 mm |
Transparency
The selection of devices to be reviewed is made by our editorial team. The test sample was provided to the author as a loan by the manufacturer or retailer for the purpose of this review. The lender had no influence on this review, nor did the manufacturer receive a copy of this review before publication. There was no obligation to publish this review. As an independent media company, Notebookcheck is not subjected to the authority of manufacturers, retailers or publishers.
This is how Notebookcheck is testing
Every year, Notebookcheck independently reviews hundreds of laptops and smartphones using standardized procedures to ensure that all results are comparable. We have continuously developed our test methods for around 20 years and set industry standards in the process. In our test labs, high-quality measuring equipment is utilized by experienced technicians and editors. These tests involve a multi-stage validation process. Our complex rating system is based on hundreds of well-founded measurements and benchmarks, which maintains objectivity. Further information on our test methods can be found here.
