GMK NucBox M5 mini PC review: AMD Zen 2 is feeling long in the tooth

The NucBox M5 is the latest entry-level mini PC from GMK in contrast to the more expensive NucBox K series. It utilizes older processor options in order to keep costs low.
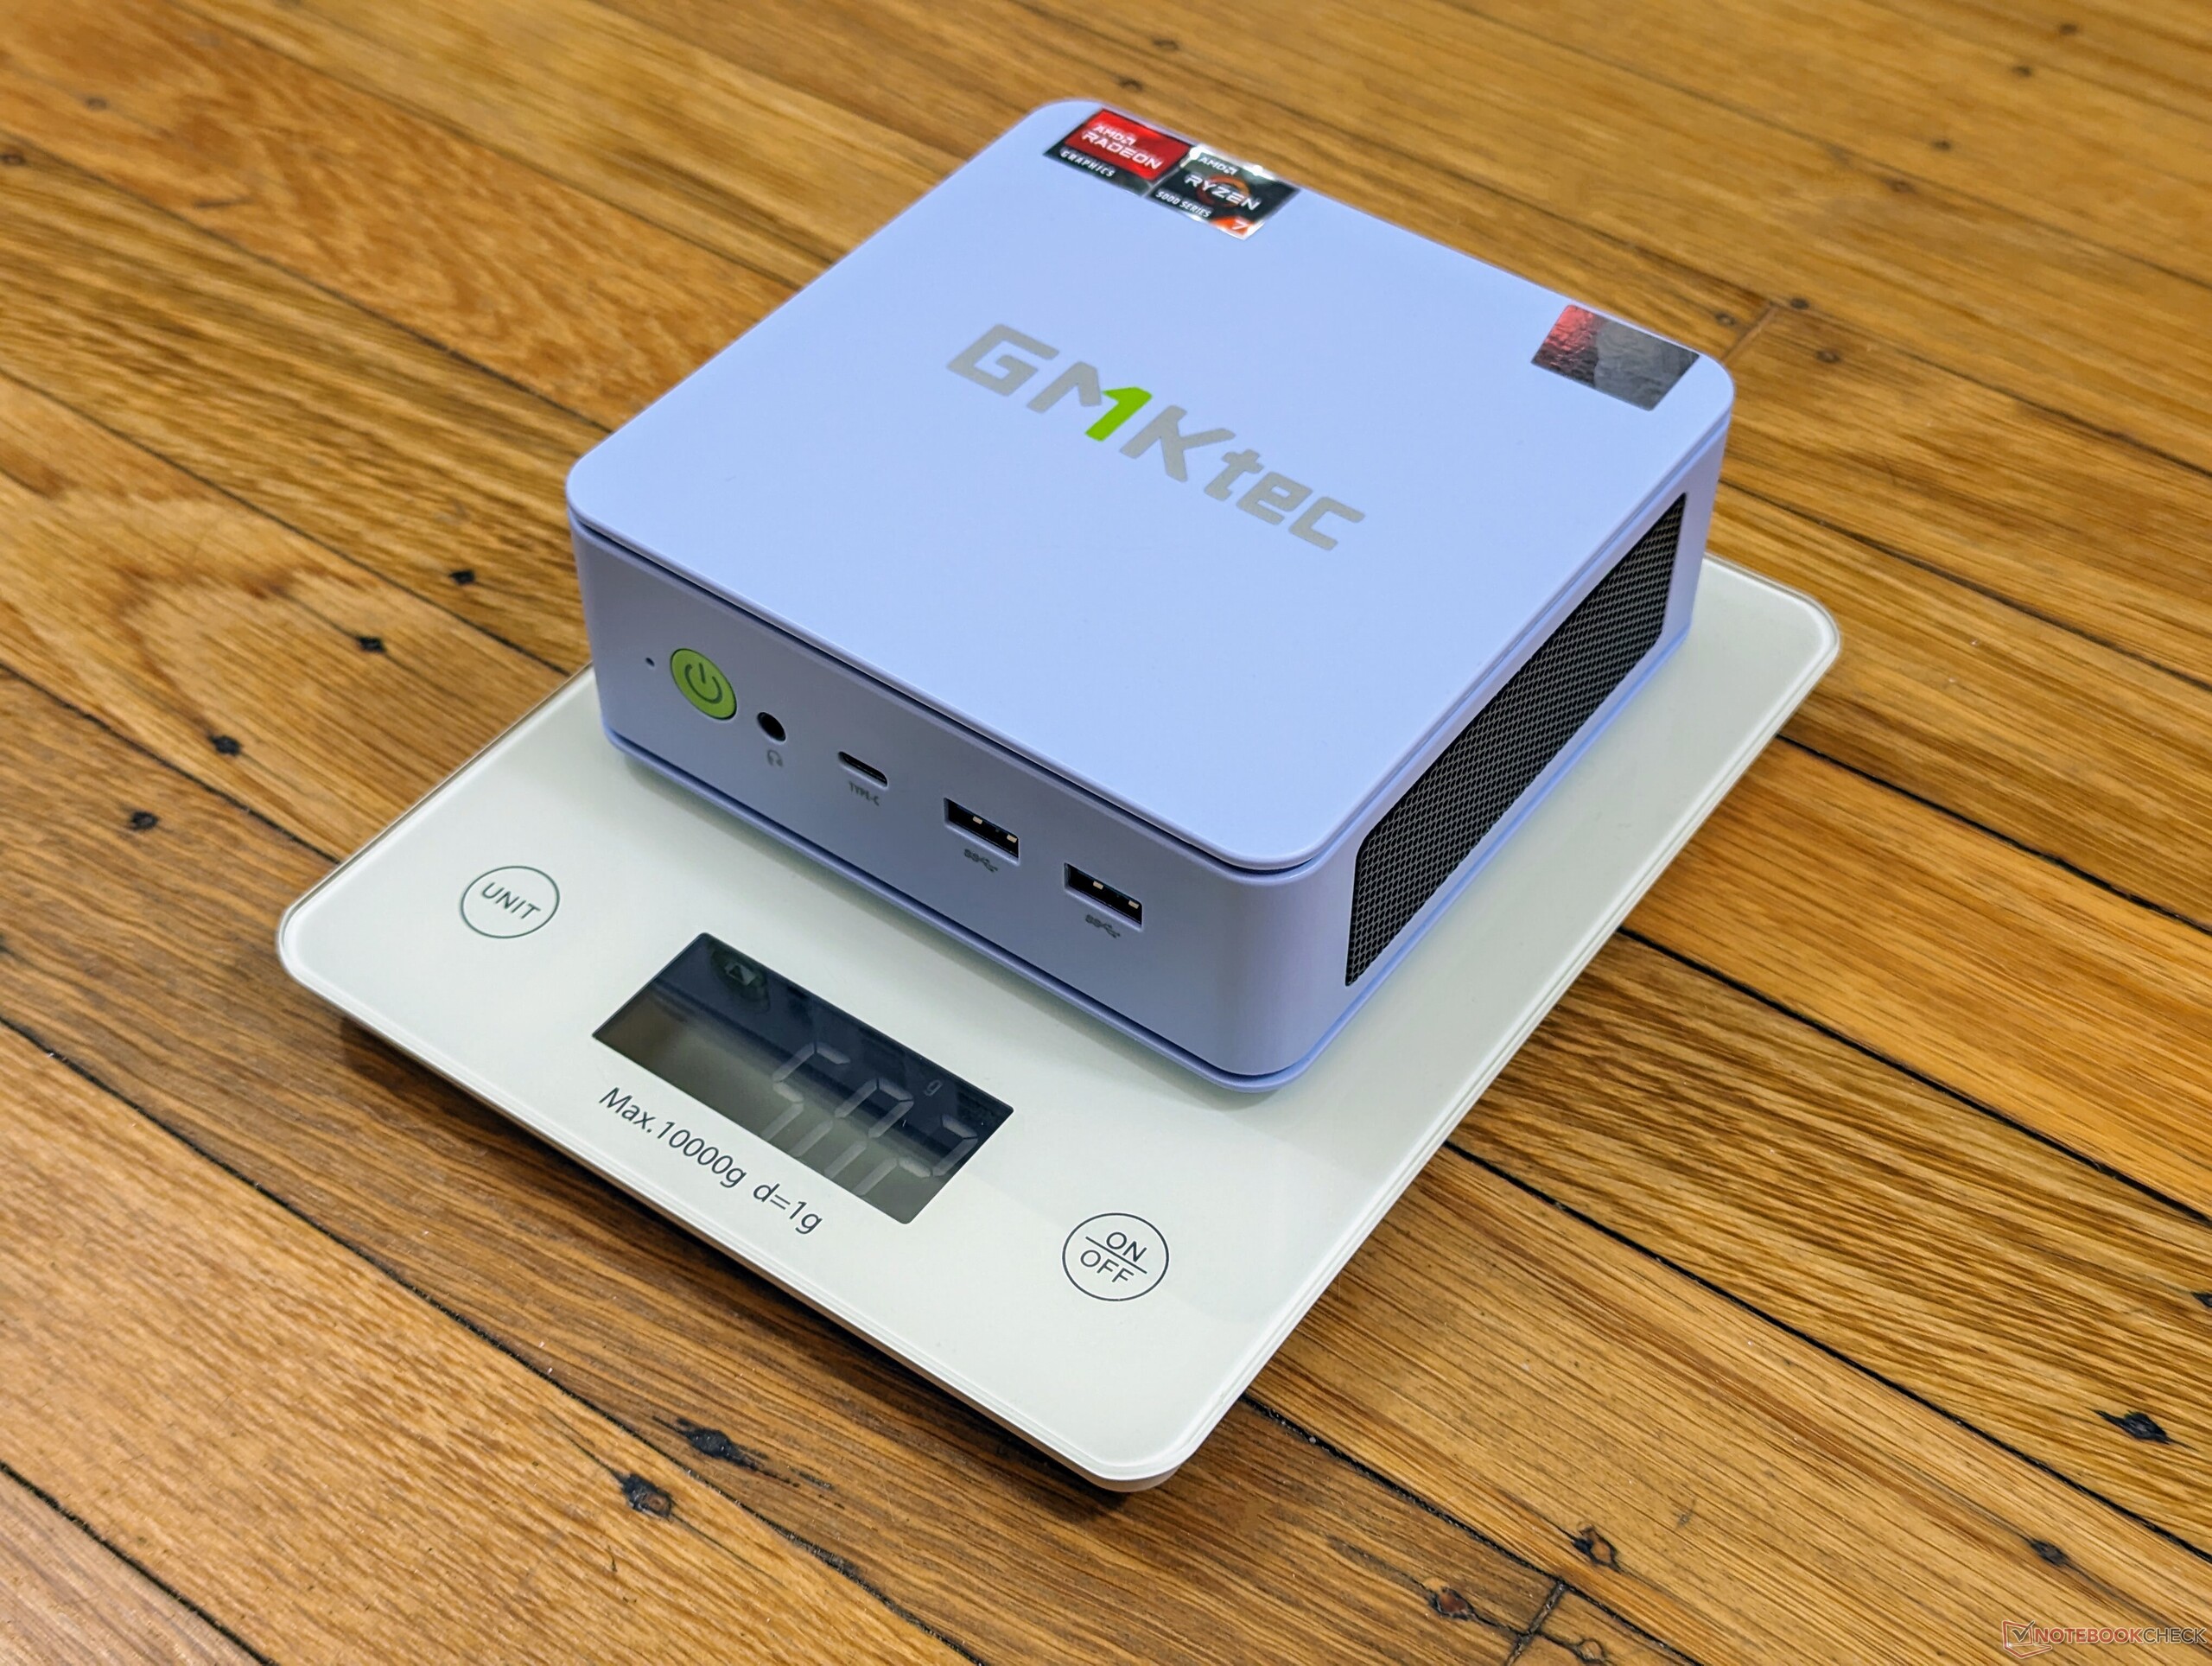
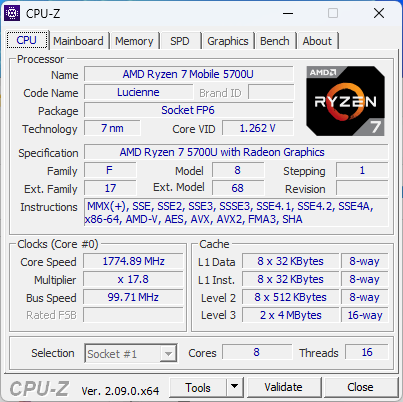
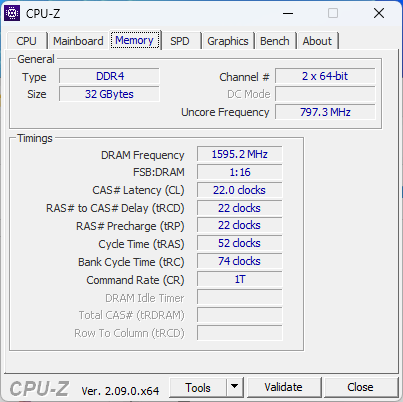
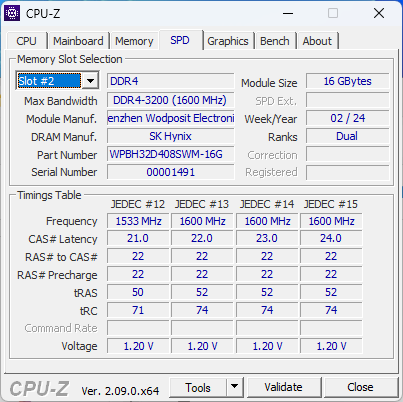
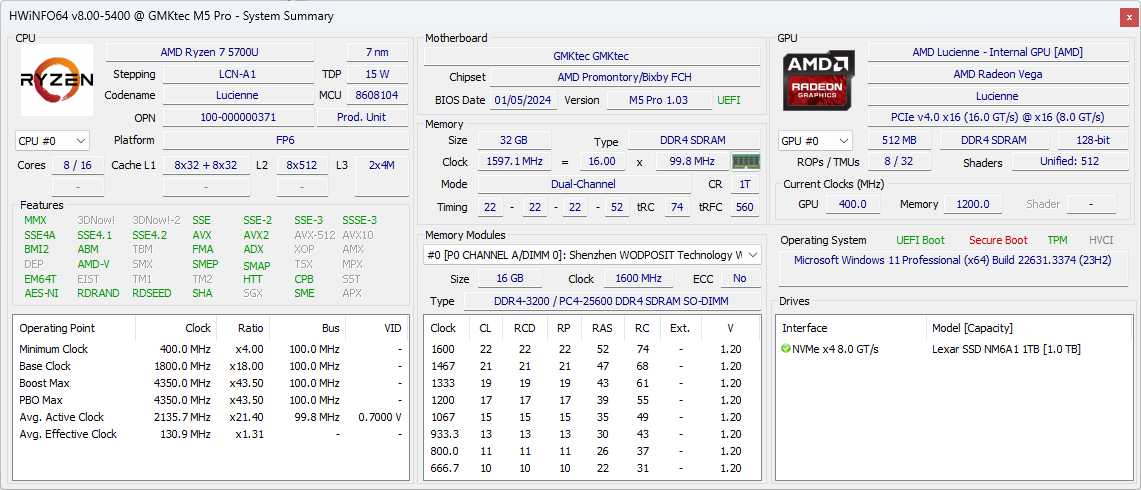
Our test unit comes configured with the Zen 2 Ryzen 7 5700U CPU, 32 GB of DDR4-3200 RAM, and 1 TB of storage for approximately $470. Barebone SKUs are also available with no RAM or storage starting at $320, but all options otherwise come with the same processor.
Alternatives to the NucBox M4 include other inexpensive mini PCs like the Beelink SER5, BMax B7 Power, or Maxtang MTN-FP750.
More GMKtec reviews:
Potential Competitors in Comparison
Rating | Date | Model | Weight | Height | Size | Resolution | Price |
|---|---|---|---|---|---|---|---|
| 78.9 % v7 (old) | 04 / 2024 | GMK NucBox M5 R7 5700U, Vega 8 | 505 g | 48 mm | x | ||
| 81.1 % v7 (old) | 12 / 2023 | GMK NucBox M4 i9-11900H, UHD Graphics Xe 32EUs (Tiger Lake-H) | 951 g | 37 mm | x | ||
| 83.6 % v7 (old) | 04 / 2024 | GMK NucBox K6 R7 7840HS, Radeon 780M | 514 g | 47 mm | x | ||
| 83.4 % v7 (old) | 04 / 2024 | Acemagic F2A Ultra 7 155H, Arc 8-Core | 768 g | 57 mm | x | ||
| 82.6 % v7 (old) | 03 / 2024 | Geekom A7 R9 7940HS, Radeon 780M | 417 g | 38 mm | x | ||
| 83.1 % v7 (old) | 08 / 2023 | Intel NUC 13 Pro Desk Edition Kit i7-1360P, Iris Xe G7 96EUs | 558 g | 37 mm | x |
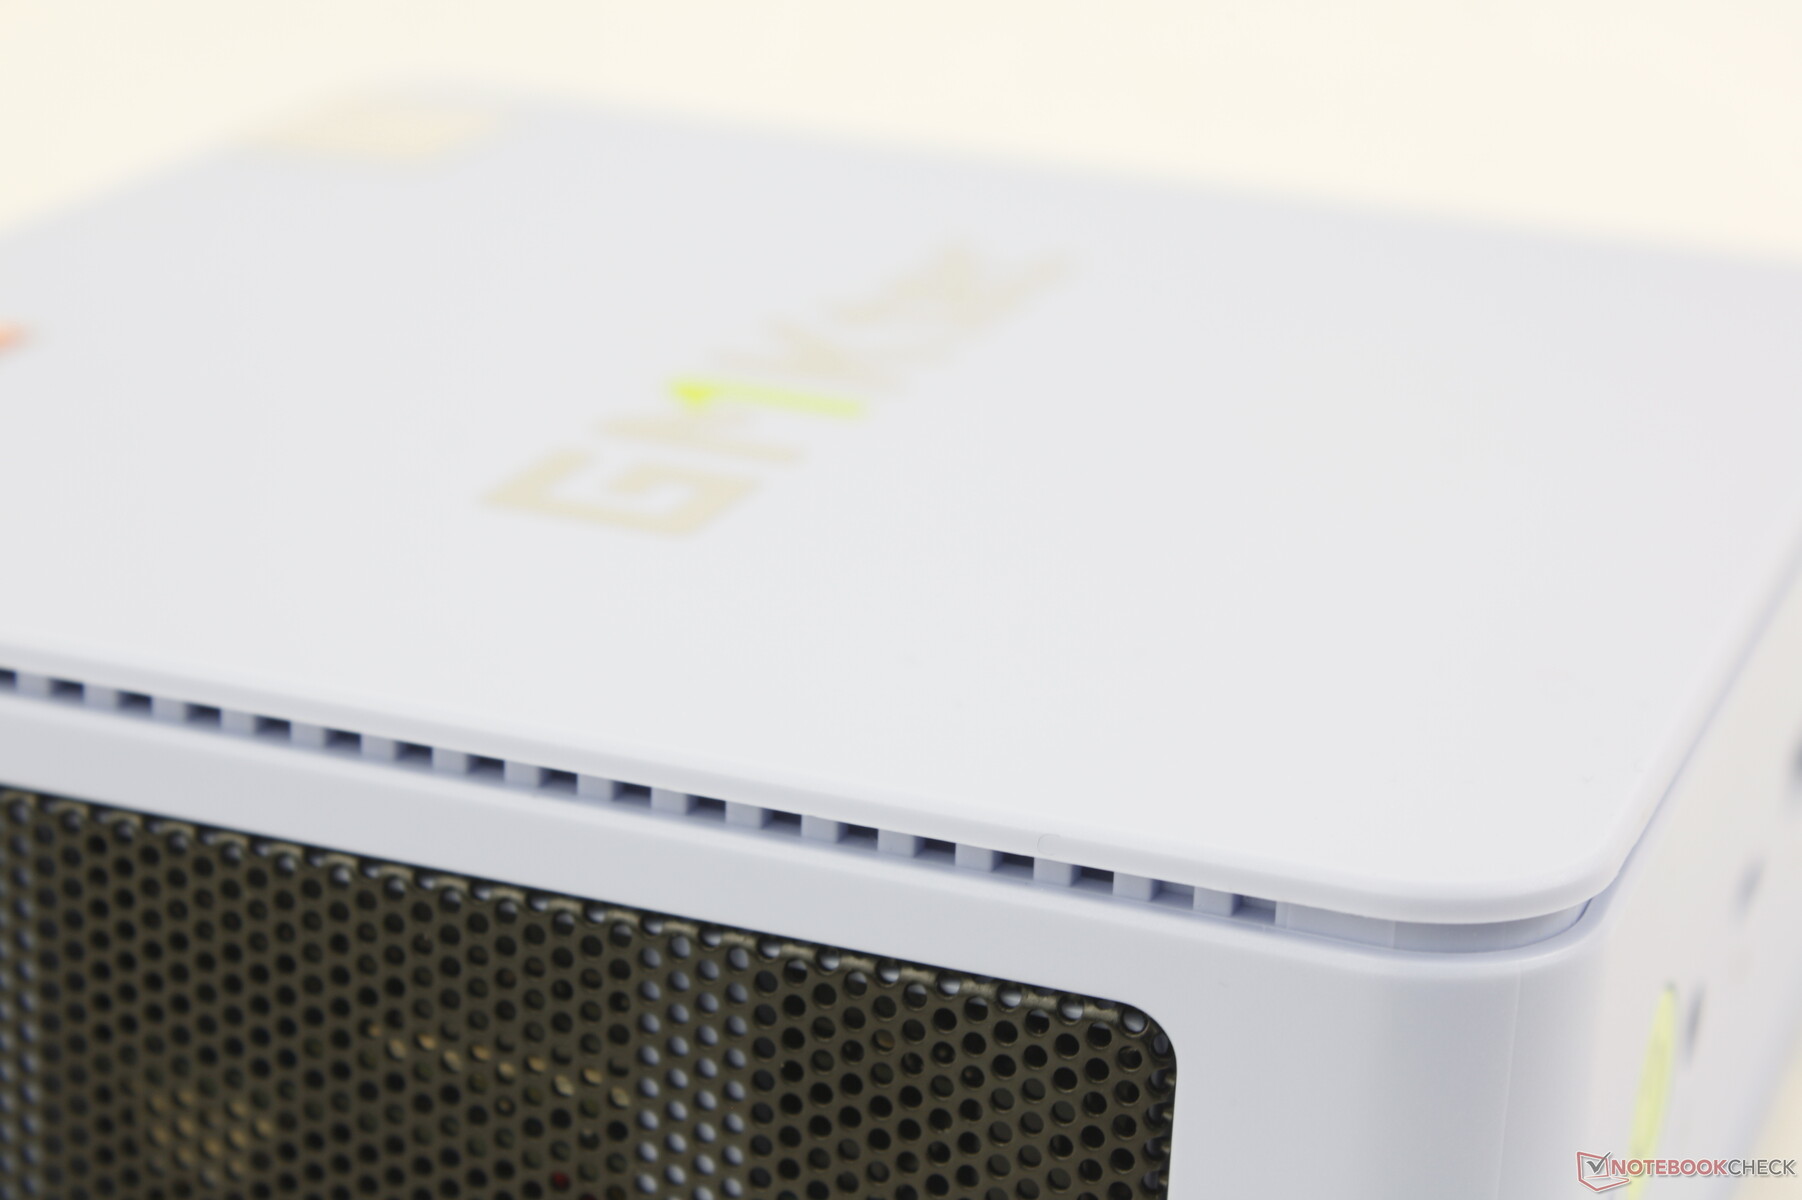
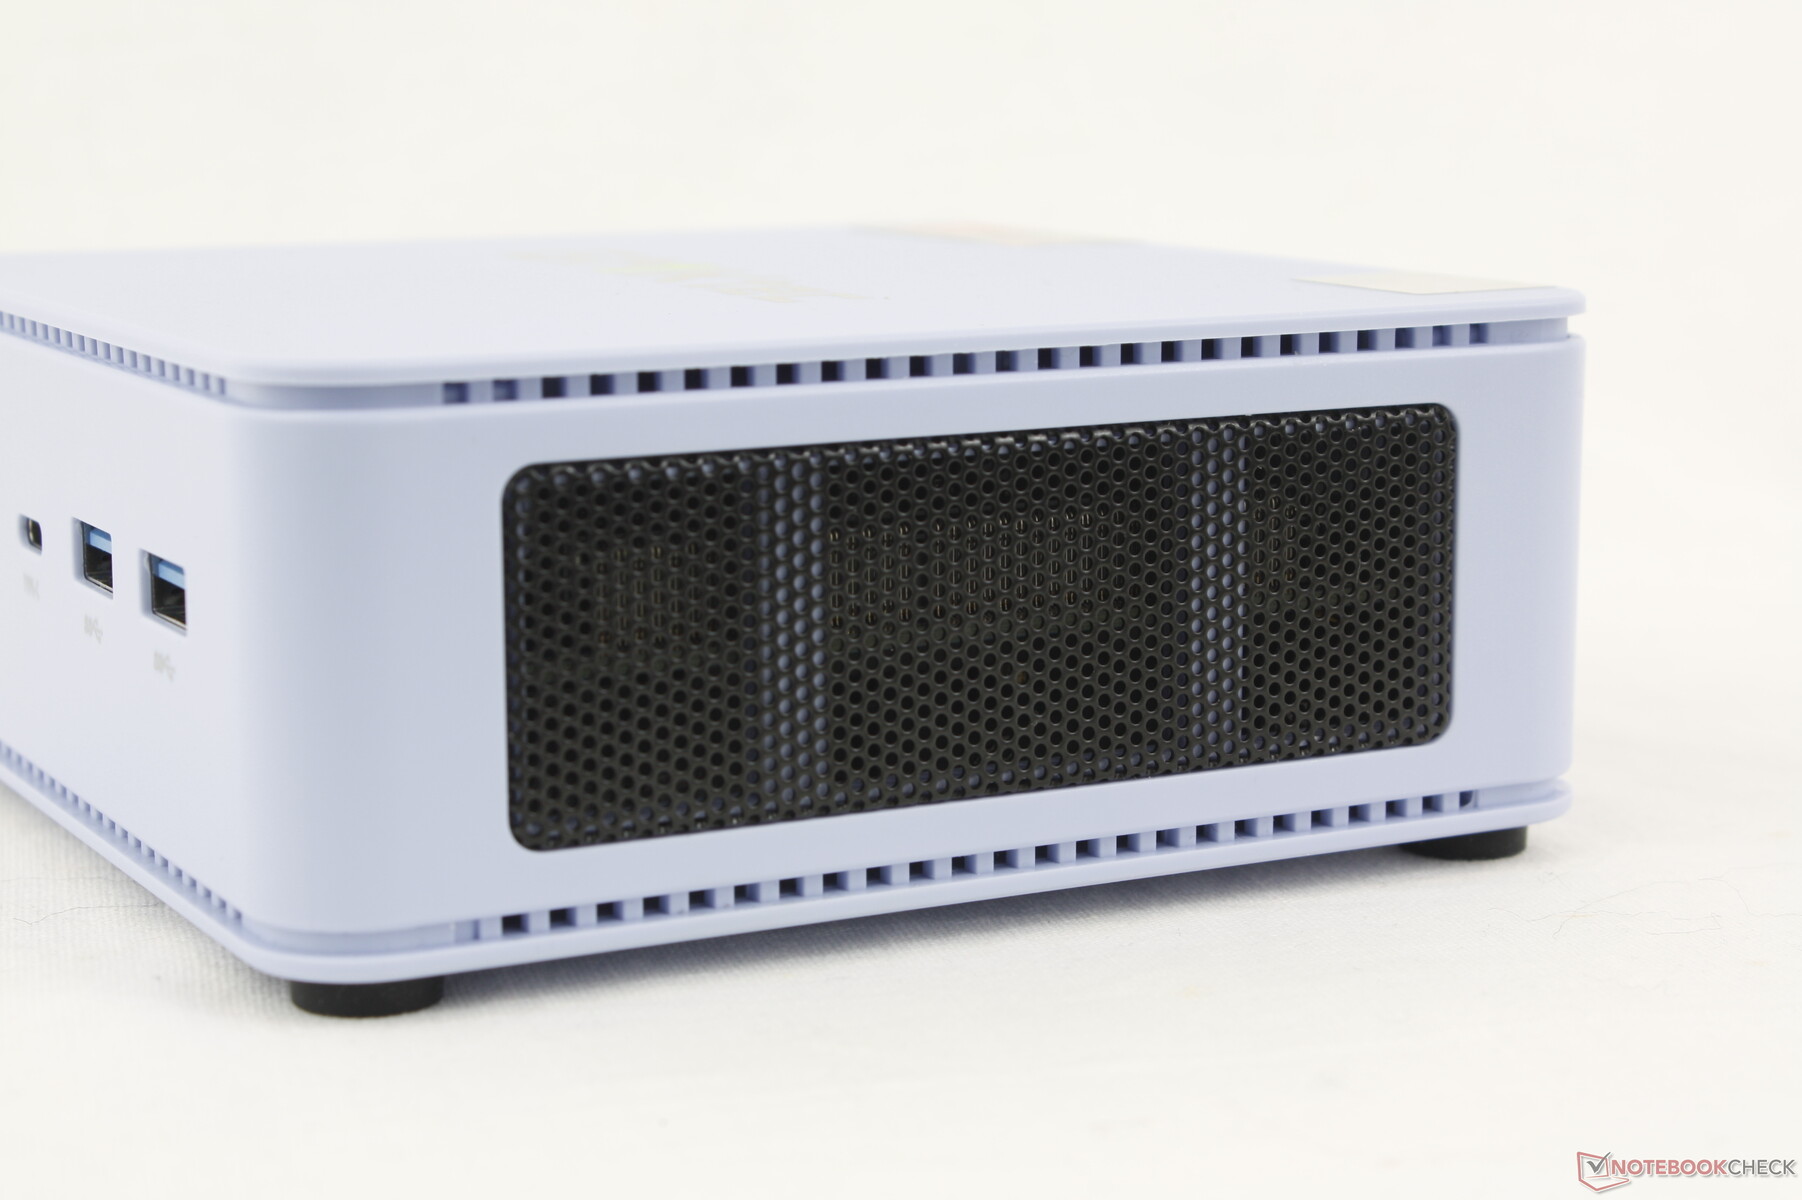
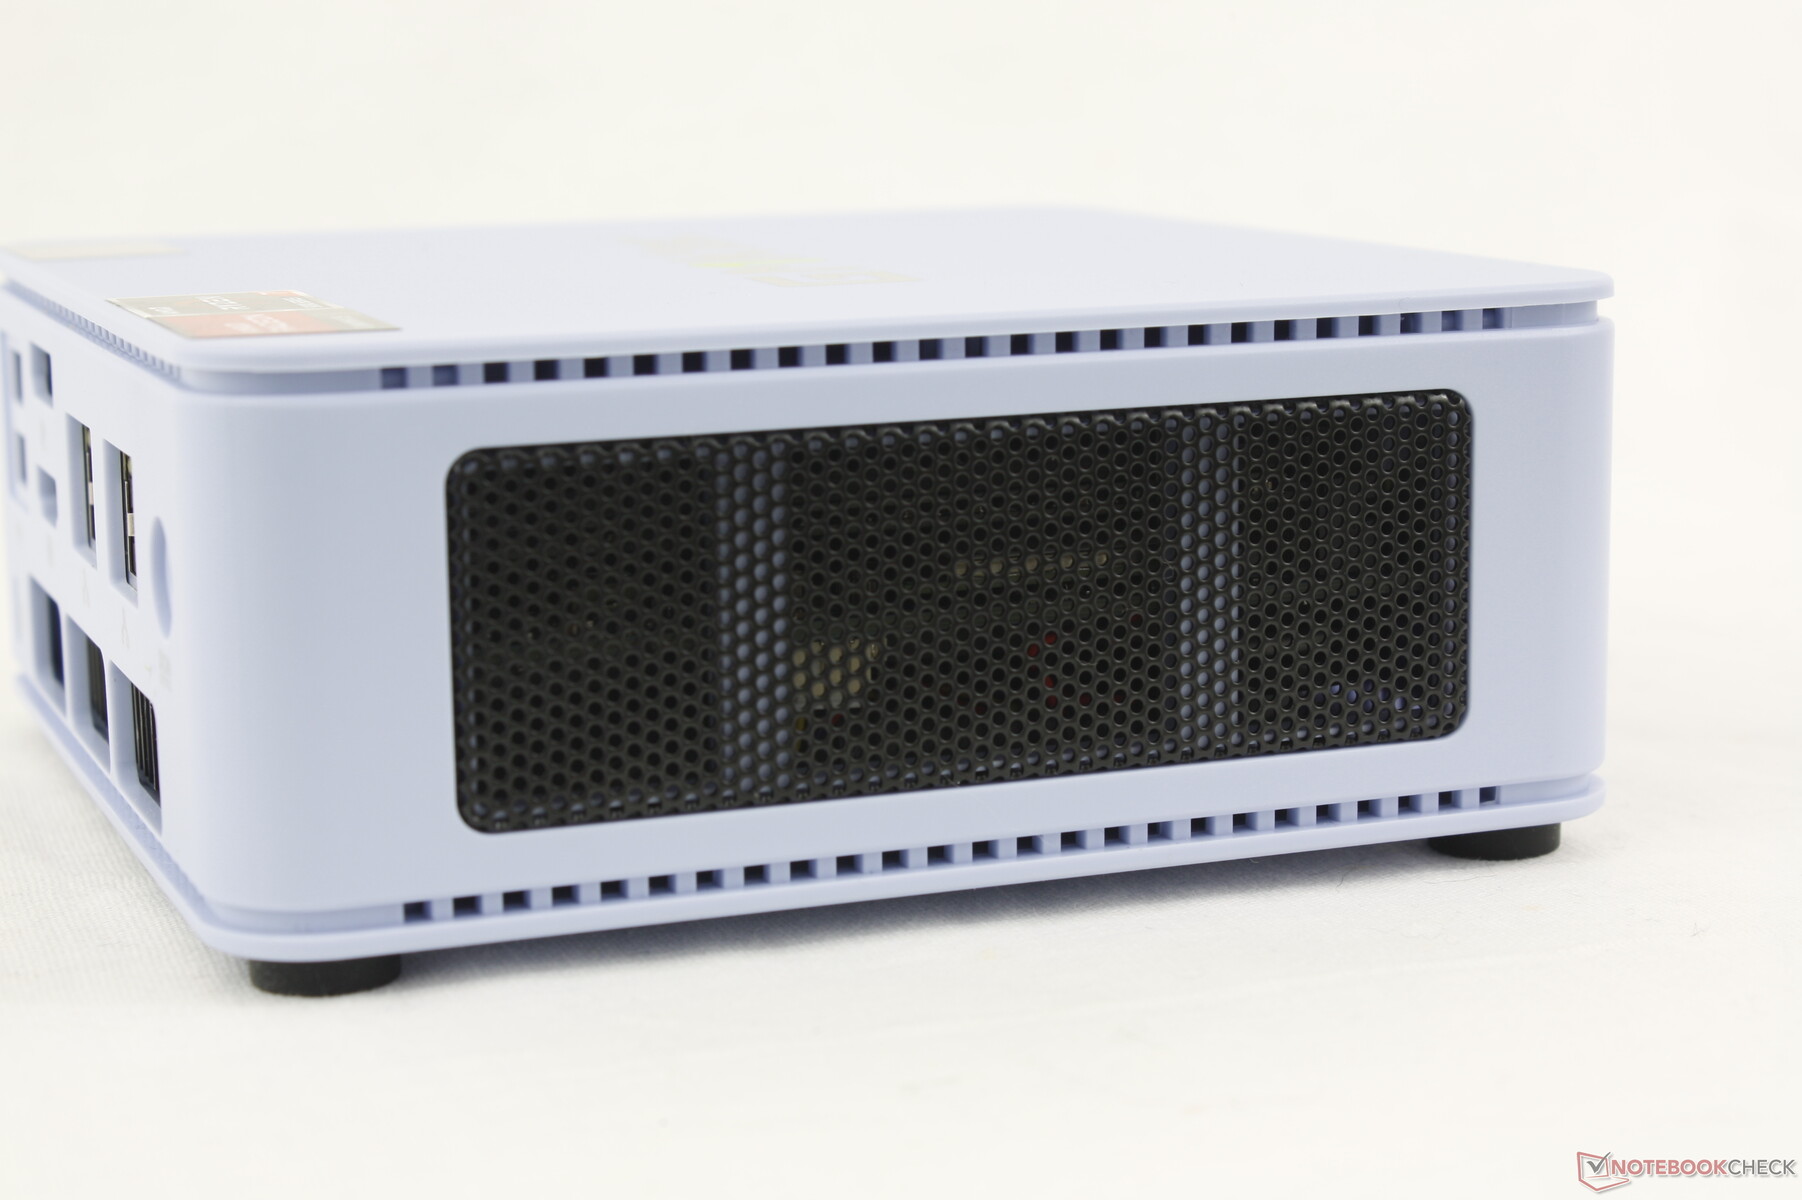
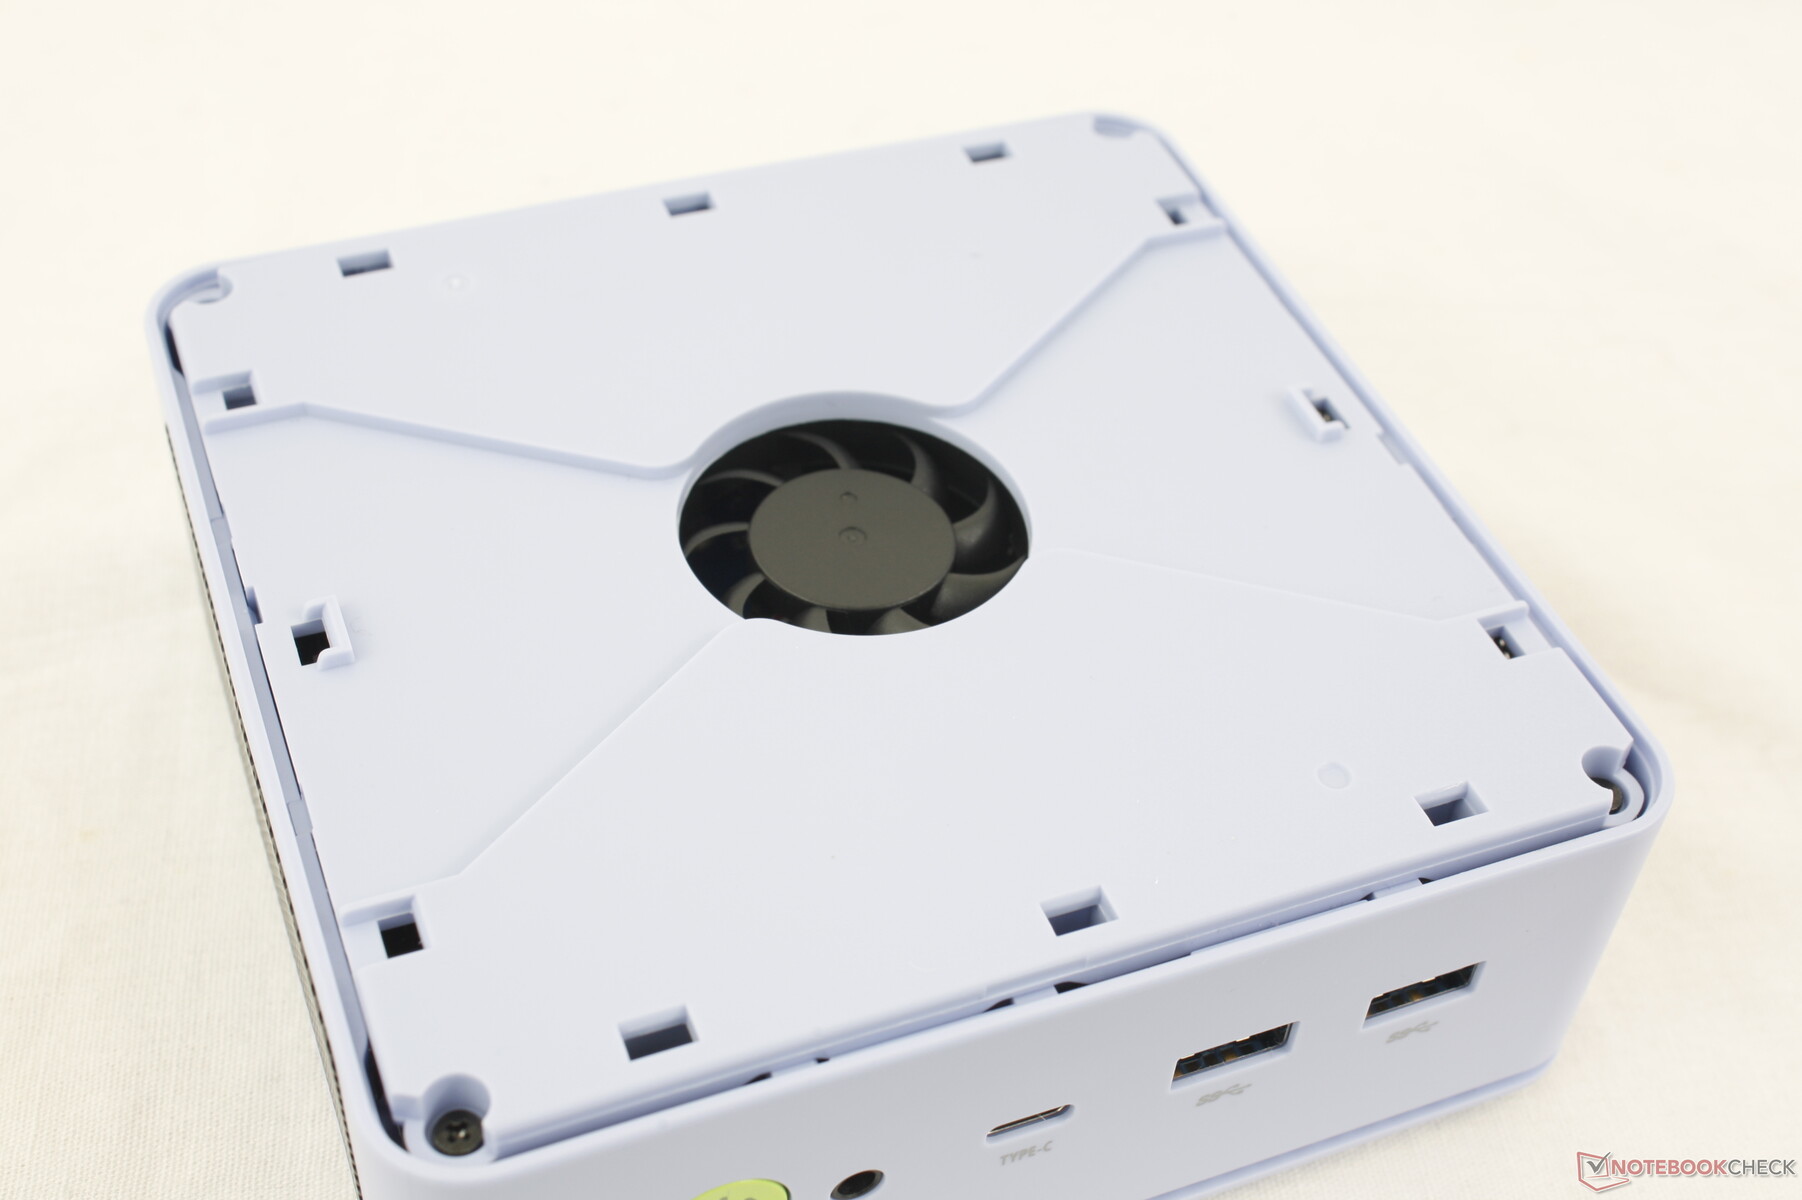
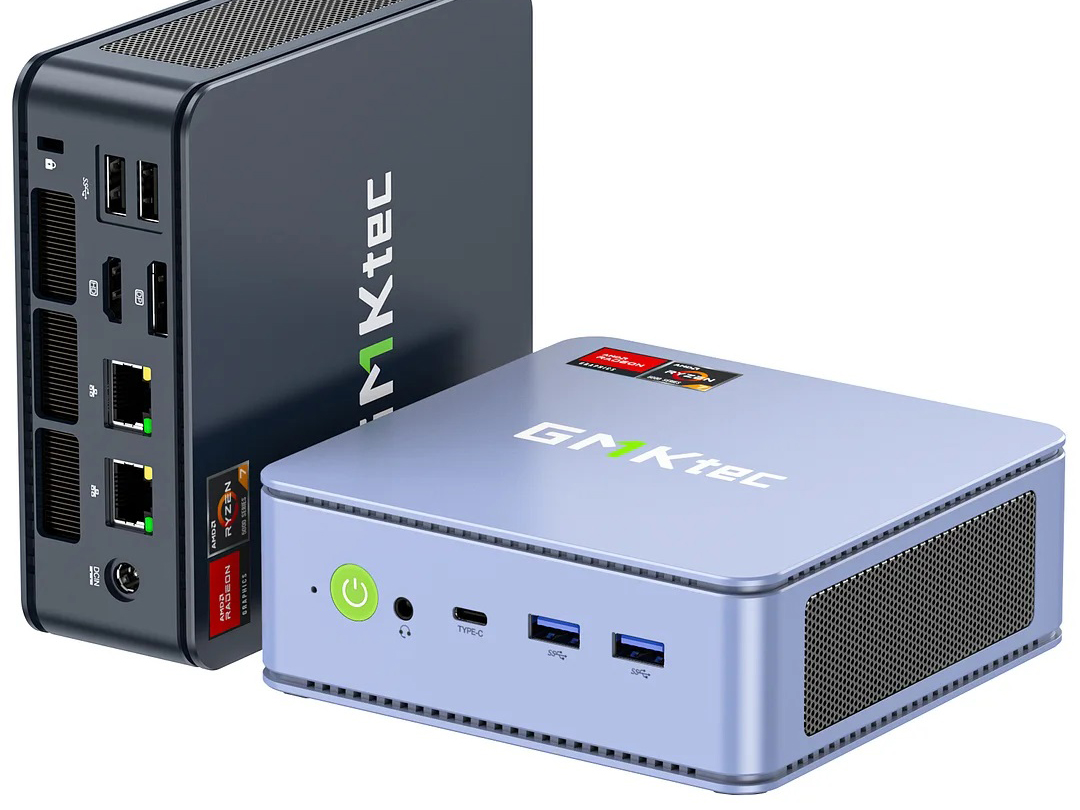
Case — Refreshed Design With Improved Ventilation
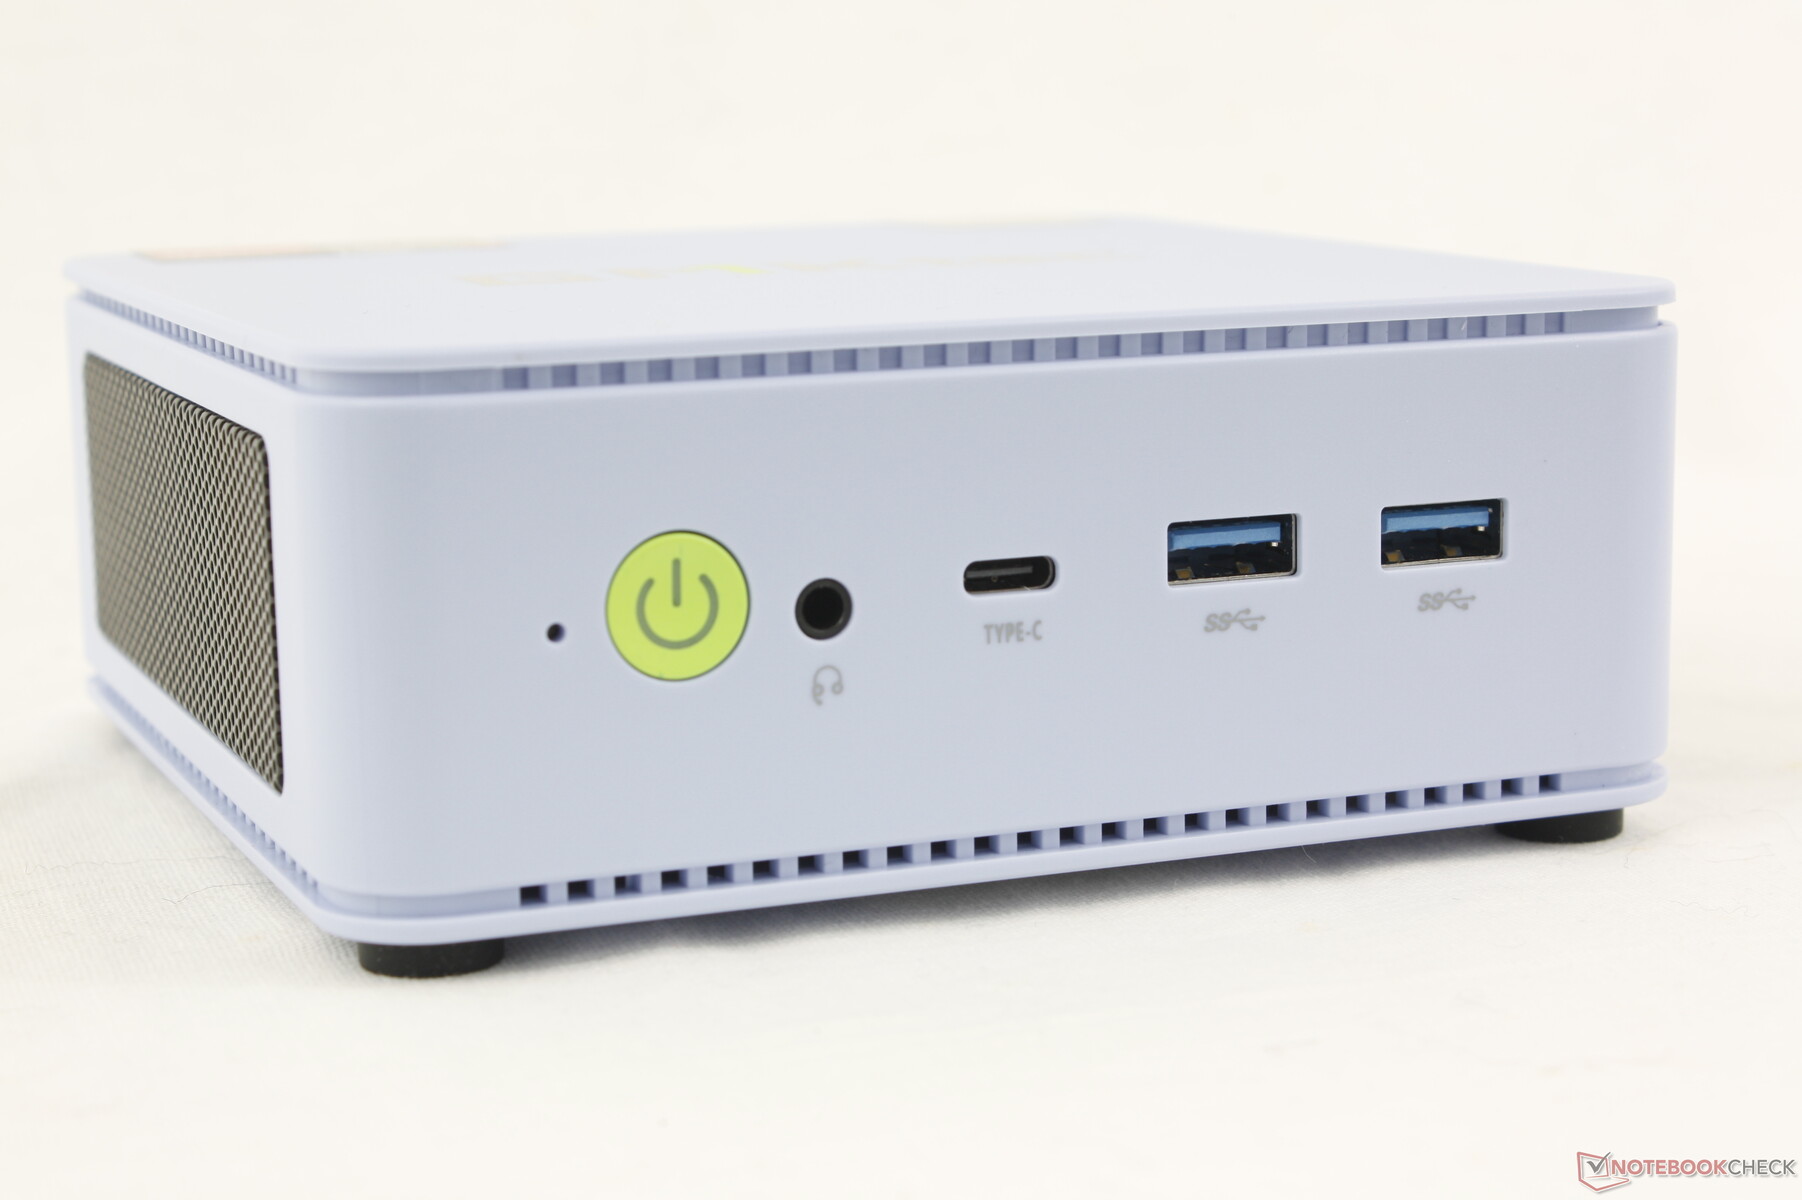
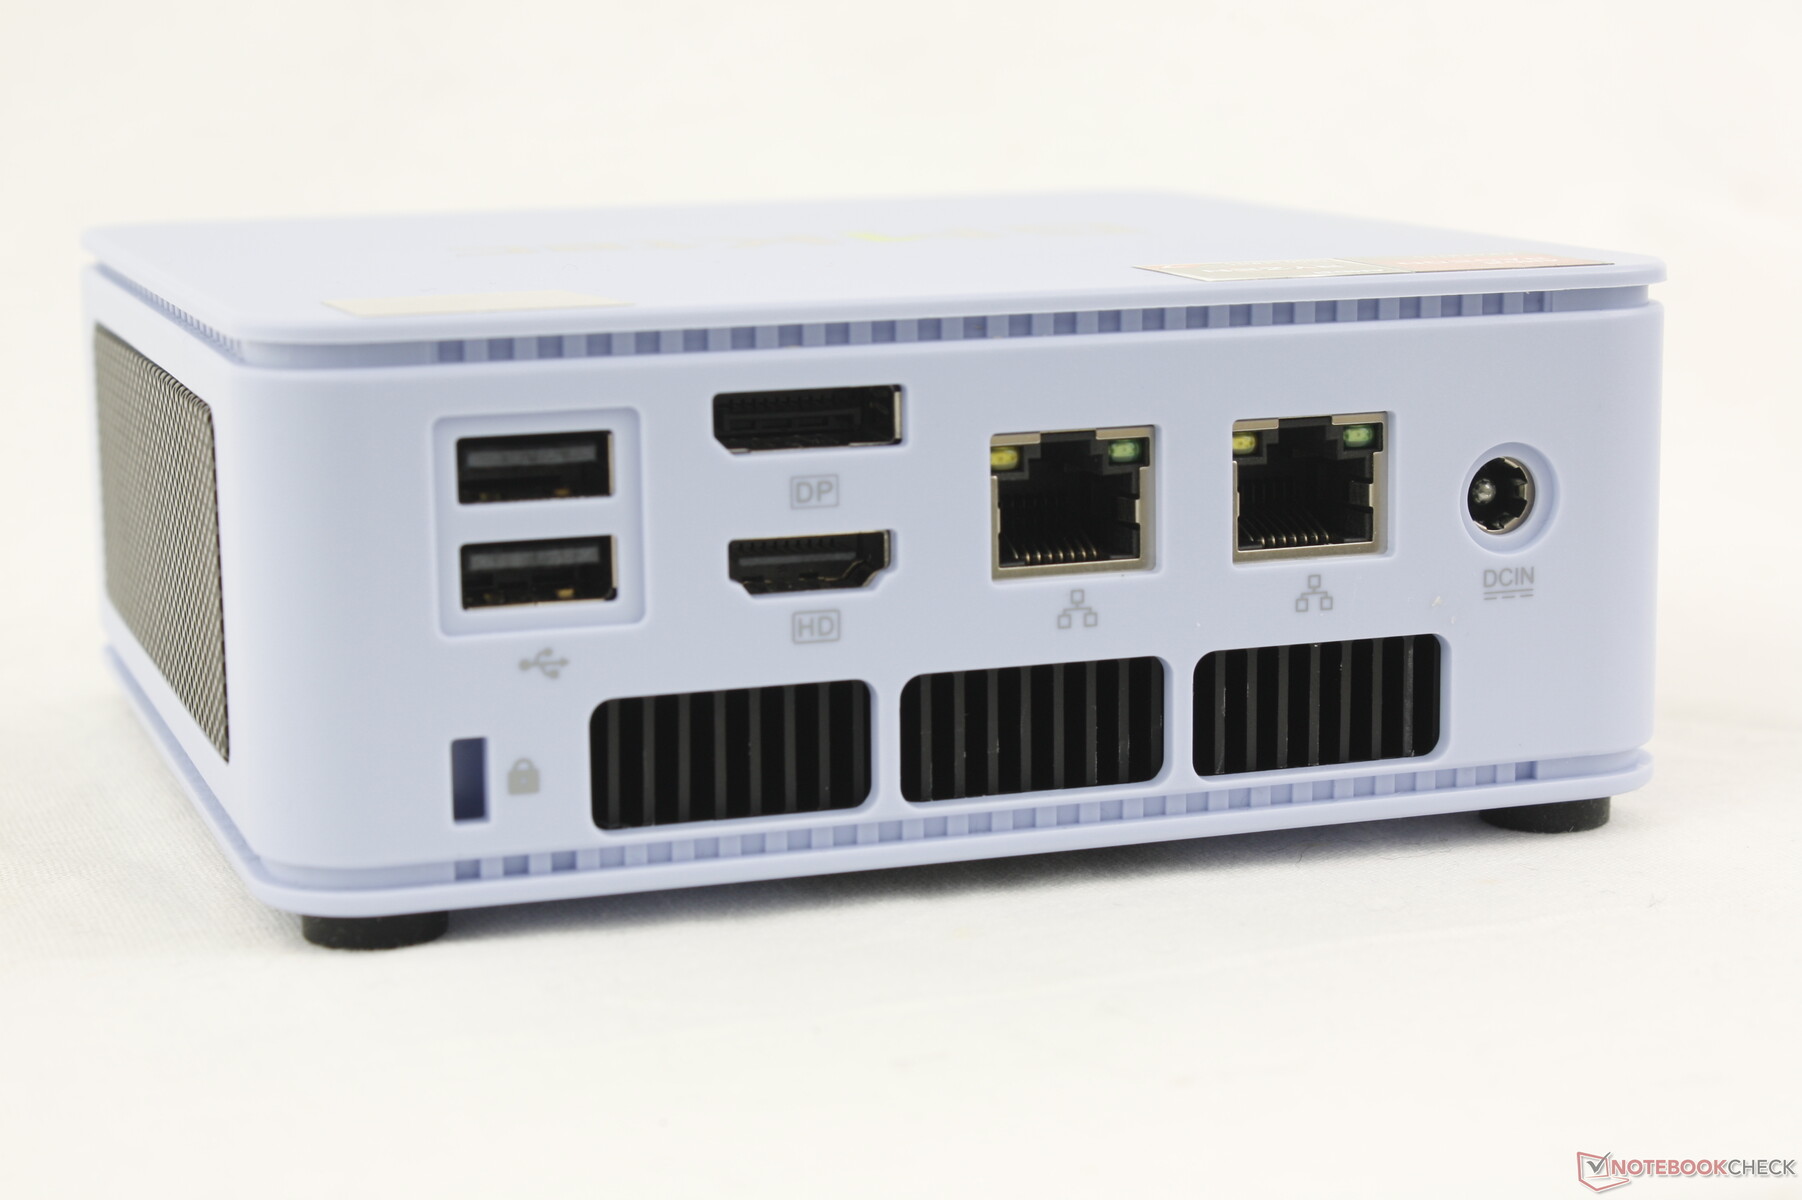
Connectivity
Port options are the same as on the NucBox K6 but with two key downgrades. The single USB-C port now lacks USB4 and Thunderbolt support while one of the rear USB-A ports is now 2.0 instead of 3.2.
Communication
| Networking | |
| iperf3 transmit AXE11000 | |
| GMK NucBox M5 | |
| Intel NUC 13 Pro Desk Edition Kit | |
| Geekom A7 | |
| GMK NucBox M4 | |
| Acemagic F2A | |
| GMK NucBox K6 | |
| iperf3 receive AXE11000 | |
| GMK NucBox M5 | |
| GMK NucBox K6 | |
| Intel NUC 13 Pro Desk Edition Kit | |
| Geekom A7 | |
| Acemagic F2A | |
| GMK NucBox M4 | |
| iperf3 transmit AXE11000 6GHz | |
| Acemagic F2A | |
| Intel NUC 13 Pro Desk Edition Kit | |
| GMK NucBox M5 | |
| Geekom A7 | |
| GMK NucBox K6 | |
| iperf3 receive AXE11000 6GHz | |
| Acemagic F2A | |
| Intel NUC 13 Pro Desk Edition Kit | |
| Geekom A7 | |
| GMK NucBox M5 | |
| GMK NucBox K6 | |
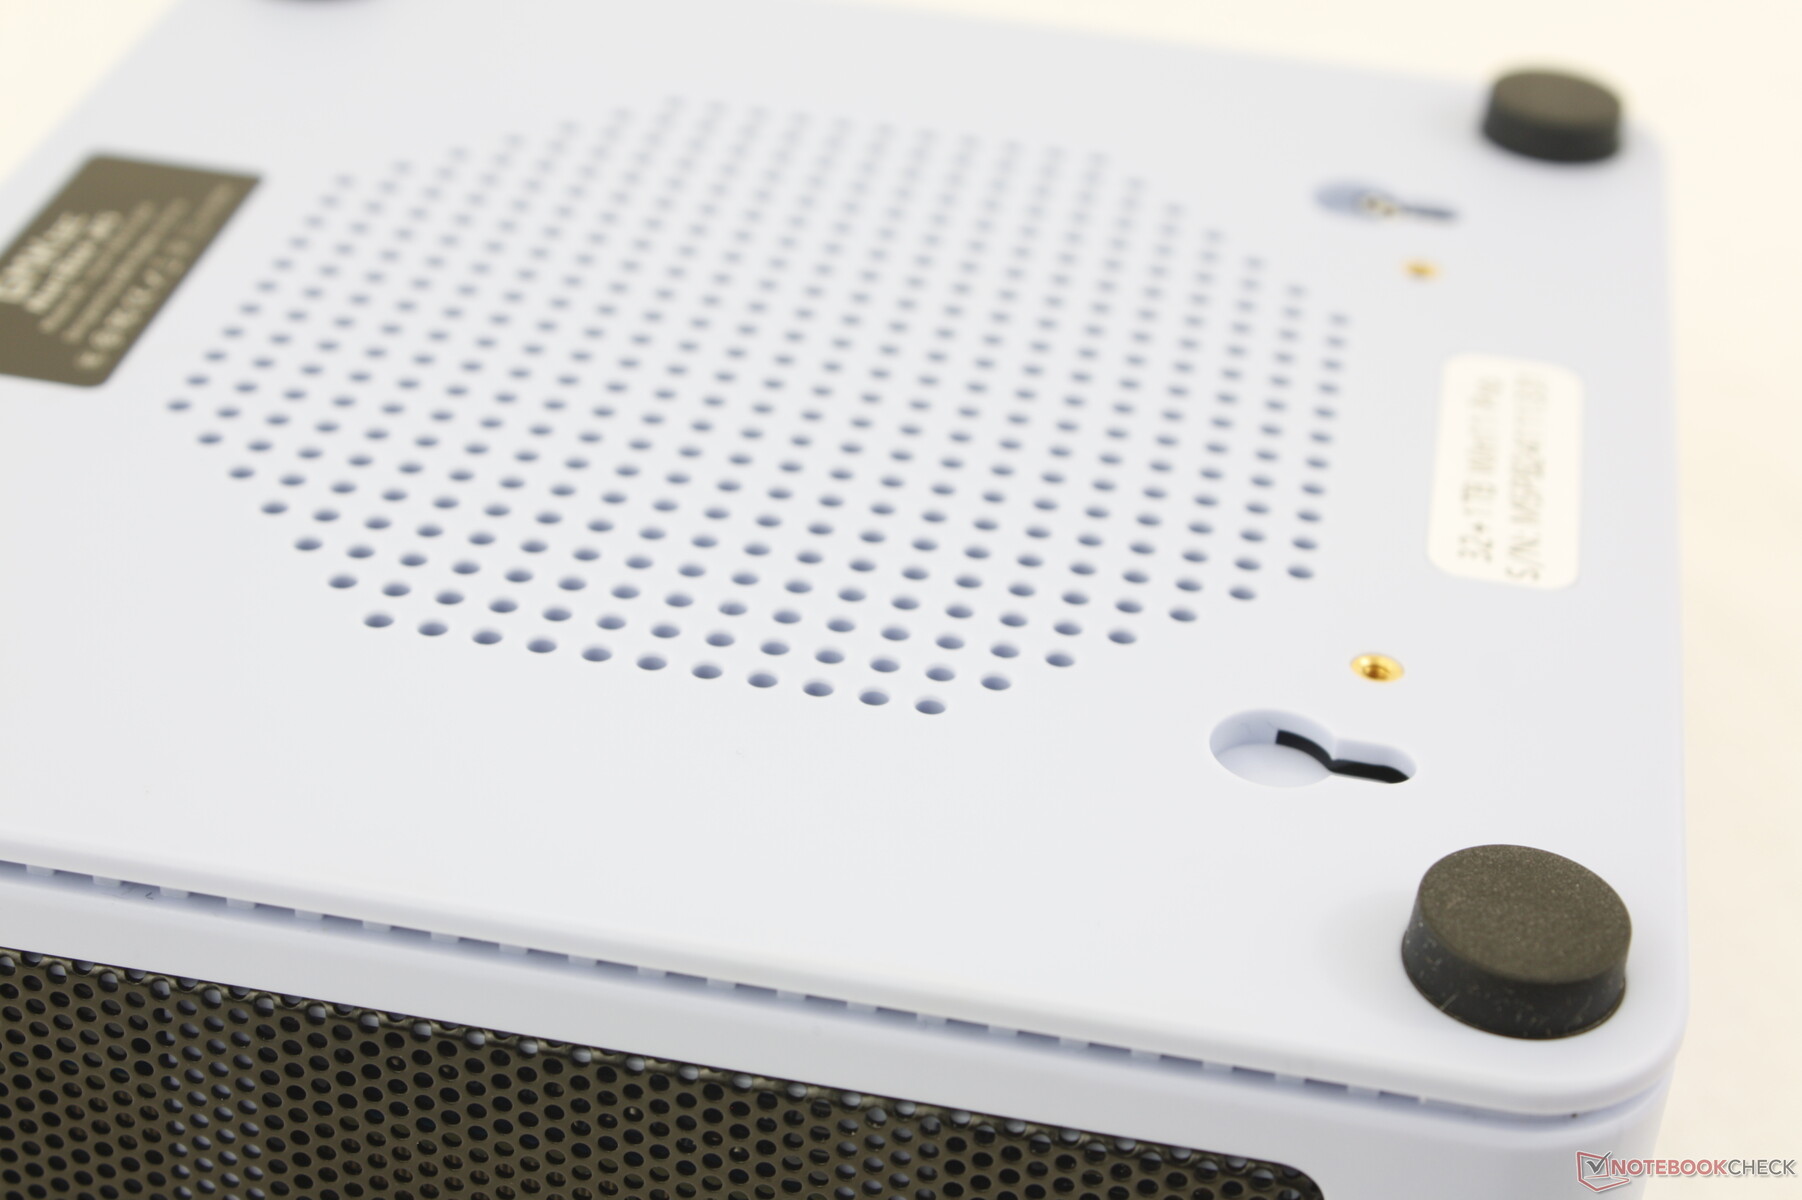
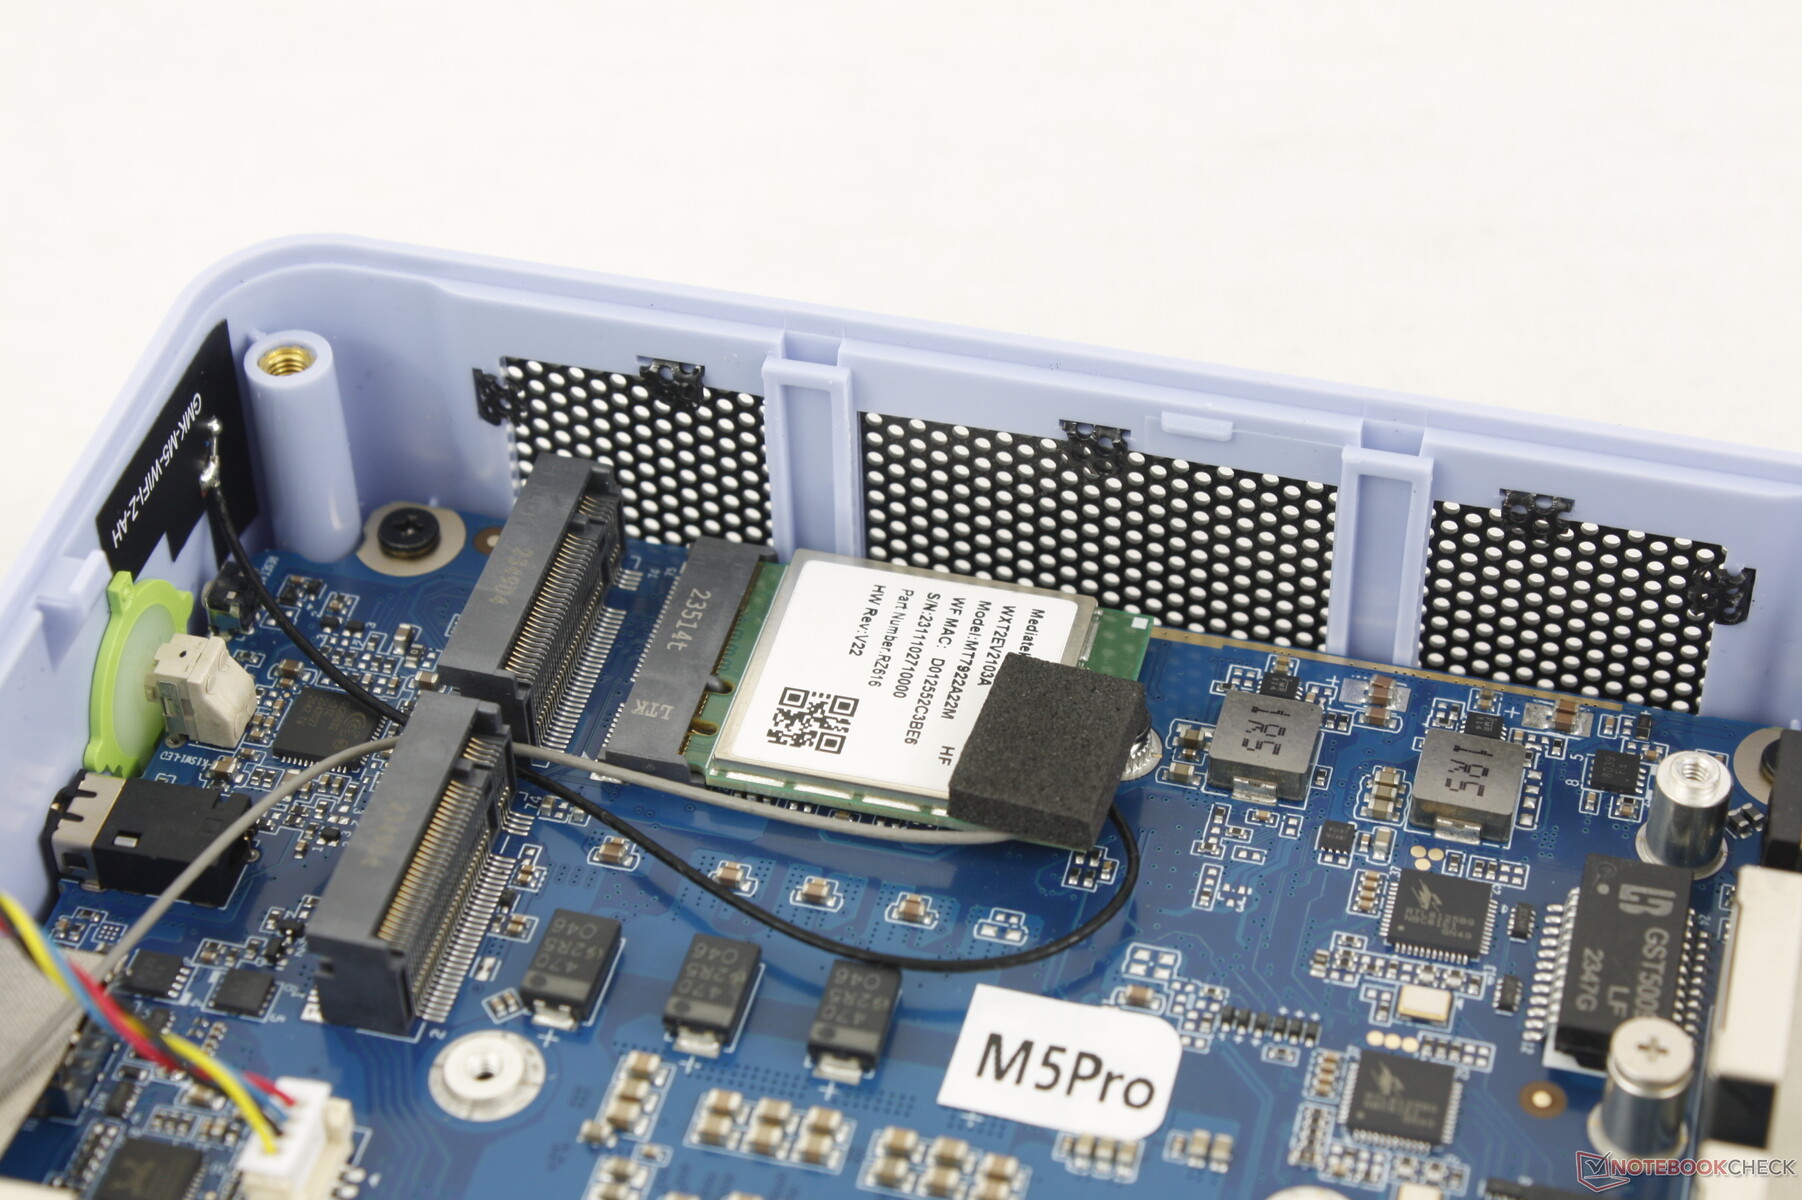
Maintenance
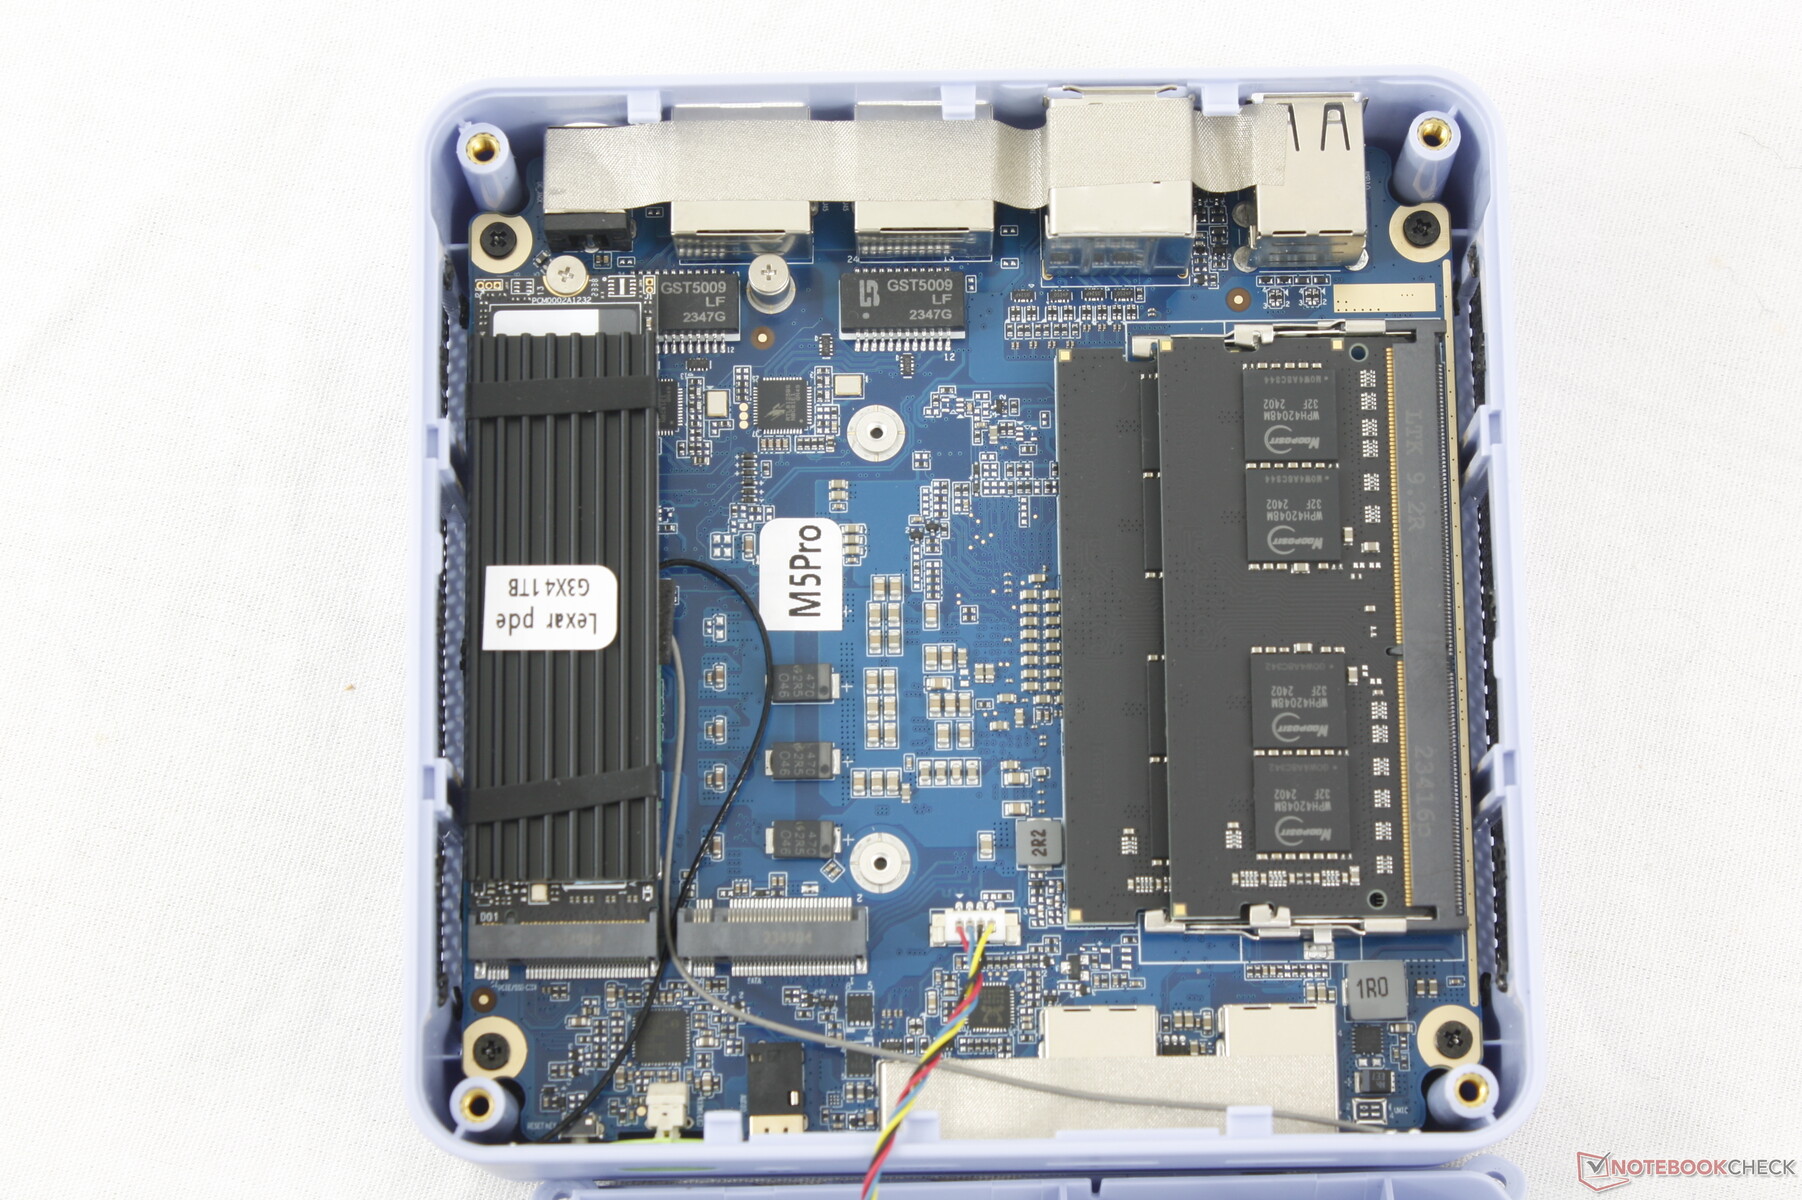
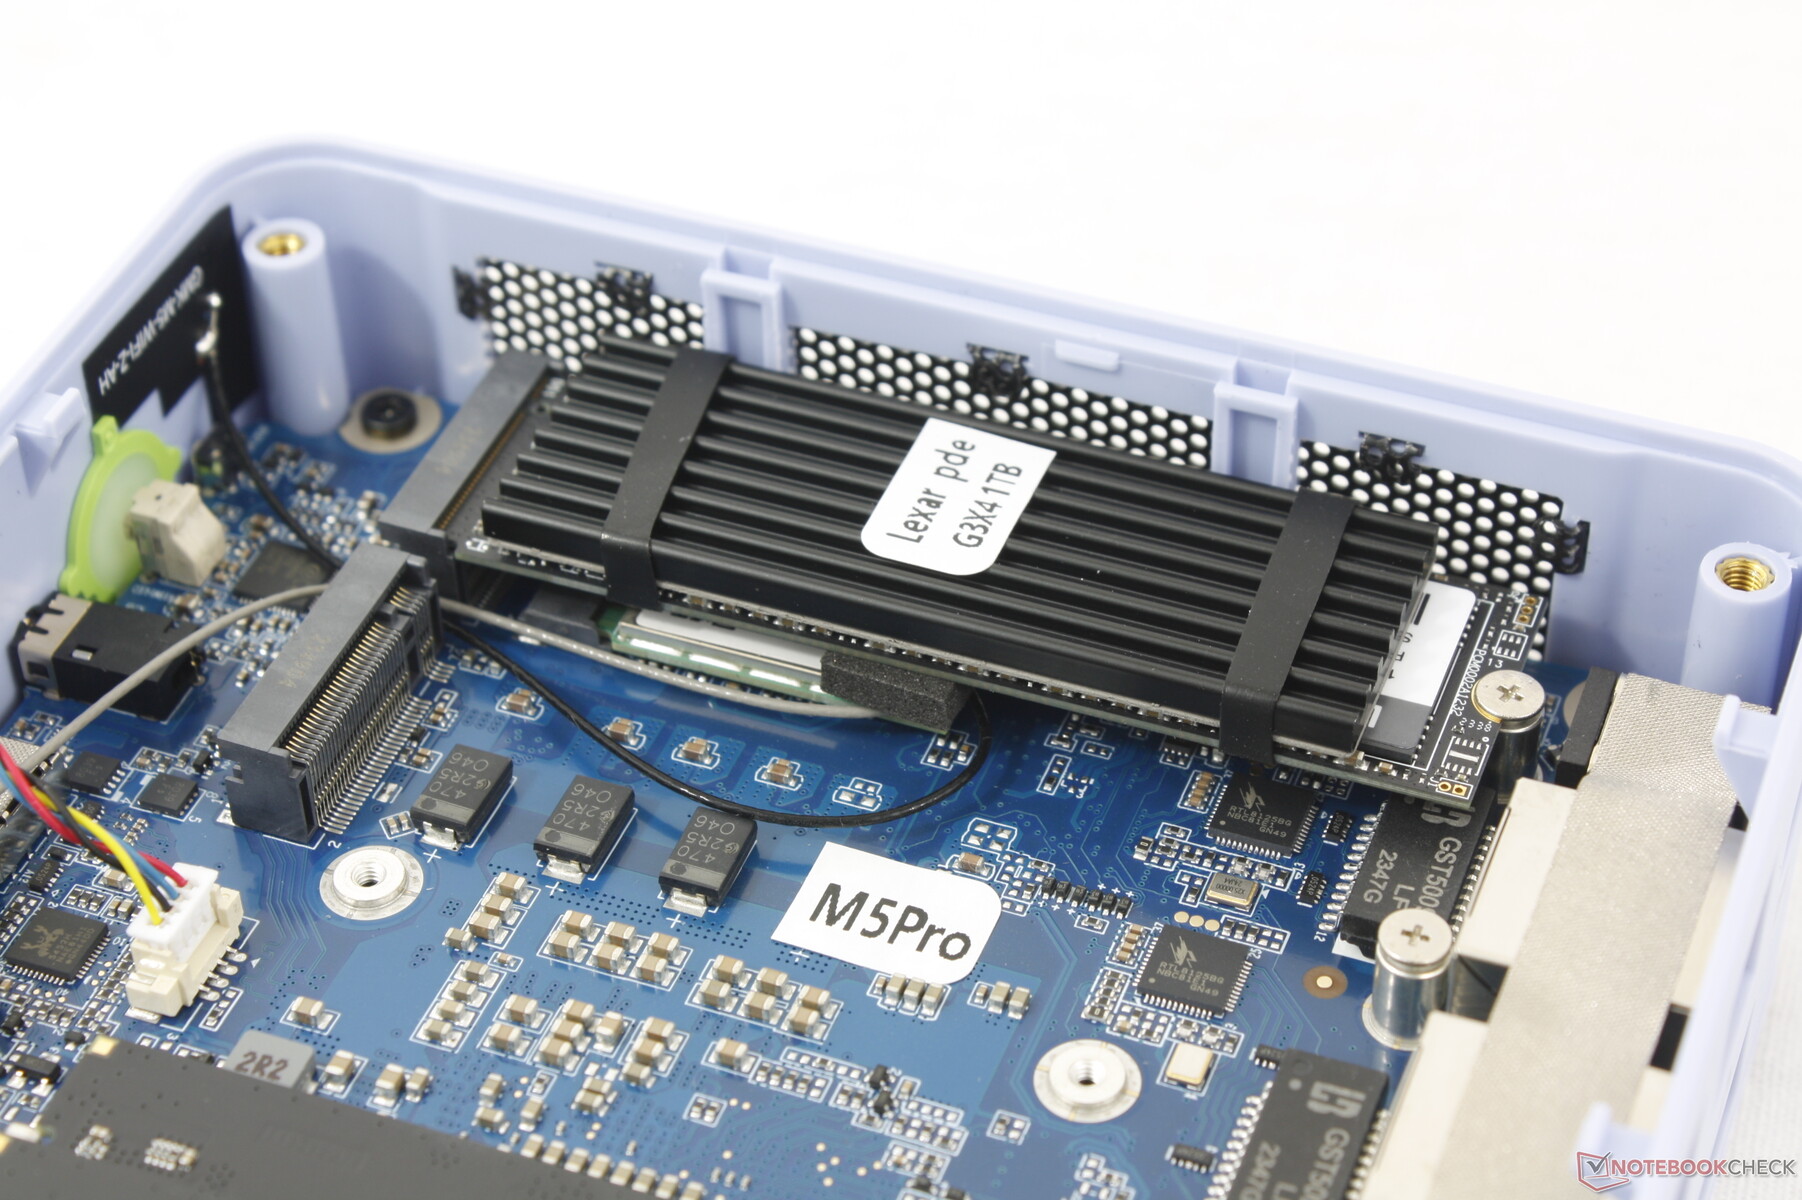
The top cover pops off to reveal the fan cover underneath and four Phillips screws for easy access to the two DDR4 SODIMM slots, 2x M.2 2280 SSD slots, and WLAN module. Meanwhile, the bottom cover is not removable and so the other side of the motherboard is more difficult to access.
Accessories And Warranty
The retail box includes an HDMI cable and a removable VESA mounting bracket alongside the AC adapter and paperwork. The standard one-year limited manufacturer warranty applies if purchased in the US.
Performance — Zen 2 Ain't Worth It In 2024
Testing Conditions
We set Windows to Performance mode prior to running the benchmarks below. The system comes with no bloatware or manufacturer-specific applications for a clean Windows experience.
Processor
CPU performance is slower than expected. Our Ryzen 7 5700U would run 20 to 25 percent slower than the average laptop in our database equipped with the exact same processor. It still runs laps around any mobile Celeron, Pentium, or Atom solution, but raw performance is still a bit disappointing as we know the Ryzen 7 5700U is capable of much more.
Overall performance is neck-to-neck with the 11th gen Intel Core i7-1165G7 as found on the older 2021 NUC11 series.
Cinebench R15 Multi Loop
Cinebench R23: Multi Core | Single Core
Cinebench R20: CPU (Multi Core) | CPU (Single Core)
Cinebench R15: CPU Multi 64Bit | CPU Single 64Bit
Blender: v2.79 BMW27 CPU
7-Zip 18.03: 7z b 4 | 7z b 4 -mmt1
Geekbench 6.7: Multi-Core | Single-Core
Geekbench 5.5: Multi-Core | Single-Core
HWBOT x265 Benchmark v2.2: 4k Preset
LibreOffice : 20 Documents To PDF
R Benchmark 2.5: Overall mean
| CPU Performance rating | |
| GMK NucBox K6 | |
| Geekom A7 | |
| Acemagic F2A | |
| Intel NUC X15 LAPAC71H | |
| Intel NUC 13 Pro Desk Edition Kit | |
| GMK NucBox K2 | |
| GMK NucBox M4 | |
| Acer TravelMate P4 TMP416-51-55KN -2! | |
| Average AMD Ryzen 7 5700U | |
| GMK NucBox M5 | |
| Intel NUC11ATKPE, N6005 -2! | |
| Intel NUC11ATKC2, N4505 -2! | |
| GMK NucBox 3 -2! | |
| Cinebench R20 / CPU (Multi Core) | |
| Acemagic F2A | |
| Intel NUC X15 LAPAC71H | |
| Geekom A7 | |
| GMK NucBox K6 | |
| Intel NUC 13 Pro Desk Edition Kit | |
| GMK NucBox K2 | |
| GMK NucBox M4 | |
| Acer TravelMate P4 TMP416-51-55KN | |
| Average AMD Ryzen 7 5700U (1887 - 3877, n=21) | |
| GMK NucBox M5 | |
| Intel NUC11ATKPE, N6005 | |
| Intel NUC11ATKC2, N4505 | |
| GMK NucBox 3 | |
| Cinebench R20 / CPU (Single Core) | |
| Intel NUC 13 Pro Desk Edition Kit | |
| Geekom A7 | |
| GMK NucBox K6 | |
| Intel NUC X15 LAPAC71H | |
| Acemagic F2A | |
| Acer TravelMate P4 TMP416-51-55KN | |
| GMK NucBox M4 | |
| GMK NucBox K2 | |
| GMK NucBox M5 | |
| Average AMD Ryzen 7 5700U (471 - 495, n=21) | |
| Intel NUC11ATKPE, N6005 | |
| Intel NUC11ATKC2, N4505 | |
| GMK NucBox 3 | |
| Cinebench R15 / CPU Multi 64Bit | |
| Acemagic F2A | |
| GMK NucBox K6 | |
| Intel NUC X15 LAPAC71H | |
| Geekom A7 | |
| Intel NUC 13 Pro Desk Edition Kit | |
| GMK NucBox K2 | |
| Acer TravelMate P4 TMP416-51-55KN | |
| GMK NucBox M4 | |
| Average AMD Ryzen 7 5700U (856 - 1691, n=20) | |
| GMK NucBox M5 | |
| Intel NUC11ATKPE, N6005 | |
| GMK NucBox 3 | |
| Intel NUC11ATKC2, N4505 | |
| Cinebench R15 / CPU Single 64Bit | |
| GMK NucBox K6 | |
| Geekom A7 | |
| Intel NUC 13 Pro Desk Edition Kit | |
| Acemagic F2A | |
| Intel NUC X15 LAPAC71H | |
| GMK NucBox K2 | |
| GMK NucBox M4 | |
| Acer TravelMate P4 TMP416-51-55KN | |
| GMK NucBox M5 | |
| Average AMD Ryzen 7 5700U (181 - 190, n=19) | |
| Intel NUC11ATKPE, N6005 | |
| Intel NUC11ATKC2, N4505 | |
| GMK NucBox 3 | |
| Geekbench 6.7 / Multi-Core | |
| Geekom A7 | |
| GMK NucBox K6 | |
| Intel NUC X15 LAPAC71H | |
| Acemagic F2A | |
| Intel NUC 13 Pro Desk Edition Kit | |
| GMK NucBox K2 | |
| GMK NucBox M4 | |
| GMK NucBox M5 | |
| Average AMD Ryzen 7 5700U (4983 - 6260, n=5) | |
| Geekbench 6.7 / Single-Core | |
| Geekom A7 | |
| GMK NucBox K6 | |
| Intel NUC 13 Pro Desk Edition Kit | |
| Intel NUC X15 LAPAC71H | |
| Acemagic F2A | |
| GMK NucBox M4 | |
| GMK NucBox K2 | |
| GMK NucBox M5 | |
| Average AMD Ryzen 7 5700U (1550 - 1625, n=5) | |
| HWBOT x265 Benchmark v2.2 / 4k Preset | |
| Geekom A7 | |
| GMK NucBox K6 | |
| Acemagic F2A | |
| Intel NUC X15 LAPAC71H | |
| GMK NucBox K2 | |
| Intel NUC 13 Pro Desk Edition Kit | |
| GMK NucBox M4 | |
| Acer TravelMate P4 TMP416-51-55KN | |
| Average AMD Ryzen 7 5700U (6.08 - 12.1, n=20) | |
| GMK NucBox M5 | |
| Intel NUC11ATKPE, N6005 | |
| GMK NucBox 3 | |
| Intel NUC11ATKC2, N4505 | |
| LibreOffice / 20 Documents To PDF | |
| GMK NucBox 3 | |
| Intel NUC11ATKPE, N6005 | |
| Intel NUC11ATKC2, N4505 | |
| Average AMD Ryzen 7 5700U (52.4 - 75.5, n=20) | |
| GMK NucBox M5 | |
| Geekom A7 | |
| Acer TravelMate P4 TMP416-51-55KN | |
| Intel NUC 13 Pro Desk Edition Kit | |
| GMK NucBox K2 | |
| Acemagic F2A | |
| GMK NucBox K6 | |
| GMK NucBox M4 | |
| Intel NUC X15 LAPAC71H | |
Cinebench R23: Multi Core | Single Core
Cinebench R20: CPU (Multi Core) | CPU (Single Core)
Cinebench R15: CPU Multi 64Bit | CPU Single 64Bit
Blender: v2.79 BMW27 CPU
7-Zip 18.03: 7z b 4 | 7z b 4 -mmt1
Geekbench 6.7: Multi-Core | Single-Core
Geekbench 5.5: Multi-Core | Single-Core
HWBOT x265 Benchmark v2.2: 4k Preset
LibreOffice : 20 Documents To PDF
R Benchmark 2.5: Overall mean
* ... smaller is better
AIDA64: FP32 Ray-Trace | FPU Julia | CPU SHA3 | CPU Queen | FPU SinJulia | FPU Mandel | CPU AES | CPU ZLib | FP64 Ray-Trace | CPU PhotoWorxx
| Performance rating | |
| Geekom A7 | |
| GMK NucBox K6 | |
| Acemagic F2A | |
| GMK NucBox M4 | |
| Intel NUC 13 Pro Desk Edition Kit | |
| Average AMD Ryzen 7 5700U | |
| GMK NucBox M5 | |
| AIDA64 / FP32 Ray-Trace | |
| GMK NucBox K6 | |
| Geekom A7 | |
| Acemagic F2A | |
| GMK NucBox M4 | |
| Intel NUC 13 Pro Desk Edition Kit | |
| Average AMD Ryzen 7 5700U (5679 - 12346, n=20) | |
| GMK NucBox M5 | |
| AIDA64 / FPU Julia | |
| GMK NucBox K6 | |
| Geekom A7 | |
| Acemagic F2A | |
| Average AMD Ryzen 7 5700U (39042 - 69580, n=20) | |
| Intel NUC 13 Pro Desk Edition Kit | |
| GMK NucBox M4 | |
| GMK NucBox M5 | |
| AIDA64 / CPU SHA3 | |
| GMK NucBox K6 | |
| Geekom A7 | |
| Acemagic F2A | |
| GMK NucBox M4 | |
| Intel NUC 13 Pro Desk Edition Kit | |
| Average AMD Ryzen 7 5700U (1103 - 2231, n=20) | |
| GMK NucBox M5 | |
| AIDA64 / CPU Queen | |
| Geekom A7 | |
| GMK NucBox K6 | |
| Acemagic F2A | |
| GMK NucBox M4 | |
| Average AMD Ryzen 7 5700U (57016 - 99178, n=20) | |
| Intel NUC 13 Pro Desk Edition Kit | |
| GMK NucBox M5 | |
| AIDA64 / FPU SinJulia | |
| GMK NucBox K6 | |
| Geekom A7 | |
| Average AMD Ryzen 7 5700U (6837 - 14169, n=20) | |
| Acemagic F2A | |
| GMK NucBox M5 | |
| GMK NucBox M4 | |
| Intel NUC 13 Pro Desk Edition Kit | |
| AIDA64 / FPU Mandel | |
| GMK NucBox K6 | |
| Geekom A7 | |
| Acemagic F2A | |
| GMK NucBox M4 | |
| Average AMD Ryzen 7 5700U (20179 - 36523, n=20) | |
| Intel NUC 13 Pro Desk Edition Kit | |
| GMK NucBox M5 | |
| AIDA64 / CPU AES | |
| Geekom A7 | |
| GMK NucBox K6 | |
| Acemagic F2A | |
| GMK NucBox M4 | |
| Intel NUC 13 Pro Desk Edition Kit | |
| Average AMD Ryzen 7 5700U (26066 - 64646, n=20) | |
| GMK NucBox M5 | |
| AIDA64 / CPU ZLib | |
| Acemagic F2A | |
| GMK NucBox K6 | |
| Geekom A7 | |
| Intel NUC 13 Pro Desk Edition Kit | |
| GMK NucBox M4 | |
| Average AMD Ryzen 7 5700U (440 - 776, n=20) | |
| GMK NucBox M5 | |
| AIDA64 / FP64 Ray-Trace | |
| GMK NucBox K6 | |
| Geekom A7 | |
| Acemagic F2A | |
| GMK NucBox M4 | |
| Intel NUC 13 Pro Desk Edition Kit | |
| Average AMD Ryzen 7 5700U (2985 - 6784, n=20) | |
| GMK NucBox M5 | |
| AIDA64 / CPU PhotoWorxx | |
| GMK NucBox K6 | |
| Geekom A7 | |
| Acemagic F2A | |
| Intel NUC 13 Pro Desk Edition Kit | |
| GMK NucBox M5 | |
| GMK NucBox M4 | |
| Average AMD Ryzen 7 5700U (6903 - 25066, n=20) | |
Stress Test
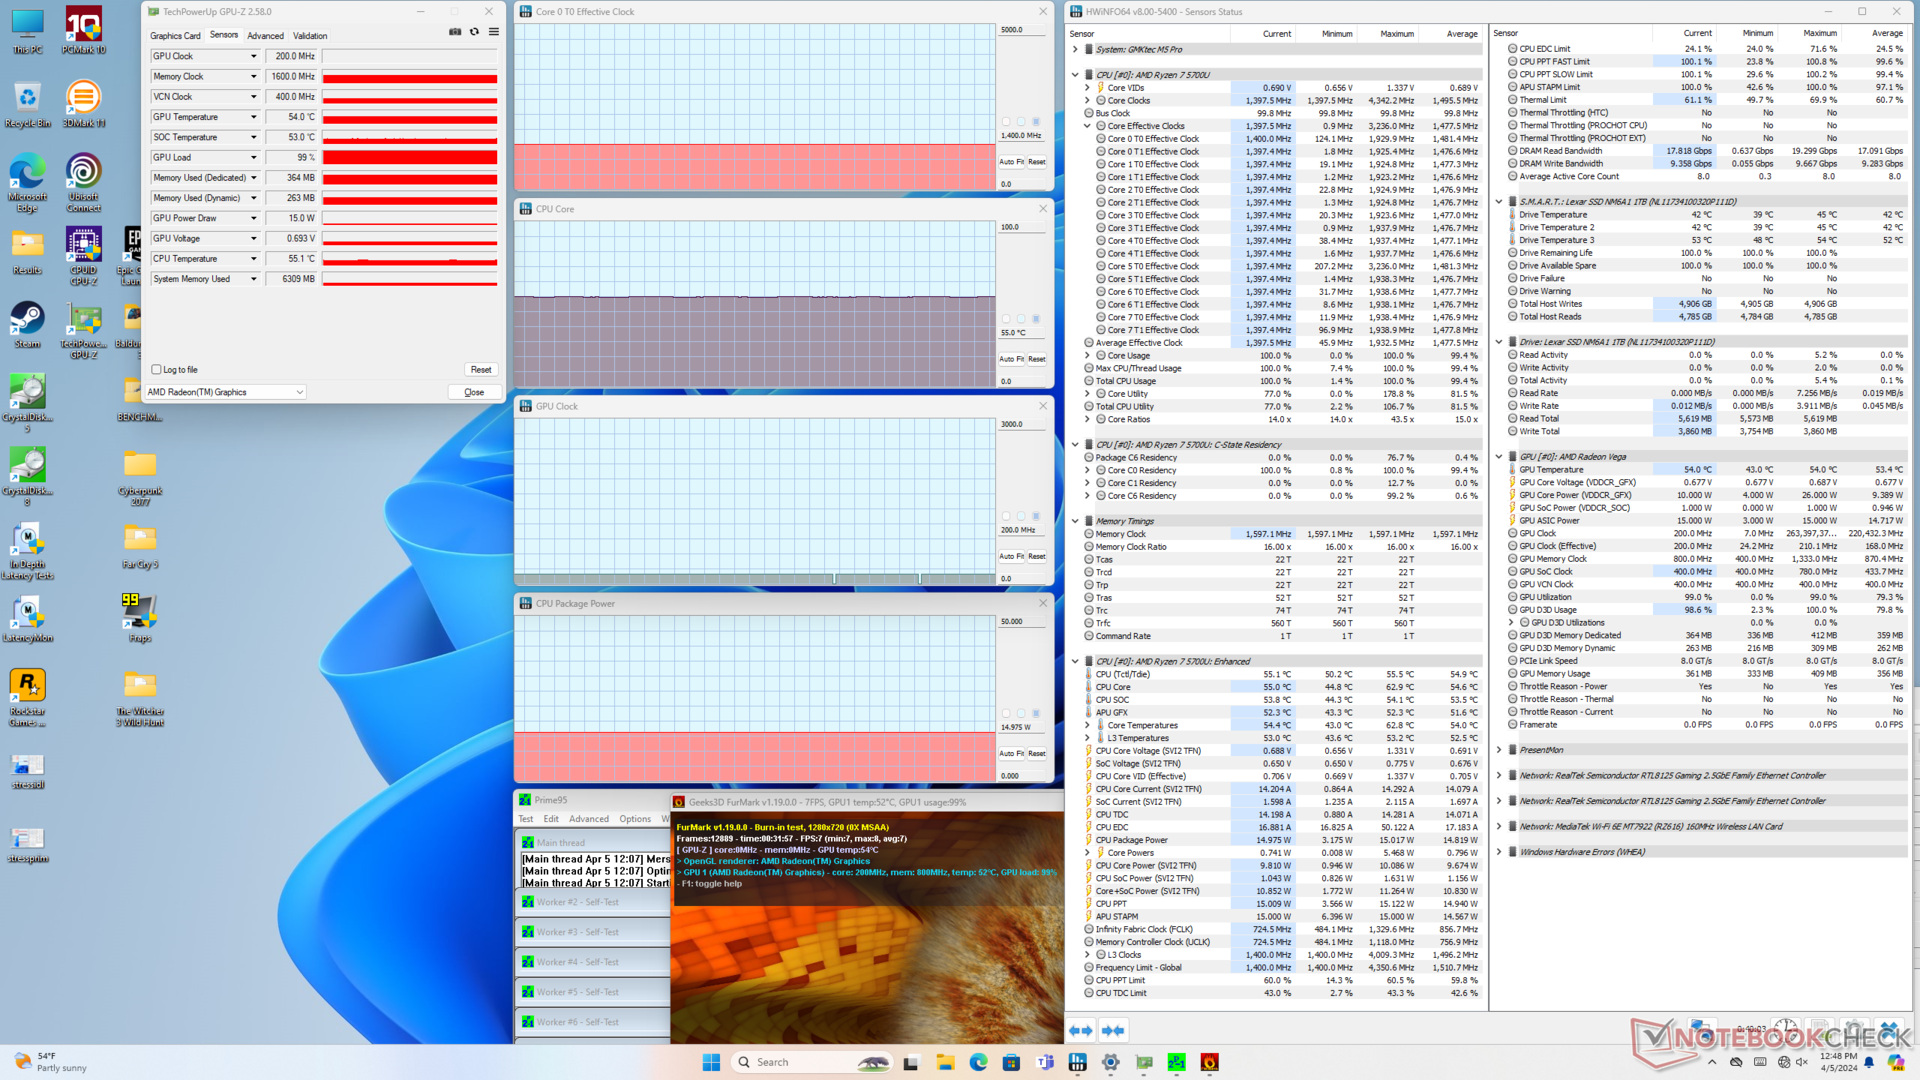
When running Prime95 to stress the CPU, clock rates and board power draw would spike to 1.9 GHz and 15 W, respectively. We believe that the processor is capable of higher power envelopes of up to 28 W especially since core temperature is only 55 C under stress, but package power is seemingly limited to 15 W on the NucBox M5 even after double-checking any BIOS settings or Windows power profiles. The low 15 W ceiling also explains the slower-than-expected performance as mentioned in the Processor section above.
Core temperature would stabilize at just 55 C when running Witcher 3 compared to 70 C on the much faster Beelink SER6 Pro.
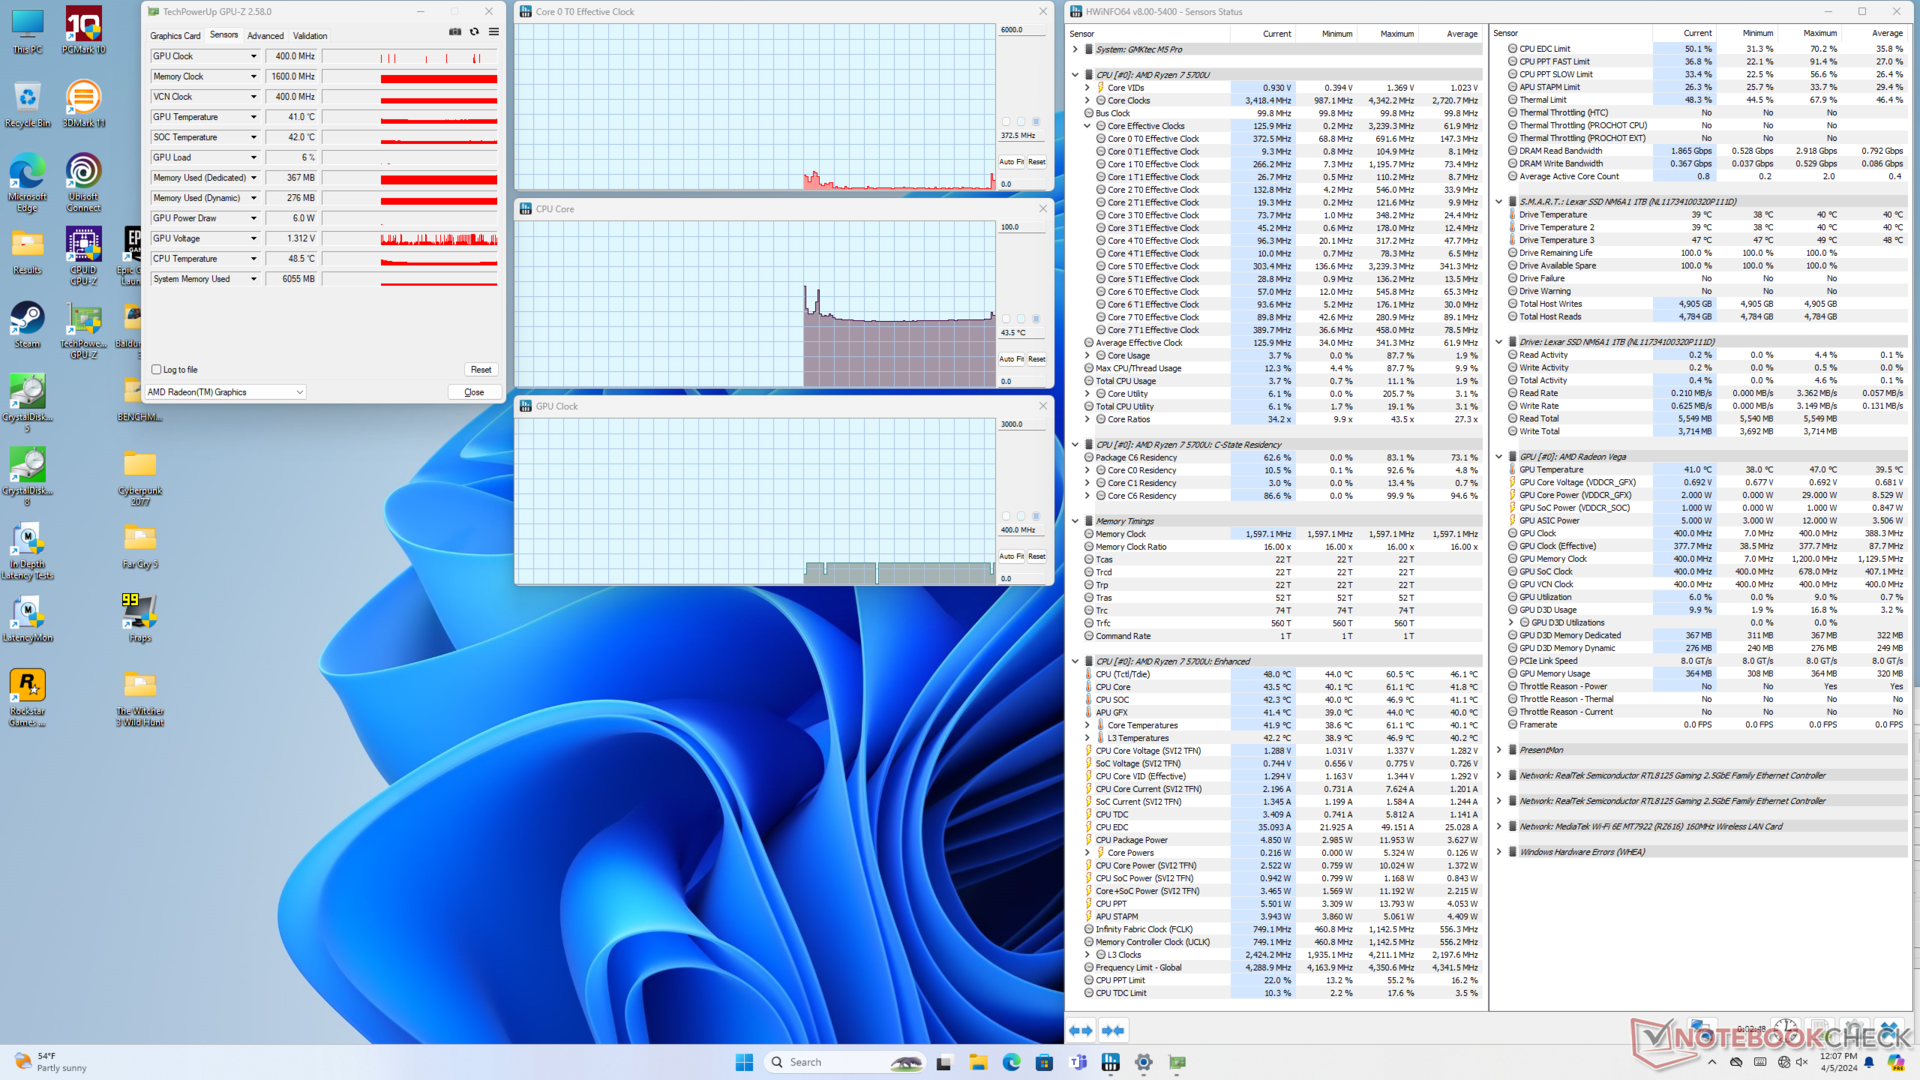
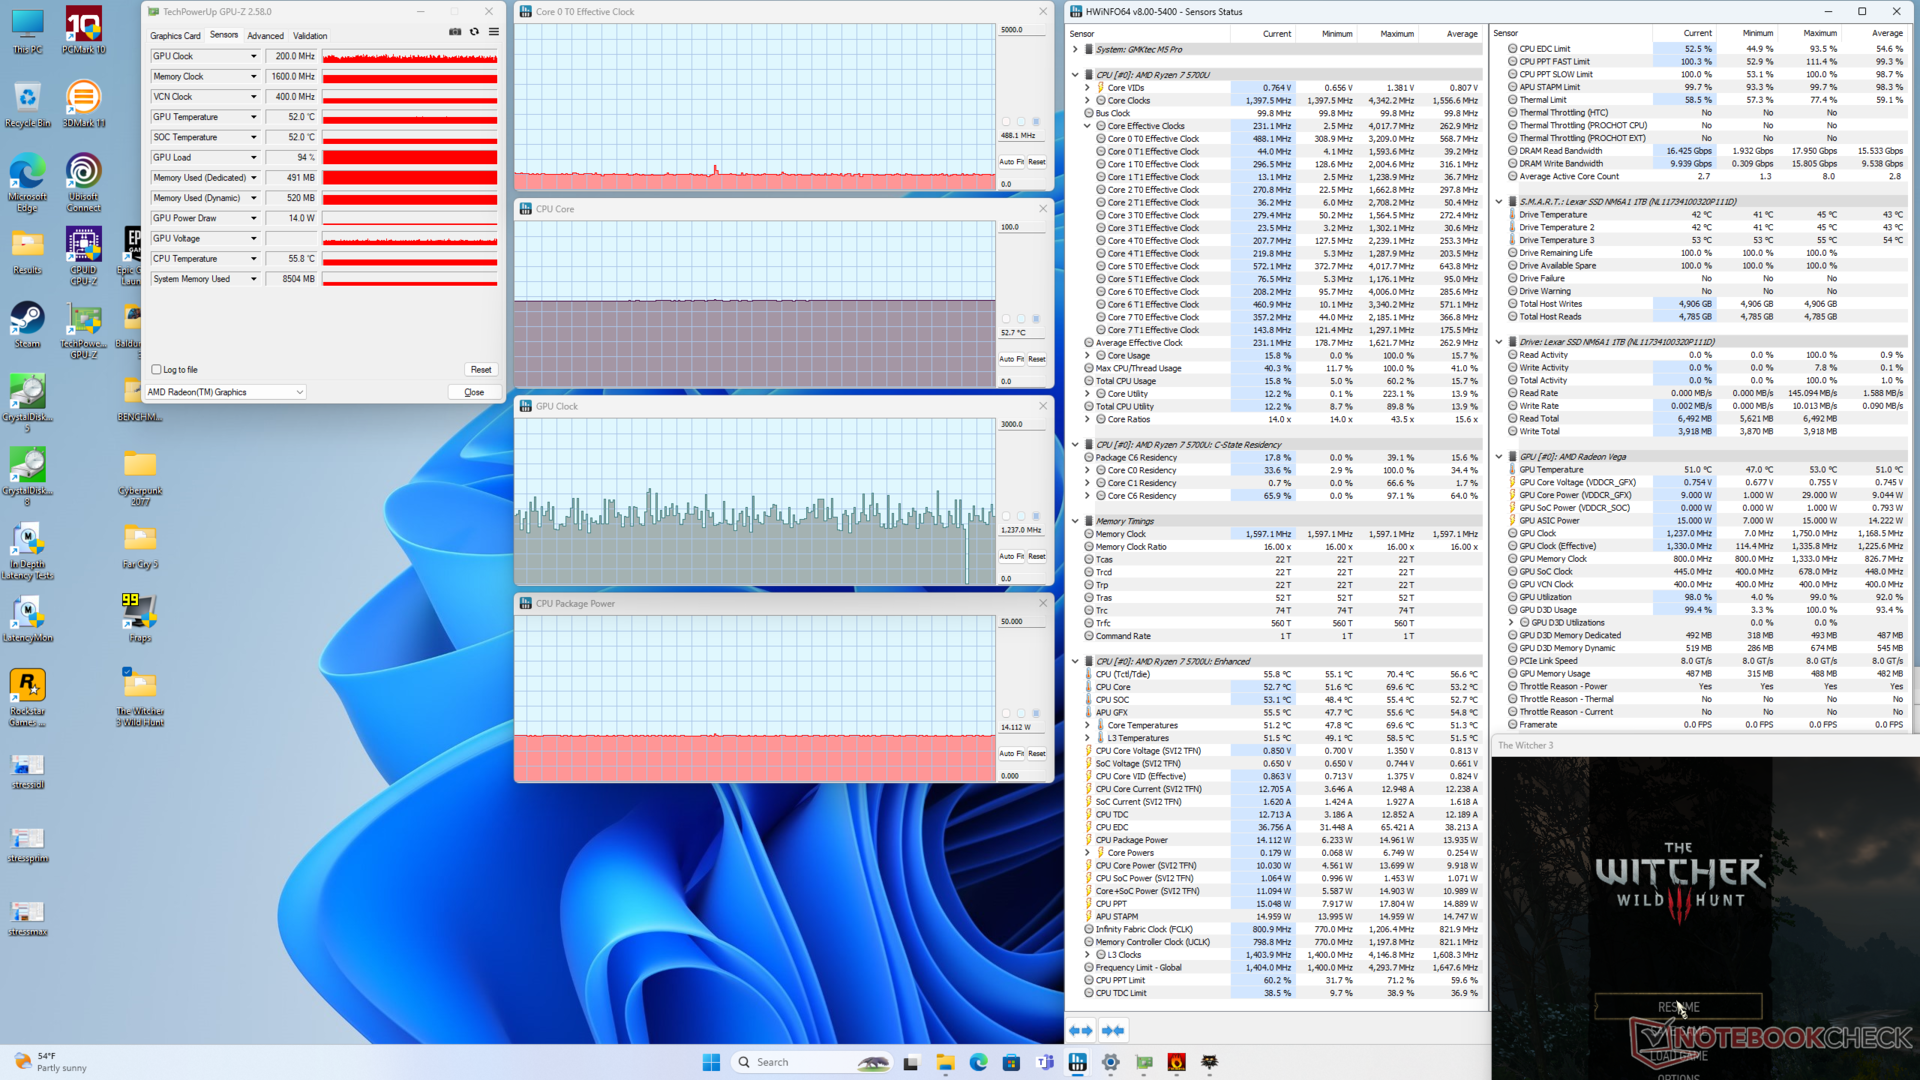
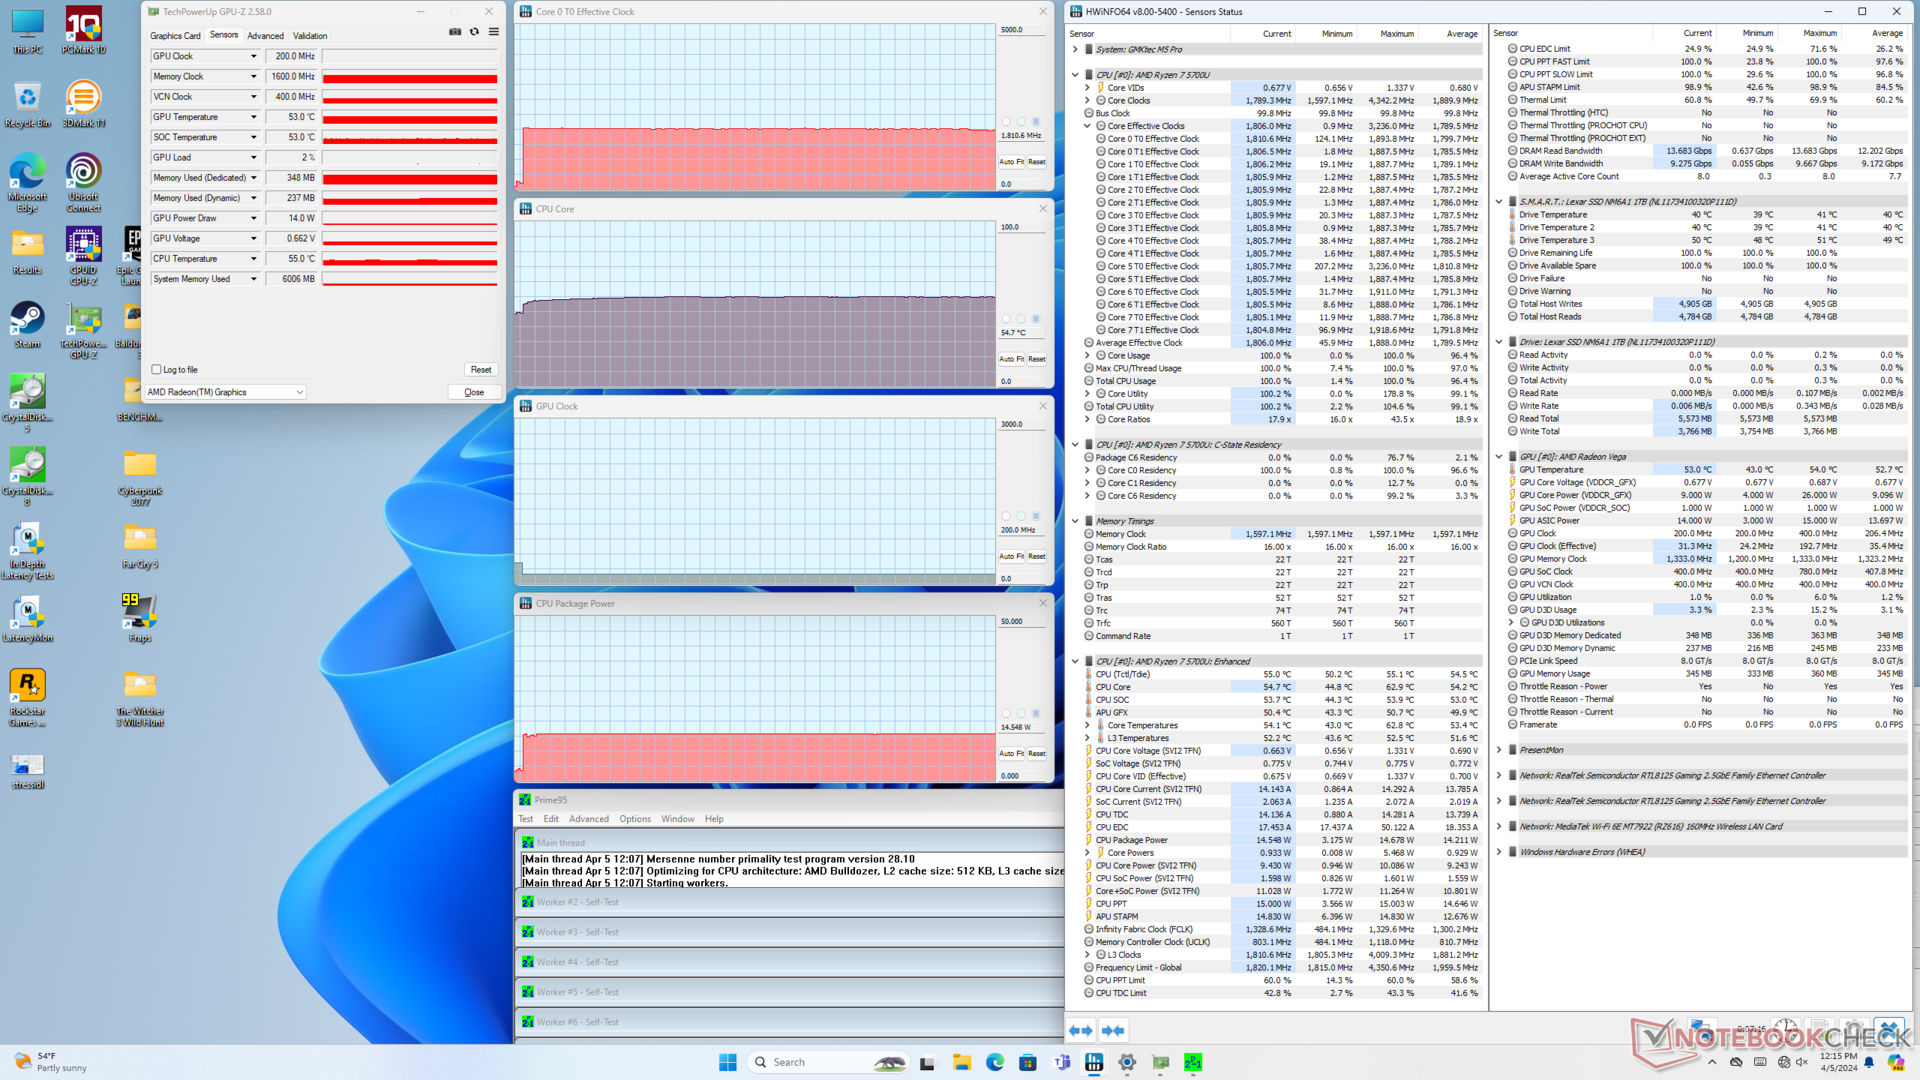
| CPU Clock (GHz) | GPU Clock (MHz) | Average CPU Temperature (°C) | |
| System Idle | -- | -- | 43 |
| Prime95 Stress | 1.8 | -- | 55 |
| Prime95 + FurMark Stress | 1.4 | 200 | 55 |
| Witcher 3 Stress | ~0.5 | ~1237 | 53 |
System Performance
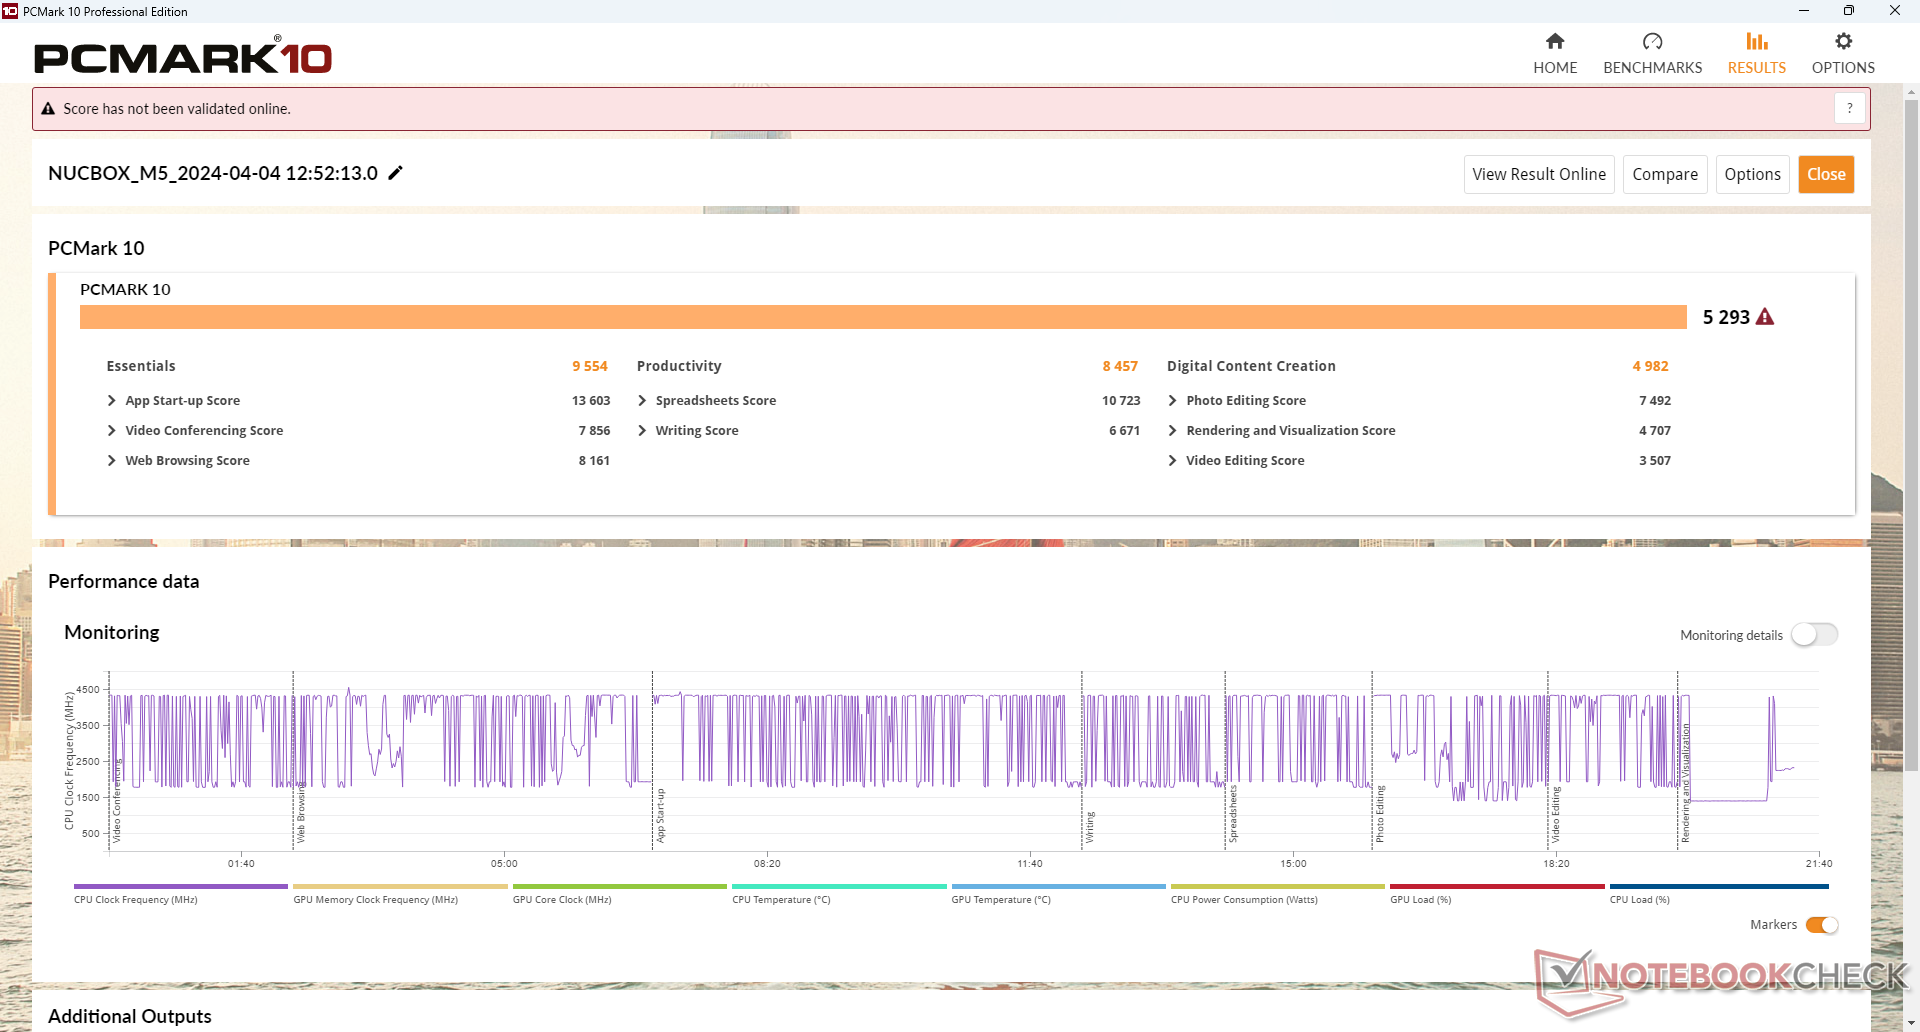
PCMark results are behind many current mini PCs running on latest gen processors such as the GMK NucBox K6 or Intel NUC 13 Pro. The Digital Content Creation subtest score is especially lower due to the slow integrated GPU.
CrossMark: Overall | Productivity | Creativity | Responsiveness
WebXPRT 3: Overall
WebXPRT 4: Overall
Mozilla Kraken 1.1: Total
| PCMark 10 / Score | |
| GMK NucBox K6 | |
| Geekom A7 | |
| Acemagic F2A | |
| Intel NUC 13 Pro Desk Edition Kit | |
| GMK NucBox M4 | |
| GMK NucBox M5 | |
| Average AMD Ryzen 7 5700U, AMD Radeon RX Vega 8 (Ryzen 4000/5000) (4325 - 5518, n=15) | |
| PCMark 10 / Essentials | |
| GMK NucBox K6 | |
| Acemagic F2A | |
| Geekom A7 | |
| Intel NUC 13 Pro Desk Edition Kit | |
| GMK NucBox M4 | |
| GMK NucBox M5 | |
| Average AMD Ryzen 7 5700U, AMD Radeon RX Vega 8 (Ryzen 4000/5000) (8025 - 10091, n=15) | |
| PCMark 10 / Productivity | |
| GMK NucBox K6 | |
| Geekom A7 | |
| Acemagic F2A | |
| GMK NucBox M5 | |
| Average AMD Ryzen 7 5700U, AMD Radeon RX Vega 8 (Ryzen 4000/5000) (7001 - 8457, n=15) | |
| GMK NucBox M4 | |
| Intel NUC 13 Pro Desk Edition Kit | |
| PCMark 10 / Digital Content Creation | |
| Acemagic F2A | |
| Geekom A7 | |
| GMK NucBox K6 | |
| Intel NUC 13 Pro Desk Edition Kit | |
| GMK NucBox M4 | |
| Average AMD Ryzen 7 5700U, AMD Radeon RX Vega 8 (Ryzen 4000/5000) (3738 - 5964, n=15) | |
| GMK NucBox M5 | |
| CrossMark / Overall | |
| GMK NucBox K6 | |
| Geekom A7 | |
| Acemagic F2A | |
| GMK NucBox M4 | |
| Intel NUC 13 Pro Desk Edition Kit | |
| GMK NucBox M5 | |
| Average AMD Ryzen 7 5700U, AMD Radeon RX Vega 8 (Ryzen 4000/5000) (866 - 1183, n=8) | |
| CrossMark / Productivity | |
| GMK NucBox K6 | |
| Geekom A7 | |
| Acemagic F2A | |
| GMK NucBox M4 | |
| Intel NUC 13 Pro Desk Edition Kit | |
| GMK NucBox M5 | |
| Average AMD Ryzen 7 5700U, AMD Radeon RX Vega 8 (Ryzen 4000/5000) (931 - 1191, n=8) | |
| CrossMark / Creativity | |
| Geekom A7 | |
| GMK NucBox K6 | |
| Acemagic F2A | |
| Intel NUC 13 Pro Desk Edition Kit | |
| GMK NucBox M4 | |
| GMK NucBox M5 | |
| Average AMD Ryzen 7 5700U, AMD Radeon RX Vega 8 (Ryzen 4000/5000) (907 - 1197, n=8) | |
| CrossMark / Responsiveness | |
| GMK NucBox K6 | |
| Acemagic F2A | |
| Geekom A7 | |
| GMK NucBox M4 | |
| Intel NUC 13 Pro Desk Edition Kit | |
| GMK NucBox M5 | |
| Average AMD Ryzen 7 5700U, AMD Radeon RX Vega 8 (Ryzen 4000/5000) (605 - 1159, n=8) | |
| WebXPRT 3 / Overall | |
| Geekom A7 | |
| GMK NucBox K6 | |
| Intel NUC 13 Pro Desk Edition Kit | |
| GMK NucBox M4 | |
| Acemagic F2A | |
| GMK NucBox M5 | |
| Average AMD Ryzen 7 5700U, AMD Radeon RX Vega 8 (Ryzen 4000/5000) (197.4 - 222, n=14) | |
| WebXPRT 4 / Overall | |
| Geekom A7 | |
| GMK NucBox K6 | |
| Intel NUC 13 Pro Desk Edition Kit | |
| Acemagic F2A | |
| GMK NucBox M4 | |
| Average AMD Ryzen 7 5700U, AMD Radeon RX Vega 8 (Ryzen 4000/5000) (158.5 - 225, n=5) | |
| GMK NucBox M5 | |
| Mozilla Kraken 1.1 / Total | |
| Average AMD Ryzen 7 5700U, AMD Radeon RX Vega 8 (Ryzen 4000/5000) (791 - 835, n=15) | |
| GMK NucBox M5 | |
| GMK NucBox M4 | |
| Acemagic F2A | |
| GMK NucBox K6 | |
| Geekom A7 | |
| Intel NUC 13 Pro Desk Edition Kit | |
* ... smaller is better
| PCMark 10 Score | 5293 points | |
Help | ||
| AIDA64 / Memory Copy | |
| GMK NucBox K6 | |
| Geekom A7 | |
| Acemagic F2A | |
| Intel NUC 13 Pro Desk Edition Kit | |
| GMK NucBox M4 | |
| GMK NucBox M5 | |
| Average AMD Ryzen 7 5700U (15867 - 39326, n=20) | |
| AIDA64 / Memory Read | |
| Acemagic F2A | |
| GMK NucBox K6 | |
| Geekom A7 | |
| GMK NucBox M4 | |
| GMK NucBox M5 | |
| Intel NUC 13 Pro Desk Edition Kit | |
| Average AMD Ryzen 7 5700U (17632 - 47190, n=20) | |
| AIDA64 / Memory Write | |
| Geekom A7 | |
| GMK NucBox K6 | |
| Acemagic F2A | |
| GMK NucBox M5 | |
| GMK NucBox M4 | |
| Intel NUC 13 Pro Desk Edition Kit | |
| Average AMD Ryzen 7 5700U (11554 - 47048, n=20) | |
| AIDA64 / Memory Latency | |
| Acemagic F2A | |
| GMK NucBox M5 | |
| Average AMD Ryzen 7 5700U (84.9 - 113, n=20) | |
| Intel NUC 13 Pro Desk Edition Kit | |
| Geekom A7 | |
| GMK NucBox K6 | |
| GMK NucBox M4 | |
* ... smaller is better
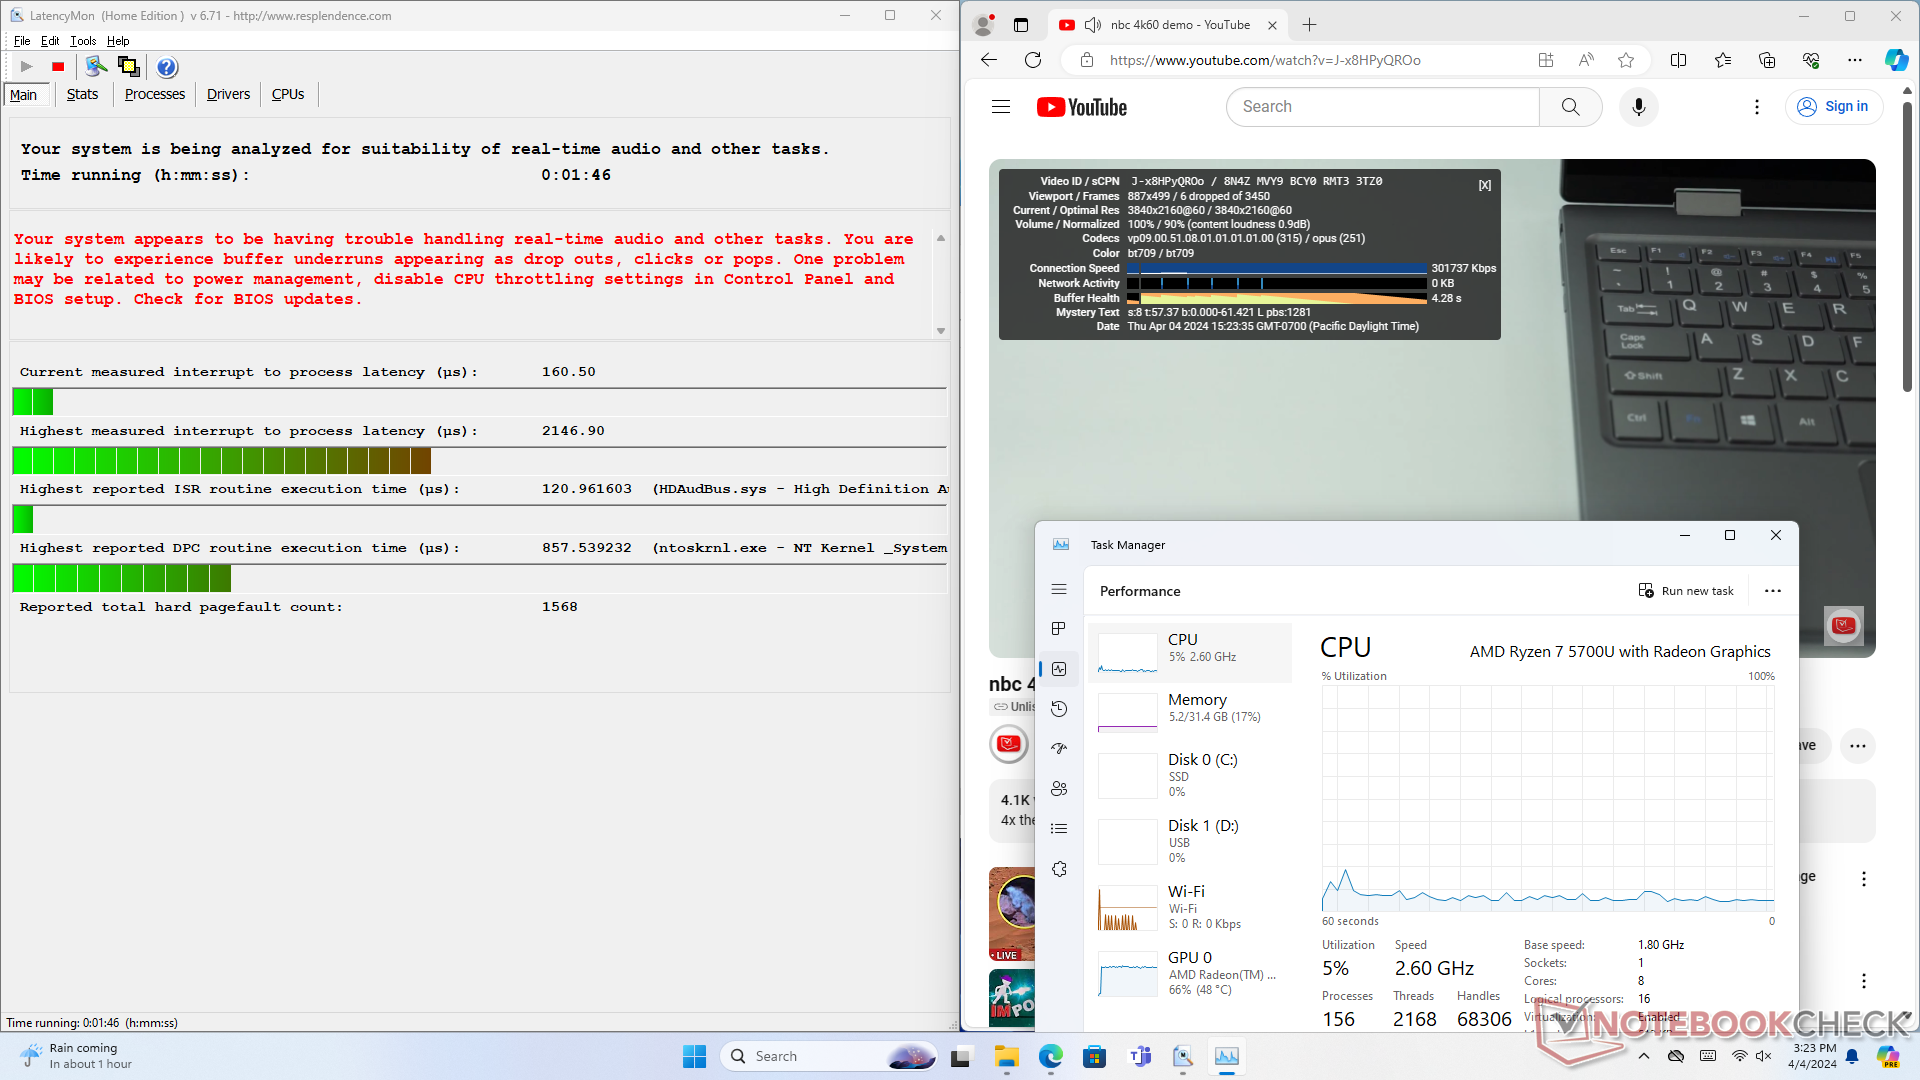
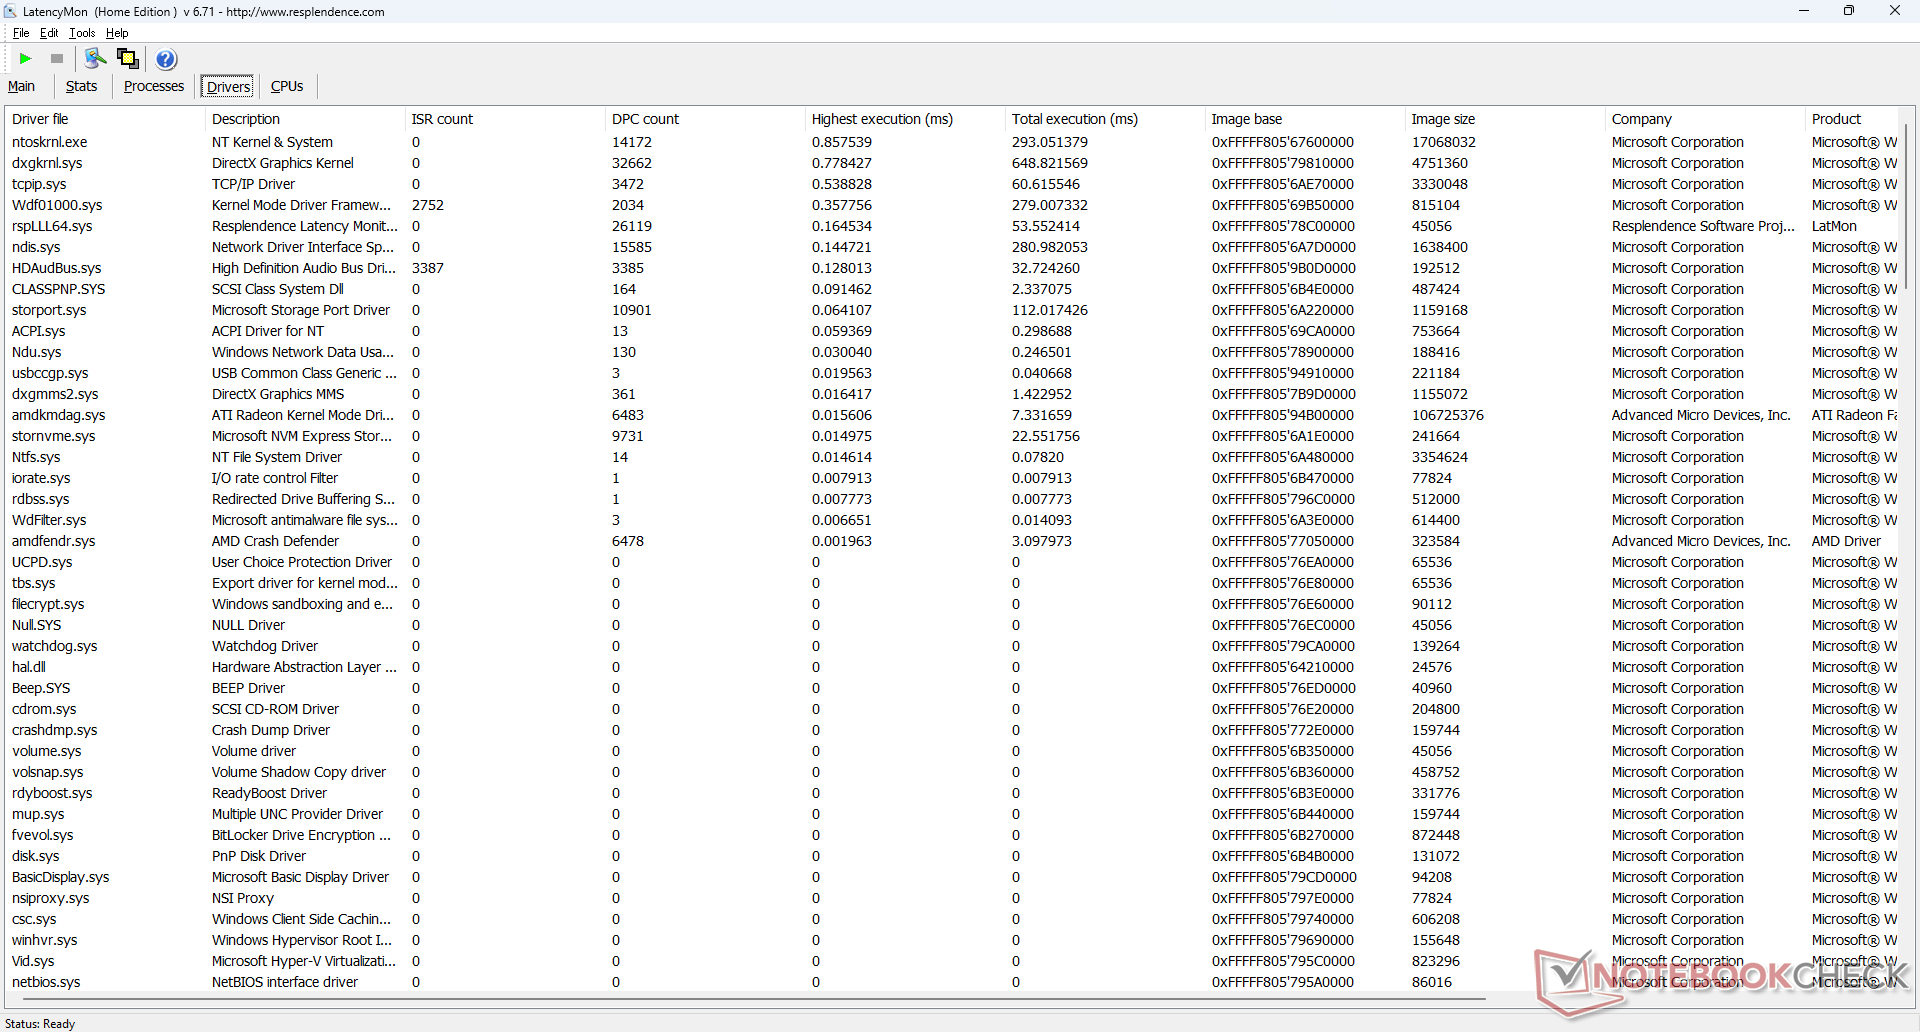
DPC Latency
LatencyMon reveals minor DPC issues when opening multiple browser tabs of our homepage. 4K video playback at 60 FPS is also imperfect with 6 dropped frames recorded during a one-minute timeframe.
| DPC Latencies / LatencyMon - interrupt to process latency (max), Web, Youtube, Prime95 | |
| GMK NucBox K6 | |
| Acemagic F2A | |
| GMK NucBox M5 | |
| Geekom A7 | |
| Intel NUC 13 Pro Desk Edition Kit | |
| GMK NucBox M4 | |
* ... smaller is better
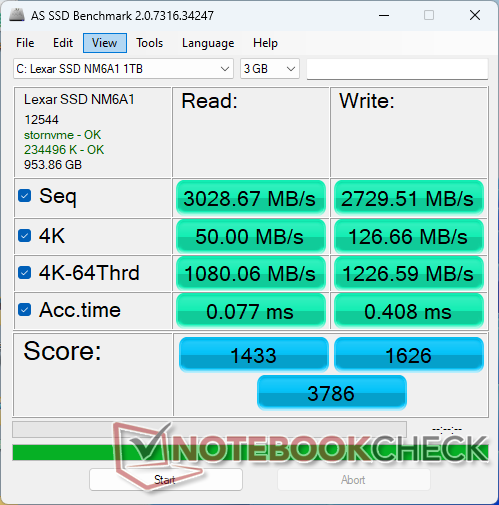
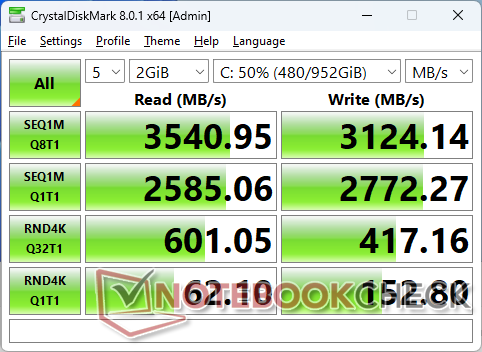
Storage Devices
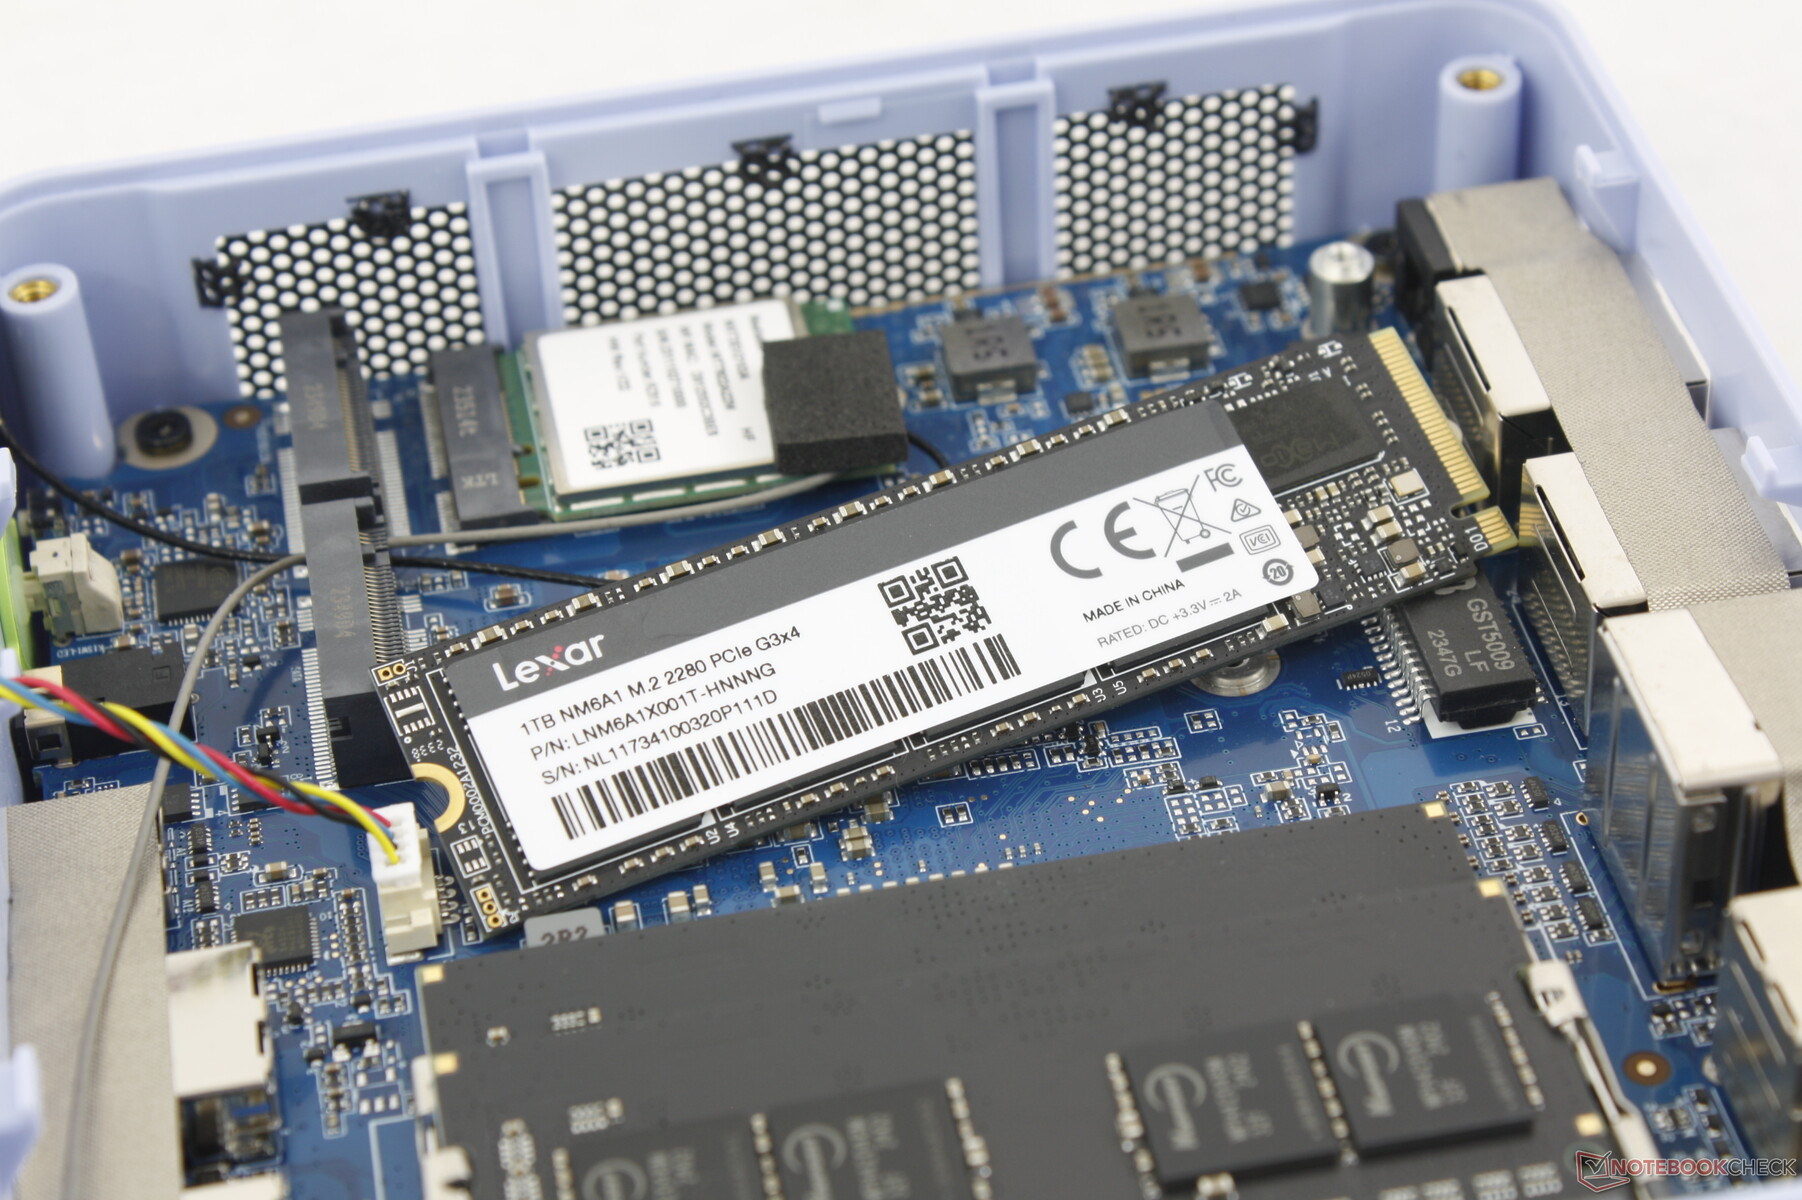
Much like on the NucBox M4, the M5 ships with a Lexar PCIe4 x4 NVMe SSD for steady transfer rates of up to 3600 MB/s. Sequential write speeds are quite good as well at 3100 MB/s to be one of the better midrange PCIe4 SSDs.

| Drive Performance rating - Percent | |
| GMK NucBox K6 | |
| Intel NUC 13 Pro Desk Edition Kit | |
| Geekom A7 | |
| Acemagic F2A | |
| GMK NucBox M5 | |
| GMK NucBox M4 | |
* ... smaller is better
Disk Throttling: DiskSpd Read Loop, Queue Depth 8
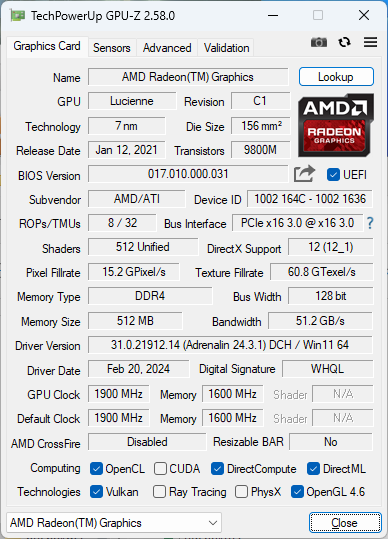
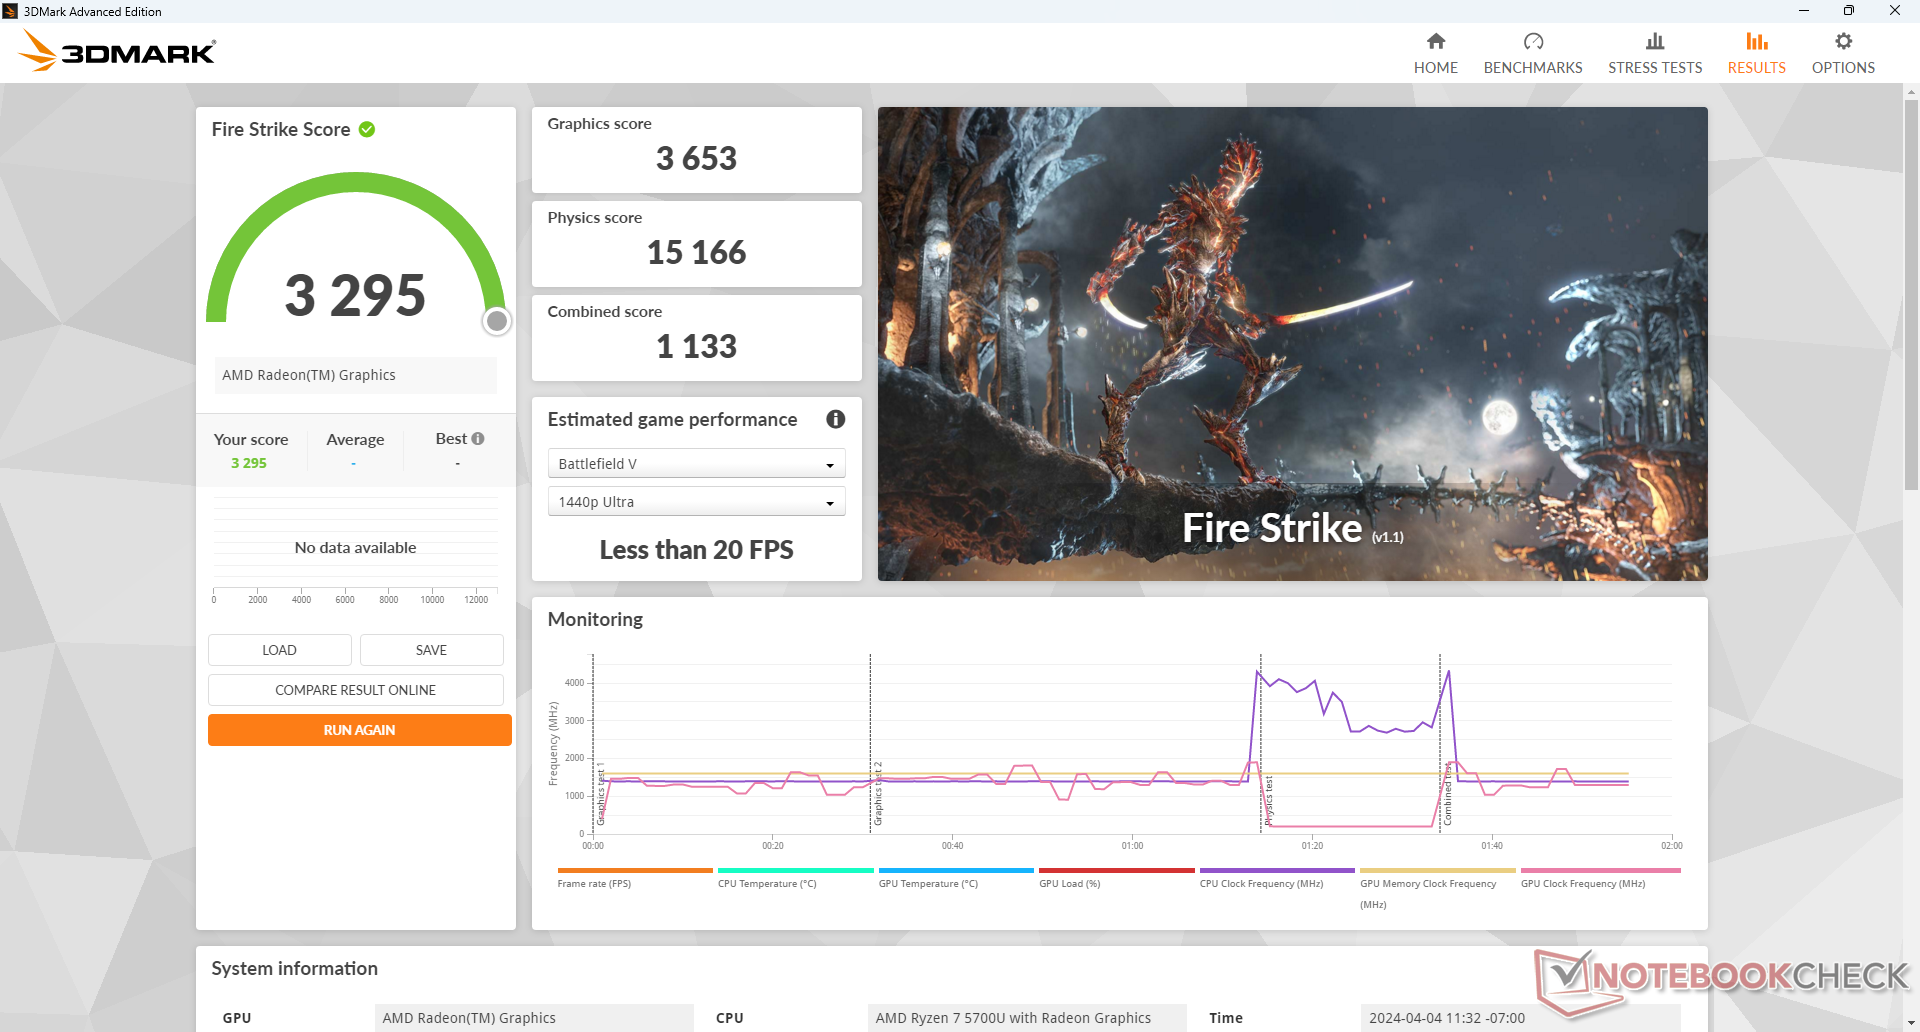
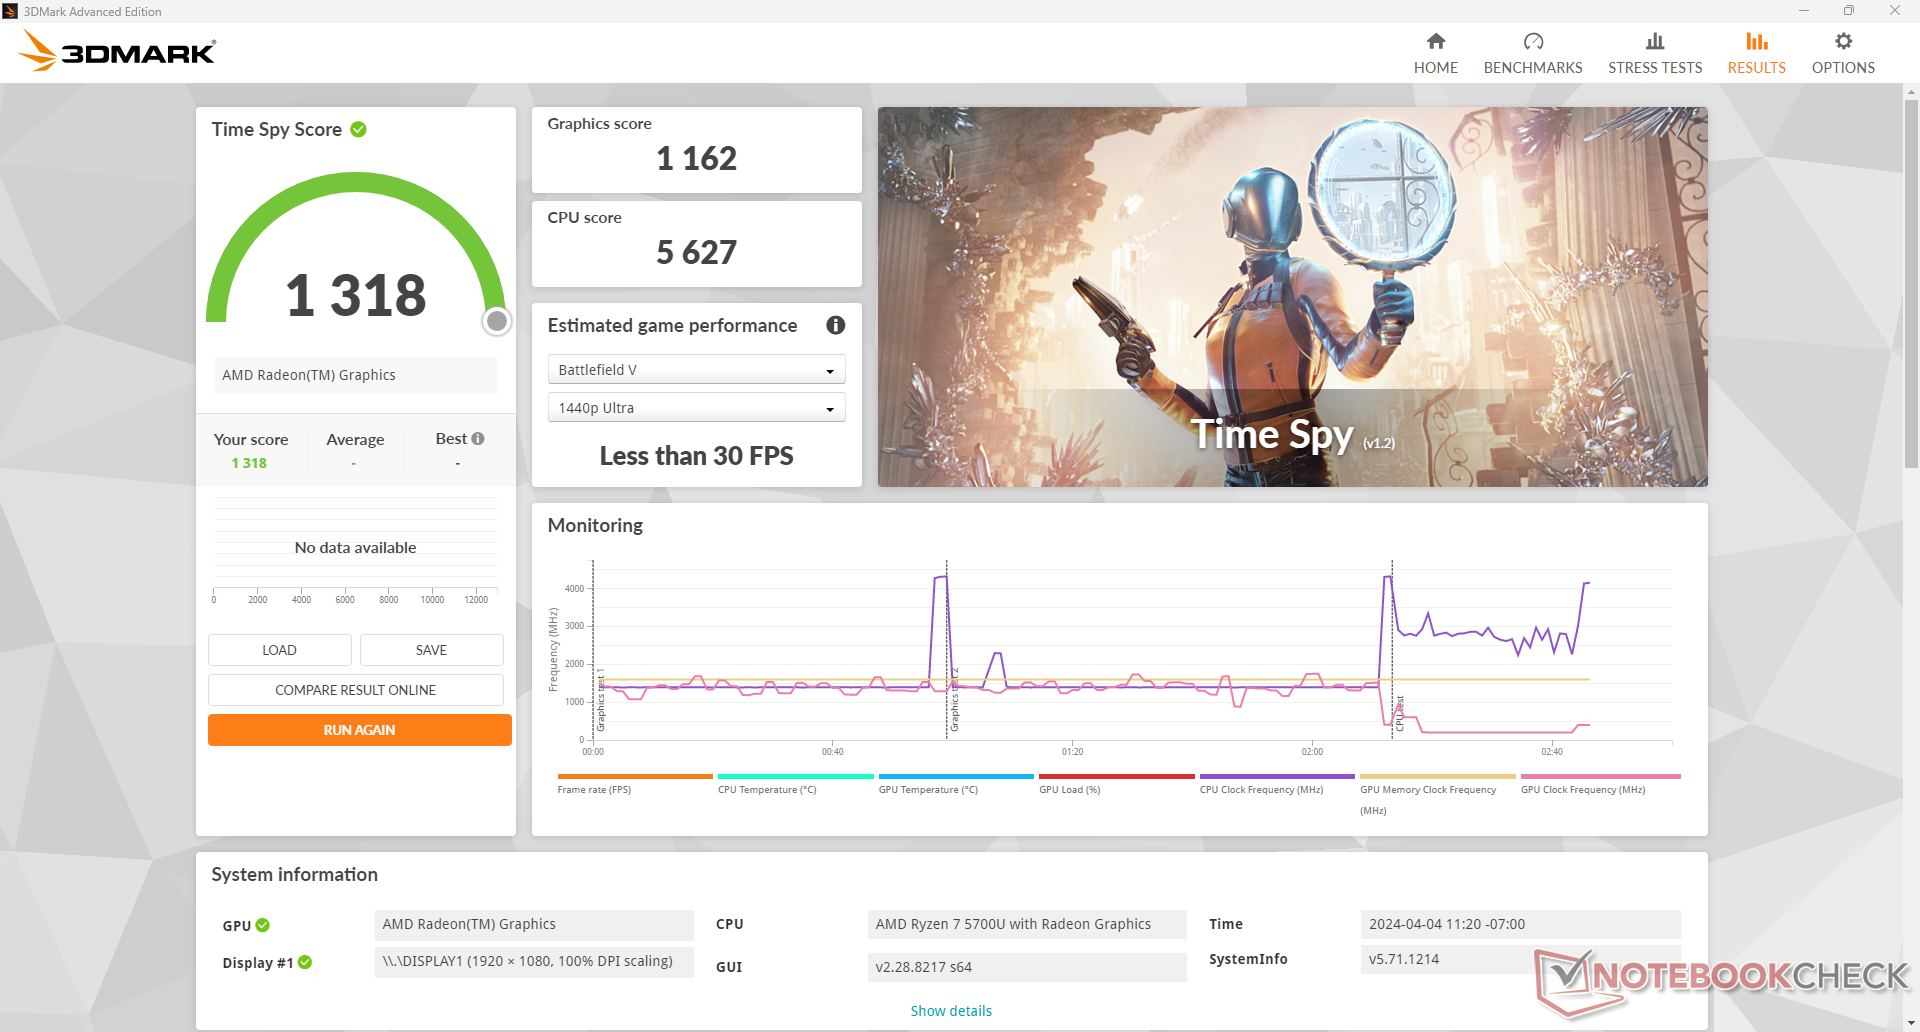
GPU Performance — Outdated Radeon RX Vega 8
The integrated Radeon RX Vega 8 predates the Radeon 680M and 780M that now dominate midrange or higher mini PCs and laptops. It's significantly slower than the Radeon 680M by about 50 to 60 percent to be more in line with the Iris Xe Graphics G7 96EUs on 11th gen Intel CPUs. The Radeon RX Vega 8 cannot run most games locally at reasonable frame rates.
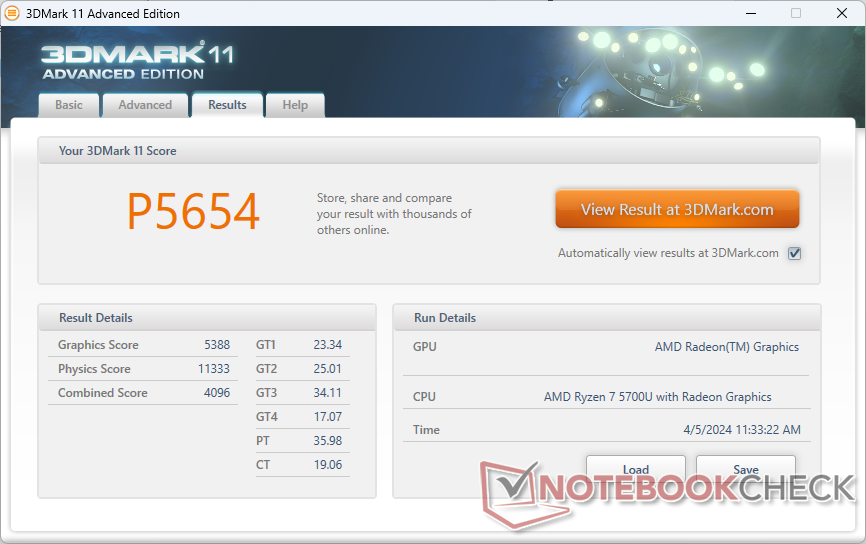
| 3DMark 11 Performance | 5654 points | |
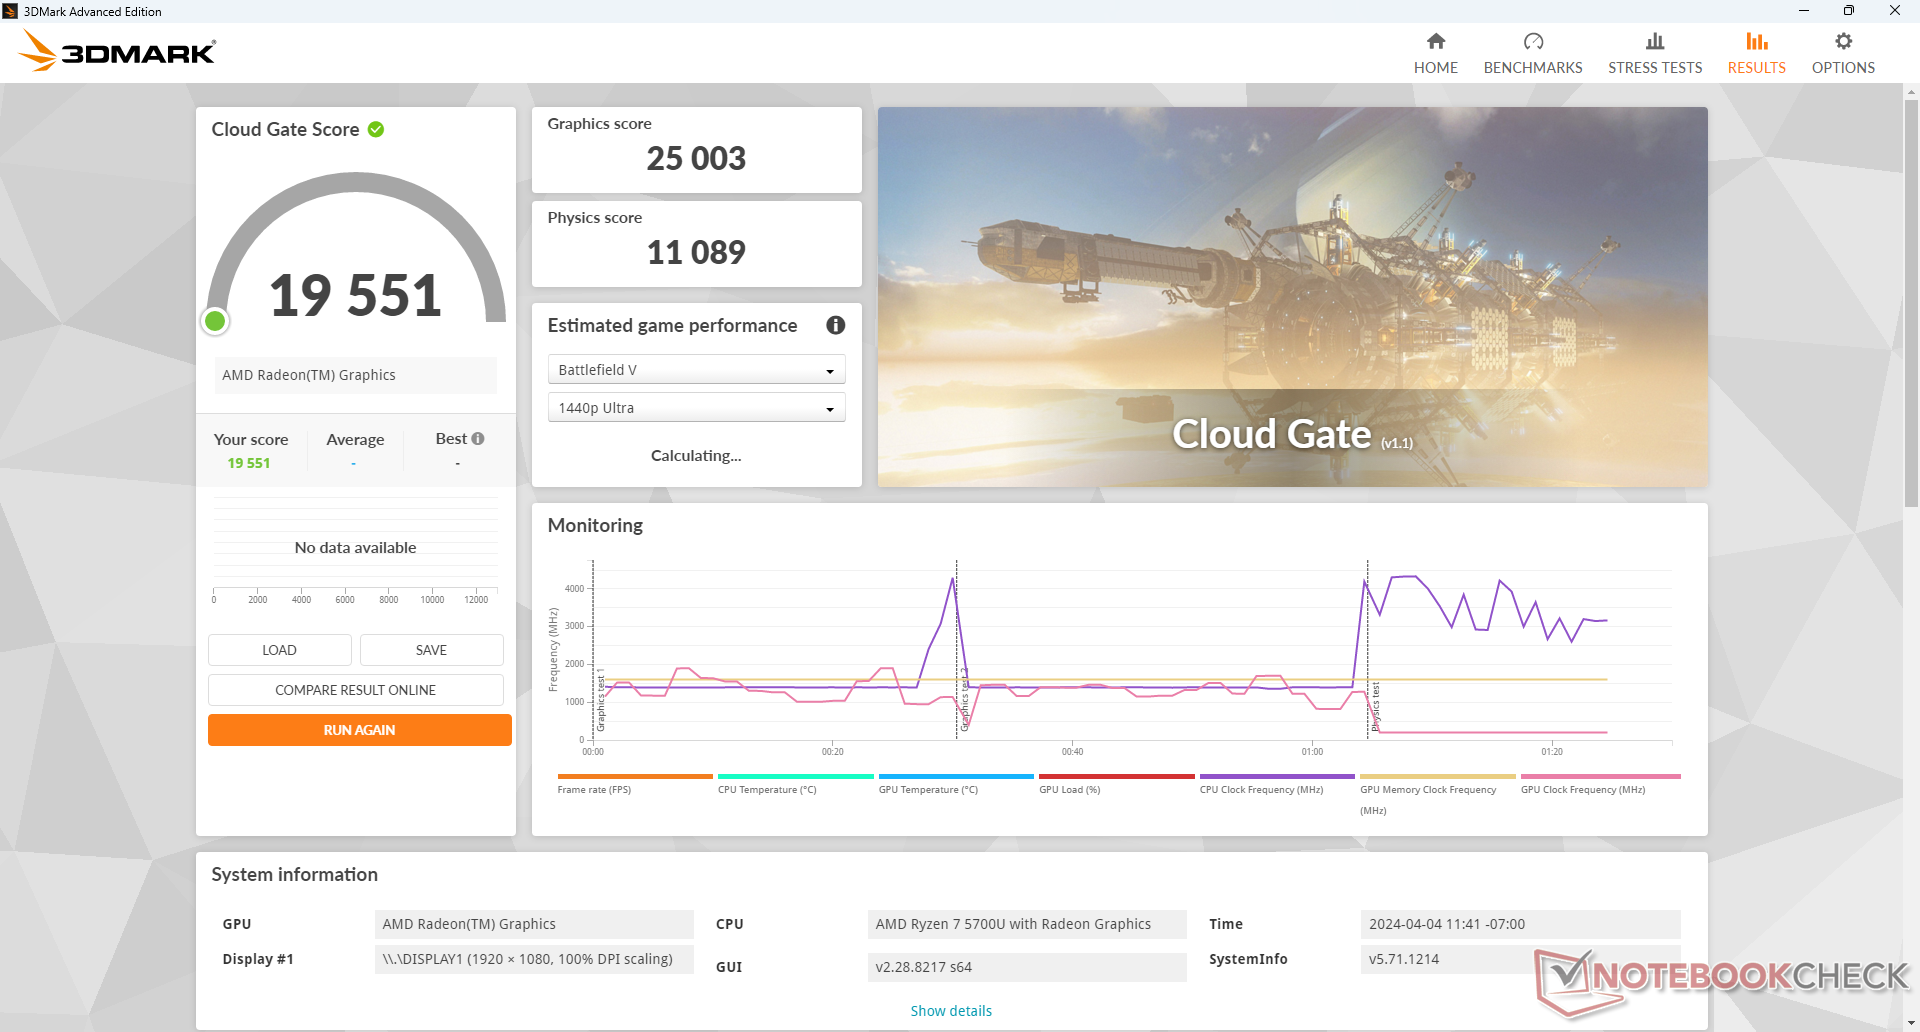
| 3DMark Cloud Gate Standard Score | 19551 points | |
| 3DMark Fire Strike Score | 3295 points | |
| 3DMark Time Spy Score | 1318 points | |
Help | ||
* ... smaller is better
| Performance rating - Percent | |
| GMK NucBox K6 | |
| Geekom A7 -1! | |
| Acemagic F2A | |
| Intel NUC 13 Pro Desk Edition Kit | |
| GMK NucBox M5 | |
| GMK NucBox M4 -1! | |
| The Witcher 3 - 1920x1080 Ultra Graphics & Postprocessing (HBAO+) | |
| Geekom A7 | |
| GMK NucBox K6 | |
| Acemagic F2A | |
| Intel NUC 13 Pro Desk Edition Kit | |
| GMK NucBox M5 | |
| GMK NucBox M4 | |
| Final Fantasy XV Benchmark - 1920x1080 High Quality | |
| GMK NucBox K6 | |
| Geekom A7 | |
| Acemagic F2A | |
| Intel NUC 13 Pro Desk Edition Kit | |
| GMK NucBox M5 | |
| Strange Brigade - 1920x1080 ultra AA:ultra AF:16 | |
| GMK NucBox K6 | |
| Acemagic F2A | |
| Intel NUC 13 Pro Desk Edition Kit | |
| GMK NucBox M5 | |
| GMK NucBox M4 | |
| Dota 2 Reborn - 1920x1080 ultra (3/3) best looking | |
| GMK NucBox K6 | |
| Geekom A7 | |
| Acemagic F2A | |
| Intel NUC 13 Pro Desk Edition Kit | |
| GMK NucBox M5 | |
| GMK NucBox M4 | |
| X-Plane 11.11 - 1920x1080 high (fps_test=3) | |
| Geekom A7 | |
| GMK NucBox K6 | |
| Intel NUC 13 Pro Desk Edition Kit | |
| Acemagic F2A | |
| GMK NucBox M5 | |
| GMK NucBox M4 | |
| Cyberpunk 2077 | |
| 1280x720 Low Preset (FSR off) | |
| Intel NUC X15 LAPAC71H | |
| GMK NucBox K6 | |
| Acemagic F2A | |
| Average AMD Radeon RX Vega 8 (Ryzen 4000/5000) (16.6 - 35.2, n=4) | |
| GMK NucBox M5 | |
| 1920x1080 Low Preset (FSR off) | |
| Intel NUC X15 LAPAC71H | |
| GMK NucBox K6 | |
| Acemagic F2A | |
| Average AMD Radeon RX Vega 8 (Ryzen 4000/5000) (9.9 - 19.9, n=5) | |
| GMK NucBox M5 | |
| 1920x1080 Medium Preset (FSR off) | |
| Intel NUC X15 LAPAC71H | |
| GMK NucBox K6 | |
| Acemagic F2A | |
| Average AMD Radeon RX Vega 8 (Ryzen 4000/5000) (7.7 - 14.8, n=4) | |
| GMK NucBox M5 | |
| 1920x1080 High Preset (FSR off) | |
| Intel NUC X15 LAPAC71H | |
| GMK NucBox K6 | |
| Acemagic F2A | |
| GMK NucBox M5 | |
| Average AMD Radeon RX Vega 8 (Ryzen 4000/5000) (5.71 - 12.3, n=5) | |
| 1920x1080 Ultra Preset (FSR off) | |
| Intel NUC X15 LAPAC71H | |
| GMK NucBox K6 | |
| Acemagic F2A | |
| Average AMD Radeon RX Vega 8 (Ryzen 4000/5000) (8.23 - 10.5, n=2) | |
| F1 22 | |
| 1280x720 Ultra Low Preset AA:T AF:16x | |
| Geekom A7 | |
| GMK NucBox K6 | |
| GMK NucBox K2 | |
| Acemagic F2A | |
| Intel NUC 13 Pro Desk Edition Kit | |
| Average AMD Radeon RX Vega 8 (Ryzen 4000/5000) (40.8 - 89.3, n=8) | |
| GMK NucBox M5 | |
| 1920x1080 Low Preset AA:T AF:16x | |
| GMK NucBox K6 | |
| Geekom A7 | |
| GMK NucBox K2 | |
| Acemagic F2A | |
| Intel NUC 13 Pro Desk Edition Kit | |
| GMK NucBox M5 | |
| Average AMD Radeon RX Vega 8 (Ryzen 4000/5000) (22.1 - 48.8, n=12) | |
| 1920x1080 Medium Preset AA:T AF:16x | |
| Geekom A7 | |
| GMK NucBox K6 | |
| GMK NucBox K2 | |
| Acemagic F2A | |
| Intel NUC 13 Pro Desk Edition Kit | |
| GMK NucBox M5 | |
| Average AMD Radeon RX Vega 8 (Ryzen 4000/5000) (19.7 - 42.4, n=13) | |
| 1920x1080 High Preset AA:T AF:16x | |
| GMK NucBox K6 | |
| Geekom A7 | |
| Acemagic F2A | |
| GMK NucBox K2 | |
| Intel NUC 13 Pro Desk Edition Kit | |
| GMK NucBox M5 | |
| Average AMD Radeon RX Vega 8 (Ryzen 4000/5000) (15.1 - 31.2, n=11) | |
| 1920x1080 Ultra High Preset AA:T AF:16x | |
| Intel NUC 13 Pro Desk Edition Kit | |
| Geekom A7 | |
| GMK NucBox K6 | |
| Average AMD Radeon RX Vega 8 (Ryzen 4000/5000) (11 - 22.5, n=8) | |
| GMK NucBox M5 | |
| Acemagic F2A | |
| GMK NucBox K2 | |
| Baldur's Gate 3 | |
| 1920x1080 Low Preset AA:SM | |
| Intel NUC X15 LAPAC71H | |
| GMK NucBox K6 | |
| GMK NucBox M5 | |
| Average AMD Radeon RX Vega 8 (Ryzen 4000/5000) (9.78 - 17.6, n=4) | |
| 1920x1080 Medium Preset AA:T | |
| Intel NUC X15 LAPAC71H | |
| GMK NucBox K6 | |
| Average AMD Radeon RX Vega 8 (Ryzen 4000/5000) (7.5 - 14.4, n=3) | |
| 1920x1080 High Preset AA:T | |
| Intel NUC X15 LAPAC71H | |
| GMK NucBox K6 | |
| Average AMD Radeon RX Vega 8 (Ryzen 4000/5000) (6.11 - 11.7, n=3) | |
Witcher 3 FPS Chart
| low | med. | high | ultra | |
|---|---|---|---|---|
| The Witcher 3 (2015) | 67.6 | 43.3 | 22 | 13.7 |
| Dota 2 Reborn (2015) | 99.7 | 80.6 | 50.5 | 47.6 |
| Final Fantasy XV Benchmark (2018) | 35.2 | 18 | 13.1 | |
| X-Plane 11.11 (2018) | 40.4 | 27.3 | 25.1 | |
| Far Cry 5 (2018) | 42 | 20 | 19 | 17 |
| Strange Brigade (2018) | 79.8 | 32.4 | 26.8 | 22.7 |
| Tiny Tina's Wonderlands (2022) | 27.3 | 21.5 | 13.8 | 10.3 |
| F1 22 (2022) | 35.7 | 32.3 | 23.8 | 16.8 |
| Baldur's Gate 3 (2023) | 14.2 | |||
| Cyberpunk 2077 (2023) | 13.8 | 10.9 | 9.17 |
Emissions
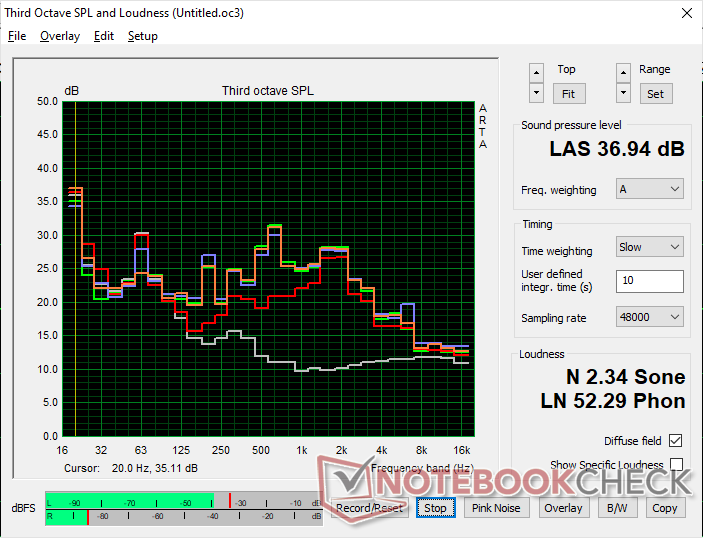
System Noise
Fan noise is always present at a floor of 33.8 dB(A) no matter the onscreen load or profile setting. The quiet whir is audible in an HTPC environment like the living room, but it's not loud enough to be distracting.
Fan RPM range is thankfully quite narrow and so the difference between maximum and minimum fan noise is relatively small. For example, we're able to record a maximum of just 37 dB(A) compared to over 48 dB(A) on the NucBox K6 or Acemagic F2A.
Noise level
| Idle |
| 33.8 / 33.8 / 33.8 dB(A) |
| Load |
| 36.5 / 36.9 dB(A) |
 | ||
30 dB silent 40 dB(A) audible 50 dB(A) loud |
||
min: | ||
| GMK NucBox M5 Vega 8, R7 5700U, Lexar 1024GB LNM6A1X001T-HNNNG | GMK NucBox M4 UHD Graphics Xe 32EUs (Tiger Lake-H), i9-11900H, Lexar NM620 512GB | GMK NucBox K6 Radeon 780M, R7 7840HS, MasonSemi 1TB MC7000 | Acemagic F2A Arc 8-Core, Ultra 7 155H, Kingston OM8SEP1024Q-A0 | Geekom A7 Radeon 780M, R9 7940HS, Acer N5000 | Intel NUC 13 Pro Desk Edition Kit Iris Xe G7 96EUs, i7-1360P, Samsung PM9A1 MZVL2512HCJQ | |
|---|---|---|---|---|---|---|
| Noise | 12% | -9% | -3% | -9% | 2% | |
| off / environment * (dB) | 23.4 | 22.7 3% | 23.2 1% | 24.9 -6% | 25.4 -9% | 25.2 -8% |
| Idle Minimum * (dB) | 33.8 | 24.4 28% | 31.3 7% | 25.4 25% | 33.3 1% | 28.1 17% |
| Idle Average * (dB) | 33.8 | 24.4 28% | 31.3 7% | 25.7 24% | 33.6 1% | 28.2 17% |
| Idle Maximum * (dB) | 33.8 | 28 17% | 33.4 1% | 25.7 24% | 33.7 -0% | 28.3 16% |
| Load Average * (dB) | 36.5 | 28 23% | 47.5 -30% | 47.8 -31% | 43.3 -19% | 42 -15% |
| Witcher 3 ultra * (dB) | 36.8 | 33.7 8% | 43.6 -18% | 45.23 -23% | 43.2 -17% | |
| Load Maximum * (dB) | 36.9 | 44.6 -21% | 47.7 -29% | 49 -33% | 43.3 -17% | 42.1 -14% |
* ... smaller is better
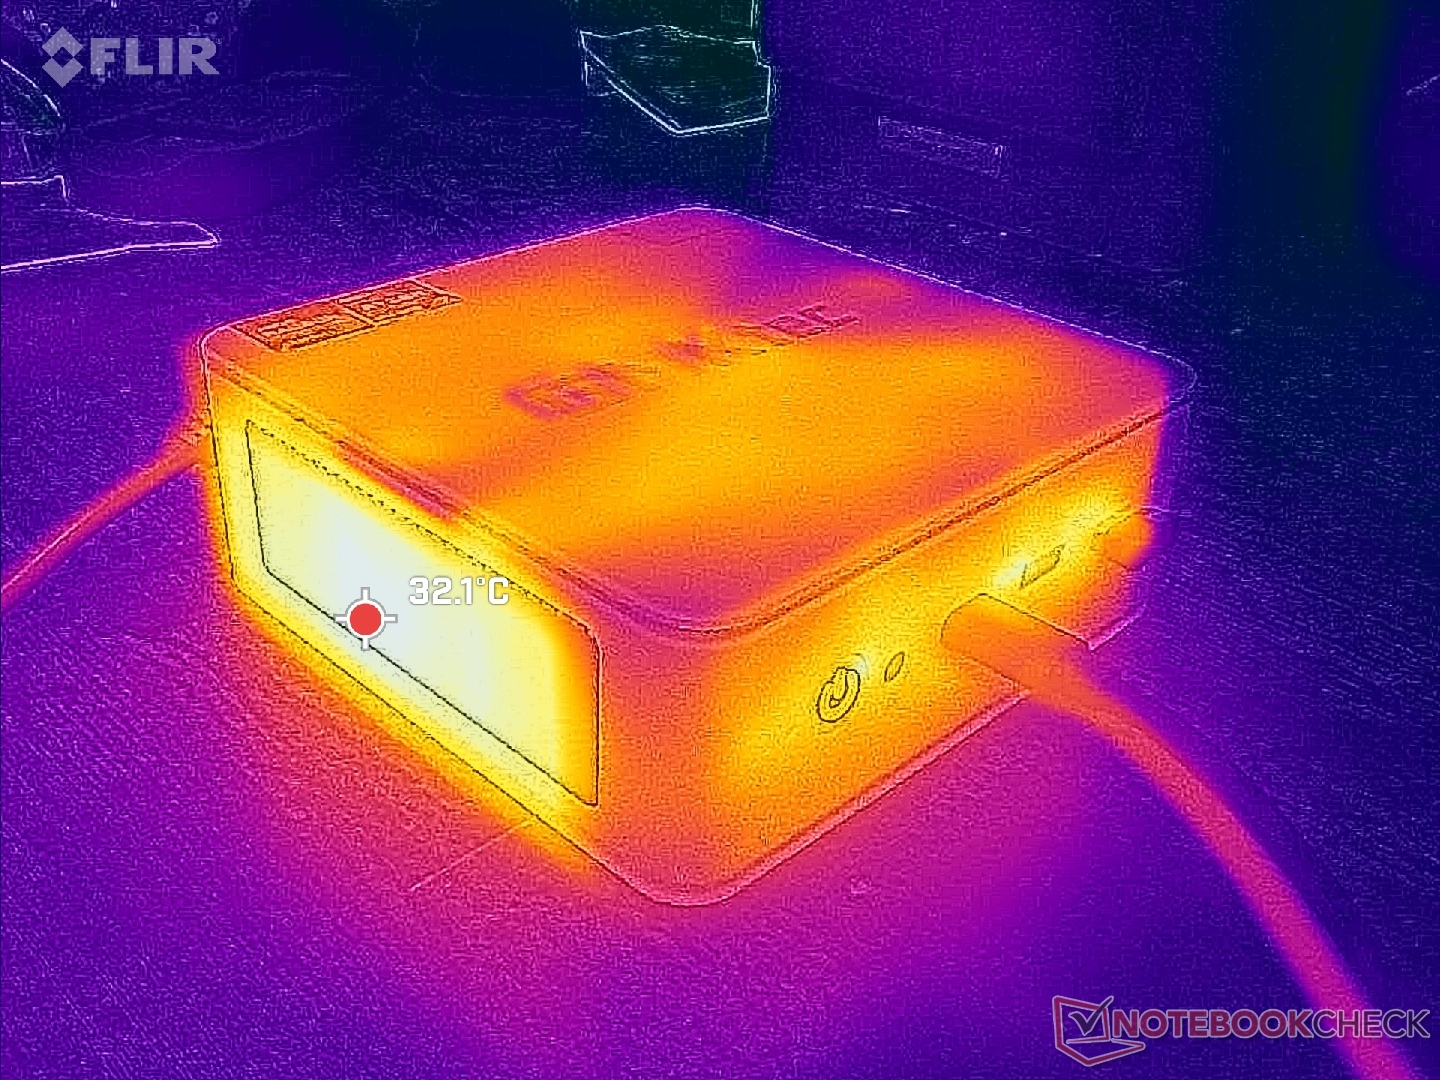
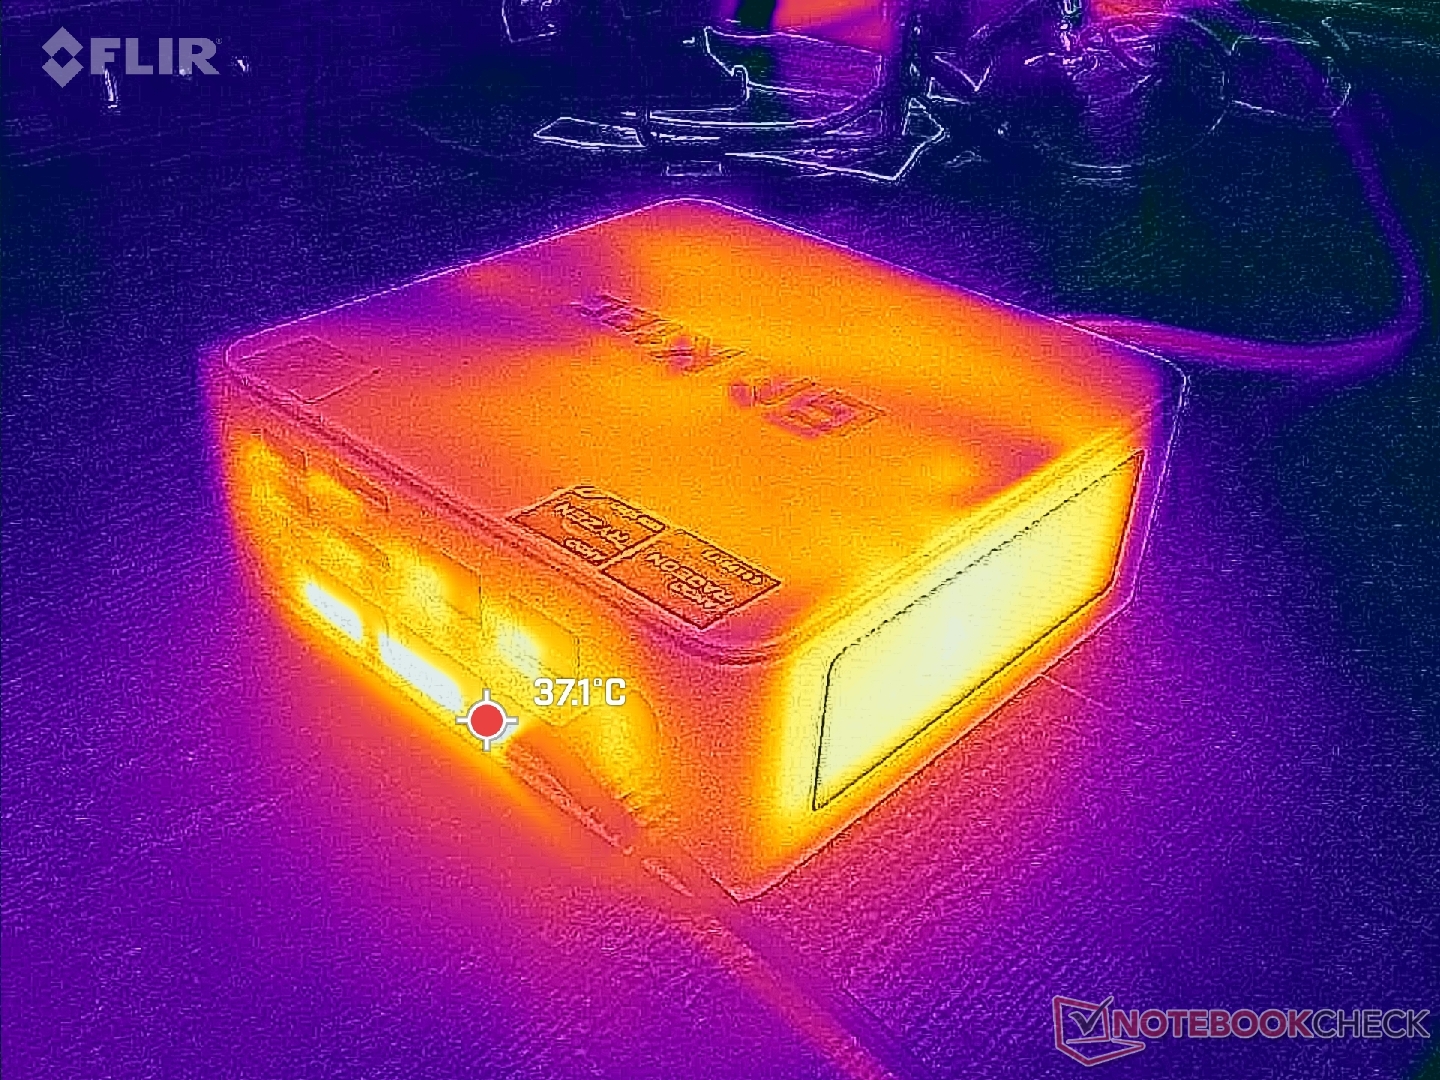
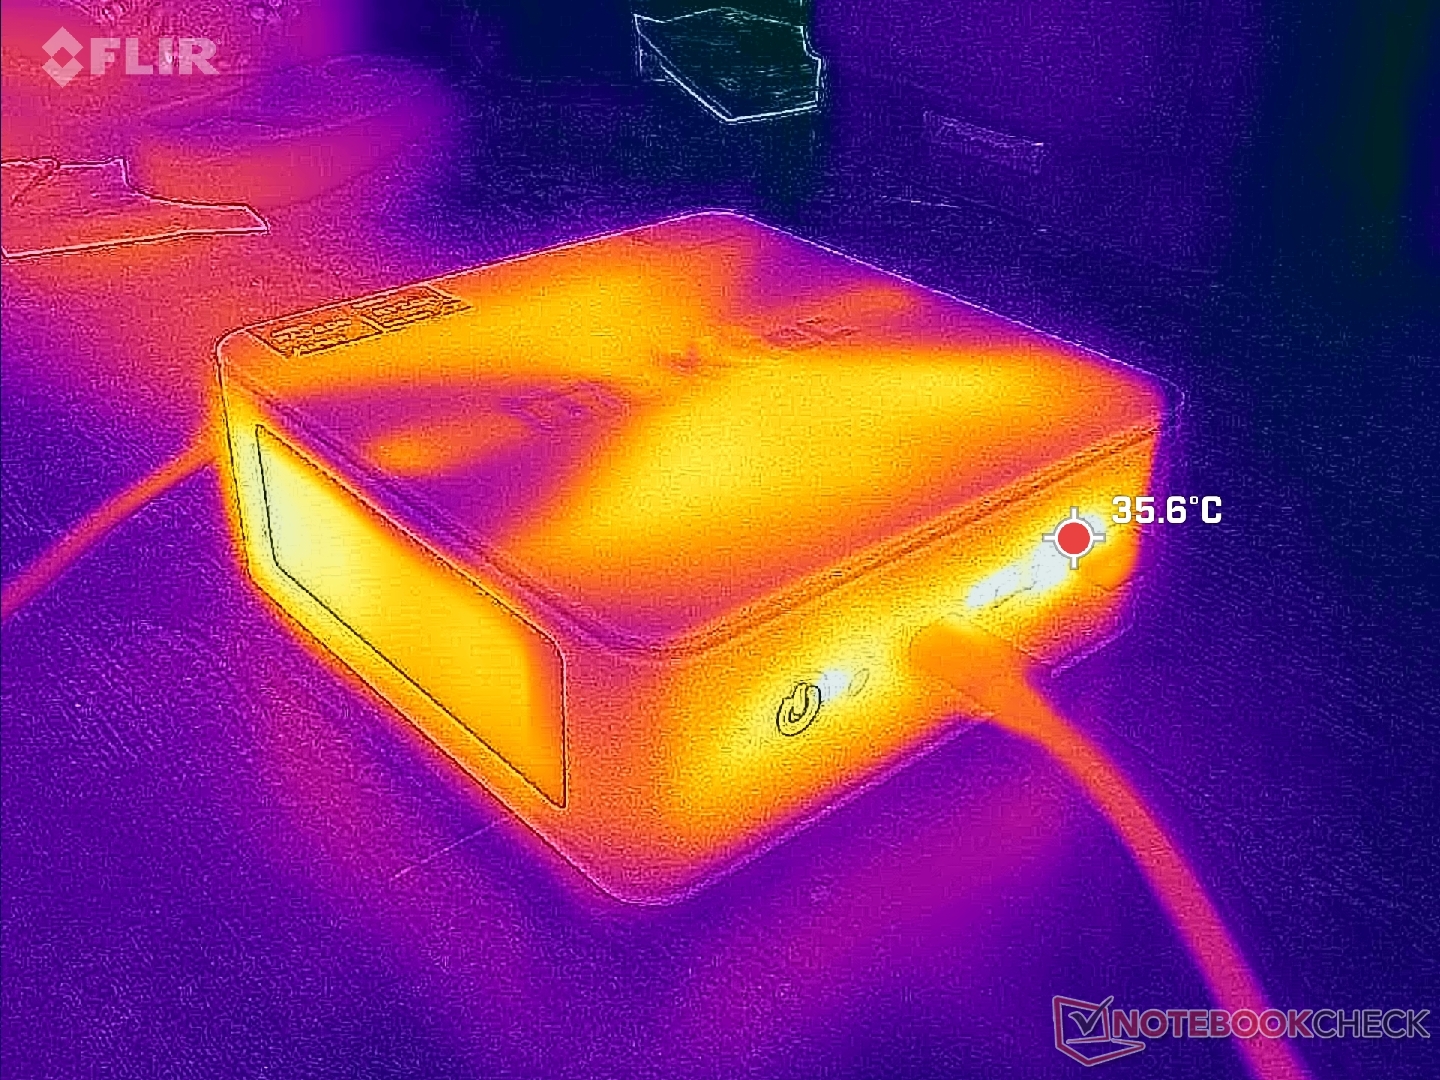
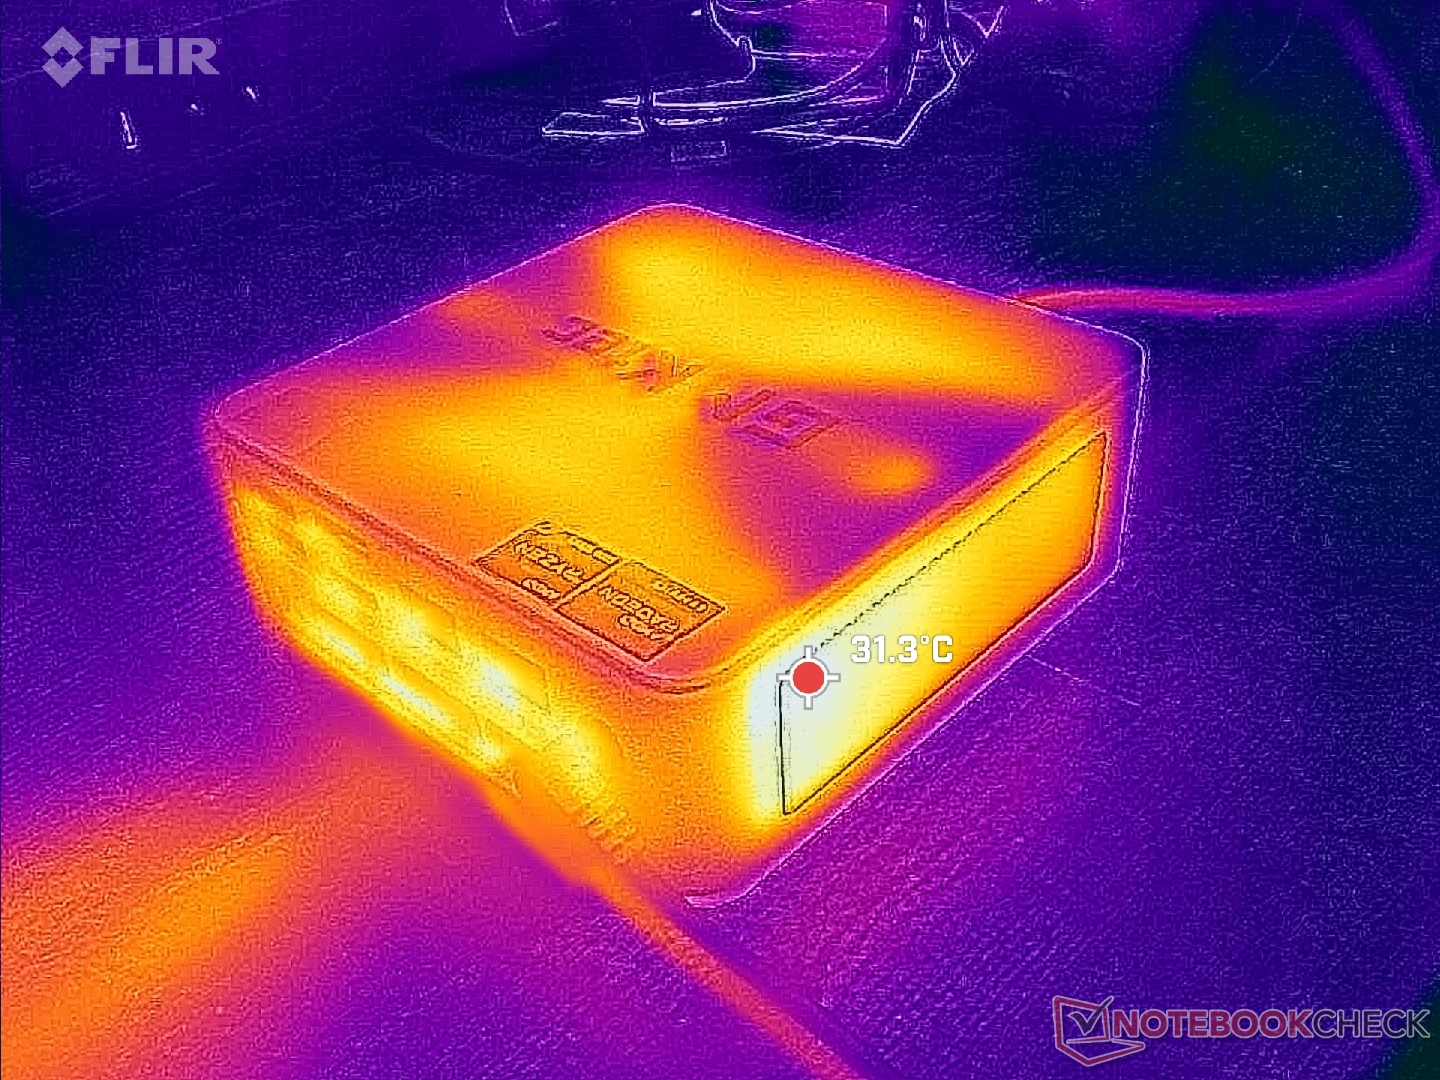
Temperature
Surface temperatures are not an issue due to superfluous ventilation all around the chassis. The system utilizes two fans much like on the NucBox K6 even though one fan would have likely been sufficient considering the low-power Core U-series CPU.
Energy Management
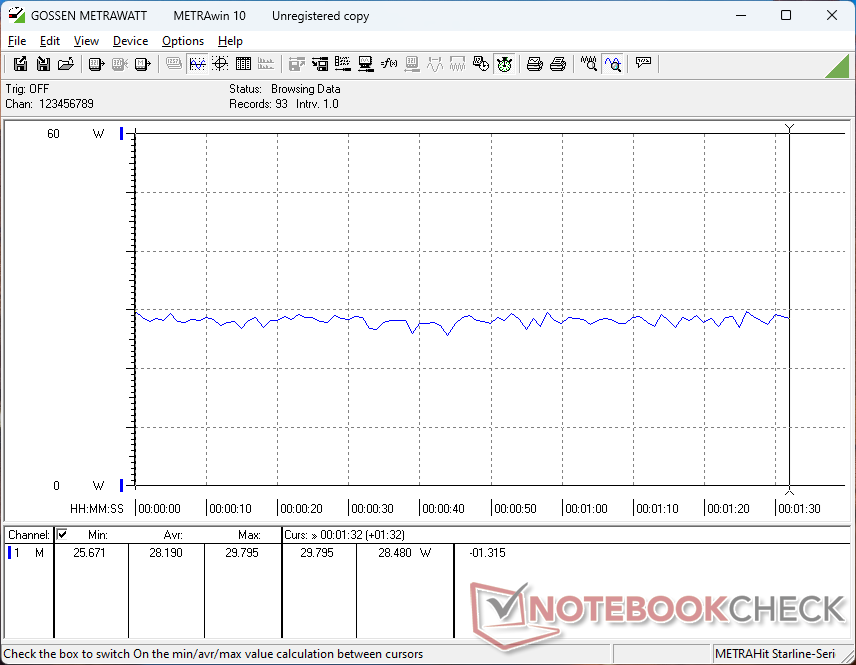
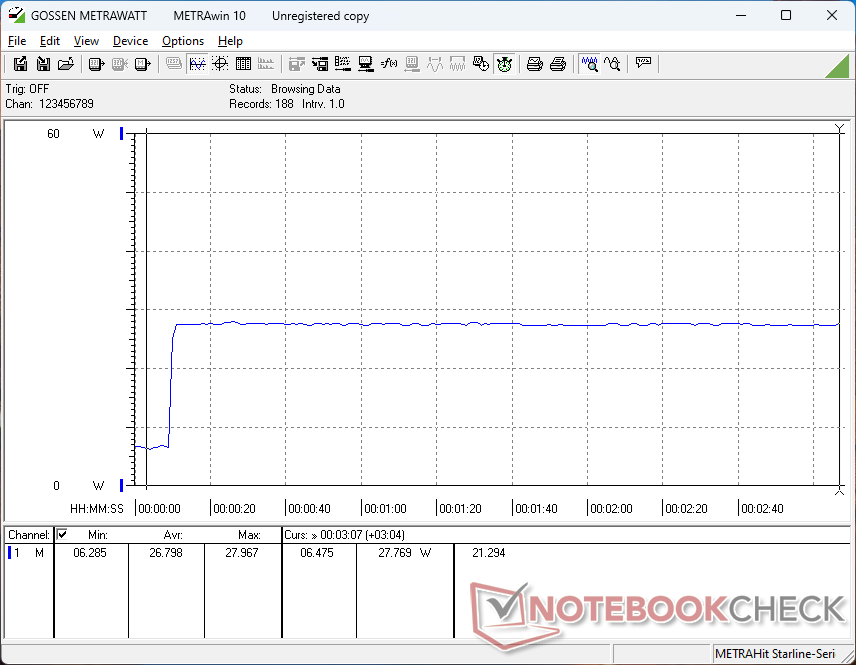
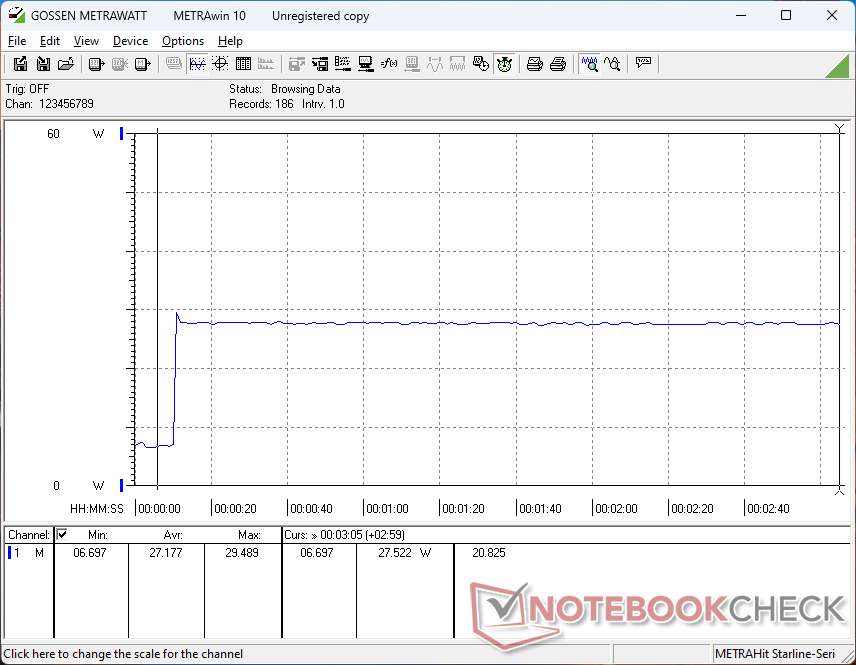
Power Consumption
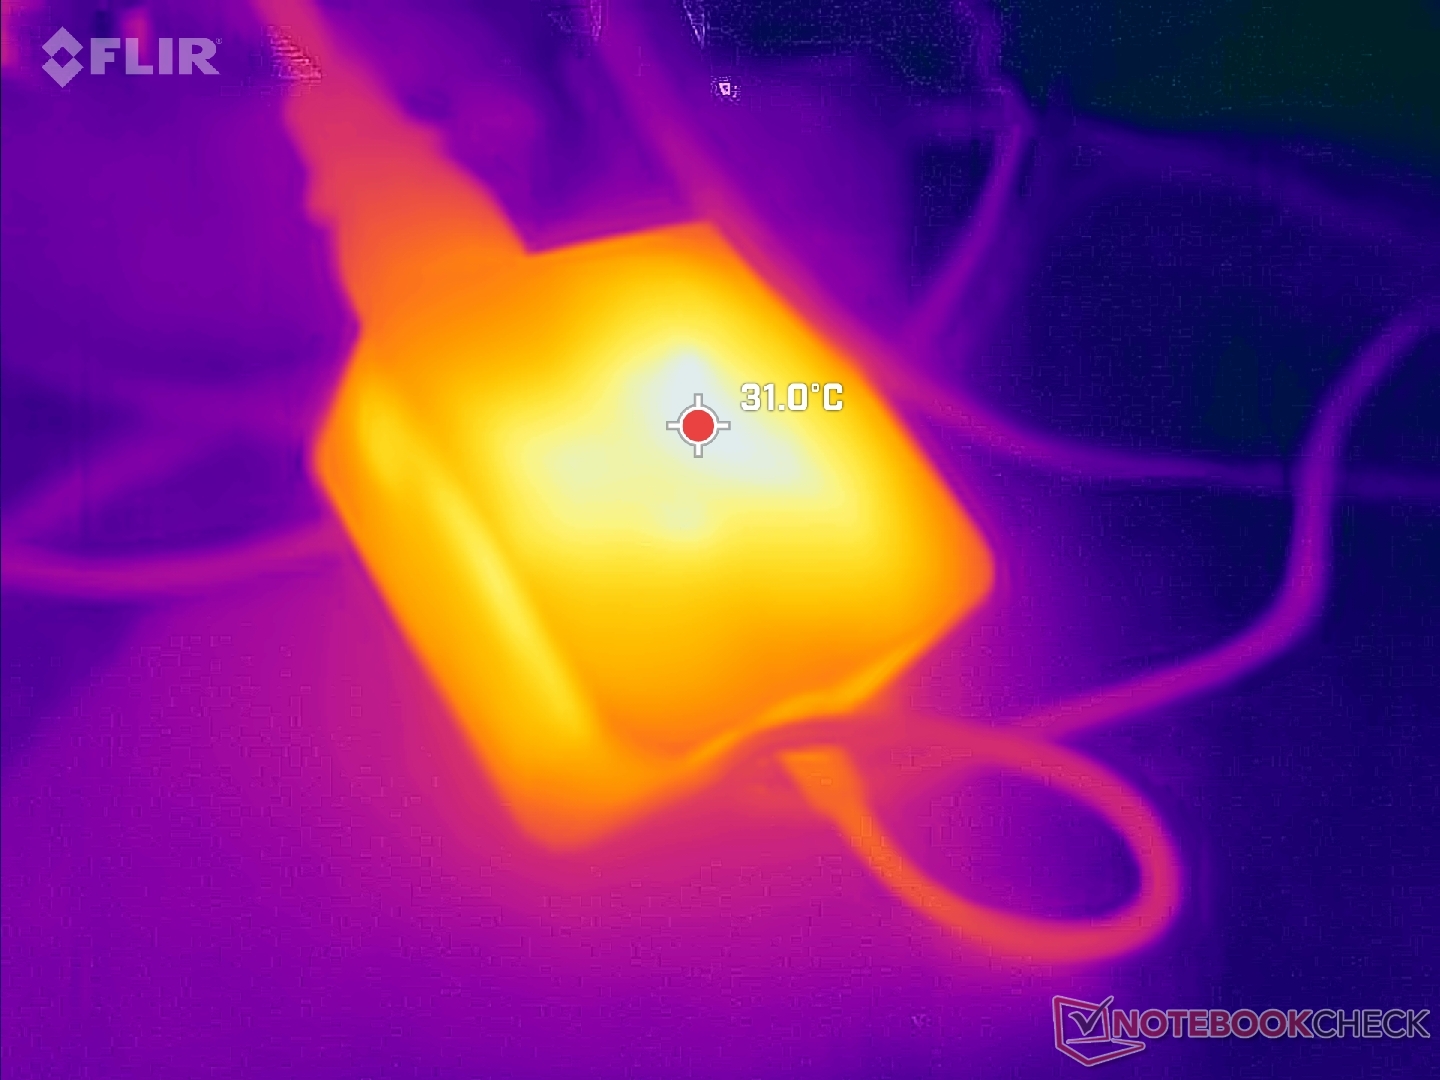
Running Witcher 3 to represent typical high loads would draw around 35 W or just under half of what the NucBox K6 demands. The power savings are enough to make the NucBox M5 more efficient than most other mini PCs which also correlate with the low maximum fan noise and TDP ceiling. However, CPU and GPU performance suffer as a result.
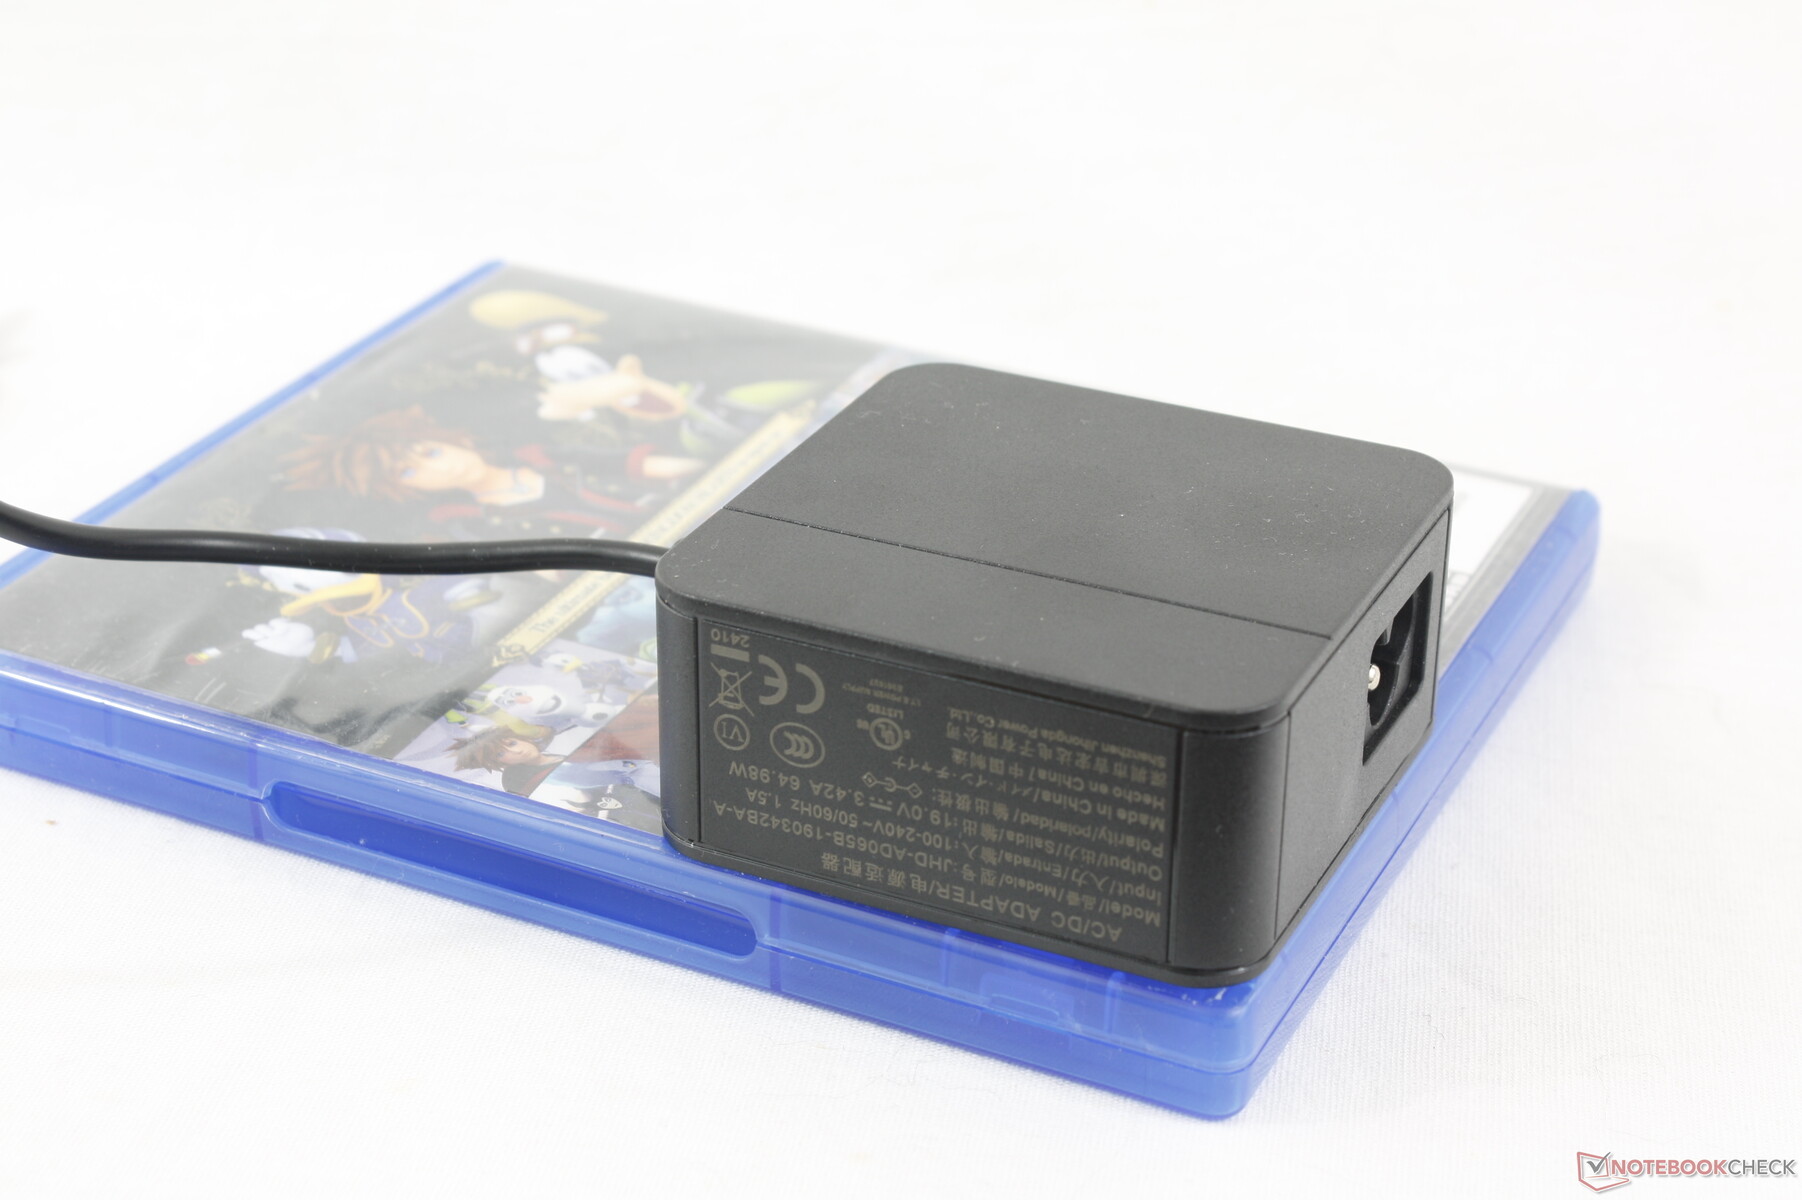
The model ships with a much smaller (~6.8 x 6.8 x 3.2 cm) 65 W AC adapter when compared to the 130 W adapter that ships with the NucBox K6. Third-party USB-C AC adapters are supported.

| Off / Standby | |
| Idle | |
| Load |
|
Key:
min: | |
| GMK NucBox M5 R7 5700U, Vega 8, Lexar 1024GB LNM6A1X001T-HNNNG, , x, | GMK NucBox M4 i9-11900H, UHD Graphics Xe 32EUs (Tiger Lake-H), Lexar NM620 512GB, , x, | GMK NucBox K6 R7 7840HS, Radeon 780M, MasonSemi 1TB MC7000, , x, | Acemagic F2A Ultra 7 155H, Arc 8-Core, Kingston OM8SEP1024Q-A0, , x, | Geekom A7 R9 7940HS, Radeon 780M, Acer N5000, , x, | Intel NUC 13 Pro Desk Edition Kit i7-1360P, Iris Xe G7 96EUs, Samsung PM9A1 MZVL2512HCJQ, , x, | |
|---|---|---|---|---|---|---|
| Power Consumption | -153% | -96% | -123% | -64% | -88% | |
| Idle Minimum * (Watt) | 5.9 | 15.2 -158% | 6.7 -14% | 9.1 -54% | 3.8 36% | 7 -19% |
| Idle Average * (Watt) | 6.2 | 17.2 -177% | 7 -13% | 10.3 -66% | 4.8 23% | 9.2 -48% |
| Idle Maximum * (Watt) | 6.4 | 17.4 -172% | 7.6 -19% | 14.4 -125% | 6.5 -2% | 11.8 -84% |
| Load Average * (Watt) | 28.2 | 40 -42% | 74.3 -163% | 54.9 -95% | 71.9 -155% | 45 -60% |
| Witcher 3 ultra * (Watt) | 27.5 | 50.6 -84% | 75 -173% | |||
| Load Maximum * (Watt) | 29.5 | 112.8 -282% | 85.7 -191% | 110.4 -274% | 94.7 -221% | 97.2 -229% |
* ... smaller is better
Power Consumption Witcher 3 / Stresstest
Power Consumption external Monitor
Pros
Cons
Verdict — Better Options Are Available
The NucBox M5 currently retails for $300 to $380 with RAM and storage. Meanwhile, the NucBox K6 can be found for $500 while offering 2x to 2.5x the CPU and GPU performance without being any bigger or heavier. Needless to say, it's hard to recommend the NucBox M5 when GMktec already offers an objectively better alternative for not that much more. Even outside of GMK, the Beelink SER6 can be found for under $500 with much faster performance than the NucBox M5.
The NucBox M5 isn't necessarily a bad system, but there are a handful of much faster mini PCs available for the same <$500 price range.
There are some standout features of the NucBox M5 including the dual 2.5 Gbps RJ-45 ports, dual fans, and SSD heatsink all of which are relatively uncommon on budget mini PCs. Nonetheless, the poor performance-per-dollar overshadows any advantages the model might have.
Price and Availability
GMK NucBox M5
- 04/10/2024 v7 (old)
Allen Ngo
Transparency
The selection of devices to be reviewed is made by our editorial team. The test sample was provided to the author as a loan by the manufacturer or retailer for the purpose of this review. The lender had no influence on this review, nor did the manufacturer receive a copy of this review before publication. There was no obligation to publish this review. As an independent media company, Notebookcheck is not subjected to the authority of manufacturers, retailers or publishers.
This is how Notebookcheck is testing
Every year, Notebookcheck independently reviews hundreds of laptops and smartphones using standardized procedures to ensure that all results are comparable. We have continuously developed our test methods for around 20 years and set industry standards in the process. In our test labs, high-quality measuring equipment is utilized by experienced technicians and editors. These tests involve a multi-stage validation process. Our complex rating system is based on hundreds of well-founded measurements and benchmarks, which maintains objectivity. Further information on our test methods can be found here.
Price comparison
