Maxtang MTN-FP750 mini PC review: AMD Ryzen 7 7735HS slowed down by a poorly conceived configuration

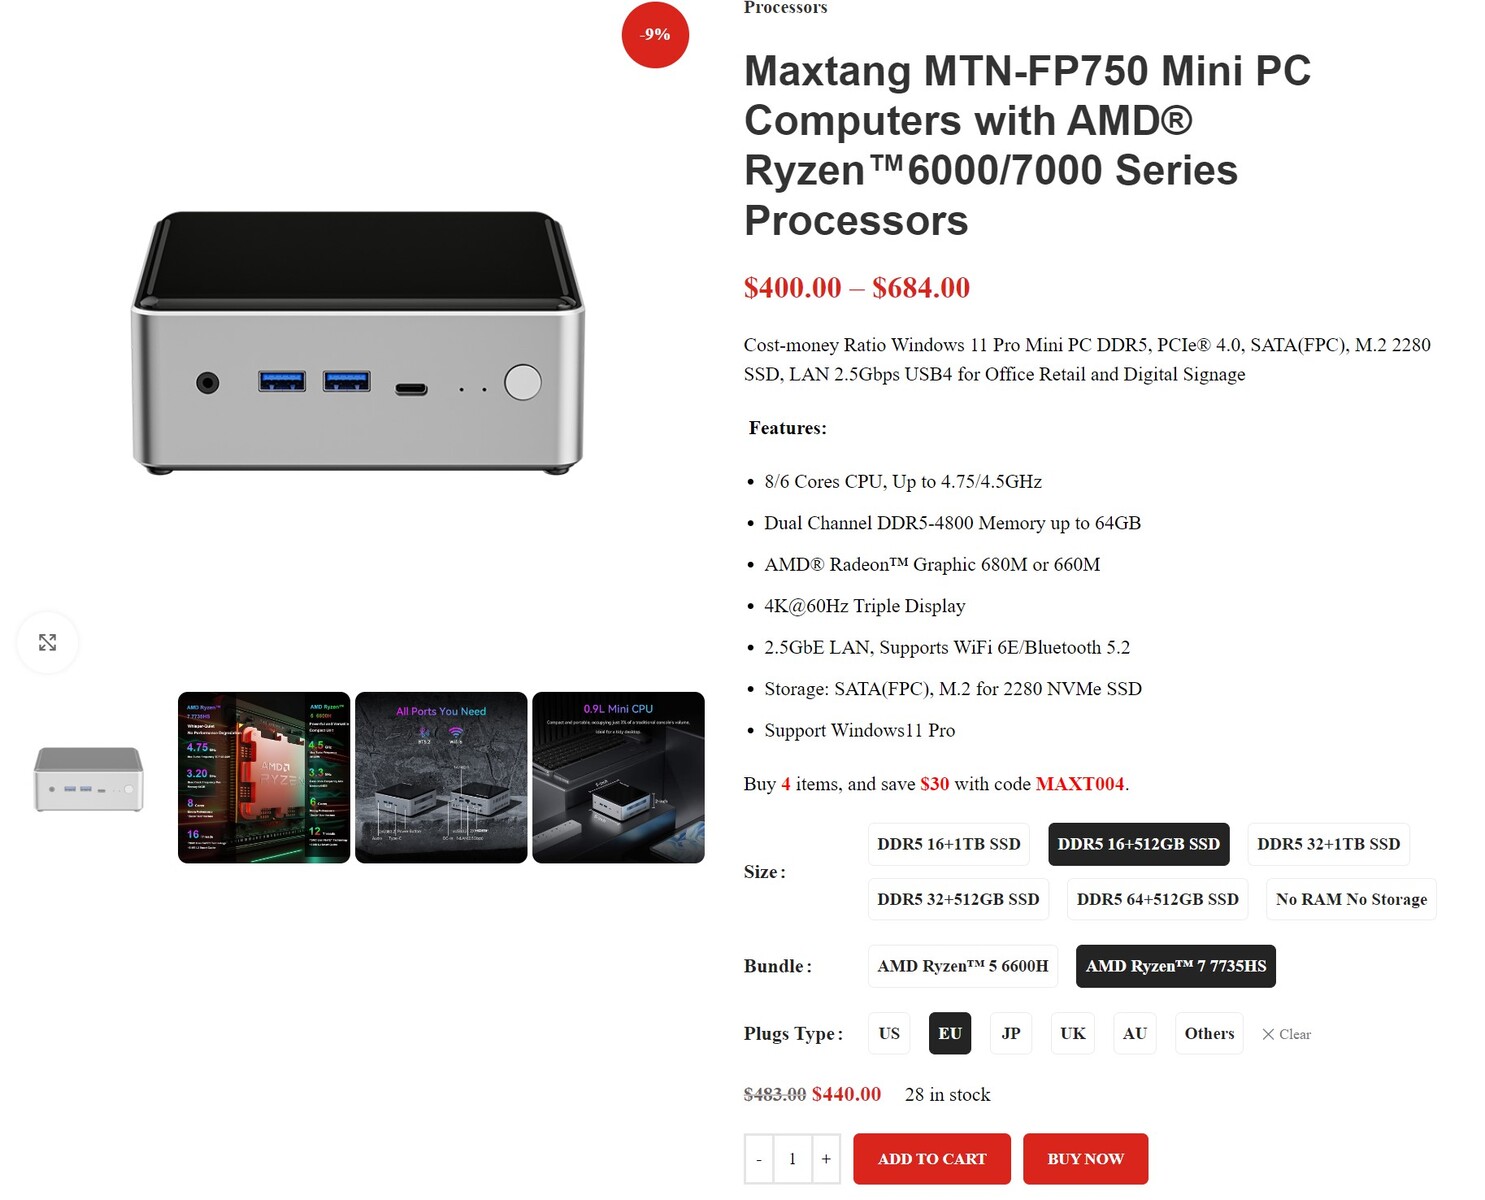
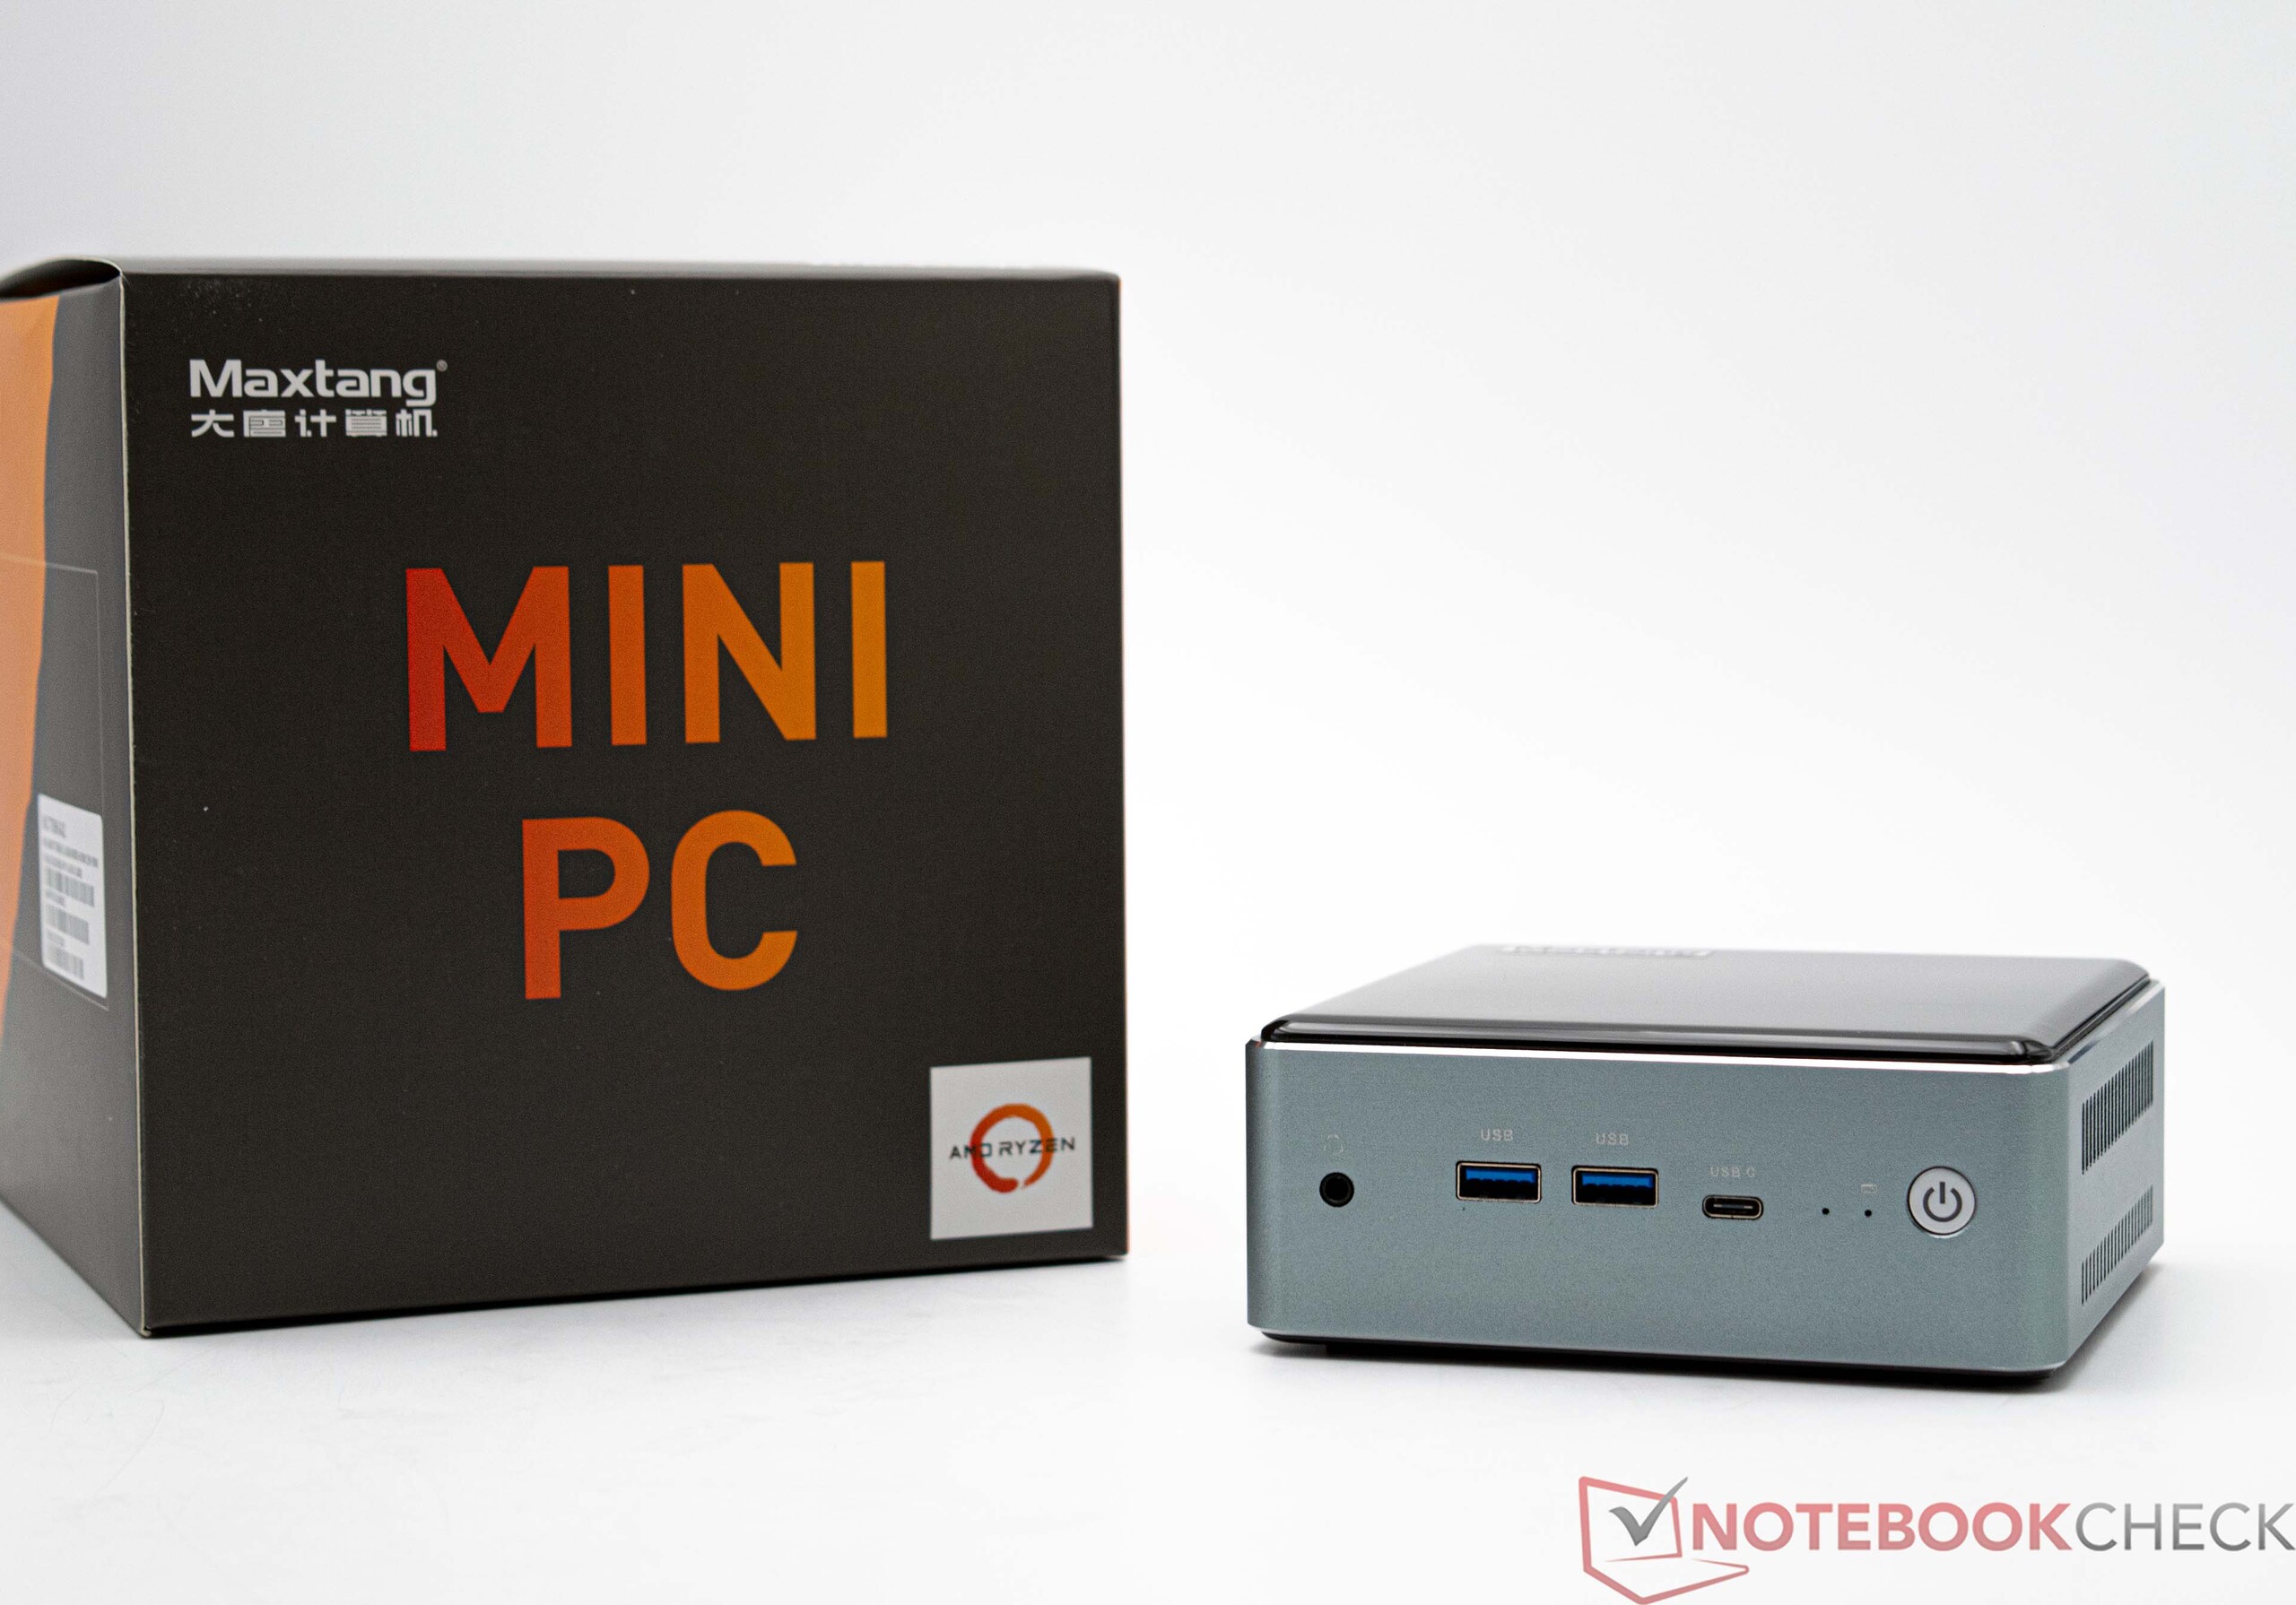
Maxtang is a Chinese system manufacturer that sells special industrial solutions in the form of embedded systems as well as mini PCs designed for office use. In this review, we are focussing on the Maxtang MTN-FP750 which costs $440 US dollars. The system is comprised of an AMD Ryzen 7 7735HS and 16 GB of DDR5 RAM as well as a 512 GB SSD. Alternatively, an AMD Ryzen 5 6600H processor is also available. On top of this, the mini PC can be ordered with additional RAM and a larger SSD. Maxtang also offers a barebones option, however, this only comes with the AMD Ryzen 7 7735HS.
In this review, the Maxtang MTN-FP750 pits itself against current mini PCs. A more detailed list of the comparison devices found in this review is summarized in the following table.
Possible competitors compared
Rating | Date | Model | Weight | Height | Price |
|---|---|---|---|---|---|
| 79.5 % v7 (old) | 02 / 2024 | Maxtang MTN-FP750 R7 7735HS, Radeon 680M | 601 g | 52 mm | |
| 85.1 % v7 (old) | 01 / 2023 | Minisforum Neptune Series NAD9 i9-12900H, Iris Xe G7 96EUs | 1.2 kg | 66 mm | |
| 82.8 % v7 (old) | 07 / 2023 | Geekom AS 6, R9 6900HX R9 6900HX, Radeon 680M | 753 g | 58 mm | |
| 82.3 % v7 (old) | 05 / 2023 | Geekom Mini IT12 i7-1260P, Iris Xe G7 96EUs | 572 g | 45.6 mm | |
| 81.2 % v7 (old) | 10 / 2023 | Geekom A5 R7 5800H, Vega 8 | 555 g | 49.2 mm | |
| 81.9 % v7 (old) | 05 / 2023 | Minisforum Venus Series NAB6 i7-12650H, UHD Graphics 64EUs | 616 g | 55 mm | |
| 78.4 % v7 (old) | 01 / 2024 | NiPoGi AD08 i7-12650H, UHD Graphics 64EUs | 878 g | 188.5 mm |
The Maxtang MTN-FP750 in detail
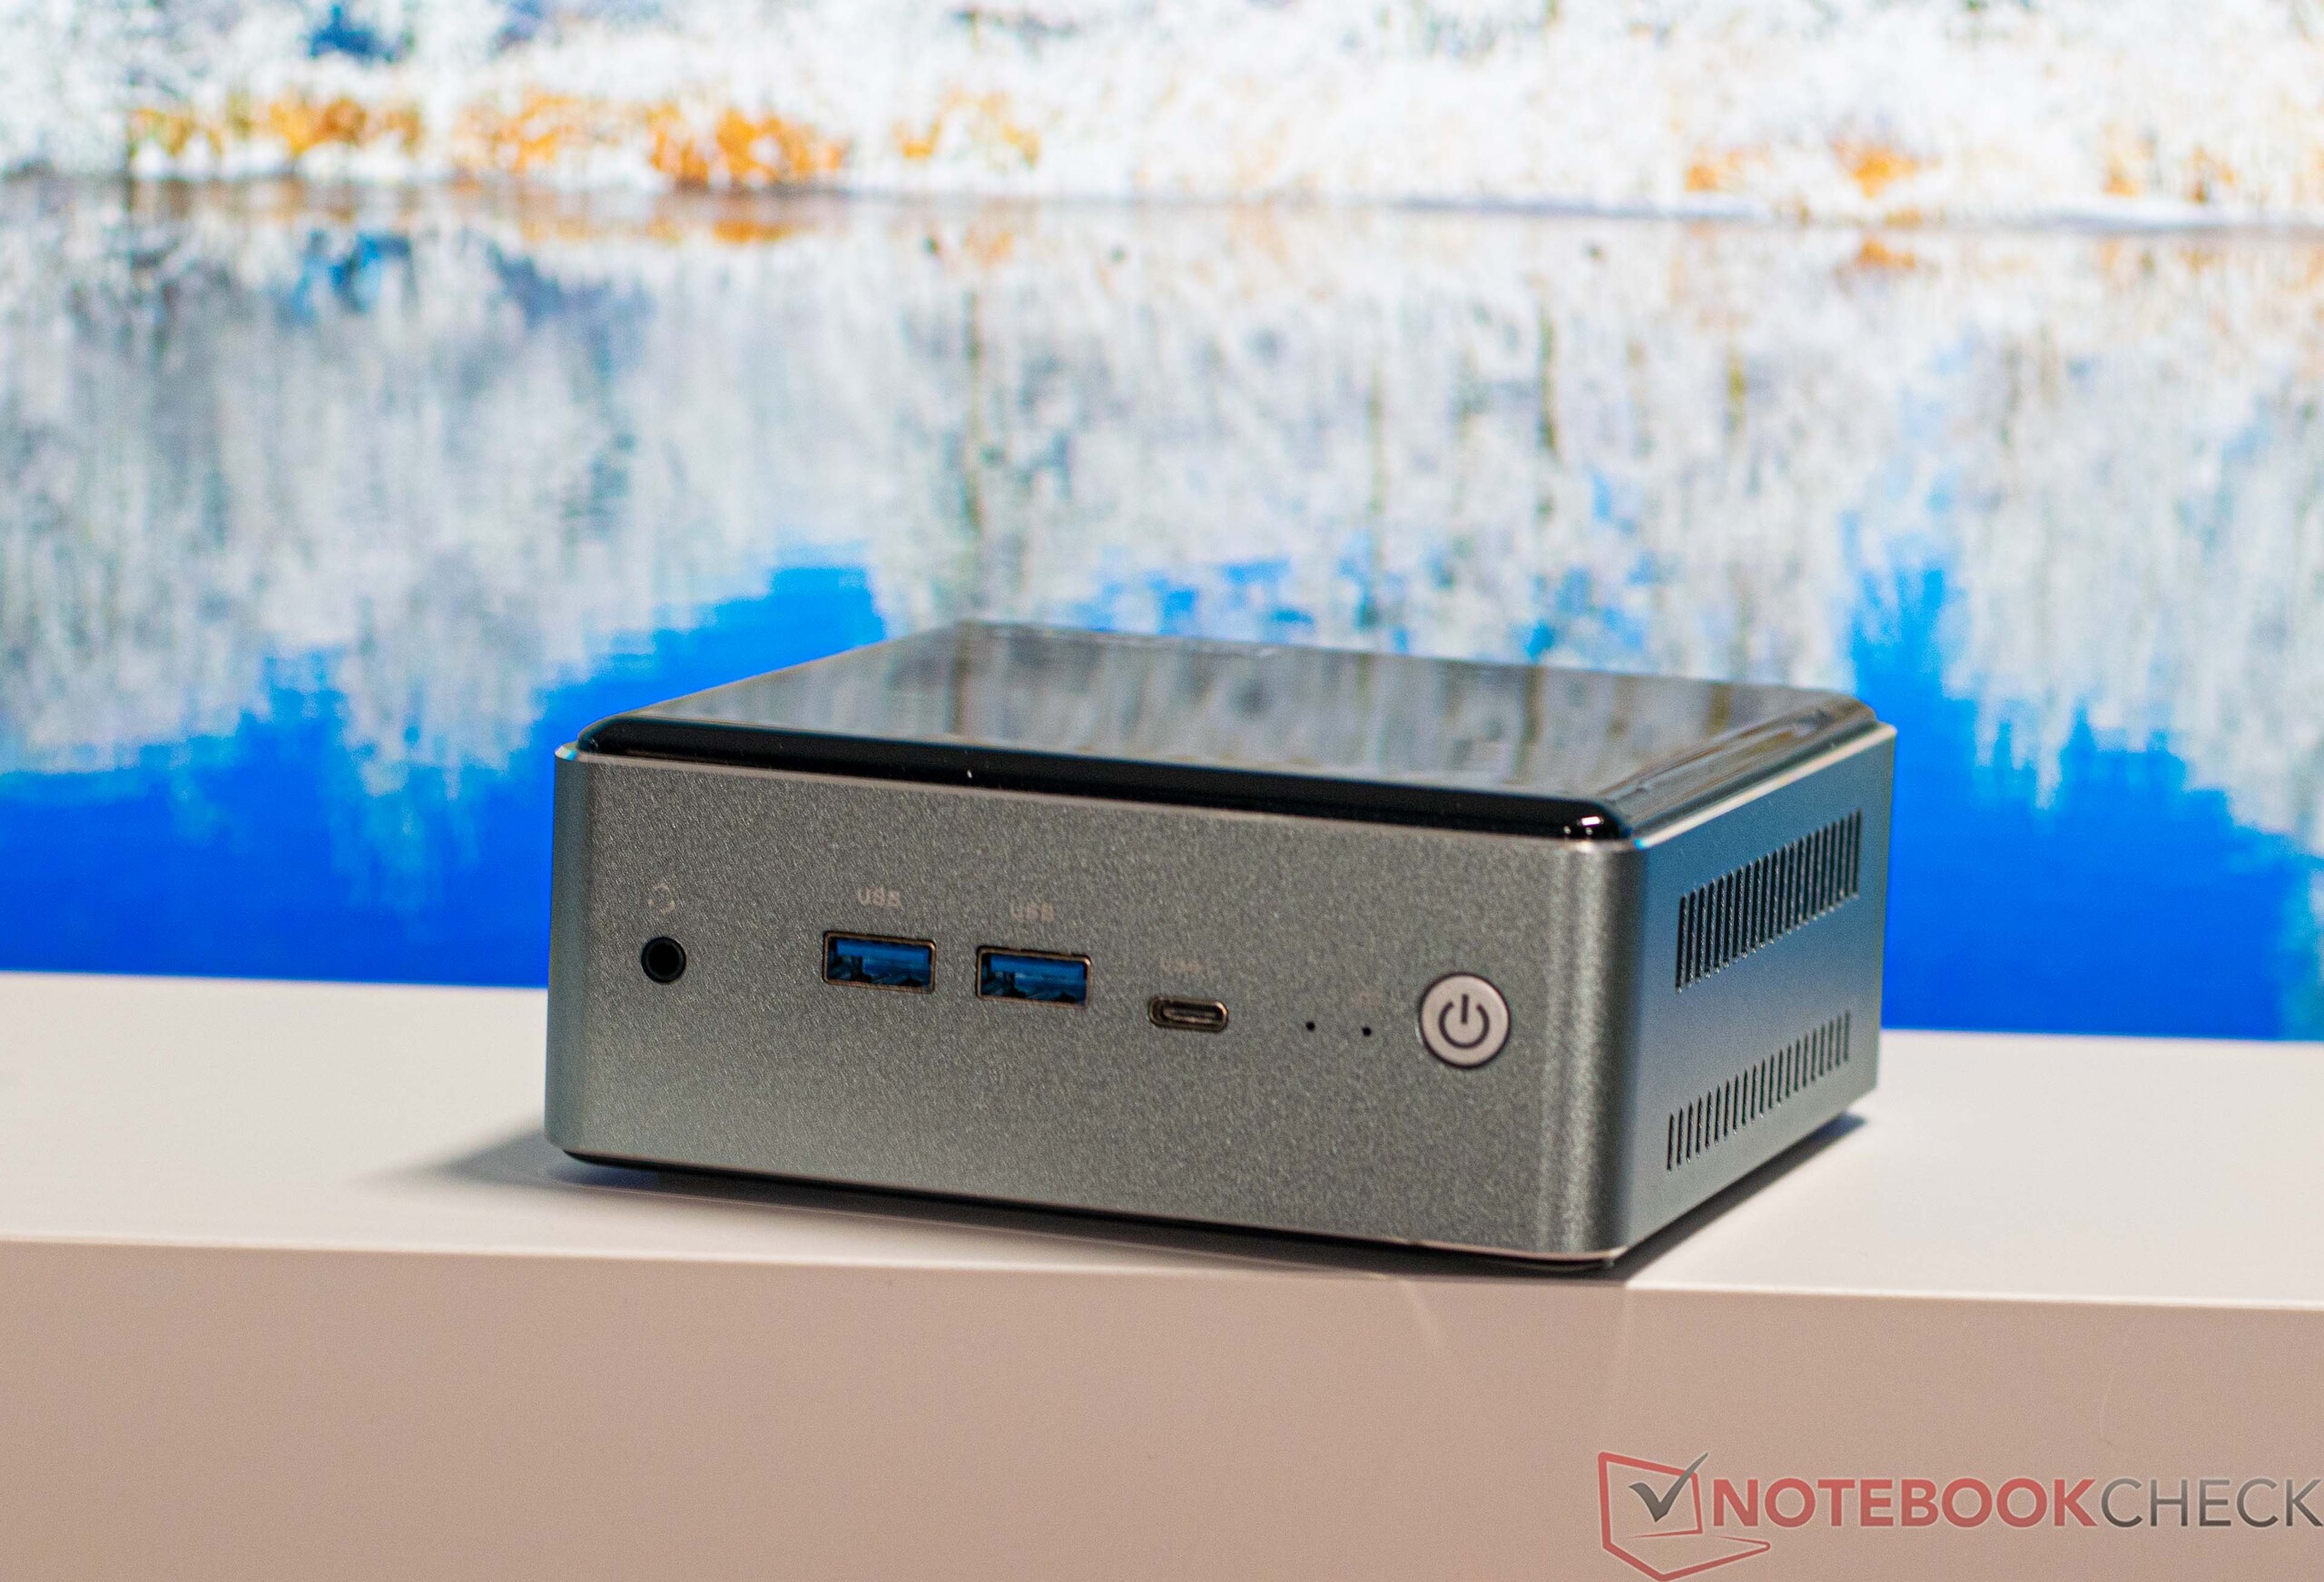
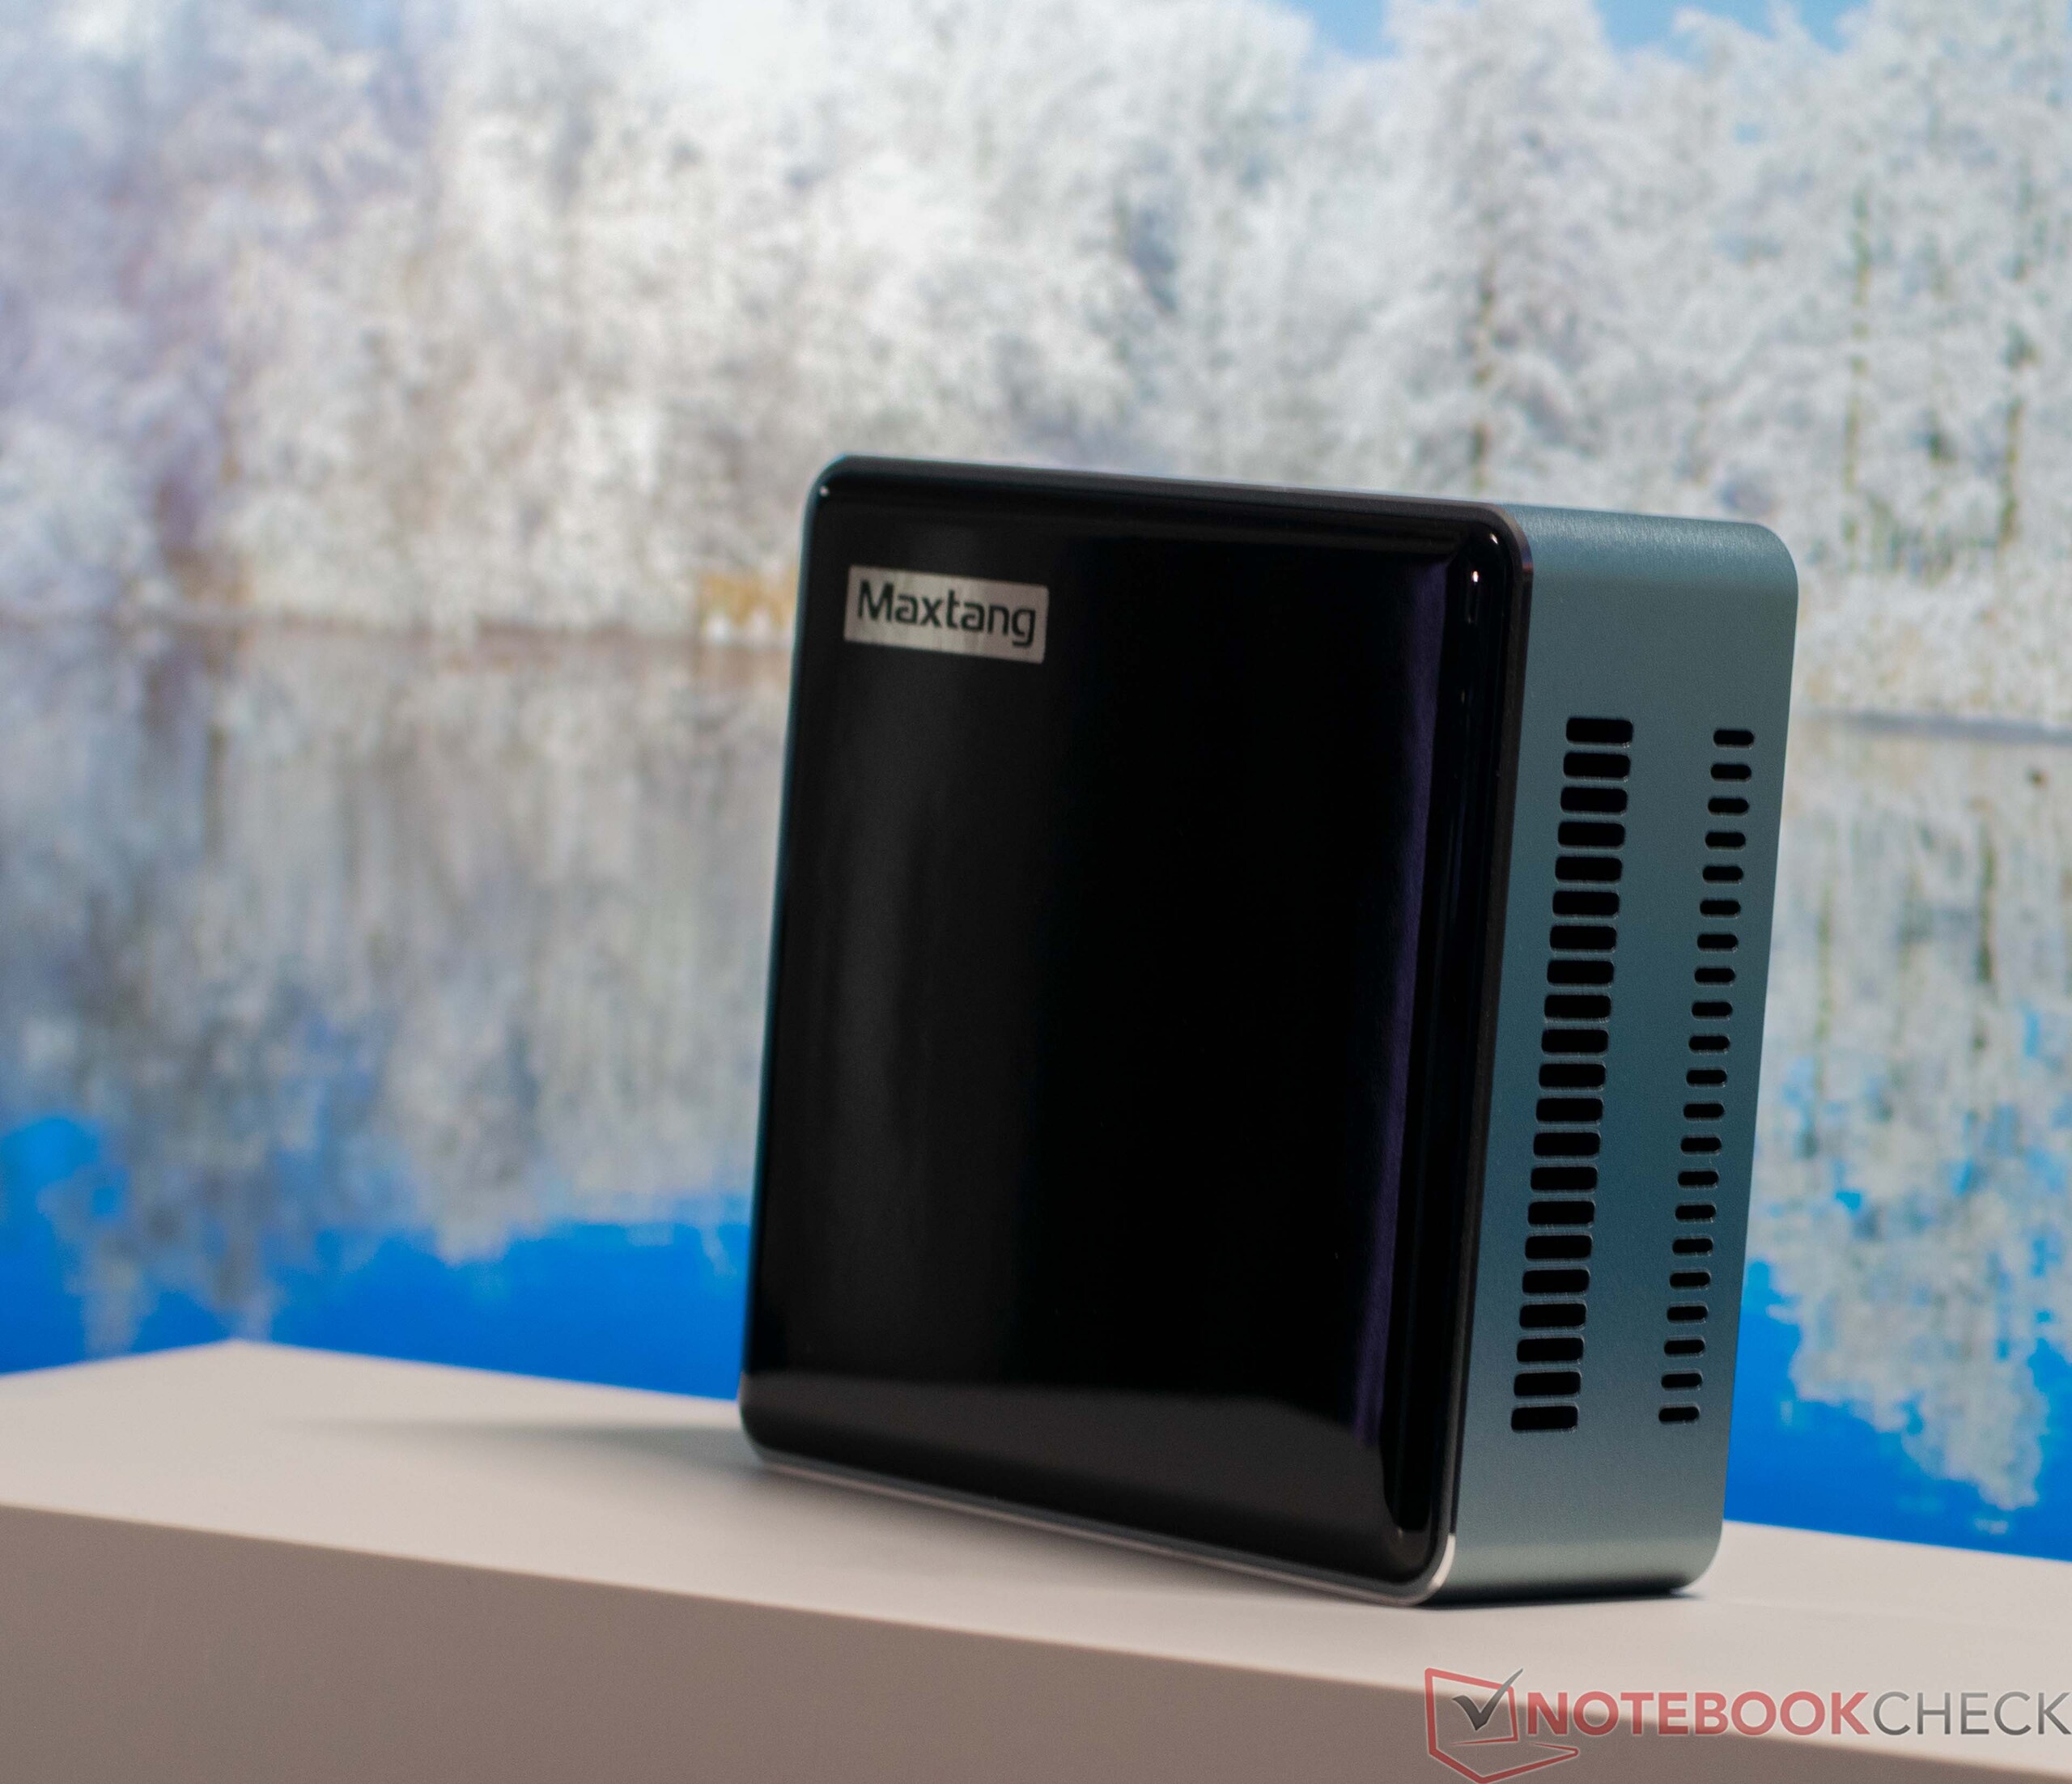
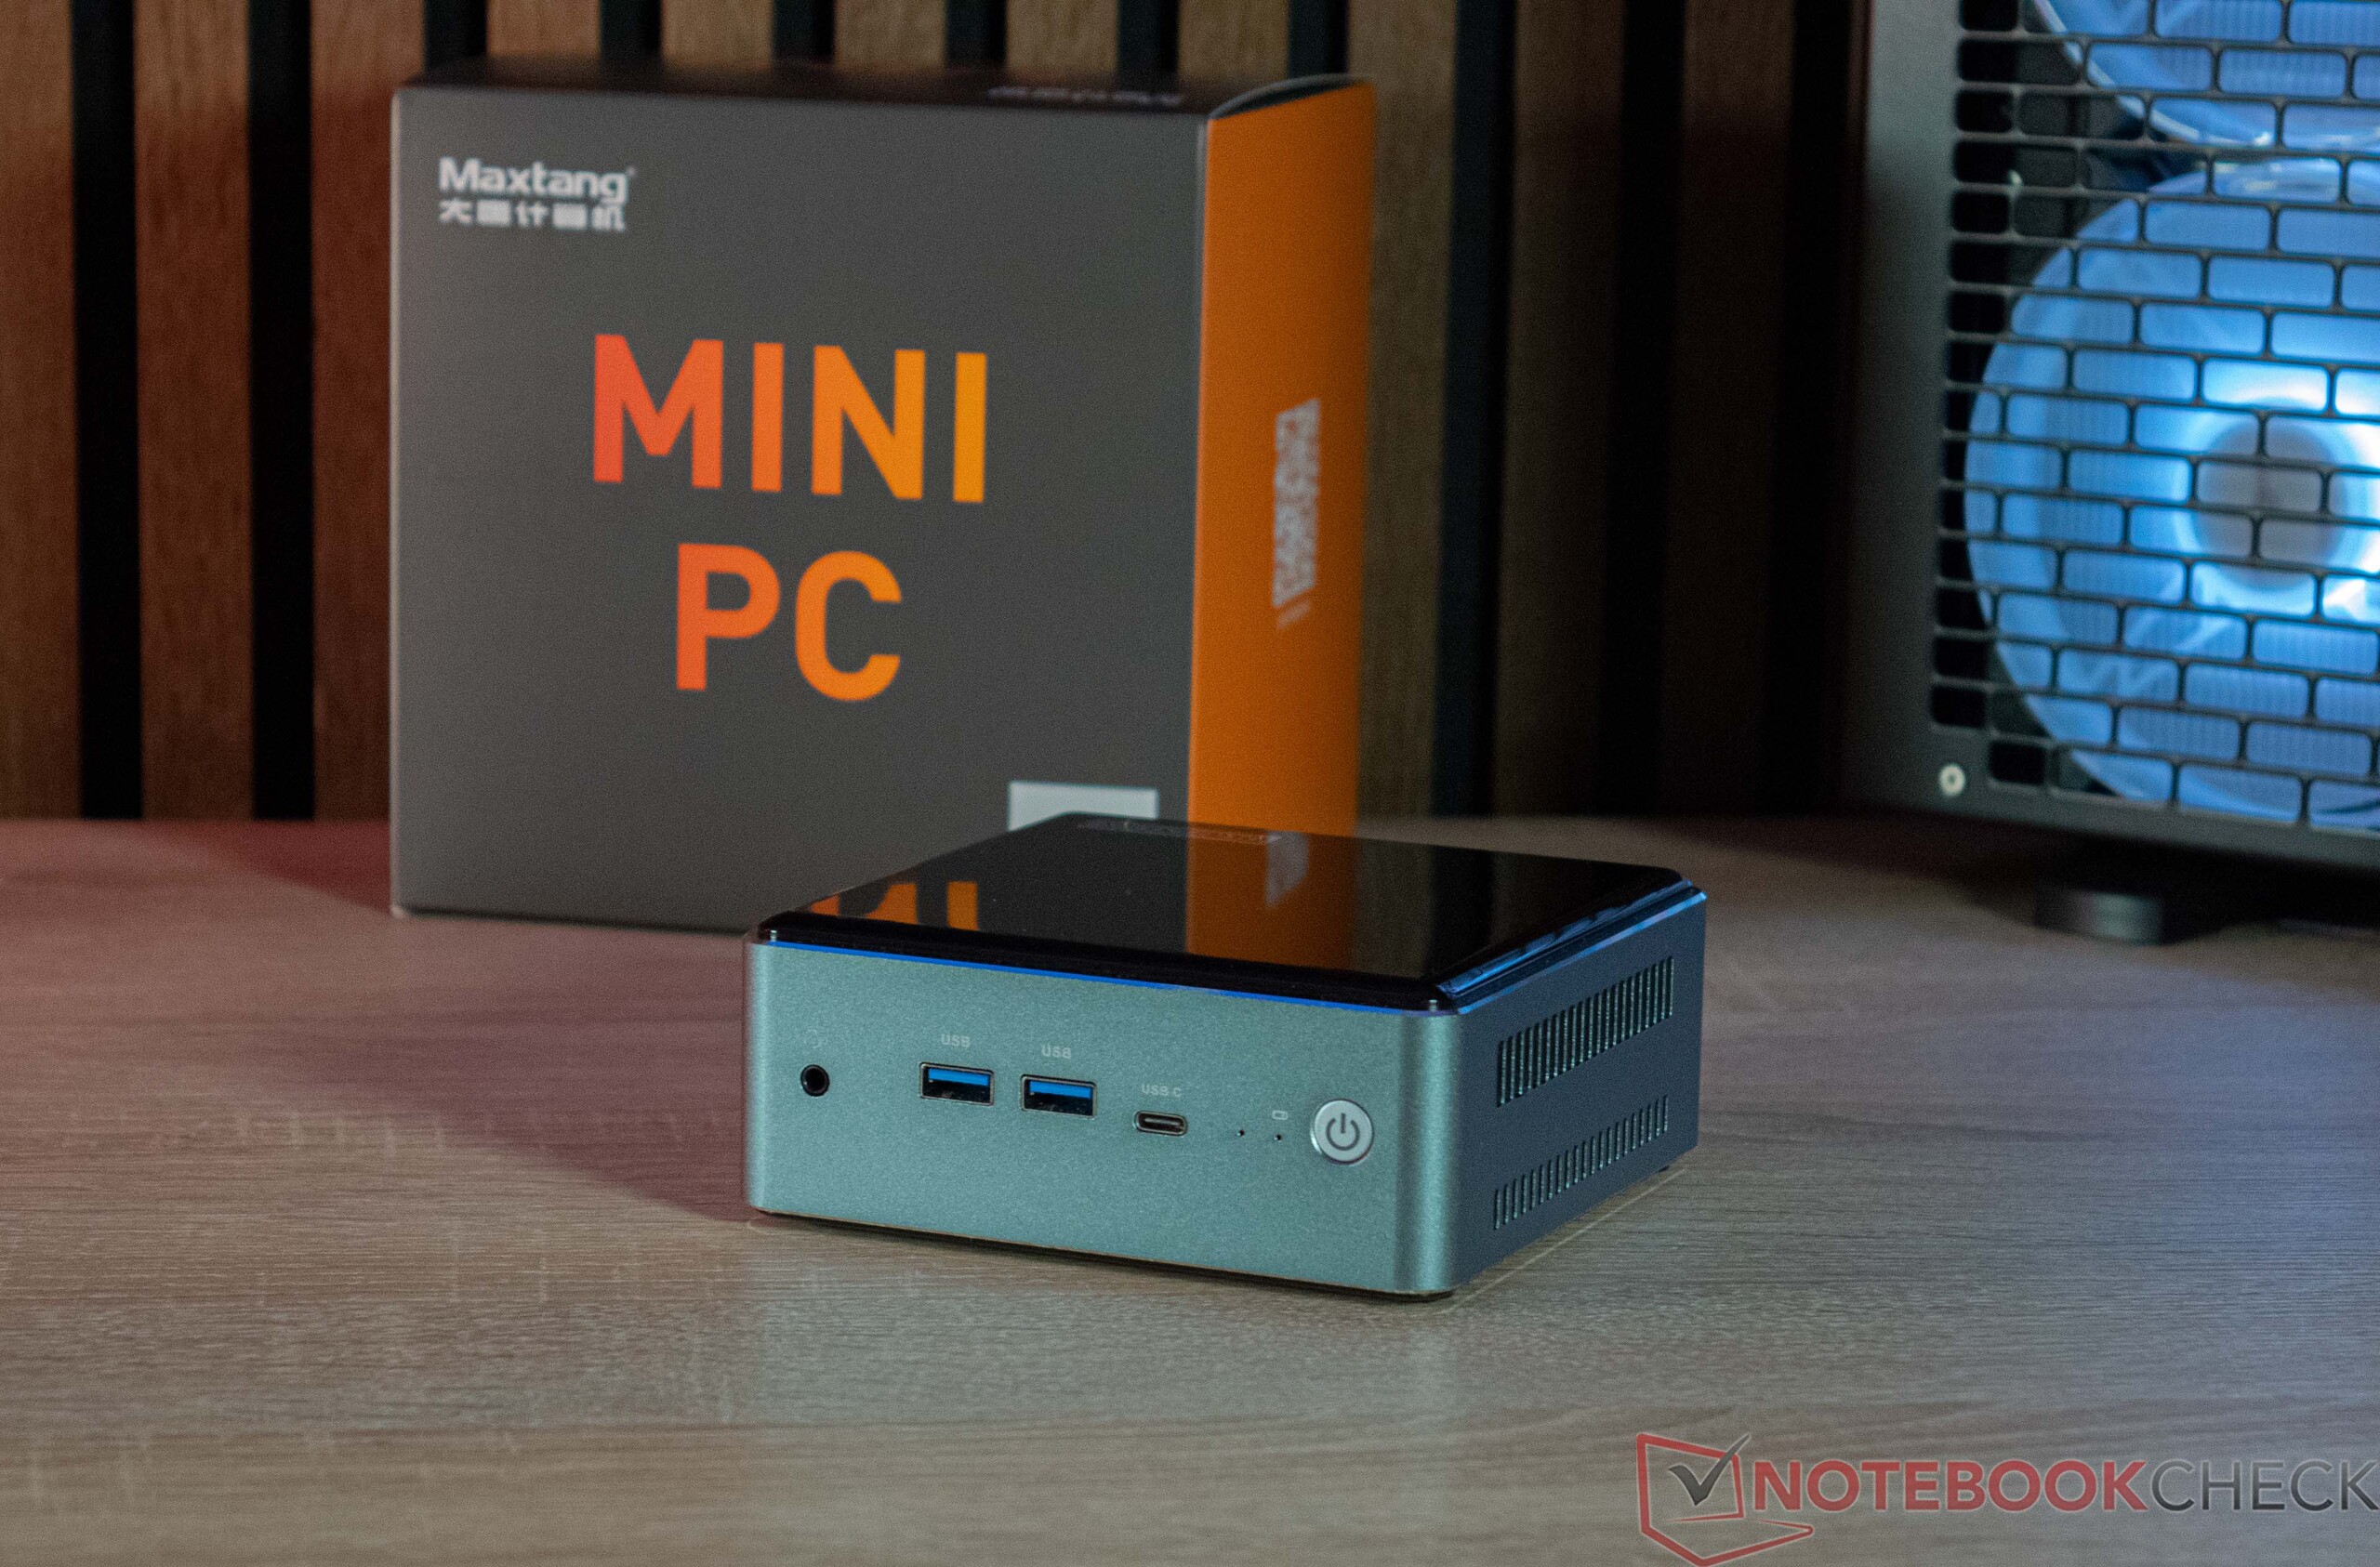
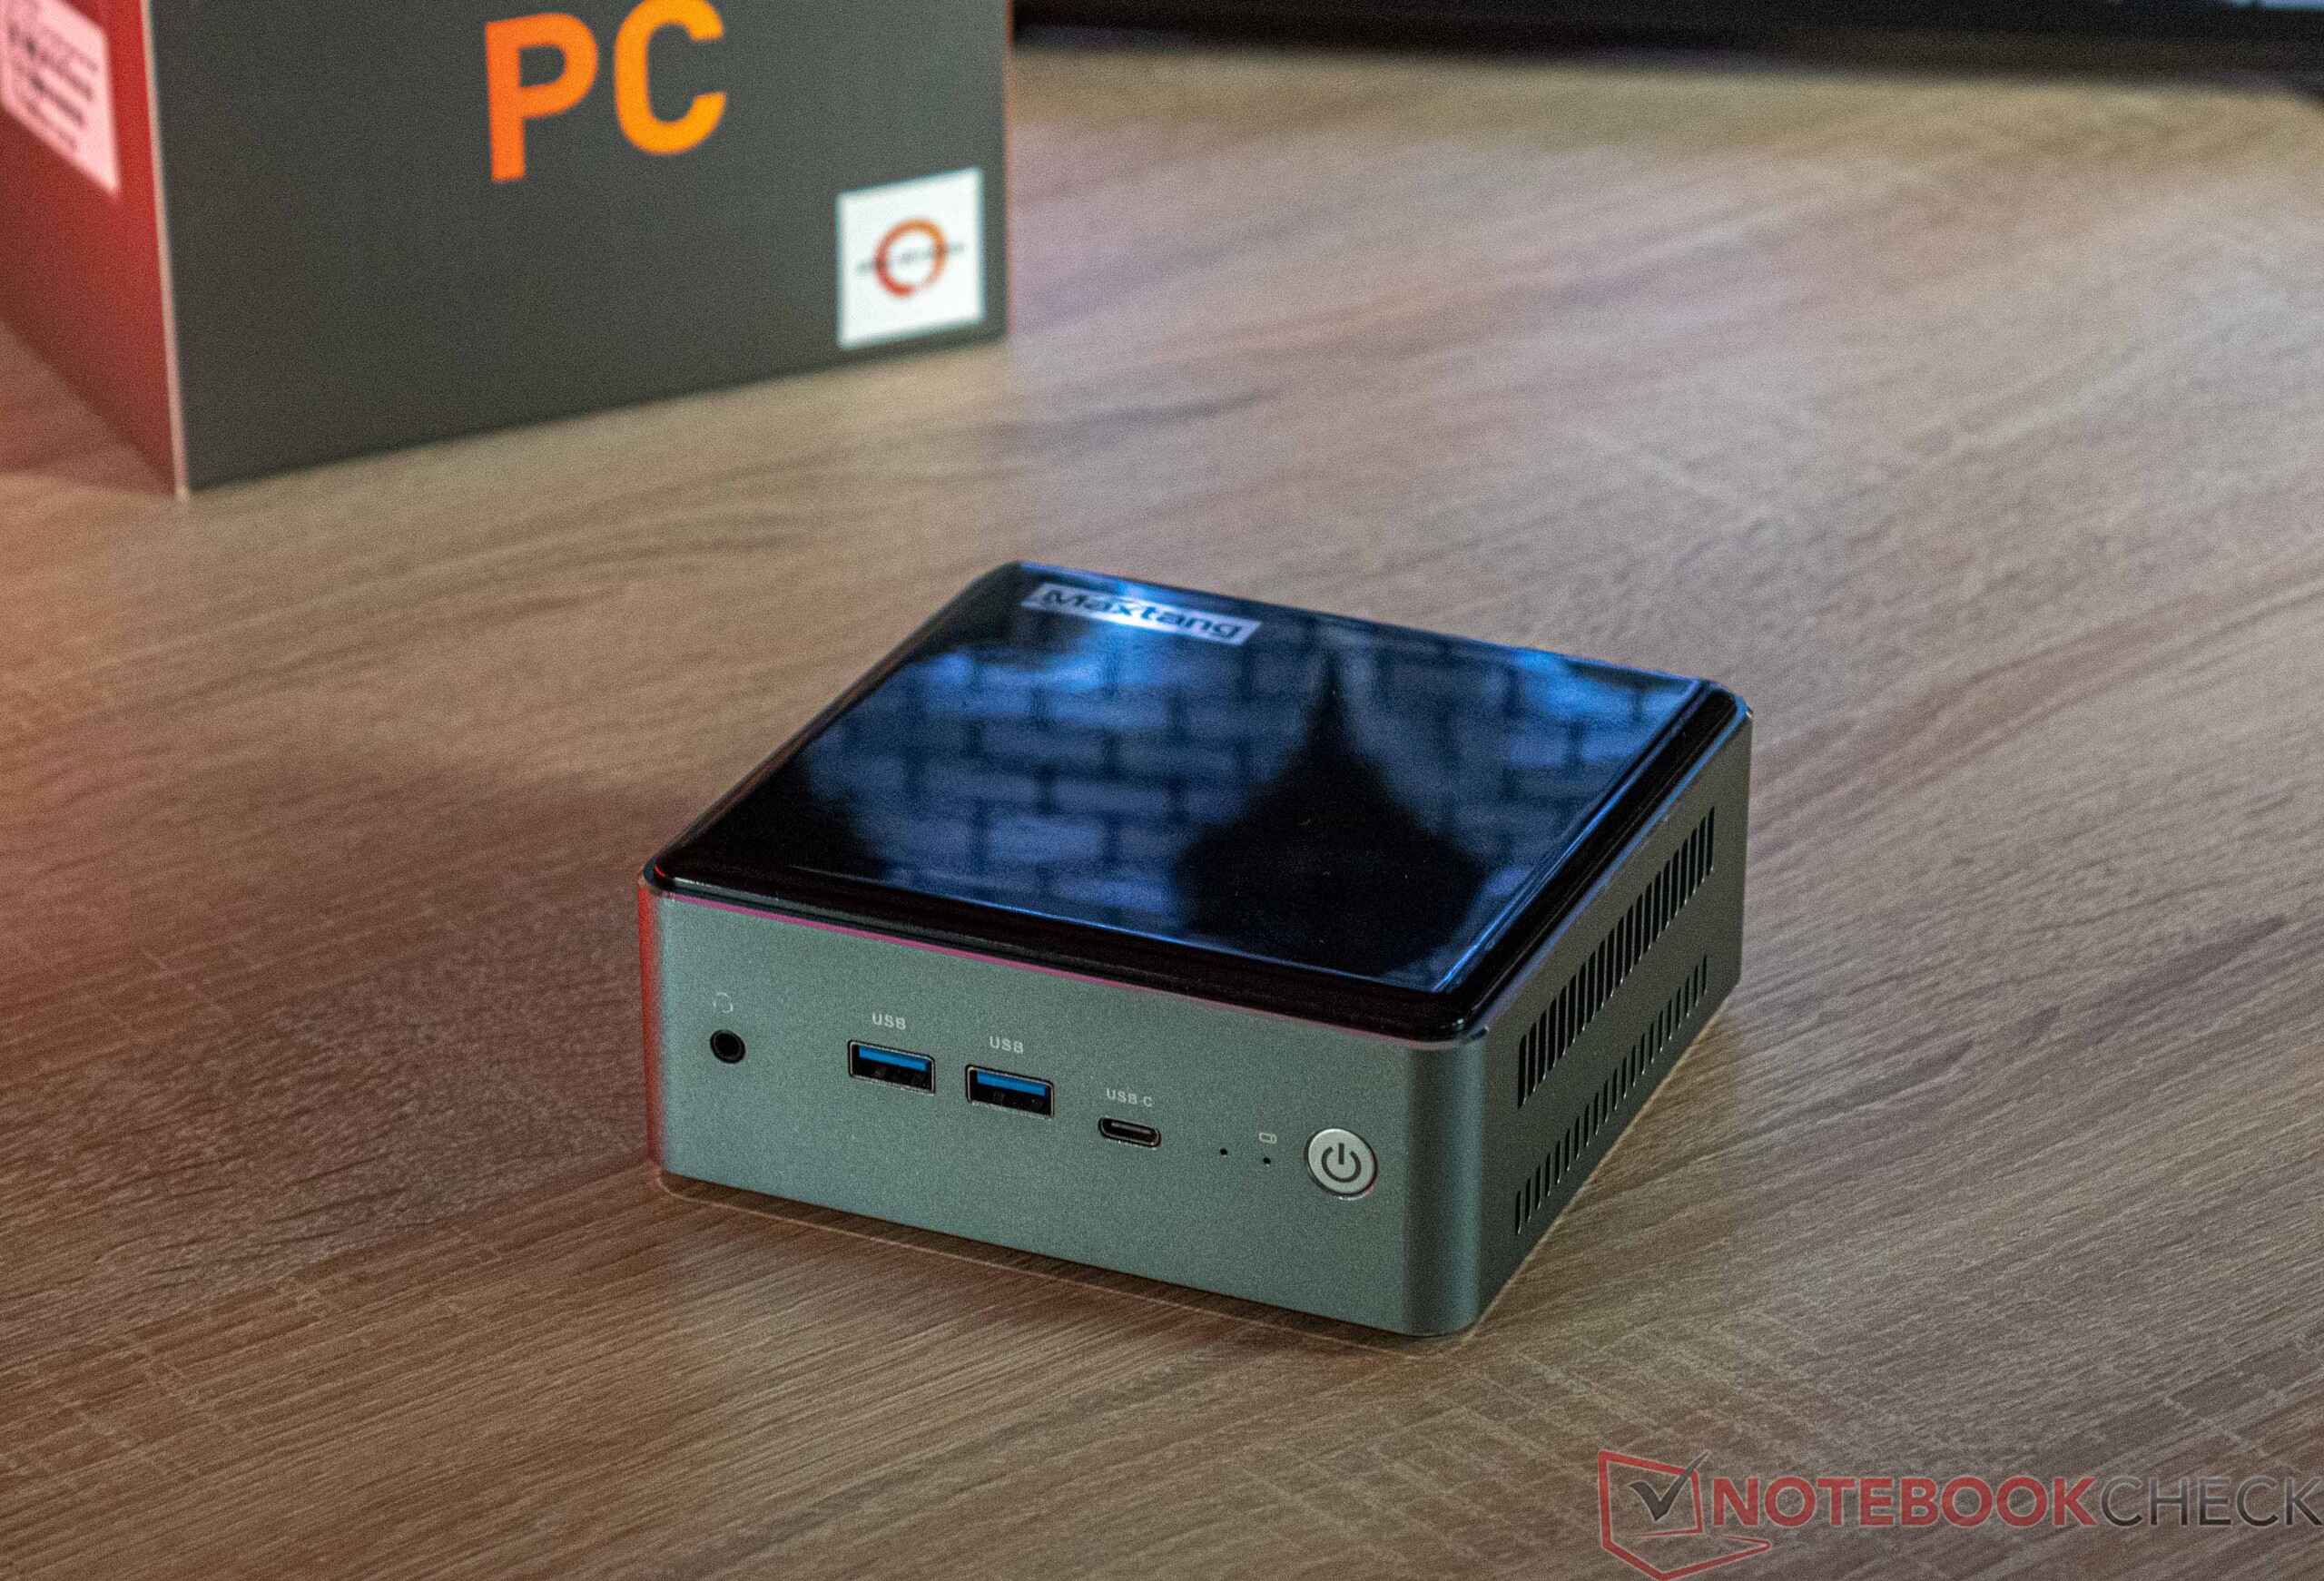
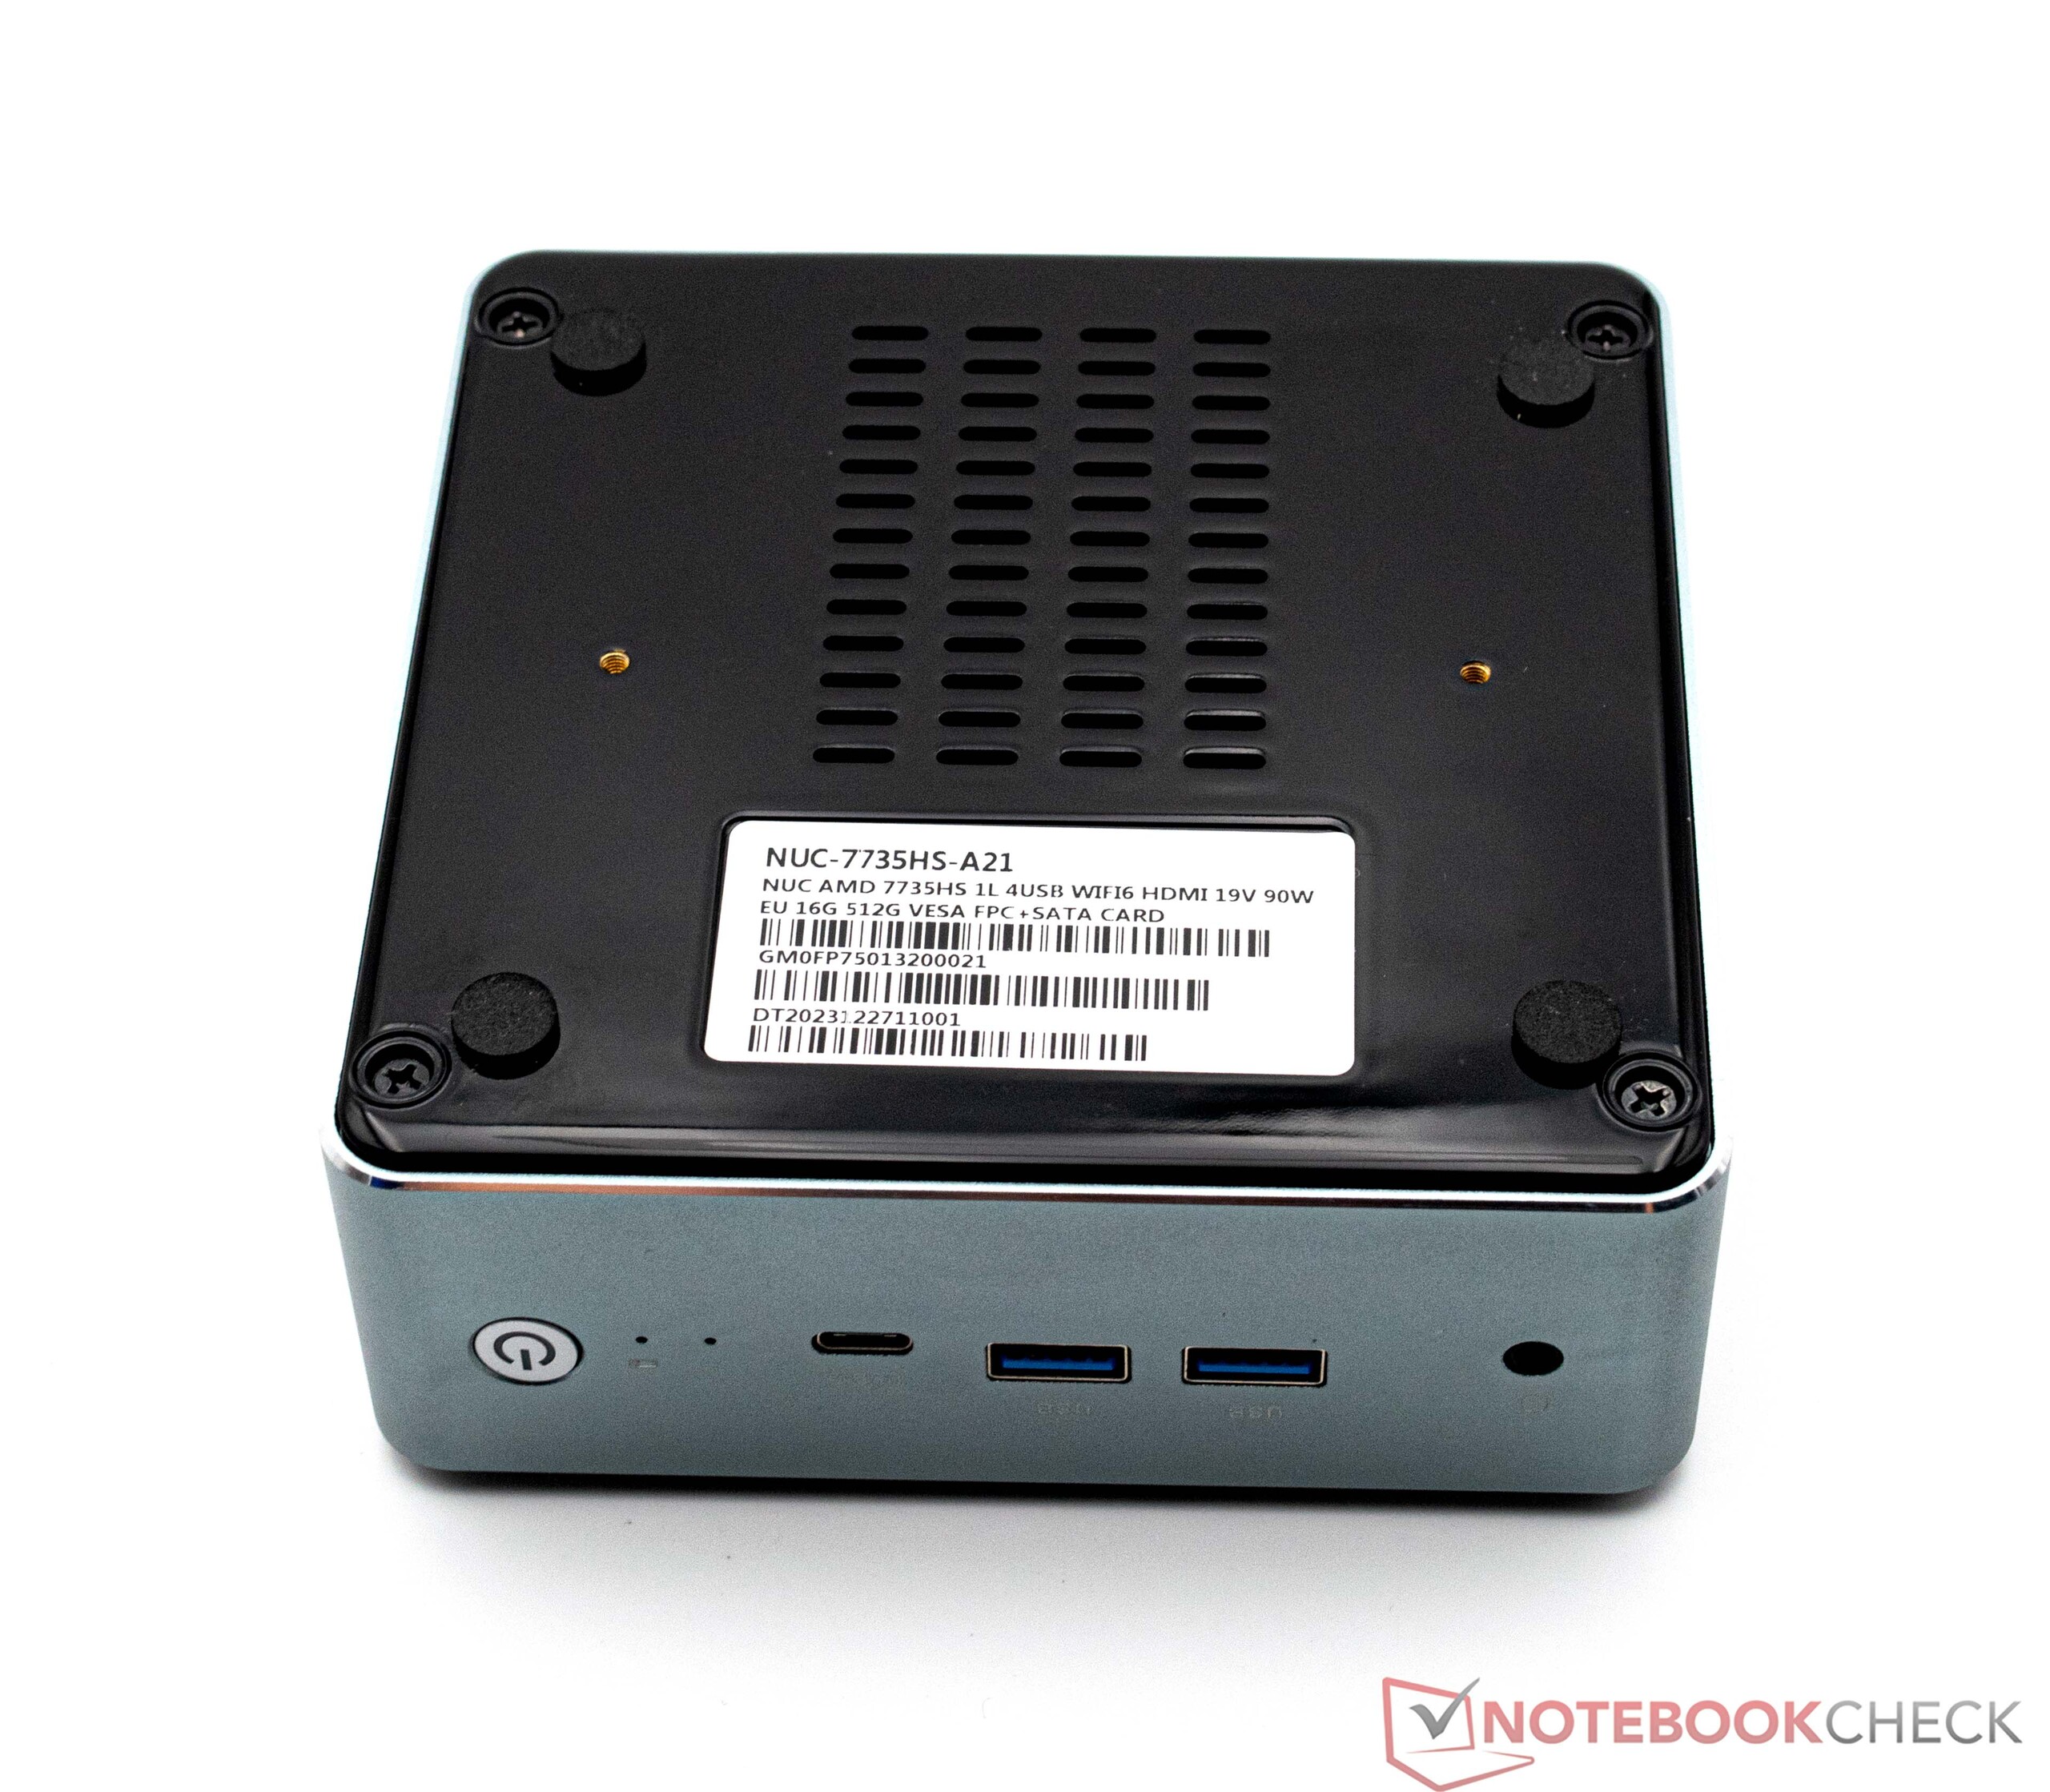
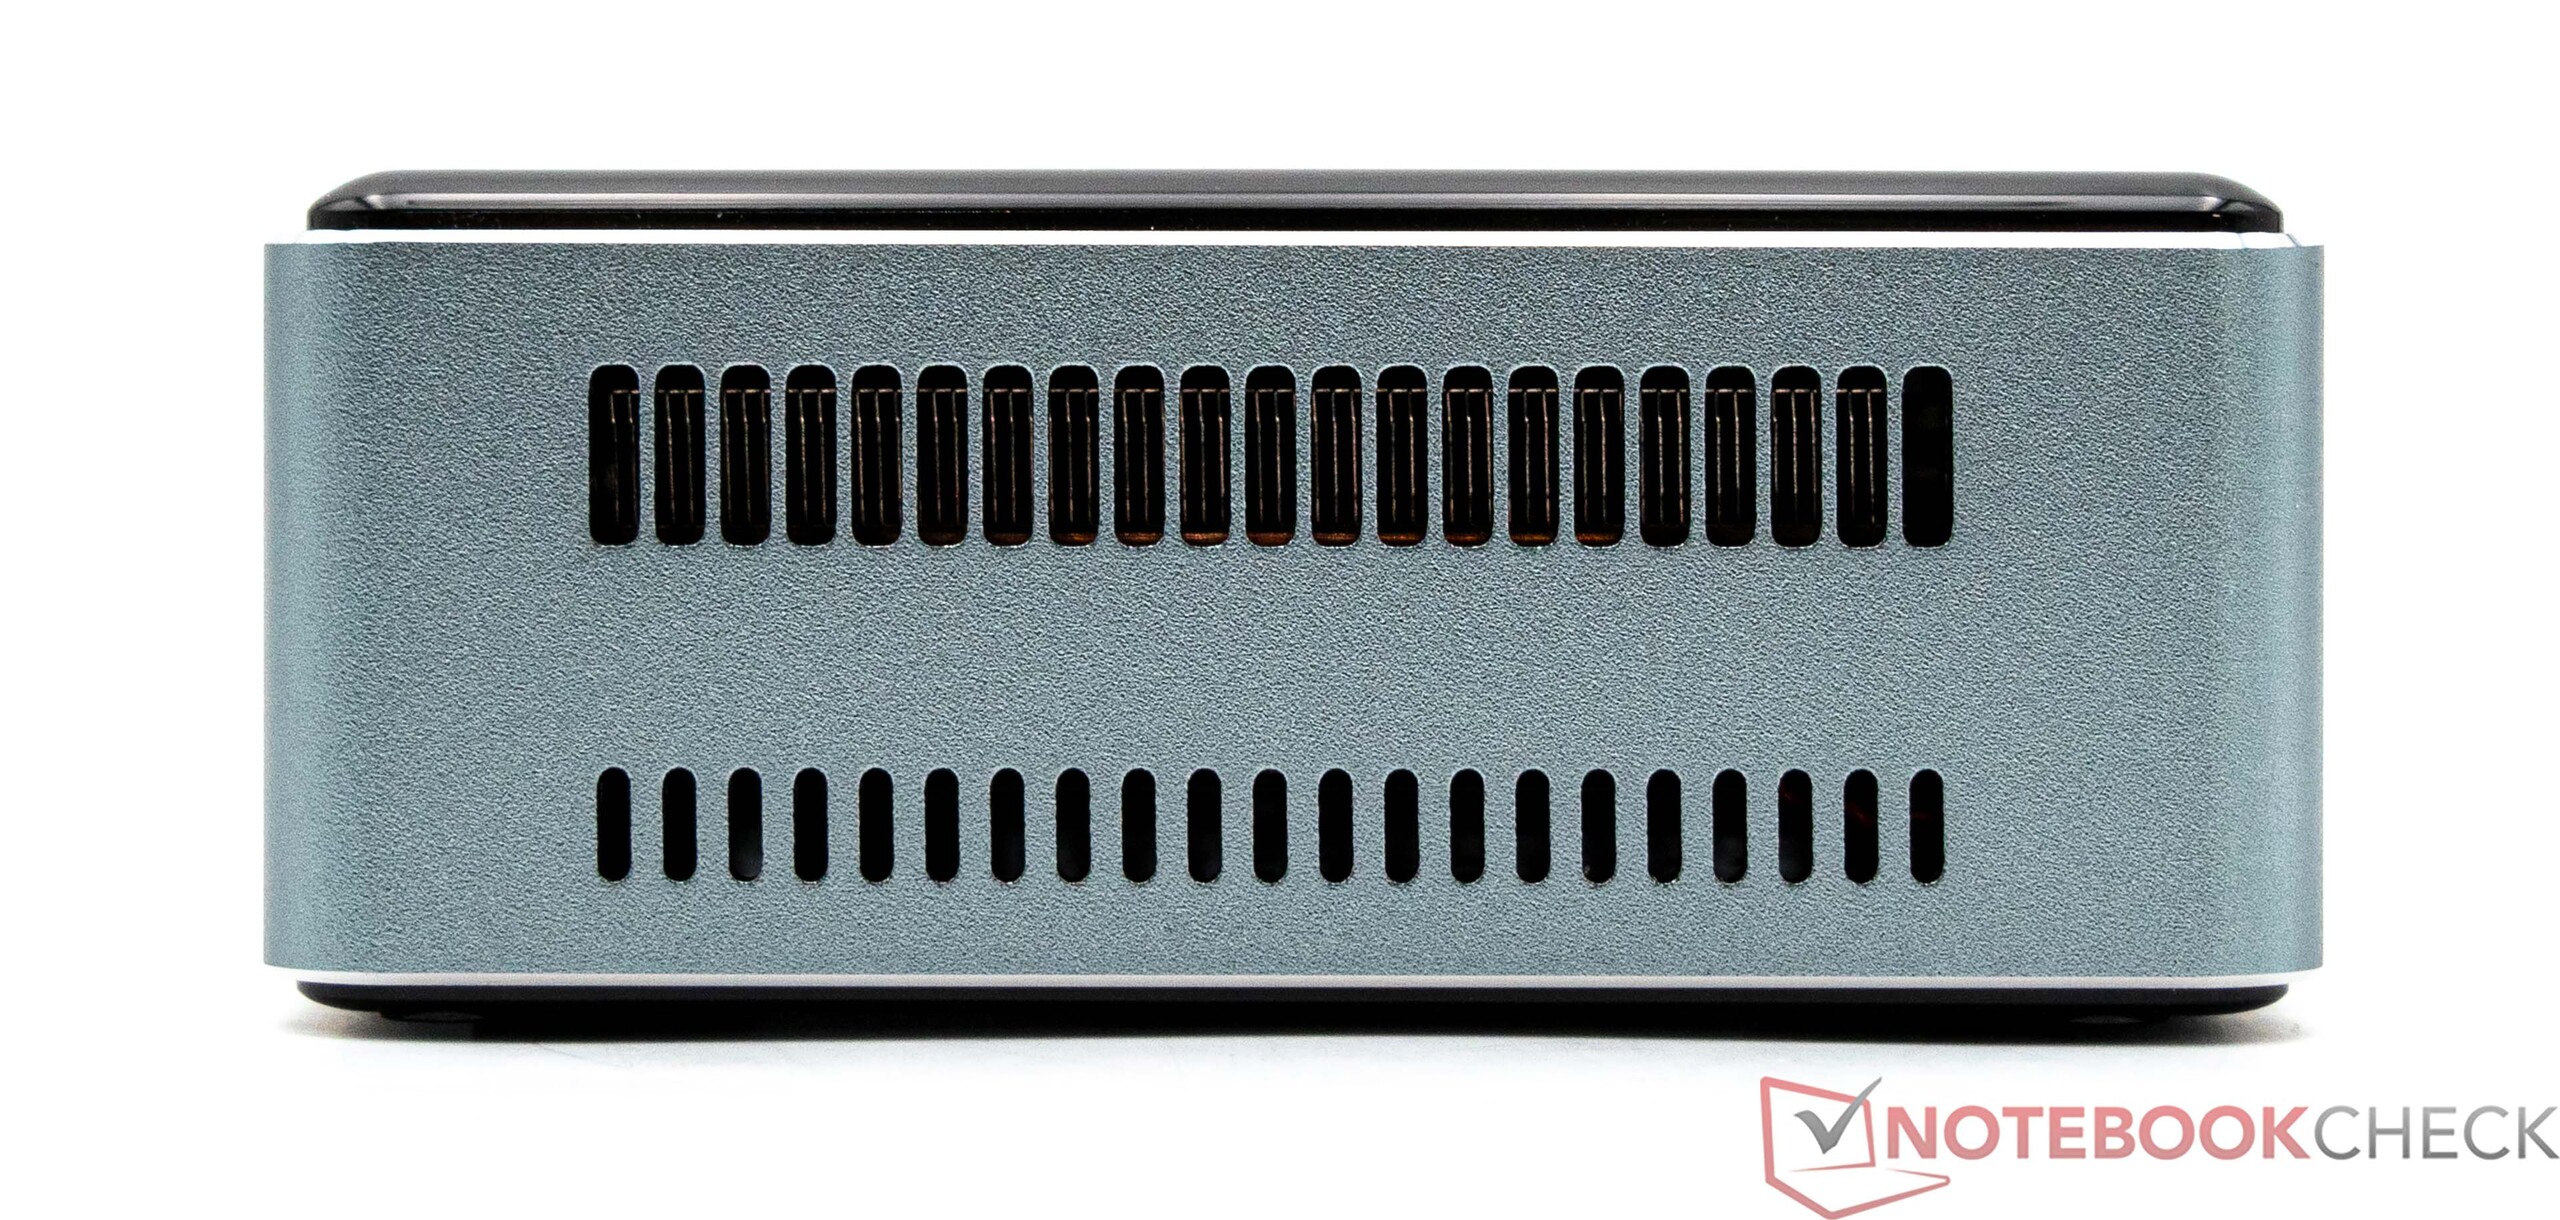

Case - Metal and plastic in piano black
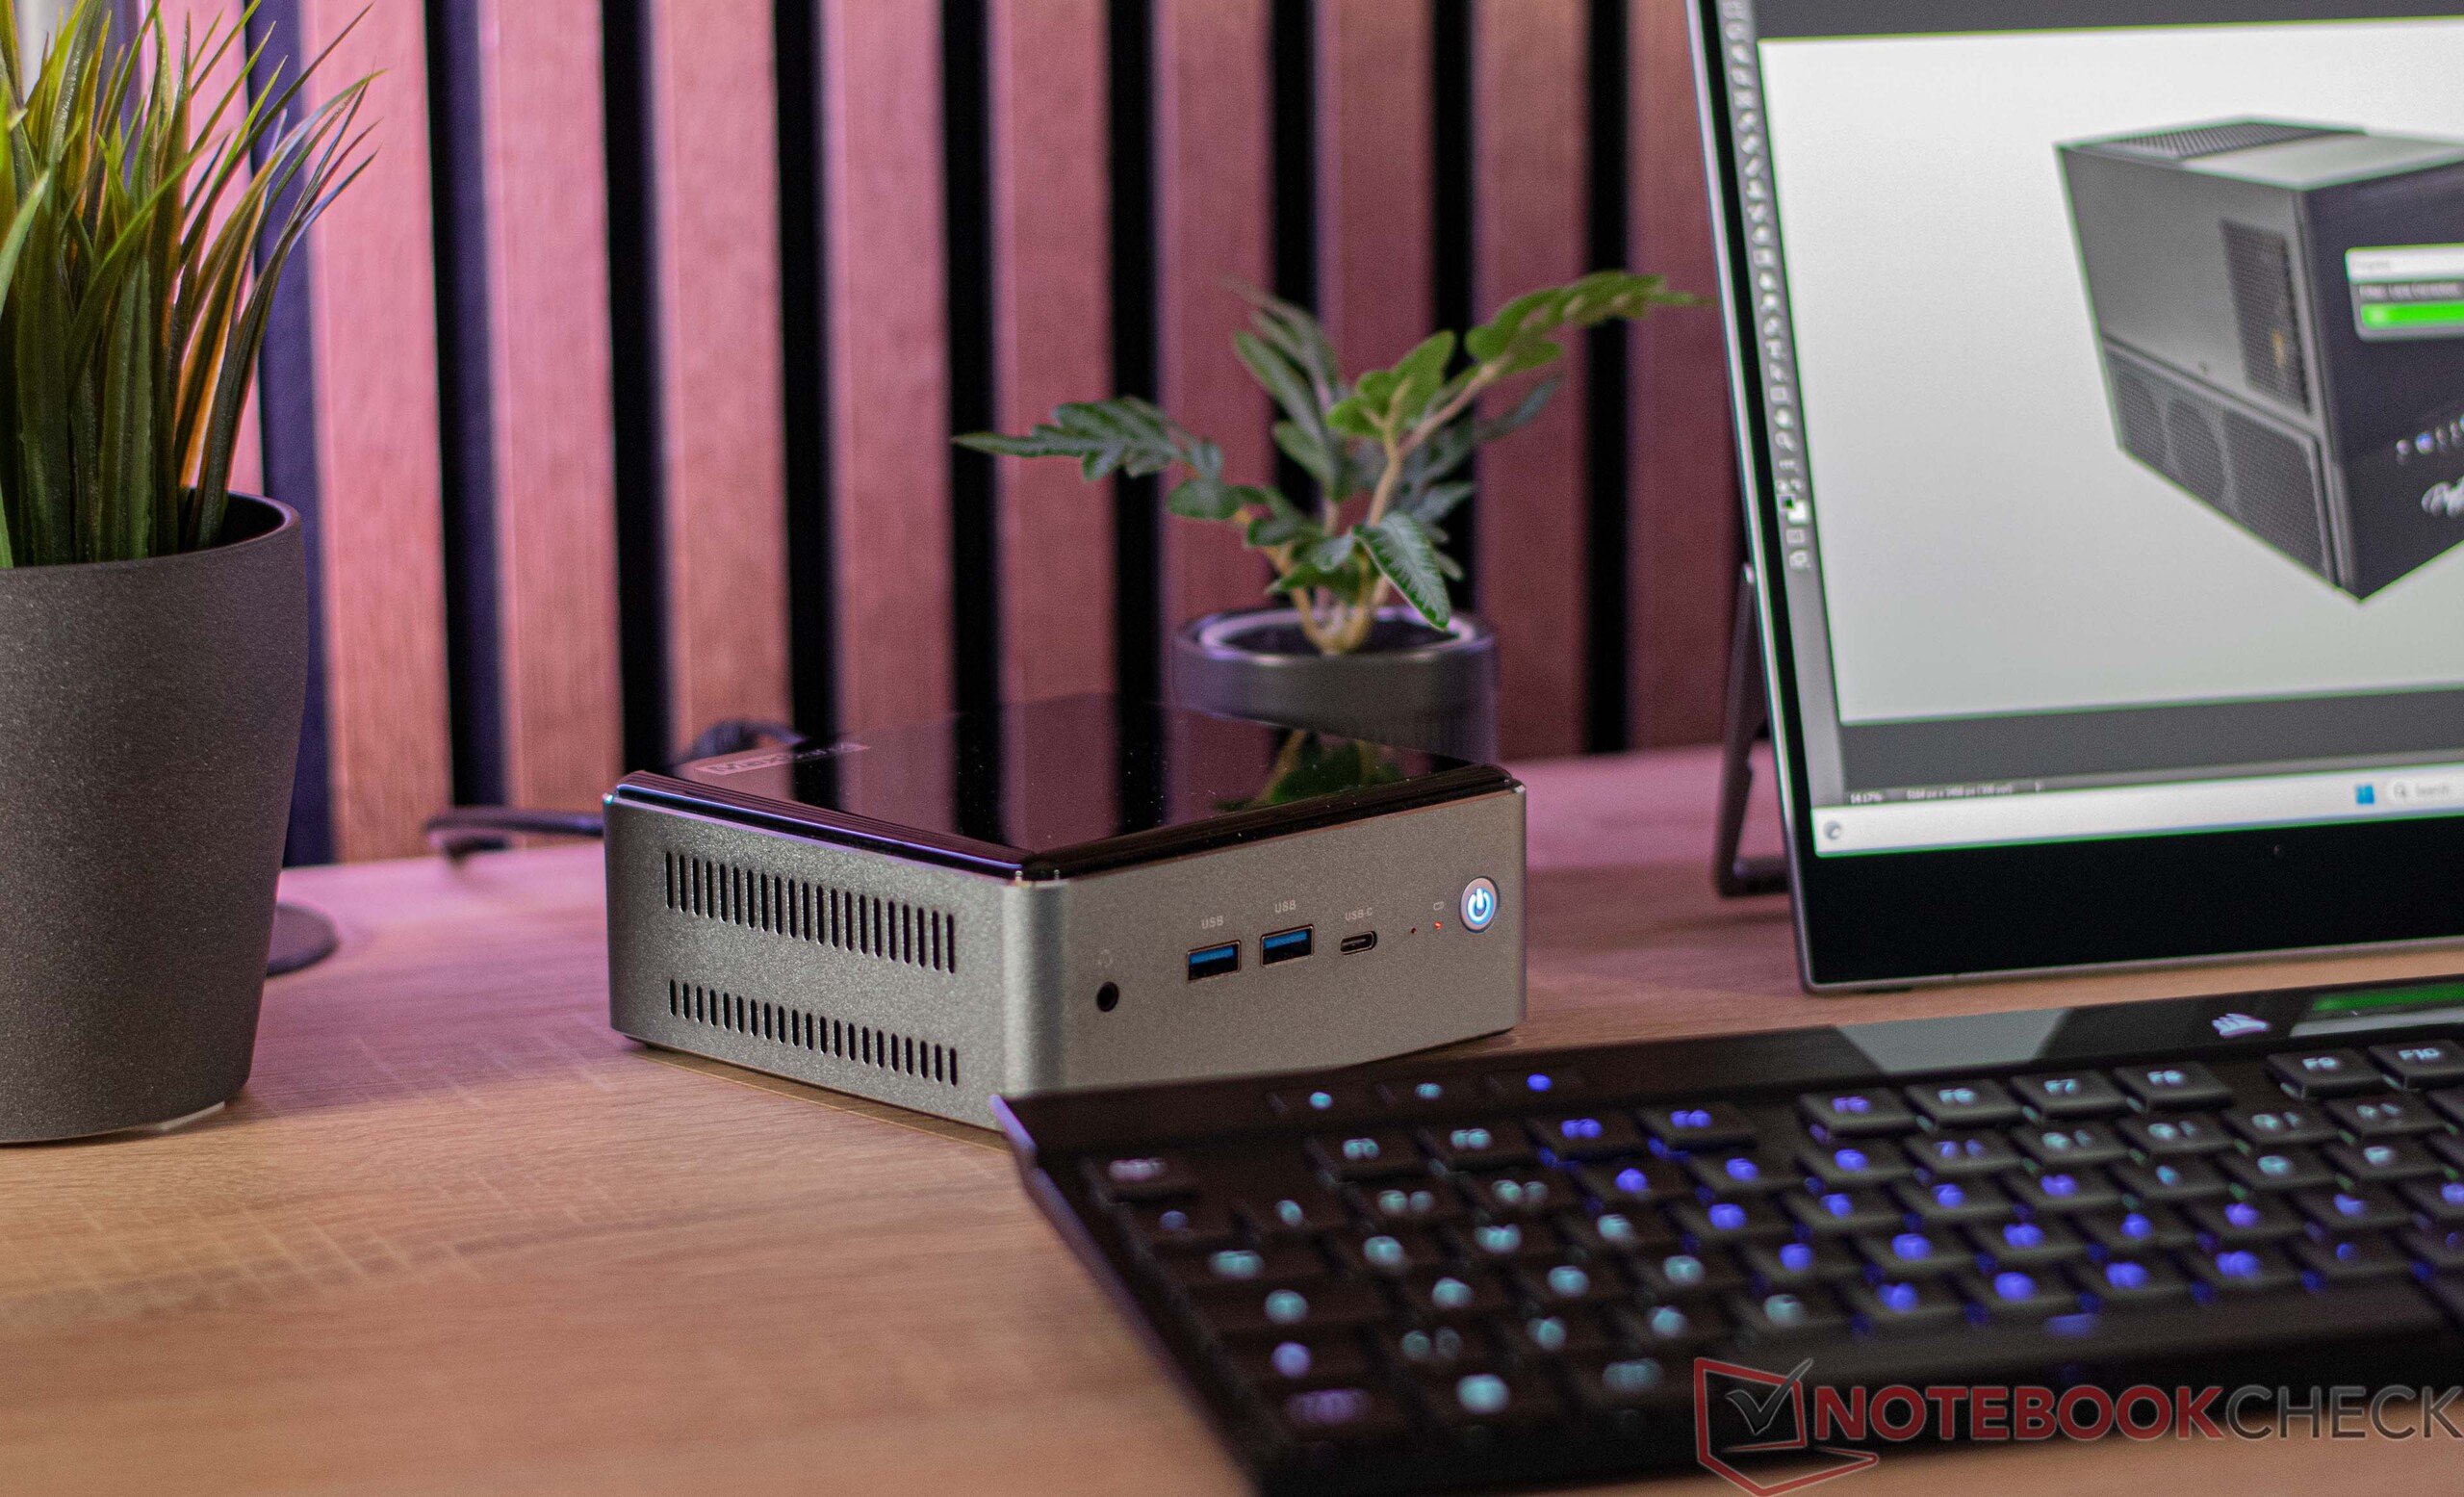
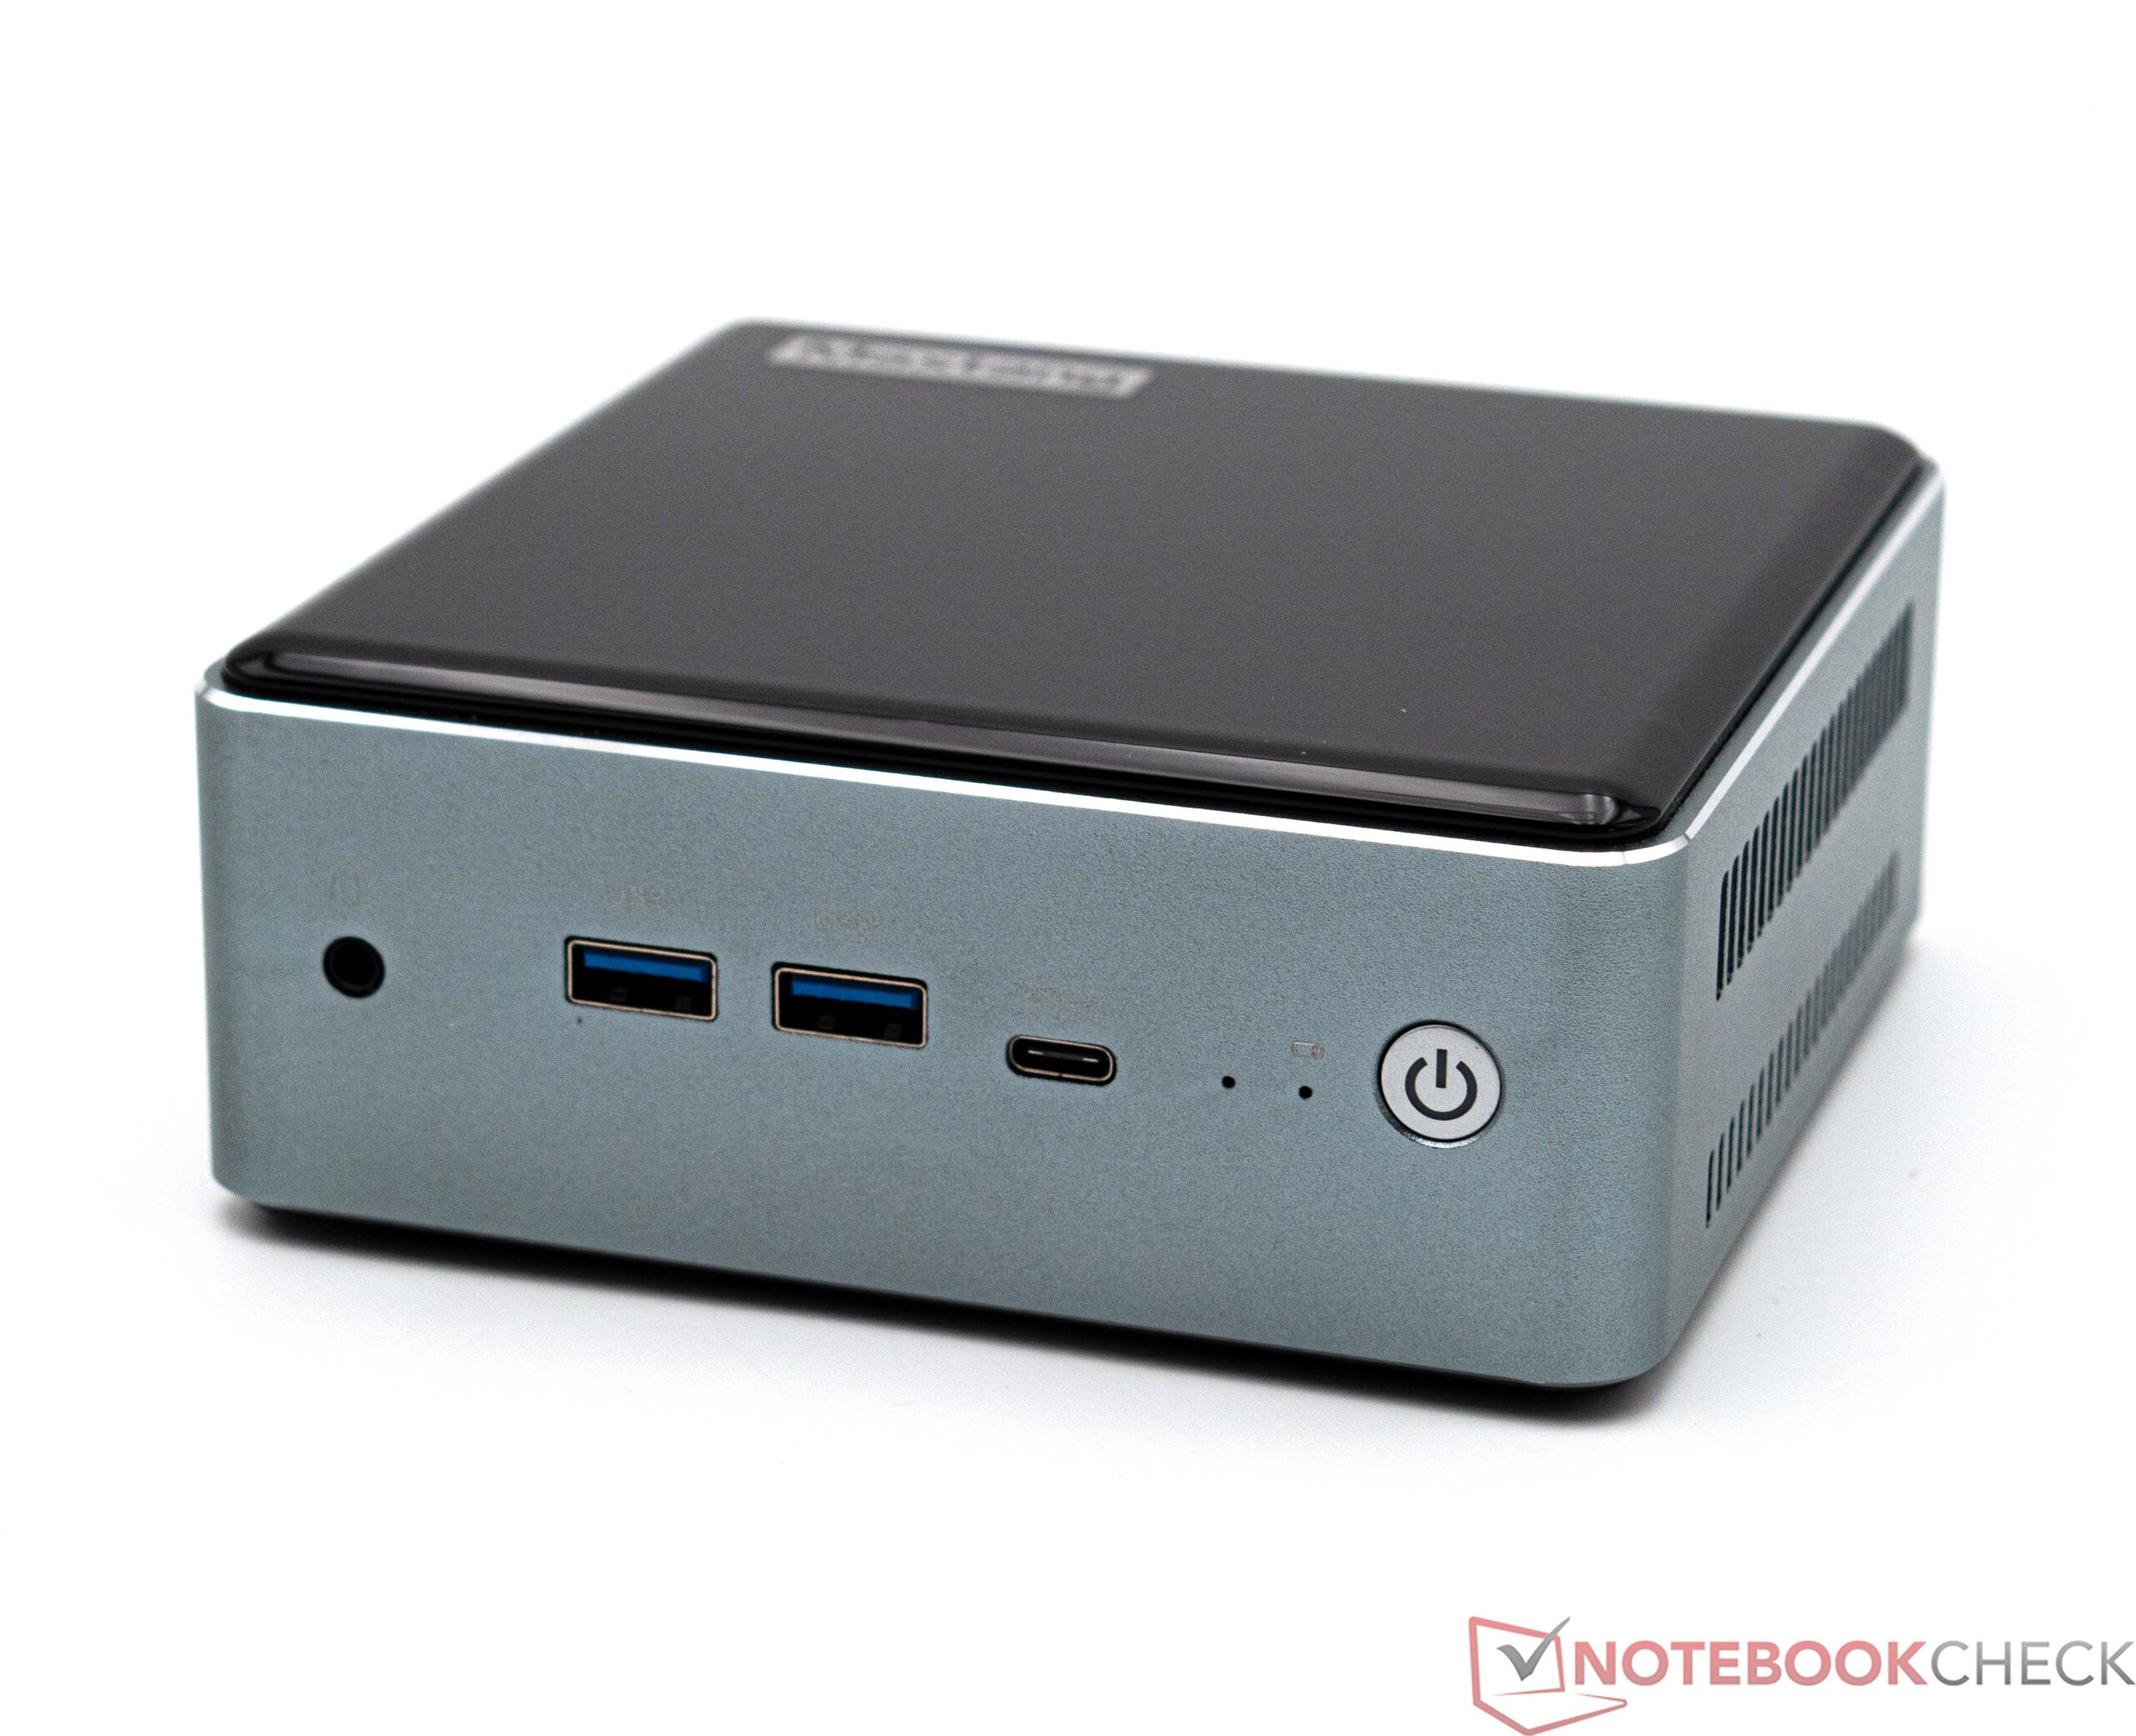
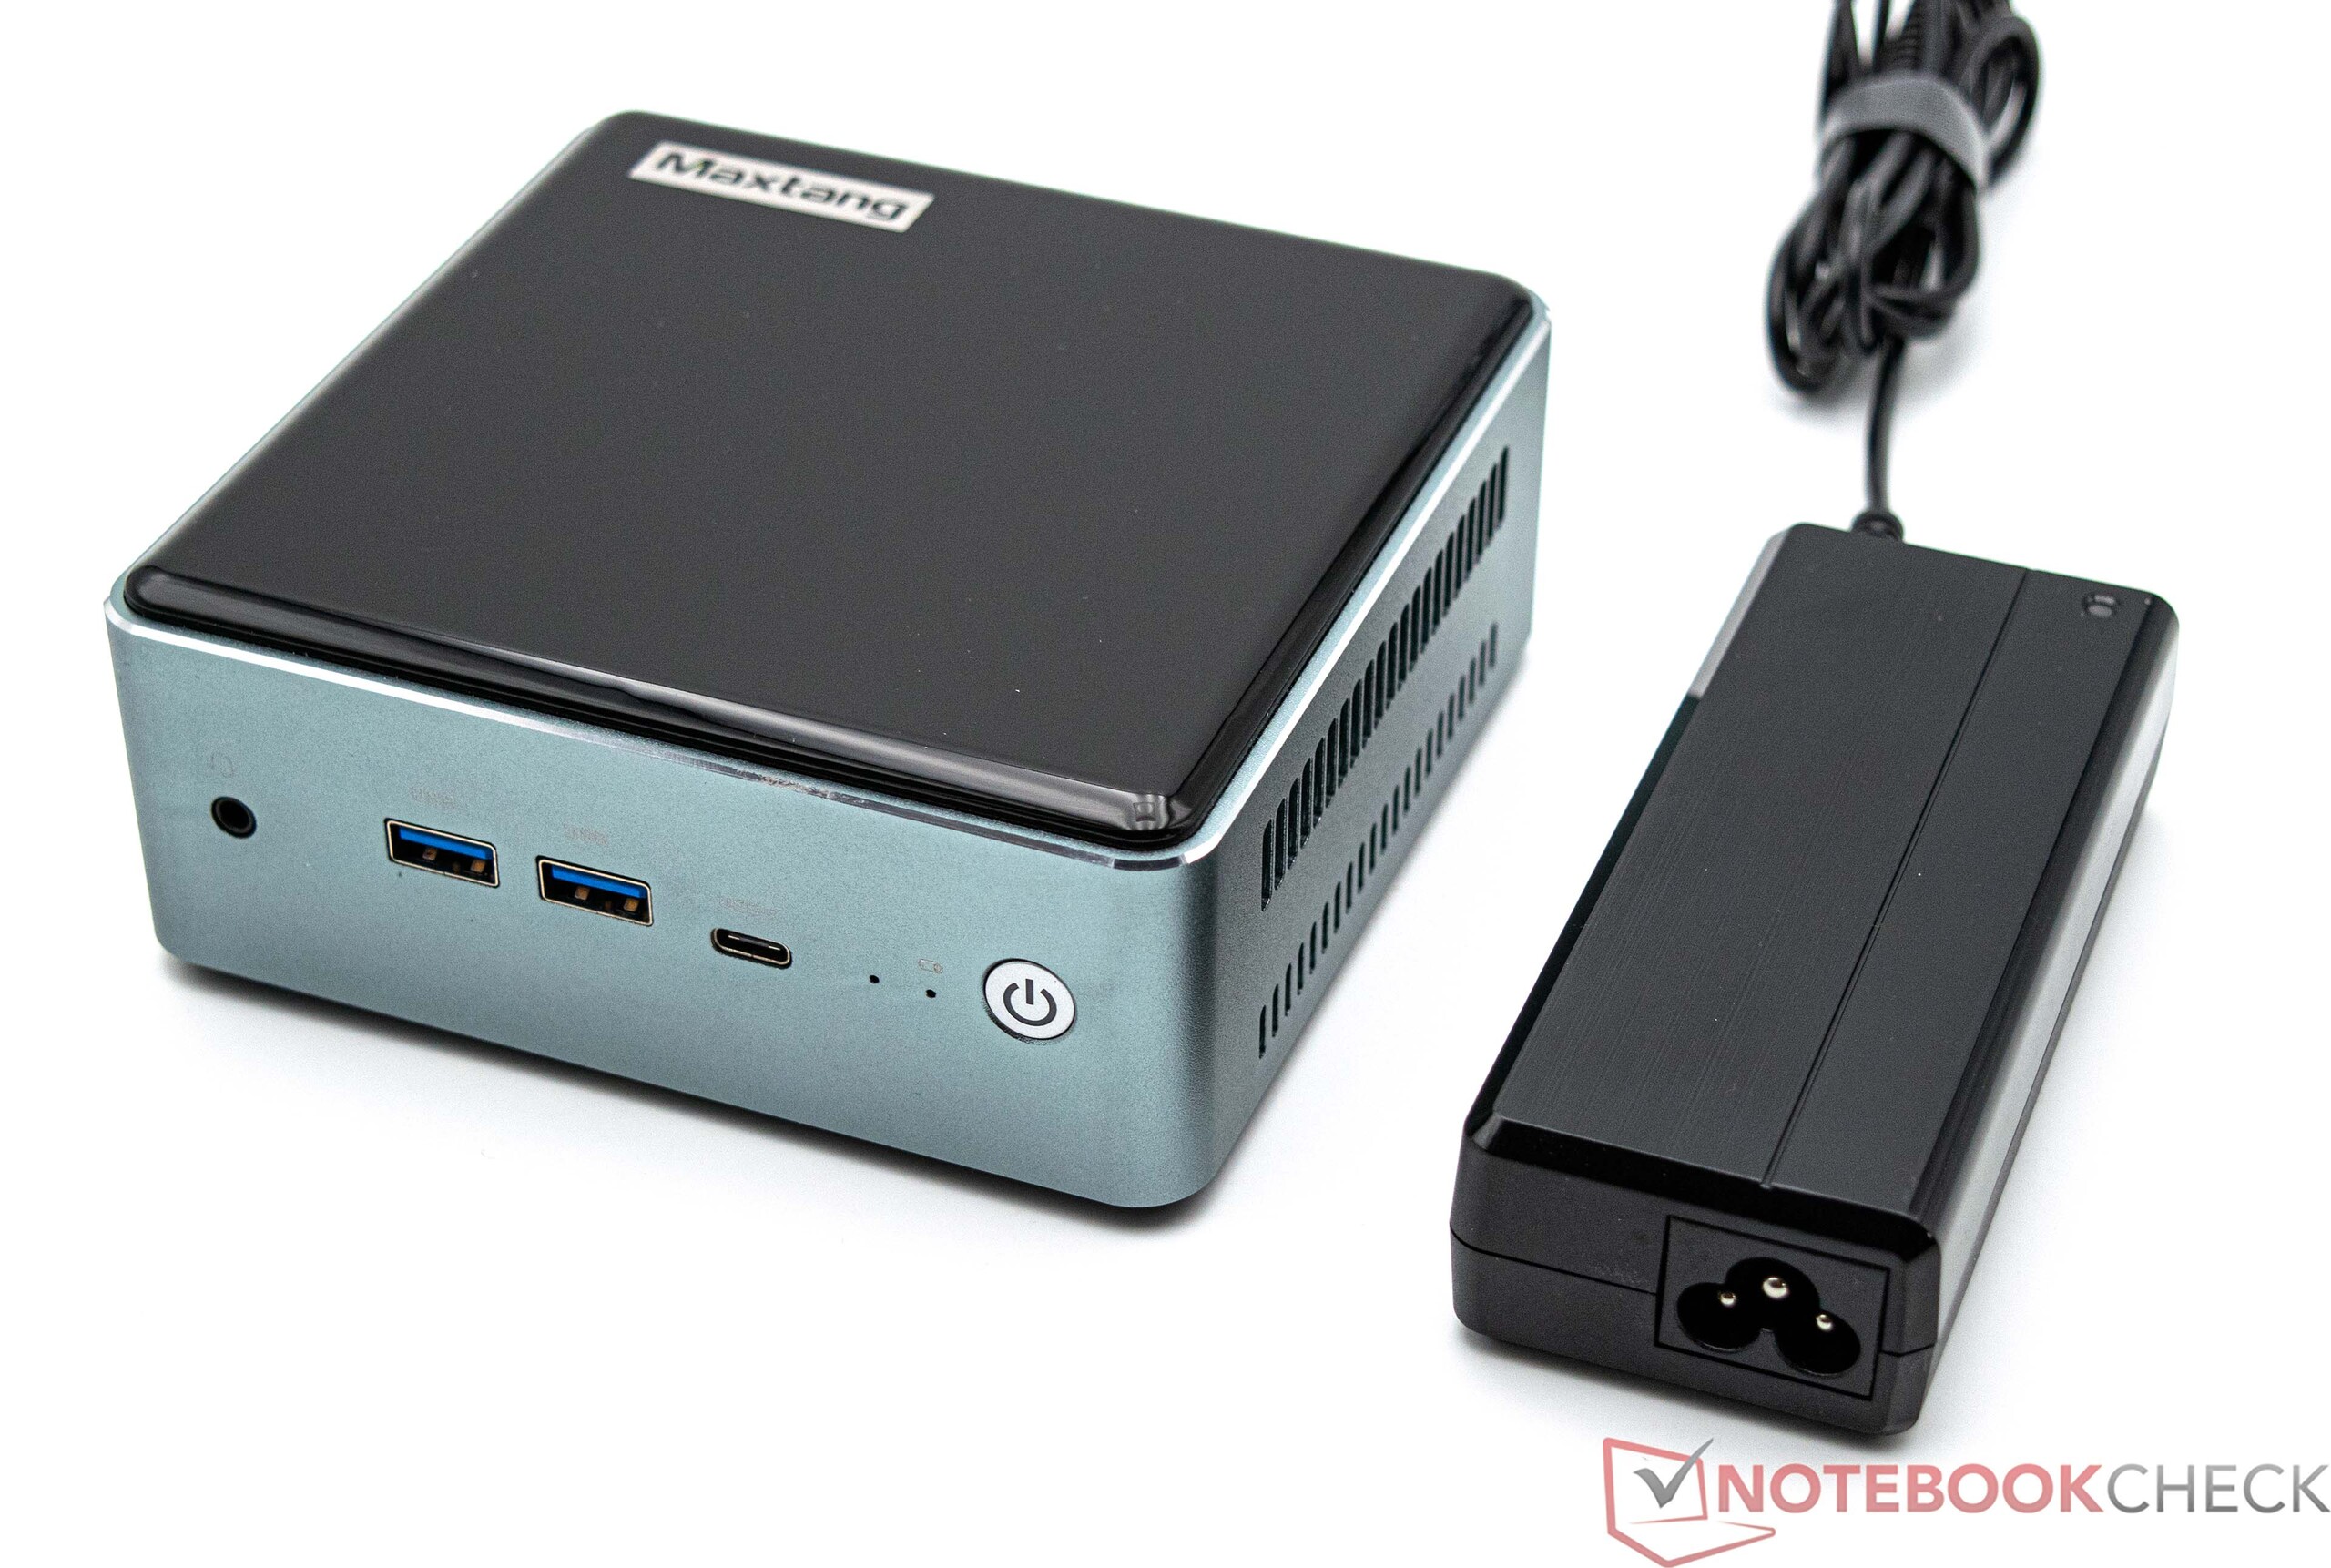
The Maxtang MTN-FP750 has a robust metal case which is complimented by black shiny plastic surfaces on the top and bottom of the device. Very quickly, fingerprints become visible and, sooner or later, scratches are unavoidable. Stability-wise, the machine doesn't appear to suffer from having plastic covers. The Maxtang branding is emblazoned on the top of the mini PC.
At around 13 x 13 centimeters, the device takes up a little more desk space than the competition and with a weight of 600 grams, the Maxtang MTN-FP750 is relatively light. The PSU tips the scales at just shy of 290 grams. The Maxtang MTN-FP750 can also be attached to a monitor and a VESA mount is included in the box.
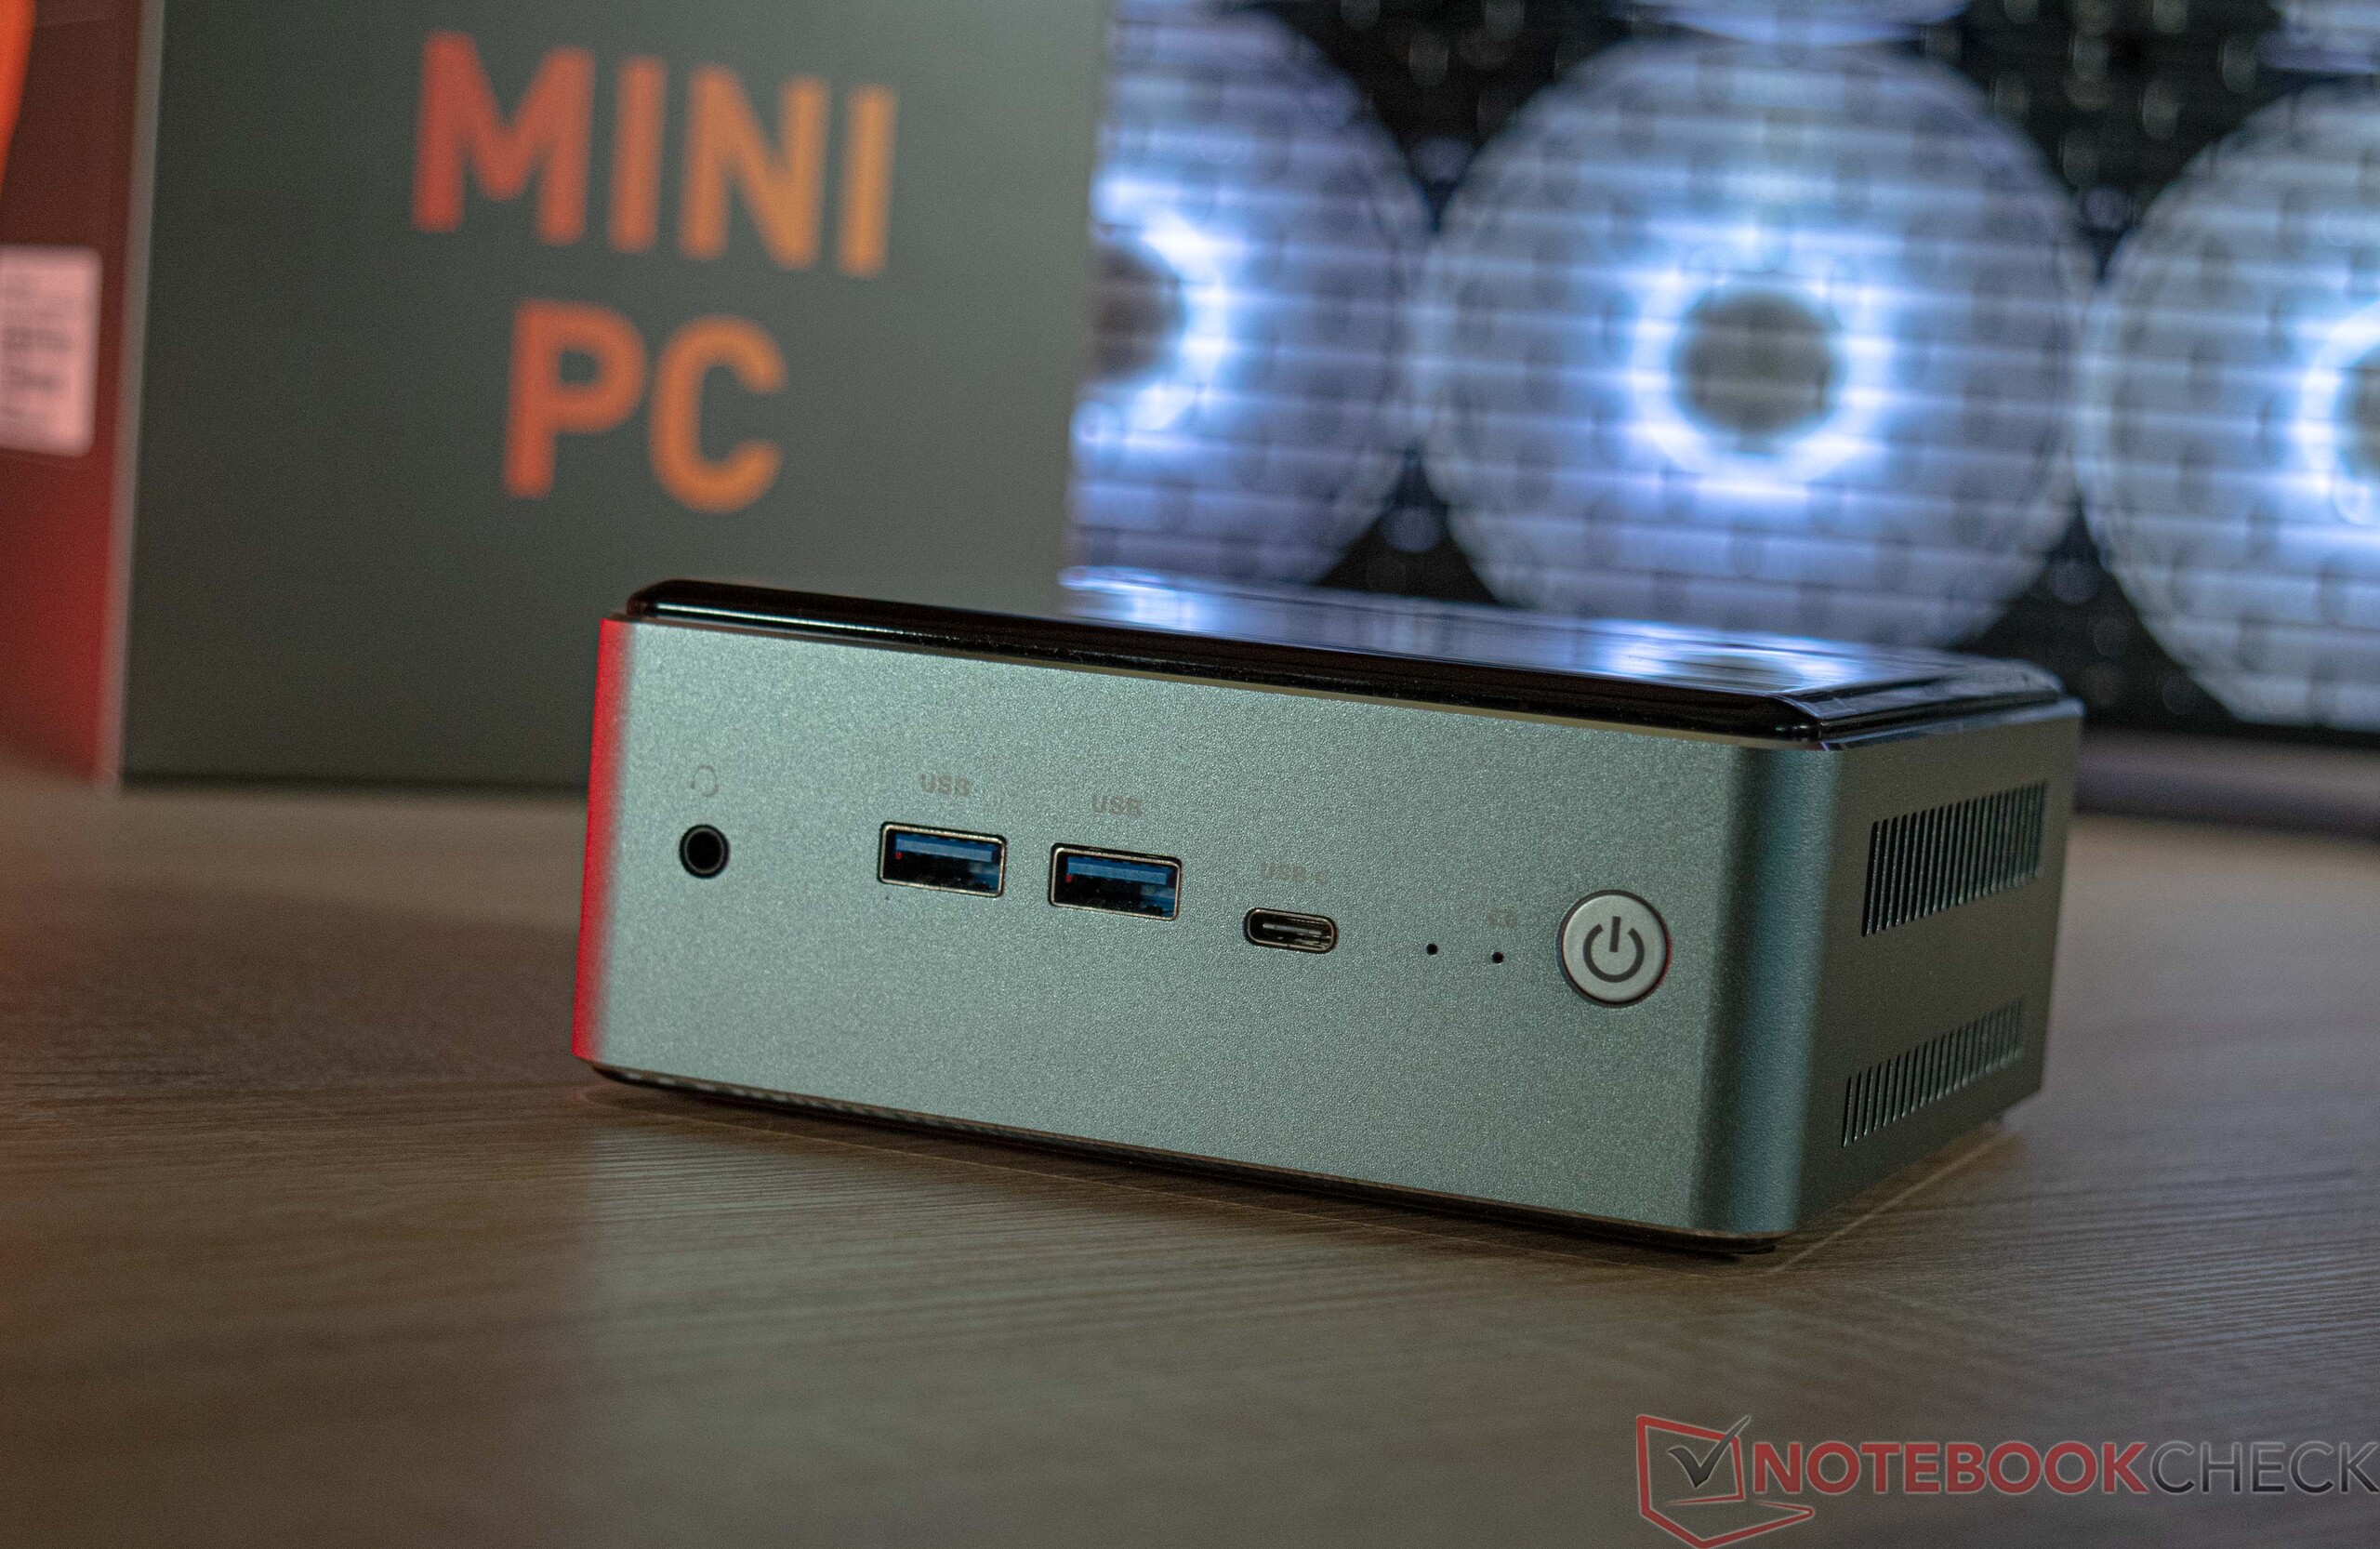
Features
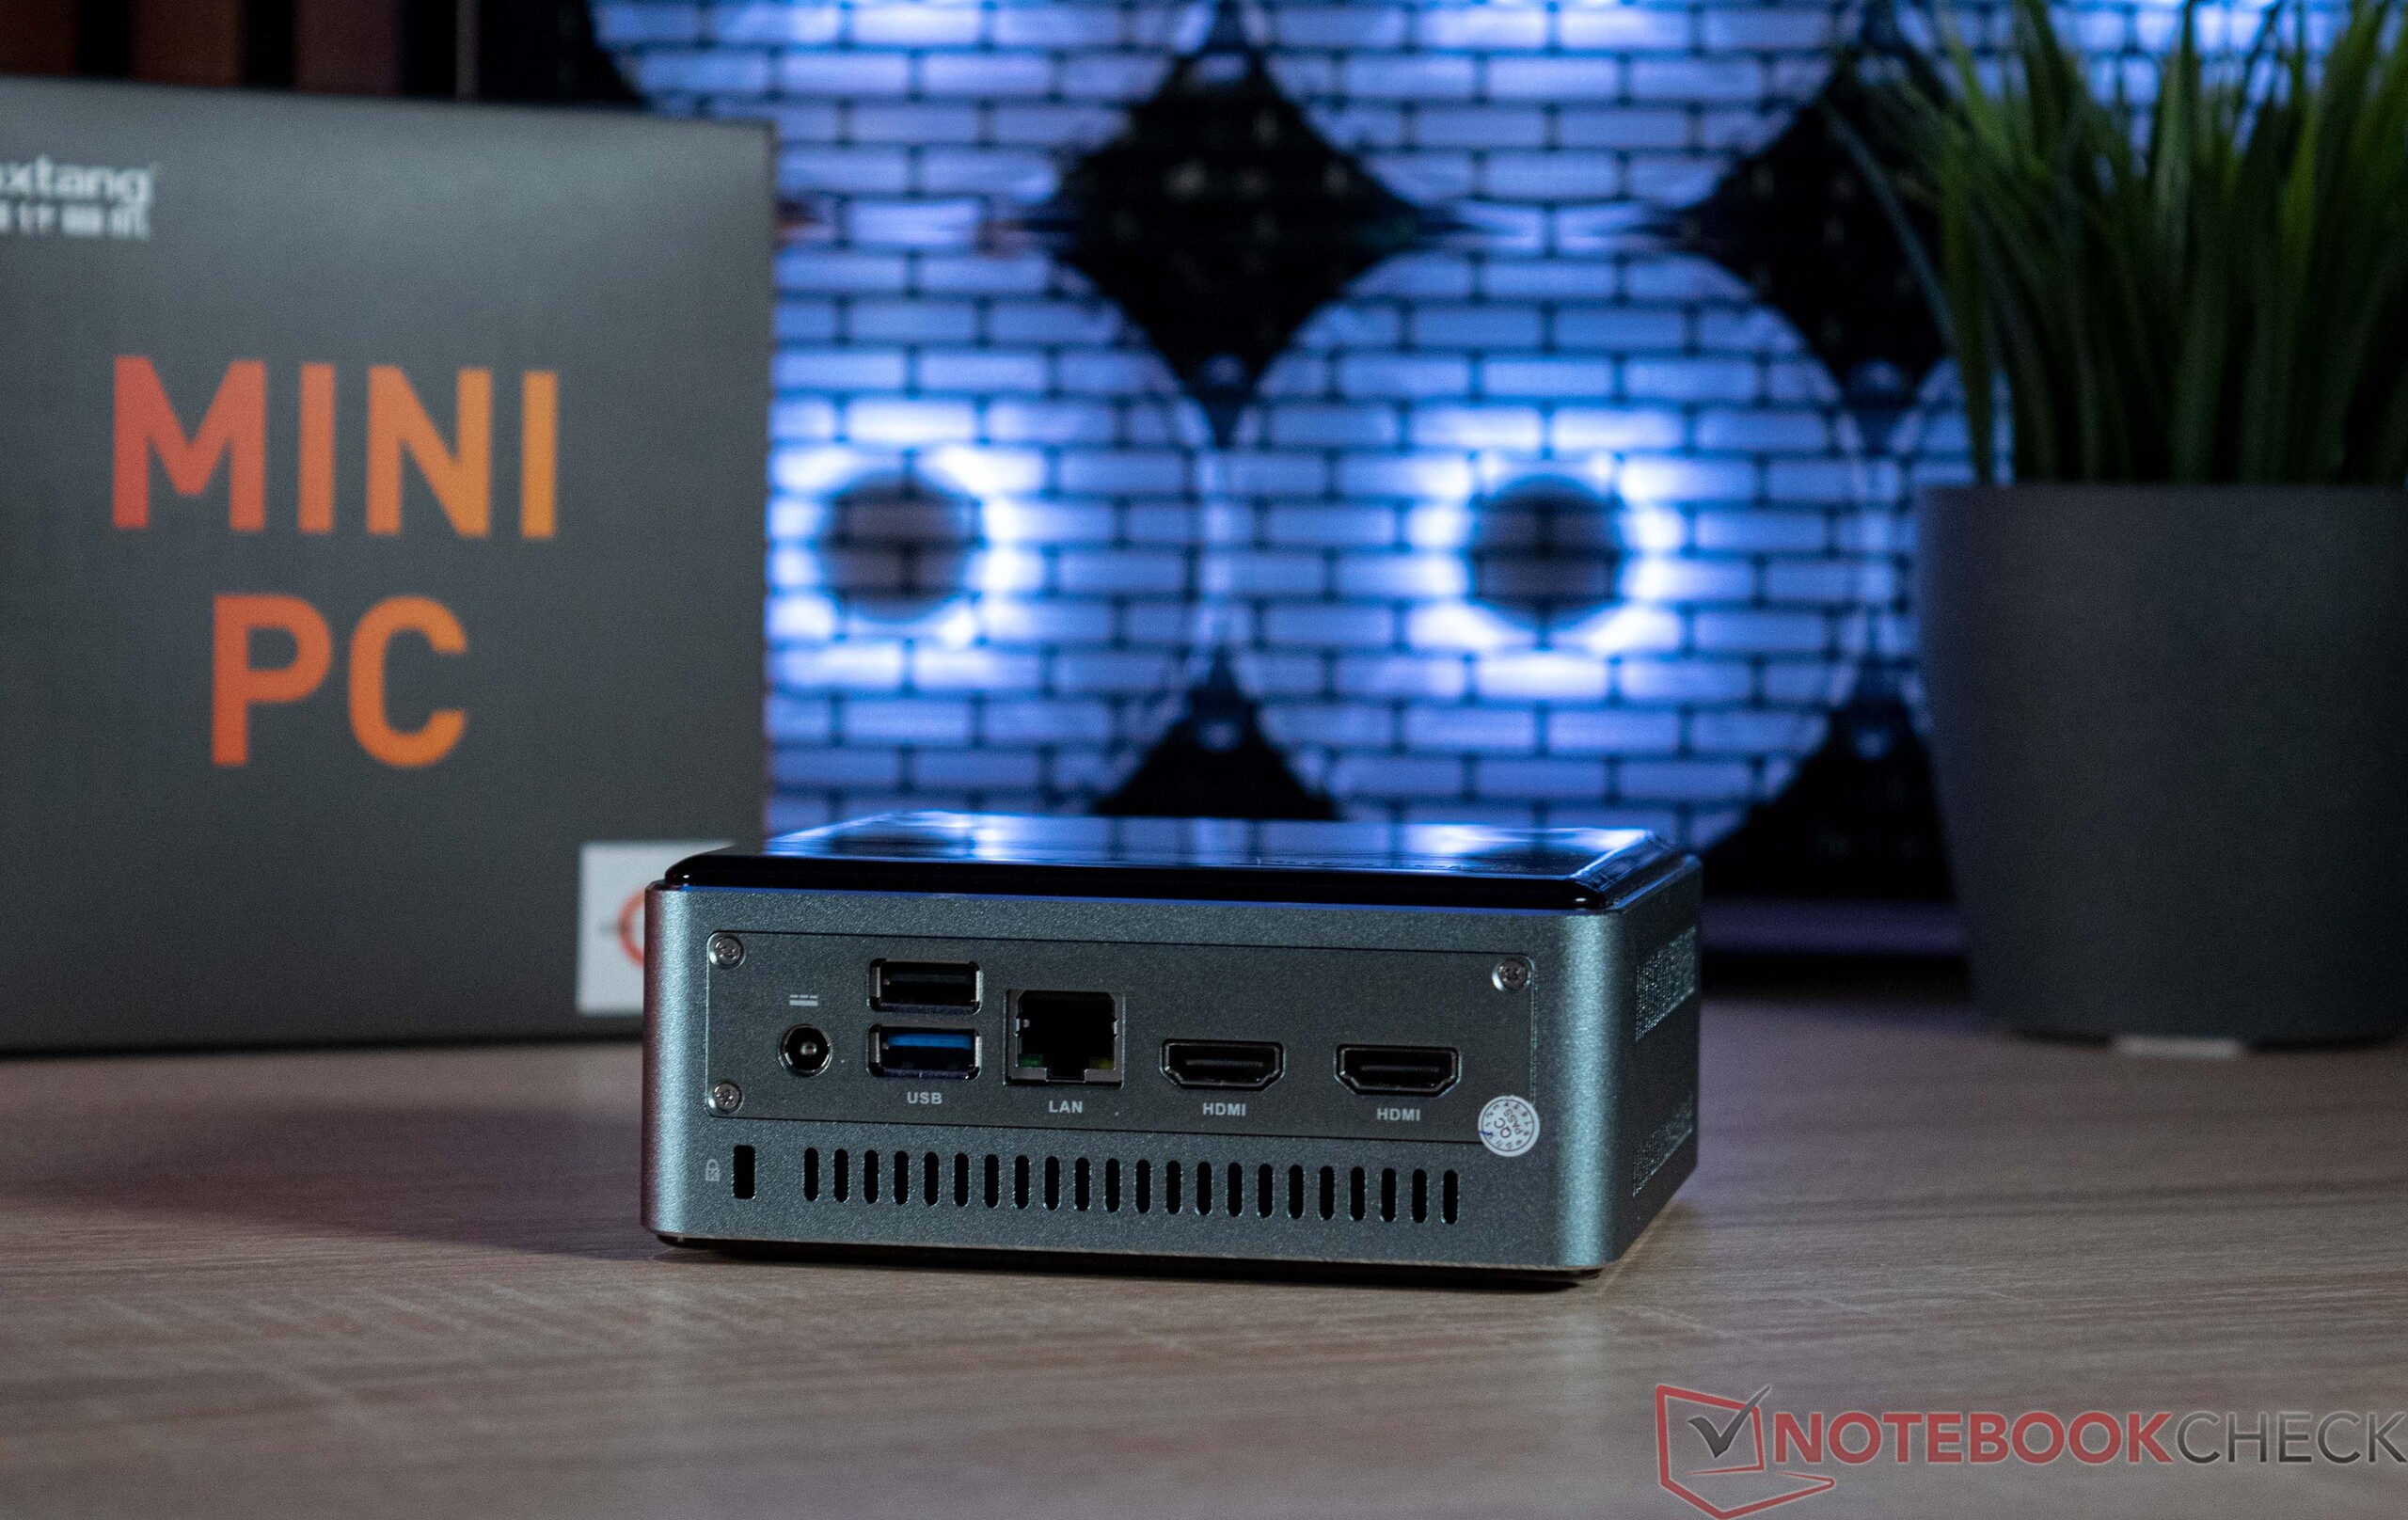
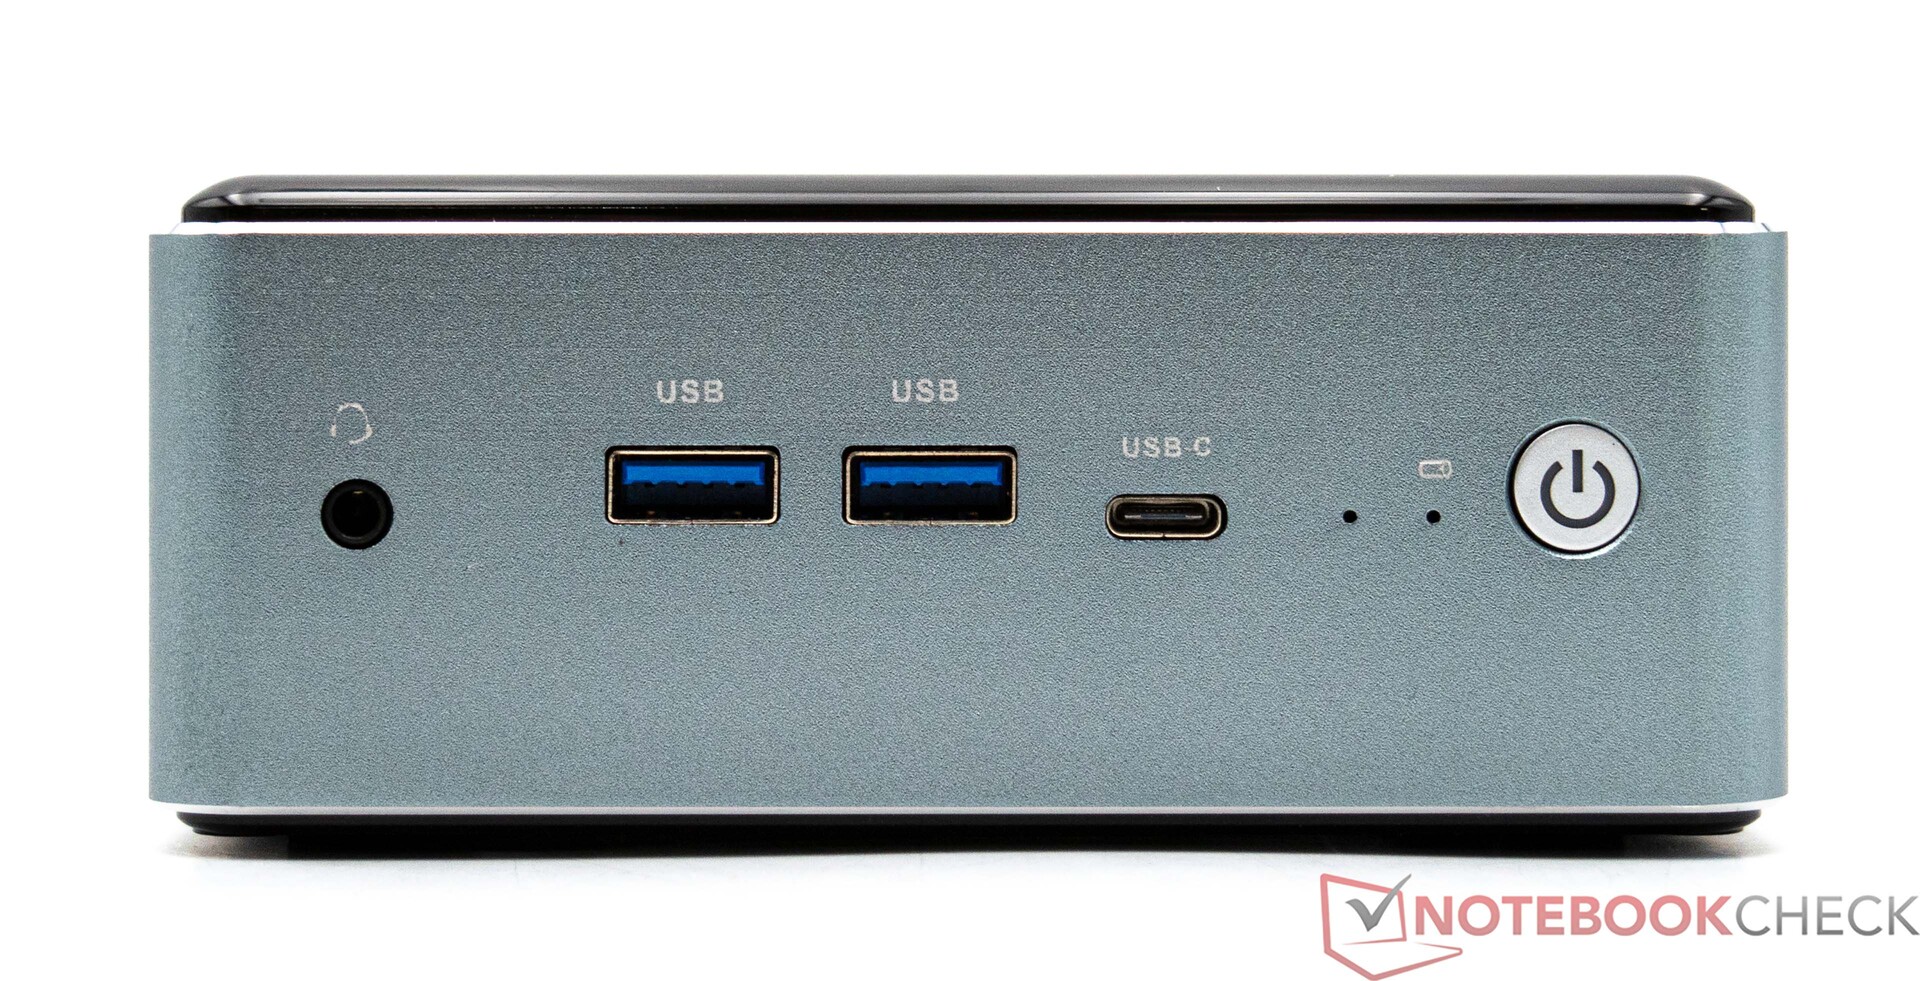
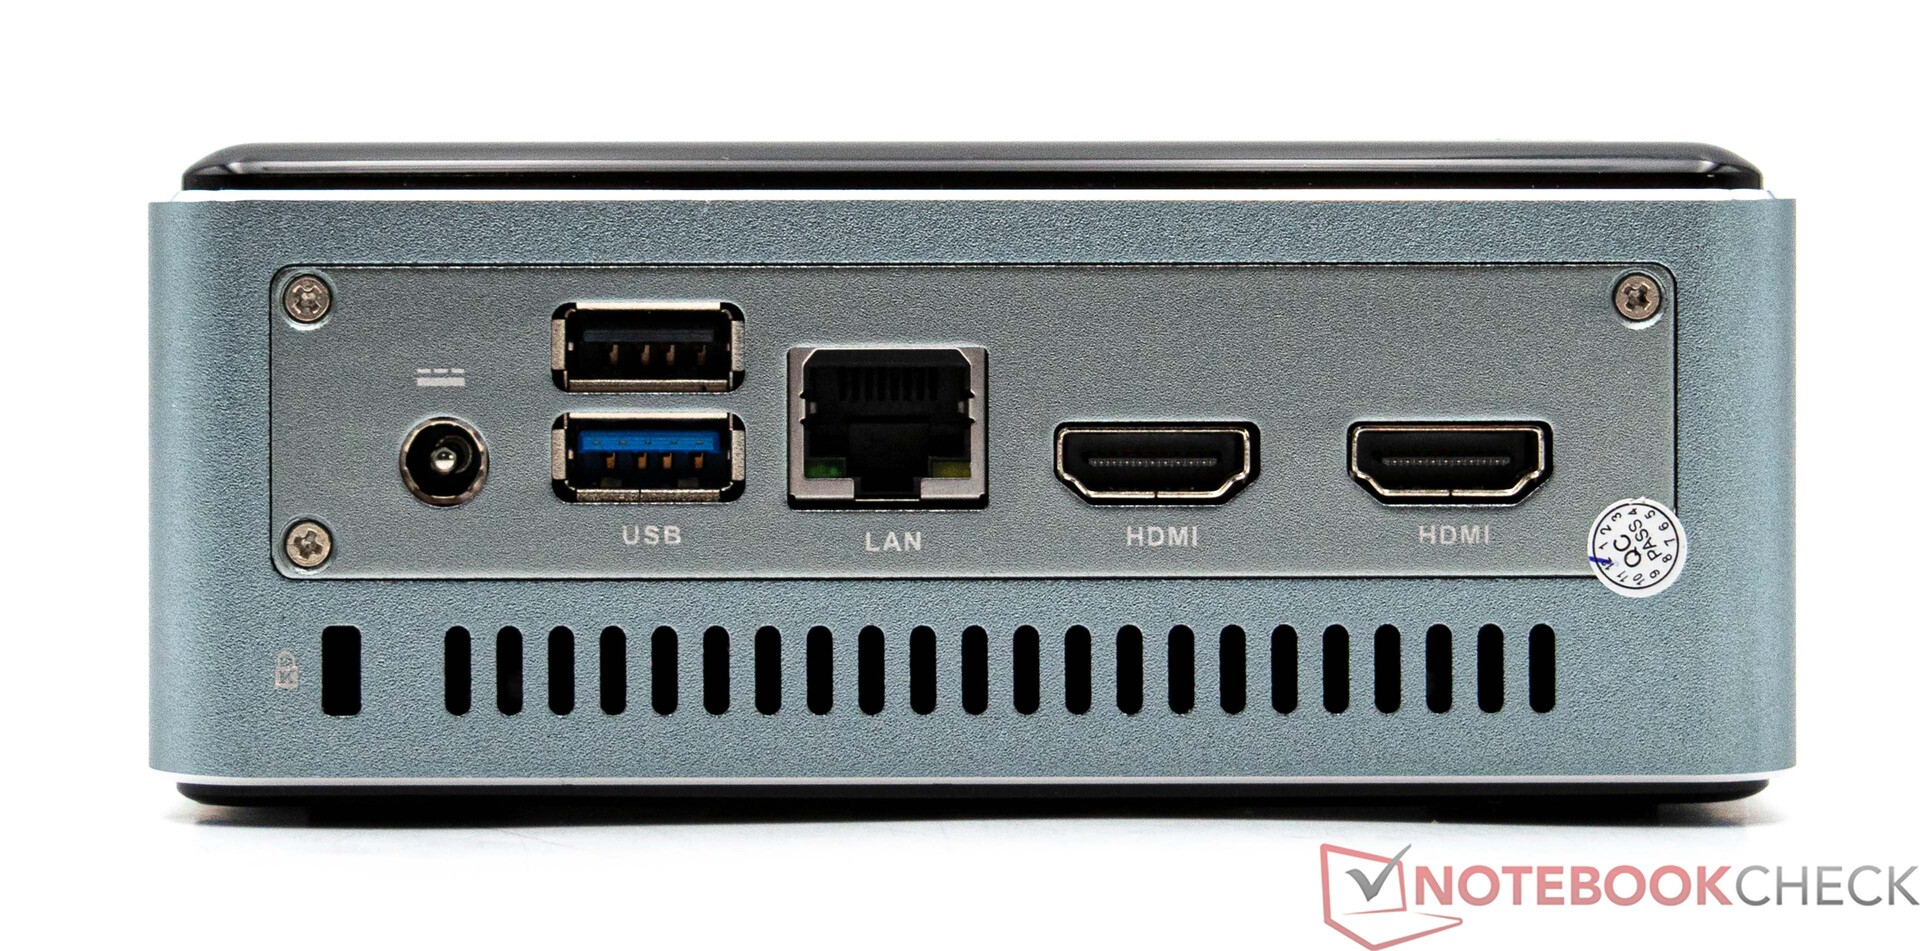
When it comes to ports, the Maxtang MTN-FP750 offers the basics. All of these can be found on the front and rear. There are a total of five USB ports, one of which (USB Type C) can also be used as a display connector. Together with the two HDMI outputs on the rear, this means a total of three monitors can be operated simultaneously. In addition, the rear of the device is also home to the 2.5G LAN port.
Communication
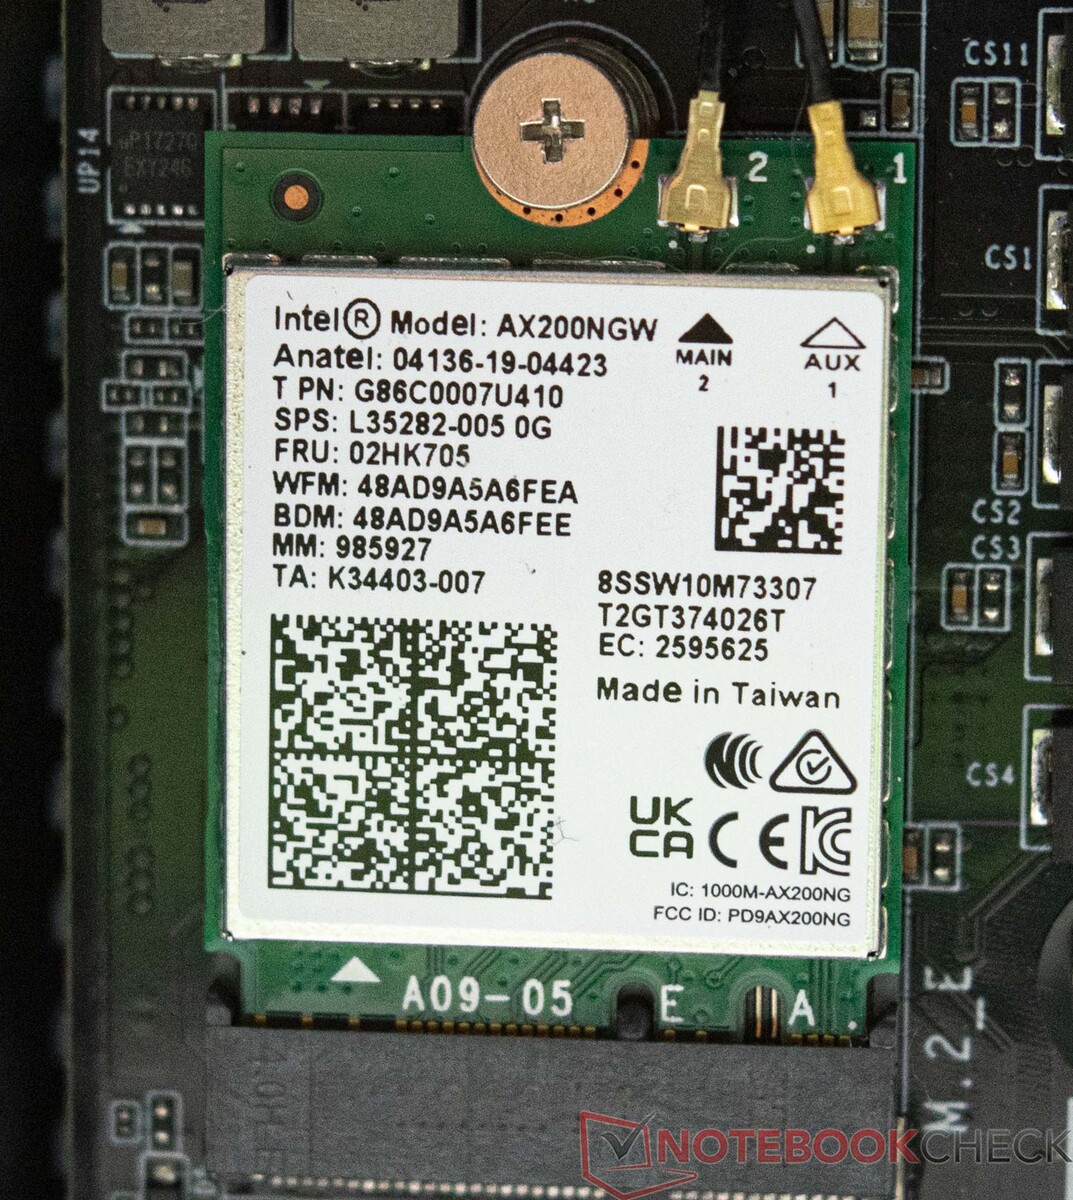
The Maxtang MTN-FP750 is home to an Intel Wi-Fi 6 AX200 wireless module that can handle 2.4 and 5 GHz frequencies. In tests, our review sample didn't exactly bowl us over with impressive results. For the test, we used an Asus ROG Rapture GT-AXE11000. Alternatively, you can also connect the Maxtang mini PC to the network via an ethernet port. Transfer speeds of up to 2.5 Gbit/s are possible.
Accessories
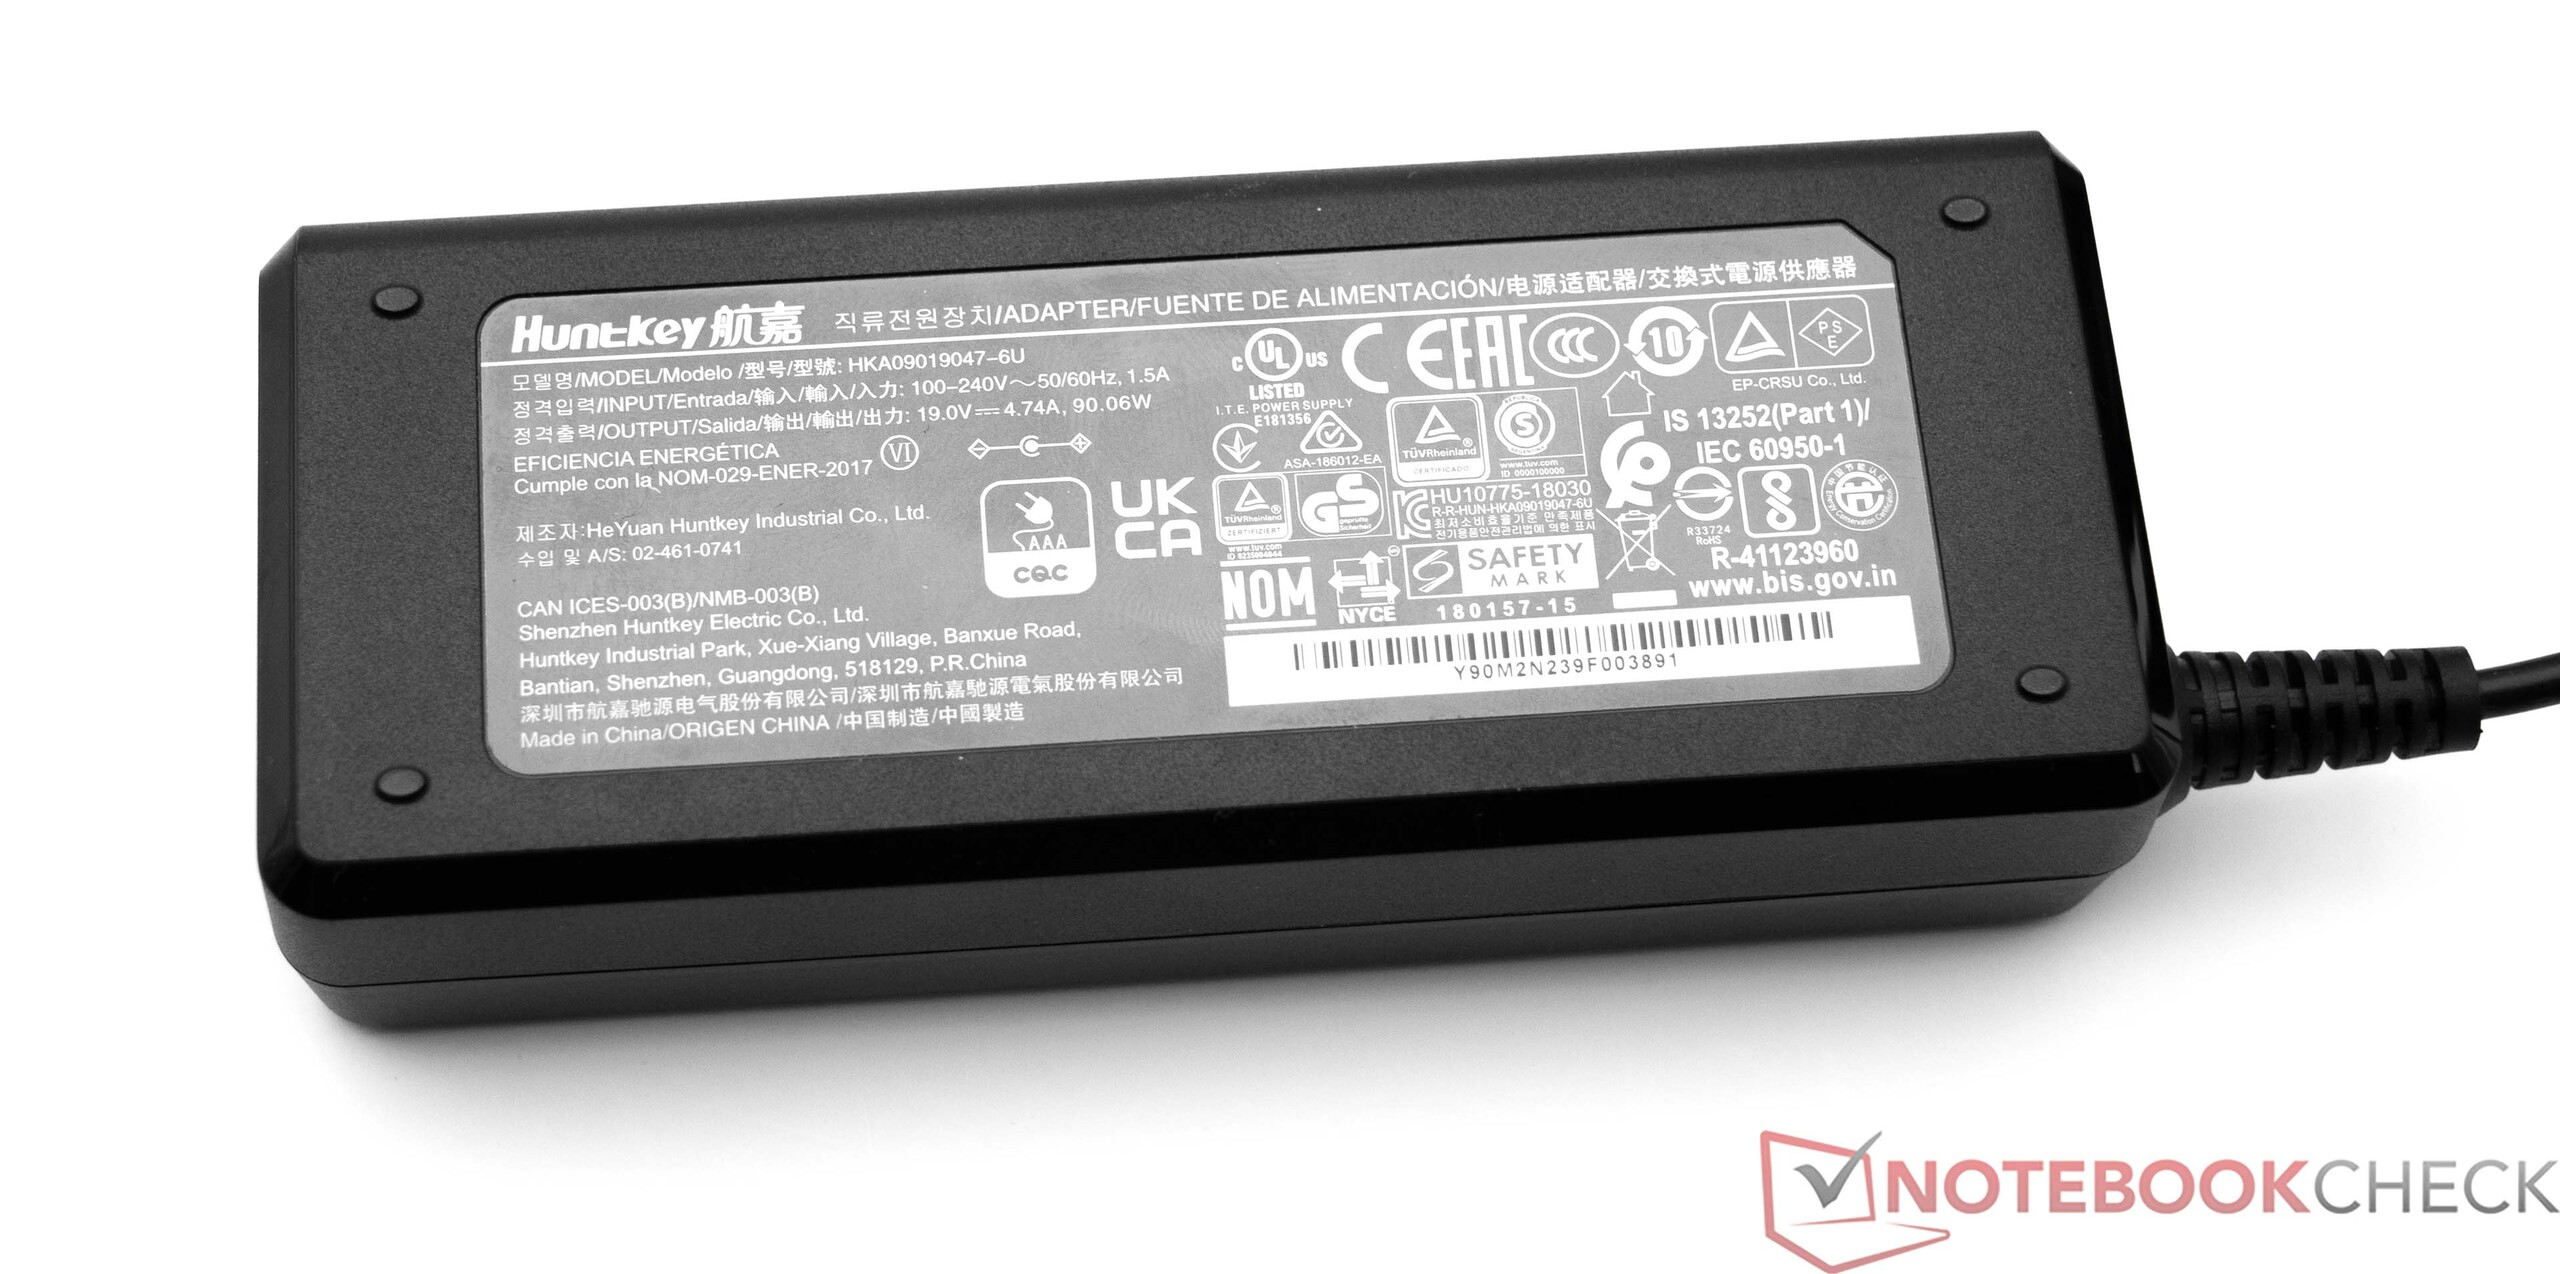
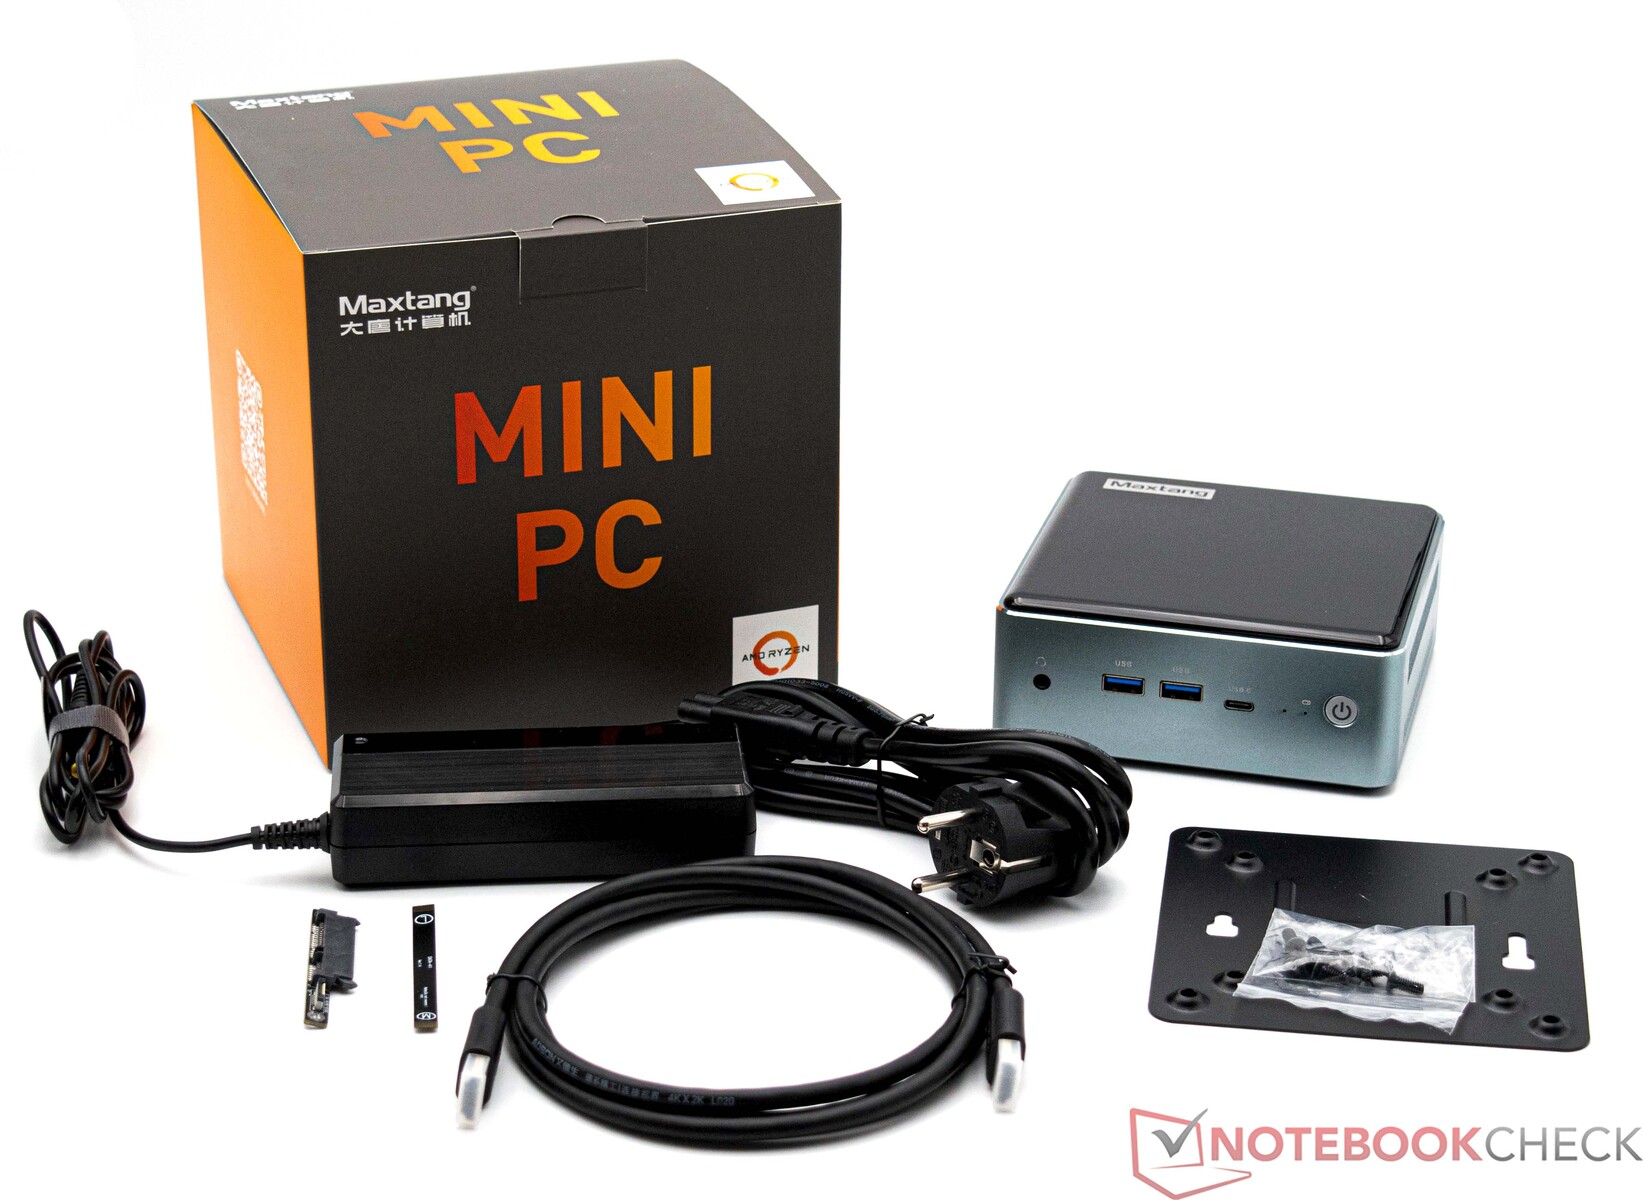
The Maxtang MTN-FP750 comes with all the most important components to get the device up and running. In addition to the machine itself, the box contains a 90-watt PSU (19 V; 4,74 A) as well as a mounting plate for the VESA assembly. Likewise, an HDMI cable and a quick setup guide are also part of the package.
Maintenance
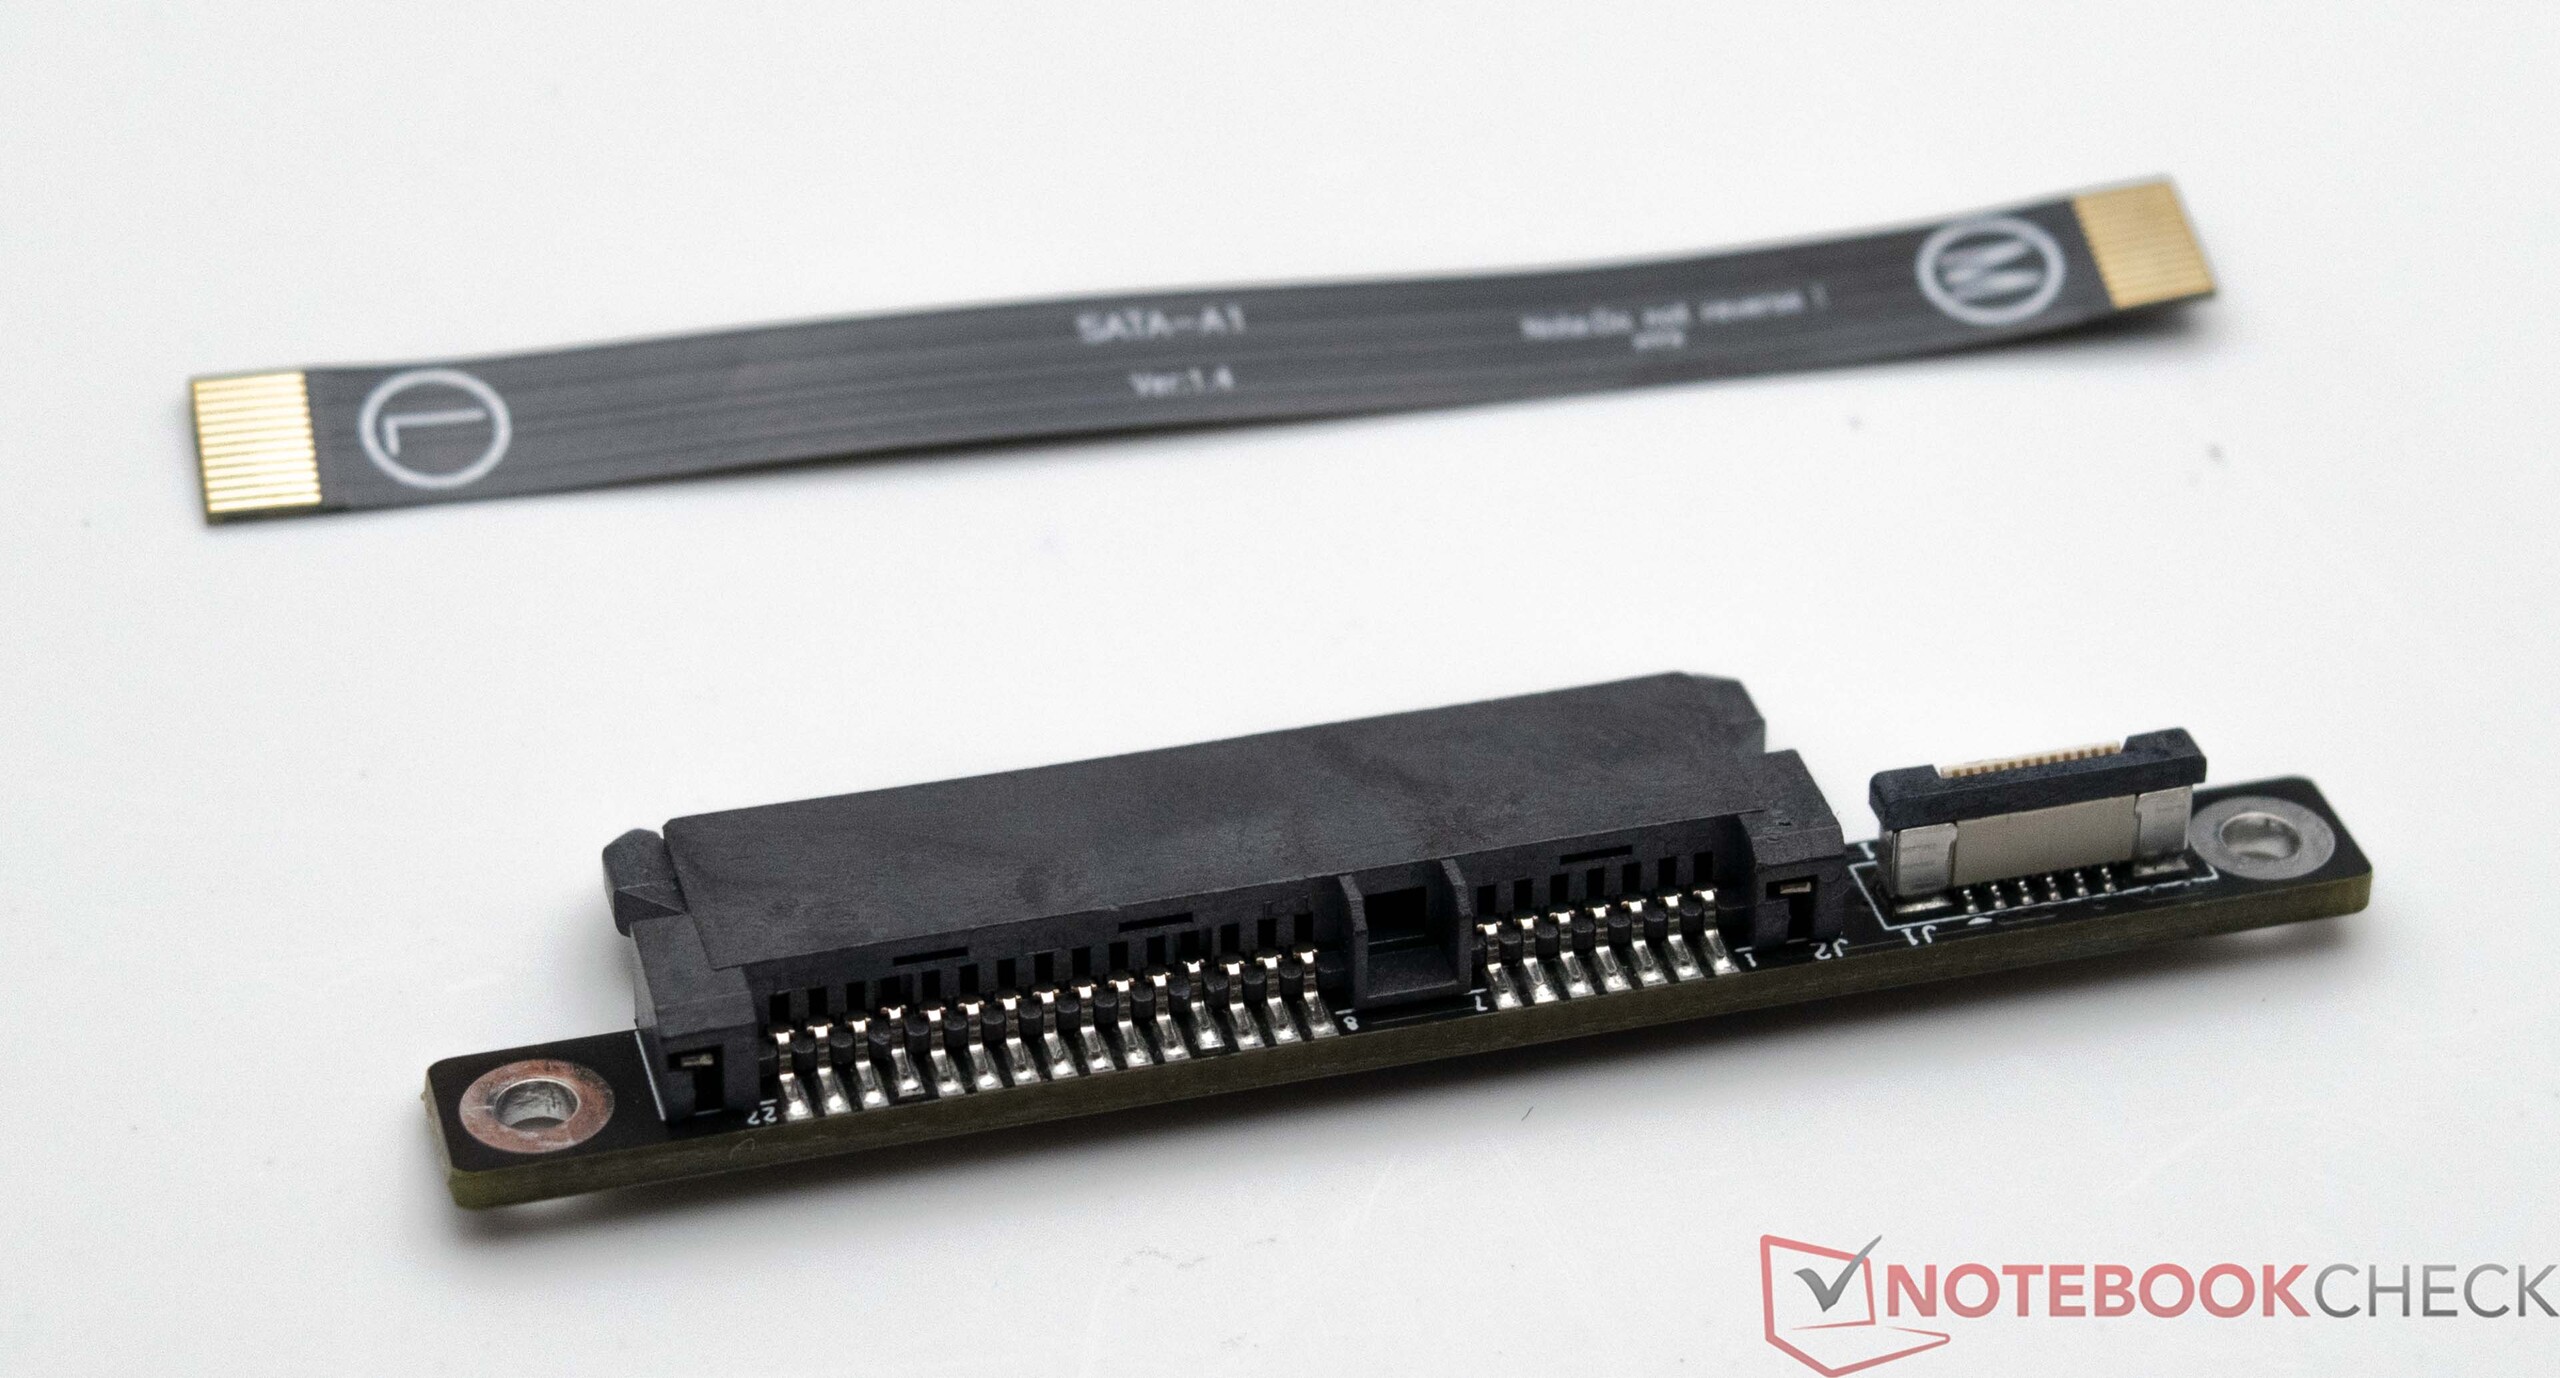
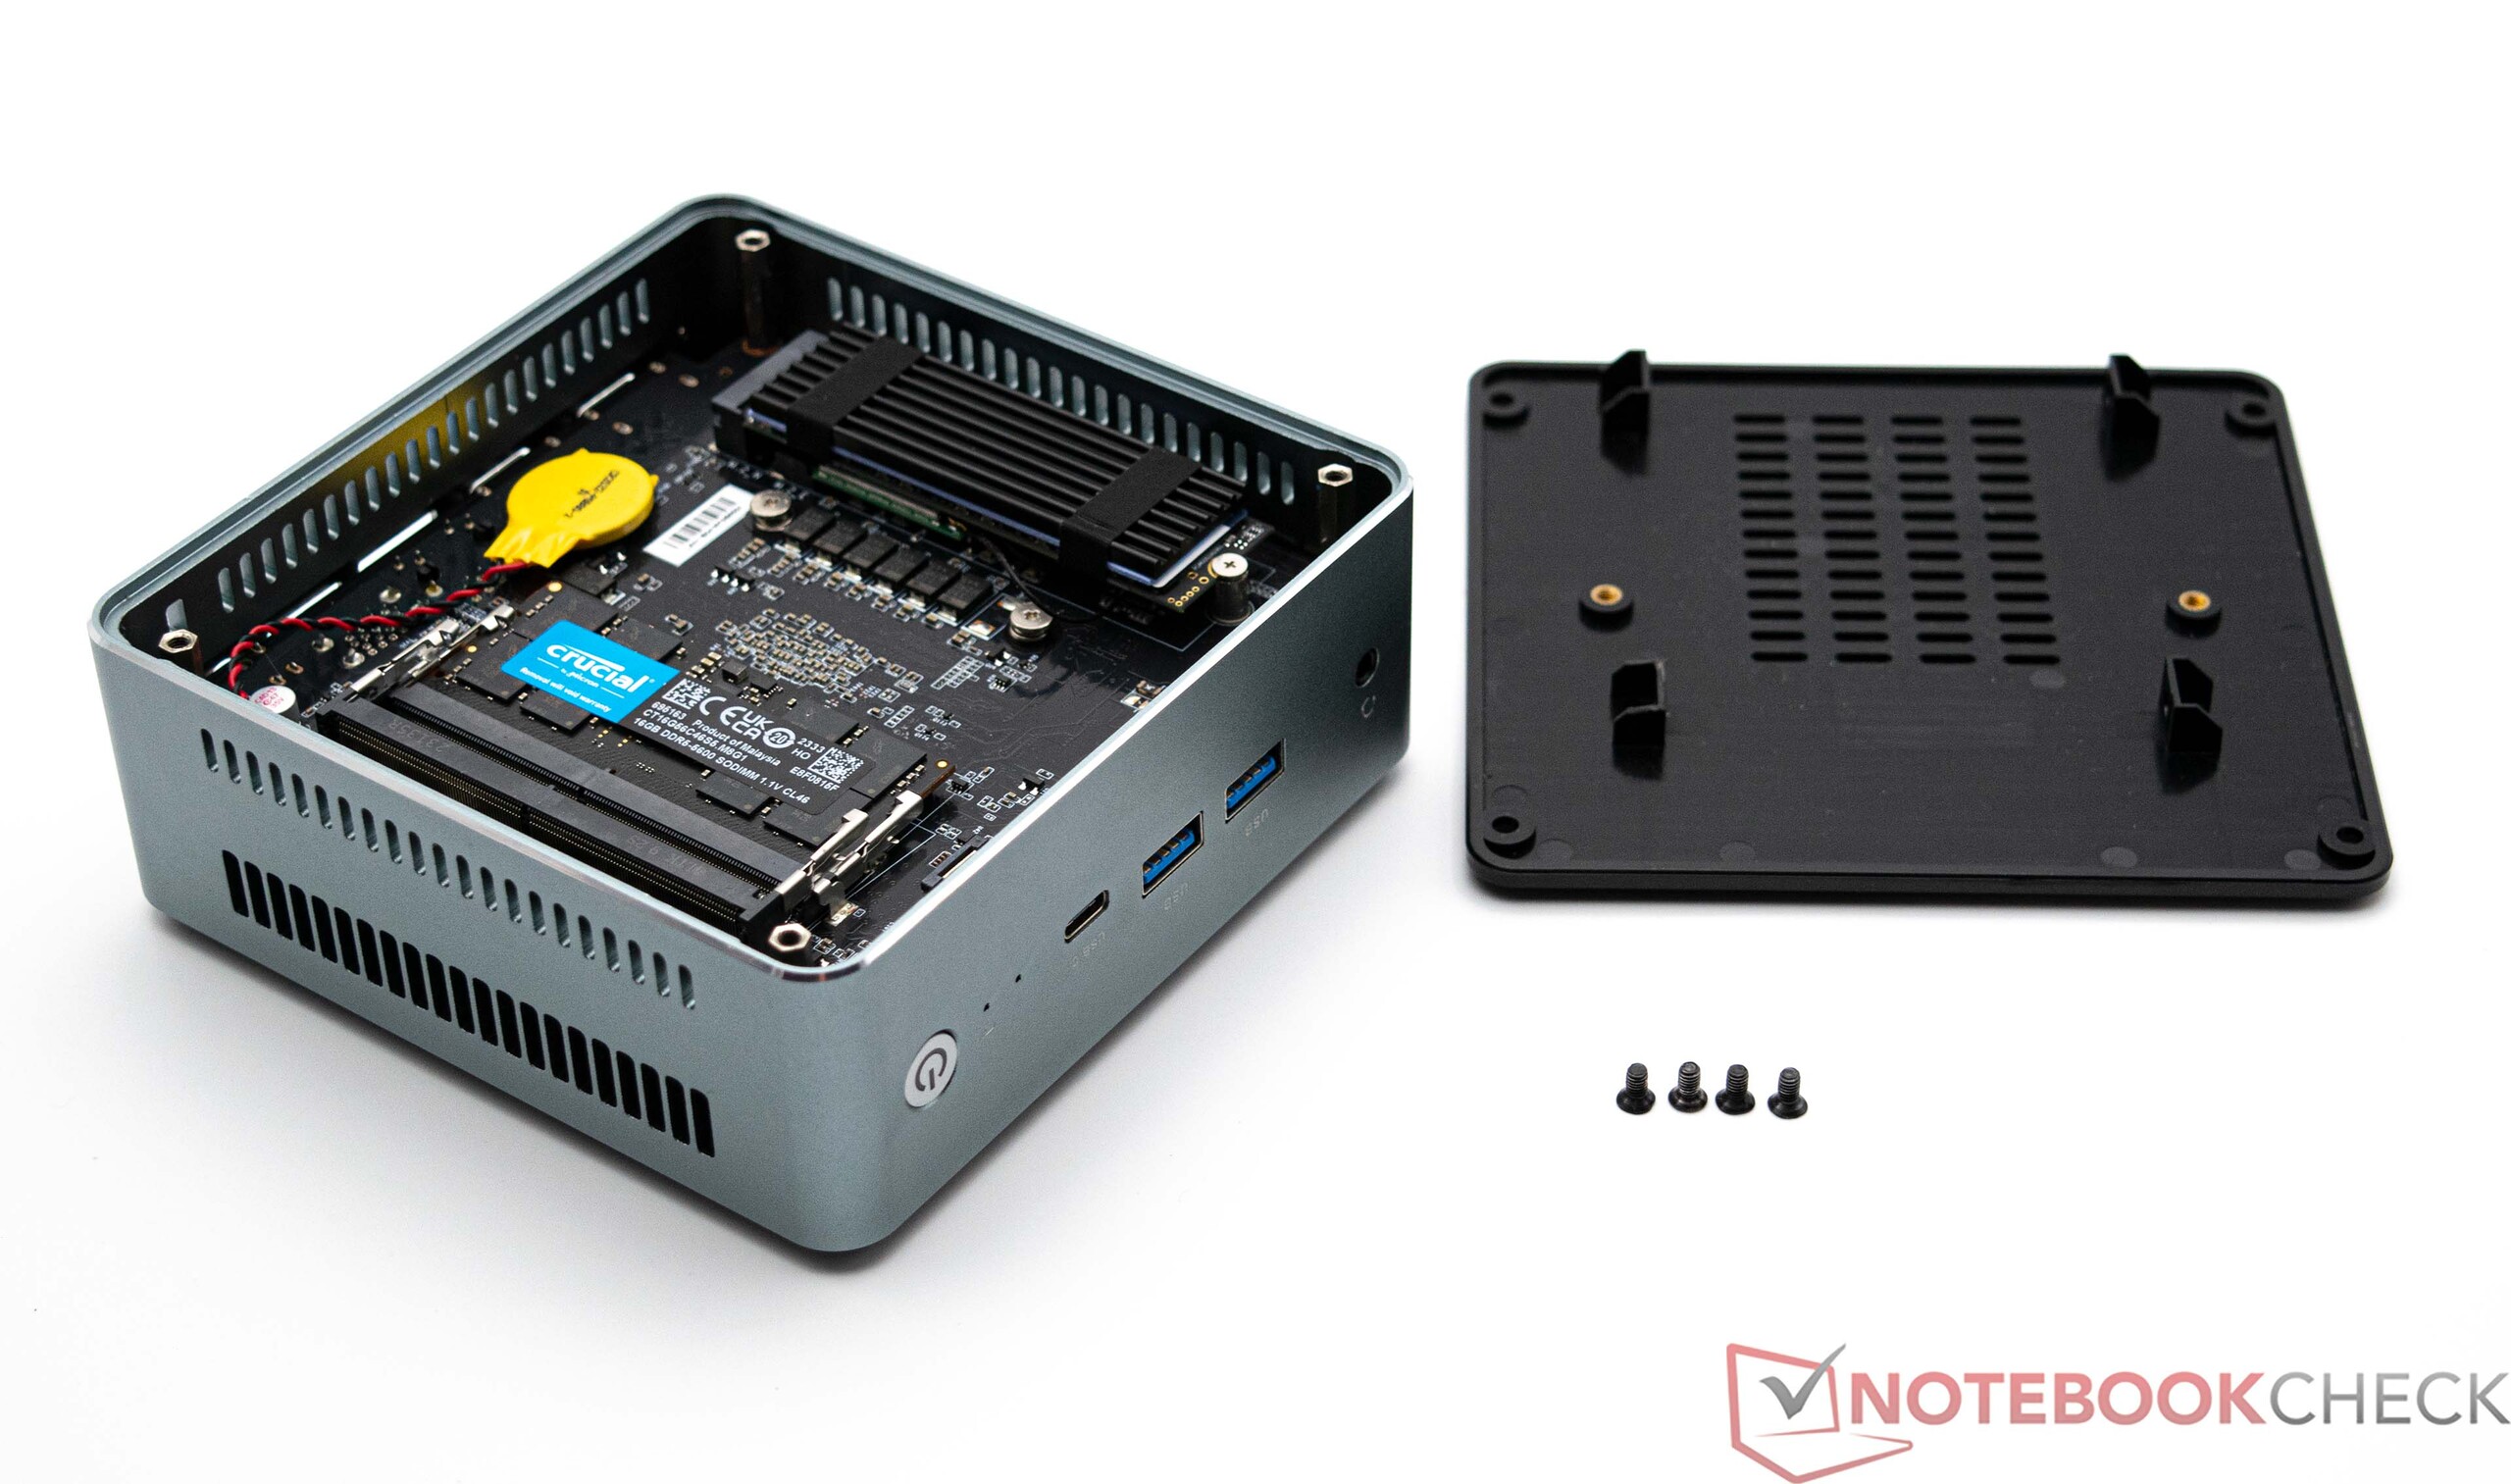
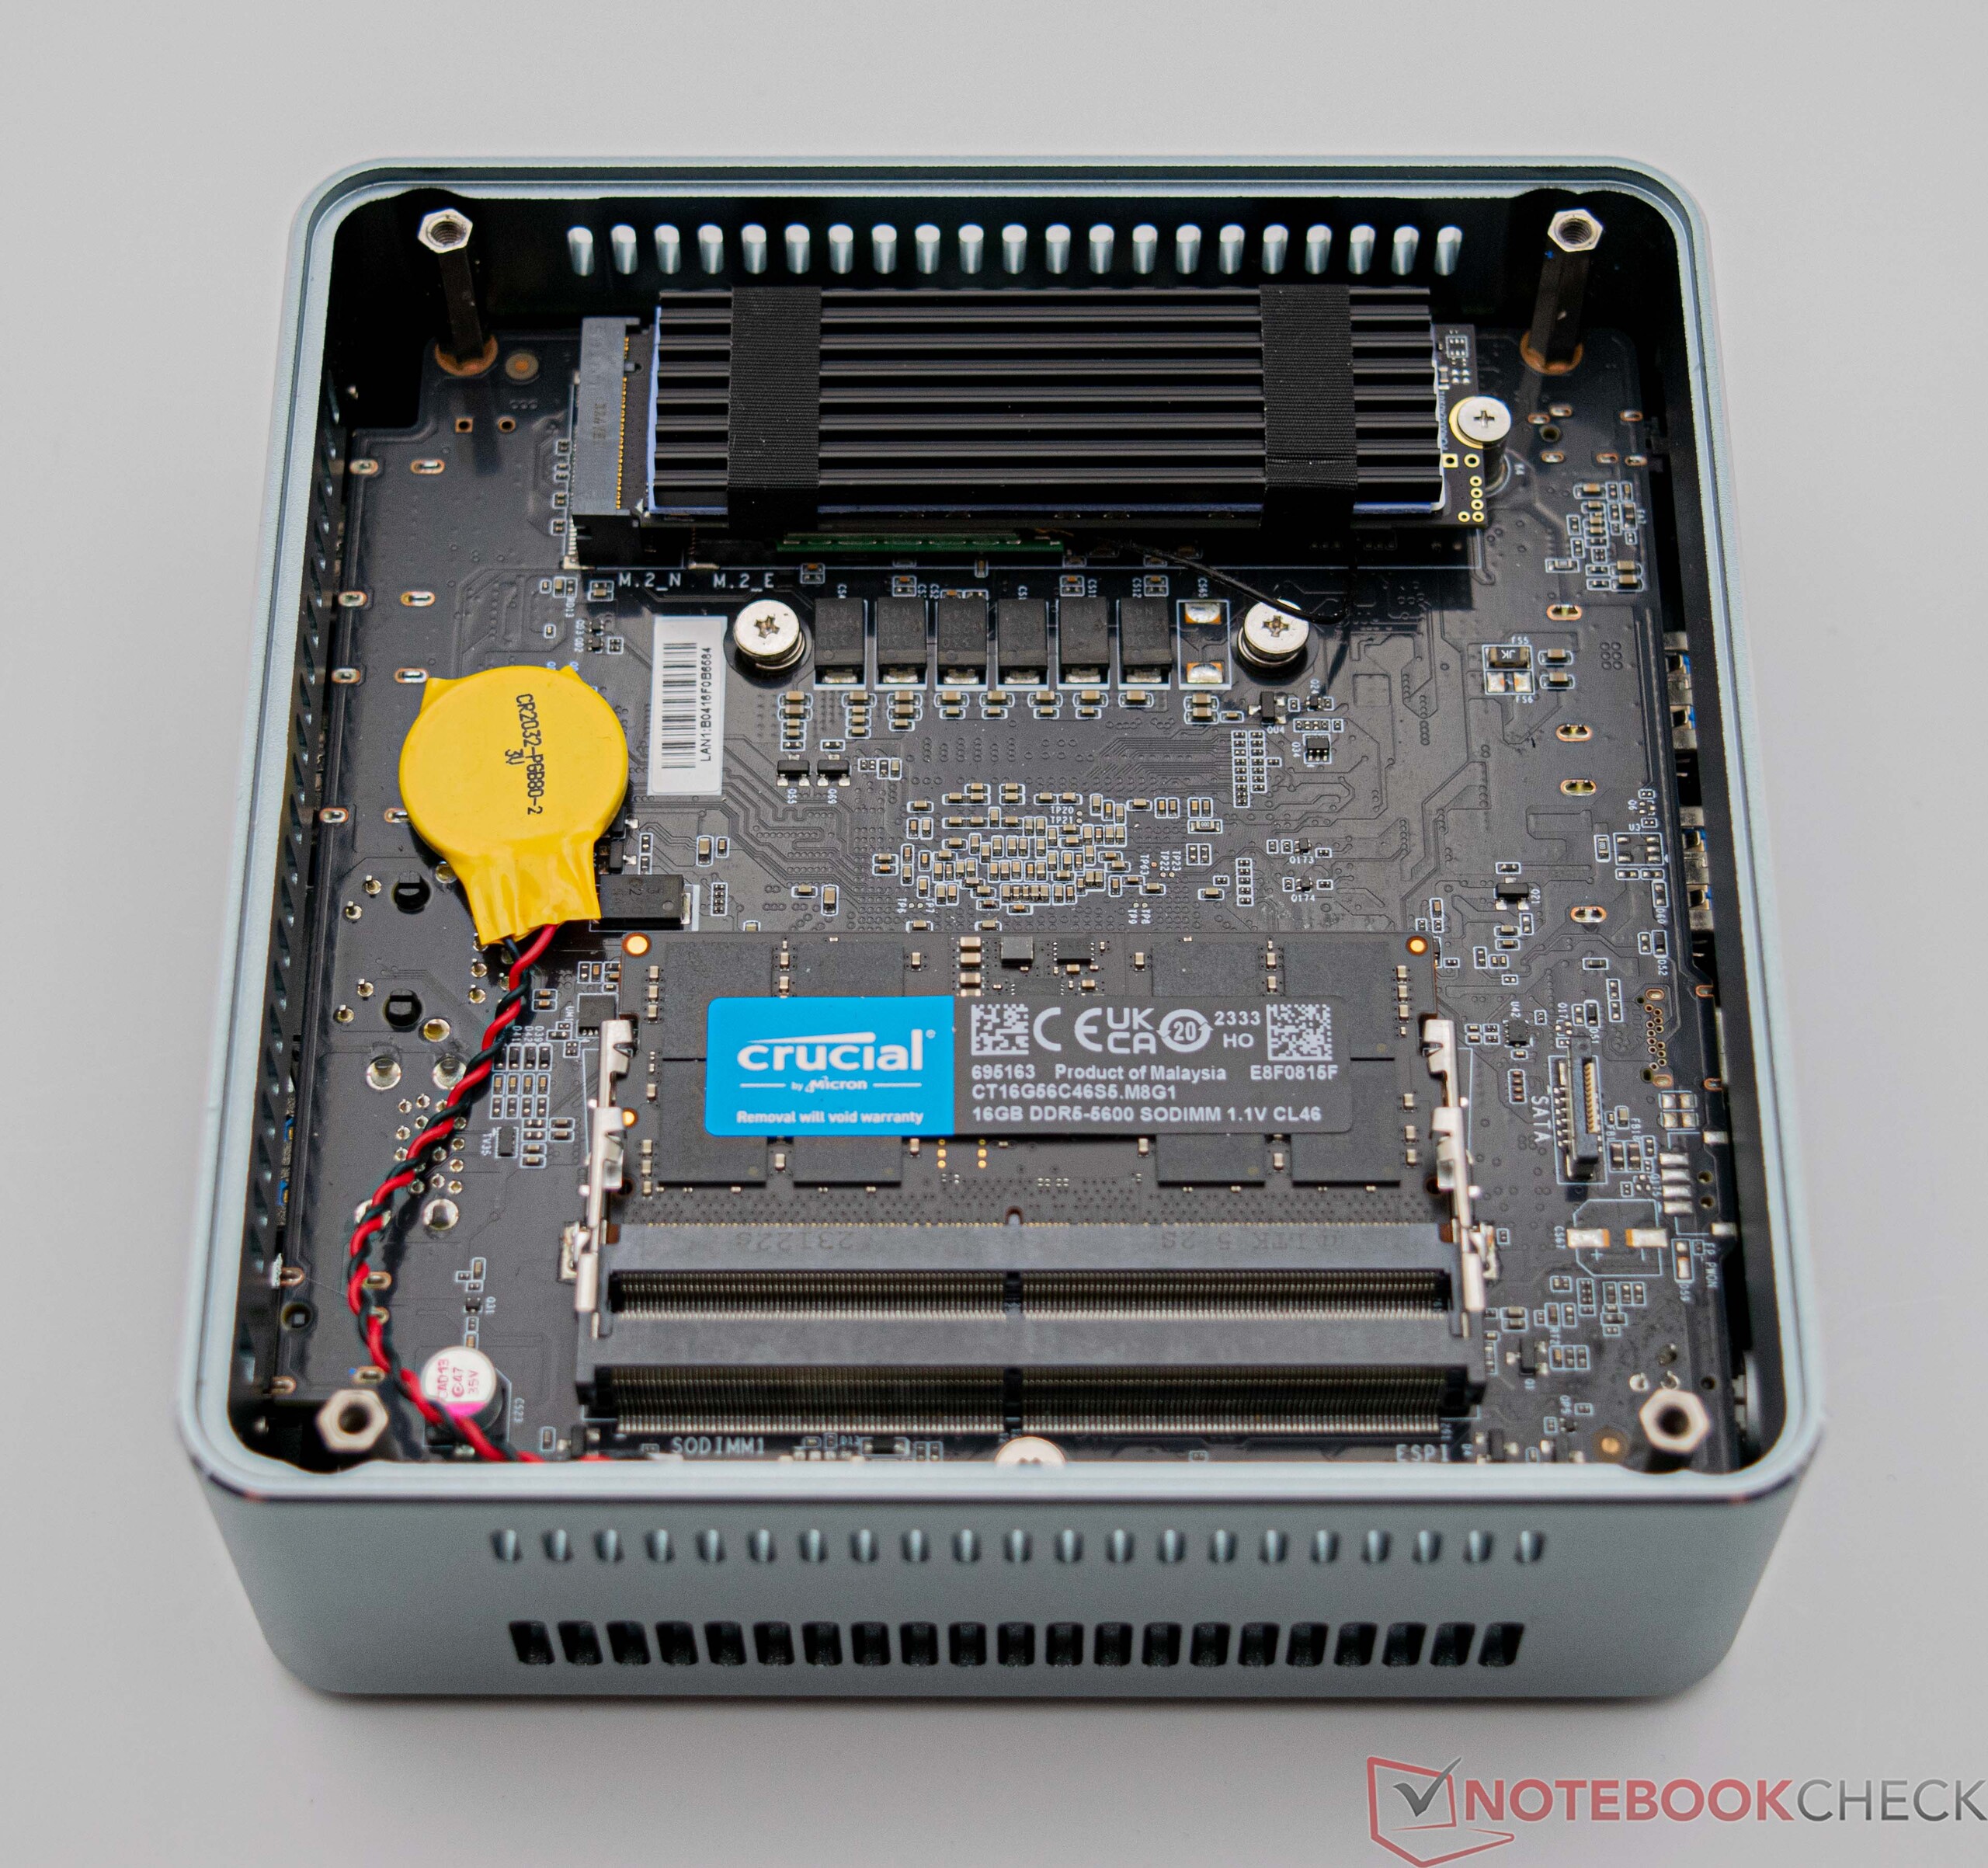
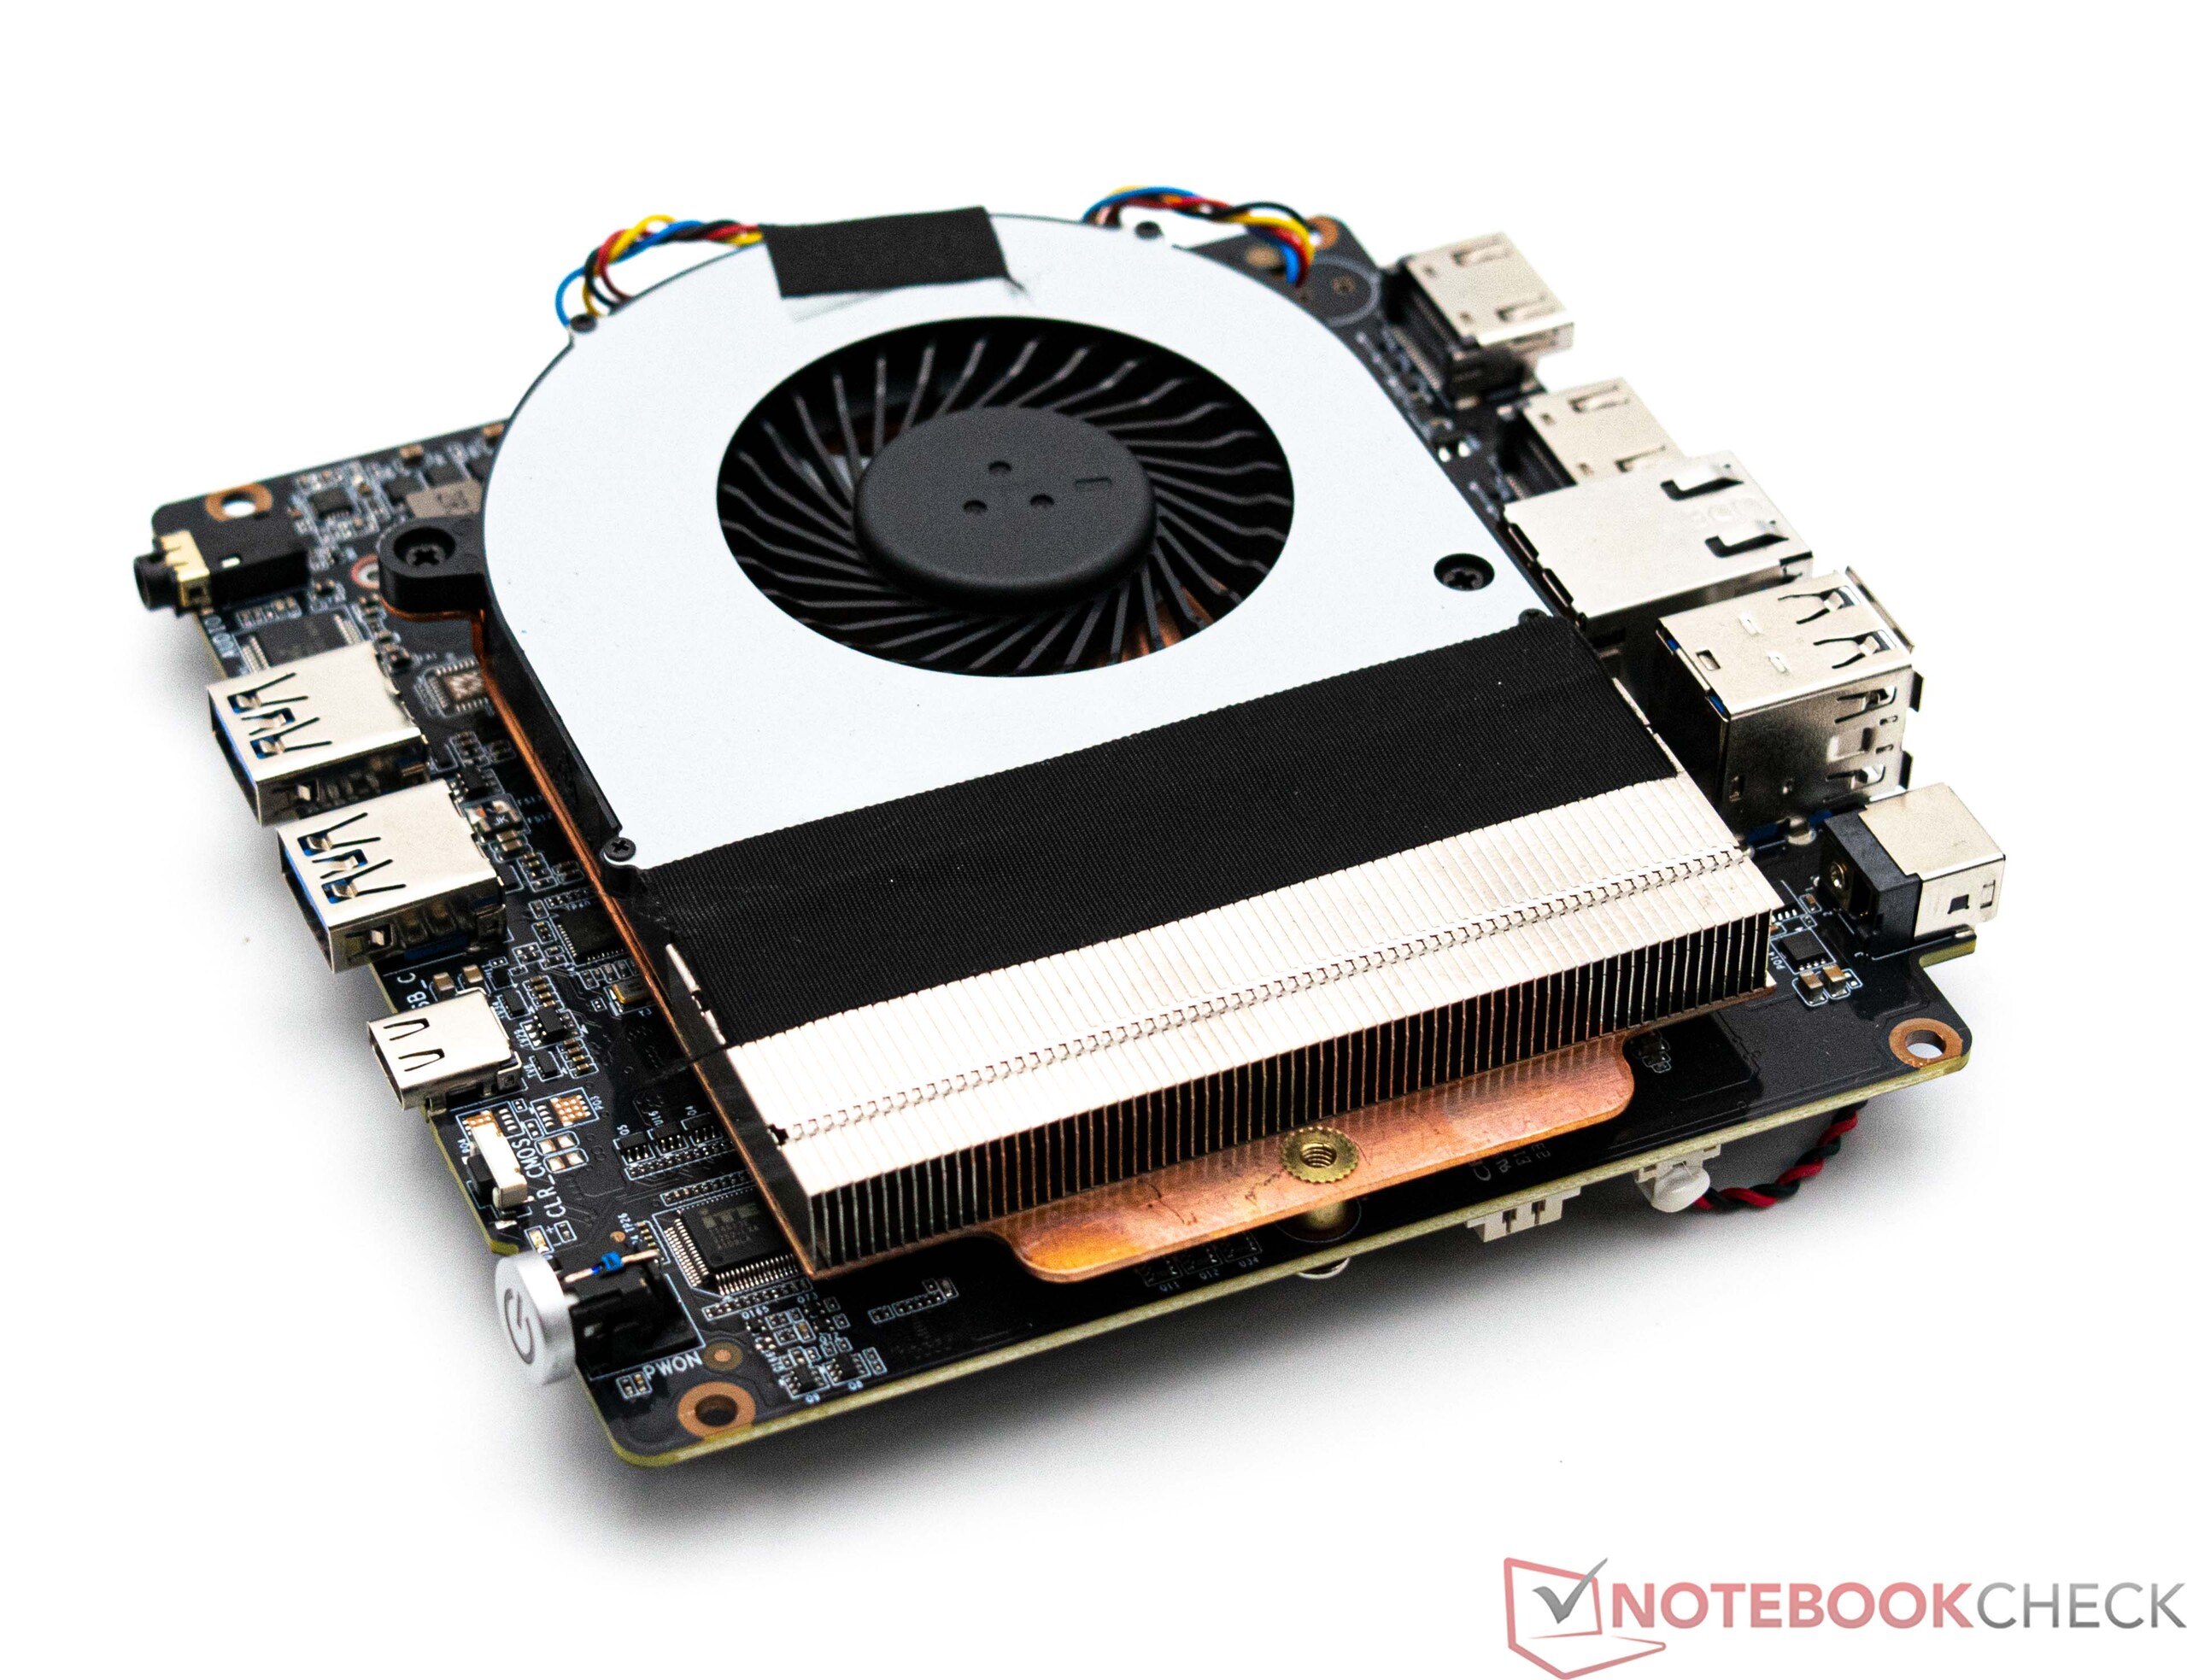
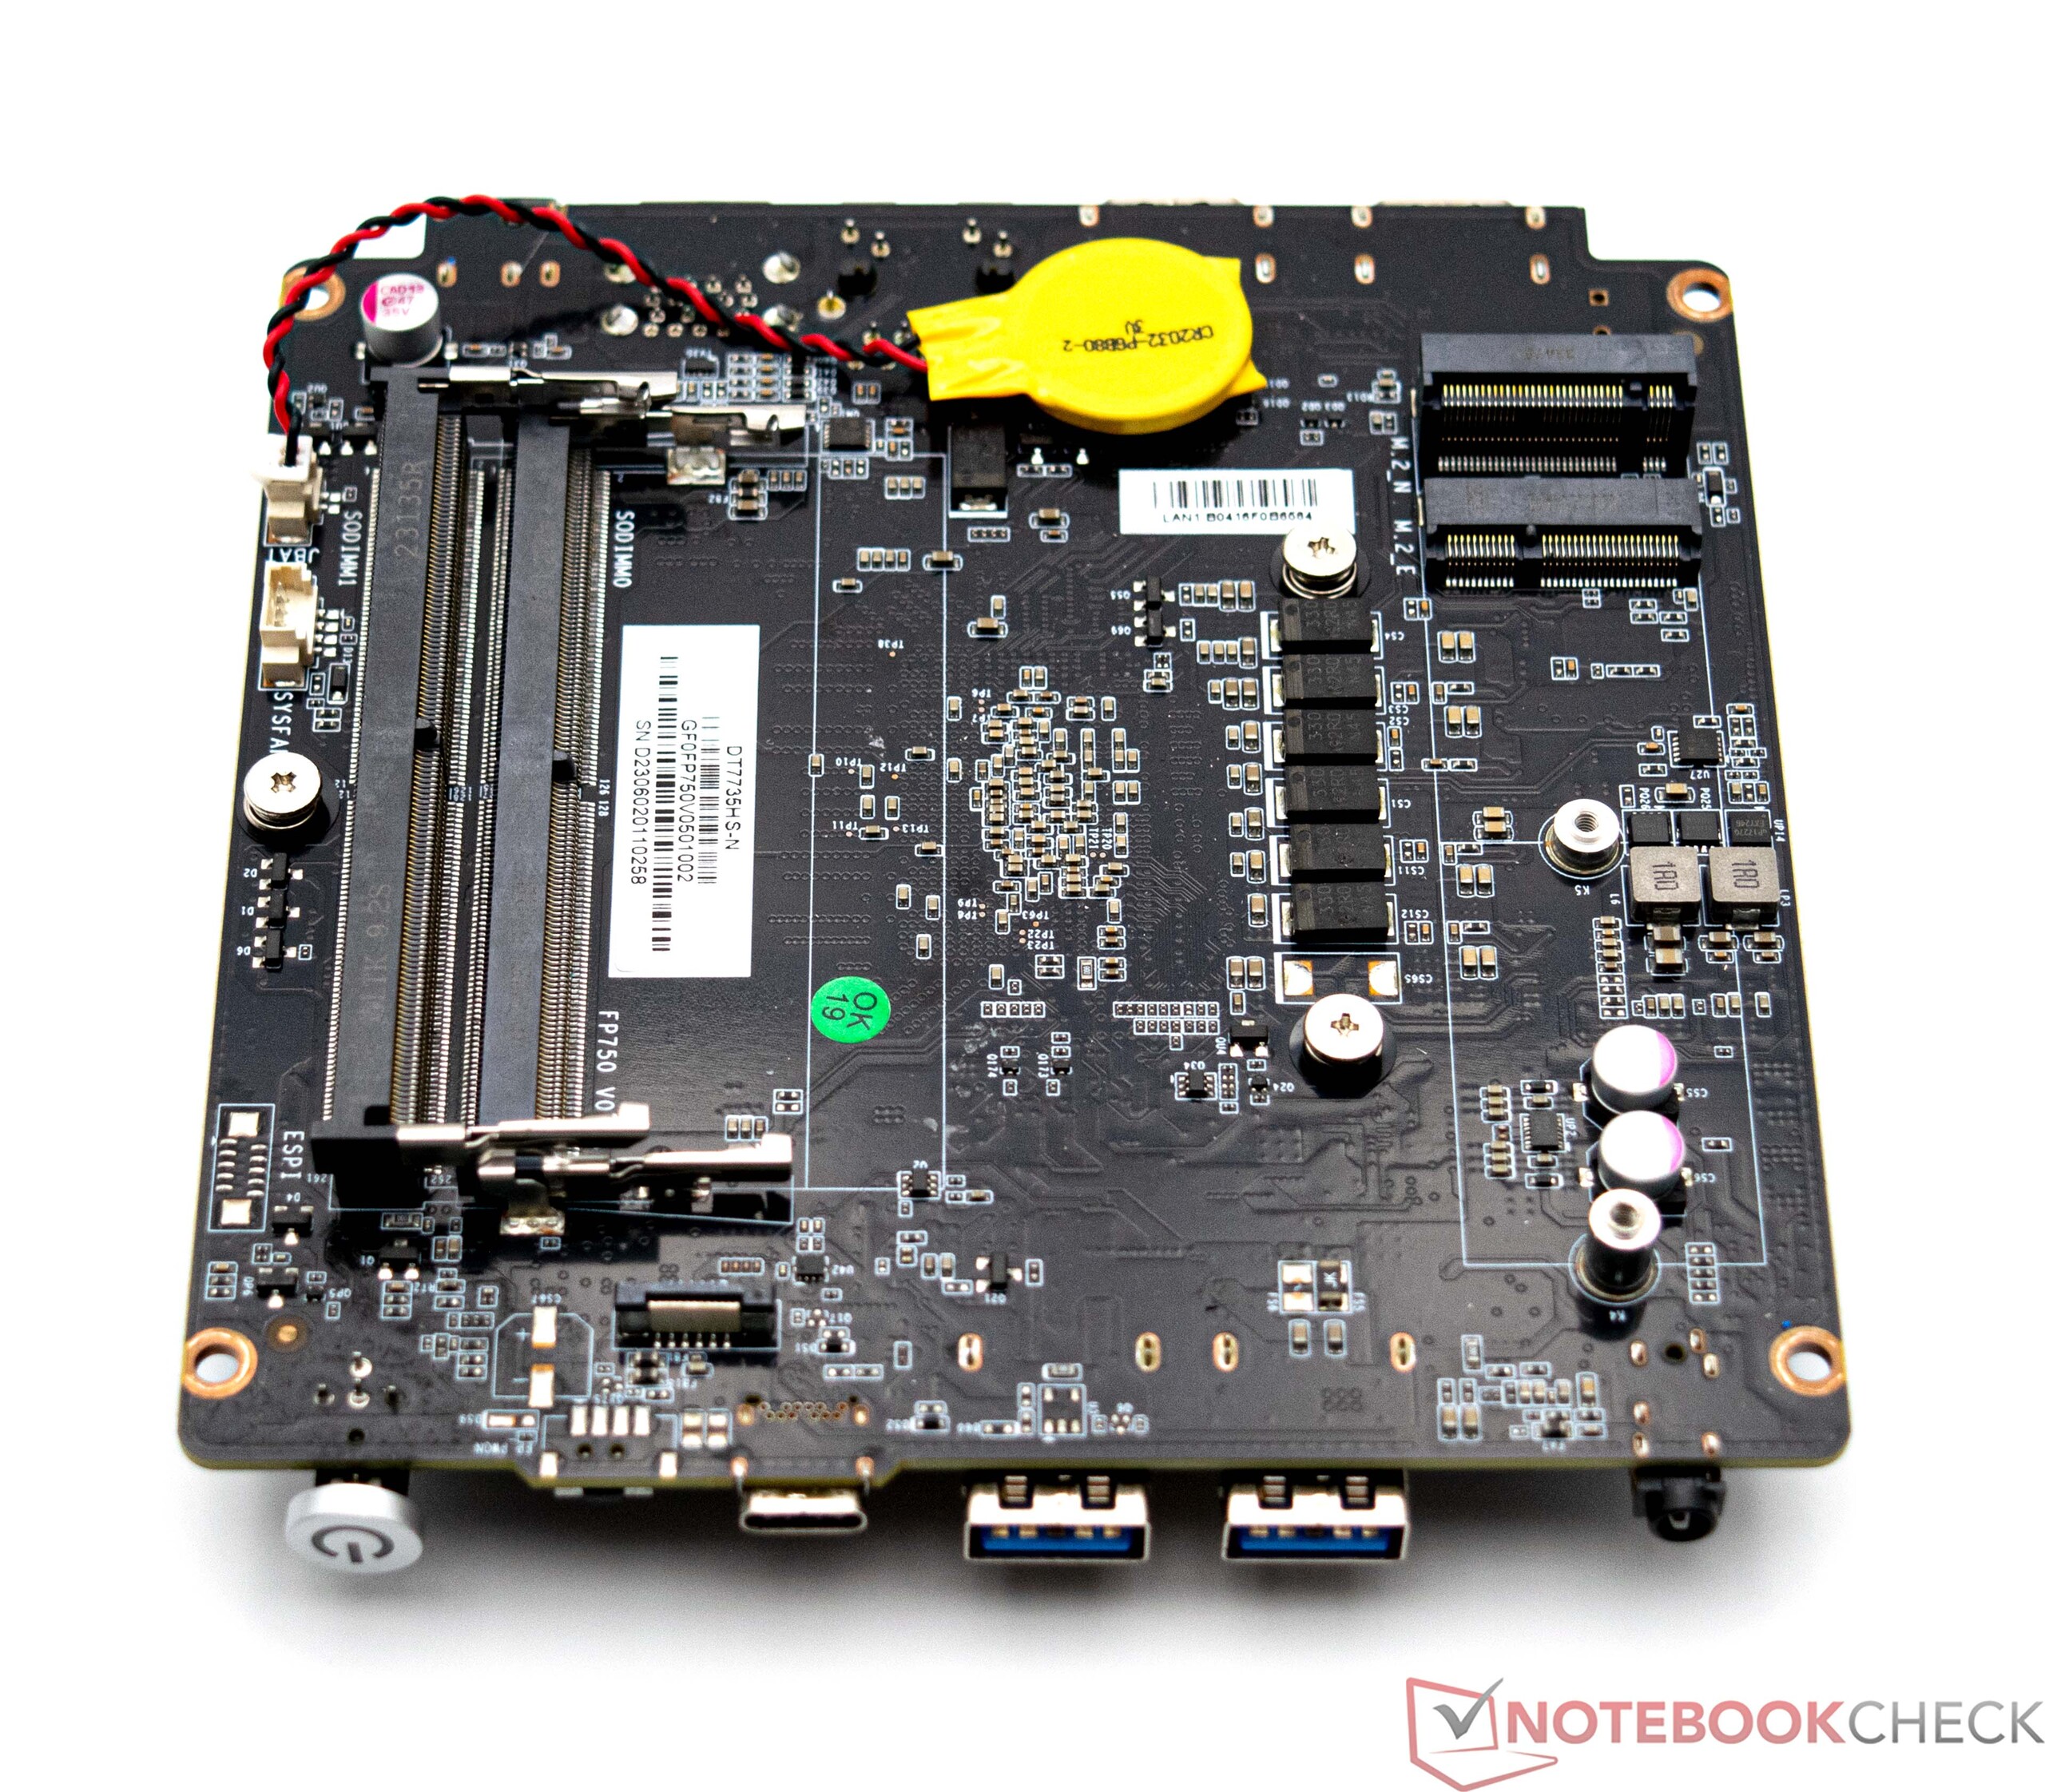
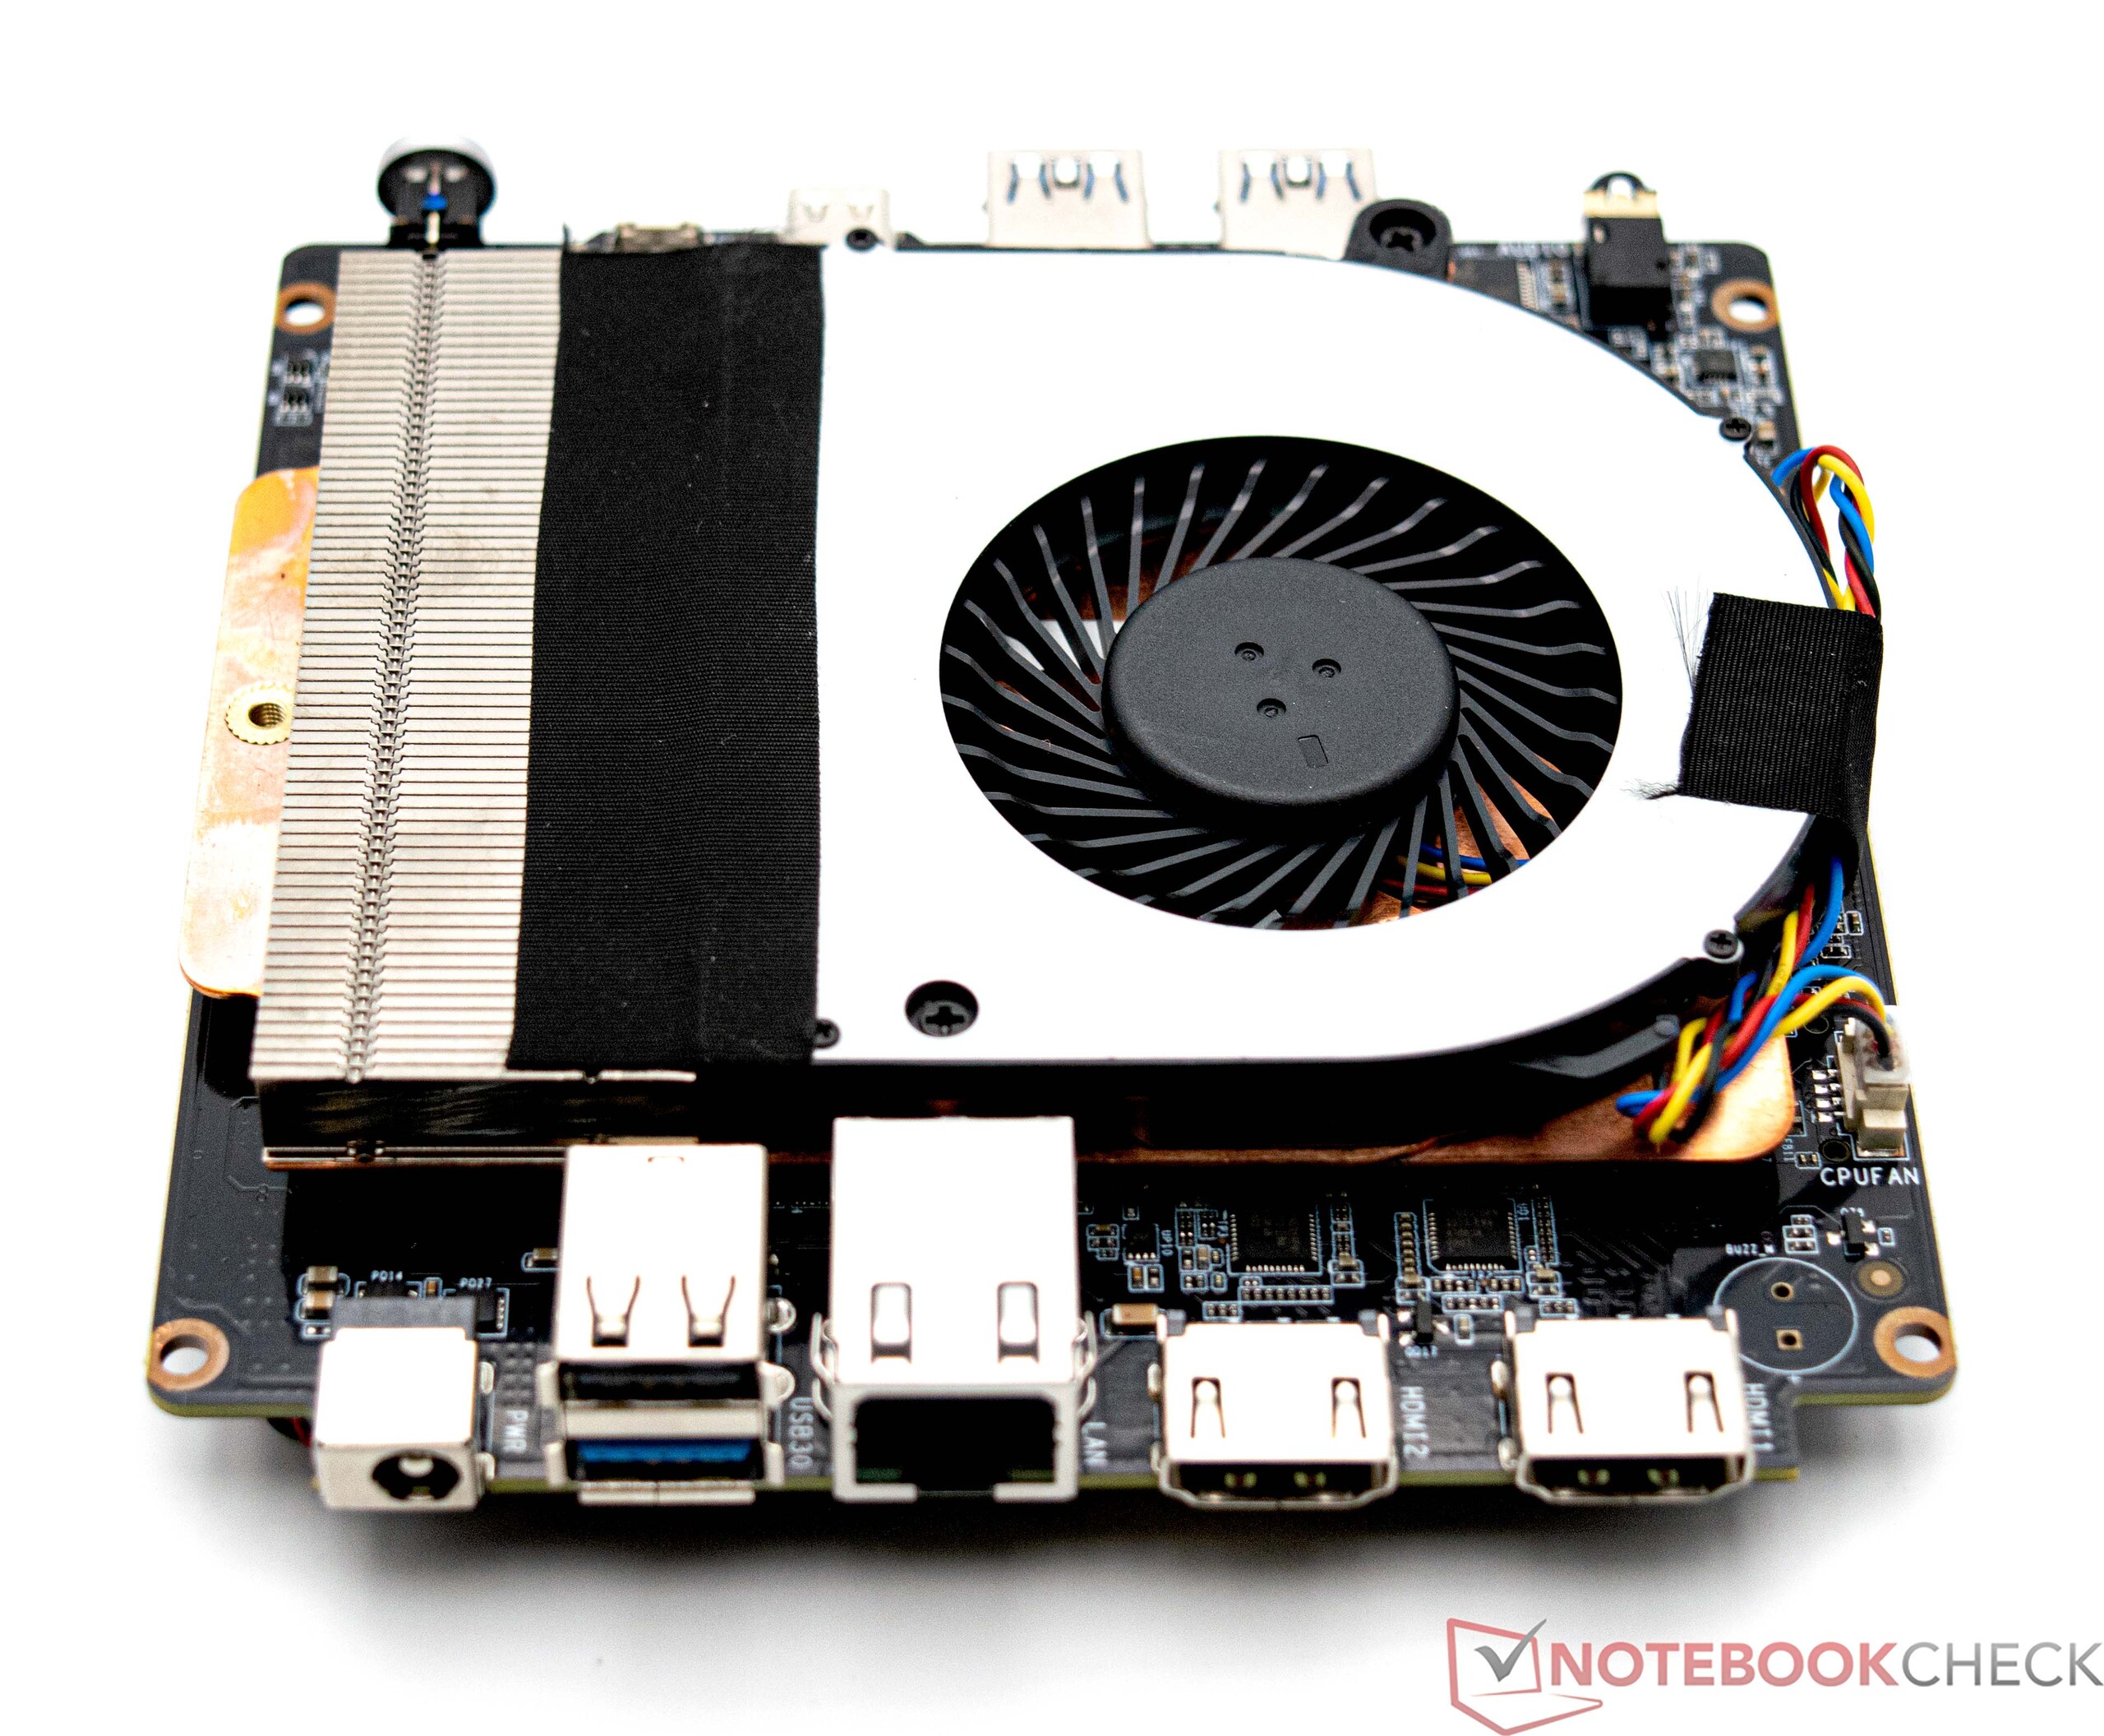
The Maxtang mini PC can be opened relatively easily. The base is secured by four screws which are concealed by glued-on rubber feet. Beneath the base plate, it's quite straightforward to access the RAM or the M.2 SSD. In our case, there is still space to install an additional RAM module and a second mass storage device (2.5-inch format). To access the fan, the device has to be further disassembled making quick cleaning an impossibility.
Performance - An AMD Ryzen 7 7735HS with 8 cores and 16 threads
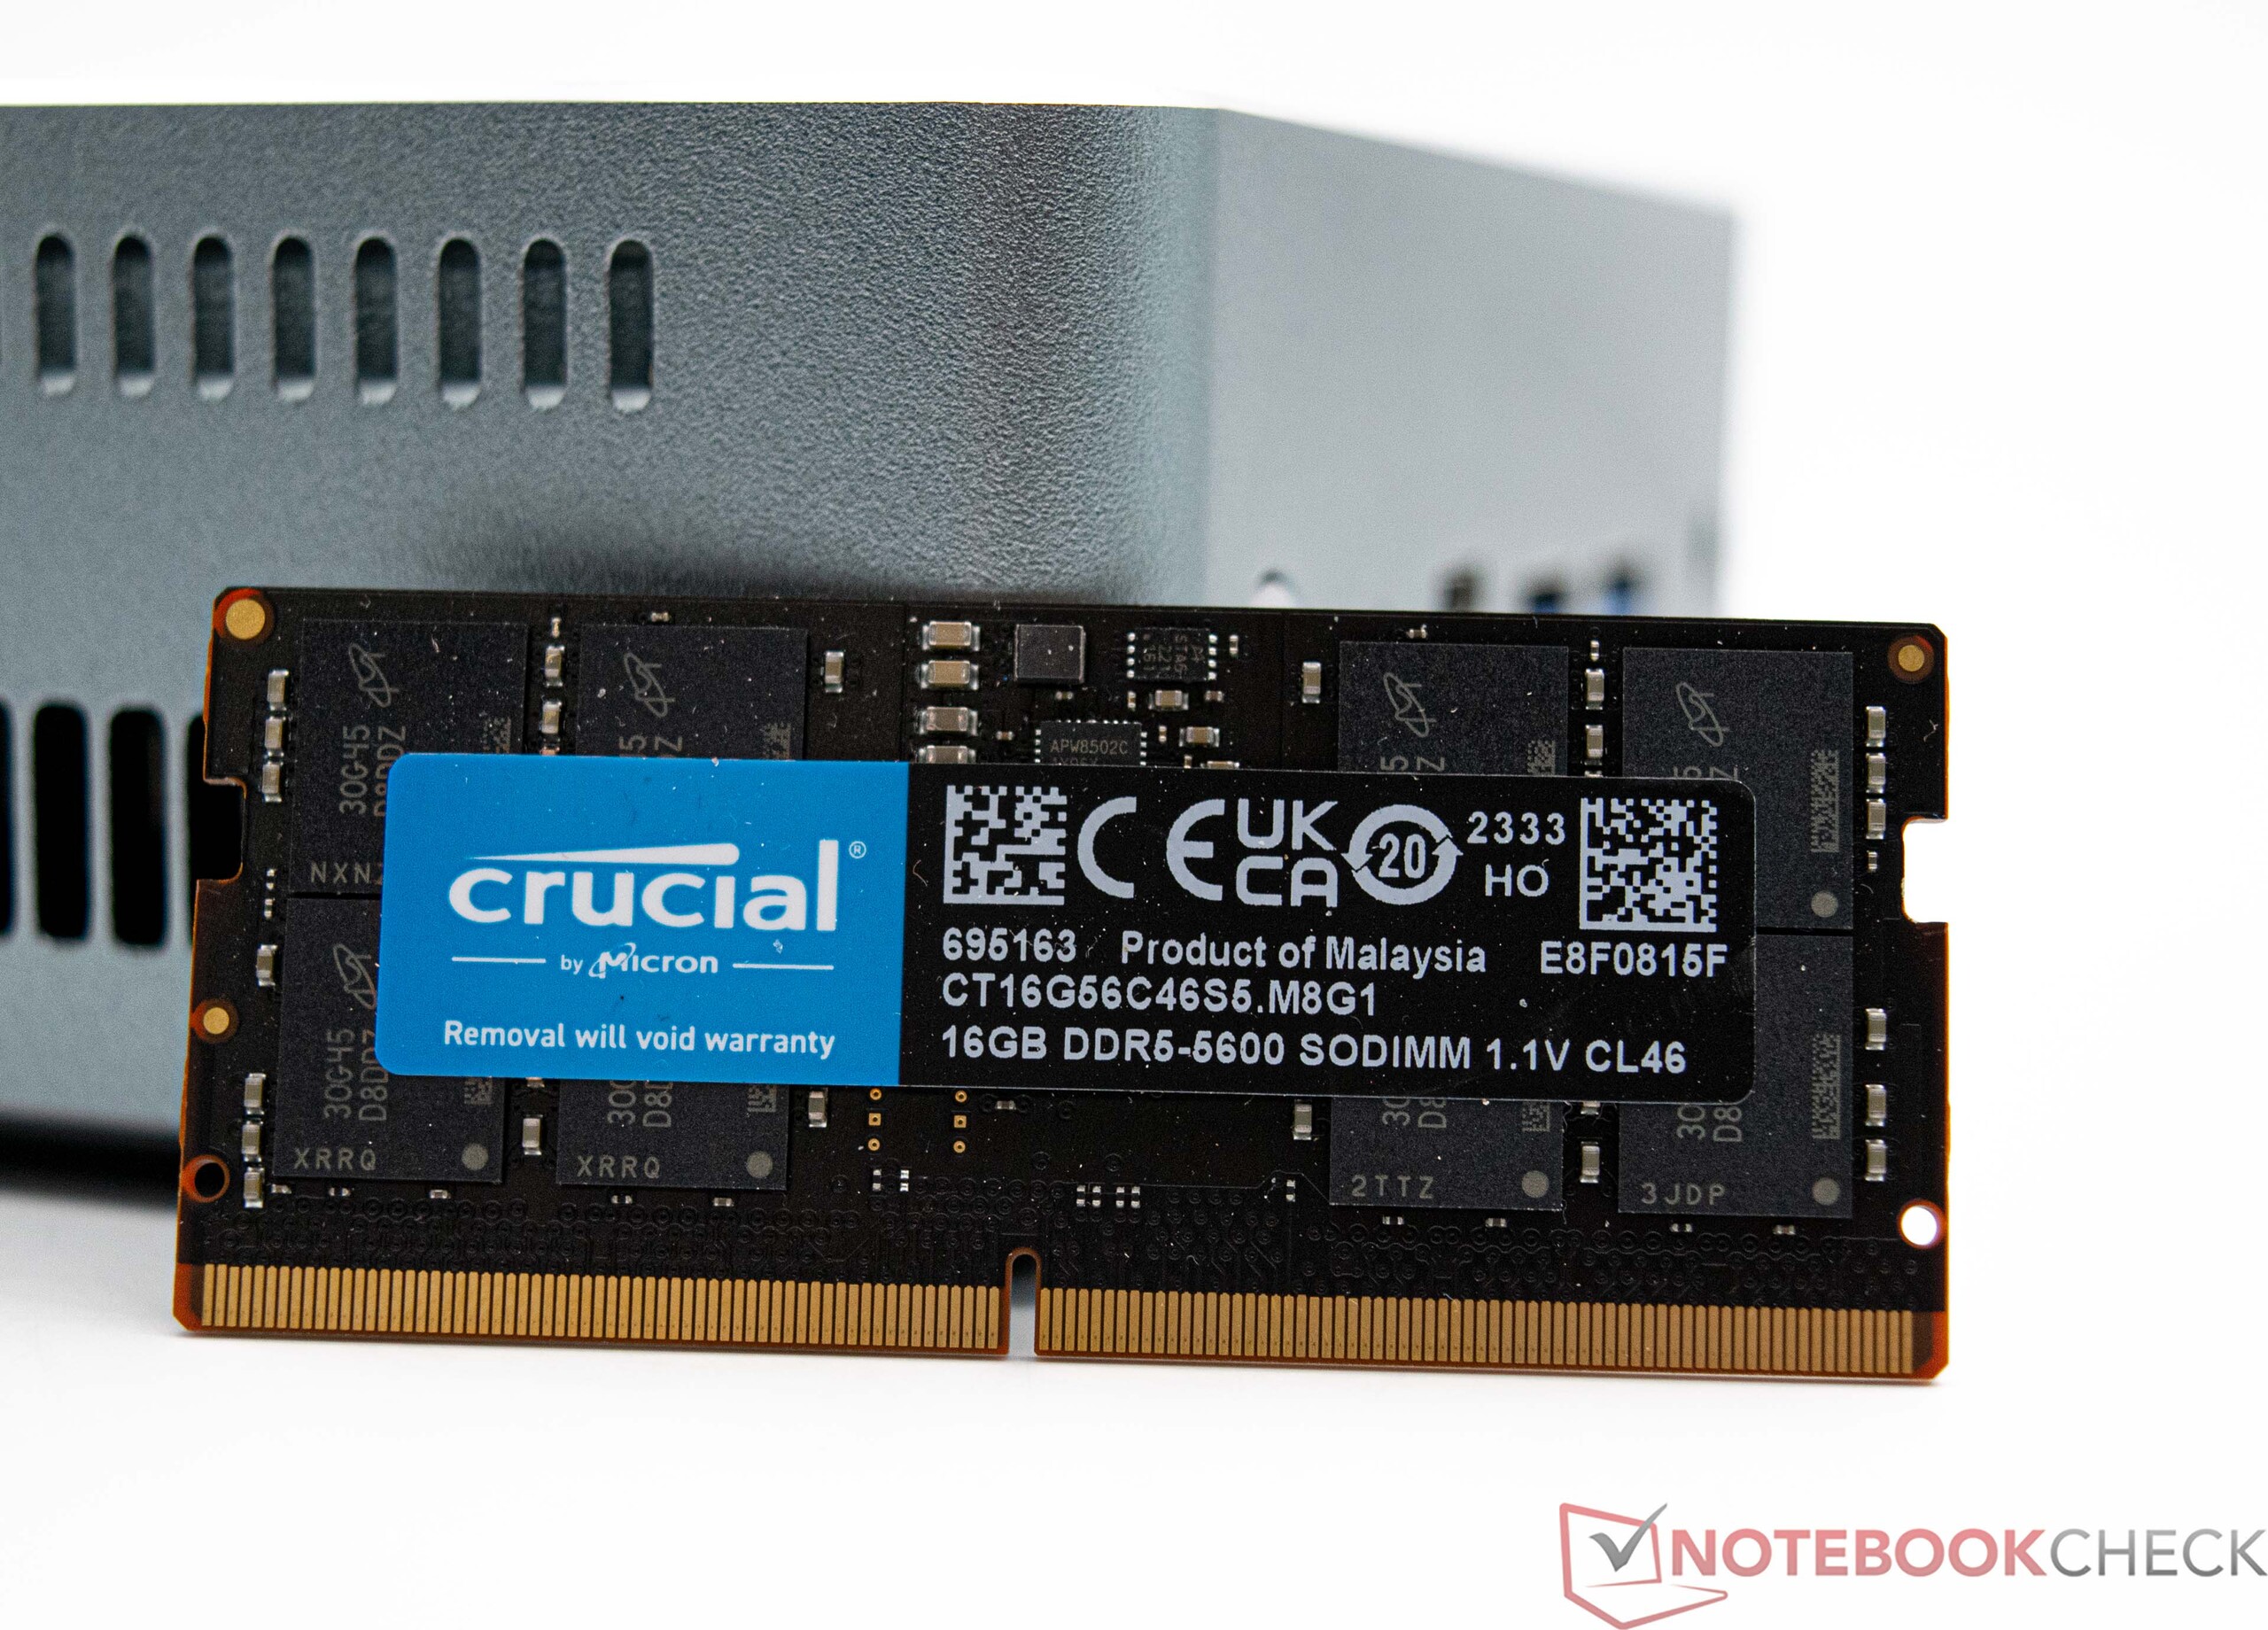
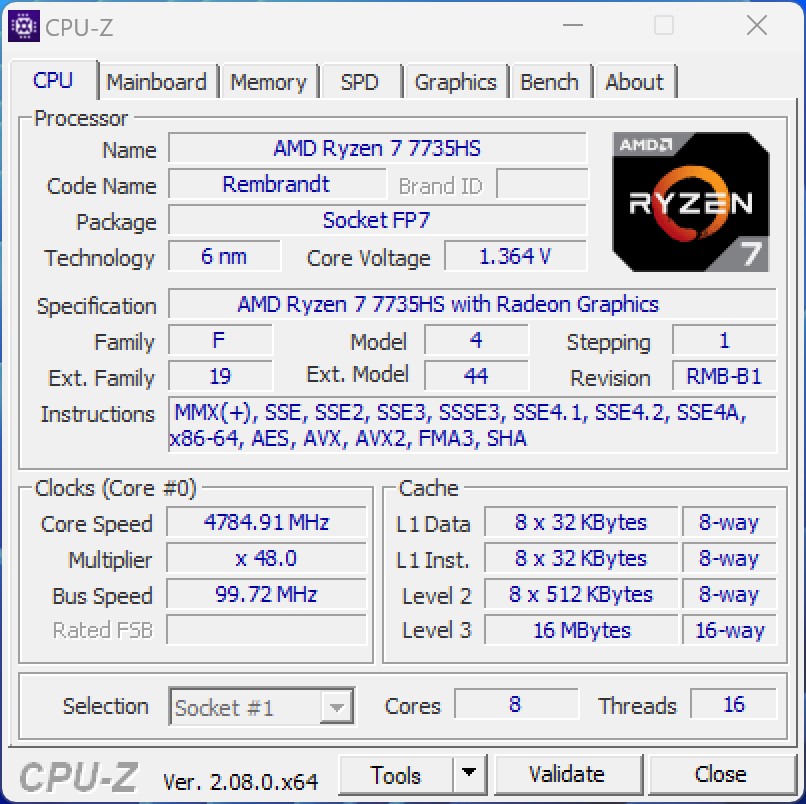
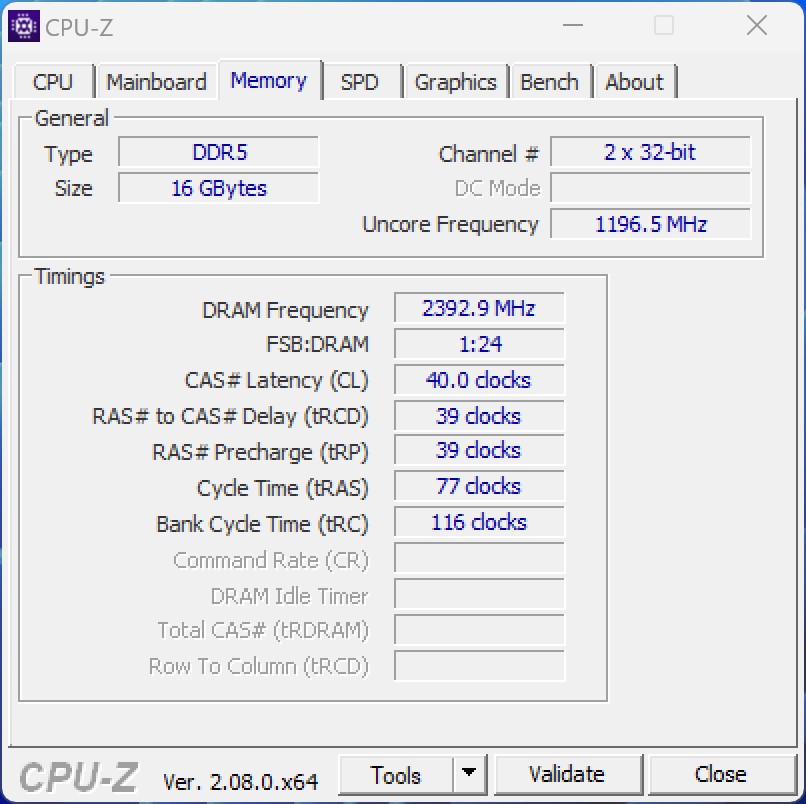
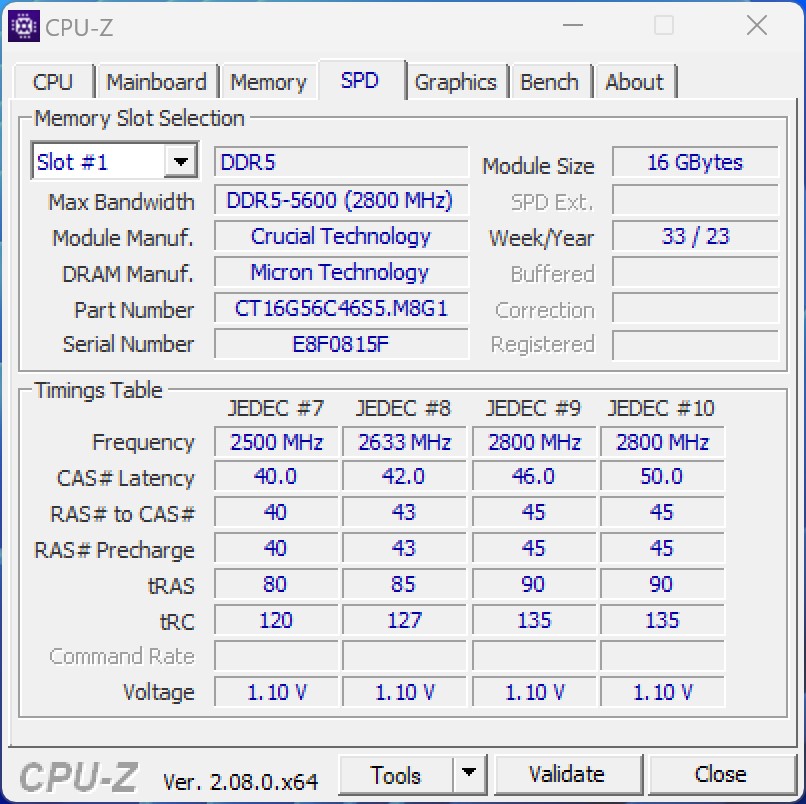
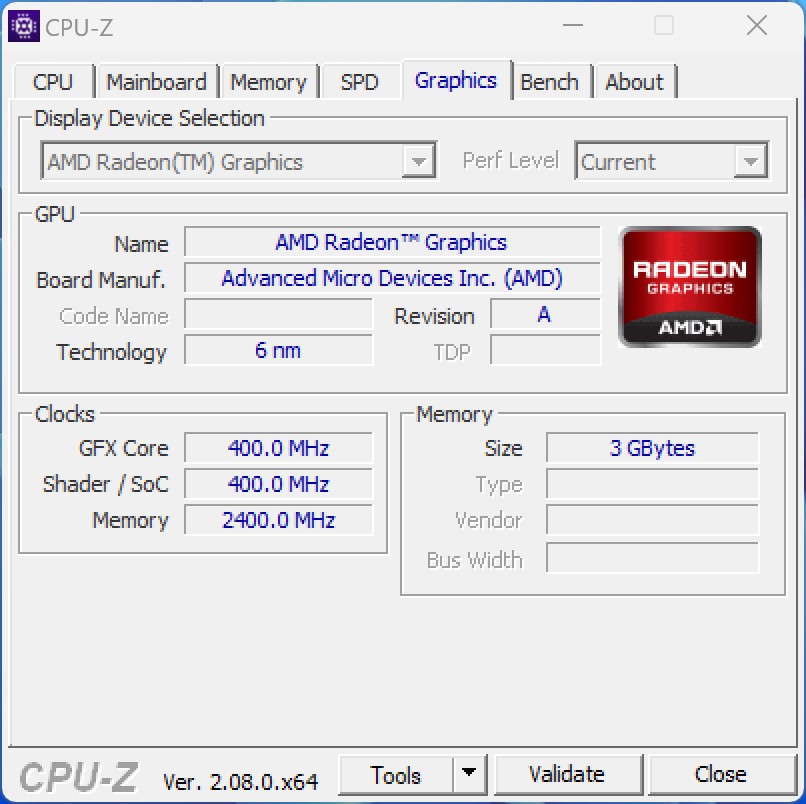
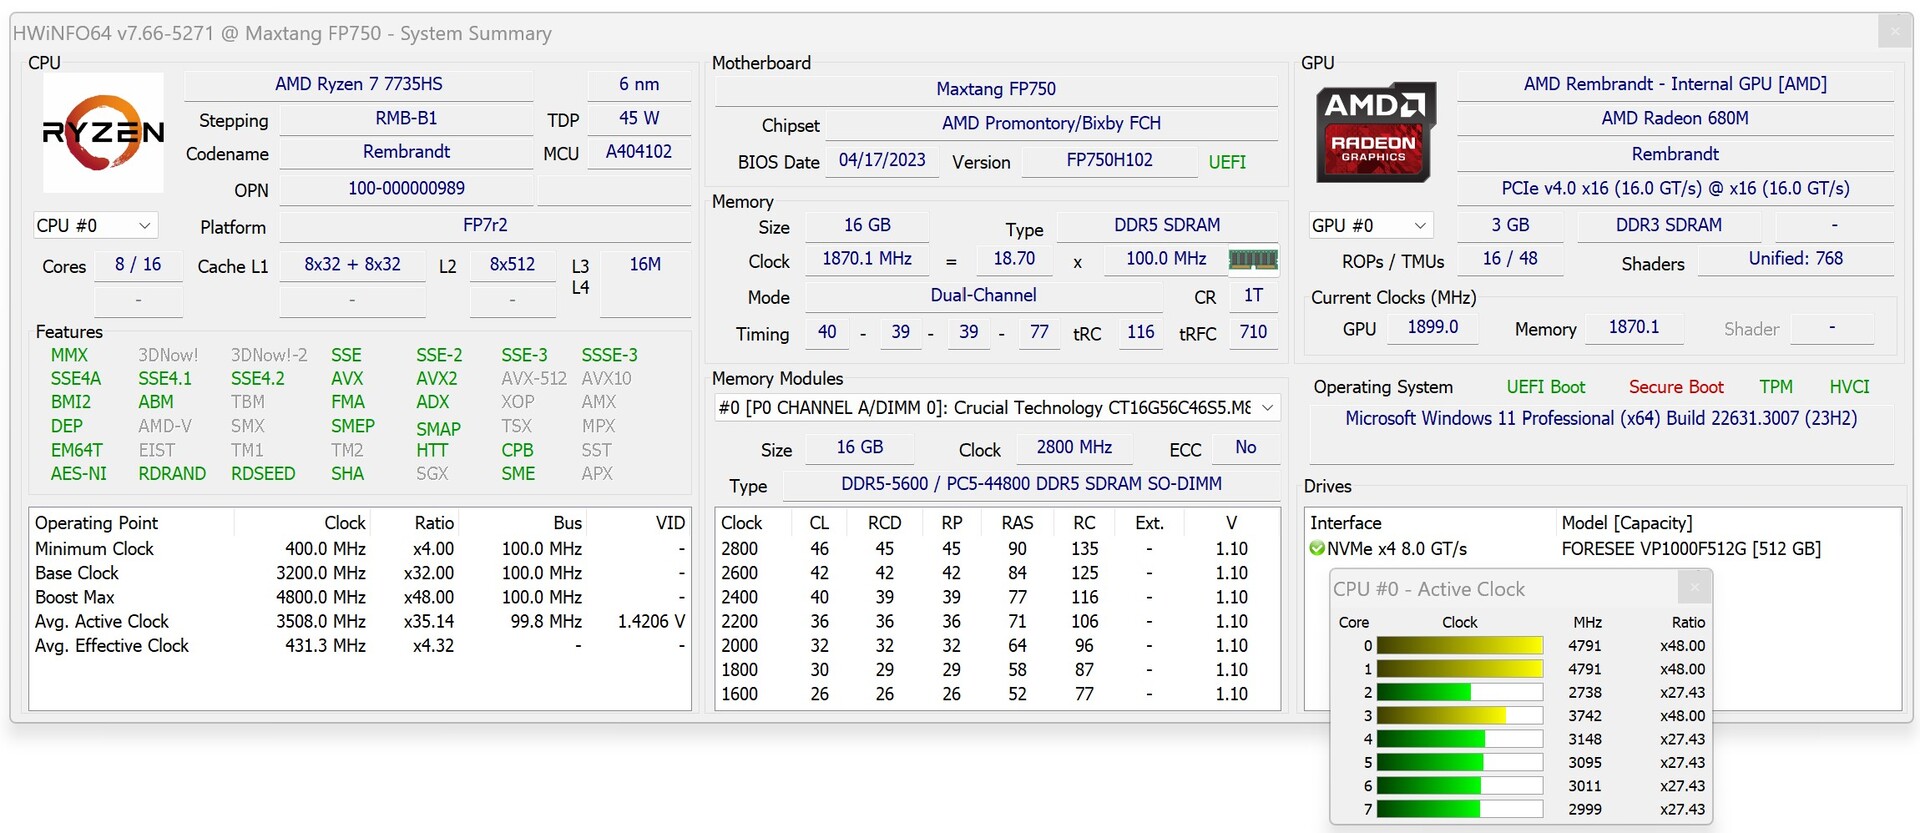
Our Maxtang MTN-FP750 review device comes with the AMD Ryzen 7 7735HS. In the AMD Radeon 680M, the SoC also has a powerful iGPU at its disposal. However, in terms of the RAM, the manufacturer has opted to give the mini PC a single 16 GB, DDR5-5600 module, even though, in practice, only a DDR5-4800 can be used.
Test conditions
We carried out all of the performance tests using the "highest performance" energy profile. The SoC's performance was not changed or altered in the BIOS and the device retained its factory settings.
Processor
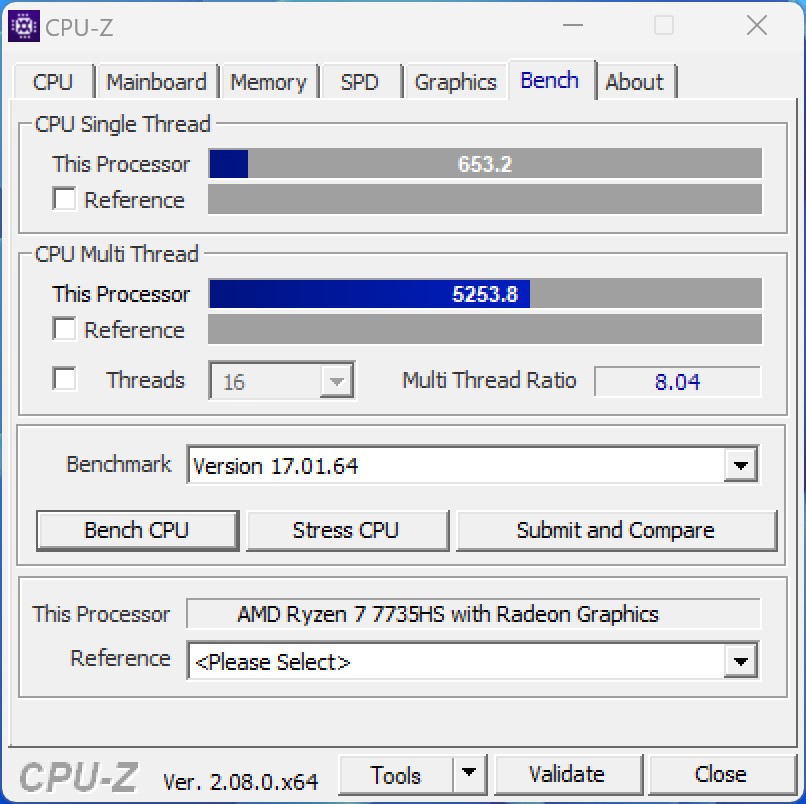
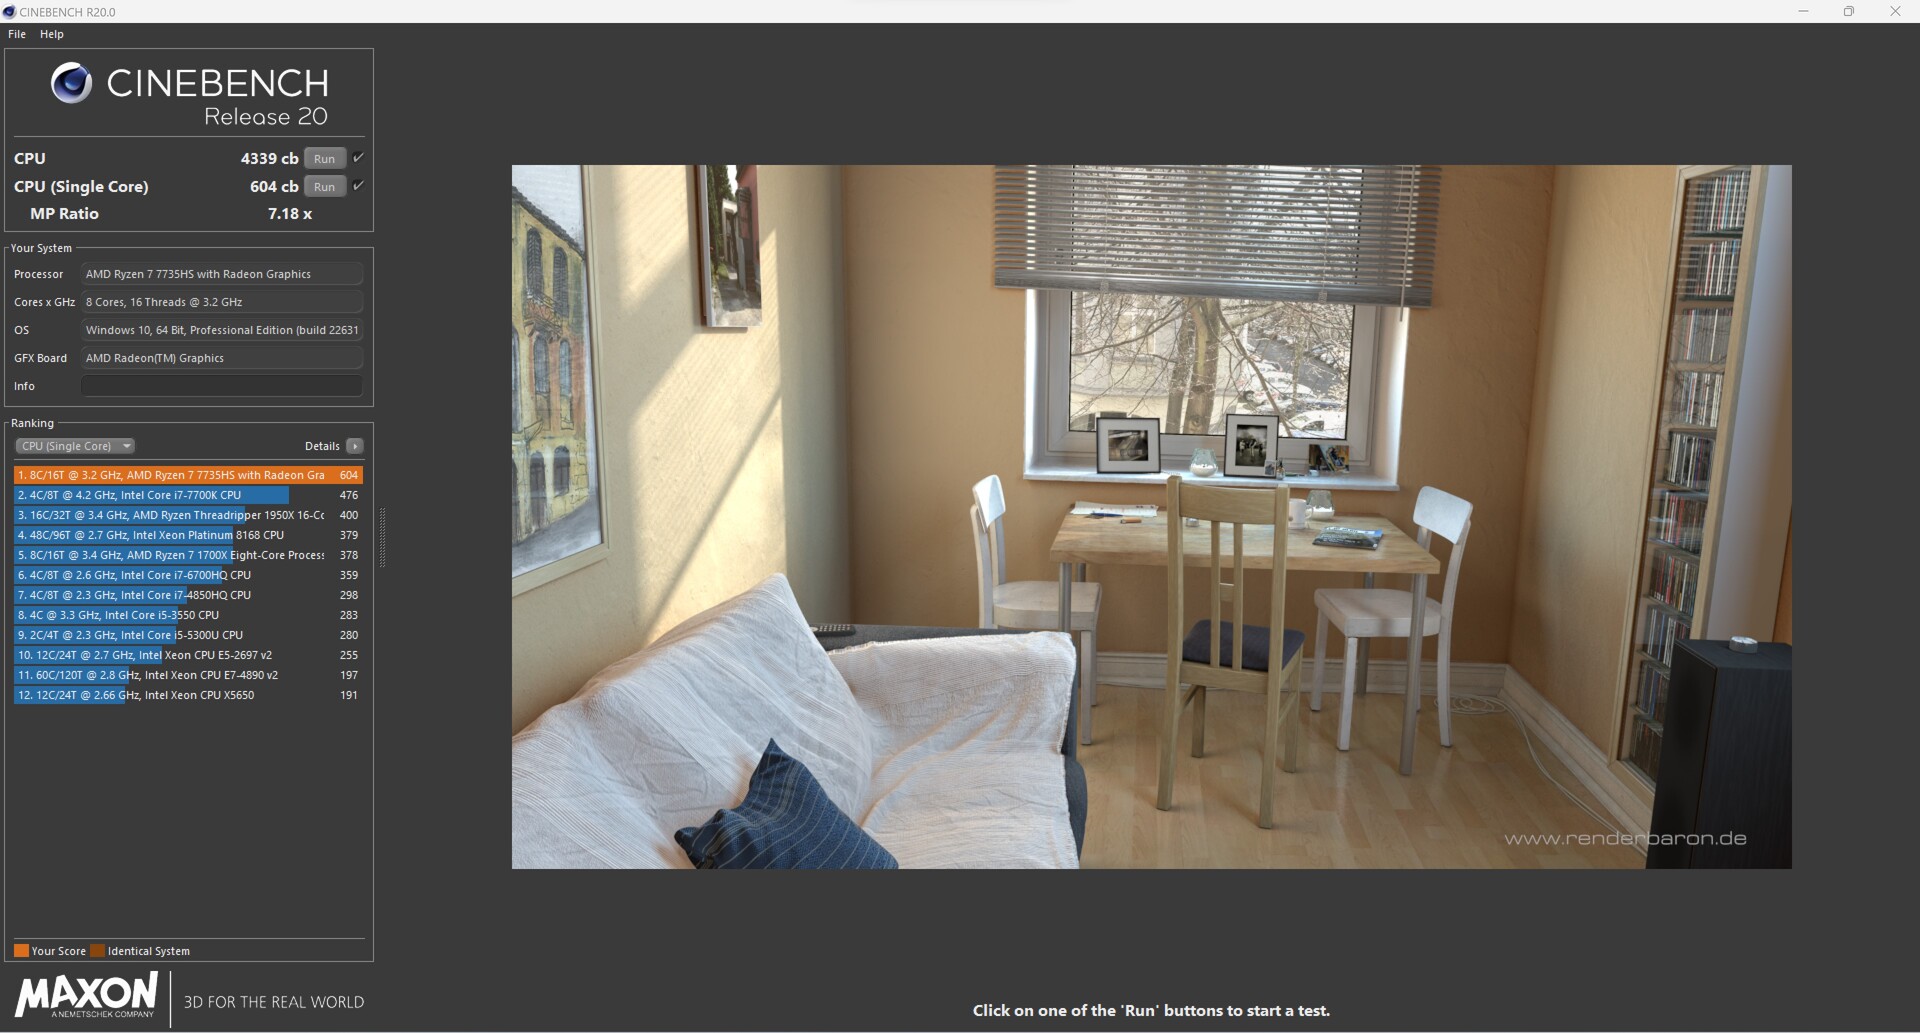
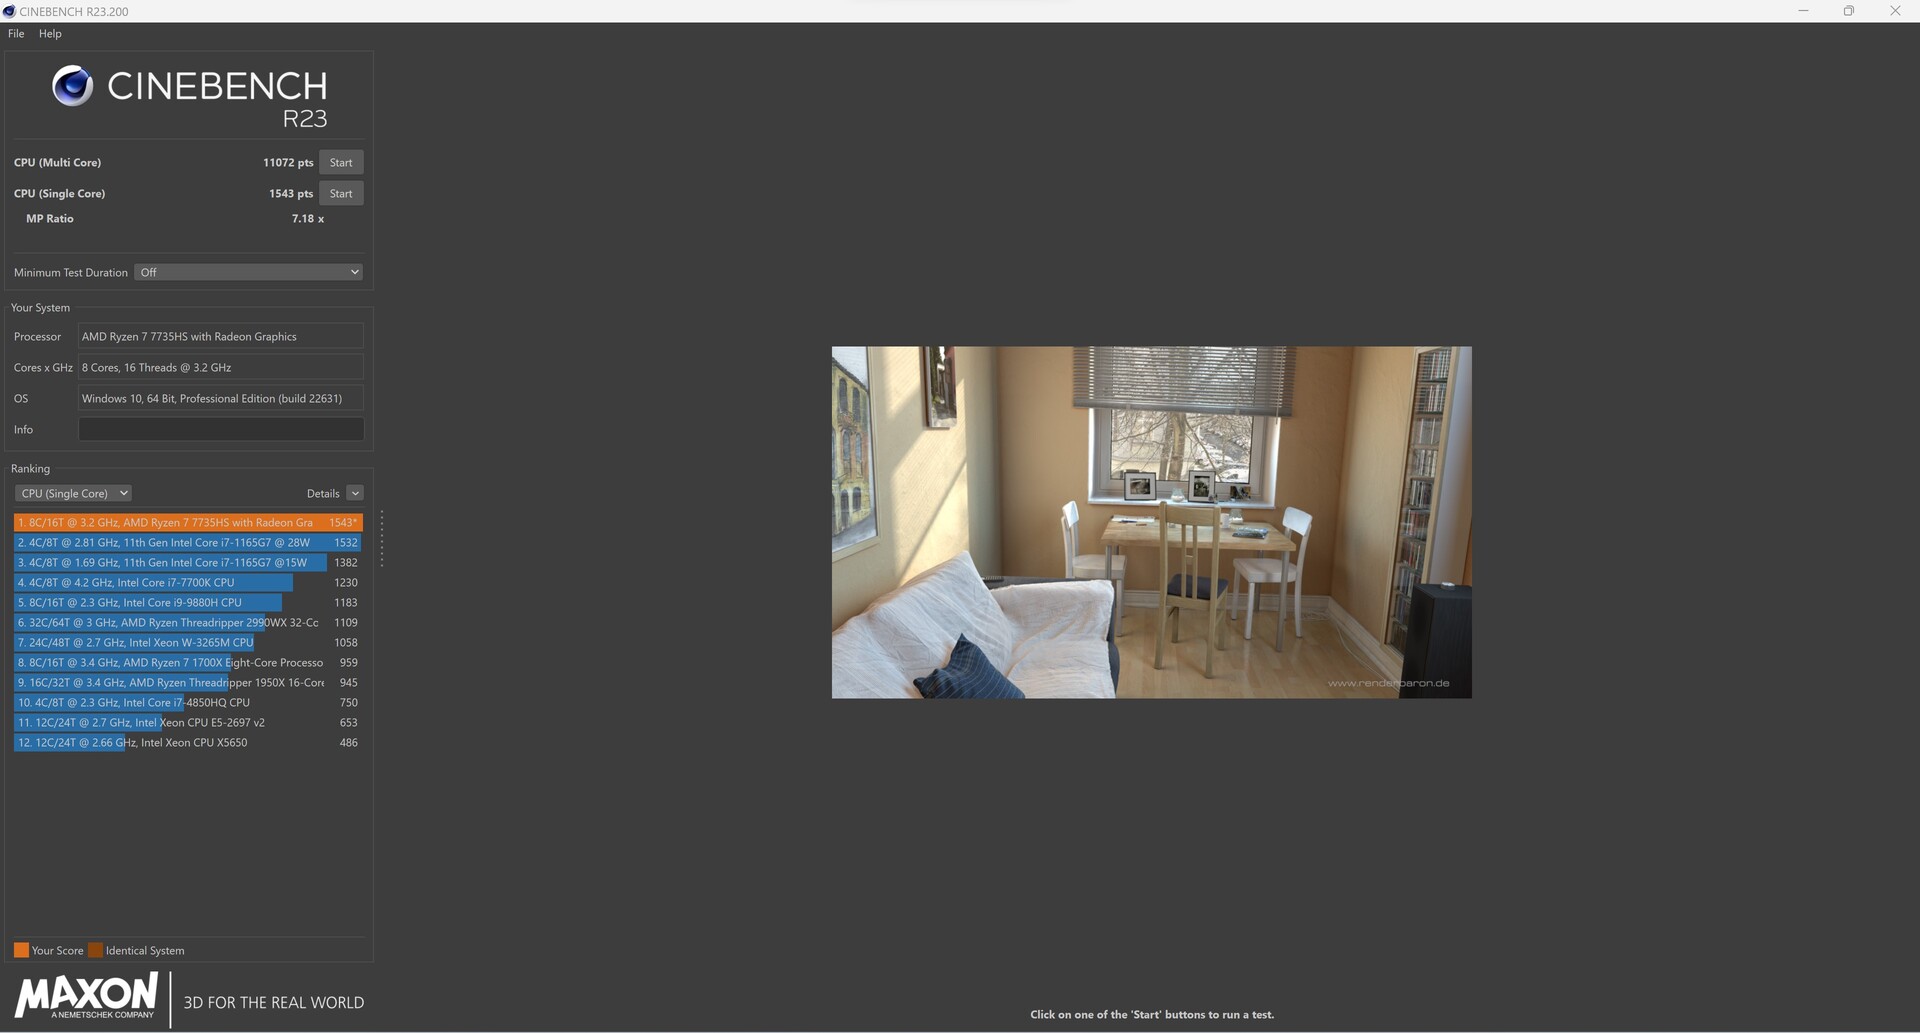
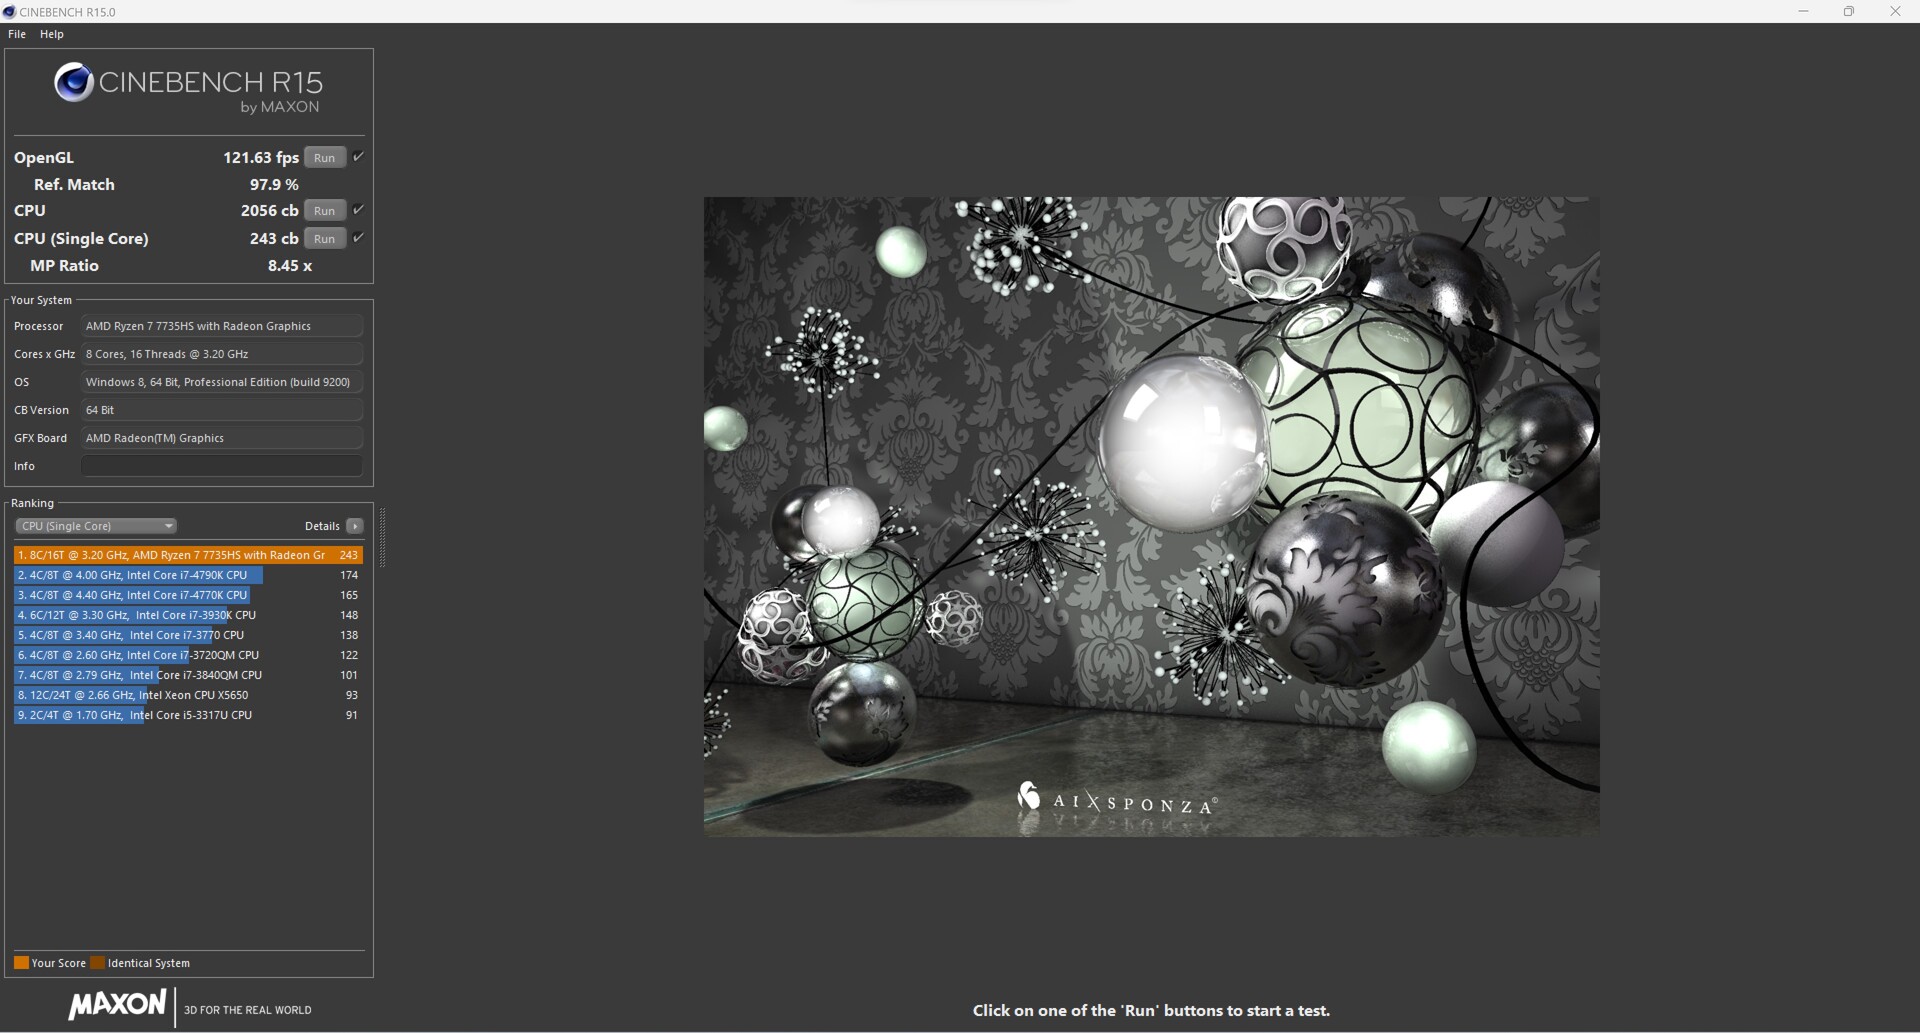
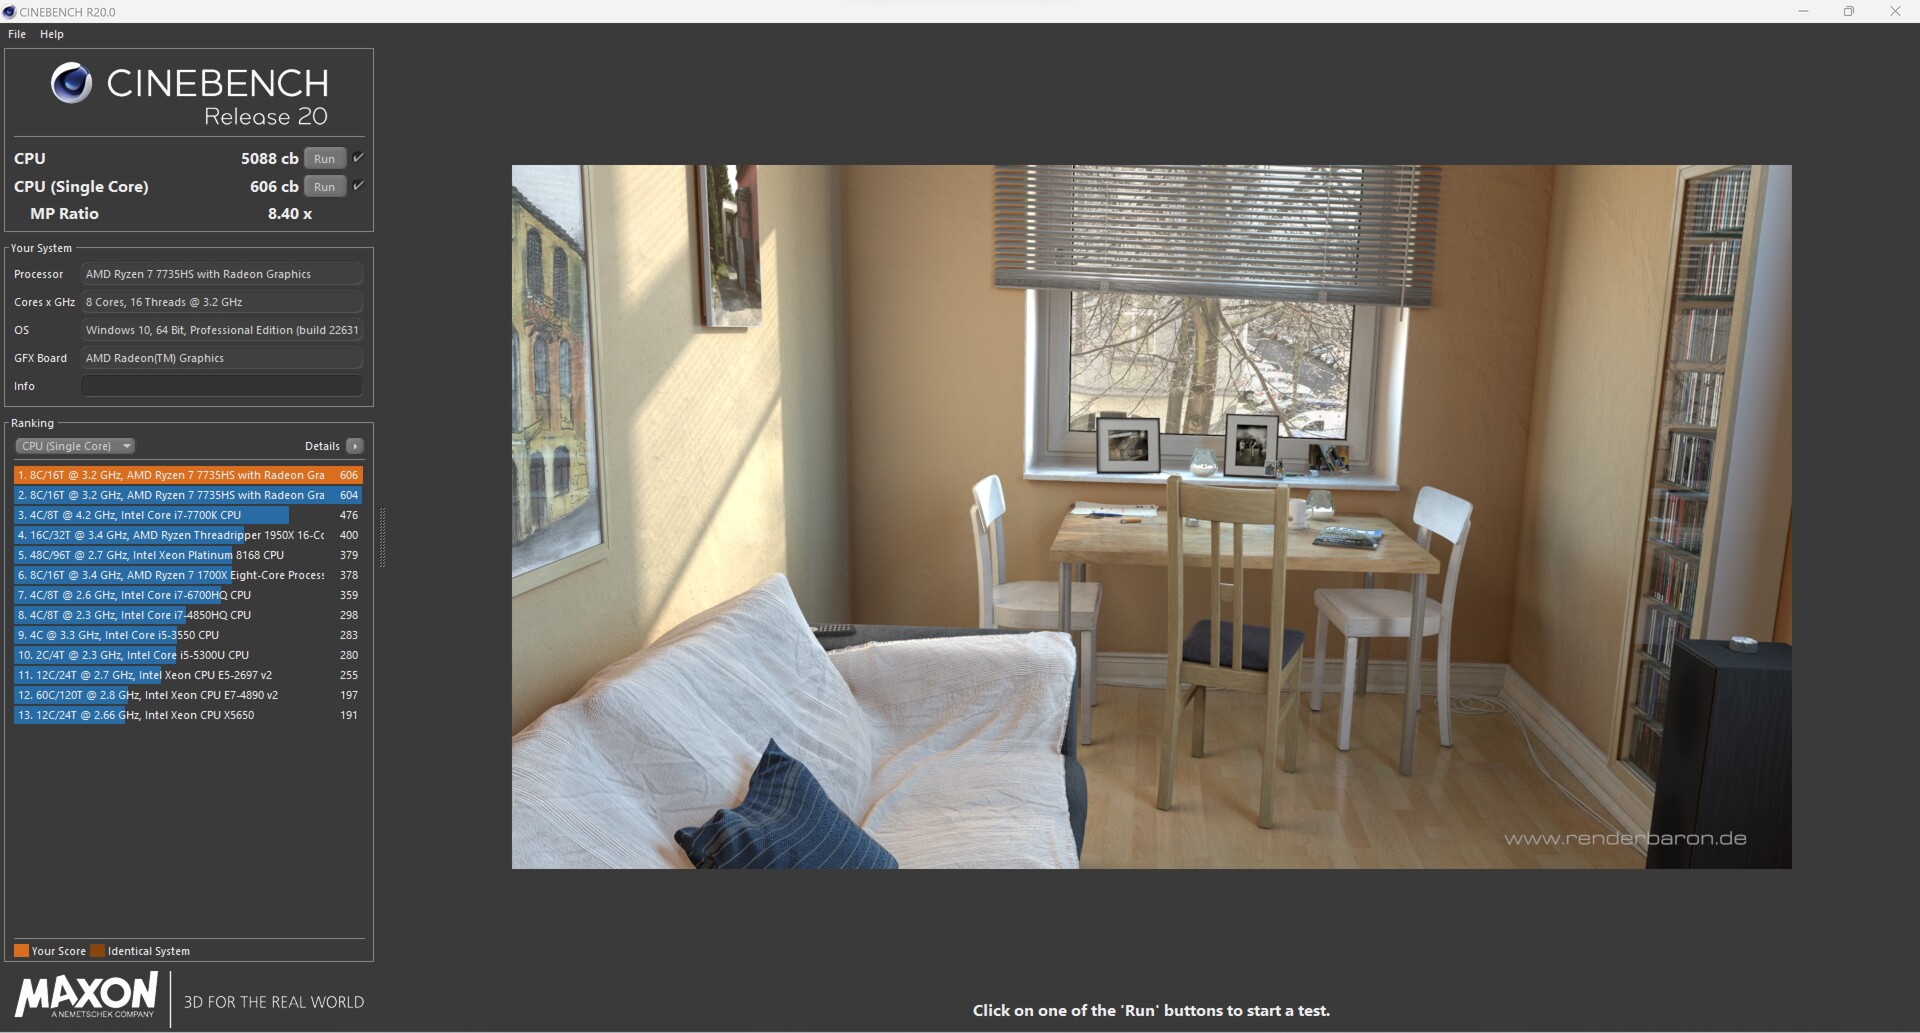
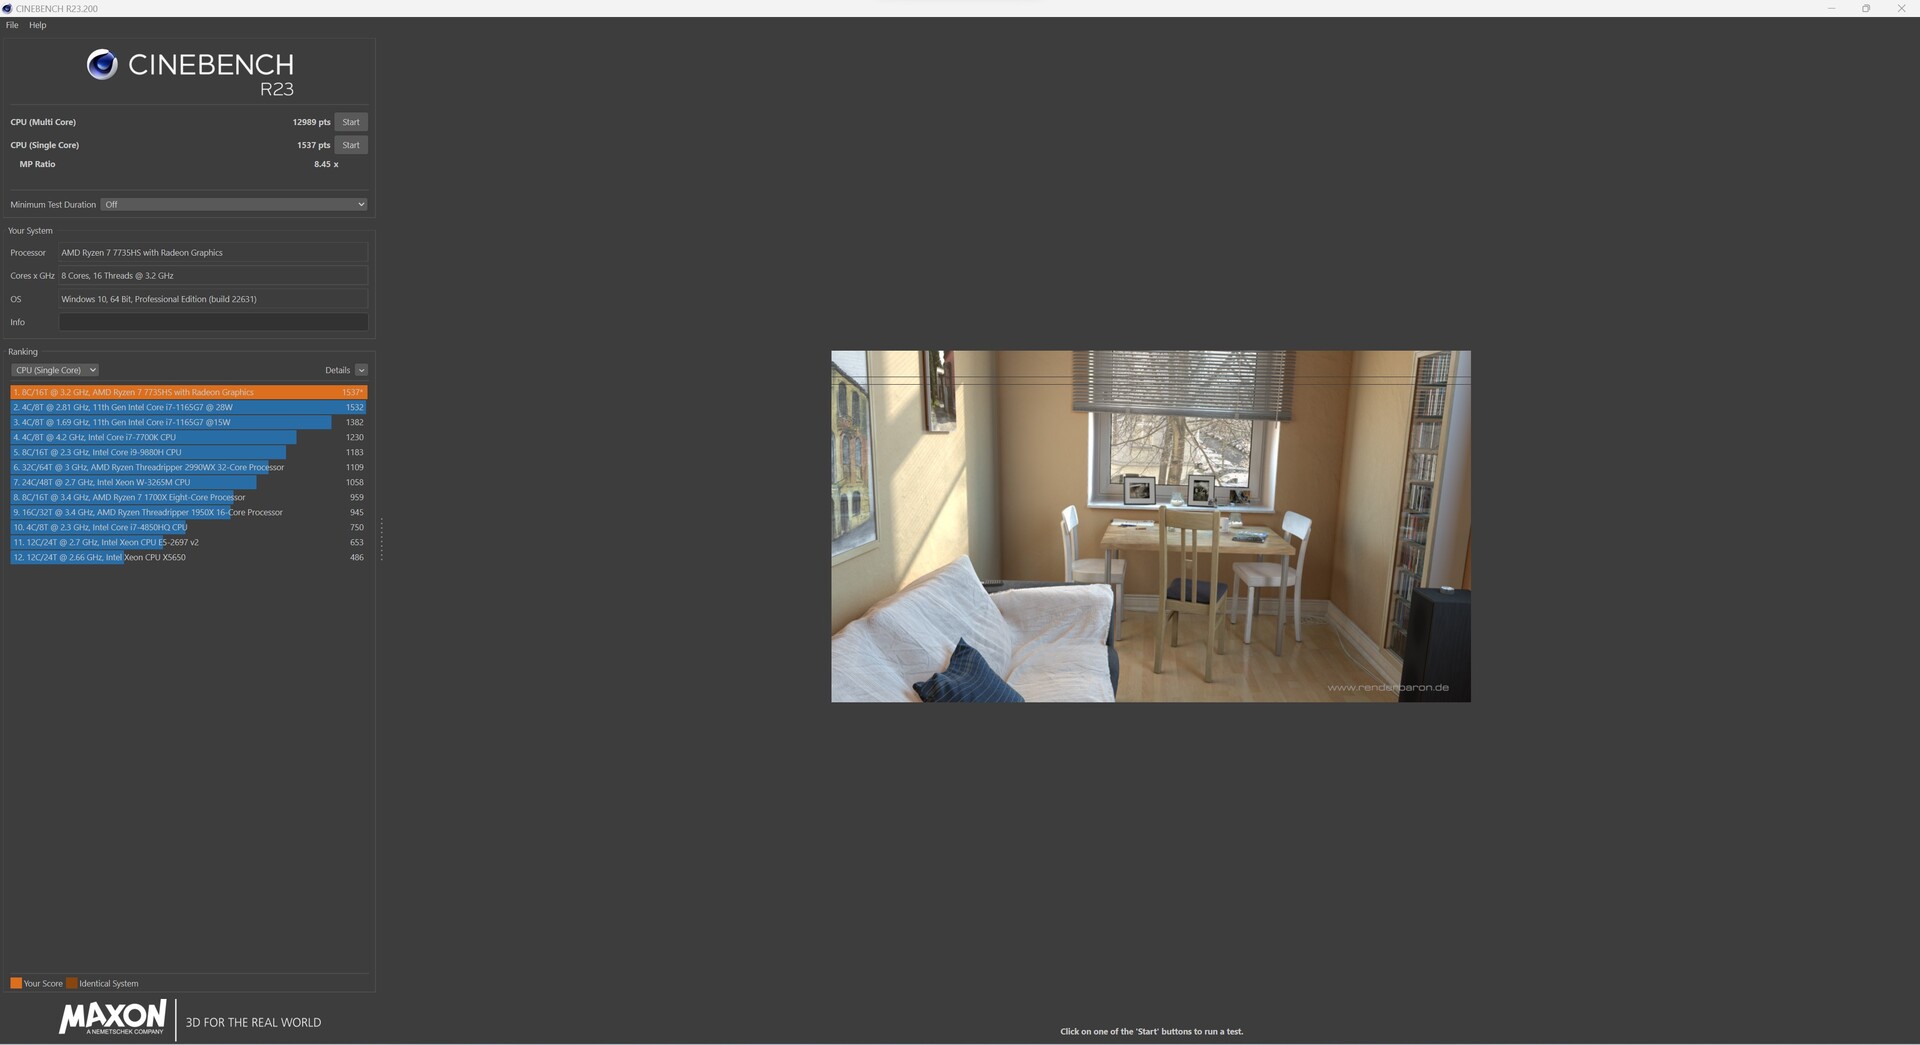
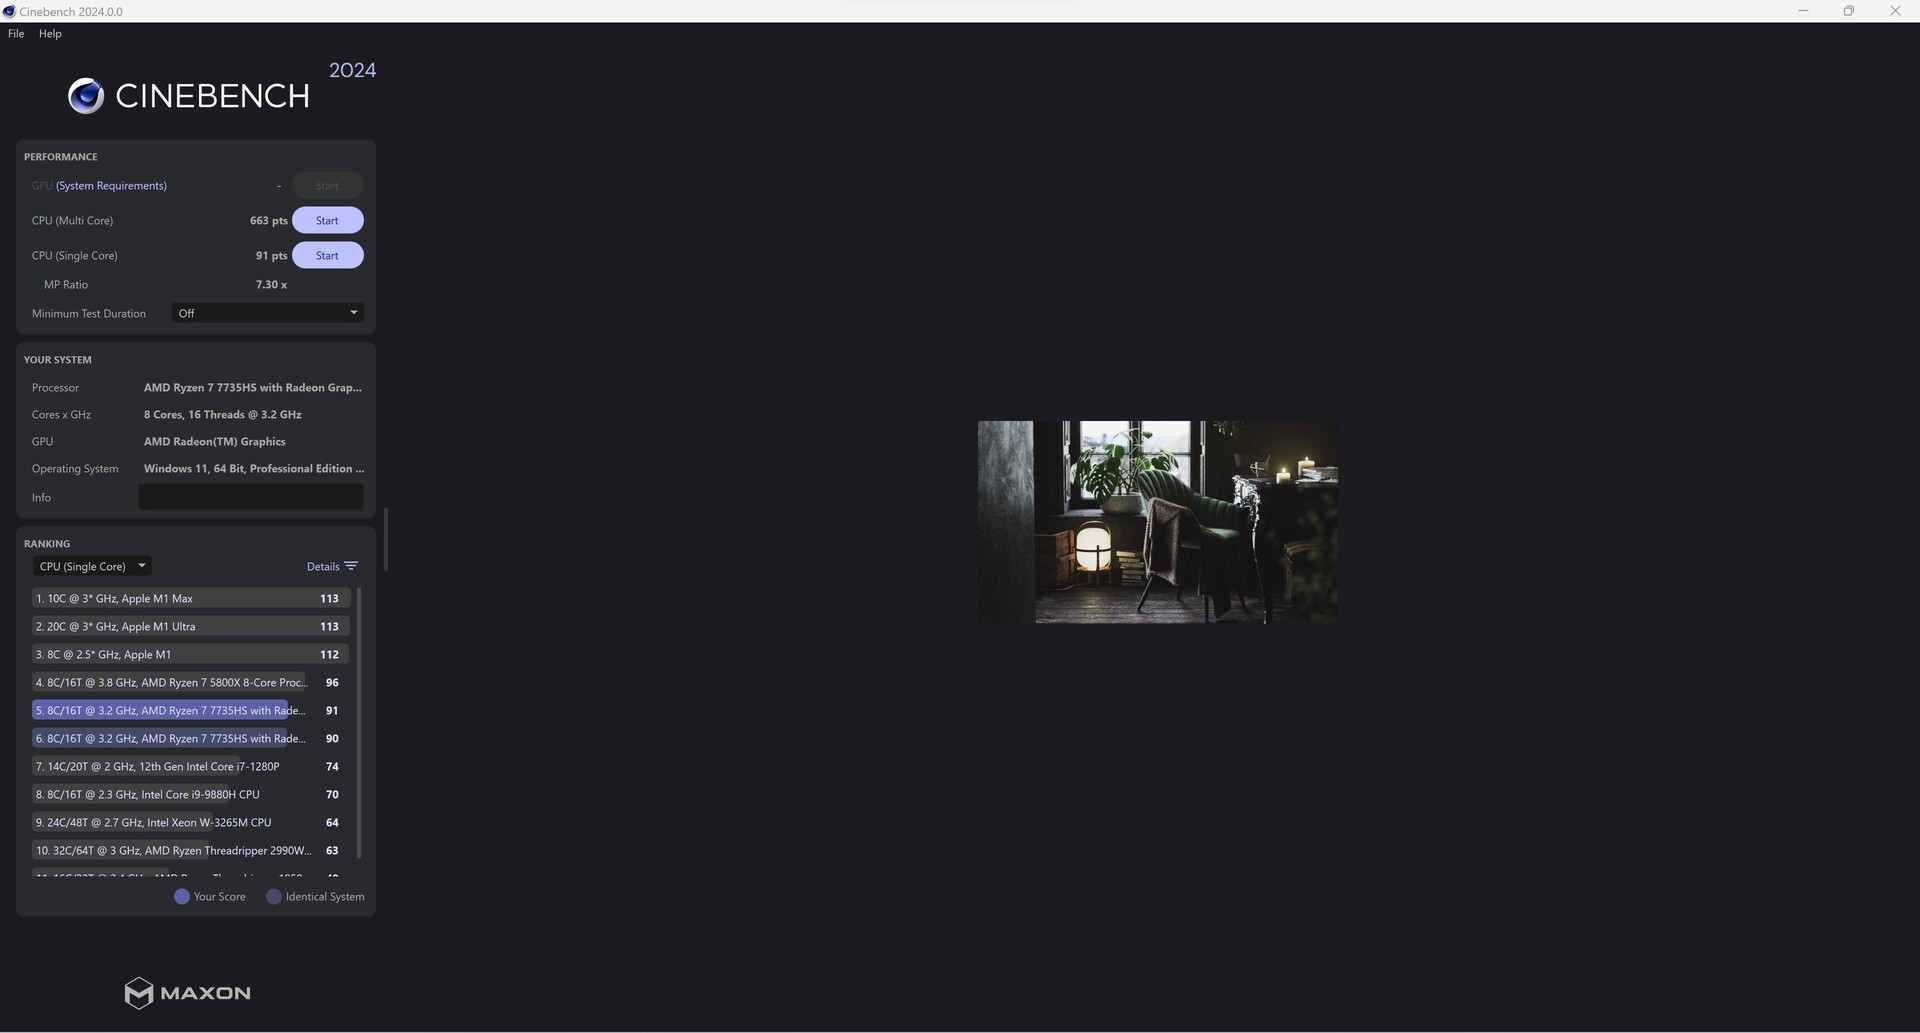
The AMD Ryzen 7 7735HS is a relatively modern 8-core processor in the Rembrandt series. However, AMD's Zen3 SoC can no longer be considered one of the new kids on the block. Despite this, the processor can process 16 threads in parallel which is good multi-thread performance. In the performance comparison, our Maxtang MTN-FP750 could only secure second last place. The reason for this is the AMD Ryzen 7 7735HS's 35-watt power limit.
Additional processor benchmarks can be found here.
Cinebench results with factory settings (PL1 and PL2 = 35 watts)


Cinebench results with a higher power target (PL1 = 54 watts, PL2 = 65 watts)
| Performance rating - Percent | |
| Minisforum Neptune Series NAD9 | |
| Minisforum Venus Series NAB6 | |
| Geekom AS 6, R9 6900HX | |
| NiPoGi AD08 | |
| Geekom A5 | |
| Geekom Mini IT12 | |
| Maxtang MTN-FP750 | |
| Cinebench R10 | |
| Rendering Single CPUs 64Bit | |
| Minisforum Venus Series NAB6 | |
| Geekom Mini IT12 | |
| NiPoGi AD08 | |
| Minisforum Neptune Series NAD9 | |
| Maxtang MTN-FP750 | |
| Geekom AS 6, R9 6900HX | |
| Geekom A5 | |
| Rendering Multiple CPUs 64Bit | |
| Minisforum Neptune Series NAD9 | |
| Minisforum Venus Series NAB6 | |
| Geekom AS 6, R9 6900HX | |
| Geekom A5 | |
| Maxtang MTN-FP750 | |
| NiPoGi AD08 | |
| Geekom Mini IT12 | |
| Blender - v2.79 BMW27 CPU | |
| NiPoGi AD08 | |
| Geekom A5 | |
| Minisforum Venus Series NAB6 | |
| Geekom Mini IT12 | |
| Maxtang MTN-FP750 | |
| Minisforum Neptune Series NAD9 | |
| Geekom AS 6, R9 6900HX | |
| WinRAR - Result | |
| Minisforum Venus Series NAB6 | |
| Minisforum Neptune Series NAD9 | |
| NiPoGi AD08 | |
| Geekom A5 | |
| Geekom AS 6, R9 6900HX | |
| Geekom Mini IT12 | |
| Maxtang MTN-FP750 | |
| 3DMark 11 - 1280x720 Performance Physics | |
| Minisforum Neptune Series NAD9 | |
| Minisforum Venus Series NAB6 | |
| Geekom AS 6, R9 6900HX | |
| Geekom A5 | |
| NiPoGi AD08 | |
| Maxtang MTN-FP750 | |
| Geekom Mini IT12 | |
| HWBOT x265 Benchmark v2.2 - 4k Preset | |
| Geekom AS 6, R9 6900HX | |
| Minisforum Neptune Series NAD9 | |
| Minisforum Venus Series NAB6 | |
| Geekom A5 | |
| Maxtang MTN-FP750 | |
| NiPoGi AD08 | |
| Geekom Mini IT12 | |
| R Benchmark 2.5 - Overall mean | |
| Geekom A5 | |
| Maxtang MTN-FP750 | |
| Geekom AS 6, R9 6900HX | |
| NiPoGi AD08 | |
| Geekom Mini IT12 | |
| Minisforum Neptune Series NAD9 | |
| Minisforum Venus Series NAB6 | |
| LibreOffice - 20 Documents To PDF | |
| Maxtang MTN-FP750 | |
| Geekom A5 | |
| Geekom Mini IT12 | |
| NiPoGi AD08 | |
| Geekom AS 6, R9 6900HX | |
| Minisforum Venus Series NAB6 | |
| Minisforum Neptune Series NAD9 | |
| WebXPRT 3 - Overall | |
| Minisforum Neptune Series NAD9 | |
| Minisforum Venus Series NAB6 | |
| NiPoGi AD08 | |
| Geekom Mini IT12 | |
| Maxtang MTN-FP750 | |
| Geekom A5 | |
| Geekom AS 6, R9 6900HX | |
| Mozilla Kraken 1.1 - Total | |
| Geekom A5 | |
| Geekom AS 6, R9 6900HX | |
| Maxtang MTN-FP750 | |
| Minisforum Neptune Series NAD9 | |
| Geekom Mini IT12 | |
| NiPoGi AD08 | |
| Minisforum Venus Series NAB6 | |
* ... smaller is better
AIDA64: FP32 Ray-Trace | FPU Julia | CPU SHA3 | CPU Queen | FPU SinJulia | FPU Mandel | CPU AES | CPU ZLib | FP64 Ray-Trace | CPU PhotoWorxx
| Performance rating | |
| Average of class Mini PC | |
| Geekom AS 6, R9 6900HX | |
| Geekom A5 | |
| Maxtang MTN-FP750 | |
| Minisforum Neptune Series NAD9 | |
| Minisforum Venus Series NAB6 | |
| NiPoGi AD08 | |
| Geekom Mini IT12 | |
| AIDA64 / FP32 Ray-Trace | |
| Average of class Mini PC (974 - 82725, n=97, last 2 years) | |
| Geekom AS 6, R9 6900HX | |
| Maxtang MTN-FP750 | |
| Geekom A5 | |
| Minisforum Neptune Series NAD9 | |
| Minisforum Venus Series NAB6 | |
| NiPoGi AD08 | |
| Geekom Mini IT12 | |
| AIDA64 / FPU Julia | |
| Average of class Mini PC (6115 - 363782, n=97, last 2 years) | |
| Geekom AS 6, R9 6900HX | |
| Maxtang MTN-FP750 | |
| Geekom A5 | |
| Minisforum Neptune Series NAD9 | |
| Minisforum Venus Series NAB6 | |
| NiPoGi AD08 | |
| Geekom Mini IT12 | |
| AIDA64 / CPU SHA3 | |
| Average of class Mini PC (385 - 9475, n=97, last 2 years) | |
| Geekom AS 6, R9 6900HX | |
| Maxtang MTN-FP750 | |
| Geekom A5 | |
| Minisforum Neptune Series NAD9 | |
| Minisforum Venus Series NAB6 | |
| NiPoGi AD08 | |
| Geekom Mini IT12 | |
| AIDA64 / CPU Queen | |
| Geekom AS 6, R9 6900HX | |
| Average of class Mini PC (20501 - 154404, n=80, last 2 years) | |
| Geekom A5 | |
| Maxtang MTN-FP750 | |
| Minisforum Neptune Series NAD9 | |
| Minisforum Venus Series NAB6 | |
| Geekom Mini IT12 | |
| NiPoGi AD08 | |
| AIDA64 / FPU SinJulia | |
| Average of class Mini PC (1116 - 31931, n=97, last 2 years) | |
| Maxtang MTN-FP750 | |
| Geekom AS 6, R9 6900HX | |
| Geekom A5 | |
| Minisforum Neptune Series NAD9 | |
| Minisforum Venus Series NAB6 | |
| NiPoGi AD08 | |
| Geekom Mini IT12 | |
| AIDA64 / FPU Mandel | |
| Average of class Mini PC (3322 - 192994, n=97, last 2 years) | |
| Geekom AS 6, R9 6900HX | |
| Maxtang MTN-FP750 | |
| Geekom A5 | |
| Minisforum Neptune Series NAD9 | |
| Minisforum Venus Series NAB6 | |
| NiPoGi AD08 | |
| Geekom Mini IT12 | |
| AIDA64 / CPU AES | |
| Geekom AS 6, R9 6900HX | |
| Geekom A5 | |
| Minisforum Neptune Series NAD9 | |
| Minisforum Venus Series NAB6 | |
| Average of class Mini PC (9915 - 204742, n=96, last 2 years) | |
| Geekom Mini IT12 | |
| Maxtang MTN-FP750 | |
| NiPoGi AD08 | |
| AIDA64 / CPU ZLib | |
| Average of class Mini PC (127.2 - 2431, n=97, last 2 years) | |
| Geekom AS 6, R9 6900HX | |
| Minisforum Neptune Series NAD9 | |
| Geekom A5 | |
| NiPoGi AD08 | |
| Minisforum Venus Series NAB6 | |
| Maxtang MTN-FP750 | |
| Geekom Mini IT12 | |
| AIDA64 / FP64 Ray-Trace | |
| Average of class Mini PC (537 - 43587, n=97, last 2 years) | |
| Geekom AS 6, R9 6900HX | |
| Maxtang MTN-FP750 | |
| Geekom A5 | |
| Minisforum Neptune Series NAD9 | |
| Minisforum Venus Series NAB6 | |
| NiPoGi AD08 | |
| Geekom Mini IT12 | |
| AIDA64 / CPU PhotoWorxx | |
| Average of class Mini PC (8069 - 96843, n=97, last 2 years) | |
| Geekom AS 6, R9 6900HX | |
| Geekom Mini IT12 | |
| Minisforum Venus Series NAB6 | |
| Geekom A5 | |
| NiPoGi AD08 | |
| Minisforum Neptune Series NAD9 | |
| Maxtang MTN-FP750 | |
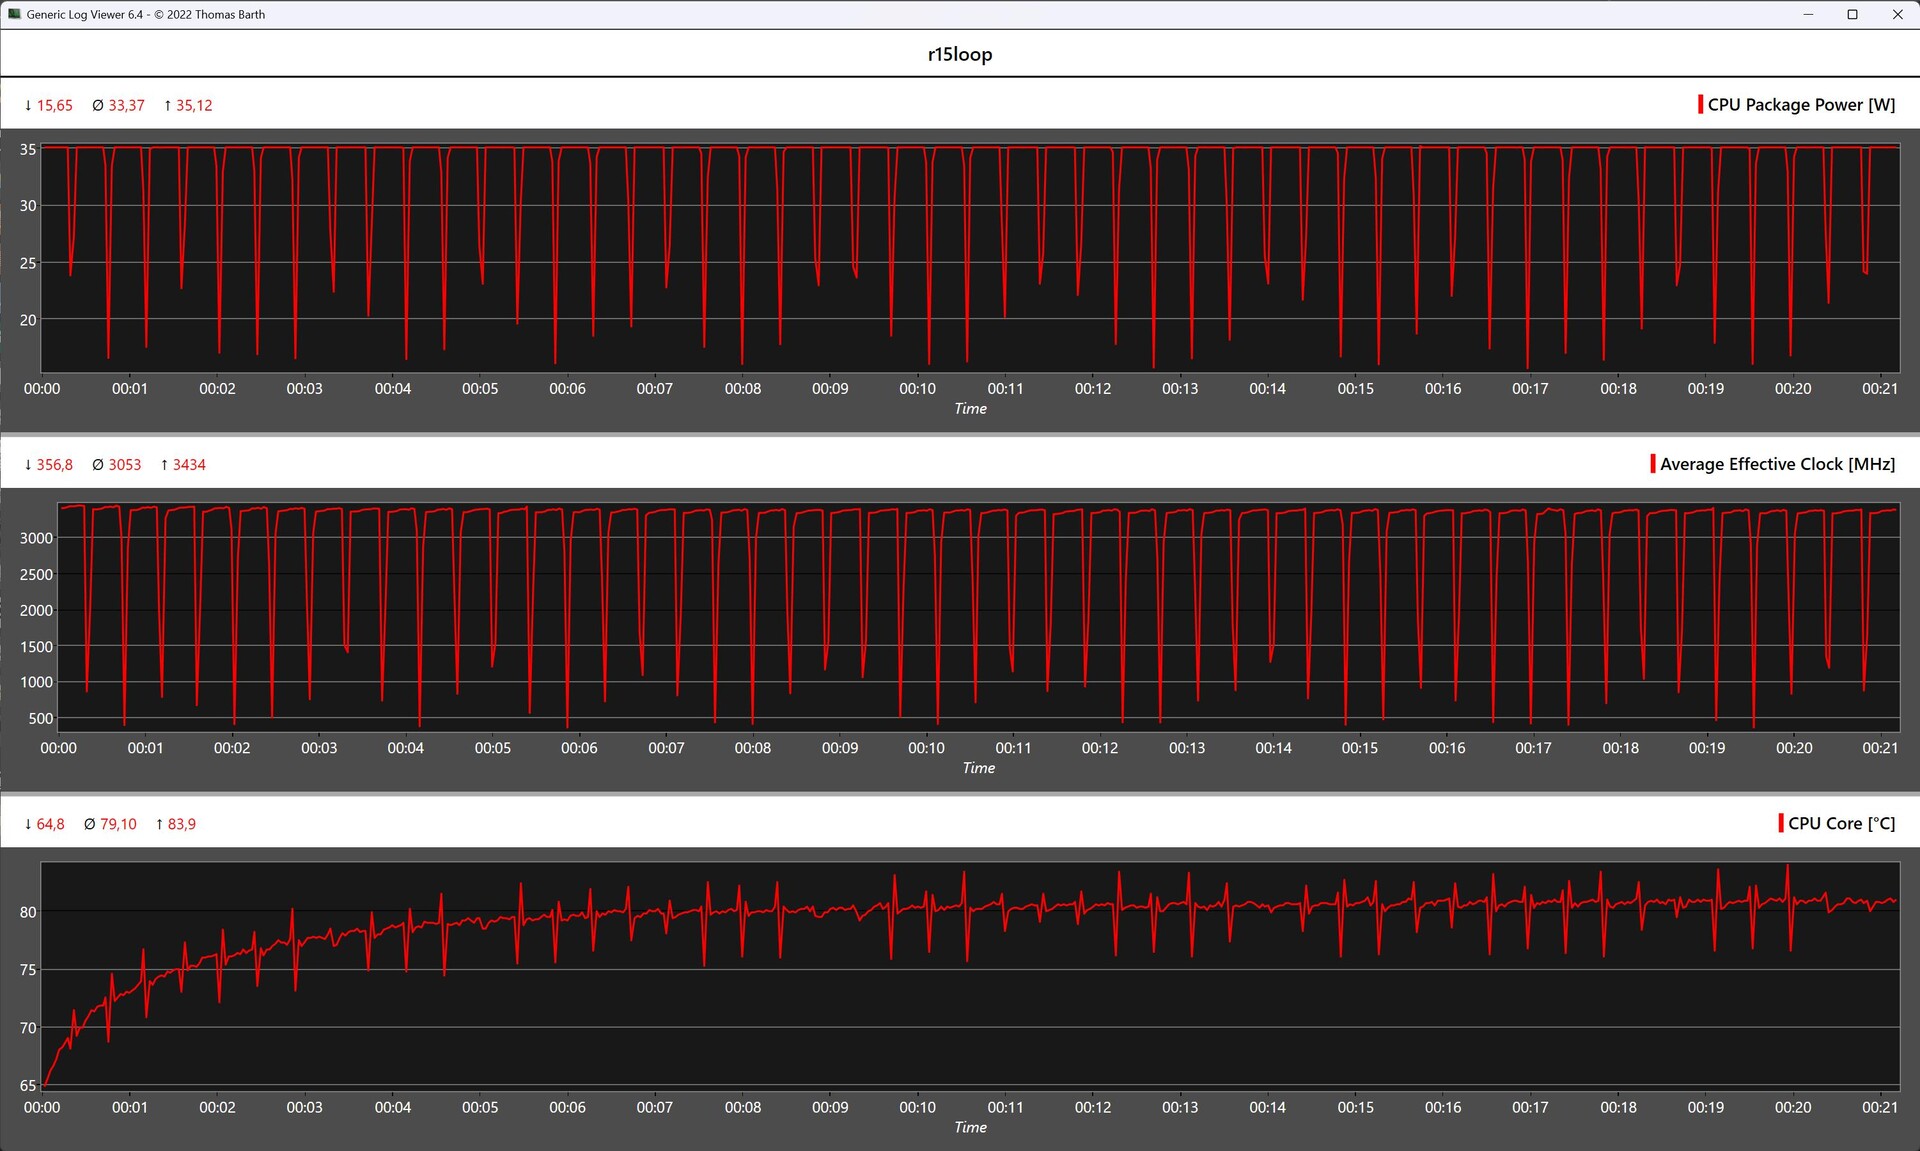
Maxtang MTN-FP750 vs. Cinebench R15 Multi-Loop
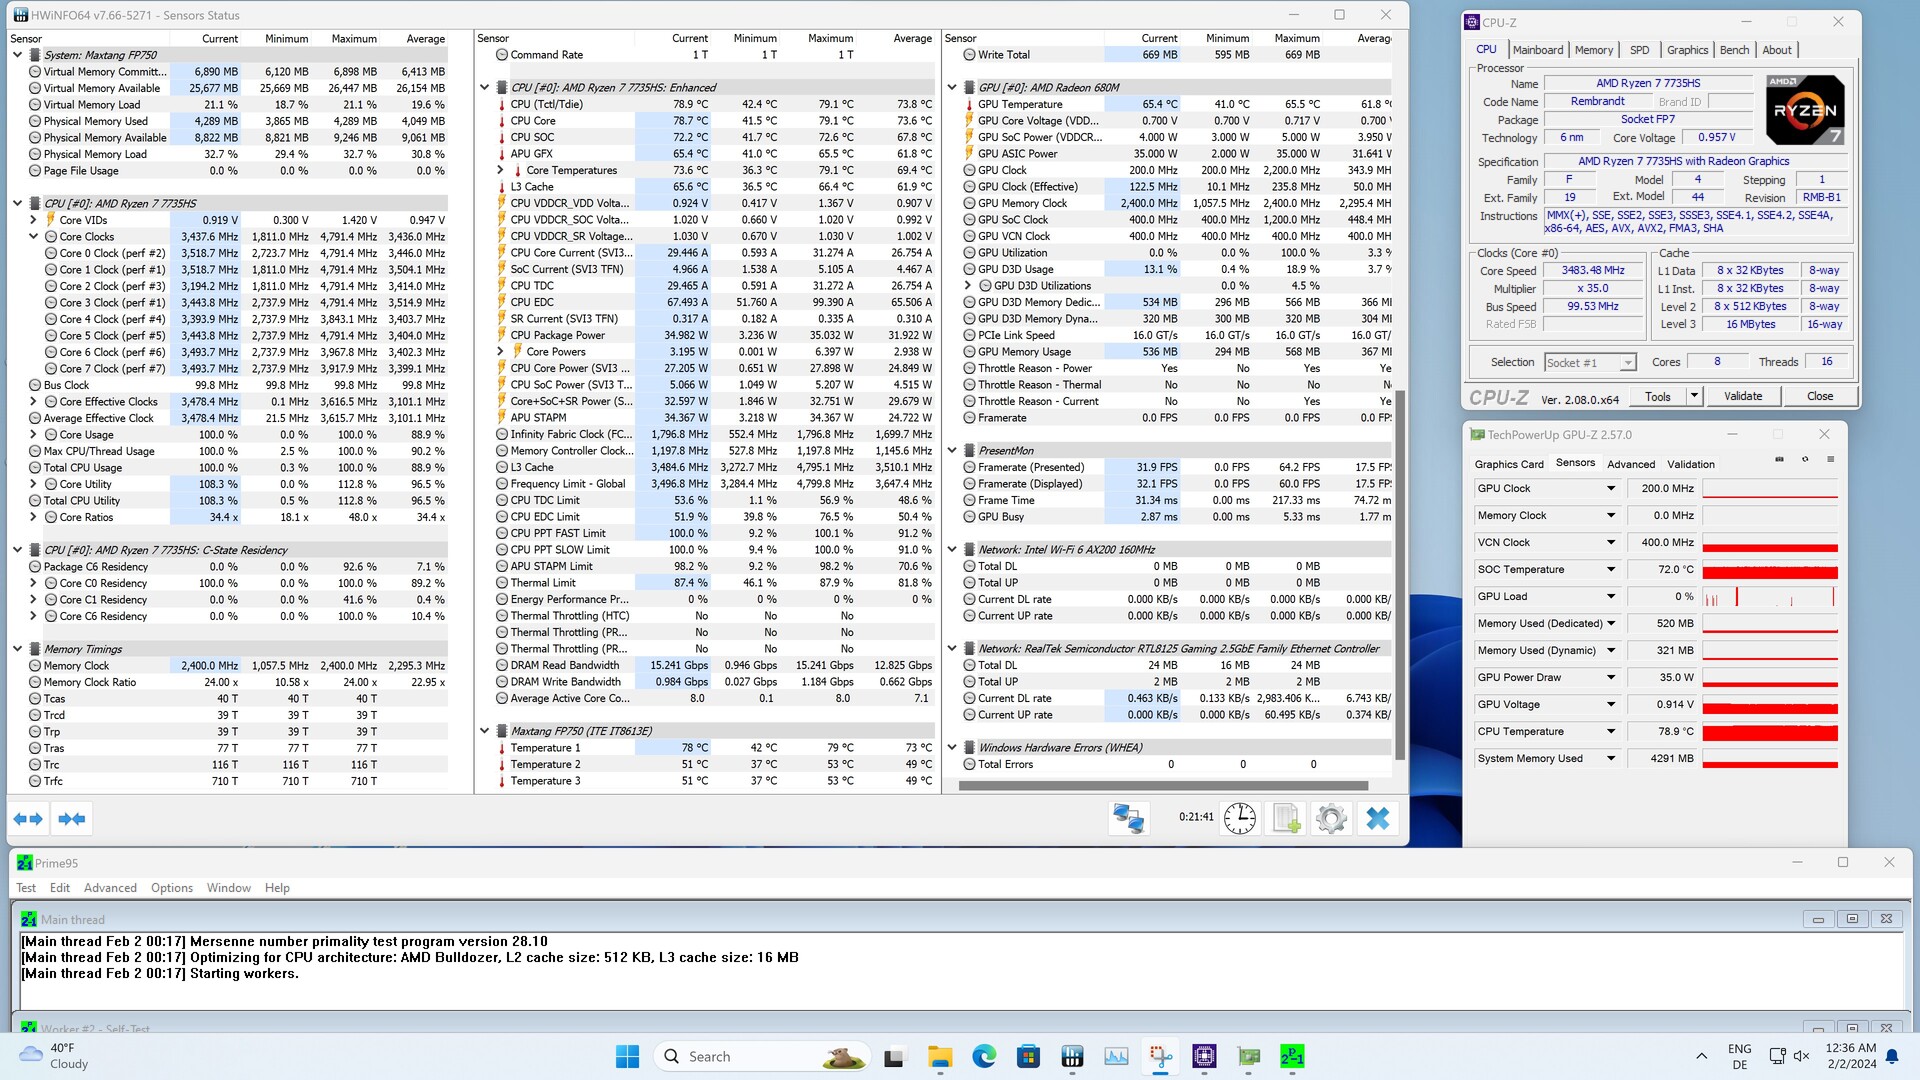
The Cinebench R15 multi-loop showed us how well the cooling system works under load. The cooling unit doesn't reach its limits due to a low maximum TDP of only 35 watts and this is why the device was able to achieve consistently stable CPU performance. In the comparison, our review sample even managed to secure second place behind the Geekom AS 6.
System performance
Once more, in the system performance synthetic tests, our review device was also to be found bringing up the rear. In daily tasks during testing and from a subjective point of view, the Maxtang MTN-FP750 was able to deliver good system performance, as long as the system wasn't challenged with handling too many tasks simultaneously. The RAM appears to be the bottleneck because once you subtract the graphics memory, only 12 of the 16 GB are available.
| AIDA64 / Memory Copy | |
| Average of class Mini PC (15933 - 163031, n=97, last 2 years) | |
| Geekom AS 6, R9 6900HX | |
| Minisforum Venus Series NAB6 | |
| Minisforum Neptune Series NAD9 | |
| Geekom Mini IT12 | |
| NiPoGi AD08 | |
| Geekom A5 | |
| Maxtang MTN-FP750 | |
| AIDA64 / Memory Read | |
| Average of class Mini PC (14143 - 123769, n=97, last 2 years) | |
| Geekom AS 6, R9 6900HX | |
| Minisforum Venus Series NAB6 | |
| Minisforum Neptune Series NAD9 | |
| Geekom Mini IT12 | |
| NiPoGi AD08 | |
| Geekom A5 | |
| Maxtang MTN-FP750 | |
| AIDA64 / Memory Write | |
| Average of class Mini PC (10630 - 216693, n=97, last 2 years) | |
| Geekom AS 6, R9 6900HX | |
| Minisforum Venus Series NAB6 | |
| Minisforum Neptune Series NAD9 | |
| Geekom Mini IT12 | |
| Geekom A5 | |
| NiPoGi AD08 | |
| Maxtang MTN-FP750 | |
| AIDA64 / Memory Latency | |
| NiPoGi AD08 | |
| Average of class Mini PC (88.1 - 170, n=98, last 2 years) | |
| Minisforum Neptune Series NAD9 | |
| Geekom AS 6, R9 6900HX | |
| Geekom A5 | |
| Geekom Mini IT12 | |
| Maxtang MTN-FP750 | |
| Minisforum Venus Series NAB6 | |
* ... smaller is better
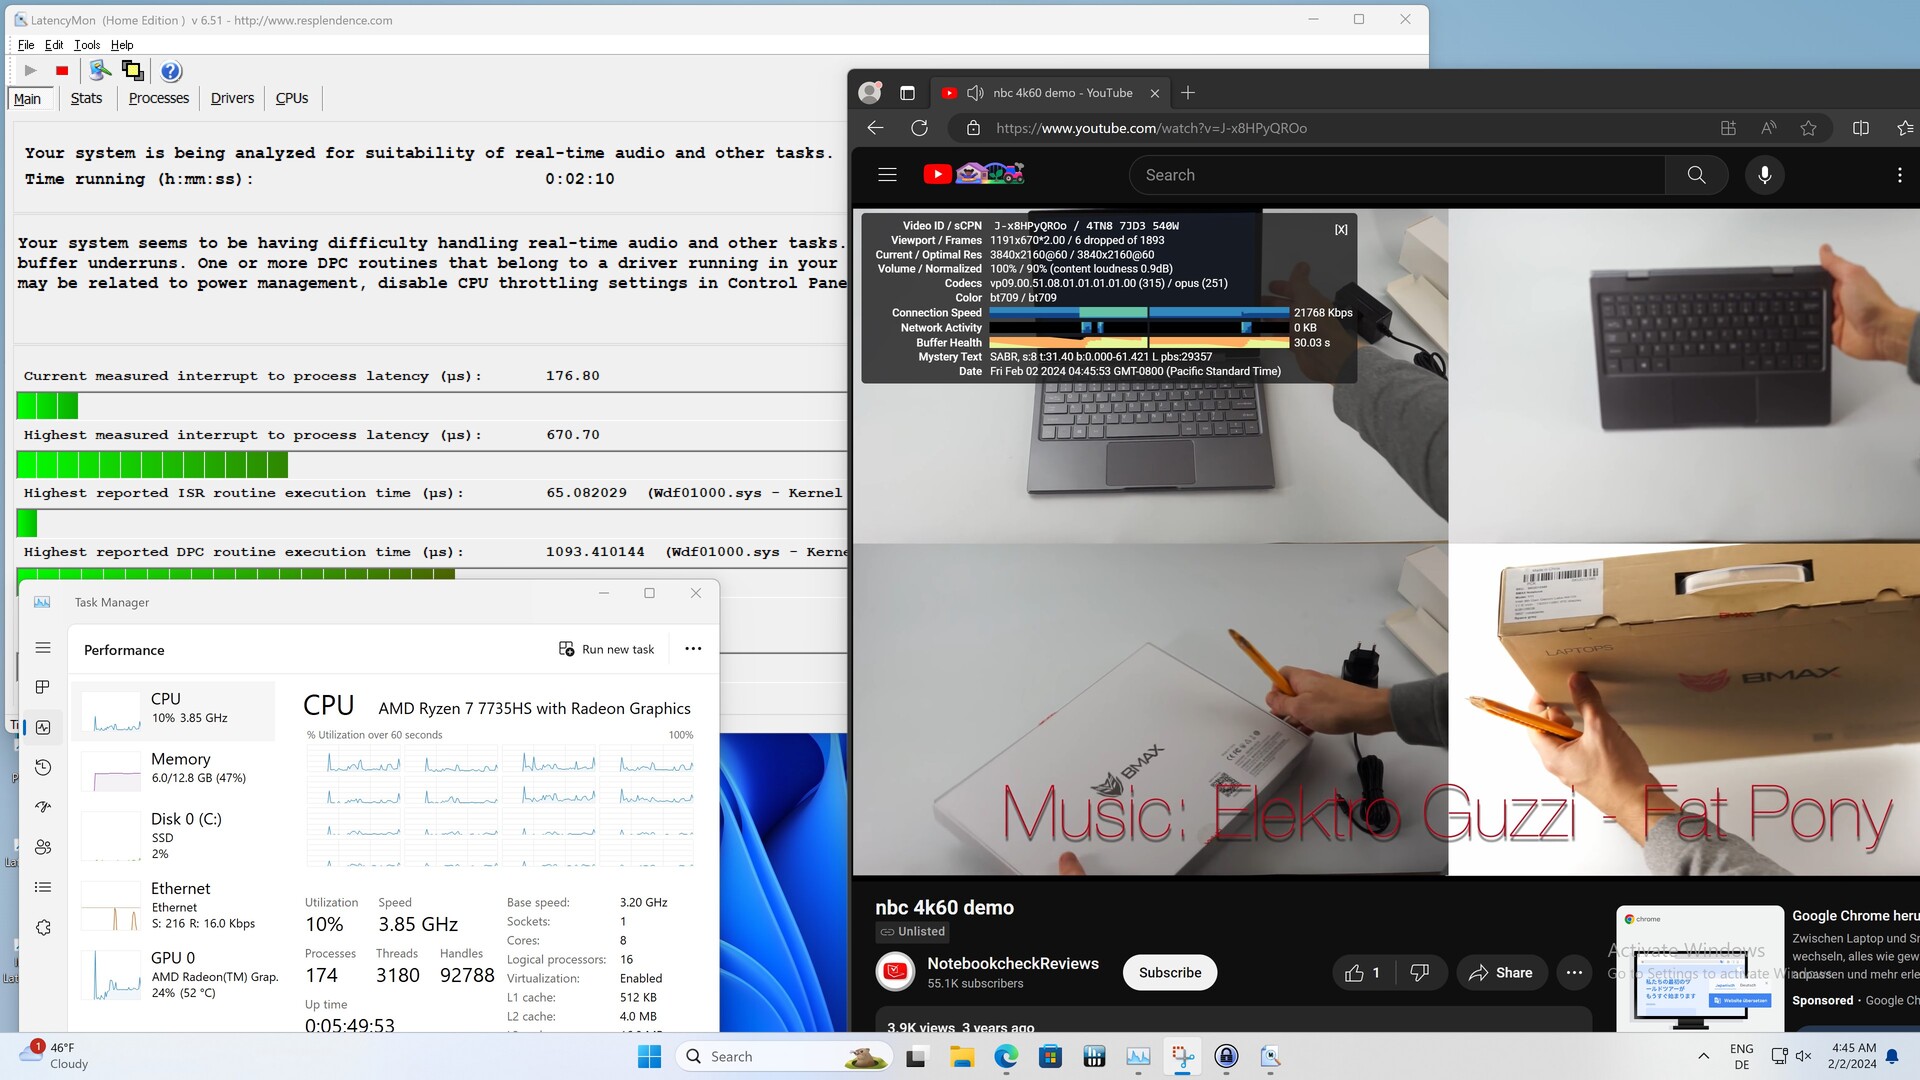
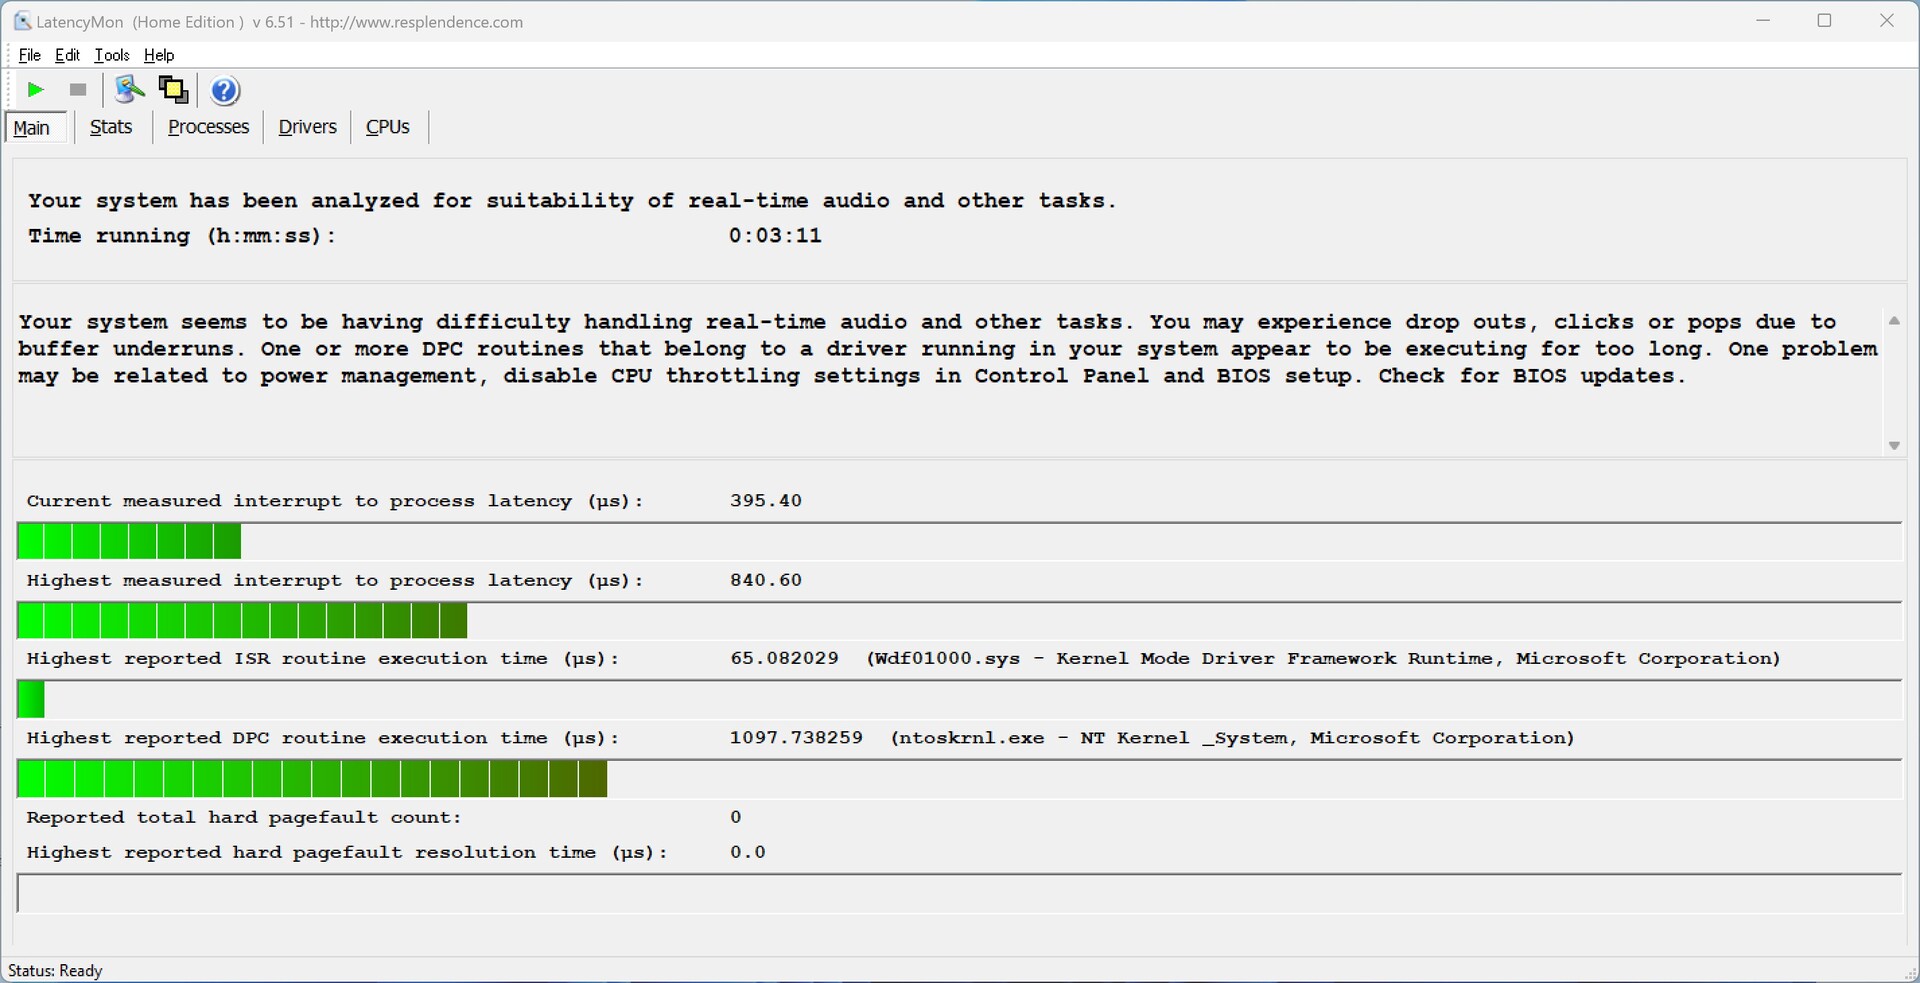
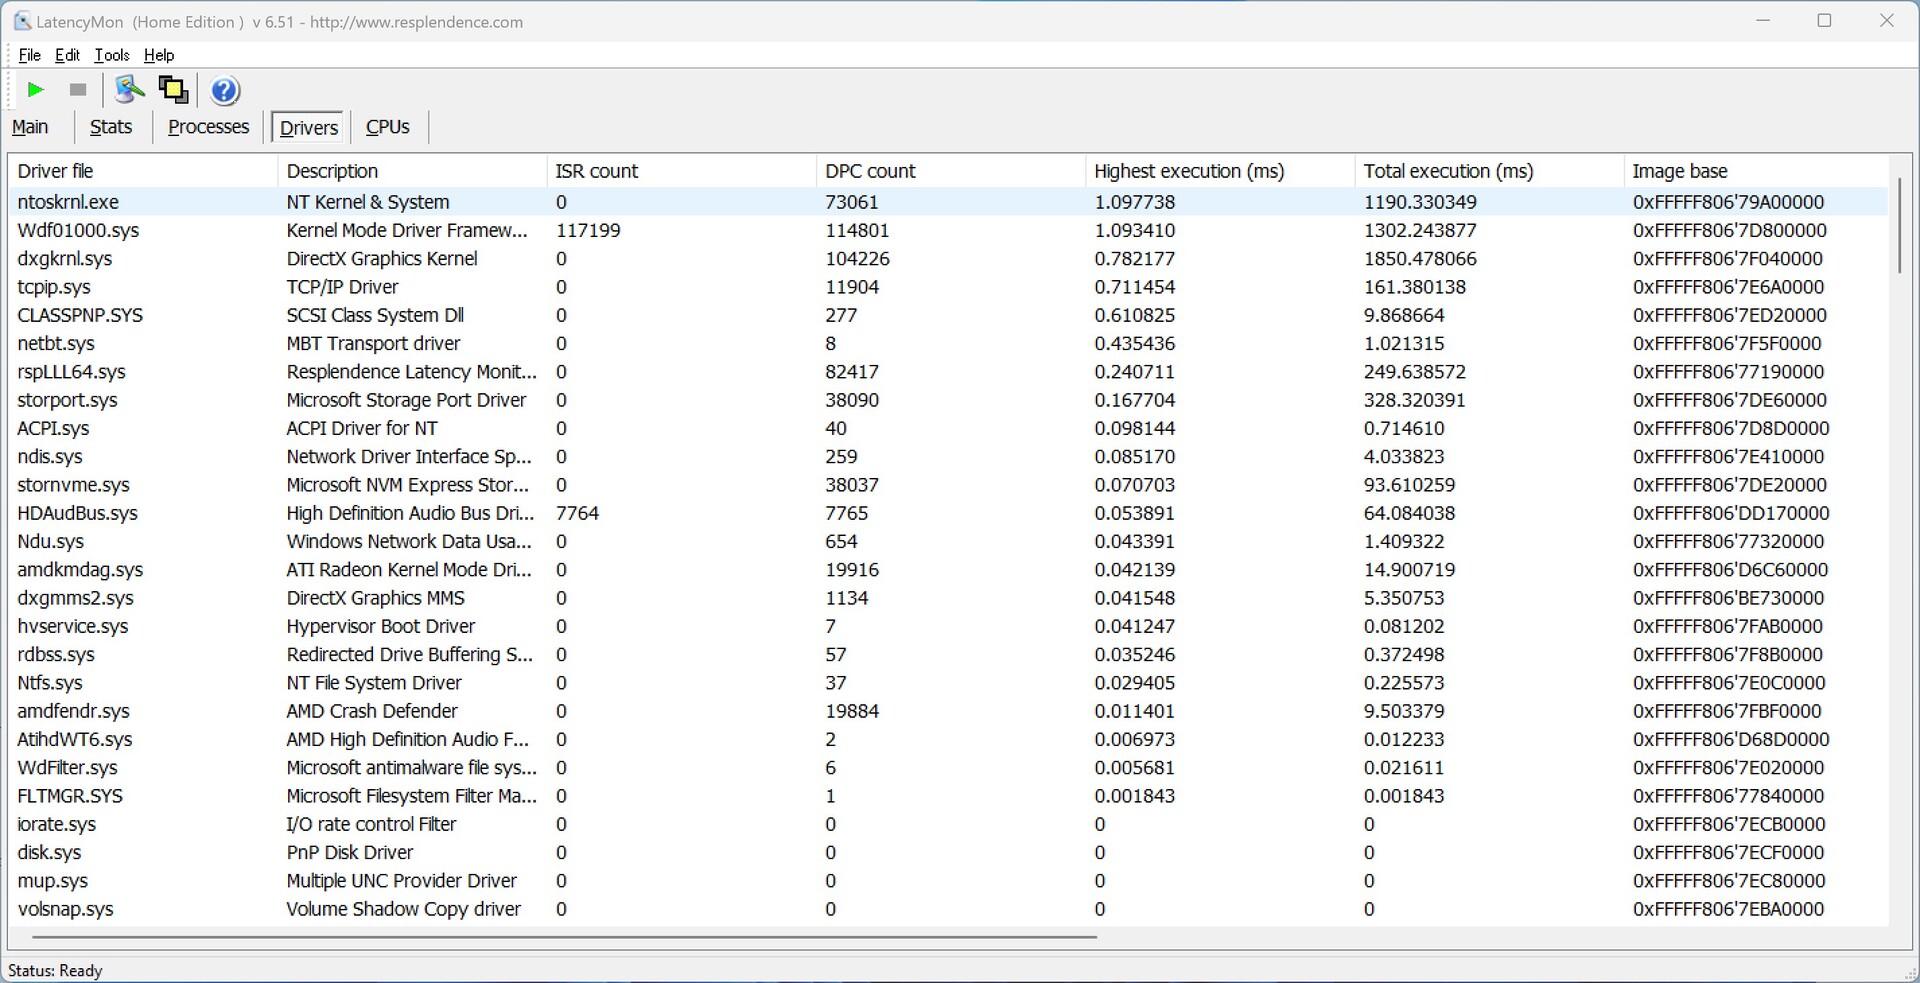
DPC latencies
We already recorded slightly increased latencies when opening multiple tabs using the Edge browser. However, they didn't increase as the test continued. When playing our 4K test video, the iGPU was stressed to around 24 percent of its capacity.
| DPC Latencies / LatencyMon - interrupt to process latency (max), Web, Youtube, Prime95 | |
| Geekom AS 6, R9 6900HX | |
| Geekom A5 | |
| Minisforum Neptune Series NAD9 | |
| Maxtang MTN-FP750 | |
| NiPoGi AD08 | |
| Geekom Mini IT12 | |
| Minisforum Venus Series NAB6 | |
* ... smaller is better
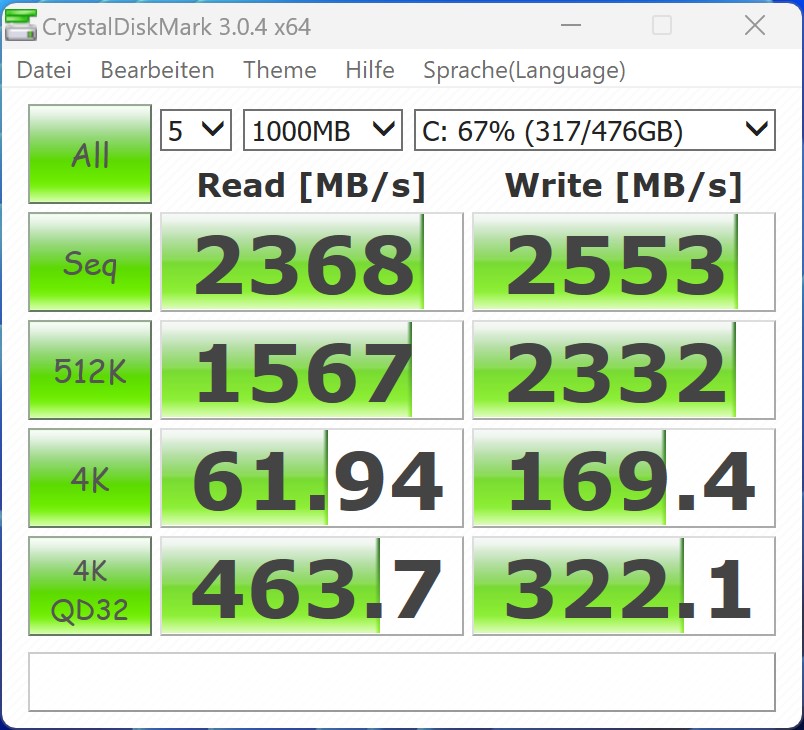
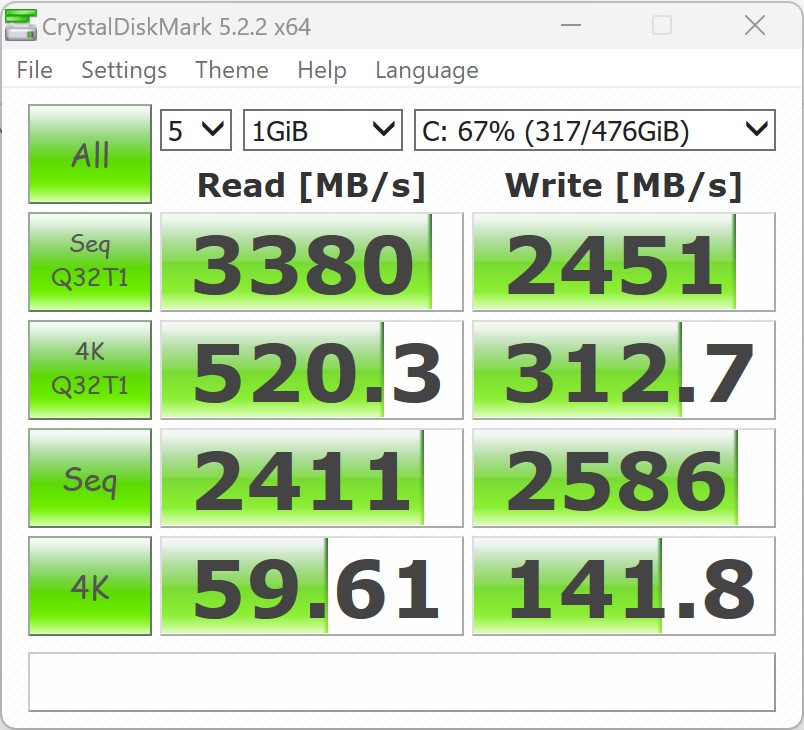
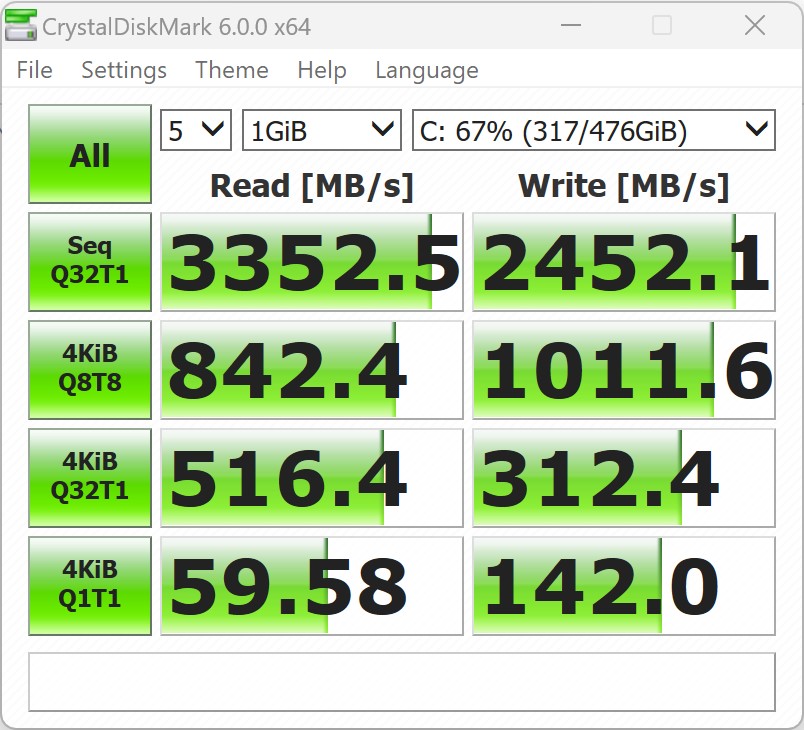
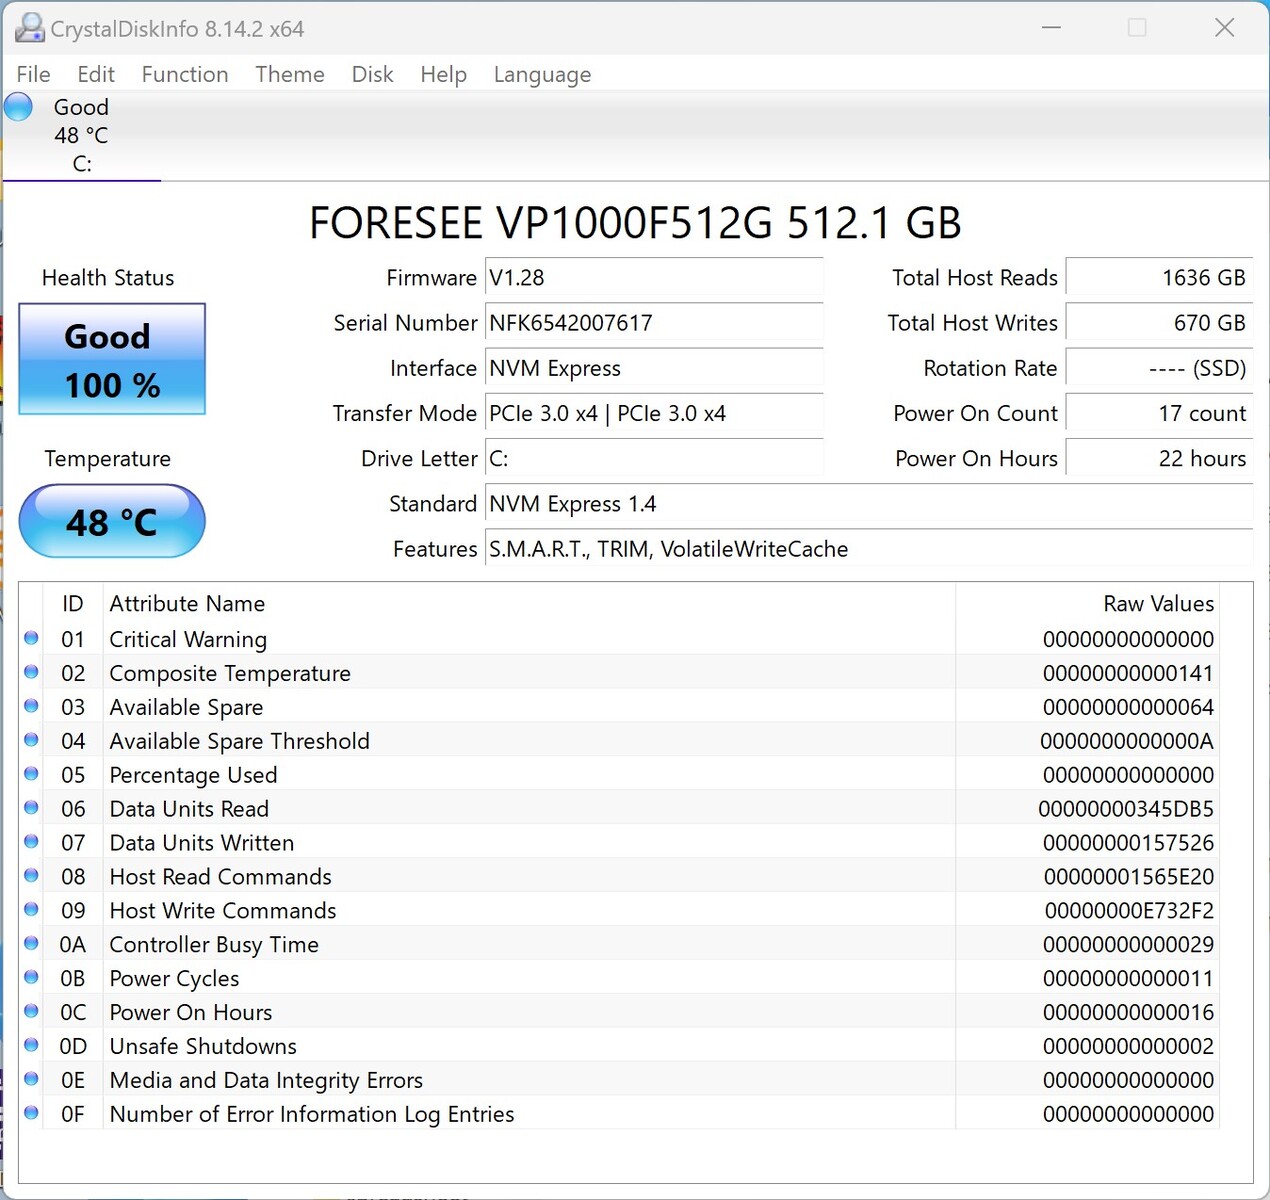
Mass storage
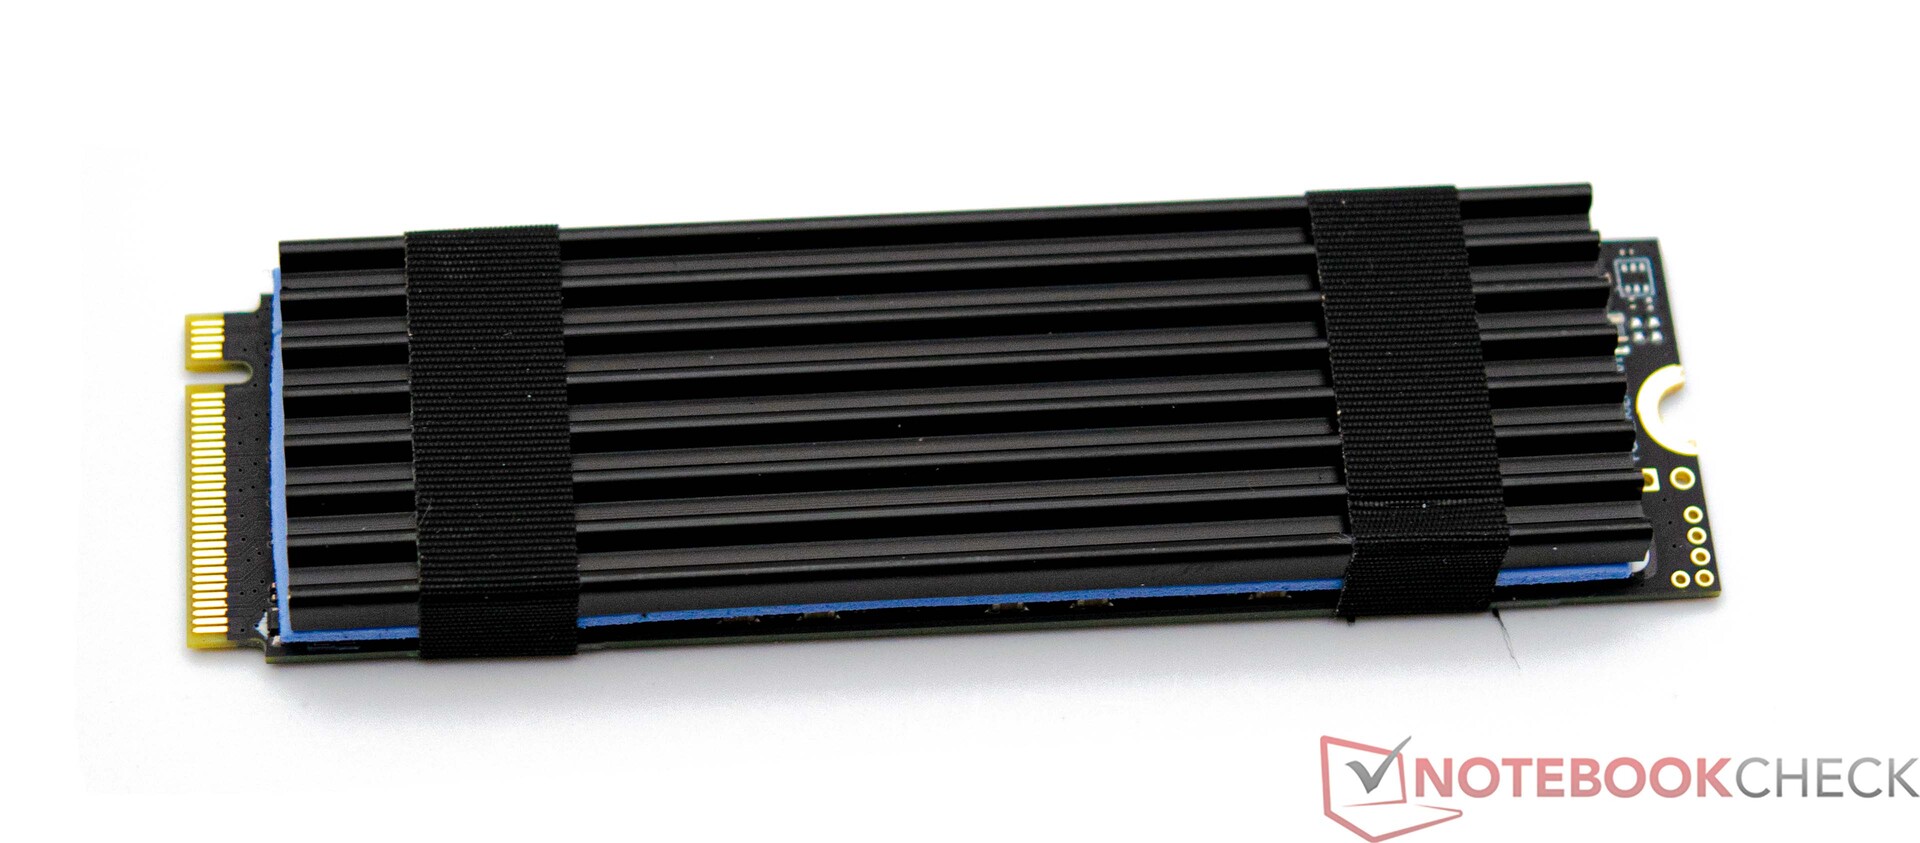
Maxtang equipped our MTN-FP750 review sample with a Foresee 512 GB SSD. The PCIe 3.0 SSD makes use of the M.2 interface at the maximum possible bandwidth and is not artificially held back by a slow interface. Despite this, our review device could only earn itself a mid-table place. An additional 2.5-inch storage device can be installed. See our comparison table for further comparisons and benchmarks.


| Drive Performance rating - Percent | |
| Minisforum Neptune Series NAD9 | |
| Minisforum Venus Series NAB6 | |
| Average of class Mini PC | |
| Geekom A5 | |
| NiPoGi AD08 | |
| Geekom Mini IT12 | |
| Maxtang MTN-FP750 | |
| Geekom AS 6, R9 6900HX | |
* ... smaller is better
Continuous Performance Read: DiskSpd Read Loop, Queue Depth 8
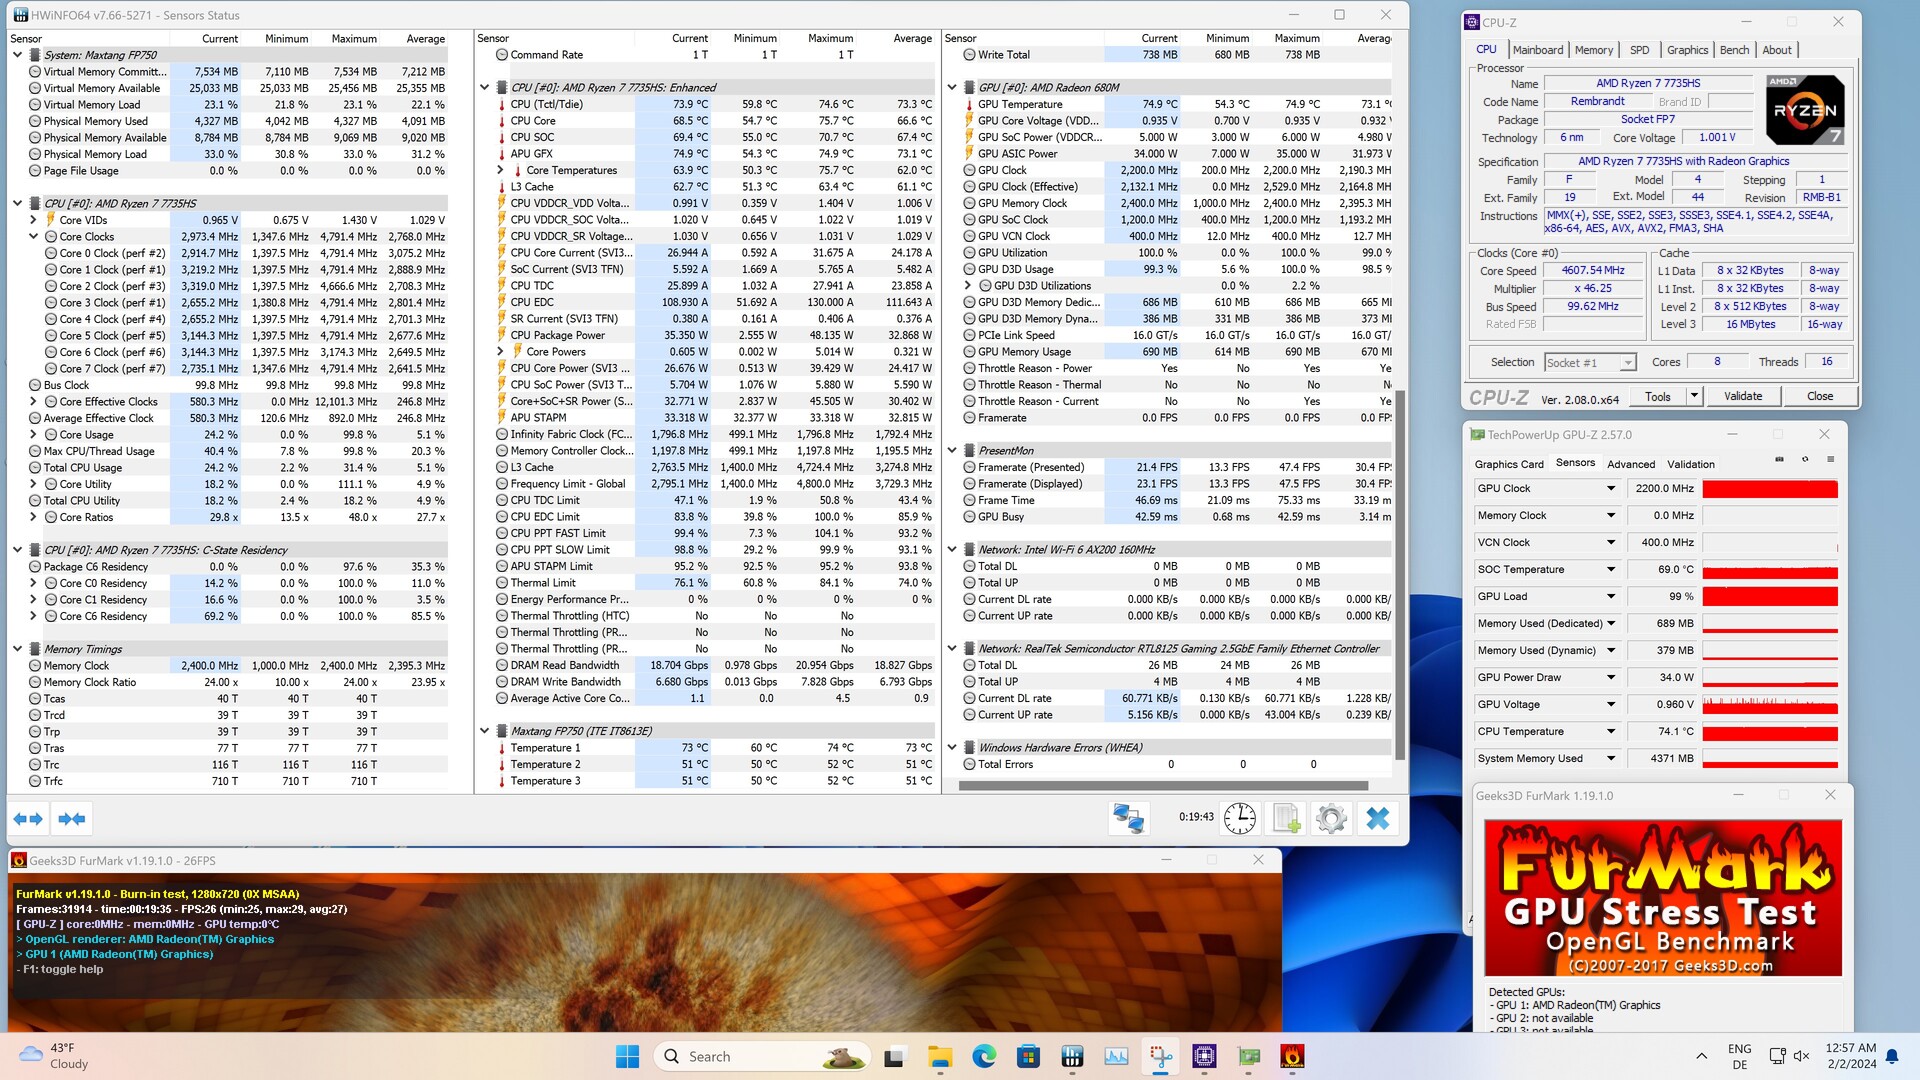
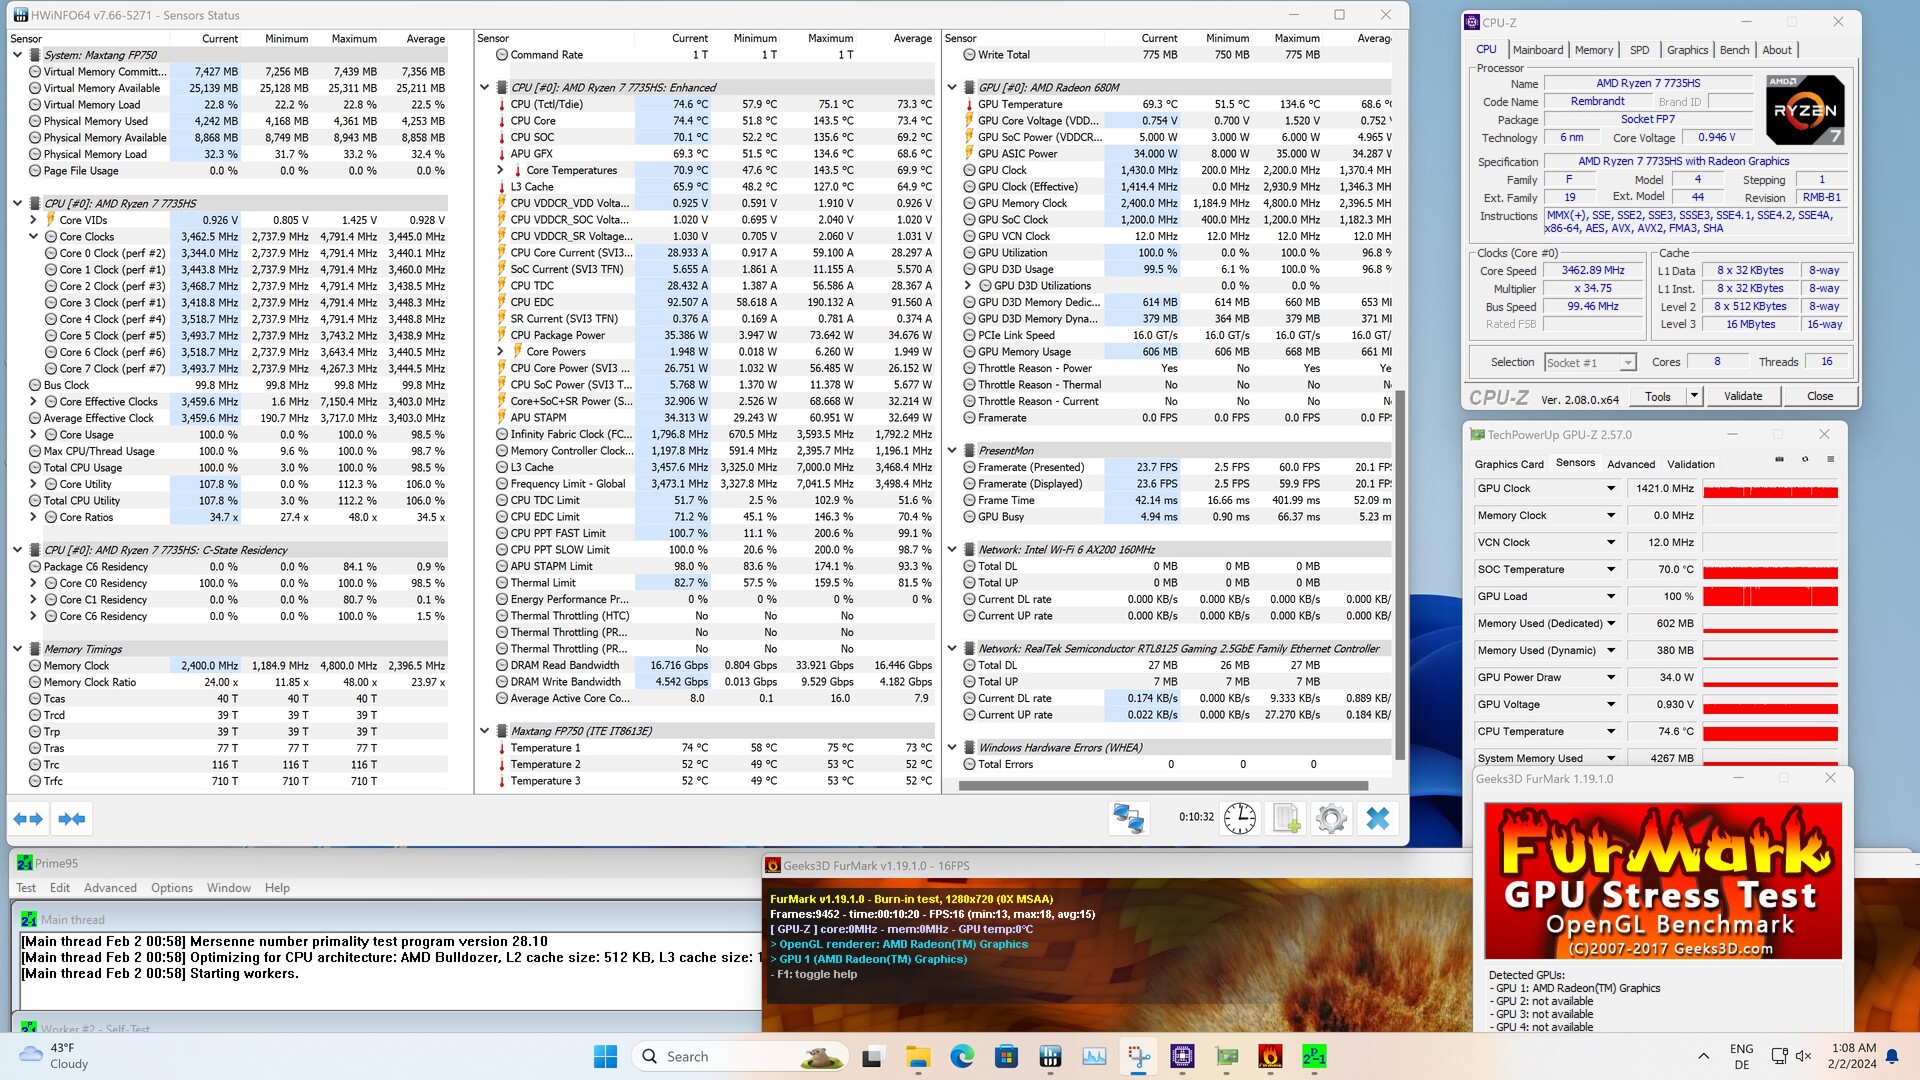
Graphics card
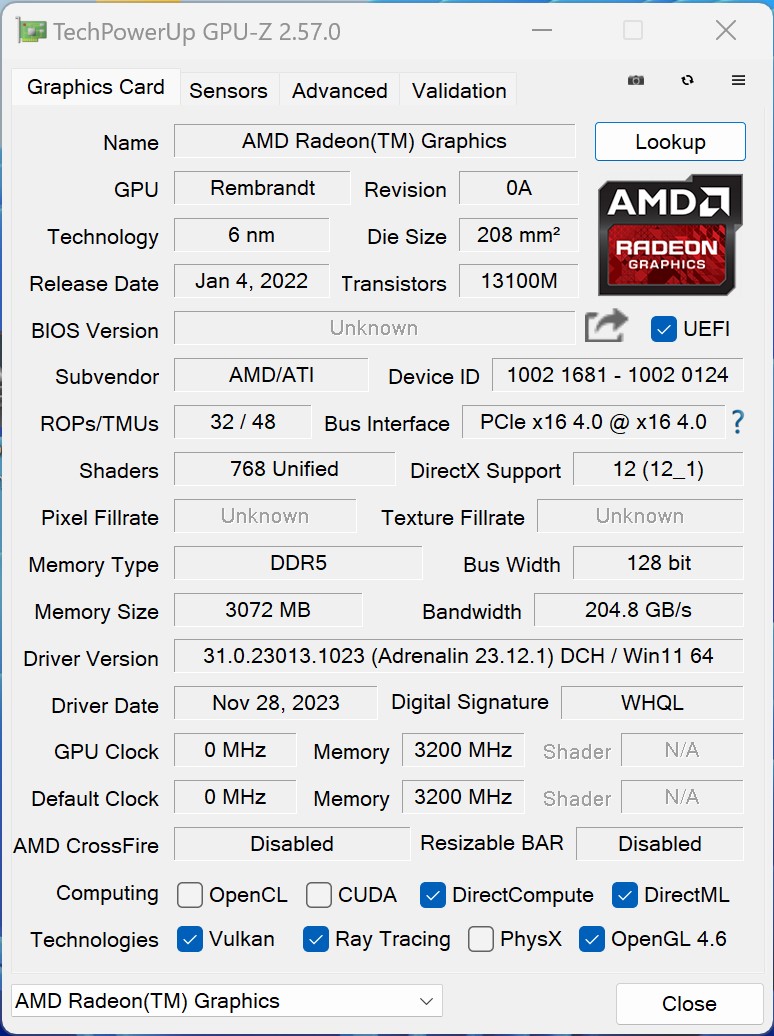
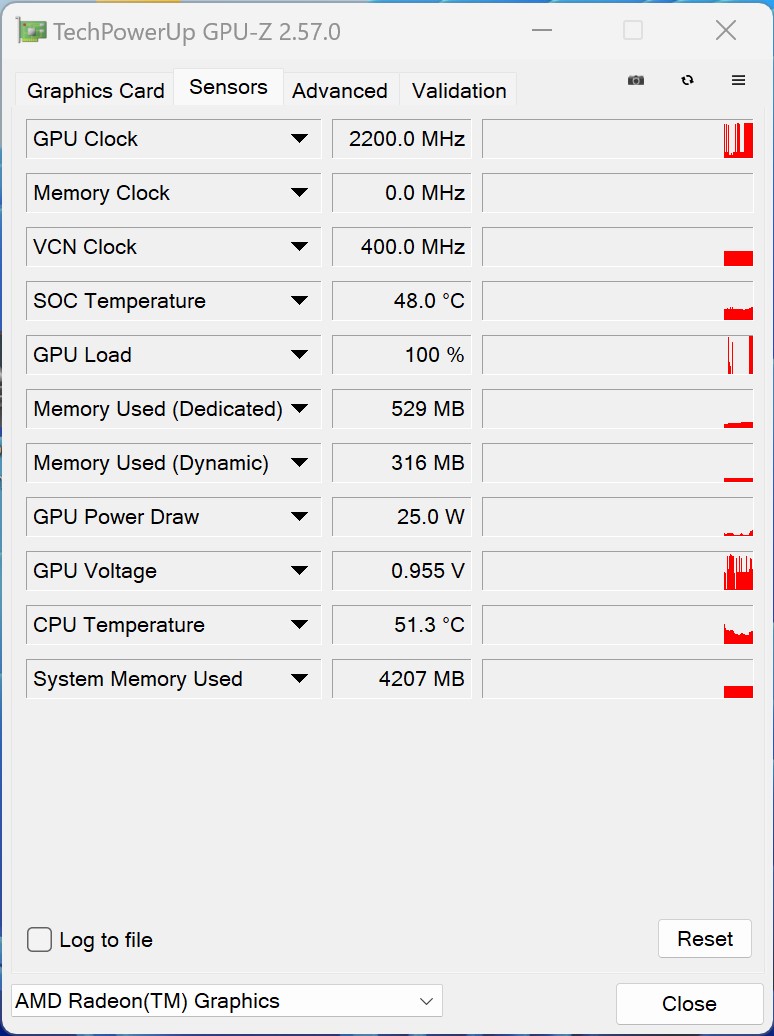
The graphics output is handled by the AMD Radeon 680M, an iGPU which delivers good performance in most situations. However, with the Maxtang MTN-FP750, this is somewhat different and the reason is the installed RAM. The manufacturer only equipped our review device with one RAM module. In this configuration, the AMD Radeon 680M is hardly any faster than the Intel Iris Xe Graphics G7 with 96 EUs. Even the Geekom A5 has its nose in front of our review sample with its older AMD Radeon RX Vega 8.
To get to the bottom of the weak performance, we took another RAM module from our supplies and carried out some benchmarks. This led to results roughly on par with the Geekom AS 6 thereby making the Maxtang MTN-FP750 in no way inferior to its competitors.
Additional AMD Radeon 680M benchmarks can be found here.
| 3DMark Performance rating - Percent | |
| Average AMD Radeon 680M | |
| Geekom AS 6, R9 6900HX | |
| Minisforum Neptune Series NAD9 | |
| Geekom A5 | |
| Geekom Mini IT12 | |
| Maxtang MTN-FP750 | |
| Minisforum Venus Series NAB6 | |
| NiPoGi AD08 | |
| Performance rating - Percent | |
| Geekom AS 6, R9 6900HX | |
| Geekom A5 | |
| Maxtang MTN-FP750 | |
| Minisforum Neptune Series NAD9 | |
| Geekom Mini IT12 | |
| Minisforum Venus Series NAB6 | |
| NiPoGi AD08 | |
| Unigine Valley 1.0 | |
| 1920x1080 Extreme HD DirectX AA:x8 | |
| Geekom AS 6, R9 6900HX | |
| Minisforum Neptune Series NAD9 | |
| Geekom A5 | |
| Geekom Mini IT12 | |
| Minisforum Venus Series NAB6 | |
| NiPoGi AD08 | |
| Maxtang MTN-FP750 | |
| 1920x1080 Extreme HD Preset OpenGL AA:x8 | |
| Geekom AS 6, R9 6900HX | |
| Geekom Mini IT12 | |
| Minisforum Neptune Series NAD9 | |
| Minisforum Venus Series NAB6 | |
| Geekom A5 | |
| Maxtang MTN-FP750 | |
| NiPoGi AD08 | |
| Maxtang MTN-FP750, AMD Radeon 680M R7 7735HS | Minisforum Neptune Series NAD9, Intel Iris Xe Graphics G7 96EUs i9-12900H | Geekom AS 6, R9 6900HX, AMD Radeon 680M R9 6900HX | Geekom Mini IT12, Intel Iris Xe Graphics G7 96EUs i7-1260P | Geekom A5, AMD Radeon RX Vega 8 (Ryzen 4000/5000) R7 5800H | Minisforum Venus Series NAB6, Intel UHD Graphics 64EUs (Alder Lake 12th Gen) i7-12650H | NiPoGi AD08, Intel UHD Graphics 64EUs (Alder Lake 12th Gen) i7-12650H | Average of class Mini PC | |
|---|---|---|---|---|---|---|---|---|
| SPECviewperf 12 | -26% | 58% | -31% | 2% | -37% | -34% | 211% | |
| 1900x1060 3ds Max (3dsmax-05) (fps) | 46.9 | 40.9 -13% | 75.3 61% | 38.7 -17% | 51.7 10% | 36.2 -23% | 34.4 -27% | 149.4 ? 219% |
| 1900x1060 Catia (catia-04) (fps) | 51.5 | 41.2 -20% | 70.3 37% | 38.5 -25% | 44.2 -14% | 34.5 -33% | 30.3 -41% | 142.7 ? 177% |
| 1900x1060 Creo (creo-01) (fps) | 33.2 | 9.64 -71% | 45.2 36% | 7.52 -77% | 36.3 9% | 6.44 -81% | 21.1 -36% | 66.4 ? 100% |
| 1900x1060 Energy (energy-01) (fps) | 0.41 | 76.1 | 0.41 | 0.35 | 0.77 | 22.2 ? | ||
| 1900x1060 Maya (maya-04) (fps) | 45.2 | 39.9 -12% | 58.3 29% | 36.5 -19% | 40.3 -11% | 33.4 -26% | 32.5 -28% | 128.8 ? 185% |
| 1900x1060 Medical (medical-01) (fps) | 17.9 | 12.3 -31% | 44 146% | 11.2 -37% | 18.2 2% | 9.12 -49% | 8.41 -53% | 79.8 ? 346% |
| 1900x1060 Showcase (showcase-01) (fps) | 17.5 | 17.9 2% | 30.1 72% | 16.7 -5% | 21.7 24% | 15.9 -9% | 15.2 -13% | 85.5 ? 389% |
| 1900x1060 Solidworks (sw-03) (fps) | 72.1 | 47.2 -35% | 88.8 23% | 43.7 -39% | 68.3 -5% | 44.5 -38% | 43.4 -40% | 118.4 ? 64% |
| SPECviewperf 13 | -27% | 51% | -30% | 2% | -37% | -40% | 241% | |
| 3ds Max (3dsmax-06) (fps) | 48.3 | 40.5 -16% | 76.7 59% | 37.9 -22% | 51.6 7% | 36 -25% | 34.1 -29% | 145.4 ? 201% |
| Catia (catia-05) (fps) | 73.9 | 59.4 -20% | 105 42% | 56.3 -24% | 62.1 -16% | 49.6 -33% | 43.2 -42% | 195.5 ? 165% |
| Creo (creo-02) (fps) | 44.9 | 38.8 -14% | 78.4 75% | 36.8 -18% | 50.6 13% | 33 -27% | 33.1 -26% | 161.8 ? 260% |
| Energy (energy-02) (fps) | 11.4 | 4.27 -63% | 13.9 22% | 4.29 -62% | 10.6 -7% | 2.82 -75% | 2.62 -77% | 40.2 ? 253% |
| Maya (maya-05) (fps) | 58.3 | 44.2 -24% | 99 70% | 42.9 -26% | 56.5 -3% | 38.2 -34% | 41.3 -29% | 204 ? 250% |
| Medical (medical-02) (fps) | 32.8 | 14.5 -56% | 44.9 37% | 14 -57% | 31 -5% | 10.9 -67% | 8.63 -74% | 152.5 ? 365% |
| Showcase (showcase-02) (fps) | 17.4 | 17.9 3% | 30.4 75% | 16.8 -3% | 21.5 24% | 15.7 -10% | 15.1 -13% | 80.9 ? 365% |
| Solidworks (sw-04) (fps) | 72.9 | 55.8 -23% | 95 30% | 54.1 -26% | 72.4 -1% | 53.9 -26% | 51.9 -29% | 121.4 ? 67% |
| SPECviewperf 2020 | -35% | 84% | -24% | 2% | -43% | 320% | ||
| 3840x2160 Medical (medical-03) (fps) | 4.72 | 2.57 -46% | 8.59 82% | 3.37 -29% | 4.82 2% | 2.54 -46% | 24.2 ? 413% | |
| 3840x2160 Energy (energy-03) (fps) | 6.6 | 3.02 -54% | 16.9 156% | 7.39 12% | 5.33 -19% | 1.9 -71% | 36.2 ? 448% | |
| 3840x2160 Creo (creo-03) (fps) | 17.5 | 15.3 -13% | 28.9 65% | 15.1 -14% | 19.1 9% | 12.7 -27% | 52 ? 197% | |
| 3840x2160 CATIA (catia-06) (fps) | 13.1 | 8.2 -37% | 20.4 56% | 8.23 -37% | 13.1 0% | 7.63 -42% | 36.7 ? 180% | |
| 3840x2160 3ds Max (3dsmax-07) (fps) | 9.26 | 9.67 4% | 17.5 89% | 9.65 4% | 11.3 22% | 8.65 -7% | 58.9 ? 536% | |
| 3840x2160 Siemens NX (snx-04) (fps) | 33 | 6.69 -80% | 58.5 77% | 6.23 -81% | 38 15% | 6.61 -80% | 52.5 ? 59% | |
| 3840x2160 Maya (maya-06) (fps) | 29.5 | 24 -19% | 47.4 61% | 23.7 -20% | 25.8 -13% | 21.2 -28% | 150.1 ? 409% | |
| Total Average (Program / Settings) | -29% /
-29% | 64% /
64% | -28% /
-28% | 2% /
2% | -39% /
-39% | -37% /
-37% | 257% /
257% |
| 3DMark 06 Score 1366x768 | 25274 points | |
| 3DMark Vantage P Result | 24874 points | |
| 3DMark 11 Performance | 6723 points | |
| 3DMark Ice Storm Standard Score | 127954 points | |
| 3DMark Cloud Gate Standard Score | 21960 points | |
| 3DMark Fire Strike Score | 4002 points | |
| 3DMark Fire Strike Extreme Score | 2090 points | |
| 3DMark Time Spy Score | 1591 points | |
Help | ||
Gaming performance
Our review specification Maxtang MTN-FP750 only enjoys limited suitability for gaming. The relatively powerful AMD Radeon 680M doesn't manage to deliver its full power. Therefore, we recommend the installation of two RAM modules to achieve top performance. A rough guideline regarding gaming performance can be found in the form of the Geekom AS 6.
For further comparisons and benchmarks, take a look at our GPU games list.
| The Witcher 3 | |
| 1024x768 Low Graphics & Postprocessing | |
| Geekom AS 6, R9 6900HX | |
| Minisforum Neptune Series NAD9 | |
| Geekom Mini IT12 | |
| Geekom A5 | |
| Minisforum Venus Series NAB6 | |
| NiPoGi AD08 | |
| Maxtang MTN-FP750 | |
| 1920x1080 High Graphics & Postprocessing (Nvidia HairWorks Off) | |
| Geekom AS 6, R9 6900HX | |
| Minisforum Neptune Series NAD9 | |
| NiPoGi AD08 | |
| Geekom Mini IT12 | |
| Minisforum Venus Series NAB6 | |
| Geekom A5 | |
| Maxtang MTN-FP750 | |
| Borderlands 3 | |
| 1280x720 Very Low Overall Quality (DX11) | |
| Geekom A5 | |
| Geekom AS 6, R9 6900HX | |
| Minisforum Neptune Series NAD9 | |
| Maxtang MTN-FP750 | |
| Geekom Mini IT12 | |
| Minisforum Venus Series NAB6 | |
| NiPoGi AD08 | |
| 1920x1080 High Overall Quality (DX11) | |
| Geekom AS 6, R9 6900HX | |
| Geekom A5 | |
| Minisforum Neptune Series NAD9 | |
| Maxtang MTN-FP750 | |
| Geekom Mini IT12 | |
| Minisforum Venus Series NAB6 | |
| NiPoGi AD08 | |
| GTA V | |
| 1024x768 Lowest Settings possible | |
| Geekom A5 | |
| Minisforum Neptune Series NAD9 | |
| Minisforum Venus Series NAB6 | |
| Geekom AS 6, R9 6900HX | |
| Geekom Mini IT12 | |
| NiPoGi AD08 | |
| Maxtang MTN-FP750 | |
| 1920x1080 High/On (Advanced Graphics Off) AA:2xMSAA + FX AF:8x | |
| Geekom AS 6, R9 6900HX | |
| Geekom A5 | |
| Maxtang MTN-FP750 | |
| Minisforum Neptune Series NAD9 | |
| Geekom Mini IT12 | |
| Minisforum Venus Series NAB6 | |
| NiPoGi AD08 | |
| low | med. | high | ultra | |
|---|---|---|---|---|
| GTA V (2015) | 95.5 | 85.7 | 28.2 | 12.7 |
| The Witcher 3 (2015) | 73 | 46.7 | 23.7 | 14.9 |
| Dota 2 Reborn (2015) | 115.8 | 87.4 | 60.5 | 53.1 |
| Final Fantasy XV Benchmark (2018) | 39.2 | 20.5 | 14.6 | |
| X-Plane 11.11 (2018) | 49.8 | 39.8 | 33.8 | |
| Far Cry 5 (2018) | 46 | 25 | 22 | 21 |
| Strange Brigade (2018) | 78.4 | 31.4 | 26.7 | 23.1 |
| Shadow of the Tomb Raider (2018) | 53.3 | 21.8 | 19.8 | 16.4 |
| Far Cry New Dawn (2019) | 40 | 23 | 21 | 20 |
| Metro Exodus (2019) | 43.1 | 17.6 | 13.8 | 11.7 |
| Borderlands 3 (2019) | 58.2 | 24.8 | 15.7 | 12.5 |
| F1 2020 (2020) | 96.9 | 49.8 | 39.1 | 27.5 |
| F1 2021 (2021) | 97 | 49.8 | 36.4 | 16.7 |
| God of War (2022) | 19.5 | 15.9 | 11.7 | |
| GRID Legends (2022) | 58.2 | 45 | 34.2 | 26.6 |
| Tiny Tina's Wonderlands (2022) | 37.7 | 28.2 | 20.2 | 16.2 |
| F1 22 (2022) | 45.6 | 40.6 | 32.1 | 9.25 |
| F1 23 (2023) | 45.3 | 40.1 | 29.1 | |
| Total War Pharaoh (2023) | 43.3 | 33.3 | 21.6 | 16.9 |
| Prince of Persia The Lost Crown (2024) | 89.3 | 58.8 | 58.4 |
Emissions - Economical but not inaudible
Noise emissions
Without being stressed, the Maxtang MTN-FP750 is, for the most part, silent. However, under load, we quickly reached 45 dB(A) and we were only able to discern a minimal difference between medium and full load. But, we could chalk this up as being within the measurement tolerance. It's a pity there seem to be only two fan levels. A glance at the table shows that both the Geekom A5 and the NiPoGi AD08 were even louder in the same scenario.
Noise level
| Idle |
| 25.3 / 25.3 / 25.4 dB(A) |
| Load |
| 45.1 / 45.3 dB(A) |
 | ||
30 dB silent 40 dB(A) audible 50 dB(A) loud |
||
min: | ||
| Maxtang MTN-FP750 R7 7735HS, Radeon 680M | Minisforum Neptune Series NAD9 i9-12900H, Iris Xe G7 96EUs | Geekom AS 6, R9 6900HX R9 6900HX, Radeon 680M | Geekom Mini IT12 i7-1260P, Iris Xe G7 96EUs | Geekom A5 R7 5800H, Vega 8 | Minisforum Venus Series NAB6 i7-12650H, UHD Graphics 64EUs | NiPoGi AD08 i7-12650H, UHD Graphics 64EUs | |
|---|---|---|---|---|---|---|---|
| Noise | -3% | -14% | -3% | -7% | -4% | -14% | |
| off / environment * (dB) | 25 | 30.2 -21% | 30 -20% | 29.8 -19% | 25 -0% | 29.4 -18% | 25 -0% |
| Idle Minimum * (dB) | 25.3 | 30.5 -21% | 33.2 -31% | 29.9 -18% | 28.2 -11% | 29.4 -16% | 31.1 -23% |
| Idle Average * (dB) | 25.3 | 30.5 -21% | 33.6 -33% | 30.1 -19% | 28.2 -11% | 29.5 -17% | 31.2 -23% |
| Idle Maximum * (dB) | 25.4 | 30.5 -20% | 33.6 -32% | 30.2 -19% | 28.2 -11% | 29.7 -17% | 31.3 -23% |
| Load Average * (dB) | 45.1 | 30.5 32% | 36.8 18% | 32.1 29% | 47.8 -6% | 34.6 23% | 51.7 -15% |
| Load Maximum * (dB) | 45.3 | 30.5 33% | 39.8 12% | 32.5 28% | 47.4 -5% | 36.1 20% | 45.8 -1% |
* ... smaller is better
Temperature
The Maxtang MTN-FP750's case only heats up minimally when running either idle or under load. We observed a hotspot on the top of the unit, only measuring just short of 40 °C, whereas the bottom of the device did not even hit 35 °C. However, the SoC gets considerably warmer although, at almost 80 °C, we were still in the green zone. In addition, the manufacturer has set a maximum temperature of 90 °C in the BIOS. We still weren't able to achieve this with the preset power limit of 35 watts.
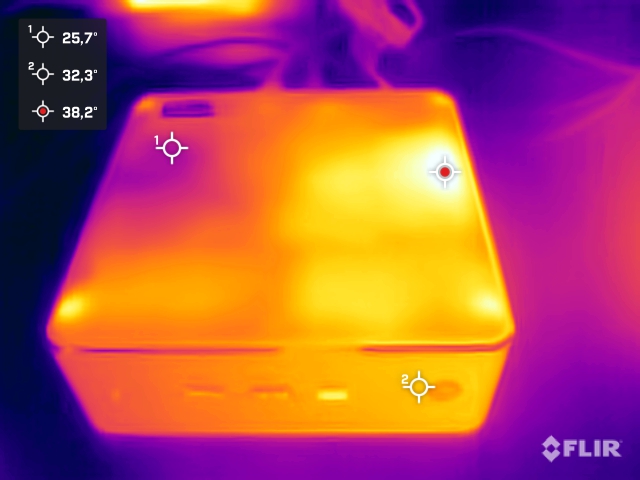
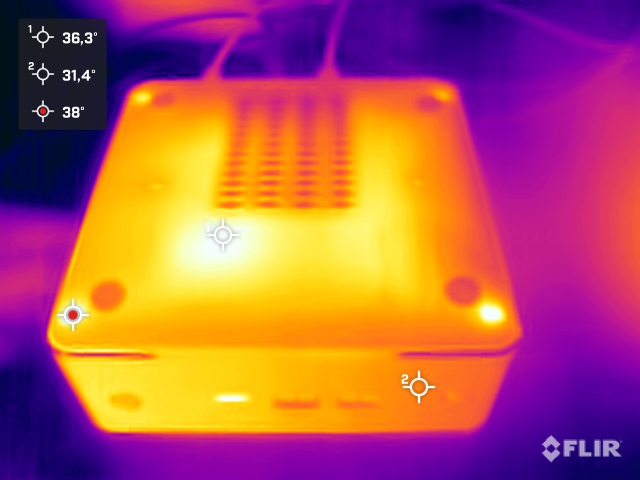
(+) The maximum temperature on the upper side is 39.7 °C / 103 F, compared to the average of 35.4 °C / 96 F, ranging from 20.6 to 69.5 °C for the class Mini PC.
(+) The bottom heats up to a maximum of 34.3 °C / 94 F, compared to the average of 36.1 °C / 97 F
(+) In idle usage, the average temperature for the upper side is 29.4 °C / 85 F, compared to the device average of 32.1 °C / 90 F.
Power consumption
In our comparison, the Maxtang MTN-FP750 belongs to the most economical of devices. Running idle, we already recorded very low power consumption of just 7 to 8.4 watts. Only the Geekom A5 and the Geekom Mini IT12 can keep pace with similarly low scores. Under load, our review sample continued to remain comparatively economical with our measuring device registering a peak of only 61.4 watts. Considering the processor's restricted power limits, these are not particularly surprising energy requirements under load.
This means the 90-watt PSU never has any problems in reliably supplying the mini PC with enough energy. The PSU can even effortlessly handle manual power consumption adjustment.


| Off / Standby | |
| Idle | |
| Load |
|
Key:
min: | |
| Maxtang MTN-FP750 R7 7735HS, Radeon 680M | Minisforum Neptune Series NAD9 i9-12900H, Iris Xe G7 96EUs | Geekom AS 6, R9 6900HX R9 6900HX, Radeon 680M | Geekom Mini IT12 i7-1260P, Iris Xe G7 96EUs | Geekom A5 R7 5800H, Vega 8 | Minisforum Venus Series NAB6 i7-12650H, UHD Graphics 64EUs | NiPoGi AD08 i7-12650H, UHD Graphics 64EUs | Average AMD Radeon 680M | Average of class Mini PC | |
|---|---|---|---|---|---|---|---|---|---|
| Power Consumption | -73% | -23% | -2% | -12% | -50% | -107% | -10% | -43% | |
| Idle Minimum * (Watt) | 7 | 12.1 -73% | 6.8 3% | 5 29% | 6.9 1% | 10.4 -49% | 14.2 -103% | 6.93 ? 1% | 8.63 ? -23% |
| Idle Average * (Watt) | 8.1 | 13 -60% | 9.4 -16% | 7 14% | 7.9 2% | 12.3 -52% | 15.1 -86% | 8.98 ? -11% | 10.8 ? -33% |
| Idle Maximum * (Watt) | 8.4 | 18.2 -117% | 13.7 -63% | 10.7 -27% | 8.9 -6% | 12.4 -48% | 28.7 -242% | 10.5 ? -25% | 13.5 ? -61% |
| Load Average * (Watt) | 54.2 | 70.6 -30% | 45.3 16% | 50.3 7% | 60.8 -12% | 72.9 -35% | 76.9 -42% | 53.5 ? 1% | 63.6 ? -17% |
| Load Maximum * (Watt) | 61.4 | 113 -84% | 94.8 -54% | 82 -34% | 89.7 -46% | 101.2 -65% | 100.2 -63% | 70.5 ? -15% | 110.9 ? -81% |
* ... smaller is better
Power consumption with an external monitor
Pros
Cons
Verdict - Better performance but only after optimization

The Maxtang MTN-FP750 is a relatively straightforward mini PC for office use at home or in the workplace. The AMD Ryzen 7 7735HS offers sufficient power to be able to handle most tasks. Its 8 cores and 16 threads make the mini PC suitable for performance-hungry applications. The installed RAM comprises 16 GB, which doesn't pose any problems for now. However, when it comes down to it, the use of a single RAM module has paid off, despite the Maxtang MTN-FP750 allowing the installation of SO-DIMM modules. This meant, in tests, the Maxtang MTN-FP750 didn't deliver the kind of performance we would have expected. The most notable performance differences can be found in the 3D benchmarks. This problem can be prevented by installing an additional RAM module and, this is, without question, something customers should pay attention to.
According to the datasheet, the Maxtang MTN-FP750 offers excellent performance. However, in tests, the mini PC failed to deliver its promised power.
The Maxtang MTN-FP750's biggest advantage is its low price compared to the competition presented here in our comparison. The performance is slightly worse unless you take the matter into your own hands and the SoC's power limits cannot be adjusted. In our opinion, the defined 35-watt power limit is a little too conservative. At 45 watts, the manufacturer could have struck a good compromise. The same applies to the RAM which can be expanded with a second module. If you consider both of these points, performance-wise, that is a completely different Maxtang MTN-FP750 from the one we tested.
The port selection can be described as solid. All the important ones are on board - but that's about it. Thunderbolt or USB4 are absent which slightly limits the number of use cases. One positive side effect of having a CPU with performance limitations is the Maxtang MTN-FP750's energy requirements. In tests, this device was significantly more economical than its competitors. Unfortunately, this didn't positively influence the comparatively loud fan noise. A slightly better cooling concept would have resulted in better scores in this area.
Price and availability
In our review configuration, the Maxtang MTN-FP750 can be purchased for $440 US dollars directly from the manufacturer.
Maxtang MTN-FP750
- 02/27/2024 v7 (old)
Sebastian Bade
Transparency
The selection of devices to be reviewed is made by our editorial team. The test sample was given to the author by the manufacturer free of charge for the purposes of review. There was no third-party influence on this review, nor did the manufacturer receive a copy of this review before publication. There was no obligation to publish this review. As an independent media company, Notebookcheck is not subjected to the authority of manufacturers, retailers or publishers.
This is how Notebookcheck is testing
Every year, Notebookcheck independently reviews hundreds of laptops and smartphones using standardized procedures to ensure that all results are comparable. We have continuously developed our test methods for around 20 years and set industry standards in the process. In our test labs, high-quality measuring equipment is utilized by experienced technicians and editors. These tests involve a multi-stage validation process. Our complex rating system is based on hundreds of well-founded measurements and benchmarks, which maintains objectivity. Further information on our test methods can be found here.

