Verdict
At a current price of around €2,000 (~$2332), the Crosshair A17 HX is neither a cheap nor a particularly expensive RTX 5070 notebook. While the graphics card with its 8 GB VRAM is only partially convincing, the 17-inch model really comes up trumps when it comes to the processor. Thanks to its high core count, the Ryzen 9 8940HX can easily compete with Intel's Arrow Lake counterparts. Accordingly, the selected CPU is practically the highlight of the Crosshair A17, even though the power consumption and noise emissions are not without their drawbacks. MSI needs to work on the fan control in particular, as the fans sometimes rev up massively even in idle mode.
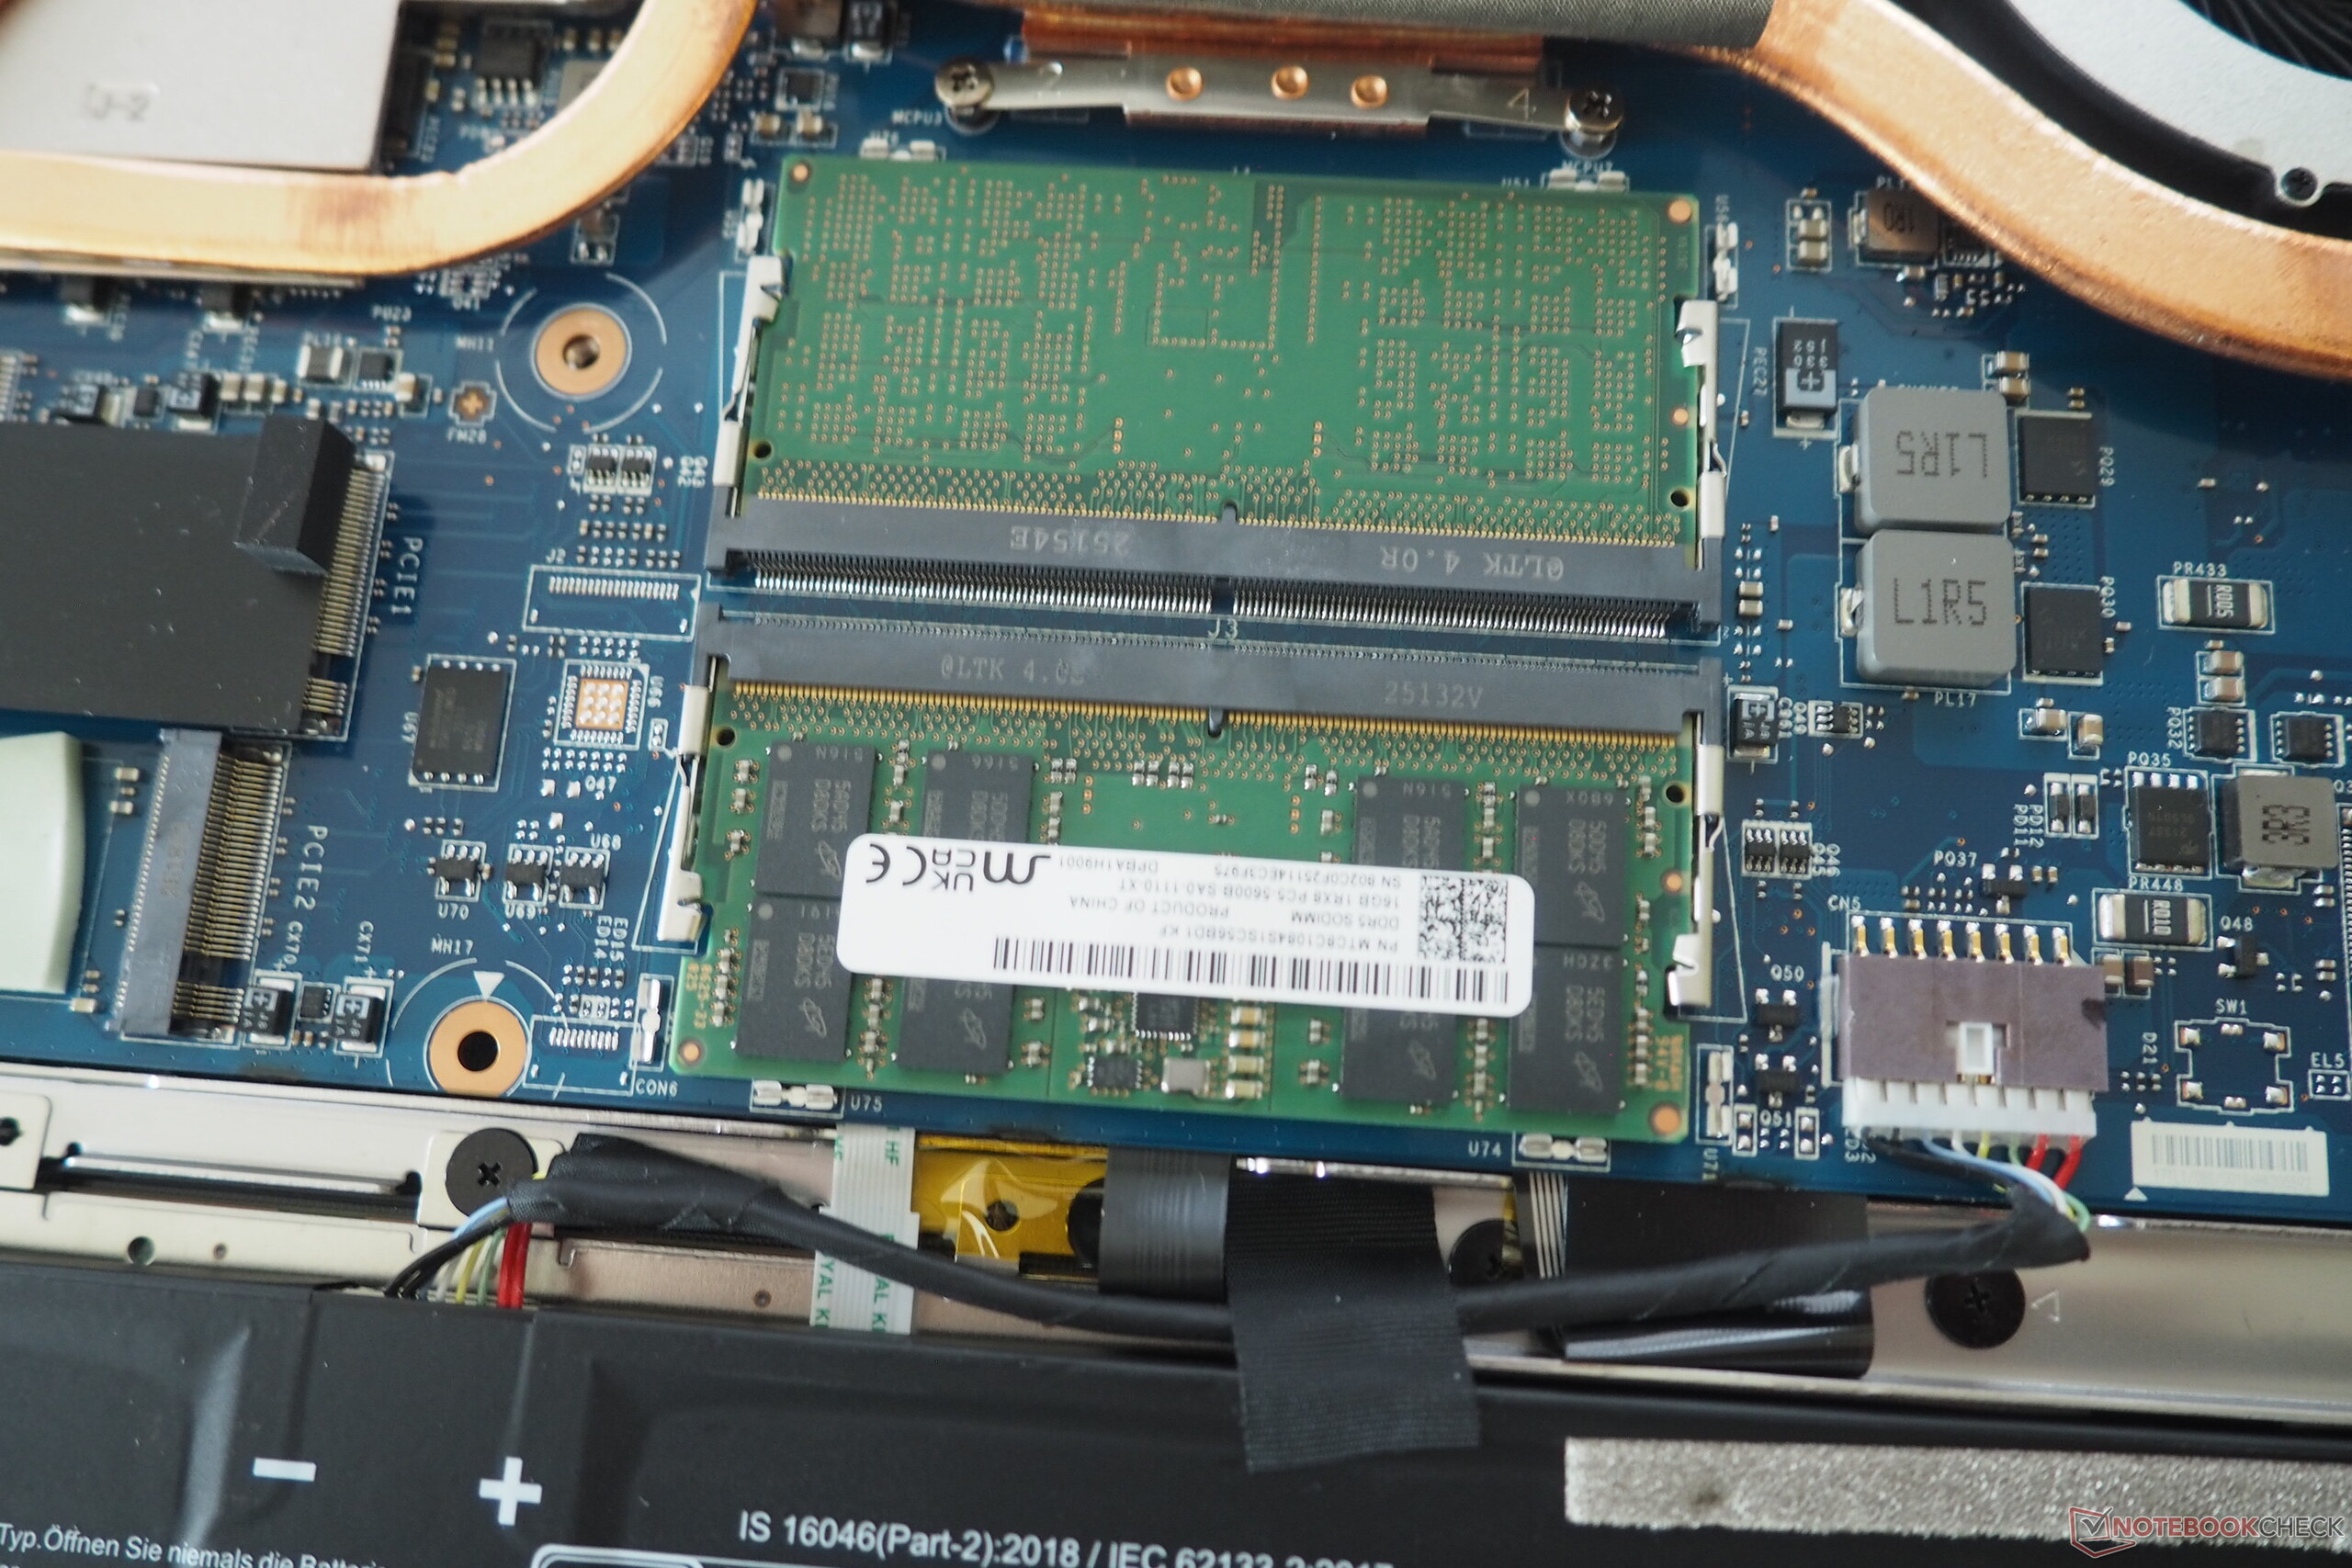
Meanwhile, the case leaves a good impression, whether on the outside (quality, stability, etc.) or under the hood (two RAM and two SSD slots). The same applies to the input devices, although buyers will first have to get used to the unconventional keyboard layout. On the other hand, lighting fans will get their money's worth thanks to the 24 RGB zones. Minuses include the meagre webcam, the modest speakers and the short battery life.
Pros
Cons
Price and availability
The tested MSI Crosshair A17 HX D8WGKG with Ryzen 9 8940HX and GeForce RTX 5070 is available for around €2,000 (~$2332 e.g. from Amazon).
- $39.99SLRIOYS 240W 200W Charger Compatible with MSI Katana GF76 GF66 17 15 A17 A15 Crosshair A18 A17 A16 15 18 17 16 Pulse 15 16 17 AI GL76 Stealth 15M 17M 14 15 Sword 16 15 Bravo, Creator Laptop
- $25.99Silent Wireless Mouse for MSI Crosshair A17 HX D8WGKG,Bluetooth,2.4GHz with USB Receiver, Quiet & Lightweight
- $1,279.99msi Crosshair A16 HX 16” QHD+ 240Hz Gaming Laptop – AMD Ryzen 9 8940HX, NVIDIA GeForce RTX 5060, 16GB DDR5, 1TB NVMe SSD, Wi-Fi 6E, USB-C, Windows 11 D8WFKG-090US
The Crosshair A17 HX's competitors include other gaming laptops with RTX 5070 or RTX 5070 Ti such as the MSI Katana 17 HX, the Aorus Elite 16, the Lenovo Legion 5 Pro 16 and the MSI Vector 16 HX AI, which are all listed in the tables as comparison devices.
Specifications
Case
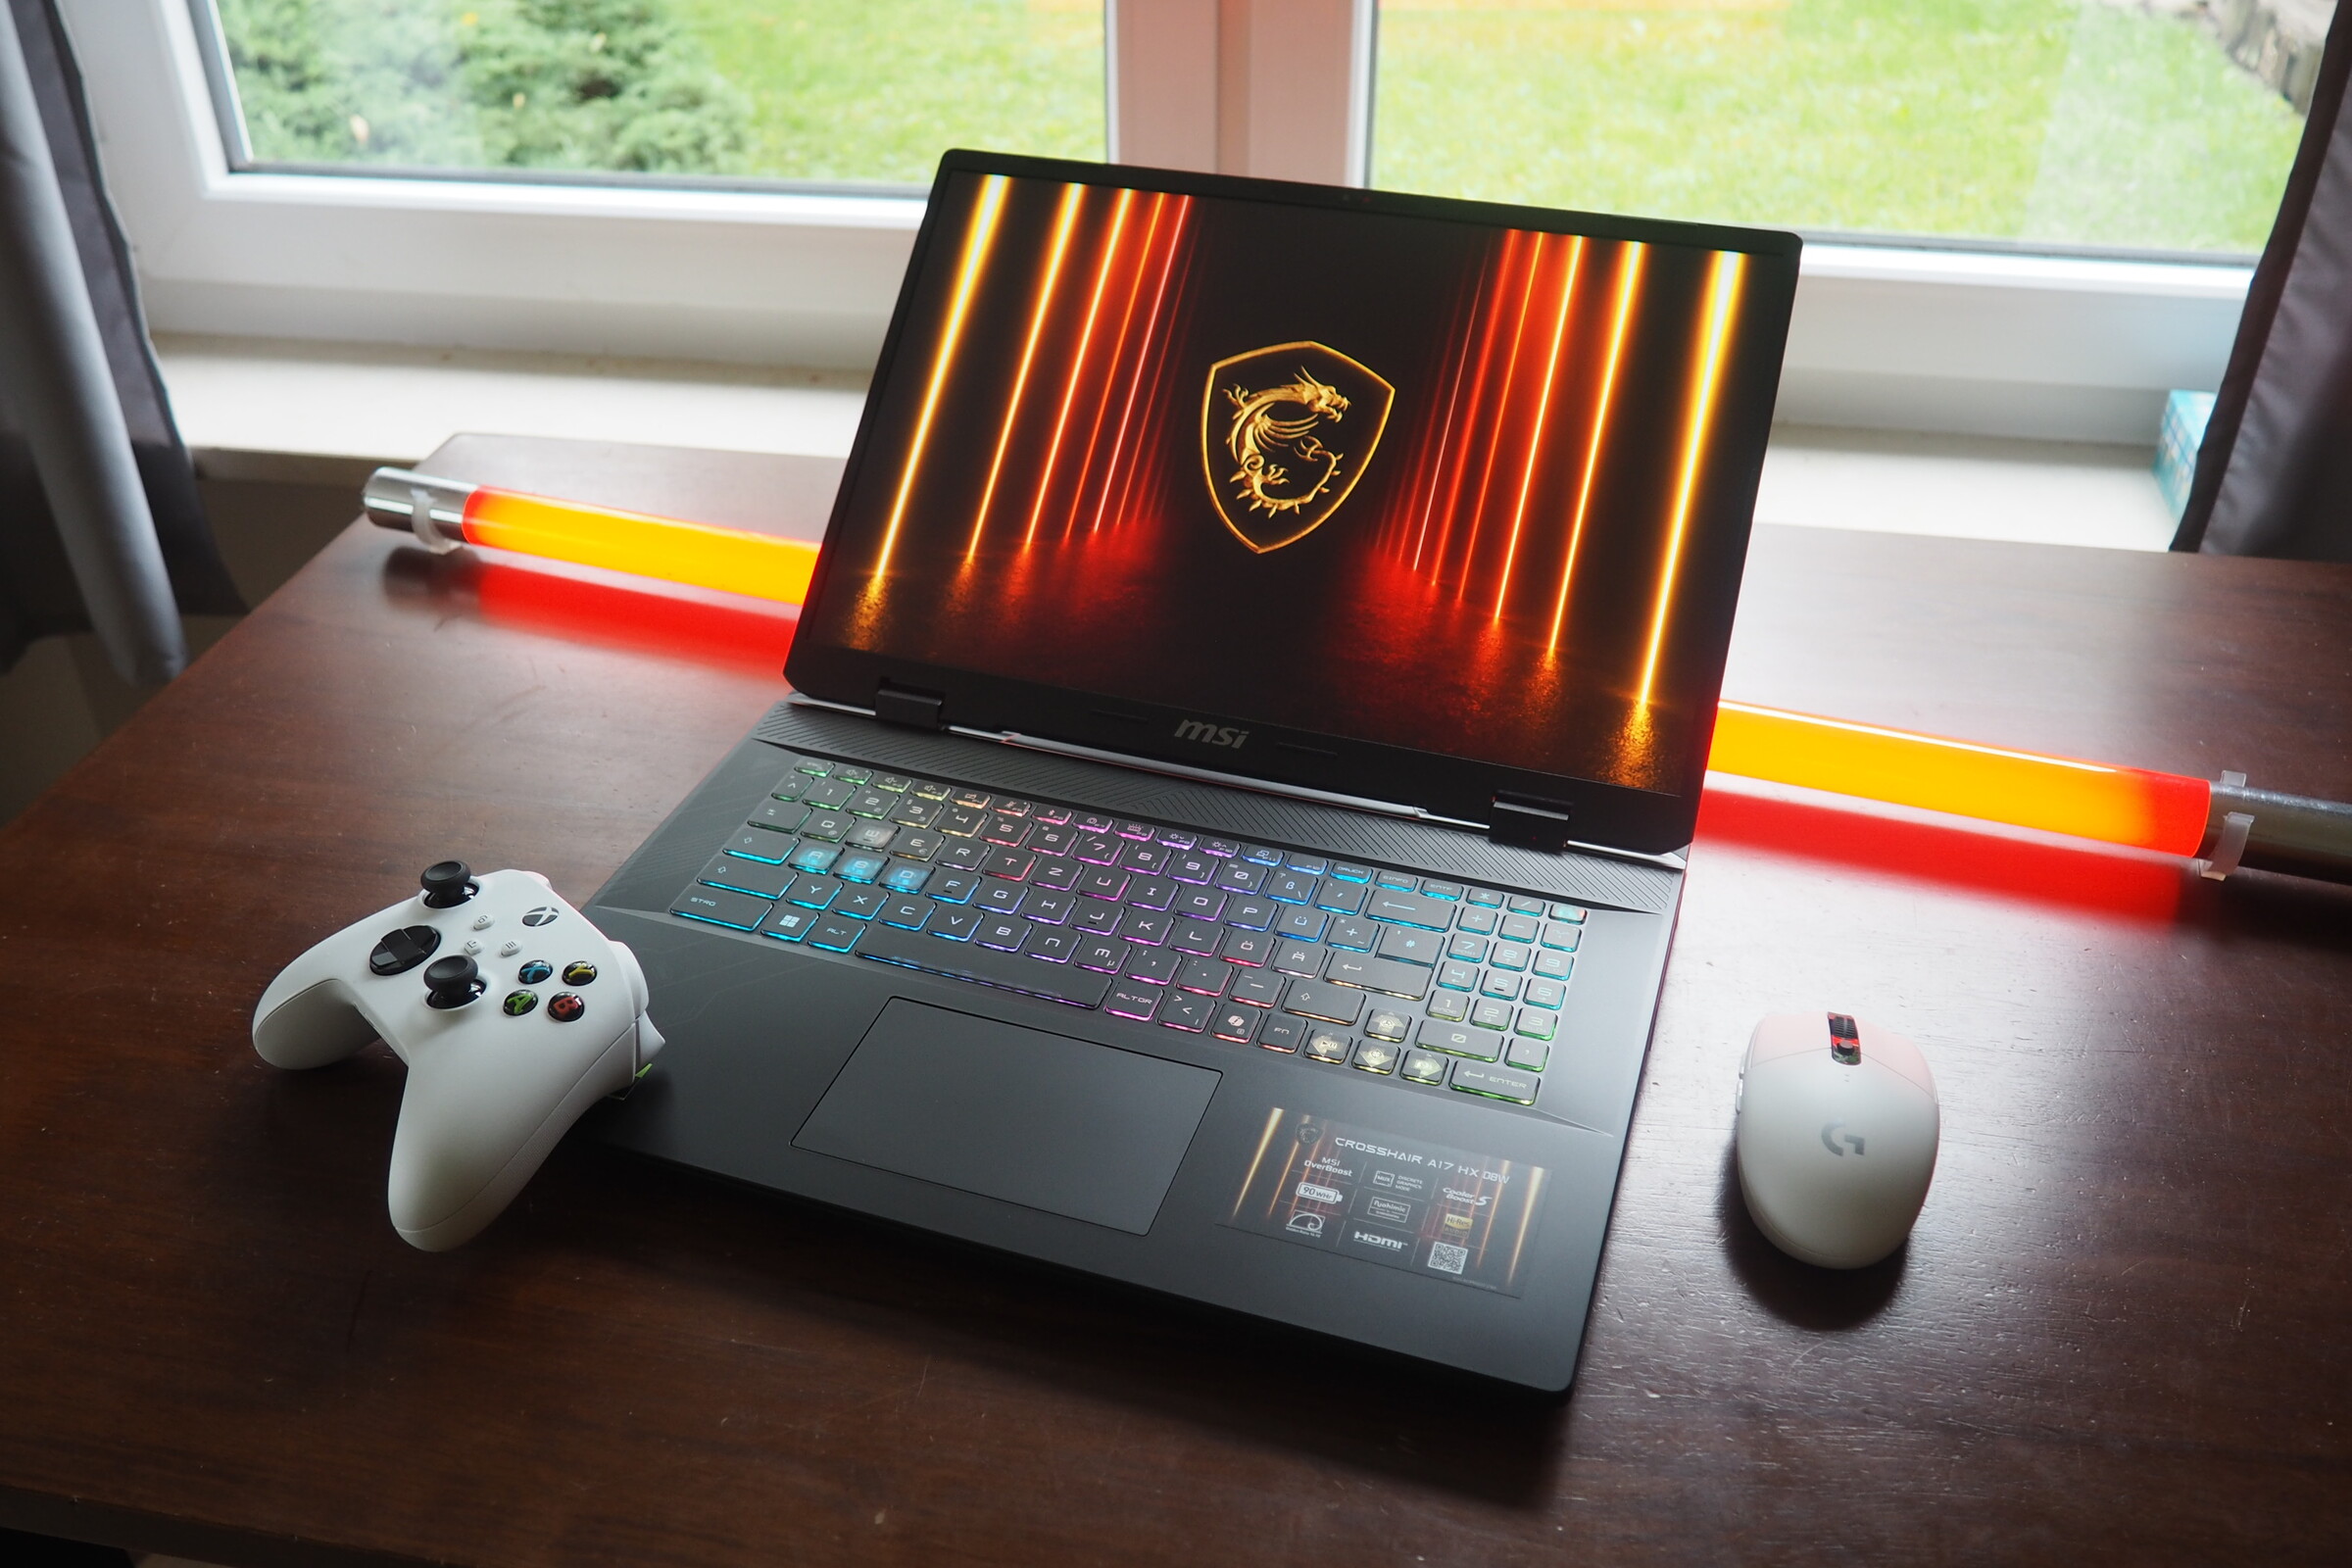
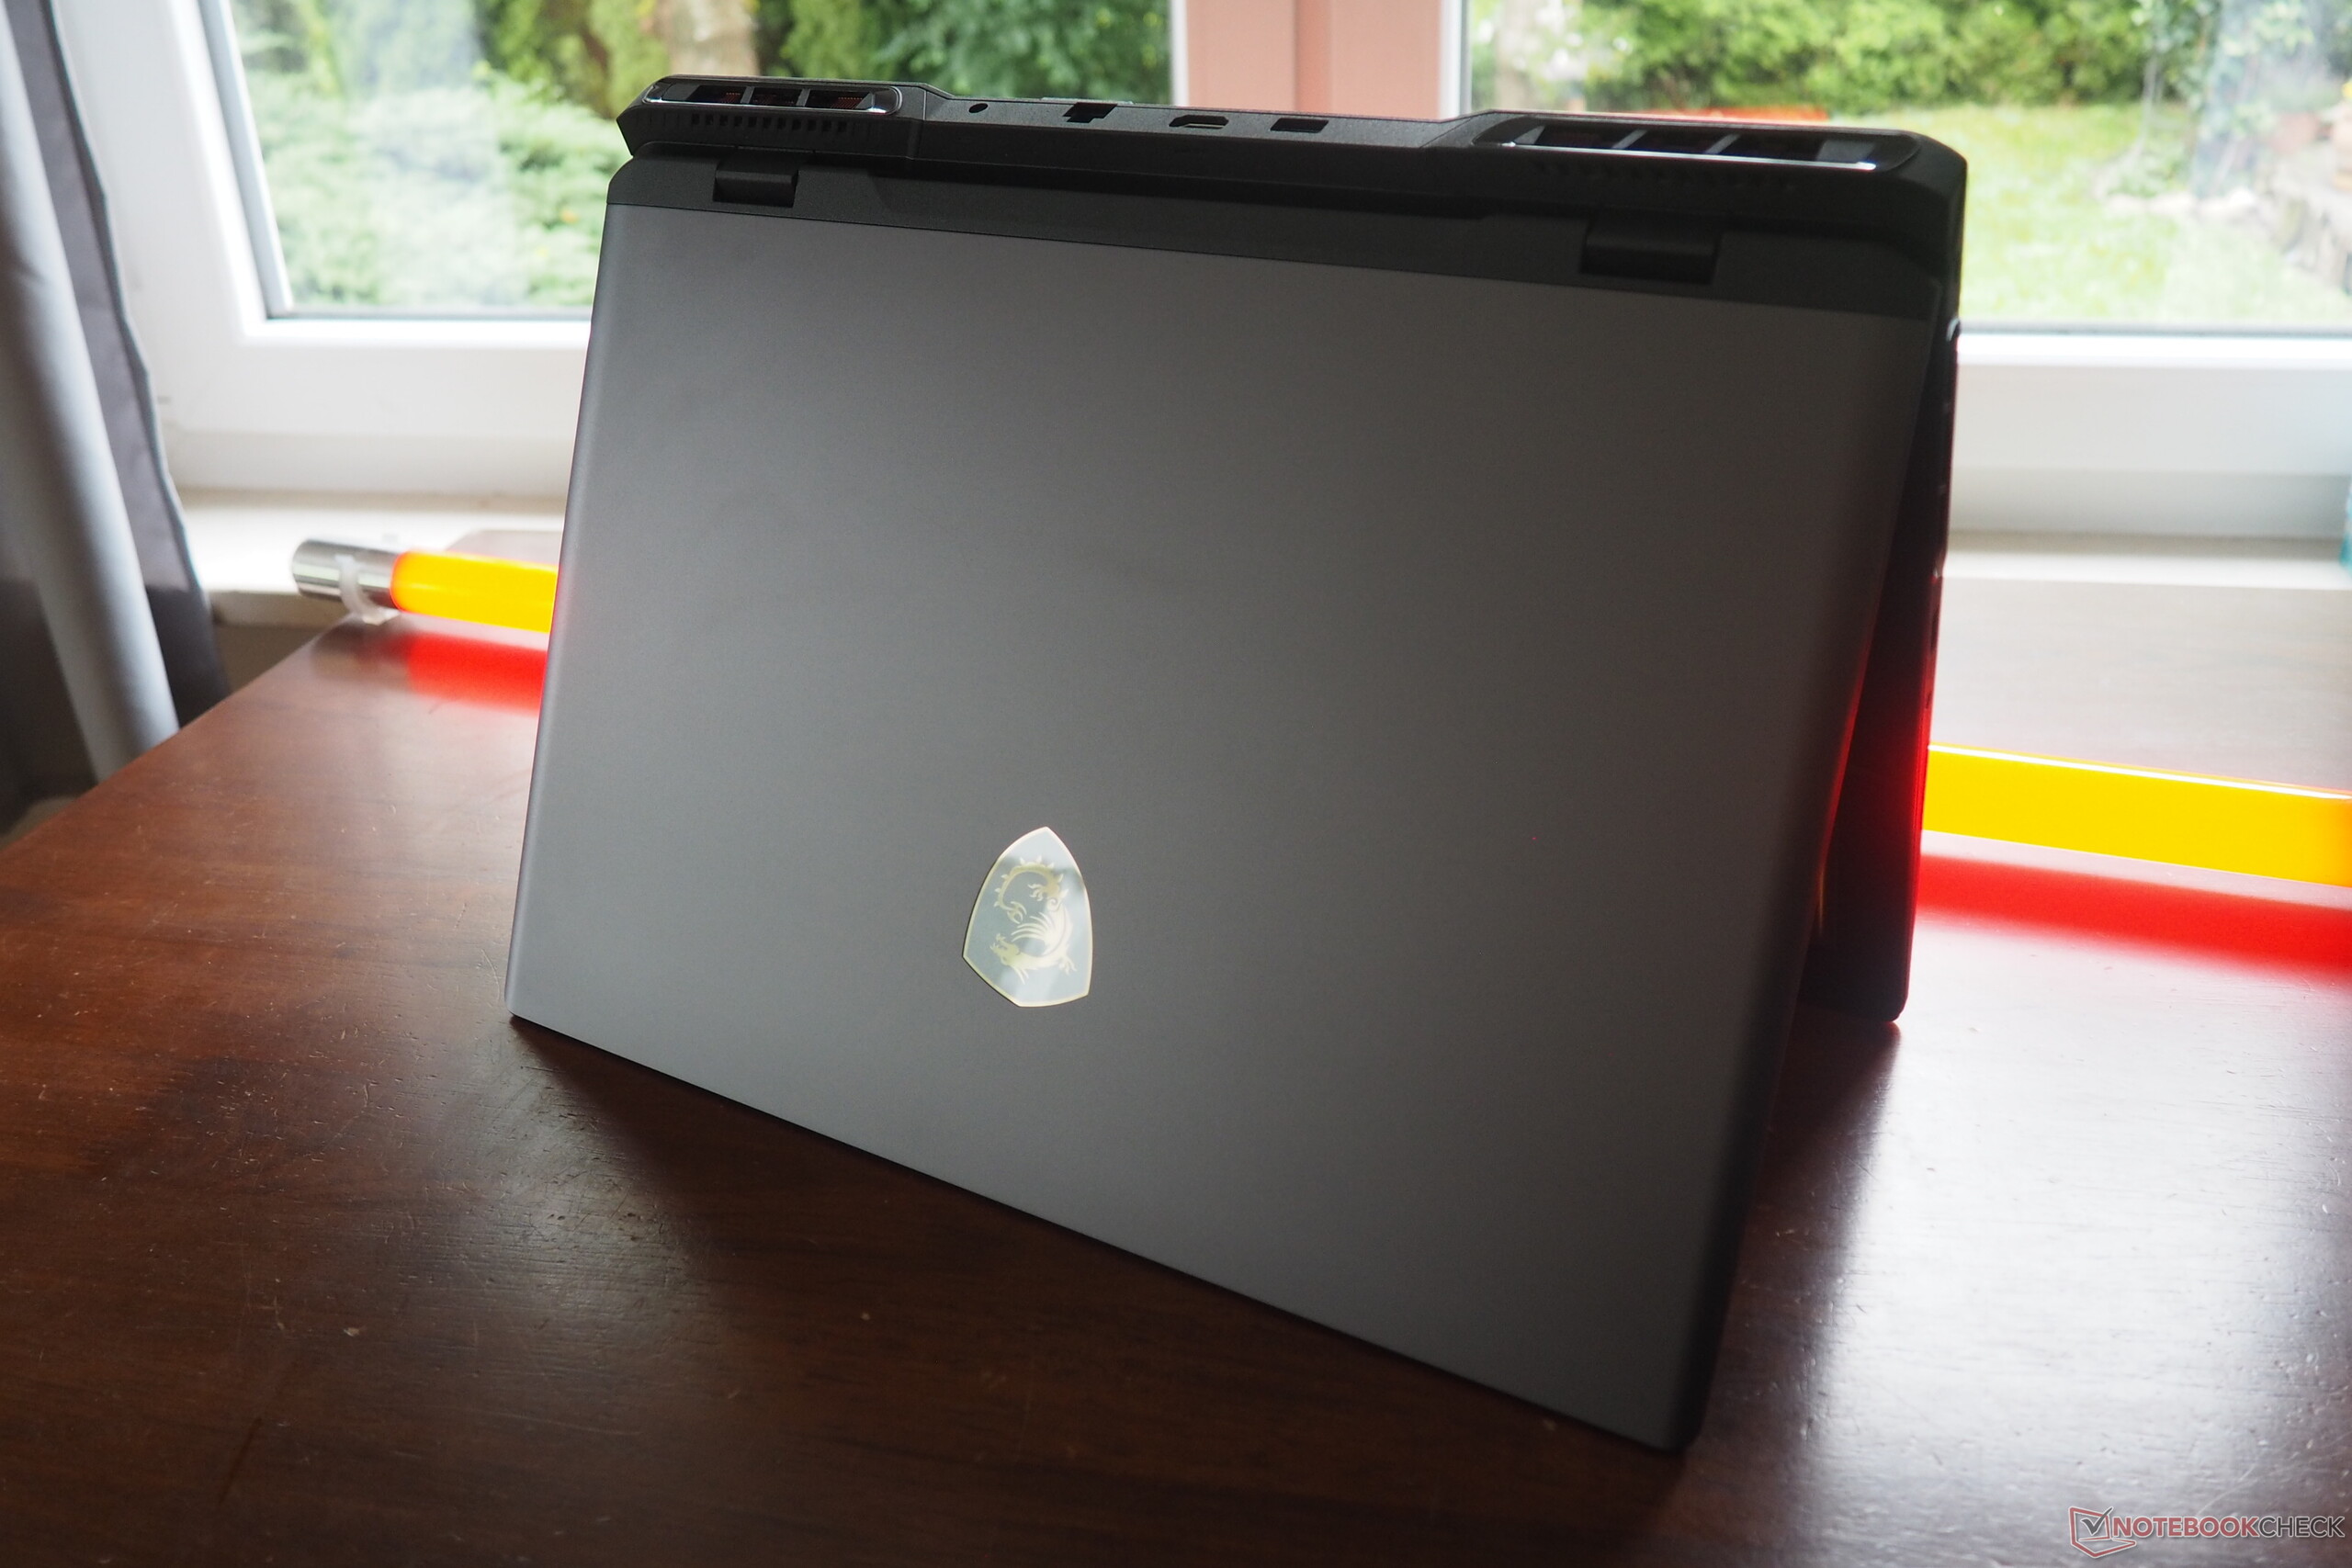
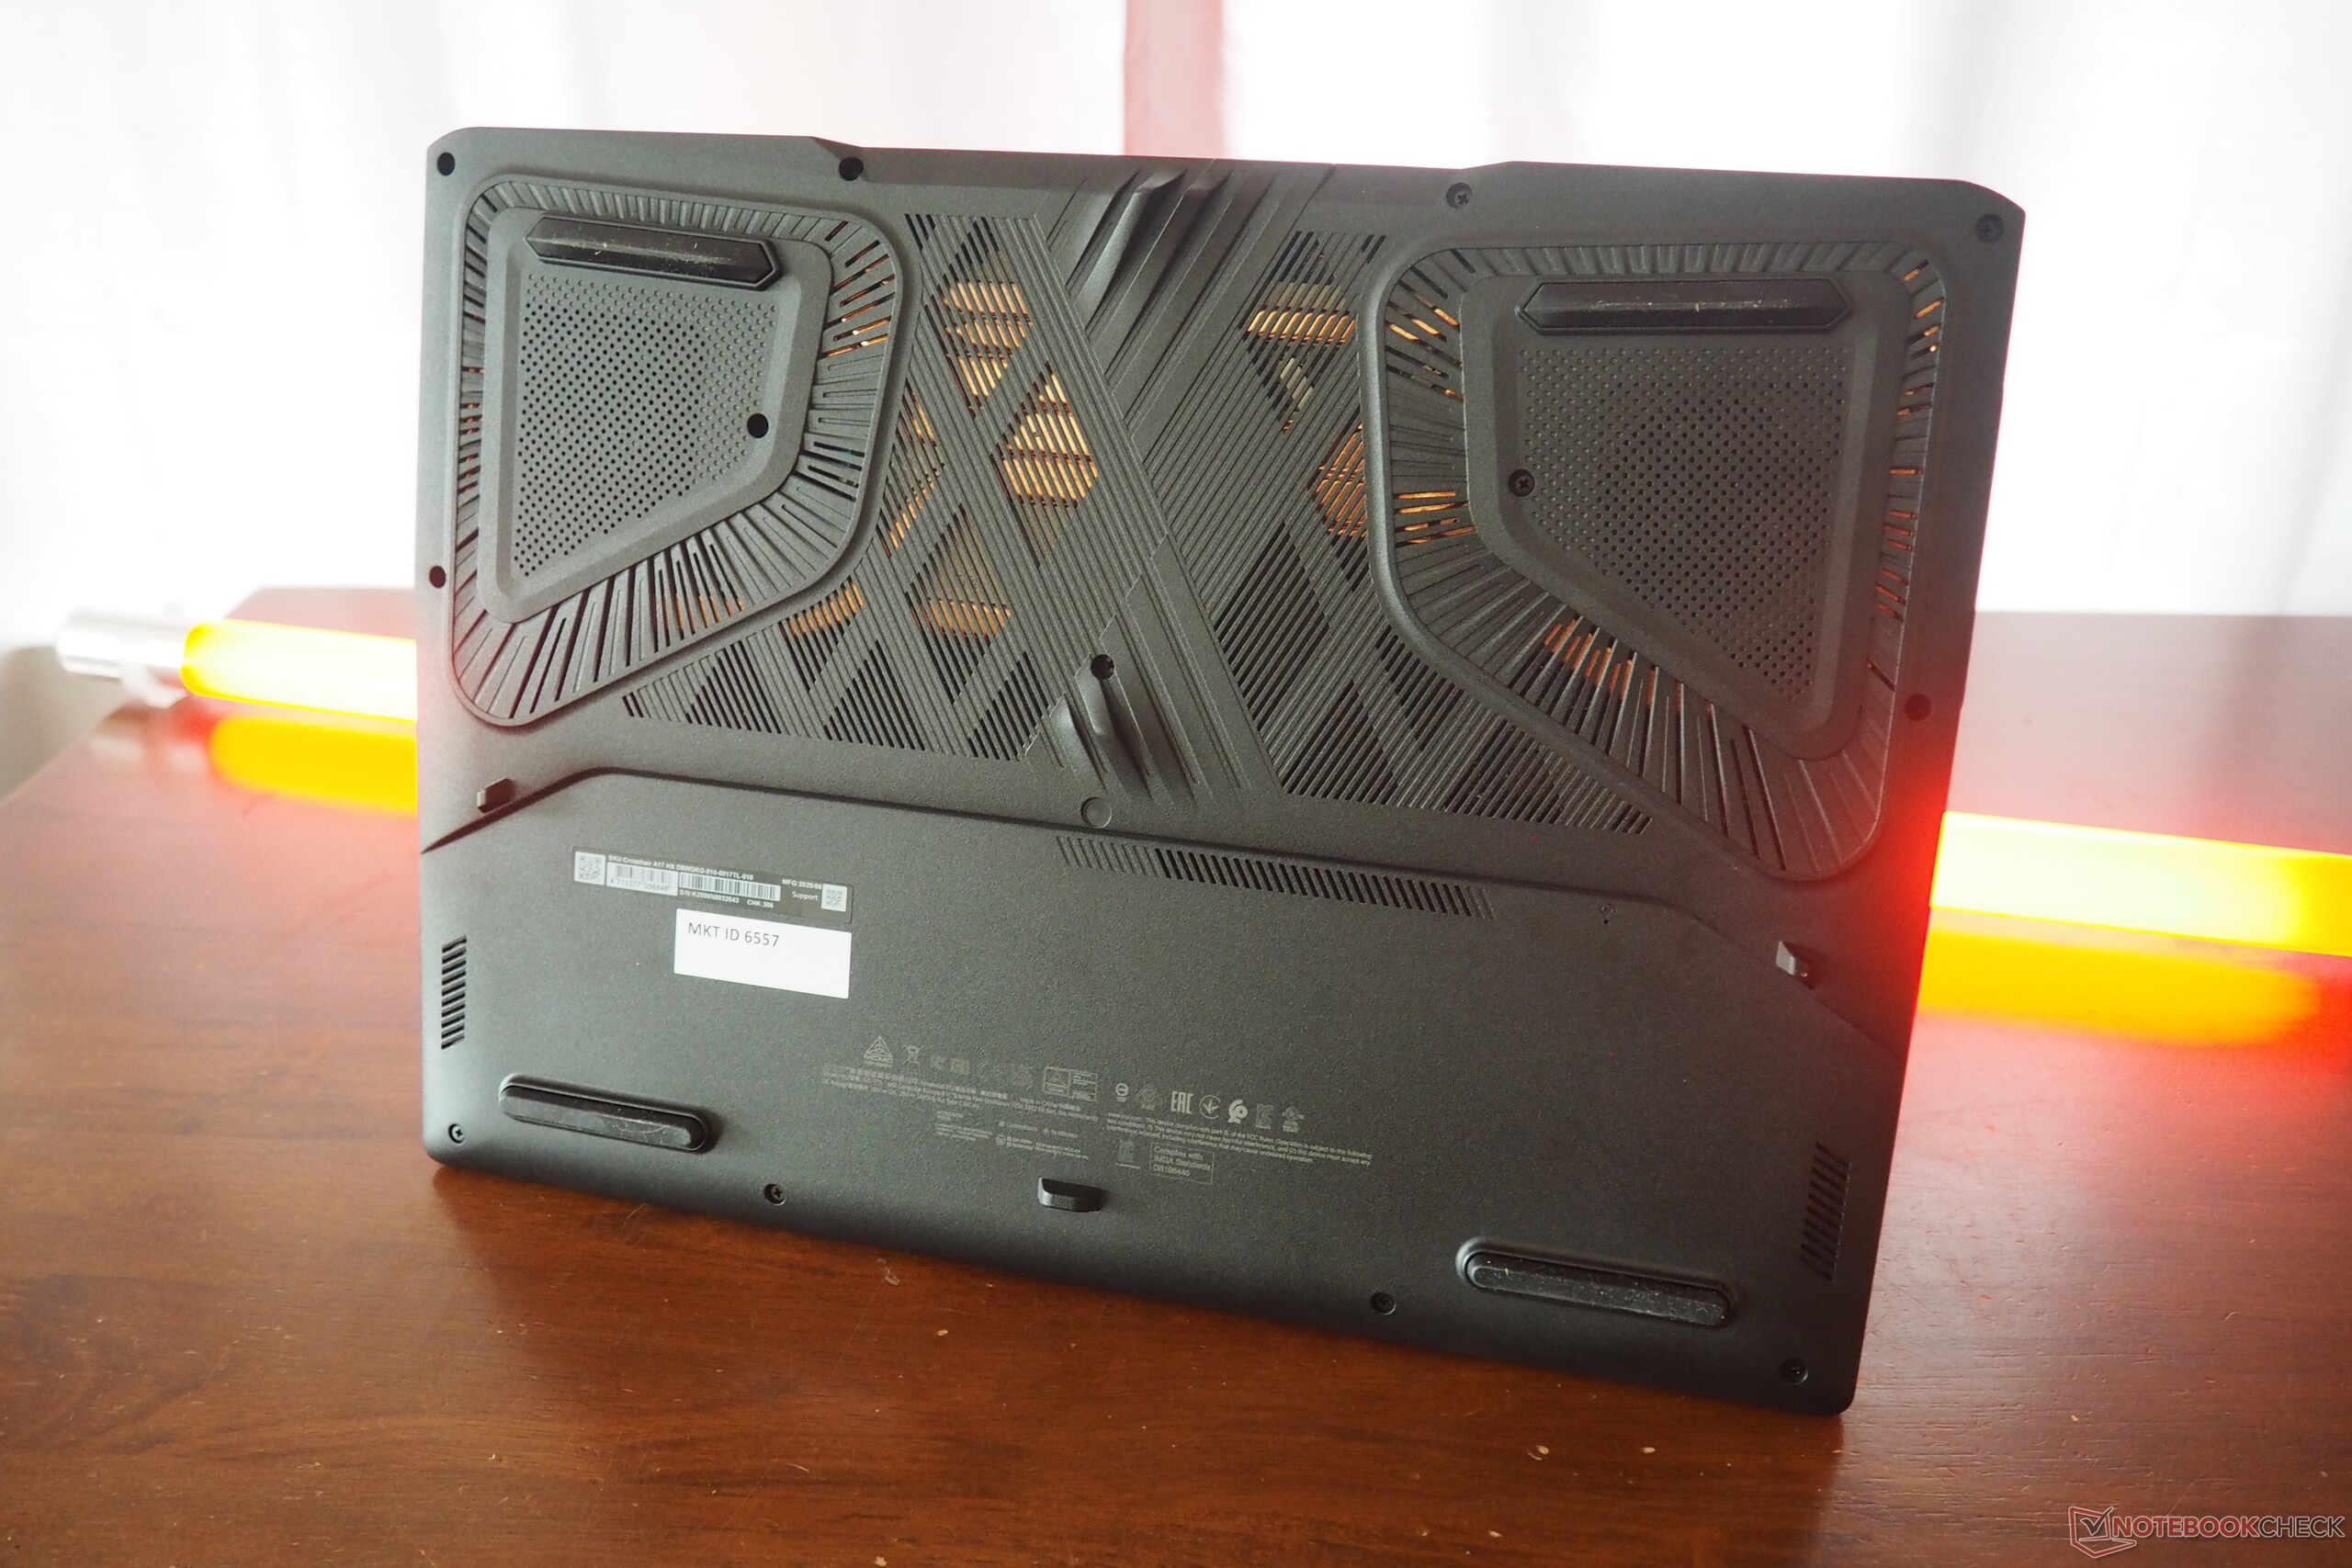
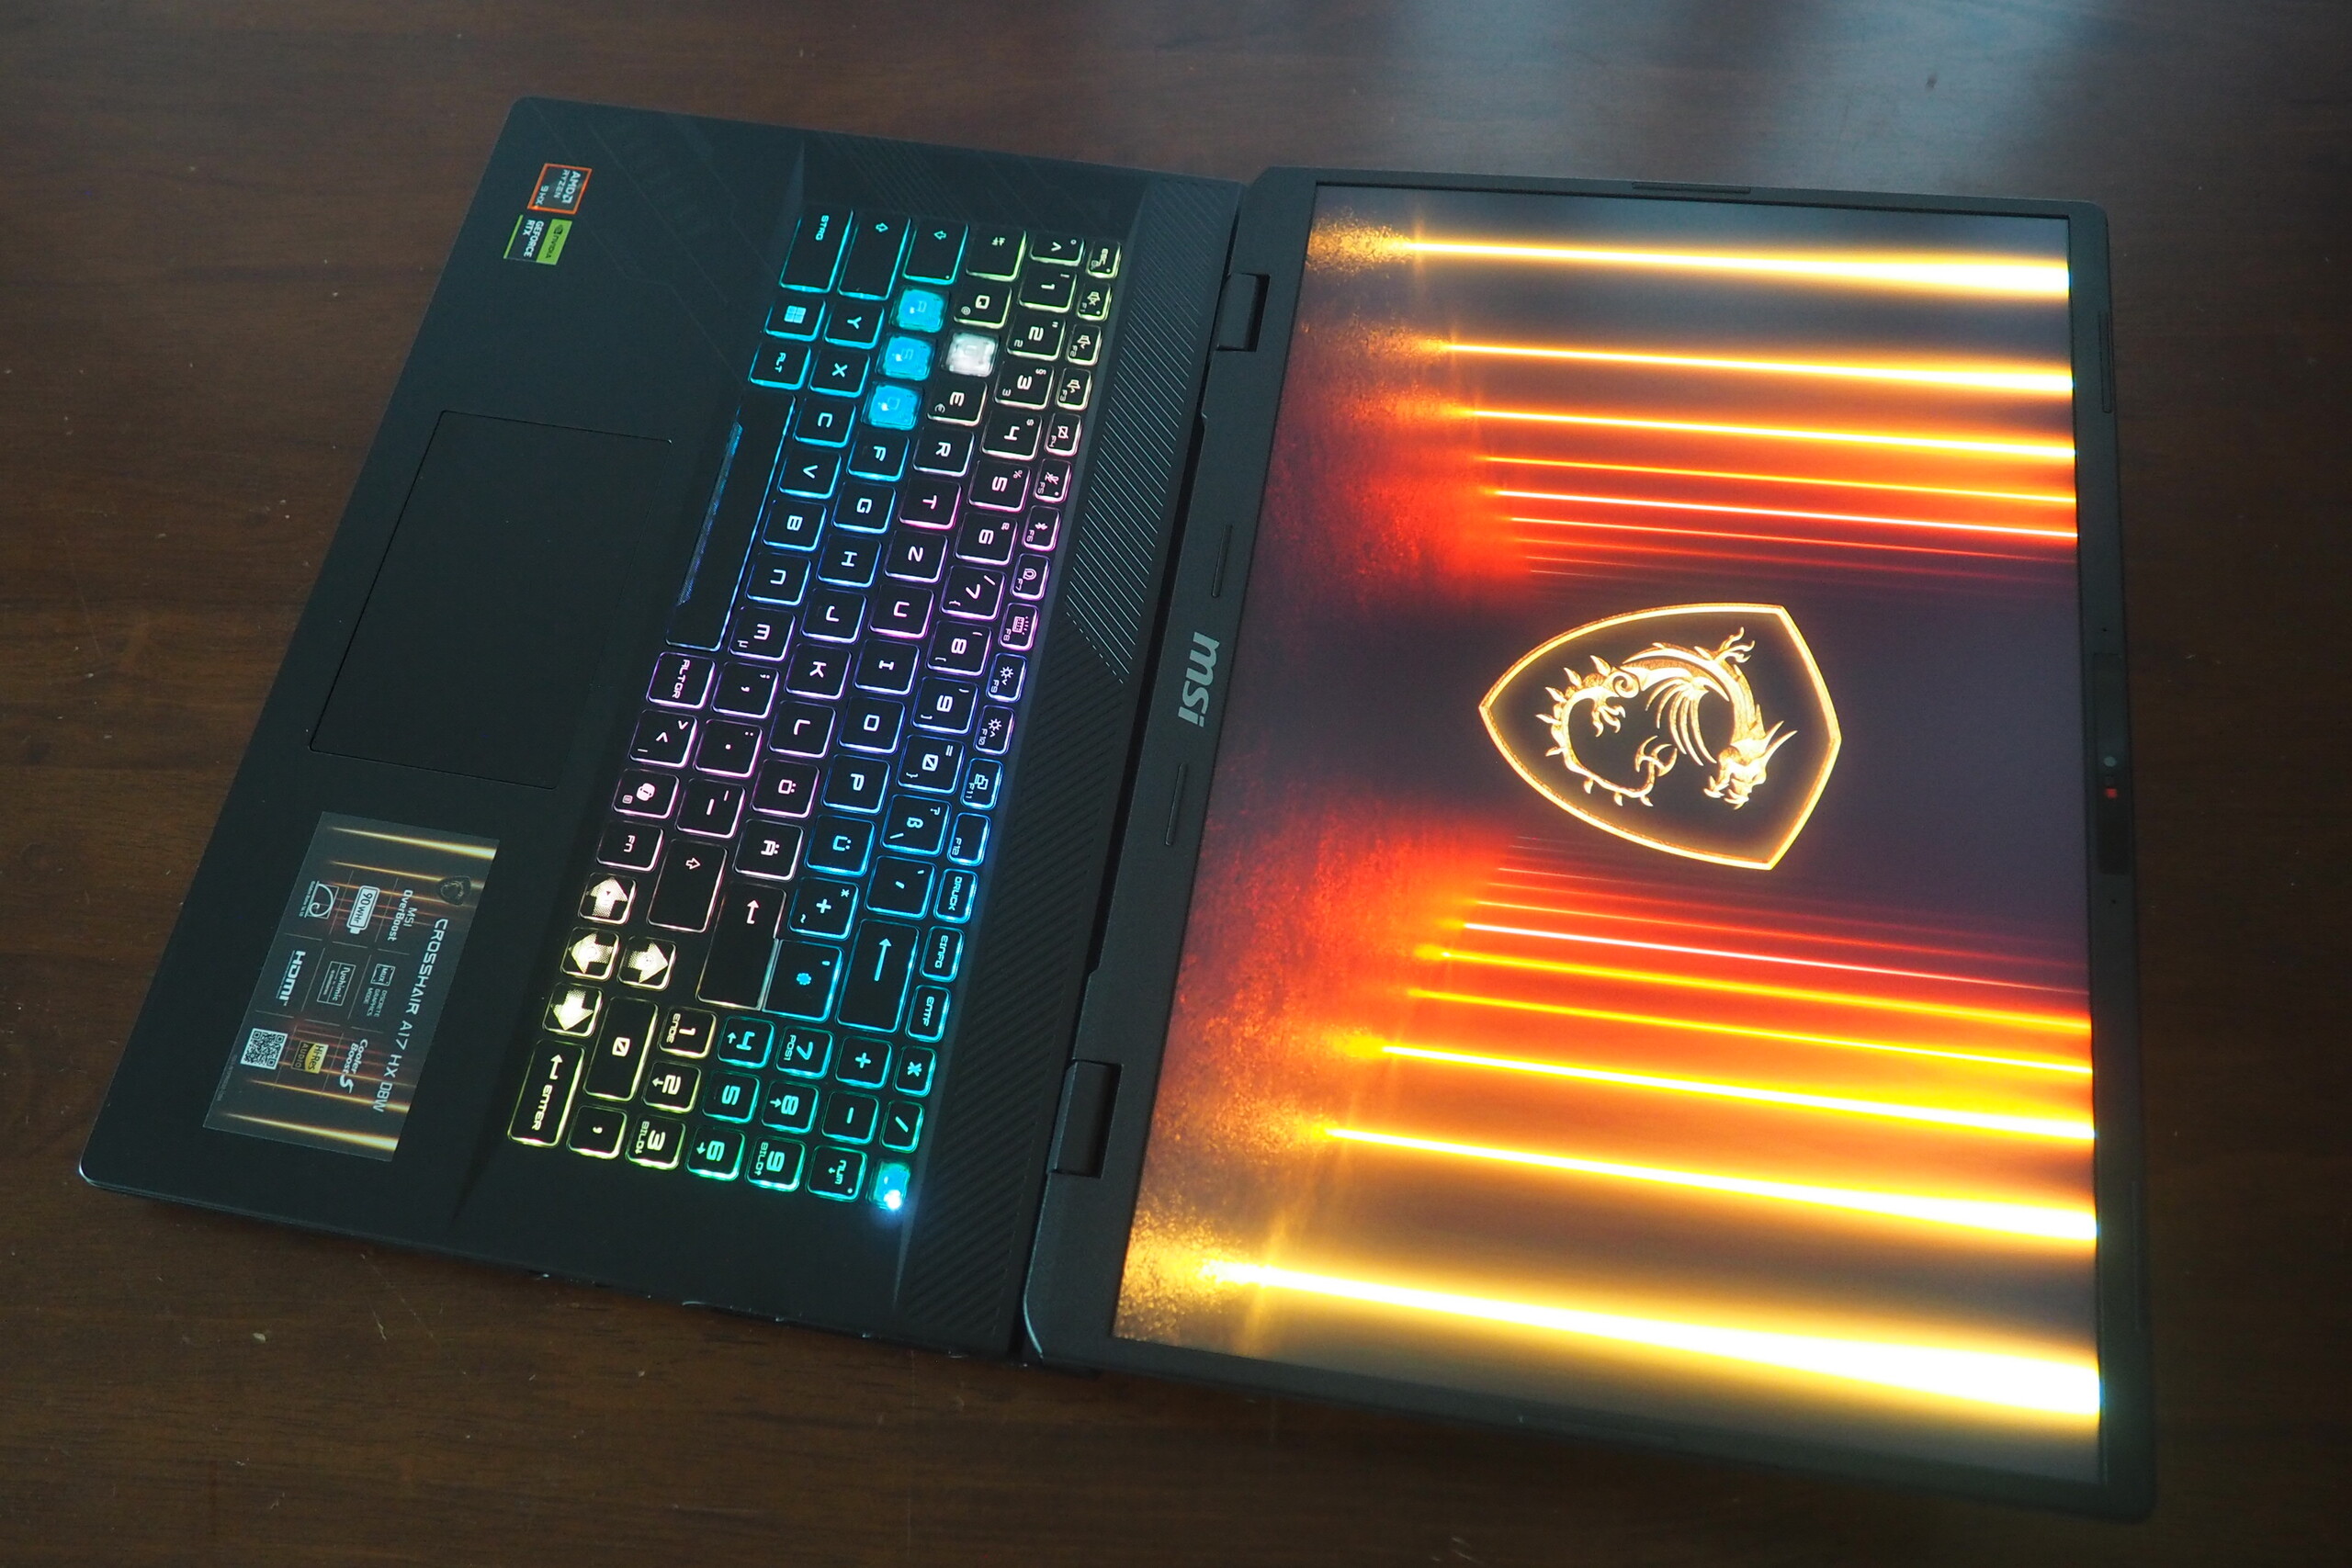
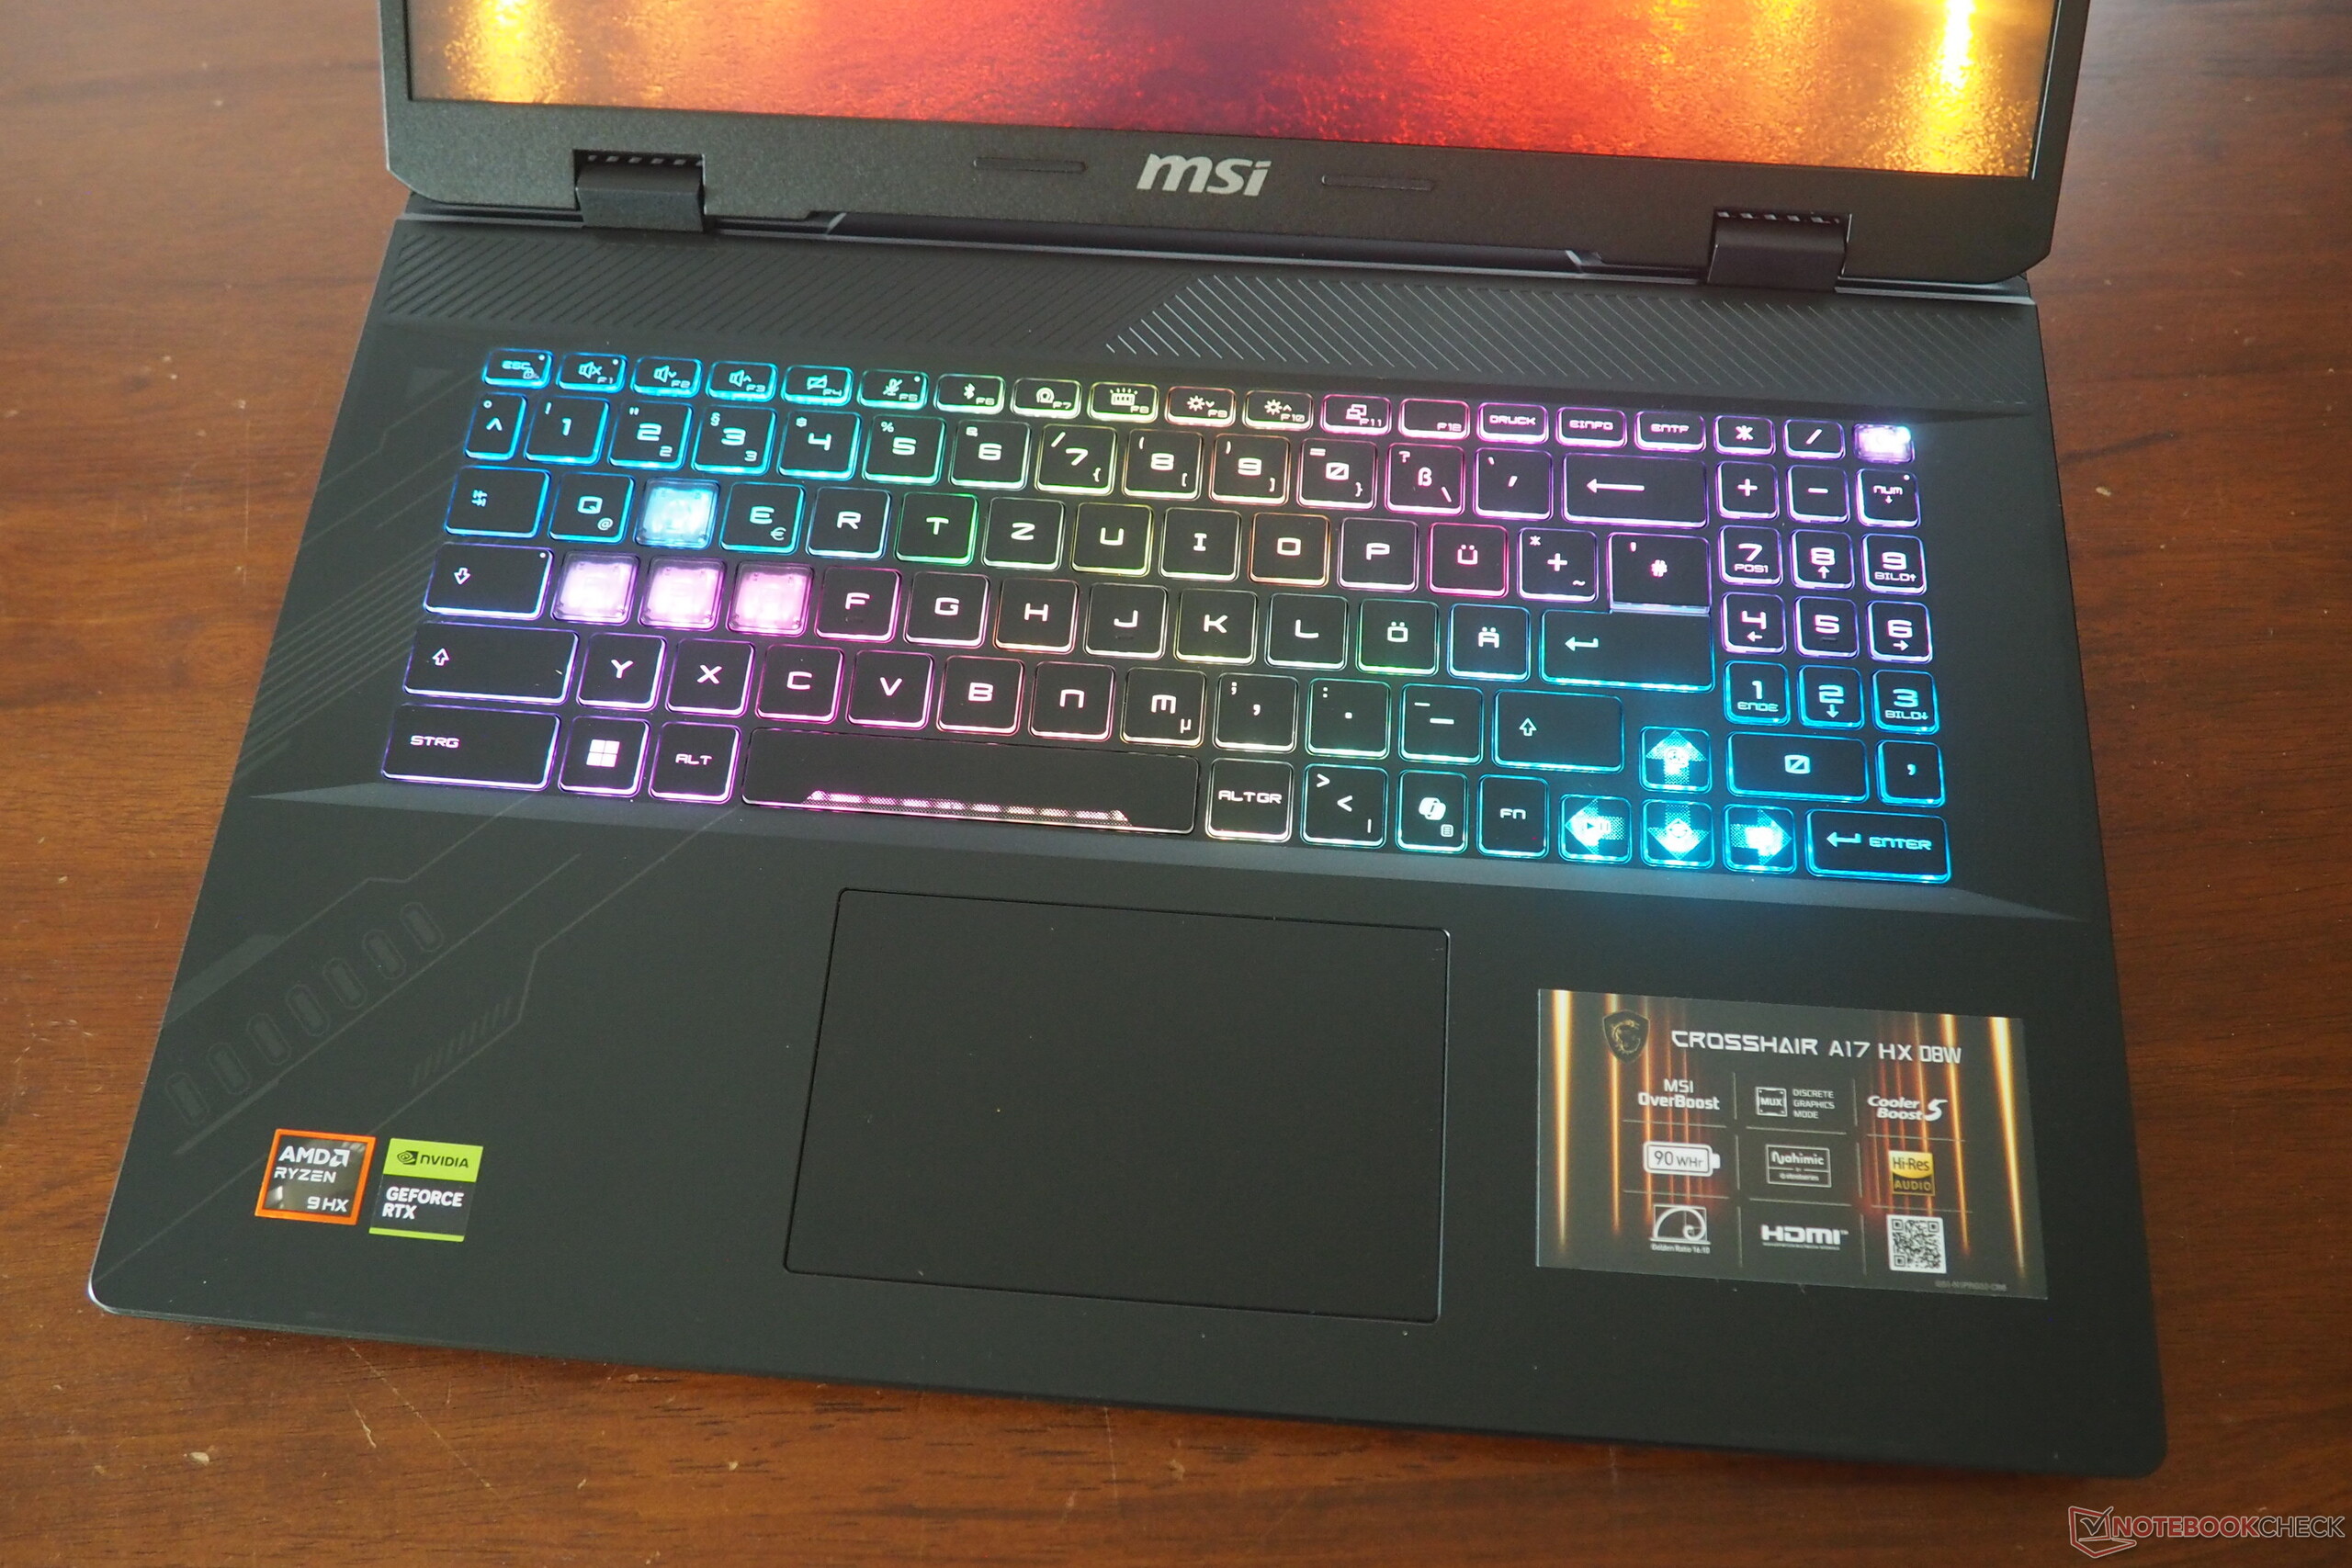
MSI uses a mix of materials for the casing. While the lid is made of metal, the base unit is made of fairly sturdy plastic. A big plus point is the generous opening angle of 180°, which not every gamer can offer. In terms of design, the manufacturer has mainly gone wild with the base of the case (see photos), while the rest of the chassis is still reasonably discreet and solid. With a weight of 2.9 kg (~6.4 lb), the Crosshair A17 is heavier than the selected competitors, although most of the latter are only 16-inch instead of 17-inch. The Crosshair A17 is also at the top of the league in terms of height (just under 3 cm/~1.2 in without feet).
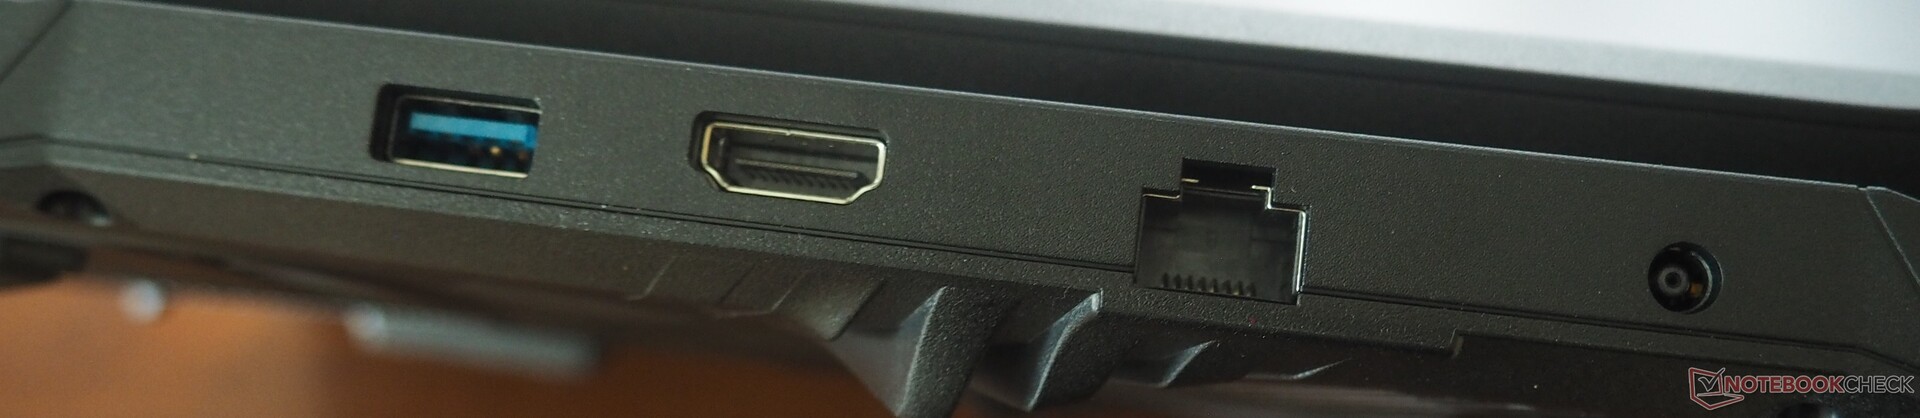
Connectivity and Features
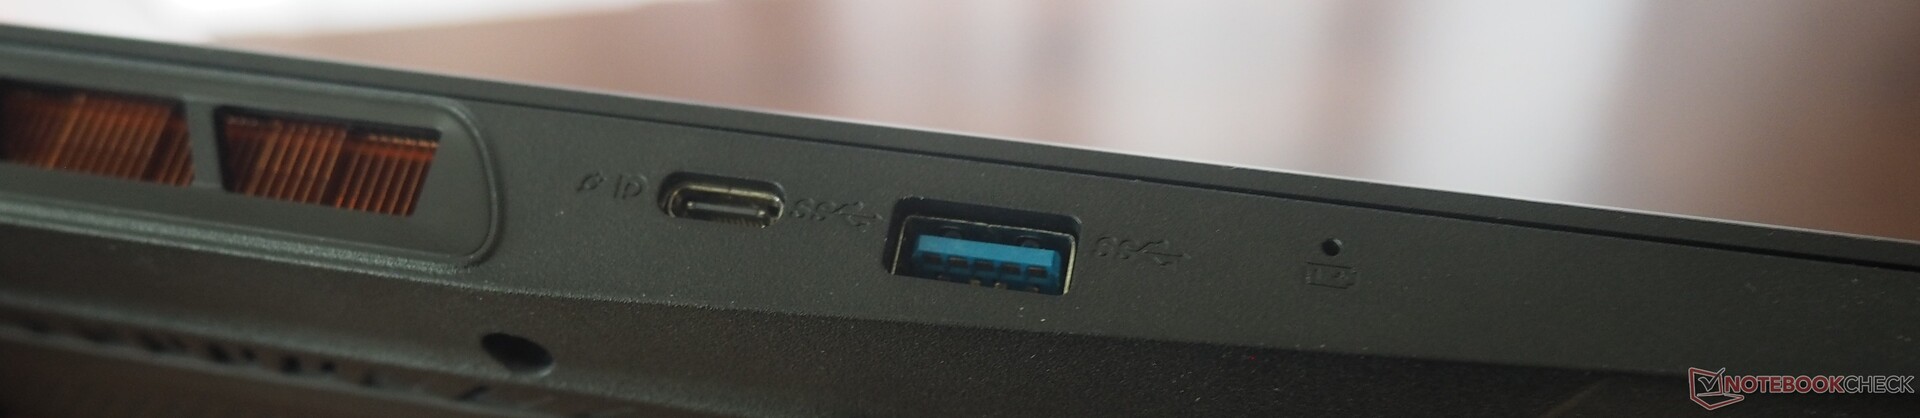
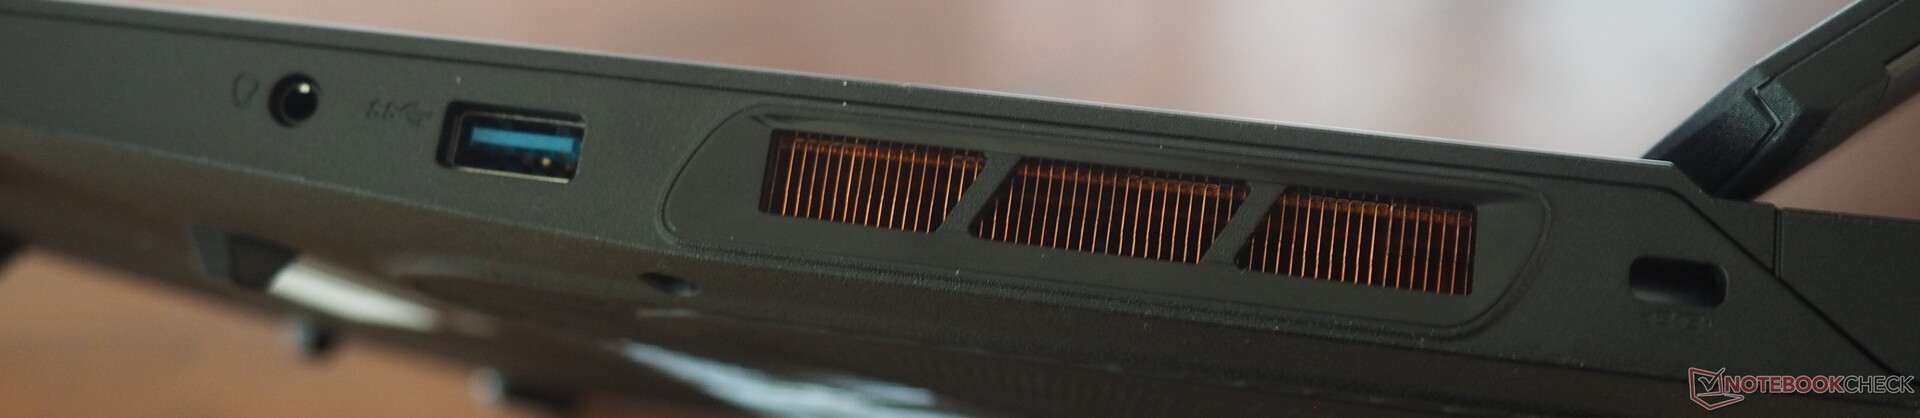
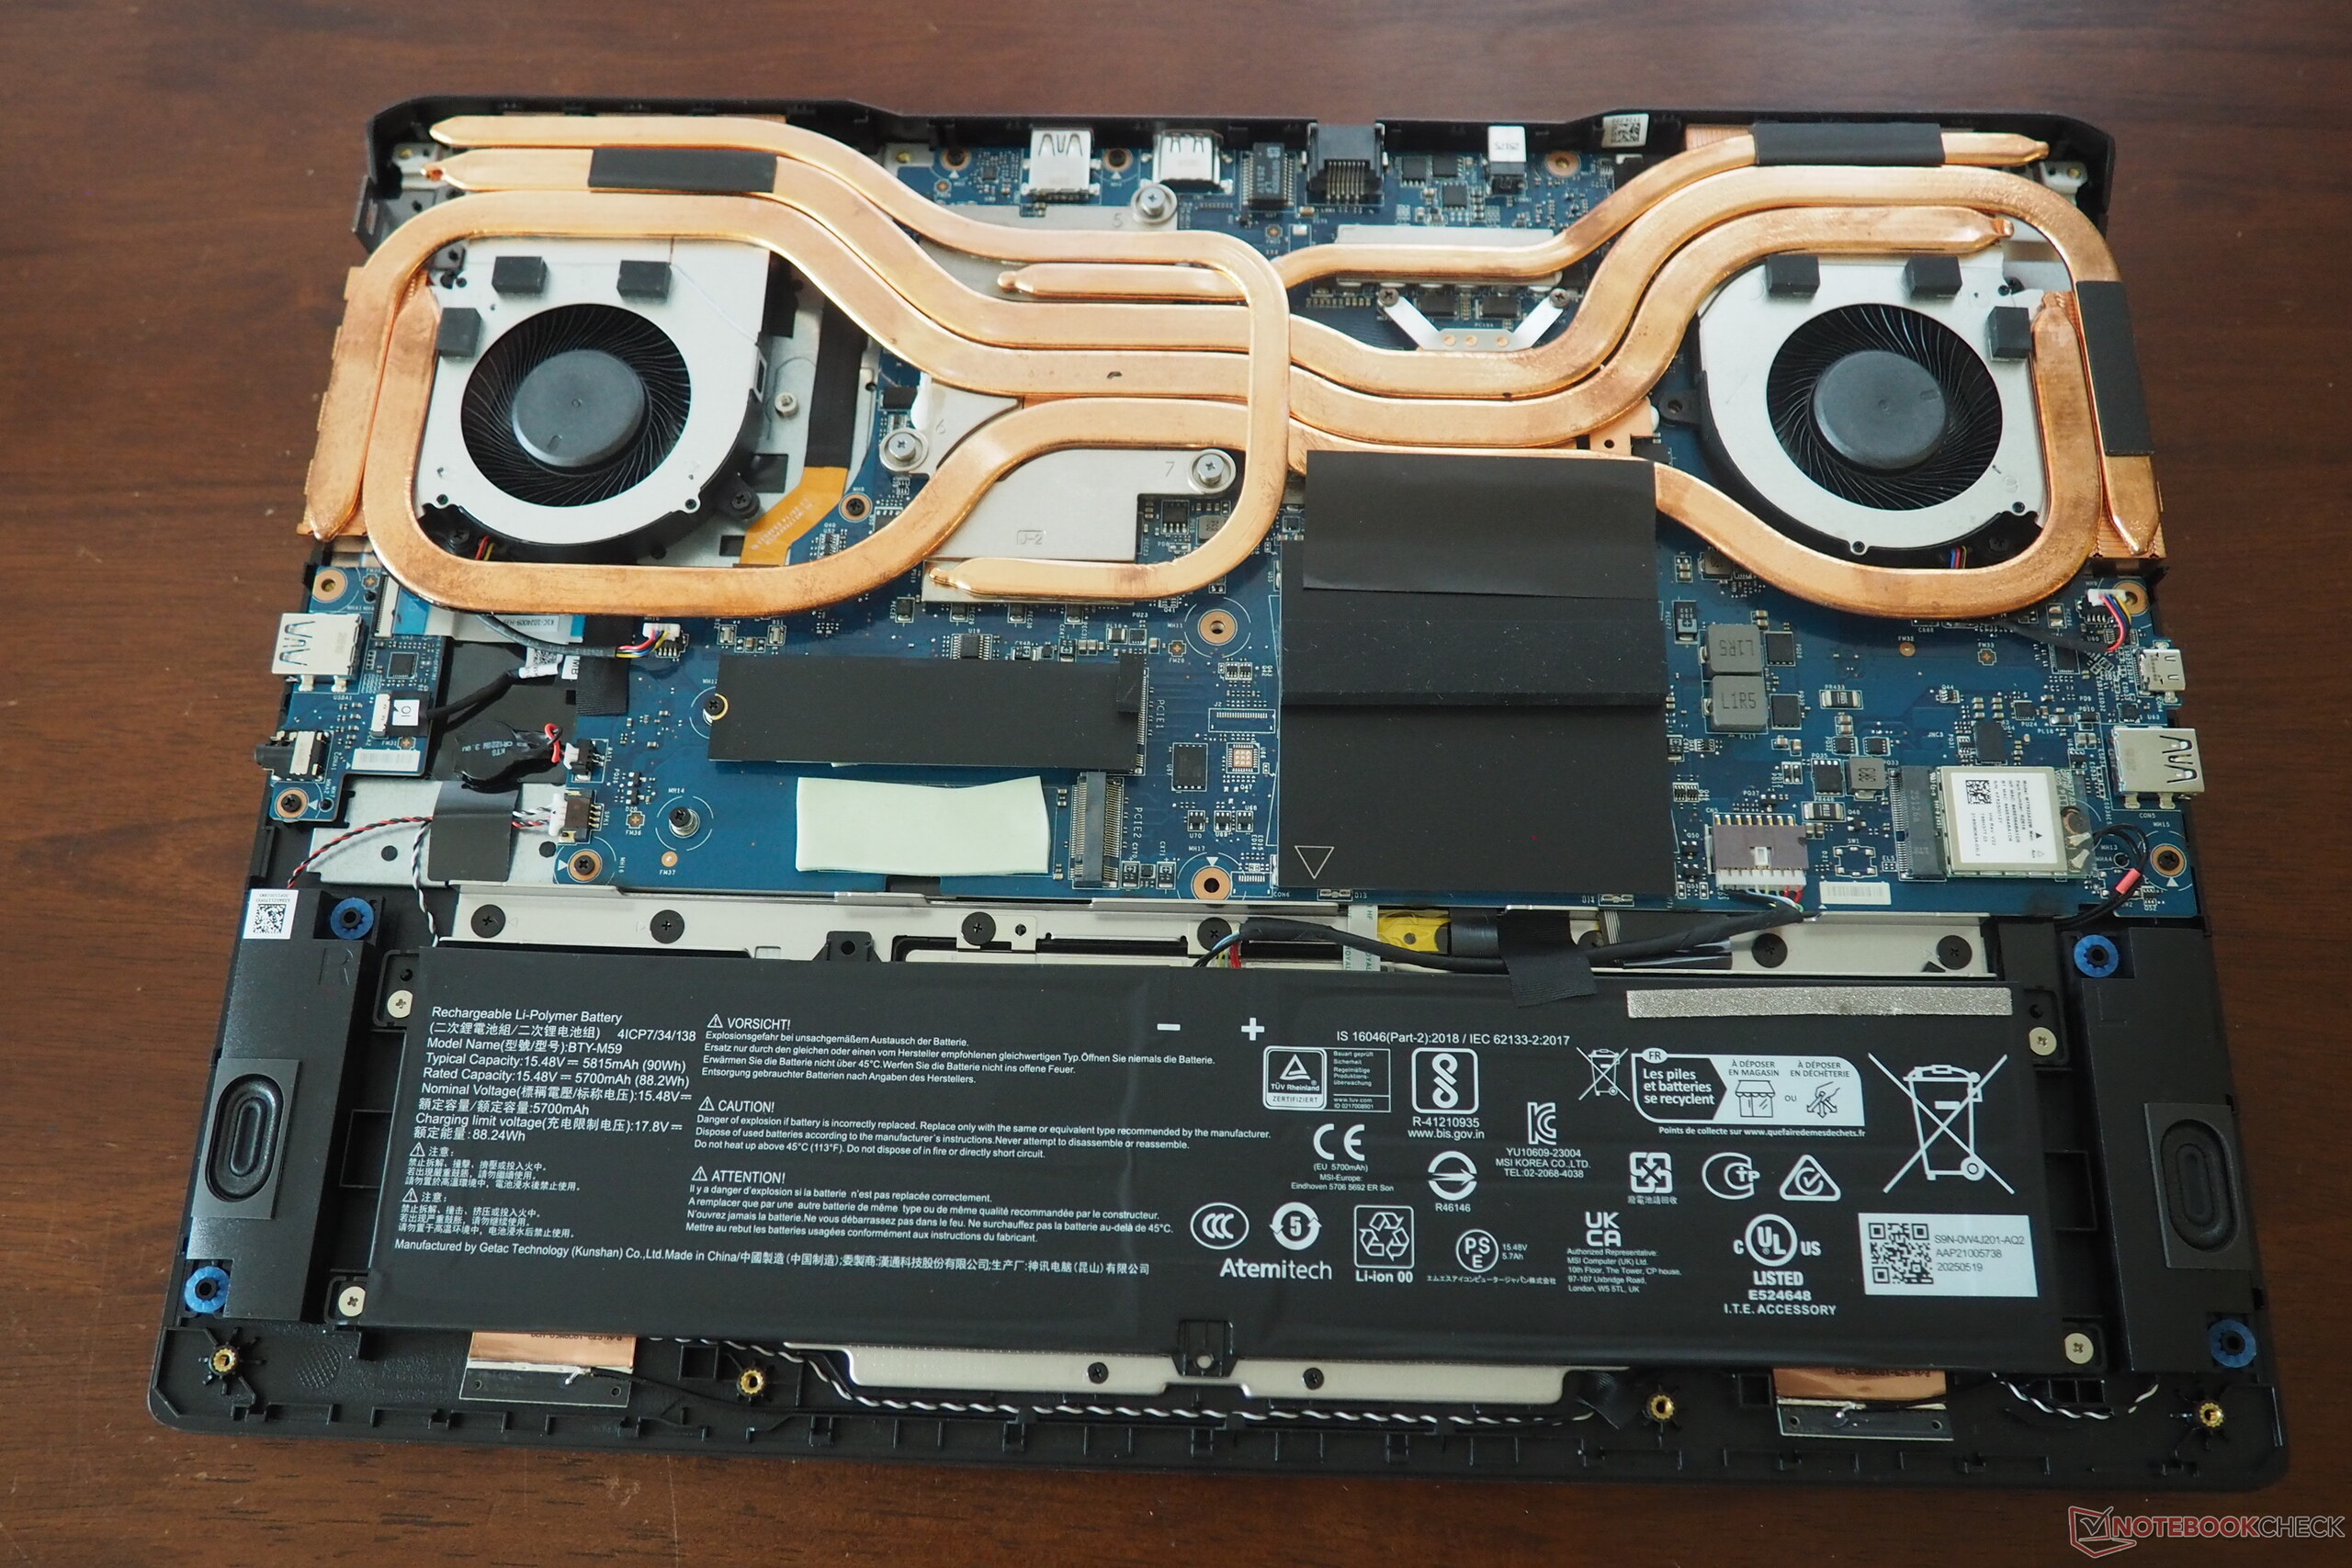
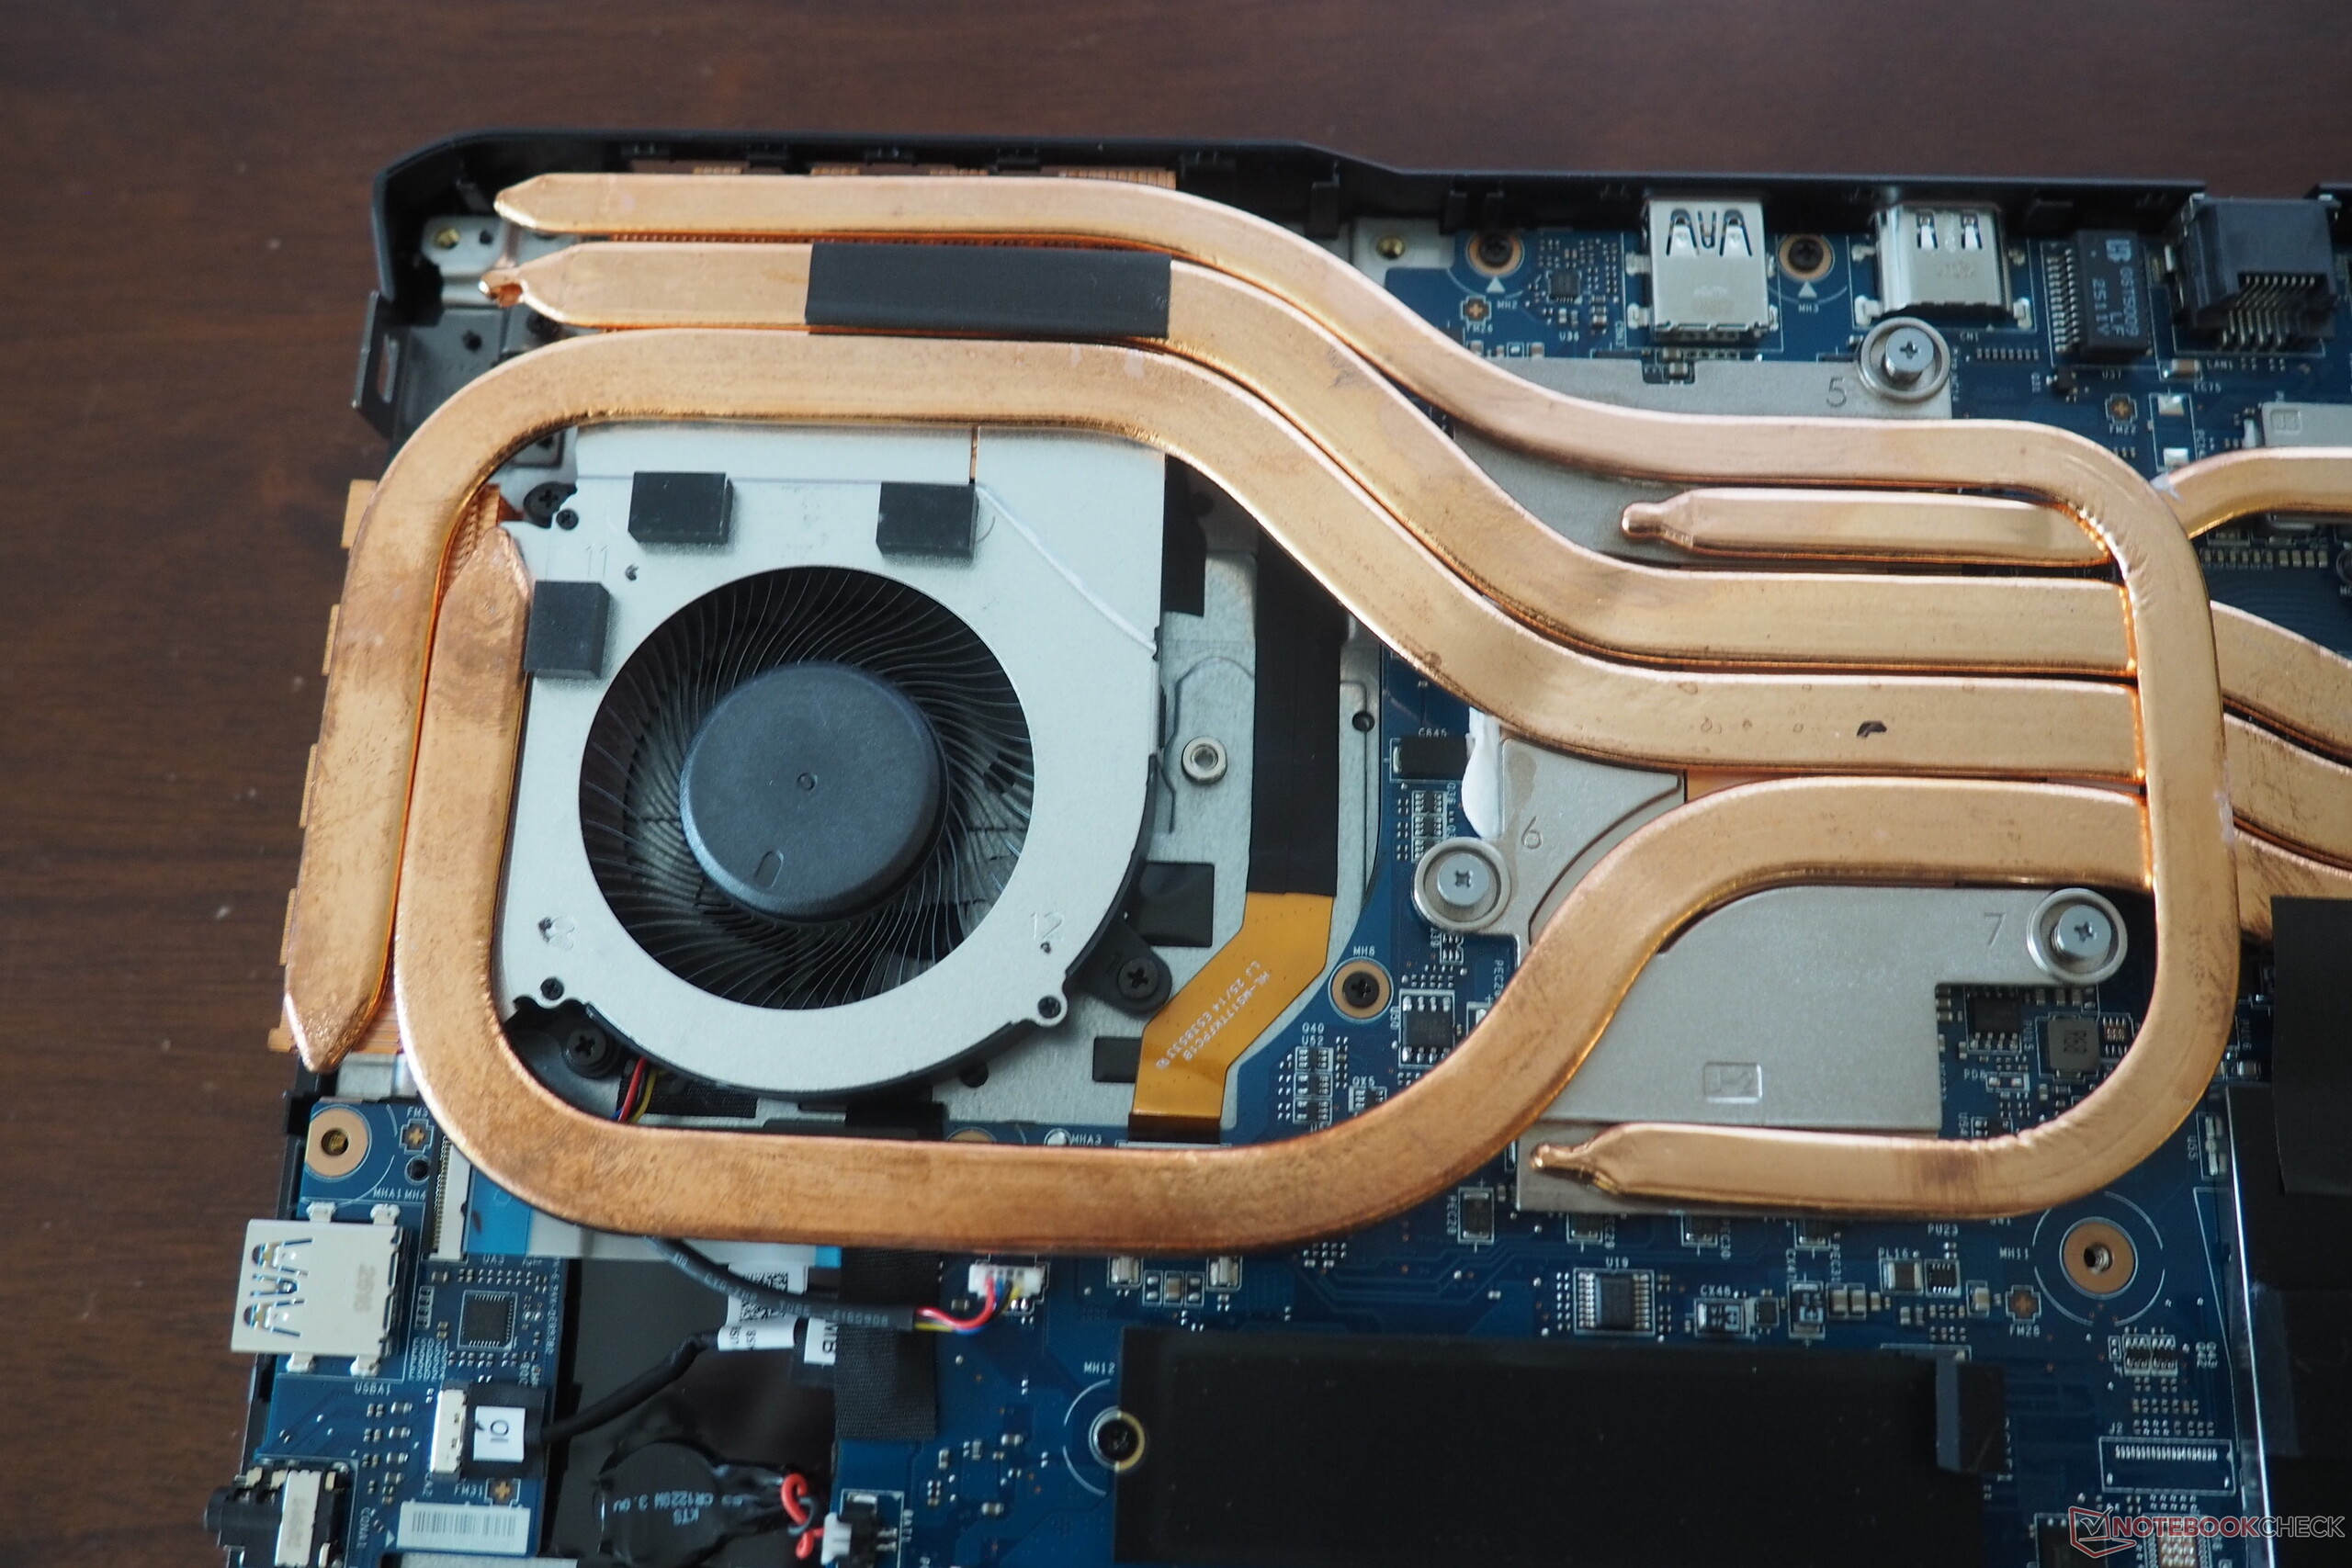
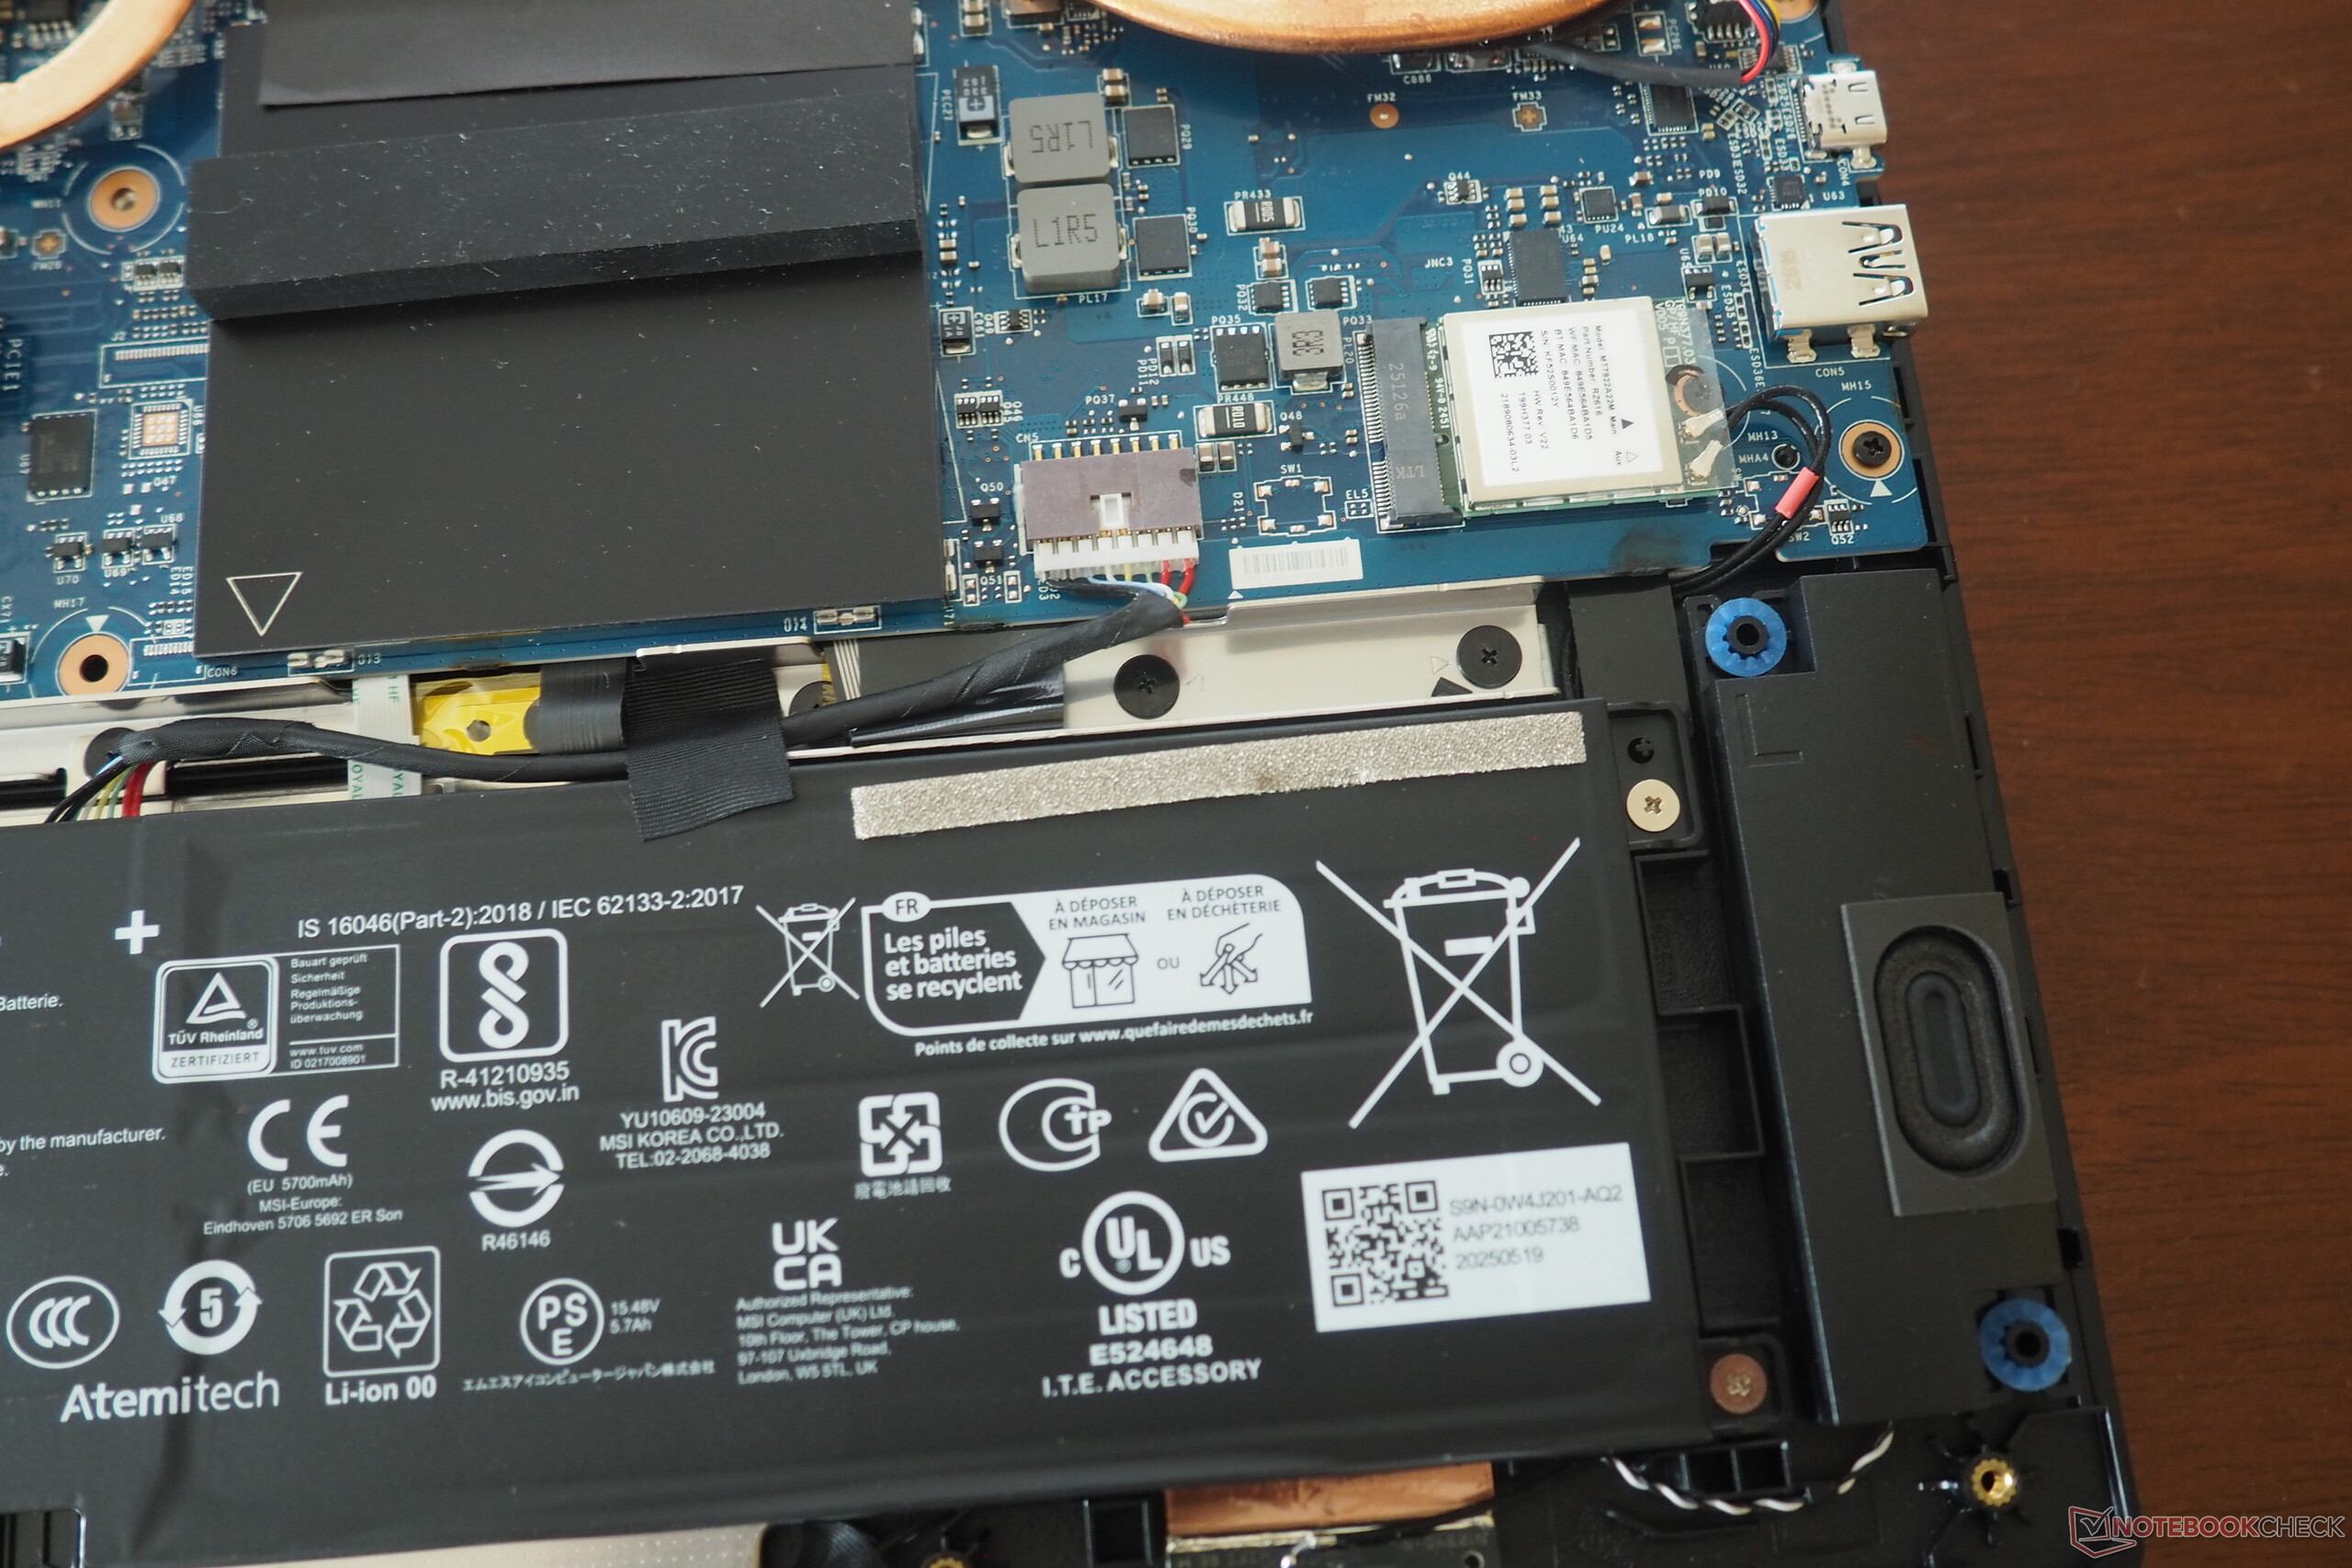
The gaming laptop has to do without modern USB 4 or Thunderbolt. MSI relies on the outdated 3.2 Gen2 standard for the four available USB ports, although the Type-C port at least supports DisplayPort and PowerDelivery 3.0. The easiest way to connect external monitors is via HDMI 2.1. There is also an audio socket, a Gigabit LAN port and an opening for Kensington locks. The manufacturer has omitted a card reader. Wireless communication takes place via a Wi-Fi 6E chip from MediaTek (model RZ616), which delivers a good performance, especially when receiving data. Meanwhile, the quality of the HD webcam is limited; in addition to the color fidelity, the image sharpness could also be better. Servicing the Crosshair A17 requires a little patience, as 13 Phillips screws have to be removed before the base plate can be loosened. You can see photos of the internal structure below.
Communication
Webcam


Maintenance

Input devices
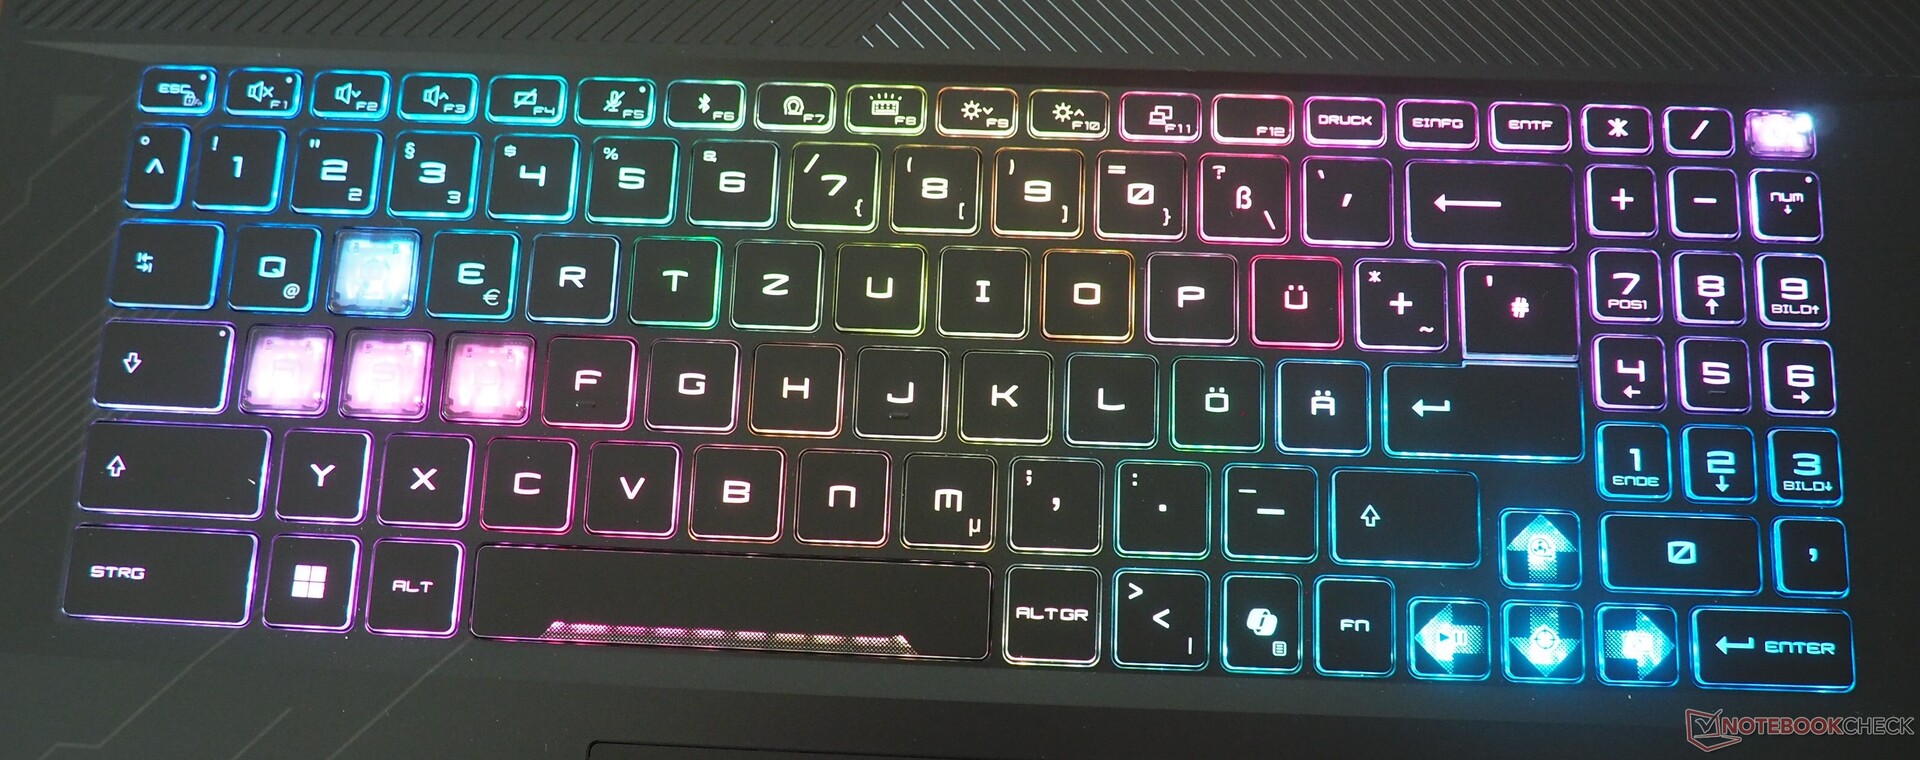
As mentioned at the beginning, MSI uses its typical gaming layout, which takes some getting used to at first glance, as the position of some keys does not correspond to the usual standard. The three-column instead of four-column numeric keypad does not necessarily make the situation any easier. Nevertheless, the 17-inch device impresses with its well-dimensioned directional arrows, which is not a matter of course. The typing feel is acceptable for a rubber dome model. The touchpad measures approx. 12 x 7.5 cm (~4.7 x 3 in) and has good gliding properties and clean precision. However, the fact that the click surfaces tend to rattle is a bit of a shame and detracts from the quality feel of the device.
Display
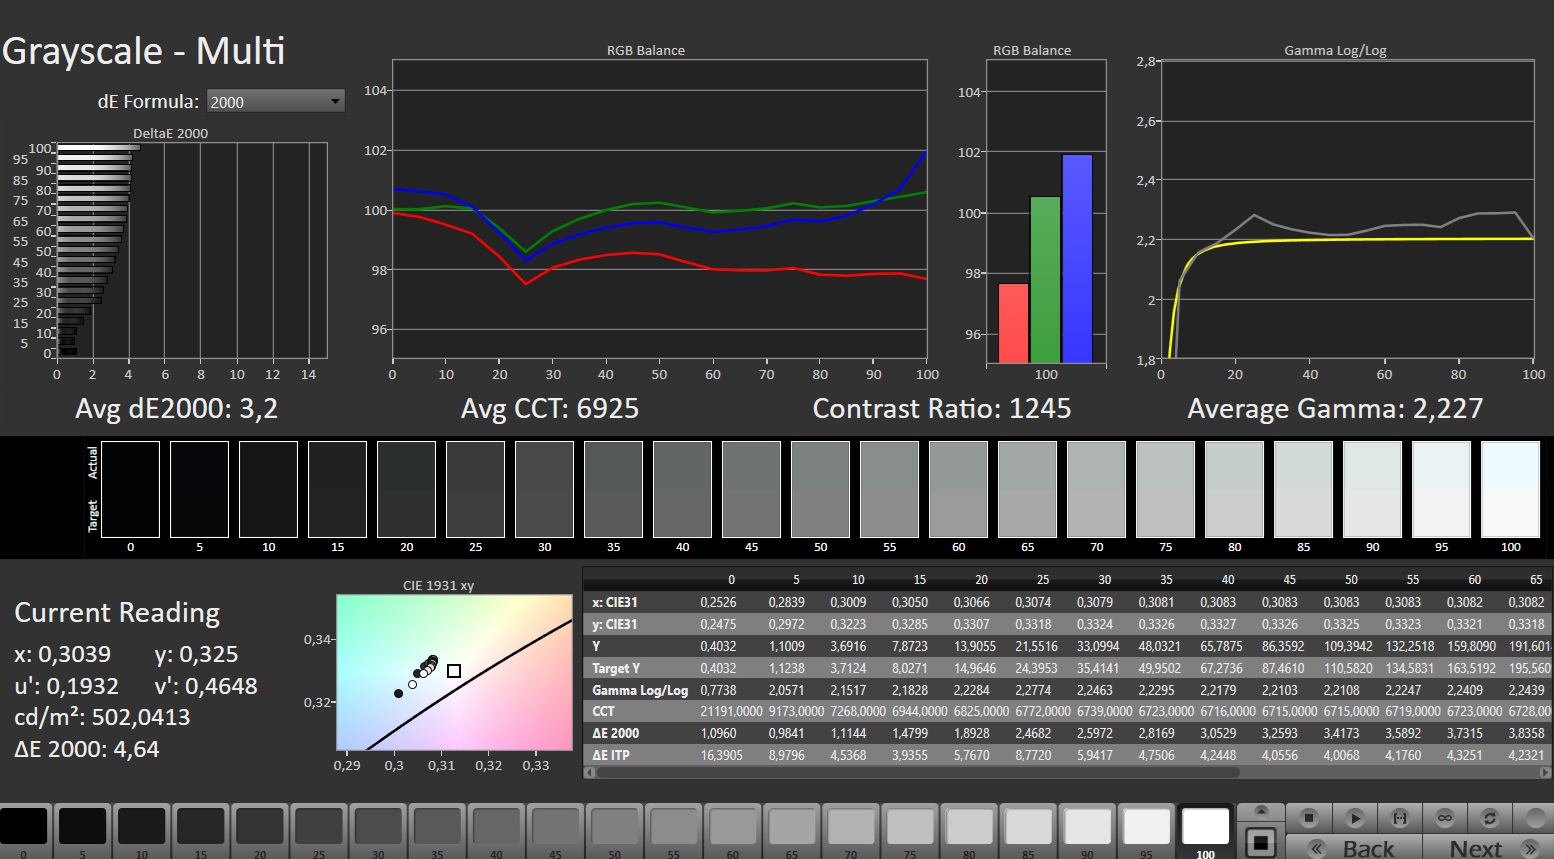
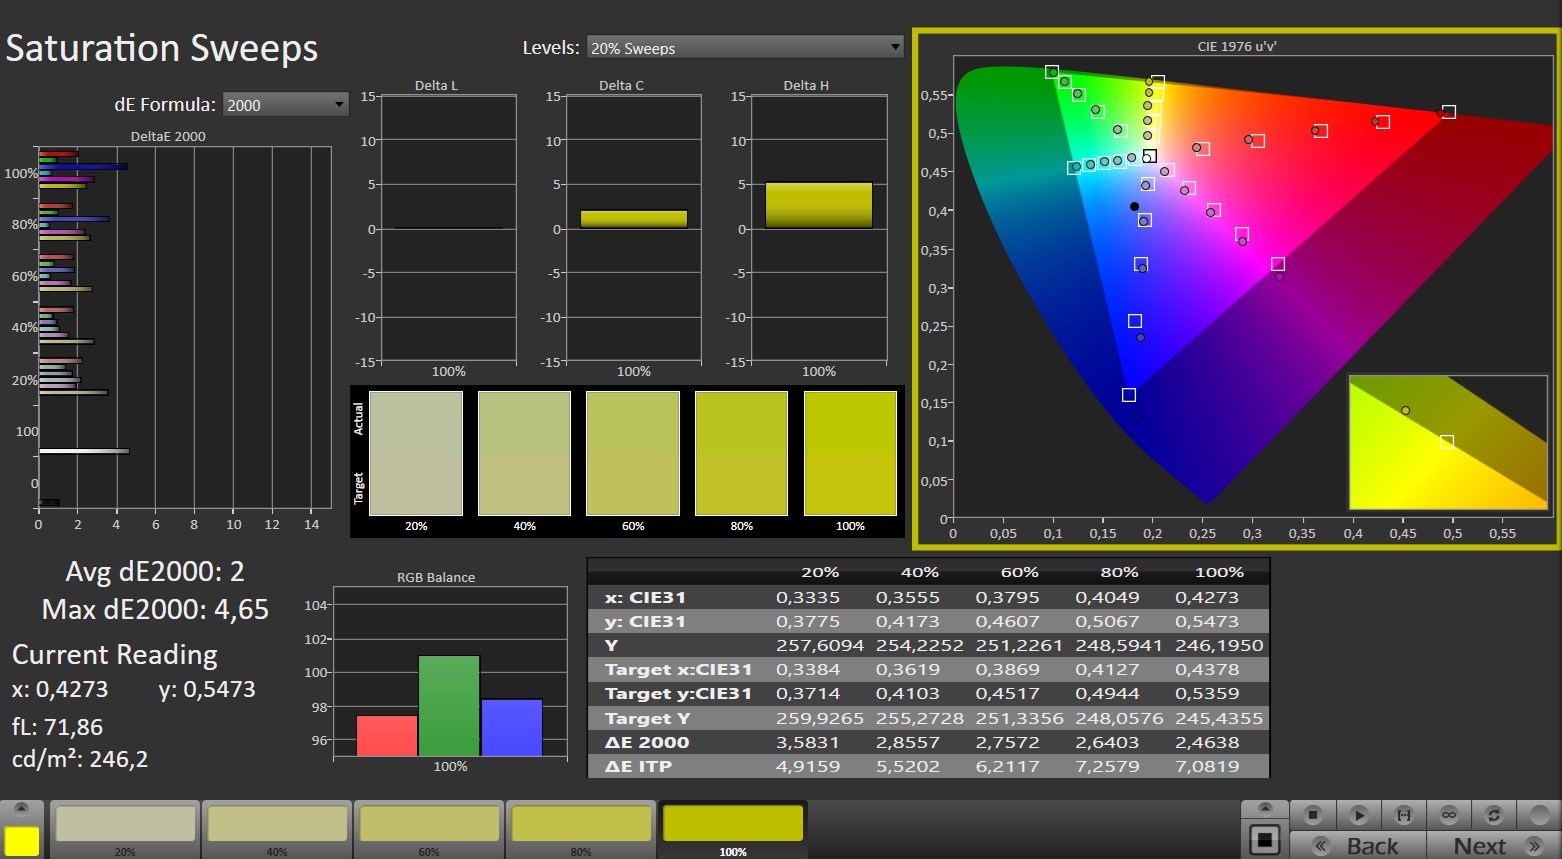
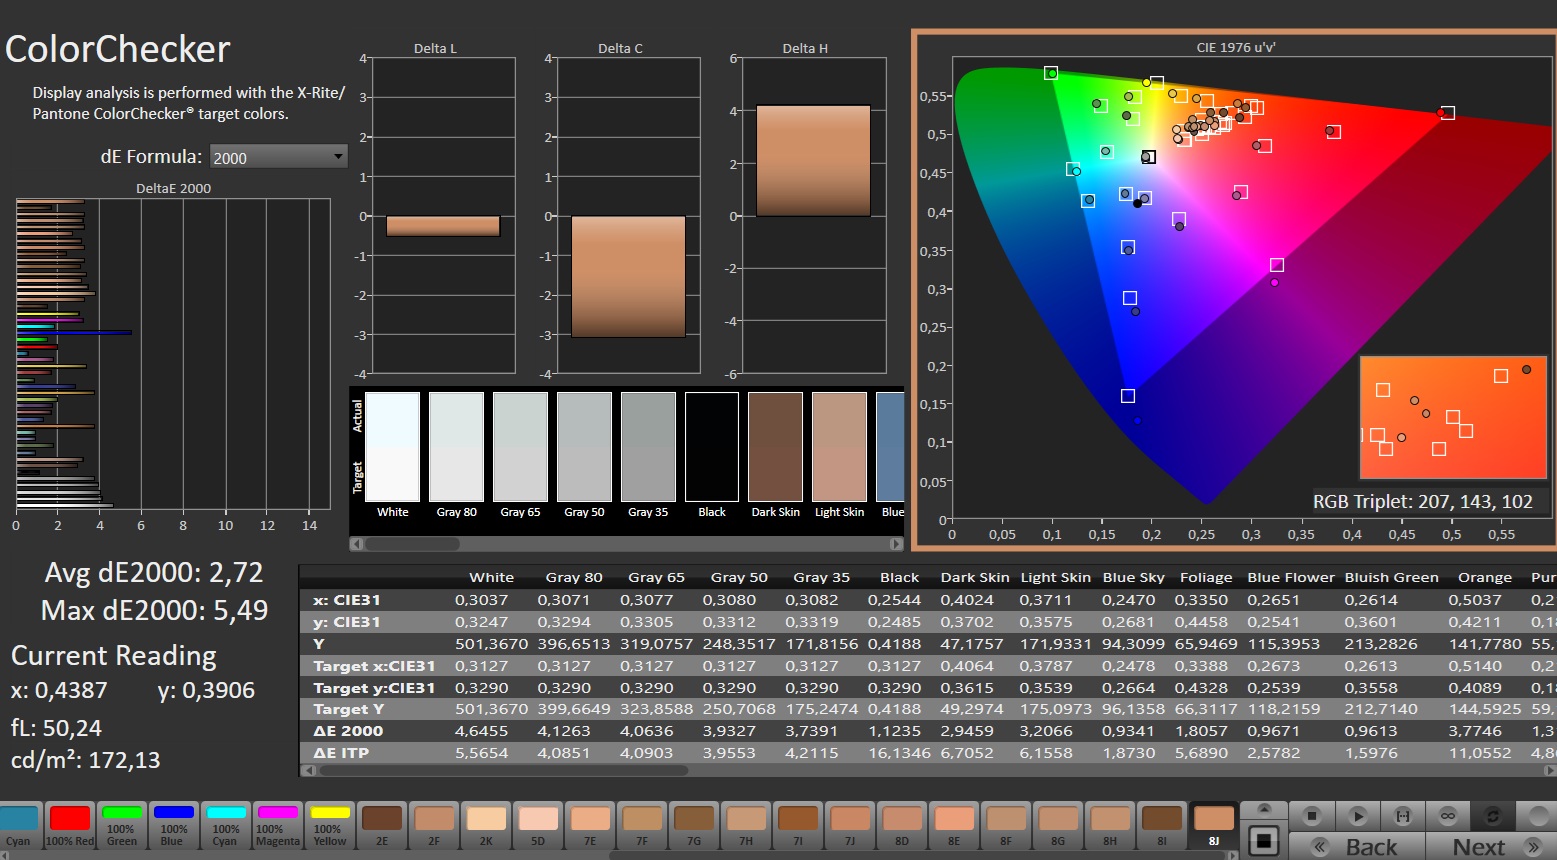
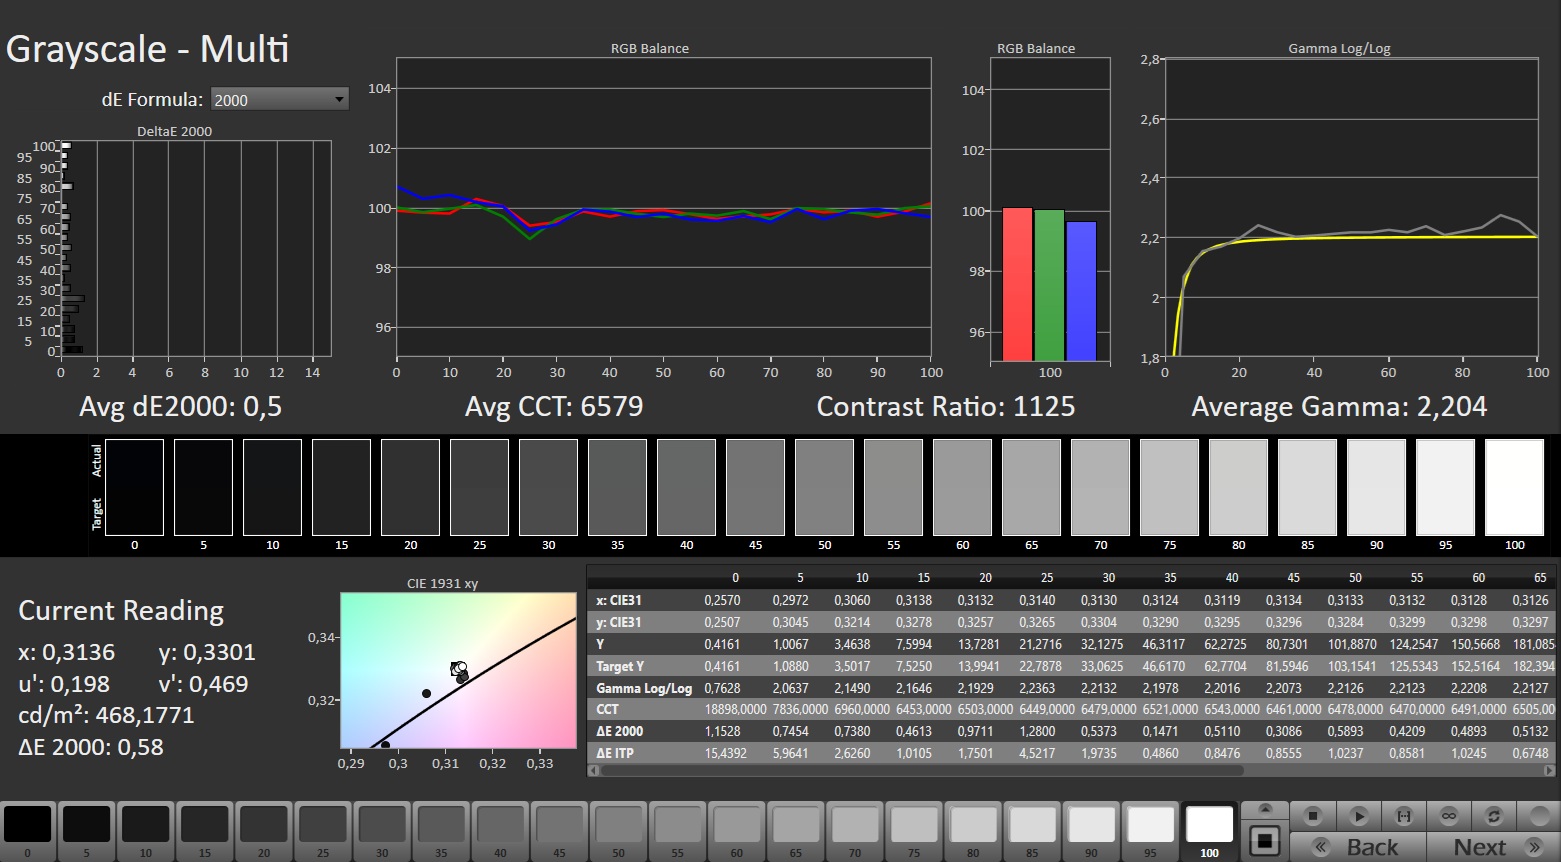
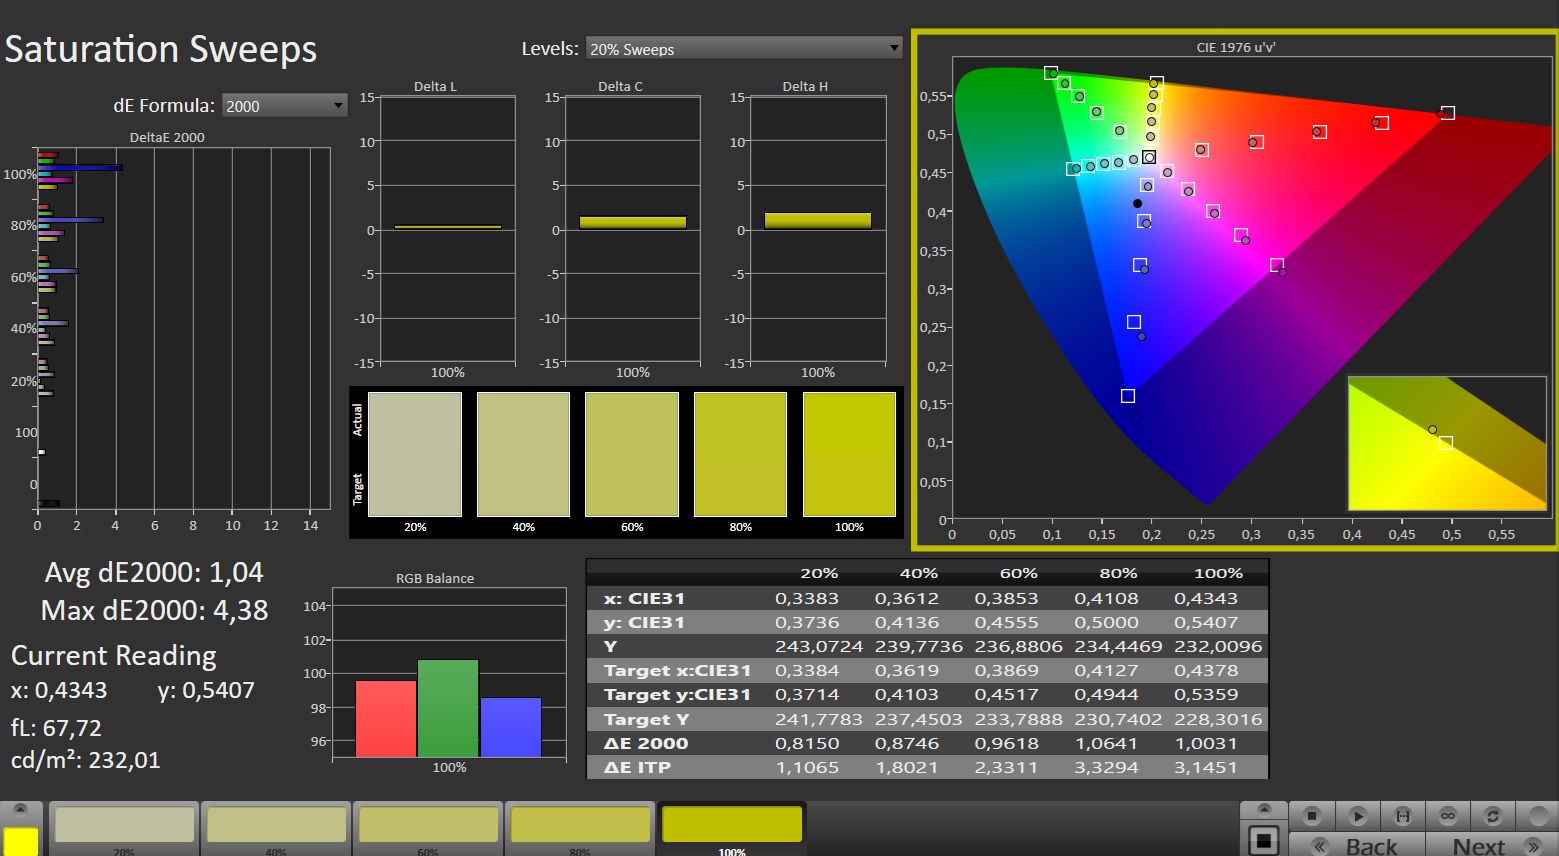
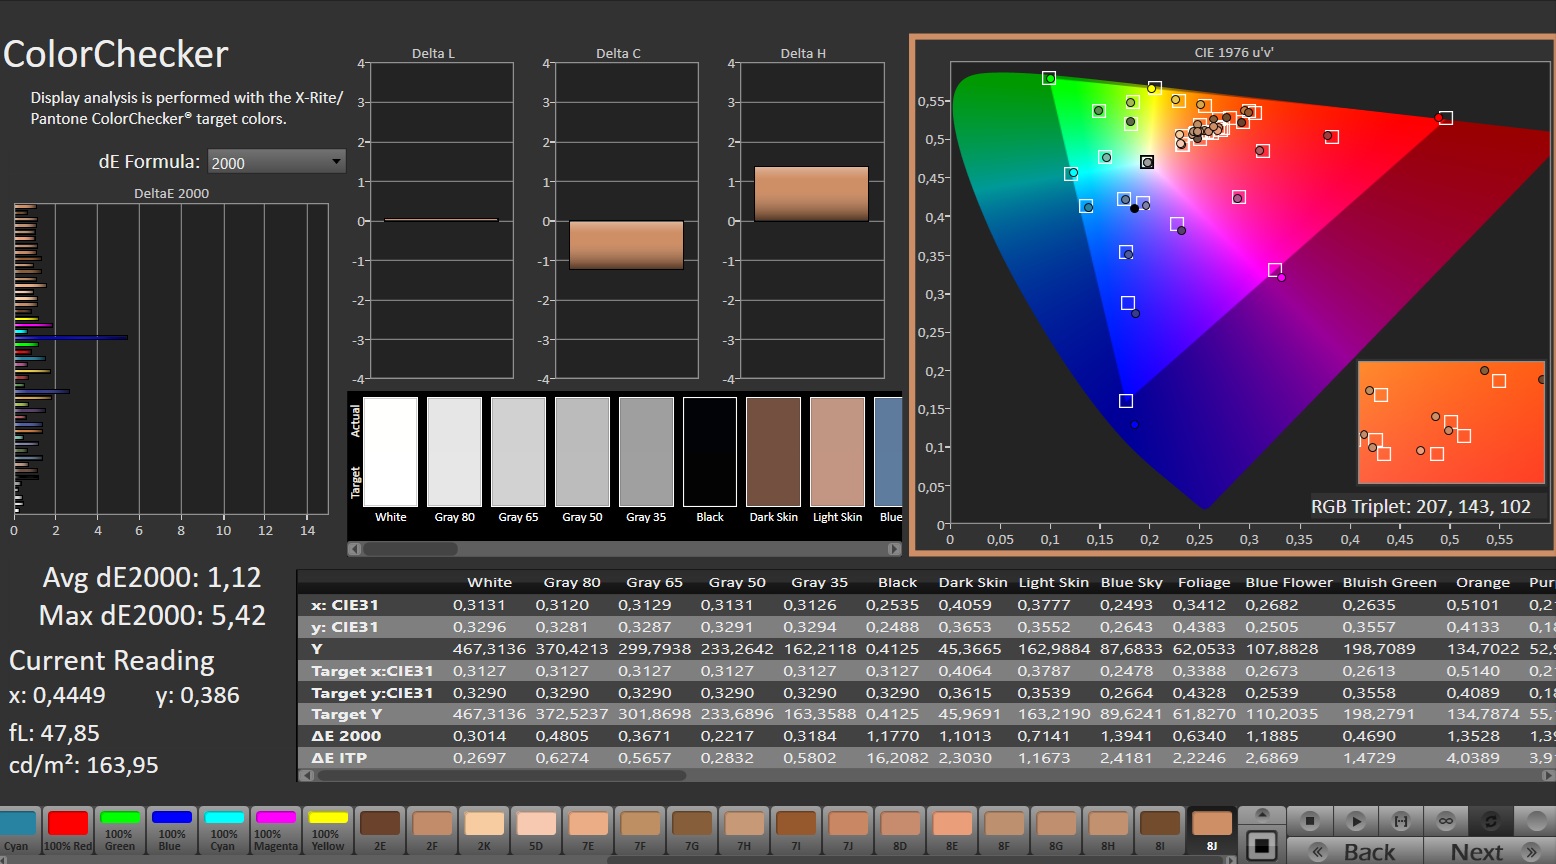
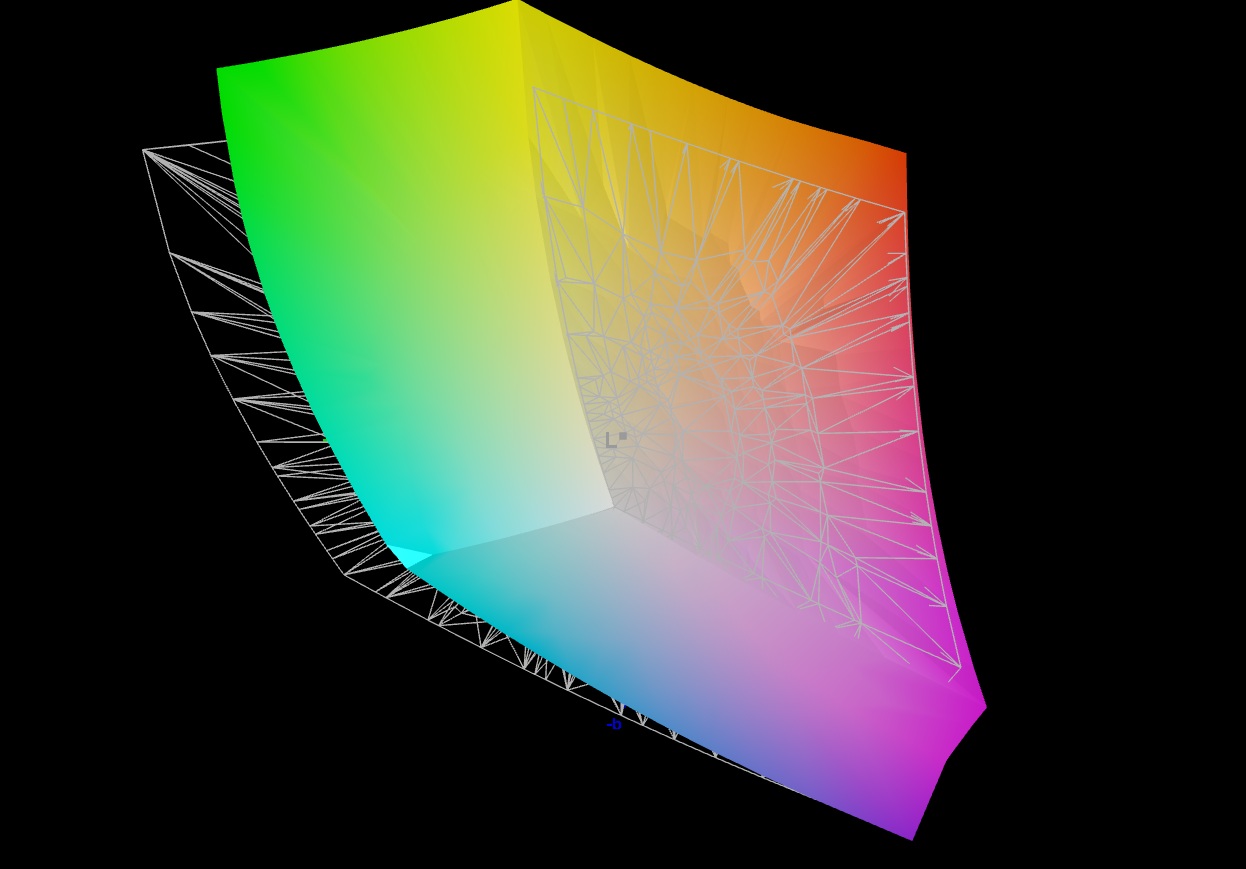
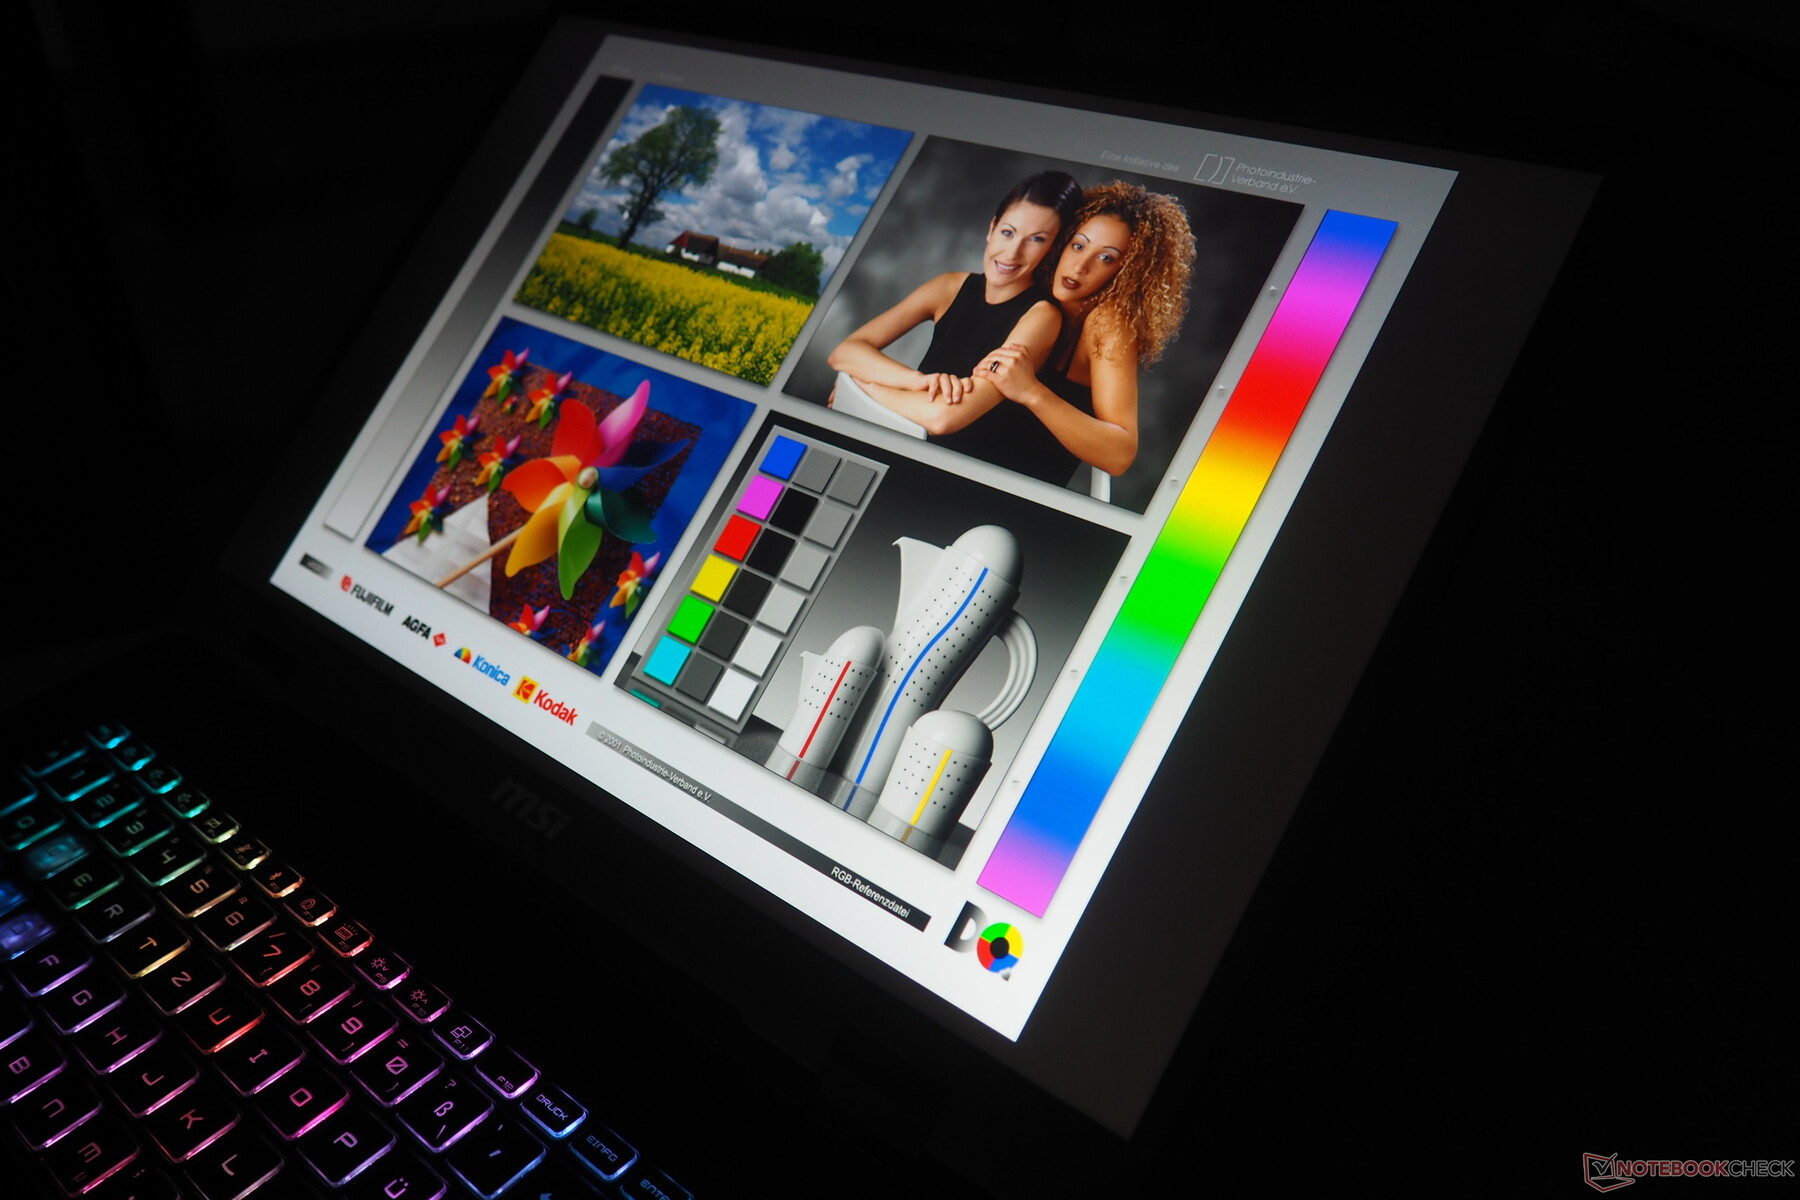
By IPS standards, the 240 Hz display, which has a resolution of 2,560 x 1,600 pixels (16:10), cuts a pretty good figure. Starting with the color space, which should not only satisfy gamers in view of the almost 100% DCI-P3. Although the response times are not at OLED level, they are also sufficient. The contrast of our test sample is a solid 1178:1, while the black level (0.4 cd/m²) could be slightly better. With a brightness of 468 cd/m², the Crosshair A17 HX ranks above the gaming average; only the Legion 5 Pro is ahead of the competition. Thanks to the usable brightness, the 17-incher is also suitable for brighter rooms and even the occasional outdoor use, as long as the sun doesn't shine too brightly or directly on the screen. Let's move on to the color fidelity, which is already quite good out of the box. The package is rounded off by relatively good viewing angles, which are in line with the usual IPS level.
| |||||||||||||||||||||||||
Brightness Distribution: 96 %
Center on Battery: 471 cd/m²
Contrast: 1178:1 (Black: 0.4 cd/m²)
ΔE ColorChecker Calman: 2.72 | ∀{0.5-29.43 Ø4.73}
calibrated: 1.12
ΔE Greyscale Calman: 3.2 | ∀{0.09-98 Ø4.97}
84.9% AdobeRGB 1998 (Argyll 3D)
99.9% sRGB (Argyll 3D)
97.1% Display P3 (Argyll 3D)
Gamma: 2.227
CCT: 6925 K
| MSI Crosshair A17 HX D8WGKG B170QAN01.2, IPS, 2560x1600, 17", 240 Hz | MSI Katana 17 HX B14WGK CSOT MNH301CA3-1, IPS, 2560x1440, 17.3", 240 Hz | Aorus Elite 16 AE6H NE160QDM-NYJ, IPS, 2560x1600, 16", 165 Hz | Lenovo Legion 5 Pro 16IAX10H ATNA60HS01-0 (Samsung SDC420A), OLED, 2560x1600, 16", 165 Hz | MSI Vector 16 HX AI A2XWHG B160QAN02.3 (AUO7DB2), IPS, 2560x1600, 16", 240 Hz | |
|---|---|---|---|---|---|
| Display | 2% | -14% | 5% | -1% | |
| Display P3 Coverage (%) | 97.1 | 97.3 0% | 70.8 -27% | 99.9 3% | 96.6 -1% |
| sRGB Coverage (%) | 99.9 | 99.6 0% | 99.8 0% | 100 0% | 99.8 0% |
| AdobeRGB 1998 Coverage (%) | 84.9 | 89 5% | 72.6 -14% | 94.1 11% | 84.4 -1% |
| Response Times | 0% | -33% | 80% | 32% | |
| Response Time Grey 50% / Grey 80% * (ms) | 13.3 ? | 5.2 ? 61% | 16.8 ? -26% | 2 ? 85% | 4.3 ? 68% |
| Response Time Black / White * (ms) | 5.7 ? | 9.2 ? -61% | 7.9 ? -39% | 1.4 ? 75% | 6 ? -5% |
| PWM Frequency (Hz) | 1300 | ||||
| PWM Amplitude * (%) | 16.7 | ||||
| Screen | 5% | -23% | -7% | -12% | |
| Brightness middle (cd/m²) | 471 | 296 -37% | 443 -6% | 518 10% | 473 0% |
| Brightness (cd/m²) | 468 | 272 -42% | 433 -7% | 522 12% | 426 -9% |
| Brightness Distribution (%) | 96 | 87 -9% | 90 -6% | 97 1% | 85 -11% |
| Black Level * (cd/m²) | 0.4 | 0.27 32% | 0.42 -5% | 0.42 -5% | |
| Contrast (:1) | 1178 | 1096 -7% | 1055 -10% | 1126 -4% | |
| Colorchecker dE 2000 * | 2.72 | 1.35 50% | 3.82 -40% | 2.49 8% | 3.47 -28% |
| Colorchecker dE 2000 max. * | 5.49 | 4.76 13% | 7.61 -39% | 5.25 4% | 7.24 -32% |
| Colorchecker dE 2000 calibrated * | 1.12 | 0.78 30% | 1.33 -19% | 2.15 -92% | 1.36 -21% |
| Greyscale dE 2000 * | 3.2 | 2.7 16% | 5.5 -72% | 3.02 6% | 3.1 3% |
| Gamma | 2.227 99% | 2.201 100% | 2.249 98% | 2.37 93% | 2.486 88% |
| CCT | 6925 94% | 6770 96% | 6549 99% | 6426 101% | 6832 95% |
| Total Average (Program / Settings) | 2% /
4% | -23% /
-22% | 26% /
10% | 6% /
-3% |
* ... smaller is better


Display Response Times
| ↔ Response Time Black to White | ||
|---|---|---|
| 5.7 ms ... rise ↗ and fall ↘ combined | ↗ 1.7 ms rise | 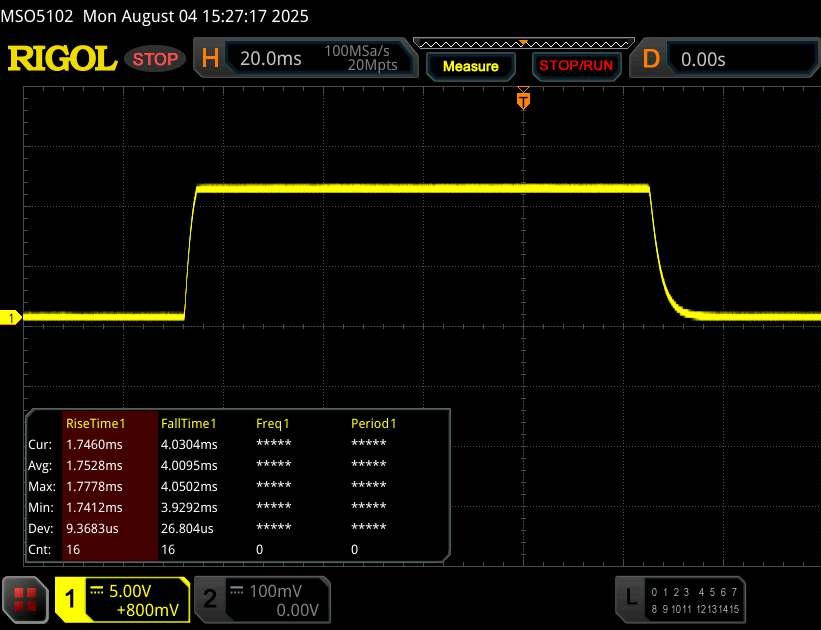 |
| ↘ 4 ms fall | ||
| The screen shows very fast response rates in our tests and should be very well suited for fast-paced gaming. In comparison, all tested devices range from 0.1 (minimum) to 240 (maximum) ms. » 18 % of all devices are better. This means that the measured response time is better than the average of all tested devices (19.9 ms). | ||
| ↔ Response Time 50% Grey to 80% Grey | ||
| 13.3 ms ... rise ↗ and fall ↘ combined | ↗ 6.3 ms rise | 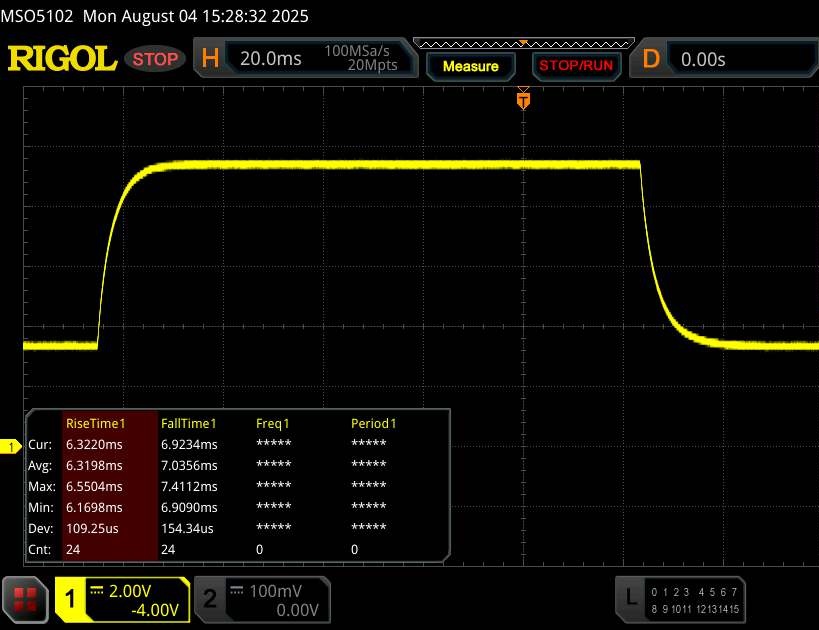 |
| ↘ 7 ms fall | ||
| The screen shows good response rates in our tests, but may be too slow for competitive gamers. In comparison, all tested devices range from 0.165 (minimum) to 636 (maximum) ms. » 27 % of all devices are better. This means that the measured response time is better than the average of all tested devices (31.1 ms). | ||
Screen Flickering / PWM (Pulse-Width Modulation)
| Screen flickering / PWM not detected |  | ||
In comparison: 52 % of all tested devices do not use PWM to dim the display. If PWM was detected, an average of 7794 (minimum: 5 - maximum: 343500) Hz was measured. | |||

Performance
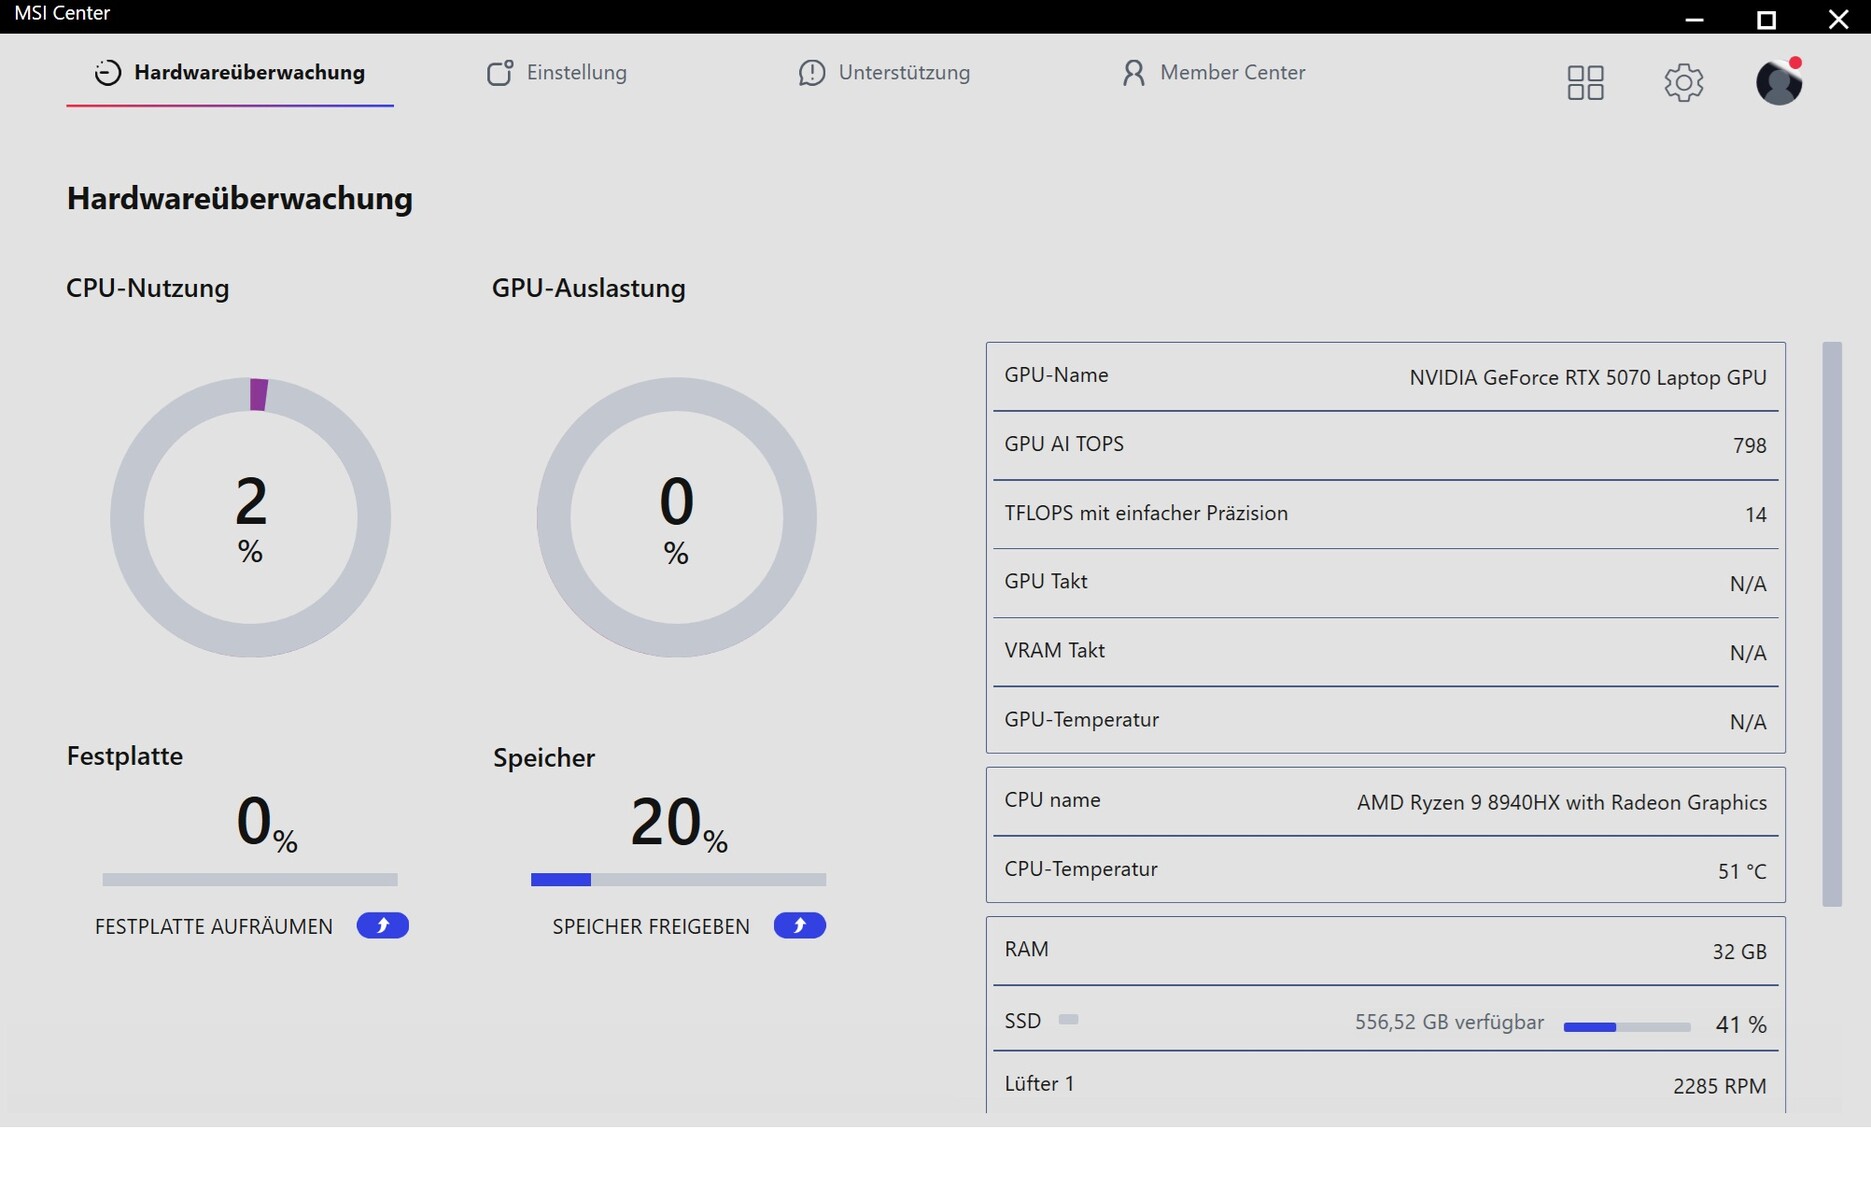
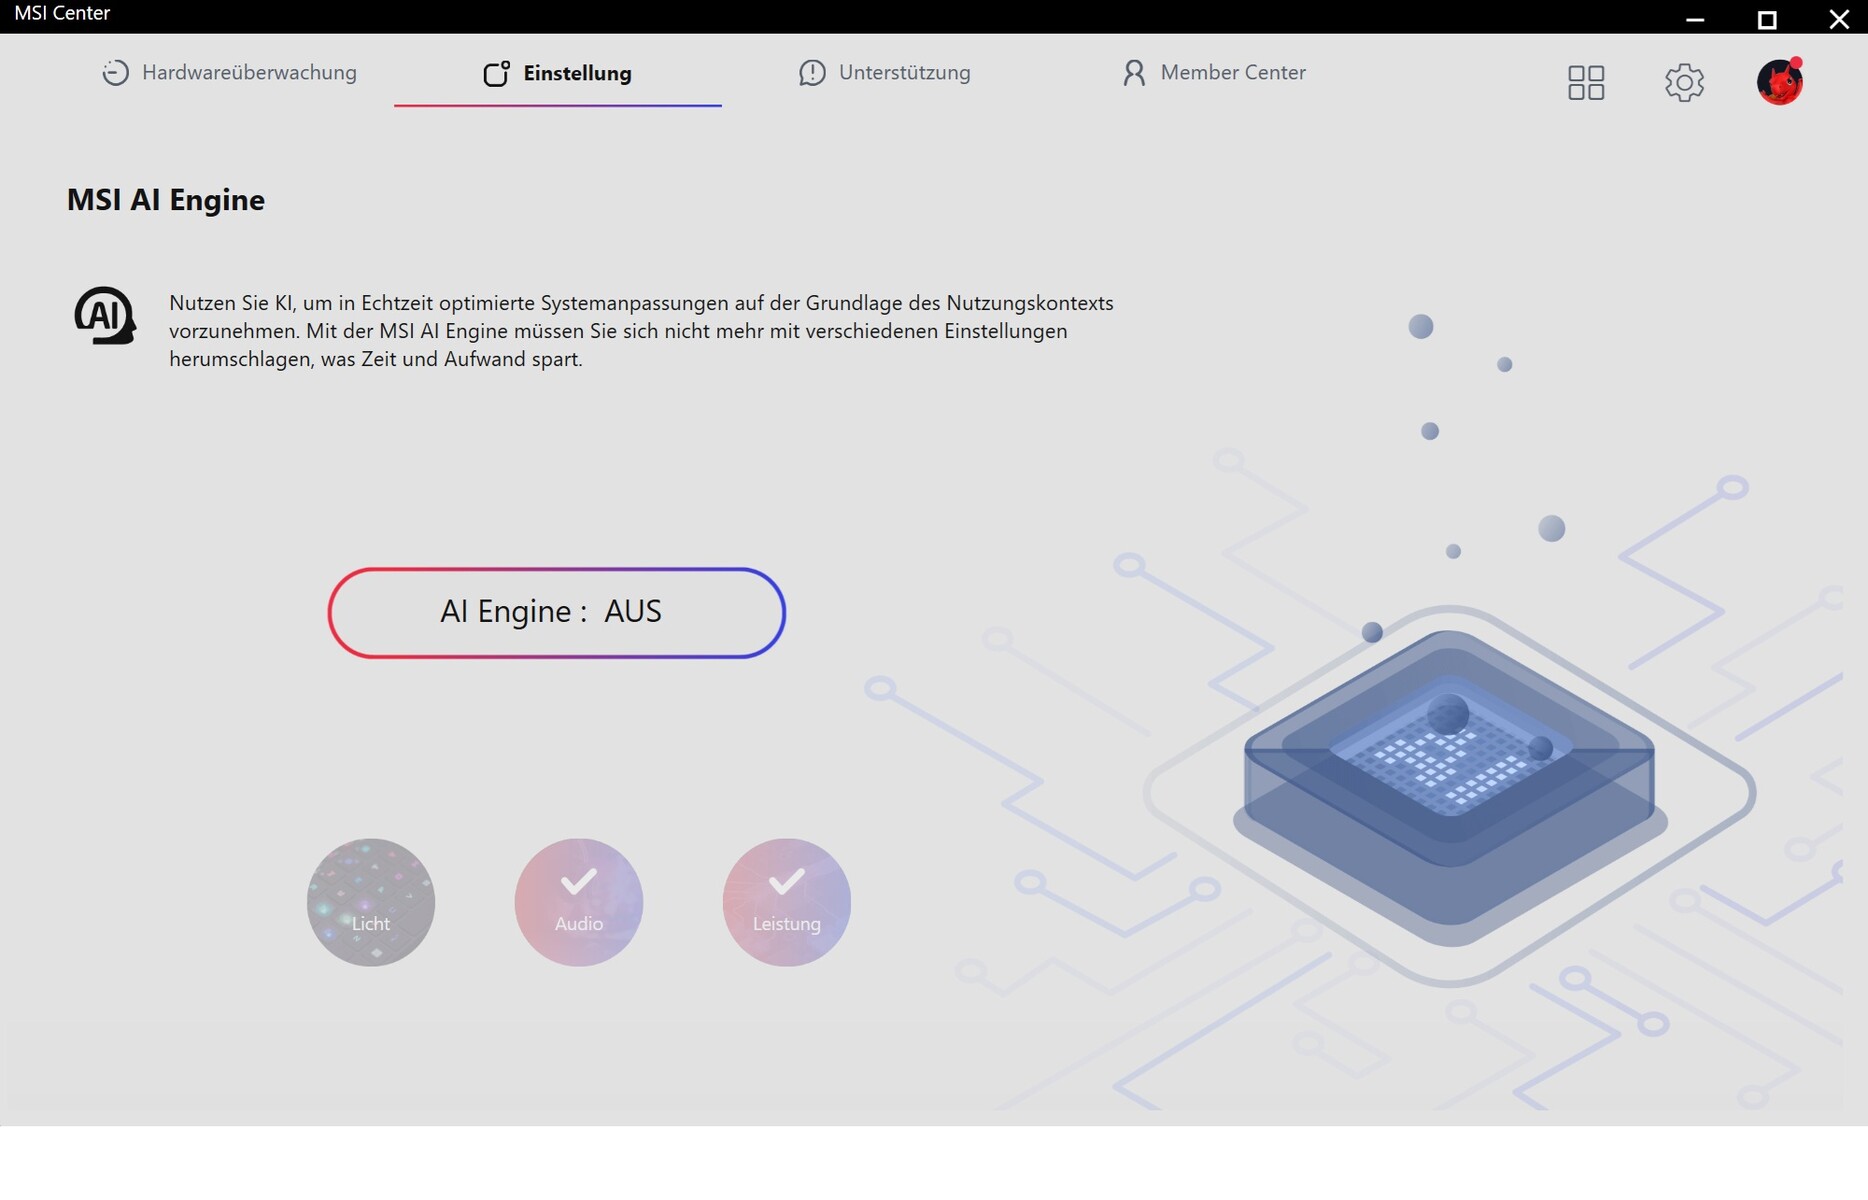
Test conditions
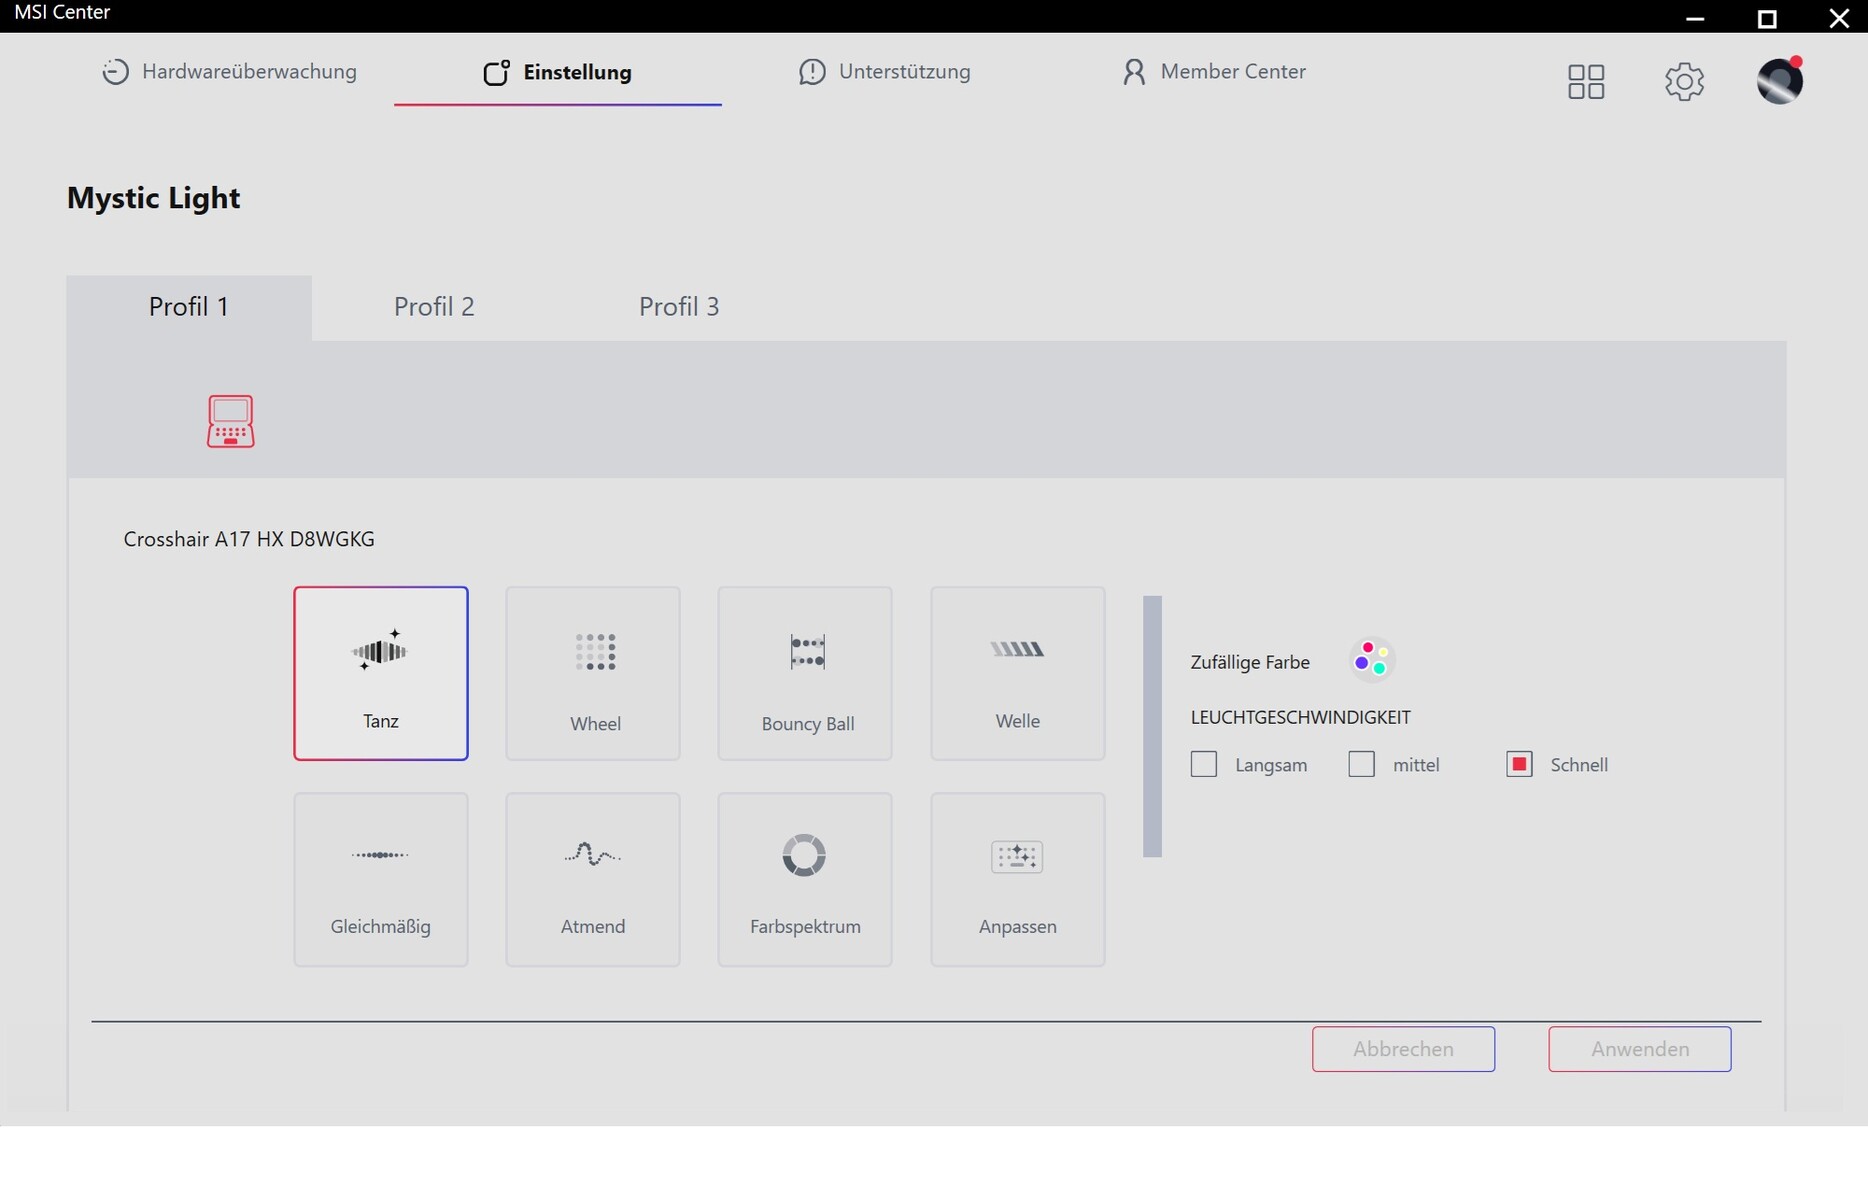
There are four user scenarios in the pre-installed MSI Center, ranging from ECO silent to an AI mode. We actually wanted to carry out the measurements with the latter, but since the AI profile turned out to be immature (e.g. fluctuating results & strange fan behavior), we resorted to the "Extreme performance" scenario for the test, which delivers significantly more CPU power and slightly more GPU power than the "Balanced" mode (see table).
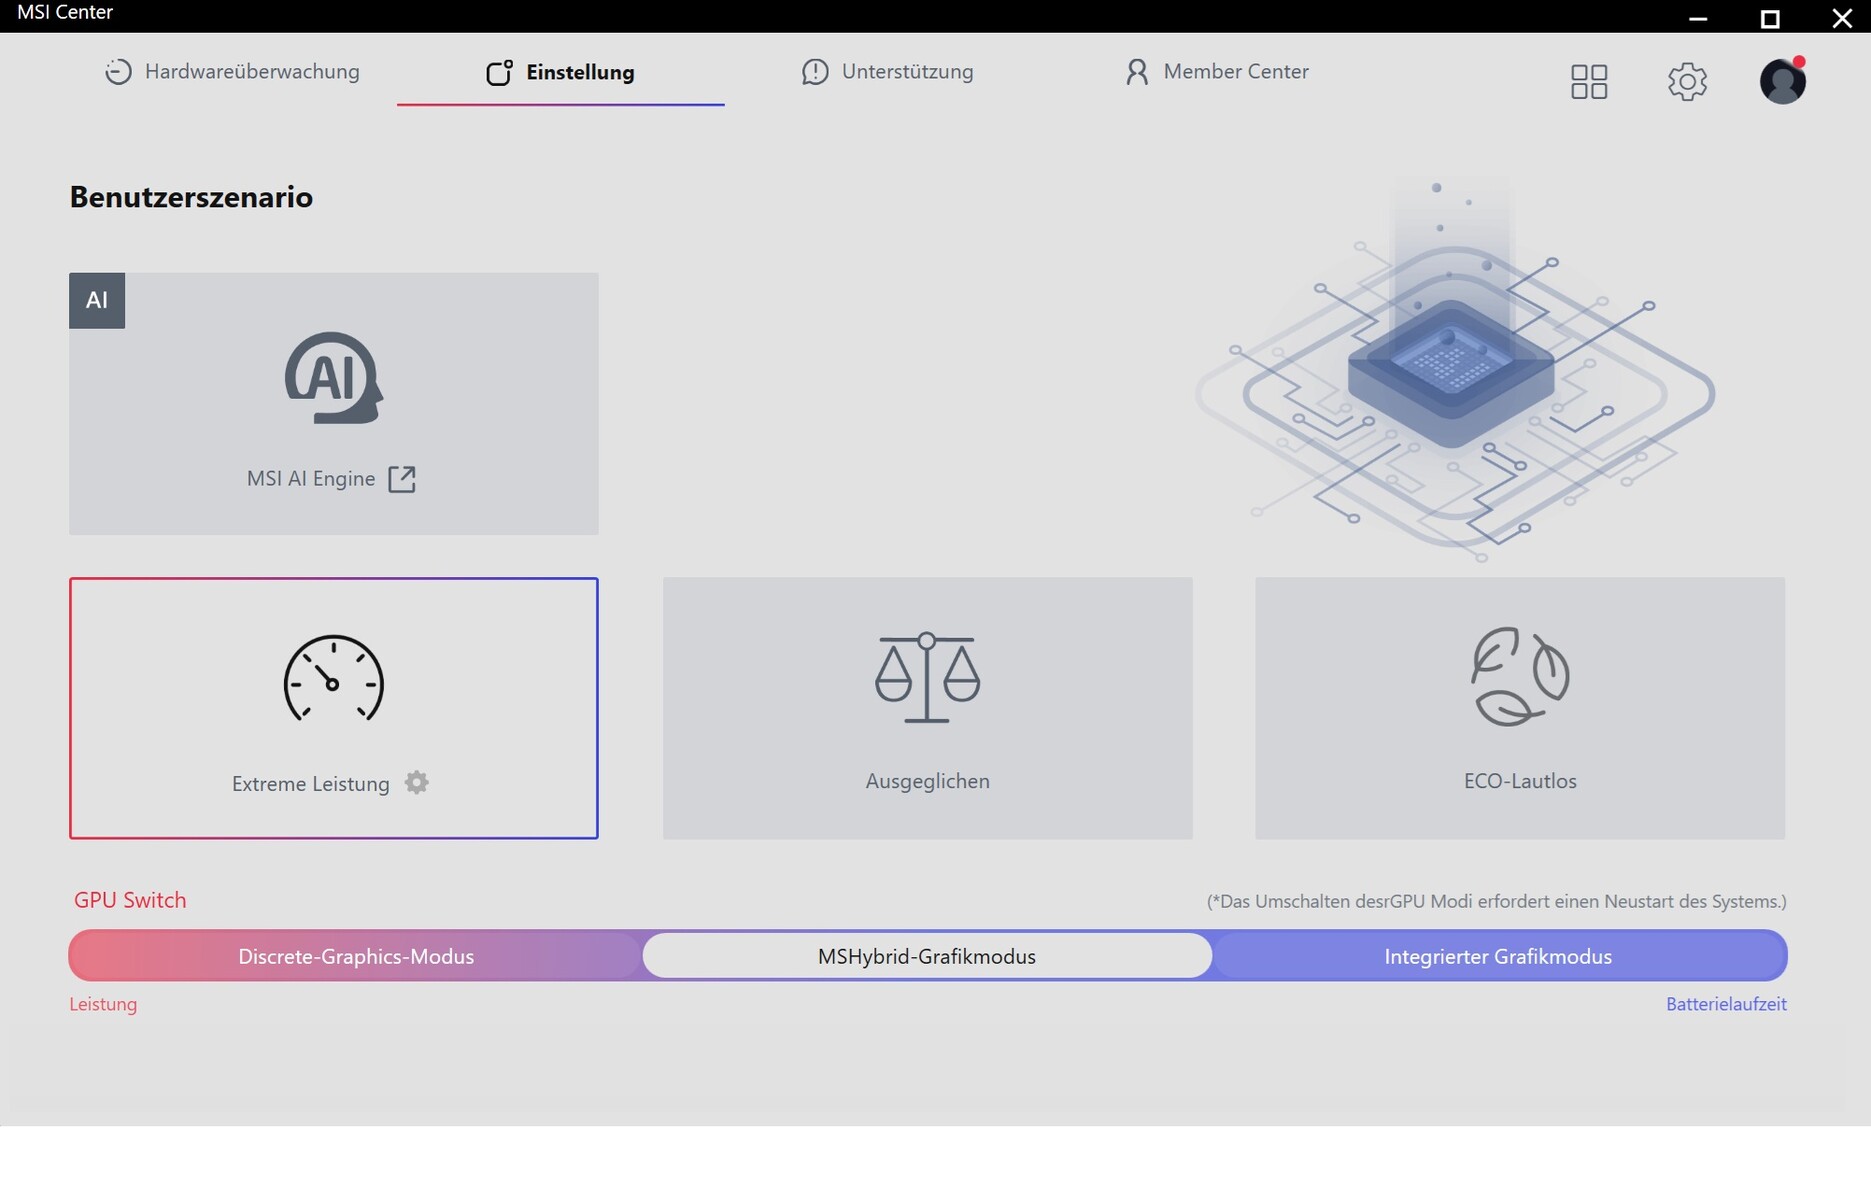
| Mode | Extreme performance | Balanced | Eco silent |
| Cyberpunk 2077 Noise | 57 dB(A) | 49 dB(A) | 36 dB(A) |
| Cyberpunk 2077 Performance (FHD/Ultra) | 107 fps | 89 fps | 30 fps locked |
| Cinebench R15 Multi Score | 5288 Points | 3431 Points | 1452 Points |
| CPU PL1 | 90 Watt | 50 Watt | 35 Watt |
| CPU PL2 | 108 watts | 55 watts | 35 watts |
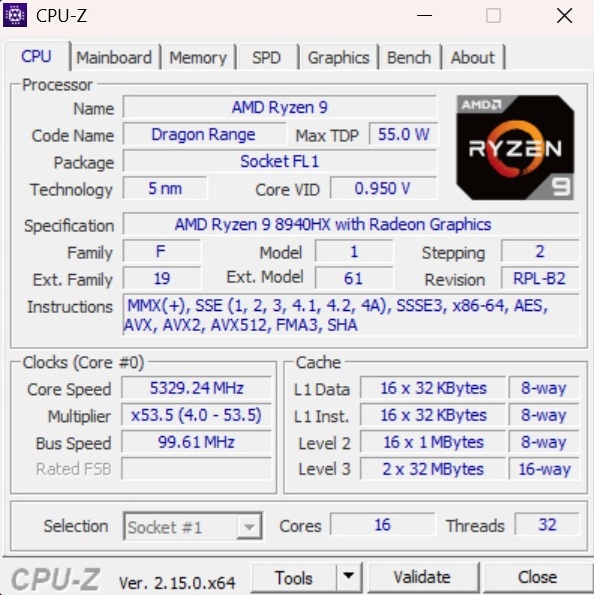
Processor
The Ryzen 9 8940HX celebrates its premiere in the Crosshair A17 HX. The Zen 4 chip offers a full 16 cores that can process up to 32 threads simultaneously via SMT, which is more than respectable in the notebook segment. According to our CPU benchmarks, the AMD model even outperforms the powerful Intel Core Ultra 9 275HX and also delivers a fairly consistent performance in the Cinebench loop. A Ryzen AI 9 HX 370 is left behind by just under 20% on average, a Ryzen AI 7 350 even by around 40%. Accordingly, the Crosshair A17 is particularly worthwhile for users who value or rely on high CPU performance.
Cinebench R15 Multi endurance test
* ... smaller is better
AIDA64: FP32 Ray-Trace | FPU Julia | CPU SHA3 | CPU Queen | FPU SinJulia | FPU Mandel | CPU AES | CPU ZLib | FP64 Ray-Trace | CPU PhotoWorxx
| Performance rating | |
| MSI Crosshair A17 HX D8WGKG | |
| Average AMD Ryzen 9 8940HX | |
| Lenovo Legion 5 Pro 16IAX10H | |
| Aorus Elite 16 AE6H | |
| Average of class Gaming | |
| MSI Vector 16 HX AI A2XWHG | |
| MSI Katana 17 HX B14WGK | |
| AIDA64 / FP32 Ray-Trace | |
| MSI Crosshair A17 HX D8WGKG | |
| Average AMD Ryzen 9 8940HX (43311 - 52718, n=2) | |
| Lenovo Legion 5 Pro 16IAX10H | |
| Aorus Elite 16 AE6H | |
| Average of class Gaming (10227 - 85542, n=109, last 2 years) | |
| MSI Vector 16 HX AI A2XWHG | |
| MSI Katana 17 HX B14WGK | |
| AIDA64 / FPU Julia | |
| MSI Crosshair A17 HX D8WGKG | |
| Average AMD Ryzen 9 8940HX (171374 - 212581, n=2) | |
| Lenovo Legion 5 Pro 16IAX10H | |
| Aorus Elite 16 AE6H | |
| MSI Vector 16 HX AI A2XWHG | |
| Average of class Gaming (51376 - 238426, n=109, last 2 years) | |
| MSI Katana 17 HX B14WGK | |
| AIDA64 / CPU SHA3 | |
| MSI Crosshair A17 HX D8WGKG | |
| Average AMD Ryzen 9 8940HX (7988 - 9259, n=2) | |
| Lenovo Legion 5 Pro 16IAX10H | |
| Aorus Elite 16 AE6H | |
| MSI Vector 16 HX AI A2XWHG | |
| Average of class Gaming (2180 - 9817, n=109, last 2 years) | |
| MSI Katana 17 HX B14WGK | |
| AIDA64 / CPU Queen | |
| MSI Crosshair A17 HX D8WGKG | |
| Average AMD Ryzen 9 8940HX (169334 - 172010, n=2) | |
| Lenovo Legion 5 Pro 16IAX10H | |
| Aorus Elite 16 AE6H | |
| MSI Vector 16 HX AI A2XWHG | |
| Average of class Gaming (49785 - 173351, n=100, last 2 years) | |
| MSI Katana 17 HX B14WGK | |
| AIDA64 / FPU SinJulia | |
| MSI Crosshair A17 HX D8WGKG | |
| Average AMD Ryzen 9 8940HX (26855 - 29514, n=2) | |
| Average of class Gaming (4424 - 33636, n=109, last 2 years) | |
| Lenovo Legion 5 Pro 16IAX10H | |
| Aorus Elite 16 AE6H | |
| MSI Vector 16 HX AI A2XWHG | |
| MSI Katana 17 HX B14WGK | |
| AIDA64 / FPU Mandel | |
| MSI Crosshair A17 HX D8WGKG | |
| Average AMD Ryzen 9 8940HX (90684 - 113321, n=2) | |
| Lenovo Legion 5 Pro 16IAX10H | |
| Aorus Elite 16 AE6H | |
| MSI Vector 16 HX AI A2XWHG | |
| Average of class Gaming (25115 - 128721, n=109, last 2 years) | |
| MSI Katana 17 HX B14WGK | |
| AIDA64 / CPU AES | |
| MSI Crosshair A17 HX D8WGKG | |
| Average AMD Ryzen 9 8940HX (150768 - 168749, n=2) | |
| Lenovo Legion 5 Pro 16IAX10H | |
| Aorus Elite 16 AE6H | |
| Average of class Gaming (39258 - 247074, n=109, last 2 years) | |
| MSI Vector 16 HX AI A2XWHG | |
| MSI Katana 17 HX B14WGK | |
| AIDA64 / CPU ZLib | |
| Lenovo Legion 5 Pro 16IAX10H | |
| MSI Crosshair A17 HX D8WGKG | |
| Average AMD Ryzen 9 8940HX (1784 - 2092, n=2) | |
| Aorus Elite 16 AE6H | |
| Average of class Gaming (574 - 2531, n=109, last 2 years) | |
| MSI Vector 16 HX AI A2XWHG | |
| MSI Katana 17 HX B14WGK | |
| AIDA64 / FP64 Ray-Trace | |
| MSI Crosshair A17 HX D8WGKG | |
| Average AMD Ryzen 9 8940HX (23193 - 28180, n=2) | |
| Lenovo Legion 5 Pro 16IAX10H | |
| Aorus Elite 16 AE6H | |
| Average of class Gaming (5509 - 45446, n=109, last 2 years) | |
| MSI Vector 16 HX AI A2XWHG | |
| MSI Katana 17 HX B14WGK | |
| AIDA64 / CPU PhotoWorxx | |
| Lenovo Legion 5 Pro 16IAX10H | |
| Aorus Elite 16 AE6H | |
| Average of class Gaming (12271 - 89891, n=109, last 2 years) | |
| MSI Vector 16 HX AI A2XWHG | |
| MSI Crosshair A17 HX D8WGKG | |
| MSI Katana 17 HX B14WGK | |
| Average AMD Ryzen 9 8940HX (18283 - 34819, n=2) | |
System performance
The system performance is not quite as spectacular. If you take all benchmarks together, the 17-incher is only just ahead of the Katana 17.
PCMark 10: Score | Essentials | Productivity | Digital Content Creation
CrossMark: Overall | Productivity | Creativity | Responsiveness
WebXPRT 3: Overall
WebXPRT 4: Overall
Mozilla Kraken 1.1: Total
| Performance rating | |
| Lenovo Legion 5 Pro 16IAX10H | |
| Aorus Elite 16 AE6H | |
| Average of class Gaming | |
| MSI Vector 16 HX AI A2XWHG | |
| MSI Crosshair A17 HX D8WGKG | |
| Average AMD Ryzen 9 8940HX, NVIDIA GeForce RTX 5070 Laptop | |
| MSI Katana 17 HX B14WGK | |
| PCMark 10 / Score | |
| Average of class Gaming (5828 - 11574, n=95, last 2 years) | |
| Lenovo Legion 5 Pro 16IAX10H | |
| MSI Crosshair A17 HX D8WGKG | |
| Average AMD Ryzen 9 8940HX, NVIDIA GeForce RTX 5070 Laptop (n=1) | |
| Aorus Elite 16 AE6H | |
| MSI Vector 16 HX AI A2XWHG | |
| MSI Katana 17 HX B14WGK | |
| PCMark 10 / Essentials | |
| MSI Crosshair A17 HX D8WGKG | |
| Average AMD Ryzen 9 8940HX, NVIDIA GeForce RTX 5070 Laptop (n=1) | |
| Aorus Elite 16 AE6H | |
| Lenovo Legion 5 Pro 16IAX10H | |
| MSI Vector 16 HX AI A2XWHG | |
| Average of class Gaming (8810 - 12600, n=99, last 2 years) | |
| MSI Katana 17 HX B14WGK | |
| PCMark 10 / Productivity | |
| Average of class Gaming (6845 - 18766, n=97, last 2 years) | |
| Lenovo Legion 5 Pro 16IAX10H | |
| MSI Vector 16 HX AI A2XWHG | |
| MSI Crosshair A17 HX D8WGKG | |
| Average AMD Ryzen 9 8940HX, NVIDIA GeForce RTX 5070 Laptop (n=1) | |
| Aorus Elite 16 AE6H | |
| MSI Katana 17 HX B14WGK | |
| PCMark 10 / Digital Content Creation | |
| Lenovo Legion 5 Pro 16IAX10H | |
| Aorus Elite 16 AE6H | |
| Average of class Gaming (7602 - 19657, n=97, last 2 years) | |
| MSI Crosshair A17 HX D8WGKG | |
| Average AMD Ryzen 9 8940HX, NVIDIA GeForce RTX 5070 Laptop (n=1) | |
| MSI Vector 16 HX AI A2XWHG | |
| MSI Katana 17 HX B14WGK | |
| CrossMark / Overall | |
| Lenovo Legion 5 Pro 16IAX10H | |
| Aorus Elite 16 AE6H | |
| Average of class Gaming (1366 - 2409, n=97, last 2 years) | |
| MSI Crosshair A17 HX D8WGKG | |
| Average AMD Ryzen 9 8940HX, NVIDIA GeForce RTX 5070 Laptop (n=1) | |
| MSI Katana 17 HX B14WGK | |
| MSI Vector 16 HX AI A2XWHG | |
| CrossMark / Productivity | |
| Lenovo Legion 5 Pro 16IAX10H | |
| Aorus Elite 16 AE6H | |
| MSI Katana 17 HX B14WGK | |
| Average of class Gaming (1386 - 2254, n=97, last 2 years) | |
| MSI Vector 16 HX AI A2XWHG | |
| MSI Crosshair A17 HX D8WGKG | |
| Average AMD Ryzen 9 8940HX, NVIDIA GeForce RTX 5070 Laptop (n=1) | |
| CrossMark / Creativity | |
| Lenovo Legion 5 Pro 16IAX10H | |
| Aorus Elite 16 AE6H | |
| MSI Vector 16 HX AI A2XWHG | |
| Average of class Gaming (1343 - 2729, n=97, last 2 years) | |
| MSI Crosshair A17 HX D8WGKG | |
| Average AMD Ryzen 9 8940HX, NVIDIA GeForce RTX 5070 Laptop (n=1) | |
| MSI Katana 17 HX B14WGK | |
| CrossMark / Responsiveness | |
| Aorus Elite 16 AE6H | |
| MSI Katana 17 HX B14WGK | |
| Lenovo Legion 5 Pro 16IAX10H | |
| MSI Crosshair A17 HX D8WGKG | |
| Average AMD Ryzen 9 8940HX, NVIDIA GeForce RTX 5070 Laptop (n=1) | |
| Average of class Gaming (1226 - 2334, n=97, last 2 years) | |
| MSI Vector 16 HX AI A2XWHG | |
| WebXPRT 3 / Overall | |
| Lenovo Legion 5 Pro 16IAX10H | |
| MSI Vector 16 HX AI A2XWHG | |
| Average of class Gaming (242 - 532, n=100, last 2 years) | |
| Aorus Elite 16 AE6H | |
| MSI Katana 17 HX B14WGK | |
| MSI Crosshair A17 HX D8WGKG | |
| Average AMD Ryzen 9 8940HX, NVIDIA GeForce RTX 5070 Laptop (n=1) | |
| WebXPRT 4 / Overall | |
| Aorus Elite 16 AE6H | |
| Lenovo Legion 5 Pro 16IAX10H | |
| MSI Vector 16 HX AI A2XWHG | |
| Average of class Gaming (176.4 - 354, n=100, last 2 years) | |
| MSI Katana 17 HX B14WGK | |
| MSI Crosshair A17 HX D8WGKG | |
| Average AMD Ryzen 9 8940HX, NVIDIA GeForce RTX 5070 Laptop (n=1) | |
| Mozilla Kraken 1.1 / Total | |
| MSI Crosshair A17 HX D8WGKG | |
| Average AMD Ryzen 9 8940HX, NVIDIA GeForce RTX 5070 Laptop (n=1) | |
| MSI Katana 17 HX B14WGK | |
| Average of class Gaming (391 - 590, n=105, last 2 years) | |
| MSI Vector 16 HX AI A2XWHG | |
| Aorus Elite 16 AE6H | |
| Lenovo Legion 5 Pro 16IAX10H | |
* ... smaller is better
| PCMark 10 Score | 8106 points | |
Help | ||
| AIDA64 / Memory Copy | |
| Aorus Elite 16 AE6H | |
| Lenovo Legion 5 Pro 16IAX10H | |
| Average of class Gaming (21750 - 129946, n=109, last 2 years) | |
| MSI Vector 16 HX AI A2XWHG | |
| MSI Katana 17 HX B14WGK | |
| MSI Crosshair A17 HX D8WGKG | |
| Average AMD Ryzen 9 8940HX (29102 - 51173, n=2) | |
| AIDA64 / Memory Read | |
| Lenovo Legion 5 Pro 16IAX10H | |
| Aorus Elite 16 AE6H | |
| MSI Vector 16 HX AI A2XWHG | |
| Average of class Gaming (22956 - 118858, n=109, last 2 years) | |
| MSI Katana 17 HX B14WGK | |
| MSI Crosshair A17 HX D8WGKG | |
| Average AMD Ryzen 9 8940HX (35634 - 62219, n=2) | |
| AIDA64 / Memory Write | |
| Aorus Elite 16 AE6H | |
| Lenovo Legion 5 Pro 16IAX10H | |
| Average of class Gaming (22297 - 135096, n=109, last 2 years) | |
| MSI Vector 16 HX AI A2XWHG | |
| MSI Crosshair A17 HX D8WGKG | |
| MSI Katana 17 HX B14WGK | |
| Average AMD Ryzen 9 8940HX (32239 - 61929, n=2) | |
| AIDA64 / Memory Latency | |
| Lenovo Legion 5 Pro 16IAX10H | |
| Aorus Elite 16 AE6H | |
| MSI Vector 16 HX AI A2XWHG | |
| Average of class Gaming (75.3 - 259, n=109, last 2 years) | |
| MSI Katana 17 HX B14WGK | |
| MSI Crosshair A17 HX D8WGKG | |
| Average AMD Ryzen 9 8940HX (83.5 - 83.9, n=2) | |
* ... smaller is better
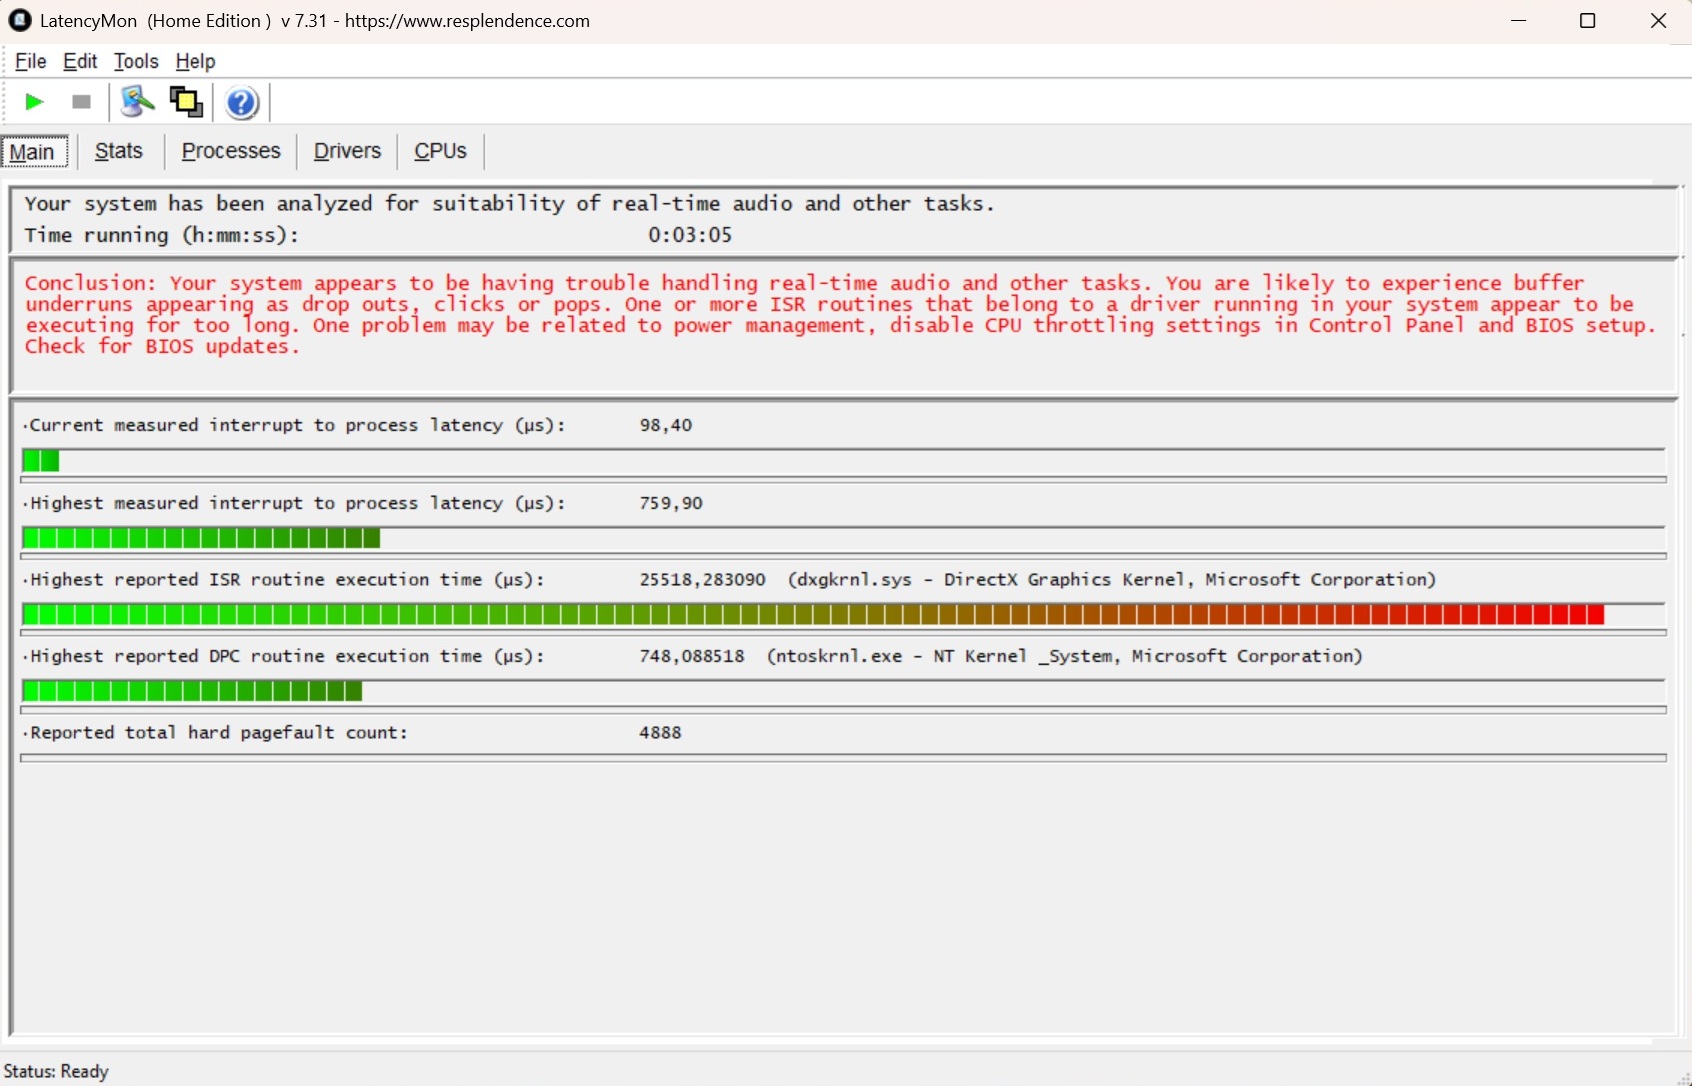
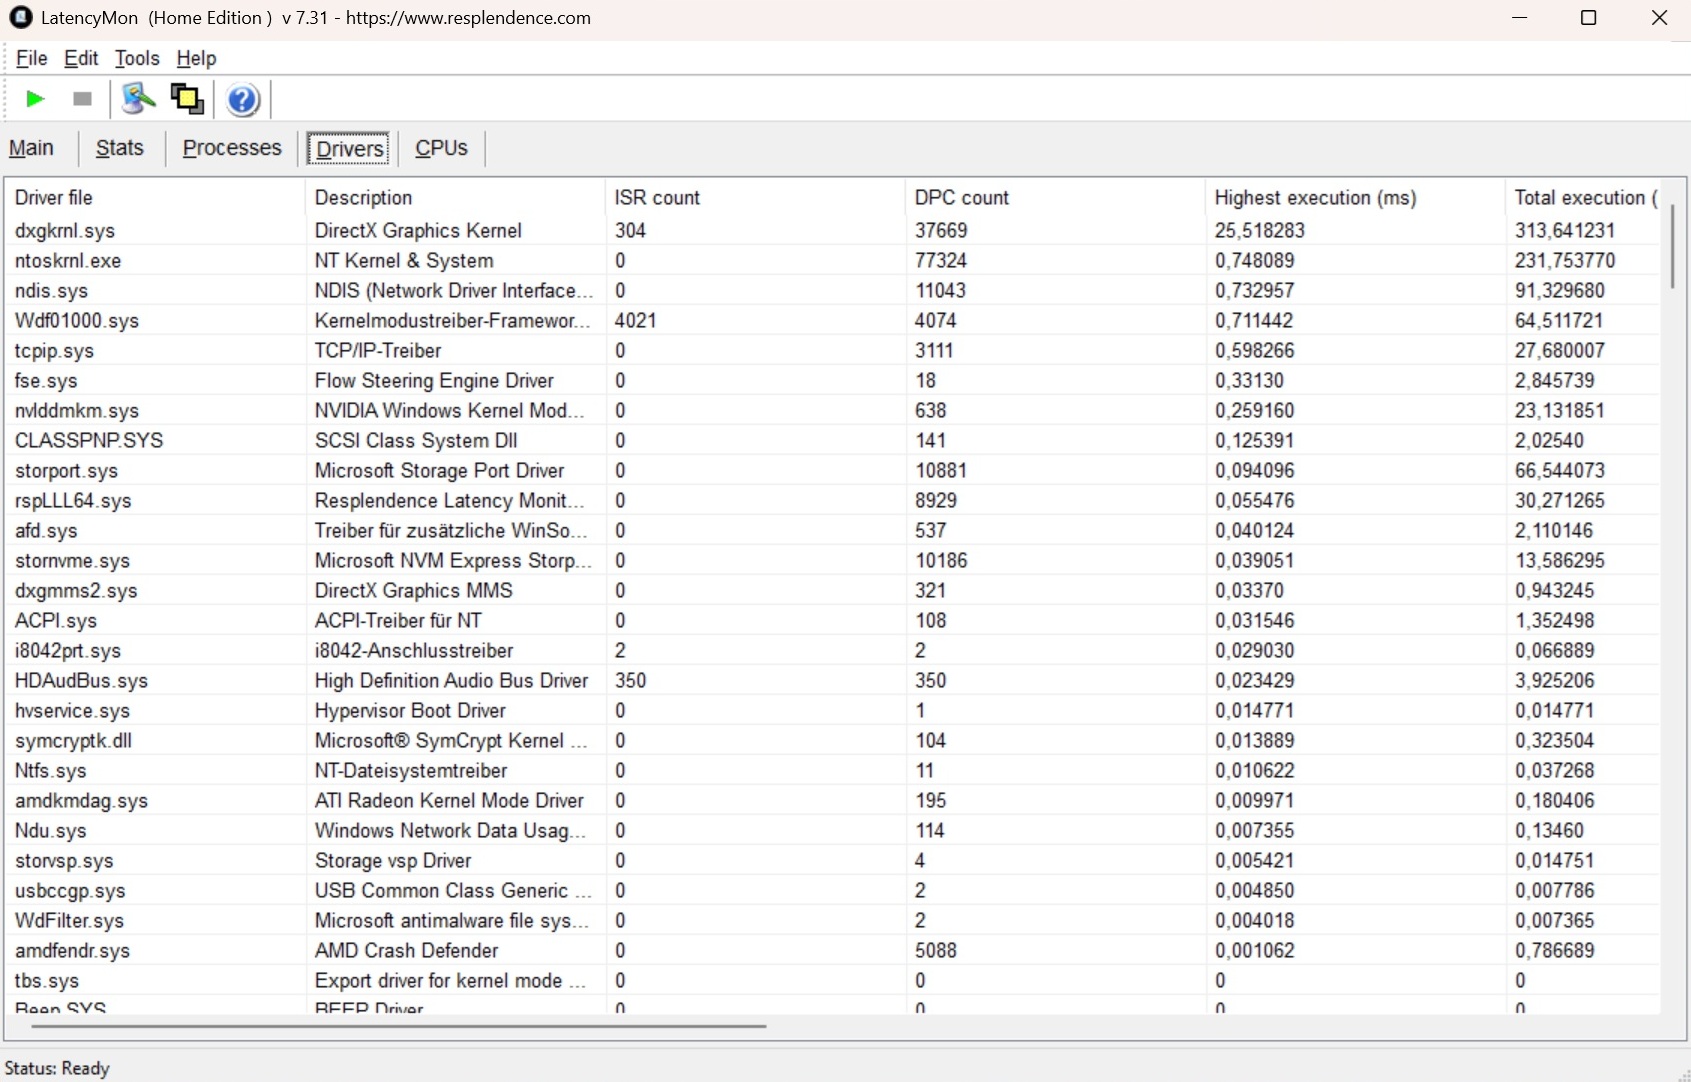
DPC latencies
Although the latencies are not as high as with some other devices, the LatencyMon tool still mentions potential problems in certain applications.
| DPC Latencies / LatencyMon - interrupt to process latency (max), Web, Youtube, Prime95 | |
| MSI Katana 17 HX B14WGK | |
| MSI Vector 16 HX AI A2XWHG | |
| Lenovo Legion 5 Pro 16IAX10H | |
| Aorus Elite 16 AE6H | |
| MSI Crosshair A17 HX D8WGKG | |
* ... smaller is better
Mass storage
There is praise for the fast mass storage. The built-in 1 TB SSD from Samsung takes third place in the comparison field and manages without a drop in speed in the DiskSpd loop. Top: An M.2 slot is still available for later upgrades.

* ... smaller is better
Read continuous performance: DiskSpd Read Loop, Queue Depth 8
GPU performance
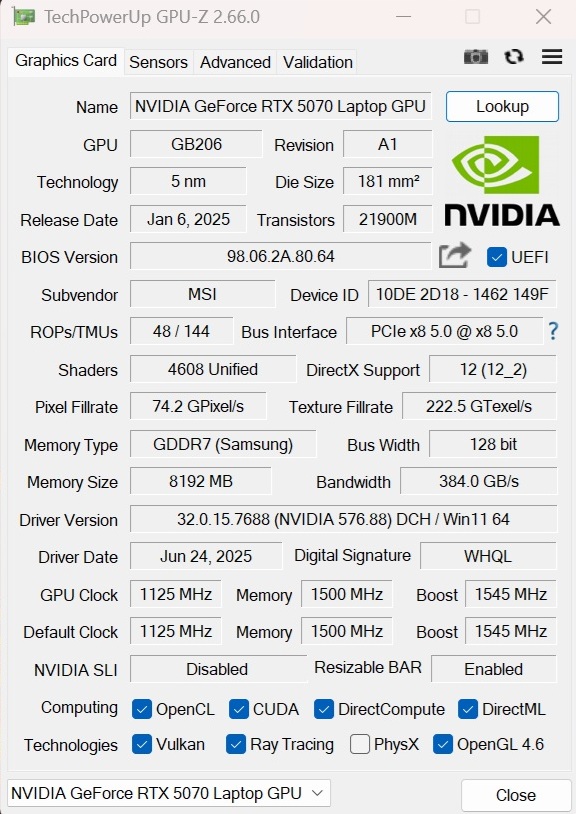
The GeForce RTX 5070 is currently used in many gaming laptops despite its meagre VRAM configuration (8 GB is only recommended to a limited extent in 2025). MSI has opted for the maximum TGP of 115 watts for the Crosshair A17 (including Dynamic Boost). Our 3DMark course confirms that the 17-inch model performs at the expected level, and occasionally the performance is also slightly above the previously determined average for this graphics card.
| 3DMark 11 Performance | 36864 points | |
| 3DMark Cloud Gate Standard Score | 65538 points | |
| 3DMark Fire Strike Score | 33730 points | |
| 3DMark Time Spy Score | 13400 points | |
Help | ||
* ... smaller is better
Gaming performance
In the gaming course, the gap to the RTX 5070 average increases, so that the 17-incher is even a threat to some RTX 5070 Ti laptops. With the exception of very demanding, VRAM-heavy or moderately optimized games such as Oblivion Remastered most titles run in QHD resolution and maximum settings with a decent frame rate (40+ FPS). If the RTX 5070 does run out of steam, reducing the detail level and/or upscaling in the form of DLSS (including frame generation for supported games) can help.
| Performance rating - Percent | |
| Lenovo Legion 5 Pro 16IAX10H | |
| MSI Vector 16 HX AI A2XWHG -1! | |
| MSI Crosshair A17 HX D8WGKG -1! | |
| Aorus Elite 16 AE6H -1! | |
| Average of class Gaming | |
| MSI Katana 17 HX B14WGK -2! | |
| Average NVIDIA GeForce RTX 5070 Laptop | |
| Final Fantasy XV Benchmark - 1920x1080 High Quality | |
| Lenovo Legion 5 Pro 16IAX10H | |
| MSI Vector 16 HX AI A2XWHG | |
| Aorus Elite 16 AE6H | |
| Average of class Gaming (41 - 215, n=103, last 2 years) | |
| MSI Crosshair A17 HX D8WGKG | |
| Average NVIDIA GeForce RTX 5070 Laptop (96 - 150.7, n=25) | |
| Strange Brigade - 1920x1080 ultra AA:ultra AF:16 | |
| Lenovo Legion 5 Pro 16IAX10H | |
| Average of class Gaming (76.3 - 456, n=93, last 2 years) | |
| Average NVIDIA GeForce RTX 5070 Laptop (203 - 261, n=23) | |
| low | med. | high | ultra | QHD DLSS | QHD | |
|---|---|---|---|---|---|---|
| GTA V (2015) | 186.7 | 185.2 | 160.2 | 122.5 | ||
| Dota 2 Reborn (2015) | 246 | 213 | 203 | 184.2 | ||
| Final Fantasy XV Benchmark (2018) | 185 | 141.5 | 103.7 | |||
| X-Plane 11.11 (2018) | 156 | 134.4 | 107.4 | |||
| Baldur's Gate 3 (2023) | 154.5 | 128.2 | 124.9 | 84.9 | ||
| Cyberpunk 2077 (2023) | 144.1 | 121.3 | 106.7 | 66.8 | ||
| Horizon Forbidden West (2024) | 108.1 | 82.6 | 77.9 | 81.3 | 64 | |
| Ghost of Tsushima (2024) | 100 | 92.1 | 71 | 74.6 | 53.8 | |
| Senua's Saga Hellblade 2 (2024) | 71 | 51.4 | 56.2 | 36.7 | ||
| The Elder Scrolls IV Oblivion Remastered (2025) | 74.2 | 65.4 | 32.1 | 34 | 19.5 | |
| Doom: The Dark Ages (2025) | 75.2 | 68.1 | 66.6 | 66.1 | 44.8 | |
| F1 25 (2025) | 239 | 199 | 31 | 29 | 17 |
| F1 25 | |
| 2560x1440 Ultra Max Preset AA:T AF:16x | |
| Average of class Gaming (5 - 37.5, n=24, last 2 years) | |
| Lenovo Legion 5 Pro 16IAX10H | |
| MSI Crosshair A17 HX D8WGKG | |
| Average NVIDIA GeForce RTX 5070 Laptop (7.69 - 17, n=8) | |
| 2560x1440 Ultra Max Preset + DLSS Quality AA:DLSS AF:16x | |
| Average of class Gaming (9 - 67.5, n=22, last 2 years) | |
| Lenovo Legion 5 Pro 16IAX10H | |
| Average NVIDIA GeForce RTX 5070 Laptop (27.1 - 33.4, n=6) | |
| MSI Crosshair A17 HX D8WGKG | |
| The Elder Scrolls IV Oblivion Remastered | |
| 2560x1440 Ultra Preset AA:T | |
| MSI Vector 16 HX AI A2XWHG | |
| Average of class Gaming (12.7 - 45.9, n=14, last 2 years) | |
| MSI Katana 17 HX B14WGK | |
| Average NVIDIA GeForce RTX 5070 Laptop (19.5 - 20.9, n=3) | |
| MSI Crosshair A17 HX D8WGKG | |
| 2560x1440 Ultra Preset + Quality DLSS | |
| MSI Vector 16 HX AI A2XWHG | |
| Average of class Gaming (25.3 - 59.7, n=12, last 2 years) | |
| MSI Crosshair A17 HX D8WGKG | |
| Average NVIDIA GeForce RTX 5070 Laptop (30.3 - 34, n=3) | |
| MSI Katana 17 HX B14WGK | |
| Horizon Forbidden West | |
| 2560x1440 Very High Preset AA:T | |
| MSI Vector 16 HX AI A2XWHG | |
| Average of class Gaming (39.6 - 100.9, n=10, last 2 years) | |
| MSI Crosshair A17 HX D8WGKG | |
| Average NVIDIA GeForce RTX 5070 Laptop (57.9 - 64, n=2) | |
| MSI Katana 17 HX B14WGK | |
| 2560x1440 Very High Preset + DLSS Quality | |
| MSI Vector 16 HX AI A2XWHG | |
| Average of class Gaming (58.4 - 116.6, n=8, last 2 years) | |
| MSI Crosshair A17 HX D8WGKG | |
| Average NVIDIA GeForce RTX 5070 Laptop (70.3 - 81.3, n=2) | |
| MSI Katana 17 HX B14WGK | |
| Ghost of Tsushima | |
| 2560x1440 Very High Preset AA:T | |
| MSI Vector 16 HX AI A2XWHG | |
| Average of class Gaming (22.7 - 100.3, n=13, last 2 years) | |
| MSI Crosshair A17 HX D8WGKG | |
| Average NVIDIA GeForce RTX 5070 Laptop (49.1 - 53.8, n=2) | |
| MSI Katana 17 HX B14WGK | |
| 2560x1440 Very High Preset + Quality DLSS | |
| MSI Vector 16 HX AI A2XWHG | |
| MSI Crosshair A17 HX D8WGKG | |
| Average of class Gaming (55.2 - 105.2, n=10, last 2 years) | |
| Average NVIDIA GeForce RTX 5070 Laptop (66.5 - 74.6, n=2) | |
| MSI Katana 17 HX B14WGK | |
| Senua's Saga Hellblade 2 | |
| 2560x1440 High Preset | |
| MSI Vector 16 HX AI A2XWHG | |
| Average of class Gaming (24.2 - 63.1, n=11, last 2 years) | |
| MSI Crosshair A17 HX D8WGKG | |
| Average NVIDIA GeForce RTX 5070 Laptop (31.7 - 36.7, n=2) | |
| MSI Katana 17 HX B14WGK | |
| 2560x1440 High Preset + Quality DLSS | |
| MSI Vector 16 HX AI A2XWHG | |
| MSI Crosshair A17 HX D8WGKG | |
| Average of class Gaming (39.6 - 81.9, n=9, last 2 years) | |
| Average NVIDIA GeForce RTX 5070 Laptop (49.4 - 56.2, n=2) | |
| MSI Katana 17 HX B14WGK | |
As our Cyberpunk test shows, the GPU performance - similar to the CPU and SSD performance - remains pleasingly stable even over longer periods of time.
Cyberpunk 2077 ultra FPS chart
Emissions
Noise emissions
Unsurprisingly, the "Extreme performance" mode leads to a hefty background noise. 57 to 58 dB(A) in 3D mode is annoyingly loud without a headset (in balanced mode, the performance drops noticeably in some cases, but the device also remains noticeably quieter). We found the fan behavior in idle mode to be just as annoying, as the cooling system sometimes revs up to over 40 dB(A) for no reason. All competitors manage this better.
Noise level
| Idle |
| 25 / 30 / 47 dB(A) |
| Load |
| 57 / 58 dB(A) |
 | ||
30 dB silent 40 dB(A) audible 50 dB(A) loud |
||
min: | ||
| MSI Crosshair A17 HX D8WGKG R9 8940HX, GeForce RTX 5070 Laptop | MSI Katana 17 HX B14WGK i7-14650HX, GeForce RTX 5070 Laptop | Aorus Elite 16 AE6H Ultra 9 275HX, GeForce RTX 5070 Laptop | Lenovo Legion 5 Pro 16IAX10H Ultra 9 275HX, GeForce RTX 5070 Ti Laptop | MSI Vector 16 HX AI A2XWHG Ultra 7 255HX, GeForce RTX 5070 Ti Laptop | |
|---|---|---|---|---|---|
| Noise | 0% | 3% | 9% | 3% | |
| off / environment * (dB) | 24 | 25 -4% | 24 -0% | 24 -0% | 25 -4% |
| Idle Minimum * (dB) | 25 | 31 -24% | 25 -0% | 24 4% | 33 -32% |
| Idle Average * (dB) | 30 | 32 -7% | 29 3% | 24 20% | 34 -13% |
| Idle Maximum * (dB) | 47 | 34 28% | 32 32% | 30.9 34% | 38 19% |
| Load Average * (dB) | 57 | 50 12% | 60 -5% | 55.9 2% | 46 19% |
| Cyberpunk 2077 ultra * (dB) | 57 | 58 -2% | 59 -4% | 56.72 -0% | 47 18% |
| Load Maximum * (dB) | 58 | 59 -2% | 61 -5% | 56.72 2% | 49 16% |
* ... smaller is better
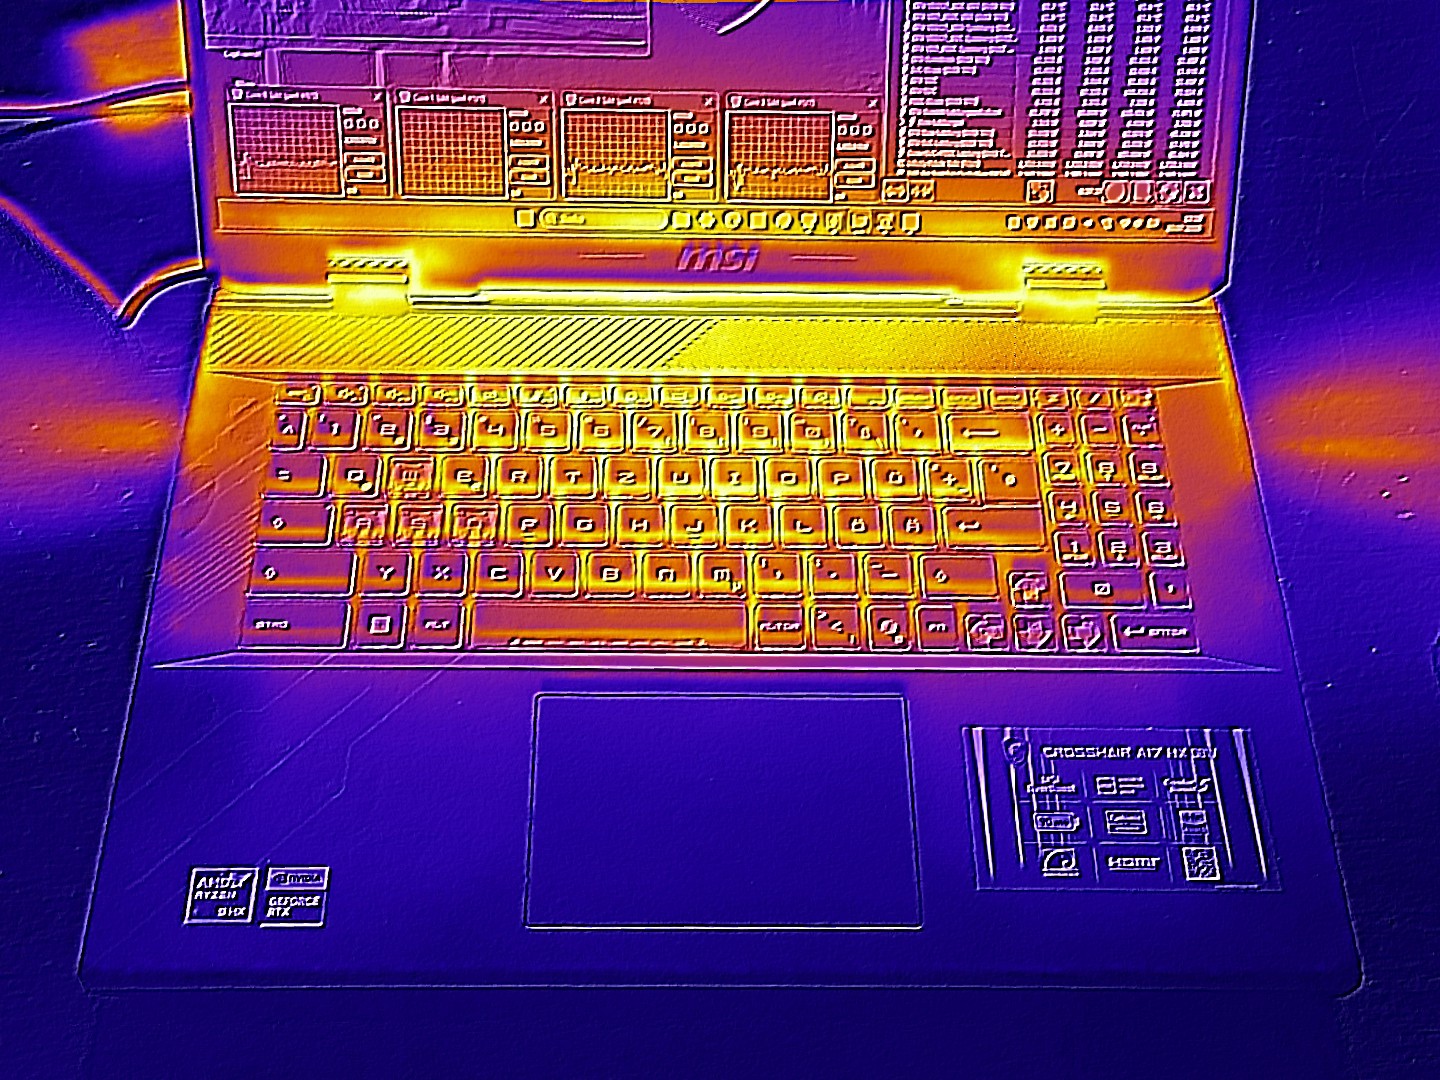
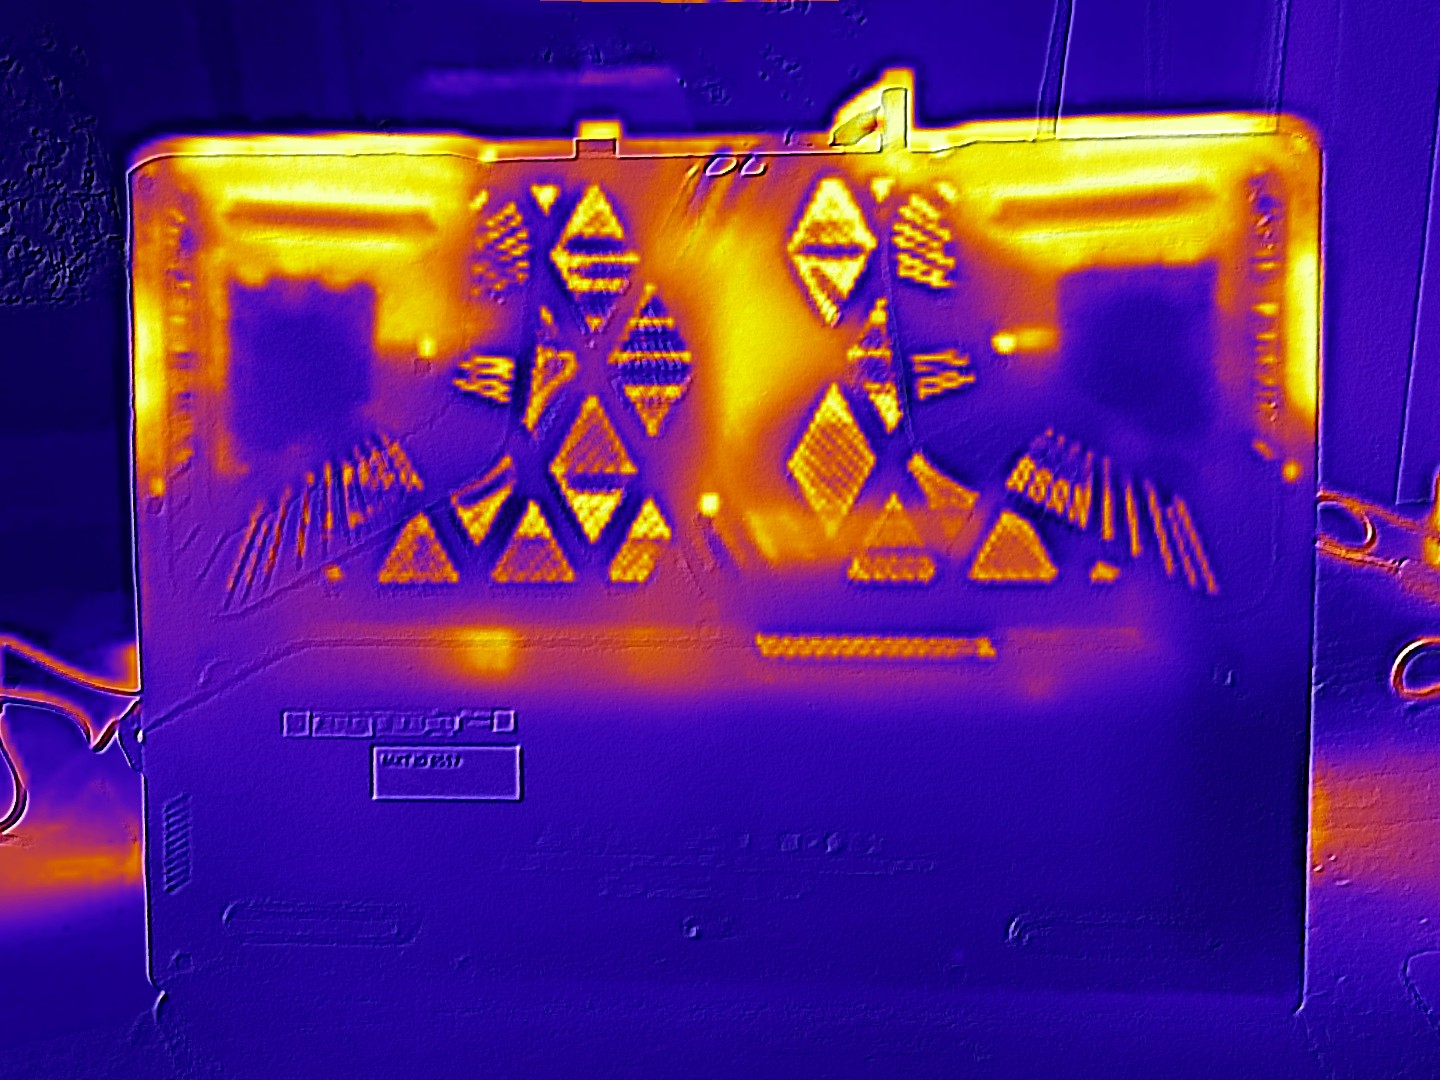
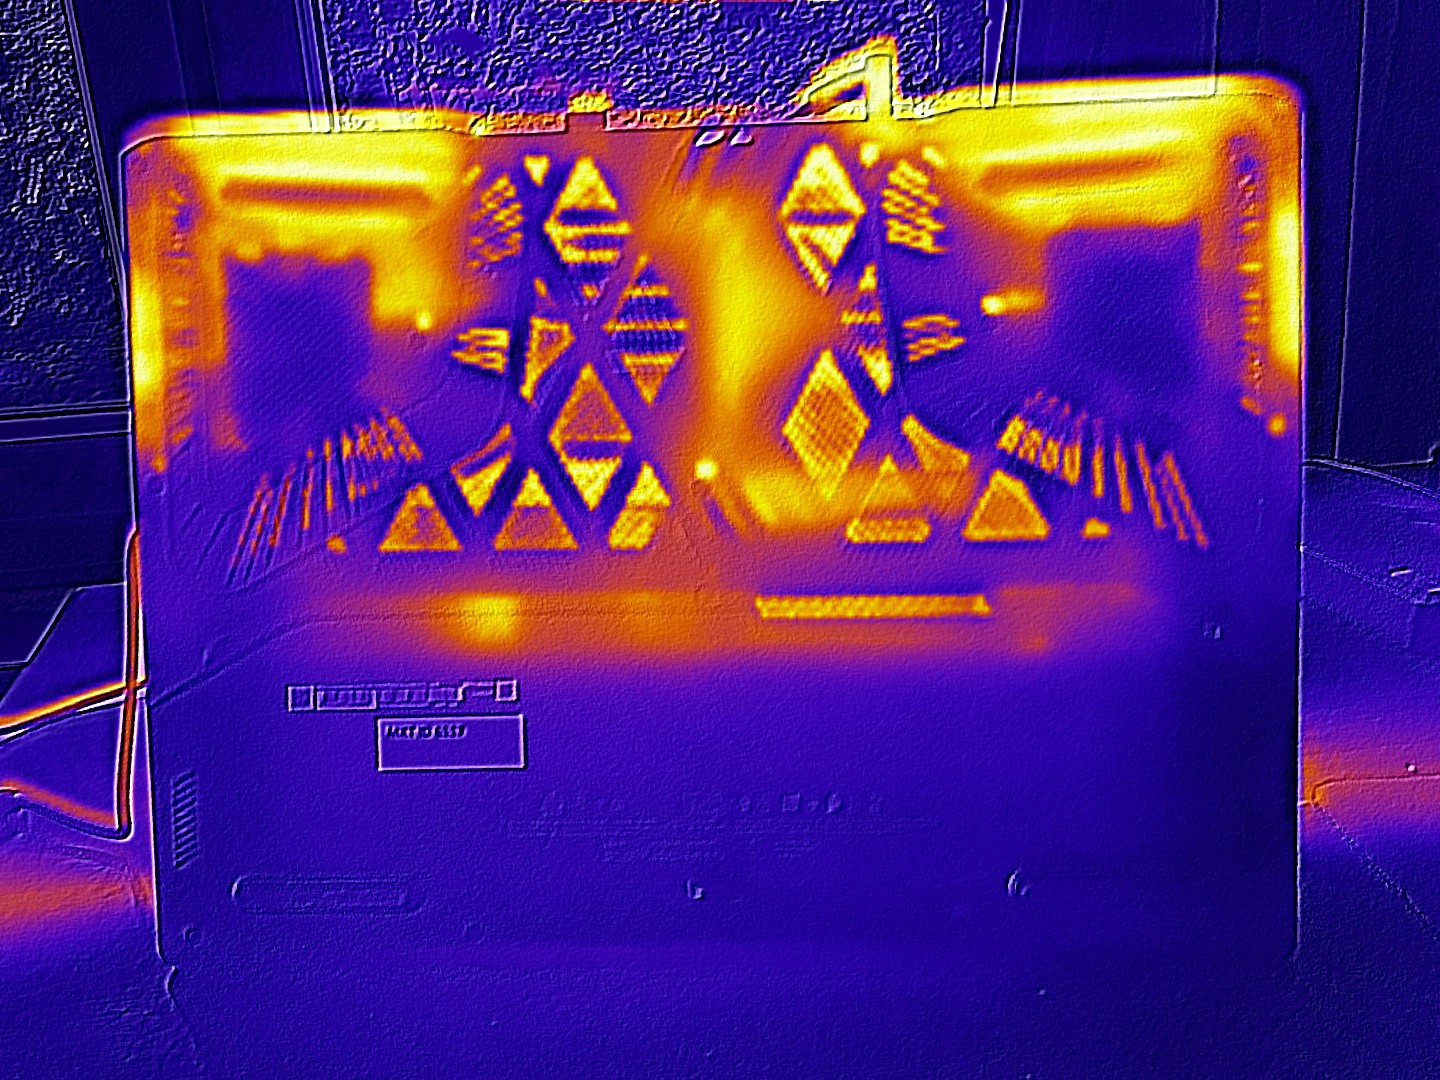
Temperature
Under load, the temperatures are in line with the competition; when idling, the chassis is warmer than its counterparts over long stretches.
(-) The maximum temperature on the upper side is 51 °C / 124 F, compared to the average of 40.4 °C / 105 F, ranging from 21.2 to 68.8 °C for the class Gaming.
(-) The bottom heats up to a maximum of 49 °C / 120 F, compared to the average of 43.2 °C / 110 F
(±) In idle usage, the average temperature for the upper side is 33.7 °C / 93 F, compared to the device average of 33.9 °C / 93 F.
(-) 3: The average temperature for the upper side is 39.6 °C / 103 F, compared to the average of 33.9 °C / 93 F for the class Gaming.
(+) The palmrests and touchpad are cooler than skin temperature with a maximum of 30 °C / 86 F and are therefore cool to the touch.
(±) The average temperature of the palmrest area of similar devices was 28.8 °C / 83.8 F (-1.2 °C / -2.2 F).
| MSI Crosshair A17 HX D8WGKG R9 8940HX, GeForce RTX 5070 Laptop | MSI Katana 17 HX B14WGK i7-14650HX, GeForce RTX 5070 Laptop | Aorus Elite 16 AE6H Ultra 9 275HX, GeForce RTX 5070 Laptop | Lenovo Legion 5 Pro 16IAX10H Ultra 9 275HX, GeForce RTX 5070 Ti Laptop | MSI Vector 16 HX AI A2XWHG Ultra 7 255HX, GeForce RTX 5070 Ti Laptop | |
|---|---|---|---|---|---|
| Heat | 3% | 10% | -2% | 7% | |
| Maximum Upper Side * (°C) | 51 | 52 -2% | 41 20% | 48 6% | 53 -4% |
| Maximum Bottom * (°C) | 49 | 56 -14% | 45 8% | 50 -2% | 52 -6% |
| Idle Upper Side * (°C) | 40 | 33 17% | 35 12% | 38 5% | 33 17% |
| Idle Bottom * (°C) | 36 | 32 11% | 36 -0% | 42 -17% | 29 19% |
* ... smaller is better
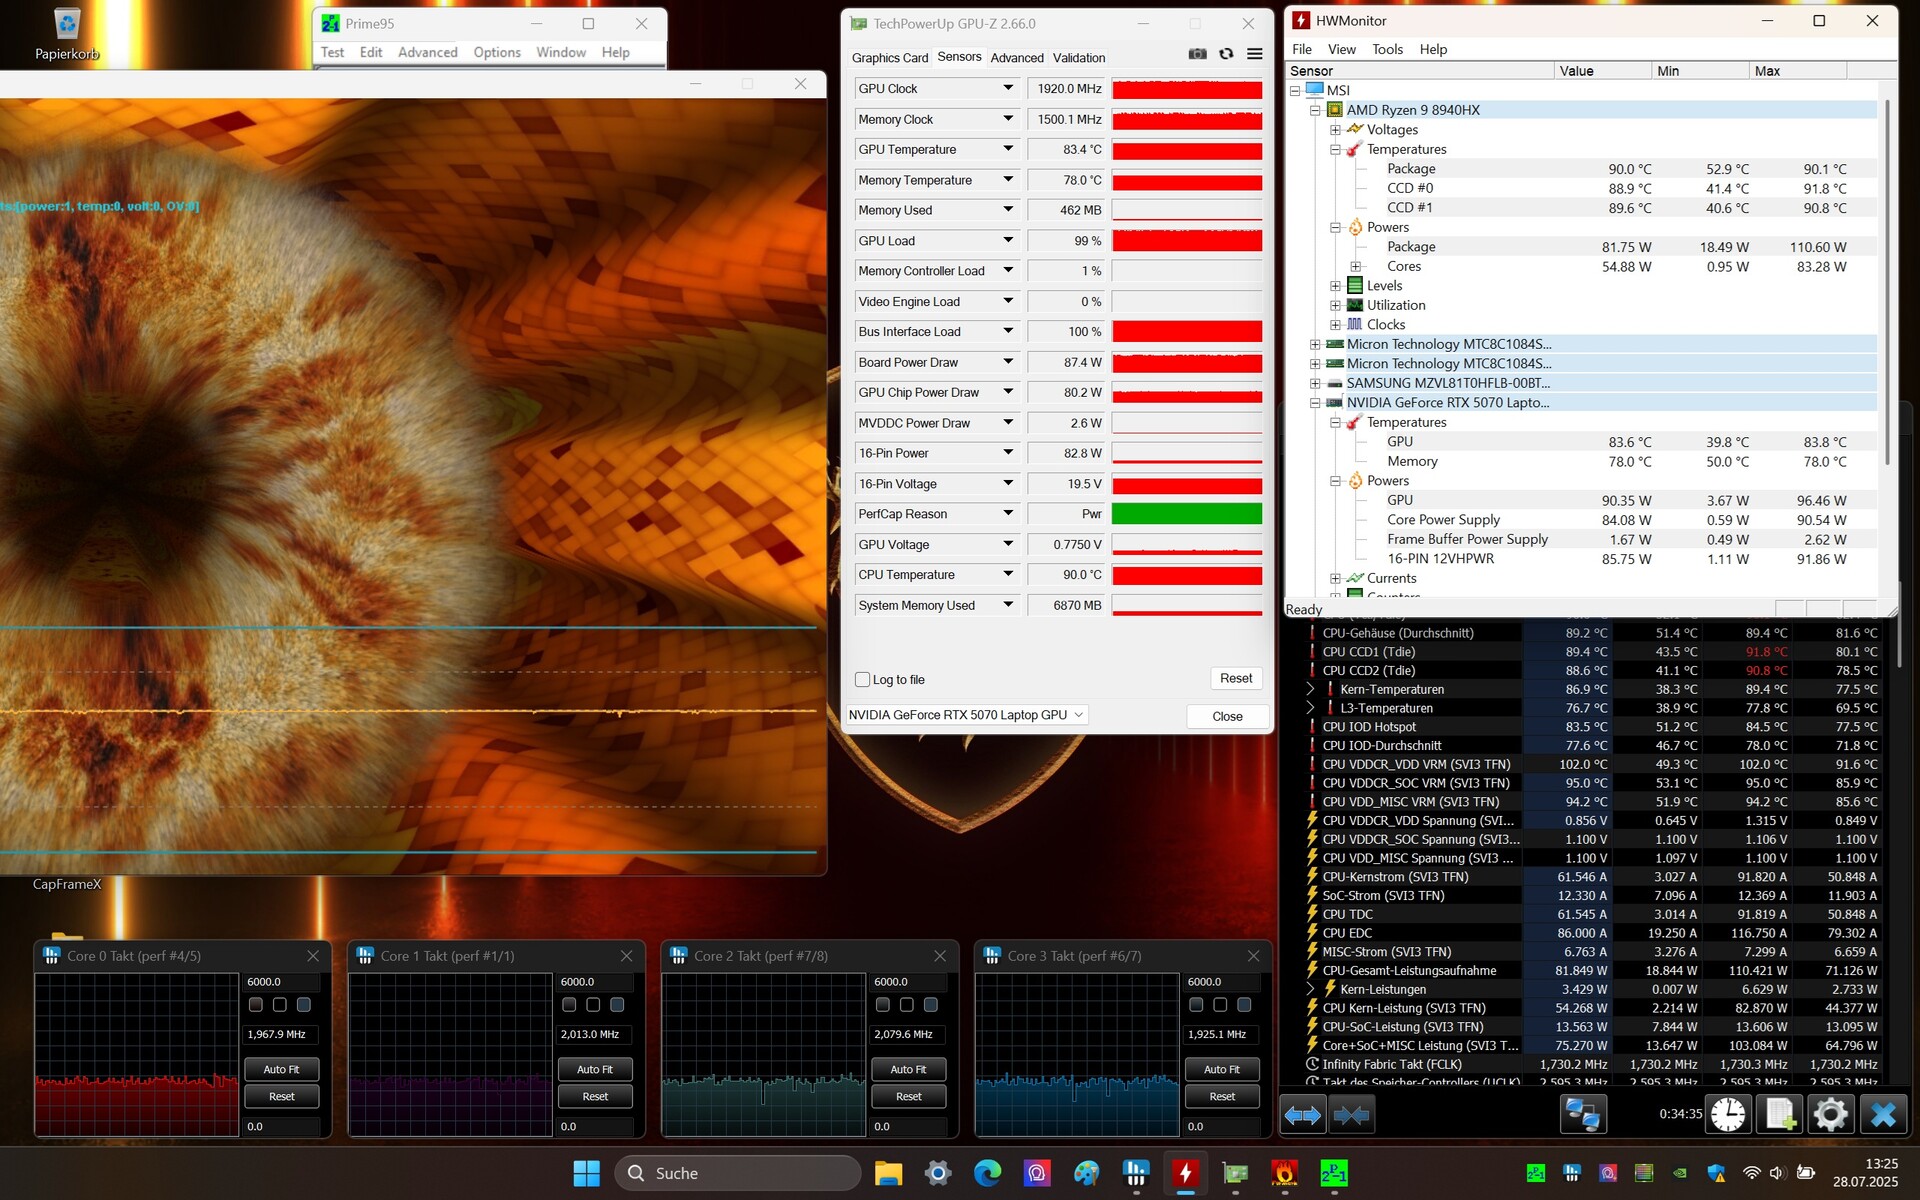
Stress test
In the stress test with the FurMark and Prime95 tools, the R9 8940HX stabilized at 90 °C (194 °F) after a while, while the RTX 5070 reached a somewhat more moderate 83 °C (181.4 °F).


Speakers
The sound quality of the Crosshair A17 HX is in the mid-range. The in-house Vector 16 not only offers a higher maximum volume, but also a more powerful bass.
MSI Crosshair A17 HX D8WGKG audio analysis
(±) | speaker loudness is average but good (81 dB)
Bass 100 - 315 Hz
(-) | nearly no bass - on average 18% lower than median
(±) | linearity of bass is average (12.4% delta to prev. frequency)
Mids 400 - 2000 Hz
(±) | higher mids - on average 6.6% higher than median
(±) | linearity of mids is average (7% delta to prev. frequency)
Highs 2 - 16 kHz
(+) | balanced highs - only 3% away from median
(+) | highs are linear (5.1% delta to prev. frequency)
Overall 100 - 16.000 Hz
(±) | linearity of overall sound is average (17.8% difference to median)
Compared to same class
» 53% of all tested devices in this class were better, 10% similar, 37% worse
» The best had a delta of 6%, average was 18%, worst was 132%
Compared to all devices tested
» 36% of all tested devices were better, 8% similar, 56% worse
» The best had a delta of 4%, average was 24%, worst was 134%
MSI Vector 16 HX AI A2XWHG audio analysis
(+) | speakers can play relatively loud (86 dB)
Bass 100 - 315 Hz
(±) | reduced bass - on average 12.3% lower than median
(±) | linearity of bass is average (8.5% delta to prev. frequency)
Mids 400 - 2000 Hz
(±) | higher mids - on average 9.9% higher than median
(+) | mids are linear (6.8% delta to prev. frequency)
Highs 2 - 16 kHz
(+) | balanced highs - only 1.8% away from median
(+) | highs are linear (2.9% delta to prev. frequency)
Overall 100 - 16.000 Hz
(±) | linearity of overall sound is average (15.8% difference to median)
Compared to same class
» 37% of all tested devices in this class were better, 7% similar, 56% worse
» The best had a delta of 6%, average was 18%, worst was 132%
Compared to all devices tested
» 24% of all tested devices were better, 5% similar, 71% worse
» The best had a delta of 4%, average was 24%, worst was 134%
Energy management
Energy consumption
For an RTX 5070 notebook, the 17-inch model consumes an above-average amount of energy. In particular, an idle requirement of 32 to 47 watts is suspiciously high. This may still be a bug at the moment. When connecting an external monitor, the consumption was reproducibly lower.
| Off / Standby | |
| Idle | |
| Load |
|
Key:
min: | |
| MSI Crosshair A17 HX D8WGKG R9 8940HX, GeForce RTX 5070 Laptop | MSI Katana 17 HX B14WGK i7-14650HX, GeForce RTX 5070 Laptop | Aorus Elite 16 AE6H Ultra 9 275HX, GeForce RTX 5070 Laptop | Lenovo Legion 5 Pro 16IAX10H Ultra 9 275HX, GeForce RTX 5070 Ti Laptop | MSI Vector 16 HX AI A2XWHG Ultra 7 255HX, GeForce RTX 5070 Ti Laptop | Average of class Gaming | |
|---|---|---|---|---|---|---|
| Power Consumption | 30% | 29% | 13% | 21% | 35% | |
| Idle Minimum * (Watt) | 32 | 9.7 70% | 8.5 73% | 14 56% | 7.1 78% | 13.2 ? 59% |
| Idle Average * (Watt) | 36 | 15 58% | 13.6 62% | 14.3 60% | 15.9 56% | 18.9 ? 48% |
| Idle Maximum * (Watt) | 47 | 23.7 50% | 22 53% | 20.1 57% | 29.5 37% | 24.3 ? 48% |
| Load Average * (Watt) | 132 | 126 5% | 113 14% | 177 -34% | 124 6% | 108 ? 18% |
| Cyberpunk 2077 ultra * (Watt) | 222 | 205 8% | 223 -0% | 255 -15% | 222 -0% | |
| Cyberpunk 2077 ultra external monitor * (Watt) | 216 | 202 6% | 219 -1% | 255 -18% | 217 -0% | |
| Load Maximum * (Watt) | 261 | 227 13% | 257 2% | 294 -13% | 336 -29% | 254 ? 3% |
* ... smaller is better
Energy consumption Cyberpunk / Stress test
Energy consumption with external monitor
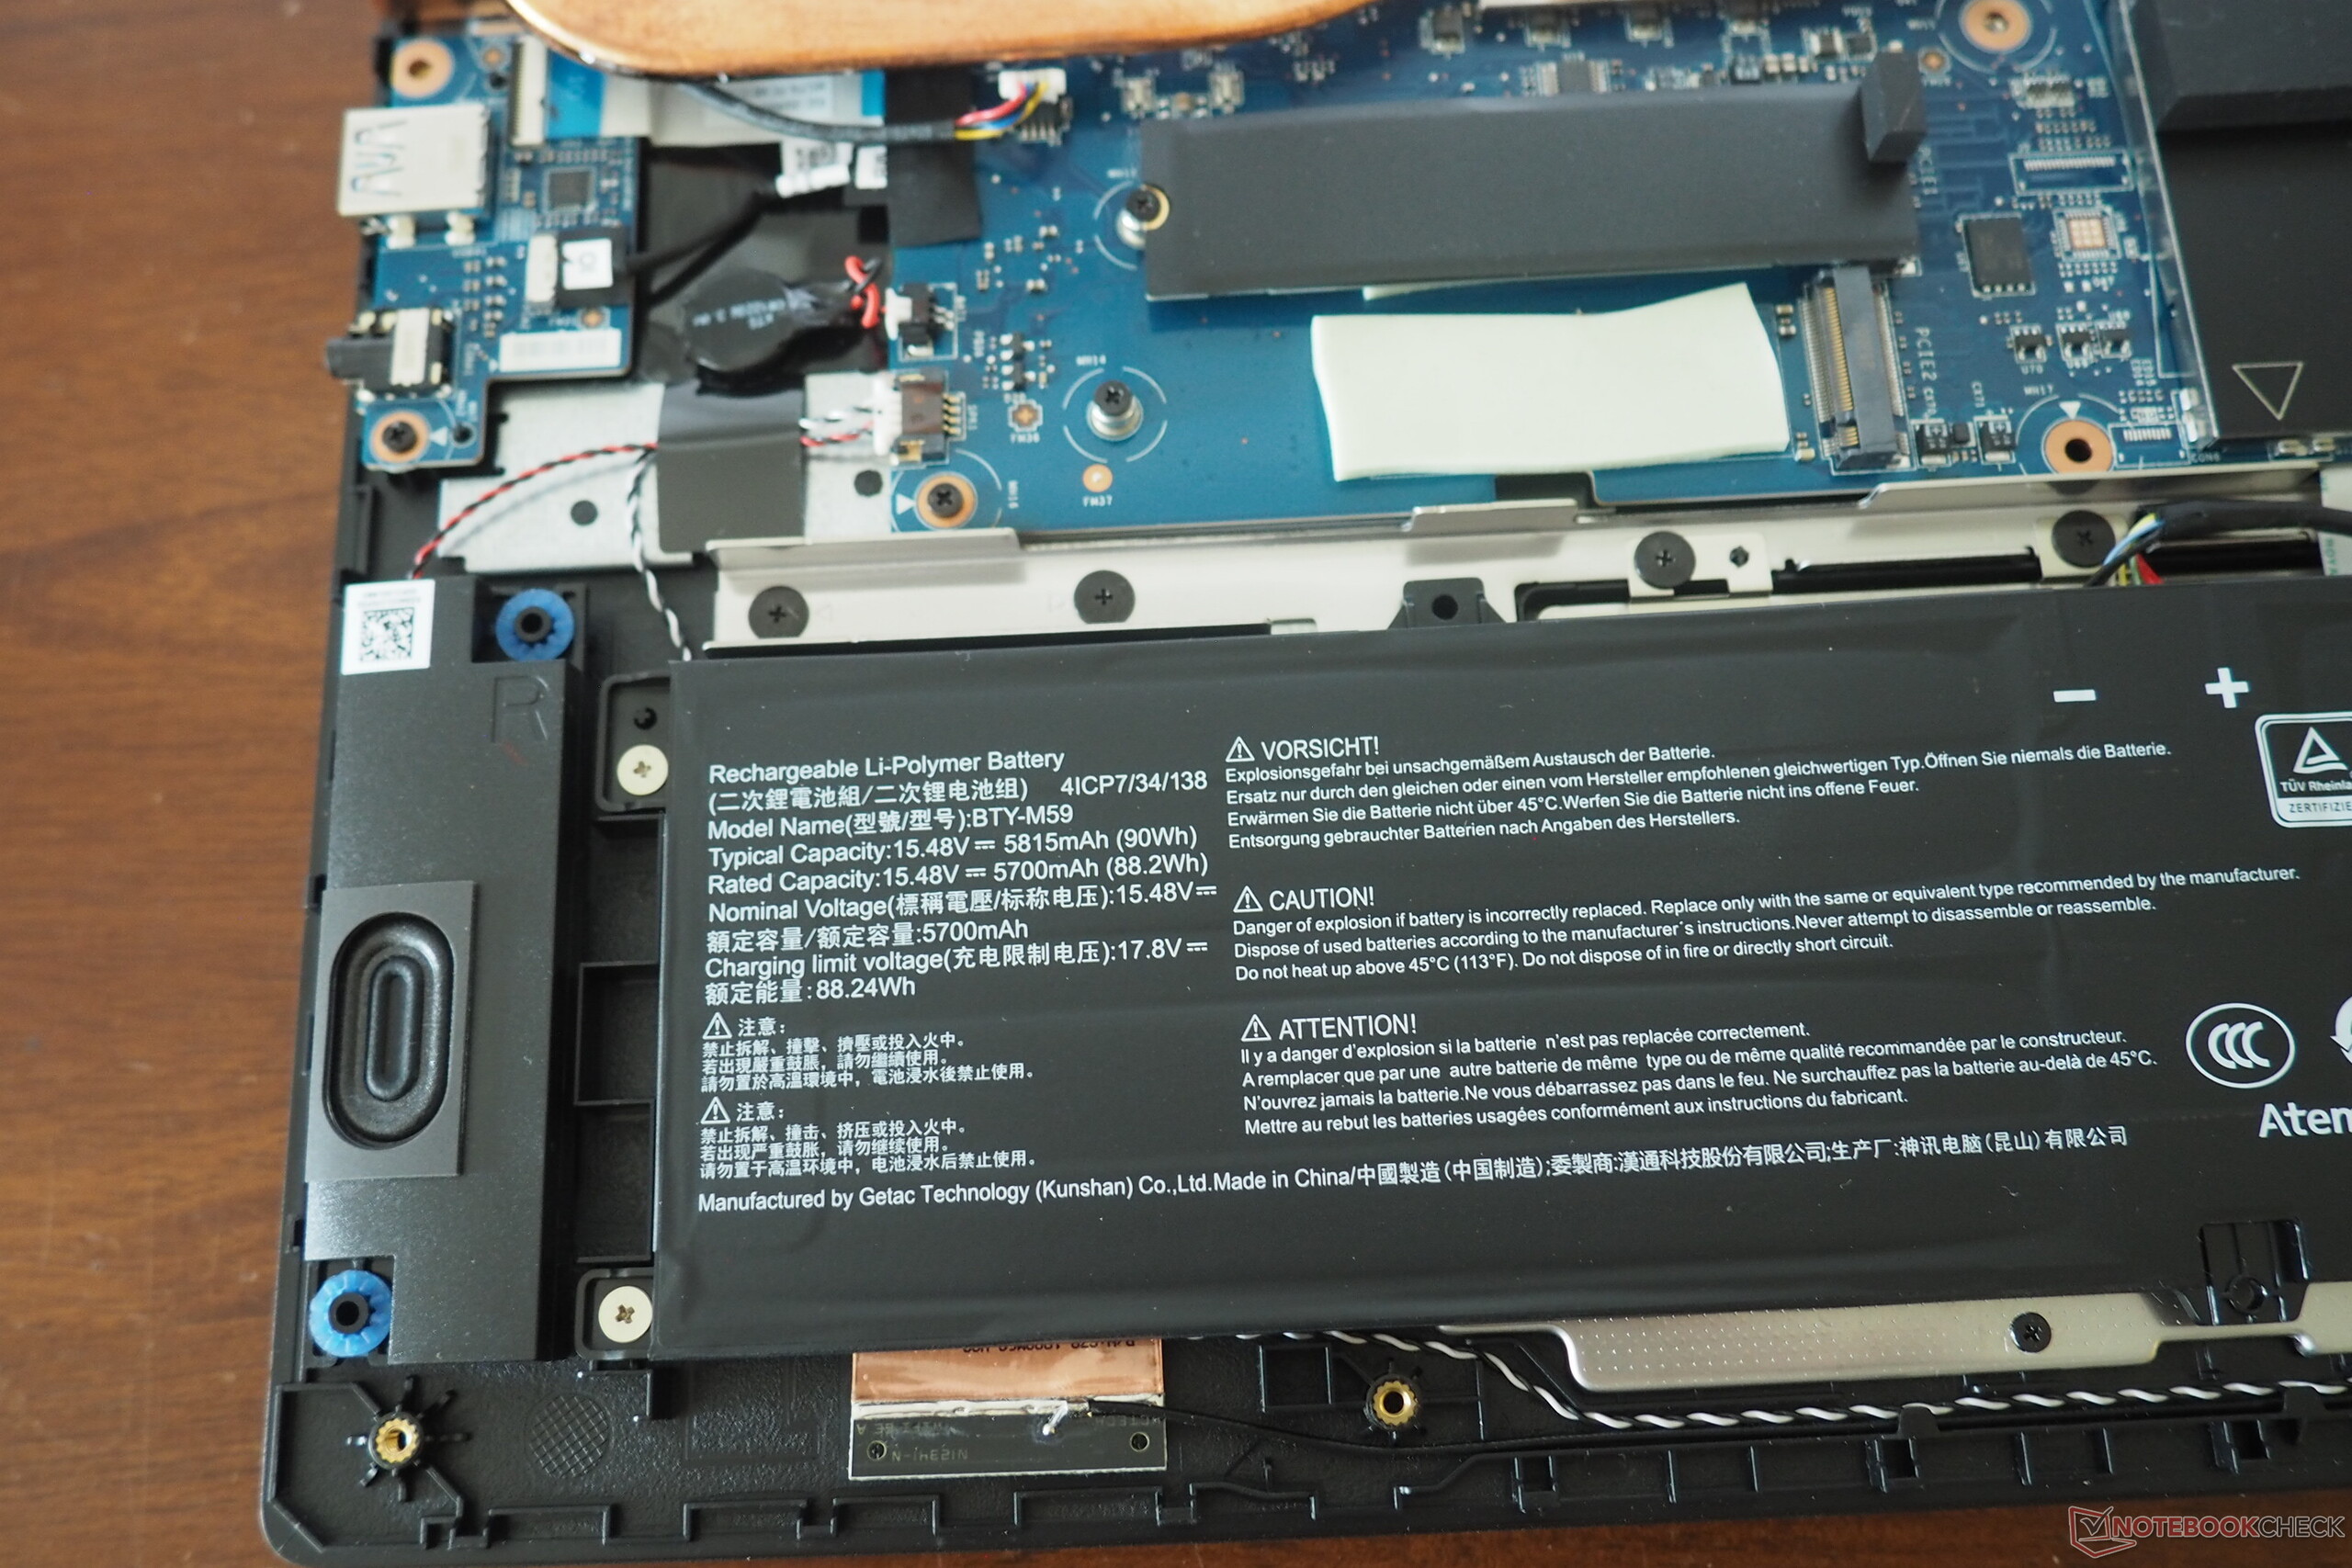
Battery life
Due to the high energy consumption, the battery runtimes are rather poor. In our WLAN test with the brightness reduced to 150 cd/m², the powerful 90 Wh, battery ran out of breath after around 4.5 hours when using the "Balanced" mode. In comparison: the competition manages 5 to 8.5 hours.
| MSI Crosshair A17 HX D8WGKG R9 8940HX, GeForce RTX 5070 Laptop, 90 Wh | MSI Katana 17 HX B14WGK i7-14650HX, GeForce RTX 5070 Laptop, 75 Wh | Aorus Elite 16 AE6H Ultra 9 275HX, GeForce RTX 5070 Laptop, 99 Wh | Lenovo Legion 5 Pro 16IAX10H Ultra 9 275HX, GeForce RTX 5070 Ti Laptop, 80 Wh | MSI Vector 16 HX AI A2XWHG Ultra 7 255HX, GeForce RTX 5070 Ti Laptop, 90 Wh | Average of class Gaming | |
|---|---|---|---|---|---|---|
| Battery runtime | 16% | 93% | 11% | 59% | 60% | |
| WiFi v1.3 (h) | 4.4 | 5.1 16% | 8.5 93% | 4.9 11% | 7 59% | 7.02 ? 60% |
| H.264 (h) | 4.8 | 8.26 ? | ||||
| Load (h) | 1.7 | 1.47 ? |
Notebookcheck overall rating
The Crosshair A17 HX scores with an extremely high multi-core performance thanks to the potent 16-core from AMD, but has flaws when it comes to energy consumption and fan control.
MSI Crosshair A17 HX D8WGKG
- 08/06/2025 v8
Florian Glaser
 Total Sustainability Score:
 Possible alternatives in comparison
Image | Model / Review | Price | Weight | Height | Display |
|---|---|---|---|---|---|
1. 79.6%  | MSI Crosshair A17 HX D8WGKG AMD Ryzen 9 8940HX ⎘ NVIDIA GeForce RTX 5070 Laptop ⎘ 32 GB Memory, 1024 GB SSD | Amazon: List Price: 2000 EUR | 2.9 kg | 29.7 mm | 17.00" 2560x1600 178 PPI IPS |
2. 77.3%  | MSI Katana 17 HX B14WGK Intel Core i7-14650HX ⎘ NVIDIA GeForce RTX 5070 Laptop ⎘ 16 GB Memory, 1024 GB SSD | Amazon: List Price: 1800 EUR | 2.7 kg | 28 mm | 17.30" 2560x1440 170 PPI IPS |
3. 84.4%  | Aorus Elite 16 AE6H Intel Core Ultra 9 275HX ⎘ NVIDIA GeForce RTX 5070 Laptop ⎘ 32 GB Memory, 1024 GB SSD | List Price: 2300 EUR | 2.4 kg | 26 mm | 16.00" 2560x1600 189 PPI IPS |
4. 84.5%  | Lenovo Legion 5 Pro 16IAX10H Intel Core Ultra 9 275HX ⎘ NVIDIA GeForce RTX 5070 Ti Laptop ⎘ 32 GB Memory, 1024 GB SSD | Amazon: 1. $1,749.99 Lenovo Legion Pro 5 AI Gamin... 2. $99.99 Lenovo Slim 245W AC Adapter ... 3. $2,259.99 Lenovo Legion Pro 7 16IAX10H... List Price: 2500 Euro | 2.4 kg | 25.95 mm | 16.00" 2560x1600 189 PPI OLED |
5. 84%  | MSI Vector 16 HX AI A2XWHG Intel Core Ultra 7 255HX ⎘ NVIDIA GeForce RTX 5070 Ti Laptop ⎘ 16 GB Memory, 512 GB SSD | Amazon: List Price: 2000 EUR | 2.6 kg | 28.6 mm | 16.00" 2560x1600 189 PPI IPS |
Transparency
The selection of devices to be reviewed is made by our editorial team. The test sample was provided to the author as a loan by the manufacturer or retailer for the purpose of this review. The lender had no influence on this review, nor did the manufacturer receive a copy of this review before publication. There was no obligation to publish this review. As an independent media company, Notebookcheck is not subjected to the authority of manufacturers, retailers or publishers.
This is how Notebookcheck is testing
Every year, Notebookcheck independently reviews hundreds of laptops and smartphones using standardized procedures to ensure that all results are comparable. We have continuously developed our test methods for around 20 years and set industry standards in the process. In our test labs, high-quality measuring equipment is utilized by experienced technicians and editors. These tests involve a multi-stage validation process. Our complex rating system is based on hundreds of well-founded measurements and benchmarks, which maintains objectivity. Further information on our test methods can be found here.

