Verdict: Strong performance with expected trade-offs
With an Intel Core Ultra 9 275HX and an Nvidia GeForce RTX 5070 Laptop, the MSI Crosshair 16 HX AI is a capable QHD gaming laptop for 2025 that is also quite amenable for content creation.
The Crosshair 16 HX AI can handle 1440p Ultra gaming with acceptable frame rates, although VRAM-intensive titles can prove to be a challenge given the RTX 5070 Laptop's paltry 8 GB frame buffer. DLSS4 and multi-frame generation can help, but this may not always bode well, especially for competitive shooters.
Extreme Performance mode unleashes the full potential of the Crosshair 16 HX AI, but this comes with the bane of increased heat and noise emissions along with higher power draws.
Otherwise, MSI hasn't cut any corners more than what we already anticipated. There's little to complain about the plastic construction and the connectivity is reasonable, though we would have liked an extra Thunderbolt 4/USB Type-C port and better Wi-Fi 5 performance.
The 240 Hz QHD+ display is no mini-LED or OLED but delivers impressive visuals, quick response times, and no PWM.
Overall, the MSI Crosshair 16 HX AI fits the bill if you're on the lookout for a decent 1440p gaming and content creation laptop around the $2,000 mark.
Pros
Cons
Price and Availability
In the US, the Crosshair 16 HX AI is available at Micro Center starting from $1,499.99 for the Core Ultra 7 255HX variant.
In India, the MSI Crosshair 16 HX AI starts from ₹1,59,990 for the Core Ultra 9 275HX + RTX 5060 variant on MSI.com and other retailers while the Core Ultra 9 275HX + RTX 5070 combo can be had for ₹1,99,990 via Amazon India.
- $1,998.00MSI Crosshair 16 HX AI D2XWGKG-211US 16" Gaming Notebook - QHD+ - 240 Hz - Intel Core Ultra 7 255HX - 32 GB - 1 TB SSD - Cosmos Gray
- $1,799.99msi Crosshair 18 HX AI 18" 2560x1600 240Hz Display Gaming Laptop, Intel Core Ultra 9 275HX (24 Cores, 2.1-5.4 GHz), NVIDIA RTX 5070 8GB GDDR7, 32GB RAM, 1TB NVMe SSD, Windows 11 Home
- $1,895.88MSI Crosshair 16 HX AI D2XWFKG-210US 16" Gaming Notebook - QHD+ - 240 Hz - Intel Core Ultra 7 255HX - 32 GB - 1 TB SSD - Cosmos Gray
Table of Contents
- Verdict: Strong performance with expected trade-offs
- Specifications
- Chassis: Plastic build with decent connectivity options
- Connectivity: High 6 GHz 6E throughput
- Input devices: Decent typing experience with enough RGB
- Display: QHD+ 240 Hz panel with good gamut coverage and no PWM
- Performance: Core Ultra 9 275HX and RTX 5070 throw no surprises
- Emissions: Robust cooling but with high decibel levels and thermals
- Power consumption: Not the most frugal in the comparison
- Notebookcheck's overall impressions of the MSI Crosshair 16 HX AI
- Potential competitors in comparison
After having reviewed the MSI Crosshair A17 HX and the Crosshair 18 HX AI, we now turn our attention to the MSI Crosshair 16 HX AI.
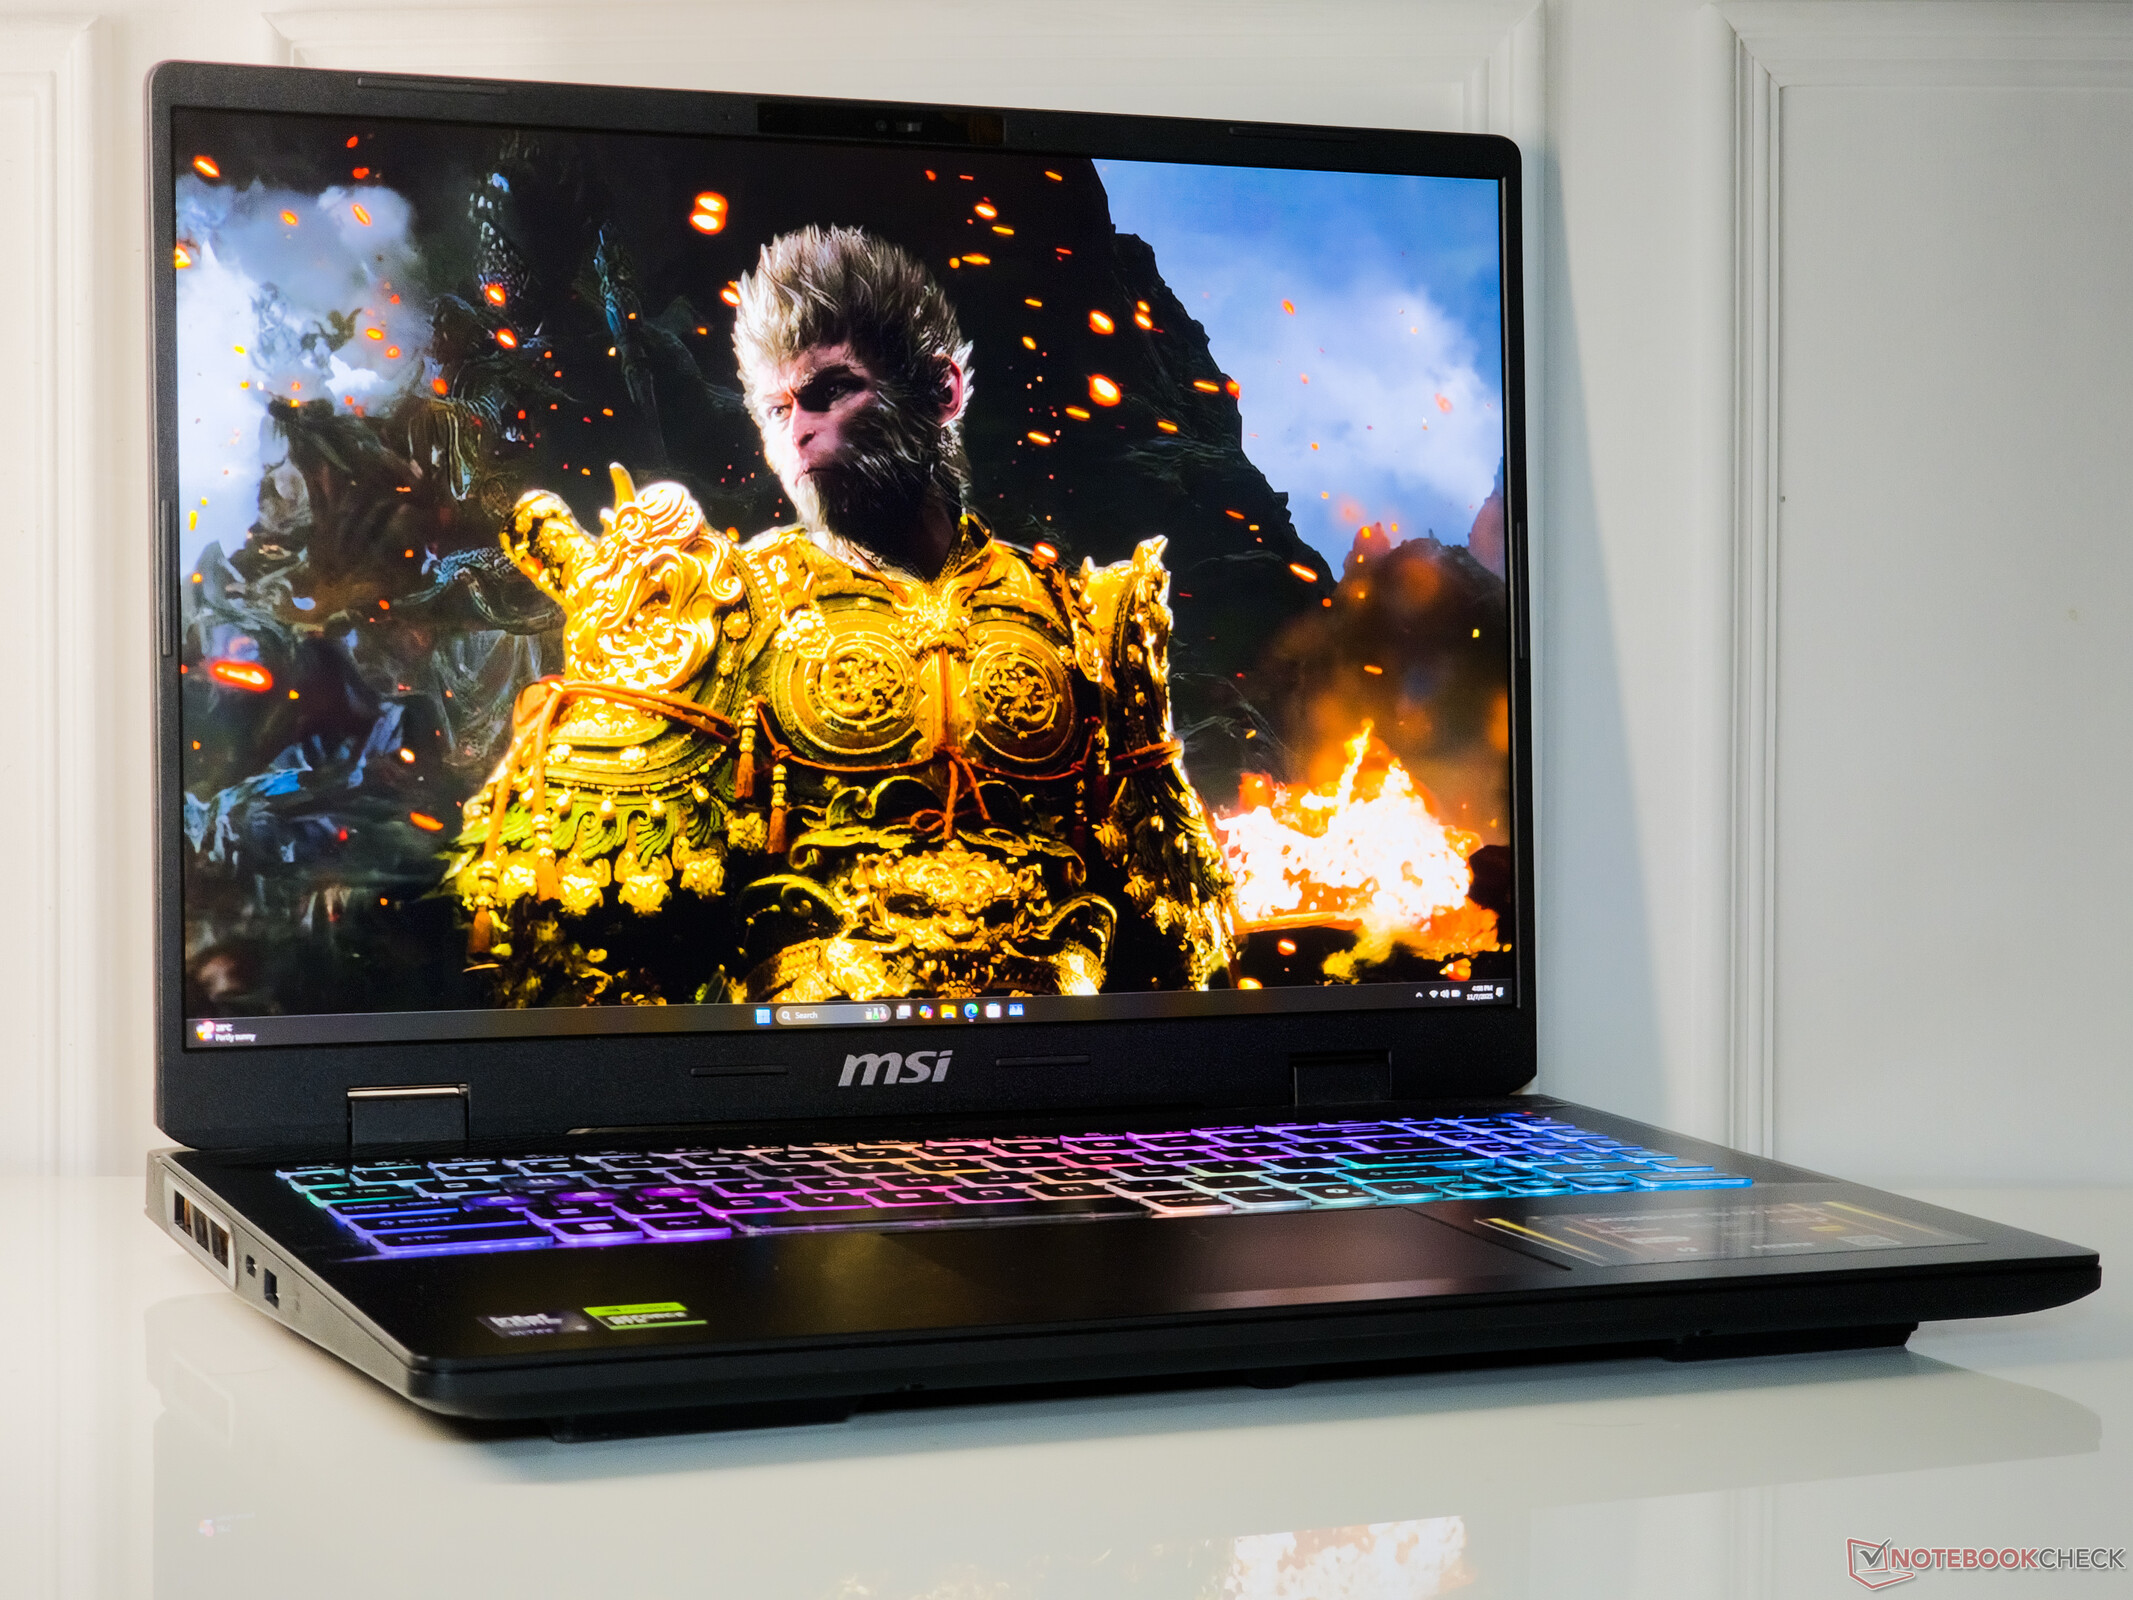
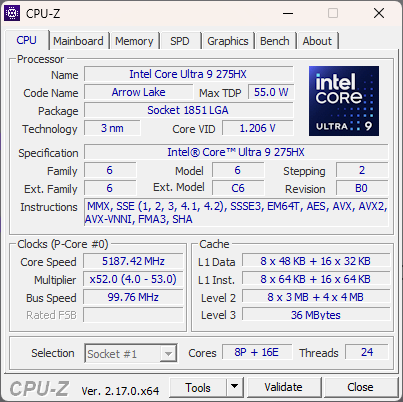
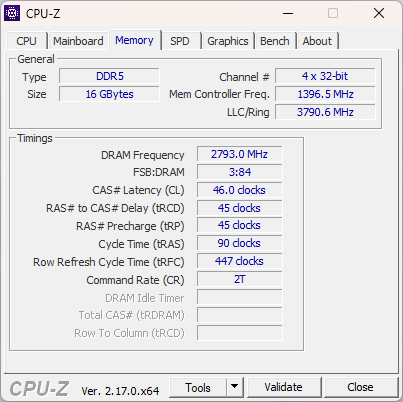
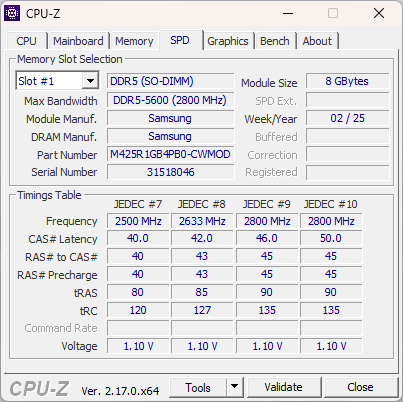
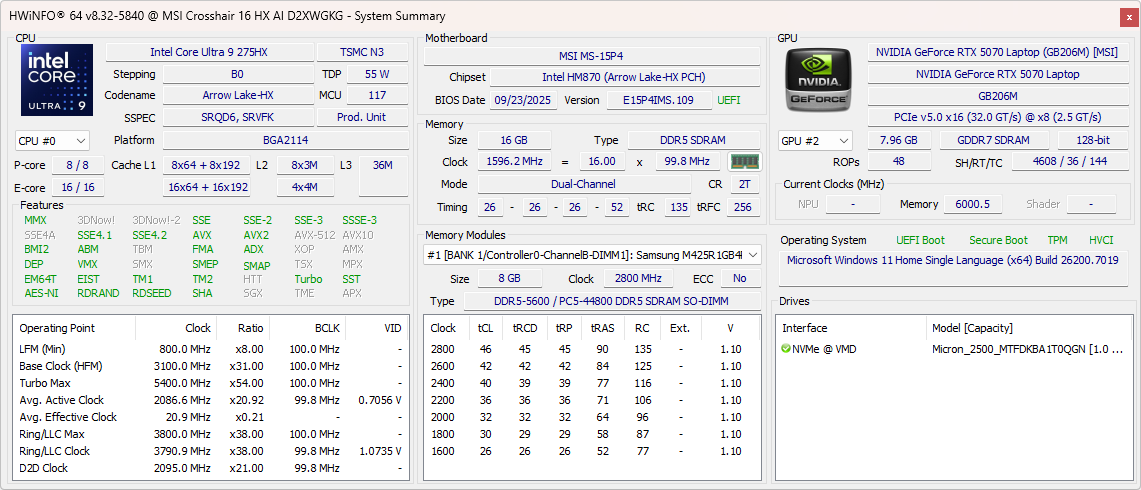
Our Crosshair 16 HX AI unit features the Core Ultra 9 275HX and a 115 W RTX 5070 Laptop GPU along with 16 GB of DDR5-5600 memory, a 1 TB NVMe SSD, and a QHD+ 240 Hz IPS-level display in a familiar Crosshair 16 HX D14 chassis.
Specifications
Chassis: Plastic build with decent connectivity options
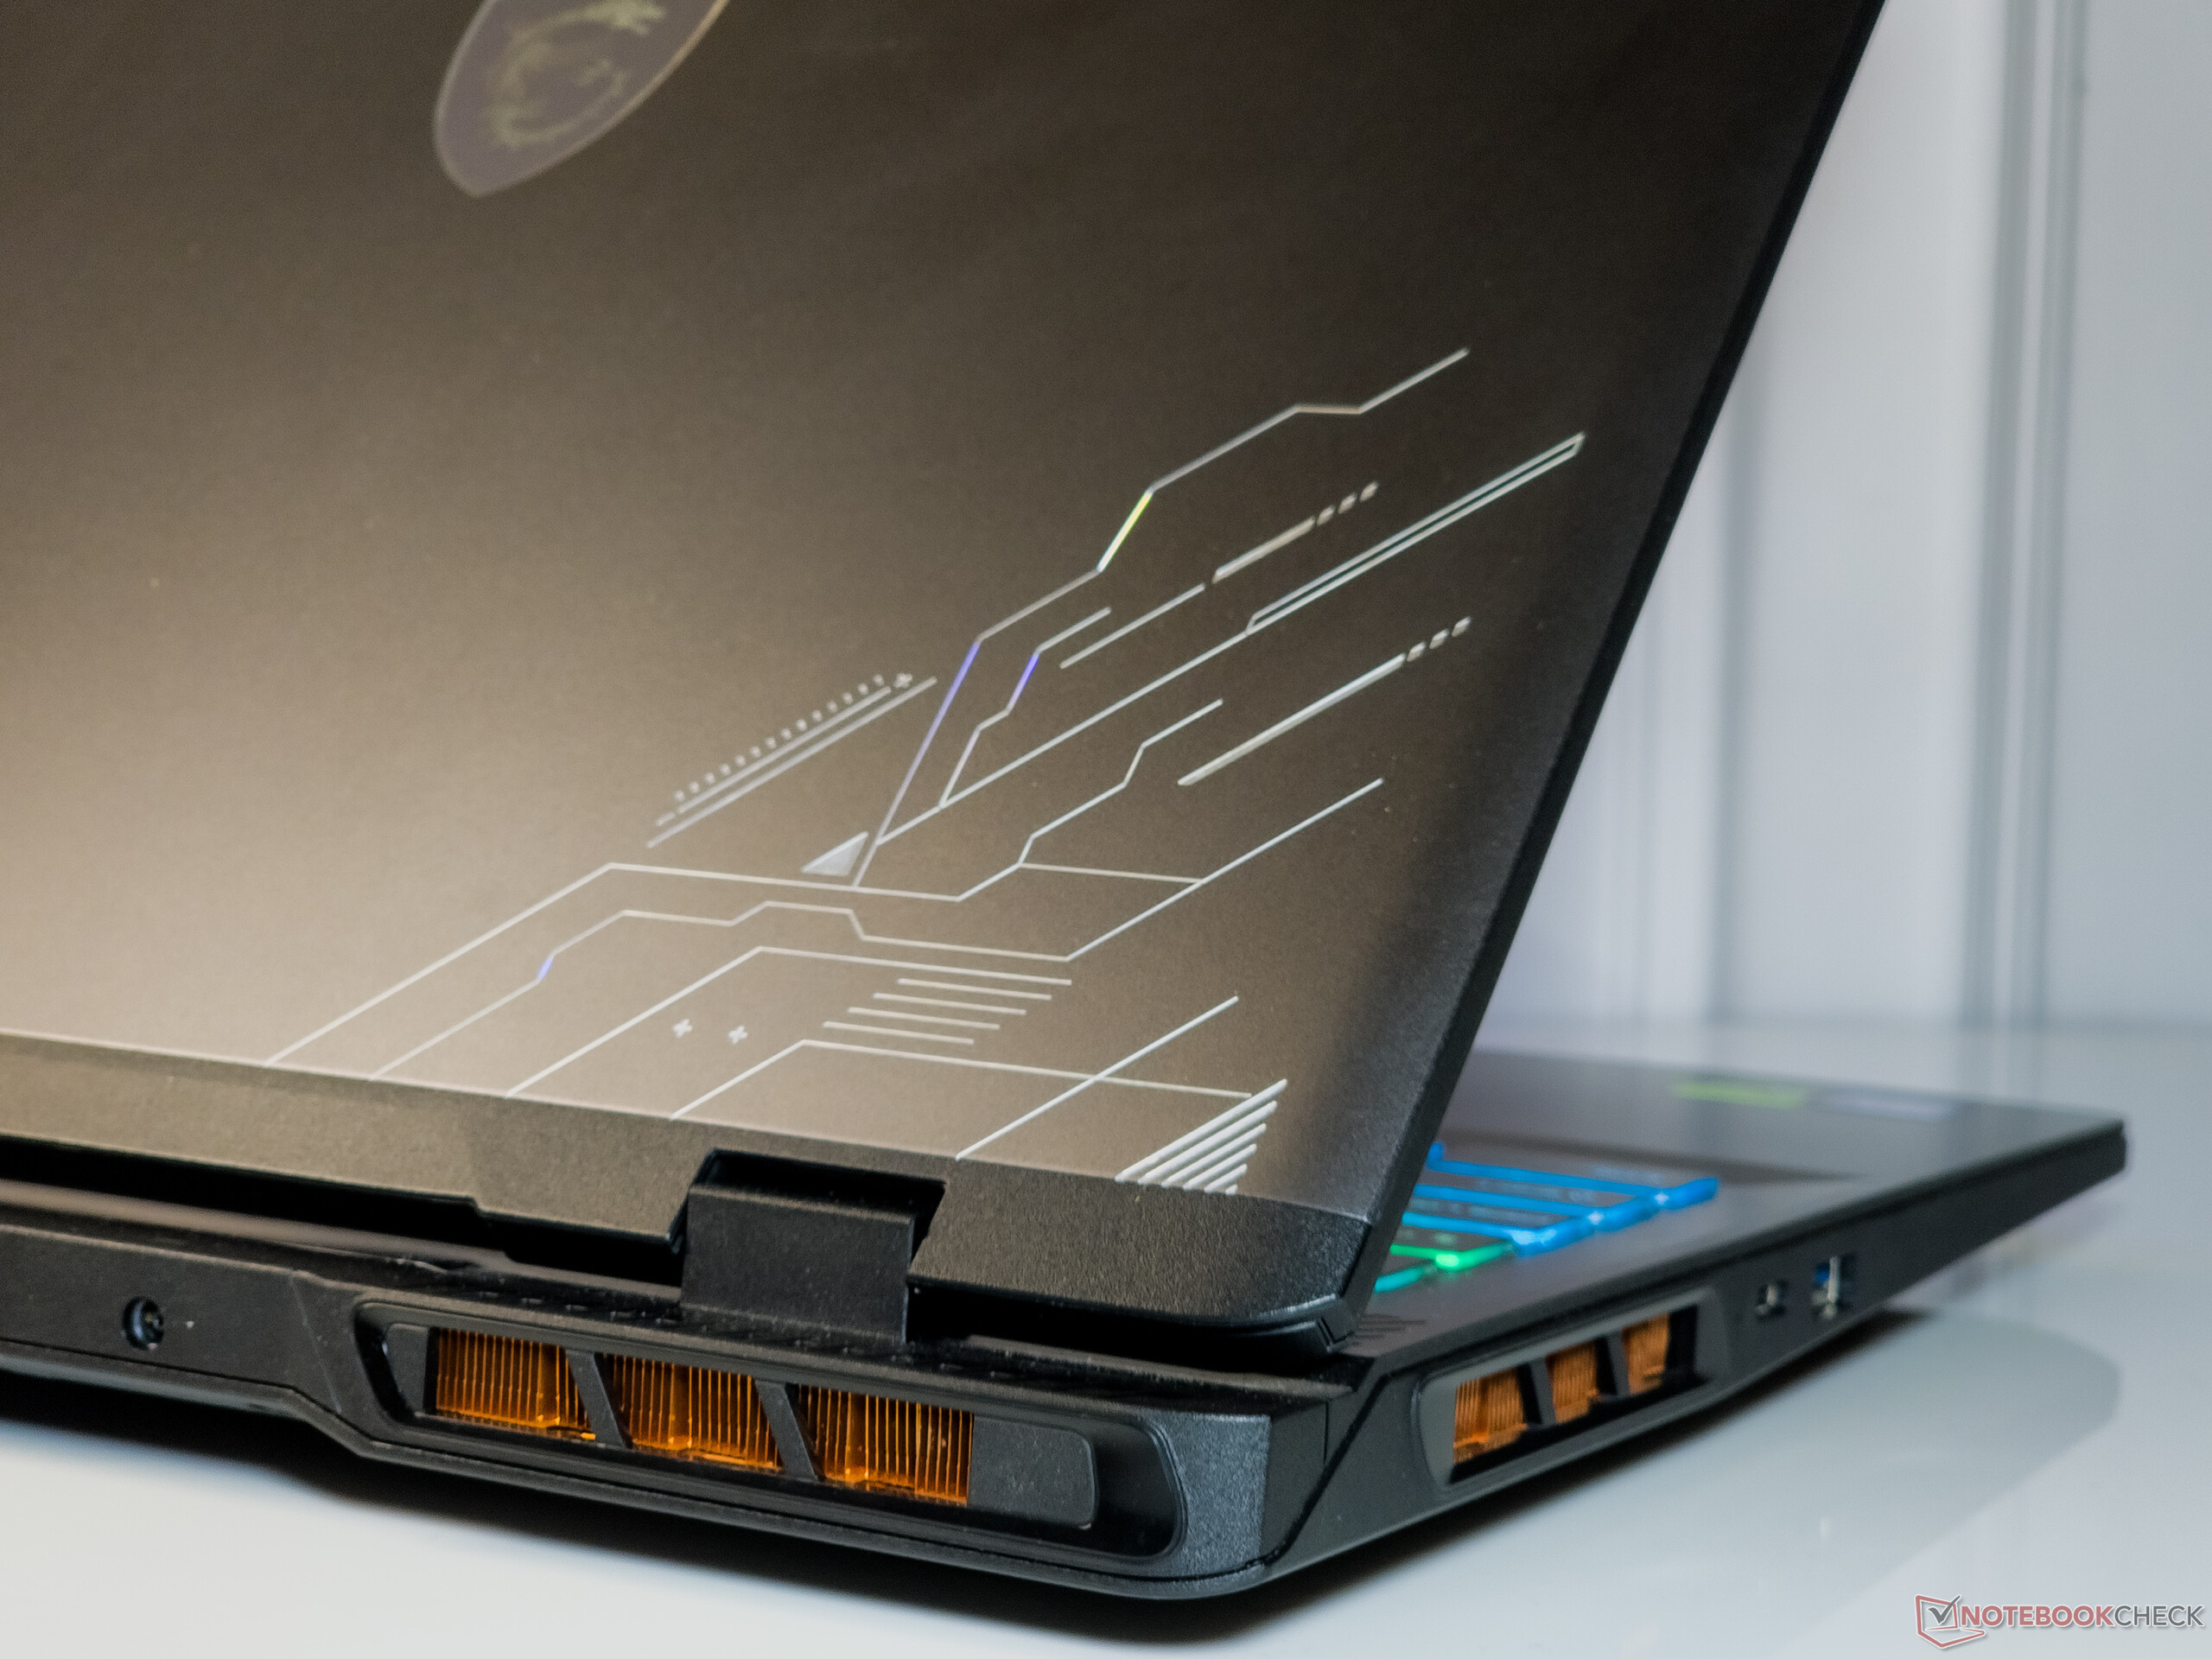
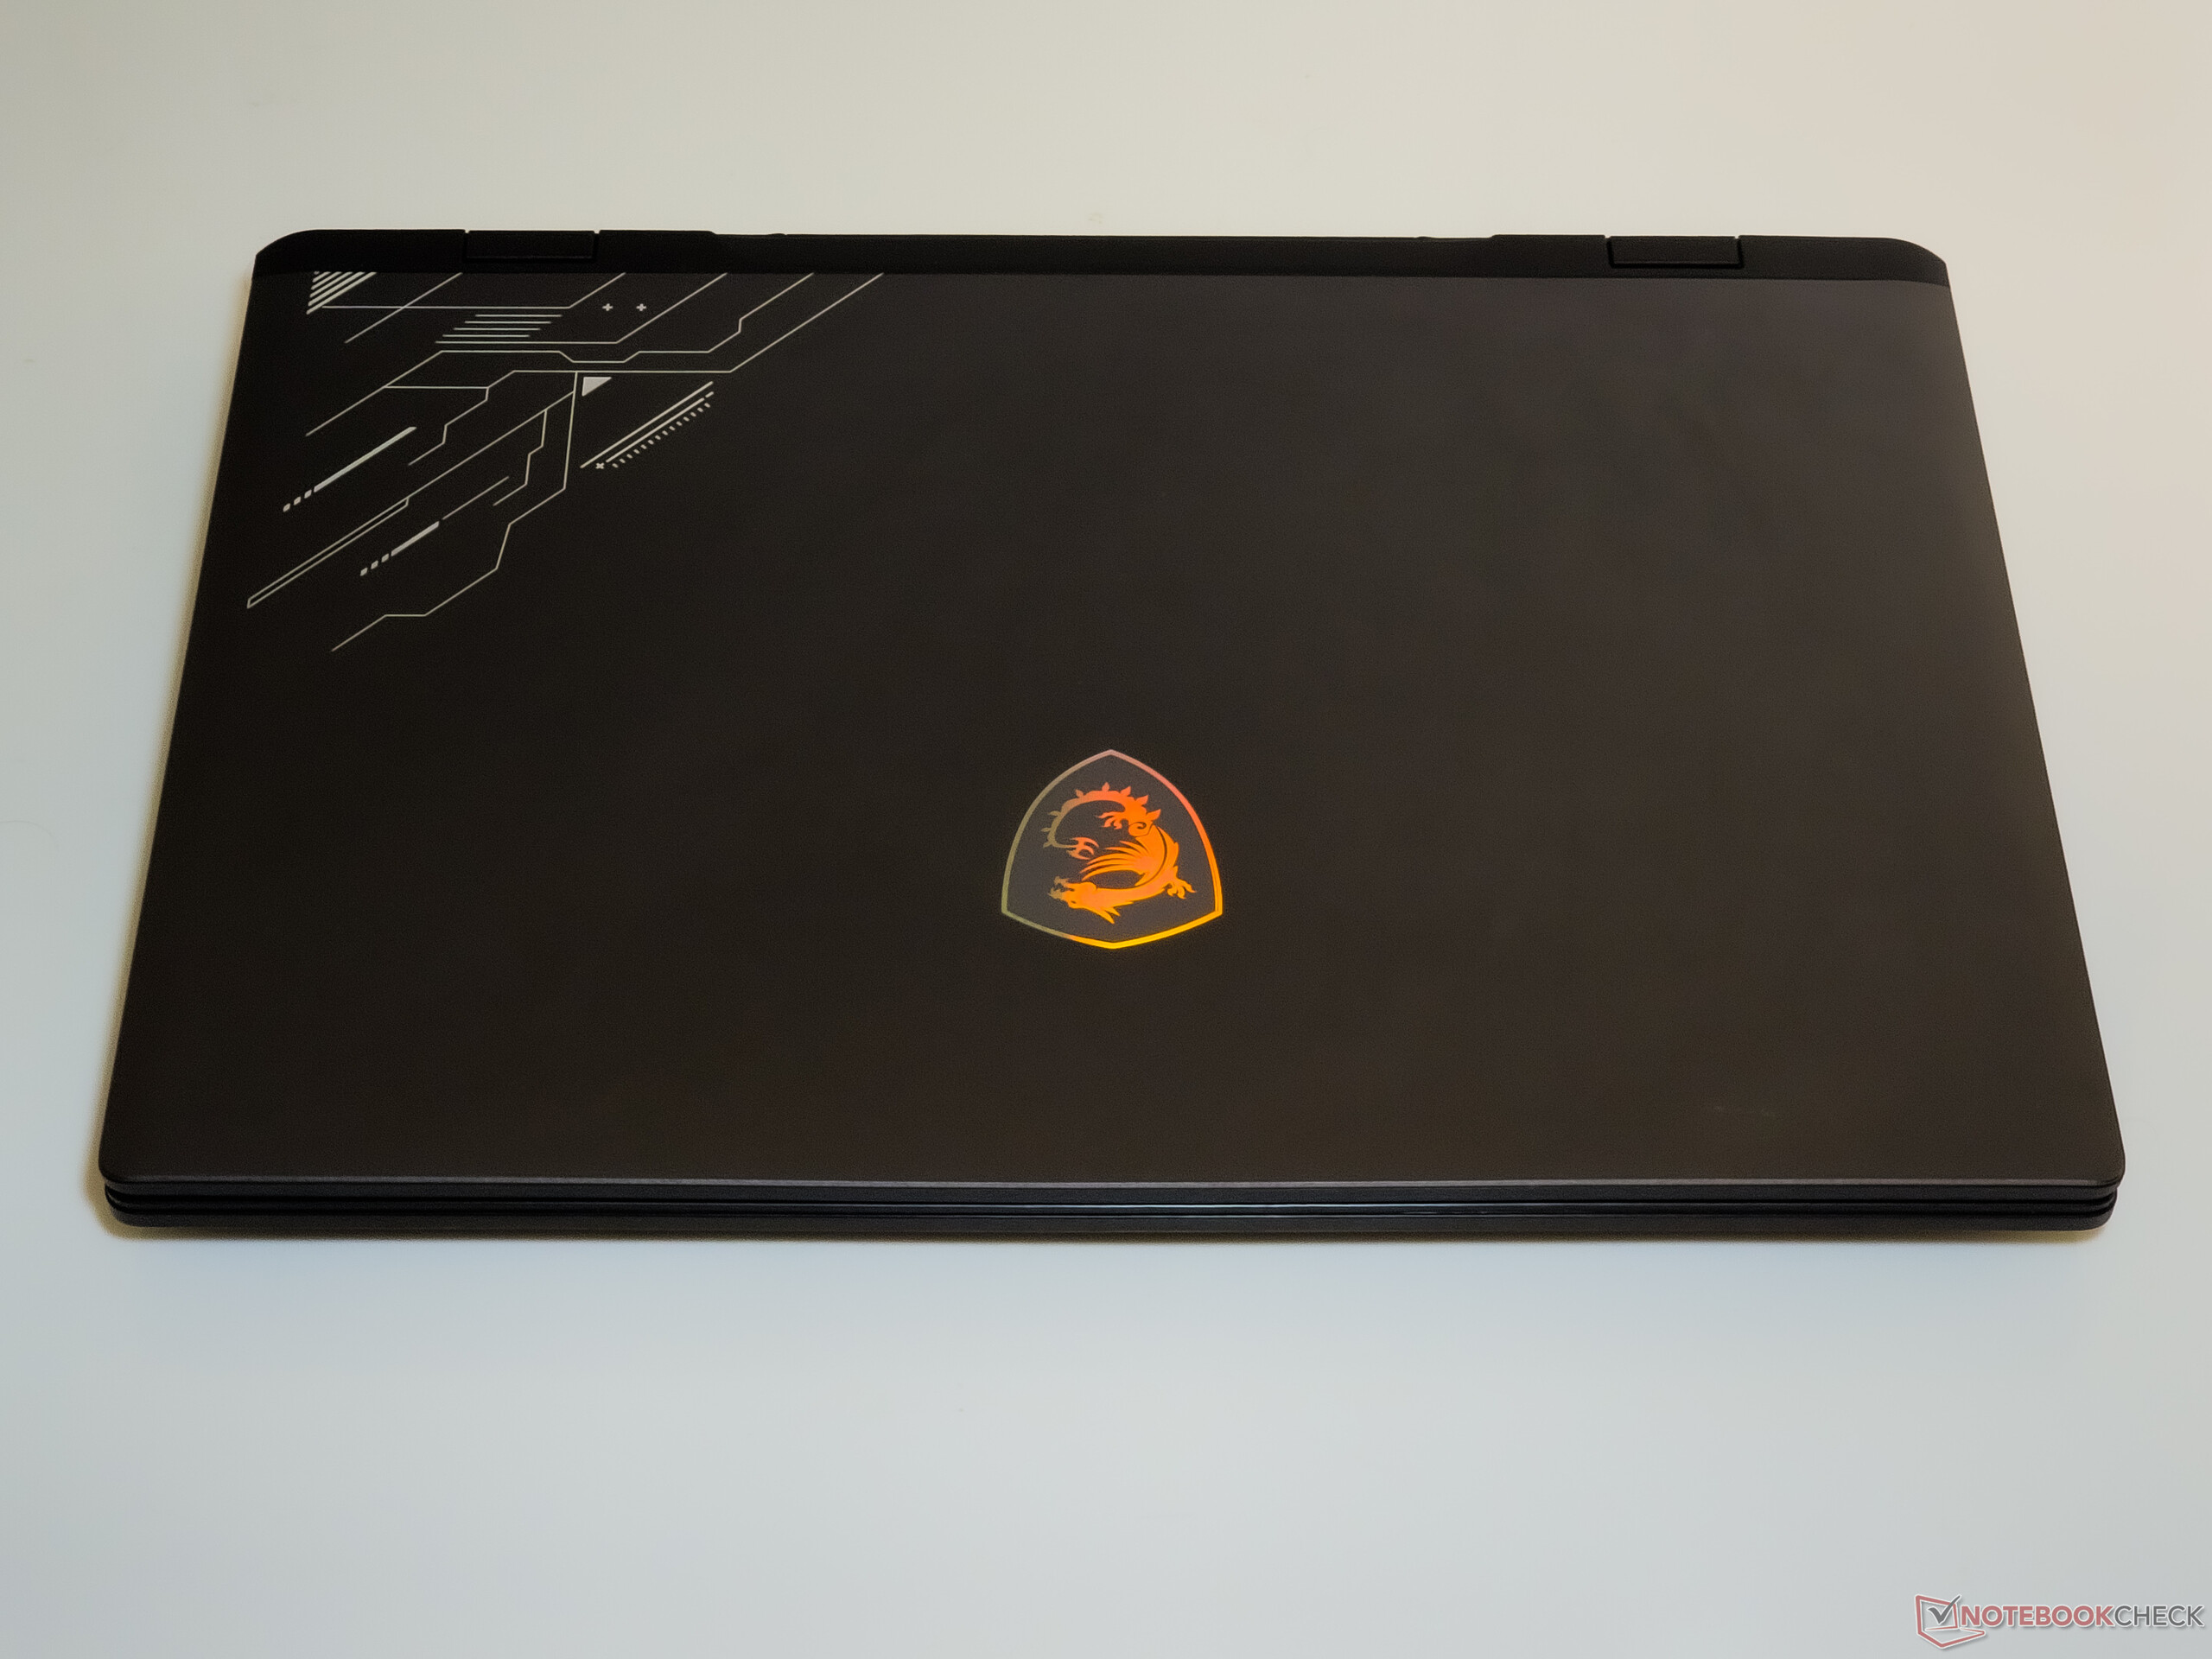
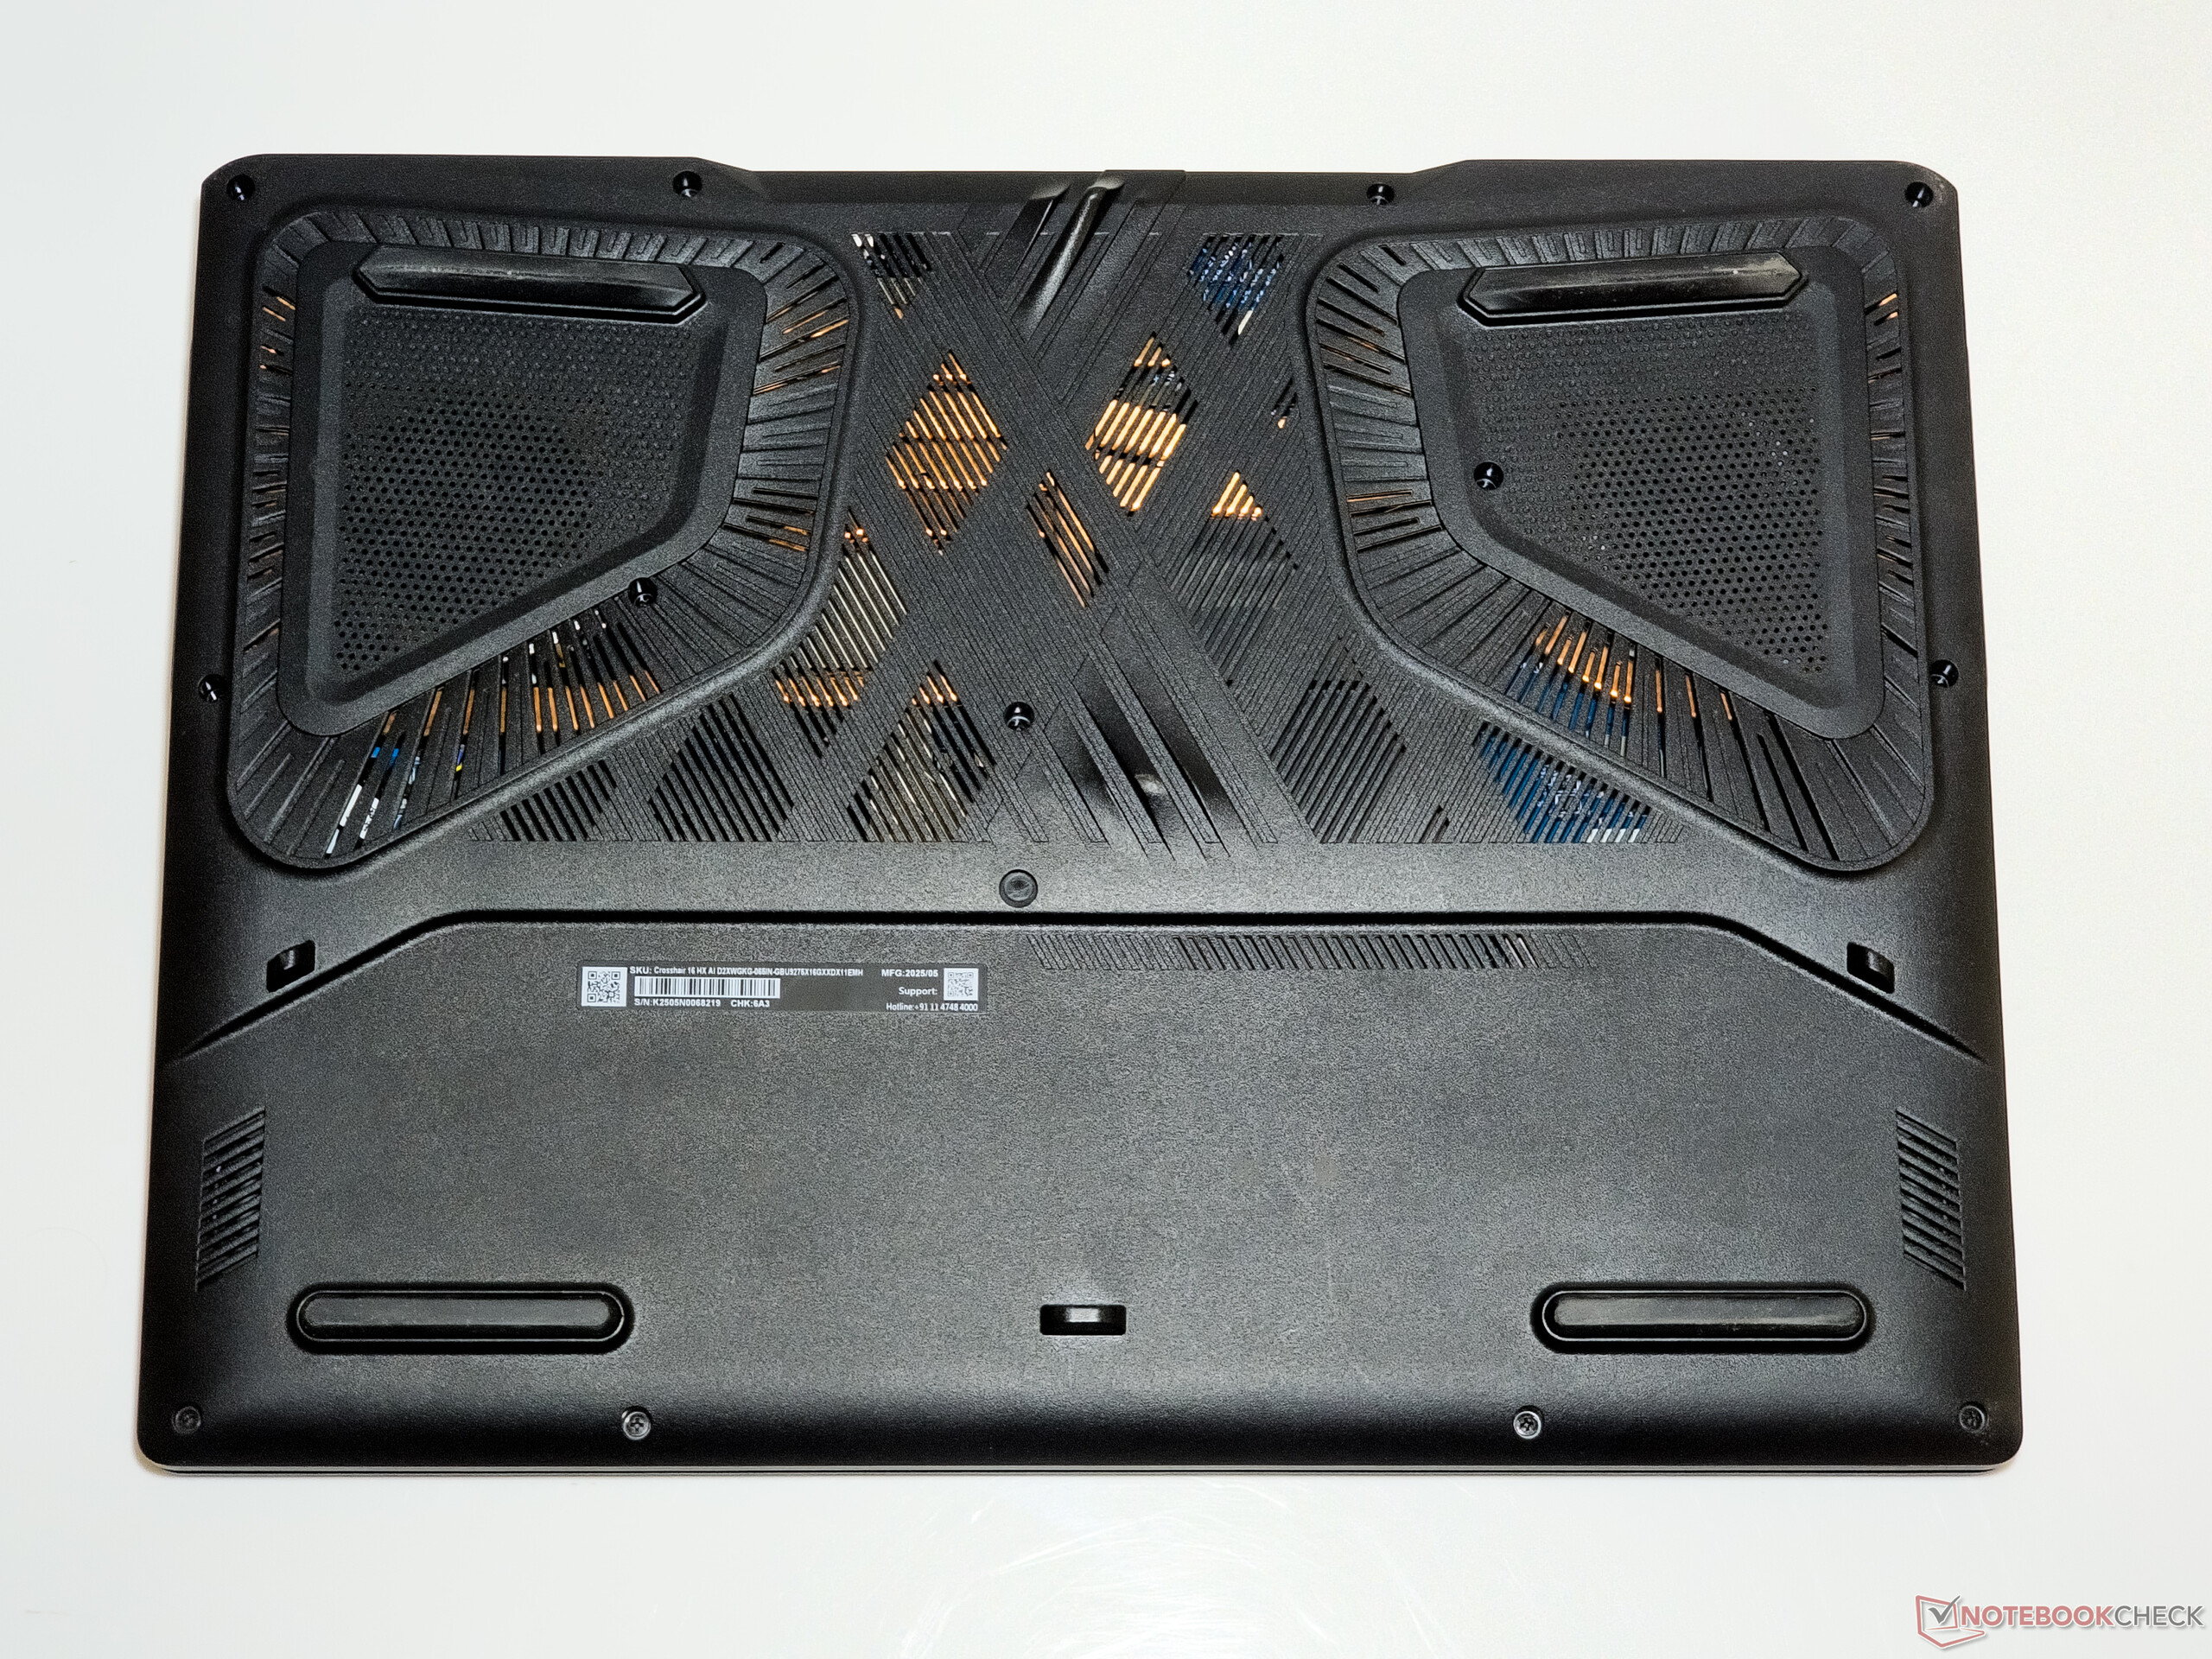
The Crosshair 16 HX AI comes in a primarily plastic construction in a Cosmos Gray finish with a metallic lid that can fully lay flat at a 180° angle.
The build quality is sturdy with minimal flex on the keyboard deck and the lid.
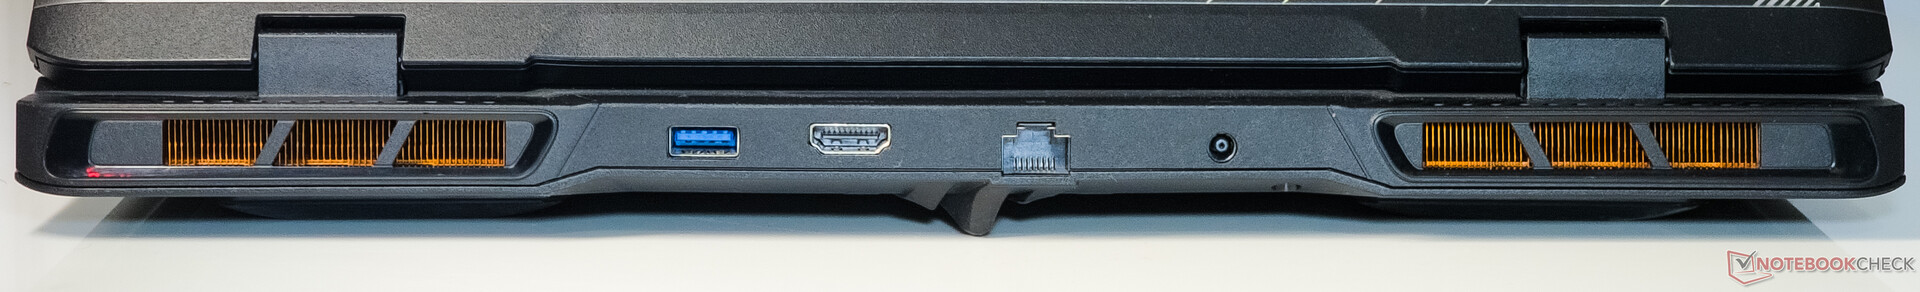
Port selection is similar to that of the Crosshair 18 HX AI and that includes a Thunderbolt 4 port, 3x USB 3.2 Gen1 Type-A ports, a HDMI 2.1-out, and Gigabit Ethernet. We faced no hindrance while connecting peripherals adjacent to each other.


Connectivity: High 6 GHz 6E throughput
The Intel Wi-Fi 6E AX211 WLAN card shows decent speeds in the 5 GHz band, but the 6 GHz 6E band offers a high 1.7 Gbps transmit and receive throughput when tested with our reference Asus ROG Rapture GT-AXE11000 router.
| Networking / iperf3 transmit AXE11000 | |
| Asus TUF Gaming A16 FA608UP | |
| Average of class Gaming (560 - 1862, n=94, last 2 years) | |
| Average Intel Wi-Fi 6E AX211 (64 - 1921, n=276) | |
| Aorus Elite 16 AE6H | |
| Lenovo Legion 5 Pro 16IAX10H | |
| MSI Crosshair 16 HX AI D2XWGKG | |
| Alienware 16X Aurora, RTX 5070 | |
| Networking / iperf3 receive AXE11000 | |
| Asus TUF Gaming A16 FA608UP | |
| Aorus Elite 16 AE6H | |
| Average of class Gaming (680 - 1745, n=94, last 2 years) | |
| Average Intel Wi-Fi 6E AX211 (582 - 1890, n=276) | |
| MSI Crosshair 16 HX AI D2XWGKG | |
| Alienware 16X Aurora, RTX 5070 | |
| Lenovo Legion 5 Pro 16IAX10H | |
| Networking / iperf3 transmit AXE11000 6GHz | |
| MSI Crosshair 16 HX AI D2XWGKG | |
| Average of class Gaming (723 - 2355, n=38, last 2 years) | |
| Average Intel Wi-Fi 6E AX211 (385 - 1851, n=226) | |
| Alienware 16X Aurora, RTX 5070 | |
| Networking / iperf3 receive AXE11000 6GHz | |
| MSI Crosshair 16 HX AI D2XWGKG | |
| Average of class Gaming (975 - 1775, n=37, last 2 years) | |
| Average Intel Wi-Fi 6E AX211 (700 - 1857, n=226) | |
| Alienware 16X Aurora, RTX 5070 | |
The 720p webcam quality is nothing to write home about. There is no Windows Hello IR login onboard, but a physical privacy shutter comes standard.


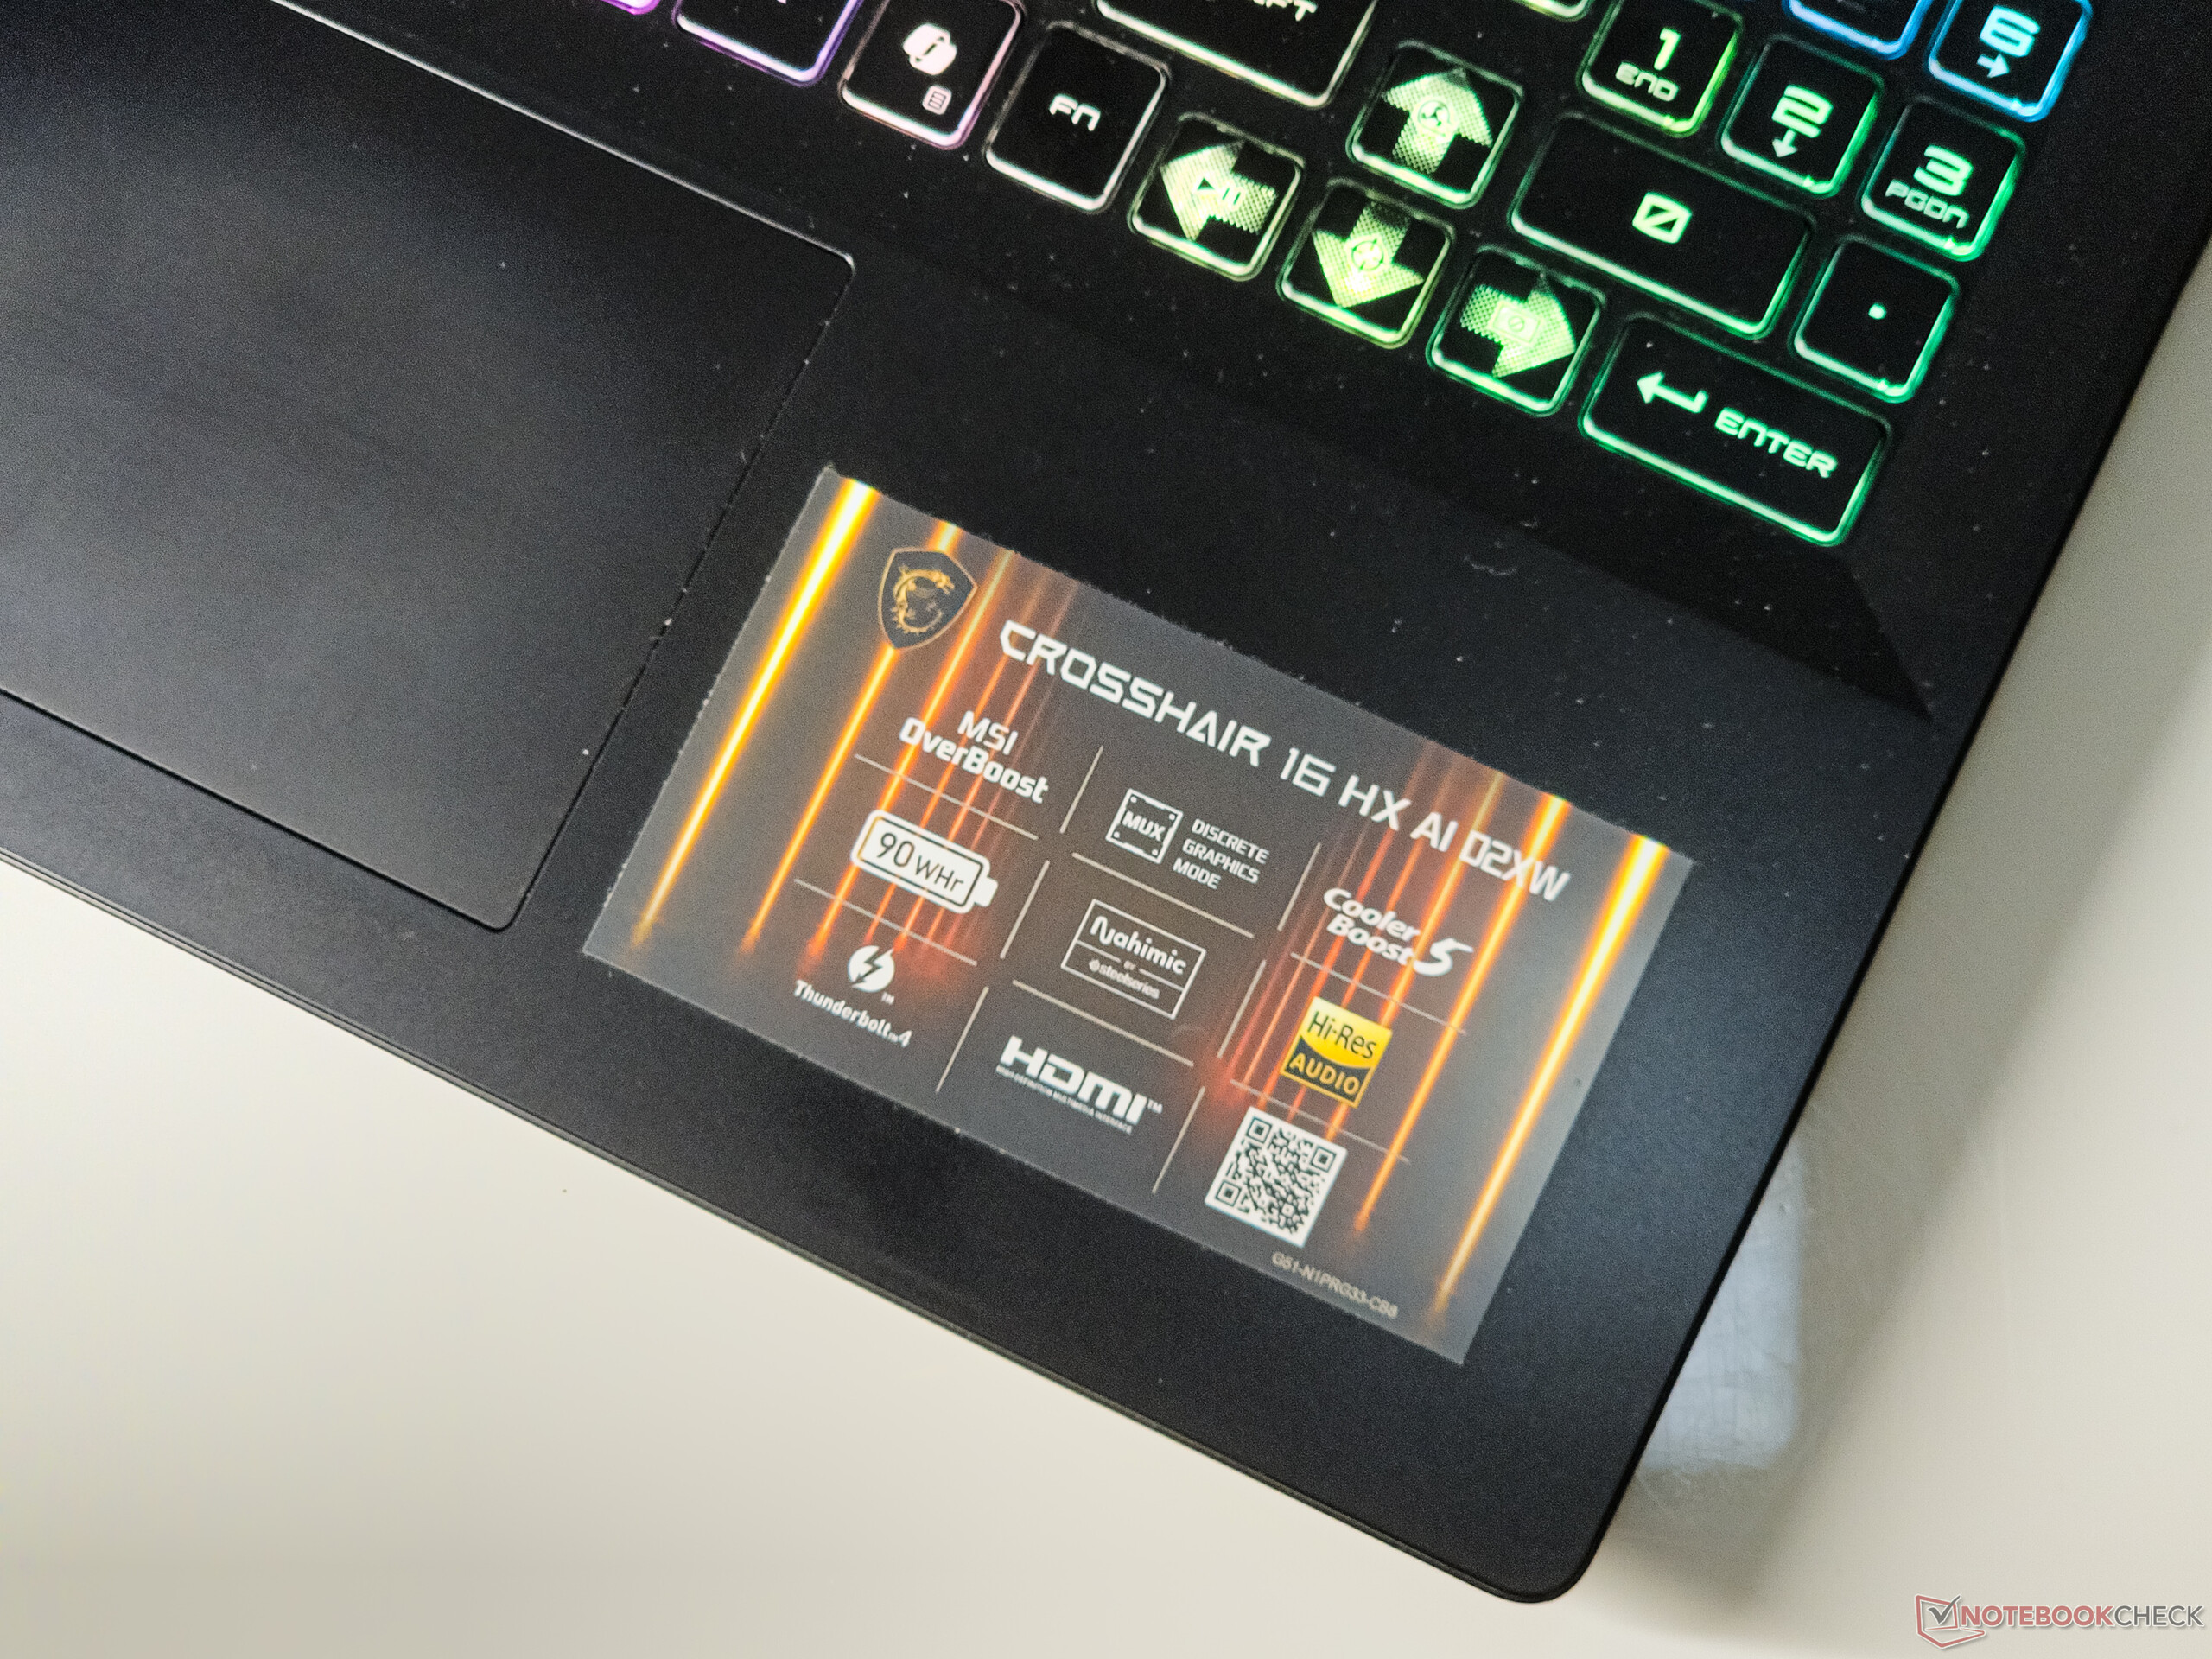
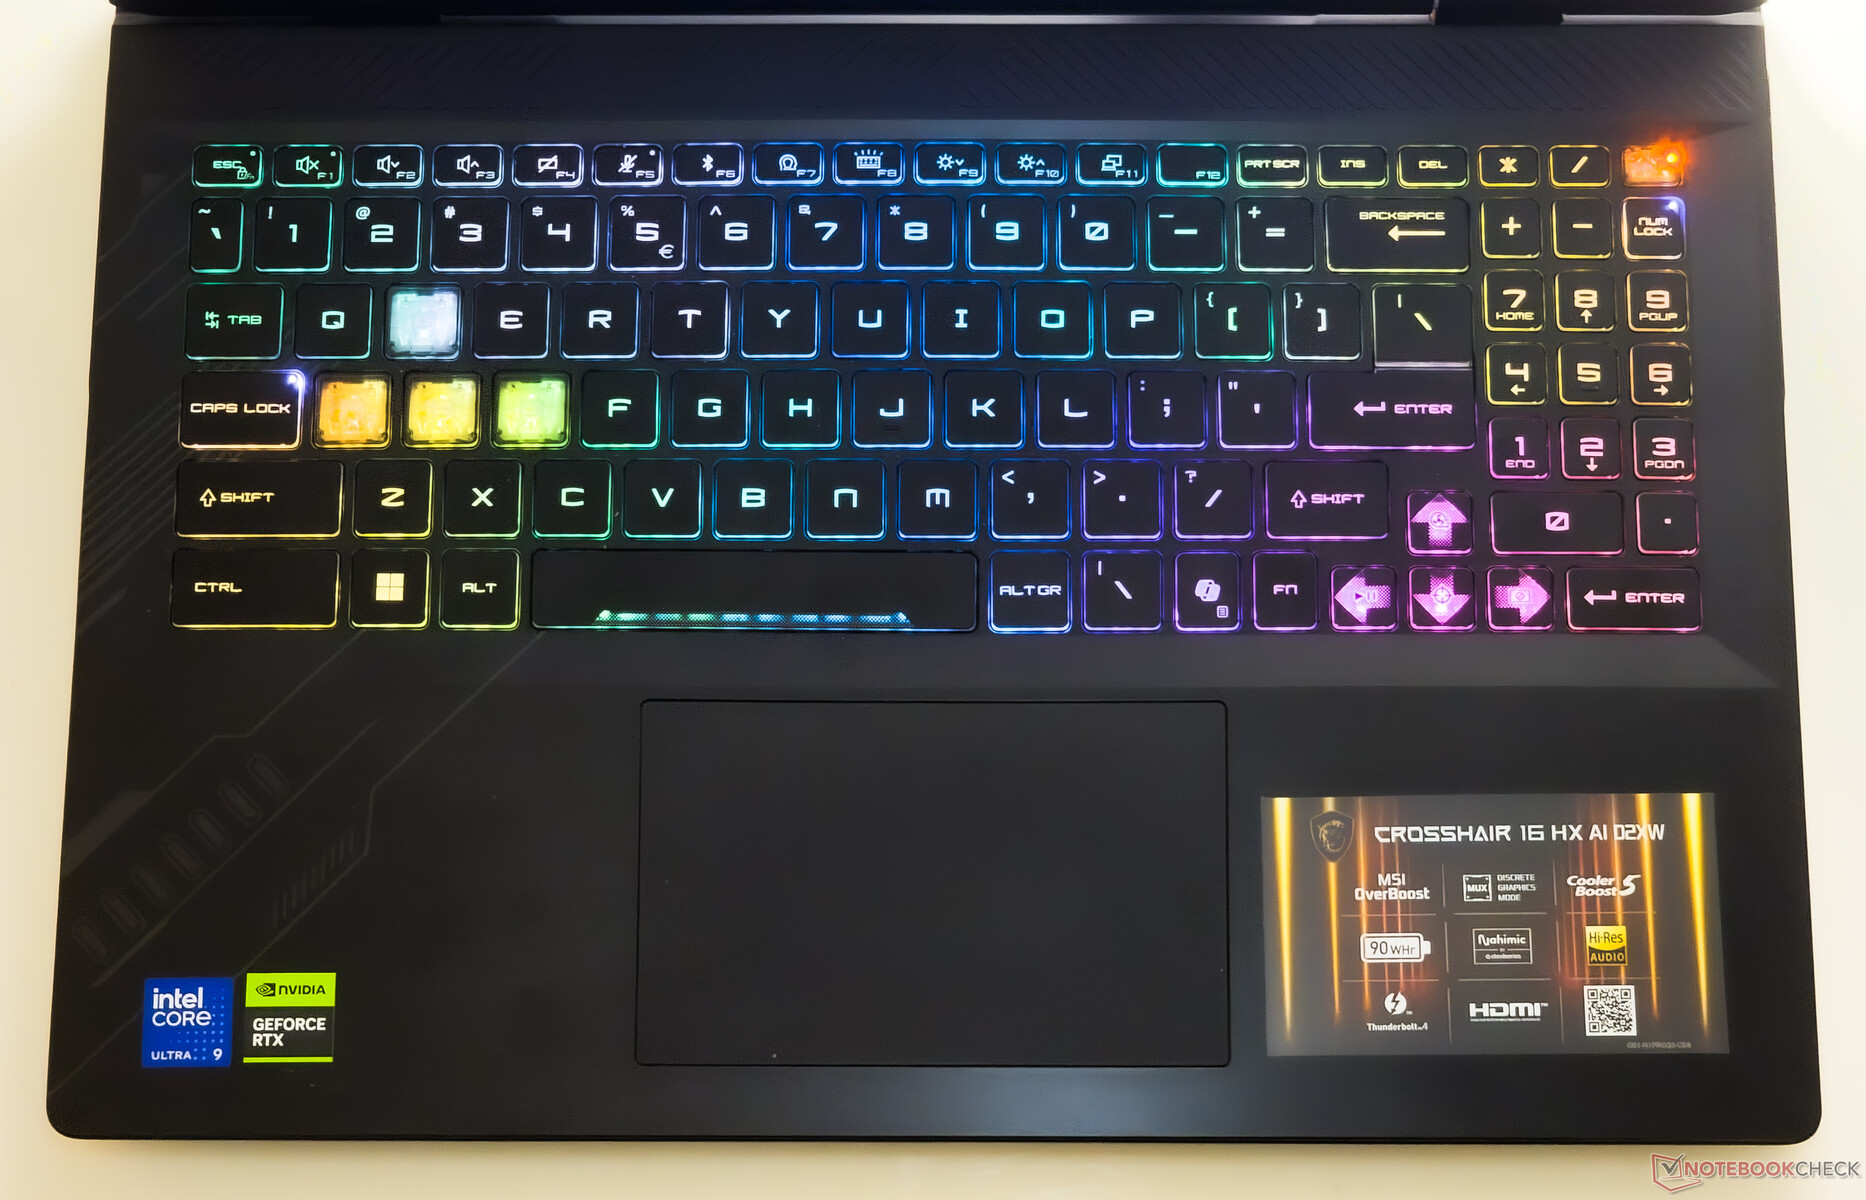
Input devices: Decent typing experience with enough RGB
The Crosshair 16 HX AI's 24-zone RGB keyboard offers decent tactility with a 1.7 mm key travel and full-sized arrow keys. The somewhat atypical layout may result in hitting the Fn key more often than the left arrow.
The three-column numpad comes in handy but feels cramped and is not really suited for fast number crunching.
The four-stage backlight offers good lighting in the dark and shines well, particularly through the fully transparent WASD keys.
The 12 x 7.5 cm touchpad demonstrates good gliding properties and supports Windows Precision gestures, though clicks and gestures along the top edge can be hard to register at times.
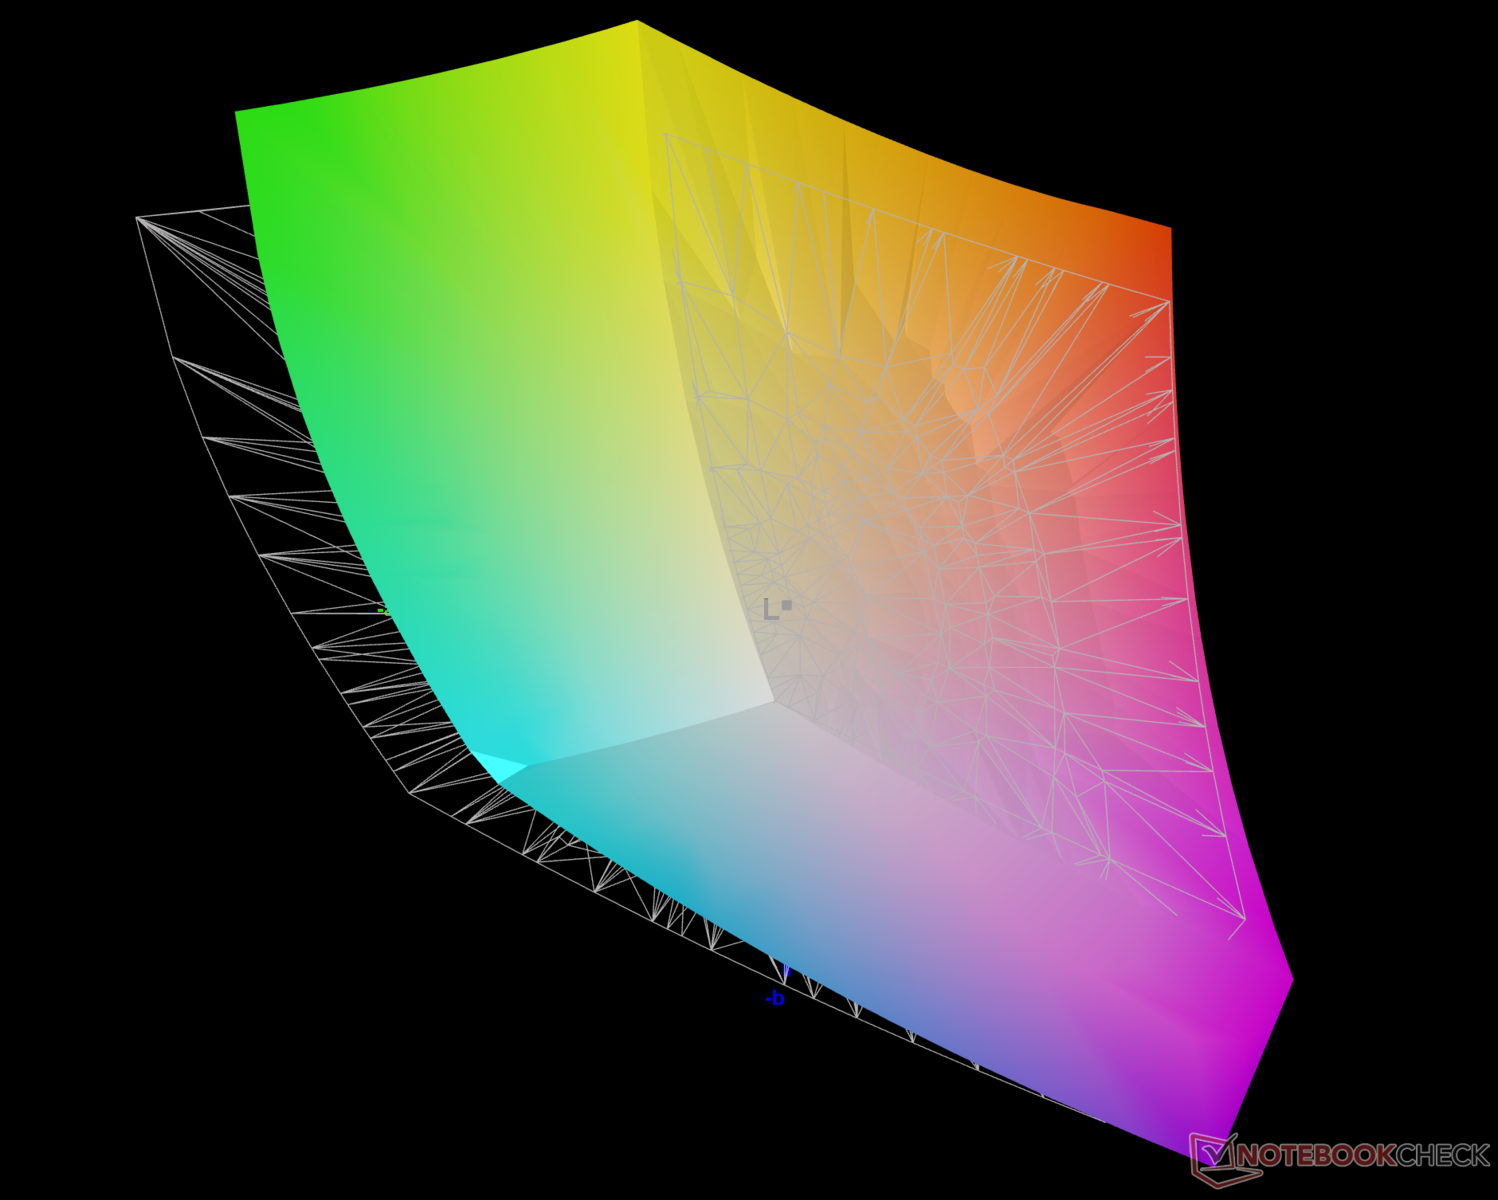
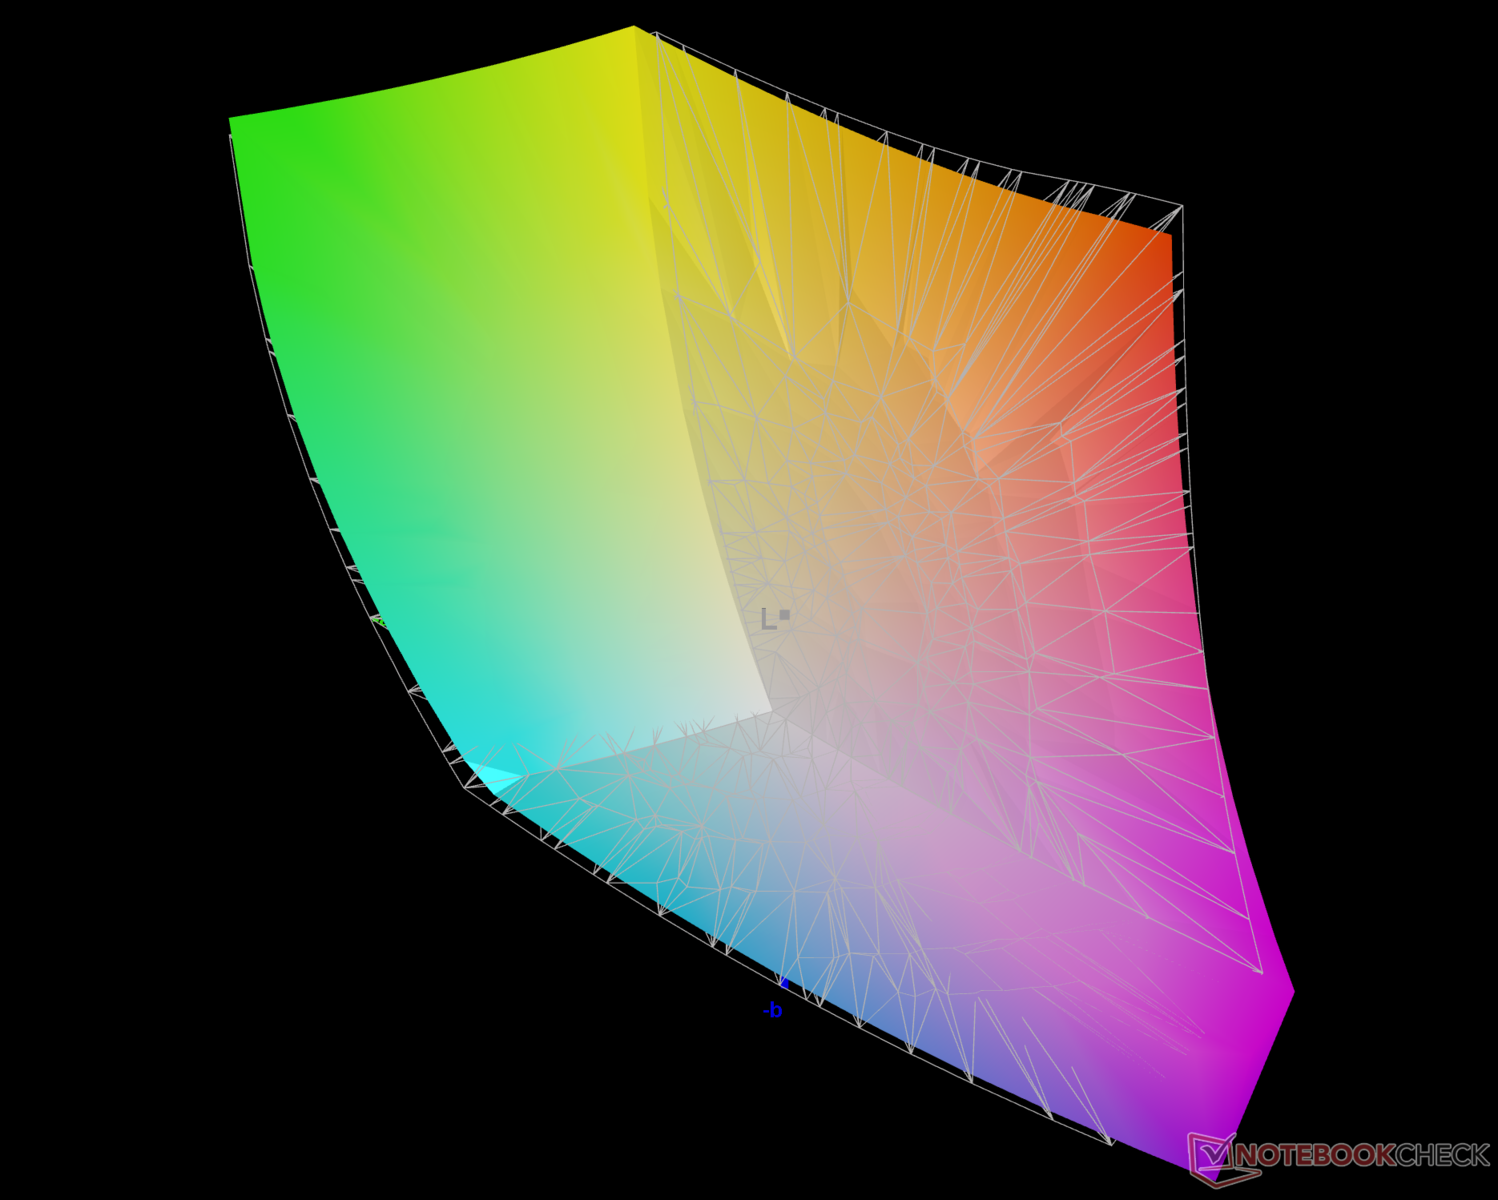
Display: QHD+ 240 Hz panel with good gamut coverage and no PWM
The Crosshair 16 HX AI's 16:10 QHD+ 240 Hz IPS-level display offers a maximum brightness of 472 nits with a good 88% uniformity, which is a decent level for indoor use.
The 1,180:1 measured contrast ratio lends itself to a subjectively good viewing experience with near-complete sRGB and Display P3 color gamut coverage.
That being said, the display does not support HDR or any form of adaptive sync.


| |||||||||||||||||||||||||
Brightness Distribution: 88 %
Center on Battery: 471 cd/m²
Contrast: 1180:1 (Black: 0.4 cd/m²)
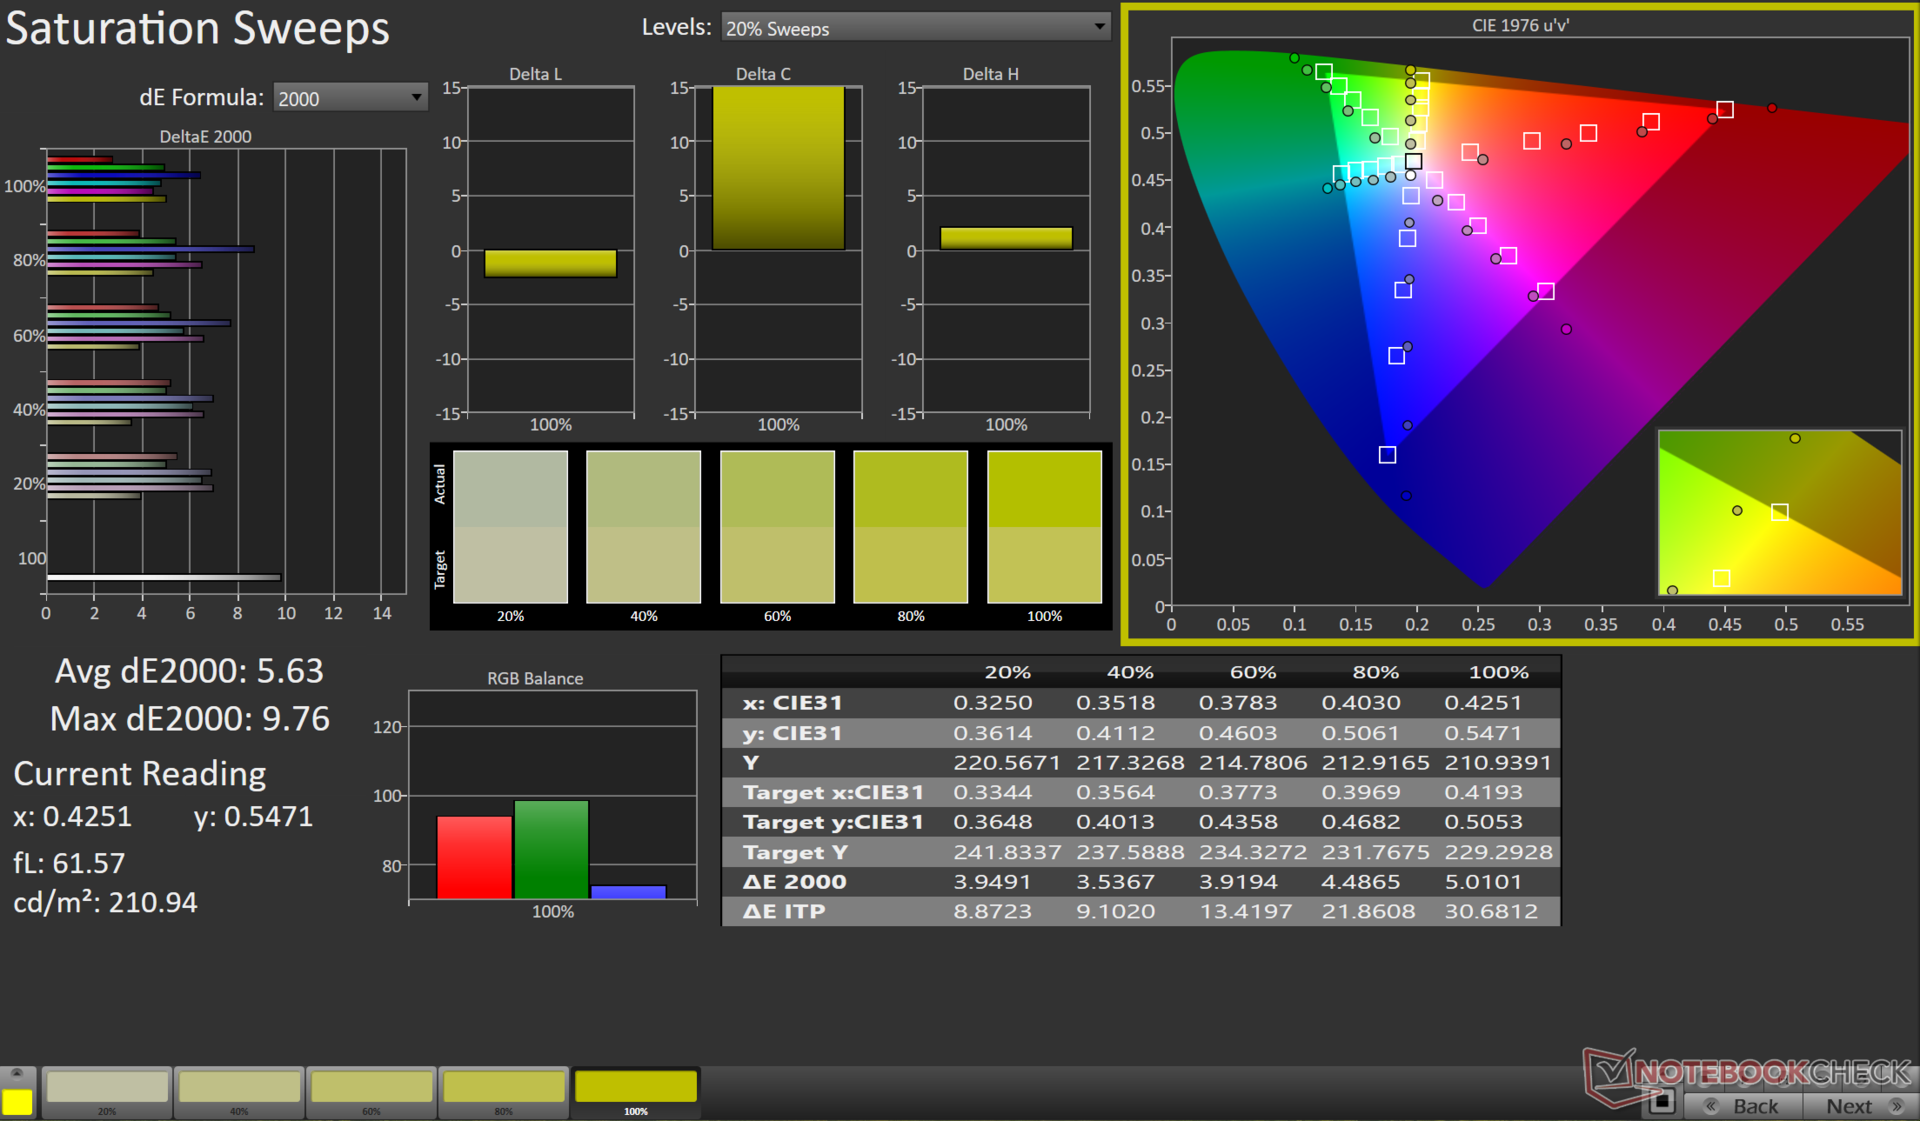
ΔE ColorChecker Calman: 6.07 | ∀{0.5-29.43 Ø4.73}
calibrated: 2.25
ΔE Greyscale Calman: 6.4 | ∀{0.09-98 Ø4.97}
83.9% AdobeRGB 1998 (Argyll 3D)
99.7% sRGB (Argyll 3D)
95.5% Display P3 (Argyll 3D)
Gamma: 2.52
CCT: 7987 K
| MSI Crosshair 16 HX AI D2XWGKG AUO B160QAN02.3, IPS, 2560x1600, 16", 240 Hz | Alienware 16X Aurora, RTX 5070 LG Philips 160WQG, IPS, 2560x1600, 16", 240 Hz | Aorus Elite 16 AE6H NE160QDM-NYJ, IPS, 2560x1600, 16", 165 Hz | Lenovo Legion 5 Pro 16IAX10H ATNA60HS01-0 (Samsung SDC420A), OLED, 2560x1600, 16", 165 Hz | Asus TUF Gaming A16 FA608UP MNG007DA5-3, IPS, 2560x1600, 16", 165 Hz | |
|---|---|---|---|---|---|
| Display | 3% | -13% | 6% | -15% | |
| Display P3 Coverage (%) | 95.5 | 96.9 1% | 70.8 -26% | 99.9 5% | 69.4 -27% |
| sRGB Coverage (%) | 99.7 | 99.8 0% | 99.8 0% | 100 0% | 97.2 -3% |
| AdobeRGB 1998 Coverage (%) | 83.9 | 89.7 7% | 72.6 -13% | 94.1 12% | 71.9 -14% |
| Response Times | -22% | -190% | 62% | -22% | |
| Response Time Grey 50% / Grey 80% * (ms) | 3.59 ? | 4.3 ? -20% | 16.8 ? -368% | 2 ? 44% | 6.3 ? -75% |
| Response Time Black / White * (ms) | 7.09 ? | 8.7 ? -23% | 7.9 ? -11% | 1.4 ? 80% | 4.8 ? 32% |
| PWM Frequency (Hz) | 1300 | ||||
| PWM Amplitude * (%) | 16.7 | ||||
| Screen | 18% | 10% | 29% | 37% | |
| Brightness middle (cd/m²) | 472 | 493.2 4% | 443 -6% | 518 10% | 480 2% |
| Brightness (cd/m²) | 438 | 477 9% | 433 -1% | 522 19% | 456 4% |
| Brightness Distribution (%) | 88 | 93 6% | 90 2% | 97 10% | 91 3% |
| Black Level * (cd/m²) | 0.4 | 0.5 -25% | 0.42 -5% | 0.32 20% | |
| Contrast (:1) | 1180 | 986 -16% | 1055 -11% | 1500 27% | |
| Colorchecker dE 2000 * | 6.07 | 3.57 41% | 3.82 37% | 2.49 59% | 1.4 77% |
| Colorchecker dE 2000 max. * | 9.76 | 7.03 28% | 7.61 22% | 5.25 46% | 2.5 74% |
| Colorchecker dE 2000 calibrated * | 2.25 | 0.68 70% | 1.33 41% | 2.15 4% | 1.3 42% |
| Greyscale dE 2000 * | 6.4 | 3.7 42% | 5.5 14% | 3.02 53% | 1.2 81% |
| Gamma | 2.52 87% | 2.16 102% | 2.249 98% | 2.37 93% | 2.16 102% |
| CCT | 7987 81% | 5876 111% | 6549 99% | 6426 101% | 6620 98% |
| Total Average (Program / Settings) | -0% /
9% | -64% /
-23% | 32% /
29% | 0% /
17% |
* ... smaller is better

The Crosshair 16 HX AI's out-of-the-box color accuracy is a bit off.
Our calibration routine using the X-Rite i1Basic Pro 3 spectrophotometer and Calman Ultimate software from Portrait Displays significantly improves the Grayscale DeltaE2000 to just 0.5 and the average ColorChecker DeltaE2000 to 2.25.
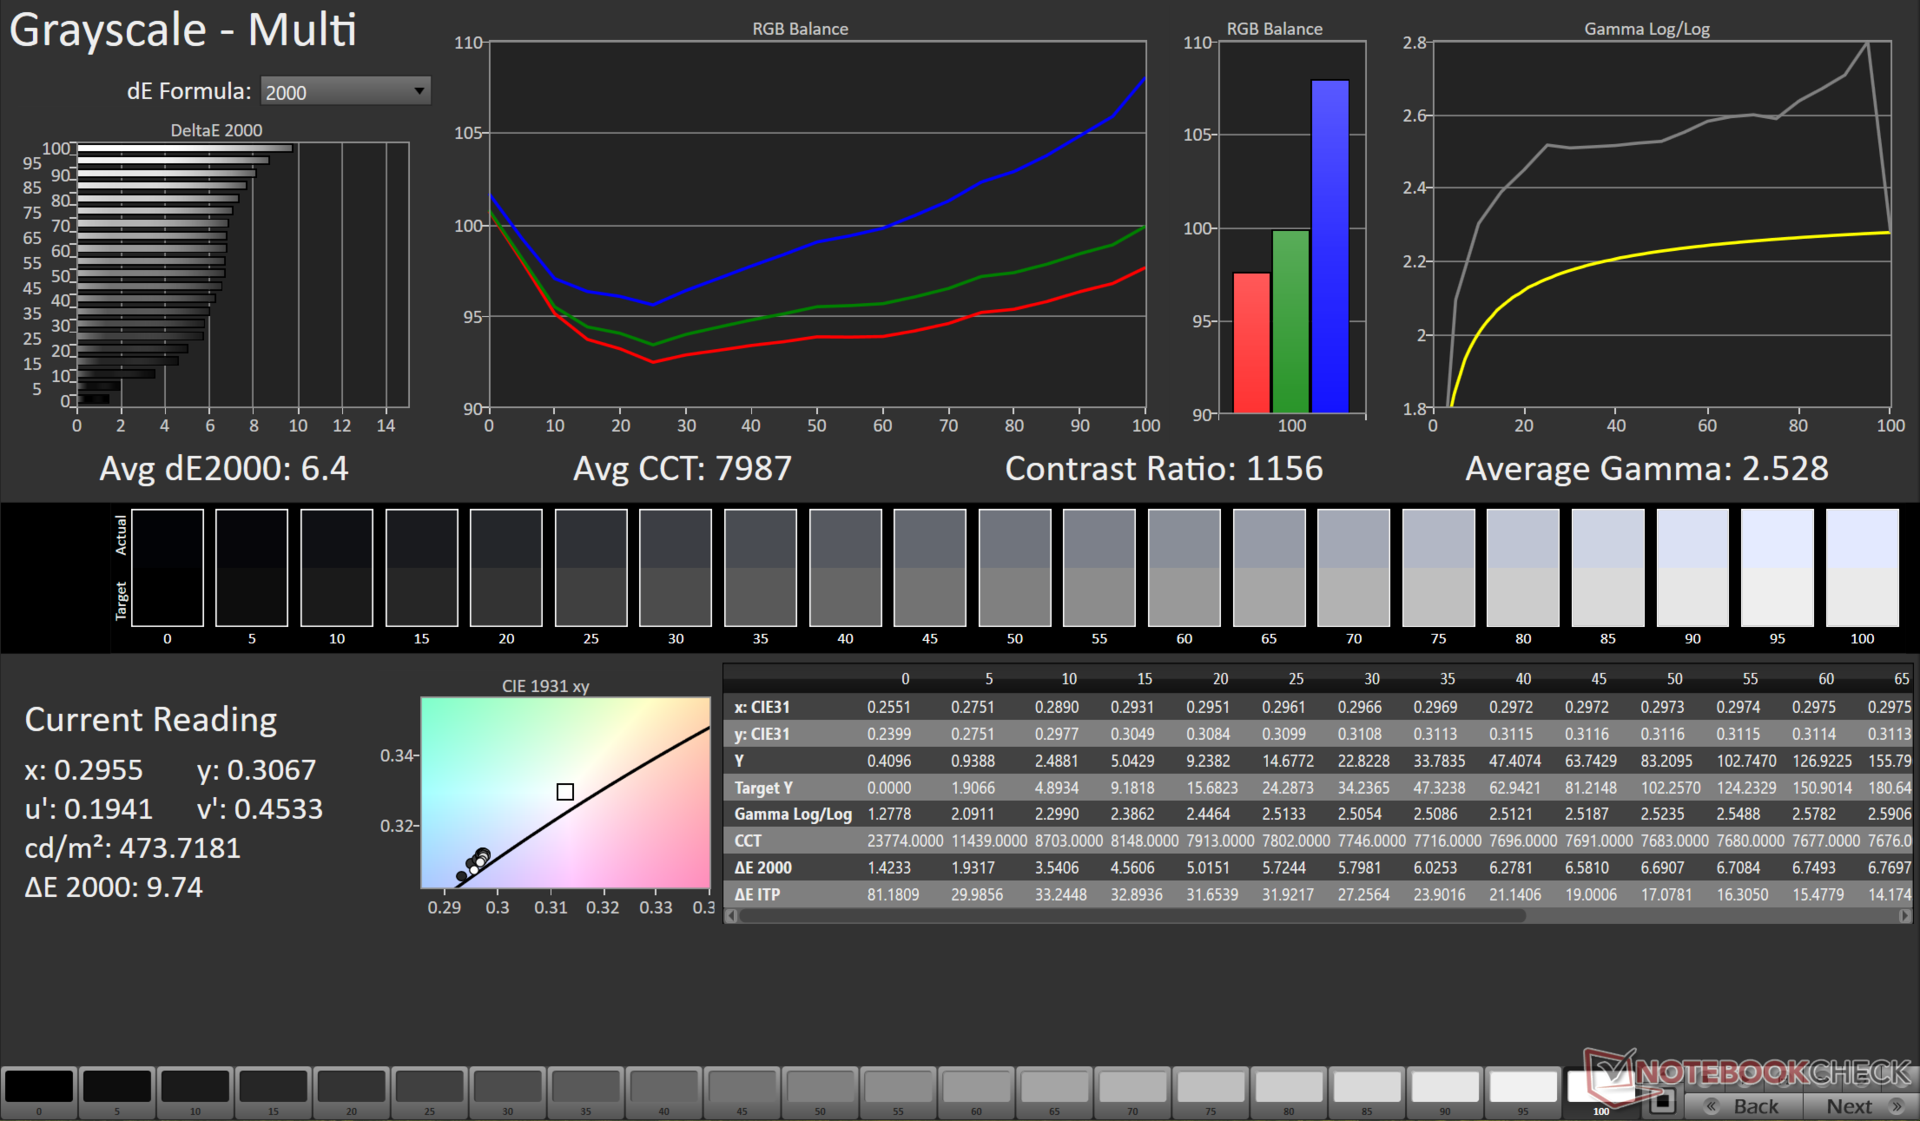

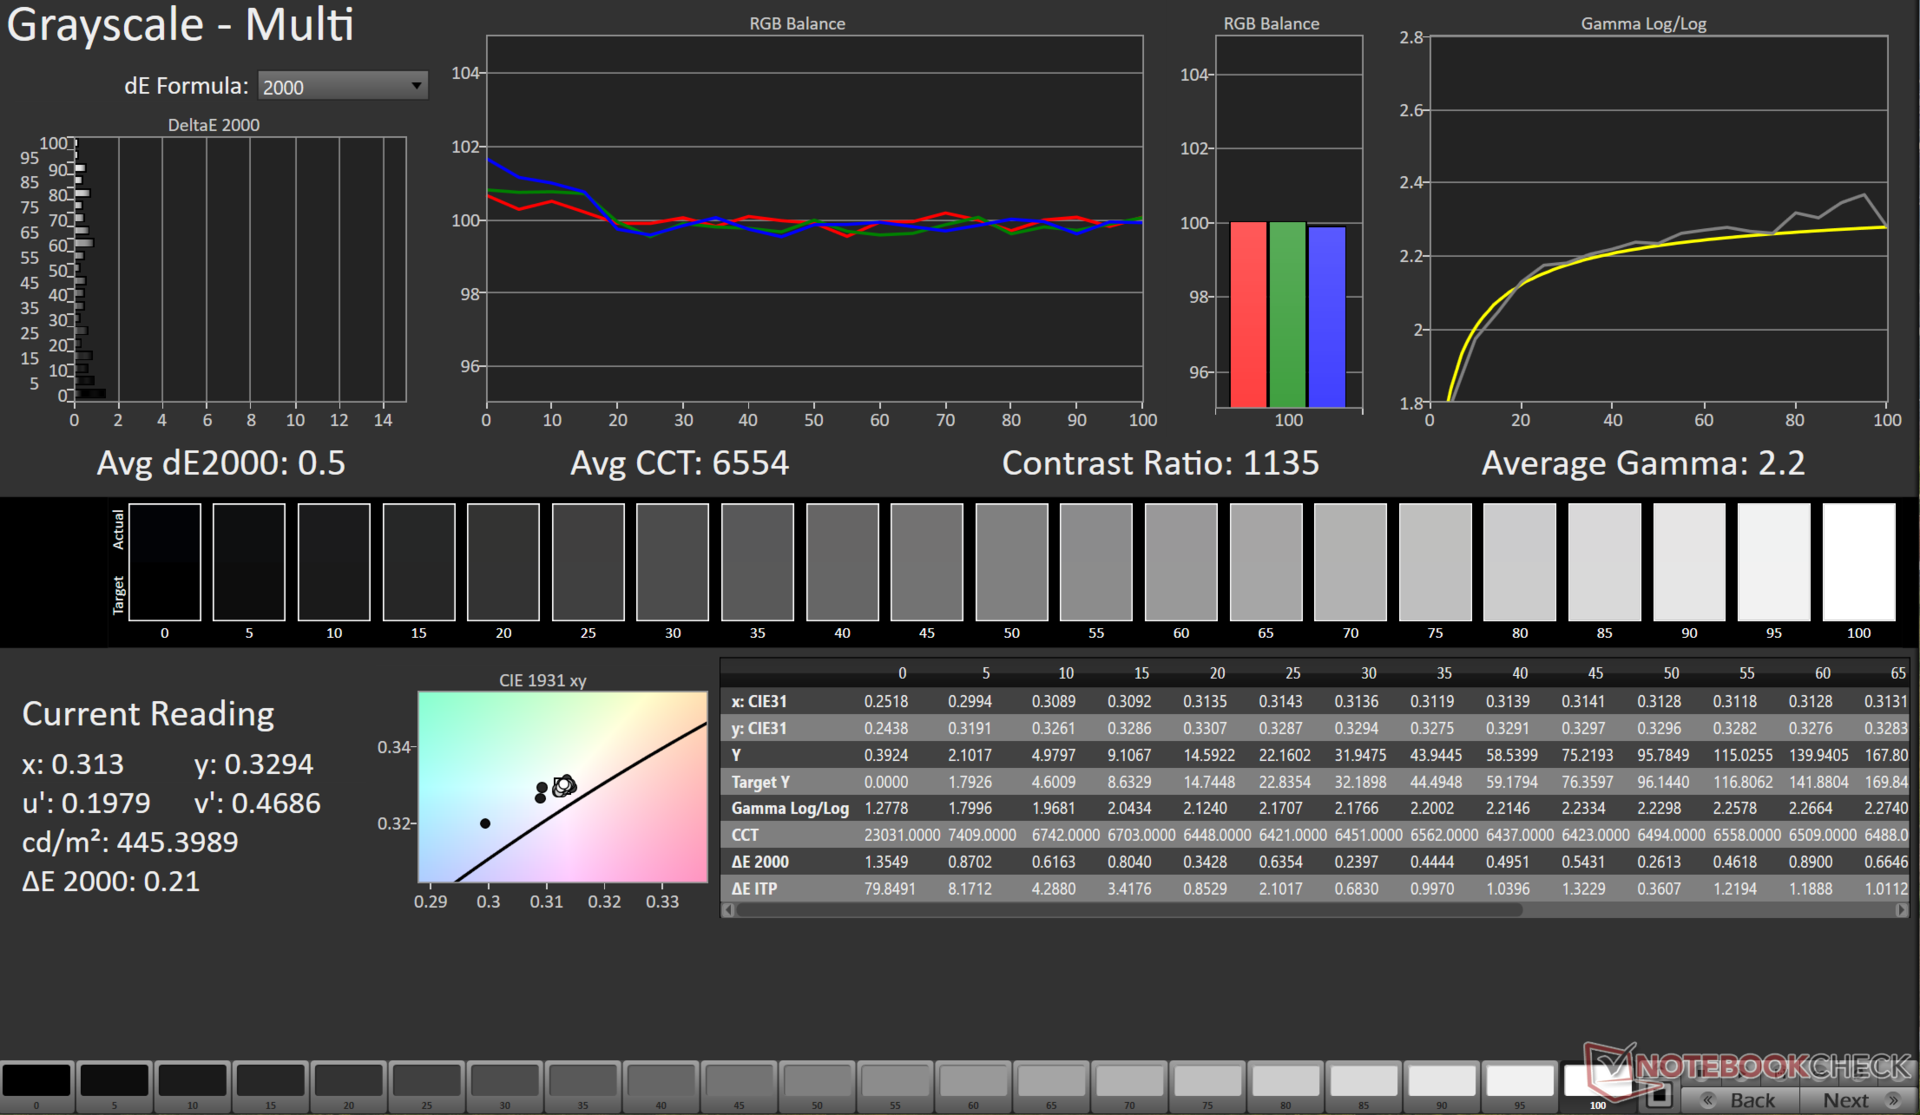


Our calibrated ICC file can be downloaded from the link above.
Display Response Times
| ↔ Response Time Black to White | ||
|---|---|---|
| 7.09 ms ... rise ↗ and fall ↘ combined | ↗ 3.52 ms rise | 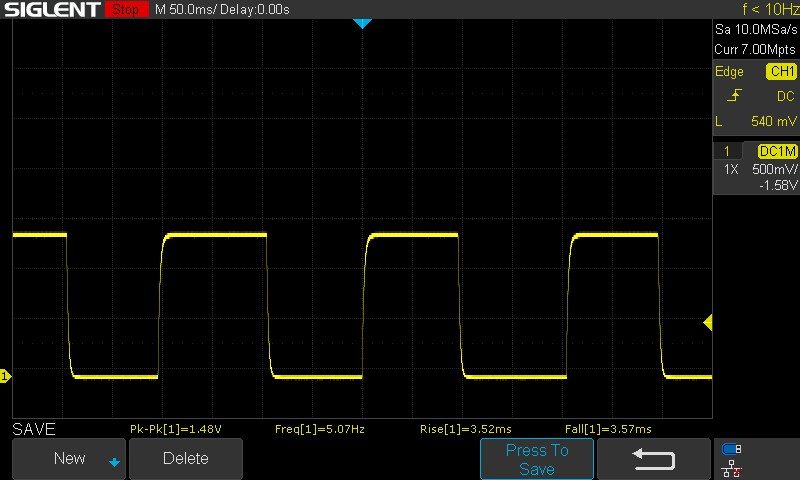 |
| ↘ 3.57 ms fall | ||
| The screen shows very fast response rates in our tests and should be very well suited for fast-paced gaming. In comparison, all tested devices range from 0.1 (minimum) to 240 (maximum) ms. » 21 % of all devices are better. This means that the measured response time is better than the average of all tested devices (19.9 ms). | ||
| ↔ Response Time 50% Grey to 80% Grey | ||
| 3.59 ms ... rise ↗ and fall ↘ combined | ↗ 1.51 ms rise | 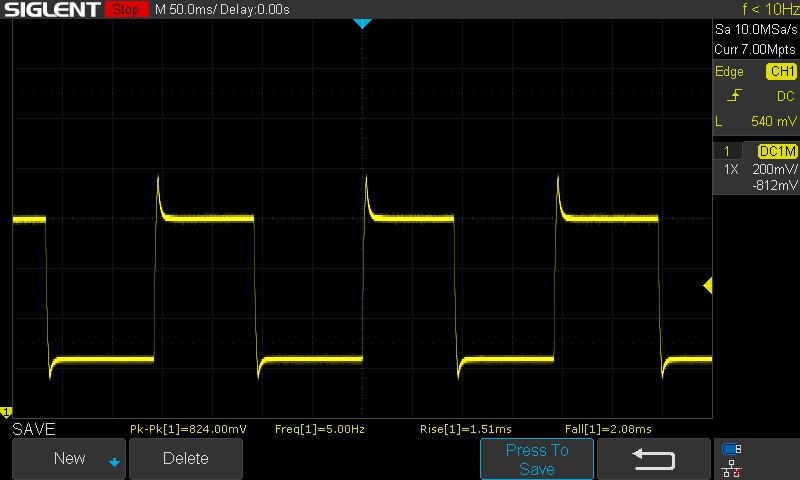 |
| ↘ 2.08 ms fall | ||
| The screen shows very fast response rates in our tests and should be very well suited for fast-paced gaming. In comparison, all tested devices range from 0.165 (minimum) to 636 (maximum) ms. » 14 % of all devices are better. This means that the measured response time is better than the average of all tested devices (31.1 ms). | ||
The panel uses overdrive by default.
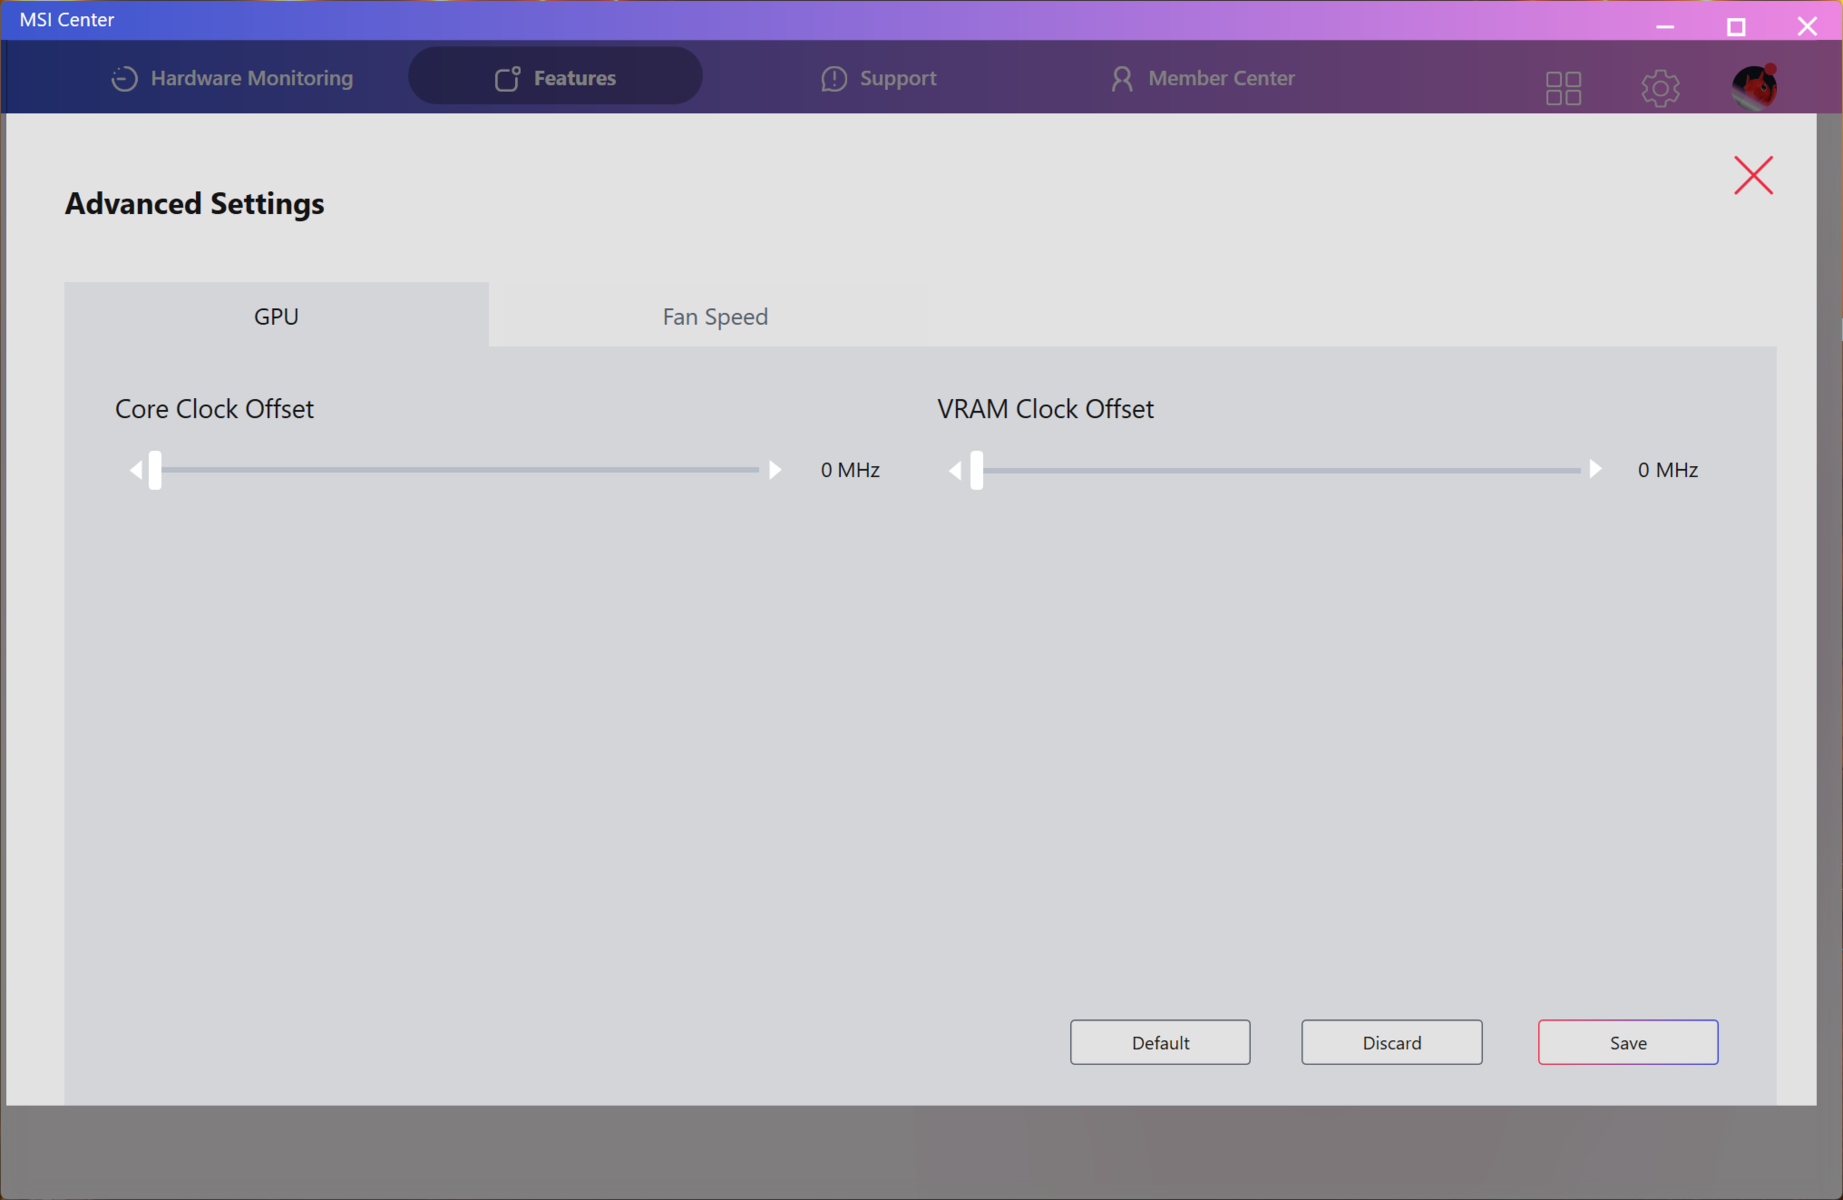
Disabling panel overdrive via MSI Center increases the 50% grey to 80% grey response times from 3.59 ms to 10.24 ms.
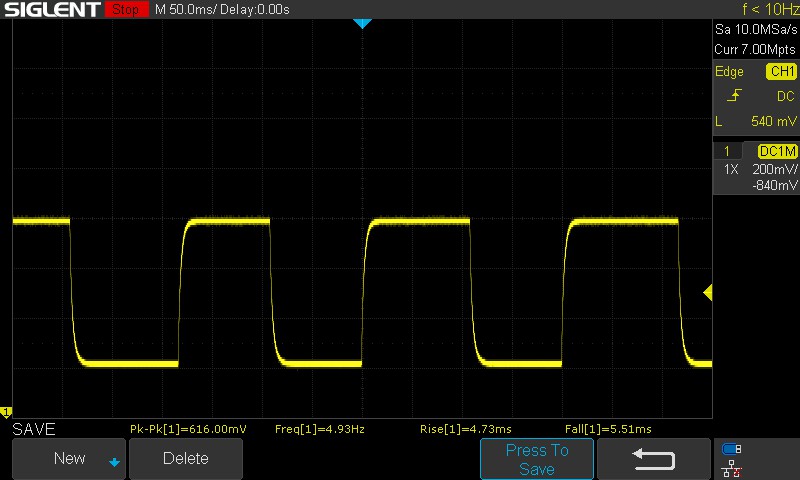
We did not observe any PWM flickering at all tested brightness levels.
Screen Flickering / PWM (Pulse-Width Modulation)
| Screen flickering / PWM not detected | ≤ 100 % brightness setting |  | |
In comparison: 52 % of all tested devices do not use PWM to dim the display. If PWM was detected, an average of 7791 (minimum: 5 - maximum: 343500) Hz was measured. | |||


Performance: Core Ultra 9 275HX and RTX 5070 throw no surprises
MSI offers the Crosshair 16 HX AI in two SKUs: Core Ultra 7 255HX + RTX 5060 Laptop and Core Ultra 9 275HX + RTX 5070 Laptop.
Both SKUs can be fitted with up to 96 GB of DDR5-6400 memory, but our unit came with only 16 GB of DDR5-5600 RAM installed.
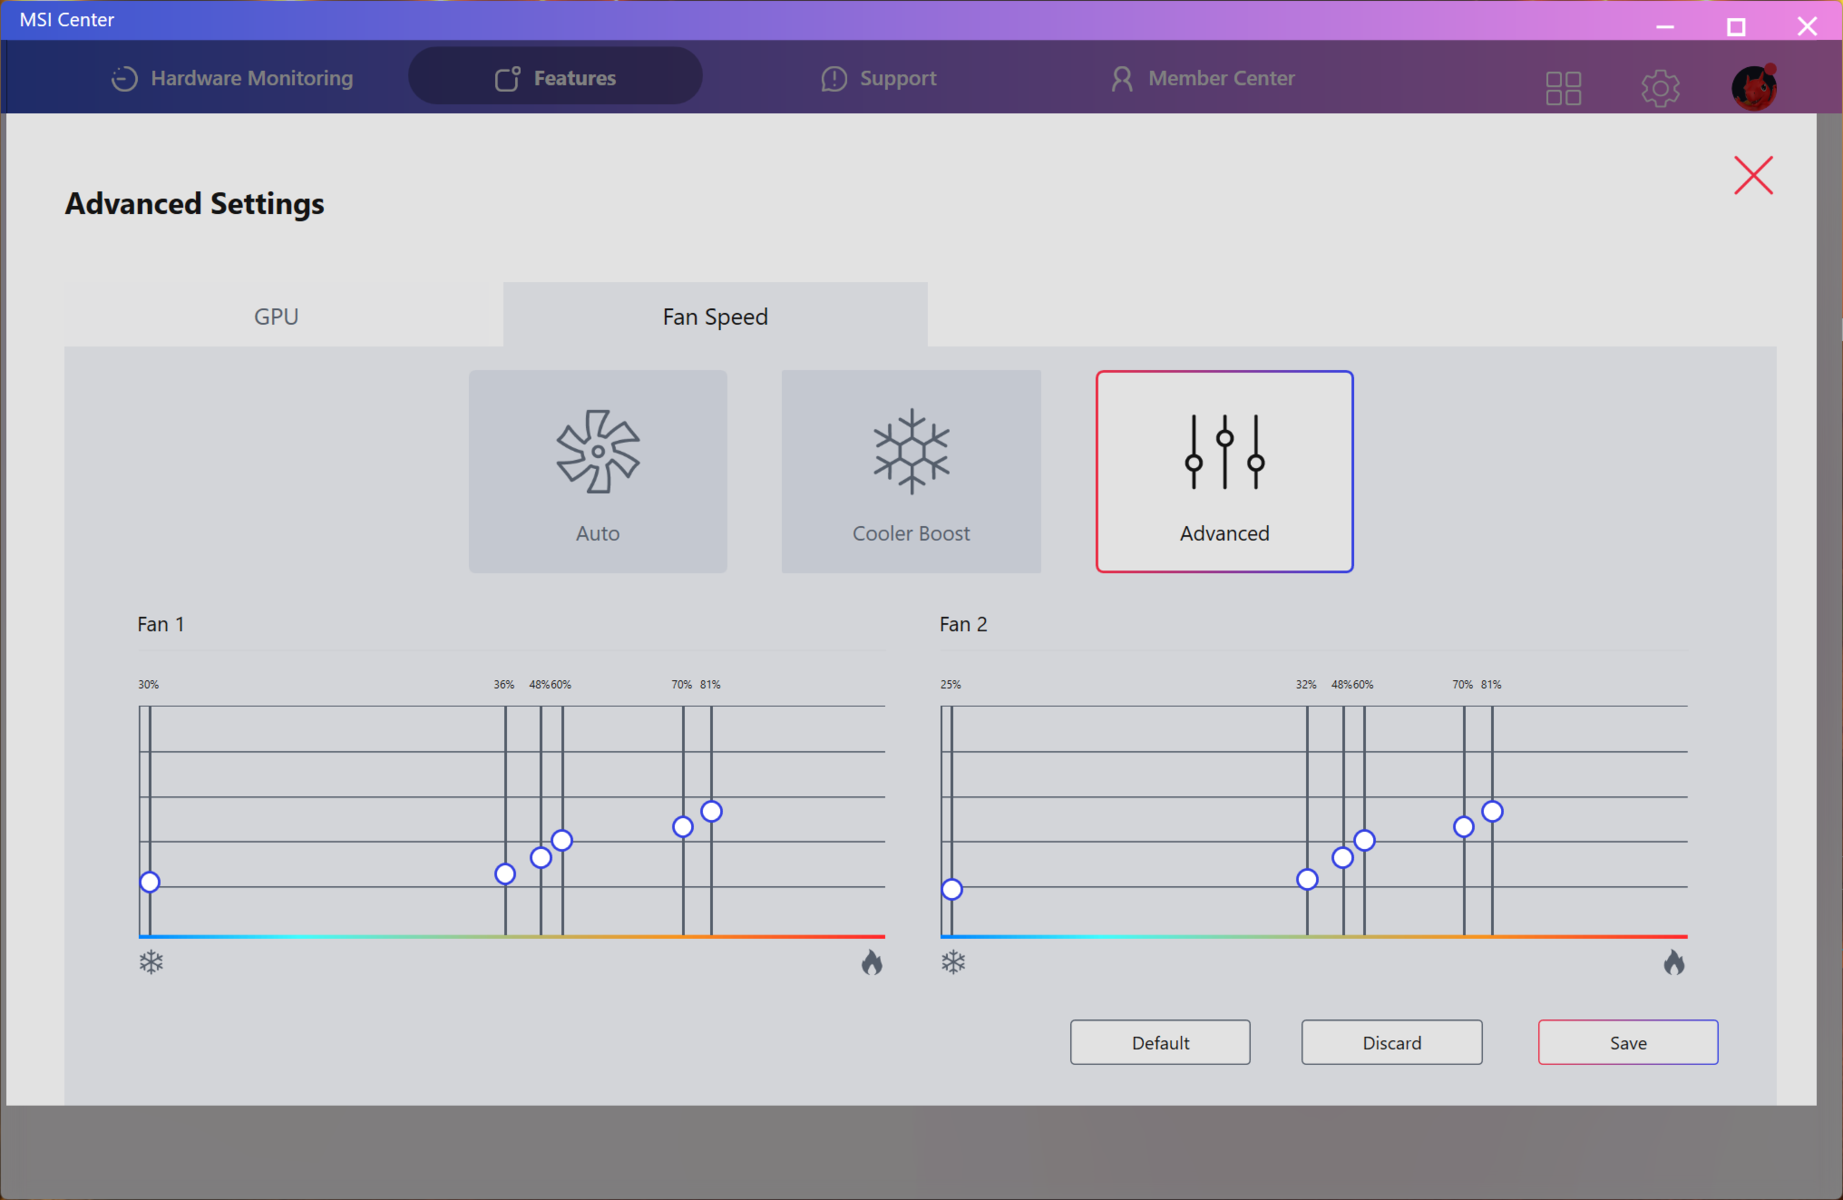
Testing conditions
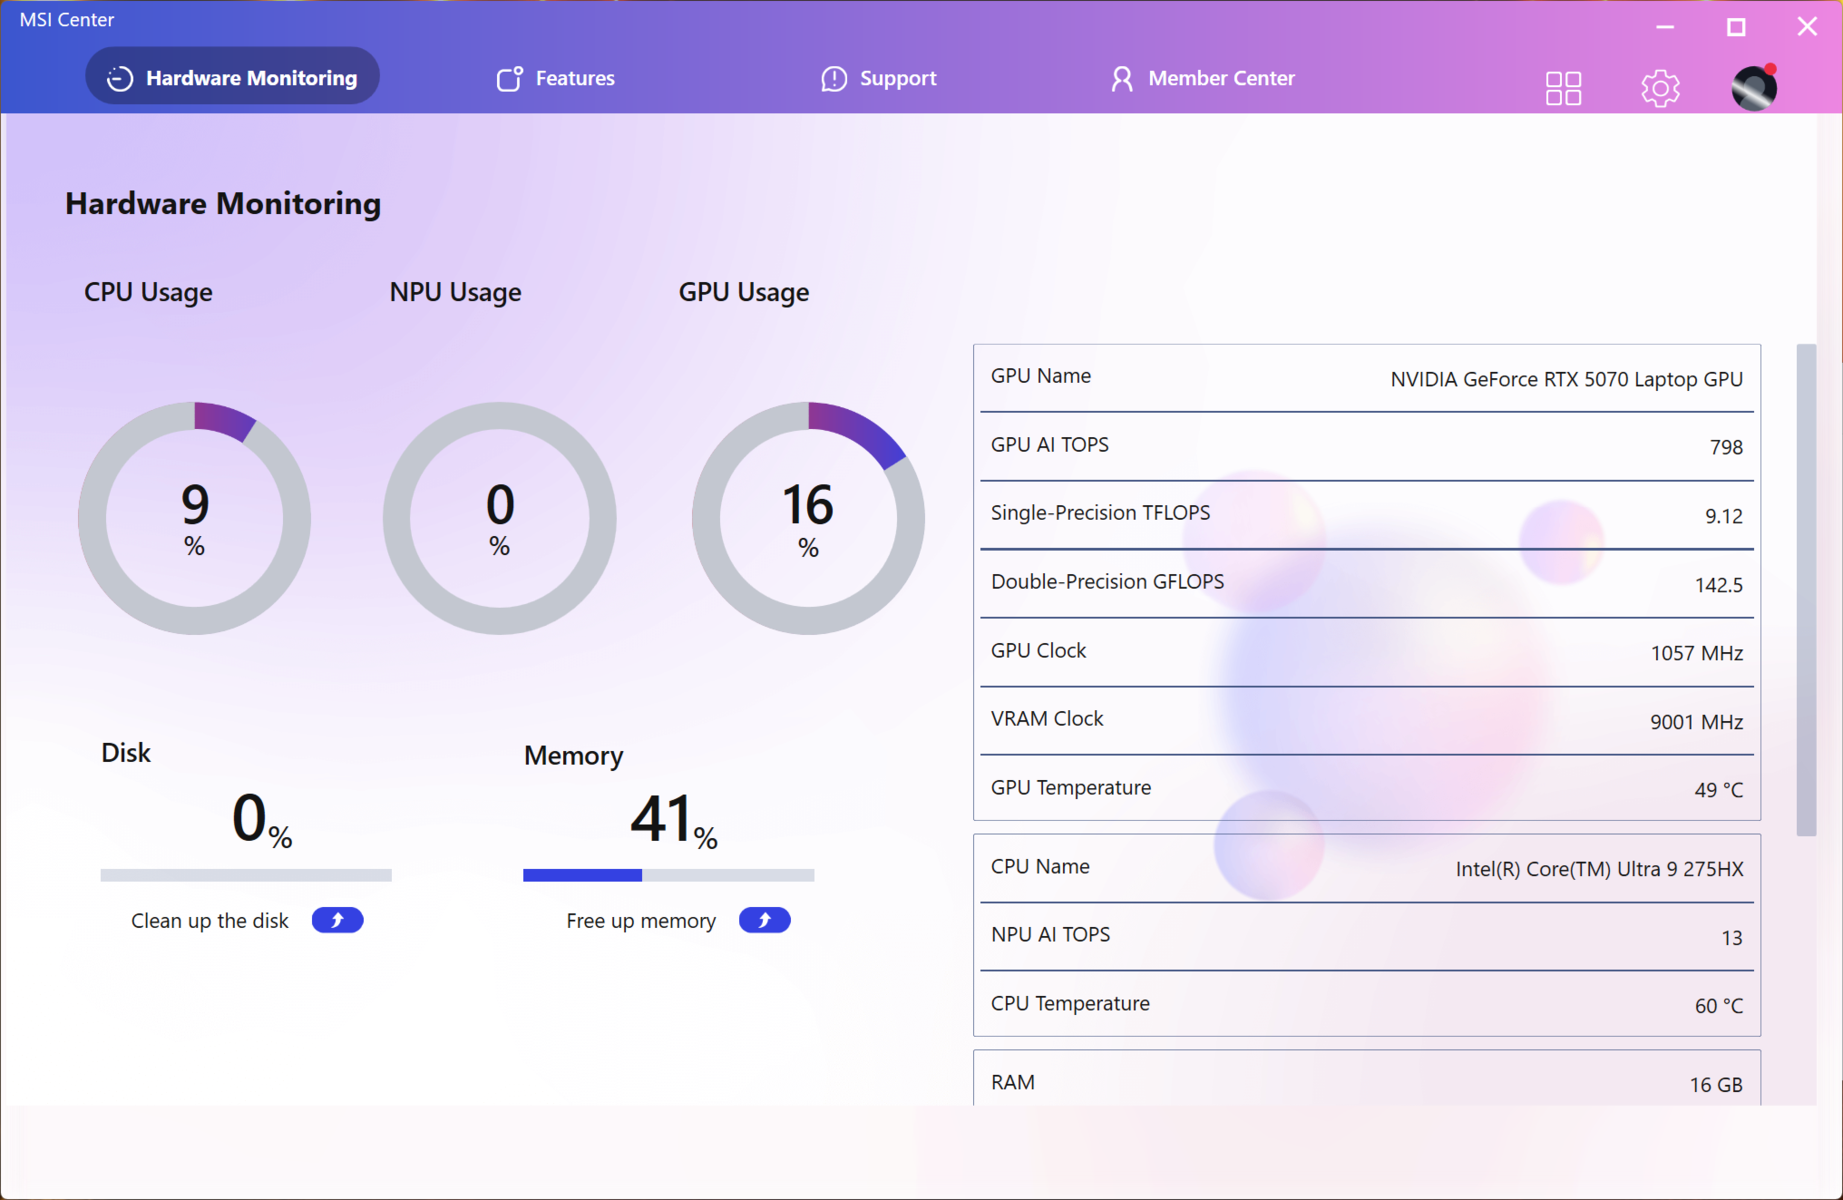
We used the Extreme Performance mode in MSI Center with dGPU MUX for all benchmarks and games.
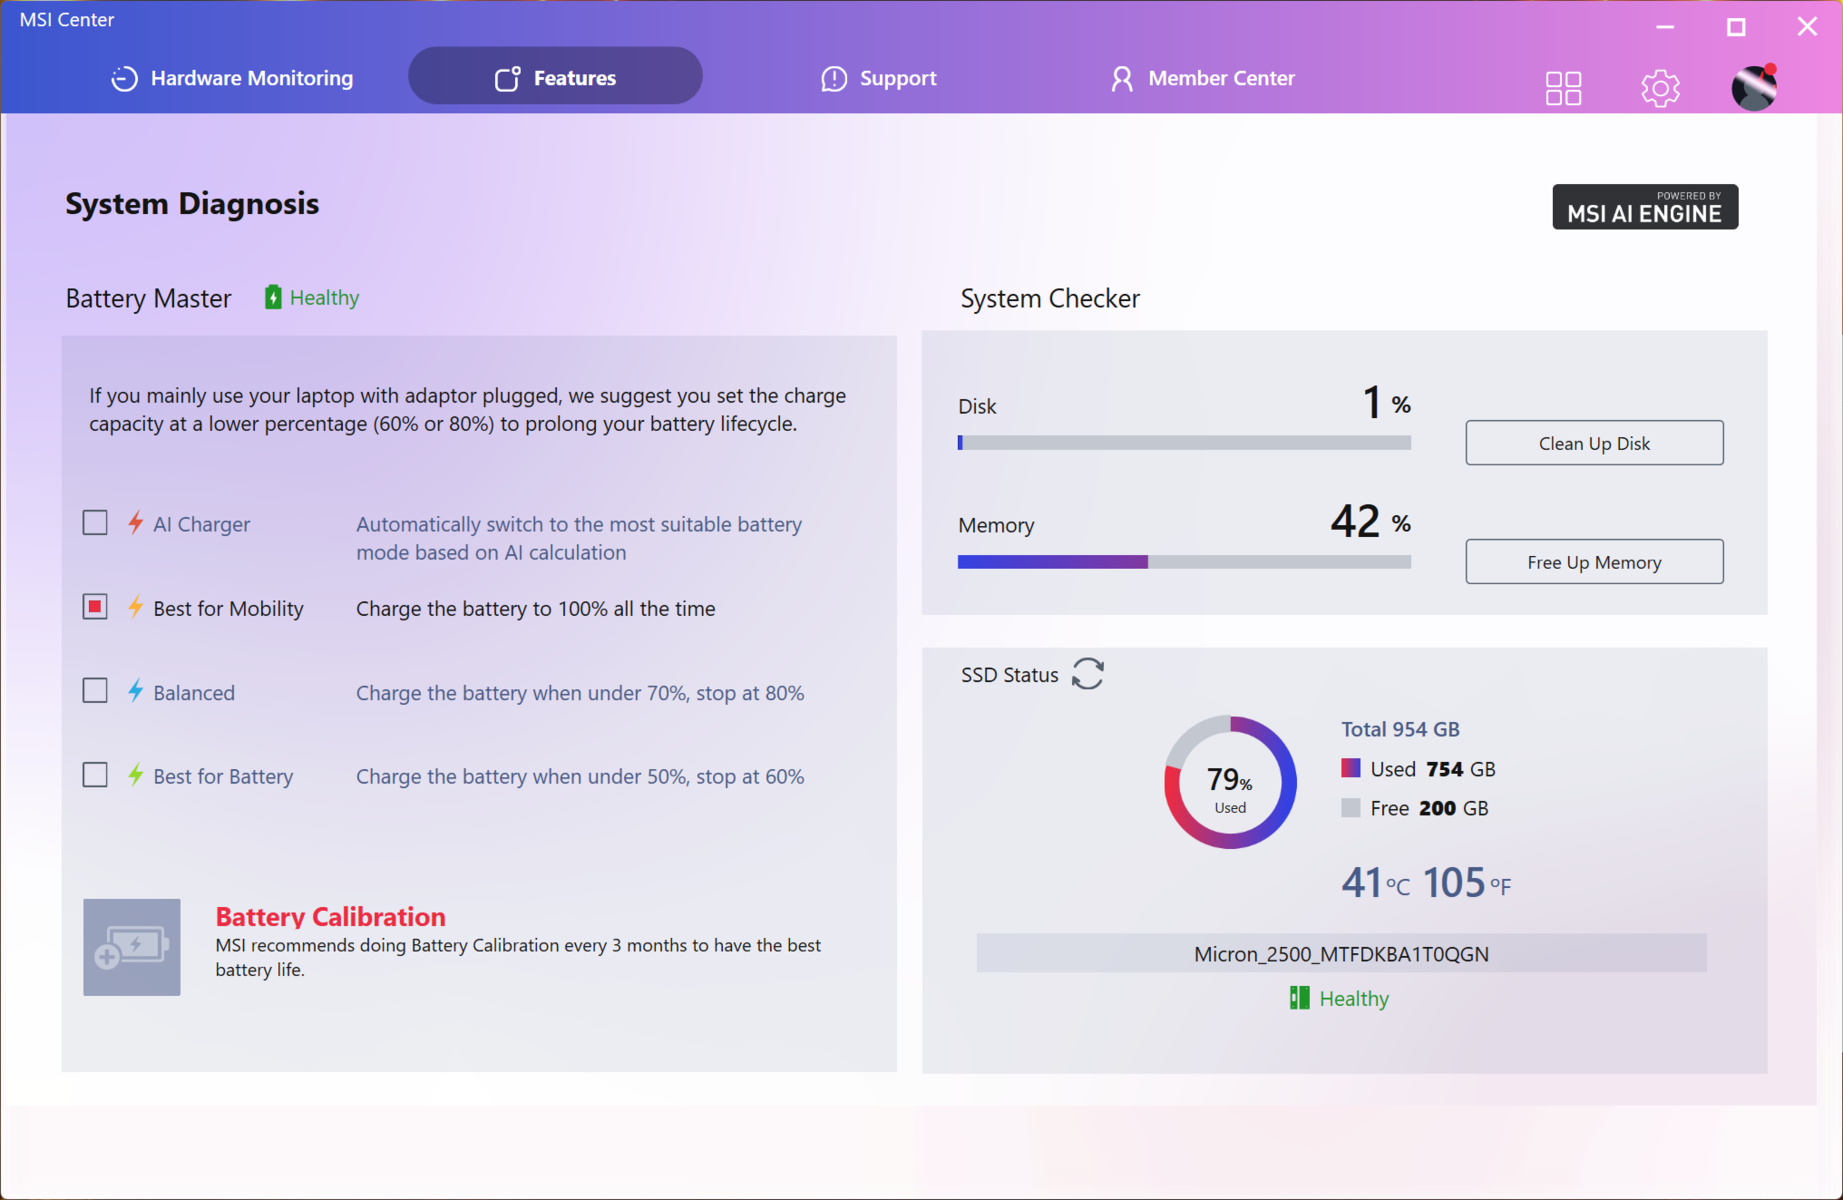
Battery tests were performed in the ECO-Silent mode with the GPU set to MSHybrid.


| Performance mode | PL1 (PBP) / Tau | PL2 (MTP) / Tau | GPU TGP (FurMark) | Cinebench R15 Multi score | Cinebench R15 Multi score (30 loops) |
|---|---|---|---|---|---|
| ECO-Silent | 20 W / 56 s | 20 W / 2.44 ms | 13 W | 1728 (-67.8%) | 1752 (-65.05%) |
| Balanced | 40 W / 56 s | 60 W / 2.44 ms | 75 W | 4171 (-22.28%) | 3517 (-29.84%) |
| Extreme Performance | 100 W / 56 s | 130 W / 2.44 ms | 92 W | 5367 (100%) | 5013 (100%) |
Processor
The Crosshair 16 HX AI's Intel Core Ultra 9 275HX delivers comparable performance to other laptops equipped with the same CPU, although the Lenovo Legion Pro 5's implementation is a smidgen faster overall due to higher PL1/PL2.
Multi-core sustained performance is generally stable, save for a momentary dip in the 20th run during a Cinebench R15 multi-core loop.
Cinebench R15 Multi-core loop
Cinebench R23: Multi Core | Single Core
Cinebench R20: CPU (Multi Core) | CPU (Single Core)
Cinebench R15: CPU Multi 64Bit | CPU Single 64Bit
Blender: v2.79 BMW27 CPU
7-Zip 18.03: 7z b 4 | 7z b 4 -mmt1
Geekbench 6.7: Multi-Core | Single-Core
Geekbench 5.5: Multi-Core | Single-Core
HWBOT x265 Benchmark v2.2: 4k Preset
LibreOffice : 20 Documents To PDF
R Benchmark 2.5: Overall mean
| CPU Performance rating | |
| Lenovo Legion 5 Pro 16IAX10H | |
| Aorus Elite 16 AE6H -1! | |
| Average Intel Core Ultra 9 275HX | |
| Alienware 16X Aurora, RTX 5070 | |
| MSI Crosshair 16 HX AI D2XWGKG | |
| MSI Crosshair 18 HX AI A2XW | |
| MSI Crosshair A17 HX D8WGKG | |
| Average of class Gaming | |
| Schenker XMG Core 16 M25 | |
| Asus TUF Gaming A16 FA608UP | |
| Cinebench R23 / Multi Core | |
| Lenovo Legion 5 Pro 16IAX10H | |
| Average Intel Core Ultra 9 275HX (30712 - 40970, n=31) | |
| Alienware 16X Aurora, RTX 5070 | |
| MSI Crosshair 16 HX AI D2XWGKG | |
| Aorus Elite 16 AE6H | |
| MSI Crosshair 18 HX AI A2XW | |
| MSI Crosshair A17 HX D8WGKG | |
| Average of class Gaming (10488 - 40970, n=110, last 2 years) | |
| Schenker XMG Core 16 M25 | |
| Asus TUF Gaming A16 FA608UP | |
| Cinebench R23 / Single Core | |
| Lenovo Legion 5 Pro 16IAX10H | |
| MSI Crosshair 16 HX AI D2XWGKG | |
| Average Intel Core Ultra 9 275HX (2009 - 2267, n=31) | |
| Alienware 16X Aurora, RTX 5070 | |
| Aorus Elite 16 AE6H | |
| MSI Crosshair 18 HX AI A2XW | |
| Schenker XMG Core 16 M25 | |
| Average of class Gaming (1166 - 2356, n=110, last 2 years) | |
| MSI Crosshair A17 HX D8WGKG | |
| Asus TUF Gaming A16 FA608UP | |
| Cinebench R20 / CPU (Multi Core) | |
| Lenovo Legion 5 Pro 16IAX10H | |
| Average Intel Core Ultra 9 275HX (12026 - 16108, n=30) | |
| Alienware 16X Aurora, RTX 5070 | |
| MSI Crosshair 16 HX AI D2XWGKG | |
| MSI Crosshair 18 HX AI A2XW | |
| Aorus Elite 16 AE6H | |
| MSI Crosshair A17 HX D8WGKG | |
| Average of class Gaming (4029 - 16108, n=109, last 2 years) | |
| Schenker XMG Core 16 M25 | |
| Asus TUF Gaming A16 FA608UP | |
| Cinebench R20 / CPU (Single Core) | |
| Lenovo Legion 5 Pro 16IAX10H | |
| MSI Crosshair 16 HX AI D2XWGKG | |
| Alienware 16X Aurora, RTX 5070 | |
| Average Intel Core Ultra 9 275HX (774 - 870, n=30) | |
| Aorus Elite 16 AE6H | |
| MSI Crosshair 18 HX AI A2XW | |
| Schenker XMG Core 16 M25 | |
| Average of class Gaming (442 - 895, n=109, last 2 years) | |
| MSI Crosshair A17 HX D8WGKG | |
| Asus TUF Gaming A16 FA608UP | |
| Cinebench R15 / CPU Multi 64Bit | |
| Lenovo Legion 5 Pro 16IAX10H | |
| Alienware 16X Aurora, RTX 5070 | |
| Average Intel Core Ultra 9 275HX (4737 - 6271, n=30) | |
| MSI Crosshair A17 HX D8WGKG | |
| MSI Crosshair 16 HX AI D2XWGKG | |
| Aorus Elite 16 AE6H | |
| MSI Crosshair 18 HX AI A2XW | |
| Average of class Gaming (1578 - 6271, n=109, last 2 years) | |
| Schenker XMG Core 16 M25 | |
| Asus TUF Gaming A16 FA608UP | |
| Cinebench R15 / CPU Single 64Bit | |
| Lenovo Legion 5 Pro 16IAX10H | |
| Average Intel Core Ultra 9 275HX (306 - 343, n=31) | |
| MSI Crosshair 16 HX AI D2XWGKG | |
| Alienware 16X Aurora, RTX 5070 | |
| Aorus Elite 16 AE6H | |
| MSI Crosshair 18 HX AI A2XW | |
| Average of class Gaming (188.8 - 343, n=109, last 2 years) | |
| MSI Crosshair A17 HX D8WGKG | |
| Asus TUF Gaming A16 FA608UP | |
| Schenker XMG Core 16 M25 | |
| Blender / v2.79 BMW27 CPU | |
| Asus TUF Gaming A16 FA608UP | |
| Average of class Gaming (80 - 330, n=107, last 2 years) | |
| Schenker XMG Core 16 M25 | |
| MSI Crosshair A17 HX D8WGKG | |
| Alienware 16X Aurora, RTX 5070 | |
| MSI Crosshair 18 HX AI A2XW | |
| Lenovo Legion 5 Pro 16IAX10H | |
| MSI Crosshair 16 HX AI D2XWGKG | |
| Average Intel Core Ultra 9 275HX (82 - 116, n=29) | |
| 7-Zip 18.03 / 7z b 4 | |
| MSI Crosshair A17 HX D8WGKG | |
| Average Intel Core Ultra 9 275HX (98236 - 124155, n=30) | |
| Lenovo Legion 5 Pro 16IAX10H | |
| Aorus Elite 16 AE6H | |
| MSI Crosshair 18 HX AI A2XW | |
| MSI Crosshair 16 HX AI D2XWGKG | |
| Alienware 16X Aurora, RTX 5070 | |
| Average of class Gaming (33491 - 148086, n=108, last 2 years) | |
| Schenker XMG Core 16 M25 | |
| Asus TUF Gaming A16 FA608UP | |
| 7-Zip 18.03 / 7z b 4 -mmt1 | |
| MSI Crosshair A17 HX D8WGKG | |
| MSI Crosshair 16 HX AI D2XWGKG | |
| Average Intel Core Ultra 9 275HX (6026 - 7149, n=30) | |
| Lenovo Legion 5 Pro 16IAX10H | |
| Alienware 16X Aurora, RTX 5070 | |
| Schenker XMG Core 16 M25 | |
| Aorus Elite 16 AE6H | |
| Average of class Gaming (4199 - 7436, n=108, last 2 years) | |
| MSI Crosshair 18 HX AI A2XW | |
| Asus TUF Gaming A16 FA608UP | |
| Geekbench 6.7 / Multi-Core | |
| Lenovo Legion 5 Pro 16IAX10H | |
| Average Intel Core Ultra 9 275HX (16033 - 21668, n=33) | |
| Alienware 16X Aurora, RTX 5070 | |
| MSI Crosshair 18 HX AI A2XW | |
| Aorus Elite 16 AE6H | |
| MSI Crosshair 16 HX AI D2XWGKG | |
| MSI Crosshair A17 HX D8WGKG | |
| Schenker XMG Core 16 M25 | |
| Average of class Gaming (6625 - 22104, n=109, last 2 years) | |
| Asus TUF Gaming A16 FA608UP | |
| Geekbench 6.7 / Single-Core | |
| Lenovo Legion 5 Pro 16IAX10H | |
| Alienware 16X Aurora, RTX 5070 | |
| MSI Crosshair 16 HX AI D2XWGKG | |
| Average Intel Core Ultra 9 275HX (2843 - 3160, n=33) | |
| Aorus Elite 16 AE6H | |
| Schenker XMG Core 16 M25 | |
| MSI Crosshair 18 HX AI A2XW | |
| MSI Crosshair A17 HX D8WGKG | |
| Average of class Gaming (1490 - 3259, n=109, last 2 years) | |
| Asus TUF Gaming A16 FA608UP | |
| Geekbench 5.5 / Multi-Core | |
| Average Intel Core Ultra 9 275HX (19105 - 25855, n=31) | |
| Aorus Elite 16 AE6H | |
| MSI Crosshair 18 HX AI A2XW | |
| Lenovo Legion 5 Pro 16IAX10H | |
| MSI Crosshair 16 HX AI D2XWGKG | |
| Alienware 16X Aurora, RTX 5070 | |
| MSI Crosshair A17 HX D8WGKG | |
| Average of class Gaming (6460 - 27010, n=108, last 2 years) | |
| Schenker XMG Core 16 M25 | |
| Asus TUF Gaming A16 FA608UP | |
| Geekbench 5.5 / Single-Core | |
| Lenovo Legion 5 Pro 16IAX10H | |
| Alienware 16X Aurora, RTX 5070 | |
| MSI Crosshair 16 HX AI D2XWGKG | |
| Average Intel Core Ultra 9 275HX (2033 - 2292, n=31) | |
| Aorus Elite 16 AE6H | |
| MSI Crosshair 18 HX AI A2XW | |
| Schenker XMG Core 16 M25 | |
| Average of class Gaming (986 - 2474, n=108, last 2 years) | |
| Asus TUF Gaming A16 FA608UP | |
| MSI Crosshair A17 HX D8WGKG | |
| HWBOT x265 Benchmark v2.2 / 4k Preset | |
| Lenovo Legion 5 Pro 16IAX10H | |
| Average Intel Core Ultra 9 275HX (30.7 - 43.8, n=30) | |
| Alienware 16X Aurora, RTX 5070 | |
| MSI Crosshair A17 HX D8WGKG | |
| MSI Crosshair 16 HX AI D2XWGKG | |
| MSI Crosshair 18 HX AI A2XW | |
| Aorus Elite 16 AE6H | |
| Schenker XMG Core 16 M25 | |
| Average of class Gaming (11.5 - 44.3, n=108, last 2 years) | |
| Asus TUF Gaming A16 FA608UP | |
| LibreOffice / 20 Documents To PDF | |
| Asus TUF Gaming A16 FA608UP | |
| Schenker XMG Core 16 M25 | |
| Average of class Gaming (19 - 88.8, n=108, last 2 years) | |
| Average Intel Core Ultra 9 275HX (33.2 - 62.1, n=30) | |
| MSI Crosshair 16 HX AI D2XWGKG | |
| MSI Crosshair A17 HX D8WGKG | |
| Aorus Elite 16 AE6H | |
| Alienware 16X Aurora, RTX 5070 | |
| MSI Crosshair 18 HX AI A2XW | |
| Lenovo Legion 5 Pro 16IAX10H | |
| R Benchmark 2.5 / Overall mean | |
| MSI Crosshair 18 HX AI A2XW | |
| Asus TUF Gaming A16 FA608UP | |
| MSI Crosshair A17 HX D8WGKG | |
| Average of class Gaming (0.3439 - 0.759, n=109, last 2 years) | |
| Aorus Elite 16 AE6H | |
| Alienware 16X Aurora, RTX 5070 | |
| Average Intel Core Ultra 9 275HX (0.3943 - 0.4568, n=30) | |
| Lenovo Legion 5 Pro 16IAX10H | |
| MSI Crosshair 16 HX AI D2XWGKG | |
| Schenker XMG Core 16 M25 | |
* ... smaller is better
AIDA64: FP32 Ray-Trace | FPU Julia | CPU SHA3 | CPU Queen | FPU SinJulia | FPU Mandel | CPU AES | CPU ZLib | FP64 Ray-Trace | CPU PhotoWorxx
| Performance rating | |
| MSI Crosshair A17 HX D8WGKG | |
| Lenovo Legion 5 Pro 16IAX10H | |
| Average Intel Core Ultra 9 275HX | |
| MSI Crosshair 18 HX AI A2XW | |
| MSI Crosshair 16 HX AI D2XWGKG | |
| Alienware 16X Aurora, RTX 5070 | |
| Aorus Elite 16 AE6H | |
| Schenker XMG Core 16 M25 | |
| Average of class Gaming | |
| Asus TUF Gaming A16 FA608UP | |
| AIDA64 / FP32 Ray-Trace | |
| MSI Crosshair A17 HX D8WGKG | |
| Schenker XMG Core 16 M25 | |
| MSI Crosshair 18 HX AI A2XW | |
| MSI Crosshair 16 HX AI D2XWGKG | |
| Average Intel Core Ultra 9 275HX (28039 - 39895, n=30) | |
| Lenovo Legion 5 Pro 16IAX10H | |
| Alienware 16X Aurora, RTX 5070 | |
| Aorus Elite 16 AE6H | |
| Average of class Gaming (10227 - 85542, n=107, last 2 years) | |
| Asus TUF Gaming A16 FA608UP | |
| AIDA64 / FPU Julia | |
| MSI Crosshair A17 HX D8WGKG | |
| MSI Crosshair 18 HX AI A2XW | |
| Lenovo Legion 5 Pro 16IAX10H | |
| MSI Crosshair 16 HX AI D2XWGKG | |
| Average Intel Core Ultra 9 275HX (140254 - 200744, n=30) | |
| Aorus Elite 16 AE6H | |
| Alienware 16X Aurora, RTX 5070 | |
| Schenker XMG Core 16 M25 | |
| Average of class Gaming (51376 - 238426, n=107, last 2 years) | |
| Asus TUF Gaming A16 FA608UP | |
| AIDA64 / CPU SHA3 | |
| MSI Crosshair A17 HX D8WGKG | |
| Average Intel Core Ultra 9 275HX (6710 - 9817, n=30) | |
| Lenovo Legion 5 Pro 16IAX10H | |
| MSI Crosshair 16 HX AI D2XWGKG | |
| MSI Crosshair 18 HX AI A2XW | |
| Alienware 16X Aurora, RTX 5070 | |
| Aorus Elite 16 AE6H | |
| Average of class Gaming (2180 - 9817, n=107, last 2 years) | |
| Schenker XMG Core 16 M25 | |
| Asus TUF Gaming A16 FA608UP | |
| AIDA64 / CPU Queen | |
| MSI Crosshair A17 HX D8WGKG | |
| Lenovo Legion 5 Pro 16IAX10H | |
| Alienware 16X Aurora, RTX 5070 | |
| Average Intel Core Ultra 9 275HX (113887 - 140937, n=30) | |
| Aorus Elite 16 AE6H | |
| MSI Crosshair 16 HX AI D2XWGKG | |
| MSI Crosshair 18 HX AI A2XW | |
| Asus TUF Gaming A16 FA608UP | |
| Average of class Gaming (49785 - 173351, n=98, last 2 years) | |
| Schenker XMG Core 16 M25 | |
| AIDA64 / FPU SinJulia | |
| MSI Crosshair A17 HX D8WGKG | |
| Schenker XMG Core 16 M25 | |
| Asus TUF Gaming A16 FA608UP | |
| Average of class Gaming (4424 - 33636, n=107, last 2 years) | |
| Lenovo Legion 5 Pro 16IAX10H | |
| Alienware 16X Aurora, RTX 5070 | |
| Average Intel Core Ultra 9 275HX (11172 - 14425, n=30) | |
| MSI Crosshair 16 HX AI D2XWGKG | |
| Aorus Elite 16 AE6H | |
| MSI Crosshair 18 HX AI A2XW | |
| AIDA64 / FPU Mandel | |
| MSI Crosshair A17 HX D8WGKG | |
| MSI Crosshair 18 HX AI A2XW | |
| MSI Crosshair 16 HX AI D2XWGKG | |
| Average Intel Core Ultra 9 275HX (72596 - 104508, n=30) | |
| Lenovo Legion 5 Pro 16IAX10H | |
| Aorus Elite 16 AE6H | |
| Alienware 16X Aurora, RTX 5070 | |
| Schenker XMG Core 16 M25 | |
| Average of class Gaming (25115 - 128721, n=107, last 2 years) | |
| Asus TUF Gaming A16 FA608UP | |
| AIDA64 / CPU AES | |
| MSI Crosshair A17 HX D8WGKG | |
| Lenovo Legion 5 Pro 16IAX10H | |
| Average Intel Core Ultra 9 275HX (105608 - 247074, n=30) | |
| MSI Crosshair 16 HX AI D2XWGKG | |
| Alienware 16X Aurora, RTX 5070 | |
| MSI Crosshair 18 HX AI A2XW | |
| Schenker XMG Core 16 M25 | |
| Aorus Elite 16 AE6H | |
| Average of class Gaming (39258 - 247074, n=107, last 2 years) | |
| Asus TUF Gaming A16 FA608UP | |
| AIDA64 / CPU ZLib | |
| Lenovo Legion 5 Pro 16IAX10H | |
| MSI Crosshair A17 HX D8WGKG | |
| Average Intel Core Ultra 9 275HX (1582 - 2263, n=30) | |
| MSI Crosshair 16 HX AI D2XWGKG | |
| Alienware 16X Aurora, RTX 5070 | |
| MSI Crosshair 18 HX AI A2XW | |
| Aorus Elite 16 AE6H | |
| Average of class Gaming (574 - 2531, n=107, last 2 years) | |
| Schenker XMG Core 16 M25 | |
| Asus TUF Gaming A16 FA608UP | |
| AIDA64 / FP64 Ray-Trace | |
| MSI Crosshair A17 HX D8WGKG | |
| Schenker XMG Core 16 M25 | |
| MSI Crosshair 18 HX AI A2XW | |
| MSI Crosshair 16 HX AI D2XWGKG | |
| Average Intel Core Ultra 9 275HX (14847 - 21854, n=30) | |
| Lenovo Legion 5 Pro 16IAX10H | |
| Aorus Elite 16 AE6H | |
| Alienware 16X Aurora, RTX 5070 | |
| Average of class Gaming (5509 - 45446, n=107, last 2 years) | |
| Asus TUF Gaming A16 FA608UP | |
| AIDA64 / CPU PhotoWorxx | |
| Schenker XMG Core 16 M25 | |
| Average Intel Core Ultra 9 275HX (37482 - 62916, n=30) | |
| Lenovo Legion 5 Pro 16IAX10H | |
| Alienware 16X Aurora, RTX 5070 | |
| Aorus Elite 16 AE6H | |
| MSI Crosshair 18 HX AI A2XW | |
| Average of class Gaming (12271 - 89891, n=107, last 2 years) | |
| Asus TUF Gaming A16 FA608UP | |
| MSI Crosshair 16 HX AI D2XWGKG | |
| MSI Crosshair A17 HX D8WGKG | |
System performance
We had to temporarily downgrade the Nvidia driver to version 577.00 in order to get PCMark 10 to run reliably.
Overall system performance is more than adequate for daily productivity and web browsing.
PCMark 10: Score | Essentials | Productivity | Digital Content Creation
CrossMark: Overall | Productivity | Creativity | Responsiveness
AIDA64: Memory Copy | Memory Read | Memory Write | Memory Latency
WebXPRT 3: Overall
WebXPRT 4: Overall
Mozilla Kraken 1.1: Total
| Performance rating | |
| Lenovo Legion 5 Pro 16IAX10H | |
| Aorus Elite 16 AE6H | |
| Average Intel Core Ultra 9 275HX, NVIDIA GeForce RTX 5070 Laptop | |
| Alienware 16X Aurora, RTX 5070 -4! | |
| MSI Crosshair 18 HX AI A2XW | |
| MSI Crosshair 16 HX AI D2XWGKG | |
| Schenker XMG Core 16 M25 -4! | |
| Average of class Gaming | |
| MSI Crosshair A17 HX D8WGKG | |
| Asus TUF Gaming A16 FA608UP -4! | |
| PCMark 10 / Score | |
| Average Intel Core Ultra 9 275HX, NVIDIA GeForce RTX 5070 Laptop (8018 - 9667, n=4) | |
| Average of class Gaming (5828 - 11574, n=94, last 2 years) | |
| Lenovo Legion 5 Pro 16IAX10H | |
| MSI Crosshair 16 HX AI D2XWGKG | |
| MSI Crosshair A17 HX D8WGKG | |
| Aorus Elite 16 AE6H | |
| MSI Crosshair 18 HX AI A2XW | |
| PCMark 10 / Essentials | |
| MSI Crosshair A17 HX D8WGKG | |
| MSI Crosshair 18 HX AI A2XW | |
| Aorus Elite 16 AE6H | |
| MSI Crosshair 16 HX AI D2XWGKG | |
| Lenovo Legion 5 Pro 16IAX10H | |
| Average Intel Core Ultra 9 275HX, NVIDIA GeForce RTX 5070 Laptop (10259 - 11025, n=4) | |
| Average of class Gaming (8810 - 12600, n=98, last 2 years) | |
| PCMark 10 / Productivity | |
| Average Intel Core Ultra 9 275HX, NVIDIA GeForce RTX 5070 Laptop (8307 - 16716, n=4) | |
| Average of class Gaming (6845 - 18766, n=96, last 2 years) | |
| MSI Crosshair 18 HX AI A2XW | |
| Lenovo Legion 5 Pro 16IAX10H | |
| MSI Crosshair A17 HX D8WGKG | |
| Aorus Elite 16 AE6H | |
| MSI Crosshair 16 HX AI D2XWGKG | |
| PCMark 10 / Digital Content Creation | |
| MSI Crosshair 16 HX AI D2XWGKG | |
| Lenovo Legion 5 Pro 16IAX10H | |
| Average Intel Core Ultra 9 275HX, NVIDIA GeForce RTX 5070 Laptop (13010 - 16417, n=4) | |
| Aorus Elite 16 AE6H | |
| Average of class Gaming (7602 - 19657, n=96, last 2 years) | |
| MSI Crosshair A17 HX D8WGKG | |
| MSI Crosshair 18 HX AI A2XW | |
| CrossMark / Overall | |
| Alienware 16X Aurora, RTX 5070 | |
| Lenovo Legion 5 Pro 16IAX10H | |
| Average Intel Core Ultra 9 275HX, NVIDIA GeForce RTX 5070 Laptop (2084 - 2269, n=5) | |
| Aorus Elite 16 AE6H | |
| MSI Crosshair 16 HX AI D2XWGKG | |
| MSI Crosshair 18 HX AI A2XW | |
| Schenker XMG Core 16 M25 | |
| Average of class Gaming (1366 - 2409, n=96, last 2 years) | |
| MSI Crosshair A17 HX D8WGKG | |
| Asus TUF Gaming A16 FA608UP | |
| CrossMark / Productivity | |
| Alienware 16X Aurora, RTX 5070 | |
| Lenovo Legion 5 Pro 16IAX10H | |
| Aorus Elite 16 AE6H | |
| Average Intel Core Ultra 9 275HX, NVIDIA GeForce RTX 5070 Laptop (1931 - 2173, n=5) | |
| MSI Crosshair 16 HX AI D2XWGKG | |
| MSI Crosshair 18 HX AI A2XW | |
| Average of class Gaming (1386 - 2254, n=96, last 2 years) | |
| MSI Crosshair A17 HX D8WGKG | |
| Schenker XMG Core 16 M25 | |
| Asus TUF Gaming A16 FA608UP | |
| CrossMark / Creativity | |
| Lenovo Legion 5 Pro 16IAX10H | |
| Schenker XMG Core 16 M25 | |
| Alienware 16X Aurora, RTX 5070 | |
| Average Intel Core Ultra 9 275HX, NVIDIA GeForce RTX 5070 Laptop (2322 - 2430, n=5) | |
| MSI Crosshair 16 HX AI D2XWGKG | |
| MSI Crosshair 18 HX AI A2XW | |
| Aorus Elite 16 AE6H | |
| Average of class Gaming (1343 - 2729, n=96, last 2 years) | |
| MSI Crosshair A17 HX D8WGKG | |
| Asus TUF Gaming A16 FA608UP | |
| CrossMark / Responsiveness | |
| Alienware 16X Aurora, RTX 5070 | |
| Aorus Elite 16 AE6H | |
| Average Intel Core Ultra 9 275HX, NVIDIA GeForce RTX 5070 Laptop (1754 - 2143, n=5) | |
| Lenovo Legion 5 Pro 16IAX10H | |
| MSI Crosshair 16 HX AI D2XWGKG | |
| MSI Crosshair 18 HX AI A2XW | |
| MSI Crosshair A17 HX D8WGKG | |
| Average of class Gaming (1226 - 2334, n=96, last 2 years) | |
| Schenker XMG Core 16 M25 | |
| Asus TUF Gaming A16 FA608UP | |
| AIDA64 / Memory Copy | |
| Aorus Elite 16 AE6H | |
| Lenovo Legion 5 Pro 16IAX10H | |
| Alienware 16X Aurora, RTX 5070 | |
| MSI Crosshair 18 HX AI A2XW | |
| Average Intel Core Ultra 9 275HX, NVIDIA GeForce RTX 5070 Laptop (68559 - 83499, n=5) | |
| Schenker XMG Core 16 M25 | |
| Average of class Gaming (21750 - 129946, n=107, last 2 years) | |
| MSI Crosshair 16 HX AI D2XWGKG | |
| Asus TUF Gaming A16 FA608UP | |
| MSI Crosshair A17 HX D8WGKG | |
| AIDA64 / Memory Read | |
| Average Intel Core Ultra 9 275HX, NVIDIA GeForce RTX 5070 Laptop (83924 - 93622, n=5) | |
| Lenovo Legion 5 Pro 16IAX10H | |
| Aorus Elite 16 AE6H | |
| Alienware 16X Aurora, RTX 5070 | |
| Schenker XMG Core 16 M25 | |
| MSI Crosshair 18 HX AI A2XW | |
| MSI Crosshair 16 HX AI D2XWGKG | |
| Average of class Gaming (22956 - 118858, n=107, last 2 years) | |
| MSI Crosshair A17 HX D8WGKG | |
| Asus TUF Gaming A16 FA608UP | |
| AIDA64 / Memory Write | |
| Aorus Elite 16 AE6H | |
| Asus TUF Gaming A16 FA608UP | |
| Average Intel Core Ultra 9 275HX, NVIDIA GeForce RTX 5070 Laptop (66719 - 106063, n=5) | |
| Schenker XMG Core 16 M25 | |
| Alienware 16X Aurora, RTX 5070 | |
| Lenovo Legion 5 Pro 16IAX10H | |
| MSI Crosshair 18 HX AI A2XW | |
| Average of class Gaming (22297 - 135096, n=107, last 2 years) | |
| MSI Crosshair 16 HX AI D2XWGKG | |
| MSI Crosshair A17 HX D8WGKG | |
| AIDA64 / Memory Latency | |
| Alienware 16X Aurora, RTX 5070 | |
| Lenovo Legion 5 Pro 16IAX10H | |
| Aorus Elite 16 AE6H | |
| MSI Crosshair 16 HX AI D2XWGKG | |
| Average Intel Core Ultra 9 275HX, NVIDIA GeForce RTX 5070 Laptop (106.8 - 116, n=5) | |
| MSI Crosshair 18 HX AI A2XW | |
| Average of class Gaming (75.3 - 259, n=107, last 2 years) | |
| Asus TUF Gaming A16 FA608UP | |
| Schenker XMG Core 16 M25 | |
| MSI Crosshair A17 HX D8WGKG | |
| WebXPRT 3 / Overall | |
| Lenovo Legion 5 Pro 16IAX10H | |
| Alienware 16X Aurora, RTX 5070 | |
| Schenker XMG Core 16 M25 | |
| Average Intel Core Ultra 9 275HX, NVIDIA GeForce RTX 5070 Laptop (309 - 364, n=5) | |
| MSI Crosshair 16 HX AI D2XWGKG | |
| MSI Crosshair 18 HX AI A2XW | |
| Average of class Gaming (242 - 532, n=99, last 2 years) | |
| Aorus Elite 16 AE6H | |
| Asus TUF Gaming A16 FA608UP | |
| MSI Crosshair A17 HX D8WGKG | |
| WebXPRT 4 / Overall | |
| Schenker XMG Core 16 M25 | |
| Alienware 16X Aurora, RTX 5070 | |
| Aorus Elite 16 AE6H | |
| Lenovo Legion 5 Pro 16IAX10H | |
| MSI Crosshair 18 HX AI A2XW | |
| Average Intel Core Ultra 9 275HX, NVIDIA GeForce RTX 5070 Laptop (297 - 330, n=5) | |
| MSI Crosshair 16 HX AI D2XWGKG | |
| Average of class Gaming (176.4 - 354, n=99, last 2 years) | |
| Asus TUF Gaming A16 FA608UP | |
| MSI Crosshair A17 HX D8WGKG | |
| Mozilla Kraken 1.1 / Total | |
| Asus TUF Gaming A16 FA608UP | |
| MSI Crosshair A17 HX D8WGKG | |
| Average of class Gaming (391 - 590, n=104, last 2 years) | |
| MSI Crosshair 18 HX AI A2XW | |
| Aorus Elite 16 AE6H | |
| Average Intel Core Ultra 9 275HX, NVIDIA GeForce RTX 5070 Laptop (407 - 431, n=5) | |
| Schenker XMG Core 16 M25 | |
| Lenovo Legion 5 Pro 16IAX10H | |
| Alienware 16X Aurora, RTX 5070 | |
| MSI Crosshair 16 HX AI D2XWGKG | |
* ... smaller is better
| PCMark 10 Score | 8149 points | |
Help | ||
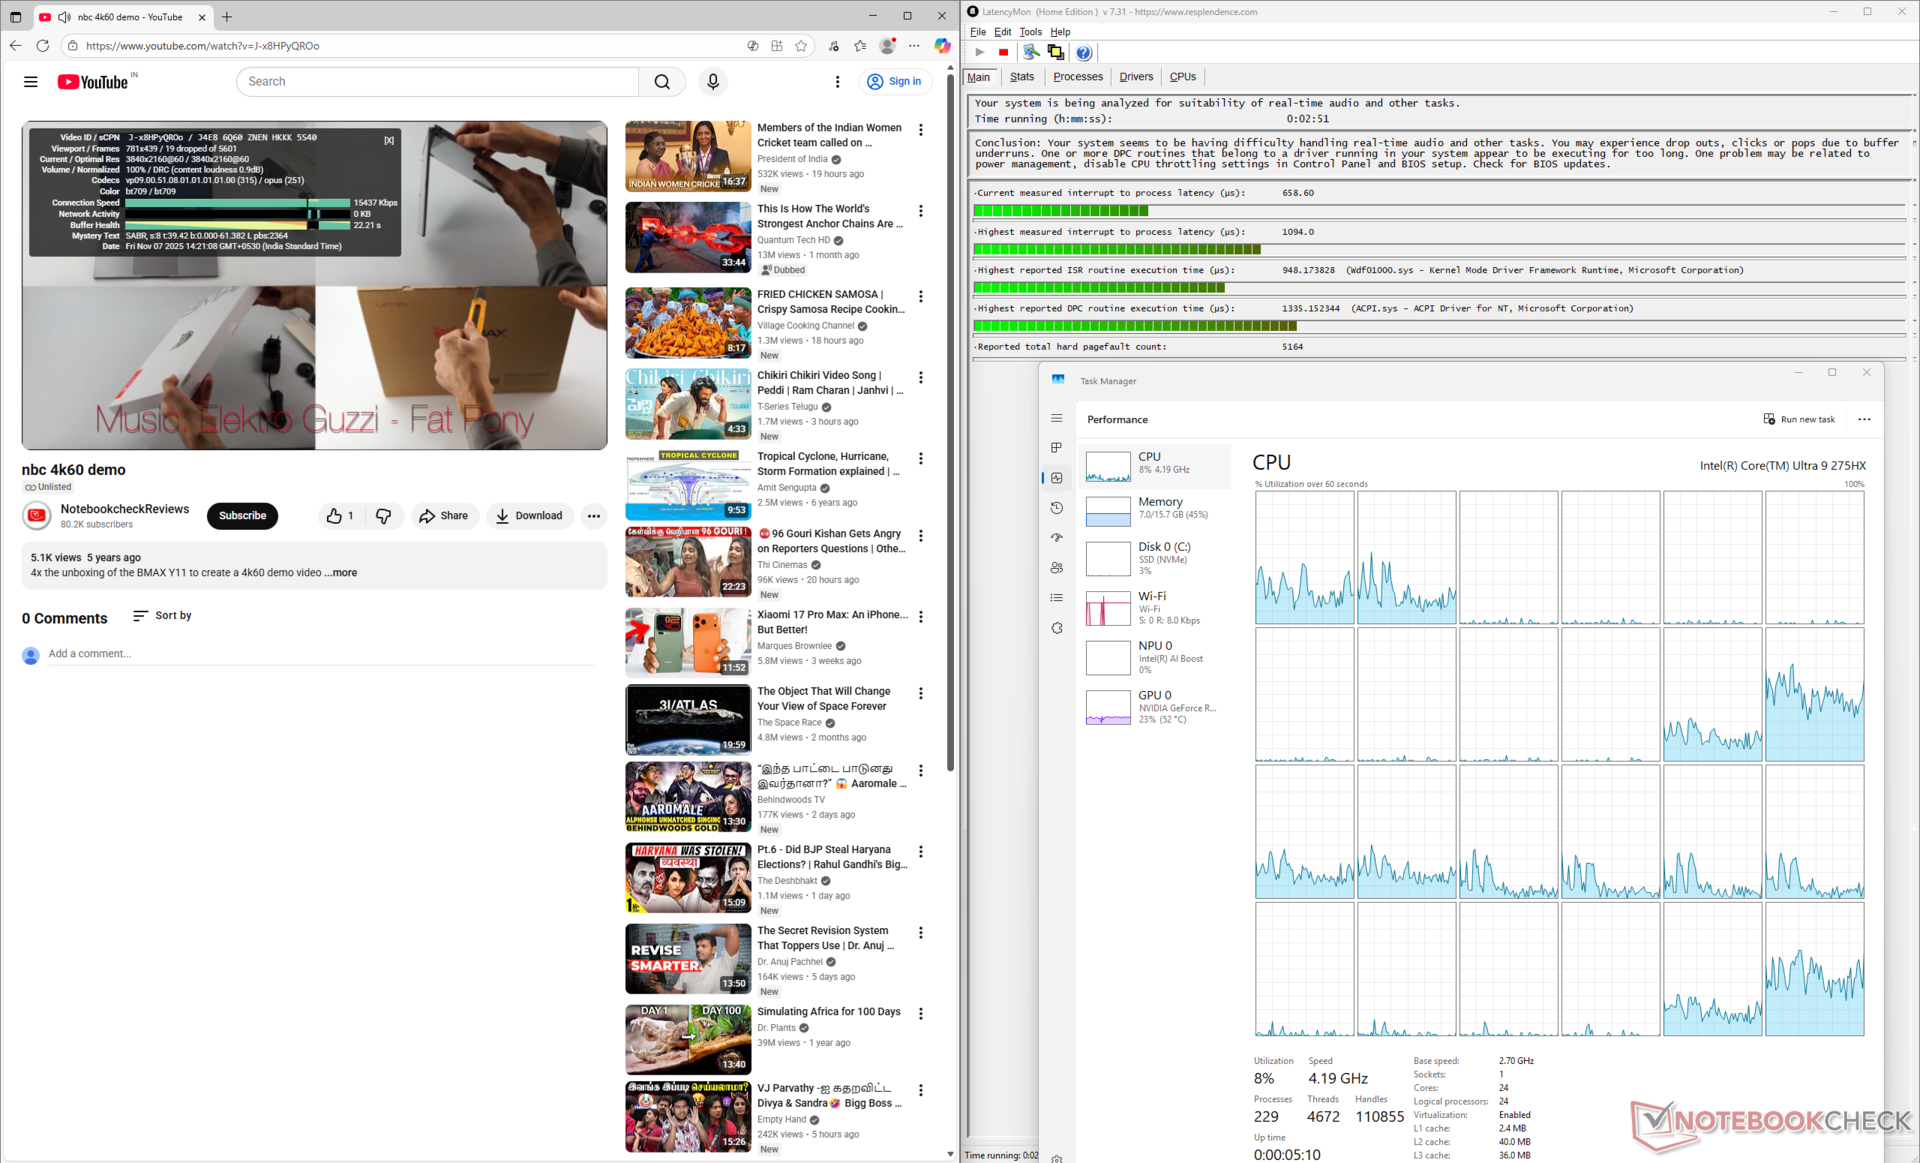
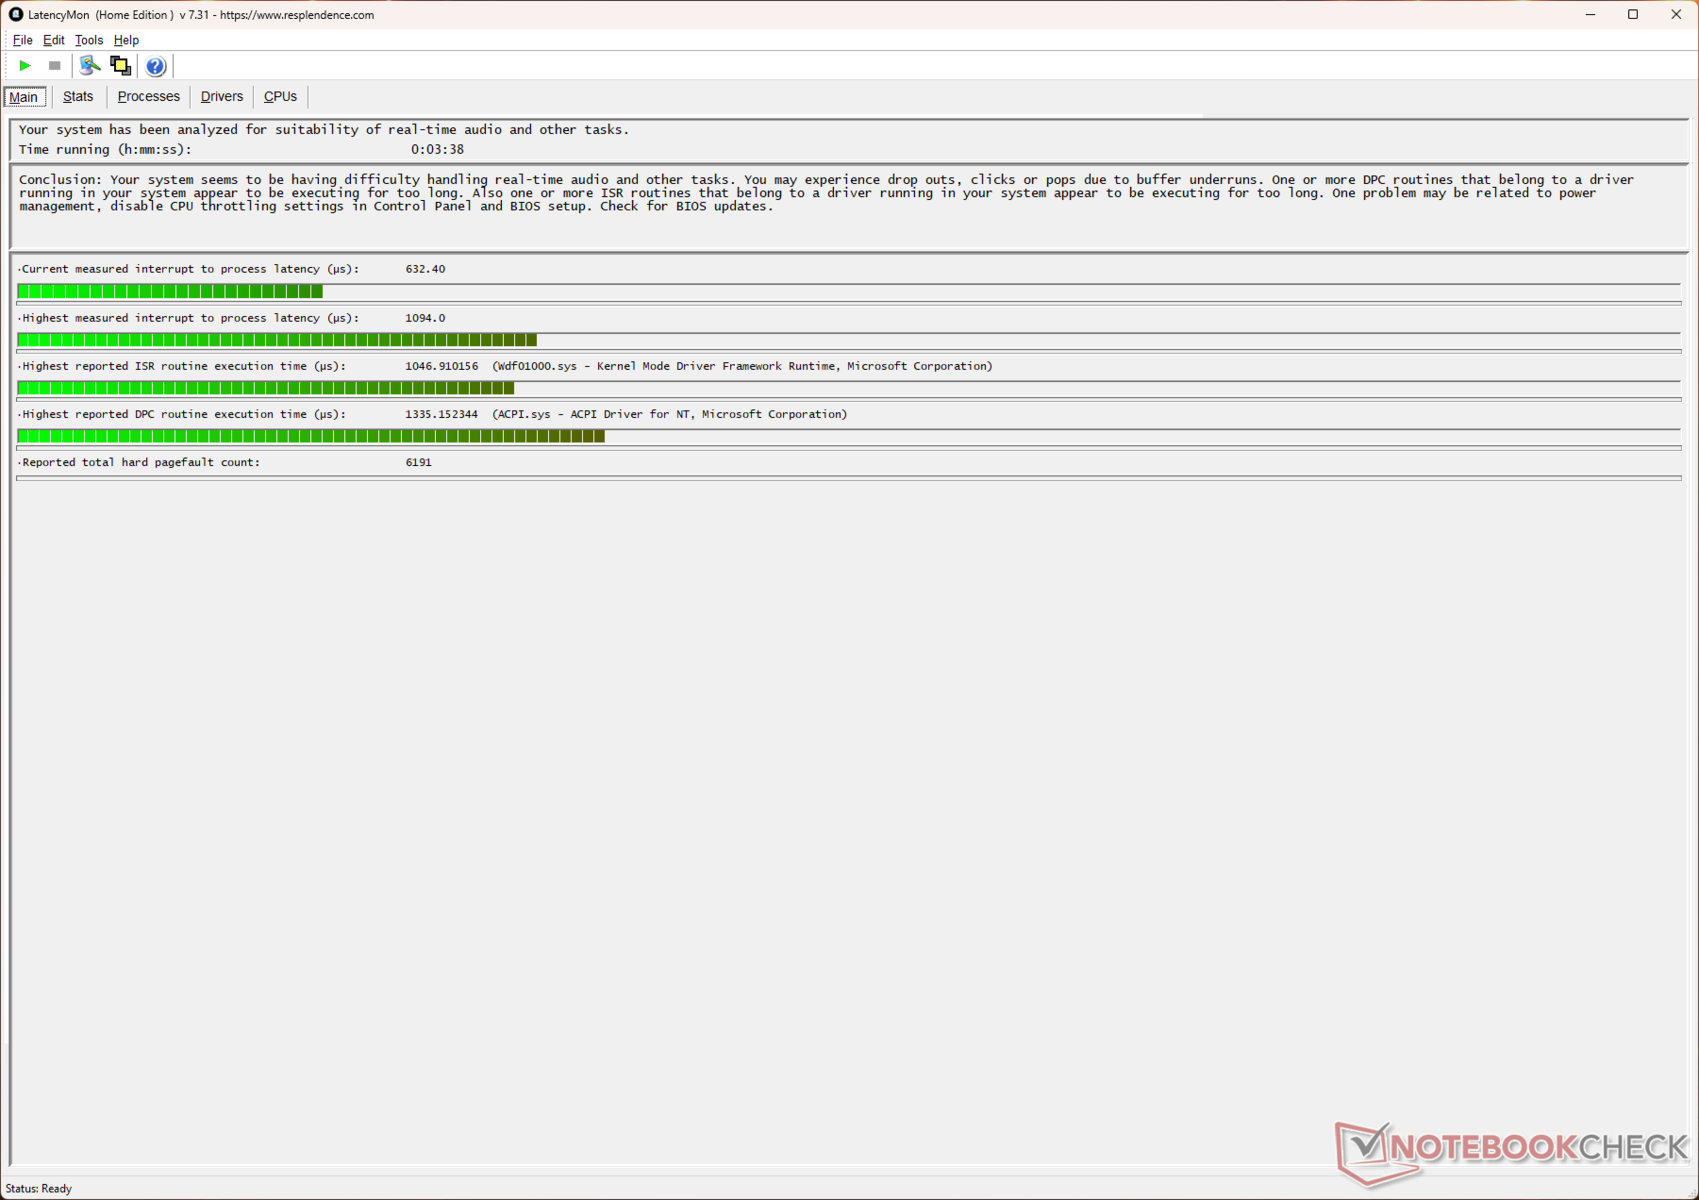
DPC latency
The measured DPC latency is on the higher side, which may potentially pose issues during real-time audio workflows.

| DPC Latencies / LatencyMon - interrupt to process latency (max), Web, Youtube, Prime95 | |
| Alienware 16X Aurora, RTX 5070 | |
| Lenovo Legion 5 Pro 16IAX10H | |
| MSI Crosshair 16 HX AI D2XWGKG | |
| MSI Crosshair 18 HX AI A2XW | |
| Aorus Elite 16 AE6H | |
| MSI Crosshair A17 HX D8WGKG | |
| Schenker XMG Core 16 M25 | |
| Asus TUF Gaming A16 FA608UP | |
* ... smaller is better
Storage devices
The Micron 2500 1 TB PCIe Gen 4 NVMe SSD offers decent read/write performance, but it cannot match up to the likes of the Samsung PM9C1 in the Crosshair A17 HX.
An additional M.2 slot is available for storage expansion.

* ... smaller is better
Disk Throttling: DiskSpd Read Loop, Queue Depth 8
GPU performance
The Crosshair 16 HX AI's 115 W Nvidia GeForce RTX 5070 Laptop GPU performs on expected lines.
The laptop trails the Legion Pro 5 with a 140 W RTX 5070 Ti Laptop GPU by 22% in overall 3DMark tests.
| 3DMark 11 Performance | 36966 points | |
| 3DMark Ice Storm Standard Score | 313398 points | |
| 3DMark Cloud Gate Standard Score | 67854 points | |
| 3DMark Fire Strike Score | 28686 points | |
| 3DMark Fire Strike Extreme Score | 16912 points | |
| 3DMark Time Spy Score | 13956 points | |
| 3DMark Steel Nomad Score | 3108 points | |
| 3DMark Steel Nomad Light Score | 14107 points | |
Help | ||
| Blender / v3.3 Classroom OPTIX/RTX | |
| Schenker XMG Core 16 M25 | |
| MSI Crosshair 16 HX AI D2XWGKG | |
| Asus TUF Gaming A16 FA608UP | |
| Average NVIDIA GeForce RTX 5070 Laptop (17 - 24, n=27) | |
| Aorus Elite 16 AE6H | |
| MSI Crosshair 18 HX AI A2XW | |
| Average of class Gaming (9 - 32, n=109, last 2 years) | |
| Alienware 16X Aurora, RTX 5070 | |
| MSI Crosshair A17 HX D8WGKG | |
| Lenovo Legion 5 Pro 16IAX10H | |
| Blender / v3.3 Classroom CUDA | |
| Average NVIDIA GeForce RTX 5070 Laptop (29 - 228, n=28) | |
| Schenker XMG Core 16 M25 | |
| Asus TUF Gaming A16 FA608UP | |
| Average of class Gaming (15 - 228, n=109, last 2 years) | |
| Aorus Elite 16 AE6H | |
| MSI Crosshair 16 HX AI D2XWGKG | |
| MSI Crosshair A17 HX D8WGKG | |
| MSI Crosshair 18 HX AI A2XW | |
| Alienware 16X Aurora, RTX 5070 | |
| Lenovo Legion 5 Pro 16IAX10H | |
| Blender / v3.3 Classroom CPU | |
| Asus TUF Gaming A16 FA608UP | |
| Average NVIDIA GeForce RTX 5070 Laptop (137 - 507, n=25) | |
| Average of class Gaming (122 - 565, n=105, last 2 years) | |
| Schenker XMG Core 16 M25 | |
| Alienware 16X Aurora, RTX 5070 | |
| MSI Crosshair 18 HX AI A2XW | |
| Lenovo Legion 5 Pro 16IAX10H | |
| MSI Crosshair 16 HX AI D2XWGKG | |
* ... smaller is better
The Crosshair 16 HX AI can convincingly run many titles at QHD Ultra settings, but the 8 GB VRAM limitation becomes immediately apparent in VRAM-intensive games such as Black Myth: Wukong and F1 25.
Cyberpunk 2077 1080p Ultra fps chart
We noticed no major throttling issues during an extended run of Cyberpunk 2077: Phantom Liberty at 1080p Ultra.
| low | med. | high | ultra | QHD DLSS | QHD | |
|---|---|---|---|---|---|---|
| GTA V (2015) | 179.8 | 174.1 | 172.4 | 142.3 | 125.9 | |
| Dota 2 Reborn (2015) | 217 | 190.5 | 183.8 | 170 | ||
| Final Fantasy XV Benchmark (2018) | 234 | 192.6 | 141.9 | 104 | ||
| X-Plane 11.11 (2018) | 148.1 | 133.9 | 111 | |||
| Strange Brigade (2018) | 536 | 362 | 302 | 259 | 171.8 | |
| Baldur's Gate 3 (2023) | 204 | 150.7 | 135.5 | 131 | 133.9 | 90.7 |
| Cyberpunk 2077 (2023) | 174.2 | 145 | 120.1 | 107.1 | 77 | 66.3 |
| F1 24 (2024) | 305 | 316 | 251 | 87.6 | 86.7 | 53.8 |
| Black Myth: Wukong (2024) | 197 | 112 | 86 | 44 | 40 | 26 |
| F1 25 (2025) | 267 | 242 | 191 | 26.5 | 29.1 | 7.69 |
| Battlefield 6 (2025) | 154 | 138.6 | 106.6 | 79.9 | 56.1 | 43.4 |
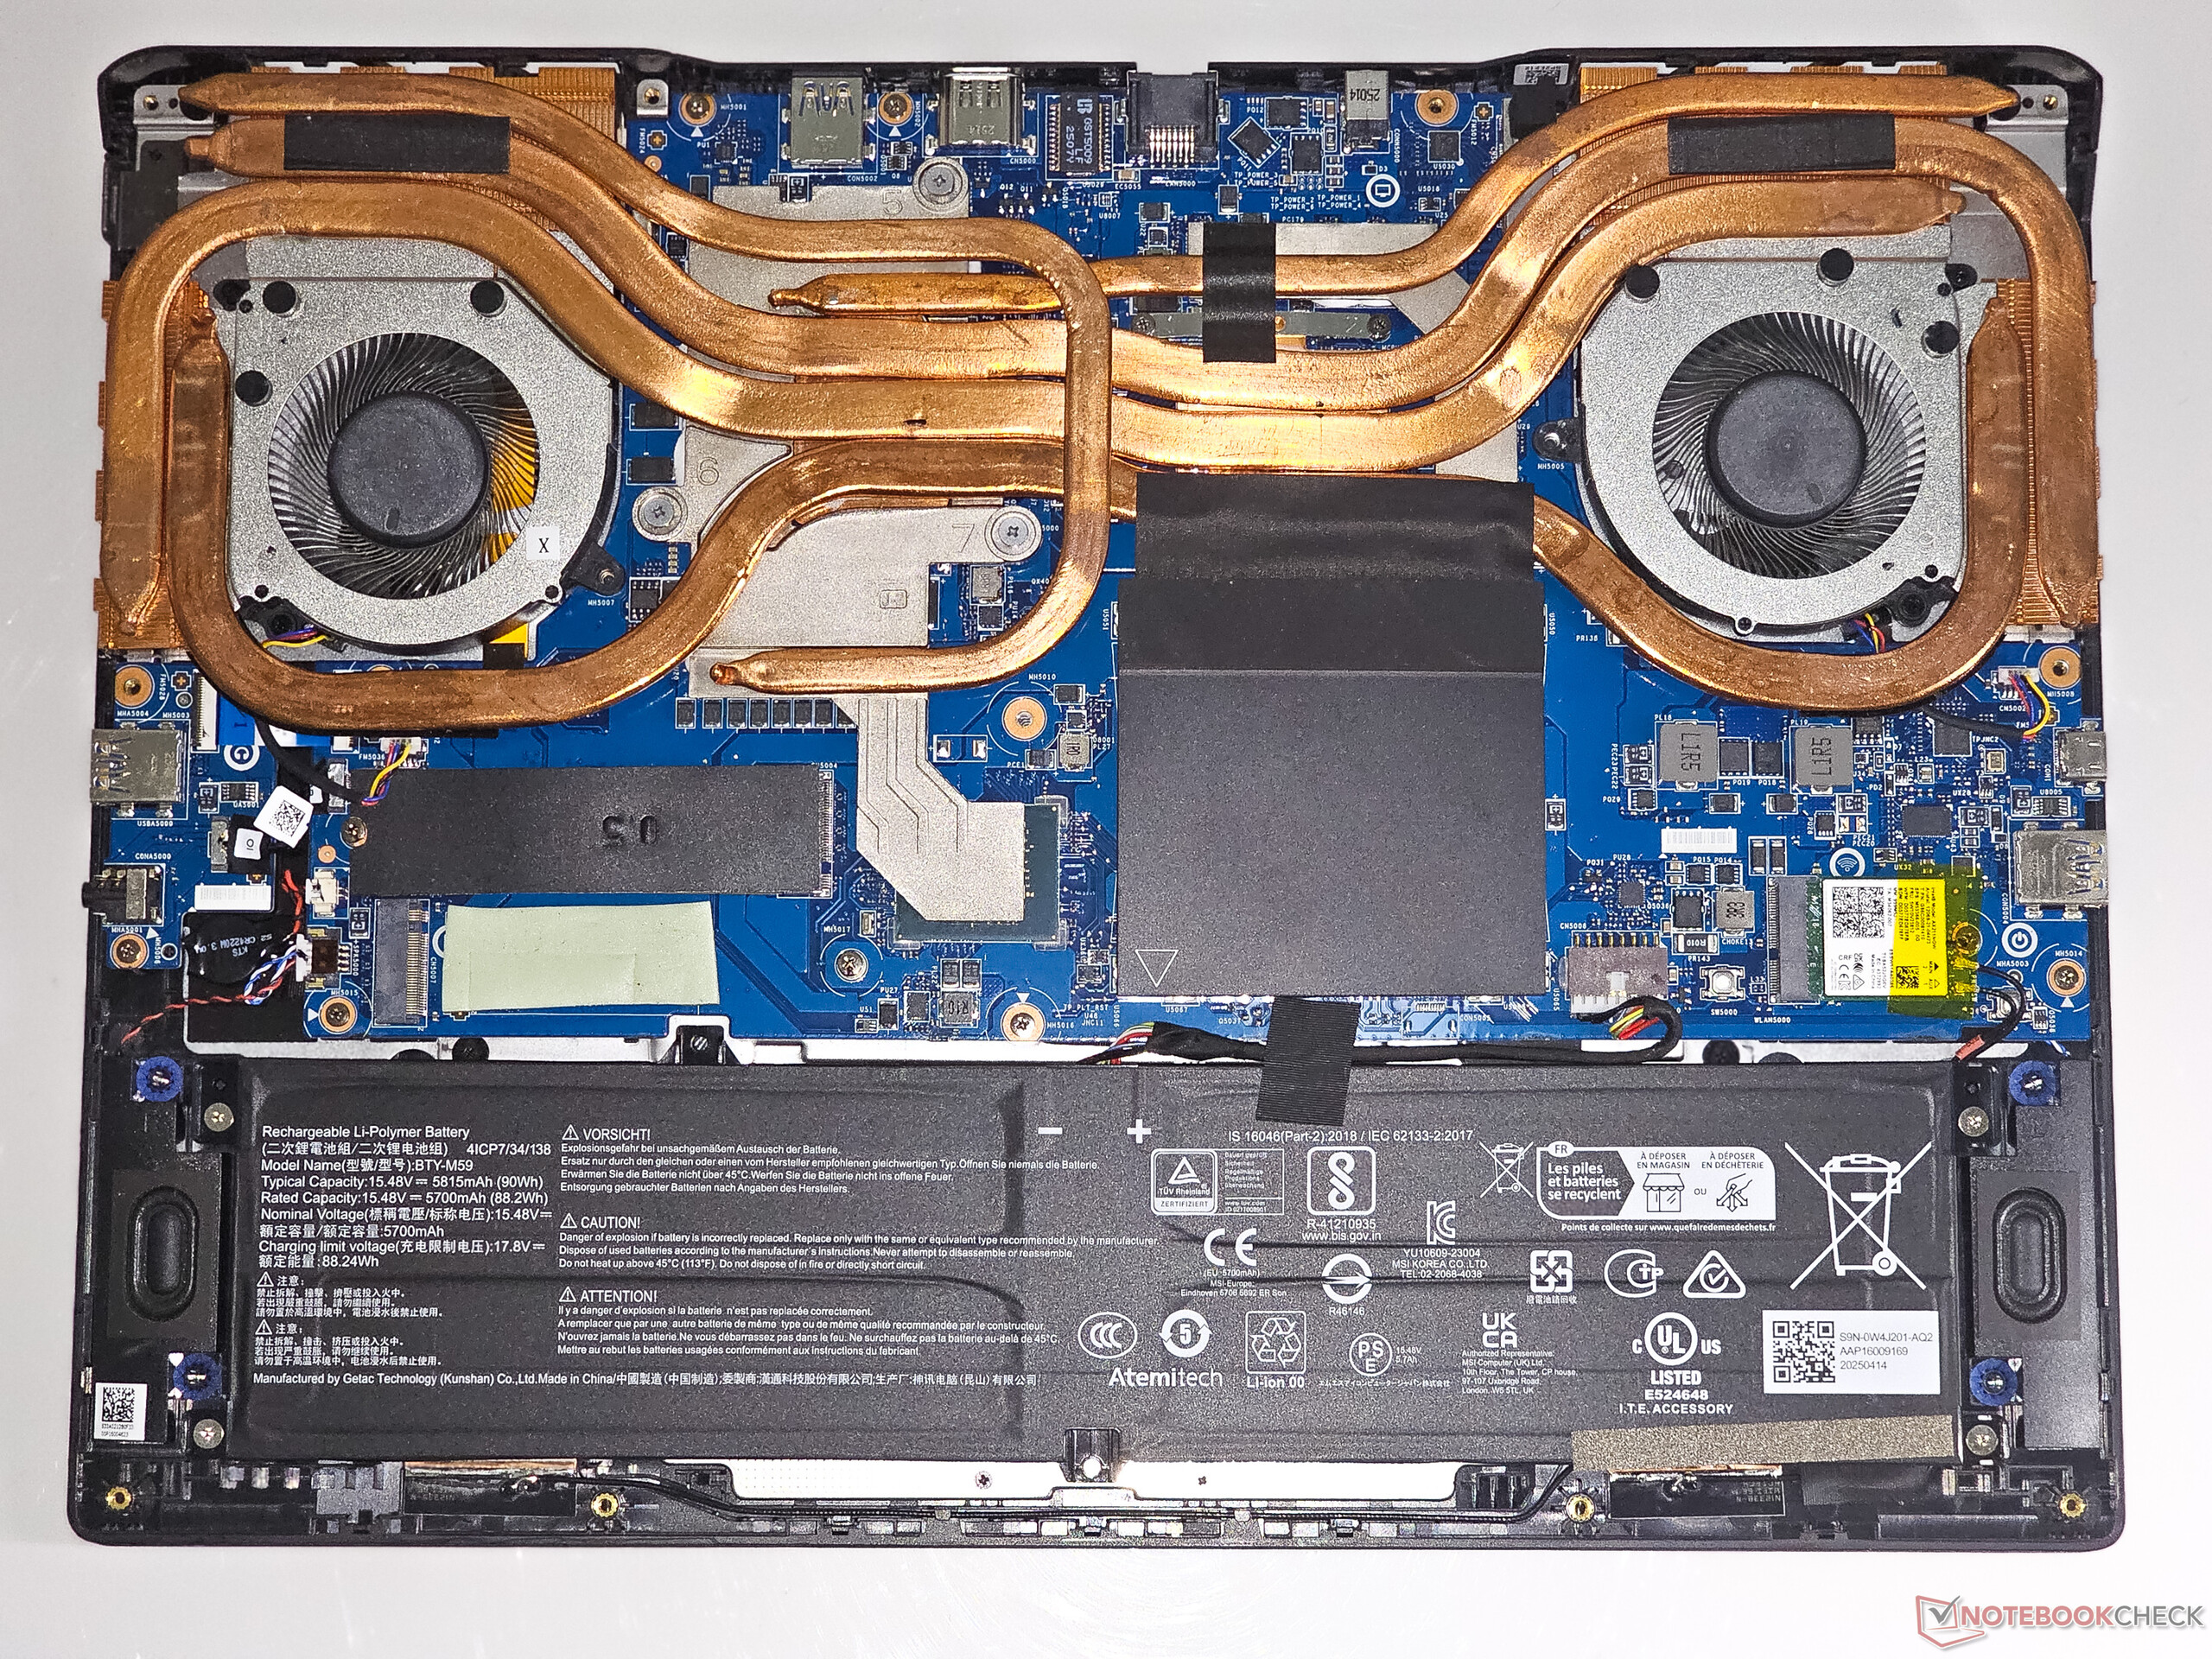
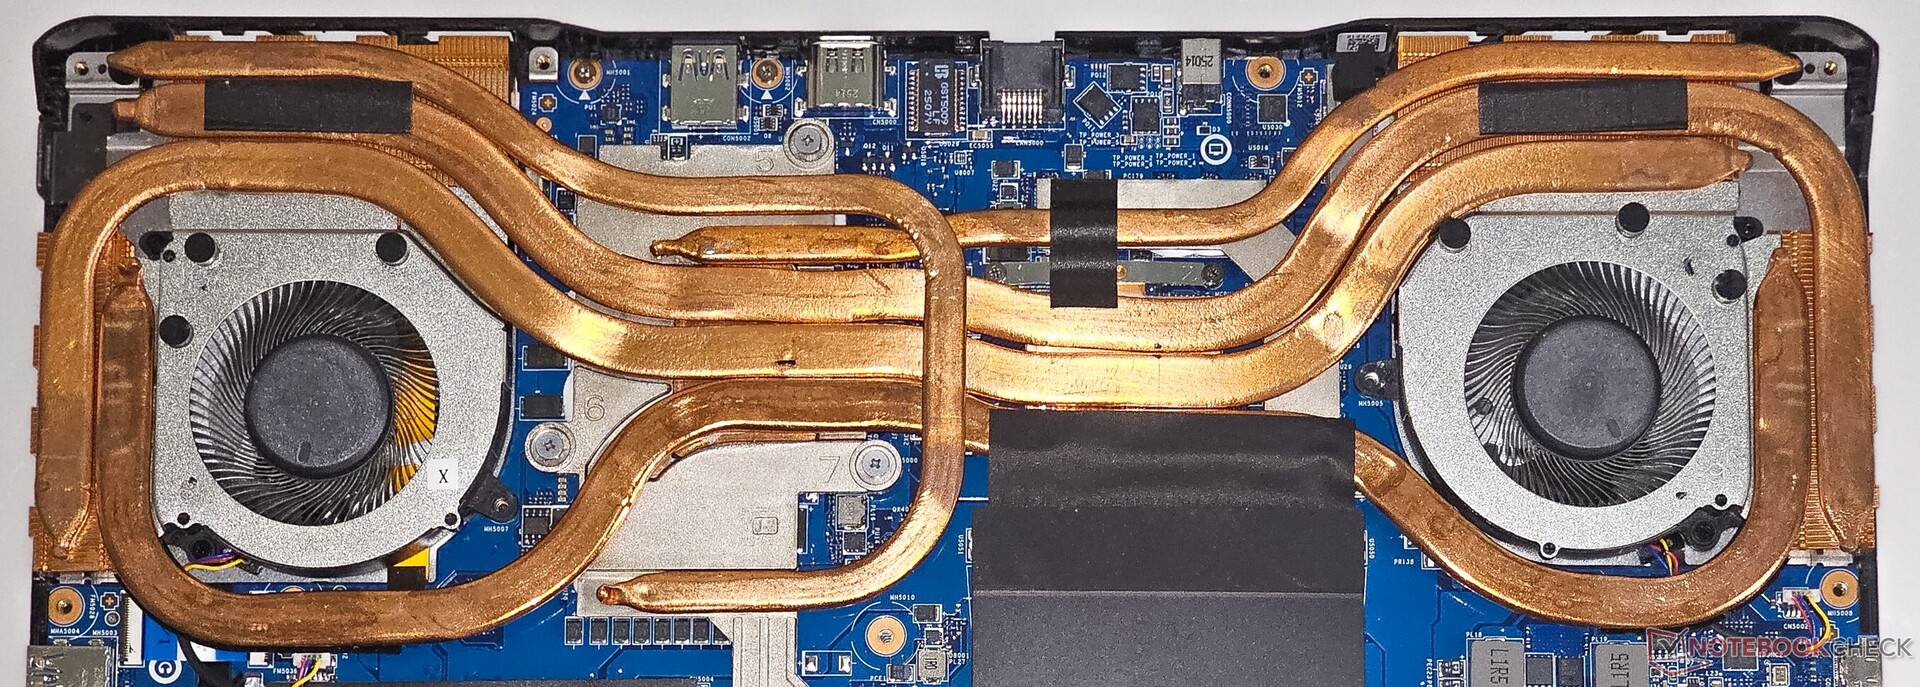
Emissions: Robust cooling but with high decibel levels and thermals
System noise
Fan noise in the Extreme Performance mode reaches nearly 58 db(A) under full load.
The Extreme Performance profile includes a Cooler Boost fan mode, which peaks at 65 db(A), so use of headphones while gaming in this mode is strongly recommended.
Noise level
| Idle |
| 28.3 / 28.3 / 28.3 dB(A) |
| Load |
| 50.26 / 57.95 dB(A) |
 | ||
30 dB silent 40 dB(A) audible 50 dB(A) loud |
||
min: | ||
| MSI Crosshair 16 HX AI D2XWGKG Ultra 9 275HX, GeForce RTX 5070 Laptop | Alienware 16X Aurora, RTX 5070 Ultra 9 275HX, GeForce RTX 5070 Laptop | Aorus Elite 16 AE6H Ultra 9 275HX, GeForce RTX 5070 Laptop | Lenovo Legion 5 Pro 16IAX10H Ultra 9 275HX, GeForce RTX 5070 Ti Laptop | Asus TUF Gaming A16 FA608UP R7 260, GeForce RTX 5070 Laptop | |
|---|---|---|---|---|---|
| Noise | 15% | -3% | 3% | -1% | |
| off / environment * (dB) | 25.56 | 23.7 7% | 24 6% | 24 6% | 25.1 2% |
| Idle Minimum * (dB) | 28.3 | 23.9 16% | 25 12% | 24 15% | 32.2 -14% |
| Idle Average * (dB) | 28.3 | 23.9 16% | 29 -2% | 24 15% | 32.2 -14% |
| Idle Maximum * (dB) | 28.3 | 26.1 8% | 32 -13% | 30.9 -9% | 32.2 -14% |
| Load Average * (dB) | 50.26 | 26.8 47% | 60 -19% | 55.9 -11% | 38.1 24% |
| Cyberpunk 2077 ultra * (dB) | 57.8 | 51.8 10% | 59 -2% | 56.72 2% | 53.9 7% |
| Load Maximum * (dB) | 57.95 | 58 -0% | 61 -5% | 56.72 2% | 57.1 1% |
* ... smaller is better
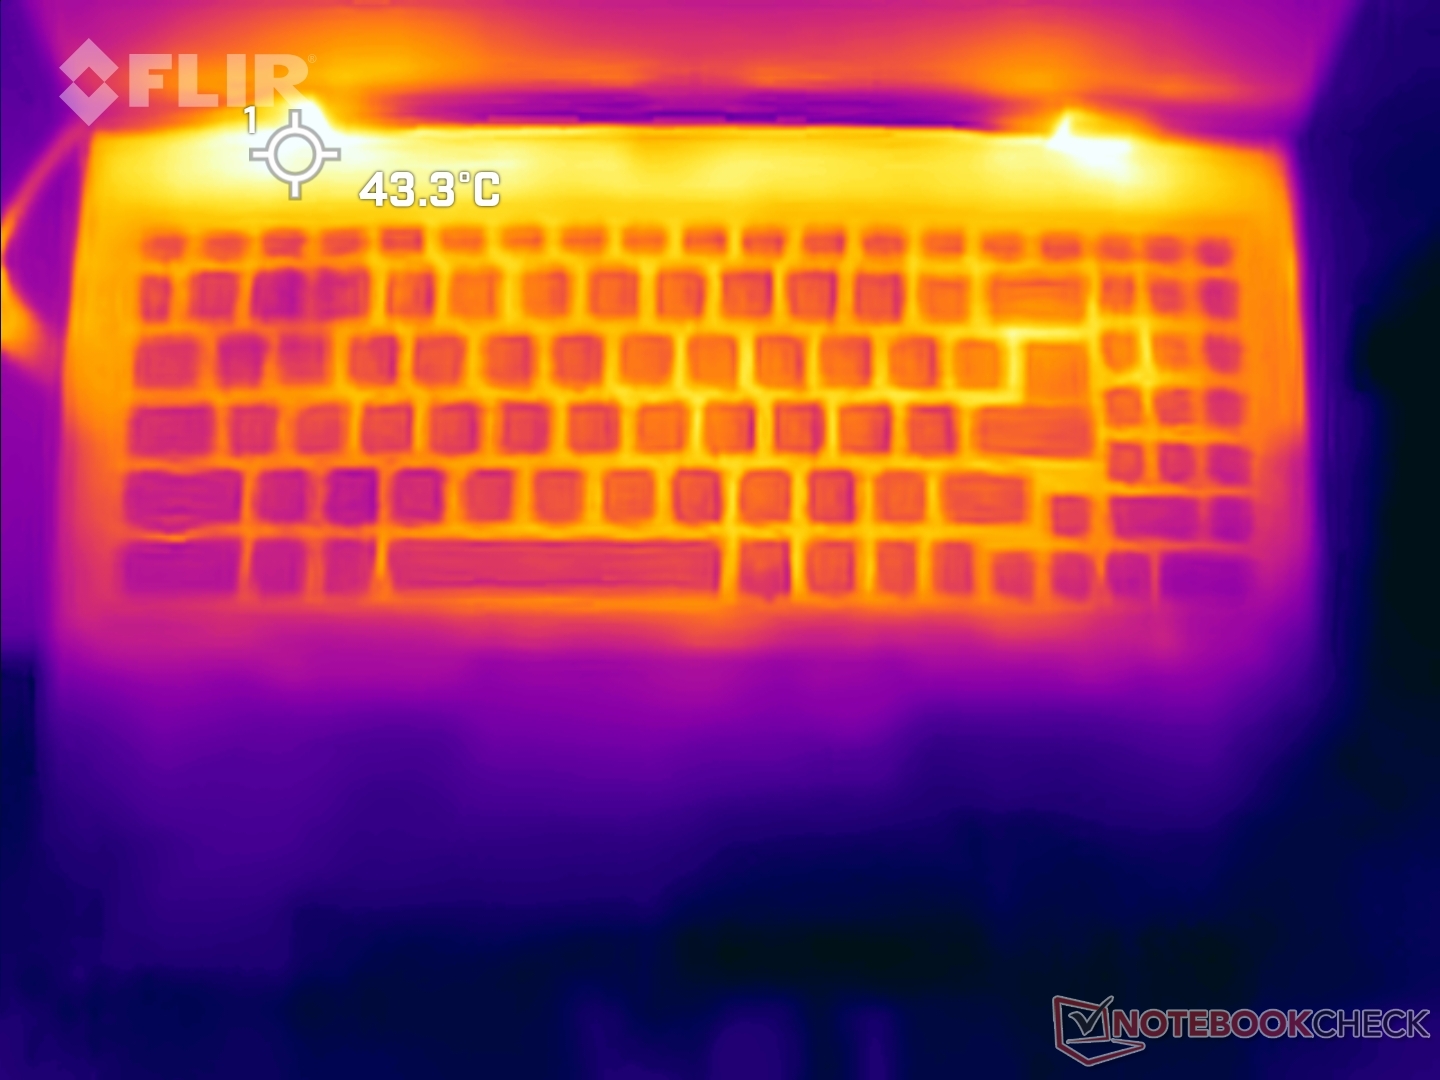
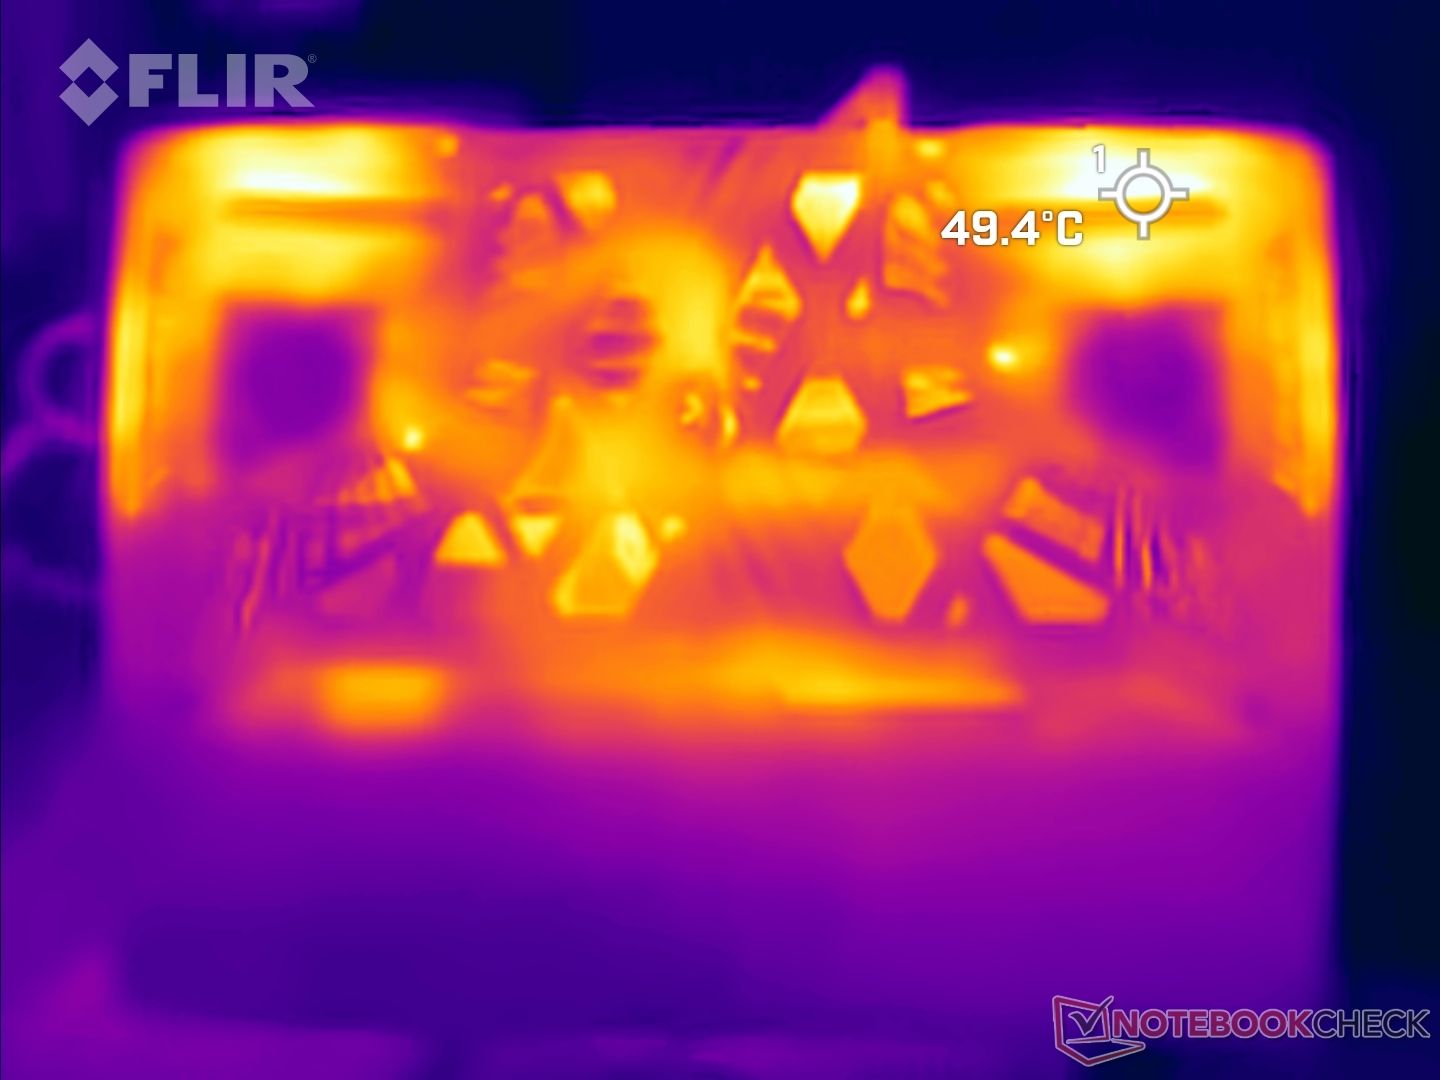
Temperature
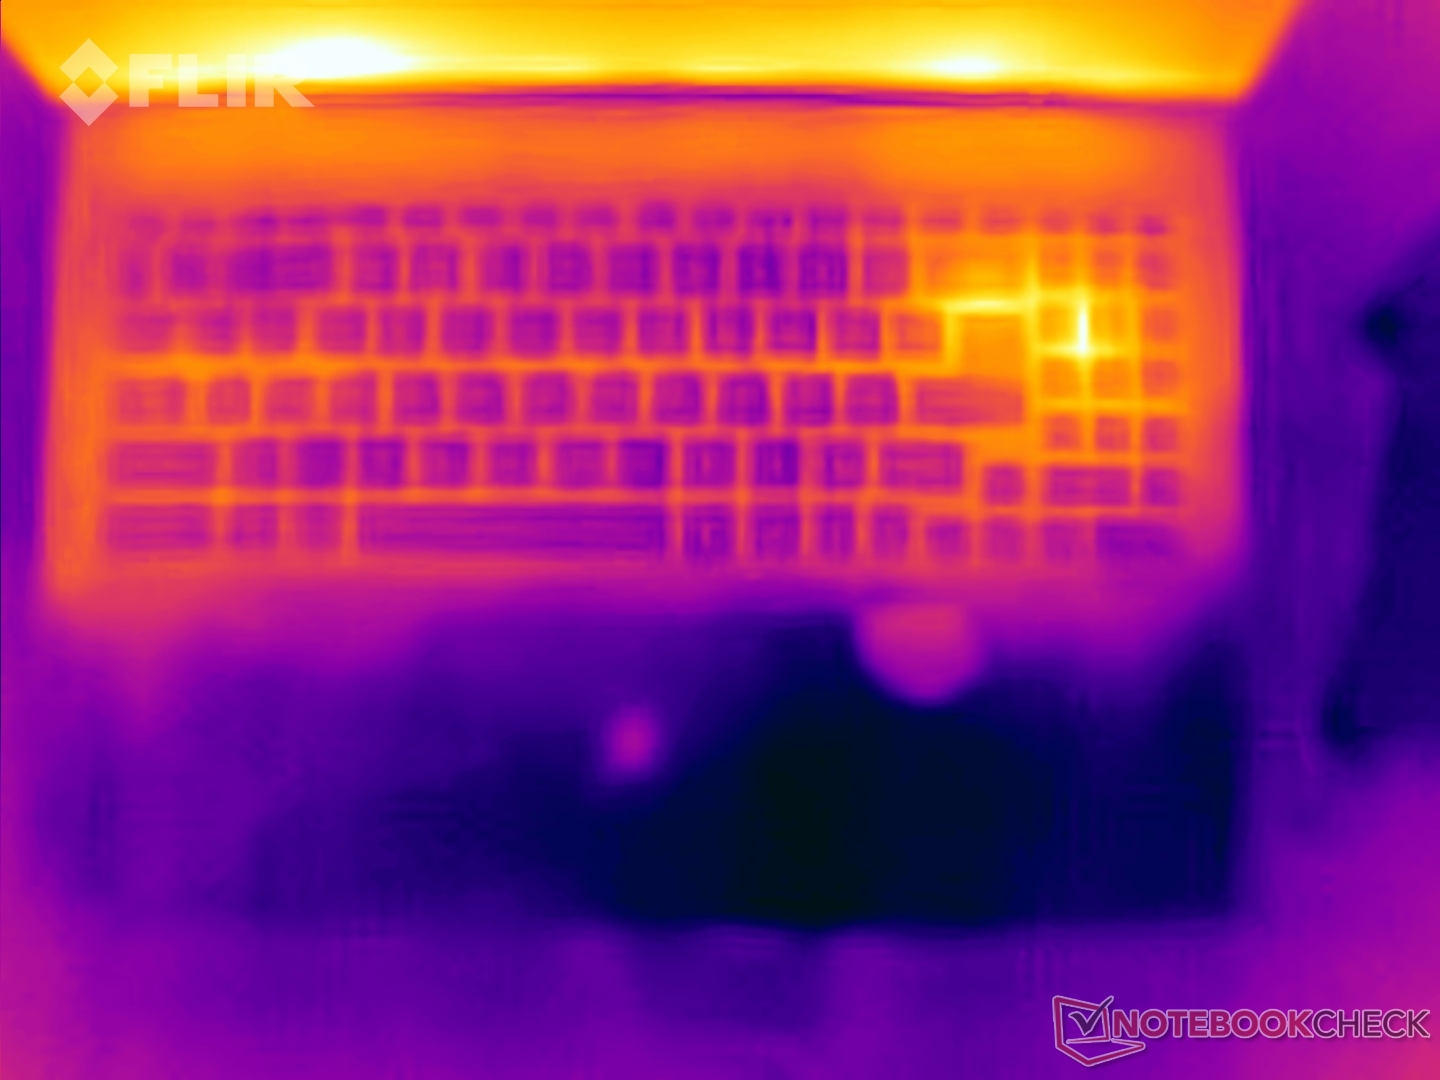
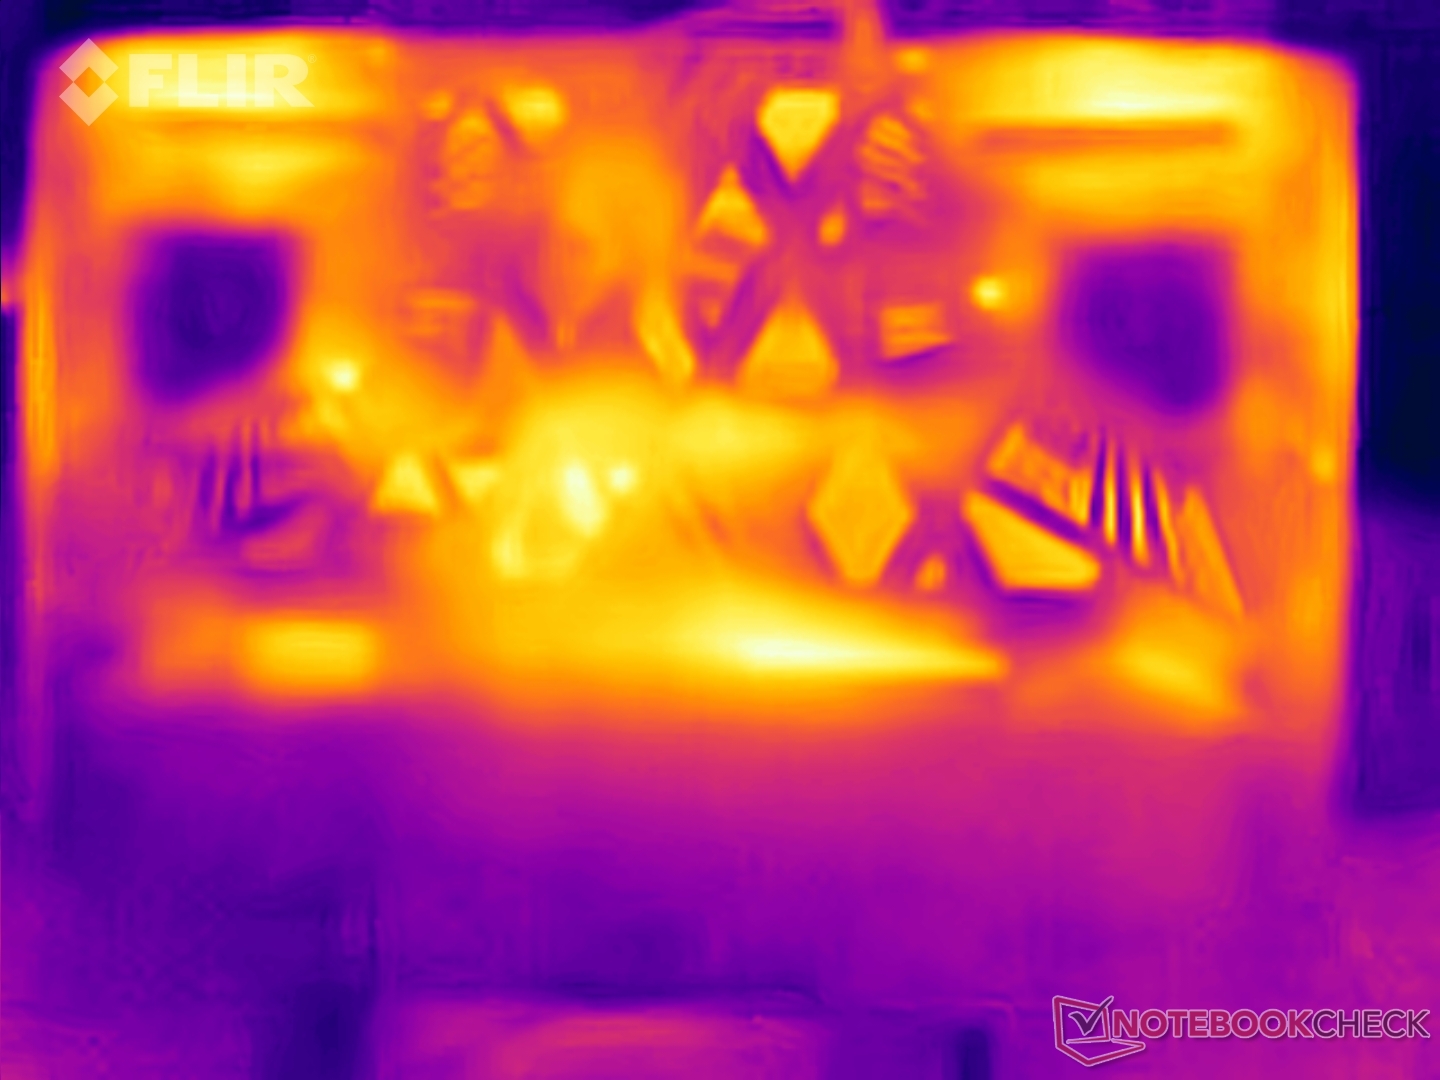
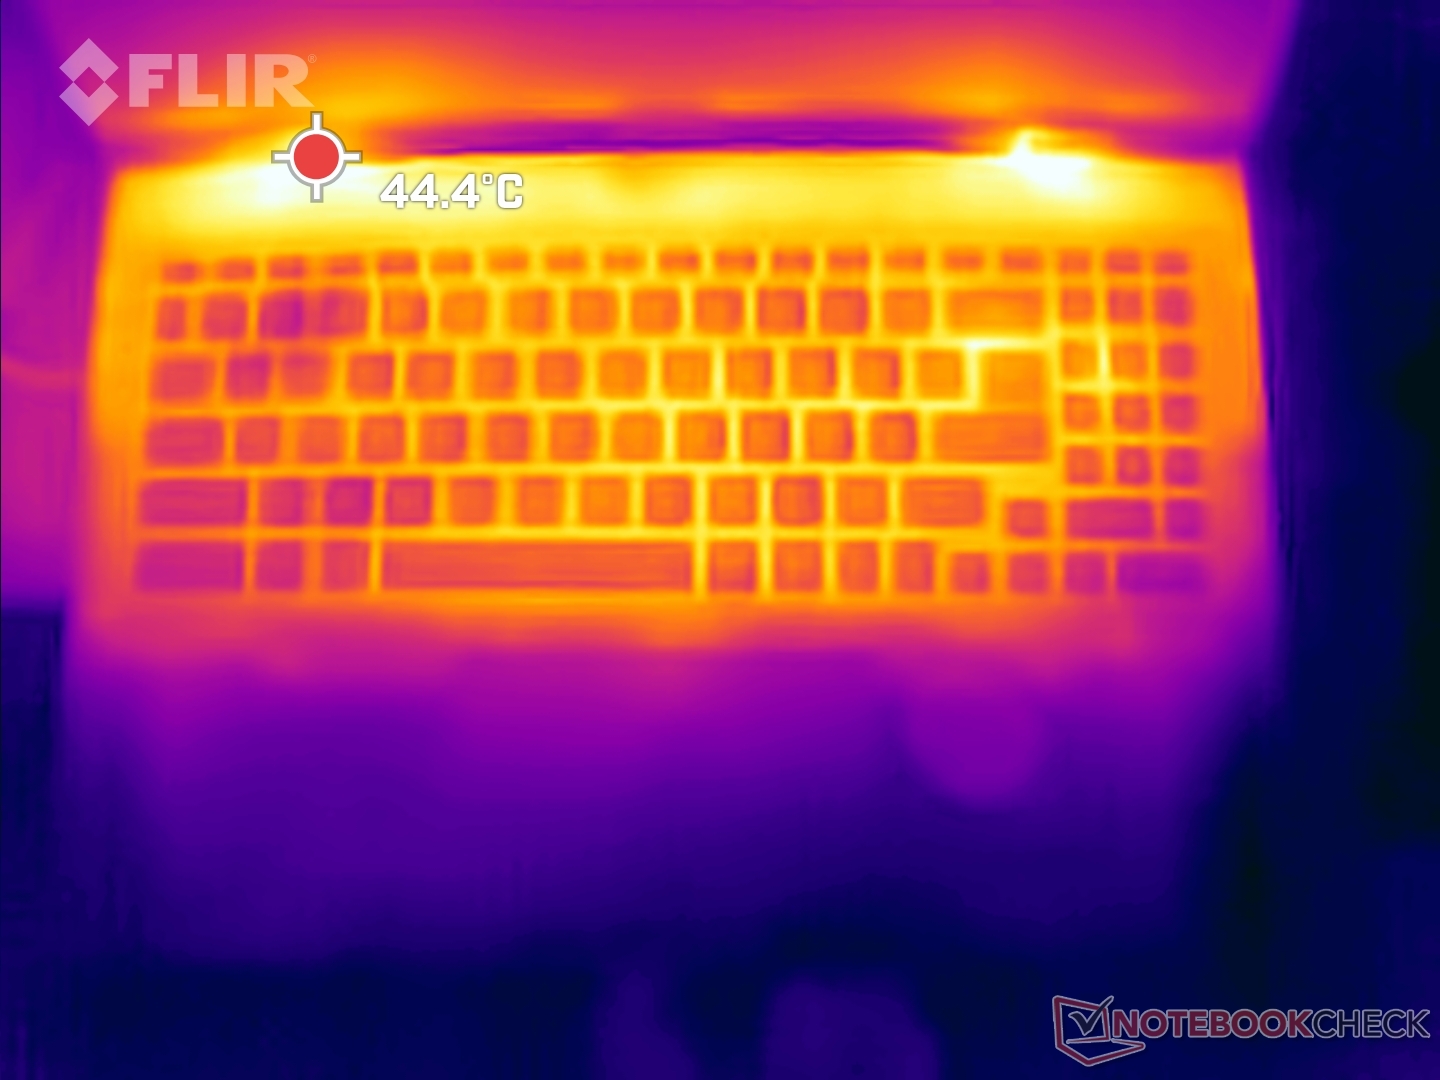
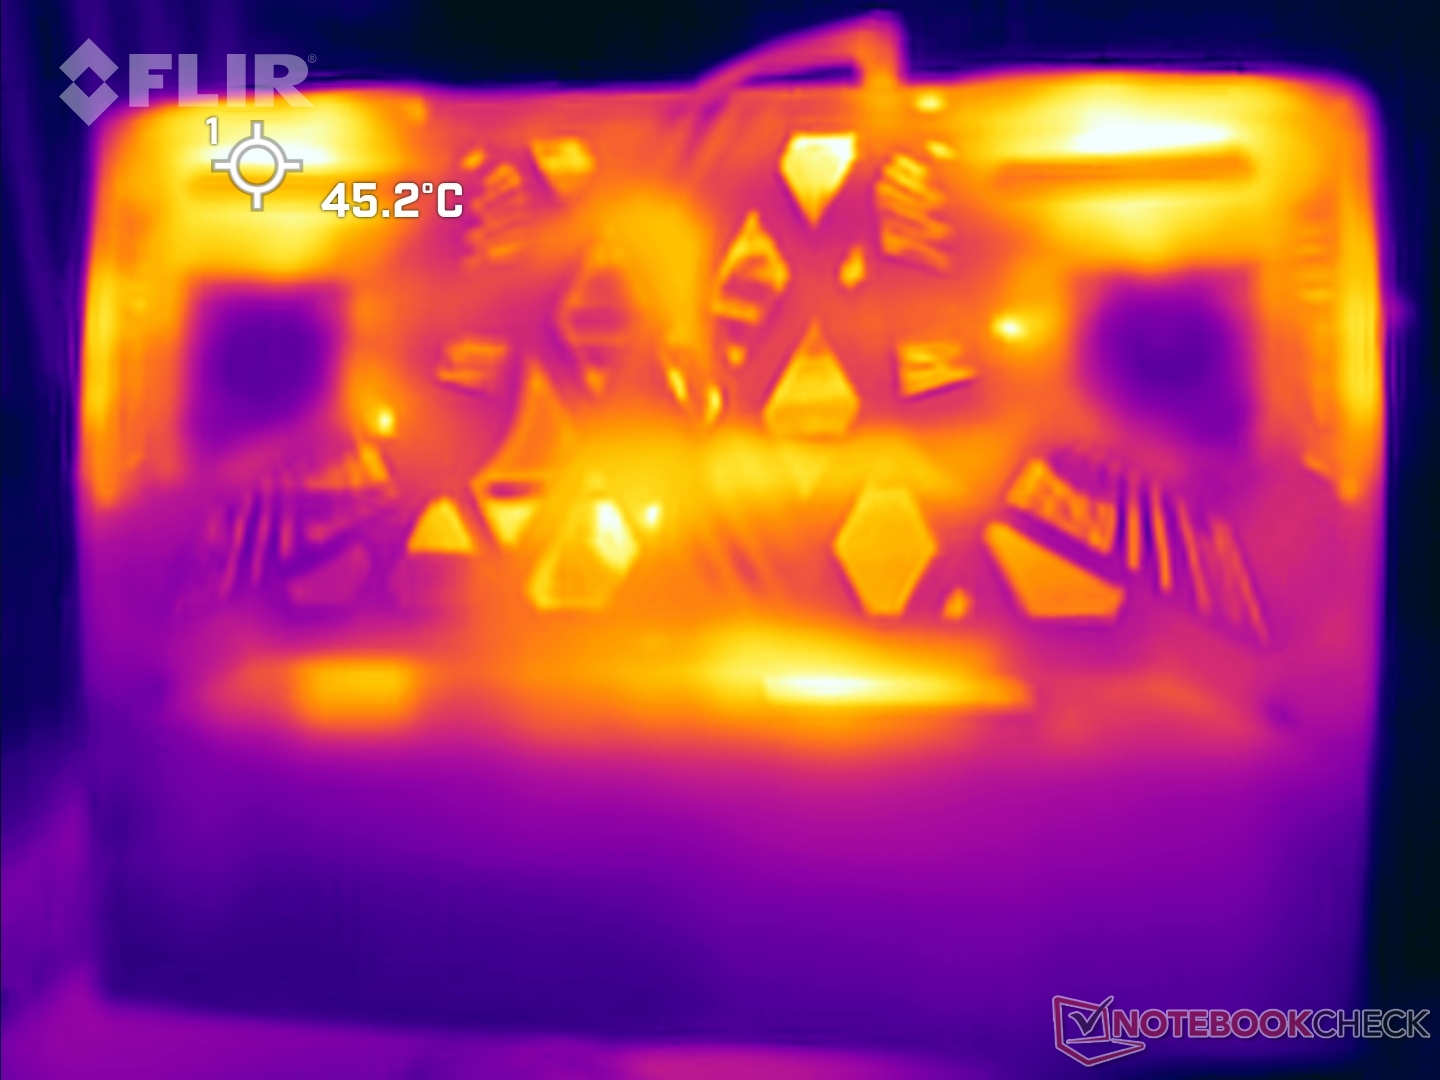
Surface temperatures can reach up to 45 °C on the upper side and nearly 49 °C on the bottom under load in the Extreme Performance mode.
The WASD, touchpad, and palm rest areas remained relatively cool during stress testing.
Given that the fans push out a lot of air from the multiple vents, those using a mouse may want to position themselves appropriately to avoid discomfort from the hot exhaust.
(±) The maximum temperature on the upper side is 44.8 °C / 113 F, compared to the average of 40.4 °C / 105 F, ranging from 21.2 to 68.8 °C for the class Gaming.
(±) The bottom heats up to a maximum of 43.4 °C / 110 F, compared to the average of 43.2 °C / 110 F
(+) In idle usage, the average temperature for the upper side is 28.9 °C / 84 F, compared to the device average of 33.9 °C / 93 F.
(±) 3: The average temperature for the upper side is 36.9 °C / 98 F, compared to the average of 33.9 °C / 93 F for the class Gaming.
(+) The palmrests and touchpad are cooler than skin temperature with a maximum of 31 °C / 87.8 F and are therefore cool to the touch.
(-) The average temperature of the palmrest area of similar devices was 28.8 °C / 83.8 F (-2.2 °C / -4 F).
| MSI Crosshair 16 HX AI D2XWGKG Ultra 9 275HX, GeForce RTX 5070 Laptop | Alienware 16X Aurora, RTX 5070 Ultra 9 275HX, GeForce RTX 5070 Laptop | Aorus Elite 16 AE6H Ultra 9 275HX, GeForce RTX 5070 Laptop | Lenovo Legion 5 Pro 16IAX10H Ultra 9 275HX, GeForce RTX 5070 Ti Laptop | Asus TUF Gaming A16 FA608UP R7 260, GeForce RTX 5070 Laptop | |
|---|---|---|---|---|---|
| Heat | -3% | -8% | -23% | 9% | |
| Maximum Upper Side * (°C) | 44.8 | 51 -14% | 41 8% | 48 -7% | 39.5 12% |
| Maximum Bottom * (°C) | 43.4 | 45.6 -5% | 45 -4% | 50 -15% | 45.1 -4% |
| Idle Upper Side * (°C) | 31.2 | 29.8 4% | 35 -12% | 38 -22% | 25.7 18% |
| Idle Bottom * (°C) | 28.8 | 27.4 5% | 36 -25% | 42 -46% | 25.5 11% |
* ... smaller is better
Speakers
The Crosshair 16 HX AI's stereo speakers have decent loudness levels but lack good bass response.
MSI Crosshair 16 HX AI D2XWGKG audio analysis
(±) | speaker loudness is average but good (81.5 dB)
Bass 100 - 315 Hz
(-) | nearly no bass - on average 15.6% lower than median
(±) | linearity of bass is average (10.5% delta to prev. frequency)
Mids 400 - 2000 Hz
(±) | higher mids - on average 6.6% higher than median
(±) | linearity of mids is average (7.1% delta to prev. frequency)
Highs 2 - 16 kHz
(+) | balanced highs - only 1.6% away from median
(+) | highs are linear (5.8% delta to prev. frequency)
Overall 100 - 16.000 Hz
(+) | overall sound is linear (14.7% difference to median)
Compared to same class
» 28% of all tested devices in this class were better, 7% similar, 64% worse
» The best had a delta of 6%, average was 18%, worst was 132%
Compared to all devices tested
» 19% of all tested devices were better, 4% similar, 77% worse
» The best had a delta of 4%, average was 24%, worst was 134%
Apple MacBook Pro 16 2021 M1 Pro audio analysis
(+) | speakers can play relatively loud (84.7 dB)
Bass 100 - 315 Hz
(+) | good bass - only 3.8% away from median
(+) | bass is linear (5.2% delta to prev. frequency)
Mids 400 - 2000 Hz
(+) | balanced mids - only 1.3% away from median
(+) | mids are linear (2.1% delta to prev. frequency)
Highs 2 - 16 kHz
(+) | balanced highs - only 1.9% away from median
(+) | highs are linear (2.7% delta to prev. frequency)
Overall 100 - 16.000 Hz
(+) | overall sound is linear (4.6% difference to median)
Compared to same class
» 0% of all tested devices in this class were better, 0% similar, 100% worse
» The best had a delta of 5%, average was 17%, worst was 45%
Compared to all devices tested
» 0% of all tested devices were better, 0% similar, 100% worse
» The best had a delta of 4%, average was 24%, worst was 134%
Power consumption: Not the most frugal in the comparison
The Crosshair 16 HX AI is not very economical when it comes to power consumption in the Extreme Performance mode. Power draws are somewhat higher even in the off and standby states.
| Off / Standby | |
| Idle | |
| Load |
|
Key:
min: | |
| MSI Crosshair 16 HX AI D2XWGKG Ultra 9 275HX, GeForce RTX 5070 Laptop, IPS, 2560x1600, 16" | Alienware 16X Aurora, RTX 5070 Ultra 9 275HX, GeForce RTX 5070 Laptop, IPS, 2560x1600, 16" | Aorus Elite 16 AE6H Ultra 9 275HX, GeForce RTX 5070 Laptop, IPS, 2560x1600, 16" | Lenovo Legion 5 Pro 16IAX10H Ultra 9 275HX, GeForce RTX 5070 Ti Laptop, OLED, 2560x1600, 16" | Asus TUF Gaming A16 FA608UP R7 260, GeForce RTX 5070 Laptop, IPS, 2560x1600, 16" | Average NVIDIA GeForce RTX 5070 Laptop | Average of class Gaming | |
|---|---|---|---|---|---|---|---|
| Power Consumption | 11% | 26% | 9% | 43% | 40% | 29% | |
| Idle Minimum * (Watt) | 26.2 | 20.1 23% | 8.5 68% | 14 47% | 4.6 82% | 10.7 ? 59% | 13.2 ? 50% |
| Idle Average * (Watt) | 33.8 | 27.6 18% | 13.6 60% | 14.3 58% | 9.8 71% | 15.3 ? 55% | 18.9 ? 44% |
| Idle Maximum * (Watt) | 34 | 31.8 6% | 22 35% | 20.1 41% | 10.2 70% | 20.2 ? 41% | 24.3 ? 29% |
| Load Average * (Watt) | 112 | 102.7 8% | 113 -1% | 177 -58% | 76.1 32% | 97.5 ? 13% | 108.3 ? 3% |
| Cyberpunk 2077 ultra external monitor * (Watt) | 220 | 192.3 13% | 219 -0% | 255 -16% | 198.1 10% | ||
| Cyberpunk 2077 ultra * (Watt) | 224 | 217 3% | 223 -0% | 255 -14% | 198.9 11% | ||
| Load Maximum * (Watt) | 315 | 292 7% | 257 18% | 294 7% | 235.2 25% | 216 ? 31% | 254 ? 19% |
* ... smaller is better
Power consumption: Cyberpunk 2077 / Stress test
Power consumption: External monitor
Battery life
Battery run time nearing 12 hours or more is possible in the ECO-Silent mode with MSHybrid and the refresh rate set to 60 Hz.
| MSI Crosshair 16 HX AI D2XWGKG Ultra 9 275HX, GeForce RTX 5070 Laptop, 90 Wh | Alienware 16X Aurora, RTX 5070 Ultra 9 275HX, GeForce RTX 5070 Laptop, 96 Wh | Aorus Elite 16 AE6H Ultra 9 275HX, GeForce RTX 5070 Laptop, 99 Wh | Lenovo Legion 5 Pro 16IAX10H Ultra 9 275HX, GeForce RTX 5070 Ti Laptop, 80 Wh | Asus TUF Gaming A16 FA608UP R7 260, GeForce RTX 5070 Laptop, 90 Wh | Average of class Gaming | |
|---|---|---|---|---|---|---|
| Battery runtime | ||||||
| WiFi v1.3 (h) | 11.1 | 4.3 -61% | 8.5 -23% | 4.9 -56% | 13 17% | 7.04 ? -37% |
Notebookcheck's overall impressions of the MSI Crosshair 16 HX AI
The MSI Crosshair 16 HX AI comes across as a capable upper mid-range gaming laptop. There are visible cost cutting measures but none that adversely affect the actual gaming experience.
MSI Crosshair 16 HX AI D2XWGKG
- 11/11/2025 v8
Vaidyanathan Subramaniam
 Total Sustainability Score:
 Potential competitors in comparison
Image | Model / Review | Price | Weight | Height | Display |
|---|---|---|---|---|---|
1. 81.9%  | MSI Crosshair 16 HX AI D2XWGKG Intel Core Ultra 9 275HX ⎘ NVIDIA GeForce RTX 5070 Laptop ⎘ 16 GB Memory, 1024 GB SSD | Amazon: List Price: 2500 EUR | 2.5 kg | 27.9 mm | 16.00" 2560x1600 189 PPI IPS |
2. 84.9%  | Alienware 16X Aurora, RTX 5070 Intel Core Ultra 9 275HX ⎘ NVIDIA GeForce RTX 5070 Laptop ⎘ 32 GB Memory | Amazon: List Price: 1800 USD | 2.5 kg | 23.4 mm | 16.00" 2560x1600 189 PPI IPS |
3. 84.4%  | Aorus Elite 16 AE6H Intel Core Ultra 9 275HX ⎘ NVIDIA GeForce RTX 5070 Laptop ⎘ 32 GB Memory, 1024 GB SSD | List Price: 2300 EUR | 2.4 kg | 26 mm | 16.00" 2560x1600 189 PPI IPS |
4. 84.5%  | Lenovo Legion 5 Pro 16IAX10H Intel Core Ultra 9 275HX ⎘ NVIDIA GeForce RTX 5070 Ti Laptop ⎘ 32 GB Memory, 1024 GB SSD | Amazon: 1. $2,299.99 Lenovo Legion Pro 7 16IAX10H... 2. $1,749.99 Lenovo Legion Pro 5 AI Gamin... 3. $2,474.00 Lenovo Legion Pro 5i Gen 10 ... List Price: 2500 Euro | 2.4 kg | 25.95 mm | 16.00" 2560x1600 189 PPI OLED |
5. 83.8%  | Asus TUF Gaming A16 FA608UP AMD Ryzen 7 260 ⎘ NVIDIA GeForce RTX 5070 Laptop ⎘ 32 GB Memory, 1024 GB SSD | Amazon: List Price: 2199€ | 2.2 kg | 25.7 mm | 16.00" 2560x1600 189 PPI IPS |
